town of jupiter staff report for angelo's pizza expansion town ...
STOCHASTIC VARIABILITY IN THE A T M O S P H E R I C ACTIVITY OF
JUPITER
I. XANTHAKIS,* I. LIRITZIS and B. PETROPOULOS Research Center for Astronomy and Applied Mathematics, Academy of Athens, 14 Anagnostopoulou
Str., Athens 106 73
and
C. BANOS and E. SARRIS Astronomical Institute, National Observatory of Athens
(Received 22 August 1994)
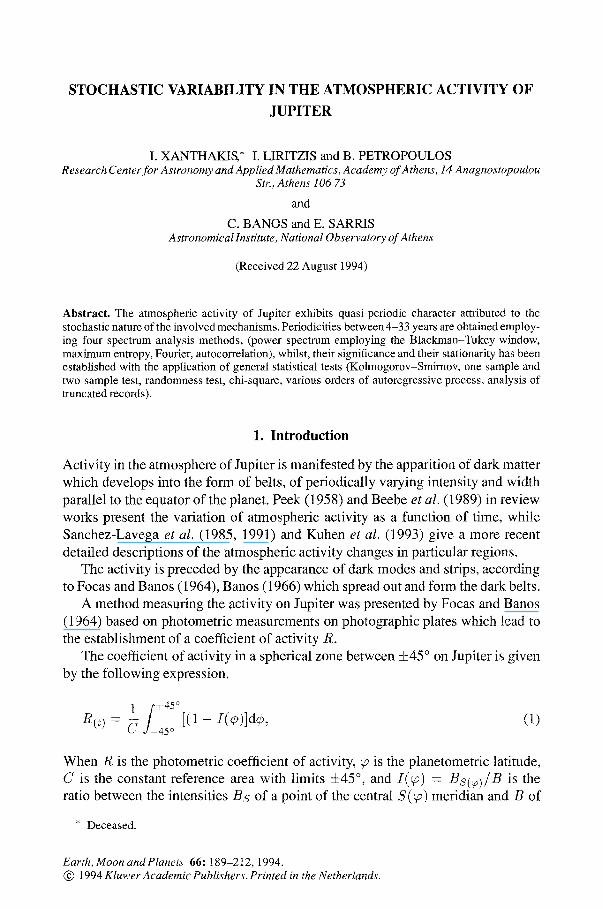
Abstract. The atmospheric activity of Jupiter exhibits quasi-periodic character attributed to the stochastic nature of the involved mechanisms. Periodicities between 4-33 years are obtained employ- ing four spectrum analysis methods, (power spectrum employing the Blackman-Tukey window, maximum entropy, Fourier, autocorrelation), whilst, their significance and their stationarity has been established with the application of general statistical tests (Kolmogorov-Smimov, one sample and two sample test, randomness test, chi-square, various orders of autoregressive process, analysis of truncated records).
1. Introduction
Activity in the atmosphere of Jupiter is manifested by the apparition of dark matter which develops into the form of belts, of periodically varying intensity and width parallel to the equator of the planet. Peek (1958) and Beebe et al. (1989) in review works present the variation of atmospheric activity as a function of time, while Sanchez-Lavega et al. (1985, 1991) and Kuhen et al. (1993) give a more recent detailed descriptions of the atmospheric activity changes in particular regions.
The activity is preceded by the appearance of dark modes and strips, according to Focas and Banos (1964), Banos (1966) which spread out and form the dark belts.
A method measuring the activity on Jupiter was presented by Focas and Banos (1964) based on photometric measurements on photographic plates which lead to the establishment of a coefficient of activity R.
The coefficient of activity in a spherical zone between +45 ° on Jupiter is given by the following expression.
1 f +45° R(0 = C J-45o [(1 - I (~)]d~, (1)
When R is the photometric coefficient of activity, f is the planetometric latitude, C is the constant reference area with limits +45 °, and [ (~ ) = Bs(~) /B is the ratio between the intensities Bs of a point of the central S(c2) meridian and B of
* Deceased.
Earth, Moon and Planets 66: 189-212, 1994. @ 1994 Kluwer Academic Publishers. Printed in the Netherlands.
190 J. XANTHAKIS ET AL.
the brightest point near the center of the disc, if the center is not the brightest, with limits 0 to 1.
Xanthakis et al. (1991) have given a statistical analysis of the coefficient of activity R for the time period 1915-1985 and determined periodicities of 22, 8 and 6 years. The period of 22 years has been obtained by fitting the measured values with trigonometric functions using the method of successive approximations. In order to perform a more extensive study of the search for possible (quasi-) periodicities in the coefficient of atmospheric activity R for the above period, more sophisticated statistical methods of spectrum analysis, have been applied.
In this work we have used the same values of the coefficient of atmospheric activity of Jupiter given by Xanthakis et al. (1991), obtained by Focas (1971), Focas and Banos (1964) and Banos and Sarris (1985).
In the present work we have investigated the variation of the coefficient of atmo- spheric activity of Jupiter, that is, if this variation inheres a periodic or stochastic process for the time interval 1916-1985.
For this reason, the time-series analysis of Jupiter's atmospheric activity (abbre- viated JAA) was approached by three methods of spectrum analysis; Fourier (FFT), Maximum entropy (MESA) and power spectrum (smoothed spectrum using the Blackman-Tukey window).
Various tests of significance and stationarity were applied to examine the reli- ability of the obtained periodicities. Moreover, in our endeavour to interpret the obtained periodic cycles a correlation study was made between JAA and sunspot numbers.
Finally, an attempt was made to apply prediction models to forecast the JAA variation in the next few years.
2. Selection of Data
The plates used in this work have been taken: 1. From the archives of Lowell Observatory for the period 1916-1955. 2. From the archives of the National Observatory of Athens for the period 1955-
1985 which include plates taken with the 16 'r refractor of Athens, the 25 ~r refractor of Pedele Athens and the 48 H reflector of Kryonerion Station (northern Peloponesse, Greece).
The selection of the plates has been made with special care in order to avoid overexposed and underexposed plates. With this criterion we can have plates giving a contrast as true as possible between dark, semitone and bright areas on the image of the planet.
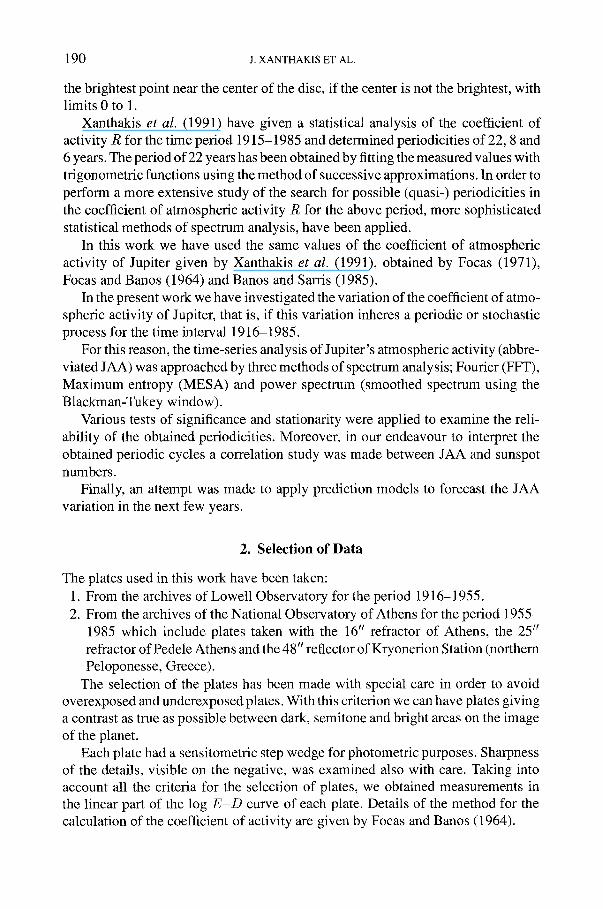
Each plate had a sensitometric step wedge for photometric purposes. Sharpness of the details, visible on the negative, was examined also with care. Taking into account all the criteria for the selection of plates, we obtained measurements in the linear part of the log E - D curve of each plate. Details of the method for the calculation of the coefficient of activity are given by Focas and Banos (1964).
STOCHASTIC VARIABILITY IN THE ATMOSPHERIC ACTIVITY OF JUPITER 191
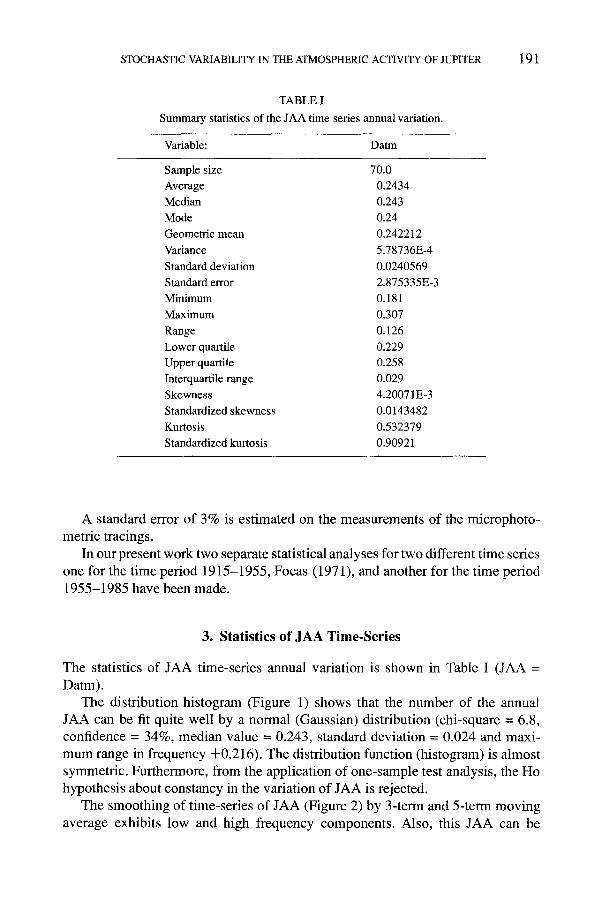
TABLE I Summary statistics of the JAA time series annual variation.
Variable: Datm
Sample size 70.0 Average 0.2434 Median 0.243 Mode 0.24 Geometric mean 0.242212 Variance 5.78736E-4 Standard deviation 0.0240569 Standard error 2.875335E-3 Minimum 0.181 Maximum 0.307 Range 0.126 Lower quartile 0.229 Upper quartile 0.258 Interquartile range 0.029 Skewness 4.20071E-3 Standardized skewness 0.0143482 Kurtosis 0.532379 Standardized kurtosis 0.90921
A standard error of 3% is estimated on the measurements of the microphoto- metric tracings.
In our present work two separate statistical analyses for two different time series one for the time period 1915-1955, Focas (1971), and another for the time period 1955-1985 have been made.
3. Statistics of JAA Time.Series
The statistics of JAA time-series annual variation is shown in Table I (JAA = Datm).
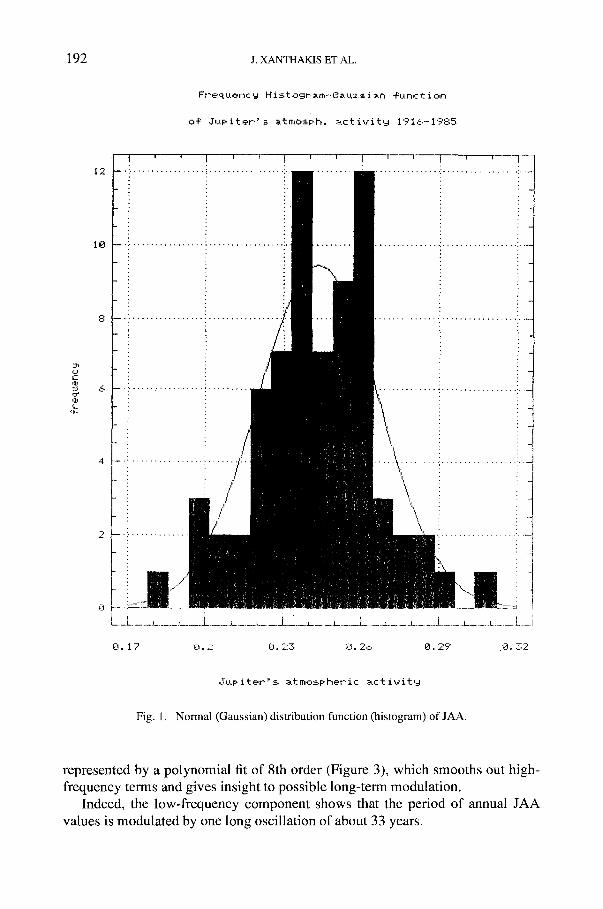
The distribution histogram (Figure 1) shows that the number of the annual JAA can be fit quite well by a normal (Gaussian) distribution (chi-square = 6.8, confidence = 34%, median value = 0.243, standard deviation = 0.024 and maxi- mum range in frequency -4-0.216). The distribution function (histogram) is almost symmetric. Furthermore, from the application of one-sample test analysis, the Ho hypothesis about constancy in the variation of JAA is rejected.
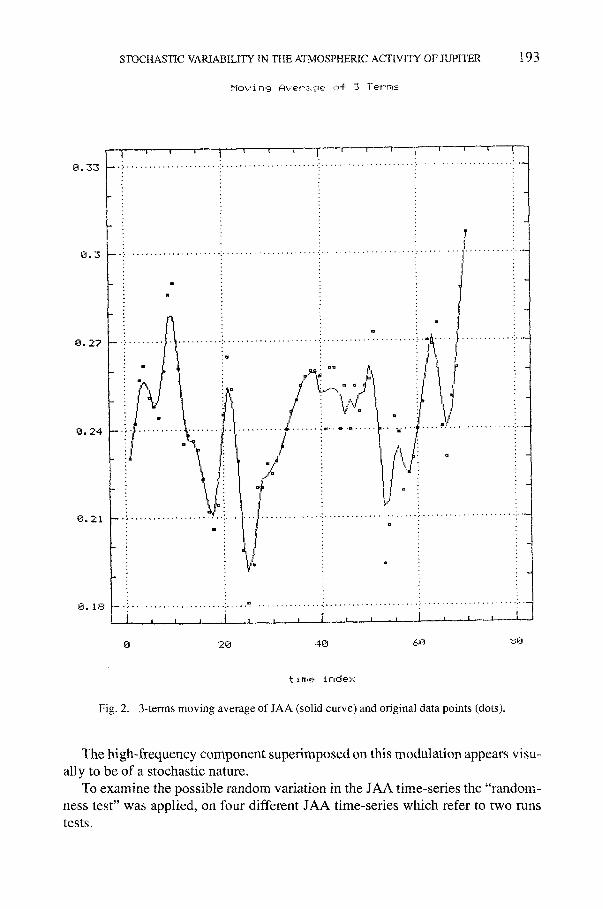
The smoothing of time-series of JAA (Figure 2) by 3-term and 5-term moving average exhibits low and high frequency components. Also, this JAA can be
192 J. XANTHAKIS ET AL.
Freqoen,:,.-.; Hi~togt-.im-G~.~.t.=.~i~.n ~%tnct ion
o$ J~Ipiter."~ ~.tm,:,~-.ph. ~.,:tivit,~ 191,S-1985
iii
r e 1,1!
12
iO
I I I I ~ - -
I I
I L
8.17 0.2 0.23 0.26 0.29 8.32
.Jb.t;. iter" -~. ~tmo~pher.ic ~.ct ivit,_4
Fig. 1. Normal (Gaussian) distribution function (histogram) of JAA.
represented by a polynomial fit of 8th order (Figure 3), which smooths out high- frequency terms and gives insight to possible long-term modulation.
Indeed, the low-frequency component shows that the period of annual JAA values is modulated by one long oscillation of about 33 years.
STOCHASTIC VARIABILITY IN THE ATMOSPHERIC ACTIVITY OF JUPITER
NO',.,' i r r ~ A ',.r' e [I" ~L '-~ ~ 'Z"~ ~ ]* e l ' " [T[].
193
0.33
0.3
0.27
0.24
0.21
0.18
l - , [ . . . . . . . . . . . . . . . . . . . . . . . . . . . . . . . . . . . . . . . . . . . . . , . . . . . . . . . . . . . . . . . . . . . , . . . . . . . . . . ] . . . . . . . . . . . . . .
( : • i t : i
. . . . . . . . . . . . . . . . . . : . . . . . . . . . . . . . . . . . . . . . : . . . . . . . . . . . . . . . . . . . . . : > . . . . . . . . . . . . . . . .
I t/' /
D
l ~ I I , i x. t a t _a___ i ___t___ i l __
0 20 40 ,~0 80
t iff~e iri,-lex
Fig. 2. 3 - t e r m s m o v i n g a v e r a g e o f J A A ( so l id c u r v e ) a n d o r i g i n a l data po in t s (dots) .
The high-frequency component superimposed on this modulation appears visu- ally to be of a stochastic nature.
To examine the possible random variation in the JAA time-series the "random- ness test" was applied, on four different JAA time-series which refer to two runs tests.

194 J. XANTHAKIS ET AL.
0.33
0.3
0.27
E
0.2,4
0.21
0. 18
* d ~ . t rr i
~ - , ~ 0 t - . , - l e r ' . 8
- ~ - ~ . r r r , _ - , o t h
- - - - - - ] . . . . r - - - - - T . . . . . . . . . . . . r . . . . . . . . . . - f . . . . . . . 7 " . . . . . 7 - - - - - ' r . . . . . . "t . . . . r . . . . . . . . . . F . . . . . W - - - ' t - - - - "
~ a 3
. . , . . . . . . . . . . . . . . . . . . . . . . . . . . . . . . . . . . . . . . . . . . . . . . . . . . . . . . . . . . . . . . . . . . . . . . . . . . . . . . . . . . . . . . . . . , . .
" I
t ~33 * tl * +
- i . . . . . . . ~ . . . . . . . . . . . . ! . . . . . . . . . . ' . . . . . . . . . . :~: . . . . . . . . . . . . . . . . . . . . . ! " - i t . . . . . . . . . . . . . . ~
' f ¢ - ' ~ " : ° * : ~ ° : / " : i o~. "~. i ° j , . . o ; ~ : r " • " n ° m" • D u = . t
• d " t ~ ,aft ' : '~.~ : " " ! d' ° 'h ~' ~' ? , , ° i / i
• • . . . . . . . . . . . . . . . t . . . . . . . . . . . . . . . . . . . ~ . . . . . . . . o . . ~ . o . . . . "h ~ " ' • "D . . . . . . . . . ~ . . . . . . . . . . . . . . . . . . . . .
° °°h i ('° ~ " ' - " !
i . ' ~ i / " ° i
! * i . - . . i
D
n
i i o
I ........ ~ . . . . . . 2 ~ . . . . . . . . . . . 2 . . . . . . ± _ ~ . . . . . . . . . . 2 . . . . . . , . . . . . . . . . . . : .... , . . . . . ; .........
0 20 40 60 :5:8
t ime i F i d e x
Fig. 3. Polynomial smoothing of 8 t h o r d e r (solid curve) and original data points (dots). N o t e t h e long period of approx. 33 y e a r s .
Table II shows the results of this test for the original JAA time-series. Similar results were obtained for the other three time-series; the detrended JAA with a 2nd order polynomial, and the smoothed JAA with 3- and 5-terms moving averages.
STOCHASTIC VARIABILITY IN THE ATMOSPHERIC ACTIVITY OF JUPITER 195
TABLE II
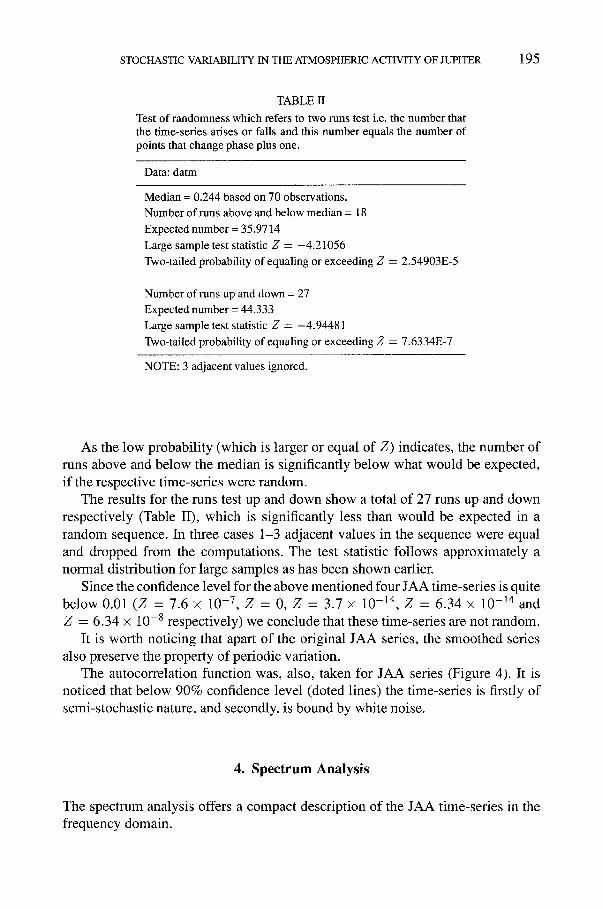
Test of randomness which refers to two runs test i.e. the number that the time-series arises or falls and this number equals the number of points that change phase plus one.
Data: datm
Median = 0.244 based on 70 observations. Number of runs above and below median = 18 Expected number = 35.9714 Large sample test statistic Z = -4.21056 Two-tailed probability of equaling or exceeding Z = 2.54903E-5
Number of runs up and down = 27 Expected number = 44.333 Large sample test statistic Z = -4.94481 Two-tailed probability of equaling or exceeding Z = 7.6334E-7
NOTE: 3 adjacent values ignored.
As the low probabil i ty (which is larger or equal of Z) indicates, the number of runs above and below the median is significantly be low what would be expected,
i f the respective t ime-series were random. The results for the runs test up and down show a total o f 27 runs up and down
respect ively (Table II), which is significantly less than would be expected in a
random sequence. In three cases 1-3 adjacent values in the sequence were equal and dropped f rom the computat ions. The test statistic fol lows approximate ly a normal distribution for large samples as has been shown earlier.
Since the confidence level for the above ment ioned four JAA time-series is quite below 0.01 (Z = 7.6 x 10 -7, Z = 0, Z = 3.7 x 10 -14, Z = 6.34 x 10 -14 and
Z = 6.34 × 10 -8 respectively) we conclude that these t ime-series are not random.
It is worth noticing that apart o f the original JAA series, the smoothed series also preserve the property of periodic variation.
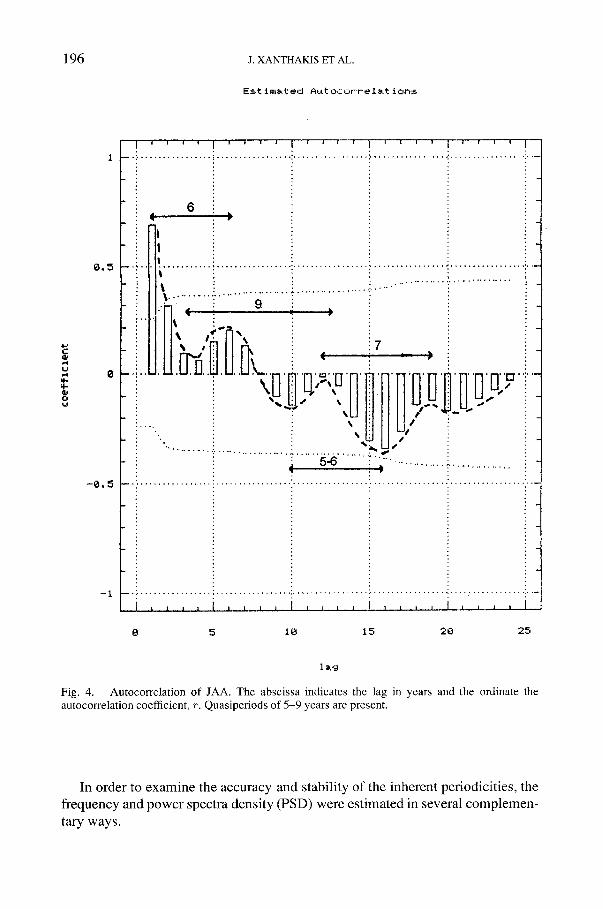
The autocorrelation function was, also, taken for JAA series (Figure 4). It is
noticed that below 90% confidence level (doted lines) the t ime-series is firstly of semi-stochast ic nature, and secondly, is bound by white noise.
4. Spectrum Analysis
The spectrum analysis offers a compac t description of the JAA time-series in the frequency domain.
196 J. X A N T H A K I S E T A L .
E~t imp.ted ALttoc,z, r r e l . ~ t ion~
4,.., C @
o ~J
0 . 5
- 0 . 5
- 1
i i i i i i i ! ; i i i i i i i ! i
_ . ; . . . . . . . . . . . . . . . . : . . . . . . . . . . . . . . . . . . . . . . . . . . . . . . . . . . . . . . . . . . . . . . . . . . . . . . . . . . . . . . . . . . . . . . . . , . -
6 4 ).
I I
. . . . . . i . . . . . . . . . . . ! . . . . . . . . . . . . . . . . . :: . . . . . . . . . . . . . . . . . ! . . . . . . . . . . . . . . . . ~ . . . . . . . . . . . . . . . . . . .
i ~ .......... i. .................. .................. -." _ : 9
i ~ \ , - . "~ ' , : I I ~ omll~ 7 . : • % 4 : - U ~r~ W g g},_ ~ , D . . . . . D ~ ....
. . . . . . . . . . . . . . g ! rll TINl-r[lnTlrl., ,.,u i1H
""-... ~ ~ ' . ~ U . " i ~ . . . . . . . . : . . . . . . . . . . . . . . . . . . ~ . . . . . . ~ ; 6 . . . . . . . , . ; . - r . . . . . . . . . . . . . . i . . . . i
| | I I I i i i i i i i i i i i i i i I
0 5 1 0 15 20 25
l a g
F i g . 4 . A u t o c o r r e l a t i o n o f J A A . T h e a b s c i s s a i n d i c a t e s t h e l a g i n y e a r s a n d t h e o r d i n a t e t h e
a u t o c o r r e l a t i o n c o e f f i c i e n t , r . Q u a s i p e r i o d s o f 5 - 9 y e a r s a r e p r e s e n t .
In order to examine the accuracy and stability of the inherent periodicities, the frequency and power spectra density (PSD) were estimated in several complemen- tary ways.
STOCHASTIC VARIABILITY IN THE ATMOSPHERIC ACTIVITY OF JUPITER 197
(a) Fourier analysis (FFT), (b) Maximum entropy (MESA) and (c) Blackman- Tukey power spectrum analysis (PSA), which includes a z2-test too (Liritzis, 1990, Liritzis and Tsapanos, 1993).
The results are almost similar, but some details in the computed sideband structure of power spectrum density (PSD) with frequency (i.e. the resolution) in MESA depends upon the order of autoregressive process or the number of lags respectively. Analytically, the spectrum analysis per method is described below.
a) FOURIER (FFT)
Initially, from the JAA time-series, which had been already smoothed with moving average terms of the kind R~t ) = ( / ~ t - 1 + 2Rt + R~+1)/4, by Xanthakis et al. (1991), the mean trend represented by a polynomial of 2nd order, was subtracted (DATM2 file), (Figure 5). It was noticed that applying a 1st order (mean) or a 3rd order polynomial the result does not differ from this smoothing.
Following the 2nd order polynomial subtraction the residuals (DATM2) were analysed by FFT.
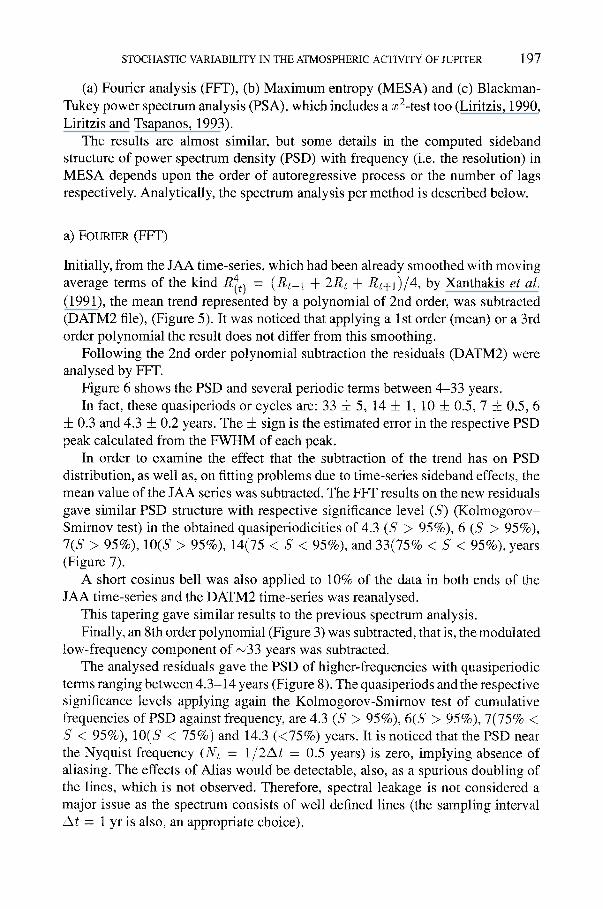
Figure 6 shows the PSD and several periodic terms between 4-33 years. In fact, these quasiperiods or cycles are: 33 + 5, 14 + 1, 10 -4- 0.5, 7 ± 0.5, 6
± 0.3 and 4.3 ± 0.2 years. The ± sign is the estimated error in the respective PSD peak calculated from the FWHM of each peak.
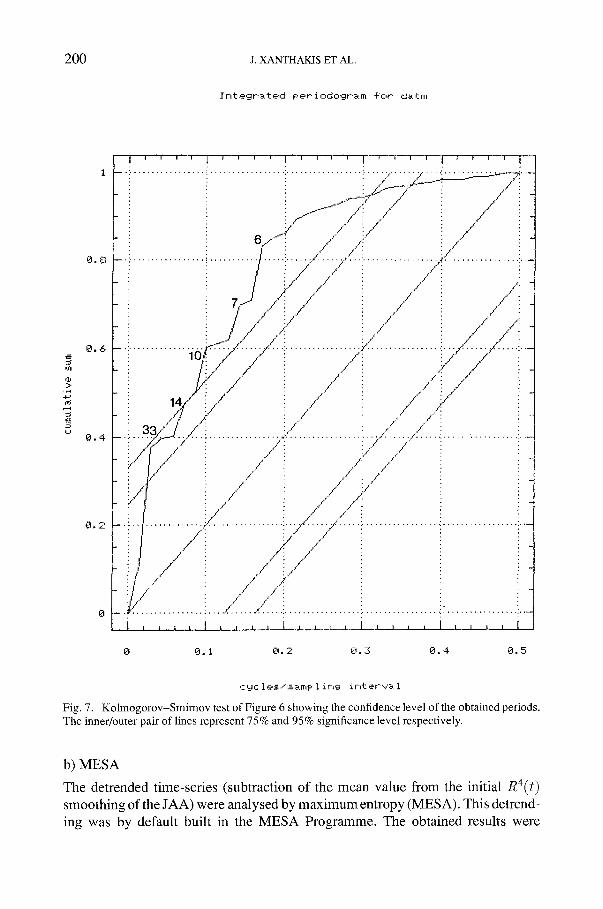
In order to examine the effect that the subtraction of the trend has on PSD distribution, as well as, on fitting problems due to time-series sideband effects, the mean value of the JAA series was subtracted. The FFT results on the new residuals gave similar PSD structure with respective significance level (5') (Kolmogorov- Smimov test) in the obtained quasiperiodicities of 4.3 (S > 95%), 6 (S > 95%), 7(S > 95%), 10(S > 95%), 14(75 < S < 95%), and 33(75% < 5" < 95%), years (Figure 7).
A short cosinus bell was also applied to 10% of the data in both ends of the JAA time-series and the DATM2 time-series was reanalysed.
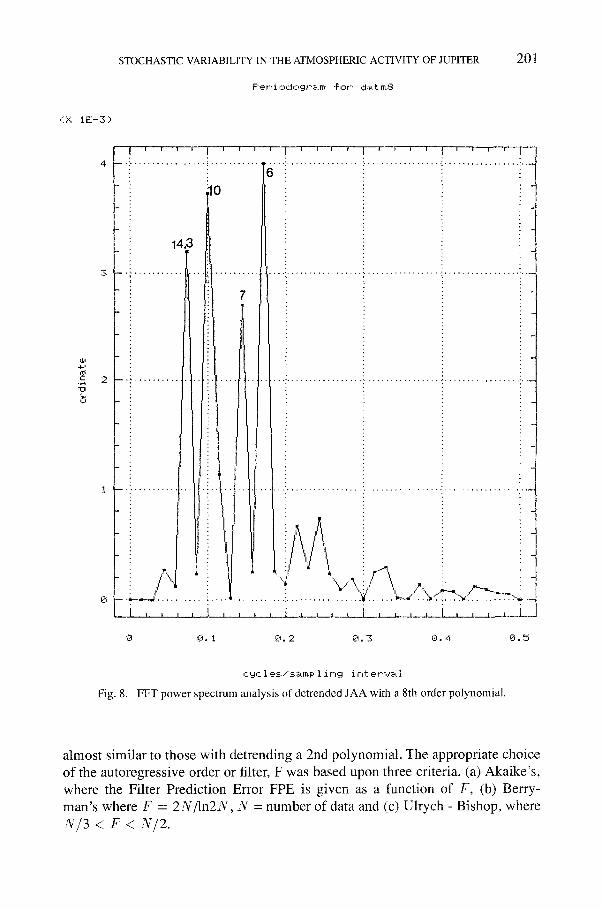
This tapering gave similar results to the previous spectrum analysis. Finally, an 8th order polynomial (Figure 3) was subtracted, that is, the modulated
low-frequency component of ~33 years was subtracted. The analysed residuals gave the PSD of higher-frequencies with quasiperiodic
terms ranging between 4.3-14 years (Figure 8). The quasiperiods and the respective significance levels applying again the Kolmogorov-Smirnov test of cumulative frequencies of PSD against frequency, are 4.3 (S > 95%), 6(S > 95%), 7(75% < S < 95%), 10(S < 75%) and 14.3 (<75%) years. It is noticed that the PSD near the Nyquist frequency (Nt = 1/22xt = 0.5 years) is zero, implying absence of aliasing. The effects of Alias would be detectable, also, as a spurious doubling of the lines, which is not observed. Therefore, spectral leakage is not considered a major issue as the spectrum consists of well defined lines (the sampling interval At = 1 yr is also, an appropriate choice).

1 9 8 J. XANTHAKIS ET AL.
O. 33
0 . 3
0 . 2 7
O. 24
0.21
0 . 1 8
Pol 9nomi&l Smoothin9
• d~tm o{ Or.def. 2
-4- smooth
a ! ! i i i i ! ! i ; i
: m
: • • • : smm : um ~ m •
: • . . ' : a ,i •
i" :'!Tf<. - . 5 . : . . . . . . . . . . . ~ . . . . . . . : . . . . . . . . . . . . . . . . . . . . . . . . . . ~ e . . . . . . . . . . . . -: . . . . : . . . . . . . . . . . . . . . . . . .
,,m m u : • : • u
m • : • ; I o
I •
• o
! I I ; I ; I I I I I I
0 20 40 &O 80
t ime index
F i g . 5. O r i g i n a l J A A d a t a p o i n t s ( d o t s ) a n d a 2 n d o r d e r p o l y n o m i a l fit f o r d e t r e n d i n g .
Furthermore, in order to even more enhance the reliability of the obtained quasiperiods, the FFT analysis was applied to another smoothed JAA time sequence, in addition to R4(t) smoothing. The new smoothed time series of 3-terms moving average was analysed by FFT.

STOCHASTIC VARIABILITY IN THE ATMOSPHERIC ACTIVITY OF JUPITER
Per i ,= . - l oOr .~ .m #,=tr. d~.t m2
199
' : :X IE-3)
fll ,2 "0 0
i ! - " i - - ' i
1 0 - - . . . . . . . . . . . . . . . . . . . :
'33
~,z.. [
- - . i ( ' . . . . . . . . . . . . . . . . ,
1 i
! i i i ' - - "1 i i i ' i i i i I i ~ ' I ....... 4
J
I0
I t I
4 3 ............... J .... .............................. i 0.1 0.2 0.3 0.4 0.5
c ,~ c 1 e ~..."~..~.m~:, 1 i n ,o int er.v~.l
Fig. 6. FFT power spectrum analysis of detrended JAA data showing various periods ranging between 4-33 years.
The obtained quasi periodicities of 5.9, 6.9, 10, 14.3 and 33 years are similar with these found earlier, but with an anticipated lower PSD power in the two lower ones.
200 J. XANTHAKIS ET A L
Ir, te,_zr.~.ted F, er. iodc,.qr~.m ~of d~.tm
J; l
.4-' E i_f
0.8
0 , 4
0.2
i i ' / " : itt e, ,e / ' 'x i tl ¢.,~
: t / '
Y ............. I i I I
. . . . . . . . . . . . . . . . . . . . . . . . i . . . . . . . . . . . . . . . . . i . . . . ,:.,. . . . .
/ ..... / . . " . / , . ' : /
....... / ....... !! / , / " i
.j,ja ;'J'¢"i 7
i ................ /.<'i i -a" ¢.- .' • ,..
¢ . , .e ," t" ' .,;
, i / i ../ , ..... !~, . . . .
/ i , / . . ,,.¢ ,Y .,," •
~ S - ~ ' - . / i . i . . . . . . . . . . . . . . . . i : ' : . . . . . . . . . . . . . . . . . . . . / . . . . . ,..:~ . . . . :: . . . . . . . . . . . . . . . . . . . . . .
f /...' ! / / /.. /.~ g" " J d .¢"
: y j " ; J .
(,.-' 2 / ' ,1" . g,. ¢ . ..#. . . . . . . ,:'. . . . . . . . . . . . . . . . . . . . . . . , . . . . . . . . . . . . . . . . . . . . .
.,, g"
,..,Y" / . . , / !"
a .., J "
I I I I l I l - - - J . . . . . . . . . l , , I , I I I I I , I
0 8.1 0.2 0.3 0.4 0.5
,:,~c le~..-"s~.mF, 1 in,_~ inter-',~'~.l Fig. 7. Kolmogorov-Smirnov test of Figure 6 showing the confidence level of the obtained periods. The inner/outer pair of lines represent 75% and 95% significance level respectively.
b) MESA
The detrended time-series (subtraction of the mean value from the initial R4(t) smoothing of the JAA) were analysed by maximum entropy (MESA). This detrend- ing was by default built in the MESA Programme. The obtained results were
STOCHASTIC VARIABILITY IN THE ATMOSPHERIC ACTIVITY OF JUPITER
Per. iodo,_~r'~.m -For. ,d~.t m8
201
(X IE-3>
" 2
0
14.3
r I
i ~l i
. i - . -J . . . . . . . . . . . i...
:. * 7 " a l , t
h* ', . i Jl / '% i . . . . . . . . . . . . . . . . . . . ~ . . . . . . b.-~"... b.". m L--L
0 0.1 0.2 0.3 0.4 0.5
,z'~c le-=.."'=.:~.m;, 1 i r , g i r ~ t e r . v , . 1
Fig. 8. FFT power spectrum analysis of detrended JAA with a 8th order polynomial.
almost similar to those with detrending a 2nd polynomial . The appropriate choice of the autoregressive order or filter, F was based upon three criteria. (a) Akaike's, where the Filter Prediction Error FPE is given as a function of F , (b) Berry- man's where F = 2 N / l n 2 N , N -- number of data and (c) Ulrych - Bishop, where N/3 < F < N/2.
202 J. X A N T H A K I S ET AL.
da J:rn
1 .000
N o. 900 0 R 0.60o H R 0.70o
L 0.601 I Z o.soi E O o.uol
0.381 P 0 o.2ol
H 0. I01 E R 0.002
39.6
4
0 0 0 0 0 0
6 i b § i 0 0 0 0 0 0
FFE]~UENCT
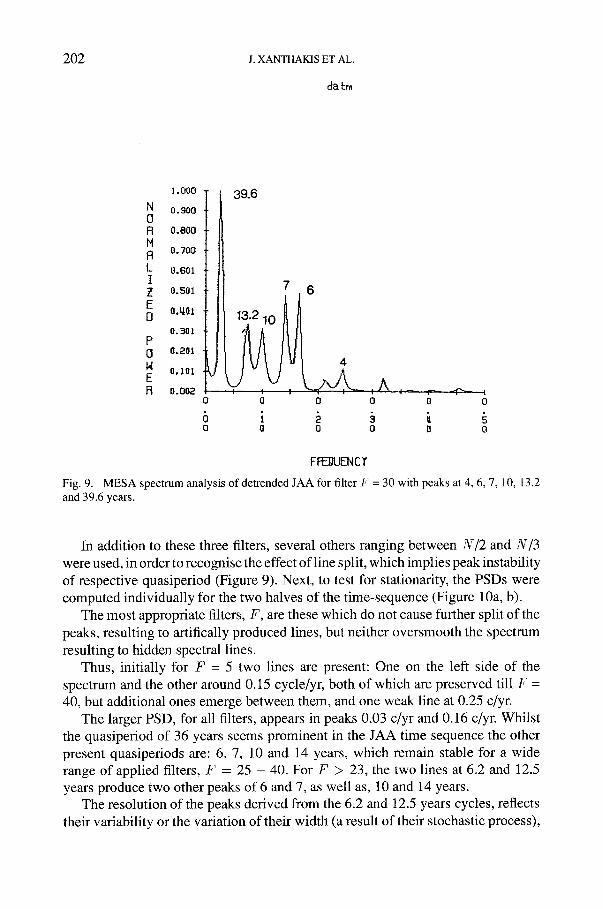
Fig. 9. MESA spectrum analysis of detrended JAA for filter/v = 30 with peaks at 4, 6, 7, 10, 13.2 and 39.6 years.
In addition to these three filters, several others ranging between N/2 and N/3 were used, in order to recognise the effect of line split, which implies peak instability of respective quasiperiod (Figure 9). Next, to test for stationarity, the PSDs were computed individually for the two halves of the time-sequence (Figure 10a, b).
The most appropriate filters, F, are these which do not cause further split of the peaks, resulting to artifically produced lines, but neither oversmooth the spectrum resulting to hidden spectral lines.
Thus, initially for F = 5 two lines are present: One on the left side of the spectrum and the other around 0.15 cycle/yr, both of which are preserved till F = 40, but additional ones emerge between them, and one weak line at 0.25 c/yr.
The larger PSD, for all filters, appears in peaks 0.03 c/yr and 0.16 c/yr. Whilst the quasiperiod of 36 years seems prominent in the JAA time sequence the other present quasiperiods are: 6, 7, 10 and 14 years, which remain stable for a wide range of applied filters, £ = 25 - 40. For F > 23, the two lines at 6.2 and 12.5 years produce two other peaks of 6 and 7, as well as, 10 and 14 years.
The resolution of the peaks derived from the 6.2 and 12.5 years cycles, reflects their variability or the variation of their width (a result of their stochastic process),

STOCHASTIC VARIABILITY IN THE ATMOSPHERIC ACTIVITY OF JUPITER 203
I, 000
N o.9oo 0 R 0.8O0 R 91 0.70o
L 0.600 ] 7 o.50o E O 0.400
0 . 3 0 0
P 0 o .~o
N o.loo E R o.o0o
39.6
11.5
o o
0 o
da 'l:t~
; . . . . [
o o
§ i o D
(a)
FBEC&ENCT
daS-. (b)
1 . 0 0 0
N 0 . 9 0 1 0 R o.8oJ H R 0.702
L 0.6O3 ] Z o.sos
E D 0.40~
0.305 P 0 o.2os
H O.lO6 E R 0.007
39.6
4.3
0 0 0 0
o o o o
6,5
I I I I1
i I1
FFIEOUENCT
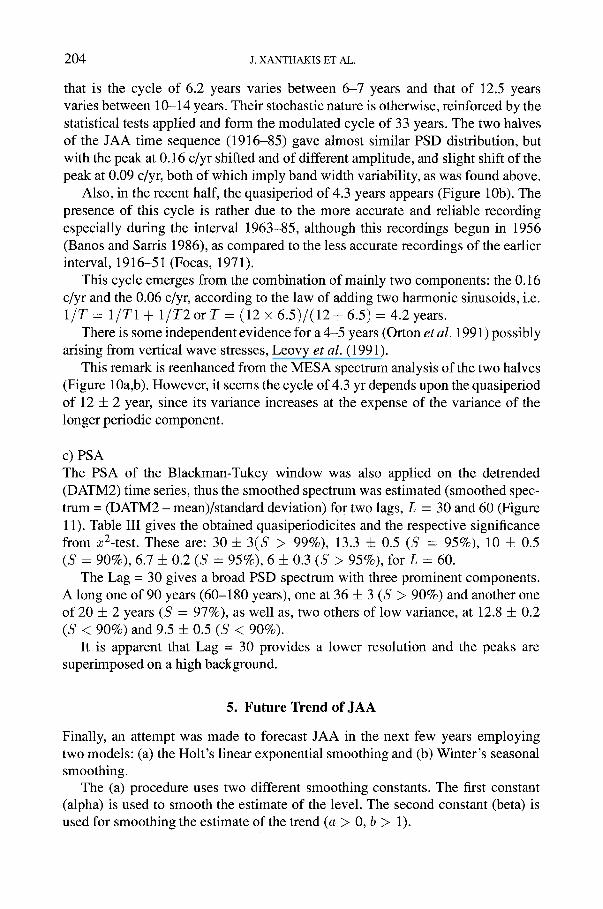
Fig. 10. (a) MESA spectrum analysis of first half of JAA data series (1916-1951) for F = 16, and (b) as per above but for 1951-1985.
204 J. XANTHAKIS ET AL.
that is the cycle of 6.2 years varies between 6-7 years and that of 12.5 years varies between 10-14 years. Their stochastic nature is otherwise, reinforced by the statistical tests applied and form the modulated cycle of 33 years. The two halves of the JAA time sequence (19t6-85) gave almost similar PSD distribution, but with the peak at 0.16 c/yr shifted and of different amplitude, and slight shift of the peak at 0.09 c/yr, both of which imply band width variability, as was found above.
Also, in the recent half, the quasiperiod of 4.3 years appears (Figure 10b). The presence of this cycle is rather due to the more accurate and reliable recording especially during the interval 1963-85, although this recordings begun in 1956 (Banos and Sarris 1986), as compared to the less accurate recordings of the earlier interval, 1916-51 (Focas, 1971).
This cycle emerges from the combination of mainly two components: the 0.16 c/yr and the 0.06 c/yr, according to the law of adding two harmonic sinusoids, i.e. 1/T= 1/T1 + 1 /TZorT= (12 × 6 . 5 ) / ( 1 2 + 6 . 5 ) = 4.2 years.
There is some independent evidence for a 4-5 years (Orton et al. 1991) possibly arising from vertical wave stresses, Leovy et al. (1991).
This remark is reenhanced from the MESA spectrum analysis of the two halves (Figure 10a,b). However, it seems the cycle of 4.3 yr depends upon the quasiperiod of 12 ± 2 year, since its variance increases at the expense of the variance of the longer periodic component.
c) PSA The PSA of the Blackman-Tukey window was also applied on the detrended (DATM2) time series, thus the smoothed spectrum was estimated (smoothed spec- trum = (DATM2 - mean)/standard deviation) for two lags, L = 30 and 60 (Figure 11). Table III gives the obtained quasiperiodicites and the respective significance from x2-test. These are: 30 -4- 3(S > 99%), 13.3 ± 0.5 (S = 95%), 10 4- 0.5 (S = 90%), 6.7 ± 0.2 (S = 95%), 6 ± 0.3 (S > 95%), for L = 60.
The Lag = 30 gives a broad PSD spectrum with three prominent components. A long one of 90 years (60-180 years), one at 36 ± 3 (S > 90%) and another one of 20 ± 2 years (S = 97%), as well as, two others of low variance, at 12.8 ± 0.2 (S < 90%) and 9.5 ± 0.5 (S < 90%).
It is apparent that Lag = 30 provides a lower resolution and the peaks are superimposed on a high background.
5. Future Trend of JAA
Finally, an attempt was made to forecast JAA in the next few years employing two models: (a) the Holt's linear exponential smoothing and (b) Winter's seasonal smoothing.
The (a) procedure uses two different smoothing constants. The first constant (alpha) is used to smooth the estimate of the level. The second constant (beta) is used for smoothing the estimate of the trend (a > 0, b > 1).

STOCHASTIC VARIABILITY IN THE ATMOSPHERIC ACTIVITY OF JUPITER 205
PERIOD, xl/3 ~ 0 0 0 0 0 0 ~
ILl
3: O ~ . 13.
..A ,<
I-- O Ld
,~. t / l
/ /
L A G
Fig. 11. PSA spectrum analysis employing the Blackman-Tukey window of detrended JAA time-series with a 2nd order polynomial. The ratio of peak height-to-background provides sig- nificance levels at 1%, 5% and 10%, based on chisquare statistics. The lower row is the lag and the upper row the periods (T) as 3T, of respective peaks.
TABLE III
Quasiperiodicities obtained from FFT, MESA and PSA along with their respective significance in parenthesis (in brackets are also the weak cycles i.e. of low variance).
Method Quasiperiod (Years)
>30 30-40 20-22 10-12 6-7 4-5
FOURIER & MESA 36 ± 6 12 4- 2 6.5 4- 0.5 (4.3)
PSA Lag = 60 30 4- 6 13 4- 1 6.3 4- 0.5 (99%) (95%) (95%)
(lO) (90%)
Lag = 30 (90) 36 ± 7 20 4- 4 (<90%) (97%)
206 J. XANTHAKIS ET AL.
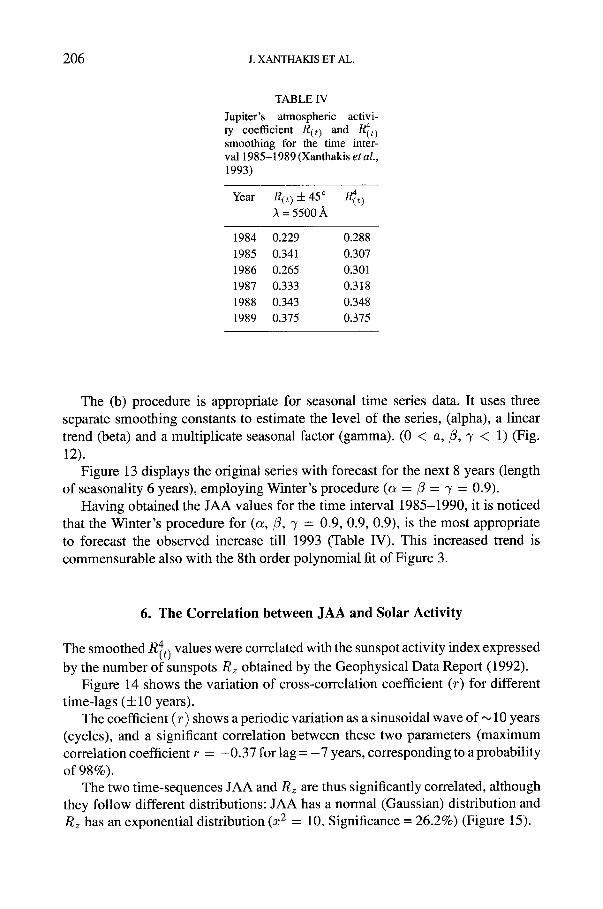
TABLE IV
Jupiter's atmospheric activi- ty coefficient R(t) and R~t ) smoothing for the time inter- val 1985-1989 (Xanthakis et al., 1993)
Year R(t) ± 45 ° R{t) = 5 5 0 0 ~
1984 0.229 0.288 1985 0.341 0.307 1986 0.265 0.301 1987 0.333 0.318 1988 0.343 0.348 1989 0.375 0.375
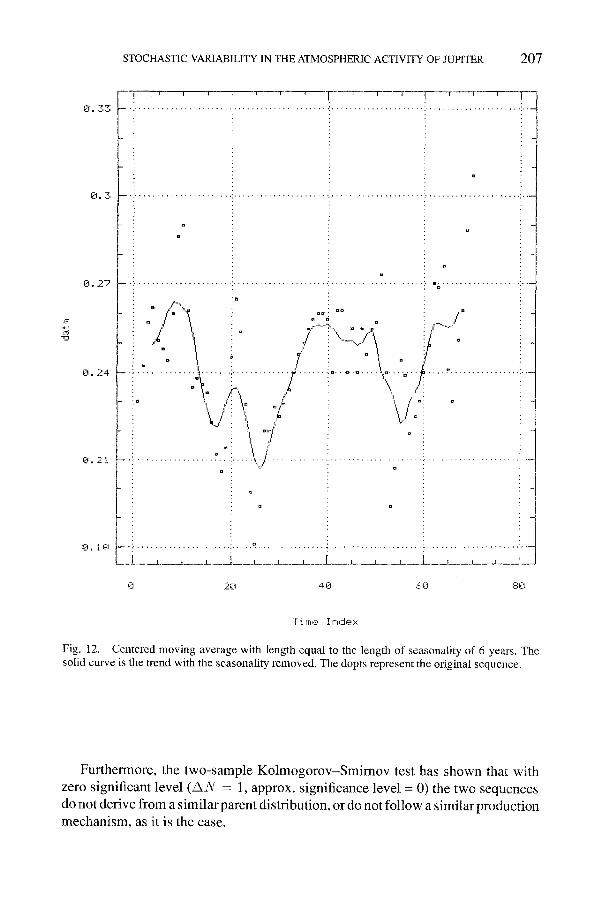
The (b) procedure is appropriate for seasonal time series data. It uses three separate smoothing constants to estimate the level of the series, (alpha), a linear trend (beta) and a multiplicate seasonal factor (gamma). (0 < a,/3, 7 < 1) (Fig. 12).
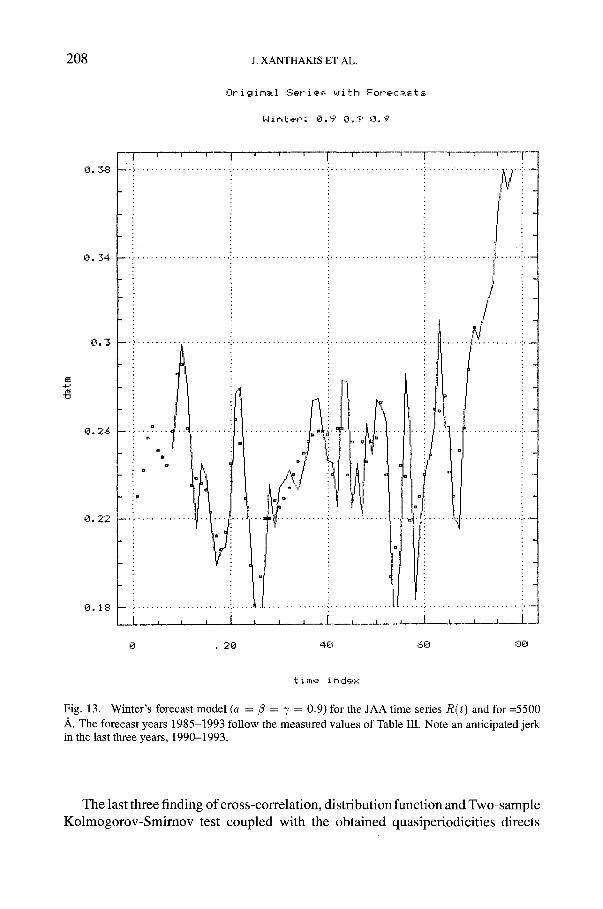
Figure 13 displays the original series with forecast for the next 8 years (length of seasonality 6 years), employing Winter's procedure (o~ = /3 = ~/= 0.9).
Having obtained the JAA values for the time interval 1985-1990, it is noticed that the Winter's procedure for (c~,/3, 3' = 0.9, 0.9, 0.9), is the most appropriate to forecast the observed increase till 1993 (Table IV). This increased trend is commensurable also with the 8th order polynomial fit of Figure 3.
6. The Correlation between JAA and Solar Activity
The smoothed R~) values were correlated with the sunspot activity index expressed
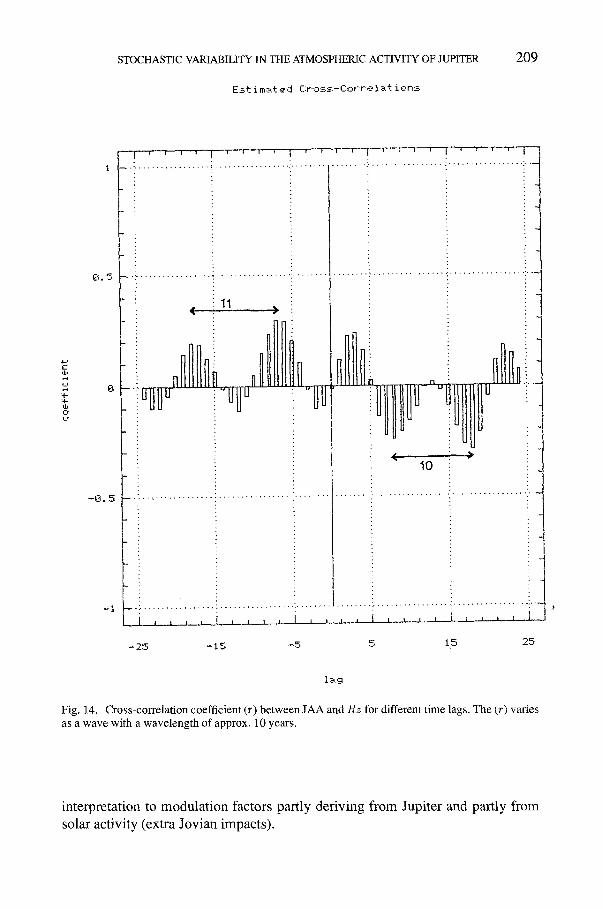
by the number of sunspots Rz obtained by the Geophysical Data Report (1992). Figure 14 shows the variation of cross-correlation coefficient (r) for different
time-lags (+ 10 years). The coefficient (r) shows a periodic variation as a sinusoidal wave of ~ 10 years
(cycles), and a significant correlation between these two parameters (maximum correlation coefficient r = -0 .37 for lag = - 7 years, corresponding to a probability of 98%).
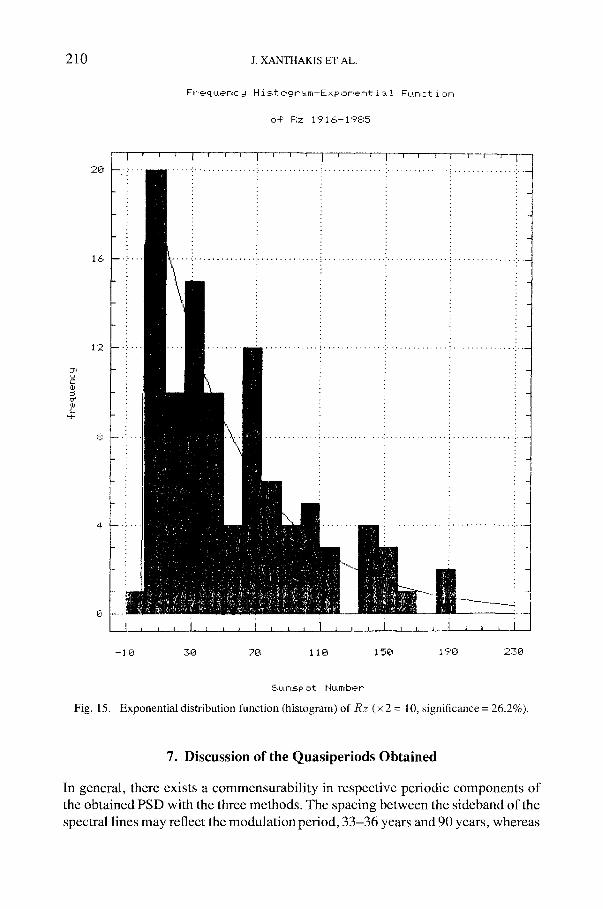
The two time-sequences JAA and Rz are thus significantly correlated, although they follow different distributions: JAA has a normal (Gaussian) distribution and R~ has an exponential distribution (z 2 = 10, Significance = 26.2%) (Figure 15).
STOCHASTIC VARIABILITY IN THE ATMOSPHERIC ACTIVITY OF JUPITER 207
LT,;
F ! I I I
O . 33 ": . . . . . . . . . . . . . . . . . . . . . . •
0 . 3
O. 2 7
0 . 2 4
0.21
0, 18
l + - - - - " r ' ~ F---'---[-----F . . . . I -'[ ' I . . . . .
. , . . . . . . . . . . . . . . . . . . . . . . . . . . . . . . . . . . . . . . . . . . . . . . . . . . . . . . . . . . . . . . . . . . . . . . . . . . . . . . . . . . . . . . . . . , . . .
n
D
u
° ~'-,~ !° : i
• i ," i " . . . . ..,,' i ~g" t i CF i "
° '1 ? ~' : 'J " ¢ . . . . ? . . . . . . . . . . . ~ . . . . . . . i . . . . . . . . . . . . . ~ ' . . . . . . . ! . . . . . . . . . . "~ . . . . . . . . ~ . . . . : . . . . . . . . . . . . . . . . . . . .
• m I " t ' " , a . .
i" 't~ I- ,' i '+" o,, 't''+' + '~+ ,' ° i ° + llll I I I ~ r I i~+ + +I 1 11 m i i
+ -.,' : + oo, ' + " + ! : ! ! t : ° : :
o l I : '. [
i o ! 5 '+ i i !
m
m
- - . J - - _ _ - i . I . . . . . i . . . . . . . . . . . . t . . . . . . . L . . . . . ~ L - . . . . . . J . . . . . I . . . . . . . L . . . . . . . . . . . l _ _ . _ . - - i . . . . J _ _ _ ~ - - - + .
O 20 40 60 : - :0
Time I r , d e > : :
Fig. 12. C e n t e r e d m o v i n g a v e r a g e wi th l e n g t h e q u a l to the l e n g t h o f s e a s o n a l i t y o f 6 years . T h e sol id cu rve is the t r end w i th the s ea sona l i t y r e m o v e d . T h e dopts represent t he o r ig ina l s e q u e n c e .
Furthermore , the t w o - s a m p l e K o l m o g o r o v - S m i r n o v test has s h o w n that wi th zero s ignif icant l eve l ( A N = 1, approx, s ign i f i cance l eve l = 0) the t w o s e q u e n c e s do not derive f r o m a s imi lar parent distribution, or do not f o l l o w a s imi lar product ion m e c h a n i s m , as it is the case .
208 J. X A N T H A K I S E T A L .
Or. igin~.l Ser. ies ,, ith For.e,z~.-=.t'--.
W i n t e r ~ . " 0.9 0 . 9 0 . 9
0.38
0.34
0 . 3
0 . 2 , - ~.
0.22
0. I ;-:
i ~ i . . . . . . . . / V i i . . . . . i i ,"ij • l ]
I .............. i FI
,~I I!, ~t F i i ................ iYlillt t 'j i i i
i .........
i.l.
0 . 20 40 6 0 :5:0
t ime index
Fig. 13. Winter's forecast model (a = /3 = 7 =- 0.9) for the JAA time series R(t) and for =5500 A. The forecast years 1985-1993 follow the measured values of Table Ill. Note an anticipated jerk in the last three years, 1990-1993.
The last three f inding o f cross -corre lat ion , distribution funct ion and T w o - s a m p l e K o l m o g o r o v - S m i m o v test coup led wi th the obta ined quas iper iodic i t i e s directs
STOCHASTIC VARIABILITY IN THE ATMOSPHERIC ACTIVITY OF JUPITER
E~t i mr.*.t e d C:r.o~.~.-¢:or, r,e 1 ~ t i o n s
209
I I i
, - i
u
1 - " : . . . . . . . . . . . . . . . . . ~ . . . . . . . . . . . . . . . . . : . . . . . . . . J . . . . . . . . - . . . . . . . . . . . . . . . . . . , . . . . . . . . . . . . . . . . . , .
i f l--I --
0 . 5 " " . . . . . . . . . . . . . . . . . . . . . . . . . . . . . . . . . . . " . . . . . . . . ' . . . . . . . . " . . . . . . . . . . . . . . . . . . " . . . . . . . . . . . . . . . . . . . .
)
8 - .
11 <
"UU
10
uUU,, uHu
-8.5 ............................................................................................
-- I I I , I I._I. l I ,I I. I.. J.__-.L-.- ........................... ]. I I l I
- 2 5 -15 -5 5 15 25
I ::~. ,.~
Fig. 14. Cross-corre la t ion coefficient (r) be tween JAA and R z for different time lags. The (r) varies as a wave with a wavelength of approx. 10 years.
interpretation to modulation factors partly deriving from Jupiter and partly from solar activity (extra Jovian impacts).
210 J. XANTHAKIS ET AL
Fr"e , : t u . e r . z ,d H i :~-t o..~r'a.m-E.:.;:p o r i e n t i a. 1
,:.4: Fzz 1 '~.' 1 ,S- 1 '.;".z:5
F u . r . : f. i ,:,N
, i
20
12
I ] i I I I I [ Z I I [ ~ - ' T - - - - ~ ' - "~"
. . . . ' . . . . . . . . . . . . . . • . . . . . . . . . . . . : . . . . . . . . . . . . . . • . . . . . . . . . . . . . . i . . . . . . . . . . . . . . : . . ~
. . . . . . . . . . . . , . . . . . . . . . . . . . . ! . . . . . . . . . . . . . . . . . . . . . . . . . . . . . .,..
-10 30 70 110 150 19'0 230
~ ; u . n s p ,:,t NLtmber"
Fig. 15. Exponential distribution function (histogram) of R z (× 2 = 10, significance : 26.2%).
7. Discussion of the Quasiperiods Obtained
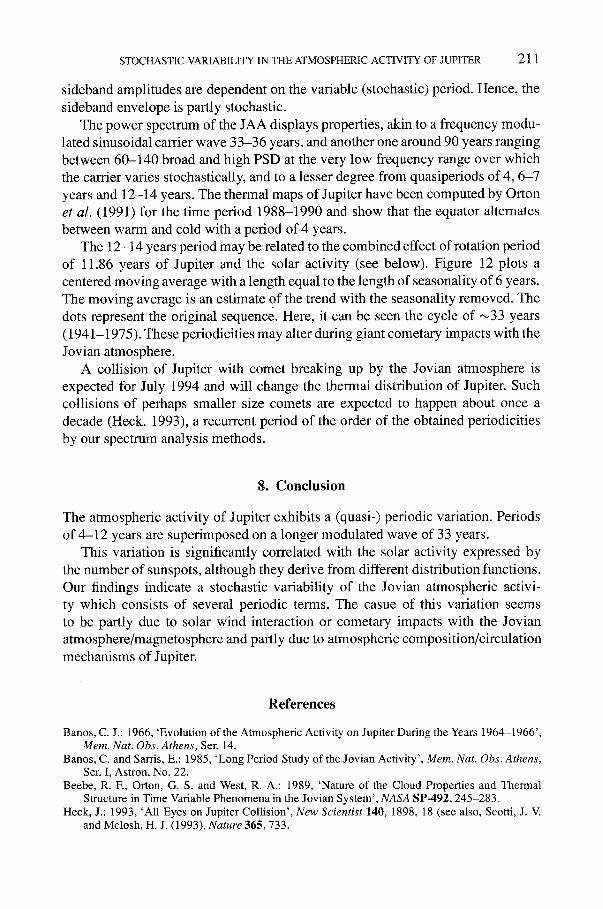
In general, there exists a commensurability in respective periodic components of the obtained PSD with the three methods. The spacing between the sideband of the spectral lines may reflect the modulation period, 33-36 years and 90 years, whereas
STOCHASTIC VARIABILITY IN THE ATMOSPHERIC ACTIVITY OF JUPITER 211
sideband amplitudes are dependent on the variable (stochastic) period. Hence, the sideband envelope is partly stochastic.
The power spectrum of the JAA displays properties, akin to a frequency modu- lated sinusoidal carrier wave 33-36 years, and another one around 90 years ranging between 60-140 broad and high PSD at the very low frequency range over which the carrier varies stochastically, and to a lesser degree from quasiperiods of 4, 6-7 years and 12-14 years. The thermal maps of Jupiter have been computed by Orton et al. (1991) for the time period 1988-1990 and show that the equator alternates between warm and cold with a period of 4 years.
The 12-14 years period may be related to the combined effect of rotation period of 11.86 years of Jupiter and the solar activity (see below). Figure 12 plots a centered moving average with a length equal to the length of seasonality of 6 years. The moving average is an estimate of the trend with the seasonality removed. The dots represent the original sequence. Here, it can be seen the cycle of ~33 years (1941-1975). These periodicities may alter during giant cometary impacts with the Jovian atmosphere.
A collision of Jupiter with comet breaking up by the Jovian atmosphere is expected for July 1994 and will change the thermal distribution of Jupiter. Such collisions of perhaps smaller size comets are expected to happen about once a decade (Heck, 1993), a recurrent period of the order of the obtained periodicities by our spectrum analysis methods.
8. Conclusion
The atmospheric activity of Jupiter exhibits a (quasi-) periodic variation. Periods of 4-12 years are superimposed on a longer modulated wave of 33 years.
This variation is significantly correlated with the solar activity expressed by the number of sunspots, although they derive from different distribution functions. Our findings indicate a stochastic variability of the Jovian atmospheric activi- ty which consists of several periodic terms. The casue of this variation seems to be partly due to solar wind interaction or cometary impacts with the Jovian atmosphere/magnetosphere and partly due to atmospheric composition]circulation mechanisms of Jupiter.
References
Banos, C. J.: 1966, 'Evolution of the Atmospheric Activity on Jupiter During the Years 1964-1966', Mem. Nat. Obs. Athens, Ser. 14.
Banos, C. and Sarris, E.: 1985, 'Long Period Study of the Jovian Activity', Mem. Nat. Obs. Athens, Ser. I, Astron. No. 22.
Beebe, R. E, Orton, G. S. and West, R. A.: 1989, 'Nature of the Cloud Properties and Thermal Structure in Time Variable Phenomena in the Jovian System', NASA SP-492,245-283.
Heck, J.: 1993, 'All Eyes on Jupiter Collision', New Scientist 140, 1898, 18 (see also, Scotti, J. V. and Melosh, H. J. (1993), Nature 365,733.

212 j. XANTHAKIS ET AL.
Focas, J. and Banos, C.: 1964, 'Photometric Study of the Atmospheric Activity of the Planet Jupiter and Peculiar Activity in Equatorial Area', Ann. Astrophys. 27(1), 36-45.
Focas, J.: 1971, 'Activity in Jupiter's Atmospheric Belts 1964 and 1963', Icarus 15, 56-57. Kuhen, A. and Beebe, R. E: 1993, Icarus 101,282. Leovy, C. B., Friedson, A. J. and Orton, G. S.: 1991, 'The Quasiquadrennial Oscillation of Jupiter's
Equatorial Stratosphere', Nature 354, 380-382. Liritzis, I.: 1990, 'Evidence for Periodicities in the Auroral Occurrence Frequency Since 300 AD and
Their Implications', PAGEOPH 133(2), 201-211. Liritzis, I. and Tsapanos, T. M.: 1993, 'Probable Evidence for Periodicities in Global Seismic Energy
Release', Earth, Moon Planets 60, 93-108. Orton, G. S. et aI.: 1991, 'Thermal Maps of Jupiter; Spatial Organization and Time Dependence of
Stratospheric Temperatures, 1980 to 1990', Science 252, 537-542. Peek, B. M.: 1958, The Planet Jupiter, Faber and Faber, London. Sanchez-Lavega, A. andRodrigo, R.: 1985, 'Ground Based Observations of Synoptic Cloud Systems
in Southern Equatorial to Temperate Latitudes of Jupiter from 1975-1983', Astron. Astrophys. 148, 67-78.
Sanchez-Lavega, A., Miyazaki, I., Parker, D., Laques, P. and Lecacheux, J.: 1991, 'A Disturbance in Jupiter's High-Speed North Temperate Jet During 1990', Icarus 94, 92-97.
Xanthakis, J., Petropoulos, B., Banos, C., and Sarris, E.: 1991,'Seasonal Variation in the Atmospheric Activity of Jupiter', Earth, Moon, Planets 52, 145-159.
Copyright © 2022 FDOKUMEN