Asteroseismology of old open clusters with Kepler: direct estimate of the integrated red giant...
13
arXiv:1109.4376v1 [astro-ph.SR] 20 Sep 2011 Mon. Not. R. Astron. Soc. 000, ??–13 (2010) Printed 21 September 2011 (MN L A T E X style file v2.2) Asteroseismology of old open clusters with Kepler : direct estimate of the integrated RGB mass loss in NGC6791 and NGC6819 A. Miglio 1⋆ , K. Brogaard 2 , D. Stello 3 , W. J. Chaplin 1 , F. D’Antona 4 , J. Montalb´an 5 , S. Basu 6 , A. Bressan 7,8 , F. Grundahl 9 , M. Pinsonneault 10 , A. M. Serenelli 11 , Y. Elsworth 1 , S. Hekker 12,1 , T. Kallinger 13 , B. Mosser 14 , P. Ventura 4 , A. Bonanno 15 , A. Noels 5 , V. Silva-Aguirre 16 , R. Szabo 17 , J. Li 18 , S. McCauliff 19 , C. K. Middour 19 , H. Kjeldsen 9 1 School of Physics and Astronomy, University of Birmingham, Edgbaston, Birmingham B15 2TT, United Kingdom 2 Department of Physics and Astronomy, University of Victoria, P.O. Box 3055, Victoria, BC V8W 3P6, Canada 3 Sydney Institute for Astronomy (SIfA), School of Physics, University of Sydney, NSW 2006, Australia 4 INAF-Osservatorio Astronomico di Roma, via Frascati 33, Monteporzio Catone (RM), Italy 5 Institut d’Astrophysique et de G´ eophysique de l’Universit´ e de Li` ege, All´ ee du 6 Aoˆ ut, 17 B-4000 Li` ege, Belgium 6 Department of Astronomy, Yale University, P.O. Box 208101, New Haven CT 06520-8101, USA 7 SISSA, via Bonomea, 265, 34136 Trieste, Italy 8 INAF-Osservatorio Astronomico di Padova, Vicolo dell’Osservatorio 5, I-35122 Padova, Italy 9 Department of Physics and Astronomy, Building 1520, Aarhus University, 8000 Aarhus C, Denmark 10 Ohio State University, Dept. of Astronomy 140 W. 18th Ave. Columbus, OH 43210 USA 11 Institute for Space Sciences (CSIC-IEEC), Facultad de Ciencies, Campus UAB, 08193 Bellaterra, Spain 12 Astronomical Institute Anton Pannekoek, University of Amsterdam, Science Park 904, 1098 XH Amsterdam, The Netherlands 13 Department of Physics and Astronomy, University of British Colombia, 6224 Agricultural Road, Vancouver, BC V6T 1Z1, Canada 14 LESIA, CNRS, Universit´ e Pierre et Marie Curie, Universit´ e Denis Diderot, Observatoire de Paris, 92195 Meudon cedex, France 15 INAF-Osservatorio Astrofisico di Catania, Via S.Sofia 78, 95123, Catania, Italy 16 Max Planck Institute for Astrophysics, Karl-Schwarzschild-Str. 1, 85748, Garching bei M¨ unchen, Germany 17 Konkoly Observatory of the Hungarian Academy of Sciences, Konkoly Thege Mikl´ os ´ ut 15-17, H-1121 Budapest, Hungary 18 SETI Institute/NASA Ames Research Center, Moffett Field, CA 94035 19 Orbital Sciences Corporation/NASA Ames Research Center, Moffett Field, CA 94035 ABSTRACT Mass loss of red giant branch (RGB) stars is still poorly determined, despite its crucial role in the chemical enrichment of galaxies. Thanks to the recent detection of solar– like oscillations in G–K giants in open clusters with Kepler, we can now directly determine stellar masses for a statistically significant sample of stars in the old open clusters NGC6791 and NGC6819. The aim of this work is to constrain the integrated RGB mass loss by comparing the average mass of stars in the red clump (RC) with that of stars in the low-luminosity portion of the RGB (i.e. stars with L L(RC)). Stellar masses were determined by combining the available seismic parameters ν max and Δν with additional photometric constraints and with independent distance estimates. We measured the masses of 40 stars on the RGB and 19 in the RC of the old metal-rich cluster NGC6791. We find that the difference between the average mass of RGB and RC stars is small, but significant (Δ M =0.09±0.03 (random) ±0.04 (systematic) M ⊙ ). Interestingly, such a small Δ M does not support scenarios of an extreme mass loss for this metal-rich cluster. If we describe the mass-loss rate with Reimers’ prescription, a first comparison with isochrones suggests that the observed Δ M is compatible with a mass-loss efficiency parameter in the range 0.1 η 0.3. Less stringent constraints on the RGB mass-loss rate are set by the analysis of the ∼ 2 Gyr-old NGC6819, largely due to the lower mass loss expected for this cluster, and to the lack of an independent and accurate distance determination. In the near future, additional constraints from frequencies of individual pulsation modes and spectroscopic effective temperatures, will allow further stringent tests of the Δν and ν max scaling relations, which provide a novel, and potentially very accurate, means of determining stellar radii and masses. Key words: asteroseismology; open clusters and associations: individual (NGC 6791,
Transcript of Asteroseismology of old open clusters with Kepler: direct estimate of the integrated red giant...

arX
iv:1
109.
4376
v1 [
astr
o-ph
.SR
] 2
0 Se
p 20
11
Mon. Not. R. Astron. Soc. 000, ??–13 (2010) Printed 21 September 2011 (MN LATEX style file v2.2)
Asteroseismology of old open clusters with Kepler :
direct estimate of the integrated RGB mass loss in
NGC6791 and NGC6819
A. Miglio1⋆, K. Brogaard2, D. Stello3, W. J. Chaplin1, F. D’Antona4, J. Montalban5,
S. Basu6, A. Bressan7,8, F. Grundahl9, M. Pinsonneault10, A. M. Serenelli11,
Y. Elsworth1, S. Hekker12,1, T. Kallinger13, B. Mosser14, P. Ventura4, A. Bonanno15,
A. Noels5, V. Silva-Aguirre16, R. Szabo17, J. Li18, S. McCauliff19, C. K. Middour19,
H. Kjeldsen91School of Physics and Astronomy, University of Birmingham, Edgbaston, Birmingham B15 2TT, United Kingdom2Department of Physics and Astronomy, University of Victoria, P.O. Box 3055, Victoria, BC V8W 3P6, Canada3Sydney Institute for Astronomy (SIfA), School of Physics, University of Sydney, NSW 2006, Australia4INAF-Osservatorio Astronomico di Roma, via Frascati 33, Monteporzio Catone (RM), Italy5Institut d’Astrophysique et de Geophysique de l’Universite de Liege, Allee du 6 Aout, 17 B-4000 Liege, Belgium6Department of Astronomy, Yale University, P.O. Box 208101, New Haven CT 06520-8101, USA7SISSA, via Bonomea, 265, 34136 Trieste, Italy8INAF-Osservatorio Astronomico di Padova, Vicolo dell’Osservatorio 5, I-35122 Padova, Italy9Department of Physics and Astronomy, Building 1520, Aarhus University, 8000 Aarhus C, Denmark10Ohio State University, Dept. of Astronomy 140 W. 18th Ave. Columbus, OH 43210 USA11Institute for Space Sciences (CSIC-IEEC), Facultad de Ciencies, Campus UAB, 08193 Bellaterra, Spain12Astronomical Institute Anton Pannekoek, University of Amsterdam, Science Park 904, 1098 XH Amsterdam, The Netherlands13Department of Physics and Astronomy, University of British Colombia, 6224 Agricultural Road, Vancouver, BC V6T 1Z1, Canada14LESIA, CNRS, Universite Pierre et Marie Curie, Universite Denis Diderot, Observatoire de Paris, 92195 Meudon cedex, France15INAF-Osservatorio Astrofisico di Catania, Via S.Sofia 78, 95123, Catania, Italy16Max Planck Institute for Astrophysics, Karl-Schwarzschild-Str. 1, 85748, Garching bei Munchen, Germany17Konkoly Observatory of the Hungarian Academy of Sciences, Konkoly Thege Miklos ut 15-17, H-1121 Budapest, Hungary18SETI Institute/NASA Ames Research Center, Moffett Field, CA 9403519Orbital Sciences Corporation/NASA Ames Research Center, Moffett Field, CA 94035
ABSTRACT
Mass loss of red giant branch (RGB) stars is still poorly determined, despite its crucialrole in the chemical enrichment of galaxies. Thanks to the recent detection of solar–like oscillations in G–K giants in open clusters with Kepler, we can now directlydetermine stellar masses for a statistically significant sample of stars in the old openclusters NGC6791 and NGC6819. The aim of this work is to constrain the integratedRGB mass loss by comparing the average mass of stars in the red clump (RC) with thatof stars in the low-luminosity portion of the RGB (i.e. stars with L . L(RC)). Stellarmasses were determined by combining the available seismic parameters νmax and ∆νwith additional photometric constraints and with independent distance estimates. Wemeasured the masses of 40 stars on the RGB and 19 in the RC of the old metal-richcluster NGC6791. We find that the difference between the average mass of RGB andRC stars is small, but significant (∆M = 0.09±0.03 (random)±0.04 (systematic) M⊙).Interestingly, such a small ∆M does not support scenarios of an extreme mass loss forthis metal-rich cluster. If we describe the mass-loss rate with Reimers’ prescription, afirst comparison with isochrones suggests that the observed ∆M is compatible with amass-loss efficiency parameter in the range 0.1 . η . 0.3. Less stringent constraints onthe RGB mass-loss rate are set by the analysis of the ∼ 2 Gyr-old NGC6819, largelydue to the lower mass loss expected for this cluster, and to the lack of an independentand accurate distance determination. In the near future, additional constraints fromfrequencies of individual pulsation modes and spectroscopic effective temperatures,will allow further stringent tests of the ∆ν and νmax scaling relations, which providea novel, and potentially very accurate, means of determining stellar radii and masses.
Key words: asteroseismology; open clusters and associations: individual (NGC 6791,
2 A. Miglio et al.
0.8 0.9 1 1.1 1.2 1.3 1.4 1.5 1.6
13
14
15
16
17
18
19
20
V
B−V
NGC6791
Stetson et al. photometryRGB stars used in this studyRC stars used in this study
0.4 0.6 0.8 1 1.2 1.4
12
12.5
13
13.5
14
14.5
15
15.5
16
16.5
V
B−V
NGC6819
Hole et al. photometryRGB stars used in this studyRC stars used in this study
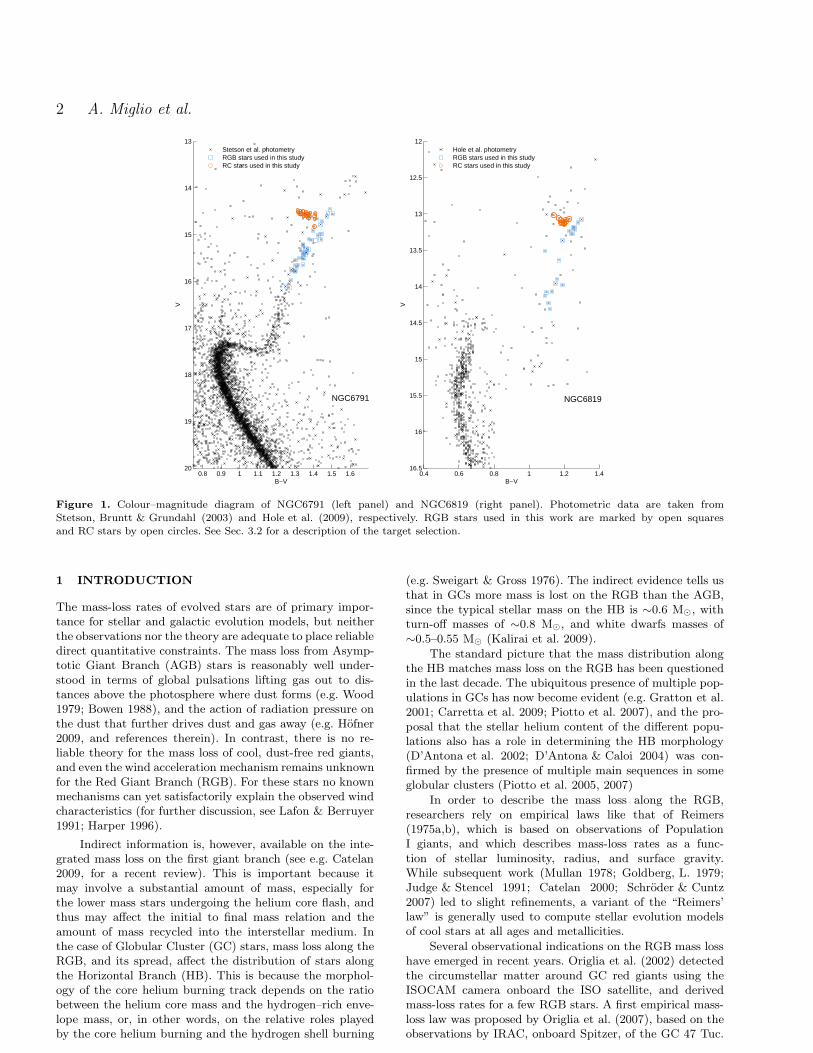
Figure 1. Colour–magnitude diagram of NGC6791 (left panel) and NGC6819 (right panel). Photometric data are taken fromStetson, Bruntt & Grundahl (2003) and Hole et al. (2009), respectively. RGB stars used in this work are marked by open squaresand RC stars by open circles. See Sec. 3.2 for a description of the target selection.
1 INTRODUCTION
The mass-loss rates of evolved stars are of primary impor-tance for stellar and galactic evolution models, but neitherthe observations nor the theory are adequate to place reliabledirect quantitative constraints. The mass loss from Asymp-totic Giant Branch (AGB) stars is reasonably well under-stood in terms of global pulsations lifting gas out to dis-tances above the photosphere where dust forms (e.g. Wood1979; Bowen 1988), and the action of radiation pressure onthe dust that further drives dust and gas away (e.g. Hofner2009, and references therein). In contrast, there is no re-liable theory for the mass loss of cool, dust-free red giants,and even the wind acceleration mechanism remains unknownfor the Red Giant Branch (RGB). For these stars no knownmechanisms can yet satisfactorily explain the observed windcharacteristics (for further discussion, see Lafon & Berruyer1991; Harper 1996).
Indirect information is, however, available on the inte-grated mass loss on the first giant branch (see e.g. Catelan2009, for a recent review). This is important because itmay involve a substantial amount of mass, especially forthe lower mass stars undergoing the helium core flash, andthus may affect the initial to final mass relation and theamount of mass recycled into the interstellar medium. Inthe case of Globular Cluster (GC) stars, mass loss along theRGB, and its spread, affect the distribution of stars alongthe Horizontal Branch (HB). This is because the morphol-ogy of the core helium burning track depends on the ratiobetween the helium core mass and the hydrogen–rich enve-lope mass, or, in other words, on the relative roles playedby the core helium burning and the hydrogen shell burning
(e.g. Sweigart & Gross 1976). The indirect evidence tells usthat in GCs more mass is lost on the RGB than the AGB,since the typical stellar mass on the HB is ∼0.6 M⊙, withturn-off masses of ∼0.8 M⊙, and white dwarfs masses of∼0.5–0.55 M⊙ (Kalirai et al. 2009).
The standard picture that the mass distribution alongthe HB matches mass loss on the RGB has been questionedin the last decade. The ubiquitous presence of multiple pop-ulations in GCs has now become evident (e.g. Gratton et al.2001; Carretta et al. 2009; Piotto et al. 2007), and the pro-posal that the stellar helium content of the different popu-lations also has a role in determining the HB morphology(D’Antona et al. 2002; D’Antona & Caloi 2004) was con-firmed by the presence of multiple main sequences in someglobular clusters (Piotto et al. 2005, 2007)
In order to describe the mass loss along the RGB,researchers rely on empirical laws like that of Reimers(1975a,b), which is based on observations of PopulationI giants, and which describes mass-loss rates as a func-tion of stellar luminosity, radius, and surface gravity.While subsequent work (Mullan 1978; Goldberg, L. 1979;Judge & Stencel 1991; Catelan 2000; Schroder & Cuntz2007) led to slight refinements, a variant of the “Reimers’law” is generally used to compute stellar evolution modelsof cool stars at all ages and metallicities.
Several observational indications on the RGB mass losshave emerged in recent years. Origlia et al. (2002) detectedthe circumstellar matter around GC red giants using theISOCAM camera onboard the ISO satellite, and derivedmass-loss rates for a few RGB stars. A first empirical mass-loss law was proposed by Origlia et al. (2007), based on theobservations by IRAC, onboard Spitzer, of the GC 47 Tuc.

3
They found mass loss to be episodic, depending less onluminosity than in Reimers’ law, and occurring predomi-nantly in the upper∼2 mag of the RGB (Origlia et al. 2010).These findings were questioned by Boyer et al. (2010) andMcDonald et al. (2011a,b), who found no evidence for dustproduction in stars with L < 1000 L⊙. By comparing withHB models they showed that mass loss on the RGB of 47 Tucis likely to be smaller than 0.24 M⊙. Constraints on thedust production and mass loss are now becoming availablefor giants belonging to other GCs (McDonald et al. 2009,Boyer et al. 2009, McDonald et al. 2011c, and the surveyby Origlia et al.), and will eventually provide a complete in-vestigation of the differential mass loss among clusters withdifferent metallicities and HB morphologies.
Asteroseismology promises to shed new light on thisproblem by directly measuring the masses of giant starsin open clusters. The NASA Kepler mission, which waslaunched successfully in March 2009, includes in its fieldof view two old open clusters, NGC6791 and NGC6819.In these clusters solar-like oscillations were detected inabout 100 giants (see Stello et al. 2010; Basu et al. 2011;Hekker et al. 2011 and Fig. 1), providing independent con-straints on the masses and radii of stars on the RGB, as wellas on the distance to the clusters and their ages (Basu et al.2011).
The goal of this paper is to constrain the RGB massloss by comparing the average mass of stars in the red clump(RC) with the low-luminosity portion of the RGB (i.e. withL . L(RC)). The structure of the paper is as follows. In Sec.2 we describe the procedures used to estimate the masses ofstars from the available seismic and non-seismic constraints.We then address the specific case of NGC6791 in Sec. 3,and of NGC6819 in Sec. 4. A first comparison with modelpredictions is presented in Sec. 5, while a brief summary andfuture prospects are given in Sec. 6.
2 ESTIMATING STELLAR MASSES
To estimate stellar masses we use the average seismic pa-rameters that characterise solar-like oscillation spectra: theso-called average large frequency separation (∆ν), and thefrequency corresponding to the maximum observed oscilla-tion power (νmax). The large frequency spacing is expectedto scale as the square root of the mean density of the star:
∆ν ≃
√
M/M⊙
(R/R⊙)3∆ν⊙, (1)
where ∆ν⊙ = 135 µHz. The frequency of maximumpower is approximatively proportional to the acoustic cut-off frequency (Brown et al. 1991; Kjeldsen & Bedding 1995;Mosser et al. 2010; Belkacem et al. 2011), and therefore:
νmax ≃M/M⊙
(R/R⊙)2√
Teff/Teff,⊙
νmax,⊙ , (2)
where νmax,⊙ = 3100 µHz and Teff,⊙ = 5777 K.These scaling relations are widely used to estimate
masses and radii of red giants (see e.g. Stello et al. 2008;Kallinger et al. 2010; Mosser et al. 2010), but they are basedon simplifying assumptions that remain to be independentlyverified. Recent advances have been made on providing atheoretical basis for the relation between the acoustic cut-off
frequency and νmax (Belkacem et al. 2011), and preliminaryinvestigations with stellar models (Stello et al. 2009) indi-cate that the scaling relations hold to within ∼ 3% on themain sequence and RGB (see also White et al. 2011).
Depending on the observational constraints available,we may derive mass estimates from Equations 1 and 2 alone,or via their combination with other available informationfrom non-seismic observations. When no information on dis-tance/luminosity is available, which is usually the case forfield stars, Eq. 1 and 2 may be solved to derive M and R(see e.g. Kallinger et al. 2010; Mosser et al. 2010):
M
M⊙
≃
(
νmax
νmax,⊙
)3 (
∆ν
∆ν⊙
)−4 (
Teff
Teff,⊙
)3/2
(3)
R
R⊙
≃
(
νmax
νmax,⊙
)(
∆ν
∆ν⊙
)−2(
Teff
Teff,⊙
)1/2
. (4)
In the case of clusters, we can use the dis-tance/luminosities estimated with independent methods(i.e. via isochrone fitting or eclipsing binaries) as an ad-ditional constraint. Including this information allows M tobe estimated also from Eq. 1 or 2 alone (see Eq. 5 and 6,respectively), or in combination leading to a mass estimatewith no explicit dependence on Teff (as in Eq. 7):
M
M⊙
≃
(
∆ν
∆ν⊙
)2(
L
L⊙
)3/2 (Teff
Teff,⊙
)−6
(5)
M
M⊙
≃
(
νmax
νmax,⊙
)(
L
L⊙
)(
Teff
Teff,⊙
)−7/2
(6)
M
M⊙
≃
(
νmax
νmax,⊙
)12/5 (∆ν
∆ν⊙
)−14/5 (L
L⊙
)3/10
. (7)
In the following sections we use Equations 3 to 7 di-rectly to estimate M (and R) without adding any extra de-pendence on stellar models. As illustrated in detail e.g. byGai et al. (2011), additional (so-called “grid-based”) meth-ods to estimate M and R can be designed. These proceduresare also based on Eqs. 1 and 2 but, by searching solutions forM and R in grids of evolutionary tracks, have the advantageof reducing uncertainties on the derived mass and radius, atthe price of some model dependence that we prefer to avoidin this study.
2.1 Error estimates
The formal uncertainties (σi) on the masses (Mi) of thestars were used to compute a weighted average mass forstars belonging to the RGB and for stars in the RC:
M =
∑N1Mi/σ
2i
∑N11/σ2
i
.
The uncertainties in these averages were estimated from theweighted scatter in the masses, i.e.
σM = t[N − 1]
√
√
√
√
√
∑N1
(Mi−M)2
σ2i
(N − 1)∑N
11/σ2
i
.
Due to the small number of stars in the samples, the correc-tion factor t[N − 1] was drawn from the Student’s t distri-bution with N − 1 degrees of freedom in order to assess the

4 A. Miglio et al.
confidence limits correctly (see e.g. Chaplin et al. 1998). Weadopted 68% as the 1-σ confidence level.
To assess how well the formal fitting uncertainties re-flected the scatter in the data we computed the ratio z =σM/σM, where σM is the weighted mean uncertainty esti-mated from the formal uncertainties on the masses, i.e. :
σM =
(
N∑
1
1/σ2
i
)−1/2
.
If mass scatter is dominated by random errors and the for-mal uncertainties reflect the true observational uncertain-ties, then z ∼ 1.
The uncertainty on ∆M = MRGB−MRC due to randomerrors was finally computed as:
σ∆M =
√
σ2
MRGB
+ σ2
MRC
.
3 NGC 6791
NGC6791 is an old open cluster, with age estimates rang-ing from ∼7 to ∼12 Gyr, depending on the choice ofreddening and metallicity (see Chaboyer, Green & Liebert1999; Stetson, Bruntt & Grundahl 2003). More recent stud-ies (Brogaard et al. 2011; Basu et al. 2011) point towardsthe lower end of this age interval. This cluster has a so-lar [α/Fe] ratio (Origlia et al. 2006) and is one of the mostmetal-rich clusters in our Galaxy (Friel & Janes 1993) witha metallicity of [Fe/H]=+0.3 to +0.5 (e.g. Brogaard et al.2011; Origlia et al. 2006, and references therein).
3.1 Mass loss in NGC6791: a puzzling open
question
As summarised in the following paragraphs, an issue widelydebated in the literature is whether the high metallicity ofNGC6791 may lead to higher-than-average mass-loss ratesalong the RGB, and whether such enhanced mass loss couldexplain the very peculiar luminosity distribution of its whitedwarfs.
By examining the white dwarf data in the deep HSTphotometry analysed by King et al. (2005), Bedin et al.(2005) found a rich population of hundreds of white dwarfs.Surprisingly, the luminosity function of these stars showedtwo peaks, the dimmer one possibly consistent with the“normal” turnoff age of∼ 8 Gyr (but see below), the brighterone indicating a much younger age of ∼ 2.4 Gyr. Whitedwarf dating of open and globular clusters has often beenused in the literature, and generally provides results consis-tent with the turnoff dating (von Hippel 2005; Hansen et al.2007). For NGC 6791, Hansen (2005) speculated that the pe-culiar luminosity function could be related to high rates ofmass loss. If all the cluster stars formed at the same epoch(∼ 8 Gyr ago), and if there has been significant mass loss onthe red giant branch, many stars may have been reducedto a mass below the threshold to ignite the core heliumflash. They would evolve much more slowly than the nor-mal carbon–oxygen white dwarfs in the cluster, leading toa more luminous peak in the white dwarf luminosity func-tion. This explanation proposed by Hansen (2005) receivedsupport from Kalirai et al. (2007), who derived a very low
average mass (M∼0.43±0.06 M⊙) for the luminous whitedwarfs for which they obtained Keck/LRIS spectra, well be-low the limit for helium ignition in a degenerate core. Inaddition, the post-helium flash, helium-core-burning starsin this cluster are divided into a red giant clump and an ex-tremely blue HB (e.g. Kalirai et al. 2007). The latter may bepopulated by the less massive stars evolving from the RGBthat were still able to ignite a late helium core flash (e.g.Castellani & Castellani 1993; Brown et al. 2001). Stars withslightly higher mass loss do not ignite helium and evolved di-rectly into helium white dwarfs, giving rise to the more lumi-nous peak in the white dwarf luminosity function. Since themass at the turnoff of NGC 6791 is ∼1.1 M⊙(Brogaard et al.2011), a huge mass loss, possibly connected to the highmetallicity of the cluster, must have occurred if the abovescenario is true.
This tentative explanation was disputed byvan Loon, Boyer & McDonald (2008), who found thatthe RGB luminosity function does not show any signs ofstar depletion, and that the number of HB (clump) starsis consistent with most cluster stars evolving through thehelium flash. In addition, dust – a sign of extreme massloss – was not detected around the most luminous giants.More recently, Bedin et al. (2008a) used additional data toexamine the white dwarf sequence in NGC 6791, confirminga second dimmer peak in the luminosity function. Sincethe first peak is ∼0.75 mag brighter than the dimmer one,Bedin et al. (2008b) proposed that binary white dwarfs areresponsible for the brighter peak. This explanation requiredthat more than ∼30% of the white dwarfs are binaries. Inthis context, the extreme HB can be attributed to binaryevolution following the same scenario as the productionof extreme B and O subdwarfs in the Galactic field (e.g.Han et al. 2003).
In the new data analysed by Bedin et al. (2008b), a he-lium white dwarf population does not seem to agree withthe colour distribution of the cooling sequences, while a fur-ther problem emerged for the interpretation of the dim-mer peak, in that its cooling age is ∼6 Gyr, comparedwith the ∼8 Gyr turnoff age. This latter problem has beenrecently addressed by including in the modelling the en-ergy released by the sedimentation of 22Ne and of the C–Omixture in the white dwarf core (Deloye & Bildsten 2002;Garcıa-Berro et al. 2010; Althaus et al. 2010), which hasthe effect of lengthening the evolution of the C–O whitedwarfs. The recent analysis by Garcıa-Berro et al. (2011)also favours a significant population of unresolved binariesas the most likely explanation for the observed white-dwarfluminosity function.
3.2 Targets and data
For our initial set of targets we took the stars listed byStello et al. (2011a), but removed those listed as seismicnon-members and blended stars. To avoid possible con-tamination by AGB stars, we then removed stars withL > L(RC), and subsequently separated the remainingstars into two groups, RGB and RC stars, by visual in-spection of the CMD. This classification agrees with theone presented by Stello et al. (2011a, Table 1). Recentwork by Montalban et al. (2010), Bedding et al. (2011), andMosser et al. (2011) has shown that the characteristics of

5
Eq. MRGB ± σM zRGB MRC ± σM zRC ∆M ± σ∆M
(3) 1.23± 0.02 1.8 1.03 ± 0.03 1.9 0.19± 0.04(5) 1.22± 0.01 (0.10) 0.7 1.20± 0.02 (0.10) 0.6 0.02± 0.02 (0.01)(6) 1.23± 0.01 (0.07) 1.1 1.14± 0.02 (0.06) 1.1 0.09± 0.02 (< 0.01)(7) 1.23± 0.02 (0.02) 1.9 1.07± 0.03 (0.02) 2.0 0.16± 0.03 (< 0.01)
Table 1. NGC6791: average mass of stars in the RGB and RC estimated using different observational constraints and scaling relations(Equations 3, 5, 6, and 7). The systematic error on M due to the uncertainty on the distance is reported in brackets. z (see Sec. 2.1) wascomputed taking into account only random errors in the observables, and the correlation between BC and Teff . No correction to the ∆ν
scaling was applied to clump stars.
Eq. MRC ± σM zRC ∆M ± σ∆M
(3) 1.15± 0.03 1.8 0.08± 0.04(5) 1.14± 0.02 (0.09) 0.6 0.08± 0.02 (0.01)(6) 1.14± 0.02 (0.06) 1.1 0.09± 0.02 (< 0.01)(7) 1.15± 0.03 (0.02) 2.0 0.08± 0.03 (< 0.01)
Table 2. As in Table 1, after applying the 2.7% suggested correction to the ∆ν scaling for clump stars (see Sec. 3.4).
the ℓ = 1 ridge in the echelle diagram can be used as an in-dicator of evolutionary state of low-mass giants. A detailedand systematic analysis of the properties of ℓ = 1 modes incluster stars is beyond the scope of this paper. Nonetheless,by visual inspection of echelle diagrams we could identifytwo misclassified stars, by looking at the typical spacing be-tween ℓ = 1 modes (see examples in Bedding et al. 2011).The first one is KIC2437103, which we now identify as acore-He burning star, and the second one is KIC2437589which has a spectrum not compatible with a RC star, anddeserves further analysis. After this selection, we are leftwith 40 stars on the RGB and 19 stars in the RC (see Fig.1).
If the mass loss is very high then the helium-burningstars that lost the most mass will not be in the RC, butrather on the corresponding flat part of the horizontalbranch at higher Teff and lower L. Since our sample onlyincludes RC stars, one might suspect that this introduces aselection bias. However, as shown in the membership studyby Platais et al. (2011), there are only 12 potential low-mass helium-burning stars outside the RC (disregarding theEHB stars, which most likely result from binary evolution).Among these, many are likely to be blue stragglers or non-members (see their Fig. 1 and Table 1). Furthermore, work inprogress (Brogaard et al. 2011, in prep.) shows that a theo-retical ZAHB that matches the RC stars is brighter than thepotential low-mass HB stars. It also shows that the bluest ofthese (star 2-17, first analysed by Peterson & Green (1998)and often associated with the HB), is actually a blue strag-gler. Based on this, we believe that there are no, or at mosta couple, helium-burning stars present with masses smallerthan those in the RC.
The photometric time-series data were obtained by theKepler space telescope (Koch et al. 2010) between 2009 May12 and 2010 March 20, known as observing quarters 1–4. Weused the ‘long cadence’ observing mode (∆t = 29.4min,Jenkins et al. 2010b), which provided about 14,000 datapoints per star. The data reduction from raw images tothe final light curves is described by Jenkins et al. (2010a),Garcıa et al. (2011), and Stello et al. (2011a). A detailed de-scription of the asteroseismic parameters used in this work
is given by Stello et al. (2011b), who used the method ofHuber et al. (2009) to measure ∆ν and νmax. The aver-age uncertainties in ∆ν and νmax in this sample of tar-gets are 1.3% and 1.7%, respectively. Other analyses of thesame cluster are given in our companion papers: Basu et al.(2011), Hekker et al. (2011), and Stello et al. (2011b).
The effective temperatures used in this study are, fol-lowing Basu et al. (2011), Hekker et al. (2011), Stello et al.(2011a), and Stello et al. (2011b), based on the (V − K)colour and on the calibrations of Ramırez & Melendez(2005). The value we adopted for the reddening is E(B −
V ) = 0.16 ± 0.02 mag (Brogaard et al. 2011) and forthe metallicity [Fe/H]=+0.3. As presented by Hekker et al.(2011), the estimated random star-to-star error on Teff isabout 50 K, which we also adopt in the following analysis.However, systematic errors on the Teff scale due to colour–temperature calibrations and reddening could increase theerror budget up to ∼ 110 K (Hekker et al. 2011); we dis-cuss in Sec. 3.4 the effect of systematic errors in Teff on ourresults.
Finally, luminosities were derived using V magnitudesfrom Stetson, Bruntt & Grundahl (2003), the bolometriccorrections by Flower (1996), and the distance modulus(m−M)V = 13.51± 0.06 mag estimated by Brogaard et al.(2011) using eclipsing binaries.
3.3 Results
We first applied Eq. 3 to derive masses of stars in oursample from νmax, ∆ν, and Teff . As presented in the toprow of Table 1, we find MRGB = 1.23 ± 0.02M⊙ andMRC = 1.03 ± 0.03M⊙. The mass difference we obtain isthus ∆M = 0.19 ± 0.04 M⊙. The value of z = 1.8 − 1.9reported in the first row of Table 1 suggests that the scatterin the population is larger than expected from the formaluncertainties in the masses. This could indicate that uncer-tainties in the observed quantities are underestimated, pro-vided, of course, that there is no significant intrinsic massspread within the groups of RGB and RC stars. The de-rived masses for RGB and RC stars are shown as a functionof apparent V magnitude in the top row of Fig. 2.

6 A. Miglio et al.
14.4 14.6 14.8 15 15.2 15.4 15.6 15.8 16 16.20.6
0.8
1
1.2
1.4
1.6
1.8Eq. 3
V
M/M
sun
RGB
14.5 14.6 14.7 14.8 14.9V
RC
14.5 14.6 14.7 14.8 14.90.6
0.8
1
1.2
1.4
1.6
1.8
V
M/M
sun
RC correction applied
14.4 14.6 14.8 15 15.2 15.4 15.6 15.8 16 16.20.6
0.8
1
1.2
1.4
1.6
1.8Eq. 5
V
M/M
sun
RGB
14.5 14.6 14.7 14.8 14.9V
RC
14.5 14.6 14.7 14.8 14.90.6
0.8
1
1.2
1.4
1.6
1.8
V
M/M
sun
RC correction applied
14.4 14.6 14.8 15 15.2 15.4 15.6 15.8 16 16.20.6
0.8
1
1.2
1.4
1.6
1.8Eq. 6
V
M/M
sun
RGB
14.5 14.6 14.7 14.8 14.9V
RC
14.5 14.6 14.7 14.8 14.90.6
0.8
1
1.2
1.4
1.6
1.8
V
M/M
sun
RC correction applied
14.4 14.6 14.8 15 15.2 15.4 15.6 15.8 16 16.20.6
0.8
1
1.2
1.4
1.6
1.8Eq. 7
V
M/M
sun
RGB
14.5 14.6 14.7 14.8 14.9V
RC
14.5 14.6 14.7 14.8 14.90.6
0.8
1
1.2
1.4
1.6
1.8
V
M/M
sun
RC correction applied
Figure 2. Mass of red giants in NGC6791 as a function of visual magnitude in the RGB (left panels) and in the RC (central panels).Random errors on the mass estimate of each star are represented by vertical error bars. The average mass of RGB and RC stars isrepresented with full lines, and the 1-σ error bars with dashed lines. Right panels show the masses of RC stars after a correction to the∆ν scaling is applied (see Sec. 3.4).
To check the robustness of the mass determination, wealso estimated masses using Eq. 5, 6 and 7, thereby includ-ing independent information on the distance to the cluster(see Sec. 3.2). The results are presented in Table 1, wherewe consider separately the contributions from random un-certainties and (in parentheses) systematic errors from thedistance. We notice that the systematic uncertainty has littleimpact on ∆M (6 0.01 M⊙). The correlation between Teff
and BC has been taken into account in the error estimates.
If we consider only RGB stars, excellent agreement isfound between MRGB derived using different observablesand scaling relations (see also Fig. 2, left panels). On theother hand, significant disagreement is found between MRC
determined with different combinations of scaling relations.As an additional test, and to investigate the reason forthis discrepancy, we compared radii determined from L andTeff (RCMD), with those derived seismically through Eq. 4(Rseismo). As shown in Fig. 3, for RGB stars the two deter-

7
4 6 8 10 12 14 16 180.8
0.85
0.9
0.95
1
1.05
1.1
1.15
RCMD
Rse
ism
o/RC
MD
RGB RC
M/Msun
0.8
0.9
1
1.1
1.2
1.3
1.4
1.5
1.6
Figure 3. NGC6791: ratio between radii determined using L and Teff (RCMD), and those obtained via Eq. 4 (Rseismo). The mass ofeach star determined via Eq. 3 is colour coded.
0 0.2 0.4 0.6 0.8 1−3000
−2500
−2000
−1500
−1000
−500
0
500
r/R
t ac, R
C−
t ac, R
GB [s
]
0 0.2 0.4 0.6 0.8 1
4
4.5
5
5.5
6
6.5
7
r/R
log(
T [K
])
RGBRC
0 0.2 0.4 0.6 0.8 16
6.5
7
7.5
8
r/R
log(
c [c
m/s
])
RGBRC
0 0.2 0.4 0.6 0.8 10
2
4
6
8
10x 10
4
m/Msun
t ac [s
]
RGBRC
Figure 4. Upper-left panel: difference between the acoustic radius of RGB and RC models of same mass and radius as a function ofrelative radius. Right panels: sound speed and temperature stratification as a function of the normalised radius in the RGB model (reddashed line) and RC model (blue solid line). Lower-left panel: acoustic radius as a function of mass (in solar units) for the RGB and RCmodels.
minations of radii agree within 5% (with an average relativedifference (RCMD − Rseismo)/RCMD = −0.15%). This com-parison can also be carried out in terms of distance mod-uli, instead of radii. By coupling photometric constraintswith Rseismo of the RGB stars, we find an average distancemodulus (m −M)V = 13.51 ± 0.02 mag, where the quoteduncertainty represents only the standard deviation from themean. This determination is in excellent agreement with thevalue found by Brogaard et al. (2011) using eclipsing bina-ries ((m−M)V = 13.51±0.06, see Sec. 3.2). The situation isdifferent for RC stars, whose radii obtained from Eq. 4 aresystematically smaller than those derived from the CMD,with an average relative difference of −5%. This discrepancycould indicate a systematic error in the scaling relations forRC stars.
3.4 The ∆ν scaling relation for RC and RGB stars
Following the asymptotic approximation for acoustic oscil-lation modes, ∆ν is directly related to the sound-travel timein the stellar interior. We therefore expect ∆ν to depend onthe stellar structure. Given that stars on the RGB have aninternal temperature (hence sound speed) distribution sig-nificantly different from that of RC stars, we investigatedwhether this difference could have an impact on the massdetermination via the ∆ν scaling relation.
We used the code ATON(Ventura, D’Antona & Mazzitelli 2008) to compute stellarmodels representative of red giants in NGC6791, i.e.1.2 M⊙ models with initial heavy-element mass fractionZ = 0.04, and initial helium mass fraction Y = 0.30 (seeMontalban et al. 2010, for more details on the models). The

8 A. Miglio et al.
evolution of the models was followed through the heliumflash. We then considered two models with the same radius(within 0.1%): one on the RGB and the other in the RC.We computed radial oscillation frequencies with the LOSCcode (Scuflaire et al. 2008) and found that the RC modelhad a mean large frequency separation ∼ 3.3% larger thanthe RGB model, despite having the same mean density.
The average large frequency separation is known to bedirectly related to the behaviour of the sound speed in thestellar interior, since ∆ν ≃ 1/(2Tac) where Tac is the totalacoustic radius of the star. The latter is defined as Tac =tac(R), with tac(r) =
∫ r
0dr′/c(r′) being the acoustic radius,
c the sound speed, and R the photospheric radius.
The upper-left panel of Fig 4 shows the layers contribut-ing to the difference in the overall acoustic radius. As shownin the upper-right panel, the sound speed in the RC modelis on average higher (at a given fractional radius) than thatof the RGB model, the main reason being the different tem-perature profile in the two models (lower-right panel). Thedifference in acoustic radius becomes significant in regions asdeep as m/M⊙ ≃ 0.25, which is where the boundary of thehelium core in the RGB model is located (lower-left panel).Finally, we note that while the largest contribution to theoverall difference originates in the deep interior, near-surfaceregions (r/R & 0.9) also contribute (by 0.8%) to the total3.5% difference in Tac (upper-left panel of Fig. 4).
These findings suggest that, if we intend to use the ∆νscaling to estimate stellar mean density, a relative correctionhas to be considered when dealing with RC and RGB stars.This relative correction is expected to be mass-dependentand to be larger for low-mass stars, which have significantlydifferent internal structure when ascending the RGB com-pared to when they are in the core-He burning phase. De-riving an accurate theoretical correction of the ∆ν scaling,however, is beyond the scope of this paper, as additionalmodels should be considered and detailed tests should bemade of the internal structure of such stars. Guided by therepresentative modelling presented here, we instead adoptedan empirical approach to correct the ∆ν scaling.
We determined the correction factor to the large fre-quency separation by minimising the average relative dif-ference (RCMD − Rseismo)/RCMD for RC stars. The correc-tion factor derived following this procedure is 2.7%, in goodagreement with the correction suggested by the models. Cor-recting the ∆ν scaling for RC stars has a direct effect onMRC obtained with different scaling relations. After we ap-plied the correction to the ∆ν scaling, the revised averagemass of RC stars computed with Eq. 3, 5, and 7 agreedwithin 1-σ with the value obtained with Eq. 6, which doesnot contain ∆ν.
We note that the uncertainties in Rseismo and RCMD im-ply an uncertainty of 1% in the correction factor to the ∆νscaling relation. This leads to an additional source of system-atic uncertainty in the mass estimate, which is largest (0.03M⊙) when using Eq. 3 to determine ∆M , and zero whenusing Eq. 6. Considering also potential differential temper-ature scale shifts between the RC and RGB (at the levelof 1%), we adopted 0.04 M⊙ as a conservative estimate ofthe additional systematic uncertainty in ∆M . Taking intoaccount the uncertainties and scatter of the average massof RC and RGB stars obtained with different scaling rela-tions, we derived our best estimate of the difference between
average masses of RGB and RC stars: ∆M = 0.09 ± 0.03(random) ±0.04 (systematic).
Finally, to check for additional sources of bias due to theTeff scale, we considered effective temperatures determinedfrom (V −I) colours. These Teff introduce small but system-atic trends in the derived quantities (e.g. mass vs. apparentmagnitude) and worsen the agreement between masses andradii derived using different observational constraints. Wefind, nonetheless, that ∆M obtained with the different tem-peratures scales agree within the quoted uncertainty range.
4 NGC6819
NGC6819 is an open cluster of near-solar metallicity(Bragaglia et al. 2001) estimated to be 2-2.5 Gyr old(Kalirai & Tosi 2004; Basu et al. 2011). Given that the clus-ter is significantly younger than NGC6791, a smaller RGBmass loss is expected. As for the case of NGC6791, we re-fer to Basu et al. (2011), Hekker et al. (2011), Stello et al.(2011a), and Stello et al. (2011b) for a description of theasteroseismic data available for the stars in this cluster.
We selected targets on the RGB and in the RC fol-lowing the same criteria used in Sec. 3.2, and retainedin the final list 19 RGB stars and 13 RC stars. As forNGC6791, we adopted the effective temperatures deter-mined using (V − K) colours, the colour-temperature cali-bration of Ramırez & Melendez (2005), and assuming a red-dening E(B − V ) = 0.15 mag (see Basu et al. 2011) and[Fe/H]=0.
We then performed a similar analysis as for NGC6791.However, since no accurate determination of the distancemodulus was available for this cluster, we proceeded as inBasu et al. (2011) and estimated the distance modulus usingthe seismically determined radii of RGB stars and photomet-ric constraints. We found (m − M)V = 11.80 ± 0.02 mag,where the quoted uncertainty represents only the standarddeviation from the mean (see Basu et al. 2011 for a more de-tailed discussion of systematic uncertainties on the distancedetermination due to reddening).
We repeated the same steps as in Sec. 3.3 to determinethe average mass of stars on the RGB and in the RC, andpresent our results in Table 3 and Fig. 5. We notice that,as in NGC6791, MRGB is independent of the scaling used,but significant discrepancies appear in the estimated MRC.Analogously to the case described in Sec 3.4, we used 1.6 M⊙
stellar models and found that a relative correction to the ∆νscaling was appropriate, and that the radii of RC stars aresystematically smaller than those obtained using Teff and L(although we note that L is not an independent quantity, asit is determined using Eq. 4).
We found that the correction factor for ∆ν that min-imises the relative difference between RCMD and Rseismo is1.9%, which is smaller than for NGC6791. Again, this is inqualitative agreement with the correction suggested by 1.6M⊙ models, as the differences in the sound speed profilebetween RC and RGB stars of similar luminosity decreaseswhen higher masses are considered.
By combining results from different scaling relations,we derive ∆M = −0.03 ± 0.04 M⊙ for NGC6819. Due tothe lack of an independent and accurate distance measure-

9
12.5 13 13.5 14 14.51
1.5
2
2.5Eq. 3
V
M/M
sun
RGB
12.9 13 13.1 13.2 13.3V
RC
12.9 13 13.1 13.2 13.31
1.5
2
2.5
V
M/M
sun
RC correction applied
12.5 13 13.5 14 14.51
1.5
2
2.5Eq. 5
V
M/M
sun
RGB
12.9 13 13.1 13.2 13.3V
RC
12.9 13 13.1 13.2 13.31
1.5
2
2.5
V
M/M
sun
RC correction applied
12.5 13 13.5 14 14.51
1.5
2
2.5Eq. 6
V
M/M
sun
RGB
12.9 13 13.1 13.2 13.3V
RC
12.9 13 13.1 13.2 13.31
1.5
2
2.5
V
M/M
sun
RC correction applied
12.5 13 13.5 14 14.51
1.5
2
2.5Eq. 7
V
M/M
sun
RGB
12.9 13 13.1 13.2 13.3V
RC
12.9 13 13.1 13.2 13.31
1.5
2
2.5
V
M/M
sun
RC correction applied
Figure 5. As Fig. 2 but for red giants in NGC6819.
ment, however, we consider this result less robust than thedetermination of ∆M in NGC6791.
5 INFERENCES ON THE MASS-LOSS RATE
We now compare the difference between the average massof low-luminosity RGB and RC stars to theoretical predic-tions using a revised version of the YZVAR1 isochrones andstellar evolutionary sequences (Bertelli et al. 2008; Bertelli
1 http://stev.oapd.inaf.it/YZVAR/
2011, private communication). We varied the coefficient ηdescribing the efficiency of the RGB mass-loss rate, whichwas implemented in the models (see Bertelli et al. 1994) fol-lowing Reimers’ (1975a) empirical formulation:
dM
dt= 1.27 10−5 ηM−1L1.5 T−2
eff , (8)
where M and L are expressed in solar units, Teff in K,and t in yr. A commonly adopted value of the parame-ter describing the mass-loss efficiency is η = 0.4, see e.g.Renzini & Fusi Pecci (1988).
We considered three scenarios: isochrones computedwithout mass loss (η = 0), with moderate mass loss (η =
10 A. Miglio et al.
Eq. MRGB ± σM zRGB MRC ± σM zRC ∆M ± σ∆M
(3) 1.61± 0.04 2.3 1.52± 0.04 2.0 0.09± 0.06(5) 1.61± 0.03 0.9 1.70± 0.02 0.5 −0.09± 0.03(6) 1.61± 0.02 1.4 1.64± 0.01 0.6 −0.03± 0.03(7) 1.62± 0.03 2.5 1.56± 0.03 2.1 0.06± 0.04
Table 3. NGC6819: average mass of stars in the RGB and RCestimated using different observational constraints and scaling re-lations (Equations 3, 5, 6, and 7). No correction to the ∆ν scalingwas applied to clump stars.
Eq. MRC ± σM zRC ∆M ± σ∆M
(3) 1.65± 0.04 2.0 −0.03± 0.06(5) 1.63± 0.02 0.5 −0.03± 0.03(6) 1.64± 0.01 0.7 −0.03± 0.03(7) 1.64± 0.03 2.1 −0.02± 0.05
Table 4. As in Table 3, after applying the 1.9% suggested cor-rection to the ∆ν scaling for clump stars.
0.35), and with an extreme value of the mass-loss efficiency(η = 0.7). We notice that for these relatively young clus-ters, such a high mass-loss rate is not enough to suppressthe RC and AGB phases, in contrast to old GCs (see e.g.Renzini & Fusi Pecci 1988).
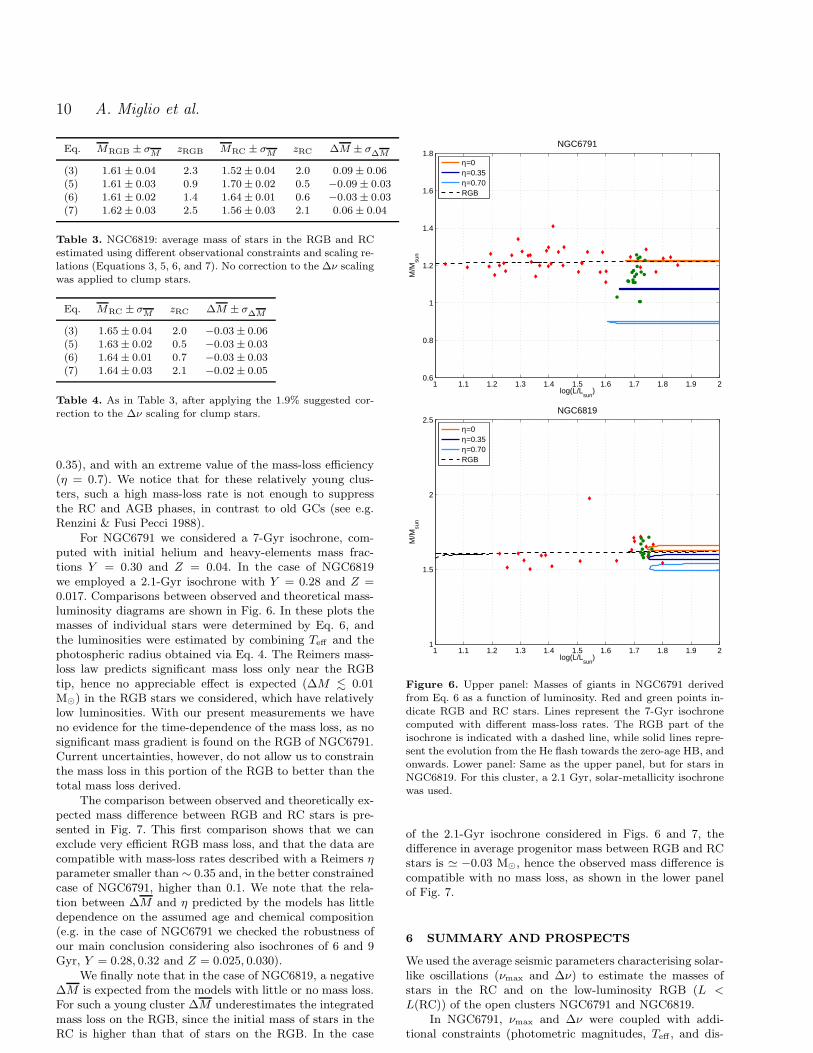
For NGC6791 we considered a 7-Gyr isochrone, com-puted with initial helium and heavy-elements mass frac-tions Y = 0.30 and Z = 0.04. In the case of NGC6819we employed a 2.1-Gyr isochrone with Y = 0.28 and Z =0.017. Comparisons between observed and theoretical mass-luminosity diagrams are shown in Fig. 6. In these plots themasses of individual stars were determined by Eq. 6, andthe luminosities were estimated by combining Teff and thephotospheric radius obtained via Eq. 4. The Reimers mass-loss law predicts significant mass loss only near the RGBtip, hence no appreciable effect is expected (∆M . 0.01M⊙) in the RGB stars we considered, which have relativelylow luminosities. With our present measurements we haveno evidence for the time-dependence of the mass loss, as nosignificant mass gradient is found on the RGB of NGC6791.Current uncertainties, however, do not allow us to constrainthe mass loss in this portion of the RGB to better than thetotal mass loss derived.
The comparison between observed and theoretically ex-pected mass difference between RGB and RC stars is pre-sented in Fig. 7. This first comparison shows that we canexclude very efficient RGB mass loss, and that the data arecompatible with mass-loss rates described with a Reimers ηparameter smaller than ∼ 0.35 and, in the better constrainedcase of NGC6791, higher than 0.1. We note that the rela-tion between ∆M and η predicted by the models has littledependence on the assumed age and chemical composition(e.g. in the case of NGC6791 we checked the robustness ofour main conclusion considering also isochrones of 6 and 9Gyr, Y = 0.28, 0.32 and Z = 0.025, 0.030).
We finally note that in the case of NGC6819, a negative∆M is expected from the models with little or no mass loss.For such a young cluster ∆M underestimates the integratedmass loss on the RGB, since the initial mass of stars in theRC is higher than that of stars on the RGB. In the case
1 1.1 1.2 1.3 1.4 1.5 1.6 1.7 1.8 1.9 20.6
0.8
1
1.2
1.4
1.6
1.8
M/M
sun
log(L/Lsun
)
NGC6791
η=0η=0.35η=0.70RGB
1 1.1 1.2 1.3 1.4 1.5 1.6 1.7 1.8 1.9 21
1.5
2
2.5M
/Msu
n
log(L/Lsun
)
NGC6819
η=0η=0.35η=0.70RGB
Figure 6. Upper panel: Masses of giants in NGC6791 derivedfrom Eq. 6 as a function of luminosity. Red and green points in-
dicate RGB and RC stars. Lines represent the 7-Gyr isochronecomputed with different mass-loss rates. The RGB part of theisochrone is indicated with a dashed line, while solid lines repre-sent the evolution from the He flash towards the zero-age HB, andonwards. Lower panel: Same as the upper panel, but for stars inNGC6819. For this cluster, a 2.1 Gyr, solar-metallicity isochronewas used.
of the 2.1-Gyr isochrone considered in Figs. 6 and 7, thedifference in average progenitor mass between RGB and RCstars is ≃ −0.03 M⊙, hence the observed mass difference iscompatible with no mass loss, as shown in the lower panelof Fig. 7.
6 SUMMARY AND PROSPECTS
We used the average seismic parameters characterising solar-like oscillations (νmax and ∆ν) to estimate the masses ofstars in the RC and on the low-luminosity RGB (L <L(RC)) of the open clusters NGC6791 and NGC6819.
In NGC6791, νmax and ∆ν were coupled with addi-tional constraints (photometric magnitudes, Teff , and dis-

11
−0.1 0 0.1 0.2 0.3 0.4 0.5 0.6 0.7 0.8−0.05
0
0.05
0.1
0.15
0.2
0.25
0.3
0.35
0.4
η
∆M
NGC6791
−0.1 0 0.1 0.2 0.3 0.4 0.5 0.6 0.7 0.8−0.1
−0.05
0
0.05
0.1
0.15
0.2NGC6819
η
∆M
Figure 7. Upper panel: The dots connected by a dashed lineshows the difference (∆M) between the average mass of RGBstars (in the luminosity domain of the targets) and RC starsas a function of the η parameter, resulting from a 7 Gyr modelisochrone. The grey areas represent the 1-σ region of the observed∆M . Lower panel: Same plot as the upper panel, but for stars inNGC6819 and a 2.1 Gyr isochrone.
tance modulus from eclipsing binaries) to measure stellarradii, and to determine the average mass of stars on theRGB and in the RC. When considering RGB stars, we foundgood agreement between different determinations of radiusand mass, while in the RC a larger scatter between MRC wasfound, together with a systematic underestimation of theradii obtained via Eq. 4 compared to those determined usingphotometric constraints and the independent distance deter-mination obtained by Brogaard et al. (2011). Supported bya comparison between RC and RGB models, we ascribedthis discrepancy to the ∆ν scaling (Eq. 1), and argued thata relative correction of ∼ 3% to ∆ν between RC and RGBstars should be adopted for stars in this cluster.
Taking into account the uncertainties in the observa-tional constraints, we found that in NGC6791 the differencebetween the average mass of RGB and RC stars is small butsignificant (∆M = 0.09± 0.03 (random) ±0.04 (systematic)
M⊙). In the context of the controversial and highly debatedresults on the mass-loss rates in NGC6791 (see Sec. 3.1), ourdirect estimate of ∆M is incompatible with an extreme massloss for this metal-rich cluster. If we describe the mass-lossrate with Reimers’ prescription (see Eq. 8), and assume a 7-Gyr isochrone, we find that the observed ∆M is compatiblewith a mass-loss efficiency parameter of 0.1 . η . 0.3. Thelow mass-loss of the RC stars, coupled with a RC mass-lossdispersion lower than our measurement errors, provides sup-port for our assumption (see Sec. 3.2) that either no helium-burning stars exist with masses significantly lower than themeasured RC stars or, if they do, they must originate froma very different evolution.
Constraints on the RGB mass loss set by the analysisof NGC6819 are less compelling, largely because this clus-ter is too young to exhibit a significant mass loss (at leastaccording to Reimers’ formula). Moreover, no accurate andindependent information on the distance was available forthis cluster.
In the future, a reliable age determination of the clus-ters obtained by combining all available constraints will po-tentially allow detailed tests of different formulations of theRGB mass-loss rate (e.g. Catelan 2000; Schroder & Cuntz2005, 2007), eventually leading to a better understandingof the physical mechanism responsible for the mass loss it-self. Moreover, as the duration of Kepler observations in-creases, it will soon be possible to study in detail the pulsa-tional properties of stars with luminosities higher than theRC. These targets could provide the link between the starsstudied in this paper and the luminous (L & 103L⊙) RGBand AGB giants in which a connection between mass lossand pulsations has been suggested by several studies in theliterature (see e.g., Lebzelter & Wood 2005, and referencestherein).
In this work we reached a point where possible system-atic biases in the ∆ν and νmax scaling relations may becomethe largest source of uncertainty in the determination of stel-lar parameters. As shown in Sec. 3.4, we have found evidencefor systematic differences in the ∆ν scaling relation betweenHe-burning and H-shell burning giants. A more systematicstudy using a larger set of stellar models is needed to ad-dress this issue in detail. In particular, robust model-basedcorrections to the ∆ν scaling relation would allow testing indetail possible systematic errors in the νmax scaling, henceimproving the accuracy of the mass determination.
The frequency of maximum power will in general de-pend on the dynamical properties of near-surface convec-tive layers, and on the complex interaction between os-cillation modes and convection. The published relations,however, assume a simple scaling of νmax with the acous-tic cutoff frequency in the atmosphere, and simplifying as-sumptions about the latter. It is therefore possible thatevolutionary-state dependent corrections may be requiredfor νmax also. However, the close correspondence betweenthe radius anomalies expected from ∆ν effects and thoseseen in NGC6791 suggests either that the impact of suchcorrections is modest, or that there is some effective cancella-tion of terms in the radius scalings. The νmax scaling shouldbe investigated, but a proper formulation would involve de-tailed convective modelling which is outside the scope of thecurrent work. One promising approach would be to searchfor residual differences in stars of known mass and radius

12 A. Miglio et al.
once more robust theoretical corrections to ∆ν are applied,and there is work in preparation pursuing this avenue ofapproach.
In this context, pulsating red giants with independentmasses and/or radii (e.g. binary members and nearby gi-ants) would allow calibration of the ∆ν and νmax scaling re-lations, and provide an unprecedented, and potentially veryaccurate, means of determining stellar parameters.
Additional observational constraints that will improvethe precision and accuracy of our conclusions include Ke-
pler data that will soon be available for most stars in theclusters. Moreover, the availability in the near future of notonly average seismic parameters such as νmax and ∆ν, butalso of accurate frequencies of individual oscillation modesin red giants, will allow more detailed tests of the scalingrelations as well as of the internal structure of these stars.Finally, spectroscopic constraints on Teff will also be of greatrelevance to check the validity of the adopted Teff scale, andto further test the robustness of the agreement we find be-tween global parameters of stars determined using differentconstraints (asteroseismology, photometry, distance deter-mined using eclipsing binaries).
ACKNOWLEDGEMENTS
The authors acknowledge the Kepler Science Team and allthose who have contributed to making the Kepler missionpossible. Funding for the Kepler Discovery mission is pro-vided by NASA’s Science Mission Directorate. AM acknowl-edges the support of the School of Physics and Astron-omy, University of Birmingham. KB acknowledges financialsupport from the Carlsberg Foundation. DS acknowledgessupport from the Australian Research Council. WJC andYE acknowledge support from the UK STFC. AMS is sup-ported by the European Union International ReintegrationGrant PIRG-GA-2009-247732, the MICINN grant AYA08-1839/ESP, by the ESF EUROCORES Program EuroGENE-SIS (MICINN grant EUI2009-04170), by SGR grants of theGeneralitat de Catalunya and by the EU-FEDER funds. SHacknowledges financial support from the Netherlands Or-ganisation for Scientific Research (NWO). This project hasbeen supported by the ‘Lendulet’ program of the Hungar-ian Academy of Sciences and the Hungarian OTKA grantsK83790 and MB08C 81013. R.Sz. thanks the support of theJanos Bolyai Research Scholarship. The research leading tothese results has received funding from the European Com-munity’s Seventh Framework Programme (FP7/2007-2013)under grant agreement no. 269194.
REFERENCES
Althaus L. G., Garcıa-Berro E., Renedo I., Isern J., CorsicoA. H., Rohrmann R. D., 2010, ApJ, 719, 612
Basu S. et al., 2011, ApJ, 729, L10Bedding T. R. et al., 2011, Nature, 471, 608
Bedin L. R., King I. R., Anderson J., Piotto G., Salaris M.,Cassisi S., Serenelli A., 2008a, ApJ, 678, 1279
Bedin L. R., Salaris M., Piotto G., Cassisi S., Milone A. P.,Anderson J., King I. R., 2008b, ApJ, 679, L29
Bedin L. R., Salaris M., Piotto G., King I. R., Anderson J.,Cassisi S., Momany Y., 2005, ApJ, 624, L45
Belkacem K., Goupil M. J., Dupret M. A., Samadi R., BaudinF., Noels A., Mosser B., 2011, A&A, 530, A142
Bertelli G., Bressan A., Chiosi C., Fagotto F., Nasi E., 1994,
A&AS, 106, 275Bertelli G., Girardi L., Marigo P., Nasi E., 2008, A&A, 484, 815
Bowen G. H., 1988, ApJ, 329, 299Boyer M. L. et al., 2009, ApJ, 705, 746
Boyer M. L. et al., 2010, ApJ, 711, L99Bragaglia A. et al., 2001, AJ, 121, 327
Brogaard K., Bruntt H., Grundahl F., Clausen J. V., FrandsenS., Vandenberg D. A., Bedin L. R., 2011, A&A, 525, A2
Brown T. M., Gilliland R. L., Noyes R. W., Ramsey L. W., 1991,ApJ, 368, 599
Brown T. M., Sweigart A. V., Lanz T., Landsman W. B.,Hubeny I., 2001, ApJ, 562, 368
Carretta E., Bragaglia A., Gratton R., Lucatello S., 2009, A&A,505, 139
Castellani M., Castellani V., 1993, ApJ, 407, 649
Catelan M., 2000, ApJ, 531, 826—, 2009, Ap&SS, 320, 261
Chaboyer B., Green E. M., Liebert J., 1999, The AstronomicalJournal, 117, 1360
Chaplin W. J., Elsworth Y., Isaak G. R., Lines R., McLeod C. P.,Miller B. A., New R., 1998, MNRAS, 300, 1077
D’Antona F., Caloi V., 2004, ApJ, 611, 871
D’Antona F., Caloi V., Montalban J., Ventura P., Gratton R.,2002, A&A, 395, 69
Deloye C. J., Bildsten L., 2002, ApJ, 580, 1077
Flower P. J., 1996, ApJ, 469, 355Friel E. D., Janes K. A., 1993, A&A, 267, 75
Gai N., Basu S., Chaplin W. J., Elsworth Y., 2011, ApJ, 730,63
Garcıa R. A. et al., 2011, MNRAS, L239Garcıa-Berro E. et al., 2010, Nature, 465, 194
Garcıa-Berro E., Torres S., Renedo I., Camacho J., AlthausL. G., Corsico A. H., Salaris M., Isern J., 2011, ArXiv e-prints
Goldberg, L., 1979, Royal Astronomical Society, 20, 361
Gratton R. G. et al., 2001, A&A, 369, 87Han Z., Podsiadlowski P., Maxted P. F. L., Marsh T. R., 2003,Monthly Notices of the Royal Astronomical Society, 341, 669
Hansen B. M. S., 2005, ApJ, 635, 522
Hansen B. M. S. et al., 2007, ApJ, 671, 380Harper G., 1996, Cool stars; stellar systems; and the sun : 9 :Astronomical Society of the Pacific Conference Series, 109
Hekker S. et al., 2011, A&A, 530, A100Hofner S., 2009, in Astronomical Society of the Pacific Confer-ence Series, Vol. 414, Cosmic Dust - Near and Far, T. Henning,E. Grun, & J. Steinacker, ed., p. 3
Hole K. T., Geller A. M., Mathieu R. D., Platais I., Meibom S.,Latham D. W., 2009, AJ, 138, 159
Huber D., Stello D., Bedding T. R., Chaplin W. J., Arentoft T.,Quirion P.-O., Kjeldsen H., 2009, Communications in Astero-seismology, 160, 74
Jenkins J. M. et al., 2010a, ApJ, 713, L87
—, 2010b, ApJ, 713, L120Judge P. G., Stencel R. E., 1991, ApJ, 371, 357
Kalirai J. S., Bergeron P., Hansen B. M. S., Kelson D. D., ReitzelD. B., Rich R. M., Richer H. B., 2007, ApJ, 671, 748
Kalirai J. S., Saul Davis D., Richer H. B., Bergeron P., CatelanM., Hansen B. M. S., Rich R. M., 2009, ApJ, 705, 408
Kalirai J. S., Tosi M., 2004, MNRAS, 351, 649Kallinger T. et al., 2010, A&A, 509, A77
King I. R., Bedin L. R., Piotto G., Cassisi S., Anderson J., 2005,The Astronomical Journal, 130, 626
Kjeldsen H., Bedding T. R., 1995, A&A, 293, 87Koch D. G. et al., 2010, ApJ, 713, L79
Lafon J. P. J., Berruyer N., 1991, The A&AReview, 2, 249Lebzelter T., Wood P. R., 2005, A&A, 441, 1117
McDonald I., Boyer M. L., van Loon J. T., Zijlstra A. A., 2011a,ApJ, 730, 71

13
McDonald I. et al., 2011b, ApJS, 193, 23
McDonald I., van Loon J. T., Decin L., Boyer M. L., DupreeA. K., Evans A., Gehrz R. D., Woodward C. E., 2009, MNRAS,394, 831
McDonald I. et al., 2011c, ArXiv e-printsMontalban J., Miglio A., Noels A., Scuflaire R., Ventura P., 2010,ApJ, 721, L182
Mosser B. et al., 2011, A&A, 532, A86—, 2010, A&A, 517, A22Mullan D. J., 1978, ApJ, 226, 151Origlia L., Ferraro F. R., Fusi Pecci F., Rood R. T., 2002, ApJ,571, 458
Origlia L., Rood R. T., Fabbri S., Ferraro F. R., Fusi Pecci F.,Rich R. M., 2007, ApJ, 667, L85
Origlia L., Rood R. T., Fabbri S., Ferraro F. R., Fusi Pecci F.,Rich R. M., Dalessandro E., 2010, ApJ, 718, 522
Origlia L., Valenti E., Rich R. M., Ferraro F. R., 2006, ApJ, 646,499
Peterson R. C., Green E. M., 1998, ApJ, 502, L39Piotto G. et al., 2007, ApJ, 661, L53—, 2005, ApJ, 621, 777Platais I., Cudworth K. M., Kozhurina-Platais V., McLaughlinD. E., Meibom S., Veillet C., 2011, ApJ, 733, L1
Ramırez I., Melendez J., 2005, ApJ, 626, 446Reimers D., 1975a, Memoires of the Societe Royale des Sciencesde Liege, 8, 369
—, 1975b, Circumstellar envelopes and mass loss of red giantstars, Baschek, B., Kegel, W. H., & Traving, G., ed., p. 229
Renzini A., Fusi Pecci F., 1988, ARA&A, 26, 199Schroder K.-P., Cuntz M., 2005, ApJ, 630, L73—, 2007, A&A, 465, 593Scuflaire R., Theado S., Montalban J., Miglio A., Bourge P.-O.,Godart M., Thoul A., Noels A., 2008, Ap&SS, 316, 83
Stello D. et al., 2010, ApJ, 713, L182Stello D., Bruntt H., Preston H., Buzasi D., 2008, ApJ, 674, L53Stello D., Chaplin W. J., Basu S., Elsworth Y., Bedding T. R.,2009, MNRAS, 400, L80
Stello D. et al., 2011a, ApJ, 737, L10—, 2011b, ApJ, 739, 13Stetson P. B., Bruntt H., Grundahl F., 2003, Publications of theAstronomical Society of the Pacific, 115, 413
Sweigart A. V., Gross P. G., 1976, The Astrophysical JournalSupplement Series, 32, 367
van Loon J. T., Boyer M. L., McDonald I., 2008, ApJ, 680, L49Ventura P., D’Antona F., Mazzitelli I., 2008, Ap&SS, 316, 93von Hippel T., 2005, ApJ, 622, 565White et al., 2011, ApJ submitted
Wood P. R., 1979, ApJ, 227, 220