An Asteroseismic Membership Study of the Red Giants in Three Open Clusters Observed by Kepler: NGC...
12
arXiv:1107.1234v1 [astro-ph.SR] 6 Jul 2011 DRAFT VERSION J ULY 8, 2011 Preprint typeset using L A T E X style emulateapj v. 2/19/04 AN ASTEROSEISMIC MEMBERSHIP STUDY OF THE RED GIANTS IN THREE OPEN CLUSTERS OBSERVED BY Kepler: NGC 6791, NGC 6819, AND NGC 6811 DENNIS STELLO, 1 SØREN MEIBOM, 2 RONALD L. GILLILAND, 3 FRANK GRUNDAHL, 4 SASKIA HEKKER, 5 BENOˆ IT MOSSER, 6 THOMAS KALLINGER, 7,8 SAVITA MATHUR, 9 RAFAEL A. GARC´ IA, 10 DANIEL HUBER, 1 SARBANI BASU, 11 TIMOTHY R. BEDDING, 1 KARSTEN BROGAARD, 12,4 WILLIAM J. CHAPLIN, 5 YVONNE P. ELSWORTH, 5 J OANNA MOLENDA- ˙ ZAKOWICZ, 13 ROBERT SZAB ´ O, 14 MARTIN STILL, 15 J ON M. J ENKINS, 16 J ØRGEN CHRISTENSEN-DALSGAARD, 4 HANS KJELDSEN, 4 ALDO M. SERENELLI , 17 BILL WOHLER, 18 Draft version July 8, 2011 ABSTRACT Studying star clusters offers significant advances in stellar astrophysics due to the combined power of having many stars with essentially the same distance, age, and initial composition. This makes clusters excellent test benches for verification of stellar evolution theory. To fully exploit this potential, it is vital that the star sample is uncontaminated by stars that are not members of the cluster. Techniques for determining cluster membership therefore play a key role in the investigation of clusters. We present results on three clusters in the Kepler field of view based on a newly established technique that uses asteroseismology to identify fore- or background stars in the field, which demonstrates advantages over classical methods such as kinematic and photometry measurements. Four previously identified seismic non-members in NGC 6819 are confirmed in this study, and three additional non-members are found – two in NGC 6819 and one in NGC 6791. We further highlight which stars are, or might be, affected by blending, which needs to be taken into account when analysing these Kepler data. Subject headings: stars: fundamental parameters — stars: oscillations — stars: interiors — techniques: photo- metric — open clusters and associations: individual (NGC 6791, NGC 6819, NGC 6811) 1. INTRODUCTION Determination of cluster membership is a crucial step in the analysis of stellar clusters. Stars in an open cluster are thought to have formed from the same interstellar cloud of gas and 1 Sydney Institute for Astronomy (SIfA), School of Physics, University of Sydney, NSW 2006, Australia 2 Harvard-Smithsonian Center for Astrophysics, 60 Garden Street, Cam- bridge, MA, 02138, USA 3 Space Telescope Science Institute, 3700 San Martin Drive, Baltimore, Maryland 21218, USA 4 Department of Physics and Astronomy, Aarhus University, Ny Munkegade 120, 8000 Aarhus C, Denmark 5 School of Physics and Astronomy, University of Birmingham, Edgbas- ton, Birmingham B15 2TT, UK 6 LESIA, CNRS, Universit´ e Pierre et Marie Curie, Universit´ e Denis Diderot, Observatoire de Paris, 92195 Meudon, France 7 Institute for Astronomy, University of Vienna, T ¨ urkenschanzstrasse 17, 1180 Vienna, Austria 8 Department of Physics and Astronomy, University of British Columbia, 6224 Agricultural Road, Vancouver, BC V6T 1Z1, Canada 9 High Altitude Observatory, NCAR, P.O. Box 3000, Boulder, CO 80307, USA 10 Laboratoire AIM, CEA/DSM-CNRS, Universit´ e Paris 7 Diderot, IRFU/SAp, Centre de Saclay, 91191, Gif-sur-Yvette, France 11 Department of Astronomy, Yale University, P.O. Box 208101, New Haven, CT 06520-8101 12 Department of Physics & Astronomy, University of Victoria, P.O. Box 3055, Victoria, B.C., V8W 3P6, Canada 13 Instytut Astronomiczny Uniwersytetu Wroclawskiego, ul. Kopernika 11,51-622 Wroclaw, Poland 14 Konkoly Observatory of the Hungarian Academy of Sciences, Konkoly Thege Mikl´ os ´ ut 15-17, H-1121 Budapest, Hungary 15 Bay Area Environmental Research Institute/NASA Ames Research Center, Moffett Field, CA 94035, USA 16 SETI Institute/NASA Ames Research Center, MS 244-30, Moffat Field, CA 94035, USA 17 Instituto de Ciencias del Espacio (CSIC-IEEC), Facultad de Ci` encies, Campus UAB, 08193 Bellaterra, Spain 18 Orbital Sciences Corporation/NASA Ames Research Center, Moffett Field, CA 94035 dust, and hence share a common age and space velocity. Clus- ter membership can therefore be inferred from the location of the stars along an isochrone in the color-magnitude diagram (photometric membership), and from their common space ve- locity (kinematic membership) measured as the line-of-sight radial velocity and the perpendicular proper motion. Recently, a new independent method was introduced by Stello et al. (2010) who performed an asteroseismic analysis based on the first month of data from the Kepler Mission (Koch et al. 2010) to infer the cluster membership for a small sample of red gi- ant stars in NGC 6819. Asteroseismology has the advantage that the oscillations in a star, which depend on the physical properties of the star’s interior (Christensen-Dalsgaard 2004), are independent of stellar distance, interstellar extinction, and any random alignment between the space velocity of the clus- ter and field stars. In particular, the so-called average large frequency separation, Δν , between consecutive overtone os- cillation modes depends on the mean density of the star, and the frequency of maximum oscillation power, ν max , is related to its surface gravity and effective temperature. Both Δν and ν max are known to scale with the basic stellar properties, M , L, and T eff , (Ulrich 1986; Kjeldsen & Bedding 1995) and can therefore be used to infer those properties without relying on detailed modelling of stellar interiors (e.g. Stello et al. 2008; Kallinger et al. 2010b). We now have Kepler time series photometry that span 10 times longer than in the work by Stello et al. (2010). In this paper we are therefore able to present an asteroseismic mem- bership analysis of a more comprehensive set of red giant stars in three open clusters within Kepler’s fixed field of view: NGC 6791, NGC 6819, and NGC 6811. We are further able to measure and make use of both Δν and ν max for this purpose. In addition, to facilitate our inference on cluster membership and obtain more robust results we include an investigation of T eff found from different color indices and present a detailed
Transcript of An Asteroseismic Membership Study of the Red Giants in Three Open Clusters Observed by Kepler: NGC...
arX
iv:1
107.
1234
v1 [
astr
o-ph
.SR
] 6
Jul 2
011
DRAFT VERSIONJULY 8, 2011Preprint typeset using LATEX style emulateapj v. 2/19/04
AN ASTEROSEISMIC MEMBERSHIP STUDY OF THE RED GIANTS IN THREEOPEN CLUSTERS OBSERVED BYKepler: NGC 6791, NGC 6819, AND NGC 6811
DENNIS STELLO,1 SØREN MEIBOM,2 RONALD L. GILLILAND ,3 FRANK GRUNDAHL ,4 SASKIA HEKKER,5 BENOIT MOSSER,6
THOMAS KALLINGER ,7,8 SAVITA MATHUR,9 RAFAEL A. GARCIA ,10 DANIEL HUBER,1 SARBANI BASU,11 TIMOTHY R. BEDDING,1
KARSTEN BROGAARD,12,4 WILLIAM J. CHAPLIN ,5 YVONNE P. ELSWORTH,5 JOANNA MOLENDA-ZAKOWICZ ,13 ROBERT SZABO,14
MARTIN STILL ,15 JON M. JENKINS,16 JØRGENCHRISTENSEN-DALSGAARD,4 HANS KJELDSEN,4 ALDO M. SERENELLI,17
BILL WOHLER,18
Draft version July 8, 2011
ABSTRACTStudying star clusters offers significant advances in stellar astrophysics due to the combined power of having
many stars with essentially the same distance, age, and initial composition. This makes clusters excellent testbenches for verification of stellar evolution theory. To fully exploit this potential, it is vital that the star sampleis uncontaminated by stars that are not members of the cluster. Techniques for determining cluster membershiptherefore play a key role in the investigation of clusters. We present results on three clusters in theKepler fieldof view based on a newly established technique that uses asteroseismology to identify fore- or backgroundstars in the field, which demonstrates advantages over classical methods such as kinematic and photometrymeasurements. Four previously identified seismic non-members in NGC 6819 are confirmed in this study,and three additional non-members are found – two in NGC 6819 and one in NGC 6791. We further highlightwhich stars are, or might be, affected by blending, which needs to be taken into account when analysing theseKepler data.Subject headings: stars: fundamental parameters — stars: oscillations — stars: interiors — techniques: photo-
metric — open clusters and associations: individual (NGC 6791, NGC 6819, NGC 6811)
1. INTRODUCTION
Determination of cluster membership is a crucial step in theanalysis of stellar clusters. Stars in an open cluster are thoughtto have formed from the same interstellar cloud of gas and
1 Sydney Institute for Astronomy (SIfA), School of Physics, University ofSydney, NSW 2006, Australia
2 Harvard-Smithsonian Center for Astrophysics, 60 Garden Street, Cam-bridge, MA, 02138, USA
3 Space Telescope Science Institute, 3700 San Martin Drive, Baltimore,Maryland 21218, USA
4 Department of Physics and Astronomy, Aarhus University, NyMunkegade 120, 8000 Aarhus C, Denmark
5 School of Physics and Astronomy, University of Birmingham,Edgbas-ton, Birmingham B15 2TT, UK
6 LESIA, CNRS, Universite Pierre et Marie Curie, Universit´e DenisDiderot, Observatoire de Paris, 92195 Meudon, France
7 Institute for Astronomy, University of Vienna, T urkenschanzstrasse 17,1180 Vienna, Austria
8 Department of Physics and Astronomy, University of BritishColumbia,6224 Agricultural Road, Vancouver, BC V6T 1Z1, Canada
9 High Altitude Observatory, NCAR, P.O. Box 3000, Boulder, CO80307,USA
10 Laboratoire AIM, CEA/DSM-CNRS, Universite Paris 7 Diderot,IRFU/SAp, Centre de Saclay, 91191, Gif-sur-Yvette, France
11 Department of Astronomy, Yale University, P.O. Box 208101,NewHaven, CT 06520-8101
12 Department of Physics & Astronomy, University of Victoria,P.O. Box3055, Victoria, B.C., V8W 3P6, Canada
13 Instytut Astronomiczny Uniwersytetu Wrocławskiego, ul. Kopernika11,51-622 Wrocław, Poland
14 Konkoly Observatory of the Hungarian Academy of Sciences, KonkolyThege Miklos ut 15-17, H-1121 Budapest, Hungary
15 Bay Area Environmental Research Institute/NASA Ames ResearchCenter, Moffett Field, CA 94035, USA
16 SETI Institute/NASA Ames Research Center, MS 244-30, Moffat Field,CA 94035, USA
17 Instituto de Ciencias del Espacio (CSIC-IEEC), Facultad deCiencies,Campus UAB, 08193 Bellaterra, Spain
18 Orbital Sciences Corporation/NASA Ames Research Center, MoffettField, CA 94035
dust, and hence share a common age and space velocity. Clus-ter membership can therefore be inferred from the location ofthe stars along an isochrone in the color-magnitude diagram(photometric membership), and from their common space ve-locity (kinematic membership) measured as the line-of-sightradial velocity and the perpendicular proper motion. Recently,a new independent method was introduced by Stello et al.(2010) who performed an asteroseismic analysis based on thefirst month of data from theKepler Mission (Koch et al. 2010)to infer the cluster membership for a small sample of red gi-ant stars in NGC 6819. Asteroseismology has the advantagethat the oscillations in a star, which depend on the physicalproperties of the star’s interior (Christensen-Dalsgaard2004),are independent of stellar distance, interstellar extinction, andany random alignment between the space velocity of the clus-ter and field stars. In particular, the so-called average largefrequency separation,∆ν, between consecutive overtone os-cillation modes depends on the mean density of the star, andthe frequency of maximum oscillation power,νmax, is relatedto its surface gravity and effective temperature. Both∆ν andνmax are known to scale with the basic stellar properties,M ,L, andTeff , (Ulrich 1986; Kjeldsen & Bedding 1995) and cantherefore be used to infer those properties without relyingondetailed modelling of stellar interiors (e.g. Stello et al.2008;Kallinger et al. 2010b).
We now haveKepler time series photometry that span 10times longer than in the work by Stello et al. (2010). In thispaper we are therefore able to present an asteroseismic mem-bership analysis of a more comprehensive set of red giantstars in three open clusters withinKepler’s fixed field of view:NGC 6791, NGC 6819, and NGC 6811. We are further able tomeasure and make use of both∆ν andνmax for this purpose.In addition, to facilitate our inference on cluster membershipand obtain more robust results we include an investigation ofTeff found from different color indices and present a detailed
2 Stello et al.
analysis of blending. Our membership results are comparedwith those from classical techniques.
We refer to our four companion papers for additional as-teroseismic exploration of the same cluster data including(i)the determination of stellar mass and radius and cluster dis-tances (Basu et al. 2011), (ii) verification of scaling relationsfor ∆ν andνmax (Hekker et al. 2011), (iii) derivation of a newscaling relation for oscillation amplitude (Stello et al. 2011),(iv) and mass loss properties of red giants during their tran-sition between the hydrogen-shell and core-helium-burningphases (Miglio et al. 2011). Like this paper, these studiesare based on the global asteroseismic seismic properties,∆ν,νmax and amplitude, while more detailed frequency analysesrequires more data for these relative faint and crowded clusterstars.
2. TARGET SELECTION
For the purpose of determining cluster membership we useonly stars showing oscillations that are stochatically driven bynear-surface convection (solar-like oscillations) because theirseismic observables are strongly linked to the fundamentalstellar properties described by well established scaling rela-tions (see Sect. 6). This limits our current study to the redgiants as we require the oscillations to be sufficiently sampledby the spacecraft’s half-hour cadence.
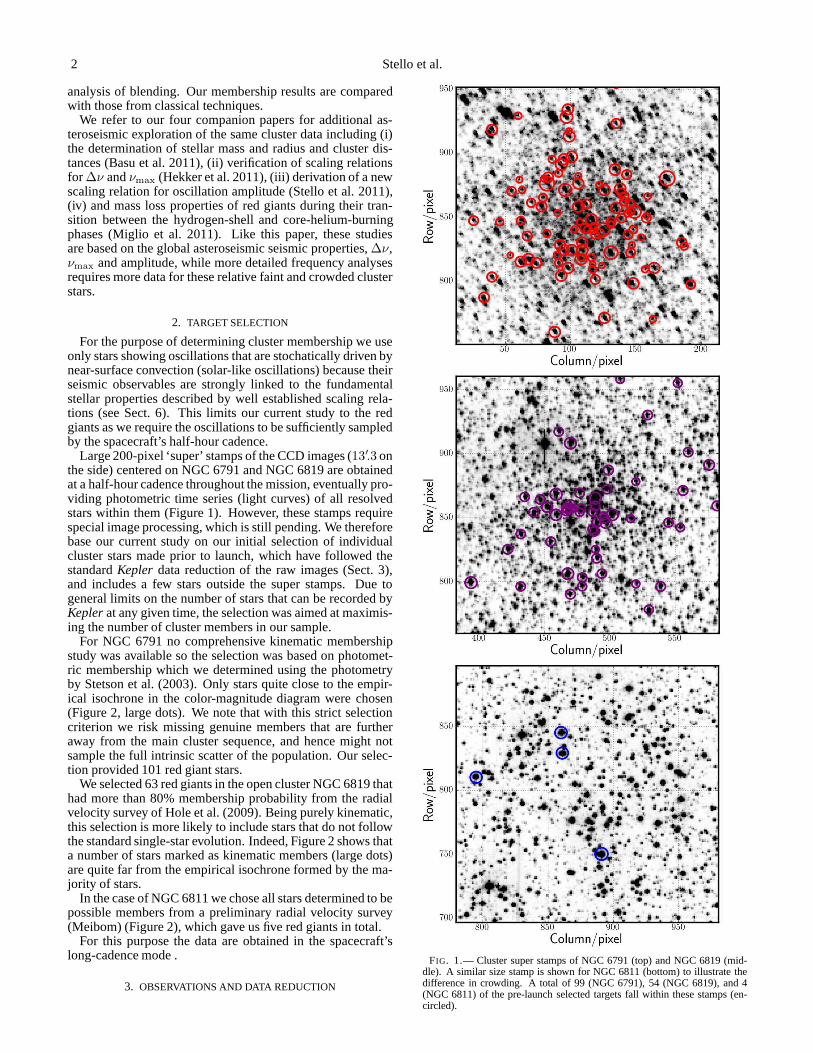
Large 200-pixel ‘super’ stamps of the CCD images (13′.3 onthe side) centered on NGC 6791 and NGC 6819 are obtainedat a half-hour cadence throughout the mission, eventually pro-viding photometric time series (light curves) of all resolvedstars within them (Figure 1). However, these stamps requirespecial image processing, which is still pending. We thereforebase our current study on our initial selection of individualcluster stars made prior to launch, which have followed thestandardKepler data reduction of the raw images (Sect. 3),and includes a few stars outside the super stamps. Due togeneral limits on the number of stars that can be recorded byKepler at any given time, the selection was aimed at maximis-ing the number of cluster members in our sample.
For NGC 6791 no comprehensive kinematic membershipstudy was available so the selection was based on photomet-ric membership which we determined using the photometryby Stetson et al. (2003). Only stars quite close to the empir-ical isochrone in the color-magnitude diagram were chosen(Figure 2, large dots). We note that with this strict selectioncriterion we risk missing genuine members that are furtheraway from the main cluster sequence, and hence might notsample the full intrinsic scatter of the population. Our selec-tion provided 101 red giant stars.
We selected 63 red giants in the open cluster NGC 6819 thathad more than 80% membership probability from the radialvelocity survey of Hole et al. (2009). Being purely kinematic,this selection is more likely to include stars that do not followthe standard single-star evolution. Indeed, Figure 2 showsthata number of stars marked as kinematic members (large dots)are quite far from the empirical isochrone formed by the ma-jority of stars.
In the case of NGC 6811 we chose all stars determined to bepossible members from a preliminary radial velocity survey(Meibom) (Figure 2), which gave us five red giants in total.
For this purpose the data are obtained in the spacecraft’slong-cadence mode .
3. OBSERVATIONS AND DATA REDUCTION
FIG. 1.— Cluster super stamps of NGC 6791 (top) and NGC 6819 (mid-dle). A similar size stamp is shown for NGC 6811 (bottom) to illustrate thedifference in crowding. A total of 99 (NGC 6791), 54 (NGC 6819), and 4(NGC 6811) of the pre-launch selected targets fall within these stamps (en-circled).

An asteroseismic membership study of NGC 6791, NGC 6819, andNGC 6811 3
FIG. 2.— Color-magnitude diagrams of the clusters. Photometryis fromStetson et al. (2003) (NGC 6791), Hole et al. (2009) (NGC 6819), and theWebda database (http://www.univie.ac.at/webda/) (NGC 6811). Representa-tive isochrones from Pietrinferni et al. (2004) (NGC 6791 and NGC 6811) andMarigo et al. (2008) (NGC 6819) are matched to the red giant stars to guidethe eye. Near horizontal dashed lines mark the sampling limit for solar-likeoscillations withKepler’s long-cadence mode. Large black dots show starsfor which Kepler data are currently available, while large colored dots (red,purple and blue) indicate the subset of these which show evidence of solar-like oscillations. All large dots in the two lower panels show likely membersfrom radial velocity surveys (Hole et al. 2009 and unpublished work by Mei-bom). Vertical dashed lines mark the approximate location of the classicalinstability strip. Stars marked as ’Clump star’ in Tables 1 and 2 are encircled.
The photometric time series data presented here were ob-tained in ’long cadence’ (∆t ∼ 30min, Jenkins et al. (2010a))between 2009 May 12 and 2010 March 20, known as ob-serving quarters 1–4 (Q1–Q4). Within this period the space-craft’s long-cadence mode provided approximately 14,000data points per star. The raw images were processed by thestandardKepler Science Pipeline and included steps to re-move signatures in the data from sources such as pointingdrifts, focus changes, and thermal variations all performedduring the Pre-search Data Conditioning (PDC) procedure(Jenkins et al. 2010b). PDC also corrects for flux from neigh-boring stars within each photometric aperture based on astatic aperture model. However, this model is not adequatefor all stars, due to small changes in the telescope point-spread-function and pointing between subsequent quarterlyrolls when the spacecraft is rotated 90 degrees to align itssolar panels. As a result the light curves show jumps in theaverage flux level from one quarter to the next. To correctfor that we shifted the average flux levels for each quarterto match that of the raw (pre-PDC) data before stitching to-gether the time series from all four quarters. This ensured thatthe relative flux variations were consistent from one quarterto the next. We compared our corrected (post-PDC) data withthe raw data and also after we performed a number of “man-ual” corrections based entirely on the appearance of the lightcurves (hence not taking auxiliary house-keeping data suchaspointing into account). These corrections included removalof outliers, jumps, and slow trends in a similar way as the ap-proach by Garcia et al. (2011). The comparison revealed thatfor a few stars PDC did not perform well, in which case wechose the raw or “manually” corrected raw data.
4. BLENDING AND LIGHT CURVE VERIFICATION
The super stamps in Figure 1 clearly illustrate that blend-ing is an issue we need to address before proceeding withthe analysis of these cluster data. Some stars show clearsignatures of blending arising from the relatively large pixelscale (∼ 4′′) of theKepler photometer compared to the fairlycrowded cluster fields. Blending will give rise to additionallight in the photometric aperture, which will reduce the rela-tive stellar variability, and increase the photon countingnoise.In severe cases, the detected stellar variability arises from ablending star and not the target.
We have studied the effects from blending by looking atcorrelations between light curves of all the target stars (black,red, purple, and blue dots in Figure 2). The light curve corre-lations show no significant increase unless the stars are withinapproximately five pixels of each other and the blending staris at least as bright as the target (Figure 3). We visuallyassessed the light curves of all stars separated by less thanfive pixels, and identified those that showed clear correlationover extended periods of time as blends. We list the blend-ing stars in Table 1 (column-3), Table 2 (column-4), and Ta-ble 3 (column-4). Also listed here, is the variability type ofblending stars identified from single light curves that clearlyshowed variability from two stars. If the variability includedthe expected seismic signal of the target, under the assumptionthat the target was a cluster member, we interpreted the addi-tional signal as caused by a blend. We see no blending forour NGC 6811 targets. We note that the stars for which wecurrently have light curves are far from all stars in the vicinityof the clusters (see Figure 1). It is therefore likely that ourcorrelation analysis has not revealed all blends. For the twomost crowded clusters (NGC 6791 and NGC 6819) there are

4 Stello et al.
FIG. 3.— Correlation coefficients for light curves of all pairs of stars in ourtarget list shown as a function of their separation on the CCD. Fiducial dashedline indicates the average increase in correlation towardslower separations.There is one pair of stars in NGC 6791 that show large correlation despitetheir large separation (see text). The six pairs of stars with abnormally highcorrelation coefficients in NGC 6819 are all blended by the W UMa variableKIC5112741 (see text).
about 1000 stars brighter thanKp ≃ 16.5 within the superstamps. We expect a significant fraction of those stars to beaccessible when these stamps have been analyzed, which willfurther aid the characterisation of blending.
In addition to the light curve correlations, we identified allsignificantly bright stars nearby each target using informationfrom theKepler Input Catalogue (KIC), which was designedto reach down toKp . 16.0. This was just adequate forour purpose. We identified targets to be potentially affectedby blending if there were stars within five pixels that wereat least half as bright as the target itself, which we regard aconservative choice given the results from the above corre-lation analysis. Potentially blended targets are listed inTa-ble 1 (column-4), Table 2 (column-5), and Table 3 (column-5), while the blending stars, their flux ratios with respect tothe target, and their separations are given in Tables 4 and5. Again, the NGC 6811 targets show no signs of potentialblending. Due to slight temporal changes in telescope point-ing, the degree of blending for each target can vary consid-erably over time for the crowded cluster fields. We took thisinto account in our approach to correct the light curves, whichwe describe in detail below for the two clusters affected byblending and other possibly related effects.
4.1. NGC 6791
There is one pair of stars (KIC2569488, 2568916) thatshow an abnormally high correlation despite their large sep-aration (∼ 70 pixels) (see Figure 3). Visual inspection of thelight curves reveals that it arises from a strong trend localized
within a relatively narrow time span. They are not mutuallyinfluenced by a bad column, neither do they lie within thewings of a really bright star. From inspection of the raw im-ages they should not correlate, and there are no indicationsthat the oscillation signals of the two are affected by eachother. We therefore leave the light curves uncorrected.
The Q1 data were not used for KIC2570384, and Q3 wasnot used for KIC2437488, both due to apparent blendingby short-period eclipsing binaries. Possible candidates forthese blends can be found in Table 4 (column-2). An abnor-mally strong peak of unknown origin was seen slightly off-set from the main excess envelope in the power spectrum ofKIC2569935. Hence, to avoid strong bias in the measurementof the asteroseismic parameters, we fitted and removed a cor-responding single sine wave from the data.
4.2. NGC 6819
The four stars KIC5024582, 5112734, 5112751, and5112741 form six correlation pairs that stand out in Figure 3(encircled). It turns out that the increased correlation iscausedby the same large-amplitude contact binary (W UMa vari-able), KIC5112741. Fortunately, we were able to retrieve thepulsation signal to a degree that allowed the measurement ofthe seismic parameters used in this paper (see Sect. 5) exceptfor the W UMa variable itself. We did that by applying a high-pass filter to the three affected light curves using a movingaverage of two days. The resulting light curves show corre-lation coefficients in line with the trend shown by the dashedline in Figure 3. We followed the same approach to removethe variability of what appears to be a bright M-giant (mostlikely KIC5024470, Table 5 column-2), from the light curveof KIC5024456, in this case using a four-day moving average.
The Q1 data were not used for KIC5024583 due to the pres-ence of an eclipsing binary signal. KIC5024268 was alsosignificantly affected by apparent blending by aδ Scuti starin the Q1 and Q2 data. These data were therefore removedfrom the light curve. Like in one of the NGC 6791 targets,KIC4937770 showed an abnormal peak in the power spec-trum, which we removed by fitting a single sine wave.
5. EXTRACTION OF ASTEROSEISMIC PARAMETERS
In Figure 4 we show a typical example of a power spec-trum and indicate for illustration the average large separation,∆ν, and the frequency of maximum oscillation power,νmax.Values of∆ν andνmax were extracted from the data usingeach of the time series analysis pipelines described in Hekkeret al. (2010); Huber et al. (2009); Kallinger et al. (2010a);Mathur et al. (2010); Mosser & Appourchaux (2009). If atleast one pipeline detected oscillations, the star was includedin our sample for further investigation. The results of all starswere then verified by visual inspection of the power spec-trum and the autocorrelation of the power spectrum. We fur-ther verified values of∆ν by forming the so-called echellediagram of the power spectrum, constructed by dividing thepower spectrum into segments, each∆ν wide, which werethen stacked one above the other. To illustrate, Figure 5 showsthree examples of the echelle diagram for the same star, eachbased on a slightly different segment width (adopted largeseparation). If∆ν is correct, the radial oscillation modes forma vertical ridge in the echelle, offset from zero byǫ in agree-ment with recent results on theǫ-∆ν relation of red giants(Huber et al. 2010; Mosser et al. 2011; White et al. 2011).The echelle diagram clearly reveals if the adopted large sep-aration is too small (ridges tilt to the right; panel A) or too

An asteroseismic membership study of NGC 6791, NGC 6819, andNGC 6811 5
TABLE 1TARGET PROPERTIES OFNGC 6791.
Target IDa Target ID Blend Blend Clump Membership Membership Member Seismic(KIC) (Stetson)b known potential star (M&P)c (Garnavich)d (Other)e member
[1] [2] [3] [4] [5] [6] [7] [8]2297384 5583 No Yes Yes Yes2297793 11539 No No No R18/No? No2297825 11957 No No Yes Yes2435987 611 No Yes No Yes2436097 1110 No No No Yes2436209 1705 No No No Yes2436332 2309 No Yes No 33% Yes2436417 2723 No No Yes 17% W Yes2436458 2915 No Yes No 49% Yes2436540 3354 No No No Yes2436593 3609 No Yes No 13% Yes2436676 4122 No No No 88% Yes2436688 4202 No Yes No 98% Yes2436732 4482 No No Yes 98% Yes2436759 4616 No Yes No 88% Yes2436814 4952 No Yes No W Yes2436818 4968 No No No Yes2436824 4994 No Yes No 82% Yes2436900 5454 No Yes No 98% Yes2436912 5503 No Yes Yes 88% Yes2436944 5712 No No Yes 23% Yes2436954 5787 2436944 Yes No Yes2437040 6288 No Yes No 29% Yes2437103 6626 No Yes No Yes2437171 6963 2437209 Yes No 98% R4/Yes O ?2437240 7347 No Yes No 99% Yes2437270 7564 No Yes No 89% Yes2437325 7912 No Yes No 97% Yes2437340 7972 No No No 92% R19/Yes C Yes2437353 8082 No Yes Yes 93% C,Gr Yes2437394 8317 No Yes No 98% Yes2437402 8351 No Yes No 96% Yes2437444 8563 No No No C Yes2437488 8865 Binary* Yes No Yes2437496 8904 No Yes No 42% R12/Yes O Yes2437507 8988 No No No 29% C Yes2437564 9316 No Yes Yes 24% Gr Yes2437589 9462 No No Yes 99% Yes2437653 9827 No Yes No 94% Yes2437698 10135 No No Yes 77% Yes2437781 10674 No Yes No Yes2437804 10809 No Yes Yes 97% Yes2437805 10806 No Yes Yes 97% Gr Yes2437816 10898 No No No 68% C Yes2437851 11116 No Yes No 17% ?2437933 11598 No Yes No 94% Yes2437957 11797 No Yes No 11% Yes2437965 11814 No Yes No 98% R8/Yes C Yes2437972 11862 No Yes No 85% Yes2437976 11895 No Yes No 98% Yes2437987 11938 No Yes Yes 96% Yes2438038 12249 No Yes No 96% Yes2438051 12333 No Yes Yes 99% Yes2438140 12836 No No No Yes2438333 13847 No No No Yes2438421 14379 No No No 47% R7/Yes O ?2568916 996 No No Yes Yes2569055 1904 No No Yes Yes2569360 3754 No No No 94% W Yes2569488 4715 No No Yes 49% C Yes2569618 5796 No No No 99% Yes2569935 8266 High peak* No No R16/Yes O,C Yes2569945 8395 No Yes Yes 89% Yes2570094 9786 No Yes No 85% Yes2570172 10407 No Yes No Yes2570214 10695 No Yes Yes 88% Yes2570244 11006 No Yes No 90% Yes2570384 12265 Binary* Yes No Yes2570518 13260 No Yes No Yes
aOnly targets for which we detect oscillations are listed.bIDs from Stetson et al. (2003).cPreliminary membership probabilities from radial velocity (Meibom &
Platais, priv. comm. (2010)).
6 Stello et al.
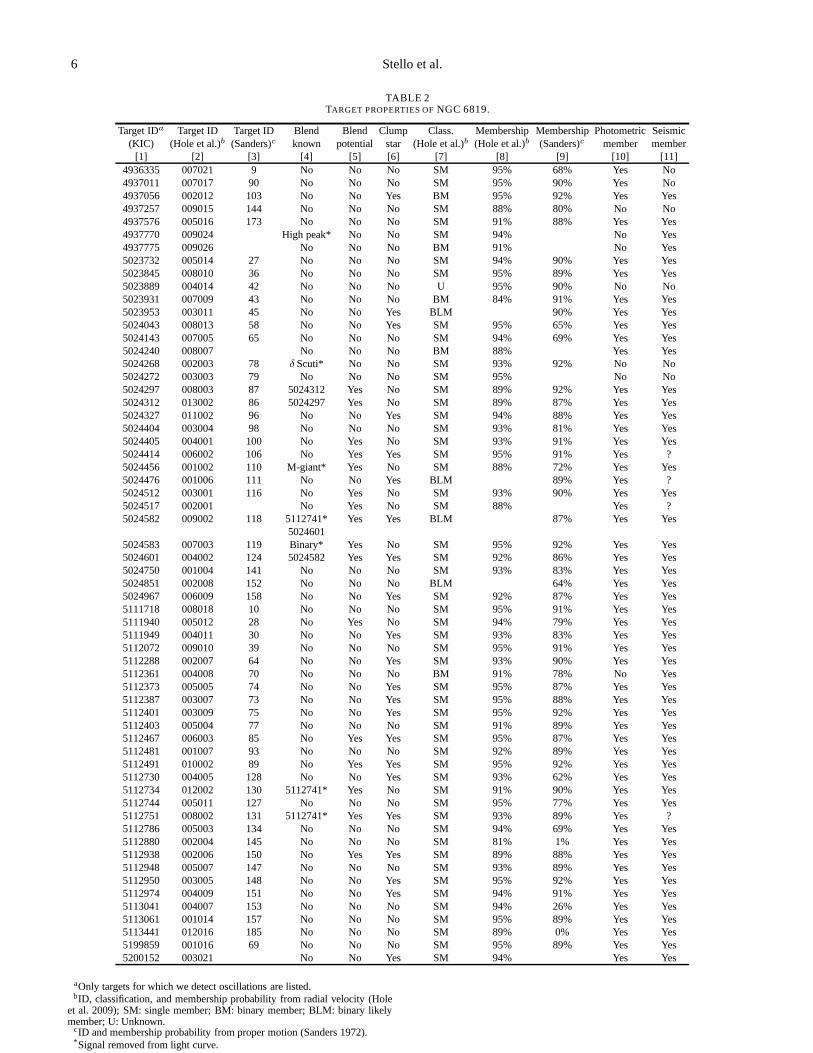
TABLE 2TARGET PROPERTIES OFNGC 6819.
Target IDa Target ID Target ID Blend Blend Clump Class. Membership Membership Photometric Seismic(KIC) (Hole et al.)b (Sanders)c known potential star (Hole et al.)b (Hole et al.)b (Sanders)c member member
[1] [2] [3] [4] [5] [6] [7] [8] [9] [10] [11]4936335 007021 9 No No No SM 95% 68% Yes No4937011 007017 90 No No No SM 95% 90% Yes No4937056 002012 103 No No Yes BM 95% 92% Yes Yes4937257 009015 144 No No No SM 88% 80% No No4937576 005016 173 No No No SM 91% 88% Yes Yes4937770 009024 High peak* No No SM 94% No Yes4937775 009026 No No No BM 91% No Yes5023732 005014 27 No No No SM 94% 90% Yes Yes5023845 008010 36 No No No SM 95% 89% Yes Yes5023889 004014 42 No No No U 95% 90% No No5023931 007009 43 No No No BM 84% 91% Yes Yes5023953 003011 45 No No Yes BLM 90% Yes Yes5024043 008013 58 No No Yes SM 95% 65% Yes Yes5024143 007005 65 No No No SM 94% 69% Yes Yes5024240 008007 No No No BM 88% Yes Yes5024268 002003 78 δ Scuti* No No SM 93% 92% No No5024272 003003 79 No No No SM 95% No No5024297 008003 87 5024312 Yes No SM 89% 92% Yes Yes5024312 013002 86 5024297 Yes No SM 89% 87% Yes Yes5024327 011002 96 No No Yes SM 94% 88% Yes Yes5024404 003004 98 No No No SM 93% 81% Yes Yes5024405 004001 100 No Yes No SM 93% 91% Yes Yes5024414 006002 106 No Yes Yes SM 95% 91% Yes ?5024456 001002 110 M-giant* Yes No SM 88% 72% Yes Yes5024476 001006 111 No No Yes BLM 89% Yes ?5024512 003001 116 No Yes No SM 93% 90% Yes Yes5024517 002001 No Yes No SM 88% Yes ?5024582 009002 118 5112741* Yes Yes BLM 87% Yes Yes
50246015024583 007003 119 Binary* Yes No SM 95% 92% Yes Yes5024601 004002 124 5024582 Yes Yes SM 92% 86% Yes Yes5024750 001004 141 No No No SM 93% 83% Yes Yes5024851 002008 152 No No No BLM 64% Yes Yes5024967 006009 158 No No Yes SM 92% 87% Yes Yes5111718 008018 10 No No No SM 95% 91% Yes Yes5111940 005012 28 No Yes No SM 94% 79% Yes Yes5111949 004011 30 No No Yes SM 93% 83% Yes Yes5112072 009010 39 No No No SM 95% 91% Yes Yes5112288 002007 64 No No Yes SM 93% 90% Yes Yes5112361 004008 70 No No No BM 91% 78% No Yes5112373 005005 74 No No Yes SM 95% 87% Yes Yes5112387 003007 73 No No Yes SM 95% 88% Yes Yes5112401 003009 75 No No Yes SM 95% 92% Yes Yes5112403 005004 77 No No No SM 91% 89% Yes Yes5112467 006003 85 No Yes Yes SM 95% 87% Yes Yes5112481 001007 93 No No No SM 92% 89% Yes Yes5112491 010002 89 No Yes Yes SM 95% 92% Yes Yes5112730 004005 128 No No Yes SM 93% 62% Yes Yes5112734 012002 130 5112741* Yes No SM 91% 90% Yes Yes5112744 005011 127 No No No SM 95% 77% Yes Yes5112751 008002 131 5112741* Yes Yes SM 93% 89% Yes ?5112786 005003 134 No No No SM 94% 69% Yes Yes5112880 002004 145 No No No SM 81% 1% Yes Yes5112938 002006 150 No Yes Yes SM 89% 88% Yes Yes5112948 005007 147 No No No SM 93% 89% Yes Yes5112950 003005 148 No No Yes SM 95% 92% Yes Yes5112974 004009 151 No No Yes SM 94% 91% Yes Yes5113041 004007 153 No No No SM 94% 26% Yes Yes5113061 001014 157 No No No SM 95% 89% Yes Yes5113441 012016 185 No No No SM 89% 0% Yes Yes5199859 001016 69 No No No SM 95% 89% Yes Yes5200152 003021 No No Yes SM 94% Yes Yes
aOnly targets for which we detect oscillations are listed.bID, classification, and membership probability from radialvelocity (Hole
et al. 2009); SM: single member; BM: binary member; BLM: binary likelymember; U: Unknown.
cID and membership probability from proper motion (Sanders 1972).* Signal removed from light curve.
An asteroseismic membership study of NGC 6791, NGC 6819, andNGC 6811 7
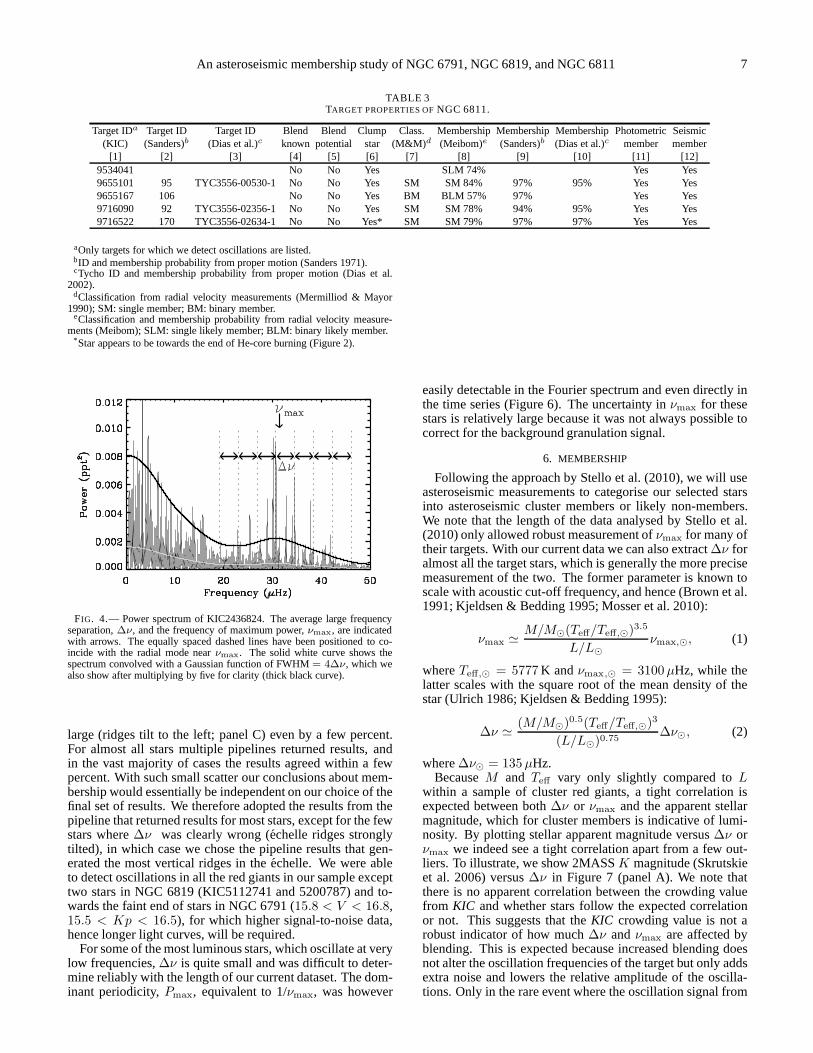
TABLE 3TARGET PROPERTIES OFNGC 6811.
Target IDa Target ID Target ID Blend Blend Clump Class. Membership Membership Membership Photometric Seismic(KIC) (Sanders)b (Dias et al.)c known potential star (M&M)d (Meibom)e (Sanders)b (Dias et al.)c member member
[1] [2] [3] [4] [5] [6] [7] [8] [9] [10] [11] [12]9534041 No No Yes SLM 74% Yes Yes9655101 95 TYC3556-00530-1 No No Yes SM SM 84% 97% 95% Yes Yes9655167 106 No No Yes BM BLM 57% 97% Yes Yes9716090 92 TYC3556-02356-1 No No Yes SM SM 78% 94% 95% Yes Yes9716522 170 TYC3556-02634-1 No No Yes* SM SM 79% 97% 97% Yes Yes
aOnly targets for which we detect oscillations are listed.bID and membership probability from proper motion (Sanders 1971).cTycho ID and membership probability from proper motion (Dias et al.
2002).dClassification from radial velocity measurements (Mermilliod & Mayor
1990); SM: single member; BM: binary member.eClassification and membership probability from radial velocity measure-
ments (Meibom); SLM: single likely member; BLM: binary likely member.* Star appears to be towards the end of He-core burning (Figure2).
FIG. 4.— Power spectrum of KIC2436824. The average large frequencyseparation,∆ν, and the frequency of maximum power,νmax, are indicatedwith arrows. The equally spaced dashed lines have been positioned to co-incide with the radial mode nearνmax. The solid white curve shows thespectrum convolved with a Gaussian function of FWHM= 4∆ν, which wealso show after multiplying by five for clarity (thick black curve).
large (ridges tilt to the left; panel C) even by a few percent.For almost all stars multiple pipelines returned results, andin the vast majority of cases the results agreed within a fewpercent. With such small scatter our conclusions about mem-bership would essentially be independent on our choice of thefinal set of results. We therefore adopted the results from thepipeline that returned results for most stars, except for the fewstars where∆ν was clearly wrong (echelle ridges stronglytilted), in which case we chose the pipeline results that gen-erated the most vertical ridges in the echelle. We were ableto detect oscillations in all the red giants in our sample excepttwo stars in NGC 6819 (KIC5112741 and 5200787) and to-wards the faint end of stars in NGC 6791 (15.8 < V < 16.8,15.5 < Kp < 16.5), for which higher signal-to-noise data,hence longer light curves, will be required.
For some of the most luminous stars, which oscillate at verylow frequencies,∆ν is quite small and was difficult to deter-mine reliably with the length of our current dataset. The dom-inant periodicity,Pmax, equivalent to 1/νmax, was however
easily detectable in the Fourier spectrum and even directlyinthe time series (Figure 6). The uncertainty inνmax for thesestars is relatively large because it was not always possibletocorrect for the background granulation signal.
6. MEMBERSHIP
Following the approach by Stello et al. (2010), we will useasteroseismic measurements to categorise our selected starsinto asteroseismic cluster members or likely non-members.We note that the length of the data analysed by Stello et al.(2010) only allowed robust measurement ofνmax for many oftheir targets. With our current data we can also extract∆ν foralmost all the target stars, which is generally the more precisemeasurement of the two. The former parameter is known toscale with acoustic cut-off frequency, and hence (Brown et al.1991; Kjeldsen & Bedding 1995; Mosser et al. 2010):
νmax ≃
M/M⊙(Teff/Teff,⊙)3.5
L/L⊙
νmax,⊙, (1)
whereTeff,⊙ = 5777K andνmax,⊙ = 3100µHz, while thelatter scales with the square root of the mean density of thestar (Ulrich 1986; Kjeldsen & Bedding 1995):
∆ν ≃
(M/M⊙)0.5(Teff/Teff,⊙)
3
(L/L⊙)0.75∆ν⊙, (2)
where∆ν⊙ = 135µHz.BecauseM and Teff vary only slightly compared toL
within a sample of cluster red giants, a tight correlation isexpected between both∆ν or νmax and the apparent stellarmagnitude, which for cluster members is indicative of lumi-nosity. By plotting stellar apparent magnitude versus∆ν orνmax we indeed see a tight correlation apart from a few out-liers. To illustrate, we show 2MASSK magnitude (Skrutskieet al. 2006) versus∆ν in Figure 7 (panel A). We note thatthere is no apparent correlation between the crowding valuefrom KIC and whether stars follow the expected correlationor not. This suggests that theKIC crowding value is not arobust indicator of how much∆ν andνmax are affected byblending. This is expected because increased blending doesnot alter the oscillation frequencies of the target but onlyaddsextra noise and lowers the relative amplitude of the oscilla-tions. Only in the rare event where the oscillation signal from
8 Stello et al.
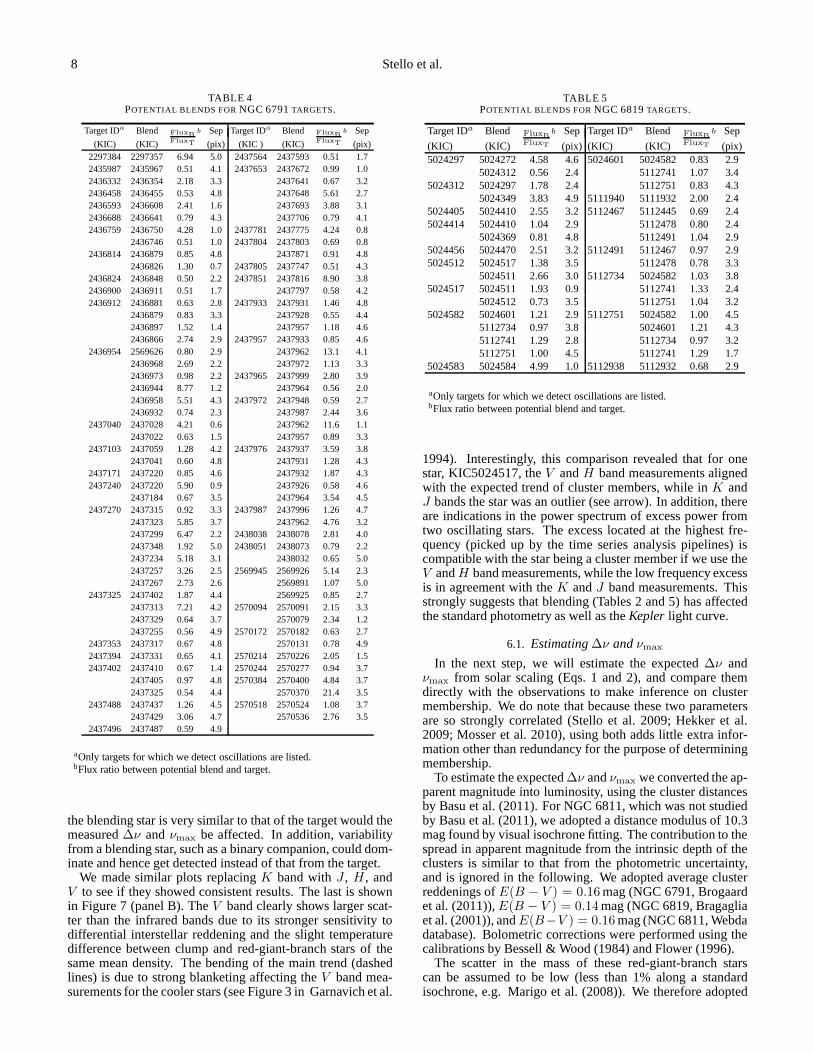
TABLE 4POTENTIAL BLENDS FORNGC 6791TARGETS.
Target IDa Blend Sep Target IDa Blend Sep
(KIC) (KIC)FluxB
FluxT
b
(pix) (KIC ) (KIC)FluxB
FluxT
b
(pix)2297384 2297357 6.94 5.0 2437564 2437593 0.51 1.72435987 2435967 0.51 4.1 2437653 2437672 0.99 1.02436332 2436354 2.18 3.3 2437641 0.67 3.22436458 2436455 0.53 4.8 2437648 5.61 2.72436593 2436608 2.41 1.6 2437693 3.88 3.12436688 2436641 0.79 4.3 2437706 0.79 4.12436759 2436750 4.28 1.0 2437781 2437775 4.24 0.8
2436746 0.51 1.0 2437804 2437803 0.69 0.82436814 2436879 0.85 4.8 2437871 0.91 4.8
2436826 1.30 0.7 2437805 2437747 0.51 4.32436824 2436848 0.50 2.2 2437851 2437816 8.90 3.82436900 2436911 0.51 1.7 2437797 0.58 4.22436912 2436881 0.63 2.8 2437933 2437931 1.46 4.8
2436879 0.83 3.3 2437928 0.55 4.42436897 1.52 1.4 2437957 1.18 4.62436866 2.74 2.9 2437957 2437933 0.85 4.6
2436954 2569626 0.80 2.9 2437962 13.1 4.12436968 2.69 2.2 2437972 1.13 3.32436973 0.98 2.2 2437965 2437999 2.80 3.92436944 8.77 1.2 2437964 0.56 2.02436958 5.51 4.3 2437972 2437948 0.59 2.72436932 0.74 2.3 2437987 2.44 3.6
2437040 2437028 4.21 0.6 2437962 11.6 1.12437022 0.63 1.5 2437957 0.89 3.3
2437103 2437059 1.28 4.2 2437976 2437937 3.59 3.82437041 0.60 4.8 2437931 1.28 4.3
2437171 2437220 0.85 4.6 2437932 1.87 4.32437240 2437220 5.90 0.9 2437926 0.58 4.6
2437184 0.67 3.5 2437964 3.54 4.52437270 2437315 0.92 3.3 2437987 2437996 1.26 4.7
2437323 5.85 3.7 2437962 4.76 3.22437299 6.47 2.2 2438038 2438078 2.81 4.02437348 1.92 5.0 2438051 2438073 0.79 2.22437234 5.18 3.1 2438032 0.65 5.02437257 3.26 2.5 2569945 2569926 5.14 2.32437267 2.73 2.6 2569891 1.07 5.0
2437325 2437402 1.87 4.4 2569925 0.85 2.72437313 7.21 4.2 2570094 2570091 2.15 3.32437329 0.64 3.7 2570079 2.34 1.22437255 0.56 4.9 2570172 2570182 0.63 2.7
2437353 2437317 0.67 4.8 2570131 0.78 4.92437394 2437331 0.65 4.1 2570214 2570226 2.05 1.52437402 2437410 0.67 1.4 2570244 2570277 0.94 3.7
2437405 0.97 4.8 2570384 2570400 4.84 3.72437325 0.54 4.4 2570370 21.4 3.5
2437488 2437437 1.26 4.5 2570518 2570524 1.08 3.72437429 3.06 4.7 2570536 2.76 3.5
2437496 2437487 0.59 4.9
aOnly targets for which we detect oscillations are listed.bFlux ratio between potential blend and target.
the blending star is very similar to that of the target would themeasured∆ν andνmax be affected. In addition, variabilityfrom a blending star, such as a binary companion, could dom-inate and hence get detected instead of that from the target.
We made similar plots replacingK band withJ , H , andV to see if they showed consistent results. The last is shownin Figure 7 (panel B). TheV band clearly shows larger scat-ter than the infrared bands due to its stronger sensitivity todifferential interstellar reddening and the slight temperaturedifference between clump and red-giant-branch stars of thesame mean density. The bending of the main trend (dashedlines) is due to strong blanketing affecting theV band mea-surements for the cooler stars (see Figure 3 in Garnavich et al.
TABLE 5POTENTIAL BLENDS FORNGC 6819TARGETS.
Target IDa Blend Sep Target IDa Blend Sep
(KIC) (KIC)FluxB
FluxT
b
(pix) (KIC) (KIC)FluxB
FluxT
b
(pix)5024297 5024272 4.58 4.65024601 5024582 0.83 2.9
5024312 0.56 2.4 5112741 1.07 3.45024312 5024297 1.78 2.4 5112751 0.83 4.3
5024349 3.83 4.95111940 5111932 2.00 2.45024405 5024410 2.55 3.25112467 5112445 0.69 2.45024414 5024410 1.04 2.9 5112478 0.80 2.4
5024369 0.81 4.8 5112491 1.04 2.95024456 5024470 2.51 3.25112491 5112467 0.97 2.95024512 5024517 1.38 3.5 5112478 0.78 3.3
5024511 2.66 3.05112734 5024582 1.03 3.85024517 5024511 1.93 0.9 5112741 1.33 2.4
5024512 0.73 3.5 5112751 1.04 3.25024582 5024601 1.21 2.95112751 5024582 1.00 4.5
5112734 0.97 3.8 5024601 1.21 4.35112741 1.29 2.8 5112734 0.97 3.25112751 1.00 4.5 5112741 1.29 1.7
5024583 5024584 4.99 1.05112938 5112932 0.68 2.9
aOnly targets for which we detect oscillations are listed.bFlux ratio between potential blend and target.
1994). Interestingly, this comparison revealed that for onestar, KIC5024517, theV andH band measurements alignedwith the expected trend of cluster members, while inK andJ bands the star was an outlier (see arrow). In addition, thereare indications in the power spectrum of excess power fromtwo oscillating stars. The excess located at the highest fre-quency (picked up by the time series analysis pipelines) iscompatible with the star being a cluster member if we use theV andH band measurements, while the low frequency excessis in agreement with theK andJ band measurements. Thisstrongly suggests that blending (Tables 2 and 5) has affectedthe standard photometry as well as theKepler light curve.
6.1. Estimating ∆ν and νmax
In the next step, we will estimate the expected∆ν andνmax from solar scaling (Eqs. 1 and 2), and compare themdirectly with the observations to make inference on clustermembership. We do note that because these two parametersare so strongly correlated (Stello et al. 2009; Hekker et al.2009; Mosser et al. 2010), using both adds little extra infor-mation other than redundancy for the purpose of determiningmembership.
To estimate the expected∆ν andνmax we converted the ap-parent magnitude into luminosity, using the cluster distancesby Basu et al. (2011). For NGC 6811, which was not studiedby Basu et al. (2011), we adopted a distance modulus of 10.3mag found by visual isochrone fitting. The contribution to thespread in apparent magnitude from the intrinsic depth of theclusters is similar to that from the photometric uncertainty,and is ignored in the following. We adopted average clusterreddenings ofE(B − V ) = 0.16mag (NGC 6791, Brogaardet al. (2011)),E(B − V ) = 0.14mag (NGC 6819, Bragagliaet al. (2001)), andE(B−V ) = 0.16mag (NGC 6811, Webdadatabase). Bolometric corrections were performed using thecalibrations by Bessell & Wood (1984) and Flower (1996).
The scatter in the mass of these red-giant-branch starscan be assumed to be low (less than 1% along a standardisochrone, e.g. Marigo et al. (2008)). We therefore adopted

An asteroseismic membership study of NGC 6791, NGC 6819, andNGC 6811 9
FIG. 5.— Echelle diagrams of the power spectrum of KIC2436824. Thepower spectrum was smoothed for better visual impression. Ellipses indicatethe four ridges formed by oscillation modes of spherical degreesl = 0–3.The dotted lines mark the expected position of the radial (l = 0) modes(see text). Each panel shows the echelle for slightly different choices of thesegment width used to divide the power spectrum. Panel B shows the bestchoice of∆ν.
the average red giant mass from Basu et al. (2011) forNGC 6791 and NGC 6819. It should be noted that the as-sumed common mass might result in a systematic overesti-mation of the expected∆ν for the red clump stars – not in-cluded in the study by Basu et al. (2011) – if they have experi-enced significant mass loss compared to the red-giant-branchstars (Miglio et al. 2011). We indicate in Table 1 (column-5),Table 2 (column-6), and Table 3 (column-6) which stars areclump stars inferred from the color-magnitude diagram (Fig-ure 2). For NGC 6811, we used an average mass of2.35M⊙
derived from∆ν, νmax, andTeff by combining Equations 1and 2 (Kallinger et al. 2010b) similar to what was done byHekker et al. (2011). Finally, we emphasize that the abso-lute values adopted for the average cluster properties are ofless importance since we are looking only to distinguish starsthat deviate from the average trend. Hence, it is important to
FIG. 6.— Power spectrum and part of light curve (inset) of one of thelong period stars where∆ν could not be reliably determined (KIC2437171).The thick curve shows the spectrum convolved with a Gaussianfunction ofFWHM ∼ 0.4µHz. The frequency of maximum power,νmax, and corre-sponding dominant periodicity in the light curve are indicated with arrows.
take into account the relativeTeff and bolometric correctionsof each star.
To obtainTeff we transformed theV −K color index usingthe calibrations by Ramırez & Melendez (2005). We estimatethe uncertainty inTeff to be∼ 100K, which includes contri-butions from the photometry, color-temperature calibration,and reddening (Hekker et al. see 2011 for further details). Asa double check we compared ourTeff with those derived fromB−V . The results are shown in Figure 8. The offset seen forNGC 6819 shows a slight dependency with color and is mostlikely due to calibration errors in the standard photometry.
TheV − K index is genrally the better temperature proxyfor cool red giants, it is less sensitive to metalicity, and itstemperature calibration show lower scatter than forB − V .We therefore chooseV −K. The two outliers, KIC2437171and KIC2438421, are much cooler than they appear inB−V(Garnavich et al. 1994), supporting thatV − K is the pref-ered color index. However, for KIC5024517 – the outlier inNGC 6819 – we recall that theK-band measurement is prob-ably affected by blending (Figure 7), suggestingV −K mightnot be the best temperature indicator in this case.
6.2. Results on the observed-to-expected ratio
The observed-to-expected ratios for∆ν and νmax areshown in Figure 9. The expected ratio is 1.0, with an uncer-tainty slightly below 10% (1-σ region marked in gray), whichis dominated by the uncertainty inTeff . The size of the uncer-tainty underpins that ignoring the expected spread in mass of. 1% is sound. For our purpose the absolute value of the av-erage ratio is not important but rather the deviation of singlestars from the ensemble. However, it turns out that the major-ity of stars fall close to 1.0, which shows that any possible sys-tematic errors in the expected (scaled)∆ν andνmax, causedby offsets in the calibration of the scaling relations or inac-curate adopted cluster parameters, have cancelled out. Apartfrom a few clear outliers we see generally little scatter, whichindicates that blending is less of an issue than suggested bythelarge number of potential blends, particularly for NGC 6791(Table 1, column-4). We note that we did not find any generaltrends between on the one hand stellar brightness or color andthe other hand the deviation of∆ν andνmax from the clus-
10 Stello et al.
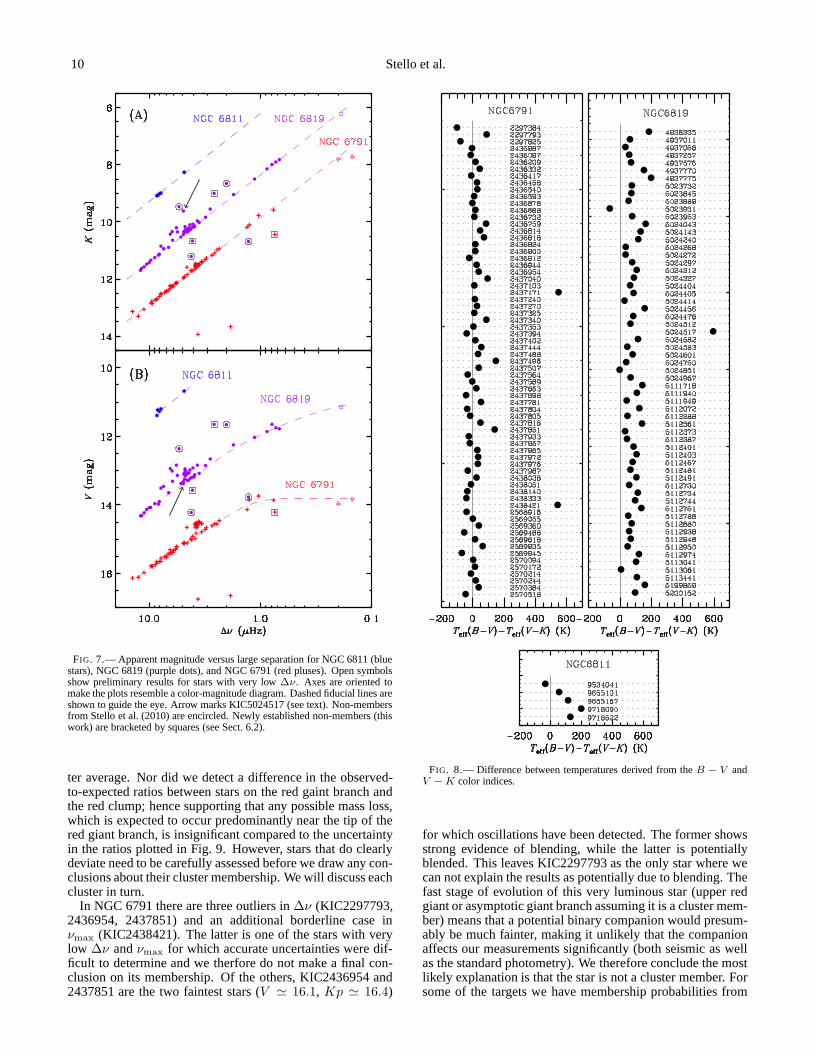
FIG. 7.— Apparent magnitude versus large separation for NGC 6811 (bluestars), NGC 6819 (purple dots), and NGC 6791 (red pluses). Open symbolsshow preliminary results for stars with very low∆ν. Axes are oriented tomake the plots resemble a color-magnitude diagram. Dashed fiducial lines areshown to guide the eye. Arrow marks KIC5024517 (see text). Non-membersfrom Stello et al. (2010) are encircled. Newly established non-members (thiswork) are bracketed by squares (see Sect. 6.2).
ter average. Nor did we detect a difference in the observed-to-expected ratios between stars on the red gaint branch andthe red clump; hence supporting that any possible mass loss,which is expected to occur predominantly near the tip of thered giant branch, is insignificant compared to the uncertaintyin the ratios plotted in Fig. 9. However, stars that do clearlydeviate need to be carefully assessed before we draw any con-clusions about their cluster membership. We will discuss eachcluster in turn.
In NGC 6791 there are three outliers in∆ν (KIC2297793,2436954, 2437851) and an additional borderline case inνmax (KIC2438421). The latter is one of the stars with verylow ∆ν andνmax for which accurate uncertainties were dif-ficult to determine and we therfore do not make a final con-clusion on its membership. Of the others, KIC2436954 and2437851 are the two faintest stars (V ≃ 16.1, Kp ≃ 16.4)
FIG. 8.— Difference between temperatures derived from theB − V andV −K color indices.
for which oscillations have been detected. The former showsstrong evidence of blending, while the latter is potentiallyblended. This leaves KIC2297793 as the only star where wecan not explain the results as potentially due to blending. Thefast stage of evolution of this very luminous star (upper redgiant or asymptotic giant branch assuming it is a cluster mem-ber) means that a potential binary companion would presum-ably be much fainter, making it unlikely that the companionaffects our measurements significantly (both seismic as wellas the standard photometry). We therefore conclude the mostlikely explanation is that the star is not a cluster member. Forsome of the targets we have membership probabilities from

An asteroseismic membership study of NGC 6791, NGC 6819, andNGC 6811 11
FIG. 9.— Ratio between measured and solar-scaled∆ν (left) andνmax (right) for targets in NGC 6791 (top), NGC 6819 (middle), andNGC 6811 (bottom). The 1-σ region of the expected ratio is shown in gray.Open symbols show preliminary results for stars with very low ∆ν. Starsymbols show results using theB − V temperature (see text for details).
radial velocity (Meibom & Platais, priv. comm. (2010) andGarnavich et al. (1994)), and from both radial velocity andmetallicity (Worthey & Jowett 2003; Origlia et al. 2006; Car-raro et al. 2006; Gratton et al. 2006), which we list in Ta-ble 1 (column-6–8), while column-9 lists our seismic mem-bership results. Our results on KIC2297793 reaffirm that ofGarnavich et al. (1994) who’s ambiguous ’no?’ designationwas chosen because the star’s radial velocity was significantlydifferent from the cluster average despite moving in the samedirection as the cluster as opposed to the bulk of the field.Finally, it is noticeable that quite a few seismic members –all initially selected as photometric members – are assignedlow probability membership from the radial velocity surveyby (Meibom & Platais). We speculate that this could be dueto binary companions, which we will address using seismol-ogy in a forthcomming paper.
NGC 6819 shows a few more outliers than NGC 6791despite the stars being brighter and less affected by blend-ing (compare Tables 4 and 5). Our results confirm allfour seismic non-members identified by Stello et al. (2010)KIC4936335, 4937257, 5023889, and 5024272. In addition,we can identify two new seismic non-members, KIC4937011and 5024268. All other apparently discrepant stars couldbe explained by potential blending or binarity (KIC5024414,5024476, 5024517, and 5112751) affecting both the seismicmeasurements and the temperature estimates (spectroscopicbinaries are listed in Table 2 column-7). In fact, adoptingthe temperature fromB − V for KIC5024517 makes it agreequite well (star symbol). We see the opposite in KIC5023931,which is a known binary where theV −K temperature and thedetected oscillations agree with membership, while it wouldappear as a non-member if we adopt theB − V temperature.For comparison we list membership probabilities from radialvelocity, and proper motion in Table 2 (column-8 and 9), aswell as photometric membership alongside the identified seis-mic membership (column-10 and 11). In four cases stars ap-pear to be both seismic and photometric non-members. Threestars (KIC5112880, 5113041, and 5113441) have very lowproper motion probability contradicting the results from ra-dial velocity, photometry, and seismology.
Finally, all five stars selected in NGC 6811 show seis-mic signals that agree with them being cluster members (Ta-ble 3, column-12). Our results agree well with those in-ferred from radial velocity measurements (column-7 and 8),proper motion (column-9 and 10), and photometric member-ship (column-11).
7. DISCUSSION AND CONCLUSION
We have demonstrated that cluster membership determinedfrom seismology show advantages over more orthodox meth-ods, and hence offers important complementary informationto that of kinematic and photometric measurements. In ourasteroseismic investigation we implicitly assumed a standardevolution history for the cluster stars when estimating theseismic parameters. Any exotic stars, such as remnants ofstrong dynamic interactions, would therefore appear as non-members under this assumption. While a kinematic studydoes not assume a standard stellar evolution, it can assign spu-rious field stars as members and vice versa if the space veloc-ity of the cluster is not clearly distinct from that of the field.The asteroseismic determination, however, is insensitivetothat, as it essentially separates non-members from membersby revealing stars that are at a different distance than the en-semble mean.
12 Stello et al.
From almost a year ofKepler data, we were able to measureglobal seismic properties of over a hundred red giant starsin three open clusters allowing inference to be made on thecluster membership of each star. Among our list, compris-ing likely members determined from photometric and kine-matic surveys, we found three new non-members and con-firmed the four previously identified seismic non-members byStello et al. (2010). We found more seismic non-membersin NGC 6819 despite this cluster having fewer members thanNGC 6791. This could indicate issues with obtaining a cleansample of members purely from the kinematic properties ofNGC 6819. However, we note that a probably significantcontribution to the difference in number of identified non-members in these two clusters comes from the different se-lection criteria adopted for each cluster.
Finally, we highlighted that the presence of binary stars andblends needs careful investigation to avoid misinterpretationof the seismic results as well as the auxiliary standard pho-tometry. In some cases the light curves revealed seismic sig-nal from more than one star, which could be used to identifyand to some extent disentangle signals from blends and bina-ries.
FutureKepler data of the so-called cluster super stamps will
give access to most stars in NGC 6791 and NGC 6819, provid-ing more comprehensive assessment of the effects from blend-ing, and enable us to make unbiased selections of the clusterstars, which will further extend the asteroseismic analyses ofthese clusters. In addition, we will get short cadence data (1-minute sampling) of selected stars in NGC 6819 which willallow us to probe the interiors of the less evolved turn-off andsubgiant stars.
Funding for this Discovery mission is provided by NASA’sScience Mission Directorate. The authors would like to thankthe entireKepler team without whom this investigation wouldnot have been possible. DS acknowledges support from theAustralian Research Council. This project has been supportedby the ‘Lendulet’ program of the Hungarian Academy of Sci-ences and the Hungarian OTKA grant K83790 and MB08C81013. SH acknowledges financial support from the UKScience and Technology Facilities Council (STFC). KB ac-knowledges financial support from the Carlsberg Foundation.NCAR is supported by the National Science Foundation. RSthanks the support of the Janos Bolyai Research Scholarship.
REFERENCES
Basu, S., et al. 2011, ApJ, 729, L10Bessell, M. S., & Wood, P. R. 1984, PASP, 96, 247Bragaglia, A., et al. 2001, AJ, 121, 327Brogaard, K., Bruntt, H., Grundahl, F., Clausen, J. V., Frandsen, S.,
Vandenberg, D. A., & Bedin, L. R. 2011, A&A, 525, A2Brown, T. M., Gilliland, R. L., Noyes, R. W., & Ramsey, L. W. 1991, ApJ,
368, 599Carraro, G., Villanova, S., Demarque, P., McSwain, M. V., Piotto, G., &
Bedin, L. R. 2006, ApJ, 643, 1151Christensen-Dalsgaard, J. 2004, Sol. Phys., 220, 137Dias, W. S., Lepine, J. R. D., & Alessi, B. S. 2002, A&A, 388, 168Flower, P. J. 1996, ApJ, 469, 355Garcia, R. A., et al. 2011, MNRAS, 414, 6Garnavich, P. M., Vandenberg, D. A., Zurek, D. R., & Hesser, J. E. 1994, AJ,
107, 1097Gratton, R., Bragaglia, A., Carretta, E., & Tosi, M. 2006, ApJ, 642, 462Hekker, S., et al. 2009, A&A, 506, 465—. 2010, MNRAS, 402, 2049—. 2011, A&A, 530, 100Hole, K. T., Geller, A. M., Mathieu, R. D., Platais, I., Meibom, S., & Latham,
D. W. 2009, AJ, 138, 159Huber, D., Stello, D., Bedding, T. R., Chaplin, W. J., Arentoft, T., Quirion, P.,
& Kjeldsen, H. 2009, Communications in Asteroseismology, 160, 74Huber, D., et al. 2010, ApJ, 723, 1607Jenkins, J. M., et al. 2010a, ApJ, 713, L120—. 2010b, ApJ, 713, L87Kallinger, T., et al. 2010a, A&A, 522, 1—. 2010b, A&A, 509, 77
Kjeldsen, H., & Bedding, T. R. 1995, A&A, 293, 87Koch, D. G., et al. 2010, ApJ, 713, L79Marigo, P., Girardi, L., Bressan, A., Groenewegen, M. A. T.,Silva, L., &
Granato, G. L. 2008, A&A, 482, 883Mathur, S., et al. 2010, A&A, 511, 46Mermilliod, J., & Mayor, M. 1990, A&A, 237, 61Miglio et al. 2011, in prep.Mosser, B., & Appourchaux, T. 2009, A&A, 508, 877Mosser, B., et al. 2010, A&A, 517, 22—. 2011, A&A, 525, L9Origlia, L., Valenti, E., Rich, R. M., & Ferraro, F. R. 2006, ApJ, 646, 499Pietrinferni, A., Cassisi, S., Salaris, M., & Castelli, F. 2004, ApJ, 612, 168Ramırez, I., & Melendez, J. 2005, ApJ, 626, 465Sanders, W. L. 1971, A&A, 15, 368—. 1972, A&A, 19, 155Skrutskie, M. F., et al. 2006, AJ, 131, 1163Stello, D., Bruntt, H., Preston, H., & Buzasi, D. 2008, ApJ, 674, L53Stello, D., Chaplin, W. J., Basu, S., Elsworth, Y., & Bedding, T. R. 2009,
MNRAS, 400, L80Stello, D., et al. 2010, ApJ, 713, L182Stello et al. 2011, ApJ in press (arXiv:1107.0490)Stetson, P. B., Bruntt, H., & Grundahl, F. 2003, PASP, 115, 413Ulrich, R. K. 1986, ApJ, 306, L37White et al. 2011, ApJ submittedWorthey, G., & Jowett, K. J. 2003, PASP, 115, 96