Filamentary star formation in NGC 1275
14
MNRAS 444, 336–349 (2014) doi:10.1093/mnras/stu1191 Filamentary star formation in NGC 1275 R. E. A. Canning, 1, 2 ‹ J. E. Ryon, 3 J. S. Gallagher III, 3 R. Kotulla, 4 R. W. O’Connell, 5 A. C. Fabian, 6 R. M. Johnstone, 6 C. J. Conselice, 7 A. Hicks, 8 D. Rosario 9 and R. F. G. Wyse 10 1 Kavli Institute for Particle Astrophysics and Cosmology (KIPAC), Stanford University, 452 Lomita Mall, Stanford, CA 94305-4085, USA 2 Department of Physics, Stanford University, 452 Lomita Mall, Stanford, CA 94305-4085, USA 3 Department of Astronomy, University of Wisconsin-Madison, 475 N. Charter St., Madison, WI 53706, USA 4 Department of Physics, University of Wisconsin-Milwaukee, 1900 E. Kenwood Blvd., Milwaukee, WI 53211, USA 5 Department of Astronomy, University of Virginia, PO Box 400235, Charlottesville, VA 22904, USA 6 Institute of Astronomy, University of Cambridge, Madingley Road, Cambridge CB3 0HA, UK 7 School of Physics and Astronomy, University of Nottingham, University Park, Nottingham NG7 2RD, UK 8 Department of Physics and Astronomy, Michigan State University, East Lansing, MI 48824-2320, USA 9 Max Planck Institute for Extraterrestrial Physics, Postfach 1312, 85741 Garching, Germany 10 Physics and Astronomy Department, Johns Hopkins University, 3400 North Charles Street, Baltimore, MD 21218, USA Accepted 2014 June 16. Received 2014 June 16; in original form 2014 March 21 ABSTRACT We examine the star formation in the outer halo of NGC 1275, the central galaxy in the Perseus cluster (Abell 426), using far-ultraviolet and optical images obtained with the Hubble Space Telescope. We have identified a population of very young, compact star clusters with typical ages of a few Myr. The star clusters are organized on multiple kiloparsec scales. Many of these star clusters are associated with ‘streaks’ of young stars, the combination of which has a cometary appearance. We perform photometry on the star clusters and diffuse stellar streaks, and fit their spectral energy distributions to obtain ages and masses. These young stellar populations appear to be normal in terms of their masses, luminosities and cluster formation efficiency; <10 per cent of the young stellar mass is located in star clusters. Our data suggest star formation is associated with the evolution of some of the giant gas filaments in NGC 1275 that become gravitationally unstable on reaching and possibly stalling in the outer galaxy. The stellar streaks then could represent stars moving on ballistic orbits in the potential well of the galaxy cluster. We propose a model where star-forming filaments, switched on ∼50 Myr ago and are currently feeding the growth of the NGC 1275 stellar halo at a rate of ≈−2 to 3M yr −1 . This type of process may also build stellar haloes and form isolated star clusters in the outskirts of youthful galaxies. Key words: galaxies: clusters: individual: Perseus – galaxies: individual: NGC1275 – galaxies: star clusters: general. 1 INTRODUCTION Most star formation in the local Universe occurs in galaxy discs. Dynamical instabilities in discs aid in the formation of star-forming gas clouds (e.g. Toomre 1977; Kennicutt 1998; Leroy et al. 2008). Low level star formation is also observed in more diffuse gas struc- tures, including extraplanar colliding gas shells (T¨ ullmann et al. 2003), tidal debris (de Mello et al. 2008; Werk et al. 2008) and in gas on the boundaries of radio jets and lobes (e.g. Graham 1998; Mould et al. 2000; O’Dea et al. 2004). The most spectac- E-mail: [email protected] ular examples of star formation outside of galactic discs, how- ever, occur in the vicinities of some brightest cluster galaxies (BCGs) in rich X-ray ‘cool core’ galaxy clusters (e.g. Allen 1995; McNamara et al. 2006; O’Dea et al. 2008, 2010; Quillen et al. 2008; Rafferty, McNamara & Nulsen 2008; Hicks, Mushotzky & Donahue 2010; McDonald et al. 2011, 2012; Oonk et al. 2011; Tremblay et al. 2012). These objects can support galactic-scale star formation in ex- tended gas structures which are products of interactions between the BCG and its surroundings. In this paper, we present an ultraviolet (UV) imaging study of the spectacular outer star-forming filaments associated with NGC 1275, the BCG in the Perseus galaxy cluster, based on data obtained with the Hubble Space Telescope (HST). Despite being initially classified C 2014 The Authors Published by Oxford University Press on behalf of the Royal Astronomical Society Downloaded from https://academic.oup.com/mnras/article/444/1/336/1008420 by University of Portsmouth Library user on 14 October 2020
-
Upload
khangminh22 -
Category
Documents
-
view
0 -
download
0
Transcript of Filamentary star formation in NGC 1275
MNRAS 444, 336–349 (2014) doi:10.1093/mnras/stu1191
Filamentary star formation in NGC 1275
R. E. A. Canning,1,2‹ J. E. Ryon,3 J. S. Gallagher III,3 R. Kotulla,4 R. W. O’Connell,5
A. C. Fabian,6 R. M. Johnstone,6 C. J. Conselice,7 A. Hicks,8 D. Rosario9
and R. F. G. Wyse10
1Kavli Institute for Particle Astrophysics and Cosmology (KIPAC), Stanford University, 452 Lomita Mall, Stanford, CA 94305-4085, USA2Department of Physics, Stanford University, 452 Lomita Mall, Stanford, CA 94305-4085, USA3Department of Astronomy, University of Wisconsin-Madison, 475 N. Charter St., Madison, WI 53706, USA4Department of Physics, University of Wisconsin-Milwaukee, 1900 E. Kenwood Blvd., Milwaukee, WI 53211, USA5Department of Astronomy, University of Virginia, PO Box 400235, Charlottesville, VA 22904, USA6Institute of Astronomy, University of Cambridge, Madingley Road, Cambridge CB3 0HA, UK7School of Physics and Astronomy, University of Nottingham, University Park, Nottingham NG7 2RD, UK8Department of Physics and Astronomy, Michigan State University, East Lansing, MI 48824-2320, USA9Max Planck Institute for Extraterrestrial Physics, Postfach 1312, 85741 Garching, Germany10Physics and Astronomy Department, Johns Hopkins University, 3400 North Charles Street, Baltimore, MD 21218, USA
Accepted 2014 June 16. Received 2014 June 16; in original form 2014 March 21
ABSTRACTWe examine the star formation in the outer halo of NGC 1275, the central galaxy in the Perseuscluster (Abell 426), using far-ultraviolet and optical images obtained with the Hubble SpaceTelescope. We have identified a population of very young, compact star clusters with typicalages of a few Myr. The star clusters are organized on multiple kiloparsec scales. Many ofthese star clusters are associated with ‘streaks’ of young stars, the combination of which has acometary appearance. We perform photometry on the star clusters and diffuse stellar streaks,and fit their spectral energy distributions to obtain ages and masses. These young stellarpopulations appear to be normal in terms of their masses, luminosities and cluster formationefficiency; <10 per cent of the young stellar mass is located in star clusters. Our data suggeststar formation is associated with the evolution of some of the giant gas filaments in NGC 1275that become gravitationally unstable on reaching and possibly stalling in the outer galaxy. Thestellar streaks then could represent stars moving on ballistic orbits in the potential well ofthe galaxy cluster. We propose a model where star-forming filaments, switched on ∼50 Myrago and are currently feeding the growth of the NGC 1275 stellar halo at a rate of ≈−2 to3 M� yr−1. This type of process may also build stellar haloes and form isolated star clustersin the outskirts of youthful galaxies.
Key words: galaxies: clusters: individual: Perseus – galaxies: individual: NGC1275 –galaxies: star clusters: general.
1 IN T RO D U C T I O N
Most star formation in the local Universe occurs in galaxy discs.Dynamical instabilities in discs aid in the formation of star-forminggas clouds (e.g. Toomre 1977; Kennicutt 1998; Leroy et al. 2008).Low level star formation is also observed in more diffuse gas struc-tures, including extraplanar colliding gas shells (Tullmann et al.2003), tidal debris (de Mello et al. 2008; Werk et al. 2008) andin gas on the boundaries of radio jets and lobes (e.g. Graham1998; Mould et al. 2000; O’Dea et al. 2004). The most spectac-
� E-mail: [email protected]
ular examples of star formation outside of galactic discs, how-ever, occur in the vicinities of some brightest cluster galaxies(BCGs) in rich X-ray ‘cool core’ galaxy clusters (e.g. Allen 1995;McNamara et al. 2006; O’Dea et al. 2008, 2010; Quillen et al. 2008;Rafferty, McNamara & Nulsen 2008; Hicks, Mushotzky & Donahue2010; McDonald et al. 2011, 2012; Oonk et al. 2011; Tremblay et al.2012). These objects can support galactic-scale star formation in ex-tended gas structures which are products of interactions between theBCG and its surroundings.
In this paper, we present an ultraviolet (UV) imaging study of thespectacular outer star-forming filaments associated with NGC 1275,the BCG in the Perseus galaxy cluster, based on data obtained withthe Hubble Space Telescope (HST). Despite being initially classified
C© 2014 The AuthorsPublished by Oxford University Press on behalf of the Royal Astronomical Society
Dow
nloaded from https://academ
ic.oup.com/m
nras/article/444/1/336/1008420 by University of Portsm
outh Library user on 14 October 2020
Filamentary star formation in NGC 1275 337
as an early-type galaxy (Hubble & Humason 1931), several struc-tural oddities of NGC 1275 were soon discovered. One mysteriousfeature is an extensive ‘web’ of gaseous, emission-line filaments,strongly emitting in Hα (Minkowski 1955; Lynds 1970). Observa-tions of H2 and CO have shown a substantial mass of molecular gasexists in the core of NGC 1275 (Bridges & Irwin 1998; Donahueet al. 2000; Edge et al. 2002) and is also entrained in the filaments(Hatch et al. 2005; Salome et al. 2006, 2011; Johnstone et al. 2007;Lim et al. 2012), and recent far-infrared (FIR) observations with theHerschel Space Telescope are allowing us to probe the nature of thiscold gas reservoir (Mittal et al. 2012). The most promising mecha-nism for heating these multiphase filaments is suprathermal particleheating from the surrounding hot X-ray intracluster medium (ICM;Ferland et al. 2009).
Perhaps the most peculiar feature of NGC 1275 is evidence forrecent massive star formation in and around the galaxy’s mainbody. The presence of this star formation has been known for sometime (see e.g. Sandage 1971; van den Bergh 1977, and referencestherein). Adams (1977) noted UV emission beyond the galaxy’smain body to the north-west and south-east. He suggested it couldbe due to the presence of hot stars, a point also discussed by Smithet al. (1992) on the basis of far-ultraviolet (FUV) imaging. Based onstellar population synthesis modelling and the detection of strongBalmer emission in an integrated spectrum of the central 25 arcsecof NGC 1275, Wirth, Kenyon & Hunter (1983) concluded that alarge population of B stars must be present. A localized populationof young stars was directly detected spectroscopically ∼19 arcsecfrom the galaxy’s centre by Shields, Filippenko & Basri (1990), andsince then, multiple young clusters have been found in the galaxy’soutskirts (e.g. Shields et al. 1990; Holtzman et al. 1992). McNa-mara, O’Connell & Sarazin (1996) conducted a multiwavelengthstudy of the structure of NGC 1275, and suggested the presence ofyoung stars in the outskirts, which were later found by Conselice,Gallagher & Wyse (2001) to have very blue colours, consistent withyoung stellar populations.
Canning et al. (2010, hereafter Paper I) used optical HST imagingto demonstrate that the outer UV-bright structures contain star clus-ters with ages <100 Myr, in contrast to the high-luminosity clustersin the galaxy’s central regions with ages >100 Myr. The authorsinfer, from the optical colours, a star formation rate of ∼20 M�yr−1
in these outer regions and conclude that the outer stellar featuresmust have a different origin to the blue cluster population studiedby Carlson et al. (1998) in the central regions of NGC 1275. How-ever, without higher resolution UV imaging, more accurate agesof these star clusters could not determined. Paper I also discussesthe presence of clumpy stellar ‘streaks’, cometary features with astar cluster at the ‘head’, followed by a ‘tail’ of more diffuse stellarlight, within the larger UV-bright structures of Adams (1977) (seeSection 5). These streaks may be due to the dissolution of the starclusters as they are released from their natal gas and fall towardsthe centre of NGC 1275. More accurate ages of the star clusters andstellar streaks are needed to understand their origin.
Our investigation utilizes results of our FUV and optical HSTAdvanced Camera for Surveys (ACS) observations of the outerUV-bright filaments of young stars in NGC 1275. We combine So-lar Blind Channel (SBC) FUV data with Wide Field Camera (WFC)optical data to obtain accurate ages and masses of the young starcluster candidates and associated diffuse light. Section 2 describesour HST observations, data reduction, source selection and photom-etry. In Section 3, we describe the method for fitting the SEDs ofour sources. Section 4 addresses the colours, masses and ages of thecompact star clusters. In Section 5, we discuss the properties of the
Table 1. Summary of HST observations.
Camera Filter Date Program ID Exp. time(s)
ACS/SBC F140LP 2008 March 16–21 GO 11207 2552ACS/WFC F435W 2006 August 05 GO 10546 9834ACS/WFC F550M 2006 August 05 GO 10546 12 132ACS/WFC F625W 2006 August 05 GO 10546 12 405
stellar streaks. Section 6 addresses how the star formation studiedhere fits in the context of the large-scale emission-line filaments.Section 7 contains our conclusions.
Throughout this paper we assume the standard � cold dark mat-ter (�CDM) cosmology where H0 = 71 km s−1, �m = 0.3 and�λ = 0.7. For this cosmology and at the redshift of NGC 1275(z = 0.0176), an angular size of 10 arcsec corresponds to a distanceof 3.5 kpc.
2 O B S E RVAT I O N S A N D DATA R E D U C T I O N
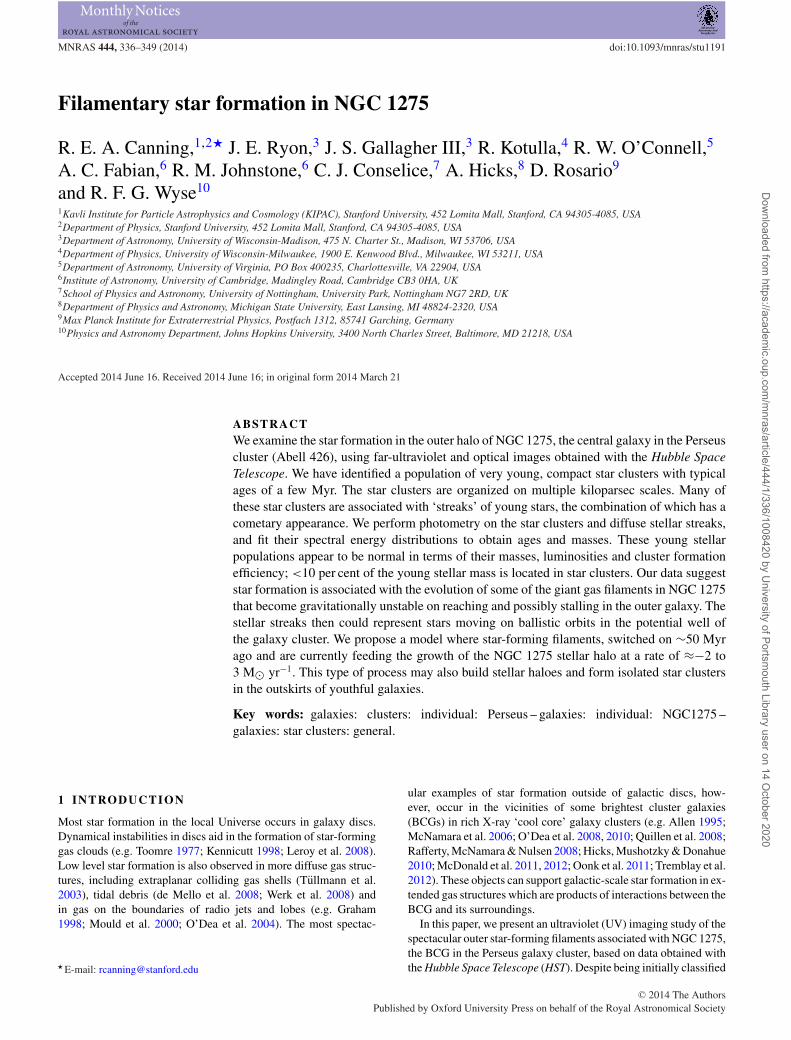
Optical observations of NGC 1275 were obtained with the HSTACS/WFC on 2006 August 5 in the F435W, F550M and F625Wfilters (first published in Fabian et al. 2008), The ACS/WFC fieldof view is 202 × 202 arcsec2 with pixel scale 0.05 arcsec pixel−1.Two F435W pointings and three F550M and F6255W pointingswere required, taken in a mosaic across NGC 1275, and FUV ob-servations were obtained with the ACS/SBC on 2008 March 16–21in the F140LP filter. Table 1 summarizes these observations. Thefield of view of ACS/SBC (FoV: 34.6 × 30.8 arcsec2, pixel scale:0.034 × 0.030 arcsec2 pixel−1) is smaller than the ACS/WFC andmultiple pointings with the SBC were required to image the sitesof outer star formation. Fig. 1 shows these SBC pointing locationsoverlaid on the WFC F435W optical image. Note that the SBCpointings have been labelled 01, 02, 06, 07 and 08. Pointings 03and 04 suffer from confusion with the high velocity system (HVS)and so we choose not to analyse these images here. 01 and 02 coverthe north-west region, 06 covers the southern filament and 07 and08 cover the blue loop.
NGC 1275 consists of two distinct velocity components, theHVS at v = 8200 km s−1 and the low velocity system (LVS) atv = 5200 km s−1 (Minkowski 1955). The HVS is associated witha dusty foreground object, possibly a late-type galaxy falling in tothe cluster, while the early-type galaxy and emission-line filamentsconstitute the LVS (Rubin et al. 1977; Conselice et al. 2001). X-rayabsorption by the HVS requires that the distance between the HVSand LVS is greater than 100 kpc (Sanders & Fabian 2007). The starformation in the north-west region (pointings 01 and 02) could beassociated with the HVS, but we view this as unlikely due to themorphological similarity of the stellar streaks with the emission-line filaments. In addition, spectroscopic studies have confirmedthat a complex of bright star clusters to the south of the north-westregion, nicknamed the ‘Snake’ (see Fig. 1), lies at the redshift ofthe LVS (Hatch et al. 2006). For the remainder of this paper weshall make the assumption that the star formation identified in theregions specified above is associated with the LVS.
The WFC F625W filter includes Hα, [N II] and [S II] emissionfrom both the HVS and LVS, and the WFC F435W filter includes[O II] emission from both the HVS and LVS. The SBC F140LP filtertransmits both the two-photon continuum, which is expected to beassociated with the Hα filaments (Johnstone et al. 2012), and C IV
MNRAS 444, 336–349 (2014)
Dow
nloaded from https://academ
ic.oup.com/m
nras/article/444/1/336/1008420 by University of Portsm
outh Library user on 14 October 2020

338 R. E. A. Canning et al.
Figure 1. F435W optical image overlaid with the five SBC pointings analysed in this paper. 01 and 02 cover the north-west region, 06 covers the southernfilament and 07 and 08 cover the blue loop. The inset shows a close up of the eastern arm of the blue loop (see pointing 08) illustrating the presence ofdiffuse stellar ‘streaks’ and compact UV sources; one such streak is labelled. The SBC field-of-view covers 34.6 × 30.8 arcsec2 while the larger ACS WFCfield-of-view is 202 × 202 arcsec2. The centre of NGC 1275 is at coordinates 49.◦9507, 41.◦5118.
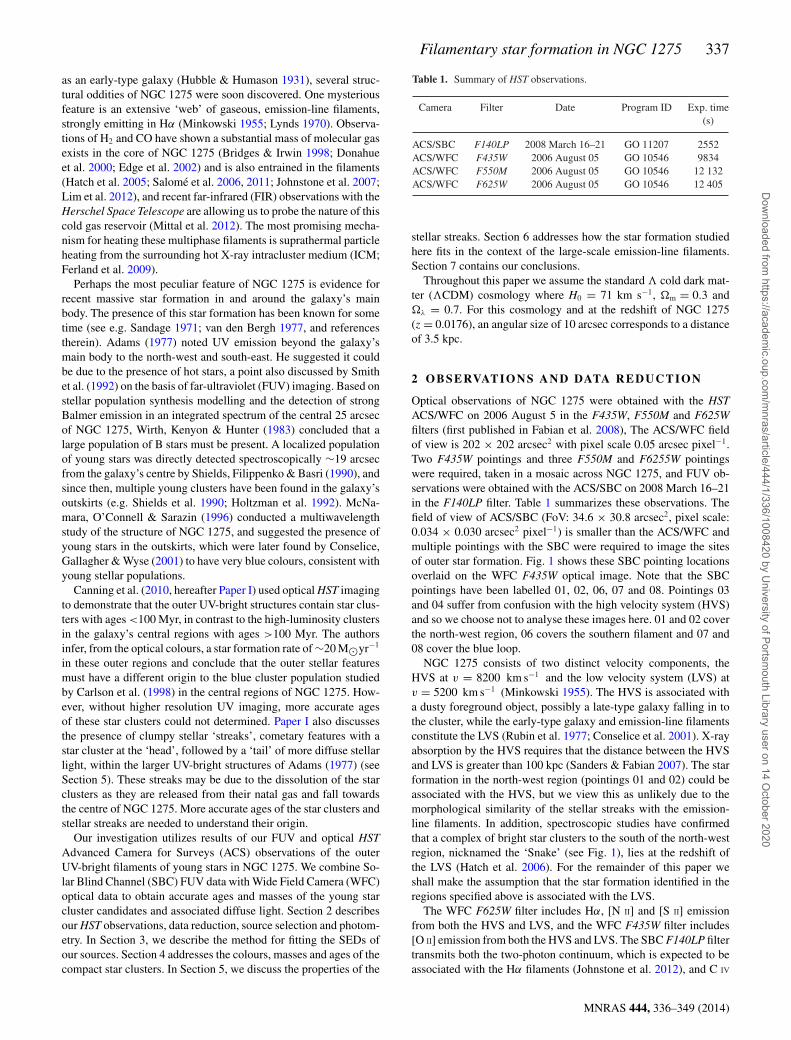
Figure 2. Three colour Hα, F435W and F140LP images of the three star-forming regions in the outskirts of the NGC 1275 LVS; left: blue loop (49.◦9671,41.◦5040); middle: north-west region (49.◦9458, 41.◦5295) and right: southern filament (49.◦4937, 41.◦5019). The Hα is from narrow-band imaging using theWIYN telescope. The bright galaxy in the northern region is a cluster member 2MASXi J0319467+413145.
1549 Å line emission, a strong cooling line diagnostic of 105 K gaswhich has been seen in a similar filamentary system surroundingM87 in the Virgo cluster (Sparks et al. 2009, 2012). As noted inPaper I, the young star clusters are typically offset from the brightestfilamentary emission (typical offsets are ∼a few arcsec so 0.6–1 kpc;see Fig. 2); the distribution of the UV emission follows that of thebroad-band optical filters not the narrow-band Hα imaging. UsingWIYN narrow-band Hα imaging and scaling from the ratios ofC IV, He II (Sparks et al. 2009, 2012) and F1500 Å (Johnstone et al.
2012) to Hα on the tails of the streaks we estimate emission-linecontamination in the F140LP filter to be at most 2000th of the totalflux. However, in order to minimize the contamination by emissionlines, not associated with the clusters, we take background regionslocal to the sources for our photometry. Our approach thereforeassumes that any background due to ionized gas and stars is uniformover small regions of the outer galaxy.
The standard procedure was used to bias subtract and flat-fieldthe data frames. These were then drizzled together as described
MNRAS 444, 336–349 (2014)
Dow
nloaded from https://academ
ic.oup.com/m
nras/article/444/1/336/1008420 by University of Portsm
outh Library user on 14 October 2020
Filamentary star formation in NGC 1275 339
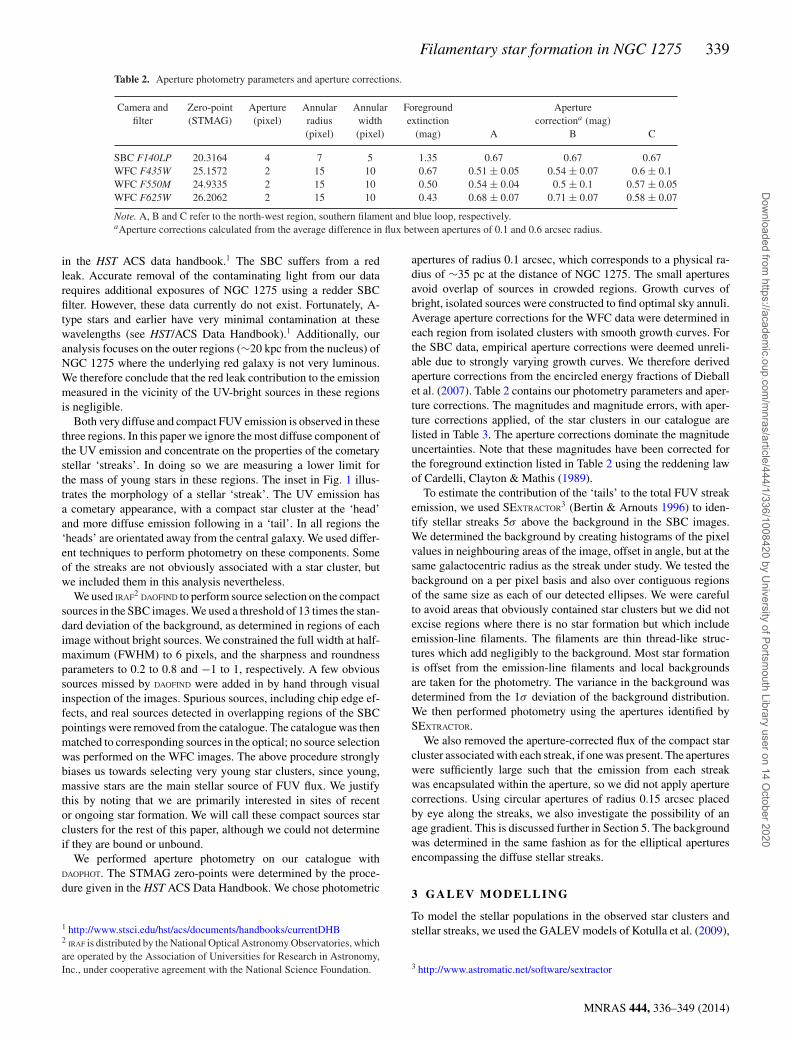
Table 2. Aperture photometry parameters and aperture corrections.
Camera and Zero-point Aperture Annular Annular Foreground Aperturefilter (STMAG) (pixel) radius width extinction correctiona (mag)
(pixel) (pixel) (mag) A B C
SBC F140LP 20.3164 4 7 5 1.35 0.67 0.67 0.67WFC F435W 25.1572 2 15 10 0.67 0.51 ± 0.05 0.54 ± 0.07 0.6 ± 0.1WFC F550M 24.9335 2 15 10 0.50 0.54 ± 0.04 0.5 ± 0.1 0.57 ± 0.05WFC F625W 26.2062 2 15 10 0.43 0.68 ± 0.07 0.71 ± 0.07 0.58 ± 0.07
Note. A, B and C refer to the north-west region, southern filament and blue loop, respectively.aAperture corrections calculated from the average difference in flux between apertures of 0.1 and 0.6 arcsec radius.
in the HST ACS data handbook.1 The SBC suffers from a redleak. Accurate removal of the contaminating light from our datarequires additional exposures of NGC 1275 using a redder SBCfilter. However, these data currently do not exist. Fortunately, A-type stars and earlier have very minimal contamination at thesewavelengths (see HST/ACS Data Handbook).1 Additionally, ouranalysis focuses on the outer regions (∼20 kpc from the nucleus) ofNGC 1275 where the underlying red galaxy is not very luminous.We therefore conclude that the red leak contribution to the emissionmeasured in the vicinity of the UV-bright sources in these regionsis negligible.
Both very diffuse and compact FUV emission is observed in thesethree regions. In this paper we ignore the most diffuse component ofthe UV emission and concentrate on the properties of the cometarystellar ‘streaks’. In doing so we are measuring a lower limit forthe mass of young stars in these regions. The inset in Fig. 1 illus-trates the morphology of a stellar ‘streak’. The UV emission hasa cometary appearance, with a compact star cluster at the ‘head’and more diffuse emission following in a ‘tail’. In all regions the‘heads’ are orientated away from the central galaxy. We used differ-ent techniques to perform photometry on these components. Someof the streaks are not obviously associated with a star cluster, butwe included them in this analysis nevertheless.
We used IRAF2 DAOFIND to perform source selection on the compactsources in the SBC images. We used a threshold of 13 times the stan-dard deviation of the background, as determined in regions of eachimage without bright sources. We constrained the full width at half-maximum (FWHM) to 6 pixels, and the sharpness and roundnessparameters to 0.2 to 0.8 and −1 to 1, respectively. A few obvioussources missed by DAOFIND were added in by hand through visualinspection of the images. Spurious sources, including chip edge ef-fects, and real sources detected in overlapping regions of the SBCpointings were removed from the catalogue. The catalogue was thenmatched to corresponding sources in the optical; no source selectionwas performed on the WFC images. The above procedure stronglybiases us towards selecting very young star clusters, since young,massive stars are the main stellar source of FUV flux. We justifythis by noting that we are primarily interested in sites of recentor ongoing star formation. We will call these compact sources starclusters for the rest of this paper, although we could not determineif they are bound or unbound.
We performed aperture photometry on our catalogue withDAOPHOT. The STMAG zero-points were determined by the proce-dure given in the HST ACS Data Handbook. We chose photometric
1 http://www.stsci.edu/hst/acs/documents/handbooks/currentDHB2 IRAF is distributed by the National Optical Astronomy Observatories, whichare operated by the Association of Universities for Research in Astronomy,Inc., under cooperative agreement with the National Science Foundation.
apertures of radius 0.1 arcsec, which corresponds to a physical ra-dius of ∼35 pc at the distance of NGC 1275. The small aperturesavoid overlap of sources in crowded regions. Growth curves ofbright, isolated sources were constructed to find optimal sky annuli.Average aperture corrections for the WFC data were determined ineach region from isolated clusters with smooth growth curves. Forthe SBC data, empirical aperture corrections were deemed unreli-able due to strongly varying growth curves. We therefore derivedaperture corrections from the encircled energy fractions of Dieballet al. (2007). Table 2 contains our photometry parameters and aper-ture corrections. The magnitudes and magnitude errors, with aper-ture corrections applied, of the star clusters in our catalogue arelisted in Table 3. The aperture corrections dominate the magnitudeuncertainties. Note that these magnitudes have been corrected forthe foreground extinction listed in Table 2 using the reddening lawof Cardelli, Clayton & Mathis (1989).
To estimate the contribution of the ‘tails’ to the total FUV streakemission, we used SEXTRACTOR3 (Bertin & Arnouts 1996) to iden-tify stellar streaks 5σ above the background in the SBC images.We determined the background by creating histograms of the pixelvalues in neighbouring areas of the image, offset in angle, but at thesame galactocentric radius as the streak under study. We tested thebackground on a per pixel basis and also over contiguous regionsof the same size as each of our detected ellipses. We were carefulto avoid areas that obviously contained star clusters but we did notexcise regions where there is no star formation but which includeemission-line filaments. The filaments are thin thread-like struc-tures which add negligibly to the background. Most star formationis offset from the emission-line filaments and local backgroundsare taken for the photometry. The variance in the background wasdetermined from the 1σ deviation of the background distribution.We then performed photometry using the apertures identified bySEXTRACTOR.
We also removed the aperture-corrected flux of the compact starcluster associated with each streak, if one was present. The apertureswere sufficiently large such that the emission from each streakwas encapsulated within the aperture, so we did not apply aperturecorrections. Using circular apertures of radius 0.15 arcsec placedby eye along the streaks, we also investigate the possibility of anage gradient. This is discussed further in Section 5. The backgroundwas determined in the same fashion as for the elliptical aperturesencompassing the diffuse stellar streaks.
3 G A L E V M O D E L L I N G
To model the stellar populations in the observed star clusters andstellar streaks, we used the GALEV models of Kotulla et al. (2009),
3 http://www.astromatic.net/software/sextractor
MNRAS 444, 336–349 (2014)
Dow
nloaded from https://academ
ic.oup.com/m
nras/article/444/1/336/1008420 by University of Portsm
outh Library user on 14 October 2020
340 R. E. A. Canning et al.
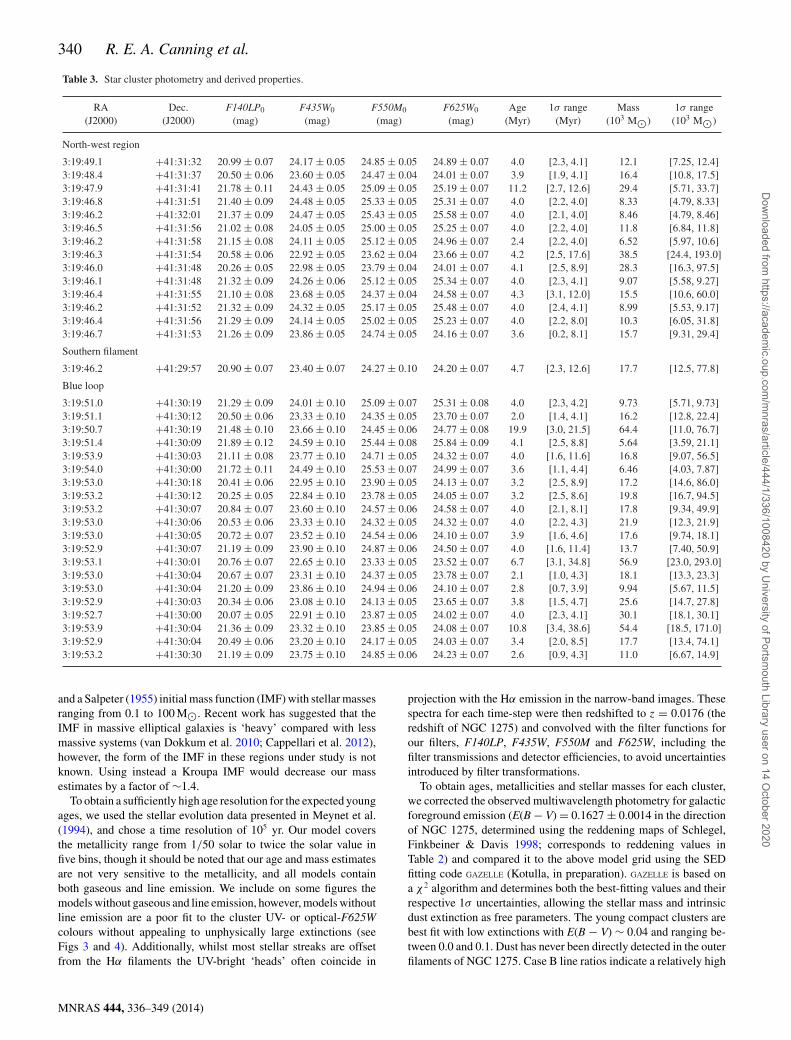
Table 3. Star cluster photometry and derived properties.
RA Dec. F140LP0 F435W0 F550M0 F625W0 Age 1σ range Mass 1σ range(J2000) (J2000) (mag) (mag) (mag) (mag) (Myr) (Myr) (103 M�) (103 M�)
North-west region
3:19:49.1 +41:31:32 20.99 ± 0.07 24.17 ± 0.05 24.85 ± 0.05 24.89 ± 0.07 4.0 [2.3, 4.1] 12.1 [7.25, 12.4]3:19:48.4 +41:31:37 20.50 ± 0.06 23.60 ± 0.05 24.47 ± 0.04 24.01 ± 0.07 3.9 [1.9, 4.1] 16.4 [10.8, 17.5]3:19:47.9 +41:31:41 21.78 ± 0.11 24.43 ± 0.05 25.09 ± 0.05 25.19 ± 0.07 11.2 [2.7, 12.6] 29.4 [5.71, 33.7]3:19:46.8 +41:31:51 21.40 ± 0.09 24.48 ± 0.05 25.33 ± 0.05 25.31 ± 0.07 4.0 [2.2, 4.0] 8.33 [4.79, 8.33]3:19:46.2 +41:32:01 21.37 ± 0.09 24.47 ± 0.05 25.43 ± 0.05 25.58 ± 0.07 4.0 [2.1, 4.0] 8.46 [4.79, 8.46]3:19:46.5 +41:31:56 21.02 ± 0.08 24.05 ± 0.05 25.00 ± 0.05 25.25 ± 0.07 4.0 [2.2, 4.0] 11.8 [6.84, 11.8]3:19:46.2 +41:31:58 21.15 ± 0.08 24.11 ± 0.05 25.12 ± 0.05 24.96 ± 0.07 2.4 [2.2, 4.0] 6.52 [5.97, 10.6]3:19:46.3 +41:31:54 20.58 ± 0.06 22.92 ± 0.05 23.62 ± 0.04 23.66 ± 0.07 4.2 [2.5, 17.6] 38.5 [24.4, 193.0]3:19:46.0 +41:31:48 20.26 ± 0.05 22.98 ± 0.05 23.79 ± 0.04 24.01 ± 0.07 4.1 [2.5, 8.9] 28.3 [16.3, 97.5]3:19:46.1 +41:31:48 21.32 ± 0.09 24.26 ± 0.06 25.12 ± 0.05 25.34 ± 0.07 4.0 [2.3, 4.1] 9.07 [5.58, 9.27]3:19:46.4 +41:31:55 21.10 ± 0.08 23.68 ± 0.05 24.37 ± 0.04 24.58 ± 0.07 4.3 [3.1, 12.0] 15.5 [10.6, 60.0]3:19:46.2 +41:31:52 21.32 ± 0.09 24.32 ± 0.05 25.17 ± 0.05 25.48 ± 0.07 4.0 [2.4, 4.1] 8.99 [5.53, 9.17]3:19:46.4 +41:31:56 21.29 ± 0.09 24.14 ± 0.05 25.02 ± 0.05 25.23 ± 0.07 4.0 [2.2, 8.0] 10.3 [6.05, 31.8]3:19:46.7 +41:31:53 21.26 ± 0.09 23.86 ± 0.05 24.74 ± 0.05 24.16 ± 0.07 3.6 [0.2, 8.1] 15.7 [9.31, 29.4]
Southern filament
3:19:46.2 +41:29:57 20.90 ± 0.07 23.40 ± 0.07 24.27 ± 0.10 24.20 ± 0.07 4.7 [2.3, 12.6] 17.7 [12.5, 77.8]
Blue loop
3:19:51.0 +41:30:19 21.29 ± 0.09 24.01 ± 0.10 25.09 ± 0.07 25.31 ± 0.08 4.0 [2.3, 4.2] 9.73 [5.71, 9.73]3:19:51.1 +41:30:12 20.50 ± 0.06 23.33 ± 0.10 24.35 ± 0.05 23.70 ± 0.07 2.0 [1.4, 4.1] 16.2 [12.8, 22.4]3:19:50.7 +41:30:19 21.48 ± 0.10 23.66 ± 0.10 24.45 ± 0.06 24.77 ± 0.08 19.9 [3.0, 21.5] 64.4 [11.0, 76.7]3:19:51.4 +41:30:09 21.89 ± 0.12 24.59 ± 0.10 25.44 ± 0.08 25.84 ± 0.09 4.1 [2.5, 8.8] 5.64 [3.59, 21.1]3:19:53.9 +41:30:03 21.11 ± 0.08 23.77 ± 0.10 24.71 ± 0.05 24.32 ± 0.07 4.0 [1.6, 11.6] 16.8 [9.07, 56.5]3:19:54.0 +41:30:00 21.72 ± 0.11 24.49 ± 0.10 25.53 ± 0.07 24.99 ± 0.07 3.6 [1.1, 4.4] 6.46 [4.03, 7.87]3:19:53.0 +41:30:18 20.41 ± 0.06 22.95 ± 0.10 23.90 ± 0.05 24.13 ± 0.07 3.2 [2.5, 8.9] 17.2 [14.6, 86.0]3:19:53.2 +41:30:12 20.25 ± 0.05 22.84 ± 0.10 23.78 ± 0.05 24.05 ± 0.07 3.2 [2.5, 8.6] 19.8 [16.7, 94.5]3:19:53.2 +41:30:07 20.84 ± 0.07 23.60 ± 0.10 24.57 ± 0.06 24.58 ± 0.07 4.0 [2.1, 8.1] 17.8 [9.34, 49.9]3:19:53.0 +41:30:06 20.53 ± 0.06 23.33 ± 0.10 24.32 ± 0.05 24.32 ± 0.07 4.0 [2.2, 4.3] 21.9 [12.3, 21.9]3:19:53.0 +41:30:05 20.72 ± 0.07 23.52 ± 0.10 24.54 ± 0.06 24.10 ± 0.07 3.9 [1.6, 4.6] 17.6 [9.74, 18.1]3:19:52.9 +41:30:07 21.19 ± 0.09 23.90 ± 0.10 24.87 ± 0.06 24.50 ± 0.07 4.0 [1.6, 11.4] 13.7 [7.40, 50.9]3:19:53.1 +41:30:01 20.76 ± 0.07 22.65 ± 0.10 23.33 ± 0.05 23.52 ± 0.07 6.7 [3.1, 34.8] 56.9 [23.0, 293.0]3:19:53.0 +41:30:04 20.67 ± 0.07 23.31 ± 0.10 24.37 ± 0.05 23.78 ± 0.07 2.1 [1.0, 4.3] 18.1 [13.3, 23.3]3:19:53.0 +41:30:04 21.20 ± 0.09 23.86 ± 0.10 24.94 ± 0.06 24.10 ± 0.07 2.8 [0.7, 3.9] 9.94 [5.67, 11.5]3:19:52.9 +41:30:03 20.34 ± 0.06 23.08 ± 0.10 24.13 ± 0.05 23.65 ± 0.07 3.8 [1.5, 4.7] 25.6 [14.7, 27.8]3:19:52.7 +41:30:00 20.07 ± 0.05 22.91 ± 0.10 23.87 ± 0.05 24.02 ± 0.07 4.0 [2.3, 4.1] 30.1 [18.1, 30.1]3:19:53.9 +41:30:04 21.36 ± 0.09 23.32 ± 0.10 23.85 ± 0.05 24.08 ± 0.07 10.8 [3.4, 38.6] 54.4 [18.5, 171.0]3:19:52.9 +41:30:04 20.49 ± 0.06 23.20 ± 0.10 24.17 ± 0.05 24.03 ± 0.07 3.4 [2.0, 8.5] 17.7 [13.4, 74.1]3:19:53.2 +41:30:30 21.19 ± 0.09 23.75 ± 0.10 24.85 ± 0.06 24.23 ± 0.07 2.6 [0.9, 4.3] 11.0 [6.67, 14.9]
and a Salpeter (1955) initial mass function (IMF) with stellar massesranging from 0.1 to 100 M�. Recent work has suggested that theIMF in massive elliptical galaxies is ‘heavy’ compared with lessmassive systems (van Dokkum et al. 2010; Cappellari et al. 2012),however, the form of the IMF in these regions under study is notknown. Using instead a Kroupa IMF would decrease our massestimates by a factor of ∼1.4.
To obtain a sufficiently high age resolution for the expected youngages, we used the stellar evolution data presented in Meynet et al.(1994), and chose a time resolution of 105 yr. Our model coversthe metallicity range from 1/50 solar to twice the solar value infive bins, though it should be noted that our age and mass estimatesare not very sensitive to the metallicity, and all models containboth gaseous and line emission. We include on some figures themodels without gaseous and line emission, however, models withoutline emission are a poor fit to the cluster UV- or optical-F625Wcolours without appealing to unphysically large extinctions (seeFigs 3 and 4). Additionally, whilst most stellar streaks are offsetfrom the Hα filaments the UV-bright ‘heads’ often coincide in
projection with the Hα emission in the narrow-band images. Thesespectra for each time-step were then redshifted to z = 0.0176 (theredshift of NGC 1275) and convolved with the filter functions forour filters, F140LP, F435W, F550M and F625W, including thefilter transmissions and detector efficiencies, to avoid uncertaintiesintroduced by filter transformations.
To obtain ages, metallicities and stellar masses for each cluster,we corrected the observed multiwavelength photometry for galacticforeground emission (E(B − V) = 0.1627 ± 0.0014 in the directionof NGC 1275, determined using the reddening maps of Schlegel,Finkbeiner & Davis 1998; corresponds to reddening values inTable 2) and compared it to the above model grid using the SEDfitting code GAZELLE (Kotulla, in preparation). GAZELLE is based ona χ2 algorithm and determines both the best-fitting values and theirrespective 1σ uncertainties, allowing the stellar mass and intrinsicdust extinction as free parameters. The young compact clusters arebest fit with low extinctions with E(B − V) ∼ 0.04 and ranging be-tween 0.0 and 0.1. Dust has never been directly detected in the outerfilaments of NGC 1275. Case B line ratios indicate a relatively high
MNRAS 444, 336–349 (2014)
Dow
nloaded from https://academ
ic.oup.com/m
nras/article/444/1/336/1008420 by University of Portsm
outh Library user on 14 October 2020

Filamentary star formation in NGC 1275 341
Figure 3. FUV–optical (left) and optical-only (right) cluster CMDs with foreground reddening corrections applied to the measured magnitudes. The north-westregion, southern filament and blue loop sources are denoted with orange diamonds, green triangles and blue squares, respectively. Blue dashed and dotted linesare evolutionary tracks corresponding to solar and half-solar metallicity SEDs, respectively, with mass 2 × 10⁴ M� (lowering the mass of the cluster resultsin the vertical movement of the tracks to dimmer magnitudes) and the orange solid line indicates the tracks for a solar metallicity model without line emission.The numbered points on each track represent the location of an SSP of age 1, 3, 5, 7, 10 and 20 Myr. When emission lines are included initially the light isdominated by nebular continuum and Hα emission making the F435W–F625W colour redder. The turnover at 7 Myr is due to the appearance of supergiantstars, in this case the blue supergiants dominate over the red supergiant stars.
Figure 4. Colour–colour plots of the star-forming sites with foreground reddening corrections applied. The left-hand panel shows the young clusters at the‘cometary head’ and the right-hand panel the stellar streaks forming the ‘cometary tail’ of emission. Points are the same as in Fig. 3. Blue dashed and dottedlines are evolutionary tracks corresponding to solar and half-solar metallicity SEDs, respectively, with mass 2 × 10⁴ M� (lowering the mass of the cluster hasno effect on the colour) and the orange solid line indicates the tracks for a solar metallicity model without line emission. The numbered points on each trackrepresent the location of an SSP of age 1, 3, 5, 7, 10 and 20 Myr.
Hα/Hβ line ratio ∼3–5 (Hatch et al. 2005), however, the ionizationmechanism is uncertain and probably has a significant contributionfrom collisional excitation. When fitting the stellar streaks we makethe assumption that the extinction will be similar or less than theUV-bright regions and limit the extinction to be E(B − V) < 0.1.
4 PRO P E RT I E S O F T H E YO U N G S TA RCLUSTERS
Paper I found a bimodal distribution of clusters in the outer enve-lope of NGC 1275. The bluer clusters were distributed anisotrop-ically, similar to, but typically offset by 0.6–1 kpc, from the Hα
MNRAS 444, 336–349 (2014)
Dow
nloaded from https://academ
ic.oup.com/m
nras/article/444/1/336/1008420 by University of Portsm
outh Library user on 14 October 2020
342 R. E. A. Canning et al.
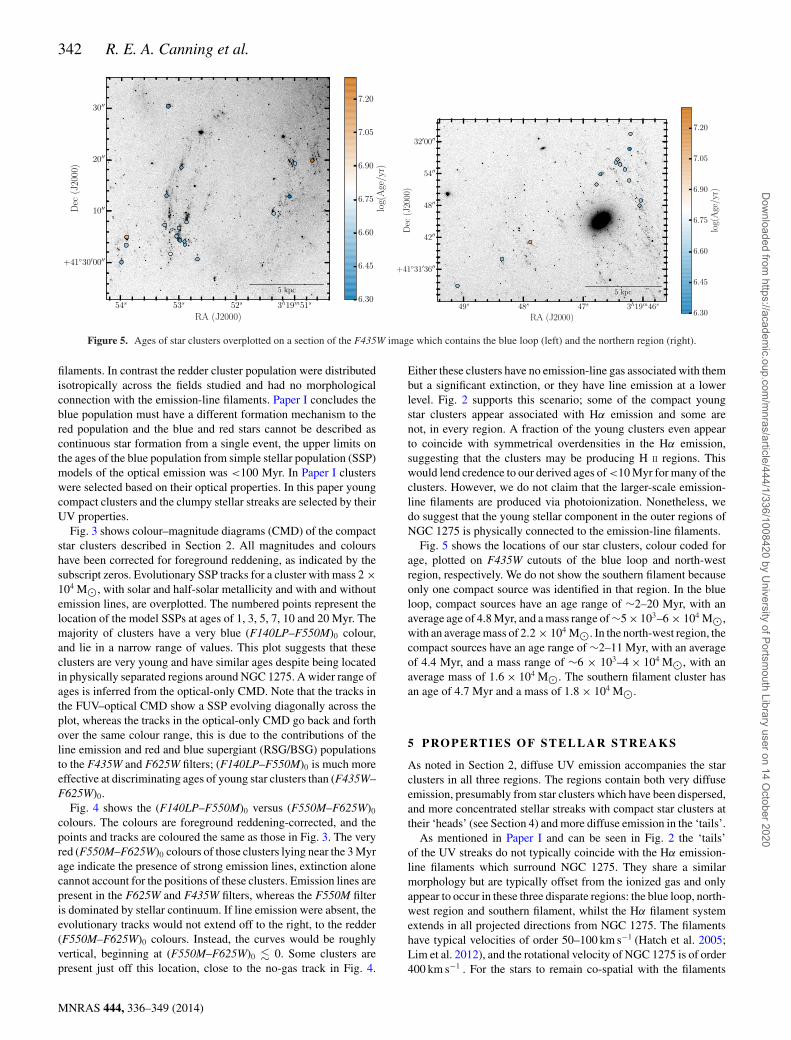
Figure 5. Ages of star clusters overplotted on a section of the F435W image which contains the blue loop (left) and the northern region (right).
filaments. In contrast the redder cluster population were distributedisotropically across the fields studied and had no morphologicalconnection with the emission-line filaments. Paper I concludes theblue population must have a different formation mechanism to thered population and the blue and red stars cannot be described ascontinuous star formation from a single event, the upper limits onthe ages of the blue population from simple stellar population (SSP)models of the optical emission was <100 Myr. In Paper I clusterswere selected based on their optical properties. In this paper youngcompact clusters and the clumpy stellar streaks are selected by theirUV properties.
Fig. 3 shows colour–magnitude diagrams (CMD) of the compactstar clusters described in Section 2. All magnitudes and colourshave been corrected for foreground reddening, as indicated by thesubscript zeros. Evolutionary SSP tracks for a cluster with mass 2 ×10⁴ M�, with solar and half-solar metallicity and with and withoutemission lines, are overplotted. The numbered points represent thelocation of the model SSPs at ages of 1, 3, 5, 7, 10 and 20 Myr. Themajority of clusters have a very blue (F140LP–F550M)0 colour,and lie in a narrow range of values. This plot suggests that theseclusters are very young and have similar ages despite being locatedin physically separated regions around NGC 1275. A wider range ofages is inferred from the optical-only CMD. Note that the tracks inthe FUV–optical CMD show a SSP evolving diagonally across theplot, whereas the tracks in the optical-only CMD go back and forthover the same colour range, this is due to the contributions of theline emission and red and blue supergiant (RSG/BSG) populationsto the F435W and F625W filters; (F140LP–F550M)0 is much moreeffective at discriminating ages of young star clusters than (F435W–F625W)0.
Fig. 4 shows the (F140LP–F550M)0 versus (F550M–F625W)0
colours. The colours are foreground reddening-corrected, and thepoints and tracks are coloured the same as those in Fig. 3. The veryred (F550M–F625W)0 colours of those clusters lying near the 3 Myrage indicate the presence of strong emission lines, extinction alonecannot account for the positions of these clusters. Emission lines arepresent in the F625W and F435W filters, whereas the F550M filteris dominated by stellar continuum. If line emission were absent, theevolutionary tracks would not extend off to the right, to the redder(F550M–F625W)0 colours. Instead, the curves would be roughlyvertical, beginning at (F550M–F625W)0 � 0. Some clusters arepresent just off this location, close to the no-gas track in Fig. 4.
Either these clusters have no emission-line gas associated with thembut a significant extinction, or they have line emission at a lowerlevel. Fig. 2 supports this scenario; some of the compact youngstar clusters appear associated with Hα emission and some arenot, in every region. A fraction of the young clusters even appearto coincide with symmetrical overdensities in the Hα emission,suggesting that the clusters may be producing H II regions. Thiswould lend credence to our derived ages of <10 Myr for many of theclusters. However, we do not claim that the larger-scale emission-line filaments are produced via photoionization. Nonetheless, wedo suggest that the young stellar component in the outer regions ofNGC 1275 is physically connected to the emission-line filaments.
Fig. 5 shows the locations of our star clusters, colour coded forage, plotted on F435W cutouts of the blue loop and north-westregion, respectively. We do not show the southern filament becauseonly one compact source was identified in that region. In the blueloop, compact sources have an age range of ∼2–20 Myr, with anaverage age of 4.8 Myr, and a mass range of ∼5 × 10³–6 × 10⁴ M�,with an average mass of 2.2 × 10⁴ M�. In the north-west region, thecompact sources have an age range of ∼2–11 Myr, with an averageof 4.4 Myr, and a mass range of ∼6 × 10³–4 × 10⁴ M�, with anaverage mass of 1.6 × 10⁴ M�. The southern filament cluster hasan age of 4.7 Myr and a mass of 1.8 × 10⁴ M�.
5 PRO P E RT I E S O F ST E L L A R ST R E A K S
As noted in Section 2, diffuse UV emission accompanies the starclusters in all three regions. The regions contain both very diffuseemission, presumably from star clusters which have been dispersed,and more concentrated stellar streaks with compact star clusters attheir ‘heads’ (see Section 4) and more diffuse emission in the ‘tails’.
As mentioned in Paper I and can be seen in Fig. 2 the ‘tails’of the UV streaks do not typically coincide with the Hα emission-line filaments which surround NGC 1275. They share a similarmorphology but are typically offset from the ionized gas and onlyappear to occur in these three disparate regions: the blue loop, north-west region and southern filament, whilst the Hα filament systemextends in all projected directions from NGC 1275. The filamentshave typical velocities of order 50–100 km s−1 (Hatch et al. 2005;Lim et al. 2012), and the rotational velocity of NGC 1275 is of order400 km s−1 . For the stars to remain co-spatial with the filaments
MNRAS 444, 336–349 (2014)
Dow
nloaded from https://academ
ic.oup.com/m
nras/article/444/1/336/1008420 by University of Portsm
outh Library user on 14 October 2020
Filamentary star formation in NGC 1275 343
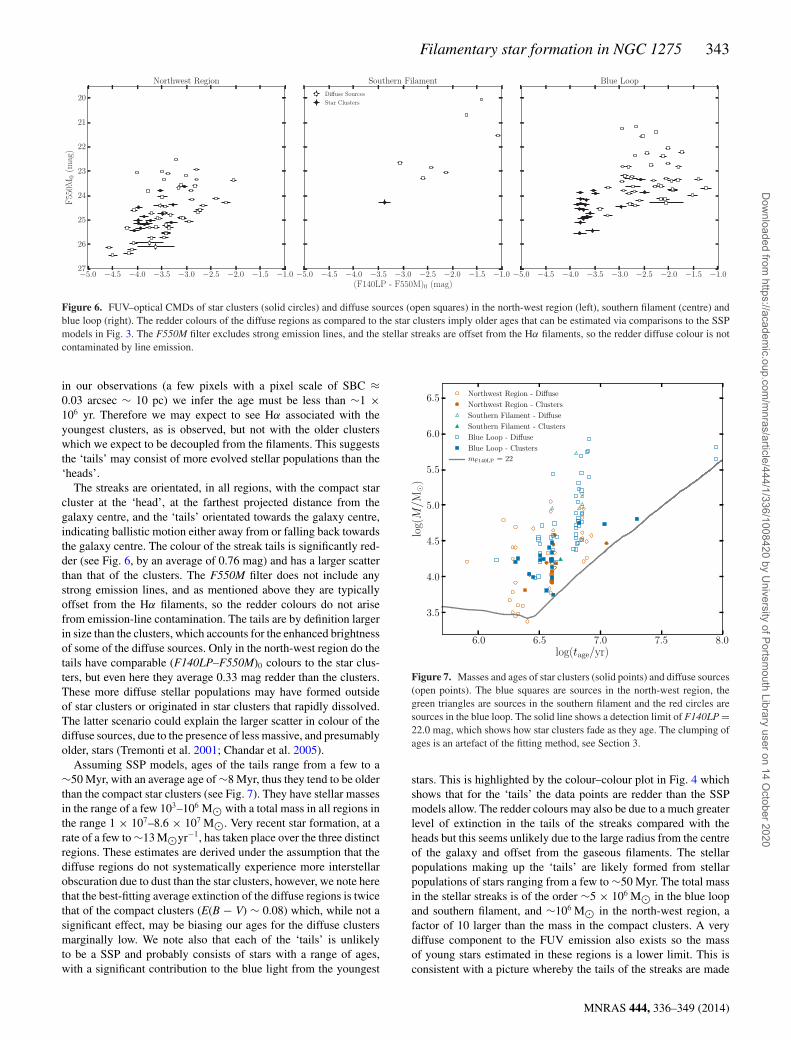
Figure 6. FUV–optical CMDs of star clusters (solid circles) and diffuse sources (open squares) in the north-west region (left), southern filament (centre) andblue loop (right). The redder colours of the diffuse regions as compared to the star clusters imply older ages that can be estimated via comparisons to the SSPmodels in Fig. 3. The F550M filter excludes strong emission lines, and the stellar streaks are offset from the Hα filaments, so the redder diffuse colour is notcontaminated by line emission.
in our observations (a few pixels with a pixel scale of SBC ≈0.03 arcsec ∼ 10 pc) we infer the age must be less than ∼1 ×10⁶ yr. Therefore we may expect to see Hα associated with theyoungest clusters, as is observed, but not with the older clusterswhich we expect to be decoupled from the filaments. This suggeststhe ‘tails’ may consist of more evolved stellar populations than the‘heads’.
The streaks are orientated, in all regions, with the compact starcluster at the ‘head’, at the farthest projected distance from thegalaxy centre, and the ‘tails’ orientated towards the galaxy centre,indicating ballistic motion either away from or falling back towardsthe galaxy centre. The colour of the streak tails is significantly red-der (see Fig. 6, by an average of 0.76 mag) and has a larger scatterthan that of the clusters. The F550M filter does not include anystrong emission lines, and as mentioned above they are typicallyoffset from the Hα filaments, so the redder colours do not arisefrom emission-line contamination. The tails are by definition largerin size than the clusters, which accounts for the enhanced brightnessof some of the diffuse sources. Only in the north-west region do thetails have comparable (F140LP–F550M)0 colours to the star clus-ters, but even here they average 0.33 mag redder than the clusters.These more diffuse stellar populations may have formed outsideof star clusters or originated in star clusters that rapidly dissolved.The latter scenario could explain the larger scatter in colour of thediffuse sources, due to the presence of less massive, and presumablyolder, stars (Tremonti et al. 2001; Chandar et al. 2005).
Assuming SSP models, ages of the tails range from a few to a∼50 Myr, with an average age of ∼8 Myr, thus they tend to be olderthan the compact star clusters (see Fig. 7). They have stellar massesin the range of a few 103–106 M� with a total mass in all regions inthe range 1 × 10⁷–8.6 × 10⁷ M�. Very recent star formation, at arate of a few to ∼13 M�yr−1, has taken place over the three distinctregions. These estimates are derived under the assumption that thediffuse regions do not systematically experience more interstellarobscuration due to dust than the star clusters, however, we note herethat the best-fitting average extinction of the diffuse regions is twicethat of the compact clusters (E(B − V) ∼ 0.08) which, while not asignificant effect, may be biasing our ages for the diffuse clustersmarginally low. We note also that each of the ‘tails’ is unlikelyto be a SSP and probably consists of stars with a range of ages,with a significant contribution to the blue light from the youngest
Figure 7. Masses and ages of star clusters (solid points) and diffuse sources(open points). The blue squares are sources in the north-west region, thegreen triangles are sources in the southern filament and the red circles aresources in the blue loop. The solid line shows a detection limit of F140LP =22.0 mag, which shows how star clusters fade as they age. The clumping ofages is an artefact of the fitting method, see Section 3.
stars. This is highlighted by the colour–colour plot in Fig. 4 whichshows that for the ‘tails’ the data points are redder than the SSPmodels allow. The redder colours may also be due to a much greaterlevel of extinction in the tails of the streaks compared with theheads but this seems unlikely due to the large radius from the centreof the galaxy and offset from the gaseous filaments. The stellarpopulations making up the ‘tails’ are likely formed from stellarpopulations of stars ranging from a few to ∼50 Myr. The total massin the stellar streaks is of the order ∼5 × 10⁶ M� in the blue loopand southern filament, and ∼106 M� in the north-west region, afactor of 10 larger than the mass in the compact clusters. A verydiffuse component to the FUV emission also exists so the massof young stars estimated in these regions is a lower limit. This isconsistent with a picture whereby the tails of the streaks are made
MNRAS 444, 336–349 (2014)
Dow
nloaded from https://academ
ic.oup.com/m
nras/article/444/1/336/1008420 by University of Portsm
outh Library user on 14 October 2020
344 R. E. A. Canning et al.
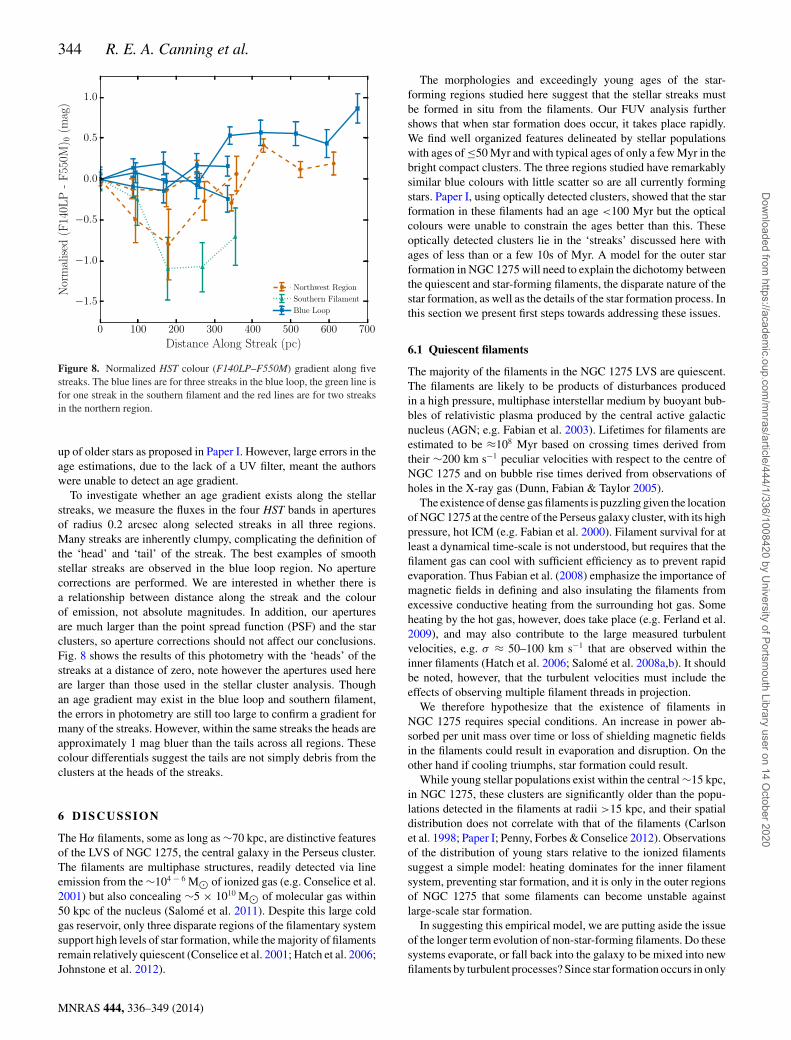
Figure 8. Normalized HST colour (F140LP–F550M) gradient along fivestreaks. The blue lines are for three streaks in the blue loop, the green line isfor one streak in the southern filament and the red lines are for two streaksin the northern region.
up of older stars as proposed in Paper I. However, large errors in theage estimations, due to the lack of a UV filter, meant the authorswere unable to detect an age gradient.
To investigate whether an age gradient exists along the stellarstreaks, we measure the fluxes in the four HST bands in aperturesof radius 0.2 arcsec along selected streaks in all three regions.Many streaks are inherently clumpy, complicating the definition ofthe ‘head’ and ‘tail’ of the streak. The best examples of smoothstellar streaks are observed in the blue loop region. No aperturecorrections are performed. We are interested in whether there isa relationship between distance along the streak and the colourof emission, not absolute magnitudes. In addition, our aperturesare much larger than the point spread function (PSF) and the starclusters, so aperture corrections should not affect our conclusions.Fig. 8 shows the results of this photometry with the ‘heads’ of thestreaks at a distance of zero, note however the apertures used hereare larger than those used in the stellar cluster analysis. Thoughan age gradient may exist in the blue loop and southern filament,the errors in photometry are still too large to confirm a gradient formany of the streaks. However, within the same streaks the heads areapproximately 1 mag bluer than the tails across all regions. Thesecolour differentials suggest the tails are not simply debris from theclusters at the heads of the streaks.
6 D ISCUSSION
The Hα filaments, some as long as ∼70 kpc, are distinctive featuresof the LVS of NGC 1275, the central galaxy in the Perseus cluster.The filaments are multiphase structures, readily detected via lineemission from the ∼104 − 6 M� of ionized gas (e.g. Conselice et al.2001) but also concealing ∼5 × 10¹⁰ M� of molecular gas within50 kpc of the nucleus (Salome et al. 2011). Despite this large coldgas reservoir, only three disparate regions of the filamentary systemsupport high levels of star formation, while the majority of filamentsremain relatively quiescent (Conselice et al. 2001; Hatch et al. 2006;Johnstone et al. 2012).
The morphologies and exceedingly young ages of the star-forming regions studied here suggest that the stellar streaks mustbe formed in situ from the filaments. Our FUV analysis furthershows that when star formation does occur, it takes place rapidly.We find well organized features delineated by stellar populationswith ages of ≤50 Myr and with typical ages of only a few Myr in thebright compact clusters. The three regions studied have remarkablysimilar blue colours with little scatter so are all currently formingstars. Paper I, using optically detected clusters, showed that the starformation in these filaments had an age <100 Myr but the opticalcolours were unable to constrain the ages better than this. Theseoptically detected clusters lie in the ‘streaks’ discussed here withages of less than or a few 10s of Myr. A model for the outer starformation in NGC 1275 will need to explain the dichotomy betweenthe quiescent and star-forming filaments, the disparate nature of thestar formation, as well as the details of the star formation process. Inthis section we present first steps towards addressing these issues.
6.1 Quiescent filaments
The majority of the filaments in the NGC 1275 LVS are quiescent.The filaments are likely to be products of disturbances producedin a high pressure, multiphase interstellar medium by buoyant bub-bles of relativistic plasma produced by the central active galacticnucleus (AGN; e.g. Fabian et al. 2003). Lifetimes for filaments areestimated to be ≈108 Myr based on crossing times derived fromtheir ∼200 km s−1 peculiar velocities with respect to the centre ofNGC 1275 and on bubble rise times derived from observations ofholes in the X-ray gas (Dunn, Fabian & Taylor 2005).
The existence of dense gas filaments is puzzling given the locationof NGC 1275 at the centre of the Perseus galaxy cluster, with its highpressure, hot ICM (e.g. Fabian et al. 2000). Filament survival for atleast a dynamical time-scale is not understood, but requires that thefilament gas can cool with sufficient efficiency as to prevent rapidevaporation. Thus Fabian et al. (2008) emphasize the importance ofmagnetic fields in defining and also insulating the filaments fromexcessive conductive heating from the surrounding hot gas. Someheating by the hot gas, however, does take place (e.g. Ferland et al.2009), and may also contribute to the large measured turbulentvelocities, e.g. σ ≈ 50–100 km s−1 that are observed within theinner filaments (Hatch et al. 2006; Salome et al. 2008a,b). It shouldbe noted, however, that the turbulent velocities must include theeffects of observing multiple filament threads in projection.
We therefore hypothesize that the existence of filaments inNGC 1275 requires special conditions. An increase in power ab-sorbed per unit mass over time or loss of shielding magnetic fieldsin the filaments could result in evaporation and disruption. On theother hand if cooling triumphs, star formation could result.
While young stellar populations exist within the central ∼15 kpc,in NGC 1275, these clusters are significantly older than the popu-lations detected in the filaments at radii >15 kpc, and their spatialdistribution does not correlate with that of the filaments (Carlsonet al. 1998; Paper I; Penny, Forbes & Conselice 2012). Observationsof the distribution of young stars relative to the ionized filamentssuggest a simple model: heating dominates for the inner filamentsystem, preventing star formation, and it is only in the outer regionsof NGC 1275 that some filaments can become unstable againstlarge-scale star formation.
In suggesting this empirical model, we are putting aside the issueof the longer term evolution of non-star-forming filaments. Do thesesystems evaporate, or fall back into the galaxy to be mixed into newfilaments by turbulent processes? Since star formation occurs in only
MNRAS 444, 336–349 (2014)
Dow
nloaded from https://academ
ic.oup.com/m
nras/article/444/1/336/1008420 by University of Portsm
outh Library user on 14 October 2020

Filamentary star formation in NGC 1275 345
a minority of filaments, some process in addition to star formationmust limit the radial extent of the LVS filaments.
6.2 Filaments and star formation
6.2.1 External perturbations
The ICM is not static; bulk sloshing motions which spiral to largeradii can be seen as spirals in the ICM X-ray surface brightness,in the spectacular, deep Chandra X-ray images presented in Fabianet al. (2011b). The sloshing motions are likely due to a subclustermerger or interaction and can persist in the ICM for a very long time(for a review, see Markevitch & Vikhlinin 2007). However, the bulkmotions do not appear to be effective triggers of star formation inthe filaments as shown by the radial extent of the filaments, smoothradial velocity measurements (Hatch et al. 2006) and long lifetimes.
Rising relativistic gas bubbles might also affect pre-existing fila-ments, possibly leading to star formation. Fig. 9 shows the projectedspatial correspondence between the X-ray surface brightness, ion-ized gas filaments and UV emission in the three regions understudy. The correlation between the ionized gas filaments and thestar formation is obvious, but any correlation of these features withthe X-ray bubbles is less clear: In the south-east, the centre of theblue loop coincides spatially with a depression in the X-ray image.
Figure 9. Chandra X-ray surface brightness image from (Fabian et al.2011b) with the average at each radius subtracted overlaid with contoursof Hα emission (magenta; Conselice et al. 2001) and young star-formingregions (green; this study). The X-ray bubbles blown by the AGN are seenas dark depressions in the X-ray surface brightness image. The centre ofNGC 1275 is at coordinates 49.◦9507, 41.◦5118.
The expansion of this bubble underneath the ionized gas could betriggering compression and star formation along a filament. How-ever, no clear correspondence of star formation with the X-raybubbles is observed in the north-west region or southern filament.The star formation in the southern filament is slightly offset fromnearby ionized gas filaments, and is confused with the large innerbubbles which dominate the X-ray signatures in this region, whilein the North-west the star formation is not clearly associated withany bright dense regions of X-ray gas, although X-ray depressionsare apparent to the east, west and south. It is also important to notethat we do not know the projection angles of the ionized filamentsor of the star-forming regions. Additionally, little scatter exists inthe ages of the compact stellar features across all regions, with starformation switching on <50 Myr ago, suggesting a common mech-anism disrupted the three filaments. Estimated rise times for thelarge southernmost bubble preceding the blue loop, and the largebubbles still connected to the nucleus (see Fig. 9) differ by closeto order of magnitude being 75 and 15 Myr, respectively (Dunn,Fabian & Sanders 2006). If separate generations of X-ray bubbleswere responsible for the star formation this would lead to detectablevariations in the ages of the clusters in each region. However, es-timations of bubble rise times can have large uncertainties fromprojection effects. Additionally these bubbles use different meth-ods to estimate their age as the inner bubbles are still connected tothe nucleus. The buoyancy time-scale is used for the outer bubblesand the sound speed time-scale (an expansion time-scale) for theinner bubbles (see Dunn et al. 2006).
Weak shocks, from the generation of the bubbles, are apparentin the X-ray gas and could simultaneously disrupt the filaments.The straight edge running north-west through the north-west regionmay be caused by a weak shock in the gas from the inflation of thebubbles. The projected distance from the nucleus of ∼25 kpc wouldrequire a transport process travelling at ∼1000 km s−1 to synchro-nize the star formation to 10s of Myr. A shock in the hot X-raygas might reach these velocities. However, a shock would compressthe gas along the shock front, not perpendicular to it and shouldhave disrupted also the inner regions of the filaments leading to agradient in age with distance from the nucleus, we do not find anyevidence for this in our data.
While the structure of NGC 1275 resembles that of late phase fieldE-galaxy merger products with shell-like features (e.g. Schweizer1998), these features are unlikely to originate from simple gas-richmergers. Wet mergers with the BCG are unlikely due to the highvelocity dispersions in massive, low-redshift galaxy clusters; theactive star formation in NGC 1275 probably does not result fromthe kinds of processes occurring in wet mergers of field galaxies(Monaco et al. 2006; Conroy, Wechsler & Kravtsov 2007). Anexternal perturbation such as disruption of pre-existing filaments bya passing galaxy or dark matter clump is not a likely mechanism forproducing the outer young stellar filaments. Any effects from suchcollisions, such as tidal compression, should be localized aroundthe site of the interaction, which might affect regions in a fewfilaments, but not yield large coherent features. Tidal debris from aninfalling star-forming galaxy, as in the HVS, would likely producemore spatially localized and disturbed young stellar structures thanwhat we observe. Furthermore, the galaxy responsible for the tidaldebris should be observable. Aside from the obvious presence of agalaxy in the HVS, the debris from which is unrelated to the regionswe are studying, no candidate impactor has been found that couldsimultaneously lead to star formation in the south-east, south andnorth-west of NGC 1275.
MNRAS 444, 336–349 (2014)
Dow
nloaded from https://academ
ic.oup.com/m
nras/article/444/1/336/1008420 by University of Portsm
outh Library user on 14 October 2020

346 R. E. A. Canning et al.
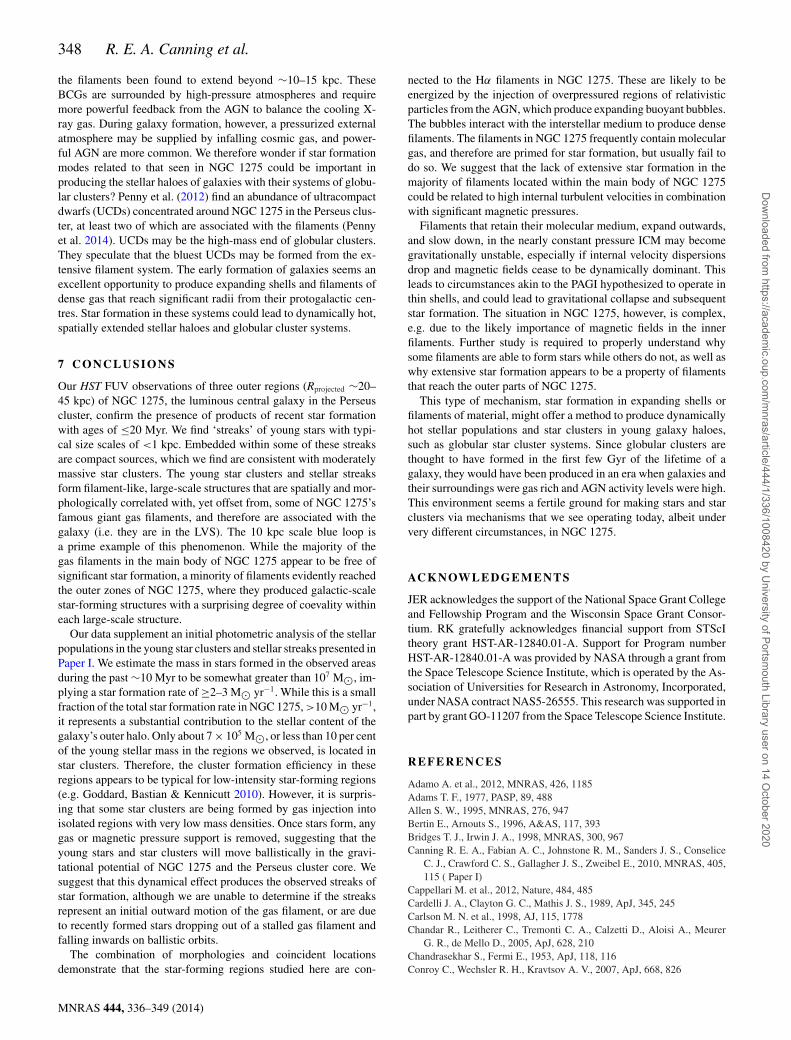
Figure 10. The ‘Snake’ (49.◦9408, 41.◦5527) (left) and a section of the blue loop (49.◦9706, 41.◦5027) (right) in F435W and F140LP emission. Star formationin stellar streaks occurs in clumps with a projected periodicity of ∼0.3–0.5 arcsec (105–175 pc).
6.2.2 Internal instabilities
As discussed in Paper I, the structure of the young stellar streaks issuggestive of coherent motions. We also note that the streaks withina given region tend to be parallel to one another, as expected ifthe stellar streaks are moving along similar paths. With our moreaccurate age estimates, we can estimate the minimum velocity ofthe streaks if they are associated with progressive star formation.Projected streak lengths are ∼0.7–1.5 kpc, which gives vproj ≈30/t∗(20)–60/t∗(20) km s−1, where t∗(20) is the stellar populationage range in units of 20 Myr.
This suggests that the speeds of the young stars could be slowerthan the 100–200 km s−1 radial velocities measured for outer fila-ments by Hatch et al. (2006). Paper 1 discusses the possibility thatonce stars form in the filaments, they can no longer be supportedby gas and/or magnetic pressure. If star-forming filaments stall inthe outer parts of NGC 1275, stars and star clusters could beginto fall back towards NGC 1275, forming the stellar streaks we ob-serve. Another possibility is that the streaks represent the outwardvelocities of the gas filaments, but in either case the parallel streakswithin the regular large scale patterns of star formation indicate thatthe filaments responsible for star formation retained much of theirinitial structure during the star formation process, implying that starformation was not triggered by a disruptive process.
We first consider the possibility that the star formation is dueto perturbations propagating along filaments. Our GALEV modelsshow that the spread in star cluster ages is 50 Myr. Assuming afilament length of 10 kpc, any triggering perturbation would need topropagate along the filament at speeds of ≥200 km s−1 . The soundspeed for gas with 104 K, typical of the ionized component of thefilaments, is ≈15 km s−1 , while in the cold dense molecular gas (T ∼100 K) the sound speed is ∼2 km s−1 . Any disturbance propagatingalong a filament with sufficient speed to produce the observed smallrange in stellar ages would need to be highly supersonic and wouldlead to observable shock line diagnostics which are not seen.
Ferland et al. (2009) and Fabian et al. (2011a) suggest that if theexcitation of the filaments in NGC 1275 is from energetic particlesin the hot gas impacting and mixing with the cool and cold gasphases, these particles may lose energy and remain in the filament.In this way the filaments, which were initially seeded through gasuplift, may grow in mass by up to 100 M�yr−1. Filaments may thengrow in mass to the point where they become Jeans unstable and
fragmentation of the filament leads to massive star formation. How-ever, near simultaneous growth of only three disparate filaments isagain difficult to place within this scenario, we might instead ex-pect to observe continuous outer halo star formation across all thefilaments.
A very rough periodicity exists in the spacing of the streaksalong a filament, with typical spacings of ∼1 kpc. This pattern re-sembles the ‘beads-on-a-string’ distribution of star formation alongspiral arms, which result from large-scale gravitational instabilities(Elmegreen & Elmegreen 1983; Kim & Ostriker 2006). On smallerscales, some stellar streaks contain several star clusters, also spacedat somewhat regular intervals of roughly 100 pc (∼0.3 arcsec),though projection effects make it difficult to measure the exact wave-length of perturbations. Fig. 10 illustrates this periodicity with closeup F435W and F140LP images of two such streaks, the ‘Snake’, asmentioned in Section 2, and part of the eastern side of the blue loop.Similar periodic structures are also seen in nearby star-forming fila-ments such as the ‘Nessie nebulae’ (Jackson et al. 2010). Modellingthe filaments as infinite, isothermal cylinders, supported by thermalpressure in the gas, with a central density 104 cm−3 , the periodicityof star formation is expected to be <10 pc (Chandrasekhar & Fermi1953; Nagasawa 1987), which would not be observable in our data.Magnetic fields and turbulence in the filaments can add support andincrease the maximally unstable wavelength. If turbulent supportdominates then turbulent motions of ∼17 km s−1 are required forthe observed cluster spacing. This is comparable to the limit of cur-rent observations which are limited by the beam size, however, highspatial resolution observations may allow us to quantify the turbu-lent pressure support in these structures. NGC 1275 is at the limitof observability by the Atacama Large Millimeter/submillimeterArray (ALMA). These structural features indicate that gravitationalinstabilities within filaments are playing a key role in the outer starformation in NGC 1275, although the dynamics of substructure for-mation likely differs between spiral arms and filaments (e.g. Shetty& Ostriker 2006).
6.3 Star formation in unstable filaments
We therefore consider models where stars form in response to theoverall evolution of some gas filaments. Our conceptual model as-sumes that the ionized gas filaments maintain their identities as
MNRAS 444, 336–349 (2014)
Dow
nloaded from https://academ
ic.oup.com/m
nras/article/444/1/336/1008420 by University of Portsm
outh Library user on 14 October 2020

Filamentary star formation in NGC 1275 347
they expand outward from the centre of NGC 1275. This assump-tion is consistent with the structures of ionized filaments observedin high angular resolution HST images, with dynamical models forfilament formation associated with rising bubbles of relativistic ma-terial ejected from the AGN (Fabian et al. 2003, 2008; Hatch et al.2006), as well as with models invoking large-scale turbulence withinNGC 1275 to organize matter into filaments (Falceta-Goncalveset al. 2010; Fabian et al. 2011a).
Ionized gas within filaments located in the main body ofNGC 1275 frequently has large internal velocity dispersions(σ ≈ 50–100 km s−1 ), while in the outer galaxy dispersions ap-pear to drop to σ ∼ 20 km s−1 (Hatch et al. 2006). Whilst confusionwith multiple filament threads may play a significant role here,one explanation for this behaviour is that gas filaments in the innergalaxy are stabilized against star formation by their high internal ve-locity dispersions perhaps maintained by the heating and turbulencegenerated by the radio mode AGN. Those filaments that reach theouter galaxy with low internal velocity dispersions and sufficientmolecular masses may be subject to gravitational collapse alongthe filament, which leads to star formation. Several conditions mustbe satisfied for this to occur, including a sufficient mass density,an ability for the molecular gas to cool to temperatures typical ofstar-forming regions (<100 K) and that magnetic pressure does notprevent collapse. Zhuravleva et al. (in preparation) explore the X-ray surface brightness fluctuations in the core of the Perseus clusterand find stronger fluctuations towards the centre possibly indicat-ing higher turbulence at smaller radii (see also Gaspari et al. 2014;Zhuravleva et al. 2014). The forthcoming Astro-H satellite will beinstrumental in constraining turbulent motions in galaxy clusters.
The collect-and-collapse mechanism for star formation in ex-panding shells (Elmegreen & Lada 1977) has some features incommon with such a filament. As an expanding shell sweeps up gasfrom the surrounding medium, it can become gravitationally un-stable against star formation (Dale et al. 2009). These instabilitiescause the shell to break up into clumps of gas, but the end resultdepends on the relative mass in these structures. If there is sufficientmass density in the perturbed regions, near-simultaneous star forma-tion can occur in the shell over short time-scales. This phenomenonis seen, for example, in star formation associated with supershellsin the Large Magellanic Cloud (e.g. Efremov & Elmegreen 1998),and in NGC 2146, where a central star formation event has drivena shell into the surrounding dense molecular medium, causing theformation of a ring of star clusters (Adamo et al. 2012).
In NGC 1275, however, the filaments expand into the hot, low-density ICM, which prevents them from sweeping up a substantialgas mass. The standard shell instability probably does not apply.Fortunately, the case of a thin gaseous shell expanding into a high-pressure, low-density medium has also been studied (Dale et al.2009). Because of the presence of the hot ICM, the pressure withina ∼75 kpc radius around NGC 1275 stays constant to within afactor of ∼2 (Fabian & Sanders 2007). We can qualitatively con-sider whether a pressure-induced instability might apply in an outerNGC 1275 gaseous filament where the internal velocity dispersionis low. While models refer to spherical shells dominated by thermalgas pressure, the filaments around NGC 1275 experience externallydriven heating and turbulent velocities (e.g. Fabian et al. 2011a),as well as substantial magnetic fields (Taylor et al. 2006; Fabianet al. 2008). A full theoretical study therefore is needed to see if thisapproach quantitatively applies to the situation in NGC 1275.
A massive, thin gaseous shell expanding into a vacuum that isinitially gravitationally stable may remain in this state. As the shellexpands, its density declines, which inhibits the growth of gravi-
tational instabilities. Some combination of increased gas density,reduced expansion rate and decreased pressure time-scales is re-quired for the shell to break up into self-gravitating clumps, whichare potential sites for star formation. The pressure-assisted gravita-tional instability (PAGI; Dale et al. 2009; Wunsch et al. 2010, 2012)is a possible candidate for producing self-gravitating sites for starformation from outer filaments in NGC 1275. In PAGI, the swept-upmass is assumed to be small, thereby reducing effects of the Vish-niac instability so that the filament could remain in equilibrium witha substantial external pressure. Under these conditions even a fila-ment that is stretching as it moves outwards can sustain a constant oreven decreasing thickness so as to meet the requirement of pressurebalance. Thus the filament density may not significantly decreaserelative to a freely expanding thin shell, and may even increase.Higher gas densities in turn promote Jeans-types of gravitationalfragmentation with the passage of time.
Our initial picture for outer star formation in NGC 1275 is thata gaseous filament, perhaps with a denser or less turbulent molec-ular medium than in the majority of filaments in the main body ofNGC 1275, coasts radially outwards over a time-scale of ∼108 yr.As a filament leaves the inner galaxy, a combination of factors canact to increase its density. One possibility is that the modest drop indensity of the surrounding hot medium leads to PAGI, which couldbe aided by decreases in the gas temperature and turbulent velocitywithin the outward moving filament. An additional factor may comefrom filament dynamics. Filament expansion may slow in the outerparts of NGC 1275 due to the galaxy’s gravitational potential. Thusthe shear that occurs if a filament is being stretched in radius, as inthe Fabian et al. (2003) model for filament interactions with risingbubbles of non-thermal radio-emitting lobes, would decrease. Themagnetic field also may become less of a factor over time. Once thegravitational instability becomes non-linear, the molecular gas dom-inating the filament mass breaks up into classic ‘beads on a string’,producing roughly equally spaced sites of star formation makingstreaks, within which the spaced out star clusters are found. Starformation within the gravitationally unstable region of a filamentthen occurs over time-scales of 10s of Myr, leading to star-formingsites being elongated into streak-like structures.
6.4 Filaments and stellar halo formation
Once stars form they will move on ballistic orbits within the gravita-tional potential. Since the NGC 1275 filaments show at most modestsignatures for rotational support, the resulting stellar orbits will in-herit low specific angular momentum and so may pass through themain body of NGC 1275. Even so they will spend most of theirtime in the outer parts of the galaxy. Thus in NGC 1275 we observethe production of an outer stellar halo due to a specific mode ofstar formation, rather than from collisional stellar debris associatedwith galaxy–galaxy interactions. Our inferred star formation rate of∼2–3 M� yr−1 is sufficient to produce a significant stellar popula-tion around the main body of NGC 1275, provided that the processwill remain active for at least several 100 Myr. Many generations ofX-ray bubbles are observed in NGC 1275; if these bubbles are re-sponsible for depositing gas reservoirs in the outskirts of the galaxythen this process has been occurring for >5 × 10⁸ yr (Fabian et al.2011b).
Is star formation and star cluster formation in gas filaments aris-ing from the interiors of galaxies a unique feature of BCGs in richgalaxy clusters? While similar gas filaments are found around manygiant elliptical galaxies with large X-ray haloes and hosting pow-erful radio-mode AGN, only in rich cool-core cluster BCGs have
MNRAS 444, 336–349 (2014)
Dow
nloaded from https://academ
ic.oup.com/m
nras/article/444/1/336/1008420 by University of Portsm
outh Library user on 14 October 2020
348 R. E. A. Canning et al.
the filaments been found to extend beyond ∼10–15 kpc. TheseBCGs are surrounded by high-pressure atmospheres and requiremore powerful feedback from the AGN to balance the cooling X-ray gas. During galaxy formation, however, a pressurized externalatmosphere may be supplied by infalling cosmic gas, and power-ful AGN are more common. We therefore wonder if star formationmodes related to that seen in NGC 1275 could be important inproducing the stellar haloes of galaxies with their systems of globu-lar clusters? Penny et al. (2012) find an abundance of ultracompactdwarfs (UCDs) concentrated around NGC 1275 in the Perseus clus-ter, at least two of which are associated with the filaments (Pennyet al. 2014). UCDs may be the high-mass end of globular clusters.They speculate that the bluest UCDs may be formed from the ex-tensive filament system. The early formation of galaxies seems anexcellent opportunity to produce expanding shells and filaments ofdense gas that reach significant radii from their protogalactic cen-tres. Star formation in these systems could lead to dynamically hot,spatially extended stellar haloes and globular cluster systems.
7 C O N C L U S I O N S
Our HST FUV observations of three outer regions (Rprojected ∼20–45 kpc) of NGC 1275, the luminous central galaxy in the Perseuscluster, confirm the presence of products of recent star formationwith ages of ≤20 Myr. We find ‘streaks’ of young stars with typi-cal size scales of <1 kpc. Embedded within some of these streaksare compact sources, which we find are consistent with moderatelymassive star clusters. The young star clusters and stellar streaksform filament-like, large-scale structures that are spatially and mor-phologically correlated with, yet offset from, some of NGC 1275’sfamous giant gas filaments, and therefore are associated with thegalaxy (i.e. they are in the LVS). The 10 kpc scale blue loop isa prime example of this phenomenon. While the majority of thegas filaments in the main body of NGC 1275 appear to be free ofsignificant star formation, a minority of filaments evidently reachedthe outer zones of NGC 1275, where they produced galactic-scalestar-forming structures with a surprising degree of coevality withineach large-scale structure.
Our data supplement an initial photometric analysis of the stellarpopulations in the young star clusters and stellar streaks presented inPaper I. We estimate the mass in stars formed in the observed areasduring the past ∼10 Myr to be somewhat greater than 107 M�, im-plying a star formation rate of ≥2–3 M� yr−1. While this is a smallfraction of the total star formation rate in NGC 1275, >10 M� yr−1,it represents a substantial contribution to the stellar content of thegalaxy’s outer halo. Only about 7 × 10⁵ M�, or less than 10 per centof the young stellar mass in the regions we observed, is located instar clusters. Therefore, the cluster formation efficiency in theseregions appears to be typical for low-intensity star-forming regions(e.g. Goddard, Bastian & Kennicutt 2010). However, it is surpris-ing that some star clusters are being formed by gas injection intoisolated regions with very low mass densities. Once stars form, anygas or magnetic pressure support is removed, suggesting that theyoung stars and star clusters will move ballistically in the gravi-tational potential of NGC 1275 and the Perseus cluster core. Wesuggest that this dynamical effect produces the observed streaks ofstar formation, although we are unable to determine if the streaksrepresent an initial outward motion of the gas filament, or are dueto recently formed stars dropping out of a stalled gas filament andfalling inwards on ballistic orbits.
The combination of morphologies and coincident locationsdemonstrate that the star-forming regions studied here are con-
nected to the Hα filaments in NGC 1275. These are likely to beenergized by the injection of overpressured regions of relativisticparticles from the AGN, which produce expanding buoyant bubbles.The bubbles interact with the interstellar medium to produce densefilaments. The filaments in NGC 1275 frequently contain moleculargas, and therefore are primed for star formation, but usually fail todo so. We suggest that the lack of extensive star formation in themajority of filaments located within the main body of NGC 1275could be related to high internal turbulent velocities in combinationwith significant magnetic pressures.
Filaments that retain their molecular medium, expand outwards,and slow down, in the nearly constant pressure ICM may becomegravitationally unstable, especially if internal velocity dispersionsdrop and magnetic fields cease to be dynamically dominant. Thisleads to circumstances akin to the PAGI hypothesized to operate inthin shells, and could lead to gravitational collapse and subsequentstar formation. The situation in NGC 1275, however, is complex,e.g. due to the likely importance of magnetic fields in the innerfilaments. Further study is required to properly understand whysome filaments are able to form stars while others do not, as well aswhy extensive star formation appears to be a property of filamentsthat reach the outer parts of NGC 1275.
This type of mechanism, star formation in expanding shells orfilaments of material, might offer a method to produce dynamicallyhot stellar populations and star clusters in young galaxy haloes,such as globular star cluster systems. Since globular clusters arethought to have formed in the first few Gyr of the lifetime of agalaxy, they would have been produced in an era when galaxies andtheir surroundings were gas rich and AGN activity levels were high.This environment seems a fertile ground for making stars and starclusters via mechanisms that we see operating today, albeit undervery different circumstances, in NGC 1275.
AC K N OW L E D G E M E N T S
JER acknowledges the support of the National Space Grant Collegeand Fellowship Program and the Wisconsin Space Grant Consor-tium. RK gratefully acknowledges financial support from STScItheory grant HST-AR-12840.01-A. Support for Program numberHST-AR-12840.01-A was provided by NASA through a grant fromthe Space Telescope Science Institute, which is operated by the As-sociation of Universities for Research in Astronomy, Incorporated,under NASA contract NAS5-26555. This research was supported inpart by grant GO-11207 from the Space Telescope Science Institute.
R E F E R E N C E S
Adamo A. et al., 2012, MNRAS, 426, 1185Adams T. F., 1977, PASP, 89, 488Allen S. W., 1995, MNRAS, 276, 947Bertin E., Arnouts S., 1996, A&AS, 117, 393Bridges T. J., Irwin J. A., 1998, MNRAS, 300, 967Canning R. E. A., Fabian A. C., Johnstone R. M., Sanders J. S., Conselice
C. J., Crawford C. S., Gallagher J. S., Zweibel E., 2010, MNRAS, 405,115 ( Paper I)
Cappellari M. et al., 2012, Nature, 484, 485Cardelli J. A., Clayton G. C., Mathis J. S., 1989, ApJ, 345, 245Carlson M. N. et al., 1998, AJ, 115, 1778Chandar R., Leitherer C., Tremonti C. A., Calzetti D., Aloisi A., Meurer
G. R., de Mello D., 2005, ApJ, 628, 210Chandrasekhar S., Fermi E., 1953, ApJ, 118, 116Conroy C., Wechsler R. H., Kravtsov A. V., 2007, ApJ, 668, 826
MNRAS 444, 336–349 (2014)
Dow
nloaded from https://academ
ic.oup.com/m
nras/article/444/1/336/1008420 by University of Portsm
outh Library user on 14 October 2020
Filamentary star formation in NGC 1275 349
Conselice C. J., Gallagher J. S., III, Wyse R. F. G., 2001, AJ, 122, 2281Dale J. E., Wunsch R., Whitworth A., Palous J., 2009, MNRAS, 398, 1537de Mello D. F., Smith L. J., Sabbi E., Gallagher J. S., Mountain M., Harbeck
D. R., 2008, AJ, 135, 548Dieball A., Knigge C., Zurek D. R., Shara M. M., Long K. S., Charles P. A.,
Hannikainen D., 2007, ApJ, 670, 379Donahue M., Mack J., Voit G. M., Sparks W., Elston R., Maloney P. R.,
2000, ApJ, 545, 670Dunn R. J. H., Fabian A. C., Taylor G. B., 2005, MNRAS, 364, 1343Dunn R. J. H., Fabian A. C., Sanders J. S., 2006, MNRAS, 366, 758Edge A. C., Wilman R. J., Johnstone R. M., Crawford C. S., Fabian A. C.,
Allen S. W., 2002, MNRAS, 337, 49Efremov Y. N., Elmegreen B. G., 1998, MNRAS, 299, 643Elmegreen B. G., Elmegreen D. M., 1983, MNRAS, 203, 31Elmegreen B. G., Lada C. J., 1977, ApJ, 214, 725Fabian A. C., Sanders J. S., 2007, in Bohringer H., Pratt G. W.,
Finoguenov A., Schuecker P., eds, Heating Versus Cooling in Galaxiesand Clusters of Galaxies. Springer-Verlag, Berlin, p. 65
Fabian A. C. et al., 2000, MNRAS, 318, L65Fabian A. C., Sanders J. S., Crawford C. S., Conselice C. J., Gallagher J. S.,
Wyse R. F. G., 2003, MNRAS, 344, L48Fabian A. C., Johnstone R. M., Sanders J. S., Conselice C. J., Crawford
C. S., Gallagher J. S., III, Zweibel E., 2008, Nature, 454, 968Fabian A. C., Sanders J. S., Williams R. J. R., Lazarian A., Ferland G. J.,
Johnstone R. M., 2011a, MNRAS, 417, 172Fabian A. C. et al., 2011b, MNRAS, 418, 2154Falceta-Goncalves D., de Gouveia Dal Pino E. M., Gallagher J. S.,
Lazarian A., 2010, ApJ, 708, L57Ferland G. J., Fabian A. C., Hatch N. A., Johnstone R. M., Porter R. L.,
van Hoof P. A. M., Williams R. J. R., 2009, MNRAS, 392, 1475Gaspari M., Churazov E., Nagai D., Lau E. T., Zhuravleva I., 2014, A&A,
submitted (arXiv:1404.5302)Goddard Q. E., Bastian N., Kennicutt R. C., 2010, MNRAS, 405, 857Graham J. A., 1998, ApJ, 502, 245Hatch N. A., Crawford C. S., Fabian A. C., Johnstone R. M., 2005, MNRAS,
358, 765Hatch N. A., Crawford C. S., Johnstone R. M., Fabian A. C., 2006, MNRAS,
367, 433Hicks A. K., Mushotzky R., Donahue M., 2010, ApJ, 719, 1844Holtzman J. A. et al., 1992, AJ, 103, 691Hubble E., Humason M. L., 1931, ApJ, 74, 43Jackson J. M., Finn S. C., Chambers E. T., Rathborne J. M., Simon R., 2010,
ApJ, 719, L185Johnstone R. M., Hatch N. A., Ferland G. J., Fabian A. C., Crawford C. S.,
Wilman R. J., 2007, MNRAS, 382, 1246Johnstone R. M., Canning R. E. A., Fabian A. C., Ferland G. J., Lykins M.,
Porter R. L., van Hoof P. A. M., Williams R. J. R., 2012, MNRAS, 425,1421
Kennicutt R. C., Jr, 1998, ARA&A, 36, 189Kim W.-T., Ostriker E. C., 2006, ApJ, 646, 213Kotulla R., Fritze U., Weilbacher P., Anders P., 2009, MNRAS, 396, 462Leroy A. K., Walter F., Brinks E., Bigiel F., de Blok W. J. G., Madore B.,
Thornley M. D., 2008, AJ, 136, 2782Lim J., Ohyama Y., Chi-Hung Y., Dinh-V-Trung, Shiang-Yu W., 2012, ApJ,
744, 112Lynds R., 1970, ApJ, 159, L151McDonald M., Veilleux S., Rupke D. S. N., Mushotzky R., Reynolds C.,
2011, ApJ, 734, 95McDonald M. et al., 2012, Nature, 488, 349McNamara B. R., O’Connell R. W., Sarazin C. L., 1996, AJ, 112, 91McNamara B. R. et al., 2006, ApJ, 648, 164Markevitch M., Vikhlinin A., 2007, Phys. Rep., 443, 1Meynet G., Maeder A., Schaller G., Schaerer D., Charbonnel C., 1994,
A&AS, 103, 97
Minkowski R., 1955, Carnegie Yearbook, 54, 25Mittal R. et al., 2012, MNRAS, 426, 2957Monaco P., Murante G., Borgani S., Fontanot F., 2006, ApJ, 652, L89Mould J. R. et al., 2000, ApJ, 536, 266Nagasawa M., 1987, Progress Theor. Phys., 77, 635O’Dea C. P., Baum S. A., Mack J., Koekemoer A. M., Laor A., 2004, ApJ,
612, 131O’Dea C. P. et al., 2008, ApJ, 681, 1035O’Dea K. P. et al., 2010, ApJ, 719, 1619Oonk J. B. R., Hatch N. A., Jaffe W., Bremer M. N., van Weeren R. J., 2011,
MNRAS, 414, 2309Penny S. J., Forbes D. A., Conselice C. J., 2012, MNRAS, 422, 885Penny S. J., Forbes D. A., Strader J., Usher C., Brodie J. P., Romanowsky
A. J., 2014, MNRAS, 439, 3808Quillen A. C. et al., 2008, ApJS, 176, 39Rafferty D. A., McNamara B. R., Nulsen P. E. J., 2008, ApJ, 687, 899Rubin V. C., Oort J. H., Ford W. K., Jr, Peterson C. J., 1977, ApJ, 211, 693Salome P. et al., 2006, A&A, 454, 437Salome P., Revaz Y., Combes F., Pety J., Downes D., Edge A. C., Fabian A.
C., 2008a, A&A, 483, 793Salome P., Combes F., Revaz Y., Edge A. C., Hatch N. A., Fabian A. C.,
Johnstone R. M., 2008b, A&A, 484, 317Salome P., Combes F., Revaz Y., Downes D., Edge A. C., Fabian A. C.,
2011, A&A, 531, A85Salpeter E. E., 1955, ApJ, 121, 161Sandage A. R., 1971, in O’Connell D. J. K., ed., Pontificiae Academiae
Scientiarum Scripta Varia, Proceedings of a Study Week on Nuclei ofGalaxies. North Holland, Amsterdam, p. 271
Sanders J. S., Fabian A. C., 2007, MNRAS, 381, 1381Schlegel D. J., Finkbeiner D. P., Davis M., 1998, ApJ, 500, 525Schweizer F., 1998, in Kennicutt R. C., Jr, Schweizer F., Barnes J. E.,
Friedli D., Martinet L., Pfenniger D., eds, Saas-Fee Advanced Course26, Galaxies: Interactions and Induced Star Formation. Springer-Verlag,Berlin, p. 105
Shetty R., Ostriker E. C., 2006, ApJ, 647, 997Shields J. C., Filippenko A. V., Basri G., 1990, AJ, 100, 1805Smith E. P. et al., 1992, ApJ, 395, L49Sparks W. B., Pringle J. E., Donahue M., Carswell R., Voit M., Cracraft M.,
Martin R. G., 2009, ApJ, 704, L20Sparks W. B. et al., 2012, ApJ, 750, L5Taylor G. B., Gugliucci N. E., Fabian A. C., Sanders J. S., Gentile G., Allen
S. W., 2006, MNRAS, 368, 1500Toomre A., 1977, ARA&A, 15, 437Tremblay G. R. et al., 2012, MNRAS, 424, 1042Tremonti C. A., Calzetti D., Leitherer C., Heckman T. M., 2001, ApJ, 555,
322Tullmann R., Rosa M. R., Elwert T., Bomans D. J., Ferguson A. M. N.,
Dettmar R.-J., 2003, A&A, 412, 69van den Bergh S., 1977, Astron. Nachr., 298, 285van Dokkum P. G. et al., 2010, ApJ, 709, 1018Werk J. K., Putman M. E., Meurer G. R., Oey M. S., Ryan-Weber E. V.,
Kennicutt R. C., Jr, Freeman K. C., 2008, ApJ, 678, 888Wirth A., Kenyon S. J., Hunter D. A., 1983, ApJ, 269, 102Wunsch R., Dale J. E., Palous J., Whitworth A. P., 2010, MNRAS, 407,
1963Wunsch R., Jachym P., Sidorin V., Ehlerova S., Palous J., Dale J., Dawson
J. R., Fukui Y., 2012, A&A, 539, A116Zhuravleva I. et al., 2014, ApJ, 788, L13
This paper has been typeset from a TEX/LATEX file prepared by the author.
MNRAS 444, 336–349 (2014)
Dow
nloaded from https://academ
ic.oup.com/m
nras/article/444/1/336/1008420 by University of Portsm
outh Library user on 14 October 2020