Modelling galaxy clustering: is new physics needed in galaxy formation models?
Upload
independentCategory
view
0download
0
arX
iv:1
106.
2092
v1 [
astr
o-ph
.CO
] 1
0 Ju
n 20
11Accepted for publication in the ApJ: June 9, 2011Preprint typeset using LATEX style emulateapj v. 5/2/11
STAR AND DUST FORMATION ACTIVITIES IN AZTEC-3,A STARBURST GALAXY AT Z = 5.3
Eli Dwek1, Johannes G. Staguhn1,2, Richard G. Arendt1,4, Peter L. Capak3, Attila Kovacs6, Dominic Benford1,Dale Fixsen1,4, Alexander Karim5, Samuel Leclercq7, Stephen F. Maher1,8, Samuel H. Moseley1, Eva
Schinnerer5, and Elmer H. Sharp1,9
Accepted for publication in the ApJ: June 9, 2011
ABSTRACT
Analyses of high-redshift ultraluminous infrared (IR) galaxies traditionally use the observed opticalto submillimeter spectral energy distribution (SED) and estimates of the dynamical mass as observa-tional constraints to derive the star formation rate (SFR), the stellar mass, and age of these objects.An important observational constraint neglected in the analysis is the mass of dust giving rise to theIR emission. In this paper we add this constraint to the analysis of AzTEC–3. Adopting an upperlimit to the mass of stars and a bolometric luminosity for this object, we construct different stellar andchemical evolutionary scenarios, constrained to produce the inferred dust mass and observed luminos-ity before the associated stellar mass exceeds the observational limit. We use the PEGASE populationsynthesis code and a chemical evolution model to follow the evolution of the galaxy’s SED and itsstellar and dust masses as a function of galactic age for seven different stellar initial mass functions(IMFs). We find that the model with a Top Heavy IMF provided the most plausible scenario consis-tent with the observational constraints. In this scenario the dust formed over a period of ∼ 200 Myr,with a SFR of ∼ 500 M⊙ yr−1. These values for the age and SFR in AzTEC–3 are significantly higherand lower, respectively, from those derived without the dust mass constraint. However, this scenariois not unique, and others cannot be completely ruled out because of the prevailing uncertainties inthe age of the galaxy, its bolometric luminosity, and its stellar and dust masses. A robust result ofour models is that all scenarios require most of the radiating dust mass to have been accreted inmolecular clouds. Our new procedure highlights the importance of a multiwavelength approach, andof the use of dust evolution models in constraining the age and the star formation activity and historyin galaxies.Subject headings: galaxies: evolution, high-redshift, starburst: individual: (AzTEC3) - infrared: galax-
ies
1. INTRODUCTION
The origin of the dust in ultraluminous highredshift galaxies with redshifts z & 4 is still un-resolved, with supernovae (SNe), evolved AGBstars, the winds around active galactic nuclei(AGN), or growth in molecular clouds as possiblesources (Elvis et al. 2002; Morgan & Edmunds 2003;Maiolino et al. 2004; Dwek et al. 2007; Valiante et al.2009; Dwek & Cherchneff 2011; Micha lowski et al.2010a; Gall et al. 2011a,b). Further complicating the
1 Observational Cosmology Lab, Code 665, NASA God-dard Space Flight Center, Greenbelt, MD 20771, USA;[email protected]
2 The Henry A. Rowland Department of Physics and Astron-omy, Johns Hopkins University, 3400 N. Charles Street, Balti-more, MD 21218, USA
3 Spitzer Science Centre, 314-6 California Institute of Technol-ogy, 1200 E. California Blvd., Pasadena, CA 91125, USA
4 CRESST, University of Maryland – College Park, CollegePark, MD 20742, USA
5 Max-Planck-Institute fur Astronomie, Konigstuhl 17, D-69117, Heidelberg, Germany
6 University of Minnesota, 116 Church St SE, Minneapolis,MN 55414, USA
7 Institut de RadioAstronomie Millimetrique, 300 rue de laPiscine, 38406 Saint Martin d’Heres, France
8 Science Systems and Applications, Inc., 10210 Greenbelt Rd,Suite 600, Lanham, MD 20706, USA
9 Global Science & Technology, Inc., 7855 Walker Drive, Suite200, Greenbelt, MD 20770, USA
origin of dust in some objects is the energy sourcepowering the IR emission. An IR luminosity powered byluminous massive stars will suggest a high present SFR,favoring a SN origin for the dust. An IR luminosity thatis powered by an active galactic nucleus (AGN) suggestsa low present SFR and may favor the delayed injectionof dust by AGB stars that may have formed duringan earlier phase of much higher star formation activity(Valiante et al. 2009; Dwek & Cherchneff 2011).
No such ambiguity exists for AzTEC–3, an ultralumi-nous IR galaxy located at redshift z = 5.3, that was firstdetected at submillimeter wavelengths by Scott et al.(2008). It is a radio-dim source (Younger et al. 2007)with no X-ray counterpart (Capak et al. 2011), and partof a young cluster, representing an overdensity of earlymassive galaxies at the same redshift (Capak et al. 2011).Optical to submillimeter observations summarized inCapak et al. (2011) show that the energy output is dom-inated by its far-infrared (IR) emission with luminositiesbetween ∼ (0.6 − 2)× 1013 L⊙. The lack of any radio orX-ray counterparts suggests that this luminosity is pow-ered by a 1800 M⊙ yr−1 starburst (Riechers et al. 2010;Capak et al. 2011). The total CO-inferred gas mass is∼ 5 × 10¹⁰ M⊙, which will be depleted in less than∼ 30 Myr at this SFR. Such energy output suggeststhe presence of a large amount of dust, which had tobe created (at least) in less than ∼ 1.1 Gyr, the age of

2
the universe at that redshift. AzTEC–3 therefore fallsin the category of extreme starburst galaxies with largedust masses (& 108 M⊙) described by Micha lowski et al.(2010b) and Robson et al. (2004).
In this paper we present a new comprehensive approachfor studying the star formation properties and the originof dust in AzTEC–3. The approach is quite general andcan be applied to any local or high-redshift galaxy. Wefirst use the UV to far-IR SED of the galaxy to deter-mine its bolometric luminosity and dust mass. Its SFRdepends on the adopted IMF, and we generate a seriesof models relating the bolometric luminosity to the stel-lar mass and galactic age for different stellar IMFs (Sec-tion 2). In Section 3 we use the observed UV-optical(UVO) spectrum, the UVNIR SED, and dynamical lim-its on the stellar mass to constrain the age of the galaxyfrom observations. We then generate different scenar-ios for the evolution of the dust, characterized by dif-ferent IMFs, and examine which scenario is capable ofproducing the inferred dust mass in AzTEC–3 withinthe allowed age limit, that is, before the concurrent stel-lar mass production exceeds the stellar mass limit (Sec-tion 4). Our results are discussed and summarized inSection 5.
In all our calculations we adopt a flat ΛCDM cosmol-ogy, with a baryonic density parameter Ωb = 0.044, a to-tal matter (dark+baryonic) density parameter of Ωm =0.27, a vacuum energy density ΩΛ = 0.73, and a Hub-ble constant of H0 = 70 km s−1 Mpc−1 (Spergel et al.2007).
2. PROPERTIES OF AzTEC–3
2.1. Bolometric Luminosity and Dust Mass
Figure 1 depicts the visible to far-IR flux, ν Fν , fromthe galaxy calculated for a redshift of z = 5.3. The ob-served fluxes were taken from Capak et al. (2011). Thefigure shows that the energy output from the galaxy isdominated by the stellar radiation that is absorbed andreradiated by dust at IR wavelengths. Observed IR fluxdensities and their 1σ uncertainties are listed in Table 1.Figure 2 shows the far-IR galaxy’s SED in its rest frame(left panel) and the observer’s frame (right panel). Alsoshown in the Figure are fits of the spectra of individual
Figure 1. The observed visual to submm fluxes from AzTEC–3,calculated for a redshift of z = 5.3, are plotted as a function ofwavelength.
Table 1Summary of Submillimeter Observations of AzTEC–31
λobs (µm) Fν(λ) (mJy) σ (mJy) λ0 (µm)1 Lν(λ0)(L⊙ Hz−1)
890 8.7 1.5 141.3 1.1581100 7.6 1.2 174.6 1.0112000 3.7 1.4 317.5 0.4922730 0.472 · · · 433.3 0.04123280 0.202 · · · 520.6 0.01738165 0.0872 · · · 1296.0 0.0116
1 Restframe wavelengths and specific luminosities were calculated for aredshift of z = 5.3.2 3-σ upper limits.
dust species to the observations. In order to determinethe uncertainties in the derived dust temperatures, dustmasses, and IR luminosities, we constructed 1000 realiza-tions of the observed spectrum. The flux at each wave-length was randomly chosen from a normal distributioncentered around the nominal flux. The derived quantitiesfor the different dust compositions are listed in Table 2.The Fe and graphite dust spectra are similar to that ofthe silicate dust, and were left out of the figure for sakeof clarity. Dust masses vary greatly from 0.3 × 10⁹ M⊙,if all the dust in AzTEC–3 is in the form of amorphouscarbon, to 3.2×10⁹ M⊙, if it consists of only silicate dust.Because of the skin effect, the absorptivity of metallic Fedepends on the the grain radius, and the mass presentedin the table was calculated for a radius of 0.33 µm forwhich the mass absorption coefficient, κ, was maximumat the wavelength of 174.6 µm. This choice of κ mini-mizes the mass of Fe dust required to fit the observedfluxes. Since AzTEC–3 is not likely to contain only pureFe, silicate, or carbon-type dust, any dust consisting ofa mixture of these elements will vary between betweenthese mass estimates.
To get a more realistic presentation of the mixtureof dust compositions and size distribution in AzTEC–3we also fitted its spectrum with that of two local star-burst galaxies: M82, and Arp220, and a normal starforming galaxy NGC6946. The spectra of these galax-ies were obtained by using population synthesis mod-els to derive their stellar emission, chemical evolutionmodels to derive their metallicity and dust composition,and radiative transfer models including the stochasticheating of dust to derive their IR spectrum and dustmass (Galliano et al. 2008). Transferred to a redshiftof z = 5.3, the IR luminosities and dust masses for allthree galaxies were derived from their normalization fac-tors, obtained from the least-squares fit of their spec-tra to the AzTEC–3 observations. The spectra depictedin the Figure represent the total IR emission from dustresiding in HII and photodissociation regions. Bothstarburst galaxies, M82 and Arp220, provided a verygood fit to the data. Dust masses varied from 1.4 to2.6 × 109 M⊙, and IR luminosities (∼ 3 − 1000 µm)from 0.79 to 1.7 × 10¹³ L⊙. In contrast, the dust inNGC6946 is too cold, and its far-IR emission exceedsthe 3-σ upper limits on the underlying continuum of thedetected CO(J = 5 → 4) and CO(J = 6 → 5) lines(Riechers et al. 2010). This is evident in the inferred dustmass for this galaxy, which is in excess of ∼ 1010 M⊙.

3
Table 2Derived Temperatures, Masses, and IR Luminosities for Different Dust
Compositions and Galaxy Templates
Composition Td (K) Md (109M⊙) LIR (1013L⊙) κ (cm2 g−1)1
Fe2 32.4± 6.1 1.4+1.2
−0.70.6+0.4
−0.216.5
Graphite 27.5±4.5 2.2+4.6
−2.20.5+0.3
−0.217.6
Silicate 28.5± 4.3 3.2+2.6
−1.40.6+0.4
−0.210.5
A-carbon 46.9±14.8 0.3+0.35
−0.171.1+1.7
−0.6728.0
M 82 template · · · 2.6 ± 0.9 1.7 ± 0.6 · · ·Arp 220 template · · · 1.4 ± 0.8 0.8 ± 0.5 · · ·NGC 6946 template · · · 18 ± 8 0.6 ± 0.3 · · ·
1 The mass absorption coefficient at wavelength λ = 174.6 µm.2 Fe mass was calculated for a grain radius of 0.33 µm. See text for details.
Figure 2. The intrinsic far-IR luminosity (top panel) and theobserved specific intensity (bottom panel) of AzTEC–3 are plot-ted as a function of the rest frame and observed wavelengths, re-spectively. Also plotted are template spectra of local galaxies andsingle-temperature fits of dust grains of different compositions tothe observed spectrum. Data and references are given in Table 1.
For sake of being definitive we adopt throughout thispaper a dust mass, Mdust, of 2.0 ± 1.0 × 10⁹ M⊙, rep-resenting the average value between M82 and Arp220.Our choice of average dust mass derived from these tem-plate galaxies is more realistic than any choice based onthe assumption that all the IR emission is produced bya single dust specie. The average IR luminosity of thesetwo galaxies is 1.0 × 10¹³ L⊙ and since the bolometricluminosity of AzTEC–3 is dominated by the IR emissioncomponent we adopt a bolometric luminosity, Lbol, thatis equal to 1.0 × 10¹³ L⊙.
2.2. The Star Formation Rate
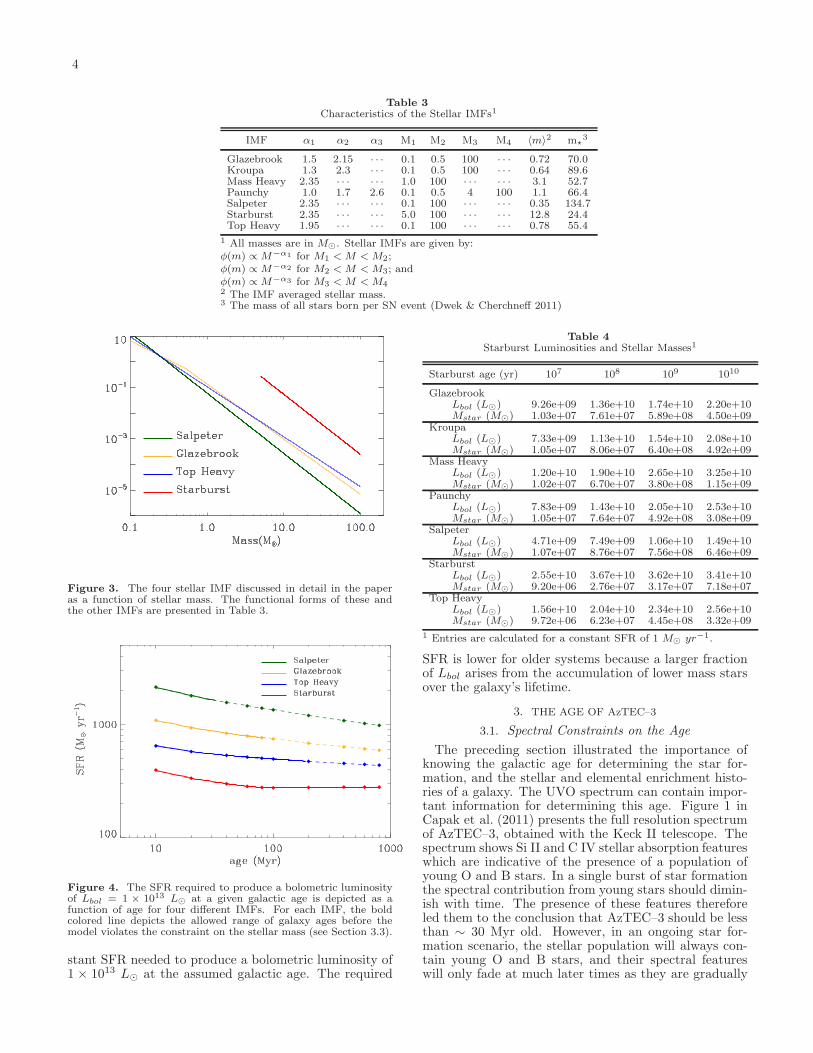
The far-IR luminosity provides a good measure of thestar formation activities in galaxies (Kennicutt 1998).In a galaxy with ongoing star formation the bolometricluminosity and stellar mass increase with time becauseof the cumulative contribution from long-lived low-massstars. Derived star formation rates depend therefore onthe assumed star formation history of the galaxy. Fur-thermore, the relation between the luminosity and starformation rate depends on the adopted stellar IMF. Mas-sive stars radiate much more efficiently than low massones (L ∝ M3.3, in solar units) so that an IMF weightedmore heavily towards massive stars will require a lowerSFR for a given observed luminosity. To explore the de-pendence of the SFR on the stellar IMF, we used sevendifferent functional forms to characterize the latter. Theparameters characterizing the IMFs are given in Table 3,and Figure 3 depicts the functional form of 4 select IMFs.Table 3 also includes two characteristic values of the dif-ferent IMFs: 〈m〉, which is the IMF-averaged mass, andm⋆, which is the mass of stars that need to be formed toproduce one Type II SN event. With these definitions,the stellar birthrate (yr−1) is given by SFR/〈m〉, and theSN rate by SFR/m⋆.
To determine the SFR and the mass of stellar objects asa function of galactic age we ran the PEGASE populationsynthesis code developed by Fioc & Rocca-Volmerange(1997) for the seven different stellar IMFs, listed in Ta-ble 3, for a constant SFR of 1 M⊙ yr−1. Table 4 list thecorresponding bolometric luminosities and stellar massesat different galactic ages. For example, for the adoptedLbol = 1×10¹³ L⊙, the table shows that for a GlazebrookIMF the SFR is ∼ 735 M⊙ yr−1 and the total mass ofstars is ∼ 5.6 × 10¹⁰ M⊙ when the galaxy reaches anage of 100 Myr. At the same age, a starburst IMF willrequire a SFR of only ∼ 270 M⊙ yr−1 to produce thesame luminosity, and will have created ∼ 7.5 × 10⁹ M⊙
of stars. Figure 4 depicts these results in graphic form,showing the constant SFR required to produce a bolo-metric luminosity of 1 × 10¹³ L⊙ at a given age for 4different IMFs. The bold section in each line depicts theallowed range of galaxy ages before the model violatesthe constraint on the stellar mass, a topic discussed indetail in Section 3.3 below. We emphasize that this figuredoes not represent the evolution of the SFR with time.For each stellar IMF, it depicts the value of the con-
4
Table 3Characteristics of the Stellar IMFs1
IMF α1 α2 α3 M1 M2 M3 M4 〈m〉2 m⋆3
Glazebrook 1.5 2.15 · · · 0.1 0.5 100 · · · 0.72 70.0Kroupa 1.3 2.3 · · · 0.1 0.5 100 · · · 0.64 89.6Mass Heavy 2.35 · · · · · · 1.0 100 · · · · · · 3.1 52.7Paunchy 1.0 1.7 2.6 0.1 0.5 4 100 1.1 66.4Salpeter 2.35 · · · · · · 0.1 100 · · · · · · 0.35 134.7Starburst 2.35 · · · · · · 5.0 100 · · · · · · 12.8 24.4Top Heavy 1.95 · · · · · · 0.1 100 · · · · · · 0.78 55.4
1 All masses are in M⊙. Stellar IMFs are given by:φ(m) ∝ M−α1 for M1 < M < M2;φ(m) ∝ M−α2 for M2 < M < M3; andφ(m) ∝ M−α3 for M3 < M < M42 The IMF averaged stellar mass.3 The mass of all stars born per SN event (Dwek & Cherchneff 2011)
Figure 3. The four stellar IMF discussed in detail in the paperas a function of stellar mass. The functional forms of these andthe other IMFs are presented in Table 3.
Figure 4. The SFR required to produce a bolometric luminosityof Lbol = 1 × 10¹³ L⊙ at a given galactic age is depicted as afunction of age for four different IMFs. For each IMF, the boldcolored line depicts the allowed range of galaxy ages before themodel violates the constraint on the stellar mass (see Section 3.3).
stant SFR needed to produce a bolometric luminosity of1 × 1013 L⊙ at the assumed galactic age. The required
Table 4Starburst Luminosities and Stellar Masses1
Starburst age (yr) 107 108 109 1010
GlazebrookLbol (L⊙) 9.26e+09 1.36e+10 1.74e+10 2.20e+10Mstar (M⊙) 1.03e+07 7.61e+07 5.89e+08 4.50e+09
KroupaLbol (L⊙) 7.33e+09 1.13e+10 1.54e+10 2.08e+10Mstar (M⊙) 1.05e+07 8.06e+07 6.40e+08 4.92e+09
Mass HeavyLbol (L⊙) 1.20e+10 1.90e+10 2.65e+10 3.25e+10Mstar (M⊙) 1.02e+07 6.70e+07 3.80e+08 1.15e+09
PaunchyLbol (L⊙) 7.83e+09 1.43e+10 2.05e+10 2.53e+10Mstar (M⊙) 1.05e+07 7.64e+07 4.92e+08 3.08e+09
SalpeterLbol (L⊙) 4.71e+09 7.49e+09 1.06e+10 1.49e+10Mstar (M⊙) 1.07e+07 8.76e+07 7.56e+08 6.46e+09
StarburstLbol (L⊙) 2.55e+10 3.67e+10 3.62e+10 3.41e+10Mstar (M⊙) 9.20e+06 2.76e+07 3.17e+07 7.18e+07
Top HeavyLbol (L⊙) 1.56e+10 2.04e+10 2.34e+10 2.56e+10Mstar (M⊙) 9.72e+06 6.23e+07 4.45e+08 3.32e+09
1 Entries are calculated for a constant SFR of 1 M⊙ yr−1.
SFR is lower for older systems because a larger fractionof Lbol arises from the accumulation of lower mass starsover the galaxy’s lifetime.
3. THE AGE OF AzTEC–3
3.1. Spectral Constraints on the Age
The preceding section illustrated the importance ofknowing the galactic age for determining the star for-mation, and the stellar and elemental enrichment histo-ries of a galaxy. The UVO spectrum can contain impor-tant information for determining this age. Figure 1 inCapak et al. (2011) presents the full resolution spectrumof AzTEC–3, obtained with the Keck II telescope. Thespectrum shows Si II and C IV stellar absorption featureswhich are indicative of the presence of a population ofyoung O and B stars. In a single burst of star formationthe spectral contribution from young stars should dimin-ish with time. The presence of these features thereforeled them to the conclusion that AzTEC–3 should be lessthan ∼ 30 Myr old. However, in an ongoing star for-mation scenario, the stellar population will always con-tain young O and B stars, and their spectral featureswill only fade at much later times as they are gradually

5
overwhelmed by the featureless continuum from the lessmassive stars.
Figure 5. Top panel: The observed Keck II spectrum ofAzTEC–3 (Capak et al. 2011) is compared to high-resolution UVspectra generated by Starburst99. The observed spectrum hasbeen redshifted by z = 5.3 and rebinned to the 0.75 A resolu-tion of the model spectra. Model spectra were calculated assum-ing ongoing constant star formation rates, and are depicted fortwo stellar IMFs: Salpeter (Sp) and Top-Heavy (TH). To facilitatethe comparison between the models and observations the spectrawere normalized and shifted with respect to each other. The figurealso depicts the location of important stellar lines. The observedAzTEC–3 spectrum is more complex since it also contains inter-stellar absorption lines. The main point of this panel is to illustratethat the observed spectrum cannot be used as an effective deter-minator of the age of AzTEC–3. Bottom panel: The correlationbetween the observed and the model spectrum. The colored linedepicts the best fit line to the correlation. The synthetic spectraare essentially identical for all models depicted in the figure (ex-cept for a scaling factor), yielding an identical degree of correlationbetween the models and observations, regardless of the age of thesystem.
To examine if the observed spectrum can be used todetermine the age of the galaxy we constructed syntheticUV spectra for constant star formation scenarios and dif-ferent stellar IMFs (TH=Top Heavy; Sp=Salpeter) usingStarburst99 (Leitherer et al. 1999; Vazquez & Leitherer2005; Leitherer et al. 2010). Figure 5 compares the syn-thetic spectra with the observed one. The figure showsthat the TH model spectra have not evolved significantlyin shape between the ages of 30 and 200 Myr. Their totalintensity has, of course evolved, an effect not shown inthe figure because of the offset. They are also identicalto the Sp model at 30 Myr. The simulations show thatwhen star formation is an ongoing process, the spectrum
does not evolve significantly because even a very smallnumber of O/B stars will dominate the UV emission.The AzTEC–3 spectrum shows some of the same stel-lar absorption features present in the synthetic spectra,but contains in addition features caused by interstellarabsorption, a process that is not included in the Star-burst99 models. The right panel of the figure shows thecorrelation between the observed spectrum and that ofone of the models. Except for a constant offset causedby the evolution of the total intensity of the spectrum,the correlation plot is identical for all models.
The similarity of the AzTEC–3 spectrum to the modelspectra, and the fact that the model spectra are es-sentially identical even though they represent differentepochs and were generated with different IMFs, showsthat the observed ∼ 1200 − 1600 A spectrum cannot beused to constrain the age of the galaxy when star forma-tion is an ongoing process.
3.2. SED Contraints on the Age: The Age Degeneracy
The UVNIR SED of a galaxy can provide independentconstraints on its age. Using the results of the previoussection we created a library of intrinsic stellar SEDs forthe seven IMFs and for a grid of galaxy ages, ranging upto to 800 Myr. The results are shown in Figures 6 and 7for 4 select IMFs and for ages between 10 and 400 Myr.Each panel in the figure presents the intrinsic SED (blackline) generated by a distinct evolutionary sequence that isterminated at the assumed galactic age presented in thepanel. Each evolutionary sequence is characterized by aconstant SFR which is distinct from other sequences anddetermined by the stellar IMF and the galactic age forthe adopted bolometric luminosity of 1 × 10¹³ L⊙ (seeTable 4 and Figure 4). So the Salpeter 20 Myr panelrepresents the SED of a galaxy that underwent a con-stant SFR of ∼ 1900 M⊙ yr−1 for that length of time.In each panel, the intrinsic SED is clearly in excess ofthe observed stellar flux (red diamonds), which has beensignificantly attenuated by dust. Lacking a definitivedust model for the IR emission, we used the Calzetti law(Calzetti et al. 2000) to characterize the extinction. Foreach evolutionary sequence we calculated the visual opti-cal depth, τ(V ), that provided the best least-squares fitto the observations. Values of τ(V ) ranged from ∼ 2−4.The attenuated stellar spectra are presented by violetlines in the figures.
Figure 8 depicts the minimum χ2 of the fit of the atten-uated spectra to the data as a function of galaxy age andstellar IMF. The figure shows that for each IMF there ex-ists an age degeneracy for which the value of χ2 is essen-tially unchanged. This degeneracy is caused by the factthat the galaxy’s SED changes very little with time forthe first ∼ 100 Myr. The small changes that do occurare compensated for with small changes in the magni-tude of the attenuation. This effect is exhibited in boththe figures of the SEDs and that depicting the value χ2
with galactic age. For example, Figure 8 shows that theSalpeter and Glazebrook IMFs provide equally good fitsto the observed UVNIR SED for ages up to ∼ 100 Myr,and the Top Heavy IMF for ages up to ∼ 200 Myr. Thefits become significantly worse thereafter, an effect thatis also clearly seen in Figures 6 and 7. The Starburst IMFprovides an equally good fit to the observed spectrum atall epochs. Better fits to the observed spectra at later

6
Figure 6. Intrinsic (black curve) and attenuated (violet curve) stellar SEDs are plotted for an adopted Lbol = 1 × 10¹³ L⊙, andfor 2 different IMFs (Salpeter and Glazebrook) and 6 different galactic ages. Each panel represents a distinct evolutionary scenario,characterized by a constant SFR determined by the requirement that the intrinsic bolometric luminosity be equal to the adopted observedvalue of 1 × 10¹³ L⊙ at the designated galactic age (see Figure 4). The value of AV that provided the best fit of the attenuated spectrumto the observed UVNIR fluxes (red diamonds) is given in the figure.

7
Figure 7. Same as Figure 6 for the Top Heavy and Starburst IMFs.

8
Figure 8. The value of χ2 for the fit of the attenuated SEDs to theUVNIR observations for 4 different IMFs as a function of galacticage. The figure shows that for each IMF the best fitting SED is notsensitive to age. For ages less than ∼ 100 Myr, the small changesin the intrinsic SED are compensated for by small changes in theamount of dust attenuation. The galaxy’s SED provides only aweak limit on the age. The starburst IMF produces equally goodfits to the observed SED for all galactic ages.
epochs can probably be obtained if we adopted a differ-ent extinction law, or a time-dependent extinction lawthat reflects the changing dust composition with time.Such changes would need to be consistent with the far-IR emission as well. Such detailed investigation into theextinction law (i.e. optical properties of the dust, andthe physical distribution of the dust with respect to theradiation sources) is currently beyond the scope of thispaper.
3.3. Stellar Mass Constraints of the Age: A PartialLifting of the Degeneracy.
The ambiguity in stellar age can be partially lifted byconsidering the upper limits on the stellar mass in thegalaxy. Capak et al. (2011) derived a stellar mass of∼ 1010 M⊙, using the Maraston library of stellar SEDs(Maraston 2005) and a galactic age of ∼ 30 Myr. Thisage was inferred from the Keck II spectrum, assumingthat all the star formation occurred in a single burst.Since we have shown that the UV spectrum cannot con-strain the age of AzTEC–3, we prefer to use a weaker,but observationally determined, constraint on the stellarmass. Using kinematic CO data and limits on the angu-lar size of the galaxy, Riechers et al. (2010) derived thevalues of Mgas, the mass of the gas (dominated by themolecular component), and Mdyn, the dynamical massof the galaxy. The dynamical mass is given by Mdyn≃Mgas+ Mstars + MDM , where Mstars and MDM are, re-spectively, the mass in stars and dark matter. The dy-namical mass offers therefore a strict upper limit on thestellar mass. Adopting a gas fraction (≡ Mgas/Mdyn)of 0.5 (Riechers et al. 2010), we adopt an upper limit ofMstars ≃ Mgas ≃ 5 × 10¹⁰M⊙ on the stellar mass of thegalaxy.
Since the mass of stars builds up at different rates forthe different IMFs, this upper limit can provide usefulconstraints on the age of the galaxy. This effect is shown
Figure 9. The stellar mass as a function of the assumed durationof the star formation activity in AzTEC3 for four different IMFs.The dashed horizontal line corresponds to the upper limit on thestellar mass in the galaxy derived from estimates of the dynamicaland gas masses of the galaxy (Riechers et al. 2010). For each IMF,the bold colored line depicts the allowed range of galaxy ages beforethe model violates the constraint on the stellar mass.
in Figure 9, which depicts the derived mass of stars asa function of the assumed age of AzTEC–3 for differentstellar IMFs. Each symbol represents a distinct evolu-tionary sequence in which the SFR proceeded at a con-stant rate determined by the assumed galactic age andstellar IMF (see Figure 4). The Salpeter IMF requiresthe largest SFR, and is therefore the first to exceed thismass limit after tage(max) ∼ 30 Myr. The GlazebrookIMF exceeds this mass limit after ∼ 80 Myr, and the TopHeavy IMF after ∼ 200 Myr. The Starburst IMF is themost efficient one in producing the observed bolometricluminosity with a low SFR, and does not have a largepopulation of low mass stars. Consequently, it does notexceed the adopted stellar mass limit within ∼ 1 Gyr,the approximate age of the universe at that redshift.
4. DUST EVOLUTION: A NEW CONSTRAINTON GALACTIC PROPERTIES
The presence of (2 ± 1) × 109 M⊙ of dust providesnew additional constraints on the star formation rateand history of AzTEC–3. To demonstrate this ef-fect we used the chemical evolution model described inDwek & Cherchneff (2011) to follow the evolution of thedust for the four different astrophysical scenarios deter-mined by the stellar IMFs and the upper limit of the massof stars in the galaxy. For each IMF we adopted a galac-tic age, tage(max), taken to be equal to the last epoch be-fore the mass of stars produced by the model violates thestellar mass limit. The ages are ∼ 30, 80, and 200 Myrfor the Salpeter, Glazebrook, and Top Heavy IMFs, re-spectively (see Fig. 9). For the Starburst IMF we chose,quite arbitrary, a value of tage(max) = 800 Myr. Themodels then assume that star formation proceeds at aconstant rate of ∼ 1800, 700, 500, and 300 M⊙ yr−1,repectively (see Fig. 4).
We used a closed box model to follow the chemical evo-lution of AzTEC–3. The initial gas mass was chosen sothat each model reproduced the inferred gas mass of ∼5×10¹⁰ M⊙ at age t =tage(max). The chemical evolution

9
Figure 10. The evolution of the dust and gas mass in AzTEC–3 are plotted as a function of time for the models characterized by theirdifferent IMFs. Total dust masses (blue curves) represent the sum of the dust masses produced by SNe and AGB stars. The contributionof AGB stars is depicted by red lines. Total and AGB dust masses are plotted for two cases: upper curves ignore the effects of graindestruction, whereas the lower curves adopt a Milky Way destruction efficiency. The bold section of each curve depicts the evolution overthe time span allowed before the galaxy violates the upper limit on the stellar mass (see Fig. 9). The shaded region depicts the adopteddust mass limits inferred from the far-IR observations.
model follows the changes in metallicities over timescalesthat are comparable to the main sequence lifetimes of themassive SN progenitors. Consequently, in addition to thedelayed recycling of matter by long-lived AGB stars, themodel also includes the delayed recycling of matter bymassive stars. AGB yields for stars with masses below8 M⊙ were taken from Karakas & Lattanzio (2007) fora metallicity of Z = 0.008. SN dust yields of massivestars were taken as an average between the zero and solarmetallicity yields given by Heger & Woosley (2010) andWoosley & Heger (2007), respectively (see Table 5 for se-lect stellar masses). Dust condensation efficiencies werechosen to be unity for AGB stars, and 0.5 for Type IISNe.
The results of our model calculations are shown in Fig-ure 10. The green curve depicts the evolution of the gasmass which plummets when the constant SFR depletesall the gas (and dust) into stars. The blue curves depictthe evolution of the total dust mass, which is the sumof the contribution from SNe and AGB stars. The AGBcontribution is a small fraction of the total dust mass,and is shown separately by red curves. Models were runfor two cases: the first ignores the effect of grain destruc-tion, and is depicted by the solid blue curves; and thesecond takes the effect of grain destruction into accountand is depicted by the dashed blue curves. The grain
destruction rate was calculated by integrating the massof dust destroyed as a function of shock velocity (Jones2004), over the evolution of a supernova remnant. Themass of dust destroyed by a single SN remnant during itslifetime is about mdest ≈ 3 M⊙ (Dwek et al. 2007) andthe grain destruction rate is given by SFR×mdest/m⋆.The bold section of each curve depicts the evolution overthe time span allowed before the galaxy violates the up-per limit on the stellar mass (see Fig. 9). The shadedregion depicts the range of dust masses inferred from thefar-IR observations.
The figure shows that when grain destruction is takeninto account, none of the models is capable of produc-ing the required dust mass at any time. With no graindestruction, all models depicted in the figure are capa-ble of producing the required dust mass, albeit at differ-ent quantities. These idealized models can be consideredas representatives of models in which rapid accretion inmolecular clouds compensates for the mass of dust thatis destroyed in the ISM. So the models show that rapidgrain growth in clouds is an essential process for produc-ing the inferred dust mass in AzTEC–3.
The model that is clearly most capable of producingthe inferred dust mass is the one with the Top HeavyIMF. At the age of 200 Myr it produces more than theinferred upper range of the dust mass, thus allowing for

10
Figure 11. The intrinsic UV to far-IR luminosity from AzTEC–3
(grey line) calculated with the PEGASE stellar population code isplotted as a function of the rest frame wavelength, λ0. The twogalactic templates of M82 and Arp220 represent two possible fits tothe far-IR spectrum of AzTEC3. The intrinsic stellar luminosity of1013 L⊙ falls between that of the two galactic templates (see Ta-ble 2). The black curve represent the attenuated starlight derivedwith the Calzetti extinction curve for a value of A(V ) = 2.30.
a modest amount of grain destruction. It therefore doesnot require that the accretion in molecular clouds recon-stitute all the dust that was destroyed in the more diffuseISM. The Starburst model is just capable of producingthe lower range of inferred dust mass at t = 400 Myr,and requires that all the refractory elements returned bygrain processing into the gas are quickly reaccreted ontosurviving grains in molecular clouds. The models witha Salpeter or Glazebrook IMF fall in between these twomodels.
Figure 11 depicts the spectrum produced by starsgenerated by the most plausible scenario that satisfiesboth the stellar mass and the dust mass constraints ofAzTEC–3: a galaxy with a Top Heavy IMF undergoing aconstant SFR at a rate of 300 M⊙ yr−1 over a timespanof 200 Myr, and allowing for over half of its dust to bedestroyed. The stellar SED is attenuated by a Calzettiextinction law with τ(V ) = 2.3. The intrinsic stellarspectrum is shown as the gray curve, and has a lumi-nosity of 1 × 10¹³ L⊙, which lies between the luminosityof the two galactic templates, M82 and Arp 220 (see Ta-ble 2). This scenario is not unique, but the most plausibleone among the models. A Top Heavy IMF was also thepreferred scenario for the rapid and efficient productionof dust in the early universe by Gall et al. (2011a) andDunne et al. (2010).
5. A POPULATION III ORIGIN FOR THE DUST?
Population III (Pop III) stars, the first populationof stars being born out of a pristine, zero metallic-ity gas, may also be important contributors to thedust in these young galaxies (Nozawa et al. 2003, 2009;Todini & Ferrara 2001; Cherchneff & Dwek 2010). Theyare believed to be massive (Bromm & Larson 2004), andsupported by radiation pressure at the Eddington lumi-nosity:
(
Ledd
L⊙
)
= 3 × 10⁴(
m
M⊙
)
. (1)
Consider a population of massive Pop III stars all ofidentical mass m, and let Lbol be the total bolometricoutput of this stellar population. To maintain a steadyabundance of such stars, they have to be created at arate given by:
dN
dt=
[
Lbol
Ledd
]
× τ−1MS , (2)
where τMS , their main sequence lifetime, is determinedby the time it takes to radiate all the energy releasedin the production of helium and heavy elements at theEddington luminosity. It is independent of stellar mass,and given by:
τMS = 0.007mc2/Ledd ≈ 3 × 10⁶ yr. (3)
The SFR needed to maintain the observed luminosity isindependent of the stellar mass and given by SFR =m (dN/dt) ≈ 10−12 × Lbol M⊙ yr−1. The rate of dustproduction is given by:
dMdust
dt= Ydust
(
dN
dt
)
=
(
Ydust
τMS
) (
Lbol
Ledd
)
(4)
where Ydust is the amount of dust produced in these ob-jects.
Dust formation in massive Pop III stars has onlybeen calculated for 170 M⊙ stars (Nozawa et al. 2003;Cherchneff & Dwek 2010). Such a Pop III star will havea luminosity of ∼ 5 × 10⁶ L⊙. The dust yield dependson the whether the ejecta maintains its stratified com-positional structure or becomes completely mixed, andranges from ∼ 7 to ∼ 35 M⊙, for unmixed and fullymixed ejecta, respectively. The total mass of dust pro-duced at time t, assuming no grain destruction, is givenby:
(
Mdust
M⊙
)
≈ (5 − 25) ×
(
t
yr
)
(5)
where the range of ages reflects the uncertainty in thedust yield of such stars. The time needed to create anaverage Mdust = 2× 10⁹ M⊙ of dust by 170 M⊙ Pop IIIstars is therefore ∼ 100− 400 Myr. This timescale is sig-nificantly longer than their main sequence lifetime, andtoo long to maintain a pristine reservoir of gas to feedthe formation of metal-free stars. We therefore concludethat the massive amount of dust seen in AzTEC–3 can-not have been produced by a burst of Pop III stars thatare currently giving rise to the observed far-IR luminos-ity of the galaxy.
6. DISCUSSION
Deriving the physical properties of high redshift galax-ies from their spectra is an important goal for under-standing their origin and evolution. In the absence ofperfect and complete information, these derived physicalproperties are not unique, allowing for different evolu-tionary scenarios to explain the observations.
In this paper we explore a new method that can,in principle, discriminate between different evolutionaryscenarios. The method requires that the mass of dustinferred from the far-IR emission to be present in thesegalaxies be produced within an allotted time span im-posed by other observations. We applied our method to

11
Table 5Yields of Condensible Elements and Maximum Dust
Masses in Massive Stars1
Element/ 20 M⊙ 50 M⊙
Metallicity Z = 0 Z = Z⊙ Z = 0 Z = Z⊙
12C 0.21 0.23 1.86 1.6116O 1.34 1.38 11.2 9.724Mg 0.065 0.065 0.31 0.3328Si 0.0025 0.19 0.27 0.2156Fe ∼ 0 0.12 0.41 0.28Carbon dust 0.21 0.23 1.86 1.61Silicate dust2 0.11 0.52 1.10 1.00Iron dust 0.0 0.12 0.41 0.28Total dust3 0.32 0.87 3.4 2.9
1 Zero metallicity yields were calculated for models withno mixing and with explosion energies of 1.2 × 1051 ergand 5 × 1051 erg, for the 20 and 50 M⊙ stars, respectively(Heger & Woosley 2010); Z⊙ metallicity yields were takenfrom Woosley & Heger (2007). All entries are in units ofM⊙.2 The silicate dust mass was calculated assuming that all theMg and Si are locked up in MgO and SiO2 dust precursors.3 Total dust masses listed assume a 100 percent condensa-tion efficiency.
the analysis of the ultraluminous submillimeter galaxyAzTEC–3. The basic observations available to constrainthe models are the high-resolution UV-optical spectrum,the UV to millimeter SED, and the CO transitions thatwere detected from this object.
A fundamental observed quantity is the bolometric lu-minosity of the galaxy which in AzTEC–3 is dominatedby the far-IR emission, and can be used to infer the SFRof the galaxy. However, converting Lbol to a SFR requiresknowledge of the stellar IMF and the age of the galaxy,since for a constant SFR and given IMF, the bolometricluminosity increases with time because of the contribu-tion of long-lived low mass stars to the emission.
The IR region of the spectrum can be used to derive themass of dust giving rise to the emission. The dust massdepends on the dust composition and the dust tempera-ture distribution, both unknown quantities. Estimates ofthe dust mass can be derived for pure dust compositions(graphite, amorphous carbon, or silicates), based on dustmodels for the Milky Way. Alternatively, the dust masscan also be estimated by fitting the observed SED withthat of known galaxies for which the dust mass has beenderived from detailed models.
The CO emission spectrum can be used to derive thedynamical mass of the galaxy and the mass of moleculargas. Both quantities are uncertain. The dynamical massestimate depends on the basic premise that the systemhas relaxed to a Keplerian disk, and the determinationof the gas mass depends on the uncertain X-factor thatconverts the CO line intensity to an H2 mass. With-out any further assumptions, only an upper limit can beobtained for the stellar mass in this galaxy.
The high-resolution UV spectrum can be used to deter-mine the age of the system. Massive young stars exhibitcharacteristic P-Cygni profiles. The presence of thesefeatures in the spectrum can therefore be used to deter-mine the age of the system. For an instantaneous burstof star formation, these features disappear as these mas-sive stars die off within ∼ 30 Myr. So their presence canbe used to estimate the age. When star formation is a
continuous process, the massive stars are always present,and the strengths of the features relative to the contin-uum changes then much more gradually. Therefore, theage inferred from such spectrum will be much longer thanthat inferred for an instantaneous burst. From our sim-ulations, assuming a constant SFR, we find that the UVspectrum cannot discriminate between systems that arebetween ∼ 30 to 400 Myr old, the relevant age limits forAzTEC–3.
The bolometric luminosity of AzTEC–3 lies between0.6 to 2×10¹³ L⊙, and to be definitive we adopted a valueof Lbol= 1 × 10¹³ L⊙. For the dust mass we adopted avalue of 2±1×10⁹ M⊙. We adopted a very conservativeupper limit of 5× 10¹⁰ M⊙ on the stellar mass, based onthe estimated dynamical and gas mass from this object.
Using these basic constraints, Lbol, Mdust, and Mstars,we constructed models to follow the evolution of thegalaxy’s SED, stellar, and dust content as a functionof time for 7 different stellar IMFs. Viable models werethose that were able to produce the inferred mass of dustbefore the concurrently produced mass in stars exceededthe mass limit. The results of these models are depictedin Figure 10, and described in Section 4.
The results of the paper can be briefly summarized asfollows:
1. Most of the dust giving rise to the far-IR emis-sion from AzTEC–3 must have been grown inmolecular clouds. In the Milky Way, the needfor grain growth in molecular clouds to explainthe abundance of dust was first pointed outby Dwek & Scalo (1980), and more recently byZhukovska et al. (2008) and Jones & Nuth (2011).Micha lowski et al. (2010a) argued that growth inmolecular clouds is the main source of dust in high-redshift (5 < z < 6.5) quasars. In this paper wehave extended this point to the ultraluminous star-burst AzTEC–3 using detailed chemical evolutionmodels.
2. There is a correlation between grain destruction

12
and the required growth in molecular clouds. Atthe peak of its dust production, which occurs at∼ 200 Myr, the Top Heavy model can form the in-ferred dust mass in AzTEC–3 without resorting tograin growth in the ISM, but with a significantlyreduced (compared to the Milky Way) efficiency ofgrain destruction. At earlier epochs grain growthin molecular clouds must account for a significantlylarger fraction of the dust mass. In the Starburstmodel any grain destruction must be rapidly bal-anced by accretion in the ISM. The Salpeter andGalzebrook IMFs are less efficient in producingdust than the Top Heavy one. They can affordonly little grain destruction, and therefore requirea large fraction of their dust to be of interstellarorigin.
3. The model with the Top Heavy IMF is the most ef-ficient one for producing the dust in AzTEC–3, andtherefore the more favorable model for the origin ofthe dust in this galaxy. Taking the galaxy’s age tobe 200 Myr, the longest time allowed by the stel-lar mass constraint, the constant SFR required toprovide the observed bolometric luminosity and therequired dust mass is ∼ 500 M⊙ yr−1. The inferredconstant SFR is significantly smaller and the ageis significantly longer than the previous estimatesof ∼ 1800 M⊙ yr−1and ∼ 30 Myr, respectively,assuming a single burst of star formation.
4. The Top Heavy model is, however, not unique. Aclear discrimination between the different modelsrequires a significant reduction in the uncertaintiesof the measured quantities. For example, a betterdetermination of the stellar mass may have resultedin a lower value than the upper limit adopted in thispaper, ruling out the models using the Salpeter orthe Glazebrook functions to characterize the stellarIMF.
5. Finally, Population III stars could not have pro-duced both the currently observed luminosity anddust mass in AzTEC–3.
The studies presented here illustrate the power of mul-tiwavelength observations and the simultaneous use ofspectral, stellar, and dust mass constraints for determin-ing the properties of high-redshift galaxies. Our studiesalso highlight the need for more observational data andimproved model input parameters.Acknowledgements ED acknowledges helpful discus-
sions with Dominik Riechers. GISMO millimeter ob-servations used in the analysis were supported throughNSF grants AST-0705185 and AST-1020981. We alsoacknowledge useful comments by the referee that helpedclarify the paper.
REFERENCES
Bromm, V. & Larson, R. B. 2004, ARA&A, 42, 79Calzetti, D., Armus, L., Bohlin, R. C., et al. 2000, ApJ, 533, 682Capak, P. L., Riechers, D., Scoville, N. Z., et al. 2011, Nature,
470, 233
Cherchneff, I. & Dwek, E. 2010, ApJ, 713, 1Coppin, K., Chapin, E. L., Mortier, A. M. J., et al. 2006,
MNRAS, 372, 1621Dunne, L., Gomez, H., da Cunha, E., et al. 2010, ArXiv e-printsDwek, E. & Cherchneff, I. 2011, ApJ, 727, 63Dwek, E., Galliano, F., & Jones, A. P. 2007, ApJ, 662, 927Dwek, E. & Scalo, J. M. 1980, ApJ, 239, 193Elvis, M., Marengo, M., & Karovska, M. 2002, ApJ, 567, L107Fioc, M. & Rocca-Volmerange, B. 1997, A&A, 326, 950Gall, C., Andersen, A. C., & Hjorth, J. 2011a, A&A, 528, A13+Gall, C., Andersen, A. C., & Hjorth, J. 2011b, A&A, 528, A14+Galliano, F., Dwek, E., & Chanial, P. 2008, ApJ, 672, 214Heger, A. & Woosley, S. E. 2010, ApJ, 724, 341Jones, A. P. 2004, in ASP Conf. Ser. 309: Astrophysics of Dust,
ed. A. N. Witt, G. C. Clayton, & B. T. Draine, 347–+Jones, A. P. & Nuth, J. A. 2011, A&A, 530, A44+Karakas, A. & Lattanzio, J. C. 2007, Publications of the
Astronomical Society of Australia, 24, 103Kennicutt, Jr., R. C. 1998, ARA&A, 36, 189Kovacs, A., Chapman, S. C., Dowell, C. D., et al. 2006, ApJ, 650,
592Kovacs, A., Omont, A., Beelen, A., et al. 2010, ApJ, 717, 29Leitherer, C., Ortiz Otalvaro, P. A., Bresolin, F., et al. 2010,
ApJS, 189, 309Leitherer, C., Schaerer, D., Goldader, J. D., et al. 1999, ApJS,
123, 3Maiolino, R., Schneider, R., Oliva, E., et al. 2004, Nature, 431,
533Maraston, C. 2005, MNRAS, 362, 799Micha lowski, M. J., Murphy, E. J., Hjorth, J., et al. 2010a, A&A,
522, A15+Micha lowski, M. J., Watson, D., & Hjorth, J. 2010b, ApJ, 712,
942Morgan, H. L. & Edmunds, M. G. 2003, MNRAS, 343, 427Nozawa, T., Kozasa, T., Umeda, H., et al. 2009, in Astronomical
Society of the Pacific Conference Series, Vol. 414, Cosmic Dust -Near and Far, ed. T. Henning, E. Grun, & J. Steinacker, 247–+
Nozawa, T., Kozasa, T., Umeda, H., Maeda, K., & Nomoto, K.2003, ApJ, 598, 785
Riechers, D. A., Capak, P. L., Carilli, C. L., et al. 2010, ApJ, 720,L131
Robson, I., Priddey, R. S., Isaak, K. G., & McMahon, R. G. 2004,MNRAS, 351, L29
Scott, K. S., Austermann, J. E., Perera, T. A., et al. 2008,MNRAS, 385, 2225
Spergel, D. N., Bean, R., Dore, O., et al. 2007, ApJS, 170, 377Todini, P. & Ferrara, A. 2001, MNRAS, 325, 726Valiante, R., Schneider, R., Bianchi, S., & Andersen, A. C. 2009,
MNRAS, 397, 1661Vazquez, G. A. & Leitherer, C. 2005, ApJ, 621, 695Weiß, A., Kovacs, A., Coppin, K., et al. 2009, ApJ, 707, 1201Woosley, S. E. & Heger, A. 2007, Phys. Rep., 442, 269Younger, J. D., Fazio, G. G., Huang, J.-S., et al. 2007, ApJ, 671,
1531Zhukovska, S., Gail, H., & Trieloff, M. 2008, A&A, 479, 453
Copyright © 2022 FDOKUMEN