Modelling the dusty universe - II. The clustering of submillimetre-selected galaxies
Upload
independentCategory
view
0download
0
arX
iv:a
stro
-ph/
0206
029v
1 3
Jun
200
2
1
Abstract. We revisit the nature of the far infrared(FIR)/Radio correlation by means of the most recent mod-els for star forming galaxies, focusing in particular on thecase of obscured starbursts. We model the IR emissionwith our population synthesis code, GRASIL (Silva etal. 1998). As for the radio emission, we revisit the sim-ple model of Condon & Yin (1990). We find that a tightFIR/Radio correlation is natural when the synchrotronmechanism dominates over the inverse Compton, and theelectrons cooling time is shorter than the fading time ofthe supernova (SN) rate. Observations indicate that boththese conditions are met in star forming galaxies, fromnormal spirals to obscured starbursts. However, since theradio non thermal (NT) emission is delayed, deviationsare expected both in the early phases of a starburst, whenthe radio thermal component dominates, and in the post-starburst phase, when the bulk of the NT component orig-inates from less massive stars. We show that this delayallows the analysis of obscured starbursts with a time res-olution of a few tens of Myrs, unreachable with other starformation (SF) indicators. We suggest to complement theanalysis of the deviations from the FIR/Radio correlationwith the radio slope (q–Radio slope diagram) to obtaincharacteristic parameters of the burst, e.g. its intensity,age and fading time scale. The analysis of a sample of com-pact ULIRGs shows that they are intense but transientstarbursts, to which one should not apply usual SF indi-cators devised for constant SF rates. We also discuss thepossibility of using the q–radio slope diagram to asses thepresence of obscured AGN. A firm prediction of the mod-els is an apparent radio excess during the post-starburstphase, which seems to be typical of a class of star forminggalaxies in rich cluster cores. Finally we discuss how devi-ations from the correlation, due to the evolutionary statusof the starburst, affect the technique of photometric red-shift determination widely used for the high-z sources.
Key words: – Interstellar medium: dust extinction –Galaxies: stellar content – Infrared: galaxies – Radio con-tinuum: galaxies

A&A manuscript no.(will be inserted by hand later)
Your thesaurus codes are:missing; you have not inserted them
ASTRONOMYAND
ASTROPHYSICS
Far infrared and Radio emission in dusty starburst galaxies
A. Bressan1,2, L. Silva3, and G. L. Granato1,2
1 INAF, Osservatorio Astronomico di Padova, Vicolo Osservatorio 5, I-35122 Padova, Italy2 SISSA, Strada Costiera, I-34131 Trieste, Italy3 INAF, Osservatorio Astronomico di Trieste, Via Tiepolo 11, I-34131 Trieste, Italy
Received / Accepted
1. Introduction
In recent years the study of starburst galaxies has becomea very popular subject because of its intimate connectionwith the global star formation history of the Universe. Onone side high redshift observations in the optical bandsprobe rest frame spectral regions that are highly affectedby even tiny amounts of ongoing star formation and dustextinction. On the other, theoretical models following theparadigm of the hierarchical clustering scenario predictthat merging induced star formation should be highly en-hanced in the past. Current estimates of the star formationrate (SFR) of the Universe have thus been interpreted onthe basis of our understanding of local analogous galax-ies, in particular through UV continuum and optical lineemission. However in local starbursts a significant frac-tion of the ongoing star formation may be hidden to UVand optical estimators. In fact, though starburst galaxieswere initially selected for the prominence of their opticalemission lines, it appears that this criterion excludes otheractively star forming objects and possibly limits our un-derstanding to a small phase of their evolution. After theIRAS satellite, it became clear that SF is also highly en-hanced in very and ultra luminous infrared galaxies thatare otherwise highly attenuated in the optical. With spacedensities similar to those of quasars (Soifer et al. 1986)and total infrared luminosities spanning the range 1011–1012L⊙ and above 1012L⊙, respectively, Luminous and Ul-traluminous Infrared galaxies (LIRGs and ULIRGs) arethe most luminous objects in the local Universe. Evidenceof the important role played by dust reprocessing was pro-vided by the detection of a diffuse FIR background whosehigh intensity (equal to or higher than that of the opti-cal, e.g. Hauser et al. 1998) implies that these galaxies areundergoing intense star formation activity (Puget et al.1996; Dwek et al. 1998). Furthermore, the advent of theInfrared Space Observatory (ISO), in combination withthe availability of new ground facilities such as SCUBAon the JCMT, have discovered numerous high-z galaxieswith enhanced IR emission (e.g. Elbaz et al. 1999; Smailet al. 2000; Barger et al. 2000).
Send offprint requests to: A. Bressan, [email protected]
Silva et al. (1998) have first introduced the conceptof age-selective obscuration, to explain the features of theobserved spectral energy distribution (SED) of star form-ing galaxies, from normal spirals to dust obscured star-bursts, from the UV to the sub-mm. In this model youngstars are supposed to originate within molecular cloudsand correspondingly their light is attenuated more thanthat of older stars, that already got rid of their parentalcloud. The UV light in many starbursts is thus dominatedby the older stars rather than by the younger popula-tions. With the same assumptions, Granato et al. (2000)reproduced the observable properties of local galaxies (inparticular the IRAS luminosity function), working withinthe context of structure formation through hierarchicalclustering, which has successfully confronted a wide rangeof observations on large scale structure and microwavebackground anisotropies. They showed that the conceptof age-selective obscuration could explain the differencebetween the galactic extinction law and the attenuationlaw observed in starburst galaxies (Calzetti, Kinney, &Storchi-Bergmann 1994).
Poggianti, Bressan, & Franceschini (2001) have re-cently investigated the optical spectra of very luminousinfrared galaxies to constrain the recent history of SF andthe dust extinction characteristic of various stellar popu-lations. They have found that the most plausible explana-tion for their unusual combination of strong Hδ absorp-tion and moderate [OII] emission is again age-selectiveextinction. Indeed HII regions (wherein the [OII] emissionoriginates) are highly embedded and thus are affected bya greater extinction compared to the older stellar popu-lations which are responsible for the Balmer absorption.Under standard assumptions for the IMF, the SFR derivedfrom the fit of the optical spectrum (continuum, absorp-tion and emission lines) may account for a small fractionof the FIR emission. Moreover, even complemented withthe information on the FIR flux, the optical-UV spectrumis not enough to identify univocal solutions. Further evi-dence along this direction is provided by recent observa-tions of UV properties of ULIRGs (Goldader et al. 2002).
These studies underline an intrinsic difficulty of evalu-ating the properties of massive starbursts only from their

A. Bressan et al.: FIR and Radio emission in dusty starbursts 3
UV, optical and even NIR properties and the natural wayout from this impasse seems provided by studies at longerwavelengths. The capability of FIR and radio spectral re-gions to reveal otherwise hidden complex phenomena instar forming galaxies, is testified by the existence of a”miraculous” correlation between their properties in thesespectral windows. The FIR/Radio correlation is locallywell established over a significant range of luminosity, fromnormal spirals to the most extreme ULIRGs and its smallscatter states the universal proportions with which en-ergy is radiated away at IR and radio wavelengths. Inspite of its obscure nature, its utility appears in severalaspects, beside being a firm tool within the manifold ofstar formation indicators. For instance the validity of theFIR/Radio correlation has been recently confirmed up toredshift ≃ 1.3 (Garret 2001) and it is widely extrapo-lated much beyond, to estimate the redshift of more dis-tant objects (e.g. Carilli & Yun 2000). Also, deviationsfrom the correlation observed toward the central regionsof rich cluster of galaxies, where a significant fraction ofstar forming galaxies show a radio excess, are used to tracethe effect of the hot intracluster medium on their galac-tic magnetic field (Gavazzi & Jaffe 1986; Miller & Owen2001).
So far there have been many attempts to explain theFIR/Radio correlation but all have soon or late invokeda fine tuning of the relevant physical properties, such asthe intensity of the radiative and magnetic energy den-sity (e.g. Lisenfeld, Volk & Xu 1996). In this paper werevisit this correlation by combining our spectrophotomet-ric code GRASIL, particularly suited to the study of theIR properties of dusty galaxies, with a new model of radioemission. The latter essentially follows the recipes by Con-don (1992), but after a careful assessment of the validityof one of its basic assumptions, namely the proportion-ality between the non thermal (NT) radio emission andthe core-collapse supernova (CCSN) rate. This fact ren-ders the FIR/Radio correlation so robust and we provide,for the first time, a simple explanation of its universality.For the same reason we show that deviations are to beexpected during and soon after the starburst episode, andwe suggest that they can help in constraining the star for-mation history of these galaxies, something that cannotbe done with optical, NIR and even FIR observations.
In Sect. 2 we briefly describe our population synthe-sis code for dusty galaxies. Sect. 3 is devoted to the newmodel of radio emission. In Sect. 4 we describe our cali-bration of the NT radio emission model and obtain newrelations for the SFR against radio emission for the caseof quiescent galaxies. In Sect. 5 we analyse infrared andradio properties of starburst galaxies. We show that thedifferent fading times of FIR and radio emissions may beused to reach a time resolution of a few tens of Myr, whichis impossible resting only on the UV-FIR. In Sect. 6 weintroduce a new diagnostic tool, the FIR/Radio (q) vs ra-dio spectral slope diagram, which potentially allows the
determination of the evolutionary status of a starburst inabsence of a good radio spectral coverage. We examine thelocation of an observed sample of compact ULIRGs anddiscuss whether this diagram may also provide a quan-titative estimate of the threshold between AGN and starformation powered ULIRGs. In Sect. 7 we analyse the evo-lution in the post-starburst phase and suggest that radioexcess is actually an indication of the occurrence of thisphase rather than an environmental effect. In Sect. 8 wediscuss the impact of these new findings on the determi-nation of the redshift of SCUBA sources, a method thatrelies on the FIR/Radio correlation. Sect. 9 is devoted toour conclusions.
2. Infrared Emission
Infrared emission is calculated with GRASIL, a code de-signed to perform population synthesis in presence of dust(Silva et el. 1998). In brief, the star formation history, themetal enrichment and the current gas fraction are pro-vided by a chemical evolution code. Stars and dust aredistributed either in a disk or in a bulge or both, includ-ing high density clumps, the molecular clouds. Young starsare supposed to originate within molecular clouds and toleave them in a characteristic time scale tesc. The volumeemissivity is computed by considering the light of youngstars, absorbed by the molecular clouds, and the light ofolder populations, both propagated through the diffusedust component. The code has been thoroughly testedagainst observations (e.g. Silva et al. 1998; Granato etal. 2000).
For a given star formation history, gas fraction andmetallicity, one of the parameters that largely affects theFIR emission is the escape time tesc. Silva et al. (1998)and Granato et al. (2000) have shown that the UV, opti-cal and FIR properties of local spirals are well reproducedwith a typical tesc ≃ 3 Myr. Normal star forming regionsare also characterized by a moderate visual attenuationAV ≃ 1 mag. In the case of dusty starbursts, the slopeof the UV continuum (Meurer et al. 1999) indicates largeobscuration times. Silva et al. (1998) and Granato et al.(2000) were able to reproduce the SEDs, from the UV tothe FIR, with a tesc in excess of several Myr and a com-pact geometry with a characteristic radius of a fractionof a Kpc. Similar obscuration times seem to be requiredto interpret the optical spectra of very luminous infraredgalaxies (Poggianti et al. 2001).
We have considered as representative of a normal spirala model with the parameters shown in Table 1. We adopta Schmidt type star formation law, i.e. SFR=ν Mk
g , withinfall of gas with primordial composition in a time scaletinf , and a Salpeter initial mass function (IMF) (slopex=1.35 in mass), from 0.15 M⊙ to 120 M⊙. For starburstgalaxies we superimpose an exponentially decreasing burst(tb=10, 15, 25, 50 Myr) of star formation at an epoch of11.95 Gyr, with the same IMF. The mass of stars formed

4 A. Bressan et al.: FIR and Radio emission in dusty starbursts
Table 1. Parameters for a disk galaxy model. See text fordetails.
ν k tinf x MLow MUP
0.5 Gyr−1 1 9 Gyr 1.35 0.15 M⊙ 120 M⊙
during the burst is set to 10% of the disk mass. Our mainconclusions are not affected by details in these choices.
3. Radio emission
A clear picture of radio emission from normal galaxies isstill missing, particularly for the often dominant non ther-mal component. Indeed, it is well known that the intensityof the thermal component is tightly related to the numberof H ionizing photons, Q(H), and scales as ≈ ν−0.1 (Rubin,1968). Computing HII region models with CLOUDY (Fer-land 1996), for different mass (104M⊙ to 105M⊙), metal-licity (Z = 0.008, 0.02 and 0.05) and age (1 to 10 Myr)of the ionizing cluster, and for electron densities of 101 to103 cm−3 and inner radii of the nebula of 10 and 100 pc,we have obtained the following average relation at 1.49GHz (see Panuzzo et al. 2002 for details of the inclusionof nebular emission in GRASIL):
LTν
erg/s/Hz≃
Q(H)
5.495 × 1025
(
Te
104K
)0.45( ν
1.49GHz
)−0.1
(1)
It is then straightforward to obtain Q(H) and the intensityof thermal radio emission from simple stellar populations.
On the other hand, little is known about the source ofthe non thermal emission which, in normal star forminggalaxies may account 90% of the radio emission (Condon1992). Observations indicate that FIR and radio emissionare strongly correlated over a wide range of IR luminosi-ties. At 1.49 GHz (Sanders & Mirabel 1996):
q = logFFIR/(3.75 × 1012Hz)
Fν(1.49GHz)/(W m−2Hz−1)≃ 2.35 ± 0.2 (2)
where FFIR = 1.26 10−14(2.58 S60µm + S100µm) W m−2,with S60 and S100 in Jy. This correlation suggests thatNT emission is related to the recent star formation and themost likely mechanism is synchrotron emission from rela-tivistic electrons accelerated into the shocked interstellarmedium, following CCSN explosions. But the poor knowl-edge of the accelerating mechanism hinders any quantita-tive prediction of this phenomenon which can only be for-mulated in an empirical way (Condon 1992). The observedaverage luminosity per supernova event can be estimatedwith the ratio between NT radio emission and CCSN rate(νCCSN ) in our Galaxy (e.g. Condon & Yin 1990). WithνCCSN ≃ 0.015 (Turatto, private communication) andafter converting L0.4GHz ≃ 6.1× 10²¹W Hz−1 (Berkhui-jsen, 1984) to 1.49 GHz by assuming a radio slope ofα ≡ −
d log Sν
d log ν =0.8, we obtain
ENT1.49 =
LNT1.49GHz/(1030erg s−1 Hz−1)
νCCSN/yr−1≃ 1.44 (3)
It is still a matter of debate why the FIR/radio corre-lation is unaffected by the dependence of the electrons life-time and luminosity on the magnetic and radiation densityfields, which may change significantly in different environ-ments.
Lisenfeld et al. (1996) claimed that, in normal starforming galaxies, the existence of the FIR/Radio corre-lation requires a correlation between the radiation andmagnetic energy density fields. However the radiation fieldchanges dramatically in starburst galaxies, and there mustbe a significant fine tuning between the parameters reg-ulating the intensity of the two fields, because they mustscale in such a way that they give rise to the FIR/Radiocorrelation and, at the same time, they must prevent in-verse Compton to dominate over synchrotron losses.
As a possible way out of this conundrum, we suggesthere that a FIR/Radio correlation originates because syn-chrotron electron lifetimes are shorter than the fading timeof the CCSN rate. Assuming that cosmic ray electronsare injected during the adiabatic phase of SN explosions(t≤104–105yr), i.e. in a characteristic time scale which isshort compared to the star formation time scale, the bolo-metric synchrotron luminosity at an epoch T is given by
LNT =
∫ min(T,τels )
0
νCCSN(T − t) lNT (t)dt (4)
where t is the lookback time, lNT (t) is the NT luminosityof the injected electrons after a time t has elapsed, T isthe age of the galaxy and τel
s is the lifetime of electronsagainst synchrotron losses and depends on the intensityof the magnetic field. For normal spiral galaxies τel
s (<<T) may be as large as several 107 yr but, since the starformation rate is almost constant over the last Gyr, theabove integral becomes
LNT = νCCSN
∫ τels
0
dE
dtdt = νCCSNEel (5)
where we put lNT (t) = dE/dt. Thus the bolometric NTluminosity scales linearly with the SN rate and the propor-tionality constant is the injected energy of the electronsper SN (Eel).
In the case of starburst galaxies the SN rate cannotbe considered constant over such a large time scale. How-ever also τel
s must be much shorter: to avoid significantlosses from inverse Compton on the intense stellar radia-tion field τel
s <<1-0.1 Myr (Condon 1992). Thus we maystill make use of the approximation in Eq. 5, because wemay consider νCCSN almost constant over such a smalltime scale.
In brief, the NT radio luminosity of a galaxy is pro-portional to the integral of the synchrotron power overthe electron lifetime, and an increase of the former in alarger magnetic field is compensated by a shortening ofthe latter.
Since both the SN rate and the FIR emission arestrictly related to the recent star formation rate, our jus-tification of the validity of Eq. 5 in very different envi-

A. Bressan et al.: FIR and Radio emission in dusty starbursts 5
ronments, explains why the FIR/Radio correlation is sorobust. No fine tuning is necessary, apart from the require-ment that the magnetic field is large in starburst galaxies,which, by itself, is an independent observational fact.
The considerations above apply to the bolometric radioluminosity, but what is actually measured is the specificluminosity LNT
ν . However, under plausible assumptions,also LNT
ν scales linearly with the SN rate, with the onlydependence on environmental conditions being an almostvanishing one on the magnetic field. This is a consequenceof the observed spectral index of the NT radio emission.
Indeed, the diffusion-loss equation (e.g. Longair 1994)for the time evolution of the number density of relativisticelectrons per unit energy interval N(E, t) isdN(E, t)
dt=
d
dE[b(E)N(E, t)] + Q(E, t) + D∇2N(E, t)(6)
where b(E) is the rate at which particles lose energy,Q(E, t) is the rate at which electrons are injected in thesystem per unit volume, time and energy interval (thesource term) and D is the diffusion coefficient. We assumethat the distribution of sources of fresh electrons (i.e. theSNae) is sufficiently uniform and extended to make neg-ligible the diffusion term, and that each SN event injectshigh energy electrons with a power law energy spectrum∝ E−p, so that the source term can be written as
Q(E, t) = kνCCSN(t)
VE−p
where k and p are constants (depending on the detailedphysics of SN explosion) and V is the volume of thesystem. Also, we are interested in stationary solutionsdN/dt = 0, that is we consider electron energies at whichthe lifetime against radiative losses is short compared tothe typical time scale for variations of νCCSN(t). The so-lution of Eq. 6 is then simply
N(E) =kνCCSNE−(p−1)
V (p − 1)b(E)where b(E) is the rate at which particles lose energy. Ifthe dominant loss mechanism is synchrotron radiation,
b(E) = −dE
dt synch=
4
3σT cγ2 B2
8πIn this case
N(E) =AkνCCSN
V
E−(p+1)
B2
where the multiplicative factor A depends only on p andfundamental constants: electrons with a sufficiently shortlifetime have a power law energy distribution, with anindex steeper by 1 than the injected distribution.
On the other hand, the synchrotron luminosity of anoptically thin source with a random magnetic field andelectrons having a power law energy distribution N(E) =CE−q is
LNTν = jν,synchV = C D(q)V B
q+1
2 ν−q−1
2
D(q) depends only on q and fundamental constants. Thisequation with C = AkνCCSN/V B2 and α = (q − 1)/2becomes
LNTν = νCCSN
(
AkD(p) Bα−1ν−α)
which shows that also the specific luminosity is propor-tional to the SN rate, with a proportionality factor which,given the observed spectral index of radio emission α ≈ 1,has only a very weak dependence on the magnetic field.It may be useful to note explicitly that the above formulaintegrated over ν yields again the result expressed by Eq.5, namely that the bolometric NT luminosity does notdepend on B. This is because the limit of integration infrequency are those corresponding to the limits in energywithin which the power law electron distribution applies,and the link between the two is ν ∝ B × E.
The crucial assumptions in this derivation are that theSN rate is constant over time scales of the order of the life-times of relevant electrons, and that the dominant electronenergy loss is synchrotron emission, as already discussed.
3.1. The contribution of Radio Supernova Remnants
Before discussing how to calibrate Eq. 5, we consider thepossible sources of non thermal radio emission in our ownGalaxy.
We have checked that, among the identified galacticsources, only radio Supernova Remnants (SNR) may pro-vide a significant contribution to the NT radio emission.Other sources like the pulsars themselves and the bubblesof NT radio emission associated with X-ray binaries pro-vide a negligible contribution. However SNRs, while beingthe obvious most appealing sources, cannot be responsibleof the bulk of NT radio emission in normal galaxies for tworeasons. First, their spectrum has a characteristic radioslope Lν ∝ ν−α with a broad range of α between 0.2 and0.5 (Gordon et al. 1999) which is, on the average, less thanthat characteristic of normal galaxies (α ≃0.8). Second,one may easily show that they cannot supply more thanabout 5% of the total NT luminosity, or, equivalently, theSN rate needed to reproduce the NT radio emission of theGalaxy is more than one order of magnitude larger thanobserved (see e.g. Condon 1992 and references therein).
In fact, because the typical lifetime of a SNR is of afew 104yr, we may estimate the contribution of a popula-
tion of SNRs originated by an instantaneous burst of starformation, by applying the fuel consumption theorem ofpost main sequence evolutionary phases (Renzini & Buz-zoni 1986). Indeed short evolutionary phases beyond themain sequence provide an integrated luminosity
LSSP = φ(md)dmd
dt
∫ tend
tbeg
ld(t)dt (7)
where md is the dying mass (≃ MTurn−off), ld(t) is theluminosity evolution within the phase, φ(md) is the IMF,dmd
dt is the time derivative of the dying mass, and the inte-gral refers to the particular phase. Altogether the quantityφ(md)dmd
dt provides the evolutionary flux, namely the rateof dying stars of the given population.
6 A. Bressan et al.: FIR and Radio emission in dusty starbursts
The luminosity evolution of a single SNR may bederived by combining the observed surface brightness–diameter (Σ − D) relation at 408 MHz
Σ (W m−2Hz−1sr−1) ≃ 10−15 D−3pc (8)
with the time evolution of the linear diameter of a SNR(Clark & Caswell 1976)
Dpc ≃ 0.43 E1/550 n−1/5t2/5 (9)
It follows that
l(erg s−1Hz−1) ≃ 3.55 × 1026 D−1pc (10)
and the evolution of the luminosity of a SNR (at 1.49 GHz,assuming a slope α=0.3) is (see e.g. Condon 1992)l1.49(t)
erg/s/Hz≃ 1026 E
−1/550 n1/5t−2/5 (11)
The integrated contribution of the population of SNRsfrom an instantaneous burst of star formation, at an aget, is then
LSSP1.49
erg/s/Hz≃ 1.7 × 1026 E
−1/550 n1/5τ3/5
c φ(md)dmd
dt(12)
where E50 is the SN blast energy in units of 1050 erg,n (cm−3) is the ambient particle density and τc is thelifetime of the SNR in yr. Note that md is a functionof time, but it is almost constant during the consideredphase.
The lifetime of a SNR is usually associated with itsadiabatic phase (Condon 1992)
τc ≃ 2 × 10⁴ E4/1750 n−9/17 yr (13)
thusLSSP
1.49
erg/s/Hz≃ 0. 6 × 1029 n−2/17E
−1/1750 φ(md)
dmd
dt. (14)
Integrating over the past SFR, ϕ(t), until we still getCCSN events (t ≤ tCCSN ) and after defining the currentsupernova rate
νCCSN(yr−1) =
∫ tCCSN
0
φ(md)dmd
dtϕ(t)dt. (15)
we obtain for the average SNR non thermal luminosity persupernova event
ESNR1.49 =
LSNR1.49 /(1030erg/s/Hz)
νCCSN/yr−1≃ 0.06 n−2/17E
−1/1750 (16)
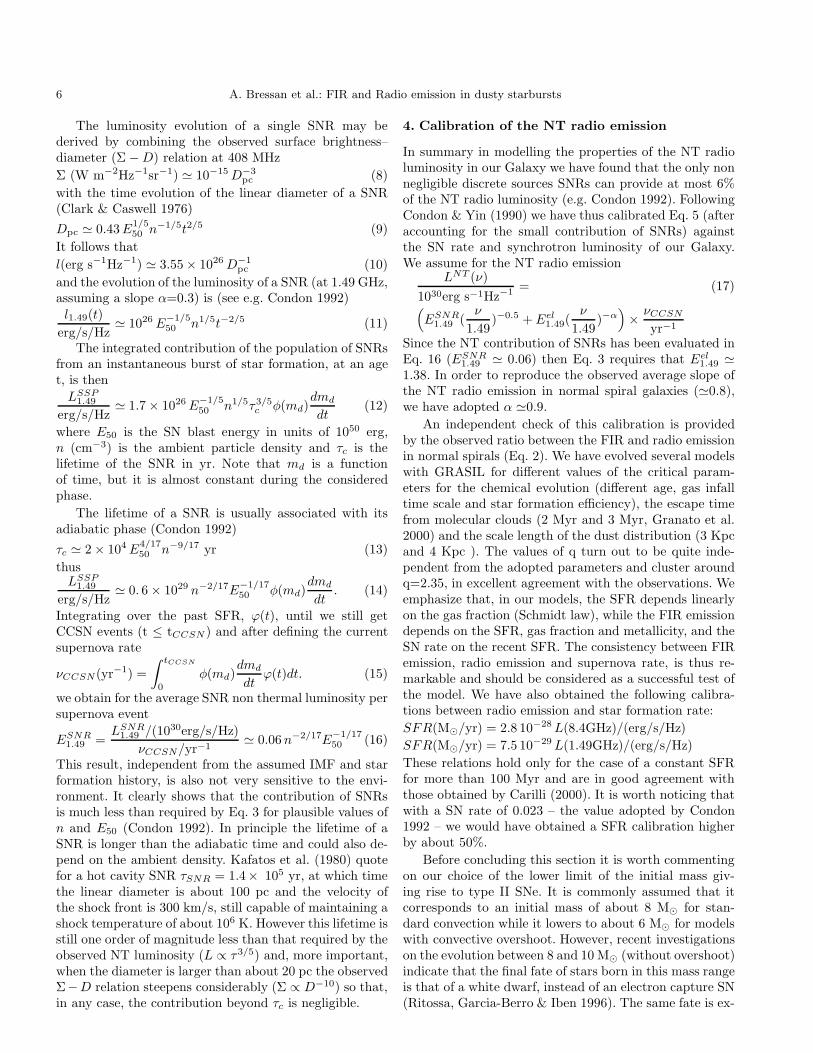
This result, independent from the assumed IMF and starformation history, is also not very sensitive to the envi-ronment. It clearly shows that the contribution of SNRsis much less than required by Eq. 3 for plausible values ofn and E50 (Condon 1992). In principle the lifetime of aSNR is longer than the adiabatic time and could also de-pend on the ambient density. Kafatos et al. (1980) quotefor a hot cavity SNR τSNR = 1.4× 10⁵ yr, at which timethe linear diameter is about 100 pc and the velocity ofthe shock front is 300 km/s, still capable of maintaining ashock temperature of about 106 K. However this lifetime isstill one order of magnitude less than that required by theobserved NT luminosity (L ∝ τ3/5) and, more important,when the diameter is larger than about 20 pc the observedΣ−D relation steepens considerably (Σ ∝ D−10) so that,in any case, the contribution beyond τc is negligible.
4. Calibration of the NT radio emission
In summary in modelling the properties of the NT radioluminosity in our Galaxy we have found that the only nonnegligible discrete sources SNRs can provide at most 6%of the NT radio luminosity (e.g. Condon 1992). FollowingCondon & Yin (1990) we have thus calibrated Eq. 5 (afteraccounting for the small contribution of SNRs) againstthe SN rate and synchrotron luminosity of our Galaxy.We assume for the NT radio emission
LNT (ν)
1030erg s−1Hz−1 = (17)
(
ESNR1.49 (
ν
1.49)−0.5 + Eel
1.49(ν
1.49)−α
)
×νCCSN
yr−1
Since the NT contribution of SNRs has been evaluated inEq. 16 (ESNR
1.49 ≃ 0.06) then Eq. 3 requires that Eel1.49 ≃
1.38. In order to reproduce the observed average slope ofthe NT radio emission in normal spiral galaxies (≃0.8),we have adopted α ≃0.9.
An independent check of this calibration is providedby the observed ratio between the FIR and radio emissionin normal spirals (Eq. 2). We have evolved several modelswith GRASIL for different values of the critical param-eters for the chemical evolution (different age, gas infalltime scale and star formation efficiency), the escape timefrom molecular clouds (2 Myr and 3 Myr, Granato et al.2000) and the scale length of the dust distribution (3 Kpcand 4 Kpc ). The values of q turn out to be quite inde-pendent from the adopted parameters and cluster aroundq=2.35, in excellent agreement with the observations. Weemphasize that, in our models, the SFR depends linearlyon the gas fraction (Schmidt law), while the FIR emissiondepends on the SFR, gas fraction and metallicity, and theSN rate on the recent SFR. The consistency between FIRemission, radio emission and supernova rate, is thus re-markable and should be considered as a successful test ofthe model. We have also obtained the following calibra-tions between radio emission and star formation rate:
SFR(M⊙/yr) = 2.8 10−28 L(8.4GHz)/(erg/s/Hz)
SFR(M⊙/yr) = 7.5 10−29 L(1.49GHz)/(erg/s/Hz)
These relations hold only for the case of a constant SFRfor more than 100 Myr and are in good agreement withthose obtained by Carilli (2000). It is worth noticing thatwith a SN rate of 0.023 – the value adopted by Condon1992 – we would have obtained a SFR calibration higherby about 50%.
Before concluding this section it is worth commentingon our choice of the lower limit of the initial mass giv-ing rise to type II SNe. It is commonly assumed that itcorresponds to an initial mass of about 8 M⊙ for stan-dard convection while it lowers to about 6 M⊙ for modelswith convective overshoot. However, recent investigationson the evolution between 8 and 10 M⊙ (without overshoot)indicate that the final fate of stars born in this mass rangeis that of a white dwarf, instead of an electron capture SN(Ritossa, Garcia-Berro & Iben 1996). The same fate is ex-

A. Bressan et al.: FIR and Radio emission in dusty starbursts 7
Table 2. Starburst parameters for the SEDs in Figg. 1and 2
Case Age tb Current SFR Burst Mass(Myr) (Myr) (M⊙/yr) (M/Mtot)
M82a dotted 45 50 3.41 0.011b solid 24 8 2.37 0.011
ARP220a solid 50 50 271 0.121b dotted 40 30 280 0.121c dashed 25 8 149 0.121
Fig. 1. M82: two models with different age and e-foldingtime scale (Tab. 2), fit the observed SED from UV to thesub-mm. Inclusion of radio wavelengths is necessary todisentangle the two cases. For details on the models seeSilva et al. (1998).
pected in the mass range 6 to 8 M⊙ if the overshoot schemeis adopted (Portinari, Chiosi, & Bressan 1998). We havethus assumed that CCSN are produced in stars with massM≥8 M⊙ and for ages younger than tCCSN ≃50Myr.
5. FIR/Radio properties of starburst models
In this section we examine the FIR and radio propertiesof our new models and compare them with two well stud-ied local starbursts, M82 and ARP220. To obtain a realis-tic starburst model, we added an exponentially decreasingburst of star formation to the underlying secular disk evo-lution of the spirals models used in the previous section.Table 2 summarizes the burst parameters in few adoptedmodels. Notice that in all models of the same galaxy, thetotal mass of gas converted into stars is the same (columnM/Mtot). The corresponding GRASIL parameters havebeen selected according to Silva et al. (1998) and, in par-
Fig. 2. Same as in Fig. 1, for three models for ARP220.
ticular, the adopted obscuration time must be significantlylarger than that characteristic of normal galaxies.
Fig. 1 shows two fits to the SED of M82, differing onlyin the age (45 and 24 Myr) and e–folding time (50 and 8Myr) of the burst. The UV-optical-FIR SED of the star-burst is degenerate, in the sense that it may be fitted bydifferent set of burst parameters. Both models provide agood fit to the UV to sub-mm data. At radio frequencieshowever, only the short burst is able to reproduce the ob-servations while the longer one falls significant below theobserved flux. A similar example is shown in Fig. 2 for theULIRG ARP220. ARP220 is not consistent with a shortburst, though this could not be excluded by the inspec-tion of UV-optical-FIR data alone. Notice that the currentSFR of the models differ by about 40% and 90% in M82and ARP220, respectively.
The cases of M82 and ARP220 show that the inclusionof the radio emission constitutes a powerful diagnostic toolto investigate starburst galaxies. Indeed, while the UV, theFIR and the radio thermal continua are sensitive to thenumber of living massive stars, the NT emission is a mea-sure of the current CCSN rate. Thus the FIR/Radio ratiois a measure of the ratio between the almost instantaneousSFR and the SFR averaged over the last few tens of Myrs.Combining the FIR and radio spectral regions is particu-larly important for the case of obscured starbursts, wherethe burst properties cannot be derived by UV, optical,NIR and even mid and far IR (continuum) observations.We ought to stress in the following, that a careful combina-tion of FIR and Radio data may be sufficient to determinethe recent star formation history even for those galaxiesthat are not as thoroughly observed as M82 or ARP220.Inspection of Figg. 1 and 2 shows that the expected valueof the q ratio at 1.49 GHz and 8.44 GHz changes by more
8 A. Bressan et al.: FIR and Radio emission in dusty starbursts
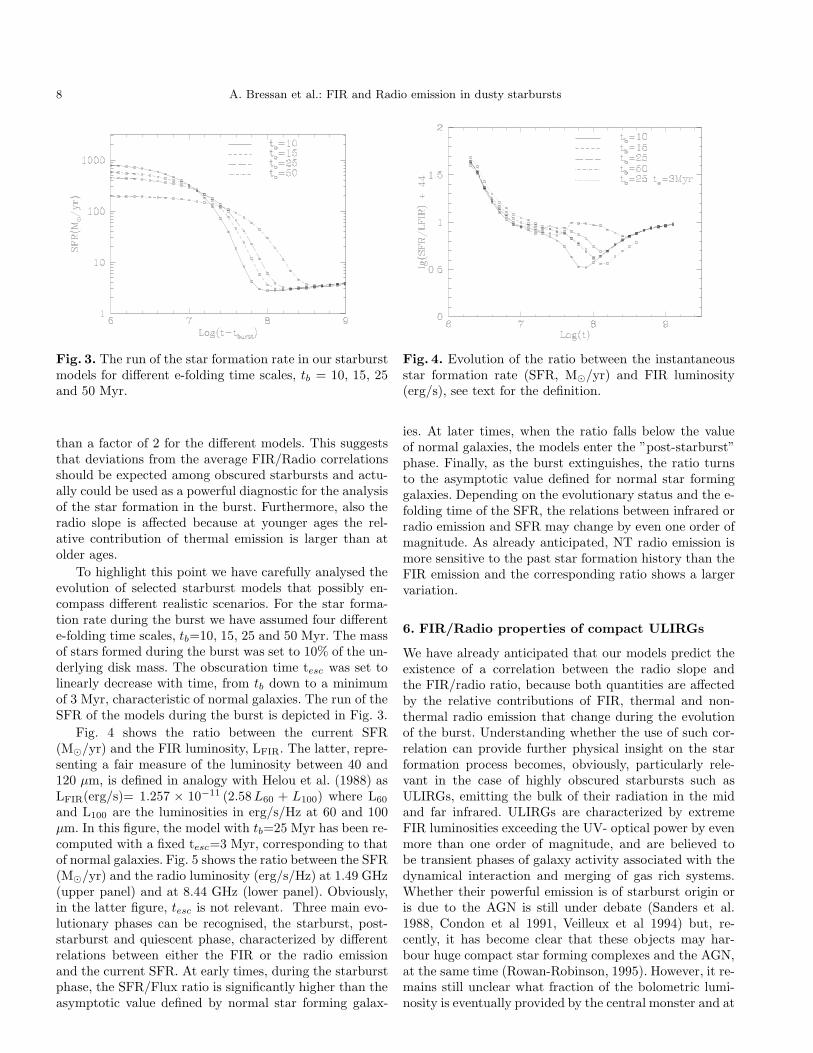
Fig. 3. The run of the star formation rate in our starburstmodels for different e-folding time scales, tb = 10, 15, 25and 50 Myr.
than a factor of 2 for the different models. This suggeststhat deviations from the average FIR/Radio correlationsshould be expected among obscured starbursts and actu-ally could be used as a powerful diagnostic for the analysisof the star formation in the burst. Furthermore, also theradio slope is affected because at younger ages the rel-ative contribution of thermal emission is larger than atolder ages.
To highlight this point we have carefully analysed theevolution of selected starburst models that possibly en-compass different realistic scenarios. For the star forma-tion rate during the burst we have assumed four differente-folding time scales, tb=10, 15, 25 and 50 Myr. The massof stars formed during the burst was set to 10% of the un-derlying disk mass. The obscuration time tesc was set tolinearly decrease with time, from tb down to a minimumof 3 Myr, characteristic of normal galaxies. The run of theSFR of the models during the burst is depicted in Fig. 3.
Fig. 4 shows the ratio between the current SFR(M⊙/yr) and the FIR luminosity, LFIR. The latter, repre-senting a fair measure of the luminosity between 40 and120 µm, is defined in analogy with Helou et al. (1988) asLFIR(erg/s)= 1.257 × 10⁻¹¹ (2.58 L60 + L100) where L60
and L100 are the luminosities in erg/s/Hz at 60 and 100µm. In this figure, the model with tb=25 Myr has been re-computed with a fixed tesc=3 Myr, corresponding to thatof normal galaxies. Fig. 5 shows the ratio between the SFR(M⊙/yr) and the radio luminosity (erg/s/Hz) at 1.49 GHz(upper panel) and at 8.44 GHz (lower panel). Obviously,in the latter figure, tesc is not relevant. Three main evo-lutionary phases can be recognised, the starburst, post-starburst and quiescent phase, characterized by differentrelations between either the FIR or the radio emissionand the current SFR. At early times, during the starburstphase, the SFR/Flux ratio is significantly higher than theasymptotic value defined by normal star forming galax-
Fig. 4. Evolution of the ratio between the instantaneousstar formation rate (SFR, M⊙/yr) and FIR luminosity(erg/s), see text for the definition.
ies. At later times, when the ratio falls below the valueof normal galaxies, the models enter the ”post-starburst”phase. Finally, as the burst extinguishes, the ratio turnsto the asymptotic value defined for normal star forminggalaxies. Depending on the evolutionary status and the e-folding time of the SFR, the relations between infrared orradio emission and SFR may change by even one order ofmagnitude. As already anticipated, NT radio emission ismore sensitive to the past star formation history than theFIR emission and the corresponding ratio shows a largervariation.
6. FIR/Radio properties of compact ULIRGs
We have already anticipated that our models predict theexistence of a correlation between the radio slope andthe FIR/radio ratio, because both quantities are affectedby the relative contributions of FIR, thermal and non-thermal radio emission that change during the evolutionof the burst. Understanding whether the use of such cor-relation can provide further physical insight on the starformation process becomes, obviously, particularly rele-vant in the case of highly obscured starbursts such asULIRGs, emitting the bulk of their radiation in the midand far infrared. ULIRGs are characterized by extremeFIR luminosities exceeding the UV- optical power by evenmore than one order of magnitude, and are believed tobe transient phases of galaxy activity associated with thedynamical interaction and merging of gas rich systems.Whether their powerful emission is of starburst origin oris due to the AGN is still under debate (Sanders et al.1988, Condon et al 1991, Veilleux et al 1994) but, re-cently, it has become clear that these objects may har-bour huge compact star forming complexes and the AGN,at the same time (Rowan-Robinson, 1995). However, it re-mains still unclear what fraction of the bolometric lumi-nosity is eventually provided by the central monster and at

A. Bressan et al.: FIR and Radio emission in dusty starbursts 9
Table 3. Selected galaxies from the sample of compact ULIRGs by Condon et al. (1991)
Name S1.49GHz q S8.44GHz α1.49−8.44 FIR N#e Symbol♮ Classification⋆
IRAS10566+2448 46.1 2.55 14.1 0.68 11.90 - H HIIA11010+4107 28.0 2.54 10.7 0.55 11.52 - H HIIIRAS12112+0305 22.6 2.66 10.0 0.47 12.18 - H HIIUGC08335 51.2 2.46 17.0 0.64 11.62 590 H HIIIRAS22491-1808 6.1 3.00 3.0 0.41 12.02 - H HII Tb=5.2
IRAS17132+5313 28.4 2.46 8.9♭ 0.67 11.79 450 H HII Tb<5UGC04881 29.0 2.50 8.8 0.69 11.61 210 H HII Tb>7 aIRAS01173+1405 43.1 2.46 12.7 0.70 11.54 160 H HII Tb>7 a
Mrk331 67.5 2.51 21.5♭ 0.66 11.27 510 H HII Tb>7 aIRAS10173+0828 8.8 2.92 5.0 0.28 11.70 - H –ARP220 301.1 2.63 148.0 0.41 12.11 - P HII Tb>7 a
IRAS04191-1855 27.3 2.49 8.9 0.65 11.34 100 L Liner Tb<5IRAS08572+3915 6.5 3.11 4.1 0.27 11.96 - L Liner Tb<5IRAS14348-1447 33.2 2.38 9.7 0.71 12.17 - L Liner Tb<5IRAS01364-1042 17.0 2.67 8.2 0.42 11.67 - L Liner Tb<5
UGC08387 106.0 2.28 34.9 0.64 11.51 1220♭ L LinerMrk273 130.0 2.31 43.5 0.63 12.04 - L Liner Tb>7 a
IRAS03359+1523 18.9 2.58 11.0 0.31 11.37 370 A HII Tb>7
Mrk848 46.8 2.38 12.1♭ 0.78 11.72 240 A HII Tb>7UGC02369 42.7 2.39 13.3 0.67 11.42 - A HII Tb>7 lIIIZw035 39.3 2.58 19.7 0.40 11.46 590 A Liner Tb=5.4IRAS15250+3608 12.8 2.81 10.5 0.11 11.88 - A Liner Tb=6UGC0bright 146.0 2.10 52.6 0.59 11.93 - A Liner Tb>7 lNGC2623 97.8 2.51 35.5 0.58 11.47 - A AGN Tb>7 l
NGC0034 58.7 2.52 15.2 0.78 11.28 - S Sey2 Tb=5Zw475.056 26.0 2.65 8.2 0.67 11.37 190 S Sey2 Tb<5IRAS05189-2524 28.1 2.76 11.4 0.52 11.91 - S Sey2 Tb<5Mrk231 240.0 2.24 265.0 -0.06 12.35 - M Sey1 Tb>7
♭ Uncertain value# Electron density, cm−3, from Veilleux et al. (1995)♮ Symbols adopted in Figg 6 and 7⋆ HII, Liner, AGN, Seyfert based on Veilleux et al. (1995); Tb logarithm of the brightness temperature from VLBI data bySmith, Lonsdale & Lonsdale (1998)
what level this affects FIR and radio emission. For exam-ple, very recently Berta et al. (2002) and have shown thatin IRAS 19254–7245 (”The Superantennae”), the AGN iscontributing about 40–50% of the MIR and FIR emission( essentially the bolometric luminosity), while in the ra-dio it overcomes by one order of magnitude the emissionfrom the starburst. At the same time, for IRAS 20100–4156, one of the brightest nearby objects, both the multi-wavelegth analysis (Fritz et al 2002), spectro–polarimetry(Pernechele et al 2002) and near-IR spectroscopy (FWHMPaα ≃440Km s−1, Valdes et al. 2002) show no evidenceof the AGN.
In this respect, the sample of compact ULIRGs se-lected by Condon et al. (1991) turns out to be particu-larly interesting because high resolution VLA maps sug-gest that the bulk of their radio continuum could be ofstarburst origin and several objects have been observed
at both 1.49GHz and 8.44GHz, so that a direct compari-son in term of ”observables” can be made with our star-burst models. We thus isolated all the compact ULIRGs ofthe Condon et al. sample observed at both 1.49GHz and8.44GHz, in Table 3. Optical spectroscopic classificationby Veilleux et al (1995) indeed showed that a number ofthe selected objects have emission line ratio characteris-tic of photoionization by massive stars (HII galaxies), butother show higher excitation and were classified as Linersor even Seyfert 2 galaxies. Mrk 231 is a Seyfert 1 object. Asubset of the original Condon et al. sample has been sub-sequently mapped with VLBI by Smith, Lonsdale & Lons-dale (1998, SLL), to establish the nature of the milli–arcseconds structures and in particular to obtain the bright-ness temperature of the compact inner core. SLL did notfound significant correlations between the VLBI emission(usually 10% of the 1.6GHz total flux density) and other

10 A. Bressan et al.: FIR and Radio emission in dusty starbursts
Fig. 5. Evolution of the ratio between the instantaneousstar formation rate (SFR, M⊙/yr) and radio luminosity(erg/s/Hz) at 1.49 GHz (upper panel) and at 8.44 GHz(lower panel)
physical parameters like total radio power, FIR emissionand radio slope. Perhaps more important, they have foundthat that optical excitation is not strictly correlated withhigh Tb. As can be seen from their data, summarized to-gether with the Veilleux et al. classification, in the lastcolumn of Table 3, there are HII objects showing high Tb
cores and LINERs and Sey 2 (all) galaxies with centralTb consistent with a starburst origin. Furthermore, SLLwere able to show that some of the high Tb cores couldbe explained by bright radio supernovae complexes, con-sistent with the star formation rates required by the FIR.These objects are marked with a lower case ”a” in thelast column of Table 3, while those that could not be in-terpreted in terms of bright SNRs by SLL, are markedby a lower case ”l”. Some of the high Tb objects had notenough detailed structure to allow this analysis.
According to the information provided by Veilleux etal. (1995) and SLL, we grouped all objects into four broadcategories, named with the symbol reported in column 8of Table 3. The letter ”H” indicates all galaxies of HIItype, but for three objects for which SLL could not estab-
lish that their high Tb is compatible with RSN complexes.Analogously, Liners are indicated by the symbol ”L” whentheir Tb is missing or is low, or their high Tb was foundcompatible with RSN complexes. Object classified as HII,Liners or AGN that do not fulfil the above requirementsare indicated by the symbol ”A” while, for Seyfert 2 galax-ies we use the symbol ”S”. Finally ”P” and ”M” refer toARP220, a typical starburst galaxy and Mrk 231, a Seyfert1 galaxy, respectively. According to this grouping, the ef-fect of the AGN, if any, should not be significant in typesH to L. For example a recent comprehensive analysis ofoptical-NIR-FIR SED and of spectro-polarimetric data ofIRAS 22491-1808, indicates that if the AGN is present inthis object, it must contribute less than 5% of the totalFIR emission (Fritz et al 2002).
In Figure 6 we show the run of the q values expectedfrom our starburst models, Eq.(2), at 1.49 and 8.44 GHz,against the FIR luminosity (now in solar units). Super-imposed are the selected compact ULIRGs from the localsample of Condon et al. (1991), with the correspondingsymbols listed in Table 3.
The models can be arbitrarily shifted in the horizon-tal direction by changing the mass of stars formed in theburst which, for the adopted normalization, correspondsto about 1010 M⊙. To fit the IR luminosity of the brightestcompact sources we need a SFR higher by about a factorof 2 to 3, for the shorter burst. We note that the observeddispersion of the q ratio is well explained by the starburstmodels, in particular in the lower panel, where, as we willsee, the effects of free-free absorption should be negligible.The mass of the burst is however not known a priori andwhile Fig. 6 shows that the observed data are consistentwith the sources being compact starbursts, it does not al-low to obtain an estimate of the burst parameters. On theother hand, the case of M82 and ARP220 (Figg. 1 and 2)indicates that this is within the possibility of the modelwhen enough observations are available.
We thus combine in Fig. 7 the FIR/Radio ratio withthe slope of the radio emission α between 1.49 and 8.4 Ghz.Both quantities are independent from the intensity of theburst. Rather, they depend on the form of the recent starformation history, so that the path in this diagram tracesthe evolutionary status of the starburst. The radio slope ofthe models changes because of the variation of the domi-nant source of radio emission as the starburst ages. Duringthe first 3 to 4 Myrs only thermal emission from HII re-gions contributes to the radio emission, and the radio fluxhas a characteristic slope α ≃0.1. Then CCSN explosionsfeed relativistic electrons into the galactic magnetic field,and NT emission steepens the spectrum toward a slopewhich is more typical of normal galaxies. At the same timethe total radio power increases and the evolution of the qratio, though affected by the corresponding increase of theFIR emission, continuously decrease to a minimum value.At this stage the SFR has decreased significantly and themodel can be considered in a post starburst phase. At

A. Bressan et al.: FIR and Radio emission in dusty starbursts 11
Fig. 6. Evolution of starburst models in the q vs LFIR
diagram. The upper panel is for q at 1.49 GHz, the lowerone is for q at 8.44 GHz. Stars indicate the positions oftypical models of quiescent star forming disks. The modelwith tb=25 Myr and tesc=3 Myr is also shown (small soliddots). Symbols refer to the subset of compact ULIRGs(Condon et al. 1991), drawn in Table 3.
even older ages the ratio increases again, but this corre-sponds to the very late phase where the model can nolonger be considered representative of an ultra luminousgalaxy. The model with tb=25 Myr and obscuration timeof normal galaxies, tesc=3 Myr, is not able to reproducethe observed high values of q, in both panels, confirmingthat the low UV flux observed in other obscured starburst(see e.g. Figg. 1 and 2) indicates that this escape time istoo short. The observed data show a clear trend of increas-ing q at decreasing slope, in the 1.49 GHz plot, with themodels being only able to delineate an upper envelope.At a higher frequency (lower panel), the trend in q disap-pears while the models still delineate the upper envelope.A possible explanation is that part of the effect is causedby free-free absorption (see also Condon et al. 1991). At
Fig. 7. Upper panel: evolution of the ratio q vs radio slopeα between 8.4 and 1.4 GHz for our starburst models. Char-acteristic starburst ages range from log t (yr) = 6.3 to 8.6.The model with tb=25 Myr has been recomputed bothwith a tesc=3 Myr (crossing the observed data) and byadopting a free-free absorption with τν=1.4GHz = 1 (modelon the left side up to its minimum value of q). Lower panel:same for ν=8.4 GHz. Note that q is no more affected byfree-free absorption. Symbols refer to the subset of com-pact ULIRGs (Condon et al. 1991), drawn in Table 3.
radio frequencies the optical depth of free-free absorptionby a cloud with electron density Ne and size l, is
τffν ≃ 8.2 × 10⁻² T−1.35
e (ν
GHz)−2.1(
N2e l
pc/cm6 ) (18)
In order to highlight the effects of free-free absorption wehave recomputed a model with optical depth τff
1.49Ghz=1(dot-dashed line on the left side in Fig. 7). Assuming anelectron temperature Te = 104 K, this optical depth cor-responds to an emission measure of about 6×10⁶ pc/cm6.The latter can be achieved by considering 2.5×10⁸M⊙
within 250 pc or 7.8×10⁸M⊙ within 390 pc of ionised gas,for an average electron density of about Ne=150 cm−3
or Ne=125 cm−3 and solar composition, respectively. Theabove figures compare fairly well with electron densitiesderived from emission lines ratio by Veilleux et al. (1995),

12 A. Bressan et al.: FIR and Radio emission in dusty starbursts
listed in Table 3. They are consistent both with the factthat the selected ULIRGs are compact radio sources withtypical sizes less than 1 Kpc and possibly as low as a fewhundred pc (Soifer et al. 2000), and that the total massinvolved in our starburst models is of the order of 1010M⊙.
The distribution of the data in Fig. 7 also renders quiteunlikely the possibility that the slope variation is due toan increasing importance of the electron cooling by in-verse Compton. Indeed it could be that in ULIRGs withthe lower α electrons cool down by inverse Compton on thestellar radiation field: in those objects only thermal emis-sion would be present at radio wavelengths. Not only thiswould again require a fine tuning of the two cooling pro-cesses, in order to give rise to a distribution of slopes be-tween 0.1 and 1 but, and more important, it would be dif-ficult to explain the absence of the trend at the higher fre-quency. This enforces our interpretation in terms of free-free absorption because, given the frequency dependence(Eq. 18), this effect should not affect the value of q at 8.44GHz. The quantity q8.44GHz, which still shows a range ofabout 0.6dexp, can be considered as a genuine measure ofthe age of the compact starbursts. Unfortunately, in thisdiagram, the slope is still affected by free-free absorption,and it is not possible from the above data alone to identifyprecisely the evolutionary status of the ULIRGs. However,our models suggest that, observing ultra luminous galax-ies at frequencies between 8.44 GHz and 23 GHz wouldpossibly constitute a powerful tool to investigate on therecent star formation history of obscured starbursts.
From the upper panel of Fig. 7 it is also evident thatthere is no sharp threshold value of q1.49GHz that canbe safely used to delineate a separation between star for-mation and AGN powered ULIRGs. There is a tendencyfor objects classified ”A” to occupy the lower boundaryallowed by starburst models but, even in the case of theSeyfert 1 galaxy Mrk 231, the FIR brightest object inour sample, it would be difficult to exclude a starburstorigin resting only on its q1.49GHz. However its locationin the corresponding q-slope diagram is not matched byany of our starburst models and, by looking at the higherfrequency data q8.44GHz, it appears to be at least threetimes more radio powerful (relative to the FIR) than allthe other sources and than allowed by our models in thestarburst phase. Is this an indication that the parame-ters plotted in Fig. 7 (possibly making use of a higherfrequency to avoid free-free contamination of the radioslope) could be used as a diagnostic diagram to disentan-gle a starburst from an AGN? And, in this case, why areall the Seyfert 2 galaxies in our sample just populating theupper envelope of starburst models?. From the above plotwe may only conclude that a minimum value of q1.49GHzfor a starburst powered source is around 1.8, and this mayset a threshold value below which another source of radioemission has to be invoked. One should consider howeverthat at this frequency the nuclear engine may be maskedby free-free absorption. At 8.44 GHz free-free absorption
Fig. 8. The q ratio as a function of time for the models inFig. 7.
should be less important and a fair threshold for star for-mation dominated ULIRGs is q8.44GHz=2.5.
7. The post starburst phase
In a recent comprehensive analysis of the FIR/Radio cor-relation in nearby Abell clusters, Miller & Owen (2001)found a statistically significant excess of star forminggalaxies with enhanced radio emission relative to the FIR,toward the cluster centres. High resolution radio imageshave also excluded a significant AGN contribution to theradio emission in these galaxies.
There is a long standing debate on the nature of thisexcess of galaxies with a low value of q1.49GHz, whichis always interpreted as a radio enhancement and mayreach a factor of three. Gavazzi & Jaffe (1986) advancedthe hypothesis that the radio excess is caused by the rampressure strengthening of the galaxy magnetic field, as thegalaxy travels through the intracluster medium. Accord-ing to Miller & Owen (2001) this explanation seems not towork because of the lack of any correlation with the galaxyvelocity. They suggest instead a compression of the galac-tic magnetic field by thermal pressure of the intraclustermedium.
However, due to its small scatter, the FIR/Radio cor-relation should be quite independent from the effects ofthe environment. We thus advance the hypothesis thatthe observed excess is due to an excess of post starburstgalaxies in the central regions of the cluster. Indeed soonafter a peaked starburst episode and/or a star formationinterruption, the radio emission fades less rapidly than theFIR emission, causing an apparent radio enhancement. Inthis case the effect would be only indirectly due to theenvironment, as the gas rich galaxies enhance and/or ex-haust their star formation through a central crossing.
All our models show a more or less pronounced min-imum value of q during the post starburst phase. Themodel with tb=10 Myr remains below q1.49GHz=2 for

A. Bressan et al.: FIR and Radio emission in dusty starbursts 13
about 20 Myr (Fig. 8), while its luminosity at the min-imum q has decreased by one order of magnitude (Fig. 6),but it is still infrared luminous. By decreasing the totalmass formed in the burst it is easy to populate for a shorttime the region with q1.49GHz below 2 and LFIR between1010 and 1011 L⊙. Thus a low value of q1.4GHz could simplybe a natural consequence of the particular star formationhistory experienced by the galaxy. Because high resolu-tion radio images probe that the emission is extended, therecent star formation history, either simply interrupted orenhanced and exhausted in a burst, must have been glob-ally synchronised. Our models place an upper limit of lessthan 100 Myr to the age of the last major burst and/orinterruption of the star formation. At a typical velocity of1000 Km/s, the galaxy has moved by only 100 Kpc sincethe beginning of the burst. This figure could be about twotimes larger if we allow for the formation of CCSN down to5 M⊙ (overshoot models without O, Ne, Mg white dwarfs)and use a slightly slower star formation decline.
In summary, our models indicate that the star for-mation switch-off happened not too much far from thepresent galaxy position. The excess of low q galaxies isthus simply due to the larger probability of switching offthe star formation in the higher density regions of thecluster. It is a nurture effect, possibly due to the higherdegree of harassment suffered in the central regions. As aclear implication, our spectrophotometric models predictthat these galaxies should show enhanced Balmer absorp-tion features, e.g. EW Hδ ≥5A(see also Miller & Owen2001). If our interpretation is correct, the analysis of thestatistics of the deviation from the FIR/Radio correlationat values of q lower than the average, coupled with thelow characteristic time involved, provides an independentmeasure of the local rate at which the Butcher-Oemlereffect is operating within galaxy clusters.
8. High redshift starbursts
In the last few years, a wealth of observations performed inFIR/sub-mm spectral regions revealed the existence of anew class of galaxies interpreted as the high- z analogue ofthe local ULIRGs (e.g. Smail, Ivison & Blain 1997, Hugheset al. 1998, Barger, Cowie, & Sanders 1999). The sub-mmfluxes, probably mostly powered by star formation ratherthan AGN, (Granato, Danese, & Franceschini, 1997; Al-maini, Lawrence, & Boyle, 1999), imply star formationrates of several hundreds of M⊙/yr.
The discovery of these galaxies has introduced a newtest to the theories of structure formation, but to this aimthe knowledge of their redshift distribution is of funda-mental importance. Due to the uncertain position, or tothe lack, of the optical counterparts, a spectroscopic red-shift is available only for a few sub-mm sources. Instead,an estimate of the redshift for most of these galaxies hasbeen performed exploiting the FIR-radio correlation ob-served for local star forming galaxies, under the hypothe-
sis that high-z galaxies obey the same correlation as localones (Carilli & Yun 1999, 2000; Dunne, Clements, & Eales2000; Yun & Carilli 2002).
Due to the very different power laws of the sub-mm and the radio spectra, the spectral index s353
1.4 ≡
log(S353/S1.4)/ log(353/1.4), between the 850 µm (353GHz) and the 1.4 GHz fluxes, depends very strongly onredshift, with the main uncertain factors in its effective-ness as a redshift indicator being (Carilli & Yun 2000;Dunne et al. 2000): (a) the dust temperature distribution,(b) the slope of the dust emissivity in the sub-mm and (c)the slope of the radio spectrum. Additional uncertaintiesare (d) the assumed validity of the FIR-radio correlationat high-z, that recently has been directly tested to z∼ 1.3(Garrett 2002), (e) the possible presence of AGNs (whosevalues of s353
1.4 could be attributed to lower z star forminggalaxies rather than high-z AGN), and (f) the quench-ing of the synchrotron photons due to inverse Comptonof relativistic electrons off the CMB radiation, which isexpected to be important for z > 6 (Carilli & Yun 1999).
With our model, we have investigated the s3531.4 (z) rela-
tion for starburst galaxies, keeping into account the uncer-tainties a, b and c. These factors affect the intrinsic shapeof the galaxy SED. Uncertainties due also to observationaland calibration errors are accounted for by Hughes et al.(2001). The T distribution of dust and its slope are degen-erate in the sub-mm, because a shallower slope can mimicthe effect of a colder dust component with a steeper slope(e.g. Silva 1999). This is due to the fact that the convo-lution of gray bodies of different temperatures (resultingfrom the T distribution of dust within a galaxy) yields aslope shallower than the effective one of the emissivity ofdust. Moreover both the T distribution of dust in galax-ies and the slope of the radio emission depend on severalfactors that change during the evolution of the starburst(i.e. the evolution of the stars heating the dust and theirdistribution across the galaxy, the dust optical depth, therelative importance of free-free and synchrotron emissionand the amount of free-free absorption, see Sect. 5).
Therefore we have adopted the set of starburst mod-els described in Sect. 5, i.e. the exponentially decreasingstarbursts with e–folding times tb = 10, 15, 25, 50 Myr,complemented with one more case, tb = 5 Myr, and withthe models for M82 and ARP220 (Figg. 1 and 2), to studythe dependence of s353
1.4 (z) on the evolutionary status ofthe starbursts and the consequent different shapes of theSEDs. In particular, the model for ARP220 needs a slopefor the emissivity of dust in the sub-mm of 1.5, while thisis not required for M82 and other nearby galaxies (seeSilva et al. 1998), whose SEDs can be reproduced with aslope of 2. In Sect. 5 we showed that the starburst modelscover the range of observed values of the FIR-radio re-lation and of the radio spectral index. In Fig. 9 we havechecked that the range of values of the sub-mm to radio ra-tios (850µm−1.4GHz and 450µm−5GHz to check also thespectral regions observed at high z) of the models, cover

14 A. Bressan et al.: FIR and Radio emission in dusty starbursts
Fig. 9. Color–color plot log S850µm/S1.4GHz vslog S450µm/S5GHz. Squares: Starburst models withtb = 5, 10, 15, 25, 50 Myr evolved to an age of 3 tb. Dia-monds: models for M82 and ARP220 (see Figg. 1 and 2),reproducing the SED from the UV to the radio (see Silvaet al. 1998 for details). Asteriscs connected by solid line:evolution during the starburst of the models reproducingM82 and ARP220. Triangles: Data from Dunne et al.(2000), Condon et al. (1991).
at least all the observed range. Furthermore, we can takeinto account also ratios not observed in the available localgalaxy samples, but that might be expected to be presentin some phases (e.g. during the first ∼ 3 Myr since theonset of the starburst when the radio emission is mostlythermal). The models are evolved to an age of 3 tb sincethe start of the burst. In Fig. 10 we show the s353
1.4 vs z re-lation resulting by considering all our models (we plot thehighest and the lowest one, corresponding respectively toa very initial phase dominated by free free thermal radioemission and a late phase, dominated by NT radio emis-sion), together with the relations by Carilli & Yun (2000)and Dunne et al. (2000). As already remarked by theseauthors, the effect of low frequency free-free absorptionon the relation is important only at very low z, due to itsstrong frequency dependence (τff
ν ∝ ν−2.1).
We note that the dispersion of local observations is en-tirely compatible with the one introduced by the evolutionof the starburst. Furthermore, the different evolutionarystages and thus SED shapes of the models, result in a sig-nificant dispersion of s353
1.4 at any z, sufficient to invalidateany quantitative estimate of z. We show that it might bepossible to reduce the uncertainty in the redshift estimateby combining s353
1.4 with another spectral index that de-pends mainly on the starburst age. The latter is a radiospectral index (see Sect. 5 and Fig. 7). Indeed for redshiftbetween 0 and 6 the radio spectral index of each modelchanges less than 0.2. Thus one may use this index to con-
Fig. 10. The spectral index s3531.4 as a function of redshit
for our models (upper continuos and lower dotted lines),and from Carilli & Yun (2000) and Dunne et al. (2000)(respectively dashed and 3 dot–dashed lines for averageand ±1σ). The upper model curve corresponds to a veryinitial phase of the starburst, when free free radio emis-sion dominates, while the lowest one is for a late phase.Data for galaxies and AGN with spectroscopic redshiftare reported: Asteriscs are local galaxies by Carilli & Yun(2000) and Dunne et al. (2000); Diamonds are AGN byRowan-Robinson et al. (1993), Ivison et al. (1998), Yunet al. (2000); Filled circles, Crosses, Squares, and Circlesare sub-mm and radio selected galaxies from Barger et al.(2000), Smail et al. (2000), Eales et al. (2000), and Ivisonet al. (2000) respectively. The Triangle is a cD galaxy fromEdge et al. (1999).
fine the s3531.4 -z evolution within the possible values allowed
by the corresponding selected starburst phase.In Fig. 11 we show that a linear combination of the
spectral index s3531.4 with a radio spectral index (5 − 1.4
GHz in the figures) may indeed reduce the redshift un-certainty at each z originating from age dispersion. As anexample, ∆z at z = 2 for models is 3.12, 1.67, 0.82 respec-tively for Fig. 10 and the two panels of Fig. 11. On theother hand it is important to note that, by considering thefew available sources (excluding the known AGN) with aspectroscopic z, the redshift range that would correspondto their ordinate value depends on the adopted spectralindex or combination. A detailed investigation of the red-shift distribution of sub-mm galaxies is beyond the scopeof this paper.
9. Discussion and conclusions
In this paper we have revisited the nature of theFIR/Radio correlation observed in star forming galaxies.To understand its origin and range of validity we have uti-lized models of normal star forming and starburst galax-ies. The infrared emission has been estimated with our

A. Bressan et al.: FIR and Radio emission in dusty starbursts 15
Fig. 11. Linear combinations of s3531.4 and α5
1.4 for mod-els and data. For data with only one radio flux available,the radio spectral index was set to 0.7. See Fig. 10 forreferences to data.
population synthesis code, GRASIL, which is particularlysuited for the prediction of the SED of star forming galax-ies, from the UV to the sub-mm. As for the radio emis-sion we have adopted a model which extends the capabili-ties of GRASIL into the radio regime, essentially followingthe prescriptions given by Condon & Yin (1990). Beforeadopting it we have reviewed all the possible sources ofradio emission related to the star formation activity, withparticular emphasis on the integrated properties of stellarpopulations.
In agreement with previous studies, we have found thatthe fraction of the NT emission due to radio supernovaremnants is about 6% of the total and that other dis-crete sources provide a negligible contribution. Almost allthe NT emission thus come from diffuse electrons possi-bly injected into the interstellar medium by CCSN events,and adopting a relation between the NT emission and theCCSN rate seems the safest way to proceed. However, con-trary to previous studies, we have also shown that the
latter relation, which is at the base of the tightness ofthe FIR/Radio correlation, is a natural outcome wheneversynchrotron losses happen on timescales that are shorterthan the fading time of the CCSN rate.
This is certainly the case in normal spirals, where theglobal SFR changes very little over the last billion years.But the situation may be very different in luminous star-bursts, where the SN rate may change significantly in atimescale typical of the lifetime of the most massive stars.Indeed, previous studies claimed that the existence of aFIR/Radio correlation under such conditions requires afine tuning between the magnetic and radiative energydensity, which is difficult to explain. We have shown thatthis fine tuning is not necessary. In fact the observedprevalence of synchrotron energy losses on inverse Comp-ton against the photons of the high stellar radiation field,indicates large magnetic fields and, consequently, guar-antees very short synchrotron electron lifetimes (Condon1992), certainly shorter than the typical lifetime of themost massive stars. The proportionality between the NTemission and the CCSN rate thus holds even in the ex-treme conditions found in the luminous obscured compactstarbursts. This is why the FIR/Radio correlation appearsso robust.
We have calibrated the NT emission/CCSN rate rela-tion on the observed properties of our Galaxy. With theseassumptions we reproduce well the FIR/Radio correlationof normal star forming galaxies, namely q1.4GHz=2.3. Weare thus quite confident that our model is able to repro-duce both the FIR and Radio emission of star forminggalaxies, with a minimum set of well calibrated parame-ters.
As for the starburst galaxies, with a rapidly changingSFR, we have shown that the different fading times of theFIR and Radio emission may be used to analyse in greatdetail the recent star formation history in these galax-ies. Indeed, in the cases of M82 and ARP220, presentedin Sect. 5, the combination of FIR and Radio observa-tions allows to reach a time resolution of a few tens ofMyr, which is not possible based on the UV-FIR contin-uum properties alone, and even on the optical/NIR emis-sion lines diagnostics, for obscured galaxies (Poggianti etal. 2001, Bressan et al. 2001). We have thus analysed ingreater detail the evolution of obscured starburst galaxiesunder different assumptions concerning the burst charac-teristics, challenged by the possibility of using the devia-tions from the FIR/Radio correlation as a diagnostic toolto infer the recent star formation history. We have com-pared our results with observations of a sample of compactULIRGs, having in mind that, in these objects, it is alsonot clear what fraction of IR and radio emission is pos-sibly contributed by the AGN. Compact ULIRGs show anoticeable deviation from the average FIR/Radio relation,with their q1.49GHz being generally lager than 2.3, a few ofthem with values as high as 3. Taken at face values, thesedeviations suggest that radio emission is depressed by a

16 A. Bressan et al.: FIR and Radio emission in dusty starbursts
large factor, relatively to normal spirals. Understandingthe interplay between FIR and radio emission in these ob-jects is thus fundamental to make reliable predictions forhigh redshift dust enshrouded galaxies.
Starburst models with peak SFR reaching several hun-dred M⊙/yr and thereafter exponentially declining, mayaccount for the IR and radio emission of the observedULIRGs and are able to reproduce the observed variationof the value of q1.49GHz. This view is consistent with thecurrent idea that ULIRGs and, to a larger extent high red-shift dust enshrouded galaxies, are transient phenomenathat nevertheless build up a significant fraction of starsand metals (Granato et al. 2001).
The introduction of a new diagnostic diagram, theq1.49GHz vs radio slope diagram, allows us to single outthe effects of starburst evolution and free-free absorption.Very young star bursts display an excess of FIR emis-sion relative to the radio emission because the latter isinitially contributed mainly by the free-free emission pro-cess. As the starburst ages, the NT contribution increasesand becomes the dominant source, while the radio slopereaches the typical values observed in synchrotron emis-sion. Free-free absorption affects the 1.49 GHz data, in-troducing a trend with the higher q being accompaniedby the shallower slope. The estimated optical depths forfree-free absorption at 1.49 GHz are between 0.5 and 1. At8.4 GHz, free-free absorption becomes negligible and theabove trend disappears. The value of q8.4GHz is a measureof the age of the starburst. However, even in the latterdiagram the slope is still affected by free-free absorption.Thus we suggest that a similar diagram between 8.4 GHzand a higher frequency range would be critical for the un-derstanding of the evolutionary status of compact ULIRGsbecause, in that case, the slope, unaffected by free-freeabsorption, would provide an independent estimate of theage.
If ULIRGs are transient phenomena as suggested byother independent studies, then determining their SFRfrom conventional estimators may be a problem. They arefar from being in a stationary status, the term ”averagestar formation” is meaningless, and applying standard cal-ibrations may result in a significant error and/or appar-ent discrepancy between the observable themselves. Oneshould be able to reconstruct the recent history of starformation and, for this purpose, we suggest the use of theabove diagram to determine the characteristic parametersof the burst first, and then the age-averaged SFR fromeither the FIR or radio luminosity.
Another relevant question addressed is how reliable isthe use the FIR/Radio correlation to evaluate the con-tribution of non thermal radiation from the central ac-tive nucleus. Among the plotted data, the symbol ”M”indicates the position of the Seyfert 1 galaxy Mrk 231(UGC 08058) (Thean et al. 2000). The fact that Mrk 231is clearly distinct from the other objects and occupies aposition below any starburst model, becomes particularly
evident in the q8.4GHz vs slope diagram, where the effectsof free-free absorption on the q ratio are minimized.
We have also shown that during the post starburstphase, the models reach values of q significantly lower thanthose of quiescent spirals, with still significant FIR lumi-nosities. This is consistent with the detection in nearbyAbell clusters of a statistically significant excess of starforming galaxies with enhanced radio emission relative tothe FIR (Miller & Owen 2001). We suggest that these lowvalues of q are due to an evolutionary effect rather than adirect enhancement of radio emission by interaction withthe intracluster medium.
Finally we have investigated on the redshift depen-dence of the the FIR/Radio correlation and on its valid-ity (through the sub-mm radio index, s353
1.4 ) to provide aphotometric redshift estimate of obscured distant galaxies.The large dispersion of s353
1.4 observed among local galax-ies is compatible with the evolutionary effects discussed inSect. 5. The unknown evolutionary status of the starburstrenders the s353
1.4 index very unreliable at almost any red-shift. We thus suggest to complement the index s353
1.4 witha radio slope determination, because of its tight relationwith the evolutionary phase of the starburst and the itsvery shallow dependence on the redshift. Other uncertain-ties like the sub-mm slope and the presence of a significantcontribution at radio wavelengths from a central AGN, ob-viously worsen the above picture.
Acknowledgements. We thank I. Aretxaga , L. Danese, A.Franceschini, D. Huges, P. Panuzzo, B. Poggianti and O. Prou-ton for useful discussions and the anonymous referee for use-ful comments. A.B. and G.L.G. acknowledge warm hospital-ity by INAOE. This research was partially supported by theEuropean Community under TMR grant ERBFMRX-CT96-0086 and by the Italian Ministry for University and Research(MURST) under grant Cofin 92001021149-002.
References
Almaini, O., Lawrence, A., & Boyle, B.J. 1999, MNRAS, 305,L59
Barger, A.J., Cowie L.L., & Sanders, D.B. 1999, ApJ, 518, L5Barger, A.J., Cowie L.L., & Richards, E.A. 2000, AJ, 119, 2092Berkhuijsen, E.M. 1984, A&A, 140, 431Berta, S., Fritz, J., Pernechele, C., Bressan, A. & Franceschini,
A. 2002, ApJ, submitted.Blain, A.W. 1999, MNRAS, 309, 955Bressan, A., Poggianti, B., & Franceschini, A. 2001, ”QSO
hosts and their environments”. Dordrecht: Kluwer Aca-demic / Plenum Publishers, 2001 xvii, 376 p. ISBN0306466627, p.171, 171
Calzetti, D., Kinney, A. L., & Storchi-Bergmann, T. 1994, ApJ,429, 582
Carilli, C.L., & Yun, M.S. 1999, ApJ, 513, L13Carilli, C.L., & Yun, M.S. 2000, ApJ, 530, 618Carilli, C.L., 2000, ”Radio Observations of High Redshift Star
Forming Galaxies”, in ”Starburst Galaxies Near and Far”,eds. D. Lutz and L. Taconni, Springer, (astro-ph/0011199)
Clark, D. H., & Caswell, J. L. 1976, MNRAS, 174, 267

A. Bressan et al.: FIR and Radio emission in dusty starbursts 17
Condon, J. J., & Yin, Q. F. 1990, ApJ, 357, 97Condon, J. J., Huang, Z. P., Yin, Q. F., & Thuan, T. X. 1991,
ApJ, 378, 65Condon, J. J. 1992, ARA&A, 30, 575Dunne, L., Clements, D.L., & Eales, S.A. 2000, MNRAS, 319,
813Dwek, E., Arendt, R. G., Hauser, M. G., Fixsen, D., Kelsall,
T., Leisawitz, D., Pei, Y. C., Wright, E. L., Mather, J. C.,Moseley, S. H., Odegard, N., Shafer, R., Silverberg, R. F.,& Weiland, J. L. 1998, ApJ, 508, 106
Eales, S., Lilly, S., Webb, T., Dunne, L., Gear, W., Clements,D., & Yun, M. 2000, AJ, 120, 2244
Edge, A.C., Ivison, R.J., Smail, I., Blain, A.W., & Kneib, J.P.,1999, MNRAS, 306, 599
Elbaz, D., Cesarsky, C. J., Fadda, D., Aussel, H., Desert,F. X., Franceschini, A., Flores, H., Harwit, M., Puget, J. L.,Starck, J. L., Clements, D. L., Danese, L., Koo, D. C., &Mandolesi, R. 1999, A&A, 351, L37
Ferland, G. J., 1996, Hazy, a Brief Introduction to CLOUDY
90, Univ. of Kentucky Physics Department Internal ReportFlores, H., Hammer, F., Thuan, T. X., Cesarsky, C., Desert,
F. X., Omont, A., Lilly, S. J., Eales, S., Crampton, D., &Le Fevre, O. 1999, ApJ, 517, 148
Fritz, J., Berta, S., Pernechele, C., Bressan, A. & Franceschini,A. 2002, ApJ, submitted.
Garrett, M. A. 2002, A&A, 384, L19Goldader, J. D., Meurer, G., Heckman, T. M., Seibert, M.,
Sanders, D. B., Calzetti, D., & Steidel, C. C. 2002, ApJ,568, 651
Gavazzi, G. and Jaffe, W., 1986, ApJ, 310, 53Gordon, S.M., Duric, N., Kirshner, R.P., Goss, W.M., & Vialle-
fond, F. 1999, ApJS, 120, 247Granato, G.L., Danese, L., & Franceschini, A. 1997, ApJ, 486,
147Granato, G. L., Lacey, C. G., Silva, L., Bressan, A., Baugh,
C.M., Cole, S., & Frenk, C.S. 2000, ApJ, 542, 710Granato, G. L., Silva, L., Monaco, P., Panuzzo, P., Salucci, P.,
De Zotti, G., Danese, L., 2001, MNRAS, 324, 757Hauser, M. G., Arendt, R. G., Kelsall, T., Dwek, E., Ode-
gard, N., Weiland, J. L., Freudenreich, H. T., Reach, W.T., Silverberg, R. F., Moseley, S. H., Pei, Y. C., Lubin,P., Mather, J. C., Shafer, R. A., Smoot, G. F., Weiss, R.,Wilkinson, D. T., & Wright, E. L. 1998, ApJ, 508, 25
Helou, G., Khan, I.R., Malek, L., Boehmer, L., 1988, ApJS,68, 151
Hughes, D.H., et al. 1998, Nature, 394, 241Hughes, D.H., et al. 2001, astro-ph/0111547Ivison, R.J., Smail, I., Le Borgne, J.F., Blain, A.W., Kneib,
J.P., Bezecourt, J., Kerr, T.H., & Davies, J.K. 1998, MN-RAS, 298, 583
Ivison, R.J., Smail, I., Barger, A.J., Kneib, J.P., Blain, A.W.,Owen, F.N., Kerr, T.H., & Cowie, L.L. 2000, MNRAS, 315,209
Kafatos, M., Sofia, S., Gull, T., Bruhweiler, F. 1980, ApJ, 242,294
Lisenfeld, U., Voelk, H. J., & Xu, C. 1996, A&A, 314, 745Longair, M. S. 1994, High energy astrophysics. Vol.2: Stars, the
galaxy and the interstellar medium, Cambridge UniversityPress, p.280
Meurer, G. R., Heckman, T. M. and Calzetti, D., 1999, ApJ,521, 64
Miller, N. A., Owen, F. N. , 2001, AJ, 121, 1903Panuzzo, P., Granato, G.L., Bressan, A., Silva, L. & Danese,
L., 2002, A&A, submittedPernechele, C., Bonoli, C., Bressan, A, Giro, E., Berta, S.,
Fritz, J., Marconi, A., E. & Franceschini, A., 2002, ApJ,submitted.
Poggianti, B.M., & Wu, H. 2000, ApJ, 529, 157Poggianti, B. M., Bressan, A., & Franceschini, A. 2001, ApJ,
550, 195Portinari, L., Chiosi, C., & Bressan, A. 1998, A&A, 334, 505Puget,J.-L., Abergel, A., Bernard, J.-P., Boulanger, F., Bur-
ton, W. B., Desert, F.-X., & Hartmann, D 1996, A&A,308, L5
Renzini, A., & Buzzoni, A. 1986, In Spectral evolution of galax-
ies, eds. Chiosi, C., Renzini, A., Reidel, Dordrecht, p. 195Ritossa, C., Garcia-Berro, E. & Iben, I. Jr., 1996, ApJ, 460,
489Rowan-Robinson, M., Efstathiou, A., Lawrence, A., Oliver,
S., Taylor, A., Broadhurst, T.J., McMahon, R.G., Benn,C.R., Condon, J.J., Lonsdale, C.J., Hacking, P., Conrow,T., Saunders, W.S., Clements, D.L., Ellis, R.S., & Robson,I. 1993, MNRAS, 261, 513
Rowan-Robinson, M., 1995, MNRAS, 272, 737Rubin, R. H. 1968, ApJ, 154, 391Sanders, D.B., & Mirabel, I.F. 1996, ARA&A, 34, 749Silva, L., Granato, G.L., Bressan, A., & Danese, L. 1998, ApJ
509, 103Silva, L. 1999, PhD Thesis, SISSA/ISAS, Trieste, ItalySmail, I., Ivison, R.J., & Blain, A.W. 1997, ApJ, 490, L5Smail, I., Ivison, R.J., Owen, F.N., Blain, A.W., & Kneib, J.P.
2000, ApJ, 528, 612Smith, H. E., Lonsdale, C. J., & Lonsdale, C. J. 1998, ApJ,
492, 137 (SLL)Soifer, B.T., Sanders, D.B., Neugebauer, G., Danielson, G.E.,
Lonsdale, C.J., Madore, B.F., & Persson, S.E. 1986, ApJL,303, 41
Soifer, B.T., et al., 2000, AJ, 119, 509Thean, A., Pedlar, A., Kukula, M.J., Baum, S.A., & ODea,
C.P. 2000, MNRAS, 314, 573Veilleux, S., Kim, D.-C., Sanders, D. B., Mazzarella, J. M., &
Soifer, B. T. 1995, ApJS, 98, 171Valdes Parra, J.R., Rodighiero, J., Bressan, A., Franceschini,
A., & Rigopoulou, D. 2002, in preparation.Wu, H., Zou, Z. L., Xia, X.Y., & Deng, Z.G. 1998b, A&AS,
132, 181Yun, M.S., Carilli, C.L., Kawabe, R., Tutui, Y., Kohno, K, &
Ohta, K. 2000, ApJ, 528, 171Yun, M. S. & Carilli, C. L. 2002, ApJ, 568, 88
Copyright © 2022 FDOKUMEN