VIII. The observational properties of post-merger galaxies
12
MNRAS 435, 3627–3638 (2013) doi:10.1093/mnras/stt1562 Advance Access publication 2013 September 13 Galaxy pairs in the Sloan Digital Sky Survey – VIII. The observational properties of post-merger galaxies Sara L. Ellison, 1‹ J. Trevor Mendel, 2 David R. Patton 3 and Jillian M. Scudder 1 1 Department of Physics & Astronomy, University of Victoria, Finnerty Road, Victoria, British Columbia, V8P 1A1, Canada 2 Max-Planck-Institut fur Extraterrestrische Physik, Giessenbachstrasse, D-85748 Garching, Germany 3 Department of Physics & Astronomy, Trent University, 1600 West Bank Drive, Peterborough, Ontario, K9J 7B8, Canada Accepted 2013 August 15. Received 2013 August 14; in original form 2013 June 20 ABSTRACT In order to investigate the effects of galaxy mergers throughout the interaction sequence, we present a study of 10 800 galaxies in close pairs and a smaller sample of 97 post-mergers identified in the Sloan Digital Sky Survey. We find that the average central star formation rate (SFR) enhancement (×3.5) and the fraction of starbursts (20 per cent) peak in the post- merger sample. The post-mergers also show a stronger deficit in gas phase metallicity than the closest pairs, being more metal-poor than their control by −0.09 dex. Combined with the observed trends in SFR and the time-scales predicted in merger simulations, we estimate that the post-mergers in our sample have undergone coalescence within the last few hundred Myr. In contrast with the incidence of star-forming galaxies, the frequency of active galactic nuclei (AGN) peaks in the post-mergers, outnumbering AGN in the control sample by a factor of 3.75. Moreover, amongst the galaxies that host an AGN, the black hole accretion rates in the closest pairs and post-mergers are higher by a factor of ∼3 than AGN in the control sample. These results are consistent with a picture in which star formation is initiated early on in the encounter, with AGN activity peaking post-coalescence. Key words: galaxies: abundances – galaxies: active – galaxies: evolution – galaxies: interac- tions – galaxies: Seyfert – galaxies: starburst. 1 INTRODUCTION Galaxy mergers represent a cornerstone in our picture of hierarchi- cal galaxy evolution. In addition to building up the stellar mass in galaxies, mergers are predicted to trigger central starbursts, feed the central supermassive black hole and potentially completely trans- form the galaxy’s morphology (e.g. Barnes & Hernquist 1996; Di Matteo, Springel & Hernquist 2005; Springel, Di Matteo & Hernquist 2005; Di Matteo et al. 2007, 2008; Cox et al. 2008; Montuori et al. 2010; Rupke, Kewley & Barnes 2010a; Perez, Michel-Dansac & Tissera 2011; Torrey et al. 2012). There has been considerable observational work over the last decades to con- firm these theoretical predictions, which bear out many of the gen- eral, qualitative predictions of the simulations over a range of red- shifts (e.g. Kennicutt et al. 1987; Barton, Geller & Kenyon 2000; Kewley, Geller & Barton 2006a; Woods, Geller & Barton 2006; Smith et al. 2007; Jogee et al. 2009; Rupke, Kewley & Chien 2010b; Koss et al. 2010, 2012; Silverman et al. 2011; Wong et al. 2011; Ramos-Almeida et al. 2011, 2012; Xu et al. 2012; Cotini et al. 2013; Lanz et al. 2013). However, a full and detailed picture of E-mail: [email protected] the merger transformation requires large samples of galaxies that span a range in mass, mass ratio, structural properties, environments and projected separation, since all of these properties are likely to impact the specific outcome of a merger. Moreover, a combination of both spectroscopic and imaging data, which yields simultaneous information on morphology, metallicity, star formation and black hole accretion rates, etc. is needed to fully characterize the changes that these galaxies undergo. Finally, a carefully matched control sample is essential in order to disentangle the effects of mergers from trends that are intrinsically present in the galaxy population (Perez, Tissera & Blaizot 2009). The Sloan Digital Sky Survey (SDSS) is well suited to this task, providing public imaging and spectroscopic data for approximately one million galaxies in the nearby universe. By combining the imag- ing and spectroscopic samples, it has been possible to tackle many aspects of galaxy mergers with unparalleled statistics. Samples of either close spectroscopic pairs or morphologically classified merg- ers have been used to investigate the impact of galaxy interactions on colours (Ellison et al. 2010; Patton et al. 2011; Alonso et al. 2012; Lambas et al. 2012), star formation rates (SFRs; Nikolic, Cullen & Alexander 2004; Alonso et al. 2006; Ellison et al. 2008, 2013; Li et al. 2008a; Scudder et al. 2012b; Patton et al. 2013), metallic- ity (Michel-Dansac et al. 2008; Ellison et al. 2008; Reichard et al. C 2013 The Authors Published by Oxford University Press on behalf of the Royal Astronomical Society Downloaded from https://academic.oup.com/mnras/article/435/4/3627/1040352 by guest on 21 January 2022
-
Upload
khangminh22 -
Category
Documents
-
view
0 -
download
0
Transcript of VIII. The observational properties of post-merger galaxies

MNRAS 435, 3627–3638 (2013) doi:10.1093/mnras/stt1562Advance Access publication 2013 September 13
Galaxy pairs in the Sloan Digital Sky Survey – VIII. The observationalproperties of post-merger galaxies
Sara L. Ellison,1‹ J. Trevor Mendel,2 David R. Patton3 and Jillian M. Scudder1
1Department of Physics & Astronomy, University of Victoria, Finnerty Road, Victoria, British Columbia, V8P 1A1, Canada2Max-Planck-Institut fur Extraterrestrische Physik, Giessenbachstrasse, D-85748 Garching, Germany3Department of Physics & Astronomy, Trent University, 1600 West Bank Drive, Peterborough, Ontario, K9J 7B8, Canada
Accepted 2013 August 15. Received 2013 August 14; in original form 2013 June 20
ABSTRACTIn order to investigate the effects of galaxy mergers throughout the interaction sequence, wepresent a study of 10 800 galaxies in close pairs and a smaller sample of 97 post-mergersidentified in the Sloan Digital Sky Survey. We find that the average central star formationrate (SFR) enhancement (×3.5) and the fraction of starbursts (20 per cent) peak in the post-merger sample. The post-mergers also show a stronger deficit in gas phase metallicity thanthe closest pairs, being more metal-poor than their control by −0.09 dex. Combined with theobserved trends in SFR and the time-scales predicted in merger simulations, we estimate thatthe post-mergers in our sample have undergone coalescence within the last few hundred Myr.In contrast with the incidence of star-forming galaxies, the frequency of active galactic nuclei(AGN) peaks in the post-mergers, outnumbering AGN in the control sample by a factor of3.75. Moreover, amongst the galaxies that host an AGN, the black hole accretion rates in theclosest pairs and post-mergers are higher by a factor of ∼3 than AGN in the control sample.These results are consistent with a picture in which star formation is initiated early on in theencounter, with AGN activity peaking post-coalescence.
Key words: galaxies: abundances – galaxies: active – galaxies: evolution – galaxies: interac-tions – galaxies: Seyfert – galaxies: starburst.
1 IN T RO D U C T I O N
Galaxy mergers represent a cornerstone in our picture of hierarchi-cal galaxy evolution. In addition to building up the stellar mass ingalaxies, mergers are predicted to trigger central starbursts, feed thecentral supermassive black hole and potentially completely trans-form the galaxy’s morphology (e.g. Barnes & Hernquist 1996;Di Matteo, Springel & Hernquist 2005; Springel, Di Matteo &Hernquist 2005; Di Matteo et al. 2007, 2008; Cox et al. 2008;Montuori et al. 2010; Rupke, Kewley & Barnes 2010a; Perez,Michel-Dansac & Tissera 2011; Torrey et al. 2012). There hasbeen considerable observational work over the last decades to con-firm these theoretical predictions, which bear out many of the gen-eral, qualitative predictions of the simulations over a range of red-shifts (e.g. Kennicutt et al. 1987; Barton, Geller & Kenyon 2000;Kewley, Geller & Barton 2006a; Woods, Geller & Barton 2006;Smith et al. 2007; Jogee et al. 2009; Rupke, Kewley & Chien 2010b;Koss et al. 2010, 2012; Silverman et al. 2011; Wong et al. 2011;Ramos-Almeida et al. 2011, 2012; Xu et al. 2012; Cotini et al.2013; Lanz et al. 2013). However, a full and detailed picture of
� E-mail: [email protected]
the merger transformation requires large samples of galaxies thatspan a range in mass, mass ratio, structural properties, environmentsand projected separation, since all of these properties are likely toimpact the specific outcome of a merger. Moreover, a combinationof both spectroscopic and imaging data, which yields simultaneousinformation on morphology, metallicity, star formation and blackhole accretion rates, etc. is needed to fully characterize the changesthat these galaxies undergo. Finally, a carefully matched controlsample is essential in order to disentangle the effects of mergersfrom trends that are intrinsically present in the galaxy population(Perez, Tissera & Blaizot 2009).
The Sloan Digital Sky Survey (SDSS) is well suited to this task,providing public imaging and spectroscopic data for approximatelyone million galaxies in the nearby universe. By combining the imag-ing and spectroscopic samples, it has been possible to tackle manyaspects of galaxy mergers with unparalleled statistics. Samples ofeither close spectroscopic pairs or morphologically classified merg-ers have been used to investigate the impact of galaxy interactionson colours (Ellison et al. 2010; Patton et al. 2011; Alonso et al. 2012;Lambas et al. 2012), star formation rates (SFRs; Nikolic, Cullen &Alexander 2004; Alonso et al. 2006; Ellison et al. 2008, 2013; Liet al. 2008a; Scudder et al. 2012b; Patton et al. 2013), metallic-ity (Michel-Dansac et al. 2008; Ellison et al. 2008; Reichard et al.
C© 2013 The AuthorsPublished by Oxford University Press on behalf of the Royal Astronomical Society
Dow
nloaded from https://academ
ic.oup.com/m
nras/article/435/4/3627/1040352 by guest on 21 January 2022

3628 S. L. Ellison et al.
2009; Peeples et al. 2009; Alonso, Michel-Dansac & Lambas 2010;Scudder et al. 2012b; Chung et al. 2013), morphology (Ellisonet al. 2010; Darg et al. 2010; Casteels et al. 2013), gas consumption(Fertig et al., in preparation; Scudder et al., in preparation), infra-redemission (Hwang et al. 2010, 2011; Ellison et al. 2013) and nuclearactivity (Alonso et al. 2007; Woods & Geller 2007; Li et al. 2008b;Ellison et al. 2008, 2011; Rogers et al. 2009; Darg et al. 2010; Liu,Shen & Strauss 2012; Sabater, Best, Argudo-Fernandez 2013).
Although the observational signatures of mergers are now welldocumented, quantifying the relevant time-scales for star formationand black hole accretion is more challenging to pin down. Earlysimulations (e.g. Mihos & Hernquist 1994, 1996) found that theduration of merger-triggered starbursts was fairly short, of the or-der of tens of megayears. At the time, similarly short time-scaleshad also been inferred from observations of mergers (e.g. Larson& Tinsley 1978; Kennicutt et al. 1987). The natural projected sep-arations on which to study the effects of mergers would thereforebe at most a few tens of kpc. In more recent works, the obser-vationally informed duration of triggered star formation has beenextended to several hundred megayears (e.g. Barton et al. 2000;Knapen & James 2009; Woods et al. 2010). For relative velocitiesof the order of a few hundred km s−1, this corresponds to pro-jected separations up to ∼50 h−1
70 kpc. Indeed, this has been thetypical separation that most studies of close pairs have selected,with enhanced SFRs usually detected within projected separations∼30 h−1
70 kpc (e.g. Barton et al. 2000; Alonso et al. 2007; Domingueet al. 2009; Wong et al. 2011). However, it has recently been shownthat the effects of galaxy interactions can be detected in pairs withseparations in excess of 50 h−1
70 kpc (e.g. Park & Choi 2009; Pattonet al. 2011; Scudder et al. 2012b). Using a new methodology foridentifying pairs and control samples out to projected separationsof 1 Mpc, Patton et al. (2013) have recently shown that the SFRs inSDSS galaxy pairs only decline to the level of a control sample atseparations beyond 150 h−1
70 kpc. Perhaps even more surprisingly,Patton et al. (2013) also determined that the integrated SFR en-hancement in galaxy interactions is actually dominated by widelyseparated pairs (50 < rp < 150 h−1
70 kpc), which are often excludedfrom merger studies. These results appear to be robust, and not sim-ply a feature of the analysis technique, as has recently been shownto apply to correlation function analyses (Robaina & Bell 2012).Moreover, the detection of enhanced SFRs at wide separations isconsistent with the much longer time-scales (up to a Gyr or more)for interaction-induced star formation predicted by contemporaryhydrodynamical simulations (e.g. Cox et al. 2006, 2008; Torreyet al. 2012). The short time-scales inferred from early observationalstudies (e.g. Larson & Tinsley 1978) may be in part a selection biaswhereby the morphological disturbances (as a sign of interaction)favour short post-pericentre time-scales, whereas samples of pairsmore fully sample the full interaction sequence (Lotz et al. 2008).
With the recent extension of merger samples out to projectedseparations of 1 Mpc, and with the interpretive framework pro-vided by modern simulations, we are now converging on a fairlycomplete view of galaxy–galaxy interactions. However, there isone piece of the merger story that is still missing from studies ofgalaxy pairs: final coalescence and post-merger evolution. Mergersimulations (e.g. Mihos & Hernquist 1996; Di Matteo et al. 2005,2007; Springel et al. 2005; Cox et al. 2006; Johansson, Naab &Burkert 2009; Montuori et al. 2010; Debuhr, Quataert & Ma 2011;Torrey et al. 2012) indicate that the most intense bursts of starformation (and black hole accretion) happen around the time ofcoalescence, so it is important to include this component in obser-vational studies. Certain selection criteria are known to frequently
identify late stage mergers, most notably the luminous and ultra-luminous infra-red galaxies (LIRGs and ULIRGs; e.g. Kartaltepeet al. 2010 and references therein). However, selection based on afixed IR luminosity is likely to be biased towards the most massive,most highly star-forming mergers (e.g. Hwang et al. 2010; Ellisonet al. 2013). Very few systematic studies of the post-merger phaseexist. Carpineti et al. (2012) identify a sample of 30 spheroidal post-mergers from which they measure an enhanced fraction of activegalactic nuclei (AGN). However, without a well-matched and ho-mogeneously analysed sample of galaxies in the pre-merger phase,it is not straightforward to quantify the impact of final coalescencerelative to earlier stages in the interaction sequence.
The goal of this paper is to identify a sample of post-mergergalaxies in the SDSS and analyse them identically to the sample ofclose pairs studied in our previous works. In this way, it is possibleto follow the evolution of the merger to its final stages. One ofthe strengths of this work is that we can apply identical analysistechniques to the pre- and post-merger phases, ensuring that thedata are comparable in the two regimes. In Section 2 we describethe various samples used in this work: close pairs, post-mergers andtheir respective controls. Sections 3, 4 and 5 deal with changes inthe star-forming, metallicity and nuclear properties, respectively.
We adopt a cosmology of �� = 0.7, �M = 0.3,H0 = 70 km s−1 Mpc−1.
2 SA M P L E SE L E C T I O N
2.1 Close pairs
The starting point for the selection of our sample of galaxy pairs isthe SDSS DR7 Main Galaxy Sample (14.0 ≤ mr ≤ 17.77) with aredshift range 0.01 ≤ z ≤ 0.2 and SDSS specclass=2. The criteriaand justification for our selection of pairs from the SDSS havebeen discussed extensively in our previous papers on this topic (e.g.Patton et al. 2011; Ellison et al. 2011, 2013; Scudder et al. 2012b).We therefore review only briefly the main requirements and referthe interested reader to these earlier works for more complete detailsand discussions on selection biases etc. In order to be included inour sample of close pairs, we require that a galaxy has a companionthat fulfils the following criteria:
(i) A projected physical separation rp ≤ 80 h−170 kpc.
(ii) A line-of-sight velocity difference �V ≤ 300 km s−1, in orderto minimize chance projections.
(iii) A stellar mass ratio of 0.25 ≤ M1/M2 ≤ 4.
There are two main differences in the pairs sample used in thispaper compared to our previous works. The first is our choice ofmass ratios; in our previous papers, we have investigated the effectof mergers on pairs with stellar masses that differ by up to a fac-tor of 10. However, the goal of the current study is to investigatethe evolution of mergers as they progress through the coalescencephase. It is therefore desirable to identify close pairs that are, asfar as is possible, pre-merger analogues to the post-mergers in oursample. The visual or automated selection of post-mergers, both ofwhich rely on galaxy asymmetry, is likely to be highly skewed to-wards major mergers, with approximately equal stellar masses (e.g.Lotz et al. 2010). We have therefore restricted our sample to pairswhose mass ratios are within a factor of 4 of one another. However,it is worth noting that our results change very little with this morerestrictive mass ratio cut, as may have been expected based on ourprevious work (e.g. Ellison et al. 2011; Scudder et al. 2012b). This
Dow
nloaded from https://academ
ic.oup.com/m
nras/article/435/4/3627/1040352 by guest on 21 January 2022
The properties of post-merger galaxies 3629
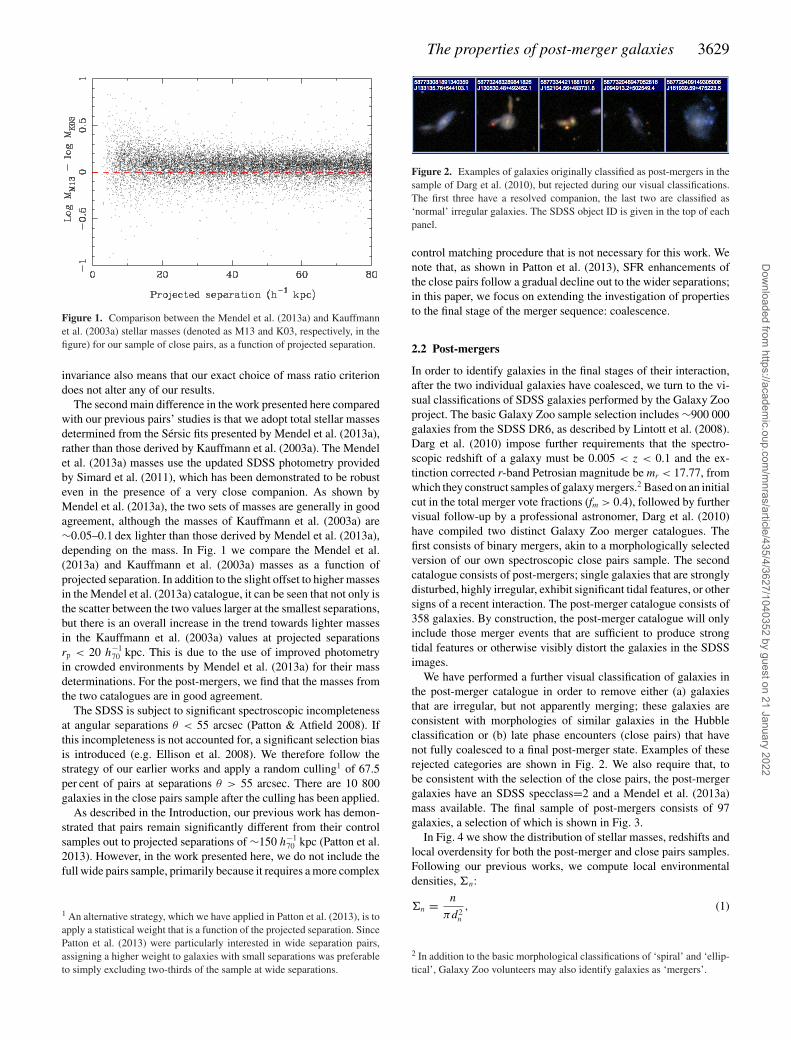
Figure 1. Comparison between the Mendel et al. (2013a) and Kauffmannet al. (2003a) stellar masses (denoted as M13 and K03, respectively, in thefigure) for our sample of close pairs, as a function of projected separation.
invariance also means that our exact choice of mass ratio criteriondoes not alter any of our results.
The second main difference in the work presented here comparedwith our previous pairs’ studies is that we adopt total stellar massesdetermined from the Sersic fits presented by Mendel et al. (2013a),rather than those derived by Kauffmann et al. (2003a). The Mendelet al. (2013a) masses use the updated SDSS photometry providedby Simard et al. (2011), which has been demonstrated to be robusteven in the presence of a very close companion. As shown byMendel et al. (2013a), the two sets of masses are generally in goodagreement, although the masses of Kauffmann et al. (2003a) are∼0.05–0.1 dex lighter than those derived by Mendel et al. (2013a),depending on the mass. In Fig. 1 we compare the Mendel et al.(2013a) and Kauffmann et al. (2003a) masses as a function ofprojected separation. In addition to the slight offset to higher massesin the Mendel et al. (2013a) catalogue, it can be seen that not only isthe scatter between the two values larger at the smallest separations,but there is an overall increase in the trend towards lighter massesin the Kauffmann et al. (2003a) values at projected separationsrp < 20 h−1
70 kpc. This is due to the use of improved photometryin crowded environments by Mendel et al. (2013a) for their massdeterminations. For the post-mergers, we find that the masses fromthe two catalogues are in good agreement.
The SDSS is subject to significant spectroscopic incompletenessat angular separations θ < 55 arcsec (Patton & Atfield 2008). Ifthis incompleteness is not accounted for, a significant selection biasis introduced (e.g. Ellison et al. 2008). We therefore follow thestrategy of our earlier works and apply a random culling1 of 67.5per cent of pairs at separations θ > 55 arcsec. There are 10 800galaxies in the close pairs sample after the culling has been applied.
As described in the Introduction, our previous work has demon-strated that pairs remain significantly different from their controlsamples out to projected separations of ∼150 h−1
70 kpc (Patton et al.2013). However, in the work presented here, we do not include thefull wide pairs sample, primarily because it requires a more complex
1 An alternative strategy, which we have applied in Patton et al. (2013), is toapply a statistical weight that is a function of the projected separation. SincePatton et al. (2013) were particularly interested in wide separation pairs,assigning a higher weight to galaxies with small separations was preferableto simply excluding two-thirds of the sample at wide separations.
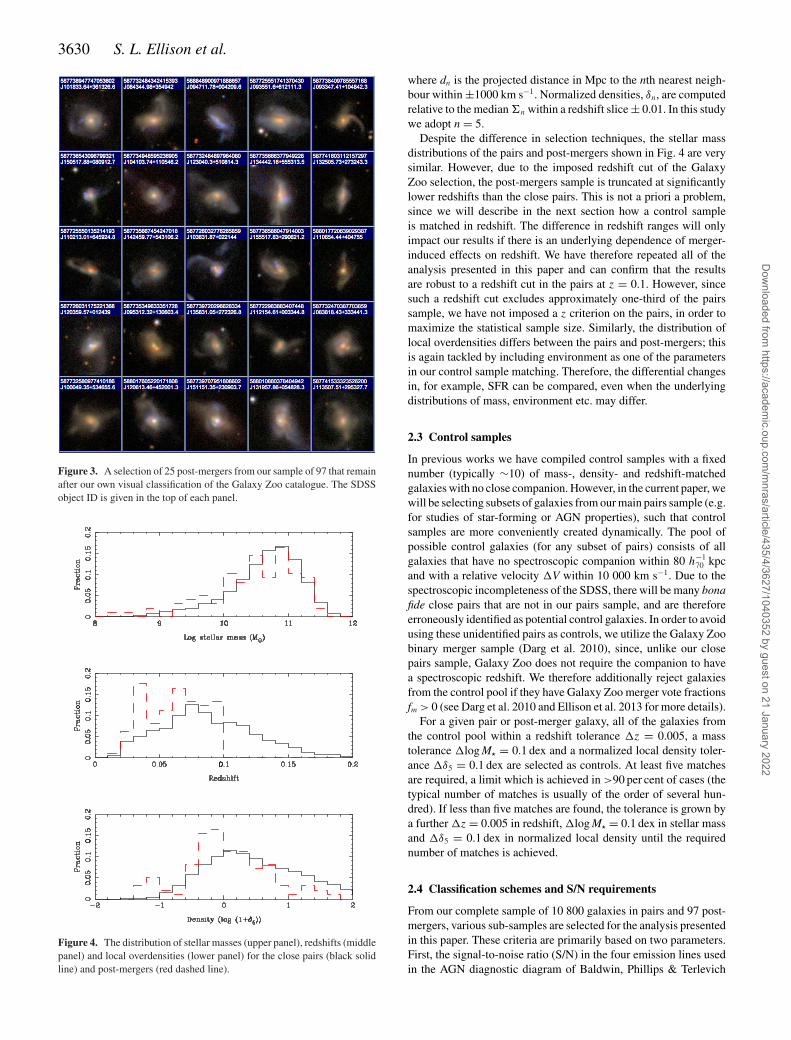
Figure 2. Examples of galaxies originally classified as post-mergers in thesample of Darg et al. (2010), but rejected during our visual classifications.The first three have a resolved companion, the last two are classified as‘normal’ irregular galaxies. The SDSS object ID is given in the top of eachpanel.
control matching procedure that is not necessary for this work. Wenote that, as shown in Patton et al. (2013), SFR enhancements ofthe close pairs follow a gradual decline out to the wider separations;in this paper, we focus on extending the investigation of propertiesto the final stage of the merger sequence: coalescence.
2.2 Post-mergers
In order to identify galaxies in the final stages of their interaction,after the two individual galaxies have coalesced, we turn to the vi-sual classifications of SDSS galaxies performed by the Galaxy Zooproject. The basic Galaxy Zoo sample selection includes ∼900 000galaxies from the SDSS DR6, as described by Lintott et al. (2008).Darg et al. (2010) impose further requirements that the spectro-scopic redshift of a galaxy must be 0.005 < z < 0.1 and the ex-tinction corrected r-band Petrosian magnitude be mr < 17.77, fromwhich they construct samples of galaxy mergers.2 Based on an initialcut in the total merger vote fractions (fm > 0.4), followed by furthervisual follow-up by a professional astronomer, Darg et al. (2010)have compiled two distinct Galaxy Zoo merger catalogues. Thefirst consists of binary mergers, akin to a morphologically selectedversion of our own spectroscopic close pairs sample. The secondcatalogue consists of post-mergers; single galaxies that are stronglydisturbed, highly irregular, exhibit significant tidal features, or othersigns of a recent interaction. The post-merger catalogue consists of358 galaxies. By construction, the post-merger catalogue will onlyinclude those merger events that are sufficient to produce strongtidal features or otherwise visibly distort the galaxies in the SDSSimages.
We have performed a further visual classification of galaxies inthe post-merger catalogue in order to remove either (a) galaxiesthat are irregular, but not apparently merging; these galaxies areconsistent with morphologies of similar galaxies in the Hubbleclassification or (b) late phase encounters (close pairs) that havenot fully coalesced to a final post-merger state. Examples of theserejected categories are shown in Fig. 2. We also require that, tobe consistent with the selection of the close pairs, the post-mergergalaxies have an SDSS specclass=2 and a Mendel et al. (2013a)mass available. The final sample of post-mergers consists of 97galaxies, a selection of which is shown in Fig. 3.
In Fig. 4 we show the distribution of stellar masses, redshifts andlocal overdensity for both the post-merger and close pairs samples.Following our previous works, we compute local environmentaldensities, �n:
�n = n
πd2n
, (1)
2 In addition to the basic morphological classifications of ‘spiral’ and ‘ellip-tical’, Galaxy Zoo volunteers may also identify galaxies as ‘mergers’.
Dow
nloaded from https://academ
ic.oup.com/m
nras/article/435/4/3627/1040352 by guest on 21 January 2022
3630 S. L. Ellison et al.
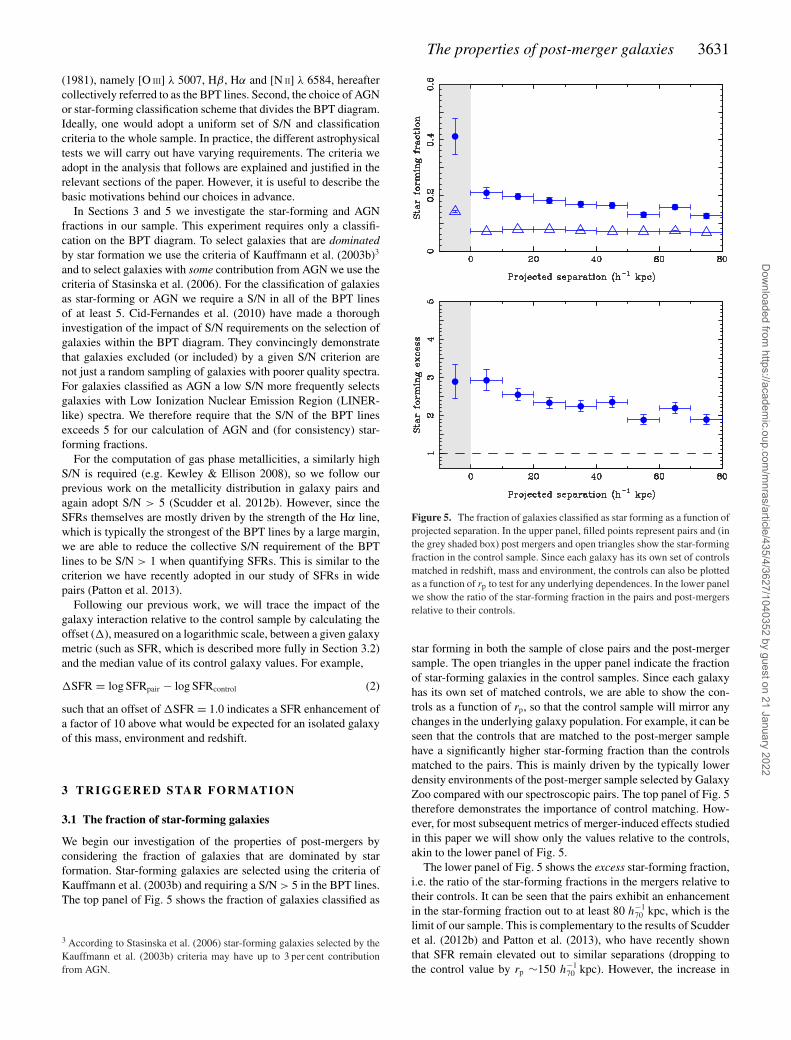
Figure 3. A selection of 25 post-mergers from our sample of 97 that remainafter our own visual classification of the Galaxy Zoo catalogue. The SDSSobject ID is given in the top of each panel.
Figure 4. The distribution of stellar masses (upper panel), redshifts (middlepanel) and local overdensities (lower panel) for the close pairs (black solidline) and post-mergers (red dashed line).
where dn is the projected distance in Mpc to the nth nearest neigh-bour within ±1000 km s−1. Normalized densities, δn, are computedrelative to the median �n within a redshift slice ± 0.01. In this studywe adopt n = 5.
Despite the difference in selection techniques, the stellar massdistributions of the pairs and post-mergers shown in Fig. 4 are verysimilar. However, due to the imposed redshift cut of the GalaxyZoo selection, the post-mergers sample is truncated at significantlylower redshifts than the close pairs. This is not a priori a problem,since we will describe in the next section how a control sampleis matched in redshift. The difference in redshift ranges will onlyimpact our results if there is an underlying dependence of merger-induced effects on redshift. We have therefore repeated all of theanalysis presented in this paper and can confirm that the resultsare robust to a redshift cut in the pairs at z = 0.1. However, sincesuch a redshift cut excludes approximately one-third of the pairssample, we have not imposed a z criterion on the pairs, in order tomaximize the statistical sample size. Similarly, the distribution oflocal overdensities differs between the pairs and post-mergers; thisis again tackled by including environment as one of the parametersin our control sample matching. Therefore, the differential changesin, for example, SFR can be compared, even when the underlyingdistributions of mass, environment etc. may differ.
2.3 Control samples
In previous works we have compiled control samples with a fixednumber (typically ∼10) of mass-, density- and redshift-matchedgalaxies with no close companion. However, in the current paper, wewill be selecting subsets of galaxies from our main pairs sample (e.g.for studies of star-forming or AGN properties), such that controlsamples are more conveniently created dynamically. The pool ofpossible control galaxies (for any subset of pairs) consists of allgalaxies that have no spectroscopic companion within 80 h−1
70 kpcand with a relative velocity �V within 10 000 km s−1. Due to thespectroscopic incompleteness of the SDSS, there will be many bonafide close pairs that are not in our pairs sample, and are thereforeerroneously identified as potential control galaxies. In order to avoidusing these unidentified pairs as controls, we utilize the Galaxy Zoobinary merger sample (Darg et al. 2010), since, unlike our closepairs sample, Galaxy Zoo does not require the companion to havea spectroscopic redshift. We therefore additionally reject galaxiesfrom the control pool if they have Galaxy Zoo merger vote fractionsfm > 0 (see Darg et al. 2010 and Ellison et al. 2013 for more details).
For a given pair or post-merger galaxy, all of the galaxies fromthe control pool within a redshift tolerance �z = 0.005, a masstolerance �log M� = 0.1 dex and a normalized local density toler-ance �δ5 = 0.1 dex are selected as controls. At least five matchesare required, a limit which is achieved in >90 per cent of cases (thetypical number of matches is usually of the order of several hun-dred). If less than five matches are found, the tolerance is grown bya further �z = 0.005 in redshift, �log M� = 0.1 dex in stellar massand �δ5 = 0.1 dex in normalized local density until the requirednumber of matches is achieved.
2.4 Classification schemes and S/N requirements
From our complete sample of 10 800 galaxies in pairs and 97 post-mergers, various sub-samples are selected for the analysis presentedin this paper. These criteria are primarily based on two parameters.First, the signal-to-noise ratio (S/N) in the four emission lines usedin the AGN diagnostic diagram of Baldwin, Phillips & Terlevich
Dow
nloaded from https://academ
ic.oup.com/m
nras/article/435/4/3627/1040352 by guest on 21 January 2022
The properties of post-merger galaxies 3631
(1981), namely [O III] λ 5007, Hβ, Hα and [N II] λ 6584, hereaftercollectively referred to as the BPT lines. Second, the choice of AGNor star-forming classification scheme that divides the BPT diagram.Ideally, one would adopt a uniform set of S/N and classificationcriteria to the whole sample. In practice, the different astrophysicaltests we will carry out have varying requirements. The criteria weadopt in the analysis that follows are explained and justified in therelevant sections of the paper. However, it is useful to describe thebasic motivations behind our choices in advance.
In Sections 3 and 5 we investigate the star-forming and AGNfractions in our sample. This experiment requires only a classifi-cation on the BPT diagram. To select galaxies that are dominatedby star formation we use the criteria of Kauffmann et al. (2003b)3
and to select galaxies with some contribution from AGN we use thecriteria of Stasinska et al. (2006). For the classification of galaxiesas star-forming or AGN we require a S/N in all of the BPT linesof at least 5. Cid-Fernandes et al. (2010) have made a thoroughinvestigation of the impact of S/N requirements on the selection ofgalaxies within the BPT diagram. They convincingly demonstratethat galaxies excluded (or included) by a given S/N criterion arenot just a random sampling of galaxies with poorer quality spectra.For galaxies classified as AGN a low S/N more frequently selectsgalaxies with Low Ionization Nuclear Emission Region (LINER-like) spectra. We therefore require that the S/N of the BPT linesexceeds 5 for our calculation of AGN and (for consistency) star-forming fractions.
For the computation of gas phase metallicities, a similarly highS/N is required (e.g. Kewley & Ellison 2008), so we follow ourprevious work on the metallicity distribution in galaxy pairs andagain adopt S/N > 5 (Scudder et al. 2012b). However, since theSFRs themselves are mostly driven by the strength of the Hα line,which is typically the strongest of the BPT lines by a large margin,we are able to reduce the collective S/N requirement of the BPTlines to be S/N > 1 when quantifying SFRs. This is similar to thecriterion we have recently adopted in our study of SFRs in widepairs (Patton et al. 2013).
Following our previous work, we will trace the impact of thegalaxy interaction relative to the control sample by calculating theoffset (�), measured on a logarithmic scale, between a given galaxymetric (such as SFR, which is described more fully in Section 3.2)and the median value of its control galaxy values. For example,
�SFR = log SFRpair − log SFRcontrol (2)
such that an offset of �SFR = 1.0 indicates a SFR enhancement ofa factor of 10 above what would be expected for an isolated galaxyof this mass, environment and redshift.
3 TR I G G E R E D STA R FO R M AT I O N
3.1 The fraction of star-forming galaxies
We begin our investigation of the properties of post-mergers byconsidering the fraction of galaxies that are dominated by starformation. Star-forming galaxies are selected using the criteria ofKauffmann et al. (2003b) and requiring a S/N > 5 in the BPT lines.The top panel of Fig. 5 shows the fraction of galaxies classified as
3 According to Stasinska et al. (2006) star-forming galaxies selected by theKauffmann et al. (2003b) criteria may have up to 3 per cent contributionfrom AGN.
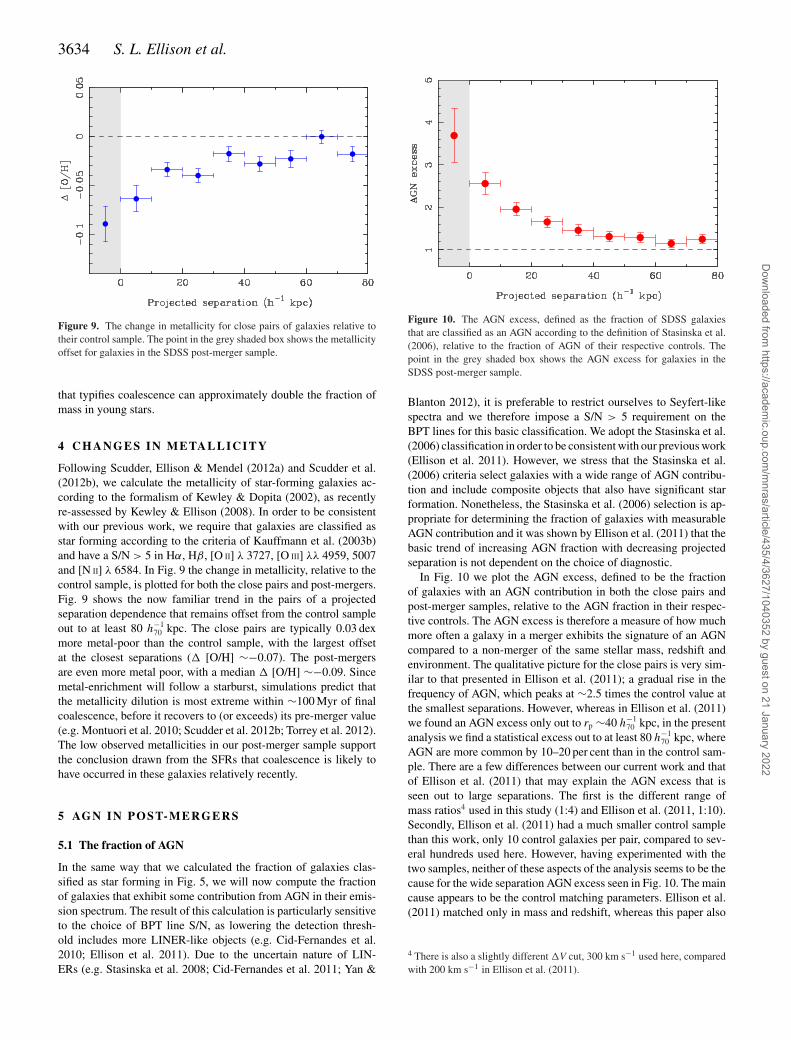
Figure 5. The fraction of galaxies classified as star forming as a function ofprojected separation. In the upper panel, filled points represent pairs and (inthe grey shaded box) post mergers and open triangles show the star-formingfraction in the control sample. Since each galaxy has its own set of controlsmatched in redshift, mass and environment, the controls can also be plottedas a function of rp to test for any underlying dependences. In the lower panelwe show the ratio of the star-forming fraction in the pairs and post-mergersrelative to their controls.
star forming in both the sample of close pairs and the post-mergersample. The open triangles in the upper panel indicate the fractionof star-forming galaxies in the control samples. Since each galaxyhas its own set of matched controls, we are able to show the con-trols as a function of rp, so that the control sample will mirror anychanges in the underlying galaxy population. For example, it can beseen that the controls that are matched to the post-merger samplehave a significantly higher star-forming fraction than the controlsmatched to the pairs. This is mainly driven by the typically lowerdensity environments of the post-merger sample selected by GalaxyZoo compared with our spectroscopic pairs. The top panel of Fig. 5therefore demonstrates the importance of control matching. How-ever, for most subsequent metrics of merger-induced effects studiedin this paper we will show only the values relative to the controls,akin to the lower panel of Fig. 5.
The lower panel of Fig. 5 shows the excess star-forming fraction,i.e. the ratio of the star-forming fractions in the mergers relative totheir controls. It can be seen that the pairs exhibit an enhancementin the star-forming fraction out to at least 80 h−1
70 kpc, which is thelimit of our sample. This is complementary to the results of Scudderet al. (2012b) and Patton et al. (2013), who have recently shownthat SFR remain elevated out to similar separations (dropping tothe control value by rp ∼150 h−1
70 kpc). However, the increase in
Dow
nloaded from https://academ
ic.oup.com/m
nras/article/435/4/3627/1040352 by guest on 21 January 2022

3632 S. L. Ellison et al.
the star-forming fraction from rp ∼80 h−170 kpc to rp ∼10 h−1
70 kpcis rather modest, increasing from a factor of ∼2 to 3 above thecontrol sample over this separation range. Similarly, although theraw fraction of star-forming galaxies in the post-merger sample ishigher than in the close pairs (upper panel of Fig. 5), so is the fractionof star-forming galaxies in the matched control sample. Therefore,the excess of star-forming galaxies in the post-mergers is actuallyconsistent with the value in the closest pairs. This result indicatesthat galaxies tend to become classified as star-forming well beforefinal coalescence.
3.2 Star formation rate enhancements
We next consider the rates of star formation within those galaxiesclassified as star forming. The strength of the Hα line relative tothe other BPT lines allows us to relax the collective BPT line S/Nconstraint to 1, without loss of accuracy in the determination of theSFR (the qualitative trends in our results are not sensitive to thischoice of S/N cut.). The SFRs are taken from Brinchmann et al.(2004) and are based on template fits to the SDSS spectra, yielding‘fibre’ SFRs that are applicable to the region of the galaxy coveredby the 3 arcsec SDSS aperture. Brinchmann et al. (2004) also applya colour-dependent correction for the light outside of the fibre, inorder to determine ‘total’ SFRs. In this paper, we additionally inferthe SFR outside of the 3 arcsec fibre by subtracting the fibre SFRfrom the total value.
In Fig. 6 we show the enhancement in the SFR (� SFR) in boththe close pair and post-merger samples relative to their respectivematched control samples. Both fibre (filled points) and outer SFRs(open points) show an excess in the close pairs relative to theircontrols out to at least 80 h−1
70 kpc. Although previous works haveinferred that the bulk of triggered star formation is centrally con-centrated (Barton, Geller & Kenyon 2003; Bergvall, Laurikainen &Aalto 2003; Ellison et al. 2010; Patton et al. 2011; Schmidt et al.2013), Fig. 6 shows explicitly that a small amount of star forma-tion is also triggered in a more spatially extended component. Starformation on an extended spatial scale has also been predicted insimulations (e.g. Powell et al. 2013). The pre-coalescence SFRsin our sample of pairs are, on average, a factor of ∼2 higher thantheir control in the fibres and 25 per cent higher in the outer parts
Figure 6. The enhancement in SFR for close pairs of galaxies that areclassified as star forming. Filled points show the enhancements in the fibre,and hollow points show the SFR enhancements outside of the fibre. Thepoints in the grey shaded box show the enhancements for galaxies in theSDSS post-merger sample presented here.
(beyond a few kpc). The post-mergers show further enhancementsin their SFRs in both the outer and fibre measurements; on averagethe post-mergers have SFRs that are higher by 70 per cent (outer)and a factor of 3.5 (fibre) than their control samples. These en-hancements exceed (in both cases) the pre-merger values by about40 per cent. Therefore, whereas the pre-coalescence phase of theinteraction most strongly affects central star formation, the finalmerger increases the SFR more uniformly on a broader spatialscale.
3.3 The frequency of starbursts
Whilst Fig. 6 measures the evolution of the average � SFR, it doesnot tell us about the distribution of SFR enhancements, includinghow frequently real starburst galaxies are formed in the mergerprocess. Whilst the average SFR enhancement in post-mergers maybe only a factor of 3.5, this may be due to a mix of galaxies that arealready quenched and some that are forming stars very aggressively.For example, Di Matteo et al. (2007, 2008) show that galaxiesthat experience more modest tidal interactions during their firstpericentric passage are able to preserve a higher gas reservoir for amore intense burst of star formation at coalescence.
In Scudder et al. (2012b) we investigated the cumulative distri-butions of �SFR in close pairs as a function of both mass ratio andseparations. It was shown that whilst close pairs of all mass ratiosand separations may exhibit modest SFR enhancements (up to afactor of 2), enhancements exceeding a factor of 10 were restrictedto approximately equal-mass mergers with small projected separa-tions (although starbursts are rare, even within these criteria). In thispaper, we take a slightly different approach, and plot the fraction ofstar-forming galaxies with enhancements greater than some thresh-old. Again, we require that the BPT lines all have a S/N > 1 and thegalaxies are classified as star forming according to the Kauffmannet al. (2003b) criteria. We set the SFR enhancement thresholds tobe a factor of 2, 5 and 10 above the matched control sample (i.e.�SFR > 0.3, 0.7, 1.0).
Fig. 7 shows that the fraction of galaxies exceeding each of thesefibre SFR thresholds increases towards the smallest separations andpeaks in the post-merger sample. Enhancements of a factor of 2are common; 60–70 per cent of the closest pairs and post-mergersexhibit an increase at this level. In the post-mergers, 40 per cent
Figure 7. The fraction of galaxies with fibre SFR enhancements at least afactor of 2, 5 or 10 (blue, cyan and purple points, respectively) above theirmatched controls. The points in the grey shaded box show the enhancementsfor galaxies in the SDSS post-merger sample.
Dow
nloaded from https://academ
ic.oup.com/m
nras/article/435/4/3627/1040352 by guest on 21 January 2022

The properties of post-merger galaxies 3633
of galaxies have SFR enhancements of at least a factor of 5. Truestarbursts are relatively rare, rising from ∼5 per cent in the widestseparation pairs to ∼15 per cent in the closest pairs and 20 per centin the post-mergers. These starburst fractions are in good agreementwith the suite of simulations presented by Di Matteo et al. (2008),who find 13–22 per cent of mergers show a SFR enhancement ofat least a factor of 10, depending on the galaxy inclinations. Theobservational data therefore emphasize the conclusion made in thetheoretical work of Di Matteo et al. (2008), that mergers do notalways trigger starbursts.
3.4 The contribution of coalescence to stellar mass
Simulations of galaxy interactions generally conclude that intensebursts of star formation should occur at, or shortly before, coales-cence (e.g. Di Matteo et al. 2007, 2008; Cox et al. 2008; Torreyet al. 2012). Although the results in Figs 6 and 7 qualitatively sup-port these predictions, the SFRs at coalescence are predicted tofrequently exceed the pre-merger phase by a factor of 10 or more.The increase in the average SFR and starburst frequency betweenthe pre- and post-merger stages shown in Figs 6 and 7 is thereforequite modest. However, it is important to take into consideration thetiming of the starburst which is usually both initiated, and reachesits peak, before the galaxies fully merge. These bursts tend to beintense, but short-lived, such that by a few hundred Myr after thecoalescence the starburst has already largely subsided (e.g. fig. 11 ofScudder et al. 2012b). It is therefore very unlikely, observationally,to catch a merger during the peak of star formation activity associ-ated with the final merger. However, it is worth noting that since wedo detect an enhancement in the SFR in post-mergers, coalescencehas probably occurred within this time-scale of a few hundred Myr,before ‘quenching’ becomes widespread, a conclusion supportedby the metallicities discussed in Section 4.
So far in this section our analysis has focused on metrics asso-ciated with the current star formation activity in pairs and post-mergers. These metrics are derived from emission lines in H II re-gions that are ionized by the presence of young, hot stars. As arguedabove, a short ‘snapshot’ of the current SFR is unlikely to catch ashort, intense burst of star formation whose overall impact (in termsof stellar mass produced) may be equivalent to a long, gentle periodof production. A complementary demonstration of the recent starformation history, that probes a more extended time-scale, comesfrom a measurement of the fraction of stellar mass in a ‘young’component. Recently, Mendel et al. (2013b) have used a spectraldecomposition technique to investigate the properties of quenchedgalaxies in the SDSS. The technique adopts two spectral templates(Bruzual & Charlot 2003), one consisting of a 7 Gyr old single stel-lar population with solar metallicity, and the other of a 300 Myrold starburst. The spectral decomposition determines the fractionalcontribution to the stellar mass from the young stellar template,fyoung.
Fig. 8 shows the median difference between fyoung measured inthe sample of pairs and post-mergers, compared to fyoung measuredin the matched control samples. Since fyoung is not a commonlyused quantity in the literature, in the top panel of Fig. 8 we showthe absolute values of this quantity for reference. We include allof the galaxies for which a spectral decomposition is successfuland are classified as star forming (Kauffmann et al. 2003b). Theenhancement in fyoung can be used to deduce the increase in thestellar mass due to star formation over ∼300–500 Myr time-scales.This is much shorter than the full interaction time-scale probedby the close pairs, so changes in fyoung in pairs do not provide a
Figure 8. The fraction of galactic stellar mass contributed from young stars,fyoung, as defined by Mendel et al. (2013b), for star-forming galaxies. Theupper panel shows the absolute value of fyoung in the mergers (filled circles)and control sample (open triangles). Since each galaxy has its own set ofcontrols matched in redshift, mass and environment, the controls can also beplotted as a function of rp to test for any underlying dependences. The lowerpanel shows the enhancement in median fyoung for mergers relative to theircontrol sample. The point in the grey shaded box shows the enhancementfor galaxies in the SDSS post-merger sample.
complete inventory of new stellar mass in the pre-merger phase.However, as we argue below, the time since coalescence of ourpost-merger sample is likely to be sufficiently short that � fyoung forthis population will encapsulate the integrated stellar mass formedduring this final stage. Fig. 8 shows a median enhancement of fyoung
in post-mergers that corresponds to an approximate doubling of thefraction of mass in young stars, relative to a matched control sample.Therefore, by using fyoung as a complementary measure of recent(but not instantaneous) star formation, we can see that coalescenceplays an important role in stellar mass production, despite the shorttime-scale that these bursts are predicted to endure.
In summary of this section, we have found that star formationis triggered early on in the interaction process. Whilst coalescencedoes induce further star formation, the SFRs are (on average) onlymodestly higher than during the pre-merger phase of the interaction.However, instantaneous SFRs do not provide the complete pictureof star formation throughout the merger sequence. Indeed, the com-bination of prolonged SFR enhancements out to wide separations(Patton et al. 2013) and the results presented here indicate that typ-ical post-pericentric bursts of star formation may endure for at leasta Gyr, but that coalescence-induced star formation may be moreshort-lived. Nonetheless, the short, intense burst of star formation
Dow
nloaded from https://academ
ic.oup.com/m
nras/article/435/4/3627/1040352 by guest on 21 January 2022
3634 S. L. Ellison et al.
Figure 9. The change in metallicity for close pairs of galaxies relative totheir control sample. The point in the grey shaded box shows the metallicityoffset for galaxies in the SDSS post-merger sample.
that typifies coalescence can approximately double the fraction ofmass in young stars.
4 C H A N G E S I N M E TA L L I C I T Y
Following Scudder, Ellison & Mendel (2012a) and Scudder et al.(2012b), we calculate the metallicity of star-forming galaxies ac-cording to the formalism of Kewley & Dopita (2002), as recentlyre-assessed by Kewley & Ellison (2008). In order to be consistentwith our previous work, we require that galaxies are classified asstar forming according to the criteria of Kauffmann et al. (2003b)and have a S/N > 5 in Hα, Hβ, [O II] λ 3727, [O III] λλ 4959, 5007and [N II] λ 6584. In Fig. 9 the change in metallicity, relative to thecontrol sample, is plotted for both the close pairs and post-mergers.Fig. 9 shows the now familiar trend in the pairs of a projectedseparation dependence that remains offset from the control sampleout to at least 80 h−1
70 kpc. The close pairs are typically 0.03 dexmore metal-poor than the control sample, with the largest offsetat the closest separations (� [O/H] ∼−0.07). The post-mergersare even more metal poor, with a median � [O/H] ∼−0.09. Sincemetal-enrichment will follow a starburst, simulations predict thatthe metallicity dilution is most extreme within ∼100 Myr of finalcoalescence, before it recovers to (or exceeds) its pre-merger value(e.g. Montuori et al. 2010; Scudder et al. 2012b; Torrey et al. 2012).The low observed metallicities in our post-merger sample supportthe conclusion drawn from the SFRs that coalescence is likely tohave occurred in these galaxies relatively recently.
5 AGN IN P OST- MERGERS
5.1 The fraction of AGN
In the same way that we calculated the fraction of galaxies clas-sified as star forming in Fig. 5, we will now compute the fractionof galaxies that exhibit some contribution from AGN in their emis-sion spectrum. The result of this calculation is particularly sensitiveto the choice of BPT line S/N, as lowering the detection thresh-old includes more LINER-like objects (e.g. Cid-Fernandes et al.2010; Ellison et al. 2011). Due to the uncertain nature of LIN-ERs (e.g. Stasinska et al. 2008; Cid-Fernandes et al. 2011; Yan &
Figure 10. The AGN excess, defined as the fraction of SDSS galaxiesthat are classified as an AGN according to the definition of Stasinska et al.(2006), relative to the fraction of AGN of their respective controls. Thepoint in the grey shaded box shows the AGN excess for galaxies in theSDSS post-merger sample.
Blanton 2012), it is preferable to restrict ourselves to Seyfert-likespectra and we therefore impose a S/N > 5 requirement on theBPT lines for this basic classification. We adopt the Stasinska et al.(2006) classification in order to be consistent with our previous work(Ellison et al. 2011). However, we stress that the Stasinska et al.(2006) criteria select galaxies with a wide range of AGN contribu-tion and include composite objects that also have significant starformation. Nonetheless, the Stasinska et al. (2006) selection is ap-propriate for determining the fraction of galaxies with measurableAGN contribution and it was shown by Ellison et al. (2011) that thebasic trend of increasing AGN fraction with decreasing projectedseparation is not dependent on the choice of diagnostic.
In Fig. 10 we plot the AGN excess, defined to be the fractionof galaxies with an AGN contribution in both the close pairs andpost-merger samples, relative to the AGN fraction in their respec-tive controls. The AGN excess is therefore a measure of how muchmore often a galaxy in a merger exhibits the signature of an AGNcompared to a non-merger of the same stellar mass, redshift andenvironment. The qualitative picture for the close pairs is very sim-ilar to that presented in Ellison et al. (2011); a gradual rise in thefrequency of AGN, which peaks at ∼2.5 times the control value atthe smallest separations. However, whereas in Ellison et al. (2011)we found an AGN excess only out to rp ∼40 h−1
70 kpc, in the presentanalysis we find a statistical excess out to at least 80 h−1
70 kpc, whereAGN are more common by 10–20 per cent than in the control sam-ple. There are a few differences between our current work and thatof Ellison et al. (2011) that may explain the AGN excess that isseen out to large separations. The first is the different range ofmass ratios4 used in this study (1:4) and Ellison et al. (2011, 1:10).Secondly, Ellison et al. (2011) had a much smaller control samplethan this work, only 10 control galaxies per pair, compared to sev-eral hundreds used here. However, having experimented with thetwo samples, neither of these aspects of the analysis seems to be thecause for the wide separation AGN excess seen in Fig. 10. The maincause appears to be the control matching parameters. Ellison et al.(2011) matched only in mass and redshift, whereas this paper also
4 There is also a slightly different �V cut, 300 km s−1 used here, comparedwith 200 km s−1 in Ellison et al. (2011).
Dow
nloaded from https://academ
ic.oup.com/m
nras/article/435/4/3627/1040352 by guest on 21 January 2022
The properties of post-merger galaxies 3635
matches in environment. Therefore, as shown in the mock surveysproduced by Perez et al. (2009), whilst mass is arguably the mostimportant parameter for matching within a control sample, environ-mental matching provides a small, but measurable, improvement insensitivity.
The main contribution of this work is to add the post-mergergalaxies to Fig. 10. In contrast to the fraction of star-forming galax-ies shown in Fig. 5, there is a clear increase in the AGN fractionpost-coalescence. The post-mergers have an AGN frequency thatexceeds their matched control sample by a factor of 3.75. This con-firms theoretical expectations that the accretion rate is increased themost during the final merger (Di Matteo et al. 2005; Springel et al.2005; Johansson et al. 2009). A similar enhancement in AGN frac-tion was found in the spheroidal post-merger sample of Carpinetiet al. (2012), but that work was not able to trace the increase in AGNoccurrence throughout the merger sequence. The high post-mergerAGN fraction in our sample is also consistent with the observa-tion that LIRGs and ULIRGs frequently exhibit nuclear activity(e.g. Yuan, Kewley & Sanders 2010; Petric et al. 2011; Ellison et al.2013). One implication of the enhanced incidence of AGN shown inFig. 10 is that attempts to quantify the merger-induced AGN fractionfrom the identification of close pairs will likely underestimate thetrue value. Although AGN may be triggered during the early phaseof an interaction (see also Rogers et al. 2009; Ellison et al. 2011;Silverman et al. 2011; Koss et al. 2012; Smith et al. 2012; Liu et al.2012; Sabater et al. 2013), the AGN rate peaks post-coalescence.A similar conclusion has recently been reached by Canalizo &Stockton (2013) for a sample of low-redshift (z ∼ 0.2) quasars,which exhibit the signature of an intermediate-age starburst, in ad-dition to the on-going AGN activity.
5.2 Black hole accretion rate
In order to quantify the black hole accretion rate in SDSSAGN, numerous studies have used the luminosity of the[O III] emission line (e.g. Kauffmann et al. 2003b; Heckmanet al. 2004; Chen et al. 2009; Liu et al. 2012). However, since star for-mation can also contribute to the [O III] line flux, some studies haveattempted to remove this possible contamination (e.g. Kauffmann& Heckman 2009; Wild, Heckman & Charlot 2010). In this paper,we have taken the approach of selecting galaxies which should haveminimal (relative) contribution from star formation by selecting forthis portion of the analysis galaxies that are classified as AGN byKewley et al. (2001). These galaxies are above the ‘maximum star-burst’ line computed from grids of models with varying metallicitiesand ionization parameters. Kauffmann & Heckman (2009) estimatethat only 10–20 per cent of the [O III] flux should be contributedfrom star formation in AGN classified by Kewley et al. (2001).More recent tests by Wild et al. (2010) imply AGN contributionsof close to unity, indicating that although the Kewley et al. (2001)classification was not necessarily designed as a ‘pure AGN’ line(e.g. see the discussion in Stasinska et al. 2006), it is effective atisolating galaxies with minimal contamination of the [O III] line bystar formation. However, the stringent nature of this AGN classifi-cation greatly reduces the size of the AGN sample and increases thestatistical uncertainty of our results. Lowering the required S/N canpartly offset this problem, but this comes at the expense of LINERcontamination, as described in previous sections. The solution weadopt is to indeed lower the BPT S/N requirement to one, but alsorequire detections of [O I] λ 6300 and [S II] λ 6717, 6731. We canthen apply the LINER diagnostic of Kewley et al. (2006b), allowingus to construct a sample of Seyfert-dominated spectra.
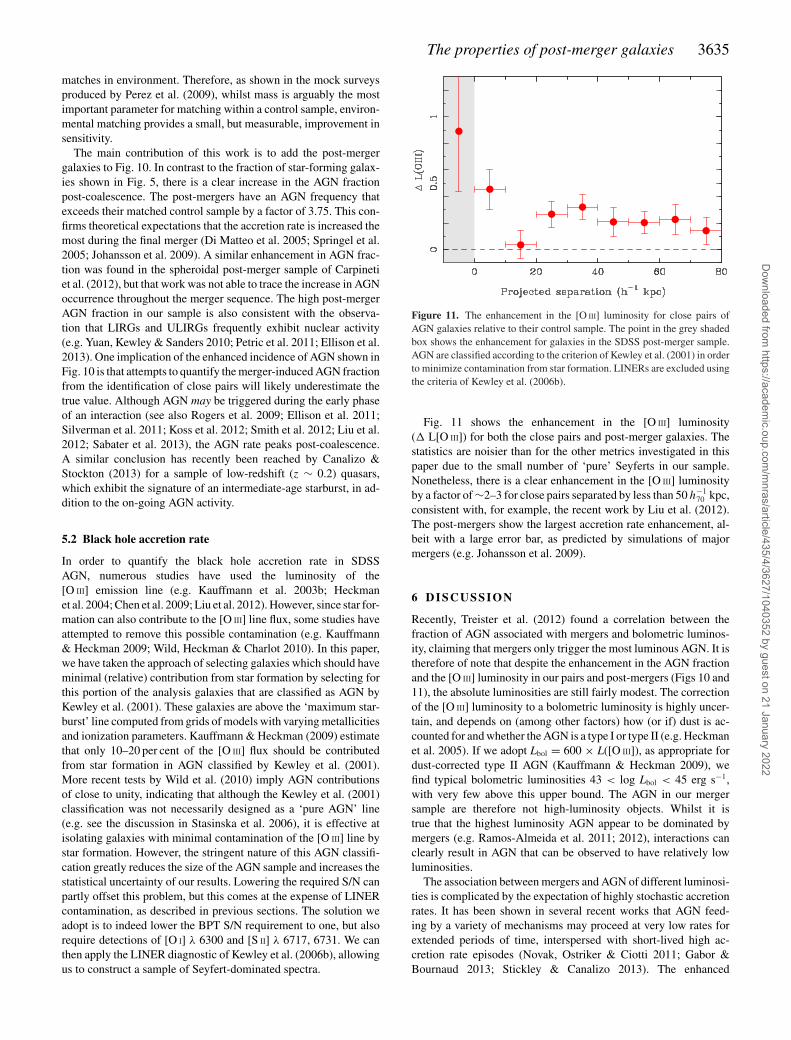
Figure 11. The enhancement in the [O III] luminosity for close pairs ofAGN galaxies relative to their control sample. The point in the grey shadedbox shows the enhancement for galaxies in the SDSS post-merger sample.AGN are classified according to the criterion of Kewley et al. (2001) in orderto minimize contamination from star formation. LINERs are excluded usingthe criteria of Kewley et al. (2006b).
Fig. 11 shows the enhancement in the [O III] luminosity(� L[O III]) for both the close pairs and post-merger galaxies. Thestatistics are noisier than for the other metrics investigated in thispaper due to the small number of ‘pure’ Seyferts in our sample.Nonetheless, there is a clear enhancement in the [O III] luminosityby a factor of ∼2–3 for close pairs separated by less than 50 h−1
70 kpc,consistent with, for example, the recent work by Liu et al. (2012).The post-mergers show the largest accretion rate enhancement, al-beit with a large error bar, as predicted by simulations of majormergers (e.g. Johansson et al. 2009).
6 D I SCUSSI ON
Recently, Treister et al. (2012) found a correlation between thefraction of AGN associated with mergers and bolometric luminos-ity, claiming that mergers only trigger the most luminous AGN. It istherefore of note that despite the enhancement in the AGN fractionand the [O III] luminosity in our pairs and post-mergers (Figs 10 and11), the absolute luminosities are still fairly modest. The correctionof the [O III] luminosity to a bolometric luminosity is highly uncer-tain, and depends on (among other factors) how (or if) dust is ac-counted for and whether the AGN is a type I or type II (e.g. Heckmanet al. 2005). If we adopt Lbol = 600 × L([O III]), as appropriate fordust-corrected type II AGN (Kauffmann & Heckman 2009), wefind typical bolometric luminosities 43 < log Lbol < 45 erg s−1,with very few above this upper bound. The AGN in our mergersample are therefore not high-luminosity objects. Whilst it istrue that the highest luminosity AGN appear to be dominated bymergers (e.g. Ramos-Almeida et al. 2011; 2012), interactions canclearly result in AGN that can be observed to have relatively lowluminosities.
The association between mergers and AGN of different luminosi-ties is complicated by the expectation of highly stochastic accretionrates. It has been shown in several recent works that AGN feed-ing by a variety of mechanisms may proceed at very low rates forextended periods of time, interspersed with short-lived high ac-cretion rate episodes (Novak, Ostriker & Ciotti 2011; Gabor &Bournaud 2013; Stickley & Canalizo 2013). The enhanced
Dow
nloaded from https://academ
ic.oup.com/m
nras/article/435/4/3627/1040352 by guest on 21 January 2022

3636 S. L. Ellison et al.
frequency of AGN observed in our sample of pairs indicates thatmerger-induced AGN triggering can occur well before coalescence(see also Ramos-Almeida et al. 2011), although these AGN typi-cally have modest luminosities. This is in good agreement with thesimulations of Stickley & Canalizo (2013) who predict that smallamounts of gas are already reaching the nucleus as galaxies recedefrom their first pericentric passage. In that model, the highest ac-cretion rates are achieved after coalescence, so we might expectthat the sample of post-mergers would include some of the highestaccretion rate objects.
Although the AGN frequency peaks in the post-merger samplepresented here, the bolometric luminosities of post-merger AGN arestill modest with values log Lbol < 45 erg s−1. There are several pos-sible reasons for the lack of high-luminosity AGN in post-mergersample. First, despite selection from one of the largest galaxy sur-veys currently available, the post merger sample is still fairly small,and high-luminosity AGN are expected to be both intrinsically rareand short-lived. Not all galaxies may have the requisite gas supplyto feed the central supermassive black holes at high fractions of theEddington rate. Finally, we have argued that the post-mergers in oursample are likely to have only recently (within a few hundred Myr)coalesced, so there may not yet have been sufficient time for thebulk of gas to reach the nucleus.
The results presented in Section 5, which include both the fre-quency of AGN and the black hole accretion rate, show both sim-ilarities and differences with the conclusions concerning triggeredstar formation in Section 3. On the one hand, both AGN and star-forming fractions (and the associated intensity of these processes asmeasured by accretion and SFRs) show enhancements out to wideseparations. The simulations presented in Scudder et al. (2012b)and Patton et al. (2013) indicate that such wide separation en-hancements are due to gas flows triggered at pericentric passagethat are seen over the course of the merger’s dynamical time-scale.However, in contrast to the frequency of star-forming galaxies, andtheir SFRs, which increase only modestly post-merger, the AGNfrequency and accretion rates rise significantly after coalescence.It seems that whilst both star formation and black hole accretionare enhanced throughout the merger sequence, the former processresponds strongly to the interaction already in the early stages,whereas the AGN phase reaches its peak after coalescence. Al-though simulations have long predicted this general scenario, in-cluding the delay between the peak in these two processes (Hopkins2012), the homogeneous analysis of the large pre- and post-mergersamples presented here has provided the first complete observa-tional picture of mergers.
7 C O N C L U S I O N S
We have presented a sample of 97 post-merger galaxies selectedfrom the Galaxy Zoo DR7 catalogue of Darg et al. (2010) whichwe have combined with our existing sample of 10 800 galaxies inspectroscopic close pairs (rp ≤ 80 h−1
70 kpc, �V ≤ 300 km s−1).Control samples have been constructed by matching in mass, red-shift and local environment; several hundred control galaxies aretypically identified for every pair or post-merger galaxy. Analysedin a homogeneous way, this combined sample allows us to trace theeffects of the interaction throughout the merger sequence and quan-tify the relative importance of coalescence. Our main conclusionsare as follows.
(i) The fraction of star-forming galaxies is enhanced, relative tothe control sample, at a similar level for close pairs and post-mergers
(Fig. 5). Whereas the early interaction phase can apparently turnnon-star-forming into star-forming (by our definition) galaxies, thefinal coalescence has a minimal additional effect. That is, most star-forming post-mergers were likely to already have been star-formingpre-coalescence.
(ii) In the pre-merger phase, we confirm previous results thatthe central SFR is enhanced by a factor of a few, on average. Wealso show that the SFR is enhanced outside of the central few kpcby 25 per cent (Fig. 6). Post-coalescence, both the inner and outerSFRs are enhanced by a further 40 per cent, leading to a fibre SFRenhancement in the post-mergers of a factor of 3.5.
(iii) The fraction of starburst galaxies, with SFR enhancementsat least a factor of 10 larger than their controls, peaks in the post-mergers at approximately 20 per cent (Fig. 7).
(iv) The star formation that is triggered at coalescence approxi-mately doubles the rate of stellar mass growth, relative to a sampleof matched control galaxies (Fig. 8).
(v) The metallicities of close pairs are lower than in the controlsample out to the widest separations in our sample, with a smoothcorrelation between metal-deficiency and rp. The post-mergers arethe most metal poor, exhibiting a median �[O/H] = −0.09 (seeFig. 9).
(vi) The persistence and relative elevation of enhanced SFRs andmetal deficiencies indicates that the galaxies in our post-mergersample are likely to have coalesced within the last few hundredMyr.
(vii) In contrast to the star-forming fractions, the fraction of AGNin post-mergers is significantly higher than in the close pairs, andhigher than the control by a factor of 3.75 (Fig. 10). Therefore,although AGN may be triggered pre-coalescence, the final mergerhas the highest impact on black hole accretion. This is demonstrateddirectly in Fig. 11, where it is shown that the enhancement in the[O III] luminosity is greatest in the post-mergers.
AC K N OW L E D G E M E N T S
SLE and DRP acknowledge the receipt of NSERC Discovery grantswhich funded this research. Thanks to Asa Bluck, Jorge Morenoand Paul Torrey for many enjoyable conversations on galaxy merg-ers and suggestions for this work. We are grateful to Daniel Dargfor providing us with his Galaxy Zoo post-merger sample, whichformed the basis of this work.
Funding for the SDSS and SDSS-II has been provided by theAlfred P. Sloan Foundation, the Participating Institutions, theNational Science Foundation, the U.S. Department of Energy,the National Aeronautics and Space Administration, the JapaneseMonbukagakusho, the Max Planck Society and the HigherEducation Funding Council for England. The SDSS Web Site ishttp://www.sdss.org/.
The SDSS is managed by the Astrophysical Research Con-sortium for the Participating Institutions. The Participating In-stitutions are the American Museum of Natural History, Astro-physical Institute Potsdam, University of Basel, University ofCambridge, Case Western Reserve University, University ofChicago, Drexel University, Fermilab, the Institute for AdvancedStudy, the Japan Participation Group, Johns Hopkins Univer-sity, the Joint Institute for Nuclear Astrophysics, the Kavli Insti-tute for Particle Astrophysics and Cosmology, the Korean Scien-tist Group, the Chinese Academy of Sciences (LAMOST), LosAlamos National Laboratory, the Max-Planck-Institute for Astron-omy (MPIA), the Max-Planck-Institute for Astrophysics (MPA),New Mexico State University, Ohio State University, University
Dow
nloaded from https://academ
ic.oup.com/m
nras/article/435/4/3627/1040352 by guest on 21 January 2022

The properties of post-merger galaxies 3637
of Pittsburgh, University of Portsmouth, Princeton University, theUnited States Naval Observatory and the University of Washington.
R E F E R E N C E S
Alonso M. S., Lambas D. G., Tissera P. B., Coldwell G., 2006, MNRAS,367, 1029
Alonso M. S., Lambas D. G., Tissera P. B., Coldwell G., 2007, MNRAS,375, 1017
Alonso M. S., Michel-Dansac L., Lambas D. G., 2010, A&A, 514, 57Alonso M. S., Mesa V., Padilla N., Lambas D. G., 2012, A&A, 539, 46Baldwin J. A., Phillips M. M., Terlevich R., 1981, PASP, 93, 5Barnes J. E., Hernquist L., 1996, ApJ, 471, 115Barton E. J., Geller M. J., Kenyon S. J., 2000, ApJ, 530, 660Barton E. J., Geller M. J., Kenyon S. J., 2003, ApJ, 582, 668Bergvall N., Laurikainen E., Aalto S., 2003, A&A, 405, 31Brinchmann J., Charlot S., White S. D. M., Tremonti C., Kauffmann G.,
Heckman T., Brinkmann J., 2004, MNRAS, 351, 1151Bruzual G., Charlot S., 2003, MNRAS, 344, 1000Canalizo G., Stockton A., 2013, ApJ, 772, 132Carpineti A., Kaviraj S., Darg D., Lintott C., Schawinski K., Shabala S.,
2012, MNRAS, 420, 2139Casteels K. R. V. et al., 2013, MNRAS, 429, 1051Chen Y.-M., Wang J.-M., Yan C.-S., Hu C., Zhang S., 2009, ApJ, 695, L130Chung J., Rey S.-C., Sung E.-C., Yeom B.-S., Humphrey A., Yi W., Kyeong
J., 2013, ApJ, 767, L15Cid-Fernandes R., Stasinska G., Schlickmann M. S., Mateus A., Vale Asari
N., Schoenell W., Sodre L., 2010, MNRAS, 403, 1036Cid-Fernandes R., Stasinska G., Mateus A., Vale Asari N., 2011, MNRAS,
413, 1687Cotini S., Ripamonti E., Caccianiga A., Colpi M., Della C. R., Mapelli M.,
Severgnini P., Segreto A., 2013, MNRAS, 431, 2661Cox T. J., Jonsson P., Primack J. R., Somerville R. S., 2006, MNRAS, 373,
1013Cox T. J., Jonsson P., Somerville R. S., Primack J. R., Dekel A., 2008,
MNRAS, 384, 386Darg D. W. et al., 2010, MNRAS, 401, 1552Debuhr J., Quataert E., Ma C.-P., 2011, MNRAS, 412, 1341Di Matteo T., Springel V., Hernquist L., 2005, Nat, 433, 604Di Matteo P., Combes F., Melchior A.-L., Semelin B., 2007, A&A, 468, 61Di Matteo P., Bournaud F., Martig M., Combes F., Melchior A.-L., Semelin
B., 2008, A&A, 492, 31Domingue D. L., Xu C. K., Jarrett T. H., Cheng Y., 2009, ApJ, 695, 1559Ellison S. L., Patton D. R., Simard L., McConnachie A. W., 2008, AJ, 135,
1877Ellison S. L., Patton D. R., Simard L., McConnachie A. W., Baldry I. K.,
Mendel J. T., 2010, MNRAS, 407, 1514Ellison S. L., Patton D. R., Mendel J. T., Scudder J. M., 2011, MNRAS,
418, 2043Ellison S. L., Mendel J. T., Scudder J. M., Patton D. R., Palmer M. J. D.,
2013, MNRAS, 430, 3128Gabor J. M., Bournaud F., 2013, MNRAS, 434, 606Heckman T. M., Kauffmann G., Brinchmann J., Charlot S., Tremonti C.,
White S. D. M., 2004, ApJ, 613, 109Heckman T. M., Ptak A., Hornschemeier A., Kauffmann G., 2005, ApJ, 634,
161Hopkins P., 2012, MNRAS, 420, L8Hwang H. S., Elbaz D., Lee J. C., Jeong W.-S., Park C., Lee M. G., Lee
H. M., 2010, A&A, 522, 33Hwang H. S. et al., 2011, A&A, 535, 60Jogee S. et al., 2009, ApJ, 697, 1971Johansson P. H., Naab T., Burkert A., 2009, ApJ, 690, 802Kartaltepe J. S. et al., 2010, ApJ, 721, 98Kauffmann G., Heckman T. M., 2009, MNRAS, 397, 135Kauffmann G. et al., 2003a, MNRAS, 341, 33Kauffmann G. et al., 2003b, MNRAS, 346, 1055Kennicutt R. C., Jr, Roettiger K. A., Keel W. C., van der Hulst J. M., Hummel
E., 1987, AJ, 93, 1011
Kewley L. J., Dopita M. A., 2002, ApJS, 142, 35Kewley L. J., Ellison S. L., 2008, ApJ, 681, 1183Kewley L. J., Dopita M. A., Sutherland R. S., Heisler C. A., Trevena J.,
2001, ApJ, 556, 121Kewley L. J., Geller M. J., Barton E. J., 2006a, AJ, 131, 2004Kewley L. J., Groves B., Kauffmann G., Heckman T., 2006b, MNRAS, 372,
961Knapen J. H., James P. A., 2009, ApJ, 698, 1437Koss M., Mushotzky R., Veilleux S., Winter L., 2010, ApJ, 716, L125Koss M., Mushotzky R., Treister E., Veilleux S., Vasudevan R., Trippe M.,
2012, ApJ, 746, L22Lambas D. G., Alonso S., Mesa V., O’Mill A. L., 2012, A&A, 539, 45Lanz L. et al., 2013, ApJ, 768, 90Larson R. B., Tinsley B. M., 1978, ApJ, 219, 46Li C., Kauffmann G., Heckman T. M., Jing Y. P., White S. D. M., 2008a,
MNRAS, 385, 1903Li C., Kauffmann G., Heckman T. M., White S. D. M., Jing Y. P., 2008b,
MNRAS, 385, 1915Lintott C. J. et al., 2008, MNRAS, 389, 1179Liu X., Shen Y., Strauss M. A., 2012, ApJ, 745, 94Lotz J. M., Jonsson P., Cox T. J., Primack J. R., 2008, MNRAS, 391, 1137Lotz J. M., Jonsson P., Cox T. J., Primack J. R., 2010, MNRAS, 404, 575Mendel J. T., Simard L., Palmer M. J. D., Ellison S. L., Patton D. R., 2013a,
ApJS, submittedMendel J. T., Simard L., Ellison S. L., Patton D. R., 2013b, MNRAS, 429,
2212Michel-Dansac L., Lambas D. G., Alonso M. S., Tissera P., 2008, MNRAS,
386, 82Mihos C., Hernquist L., 1994, ApJ, 425, L13Mihos C., Hernquist L., 1996, ApJ, 464, 641Montuori M., Di Matteo P., Lehnert M. D., Combes F., Semelin B., 2010,
A&A, 518, 56Nikolic B., Cullen H., Alexander P., 2004, MNRAS, 355, 874Novak G. S., Ostriker J. P., Ciotti L., 2011, ApJ, 737, 26Park C., Choi Y.-Y., 2009, ApJ, 691, 1828Patton D. R., Atfield J. E., 2008, ApJ, 685, 235Patton D. R., Ellison S. L., Simard L., McConnachie A. W., Mendel J. T.,
2011, MNRAS, 412, 591Patton D. R., Torrey P., Ellison S. L., Mendel J. T., Scudder J. M., 2013,
MNRAS, 433, L59Peeples M. S., Pogge R. W., Stanek K. Z., 2009, ApJ, 695, 259Perez M. J., Tissera P. B., Blaizot J., 2009, MNRAS, 397, 748Perez J., Michel-Dansac L., Tissera P. B., 2011, MNRAS, 417, 580Petric A. O. et al., 2011, ApJ, 730, 28Powell L. C., Bournaud F., Chapon D., Teyssier R., 2013, MNRAS, 434,
1028Ramos-Almeida C., Tadhunter C. N., Inskip K. J., Morganti R., Holt J.,
Dicken D., 2011, MNRAS, 410, 1550Ramos-Almeida C. et al., 2012, MNRAS, 419, 687Reichard T. A., Heckman T. M., Rudnick G., Brinchmann J., Kauffmann
G., Wild V., 2009, ApJ, 691, 1005Robaina A. R., Bell E. F., 2012, MNRAS, 427, 901Rogers B., Ferreras I., Kaviraj S., Pasquali A., Sarzi M., 2009, MNRAS,
399, 2172Rupke D. S. N., Kewley L. J., Barnes J. E., 2010a, ApJ, 710, L156Rupke D. S. N., Kewley L. J., Chien L.-H., 2010b, ApJ, 723, 1255Sabater J., Best P. N., Argudo-Fernandez M., 2013, MNRAS, 430, 638Schmidt K. B. et al., 2013, MNRAS, 432, 285Scudder J. M., Ellison S. L., Mendel J. T., 2012a, MNRAS, 423, 2690Scudder J. M., Ellison S. L., Torrey P., Patton D. R., Mendel J. T., 2012b,
MNRAS, 426, 549Silverman J. D., et al., 2011, ApJ, 743, 2Simard L., Mendel J. T., Patton D. R., Ellison S. L., McConnachie A. W.,
2011, ApJS, 196, 11Smith B. J., Struck C., Hancock M., Appleton P. N., Charmandaris V., Reach
W. T., 2007, AJ, 133, 791Smith B. J., Swartz D. A., Miller O., Burleson J. A., Nowak M. A., Struck
C., 2012, AJ, 143, 144
Dow
nloaded from https://academ
ic.oup.com/m
nras/article/435/4/3627/1040352 by guest on 21 January 2022
3638 S. L. Ellison et al.
Springel V., Di Matteo T., Hernquist L., 2005, MNRAS, 361, 776Stasinska G., Cid-Fernandes R., Mateus A., Sodre L., Asari N. V., 2006,
MNRAS, 371, 972Stasinska G., Vale Asari N., Cid-Fernandes R., Gomes J. M., Schlickmann
M., Mateus A., Schoenell W., Sodre L., Jr, 2008, MNRAS, 391, L29Stickley N. R., Canalizo G., 2013, ApJ, submittedTorrey P., Cox T. J., Kewley L. J., Hernquist L., 2012, ApJ, 746, 108Treister E., Schawinski K., Urry C. M., Simmons B. D., 2012, ApJ, 758,
L39Wild V., Heckman T., Charlot S., 2010, MNRAS, 405, 933Wong K. C. et al., 2011, ApJ, 728, 119
Woods D. F., Geller M. J., 2007, AJ, 134, 527Woods D. F., Geller M. J., Barton E. J., 2006, AJ, 132, 197Woods D. F., Geller M. J., Kurtz M. J., Westra E., Fabricant D. G.,
Dell’Antonio I., 2010, AJ, 139, 1857Xu C. K. et al., 2012, ApJ, 760, 72Yan R., Blanton M. R., 2012, ApJ, 747, 61Yuan T.-T., Kewley L. J., Sanders D. B., 2010, ApJ, 709, 884
This paper has been typeset from a TEX/LATEX file prepared by the author.
Dow
nloaded from https://academ
ic.oup.com/m
nras/article/435/4/3627/1040352 by guest on 21 January 2022