The Proposed Merger of Lahey Health System - Mass.gov
239
MASSACHUSETTS HEALTH POLICY COMMISSION REVIEW OF The Proposed Merger of Lahey Health System; CareGroup and its Component Parts, Beth Israel Deaconess Medical Center, New England Baptist Hospital, and Mount Auburn Hospital; Seacoast Regional Health Systems; and Each of their Corporate Subsidiaries into Beth Israel Lahey Health; AND The Acquisition of the Beth Israel Deaconess Care Organization by Beth Israel Lahey Health; AND The Contracting Affiliation Between Beth Israel Lahey Health and Mount Auburn Cambridge Independent Practice Association (HPC-CMIR-2017-2) Pursuant to M.G.L. ch. 6D, § 13 Final Report September 27, 2018
-
Upload
khangminh22 -
Category
Documents
-
view
0 -
download
0
Transcript of The Proposed Merger of Lahey Health System - Mass.gov
MASSACHUSETTS HEALTH POLICY COMMISSION REVIEW OF
The Proposed Merger of Lahey Health System; CareGroup and its Component Parts, Beth Israel Deaconess Medical Center, New England Baptist
Hospital, and Mount Auburn Hospital; Seacoast Regional Health Systems; and Each of
their Corporate Subsidiaries into Beth Israel Lahey Health;
ANDThe Acquisition of the Beth Israel Deaconess
Care Organization by Beth Israel Lahey Health;AND
The Contracting Affiliation Between Beth Israel Lahey Health and Mount Auburn Cambridge
Independent Practice Association (HPC-CMIR-2017-2)
Pursuant to M.G.L. ch. 6D, § 13Final Report
September 27, 2018

About the Health Policy Commission
The Massachusetts Health Policy Commission (HPC), established in 2012, is an independent
state agency charged with monitoring health care spending growth in Massachusetts and
providing data-driven policy recommendations regarding health care delivery and payment
system reform. The HPC’s mission is to advance a more transparent, accountable, and
innovative health care system through its independent policy leadership and investment
programs. For more information, visit www.mass.gov/HPC.
INTRODUCTION
Health care provider market changes, including consolidation and alignments between
providers under new care delivery and payment models, can impact health care market
functioning and the performance of the health care system in delivering high-quality, cost-
effective care. Yet, due to confidential payer-provider contracts and limited information about
provider organizations, the mechanisms by which market changes impact the cost, quality, and
availability of health care services have not historically been apparent to government,
consumers, and businesses which ultimately bear the costs of the health care system.
Recognizing the importance and lack of transparency surrounding health care provider market
changes, one of the Health Policy Commission’s (HPC) core responsibilities is to monitor and
publicly report on the evolving structure and composition of the provider market using the best
available evidence.
Through the filing of notices of material change by provider organizations, the HPC
tracks the frequency, type, and nature of changes in our health care market.1 The HPC may also
engage in a more comprehensive review of particular transactions anticipated to have a
significant impact on health care costs or market functioning. The result of such “cost and
market impact reviews” (CMIRs) is a public report detailing the HPC’s findings. In order to
allow for public assessment of the findings, the transactions may not be finalized until the HPC
issues its Final Report. Where appropriate, such reports may identify areas for further review
or monitoring, or be referred to other state agencies in support of their work on behalf of health
care consumers. This first-in-the-nation public reporting process is a unique opportunity to
enhance the transparency of significant changes to our health care system and can inform and
complement the many important efforts of other agencies, such as the Attorney General’s
Office, the Center for Health Information and Analysis, the Department of Public Health, and
the Division of Insurance, in monitoring and overseeing our health care market.
The HPC conducts its work during continued dynamic change among provider
organizations, including ongoing consolidation, new contractual and clinical alignments, and
the increased presence of alternative payment models focused on promoting accountable care.
The CMIR process allows us to improve our understanding and increase the transparency of
these trends, the opportunities and challenges they may pose, and their impact on short and
long term health care spending, quality, and consumer access. In addition, our reviews enable
us to identify particular factors for market participants to consider in proposing and responding
to potential future organizational changes. Through this process, we seek to encourage
providers and payers alike to evaluate and take steps to minimize negative impacts and
enhance positive outcomes of any given material change.
1 See MASS. GEN. LAWS ch. 6D, § 13 (requiring health care providers to notify the HPC before making material
changes to their operations or governance). See also MASS. HEALTH POLICY COMM’N, 958 CMR 7.00: NOTICES OF
MATERIAL CHANGE AND COST AND MARKET IMPACT REVIEWS (Jan. 2, 2015), available at
http://www.mass.gov/anf/docs/hpc/regs-and-notices/consolidated-regulations-circ.pdf (last visited Sept. 24, 2018).
This document is the HPC’s sixth CMIR report, examining the proposed merger of
Lahey Health System; CareGroup and its component parts, Beth Israel Deaconess Medical
Center, New England Baptist Hospital, and Mount Auburn Hospital; Seacoast Regional Health
Systems; and each of their corporate subsidiaries into Beth Israel Lahey Health; the acquisition
of the Beth Israel Deaconess Care Organization by Beth Israel Lahey Health; and the
contracting affiliation between Beth Israel Lahey Health and Mount Auburn Cambridge
Independent Practice Association. Based on criteria articulated in Massachusetts’ health care
cost containment legislation, Chapter 224 of the Acts of 2012, and informed by the facts of the
transaction, we analyzed the likely impact of this transaction, relying on the best available data
and information. Our work included review of the parties’ stated goals for the transaction and
the information they provided in support of how and when it would result in efficiencies and
care delivery improvements.
We now release this report to contribute important and evidence-based information to
the public dialogue as providers, payers, government, consumers, and other stakeholders strive
to develop a more affordable, effective, and accountable health care system.
i
TABLE OF CONTENTS
Introduction
Acronyms and Abbreviations ii
Naming Conventions iii
Executive Summary 1
I. Analytic Approach and Data Sources 6
II. Overview of the Transaction and the Parties 10
III. Analysis of Parties’ Past Performance and Impacts of the Proposed Transaction 29
A. Cost and Market Functioning 29
B. Quality and Care Delivery 69
C. Access to Care 87
IV. Conclusion 103
Data Appendix
Acknowledgements
Exhibit A: Joint Response for the Proposed Transaction to Create BILH and BILH CIN
on behalf of Beth Israel Deaconess Medical Center, Mount Auburn Hospital, New
England Baptist Hospital, Lahey Health System, Seacoast Regional Health Systems,
Beth Israel Deaconess Care Organization, and Mount Auburn Cambridge Independent
Practice Association
Exhibit B: HPC Analysis of Parties’ Response to the Preliminary Report

ii
ACRONYMS AND ABBREVIATIONS
ACO Accountable Care Organization
AGO Massachusetts Attorney General's Office
AMC Academic Medical Center
APCD All-Payer Claims Database
APM Alternative Payment Methodology
CHART Community Hospital Revitalization, Acceleration, and Transformation
Program
CHIA Massachusetts Center for Health Information and Analysis
CHNA Community Health Needs Assessment
CMIR Cost and Market Impact Review
CMS Centers for Medicare and Medicaid Services
CPT Current Procedural Terminology
DOJ Department of Justice
DoN Determination of Need
DPH Massachusetts Department of Public Health
DRG Diagnosis Related Group
ED Emergency Department
EHR Electronic Health Record
FTC Federal Trade Commission
GPSR Gross Patient Service Revenue
HHI Herfindahl-Hirschman Index
HMO Health Maintenance Organization
HPC Health Policy Commission
HSA TME Health Status Adjusted Total Medical Expenses
IQI Inpatient Quality Indicator
MSSP Medicare Shared Savings Program
NPSR Net Patient Service Revenue
PCP Primary Care Physician
POS Point of Service
PPO Preferred Provider Organization
PSA Primary Service Area
PSI Patient Safety Indicator
MA-RPO Massachusetts Registration of Provider Organizations
TME Total Medical Expenses
WTP Willingness to Pay
iii
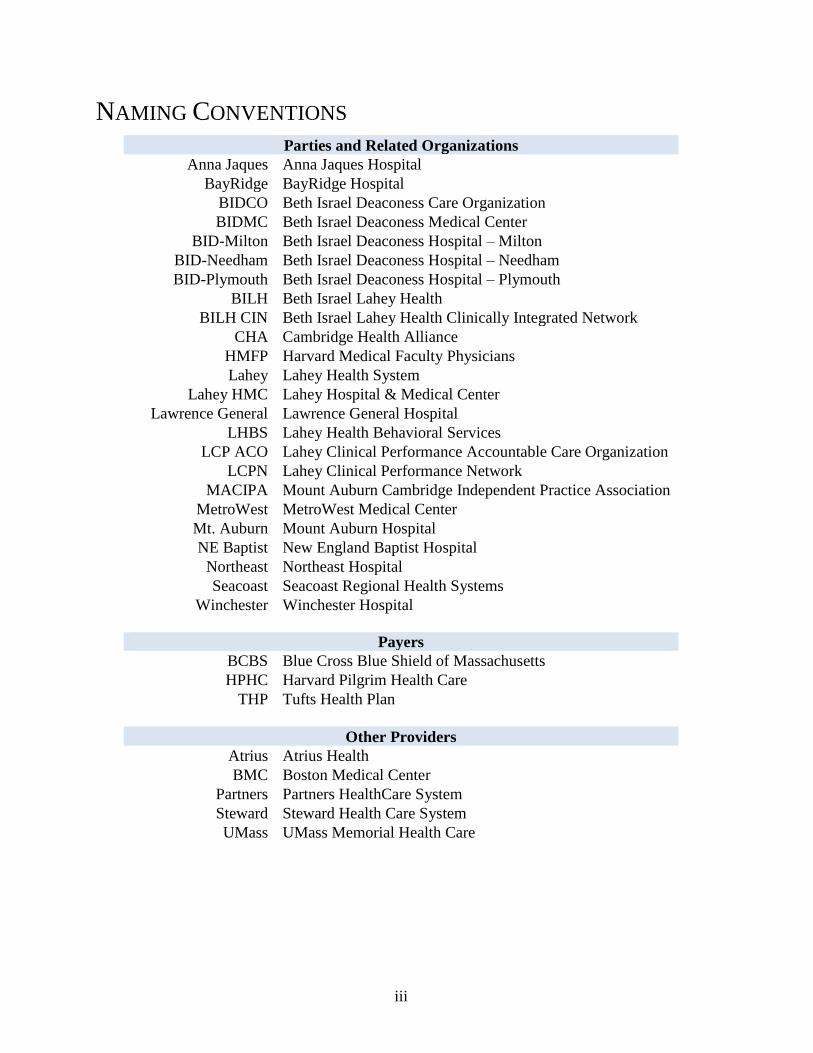
NAMING CONVENTIONS
Parties and Related Organizations
Anna Jaques Anna Jaques Hospital
BayRidge BayRidge Hospital
BIDCO Beth Israel Deaconess Care Organization
BIDMC Beth Israel Deaconess Medical Center
BID-Milton Beth Israel Deaconess Hospital – Milton
BID-Needham Beth Israel Deaconess Hospital – Needham
BID-Plymouth Beth Israel Deaconess Hospital – Plymouth
BILH Beth Israel Lahey Health
BILH CIN Beth Israel Lahey Health Clinically Integrated Network
CHA Cambridge Health Alliance
HMFP Harvard Medical Faculty Physicians
Lahey Lahey Health System
Lahey HMC Lahey Hospital & Medical Center
Lawrence General Lawrence General Hospital
LHBS Lahey Health Behavioral Services
LCP ACO Lahey Clinical Performance Accountable Care Organization
LCPN Lahey Clinical Performance Network
MACIPA Mount Auburn Cambridge Independent Practice Association
MetroWest MetroWest Medical Center
Mt. Auburn Mount Auburn Hospital
NE Baptist New England Baptist Hospital
Northeast Northeast Hospital
Seacoast Seacoast Regional Health Systems
Winchester Winchester Hospital
Payers
BCBS Blue Cross Blue Shield of Massachusetts
HPHC Harvard Pilgrim Health Care
THP Tufts Health Plan
Other Providers
Atrius Atrius Health
BMC Boston Medical Center
Partners Partners HealthCare System
Steward Steward Health Care System
UMass UMass Memorial Health Care

1
EXECUTIVE SUMMARY
In July 2017, Lahey Health System (Lahey); Beth Israel Deaconess Medical Center
(BIDMC); New England Baptist Hospital (NE Baptist); Mount Auburn Hospital (Mt. Auburn);
CareGroup, the corporate parent of BIDMC, NE Baptist, and Mt. Auburn; and Seacoast Regional
Health Systems (Seacoast), the parent of Anna Jaques Hospital (Anna Jaques), signed an
agreement to become corporately affiliated. The parties agreed to form a new corporate entity,
now called Beth Israel Lahey Health (BILH),2 which would become the sole corporate parent of
Lahey, NE Baptist, Mt. Auburn, Seacoast, and BIDMC and its owned community hospitals,
merging the hospital systems and all of their subsidiaries into one organization.
In October 2017, the parties’ affiliated contracting networks, Beth Israel Deaconess Care
Organization (BIDCO), Lahey Clinical Performance Network (LCPN), Lahey Clinical
Performance Accountable Care Organization (LCP ACO), and Mount Auburn Cambridge
Independent Practice Association (MACIPA) also signed an affiliation agreement. Under that
agreement, BILH would create a clinically integrated network (BILH CIN) that would own
BIDCO, LCPN, and LCP ACO. MACIPA would remain corporately independent, but would
participate in the design, management, and governance of the BILH CIN.3 The BILH CIN would
jointly negotiate and establish contracts with payers on behalf of the BILH-owned and
contracting affiliate hospitals4 as well as employed and independent physicians who currently
contract through BIDCO, LCPN, LCP ACO, and MACIPA. The parties have described the
proposed BILH merger and BILH CIN affiliations as interrelated components of a single
transaction.5
The parties describe the proposed transaction as a market-based solution to address rising
health care expenditures, price disparities, payment variation, and health inequities that have
been highlighted by the Health Policy Commission (HPC), Office of the Attorney General, and
others.6 The parties describe themselves as a high-quality and lower-cost alternative to other
2 The transaction agreements, notices of material change, and other filings refer to the new corporate entity as
“NewCo.” The HPC understands that the parties have since named this entity “Beth Israel Lahey Health (BILH)”
and refers to the proposed organization by this name throughout the report. See, e.g., Jessica Bartlett, Beth Israel,
Lahey Announce New Name for Mega-Merger, BOSTON BUSINESS JOURNAL, May 23, 2018, available at
https://www.bizjournals.com/boston/news/2018/05/23/beth-israel-lahey-announce-new-name-for-mega.html (last
visited Sept. 24, 2018). 3 MOUNT AUBURN CAMBRIDGE INDEPENDENT PRACTICE ASSOCIATION, NOTICE OF MATERIAL CHANGE TO THE
HEALTH POLICY COMM’N (July 13, 2017), AS REQUIRED UNDER MASS. GEN. LAWS CH. 6D, § 13, available at
https://www.mass.gov/files/documents/2017/07/zl/20170713-macipa-caregroup-lahey-bidco-srhs-mcn.pdf (last
visited Sept. 24, 2018). 4 The BILH CIN would establish payer contracts on behalf of the following BILH-owned hospitals: BIDMC, BID-
Needham, BID-Milton, BID-Plymouth, Lahey HMC, Northeast, Winchester, Anna Jaques, and NE Baptist. It would
also establish contracts on behalf of affiliated hospitals that are part of BIDCO’s current contracting network, such
as CHA and Lawrence General. 5 LAHEY HEALTH SYSTEM, NOTICE OF MATERIAL CHANGE TO THE HEALTH POLICY COMM’N (July 13, 2017), AS
REQUIRED UNDER MASS. GEN. LAWS CH. 6D, § 13, available at
https://www.mass.gov/files/documents/2017/07/zo/20170713-lahey-bidco-caregroup-macipa-srhs-mcn.pdf (last
visited Sept. 24, 2018). 6 See OFFICE OF ATTY. GEN. MAURA HEALEY, EXAMINATION OF HEALTHCARE COST TRENDS AND COST DRIVERS
PURSUANT TO G.L. C. 12C, § 17, REPORT FOR ANNUAL PUBLIC HEARING UNDER G.L. C. 12C, § 17 (October 13,
2
providers in the market and claim that their expanded geographic coverage and scope of services
will make them a more attractive option for payers and self-insured employers, and that they will
strengthen access to affordable and equitable health care.
After a 30-day initial review, the HPC determined that the proposed transaction was
likely to have a significant impact on costs and market functioning in Massachusetts and
warranted further review.7 This transaction also required a Determination of Need (DoN), and
the parties filed their DoN application with the Department of Public Health (DPH) on
September 8, 2017. In an April 4, 2018 meeting, the DPH Commissioner and the Public Health
Council voted to approve the DoN application with conditions.8 On July 18, 2018, the HPC
issued a Preliminary Report presenting the analysis and key findings from its review.9 The
parties provided a written response to these findings on August 17, 2018 (Parties’ Response).10
The HPC now issues this Final Report, including the Parties’ Response (attached as Exhibit A)
and the HPC’s Analysis of the Parties’ Response (attached as Exhibit B).
2016), available at https://www.mass.gov/files/documents/2016/10/ts/cc-market-101316.pdf (last visited Sept. 24,
2018); MASS. HEALTH POLICY COMM’N, 2015 COST TRENDS REPORT: PROVIDER PRICE VARIATION (Feb. 2016),
available at https://www.mass.gov/files/documents/2017/01/oj/2015-ctr-ppv.pdf (last visited Sept. 24, 2018); MASS.
HEALTH POLICY COMM’N, COMMUNITY HOSPITALS AT A CROSSROADS (Mar. 2016), available at
http://www.mass.gov/anf/budget-taxes-and-procurement/oversight-agencies/health-policy-
commission/publications/community-hospitals-at-a-crossroads.pdf (last visited Sept. 24, 2018); MASS. GEN. COURT,
SPECIAL COMMISSION ON PROVIDER PRICE VARIATION REPORT (Mar. 15, 2017), available at
http://www.mass.gov/anf/budget-taxes-and-procurement/oversight-agencies/health-policy-commission/ppv-report-
final.pdf (last visited Sept. 24, 2018). 7 See MASS. HEALTH POLICY COMM’N, MINUTES OF THE HEALTH POLICY COMM’N (Dec. 12, 2017) (voting to initiate
the cost and market impact review of the BILH transaction), available at
https://www.mass.gov/files/documents/2018/01/31/20180103%20-%20Meeting%20Minutes%20-
%20December%2012%2C%202017%20Meeting.pdf) (last visited Sept. 24, 2018). 8 MASS. DEPT. OF PUBLIC HEALTH, NOTICE OF FINAL ACTION DON APPLICATION NO. NEWCO 17082413-TO
CAREGROUP INC., LAHEY HEALTH SYSTEM INC., AND SEACOAST REGIONAL HEALTH SYSTEMS, available at
https://www.mass.gov/files/documents/2018/04/17/newco-decision-letter.pdf (last visited Sept. 24, 2018). However,
the Notice of DoN does not go into effect until 30 days after the CMIR final report and DPH may rescind or amend
an approved Notice of DoN on the basis of findings in a CMIR if the Commissioner determines that the parties
would fail to meet one or more of the specified DoN Factors. See 105 CMR 100,
https://www.mass.gov/files/documents/2017/10/11/105cmr100.pdf (last visited Sept. 24, 2018). 9 MASS. HEALTH POLICY COMM’N, REVIEW OF THE PROPOSED MERGER OF LAHEY HEALTH SYSTEM; CAREGROUP
AND ITS COMPONENT PARTS, BETH ISRAEL DEACONESS MEDICAL CENTER, NEW ENGLAND BAPTIST HOSPITAL, AND
MOUNT AUBURN HOSPITAL; SEACOAST REGIONAL HEALTH SYSTEMS; AND EACH OF THEIR CORPORATE
SUBSIDIARIES INTO BETH ISRAEL LAHEY HEALTH; AND THE ACQUISITION OF THE BETH ISRAEL DEACONESS CARE
ORGANIZATION BY BETH ISRAEL LAHEY HEALTH; AND THE CONTRACTING AFFILIATION BETWEEN BETH ISRAEL
LAHEY HEALTH AND MOUNT AUBURN CAMBRIDGE INDEPENDENT PRACTICE ASSOCIATION, PURSUANT TO M.G.L. C.
6D, § 13 PRELIMINARY REPORT at 74-75 (July 18, 2018), available at
https://www.mass.gov/files/documents/2018/07/18/Preliminary%20CMIR%20Report%20-
%20Beth%20Israel%20Lahey%20Health_0.pdf (last visited Sept. 24, 2018). 10
Joint Response for the Proposed Transaction to Create BILH and BILH CIN on behalf of Beth Israel Deaconess
Medical Center, Inc., Mount Auburn Hospital, New England Baptist Hospital, Lahey Health System, Inc., Seacoast
Regional Health Systems, Inc., Beth Israel Deaconess Physician Organization, LLC d/b/a Beth Israel Deaconess
Care Organization, and Mount Auburn Cambridge Independent Practice Association, Inc. (Aug. 17, 2018), available
at https://www.mass.gov/files/documents/2018/08/20/BILH%20Response%20-%20HPC-CMIR-2018-1_0.pdf (last
visited Sept. 24, 2018).

3
This report is organized into four parts. Part I outlines our analytic approach and the data
we utilized. Part II describes the parties to this CMIR and their goals and plans for undertaking
the transaction. Part III then presents our findings. We conclude in Part IV. Below is a summary
of the findings presented in Part III:
1. Cost and Market Profile: Historically, the parties have generally had low to moderate
prices and moderate spending levels compared to other Massachusetts providers. As
Lahey and BIDCO have grown by affiliating with or acquiring new community hospitals,
their prices have not generally risen relative to competitors, and their spending has grown
at generally the same rate as the rest of the market based on current available data. While
BIDMC and Lahey have had some success at retaining local care at community hospitals
they have recently acquired, shifts in care to their hospitals following past acquisitions
and affiliations have come from both lower-priced and higher-priced hospitals, and
spending trends for local patients have remained largely unchanged.
2. Cost and Market Impact: After the transaction, BILH’s market share would nearly
equal that of Partners HealthCare System, market concentration would increase
substantially, and BILH would have significantly enhanced bargaining leverage with
commercial payers. BILH’s enhanced bargaining leverage would enable it to
substantially increase commercial prices that could increase total health care spending by
an estimated $128.4 million to $170.8 million annually for inpatient, outpatient, and adult
primary care services. Additional spending impacts would be likely for other services; for
example, spending for specialty physician services could increase by an additional $29.8
million to $59.7 million annually if the parties obtain similar price increases for these
services. These would be in addition to the price increases the parties would have
otherwise received. These figures are likely to be conservative. The parties could obtain
these projected price increases, significantly increasing health care spending, while
remaining lower-priced than Partners.
Plans to shift care to BILH from other providers and to lower-cost settings within the
BILH system would generally be cost-reducing and proposed care delivery programs
may also result in savings, but there is no reasonable scenario in which such savings
would offset spending increases if BILH obtains the projected price increases. Achieving
all of the parties’ care redirection goals could save approximately $8.7 million to $13.6
million annually at current price levels, or $5.3 million to $9.8 million annually with
projected price increases. The scope of care delivery savings is uncertain; however, the
parties have estimated that their care delivery plans will save an additional $52 million to
$87 million. The parties have stated that BILH would achieve internal savings and new
revenue that would allow them to invest in these plans and enable BILH to be financially
successful without significant price increases. Nonetheless, to date, the parties have
declined to offer any commitments to limit future price increases.
3. Quality and Care Delivery Profile: Historically, the parties have generally performed
comparably to statewide average performance on hospital and ambulatory measures of
clinical quality, with some variation among their hospitals and physician networks on
specific measures. They have each developed unique structures to promote and improve
4
the delivery of high-quality health care and have engaged in a wide variety of targeted
care delivery initiatives. They have also participated in various government and
commercial payer contracting arrangements that promote quality and efficiency, although
their participation in individual payment models varies.
4. Quality and Care Delivery Impact: The parties have identified some quality metrics for
ongoing measurement post-transaction but have not yet identified baseline data or
transaction-specific quality improvement goals, except in relation to a few specific care
delivery proposals. They are considering plans for integrating their unique quality
oversight and management structures and have stated an intention to expand or integrate
current care delivery initiatives. While most of these plans are still in development, the
parties have provided more detailed plans for a few of these initiatives, and these
proposals suggest a potential for quality improvement.
5. Access Profile: The hospitals proposing to join the BILH-owned system generally have a
lower mix of Medicaid patients than the overall mix in their service areas and a lower
Medicaid mix than most comparator hospitals, although some serve a higher share of
Medicare patients. In contrast, current BIDCO contracting affiliate hospitals that are
anticipated to be BILH contracting affiliates (Cambridge Health Alliance, Lawrence
General Hospital, and MetroWest Medical Center) have a higher mix of Medicaid
patients. The parties also provide a smaller proportion of inpatient and emergency
department (ED) care to non-white patients and Hispanic patients than other large eastern
Massachusetts hospital systems, and their patients come from more affluent communities
on average. The parties are important providers of behavioral health services in eastern
Massachusetts.
6. Access Impact: Based on the current patient mix of the proposed BILH-owned hospitals,
the BILH-owned system would have among the lowest mix of Medicaid discharges and
proportion of discharges and ED visits for non-white patients and Hispanic patients
compared to other large eastern Massachusetts hospital systems. BILH’s patients, on
average, would also come from more affluent communities. It is not yet clear whether or
how BILH’s patient mix would change as a result of the proposed transaction, although
the parties do not expect significant changes to their current payer mix, and they have so
far declined to offer any commitments to expand access for Medicaid patients. While
many of the parties’ plans for how they might expand clinical services are still under
development, the parties have provided some plans for expanding behavioral health
services that have the potential to enhance access to these services.
In summary, while the BILH parties have historically been low-priced to mid-priced and
have not increased their prices relative to the market as they have grown through smaller
transactions to date, the BILH transaction is likely to enable the parties to obtain significantly
higher commercial prices across inpatient, outpatient, and physician services. Achieving all of
the parties’ goals for their proposed care delivery programs and for shifting patients to lower-cost
settings would result in savings, but these savings would be less than the impact of projected
price increases as a result of the parties’ enhanced bargaining leverage. To date, the parties have
not committed to constraining future price increases, despite the fact that their own financial
5
projections indicate that they expect internal efficiencies and new revenue that would allow
BILH to invest in its proposed care delivery programs and enable BILH to be profitable without
significant price increases.
The parties also claim that the transaction would result in improvements in the quality of
patient care and access to services and are developing plans in these areas. Most of the plans
provided by the parties are not sufficiently detailed for the HPC to robustly assess the likelihood
or degree to which they would result in improvements to health care quality or access; however,
the initiatives for which the parties have provided details have the potential to improve care
delivery and access to needed services, particularly behavioral health, if implemented as
described.
Based on these findings, the HPC concludes that the transaction warrants further review
and refers this report to the Attorney General to assess whether there are enforceable steps that
the parties may take to mitigate concerns about the potential for significant price increases and
maximize the likelihood that BILH will enhance access to high quality care, particularly for
underserved populations. The HPC additionally recommends that the Commissioner of the
Department of Public Health reconsider the approval with conditions of the Determination of
Need Application NEWCO-17082413-TO and assess the need for additional or revised
conditions to ensure that the applicable Determination of Need factors are met.

6
I. ANALYTIC APPROACH AND DATA SOURCES
A. ANALYTIC APPROACH
The Health Policy Commission (HPC) is tasked with examining impact in three
interrelated areas in a cost and market impact review (CMIR):11
1. Costs and Market Functioning. The HPC may examine factors such as prices, total
medical expenses, provider costs, and other measures of health care spending as well as
market share, the provider’s methods for attracting patient volume and health care
professionals, and the provider’s impact on competing options for care delivery.
2. Quality and Care Delivery. The HPC may examine factors related to the quality of
services provided, including patient experience.
3. Access to Care. The HPC may also examine the availability and accessibility of services
provided, such as the provider’s role in serving at-risk, underserved, and government-
payer patient populations.
Additionally, the HPC may consider any other factors it deems to be in the public interest,
including consumer concerns.12
Within this statutory and regulatory framework, the HPC determines those factors most
relevant to a given transaction and then gathers detailed information relevant to those factors
from the sources discussed below. The HPC examines recent data to establish the parties’
baseline performance and current trends in each of these areas prior to the transaction. The
HPC then combines the parties’ baseline performance with known details of the transaction, as
well as the parties’ goals and plans, to project the impact of the transaction on baseline
performance. The analytic section of this report is divided into three parts, each addressing the
parties’ baseline performance and the likely impact of the transaction: Section III.A addresses
costs and market functioning, Section III.B addresses quality and care delivery, and Section III.C
addresses access to care.
11
See MASS. GEN. LAWS ch. 6D, § 13(d) and 958 CMR 7.06. 12
Id.

7
B. DATA SOURCES
To conduct this review, we relied on the documents and data the parties produced to us in
response to HPC information requests13
and the parties’ response to the HPC’s Preliminary
Report,14
the parties’ own description of the transaction as presented in their material change
notices and application for Determination of Need (DoN) and supporting materials filed with the
Massachusetts Department of Public Health (DPH), and publicly available information published
by the parties. The HPC also utilized extensive information from the Massachusetts Registration
of Provider Organizations program (MA-RPO)15
and obtained data and documents from a
number of other sources. These include other state agencies such as the Massachusetts Attorney
General’s Office (AGO) Non-Profit Organizations/Public Charities Division, from which we
received audited financial statements for non-profit institutions relevant to our review, and the
Center for Health Information and Analysis (CHIA), from which we received provider- and
payer-level data,16
hospital discharge data,17
and claims-level data from the All-Payer Claims
Database (APCD);18
federal agencies such as the Agency for Healthcare Research and Quality
(AHRQ) and the Centers for Medicare and Medicaid Services (CMS); payers such as Blue Cross
Blue Shield of Massachusetts (BCBS), Harvard Pilgrim Health Care (HPHC), and Tufts Health
Plan (THP); and other market participants. The HPC appreciates the cooperation of all entities
that provided information in support of this review.
13
The parties provided information to the HPC over the course of more than six months, including responses to the
HPC’s initial information requests, to clarifying questions about initial submissions, and under their continuing
obligation to produce information relevant to the HPC’s information requests whenever it becomes available during
the course of the HPC’s review. 14
Exh. A: Joint Response for the Proposed Transaction to Create BILH and BILH CIN on behalf of Beth Israel
Deaconess Medical Center, Inc., Mount Auburn Hospital, New England Baptist Hospital, Lahey Health System,
Inc., Seacoast Regional Health Systems, Inc., Beth Israel Deaconess Physician Organization, LLC d/b/a Beth Israel
Deaconess Care Organization, and Mount Auburn Cambridge Independent Practice Association, Inc. (Aug. 17,
2018) [hereinafter Parties’ Response], available at
https://www.mass.gov/files/documents/2018/08/20/BILH%20Response%20-%20HPC-CMIR-2018-1_0.pdf (last
visited Sept. 24, 2018). 15
MASS. GEN. LAWS ch. 6D, § 11 and ch. 12C, § 9 (requiring provider organizations to register annually with the
HPC and CHIA and provide information on organizational structure and affiliations, and other requested
information); see also 958 CMR §§ 6.00 (2014) and 957 CMR §§ 11.00 (2017); MA-RPO Data, MASS. HEALTH
POLICY COMM’N, https://www.mass.gov/service-details/ma-rpo-data (last visited Sept. 24, 2018). 16
These data include relative price (RP) data and total medical expense (TME) data. See Relative Price and
Provider Price Variation, CTR. FOR HEALTH INFO. & ANALYSIS, http://www.chiamass.gov/relative-price-and-
provider-price-variation/ (last visited Sept. 24, 2018); Total Medical Expenses, CTR. FOR HEALTH INFO. &
ANALYSIS, http://www.chiamass.gov/total-medical-expenses-2/ (last visited Sept. 24, 2018). The most recent
available year of data for RP was 2016 for hospitals and 2015 for physicians, and the most recent year of data for
TME was 2016. In addition to the published data for these metrics, the HPC used the confidential raw data
underlying these metrics provided by payers to CHIA. Harvard Pilgrim Health Care (HPHC) updated its 2016
outpatient hospital RP data after the most recent publication of RP by CHIA. For all uses of HPHC outpatient RP
data in this report, the HPC used the updated submission of HPHC outpatient data. 17
See Case Mix Data, CTR. FOR HEALTH INFO. & ANALYSIS, http://www.chiamass.gov/case-mix-data/ (last
visited Sept. 24, 2018). Our analyses for this report primarily used CHIA hospital discharge data for 2017 and
emergency department (ED) visit data for 2016, with retrospective analyses using data from as early as 2009. 18
The APCD includes medical, pharmacy, and dental claims, as well as information about member eligibility,
benefit design, and providers for all payers covering Massachusetts residents.The most recent available year of data
for the APCD was 2015. See All-Payer Claims Database, CTR. FOR HEALTH INFO. & ANALYSIS,
http://www.chiamass.gov/ma-apcd/ (last visited Sept. 24, 2018).

8
To assist in our review and analysis of information, the HPC engaged consultants with
extensive experience evaluating provider organizations and their impact on health care costs and
the health care market, including economists, actuaries, accountants, and experts in health care
quality and care delivery. Working with these experts, the HPC comprehensively analyzed the
data and other materials detailed above.
Where our analyses rely on nonpublic information produced by the parties or other
market participants, MASS. GEN. LAWS ch. 6D, § 13 and 958 CODE MASS. REGS. 7.09 prohibit
the HPC from disclosing such information without the consent of the producing entity, except in
a preliminary or final CMIR report where “the commission believes that such disclosure should
be made in the public interest after taking into account any privacy, trade secret or anti-
competitive considerations.”19
Consistent with this requirement, this Final Report contains only
limited disclosures of such confidential information where the HPC has determined that the
public interest in disclosure outweighs privacy, trade secret, and anti-competitive considerations.
For each analysis, the HPC utilized the most recent and reliable data available.
Recognizing the HPC’s interest in ensuring the highest level of accuracy, this Final Report
includes updates to a number of analyses that were published in the Preliminary Report to
incorporate more recent data and make minor technical updates.20
These include updated
assessments of the financial position of the parties and comparator systems; price impacts of
willingness-to-pay changes for inpatient and outpatient hospital services; and payer mix, patient
demographics, and socioeconomic statistics for inpatients at the parties’ hospitals and
comparator hospitals and systems. The updated figures are consistent with those published in the
Preliminary Report.
Because data—whether publicly reported or privately held—is usually generated on a
variable schedule from entity to entity, the most recent and reliable data primarily reflect 2015 to
2017 data; historic data used in longitudinal analyses are from as early as 2009.21
We have noted
the applicable year for the underlying data throughout this report and, wherever possible, we
examined multiple years of data to analyze trends and to report on the consistency of findings
over time. For data and materials produced by the parties and other market participants, the HPC
tested the accuracy and consistency of the data collected to the extent possible, but also relied in
large part on the producing party for the quality of the information provided.
The availability of accurate data, time constraints, and a focus on those analyses that
complement—rather than duplicate—the work of other agencies may affect the analyses
included in this and other reviews of material changes. Future reviews may encompass new and
19
MASS. GEN. LAWS ch. 6D, § 13(c), amended by 2013 Mass. Acts 38, § 20. 20
Specifically, many of the analyses within this report have been updated to incorporate fiscal year 2017 financial
data, 2017 hospital discharge data, and 2016 hospital relative price data. See Exh. B: HPC Analysis of the Parties’
Response to the Health Policy Commission’s Preliminary CMIR Report, at Section V [hereinafter HPC Analysis of
the Parties’ Response]. 21
Some data sources use fiscal year rather than calendar year data, notably CHIA’s hospital discharge data and
Hospital Profiles. Therefore, hospital discharge and Hospital Profiles data presented here are fiscal year data.
9
evolving analyses depending on the facts of a transaction, recent market developments, areas of
public interest, and the availability of improved data resources.22
Finally, most of our cost and market analyses focus on the anticipated impact in the
commercially insured market. In the commercially insured market, prices for health care
services—whether fee-for-service, global budgets, or other forms of alternative payments—are
established through private negotiations between payers and providers. The terms of these payer-
provider contracts vary widely, with regard to both price and other material terms that impact
health care costs and market functioning.23
22
For example, this review includes a new “willingness-to-pay” analysis of the impact of the proposed transaction
on competition in the health care market. See Section III.A.5 for details of this analysis and our findings. 23
See, e.g., OFFICE OF ATT’Y GEN. MARTHA COAKLEY, EXAMINATION OF HEALTH CARE COST TRENDS AND COST
DRIVERS PURSUANT TO G.L. C. 118G, § 6 ½(b): REPORT FOR ANNUAL PUBLIC HEARING at 40-43 (Mar. 16, 2010),
available at http://www.mass.gov/ago/docs/healthcare/2010-hcctd-full.pdf (last visited Sept. 24, 2018); MASS.
HEALTH POLICY COMM’N, 2015 COST TRENDS REPORT: PROVIDER PRICE VARIATION (Jan. 2016), available at
http://www.mass.gov/anf/budget-taxes-and-procurement/oversight-agencies/health-policy-
commission/publications/2015-ctr-ppv.pdf (last visited Sept. 24, 2018).

10
II. OVERVIEW OF THE TRANSACTION AND THE PARTIES
A. THE PROPOSED TRANSACTION
In July 2017, Lahey Health System (Lahey); Beth Israel Deaconess Medical Center
(BIDMC); New England Baptist Hospital (NE Baptist); Mount Auburn Hospital (Mt. Auburn);
CareGroup, the corporate parent of BIDMC, NE Baptist, and Mt. Auburn; and Seacoast Regional
Health Systems (Seacoast), the parent of Anna Jaques Hospital (Anna Jaques), signed an
agreement to become corporately affiliated. The parties agreed to form a new corporate entity
called Beth Israel Lahey Health (BILH),24
which would become the sole corporate parent of NE
Baptist, Mt. Auburn, Lahey, Seacoast, and BIDMC and its owned community hospitals, merging
the hospital systems and all of their subsidiaries into one organization.
In October 2017, the parties’ affiliated contracting networks, Beth Israel Deaconess Care
Organization (BIDCO), Lahey Clinical Performance Network (LCPN), Lahey Clinical
Performance Accountable Care Organization (LCP ACO), and Mount Auburn Cambridge
Independent Practice Association (MACIPA) also signed an affiliation agreement. Under that
agreement, BILH would create a clinically integrated network (BILH CIN) that would own
BIDCO, LCPN, and LCP ACO. MACIPA would remain corporately independent, but would
participate in the design, management, and governance of the BILH CIN.25
The BILH CIN
would jointly negotiate and establish contracts with payers on behalf of both owned and
affiliated hospitals26
as well as employed and independent physicians who currently contract
through BIDCO, LCPN, LCP ACO, and MACIPA. The parties have described the proposed
BILH merger and BILH CIN affiliations as interrelated components of a single transaction.27
The
new proposed relationships between the parties are summarized in the organizational chart and
table below.
24
The transaction agreements refer to the new corporate entity as “NewCo.” The parties have since named this
entity “Beth Israel Lahey Health (BILH)” and we refer to the proposed organization by this name throughout the
report. See, e.g., Jessica Bartlett, Beth Israel, Lahey Announce New Name for Mega-Merger, BOSTON BUSINESS
JOURNAL, May 23, 2018, available at https://www.bizjournals.com/boston/news/2018/05/23/beth-israel-lahey-
announce-new-name-for-mega.html (last visited Sept. 24, 2018). 25
MOUNT AUBURN CAMBRIDGE INDEPENDENT PRACTICE ASSOCIATION, NOTICE OF MATERIAL CHANGE TO THE
HEALTH POLICY COMM’N (July 13, 2017), AS REQUIRED UNDER MASS. GEN. LAWS CH. 6D, § 13, available at
https://www.mass.gov/files/documents/2017/07/zl/20170713-macipa-caregroup-lahey-bidco-srhs-mcn.pdf (last
visited Sept. 24, 2018). 26
BILH would establish payer contracts on behalf of the following BILH-owned hospitals: BIDMC, Beth Israel
Deaconess Hospital-Needham, Beth Israel Deaconess Hospital-Milton, and Beth Israel Deaconess Hospital-
Plymouth, Lahey Hospital & Medical Center, Northeast Hospital, Winchester Hospital, Anna Jaques, and NE
Baptist. It would also establish contracts on behalf of affiliated hospitals that are part of BIDCO’s current
contracting network, such as Cambridge Health Alliance and Lawrence General Hospital. 27
LAHEY HEALTH SYSTEM, NOTICE OF MATERIAL CHANGE TO THE HEALTH POLICY COMM’N (July 13, 2017), AS
REQUIRED UNDER MASS. GEN. LAWS CH. 6D, § 13 [hereinafter LAHEY NOTICE OF MATERIAL CHANGE], available at
https://www.mass.gov/files/documents/2017/07/zo/20170713-lahey-bidco-caregroup-macipa-srhs-mcn.pdf (last
visited Sept. 24, 2018).
https://www.bizjournals.com/boston/news/2018/05/23/beth-israel-lahey-announce-new-name-for-mega.html

11
Proposed BILH Organizational Chart (Hospital and Physician Network Entities Only)
Source: HPC interpretation based on information provided by the parties. Note: MetroWest is a member of BIDCO, but is not currently participating in any BIDCO payer contracts.
28
The table below shows the current corporate and contracting affiliations of the parties, as well as
their proposed affiliations with BILH.
28
MetroWest Medical Center (MetroWest) became a member of BIDCO in 2017, but does not yet participate in
payer contracts established by BIDCO. MASSACHUSETTS REGISTRATION OF PROVIDER ORGANIZATIONS 2017 FILING:
BETH ISRAEL DEACONESS CARE ORGANIZATION (Jan. 18, 2018) [hereinafter BIDCO 2017 MA-RPO FILING]. For
more information about MetroWest joining BIDCO, see MASS. HEALTH POLICY COMM’N, REVIEW OF BETH ISRAEL
DEACONESS CARE ORGANIZATION’S PROPOSED CONTRACTING AFFILIATION WITH NEW ENGLAND BAPTIST HOSPITAL
AND NEW ENGLAND BAPTIST CLINICAL INTEGRATION ORGANIZATION (HPC-CMIR-2015-1) AND BETH ISRAEL
DEACONESS CARE ORGANIZATION’S PROPOSED CONTRACTING AFFILIATION AND BETH ISRAEL DEACONESS
MEDICAL CENTER’S AND HARVARD MEDICAL FACULTY PHYSICIANS’ PROPOSED CLINICAL AFFILIATION WITH
METROWEST MEDICAL CENTER (HPC-CMIR-2015-2 AND HPC-CMIR-2016-1) PURSUANT TO M.G.L. CH. 6D, § 13
FINAL REPORT (Sept. 7, 2016) [hereinafter 2016 BID CMIR FINAL REPORT], available at
https://www.mass.gov/files/documents/2016/09/xi/bidco-nebh-metrowest-bidmc-final-cmir.pdf (last visited Sept.
24, 2018). In an effort to be conservative and in recognition of the unique status of MetroWest as a member of
BIDCO, and an anticipated contracting affiliate of BILH, but not a current participant in BIDCO payer contracts, in
this report the HPC generally does not include MetroWest in analyses of market share, market concentration, or
other analyses relating to competition and potential price changes. We do include MetroWest in discussion of the
size of the BILH contracting network and in analyses where we are specifically looking at BILH contracting affiliate
hospitals (e.g., contracting affiliate payer mix).

12
Entity Name Current Corporate Affiliation Current Contracting
Affiliation
Post-Transaction Corporate and
Contracting Relationship
Lahey HMC
Lahey Lahey
BILH owned
Northeast
Winchester
LCP ACO
LCPN
Mt. Auburn Independent
CareGroup29
Independent
NE Baptist
BIDMC
BID-owned
BIDCO
BID-Milton
BID-Needham
BID-Plymouth
BIDCO
Independent Anna Jaques
CHA BILH contracting affiliates; no
change to corporate affiliation
Lawrence General
MetroWest30 Tenet Healthcare Corporation
MACIPA Independent Independent
Note: For simplicity, this chart omits some corporate subsidiaries of the parties, and does not show physician groups that contract through the LCPN, LCP ACO, and BIDCO contracting networks, some of which are owned by the parties and some of which are corporately independent.
The parties have described the governance model for BILH as involving both centralized
oversight and management as well as local governance. BILH would be governed by a single
board and select administrative functions would be provided at the BILH level. However, local
hospital management and boards would continue to oversee day-to-day operations. The parties
state that this shared governance would allow the system to take advantage of local knowledge
and accountability to serve each hospital’s community and address its unique needs, while
gaining financial and operational efficiency by consolidating certain functions in a strong central
board.31
29
CareGroup is a corporate entity under which BIDMC, Mt. Auburn, and NE Baptist jointly borrow funds and
purchase services, but do not jointly contract with payers or share centralized operations. Thus, while some of the
parties are currently members of CareGroup, we do not generally view them or treat them as corporately integrated
in this report. See “What is CareGroup?,” infra page 17. 30
MetroWest is not yet participating in BIDCO payer contracts. See supra note 28. 31
APPLICATION BY LAHEY HEALTH SYSTEM, CAREGROUP, AND SEACOAST REGIONAL HEALTH SYSTEMS FOR
DETERMINATION OF NEED FOR TRANSFER OF OWNERSHIP, Response to Questions 2.1, 6.5, 6.6, and 13, Factor 1 at 17
(Sept. 7, 2017), [hereinafter DON NARRATIVE], available at https://www.mass.gov/files/documents/2017/09/zj/don-
application-response-newco.pdf (last visited Sept. 24, 2018).

13
The parties have stated a goal of full economic and clinical integration across the
proposed BILH system, although many of the details of how this goal would be achieved are still
being developed. The parties have a robust planning process and have formed 32 working groups
to explore how they might integrate clinical and administrative services.32
The groups consist of
representatives from the parties and are responsible for recommending potential plans for future
BILH structures and initiatives. Each group has a specific focus, including, for example: clinical
collaboration in a service line (e.g., cancer, behavioral health), information technology,
laboratory services, care retention, financial operations, population health management, human
resources, and supply chain.33
Some of the proposals from the groups are relatively detailed
while others are still relatively high-level, although according to the parties, each proposal has
“received preliminary endorsement.”34
The parties have stated that, in many cases, they are
legally restricted from sharing information and further developing their plans while they remain
separate corporate entities. In all cases, the parties have emphasized that this planning process is
ongoing and any final decisions regarding integration and specific initiatives would not be made
until after the transaction is finalized.
For example, the parties have stated that they plan to expand access to community-based
services and promote access to convenient, low-cost care by investing in expanding specific
services lines, including primary care, behavioral health, cancer care, and urgent care. Similarly,
they have stated that they plan to build upon their individual quality improvement strategies
through improved access to patient information and the sharing of best practices, evidence-based
medicine, and quality improvement infrastructure.35
They have also expressed a commitment to
leverage existing expertise to improve quality and identified some measures they would monitor
as an integrated system post-transaction. However, except for four specific care delivery
initiatives described in the Parties’ Response, they have not yet provided specific targets,
timelines, or budgets for such initiatives; nor have they compared the expected benefits of these
activities to activities that each system would pursue absent the proposed transaction.36
These
goals for quality improvement and service line expansions are discussed in more detail in
Sections III.B and III.C, respectively.
The parties also expect that the transaction would improve their financial performance.
The financial projections they have provided for the BILH system indicate that they expect they
would achieve positive margins as a combined system, even if they do not obtain price increases
as a result of the proposed transaction.37
They expect higher revenue as a result of increases in
32
See Parties’ Response, supra note 14, at 37. 33
See id. at Appendix 3 for a full list of these groups. 34
The Parties’ Response states that the recommendations of all design teams have received “preliminary
endorsement” from the parties’ leadership working group, and that each of the teams has moved on to additional
planning steps. Id. at 37. This Final Report reflects only those plans provided to the HPC. 35
LAHEY NOTICE OF MATERIAL CHANGE, supra note 27. 36
The parties would be required to report some baseline data, measure specifications, and timelines to the DoN
program six months after the transaction is concluded under the conditions imposed by the DoN program. See
Section III.B.2 for more detail. 37
The parties expect a financial benefit to BILH of $88 million to $169 million annually from increased revenue and
lower expenses as a result of the proposed transaction. Parties’ Response, supra note 14, at 22. See also BDO USA
LLP, ANALYSIS OF THE REASONABLENESS OF ASSUMPTIONS USED FOR AND FEASIBILITY OF PROJECTED FINANCIALS
OF: LAHEY HEALTH SYSTEM, INC. BETH ISRAEL DEACONESS MEDICAL CENTER, INC. MOUNT AUBURN HOSPITAL
NEW ENGLAND BAPTIST HOSPITAL AND ANNA JAQUES HOSPITAL COMBINED TOGETHER AS NEWCO (Sept. 7, 2017)

14
volume and decreased expenses as a result of savings in supplies and non-clinical functional
areas. These include joint purchasing, shared administrative functions, revenue cycle
management, and improved debt financing.38
The parties have indicated that they intend to retain
any such savings to fund their operations and “reinvest in services and programs needed to better
care for [the BILH] patient panel.”39
These financial goals and projections are discussed in more
detail in Section III.A.7.
The parties describe the proposed transaction as a market-based solution to address rising
health care expenditures, price disparities, payment variation, and health inequities that have
been highlighted by the HPC, AGO, and others.40
In particular, the parties claim that BILH will
“introduce competition, particularly price competition, into the marketplace” and generally
position themselves as a high-quality and lower-cost alternative to other providers in the
market.41
They claim that their expanded geographic coverage and scope of services will make
them a more attractive option to payers and self-insured employers and that they will strengthen
access to affordable and equitable health care for Massachusetts residents by:
1) “Re-investing in advanced APMs to assume increased responsibility for health
outcomes and efficiencies in care delivery (the ‘right care’);
2) Reducing outmigration to costlier sites of care when equivalent or better quality care
is accessible in the local community (e.g., reducing “community appropriate”
inpatient volume at academic medical centers and teaching hospitals) resulting in
more patients treated closer to home at a reduced cost (the ‘right place’);
[hereinafter BDO REPORT], available at https://www.mass.gov/files/documents/2017/09/zv/don-cpa-certification-
lahey.pdf (last visited Sept. 24, 2018) (concluding that the projections are reasonable and feasible, and not likely to
have a negative impact on the patient panel or result in a liquidation of assets). Information provided confidentially
by the parties indicates that the parties’ “low,” “medium,” and “high” performance financial projections assume the
same level of price increases as their “baseline” scenario, which trends forward the parties’ current financial
projections assuming the parties would gain no financial benefits, including no price increases as a result of the
proposed merger. In response to Commissioner questions about the financial implications if the BILH merger does
not go through, the Parties’ Response provides additional information about the parties’ FY17 financial performance
and states that “[u]nless BILH is formed, many of the Parties will be increasingly challenged to sustain their current
level of investment in clinical services, behavioral health programs, and population health initiatives….” Parties’
Response, supra note 14, at 4. The financial performance of each party is discussed in more detail in Sections II.B
through II.H. While the parties have stated that a goal of the transaction is to improve their financial performance,
none has stated that the transaction is necessary to avoid closure of any of the facilities, nor is it the HPC’s analysis
that any of the parties appears to be in immediate danger of closure. 38
See DON NARRATIVE, supra note 31. The parties’ financial models assume that the proposed merger would result
in savings in supply costs and non-clinical functional areas of between 1.5% and 3%, or $42 million to $66 million
as described in the Parties’ Response, supra note 14, at 22. 39
DON NARRATIVE, supra note 31, at 17. 40
See, e.g., OFFICE OF ATTY. GEN. MAURA HEALEY, EXAMINATION OF HEALTHCARE COST TRENDS AND COST
DRIVERS PURSUANT TO G.L. C. 12C, § 17, REPORT FOR ANNUAL PUBLIC HEARING UNDER G.L. C. 12C, § 17 (October
13, 2016), available at https://www.mass.gov/files/documents/2016/10/ts/cc-market-101316.pdf (last visited Sept.
24, 2018) 41
DON NARRATIVE, supra note 31, at 14.

15
3) Providing a high-value, full continuum and geographically distributed alternative to
peer organizations that is easily accessible to all patients and their families no matter
their health concern (the ‘right time’); and
4) Driving development of new insurance products with commercial payers that
incentivize the utilization of high-quality, lower-cost providers and contribute to the
reduction of premiums (the ‘right price’).”42
Finally, the parties have suggested that the transaction will better allow them to achieve
other goals, stating that BILH will be better positioned to “properly incent providers within the
delivery system to succeed under value based payment methodologies”; “optimally utilize the
combined ambulatory, inpatient, community, tertiary, home care, and post-acute assets of
[BILH] based on patient need and convenience”; “leverage existing community partnerships and
evidence-based programs to maximum effect, strengthening… public health and prevention
expertise and efforts”; “provide streamlined transitions of care and navigational supports to
patients”; “bolster clinical programs and services to expand access”; “strengthen teaching and
research programs”; and “achieve operational synergies, economies of scale, and
efficiencies….”43
Section III examines these claims in light of our analyses of the parties’
historic performance and the likely impact of the transaction on health care costs and market
functioning, quality and care delivery, and access to care.
The remainder of this section describes each of the parties to the transaction in greater
detail.
B. BETH ISRAEL DEACONESS MEDICAL CENTER
Founded in 1996 by the merger of Beth Israel Hospital and New England Deaconess
Hospital, BIDMC44
is the academic medical center (AMC) anchor for a non-profit health care
system (BID-owned system), the third-largest in the Commonwealth by net patient service
revenue (NPSR).45
The system includes BIDMC, the Commonwealth’s fifth largest acute
hospital,46
and three owned community hospitals:
BIDMC, a 669-bed Academic Medical Center
42
Id. at 4-5. 43
Id. at 5-6. 44
A History of Improving Care for All, BETH ISRAEL DEACONESS MEDICAL CENTER, https://www.bidmc.org/about-
bidmc/a-history-of-improving-care-for-all (last visited Sept. 24, 2018). 45
See the Data Appendix, Figure 1, for more information on the Commonwealth’s seven largest provider systems by
NPSR. 46
CTR. FOR HEALTH INFO. & ANALYSIS, HOSPITAL PROFILE: BETH ISRAEL DEACONESS MEDICAL CENTER (Jan.
2018), available at
http://www.chiamass.gov/assets/docs/r/hospital-profiles/2016/bi-deac.pdf (last visited Sept. 24, 2018) (BIDMC is
the fifth largest hospital by staffed bed count).
16
Beth Israel Deaconess Hospital-Needham (BID-Needham), a 41-bed hospital acquired in
200247
Beth Israel Deaconess Hospital-Milton (BID-Milton), a 68-bed hospital acquired in
201248
Beth Israel Deaconess Hospital-Plymouth (BID-Plymouth), a 169-bed hospital acquired
in 201449
In total, the BID-owned system includes 947 staffed beds across eastern Massachusetts.50
The
system also owns two physician practices, Jordan Physician Associates (69 physicians) and
Affiliated Physicians Group (APG), also known as BID Healthcare (128 physicians).51
APG
operates primary care practices in the system’s community hospital service areas.
BIDMC has an affiliation with Harvard Medical Faculty Physicians at Beth Israel
Deaconess Medical Center (HMFP), which employs many of the physicians at BIDMC and its
owned community hospitals.52
HMFP consists of approximately 1,306 physicians, including
approximately 209 primary care physicians (PCPs).53
HMFP is corporately distinct from the
BID-owned system but has an exclusive affiliation agreement with the system for patient care,
47
A History of Improving Care for All, BETH ISRAEL DEACONESS MEDICAL CENTER, https://www.bidmc.org/about-
bidmc/a-history-of-improving-care-for-all (last visited Sept. 24, 2018); CTR. FOR HEALTH INFO. & ANALYSIS,
HOSPITAL PROFILE: BID-NEEDHAM HOSPITAL (JAN. 2018), available at
http://www.chiamass.gov/assets/docs/r/hospital-profiles/2016/bid-need.pdf (last visited Sept. 24, 2018). 48
CTR. FOR HEALTH INFO. & ANALYSIS, HOSPITAL PROFILE: BETH ISRAEL DEACONESS HOSPITAL - MILTON (Jan.
2018), available at http://www.chiamass.gov/assets/docs/r/hospital-profiles/2016/milton.pdf (last visited Sept. 24,
2018). 49
CTR. FOR HEALTH INFO. & ANALYSIS, HOSPITAL PROFILE: BETH ISRAEL DEACONESS HOSPITAL - PLYMOUTH (Jan.
2018), available at http://www.chiamass.gov/assets/docs/r/hospital-profiles/2016/bid-plymouth.pdf (last visited
Sept. 24, 2018). 50
BIDMC plans to build a new 10-story, inpatient building on its West Campus, which would contain up to 128
single-bedded medical/surgical rooms and up to 30 intensive care and critical care rooms. The project would result
in 69 net new beds in the new tower, and BIDMC expects to renovate and reopen 20 additional beds in its existing
facilities as part of the project. The project is subject to review by DPH’s DoN program. See DoN - CareGroup, Inc.
- BIDMC - Substantial Capital Expenditure, MASS. DEP’T. OF PUBLIC HEALTH, https://www.mass.gov/lists/don-
caregroup-inc-bidmc-substantial-capital-expenditure (last visited Sept. 24, 2018). 51
HPC analysis of MA-RPO data for 2017; APG’s legal name is Medical Care of Boston Management Corporation. 52
BETH ISRAEL DEACONESS MEDICAL CENTER (BIDMC), NOTICE OF MATERIAL CHANGE TO THE HEALTH POLICY
COMM’N (Jan. 14, 2016), AS REQUIRED UNDER MASS. GEN. LAWS CH. 6D, § 13, available at
https://www.mass.gov/files/documents/2017/01/xb/20160114-bidmc-mw-hmfp.pdf (last visited Sept. 24, 2018);
HARVARD MEDICAL FACULTY PHYSICIANS (HMFP), NOTICE OF MATERIAL CHANGE TO THE HEALTH POLICY
COMM’N (Jan. 14, 2016), AS REQUIRED UNDER MASS. GEN. LAWS CH. 6D, § 13, available at
https://www.mass.gov/files/documents/2017/01/nt/20160115-hmfp-bidmc-mwmc-2.pdf (last visited Sept. 24, 2018);
METROWEST MEDICAL CENTER, NOTICE OF MATERIAL CHANGE TO THE HEALTH POLICY COMM’N (JAN. 14, 2016),
AS REQUIRED UNDER MASS. GEN. LAWS CH. 6D, § 13, available at
https://www.mass.gov/files/documents/2017/01/qz/20160114-metrowest-bidmc-hmfp-mcn.pdf (last visited Sept. 24,
2018). Many of HMFP’s physicians are also faculty members at Harvard Medical School. 53
Counts of physicians in HMFP are based on information provided by BIDCO to the HPC’s MA-RPO program for
2017.

17
What is CareGroup?
BIDMC and its owned community hospitals,
along with Mt. Auburn and NE Baptist, are the
members of CareGroup. CareGroup is a
corporate entity under which these provider
organizations jointly borrow funds and purchase
services, but do not jointly contract with payers
or share centralized operations. In contrast to the
current CareGroup relationship, BIDMC, Mt.
Auburn, NE Baptist, Lahey, and Anna Jaques
plan to be operationally integrated under the
proposed transaction, including through a joint
governance structure, shared finances, and joint
contracting with payers. For further details on the
parties’ planned structure under the proposed
transaction, see Section II.A.
research, and teaching services. HMFP
comprises the majority of medical staff at
BIDMC.54
HMFP also employs the
physicians who staff APG’s primary care
practices and provides some specialty
services to BIDMC’s clinical affiliates.
While HMFP is not a party to the proposed
transaction, the HPC understands that the
affiliation agreement between BIDMC and
HMFP is expected to continue.
The BID-owned system is currently
the third largest provider system in
Massachusetts by total NPSR, and its total
net assets are second in size only to
Partners HealthCare System (Partners).55
The system has a strong financial balance
sheet compared to most other large
provider systems in the Commonwealth.
At the end of fiscal year 2017, it had an above-average reserve of days cash on hand, a high
current ratio, and a low debt-to-capital ratio relative to other large Massachusetts provider
systems.56
It generated a positive operating margin and total margin every year since 2012,
although its margins have been lower in recent years. Its average age of plant is higher than that
of comparator systems, suggesting a potential need for new capital investment.57
BIDMC has clinical affiliations with many providers throughout the state. BIDMC is
affiliated with Community Care Alliance, a partnership of six community health centers, where
54
BETH ISRAEL DEACONESS MEDICAL CENTER (BIDMC), NOTICE OF MATERIAL CHANGE TO THE HEALTH POLICY
COMM’N (July 29, 2013), AS REQUIRED UNDER MASS. GEN. LAWS CH. 6D, § 13, [hereinafter BIDMC-JORDAN MCN]
available at https://www.mass.gov/files/documents/2016/07/vx/beth-israel-deaconess-jordan-hospital.pdf (last
visited Sept. 24, 2018). 55
The HPC reviewed audited financial statements from 2012 to 2017 for six of the seven largest provider systems in
Massachusetts, measured by NPSR. These were, in descending order, Partners, UMass, the BID-owned system,
Steward Health Care System, Lahey, Atrius Health, and Wellforce (including Tufts Medical Center, Circle Health,
and MelroseWakefield Healthcare, formerly Hallmark Health System). These financial statements are available
from the Charities Division of the Massachusetts AGO at Non-Profits & Charities Document Search, OFFICE OF
ATT’Y. GEN. MAURA HEALEY, http://www.charities.ago.state.ma.us/ (last visited Sept. 24, 2018). Current financial
statements were not available from Steward; the HPC therefore reviewed financial information on Steward
published by the AGO as part of its assessment and monitoring efforts, as well as fiscal year 2015 financial
information provided to the MA-RPO program. See OFFICE OF ATT’Y. GEN. MAURA HEALEY, REPORTS ON
STEWARD HEALTH CARE SYSTEM PURSUANT TO 2010 AND 2011 ASSESSMENT & MONITORING AGREEMENTS at 33-
38 (Dec. 30, 2015), available at http://www.mass.gov/ago/docs/healthcare/shcs-report-123015.pdf (last visited Sept.
24, 2018). Steward’s ranking by NPSR is based on fiscal year 2015. 56
Days cash on hand is the number of days of operating expenses that the system could pay with its current
available cash, cash equivalents, and short-term investments. Current ratio measures the systems’ ability to meet its
current liabilities with its current assets. Debt to capitalization compares how much debt a system has to its overall
assets. See the Data Appendix, Figure 1, for more detail. 57
See Data Appendix, Figure 1.

18
BIDMC supports clinical programs and provides specialty services.58
Additionally, BIDMC is
the preferred referral partner for tertiary and quaternary services for the BID-owned community
hospitals as well as for BIDCO contracting affiliate hospitals Cambridge Health Alliance (CHA),
Lawrence General Hospital (Lawrence General), and Anna Jaques. BIDMC provides clinical
support across many of these hospitals’ specialty service lines.59
BIDMC also has close clinical
relationships with Signature Healthcare Brockton Hospital (Signature Brockton),60
Atrius Health
(Atrius),61
and BIDCO contracting affiliate hospital NE Baptist.62
BIDMC, its owned community hospitals, and its owned and affiliated physician groups
jointly contract with payers through the contracting organization BIDCO, which is described in
more detail in the next section.
C. BETH ISRAEL DEACONESS CARE ORGANIZATION (BIDCO)
Founded in 2012 by BIDMC and the Beth Israel Deaconess Physician Organization,63
BIDCO is a provider organization that operates clinical integration programs and contracts with
payers on behalf of its members, the majority of which are not corporately affiliated. BIDCO
58
The six community health centers are: Bowdoin Street Health Center, which operates under the BIDMC hospital
license, Charles River Community Health, The Dimock Center, Fenway Health, Outer Cape Health Services, and
South Cove Community Health Center. Parties’ Response, supra note 14, at 31-32. See also Community Care
Alliance, BETH ISRAEL DEACONESS MEDICAL CTR., https://www.bidmc.org/about-bidmc/helping-our-
community/community-initiatives/community-benefits/bidmcs-community-health-centers/community-care-alliance
(last visited Sept. 24, 2018). 59
See, e.g., Parties’ Response, supra note 14, at 33. BIDMC provides medical direction for several specialty
services at Lawrence General, and has helped Lawrence General and CHA develop services and recruit physicians. 60
Since 2013, BIDMC has had a clinical relationship with Signature Brockton, under which BIDMC is a preferred
provider for Signature Brockton, BIDMC physicians provide select specialty services to Signature Brockton
patients, and Signature Brockton hosts BIDMC medical and surgical residents. MASSACHUSETTS REGISTRATION OF
PROVIDER ORGANIZATIONS 2017 FILING: BETH ISRAEL DEACONESS MEDICAL CENTER (May 11, 2018). 61
BIDMC has been affiliated with Atrius, the state’s largest independent physician group, since 2010. BIDMC and
Atrius have established shared systems, including for bi-directional electronic medical record access, and processes
to better coordinate care and patient experience for shared patients. BIDMC and its owned community hospitals are
preferred providers of tertiary care for Atrius patients. See id.; Our Affiliated Hospitals, ATRIUS HEALTH,
https://www.atriushealth.org/about-us/our-care-network/our-affiliated-hospitals (last visited Sept. 24, 2018). 62
NE Baptist, BIDMC, and HMFP have been clinically affiliated since 2014, when they began developing a joint
musculoskeletal care delivery system, anchored by a joint venture. The goals of the affiliation included creating a
broader network of NE Baptist-branded musculoskeletal care, integrating HMFP into NE Baptist’s medical staff,
and future development of a new NE Baptist hospital facility; NE Baptist and BIDMC have so far focused on
integration of services and care processes at their main campus locations. See BETH ISRAEL DEACONESS MEDICAL
CENTER (BIDMC), NOTICE OF MATERIAL CHANGE TO THE HEALTH POLICY COMM’N (Mar. 18, 2014), AS REQUIRED
UNDER MASS. GEN. LAWS CH. 6D, § 13, available at http://www.mass.gov/anf/docs/hpc/material-change-
notices/hpc-notice-of-material-change-form-bidmc.pdf (last visited Sept. 24, 2018); HARVARD MEDICAL FACULTY
PHYSICIANS (HMFP), NOTICE OF MATERIAL CHANGE TO THE HEALTH POLICY COMM’N (Mar. 18, 2014), AS
REQUIRED UNDER MASS. GEN. LAWS CH. 6D, § 13, available at http://www.mass.gov/anf/docs/hpc/material-change-
notices/hpc-notice-of-material-change-hmfp-bidmc-nebh-strategic-relationship-agreement.pdf (last visited Sept. 24,
2018); NEW ENGLAND BAPTIST HOSPITAL, NOTICE OF MATERIAL CHANGE TO THE HEALTH POLICY COMM’N (Mar.
18, 2014), AS REQUIRED UNDER MASS. GEN. LAWS CH. 6D, § 13, available at
http://www.mass.gov/anf/docs/hpc/material-change-notices/hpc-notice-of-material-change-form-nebh.pdf (last
visited Sept. 24, 2018). 63
We understand that HMFP will retain its role jointly governing BIDCO until the structure and governance of
BIDCO are fully incorporated into that of the BILH CIN.
19
describes itself as “a value-based physician and hospital network and an Accountable Care
Organization” that offers “physician groups and hospitals the structure to contract together, share
risk, and build centralized care management systems, with the goal of providing the highest
quality care in the most cost-efficient way.”64
BIDCO establishes payer contracts on behalf of its members and provides its members
with information sharing and clinical integration structures designed to support risk contract
success, including data gathering and analysis, and care management programs focused on
improving quality and efficiency for specific risk patient populations. BIDCO was a Medicare
Pioneer Accountable Care Organization (ACO) from 2011 to 2016 and joined the Medicare
Shared Savings Program (track 3) in 2017.65
In 2017, BIDCO became an HPC-certified ACO
and began performance on a MassHealth ACO contract in 2018. BIDCO establishes both risk
and non-risk commercial, managed Medicare, and managed Medicaid contracts on behalf of
members, including with the three largest commercial payers in the Commonwealth (for its
hospitals and physicians) and some of the smaller commercial payers (for its physicians only).66
While all BIDCO members participate in BIDCO commercial contracts, only a subset participate
in BIDCO’s MassHealth ACO contracts; for example, both CHA and Lawrence General have
created their own MassHealth ACOs.
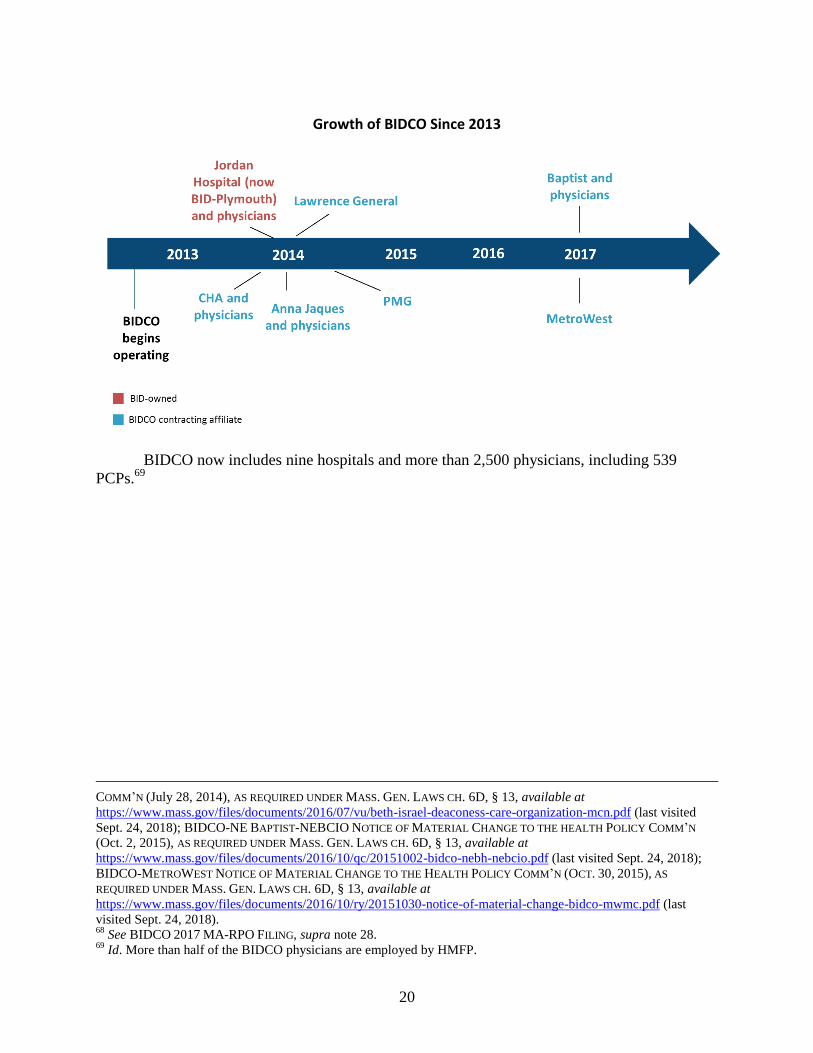
Since its creation in 2012 by BIDMC and the Beth Israel Deaconess Physician
Organization (including HMFP), eight additional hospitals and five physician groups have joined
BIDCO. All of BIDMC’s owned hospitals and physician groups are members of and contract
with payers through BIDCO: BID-Needham; BID-Milton; and BID-Plymouth and its affiliated
physician group, Jordan Physician Associates (all joined in 2014). BIDCO also contracts with
payers on behalf of member contracting affiliates that are not owned by BIDMC: CHA and its
affiliated physician group the Cambridge Health Alliance Physician Organization (joined in early
2014); Anna Jaques and its affiliated physician group Whittier IPA (joined in 2014); PMG
Physician Associates (joined in 2014); Lawrence General (joined in 2014); and NE Baptist and
its affiliated physician group New England Baptist Clinical Integration Organization (NEBCIO)
(joined in 2017).67
MetroWest Medical Center (MetroWest) also joined BIDCO in 2017, but
does not yet participate in any payer contracts established by BIDCO.68
64
See About Us, BETH ISRAEL DEACONESS CARE ORGANIZATION, http://www.bidpo.org/aboutus/index.html (last
visited Sept. 24, 2018). 65
See Section III.B.5 for more details on BIDCO’s participation in Medicare ACOs. 66
2016 BID CMIR FINAL REPORT, supra note 28, at 16 and Parties’ Response, supra note 14, at 11. 67
BETH ISRAEL DEACONESS CARE ORGANIZATION (BIDCO), NOTICE OF MATERIAL CHANGE TO THE HEALTH POLICY
COMM’N (Aug. 1, 2013), AS REQUIRED UNDER MASS. GEN. LAWS. CH. 6D, § 13, available at
https://www.mass.gov/files/documents/2016/07/nk/bidco-cha-notice-of-material-change-bidco.pdf (last visited Sept.
24, 2018); BETH ISRAEL DEACONESS CARE ORGANIZATION (BIDCO), NOTICE OF MATERIAL CHANGE TO THE
HEALTH POLICY COMM’N (Aug. 8, 2013), AS REQUIRED UNDER MASS. GEN. LAWS. CH. 6D, § 13, available at
https://www.mass.gov/files/documents/2016/07/ng/bidco-jordan-mcn.pdf (last visited Sept. 24, 2018); BETH ISRAEL
DEACONESS CARE ORGANIZATION (BIDCO), NOTICE OF MATERIAL CHANGE TO THE HEALTH POLICY COMM’N (Feb.
28, 2014), AS REQUIRED UNDER MASS. GEN. LAWS. CH. 6D, § 13, [hereinafter BIDCO-ANNA JAQUES MCN]
available at https://www.mass.gov/files/documents/2016/07/te/bidco-hpc-notice-02-28-2014.pdf (last visited Sept.
24, 2018); BETH ISRAEL DEACONESS CARE ORGANIZATION (BIDCO), NOTICE OF MATERIAL CHANGE TO THE
HEALTH POLICY COMM’N (May 7, 2014), AS REQUIRED UNDER MASS. GEN. LAWS. CH. 6D, § 13, available at
https://www.mass.gov/files/documents/2016/07/nn/bidco-lgh-hcp-notice-5-6-14.pdf (last visited Sept. 24, 2018);
BETH ISRAEL DEACONESS CARE ORGANIZATION (BIDCO), NOTICE OF MATERIAL CHANGE TO THE HEALTH POLICY
20
Growth of BIDCO Since 2013
BIDCO now includes nine hospitals and more than 2,500 physicians, including 539
PCPs.69
COMM’N (July 28, 2014), AS REQUIRED UNDER MASS. GEN. LAWS CH. 6D, § 13, available at
https://www.mass.gov/files/documents/2016/07/vu/beth-israel-deaconess-care-organization-mcn.pdf (last visited
Sept. 24, 2018); BIDCO-NE BAPTIST-NEBCIO NOTICE OF MATERIAL CHANGE TO THE HEALTH POLICY COMM’N
(Oct. 2, 2015), AS REQUIRED UNDER MASS. GEN. LAWS CH. 6D, § 13, available at
https://www.mass.gov/files/documents/2016/10/qc/20151002-bidco-nebh-nebcio.pdf (last visited Sept. 24, 2018);
BIDCO-METROWEST NOTICE OF MATERIAL CHANGE TO THE HEALTH POLICY COMM’N (OCT. 30, 2015), AS
REQUIRED UNDER MASS. GEN. LAWS CH. 6D, § 13, available at
https://www.mass.gov/files/documents/2016/10/ry/20151030-notice-of-material-change-bidco-mwmc.pdf (last
visited Sept. 24, 2018). 68
See BIDCO 2017 MA-RPO FILING, supra note 28. 69
Id. More than half of the BIDCO physicians are employed by HMFP.

21
Current BIDCO Hospital Members
BIDCO Hospital Members City/Town CHIA Hospital Cohort Staffed
Beds
BID
-ow
ned
Beth Israel Deaconess Medical Center (BIDMC)
Boston Academic Medical Center
669
Beth Israel Deaconess Hospital-Milton (BID-Milton)
Milton Community 68
Beth Israel Deaconess Hospital-Needham (BID-Needham)
Needham Community 41
Beth Israel Deaconess Hospital-Plymouth (BID-Plymouth)
Plymouth Community, High Public Payer
169
Co
ntr
acti
ng
Aff
iliat
es
Anna Jaques Hospital Newburyport Community 140
Cambridge Health Alliance (CHA)
Cambridge, Somerville, and Everett
Teaching, High Public Payer70
229
Lawrence General Hospital Lawrence Community, High Public Payer
230
MetroWest Medical Center (MetroWest)71
Framingham and Natick
Community, High Public Payer
337
New England Baptist Hospital (NE Baptist)
Boston Specialty Teaching 100
Total 1,883 Source: CHIA HOSPITAL PROFILES DATABOOK, infra note 143.
70
Some teaching hospitals provide advanced clinical services more similar to AMCs, and share other features with
AMCs (e.g., referral, pricing, and service mix patterns), while others provide a range of services and share features
more similar to those of community hospitals. See MASS. HEALTH POLICY COMM’N, COMMUNITY HOSPITALS AT A
CROSSROADS at 3, n. 3. (Mar. 2016) [hereinafter CROSSROADS REPORT], available at
http://www.mass.gov/anf/budget-taxes-and-procurement/oversight-agencies/health-policy-
commission/publications/community-hospitals-at-a-crossroads.pdf (last visited Sept. 24, 2018). Because CHA
functions in many ways more like a community hospital (e.g., sharing similar pricing and patient mix patterns), for
our purposes we include it in our discussions of “BIDCO community hospitals” throughout this report except where
specifically noted. 71
MetroWest is not yet participating in BIDCO payer contracts. See supra note 28.
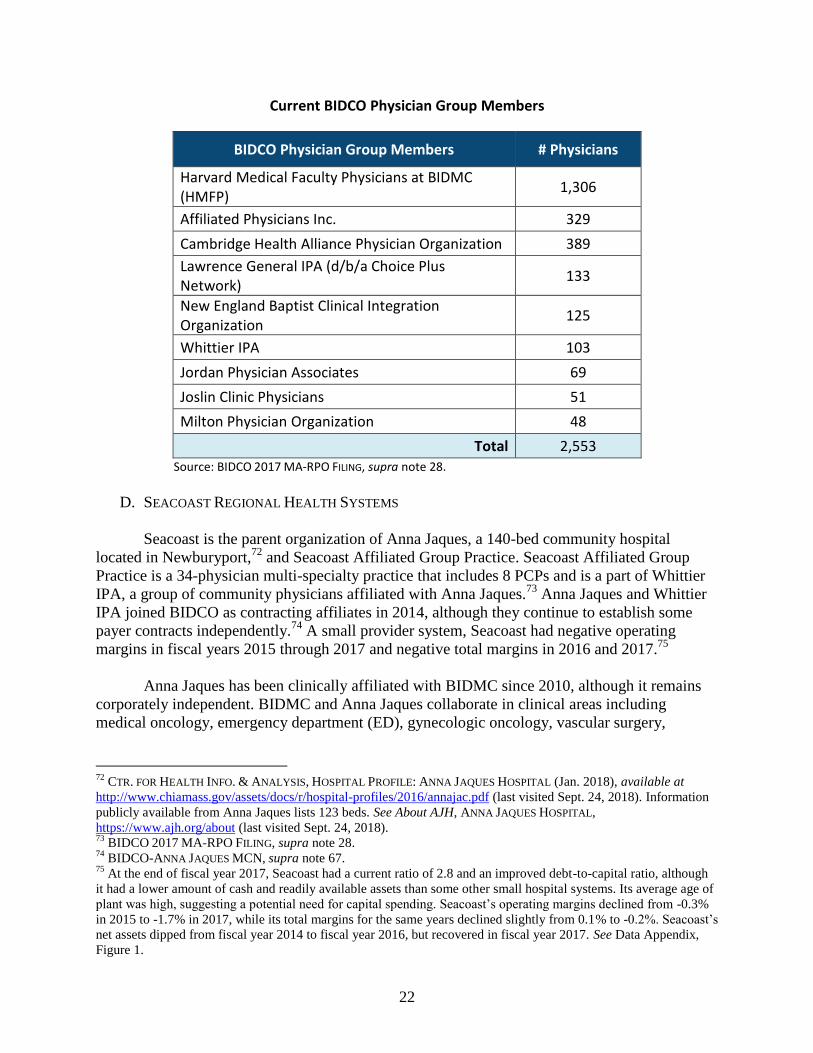
22
Current BIDCO Physician Group Members
BIDCO Physician Group Members # Physicians
Harvard Medical Faculty Physicians at BIDMC (HMFP)
1,306
Affiliated Physicians Inc. 329
Cambridge Health Alliance Physician Organization 389
Lawrence General IPA (d/b/a Choice Plus Network)
133
New England Baptist Clinical Integration Organization
125
Whittier IPA 103
Jordan Physician Associates 69
Joslin Clinic Physicians 51
Milton Physician Organization 48
Total 2,553 Source: BIDCO 2017 MA-RPO FILING, supra note 28.
D. SEACOAST REGIONAL HEALTH SYSTEMS
Seacoast is the parent organization of Anna Jaques, a 140-bed community hospital
located in Newburyport,72
and Seacoast Affiliated Group Practice. Seacoast Affiliated Group
Practice is a 34-physician multi-specialty practice that includes 8 PCPs and is a part of Whittier
IPA, a group of community physicians affiliated with Anna Jaques.73
Anna Jaques and Whittier
IPA joined BIDCO as contracting affiliates in 2014, although they continue to establish some
payer contracts independently.74
A small provider system, Seacoast had negative operating
margins in fiscal years 2015 through 2017 and negative total margins in 2016 and 2017.75
Anna Jaques has been clinically affiliated with BIDMC since 2010, although it remains
corporately independent. BIDMC and Anna Jaques collaborate in clinical areas including
medical oncology, emergency department (ED), gynecologic oncology, vascular surgery,
72
CTR. FOR HEALTH INFO. & ANALYSIS, HOSPITAL PROFILE: ANNA JAQUES HOSPITAL (Jan. 2018), available at
http://www.chiamass.gov/assets/docs/r/hospital-profiles/2016/annajac.pdf (last visited Sept. 24, 2018). Information
publicly available from Anna Jaques lists 123 beds. See About AJH, ANNA JAQUES HOSPITAL,
https://www.ajh.org/about (last visited Sept. 24, 2018). 73
BIDCO 2017 MA-RPO FILING, supra note 28. 74
BIDCO-ANNA JAQUES MCN, supra note 67. 75
At the end of fiscal year 2017, Seacoast had a current ratio of 2.8 and an improved debt-to-capital ratio, although
it had a lower amount of cash and readily available assets than some other small hospital systems. Its average age of
plant was high, suggesting a potential need for capital spending. Seacoast’s operating margins declined from -0.3%
in 2015 to -1.7% in 2017, while its total margins for the same years declined slightly from 0.1% to -0.2%. Seacoast’s
net assets dipped from fiscal year 2014 to fiscal year 2016, but recovered in fiscal year 2017. See Data Appendix,
Figure 1.
23
maternal-fetal medicine, and primary care.76
BIDMC also provides tele-stroke services to the
Anna Jaques ED and is Anna Jaques’ preferred provider for tertiary care.77
E. NEW ENGLAND BAPTIST HOSPITAL
NE Baptist, the only orthopedic specialty hospital in Massachusetts, is a non-profit
specialty hospital located in Boston. It has 100 staffed beds and specializes in the treatment of
orthopedic and musculoskeletal conditions.78
It is a teaching affiliate of Tufts University School
of Medicine, Harvard School of Public Health, and the Harvard School of Medicine.79
In
addition to its main hospital, NE Baptist operates three licensed outpatient facilities: New
England Baptist Outpatient Surgery Satellite in Dedham, New England Baptist Outpatient Care
Center at Chestnut Hill, and New England Baptist Surgical Care in Brookline.80
NE Baptist is the corporate parent of NEBCIO, an entity formed to establish payer
contracts on behalf of NE Baptist-affiliated physicians. NEBCIO consists of 125 physicians,
including approximately 14 PCPs and 111 specialists; 46 of the NEBCIO physicians are directly
employed.81
NE Baptist has maintained modest but positive operating margins and total margins
over the last several fiscal years despite a small downturn in NPSR in fiscal years 2016 and
2017.82
NE Baptist is part of CareGroup, and NE Baptist and NEBCIO joined BIDCO as
contracting affiliates in 2017.83
NE Baptist has a number of clinical affiliations, including with
Atrius, BIDMC, and Joslin Diabetes Center.84
F. LAHEY HEALTH SYSTEM
Lahey is a non-profit health system that was formed in May 2012 by the merger of
Northeast Health System and the Lahey Clinic Foundation. Lahey acquired Winchester Hospital
(Winchester) in July 2014.85
Lahey is now the fifth largest provider system in the
Commonwealth by NPSR,86
with the following general acute care hospitals and a total of 859
beds:
76
MASSACHUSETTS REGISTRATION OF PROVIDER ORGANIZATIONS 2017 FILING: SEACOAST REGIONAL HEALTH
SYSTEMS (Jan. 8, 2018). 77
Id.; Clinical Affiliation with Beth Israel Deaconess Medical Center, ANNA JAQUES HOSPITAL,
https://www.ajh.org/about/beth-israel-deaconess-affiliation (last visited Sept. 24, 2018). 78
CTR. FOR HEALTH INFO. & ANALYSIS, HOSPITAL PROFILE: NEW ENGLAND BAPTIST HOSPITAL (Jan. 2018),
available at http://www.chiamass.gov/assets/docs/r/hospital-profiles/2016/ne-bapti.pdf (last visited Sept. 24, 2018). 79
Id. 80
MASSACHUSETTS REGISTRATION OF PROVIDER ORGANIZATIONS 2017 FILING: NEW ENGLAND BAPTIST HOSPITAL
(Jan. 26, 2018) [hereinafter NE BAPTIST 2017 MA-RPO FILING]. 81
Id. 82
NE Baptist’s NPSR decreased slightly in fiscal years 2016 and 2017, although NE Baptist also succeeded in
decreasing its operating expenses in both years, preserving its positive operating margins. NE Baptist’s days cash on
hand and current ratio both increased from fiscal year 2014 to fiscal year 2017. See Data Appendix, Figure 1. 83
See 2016 BID CMIR FINAL REPORT, supra note 28. 84
NE BAPTIST 2017 MA-RPO FILING, supra note 80. 85
MASS. HEALTH POLICY COMM’N, REVIEW OF LAHEY HEALTH SYSTEM’S PROPOSED ACQUISITION OF WINCHESTER
HOSPITAL (HPC-CMIR-2013-3) PURSUANT TO M.G.L. CH. 6D, § 13 FINAL REPORT (May 22, 2014) [hereinafter
LAHEY-WINCHESTER CMIR], available at https://www.mass.gov/files/documents/2016/09/uw/20140522-final-cmir-
report-lhs-wh.pdf (last visited Sept. 24, 2018). 86
See Data Appendix, Figure 1.

24
Lahey Hospital & Medical Center (Lahey HMC) in Burlington and Peabody (345 beds)87
Northeast Hospital (Northeast) (404 beds), with main campuses in Beverly (Beverly
Hospital) and Gloucester (Addison Gilbert Hospital), and a satellite psychiatric hospital
in Lynn (BayRidge Hospital)88
Winchester Hospital in Winchester (229 beds)89
Lahey HMC, in Burlington and Peabody, is Lahey’s central and largest hospital and acts
as the tertiary hospital for the Lahey community hospitals. It also serves as a teaching hospital of
Tufts University School of Medicine. Lahey has a number of clinical affiliations, including with
Atrius, Boston Children’s Hospital, and Emerson Hospital.90
In addition to its general acute care hospitals, Lahey owns outpatient centers in Danvers
and Lexington;91
urgent care centers in Danvers, Gloucester, Wilmington, and Woburn; and
more than a dozen community primary care and satellite specialty care locations throughout
northeastern Massachusetts and southern New Hampshire.92
Lahey Health Behavioral Services
(LHBS) provides inpatient, outpatient, and residential mental health and substance use disorder
treatment services.93
Inpatient behavioral health care is provided at Northeast’s campuses,
including BayRidge Hospital, as well as three separately licensed inpatient detoxification
treatment facilities.94
Lahey Health Continuing Care provides care for seniors, including home
health services, adult day health services, skilled nursing care, and assisted living.95
Lahey negotiates contracts with payers on behalf of its hospitals and its employed and
affiliated physicians. Lahey’s managed care network, LCPN, negotiates payer contracts on
behalf of approximately 217 PCPs and 1,003 specialists practicing in northeastern Massachusetts
and southern New Hampshire.96
LCPN has participated in the Medicare Shared Savings Program
87
CTR. FOR HEALTH INFO. & ANALYSIS, HOSPITAL PROFILE: LAHEY HOSPITAL AND MEDICAL CENTER (Jan. 2018),
available at http://www.chiamass.gov/assets/docs/r/hospital-profiles/2016/lahey.pdf (last visited Sept. 24, 2018). 88
CTR. FOR HEALTH INFO. & ANALYSIS, HOSPITAL PROFILE: NORTHEAST HOSPITAL (Jan. 2018), available at
http://www.chiamass.gov/assets/docs/r/hospital-profiles/2016/northeas.pdf (last visited Sept. 24, 2018). 89
CTR. FOR HEALTH INFO. & ANALYSIS, HOSPITAL PROFILE: WINCHESTER HOSPITAL (Jan. 2018), available at
http://www.chiamass.gov/assets/docs/r/hospital-profiles/2016/winchest.pdf (last visited Sept. 24, 2018). 90
MASSACHUSETTS REGISTRATION OF PROVIDER ORGANIZATIONS 2017 FILING: LAHEY HEALTH SYSTEM (Feb. 2,
2018) [hereinafter LAHEY 2017 MA-RPO FILING]. 91
Id. 92
Departments and Locations, LAHEY HOSPITAL & MEDICAL CENTER,
http://www.lahey.org/DepartmentsandLocations/ (last visited Sept. 24, 2018). 93
History of Lahey Health Behavioral Services, LAHEY HEALTH BEHAVIORAL SERVICES,
http://www.nebhealth.org/about-lhbs/history-of-lahey-health-behavioral-services/ (last visited Sept. 24, 2018). 94
Services and Locations, LAHEY HEALTH BEHAVIORAL SERVICES, http://www.nebhealth.org/services-locations/
(last visited July 14, 2018). BayRidge is licensed by DPH as part of Northeast Hospital. 95
Lahey Health Continuing Care, LAHEY HEALTH SYSTEM, https://www.beverlyhospital.org/locations--
services/health-services/senior-health-services/continuing-care (last visited Sept. 24, 2018). 96
LAHEY 2017 MA-RPO FILING, supra note 90. Lahey’s physician groups include physicians employed by and
affiliated with Lahey HMC (Lahey HMC physicians), Northeast (Northeast physicians), and Winchester
(Winchester physicians). Lahey’s physician groups together employ approximately 887 physicians. Northeast
physicians are often referred to in data as Northeast PHO. Winchester physicians are sometimes referred to in data

25
(track 1) since 2013, became an HPC-certified ACO in 2017, and began performance on a
MassHealth ACO (Model C) contract in 2018.97
Lahey maintained positive total margins for fiscal years 2012 through 2016, although in
fiscal years 2015 and 2017 it experienced operating losses, resulting in a negative total margin in
2017.98
Documents provided by the parties indicate that Lahey identified expense growth and
slow revenue growth due to difficulty hiring and retaining physicians as among the main drivers
of its poor performance. These documents indicate that Lahey implemented reforms that it
expects will result in at least break-even performance starting in fiscal year 2019. Lahey’s days
cash on hand has declined in recent years and is lower than that of other large Massachusetts
provider systems despite a slight increase in fiscal year 2017.99
G. MOUNT AUBURN HOSPITAL
Mt. Auburn is a 233-bed, non-profit hospital located in Cambridge, Massachusetts.100
It is
a teaching hospital affiliated with Harvard Medical School. Mt. Auburn is a preferred hospital
provider for Atrius and Mt. Auburn has a clinical affiliation with BIDMC under which BIDMC’s
stroke team provides telemedicine services to Mt. Auburn patients.101
As discussed above, Mt.
Auburn is a member of CareGroup along with BIDMC and NE Baptist, but currently establishes
payer contracts independently.102
Mt. Auburn achieved positive operating margins and total
margins in each year from fiscal year 2013 to fiscal year 2016 but had significant negative
margins in fiscal year 2017. Mt. Auburn’s days cash on hand ratio declined also sharply in fiscal
year 2017, although it was still comparable to that of other small hospital systems.103
Documents
provided by the parties indicate that Mt. Auburn expects to return to at least break-even
performance beginning in fiscal year 2019.
H. MOUNT AUBURN CAMBRIDGE INDEPENDENT PRACTICE ASSOCIATION
MACIPA is an independent physician association with approximately 460 physician
members, including approximately 93 PCPs and approximately 367 specialists.104
MACIPA
includes the employed physicians at Mt. Auburn, some CHA physicians, and physicians from
small private practices. MACIPA contracts independently on behalf of its members for
as Winchester Physician Associates (WPA), Winchester’s employed physician group, and sometimes as Winchester
PHO, which includes both employed and affiliated physicians. 97
See Section III.B.5 for more details on Lahey’s participation in public payer ACO programs. 98
See Data Appendix, Figure 1. 99
See id. 100
CTR. FOR HEALTH INFO. & ANALYSIS, HOSPITAL PROFILE: MOUNT AUBURN HOSPITAL (Jan. 2018), available at
http://www.chiamass.gov/assets/docs/r/hospital-profiles/2016/mt-aubur.pdf (last visited Sept. 24, 2018). 101
MASSACHUSETTS REGISTRATION OF PROVIDER ORGANIZATIONS 2017 FILING: MOUNT AUBURN HOSPITAL (Jan.
24, 2018). 102
Id.; see “What is CareGroup?,” supra page 17. 103
Mt. Auburn’s days cash on hand ratio declined from 158 days in fiscal year 2014 to 117 days in fiscal year 2017.
This appears to have been due in part to an increase in Mt. Auburn’s capital investments in 2016 and 2017, as Mt.
Auburn’s average age of plant fell from 18.3 years in 2016 to 15.9 years in 2017. See Data Appendix, Figure 1. 104
MASSACHUSETTS REGISTRATION OF PROVIDER ORGANIZATIONS 2017 FILING: MOUNT AUBURN CAMBRIDGE
INDEPENDENT PRACTICE ASSOCIATION (May 14, 2018) [hereinafter MACIPA 2017 MA-RPO FILING]. Mt. Auburn
employs 215 of MACIPA’s physicians.

26
government and commercial payer contracts and provides services to its members, including
developing and managing programs for care management, preventive medicine, population
management, patient experience, pharmacy, social work, health coaching, health information
exchange, and quality support services.105
MACIPA participated in the Pioneer ACO program
from 2011 until 2014 and began participating in the Medicare Shared Savings Program (track 3)
in January 2017.106
I. THE PROPOSED BILH SYSTEM
Based on the parties’ current size and the proposed transaction, the BILH system would
be one of the largest provider systems in Massachusetts and nearly equal in size to Partners,
owning ten general acute care hospitals with 2,398 acute care beds. BILH is also anticipated to
contract on behalf of three additional hospitals that are currently BIDCO contracting affiliates,
with an additional 796 beds.107
BILH would also contract on behalf of 4,233 physicians,
including 849 PCPs.
Massachusetts Hospital Counts by System (2016)
System Number of
Owned Acute Care Hospitals
Number of Owned Non-Acute Care
Number of Contracting Affiliate Hospitals
Total Contracting Network
(Acute + Non-Acute)
Partners 8 4 1 13
BILH 10 0 3 13
Steward 8 1 0 9
Wellforce 3 0 0 3 Source: 2017 MA-RPO Filing, supra note 28. Note: Hospitals with multiple campuses are counted only once. For example, Northeast Hospital is counted as one of the 10 BILH hospitals, although Northeast includes Beverly Hospital, Addison-Gilbert Hospital, and BayRidge psychiatric hospital, which all operate as campuses of Northeast. MetroWest is included in the count of BILH contracting affiliate hospitals; see supra note 28. Partners contracts on behalf of Emerson Hospital.
105
Id. 106
See Section III.B.5 for more details on Lahey’s participation in Medicare ACO programs. 107
See supra Section II.C for a chart of current BIDCO hospital members.

27
Massachusetts Bed Counts by System (2016 - Acute Care Hospitals Only)
System Number of
Staffed Beds (Owned)
Number of Staffed Beds (Contracting
Affiliates)
Total Staffed Beds in Contracting Network
(percent of all MA staffed beds)
BILH 2,398 796 3,194 (22.2%)
Partners 2,906 199 3,105 (21.6%)
Steward 1,159 0 1,159 (8.1%)
Wellforce 772 0 772 (5.4%)
2016 Total 14,394 Source: CHIA HOSPITAL PROFILES DATABOOK, infra note 143. Note: As described in supra note 28, MetroWest is included in the count of BILH contracting affiliates; BILH would have approximately 20% of all staffed beds if MetroWest were not included.
Massachusetts Physician Counts by System (2017)
System Number of Physicians
(% of all reported MA physicians) Number of PCPs
(% of all reported MA PCPs)
Partners 5,197 (23.5%) 922 (16.5%)
BILH 4,233 (19.1%) 849 (15.2%)
Steward 2,380 (10.7%) 586 (10.5%)
Wellforce 1,595 (7.2%) 494 (8.9%)
Atrius Health 897 (4%) 357 (6.4%)
2017 Total 22,150 5,580 Source: 2017 MA-RPO Filing, supra note 28. Notes: 2017 total reflects only physicians reported to the MA-RPO program. PCP counts reflect physicians reported as a PCP or as both a specialist and PCP in field RPO-96.
As shown below, the inpatient service areas of the BILH hospitals would include most of eastern
Massachusetts.
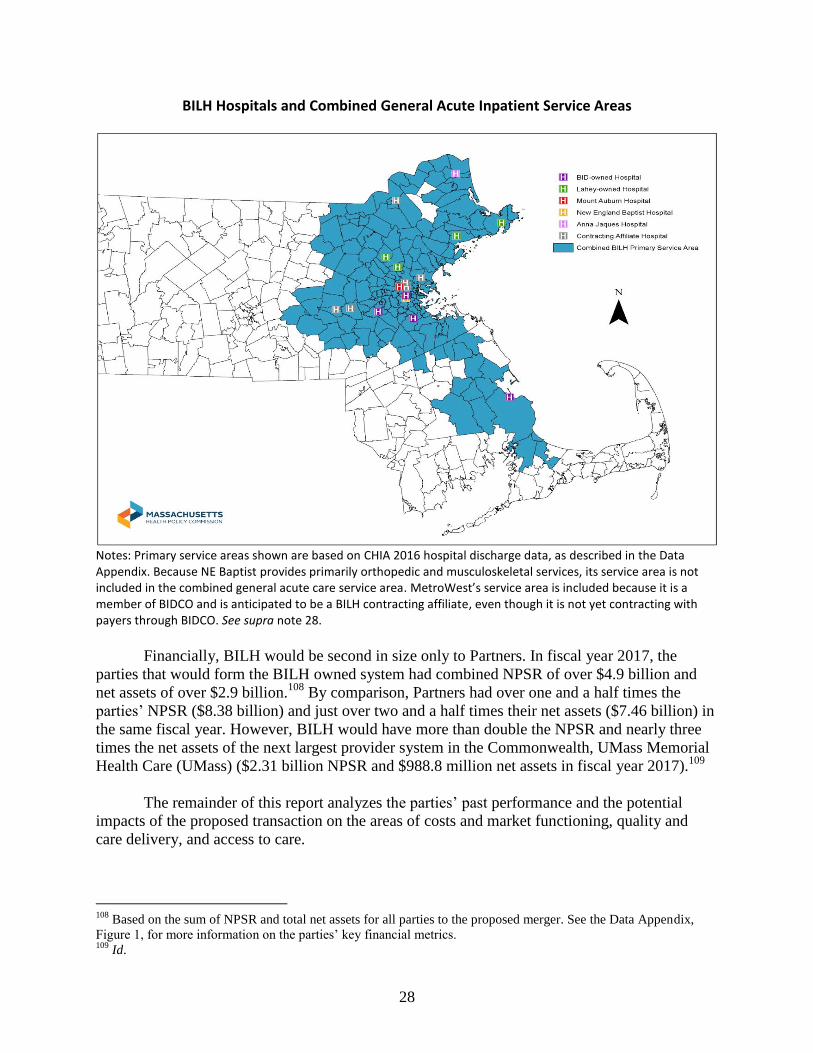
28
BILH Hospitals and Combined General Acute Inpatient Service Areas
Notes: Primary service areas shown are based on CHIA 2016 hospital discharge data, as described in the Data Appendix. Because NE Baptist provides primarily orthopedic and musculoskeletal services, its service area is not included in the combined general acute care service area. MetroWest’s service area is included because it is a member of BIDCO and is anticipated to be a BILH contracting affiliate, even though it is not yet contracting with payers through BIDCO. See supra note 28.
Financially, BILH would be second in size only to Partners. In fiscal year 2017, the
parties that would form the BILH owned system had combined NPSR of over $4.9 billion and
net assets of over $2.9 billion.108
By comparison, Partners had over one and a half times the
parties’ NPSR ($8.38 billion) and just over two and a half times their net assets ($7.46 billion) in
the same fiscal year. However, BILH would have more than double the NPSR and nearly three
times the net assets of the next largest provider system in the Commonwealth, UMass Memorial
Health Care (UMass) ($2.31 billion NPSR and $988.8 million net assets in fiscal year 2017).109
The remainder of this report analyzes the parties’ past performance and the potential
impacts of the proposed transaction on the areas of costs and market functioning, quality and
care delivery, and access to care.
108
Based on the sum of NPSR and total net assets for all parties to the proposed merger. See the Data Appendix,
Figure 1, for more information on the parties’ key financial metrics. 109
Id.
29
III. ANALYSIS OF THE PARTIES’ PAST PERFORMANCE AND IMPACTS OF THE
PROPOSED TRANSACTION
Our analysis of a proposed transaction includes assessments of potential impacts on costs
and market functioning, care delivery and quality, and access to care. In the following sections
we examine the parties’ baseline performance in each of these areas and then assess the potential
impacts of the proposed transaction based on this past performance and the parties’ stated plans
and commitments.
A. COSTS AND MARKET FUNCTIONING
The law governing CMIRs directs the HPC to examine different measures of the parties’
respective cost and market position, including their size, prices, health status adjusted total
medical expenses (HSA TME), and market shares.110
The HPC examined the parties’
performance on these measures over time and compared to other providers to establish a profile
of the parties’ baseline performance leading up to the proposed transaction. The HPC then
combined the parties’ performance to date with details of the transaction and the parties’ goals
and plans to project the likely impacts of the transaction on health care spending and market
functioning.111
The HPC’s findings are summarized below.
Cost and Market Profile:
Historically, the parties have generally had low to moderate prices compared to other
Massachusetts providers. Even as BIDCO and Lahey have grown, their prices have not
generally risen relative to comparators, based on current available data.
The parties have also historically had moderate spending levels compared to other
Massachusetts providers. As BIDCO and Lahey have grown, their spending has also
grown at generally the same rate as the rest of the market based on current available data.
BIDCO, BIDMC, and Lahey have stated goals of keeping low-acuity care in the
community and reducing spending in connection with their past community hospital
acquisitions and affiliations. While BIDMC and Lahey have had some success at
retaining local care at community hospitals they have recently acquired, shifts in care to
their hospitals have come from both lower-priced and higher-priced hospitals and
spending for local patients has remained largely unchanged.
110
See Section I.B. Because provider organizations primarily negotiate with commercial, not government, payers for
prices, commercial market share is more relevant for assessing the competitive impact of a transaction. Our
assessments of market shares for provider organizations or contracting networks are based on the share of services
of hospitals or physicians for which the organization establishes commercial contracts, as well as any providers from
which a provider organization receives patient service revenue. 111
One of the HPC’s central responsibilities is to monitor health care spending to ensure that the Commonwealth
can successfully meet the health care cost growth benchmark set forth in Chapter 224 of the Acts of 2012, and one
mechanism through which we meet this responsibility is to conduct cost and market impact reviews. MASS. GEN.
LAWS ch. 6D, § 9 (requiring the HPC to establish annually “a health care cost growth benchmark for the average
growth in total health care expenditures in the commonwealth,” pegged to the growth rate of the gross state
product).
30
Cost and Market Impact:
The transaction would create a second-largest system with market share nearly equivalent to
Partners, and it would significantly enhance the parties’ bargaining leverage with commercial
payers, enabling the parties to substantially increase commercial prices.
After the transaction, BILH would be nearly equivalent in market share to Partners, and
market concentration would increase substantially.
Consistent with the parties’ claim that the transaction would make them more attractive
to payers, the HPC finds that the transaction would significantly enhance the parties’
bargaining leverage with commercial payers.
BILH’s enhanced bargaining leverage would enable it to substantially increase
commercial prices. Such price increases could increase total commercial health care
spending by an estimated $128.4 million to $170.8 million annually for inpatient,
outpatient, and adult primary care services; additional spending impacts would be likely
for other services (e.g., specialty physician services).
These projected price increases are likely to be conservative.
Despite the fact that the parties’ financial projections indicate that BILH would not need
substantial price increases to achieve positive financial margins, they have not yet
committed to limiting future price increases. The parties could obtain the projected price
increases, significantly increasing health care spending, while still remaining lower-
priced than Partners.
Achieving care redirection and utilization reductions consistent with the parties’ estimates could
result in savings, but there is no reasonable scenario in which such savings would offset
spending increases if BILH obtains the price increases described above.
While the parties are still developing plans for how they will attract patient volume to
their system from other providers, shifts in care to BILH would generally be cost-saving.
Similarly, redirecting care within BILH to lower-priced settings would be cost-saving.
However, even if BILH achieves all of its stated care redirection goals, the savings would
offset approximately 3% to 8% of the spending impact if BILH obtains the price
increases described above.
The parties have also proposed care delivery programs that may result in savings, but the
scope of these savings is uncertain, and even the parties’ highest estimates of $52 million
to $87 million would also not be sufficient to offset projected price increases.
The parties intend to work with payers to develop new, innovative insurance products,
but it is unclear how these products would increase market competition or reduce
spending, given that the parties do not plan to offer lower prices in such products.
31
It is also unclear how BILH would reduce spending by more effectively competing with
other providers.
The remainder of this section discusses these findings in greater depth.
1. The parties have generally had low to moderate prices compared to other Massachusetts
providers.
In explaining their rationale for the transaction, the parties have emphasized that they are
lower-priced than their competitors and, therefore, that increases in their patient volume post-
merger would reduce health care spending. To evaluate these claims, the HPC examined the
parties’ current prices and recent price trends, using the relative price measure developed by
CHIA.112
A relative price of 1.0 represents each payer network’s average price across inpatient,
outpatient, or physician services.113
Accordingly, a relative price of 1.2 means that the provider’s
price level is 20% above the average inpatient, outpatient, or physician price in a payer’s
network.
When we examined the parties’ inpatient and outpatient hospital relative prices for the
three largest commercial payers, we found that individually, many of the parties’ hospitals have
moderate prices, while BIDCO community hospitals (both BID-owned and the BIDCO
contracting affiliates) are lower-priced. 114,115
We also evaluated the system average inpatient and outpatient relative prices for all BID-
owned and Lahey-owned hospitals, weighted by the volume at each system hospital.116
The
charts below show weighted average inpatient and outpatient relative price by system for the
112
For the most recent relative price data, see CTR. FOR HEALTH INFO. & ANALYSIS, PROVIDER PRICE VARIATION IN
THE MASSACHUSETTS HEALTH CARE MARKET (CALENDAR YEAR 2016 DATA) (APRIL 2018) [hereinafter CHIA
RELATIVE PRICE DATABOOK], available at http://www.chiamass.gov/assets/docs/r/pubs/18/Relative-Price-
Databook-2018.xlsx (last visited Sept. 24, 2018). 113
Relative price is a standardized pricing measure that accounts for differences among provider service volume,
service mix, patient acuity, and insurance product types in order to allow comparison of negotiated price levels. For
details on the methodology for calculating relative price, see CTR. FOR HEALTH INFO & ANALYSIS, RELATIVE PRICE
METHODOLOGY PAPER (Sept. 2016), available at http://www.chiamass.gov/assets/docs/r/pubs/16/RP-Methodology-
Paper-9-15-16.pdf (last visited Sept. 24, 2018). 114
See the Data Appendix, Figures 2A through 2E, for charts showing 2016 inpatient relative price data for all of the
parties’ hospitals for BCBS, HPHC, and THP and outpatient relative price data for BCBS and THP. 115
Because relative price accounts for all service lines and NE Baptist specializes in certain services, we also
examined prices for inpatient orthopedic services (MDC 08) using BCBS, HPHC, and THP claims data from the
2015 APCD. The results were fairly similar to the BCBS inpatient relative prices displayed in the chart below. NE
Baptist received higher prices than Northeast, Winchester, Lowell, and BID-Milton for these services, and lower
prices than all of its other comparator hospitals, including AMCs and non-AMCs. 116
We calculated system average inpatient relative price by payer for BCBS, HPHC, and THP by taking the
weighted average of the inpatient relative prices for each hospital owned by the system, weighting by each hospital’s
inpatient discharges. CHIA RELATIVE PRICE DATABOOK, supra note 112. System average outpatient relative price
by payer is constructed similarly, except that the outpatient relative prices for each hospital in a system are weighted
by a proxy for outpatient volume, calculated by dividing a hospital’s outpatient revenue by its outpatient relative
price.

32
BID-owned and Lahey systems compared to other major hospital systems in eastern
Massachusetts.
System Average Inpatient Relative Price (2016)
Source: HPC analysis of CHIA RELATIVE PRICE DATABOOK, supra note 112. Notes: Because relative price is calculated individually by payer, the price level associated with each payer’s network average relative price (1.0) is not the same for different payers. Therefore, relative price should not be compared across payers. BID-owned hospitals: BIDMC, BID-Milton, BID-Needham, BID-Plymouth Lahey hospitals: Lahey HMC, Northeast, Winchester Comparators: Partners (including Brigham & Women’s Hospital, Massachusetts General Hospital, Newton-Wellesley Hospital, North Shore Medical Center, Brigham & Women’s Faulkner Hospital, Martha’s Vineyard Hospital, and Nantucket Cottage Hospital
117); Steward (including Steward Carney
Hospital, Steward Good Samaritan Medical Center, Steward Holy Family Hospital, Morton Hospital, Nashoba Valley Medical Center, Norwood Hospital, Steward St. Anne’s Hospital, and Steward St. Elizabeth’s Medical Center); and Wellforce (including Tufts Medical Center, Lowell General Hospital, and MelroseWakefield Healthcare)
117
THP does not have inpatient relative price data for Martha’s Vineyard in 2016, so the Partners system-level
relative price does not include Martha’s Vineyard for THP. We calculated the system-level relative price for
Partners for BCBS and HPHC with and without Martha’s Vineyard and Nantucket Cottage, and found that the result
was the same.
BCBS HPHC THP
0.94
0.99
1.04
1.09
1.14
1.19
1.24
1.29
1.34
1.39
1.44

33
System Average Outpatient Relative Price (2016)
Source: HPC analysis of CHIA RELATIVE PRICE DATABOOK, supra note 112. Notes: Because relative price is calculated individually by payer, the price level associated with each payer’s network average relative price (1.0) is not the same for different payers. Therefore, relative price should not be compared across payers. BID-owned hospitals: BIDMC, BID-Milton, BID-Needham, BID-Plymouth Lahey hospitals: Lahey HMC, Northeast, Winchester Comparators: Partners (including Brigham & Women’s Hospital, Massachusetts General Hospital, Newton-Wellesley Hospital, North Shore Medical Center, Brigham & Women’s Faulkner Hospital, Martha’s Vineyard Hospital, and Nantucket Cottage Hospital); Steward (including Steward Carney Hospital, Steward Good Samaritan Medical Center, Steward Holy Family Hospital, Morton Hospital, Nashoba Valley Medical Center, Norwood Hospital, Steward St. Anne’s Hospital, and Steward St. Elizabeth’s Medical Center); and Wellforce (including Tufts Medical Center, Lowell General Hospital, and MelroseWakefield Healthcare)
Evaluating the weighted price across the system reinforces past findings by the HPC and
others that Partners is, by a substantial margin, higher-priced than other Massachusetts systems.
Aside from Partners, the BID-owned and Lahey systems are not generally lower-priced than
other Massachusetts systems. The BID-owned system is consistently the second-highest priced
system for inpatient services, and Lahey is generally comparably priced to Steward Health Care
System (Steward) and Wellforce.118
We also examined relative price for the parties’ physician networks and found that
BIDCO, Lahey, and MACIPA generally have low to moderate physician prices compared to
other eastern Massachusetts physician groups, and they are consistently lower-priced than
118
For THP, Lahey has somewhat higher inpatient prices than Steward and Wellforce, but somewhat lower
outpatient prices.
BCBS HPHC THP
0.82
0.87
0.92
0.97
1.02
1.07
1.12
1.17
1.22
1.27
1.32
1.37
1.42

34
Partners and Atrius. The relative ranking among BIDCO, Lahey, and MACIPA physician prices
varies by payer.119
Finally, recognizing that both the Lahey system and the BIDCO network have grown
substantially in recent years, we examined the extent to which there were price changes
associated with the parties’ past transactions, including both corporate acquisitions and
contracting affiliations with community hospitals. Using the most recent inpatient and outpatient
relative price data, we found that overall, the prices of community hospitals that were recently
acquired by BIDMC or Lahey or became affiliated with BIDCO have not risen relative to their
local competitors in the years following those transactions.120
In addition, we examined changes in the weighted average relative price for the BIDCO
hospitals (both BID-owned and BIDCO contracting affiliates) and the Lahey hospitals for the
three largest commercial payers.121
We found that the weighted average inpatient and outpatient
relative price across the BIDCO and Lahey hospitals also did not generally increase following
new community hospital affiliations.122
Overall, we have not found evidence that the parties have negotiated higher prices, either
for new community hospital affiliates or for their hospitals overall, following past acquisitions or
contracting affiliations with community hospitals.123
119
See the Data Appendix, Figure 2F, for a chart showing physician group relative price data for BCBS, HPHC, and
THP. In some cases, we understand that the gap between the parties may have narrowed in the years following this
2015 data. 120
Their prices also did not decrease relative to local competitors. For each year, we examined the ratio of the focal
community hospitals’ inpatient and outpatient relative prices to the weighted average of their local competitors. For
inpatient services, we used 2016 CHIA hospital discharge data to weight hospitals based on their average share of
inpatient discharges by payer in each community hospital’s inpatient PSA from 2010 to 2016. For outpatient
services, we weighted hospitals by a proxy for their outpatient volume in the PSA, calculated by multiplying their
inpatient volume in the PSA by their ratio of outpatient to inpatient revenue. The parties also examined a similar
question, comparing community hospital inpatient and outpatient relative price compared to a set of comparators
over time. The HPC and the parties used different comparators and slightly different methods, which yielded slightly
different results in individual cases, but the overall conclusion—that there is no evidence, to date, of significant
price increases relative to local competitors—is the same. 121
We based this analysis on the same methodology used to calculate the system weighted average relative prices.
See supra note 116. To calculate changes in the weighted average relative prices from 2012 to 2016, we held each
hospital’s volume constant. We weighted each hospital’s inpatient price in each year by its share of total discharges
from 2012 to 2016. We weighted each hospital’s outpatient price in each year by a proxy for outpatient volume,
calculated as its share of outpatient revenue divided by its outpatient relative price from 2014 to 2016 (due to data
limitations, we were unable to include outpatient weights for 2012 and 2013). We also evaluated physician relative
price over time for BIDCO and Lahey, and similarly did not find evidence of rising relative prices. Note that for
Lahey, we incorporated relative price for all Lahey physician groups, weighting their separate relative prices based
on their revenue in the CHIA RELATIVE PRICE DATABOOK, supra note 112. 122
The weighted average inpatient and outpatient relative price also did not decrease. 123
However, past acquisitions lacked the scale and competitive overlap of the current proposed transaction. For
example, when Lahey acquired Winchester, the HPC modeled changes in market concentration and found smaller
changes than those described in this review at Section III.A.4. See LAHEY-WINCHESTER CMIR, supra note 85, at 36.
We also evaluated the changes in market concentration effectuated by the acquisitions of Northeast, BID-Milton and
BID-Plymouth, and the contracting affiliations between BIDCO and Lawrence General, CHA, and Anna Jaques.
The increases in market concentration in the inpatient PSAs of these hospitals are all smaller than those described
for nearly all PSAs in this review at Section III.A.4. For some recent transactions, there are also few post-transaction
years of data available to examine.
35
2. The parties have had moderate spending levels compared to other Massachusetts
providers.
The HPC also evaluated the parties’ performance in managing patient spending by
examining total medical expense (TME) data collected by CHIA for the health maintenance
organization (HMO)/point of service (POS) patients who have selected BIDCO, Lahey, or
MACIPA PCPs. As a measure of per member per month spending on all medical services, TME
reflects both utilization and price. High TME can reflect high utilization of services or high
prices of the hospitals or physicians that patients use, or a combination of both. We examined
health status adjusted TME (HSA TME) to account for underlying health differences that may
affect spending levels for different physician groups. 124
The parties’ physician networks generally have moderate spending for patients of their
PCPs compared to other eastern Massachusetts physician groups as shown below. BIDCO,
Lahey, and MACIPA all have HSA TME within approximately 4% of the payer network average
for the three largest commercial payers in the most recent final HSA TME data, and their
spending levels are below Partners in all three payer networks and below Atrius in two of the
three.125
We also found that the parties’ HSA TME levels relative to each other vary by payer; no
party is consistently higher-spending or lower-spending than the others. The chart below shows
the parties’ per member per month HSA TME, as well as that of their major eastern
Massachusetts competitors, for the three largest commercial payers.
124
TME is expressed as a per member per month dollar figure that reflects the average monthly covered medical
expenses paid by the payer and the member for all of the health care services the member receives in a year. TME is
publicly reported by provider organization for patients who have explicitly selected a PCP affiliated with that
organization (this only includes patients in HMO and POS products, which require patients to select a PCP and
obtain referrals to other providers through that PCP). It is standard industry practice to adjust for health status
differences when comparing TME, so that a provider caring for a sicker population will not appear to have higher
spending solely for that reason. 125
This analysis is based on a comparison of each party’s HSA TME to the weighted average HSA TME in each
payer network. Network averages are weighted by physician group member months. For this analysis, we created a
combined HSA TME for Lahey HMC physicians, Winchester physicians, and Northeast physicians, based on each
group’s member months, because some payers report one or both of these organizations separately.

36
Source: CTR. FOR HEALTH INFO. & ANALYSIS, 2016 ANNUAL REPORT TME DATABOOK (2016), available at http://www.chiamass.gov/assets/2016-annual-report/2016-Annual-Report-databooks-and-technical-appendices.zip (last visited Sept. 24, 2018). Notes: Because payers use different risk adjustment tools, per member per month spending levels should not be compared between payer networks. The red line in each graph indicates the payer’s network average HSA TME.
The HPC has also examined spending by physician network by looking at both HMO and
preferred provider organization (PPO) claims in the APCD for all services provided to patients
attributable to PCPs in these networks.126
Consistent with findings from the HSA TME data,
spending for the parties’ primary care patients is generally moderate compared to other
Massachusetts provider groups.127
We also examined annual growth of each party’s HSA TME for the three largest
commercial payers to evaluate their performance over time.128
We found that BIDCO and Lahey
126
These spending figures differ from HSA TME in that they reflect spending for all patients attributed to a provider
group’s PCPs (including PPO members), but only include claims-based spending. For details on the attribution
methodology used, see MASS. HEALTH POLICY COMM’N, 2017 COST TRENDS REPORT at 29-30 (March 2018)
[hereinafter 2017 HPC COST TRENDS REPORT], available at
https://www.mass.gov/files/documents/2018/03/28/Cost%20Trends%20Report%202017.pdf (last visited Sept. 24,
2018). 127
See the Data Appendix, Figure 3, for a chart showing these findings. 128
Network averages are computed by calculating a weighted (by member months) average HSA TME across all of
the physician groups within each payer’s network. For purposes of assessing the HSA TME growth of Lahey, we
calculated a weighted average as described in supra note 125. To ensure that we are comparing HSA TME values
calculated using the same risk adjustment tool and methodology, we only calculate growth rates between years
reported in the same CHIA data book. CHIA reports TME data in three year increments (e.g., final 2013, final 2014,
and preliminary 2015 data are reported in CHIA’s 2016 Annual Report TME Databook), and payers are required to
file TME data using the same risk adjustment tool for all three years contained in a given data book. Here, we used
the 2015 Databook to calculate the growth rate between 2012 and 2013, the 2016 Databook to calculate the growth
rate between 2013 and 2014, and the 2017 Databook to calculate the growth rate between 2014 and 2015, as well as
the growth rate between 2015 and preliminary 2016. CTR. FOR HEALTH INFO. & ANALYSIS, 2015 ANNUAL
REPORT TME DATABOOK (2015), available at http://www.chiamass.gov/assets/2015-annual-report/2015-Report-
All-Files.zip (last visited Sept. 24, 2018); CTR. FOR HEALTH INFO. & ANALYSIS, 2016 ANNUAL REPORT TME
DATABOOK (2016), available at http://www.chiamass.gov/assets/2016-annual-report/2016-Annual-Report-
$200$220$240$260$280$300$320$340$360$380
Low
ell P
HO
BID
CO
Sou
th S
ho
re P
HO
Ste
war
d
Lah
ey
MA
CIP
A
NEQ
CA
Atr
ius
Par
tner
s
HSA TME (BCBS 2015)
$200$220$240$260$280$300$320$340$360$380
Low
ell P
HO
Atr
ius
MA
CIP
A
Lah
ey
Ste
war
d
NEQ
CA
BID
CO
Sou
th S
ho
re P
HO
Par
tner
s
HSA TME (HPHC 2015)
$200$220$240$260$280$300$320$340$360$380
NEQ
CA
MA
CIP
A
BID
CO
Lah
ey
Sou
th S
ho
re P
HO
Low
ell P
HO
Ste
war
d
Atr
ius
Par
tner
s
HSA TME (THP 2015)

37
experienced only modest changes in HSA TME growth over time, and that these changes were
generally in line with changes in payer network averages.129
We did not find changes in their
performance following recent acquisitions or affiliations with new community hospitals.
3. The parties have had some success at retaining local care at community hospitals they
have recently acquired, but spending trends for local patients have remained largely
unchanged.
As detailed in Section II.A., one of the parties’ claims is that the transaction will enable
them to “Reduc[e] outmigration to costlier sites of care when equivalent or better quality care is
accessible in the local community (e.g., reducing “community appropriate” inpatient volume at
academic medical centers and teaching hospitals) resulting in more patients treated closer to
home at a reduced cost (the “right place”).”130
In connection with past acquisitions of and
contracting affiliations with community hospitals, both Lahey and BIDMC/BIDCO have stated a
similar goal of keeping low-acuity care in the community, thereby achieving savings.131
To understand the extent to which the parties have achieved such goals in the past, which
can inform assessments of how successful the parties may be in achieving these goals in the
current transaction, the HPC examined where patients living in primary service areas (PSAs) of
newly acquired or affiliated community hospitals received inpatient care before and after the
community hospital’s affiliation with BIDMC, BIDCO, or Lahey.132
We looked at the
community hospital’s share of discharges in its PSA separately for discharges we defined as
“community-appropriate” and for those that are higher-acuity.133
We also compared trends at
newly-affiliated community hospitals with the statewide trends for all community hospitals.134
databooks-and-technical-appendices.zip (last visited Sept. 24, 2018); CTR. FOR HEALTH INFO. & ANALYSIS,
2017 ANNUAL REPORT TME DATABOOK (2017), available at http://www.chiamass.gov/assets/2017-annual-
report/2017-Annual-Report-Databooks.zip (last visited Sept. 24, 2018). 129
MACIPA’s performance varies more significantly from payer network averages; for some payers in some years,
MACIPA’s growth is notably lower than the network average, and in others higher. 130
DON NARRATIVE, supra note 31, at 4. 131
See Robert Weisman, Adding Milton Hospital, Beth Israel Enters New Era, BOSTON GLOBE, Jan. 3, 2012,
available at https://www.bostonglobe.com/business/2012/01/03/adding-milton-hospital-beth-israel-enters-new-
era/Vnptj0Cu6vXyDT82CjB8vJ/story.html (last visited Sept. 24, 2018); Richard Gaines, Northeast, Lahey Join
Forces, GLOUCESTER TIMES, Jul. 19, 2011, available at
http://www.gloucestertimes.com/news/local_news/northeast-lahey-join-forces/article_67a2b52a-ab5f-5c83-98b5-
84675f69ac6f.html (last visited Sept. 24, 2018); Chelsea Conaboy, Beth Israel Deaconess, Cambridge Health to
Partner, BOSTON GLOBE, May 3, 2013, available at https://www.bostonglobe.com/lifestyle/health-
wellness/2013/05/02/beth-israel-deaconess-cambridge-health-alliance-form-
partnership/hDXbzqCTwAP4BZ35w8RY7J/story.html (last visited Sept. 24, 2018); BIDMC-JORDAN MCN, supra
note 54; LAHEY-WINCHESTER CMIR, supra note 85, at 6; Press Release, Lawrence General Hospital, Lawrence
General Hospital Announces Stronger Affiliation with Beth Israel Deaconess Medical Center, available at
http://www.lawrencegeneral.org/about-us/news-details.aspx?newsid=92 (last visited Sept. 24, 2018); BIDCO-ANNA
JAQUES MCN, supra note 67. 132
The HPC did not examine trends for BID-Needham, because it was acquired in 2000 and pre-transaction data are
not available. 133
The methodology to define “community-appropriate” discharges is designed to be very conservative, identifying
care that nearly any Massachusetts community hospital could deliver. We recognize that many community hospitals
can provide more complex care, and therefore we also examined patterns in site of care for higher-acuity discharges
(see findings below). Community-appropriate discharges are defined as follows: Starting from the full 2015 hospital
discharge database, the HPC first excluded diagnosis related groups (DRGs) that are too complex for most

38
The graph below details the change in shares between the last year before the transaction and the
most recent year with available data (2016) across all payer types (commercial, Medicare,
Medicaid, and other). Changes in the share of the “focal” community hospital—i.e., the hospital
newly acquired by BIDMC or Lahey or newly affiliated with and contracting through BIDCO—
are shown in blue, while changes in the share of the anchor teaching hospital—i.e., BIDMC or
Lahey HMC—are shown in red. Changes in the statewide community hospital share over the
same time periods are shown in green.
community hospitals (e.g., transplants, major chest procedures, serious extensive burn treatment, and major trauma
procedures), then excluded DRGs with “complications or comorbidities” or “major complications or comorbidities.”
We also excluded DRGs with fewer than 500 total discharges statewide and those where community hospitals
collectively provided fewer than 15% of discharges. We employed our standard data cleaning methods, including
exclusions of non-Massachusetts residents, non-acute discharges, and normal newborns and transfers (to prevent
double-counting). Finally, we excluded from our analysis those discharges transferred to a teaching hospital, on the
basis that in such cases a judgment was made that the particular patient required care at a non-community setting
and therefore that the discharge would not have been appropriate for redirection to the community. Approximately
12% of DRGs, accounting for 41% of discharges in 2016, are defined as “community-appropriate.” 134
The parties also conducted some analyses that distinguished between lower-acuity and higher-acuity discharges.
The HPC applied the parties’ definitions of lower-acuity and higher-acuity care to the same analysis described
below and found that the overall results were broadly consistent with our findings, as described below.

39
Difference between Pre- and Post-Transaction Shares of Local Community-Appropriate
Discharges (All Payers)
Source: HPC analysis of 2009-2016 CHIA hospital discharge data.
To varying degrees, the community hospitals that became BIDCO contracting affiliates
experienced declining shares of community-appropriate discharges in their service areas
following affiliation, and these decreases exceeded the statewide trend during the same time
periods. In Anna Jaques’ and CHA’s PSAs, BIDMC’s share of local community-appropriate
discharges grew as Anna Jaques’ and CHA’s shares declined. In contrast, the hospitals that were
acquired by BIDMC or Lahey experienced growing shares of community-appropriate
discharges. In every PSA except BID-Plymouth’s, however, we found that the anchor teaching
hospital share of local community-appropriate discharges increased by more than the focal
-6
-4
-2
0
2
4
6
Anna JaquesPSA - BIDCOContracting
Affiliate
CHA PSA -BIDCO
ContractingAffiliate
LawrenceGen. PSA -
BIDCOContracting
Affiliate
BID-MiltonPSA - BIDCorporate
Affiliate
WinchesterPSA - LaheyCorporate
Affiliate
Northeast PSA- Lahey
CorporateAffiliate
BID-PlymouthPSA - BIDCorporate
Affiliate
Pe
rce
nta
ge P
oin
t C
han
ge
Focal Community Hospital Share in PSAAnchor Teaching Hospital Share in PSAAll Community Hospital Share of CADs Statewide During Same Time Period
Following contracting affiliations with BIDCO, community hospitals’ share of local CADs decreased more than community hospitals’ share statewide (blue vs. green bars).
BIDMC’s shares of CADs (red bars) increased from two out of three contracting affiliates’ service areas.
Following corporate affiliations with BID and Lahey, community hospitals’ shares of local CADs increased (blue bars) while community hospitals’ share of CADs statewide generally decreased (green bars).
But BIDMC’s and Lahey HMC’s shares of these local CADs (red bars) increased more than newly-acquired community hospitals’ shares in three of four service areas.

40
community hospital’s share.135,136
That is, growth in the system’s share was due more to the
anchor hospital itself drawing a higher share of local patients (BID-Plymouth is the exception).
We also evaluated changes in hospitals’ shares of local higher-acuity discharges.
137
Higher-acuity discharges are all discharges that are not “community appropriate” discharges as
defined above.138
Like the graph for community-appropriate discharges, the graph below details
the change in shares between the last year before the transaction and the most recent year with
available data across all payer types. Changes in the share of the “focal” community hospital are
shown in blue, while changes in the share of the anchor teaching hospital are shown in red.
Changes in the statewide community hospital share over the same time periods are shown in
green.
135
When only commercial discharges are examined, Winchester and Northeast (both acquired by Lahey) retained a
somewhat greater share of local community-appropriate discharges than Lahey. Nonetheless, the general finding is
consistent across all-payer and commercial payer discharge trends—where there have been community hospital
acquisitions, the community hospital retained a greater share of local community appropriate discharges, but the
anchor teaching hospitals’ shares of local community appropriate discharges also increased; where there have been
community hospital contracting affiliations, contracting affiliates’ shares of local discharges have not generally
increased, while anchor teaching hospitals’ shares of such discharges have generally either increased slightly or
decreased less than community hospitals’ shares. See the Data Appendix, Figure 4A, for a chart showing these
commercial discharges. 136
Lahey has described a policy under which patients who present at Lahey HMC may be transferred to Northeast or
Winchester where clinically appropriate and convenient for the patient, and the parties report that more than 1,000
such transfers have occurred since 2012. See LAHEY HEALTH SYSTEM, CAREGROUP, AND SEACOAST REGIONAL
HEALTH SYSTEMS, RESPONSE TO ADDITIONAL QUESTION REQUEST at 4, available at
https://www.mass.gov/files/documents/2018/02/12/don-response-to-additional-questions-newco.pdf (last visited
Sept. 24, 2018). We recognize the value of such a policy, which may both reduce spending and increase
convenience for patients. It is likely that without this policy, the patterns described here would be less favorable for
Northeast and Winchester. 137
See the Data Appendix, Figure 4B, for charts showing data on higher-acuity commercial discharges. 138
See supra note 133, describing the methodology for identifying community appropriate discharges.

41
Difference between Pre- and Post-Transaction Shares of Local Higher-Acuity Discharges (All Payers)
Source: HPC analysis of 2009-2016 CHIA hospital discharge data.
Several community hospitals experienced somewhat more favorable trends for higher-
acuity discharges, including one contracting affiliate, Lawrence General, which experienced a
small increase in its share of local higher-acuity discharges while BIDMC’s share decreased.
Northeast’s share of higher-acuity discharges increased more than Lahey HMC’s share, and
BID-Milton’s share increased nearly as much as BIDMC’s. These results are consistent with
increases in these community hospitals’ case mix indices.139
However, consistent with the
139
Lawrence General’s case mix index increased from 0.69 in 2010 to 0.86 in 2016. Following its affiliation with
BIDCO in 2014, Lawrence General’s case mix index increased from 0.77 to 0.86. Northeast’s case mix index
increased more moderately, from 0.78 in 2012 to 0.82 in 2016, while BID-Milton’s case mix index increased
significantly, from 0.77 in 2012 to 1.06 in 2016. CTR. FOR HEALTH INFO. & ANALYSIS, MASSACHUSETTS HOSPITAL
PROFILES ACUTE DATABOOK DATA THROUGH FISCAL YEAR 2013 (Jan. 2015); CTR. FOR HEALTH INFO. & ANALYSIS,
MASSACHUSETTS HOSPITAL PROFILES ACUTE DATABOOK DATA THROUGH FISCAL YEAR 2014 (Nov. 2015); CTR.
-6
-4
-2
0
2
4
6
Anna JaquesPSA - BIDCOContracting
Affiliate
CHA PSA -BIDCO
ContractingAffiliate
LawrenceGen. PSA -
BIDCOContracting
Affiliate
BID-MiltonPSA - BIDCorporate
Affiliate
WinchesterPSA - LaheyCorporate
Affiliate
Northeast PSA- Lahey
CorporateAffiliate
BID-PlymouthPSA - BIDCorporate
Affiliate
Pe
rce
nta
ge P
oin
t C
han
ge
Focal Community Hospital Share in PSA
Anchor Teaching Hospital Share in PSA
All Community Hospital Share of Higher-Acuity Discharges Statewide During Same Time Period
Following contracting affiliation with BIDCO, Lawrence General increased its share of higher-acuity discharges slightly more than other community hospitals statewide, and BIDMC’s share decreased. However, Anna Jaques’ and CHA’s shares of higher acuity discharges also decreased, while BIDMC’s increased.
Following corporate affiliations with BIDMC and Lahey, community hospitals’ shares of higher-acuity discharges increased more than community hospitals’ share statewide (blue vs. green bars).
BIDMC’s and LHMC’s shares of higher acuity discharges increased in all four cases (red bars) and to a greater extent than community hospital shares in two cases.

42
findings for community-appropriate discharges, BIDMC and Lahey HMC experienced growing
shares of local higher-acuity discharges in nearly all PSAs, and we did not find evidence of shifts
in volume for higher-acuity discharges from anchor teaching hospitals to new community
hospital affiliates.
In addition, the HPC examined certain trends for all local discharges (community-
appropriate and higher-acuity), focusing on the four PSAs where the parties’ community
hospitals’ shares of all local discharges increased (BID-Milton, BID-Plymouth, Northeast, and
Winchester). In order to better understand where care was shifting from, we identified which
hospitals’ shares decreased while the parties’ community hospitals’ shares were increasing. In all
four PSAs, we found that the largest decreases in shares of local discharges were at other
community hospitals, not at teaching hospitals or AMCs.140
For BID-Milton’s and BID-
Plymouth’s PSAs, non-Partners community hospitals experienced the largest decrease in their
share of local discharges, while in Northeast’s and Winchester’s PSAs, Partners’ community
hospitals experienced the largest decrease.
We then evaluated whether volume shifts to BIDCO or Lahey after recent community
hospital affiliations came from lower-priced or higher-priced hospitals, resulting in higher or
lower average prices for commercial payers.141
In three of the five PSAs where BIDCO or Lahey
hospitals’ shares of all local commercial discharges increased after affiliations, commercial
payers ended up paying a somewhat reduced average price in three service areas (Northeast,
Winchester and BID-Milton); the average price increased in the remaining in two service areas
(BID-Plymouth and CHA). In these five PSAs, the increased share of discharges at BIDCO or
Lahey hospitals was accompanied by a decreased share of discharges at both lower-priced and
higher-priced hospitals. Thus, while the parties have demonstrated some success at retaining
FOR HEALTH INFO. & ANALYSIS, MASSACHUSETTS HOSPITAL PROFILES ACUTE DATABOOK DATA THROUGH FISCAL
YEAR 2015 (Mar. 2017); CHIA HOSPITAL PROFILES DATABOOK, infra note 143. Case mix data for 2010 through
2012 may be requested from CHIA. The Parties’ Response includes a graph of case mix indices from 2012 to 2016
for Addison Gilbert, Beverly, Winchester, BID-Needham, BID-Milton, and BID-Plymouth. It appears that the
parties calculated the case mix indices independently, rather than using the data published in CHIA’s hospital profile
databooks, resulting in some differences in numbers. However, the graph appears to be consistent with the finding
that Northeast (particularly Beverly) and BID-Milton experienced increases in their case mix indices. The Parties’
Response also shows increases for BID-Plymouth and Winchester, although we do not find associated improvement
in these hospitals’ retention of local higher-acuity discharges. The Parties’ Response shows significant growth in
BID-Needham’s case mix index; because this transaction occurred in 2000, we lack appropriate data to analyze its
impact on the distribution of inpatient care. Parties’ Response, supra note 14, at 28. 140
During the July 18, 2018 Board Meeting, multiple Commissioners requested further information regarding the
parties’ plans and timelines for keeping more community-appropriate care at community hospitals. The Parties’
Response does not directly respond to this request, but rather describes how BIDMC and Lahey HMC have invested
in their owned community hospitals to improve their capacity to deliver higher-acuity care. The Parties’ Response
also includes data about volume increases at BID-Milton, BID-Plymouth, Northeast, and Winchester compared to
the volume change in eastern Massachusetts, which shows that volume increased more at these hospitals than across
this region. Parties’ Response, supra note 14, at 27. While we commend the parties’ investments in their community
hospitals, and recognize that volume growth at these hospitals is important, the HPC’s methodology is designed to
understand whether, consistent with the parties’ stated goals of keeping more care local, care appears to be shifting
from generally higher-acuity and higher-cost settings (e.g., AMCs) to community settings. However, as described
above, we find that the primary sources of greater share of both higher- and lower-acuity discharges at the parties’
community hospitals are other area community hospitals, not teaching hospitals and AMCs. 141
Unlike the analysis above, which applied to all payers, here we evaluated the impact of transactions for
commercial payers.

43
inpatient care at their owned (but not affiliated) community hospitals, the overall effect has not
always been that patients are receiving care in a lower-cost setting. Shifts in care have come
from both lower-priced and higher-priced hospitals, and care has shifted both to the systems’
higher-priced anchor teaching hospitals, BIDMC and Lahey HMC, and to the lower-priced local
community hospital.
Finally, we examined spending, as measured by unadjusted and HSA TME, for
individuals living near the recently acquired or affiliated community hospitals. 142
We found that
spending growth for these patients was not generally lower than trends in eastern Massachusetts
and statewide, likely reflecting the fact that the overall numbers of patients that have been
redirected is relatively small and, as described above, patients have not always shifted to lower-
priced settings. Based on these results, we find that BIDCO and Lahey have had some success at
retaining care at their community hospitals after recent community hospital acquisitions, but that
even where care has shifted to these systems after recent transactions, spending trends for local
patients have remained largely unchanged.143
4. After the transaction, BILH would be nearly equivalent in market share to Partners, and
market concentration would increase substantially.
Comparisons of providers’ market shares show their relative importance to patients and
the payers that cover those patients. Increased market share and market concentration (i.e., fewer
providers accounting for a larger share of volume) may also increase a provider’s bargaining
leverage to negotiate higher commercial prices and other favorable contract terms with
commercial payers. The HPC examined the parties’ market shares both statewide and within
their primary service areas (PSAs).144
Statewide market shares illustrate the parties’ overall
142
We calculated each PSA’s HSA TME and unadjusted TME by payer for the three largest commercial payers by
weighting HSA TME and unadjusted TME for each zip code within a hospital’s PSA by the patient member months
for the payer in each zip code. We calculated HSA TME and unadjusted TME for eastern Massachusetts for each
payer by applying the same methodology to all zip codes in eastern Massachusetts, excluding Cape Cod, Nantucket,
and Martha’s Vineyard. We examined changes in spending for patients living in these PSAs using HSA TME from
2013 to 2016 and unadjusted TME and risk scores from 2009 to 2016, and compared pre- and post-transaction levels
and growth rates in the PSA to statewide and eastern Massachusetts data. 143
In addition to market shares and spending, we reviewed CHIA Hospital Cost Report data on changes in internal
costs and operating margins for the community hospitals that affiliated with the parties. Examining inpatient costs
per case-mix-adjusted discharge, a measure of the cost efficiency of hospital care, we found that BID-Milton,
Winchester, and Lawrence General had downward trends after affiliation, suggesting greater efficiency, while the
trends for other new affiliates were flat, or in some cases volatile. The operating margins of Northeast and
Winchester improved in the fiscal years after their acquisitions, while the operating margins of the BID-owned
community hospitals tended to follow the trends of other Massachusetts community hospitals, rising in some years
and falling in others. Lawrence General and CHA did not experience consistent trends in operating margin after
affiliating with BIDCO. See CTR. FOR HEALTH INFO. & ANALYSIS, MASS. HOSPITAL PROFILES COMPENDIUM 13 (Jan.
2018), available at http://www.chiamass.gov/assets/docs/r/hospital-profiles/2016/Massachusetts-Hospitals-Profiles-
Compendium-2016.pdf (last visited Sept. 24, 2018) (showing median hospital operating margin by hospital cohort
for fiscal years 2012 through 2016); CTR. FOR HEALTH INFO. & ANALYSIS, MASSACHUSETTS HOSPITAL PROFILES
ACUTE DATABOOK DATA THROUGH FISCAL YEAR 2016 (Jan. 2018) [hereinafter CHIA HOSPITAL PROFILES
DATABOOK], available at http://www.chiamass.gov/assets/docs/r/hospital-profiles/2016/Acute-Care-Massachusetts-
Hospitals-Databook-FY16-1-23-18-v2.xlsx (last visited Sept. 24, 2018), showing individual hospital operating
margins. 144
The CMIR statute directs the HPC to “examine factors relating to the provider or provider organization’s
business and its relative market position,” including “the provider or provider organization’s size and market share

44
importance in Massachusetts, while shares and market concentration in primary service areas
illustrate the parties’ importance in those areas where most of their patients reside.
a. Inpatient and Outpatient Market Shares
Statewide, BIDCO and Lahey have the second and third largest shares, respectively, of
inpatient and outpatient services, and Partners has more than twice the shares of BIDCO. After
the transaction, BILH’s statewide share of inpatient and outpatient services would become a
close second to Partners’, and BILH’s share would be more than triple that of the third largest
system.
within its primary service areas” and “the provider or provider organization’s impact on competing options for the
delivery of health care services within its primary service areas.” MASS. GEN. LAWS ch. 6D, § 13(d) (emphasis
added). The HPC defines a hospital’s inpatient and outpatient primary service areas or PSAs as the areas from which
a hospital draws 75% of its inpatient and outpatient commercial patients, respectively. For details regarding the
HPC’s methodology for defining an inpatient PSA, see MASS. HEALTH POLICY COMM’N, TECHNICAL BULLETIN FOR
958 CMR 7.00: NOTICES OF MATERIAL CHANGE AND COST AND MARKET IMPACT REVIEWS (Aug. 6, 2014)
[hereinafter TECHNICAL BULLETIN], available at http://www.mass.gov/anf/docs/hpc/regs-and-notices/technical-
bulletin-circ.pdf (last visited Sept. 24, 2018). As articulated by the Federal Trade Commission and Department of
Justice, “[a]lthough a PSA does not necessarily constitute a relevant geographic market, it nonetheless serves as a
useful screen for evaluating potential competitive effects.” Statement of Antitrust Enforcement Policy Regarding
Accountable Care Organizations (ACO), 76 FED. REG. 67026, 67028 (Oct. 28, 2011), available at
http://www.gpo.gov/fdsys/pkg/FR-2011-10-28/pdf/2011-27944.pdf (last visited Sept. 24, 2018).

45
Statewide Market Shares for Inpatient and Outpatient Services
Hospital System/Network Inpatient Statewide Share145
(2017) Outpatient Statewide
Share146 (2015)
Partners 27.4% 26.9%
BIDCO, Lahey, Mt. Auburn combined
23.6% (13.0% + 7.9% + 2.7%)
24.9%
(12.3% + 10.2% + 2.4%)
UMass 7.0% 5.2%
Wellforce 5.8% 6.8%
Steward 5.7% 4.6%
All Other Facilities 30.6% 31.6%
Source: HPC analysis of 2017 CHIA hospital discharge data for all commercial payers (inpatient shares) and 2015 APCD data for the three largest commercial payers (outpatient shares).
The HPC also examined shares in each of the parties’ general acute care hospitals’ PSAs
in accordance with the CMIR statute. In many of the individual PSAs for the BILH hospitals,
BILH would have the largest share of inpatient and outpatient services by a substantial
margin.147
The parties are also especially important providers of certain specialty services. In
particular, the HPC focused on the parties’ shares of musculoskeletal services and maternity
care. As described in the HPC’s 2016 review of BIDCO’s proposed contracting affiliation with
NE Baptist, NE Baptist provides a very substantial share of inpatient and outpatient orthopedic
services.148
After the transaction, BILH would provide 40.2% of a range of inpatient orthopedic
145
We used 2017 CHIA hospital discharge data to identify each provider’s share of commercial hospital discharges
provided in Massachusetts for general acute care services (i.e., services provided in non-specialty inpatient
hospitals), excluding normal newborns (including normal newborns would effectively double-count a single delivery
as two discharges), non-acute discharges (e.g., discharges with a length of stay of greater than 180 days,
rehabilitation discharges), and out-of-state patients. 146
We used claims-level data from the 2015 APCD for BCBS, HPHC, and THP to identify services provided by all
facilities, including acute and non-acute care hospital outpatient departments and satellite facilities, and freestanding
ambulatory surgery centers. We then determined the share of patient visits at each provider, counting all claims on
the same day at the same provider for the same patient as a single visit. 147
We found that the parties generally have substantial shares of inpatient and outpatient services in their PSAs, and
that in many of those PSAs, these shares would increase substantially following the transaction. A combined BILH
would have shares of discharges in its hospitals’ PSAs ranging from 21.9% in BID-Needham’s PSA to 63.1% in
Anna Jaques PSA. For outpatient facility visits, BILH’s share would range from 20.0% in BID-Milton’s PSA to
64.3% in Anna Jaques’ PSA. See the Data Appendix, Figures 5A through 5D, for maps of each hospital’s inpatient
PSA (defined using 2016 discharges) and the Data Appendix, Figures 7A and 7B, for tables showing shares in each
PSA for inpatient (2017) and outpatient (2015) services. 148
2016 BID CMIR FINAL REPORT, supra note 28, at 30-33.

46
and musculoskeletal services statewide,149,150
and the eastern Massachusetts market would have
two dominant provider networks for orthopedic and musculoskeletal services: Partners and
BILH.151
In addition, Northeast, Winchester, Mt. Auburn, and BIDMC are important providers of
maternity care, and the parties would have a combined share of 25.4% of all maternity
discharges statewide, with higher shares in individual hospital PSAs.152
b. Adult Primary Care Services
Statewide, the market for primary care services is less concentrated than the market for
inpatient and outpatient services. Currently, BIDCO and Lahey have the fourth and seventh
largest shares of adult primary care services statewide, respectively. After the transaction, BILH
would surpass Partners in its share of statewide adult primary care visits.
149
We examined shares for NE Baptist’s “core” inpatient services using the same methodology described in the
2016 BID CMIR FINAL REPORT, supra note 28 at 31, n. 119 and n. 121. We updated the set of “core” services using
2016 CHIA hospital discharge data. The 26 MS-DRGs included in our definition of NE Baptist’s core services are
453-462, 466-473, 483-489, and 509. These accounted for over 93% of NE Baptists’ commercial discharges in
2016. We examined shares for outpatient orthopedic surgical services using the method described in 2016 BID
CMIR FINAL REPORT, supra note 28 at 32, n. 125, updated with 2015 APCD claims data for BCBS, HPHC, and
THP. 150
The parties’ combined share of inpatient orthopedic services would be higher in BILH hospitals’ inpatient PSAs,
reaching a high of 68.4% (in Anna Jaques’ PSA). BILH would have a 48.2% share in NE Baptist’s inpatient PSA,
which encompasses much of eastern Massachusetts. The parties’ combined share of outpatient orthopedic surgical
services would be 34.9% in NE Baptist’s outpatient PSA, which encompasses most of eastern Massachusetts
(BIDCO, including NE Baptist, currently provides 25.8% of these services). See the Data Appendix, Figures 7C and
7D, for tables showing shares for major providers in NE Baptist’s inpatient and outpatient PSAs. 151
In NE Baptist’s inpatient and outpatient PSAs, which encompass most of eastern Massachusetts, BILH and
Partners would account for 73.7% orthopedic and musculoskeletal discharges and over 63% of outpatient orthopedic
and musculoskeletal surgical services. 152
The parties’ combined share would be higher in BILH hospitals’ inpatient PSAs, reaching a high of 75.5% (in
Anna Jaques’ PSA). BILH would provide approximately one third or more of all maternity discharges in all BILH
hospitals’ PSAs except those of BID-Milton, BID-Needham, BID-Plymouth, and NE Baptist, and BILH would be
the largest provider of maternity services in half of its hospital PSAs. The maternity discharges are defined as those
DRGs falling into the Major Diagnostic Category for maternity services (MDC 14), which includes DRGs for
pregnancy, childbirth, and puerperium. See the Data Appendix, Figure 7E, for detailed information about the
parties’ and other major providers’ market shares in their PSAs.

47
Statewide Shares of Adult Primary Care Services
Physician Network Share of Adult Primary Care Visits (2015)
BIDCO, Lahey, MACIPA combined 17.7% (9.6% + 5.6% + 2.3%)
Partners 14.1%
Atrius 13.2%
Steward 12.6%
Wellforce 7.3%
UMass 6.0%
All Others 29.1%
Source: HPC analysis of 2015 APCD data for the three largest commercial payers.
The parties’ shares are more significant in their own primary care PSAs.153
c. Market Concentration
Consistent with past reviews, the HPC also examined inpatient market concentration
before and after the proposed transactions in the parties’ PSAs, since increased market
concentration, while not determinative, can be probative of the impact of a transaction on market
leverage and the ability of the parties to negotiate higher prices.154
For each BILH hospital PSA,
the HPC calculated the Herfindahl-Hirschman Index (HHI),155
a commonly used measure of
153
In their respective PSAs, BIDCO, Lahey, and MACIPA provide 18.8%, 26.3%, and 13.5% of adult primary care
visits, exceeding Partners’ share in these PSAs. Following the transaction, BILH would become the largest provider
of adult primary care visits in each of BIDCO’s, Lahey’s, and MACIPA’s PSAs, more than both of the other major
Boston-area primary care provider networks, Atrius and Partners. We defined primary care services using the
methodology described in 2016 BID CMIR FINAL REPORT, supra note 28, at 28, n. 111, updated with 2015 APCD
claims data for BCBS, HPHC, and THP. See the Data Appendix, Figures 6A through 6C, for maps of the parties’
adult primary care PSAs and Figure 7F for a table detailing the parties’ current shares. 154
For example, the Department of Justice and Federal Trade Commission have noted that “[m]ost studies of the
relationship between competition and hospital prices generally find increased hospital concentration is associated
with increased price.” U.S. DEP’T OF JUSTICE & FED. TRADE COMM’N, IMPROVING HEALTHCARE: A DOSE OF
COMPETITION 1, 15 (July 2004), available at http://www.ftc.gov/reports/healthcare/040723healthcarerpt.pdf (last
visited Sept. 24, 2018). 155
The HHI is calculated by squaring the market share of each firm competing in the market and then summing the
resulting numbers. For example, for a market consisting of four firms with shares of 30, 30, 20, and 20 percent, the
HHI is 2,600 (900 + 900 + 400 + 400 = 2,600). HHIs range from near 0 (perfect competition) to 10,000 (one firm
with a monopoly). When firms are equally sized, the HHI is equal to 100 times the per-firm market share. For
example, two firms with a 50% share each give rise to an HHI of 5,000. Three firms with 33.3% share each give rise
to an HHI of 3,333, and so on.

48
market concentration. The Department of Justice (DOJ) and Federal Trade Commission (FTC)
use changes in HHIs in PSAs as screens for determining whether a given transaction raises
competitive concerns and warrants further scrutiny.156
The highest level of scrutiny is reserved
for transactions that result in a “highly concentrated market” (defined as an HHI of greater than
2,500) where the increase in HHI resulting from the transaction is greater than 200. Such
transactions are presumed likely to enhance market power.157
Here, we found that HHIs for inpatient services increased substantially in most of the
inpatient PSAs of the parties’ hospitals, with eight of the 12 BILH-owned and contracting
affiliate PSAs exceeding thresholds where the increase would be presumed likely to enhance
market power, as highlighted in red in the chart below.158,159
Summary of Changes in Market Concentration (2017)
Current Network/ System Affiliation PSA Pre-Transaction HHI Post-Transaction HHI HHI change
Lahey-owned Lahey HMC 2,217 3,211 993
Lahey-owned Winchester 2,334 3,563 1,229
Lahey-owned Northeast 3,516 4,100 584
BID-owned BIDMC 2,055 2,696 641
BID-owned BID-Milton 1,902 1,977 76
BID-owned BID-Needham 3,673 3,749 76
BID-owned BID-Plymouth 2,431 2,458 27
BIDCO contracting affiliate Anna Jaques 2,841 4,455 1,614
BIDCO contracting affiliate CHA 2,328 3,489 1,161
BIDCO contracting affiliate
Lawrence General 2,157 3,206 1,049
BIDCO contracting affiliate NE Baptist 1,607 2,106 498
Independent Mt. Auburn 2,638 3,483 845
Source: HPC analysis of 2017 CHIA hospital discharge data for all commercial payers.
156
See U.S. DEP’T OF JUSTICE & FED. TRADE COMM’N, HORIZONTAL MERGER GUIDELINES § 5.3 (2010) [hereinafter
FTC/DOJ HORIZONTAL MERGER GUIDELINES], available at http://www.justice.gov/atr/public/guidelines/hmg-
2010.pdf (last visited Sept. 24, 2018). As discussed in supra note 144, the DOJ and the FTC use market shares
within PSAs as “a useful screen for evaluating potential competitive effects.” To that end, and consistent with MASS.
GEN. LAWS ch. 6D, § 13 (2012), we have used PSAs for our analyses, but we have not conducted a formal market
definition analysis. 157
FTC/DOJ HORIZONTAL MERGER GUIDELINES, supra note 156. 158
As explained in supra note 28, we do not include MetroWest as part of BIDCO or BILH in these analyses and
treat it a part of the Tenet system, both to be conservative and because MetroWest is not currently contracting with
any payers through BIDCO. 159
The FTC and DOJ consider a market to be moderately concentrated if it has an HHI between 1,500 and 2,500,
and highly concentrated if it has an HHI over 2,500. See FTC/DOJ HORIZONTAL MERGER GUIDELINES, supra note
156. The degree of market concentration that would be generated by this transaction is generally greater than that of
the parties’ previous acquisitions and contracting affiliations. See supra note 123.

49
5. The transaction would significantly enhance the parties’ bargaining leverage with
commercial payers, which would enable BILH to substantially increase commercial
prices.
The HPC also conducted a merger simulation, working closely with a team of economists
with extensive expertise in hospital mergers, to determine the transaction’s likely impact on
BILH’s bargaining leverage with commercial payers and its ability to negotiate higher prices.
The HPC employed what is now the standard model for understanding hospital competition—
generally referred to as the two stage competition model and “willingness-to-pay” analysis—
which has been accepted by courts in a range of recent antitrust cases160
and which has been
shown to be effective in identifying potentially anti-competitive mergers.161
“Willingness-to-pay” (WTP) refers to an econometric model that quantifies bargaining
leverage by estimating the difference between the value of a payer’s network when it includes a
given provider versus when it does not.162
That difference in network value with and without a
provider is an estimation of the “attractiveness” of a given provider to patients163
that is
computed by using detailed information about actual patients and the providers they chose for
specific services. By using detailed information about patients, the services provided, and the
providers they chose, WTP models account for the fact that different patients in different
circumstances are likely to make different choices; for example, these data can reveal that
patients are more likely to choose a hospital that is close to their home for labor and delivery but
160
With regard to court acceptance, see Opinion, Saint Alphonsus Med. Ctr. - Nampa Inc. v. St. Luke’s Health Sys.,
Ltd., No. 14-35173 (9th Cir. Feb. 10, 2015), at n.10 (“This ‘two-stage model’ of health care competition is ‘the
accepted model.’” Citing John J. Miles, 1 Health Care & Antitrust L. § 1:5 (2014)). Complaint, In re Evanston
Northwestern Healthcare Corp., No. 9315 (2004). See also, United States v. Rockford Mem’l Corp., 717 F. Supp.
1251, 1266-78 (N.D. Ill. 1989), aff’d, 898 F.2d 1278 (7th Cir. 1990); ProMedica Health Sys., Inc. v. FTC, 749 F.3d
559 (6th Cir. 2014); St. Alphonsus Med. Ctr.-Nampa Inc. v. St. Luke’s Health Sys., Ltd., 778 F.3d 775 (9th Cir.
2015); FTC et al. v. Advocate Health Care et al., No. 15 C 11473 (7th Cir. Oct. 31, 2016); and FTC et al. v. Penn
State Hershey Medical Center et al., No. 1:15-cv-2363 (3d Cir. June 2016). 161
A recent study that evaluated the effectiveness of merger screening tools based on actual subsequent price
changes found that out of five different screening tools, WTP correctly flagged a likelihood of price increases most
often and also had the lowest rate of “false positives,” or flagging a likely price increase where none occurred. See
Christopher Garmon, The accuracy of hospital merger screening methods, 48 RAND J. OF ECON. 1068 (2017)
[hereinafter Garmon]. 162
Economic research has shown that hospitals that have a higher value to payer networks generally negotiate higher
prices with health plans. Cory Capps, David Dranove, & Mark Satterthwaite, Competition and Market Power in
Option Demand Markets, 34 RAND J. OF ECON. 737 (2003) [hereinafter Capps, Dranove & Satterthwaite 2003];
Robert J. Town & Gregory Vistnes, Hospital Competition in HMO Networks, 20 J. OF HEALTH ECON. 733 (2001);
Martin Gaynor & William B. Vogt, Competition among Hospitals, 34 RAND J. OF ECON. 764 (2003); Gary M.
Fournier & Yunwei Gai, What Does Willingness-to-Pay Reveal About Hospital Market Power in Merger Cases?
(iHEA 2007 6th World Congress: Explorations in Health Economics Paper, 2007) available at
https://papers.ssrn.com/sol3/papers.cfm?abstract_id=993213 (last visited Sept. 24, 2018). 163
Under the two-stage competition model, providers first compete—largely on the basis of price—to participate in
commercial payer networks, and the providers and payers often negotiate intensely over the price and other terms of
the providers’ participation. In the second stage of competition, in-network providers compete—largely on the basis
of non-price factors (e.g., quality, specific services provided)—for patients. The two stages of competition are
interrelated. When a provider is more attractive to patients, its inclusion in an insurance network makes that
insurer’s network more marketable to employers and consumers. Thus, when a provider is more attractive to patients
(stage-two competition), it will have more leverage with payers in negotiations over price and network inclusion
(stage-one competition) and be able to command a higher price.
50
are more willing to travel for complex procedures. The model also can account for the fact that
not all providers offer all services. Of particular relevance, the WTP model gives a prediction of
where patients would shift if one provider were to become unavailable to patients (i.e., for any
given provider, what are the most likely alternatives for patients). This measures the degree to
which providers are close substitutes for each other from the perspective of patients.
For the BILH transaction, we created separate WTP models for inpatient,164
outpatient
facility, and adult primary care services.165,166
We related the estimated willingness-to-pay per
visit for each Massachusetts provider to prices in commercial insurance networks and found, as
expected, a strong and positive relationship.167
We then used these estimated models to
determine how willingness-to-pay would change if providers that were previously unaffiliated
began to contract jointly.168
164
To estimate an inpatient WTP model, we used detailed data on tens of thousands of hospital discharges in
Massachusetts (i.e., all hospital discharges from 2016) to examine the actual choices patients made for hospital care,
alongside key information about the patients (e.g., zip code of residence, age, gender, diagnosis, disease category)
and the hospitals they chose to determine those factors that, on average, lead particular types of patients to choose
particular hospitals. We used a conditional logit model to estimate the demand for inpatient services among patients.
Using the estimated model, we computed WTP for each system, which is defined as the difference between the
value of a network that includes that hospital and the value of a network that does not. The conditional logit model
included indicator variables (fixed effects) for each hospital that capture the combined effect of each hospital’s
attributes (e.g., location, teaching status, service offerings, etc.). 165
To estimate an outpatient and adult primary care WTP, we used detailed claim-line data from the 2015 APCD,
alongside key information about patients (e.g., zip code, gender, age, primary diagnosis, and ambulatory payment
classification weights) and their chosen facility/provider, including network affiliation information from MA-RPO
data. We used data from BCBS, THP, and HPHC, the three largest commercial payers, for outpatient facility
services, but only BCBS and HPHC data for professional claims due to data limitations. This model mirrors that
used by the FTC’s expert in FTC & State of Idaho v. St. Luke’s Health System & Saltzer Medical Group, No. 1:13-
cv-00116. For outpatient and physician services, rather than estimate a conditional logit model, we use a “micro-
shares” approach. This non-parametrically estimates the probabilities that patients with a given set of attributes (a
“patient micro segment”) will select each outpatient provider or PCP. The micro-share estimated probabilities are
used to compute WTP for each system. 166
For primary care services, we limited our analyses to preventative care and evaluation and management visits.
Specifically, we examined all services provided in a single day to a single patient by a single PCP (defined as a
“visit”) involving 10 Current Procedural Terminology (CPT) codes for evaluation and management visits (99201-
99205 for new patients and 99211-99215 for existing patients) and 14 CPT codes for preventative care/annual
physical exam visits (99381-99387 for new patients and 99391-99397 for existing patients). 167
The strength of the relationship between WTP and prices has not decreased over time. See HPC Analysis of the
Parties’ Response, supra note 20, at 12. The prices for the inpatient analysis are based on the confidential revenue
per discharge data underlying 2013 through 2016 inpatient relative prices. The prices for the outpatient facility
analysis are the outpatient relative prices found in the 2013 through 2015 relative price datasets. CTR. FOR HEALTH
INFO. & ANALYSIS, PROVIDER PRICE VARIATION IN THE MASSACHUSETTS HEALTH CARE MARKET (CALENDAR YEAR
2013 DATA) (Feb. 2015); CTR. FOR HEALTH INFO. & ANALYSIS, PROVIDER PRICE VARIATION IN THE
MASSACHUSETTS HEALTH CARE MARKET (CALENDAR YEAR 2014 DATA) (Feb. 2016), available at
http://www.chiamass.gov/assets/docs/r/pubs/16/relative-price-databook-2014.xlsx (last visited Sept. 24, 2018); CTR.
FOR HEALTH INFO. & ANALYSIS, PROVIDER PRICE VARIATION IN THE MASSACHUSETTS HEALTH CARE MARKET
(CALENDAR YEAR 2015 DATA) (May 2017), available at http://www.chiamass.gov/assets/docs/r/pubs/17/Relative-
Price-Databook-2017.xlsx (last visited Sept. 24, 2018); CHIA RELATIVE PRICE DATABOOK, supra note 112. The
prices for the adult primary care services are total allowed amount per work RVU computed using 2013 to 2015
APCD professional claims data for BCBS and HPHC. 168
When providers begin contracting with payers jointly, and those providers are close substitutes for each other,
payers cannot hold prices down by using the threat of turning to one of those two providers if the other does not
offer an attractive price. In this way, the loss of a significant competitive alternative can drive up prices. For

51
In the BILH transaction, we found that the parties’ bargaining leverage as measured by
WTP is projected to increase substantially for all services modeled—inpatient, outpatient, and
adult primary care services. Because WTP is highly correlated with prices, we can estimate what
this increase in WTP would imply in terms of one-time commercial price increases169
and annual
spending impacts for the parties’ inpatient, outpatient, and adult primary care services.170
This
model projects that the increase in BILH’s bargaining leverage could allow it to obtain one-
time171
commercial price increases of:
5% to 7.8% for inpatient services, with an annual commercial spending impact of
$37.9 million to $59.2 million;172
example, a payer might be able to market a network that excluded the most popular local hospital for maternity care
if it included the second most popular local hospital for maternity care (and vice versa). However, if those two
hospitals merged and began to contract together and could both threaten to leave a network if certain price or other
terms were not met, a payer might find it very difficult to exclude both hospitals from its network and might instead
be willing to pay higher rates. In other words, because the outside option of not contracting with either hospital
would be sharply less attractive to a payer, the merged hospitals would have greater bargaining leverage and a
greater ability to obtain higher rates than they would when they were independent competitors. 169
As noted above, prices in Massachusetts are highly correlated with bargaining leverage (as measured by WTP).
However, even where prices are not negotiated, there is substantial evidence that reductions in competition
nevertheless adversely affect consumers. When prices are fixed rather than set by market forces, providers compete
to attract patients from their competitors based on quality. When there is more competition in a market where prices
are constrained, empirical evidence demonstrates that quality typically improves; conversely, reductions in
competition can lead to lower quality. See Martin Gaynor, Katherine Ho, and Robert J. Town, The Industrial
Organization of Health-Care Markets, 53 J. OF ECON. LIT. 235 (2015); Martin Gaynor, What Do We Know about
Competition and Quality in Health Care Markets? NBER WORKING PAPER 12301 (2006); Daniel Kessler & Mark
McClellan, Is Hospital Competition Socially Wasteful? 115 QUARTERLY J. OF ECON. 577 (2000). 170
To identify the impact on prices of increases in WTP for all BILH CIN hospitals, we estimated a regression
equation that quantifies the relationship between WTP per discharge and price. The regressions for inpatient,
outpatient, and adult primary care services all include variables to control for provider costs. We control for provider
cost based on Capps, Dranove & Satterthwaite 2003, supra note 162, which links variable profit (i.e., revenue minus
variable cost) to a hospital’s WTP: 𝑃𝑄 − 𝐶𝑄 = 𝛼 ×𝑊𝑇𝑃, where 𝑃 is the per-discharge price, 𝑄 is the number of
discharges, and 𝐶(𝑄) is variable cost. This equation can be rearranged as 𝑃 = 𝛼 ×𝑊𝑇𝑃
𝑄+
𝐶(𝑄)
𝑄. This shows that,
when quantifying the relationship between price and WTP, the right hand side should also include a measure of
variable cost. We use the empirical relationship between WTP-per-discharge for a provider and its price, as
estimated by the regression model, to predict how prices will likely change as WTP increases. 171
These one-time increases would not necessarily occur over the course of a single year but could, for example, be
effectuated over a three-year contract term, reducing the likelihood that HSA TME would increase in excess of the
benchmark in any single year. However, these price increases would result in a permanently increased price level
that could result in the annual commercial spending impacts detailed in this section. 172
Our WTP analysis found that the transaction would yield a 10.8% increase in inpatient WTP for the BILH system
as a whole. A WTP increase of this magnitude has been flagged as a reliable indicator that a proposed merger merits
further investigation. Garmon, supra note 161 (finding that the best threshold for identifying transactions that merit
further investigation is a WTP change over 6%; in his sample, seven of nine mergers with statistically significant
post-merger price increases (i.e., larger increases than control hospitals) had WTP changes over 6%, while of six
mergers with statistically significant price decreases, three had WTP change of less than 6%.). Some hospitals in this
analysis contribute more than others to the increase in WTP for the BILH system and to the system’s corresponding
projected price increases. For example, we found that if we exclude Mt. Auburn from the BILH system in the
analysis, BILH’s inpatient WTP would increase by 7.2% instead of 10.8%. Without Mt. Auburn, we would predict
that BILH would be able to obtain price increases in the range of 3.3% to 5.1% rather than 5.0% to 7.8%, in addition
to the price increases the parties would otherwise have been able to obtain. See the Data Appendix, Figure 7G, for a
chart showing the extent of overlap between the parties’ market shares in different regions.
52
7.5% to 9.5% for outpatient facility services, with an annual commercial
spending impact of $78.9 million to $100.0 million;173
and
8.7% to 9% for adult primary care services, with an annual commercial spending
impact of $11.5 million, to the extent that such price increases were not offset by
savings from improved care management.174
In total, we estimate that commercial spending could increase by $128.4 million to
$170.8 million annually for inpatient, outpatient, and adult primary care services if the parties
obtain these projected price increases, with additional price increases likely across other services
not formally quantified (e.g., specialty physician services). Because the projected price increases
across inpatient, outpatient, and adult primary care services are quite consistent,175
we might
expect to find similar ranges of price increases across other sets of services not modeled.176
If we
were to apply 5% to 10% price increases to all other BILH physician services (e.g., specialty
physician spending), commercial spending for these services would increase by $29.8 million to
$59.7 million annually, in addition to the price increases modeled above.177
All such projected price increases would be in addition to the price increases the parties
would have otherwise received and would permanently increase the baseline price level for the
parties, meaning that any future percent increases would apply to a higher base of spending, and
thus have an increased dollar impact on health care spending.
6. These projected price increases are likely to be conservative.
The enhanced bargaining leverage and related projected price increases detailed above
are likely to be conservative estimates of the overall effect of the proposed merger on prices and
spending. For example, the willingness-to-pay analyses are based on current volume at each of
the parties’ hospitals. However, as discussed in Section III.A.8 below, BILH expects to increase
its volume by, for example, reducing the use of non-BILH providers by BILH primary care
patients and enhancing BILH’s brand. To the extent that BILH achieves its goal of attracting
more patients, its importance to payers would be expected to increase as well, meaning that it
would likely have leverage to increase prices to a greater extent than the increase from
173
We found that the outpatient WTP increase from this merger would be 12.7%. 174
We found that WTP for the parties’ adult primary care services would increase by 10.4%. 175
The consistency of these results likely also reflects that such estimates are robust. 176
For example, we understand there to be overlap between the parties’ specialty physician services. Based on data
provided through the MA-RPO program, the BIDCO, Lahey, and MACIPA physician groups all include specialists
in allergy and immunology, pathology, cardiology, colorectal surgery, radiology, dermatology, general surgery,
orthopedics, ophthalmology, plastic surgery, podiatry, pulmonology, rheumatology, and urology, among others. See
BIDCO 2017 MA-RPO FILING, supra note 28; LAHEY 2017 MA-RPO FILING, supra note 90; MACIPA 2017 MA-
RPO FILING, supra note 104. 177
We understand that the parties will ultimately seek to have all of BILH CIN operate under single contracts with
each payer, which could mean that their prices converge to the same level over time (although this is not technically
required for the operation of a single contract). As we do not expect any of the parties’ physician groups to accept
price reductions as a result of the transaction, we modeled the impact if each party’s physicians received the same
price as the highest-priced group for each commercial payer network, based on 2015 physician relative prices and
revenue. We found that the impact from such increases is comparable to those described here.
53
eliminating competition between the parties based on their current volume as modeled through
the WTP analyses.
Additionally, several recent economic studies have documented so-called “cross-market
merger effects” that would not be captured in the WTP analyses and would be expected to result
in additional bargaining leverage for the merged entity.178
As described above, WTP analyses
quantify the attractiveness of providers to patients in order to assess the additional value of
including the provider in a payer’s contracting network. Where two providers are close
substitutes from the perspective of an individual patient, WTP analyses predict that a merger
between the two providers will generally increase their prices. Where two providers are merging
or begin contracting jointly but are not close substitutes for patients, a WTP analysis generally
will not predict a significant increase in their bargaining leverage. However, in practice,
decisions about purchasing a health plan—and thus, choosing a provider network—are more
often made by employers than individuals. Where an employer is choosing a plan, it may seek to
ensure in-network access to geographically dispersed hospitals for employees who commute
from different geographies. Therefore, providers who are geographically far apart may be
substitutes for employers, even when they would not be close substitutes for individual
patients.179
Being substitutes from the perspective of employers effectively makes providers
substitutes for the payers that market to those employers. In this case, a merger between
relatively distant providers (but close enough such that many firms would have employees in the
areas near each system) could have substantial price effects; a recent study found that merging
hospitals located 30 and 90 minutes from one another (within the same state) had, after four
years, 19% higher prices than non-merging hospitals.180
The WTP analyses detailed above do not
capture any potential cross-market merger effects. Thus, to the extent that similar cross-market
effects applied here, BILH could potentially increase its prices by more than projected above.181
There are other mechanisms detailed in economic literature that could also increase
spending beyond those the WTP analyses capture. For example, there is some evidence that
mergers can increase the bargaining leverage of rival hospitals through the so-called price
178
See Leemore Dafny, Kate Ho & Robin Lee, The Price Effects of Cross-Market Mergers: Theory and Evidence
from the Hospital Industry (Nat’l Bureau of Econ. Research, Working Paper No. 22106, 2018) [hereinafter Dafny,
Ho & Lee 2018], available at http://www.nber.org/papers/w22106.pdf (last visited Sept. 24, 2018); Matthew S.
Lewis& Kevin E. Pflum, Hospital systems and bargaining power: evidence from out-of-market acquisitions, 48
RAND J. OF ECON. 579 (2017) [hereinafter Lewis & Pflum]; Gregory S. Vistnes & Yianis Sarafidis, Cross-market
hospital mergers: A holistic approach, 79 ANTITRUST L. J. 253 (2013). 179
For example, an employer based in Boston may be willing to purchase an insurance product for its employees
that excluded some key hospitals on the North Shore or which excluded some key hospitals on the South Shore, but
may be far more reluctant to purchase a product that excluded key hospitals in both regions. This dynamic would
confer additional bargaining leverage to a provider with hospitals in both regions, even though an individual patient
would be unlikely to view a hospital on the North Shore as a substitute for a hospital on the South Shore and vice
versa. 180
Dafny, Ho & Lee 2018, supra note 178. The authors conclude that these effects are due to the “common
customer” effect—that is, the existence of employers (or households) that value hospitals in different markets.
Where hospitals are further than 90 minutes apart, or are located across state lines, the effects on price are not
statistically significant. See also, Lewis & Pflum, supra note 178 (finding that independent hospitals acquired by
systems in different markets raise prices by about 17% more than independent hospitals that were not acquired). 181
The parties’ statement that BILH “will cover a large enough geography to better meet insurer and employer
needs…” suggests that cross-market effects may meaningfully increase bargaining leverage in the current
transaction. See DON NARRATIVE, supra note 31, at 3.
54
reinforcement effect. If BILH negotiates higher prices after the merger, this could improve the
bargaining position of rival hospitals, particularly those with lower prices than BILH, because
their exclusion from a payer’s network would send more patients to the more expensive BILH
network. If these other providers negotiate higher prices, this would further increase
spending.182,183
7. Despite the fact that the parties’ financial projections indicate that BILH would not need
substantial price increases to achieve positive financial margins, they have not yet
committed to limiting future price increases. The parties could obtain the projected price
increases, significantly increasing health care spending, while remaining lower-priced
than Partners.
As described in Section II.A., the parties have provided financial projections for the
proposed BILH system.184
The baseline projection combines the parties’ individual projected
financial performance assuming no impacts of the transaction, while the parties’ low, medium,
and high performance projections assume various levels of achievement of the parties’ stated
goals. The baseline projection shows that the parties expect BILH to achieve small but increasing
positive financial margins as a system even absent any changes or shared initiatives.185
The
substantial additional revenue included in their other scenarios would be generated by increased
volume due to shifts in patient care, as discussed in the next sections. In addition, the parties’
scenarios include potential efficiencies in non-clinical functional areas and supply costs of
between 1.5% and 3%, based on conservative assumptions.186
The parties also anticipate
achieving more favorable debt financing rates as a combined system, which could result in small
additional efficiencies.187
The parties have indicated that they intend to retain any such
efficiencies to fund their operations and “reinvest in services and programs needed to better care
182
See Leemore Dafny, Estimation and Identification of Merger Effects: An Application to Hospital Mergers, 52 J.
OF L. AND ECON. 523 (2009). 183
Additionally, with fewer firms, tacit coordination (e.g., on service offerings or advertising territories) may be
more feasible or sustainable. The DOJ recently settled such a case against Henry Ford Allegiance Health. See Press
Release, U.S. Dep’t of Justice, Justice Department Reaches Settlement with Henry Ford Allegiance Health on
Antitrust Charges (Feb. 9, 2018), available at https://www.justice.gov/opa/pr/justice-department-reaches-settlement-
henry-ford-allegiance-health-antitrust-charges (last visited Sept. 24, 2018). 184
BDO REPORT, supra note 37. 185
Id. at 8-9. 186
The Parties’ Response quantifies the range of these internal efficiencies as $42 million to $66 million annually by
BILH’s fifth year of operation. Parties’ Response, supra note 14, at 22. 187
See DON NARRATIVE, supra note 31 at 17. CareGroup, which holds debt on behalf of BIDMC, Baptist, and Mt.
Auburn, is currently rated “Baa1 - stable” by Moody’s. Rating Action: Moody's assigns Baa1 to CareGroup's (MA)
Ser. J (2018); outlook stable, MOODY’S INVESTORS SERVICE, https://www.moodys.com/research/Moodys-assigns-
Baa1-to-CareGroups-MA-Ser-J-2018-outlook--PR_904600792 (May 23, 2018) (last visited Sept. 24, 2018). Lahey
holds debt through Northeast Health System, also rated Baa1 - stable, as well as through Winchester and at the
Lahey system level; Lahey and Winchester are not rated by Moody’s, but are rated A and A-, respectively, by
Standard and Poors. Alia Paavola, S&P Downgrades Lahey Health System Obligated Group Bond Rating to 'A',
BECKER’S HOSPITAL REVIEW, August 21, 2017, available at https://www.beckershospitalreview.com/finance/s-p-
downgrades-lahey-health-system-obligated-group-bond-rating-to-a.html (last visited Sept. 24, 2018). If the parties
refinance their current long-term debt at a more favorable rate, it would likely result in small savings on their
interest payments; for example, an interest rate reduction of half a percentage point on the parties’ current total debt
would result in annual savings to the parties of approximately $6 million based on the current debt obligations of the
parties shown on their 2016 audited financial statements. More favorable rates would also apply to additional debt
the parties may take on in the future.
55
for [the BILH] patient panel.”188
Importantly, all of the projections anticipate small positive
financial margins and none relies on price increases in excess of the parties’ baseline scenario,
which assumes no change as a result of the proposed transaction, in order to achieve such
margins.189
Despite the fact that the parties expect BILH to achieve small positive margins even
without substantial price increases, the parties have not yet committed to constraining future
price increases.190
The parties state that they plan to remain a lower-priced provider and would
not seek to diminish their value as a lower-priced provider.191
However, BILH could increase its
prices significantly, with a substantial impact on health care spending, and still remain a lower-
188
DON NARRATIVE, supra note 31, at 17. Internal efficiencies achieved by merging provider organizations do not
necessarily result in savings for consumers; however, they have the potential to result in savings to consumers if the
merging parties limit future rate increases (to lower levels than they would have absent the merger) as a result of the
efficiencies. The parties have not yet committed to any limitations on future rate increases. See also Exh. B at
Section II.A.3. 189
The Parties’ Response discusses financial challenges experienced by some of the parties in fiscal year 2017, and
states that the efficiencies and increased revenues they expect as a result of the proposed transaction would help to
address these challenges and allow BILH to invest in care delivery efforts. Parties’ Response, supra note 14, at 22-
23. The parties’ operating losses in fiscal year 2017 are consistent with their projections that anticipate profitability
in coming years. 190
For example, in response to the question from the DoN program “how will you limit price increases?” the parties
responded that BILH would “function in a competitive marketplace in an environment that requires extensive
transparency and accountability coupled with close regulatory scrutiny of health care costs by the Department of
Public Health, HPC, and other regulators” rather than offering any express commitment. LAHEY HEALTH SYSTEM,
CAREGROUP, AND SEACOST REGIONAL HEALTH SYSTEMS, RESPONSE TO SECOND QUESTION REQUEST at 6 (Dec.
2017), available at https://www.mass.gov/files/documents/2017/12/13/newco-don-questions-responses.pdf (last
visited Sept. 24, 2018). While Massachusetts has an accountability framework for total health care spending in the
state through its health care cost growth benchmark, the benchmark itself does not cap individual prices or spending
performance, and there are limits on when and how a Performance Improvement Plan (PIP), the key enforcement
mechanism for the benchmark, can address individual performance. For example, the PIPs process only looks at
health status adjusted spending for members enrolled in HMO plans (as measured by HSA TME) and therefore
would not account for price increases applied to other product types, and the HSA TME data used to analyze
spending increases is lagged by two years, such that it would take time to see effects even from price increases that
do increase health status adjusted HMO spending. In fact, the parties have themselves acknowledged “the complex
nature of HSA TME,” the key measure used to enforce provider compliance with the health care cost growth
benchmark, have characterized it as “one indicator of system performance,” and have requested to other state
agencies that the measure be used in concert with measures of pricing. See Ltr. to Nora Mann from Jamie Katz and
David Spackman, DON PROJECT NEWCO-17082413-TO: WRITTEN COMMENTS TO THE STAFF SUMMARY PURSUANT
TO 105 CMR 100.501(C) at 1 (Mar. 15, 2018), available at
https://www.mass.gov/files/documents/2018/03/22/newco-staff-report-public-comments.pdf (last visited Sept. 24,
2018). Finally, the benchmark is intended to be a ceiling on spending, not a target; lower levels of spending growth,
such as the 1.6% preliminary growth estimate for 2016 to 2017, are desirable and achievable. If, absent the
transaction, the parties’ spending would grow at a rate lower than the benchmark, they would still have “room” to
increase their annual spending before any potential enforcement mechanisms would be triggered. In this case, the
transaction would still have increased health care spending in the Commonwealth beyond the level that it would
have been absent the transaction. 191
See MASS. DEP’T. OF PUBLIC HEALTH, STAFF REPORT TO THE PUBLIC HEALTH COUNCIL FOR THE DETERMINATION
OF NEED FOR DON APPLICATION NEWCO-17082413 at 23 (Mar. 5, 2018) [hereinafter DON STAFF REPORT],
available at https://www.mass.gov/files/documents/2018/03/06/newco-staff-report.pdf (last visited Sept. 24, 2018)
(“NewCo … argues that maintaining its competitive position in the marketplace requires retaining its status as a
high-value provider compared to system alternatives. Moreover, NewCo asserts that it will face competition from
larger systems, and NewCo will need to differentiate itself by providing value within a broad and complementary
system.”).

56
priced provider than Partners; the price increases projected above would close approximately
29% to 39% of the current gap between the parties’ and Partners’ inpatient, outpatient, and
primary care prices.192
If, however, the parties were to close 75% of the gap between their prices
and those of Partners for these services, health care spending would increase by $330 million
annually, and if they were to close the payment gap for these services entirely, spending would
increase by $440 million annually, as shown below.193
Impact of Projected Inpatient, Outpatient, and Primary Care Physician Price Increases and Alternative Scenarios for Closing of the Price Gap Between BILH and Partners
8. Achieving care redirection and population health management successes consistent with
the parties’ estimates could result in savings, but there is no reasonable scenario in which
such savings would offset spending increases if BILH obtains the price increases
described above.
As described in Section II.A., the parties claim that the transaction would result in reduced
health care expenditures by attracting more patients to the BILH system, which would be lower-
cost than competitors; by redirecting care to lower-cost settings within their system; and by
reducing unnecessary utilization as a result of new care delivery programs. While many of the
parties’ plans for how they would achieve these goals are still under development, and we
therefore cannot opine on the likelihood that the parties would achieve care redirection consistent
192
As described in Section II.A., the parties’ financial projections show that they expect positive margins for BILH
even assuming price increases that are lower than what the parties have generally achieved to date. Thus, while the
parties have not committed to limiting future price increases, it is also worth noting that the financial success of the
BILH system does not appear to depend on substantial price increases. 193
These figures only include inpatient, outpatient, and adult primary care services, as those were the services
included in the HPC’s WTP models. However, if the parties were to close the gap between themselves and Partners
for all hospital and physician services (including, e.g., all physician services in addition to adult PCP services),
commercial spending would increase by $605 million annually.

57
with their estimates,194
we modeled the likely scope of savings if the parties were to achieve care
redirection in line with their projections.
Based on materials provided by the parties regarding their goals and expectations for the
transaction, the HPC identified four key mechanisms by which the parties could redirect care and
potentially achieve savings:
Increased retention of current BILH primary care patients at BILH hospitals;195
Increased volume at BILH hospitals due to enhanced consumer preference or brand;
Recruitment of new primary care patients (or physicians) to BILH; and
Shifts of patient volume within BILH from BIDMC and Lahey HMC to lower-priced
BILH hospitals.
We modeled the spending impact for each of these four mechanisms, assuming that the
parties were able to achieve their projected levels of care redirection. As detailed below, we
found that redirecting care to the parties’ hospitals from competitors would, on balance, be cost-
saving. Similarly, redirecting care to lower-priced settings within BILH would be cost-saving.
However, even if the parties redirected care in line with their projections, the savings would not
offset spending increases if BILH achieves the price increases described in Section III.A.5.
Indeed, we can find no reasonable scenario in which the savings from shifts in care would be
sufficient to offset the price increases detailed above.196
We also reviewed the parties’ estimates
of potential savings from specific care delivery programs based on information provided in the
Parties’ Response. While these programs have the potential to be cost-saving, the exact scope of
savings is unclear, and even success in line with the parties’ highest projections would not offset
predicted price increases.
194
We understand that the parties are currently engaged in a rigorous planning process designed to improve
retention of current BILH primary care patients at BILH hospitals, including through communication and marketing;
benefit design; patient navigation tools and other supports to enhance patient access and convenience; referral
management tools and supports for in-system referrals; and other mechanisms. See Section III.C.3, infra, for further
discussion of the parties’ plans. These plans could result in increased volume at BILH, but we are not able to
determine the probability that the parties will achieve any specific level of volume increases. Therefore our care
redirection models are based on the assumption most favorable to the parties—that the parties would achieve their
care redirection goals. However, see Section III.A.3 above, regarding past performance of BIDCO and Lahey in
“keeping care local” following affiliations with community hospitals. We did find evidence that BIDCO and Lahey
have increased their systems’ overall share of local volume following acquisitions, although that has not always
resulted in patients receiving care in lower-cost settings, and we have not seen changes in spending trends. 195
“Retention” here refers to retaining patients with BILH PCPs within the BILH system when these patients seek
hospital services. “Leakage” is the opposite of retention; when patients with a PCP in a given system seek care from
non-system providers, they may be described as having “leaked” from a system. 196
For example, to fully mitigate a 5% to 7.8% inpatient price increase, BILH would have to increase its commercial
inpatient volume by more than 50%. However, based on current bed counts, average length of stay, and occupancy
rates, and assuming that the parties increased their patient volume proportionally for commercial and public payers,
we find that BILH could add no more than 14% additional volume across the system before needing to add more
beds.

58
a. Increased retention of current BILH patients
The parties have stated that they expect most of their new hospital volume to come from
their current primary care patients; specifically, the parties seek to attract more patients to BILH
hospitals by reducing “leakage” (i.e., retaining at BILH hospitals a portion of current primary
care patients who receive hospital care from non-BILH providers) for elective services. The
parties provided the HPC with estimates of the proportion of leakage they expect to retain at
BILH hospitals for each physician network (BIDCO, LCPN, MACIPA) as a result of the
transaction.197
Based on current data on hospital utilization198
for patients with BIDCO, LCPN,
and MACIPA PCPs, we modeled the change in spending if the parties recapture the proportions
of leakage they project.199
We found that the parties’ patients currently use hospitals that are
higher-priced as well as lower-priced than BILH hospitals, so shifts in volume to BILH from
some of these hospitals would decrease spending, while shifts to BILH from others would
increase spending. Based on the mix of non-BILH hospitals that the parties’ patients currently
use, reducing leakage would, on balance, reduce spending. We expect that achieving the parties’
projected leakage reduction would save approximately $4.8 million to $6.9 million annually for
inpatient and outpatient services for all commercial payers if all prices, including the merging
parties’ prices (notwithstanding the increase in bargaining leverage) were to remain
unchanged.200
However, if BILH were to obtain the price increases projected above, the value of
197
The parties’ various estimates relating to volume recapture were internally inconsistent. The HPC has used the
estimates that are most favorable to the parties in the analyses described here. 198
We received 2016 data from the three largest commercial payers showing “site of care statistics” for their
HMO/POS members. “Site of care” statistics show the total volume of inpatient and outpatient services provided to
BIDCO, Lahey, and MACIPA primary care patients at different in-system and out-of-system hospitals, and the
corresponding amounts paid for these services. This allows the HPC to identify the proportions in which the parties’
primary care patients receive care from non-BILH hospitals. 199
For this analysis, we applied the parties’ assumptions about what percentages of BIDCO, LCPN, and MACIPA
“elective” inpatient volume going to non-BILH hospitals would be recaptured. We assumed that volume going to
non-BILH AMCs would be distributed between BIDMC, NE Baptist, Lahey HMC, and Mt. Auburn, that care going
to non-BILH teaching hospitals would be distributed between NE Baptist, Mt. Auburn, and Lahey HMC, and that
care going to non-BILH community hospitals would be distributed among BILH community hospitals. We assumed
care returning to the BILH system would be distributed based on how each practice group’s patients staying within
the BILH system are currently distributed. We assumed contracting affiliate hospitals that would not be BILH-
owned (CHA, Lawrence General, and MetroWest), out-of-state hospitals, and specialty hospitals would not be
affected by these changes. 200
We applied the parties’ assumptions about the portion of each BILH’s physician network’s inpatient “leakage”
(care provided by non-BILH hospitals) that would be retained in order to estimate the total volume of inpatient
discharges that would be brought back into the BILH system if the parties were successful in reaching estimated
levels of retention. Because the parties only provided estimates of the portion of inpatient discharges they expected
to be able to retain, we made the assumption that outpatient care would be retained at similar rates. Based on the
methodology described at supra note 199, we then estimated the BILH hospitals to which these services would shift
if care were retained in-system. We calculated a price differential between each non-party hospital expected to lose
patients and each BILH hospital expected to gain patients under this model using 2016 inpatient and outpatient
hospital relative prices. To calculate a spending impact, we multiplied the amounts paid to each non-party hospital
by the corresponding price differential to estimate how much the services would cost when provided within BILH,
and compared the resulting amount with current spending. Because we only had data for the three largest
commercial payers’ HMO/POS members, we scaled the results up in order to model a spending impact for all
commercial payers, including PPO members. For inpatient services, we calculated the ratio of all commercial
discharges to HMO/POS discharges for the three largest commercial payers in the 2016 relative price data set, and
multiplied our inpatient results by this ratio to estimate an inpatient spending impact for all commercial payers. For
outpatient services, we calculated and applied a similar ratio based on outpatient revenue.
59
this leakage recapture would be diminished, yielding $2.5 million to $4.6 million in savings
annually.201,202
b. Enhanced consumer preference or brand
The parties also expect that an enhanced brand as a result of the transaction would result
in a modest number of additional patients choosing to receive inpatient and outpatient care at
BILH hospitals.203
The HPC used a simulation based on the hospital choice model developed for
our inpatient willingness-to-pay analyses to determine, if the parties achieve their expected
volume increase, from which hospitals and systems the parties would most likely draw patients.
As described in Section III.A.5, the inpatient hospital choice model incorporates detailed data on
patients and hospitals to examine the actual choices patients made for hospital care to determine
those factors that, on average, lead particular types of patients to choose particular hospitals.
Utilizing this simulation model, we increased the overall attractiveness of BILH hospitals by
enough to increase the expected volume at the merged system in line with the parties’
expectations. We then used the simulation to compare the expected patient utilization patterns of
the brand-enhanced BILH to the actual patient utilization patterns in order to measure which
hospitals would be expected to lose volume as BILH gained volume. Overall, our model projects
that approximately 56% of new commercial inpatient discharges due to brand enhancement
would come from the Partners system, 13.5% would come from the Wellforce system, 9.7%
would come from the Steward system, and the remainder would come from other area
hospitals.204
These volume shifts would likely be cost-saving at current price levels. If the parties
achieve their projected volume increases from an enhanced brand, and do not increase current
prices relative to the market, we expect that shifts in inpatient and outpatient care to the parties
could save approximately $1.8 million to $3.5 million in commercial spending annually. If the
parties obtain the price increases projected by the WTP analyses, the savings would decline to
201
To estimate a spending impact with price increases, we followed the methodology above, adjusting the relative
price differential to reflect a price increase for the BILH hospitals to which care would shift. 202
Although the parties did not project that they could eliminate leakage to non-BILH hospitals, we also modeled
the scope of savings that would be possible if all leakage for elective hospital care were eliminated. We found that
even if the parties were able to recapture all of their current leakage for elective services, the savings to commercial
payers would be $25.8 million annually at current prices, and $13.6 million to $17.2 million annually with projected
price increases, a small fraction of the amount needed to offset the spending impact of projected price increases. 203
The parties provided different estimates of the increased volume they expect from brand enhancement. The HPC
modeled the savings that would result if the parties achieved the largest of their estimates (i.e., the most favorable
assumption to the parties). Specifically, we utilized an estimate of the percentage of BILH’s total projected post-
transaction volume increase that they expect to come from “consumer awareness” (i.e., brand enhancement). Based
on this percentage and the number of additional discharges we estimated would come from patient retention, we
then calculated how many additional discharges BILH might gain from consumer awareness. 204
The hospital choice model predicts which hospitals a patient would choose based on various characteristics
including: patient zip code, diagnosis/severity, demographic characteristics, hospital location, and “hospital fixed
effects” that reflect the brand and other characteristics unique to a given hospital, including services offered. See
supra note 164. We used this model to predict, if the fixed effects for BILH hospitals were changed to make these
hospitals a more appealing choice generally, which patients they would most likely attract, and from which
competing hospitals.

60
$1.1 million to $2.5 million in commercial spending annually.205, 206
However, as described in
Sections III.A.6 and III.A.10, it is likely that any increased volume from enhanced brand at
BILH would also increase its bargaining leverage and ability to increase prices (beyond the
increases captured in the WTP analysis), further reducing any annual savings.
c. Recruitment of new primary care patients (or physicians)
The parties also anticipate that more patients will choose BILH PCPs, driven in part by
brand enhancement and in part by physician recruitment to BILH. In order to estimate the impact
of patients transitioning to BILH PCPs from other physician groups, the HPC compared HSA
TME for BIDCO, LCPN, and MACIPA patients with HSA TME of their competitors.207
We
estimate that, at current price and utilization levels, each commercial patient that switches to a
BILH PCP from other local physician groups would result in a savings, on average, of
approximately $32 per member per month.208, 209
In order to achieve a savings equivalent to the
projected price increases for inpatient, outpatient, and adult primary care services through
primary care patient recruitment alone, the parties would therefore need 333,000 to 443,000 new
205
For shifts in inpatient services, we found that commercial spending would be reduced by approximately $970,000
to $1.8 million annually if the parties achieve their goals for increased volume and do not increase their prices
relative to the market. However, if the parties obtain 5% to 7.8% inpatient price increases, the cost-savings would
decline to $583,000 to $1.4 million annually. We used a hospital choice model to estimate where the additional
discharges from brand enhancement would come from and which BILH hospitals would receive them. We then
applied relative price differentials (using the methodology described in supra note 200) to the revenue shifting to
BILH hospitals in order to estimate a spending impact. We modeled this two ways: assuming that the shifting
volume would have the same case mix index as the hospital from which the volume moved, and assuming that the
shifting volume would have the same case mix as the BILH hospital to which the volume moved. We then averaged
the resulting price differentials. 206
For shifts in outpatient services, we found that commercial spending would be reduced by approximately
$870,000 to $1.7 million annually if the parties achieve their goals for increased volume and do not increase their
prices relative to the market. However, with the outpatient price increases projected by the WTP analyses, the
outpatient savings would decline to $488,000 to $1.1 million annually. To model an outpatient spending impact
from brand enhancement, we assumed that inpatient and outpatient care would shift due to brand enhancements in
proportions similar to those modeled in the patient retention scenario. We calculated the ratio of the outpatient to
inpatient estimated spending impacts from patient retention, and applied this ratio to the estimated inpatient
spending impact from brand enhancement to yield an estimated outpatient spending impact from brand
enhancement. We estimated an outpatient spending impact with price increases by calculating the ratio of the
outpatient patient retention spending impact with price increases to the impact without price increases, and applied
this ratio to the estimated outpatient brand enhancement impact at current prices. 207
The HPC applied the patient attribution model detailed in 2017 HPC COST TRENDS REPORT, supra note 126, at
29-30 to identify the proportions of BCBS, HPHC, and THP primary care patients attributed to other physician
groups within the BIDCO, Lahey, and MACIPA primary care PSAs. The HPC then used these proportions in
developing a weighted average HSA TME differential between each of BIDCO, Lahey, and MACIPA and the other
physician groups serving primary care patients in these regions. 208
Based on an analysis of commercial full-claims HSA TME data for BCBS, HPHC, and THP members. The $32
figure is derived from the payer for which there is the largest potential savings from patient shifts, and assumes the
patients shifting have the same health status as the average for the provider groups to which they are currently
attributed. If the parties’ TME position changes relative to their competitors after the transaction due to price
increases or other factors, the potential for savings would be reduced. 209
These savings overlap with those identified in the consumer awareness scenario; both include shifts to BILH
hospitals for patients who do not currently have BILH PCPs. For that reason, this figure may over-estimate the
savings potential.

61
commercially insured primary care patients, which is approximately the size of their current
HMO/POS patient population for the three largest commercial payers.210
d. Redirecting care within BILH
The parties state that in addition to attracting care to BILH from non-BILH providers,
they will also be able to reduce spending by shifting care from BIDMC and Lahey HMC to
lower-priced BILH hospitals, especially Mt. Auburn and Anna Jaques. We modeled the impact
of the parties’ predicted volume shifts on commercial spending and found that these shifts could
save $2.1 million to $3.1 million annually at current prices, or $1.7 million to $2.8 million
annually with projected price increases.211
e. Successful implementation of proposed care delivery initiatives could reduce
spending, although it is unclear whether the parties would achieve their projected
amount of savings.
The parties’ submissions include a broad range of potential care delivery initiatives, as
discussed in Section III.B.4. The parties have provided estimates of the potential impacts of four
of these proposals: expanding behavioral health integration with primary care, integrating the
parties’ preferred skilled nursing facility networks, developing a system-wide pharmacist
intervention for high-risk hospitalized patients, and expanding an after-hours nurse call line for
care triage.212
The parties estimate that these programs, combined, would reduce annual spending
by between $52 million and $87 million by the fifth year of BILH’s operation.213
These programs have the potential to result in savings if the parties achieve the projected
utilization reductions.214
However, there are outstanding methodological questions about some of
the parties’ savings estimates. For example, the parties’ estimated savings for three of the four
initiatives are based on research literature, some of which includes different designs and scopes
of interventions than the parties’ proposed programs, rather than modeling their estimates on
actual results achieved to-date by their own pilot programs.215,
216
Given this and other
210
However, if the parties significantly increase their prices, their HSA TME would also likely rise relative to
competitors, further diminishing any savings that might be able to obtain by recruiting new PCPs to their system. 211
The HPC modeled this by calculating, by payer, the difference in average price per case-mix-adjusted discharge
at each combination of hospitals to and from which are would be shifting. Using the parties’ assumptions about the
number of discharges shifting internally, we estimated how much case-mix-adjusted spending would change by
shifting care from BIDMC and Lahey HMC to Mt. Auburn and Anna Jaques. We then multiplied case-mix-adjusted
spending by the receiving hospital’s case mix index to estimate this impact in non-case-mix-adjusted dollars. To
estimate the potential savings with price increases, we inflated each hospital’s original price per case-mix-adjusted
discharge by its estimated price increase before calculating the estimated savings amount as described above. 212
See Parties’ Response, supra note 14, at 23-25. The parties have not provided information about the expected
scope, goals, and timelines of other care delivery programs, and the HPC therefore lacks sufficient information to
assess their potential impacts on spending. 213
Id. 214
The potential impacts of these programs on quality of care and access to care are assessed in more detail in
Sections III.B.4, III.C.2.c, and III.C.3. 215
Only the parties’ estimate of savings for the nurse triage line is based on the results of a pilot program conducted
by Lahey. See Parties’ Response, supra note 14, at 24-25. The data for this program were not shared with the HPC,
and we therefore cannot assess whether the parties’ use of these data in their estimate is reasonable.

62
methodological questions,217
it is unclear to what extent the parties would realize their estimated
savings. It is also unclear to what extent the parties would continue to pursue similar programs
independently if the transaction did not proceed, although they would likely be more easily able
to implement broad scale care delivery programs using the greater resources of a unified system.
***
In summary, shifts in care to BILH from other providers and to lower-priced settings
within BILH through the each of the mechanisms detailed above could result in cost savings.
However, if BILH succeeds in redirecting care in accordance with its own projections for
leakage recapture, brand enhancement, and internal shifts of patients within BILH to lower-cost
settings, the savings would be approximately $8.7 million to $13.6 million in commercial
spending annually at current price levels. If BILH obtains the price increases projected above,
the savings would likely be approximately $5.3 million to $9.8 million in commercial spending
annually, offsetting 3% to 8% of the $128.4 million to $170.8 million projected annual
commercial spending increase from price increases. It is also highly unlikely that the parties
would be able to recruit new primary care providers (or primary care patients) to offset the
remaining spending impact due to price increases.218
While the care delivery programs described
by the parties could reduce spending if successfully implemented, the scope of these savings is
uncertain, and even the parties’ highest savings estimates of $52 million to $87 million would
not be sufficient to offset projected spending impacts from price increases.
216
For example, the parties’ estimate of savings from expanding behavioral health integration is based on results
described in a longitudinal study of integrated primary care programs. See Parties’ Response, supra note 14, at 24.
Many of the programs included in the cited study focused specifically on the impact of such programs on patients
with specific diagnoses (e.g., major depression). See Stephen Melek, et al., Milliman, POTENTIAL ECONOMIC IMPACT
OF INTEGRATED MEDICAL-BEHAVIORAL HEALTHCARE UPDATED PROJECTIONS FOR 2017 (Jan. 2018), available at
http://www.milliman.com/uploadedFiles/insight/2018/Potential-Economic-Impact-Integrated-Healthcare.pdf (last
visited Sept. 24, 2018). As the parties’ estimate is based on an intervention population that includes all patients with
any diagnosable mental illness, including mild mental illness, it is not clear that the parties would achieve the level
of savings reached in case studies focused only on specific diagnoses. Additionally, the parties’ estimate of savings
from integrating their preferred skilled nursing facility networks is based on a study comparing utilization reductions
for hospitals that had a preferred network to those that did not. John McHugh et al., Reducing Hospital
Readmissions Through Preferred Networks Of Skilled Nursing Facilities, 36 HEALTH AFFAIRS 1591, 1593 (Sept.
2017), available at https://www.healthaffairs.org/doi/10.1377/hlthaff.2017.0211 (last visited Sept. 24, 2018). As
MACIPA, BIDCO, and Lahey each already have a preferred network, it is not clear why the parties expect to
achieve any additional savings. 217
See Exh. B, Section III.B.2 In addition, the parties’ estimated savings from these care delivery programs do not
appear to account for risk sharing with payers. If the parties succeed in reducing spending, some of the savings
would likely be retained by the parties as risk contract incentive payments rather than going back to payers and
consumers. 218
As described in supra note 194, these estimates are likely to be upper bounds because they assume the parties
would achieve all of their care redirection goals, but we are not able to determine the probability that they will do so.
In addition, while our modeling indicates that most competitor hospitals would likely lose no more than three
percent of their commercial discharges if BILH were to achieve its goals of increased volume, we would expect
these competitors to make efforts to retain patients. Finally, any increases in volume to the BILH system will enable
it to further increase prices, reducing the savings from care redirection to a greater extent than described in this
section.

63
9. The parties intend to work with payers to develop new, innovative insurance products,
but it is unclear how these products would increase market competition or reduce
spending, given that the parties do not plan to offer lower prices in such products.
One of the ways in which the parties hope to attract more patients to BILH is through
new, innovative insurance products developed with payers. The parties anticipate that the
geographic reach of their new system would be sufficiently broad to appeal to both small and
large self-insured employers that need to ensure access for employees living throughout eastern
Massachusetts. They emphasize that “innovative insurance products built on tiered or limited
networks with a recognized brand that can meet all of a patient’s needs have been proven to shift
market share,” which would create pressure on Partners to lower its prices.219
The three largest commercial payers currently offer limited network products that include
BIDCO and Lahey and exclude Partners. That is, the set of providers that would make up the
proposed new product is already available in several existing products.220
Therefore, in order for
the parties to recruit more members to an additional new product that also excludes Partners,
they would need to make their network substantially more attractive than current offerings, for
example by enhancing their brand. As explained below in Section III.A.10, it does not appear
likely that any practically feasible shift in market share from Partners to BILH, whether achieved
through limited networks or any other mechanism, would cause Partners to reduce its prices
enough to offset the associated increase in BILH’s prices from increased market share if BILH’s
prices were unconstrained.
Alternatively, the parties could make a limited network more attractive by lowering
prices sufficiently to reduce the product’s premium by enough to draw substantial numbers of
new members. Theoretically, the merger could make it more likely that the parties could reduce
prices this way.221
If the premium for a new limited network product were substantially lower
219
Parties’ Response, supra note 14, at 17. The parties cite an article about the effectiveness of limited networks in
the Massachusetts Group Insurance Commission (GIC) in support of the idea that tiered and limited network
products have the potential to shift market share, and identified the GIC as a “strong opportunity for partnering to
offer innovative products.” Id. at 17 and 35. While the study supports the idea that a limited network plan with a
substantially reduced premium can be effectively marketed to consumers, it also demonstrates that shifts to limited
network plans can be accomplished in the current Massachusetts health care market without further provider
consolidation. 220
The following limited network plans include BIDCO and Lahey general acute care hospitals and exclude most or
all Partners general acute care hospitals: HMO Blue Select (BCBS), Focus Network - MA (HPHC), and Select
HMO, EPO, and Advantage HMO Select (THP). See Find a Doctor and Estimate Costs, BLUE CROSS AND BLUE
SHIELD OF MASS., https://myfindadoctor.bluecrossma.com/ (last visited Sept. 24, 2018); Find a Doctor or Care
Provider, HARVARD PILGRIM HEALTH CARE,
https://www.providerlookuponline.com/harvardpilgrim/po7/Search.aspx (last visited Sept. 24, 2018); Find a Doctor,
TUFTS HEALTH PLAN, http://tuftshealthplan.prismisp.com/ (last visited Sept. 24, 2018). 221
Current limited network products that include the parties but not Partners are not widely purchased. One possible
explanation is that the providers in those limited products have not reduced their prices by enough (if at all) to
facilitate a lower premium sufficient to induce many customers to purchase the limited network product. This could
be a result of a “free rider” problem. As separate entities in a limited network product, each provider has an
incentive to not lower price in an attempt to “free ride” (i.e., benefit without bearing a cost) on price reductions by
other providers. This is because individually small providers in a limited network product would bear all of the costs
(i.e., lost revenue) of reducing their prices but realize only a fraction of the benefits (i.e., greater volume). In other
words, if one provider’s price cut increases membership for the product, the additional revenue will be shared by the

64
than premiums in existing limited network products, the parties could potentially inject more
competition into the market, leading other providers to offer lower prices to compete with the
new product.222
However, when asked if BILH would offer lower prices in tiered or limited
networks plans going forward, the parties replied that they would not expect BILH to offer lower
prices.223,
224
10. It is also unclear how BILH would reduce spending by more effectively competing with
other providers.
The parties also claim that BILH would generally be a more effective competitor to the
higher-priced Partners system, thereby reducing spending. To determine whether the creation of
BILH could foster a more competitive market, the HPC first reviewed evidence from economic
literature and past mergers to determine whether there is theoretical or empirical evidence that a
merger of multiple competing providers into a second largest system would constrain the prices
of the largest system and reduce overall spending. Then, the HPC analyzed results from
econometric models projecting the impact on spending if Partners were to lose volume (and thus
bargaining leverage) to BILH.
a. Evidence from economic literature on the competitive effects of a merger of
competing providers into a second-largest system
Economic literature does not provide definitive guidance on the circumstances in which
the merger of multiple competing providers into a second system nearly equal in size to the
largest system could constrain the prices of the largest system.225
The core question is as follows:
If BILH becomes more attractive to payers and consumers, would BILH become a true
alternative to Partners in payer networks and thereby constrain Partners’ “must-have” status,
or would the result instead be a second “must-have” system?
If enough consumers (patients or employers) would have a strong preference for a plan
that includes both systems, BILH could become a second “must-have” system in the
various providers that participate in the limited network product. If all providers act on this incentive to free ride, a
limited network product is unlikely to succeed. As a merged entity that, hypothetically, accounts for a large
proportion of medical services provided to enrollees, the incentive for the parties to free ride in this way could be
much lower. Reduced scope for free riding could give the merged entity a stronger incentive to lower prices within a
limited network product. 222
The parties agree that this economic theory is valid, emphasizing that “an integrated system would be more likely
to negotiate more favorable terms because they know they will receive the majority of the benefits from any
concessions.” Parties’ Response, supra note 14, at 36. 223
In-person meeting with HPC staff, April 11, 2018. Based on this direct response, the HPC has not factored a
likelihood that the parties would offer significant price concessions in tiered and limited networks into our
conclusions; however, the HPC would welcome any commitments by the parties to offer reduced prices in these
products. 224
In addition, if the formation of BILH were likely to increase competition and reduce spending, whether through
innovative insurance product design or other mechanisms, we would expect that at least some health plans would
voice support for the transaction. However, to date, the HPC is not aware of any health plans which have publicly
supported the BILH transaction. 225
Following a literature review and discussions with multiple leading health economists, we were unable to identify
any literature that squarely addresses this question.

65
Commonwealth. In this scenario, it would be difficult for payers to exclude BILH from their
broad networks, just as it is currently difficult for payers to exclude Partners. BILH would have
significant bargaining leverage as a result, and that would allow it to negotiate higher prices than
each party can negotiate at present, even as Partners would continue to receive its own high
prices. Some of the commercial payers with whom we have discussed the transaction have
indicated that, at least in the short term, they do not anticipate that Partners would become any
less important in their networks, lending some credence to the notion that the transaction could
simply create two “must-have” systems in the Commonwealth, both with substantial bargaining
leverage.
If, on the other hand, a combined BILH system were viewed as a true alternative to
Partners, payers would have an increased ability to build a viable network without Partners,
which would constrain Partners’ bargaining leverage and reduce the price increases it would
otherwise be able to negotiate.226
However, since Massachusetts payers already can (and do)
construct provider networks that include each of the components of BILH individually, the
combined BILH system would presumably have to make significant investments (e.g., in new or
expanded services, improved quality, or brand recognition) 227
or lower its prices (e.g., in new
226
In our review of past mergers in other markets, we found only one instance in which the merger of smaller
competitors into a second largest system may have reduced the market leader’s bargaining leverage. In Peoria,
Illinois, OSF HealthCare’s Saint Francis Medical Center (SFMC) has long been the market leader and was included
in nearly all major commercial insurance networks. Its rival, Methodist Medical Center (MMC) was included in
fewer networks, in part because SFMC insisted on a higher price within networks that included MMC. In 2013 and
2017, MMC acquired two smaller hospitals, leaving the region with only two hospital systems. MMC also joined a
larger regional system, UnityPoint Health. In late 2017, for the first time, a major commercial insurer in the area,
Blue Cross and Blue Shield of Illinois, terminated its contract with the market leader, SFMC; simultaneously, it
added MMC to its network for the first time in 30 years. Nick Vlahos & Pam Adams, Blue Cross Blue Shield Drop
OSF Hospitals, Adds Methodist, PEORIA JOURNAL STAR, Oct. 10, 2017, available at
http://www.pjstar.com/news/20171010/blue-cross-blue-shield-drops-osf-hospitals-adds-methodist (last visited Sept.
24, 2018). See also OSF HealthCare, Blue Cross and Blue Shield of Illinois FAQs (Nov. 1, 2017), available at
https://www.osfhealthcare.org/media/filer_public/87/91/87918498-948b-4438-8518-e523fcd1ed4c/bcbs-faq-
110117.pdf (last visited Sept. 24, 2018). SFMC eventually came back to the bargaining table and reached an
agreement, presumably at prices lower than those that had led to the termination of its contract, while MMC also
remained in-network for the insurer. Chris Kaergard, OSF HealthCare Reaches Agreement to Keep Blue Cross Blue
Shield Insurance, PEORIA JOURNAL STAR, Nov. 22, 2017, available at http://www.pjstar.com/news/20171122/osf-
healthcare-reaches-agreement-to-keep-blue-cross-blue-shield-insurance (last visited Sept. 24, 2018). Although
definitive evidence is not available, it is possible that the enhancement of SFMC’s rival contributed to Blue Cross’s
bargaining leverage in negotiations with SFMC. At the same time, it is possible that MMC not only gained the
leverage to be included in more payer networks, but also to raise prices. Importantly, there are key distinctions
between the market conditions in Peoria and in eastern Massachusetts. For example, the HPC has not reviewed
evidence that Partners has used its bargaining leverage to encourage payers not to contract with the hospitals that
will be joining BILH; indeed, most insurance products in Massachusetts include the Partners hospitals and the
proposed BILH hospitals. 227
In general, competition among health care providers is associated with higher quality. See Martin Gaynor,
Katherine Ho & Robert J. Town, The Industrial Organization of Health-Care Markets, 53 J. OF ECON. LITERATURE
(2015). However, where the fixed costs of quality investments do not decline rapidly with the number of competing
providers, larger providers can spread these fixed costs over a larger volume of consumers, making it more feasible
to make investments. Rajiv D. Banker, Inder Khosla & Kingshuk K. Sinha, Quality and Competition, 44
MANAGEMENT SCIENCE 1179 (1998). In addition, marketing dollars may be more effectively deployed for a merged
system, as a marketing effort by one party would likely improve the brand of all hospitals, compared to only
improving the brand of the party making the investment.

66
narrow networks described in Section III.A.9 above) in order to enhance its attractiveness to
patients and employers.
b. Modeling the effects of increased volume at BILH on the bargaining leverage and
prices of other systems
The HPC examined the effect of a more-attractive BILH on Partners and other
competitors and found that any savings from reduced prices at competitors would likely be offset
by further price increases at BILH if its prices were unconstrained.
The HPC analyzed the parties’ claim that the transaction could reduce, or slow the
growth of, Partners’ prices.228
Specifically, even though there is some uncertainty as to how
successful the parties would be in attracting more patients than their component entities are
currently able to attract individually, the HPC modeled the impact on competitors’ prices if the
parties were to attract more patients in line with their stated goals.
If BILH were to attract more patients, Partners (and other providers) would become less
valuable for payers to include in their networks, which would reduce these providers’ bargaining
leverage. BILH could increase its attractiveness through several mechanisms, including
provision of new services, enhancement of their physical plants, advertising and marketing,
and/or through insurance products that incentivize patients to choose BILH providers.
Accordingly, the HPC modeled the change in WTP for inpatient services and the impact on
inpatient prices in Massachusetts if BILH were to make changes to become more attractive to
patients after the transaction. The parties state in their response that “to the extent that a second
system is an alternative, its downward pricing pressure on the true ‘must-have’ system, whose
prices significantly exceed those of any other system, would far outweigh any gain in price
negotiations of BILH, which will always be constrained to demonstrate its value.”229
The HPC’s
analysis indicates that, on the contrary, in the event of significant volume shifts to BILH,
downward pressure on Partners would be offset by BILH’s own price increases (if BILH did not
commit to restrictions on its price growth).
228
The parties describe two mechanisms through which Partners’ prices could be constrained. Parties’ Response,
supra note 14, at 18. The first mechanism is that payers would have more leverage to negotiate lower price increases
with Partners because fewer of their members would consider Partners a necessary network component. That is,
payers’ leverage would grow as their members sought care from non-Partners providers, such as BILH. The HPC
modeled this scenario, as described below. The second mechanism is that Partners, facing substantial loss of market
share, would voluntarily offer a limited network with steep price reductions to regain its market share. This may be
theoretically possible, and we agree that Partners would need to offer a significant discount to succeed with its own
limited network product. However, inducing such a major change in Partners’ pricing and marketing strategy would
likely require a far larger increase in BILH’s market share than is reflected in the parties’ submissions. If the parties
attract 10% more patients, BILH’s share of discharges in the Boston area would increase from 29.6% to 32.6%,
while we estimate that Partners’ share would drop from 32.1% to 30.4% (because only 56% of the new BILH
volume would come from Partners). Thus, the parties’ growth target corresponds to less than a 2 percentage point
decrease in Partners’ share. 229
It appears that the parties are claiming that BILH’s prices will remain lower than Partners’ prices to demonstrate
its value relative to Partners. However, as explained in Section III.A.7, the parties could achieve the projected price
increases while remaining lower-priced than Partners.

67
Specifically, the HPC analyzed how an enhanced brand for BILH would impact
commercial health spending by computing WTP changes for all hospitals following brand
enhancement by BILH. These WTP changes reflect BILH hospitals having 10% more patient
volume (in line with the parties’ plans) and, therefore, higher WTP, while Partners and others
have less patient volume and, therefore, lower WTP.230
The HPC then computed the change in
WTP for each hospital system and the corresponding impact on prices for each system, as caused
by the increase in BILH’s attractiveness and volume.
If discharges at BILH increase by 10%, approximately 56% of those discharges are
expected to come from Partners system hospitals, based on current patient distribution and
hospital usage patterns. The loss of that volume at Partners’ owned and contracting affiliate
hospitals would reduce WTP for the Partners system, yielding an estimated inpatient hospital
price reduction of 0.7%-1.1% and reducing inpatient spending at Partners hospitals by an
estimated $8.8 million to $13.8 million. For the 44% of new BILH discharges that are expected
to come from hospitals outside of the Partners system,231
we would also expect to see decreased
bargaining leverage. Reduced WTP for these hospitals would reduce inpatient spending by an
additional estimated $3.1 million to $4.9 million.232, 233
At the same time, a 10% increase in BILH’s volume would cause its own bargaining
leverage to increase beyond that projected by WTP analyses of the merger alone, allowing BILH
to receive additional price increases, as noted above in Section III.A.6. If BILH received 10%
more patients, further increases to its bargaining leverage would allow it to further increase its
prices, with a projected additional increase in inpatient spending of $14.9 million to $23.3
million at BILH hospitals (above the price impacts described in Section III.A.5), more than
counteracting the reduced spending at Partners’ hospitals and other hospitals.234
Only if BILH
committed to constraining price increases would the effect of price reductions for other providers
ultimately result in cost savings for the public.
***
230
We believe modeling a 10% increase in BILH’s volume is reasonable because it approximates the percent
increase that would occur if the parties achieved their care redirection goals. 231
For an explanation of the methodology the HPC used to calculate the sources of new BILH patients, see supra
note 204. 232
Note that this applies to some providers who are currently lower-priced than the parties, as well as to some
providers that currently have higher prices. 233
In addition, it is possible that higher-priced providers—Partners in particular—would lose some of their ability to
“recapture” patients whose insurance carriers drop Partners from the network. Currently, payers know that if they
were to drop Partners from their network, some patients would switch to a payer that had kept Partners in-network—
so that Partners “recaptures” some patients whose carriers drop Partners. To the extent that BILH becomes a more
attractive alternative to Partners, fewer patients might be expected to make such a choice, which would reduce
Partners’ negotiating leverage. If the parties’ brand enhancement were sufficiently strong, however, this same
recapture effect could give BILH leverage to increase its prices beyond the levels modeled in this report. 234
The parties argue that such potential price increases at BILH would be constrained by the regulatory framework
put in place by Chapter 224. However, price reductions for Partners as a result of BILH’s increased attractiveness—
which the parties claim would result from the transaction—would only occur to the extent that this regulatory
framework is not already constraining Partners’ prices. If Partners were already constrained in the way the parties
claim BILH would be constrained, a reduction in Partners’ negotiating leverage would have no effect, because the
regulatory framework, not leverage, would be determining its price increases.

68
In summary, we find that while the parties have had low to moderate prices and moderate
spending levels compared to other Massachusetts providers to date, the proposed transaction
would create a second-largest system with market share nearly equivalent to Partners and
significantly enhanced bargaining leverage, which would enable the parties to substantially
increase commercial prices.
We conservatively estimate that the parties’ increased bargaining leverage would enable
them to obtain one-time commercial price increases of 5% to 9.5% which could increase annual
commercial spending as detailed below.
Annual Commercial Spending Impact of Projected BILH Price Increases
Lower Estimate Higher Estimate
Hospital inpatient services $37.9M $59.2M
Hospital outpatient services $78.9M $100.0M
Adult primary care services $11.5M $11.5M
Total spending impact of projected price increases $128.4M $170.8M
Note: These figures do not include price increases for services other than inpatient, outpatient, and adult primary care. However, the parties could likely obtain price increases across other services as well. If the parties obtain price increases for specialty physician services that are in line with projected price increases across inpatient, outpatient, and adult primary care services, spending for these services could increase by an additional $29.8 million to $59.7 million annually.
The parties could obtain these price increases, significantly increasing health care
spending, and remain lower-priced than Partners. They have not yet committed to limiting future
price increases, despite the fact that their own financial projections indicate that they would be
profitable without significant price increases.
While the parties may be able to achieve some savings by reducing leakage of their
current patients, attracting new patients, or redirecting care within BILH to lower-priced settings,
there is no reasonable scenario in which these site-of-care shifts could offset the spending impact
if the parties were to obtain the projected price increases. If the parties achieve all of their care
redirection goals, including retaining current patients, enhancing consumer awareness to attract
new patients, and redirecting care within BILH, they could save approximately $8.7 million to
$13.6 million annually at current price levels, or approximately $5.3 million to $9.8 million
annually with the projected price increases.235
This would offset approximately 3% to 8% of the
annual spending impact of the projected price increases.
235
As described in Section III.A.8 above, the savings at current prices are composed of approximately $4.8 million
to $6.9 million from care retention, $1.8 million to $3.5 million from enhanced consumer preference, and $2.1
million to $3.1 million from shifts within BILH from higher-priced to lower-priced hospitals. The savings with price
increases are composed of approximately $2.5 million to $4.6 million from care retention, $1.1 million to $2.5
million from enhanced consumer preference, and $1.7 million to $2.8 million from shifts within BILH from higher-
priced to lower-priced hospitals.

69
Finally, the parties may be able to achieve some additional savings by implementing care
delivery programs that reduce unnecessary utilization. The scope of these savings is uncertain
based on the information provided, but even the parties' highest estimates of $52 million to $87
million annually after five years would not be sufficient to offset projected price increases.
B. QUALITY AND CARE DELIVERY
To assess the quality of care delivered by the parties, the HPC considered the parties’
performance on widely accepted clinical performance measures; documentation provided by the
parties on their quality and care delivery priorities, strategies, and structures; their historic
participation in alternative payment models; and an assessment of their participation and
performance in care delivery transformation efforts, including HPC care delivery grant
initiatives. We also reviewed the parties’ plans and goals for the proposed transaction in both
public and confidentially provided documents in order to assess the potential impacts of the
transaction on clinical quality. The HPC’s findings are summarized below.
Historically, the parties have generally performed comparably to statewide average
performance on hospital and ambulatory measures of clinical quality, with some variation
among the parties’ hospitals and physician networks on specific measures.
The parties have identified some quality metrics for ongoing measurement post-
transaction, but have not yet identified baseline data or transaction-specific quality
improvement goals, except in relation to a few specific proposed care delivery programs.
The parties currently have systems in place to promote and improve the delivery of high-
quality health care and are considering potential structures for integrating their distinct
quality oversight and management systems.
The parties are engaged in a variety of care delivery initiatives. Although they have
provided detailed plans for expansion and integration of only a few of these initiatives,
these plans suggest some potential for quality improvement.
The parties have each participated in various government and commercial payer
alternative payment methodology (APM) contracts and ACOs, although participation in
individual payment models varies by party. The parties are considering plans for
coordinating their APM structures, but it is unclear to what extent they will focus on
expanding their participation in risk-based contracting.
The remainder of this section discusses these findings in greater depth.
1. Historically, the parties have generally performed comparably to statewide average
performance on hospital and ambulatory measures of clinical quality, with some variation
among the parties’ hospitals and physician networks on specific measures.
In our evaluation of clinical quality, we reviewed the parties’ performance on over 100
widely accepted measures applicable to acute care hospitals and physician groups. We assessed a

70
broad spectrum of measures in the domains of clinical processes, clinical outcomes, and patient
experience, with a focus on certain measures most relevant to the proposed transaction.
Applicable measures were drawn in part from the 2018 Massachusetts Standard Quality Measure
Set. 236,
237
a. Hospital quality measures
We examined the parties’ performance on 53 hospital quality measures over time. On
process measures,238
we found that the parties’ hospitals tended to perform comparably to the
state average on a majority of measures, and most performed significantly better than average on
at least a few measures.239
Mt. Auburn’s performance was notably strong: it performed
significantly better than average on eight of the 29 process measures we examined and was not
significantly below average on any measure.240
The parties’ hospitals also performed well on
certain process measures related to inpatient psychiatric care: every party hospital with an
inpatient psychiatric unit performed better than the state average on measures of physical
restraint use and hours of seclusion, and Northeast and Mt. Auburn performed above average on
metrics for following up with patients after hospitalizations for mental illness.241
236
See Standard Quality Measure Set (SQMS), CTR. FOR HEALTH INFO & ANALYSIS,
http://www.chiamass.gov/sqms/ (last visited Sept. 24, 2018). 237
The majority of the measures we considered were hospital-based process measures, as these measures are easier
to collect through administrative data and are therefore more readily available through public data sources.
Outcomes measures and measures that evaluate the quality of care across the health care continuum are critically
important, but are also more resource-intensive to develop, collect, and risk-adjust, and fewer of these measures
have been endorsed by the National Quality Forum or integrated into existing datasets. See MASS. HEALTH POLICY
COMM’N, HPC DATAPOINTS: QUALITY MEASUREMENT MISALIGNMENT IN MASSACHUSETTS (January 10, 2018),
https://www.mass.gov/files/documents/2018/01/09/Datapoints_Quality%20Measurement.pdf (last visited Sept. 24,
2018). 238
The HPC obtained data for process measures related to the provision of timely and effective care, the use of
appropriate medical imaging, and the provision of appropriate inpatient psychiatric care from Hospital Compare
Datasets, CTRS. FOR MEDICARE & MEDICAID SERVICES, [hereinafter Hospital Compare Datasets],
https://data.medicare.gov/data/hospital-compare (last visited Sept. 24, 2018) and data for measures related to early
elective deliveries, care processes designed to avoid harm, and appropriate use of antibiotics from Hospital Choices,
THE LEAPFROG GROUP, [hereinafter Hospital Choices], http://www.leapfroggroup.org/hospital-choice (last visited
Sept. 24, 2018). The most recent full year of performance data for Hospital Compare measures varied by measure
but was most often 2017. The years of historical data available also varied by measure, but the earliest year of data
examined was typically between 2010 and 2015. Leapfrog Group data reflect 2017 survey results. 239
Statistical significance was determined using chi-square tests and t-tests at the p≤0.05 level. Some measures were
not applicable to all of the parties’ hospitals, such as those that do not have a psychiatric unit or those that do not
perform cardiac surgery. Only three of the 29 process measures we examined were applicable to NE Baptist because
of its specialized service offerings. 240
BID-Needham, BID-Plymouth, and Lahey HMC each performed better than average on three measures and none
performed below average on any measure. CHA, which is a BIDCO contracting affiliate and expected to become a
BILH contracting affiliate, also performed better than average on eight of the 29 measures we examined. 241
Physical restraint use and hours of seclusion use are measured by CMS Hospital Compare performance measures
HBIPS-2 and HBIPS-3, respectively. Outpatient follow-up for patients after hospitalization for mental illness is
measured by CMS Hospital Compare performance measure FUH. These measures are reported by facilities and
hospitals that are reimbursed under the Inpatient Psychiatric Facility Prospective Payment Systems and the data
reflects rates for all patients within the psychiatric facility or unit, including non-Medicare patients. For measure
specifications and reporting requirements, see Inpatient Psychiatric Facility Quality Reporting Program Manual,
Version 4.0, CTRS. FOR MEDICARE & MEDICAID SERVICES, (May 20, 2018),
https://www.qualityreportingcenter.com/wp-

71
On outcome measures, the parties’ hospitals tended to perform comparably to the
statewide average.242
Few of the parties’ hospitals performed significantly above or below
average on more than a couple measures, although Lahey HMC and BIDMC performed below
average on three and four measures, respectively, and NE Baptist performed better than average
on four measures, including measures related to complications and readmissions following hip
and knee replacements.243
While many of these hospitals’ performance on select outcome
measures has improved over time, this improvement was generally in line with statewide
improvements on these measures during the same time period, although in a few cases the
performance trend for the parties’ hospitals was better or worse than the state average.244
content/uploads/2018/05/IPF_ProgramManual_Version4.0_20180507_vFINAL.508.pdf (last visited Sept. 24,
2018). 242
The HPC obtained data on 16 outcome measures related to unplanned hospital visits and complications and
deaths from Hospital Compare Datasets, supra note 238. The most recent full year of performance data for these
measures was 2017. We obtained data for four measures related to C-sections and episiotomies from Hospital
Choices, supra note 238; results reflect 2017 survey results. We also examined performance of the parties’ hospitals
on three composite measures that evaluate risk-adjusted inpatient mortality for certain procedures and conditions
(IQI 90 and IQI 91, respectively) and observed-to-expected ratios for 11 measures of patient safety and adverse
events (PSI 90). Measure results were calculated based on the 2017 hospital discharge dataset. For more detail on
IQI measures, see Inpatient Quality Indicators Overview, AGENCY FOR HEALTH CARE RESEARCH & QUALITY,
http://www.qualityindicators.ahrq.gov/modules/iqi_resources.aspx (last visited Sept. 24, 2018); for full measure
specifications, see AGENCY FOR HEALTH CARE RESEARCH & QUALITY, MORTALITY FOR SELECTED PROCEDURES,
INPATIENT QUALITY INDICATORS #90 (IQI #90) (Mar. 2017), available at
https://www.qualityindicators.ahrq.gov/Downloads/Modules/IQI/V60/TechSpecs/IQI_90_Mortality_for_Selected_P
rocedures.pdf (last visited Sept. 24, 2018) and AGENCY FOR HEALTH CARE RESEARCH & QUALITY, MORTALITY FOR
SELECTED CONDITIONS, INPATIENT QUALITY INDICATOR #91 (IQI #91) (Mar. 2017), available at
https://www.qualityindicators.ahrq.gov/Downloads/Modules/IQI/V60/TechSpecs/IQI_91_Mortality_for_Selected_C
onditions.pdf (last visited Sept. 24, 2018). For more detail on the PSI 90 measure, see Patient Safety Indicators
Overview, AGENCY FOR HEALTH CARE RESEARCH & QUALITY,
http://www.qualityindicators.ahrq.gov/modules/psi_resources.aspx (last visited July 13, 2018). 243
Lahey HMC performed below average on Complication Rate Following Elective Primary Total Hip Arthroplasty
and/or Total Knee Arthroplasty, and BIDMC performed below average on 30-Day Readmission Rate Following
Elective Primary Total Hip Arthroplasty and/or Total Knee Arthroplasty; NE Baptist performed above the statewide
average on both of these measures. The parties have provided internal data suggesting that the existing joint venture
between NE Baptist and BIDMC has resulted in decreased rates of referral to post-acute care facilities, decreases in
length of stay, and reductions in primary related readmissions. In addition to hip and knee related measures, both
Lahey HMC and BIDMC performed below average on 30-Day Hospital-Wide All-Cause Unplanned Readmission
Rate. CMS risk adjusts this measure and certain other outcome measures to account for patient complexity, although
several Massachusetts AMCs and teaching hospitals performed worse than the statewide average performance on
all-cause readmissions. See Unplanned hospital visits, CTRS. FOR MEDICARE AND MEDICAID SERVS.,
https://www.medicare.gov/hospitalcompare/Data/Hospital-returns.html (last visited Sept. 24, 2018) (“To accurately
compare hospital performance, the unplanned hospital visit measures adjust for patient characteristics that may make
returning to the hospital more likely. These characteristics include the patient’s age, past medical history, and other
diseases or conditions (comorbidities) the patient had when they were admitted that are known to increase the
patient’s chance of returning to the hospital”). 244
We examined the change in the performance of the parties’ hospitals from 2010 to 2017 compared to the change
in statewide average performance during the same time period on AHRQ’s PSI 90, IQI 90, and IQI 91 composite
measures and CMS’ 30-Day Hospital-Wide All-Cause Unplanned Readmission Rate measure. This Final Report
reflects an additional year of data available for the AHRQ composite measures, which were calculated based on the
2017 hospital discharge dataset. For the PSI 90 composite, performance at BID-Needham and BID-Plymouth
declined over these years while the statewide average improved. While these hospitals’ 2010 performance on the
PSI 90 composite was better than the state average, each had fallen below average by 2017. Lawrence General, a
BIDCO contracting affiliate, had performance on the IQI 90 composite that improved more than the state average,
72
On patient experience, as measured by patients’ overall ratings of the hospitals and their
willingness to recommend the hospitals,245
the parties’ hospitals generally demonstrated strong
performance. Several of the parties’ hospitals performed significantly better than the statewide
average on both measures, with NE Baptist ranking as one of the top three hospitals in the state
on each measure and Mt. Auburn ranking in the top ten. No party hospital performed
significantly below average on both measures examined.246
We also examined changes in
performance of the parties’ hospitals on these two measures from 2010 to 2017 and found their
performance generally consistent with small statewide average improvement on these measures
during this time period.
In summary, the parties’ hospitals generally performed comparably to the state average
on the examined quality measures, with some notably strong performance in the process and
patient experience domains and more mixed performance on certain outcome measures. Mt.
Auburn and NE Baptist performed well on applicable measures across all three domains.
b. Ambulatory quality measures
In addition to evaluating hospital quality, we reviewed the performance of the parties’
physician groups on select ambulatory process, outcome, and patient experience measures.247
We examined the performance of BIDCO, LCPN, and MACIPA on select HEDIS
process and outcome measures compared to the national 75th
and 90th
percentile benchmarks
identified by the National Committee for Quality Assurance for each measure.248
We found that
each of these groups met or exceeded the 75th
percentile for at least three quarters of the
measures and met or exceeded the 90th
percentile for at least half of the measures, with MACIPA
outperforming each benchmark more consistently. We found that some other large physician
organizations in eastern MA exceeded the 75th
and 90th
percentiles for a similar or greater
number of measures than either BIDCO or LCPN; few other groups met these benchmarks as
consistently as MACIPA.
while BIDMC’s performance on the IQI 90 composite declined more than the state average over this time period.
BID-Milton’s performance on 30-day all-cause readmissions improved more than the state average. 245
The HPC obtained performance data from CMS, see Hospital Compare Datasets, supra note 238, for two global
measures of patient experience: Overall Rating of Hospital and Willingness to Recommend Hospital. We analyzed
“top-box” response rates for each measure. The “top-box” score indicates how often patients selected the most
positive response category when asked about their hospital experience. Responses of either “9” or “10” are
considered top-box for the Overall Rating of Hospital measure; a response of “Definitely yes” is considered top-box
for the Willingness to Recommend Hospital measure. For more information, see HCAHPS Tables on HCAHPS On-
Line, HOSPITAL CONSUMER ASSESSMENT OF HEALTHCARE PROVIDERS AND SYSTEMS,
http://www.hcahpsonline.org/en/summary-analyses/ (last visited Sept. 24, 2018). 246
Lawrence General and CHA, BIDCO contracting affiliate hospitals that are expected to become BILH
contracting affiliates, performed below average on these measures of patient experience. 247
The HPC obtained 2016 ambulatory performance measure data on select HEDIS measures from quality
settlement reports for risk-based contracts provided confidentially by payers and the parties. 248
We assessed performance on HEDIS measures based on confidential, payer-generated quality reports from the
parties’ largest commercial risk contracts. For more information on the HEDIS physician measures, see HEDIS ®
and Performance Measurement ®, NAT’L COMM. FOR QUALITY ASSURANCE,
http://www.ncqa.org/HEDISQualityMeasurement/WhatisHEDIS.aspx (last visited Sept. 24, 2018).
73
We also reviewed four adult ambulatory composite measures of patient experience in the
following domains: ability to get timely appointments, care, and information; integration of care;
patient-provider communication; and overall willingness to recommend the doctor. 249
LCPN and
MACIPA performed comparably to the state average on these measures. BIDCO’s performance
was also average on all but one measure, Organizational Access, for which it was below average.
The parties’ performance was in line with that of other large physician networks in eastern
Massachusetts. On pediatric patient experience composite measures in the same domains, we
examined performance for Northeast physicians, Winchester physicians, MACIPA, and
BIDCO.250
Winchester PHO performed below average on one measure and MACIPA performed
below average on three measures.251
Except for MACIPA, the party physician groups generally
performed comparably to other large physician networks in eastern Massachusetts.
We also considered the rates at which the patients attributed to the parties’ physicians
used the ED, used the ED when the visit was potentially avoidable, and received low-value
care.252
We found that patients of all three party physician groups had risk-adjusted rates of ED
utilization below the state average, but had higher-than-average rates of potentially avoidable ED
visits.253
In addition to ED utilization, use of low-value care is an important quality and care
delivery consideration. Many low-value services are prone to overuse, and may result in higher
health care costs and unnecessary patient exposure to potential risks such as radiation, false
positives, and follow-up on benign issues.254
The frequency of low value care may also indicate
whether efficient standards of care are used across physician networks. The HPC examined the
frequency with which patients attributed to the 14 largest physician networks in the
Commonwealth received certain types of low-value imaging, pre-operative care, procedures, and
249
The HPC obtained ambulatory performance measure data for 2017 on select CG-CAHPS measures from CTR.
FOR HEALTH INFO. & ANALYSIS, PERFORMANCE OF THE MASSACHUSETTS HEALTH CARE SYSTEM QUALITY
DATABOOK (Sept. 12, 2018), available at http://www.chiamass.gov/annual-report (last visited Sept. 24, 2018),
focusing on Organizational Access, Integration of Care, Communication, and Willingness to Recommend. 250
We reviewed medical group level data for Northeast physicians and Winchester physicians because these are the
only groups within Lahey that provide pediatric primary care services, and Lahey therefore does not report CG-
CAHPS data at the network level. Additionally, CHIA did not report pediatric CG-CAHPS data for BIDCO for
2017. Our analysis reflects BIDCO’s performance on these measures in 2016. 251
Winchester PHO performed below average on Organizational Access. MACIPA performed below average on the
pediatric patient experience measures examined except for Organizational Access, on which it performed
comparably to the statewide average. 252
These analyses compare provider organizations by averaging APCD spending and utilization across BCBS, THP,
and HPHC commercially insured patients whose PCPs are affiliated with, or owned by, a given organization. These
analyses control for patient health status, demographics, and insurance characteristics. All spending and utilization
across all sites of care for these patients is attributed to the PCP and its affiliated provider organization, regardless of
whether the care was actually delivered by that provider organization. ED utilization and avoidable ED utilization
data are based on 2015 claims; low-value care measures are based on October 2013 through October 2015 claims.
For a full description of the attribution methodology, see 2017 HPC COST TRENDS REPORT, supra note 126, at 29-
30. 253
Based on HPC analysis of the 2015 APCD. This analysis controlled for differences in patient health status,
demographics, and insurance type. For complete results and an explanation of methodology, see 2017 HPC COST
TRENDS REPORT, supra note 126. 254
See HEALTH POLICY COMM’N, HPC DATAPOINTS: VARIATION IN IMAGING SPENDING (May 4, 2018),
https://www.mass.gov/service-details/hpc-datapoints-issue-7-variation-in-imaging-spending (last visited Sept. 24,
2018).

74
screenings.255
As shown below, LCPN and BIDCO had the highest and second highest
percentage of members who received some form of low-value care, while MACIPA patients
were slightly less likely than average to have received a low-value service; as with other
physician groups, screenings constituted the majority of low-value care received by the parties’
patients.
Percentage of Attributed Primary Care Patients Exposed to Any Low-Value Service (Oct. 2013 - Oct. 2015)
Source: HPC analysis of 2014-15 APCD data; see JUNE MOAT COMMITTEE PRESENTATION, supra note 255. Note: “LVC members” are any patients attributed to the physician group that received some form of low-value care. BIDCO figures include patients attributed to physicians that are part of groups affiliated with CHA and Lawrence General.
2. The parties have identified some quality metrics for ongoing measurement post-
transaction, but have not yet identified baseline data or transaction-specific quality
improvement goals, except in relation to a few specific proposed care delivery programs.
The parties have committed to monitor and report publicly on certain quality measures
post-transaction as evidence of the proposed transaction’s impact on the quality of care.256
255
MASS. HEALTH POLICY COMM’N, MEETING OF THE MARKET OVERSIGHT AND TRANSPARENCY COMMITTEE at 30
(June 13, 2018) [hereinafter JUNE MOAT COMMITTEE PRESENTATION], available at
https://www.mass.gov/files/documents/2018/06/13/20180613%20-%20MOAT%20-
%20Presentation%20Posting.pdf (last visited Sept. 24, 2018) (showing original published data; as noted on slide 25,
estimates of low-value service usage were created to be conservative and exclude from consideration all claims for
members with any diagnosis for which a particular service may be of value). 256
The measures on which the parties would report are identified at DON STAFF REPORT, supra note 191, at
Attachment 4. A few of the identified measures align with measures for which the HPC examined the parties’
current performance, including hospital-wide readmissions, avoidable ED utilization, timely access to urgent care,
primary care patient experience, and control of high blood pressure and HbA1c levels for primary care patients. In
15.7%
16.6%
17.8%
18.9%
21.1%
21.5%
22.1%
22.9%
22.8%
23.2%
23.2%
24.7%
25.5%
28.3%
32.0%
3.1%
3.9%
3.4%
3.0%
3.4%
3.1%
3.3%
3.5%
3.4%
3.6%
4.4%
3.2%
5.0%
3.3%
3.4%
Atrius
Baystate
Reliant
BMC
South Shore
MACIPA
Wellforce
Average
CMIPA
UMass
Steward
Partners
Southcoast
BIDCO
Lahey
LVC members affected by screening LVC members without low value screening

75
However, baseline performance, targets, and timelines for improvement on these measures have
not yet been identified. The parties would be required to submit this information to the DoN
Program in their first mandated report six months after the close of the transaction.257
All of the
proposed measures of clinical quality are either required components of MassHealth ACO
contracts or measures identified by Lahey for the purpose of measuring MassHealth ACO
performance.258
As further described below, both BIDCO and Lahey are currently participating
in the MassHealth ACO program and will therefore monitor and report on these measures even
in the absence of the transaction, and their shared savings or shared losses will be partially tied to
these measures. If the parties identify any differences between their current targets for
improvement and those they aim to achieve as a combined system—and explain how the
transaction would enable them to achieve these goals—the public would be better able to assess
the potential impacts of the proposed transaction on these measures.
In addition to the measures the parties have committed to monitor and report publicly, the
Parties’ Response identifies specific goals for improvement related to select care delivery
programs the parties propose to expand. The parties identify goals of reducing readmissions for
patients discharged to skilled nursing facilities and reducing ED visits within 30 days post-
discharge for high-risk patients discharged on multiple medications.259
The parties also identify
spending reduction goals for patients of their employed primary care practices as a result of
implementing behavioral health integration and a nurse telephone care triage program; these
spending impacts would presumably be secondary effects of reductions in unnecessary
utilization, although the parties have not yet identified their goals for these primary impacts.260
The Parties’ Response assumes that the identified goals will be reached within a five-year
timeline, although the parties have not identified baseline data for the relevant patient
populations to date. The proposed care delivery programs and their potential impacts are
discussed in more detail in Section III.B.4.
The parties are also in the process of discussing other potential programs and structures
for quality improvement as a combined system, as detailed in the next sections. As discussed in
Section II.A, these plans are still in development, and BILH would consider whether and how to
further develop them post-transaction. It is therefore not yet clear to what extent BILH would
develop a robust performance management framework with measurable targets for improvement
the data that the HPC examined, none of the parties performed consistently better than the others on the ambulatory
measures; on hospital readmissions, Lahey HMC and BIDMC both performed below the state average, NE Baptist
performed better than average, and all of the other parties’ hospitals performed comparably to the average. 257
MASS. DEPT. OF PUBLIC HEALTH, NOTICE OF FINAL ACTION DON APPLICATION NO. NEWCO 17082413-TO
CAREGROUP INC., LAHEY HEALTH SYSTEM INC., AND SEACOAST REGIONAL HEALTH SYSTEMS, available at
https://www.mass.gov/files/documents/2018/04/17/newco-decision-letter.pdf (last visited Sept. 24, 2018). 258
See, e.g., MASS. EXEC. OFFICE OF HEALTH AND HUMAN SERVS., MCO-ADMINISTERED ACO CONTRACT,
APPENDIX B - EOHHS ACCOUNTABLE CARE ORGANIZATION QUALITY INDEX at 4-9 (July 2017), available at
https://www.mass.gov/files/documents/2017/11/17/mco-admin-aco-appendix-b-eohhs-accoutable-care-organization-
quality-appendix.pdf (last visited Sept. 24, 2018). We understand that MassHealth is still in the process of updating
and refining the measures to be used for ACO quality measurement. 259
Parties’ Response, supra note 14, at n. 60 and n. 62. 260
See id., at n. 56 and n. 64.
76
(including for vulnerable populations) and a plan for achieving those targets261
that would allow
the public to evaluate any post-transaction quality improvements.
3. The parties currently have systems in place to promote and improve the delivery of high-
quality health care and are considering potential structures for integrating their distinct
quality oversight and management systems.
In addition to the clinical quality measures discussed above, we evaluated the parties’
performance on nationally recognized measures of structures that support quality and patient
safety, descriptions of their internal systems and structures to track and promote quality, and
whether they have implemented structures to provide accountable, patient-centered care as
assessed by the HPC’s ACO Certification Program. We also assessed the parties’ plans for
integrating these structures and capabilities across the BILH system.
a. Structural quality measures
We examined seven measures related to structures designed to promote health care
quality262
and found that the parties typically have fully or partially implemented most of these
systems, although many of the parties’ hospitals lacked a strong bar code medication
administration program.263
The parties regularly track and share information on the quality of
care at multiple levels within their organizations, although their methods and models for these
efforts vary. Many of the parties track performance reports from multiple payers and incorporate
data from public datasets, payers, accrediting agencies, and claims systems in their internal
performance dashboards. Many also compare their current performance to their past
performance, analyze their results against peer benchmarks, and have established internal
improvement targets.264
Reports on these efforts are typically reviewed by each party’s board of
directors and senior leadership. In many cases the results are transmitted to local patient safety
committees and frontline providers. Some of the parties also publish their results and plans for
improvement on their websites.265
261
The HPC’s Accountable Care Organization (ACO) Certification Program Application Requirements and
Platform User Guide Assessment Criteria 3 is one example of a format in which the parties could report information
about their future quality improvement planning and performance. 262
The HPC evaluated hospitals’ use of intensivists for ICU care, the use of computer medication order systems, and
safe medication administration using Leapfrog Group survey results. See Survey Content, LEAPFROG GROUP,
http://www.leapfroggroup.org/ratings-reports/survey-content (last visited Sept. 24, 2018). The HPC also examined
Hospital Compare measures of health care personnel flu vaccination, use of safe surgery checklists, tracking clinical
results between visits, and the integration of laboratory results into providers’ electronic health record (EHR)
systems. See Hospital Compare Datasets, supra note 238. 263
Performance on Leapfrog Group measures is reported in four tiers: Fully Meets the Standard, Substantial
Progress, Some Progress, and Willing to Report. Anna Jaques received a “Willing to Report” rating on two of the
three structural Leapfrog Group measures that we assessed and a “Substantial Progress” rating on the third. Anna
Jaques performed more favorably on the Hospital Compare structural measures we reviewed. 264
Some of the parties, particularly the larger organizations with greater access to technical resources, have
developed more robust internal quality measurement and reporting systems than others. 265
See, e.g., Quality Data, NEW ENGLAND BAPTIST HOSPITAL, https://www.nebh.org/about-nebh/patient-
safety/annual-quality-data/ (last visited Sept. 24, 2018); Specific Clinical Service Measures and Volumes, BETH
ISRAEL DEACONESS MEDICAL CENTER, https://www.bidmc.org/about-bidmc/quality-and-safety/specific-clinical-
service-measures-and-volumes (last visited Sept. 24, 2018); Quality Measures & Reports, MOUNT AUBURN
HOSPITAL, https://www.mountauburnhospital.org/quality-safety/measures-reports/ (last visited Sept. 24, 2018).

77
The HPC’s ACO Certification Program assesses whether an applicant has established the
structures and processes necessary to provide high-value, patient-centered care to a defined
population.266
To achieve ACO Certification, applicants must demonstrate specific capabilities
and structures in the design of their governance structure, participation in quality-based risk
contracts, population health management programs, and provision of cross-continuum care. Both
Lahey and BIDCO, along with 15 other health care provider organizations, received ACO
Certification in 2017;267
MACIPA submitted a notice of intent to seek HPC ACO certification in
July 2018.
As described in Section II.A, the parties are engaging in an extensive integration planning
process that includes numerous integration planning teams focusing on specific content areas.
The parties have a team dedicated to system-wide quality management, and several of the other
teams developing proposals related to clinical programs have incorporated quality considerations
into their planning. Although the parties’ future plans for quality and care delivery improvement
are still largely in development, they have stated an intention to develop “[a BILH] system
quality and governance structure that promotes quality and safety at the highest levels of the
organization, and engages leaders and clinicians at each local organization[.]”268
The HPC
recognizes that a governance structure in which leadership regularly assesses and sets strategic
performance improvement goals is an integral part of an effective ACO structure,269
and the
parties are considering several proposals for governance structures that could support decision
making and oversight of quality improvement initiatives. They have also been developing plans
related to system-wide quality measurement, patient safety reviews, staff training, and quality
research. While this planning process seems to reflect a commitment to building strong quality
structures in the BILH system, the preliminary nature and lack of specificity in the parties’
submissions limits the HPC’s ability to assess their potential impacts.270
The quality integration
planning team’s recommendations are focused on the parties’ need to integrate their many
distinct existing programs and policies into a single system, which would be a necessary first
step for the system toward building transformative quality improvement programs.
266
See MASS. HEALTH POLICY COMM’N, FINAL ACCOUNTABLE CARE ORGANIZATION (ACO) CERTIFICATION
STANDARDS FOR CERTIFICATION YEAR 1 (April 2016), available at
https://www.mass.gov/files/documents/2016/07/qz/aco-certification-final-criteria-and-requirements.pdf (last visited
July 13, 2018). 267
Press Release, Mass. Health Policy Comm’n, Health Policy Commission Certifies 17 Health Care Organizations
Through New ACO Program (Jan. 4, 2018), available at http://www.mass.gov/anf/budget-taxes-and-
procurement/oversight-agencies/health-policy-commission/hpc-certifies-17-organizations-through-new-aco-
program.html (last visited Sept. 24, 2018). 268
DON NARRATIVE, supra note 31, at 39. 269
Assessment of governance structures and their role in supporting performance improvement activities are key
components of the HPC ACO Certification Program. The HPC Accountable Care Organization (ACO) Certification
Program, MASS. HEALTH POLICY COMM’N, https://www.mass.gov/service-details/the-hpc-accountable-care-
organization-aco-certification-program (last visited Sept. 24, 2018). 270
Although the Parties’ Response indicates that all of the parties’ plans in development have been vetted and
received “preliminary approval,” the parties have not provided any additional information about their system-wide
quality structures beyond general statements. See, e.g., Parties’ Response, supra note 14, at 47 (recommendation
from the CIN/Population Health Management working group to “Support the development of a systemwide,
comprehensive approach to improving ambulatory and hospital quality performance”).
78
b. Information technology systems that may support quality
All of the parties’ hospitals currently use an electronic health record (EHR) system that
allows providers to record and share patient records in electronic format. EHRs can promote
patient safety and quality improvement by standardizing and consolidating patient records and
incorporating features such as medication reconciliation, clinician decision support tools, and
patient safety checklists.271
The parties’ hospitals currently use several different EHR systems,
with some variation even within a given provider organization. The parties’ affiliated physicians
also generally use EHR systems, although they have not mandated that all physicians in their
networks use the same systems.272
To date, the parties have prioritized achieving interoperability
between different platforms, allowing providers with shared patients to view the patients’
records, even if the providers do not use the same EHR system.273
However, integrating systems
across a much larger combined organization presents challenges as well as opportunities. The
parties have not indicated that they plan to migrate all of their hospitals or physician practices
onto a single platform,274
and they note their successes integrating some EHR functions within
their individual systems even across different EHR platforms.275
While the parties have
identified the development of interoperability across these systems as a priority for shared
investment,276
their integration planning groups are still developing specific plans for achieving
this goal, and based on the information currently available, the HPC is not able to evaluate to
what extent or how quickly the parties may achieve interoperability. We are also not able to
effectively assess the parties’ plans to ensure that their systems facilitate transfers of care to other
271
Sharon Silow-Carroll et al., THE COMMONWEALTH FUND, USING ELECTRONIC HEALTH RECORDS TO IMPROVE
QUALITY AND EFFICIENCY: THE EXPERIENCES OF LEADING HOSPITALS (July 2012), available at
https://pdfs.semanticscholar.org/0e75/8272eab4ba74933ed4fdf860362f2365f3d3.pdf (last visited Sept. 24, 2018). 272
See, e.g., 2016 BID CMIR FINAL REPORT, supra note 28, at 45 (“BIDCO does not require all members to use a
single EHR platform, and the HPC understands that members use a range of different platforms. New BIDCO
members (e.g., hospitals or physician practices) are generally required to adopt one of two specific EHR platforms if
they are not already using one of six approved alternatives”). 273
Id. 274
See DON NARRATIVE, supra note 31, at 38-39 (The parties state that an affiliation will expand on existing
BIDCO systems that allow real-time visibility of patient records between providers using different EHR systems). 275
Id. at 38-39. 276
Investment in technology systems, especially EHRs, has represented a major expense for provider organizations,
with Mt. Auburn and Lahey notably investing $110 million and $160 million respectively to implement the Epic
EHR system in their organizations in recent years. Jessica Bartlett, Mount Auburn Details Hefty Tab to Adopt New
Record System, BOSTON BUSINESS JOURNAL, May 24, 2016, available at
https://www.bizjournals.com/boston/blog/health-care/2016/05/mount-auburn-details-hefty-tab-to-adopt-new-
record.html (last visited Sept. 24, 2018); Jessica Bartlett, Lahey Hospital's Operating Loss Widens as IT, Drug Costs
Mount, BOSTON BUSINESS JOURNAL, Mar. 1, 2016, available at https://www.bizjournals.com/boston/blog/health-
care/2016/03/lahey-hospitals-operating-loss-widens-as-it-drug.html (last visited Sept. 24, 2018).
79
providers when appropriate277
and ensure that legacy systems are effectively able to work
together.278
In addition to EHR systems, the parties also use a variety of clinical data repositories,
population health management platforms, and notification tools. The parties have stated that the
proposed transaction would allow them to “jointly invest in scaling data management and
analytic systems that work to improve coordination among all member hospitals, physicians, and
patients” and allow the smaller parties to “access technology, analytics, and staff that would not
be feasible to obtain and maintain as standalone organizations[.]”279
They expect that these
supports would enable integrated population health strategies across the combined system and
improve their risk contract performance. While such integration could positively impact both
care quality and operational efficiencies for the BILH system, the parties’ plans are not yet
sufficiently detailed for us to evaluate the extent or timeline of these potential benefits.
4. The parties are engaged in a variety of care delivery initiatives. The parties have provided
more detailed plans for expansion and integration of a few of these initiatives, and these
proposals suggest a potential for quality improvement.
The parties’ submissions to the HPC and the DoN program describe a number of the
individual parties’ past care delivery initiatives and achievements. For example, the parties note
their successful participation in the Medicare Pioneer ACO Program, including achieving high
quality composite scores.280
The parties have also undertaken some behavioral health integration
initiatives, including embedding behavioral health clinicians with primary care providers,
incorporating tele-behavioral health, and embedding behavioral health case managers in their
EDs.281
Many of the parties have also undertaken strategies to improve patient health outcomes
by developing chronic disease management programs, providing more specialized services at
affiliated community hospitals, and establishing patient-centered post-acute programs that utilize
preferred nursing facilities, incorporate hospice and palliative care when appropriate, and
establish parameters for patient transitions between settings.282
277
The implementation of health information technology can facilitate as well as raise challenges for care
coordination and health care competition. Tools that facilitate interoperability, both within a provider organization
and between different provider organizations, can enhance coordinated, effective care delivery. Tools that lack
interoperability can create silos, with challenges both for care coordination and access to competitors. See Katherine
Baicker & Helen Levy, Coordination versus Competition in Health Care Reform, 369 NEW ENGL. J. MED. 789
(2013), available at http://www.nejm.org/doi/pdf/10.1056/NEJMp1306268 (last visited Sept. 24, 2018). The HPC
understands that, in the Massachusetts market, new systems have in some cases made it more difficult for system-
affiliated providers to refer patients to other providers, including independent providers. 278
See Thomas Payne et al., Use of more than one electronic medical record system within a single health care
organization, 356 APPLIED CLINICAL INFORMATICS 462, 465-466 (Dec. 12, 2012) (“Some of the features of [EHRs]
that are cited as making care safer, such as improving communication, providing access to patient information, and
stopping mistakes at the ordering process may be more difficult to achieve if more than one [EHR] is used without
appropriate integration. A secondary but significant risk encompasses increased practitioner time requirement for
both patient care and for training which results in loss of income and in provider dissatisfaction with the [EHR]”). 279
DON NARRATIVE, supra note 31, at 39. 280
Id. at 23 (noting that BIDCO earned the highest quality score of all Pioneer ACOs in 2015). 281
Id. at 23, 28. 282
Id. at 20-21, 24-25, 29.

80
Many of the parties have also participated in health care transformation initiatives funded
through HPC investment programs: the Community Hospital Revitalization, Acceleration, and
Transformation (CHART) Program and the Health Care Innovation and Investment Program
(HCII). CHART Phase 2 awards provided funding to eligible community hospitals’ efforts to
maximize appropriate hospital use, enhance behavioral health care, and improve processes to
reduce waste and improve quality and safety.283
Anna Jaques, BID-Milton, BID-Plymouth,
Northeast, and Winchester each received CHART Phase 2 grants, and Northeast and Winchester
also received a joint grant with Lowell General Hospital.284
The HCII Program’s first round of
investments was divided among three pathways: targeted cost challenge investments that support
innovative delivery and payment models, telemedicine pilots, and neonatal abstinence syndrome
investment opportunities.285
Lahey is implementing a two-year neonatal abstinence syndrome
investment award, while BIDCO participated in the targeted cost challenge investment pathway
through its partnership with awardee Brookline Community Mental Health Center.286
In addition to their plans to integrate their systems’ quality oversight structures as
described in Section III.B.3, the parties have indicated that they intend to expand some of their
care delivery initiatives. They have stated a general intent to “leverage existing expertise across
sites to further improve outcomes and patient experience in the future” as a combined system287
and to maintain and expand these commitments after the proposed transaction.288
For the most
part, the parties have not yet identified which of these existing initiatives—which differ in
approach, size, and scope—would be expanded as a result of the proposed transaction. They
have also not yet identified where or when such expansions would take place or what resources
would be committed to supporting them.289
The parties have emphasized that they cannot
develop more detailed plans before the transaction is finalized.290
However, the Parties’
283
See MASS. HEALTH POLICY COMM’N, CHART PHASE 2 SUMMARY, available at http://www.mass.gov/anf/budget-
taxes-and-procurement/oversight-agencies/health-policy-commission/investment-programs/chart/phase-2/chart-
phase-2-summary.pdf (last visited Sept. 24, 2018). 284
These hospitals’ programs focused on activities designed to both improve the quality of patient care and reduce
costs, including reducing readmissions, managing care across the continuum, reducing ED utilization and decreasing
ED boarding, and better integrating behavioral health care services. CHART awarded Phase 2 grants separately to
the Northeast hospitals, Beverly and Addison Gilbert. CHART Phase 2 Awards, MASS. HEALTH POLICY COMM’N,
http://www.mass.gov/anf/budget-taxes-and-procurement/oversight-agencies/health-policy-commission/investment-
programs/chart/phase-2/ (last visited Sept. 24, 2018). 285
See HPC Innovation Investments, MASS. HEALTH POLICY COMM’N, https://www.mass.gov/service-details/hpc-
innovation-investments (last visited Sept. 24, 2018). 286
BIDCO and Brookline Community Mental Health Center worked to provide high-touch care management to
eligible patients with a serious chronic medical condition and behavioral health comorbidity. 287
DON NARRATIVE, supra note 31, at 27. 288
Id. at 23-29. 289
For example, the parties have stated that “[BILH] can implement [NE Baptist’s] model of care, where
appropriate.” Id. at 27. The proposals that the parties have provided for expanding NE Baptist’s orthopedic and
musculoskeletal care practices are among the most detailed, but contain elements still to be determined, including
locations for first-round integration that have yet to be identified, as well as personnel and resource commitments
that would be necessary to implement these integration activities. The plans described in the Parties’ Response
similarly lack important details. Parties’ Response, supra note 14, at 37-47. Therefore, it is unclear to what extent
these plans may ultimately impact quality. 290
The Parties’ Response states that the recommendations of all of the parties’ working groups have “received
preliminary endorsement from the Leadership Work Group” and are now “focused on synergies quantification,
implementation work planning, and preparations for Day 1.” Parties’ Response, supra note 14, at 37. Apart from the
81
Response provides additional details about four of the parties’ proposed care delivery programs:
expanding behavioral health integration, integrating the parties post-acute care networks,
expanding pharmacist intervention for high-risk patients at discharge, and expanding the use of a
nurse call line for care triage.291
The new details include the scope of proposed program
expansions, goals for the improvement of some specific quality metrics, identified intervention
populations, and a five-year timeline.292
a. Behavioral health integration
The parties propose to extend integrated behavioral health services, which the parties call
the Collaborative Care Model, to all BILH employed primary care practices within five years.
The response also provides an estimate of the patient population for intervention and a
performance improvement target, although the target is based on results achieved by other
provider systems rather than the parties’ own results to-date.293
Expanding primary care
integration from the current 20 integrated practices to an additional 85 employed BILH practices
in five years would be a significant acceleration of the parties’ behavioral health integration
efforts to-date,294
and expansion of this program and Lahey’s centralized behavioral health bed
management system295
could result in improved care for BILH patients.296
b. Pharmacist medication management
The parties describe a care delivery program proposal in which pharmacists in each BILH
hospital would engage high-risk patients to reconcile medications prior to discharge.297
The
information provided in the Parties’ Response, the parties have not provided the HPC with any additional
information about their care delivery plans since April 30, 2018. 291
See Parties’ Response, supra note 14, at 23-25. We note that although the parties describe these proposals as
“actionable commitments,” they also describe them as having received “preliminary endorsement,” and the parties
have not yet made enforceable commitments to enact the proposals or achieve any specific related goals. 292
The parties have not explicitly provided timelines for their care delivery initiatives, but indicate that they expect
to fully achieve the identified impacts “by year five of operation as BILH.” Id. at n. 49. We therefore assume that
these programs will be fully implemented within this timeline, if not sooner. 293
Although the target identified by the parties is expressed as a reduction in medical spending for patients with
behavioral health conditions of 5%-10%, these savings would be generated through improved care management
(e.g., reduced avoidable hospitalizations) that could be tracked as primary results of the intervention. The parties
have not provided information about the results achieved to-date by their primary care practices that have already
adopted the Collaborative Care Model. 294
Documents provided by the parties indicate that they have extended the Collaborative Care Model to one
additional practice per quarter, or four per year, on average in recent years; integrating 85 practices over five years
would therefore be a four-fold increase in this historic rate. The parties have also identified workforce development
as a significant challenge when integrating new practices. Materials provided confidentially to the HPC show that
the parties’ behavioral health working group has discussed further extending the behavioral health integration
program to non-owned primary care offices as a potential second phase of implementation, although it is unclear
whether and on what timeline this might occur. 295
The parties have not yet identified specific performance improvement targets related to the proposed centralized
bed management and placement system, although the response provides statistics on ED boarding at Winchester
after the implementation of such a system. See Parties’ Response, supra note 14, at 39. 296
As discussed in Section III.C.2, this expansion would also likely improve access to behavioral health services. 297
Parties’ Response, supra note 14, at 25, 43.
82
parties identify a goal of reaching all patients discharged with polypharmacy298
at a BILH
hospital, and that 30-day ED visits for these patients post-discharge would decline as a result.299
Some patients in this identified intervention population are likely already benefitting from the
parties’ existing medication reconciliation programs,300
and it is unclear why the parties base
their goal for the proposed program on research literature on similar interventions by other
systems, rather than their own results to-date.301
Nonetheless, the expansion of such a program to
sites where it is not currently implemented may improve patient care.
c. Nurse triage program
The Parties’ Response provides some additional details regarding plans to expand
Lahey’s model of using nurse call lines to appropriately triage care for patients of their PCPs at
times when the primary care office is closed. The parties identify a goal of extending this service
to all employed physician practices within five years,302
although they do not provide underlying
data on the results of this program at Lahey practices to-date, making it impossible to evaluate
their projections of the benefits of extending the program.303
Nonetheless, if the parties
implement this service as described, it may improve patient access to appropriate care and help
to avoid unnecessary utilization.304
d. Post-acute care network development
The parties describe at a high level their plans for integrating and expanding their home
health, skilled nursing, palliative, hospice, rehabilitation, and high-risk geriatric care services.305
As discussed in Section II, the parties’ systems currently include home health care providers, and
each of them has established a network of preferred skilled nursing facilities to help manage
298
Polypharmacy is a term used for patients prescribed multiple medications, although the number of medications
needed to qualify is not universally defined. Nashwa Mansoon et al., What is polypharmacy? A systematic review of
definitions, BMC GERIATRICS (Oct. 10, 2017), available at
https://bmcgeriatr.biomedcentral.com/articles/10.1186/s12877-017-0621-2 (last visited Sept. 24, 2018) (finding that
polypharmacy was most commonly defined as having five or more daily medications, but that definitions ranged
from between two to eleven daily medications). The parties did not indicate how they defined polypharmacy for the
purpose of estimating their patient population for this proposed intervention. 299
Parties’ Response, supra note 14, at n. 62. 300
For example, CHART grant awards to Northeast’s Beverly and Addison Gilbert hospitals helped to fund
interventions for high-risk patients that included the involvement of pharmacists and pharmacist technicians to help
select high-risk patients review and reconcile their medications. It is unclear to what extent similar programs are
already in place at other BILH hospitals. These pilot programs demonstrate the potential benefits of pharmacist-led
interventions, but suggest that some of the potential results projected by the parties may already be being realized.
See also DON NARRATIVE, supra note 31, at 25 (“Within the three current affiliated CINs (BIDCO, LCPN, and
MACIPA), care management is structured and executed differently, from care navigators embedded in primary care
practices to a team of managers led by a pharmacist”). 301
Parties’ Response, supra note 14, at 25, note 62. 302
Id. at 25. 303
As with the expansion of integrated behavioral health care, the parties’ goals for the nurse triage program are
expressed as potential savings, but we assume that these estimates are based on patients avoiding unnecessary
utilization as a result of improved care management. See id. at n. 64. 304
The potential impacts of this proposed program on access to care are also discussed in Section III.C.3. 305
Parties’ Response, supra note 14, at 24, 39-40.

83
patients across settings of care.306
Although the parties identify a specific goal of reducing
hospital readmissions of all patients discharged to skilled nursing facilities from their hospitals
within five years, they have not provided details related to the proposed integration or how it
would improve care beyond the successes of the parties’ current networks.307
The parties also
have not provided information regarding their proposed care management program for high risk
geriatric patients beyond the description at page 40 of the Parties’ Response, making it difficult
to assess whether and to what extent such a program would result in specific quality
improvements, or the extent to which it overlaps with existing care delivery efforts already
underway.
***
The proposed transaction would provide the parties with access to a larger shared pool of
capital, patients, and knowledge that might provide greater opportunities for the development of
quality and care delivery improvement initiatives.308
However, the merger alone is unlikely to
result in quality improvement without well-developed plans for realizing those opportunities.309
306
See id. at 24, 40; DON NARRATIVE, supra note 31, at 29. 307
The parties’ calculation of the potential impact of this program is that, of the 27,115 discharges from BILH
hospitals to skilled nursing facilities, they expect a reduction in readmissions of 6.1%, equivalent to 1,079 avoided
readmissions annually, within five years. HPC analysis of CHIA 2017 hospital discharge data indicates that the
parties’ hospitals discharged approximately 20,000 patients to skilled nursing facilities that year, substantially lower
than the parties’ estimated intervention population. The literature the parties cite for the degree of reduction in
readmission rates as the result of implementing formal skilled nursing facility networks indicates that hospitals with
such a network decreased hospital readmissions by 4.1 percentage points over four years compared to hospitals that
did not (6.1 percentage points as opposed to 1.6 percentage points). The parties provide no data regarding their
independent success to-date in reducing readmissions through developing their current preferred post-acute care
networks. The literature cited by the parties discusses only the impact of newly implemented preferred SNF
networks, not the combination or expansion of existing preferred SNF networks. John McHugh et al., Reducing
Hospital Readmissions Through Preferred Networks Of Skilled Nursing Facilities, 36 HEALTH AFFAIRS 1591, 1593
(Sept. 2017), available at https://www.healthaffairs.org/doi/10.1377/hlthaff.2017.0211 (last visited Sept. 24, 2018)
(study compared four hospitals that had developed formal contractual relationships with skilled nursing facilities
with twelve that “had not adopted post discharge care management approaches that included formal development of
a [skilled nursing facility] network, although several of the hospitals had developed processes to manage patients
discharged to home”). 308
The Parties’ Response states that “[u]nless BILH is formed, many of the Parties will be increasingly challenged
to sustain their current level of investment in clinical services, behavioral health programs, and population health
initiatives…” Parties’ Response, supra note 14, at 4. As discussed in Section II, some of the parties to the proposed
transaction have experienced weak financial performance in recent years relative to prior years, and continued poor
performance may impact their operations in the long term. However, the parties have not provided revised financial
projections for any of their institutions based on their most recent year of performance, and have not indicated how
or to what extent their financial performance may impact their current care delivery programs absent the proposed
transaction. 309
Some scholarly research suggests that mergers that reduce competition can in fact reduce quality. Martin Gaynor
& Robert Town, THE IMPACT OF HOSPITAL CONSOLIDATION - UPDATE, ROBERT WOOD JOHNSON FOUNDATION,
SYNTHESIS PROJECT POLICY BRIEF, no. 9 (2012), available at
https://www.rwjf.org/content/dam/farm/reports/issue_briefs/2012/rwjf73261 (last visited Sept. 24, 2018). In
addition, even where differences in quality performance suggest the potential for quality improvement, as with NE
Baptist’s superior performance on measures related to its core services, quality improvement may be possible
through clinical affiliations and other arrangements that have fewer implications for market functioning than a
corporate merger. See, e.g., 2016 BID CMIR FINAL REPORT, supra note 28, at 78 (discussing the plans among
BIDMC and NE Baptist to extend NE Baptist’s model of care to BIDMC community sites under existing clinical
84
The Parties’ Response provides some details on the potential scope of improvement from four
care delivery programs, as well as goals and timelines by which their success could be measured.
While the parties’ ongoing planning process may result in other specific quality improvement
and care delivery plans, those plans are not yet available for the public to evaluate or sufficiently
developed for the HPC to assess the extent to which they might result in specific improvements.
5. The parties have each participated in various government and commercial payer
alternative payment methodology (APM) contracts and ACOs, although participation in
individual payment models varies by party. The parties are considering plans for
coordinating their APM structures, but it is unclear to what extent they will focus on
expanding their participation in risk-based contracting.
Over the last several years, initiatives at both the state and national level have sought to
increase provider accountability for delivering high-quality, cost-effective, patient-centered care,
including through supporting the adoption of APMs and incentivizing provider participation in
ACOs. When providers participate in these initiatives, they accept responsibility for managing
the health of their attributed patients and meeting risk-adjusted spending targets. We evaluated
the parties’ history of participating in commercial, Medicare, and MassHealth APMs and ACOs.
CMS launched its first ACO demonstration program, the Pioneer ACO model, in 2012.
Both BIDCO and MACIPA were among the original 32 participants. BIDCO remained in the
Pioneer ACO model for four-and-a-half years of the five year program, while MACIPA
participated for three years.310
In 2015, BIDCO earned a quality score of 98.38%, the highest
score of all Pioneer ACOs that year, and MACIPA earned a total quality score of 91.36% in its
last year of participation, which was among the top 5 best scores that year.311
CMS also began its Medicare Shared Savings Program (MSSP) in 2012, which offers
providers a chance to participate in an ACO model without taking on the same level of risk
required of Pioneer and Next Generation ACOs. Lahey has participated in Track 1 of the MSSP
Program since 2013, under which it is able to earn shared savings but is not responsible for
affiliation and joint venture agreements); FED. TRADE COMM., STATEMENT OF THE FEDERAL TRADE COMMISSION IN
THE MATTER OF CABELL HUNTINGTON HOSPITAL, INC., DOCKET NO. 9366 at 2 (July 6, 2016), available
at https://www.ftc.gov/system/files/documents/public_statements/969783/160706cabellcommstmt.pdf (last visited
Sept. 24, 2018) (“We understand that coordination of care has the potential to further key goals of healthcare reform
and consider those benefits when evaluating a provider merger…Claimed benefits, however, are only cognizable if
they are merger-specific. Many of the purported benefits of hospital mergers—including coordination of patient
care, sharing information through electronic medical records, population health management, risk-based contracting,
standardizing care, and joint purchasing—can often be achieved through alternative means that do not impair
competition”). 310
See L&M POLICY RESEARCH, EVALUATION OF CMMI ACCOUNTABLE CARE ORGANIZATION INITIATIVES
(December 2, 2016), available at https://innovation.cms.gov/Files/reports/pioneeraco-finalevalrpt.pdf (last visited
Sept. 24, 2018). 311
CTRS. FOR MEDICAID & MEDICARE SERVICES, MEDICARE PIONEER ACCOUNTABLE CARE ORGANIZATION MODEL
PERFORMANCE YEAR 4 (2015) RESULTS, https://innovation.cms.gov/Files/x/pioneeraco-fncl-py4.pdf (last visited
Sept. 24, 2018); CTRS. FOR MEDICAID & MEDICARE SERVICES, MEDICARE PIONEER ACCOUNTABLE CARE
ORGANIZATION MODEL PERFORMANCE YEAR 3 (2014) RESULTS, https://innovation.cms.gov/Files/x/pioneeraco-fncl-
py3.pdf (last visited Sept. 24, 2018).

85
shared losses.312
Lahey met CMS’s quality performance standard in 2016, the most recent year
for which performance results are available but had the lowest quality score among
Massachusetts MSSP ACOs in that year.313
BIDCO and MACIPA entered the MSSP Program
after leaving the Pioneer ACO model; both were participating in Track 3 as of 2018, under which
they can share in both savings and losses based on performance.
At the state level, MassHealth launched its ACO program for Medicaid beneficiaries in
March 2018.314
BIDCO has partnered with Tufts Health Plan to form an Accountable Care
Partnership Plan (Model A) ACO, though not all BIDCO PCPs are participating in this ACO;
both CHA and Lawrence General have formed their own MassHealth ACOs.315
Model A
MassHealth ACOs require providers to take on the highest level of risk for insured patients.
Lahey has formed an MCO-Administered (Model C) ACO, under which it bears some downside
risk although risk sharing is lower for Model C ACOs than for Model A ACOs.316
In addition,
LHBS is participating in the MassHealth Behavioral Health Community Partner program, under
312
Some research suggests that Track 1 MSSP ACOs overall have resulted in net losses for Medicare, compared to
other MSSP ACOs, which have generated some savings. Press Release, Avalere Health, Medicare Accountable Care
Organizations Have Increased Federal Spending Contrary to Projections that They Would Produce Net Savings
(Mar. 29, 2018), available at http://avalere.com/expertise/managed-care/insights/medicare-accountable-care-
organizations-have-increased-federal-spending-con (last visited Sept. 24, 2018). Lahey achieved savings in the
MSSP program compared to its benchmark in performance years 2014 and 2015, but exceeded benchmark spending
in performance years 2013 and 2016. See Shared Savings Program Accountable Care Organizations (ACO) PUF,
CTRS. FOR MEDICARE & MEDICAID SERVS., https://www.cms.gov/Research-Statistics-Data-and-
Systems/Downloadable-Public-Use-Files/SSPACO/index.html (last visited Sept. 24, 2018) (public use files for
MSSP data, which can be searched for Lahey’s MSSP performance). 313
See CTRS. FOR MEDICAID & MEDICARE SERVICES, 2016 SHARED SAVINGS PROGRAM (SSP) ACCOUNTABLE CARE
ORGANIZATIONS (ACO) PUF, (March 22, 2018), https://data.cms.gov/Special-Programs-Initiatives-Medicare-
Shared-Savin/2016-Shared-Savings-Program-SSP-Accountable-Care-O/3jk5-q6dr, (last visited Sept. 24, 2018)
(Lahey’s quality score in 2016 was 90%). 314
Press Release, Mass. Exec. Office of Health and Human Servs., MassHealth Launches Restructuring To Improve
Health Outcomes for 1.2 Million Members (Mar. 1, 2018), [hereinafter MassHealth Launches Restructuring],
available at https://www.mass.gov/news/masshealth-launches-restructuring-to-improve-health-outcomes-for-12-
million-members (last visited Sept. 24, 2018). The launch of the MassHealth ACO program was preceded by a pilot
one-year program. See Press Release, Mass. Exec. Office of Health and Human Servs., MassHealth Partners with
Six Health Care Organizations to Improve Member Care (Nov. 29, 2016), available at
http://www.mass.gov/eohhs/gov/newsroom/press-releases/eohhs/masshealth-partners-with-six-health-care-
organizations.html (last visited Sept. 24, 2018). 315
See MASS. EXEC. OFFICE OF HEALTH & HUMAN SERVS., MASSHEALTH ENROLLMENT GUIDE at 17, 22 (2018),
available at https://www.masshealthchoices.com/sites/default/files/Documents/EH-MH%20(Rev.%2010-
17)%20Entire%20Guide%20(2)_WEB_110317.pdf (last visited Sept. 24, 2018) (discussing Merrimack Valley
ACO, which includes Lawrence General, and Tufts Health Together with CHA). 316
The base capitation rates in Appendix D of the Model A ACO model contract require ACOs to assume 100% risk
for savings or losses less than or equal to 3% of medical spending (excluding high-cost drugs), and 50% risk for
savings or losses above 3%, while the maximum risk sharing under Section 2.7(C) of the Model C ACO model
contract is 70% of savings or losses below 3% of medical spending (excluding high-cost drugs) and 35% of savings
or losses over 3%. See MASS. EXEC. OFFICE OF HEALTH AND HUMAN SERVS., APPENDIX D: BASE CAPITATION
RATES, Exh. 2 (2017), available at https://www.mass.gov/files/documents/2017/11/17/acpp-appendix-d-base-
capitation-rates.pdf (last visited Sept. 24, 2018); MASS. EXEC. OFFICE OF HEALTH AND HUMAN SERVS., MCO
ADMINISTERED ACO MODEL CONTRACT at Section 2.7(C) (2017), available at
https://www.mass.gov/files/documents/2017/11/17/mco-administered-aco-model-contract.pdf (last visited Sept. 24,
2018).

86
which it will support MassHealth’s commitment to expand substance use disorder treatment.317
MACIPA is not participating in the MassHealth ACO program.
Commercial payers have also been expanding APM contracts in recent years, with
varying levels of shared risk and quality incentives depending on negotiations between payers
and provider organizations. BIDCO, MACIPA, and Lahey all participated in APM contracts with
BCBS, HPHC, and THP for their HMO populations in 2016.318
In addition, Lahey and MACIPA
participated in APM contracts with BCBS for their PPO population; BIDCO did not participate
in APMs for this population.319
The table below summarizes the parties’ participation in the commercial and
government-payer APM arrangements discussed above.
Party Participation in Commercial, Medicare, and Medicaid APMs
Party
2016 Commercial Global Payment Participation
2018 Medicare ACO Status
2018 MassHealth ACO Status
HMO (BCBS, HPHC,
THP)
PPO (BCBS)
BIDCO Yes No MSSP - Track 3 Model A
Lahey Yes Yes MSSP - Track 1 Model C
MACIPA Yes Yes MSSP - Track 3 No
Notes: We limited our examination of commercial global payment participation to HMO products offered by BCBS, HPHC, and THP and PPO products offered by BCBS. The parties may participate in additional commercial global payment arrangements not identified here. Orange shading represents instances in which the party physician group has elected not to participate in an available downside risk arrangement.
In order to participate in these myriad APM arrangements, the parties currently have
multiple commercial, Medicare, and MassHealth ACO governance and management structures
across their institutions. The parties’ planning process includes discussion of the development of
a unified approach to claims data integration, data management and analytics, and system-wide
risk coding and care management practices. These plans may help to integrate and improve care
management systems across BILH’s various entities and contracts, but the proposed plans are not
finalized and do not yet include details such as timelines and necessary resource commitments. It
is also unclear whether the parties will focus primarily on improving performance in current
317
MassHealth Launches Restructuring, supra note 314. 318
See CTR. FOR HEALTH INFO & ANALYSIS, PERFORMANCE OF THE MASSACHUSETTS HEALTH CARE SYSTEM:
ALTERNATIVE PAYMENT METHODS DATABOOK (2017), available at http://www.chiamass.gov/annual-report (last
visited Sept. 24, 2018). 319
Id. In addition to Lahey and MACIPA, Partners, Steward, and Lowell General PHO all participated in the BCBS
PPO APM contract in 2016.

87
APM contracts or seek to expand their participation in APMs that include significant risk sharing
based on quality performance.
***
In summary, we find that, historically, the parties have generally performed comparably
to statewide average performance on applicable and available nationally-endorsed measures of
clinical quality. They have identified some quality metrics for ongoing measurement post-
transaction, but have not yet identified baseline data or transaction-specific quality improvement
goals, except in relation to a few specific proposed care delivery programs. They are also
engaged in a variety of targeted care delivery initiatives. While many of the parties’ plans are
still in development, they have provided more detailed plans for expansion and integration of a
few of these initiatives, and these proposed plans suggest a potential for quality improvement.
The parties currently have systems in place to promote and improve the delivery of high-quality
health care and are considering potential structures for quality oversight and management in the
BILH system. In addition, they have each participated in various government and commercial
payer APMs and ACOs, although participation in individual payment models varies by party.
Based on the information currently available regarding the parties’ plans, there appears to be
some potential for quality improvement as a result of the proposed initiatives described in the
Parties’ Response, although it is unclear whether, to what extent, and on what time frame there
may be any other specific improvements to quality or care delivery as a result of the
transaction.320
If the transaction proceeds, regular public reporting on the implementation and
results of the parties’ proposed care delivery programs and other quality improvement initiatives
would help the public assess whether and to what extent the potential benefits of the transaction
are realized.
C. ACCESS TO CARE
The HPC monitors a variety of factors relating to health care access in its review of
provider material changes, including the “availability and accessibility of services,” “the role of
the provider in serving at-risk, underserved, and government payer patient populations, including
those with behavioral, substance use disorder and mental health conditions,” and “[the provision
of] low margin or negative margin services[.]”321
We examined the parties’ current roles in these
areas and assessed the potential impacts of the proposed transaction on patient access and
whether the parties’ plans address specifically identified community needs. The HPC’s findings
are summarized below:
Payer Mix and Patient Demographics
The proposed BILH-owned hospitals generally have lower Medicaid payer mix
compared to the mix of patients in their service areas and to most competitors,
although some have higher Medicare payer mix. The hospitals that are anticipated
to be BILH contracting affiliates generally have higher Medicaid mix.
320
As discussed in Section II.A, the parties have stated that, in many cases, they are legally restricted from sharing
certain information and further developing their plans while they remain separate corporate entities. 321
MASS. GEN. LAWS ch. 6D, § 13(d)(vi, ix-xii).
88
The proposed BILH-owned hospitals generally provide lower proportions of
inpatient and ED care to non-white patients and Hispanic patients compared to
their service areas and to most competitor systems, and their patients come from
relatively affluent communities on average. The hospitals that are anticipated to
be BILH contracting affiliates generally have a higher proportion of non-white
patients and Hispanic patients, and patients from less affluent areas.
When initially formed, the inpatient Medicaid mix of BILH-owned system
hospitals would be among the lowest of the major systems in eastern
Massachusetts. BILH would serve a generally lower proportion of non-white and
Hispanic inpatient and ED care and a higher proportion of patients who, on
average, come from relatively affluent communities. It is not yet clear whether or
how BILH’s patient mix would change as a result of the proposed transaction,
although the parties do not expect significant changes to their current payer mix,
and they have so far declined to offer any commitments to expand access for
Medicaid patients.
Behavioral Health Services
The proposed BILH-owned hospitals have significant shares of inpatient
psychiatric beds in eastern Massachusetts; the hospitals that are anticipated to be
BILH contracting affiliates also have substantial numbers of psychiatric beds.
The parties provide inpatient detoxification treatment services and a variety of
outpatient behavioral health services, with LHBS being a particularly important
provider north of Boston.
The parties’ integration planning process includes proposals for enhancing
behavioral health services that could improve access to these services.
Access to Other Services
The parties have assessed the health needs of their communities and are
developing plans to expand certain services. While the parties have provided
information suggesting that some of these plans may improve access to care, the
potential impacts of these most of these plans are unclear.
The remainder of this section discusses these findings in greater depth.
1. Payer Mix and Patient Demographics
We examined the payer mix of the parties’ hospitals to identify whether they attract a
larger or smaller share of one type of patient compared to the population of their primary service
areas (PSAs) and compared to other nearby providers. Providers serving high proportions of
patients on government insurance, in particular Medicaid, provide important points of access for

89
patients who often face barriers to accessing care. In addition, a provider’s payer mix may
impact its financial and quality performance due to lower payments by government payers
relative to commercial payers and socioeconomic factors that disproportionately impact the
complexity and health outcomes of government payer patients. These factors can incentivize
providers to try to attract more commercial patients rather than Medicaid patients. We also
examined certain demographic information for the parties’ patient populations, including to what
extent they serve racial and ethnic minorities and whether their patients come from communities
with lower average income levels and high rates of socioeconomic challenges that can create
access barriers.
a. The proposed BILH-owned hospitals generally have lower Medicaid payer mix
than their service areas and most competitors, although some have higher
Medicare payer mix. The hospitals that are anticipated to be BILH contracting
affiliates have higher Medicaid payer mix.
We examined the historical payer mix of the parties’ hospitals compared to the mix of
patients living in their PSAs322
as well as to competitor hospitals.323
We also examined changes
in payer mix over time. These analyses include only care provided by the parties’ general acute
care hospitals, for which data on comparators and the general patient population are available;324
information provided by the parties suggests that their inpatient detox facilities and outpatient
behavioral health services provide substantially higher proportions of care to Medicaid patients,
although we cannot assess whether the parties’ mix of these patients is high relative to others
providers or the general patient population.325
We found that the hospitals proposing to join the BILH-owned system generally have
lower inpatient Medicaid payer mix as compared to the payer mix of their PSAs. As shown
below, all of the parties’ hospitals have a smaller proportion of Medicaid discharges from their
PSAs than the overall proportion of Medicaid discharges for patients living in their PSAs (at all
322
Based on HPC analysis of CHIA hospital discharge data for 2010 through 2017. These data include patient zip
code data, which allow us to determine the extent to which the parties’ hospitals’ inpatient payer mix reflects the
mix of patients living in their service areas. Discharges without complete zip code information were assigned to zip
codes for the purposes of our analyses using information about their city of residence and their chosen hospital. 323
We compared the parties’ hospitals’ payer mix to that of competitors using total inpatient and outpatient charge
data (gross patient service revenue (GPSR)) gathered by CHIA for 2009 through 2016. CHIA HOSPITAL PROFILES
DATABOOK, supra note 143. Because charges do not generally vary based on the insurance type of the patient,
calculating payer mix based on GPSR data allows us to understand the volume of services being provided to patients
with different insurance types, and GPSR data is available for both inpatient and outpatient services. Calculating
payer mix based on revenue received (NPSR) would tend to inflate commercial mix relative to public payers as
commercial rates are generally higher than those of public payers. 324
General acute care hospitals regularly report discharge data and GPSR data to CHIA, allowing the HPC to
compare the payer mix of these hospitals on an equal basis. We lack similarly uniform data to assess the payer mix
of other services, including physician and ambulatory sites not operating under a hospital license, as well as facilities
licensed solely by the Department of Mental Health or the Bureau of Substance Abuse Services (such as the parties’
inpatient detoxification facilities) that do not report discharge data to CHIA. Because Lahey’s Bayridge psychiatric
facility operates under the Northeast general acute care hospital license, Bayridge’s payer mix is included in
Northeast’s figures. 325
See HPC Analysis of the Parties’ Response, supra note 20, at Section IV.

90
hospitals).326
However, a number of the BILH hospitals serve a larger proportion of Medicare
patients. We found similar patterns when we compared the these hospitals’ payer mix to
comparator hospitals using inpatient and outpatient charge data.327
Inpatient Payer Mix in Proposed BILH-owned Hospital PSAs (2017)
Source: CHIA 2017 hospital discharge data. Note: Payer mix for NE Baptist and its PSA are for core orthopedic and musculoskeletal discharges only; see note 149 for a description of NE Baptist’s core services.
326
Anna Jaques and Northeast have Medicaid payer mix relatively close to that of their PSAs. The Parties’ Response
also notes that BIDMC provides support to its clinically affiliated community health centers, which serve a higher
proportion of Medicaid patients, as well as to clinically affiliated community hospitals that have higher Medicaid
payer mix, including Anna Jaques, CHA, and Signature Brockton. Parties’ Response, supra note 14, at 31-33. 327
Based on HPC analysis of gross patient service revenue (GPSR) data from CHIA Hospital Cost Reports for 2009
through 2016. CHIA HOSPITAL PROFILES DATABOOK, supra note 143. See the Data Appendix, Figures 8A through
8E, for graphs showing the parties’ inpatient and outpatient payer mix by GPSR. The proposed BILH-owned
hospitals generally have lower Medicaid payer mix than comparator hospitals, although their Medicaid mix is higher
than most Partners hospitals except for North Shore Medical Center. Northeast has a higher Medicaid payer mix
than the MelroseWakefield Healthcare hospital campuses, Newton-Wellesley Hospital, and Emerson, and BID-
Plymouth has a higher Medicaid mix relative to South Shore Hospital, Brigham and Women’s Faulkner Hospital,
and Newton-Wellesley. Some of the parties’ hospitals have also seen larger increases in Medicaid payer mix than
some comparator hospitals in recent years. The hospitals serving high proportions of Medicare discharges relative to
their PSAs also usually have a higher Medicare mix by GPSR. As discussed in our prior CMIR reports on NE
Baptist joining the BIDCO contracting network, NE Baptist’s Medicaid mix is small and has been growing slowly
over time (its inpatient Medicaid payer mix for its core services in its PSA was less than 1% in 2017), although NE
Baptist has stated its intention to increase its Medicaid payer mix and has opened a specialty clinic focused on
serving Medicaid patients. 2016 BID CMIR FINAL REPORT, supra note 28, at 57-58.
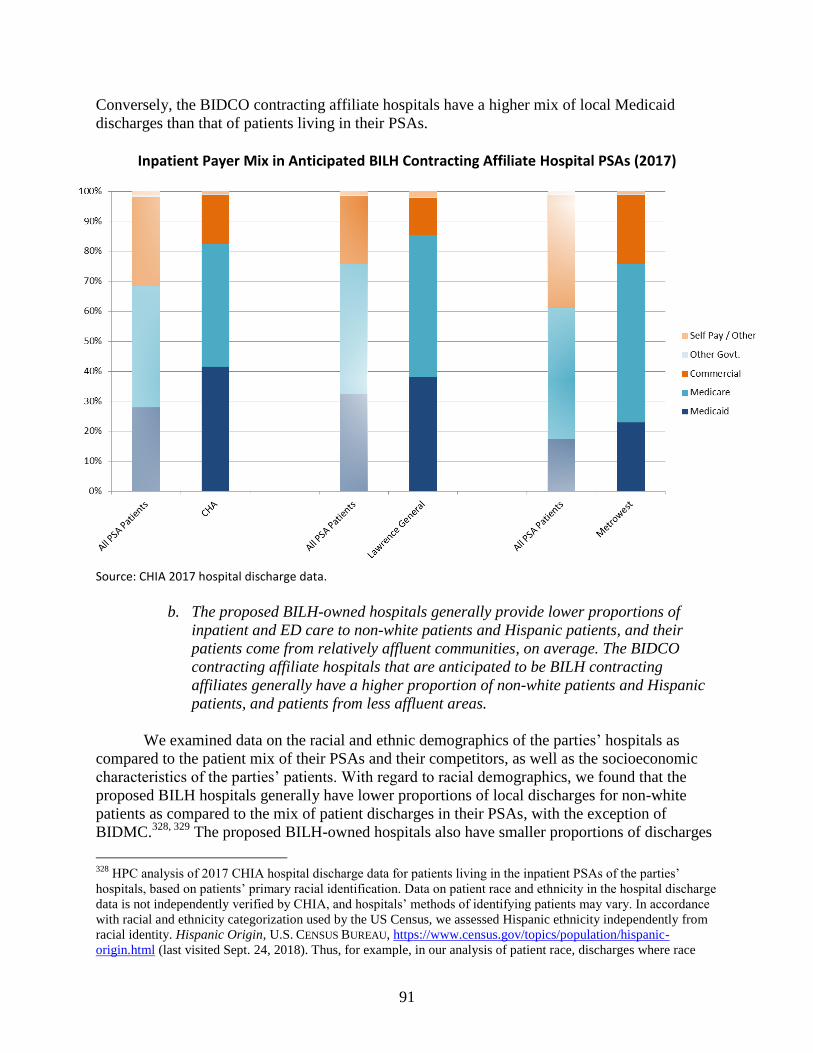
91
Conversely, the BIDCO contracting affiliate hospitals have a higher mix of local Medicaid
discharges than that of patients living in their PSAs.
Inpatient Payer Mix in Anticipated BILH Contracting Affiliate Hospital PSAs (2017)
Source: CHIA 2017 hospital discharge data.
b. The proposed BILH-owned hospitals generally provide lower proportions of
inpatient and ED care to non-white patients and Hispanic patients, and their
patients come from relatively affluent communities, on average. The BIDCO
contracting affiliate hospitals that are anticipated to be BILH contracting
affiliates generally have a higher proportion of non-white patients and Hispanic
patients, and patients from less affluent areas.
We examined data on the racial and ethnic demographics of the parties’ hospitals as
compared to the patient mix of their PSAs and their competitors, as well as the socioeconomic
characteristics of the parties’ patients. With regard to racial demographics, we found that the
proposed BILH hospitals generally have lower proportions of local discharges for non-white
patients as compared to the mix of patient discharges in their PSAs, with the exception of
BIDMC.328, 329
The proposed BILH-owned hospitals also have smaller proportions of discharges
328
HPC analysis of 2017 CHIA hospital discharge data for patients living in the inpatient PSAs of the parties’
hospitals, based on patients’ primary racial identification. Data on patient race and ethnicity in the hospital discharge
data is not independently verified by CHIA, and hospitals’ methods of identifying patients may vary. In accordance
with racial and ethnicity categorization used by the US Census, we assessed Hispanic ethnicity independently from
racial identity. Hispanic Origin, U.S. CENSUS BUREAU, https://www.census.gov/topics/population/hispanic-
origin.html (last visited Sept. 24, 2018). Thus, for example, in our analysis of patient race, discharges where race
92
of Hispanic patients compared to the mix of patients in their PSAs.330
Conversely, the BIDCO
contracting affiliate hospitals that are expected to become BILH contracting affiliates generally
have higher proportions of non-white discharges than the proposed BILH-owned hospitals and
higher proportions of Hispanic discharges than the mix of patients in their PSAs.331
Examining
the racial and ethnic demographics of ED patients for large eastern Massachusetts hospital
systems, we found that all of the hospital systems have larger proportions of ED visits for non-
white patients and Hispanic patients than for inpatient care, but the proposed BILH-owned
hospitals have the lowest proportions of non-white and Hispanic ED patients among the hospital
systems we examined.332
To examine the socioeconomic status of the parties’ patients, we reviewed the average
household income and area deprivation index of the communities where the patients live.333
We
found that patients who received inpatient or ED care at the parties’ hospitals tended to come
from communities with higher average incomes and lower deprivation index scores (indicating
less deprivation).334
We found similar socioeconomic patterns for commercially insured patients
attributable to BIDCO, LCPN, and MACIPA PCPs.335
was categorized as white include both white Hispanic patients as well as white non-Hispanic. See the Data
Appendix, Figure 10A, for more detail on our findings. The parties provided an analysis to the DoN program of the
racial and ethnic demographics of the patients seen at their hospitals. NEWCO DON APPLICANTS, PATIENT PANEL
SUMMARY, NEWCO FY2015 - FY2017 (Jan. 2018), available at
https://www.mass.gov/files/documents/2018/02/12/don-patient-panel-newco.pdf (last visited Sept. 24, 2018). This
analysis includes self-reported data from all facilities on a party hospital license. The party analysis varies from the
HPC analysis in that it counts unique patients that visited each hospital, but it includes non-ED outpatient care in
addition to inpatient and ED visits. Thus, the party analysis describes the demographics of the patients who have
been seen at least once in a given year for care at the parties’ hospitals, while our analysis assesses the proportion of
inpatient and ED services provided to patients of different racial and ethnic backgrounds, including services
provided to patients who had more than one visit to a hospital in a given year. The parties’ analysis indicates that
74.6% of their patient population was white in fiscal year 2017. No comparable data are available for other systems. 329
See Data Appendix, Figure 10A. 330
HPC analysis of 2017 CHIA hospital discharge data, based on patients’ identification as Hispanic or non-
Hispanic. Hispanic identification in patient records may not fully capture all patients who may have language or
cultural barriers to accessing care. See Data Appendix, Figure 10B. 331
See Data Appendix, Figures 10A and 10B. 332
See Data Appendix, Figures 9B and 9D. 333
The area deprivation index is a proxy for socioeconomic deprivation in a community that combines a number of
measures including home values and amenities, employment, poverty, and education levels. It is measured by U.S.
Census block at the 9-digit-zip code level and collapsed to 5 digits in the data we used. Values in Massachusetts
range from 120 (greatest deprivation) in parts of Boston and Springfield to -12 (least deprivation) in Weston. 2017
HPC COST TRENDS REPORT, supra note 126, at 31. 334
Based on HPC analysis of 2017 CHIA hospital discharge and 2016 ED visit data and U.S. Census Bureau
American Community Survey data. See Data Appendix, Figure 11A. 335
HPC analysis of the 2015 APCD and U.S. Census Bureau American Community Survey data. See Data
Appendix, Figure 11B; see also 2017 HPC COST TRENDS REPORT, supra note 126 at 31 (the HPC’s patient
attribution methodology is described at pages 29-30). The statistics for BIDCO published in the Cost Trends Report
and the Data Appendix include some patients attributed to physicians that are part of groups affiliated with the
proposed BILH contracting affiliate hospitals; excluding the patients attributed to CHA and Lawrence General
physicians, the zip-code income of BIDCO patients would be approximately $2,000 higher than the published
statistics for BIDCO, and BIDCO’s average deprivation index would be one point lower.

93
c. When initially formed, the inpatient Medicaid mix of BILH-owned system
hospitals would be among the lowest of the major systems in eastern
Massachusetts. BILH would serve a generally lower proportion of non-white and
Hispanic inpatient and ED care and higher proportion of patients who come from
relatively affluent communities. It is not yet clear whether or how BILH’s patient
mix would change as a result of the proposed transaction, although the parties do
not expect significant changes to their current payer mix, and they have so far
declined to offer any commitments to expand access for Medicaid patients.
When initially formed, the BILH-owned system general acute care hospitals would have
among the lowest combined mix of Medicaid discharges of any of the major hospital systems in
eastern Massachusetts, and BILH’s mix of commercially-insured discharges would be second
only to that of Partners, as shown in the graph below.336, 337
336
Boston Medical Center, not shown in the graph because it has only one hospital, has approximately 53%
Medicaid payer mix and approximately 13% commercial payer mix, and its Medicaid mix has grown by 7.2
percentage points since 2010. Based on HPC analysis of CHIA hospital discharge data, 2010-2017. 337
As discussed in the HPC’s Analysis of the Parties’ Response, the HPC does not currently have access to discharge
data for facilities other than general acute care hospitals. Nonetheless, even if we were to add discharges from
inpatient detox facilities, as provided by the parties in the Parties’ Response, to BILH’s inpatient payer mix without
having comparable data to add for other systems, BILH’s Medicaid mix of 19.7% would still be only slightly higher
than that of Partners, which had 18.6% Medicaid mix in 2017, and BILH’s Medicaid mix would be below the
statewide average of 22.3%. See HPC Analysis of the Parties’ Response, supra note 20, at Section IV.

94
Inpatient Payer Mix of BILH and Comparator Systems (2017 with change since 2010)
Source: HPC analysis of 2010-17 CHIA hospital discharge data. Notes: System payer mix and BILH Contracting Affiliates category payer mix are based on the sum of discharges at component hospitals by payer category. Partners’ payer mix includes contracting affiliate Emerson Hospital. BILH-Owned includes Lahey hospitals, BID-owned hospitals, NE Baptist, Mt. Auburn, and Anna Jaques; BILH Contracting Affiliates includes CHA, Lawrence General, and MetroWest.
BILH-owned hospitals would also provide the lowest proportion of ED care to non-white
patients and the lowest proportion of ED care to Hispanic patients compared to other large
eastern Massachusetts hospital systems.338
BILH-owned hospital patients would also
predominantly come from comparatively affluent areas, as shown below.
338
BILH-owned hospitals would provide a proportion of inpatient care to non-white patients similar to that of
Steward, and the lowest proportion of inpatient care to Hispanic patients compared to other large eastern
Massachusetts hospital systems. See Data Appendix, Figures 9A and 9C.

95
Average Income and Area Deprivation Index of Hospital Patients of BILH and Comparator Systems
Inpatient Care (2017) ED Visits (2016)
System Zip-code income
Average area deprivation index
System
Zip-code income
Average area deprivation index
BILH-Owned $82,503 80 BILH-Owned $81,745 80
All BILH (owned + contracting affiliates)
$80,281 82 Partners $75,165 81
Partners $79,150 81 All BILH (owned + contracting affiliates)
$73,989 84
BILH contracting affiliates
$70,698 88 Wellforce $65,276 92
Wellforce $70,164 90 BILH contracting affiliates
$63,274 91
Steward $67,332 92 Steward $61,229 94
Sources: HPC analysis of 2017 CHIA hospital discharge data; 2016 CHIA ED visit data; U.S. Census Bureau, American Community Survey data.
Patients attributed to BILH PCPs would similarly come from more affluent areas, as shown
below.
Average Income and Area Deprivation Index of Commercially Insured Population Attributed to Provider Organizations (2015)
Zip-code income Average area
deprivation index
Partners $88,340 76.8
All BILH (BIDCO + LCPN + MACIPA) $86,507 76.2
Atrius $86,091 77.0
South Shore $85,507 82.5
Wellforce $82,086 84.9
Reliant Medical Group $80,265 89.9
UMass $74,609 93.7
Steward $71,796 90.3
CMIPA $70,164 95.9
Boston Medical Center $65,518 88.5
Baystate $62,560 99.1
Southcoast $61,679 97.6
Sources: HPC analysis of 2015 APCD claims data; MA-RPO, 2016; SK&A, 2015; U.S. Census Bureau, American Community Survey; see 2017 HPC COST TRENDS REPORT, supra note 126, at 31. Note: See supra note 333 for a description of the area deprivation index. Statistics for All BILH are an average of the component physician networks, weighted by number of attributed patients. BILH figures include patients attributed to physicians affiliated with contracting affiliate hospitals CHA and Lawrence General.
It is unclear how, if at all, the parties’ payer mix and patient demographics might change
as a result of the proposed transaction. The parties have stated that they do not expect the

96
proposed transaction to result in significant changes in payer mix.339
The parties have stated
intentions to improve care for MassHealth members and have identified improving health care
access for low income individuals and racial and ethnic minorities in their service areas as
priorities in their Community Health Needs Assessments (CHNAs) and community health
implementation plans.340
The parties’ statements regarding how they might better serve these
patients as a result of the proposed transaction have primarily referenced BIDCO’s and Lahey’s
current participation in the MassHealth ACO program, clinical affiliations with community
health centers and other providers with high MassHealth payer mix, and other current efforts.341
However, the parties have not yet detailed what new steps BILH might take to enhance patient
access and have so far declined to make commitments to expand their services to more Medicaid
patients. As discussed in Section III.A.8, retaining and attracting new patients are key
components of the parties’ plans. BILH’s advertising, branding, and marketing activities may
influence which patients are attracted to the system, as would BILH’s decisions about where to
invest in developing services across a broad geographic region with varying patient
demographics.342
Given the parties’ expectation that BILH will expand its patient population, it
remains important for them to articulate how they will enhance access for underserved patient
populations as part of the proposed transaction.
Additionally, while the parties have focused on the possibility that additional BILH
patients would be drawn away from relatively large and expensive competitors, at least some of
BILH’s additional patients would likely be drawn from smaller competitors.343
Shifts of
commercial patients away from competitors with already high Medicaid payer mix may
financially stress these hospitals.344
It is also unclear whether contracting affiliates like Lawrence
General and CHA would be impacted by shifts in commercial volume to BILH-owned hospitals.
Although these hospitals would remain contractually affiliated with BIDCO, the parties have
emphasized the need for full corporate integration in order to achieve the reputational and
financial benefits they are seeking, and so it is unclear whether contracting affiliate hospitals like
339
The parties’ projections for BILH assume only that their payer mix will follow broader demographic trends, and
that they will see a higher proportion of Medicare patients as the general population ages. BDO REPORT, supra note
37, at 10. 340
See, e.g., BETH ISRAEL DEACONESS MEDICAL CTR., COMMUNITY HEALTH IMPLEMENTATION PLAN (Sept. 20,
2016), available at https://www.bidmc.org/-/media/files/beth-israel-org/community-benefits/community-health-
implementation-plan.ashx?la=en&hash=34ABD4FEC2D8FBB7D060A94A74351C9EFE4F0699 (last visited Sept.
24, 2018) (identifying racially and ethnically diverse and low-income populations as targets for community health
improvement efforts). 341
DON NARRATIVE, supra note 31, at 33; Parties’ Response, supra note 14, at 30-33. 342
Some research suggests that individuals who are relatively educated, high-income, healthy, young, and able to
travel may be more likely to actively choose their PCP or hospital, suggesting that commercially insured patients
may be more likely to change providers based on changes in provider affiliation and brand. Aafke Victoor et al.,
Determinants of patient choice of healthcare providers: a scoping review, 12 BMC HEALTH SERV RES 272 (2012),
available at https://bmchealthservres.biomedcentral.com/track/pdf/10.1186/1472-6963-12-272 (last visited Sept. 24,
2018). 343
As discussed in Section III.A.8, approximately 45% of BILH’s new commercial inpatient volume obtained
through brand enhancement would likely be drawn from non-Partners hospitals. 344
As discussed in Community Hospitals at a Crossroads, shifts in commercial patient volume from community
hospitals with high public payer mix can be part of a self-perpetuating cycle of challenges. In particular, hospitals
that serve more patients covered by government insurance programs, including the elderly, poor, and/or disabled,
generally have both the lowest commercial relative prices and depend more on lower public payer reimbursements.
CROSSROADS REPORT, supra note 70, at 50.

97
Lawrence General and CHA would share in these benefits, or whether they might face greater
challenges given their continued corporate independence. The Parties’ Response states that
BIDMC’s ability to continue supporting affiliated hospitals will depend on its future financial
performance, which would be improved by the proposed transaction, although the parties provide
no indication of what specific changes may occur as a result of declining or improving
performance.345
2. Behavioral Health Services
Patients seeking behavioral health care have historically experienced barriers to access
due to relatively low reimbursement rates and a lack of provider capacity for both inpatient and
outpatient services. Patients who are able to obtain care often experience long wait times for
inpatient, outpatient, and ambulatory services, and patients with a behavioral health diagnosis are
significantly more likely to spend 12 or more hours in an ED awaiting services (“ED boarding”)
than patients without a behavioral health diagnosis.346
The parties have identified a particular
need for behavioral health services in the communities that they serve.347
In this section, we
examine the inpatient psychiatric bed capacity at the parties’ hospitals, their role in providing
other behavioral health services, and their proposed plans related to behavioral health services.
a. The proposed BILH-owned hospitals have significant shares of inpatient
psychiatric beds in eastern Massachusetts; the hospitals anticipated to be BILH
contracting affiliates also have substantial numbers of psychiatric beds.
As shown below, several of the parties’ hospitals have inpatient psychiatric bed capacity.
Northeast Hospital, which includes the BayRidge psychiatric campus, is particularly notable,
with approximately 3.3% of all licensed eastern Massachusetts psychiatric beds.348
CHA and
MetroWest, which would be BILH contracting affiliates, also have large inpatient psychiatric
capacity, including 16.2% of child and adolescent beds in Eastern Massachusetts.349
In total,
345
Parties’ Response, supra note 14, at 33. We note that BIDMC, the third-largest provider system in the state, has
the largest financial resources of any of the parties, as discussed in Section II.B, and saw improved financial
performance in fiscal year 2017. 346
MASS. HEALTH POLICY COMM’N, BEHAVIORAL HEALTH-RELATED EMERGENCY DEPARTMENT BOARDING IN
MASSACHUSETTS at 14-21 (Nov. 17, 2017), available at http://www.mass.gov/anf/budget-taxes-and-
procurement/oversight-agencies/health-policy-commission/publications/20171113-hpc-ed-boarding-chart-pack.pdf
(last visited Sept. 24, 2018) (Although patients with a behavioral health diagnosis only accounted for 14% of ED
visits in 2015, they accounted for 71% of all ED visits that “boarded” in an ED for an extended period and waited on
average twice as long as other patients. ED boarding is particularly common for younger patients, Medicaid
members, homeless patients, and people from lower-income communities). 347
See, e.g., BETH ISRAEL DEACONESS MEDICAL CENTER, COMMUNITY HEALTH NEEDS ASSESSMENT FINAL REPORT
4-5 (Sept. 20, 2016), [hereinafter BIDMC CHNA], available at https://www.bidmc.org/-/media/files/beth-israel-
org/community-benefits/bidmc-2016-chna-community-health-needs-
assessment.ashx?la=en&hash=250FB0AF225C6F2255CB73C6066A9A82FD054D7F (last visited Sept. 24, 2018)
(finding that community members who are low income, on Medicaid, or uninsured face barriers to accessing
behavioral health providers, and that substance use and mental health issues are a major concern in the community). 348
HPC analysis of MASS. DEPT. OF MENTAL HEALTH, DMH LICENSED HOSPITALS HOSPITAL LISTING (June 18,
2018), available at https://www.mass.gov/files/documents/2018/06/01/dmh-licensed-hospitals-list-june-18.pdf (last
visited Sept. 24, 2018). 349
Id.
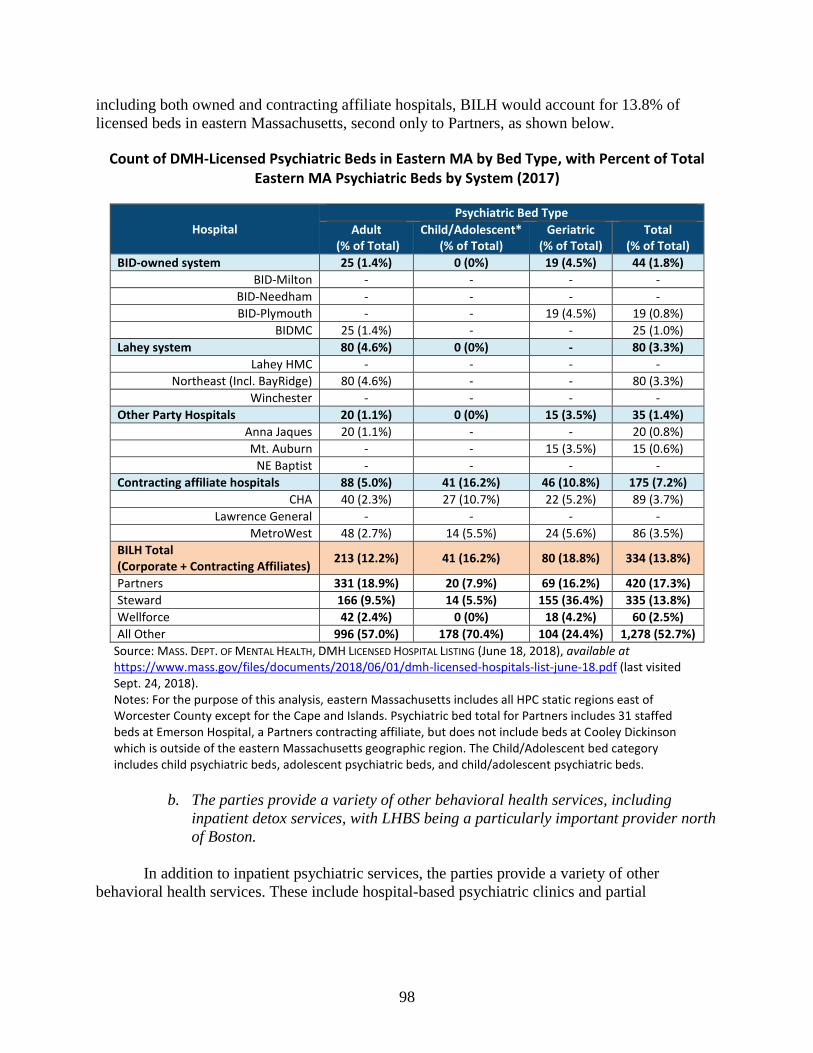
98
including both owned and contracting affiliate hospitals, BILH would account for 13.8% of
licensed beds in eastern Massachusetts, second only to Partners, as shown below.
Count of DMH-Licensed Psychiatric Beds in Eastern MA by Bed Type, with Percent of Total Eastern MA Psychiatric Beds by System (2017)
Hospital
Psychiatric Bed Type
Adult (% of Total)
Child/Adolescent* (% of Total)
Geriatric (% of Total)
Total (% of Total)
BID-owned system 25 (1.4%) 0 (0%) 19 (4.5%) 44 (1.8%)
BID-Milton - - - -
BID-Needham - - - -
BID-Plymouth - - 19 (4.5%) 19 (0.8%)
BIDMC 25 (1.4%) - - 25 (1.0%)
Lahey system 80 (4.6%) 0 (0%) - 80 (3.3%)
Lahey HMC - - - -
Northeast (Incl. BayRidge) 80 (4.6%) - - 80 (3.3%)
Winchester - - - -
Other Party Hospitals 20 (1.1%) 0 (0%) 15 (3.5%) 35 (1.4%)
Anna Jaques 20 (1.1%) - - 20 (0.8%)
Mt. Auburn - - 15 (3.5%) 15 (0.6%)
NE Baptist - - - -
Contracting affiliate hospitals 88 (5.0%) 41 (16.2%) 46 (10.8%) 175 (7.2%)
CHA 40 (2.3%) 27 (10.7%) 22 (5.2%) 89 (3.7%)
Lawrence General - - - -
MetroWest 48 (2.7%) 14 (5.5%) 24 (5.6%) 86 (3.5%)
BILH Total (Corporate + Contracting Affiliates)
213 (12.2%) 41 (16.2%) 80 (18.8%) 334 (13.8%)
Partners 331 (18.9%) 20 (7.9%) 69 (16.2%) 420 (17.3%)
Steward 166 (9.5%) 14 (5.5%) 155 (36.4%) 335 (13.8%)
Wellforce 42 (2.4%) 0 (0%) 18 (4.2%) 60 (2.5%)
All Other 996 (57.0%) 178 (70.4%) 104 (24.4%) 1,278 (52.7%)
Source: MASS. DEPT. OF MENTAL HEALTH, DMH LICENSED HOSPITAL LISTING (June 18, 2018), available at https://www.mass.gov/files/documents/2018/06/01/dmh-licensed-hospitals-list-june-18.pdf (last visited Sept. 24, 2018). Notes: For the purpose of this analysis, eastern Massachusetts includes all HPC static regions east of Worcester County except for the Cape and Islands. Psychiatric bed total for Partners includes 31 staffed beds at Emerson Hospital, a Partners contracting affiliate, but does not include beds at Cooley Dickinson which is outside of the eastern Massachusetts geographic region. The Child/Adolescent bed category includes child psychiatric beds, adolescent psychiatric beds, and child/adolescent psychiatric beds.
b. The parties provide a variety of other behavioral health services, including
inpatient detox services, with LHBS being a particularly important provider north
of Boston.
In addition to inpatient psychiatric services, the parties provide a variety of other
behavioral health services. These include hospital-based psychiatric clinics and partial
99
hospitalization programs at some of the parties’ hospitals,350
as well as collaborations with local
behavioral health care providers.351
Lahey’s BayRidge Hospital provides outpatient psychiatric
and substance use disorder treatment,352
and as noted in Section II.F, Lahey Health Behavioral
Services (LHBS) is a component of the Lahey system focused on behavioral health services.353
LHBS provides services including inpatient and outpatient addiction treatment, outpatient
counseling, children’s behavioral health services, psychiatric emergency services, and youth
residential programs354
in a number of locations across the North Shore and Merrimack
Valley.355
LHBS facilities account for approximately 15% of all licensed inpatient detoxification
beds in the state, as well as 17% of transitional support services beds.356
LHBS also began
participating in the MassHealth ACO program as a behavioral health community partner in 2018,
supporting MassHealth’s commitment to expand substance misuse disorder treatment.357
We also found, based on a review of physician rosters submitted to the HPC, that the
parties collectively contract on behalf of approximately 14% of all physicians with a behavioral
health specialty in our data.358
As these data do not include non-physician providers, this
percentage likely does not reflect the parties’ share of all behavioral health clinicians,359
yet still
350
Psychiatry Clinics, BETH ISRAEL DEACONESS MEDICAL CENTER, https://www.bidmc.org/centers-and-
departments/psychiatry/ambulatory-service (last visited Sept. 24, 2018); Psychiatry and Behavioral Medicine,
LAHEY HEALTH SYSTEM, https://www.lahey.org/Psychiatry/ (last visited Sept. 24, 2018); Behavioral Health,
MOUNT AUBURN HOSPITAL, https://www.mountauburnhospital.org/care-treatment/behavioral-health/ (last visited
Sept. 24, 2018). 351
Integrated Healthcare & Substance Use Collaborative, BETH ISRAEL DEACONESS HOSPITAL PLYMOUTH,
http://www.bidplymouth.org/ici (last visited Sept. 24, 2018). 352
BayRidge Hospital Overview of Services, LAHEY HEALTH SYSTEM, https://www.beverlyhospital.org/locations--
services/locations/bayridge-hospital/overview-of-services (last visited Sept. 24, 2018). 353
DON NARRATIVE, supra note 31, at 22-23; Lahey Health Behavioral Services, LAHEY HEALTH SYSTEM
http://www.nebhealth.org/ (last visited Sept. 24, 2018). 354
Lahey Health Behavioral Services, Description of Services, LAHEY HEALTH SYSTEM,
http://www.nebhealth.org/about-lhbs/services-described/ (last visited Sept. 24, 2018). 355
Lahey Health Behavioral Services, Services and Locations, LAHEY HEALTH SYSTEM,
http://www.nebhealth.org/services-locations/ (last visited Sept. 24, 2018). 356
HPC analysis of data provided by the Massachusetts Bureau of Substance Abuse Services (BSAS). Percentages
based on share of all BSAS licensed medically monitored detoxification level 3.7 beds, and share of all transitional
support services beds licensed by BSAS. 357
Lahey MassHealth ACO, LAHEY HEALTH SYSTEM, http://www.laheyhealth.org/what-we-offer/lahey-masshealth-
aco (last visited Sept. 24, 2018); DON NARRATIVE, supra note 31, at 33; Press Release, Mass. Exec. Office of Health
and Human Servs, MassHealth Partners with 18 Health Care Organizations to Improve Health Care Outcomes for
Members (June 8, 2017), available at https://www.mass.gov/news/masshealth-partners-with-18-health-care-
organizations-to-improve-health-care-outcomes-for (last visited Sept. 24, 2018); Press Release, Mass. Exec. Office
of Health and Human Servs, MassHealth Selects 26 Community Partners to Help Improve Health Care for 60,000
Members (Aug. 28, 2017), available at http://www.mass.gov/eohhs/gov/newsroom/press-releases/eohhs/masshealth-
selects-26-community-partners.html (last visited Sept. 24, 2018). 358
Based on physician rosters provided to the MA-RPO program. Counts were limited to physicians with one of 40
behavioral health related primary or secondary specialties. Of the 1,304 physicians with one of these behavioral
health specialties identified in MA-RPO data, BIDCO listed 135 physicians, MACIPA listed 32 physicians, and
Lahey listed 17 physicians. 359
We also analyzed another clinician database, SK&A, which includes some allied health professionals, nurse
practitioners, and other non-physician providers. Of the 2,356 behavioral health physician and non-physician
clinicians we identified in the 2015 data, 50 were associated with Lahey hospitals, 45 with BIDMC hospitals, 11
with Mt. Auburn, and 3 with NE Baptist. 39 additional behavioral health clinicians were associated with BIDCO
hospital members that are anticipated to be BILH contracting affiliates.
https://www.beverlyhospital.org/locations--services/locations/bayridge-hospital/overview-of-services

100
suggests that they have a sizeable behavioral health workforce. The parties and other providers in
Massachusetts have cited difficulties finding qualified behavioral health clinicians as one of the
barriers to expanding these services.360
c. The parties’ integration planning process includes proposals for enhancing
behavioral health services that could improve access to these services.
Recognizing the parties’ important role in providing behavioral health services, as
described above, it is critical that the parties maintain and, ideally, expand and enhance these
services. The parties have stated that BILH would undertake a number of activities to increase
the accessibility of care within the BILH service area, including by enhancing their behavioral
health care offerings.361
The parties are engaged in an ongoing integration planning process that
includes behavioral health service planning. As discussed in the Parties’ Response, the parties
propose to expand behavioral health integration to all BILH employed physician practices within
five years362
and are developing plans to expand a centralized system for behavioral health triage
and admissions developed by Lahey to all of the parties’ hospitals.363
Additionally, the parties
have developed some projections for the financial sustainability of these services in a system
through risk sharing incentives. Although there are still some outstanding questions about the
details of these plans,364
if BILH is able to implement these plans as described, using the
resources of a combined BILH system, they would increase access to behavioral health
services.365, 366
3. Access to Other Services
The parties have emphasized their work to date in addressing the needs of patients in
their communities. The parties have assessed community need through CHNAs conducted by
their hospitals, as well as through studies of population health data. In general, the parties’
360
See, e.g., Testimony to the Health Policy Commission Re: Health Care Cost Growth Benchmark,
MASSACHUSETTS ASSOCIATION OF BEHAVIORAL HEALTH SYSTEMS (Mar. 29, 2018), available at
https://www.mass.gov/files/documents/2018/04/03/TestimonyHealthPolicyCommissionMarch2018finalpdf_0.pdf
(last visited Sept. 24, 2018) (citing difficulties recruiting psychiatrists, particularly for inpatient psychiatric units). 361
DON NARRATIVE, supra note 31, at 13, 22-23; Parties’ Response, supra note 14, at 37-39. 362
Materials provided confidentially to the HPC show that the parties’ behavioral health working group has
discussed further extending the behavioral health integration program to non-owned primary care offices as a
potential second phase of implementation, although it is unclear whether and on what timeline this might occur. 363
See Parties’ Response, supra note 14, at 23-24, 37-39. 364
For example, expanding primary care integration from the current 20 practices to an additional 85 employed
BILH practices in five years would be a four-fold increase in the rate of the parties’ behavioral health integration
efforts to-date, and the parties have identified potential challenges in recruiting qualified physicians and support
staff. 365
Such investments may also reduce overall medical spending for patients with behavioral health diagnoses, as
discussed in Section III.A.8. 366
The Parties’ Response states that “Without BILH, Lahey faces financial challenges that will limit its ability to
continue to provide [innovative behavioral health] services.” Parties’ Response, supra note 14, at 5. As discussed in
Section II.F, Lahey’s financial performance in fiscal year 2017 was poor, but Lahey expects to return to at least
break-even performance beginning in fiscal year 2019. While BILH would have a greater pool of resources with
which to support and expand behavioral health programs, the parties have not provided information sufficient to
assess whether or to what extent Lahey’s current behavioral health services may be limited if it continues as an
independent entity.
101
CHNAs indicate that mental health, substance use disorders, and chronic conditions are among
the most pressing health issues facing their communities. In addition, community members often
mentioned that Medicaid, behavioral health, and substance use disorder patients frequently had
difficulty accessing PCP, specialist, and behavioral health services.367
The assessments found
that social determinants such as economic instability, low levels of educational attainment, high
rates of violence, and limited transportation options are important factors that limit the ability of
community members to care for their own health.368
The parties have stated that BILH would undertake a number of activities to increase the
accessibility of care within the BILH service area, including enhancing the parties’ primary care
and urgent care offerings, expanding after-hours care coverage, expanding musculoskeletal and
other specialty services at community hospitals, streamlining patient scheduling and referrals,
and working with local community partners and patient-centered medical homes.369
They have
also noted that, as a corporately integrated system, they would be better able to pool and allocate
resources for such investments.
The parties’ ongoing planning process includes planning teams developing some
proposals related to these potential service expansions. In some areas, such as primary care
development, the parties’ proposals, if further developed and enacted, might lead to
improvements in access to care that align with identified community needs. The parties have
noted their prior work to expand such services within their existing systems.370
The parties have
also proposed centralized scheduling and referral services that may improve the ease with which
patients can make appointments and arrange to transfer records between BILH providers, as well
as making a call line available to all patients of employed PCPs that would allow nurses to
appropriately triage care when the primary care office is closed.371
However, in other areas it is
not clear whether the plans would duplicate already available services; in some cases the parties’
plans have focused on how service expansions would contribute to patient retention, rather than
whether they would provide access to services not otherwise available.372
367
See, e.g., BIDMC CHNA, supra note 347, at 4-5 (finding that community members who are low income, on
Medicaid, or uninsured face barriers to accessing PCPs, specialists, oral care providers, and behavioral health
providers, and that substance use and mental health issues are a major concern in the community). 368
See, e.g., LAHEY HOSPITAL & MEDICAL CENTER, COMMUNITY HEALTH NEEDS ASSESSMENT 4-6 (2016), available
at
https://www.lahey.org/uploadedfiles/Content/About_Lahey/In_the_Community/LHMC%20Master%20Report%20a
nd%20Appendices.pdf (last visited Sept. 24, 2018) (stating that a dominant theme of interviews with community
members was the impact of social determinants, particularly on vulnerable community members). 369
DON NARRATIVE, supra note 31, at 5, 13, 15, 21, 40; Parties’ Response, supra note 14, at 41-44. 370
For example, BIDMC has recruited PCPs to practice in the service areas of Anna Jaques and BID-owned
community hospitals, and Lahey has made investments in expanding behavioral health services, including building
behavioral health focused space into Lahey HMC’s newly renovated ED. Press Release, Lahey Health, New
Emergency Department Unveiled in Burlington (Jan. 25, 2017), available at http://www.laheyhealth.org/media-
room/press-releases/2017/new-emergency-department-unveiled-in-burlington (last visited Sept. 24, 2018). 371
The nurse triage program is discussed in more detail in Section III.B.4. See also, Parties’ Response, supra note
14, at 41, 44. 372
The parties have highlighted their past investments in specialty services at community hospitals, including
surgical services and cancer care. DON NARRATIVE, supra note 31, at 20-21. As the parties state, these investments
may provide financial benefits to community hospitals and may reduce health care spending if they attract patients
who would otherwise seek these services at higher-priced hospitals. It is not clear, however, to what extent these
investments have filled gaps in care not otherwise available to patients.
102
Because the parties’ planning process is ongoing, most of their plans do not yet include
key details that would help the public assess the potential impacts of the transaction on access to
care. These include specific locations where expansions would occur, assessments of current
provider capacity for the relevant services, the number and type of clinicians needed to support
new services, other resource commitments necessary to support any expansions, and timelines
for expansion.373
The parties’ more well-developed plans to expand a nurse triage line to cover
all employed practices within five years may improve access to appropriate care for patients of
those practices.
***
In summary, we find that the parties’ hospitals generally have relatively low Medicaid
payer mix, that they generally provide lower proportions of inpatient and ED care to non-white
patients and Hispanic patients than other large eastern Massachusetts hospital systems, and that
their patients come from relatively affluent areas on average. The parties have stated that they do
not expect significant changes to their current payer mix and have not articulated how they
would enhance access for underserved patient populations as part of the proposed transaction.
The parties are important providers of behavioral health services in eastern Massachusetts and
have provided some proposals for enhancing behavioral health services that could result in
improved access to these services. In addition, the parties are developing plans to expand certain
other services, but while some of these plans may result in improvements in access, most do not
yet include key details that would help the public assess the potential impacts of the transaction
on access to care.
373
As discussed in Section II.A, the parties have stated that, in many cases, they are legally restricted from sharing
certain information and further developing their plans while they remain separate corporate entities. The Parties’
Response states that the parties’ working groups have been engaged in “implementation work planning, and
preparations for Day 1.” Parties’ Response, supra note 14, at 37.

103
IV. CONCLUSION
As described in Section III, the HPC found:
1. Cost and Market: The parties have historically had low to moderate prices and moderate
spending levels compared to other Massachusetts providers. However, after the
transaction, BILH’s market share would nearly equal that of Partners, market
concentration would increase substantially, and BILH would have significantly enhanced
bargaining leverage with commercial payers. BILH’s enhanced bargaining leverage
would enable it to substantially increase commercial prices that could increase total
health care spending by an estimated $128.4 million to $170.8 million annually for
inpatient, outpatient, and adult primary care services. Additional spending impacts would
be likely for other services; for example, spending for specialty physician services could
increase by an additional $29.8 million to $59.7 million annually if the parties obtain
similar price increases for these services. These would be in addition to the price
increases the parties would have otherwise received. These figures are likely to be
conservative. The parties could obtain these projected price increases, significantly
increasing health care spending, while remaining lower-priced than Partners.
Plans to shift care to BILH from other providers and to lower-cost settings within the
BILH system would generally be cost-reducing and proposed care delivery programs
may also result in savings, but there is no reasonable scenario in which such savings
would offset spending increases if BILH obtains the projected price increases. Achieving
all of the parties’ care redirection goals could save approximately $8.7 million to $13.6
million annually at current price levels, or $5.3 million to $9.8 million annually with
projected price increases. The scope of care delivery savings is uncertain; however, the
parties have estimated that their care delivery plans will save an additional $52 million to
$87 million. The parties have stated that BILH would achieve internal savings and new
revenue that would allow them to invest in these plans and enable BILH to be financially
successful without significant price increases. Nonetheless, to date, the parties have
declined to offer any commitments to limit future price increases.
2. Quality and Care Delivery: Historically, the parties have generally performed
comparably to statewide average performance on hospital and ambulatory measures of
clinical quality. The parties have identified some quality metrics for ongoing
measurement post-transaction but have not yet identified baseline data or transaction-
specific quality improvement goals, except in relation to a few specific care delivery
proposals. They are considering plans for integrating their unique quality oversight and
management structures and have stated an intention to expand or integrate current care
delivery initiatives. While most of these plans are still in development, the parties have
provided more detailed plans for a few of these initiatives, and these proposals suggest a
potential for quality improvement.
3. Access to Care: Based on the current patient mix of the proposed BILH-owned hospitals,
the BILH-owned system would have among the lowest mix of Medicaid discharges and
proportion of discharges and ED visits for non-white patients and Hispanic patients
104
compared to other large eastern Massachusetts hospital systems. BILH’s patients, on
average, would also come from more affluent communities. It is not yet clear whether or
how BILH’s patient mix would change as a result of the proposed transaction, although
the parties do not expect significant changes to their current payer mix, and they have so
far declined to offer any commitments to expand access for Medicaid patients. The
parties are important providers of behavioral health services in eastern Massachusetts,
and while many of the parties’ plans for how they might expand clinical services are still
under development, the parties have provided some plans for expanding behavioral health
services that have the potential to enhance access to these services.
In summary, while the BILH parties have historically been low-priced to mid-priced and
have not increased their prices relative to the market as they have grown through smaller
transactions to date, the BILH transaction is likely to enable the parties to obtain significantly
higher commercial prices across inpatient, outpatient, and physician services. Achieving all of
the parties’ goals for their proposed care delivery programs and for shifting patients to lower-cost
settings would result in savings, but these savings would be less than the impact of projected
price increases as a result of the parties’ enhanced bargaining leverage. To date, the parties have
not committed to constraining future price increases, despite the fact that their own financial
projections indicate that they expect internal efficiencies and new revenue that would allow
BILH to invest in its proposed care delivery programs and enable BILH to be profitable without
significant price increases.
The parties also claim that the transaction would result in improvements in the quality of
patient care and access to services and are developing plans in these areas. Most of the plans
provided by the parties are not sufficiently detailed for the HPC to robustly assess the likelihood
or degree to which they would result in improvements to health care quality or access; however,
the initiatives for which the parties have provided details have the potential to improve care
delivery and access to needed services, particularly behavioral health, if implemented as
described.
Based on these findings, the HPC concludes that the transaction warrants further review
and refers this report to the Attorney General to assess whether there are enforceable steps that
the parties may take to mitigate concerns about the potential for significant price increases and
maximize the likelihood that BILH will enhance access to high quality care, particularly for
underserved populations. The HPC additionally recommends that the Commissioner of the
Department of Public Health reconsider the approval with conditions of the Determination of
Need Application NEWCO-17082413-TO and assess the need for additional or revised
conditions to ensure that the applicable Determination of Need factors are met.

Data Appendix
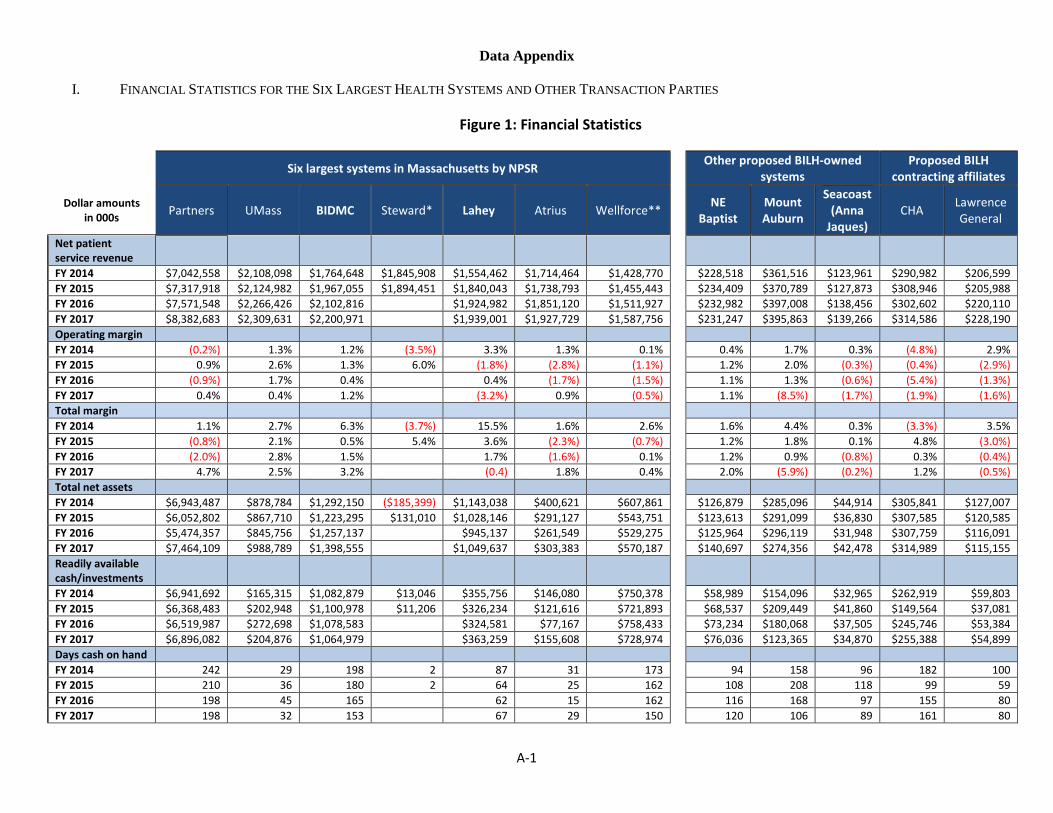
A-1
Data Appendix
I. FINANCIAL STATISTICS FOR THE SIX LARGEST HEALTH SYSTEMS AND OTHER TRANSACTION PARTIES
Figure 1: Financial Statistics
Six largest systems in Massachusetts by NPSR Other proposed BILH-owned
systems Proposed BILH
contracting affiliates
Dollar amounts in 000s
Partners UMass BIDMC Steward* Lahey Atrius Wellforce** NE
Baptist Mount Auburn
Seacoast (Anna
Jaques) CHA
Lawrence General
Net patient service revenue FY 2014 $7,042,558 $2,108,098 $1,764,648 $1,845,908 $1,554,462 $1,714,464 $1,428,770 $228,518 $361,516 $123,961 $290,982 $206,599
FY 2015 $7,317,918 $2,124,982 $1,967,055 $1,894,451 $1,840,043 $1,738,793 $1,455,443 $234,409 $370,789 $127,873 $308,946 $205,988
FY 2016 $7,571,548 $2,266,426 $2,102,816 $1,924,982 $1,851,120 $1,511,927 $232,982 $397,008 $138,456 $302,602 $220,110
FY 2017 $8,382,683 $2,309,631 $2,200,971 $1,939,001 $1,927,729 $1,587,756 $231,247 $395,863 $139,266 $314,586 $228,190
Operating margin
FY 2014 (0.2%) 1.3% 1.2% (3.5%) 3.3% 1.3% 0.1% 0.4% 1.7% 0.3% (4.8%) 2.9%
FY 2015 0.9% 2.6% 1.3% 6.0% (1.8%) (2.8%) (1.1%) 1.2% 2.0% (0.3%) (0.4%) (2.9%)
FY 2016 (0.9%) 1.7% 0.4% 0.4% (1.7%) (1.5%) 1.1% 1.3% (0.6%) (5.4%) (1.3%)
FY 2017 0.4% 0.4% 1.2% (3.2%) 0.9% (0.5%) 1.1% (8.5%) (1.7%) (1.9%) (1.6%)
Total margin
FY 2014 1.1% 2.7% 6.3% (3.7%) 15.5% 1.6% 2.6% 1.6% 4.4% 0.3% (3.3%) 3.5%
FY 2015 (0.8%) 2.1% 0.5% 5.4% 3.6% (2.3%) (0.7%) 1.2% 1.8% 0.1% 4.8% (3.0%)
FY 2016 (2.0%) 2.8% 1.5% 1.7% (1.6%) 0.1% 1.2% 0.9% (0.8%) 0.3% (0.4%)
FY 2017 4.7% 2.5% 3.2% (0.4) 1.8% 0.4% 2.0% (5.9%) (0.2%) 1.2% (0.5%)
Total net assets
FY 2014 $6,943,487 $878,784 $1,292,150 ($185,399) $1,143,038 $400,621 $607,861 $126,879 $285,096 $44,914 $305,841 $127,007
FY 2015 $6,052,802 $867,710 $1,223,295 $131,010 $1,028,146 $291,127 $543,751 $123,613 $291,099 $36,830 $307,585 $120,585
FY 2016 $5,474,357 $845,756 $1,257,137 $945,137 $261,549 $529,275 $125,964 $296,119 $31,948 $307,759 $116,091
FY 2017 $7,464,109 $988,789 $1,398,555 $1,049,637 $303,383 $570,187 $140,697 $274,356 $42,478 $314,989 $115,155
Readily available cash/investments
FY 2014 $6,941,692 $165,315 $1,082,879 $13,046 $355,756 $146,080 $750,378 $58,989 $154,096 $32,965 $262,919 $59,803
FY 2015 $6,368,483 $202,948 $1,100,978 $11,206 $326,234 $121,616 $721,893 $68,537 $209,449 $41,860 $149,564 $37,081
FY 2016 $6,519,987 $272,698 $1,078,583 $324,581 $77,167 $758,433 $73,234 $180,068 $37,505 $245,746 $53,384
FY 2017 $6,896,082 $204,876 $1,064,979 $363,259 $155,608 $728,974 $76,036 $123,365 $34,870 $255,388 $54,899
Days cash on hand
FY 2014 242 29 198 2 87 31 173 94 158 96 182 100
FY 2015 210 36 180 2 64 25 162 108 208 118 99 59
FY 2016 198 45 165 62 15 162 116 168 97 155 80
FY 2017 198 32 153 67 29 150 120 106 89 161 80

A-2
Dollar amounts in 000s
Partners UMass BIDMC Steward* Lahey Atrius Wellforce** NE
Baptist Mount Auburn
Seacoast (Anna
Jaques) CHA
Lawrence General
Current ratio
FY 2014 2.66 1.76 3.15 0.79 1.56 1.25 1.89 3.58 4.70 3.28 2.86 3.00
FY 2015 2.26 1.52 3.04 0.79 1.33 1.01 1.92 3.44 4.67 2.73 3.67 2.17
FY 2016 2.00 1.38 3.06 1.42 0.88 1.94 3.82 4.52 2.57 3.45 1.78
FY 2017 1.98 1.25 3.10 1.41 1.31 1.31 4.33 3.25 2.80 3.62 1.88
Debt to capitalization
FY 2014 0.36 0.31 0.27 1.81 0.31 0.27 0.49 0.41 0.27 0.34 0.27 0.32
FY 2015 0.42 0.33 0.27 0.78 0.33 0.32 0.52 0.40 0.34 0.41 0.03 0.38
FY 2016 0.48 0.34 0.25 0.37 0.39 0.53 0.33 0.34 0.44 0.02 0.45
FY 2017 0.40 0.37 0.22 0.34 0.34 0.54 0.29 0.34 0.35 0.00 0.45
Equity to assets
FY 2014 0.47 0.42 0.55 (0.15) 0.48 0.38 0.35 0.52 0.62 0.42 0.63 0.58
FY 2015 0.40 0.39 0.52 0.11 0.44 0.38 0.32 0.51 0.56 0.34 0.61 0.51
FY 2016 0.34 0.37 0.53 0.39 0.35 0.31 0.56 0.57 0.29 0.60 0.45
FY 2017 0.44 0.40 0.58 0.43 0.39 0.31 0.62 0.55 0.39 0.61 0.43
Average age of plant
FY 2014 7.4 10.9 18.3 N/A 11.7 9.0 12.0 11.7 16.8 15.5 11.3 10.3
FY 2015 7.6 10.6 18.0 N/A 9.3 10.3 12.6 11.8 17.6 16.6 13.6 10.3
FY 2016 7.4 10.0 18.6 9.3 11.3 13.6 13.4 18.3 18.0 16.4 10.5
FY 2017 7.4 10.4 19.2 10.3 12.4 14.3 15.3 15.9 18.4 18.4 10.0
Sources: HPC analysis of audited financial statements provided by Non-Profits & Charities Document Search, OFFICE OF ATT’Y. GEN. MAURA HEALEY, http://www.charities.ago.state.ma.us/ (last visited Sept. 14, 2018). Full audited financial statements were not available for Steward; the HPC therefore reviewed financial information on Steward published by the AGO as part of its assessment and monitoring efforts, as well as redacted financial information provided to the MA-RPO program. See OFFICE OF ATT’Y. GEN. MAURA HEALEY, REPORTS ON STEWARD HEALTH CARE SYSTEM PURSUANT TO 2010 AND 2011 ASSESSMENT & MONITORING AGREEMENTS 33-38 (Dec. 30, 2015), available at http://www.mass.gov/ago/docs/healthcare/shcs-report-123015.pdf. Notes:
(*) No fiscal year 2016 or 2017 data are available for Steward. Because of its status as a for-profit subsidiary of a private equity firm, Steward’s balance sheet assets differ significantly from those of nonprofit health care systems; some details of Steward’s debt structure are discussed in the AGO’s monitoring report, referenced above.
(**) Wellforce did not have consolidated audited financial statements for these fiscal years. The above information was calculated by the HPC by combining the amounts from audited financial statements of Tufts Medical Center, Hallmark Health (now MelroseWakefield Healthcare), and Circle Health, the three provider organizations that are part of Wellforce.
(1) Net patient service revenue (NPSR) is the provider’s total revenue from inpatient, outpatient and other patient care services, after deductions for charity care charges, bad debts, and contractual adjustments. (2) Operating margin is a measure of financial performance and represents the system’s income or loss from patient care services and other operations. (3) Total margin is another measure of financial performance and represents the system’s overall gain or loss from all operating and non-operating activities. (4) Total net assets are the system’s total assets minus its liabilities. (5) Readily available cash/investments refer to cash and investments that may be readily converted to cash, whose use is not restricted, limited contractually, or limited by an external party. Variations in providers’
methods of reporting their assets may affect these figures. (6) Days cash on hand is a measure of liquidity and represents the number of days of operating expenses that the system could pay with its readily available cash/investments. (7) Current ratio measures the system’s ability to meet its current liabilities with its current assets; a ratio of 1.0 or higher indicates that all current liabilities could be covered by the system’s existing current assets. (8) Debt to capitalization is the ratio of the system’s long-term debt to its total net assets, a measure of how much of the system’s assets are financed by borrowing. (9) Equity to assets is the ratio of the system’s total net assets to its total assets, a comparison of the system’s assets to its debts. (10) Average age of plant is intended to measure the average age of the system’s facilities, including capital improvements and major equipment purchases. Steward’s age of plant is not included because
comparable data were not available.
A-3
II. RELATIVE PRICE CHARTS
A. INPATIENT RELATIVE PRICE1
Figure 2A: Inpatient Relative Price (BCBS 2016)
Source: HPC analysis of CTR. FOR HEALTH INFO. & ANALYSIS, PROVIDER PRICE VARIATION IN THE MASSACHUSETTS HEALTH CARE MARKET
(CALENDAR YEAR 2016 DATA) (APRIL 2018), available at http://www.chiamass.gov/assets/docs/r/pubs/18/Relative-Price-Databook-2018.xlsx (last visited July 3, 2018). Note: Comparators listed from top to bottom. BIDMC, Lahey HMC, and NE Baptist AMC Comparators: Brigham & Women’s Hospital, Massachusetts General Hospital, Tufts Medical Center, Boston Medical Center; NE Baptist Community Hospital Comparators: Newton-Wellesley Hospital, North Shore Medical Center, Brigham & Women’s Hospital Faulkner, Winchester, South Shore, Northeast, Lowell General, BID-Milton; Lahey Hospitals Community Hospital Comparators: Newton-Wellesley Hospital, North Shore Medical Center, Winchester, Mt. Auburn, Lowell General, Emerson Hospital, MelroseWakefield Healthcare, Lawrence General, CHA; Anna Jaques Comparators: North Shore Medical Center, Lahey HMC, Northeast, Holy Family Hospital, Lawrence General; Mt. Auburn Comparators: St. Elizabeth’s Medical Center, Newton-Wellesley Hospital, Winchester, CHA; BID-Owned Community Hospital Comparators: St. Elizabeth’s Medical Center, Cape Cod Hospital, Falmouth Hospital, Brigham & Women’s Hospital Faulkner, Newton-Wellesley Hospital, Good Samaritan Hospital, South Shore Hospital, MetroWest, Carney Hospital, Signature Brockton Medical Center.
1 We treat the Boston AMCs as the comparators for BIDMC, Lahey HMC, and NE Baptist because they provide similar services and
are able to care for similarly complex patients. For other hospitals, we defined comparators as all non-AMC hospitals with inpatient
market share above 2% in each party hospital’s inpatient PSA. We define NE Baptist’s community hospital comparators as those
community hospitals with at least 2% share of NEBH’s inpatient core services in the NEBH core services PSA. We apply the same
comparators to the outpatient relative price analyses below.
BIDMC, LaheyHMC, and NEBaptist + AMCComparators
NE Baptist andCommunity
HospitalComparators
LaheyHospitals andCommunity
HospitalComparators
Anna Jaquesand
Comparators
Mt. Auburnand
Comparators
BID-OwnedCommunity
Hospitals andComparators
0.75
0.8
0.85
0.9
0.95
1
1.05
1.1
1.15
1.2
1.25
1.3
1.35
BIDMC
NE Baptist
Lahey HMC
NE Baptist Winchester
Lahey HMC
Northeast
Anna Jaques
Mt. Auburn BID- Plymouth
BID- Milton
BID- Needham

A-4
Figure 2B: Inpatient Relative Price (HPHC 2016)
See Figure 2A for source. Note: Comparators listed from top to bottom. BIDMC, Lahey HMC, and NE Baptist AMC Comparators: Massachusetts General Hospital, Brigham & Women’s Hospital, Tufts Medical Center, Boston Medical Center; NE Baptist Community Hospital Comparators: South Shore, Newton-Wellesley Hospital, Brigham & Women’s Hospital Faulkner, North Shore Medical Center, Winchester, Lowell General, BID-Milton, Northeast; Lahey Hospitals Community Hospital Comparators: Newton-Wellesley Hospital, North Shore Medical Center, Mt. Auburn, Lowell General, MelroseWakefield Healthcare, Emerson Hospital, CHA, Lawrence General; Anna Jaques Comparators: Lahey HMC, North Shore Medical Center, Winchester, Holy Family Hospital, Northeast, Lawrence General; Mt. Auburn Comparators: St. Elizabeth’s Medical Center, Newton-Wellesley Hospital, Winchester, CHA; BID-Owned Community Hospital Comparators: Cape Cod Hospital, South Shore Hospital, Falmouth Hospital, St. Elizabeth’s Medical Center, Newton-Wellesley Hospital, Carney Hospital, Brigham & Women’s Hospital Faulkner, Good Samaritan Hospital, MetroWest, Signature Brockton Medical Center.
BIDMC, LaheyHMC, and NEBaptist + AMCComparators
NE Baptist andCommunity
HospitalComparators
LaheyHospitals andCommunity
HospitalComparators
Anna Jaquesand
Comparators
Mt. Auburnand
Comparators
BID-OwnedCommunity
Hospitals andComparators
0.65
0.7
0.75
0.8
0.85
0.9
0.95
1
1.05
1.1
1.15
1.2
1.25
1.3
1.35
1.4
1.45
1.5
1.55
BIDMC
NE Baptist
Lahey HMC
Winchester
Lahey HMC
Northeast
Anna Jaques Mt. Auburn
BID- Plymouth
BID- Milton
BID-Needham
NE Baptist

A-5
Figure 2C: Inpatient Relative Price (THP 2016)
See Figure 2A for source. Note: Comparators listed from top to bottom. BIDMC, Lahey HMC, and NE Baptist AMC Comparators: Massachusetts General Hospital, Brigham & Women’s Hospital, Tufts Medical Center, Boston Medical Center; NE Baptist Community Hospital Comparators: North Shore Medical Center, Winchester, Newton-Wellesley Hospital, Brigham & Women’s Hospital Faulkner, South Shore, Northeast, Lowell General, BID-Milton; Lahey Hospitals Community Hospital Comparators: North Shore Medical Center, Newton-Wellesley Hospital, MelroseWakefield Healthcare, Emerson Hospital, Mt. Auburn, Lowell General, CHA, Lawrence General; Anna Jaques Comparators: Lahey HMC, North Shore Medical Center, Winchester, Northeast, Holy Family Hospital, Lawrence General; Mt. Auburn Comparators: St. Elizabeth’s Medical Center, Winchester, Newton-Wellesley Hospital, CHA; BID-Owned Community Hospital Comparators: St. Elizabeth’s Medical Center, Newton-Wellesley Hospital, Brigham & Women’s Hospital Faulkner, South Shore Hospital, MetroWest, Carney Hospital, Good Samaritan Hospital, Falmouth Hospital, Cape Cod Hospital, Signature Brockton Medical Center.
BIDMC, LaheyHMC, and NEBaptist + AMCComparators
NE Baptist andCommunity
HospitalComparators
LaheyHospitals andCommunity
HospitalComparators
Anna Jaquesand
Comparators
Mt. Auburnand
Comparators
BID-OwnedCommunity
Hospitals andComparators
0.55
0.6
0.65
0.7
0.75
0.8
0.85
0.9
0.95
1
1.05
1.1
1.15
1.2
1.25
1.3
1.35
1.4
1.45
1.5
1.55
1.6
BIDMC
NE Baptist
Lahey HMC
Winchester
Lahey HMC
Northeast
Anna Jaques
Mt. Auburn
BID- Plymouth
BID-Milton
BID-Needham
NE Baptist

A-6
B. OUTPATIENT RELATIVE PRICE
Figure 2D: Outpatient Relative Price (BCBS 2016)
See Figure 2A for source. Note: Comparators listed from top to bottom. BIDMC, Lahey HMC, and NE Baptist AMC Comparators: Brigham & Women’s Hospital, Massachusetts General Hospital, Tufts Medical Center, Boston Medical Center; NE Baptist Community Hospital Comparators: South Shore, Newton-Wellesley Hospital, North Shore Medical Center, Brigham & Women’s Hospital Faulkner, Lowell General, Northeast, Winchester, BID-Milton; Lahey Hospitals Community Hospital Comparators: Mt. Auburn, Newton-Wellesley Hospital, North Shore Medical Center, MelroseWakefield Healthcare, CHA, Emerson Hospital, Lowell General, Lawrence General; Anna Jaques Comparators: Lahey HMC, North Shore Medical Center, Holy Family Hospital, Northeast, Winchester, Lawrence General; Mt. Auburn Comparators: Newton-Wellesley Hospital, CHA, St. Elizabeth’s Medical Center, Winchester; BID-Owned Community Hospital Comparators: Falmouth Hospital, Cape Cod Hospital, South Shore Hospital, Carney Hospital, Newton-Wellesley Hospital, Brigham & Women’s Hospital Faulkner, St. Elizabeth’s Medical Center, Good Samaritan Hospital, MetroWest, Signature Brockton Medical Center.
BIDMC, LaheyHMC, and NEBaptist + AMCComparators
NE Baptist andCommunity
HospitalComparators
LaheyHospitals andCommunity
HospitalComparators
Anna Jaquesand
Comparators
Mt. Auburnand
Comparators
BID-OwnedCommunity
Hospitals andComparators
0.65
0.7
0.75
0.8
0.85
0.9
0.95
1
1.05
1.1
1.15
1.2
1.25
1.3
1.35
1.4
1.45
1.5
1.55
1.6
1.65
BIDMC
NE Baptist
Lahey HMC
Winchester
Lahey HMC
Northeast
Anna Jaques
Mt. Auburn
BID- Plymouth
BID- Milton
BID-Needham
NE Baptist

A-7
Figure 2E: Outpatient Relative Price (THP 2016)
See Figure 2A for source. Notes: Comparators listed from top to bottom. BIDMC, Lahey HMC, and NE Baptist AMC Comparators: Massachusetts General Hospital, Brigham & Women’s Hospital, Tufts Medical Center, Boston Medical Center; NE Baptist Community Hospital Comparators: Newton-Wellesley Hospital, North Shore Medical Center, South Shore, Brigham & Women’s Hospital Faulkner, Lowell General, Northeast, Winchester, BID-Milton; Lahey Hospitals Community Hospital Comparators: Mt. Auburn, Newton-Wellesley Hospital, North Shore Medical Center, MelroseWakefield Healthcare, Lowell General, Emerson Hospital, CHA, Lawrence General; Anna Jaques Comparators: North Shore Medical Center, Holy Family Hospital, Lahey HMC, Northeast, Winchester, Lawrence General; Mt. Auburn Comparators: Newton-Wellesley Hospital, St. Elizabeth’s Medical Center, Winchester, CHA; BID-Owned Community Hospital Comparators: Falmouth Hospital, Cape Cod Hospital, Newton-Wellesley Hospital, St. Elizabeth’s Medical Center, Good Samaritan Hospital, Carney Hospital, South Shore Hospital, Brigham & Women’s Hospital Faulkner, Signature Brockton Medical Center, MetroWest. HPHC outpatient data is omitted as HPHC submitted updated outpatient relative price data after the publication of CHIA’s most recent relative price databook.
BIDMC, LaheyHMC, and NEBaptist + AMCComparators
NE Baptist andCommunity
HospitalComparators
LaheyHospitals andCommunity
HospitalComparators
Anna Jaquesand
Comparators
Mt. Auburnand
Comparators
BID-OwnedCommunity
Hospitals andComparators
0.65
0.7
0.75
0.8
0.85
0.9
0.95
1
1.05
1.1
1.15
1.2
1.25
1.3
1.35
BIDMC
NE Baptist
Lahey HMC
Winchester
Lahey HMC Northeast
Anna Jaques
Mt. Auburn
BID- Plymouth
BID-Milton
BID-Needham
NE Baptist
A-8
C. PHYSICIAN RELATIVE PRICE
Figure 2F: Physician Relative Price (2015)
Comparators: Atrius, Lowell Physician Hospital Organization, New England Quality Care Alliance (NEQCA), Partners, South Shore Physician Hospital Organization, Steward, Signature Brockton. Source: HPC analysis of CTR. FOR HEALTH INFO. & ANALYSIS, PROVIDER PRICE VARIATION IN THE MASSACHUSETTS HEALTH CARE MARKET (CALENDAR
YEAR 2016 DATA) (APRIL 2018), available at http://www.chiamass.gov/assets/docs/r/pubs/18/Relative-Price-Databook-2018.xlsx (last visited July 13, 2018). Notes: For THP, BIDCO and Lahey’s relative price is the same, represented here by a purple dot with a green border. Because relative price is calculated individually by payer, the price level associated with each payer’s network average relative price (1.0) is not the same for different payers. Therefore, relative price should not be compared across payers. In some cases, we understand that the gap between the parties may have narrowed in the years following this 2015 data.
BCBS HPHC THP
0.65
0.7
0.75
0.8
0.85
0.9
0.95
1
1.05
1.1
1.15
1.2
1.25
1.3
1.35
1.4

A-9
III. RISK-ADJUSTED AND NORMALIZED CLAIMS-BASED SPENDING BY PROVIDER GROUP
Figure 3: Risk-Adjusted and Normalized Claims-Based Spending By Provider Group, 2015 (BCBS, HPHC, THP)
Source: MASS. HEALTH POLICY COMM’N, 2017 COST TRENDS REPORT 30 (March 2018), available at https://www.mass.gov/files/documents/2018/03/28/Cost%20Trends%20Report%202017.pdf (last visited July 3, 2018).
$-
$500
$1,000
$1,500
$2,000
$2,500
$3,000
$3,500
$4,000
$4,500
$5,000
$5,500
$6,000
$6,500
$7,000
Pe
r P
atie
nt
Pe
r Y
ear

A-10
IV. COMMUNITY HOSPITAL AND TEACHING HOSPITAL SHARES OF LOCAL DISCHARGES
Figure 4A: Difference between pre-transaction and post-transaction shares of local community-appropriate discharges (Commercial Payers Only)
Source: HPC analysis of 2009 to 2016 CHIA hospital discharge data.
-6
-4
-2
0
2
4
6
Anna Jaques PSA- BIDCO
ContractingAffiliate
CHA PSA - BIDCOContracting
Affiliate
Lawrence Gen.PSA - BIDCOContracting
Affiliate
BID-Milton PSA -BID Corporate
Affiliate
Winchester PSA- Lahey
CorporateAffiliate
Northeast PSA -Lahey Corporate
Affiliate
BID-PlymouthPSA - BIDCorporate
Affiliate
Pe
rce
nta
ge P
oin
t C
han
ge
Focal Community Hospital Share in PSAAnchor Teaching Hospital Share in PSAAll Community Hospital Share of CADs Statewide During Same Time Period

A-11
Figure 4B: Difference between pre-transaction and post-transaction shares of higher-acuity local discharges (Commercial Payers Only)
Source: HPC analysis of 2009 to 2016 CHIA hospital discharge data.
-6
-4
-2
0
2
4
6
Anna Jaques PSA- BIDCO
ContractingAffiliate
CHA PSA - BIDCOContracting
Affiliate
Lawrence Gen.PSA - BIDCOContracting
Affiliate
BID-Milton PSA -BID Corporate
Affiliate
Winchester PSA- Lahey
CorporateAffiliate
Northeast PSA -Lahey Corporate
Affiliate
BID-PlymouthPSA - BIDCorporate
Affiliate
Pe
rce
nta
ge P
oin
t C
han
ge
Focal Community Hospital Share in PSA
Anchor Teaching Hospital Share in PSA
All Community Hospital Share of Higher-Acuity Discharges Statewide During Same Time Period

A-12
V. INPATIENT PRIMARY SERVICE AREA MAPS
The HPC defines a hospital’s inpatient and outpatient primary service areas or PSAs as the areas from which a hospital
draws 75% of its inpatient and outpatient commercial patients, respectively. For details regarding the HPC’s methodology
for defining an inpatient PSA, see MASS. HEALTH POLICY COMM’N, TECHNICAL BULLETIN FOR 958 CMR 7.00: NOTICES
OF MATERIAL CHANGE AND COST AND MARKET IMPACT REVIEWS (Aug. 6, 2014) [hereinafter TECHNICAL BULLETIN],
available at http://www.mass.gov/anf/docs/hpc/regs-and-notices/technical-bulletin-circ.pdf (last visited July 3, 2018). The
Inpatient Primary Service Areas are defined based on 2016 Hospital Discharge Data for all commercial payers.
A. BIDCO
The inpatient PSAs of BIDCO’s hospitals include much of eastern Massachusetts. The map below shows the primary
service areas (PSAs) of the BIDMC-owned hospitals in dark purple, the Anna Jaques PSA in light purple, and the portions
of the PSA of contracting affiliate Lawrence General that does not overlap with BIDMC-owned hospitals in grey. CHA’s
PSA overlaps completely with those of BIDMC-owned hospitals.
Figure 5A: BIDCO Hospitals’ Inpatient PSAs

A-13
B. NE BAPTIST
NE Baptist’s inpatient core services PSA, shown below, spans the majority of eastern Massachusetts. We defined
NE Baptist’s service area based on the orthopedic and musculoskeletal services it most commonly provides.
Figure 5B: NE Baptist’s Inpatient Core Services PSA

A-14
C. LAHEY
Lahey’s inpatient PSAs are concentrated north of Boston. The map below shows the PSAs for Lahey HMC,
Northeast, and Winchester. The HPC identified a joint PSA for Northeast’s two acute hospital campuses, Beverly and
Addison Gilbert.
Figure 5C: Lahey Hospitals’ Inpatient PSAs
D. MT. AUBURN
Mt. Auburn’s PSA is concentrated in Boston and the area immediately northwest of Boston.
Figure 5D: Mt. Auburn’s Inpatient PSA

A-15
VI. ADULT PRIMARY CARE PRIMARY SERVICE AREA MAPS
We define primary care services as services delivered by physicians with a primary care specialty who derive the majority
of their revenue from adult primary care visits. We define a primary care PSA to be the area from which a physician
group’s PCPs collectively draw 75% of their commercial primary care visits. The Adult Primary Care Primary Service
Areas are defined based on 2015 APCD claims data for BCBS, HPHC, and THP.
A. BIDCO
BIDCO’s adult primary care PSA spans the areas west of Boston, as well as areas of northeastern and southeastern
Massachusetts.
Figure 6A: BIDCO’s Adult Primary Care PSA

A-16
B. LAHEY
Lahey’s adult primary care PSA, shown below, is also focused in the area north of Boston.
Figure 6B: Lahey’s Adult Primary Care PSA
C. MACIPA
MACIPA’s adult primary care PSA is concentrated in the area northwest of Boston.
Figure 6C: MACIPA’s Adult Primary Care PSA
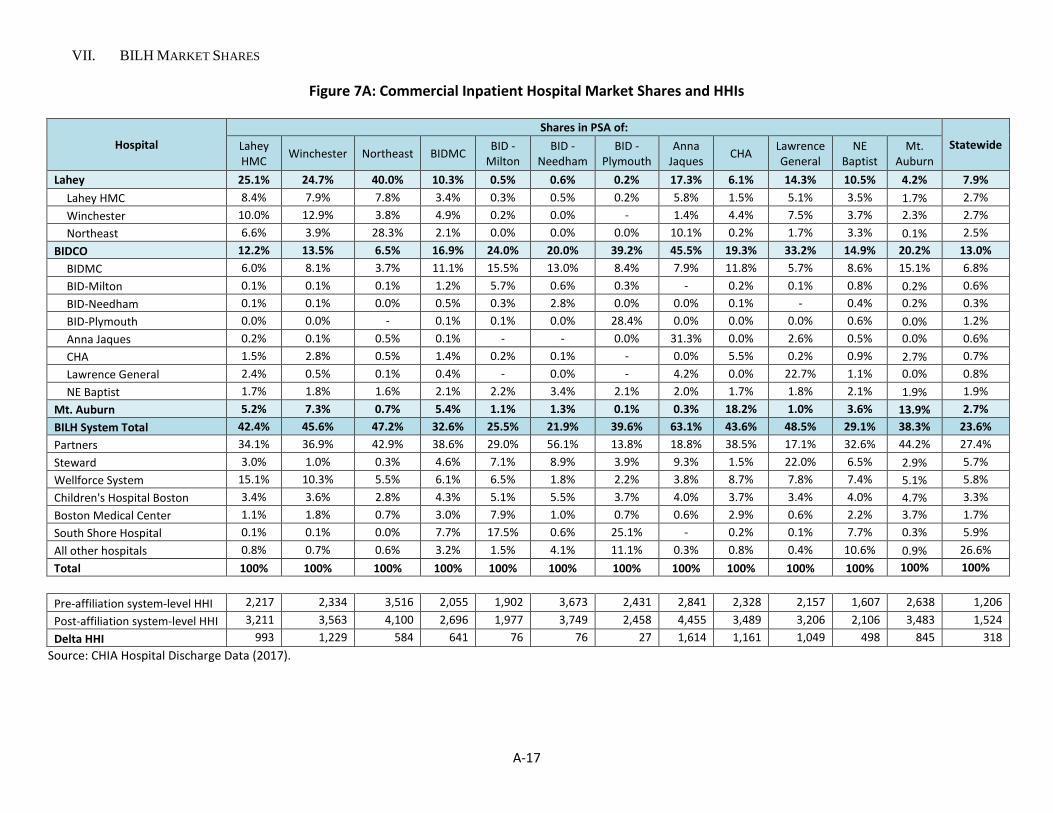
A-17
VII. BILH MARKET SHARES
Figure 7A: Commercial Inpatient Hospital Market Shares and HHIs
Hospital
Shares in PSA of:
Statewide Lahey HMC
Winchester Northeast BIDMC BID -
Milton BID -
Needham BID -
Plymouth Anna
Jaques CHA
Lawrence General
NE Baptist
Mt. Auburn
Lahey 25.1% 24.7% 40.0% 10.3% 0.5% 0.6% 0.2% 17.3% 6.1% 14.3% 10.5% 4.2% 7.9%
Lahey HMC 8.4% 7.9% 7.8% 3.4% 0.3% 0.5% 0.2% 5.8% 1.5% 5.1% 3.5% 1.7% 2.7%
Winchester 10.0% 12.9% 3.8% 4.9% 0.2% 0.0% - 1.4% 4.4% 7.5% 3.7% 2.3% 2.7%
Northeast 6.6% 3.9% 28.3% 2.1% 0.0% 0.0% 0.0% 10.1% 0.2% 1.7% 3.3% 0.1% 2.5%
BIDCO 12.2% 13.5% 6.5% 16.9% 24.0% 20.0% 39.2% 45.5% 19.3% 33.2% 14.9% 20.2% 13.0%
BIDMC 6.0% 8.1% 3.7% 11.1% 15.5% 13.0% 8.4% 7.9% 11.8% 5.7% 8.6% 15.1% 6.8%
BID-Milton 0.1% 0.1% 0.1% 1.2% 5.7% 0.6% 0.3% - 0.2% 0.1% 0.8% 0.2% 0.6%
BID-Needham 0.1% 0.1% 0.0% 0.5% 0.3% 2.8% 0.0% 0.0% 0.1% - 0.4% 0.2% 0.3%
BID-Plymouth 0.0% 0.0% - 0.1% 0.1% 0.0% 28.4% 0.0% 0.0% 0.0% 0.6% 0.0% 1.2%
Anna Jaques 0.2% 0.1% 0.5% 0.1% - - 0.0% 31.3% 0.0% 2.6% 0.5% 0.0% 0.6%
CHA 1.5% 2.8% 0.5% 1.4% 0.2% 0.1% - 0.0% 5.5% 0.2% 0.9% 2.7% 0.7%
Lawrence General 2.4% 0.5% 0.1% 0.4% - 0.0% - 4.2% 0.0% 22.7% 1.1% 0.0% 0.8%
NE Baptist 1.7% 1.8% 1.6% 2.1% 2.2% 3.4% 2.1% 2.0% 1.7% 1.8% 2.1% 1.9% 1.9%
Mt. Auburn 5.2% 7.3% 0.7% 5.4% 1.1% 1.3% 0.1% 0.3% 18.2% 1.0% 3.6% 13.9% 2.7%
BILH System Total 42.4% 45.6% 47.2% 32.6% 25.5% 21.9% 39.6% 63.1% 43.6% 48.5% 29.1% 38.3% 23.6%
Partners 34.1% 36.9% 42.9% 38.6% 29.0% 56.1% 13.8% 18.8% 38.5% 17.1% 32.6% 44.2% 27.4%
Steward 3.0% 1.0% 0.3% 4.6% 7.1% 8.9% 3.9% 9.3% 1.5% 22.0% 6.5% 2.9% 5.7%
Wellforce System 15.1% 10.3% 5.5% 6.1% 6.5% 1.8% 2.2% 3.8% 8.7% 7.8% 7.4% 5.1% 5.8%
Children's Hospital Boston 3.4% 3.6% 2.8% 4.3% 5.1% 5.5% 3.7% 4.0% 3.7% 3.4% 4.0% 4.7% 3.3%
Boston Medical Center 1.1% 1.8% 0.7% 3.0% 7.9% 1.0% 0.7% 0.6% 2.9% 0.6% 2.2% 3.7% 1.7%
South Shore Hospital 0.1% 0.1% 0.0% 7.7% 17.5% 0.6% 25.1% - 0.2% 0.1% 7.7% 0.3% 5.9%
All other hospitals 0.8% 0.7% 0.6% 3.2% 1.5% 4.1% 11.1% 0.3% 0.8% 0.4% 10.6% 0.9% 26.6%
Total 100% 100% 100% 100% 100% 100% 100% 100% 100% 100% 100% 100% 100%
Pre-affiliation system-level HHI 2,217 2,334 3,516 2,055 1,902 3,673 2,431 2,841 2,328 2,157 1,607 2,638 1,206
Post-affiliation system-level HHI 3,211 3,563 4,100 2,696 1,977 3,749 2,458 4,455 3,489 3,206 2,106 3,483 1,524
Delta HHI 993 1,229 584 641 76 76 27 1,614 1,161 1,049 498 845 318
Source: CHIA Hospital Discharge Data (2017).

A-18
Figure 7B: Commercial Outpatient Facility Market Shares
Hospital Shares in PSA of:
Statewide Lahey HMC
Winchester Northeast BIDMC BID -
Milton BID -
Needham BID -
Plymouth Anna
Jaques CHA
Lawrence General
NE Baptist
Mt. Auburn
Lahey 36.3% 44.9% 48.4% 10.1% 0.5% 1.3% 0.5% 19.5% 8.5% 23.5% 9.7% 19.0% 10.2%
Lahey HMC 15.0% 16.0% 17.3% 4.5% 0.3% 1.0% 0.4% 12.3% 3.3% 10.1% 3.8% 9.2% 4.6%
Winchester 14.0% 28.1% 1.4% 5.0% 0.1% 0.2% 0.1% 2.7% 4.8% 11.5% 4.6% 9.6% 3.6%
Northeast 7.3% 0.9% 29.7% 0.6% 0.0% 0.0% 0.0% 4.5% 0.5% 1.8% 1.3% 0.2% 2.1%
BIDCO 9.3% 8.0% 4.5% 19.1% 18.9% 16.6% 39.7% 44.4% 22.7% 23.8% 16.3% 16.8% 12.3%
BIDMC 4.1% 4.1% 2.1% 11.1% 11.6% 9.8% 2.9% 2.6% 8.6% 3.2% 8.8% 8.6% 6.1%
BID-Milton 0.0% 0.0% 0.0% 0.8% 4.6% 0.4% 0.4% 0.0% 0.0% 0.0% 0.7% 0.0% 0.4%
BID-Needham 0.2% 0.1% 0.1% 1.6% 0.9% 4.8% 0.2% 0.1% 0.1% 0.1% 1.5% 0.4% 0.9%
BID-Plymouth 0.0% 0.0% 0.0% 1.4% 0.2% 0.0% 35.3% 0.0% 0.0% 0.0% 1.5% 0.0% 1.3%
Anna Jaques 2.1% 0.1% 1.7% 0.0% 0.0% 0.0% 0.0% 36.9% 0.0% 2.1% 0.1% 0.0% 0.9%
CHA 1.2% 1.7% 0.3% 3.3% 0.5% 0.3% 0.1% 0.2% 13.4% 0.4% 2.4% 7.2% 1.6%
Lawrence General 1.3% 1.6% 0.1% 0.2% 0.0% 0.0% 0.0% 4.4% 0.0% 17.5% 0.5% 0.0% 0.6%
NE Baptist 0.3% 0.3% 0.3% 0.8% 1.1% 1.3% 0.7% 0.3% 0.4% 0.3% 0.8% 0.5% 0.6%
Mt. Auburn 3.3% 3.0% 0.3% 4.9% 0.7% 3.1% 0.2% 0.4% 10.5% 0.6% 3.9% 11.7% 2.4%
BILH System Total 48.8% 55.9% 53.3% 34.1% 20.0% 21.0% 40.3% 64.3% 41.6% 47.9% 29.8% 47.4% 24.9%
Partners 25.2% 16.3% 34.1% 34.1% 24.6% 44.6% 10.4% 13.3% 29.7% 15.3% 31.8% 27.3% 26.9%
Steward 1.9% 1.2% 0.4% 3.6% 9.5% 6.4% 4.6% 9.7% 0.8% 16.1% 5.2% 2.0% 4.6%
Wellforce System 13.4% 15.8% 2.8% 8.0% 7.6% 2.3% 2.4% 3.3% 14.5% 8.4% 6.9% 9.7% 6.8%
South Shore Hospital 0.0% 0.0% 0.0% 0.9% 7.4% 0.3% 9.7% 0.0% 0.0% 0.0% 2.3% 0.0% 1.5%
Boston Medical Center 0.5% 0.6% 0.3% 3.8% 7.7% 1.7% 0.8% 0.3% 2.3% 0.6% 2.8% 1.5% 1.8%
Children's Hospital Boston 2.9% 3.0% 2.2% 3.9% 4.4% 4.4% 2.3% 2.3% 2.3% 3.7% 3.6% 3.4% 2.7%
All other hospitals 2.4% 2.7% 1.7% 6.4% 10.4% 14.2% 20.9% 2.1% 3.3% 2.7% 12.0% 3.4% 25.0%
Non-hospital facilities 4.7% 4.5% 5.2% 5.4% 8.3% 5.1% 8.5% 4.7% 5.3% 5.2% 5.6% 5.2% 5.8%
Total share 100% 100% 100% 100% 100% 100% 100% 100% 100% 100% 100% 100% 100% Source: CHIA All-Payer Claims Database (2015).

A-19
Figure 7C: Commercial Inpatient Hospital Market Shares for NE Baptist's Core Orthopedic and Musculoskeletal Services
Hospital
Shares in PSA of:
Statewide Lahey HMC
Winchester Northeast BIDMC BID -
Milton BID -
Needham BID -
Plymouth Anna
Jaques CHA
Lawrence General
NE Baptist
Mt. Auburn
Lahey 22.6% 23.6% 36.0% 10.5% 0.3% 0.5% 0.2% 17.1% 5.6% 10.1% 10.1% 4.1% 7.3%
Lahey HMC 7.9% 7.6% 6.5% 3.5% 0.3% 0.5% 0.2% 3.9% 1.8% 4.8% 3.4% 2.0% 2.6%
Winchester 6.8% 9.5% 2.0% 3.8% - - - 2.3% 3.5% 3.1% 2.6% 1.9% 1.8%
Northeast 7.9% 6.4% 27.4% 3.2% - - - 10.9% 0.3% 2.2% 4.1% 0.2% 2.8%
BIDCO 29.1% 31.3% 22.3% 40.0% 53.5% 50.8% 58.4% 51.0% 41.1% 41.2% 36.5% 42.5% 31.8%
BIDMC 3.8% 4.4% 2.2% 5.3% 6.9% 4.9% 2.8% 3.6% 7.0% 2.6% 4.0% 6.7% 3.0%
BID-Milton 1.0% 1.2% 0.6% 3.4% 11.5% 3.1% 1.5% - 2.1% 1.2% 2.5% 2.2% 1.8%
BID-Needham 0.0% - - 0.2% 0.3% 1.2% - - 0.1% - 0.2% 0.1% 0.2%
BID-Plymouth - - - 0.2% 0.1% - 31.4% 0.3% - - 1.1% - 1.8%
Anna Jaques 1.0% 0.9% 2.8% 0.5% - - - 26.3% 0.1% 3.4% 0.9% - 0.9%
CHA 0.3% 0.6% - 0.3% 0.3% - - - 1.6% - 0.2% 0.7% 0.1%
Lawrence General 1.3% 0.2% - 0.2% - - - 2.6% - 12.0% 0.6% - 0.4%
NE Baptist 21.8% 24.0% 16.8% 29.8% 34.4% 41.6% 22.7% 18.1% 30.3% 22.1% 27.0% 32.8% 23.5%
Mt. Auburn 2.3% 3.0% 0.3% 2.5% 0.4% 0.6% 0.3% 8.7% 1.2% 1.6% 6.6% 1.1%
BILH System Total 54.1% 57.9% 58.6% 53.0% 54.1% 52.0% 58.6% 68.4% 55.5% 52.5% 48.2% 53.1% 40.2%
Partners 26.8% 29.1% 36.8% 29.4% 18.0% 37.3% 11.3% 18.8% 30.2% 14.6% 25.5% 33.5% 21.7%
Steward 2.7% 1.2% 0.2% 3.0% 4.8% 4.4% 5.0% 6.9% 0.8% 23.5% 5.5% 1.3% 5.3%
Wellforce System 14.7% 9.7% 3.3% 6.5% 8.0% 2.4% 1.7% 4.3% 9.8% 7.9% 7.8% 7.0% 5.7%
South Shore Hospital 0.1% 0.0% 0.1% 3.4% 6.7% 0.3% 10.6% - 0.2% - 3.5% 0.3% 2.5%
Boston Medical Center 0.6% 1.2% 0.3% 2.0% 6.3% 0.4% 0.6% - 2.6% 0.5% 1.4% 3.2% 1.1%
All Other Hospitals 1.1% 0.9% 0.6% 2.7% 2.1% 3.1% 12.3% 1.6% 1.0% 1.0% 8.2% 1.6% 23.6%
Total 100% 100% 100% 100% 100% 100% 100% 100% 100% 100% 100% 100% 100%
Source: CHIA Hospital Discharge Data (2017).
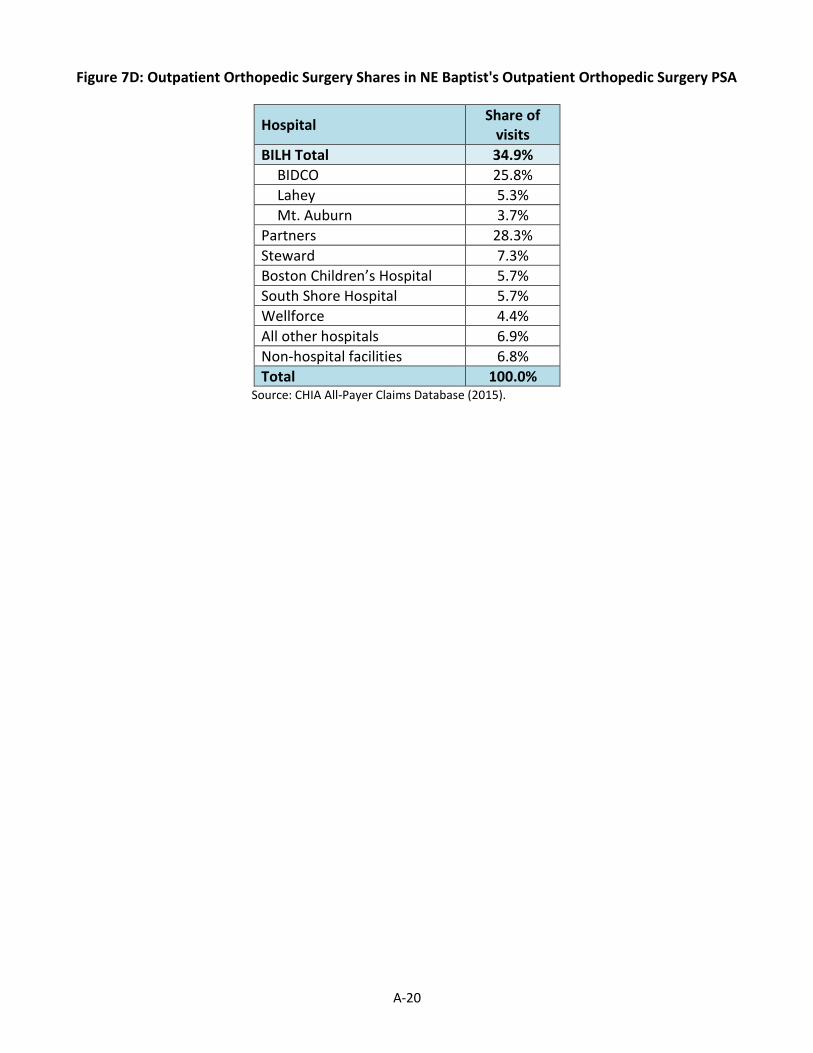
A-20
Figure 7D: Outpatient Orthopedic Surgery Shares in NE Baptist's Outpatient Orthopedic Surgery PSA
Hospital Share of
visits
BILH Total 34.9%
BIDCO 25.8%
Lahey 5.3%
Mt. Auburn 3.7%
Partners 28.3%
Steward 7.3%
Boston Children’s Hospital 5.7%
South Shore Hospital 5.7%
Wellforce 4.4%
All other hospitals 6.9%
Non-hospital facilities 6.8%
Total 100.0% Source: CHIA All-Payer Claims Database (2015).

A-21
Figure 7E: Commercial Inpatient Hospital Market Shares for Maternity Services
Hospital
Shares in PSA of:
Statewide Lahey HMC
Winchester Northeast BIDMC BID -
Milton BID -
Needham BID -
Plymouth Anna
Jaques CHA
Lawrence General
NE Baptist
Mt. Auburn
Lahey 24.2% 23.1% 46.3% 9.5% 0.4% - - 22.0% 5.2% 20.4% 9.7% 2.7% 7.7%
Lahey HMC 0.0% - - - - - - - - - 0.0% - 0.0%
Winchester 15.3% 17.2% 7.1% 6.5% 0.3% - - 3.2% 5.0% 17.3% 5.6% 2.6% 4.3%
Northeast 9.0% 6.0% 39.2% 2.9% 0.1% - - 18.8% 0.2% 3.2% 4.1% 0.1% 3.3%
BIDCO 12.6% 15.4% 7.7% 17.2% 22.1% 17.2% 31.4% 53.3% 20.3% 29.5% 14.8% 22.0% 12.8%
BIDMC 8.8% 12.1% 6.6% 15.2% 21.4% 16.8% 4.3% 5.7% 15.4% 6.1% 11.7% 19.3% 9.2%
BID-Milton - - - - - - - - - - 0.0% - 0.0%
BID-Needham - - - - - - - - - - - - -
BID-Plymouth - - - 0.1% 0.2% 0.0% 27.2% - - - 0.5% - 1.2%
Anna Jaques 0.3% 0.1% 0.3% 0.0% - - - 42.3% - 5.7% 0.6% - 0.8%
CHA 1.7% 3.0% 0.7% 1.6% 0.4% 0.3% - 0.2% 4.9% 0.5% 1.2% 2.7% 0.9%
Lawrence General 1.8% 0.3% 0.1% 0.2% - 0.0% - 5.2% - 17.3% 0.8% 0.0% 0.6%
NE Baptist - - - - - - - - - - - - -
Mt. Auburn 9.0% 12.6% 1.5% 9.0% 2.0% 2.4% 0.1% 0.2% 25.4% 1.7% 6.3% 19.2% 4.9%
BILH System Total 45.8% 51.1% 55.5% 35.6% 24.5% 19.5% 31.5% 75.5% 51.0% 51.7% 30.8% 43.9% 25.4%
Partners 34.1% 35.6% 35.7% 42.9% 36.4% 69.4% 9.8% 12.6% 37.3% 14.3% 36.9% 47.4% 31.3%
Steward 3.9% 1.5% 0.6% 3.6% 3.3% 6.4% 1.9% 6.6% 1.9% 26.2% 4.9% 2.8% 3.9%
Wellforce System 14.6% 9.5% 7.2% 5.4% 6.7% 0.6% 2.0% 5.2% 6.4% 7.5% 6.9% 2.9% 5.6%
Boston Medical Center 1.1% 2.0% 0.8% 2.4% 6.2% 0.7% - - 3.0% 0.1% 1.7% 2.5% 1.3%
South Shore Hospital 0.1% 0.1% 0.1% 7.7% 21.6% 0.9% 44.4% - 0.2% 0.2% 8.7% 0.2% 7.3%
All Other Hospitals 0.3% 0.2% 0.1% 2.4% 1.3% 2.4% 10.5% 0.2% 0.3% 0.1% 10.2% 0.2% 25.1%
Total 100% 100% 100% 100% 100% 100% 100% 100% 100% 100% 100% 100% 100%
Source: CHIA Hospital Discharge Data (2017).
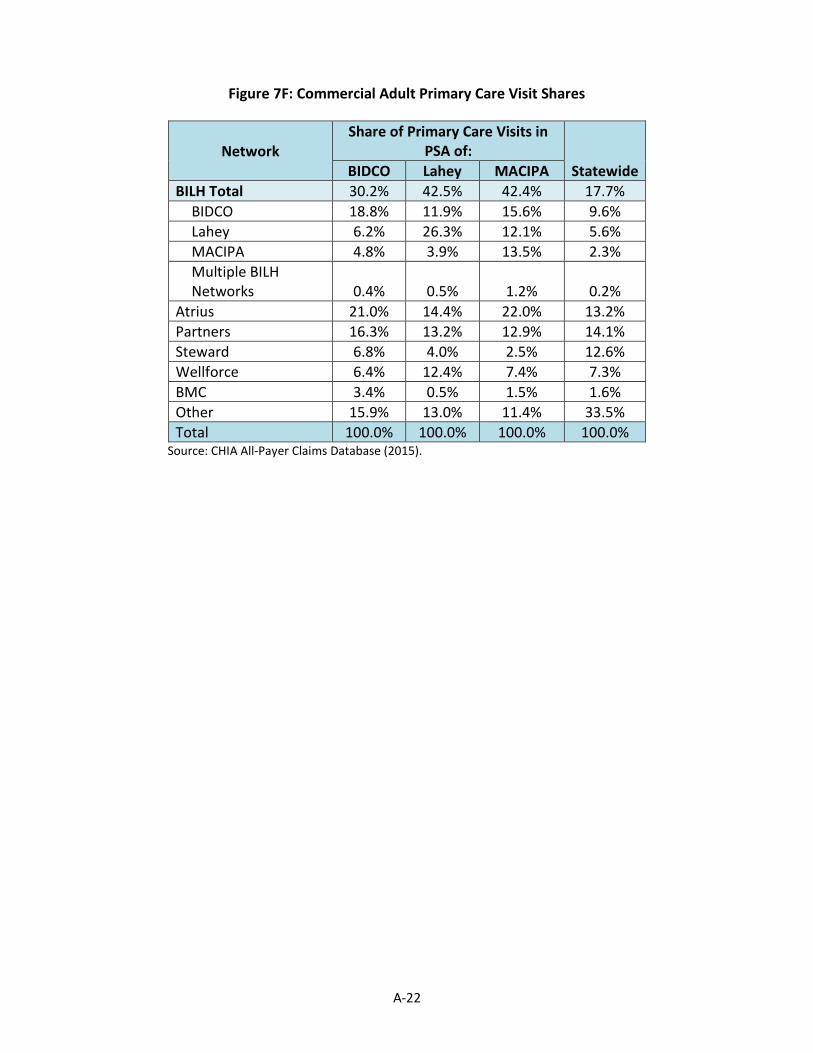
A-22
Figure 7F: Commercial Adult Primary Care Visit Shares
Network Share of Primary Care Visits in
PSA of:
Statewide BIDCO Lahey MACIPA
BILH Total 30.2% 42.5% 42.4% 17.7%
BIDCO 18.8% 11.9% 15.6% 9.6%
Lahey 6.2% 26.3% 12.1% 5.6%
MACIPA 4.8% 3.9% 13.5% 2.3%
Multiple BILH Networks 0.4% 0.5% 1.2% 0.2%
Atrius 21.0% 14.4% 22.0% 13.2%
Partners 16.3% 13.2% 12.9% 14.1%
Steward 6.8% 4.0% 2.5% 12.6%
Wellforce 6.4% 12.4% 7.4% 7.3%
BMC 3.4% 0.5% 1.5% 1.6%
Other 15.9% 13.0% 11.4% 33.5%
Total 100.0% 100.0% 100.0% 100.0% Source: CHIA All-Payer Claims Database (2015).

A-23
Figure 7G: Commercial Inpatient Shares by Zip Code

A-24
VIII. PARTY HOSPITAL PAYER MIX BY GPSR
Figure 8A: Combined Inpatient and Outpatient Payer Mix of Boston-Area AMCs and NE Baptist (2016 with change since 2009)
Source: HPC analysis of gross patient service revenue (GPSR) data from CHIA Hospital Cost Reports for 2009 through 2016. CTR. FOR
HEALTH INFO. & ANALYSIS, MASSACHUSETTS HOSPITAL PROFILES ACUTE DATABOOK DATA THROUGH FISCAL YEAR 2016 (Jan. 2018), available at http://www.chiamass.gov/assets/docs/r/hospital-profiles/2016/Acute-Care-Massachusetts-Hospitals-Databook-FY16-1-23-18-v2.xlsx. Notes: Medicaid category includes managed and non-managed Medicaid, ConnectorCare, and Health Safety Net GPSR.

A-25
Figure 8B: Combined Inpatient and Outpatient Payer Mix of BID-Owned Community Hospitals and Community Comparators (2016 with change since 2009)
See Figure 8A for source and note.

A-26
Figure 8C: Combined Inpatient and Outpatient Payer Mix of Lahey Hospitals and Community Comparators (2016 with change since 2009)
See Figure 8A for source and note.

A-27
Figure 8D: Combined Inpatient and Outpatient Payer Mix of Mt. Auburn and Community Comparators (2016 with change since 2009)
See Figure 8A for source and note.

A-28
Figure 8E: Combined Inpatient and Outpatient Payer Mix of Anna Jaques and Comparators (2016 with change since 2009)
See Figure 8A for source and note.
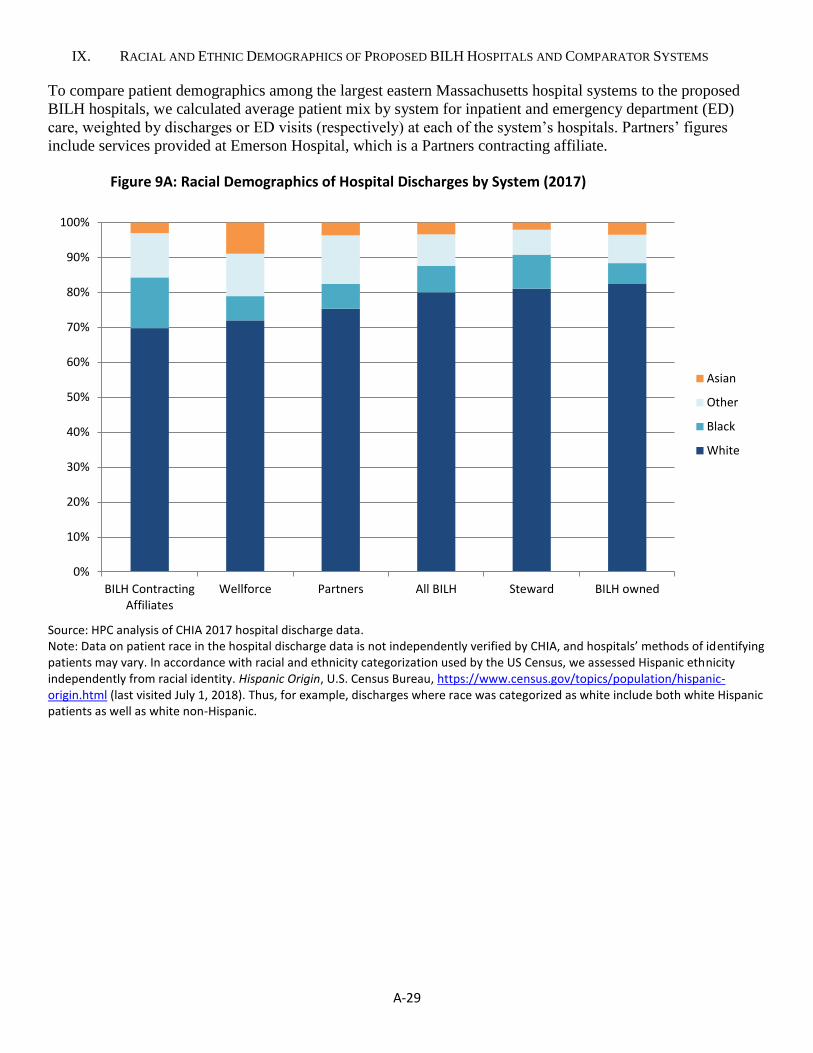
A-29
IX. RACIAL AND ETHNIC DEMOGRAPHICS OF PROPOSED BILH HOSPITALS AND COMPARATOR SYSTEMS
To compare patient demographics among the largest eastern Massachusetts hospital systems to the proposed
BILH hospitals, we calculated average patient mix by system for inpatient and emergency department (ED)
care, weighted by discharges or ED visits (respectively) at each of the system’s hospitals. Partners’ figures
include services provided at Emerson Hospital, which is a Partners contracting affiliate.
Figure 9A: Racial Demographics of Hospital Discharges by System (2017)
Source: HPC analysis of CHIA 2017 hospital discharge data. Note: Data on patient race in the hospital discharge data is not independently verified by CHIA, and hospitals’ methods of identifying patients may vary. In accordance with racial and ethnicity categorization used by the US Census, we assessed Hispanic ethnicity independently from racial identity. Hispanic Origin, U.S. Census Bureau, https://www.census.gov/topics/population/hispanic-origin.html (last visited July 1, 2018). Thus, for example, discharges where race was categorized as white include both white Hispanic patients as well as white non-Hispanic.
0%
10%
20%
30%
40%
50%
60%
70%
80%
90%
100%
BILH ContractingAffiliates
Wellforce Partners All BILH Steward BILH owned
Asian
Other
Black
White

A-30
Figure 9B: Racial Demographics of ED Visits by System (2016)
Source: HPC analysis of CHIA 2016 hospital emergency visit data. See Figure 9A for notes.
0%
10%
20%
30%
40%
50%
60%
70%
80%
90%
100%
BILHcontracting
affiliates
Wellforce Steward Partners All BILH (owned+ contracting
affiliates)
BIDMC-Owned BILH-Owned
Asian
Other
Black
White

A-31
Figure 9C: Discharges of Hispanic Patients by System (2017)
See Figure 9A for source. Note: Data on patient ethnicity in the hospital discharge data is not independently verified by CHIA, and hospitals’ methods of identifying patients may vary. In accordance with racial and ethnicity categorization used by the US Census, we assessed Hispanic ethnicity independently from racial identity. Hispanic Origin, U.S. Census Bureau, https://www.census.gov/topics/population/hispanic-origin.html (last visited July 1, 2018). Thus, discharges identified as Hispanic include Hispanic patients regardless of racial identification.
0.0%
5.0%
10.0%
15.0%
20.0%
25.0%
Lahey BILH-Owned BIDMC-Owned Wellforce Steward All BILH(owned +
contractingaffiliates)
Partners BILHContracting
Affiliates

A-32
Figure 9D: ED Visits by Hispanic Patients by System (2016)
See Figure 9B for source and notes.
0%
5%
10%
15%
20%
25%
30%
35%
40%
BILH-Owned Lahey BIDMC-Owned Steward Wellforce All BILH(owned +
contractingaffiliates)
Partners BILHcontracting
affiliates

A-33
X. RACIAL AND ETHNIC DEMOGRAPHICS OF PARTY HOSPITALS AND BIDCO AFFILIATE HOSPITALS COMPARED
TO PSA DEMOGRAPHICS
Figure 10A: Racial Demographics of PSA Discharges from Party Hospital PSAs (2017)
See Figure 9A for source and notes.

A-34
Figure 10B: Proportion of PSA Discharges of Hispanic Patients from Party Hospital PSAs (2017)
See Figure 9C for source and notes.
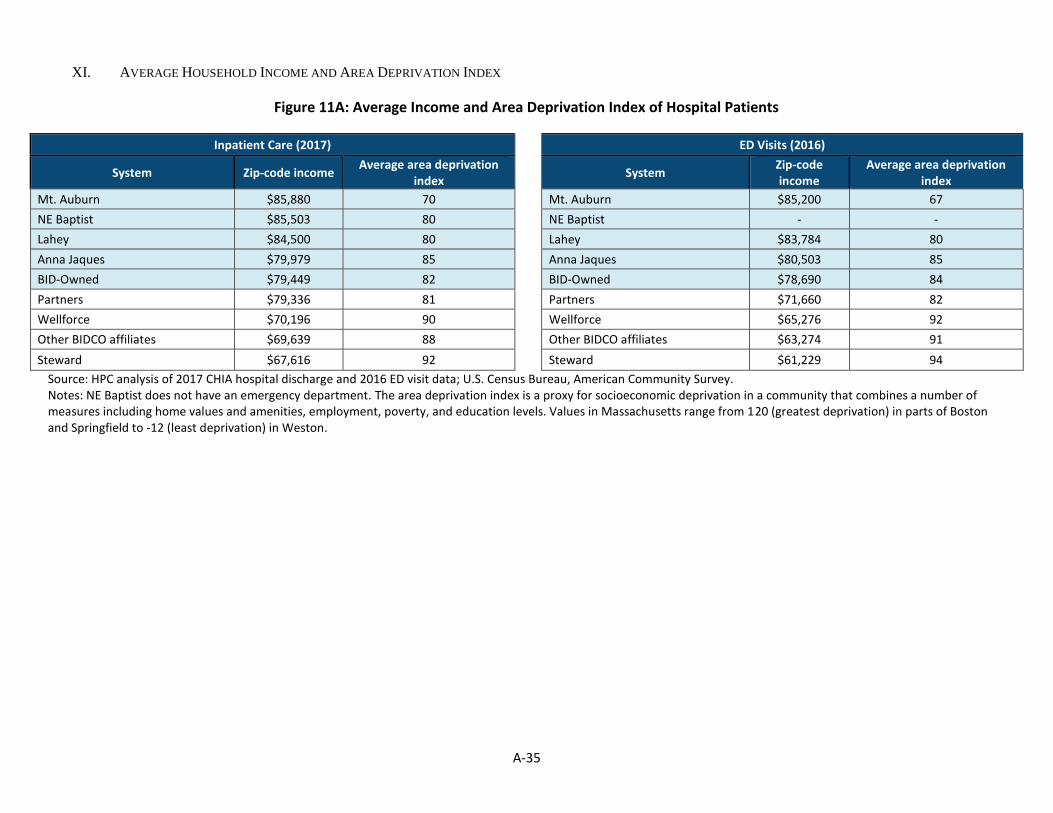
A-35
XI. AVERAGE HOUSEHOLD INCOME AND AREA DEPRIVATION INDEX
Figure 11A: Average Income and Area Deprivation Index of Hospital Patients
Inpatient Care (2017) ED Visits (2016)
System Zip-code income Average area deprivation
index
System Zip-code income
Average area deprivation index
Mt. Auburn $85,880 70 Mt. Auburn $85,200 67
NE Baptist $85,503 80 NE Baptist - -
Lahey $84,500 80 Lahey $83,784 80
Anna Jaques $79,979 85 Anna Jaques $80,503 85
BID-Owned $79,449 82 BID-Owned $78,690 84
Partners $79,336 81 Partners $71,660 82
Wellforce $70,196 90 Wellforce $65,276 92
Other BIDCO affiliates $69,639 88 Other BIDCO affiliates $63,274 91
Steward $67,616 92 Steward $61,229 94
Source: HPC analysis of 2017 CHIA hospital discharge and 2016 ED visit data; U.S. Census Bureau, American Community Survey. Notes: NE Baptist does not have an emergency department. The area deprivation index is a proxy for socioeconomic deprivation in a community that combines a number of measures including home values and amenities, employment, poverty, and education levels. Values in Massachusetts range from 120 (greatest deprivation) in parts of Boston and Springfield to -12 (least deprivation) in Weston.
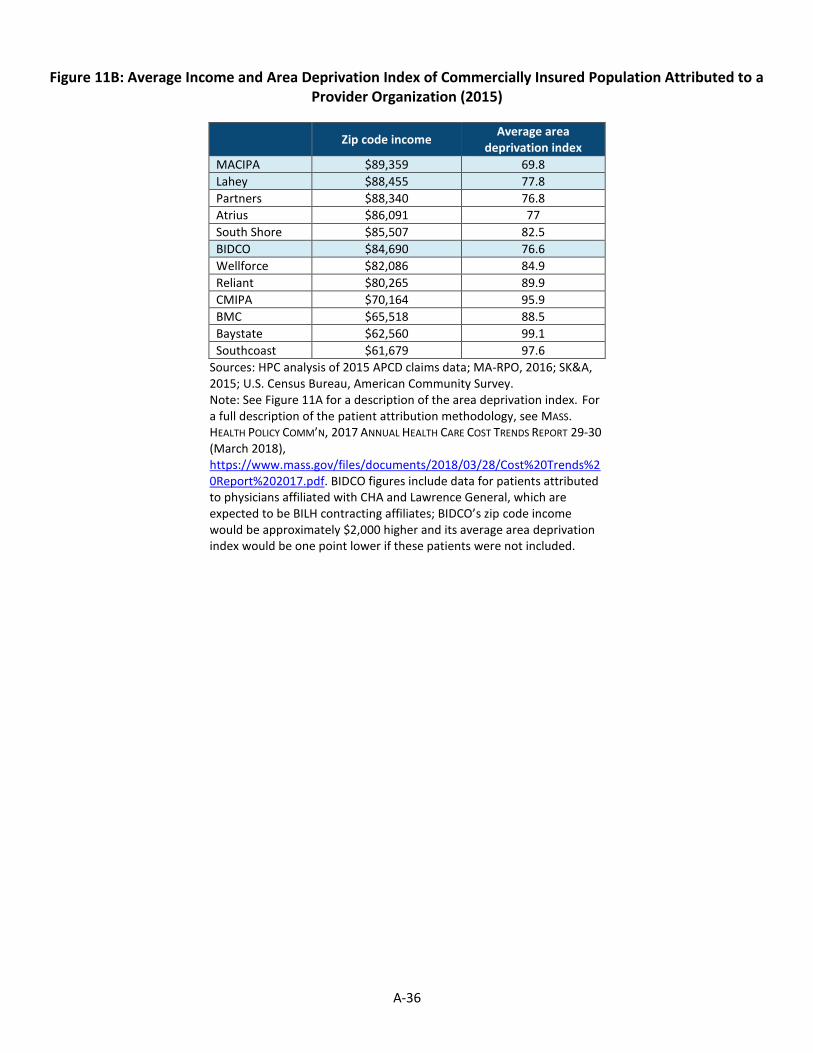
A-36
Figure 11B: Average Income and Area Deprivation Index of Commercially Insured Population Attributed to a
Provider Organization (2015)
Zip code income Average area
deprivation index
MACIPA $89,359 69.8
Lahey $88,455 77.8
Partners $88,340 76.8
Atrius $86,091 77
South Shore $85,507 82.5
BIDCO $84,690 76.6
Wellforce $82,086 84.9
Reliant $80,265 89.9
CMIPA $70,164 95.9
BMC $65,518 88.5
Baystate $62,560 99.1
Southcoast $61,679 97.6
Sources: HPC analysis of 2015 APCD claims data; MA-RPO, 2016; SK&A, 2015; U.S. Census Bureau, American Community Survey. Note: See Figure 11A for a description of the area deprivation index. For a full description of the patient attribution methodology, see MASS. HEALTH POLICY COMM’N, 2017 ANNUAL HEALTH CARE COST TRENDS REPORT 29-30 (March 2018), https://www.mass.gov/files/documents/2018/03/28/Cost%20Trends%20Report%202017.pdf. BIDCO figures include data for patients attributed to physicians affiliated with CHA and Lawrence General, which are expected to be BILH contracting affiliates; BIDCO’s zip code income would be approximately $2,000 higher and its average area deprivation index would be one point lower if these patients were not included.

Megan Wulff, Deputy Director for Market Performance, Sasha Hayes-Rusnov, Senior Manager for Market Performance, Rebecca Balder, Project Manager, Thomas Hajj, Senior Policy Associate, Ramsay Hoguet, Senior Policy Associate, Amy Katzen, Project Manager, Elizabeth Reidy, Program Manager, and Kara Vidal, Senior Manager, prepared this report under the direction of Katherine Scarborough Mills, Director of Policy for Market Performance, with significant contributions by Kateryna Fonkych, Carol Gyurina, Ashley Johnston, Rose Kerber, Lyden Marcellot, Rachel Salzberg, Katherine Shea Barrett, and Lois Johnson. The HPC wishes to acknowledge the analytic support provided by Bates White, LLC, Freedman Healthcare, LLC, Gorman Actuarial, Inc., and Health Management Associates, Inc. The HPC would also like to thank the health insurers and providers who provided information for this report for their courtesy and cooperation.
CommissionersDr. Stuart Altman, Chair
Dr. Wendy Everett, Vice Chair
Dr. Donald Berwick
Mr. Martin Cohen
Dr. David Cutler
Mr. Timothy Foley
Secretary Michael J. Heffernan Executive Office of Administration and Finance
Dr. John Christian Kryder
Mr. Richard C. Lord
Mr. Renato (Ron) Mastrogiovanni
Secretary Marylou Sudders Executive Office of Health and Human Services
Acknowledgements
Executive DirectorMr. David Seltz
Exhibit A: Joint Response for the Proposed Transaction
to Create BILH and BILH CIN on Behalf of: Beth Israel Deaconess Medical Center, Mount
Auburn Hospital, New England Baptist Hospital, Lahey Health System, Seacoast Regional
Health Systems, Beth Israel Deaconess Care Organization, and Mount Auburn Cambridge
Independent Practice Association

The Massachusetts Health Policy Commission
Cost and Market Impact Review
HPC-CMIR-2017-2
Preliminary Report Response
Joint response for the proposed transaction to create BILH and BILH CIN on behalf of
A. Beth Israel Deaconess Medical Center, Inc.
B. Mount Auburn Hospital
C. New England Baptist Hospital
D. Lahey Health System, Inc.
E. Seacoast Regional Health Systems, Inc.
F. Beth Israel Deaconess Physician Organization, LLC d/b/a Beth Israel Deaconess Care Organization
G. Mount Auburn Cambridge Independent Practice Association, Inc.

Page | 2
Responding Organization and Context
Given the Health Policy Commission’s (“HPC”) decision to present its Cost and Market Impact Review (“CMIR”) of transactions identified as HPC-CMIR-2017-21 in a single Preliminary Report (the “Preliminary Report”) dated July 18, 2018, all entities involved in the aforementioned transactions (together, the “Parties”) have agreed to respond in kind.
During the course of the HPC’s July 18 meeting, Commissioners raised a number of questions about the Preliminary Report and the transaction. This submission addresses many of those questions including transaction efficiencies and plans for operational innovation. Commissioners also raised concerns regarding access and cost, issues that were also identified as being of concern to the Attorney General in her letter dated July 9, 2018. While the Parties may disagree with many of the Preliminary Report's findings, we remain fully engaged in addressing those concerns with the Health Policy Commission, the Massachusetts Department of Public Health, the Federal Trade Commission and the Attorney General's Office to demonstrate our commitment to operate in the best interests of the Commonwealth and the patients the Parties serve.
A. Executive Summary
Recognizing the harmful effects of unwarranted price variation, the HPC has appropriately called for competition among healthcare providers to address this market dysfunction. Effective competition is exactly what BILH will provide. BILH will represent the first time that a system will have the reputation, geographic coverage, and value position to challenge the dominant health system’s market position, and pressure such system to reevaluate its pricing strategy. BILH has also planned specific initiatives to improve access to care and population health, and to achieve efficiencies that will benefit the citizens of the Commonwealth that cannot be realized by the Parties on their own.
The Parties appreciate the enormous effort of the HPC in analyzing the proposed affiliation and producing its Preliminary Report, and respectfully request consideration of the additional information provided in this response. We ask that the HPC evaluate the creation of BILH, consistent with the
1 HPC-CMIR-2017-2: The Proposed Merger of Lahey Health System (“Lahey”); CareGroup and its Component Parts, Beth Israel Deaconess Medical Center (“BIDMC”), New England Baptist Hospital (“NEBH”), and Mount Auburn Hospital (“MAH”); Seacoast Regional Health Systems; and Each of their Corporate Subsidiaries into Beth Israel Lahey Health; and The Acquisition of the Beth Israel Deaconess Care Organization by BILH; and The Contracting Affiliation Between BILH and Mount Auburn Cambridge Independent Practice Association (“MACIPA”).
Key Takeaways
− Beth Israel Lahey Health (“BILH”) will deliver improved access, quality, efficiency, and value – and we have concrete plans to do so.
− We offer what the HPC has been seeking – market-based competition to address unwarranted price variation and other market dysfunction.
− The “Willingness-to-pay” (“WTP”) model is not appropriate as applied to Massachusetts in the Preliminary Report – it failed to predict past impacts of mergers, drastically overstated potential price increases, and ignored Massachusetts’ regulatory structure.
− The Parties provide essential clinical services, including behavioral health, which they would be challenged to maintain absent the formation of BILH.
− BILH is estimated to create $149 million to $270 million in annual efficiencies and total savings.
Page | 3
HPC’s prior statements regarding its goals and the need for market-based competition, as well as the realities of the Massachusetts market.
At the board meeting on July 18, 2018, where the Preliminary Report was presented, Commissioners raised a number of questions about the Preliminary Report and sought clarification from the Parties about the following: what BILH will accomplish; why these accomplishments require the formation of BILH; estimates of savings and market efficiencies; how the Parties have supported community hospitals and will continue to do so; how BILH will transform care delivery; how to avoid above-market price increases; the impact on the competitive market and the dominant health system; how this is different from the formation of the dominant health system in 1994; how to protect providers serving low income populations; the viability of the Parties with and without the transaction; and how this will be a win for the Commonwealth and for all providers.
The Commissioners also raised questions about the WTP methodology. Chair Stuart Altman noted that “Massachusetts is different,” referring to the regulatory regime that differs from other markets where the WTP was applied. He also described the model results as “hypothetical.” Commissioner David Cutler noted of the conclusions drawn from the WTP model in the Preliminary Report, “The models here are more difficult, in terms of forecasting the future…one would be less certain in this case than in other cases because of all the unknowns.”
We address the range of the Commissioners’ questions throughout this response and provide additional support that reinforces the initial reaction of the Commissioners who questioned the WTP’s applicability in Massachusetts. We also pose additional questions for consideration in the Final CMIR Report (“Final Report”). We challenge the applicability and reliability of other key methodologies and conclusions in the Preliminary Report and urge the HPC to reconsider its assessment as it produces its Final Report.
A Reminder of BILH Commitments
At the outset, we note the following characteristics and commitments of the BILH Parties which are well-documented elsewhere and described in detail in this response:
− BILH is committed to transformational, innovative reforms for the benefit of patients, purchasers, and consumers; these reforms require the scale and combined resources of all Parties
− The formation of BILH will yield substantial cost savings and efficiencies in Massachusetts
− BILH community hospitals will be sustained and strengthened through BILH, as evidenced by prior acquisitions by the Parties; BILH will provide the financial strength to maintain these efforts
− BILH providers currently hold a lower-cost, high-quality market position, which they are committed to maintain to remain competitive through the combined system
− BILH is committed to underserved populations
In BILH, the Parties will create a forward-thinking, transformative, and geographically distributed healthcare delivery network to provide enhanced access to high-value care for patients in Eastern Massachusetts, meet the needs of purchasers seeking to reduce medical expenditures, and advance progress toward Massachusetts’ stated goals of reducing healthcare spending and promoting adoption of alternative payment methodologies (“APMs”). The Parties have been committed to this vision from the start,2 and BILH will strive to achieve essential efficiencies the individual Parties cannot achieve on their own and provide meaningful competition to the dominant health system.
2 A comprehensive explanation of how BILH will address the core concerns of the HPC and AGO – to provide market-based competition, help reduce costs, improve access, quality, value, and equity, and address market dysfunction – was previously submitted to the HPC and is now available publicly in Appendix 1.
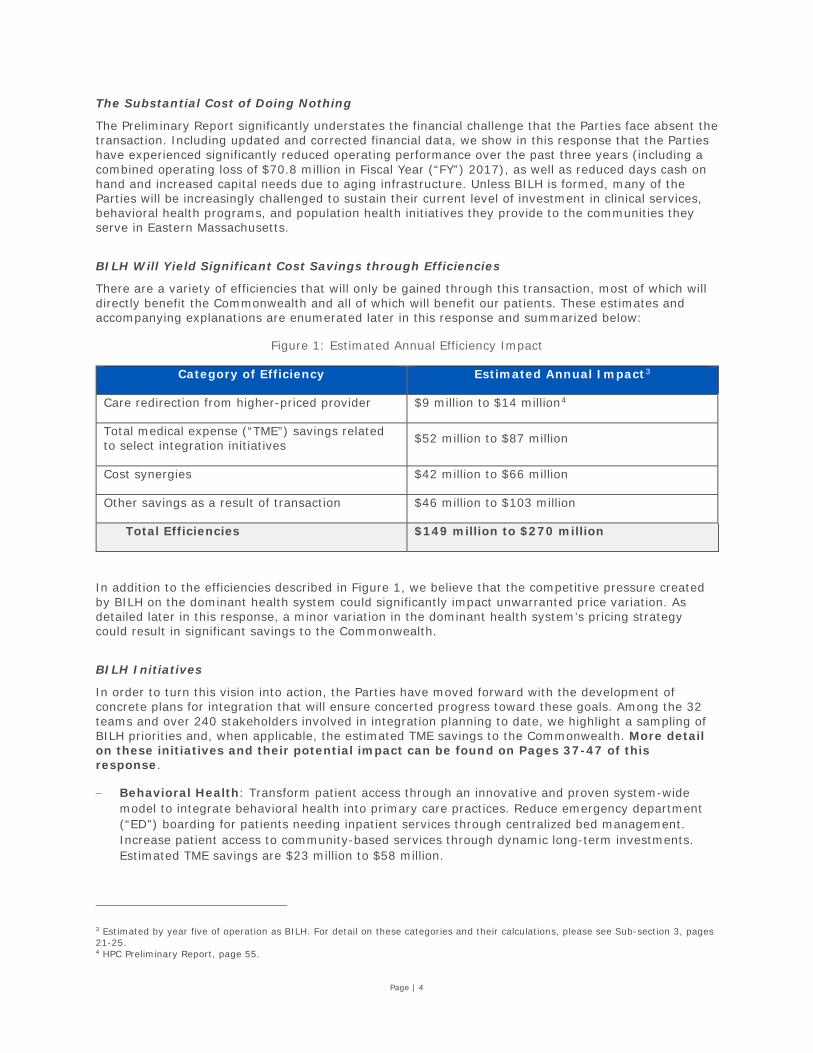
Page | 4
The Substantial Cost of Doing Nothing
The Preliminary Report significantly understates the financial challenge that the Parties face absent the transaction. Including updated and corrected financial data, we show in this response that the Parties have experienced significantly reduced operating performance over the past three years (including a combined operating loss of $70.8 million in Fiscal Year (“FY”) 2017), as well as reduced days cash on hand and increased capital needs due to aging infrastructure. Unless BILH is formed, many of the Parties will be increasingly challenged to sustain their current level of investment in clinical services, behavioral health programs, and population health initiatives they provide to the communities they serve in Eastern Massachusetts.
BILH Will Yield Significant Cost Savings through Efficiencies
There are a variety of efficiencies that will only be gained through this transaction, most of which will directly benefit the Commonwealth and all of which will benefit our patients. These estimates and accompanying explanations are enumerated later in this response and summarized below:
Figure 1: Estimated Annual Efficiency Impact
Category of Efficiency Estimated Annual Impact3
Care redirection from higher-priced provider $9 million to $14 million4
Total medical expense (“TME”) savings related to select integration initiatives $52 million to $87 million
Cost synergies $42 million to $66 million
Other savings as a result of transaction $46 million to $103 million
Total Efficiencies $149 million to $270 million
In addition to the efficiencies described in Figure 1, we believe that the competitive pressure created by BILH on the dominant health system could significantly impact unwarranted price variation. As detailed later in this response, a minor variation in the dominant health system’s pricing strategy could result in significant savings to the Commonwealth.
BILH Initiatives
In order to turn this vision into action, the Parties have moved forward with the development of concrete plans for integration that will ensure concerted progress toward these goals. Among the 32 teams and over 240 stakeholders involved in integration planning to date, we highlight a sampling of BILH priorities and, when applicable, the estimated TME savings to the Commonwealth. More detail on these initiatives and their potential impact can be found on Pages 37-47 of this response.
− Behavioral Health: Transform patient access through an innovative and proven system-wide model to integrate behavioral health into primary care practices. Reduce emergency department (“ED”) boarding for patients needing inpatient services through centralized bed management. Increase patient access to community-based services through dynamic long-term investments. Estimated TME savings are $23 million to $58 million.
3 Estimated by year five of operation as BILH. For detail on these categories and their calculations, please see Sub-section 3, pages 21-25. 4 HPC Preliminary Report, page 55.
Page | 5
− Pharmacy: Improve patient safety, clinical efficacy, and cost-effective prescribing through the development of a Pharmacy and Therapeutics (“P&T”) Committee overseeing drug use policy and formulary management. Implement a novel approach to extended pharmacist intervention for high-risk patients in transitions of care. Reduce pharmacy supply costs through new programs, services, and contracts. Estimated TME savings are $8 million.
− Continuing Care: Provide seamless and coordinated care close to patients’ homes by creating a consolidated home health program. Reduce use of unnecessary institutional post-acute care by creating a high-performing preferred extended care network. Enhance patients’ experience and improve population health outcomes through advanced geriatric services and investment in next-generation care management infrastructure. Estimated TME savings are $15 million.
− Primary Care: Create proximate and timely patient access through a system-wide nurse triage program and other fundamental access enhancements. Reduce administrative burden and enhance workforce development through new workflow and training approaches. Estimated TME savings are $6 million.
− Ambulatory Care: Develop an integrated service center that enables patients and referring providers to efficiently find and schedule the right primary care physician or specialist, via digital or telephonic access.
− Supply Chain: Centralize purchasing and establish a value analysis process and structure to ensure the introduction and ongoing use of clinically-effective and cost-conscious clinical products, technologies, and services.
− Laboratory: Deliver higher quality and more cost-effective laboratory and pathology services by reducing outsourcing of select commercial reference testing and unified purchasing of lab equipment and supplies. Reduce the high costs of turnover through internal workforce development.
− Clinically Integrated Network (“CIN”)/Population Health Management: Establish a centralized claims and clinical data repository for advanced population health analytics. Improve population health through medical management initiatives. Standardize best practices in care and quality management. Enhance pharmacy support to patients in non-hospital settings.
Against the backdrop of these commitments, we wish to address some concerns and suggestions regarding the Preliminary Report.
Attributes of the Parties and the Need to Form BILH
While the Preliminary Report highlighted many features of the proposed system and positive past contributions of the Parties that will constitute BILH, the Preliminary Report did not recognize how challenging it will be for the Parties to continue to contribute individually as they have to the health of the Commonwealth. We request that the Final Report recognize these past contributions, the challenges the Parties face in the absence of forming BILH, and the new opportunities only possible through the formation of BILH, including:
− Behavioral Health: the Parties, in particular Lahey, have led the effort to provide innovative behavioral health services. Without BILH, Lahey faces financial challenges that will limit its ability to continue to provide these services.
− Lower-Cost Providers: the Parties’ track record of maintaining a lower-cost, high-quality position through the growth of their respective systems, as stated in the Preliminary Report;5
5 “As Lahey and BIDCO have grown by affiliating with or acquiring new community hospitals, their prices have not generally risen relative to competitors, and their spending has grown at generally the same rate as the rest of the market based on current available data.” Source: HPC Preliminary Report, page 2.

Page | 6
− Stronger Community Hospitals: the Parties’ significant past success in supporting and strengthening care delivery, particularly enhancing care in local community hospitals – which requires financial investment that may not be possible without BILH;
− Commitment to the Commonwealth’s Safety Net: the Parties’ critical role in supporting the safety net for the Commonwealth’s most vulnerable and low-income populations, including its unparalleled commitment to behavioral healthcare, which can only be maintained and expanded through the combined resources of the Parties;
− Innovation and Transformation Goals: the strong potential for transformative market improvements, access, cost-savings, efficiencies, and care delivery improvements associated with the formation of BILH;
− New Market Options to Benefit Consumers: the potential for BILH to partner with insurers on innovative health plan designs that can increase competition, improve equity, and reduce costs; and
− Impact of BILH on the Dominant Health System: the potential for the sole dominant health system to lower its prices, or slow the growth rate of its prices, in response to the first meaningful competition it will have faced, and the savings that would result.6
Unique Characteristics of the Massachusetts Market
We share the concern expressed by many of the Commissioners that the Preliminary Report did not adequately address the unique nature of the healthcare market in Massachusetts. While many of these factors were identified in the Preliminary Report, the implications of this unique environment were not fully incorporated into its conclusions. We respectfully urge that the Final Report and its conclusions more appropriately reflect and rely on the following findings, observations, and market realities, including:
− Chapter 224 and Enforcement of the Cost Growth Benchmark: the Massachusetts regulatory environment, and its effectiveness in controlling price growth in the Massachusetts market, enforcing the Cost Growth Benchmark, and guarding against excessive growth in TME;7
− Deteriorating Market Environment for Providers: the financial challenges experienced by the Parties over the past three fiscal years, and the risk to their ability to continue to be viable competitors and to adequately invest in current clinical services absent the transaction;
− Destabilizing Impact of Status Quo: the persistent destabilizing and harmful impact of the status quo, including a dominant health system that impedes effective market competition;
− Market-Based Solution to Unwarranted Provider Price Variation: the HPC’s stated need for market-based solutions to the ongoing challenge of unwarranted price variation in the provider market in Massachusetts.8
WTP Model Fails When Applied to Past Transactions
When we applied the WTP model to past transactions in Massachusetts, particularly those involving BIDMC and Lahey, the WTP model predicted higher post-merger prices but no such changes actually occurred. This clear failure raises serious doubts about the accuracy and validity of the WTP
6 This addition of competition to the market differentiates this proposed transaction from the formation of the dominant health system in 1994, when there was not meaningful competition. 7 HPC Board Meeting Presentation, March 29, 2017, describing HPC enforcement of the Cost Growth Benchmark through enactment of the Performance Improvement Plan regulation. Available at https://www.mass.gov/files/documents/2017/03/zx/20170329%2520-%2520Commission%2520Document%2520-%2520Presentation%2520vFinalAM.pdf. 8 HPC, Factors Underlying Variation in Inpatient Hospital Prices, June 2017. Available at http://www.mass.gov/anf/budget-taxes-and-procurement/oversight-agencies/health-policy-commission/publications/factors-underlying-variation-in-inpatient-hospital-prices.pdf.

Page | 7
model for a state with the regulatory constraints and market dynamics of Massachusetts. Despite these and other flaws with the WTP model (enumerated in this response), the Preliminary Report presented the WTP model’s raw calculation as a virtual certainty, without any acknowledgment of these serious limitations.
WTP Model Does Not Incorporate the Effects of Chapter 224
We believe the Preliminary Report did not incorporate the impact of the Cost Growth Benchmark and other regulatory controls to effectively limit the growth in prices and spending. This was especially surprising because some Commissioners and staff have cited the effectiveness of the Cost Growth Benchmark and other controls to provide such limits.9 Without this additional context, the Preliminary Report raised concerns about theoretical cost increases in a hypothetical market that does not meaningfully reflect the actual Massachusetts market and regulatory environment.
WTP Model Ignores Pricing Pressure on the Existing Dominant Health System
Another important limitation of the Preliminary Report was the assumption that the dominant health system in the region would not be affected by the formation of BILH. That ignores the reality that, to this point, the dominant health system has not faced meaningful competition. The Preliminary Report did not adequately consider the potential impact of the introduction of meaningful competition in Eastern Massachusetts and the overarching impact of BILH creating a high-value option for purchasers and consumers. The Parties in BILH look forward to the opportunity to bring meaningful competition to the market, and to drive true savings to purchasers and consumers. Indeed, it is only through this increase in competition that BILH can achieve its objectives.
In fact, the formation of BILH is the only realistic option in the Eastern Massachusetts market that could combine the necessary components of reputation, price position, geographic coverage, and population health management capabilities to be a true competitor to the dominant health system. Since the regulatory model in Massachusetts focuses on limiting total growth in healthcare spending, it tends to lock-in unwarranted price variation. Therefore, market-based competition is necessary to address unwarranted price variation. Without competition, the underlying dysfunction in the Massachusetts market will continue, high-priced providers will continue to extract higher payments, and inequity in the system as described by the Attorney General will be maintained,10 leading to further destabilization of the remaining providers. In a market with significant unwarranted price variation, true competition from a high-value health system will provide the real possibility of a meaningful preferred healthcare solution for insurers, employers, and consumers.
There is evidence to support the conclusion that increased competition can have an impact on costs, of which price is a significant variable. Contrary to the findings of the Preliminary Report,11 there is research to support the notion that the formation of a strong, organized competitor to a dominant provider can, in fact, affect healthcare costs. Research performed by the Healthcare Financial Management Association and supported by the Commonwealth Fund has found that lower-cost markets tend to have competition among a few health systems that each have broad geographic coverage with highly aligned physician groups.12
9 Stuart Altman and David Cutler were referenced at the following source: Bartlett, Jessica “State Maintains Strict Limit on Health Care Spending for 2019,” Boston Business Journal, April 15, 2018. Available at https://www.bizjournals.com/boston/news/2018/04/25/state-maintains-strict-limit-on-health-care.html. Also, David Auerbach was referenced at the following source: Lannan, Katie “Mass. Commission Outlines Health Care Savings of $4.7B,” State House News Services, Reported by the Worcester Telegram, March 29, 2018. Available at http://www.telegram.com/news/20180329/mass-commission-outlines-health-care-savings-of-47b. 10 Examination of Healthcare Cost Trends and Cost Drivers Pursuant to G.L. c. 12C, § 17, Report for Annual Public Hearing Under G.L. c. 12C, § 17, Commonwealth of Massachusetts Office of the Attorney General, October 13, 2016. Available at https://www.mass.gov/files/documents/2016/10/ts/cc-market-101316.pdf. 11 HPC Preliminary Report, page 56. 12 Landman, James H., PHD, JD, Moore, Keith, MCP, Muhlestein, David B., PhD, JD, Smith, Nathan J., PhD, and Winfield, Lia D., PhD. “What is Driving the Total Cost of Care? An Analysis of Factors Influencing Total Cost of Care in U.S. Healthcare Markets,” Healthcare Financial Management Association, 2018. Available at https://www.hfma.org/tcoc/.

Page | 8
Goal of this Response to Preliminary Report
In this response, we strongly urge the HPC to consider critically the Massachusetts-specific context for the proposed affiliation. Several Commissioners flagged these concerns explicitly and here we provide additional information to permit both the Commissioners and the Preliminary Report authors the opportunity to reconsider the creation of BILH in the proper context for Massachusetts.
We also address the HPC’s interest in better understanding the unique and exciting commitments of BILH to improve the health of the population and cost-effectiveness of care in Massachusetts by providing detailed descriptions of opportunities for improvement that have been identified by the Parties to date.
Therefore, in addition to providing additional information and analysis, we request that the Final Report address each of these questions.
− On what basis is it valid to apply the WTP model if it has failed to predict past transaction results, including those involving BIDMC and Lahey, following passage of Chapter 224 in Massachusetts?
− If the WTP model is used despite its many flaws, how will the Final Report adjust the model’s calculation of potential price increases to address the impact of Massachusetts’ regulatory constraints, past behavior of the Parties, the presence of a dominant provider, and other factors?
− How will the HPC calculate and incorporate the potential savings from competitive pricing pressure on the dominant health system into the estimated market impact?
− If BILH is not formed, how will current or future provider organizations compete effectively with the dominant health system or provide market-based solutions to unwarranted price variation?
− How will the HPC incorporate market and TME cost saving efficiencies in its estimate of market impact in the Final Report?
− How will the HPC acknowledge the significant support the Parties have provided to strengthen their community hospitals in the Final Report?
− How will the HPC consider BILH’s significant past and future commitment to behavioral health services for the Medicaid population in its assessment of BILH’s commitment to serving the underserved?
− How will the HPC incorporate BILH’s contribution to effective, high-value, tiered or limited network products into its estimate of market impact?
− If BILH does not move forward, what will replace the care improvement initiatives identified by the Parties?
The remainder of this report describes in detail our concerns with several analyses and conclusions from the Preliminary Report (B. Rebuttal to Preliminary Report Findings), a description of new programs and initiatives that will be offered by BILH (C. Transforming Care and Value in Massachusetts), and an appendix with additional supporting material.
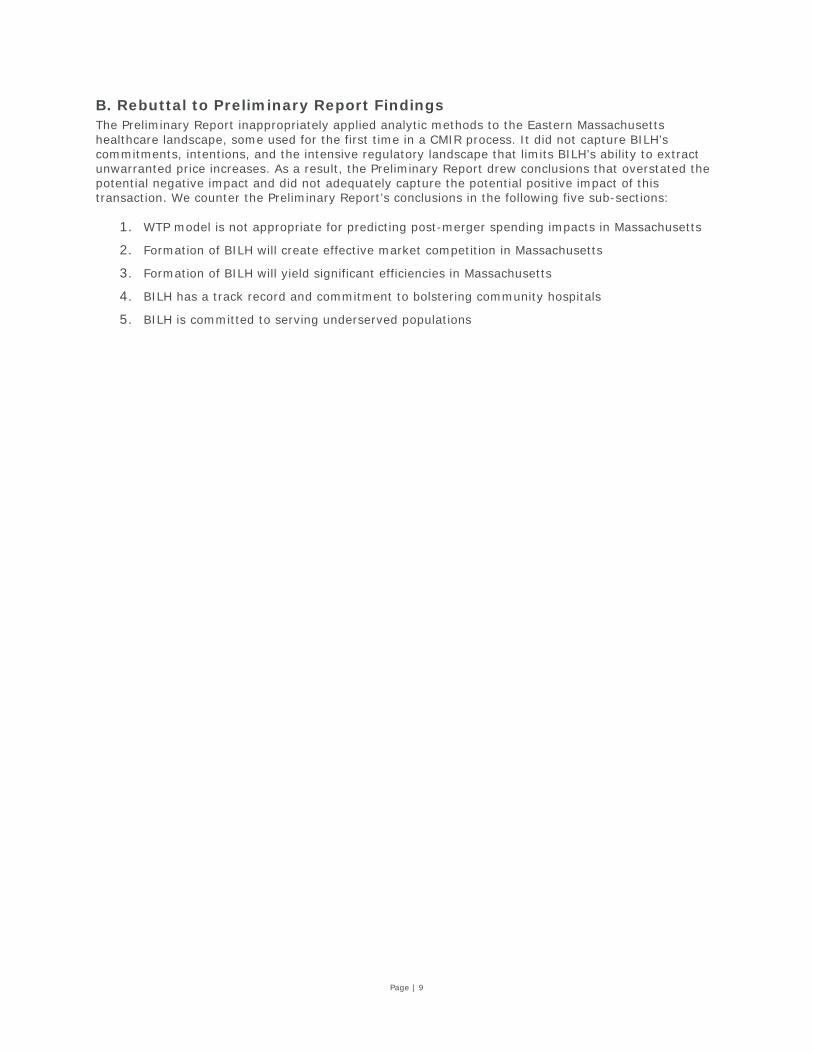
Page | 9
B. Rebuttal to Preliminary Report Findings The Preliminary Report inappropriately applied analytic methods to the Eastern Massachusetts healthcare landscape, some used for the first time in a CMIR process. It did not capture BILH’s commitments, intentions, and the intensive regulatory landscape that limits BILH’s ability to extract unwarranted price increases. As a result, the Preliminary Report drew conclusions that overstated the potential negative impact and did not adequately capture the potential positive impact of this transaction. We counter the Preliminary Report’s conclusions in the following five sub-sections:
1. WTP model is not appropriate for predicting post-merger spending impacts in Massachusetts
2. Formation of BILH will create effective market competition in Massachusetts
3. Formation of BILH will yield significant efficiencies in Massachusetts
4. BILH has a track record and commitment to bolstering community hospitals
5. BILH is committed to serving underserved populations
Page | 10
1. WTP Model is Not Appropriate for Predicting Post-Merger Spending Impacts in Massachusetts
The Preliminary Report grossly overstated the potential impact of the merger on pricing and commercial spending in Massachusetts. The Preliminary Report presented an analysis of the competitive effects of the merger based on the WTP model to argue that BILH will not only seek, but also receive commercial rate increases far above historical and projected cost growth benchmarks. The Parties fundamentally disagree with how the Preliminary Report applied the WTP analytic model to estimate the impact of the merger on prices and spending, and the conclusions reached as a result. The problems with the HPC’s application of the WTP model in this context are enumerated below.
The WTP Model Inaccurately Predicted Price Increases for Past Mergers and Affiliations in Massachusetts, when in Reality No Price Increases Occurred.
Past mergers and affiliations in Massachusetts that had meaningful changes in WTP have not led to the price increases predicted by the raw WTP calculation. BILH engaged economic experts to identify recent transactions for review in which the two-stage model approach employed by the HPC predicted a positive change in WTP of at least 4%. As a result, three recent mergers or affiliations were examined: Lahey’s acquisition of Winchester Hospital in 2014; BIDCO’s inclusion of Cambridge Health Alliance (“CHA”), Lawrence General Hospital (“Lawrence General”), and Anna Jaques Hospital (“AJH”) in 2014; and Lahey’s acquisition of Northeast Health System (“Northeast”) in 2012. For each of these affiliations, the BILH economists estimated the change in WTP for inpatient services, and then used the HPC’s own estimates to translate the change in WTP to a predicted change in price for inpatient services.13 For the Lahey-Winchester affiliation, the model estimates that the transaction would lead to a 7% increase in WTP. When using the HPC’s own estimates to translate this change in WTP to a predicted change in price, the model estimates a predicted price increase of 3% to 4%. For the BIDCO affiliation, the model calculated a 4% change in WTP, which implies a price increase of 1.5% to 3%, again based on the HPC’s own estimates. Finally, for the Lahey-Northeast affiliation, the model
13 Due to data limitations, the analysis was restricted to inpatient services only. Regardless, the implications drawn from this exercise – that the WTP model is ill-suited for making predictions about post-merger price increases in a market like Massachusetts – extend to the other segments examined by the HPC (outpatient services and physician services).
Key Takeaways
− The Preliminary Report grossly overstated the potential impact of the merger on pricing and commercial spending in Massachusetts.
− The WTP model inaccurately predicted price increases for past mergers and affiliations in Massachusetts, when in reality no price increases occurred.
− The Preliminary Report ignored the intensive regulatory oversight in Massachusetts when applying the WTP model to estimate the proposed transaction’s impact on spending.
− The Preliminary Report failed to acknowledge limitations regarding the accuracy, reliability, and precision of the WTP model.
− The WTP model ignores competitive pressure on the dominant health system.
− The WTP model does not account for market dynamics and competitive responses.
− The Parties have maintained lower pricing levels after past mergers or affiliations.

Page | 11
estimates that the transaction would lead to a 5% increase in WTP14 and, again when using the HPC’s own estimates to translate this change in WTP to a predicted change in price, the model estimates a predicted price increase of 4% to 5%. However, in all three cases, data show relative prices did not materially change following the transactions. Moreover, as acknowledged by the HPC itself in the Preliminary Report, “As Lahey and BIDCO have grown by affiliating with or acquiring new community hospitals, their prices have not generally risen relative to competitors, and their spending has grown at generally the same rate as the rest of the market based on current available data.”15
Figure 2: Analysis of Select Past Transactions16
Transaction Estimated Change in WTP
Predicted Change in Price
Actual Change in Price
Lahey-Winchester 7% 4%-5% Zero 2014 BIDCO contracting affiliations17 4% 2%-5% Zero
Lahey-Northeast 5% 4%-5% Zero Further detail on these analyses is available as Appendix 2.
The Preliminary Report Ignored the Intensive Regulatory Oversight in Massachusetts when Applying the WTP Model.
“Massachusetts is different.” This statement was made by Chair Stuart Altman during the July 18, 2018 board meeting in the context of the Commonwealth’s regulatory environment. The statement is also consistent with the actual environment as experienced by the Parties. Those three words embody the fundamental problem with applying the WTP model, particularly the WTP’s raw results, to this affiliation to predict post-merger pricing and spending impacts.
The WTP model assumes there is a relatively free market for establishing pricing. Massachusetts is different. Few (if any) states have the dedicated resources and political mandate related to transparency of information, regulatory oversight, and accountability to consumers for performance as does Massachusetts, and certainly no other state in the country combines all of those factors.
− Transparency of Provider Price information: The Center for Health Information and Analysis (“CHIA”) is tasked with tracking and publicly reporting healthcare provider information, including pricing. Providers cannot operate in Massachusetts outside of the public’s knowledge, let alone the knowledge of regulators. This level of transparency is uncommon in nearly every other market in the United States. Providers in Massachusetts understand that unwarranted price increases will be in the public domain. They also understand that the HPC possesses the requisite information to determine if price increases are warranted or excessive, and to pursue corrective action.
− Cost Growth Benchmark: Among its many activities targeted to controlling cost and improving value, the HPC establishes an annual Cost Growth Benchmark for healthcare providers.18 A first among states, this Cost Growth Benchmark, along with the transparency noted above, provides only a narrow corridor for price negotiations between providers and payers, especially as payers often cite the benchmark during negotiations in order to justify lower rates.
14 Notably, the economic model used by the BILH economists to estimate the change in WTP for past transactions was able to closely replicate the change in WTP estimated in the Preliminary Report for the BILH transaction. That is, none of the findings in this section are driven by disparities in the model used by the HPC in the Preliminary Report when compared to the model used by the Parties. 15 HPC Preliminary Report, page 2. 16 As detailed in Appendix 2, the BILH economists calculate the change in WTP per discharge corresponding to each of these transactions, and then use the HPC’s own estimated regression coefficients to calculate the predicted change in price resulting from the transaction. 17 CHA, Lawrence General, and AJH. 18 Chapter 224 of the Acts of 2012 established both the HPC and CHIA, as well as the state’s Cost Growth Benchmark.

Page | 12
In 2016, an article co-authored by Commissioner David Cutler espoused the merits and impact of the Cost Growth Benchmark and its functionality in the market.
“By and large, the reduction in cost growth has had a lot to do with reduced price increases. Payer and provider rate negotiations are now conducted in light of the 3.6% target, and both payers and providers are aware that they will be subject to a performance-improvement plan through the HPC if their high spending could potentially jeopardize the Commonwealth’s ability to meet the benchmark. …The volume of services has fallen as well, although not to the same extent. Hospital readmission rates in the Commonwealth are declining markedly, and many provider organizations have put in place high-cost case-management programs.”19
The regulatory regime in Massachusetts provides multiple safeguards against above-market, unwarranted price increases, including: the Cost Growth Benchmark, annual cost trends hearings and reports, and the threat of the imposition of Performance Improvement Plans (“PIPs”) if a provider organization is identified as having excessive health-status adjusted TME and threatens the Commonwealth’s ability to meet the Cost Growth Benchmark. In addition to the HPC, the Department of Public Health (“DPH”), and the Attorney General’s Office (“AGO”) assist in overseeing cost and prices through the mechanisms described below.
− Accountability at Annual HPC Cost Trends Hearing and Cost Trends Report: The annual healthcare cost trends hearing is a public event at which industry stakeholders, policymakers, and researchers come together to examine and address challenges and opportunities for improving care and reducing costs in the Commonwealth's healthcare sector. Healthcare and industry leaders provide sworn testimony in advance of the hearing. CHIA and the AGO also participate in the hearing, and key questions are posed from Commissioners, as well as local and national experts to address the state's performance under the Cost Growth Benchmark, the drivers of healthcare costs, and other healthcare reform efforts. The Annual Cost Trends Report is the yearly culmination of the HPC’s examination and research, and results in a series of recommendations to guide policymakers, purchasers, employers, consumers, and other market stakeholders to achieve common cost-containment and care-improvement goals.
− Department of Public Health “Determination of Need” Program and Enforcement: The purpose and objective of the newly-reformed Determination of Need (“DoN”) program is to align the Commonwealth’s DoN process, under the guidance of the DPH and the Secretary of Health and Human Services, with the HPC’s review of significant market proposals. The stated goals of the DoN program are to encourage competition within the Massachusetts healthcare sector with a public health focus; to support the development of innovative health delivery methods and population health improvement strategies within the healthcare delivery system; and to ensure that resources will be made reasonably and equitably available to every person within the Commonwealth at the lowest reasonable aggregate cost. The DPH’s goal is to advance the Commonwealth’s goals for cost containment, improved public health outcomes, and delivery system transformation.
− Accountability for Excessive, Unwarranted Cost Growth: The regulatory regime goes beyond monitoring and measurement of targets by imposing consequences and remedies when targets are not met. In 2017, a PIP process was established20 in regulation for organizations or entities that exceed the cost growth benchmark and are identified as having excessive TME in a given
19 Cutler, David, PhD, Walsh, Steven M., JD. “The Massachusetts Target on Medical Spending Growth.” NEJM Catalyst. May 11, 2016. Available at https://catalyst.nejm.org/massachusetts-target-medical-spending-growth/. 20 Established through 958 CMR 10.00.

Page | 13
calendar year.21 The PIP process is rigorous, as it requires an identified organization to create and implement a multi-faceted corrective plan within eighteen months.
The Preliminary Report stated the WTP model “has been accepted by courts in a range of recent anti-trust cases.”22 We cannot dispute this. But, it is important to recognize that neither the Federal Trade Commission (“FTC”) nor the courts have applied the WTP model to estimate post-merger pricing and spending impacts from a healthcare provider merger in a state like Massachusetts. The FTC’s jurisdiction is national, which means they investigate healthcare transactions across all types of geographies. The cases referenced in the Preliminary Report are from states such as Idaho, Illinois, Ohio, and Pennsylvania – none of which compare to Massachusetts in terms of regulatory oversight of the healthcare industry. There are also markedly different competitive dynamics that were present in those cases than are present here.23
As a result, the conditions described above, which are unique to the Commonwealth, make it impossible to circumvent regulatory and public scrutiny, render the magnitude of the predicted price increase implausible to implement, and ultimately negate the effectiveness and applicability of the WTP model to predict post-merger price and spending increases in Massachusetts.
The Preliminary Report Ignores Warnings about the Accuracy, Reliability, and Precision of the WTP Model
More generally, the Preliminary Report inappropriately imparted a sense of “precision” when it comes to the estimated price increases. There is no discussion of the technical limitations or statistical significance of the WTP model. During the July 18, 2018 board meeting, Chair Stuart Altman acknowledged the imprecision of the WTP model stating the following: “…It is still an estimate. It is still highly probabilistic. But it’s the best we have, and I think it lays out a wide degree of error. There’s just no question. So, I think we carry this out to four decimal places, but the reality is, it’s highly hypothetical.” Further, the Preliminary Report claimed the estimate to be highly conservative, without acknowledging the likelihood that it may be substantially overestimated. A telling indicator is that the academic literature that the Preliminary Report cited calls for caution while interpreting the effects of these models.24
The WTP Model Ignores Competitive Pressure on the Dominant Health System
The WTP model does not consider another key aspect of the Massachusetts environment: the existence of a dominant health system that has maintained its disproportionate market and price position, despite the regulatory conditions mentioned above. Since the regulatory model focuses on limiting total growth in healthcare spending, it tends to lock-in unwarranted price variation. Therefore, market-based competition is necessary to address unwarranted price variation. That is why the formulation of BILH is so essential.
21 The HPC may seek a PIP if “the Commission identifies significant concerns about the [organization’s] costs and determines that a Performance Improvement Plan could result in meaningful, cost-savings reforms.” (958 CMR 10.04 (1)) If a PIP is required, the organization has 45 days to submit the plan to the HPC and the organization “shall be subject to compliance monitoring and regularly provide both public and confidential reports upon progress as specified in the approved Performance Improvement Plan and as may be otherwise specified by the Commission.” (958 CMR 10.11 (2)). 22 HPC Preliminary Report, page 44. 23 Even though the HPC’s regression model relating pricing to WTP is estimated using data from Massachusetts, it does not appropriately account for the effect of the Massachusetts Cost Growth Benchmark. In particular, the HPC’s model specification identifies the effect of WTP on pricing by comparing WTP levels and prices across hospital systems at a given point in time (i.e., a cross-sectional or a pooled cross-sectional comparison). The specification does not estimate the effect of WTP on pricing by examining changes in WTP for a hospital system over time and relating those changes to changes in prices charged by that system over time. As a result, the specification does not adequately capture the effect of the Chapter 224 regulation which would restrict the ability of a provider to increase prices over time, such as in response to an increase in WTP, but leaves the current pricing differences across systems baked in. 24 Specifically, HPC Preliminary Report, page 44, footnote 152 cites Garmon, Christopher, “The accuracy of hospital merger screening methods,” 48 RAND J. OF ECON. 1068 (2017). This article includes the following caveat: “However, the relationship between the new screening tools and the post-merger price changes is not precise or robust to alternate price change measurements, so care should be taken when using the tools to screen mergers for further investigation.”

Page | 14
Only BILH can be that added dose of competition, providing a first-ever strong and credible alternative to the dominant health system for payers, rather than the disaggregated and uncoordinated pool of competition that exists today. Yet the HPC’s analysis does not account for downward pricing pressure exerted on the dominant health system as a result of the merger, and instead, solely focuses on the raw WTP calculation of the change in the bargaining position of the Parties vis-à-vis the insurers.
Allowing only half the story to be told renders this application of the WTP model as further flawed. We urge the HPC to address this shortcoming by including the downward pressure on the dominant health system’s pricing (applied within or outside the WTP model) to help appropriately adjust the WTP results for the unique market conditions brought about by the presence of a dominant provider.
The WTP Model Does Not Account for Market Dynamics and Competitive Responses
Even if the imputed rate increase were pursued, the Preliminary Report did not adequately take into account competitive responses. Massachusetts has an active healthcare marketplace, and any price increase of the magnitude alleged in the Preliminary Report would likely be met by competitive responses from other marketplace participants, mitigating the effect of any potential price increase.
Indeed, the Preliminary Report suggested rate increases could be implemented over several years, as opposed to a single year. Even so, the longer the time frame, the likelier it is that the price effects would be mitigated by competitive repositioning of rivals through new entry or expansion of existing competitors to provide access, especially in outpatient and physician services where the barriers to entry are lower. This limitation was not acknowledged in the Preliminary Report.
BILH Parties Have Maintained Lower Pricing Levels after a Merger or Affiliation
The Parties are currently low-priced providers. As the Preliminary Report acknowledged: “the Parties have generally had low to moderate prices compared to other Massachusetts providers.”25 This statement accurately reflects the Parties as they exist today, after recent mergers or contracting affiliations that have constituted the individual organizations. These recent transactions include:
− BIDMC’s acquisition of Beth Israel Deaconess Hospital-Milton (“BID-Milton”) and Beth Israel Deaconess Hospital-Plymouth (“BID-Plymouth”) (formerly Jordan Hospital);
− CHA, Lawrence General, AJH, and NEBH joining the BIDCO ACO between 2012 and 2015;
− Lahey’s acquisition of Northeast in 2012; and
− Winchester Hospital joining Lahey in 2014.
Following these transactions, the Parties did not obtain unwarranted price increases. The Preliminary Report acknowledged that there is not “evidence that the Parties have negotiated higher prices, either for new community hospital affiliates or for their hospitals overall, following past acquisitions or contracting affiliations with community hospitals.”26
The HPC has stated that past performance and actions should be a critical consideration when speculating about future behavior.27,28 The Parties strongly agree with this approach and request their
25 HPC Preliminary Report, pages 2 and 32. Additional comments on the Parties’ lower-cost positions are cited on pages 27, 29, 31, 32, 33, 34, 35. Specifically, on pages 31-32, the Preliminary Report also states “We also examined relative price for the Parties’ physician networks and found that BIDCO, Lahey, and MACIPA generally have low to moderate physician prices compared to other eastern Massachusetts physician groups, and they are consistently lower-priced than Partners and Atrius.” 26 HPC Preliminary Report, page 32. 27 HPC Preliminary Report, page 27, “Our analysis of a proposed transaction includes assessments of potential impacts on costs and market functioning, care delivery and quality, and access to care. In the following sections we examine the Parties’ baseline performance in each of these areas and then assess the potential impacts of the proposed transaction based on this past performance and the Parties’ stated plans and commitments.” 28 HPC Preliminary Report, page 35, “To understand the extent to which the Parties have achieved such goals in the past, which can inform assessments of how successful the Parties may be in achieving these goals in the current transaction…”

Page | 15
history of not receiving unwarranted price increases following significant transactions be considered in any evaluation of their future intentions.
Significantly Increased Prices Would Diminish BILH’s Competitive Advantage
As stated, the Parties have a demonstrable history of competitive price performance for their hospitals and physician groups, which will continue to remain a major competitive differentiator for BILH. As high-performing networks like BILH succeed, higher-priced systems will be pressured to reevaluate their pricing strategy to be included in insurer networks at favorable tiers and to attract consumers, further reducing healthcare expenditure and cost growth.29 In short, not only will BILH providers continue to remain lower-cost, the very introduction of BILH into the marketplace could have much broader beneficial effects on TME.
Preliminary Report Market Concentration Methodology Is Not Determinative
We noted that the HPC includes calculations of market shares and concentration measures calculated over Primary Service Areas (“PSAs”) in its Preliminary Report, even though, by the HPC’s own admission, these PSAs do not necessarily constitute relevant geographic markets for antitrust purposes.30 We emphasize that market shares and concentration measures calculated using PSAs as geographic regions should not be viewed as being determinative of the likely competitive impact of the transaction.
Conclusion
We concur with Chair Stuart Altman that the WTP model is “hypothetical,” with “a wide degree of error.” We further assert that it was misapplied in the Preliminary Report, yielding extremely misleading and inflammatory estimates of market impact.
While the Parties acknowledge that the WTP model may serve as a reasonable predictive tool when applied in other markets, the variety of factors outlined above, particularly the implementation of Chapter 224 of the Acts of 2012, the unique regulatory environment in Massachusetts, and the presence of a dominant provider, invalidate this model as an accurate predictor of future actions in Massachusetts and for BILH as a system. The WTP’s failure to accurately predict outcomes from past Massachusetts transactions strongly suggests that it is not a viable model to be used in Massachusetts.
The conclusion put forth in the Preliminary Report failed to adequately account for these problems with this approach; it did not adequately emphasize the Parties’ history of not receiving unwarranted price increases after transactions; it disregarded and rejected the undeniable success of the Cost Growth Benchmark in limiting rate increases for all providers, both large and small; and it did not fairly consider the potential impact of BILH on increasing competition, and driving the market behavior of high-priced providers like the dominant health system, which will still have revenues more than double those of BILH.
The Preliminary Report did not adequately describe these limitations, even though the HPC and its Commissioners have publicly acknowledged the effectiveness of the regulatory mechanisms in Massachusetts to ensure that the future impacts asserted in the WTP model are not possible in this environment.
29 Data from Massachusetts Health Connector’s 2017 Open Enrollment Update presentation at the Board of Directors Meeting on January 12, 2017. Available at https://www.mahealthconnector.org/wp-content/uploads/OE2017-Status-011217.pdf. Indicates members are indeed shopping for high-value plans. Specifically, the plans with the lowest average premium increase had the highest gains in membership, and the plans with the highest average premium increase lost the most membership. 30 HPC Preliminary Report, pages 39-43.

Page | 16
On what basis is it valid to apply the WTP model if it has failed to predict past transaction results, including those involving BIDMC and Lahey, following passage of
Chapter 224 in Massachusetts?
If the WTP model is used despite its many flaws, how will the Final Report adjust the model’s calculation of potential price increases to address the impact of Massachusetts’
regulatory constraints, past behavior of the Parties, the presence of a dominant provider, and other factors?

Page | 17
2. Formation of BILH Will Create Effective Market Competition in Massachusetts
Competitive Pressure on the Dominant Health System
Perhaps the most serious limitation of the analysis in the Preliminary Report is the assumption that the dominant health system in Massachusetts would be unaffected by the formation of BILH. The Preliminary Report incorrectly implied the entrance of BILH into the market would not lower or slow the increase in rates of the dominant health system.31 This statement directly contradicts assertions previously made by the HPC and other government bodies that a market-based solution is what the Commonwealth needs to address its rising healthcare expenditures, price disparities and payment variation, and health inequities.32 It also defies the basic principles of industrial organization and antitrust economics.
Several factors suggest that the dominant system would experience significant price pressure.
− The dominant health system’s high price position is exactly what makes it vulnerable to a high-value, lower-cost competitor;33
− BILH would have the combined reputation, price position, geographic coverage, and population health management skill to be a true competitor; and
− Innovative insurance products built on tiered or limited networks with a recognized brand that can meet all of a patient’s needs have been proven to shift market share.34
BILH will compete directly with the dominant health system to drive true savings to purchasers and consumers. In fact, the formation of BILH is the only identified competitive option to create a market-based solution to unwarranted price variation and the corresponding dysfunction in the market. Without such competition, nothing fundamentally changes in Massachusetts. As the current unwarranted price variation (i.e., the gap between the dominant health system and everyone else) will persist, its destabilizing impact on providers across the Commonwealth will worsen. However, with the introduction of true competition, there is the real possibility of reducing the dominant health system’s above-market pricing.
31 HPC Preliminary Report, page 56. 32 Examination of Healthcare Cost Trends and Cost Drivers Pursuant to G.L. c. 12C, § 17, Report for Annual Public Hearing Under G.L. c. 12C, § 17, Commonwealth of Massachusetts Office of the Attorney General, October 13, 2016. Referenced in HPC Preliminary Report, page 12. Available at https://www.mass.gov/files/documents/2016/10/ts/cc-market-101316.pdf. 33 From its inception, BILH has been designed to be a high-value, lower-cost competitor. Sources: Document entitled “Responses to DoN Questions” submitted as part of NEWCO-17082413-TO application to the Department of Public Health in September 2017; HPC Preliminary Report, page 50. 34 Gruber, Jonathan, and McKnight, Robin, "Controlling Health Care Costs through Limited Network Insurance Plans: Evidence from Massachusetts State Employees,” 2016. American Economic Journal: Economic Policy, 8 (2): 219-50. Available at: http://www.nber.org/papers/w20462.
Key Takeaways
− The Preliminary Report incorrectly assumed that BILH would not pressure the dominant health system to slow its rate increases.
− Research does suggest that the formation of a strong, organized high-value competitor, like BILH, can affect prices.
− To appropriately assess the cost and market impact of this transaction, the HPC must calculate the potential impact of the dominant health system reevaluating its pricing strategy as a likely outcome of BILH competition.
Page | 18
Mechanism of Price Adjustment
There are two primary mechanisms by which increased competition from BILH could lead the dominant health system to either decrease prices or increase prices at a lower rate than the market: (1) Pressure applied by payers and (2) Pressure to regain market share.
− Pressure Applied by Payers: Payers in the market could impose external pressure to reduce price increases by the dominant health system. Currently, as acknowledged in the HPC Preliminary Report, the dominant health system is a “must-have” to payers,35 which provides the system with a great deal of bargaining power. However, with a high-quality, lower-priced alternative available, payers may have greater ability to resist pricing increases and similar cost-inefficient demands made by the dominant health system during negotiations.
− Pressure to Regain Market Share: When BILH develops competitive tiered or limited network products that are priced well below existing products in the market and offers high-quality services, the dominant health system could lose market share as price-conscious employers and patients seeking high-quality alternatives shift their care to BILH. The dominant health system, out of concern to maintain market share, may be forced to develop its own limited network products. To make a limited network insurance product by the dominant health system competitively priced, it would likely need to provide significant price discounts. While this discount would only apply to the portion of patients in the limited network product, the discount itself could be much higher, resulting in significant savings.
Small Pricing Movement Yields Large Savings
Whether the mechanism is a smaller across-the-board reduction in annual increases, or a larger discount on a smaller population in a limited network insurance product, any reduction in the dominant health system’s pricing could have a significant impact. Given the annual commercial revenue of the dominant health system and its contracted physicians of approximately $5 billion in Massachusetts,36 each one percent reduction in relative price would yield approximately $50 million in savings. Even with significant pricing reductions, given the current variation in relative price, the dominant health system would still have rates well above all others in the market, but the Commonwealth will have begun to achieve savings by addressing unwarranted price variation through market-based competition.
We encourage the HPC to estimate the potential impact if the dominant health system adjusted its pricing based on the competitive threat from BILH, and that these scenarios be included in the market impact conclusions in the Final Report.
Provider Competition is Critical to Lowering Costs
Contrary to the findings of the Preliminary Report,37 there is research to support the notion that the formation of a strong, organized competitor to a dominant provider can, in fact, affect healthcare costs. Research performed by the Healthcare Financial Management Association and supported by the Commonwealth Fund has found that lower-cost markets tend to have competition among a few health systems with highly aligned physician groups.38 Specifically, research found that “in most of the lower-cost markets…sufficient consolidation had occurred to leave between two and four health systems with
35 HPC Preliminary Report, page 56. 36 Source: $5 billion based on 2016 CHIA Hospital Cost Report information for inpatient and outpatient services NPSR ($1.3 billion + $2.0 billion = $3.3 billion). Physician services NPSR was estimated to be $2.0 billion ($3.3 billion multiplied by .26/.42 as physician services represent 26% of total TME while inpatient and outpatient services represent 42% of total TME (Source: Commercial CY2014-CY2016 Unadjusted TME by Service Category from the CHIA 2017 Annual Report TME Databook). Note: NPSR includes Massachusetts Eye and Ear Infirmary, which was not part of the system in 2016. 37 HPC Preliminary Report, page 56. 38 Landman, et al., “What is Driving the Total Cost of Care? An Analysis of Factors Influencing Total Cost of Care in U.S. Healthcare Markets,” Healthcare Financial Management Association, 2018. Available at https://www.hfma.org/tcoc/.

Page | 19
good geographic coverage competing within the market.”39 This makes intuitive sense. When an attractive competitor emerges, with a full slate of comparable characteristics, it almost always forces dominant players to adjust their pricing behavior. As we have repeatedly argued, geographic coverage, low cost position, strong reputation, and population health management skills, are critical to effective market competition and resultant cost savings.
While the healthcare industry has some unique features, the underlying economic concept of competition is still relevant. Instances across a variety of industries indicate that a strong second competitor can either halt cost growth or, even more significantly, reduce prices.40 Notable examples of a lower-cost entrant constraining price growth include Wal-Mart’s entry into the grocery market41,42,43 and Samsung’s pricing strategy which drove down Apple’s iPhone prices.44,45
BILH Will be a Lower-Cost Stand-Alone Option for Payers
According to the Preliminary Report, if BILH’s entrance to the market does not create a competitive enough alternative to the dominant health system, BILH will become a second “must-have” in payer networks.46 This argument does not hold for multiple reasons. Primarily, BILH will encompass a coordinated network of services and geographic reach that is sufficient to fulfill the needs of employers in Eastern Massachusetts (which the Parties are unable to do separately). A key goal of the transaction is for BILH to become more attractive to payers and consumers, and to act as a true alternative to the dominant health system in the market through its geographic scope, high-quality, and lower-cost position and reputation, which should provide confidence to potential customers that even their most complex medical needs can be addressed within a fully coordinated and integrated system of care. Currently, only the dominant health system enjoys this market position. Consumers seeking high-quality, lower-cost care would have no reason to additionally seek care from a higher-cost provider in the market.
Further, as it stands, if one provider in the market is considered a “must-have” system that can meet all a population’s needs on its own, and has a strong clinical reputation, there is no reason payers would need to supplement these services with another “must-have”. And to the extent that a second system is an alternative, its downward pricing pressure on the true “must-have” system, whose prices significantly exceed those of any other system, would far outweigh any gain in price negotiations of BILH, which will always be constrained to demonstrate its value. This dynamic, of reducing the degree to which the dominant health system is a “must-have” system, further supports the argument above that the Final Report must reflect some estimate of savings to the Commonwealth derived from pricing pressure on the dominant health system.
39 Ibid., 22. 40 Busso, Matias and Galiani, Sebastian, “The Causal Effect of Competition on Prices and Quality: Evidence from a Field Experiment,” Inter-American Development Bank and University of Maryland – Department of Economics, February 2015. Available at http://www.nber.org/papers/w20054. 41 Basker, Emek, “Selling a Cheaper Mousetrap: Wal-Mart’s Effect on Retail Prices,” Journal of Urban Economics, 2005, 58, 203–229.9. Available at https://doi.org/10.1016/j.jue.2005.03.005. 42 Basker, Emek and Noel, Michael, “The Evolving Food Chain: Competitive Effects of Walmart’s Entry into the Supermarket Industry,” Journal of Economics and Management Strategy, Winter 2009, 18 (4), 977–1009. Available at https://onlinelibrary.wiley.com/doi/full/10.1111/j.1530-9134.2009.00235.x. 43 Jia, Panle, “What Happens When Walmart Comes to Town: An Empirical Analysis of the Discount Retailing Industry,” Econometrica, November 2008, 76 (6), 1263–1316. Available at https://onlinelibrary.wiley.com/doi/full/10.3982/ECTA6649. 44 “Rivalry between Apple and Samsung in smartphones will grow fiercer,” The Economist, September 2017. Available at https://www.economist.com/business/2017/09/14/rivalry-between-apple-and-samsung-in-smartphones-will-grow-fiercer. 45 Edwards, Jim. “Apple is once again copying a page from the Samsung playbook,” Business Insider, March 2016. Available at https://www.businessinsider.com/apple-copying-samsung-startegy-pricing-iphone-se-2016-3. 46 HPC Preliminary Report, page 56.

Page | 20
How will the HPC calculate and incorporate the potential savings from competitive pricing pressure on the dominant health system into the estimated market impact?
If BILH is not formed, how will current or future provider organizations compete effectively with the dominant health system or provide market-based solutions to
unwarranted price variation?
Page | 21
3. BILH Will Yield Significant Cost Savings and Efficiencies that Cannot Be Achieved without Creating BILH
The Preliminary Report understated efficiency savings by focusing only on care redirection, and excluding savings in improved operating efficiencies and margins, as well as TME reductions that will yield savings to the Commonwealth. The Preliminary Report described four primary areas47 of care redirection efficiencies, estimated by the HPC to generate $8.7 million to $13.6 million in savings annually. In response to the request of Commissioners,48 we are providing more detailed information in these areas to make it possible for the Final Report to recognize these benefits to the Commonwealth. Estimated savings from four types of efficiencies are summarized in the figure below and explained further throughout this section.
47 Increased retention of current BILH primary care patients at BILH hospitals, increased volume at BILH hospitals due to enhanced consumer preference or brand, recruitment of new primary care patients to BILH, and shifts of patient volume within BILH from BIDMC and Lahey HMC to lower priced BILH hospitals. Source: HPC Preliminary Report, page 51. 48 In addition, page 3 of the Preliminary Report stated: “They [BILH] are considering plans for integrating their unique quality oversight and management structures and have stated an intention to expand or integrate current care delivery initiatives, but have not yet developed detailed plans for these efforts. While the Parties’ ongoing planning process may result in initiatives that could improve patient care, it is unclear whether, to what extent, and on what time frame such initiatives may be adopted or what specific impacts any such initiatives might have.”
Key Takeaways
− The Preliminary Report did not reflect several cost savings and efficiencies that raise the total positive impact of the formation of BILH to $149 million to $270 million annually by year five.
− Operating margin improvements that can be achieved through the formation of BILH, which are estimated to be $88 million to $169 million annually by year five, include $42 million to $66 million in cost synergies.
− Selected integration initiatives will yield additional TME savings of approximately $52 to $87 million for the Commonwealth.
− The Parties’ financial strength is less than what was portrayed in the Preliminary Report, and the formation of BILH will yield much needed improved operating efficiencies and margins.

Page | 22
Figure 3: Estimated Annual Efficiency Impact
Category of Efficiency Estimated Annual Impact49
Care redirection from higher-priced provider $9 million to $14 million50
TME savings related to select integration initiatives $52 million to $87 million
Cost synergies $42 million to $66 million
Other savings as a result of transaction $46 million to $103 million
Total Efficiencies $149 million to $270 million
Improved Operating Efficiency and Margins
Market efficiencies represent only a portion of the cost saving opportunities this transaction will generate. Planning by the Parties to date involved estimating operational savings BILH is likely to achieve. As one Commissioner indicated,51 these types of savings from operational efficiencies represent true savings that flow through to yield savings for the Commonwealth and should be counted in considering the impact of the affiliation. We concur that these savings should be considered as they improve financial results and support the ability of the Parties to carry out their mission. The latest estimates determined by BILH show a range of $88 million to $169 million in annual operating margin improvement by year five of operations, of which an estimated $42 million to $66 million are from cost synergies. This estimate is consistent with the cost savings estimate provided in the Parties’ original CMIR filing and can be stated with a higher level of confidence based on the analyses completed by the Parties since the submission date.
Efficiencies Are Needed to Address Financial Challenges
The operational efficiencies and other operating margin improvements that will be made possible through this transaction are vital to the financial health of the Parties moving forward. While the Preliminary Report stated in numerous instances that the Parties’ financial performance and position is generally positive,52 the information evaluated and presented is based on financial information through FY2016. An examination of data from FY2017 shows a much more challenging financial picture for the Parties.
The Parties combined incurred an operating loss of nearly $71 million in FY2017, representing an operating margin of -1.4%, driven by a $35 million operating loss for Mount Auburn Hospital (-8.5% operating margin) and a $66 million operating loss for Lahey (-3.2% operating margin). While the operating margin has declined from past years, the Parties operated just above break-even in the two preceding fiscal years, with operating margins of 0.2% in FY2015 and 0.4% in FY2016. In the period from FY2015 to FY2017, unrestricted cash balances declined by nearly $142 million and days cash on hand declined by 24 days over that same period.53,54 Both CareGroup, the parent company of BIDMC, Mount Auburn, and NEBH, and Lahey received rating agency downgrades in the last twelve months.
An underlying question of the Commissioners is why the formation of BILH is necessary to pursue the initiatives BILH has identified. In some cases (e.g., the ability to avoid “free rider” problems with narrow network plans) the benefits are derived from the specific geographic scope, range of services,
49 Estimated by year five of operation as BILH. 50 HPC Preliminary Report, page 55. We are limited in our ability to respond to these estimates as the HPC has access to data that we do not. 51 David Cutler at the HPC Hearing on July 18, 2018. 52 HPC Preliminary Report, pages 15, 21, and 23. 53 A decline in days cash on hand can limit the ability to invest in improved services, meet bond obligations and borrow additional funds if necessary. 54 Based on audited financial statements of the BILH Parties.

Page | 23
and ability to develop a clear brand to support competition. In addition to these specific factors, there is an overarching requirement of having the financial well-being to invest in new strategies. The annual $88 million to $169 million in improved operating margin will help to overcome the challenging financial environment faced by the Parties, so BILH can invest in critical population health initiatives described below, as well as other efforts to continually improve care and compete effectively with the dominant health system.
BILH’s Integration Initiatives Will Create Substantial Savings for the Commonwealth
The HPC recently published opportunities to achieve significant healthcare savings, which include55
− reducing institutional post-acute care;
− reducing hospital readmissions;
− increasing commercial APM adoption;
− shifting community appropriate care;
− reducing avoidable ED use; and
− limiting growth in prescription drug prices.
BILH embraces these cost-saving opportunities and has committed to a number of key initiatives consistent with these goals. The following selected initiatives (which in no way represent the entirety of potential savings) are estimated to reduce healthcare costs as shown in the Figure below.
Figure 4: BILH TME Savings Estimates ($ in Millions)
Integration Initiative Estimated TME Savings
Collaborative Care Model $23 to $58 Continuing Care $15 Pharmacy $8 Primary Care $6 Total $52 to $87
Collaborative Care Model for Behavioral Health Patients
A major cost saving opportunity for BILH and the Commonwealth is the Collaborative Care Model that BILH will implement. A broad roll-out of this model will directly address improving access to care for patients needing behavioral health services by integrating behavioral health in primary care practices. Currently, there are approximately 400,000 patients at BILH that would directly benefit from this program’s implementation. It is estimated that the model will produce annual TME savings of $23
55 HPC, “Opportunities for Savings in Health Care 2018: A Roadmap to Reduce Massachusetts Health Care Spending by $4.8 Billion in Five Years,” May 2018. Available at https://www.mass.gov/files/documents/2018/05/04/Opportunities%20for%20Saving%20packet.pdf.

Page | 24
million to $58 million.56,57,58 Additional detail provided in C. Transforming Care and Value in Massachusetts.
Continuing Care
BILH will create a unified system of continuing care—including home health, palliative care, hospice, skilled nursing, and rehabilitation—that supports its commitment to providing seamless and coordinated care to patients across the continuum as close to their home as can be safely managed, resulting in reduced avoidable use of institutional post-acute care, enhanced patient experience, and improved population health outcomes. BILH will achieve this through the creation of a consolidated home health program that will meet a widening range of patient care needs either in the home or as close to home as possible, the creation of an organized, high-performing preferred skilled nursing facility (“SNF”) network, the development of advanced geriatric services for frail and medically complex older adults, and investment in next-generation care management infrastructure. While MACIPA and BIDCO have preferred SNF networks, we believe the savings impact can be much more substantial by implementing a BILH CIN preferred SNF network.59 Specifically, TME savings are estimated to be approximately $15 million.60 Additional detail provided in C. Transforming Care and Value in Massachusetts.
Pharmacy
BILH will improve patient safety, clinical efficacy, and cost-effective prescribing through a system Pharmacy and Therapeutics Committee overseeing drug use policy and formulary management. Furthermore, BILH will provide seamless pharmacy support across the care continuum by integrating ambulatory pharmacy services and extended pharmacist intervention for high-risk hospitalized patients, ensuring patients have their medications with clear instructions during transitions between settings of care. BILH will also reduce pharmacy supply costs through a variety of new programs, services, and contracts (e.g., specialty and retail pharmacies, employee pharmacy benefit manager, and group purchasing). Current estimates, backed by research literature61 indicate a potential TME savings of approximately $8 million by implementing system-wide pharmacist intervention for high-
56Calculated by taking the total BILH paneled patients within employed primary care practices that are not currently part of the collaborative care model (approximately 400,000) multiplied by approximate percentage of patients with a mental health or substance use disorder (20% to 25%). Resulting patient population (80,000 to 100,000) was multiplied by annual average healthcare expenditure for patients with behavioral health conditions ($5,796) and then by estimated percent savings attributable to behavioral health and primary care integration based on 2014 Milliman study (5% to 10%), which translates to an estimated annual savings of $23 million to $58 million. 57Milliman Report for the American Psychiatric Association, “Economic Impact of Integrated Medical-Behavioral Healthcare” April 2014; Woltmann, E., Grogan-Kaylor, A., Pero,n B., Georges, H., Kilbourne, A.M., Bauer MS., “Comparative effectiveness of collaborative chronic care models for mental health conditions across primary, specialty, and behavioral health care settings: systematic review and meta-analysis, American Journal of Psychiatry,” 2012; 169 ( 8 ): 790 – 804. Unutzer, Jurgen et al, “Long-Term Cost Effects of Collaborative Care for Late Life Depression,” American Journal of Managed Care, February 2008. Available at https://www.ncbi.nlm.nih.gov/pmc/articles/PMC3810022/. 58Substance Abuse and Mental Health Services Administration (“SAMHSA”), “Selected Drug Use, Perceptions of Great Risk, Average Annual Marijuana Initiates, Past Year Substance Dependence or Abuse, Needing But Not Receiving Treatment, and Past Year Mental Health Measures in Massachusetts, by Age Group,” 2015. Available at www.samhsa.gov/data/sites/default/files/1/1/NSDUHsaeMassachusetts2014.pdf. 59 McHugh, John P. et al, “Reducing Hospital Readmissions Through Preferred Networks Of Skilled Nursing Facilities,” Health Affairs, September 2017. Available at https://www.healthaffairs.org/doi/10.1377/hlthaff.2017.0211. 60 Total estimated BILH discharges to SNF (27,115) multiplied by estimated reduction in rehospitalization rate among patients discharged to SNF following implementation of an organized preferred SNF network based on peer-reviewed analysis (6.1%). Total re-admissions avoided (1,079) multiplied by estimated TME savings per avoided rehospitalization ($14,000) (based on average IP revenue per discharge for BILH member institutions) results in estimated annual TME savings from program implementation ($15 million). 61 Phatak, Arti, PharmD, BCPS et al “Impact of pharmacist involvement in the transitional care of high-risk patients through medication reconciliation, medication education, and post discharge call-backs (IPITCH Study),” Journal of Hospital Medicine, October 2015. Available at https://onlinelibrary.wiley.com/doi/full/10.1002/jhm.2493; Mekonnen, Alemayehu B et al, “Effectiveness of pharmacist-led medication reconciliation programmes on clinical outcomes at hospital transitions: a systematic review and meta-analysis,” BMJ Open, February 2016. Available at https://www.ncbi.nlm.nih.gov/pmc/articles/PMC4769405/pdf/bmjopen-2015-010003.pdf; Hansen, Amanda, Knoer, Scott, Rough, Steve, Schenkat, Dan. “Creating organizational value by leveraging the multihospital pharmacy enterprise.” American Society of Health-System Pharmacists, April 2018. Available at: http://www.ajhp.org/content/75/7/437; Roebuck MC, Liberman JN, Gemmill-Toyama M, Brennan TA, “Medication adherence leads to lower health care use and costs despite increased drug spending,” Health Affairs, January 2011. Available at: https://www.healthaffairs.org/doi/10.1377/hlthaff.2009.1087.

Page | 25
risk hospitalized patients.62 Additional detail provided in C. Transforming Care and Value in Massachusetts.
Primary Care
BILH will bring together a high-quality, integrated primary care system that will lead the region in superior patient and provider experience, convenient access, and population health management. To achieve this vision, BILH will build a new and systemic approach to accelerate primary care delivery redesign and innovation, create proximate and timely patient access through a system-wide nurse triage and other fundamental access enhancements, and new workflow and training approaches to reduce administrative burden and enhance workforce development. Extending a system-wide nurse triage program, currently used in some Lahey practices, is estimated to save approximately $18,500 in annual TME per physician.63 When applied to the 319 employed BILH primary care physicians to whom this service would be extended over time, the program is estimated to achieve TME savings of approximately $6 million.64 Additional detail provided in C. Transforming Care and Value in Massachusetts.
62 Total estimated BILH adult discharges with polypharmacy (97,360) multiplied by reduced probability of 30-day ED visits post-discharge based on extended pharmacist intervention, based on peer-reviewed literature (10.4 percentage points) Resulting ED visit avoidance (10,125) multiplied by average ED reimbursement per visit ($770) to estimate TME value ($8 million). 63 Lahey Health data based on proprietary third-party analysis conducted on FY 2017-2018 nurse triage program results within Lahey primary care practices. 64 Estimated annual TME savings based on third-party evaluation of nurse triage services on medical and pharmacy claims experience of Lahey members on an average per physician basis ($18,456) multiplied by 319 additional employed primary care practices to which the program would be extended over time to estimate TME savings potential ($5.9 million).
How will the HPC incorporate market and TME cost saving efficiencies in its estimate of market impact in the Final Report?
Page | 26
4. The Parties have a Track Record and Commitment to Bolstering Community Hospitals
We concur with the HPC’s statement that community hospitals “face substantial challenges, threatening Massachusetts’ progress toward an efficient, high-quality healthcare system accessible to all residents of the Commonwealth.”65 And while some health systems shift care from community hospitals to Academic Medical Centers (“AMCs”) and build major ambulatory facilities to drive care away from local community hospitals, resulting in increasing costs, the Parties have taken the opposite approach, seeking to strengthen local community hospitals, both owned and affiliated.
The Parties Have Strengthened Community Hospitals
The Preliminary Report stated that “following corporate affiliations with BID and Lahey, community hospitals’ shares of local CADs increased while community hospitals’ share of CADs statewide generally decreased.” The Parties have significant concerns regarding the CAD methodology that the HPC proposed for this analysis, as it is focused on a narrow group of admission types, distorting the overall picture of community hospital strength.66 In particular, by excluding higher-acuity care, the methodology ignores many of the largest contributions that Lahey and BIDMC have made to expand the capabilities of community hospitals. As a result, the CAD analysis shown in the Preliminary Report significantly understated the Parties’ community hospitals’ growth. Our analysis shows both Lahey and BIDMC increased inpatient discharges and case mix index (“CMI”) at their community hospitals far in excess of the overall Eastern Massachusetts market.67
65 HPC, Community Hospitals at a Crossroads, March 2016. Available at https://www.mass.gov/files/documents/2016/07/xf/community-hospitals-at-a-crossroads.pdf. 66 HPC Preliminary Report, page 37. 67 CHIA, Case Mix Database, 2012-2016. Total acute care discharges; excludes normal newborns, psychiatry, and rehabilitation.
Key Takeaways
− The Parties seek to strengthen local community hospitals, both owned and affiliated.
− The Parties have increased volume and the sophistication of care provided at their community hospitals, a key benefit that the Community Appropriate Discharges (“CAD”) analysis fails to capture.

Page | 27
Figure 5: BILH Community Hospital Growth in Inpatient Admissions Compared to Eastern MA Hospitals68
BIDMC and Lahey measure success with community hospitals by the degree to which they have been able to strengthen clinical capabilities in the community hospital setting (thereby increasing the average CMI) and reverse downward volume trends. The Parties have a well-documented history of enhancing care in local communities. A few notable examples are below:69
− BID-Milton became the system’s third site for robotic surgery following affiliation and has also seen programmatic improvements in bariatrics and the co-location of BIDMC’s renowned spine center. Inpatient bed capacity has also expanded from 88 to 102 inpatient beds;70
− at Beverly Hospital, Lahey hospitalists and intensivists have elevated critical care capabilities, recruited a pulmonologist to reduce outmigration, and added a neurosurgeon post-affiliation;
− MAH’s investment in transcatheter aortic valve replacement allows the hospital to offer minimally invasive cardio-thoracic surgical options with high-quality outcomes in a cost-effective setting;
− BIDMC further enhanced community care at BID-Needham through a new comprehensive cancer center on the BID-Needham campus, as well as a new inpatient wing, ED, and perioperative suite;
− at Winchester Hospital, Lahey has provided infectious disease back-up coverage and recruited new thoracic surgeons (among others) to see patients and perform surgeries locally;
68 CHIA, Case Mix Database, 2012-2016. Total acute care discharges; excludes normal newborns, psychiatry, and rehabilitation. 69 Excerpt from pages 20-21 of the document entitled “Responses to DoN Questions” submitted as part of NEWCO-17082413-TO application to the Department of Public Health in September 2017. Available at https://www.mass.gov/files/documents/2017/09/zj/don-application-response-newco.pdf. 70 BID-Milton recently opened a newly renovated, private room 12-bed unit.
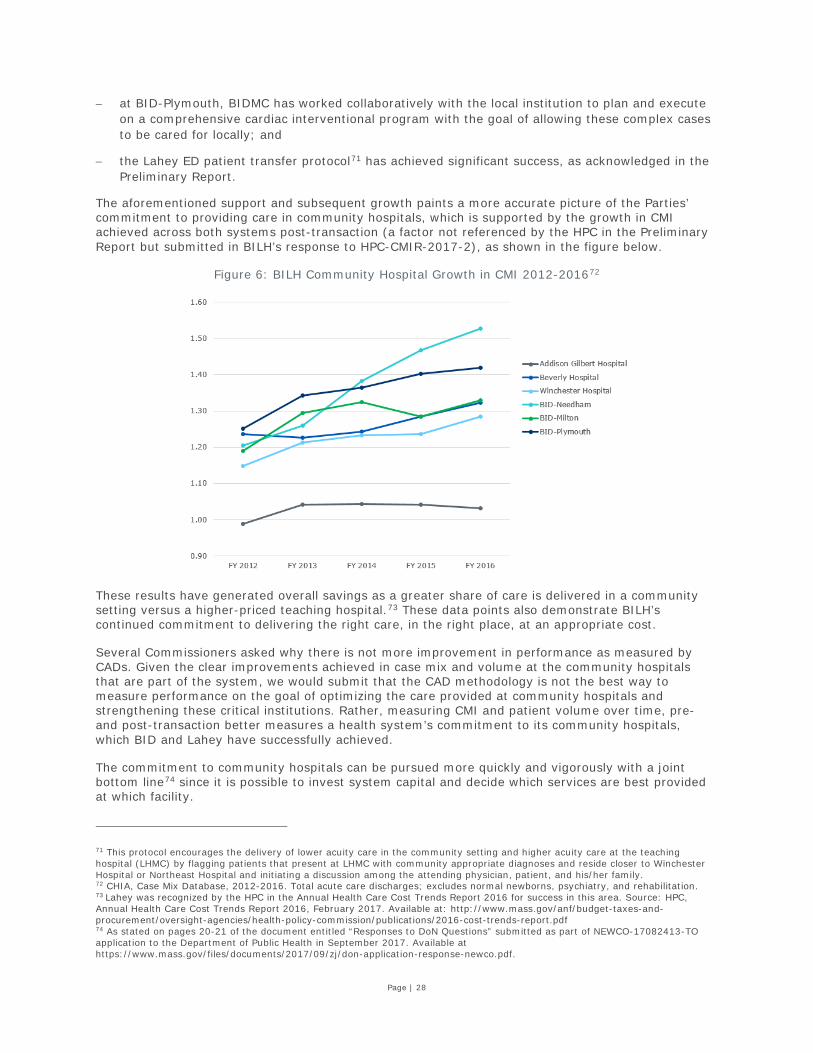
Page | 28
− at BID-Plymouth, BIDMC has worked collaboratively with the local institution to plan and execute on a comprehensive cardiac interventional program with the goal of allowing these complex cases to be cared for locally; and
− the Lahey ED patient transfer protocol71 has achieved significant success, as acknowledged in the Preliminary Report.
The aforementioned support and subsequent growth paints a more accurate picture of the Parties’ commitment to providing care in community hospitals, which is supported by the growth in CMI achieved across both systems post-transaction (a factor not referenced by the HPC in the Preliminary Report but submitted in BILH’s response to HPC-CMIR-2017-2), as shown in the figure below.
Figure 6: BILH Community Hospital Growth in CMI 2012-201672
These results have generated overall savings as a greater share of care is delivered in a community setting versus a higher-priced teaching hospital.73 These data points also demonstrate BILH’s continued commitment to delivering the right care, in the right place, at an appropriate cost.
Several Commissioners asked why there is not more improvement in performance as measured by CADs. Given the clear improvements achieved in case mix and volume at the community hospitals that are part of the system, we would submit that the CAD methodology is not the best way to measure performance on the goal of optimizing the care provided at community hospitals and strengthening these critical institutions. Rather, measuring CMI and patient volume over time, pre- and post-transaction better measures a health system’s commitment to its community hospitals, which BID and Lahey have successfully achieved.
The commitment to community hospitals can be pursued more quickly and vigorously with a joint bottom line74 since it is possible to invest system capital and decide which services are best provided at which facility.
71 This protocol encourages the delivery of lower acuity care in the community setting and higher acuity care at the teaching hospital (LHMC) by flagging patients that present at LHMC with community appropriate diagnoses and reside closer to Winchester Hospital or Northeast Hospital and initiating a discussion among the attending physician, patient, and his/her family. 72 CHIA, Case Mix Database, 2012-2016. Total acute care discharges; excludes normal newborns, psychiatry, and rehabilitation. 73 Lahey was recognized by the HPC in the Annual Health Care Cost Trends Report 2016 for success in this area. Source: HPC, Annual Health Care Cost Trends Report 2016, February 2017. Available at: http://www.mass.gov/anf/budget-taxes-and-procurement/oversight-agencies/health-policy-commission/publications/2016-cost-trends-report.pdf 74 As stated on pages 20-21 of the document entitled “Responses to DoN Questions” submitted as part of NEWCO-17082413-TO application to the Department of Public Health in September 2017. Available at https://www.mass.gov/files/documents/2017/09/zj/don-application-response-newco.pdf.

Page | 29
Nonetheless, BILH will also continue to pursue opportunities to further support and enhance community hospitals that are contracting and clinical affiliates. BIDMC, for example has worked very closely with its clinical affiliates at CHA, Lawrence General, and Signature Healthcare Brockton Hospital (“Signature Brockton”) to enhance community capabilities across a number of clinical areas, including cardiology, oncology, orthopedics, obstetrics and gynecology, podiatry, primary care, and other areas. Please see Subsection 5 for additional detail.
How will the HPC acknowledge the significant support the Parties have provided to strengthen their community hospitals in the Final Report?

Page | 30
5. BILH is Committed to Serving Underserved Populations
BILH is Committed to Serving MassHealth and Underserved Patient Populations
As not-for-profit health systems, it is core to our missions, and will be to the mission of BILH, to care for all patients regardless of insurance status and ability to pay. BIDMC’s founding institutions were created more than 100 years ago to meet the needs of underserved communities in the Boston area. BIDMC’s legacy, combined with Lahey’s leadership, particularly in behavioral health services, will yield a not-for-profit system especially committed to providing needed services, including low-margin services, to all, including those who face barriers to accessing care.
Key Behavioral Health Care Services Were Not Included in the Preliminary Report Medicaid Analysis
It is critical to note that the HPC analysis of inpatient Medicaid mix omits inpatient detoxification admissions, a key service provided by BILH providers. The inclusion of these patients paints a vastly different picture of the proposed system’s Medicaid patient panel. BILH’s overall inpatient Medicaid payer mix jumps from 14.7%75 to 19.7%76 when inpatient admissions for detoxification from BILH’s three Acute Treatment Centers are included in the inpatient data.
The scope and scale of BILH’s behavioral health enterprise, which will care for nearly 1.1 million patient visits per year with an approximate 70% Medicaid payer mix, is a fundamental component of BILH’s value to Eastern Massachusetts patients.77 BILH will continue to improve care for all patients through targeted population health improvement efforts, including, but not limited to active participation in the MassHealth ACO Program; a systemwide commitment to integrating behavioral health and primary care; and the continuation and strengthening of partnerships with important community-based safety net providers.
BILH is an Important Provider of Care for MassHealth Beneficiaries
As noted in the Preliminary Report,78 BILH hospitals treat a higher proportion of Medicaid patients than hospitals from the dominant health system, and the proportion of Medicaid patients served at
75 HPC Preliminary Report, footnote 288. 76 We encourage the HPC to use its data resources to refine this analysis. Our calculation: BILH FY2017 inpatients excluding detoxification (147,284) multiplied by HPC-reported BILH Medicaid mix (14.7%) = BILH Medicaid inpatients excluding detoxification (21,651); BILH detoxification admissions (10,900) multiplied by detoxification program Medicaid mix = additional Medicaid inpatients (9,496); BILH Medicaid discharges excluding detoxification (21,651) plus BILH detoxification-related Medicaid inpatients (9,496) = BILH Medicaid inpatients including detoxification (31,147); BILH Medicaid inpatients including detoxification (31,147) divided by total BILH patients served including detoxification (158,184) = BILH Medicaid percent of inpatients including detoxification (19.7%). Sources: Percent of Medicaid discharges calculated by the HPC for FY2017 and reported in footnote 288 of the Preliminary Report; total discharges for FY2017 from CHIA as cited by The Boston Globe (“Beth Israel-Lahey merger raises a Medicaid issue,” by McCluskey, Priyanka Dayal, July 16, 2018); and admissions and Medicaid mix for detoxification program sourced from internal Lahey Health Behavioral Services admissions data from July 1, 2017 through June 30, 2018. 77 Calculated using internal data from the Parties. 78 HPC Preliminary Report, page 77, footnote 278.
Key Takeaways
− The HPC analysis of inpatient Medicaid mix omitted admissions for detoxification services. Inclusion of these patients raises BILH’s overall inpatient Medicaid mix from 14.7% to 19.5%.
− BILH has a strong track record of supporting affiliated community health centers and safety net hospitals across Eastern Massachusetts.
Page | 31
BILH hospitals has increased over the past three years.79 We appreciate the HPC’s identification of these facts in footnote 278 of the Preliminary Report and request that it be brought forward into the conclusions of the Final Report:
“The proposed BILH-owned hospitals generally have lower Medicaid payer mix than comparator hospitals, although their Medicaid mix is higher than most of the dominant health system’s hospitals except for North Shore Medical Center. Northeast has a higher Medicaid payer mix than the Melrose Wakefield Healthcare hospital campuses, Newton-Wellesley Hospital, and Emerson, and BID-Plymouth has a higher Medicaid mix relative to South Shore Hospital, Brigham and Women’s Faulkner Hospital, and Newton-Wellesley. Some party hospitals have also seen larger increases in Medicaid payer mix than some comparator hospitals in recent years. The hospitals serving high proportions of Medicare discharges relative to their PSAs also usually have a higher Medicare mix by [gross patient service revenue].”80
It is also important to note that BIDMC – the only AMC and the largest of the BILH hospitals – is the seventh largest provider, in absolute terms, of inpatient and outpatient care for MassHealth beneficiaries across all of Massachusetts. In Eastern Massachusetts only, it is among the top five providers of inpatient care to all Medicaid beneficiaries and one of the top three providers of outpatient care to that population.81 Additionally, BIDMC extends its geographic reach of the underserved populations it provides care for through its affiliation with AJH. The affiliation with BIDMC has allowed AJH to bring a variety of service lines to underserved communities including Haverhill and Amesbury.82
BILH has Supported Affiliated Community Health Centers
BIDMC has longstanding close relationships with six community health centers across greater Boston, Quincy, Malden, and other communities, including:
− Bowdoin Street Health Center in Dorchester;
− The Dimock Center in Roxbury;
− South Cove Community Health Center (“SCCHC”) in Chinatown, Quincy, and Malden;
− Charles River Community Health (“CRCH”) in Brighton and Waltham;
− Fenway Health in Boston; and
− Outer Cape Health Services, with various locations on Cape Cod.
Together, these community health centers serve more than 120,000 patients each year – more than 50% of whom are Medicaid beneficiaries or are uninsured.
BIDMC has made significant efforts to support needed care in the local community health centers, including:
79 CHIA, Massachusetts Case Mix Hospital Inpatient Discharge Data (“HIDD”) Fiscal Year 2016 Documentation Manual (V1.00). The table shows the payer mix percentages as a percent of total discharges, excluding normal newborns, in aggregate from FY2015 through FY2017 for AJH, BIDMC, BID-Milton, BID-Needham, BID-Plymouth, LHMC, MAH, NEBH, Northeast Hospital (including Beverly Hospital and Addison Gilbert Hospital), and Winchester Hospital. The payer categories are based on CHIA “payer type definition.” Document manual available at http://www.chiamass.gov/assets/docs/r/hdd/FY2016-HIDD-Guide.pdf. 80 HPC Preliminary Report, page 77. 81 It is also important to note that the Massachusetts mean Medicaid mix (21%) provides a somewhat distorted benchmark for commitment to Medicaid populations because the mean is heavily influenced by strong outliers (e.g., Boston Medical Center is 53%. Source: HPC Preliminary Report, footnote 287). We urge the HPC to also consider the median Medicaid mix (17%) as a metric. 82 Clinical Affiliation with Beth Israel Deaconess Medical Center, Anna Jaques Hospital. Available at: https://www.ajh.org/about/beth-israel-deaconess-affiliation.

Page | 32
− Mammography Screening: BIDMC/HMFP assisted Fenway Health and Outer Cape Health Services to establish on-site mammography screening;
− Bolstering Community-Based Access to Behavioral Health Care: BIDMC sends a psychiatrist to CRCH to train and build the primary care and behavioral health teams’ capacity to treat mental health/behavioral health issues in the community;
− Community-Based Opioid Treatment: BIDMC provides financial support to stabilize and expand the Office Based Opioid Treatment (“OBOT”) program at The Dimock Center, and has also established an OBOT and Medication Assisted Treatment program at Bowdoin Street Health Center;
− Prevention and Wellness: BIDMC led funding for the building of a Wellness Center at Bowdoin Street Health Center in order to support various community health programs at Bowdoin;
− Local Maternal and Child Health Care: BIDMC has spearheaded more than 50 years of maternal and child health services at BIDMC-affiliated community health centers, and recruits residents with its health centers in mind, many of whom go on to work at the health centers;
− Improving Health Literacy for Disease Prevention: BIDMC is supporting a health literacy program at Bowdoin Street Health Center focused on teaching those who are at-risk for diabetes about nutrition, self-care, exercise, and strategies to prevent the onset of this deadly disease;
− Diabetes Prevention and Care: BIDMC has provided long-time support of the Live and Learn Program, which is focused on diabetes care and prevention at CRCH;
− Cancer Patient Navigator Program: Collaborating with SCCHC, BIDMC created a Chinese cancer patient navigator program to facilitate access to cancer screening, treatment and support for the Chinese community. BIDMC works closely with SCCH and affiliated health centers to ensure culturally and linguistically appropriate care in both community and hospital settings; and
− Support for Community-Based Care: BIDMC has provided significant financial support for capital projects needed to support community-based programs at CRCH, the Dimock Sewall Center, and the building and expansion of the new Fenway Health facility.
BIDMC also ensures that key specialty care is available in local communities in the following specialties: dermatology, endocrinology, infectious disease, neurology, nephrology, OB/Gyn, orthopedics, podiatry, and pulmonary care.
BIDMC has Supported Safety Net Hospitals across Eastern Massachusetts
BIDMC also has strong clinical affiliations with safety net institutions across Eastern Massachusetts –Signature Brockton, CHA, and Lawrence General. As part of these relationships, BIDMC serves as the tertiary and quaternary provider to patients in those communities and have also helped invest and expand critical local services to improve access for patients close to where they live and work. BIDMC has worked closely with all of its clinical affiliates to help these community providers build their own local capabilities through the recruitment of primary care physicians (“PCPs”) and specialists dedicated to practicing in the community and program development to strengthen and help retain care in their local communities. Examples for each affiliate are discussed below.
− Signature Brockton: BIDMC has worked with Signature Brockton to strengthen its cancer and orthopedics services, resulting in Signature Brockton recently opening a new comprehensive cancer center in Brockton in partnership with BIDMC. BIDMC, through its affiliated faculty practice Harvard Medical Faculty Physicians, recruited and hired a Senior Chief of Hematology/Oncology and another oncologist dedicated to the Signature Brockton program to broaden and expand the range of services provided to all cancer patients. BIDMC has closely collaborated with Signature Brockton to rebuild its orthopedics program through the recruitment of a local Senior Chief of Orthopedics and recruitment of additional orthopedic sub-specialists. Additionally, BIDMC has

Page | 33
worked collaboratively to broaden capacity in other key areas including cardiology, podiatry, plastic and reconstructive surgery, and telestroke initiatives.
− Lawrence General: In Lawrence, BIDMC has helped to build Lawrence General’s primary care base with the recruitment of seven PCPs. These are new, local PCPs practicing in their communities who refer patients to Lawrence General – and to BIDMC when they need tertiary or quaternary levels of care. Over the years, BIDMC has worked collaboratively in other areas to expand access to locally available primary and specialty care services by participating in program development efforts. For example, BIDMC provides medical direction for Lawrence General’s cath lab, outpatient radiation oncology consultation, and supports telestroke initiatives.
− Cambridge Health Alliance: In partnership with CHA, BIDMC has also worked collaboratively to help expand access to locally available specialty care services, assist with physician recruitment, and participate in program development and recruitment efforts in thoracic surgery, pulmonary care, vascular surgery, joint recruitment of dermatologists and telederm, OB/GYN and surgery residents, neonatology coverage and training, cardiology, and telestroke services.
The Parties’ ability to continue supporting safety net hospitals will depend on their financial performance, which will be improved through the efficiencies BILH will achieve.
How will the HPC consider BILH’s significant past and future commitment to behavioral health services for the Medicaid population in its assessment of BILH’s commitment to
serving the underserved?

Page | 34
C. Transforming Care and Value in Massachusetts
BILH will have the financial resources, clinical and administrative expertise, specific program experience, and scale to implement key initiatives the individual Parties would not be able to achieve on their own. Of course, there is no single-source solution to achieve the goals BILH aims to accomplish. Our success will be the result of numerous leaders and staff working countless hours across a variety of initiatives to define the path forward. The Parties have begun this process of identifying initiatives, within the antitrust constraints that apply before the transaction is completed and are pleased to share several of these initiatives below.83
BILH Will Help Create High-Value Tiered and Limited Network Insurance Products
Several Commissioners asked how BILH will create innovative insurance products, and why BILH can do better than an insurer forming a tiered or limited network from multiple competing providers. The Parties have made substantial progress in planning the delivery system and geographic coverage for transformative, innovative insurance products that will provide direct benefit to consumers, as described below. However, it is clear that the Parties cannot yet discuss payment rates and cannot bring discussions with insurers about these potential opportunities to fruition. Nonetheless, our business case rests on three principles:
− Tiered or limited network products have effectively reduced costs and are increasingly attractive to consumers;
− BILH can offer more value as the core of a provider network and a clear market option for consumers; and
− Partnering with BILH will allow insurers to offer better tiered or limited network products than contracting with a wide array of independent providers.
By reducing the use of high-priced providers, these products reduce unwarranted price variation, help eliminate the subsidization of high cost care by low income consumers and provide savings to consumers who choose high-value providers.
Tiered or limited network products have effectively reduced costs and are increasingly attractive to consumers
Academic and industry research indicates that tiered or limited networks yield cost savings and have the potential to reduce healthcare spending, making formation of these networks directly aligned with
83 While many opportunities to improve care and value have been identified, there are legal restrictions that limit what the Parties can discuss and what decisions can be made at this point. The Preliminary Report repeatedly stated that the Parties have “failed to indicate” how they will operate post-affiliation. We would respectfully note that the Parties must adhere to strict antitrust guidelines that limit the exchange of vital information that would be used to make such determinations. Until this transaction closes, the Parties are separate entities and, as such, must behave as competitors. Simply put, there are many decisions the Parties cannot make until the affiliation is complete.
Key Takeaways
− BILH would be able to create innovative insurance products that have not existed in this market.
− The Parties have undertaken a broad and collaborative pre-merger integration planning process consisting of 32 design teams to develop actionable commitments and a clear roadmap for integration that achieves value to patients, significant cost savings, and growth.

Page | 35
the HPC’s goals. In a 2016 analysis of Massachusetts Group Insurance Commission (GIC) state plan enrollees,84 for example, consumers who opted to switch from a broad network plan to a narrow network plan spent nearly 40% less on medical care. Reduced utilization and lower prices paid per service performed drove these savings.
Additional sample studies in Massachusetts have found that when cost sharing differentials between preferred, or lower-cost, providers and non-preferred providers are significant, consumer behavior changes without compromising access or quality: utilization of non-preferred providers drops while utilization of preferred providers increases.85 Additionally, research indicates that narrow networks feature lower premiums than products with larger or broader networks, 86 and that narrow network products can have positive spillover effects that drive better value among all providers, including those in broad network products.87
Consumers’ interest in participating in tiered or limited networks has significantly grown in recent years. Tiered or limited networks account for approximately 19% of the commercial lives in the state.88 Much of the growth has occurred through GIC plans.89 BILH has identified the GIC as a strong opportunity for partnering to offer innovative products. This partnership would effectively help produce cost savings for Massachusetts on two fronts—both the overall cost of care in Massachusetts and the health insurance costs of the government for its employees.
Given the significant unwarranted variation in relative price in Massachusetts, there is ample opportunity to achieve savings through tiered or limited network products. The desire of payers to mitigate unwarranted price variation and shift care to high-value providers creates a significant part of the opportunity that BILH will pursue. The savings available by keeping care in lower-priced, high-value providers will directly reduce TME, which can in turn be reflected in lower premium and/or lower out-of-pocket costs.
BILH can offer more value as the core of a provider network and a clear market option for consumers
Upon its formation, BILH (and BILH CIN) will be newly and uniquely positioned to be the network for a high-value product due to its competitive quality, low-cost position, service breadth, and geographic coverage in the context of a fully-integrated and coordinated delivery system. No other limited network in Massachusetts has been able to offer this combination of attributes to compete effectively with the dominant health system and provide a meaningful market option for consumers. The creation of this network will be a significant step forward in the quality of tiered and limited network plans, and directly responsive to the HPC’s recommendation90 to strengthen market functioning and system transparency through demand-side incentives.
BILH will bring product solutions to the market in partnership with payers that improve value to consumers and employers in four ways. We have described several initiatives to better manage population health later in this document. The solutions that we can develop will partially depend on
84 Gruber, Jonathan, and McKnight, Robin, “Controlling Health Care Costs through Limited Network Insurance Plans: Evidence from Massachusetts State Employees,” 2016. American Economic Journal: Economic Policy, 8 (2): 219-50. Available at: http://www.nber.org/papers/w20462. 85 Frank, M.B., Hsu, J., Landrum, M.B. and Chernew, M.E., “The Impact of a Tiered Network on Hospital Choice,” Health Services Research Journal, 50: 1628–1648, March 2015. Available at https://www.ncbi.nlm.nih.gov/pmc/articles/PMC4600365/. 86 Polsky, D., Cidav, Z., Swanson, A., “Marketplace Plans with Narrow Physician Networks Feature Lower Monthly Premiums than Plans with Larger Networks,” Health Affairs, October 2016. Available at: https://www.healthaffairs.org/doi/10.1377/hlthaff.2016.0693. 87 “Narrow networks may have important spillover effects worthy of further examination. For example, the popularity of low-premium plans (associated with narrow networks) has a positive spillover effect because it places pressure on providers within all networks to offer greater value—perhaps in the form of lower reimbursement rates or cooperation in the development of innovative, cost-saving alternatives to fee-for-service reimbursement.” Source: Dafny, L Leemore, Hendel, Igal, Marone, Victoria, Ody, Christopher, “Narrow Networks on the Health Insurance Marketplaces: Prevalence, Pricing, and the Cost of Network Breadth,” Health Affairs, September 2017. 88 CHIA, 2017 Cost Trends Report Chartbook, Page 42. Available at https://www.mass.gov/files/documents/2018/03/28/2017%20CTR%20Chartpack.pdf. 89 Ibid, 5. 90 HPC, 2017 Annual Health Care Cost Trends Report, page 6, March 2018. Available at https://www.mass.gov/files/documents/2018/03/28/Cost%20Trends%20Report%202017.pdf.

Page | 36
the sequencing of investments we ultimately choose to make and the capabilities of health plan partners to support our model of care.
− Improved Patient/Member Access to Care: Create new models of customer service and appointment scheduling for new and existing patients (e.g., through a system-wide service center as a unified front door to the BILH system). This will lower the barriers for patients in gaining access to physicians and other providers. Additionally, BILH intends to offer enhanced primary care access through a robust system-wide nurse triage program, further supplementing patient access to care.
− Improved Patient/Member Experience: Develop an organizational model committed to create convenient, high-quality access to care by providing a fully-integrated network of care. This will simplify the administrative complexities of dealing with multiple health systems and ensure a greater level of information exchange in support of patient care.
− Innovation-Driven, Targeted Improvements in Care Management, Continuity of Care and Quality of Care: As a fully-integrated system, BILH will be able to manage all aspects of a patient’s care transitions, an area where BILH will be investing. This would directly enhance patients’ quality of care and consolidate transition of care efforts such as discharge planning, transportation support, and scheduling follow-up appointments. Additionally, BILH will supplement these services by investing in additional health analytic capabilities that will allow for targeted identification of high-risk patients and create interventions with tailored health solutions and care management approaches to address patients’ needs.
− Affordable Market Options for Consumers: Offer competitive unit prices and reduced levels of utilization through more integrated clinical and care planning. Allowing consumers to have more accessible and affordable healthcare options in the Greater Boston area.
However, this cannot be achieved without an integrated structure that aligns financial incentives through a shared bottom line. Only through a fully-integrated model can providers fully coordinate care, reduce overhead, and fully plan together to align strategy and investments in clinical services. This will help achieve a level of integrated performance beyond what is possible through contractual affiliations alone, furthering efforts to properly support providers to succeed under value-based payment models and risk contracts by significantly improving patient care, effectively spreading risk, making investments in infrastructure, and mitigating healthcare cost growth.
Partnering with BILH will allow insurers to offer more attractive and higher performing tiered or limited network products than contracting with a wide array of independent providers.
With the growing popularity of tiered or limited network insurance products, BILH can offer a significantly better foundation for these products. Rather than focusing merely on the exclusion of certain high-priced providers, the proposed plan would include an integrated network of providers with a strong reputation, integrated flow of patient information, broad geographic coverage and access points, and moderately-priced providers.
In addition, as described in footnote 202 of the Preliminary Report, limited network insurance products that have many independent providers in their network suffer from a “free rider” problem. When deciding how to make a limited network product more attractive, independent providers will always be tempted to be “free riders” avoiding their own concessions, and seeking to benefit from the concessions of others. However, an integrated system would be more likely to negotiate more favorable terms because they know they will receive the majority of the benefits from any concessions. While this dynamic is noted in the Preliminary Report, we believe it is a major driver of behavior that should be factored more directly into the analysis and conclusions.
Furthermore, the success of tiered or limited network products helps to bring pressure on the dominant health system to reconsider its pricing strategy. When an attractive competitor emerges, with a full slate of comparable characteristics, it almost always forces dominant players to adjust their pricing behavior. The Parties believe that the dominant health system has already begun to feel the

Page | 37
effect of the tiered or limited network products that have begun to take hold in the market and will feel more impact of these products as they become more effective under BILH.
We understand that it would be difficult for the HPC to calculate how these savings might be more likely without a “free rider” problem. Nonetheless, we urge that this opportunity for market efficiency, addressing unwarranted price variation, and the footnoted insight about how BILH addresses the “free rider” problem, be reflected in the Final Report analysis and conclusions regarding benefits BILH can deliver through innovative insurance products.
32 Design Teams Have Begun to Outline BILH’s Commitments and Priorities
Since November 2017, the Parties have undertaken a broad and collaborative pre-merger integration planning process, including the establishment of 32 design teams, involving over 240 leaders from across the BILH entities to leverage the collective strengths of each institution to create an innovative, high-value health system for the benefit of purchasers and consumers. Through this process, the Parties have developed actionable commitments and a clear roadmap for integration that achieves value to patients, significant cost savings, and enterprise growth. A list of design teams is included in Appendix 3.
Over the course of April to June 2018, the design teams presented their recommendations to a 12-member Leadership Work Group with clinical and executive leaders from across the BILH member institutions. The recommendations have all been extensively vetted by design team members and have received preliminary endorsement from the Leadership Work Group. Following the report-out process, each of the teams has moved into a next-stage planning initiative focused on synergies quantification, implementation work planning, and preparations for Day 1.
The detailed outputs and recommendations of the eight design teams referenced in the Executive Summary, those that are understood to be core concerns of the HPC, are described below.
Behavioral Health
Context
− 20% of Massachusetts adults report living with a mental health disorder, and 9% report living with an alcohol or illicit substance use disorder.91
− 46% of Massachusetts adults (466,000 people) with a mental health disorder report not receiving care.92 Among Massachusetts residents ages 12 and older with illicit drug or alcohol dependence or abuse, 86% and 92%, respectively, report receiving no treatment within the past year.93
− Massachusetts patients with both a behavioral health and chronic condition co-morbidity have an average TME that is 4.2 times the average commercial patient and 7.0 times the average Medicare patient.94
− Patients with a behavioral health diagnosis in Massachusetts are far more likely than other patients to “board” (i.e., spend more than 12 hours) in the ED, resulting in inefficiency and
91 SAMHSA, “Selected Drug Use, Perceptions of Great Risk, Average Annual Marijuana Initiates, Past Year Substance Dependence or Abuse, Needing But Not Receiving Treatment, and Past Year Mental Health Measures in Massachusetts, by age group, 2015”. Available at www.samhsa.gov/data/sites/default/files/1/1/NSDUHsaeMassachusetts2014.pdf. 92 Mental Health America, Mental Health in America: Access to Care Data, 2014. Available at www.mentalhealthamerica.net/issues/mental-health-america-adult-data. 93 SAHMSA, Behavioral Health Barometer: Massachusetts, 2015. Available at https://www.samhsa.gov/data/sites/default/files/2015_Massachusetts_BHBarometer.pdf. 94 HPC, 2013 Cost Trends Report, page 56, January 2014. Available at https://www.mass.gov/files/documents/2016/07/rf/2013-cost-trends-report-full-report.pdf.
Page | 38
diminished outcomes of care. Though patients with a behavioral health diagnosis only accounted for 14% of ED visits in 2015, they accounted for 71% of all ED visits that boarded.95
Vision:
To create a transformative and unified system of behavioral healthcare. This will include a population and evidence-based approach to identify and appropriately manage psychiatric and substance use disorders, easy access to a broad array of behavioral health services with multiple entry points, seamless transitions of care, and meaningful support for BILH clinicians.
Recommendations:
1. Implement an innovative and proven model of primary care – behavioral health integration (referred to as the Collaborative Care Model or the IMPACT Model) across all BILH employed primary care practices.
− Build upon the experience and expertise of Lahey and BID-Plymouth, which have several years of experience in implementing the model across approximately 20 practices.96
− Improve access to care for 400,000 patients across approximately 85 primary care practices that have not previously implemented the model.
− Under the Collaborative Care Model, patients identified through the use of screening tools and direct PCP referral are introduced to a behavioral health clinician who works collaboratively with the PCP within the practice and is supported by a consulting psychiatrist; these clinicians deliver evidence-based behavioral health treatments, provide proactive follow-up and coordination, ensure close patient contact, and facilitate referral to more intensive treatment for more complex patients.
− Hire additional behavioral health clinicians, consulting psychiatrists, and program supervisors over the course of implementation.
2. Create a centralized bed management and bed placement system to facilitate access to inpatient psychiatry and detoxification beds across the BILH system.
− 143 inpatient detoxification beds across three acute treatment centers and 185 inpatient psychiatry beds across eight hospital sites within the BILH system.
− Expand on success of current Lahey centralized bed management program to the rest of the BILH system with anticipated economies of scale over time.
− Centralized department that monitors behavioral health patient progress through the Emergency Department and coordinates the placement of behavioral health patients to inpatient unit best suited based upon clinical presentation and geographic location.
− More rapidly identifies and places patients requiring inpatient admission thus maximizing available system resources and reducing ED boarding.
− Build capability to direct patients and providers to the full range of behavioral health services within the system, potentially facilitating alternatives to inpatient care.
95 HPC, “Behavioral Health-Related Emergency Department Boarding in Massachusetts,” November 2017. Available at http://www.mass.gov/anf/budget-taxes-and-procurement/oversight-agencies/health-policy-commission/publications/20171113-hpc-ed-boarding-chart-pack.pdf. 96 Lahey began implementing the Collaborative Care model beginning in 2015 within primary care, and today covers 14 practices. BID-Plymouth began implementation of the model in 2016, and over the past one to two year period has extended it across four employed primary care practices (as well as several independent practices not measured here).
Page | 39
3. Develop a sustainable, dynamic, and comprehensive strategy for building community-based behavioral health services.
− Define an enterprise-wide vision to guide behavioral health service delivery.
− Develop a strategic plan to guide decision making related to current and future state delivery and investments that identifies specific goals and assigns priorities.
Impact:
− Improved access to timely and appropriate behavioral healthcare (in a 2018 survey of all Lahey PCPs with an integrated practice, 96% of respondents report an increase in access to a behavioral health specialist as a function of having an embedded behavioral health clinician on site; 90% report reduced wait time for input on psychiatric medications).97
− Lower total medical expense – adoption of the Collaborative Care Model (also known as the IMPACT Model) has been shown to be associated with a high probability of both improved patient outcomes and cost savings during a multi-year period.98
− Once fully implemented, BILH will have created one of the largest behavioral health-primary care collaborative programs in the country.
− Reduced ED boarding as a result of standardized admission workflow and accelerated bed placement across the BILH system (a 2018 review of Winchester Hospital following the implementation of centralized admission process showed that 91% of ED patients receiving psychiatric evaluation were discharged or placed in under 24 hours).
Continuing Care
Context:
− 60% of the Medicare dollars spent in the first 90 days of an acute episode of care occurs post hospital discharge. A large portion of this is spent on skilled nursing facilities, which in Eastern Massachusetts exhibit wide variability in efficiency, quality, and other performance measures.
− Massachusetts has a 18.7% rate of discharge to institutional post-acute care, substantially higher than the U.S. average.99
− Reducing unnecessary use of institutional post-acute care through the use of home care services has the potential to improve quality and patient outcomes while reducing TME.
− The post-acute environment presents a unique opportunity to reinvent care delivery through the use of technology and innovative care models.
− Demand for continuing care is driven by the aging of the Massachusetts population – with individuals age 65+ projected to grow from 15% to 21% of the total state population between 2015 and 2030.100
97 Lahey primary care physician survey, 2018. Results published in “In the Know” Newsletter on June 20, 2018. 98 Milliman Report for the American Psychiatric Association, “Economic Impact of Integrated Medical-Behavioral Healthcare,” April 2014 Woltmann, E., Grogan-Kaylor, A., Pero,n B., Georges, H., Kilbourne, A.M., Bauer MS., Comparative effectiveness of collaborative chronic care models for mental health conditions across primary, specialty, and behavioral health care settings: systematic review and meta-analysis, American Journal of Psychiatry, 2012; 169 ( 8 ): 790 – 804. Jurgen Unutzer, et al, “Long-Term Cost Effects of Collaborative Care for Late Life Depression,” American Journal of Managed Care, February 2008. Available at https://www.ncbi.nlm.nih.gov/pmc/articles/PMC3810022/. 99 HPC, “Opportunities for Savings in Healthcare,” May 2018. Available at https://www.mass.gov/files/documents/2018/05/04/Opportunities%20for%20Saving%20packet.pdf. 100 Tufts Health Plan Foundation, Highlights from the Massachusetts Healthy Aging Data Report: Community Profiles 2015, 2015. Available at http://mahealthyagingcollaborative.org/wp-content/uploads/2014/01/MA_HealthyAgingDataReport_Highlights_2015.pdf.
Page | 40
Vision:
To create a unified and innovative system of continuing care—including home health, palliative care, hospice, skilled nursing, and rehabilitation—that supports BILH’s commitment to providing seamless and coordinated care to patients across the continuum as close to their home as can be safely managed, integrating with other services deployed to meet the system’s population health goals, resulting in a high degree of patient satisfaction and fostering system collaboration.
Recommendations:
1. Develop an enhanced home health care program that will enable BILH to care for a wide range of patient care needs, either in the home or as close to home as possible.
− Leverage and extend the combined expertise of MAH (CareGroup Parmenter Home Care and Hospice) and Lahey (Lahey Health at Home) as a system-wide home care platform.
− Expand services and integrate a multi-disciplinary home care team, utilize home monitoring as well as other services, such as infusion, physical therapy, and behavioral health.
− Provide more cost-effective management of high-risk patients, facilitate care retention, reduce TME, and support primary care in caring for complex patients.
2. Build and manage a high-performing, preferred skilled-nursing facility network.
− Comprised of high quality, high-value facilities and services that meet defined performance criteria (including Medicare quality ratings, readmission rates, rates of functional improvement, and willingness to partner to develop common clinical pathways).
− Robust partnerships with service providers such as skilled nursing, assisted living and inpatient rehabilitation facilities, and hospice services will create a seamless provider and patient experience while contributing to success in a value-based care environment.
3. Develop an advanced geriatric program to expand support for providers who care for frail and medically complex older adults.
− Teams providing complex care management to the elderly greatly benefit by the clinical expertise and leadership of trained geriatricians and geriatric nurse practitioners in partnership with home care, palliative care, hospice, and behavioral health.
− Providers with expertise in managing elderly patients provide important clinical guidance in many areas including communication and documentation of goals and directives for care, medication management, maintaining mobility, preventing falls, addressing cognitive impairment, and caregiver support. The program will stratify risk and intervene effectively in transitions of care for older adults, amplify system-wide expertise through geriatrician mentorship of PCPs, and expand the use of geriatric nurse practitioners providing onsite care coordinated with visiting nurse and rehabilitation services.
4. Develop a unified system-wide care management program.
− Use evidence-based care models for high-need, high-cost patients that offer the potential to reduce costs while simultaneously improving patients' health and care experiences.
− Coordinate across the entire system to improve overall population health, reduce duplicative efforts, and promote best practices.
Impact:
− Reduce institutional post-acute care utilization through investment in an integrated system-wide home care solution (combining CareGroup Parmenter Home Care and Hospice and Lahey Health at Home) - shifting the proportion of patients discharged to home care relative to institutional post-acute care would result in significant savings given the considerable cost variation between the two settings.

Page | 41
− Reduce avoidable hospital readmissions – studies support the notion that concentrating patient referrals to a limited number of SNFs that meet defined performance criteria through a preferred network may reduce avoidable rehospitalizations.101
Primary Care Context:
− The average wait time to see a family practitioner in Boston in 2017 was 109 days. Nationally, average wait times have increased by 30 percent from 2014 to 2017 in major urban areas.102
− 55% of internal medicine and family medicine physicians experienced one or more symptoms of burnout in 2017, up from 43% in 2013.103 Burnout is associated with disengagement with daily patient care activities and deterioration in quality of care.
− Average health status-adjusted TME for patients attributable to BILH PCPs are generally moderate compared to other Massachusetts provider groups. Furthermore, shifting a commercial patient to a BILH primary care practice would result in an average of $32 in PMPM savings at current price and utilization levels.104
Vision:
To create a high-quality integrated primary care system that will lead the region with superior patient experience, convenient access, and population health management. The scale, quality, and geographic distribution of our employed primary care providers is the cornerstone of the BILH delivery system. Patients will benefit from demonstrably improved access to a primary care team, and we will attract and retain providers by promoting learning and professional development and growth.
Recommendations:
1. Build systems to accelerate primary care delivery re-design and innovation. − Provide systematic, ongoing training and development for clinicians and administrative staff,
and establish an innovation model that engages providers and staff in testing, designing and implementing high value care processes.
− Explore opportunities to design, create, and test radically different care delivery approaches that improve the care team configuration, space design, use of enabling technology, and delivery of care in the community and home.
2. Create proximate and timely access to new and existing patients. − Implement a system-wide, expanded nurse triage program to provide immediate access for
primary care patients after hours and on weekends, extending the existing Lahey program to cover all employed BILH primary care practices.
− Patients will have immediate telephonic access after-hours and on weekends to a triage nurse to address and resolve a range of patient issues, with an on-call physician available as backup.
− Additional access enhancements will be achieved through a central service center, system-wide access standards, and alternative visit modalities (including virtual and on-demand care).
3. Reduce primary care administrative burden and enhance professional development.
101 McHugh, John P., et al, “Reducing Hospital Readmissions Through Preferred Networks Of Skilled Nursing Facilities,” Health Affairs, September 2017. Available at https://www.ncbi.nlm.nih.gov/pmc/articles/PMC5664928/; Rahman, Momotazur, et al, “Effect of Hospital–SNF Referral Linkages on Rehospitalization,” Health Services Research, October 2013. Available at https://www.ncbi.nlm.nih.gov/pmc/articles/PMC3844283/. 102 Hawkins, Merritt, 2017 Survey of Physician Appointment Wait Times, September 2017. Available at https://www.merritthawkins.com/news-and-insights/thought-leadership/survey/survey-of-physician-appointment-wait-times/. 103 Peckham, Carol, Medscape Lifestyle Report 2017: Race and Ethnicity, Blas and Burnout, Medscape, January 2017. Available at https://www.medscape.com/features/slideshow/lifestyle/2017/overview; Peckham, Carol, Physician Lifestyles—Linking to Burnout: A Medscape Survey, Medscape, March 2013. Available at https://www.medscape.com/features/slideshow/lifestyle/2013/public. 104 HPC Preliminary Report, page 54.

Page | 42
− Ensure provider wellbeing by 1) strategically redesigning workflows to decrease administrative workload, promote top of license practice, and distribute patient care responsibilities, and 2) providing an environment for continuous learning and development.
4. Implement shared services and a unified management structure for primary care. − Develop an integrated primary care organizational model with unified leadership for employed
primary care practices. − Build a robust shared services model to support employed primary care practices across
administrative functions including finance, revenue cycle, human resources, supply chain, information technology, marketing, communications, and legal support.
Impact: − Impact of innovation investments – expanding the use of multi-disciplinary, team-based care
models that contribute to more efficient care and improved patient outcomes.105 − Improve patient access and patient experience. − Nurse triage program is demonstrated to improve access to timely and appropriate care,
reduce avoidable ED utilization by re-directing patients without emergent needs to an appropriate care setting, and improve physician satisfaction.106
− Initiatives to reduce administrative burden and alleviate primary care burnout have the potential to support the long-term sustainability of the primary care workforce.
− Operational cost savings associated with back-office integration.
Pharmacy
Context:
− Pharmacy care within a health system has vast and ever-growing effects on patient care and system sustainability.107
− Over the past several years, both Lahey and BIDMC have been investing to improve their pharmacy offerings, including ambulatory pharmacy, 340b optimization, and further focus in retail and specialty pharmacy.
Vision:
To create a highly-functioning pharmacy enterprise that provides integrated, high-quality care to all patients and uses evidence-based practice to support all care providers in the safe and effective use of pharmaceuticals across the continuum of care (inpatient, ambulatory, ED, physician clinics/office practices, outpatient pharmacy, and home care). Pharmacy Services will utilize the global knowledge, skills, and attitudes of all members as well as state-of-the-art pharmacy technology to provide exceptional patient-centered care.
Recommendations:
1. Create a system P&T Committee to assure clinical efficacy, patient safety, and cost-effective prescribing. − Create a system wide approach to drug use policy and formulary management. − Single system decision-making body and advisory panel for medical, nursing, and pharmacy
staff on drug formulary and drug use management.
105 Wagner, Edward H., “The role of patient care teams in chronic disease management,” BMJ, February 2000. Available at https://www.ncbi.nlm.nih.gov/pmc/articles/PMC1117605/. 106 Lahey data based on proprietary third party analysis conducted on 2017 to 2018 nurse triage program results within Lahey primary care practices. 107 Kouk, Kristin, “McKesson RxO Team Identifies Five Health System Pharmacy Trends to Watch in 2018,” McKesson, December 2017. Available at https://www.mckesson.com/about-mckesson/newsroom/press-releases/2017/rxo-team-identifies-health-system-pharmacy-trends-to-watch-in-2018/.

Page | 43
− Cross populate by working closely with local medical staff P&T Committee structures. 2. Deliver integrated ambulatory services to our patients in a variety of settings.
− Implement a next-generation ambulatory pharmacy program across the BILH system that connects high-risk hospitalized patients prior to discharge with a pharmacist, sending them home with clear instructions, prescriptions that are prior authorized with insurers, minimizing inappropriate prescribing, and ensuring a safe transition of care.
− Develop an effective collaborative, interdisciplinary program using consults and evidence-based, provider-approved protocols in the care of clinic and infusion center patients.
3. Unlock system-wide retail and specialty pharmacy savings. − Develop a Pharmacy Corporation within BILH. − Deliver integrated Prescription Benefits Manager (“PBM”) services for staff and patients. − Leverage existing specialty and retail pharmacy programs and infrastructure to combine
efforts so that BILH can optimize programming. 4. Partner with Supply Chain to improve drug purchasing.
− Implement a single group purchasing organization (“GPO”) and purchasing collaborative. − Improve upon or establish new contracts previously unfeasible (i.e., 503b outsourcing,
pharmacy information technology/automation, sterile products, pumps and associated supplies, etc.).
Impact: − Reduced adverse drug events, hospital readmissions, and ED visits – strong evidence that
pharmacist involvement in hospital discharge transitions results in reduced adverse drug events, as well as lower 30-day readmissions and ED visits.108
− Significant opportunity for savings associated with system level drug formulary and clinical standardization initiatives, EHR integration, and specialty and retail pharmacy services.109
− Improved patient outcomes and reduced TME associated with appropriate prescribing and enhanced pharmacist support in the care model. A recent study determined that improved drug adherence dramatically reduced average annual medical spending for patients with congestive heart failure, hypertension, diabetes, and dyslipidemia. For all four conditions, hospitalization rates were significantly lower with higher medication adherence.110 Medication synchronization programs, like those described by our recommendation, have been associated with increased medication adherence.111
Ambulatory Access
Context:
− Most patients and providers struggle to find the right care with the right provider at a convenient time and location. The healthcare system is calling out for simpler, more efficient, and self-navigable access solutions.
− Consumers are increasingly making health system choices on the basis of convenience, ease-of use, and timeliness of care, as well as price. The pressure to meet access demands will only
109 Phatak, Arti, PharmD, BCPS et al “Impact of pharmacist involvement in the transitional care of high-risk patients through medication reconciliation, medication education, and post discharge call-backs (IPITCH Study),” Journal of Hospital Medicine, October 2015. Available at https://onlinelibrary.wiley.com/doi/full/10.1002/jhm.2493 109 Hansen, Amanda, Knoer, Scott, Rough, Steve, Schenkat, Dan, “Creating organizational value by leveraging the multihospital pharmacy enterprise,” American Society of Health-System Pharmacists, April 2018. (available at: http://www.ajhp.org/content/75/7/437). 110 Roebuck M.C., Liberman J.N., Gemmill-Toyama M., Brennan T.A., “Medication adherence leads to lower health care use and costs despite increased drug spending,” Health Affairs, January 2011. Available at: https://www.healthaffairs.org/doi/10.1377/hlthaff.2009.1087. 111 National Community Pharmacists Association, “Assessing the impact of a community pharmacy-based medication synchronization program on adherence rates,” December 2013. Available at ncpanet.org/pdf/survey/2014/ncpa-study-results.pdf.

Page | 44
intensify as non-traditional market entrants such as CVS, Walmart, and Amazon seek to compete on this basis.
Vision:
BILH is fully committed to ensuring that patients “receive the right care, at the right time, in the right place”. This can be achieved through efforts encompassing operational excellence, capacity management, navigation, information technology systems, and care coordination across the continuum. These goals will require the development of an integrated service center that enables patients and referring providers to efficiently find and schedule the right PCP or specialist, via digital or telephonic access, with expanding functionality over time.
Recommendations:
1. Establish an integrated service center that is market differentiating and consistent with the BILH brand and commitment to superior access. − Phase 1:
− Comprehensive “find-a-doc” functionality for patients and referring providers − Digital access/call-in number for triage with warm hand-offs − Scheduling for primary care, selected specialties and other willing practices − Building customer-focused culture and mentality
− Phase 2: − Transition to navigator approach for select patient cohorts − Expanded scope of scheduling − Adding technological enhancements (e.g., virtual visits) − Billing and referral management and insurance eligibility − Direct patient scheduling through web portal
2. For the access strategy to be effective, BILH must develop a set of access standards that are measurable and achievable performance goals. − Aimed at improving patient and provider experience. − Will be created with proper governance and buy-in from a myriad of stakeholders.
Supply Chain
Context:
− Supply costs continue to be a key driver of expense growth for health systems in the Commonwealth. Across the future BILH, supply expenses approach roughly $800 million in recent years, and this has been growing nearly triple the rate of inflation by internal estimates. Coupled with even steeper increases in pharmaceutical costs, this presents a significant challenge to the future sustainability of this and all healthcare systems.
− As one of the largest aggregate costs to BILH, supply chain represents one of the largest opportunities for savings achieved through the well-coordinated, data-driven, value-oriented integration of procurement processes and inventory management.
− Leveraging the combined scale of the new system, BILH will be able to negotiate better prices from suppliers and work towards greater standardization and adoption of high-value products.
Vision:
To develop a centrally coordinated and standardized model for its supply chain function — including procurement, receiving and logistics, supply value analysis, and vendor management — BILH will engage, collaborate with, and support all appropriate stakeholders across the continuum of care. By using the system’s scale and planned enhanced analytic capabilities to deliver the highest value inputs

Page | 45
to the provision of care, we will deliver significant savings and promote the business goals of providing high-quality, safe care in the most efficient and effective way possible.
Recommendations:
1. Consolidation to a single GPO.
− All legacy organizations consolidate to a single GPO to leverage the aggregate spend of the enterprise to maximize value; to facilitate the standardization of products, vendors, and pricing; and to maximize efficiencies in procurement and contracting functions.
− Moving to a single GPO allows BILH to combine its spend across all product lines and purchased services to drive greater savings. Furthermore, operating under a single GPO will streamline supply chain analytics for more efficient procurement and utilization.
2. Establish a value analysis structure.
− Establish a value analysis structure and process designed to consistently govern the introduction, evaluation, standardization, and utilization of clinical products, new clinical technology, and clinical services used within the enterprise.
− Supply and service decisions will be made using the value analysis processes. This ensures that BILH is using products and supplies with demonstrated clinical effectiveness while attaining the best possible pricing.
Impact:
− Reduced supply and service expense across the health system.
− Efficient and effective clinical product assessment, selection, and standardized use across the system to reduce variation and improve quality.
Laboratory
Context:
− Laboratory medicine, as a high fixed cost business model, presents significant opportunities to capitalize on economies of scale through appropriate consolidation of multiple laboratories under one platform.112
− Training programs for medical laboratory technologists are currently producing only a third of the workforce need, with fewer than 5,000 individuals graduating each year from accredited programs.113 Since 1990, the number of lab training programs has decreased almost 25%.
− As a result of the pressure to decrease costs and improve services, laboratory consolidation is a common and foundational initiative for any large health system as it comes together.114
Vision:
To provide the highest quality, most timely, and cost effective anatomic pathology and clinical laboratory services for our patients, in partnership with our healthcare providers, institutions, and the communities we serve.
112 Deloitte, “Understanding and evaluating deal considerations in the diagnostic and medical laboratory sector,” 2018. Available at https://www2.deloitte.com/content/dam/Deloitte/us/Documents/life-sciences-health-care/us-lshc-diagnostic-medical.pdf. 113 American Society for Clinical Pathology (ASCP), Laboratory Personnel Jobs Are Available Nationwide. Reauthorize the Workforce Investment Act Including Provisions that Support Laboratory Training Programs. Why is Federal Support of the Laboratory Workforce Needed? June 2011. 114 Cook, Jim, “Laboratory Integration and Consolidation in a Regional Health System,” ASCP, DLM, Laboratory Medicine, Volume 48, Issue 3, 1 August 2017, Pages e43–e52, https://doi.org/10.1093/labmed/lmw069.

Page | 46
Recommendations:
1. Create a system-wide approach to anatomic pathology.
− Ensure all patients and clinicians have access to the same expertise regardless of location. − Optimize distribution of anatomic pathology services and access to specialized testing. − Deploy systems to connect pathologists at all BILH sites, encouraging collaboration and
consultation from tertiary/quaternary hubs to community care settings. 2. Leverage combined volumes and internal expertise to advance in-sourced testing and reduce
external expense.
− Increase operational efficiency and lower costs through testing consolidation – including in-sourcing of commercial reference testing, consolidation of specialty and routine low-volume lab services to major specialty hubs, and increased use of testing formularies.
− Negotiate with major reference labs — BILH currently uses 76 different reference labs. − Evaluate opportunities for consolidating or owning courier services. − Establish a system-wide approach to laboratory instrumentation − Improve uniformity of methodologies and protocols. − Decrease cost of reagents, consumables, and capital equipment. − Negotiate contracts with all vendors, including blood component vendors. − Invest in education and training for physicians, technical staff, and phlebotomists. − Incorporate and align individual facility and system level staffing initiatives/needs with
expertise level assessment. Impact:
− Significant operational savings through renegotiation and consolidation of reference laboratories, standardization of instruments and equipment.
− Additional savings resulting from courier service consolidation/in-sourcing, tube vendor/supply consolidation, and additional contract consolidation and negotiation.
CIN/Population Health Management
Context:
− APM Adoption in the Commonwealth: By 2022, the HPC has recommended a target of 68% adoption for commercial HMO APMs and 40% adoption for commercial PPOs.115 At the same time, the launch and anticipated expansion of the MassHealth ACO program promises to result in even greater adoption of APMs for MassHealth patients over a similar time period.
− Role of Population Health Management and CINs in Driving Improved Performance: Robust population health management, especially the proactive management of chronic conditions as well as the coordination of transitions of care, is central to achieving the better outcomes at a lower cost. Clinically integrated networks are uniquely positioned to align provider resources and manage performance in support of these goals.
Vision:
Create a unified CIN — composed of BIDCO, LCPN, and MACIPA — which leverages best practices in population health management and takes advantage of economies of scale, coordinated care management, and shared administrative infrastructure.
115 HPC, Opportunities for Savings in Health Care, May 2018. Available at https://www.mass.gov/files/documents/2018/05/04/Opportunities%20for%20Saving%20packet.pdf.
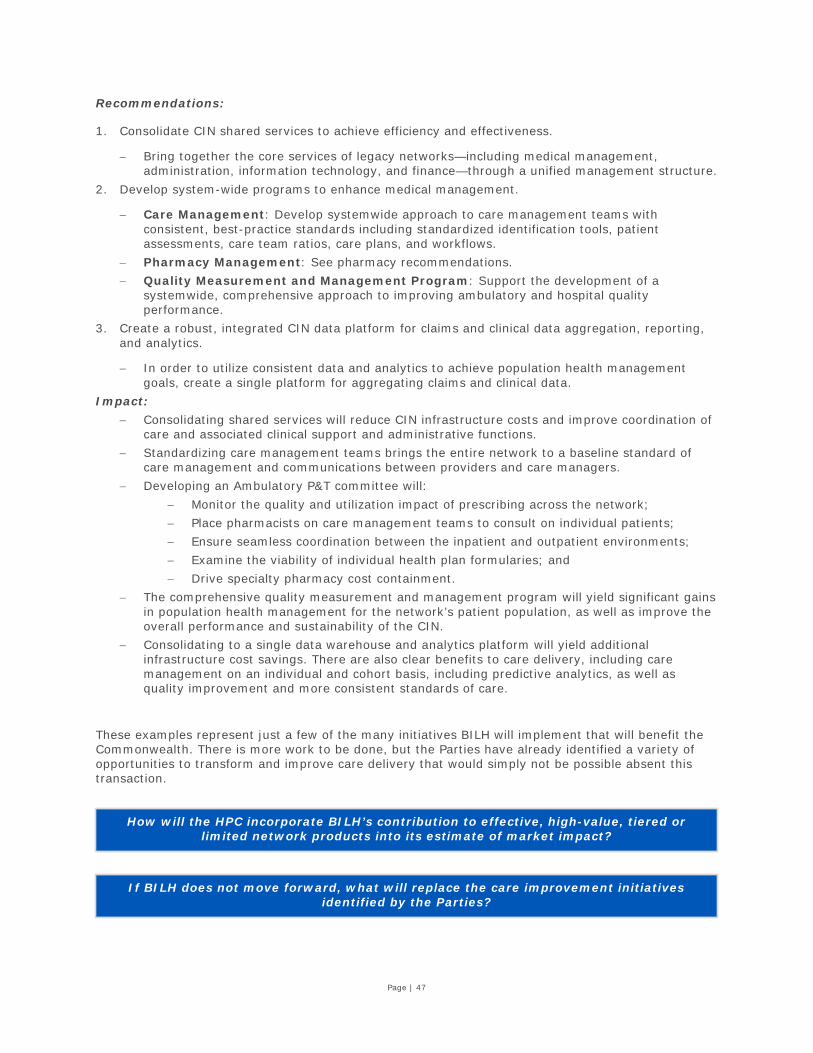
Page | 47
Recommendations:
1. Consolidate CIN shared services to achieve efficiency and effectiveness.
− Bring together the core services of legacy networks—including medical management, administration, information technology, and finance—through a unified management structure.
2. Develop system-wide programs to enhance medical management.
− Care Management: Develop systemwide approach to care management teams with consistent, best-practice standards including standardized identification tools, patient assessments, care team ratios, care plans, and workflows.
− Pharmacy Management: See pharmacy recommendations. − Quality Measurement and Management Program: Support the development of a
systemwide, comprehensive approach to improving ambulatory and hospital quality performance.
3. Create a robust, integrated CIN data platform for claims and clinical data aggregation, reporting, and analytics.
− In order to utilize consistent data and analytics to achieve population health management goals, create a single platform for aggregating claims and clinical data.
Impact: − Consolidating shared services will reduce CIN infrastructure costs and improve coordination of
care and associated clinical support and administrative functions. − Standardizing care management teams brings the entire network to a baseline standard of
care management and communications between providers and care managers. − Developing an Ambulatory P&T committee will:
− Monitor the quality and utilization impact of prescribing across the network; − Place pharmacists on care management teams to consult on individual patients; − Ensure seamless coordination between the inpatient and outpatient environments; − Examine the viability of individual health plan formularies; and − Drive specialty pharmacy cost containment.
− The comprehensive quality measurement and management program will yield significant gains in population health management for the network’s patient population, as well as improve the overall performance and sustainability of the CIN.
− Consolidating to a single data warehouse and analytics platform will yield additional infrastructure cost savings. There are also clear benefits to care delivery, including care management on an individual and cohort basis, including predictive analytics, as well as quality improvement and more consistent standards of care.
These examples represent just a few of the many initiatives BILH will implement that will benefit the Commonwealth. There is more work to be done, but the Parties have already identified a variety of opportunities to transform and improve care delivery that would simply not be possible absent this transaction.
How will the HPC incorporate BILH’s contribution to effective, high-value, tiered or
limited network products into its estimate of market impact?
If BILH does not move forward, what will replace the care improvement initiatives identified by the Parties?
The Massachusetts Health Policy Commission
Cost and Market Impact Review
HPC-CMIR-2017-2
Preliminary Report Response – Appendices
Joint response for the proposed transaction to create BILH and BILH CIN on behalf of
A. Beth Israel Deaconess Medical Center, Inc.
B. Mount Auburn Hospital
C. New England Baptist Hospital
D. Lahey Health System, Inc.
E. Seacoast Regional Health Systems, Inc.
F. Beth Israel Deaconess Physician Organization, LLCd/b/a Beth Israel Deaconess Care Organization
G. Mount Auburn Cambridge Independent PracticeAssociation, Inc.

Table of Contents
Appendix 1: Introduction from Original CMIR Submission by the BILH Parties ...................................... 3 Appendix 2: Detailed WTP Analysis ................................................................................................ 10
Appendix 3: BILH Design Teams ................................................................................................... 17
Page | 2
Appendix 1: Introduction from Original CMIR Submission by the BILH Parties
The rationale for forming BILH has been clearly articulated by the Parties from the earliest planning stages. The document below explains this rationale and was presented to the HPC as an introduction to the Parties’ CMIR submission on January 19, 2018. (The term “NewCo” in the original submission has been replaced by “BILH” to avoid confusion.)
The proposed transaction and creation of BILH will create a forward-thinking and geographically distributed health care delivery network to provide enhanced access to quality care for patients in Eastern Massachusetts, meet the needs of purchasers seeking to reduce medical expenditures, and advance progress toward Massachusetts’ stated goals of reducing health care spending and promoting adoption of alternative payment methodologies (“APMs”).
Presently, the Massachusetts marketplace is dysfunctional, as has been well documented by the Health Policy Commission (“HPC”)1, and no market-based solution has emerged to create true competition and balance; yet, to date, neither legislation nor regulatory enforcement has brought parity to the market or corrected this dysfunction. The current environment of care continues to be fragmented and unsustainable. Unwarranted price variation and a challenging financial environment impede high-value organizations from competing effectively to close the competitive gap in Eastern Massachusetts. Specifically, community hospitals are struggling and many lack viable strategic options for future sustainability in a market where expensive providers focus on increasing volume at and shifting care to tertiary hubs. So long as the highest priced providers continue to be paid at materially higher rates for a level of quality performance that is not materially better, all other hospitals – community, teaching, and academic – in Massachusetts will suffer, and statewide expenditures will remain difficult to control. BILH represents the only currently available market-based option for the Commonwealth to address the identified weaknesses and inefficiencies in the market by presenting a viable alternative to higher-priced systems for payers and employers.
While public officials continue to examine a range of policy options intended to correct this dysfunction without harming important providers, no definitive action has been taken, and consensus continues to be a challenge. In contrast to the many policy options that have been discussed, there are far more limited choices with regard to allowing the market to “right itself.” However, there is one promising opportunity: BILH will offer all critical elements necessary to compete, including a broad continuum of services, clinical expertise and depth, superb physicians, high-value performance, sufficient geographic footprint among community-based and tertiary providers, reputation, valuable research and education programs, and an effective structure for value-based insurance products and incentivized choices. Through BILH, the Commonwealth has an unprecedented opportunity to facilitate and introduce balance and competition to the marketplace.
BILH’s objectives, which are closely aligned with those of the HPC, include:
− Optimally utilize the combined ambulatory, inpatient, behavioral health, community, tertiary, home care, and post-acute assets of BILH based on patient need and convenience, with an overall goal of improving health outcomes and quality of life for patients by keeping care in the most appropriate setting and spreading best practices throughout BILH’s network of providers
− Achieve operational synergies, economies of scale, and efficiencies to further control costs and pass savings on to consumers through the development of attractive insurance products
− Reduce fragmentation in care delivery to improve cost-effectiveness and enhance the patient experience
− Bolster clinical programs, capabilities, and services in communities to expand access
− Strengthen teaching and research programs
− Provide streamlined transitions of care and navigational support to patients in their communities
1 HPC, Community Hospitals at a Crossroads: Findings from an Examination of the Massachusetts Health Care System, March 2016.
Page | 3
− Build on existing community partnerships and evidence-based programs to maximum effect, strengthening public health, primary care and prevention, and behavioral health expertise and supporting efforts across the BILH system
− Properly support providers within the delivery system to succeed under value-based payment methodologies and risk contracts, such as the MassHealth ACO Program, by significantly improving patient care, effectively spreading risk to better manage care for at-need populations, making investments in infrastructure (e.g., information technology) required to succeed, and mitigating healthcare cost growth
− Align financial incentives through a shared financial bottom line to help achieve a level of integrated performance beyond what is possible in contractual affiliations alone, further supporting efforts to shift care to the most appropriate, lowest cost settings and to enhance the clinical capabilities available in the community
The HPC commands one of the most robust sets of data, market intelligence, and benchmarking capabilities in the country. The potential impact of moving forward with this transaction will be assessed, well-documented, and monitored by the regulatory bodies, payers, and other interested parties.
The HPC should also consider and inform the public about the significant risks that will flow from efforts to prevent the potential transaction from occurring. The risk of not moving forward with this transaction is the continuation of significantly unfavorable trends in healthcare expenditures, spending on the highest-priced providers, the acceleration of a lopsided market, the further destabilization of critical community hospitals and tertiary facilities, and the invitation to national health systems to exert influence over the providers that presently remain under the full jurisdiction of the Commonwealth. Failure to obtain regulatory approval to form BILH does not mean that there will be no further consolidation in the market. Whether the forces of consolidation come from outside the Commonwealth, or from the need to rescue financially stressed hospitals, proposed consolidations are likely to occur in the future. As a top performer on value, measured by the ability to deliver demonstrably high and competitive quality of care at a lower cost, and scope broad enough to meet the needs of a diverse set of healthcare consumers and purchasers, BILH is the natural and only market-based option that brings together a full spectrum of highly reputable Massachusetts non-profit hospitals to offer a meaningful alternative to high-priced providers, and introduce true competition to a lopsided market.
For further detail regarding the creation of BILH, its strategic objectives, and transaction rationale, please reference pages 2-6 of the document entitled “Responses to DoN Questions” submitted as part of NEWCO-17082413-TO application to the Department of Public Health in September 2017.
Key Considerations
In both law and regulation,2 the HPC is empowered to “examine factors relating to the Provider or Provider Organization’s business and its relative market position, including, but not limited to” the many factors specifically addressed in the cost and market impact review (“CMIR”) questions. Of note, is the final item listed: “any other factors that the Commission determines to be in the public interest.”
This clause appropriately empowers the HPC to think broadly about the public interest implications of its recommendations, consider other factors affecting the long-term viability and sustainability of providers, evaluate broader trends and threats, and assess what will be required for long-term success of a competitive market.
Accordingly, BILH respectfully urges that any findings and report regarding the impact of the proposed affiliation be compared to a robust assessment of the future marketplace, which BILH believes will be more challenging for providers and will not address the noted dysfunction. As such, BILH believes a thorough analysis of the potential impact of this transaction must include extensive analysis of the risks of not approving the transaction.
2 Health Policy Commission, 958 CMR 7.00 Notices of Material Change and Cost and Market Impact Reviews, CMR 7.06(12); Massachusetts General Laws, Section 13: Notice of material changes to operations or governance structure of provider or provider organization; cost and market impact review, MGL 6D s. 13(d)(xii).
Page | 4
Therefore, BILH respectfully suggests that, in the public interest, the following additional key considerations be included as part of the HPC’s review.
1. BILH is the best hope for a competitive, market-based solution to unwarranted price variation.
The HPC and the Attorney General’s Office (“AGO”) have identified and repeatedly explained the market dysfunction of unwarranted price variation in which price varies dramatically between hospitals and is not correlated to individual hospital quality.3,4 This dysfunction leads to high costs and, in turn, destabilizes critical community-based providers that lack both volume and financial resources. High-priced providers do not currently face effective competition from other providers who can force them to evaluate their pricing strategy by offering a high-value alternative. The Special Commission on Provider Price Variation further explored these differences and developed recommendations to reduce unwarranted price variation.5
While additional legal or regulatory actions may seem like an option, the reality is that additional regulatory authority has not been granted to address unwarranted price variation. Therefore, BILH believes that effective competition is the best, quickest, most cost-effective, and most efficient means to address unwarranted price variation and overall cost growth within the Commonwealth; ensure needed consumer access to lower-cost community providers that are at-risk in the current environment; and promote greater affordability and access to health care and coverage for consumers throughout Eastern Massachusetts. Even if consensus is achieved and government action is taken to begin to address this dysfunction, the positive impact of BILH in the marketplace would complement any government intervention on commercial payment rates and facilitate greater affordability in the Massachusetts market.
As described throughout this response, BILH combines highly respected high-value providers that share a demonstrated commitment to quality and managing cost growth. With geographic coverage, savings from reduced utilization of high-priced providers, the ability to direct cases within BILH to the appropriate cost-effective facility, and outstanding population health management capabilities, BILH will be able to offer a unique value proposition to health plans, employers, and individual consumers. This type of innovation is exactly what providers have been asked to do: focus on managing total medical expenses (“TME”) and quality and organize to succeed in a competitive market driven by value.
Since the AGO issued its first report on cost drivers in Massachusetts,6 nothing has been able to rectify unwarranted price variation, undo its persistent negative impact on the stability of critical community providers, and secure access to care in communities throughout the Commonwealth. The single greatest opportunity to fix this dysfunction, and create a healthier and more stable competitive market, is a high-value competitor that can challenge the dominance of high-priced providers. Only a fully integrated delivery system like BILH can strengthen community providers, deliver value that competes effectively to shift volume from higher-priced providers, and apply pressure on higher-priced providers to evaluate their pricing strategy. All of these results are wins for the Commonwealth.
Blocking this affiliation would ensure that no organization would have the geographic coverage of community-based and tertiary providers, the continuum of care, competitive TME, and commitment to effective population health management necessary to successfully challenge high-priced providers in the market.
3 Per The Annual Report Series on Relative Price: Healthcare Provider Price Variation in the Massachusetts Commercial Market, The Center for Health Information and Analysis, May 2017.
4 Re-examining the Health Care Cost Drivers and Trends in the Commonwealth, Freedman Healthcare, February 2016. 5 Joint Committee on Health Care Financing, Special Commission on Provider Price Variation Report, March 15, 2017. 6 Office of Attorney General, Investigation of Health Care Cost Trends and Cost Drivers Pursuant to G.L. c. 118G, § 6½(b) Preliminary Report, January 29, 2010.
Page | 5
2. Massachusetts is unlike other markets, with several forces in place to avoid above-market price increases.
A main concern of the CMIR is the impact BILH (or any provider affiliation) could have on provider prices. The Parties disagree with any premise that BILH will be able to unilaterally increase prices for several reasons.
First, the Parties currently offer outstanding value to healthcare consumers, through high-quality services at lower relative prices and TME than their competitors. This represents a core competitive advantage for BILH and one that the organization does not want to diminish.
Second, there is market pressure to manage TME, and meaningful public accountability for performance on this measure. BILH is already highly focused on managing TME through commercial APMs, Medicare accountable care organizations (“ACOs”), Medicare Advantage, and, in March 2018, the MassHealth ACO Program.
Third, there is now significant regulatory scrutiny of cost increases, helping to ensure that future pricing changes are reflective of the value provided.
So many of the pieces are in place for high-value care in Massachusetts – payers and providers focused on risk contracting and the real value of care, as well as public transparency on cost, quality, access, and value. However, what is missing is a health system that can compete with the Commonwealth’s dominant system – applying pressure on them to evaluate their pricing strategy by offering a high-value alternative. The opportunity to facilitate establishment of such a system should have strong appeal and be welcomed by regulators, given the collective interests of market stakeholders to lower total healthcare expenditures (“THCE”) and create higher quality through improved market competition.
3. Hospitals face several threats that will undermine their standing to the detriment of Massachusetts citizens and the economy.
Competitive dynamics in healthcare portend significant challenges for non-profit hospitals and health systems. Health care is changing quickly, with multi-state affiliations and new entrants threatening to squeeze established providers, and potential policy changes pointing to very difficult times for providers and potential access threats for consumers. For Massachusetts providers to be competitive amidst these changes, they cannot be maintained in such small units that they cannot compete effectively nor maintain the capacity to provide care in local communities, care which will otherwise erode or diminish entirely. Examples of competitive threats include:
a. Multi-state Affiliations – These affiliations could shift the standing of Massachusetts providers from being leaders of systems to being small players in systems based in other states. If this happens, Massachusetts providers could lose their prestigious standing among providers nationally.
b. Disruption – Major technology and other non-provider companies are expected to enter the health care market and disrupt current models of care. If they are not engaged effectively for the benefit of Massachusetts and its citizens, these national companies could take profits and jobs out of state. BILH will be better positioned to invest in consumer-oriented information technology (“IT”), be an attractive partner, and effectively manage care to ensure that Massachusetts benefits from these disruptions. BIDCO is already a national IT leader among clinically integrated networks (“CINs”) in data sharing and care management tools and strengthening that skill set will help Massachusetts. To attract the required top talent in areas like IT and implement IT system solutions across a broad network of providers with heterogenous systems, BILH will need to spread infrastructure costs across a larger base.
c. Sending Profits Out of State - Organizations that are not community-based non-profits may “cherry-pick” profitable patients and/or services, leaving a greater financial burden on existing non-profit providers that care for all patients regardless of ability to pay or insurance status. Major national healthcare companies are acquiring physician practices, including in Massachusetts. As these companies generate profits by applying pressure to local, non-profit
Page | 6
hospital providers and others, they take their profits out of state to the detriment of the Massachusetts economy.
d. Government Payment Reductions - With the recent tax law changes and continued fiscal pressure on federal and state budgets, it is likely that Medicare hospital payments will be further reduced. Medicare physician fees are already slated for virtually no inflation increase for the next ten years, even without additional reductions due to the Tax Cuts and Jobs Act. Reductions in Medicaid payments to providers are a constant threat in the current environment, as growth trajectories in Medicaid spending are not sustainable and the federal role in financing continues to be debated. The Parties need every opportunity to be able to come together and, collectively, operate more efficiently.
In this dynamic and highly competitive landscape, government agencies, policy makers, and other stakeholders must work together to promote actions and strategies that will ensure Massachusetts has strong health systems that are leading health care delivery regionally and nationally; providing needed access to medical and behavioral health care in communities across the Commonwealth; and competing fairly and effectively with each other for the benefit of consumers, employers, and health plans.
4. Stagnation and weakening of Massachusetts hospitals will continue if this affiliation does not move forward.
The HPC, AGO, and other government regulators are implicitly part of a strategic planning process, not just for the BILH Parties, but for the health sector in Massachusetts. When setting strategy, one of the greatest errors is assuming that inaction is a viable option, and that the status quo can be maintained.
As described above, the market environment for health systems is changing quickly and is fraught with risk. In evaluating the risks associated with forming BILH, all stakeholders must also consider the risks for providers and the Commonwealth of not supporting the formation of BILH.
In this case, inaction will lead to deterioration of the constituent organizations as they cannot continue to effectively respond to external market threats or reverse the persistent negative impacts of unwarranted price variation that will intensify the destabilization of low-cost community and tertiary providers.
Without this transaction, the future Massachusetts health care market picture is bleak:
a. The market will continue to lack a high-value challenger to the dominant system, either in geographic presence, clinical capability, or reputation. As a result, no significant progress in shifting care from higher-priced providers is likely.
b. Community hospitals and academic medical centers (“AMCs”) outside the dominant provider will continue to weaken, attracting fewer commercially-insured patients, and widening the financial disparity caused by unwarranted price variation.
c. Specialty market leaders like New England Baptist Hospital (“NEBH”) will weaken without a broader affiliation, as they would likely struggle to retain cases as provider organizations seek to control referrals.
d. Independent community hospitals like Anna Jaques Hospital (“AJH”) will struggle to find sound financial footing as looser affiliations will not lead to the required investment in local clinical and technological resources. In the past, both BIDMC and Lahey have contributed to the maintenance, growth, and financial longevity/sustainability of community hospitals like BID-Plymouth (formerly Jordan Hospital), Winchester Hospital, and Beverly Hospital, none of which would have continued to be financially viable without corporate affiliates committed to their success.
5. The challenges of high public payer mix must be shared
BILH understands that other providers are concerned about this very challenging outlook as well, including providers with disproportionately higher public payer mix. BILH is committed to providing outstanding care to underserved Medicaid populations by applying the Parties’ ACO expertise in the
Page | 7

MassHealth ACO Program. BILH also recognizes and supports other efforts used to balance the proportion of payments from public payers, including the Health Safety Net (“HSN”) Trust Fund, which ensures that all acute care hospitals are contributing to those that bear disproportionate responsibility to care for our lowest income patients. BILH contends that the challenge of adequately supporting providers with a high public payer mix is critically important and is not inconsistent with the efforts of other providers to compete more effectively to address unwarranted price variation and cost growth. These issues must be addressed in parallel, or innovation and competition will be stifled.
6. Health plans, employers, and consumers must be part of the change
It will take providers and health plans to develop competitive products, and employers and consumers to select these products to shift the current market dynamic. For the first time, with the approval of BILH, Massachusetts will have a legitimate contender in the field of play. High-value plans will reward providers, payers, and consumers for reductions in TME.
By creating an attractive provider network with highly reputable providers, deep clinical expertise, and geographic coverage, BILH will increase competition in the payer market as well. Payers will have the option to offer more innovative, high-value products. Even if only some payers choose to innovate with BILH, health plans will compete more, and employers will benefit from this competition and more options for high-value health plan products.
To the extent that BILH offers an option for a high-value network product, payers still have alternative providers with which they can contract. No monopoly situations are created. In each local market that BILH will serve, payers will also have options to contract with providers of both the dominant system as well as other provider organizations.
Some providers are concerned that BILH will reduce the market share of other high-value providers. BILH’s intense focus, however, will be on putting price pressure on higher-priced providers by being a high-value alternative to them. There are several factors that support this rationale, including current outmigration patterns and the fact that under risk contracts, lowering TME will be the major performance goal, which is unlikely to be achieved unless a significant portion of the market shift is away from higher-priced systems. There is much more to be gained by market share shifting from higher-priced systems than similar or lower-cost systems.
7. Optimizing impact requires both BILH and BILH CIN
To achieve the optimal impact on managing cost growth and improving quality, two entities play distinct and interwoven roles: BILH (a fully-integrated corporate affiliation) and BILH CIN (a BILH subsidiary with contractual affiliates).
Beth Israel Deaconess Care Organization (“BIDCO”), Lahey Clinical Performance Network (“LCPN”), and Mount Auburn Cambridge Independent Practice Association (“MACIPA”) have driven innovations to manage cost growth and improve quality over many years. By investing in population health infrastructure and analytics, engaging physicians, and entering value-based contracts, these provider organizations have driven significant improvement in cost and quality. BILH has repeatedly demonstrated these accomplishments to the HPC.
Provider organizations (independent practice associations, physician-hospital organizations, and ACOs) are limited in the impact they can have on structural costs within the system. To achieve the next level of savings for the system, these contractual affiliations must be supported by a core of providers in a corporate affiliation.
Only through a fully-integrated corporate affiliation can providers reduce overhead, and plan together to align strategy and investments in clinical services. Under contractual affiliations, providers lack the legal authority, ability, and motivation to make more complex decisions about resource allocation like strengthening community hospitals to shift care from AMCs. Similarly, only through a corporate affiliation can Beth Israel Deaconess Medical Center (“BIDMC”) and Lahey Health System (“Lahey”) collaborate with Mount Auburn Hospital (“MAH”) to rationalize the movement of clinically-appropriate cases to a high-quality and lower-cost community teaching hospital. As the contracting organizations reach their limits on
Page | 8

improving value through better coordinated care, additional value must come from changes that are only possible with close strategic alignment and a fully-integrated corporate affiliation.
If BILH, a corporate affiliation, is needed to achieve maximum impact, it is reasonable to ask why BILH CIN is needed, as well. BILH CIN, more efficiently deploying the resources of existing provider organizations, will continue to be the infrastructure to drive risk contract success. That infrastructure is shared also with other providers in the BILH CIN network that are not corporate affiliates. Though that contracting affiliation has limits compared to a fully-integrated corporate affiliation, it nonetheless adds value. The contracted affiliate can access population health management infrastructure and support that would be difficult to replicate as an independent entity. The broader CIN network also supports BILH in being able to offer high-value network insurance products with greater access.
Conclusion
The current market has one dominant system which has four times the revenue of the next largest competitor. After forming BILH, the dominant system will still be more than twice as large as BILH ($12.4 billion in annual revenue compared to $5.3 billion). This alternative presents a market in which a dominant system is challenged by a high-value, but still smaller, second system. If BILH is prohibited from moving forward, there is little hope of a meaningful market-based challenge to the dominant system, leaving the current dysfunction in place.
The creation of BILH will offer the Massachusetts healthcare market a unique, highly competitive option not currently available to payers or consumers. BILH will be built on a platform of already high-value, lower-cost providers which will be further incentivized through full integration to seek opportunities to even more effectively manage TME. BILH is committed to working with health plans and employers to develop attractive insurance options that will benefit consumers and introduce meaningful competition into the healthcare market.
Page | 9

Appendix 2: Detailed WTP Analysis
The following memorandum was completed by BILH’s economic consultants.
The remainder of this page is intentionally left blank
Page | 10

This memorandum provides a summary of the methodology and the results from a retrospective
analysis of the competitive effects of past transactions involving BILH member systems and
hospitals. The objective of this analysis is to assess the extent to which the predictions of the
WTP-based merger simulation model have been borne out in Massachusetts, a state that closely
tracks and regulates healthcare spending. Specifically, we employ the two-stage model of
hospital competition used by the HPC in its Preliminary Report to estimate the change in
Willingness to Pay (WTP) resulting from prior transactions. Using this estimated change in
WTP, we arrive at a prediction of post-merger price changes for these transactions based on the
HPC’s merger simulation estimates, and then compare these predicted price changes to actual
changes in price observed in the data. In the following sub-sections, we describe the
methodology underlying each of these steps.
Identifying Candidate Transactions for Review
As an initial matter, we identified a set of candidate transactions in Massachusetts that would
be appropriate for this exercise. We focused on past transactions involving BILH member
hospitals and systems, given the HPC’s detailed review of the pricing effects of these
transactions in its Preliminary Report.1 In particular, we identified the following transactions
for which we estimated the change in WTP, the corresponding predicted price change based on
the HPC’s estimates, and the actual price change based on a retrospective analysis.
• Lahey Clinic’s acquisition of Northeast Hospital System in 2012
• Lahey Heath’s acquisition of Winchester Hospital in 2014
• BIDCO’s affiliation of Cambridge Health Alliance (CHA), Lawrence General Hospital
and Anna Jaques Hospital in 2014
• BIDMC’s acquisition of Milton Hospital in 2012
• BIDMC’s acquisition of Jordan Hospital (Plymouth) in 2014
Estimating Change in WTP
The approach we use to estimate the change in Willingness to Pay (“WTP”) for each of these
transactions follows the economic literature examining the hospital industry and the
methodology recommended in the analysis of hospital mergers by the FTC.2 Specifically, this
1 See HPC-CMIR-2017-2: “The Proposed Merger of Lahey Health System; CareGroup and its Component Parts,
Beth Israel Deaconess Medical Center, New England Baptist Hospital, and Mount Auburn Hospital; Seacoast
Regional Health Systems; and Each of their Corporate Subsidiaries into Beth Israel Lahey Health; and The
Acquisition of the Beth Israel Deaconess Care Organization by BILH; and The Contracting Affiliation Between
BILH and Mount Auburn Cambridge Independent Practice Association,” p. 32, available at
https://www.mass.gov/files/documents/2018/07/18/Preliminary%20CMIR%20Report%20-
%20Beth%20Israel%20Lahey%20Health_0.pdf. 2 See Joseph Farrell et al., “Economics at the FTC: Hospital Mergers, Authorized Generic Drugs, and Consumer
Credit Markets,” Review of Industrial Organization, Vol. 39 (2011), pp. 271-296.
Page | 11

approach is based on a “two-stage” model of competition.3 In the first stage, health plans and
hospitals bargain over prices and network composition. In the second stage, once hospital
networks have been formed, consumers choose from a set of hospitals based on a variety of
factors and under the assumption that they face the same out-of-pocket costs across all hospitals
within this set. The approach involves measuring the bargaining position of a hospital (or
hospital system) in its negotiations with health plans for inclusion in the health plans’ networks.
While bargaining position might stem from a variety of factors, including favorable location or
high quality, the analysis of unilateral effects attempts to measure the change in bargaining
position that specifically results from a possible reduction in competition through the merger of
hospitals that are viewed as substitutes by health plans and consumers. That is, the greater the
degree of substitutability between the merging hospitals, the greater the change in willingness-
to-pay or “WTP” (measured as the difference in WTP between the merged entity and the sum
of the WTPs of the separate hospital systems) arising from the merger.
To estimate the change in WTP from each of the transactions listed below, we estimate a
patient choice model using the inpatient case-mix data provided by CHIA for the time period
2012 through 2015.4 The sample includes all acute care inpatient discharges in Massachusetts
that are insured by commercial payers.5,6 The model includes a number of characteristics that
are thought to be important in determining a patient’s choice of which hospital to visit for
inpatient care, including patient demographics and clinical indicators, as well as the location of
the patient.7 We estimate the model using a flexible, semi-parametric approach that creates
groups based on patient characteristics (such as patient age and ZIP code) and estimates
substitution patterns for patients within each group by examining the hospital choices of other
patients who have similar characteristics.8 This flexible specification is well suited to capture
localized competitive interactions between hospitals that might be driven by the location of
3 The WTP model was developed and applied to insurer-hospital bargaining in several influential academic
articles: Town, R. and Vistnes, G., “Hospital Competition in HMO Networks,” Journal of Health Economics,
Vol. 20 (2001), pp. 733 – 753, and Capps, C., Dranove, D.D., and Satterthwaite M.A, “Competition and
Market Power in Option Demand Markets,” The RAND Journal of Economics, Vol. 34 (2003), pp. 737 – 763.
4 While we also estimated a patient choice model using the 2016 CHIA inpatient case-mix data, we are unable to
use this information to estimate price changes for mergers or affiliations that occurred in 2016 (e.g., NEBH’s
affiliation with BIDCO in 2016), because we do not have data on prices for 2017 that can be used to estimate
the post-merger pricing impact.
5 We identified the following payers as commercial: Blue Cross Blue Shield (“BCBS”), BCBS Managed Care,
Commercial, Commercial Managed Care, HMO, Other Non-Managed Care, PPO and Other Managed Care,
Point-of-Service, and Exclusive Provider Organization.
6 Because we lacked access to the All Payor Claims Data, we restricted the analysis to inpatient services only.
Regardless, the implications drawn from this exercise extend to the other segments examined by the HPC
(outpatient services and physician services).
7 The full list of variables that are included in the model as potential drivers of patient choice include: state,
county, ZIP code, age group (0-17, 18-45, 46-64, and 65+), gender, emergency status, DRG type (medical or
surgical), DRG weight (<2 or 2+), MDC, and DRG.
8 Patients are placed into bins based on the variables identified as potential drivers of patient choice using the
iterative grouping procedure described in Raval, D., Rosenbaum, T., and Tenn, S.A., “A Semiparametric
Discrete Choice Model: An Application to Hospital Mergers,” Economic Inquiry, Vol. 55 (2017), pp. 1919 –
1944. We set the minimum group size to 25. Ungrouped patients that remain after this procedure are grouped
together into a bin.
Page | 12

outpatient centers or physician clinics that affect referral patterns or by the unique geographies
of an urban hospital market.
Estimation of the patient choice model in this manner returns the shares assigned to each
hospital in the choice set and associated with each patient grouping. These are then used to
calculate the WTP for each hospital (and hospital system) based on the following
transformation. The total WTP for a given set of hospitals is calculated as the log of the
inverse of the residual share for each patient grouping. The total WTP for that set of hospitals is
then calculated as the sum of the WTP across all patient groupings. The change in WTP
resulting from each merger is then calculated as the difference between the WTP for the
merged entity and the sum of the WTPs for the constituent member hospitals. Because the
merging parties’ shares are summed before taking the log transformation in the first instance,
rather than after as in the second, the WTP model will predict an increase in WTP if the
merging parties both have positive share for at least one patient grouping.
Based on this model, we estimated the change in WTP corresponding to each of the
transactions listed above.9 These are presented below in Exhibit 1. Of the transactions
reviewed, three of them are associated with a meaningful change in WTP – Lahey’s acquisition
of Northeast, Lahey’s acquisition of Winchester Hospital, and BIDCO’s affiliation with CHA,
Lawrence General and Anna Jaques Hospital. We focus on these transactions in our
subsequent analysis comparing predicted and actual price changes.
Exhibit 1
BILH Transaction Change in WTP
BID-Milton 1.7%
BID-Plymouth 1.2%
Lahey-Northeast 5.2%
Lahey-Winchester 6.6%
BIDCO 4.1%
Estimating the Predicted Post-Merger Price Change from Past Transactions
The next step in the analysis entails using the estimated change in WTP to come up with a
prediction for the post-merger price change at the acquired or newly affiliated hospitals for the
set of transactions identified above that have a meaningful change in WTP. In its analysis
described in the Preliminary Report, the HPC estimated a linear regression equation (as
described in footnote 160 of the Preliminary Report) that quantifies the relationship between
WTP per discharge and price. For inpatient services, the estimates from the HPC’s regression
9 Our understanding is that the HPC uses the change in WTP/discharge as part of their regression model
estimating the impact on pricing. The change in WTP/discharge is calculated as WTP per discharge of the
combined system minus the volume (discharge) weighted averages of the pre-merger WTP/discharge values of
the merging systems. In percentage terms, this change is equivalent to the percentage change in WTP reported
in the Exhibit 1.
Page | 13

model indicate that the change in WTP associated with the BILH transaction (10.8%) would
predict a price increase of (5-6.7%), depending on the exact specification of the regression
model employed.10
We use the estimates from the HPC’s regression model to calculate the predicted price change
at the acquired or newly affiliated community hospitals resulting from past transactions
undertaken by the BILH member hospitals. Specifically, we calculate the change in WTP per
discharge for each transaction, and combine it with the HPC’s own estimates of the relationship
between WTP per discharge and price to arrive at a predicted price change at the acquired or
newly affiliated hospital associated with each transaction.11 These estimates are presented in
Exhibit 2.
Exhibit 2
BILH Transaction Implied Post-Merger Price Change at the
Acquired or Affiliated Hospital12
Lahey-Northeast 3.8 – 5.1%
Lahey-Winchester 3.9 – 5.2%
BIDCO-AJH 3.4 – 4.6%
BIDCO-CHA 2.1 – 2.8%
BIDCO-Lawrence General 2.8 – 3.8%
Comparison with Actual Post-Merger Price Changes
10 Our understanding is that the HPC models the relationship between WTP/discharge and price as linear;
however, the HPC’s estimates for changes in WTP and prices are reported in percentage terms in the
Preliminary Report.
11 In particular, we understand that in the HPC’s regression model relating price to WTP per discharge, the
coefficient on WTP per discharge is 3,949 or 5,294, depending on the specification used. We multiply the
calculated change in WTP per discharge for each of these transactions by these coefficients to arrive at a range
for the predicted price increase for each transaction (in absolute dollar terms). To convert the range of the
absolute price change to percentage terms, we divide by the inpatient, commercial Net Patient Service Revenue
(NPSR) per discharge for the acquired system for the pre-merger year estimated from the CHIA Hospital Cost
Reports. Due to a change in data reporting practices by Northeast described below, Northeast inpatient NPSR
was understated prior to 2013; therefore, we use NPSR from 2013, rather than the pre-merger year (2011) for
Northeast. This yields a conservative estimate of the percentage change, given the inpatient NPSR in 2013 was
higher for Northeast than in 2011. Commercial NPSR excludes Medicare and Medicaid managed and non-
managed care plans, but includes some types of non-commercial care, including Workers Comp, Self-pay,
Other Government, CommonWealth Care, Health Safety Net, Non-Patient, and Other, which collectively
account for only a small share of inpatient discharges. Because the HPC used unadjusted prices (i.e., not case-
mix adjusted) as the dependent variable in its regression specification, we do not adjust the NPSR estimates by
case-mix, either. The calculated percentage price changes are robust to using the NPSR estimates in the
merger year (vs. the pre-merger year) as the base.
12 Ranges of price effects are determined based on the range of coefficients reported from the HPC’s regressions of
price on WTP per discharge.
Page | 14

In its Preliminary Report, the HPC states that “[W]e have not found evidence that the parties
have negotiated higher prices, either for new community hospital affiliates or for their hospitals
overall, following past acquisitions or contracting affiliations with community hospitals.”13
That is, the HPC itself concluded that past BILH transactions did not lead to any price
increases, a finding that is at odds with the prediction of the WTP-based approach, which
predicts a positive price increase for each of these transactions.
As included in prior advocacy submissions to the HPC, the parties’ retrospective analysis of
pricing impacts of prior transactions shows that Lahey’s acquisition of Winchester and
BIDCO’s affiliations did not lead to any increases in prices at the acquired hospitals relative to
competitors, after the transaction, despite the WTP model predicting positive price increases,
shown above, .
Relative price data are not available prior to 2013, so we could not perform an analogous
analysis of the impact of integration on Northeast’s acquisition. However, as shown in Exhibit
3, negotiated rate increases for the top three insurers stayed constant or declined following the
acquisition.14
Exhibit 3
Year BCBS Rate
Increase
HPHC Rate
Increase
Tufts Rate Increase
2011 4% 3.8% 4%
2012 3.3% 4% 4%
2013 (post-merger
year)
0.1% 3.8% 3%
2014 3.2% 3.2% 2.8%
Source: internal Lahey data.
13 See HPC-CMIR-2017-2: “The Proposed Merger of Lahey Health System; CareGroup and its Component Parts,
Beth Israel Deaconess Medical Center, New England Baptist Hospital, and Mount Auburn Hospital; Seacoast
Regional Health Systems; and Each of their Corporate Subsidiaries into Beth Israel Lahey Health; and The
Acquisition of the Beth Israel Deaconess Care Organization by BILH; and The Contracting Affiliation
Between BILH and Mount Auburn Cambridge Independent Practice Association,” p. 32, available at
https://www.mass.gov/files/documents/2018/07/18/Preliminary%20CMIR%20Report%20-
%20Beth%20Israel%20Lahey%20Health_0.pdf.
14 While the CHIA Hospital Profiles show an increase in inpatient NPSR per discharge at Northeast from 2012 to
2013, this is due to a change in reporting methodology, rather than an increase in spending. Prior to 2013, gross
ED charges for all patients seen in the ED were reported as outpatient revenue. However, from 2013 onward,
gross ED revenue for patients seen in the ED and subsequently admitted as inpatients was reported as inpatient
revenue. This shift is demonstrated in Exhibit 4.
Page | 15
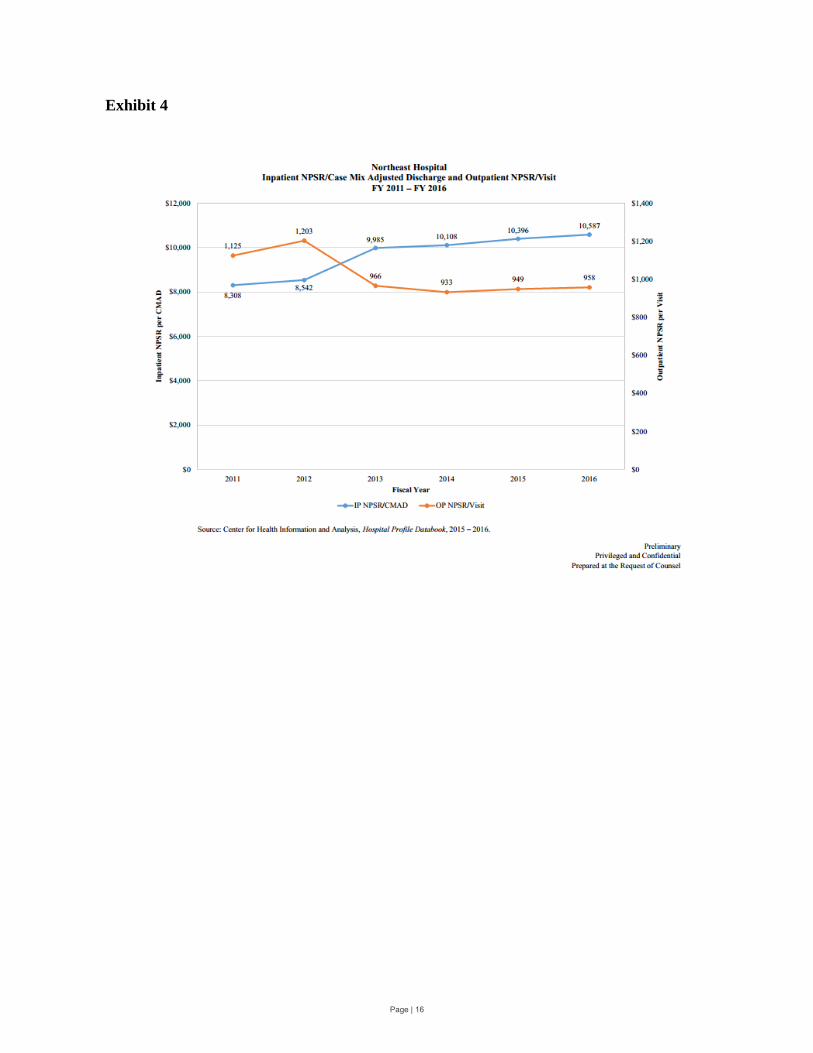
Exhibit 4
Page | 16

Appendix 3: BILH Design Teams
The 32 design teams are, in alphabetical order, as follows:
1. Academic Mission Work Group 2. Ambulatory Access 3. Behavioral Health 4. Cancer 5. Care Retention 6. Clinical Engineering 7. Clinically Integrated Networks / Population Health Management 8. Communication/Branding/Marketing 9. Continuing Care/Post-Acute Care 10. Debt 11. Electronic Health Record 12. Enterprise Resource Planning 13. Facilities/Real Estate 14. Financial Operations 15. Human Resources 16. Information Technology Operations 17. Investments 18. Laboratory 19. Legal 20. Medical Staff 21. Musculoskeletal Care 22. Nursing Leadership Council 23. Obstetrics, Maternal-Fetal Medicine, and Newborn Care 24. Patient Family Advisory Council 25. Pharmacy 26. Philanthropy 27. Primary Care 28. Quality 29. Revenue Cycle 30. Strategy and Business Planning and Development 31. Supply Chain 32. Urgent Care
Page | 17
Exhibit B:HPC Analysis of Parties’ Response
to Preliminary Report
1
Exhibit B
HPC Analysis of Parties’ Response to Preliminary Report
This document analyzes and addresses the principal topics raised in the August 17, 2018
response of the parties to the Health Policy Commission’s (HPC) Preliminary CMIR Report
(Parties’ Response).1
The HPC invited the parties, in their Response, to address a number of significant
outstanding questions and concerns regarding the proposed Beth Israel Lahey Health (BILH)
merger raised both in the Preliminary Cost and Market Impact Review Report (Preliminary
Report)2 and at the July 18, 2018 Board meeting. For example, at that Board meeting,
Commissioners asked that the parties provide:
Commitments to ensure that price increases (and associated spending impacts for payers,
consumers, and the Commonwealth) would either not occur or be moderated;
Further information about why the transaction is different from the merger that created
Partners HealthCare System and how corporately merging would make the BILH system
far more attractive to patients and higher quality than the parties are today;
Further explanation of how the merger enables the parties to do things that they are
unable to do while corporately independent (e.g., creating narrow network products
where the parties would offer a lower price point, undertaking population health
management efforts that cannot be achieved in the parties’ already-sizeable networks,
etc.);
Further information regarding the long-term financial implications for the parties if the
merger does not go through;
Additional information about the parties’ projected back office efficiencies, including if
and how those might translate into reduced prices;
Commitments to maximize the potential benefits and minimize the potential negative
impacts of the transaction on vulnerable patient populations (e.g., Medicaid patients) and
1 Exh. A: Joint Response for the Proposed Transaction to Create BILH and BILH CIN on Behalf of: Beth Israel
Deaconess Medical Center, Inc., Mount Auburn Hospital, New England Baptist Hospital, Lahey Health System,
Seacoast Regional Health Systems, Inc., Beth Israel Deaconess Physician Organization, LLC d/b/a Beth Israel
Deaconess Care Organization, and Mount Auburn Cambridge Independent Practice Association, Inc. at 4, 47 (Aug.
17, 2018) [hereinafter Parties’ Response]. 2 MASS. HEALTH POLICY COMM’N, REVIEW OF THE PROPOSED MERGER OF LAHEY HEALTH SYSTEM; CAREGROUP
AND ITS COMPONENT PARTS, BETH ISRAEL DEACONESS MEDICAL CENTER, NEW ENGLAND BAPTIST HOSPITAL, AND
MOUNT AUBURN HOSPITAL; SEACOAST REGIONAL HEALTH SYSTEMS; AND EACH OF THEIR CORPORATE
SUBSIDIARIES INTO BETH ISRAEL LAHEY HEALTH; AND THE ACQUISITION OF THE BETH ISRAEL DEACONESS CARE
ORGANIZATION BY BETH ISRAEL LAHEY HEALTH; AND THE CONTRACTING AFFILIATION BETWEEN BETH ISRAEL
LAHEY HEALTH AND MOUNT AUBURN CAMBRIDGE INDEPENDENT PRACTICE ASSOCIATION (HPC-CMIR-2017-2),
PURSUANT TO M.G.L. C. 6D, § 13 PRELIMINARY REPORT at 74-75 (July 18, 2018) [hereinafter PRELIMINARY
REPORT], available at https://www.mass.gov/files/documents/2018/07/18/Preliminary%20CMIR%20Report%20-
%20Beth%20Israel%20Lahey%20Health_0.pdf (last visited September 9, 2018).

2
other institutions (including financially vulnerable competitors as well as contracting
affiliate institutions like Cambridge Health Alliance and Lawrence General Hospital);
Further information about how the BILH merger would result in true transformation of
care delivery models (e.g., better integrated cross-system care, investments in social
determinants of health, better coordination between specialty and primary care) and plans
for expanding the Lahey Health Behavioral Services model across BILH; and
Further information regarding how the parties plan to shift care to lower-priced settings
and the timeline for achieving such shifts.
Commissioners also emphasized that how the BILH transaction might proceed is “going
to rely on the good faith of parties coming to the table and making strong statements about the
constraint of rates and the positives of bringing together these systems.” The future BILH CEO
Kevin Tabb and others provided assurances that the parties would address the Commission’s
concerns and be more specific about BILH’s plans. However, the Parties’ Response addresses
only a handful of these topics3 and offers few measurable commitments.
The remainder of this document addresses specific issues raised in the Parties’ Response
in more detail, and the Final Report has been updated as noted throughout this response. The
principal topics and new information in the Parties’ Response and addressed here include:
1. Quality and Care Delivery: The Parties’ Response identifies new goals for select
care delivery programs that have the potential to improve quality and care delivery if
fully implemented, including further expansion of the Lahey Health Behavioral
Services model.
2. Spending: While new information about the parties’ care delivery programs suggests
a potential for savings, the Parties’ Response overstates likely savings and conflates
higher revenue and internal cost savings for BILH with savings to the public. The
parties do not provide commitments or new information that change the HPC’s price
increase projections.
3. Health Care Market Functioning: The Parties’ Response is inconsistent with the
weight of the economic literature on the impact of consolidation among competitors
on health care market functioning and does not address the impact BILH may have on
3The Parties’ Response includes new and important information regarding the parties’ integration initiatives and
associated savings that would have been responsive to HPC’s information requests and the parties had a continuing
obligation during the course of the CMIR to provide responsive information. Nonetheless, this information is
addressed both in this document and in the HPC’s Final Report. MASS. HEALTH POLICY COMM’N, REVIEW OF THE
PROPOSED MERGER OF LAHEY HEALTH SYSTEM; CAREGROUP AND ITS COMPONENT PARTS, BETH ISRAEL
DEACONESS MEDICAL CENTER, NEW ENGLAND BAPTIST HOSPITAL, AND MOUNT AUBURN HOSPITAL; SEACOAST
REGIONAL HEALTH SYSTEMS; AND EACH OF THEIR CORPORATE SUBSIDIARIES INTO BETH ISRAEL LAHEY HEALTH;
AND THE ACQUISITION OF THE BETH ISRAEL DEACONESS CARE ORGANIZATION BY BETH ISRAEL LAHEY HEALTH;
AND THE CONTRACTING AFFILIATION BETWEEN BETH ISRAEL LAHEY HEALTH AND MOUNT AUBURN CAMBRIDGE
INDEPENDENT PRACTICE ASSOCIATION (HPC-CMIR-2017-2), PURSUANT TO M.G.L. C. 6D, § 13 FINAL REPORT at
61-62, 79-83, 100-102 (July 18, 2018) [hereinafter FINAL REPORT].

3
smaller competitors if the transaction were to go forward without appropriate
safeguards and constraints.
4. Access to Care for Vulnerable Populations: The parties emphasize their current
efforts to serve vulnerable patient populations but make no prospective commitments
to expand access for Medicaid patients.
Pursuant to the HPC’s responsibility to enhance the transparency of significant changes
to the health care system, we address each of these areas below. We also describe a number of
Other Additions and Technical Corrections we have made in the Final Report, including to
address new information provided by the parties, which are summarized at the end of this
document. We concurrently issue a Final Report of data-driven analysis of this transaction to
inform the work of other state agencies as well as the public, which ultimately bears the cost of
our health care system.
I. Quality and Care Delivery. The Parties’ Response identifies new goals for select
care delivery programs that have the potential to improve quality and care delivery
if fully implemented, including further expansion of the Lahey Health Behavioral
Services model.
As discussed in the Preliminary Report and Final Report, the parties’ integration planning
teams include some groups that have been developing proposals related to monitoring and
improving the quality of care and planning to expand certain services.4 These proposals were at
various stages of development when shared with the HPC; the parties emphasized that their
planning process is ongoing and that final decisions regarding integration would not be made
until after the transaction is finalized.5 Most of the descriptions of programs in the Parties’
Response remain high-level,6 but the Parties’ Response provides more specific plans and goals
related to the parties’ proposed plans for behavioral health integration, post-acute care
management, pharmacist intervention, and nurse triage programs. Although the parties have not
yet provided estimates of the costs of implementing these programs or made enforceable
commitments to enact the proposals or achieve the stated goals, the information in the Parties’
Response helps to describe the scope of the potential for quality improvement as a result of the
proposed transaction.7
4 See PRELIMINARY REPORT, supra note 2 and FINAL REPORT, supra note 3, at Sections III.C and III.D. A full list of
these groups, which the parties refer to as “design teams,” is provided in Appendix 3 of the Parties’ Response. 5 PRELIMINARY REPORT, supra note 2, at 11; FINAL REPORT, supra note 3, at 13.
6 Despite requests from commissioners for details of the parties’ care delivery integration efforts, the parties have
not identified transaction-specific goals, detailed plans, or timelines for most of the programs described at pages 37-
48 of the Parties’ Response. For example, Commissioner Cohen at the HPC’s July 18, 2018 Board meeting stated,
“One of the things that struck me in the report as it stands is there’s a lot of the potential is there but the detail is not.
And I understand that the nature of the transaction is that we may not have such details, but… the more that the
proponents can come back to us with, ‘Here’s what we think that would look like,’ … I think that would provide a
great deal of comfort to me and my fellow Commissioners.” 7 Although the Parties’ Response describes these proposals as “actionable commitments,” it also describes them as
having received “preliminary endorsement,” and the parties have not yet made enforceable commitments to enact
these proposals or achieve any specific related goals. Parties’ Response, supra note 1, at 37. The parties have stated
that they expect to fund these and other programs using the internal efficiencies discussed in infra Section II.A.

4
1. Behavioral health integration. The HPC recognized the potential benefits of the parties’
proposals for behavioral health integration in the Preliminary Report, while noting that the lack
of identified timelines, scope of implementation, and resource commitments limited our ability to
assess the extent to which this potential might be realized.8 The parties now state that they
propose to extend integrated behavioral health services, which the parties call the Collaborative
Care Model, to all BILH employed primary care practices within five years.9 The Parties’
Response does not discuss plans to integrate the primary care practices of non-employed BILH
affiliate physicians in BIDCO and MACIPA.10
The Parties’ Response also provides an estimate
of the patient population for intervention and a performance improvement target, although the
target is based on results achieved by other provider systems rather than the parties’ own results
to-date.11
Expanding behavioral health integration from the current 20 primary care practices to
an additional 85 employed BILH practices in five years would be a significant acceleration of the
parties’ efforts to-date,12
and expansion of this program and Lahey Health System’s (Lahey)
centralized behavioral health bed management system13
could result in both improved quality
and access to behavioral health services.
2. Pharmacist medication management. The parties describe a care delivery program
proposal in which pharmacists in each BILH hospital would engage high risk patients to
reconcile medications prior to discharge.14
The Parties’ Response identifies the goal that this
program would, within five years, reach all patients discharged with polypharmacy15
at a BILH
hospital and that emergency department visits for these patients within 30 days of discharge
would decline as a result. Some patients in this identified intervention population are likely
8 See PRELIMINARY REPORT, supra note 2, at III.C.2.
9 Parties’ Response, supra note 1, at 38. The parties have not explicitly provided timelines for their care delivery
initiatives, but footnote 49 of the Parties’ Response indicates that they expect to fully achieve the identified impacts
“by year five of operation as BILH.” The HPC therefore assumes that these programs will be fully implemented
within this timeline, if not sooner. 10
Materials provided confidentially to the HPC show that the parties’ behavioral health working group has
discussed further extending the behavioral health integration program to non-employed primary care offices as a
potential second phase of implementation, but it is unclear whether or on what timeline this might occur. 11
Although the target identified by the parties is expressed as a reduction in medical spending of 5%-10% for
patients with behavioral health conditions, these savings would be generated through improved care management
outcomes (e.g., reduced avoidable hospitalizations) that could be tracked as primary results of the intervention. The
parties have not provided information about the results achieved to-date by their practices that have already adopted
the Collaborative Care Model. 12
Documents provided by the parties indicate that they have extended the Collaborative Care Model to one
additional practice per quarter, or four per year, on average in recent years; integrating 85 practices over five years
would therefore be a four-fold increase in this historic rate. The parties have also identified workforce development
as a significant challenge when integrating new practices. 13
The parties have not yet identified specific performance improvement targets related to the proposed centralized
bed management and placement system, although the Parties’ Response provides statistics on ED boarding at
Winchester after the implementation of such a system. See Parties’ Response, supra note 1, at 39. 14
Id. at 25, 43. 15
Polypharmacy is a term used for patients prescribed multiple medications, although the number of medications
needed to qualify is not universally defined. Nashwa Mansoon et al., What is polypharmacy? A systematic review of
definitions, BMC GERIATRICS (Oct. 10, 2017), available at
https://bmcgeriatr.biomedcentral.com/articles/10.1186/s12877-017-0621-2 (finding that polypharmacy was most
commonly defined as having five or more daily medications, but that definitions ranged from two to eleven daily
medications). The parties did not indicate how they defined polypharmacy for the purpose of estimating their patient
population for this proposed intervention.
5
already benefitting from the parties’ existing medication reconciliation programs,16
and the
parties’ estimate of their goal for this intervention is based on research literature on the impacts
of similar interventions by other systems, rather than their own results to-date.17
Nonetheless, the
expansion of such a program to sites where it is not currently implemented may improve patient
care.
3. Nurse triage program. The Parties’ Response provides additional details regarding plans
to expand Lahey’s model of using nurse call lines to appropriately triage care for patients of
primary care providers (PCPs) at times when primary care offices are closed. The parties identify
a goal of extending this service to all employed PCP practices within five years,18
although they
do not provide underlying data on the results of this program at Lahey practices to-date, making
it difficult to assess their projections of the benefits of extending the program. Nonetheless, if the
parties implement this service as described, it may improve patient access to appropriate care and
help to avoid unnecessary utilization.
4. Post-acute care network development. The parties describe at a high level their plans for
integrating and expanding their home health, skilled nursing, palliative, hospice, rehabilitation,
and high-risk geriatric care services. As described in Section II of the Final Report, the parties’
systems currently include home health care providers, and each party has established a network
of preferred skilled nursing facilities (SNFs) to help manage patients across settings of care.19
Although the parties identify a specific goal of reducing hospital readmissions of all patients
discharged to SNFs from their hospitals within five years, they have not provided details related
to integration or how it would improve care beyond the successes of the parties’ current
preferred SNF networks.20
The parties also have not provided information regarding their
16
For example, the HPC’s Community Hospital Revitalization, Acceleration, and Transformation (CHART) grant
awards to Northeast Health System’s Beverly and Addison Gilbert hospital campuses helped to fund interventions
for high-risk patients that included the involvement of pharmacists and pharmacist technicians to help certain high-
risk patients review and reconcile their medications. It is unclear to what extent similar programs are already in
place at other BILH hospitals. These pilot programs demonstrate the potential benefits of pharmacist-led
interventions, but suggest that some of the potential results projected by the parties may already be being realized.
See also Application by Lahey Health System, CareGroup, and Seacoast Regional Health Systems for
Determination of Need for Transfer of Ownership, Response to Questions 2.1, 6.5, 6.6, and 13, Factor 1 at 25 (Sept.
7, 2017), [hereinafter DoN Narrative], available at https://www.mass.gov/files/documents/2017/09/zj/don-
application-response-newco.pdf (last visited Sept. 13, 2018) (“Within the three current affiliated CINs (BIDCO,
LCPN, and MACIPA), care management is structured and executed differently, from care navigators embedded in
primary care practices to a team of managers led by a pharmacist”). See infra note 33 for more information about
CHART grants. 17
Parties’ Response, supra note 1, at 25, note 62. 18
Id. at 25. 19
See id. at 24, 40; DoN Narrative, supra note 16, at 29. 20
The parties’ calculation of the potential impact of this program is that, of the 27,115 discharges from BILH
hospitals to SNFs, they expect a reduction in readmissions of 6.1%, equivalent to 1,079 avoided readmissions
annually, within five years. Parties’ Response, supra note 1, at 24, note 60. HPC analysis of 2017 CHIA hospital
discharge data indicates that the party hospitals discharged approximately 20,000 patients to SNFs that year,
substantially lower than the parties’ estimated intervention population. The literature the parties cite for the degree
of reduction in readmission rates as the result of implementing formal SNF networks indicates that hospitals with
such a network decreased hospital readmissions by 4.1 percentage points over four years compared to hospitals that
did not (6.1 percentage points as opposed to 1.6 percentage points). The parties provide no data regarding their
independent success to-date in reducing readmissions through developing their current preferred post-acute care
networks. The literature cited by the parties also discusses only the impact of newly implemented preferred SNF
6
proposed care management program for high risk geriatric patients beyond the description at
page 40 of the Parties’ Response. This makes it difficult to assess whether and to what extent
such a program would result in specific quality improvements or the extent to which it overlaps
with care delivery efforts already underway.
The Final Report reflects the fact that the parties have now set goals for improving
quality and access through select care delivery programs that they expect BILH would
implement within a specific time frame. The Final Report also notes that while the parties have
not provided estimates of the resources they would need to implement specific programs, they
emphasize that such investments could be supported by new revenue and efficiencies they expect
BILH would achieve, as discussed in the next section.21
Although there are outstanding questions
regarding these programs and the parties’ identified goals, the new information in the Parties’
Response helps to provide some scope of the potential for quality improvement as a result of the
proposed transaction. If the transaction proceeds, regular public reporting on the implementation
and results of these and other care delivery programs would help the public assess to what extent
these and other potential benefits of the transaction are realized.
II. Spending. While new information about the parties’ care delivery programs
suggests potential for savings, the Parties’ Response overstates likely savings and
conflates higher revenue and internal savings for BILH with savings to the public.
The parties do not provide commitments or new information that change the HPC’s
price increase projections.
A. While new information about the parties’ care delivery programs suggests potential for
savings, the Parties’ Response overstates likely savings and conflates higher revenue and
internal savings for BILH with savings to the public.
The HPC recognized in its Preliminary Report the potential for the proposed transaction
to result in both financial efficiencies that could accrue to the parties, as well as changes in
patterns of care that could result in savings to the public, including consumers, payers, and the
Commonwealth.22
The Parties’ Response includes a table of “estimated annual efficiency
impact” of the proposed transaction23
that conflates revenue increases and expense growth
savings for BILH with savings to the public and includes new estimates of savings from the
proposed care delivery programs discussed in the previous section.
networks, not the combination or expansion of existing preferred SNF networks. John McHugh et al., Reducing
Hospital Readmissions Through Preferred Networks Of Skilled Nursing Facilities, 36 HEALTH AFFAIRS 1591, 1593
(Sept. 2017), available at https://www.healthaffairs.org/doi/10.1377/hlthaff.2017.0211 (study compared four
hospitals that had developed formal contractual relationships with SNFs with twelve that “had not adopted post
discharge care management approaches that included formal development of a [SNF] network, although several of
the hospitals had developed processes to manage patients discharged to home”). 21
Parties’ Response, supra note 1, at 23. 22
See PRELIMINARY REPORT, supra note 2, at Sections III.A.7 and III.A.8. 23
Parties’ Response, supra note 1, at 4, 22.

7
Categorization of Estimates in Figure 3 of Parties’ Response
Parties’ Description Parties’ Estimated
Annual Impact HPC Analysis
Care redirection from higher-priced provider
$9M - $14M*
Potential savings from care redirection from higher- and lower-priced providers (HPC estimate)
TME savings related to select integration initiatives
$52M - $87M* Potential savings from care delivery initiatives (parties’ estimate)
Cost synergies $42M - $66M
Internal operating efficiencies for BILH (parties’ estimate; described in Preliminary Report)
Other savings as a result of transaction
$46M - $103M
Revenue to BILH from care redirection (parties’ estimate; HPC analysis of savings to the public from care redirection is in row 1)
*Note: As noted below and in Section III.A.8 of the Final Report, it is unclear to what extent these potential impacts will be realized, although in some cases the parties’ estimates appear to be reasonable.
As detailed in the remainder of this section, of the $149 million to $270 million in
“efficiencies” identified by the parties, at most $61 million to $101 million would flow back to
the public, and would flow back only if both (1) the parties’ prices do not change relative to
other providers and (2) the parties fully achieve their goals, which is uncertain based on the
information provided.
1. The HPC’s estimates of savings due to care redirection assess potential savings to the
public, while the parties’ “other savings” category describes revenue to BILH from
such redirection.
The first and last lines of the parties’ table of estimates both relate to the parties’
expectation that care will shift to BILH as a result of the proposed transaction. The parties’
“other savings as a result of the transaction” reflect $46 million to $103 million of revenue to the
parties and internal efficiencies the parties expect to receive that would come primarily from
increases in patient volume due to reduced outmigration, changes in consumer preferences, and
patients participating in new limited network products.24, 25
While BILH would benefit
24
BDO USA LLP, Analysis of the Reasonableness of Assumptions Used For and Feasibility of Projected Financials
of: Lahey Health System, Inc. Beth Israel Deaconess Medical Center, Inc. Mount Auburn Hospital New England
Baptist Hospital and Anna Jaques Hospital Combined together as NewCo at 14 (Sept. 7, 2017), available at
https://www.mass.gov/files/documents/2017/09/zv/don-cpa-certification-lahey.pdf (last visited July 13, 2018). 25
The parties’ “other savings” also include “enhanced population health management,” which includes estimated
internal efficiency savings as a result of spreading fixed care management costs across a larger patient population, as
well as increased revenue to BILH from payer risk sharing arrangements as a result of improved patient
management. These revenue projections were not supported by specific plans, and any savings to the public from
these improvements likely overlap with the savings from either shifts of patients from higher- to lower-priced sites
of care (row 1 of the savings table) or specific care delivery initiatives (row 2).
Potential Savings to the Public
Revenue and
Internal Savings to
BILH
8
financially from these projected increases,26 there would only be a resulting savings to the public
for those patients who would otherwise have used higher-priced systems.27
The HPC modeled
the scope of potential savings to the public if the parties increased BILH volume through these
mechanisms and found that these shifts in patient care would result in savings of approximately
$6.6 million to $10.4 million, with an additional $2.1 million to $3.1 million in savings to the
public if the parties achieve their goals of redirecting care within BILH to lower-cost settings.
This would yield a total of $8.7 million to $13.6 million savings in commercial spending
annually at current prices (rounded to $9 to $14 million in the first row of the table).28
However,
if the parties’ prices increased to the projected levels, such savings would be reduced to
approximately $5.3 million to $9.8 million annually, which the Parties’ Response does not
show.29
The last row of the table in the Parties’ Response, labeled “other savings as a result of
the transaction,” does not represent any new or additional savings to the public beyond those
shown in the first row of the table.
2. The parties provide new estimates of savings as a result of their proposed care
delivery initiatives. Successful implementation of the proposed initiatives could
reduce spending, although it is unclear whether the parties would achieve the
projected level of savings.
In addition to the new details of the parties’ proposed care delivery initiatives discussed
in Section I, the second line of the parties’ table of estimates includes savings from these
initiatives, which the parties label “TME savings related to select integration initiatives.”30
The
parties project savings for each initiative based on their current patient populations and spending,
historic utilization patterns, and goals for improvement that, with one exception, are based on
academic literature. The Parties’ Response identifies specific goals for utilization and spending
reduction within a five-year timeline.31
Some of the programs the parties propose have the potential to result in savings if they
achieve the projected utilization reductions.32
Integrating behavioral health services into all
employed primary care practices, in particular, has the potential to result in lower utilization that
would translate to savings for patients and payers. Through programs at Northeast Health System
26
The parties have stated that they intend to retain any efficiencies to fund their operations and “reinvest in services
and programs needed to better care for [the BILH] patient panel” DON NARRATIVE, supra note 16, at 17. Internal
efficiencies achieved by merging provider organizations do not necessarily result in savings for consumers;
however, they have the potential to result in savings to consumers if the merging parties limit future rate increases
(to lower levels than they would have absent the merger) as a result of the efficiencies. The parties have not yet
committed to such limitations. See also infra Section II.A.3. 27
PRELIMINARY REPORT, supra note 2, and FINAL REPORT, supra note 3, at Section III.A.8. 28
See FINAL REPORT, supra note 3, at Section III.A.8. The HPC’s estimates are based on the parties fully realizing
their goals for shifting patient volume, despite continued uncertainty as to whether these goals will be realized. Id. at
56, n. 197. Increased patient volume as a result of such shifts would also increase BILH’s bargaining leverage and
ability to increase prices (beyond the increases captured in the WTP analysis), further reducing any annual savings. 29
Id. at 68. 30
Parties’ Response, supra note 1, at 22. 31
As discussed in supra note 9, the parties have not explicitly provided timelines for their care delivery goals, but
the HPC infers that the parties expect to fully achieve the identified impacts within five years of operation as BILH. 32
The potential impacts of these programs on quality of care and access to care are assessed in more detail in supra
Section I of this analysis.

9
(Northeast) funded by a Community Hospital Revitalization, Acceleration, and Transformation
(CHART) grant, Lahey has demonstrated that implementing patient management teams that
include pharmacist intervention can reduce hospital utilization.33
Successfully expanding the
specified initiatives could reduce spending, but there are outstanding methodological questions
about some of the parties’ savings estimates.34
In addition, the parties have not provided
estimates of the costs of implementing any of the programs,35
and it is unclear to what extent
savings could be achieved only as a result of the proposed transaction.36, 37
However, even full
success in realizing these savings would not offset likely spending increases if the parties do not
commit to constraining price increases. The Final Report has been updated to include
information about these projected savings.38
33
CHART grants, administered by the HPC, provide funding to eligible community hospitals’ efforts to maximize
appropriate hospital use, enhance behavioral health care, and improve processes to reduce waste and improve quality
and safety. See MASS. HEALTH POLICY COMM’N, CHART PHASE 2 SUMMARY, http://www.mass.gov/anf/budget-
taxes-and-procurement/oversight-agencies/health-policy-commission/investment-programs/chart/phase-2/chart-
phase-2-summary.pdf (last visited July 13, 2018). 34
There are a number of elements of the parties’ projections that raise questions about the potential for fully
realizing the parties’ estimated savings. For example, it is unclear why the parties base their estimated utilization and
savings reductions for behavioral health integration, preferred SNF network integration, and pharmacist
interventions for high-risk patients on published data from outside institutions rather than on their own historic
experience implementing similar programs. While the nurse triage program estimates use figures generated by a
Lahey pilot program, the parties have not provided these underlying data to the HPC, making it difficult for the HPC
to evaluate the reasonableness of the savings projections. It is also not clear why the parties would achieve any
additional savings from utilization reduction as a result of integrating their SNF programs, given that MACIPA,
BIDCO, and Lahey each currently already use a preferred SNF network. See supra note 20. In addition, the parties’
estimated savings from these care delivery programs do not appear to account for risk sharing from payers. If the
parties succeed in reducing spending, some of the savings would likely be retained by the parties as risk contract
incentive payments rather than going back to payers and consumers. 35
As discussed in infra Section II.A.3, it is our understanding that the parties expect to fund these programs using
internal cost efficiencies rather than through rate increases that would increase spending. 36
Each of the programs identified by the parties is based on the parties’ current pilot programs. The HPC assumes
that the parties would continue to support and expand successful programs, and thus generate savings, even as
independent entities, although they would likely be more easily able to implement broad scale care delivery
programs of the kind discussed if they realize operating efficiencies as a unified system. 37
The parties discuss, at a high level, several other programs that they indicate they hope will result in either
efficiencies for BILH or savings to consumers, including a system-wide care delivery program for high-risk geriatric
patients, combining and improving pharmaceutical and supply purchasing, and consolidating and more efficiently
managing laboratory services. See Parties’ Response, supra note 1, at 37–47. While these programs may have the
potential to result in efficiencies and savings, the parties have not yet provided details regarding the expected scope
of these programs, timelines for implementation, goals for improvement, and other information that would be
necessary to assess the likelihood that they would achieve any specific targets. It is also unclear to what extent
efficiencies from these measures are included in the parties’ estimated $42 million to $66 million of cost synergies. 38
Although the parties describe their care delivery proposals as “actionable commitments,” they also describe them
as having received “preliminary endorsement.” Parties’ Response, supra note 1, at 34, 37. The parties have not
committed to achieving their projected savings, nor have they committed to publicly reporting on the
implementation and results of these care delivery programs, including any associated utilization reductions and
resulting reductions in patient spending.

10
3. Internal cost efficiencies for BILH would not result in savings to consumers unless
the parties constrain future rate increases.
The third line of the parties’ table of estimates quantifies internal cost efficiencies the
parties expect to realize. As outlined by Commissioners, internal efficiencies achieved by
merging provider organizations do not necessarily result in savings for consumers; however, they
have the potential to result in savings to consumers if, as a result of the efficiencies, the merging
parties limit future rate increases to levels below what they would have received absent the
merger.39
The HPC’s Preliminary Report discussed the cost synergies the parties expect to
achieve as a combined system, and the figures presented in the Parties’ Response are in line with
the 1.5% to 3% potential efficiencies identified in the report.40
However, the parties have been
clear, to-date, that they intend to retain any such savings to fund their operations and “reinvest in
services and programs needed to better care for [the BILH] patient panel,”41
presumably
including the integration initiatives discussed in Section I.42
The Parties’ Response does not
include any commitments to limit future price increases as a result of such efficiencies, and thus
there is no indication that these efficiencies would result in savings for the public.
B. The parties do not provide commitments or new information that change the HPC’s price
increase projections.
As detailed in both the Preliminary Report and Final Report, the HPC finds that the
transaction would significantly enhance BILH’s bargaining leverage with commercial payers,
enabling the combined system to substantially increase commercial prices. During the July 18
Board Meeting, HPC Commissioners requested that the parties respond to these concerns,
including by offering any commitments.43
The Parties’ Response includes no commitments to
address these concerns and instead faults the HPC’s methodology. We respond to those critiques
below.
39
The parties mischaracterize the statements of Commissioner David Cutler at the HPC Board Meeting on July 18.
Rather than saying, as the parties suggest, that operational efficiencies will automatically yield savings to the
Commonwealth, Dr. Cutler acknowledged that operational savings could put providers in a financial position in
which they could elect to limit future price increases. Dr. Cutler stated: “[A provider can be s]aying that, ‘look, we
need to invest in our institutions, and there are two ways to do it, we could either raise prices, or we can cut costs,’
far preferred for the Commonwealth is to cut costs and invest in the institutions and say ‘we can defer the price
increases,’ and I count that as a victory for the Commonwealth too, assuming that … investment is appropriate to
take place.” 40
PRELIMINARY REPORT, supra note 2, at 49. 41
DoN Narrative, supra note 16, at 17. 42
The parties have provided no estimate of the investments they would make to achieve the results they project for
their “select integration initiatives” or the numerous other plans outlined in their response and other submissions.
The need for these investments further reduces the likelihood that any internal efficiencies realized by the parties
would flow back directly to consumers in the form of lower prices. 43
Specifically, Commissioner Sudders stated that how the BILH transaction might proceed is “going to rely on the
good faith of parties coming to the table and making strong statements about the constraint of rates and the positives
of bringing together these systems,” Commissioner Altman said to the parties, “…to the extent that you can come
forward with some help on reducing the likelihood of price increases we would all be better served because then we
can focus more on the win side and less on the other side,” Commissioner Berwick posed the question, “Is there
anything that could be agreed to that would increase our confidence that the cost increase would not be, would not
occur ideally or would be moderated?” and Commissioner Cutler asked for additional information about back office
savings and whether those would reinvested in the institutions and used to “defer the price increases.”
11
1. Willingness-to-pay is appropriate for analyzing changes in bargaining leverage and
prices in Massachusetts; the resulting price increase estimates are likely conservative.
The HPC estimated the impact of the proposed transaction on the parties’ bargaining
leverage with commercial payers and ability to increase prices based on a willingness-to-pay
(WTP) model, which has been shown to be more effective in identifying potentially anti-
competitive mergers than other models44
and which provides important information about the
directionality and magnitude of potential price increases.45
While the parties state that the WTP model “grossly overstated” the impact of the merger
on pricing and commercial spending, 46
they offer little evidence to support their contention.47, 48
They neither offer their own estimates of potential price changes from the BILH merger nor
propose any alternate model for estimating such price changes. As highlighted in the Preliminary
Report and Final Report, recent economic studies present evidence that WTP analyses may in fact
underestimate increases in bargaining leverage (and ability to receive higher prices), but the
parties are silent on this point.49
Although the parties acknowledge that the HPC’s WTP model “is estimated using data
from Massachusetts,”50
they nonetheless argue that it does not appropriately account for the
effect of the Massachusetts regulatory environment, including the health care cost growth
44
A recent study that evaluated the effectiveness of merger screening tools based on actual subsequent price changes
found that out of five different screening tools, WTP correctly flagged a likelihood of price increases most often and
had the lowest rate of “false positives,” or flagging a likely price increase where none occurred. See Christopher
Garmon, The accuracy of hospital merger screening methods, 48 RAND J. OF ECON. 1068 (2017) [hereinafter
Garmon]. 45
The Parties’ Response quotes Dr. Stuart Altman at the July 18 HPC Board meeting stating “…[the WTP model] is
still an estimate. It is still highly probabilistic. But it’s the best we have, and I think it lays out a wide degree of
error. There’s just no question. So, I think we carry this out to four decimal places, but the reality is, it’s highly
hypothetical.” Parties’ Response, supra note 1, at 13. However, the Parties’ Response omits Dr. Altman’s preceding
and concluding statements that support the model’s validity and directional accuracy. Dr. Altman’s full statement
was “…the willingness-to-pay model is heads and shoulders above anything that this country has ever had before
but it is still an estimate. It is still highly probabilistic. But it’s the best we have, and I think it lays out a wide
[beam]. There’s just no question. So, I think we carry this out to four decimal places, but the reality is, it’s highly
hypothetical, but it does give us a direction.” See Dr. Altman, statement at July 18, 2018 board meeting, at time
2:22:20, available at https://www.youtube.com/watch?v=6oUXm-s99ZI (last visited Sept. 24, 2018). 46
Parties’ Response, supra note 1, at 10. 47
For example, the parties question the precision of the pricing estimates yielded by a WTP analysis, but provide no
evidence that a WTP analysis would be more likely to overestimate impacts, rather than underestimate them. They
quote a caveat from Garmon, supra note 44, that the relationship between WTP changes and price increases in that
analysis was not precise. Parties’ Response, supra note 1, at 13. However, the parties disregard that the study’s
authors had to impute price for that analysis because few states collect all-payer claims data or aggregate financial
data in sufficient detail to accurately estimate commercial inpatient prices. Because Massachusetts has more
transparency around prices than many states, as the parties themselves acknowledge, the Commission was able to
use more precise pricing estimates in its analysis than those used in Garmon. 48
The parties also acknowledge the wide acceptance of the WTP model. Parties’ Response, supra note 1, at 13
(“The Preliminary Report stated the WTP model ‘has been accepted by courts in a range of recent antitrust cases.’
We cannot dispute this.”). 49
See PRELIMINARY REPORT supra note 2, and FINAL REPORT, supra note 3, at Section III.A.6. 50
Parties’ Response, supra note 1, at 13 n. 23.

12
benchmark.51, 52
In fact, the WTP model used by the HPC is built solely using data from
Massachusetts after the establishment of the health care cost growth benchmark. Contrary to the
parties’ contention,53
the HPC also examined how the relationship between inpatient WTP and
inpatient prices changed over time since the benchmark took effect (2013 to 2016).54
If the
benchmark were decoupling bargaining leverage and prices, one would expect to see this
relationship become weaker over time. However, the relationship does not become weaker or
smaller in magnitude over this period; in fact, the relationship between WTP and price is
statistically stronger in 2016 than in 2013.55
This is not surprising, because the benchmark is a
ceiling for health care spending growth (a function of price and utilization trends); it is not a cap
on an individual provider’s unit prices or price increases and should not be expected to function
as such.56
The HPC acknowledges that its analysis is a projection, and thus there is some degree of
uncertainty around the precise dollar amounts for projected price increases. For that reason, the
51
Id. at 10-16. The parties take a quote from Chairman Altman that “Massachusetts is different” out of context. Id.
at 3 and 11. Chairman Altman stated at the July 18, 2018 Board meeting that “Massachusetts is different” to suggest
that Massachusetts might be more successful in monitoring and enforcing conduct remedies, such as limits on future
price increases, to protect against the very price increases the willingness-to-pay (WTP) analysis predicts, not to
imply that the WTP analysis is less applicable in Massachusetts. 52
The parties’ claim that regulatory oversight in Massachusetts undermines the impact of bargaining leverage on
prices is at odds with other arguments they advance. For example, the parties have described that the transaction will
create a market-driven solution to the persistent issue of unwarranted variation in provider prices, acknowledging
that existing regulatory structures have not been effective in creating a health care system where prices are tied to
value. This argument implies that, consistent with past HPC findings, market leverage is a driver of higher prices in
Massachusetts rather than higher quality or other common measures of value, notwithstanding the existing
regulatory environment. MASS. HEALTH POLICY COMM’N, 2015 COST TRENDS REPORT: PROVIDER PRICE VARIATION
(Jan. 2016), available at http://www.mass.gov/anf/budget-taxes-and-procurement/oversight-agencies/health-
policycommission/publications/2015-ctr-ppv.pdf. Similarly, they claim that the BILH merger will impose
competitive pressure on the dominant provider system in Massachusetts, reducing its prices. Parties’ Response,
supra note 1, at 17-19. This, too, acknowledges that the dominant provider system has high prices despite the
regulatory environment in Massachusetts and that they expect competition (i.e., a decrease in bargaining leverage) to
reduce prices. If the regulatory environment in Massachusetts were constraining prices, a dominant provider’s prices
would not likely be reduced by increased competition. 53
Parties’ Response, supra note 1, at 13. 54
The HPC estimated a regression equation quantifying the relationship between WTP per discharge and price
separately for each year. Specifically, we used the same methodology described in the PRELIMINARY REPORT, supra
note 2, at 46, n. 160, and FINAL REPORT, supra note 3, at 51, n. 170, except that we allowed the coefficient on WTP
per discharge to differ each year. The estimated regression coefficients and measures of fit do not decrease over
time, indicating that the relationship between WTP and price is not degrading over time under Massachusetts’
regulatory environment. 55
While the trend is similar in all regression specifications, the difference is only statistically significant in some
specifications. 56
As described in both the Preliminary Report and Final Report, and by Executive Director David Seltz and
Katherine Mills at the July 18, 2018 Board meeting, the health care cost growth benchmark is an important
accountability framework for total health care spending in Massachusetts, but the benchmark does not cap individual
prices, and there are limits on when, how, and how quickly a Performance Improvement Plan, the key enforcement
mechanism for the benchmark, can address individual performance. PRELIMINARY REPORT, supra note 2, at 50, n.
178. Additionally, the benchmark is intended to be a ceiling on spending, not a target; lower levels of spending
growth are desirable and achievable. If, absent the transaction, the parties’ spending would grow at a rate lower than
the benchmark, they would still have “room” to increase their annual spending before any potential enforcement
mechanisms would be triggered. In this case, the transaction would still have increased health care spending in the
Commonwealth. FINAL REPORT, supra note 3, at 55, n. 190.
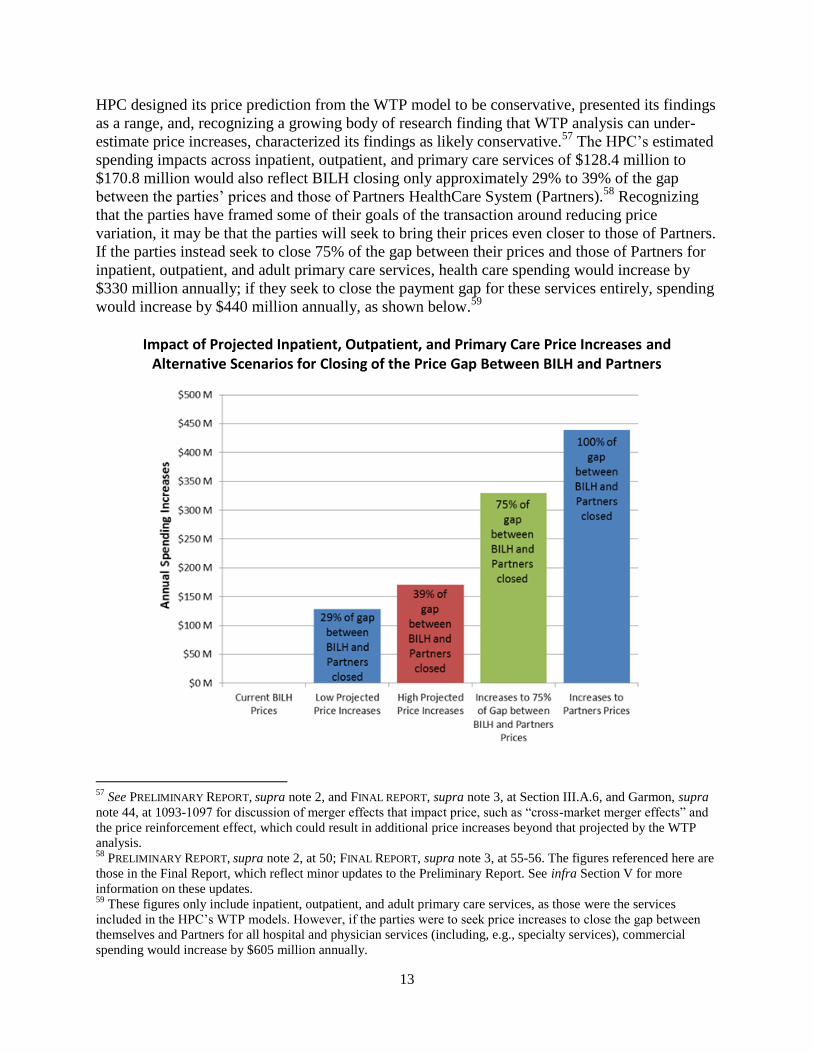
13
HPC designed its price prediction from the WTP model to be conservative, presented its findings
as a range, and, recognizing a growing body of research finding that WTP analysis can under-
estimate price increases, characterized its findings as likely conservative.57
The HPC’s estimated
spending impacts across inpatient, outpatient, and primary care services of $128.4 million to
$170.8 million would also reflect BILH closing only approximately 29% to 39% of the gap
between the parties’ prices and those of Partners HealthCare System (Partners).58
Recognizing
that the parties have framed some of their goals of the transaction around reducing price
variation, it may be that the parties will seek to bring their prices even closer to those of Partners.
If the parties instead seek to close 75% of the gap between their prices and those of Partners for
inpatient, outpatient, and adult primary care services, health care spending would increase by
$330 million annually; if they seek to close the payment gap for these services entirely, spending
would increase by $440 million annually, as shown below.59
Impact of Projected Inpatient, Outpatient, and Primary Care Price Increases and Alternative Scenarios for Closing of the Price Gap Between BILH and Partners
57
See PRELIMINARY REPORT, supra note 2, and FINAL REPORT, supra note 3, at Section III.A.6, and Garmon, supra
note 44, at 1093-1097 for discussion of merger effects that impact price, such as “cross-market merger effects” and
the price reinforcement effect, which could result in additional price increases beyond that projected by the WTP
analysis. 58
PRELIMINARY REPORT, supra note 2, at 50; FINAL REPORT, supra note 3, at 55-56. The figures referenced here are
those in the Final Report, which reflect minor updates to the Preliminary Report. See infra Section V for more
information on these updates. 59
These figures only include inpatient, outpatient, and adult primary care services, as those were the services
included in the HPC’s WTP models. However, if the parties were to seek price increases to close the gap between
themselves and Partners for all hospital and physician services (including, e.g., specialty services), commercial
spending would increase by $605 million annually.

14
The parties could thus increase their prices significantly while still remaining lower-priced than
Partners.
2. WTP analyses of the parties’ past transactions support the HPC’s findings and
underscore the difference between the current transaction and the parties’ past
acquisitions and affiliations.
The parties conducted WTP analyses of their own recent past acquisitions and contracting
affiliations60
and argue that the WTP model “is not appropriate for predicting post-merger
spending impacts in Massachusetts.” They base this on their claim that their WTP analyses
predicted price increases for some of their past transactions, yet “relative prices did not
materially change following the transactions.” 61
As shown in more detail in the Appendix, the
HPC attempted to replicate the analyses in the Parties’ Response and found that the parties’
methodology appears to contain significant flaws that overstate the predicted price impact of
these past transactions.62, 63
When the HPC applied the same WTP model used to assess the current transaction to the
parties’ past affiliations, the HPC found changes in WTP and predicted price impacts that were
significantly smaller than those found for the BILH transaction, as detailed in the Appendix.64
Indeed, all of the parties’ past transactions had a WTP change of less than 6%, below the
threshold suggested in the research literature for identifying transactions with a higher risk of
60
The parties conducted WTP analyses for BIDMC’s acquisition of Milton Hospital, BIDMC’s acquisition of
Jordan Hospital (now BID-Plymouth), Lahey’s acquisition of Northeast (including Beverly and Addison Gilbert
campuses), Lahey’s acquisition of Winchester Hospital, and three contracting affiliations with BIDCO (Cambridge
Health Alliance, Anna Jaques Hospital, and Lawrence General Hospital), which they combined into a single
transaction. Parties’ Response, supra note 1, at 13. The parties found changes in WTP for BIDMC’s acquisitions of
Milton Hospital and Jordan Hospital of 1.7% and 1.2%, respectively, which they did not describe as “meaningful.” 61
Parties’ Response, supra note 1, at 10-11 and Appendix 2. 62
For example, the HPC was only able to get close to replicating the parties’ findings by assuming erroneous pre-
transaction affiliations (e.g., treating Northeast’s Beverly and Addison Gilbert campuses as independent of one
another prior to Lahey’s acquisition of Northeast, and incorrectly treating Cambridge Health Alliance as an
independent hospital, rather than a contracting affiliate of Partners, prior to its contracting affiliation with BIDCO)
and by measuring price increases relative to the acquired hospital rather than across the system. In general, the HPC
found that the parties’ results were consistently higher than those of the HPC using the HPC’s methodology.
Applying the parties’ assumptions to the current transaction would very likely have resulted in larger WTP increases
than those in the Preliminary Report. However, the parties did not provide their own estimate of the impact of the
transaction on WTP or prices. 63
While there were several differences between the HPC’s WTP methodology and that of the parties, the parties
appear to have made errors in pre-transaction affiliations and calculated all price impacts as occurring at a single
hospital (the acquired or affiliated community hospitals) rather than across the system, and these two differences had
the greatest impact on the resulting WTP changes and predicted price increases. Other methodological differences
include that the HPC utilized a parametric approach to estimate the hospital choice model, whereas the parties
utilized a semi-parametric approach. The HPC also weighted the WTP impact per discharge by DRG weight (with
the understanding that a hospital’s dominance in high-severity services may have a greater impact on its
attractiveness to payers and consumers), whereas our replication of the parties’ analyses suggests that they did not
include DRG weighting. 64
As described in the Preliminary Report and Final Report, the HPC also found smaller increases in market
concentration for all of the parties’ past transactions, including Lahey’s acquisition of Winchester Hospital, than it
did in the current transaction. PRELIMINARY REPORT, supra note 2, at 32, n. 117; FINAL REPORT, supra note 3, at 34,
n. 123.

15
price increases.65
By contrast, for the current transaction, the HPC found a 10.8% change in
inpatient WTP, well above this 6% threshold.66
These WTP analyses of the parties’ past
transactions reinforce the differences between the parties’ past incremental transactions and the
more significant merger they propose here, as well as the HPC’s conclusions in reviews of the
parties’ past transactions.67
***
Ultimately, while the parties provide new information about care delivery programs that
could result in additional savings beyond those projected in the Preliminary Report, the parties
offer no new information or commitments68
that change the HPC’s projections of likely price
increases; instead, they argue that the existing regulatory structure in Massachusetts would
sufficiently constrain their ability to achieve higher prices.69
65
In Garmon’s sample, seven of nine mergers with statistically significant post-merger price increases (i.e., larger
increases than control hospitals) had WTP changes over 6%, while of six mergers with statistically significant price
decreases, three had WTP change of less than 6%. PRELIMINARY REPORT, supra note 2, at 46, n. 162; FINAL
REPORT, supra note 3, at 51, n. 172. Garmon selected the 6% threshold to maximize correct predictions and
minimize false negatives. Garmon, supra note 44, at 1089. 66
The HPC also found a 12.7% increase in outpatient WTP, and a 10.4% increase in WTP for adult primary care
services. PRELIMINARY REPORT, supra note 2, at 46-47, n. 162-164; FINAL REPORT, supra note 3 at 51-52, n. 172-
174. 67
The HPC received notices of material change for all but one of these past transactions (Lahey’s acquisition of
Northeast), and chose to conduct an in-depth CMIR on only one, Lahey’s acquisition of Winchester Hospital, the
only transaction for which the WTP change was close to the 6% threshold and the system-wide price increase
relative to the pre-merger weighted average price of merging parties was above 2%, as shown in the column labeled
“Analysis using HPC Methodology” in the Appendix. In its review of Lahey’s proposed acquisition of Winchester
Hospital, the HPC expressed some concern that the parties might have an increased ability to leverage higher prices
as a result of the transaction, based on increases in market shares and market concentration. MASS. HEALTH POLICY
COMM’N, REVIEW OF LAHEY HEALTH SYSTEM’S PROPOSED ACQUISITION OF WINCHESTER HOSPITAL (HPC-CMIR-
2013-3) PURSUANT TO M.G.L. CH. 6D, § 13 FINAL REPORT at 38 (May 22, 2014), available at
https://www.mass.gov/files/documents/2016/09/uw/20140522-final-cmir-report-lhs-wh.pdf (last visited Sept. 25,
2018). However, the increases in market concentration were smaller than those for the BILH transaction. Supra note
64. Due to the smaller scope of the transaction, the HPC did not conduct a WTP analysis as part of its CMIR.
However, a 2.3% to 3.7% price increase for the Lahey system would have resulted in a spending impact of $4.7
million to $7.5 million for Lahey’s inpatient services, based on 2012 revenue (the most recent data available during
the Lahey-Winchester CMIR), less than 15% of the inpatient spending impact predicted in the current transaction. 68
The Parties’ Response states only that the parties are committed to maintaining “a lower-cost, high-quality market
position.” Parties’ Response, supra note 1, at 3. However, as described at supra page 13 and in the Preliminary
Report and Final Report, the parties could achieve the predicted price increases while still remaining lower-priced
than Partners. 69
See supra note 56. As described in the Final Report, there are limitations to existing regulatory mechanisms in
constraining price increases, and existing regulatory structures are not designed to function as price caps. FINAL
REPORT, supra note 3, at 55, n. 190. In fact, the parties have themselves acknowledged “the complex nature of HSA
TME,” the key measure used to enforce provider compliance with the health care cost growth benchmark, have
characterized it as “one indicator of system performance,” and have requested that other state agencies use the
measure in concert with measures of pricing. See Ltr. to Nora Mann from Jamie Katz and David Spackman, DON
PROJECT NEWCO-17082413-TO: WRITTEN COMMENTS TO THE STAFF SUMMARY PURSUANT TO 105 CMR
100.501(C) at 1 (Mar. 15, 2018), available at https://www.mass.gov/files/documents/2018/03/22/newco-staff-
report-public-comments.pdf (last visited Sept. 14, 2018).
16
III. Health Care Market Functioning. The Parties’ Response is inconsistent with the
weight of the economic literature on the impact of consolidation among competitors
on health care market functioning and does not address the impact BILH may have
on smaller competitors if the transaction were to go forward without appropriate
safeguards and constraints.
The parties state that the formation of BILH will make the Massachusetts health care
market more competitive because BILH would be able to be “a true competitor” to Partners,
whose high prices make it “vulnerable to a high-value, lower-cost competitor.” However, they
provide few details as to how they would expect to more effectively compete with the market
leader as a combined system, relying on generalities that their reputation would be enhanced and
that tiered or limited networks can be effective in shifting market share.70
They also make no
mention of the impact of the BILH merger on smaller, and frequently lower-priced, competitors.
A. The HPC has not found evidence indicating that the present transaction is likely to
increase competition or decrease spending, unless the parties commit to constraining
price increases.
In their Response, the parties repeatedly frame the BILH transaction as the “entry” of a
new competitor into the market71
and cite to research on the entry of new competitors as
justification for their claim that the BILH transaction is pro-competitive.72
However, the
component providers of the BILH transaction are all existing providers in the Massachusetts
health care market. As such, the BILH transaction reduces the number of independent,
competing providers in Massachusetts, increases market concentration, and should be properly
considered to be a consolidation, not the entrance of a new market competitor.
Consolidation of existing competitors—in contrast to the entry of new competitors—
does not generally enhance competition. Indeed, there is a robust literature demonstrating that
significant increases in hospital market concentration generally lead to decreases in competition
and increases in the price of hospital care.73
As Martin Gaynor and Robert Town concluded
70
Parties’ Response, supra note 1, at 17. 71
Id. at 17-19. 72
Id. at 19, n. 40-43. 73
See, e.g., Martin Gaynor, Katherine Ho, & Robert J. Town, The Industrial Organization of Health-Care Markets,
53 J. OF ECON. LIT. 235 (2015); Martin Gaynor & Robert Town, The Impact of Hospital Consolidation – Update,
ROBERT WOOD JOHNSON FOUNDATION, SYNTHESIS PROJECT POLICY BRIEF, no. 9 (2012), available at
https://www.rwjf.org/content/dam/farm/reports/issue_briefs/2012/rwjf73261 (last visited August 30, 2018)
(Evaluating the findings of 13 studies on hospital market concentration and hospital mergers and noting, “All else
equal, the higher the market concentration, the less vigorous is the resulting price competition. Consolidation within
a market (e.g., via mergers) reduces independent market participants and by doing so increases market
concentration.”); Deborah Haas-Wilson & Christopher Garmon, Hospital Mergers and Competitive Effects: Two
Retrospective Analyses, 18 INT’L J. BUS. ECON. 17 (2011), available at
http://www.smith.edu/economics/documents/Haas-WilsonGarmon.pdf; Steven Tenn, FED. TRADE COMM’N, THE
PRICE EFFECTS OF HOSPITAL MERGERS: A CASE STUDY OF THE SUTTER-SUMMIT TRANSACTION 18-20 (2008),
available at https://www.ftc.gov/sites/default/files/documents/reports/price-effects-hospital-mergers%C2%A0-case-
study-sutter-summit-transaction/wp293_0.pdf (conducting a retrospective review of the 1999 acquisition of Summit
Hospital by Sutter medical system where the merger was estimated to result in about a 50% market share and
finding that, controlling for hospital characteristics, Summit’s price growth was 23% to 50% higher than other
California hospitals, depending on the payer); Cory Capps & David Dranove, Hospital Consolidation and
17
based on their 2012 survey of the research literature, “The great weight of the literature shows
that hospital consolidation leads to price increases, although a few studies reach the opposite
conclusion.” The HPC’s findings in the Preliminary Report and Final Report—that the
transaction would lead to increases in market concentration and the parties’ bargaining leverage
—are consistent with this robust literature.74
As described in the Preliminary Report and Final Report, the HPC conducted a literature
review and consulted with several health economists to identify any research addressing whether
and when the merger of several competitors into a second system nearly equal in size to the
largest system could constrain the prices of the largest system in a manner that would be pro-
competitive and/or spending reducing. We were unable to find any such literature. The parties
cite several articles to support their claim that the BILH merger will create a more competitive
market, but upon closer examination, none of the cited research supports their assertion.75
The HPC analyzed the parties’ assertion that the transaction could reduce, or slow the
growth of, Partners’ prices and took that impact into account as part of its analyses in both the
Preliminary Report and Final Report. Although the parties have not provided much specific
information about how they would be more attractive to patients than they are currently,76
the
Negotiated PPO Prices, 23 HEALTH AFFAIRS, 175 (2004) (conducting a before-and-after study of 12 hospitals in
various markets that participated in consolidations between 1998 and 2000 in which HHI increased by more than
500; finding that prices at all consolidating hospitals increased at a rate at least equal to the median rate of increase
by other providers in the same market over the same time period; and finding that nine of the 12 consolidating
hospitals increased prices by more than the median percentage). 74
See PRELIMINARY REPORT, supra note 2, at Section III.A.4-5; FINAL REPORT, supra note 3, at Section III.A.4-5. 75
To support their claim that the “formation” of a strong competitor to a dominant provider can reduce health care
costs, the parties reference a single article on the health care industry that finds that “in most of the [studied] lower-
cost markets…sufficient consolidation has occurred to leave between two and four health systems with good
geographic coverage competing within the market.” Landman, et al., What is Driving the Total Cost of Care? An
Analysis of Factors Influencing Total Cost of Care in U.S. Healthcare Markets, HEALTHCARE FINANCIAL
MANAGEMENT ASSOCIATION (2018), available at https://www.hfma.org/tcoc/ (last visited Sept. 5, 2018). Parties’
Response, supra note 1, at 18-19. This article examines differences in Medicare costs per beneficiary, which are not
subject to a provider’s bargaining leverage in the same way as commercial prices. In addition, it does not purport to
study market changes at all; there is no analysis of the impact of new entities on the market (whether through
consolidation of existing entities or entry of a new market participant, whether in the presence or absence of a
“dominant provider”). Thus, it does not address the question of whether the formation of BILH would constrain
Partners or otherwise benefit the health care market. The parties also cite several studies that show slowed cost
growth or reduced prices from the entry of new market participants in other industries which, as noted above, are not
pertinent to an inquiry about the impact of consolidation of existing competitors on a market. Parties’ Response,
supra note 1, at 19, n. 40-43. The parties also cite two articles about the smartphone market to support their claim
that a “strong second” competitor can restrain the prices of a dominant competitor, but neither article in fact supports
this argument. The first article cited does not discuss price at all. Rivalry between Apple and Samsung Will Grow
Fiercer, THE ECONOMIST (Sept. 14, 2017), available at https://www.economist.com/business/2017/09/14/rivalry-
between-apple-and-samsung-in-smartphones-will-grow-fiercer (last visited Sept. 5, 2018). The second article
explains that Apple has begun to produce lower-priced phones because most people who can afford higher-priced
phones already own one. Jim Edwards, Apple is Once Again Copying a Page from Samsung’s Playbook, BUS.
INSIDER (Mar. 23, 2016), available at https://www.businessinsider.com/apple-copying-samsung-startegy-pricing-
iphone-se-2016-3 (last visited Sept. 5. 2018). 76
The Parties’ Response did not explain how the formation of BILH would enhance the parties’ brand or describe
their marketing plans, despite a Commissioner request for such information. Specifically, during the July 18 Board
Meeting, Commissioner Mastrogiovanni asked “how much are you guys going to place into marketing? The fact that
18
primary mechanism by which the parties could constrain Partners’ bargaining leverage, and thus
pricing power, is by shifting patients from Partners to their own system.77
Thus, the HPC
modeled the impact on hospitals’ prices if, in line with their stated care redirection goals, the
parties were to attract 10% more patients. The HPC found that such a volume increase at BILH
hospitals would likely come from a combination of Partners providers and other providers. The
loss of volume would decrease bargaining leverage (and pricing power) both for Partners and for
other provider systems. However, the 10% increase in volume would also allow BILH to further
increase its prices, and the increase in spending due to increased prices at BILH would be
estimated to outweigh the reduction in spending from decreased prices at Partners hospitals and
other providers. Only if BILH committed to constraining price increases would it likely reduce
competitors’ prices in a way that would be cost saving to the public.78
The parties emphasize that one of the reasons Partners would be pressured to lower its
prices is that “innovative insurance products built on tiered or limited networks with a
recognized brand that can meet all of a patient’s needs have been proven to shift market share.”79
As explained in the Preliminary Report and Final Report, although there is a theoretical
possibility that new tiered or limited networks could enhance competition, the parties’ plans, as
described to date, appear unlikely to achieve such a result.80, 81
Further, based on the HPC’s
modeling described above, it does not appear likely that a shift in market share from Partners to
BILH, whether achieved through limited networks or another mechanism, would cause Partners
you change your name to Beth Israel Lahey isn’t going to get Joe to stop going to Mass General. What are you guys
going to do? How are you really going to make this a competitive environment?” 77
See FINAL REPORT, supra note 3, at 66, n. 228 for description of the two mechanisms the parties describe for
constraining Partners’ prices. 78
PRELIMINARY REPORT, supra note 2, at 50-54. To address the parties’ concerns that the HPC had “assumed”
BILH would not pressure the dominant health system, the HPC has provided further detail regarding this analysis in
the Final Report. FINAL REPORT, supra note 3, at 66-67. 79
Parties’ Response, supra note 1, at 17. The parties cite an article about the effectiveness of limited networks in the
Massachusetts Group Insurance Commission (GIC) in support of the idea that tiered and limited network products
have the potential to shift market share, and identify the GIC as a “strong opportunity for partnering to offer
innovative products.” Id. at 17 and 35. While the study supports the idea that a limited network plan with a
substantially reduced premium can be effectively marketed to consumers, it also demonstrates that shifts to limited
network plans can be accomplished in the Massachusetts health care market without provider consolidation. 80
As explained in the Preliminary Report and Final Report, this transaction could, however, have the potential to
reduce spending and improve competition if the parties were to lower their prices in a limited network plan such that
premiums would be reduced sufficiently to draw a substantial number of new members to the product. The
Preliminary Report described the economic theory that explains why a merged entity might be more likely to offer
price reductions, and the parties agree that this theory is valid, emphasizing that “an integrated system would be
more likely to negotiate more favorable terms because they know they will receive the majority of the benefits from
any concessions.” PRELIMINARY REPORT, supra note 2, at 55-56; FINAL REPORT, supra note 3, at 63-64. The parties
assert that this dynamic should have been factored more directly into the HPC’s analysis and conclusions. Parties’
Response, supra note 1, at 36. However, during an in-person meeting, the HPC asked the parties directly if BILH
would offer lower prices in tiered or limited networks plans going forward. The parties replied that they would not
expect BILH to offer lower prices. In-person meeting with HPC staff, April 11, 2018. Based on this direct response,
the HPC did not factor a likelihood that the parties would offer significant price concessions in tiered and limited
networks into our conclusions; however, the HPC would welcome any commitments by the parties to offer reduced
prices in these products. 81
If the formation of BILH were likely to increase competition and reduce spending, whether through limited
networks or other volume shifting mechanisms, we would also expect that at least some health plans would voice
support for the transaction. However, no health plans have publicly expressed support for the transaction.

19
to reduce its prices enough to offset the associated increase in BILH’s prices from increased
market share if BILH’s prices were unconstrained.
B. The parties do not address any impact BILH may have on smaller, generally lower-
priced competitors.
In asserting that the merger will increase competition, the parties exclusively discuss
competition with the “dominant health system” (Partners), maintaining that “BILH would have
the combined reputation, price position, geographic coverage, and population health
management skill to be a true competitor” to Partners. They do not mention or analyze
competition with other, often lower-priced, providers. They also offer no assurances that
potential market destabilizing impacts to smaller and more financially vulnerable providers
would be mitigated, although Commissioners Altman and Berwick requested information on this
topic.82
In fact, the studies the parties cite regarding Wal-Mart’s entry into retail and grocery
markets reinforce the need for evaluating effects on smaller and more vulnerable institutions; in
those studies, the smaller competitors experienced far greater impacts than the larger competitors
and many ultimately closed as a result.83
IV. Access to Care for Vulnerable Populations. The parties emphasize their current
efforts to serve vulnerable patient populations, but make no prospective
commitments to expand access for Medicaid patients.
The Parties’ Response highlights the parties’ inpatient detoxification services, including
the importance of these services for Medicaid patients, and estimates that the inclusion of
discharges from detox facilities would increase the inpatient Medicaid payer mix of the proposed
82
Past HPC work has highlighted the importance of and challenges faced by some of these smaller competitors. For
example, community hospitals, including those that are independent or affiliated with smaller hospital systems,
provide many Massachusetts residents with care that is close to home (reducing travel time substantially); serve
patients for whom access to care is often more difficult (including elders, people with disabilities, and people with
low incomes); and develop specialized resources that allow for culturally-appropriate care for minority populations.
Further, these hospitals are a good value, delivering high quality at a lower cost for consumers and payers. They also
face self-reinforcing challenges such as high public payer mix, lower commercial payment rates, and a lack of
resources. MASS. HEALTH POLICY COMM’N, COMMUNITY HOSPITALS AT A CROSSROADS at 22-34 (Mar. 2016),
available at https://www.mass.gov/files/documents/2016/07/xf/community-hospitals-at-a-crossroads.pdf (last visited
Sept. 24, 2018). Understanding whether and how the BILH transaction might exacerbate such challenges for these
providers is critical to understanding the overall impact of the transaction on health care in Massachusetts. 83
As evidence to support their claim that the BILH transaction could increase competition with the dominant system
and lead to it reducing its prices, the parties cite studies finding reductions in competitors’ prices following Wal-
Mart’s entry into retail and grocery markets. However, one of the cited studies notes that the 1-1.2% reduction found
in competitors’ prices was mostly driven by price reductions at smaller-scale competitors, and that the largest
supermarket chains saw far less (less than half) of the impact seen at smaller stores. Emek Basker, & Michael Noel,
The Evolving Food Chain: Competitive Effects of Walmart’s Entry into the Supermarket Industry, 18 J. OF ECON. &
MANAGEMENT STRATEGY 977 (2009), available at https://onlinelibrary.wiley.com/doi/full/10.1111/j.1530-
9134.2009.00235.x (last visited Sept. 5, 2018). Another cited study found that Wal-Mart’s entry into markets could
explain 40-50% of the reduction in (i.e., closings of) small discount retailers in those markets, suggesting that the
entry of a large-scale competitor could threaten the viability of smaller providers. Panle Jia, What Happens When
Walmart Comes to Town: An Empirical Analysis of the Discount Retailing Industry, 76 ECONOMETRICA, 1263
(2008), available at https://onlinelibrary.wiley.com/doi/full/10.3982/ECTA6649 (last visited Sept. 5, 2018).

20
BILH-owned system to 19.7%.84
The Final Report includes additional information about Lahey’s
role in providing these and other behavioral health services and acknowledges that the HPC’s
inpatient payer mix analyses focus on discharges from general acute care hospitals because
uniform data to assess the payer mix of other services is not available. The Final Report also
reflects that BILH’s inpatient Medicaid payer mix would remain among the lowest of any
provider system in the Commonwealth even if one were to add BILH’s inpatient detox
discharges without having comparable data for other systems.85
The Parties’ Response also emphasizes BIDMC’s historic support of clinically affiliated
community health centers and community hospitals that serve high proportions of Medicaid
patients. The parties state a general intention to strengthen these partnerships and reiterate their
intention to continue their current participation in the MassHealth ACO program. The Final
Report also reflects this additional information as well as the fact that the parties have not yet
provided specific plans or commitments to expand access to additional Medicaid patients as a
result of the proposed transaction, instead stating that continuing their current efforts will depend
on their future financial performance.86
V. Other Additions and Technical Corrections.
The Final report includes several other additions and technical corrections, including
updates of certain analyses with new years of data and the incorporation of new information
provided by the parties, as summarized below:
The HPC’s assessments of the financial position of the parties and comparator systems. The
Parties’ Response includes a discussion of the parties’ financial performance in fiscal year
2017, and the Final Report includes the HPC’s updated assessments of the financial
performance of the parties and comparator systems based on our review of audited financial
statements for fiscal year 2017. Lahey, Mount Auburn Hospital, and Anna Jaques Hospital
each experienced operating losses, while the BID-owned system’s operating margin
improved and NE Baptist’s remained steady. The parties’ performance was not materially
different from their expected performance as provided in their projections. The parties’
response neither provides new projections for future years nor addresses whether the
performance improvement plans developed by Lahey and Mount Auburn Hospital are still
expected to result in improvements in those systems’ operating performance in the current
fiscal year. The Final Report cites the parties’ claim that “[u]nless BILH is formed, many of
84
Parties’ Response, supra note 1, at 30. 85
The parties estimate that BILH’s inpatient Medicaid mix including detox discharges would be 19.7%, which is
slightly higher than the inpatient general acute care Medicaid mix of the system with the second-lowest Medicaid
mix in the state, Partners at 18.5%. The HPC does not have access to data on inpatient behavioral health and
substance use discharges outside of general acute care hospitals, so it is likely that other systems’ Medicaid mix
might also change if inpatient behavioral health and substance use discharge data were available for other providers.
For example, Partners’ McLean Hospital is not included in Partners’ inpatient payer mix figures. BILH’s inpatient
payer mix includes discharges at Lahey’s Bayridge psychiatric facility because it operates under the Northeast
Hospital general acute care hospital license. 86
Parties’ Response, supra note 1 at 5 (“Without BILH, Lahey faces financial challenges that will limit its ability to
continue to provide [innovative behavioral health] services”) and 33 (“The Parties’ ability to continue supporting
safety net hospitals will depend on their financial performance…”). The parties have provided no information
beyond these statements about potential impacts of their financial performance on their clinical programs.

21
the Parties will be increasingly challenged to sustain their current level of investment in
clinical services, behavioral health programs, and population health initiatives…”87
and
acknowledges the fact that BILH would likely have a larger pool of resources to make such
investments if the parties realize expected efficiencies. The Final Report also reflects the
HPC’s analysis that, while continued poor performance may impact the parties’ operations in
the long term, none of them appears to be in immediate danger of closure.
Additional information regarding the parties’ community hospitals’ volume and case mix
index. Although Commissioners requested further information regarding the parties’ plans
and timelines for keeping more community-appropriate care at community hospitals, the
Parties’ Response did not include more information on the parties’ efforts to keep low-acuity
care in the community in accordance with stated goals of their past transactions. However,
the parties provided information about their efforts to support their owned community
hospitals, including information about changes in volume at several of their community
hospitals following acquisition and changes in these hospitals’ case mix indices. The HPC
has incorporated this information into the Final Report. The Final Report has also been
updated to include more information about the HPC’s analyses of both community-
appropriate discharges and higher-acuity discharges and the HPC’s finding that where the
parties’ community hospitals’ shares of local discharges grew, it was generally other
community hospitals, rather than teaching hospitals or academic medical centers, that
experienced shrinking shares.
The price impacts of willingness-to-pay changes for inpatient and outpatient hospital
services. The HPC has updated its WTP analyses and the projected price impacts of WTP
changes to include updated 2016 inpatient price data and to incorporate additional changes in
hospital-system affiliations over time. For inpatient services, the WTP change from the
transaction is 10.8% and the predicted price increase range is 5.0% to 7.8%. For outpatient
services, the WTP change increases slightly from 12.2% to 12.7%, with a predicted price
increase range of 7.5% to 9.5%.
The inpatient market share, payer mix, AHRQ quality measure scores, patient demographics,
and patient economic statistics of the parties’ hospitals and comparators. The Final Report
includes updates to the HPC’s analyses of inpatient market shares, payer mix, AHRQ quality
measure scores, patient demographics, and socioeconomic statistics based on newly available
2017 CHIA hospital discharge data. The HPC also refined its methodology to include a small
number of discharges that would otherwise be excluded due to missing patient information.
These new data align closely with 2016 data and do not materially change the results or the
HPC’s findings from those in the Preliminary Report.
Measures of ambulatory patient experience (CG-CAHPS). The Final Report incorporates
updated data on ambulatory patient experience composite measures for 2017, published by
CHIA in August 2018. These new data generally align with 2016 data and do not materially
change the results or the HPC’s findings from those in the Preliminary Report.
87
Id. at 4.

22
VI. Conclusion.
The Final Report includes updates to our findings, as described in this Analysis of the
Parties’ Response, reflecting careful consideration of each of the points raised in the Parties’
Response and reflecting the most recent and accurate data available. We now provide our Final
Report of data-driven analysis of this transaction to inform the work of other state agencies as
well as the public, which ultimately bears the cost of our health care system.

23
Appendix
The chart below compares the parties’ WTP results, HPC’s replication of the parties’
analysis, described above in Section II.B.2, and HPC’s WTP results using the same methodology
the HPC used to evaluate the proposed transaction.
Change in Inpatient WTP From Past Transactions
Transaction Party
Analysis[1] HPC Replication of Party
Analysis[2]
Analysis using HPC
Methodology[3]
Lahey-Northeast 5.2% 5.2% 1.9%
BIDCO-CHA-AJH-LGH 4.1% 3.5% 2.6%
Lahey-Winchester 6.6% 5.9% 5.6%
BILH Not done88 N/A 10.8%
Notes: [1] Reflects figures in BILH submission, Appendix 2. [2] Reflects HPC’s attempt to replicate the parties’ analysis. First, Addison Gilbert and Beverly are inaccurately treated as independent of each other pre-transaction, rather than accurately treated as the combined Northeast Health System. Second, the WTP change for the set of BIDCO transactions is computed without taking account of CHA’s having contracted through Partners prior to the BIDCO affiliation. [3] Reports WTP changes from (i) using accurate pre-transaction affiliations and (ii) implementing the same methodology the HPC used to evaluate the proposed transaction.
The chart below compares the parties’ predicted price impact with results using the
HPC’s method.
Predicted Inpatient Price Impact
Transaction Party Analysis Analysis using HPC
Methodology
Lahey-Northeast 3.8-5.1%
(Northeast) 0.8-1.2% (Lahey system)*
BIDCO-CHA-AJH-LGH 3.4-4.6% (AJH) 2.1-2.8% (CHA) 2.8-3.8% (LGH)
1.0-1.6% (BIDCO network)*
Lahey-Winchester 3.9-5.2%
(Winchester) 2.3-3.7% (Lahey system)*
BILH Not done 5.0-7.8% (BILH system)
*Associated with WTP changes <6%, meaning a greater likelihood of “false positives,” or prospective identification of a price increase where none is likely.
88
The Parties’ Response includes a footnote stating that “the economic model used by the BILH economists to
estimate the change in WTP for past transactions was able to closely replicate the change in WTP estimated in the
Preliminary Report for the BILH transaction.” Parties’ Response, supra note 1, at 11, n. 14. The parties do not
provide details of their replication of the WTP estimate for BILH, and do not suggest that they would prefer any
changes to the HPC’s methodology.

Health Policy Commission50 Milk Street, 8th Floor
Boston, MA 02109www.mass.gov/HPC