Network Assessment Checklist - Mass.gov
89
Massachusetts Ambient Air Monitoring Network Assessment 2020 December 22, 2020 Massachusetts Department of Environmental Protection Bureau of Air and Waste Division of Air and Climate Programs Air Assessment Branch Wall Experiment Station Lawrence, Massachusetts Blue Hill Observatory - Milton MA
-
Upload
khangminh22 -
Category
Documents
-
view
1 -
download
0
Transcript of Network Assessment Checklist - Mass.gov

Massachusetts Ambient Air Monitoring Network Assessment 2020 December 22, 2020
Massachusetts Department of Environmental Protection Bureau of Air and Waste Division of Air and Climate Programs Air Assessment Branch Wall Experiment Station Lawrence, Massachusetts
Blue Hill Observatory - Milton MA

1
MassDEP 2020 Network Assessment
CONTENTS
I. SUMMARY ................................................................................................................................ 2
II. NETWORK PURPOSE AND DESCRIPTION .................................................................... 6
III. MASSACHUSETTS POPULATION ................................................................................. 15
Population Growth ........................................................................................................................................ 17
Sensitive Populations .................................................................................................................................... 25
IV. AIR QUALITY SUMMARY ............................................................................................... 32
National Ambient Air Quality Standards....................................................................................................... 33
Emissions Inventory Summary ...................................................................................................................... 34
Distribution of Emission Reductions ............................................................................................................. 36
V. POLLUTANT NETWORK STATUS .................................................................................. 38
Particulate Matter (PM) ................................................................................................................................ 39
Ozone............................................................................................................................................................. 60
Carbon Monoxide (CO)................................................................................................................................. 74
Sulfur Dioxide (SO2) ...................................................................................................................................... 79
Nitrogen Dioxide (NO2) ................................................................................................................................. 84
Lead (Pb) ....................................................................................................................................................... 89
Meteorology .................................................................................................................................................. 90
2
MassDEP 2020 Network Assessment
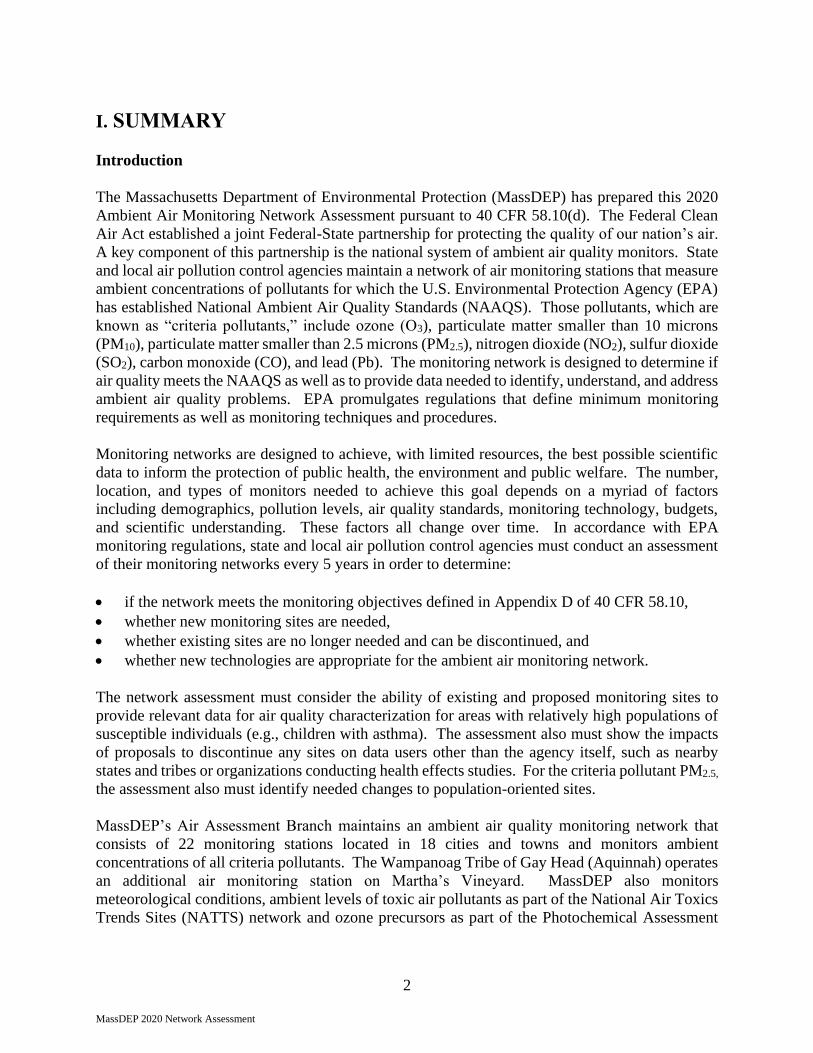
I. SUMMARY
Introduction
The Massachusetts Department of Environmental Protection (MassDEP) has prepared this 2020
Ambient Air Monitoring Network Assessment pursuant to 40 CFR 58.10(d). The Federal Clean
Air Act established a joint Federal-State partnership for protecting the quality of our nation’s air.
A key component of this partnership is the national system of ambient air quality monitors. State
and local air pollution control agencies maintain a network of air monitoring stations that measure
ambient concentrations of pollutants for which the U.S. Environmental Protection Agency (EPA)
has established National Ambient Air Quality Standards (NAAQS). Those pollutants, which are
known as “criteria pollutants,” include ozone (O3), particulate matter smaller than 10 microns
(PM10), particulate matter smaller than 2.5 microns (PM2.5), nitrogen dioxide (NO2), sulfur dioxide
(SO2), carbon monoxide (CO), and lead (Pb). The monitoring network is designed to determine if
air quality meets the NAAQS as well as to provide data needed to identify, understand, and address
ambient air quality problems. EPA promulgates regulations that define minimum monitoring
requirements as well as monitoring techniques and procedures.
Monitoring networks are designed to achieve, with limited resources, the best possible scientific
data to inform the protection of public health, the environment and public welfare. The number,
location, and types of monitors needed to achieve this goal depends on a myriad of factors
including demographics, pollution levels, air quality standards, monitoring technology, budgets,
and scientific understanding. These factors all change over time. In accordance with EPA
monitoring regulations, state and local air pollution control agencies must conduct an assessment
of their monitoring networks every 5 years in order to determine:
• if the network meets the monitoring objectives defined in Appendix D of 40 CFR 58.10,
• whether new monitoring sites are needed,
• whether existing sites are no longer needed and can be discontinued, and
• whether new technologies are appropriate for the ambient air monitoring network.
The network assessment must consider the ability of existing and proposed monitoring sites to
provide relevant data for air quality characterization for areas with relatively high populations of
susceptible individuals (e.g., children with asthma). The assessment also must show the impacts
of proposals to discontinue any sites on data users other than the agency itself, such as nearby
states and tribes or organizations conducting health effects studies. For the criteria pollutant PM2.5,
the assessment also must identify needed changes to population-oriented sites.
MassDEP’s Air Assessment Branch maintains an ambient air quality monitoring network that
consists of 22 monitoring stations located in 18 cities and towns and monitors ambient
concentrations of all criteria pollutants. The Wampanoag Tribe of Gay Head (Aquinnah) operates
an additional air monitoring station on Martha’s Vineyard. MassDEP also monitors
meteorological conditions, ambient levels of toxic air pollutants as part of the National Air Toxics
Trends Sites (NATTS) network and ozone precursors as part of the Photochemical Assessment

3
MassDEP 2020 Network Assessment
Monitoring Stations (PAMS) network. Ozone precursors are substances that react in the
atmosphere to form ground-level ozone.
MassDEP’s air monitoring network places an emphasis on monitoring ozone and PM2.5 levels. In
the past, Massachusetts air quality has been in nonattainment of the ozone standard and has been
close to the PM2.5 standard. Today, Massachusetts is designated in attainment of all standards,
with the exception of Dukes County. Dukes County is designated as nonattainment with the 2008
ozone NAAQS (0.075 ppm). However, Dukes County currently meets the 2008 ozone NAAQS
and is designated as attainment with the more stringent 2015 ozone NAAQS (0.070 ppm). The
Commonwealth still experiences days with elevated levels of ozone, making ozone monitoring a
continued priority. The ozone monitoring network is designed to measure concentrations of ozone
and its precursors in-state, as well as provide insight into ozone formation and ozone transport.
MassDEP also continues to place priority on monitoring PM2.5 concentrations due to the significant
health effects posed by PM2.5 exposure.
Figure 2-1 shows the location of monitoring stations. All these sites have been approved by EPA
as meeting applicable siting criteria, as specified in Subpart B of 40 CFR Part 58. As required by
EPA, all criteria pollutants are monitored using Federal Reference Methods (FRMs) or Federal
Equivalent Methods (FEMs) and monitors are operated according to the procedures specified in
Quality Assurance Project Plans (QAPPs) that have been approved by EPA. MassDEP’s monitors
meet EPA guidelines and requirements for characterizing micro-scale (up to 100 square meters),
middle-scale (a few city blocks), neighborhood (up to 4 square kilometer), urban (a city), and
regional (up to hundreds of square kilometers) air quality and for measuring the greatest population
exposures, highest exposures and regional transport.
Update on 2015 Network Assessment
MassDEP prepared its second Network Assessment in 2015. The 2015 Assessment noted that
MassDEP was working to establish a second NO2 near-road site in the Boston Area and an ozone
and consolidated PM2.5 site in the Pittsfield area. In 2018, MassDEP established a second near-
road NO2 monitoring station in Chelmsford (Manning Road), adding to the existing near-road
monitoring station in Boston (Von Hillern Street). In 2018, MassDEP also established an ozone
monitoring station in Pittsfield (Silver Lake Boulevard, 25-003-0008). MassDEP included PM2.5
monitoring at the new station, and in doing so was able to consolidate two former sites in Pittsfield
(Center Street and South Street) into a single monitoring station.
EPA’s 2015 ozone monitoring regulations reduced the number of required Photochemical
Assessment Monitoring Station (PAMS) sites in Massachusetts from four to one. In 2017,
MassDEP closed the Newburyport monitoring station, which was originally established as a
PAMS site. MassDEP also discontinued PAMS monitoring at the Chicopee and Ware monitoring
stations, although MassDEP continues to monitor ozone and other criteria pollutants these sites.
MassDEP continues to implement PAMS monitoring at its Lynn monitoring station, which EPA
approved as MassDEP’s PAMS network site.

4
MassDEP 2020 Network Assessment
MassDEP made several other changes to its monitoring Network since the 2015 Assessment:
• In 2016, MassDEP discontinued filter-based PM2.5 monitors at Lawrence and Worcester
(Washington Street) as part of trend of relying more on continuous PM2.5 monitors.
• In 2017, MassDEP established a site in North Adams to monitor continuous PM2.5 and black
carbon as a way to monitor wood smoke in the Greylock Valley area.
• In 2018, MassDEP closed the PM2.5 monitoring station at Boston – North Street due to a
loss of access to the site.
• In 2020, MassDEP established a temporary monitoring station in Weymouth near a natural
gas compressor station that is under construction. The station includes a continuous PM2.5
monitor, volatile organic compounds (VOCs) sampler and a carbonyl sampler. MassDEP is
working to establish a permanent monitoring station in Weymouth, which also will monitor
ozone and NO2.
2020 Network Assessment Results
MassDEP’s review of the Massachusetts monitoring network indicates that the network meets or
exceeds EPA’s minimum monitoring requirements, that the network is well designed and operated,
and adequately characterizes air quality in Massachusetts. While Massachusetts is designated in
attainment of the 2015 8-hour ozone NAAQS, MassDEP continues to make ozone monitoring a
priority to confirm the overall downward trend in ozone concentrations and to alert the public on
days when ozone is elevated. MassDEP also continues to operate a robust PM2.5 monitoring
network due to the significant health effects posed by PM2.5.
MassDEP has reviewed changes in population and pollutant emissions and determined that
MassDEP’s existing monitoring network is properly designed. Massachusetts population centers
remain the same geographically, although overall population has increased (see Figure 3-2); there
has been little change in the distribution of vehicle miles travelled across the state (see Figure 4-
3); and pollutant emissions have declined fairly uniformly across the state (see Figure 4-4). The
absence of major shifts in these factors indicates that adjustment of the basic design of the air
monitoring network is unnecessary.
In addition, review of the distribution of sensitive populations (such as children) and of the
incidence of various diseases associated with air pollution (such as asthma, respiratory disease,
lung cancer, and circulatory diseases), as well as Environmental Justice populations, indicates that
the existing network of monitoring sites adequately supports air quality characterization in areas
with sensitive populations. However, given the health impacts of PM2.5, MassDEP is evaluating
opportunities to enhance PM2.5 monitoring in Environmental Justice communities.
MassDEP used an analytical tool provided by EPA (NetAssess2020) to evaluate whether any sites
are redundant and could be removed and whether any new sites are needed in the monitoring
network. The tools evaluates correlations between existing site measurements; distance between
sites; the likelihood of the site exceeding a standard; the correlation between site measurements;

5
MassDEP 2020 Network Assessment
removal bias (i.e., the difference between the measured concentrations at a site and those that
would be estimated for that site based on data from surrounding sites); and create maps that show
the coverage area of each monitor.
MassDEP continues to evaluate opportunities to optimize the monitoring network and provides
updates for EPA review and approval through annual Network Plans. MassDEP has taken
advantage of opportunities to streamline operations by optimizing travel routes, maintenance
schedules, and relying more on automated continuous monitors for most parameters. Two
measures implemented since the 2015 Network Assessment include relying more on continuous
Federal Equivalent Method (FEM) PM2.5 monitors and reducing the workload associated with
monitoring PAMS parameters.

6
MassDEP 2020 Network Assessment
II. NETWORK PURPOSE AND DESCRIPTION
The Massachusetts ambient air quality monitoring network serves several purposes:
• Provide information about air quality to the public. MassDEP’s website provides near
real-time data from continuous monitoring sites, explanations of the health effects of
pollution, information about the NAAQS, and the ability to chart historical air quality
monitoring data and air quality trends. The network also supports MassDEP’s daily air quality
forecast and alert system. Both data and forecasts are posted at MassAir at www.mass.gov/air.
• Verify compliance with National Ambient Air Quality Standards (NAAQS). EPA
specifies the minimum number of monitors that must be located in Massachusetts to
demonstrate whether the state is in attainment of each of the criteria pollutants.
• Assess the effectiveness of current air pollution control regulations and initiatives /
support development of policies and regulations aimed at reducing air pollution.
MassDEP uses air monitoring data to develop and track progress of State Implementation
Plans (SIPs) that specify the air pollution controls and strategies to attain and maintain the
NAAQS and meet Regional Haze requirements.
• Ambient monitoring data are used in conjunction with modeling to characterize the
extent of air pollution problems, including transport into and out of the state, as well as
to evaluate the impacts of alternative control strategies. MassDEP’s monitoring data are
important to regional air pollution control planning efforts. Massachusetts is a member of
three interstate regional organizations that coordinate the development of air pollution control
plans - Ozone Transport Commission (OTC), Mid-Atlantic/Northeast Visibility Union
(MANE-VU), and Northeast States for Coordinated Air Use Management (NESCAUM).
• Site-specific permitting. MassDEP staff and consultants use ambient air quality and
meteorological monitoring data to make site-specific permitting decisions that ensure that
emissions from new or modified facilities do not cause or contribute to violations of NAAQS
or consume Prevention of Significant Deterioration increments. In addition, meteorological
and toxic chemical monitoring information is used in conjunction with models to estimate if
emissions are likely to result in exceedances of MassDEP’s Ambient Air Limits (AALs) for
toxic pollutants.
• Research. Environmental and medical academics, the Massachusetts Department of Public
Health, the World Health Organization, conservation groups, environmental advocates, and
consultants use ambient air monitoring data to evaluate the public health and environmental
impacts of air pollution and to develop and “ground truth” ambient air quality models. Air
quality data also are used to better characterize the behavior of contaminants in the
atmosphere.
MassDEP operates 22 monitoring stations located in 18 cities and towns. The Wampanoag Tribe
of Gay Head (Aquinnah) operates an air monitoring station on Martha’s Vineyard. Figure 2-1
shows the location of monitoring stations.

7
MassDEP 2020 Network Assessment
Figure 2-1
Massachusetts Air Monitoring Stations in 2020
MassDEP operates “continuous” and “intermittent” monitors. Continuous monitors sample and
measure the air 24 hours per day and generally report out hourly averages. Intermittent monitors
take discrete samples for a specific time period, usually 24 hours, at predetermined intervals,
usually every third day or every sixth day. Data is averaged in blocks of 1, 3, or 24 hours,
depending on the regulatory requirement.
Some monitors, typically those measuring gaseous pollutants, perform the entire analysis
automatically on-site. Others, such as the filter-based samples for lead, particulate matter ≤ 10
microns (PM10), particulate matter ≤ 2.5 microns (PM2.5), and volatile organic compounds (VOCs)
and toxics, require laboratory analysis.
Monitor Descriptions
MassDEP operates “continuous” and “intermittent” monitors. Continuous monitors perform
complete, automated analysis on-site, measure air quality 24 hours per day, and report the data as
hourly means. These are typically used for gaseous pollutants such as sulfur dioxide (SO2),
nitrogen oxides (NOx), carbon monoxide (CO), and ozone (O3). Some continuous monitors

8
MassDEP 2020 Network Assessment
perform analyses after an hourly sample has been collected, such as Photochemical Assessment
Monitoring Station (PAMS) automated gas chromatographs (Auto-GC) and PM2.5 Beta
Attenuation Monitors (BAMs).
Intermittent monitors obtain discrete samples that are collected by staff and brought to the
laboratory for analysis; examples include VOC canisters, carbonyl cartridges and PM2.5 filter
samples. Depending on the regulatory or analytical requirements, samples may be obtained every
day, every third day, every sixth day, or on some other prescribed schedule. The data are averaged
in 3- or 24-hour intervals based on EPA requirements for the specific pollutant.
MassDEP is moving toward greater reliance on automated methods such as continuous PM2.5
monitors and automated gas chromatographs for VOCs where possible. Advantages of automated
analysis in the field include near real-time reporting of ambient air quality data to the public using
data loggers and telemetry systems, a continuous record of air quality data 24 hours per day, and
fewer labor hours spent retrieving and analyzing samples. However, continuous monitors are
expensive, usually require climate-controlled shelters (unlike intermittent samplers that can be
placed on rooftops or compact spaces), and can break (requiring back-up equipment).
The Massachusetts network contains the following monitors for criteria pollutants:
• CO: 3 continuous monitors
• NOx: 10 continuous monitors
• O3: 17 continuous monitors (including Aquinnah tribal site)
• SO2: 6 continuous monitors
• PM2.5: 16 hourly Federal Equivalent Monitors (FEMs) PM2.5 monitors and 11 intermittent
Federal Reference Method (FRM) monitors (including collocated units)
• PM10: 4 intermittent monitors (including collocated units)
The Massachusetts network contains the following monitors for other pollutants:
• Black carbon (BC): 7 continuous monitors
• Ozone precursors at one PAMS station:
▪ Total reactive oxidized nitrogen (NOy): 1 continuous monitor
▪ VOCs: 1 continuous automated gas chromatograph (Auto-GC)
▪ Carbonyls: 1 intermittent monitor
• NATTS Toxics:
▪ VOCs: 1 intermittent monitor
▪ Carbonyls: 1 intermittent monitor
▪ Polycyclic aromatic hydrocarbons (PAHs): 1 intermittent monitor
▪ Metals (including lead): 2 collocated intermittent monitors
• Speciation of PM2.5: 2 intermittent monitors measure the individual constituents of PM2.5
including elements, sulfates/nitrates, and organic carbon
• NOy: 2 continuous monitors (in addition to PAMS NOy)
• VOCs: 1 intermittent monitor (in addition to PAMS and NATTS VOCs)
• Carbonyls: 1 intermittent monitor (in addition to PAMS and NATTS carbonyls)

9
MassDEP 2020 Network Assessment
• IMPROVE: The National Park Service and Wampanoag Tribe operate two IMPROVE
monitors
Meteorological monitors measuring atmospheric conditions that influence air pollution levels:
• Wind speed and direction (WS/WD): 13 monitors
• Relative humidity (RH): 13 monitors
• Precipitation: 2 monitors
• Atmospheric pressure (i.e., barometric pressure): 13 monitors
• Solar radiation: 13 monitors
• Ambient temperature: 13 monitors
The Boston – Harrison Avenue site is the Massachusetts NCore site and was designated a National
Air Toxics Trends Station (NATTS) in 2003. The NATTS program specifies the measurement of
certain non-criteria air pollutants at trace levels, mostly on an intermittent (every sixth day) basis.
The following parameters are measured in association with NATTS monitoring:
• Volatile organic compounds (VOCs)
• Carbonyls (formaldehyde and acetaldehyde)
• Polyaromatic hydrocarbons (PAHs)
• Metals
• Black carbon (BC)
Quality Control and Quality Assurance
Whether measurements are continuous or intermittent, all analyzers must be tested to ensure data
validity, accuracy and precision, and to ensure that the analyzer is operating properly and can be
expected to continue to operate in an acceptable manner. A large portion of MassDEP monitoring
staff time is spent calibrating equipment, challenging equipment performance in the field, and
reviewing the quality of air monitoring data.
MassDEP’s Air Assessment Branch has an active, independent Quality Assurance Section
ensuring that proper data collection and analysis procedures are followed, equipment is maintained
appropriately, and equipment is calibrated properly using the appropriate test gases. This QA
Section performs periodic performance and systems audits at air monitoring sites throughout the
network. This is essential to operating the monitoring network, analyzing samples, and producing
air quality of sufficient quality to satisfy the needs of users.
10
MassDEP 2020 Network Assessment
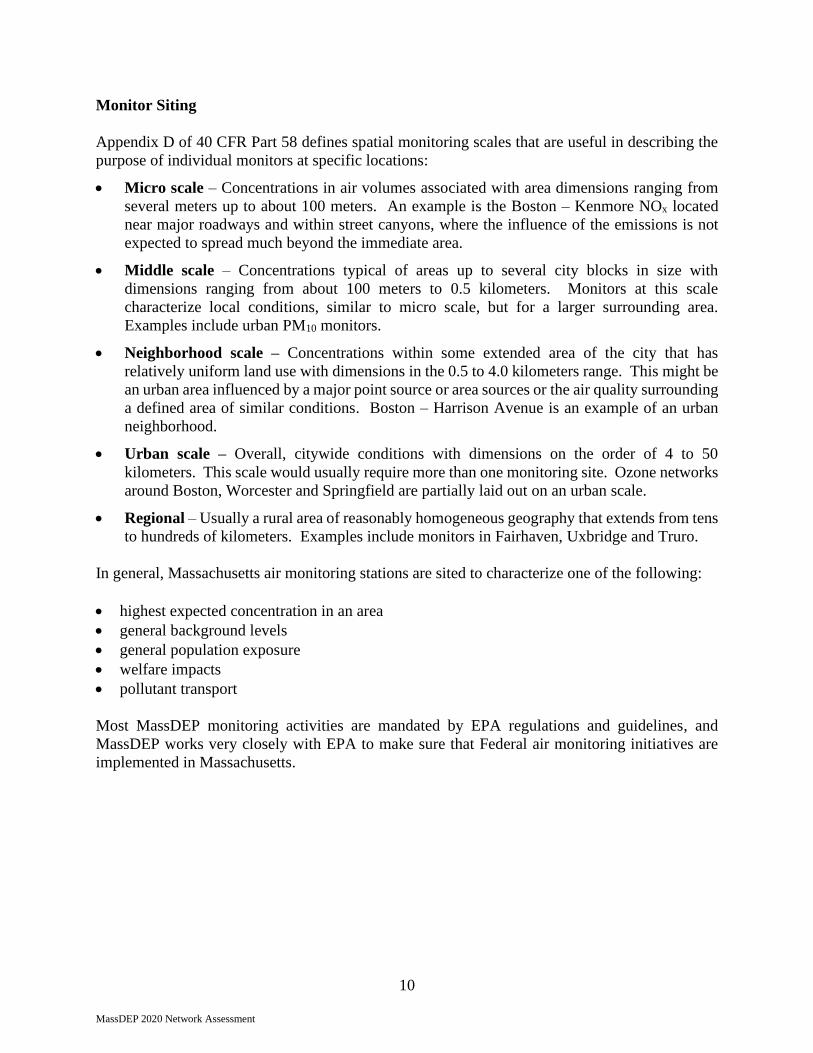
Monitor Siting
Appendix D of 40 CFR Part 58 defines spatial monitoring scales that are useful in describing the
purpose of individual monitors at specific locations:
• Micro scale – Concentrations in air volumes associated with area dimensions ranging from
several meters up to about 100 meters. An example is the Boston – Kenmore NOx located
near major roadways and within street canyons, where the influence of the emissions is not
expected to spread much beyond the immediate area.
• Middle scale – Concentrations typical of areas up to several city blocks in size with
dimensions ranging from about 100 meters to 0.5 kilometers. Monitors at this scale
characterize local conditions, similar to micro scale, but for a larger surrounding area.
Examples include urban PM10 monitors.
• Neighborhood scale – Concentrations within some extended area of the city that has
relatively uniform land use with dimensions in the 0.5 to 4.0 kilometers range. This might be
an urban area influenced by a major point source or area sources or the air quality surrounding
a defined area of similar conditions. Boston – Harrison Avenue is an example of an urban
neighborhood.
• Urban scale – Overall, citywide conditions with dimensions on the order of 4 to 50
kilometers. This scale would usually require more than one monitoring site. Ozone networks
around Boston, Worcester and Springfield are partially laid out on an urban scale.
• Regional – Usually a rural area of reasonably homogeneous geography that extends from tens
to hundreds of kilometers. Examples include monitors in Fairhaven, Uxbridge and Truro.
In general, Massachusetts air monitoring stations are sited to characterize one of the following:
• highest expected concentration in an area
• general background levels
• general population exposure
• welfare impacts
• pollutant transport
Most MassDEP monitoring activities are mandated by EPA regulations and guidelines, and
MassDEP works very closely with EPA to make sure that Federal air monitoring initiatives are
implemented in Massachusetts.

11
MassDEP 2020 Network Assessment
Monitoring Site Details
A full list of the Massachusetts monitor locations, when they were established, their purpose, what
they measure, and the equipment used are presented in Figures 2-2 through 2-5.
Figure 2-2: Air Monitoring Site Locations
Site ID Site Name County Address City
25-025-0002 Boston - Kenmore Suffolk Kenmore Square Boston
25-025-0042 Boston - Harrison Ave Suffolk 1159 Harrison Avenue Boston
25-025-0044 Boston - Von Hillern Suffolk 19 Von Hillern Street Boston
25-023-0005 Brockton Plymouth 170 Clinton Street Brockton
25-017-0009 Chelmsford - EPA Middlesex 11 Technology Drive Chelmsford
25-017-0010 Chelmsford - Near Road Middlesex Manning Road Chelmsford
25-013-0008 Chicopee Hampden Anderson Road Chicopee
25-005-1006 Fairhaven Bristol 30 School Street Fairhaven
25-005-1004 Fall River Bristol 659 Globe Street Fall River
25-011-2005 Greenfield Franklin 16 Barr Avenue Greenfield
25-009-5005 Haverhill Essex 685 Washington Street Haverhill
25-009-2006 Lynn Essex 390 Parkland Lynn
25-021-3003 Milton - Blue Hill Norfolk 1904 Canton Avenue Milton
25-003-6001 North Adams Berkshire 86 Holden Street North Adams
25-003-0008 Pittsfield Berkshire 25 Silver Lake Drive Pittsfield
25-013-0018 Springfield Hampden 600 Liberty Street Springfield
25-001-0002 Truro Barnstable 6 Collins Road Truro
25-027-0024 Uxbridge Worcester 366 E. Hartford Avenue Uxbridge
25-015-4002 Ware Hampshire Quabbin Hill Road Ware
25-021-2004 Weymouth Norfolk 6 Bridge Street Weymouth
25-027-0015 Worcester - Airport Worcester 375 Airport Drive Worcester
25-027-0023 Worcester - Summer St Worcester 260 Asylum Street Worcester
25-007-0001 Aquinnah Dukes 1 Herring Creek Road Martha’s Vineyard

12
MassDEP 2020 Network Assessment
Figure 2-3: Air Monitoring Site Descriptions
Site ID Site Name Scale Reason for Monitor Date
Established MSA / MiSA
25-025-0002 Boston - Kenmore Neighborhood/Micro Highest Concentration; Population Exposure 1/1/1965 Boston-Cambridge-Newton MSA
25-025-0042 Boston - Harrison Ave Neighborhood Population Exposure 12/15/1998 Boston-Cambridge-Newton MSA
25-025-0044 Boston - Von Hillern Middle Population Exposure; Highest Concentration 6/15/2013 Boston-Cambridge-Newton MSA
25-023-0005 Brockton Urban/Neighborhood Population Exposure 6/30/2013 Boston-Cambridge-Newton MSA
25-017-0009 Chelmsford - EPA Neighborhood Population Exposure 4/1/2005 Boston-Cambridge-Newton MSA
25-017-0010 Chelmsford - Near Road Middle Population Exposure 7/1/2018 Boston-Cambridge-Newton MSA
25-013-0008 Chicopee Urban Population Exposure 1/1/1983 Springfield MSA
25-005-1006 Fairhaven Regional Population Exposure 6/30/2013 Providence-Warwick MSA
25-005-1004 Fall River Neighborhood Population Exposure 2/1/1975 Providence-Warwick MSA
25-011-2005 Greenfield Regional/Neighborhood Population Exposure 1/1/2014 Greenfield Town MiSA
25-009-5005 Haverhill Regional/Neighborhood Population Exposure 7/19/1994 Boston-Cambridge-Newton MSA
25-009-2006 Lynn Urban/Neighborhood PAMS - Max Precursor O3; Population Exposure 1/1/1992 Boston-Cambridge-Newton MSA
25-021-3003 Milton - Blue Hill Regional Upwind Background PM2.5; Highest O3 4/2/2002 Boston-Cambridge-Newton MSA
25-003-6001 North Adams Neighborhood Population Exposure 7/1/2017 Pittsfield MSA
25-003-0008 Pittsfield Regional/Neighborhood Population Exposure 7/1/2018 Pittsfield MSA
25-013-0018 Springfield Urban Highest Concentration; Population Exposure 5/1/2018 Springfield MSA
25-001-0002 Truro Regional General Background 4/1/1987 Barnstable Town MSA
25-027-0024 Uxbridge Regional Ozone Transport; Population Exposure 11/1/2008 Worcester MSA
25-015-4002 Ware Urban Maximum O3; Background other pollutants 6/1/1985 Springfield MSA
25-021-2004 Weymouth Micro/Neighborhood Source Impact 2/4/2020 Boston-Cambridge-Newton MSA
25-027-0015 Worcester - Airport Urban Population Exposure 5/7/1979 Worcester MSA
25-027-0023 Worcester - Summer St Urban/Middle Population Exposure 1/1/2004 Worcester MSA
25-007-0001 Aquinnah Regional Regional 4/1/2004 Vineyard Haven MiSA MSA = Metropolitan Statistical Area MiSA = Micropolitan Statistical Area

13
MassDEP 2020 Network Assessment
Figure 2-4: Site Parameters
Site ID Site Name Meteorological Pollutants
25-025-0002 Boston - Kenmore None SO2, NO2, PM2.5
25-025-0042 Boston - Harrison Ave WS/WD, TEMP, RH, BP, SOLAR
O3, SO2, NO2, NOy, CO, PM10, PM2.5, PMCoarse, PM2.5Speciation, Black Carbon, VOCs, Carbonyls
25-025-0044 Boston - Von Hillern WS/WD, TEMP, RH, BP, SOLAR NO2, CO, PM2.5, Black Carbon
25-023-0005 Brockton None O3, PM2.5
25-017-0009 Chelmsford - EPA None O3
25-017-0010 Chelmsford - Near Road None O3, NO2, PM2.5, Black Carbon
25-013-0008 Chicopee WS/WD, TEMP, RH, BP, SOLAR O3, NO2, PM2.5, PM2.5Speciation
25-005-1006 Fairhaven WS/WD, TEMP, RH, BP, SOLAR O3
25-005-1004 Fall River None O3, SO2, PM2.5
25-011-2005 Greenfield WS/WD, TEMP, RH, BP, SOLAR O3, PM2.5, Black Carbon
25-009-5005 Haverhill WS/WD, TEMP, RH, BP, SOLAR O3, PM2.5
25-009-2006 Lynn WS/WD, TEMP, RH, BP, SOLAR, PRECIP O3, NO2, PM2.5, VOCs, Carbonyls
25-021-3003 Milton - Blue Hill WS/WD, TEMP, RH, BP, SOLAR O3, NO2
25-003-6001 North Adams None PM2.5, Black Carbon
25-003-0008 Pittsfield WS/WD, TEMP, RH, BP, SOLAR O3, PM2.5, Black Carbon
25-013-0018 Springfield None SO2, NO2, PM2.5, Black Carbon
25-001-0002 Truro WS/WD, TEMP, RH, BP, SOLAR O3
25-027-0024 Uxbridge WS/WD, TEMP, RH, BP, SOLAR O3
25-015-4002 Ware WS/WD, TEMP, RH, BP, SOLAR, PRECIP O3, SO2, NO2, PM10, PM2.5, NOy
25-021-2004 Weymouth None PM2.5, VOCs, Carbonyls
25-027-0015 Worcester - Airport WS/WD, TEMP, RH, BP, SOLAR O3
25-027-0023 Worcester - Summer St None SO2, NO2, CO, PM10, PM2.5
25-007-0001 Aquinnah None O3
14
MassDEP 2020 Network Assessment
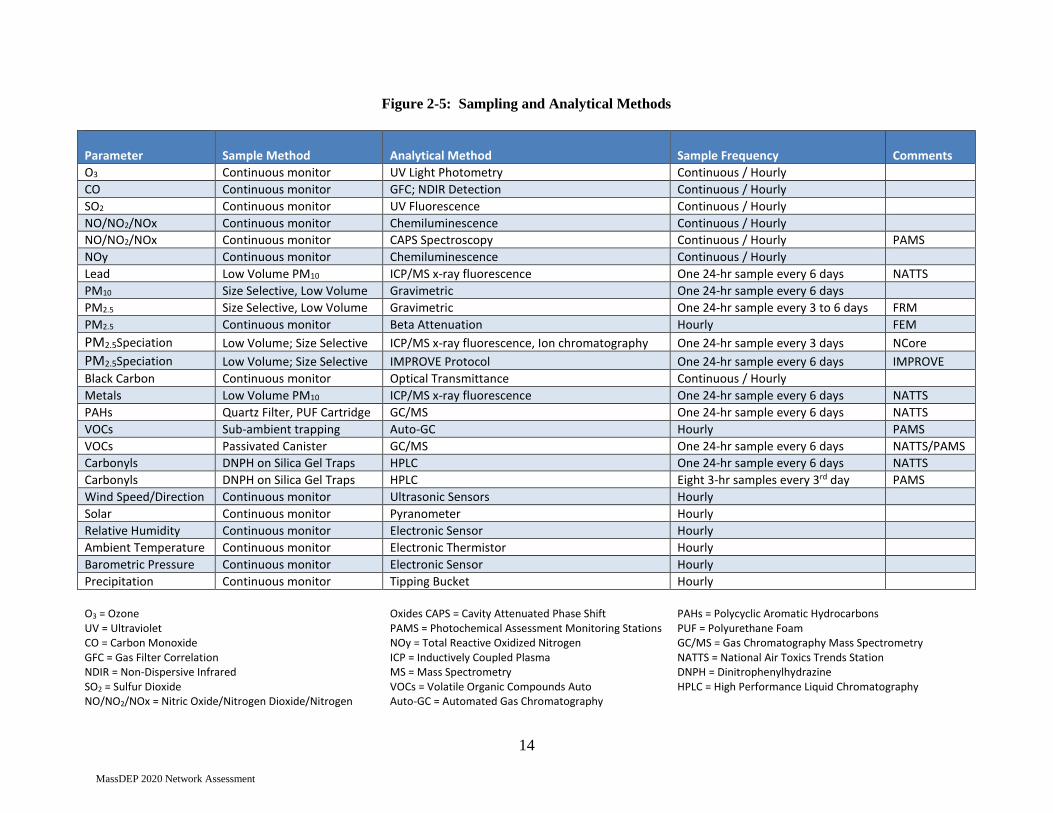
Figure 2-5: Sampling and Analytical Methods
Parameter Sample Method Analytical Method Sample Frequency Comments
O3 Continuous monitor UV Light Photometry Continuous / Hourly
CO Continuous monitor GFC; NDIR Detection Continuous / Hourly
SO2 Continuous monitor UV Fluorescence Continuous / Hourly
NO/NO2/NOx Continuous monitor Chemiluminescence Continuous / Hourly
NO/NO2/NOx Continuous monitor CAPS Spectroscopy Continuous / Hourly PAMS
NOy Continuous monitor Chemiluminescence Continuous / Hourly
Lead Low Volume PM10 ICP/MS x-ray fluorescence One 24-hr sample every 6 days NATTS
PM10 Size Selective, Low Volume Gravimetric One 24-hr sample every 6 days
PM2.5 Size Selective, Low Volume Gravimetric One 24-hr sample every 3 to 6 days FRM
PM2.5 Continuous monitor Beta Attenuation Hourly FEM
PM2.5Speciation Low Volume; Size Selective ICP/MS x-ray fluorescence, Ion chromatography One 24-hr sample every 3 days NCore
PM2.5Speciation Low Volume; Size Selective IMPROVE Protocol One 24-hr sample every 6 days IMPROVE
Black Carbon Continuous monitor Optical Transmittance Continuous / Hourly
Metals Low Volume PM10 ICP/MS x-ray fluorescence One 24-hr sample every 6 days NATTS
PAHs Quartz Filter, PUF Cartridge GC/MS One 24-hr sample every 6 days NATTS
VOCs Sub-ambient trapping Auto-GC Hourly PAMS
VOCs Passivated Canister GC/MS One 24-hr sample every 6 days NATTS/PAMS
Carbonyls DNPH on Silica Gel Traps HPLC One 24-hr sample every 6 days NATTS
Carbonyls DNPH on Silica Gel Traps HPLC Eight 3-hr samples every 3rd day PAMS
Wind Speed/Direction Continuous monitor Ultrasonic Sensors Hourly
Solar Continuous monitor Pyranometer Hourly
Relative Humidity Continuous monitor Electronic Sensor Hourly
Ambient Temperature Continuous monitor Electronic Thermistor Hourly
Barometric Pressure Continuous monitor Electronic Sensor Hourly
Precipitation Continuous monitor Tipping Bucket Hourly
O3 = Ozone UV = Ultraviolet CO = Carbon Monoxide GFC = Gas Filter Correlation NDIR = Non-Dispersive Infrared SO2 = Sulfur Dioxide NO/NO2/NOx = Nitric Oxide/Nitrogen Dioxide/Nitrogen
Oxides CAPS = Cavity Attenuated Phase Shift PAMS = Photochemical Assessment Monitoring Stations NOy = Total Reactive Oxidized Nitrogen ICP = Inductively Coupled Plasma MS = Mass Spectrometry VOCs = Volatile Organic Compounds Auto Auto-GC = Automated Gas Chromatography
PAHs = Polycyclic Aromatic Hydrocarbons PUF = Polyurethane Foam GC/MS = Gas Chromatography Mass Spectrometry NATTS = National Air Toxics Trends Station DNPH = Dinitrophenylhydrazine HPLC = High Performance Liquid Chromatography

15
MassDEP 2020 Network Assessment
III. MASSACHUSETTS POPULATION
MassDEP believes the air monitoring network is appropriately designed given the demographic,
spatial, and health characteristics of the Massachusetts population:
• There have been no major population shifts Massachusetts in the past 5 years. The shifts that
have occurred have moved population closer to areas with existing monitors (e.g., urban areas).
• Sensitive populations are adequately covered by air monitoring, and pollutant levels are well
below National Ambient Air Quality Standards.
• EJ areas are well covered by air monitors.
The U.S. Census Bureau estimates that as of 2018, Massachusetts had just over 6.9 million
inhabitants in 351 towns/cities and 14 counties. The vast majority of the population is concentrated
in the Boston metropolitan area, with additional concentrations in the Springfield and Worcester
areas as shown in Figure 3-1 (based on US Census Annual Estimates of the Resident Population).
Figure 3-1
2018 Estimated Population of Massachusetts Municipalities with Air Monitoring Stations
Source – US Census - Annual Estimates of the Resident Population: April 1, 2010 to July 1, 2018.

16
MassDEP 2020 Network Assessment
Figure 3-1.1 Total Population in 2017 by Census Tract
Source: U.S. Census Bureau, 2013-2017 American Community Survey 5-Year Estimates https://factfinder.census.gov/faces/tableservices/jsf/pages/productview.xhtml?pid=ACS_17_5YR_B01003&prodType=table

17
MassDEP 2020 Network Assessment
Population Growth
The U.S. Census Bureau estimates that Massachusetts’ population has grown by approximately
5% percent between 2010 and 2018, with the largest percent increases in Suffolk, Nantucket, and
Middlesex counties (see Figure 3-2). Rural areas such as Barnstable, Berkshire and Franklin
counties seen small population decreases. However, because the total growth in all counties has
been small, no county’s proportional share of the total statewide population changed by more than
+ / – 0.6% between 2010 and 2018.
Figure 3-2
Massachusetts Population Change 2010 – 2018
County
Population % of State Population Change 2010 - 2018
2010 2015 2018 2010 2015 2018 Total %
Barnstable 215,893 213,811 213,413 3.3% 3.1% 3.1% -2,480 -1.1%
Berkshire 131,319 127,857 126,348 2.0% 1.9% 1.8% -4,971 -3.8%
Bristol 549,177 556,878 564,022 8.4% 8.2% 8.2% 14,845 2.7%
Dukes 16,572 17,275 17,352 0.3% 0.3% 0.3% 780 4.7%
Essex 745,479 777,175 790,638 11.4% 11.4% 11.5% 45,159 6.1%
Franklin 71,366 70,902 70,963 1.1% 1.0% 1.0% -403 -0.6%
Hampden 464,256 469,230 470,406 7.1% 6.9% 6.8% 6,150 1.3%
Hampshire 159,320 160,768 161,355 2.4% 2.4% 2.3% 2,035 1.3%
Middlesex 1,507,693 1,585,775 1,614,714 23.0% 23.3% 23.4% 107,021 7.1%
Nantucket 10,167 10,945 11,327 0.2% 0.2% 0.2% 1,160 11.4%
Norfolk 673,039 694,787 705,388 10.2% 10.2% 10.2% 32,349 4.8%
Plymouth 495,930 509,146 518,132 7.6% 7.5% 7.5% 22,202 4.5%
Suffolk 725,819 782,962 807,252 11.1% 11.5% 11.7% 81,433 11.2%
Worcester 800,401 818,380 830,839 12.2% 12.0% 12.0% 30,438 3.8%
Total 6,566,431 6,795,891 6,902,149 100.0% 100.0% 100.0% 335,718 5.1% Source: U.S. Census Bureau, Population Division Annual Estimates of the Resident Population: April 1, 2010 to July 1, 2018 Release Dates: April 2019
Figure 3-3 shows population change at the municipal level from 2010 to 2018. The figure shows
modest population changes, including slight decreases in Western Massachusetts and Cape Cod
and increases in Eastern Massachusetts. Generally, these changes would not indicate a need to
reconfigure the network, and areas showing population growth have adequate monitoring
coverage.

18
MassDEP 2020 Network Assessment
Figure 3-3
Massachusetts Population Change 2010 – 2018
Source – US Census - Annual Estimates of the Resident Population: April 1, 2010 to July 1, 2018.
MassDEP used EPA’s Population Served Network Assessment Tool and NetAssess2020
(https://sti-r-shiny.shinyapps.io/EPA_Network_Assessment/) to calculate the population served
by each monitor. These tools compute shapes known as Voronoi or Thiessen polygons that are
used as an indicator of the area served by each monitor. A Voronoi polygon is the shape formed
by the line connecting the points equidistant between a given monitor and each of the other
monitors closest to it. The area within the shape created by the lines surrounding the monitor is
geographically closer to that monitor than to any other monitor in the network and is therefore
considered an approximation of its coverage area. Note that this is a mathematical construct.
Geographic features such as hills or valleys, manmade features such as pollution sources,
meteorology, and the development pattern of an area could make the actual area represented by a
monitor different from its polygon. Nevertheless, these polygons provide a reasonable starting
point for looking at the area served by the monitors.
These network assessment tools calculated populations within each polygon and the results are
presented in Figure 3-4 (see Section 5 maps showing the polygons). Note that 2018 was the latest
population data available.
19
MassDEP 2020 Network Assessment
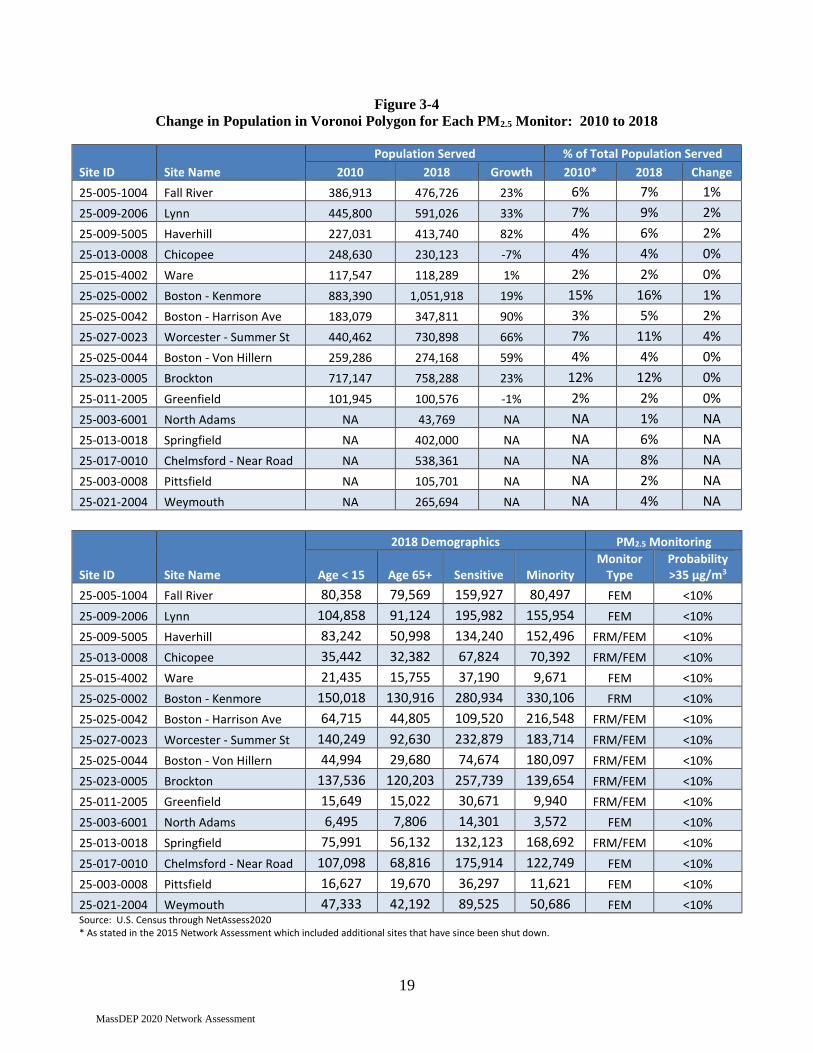
Figure 3-4 Change in Population in Voronoi Polygon for Each PM2.5 Monitor: 2010 to 2018
Site ID Site Name
Population Served % of Total Population Served
2010 2018 Growth 2010* 2018 Change
25-005-1004 Fall River 386,913 476,726 23% 6% 7% 1%
25-009-2006 Lynn 445,800 591,026 33% 7% 9% 2%
25-009-5005 Haverhill 227,031 413,740 82% 4% 6% 2%
25-013-0008 Chicopee 248,630 230,123 -7% 4% 4% 0%
25-015-4002 Ware 117,547 118,289 1% 2% 2% 0%
25-025-0002 Boston - Kenmore 883,390 1,051,918 19% 15% 16% 1%
25-025-0042 Boston - Harrison Ave 183,079 347,811 90% 3% 5% 2%
25-027-0023 Worcester - Summer St 440,462 730,898 66% 7% 11% 4%
25-025-0044 Boston - Von Hillern 259,286 274,168 59% 4% 4% 0%
25-023-0005 Brockton 717,147 758,288 23% 12% 12% 0%
25-011-2005 Greenfield 101,945 100,576 -1% 2% 2% 0%
25-003-6001 North Adams NA 43,769 NA NA 1% NA
25-013-0018 Springfield NA 402,000 NA NA 6% NA
25-017-0010 Chelmsford - Near Road NA 538,361 NA NA 8% NA
25-003-0008 Pittsfield NA 105,701 NA NA 2% NA
25-021-2004 Weymouth NA 265,694 NA NA 4% NA
Site ID Site Name
2018 Demographics PM2.5 Monitoring
Age < 15 Age 65+ Sensitive Minority Monitor
Type Probability >35 µg/m3
25-005-1004 Fall River 80,358 79,569 159,927 80,497 FEM <10%
25-009-2006 Lynn 104,858 91,124 195,982 155,954 FEM <10%
25-009-5005 Haverhill 83,242 50,998 134,240 152,496 FRM/FEM <10%
25-013-0008 Chicopee 35,442 32,382 67,824 70,392 FRM/FEM <10%
25-015-4002 Ware 21,435 15,755 37,190 9,671 FEM <10%
25-025-0002 Boston - Kenmore 150,018 130,916 280,934 330,106 FRM <10%
25-025-0042 Boston - Harrison Ave 64,715 44,805 109,520 216,548 FRM/FEM <10%
25-027-0023 Worcester - Summer St 140,249 92,630 232,879 183,714 FRM/FEM <10%
25-025-0044 Boston - Von Hillern 44,994 29,680 74,674 180,097 FRM/FEM <10%
25-023-0005 Brockton 137,536 120,203 257,739 139,654 FRM/FEM <10%
25-011-2005 Greenfield 15,649 15,022 30,671 9,940 FRM/FEM <10%
25-003-6001 North Adams 6,495 7,806 14,301 3,572 FEM <10%
25-013-0018 Springfield 75,991 56,132 132,123 168,692 FRM/FEM <10%
25-017-0010 Chelmsford - Near Road 107,098 68,816 175,914 122,749 FEM <10%
25-003-0008 Pittsfield 16,627 19,670 36,297 11,621 FEM <10%
25-021-2004 Weymouth 47,333 42,192 89,525 50,686 FEM <10% Source: U.S. Census through NetAssess2020 * As stated in the 2015 Network Assessment which included additional sites that have since been shut down.

20
MassDEP 2020 Network Assessment
Notes about Figure 3-4:
▪ Changes to the PM2.5 network since the 2015 assessment:
- North Adams, Chelmsford – Near Road, and Weymouth sites were added.
- Monitors at Milton – Blue Hill, Lawrence, North End, and Worcester – Washington
Street sites were discontinued.
- Springfield and Pittsfield sites were moved to new locations within the same municipal
boundaries.
▪ Most sites experienced significant population gains since 2010. Only two sites experienced
population losses: Chicopee (-7%) and Greenfield (-1%).
▪ The Boston – Kenmore, Brockton and Worcester – Summer Street polygons serve the largest
populations. Together these three sites account for 41% of the total population served. North
Adams serves the smallest population at about 1%.
▪ The largest change in total population served and population share is at Worcester – Summer
Street (+290,436 and +4%).
▪ Sensitive populations at all sites account for between 27% to 34% of the populations served.
Boston – Kenmore and Boston – Von Hillern showed the lowest sensitive population share
(27%), while Fall River, Brockton, Pittsfield and Weymouth showed the highest sensitive
population share (34%).
▪ Boston – Von Hillern serves the highest minority population by percentage (66%) and Boston
– Kenmore serves the largest minority population in total (330,106).
▪ All sites in the network have very low (<10%) probabilities of exceeding the 24-hour PM2.5
NAAQS of 35 µg/m3.

21
MassDEP 2020 Network Assessment
Figure 3-5
Change in Population in Voronoi Polygon for Each Ozone Monitor: 2018 to 2010
Site ID
Site Name
Population Served % of Total Population Served
2010 2018 Growth 2010* 2018 Change
25-001-0002 Truro 114,294 127,567 12% 2% 2% 0%
25-005-1004 Fall River 195,043 232,712 19% 3% 4% 1%
25-009-2006 Lynn 530,743 648,062 22% 9% 10% 1%
25-009-5005 Haverhill 377,233 423,004 12% 6% 7% 1%
25-013-0008 Chicopee 544,158 544,158 0% 9% 8% -1%
25-015-4002 Ware 83,452 79,877 -4% 1% 1% 0%
25-021-3003 Milton - Blue Hill 486,526 460,672 -5% 8% 7% -1%
25-025-0042 Boston - Harrison Ave 1,372,383 1,384,784 1% 22% 22% 0%
25-027-0015 Worcester - Airport 474,637 474,595 0% 8% 7% -1%
25-007-0001 Aquinnah 40,167 59,299 48% 1% 1% 0%
25-017-0009 Chelmsford - EPA 465,395 458,645 -1% 8% 7% -1%
25-027-0024 Uxbridge 446,291 446,291 0% 7% 7% 0%
25-005-1006 Fairhaven 265,898 306,157 15% 4% 5% 1%
25-023-0005 Brockton 501,608 551,096 10% 8% 9% 1%
25-011-2005 Greenfield 105,142 101,933 -3% 2% 2% 0%
25-003-0008 Pittsfield NA 123,680 NA NA 2% NA
Site ID
Site Name
2018 Demographics O3 Probability of Exceeding 70 ppb Age < 15 Age 65+ Sensitive Minority
25-001-0002 Truro 16,114 34,431 50,545 12,547 <10%
25-005-1004 Fall River 39,200 38,122 77,322 25,811 10%-25%
25-009-2006 Lynn 115,184 98,302 213,486 179,593 50%-75%
25-009-5005 Haverhill 85,646 51,886 137,532 155,146 <10%
25-013-0008 Chicopee 97,034 74,899 171,933 224,822 >90%
25-015-4002 Ware 14,399 10,628 25,027 7,282 25%-50%
25-021-3003 Milton - Blue Hill 89,968 68,119 158,087 121,186 <10%
25-025-0042 Boston - Harrison Ave 200,278 164,999 365,277 625,171 <10%
25-027-0015 Worcester - Airport 88,739 61,561 150,300 136,172 10%-25%
25-007-0001 Aquinnah 8,703 12,942 21,645 7,768 <10%
25-017-0009 Chelmsford - EPA 91,900 58,353 150,253 108,362 <10%
25-027-0024 Uxbridge 89,362 54,895 144,257 86,467 10%-25%
25-005-1006 Fairhaven 53,999 48,096 102,095 57,709 <10%
25-023-0005 Brockton 107,889 74,783 182,672 109,068 <10%
25-011-2005 Greenfield 15,908 15,240 31,148 9,976 <10%
25-003-0008 Pittsfield 19,241 23,076 42,317 12,891 10%-25% Source: U.S. Census through NetAssess2020 * As stated in the 2015 Network Assessment, which included additional sites that have since been shut down.
22
MassDEP 2020 Network Assessment
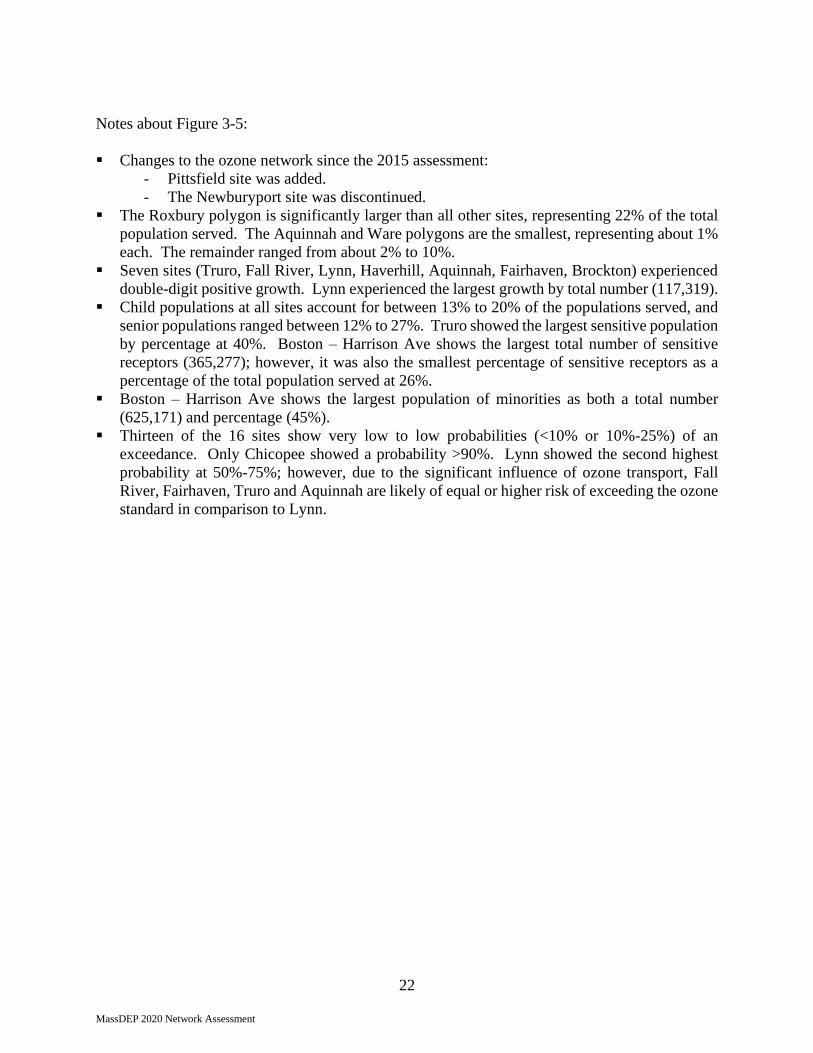
Notes about Figure 3-5:
▪ Changes to the ozone network since the 2015 assessment:
- Pittsfield site was added.
- The Newburyport site was discontinued.
▪ The Roxbury polygon is significantly larger than all other sites, representing 22% of the total
population served. The Aquinnah and Ware polygons are the smallest, representing about 1%
each. The remainder ranged from about 2% to 10%.
▪ Seven sites (Truro, Fall River, Lynn, Haverhill, Aquinnah, Fairhaven, Brockton) experienced
double-digit positive growth. Lynn experienced the largest growth by total number (117,319).
▪ Child populations at all sites account for between 13% to 20% of the populations served, and
senior populations ranged between 12% to 27%. Truro showed the largest sensitive population
by percentage at 40%. Boston – Harrison Ave shows the largest total number of sensitive
receptors (365,277); however, it was also the smallest percentage of sensitive receptors as a
percentage of the total population served at 26%.
▪ Boston – Harrison Ave shows the largest population of minorities as both a total number
(625,171) and percentage (45%).
▪ Thirteen of the 16 sites show very low to low probabilities (<10% or 10%-25%) of an
exceedance. Only Chicopee showed a probability >90%. Lynn showed the second highest
probability at 50%-75%; however, due to the significant influence of ozone transport, Fall
River, Fairhaven, Truro and Aquinnah are likely of equal or higher risk of exceeding the ozone
standard in comparison to Lynn.

23
MassDEP 2020 Network Assessment
Figure 3-6
Change in Population in Voronoi Polygon for Each NO2 Monitor: 2010 to 2018
Site ID
Site Name
Population Served % of Total Population Served
2010 2018 Growth 2010* 2018 Change
25-009-2006 Lynn 681,639 753,187 10% 12% 12% 0%
25-013-0008 Chicopee 331,622 374,856 13% 6% 6% 0%
25-015-4002 Ware 262,804 271,701 3% 5% 4% -1%
25-021-3003 Milton - Blue Hill 1,094,820 1,137,954 4% 19% 18% -1%
25-025-0002 Boston - Kenmore 1,091,887 934,098 -14% 19% 15% -4%
25-025-0042 Boston - Harrison Ave 186,988 186,988 0% 3% 3% 0%
25-027-0023 Worcester - Summer Street 799,807 860,631 8% 14% 14% 0%
25-025-0044 Boston - Von Hillern 429,349 450,782 5% 7% 7% 0%
25-013-0018 Springfield NA 522,583 NA NA 8% NA
25-017-0010 Chelmsford - Near Road NA 768,618 NA NA 12% NA
Site ID
Site Name
2018 Demographics
Age < 15 Age 65+ Sensitive Minority
25-009-2006 Lynn 132,700 116,333 249,033 165,832
25-013-0008 Chicopee 58,675 56,190 114,865 84,981
25-015-4002 Ware 45,891 38,508 84,399 21,679
25-021-3003 Milton - Blue Hill 212,030 174,915 386,945 250,725
25-025-0002 Boston - Kenmore 126,031 114,871 240,902 297,795
25-025-0042 Boston - Harrison Ave 33,944 19,425 53,369 159,365
25-027-0023 Worcester - Summer Street 163,919 109,102 273,021 207,501
25-025-0044 Boston - Von Hillern 75,528 60,569 136,097 207,683
25-013-0018 Springfield 95,539 76,348 171,887 181,407
25-017-0010 Chelmsford - Near Road 155,249 96,824 252,073 264,697 Source: U.S. Census through NetAssess2020 * As stated in the 2015 Network Assessment which included additional sites that have since been shut down.
Notes about Figure 3-6:
▪ Changes to the NO2 network since the 2015 assessment:
- The Chelmsford – Near Road site was added.
- The Newburyport site was discontinued.
- The Springfield site was moved to a new location within the same municipal
boundaries.
▪ Child populations at all sites account for between 13% to 20% of the populations served, and
senior populations ranged between 10% to 15%. Blue Hill shows the largest sensitive
population by percentage at 34% and by total number (386,945).
▪ Boston – Harrison Ave shows the largest population of minorities by percentage (85%);
however, Boston – Kenmore shows the largest by total number (297,795).

24
MassDEP 2020 Network Assessment
▪ The population share for individual monitors may not be as significant for NO2 as traffic counts
and congestion since NO2 is primarily a mobile source pollutant in Massachusetts, which limits
the utility of the polygon analysis for NO2.
Figure 3-7
Change in Population in Voronoi Polygon for Each SO2 Monitor: 2010 to 2018
Site ID Site Name
Population Served % of Total Population Served
2010 2018 Growth 2010* 2018 Change
25-005-1004 Fall River 720,610 902,163 25% 13% 14% 1%
25-015-4002 Ware 223,576 253,751 13% 4% 4% 0%
25-025-0002 Boston - Kenmore 1,845,482 1,853,376 0% 34% 29% -5%
25-025-0042 Boston - Harrison Ave 1,181,913 1,264,640 7% 22% 20% -2%
25-027-0023 Worcester - Summer Street 833,068 867,746 4% 15% 13% -2%
25-013-0018 Springfield 607,176 1,328,609 119% 11% 21% 9%
Site ID
Site Name
2018 Demographics
Age < 15 Age 65+ Sensitive Minority
25-005-1004 Fall River 148,566 158,758 307,324 129,111
25-015-4002 Ware 40,110 33,524 73,634 29,127
25-025-0002 Boston - Kenmore 300,050 246,754 546,804 556,354
25-025-0042 Boston - Harrison Ave 230,132 171,136 401,268 509,587
25-027-0023 Worcester - Summer Street 166,251 110,391 276,642 202,125
25-013-0018 Springfield 242,876 184,840 427,716 555,225 Source: U.S. Census through NetAssess2020 * As stated in the 2015 Network Assessment which included additional sites that have since been shut down.
Notes about Figure 3-7:
▪ Changes to the SO2 network since the 2015 assessment:
- The Springfield site was moved to a new location within the same municipal
boundaries.
▪ Springfield shows a significant change in population (+119%) compared to 2010. This may
be due to changes in Connecticut’s monitoring network. According to the NetAssess2020 tool,
the Springfield polygon covers a large portion of Connecticut, including portions of Hartford.
▪ Child populations at all sites account for between 16% to 19% of the populations served, and
senior populations ranged between 13% to 18%. Boston - Kenmore shows the largest sensitive
population by total number (546,804); however, all show sensitive populations in the range of
29% to 34% of populations served.
▪ Springfield and Boston – Harrison Ave show the largest population of minorities by percentage
(42% and 40%); however, Boston – Kenmore shows the largest by total number (556,354).
▪ The population share for individual monitors may not be as significant for SO2 as the location
of large stationary sources since SO2 is primarily a point source pollutant, which limits the
utility of the polygon analysis.

25
MassDEP 2020 Network Assessment
Since Massachusetts’ population distribution has remained largely stable since 2010 and no
significant shifts are expected in the future, MassDEP does not believe that it needs to change its
network design based on population distribution.
Sensitive Populations
Children
The U.S. Census estimates that in 2017 there were 1,383,532 persons under the age of 18 years in
Massachusetts comprising 20.4% of the population (down from about 21% in 2013).1 Figure 3-8
shows the distribution of children by census tract for the state and Boston area. This distribution
of children closely matches that of the general population. Figure 3-9 shows asthma prevalence
in children throughout the state. Because the state is well covered by ozone and PM2.5 monitors,
the monitoring network provides good coverage for where children live and where pediatric
asthma prevalence may be higher.
Elderly
The U.S. Census estimates that in 2017 there were 1,049,751 persons 65 years or older in
Massachusetts comprising about 15.5% of the population.2 Figure 3-10 shows the distribution of
elders by census tract for the state and Boston area. This distribution closely matches that of the
general population as shown in Figure 3-1.1. Because the state is well covered by ozone and PM2.5
monitors, the monitoring network provides good coverage for where persons 65 years or older
live.
1 U.S. Census Bureau, 2013-2017 American Community Survey 5-Year Estimates
https://factfinder.census.gov/faces/tableservices/jsf/pages/productview.xhtml?pid=ACS_17_5YR_DP05&prodType
=table 2 U.S. Census Bureau, 2013-2017 American Community Survey 5-Year Estimates
https://factfinder.census.gov/faces/tableservices/jsf/pages/productview.xhtml?pid=ACS_17_5YR_DP05&prodType
=table

26
MassDEP 2020 Network Assessment
Figure 3-8
Children Under 18 year in 2017 by Census Tract
Source: U.S. Census Bureau, 2013-2017 American Community Survey 5-Year Estimates https://factfinder.census.gov/faces/tableservices/jsf/pages/productview.xhtml?pid=ACS_17_5YR_DP05&prodType=table

27
MassDEP 2020 Network Assessment
Figure 3-9
Pediatric Asthma Prevalence per 100 Students School Years 2016-2017 Ages 5-14
Source: Massachusetts Environmental Public Health Tracking system https://matracking.ehs.state.ma.us/Health-Data/Asthma/index.html

28
MassDEP 2020 Network Assessment
Figure 3-10
Persons 65 years and Over in 2017 by Census Tract
Source: U.S. Census Bureau, 2013-2017 American Community Survey 5-Year Estimates https://factfinder.census.gov/faces/tableservices/jsf/pages/productview.xhtml?pid=ACS_17_5YR_DP05&prodType=table

29
MassDEP 2020 Network Assessment
Environmental Justice Populations
Figure 3-14 shows environmental justice (EJ) communities with monitoring stations overlaid. In
Massachusetts a community is identified as an EJ community if any of the following are true:
• Block group whose annual median household income is equal to or less than 65 percent of
the statewide median; or
• 25% or more of the residents identify as a race other than white; or
• 25% or more of households have no one over the age of 14 who speaks English only or
very well.
Based on the location of pollutant-specific monitors (as described in Section VI below), the
following observations can be made:
▪ PM2.5 – Most of the larger clusters of urban EJ areas are adequately covered by PM2.5 monitors.
Urban EJ areas without PM2.5 monitors (e.g., Leominster/Fitchburg and Framingham)
generally would be expected to experience levels similar to other urban areas. Likewise, rural
EJ areas in Western Massachusetts would be expected to experience levels similar to rural
monitors in North Adams, Greenfield and Pittsfield. Importantly, PM2.5 levels are well below
the National Ambient Air Quality Standards statewide.
▪ Ozone – The state is adequately covered by ozone monitors, and levels do not vary dramatically
over small distances.
▪ NO2 – The near-road monitors at Chelmsford – Near Road and Boston – Von Hillern are
designed to measure a maximum exposure level, and therefore generally would cover other
areas of the state.
▪ SO2 – The last coal-fired power station in Massachusetts, Brayton Point in Somerset, discontinued
operations in 2017. SO2 values throughout the state have remained very low for several years.
▪ CO – CO levels are so very low and have not been a concern for many years.

30
MassDEP 2020 Network Assessment
Figure 3-11
Massachusetts EJ Populations 2010 – Income, Race, Language

31
MassDEP 2020 Network Assessment
Source: MassGIS Environmental Justice Viewer http://maps.massgis.state.ma.us/map_ol/ej.php

32
MassDEP 2020 Network Assessment
IV. AIR QUALITY SUMMARY
MassDEP believes that emissions trends in Massachusetts do not suggest a need to change the
distribution of monitors throughout the state for the following reasons:
• The decline in emissions has been uniform across the State;
• The number of new major point sources is limited and those that are permitted are well
controlled;
• Existing point sources are emitting less;
• The monitoring network is designed to characterize highest concentrations and general
background concentrations and population exposures rather than the impacts of individual
sources; and
• There has been no significant change in population or distribution of vehicle miles travelled
across the state and therefore limited change in the distribution of area and mobile source
emissions across the state.
Ozone and PM2.5 continue to be important pollutants to monitor and MassDEP maintains an
extensive ozone and PM2.5 monitoring network. Several ozone monitors are located in the southern
and eastern part of the state where ozone transport entering the state is most likely to occur.
MassDEP monitors PM2.5 and black carbon to characterize wood smoke emissions. Continuous
and filter-based PM2.5 monitors are located throughout the state. Black carbon monitors are located
at Boston – Roxbury, Boston – Von Hillern, Chelmsford – Near Road, Greenfield, North Adams,
Pittsfield, and Springfield.

33
MassDEP 2020 Network Assessment
National Ambient Air Quality Standards
Figure 4-1 shows the National Ambient Air Quality Standards (NAAQS) for the six criteria
pollutants: ozone (O3); nitrogen dioxide (NO2); particulate matter (PM10 and PM2.5); carbon
monoxide (CO); sulfur dioxide (SO2); and lead (Pb). EPA has classified Massachusetts as
“attainment / unclassified” for all the NAAQS.
Figure 4-1
National Ambient Air Quality Standards
Pollutant Primary/
Secondary
Averaging
Time Level Form
Carbon
Monoxide primary
8-hour 9 ppm Not to be exceeded more than
once per year 1-hour 35 ppm
Lead
primary
and
secondary
Rolling 3-month
average 0.15 μg/m3 Not to be exceeded
Nitrogen
Dioxide
primary 1-hour 100 ppb 98th percentile, averaged over
3 years
primary and
secondary Annual 0.053 ppm Annual Mean
Ozone primary and
secondary 8-hour 0.070 ppm
Annual fourth-highest daily
maximum 8-hr concentration,
averaged over 3 years
Particle
Pollution
PM2.5
primary Annual 12 μg/m3 annual mean, averaged over 3
years
secondary Annual 15 μg/m3 annual mean, averaged over 3
years
primary and
secondary 24-hour 35 μg/m3
98th percentile, averaged over
3 years
PM10 primary and
secondary 24-hour 150 μg/m3
Not to be exceeded more than
once per year on average over
3 years
Sulfur Dioxide
primary 1-hour 75 ppb
99th percentile of 1-hour daily
maximum concentrations,
averaged over 3 years
secondary 3-hour 0.5 ppm Not to be exceeded more than
once per year

34
MassDEP 2020 Network Assessment
Emissions Inventory Summary
Reductions in air pollution emissions since 1990 have led to significant improvements in air
quality in Massachusetts. Figure 4-2 shows emissions reductions based on Massachusetts
emissions inventory data from 1990 to 2017 (the most recent published inventory) and EPA
projections to 2028, which show that the downward trends are expected to continue.
Figure 4-2
Source: MassDEP emissions inventories (file: Emissions by Pollutant County 2020.xlsx)
* Projected emissions from EPA 2016 Modeling Platform: ftp://newftp.epa.gov/air/emismod/2016/v1/reports/ Note: CO tons divided by 10 for ease of display with the other pollutants.
Vehicles make up one of the largest sources of VOC and NOx emissions. Vehicle miles travelled
(VMT) indicate the relative distribution and magnitude of those emissions. In the past, as VMT
Actual Decline to 2017
SO2 down 98%
NOx down 73%
CO down 88%
VOC down 69%
PM2.5
down 66%

35
MassDEP 2020 Network Assessment
increased, emissions increased. Today, due to new cleaner vehicles in the fleet, VMT does not
always result in increased emissions.
Figure 4-3 shows there has been little change in the distribution of VMT across the state, and
projections from the Massachusetts Department of Transportation (MassDOT) indicate this
general distribution is expected to remain constant into the future. The one exception is Worcester
County, where VMT is expected to rise gradually at a higher rate than other areas of the state. This
change in VMT in Worcester County is not deemed significant for the purpose of designing the
monitoring network.
Figure 4-3 Source: MassDOT Planning – emails from Bob Frey 5/15/2017 and 5/2/2019. Underlying sources: Highway Performance Monitoring System
(HPMS), MassDOT Traffic Counting Program Data, Massachusetts Statewide Travel Demand Model, MassDOT Planning staff calculations. (file:
VMT Massachusetts by County 2020.xlsx)

36
MassDEP 2020 Network Assessment
Distribution of Emission Reductions
Figure 4-4 shows that emissions reductions have been relatively uniform across the state.
Figure 4-4
Emissions Reduction by Pollutant and County 1990 – 2017
County Pollutant 1990* 2002 2005 2011 2014 2017 % change
1990 - 2017
Barnstable CO 213,453 201,372 210,206 47,949 41,556 37,259 -83%
Barnstable NOx 18,652 23,181 12,723 8,141 7,356 5,928 -68%
Barnstable PM2.5 3,603 4,074 3,346 1,491 1,281 913 -75%
Barnstable SO2 63,372 28,445 28,276 1,309 512 146 -100%
Barnstable VOC 19,681 21,209 15,975 8,245 7,636 7,329 -63%
Berkshire CO 98,671 54,441 27,745 30,996 26,863 24,085 -76%
Berkshire NOx 10,665 8,349 6,105 4,364 3,943 3,178 -70%
Berkshire PM2.5 4,315 2,414 2,393 2,631 2,260 1,612 -63%
Berkshire SO2 10,629 1,962 2,521 707 276 79 -99%
Berkshire VOC 14,161 11,139 7,869 5,676 5,256 5,045 -64%
Bristol CO 447,624 188,978 160,148 58,119 50,369 45,161 -90%
Bristol NOx 62,226 28,237 23,756 12,619 11,402 9,189 -85%
Bristol PM2.5 5,223 5,874 5,843 2,786 2,394 1,706 -67%
Bristol SO2 103,652 48,701 41,578 20,516 8,018 2,287 -98%
Bristol VOC 32,154 24,870 19,159 11,125 10,303 9,888 -69%
Dukes CO 25,104 24,053 20,948 12,283 10,645 9,544 -62%
Dukes NOx 696 4,291 2,119 2,544 2,299 1,853 -57%
Dukes PM2.5 532 895 738 744 639 456 -49%
Dukes SO2 229 1,557 313 526 206 59 -96%
Dukes VOC 4,248 3,398 2,460 2,466 2,284 2,192 -48%
Essex CO 606,854 264,599 233,286 90,005 78,004 69,938 -88%
Essex NOx 48,276 25,299 21,906 16,523 14,930 12,032 -75%
Essex PM2.5 6,114 3,457 4,525 4,050 3,480 2,481 -59%
Essex SO2 56,349 20,259 17,201 6,233 2,436 695 -99%
Essex VOC 50,166 30,433 26,192 16,435 15,220 14,608 -71%
Franklin CO 131,409 78,095 53,340 22,215 19,166 17,184 -87%
Franklin NOx 6,726 5,950 3,971 2,856 2,581 2,080 -69%
Franklin PM2.5 2,914 2,342 2,324 2,140 1,839 1,311 -55%
Franklin SO2 2,370 895 1,029 567 222 63 -97%
Franklin VOC 12,687 8,581 30,042 4,691 4,344 4,170 -67%
Hampden CO 403,137 207,516 166,954 62,090 53,811 48,247 -88%
Hampden NOx 26,049 19,981 10,861 10,827 9,783 7,884 -70%
Hampden PM2.5 4,830 3,940 3,858 3,400 2,921 2,083 -57%
Hampden SO2 20,242 9,851 9,710 2,453 959 273 -99%
Hampden VOC 25,328 20,105 16,192 11,505 10,655 10,226 -60%

37
MassDEP 2020 Network Assessment
Hampshire CO 155,653 87,955 63,832 24,911 21,589 19,357 -88%
Hampshire NOx 7,683 5,698 4,337 3,539 3,198 2,577 -66%
Hampshire PM2.5 2,905 2,512 2,498 2,206 1,895 1,351 -53%
Hampshire SO2 3,248 1,000 1,526 587 229 65 -98%
Hampshire VOC 12,788 9,191 6,382 4,170 3,862 3,707 -71%
Middlesex CO 1,194,565 686,832 581,188 157,134 136,182 122,101 -90%
Middlesex NOx 62,563 49,016 43,608 26,233 23,704 19,103 -69%
Middlesex PM2.5 12,491 7,391 7,418 5,459 4,690 3,344 -73%
Middlesex SO2 36,758 14,068 15,249 5,336 2,085 595 -98%
Middlesex VOC 87,722 62,071 54,218 27,230 25,217 24,203 -72%
Nantucket CO 16,927 21,379 15,134 7,082 6,138 5,503 -67%
Nantucket NOx 2,325 18,760 644 1,139 1,029 829 -64%
Nantucket PM2.5 302 1,899 611 270 232 165 -45%
Nantucket SO2 625 10,541 99 271 106 30 -95%
Nantucket VOC 2,612 2,890 1,632 1,161 1,075 1,032 -60%
Norfolk CO 620,449 430,702 375,218 74,817 64,841 58,136 -91%
Norfolk NOx 27,280 28,588 25,053 13,135 11,869 9,565 -65%
Norfolk PM2.5 5,560 3,931 3,899 2,556 2,196 1,566 -72%
Norfolk SO2 10,548 4,137 4,270 2,796 1,093 312 -97%
Norfolk VOC 42,215 33,557 27,741 12,847 11,897 11,419 -73%
Plymouth CO 391,226 193,139 168,608 60,471 52,408 46,989 -88%
Plymouth NOx 18,899 13,313 11,060 10,417 9,413 7,586 -60%
Plymouth PM2.5 6,851 4,191 4,147 2,808 2,412 1,720 -75%
Plymouth SO2 7,606 3,005 2,723 2,463 963 275 -96%
Plymouth VOC 36,613 22,757 16,980 11,279 10,445 10,025 -73%
Suffolk CO 388,528 202,518 178,554 53,251 46,151 41,379 -89%
Suffolk NOx 59,772 21,453 18,719 14,784 13,359 10,766 -82%
Suffolk PM2.5 6,075 1,781 2,403 2,241 1,925 1,373 -77%
Suffolk SO2 21,869 5,787 5,367 4,388 1,715 489 -98%
Suffolk VOC 25,017 20,254 18,613 11,059 10,242 9,830 -61%
Worcester CO 701631 421,181 366,744 101,129 87,645 78,582 -89%
Worcester NOx 37,342 32,895 28,065 17,606 15,908 12,821 -66%
Worcester PM2.5 10,254 6,882 7,941 7,556 6,492 4,628 -55%
Worcester SO2 14,381 6,159 6,837 3,600 1,407 401 -97%
Worcester VOC 52,203 42,911 34,030 18,682 17,301 16,606 -68%
Statewide CO 5,395,231 3,062,760 2,621,905 802,452 695,368 623,465 -88%
Statewide NOx 389,154 285,011 212,927 144,727 130,774 105,391 -73%
Statewide PM2.5 71,969 51,583 51,944 40,338 34,656 24,709 -66%
Statewide SO2 351,878 156,367 136,699 51,752 20,227 5,769 -98%
Statewide VOC 417,595 313,366 277,485 146,571 135,737 130,280 -69% Source: 2017 data: EPA NEI v.1.0 -- EIS Gateway report download (file: Emissions by Pollutant County 2020.xlsx) 2014 data: EPA NEI v.2 -- EIS Gateway report download 2011 data: MassDEP 2011 Emissions Inventory (http://www.mass.gov/eea/agencies/massdep/air/reports/emissions-inventories.html) 2005 data: State and County Emission Summaries http://www.epa.gov/air/emissions/index.htm 1990 and 2002 data: Air Data: Access to Air Pollution Data Reports and Maps http://www.epa.gov/air/data/geosel.html * For 1990, VOC, NOx and CO were estimated by multiplying TPSD from Table 1.2 of Section 1 of MA 2014 PEI Report by 312 days (52wks x 6days). Value estimate for 1990 for NOx for Dukes county appears anomalous and so reductions were calculated from 2002 instead of 1990. Note: Used the county percent from 2011 and applied to 2014 and 2017 statewide values

38
MassDEP 2020 Network Assessment
V. POLLUTANT NETWORK STATUS
Section V summarizes the status of the ambient air quality monitoring for each of the following
pollutants:
• Particulate matter (PM) (including speciation and air toxics)
• Ozone (O3) (including PAMS monitoring)
• Carbon monoxide (CO)
• Lead (Pb)
• Sulfur dioxide (SO2)
• Nitrogen dioxide (NO2) (including NOx, other oxides of nitrogen)
The following topics are covered for each of these pollutants:
• Monitor locations/descriptions/purposes
• Coverage area
• Monitoring data
• Technological issues
• Adequacy of the Monitoring Network including, for ozone and PM2.5, Correlations, New Sites
Analysis, and Removal Bias Data
• Analysis results
Section V also assesses the Meteorological Network and describes Quality Assurance and Quality
Control (QA/QC) activities.

39
MassDEP 2020 Network Assessment
Particulate Matter (PM)
Network Description
MassDEP operates PM monitors at 16 locations across the Commonwealth. The National Park
Service and Wampanoag Tribe operate PM monitors at two additional locations for the Interagency
Monitoring of Protected Visual Environments (IMPROVE) program. At least one monitor is
located in each county except for Norfolk and Nantucket. The PM network consists of:
• PM10 – 3 sites:
- All with low volume samplers.
- One (Boston-Harrison Avenue) with collocated low-volume samplers. Filters from this
site are analyzed for toxic elements as part of the National Air Toxics Trends Stations
(NATTS) air monitoring program and for lead as required by the NCore program.
• PM2.5 – 18 sites:
- 15 Federal Equivalent Method (FEM) sites, nine of which are collocated with Federal
Reference Method (FRM) samplers. Data from all sites in MassDEP’s FEM network are
currently used to determine compliance with the PM2.5 NAAQS. FEMs provide the hourly
PM2.5 data that appears on MassDEP’s website.
- Ten FRM PM2.5 sites. One (Chicopee) with collocated samplers. Five sites are on a 1-in-
3 day schedule and five sites are on a 1-in 6 day schedule.
- Two IMPROVE samplers operated by the National Park Service and Wampanoag Tribe
are on a 1-in-3 day schedule.
• PMcoarse (PM10 – PM2.5) – One site in compliance with NCore requirements at the designated
NCore site at Boston-Harrison Avenue.
• Speciated PM2.5 – Four sites:
- Two FRM sites (Boston-Harrison Avenue and Chicopee). The speciated PM2.5 program is
designed to determine some of the chemical constituents (elements, sulfates, nitrates,
carbon species) that are contained in PM2.5, which can provide information about the
sources of the PM.
- Two IMPROVE sampling sites (Truro and Aquinnah – Martha’s Vineyard) that provide
speciated PM2.5 data. The IMPROVE program measures, at rural locations, parameters that
are similar to those measured by the speciation program. The data are used to evaluate the
role of fine particulates and their constituents in the degradation of visibility.
Figure 5-1 lists the particulate matter sites, their location, type of monitoring and purpose of the
monitoring.

44
Figure 5-1
PM Monitoring Sites
Site ID Site Name Scale Reason for Monitor Date
Established MSA / MiSA PM Type
25-025-0002 Boston - Kenmore Micro Highest Concentration; Pop Exposure 1/1/1965 Boston-Cambridge-Newton FRM
25-025-0042 Boston - Harrison Ave Neighborhood Population Exposure 12/15/1998 Boston-Cambridge-Newton PM10, FRM, FEM
25-025-0044 Boston - Von Hillern Middle Pop Exposure; Highest Concentration 6/15/2013 Boston-Cambridge-Newton FRM, FEM
25-023-0005 Brockton Neighborhood Population Exposure 6/30/2013 Boston-Cambridge-Newton FRM, FEM
25-017-0010 Chelmsford - Near Road Middle Population Exposure 7/1/2018 Boston-Cambridge-Newton FEM
25-013-0008 Chicopee Urban Population Exposure 1/1/1983 Springfield FRM, FEM
25-005-1004 Fall River Neighborhood Population Exposure 2/1/1975 Providence-Warwick FEM
25-011-2005 Greenfield Neighborhood Population Exposure 1/1/2014 Greenfield Town FRM, FEM
25-009-5005 Haverhill Neighborhood Population Exposure 7/19/1994 Boston-Cambridge-Newton FRM, FEM
25-009-2006 Lynn Neighborhood PAMS - Max Precursor O3; Pop Exposure 1/1/1992 Boston-Cambridge-Newton FEM
25-003-6001 North Adams Neighborhood Population Exposure 7/1/2017 Pittsfield FEM
25-003-0008 Pittsfield Neighborhood Population Exposure 7/1/2018 Pittsfield FEM
25-013-0018 Springfield Urban Highest Concentration; Pop Exposure 5/1/2018 Springfield FRM, FEM
25-001-0002 Truro Regional General Background 4/1/1987 Barnstable IMPROVE
25-015-4002 Ware Urban Highest O3; Background other pollutants 6/1/1985 Springfield PM10, FEM
25-021-2004 Weymouth Neighborhood Population Exposure 2/4/2020 Boston-Cambridge-Newton FEM
25-027-0023 Worcester - Summer St Urban Population Exposure 1/1/2004 Worcester PM10, FRM, FEM
25-007-0001 Aquinnah Regional Regional 4/1/2004 Vineyard Haven IMPROVE
MSA = Metropolitan Statistical Area MiSA = Micropolitan Statistical Area

45
MassDEP 2020 Network Assessment
Monitor Area Served
Figure 5-2 shows the area served by each PM2.5 monitor as defined by Voroni polygons. These
polygons were developed using EPA’s NetAssess tool. The polygons show that the state is well
covered by monitors in Massachusetts or in neighboring states.
Figure 5-2
Area Served – PM2.5 FRM and FEM sites
Source: NetAssess2020 v1.1 Ambient Air Monitoring Network Assessment Tool https://sti-r-shiny.shinyapps.io/EPA_Network_Assessment/. Notes: Co-located PM2.5 monitors are treated as a single location. One site (Weymouth - 25-021-2004) was established after the NetAssess2020 tool was compiled; therefore the site was added manually using functions in the NetAssess2020 tool.

46
MassDEP 2020 Network Assessment
PM MONITORING DATA
2019 PM10 Data Summary
Figure 5-3 shows a summary of 2019 PM10 data. All values are well below applicable NAAQS.
Figure 5-3
2019 PM10 FRM Annual Data Summary (µg/m3)
1ST 2ND 3RD 4TH DAYS MAX MAX MAX MAX MAX ARITH City County Address 24-HR 24-HR 24-HR 24-HR >STD MEAN
Boston Suffolk Harrison Avenue 27 27 22 20 0 10.1
Boston Suffolk Harrison Avenue* 28 22 20 19 0 9.9
Ware Hampshire Skyline Drive 17 15 15 13 0 6.0
Worcester Worcester Summer St 52 37 33 27 0 12.7 Standard: 24-hour = 150 µg/m3 * = Collocated monitors 1ST, 2ND, 3RD, 4TH 24-HR MAX = 1ST, 2ND, 3RD, and 4TH Highest 24-hr Values for the Year ARITH MEAN = Annual Arithmetic Mean
PM10 Trends
Figure 5-4 shows trends for each PM10 monitor relative to the 24-hour standard of 150 μg/m3.
Figure 5-4
PM10 Trends 2010-2019 Annual Arithmetic Mean

47
MassDEP 2020 Network Assessment
PM2.5 2019 Data Summary
Figure 5-5 shows a summary of the 2019 FRM PM2.5 data. All values are well below applicable
NAAQS.
Figure 5-5
2019 PM2.5 FRM Annual Data Summary (µg/m3)
1ST 2ND 3RD 4TH 98TH MAX MAX MAX MAX PECENTILE ARITH City County Address 24-HR 24-HR 24-HR 24-HR 24-HR MEAN
Boston Suffolk Kenmore Square 15.0 13.3 12.9 12.7 12.9 5.67
Boston Suffolk Harrison Avenue 13.5 13.2 13.0 12.1 13.0 5.22
Boston Suffolk Von Hillern Street 12.0 12.0 11.7 11.6 12.0 5.66
Brockton Plymouth Clinton Street 12.2 11.6 11.5 9.9 11.6 4.82
Chicopee Hampden Anderson Road 13.4 12.9 12.7 12.4 12.7 4.98
Chicopee Hampden Anderson Road* 13.1 13.0 13.0 12.7 13.0 5.15
Greenfield Franklin Barr Avenue 20.0 13.5 13.2 13.1 13.2 5.47
Haverhill Essex Washington Street 11.3 10.6 9.8 8.7 10.6 4.49
Pittsfield Berkshire Silver Lake Blvd 19.0 15.7 13.2 13.2 13.2 5.32
Springfield Hampden Liberty Street 16.2 15.0 14.5 13.4 15.0 6.67
Worcester Worcester Summer Street 13.4 11.1 10.8 10.6 11.1 5.03 Standards: Annual Mean = 12 µg/m3 (primary)
24-hour (98th percentile) = 35 µg/m3 * = Collocated monitors 1ST, 2ND, 3RD, 4TH 24-HR MAX = 1ST, 2ND, 3RD, and 4TH Highest 24-hr Values for the Year 98TH PERCENTILE 24-HR = 98TH Percentile Value for the Year ARITH MEAN = Annual Arithmetic Mean

48
MassDEP 2020 Network Assessment
PM2.5 Monitoring Data Trends
Figure 5-6 shows trends for each FRM PM2.5 monitor relative to the annual standard of 12 μg/m3.
Figure 5-6
PM2.5 Annual Arithmetic Mean Trends

49
MassDEP 2020 Network Assessment
2019 FEM PM2.5 Data Summary
Figure 5-7 shows a summary of the 2019 FEM PM2.5 data. All values are well below applicable
NAAQS.
Figure 5-7
2019 PM10 FEM 24-Hour Data Summary (µg/m3)
1ST 2ND 3RD 4TH 98TH MAX MAX MAX MAX PECENTILE ARITH City County Address 24-HR 24-HR 24-HR 24-HR 24-HR MEAN
Boston Suffolk Harrison Ave 23.1 21.5 19.0 18.7 17.0 8.08
Boston Suffolk Von Hillern St 21.7 20.7 20.4 20.3 17.3 7.57
Boston Suffolk Von Hillern St* 18.9 14.4 13.8 12.2 13.8 5.60
Brockton Plymouth Clinton Street 19.7 17.2 15.6 15.6 13.9 6.80
Chelmsford Middlesex Manning Road 20.9 17.8 17.3 17.0 14.5 6.98
Chicopee Hampden Anderson Road 26.3 18.4 18.3 18.0 12.5 4.62
Fall River Bristol Globe Street 27.3 26.2 23.0 20.3 15.3 6.60
Greenfield Franklin Barr Avenue 29.4 26.5 24.9 23.2 17.3 6.56
Haverhill Essex Washington St 18.6 18.2 17.0 16.2 15.1 5.64
Lynn Essex Parkland Ave 28.3 22.1 19.0 18.1 16.2 6.57
North Adams Berkshire Holden Street 18.3 17.0 16.5 16.2 15.2 6.19
Pittsfield Berkshire Silver Lake Blvd 25.2 24.0 23.4 19.7 16.6 7.11
Springfield Hampden Liberty Street 31.6 27.2 26.3 21.7 16.6 7.71
Ware Hampshire Skyline Drive 24.0 22.8 18.5 17.5 15.5 5.61
Worcester Worcester Summer Street 24.4 20.7 20.0 20.0 16.7 8.23 Standards: Annual Mean = 12 µg/m3 (primary)
24-hour (98th percentile) = 35 µg/m3 * = Collocated monitors 1ST, 2ND, 3RD, 4TH 24-HR MAX = 1ST, 2ND, 3RD, and 4TH Highest 24-hr Values for the Year 98TH PERCENTILE 24-HR = 98TH Percentile Value for the Year ARITH MEAN = Annual Arithmetic Mean
PM2.5 Design Values
The design value is a statistic that describes the air quality measured by a monitor relative to the
NAAQS in order to classify attainment and nonattainment areas, assess progress towards meeting
the NAAQS, and develop control strategies. Design values are defined in EPA guidance and are
based on the NAAQS in 40 CFR Part 50. They often require multiple years of data that help to
ensure a stable indicator. EPA computes and publishes design values for each monitor annually.
The annual PM2.5 design value is computed at each site by averaging the daily samples taken each
quarter, averaging these quarterly averages to obtain an annual average, and then averaging three
years of annual averages. The 24-hour PM2.5 design value is computed at each site by determining
the 98th percentile of the daily samples collected each year for three years, and then averaging
these three numbers. Because design values are computed over a 3-year time period they are more
stable than the measurements recorded in any one year.

50
MassDEP 2020 Network Assessment
Several PM2.5 monitoring sites include collocated FRM and FEM instruments. At each site with
collocated FRM and FEM instruments, the FEM is considered the primary source of data for
NAAQS compliance. Sites with only one, either FRM or FEM, the individual instrument is
considered the primary monitor by default. Design values are calculated using data from the
primary monitor. Boston – Kenmore is the only site with a standalone FRM. All other design
values are based on FEM values.
Figure 5-8 shows the most recent design values for each PM2.5 FRM monitor. All design values
are well below applicable NAAQS.
Figure 5-8
FEM PM2.5 2019 Design Values
• City • County • Address
2017-2019 Design Values
24 Hour Standard 35 µg/m3
Annual Standard 15 µg/m3
Boston Suffolk Kenmore Square 13 5.9
Boston Suffolk Harrison Ave 18 7.4
Boston Suffolk Von Hillern St 18 7.9
Brockton Plymouth Clinton Street 16 5.8
Chelmsford Middlesex Manning Road 15 7.2
Chicopee Hampden Anderson Road 13 5.0
Fall River Bristol Globe Street 16 6.5
Greenfield Franklin Barr Avenue 16 5.7
Haverhill Essex Washington St 14 5.2
Lynn Essex Parkland Ave 17 5.9
North Adams Berkshire Holden Street 15 7.1
Pittsfield Berkshire Silver Lake Blvd 17 7.4
Springfield Hampden Liberty Street 16 7.3
Ware Hampshire Skyline Drive 15 5.3
Worcester Worcester Summer Street 16 6.5 Note: Does not include Chelmsford – Manning Road because three full years of data have not yet been collected.
PM MONITORING TECHNOLOGY
PM10
MassDEP uses low volume size-selective gravimetric filters. The FRM monitor works by drawing
air through a small Teflon filter for 24 hours (midnight to midnight) on the designated sample day,
after which the filter is removed from the monitor and transported to the MassDEP Laboratory in
Lawrence for weighing. The samples are run every 3rd or 6th day for 24 hours.
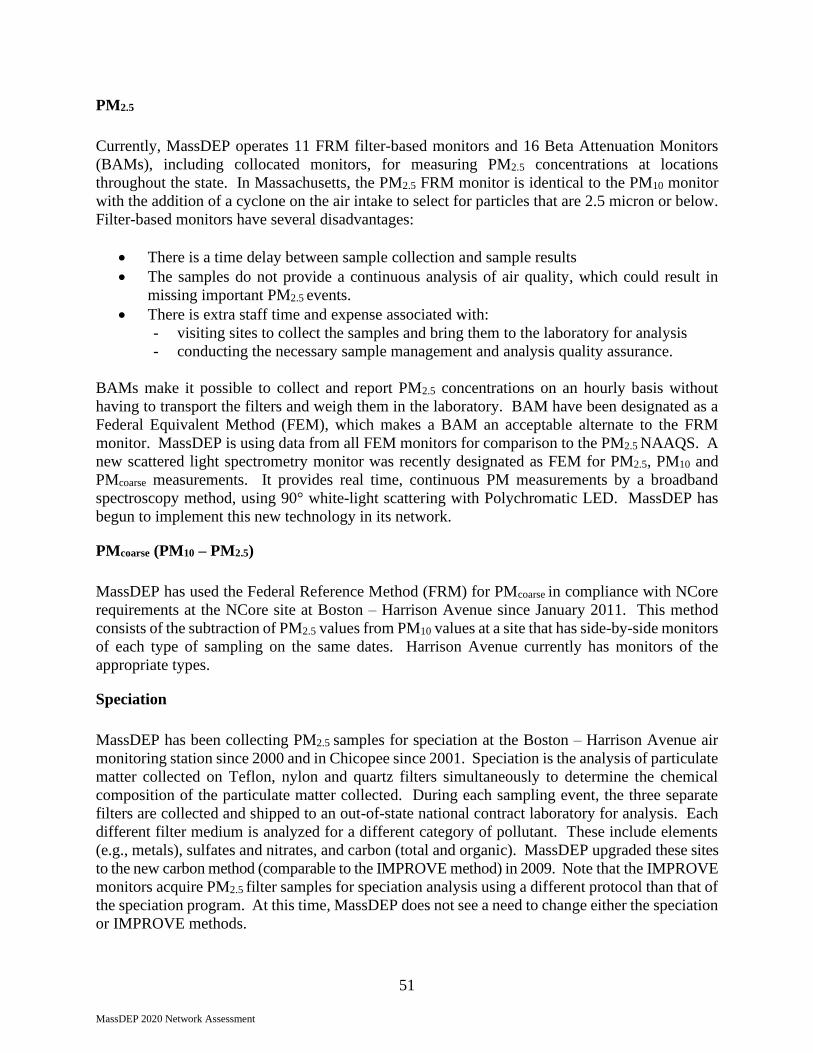
51
MassDEP 2020 Network Assessment
PM2.5
Currently, MassDEP operates 11 FRM filter-based monitors and 16 Beta Attenuation Monitors
(BAMs), including collocated monitors, for measuring PM2.5 concentrations at locations
throughout the state. In Massachusetts, the PM2.5 FRM monitor is identical to the PM10 monitor
with the addition of a cyclone on the air intake to select for particles that are 2.5 micron or below.
Filter-based monitors have several disadvantages:
• There is a time delay between sample collection and sample results
• The samples do not provide a continuous analysis of air quality, which could result in
missing important PM2.5 events.
• There is extra staff time and expense associated with:
- visiting sites to collect the samples and bring them to the laboratory for analysis
- conducting the necessary sample management and analysis quality assurance.
BAMs make it possible to collect and report PM2.5 concentrations on an hourly basis without
having to transport the filters and weigh them in the laboratory. BAM have been designated as a
Federal Equivalent Method (FEM), which makes a BAM an acceptable alternate to the FRM
monitor. MassDEP is using data from all FEM monitors for comparison to the PM2.5 NAAQS. A
new scattered light spectrometry monitor was recently designated as FEM for PM2.5, PM10 and
PMcoarse measurements. It provides real time, continuous PM measurements by a broadband
spectroscopy method, using 90° white-light scattering with Polychromatic LED. MassDEP has
begun to implement this new technology in its network.
PMcoarse (PM10 – PM2.5)
MassDEP has used the Federal Reference Method (FRM) for PMcoarse in compliance with NCore
requirements at the NCore site at Boston – Harrison Avenue since January 2011. This method
consists of the subtraction of PM2.5 values from PM10 values at a site that has side-by-side monitors
of each type of sampling on the same dates. Harrison Avenue currently has monitors of the
appropriate types.
Speciation
MassDEP has been collecting PM2.5 samples for speciation at the Boston – Harrison Avenue air
monitoring station since 2000 and in Chicopee since 2001. Speciation is the analysis of particulate
matter collected on Teflon, nylon and quartz filters simultaneously to determine the chemical
composition of the particulate matter collected. During each sampling event, the three separate
filters are collected and shipped to an out-of-state national contract laboratory for analysis. Each
different filter medium is analyzed for a different category of pollutant. These include elements
(e.g., metals), sulfates and nitrates, and carbon (total and organic). MassDEP upgraded these sites
to the new carbon method (comparable to the IMPROVE method) in 2009. Note that the IMPROVE
monitors acquire PM2.5 filter samples for speciation analysis using a different protocol than that of
the speciation program. At this time, MassDEP does not see a need to change either the speciation
or IMPROVE methods.

52
MassDEP 2020 Network Assessment
ADEQUACY OF THE PM NETWORK
EPA Requirements
As demonstrated in Figure 5-9, the PM network meets or exceeds federal requirements for PM10,
PM2.5, and speciation.
Figure 5-9
PM2.5 Monitor Siting Requirements, including Speciation
EPA Requirements for Number of PM2.5 Monitors
MSA Population
Most Recent 3-Year Design Value ≥85% of any PM2.5 NAAQS
Most Recent 3-Year Design Value <85% of any PM2.5 NAAQS or No Design Value
>1,000,000 3 2
500,000–1,000,000
2 1
50,000–<500,000
1 0
MSA 2018
Population
3 Year Design Values (2019 Maximum for a Monitor in MSA)
> 85% of any
NAAQS?
Monitors Needed
Monitors in Network 24 Hour - 35 µg/m3 Annual - 15 µg/m3
Value % of STD Value % of STD
Boston-Cambridge-Newton MSA 4,875,390 15.9 (18) 45% (51%) 6.5 (7.9) 43% (53%) NO 2 7
Barnstable MSA 213,413 NA NA NA NA NA 0 0
Providence-Warwick MSA 1,621,337* 16 46% 6.5 43% NO 1 1
Worcester MSA 947,866 16 46% 6.5 43% NO 1 1
Springfield MSA 631,761 15 (16) 43% (46%) 5.8 (7.3) 39% (49%) NO 1 4
Pittsfield MSA 126,348 16 (17) 46% (49%) 7.3 (7.4) 48% (49%) NO 0 2 * The Massachusetts population in the MSA is 564,022. The remainder of the population resides in Rhode Island.
Additional PM2.5 Monitor Requirements
MSA
Boston-Cambridge-Newton MSA
Worcester MSA Springfield MSA
At least one monitoring station is to be sited in a population-oriented area of expected maximum concentration.
Boston-Von Hillern Summer Street Liberty Street
For areas with more than one required SLAMS, a monitoring station is to be sited in an area of poor air quality.
Boston-Kenmore Boston-Harrison Ave Boston-Von Hillern
Summer Street Liberty Street
Chicopee Westover
The State, or where appropriate, local agencies must operate continuous PM2.5
analyzers equal to at least one-half (round up) the minimum required sites listed in Table D–5 of this appendix. At least one required continuous analyzer in each MSA must be collocated with one of the required FRM/FEM/ARM monitors, unless at least one of the required FRM/FEM/ARM monitors is itself a continuous FEM or ARM monitor in which case no collocation requirement applies.
6 Continuous 4 Collocated
1 Continuous 1 Collocated
3 Continuous 2 Collocated
Each State shall install and operate at least one PM2.5 site to monitor regional background and at least one PM2.5 site to monitor regional transport. These monitoring sites may be at community-oriented sites and this requirement may be satisfied by a corresponding monitor in an area having similar air quality in another State. Methods used at these sites may include non-federal reference method samplers such as IMPROVE or continuous PM2.5 monitors
1 Continuous (Ware)
Each State shall continue to conduct chemical speciation monitoring and analyses at sites designated to be part of the PM2.5 Speciation Trends Network.
1 0 1

53
MassDEP 2020 Network Assessment
Correlations, Exceedance Probability, Removal Bias
EPA recommends three analytical approaches for identifying potentially underserved areas and
redundant sites.
1. Identifying potential new sites based on the likelihood of the site exceeding a standard.
2. Evaluating the correlation between site measurements to find redundancies.
3. Estimating the removal bias – the difference between the measured concentrations at a site
and those that would be estimated for that site based on data from surrounding sites.
NetAssess2020 is an online tool that provides these analyses. NetAssess2020 was used to
implement these approaches for this report. The reference is provided below.
NetAssess2020 v1.1 Ambient Air Monitoring Network Assessment Tool. The latest data
in this version is from 2018. https://sti-r-shiny.shinyapps.io/EPA_Network_Assessment/
Exceedance Probability
NetAssess2020 provides a probability map to help determine where new monitors may be needed.
The method is explained in the excerpt below from the NetAssess2020 documentation.
Exceedance Probabilities
One objective of the network assessment is to determine if new sites are needed. In order
to make that decision, it is helpful to have some estimation of the extreme pollution levels
in areas where no monitors currently exist. NetAssess2020 provides ozone and PM2.5 maps
of the contiguous US that can be used to make spatial comparisons regarding the
probability of daily values exceeding a certain threshold.
Surface Probability Maps
To clarify, these maps do not show the probability of violating the National Ambient Air
Quality Standards (NAAQS). They provide information about the spatial distribution of
the highest daily values for a pollutant (not, for example, the probability of the 4th highest
daily 8-hour ozone maximum exceeding a threshold).
These maps are intended to be used as a spatial comparison and not for probability
estimates for a single geographic point or area. The probability estimates alone should not
be used to justify a new monitor. The maps should be used in conjunction with existing
monitoring data. If a monitor has historically measured high values, then the probability
map gives an indication of areas where you would expect to observe similar extreme
values. This information, along with demographic and emissions data, could be used in a
weight of evidence approach for proposing new monitor locations.

54
MassDEP 2020 Network Assessment
Data
The surface probability maps were created by using EPA/CDC downscaler data.
Downscaler data are daily estimates of ground level ozone and PM2.5 for every census tract
in the continental US. These are statistical estimates from “fusing” photochemical
modeling data and ambient monitoring data using Bayesian space-time methods. For more
details on how the data were generated, see the meta data document on the EPA website.
Figure 5-10 shows the probability of exceeding the 35 µg/m3 PM2.5 NAAQS. The spatial
comparison map indicates all areas of the state have a low probability of daily values exceeding
the PM2.5 threshold. No areas of high or moderate probability were indicated.
Figure 5-10
Probability of Exceeding the PM2.5 35 µg/m3 Daily NAAQS
Source: NetAssess2020 v1.1 Ambient Air Monitoring Network Assessment Tool
Site Correlation Analysis
The NetAssess2020 tool was used to provide correlations between monitors. The Correlation
Matrix tool calculates and displays the correlation, relative difference, and distance between pairs
of sites within a user selected set of air monitoring sites. The correlation matrix graphic displays
information about how concentrations at monitors within your Area of Interest compare to one
another. Each monitor comparison is represented by a square in the chart.

55
MassDEP 2020 Network Assessment
The blue squares in the bottom-left corner show the correlation between each pair of monitors,
with text indicating the number of days used in the calculation. The red squares in the top-right
corner show the mean absolute difference in concentrations between each pair of monitors, with
text indicating the distance in kilometers between each pair of monitors. The numbers along the
diagonal indicate the most recent design value for each monitor.
The purpose of this tool is to provide a means of determining possible redundant sites that could
be removed. Possible redundant sites would exhibit fairly high correlations consistently across all
their pairings and would have low average relative difference despite the distance. Usually, it is
expected that correlation between sites will decrease as distance increases. However, for a regional
air pollutant such as ozone, sites in the same air shed can have very similar concentrations and be
highly correlated. More unique sites would exhibit the opposite characteristics. They would not
be very well correlated with other sites and their relative difference would be higher than other site
to site pairs.
The Correlation Matrix tool generates a graphical display that summarizes the correlation, relative
difference and distance between pairs of monitoring sites. The correlation between two sites
quantitatively describes the degree of relatedness between the measurements made at two sites.
That relatedness could be caused by various influences including a common source affecting both
sites to pollutant transport caused meteorology. The correlation, however, may indicate whether
a pair of sites is related, but it does not indicate if one site consistently measures pollutant
concentrations at levels substantially higher or lower than the other.
The average relative difference between the two sites is an indicator of the overall measurement
similarity between the two sites. Site pairs with a lower average relative difference are more
similar to each other than pairs with a larger difference. Both the correlation and the relative
difference between sites are influenced by the distance by which site pairs are separated. Usually,
sites with a larger distance between them will generally be more poorly correlated and have large
differences in the corresponding pollutant concentrations.
Figure 5-11 shows the correlation between the measured air quality at each PM2.5 monitoring site
based on FRM and FEM data.

56
MassDEP 2020 Network Assessment
Figure 5-11
Correlation Matrix for FRM and BAM PM2.5 Monitors
Source: NetAssess2020 v1.1 Note: The Weymouth (25-021-2004) site was added in February 2020, after the NetAssess2020 tool was completed, and correlation data was not available for this assessment.
All monitors exhibit correlations less than 0.9 and most correlations are less than 0.8. Three pairs
exhibit correlations between 0.8 and 0.9, as shown in Figure 5-12. The sample sizes (n) for some
of these are very small and therefore can be ignored. The relative difference between some pairs
is close to the mean relative difference for all sites (0.257) and therefore they are not very similar
in magnitude. This leaves the valid highly correlated sites indicated in white in Figure 5-12.

57
MassDEP 2020 Network Assessment
Figure 5-12
Correlation Over 0.8 for FRM and FEM PM2.5 Monitors
Site 1 Site 2 Correlation Distance (km) n Mean
Difference
25-009-2006 - Lynn 25-023-0005 - Brockton 0.8246 45 1006 1.7857
25-011-2005 - Greenfield 25-013-0018 - Springfield 0.8711 54 234 1.9932
25-013-0018 - Springfield 25-027-0023 - Worcester 0.8236 67 231 1.9931
Source: NetAssess2020 v1.1 n = Number of observations used in correlation km = kilometers
Removal Bias Analysis
Removal bias was calculated among all the PM2.5 monitors within the state, treating FRM and FEM
as equivalent. Removal bias was calculated with NetAssess2020, which explains the process in
its documentation as follows:
The removal bias tool is meant to aid in determining redundant sites. The bias estimation
uses the nearest neighbors to each site to estimate the concentration at the location of the
site if the site had never existed. This is done using the Voronoi Neighborhood Averaging
algorithm with inverse distance squared weighting. The squared distance allows for higher
weighting on concentrations at sites located closer to the site being examined. The bias
was calculated for each day at each site by taking the difference between the predicted
value from the interpolation and the measured concentration. A positive average bias
would mean that if the site being examined was removed, the neighboring sites would
indicate that the estimated concentration would be larger than the measured concentration.
Likewise, a negative average bias would suggest that the estimated concentration at the
location of the site is smaller than the actual measured concentration.
If the bias is small, that may indicate that the monitor is redundant and could be removed. Removal
bias results are displayed in Figures 5-13 and 5-14.

58
MassDEP 2020 Network Assessment
Figure 5-13
Removal Bias for FRM and FEM PM2.5 Monitors
Source: NetAssess2020 v1.1
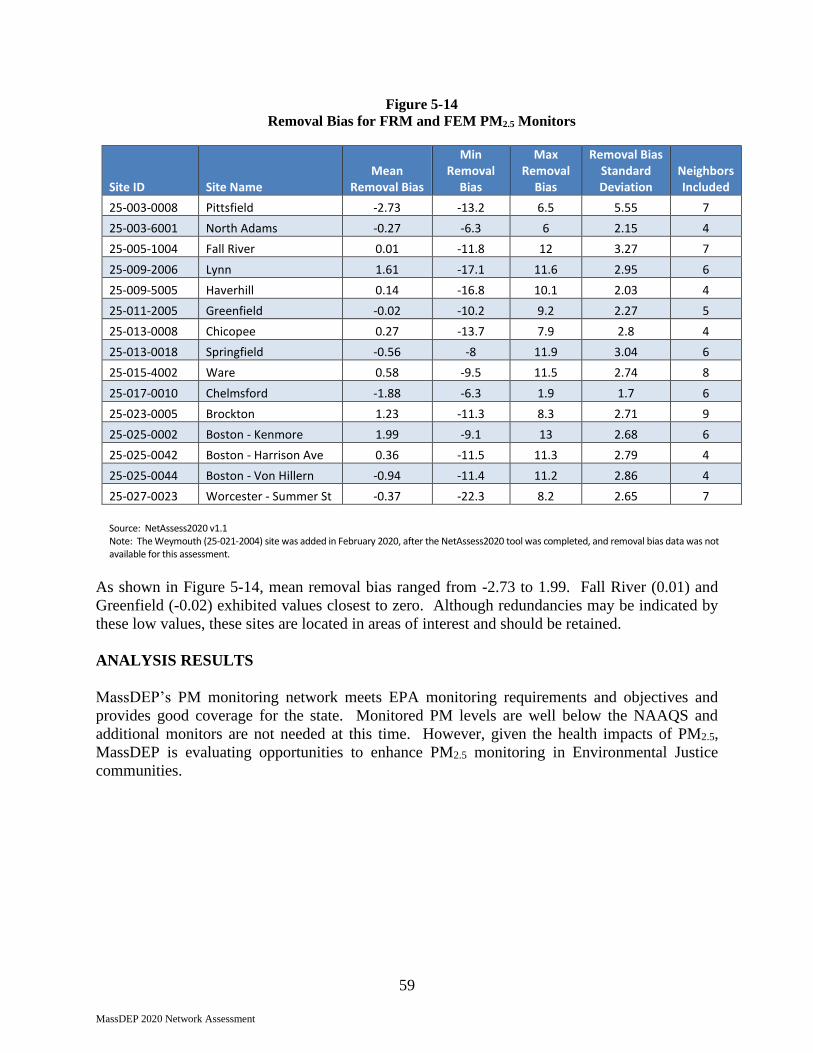
59
MassDEP 2020 Network Assessment
Figure 5-14
Removal Bias for FRM and FEM PM2.5 Monitors
Site ID Site Name Mean
Removal Bias
Min Removal
Bias
Max Removal
Bias
Removal Bias Standard Deviation
Neighbors Included
25-003-0008 Pittsfield -2.73 -13.2 6.5 5.55 7
25-003-6001 North Adams -0.27 -6.3 6 2.15 4
25-005-1004 Fall River 0.01 -11.8 12 3.27 7
25-009-2006 Lynn 1.61 -17.1 11.6 2.95 6
25-009-5005 Haverhill 0.14 -16.8 10.1 2.03 4
25-011-2005 Greenfield -0.02 -10.2 9.2 2.27 5
25-013-0008 Chicopee 0.27 -13.7 7.9 2.8 4
25-013-0018 Springfield -0.56 -8 11.9 3.04 6
25-015-4002 Ware 0.58 -9.5 11.5 2.74 8
25-017-0010 Chelmsford -1.88 -6.3 1.9 1.7 6
25-023-0005 Brockton 1.23 -11.3 8.3 2.71 9
25-025-0002 Boston - Kenmore 1.99 -9.1 13 2.68 6
25-025-0042 Boston - Harrison Ave 0.36 -11.5 11.3 2.79 4
25-025-0044 Boston - Von Hillern -0.94 -11.4 11.2 2.86 4
25-027-0023 Worcester - Summer St -0.37 -22.3 8.2 2.65 7
Source: NetAssess2020 v1.1 Note: The Weymouth (25-021-2004) site was added in February 2020, after the NetAssess2020 tool was completed, and removal bias data was not available for this assessment.
As shown in Figure 5-14, mean removal bias ranged from -2.73 to 1.99. Fall River (0.01) and
Greenfield (-0.02) exhibited values closest to zero. Although redundancies may be indicated by
these low values, these sites are located in areas of interest and should be retained.
ANALYSIS RESULTS
MassDEP’s PM monitoring network meets EPA monitoring requirements and objectives and
provides good coverage for the state. Monitored PM levels are well below the NAAQS and
additional monitors are not needed at this time. However, given the health impacts of PM2.5,
MassDEP is evaluating opportunities to enhance PM2.5 monitoring in Environmental Justice
communities.

60
MassDEP 2020 Network Assessment
Ozone
NETWORK DESCRIPTION
MassDEP operates 16 ozone monitoring sites in 15 municipalities across the state. There is at
least one state-operated ozone monitor located in each county except Dukes (Martha’s Vineyard)
and Nantucket. The Wampanoag Tribe of Gay Head (Aquinnah) operates an ozone monitor in
Dukes County.
Figure 5-16
Ozone Monitoring Sites, Location, Scale and Purpose
Site ID Site Name Scale Reason for Monitor Date
Established MSA/MiSA
25-001-0002 Truro Regional General Background 4/1/1987 Barnstable MSA
25-005-1004 Fall River Neighborhood Population Exposure 2/1/1975 Providence-Warwick MSA
25-009-2006 Lynn Urban PAMS - Max Precursor O3; Population Exposure 1/1/1992
Boston-Cambridge-Newton MSA
25-009-5005 Haverhill Regional Population Exposure 7/19/1994 Boston-Cambridge-Newton MSA
25-013-0008 Chicopee Urban Population Exposure 1/1/1983 Springfield MSA
25-015-4002 Ware Urban Max. O3 Conc.; Background for other pollutants 6/1/1985 Springfield MSA
25-021-3003 Milton - Blue Hill Regional Upwind Background PM2.5; Maximum O3 4/2/2002
Boston-Cambridge-Newton MSA
25-025-0042 Boston - Harrison Ave Neighborhood Population Exposure 12/15/1998 Boston-Cambridge-Newton MSA
25-027-0015 Worcester - Airport Urban Population Exposure 5/7/1979 Worcester MSA
25-007-0001 Aquinnah Regional Regional 4/1/2004 Providence-Warwick MSA
25-017-0009 Chelmsford - EPA Neighborhood Population Exposure 4/1/2005 Boston-Cambridge-Newton MSA
25-027-0024 Uxbridge Regional O3 Transport; Population Exposure 11/1/2008 Worcester MSA
25-005-1006 Fairhaven Regional Population Exposure 6/30/2013 Providence-Warwick MSA
25-023-0005 Brockton Urban Population Exposure 6/30/2013 Boston-Cambridge-Newton MSA
25-011-2005 Greenfield Regional Population Exposure 1/1/2014 Greenfield Town MiSA
25-003-0008 Pittsfield Regional Population Exposure 7/1/2018 Pittsfield MSA

61
MassDEP 2020 Network Assessment
OZONE MONITOR AREAS SERVED
Figure 5-17 shows the area served by each ozone monitor as defined by Voronoi polygons. These
polygons were developed using NetAssess2020. The polygons show that the state is well covered
by monitors in Massachusetts or in neighboring states.
Figure 5-17
Area Served – Ozone sites
Source: NetAssess2020 v1.1

62
MassDEP 2020 Network Assessment
OZONE MONITORING DATA
2019 Ozone Data Summary
Figure 5-18 shows a summary of 2019 ozone season data (March 1 – September 30).
Figure 5-18
2019 O3 Monitoring Data Summary (ppm)
1ST 2ND 3RD 4TH 8-HR MAX MAX MAX MAX MAX>0.070 City County Address 8-HR 8-HR 8-HR 8-HR STD
Aquinnah (Tribal) Dukes Herring Creek Drive 0.078 0.075 0.074 0.071 4
Boston Suffolk Harrison Avenue 0.066 0.063 0.062 0.061 0
Brockton Plymouth Clinton Street 0.067 0.063 0.062 0.061 0
Chelmsford Middlesex Technology Drive 0.064 0.060 0.058 0.057 0
Chelmsford Middlesex Manning Road 0.053 0.053 0.051 0.051 0
Chicopee Hampden Anderson Road 0.068 0.068 0.067 0.066 0
Fairhaven Bristol School Street 0.069 0.063 0.062 0.060 0
Fall River Bristol Globe Street 0.069 0.065 0.064 0.062 0
Greenfield Franklin Barr Avenue 0.065 0.065 0.061 0.056 0
Haverhill Essex Washington Street 0.062 0.057 0.056 0.055 0
Lynn Essex Parkland Avenue 0.077 0.067 0.066 0.065 1
Milton Norfolk Canton Avenue 0.070 0.063 0.062 0.059 0
Pittsfield Berkshire Silver Lake Blvd 0.066 0.066 0.060 0.060 0
Truro Barnstable Collins Road 0.068 0.066 0.062 0.060 0
Uxbridge Worcester E. Hartford Ave 0.068 0.065 0.060 0.060 0
Ware Hampshire Skyline Drive 0.068 0.068 0.067 0.066 0
Worcester Worcester Airport Drive 0.065 0.065 0.060 0.060 0 Standard: 8-hour = 0.070 ppm 1ST, 2ND, 3RD, 4TH MAX 8-HR = Maximum 8-hour Value for the 1st, 2nd, 3rd and 4th Highest Day 8-HR MAX > 0.070 STD = Number of Measured Daily 8-hr Maximum Values Greater Than the 0.070 ppm 8-hr Standard Note: The Chelmsford – Near Road site on Manning Road does not meet ozone siting criteria but is operating for informational purposes. Therefore, it is not a consideration for determining adequacy of the O3 monitoring network.

63
MassDEP 2020 Network Assessment
Ozone Design Values
The 2015 8-hour NAAQS for ozone is 0.070 parts per million (ppm). The design value is the 3-
year average of the annual fourth-highest daily maximum 8-hour ozone concentration. Figure 5-
19 shows ozone design values based on 2017-2019 monitored data. All monitors currently attain
the 8-hour 0.070 ppm ozone standard except for the tribal monitor on Martha’s Vineyard (Dukes
County).
Figure 5-19
Ozone Monitor 2019 Design Values (ppm)
City County Address Design Value
2017-2019
Aquinnah (Tribal) Dukes Herring Creek Drive 0.071
Boston Suffolk Harrison Avenue 0.065
Brockton Plymouth Clinton Street 0.067
Chelmsford Middlesex Technology Drive 0.062
Chelmsford Middlesex Manning Road 0.050
Chicopee Hampden Anderson Road 0.069
Fairhaven Bristol School Street 0.066
Fall River Bristol Globe Street 0.070
Greenfield Franklin Barr Avenue 0.062
Haverhill Essex Washington Street 0.061
Lynn Essex Parkland Avenue 0.068
Milton Norfolk Canton Avenue 0.066
Pittsfield Berkshire Silver Lake Blvd 0.055
Truro Barnstable Collins Road 0.067
Uxbridge Worcester E. Hartford Ave 0.066
Ware Hampshire Skyline Drive 0.066
Worcester Worcester Airport Drive 0.064

64
MassDEP 2020 Network Assessment
8-hour Ozone Exceedance Trends
Figure 5-20 shows the trends of 8-hour ozone exceedances for each monitor based on the 2015 8-
hour standard.
Figure 5-20
8-hour Ozone Exceedance Trends 2010 – 2019 Based on the 0.070 ppm 8-hour Standard

65
MassDEP 2020 Network Assessment
Figure 5-20 (continued)
8-hour Ozone Exceedance Trends 2010 – 2019 Based on the 0.070 ppm 8-hour Standard
PAMS MONITORING
Ground-level ozone is unique because it is not emitted directly into the atmosphere from a stack
or a tailpipe. Instead, it forms in the atmosphere from the photochemical reactions of other
pollutants such as volatile organic compounds (VOCs) and nitrogen oxides (NOx). Ozone
formation can occur many miles downwind from the source of the original emissions. These
reactions occur in the presence of strong sunlight and are most pronounced during the hottest days
of the summer.
PAMS (Photochemical Assessment Monitoring Station) is a special designation for enhanced
monitoring stations that gather information on the ozone formation process. Instrumentation at
these sites measures pollutants and meteorological parameters that are specific to the
photochemical processes by which ozone is created in the atmosphere at ground level. This data
makes it possible to assess ozone attainment progress independent of the meteorological variation
that occurs between years.
In addition to the standard NAAQS pollutants (ozone, NO2, etc.) that are measured at other sites,
other ozone precursors such as VOCs, including hydrocarbons and carbonyl compounds (e.g.,
aldehydes), are measured at PAMS stations on either an hourly basis or at regular intervals during
June, July and August. NOx (total oxides of nitrogen) measurements (including NOx, NO and
NO2) and NOy (total reactive oxides of nitrogen) are also required at PAMS sites. NOy
characterizes atmospheric nitrogen reactions better than traditional NOx measurements. The target

66
MassDEP 2020 Network Assessment
carbonyl compounds (formaldehyde and acetaldehyde), which have been measured as indicators
of photochemical reactions, have received renewed attention regarding their air toxics relevance.
Meteorology is a critical component of ozone formation. Each PAMS site has a full complement
of meteorological sensors including wind speed, wind direction, temperature, relative humidity,
barometric pressure and solar radiation.
Although Massachusetts is currently in attainment with the ozone NAAQS, MassDEP continues
to operate one PAMS site in Lynn (25-009-2006). Based on changes EPA made to the PAMS
program, MassDEP discontinued PAMS monitoring in Chicopee (25-013-0008), Newburyport
(25-009-4005) and Ware (25-015-4002). MassDEP continues to measure ozone in Chicopee and
Ware; however, all measurements were discontinued in Newburyport.
The benefits of continued PAMS monitoring in Lynn include obtaining spatial and temporal
trends. MassDEP is in the ozone transport region (OTR) and has collected PAMS data for over
25 years. Continued PAMS measurements can be compared with regional and historic data to
demonstrate trends in ozone precursor pollutants as they move through the heavily populated
northeast corridor.
When the ozone and PAMS sites were originally established, MassDEP worked closely with EPA
to ensure that the proper analyses were done to ensure that each site met the network design
requirements. Since population and pollution sources have not significantly changed since the
mid-1990s, MassDEP is confident that the ozone sites and the PAMS site still meet the appropriate
design criteria.
MassDEP continues to participate in regional and national discussions designed to make sure the
PAMS and ozone networks are both efficient and relevant. MassDEP plans to install a ceilometer
at the Lynn site and conduct PAMS monitoring in accordance with the approved Implementation
Plan and Enhanced Monitoring Plan (EMP) by the June 1, 2021 start date. MassDEP believes the
current configuration is sufficient for air pollution forecasting and ozone SIP development and
implementation. Figure 5-21
Location and Description of the PAMS Site
Site ID Site Name Reason for Monitor Date
Established Pollutant Measurements
Meteorological Measurements
25-009-2006 Lynn PAMS - Max. Precursor; Population Exposure 1/1/1992
O3, NO, NO2, NOX, NOY, PM2.5, VOCs, Carbonyls
WS, WD, TEMP, RH, BP, SOLAR, PRECIP
WS = wind speed WD = wind direction
TEMP = temperature RH = relative humidity
BP = barometric pressure SOLAR = solar radiation
PRECIP = precipitation
OZONE MONITORING TECHNOLOGY
Ozone
MassDEP uses continuous ultraviolet (UV) light photometry to monitor ambient ozone
concentrations. This is the Federal Automated Equivalent Method and there is no reason to change

67
MassDEP 2020 Network Assessment
this equipment, although there is current research into the reintroduction of chemiluminescence
method.
PAMS
MassDEP operates an Automated Gas Chromatograph (Auto-GCs) with a flame ionization
detector (FID) to measure ozone precursor target hydrocarbon VOCs (volatile organic compounds)
at the Lynn PAMS site. This instrument completes an hourly sample collection and analysis cycle
to measure target VOCs.
ADEQUACY OF THE OZONE MONITORING NETWORK
EPA Requirements
As demonstrated in Figure 5-22, MassDEP’s ozone monitoring network meets minimum EPA
requirements.
Figure 5-22
Minimum Ozone Monitoring Requirements
MSA 2018
Population Design Value
(max for MSA) ≥85% of
Std? Monitors Required
Monitors in Network
Maximum Concentration
Site
Boston-Cambridge-Newton
4,875,390 0.068 Yes 3 7 Lynn
Barnstable 213,413 0.067 Yes 1 1 Truro
Providence-Warwick 1,621,337 0.070 Yes 2 2 Fall River
Worcester 947,866 0.066 Yes 2 2 Uxbridge
Springfield 631,761 0.069 Yes 2 2 Chicopee
Pittsfield 126,348 0.055 No 1 1 Pittsfield
Design Criteria: If the Design value is ≥85% of the standard:
• MSAs with a population of > 10 million require 4 monitors
• MSAs with a population of 4 - 10 million require 3 monitors
• MSAs with a population of 350,000 - < 4 million require 2 monitors
• MSAs with a population of 50,000 - 349,999 require 1 monitor If the Design value is <85% of the standard:
• MSAs with a population of > 10 million require 2 monitors
• MSAs with a population of 4 - 10 million require 1 monitor
• MSAs with a population of 350,000 - < 4 million require 1 monitor
• MSAs with a population of 50,000 - 349,999 require 0 monitor

68
MassDEP 2020 Network Assessment
Figure 5-23
Metro/Micro Statistical Areas in Massachusetts
Thematic Map of Population Estimate (as of July 1, 2016)
Geography: by Metro/Micro Statistical Area
Source: U.S. Census Bureau. Annual Estimates of the Resident Population: April 1, 2010 to July 1, 2016
The benefits of continued PAMS monitoring in Lynn include monitoring spatial and temporal
trends. MassDEP is in the ozone transport region (OTR) and has collected PAMS data for over
25 years. Continued PAMS measurements can be compared with regional and historical data to
demonstrate trends in ozone precursor pollutants as they move through the heavily populated
northeast corridor.
When the ozone and PAMS sites were originally established, MassDEP worked closely with EPA
to ensure that the proper analyses were done to ensure that each site met the network design
requirements. Since population and pollution sources have not significantly changed since the
mid-1990s, MassDEP is confident that the ozone and PAMS sites still meet the appropriate design
criteria.
Exceedance Probability, Correlations, Removal Bias
EPA recommends three analytical approaches for identifying potentially underserved areas and
redundant sites in the ozone monitoring network. MassDEP used NetAssess2020 to conduct these
analyses.

69
MassDEP 2020 Network Assessment
Exceedance Probability
NetAssess2020 provides a probability map to help determine where new monitors may need to be
located.
Figure 5-24 shows the probability of exceeding the existing 70 ppb NAAQS. All areas of moderate
to high probability are covered by existing monitors and are supplemented by monitors in
Connecticut and New York to the south and southwest.
Figure 5-24
Probability of Exceeding the O3 70 ppb NAAQS
Source: NetAssess2020 v1.1 Ambient Air Monitoring Network Assessment Tool
Site Correlation Analysis
The NetAssess2020 tool was used to provide correlations between ozone monitors. The
Correlation Matrix tool uses daily summary pollutant concentration data for ozone and fine
particles. For ozone, the correlation matrix tool calculates a Pearson Correlation (r) for all valid
8-hour average ozone concentration pairs. If a site has more than one monitor collecting ozone
data, the daily maximum 8-hour ozone concentration is the average of all valid results for that site
on that date.

70
MassDEP 2020 Network Assessment
Figure 5-25 shows the correlation between ozone measurements at monitoring sites in
Massachusetts. Overall, the ozone monitors are highly correlated with an average correlation
value of 0.80 and an average mean difference value of 0.005. Figure 5-26 shows highly
correlated sites with correlation values greater than 0.90, mean difference less than 0.005 and
distance less than 65 km (~40 miles).
The Brockton (25-023-0005) and Uxbridge (25-027-0024) sites appear most frequently in
Figure 5-26, with each pairing to another site five times including one pairing between the two
sites themselves. No other site appears in Figure 5-26 more than three times.
Figure 5-25
Correlation Between Ozone Monitors in Massachusetts
Source: NetAssess2020 v1.1 Ambient Air Monitoring Network Assessment Tool

71
MassDEP 2020 Network Assessment
Figure 5-26
Highly Correlated Ozone Monitors in Massachusetts
Site 1 Site 2 Correlation Distance
(km) n Mean
Difference
25-005-1004 - Fall River 25-005-1006 - Fairhaven 0.9359 23 1025 0.0028
25-005-1004 - Fall River 25-023-0005 - Brockton 0.9236 44 1030 0.0033
25-009-2006 - Lynn 25-021-3003 - Milton 0.9218 31 1007 0.0030
25-009-2006 - Lynn 25-023-0005 - Brockton 0.9317 45 1054 0.0030
25-009-5005 - Haverhill 25-017-0009 - Chelmsford EPA 0.9071 27 1012 0.0031
25-011-2005 - Greenfield 25-013-0008 - Chicopee 0.9115 46 1026 0.0041
25-013-0008 - Chicopee 25-015-4002 - Ware 0.9226 22 1004 0.0033
25-015-4002 - Ware 25-027-0015 - Worcester Airport 0.9213 38 1020 0.0030
25-015-4002 - Ware 25-027-0024 - Uxbridge 0.9084 63 1021 0.0033
25-017-0009 - Chelmsford EPA 25-027-0015 - Worcester Airport 0.9027 57 1017 0.0032
25-017-0009 - Chelmsford EPA 25-027-0024 - Uxbridge 0.9185 62 1007 0.0030
25-021-3003 - Milton 25-023-0005 - Brockton 0.9530 18 1008 0.0030
25-021-3003 - Milton 25-027-0024 - Uxbridge 0.9193 43 992 0.0031
25-023-0005 - Brockton 25-025-0042 - Boston Harrison Ave 0.9290 30 1063 0.0046
25-023-0005 - Brockton 25-027-0024 - Uxbridge 0.9239 50 1040 0.0033
25-027-0015 - Worcester Airport 25-027-0024 - Uxbridge 0.9225 29 1030 0.0028 n = Number of observations used in correlation km = kilometers Source: NetAssess2020 v1.1

72
MassDEP 2020 Network Assessment
Removal Bias Analysis
Removal bias was calculated with NetAssess2002. Figures 5-27 and 5-28 show the removal bias
that would result from eliminating each ozone monitor individually.
Figure 5-27
Removal Bias for Ozone Monitors
Source: NetAssess2020 v1.1 Ambient Air Monitoring Network Assessment Tool

73
MassDEP 2020 Network Assessment
Figure 5-28
Removal Bias Statistics for Ozone Monitors
Site ID Site Name Mean
Removal Bias
Min Removal
Bias
Max Removal
Bias
Removal Bias Standard Deviation
Neighbors Included
25-021-3003 Milton - Blue Hill -0.0042 -0.017 0.006 0.0034 5
25-009-2006 Lynn -0.0037 -0.016 0.008 0.0029 6
25-001-0002 Truro -0.0018 -0.019 0.019 0.0040 12
25-015-4002 Ware -0.0018 -0.023 0.013 0.0031 7
25-007-0001 Aquinnah -0.0009 -0.035 0.024 0.0050 9
25-003-0008 Pittsfield -0.0004 -0.010 0.007 0.0026 6
25-017-0009 Chelmsford - EPA 0.0000 -0.013 0.018 0.0026 7
25-005-1004 Fall River 0.0002 -0.013 0.007 0.0028 5
25-013-0008 Chicopee 0.0003 -0.015 0.025 0.0038 6
25-027-0024 Uxbridge 0.0004 -0.009 0.011 0.0023 7
25-005-1006 Fairhaven 0.0005 -0.011 0.014 0.0028 4
25-023-0005 Brockton 0.0008 -0.011 0.011 0.0022 7
25-027-0015 Worcester - Airport 0.0009 -0.010 0.022 0.0033 5
25-009-5005 Haverhill 0.0023 -0.010 0.021 0.0039 5
25-011-2005 Greenfield 0.0025 -0.008 0.022 0.0036 5
25-025-0042 Boston - Harrison Ave 0.0055 -0.006 0.019 0.0036 4
Source: NetAssess2020 v1.1 Ambient Air Monitoring Network Assessment Tool
The mean removal bias is generally very small, but the standard deviation is relatively large and
the distance between the minimum and maximum are substantial. Therefore, removing any one
monitor would not introduce significant bias on average, but would introduce the potential for
relatively large errors (imprecision). This analysis therefore does not point to any particular
monitor as redundant and a good candidate for removal.
ANALYSIS RESULTS
MassDEP’s ozone monitoring network meets EPA monitoring requirements and objectives and
provides good coverage for the state, and there is no need for additional ozone or PAMS monitors
at this time. While it is possible that some ozone monitors could be eliminated, MassDEP
measures other pollutants at most ozone monitoring sites, providing additional benefits.
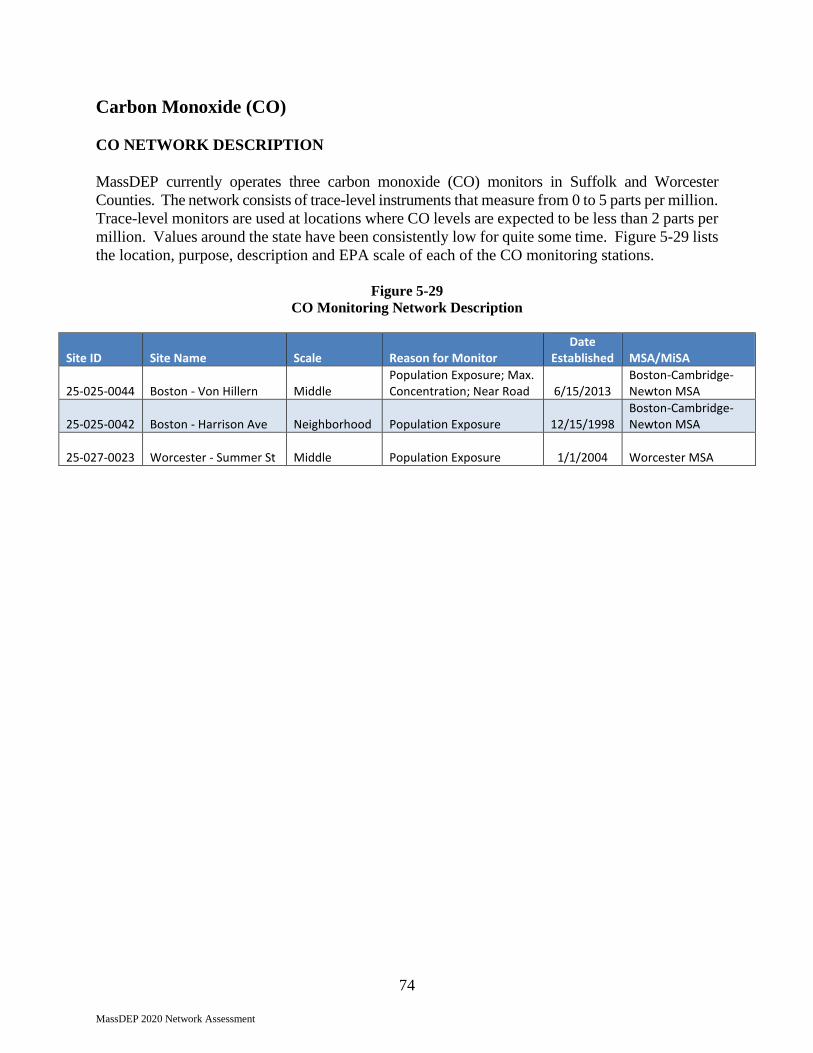
74
MassDEP 2020 Network Assessment
Carbon Monoxide (CO)
CO NETWORK DESCRIPTION
MassDEP currently operates three carbon monoxide (CO) monitors in Suffolk and Worcester
Counties. The network consists of trace-level instruments that measure from 0 to 5 parts per million.
Trace-level monitors are used at locations where CO levels are expected to be less than 2 parts per
million. Values around the state have been consistently low for quite some time. Figure 5-29 lists
the location, purpose, description and EPA scale of each of the CO monitoring stations.
Figure 5-29
CO Monitoring Network Description
Site ID Site Name Scale Reason for Monitor Date
Established MSA/MiSA
25-025-0044 Boston - Von Hillern Middle Population Exposure; Max. Concentration; Near Road 6/15/2013
Boston-Cambridge-Newton MSA
25-025-0042 Boston - Harrison Ave Neighborhood Population Exposure 12/15/1998 Boston-Cambridge-Newton MSA
25-027-0023 Worcester - Summer St Middle Population Exposure 1/1/2004 Worcester MSA

75
MassDEP 2020 Network Assessment
CO MONITOR AREAS SERVED
Figure 5-30 shows the area served by each CO monitor as defined by Voronoi polygons. These
polygons were developed using NetAssess2020. Due to the very low levels of CO monitored, CO
has become much less of a concern for EPA and states, and MassDEP has worked with EPA to
gradually reduce its CO monitoring network.
Figure 5-30
Area Served – CO sites
Source: NetAssess2020 v1.1 Ambient Air Monitoring Network Assessment Tool

76
MassDEP 2020 Network Assessment
CO DATA
2019 Summary Data
Figure 5-31 summarizes 2019 CO data. All values are well below the applicable NAAQS.
Figure 5-31
2019 CO Monitoring Data Summary (ppm)
1ST 2ND 1ST 2ND MAX MAX MAX MAX City County Address 1-HR 1-HR 8-HR 8-HR
Boston Suffolk Harrison Avenue 1.855 1.609 1.2 1.0
Boston Suffolk Von Hillern Street 0.730 0.729 0.5 0.5
Springfield Hampden Liberty Street 1.629 1.596 1.3 1.2
Worcester Worcester Summer Street 1.995 1.570 1.1 0.9 Standards: 1-hour = 35 ppm
8-hour = 9 ppm 1ST, 2ND MAX 1-HR = First and Second Highest 1-hr Value 1ST, 2ND MAX 8-HR = First and Second Highest 8-hr Value
CO Design Values
There are no design values for CO, but only values not to be exceeded. The 8-hour NAAQS for
CO is 9 parts per million (ppm) not to be exceeded more than once per year. The 1-hour NAAQS
for CO is 35 ppm not to be exceeded more than once per year. Figure 5-32 shows that
Massachusetts is consistently well below both the 8-hour and 1-hour CO standards.
Figure 5-32
2019 Summary Values for CO (ppm)
City County Address
2017 – 2019 Maximum Value
1 Hour (35 ppm) 8 Hour (9 ppm)
Boston Suffolk Harrison Avenue 1.855 1.3
Boston Suffolk Von Hillern Street 1.674 1.3
Springfield Hampden Liberty Street 2.100 1.3
Worcester Worcester Summer Street 1.995 1.1

77
MassDEP 2020 Network Assessment
CO Trends
Figure 5-33 shows the trend of each CO monitor relative to the 8-hour standard of 9 ppm.
Figure 5-33
Carbon Monoxide Trends 2010-2019
2nd Maximum 8-hour Values
CO TECHNOLOGY
MassDEP uses infrared red (IR) absorption analyzers to monitor low concentration range (trace
level) CO. There is no reason to change to another measurement technology at this time.
ADEQUACY OF THE CO MONITORING NETWORK
EPA Requirements
MassDEP has sited its CO monitors in compliance with EPA requirements, guidance and approval.
Near-road sites in CBSAs having a population of 1,000,000 or more are required to collocate one
CO monitor with one NO2 monitor. MassDEP’s Boston – Von Hillern site fulfills this requirement.
In addition, continued operation of existing CO sites using FRM or FEM monitors is required until
discontinuation is approved by EPA. The discontinuation of the Springfield CO monitor was
approved by EPA and the monitor was closed at the end of 2019. The Boston-Harrison Avenue

78
MassDEP 2020 Network Assessment
and Worcester - Summer Street monitors represent urban background, and Boston-Von Hillern
monitors near-road concentrations.
ANALYSIS RESULTS
MassDEP’s CO monitoring network meets EPA monitoring requirements and objectives and
provides adequate coverage for the state given the very low levels of CO monitored, and no
additional monitors are needed.

79
MassDEP 2020 Network Assessment
Sulfur Dioxide (SO2)
SO2 NETWORK DESCRIPTION
MassDEP currently operates six sulfur dioxide (SO2) monitors in Suffolk, Worcester, Bristol,
Hampden and Hampshire Counties. Similar to CO, SO2 concentrations have decreased so
significantly that trace instruments are used for monitoring. Figure 5-34 lists the location, purpose
and description of the SO2 monitoring stations and their EPA scales for SO2 monitoring purposes.
Figure 5-34
SO2 Monitoring Network Description
Site ID Site Name Scale Reason for Monitor Date
Established MSA/MiSA
25-025-0002 Boston - Kenmore Neighborhood Population Exposure 1/1/1965 Boston-Cambridge-Newton MSA
25-025-0042 Boston - Harrison Ave Neighborhood Population Exposure 12/15/1998 Boston-Cambridge-Newton MSA
25-005-1004 Fall River Neighborhood Population Exposure 2/1/1975 Providence-Warwick MSA
25-013-0018 Springfield Urban Population Exposure 5/1/2018 Springfield MSA
25-015-4002 Ware Urban Population Exposure 6/1/1985 Springfield MSA
25-027-0023 Worcester - Summer St Urban Population Exposure 1/1/2004 Worcester MSA
COVERAGE AREA
Figure 5-35 shows the area served by each SO2 monitor as defined by Voronoi polygons. These
polygons were developed using NetAssess2020. The SO2 monitoring network provides adequate
coverage for the state given the low levels monitored. All major SO2 emission sources in
Massachusetts have ceased operation. The last coal-fired power station in Massachusetts, Brayton
Point Station in Somerset, ceased operations in 2017. SO2 values in the state have remained very low
for several years.

80
MassDEP 2020 Network Assessment
Figure 5-35
Coverage Areas for SO2 Monitor
Source: NetAssess2020 v1.1
SO2 DATA
2019 SO2 Data Summary
Figure 5-36 summarizes 2019 monitoring data for SO2. All values are well below the applicable
NAAQS.
Figure 5-37
2019 SO2 Monitoring Data Summary (ppb)
1ST 2ND 99TH 1ST 2ND MAX MAX PCTL ARITH MAX MAX City County Address 1-HR 1-HR 1-HR MEAN 24-HR 24-HR
Boston Suffolk Kenmore Square 3.4 2.2 1.9 0.29 1.0 0.8
Boston Suffolk Harrison Avenue 2.9 1.9 1.7 0.33 0.9 0.7
Fall River Bristol Globe Street 5.1 3.4 3.0 0.49 1.6 1.3
Springfield Hampden Liberty Street 3.0 2.9 2.5 0.28 1.8 1.5
Ware Hampshire Skyline Drive 1.5 1.4 1.1 0.12 0.7 0.6
Worcester Worcester Summer Street 2.7 2.5 2.4 0.33 1.2 1.1 Standards: 1-hour = 75 ppb
3-hour = 0.5 ppm (500 ppb)

81
MassDEP 2020 Network Assessment
1ST, 2ND MAX 1-HR = First and Second Highest 1-hr Value 99TH PCTL 1-HR = 99th Percentile of the 1-hr Maximum Value ARITH MEAN = Annual Arithmetic Mean 1st, 2nd MAX 24-HR = First and Second Highest 24-hr Value
SO2 Design Values
Figure 5-37 shows the 2019 design values for each SO2 monitor. The annual SO2 NAAQS is 75
ppb measured as the 99th percentile of the 1-hour daily maximum concentrations averaged over
three years. Design values for all monitors are well below the NAAQS.
Figure 5-37
2017-2019 SO2 Design Values (ppb)
City County Address Design Value
2017-2019
Boston Suffolk Kenmore Square 3
Boston Suffolk Harrison Avenue 3
Fall River Bristol Globe Street 6
Springfield Hampden Liberty Street 3
Ware Hampshire Skyline Drive 2
Worcester Worcester Summer Street 3

82
MassDEP 2020 Network Assessment
SO2 Trend Data
Figure 5-37 shows the trends for each SO2 monitor relative to the 1-hour standard of 75 ppb.
Figure 5-37
Sulfur Dioxide Trends 2010 – 2019
1-hour 99th Percentile Annual Average
Note that the Fall River monitor was sited near coal-fired Brayton Point Station in Somerset, which
ceased operations in 2017.
SO2 TECHNOLOGY
MassDEP uses an ultraviolet (UV) fluorescence absorption continuous monitoring technology to
measure ambient SO2 trace concentrations. There is no need to change to a different monitoring
technology at this time.
ADEQUACY OF THE SO2 MONITORING NETWORK
EPA Requirements
The current SO2 monitoring network meets EPA requirements. Figure 5-39 shows the population
weighted emissions index (PWEI) and number of SO2 monitors for the state’s MSAs.

83
MassDEP 2020 Network Assessment
Figure 5-39
EPA Monitoring Requirements for SO2
MSA MA County
in MSA County
Population
MA Population
in MSA SO2
Emissions PWEI Monitors Required
Monitors in Network
Boston-Cambridge-
Newton
Essex 790,638
4,436,124 2,366 10,496 1 2 (both in Boston)
Middlesex 1,614,714
Suffolk 807,252
Norfolk 705,388
Plymouth 518,132
Barnstable Barnstable 213,413 213,413 146 31 0 0
Providence-Warwick
Bristol 564,022 564,022 2,287 1,290 0 1
Worcester Worcester 830,839 830,839 401 333 0 1
Springfield Hampden 470,406
631,761 338 214 0 2 Hampshire 161,355
Pittsfield Berkshire 126,348 126,348 79 10 0 0 Notes: SO2 emissions measured in tons per year. SO2 emissions for all counties are presented in Figure 4-4. PWEI = Population weighted emissions index PWEI = (MA Population in MSA x SO2 Emissions) / 1,000,000 Design criteria:
• MSAs with a PWEI greater than 1,000,000 require 3 monitors
• MSAs with a PWEI between 100,000 and 1,000,000 require 2 monitors
• MSAs with a PWEI between 5,000 and 100,000 require 1 monitor
ANALYSIS RESULTS
MassDEP’s SO2 monitoring network meets EPA monitoring requirements and objectives and
provides adequate coverage for the state given the very low levels of SO2 monitored, and no
additional monitors are needed. Massachusetts no longer has significant SO2 emissions sources
that would warrant SO2 monitoring.

84
MassDEP 2020 Network Assessment
Nitrogen Dioxide (NO2)
NETWORK DESCRIPTION
MassDEP operates 10 NO2 monitors in 8 municipalities (see Figure 5-40) located in Suffolk,
Norfolk, Essex, Worcester, Hampshire and Hampden Counties. Because NO2 is both a NAAQS
pollutant and, along with other oxides of nitrogen, an ozone precursor, MassDEP operates five
NO2 sites for NAAQS compliance based on population exposure and operates five NO2 monitors
at for ozone monitoring and PAMS purposes. Boston - Von Hillern Street and Chelmsford –
Manning Road are required near-road sites for monitoring compliance with the 1-hour NO2
standard. Figure 5-40
NO2 Monitor Site Location, Description and Other Pollutants Monitored
Site ID Site Name Scale Reason for Monitor Date
Established MSA/MiSA
25-025-0002 Boston - Kenmore Micro
Highest Concentration; Population Exposure 1/1/1965
Boston-Cambridge-Newton MSA
25-025-0042 Boston - Harrison Ave Neighborhood Population Exposure 12/15/1998
Boston-Cambridge-Newton MSA
25-025-0044 Boston - Von Hillern St Middle
Population Exposure; Max. Concentration; Near Road 6/15/2013
Boston-Cambridge-Newton MSA
25-017-0010 Chelmsford – Manning Rd Middle
Population Exposure; Max. Concentration; Near Road 7/1/2018
Boston-Cambridge-Newton MSA
25-013-0008 Chicopee Urban Population Exposure 1/1/1983 Springfield MSA
25-009-2006 Lynn Urban
PAMS - Max. Precursor O3; Population Exposure 1/1/1992
Boston-Cambridge-Newton MSA
25-021-3003 Milton - Blue Hill Regional
Upwind Background PM2.5; Maximum Ozone 4/2/2002
Boston-Cambridge-Newton MSA
25-013-0018 Springfield Urban
Population Exposure; Highest Concentration 5/1/2018 Springfield MSA
25-015-4002 Ware Urban
Max. O3 Conc.; background for other pollutants 6/1/1985 Springfield MSA
25-027-0023 Worcester - Summer St Urban Population Exposure 1/1/2004 Worcester MSA

85
MassDEP 2020 Network Assessment
COVERAGE AREA
Figure 5-41 shows the area served by each NO2 monitor as defined by Voronoi polygons. These
polygons were developed using NetAssess2020. The NO2 monitoring network provides adequate
coverage for the state given that the largest sources of NO2 are roadways, and the network has two
near-road sites (Boston – Von Hillern Street and Chelmsford Manning Street) that are sited where
the highest concentrations in the state are expected to be.
Figure 5-41
NO2 Monitor Coverage Area
Source: NetAssess2020 v1.1
NO2 DATA
2019 NO2 Data Summary
A summary of the 2019 NO2 data is shown in Figure 5-42. All levels are well below applicable
NAAQS.

86
MassDEP 2020 Network Assessment
Figure 5-42
2019 NO2 Monitoring Data Summary (ppb)
1ST 2ND 98TH MAX MAX PERCENTILE ARITH City County Address 1-HR 1-HR VALUE MEAN
Boston Suffolk Kenmore Square 49 48 44 12.42
Boston Suffolk Harrison Avenue 57 55 49 11.18
Boston Suffolk Von Hillern Street 56 53 49 14.17
Chelmsford Middlesex Manning Road 44 44 41 10.47
Chicopee Hampden Anderson Road 38 38 32 4.45
Lynn Essex Parkland Avenue 46 43 35 5.33
Milton Norfolk Canton Avenue 33 33 25 3.48
Springfield Hampden Liberty Street 46 46 44 10.41
Ware Hampshire Skyline Drive 26 26 20 1.83
Worcester Worcester Summer Street 51 49 48 10.49 Standards: 1-hour = 100 ppb
Annual Arithmetic Mean = 53 ppb 1ST, 2ND MAX 1-HR = First and Second Highest 1-hr Value ARITH MEAN = Annual Arithmetic Mean
NO2 Design Values
Figure 5-43 shows the 2019 design values for NO2. The annual average NO2 NAAQS is 53 ppb.
The 1-hour NO2 NAAQS is 100 ppb calculated as the 3-year average of the annual 98th percentile
of the daily 1-hour maximum.
Figure 5-43
2019 Design Values for NO2
City County Address
2017-2019 98th
Percentile 1-hour Maximum Design Value
2017-2019 Average Annual Mean
Boston Suffolk Kenmore Square 45 12.93
Boston Suffolk Harrison Avenue 48 11.20
Boston Suffolk Von Hillern Street 46 13.78
Chelmsford Middlesex Manning Road 37 10.07
Chicopee Hampden Anderson Road 35 5.01
Lynn Essex Parkland Avenue 34 4.70
Milton Norfolk Canton Avenue 29 3.76
Springfield Hampden Liberty Street 38 10.33
Ware Hampshire Skyline Drive 21 2.09
Worcester Worcester Summer Street 46 11.13 Standards: 1-hour = 100 ppb
Annual Arithmetic Mean = 53 ppb Note: Chelmsford – Manning Road site does not yet have full three years of data.
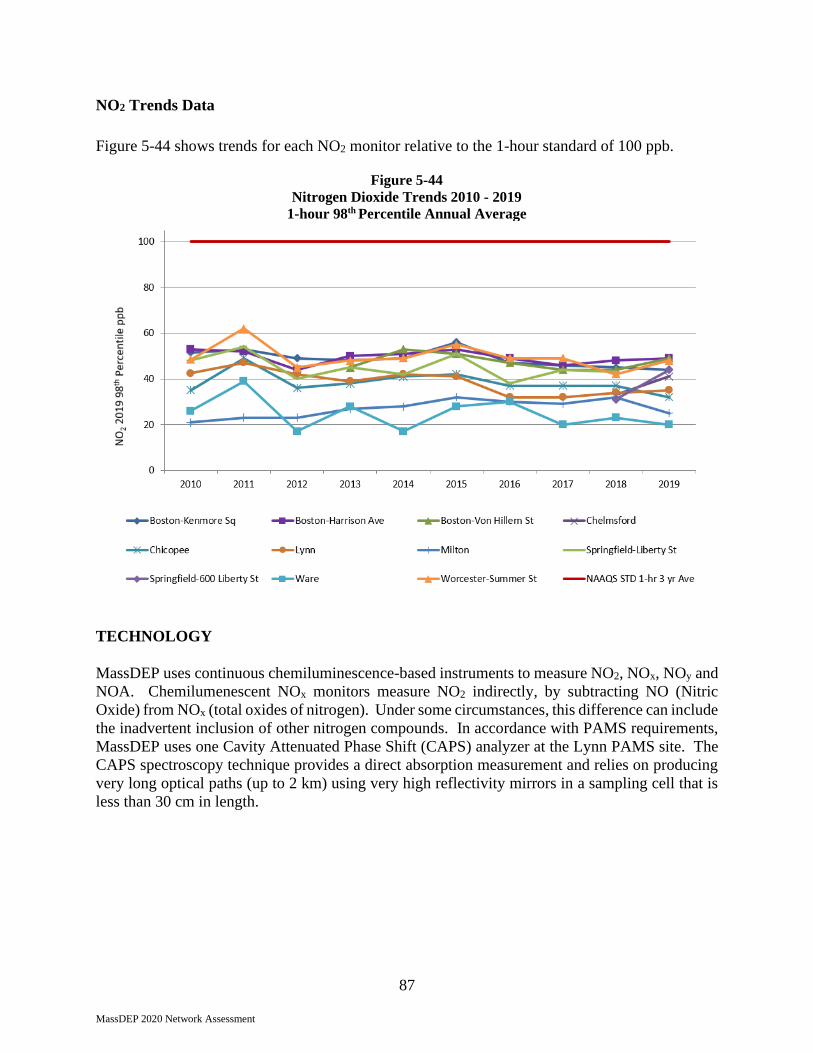
87
MassDEP 2020 Network Assessment
NO2 Trends Data
Figure 5-44 shows trends for each NO2 monitor relative to the 1-hour standard of 100 ppb.
Figure 5-44
Nitrogen Dioxide Trends 2010 - 2019
1-hour 98th Percentile Annual Average
TECHNOLOGY
MassDEP uses continuous chemiluminescence-based instruments to measure NO2, NOx, NOy and
NOA. Chemilumenescent NOx monitors measure NO2 indirectly, by subtracting NO (Nitric
Oxide) from NOx (total oxides of nitrogen). Under some circumstances, this difference can include
the inadvertent inclusion of other nitrogen compounds. In accordance with PAMS requirements,
MassDEP uses one Cavity Attenuated Phase Shift (CAPS) analyzer at the Lynn PAMS site. The
CAPS spectroscopy technique provides a direct absorption measurement and relies on producing
very long optical paths (up to 2 km) using very high reflectivity mirrors in a sampling cell that is
less than 30 cm in length.

88
MassDEP 2020 Network Assessment
ADEQUACY OF THE EXISTING MONITORING NETWORK
EPA Monitoring Requirements
In February 2010, EPA promulgated a 100 ppb 1-hour standard for NO2 and established new near-
road monitoring requirements for heavily traveled roadways, as well as area-wide monitoring. The
number of roadway and area wide monitors required in each MSA depends upon the MSA’s
population and the Annual Average Daily Traffic counts (AADTs) for major roadways in the
MSA. Figure 5-45 shows the number of NO2 monitors required in each Massachusetts MSA.
Figure 5-45
EPA NO2 Monitoring Requirements
MSA
MA County in
MSA County
Population
MA Population
in MSA 2019 AADT
Required for Near-Road Monitoring
Required for Area-Wide Monitoring
Near-Road Sites
Area-Wide Sites
Boston-Cambridge-
Newton
Essex 790,638
4,436,124 329,265 2 1 2 4
Middlesex 1,614,714
Suffolk 807,252
Norfolk 705,388
Plymouth 518,132
Barnstable Barnstable 213,413 213,413 58,879 0 0 0 0
Providence-Warwick
Bristol 564,022 564,022 77,414 0 0 0 0
Worcester Worcester 830,839 830,839 63,865 0 0 0 1
Greenfield Town Franklin 70,963 70,963 1,611 0 0 0 0
Springfield Hampden 470,406
631,761 14,733 0 0 0 3 Hampshire 161,355
Pittsfield Berkshire 126,348 126,348 16,381 0 0 0 0 Source: AADTs – MassDOT annual traffic data collection program. https://www.mass.gov/traffic-volume-and-classification Population - US Census-Annual Estimates of the Resident Population: April 1, 2010 to July 1, 2018. Near-road requirements:
• One near-road NO2 monitoring station in each MSA with a population of 1,000,000 or more persons.
• A second near-road NO2 monitoring station is required for any MSA with a population of 2,500,000 persons or more, or in any MSA with a population of 1,000,000 or more persons that has one or more roadway segments with 250,000 or greater AADT counts
Area-wide NO2 requirements:
• One monitoring station in each MSA with a population of 1,000,000 or more persons.
• PAMS sites that are situated in an area of expected high NO2 concentrations may be used to satisfy this minimum requirement
ANALYSIS RESULTS
MassDEP’s NO2 monitoring network meets EPA monitoring requirements and objectives and
provides good coverage for the state, and there is no need for NO2 monitors at this time. While it
is possible that some NO2 monitors could be eliminated, MassDEP measures other pollutants at
all NO2 monitoring sites, providing additional benefit.

89
MassDEP 2020 Network Assessment
Lead (Pb)
NETWORK DESCRIPTION
MassDEP monitors lead at the Boston – Harrison Avenue NCore site using a low-volume PM10
method for non-NAAQS purposes under the National Air Toxics Trends Site (NATTS) program.
LEAD MONITORING DATA
2018 Pb Data Summary
A summary of the 2019 Pb data is shown in Figure 5-46. All values are well below the NAAQS.
Figure 5-46
2019 Pb Monitoring Data Summary (µg/m3)
City County Address 2019 MAX
µg/m3 2019 MEAN
µg/m3 Boston Suffolk Harrison Avenue 0.00460 0.00156 Standard: 0.15 µg/m3 (rolling 3-month average) MAX = Maximum 24-hour value MEAN = Annual Arithmetic Mean
TECHNOLOGY
MassDEP currently collects Teflon low volume PM10 samples at Boston – Harrison Avenue, which
is analyzed via X-ray fluorescence by EPA contractors. The samples are collected every 6th day
for 24 hours.
ADEQUACY OF THE MONITORING NETWORK
EPA Requirements
Because lead levels are well below the NAAQS, EPA no longer requires lead monitoring at
MassDEP’s Boston NCore site. EPA requires monitoring near lead sources that emit 0.5 tons or
greater annually; however, Massachusetts does not have any sources of lead emissions that meet this
level.
ANALYSIS RESULTS
MassDEP is not required to monitor lead for NAAQS purposes. However, MassDEP monitors
toxics metals, including lead, at its Boston – Harrison Avenue as part of the National Air Toxics
Trends Site program. Levels from this monitoring show lead levels are well below the lead NAAQS
of 0.15 µg/m3.
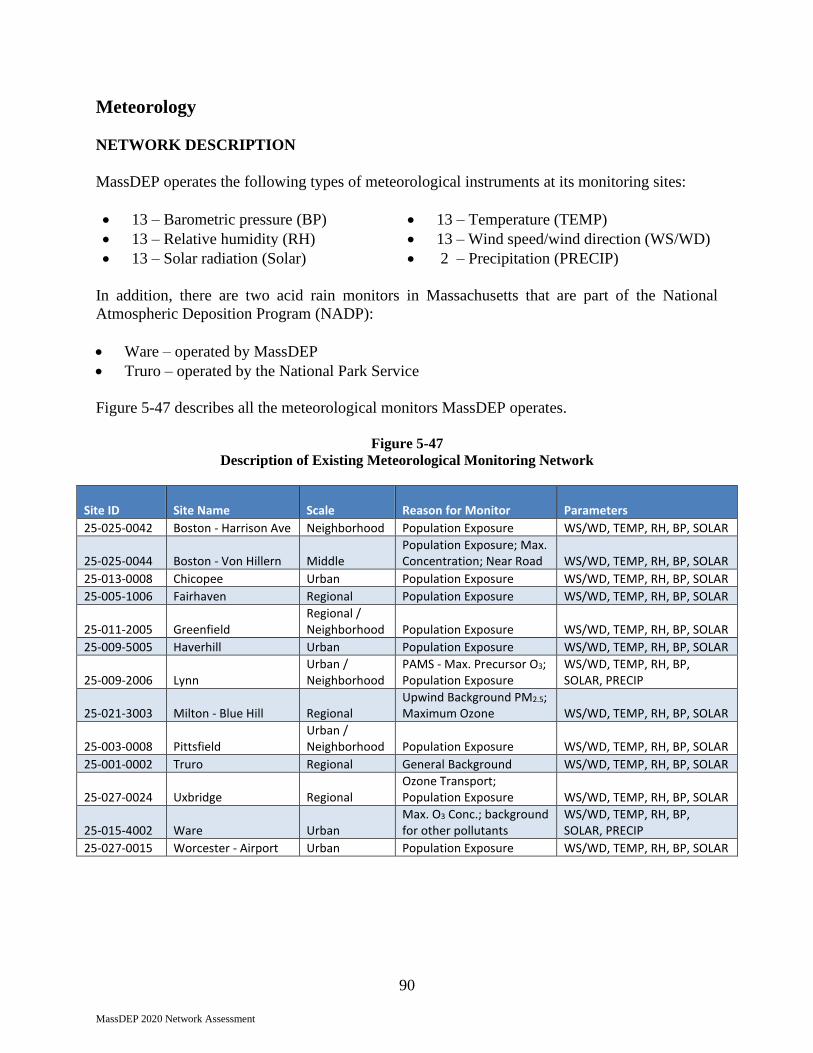
90
MassDEP 2020 Network Assessment
Meteorology
NETWORK DESCRIPTION
MassDEP operates the following types of meteorological instruments at its monitoring sites:
• 13 – Barometric pressure (BP) • 13 – Temperature (TEMP)
• 13 – Relative humidity (RH) • 13 – Wind speed/wind direction (WS/WD)
• 13 – Solar radiation (Solar) • 2 – Precipitation (PRECIP)
In addition, there are two acid rain monitors in Massachusetts that are part of the National
Atmospheric Deposition Program (NADP):
• Ware – operated by MassDEP
• Truro – operated by the National Park Service
Figure 5-47 describes all the meteorological monitors MassDEP operates.
Figure 5-47
Description of Existing Meteorological Monitoring Network
Site ID Site Name Scale Reason for Monitor Parameters
25-025-0042 Boston - Harrison Ave Neighborhood Population Exposure WS/WD, TEMP, RH, BP, SOLAR
25-025-0044 Boston - Von Hillern Middle Population Exposure; Max. Concentration; Near Road WS/WD, TEMP, RH, BP, SOLAR
25-013-0008 Chicopee Urban Population Exposure WS/WD, TEMP, RH, BP, SOLAR
25-005-1006 Fairhaven Regional Population Exposure WS/WD, TEMP, RH, BP, SOLAR
25-011-2005 Greenfield Regional / Neighborhood Population Exposure WS/WD, TEMP, RH, BP, SOLAR
25-009-5005 Haverhill Urban Population Exposure WS/WD, TEMP, RH, BP, SOLAR
25-009-2006 Lynn Urban / Neighborhood
PAMS - Max. Precursor O3; Population Exposure
WS/WD, TEMP, RH, BP, SOLAR, PRECIP
25-021-3003 Milton - Blue Hill Regional Upwind Background PM2.5; Maximum Ozone WS/WD, TEMP, RH, BP, SOLAR
25-003-0008 Pittsfield Urban / Neighborhood Population Exposure WS/WD, TEMP, RH, BP, SOLAR
25-001-0002 Truro Regional General Background WS/WD, TEMP, RH, BP, SOLAR
25-027-0024 Uxbridge Regional Ozone Transport; Population Exposure WS/WD, TEMP, RH, BP, SOLAR
25-015-4002 Ware Urban Max. O3 Conc.; background for other pollutants
WS/WD, TEMP, RH, BP, SOLAR, PRECIP
25-027-0015 Worcester - Airport Urban Population Exposure WS/WD, TEMP, RH, BP, SOLAR

91
MassDEP 2020 Network Assessment
TECHNOLOGY
The Figure 5-48 below summarizes the technology MassDEP uses to measure meteorology. There
are no plans to change existing technology.
Figure 5-48
Meteorological Monitoring Technology
Parameter Analytical Method Sample Frequency Location
Wind Speed/Direction Ultrasonic Sensors Hourly All Meteorological Sites
Solar Pyranometer Hourly All Meteorological Sites
Relative Humidity Electronic Sensor Hourly All Meteorological Sites
Ambient Temperature Electronic Thermistor Hourly All Meteorological Sites
Barometric Pressure Electronic Sensor Hourly All Meteorological Sites
Precipitation Tipping Bucket Hourly Ware and Lynn Only
ANALYSIS RESULTS
MassDEP has access to adequate meteorological information to forecast air quality, including
predicting ozone and PM2.5 episodes, modeling emissions from individual sources, evaluating the
transport of pollution (particularly ozone and its precursors), and creating wind roses. MassDEP
is planning to obtain a ceilometer for the Lynn PAMS site.
Technology Issues
Key technology issues that MassDEP must address as part of operating the air monitoring network
are listed below.
Calibration
• MassDEP’s field calibrators are suitable for ozone and trace-level dilution as appropriate.
The equipment is capable of automated quality control checks. MassDEP has an internal
ozone generator–photometer.
• MassDEP’s lab and field calibrators can generate Minimum Detection Level (MDL)
concentrations (CO, SO2, and NOy).
Zero Air Source
• MassDEP’s zero air source is compliant with NCore TAD recommendations. An ultra-pure
air cylinder is used for occasional comparison to zero air source. The equipment has the
capacity for 20+ LPM of dilution air.

92
MassDEP 2020 Network Assessment
Data Acquisition System
• MassDEP’s data system is capable of a digital system, remote diagnostics, and remotely
enabled checks. MassDEP has invested in a new, upgraded Data Acquisition System and
remote communications capabilities, which has improved data polling times and quality and
will significantly improve ongoing quality control assessments through real-time and near real-
time communications with fields analyzers.
Gas Cylinder Standards
• MassDEP’s gas cylinders are suitable for trace-level dilutions in accordance with Appendix A
of 40 CFR Part 58 audit concentrations and EPA protocol certifications, and meet the special
low-level standards needed for MDL concentrations (CO, SO2, and NOy).
Meteorological Calibration Devices
• MassDEP’s meteorological calibration devices have NIST (National Institute of Standards)
traceability for required meteorological parameters. Sonic wind instruments must be shipped
to the manufacturer annually for factory calibration.
Sampling Manifold
• MassDEP’s sampling meets the standards of Appendix E of 40 CFR Part 58, including
residence time <20 seconds, only glass or Teflon materials, and probe and monitor inlets of
acceptable heights.
Auditing Equipment
MassDEP has the following auditing equipment:
• Independent calibrators
• Zero air source and gas standards compatible with trace-level specifications
• Independent meteorological and flow standards
• A new dilution system capable of generating EPA-required concentration levels
Other
MassDEP has:
• Automated Gas Chromatograph systems for measuring VOC ozone precursors at the PAMS
site and at its laboratory for analyzing field-procured VOC canister samples
• An environmental chamber that houses a robotic weighing device for PM2.5 filters
• A real-time website for displaying current air pollution concentrations to the public