Market Analysis & Business District Assessment - Mass.gov
39
Market Analysis & Business District Assessment Downtown Middleborough Prepared by Peg Barringer FinePoint Associates www.FinePointAssociates.com Prepared for : Town of Middleborough Office of Economic and Community Development Sponsored by: MA Dept. of Housing & Community Development, MA Downtown Initiative Program
-
Upload
khangminh22 -
Category
Documents
-
view
0 -
download
0
Transcript of Market Analysis & Business District Assessment - Mass.gov

Market Analysis & Business District Assessment �Downtown Middleborough
Prepared by Peg Barringer FinePoint Associates www.FinePointAssociates.com
Prepared for :
Town of Middleborough Office of Economic and Community Development
Sponsored by: MA Dept. of Housing & Community
Development, MA Downtown Initiative Program

Contents �
Acknowledgements�
Project Scope, Purpose and Study Area…………………………………………………….…4
Part I. Analysis of the Potential Market ………………………………………………………5 A. Overview of Potential Market Segments B. Resident Market Segment
1. Trade Area Delineation 2. Trade Area Consumer Characteristics 3. Market Demand and Sales Leakage
(including Summary of Trade Area Demographics, Expenditures and Sales Leakage Data Charts) C. Sub-segments and Non Resident Market Segments
Part II. Assessment of Business District Conditions and Commercial Mix………………..23 A. Real Estate Overview B. Establishment Characteristics C. Business District Composition Assessment D. Comparative Business Mix Analysis
Part III. Recommendations for Consideration….……………………..…………..…………36
This project was conducted by FinePoint Associates, Peg Barringer, Project Director, in collaboration with the Middleborough Downtown Working Group, comprised of Town Staff and community representatives. We also received information and input from several business owners, property owners, institution representatives and residents that graciously agreed to be interviewed and 126 employees that responded to our survey. Thank you to everyone that contributed time, information and insights to this project. Thank you for the guidance and sponsorship of MA Dept. of Housing & Community Development, MA Downtown Initiative Program, Emmy Hahn, Coordinator.
Downtown Working Group and Contributors
Input, Information and Interviews Arhur Battistini Judy Bigelow-Costa Leslie Corsini Mary Dawson Willy Duphily
Lisa Dymond Valerie Glynn Peg Holzemer Paulette Lilla Jane Lopes Regina Moriarty Meri Mizaras
Kostas Palailogos Wayne Perkins Cindy Phillips Paul Provencher Joe Ramano Diane Stewart, Selectman Douglas Walo
And, thank you to everyone that responded to the Downtown Employee Survey.
Town Staff Robert Nunes, Town Manager Jane Kudcey, Director, Office of Economic and Community Development
Working Group & Community Input Coordinator Ginny Landis

3
List of Tables and Figures�
Figures
Figure 1. Regional Context Figure 2. Downtown Study Area Map Figure 3. Location of Surrounding Commercial Facilities Figure 4. Drive Time Figure 5. Trade Areas Figure 6: Summary of Trade Area Demographics, Expenditures & Sales Leakage Figure 7. Downtown Employee Survey Results (Residency, Patronage & Satisfaction Figure 8. Downtown Employee Survey Results (Desired Businesses) Figure 9. Establishments by Size Figure 10. Commercial Tax Rate Comparison Figure 11. Downtown Sub Areas Figure 12. Ownership Characteristics Figure 13. Establishment Operating Hours Figure 14. Composition of Uses Figure 15. Commercial District Business Mix Figure 16. Comparison with Shopping Centers and Commercial Districts Figure 17. Comparison with Other Commercial Centers (Selected Categories)
Tables
Table 1. Resident Annual Expenditures Table 2. Sales Leakage in Selected Categories (millions) Table 3. Eating and Drinking Places Sales Leakage Analysis Table 4. Additional Demographics Data Table 5. Estimated Employee Work Day Food Purchases and Market Opportunity Table 6. Commercial Units & Establishments by Sub Area Table 7. Establishment Type by Number and Square Footage Table 8. Top Ten Most Frequently Found establishments Table 9. Eating & Drinking Establishment Types

Prepared by: Peg Barringer, FinePoint Associates, in collaboration with the Downtown Middleborough Working Group www.FinePointAssociates.com 4
Project Scope, Purpose and Study Area �
Scope: To work collaboratively with a small working group and the Director of Economic and Community Development to conduct a market analysis and assessment of the real estate, business conditions and commercial mix in Downtown Middleborough.
Purpose: To provide foundational research that will help to identify obstacles and assess opportunities that will inform possible future actions with regard to downtown vibrancy-maintaining strategies.
Study Area: Middleborough is located approximately 40 miles south of Boston surrounded by the towns of Taunton, Plymouth, Wareham, Carver, Lakeville, Halifax, Rochester and Plympton. (see Figure 1). The downtown business district study area extends between Cambridge Street/the rail line and the Nemasket River. Businesses are predominantly located along Center Street, Main Street, Wareham Street.
Figure 1. Regional Context
Figure 2. Downtown Study Area Map
Middleborough

Prepared by: Peg Barringer, FinePoint Associates, in collaboration with the Downtown Middleborough Working Group www.FinePointAssociates.com 5
Middleborough Downtown Business District�
Part I. Analysis of the Potential Market��A. Overview of Potential Market Segments �
Businesses located in the Downtown Middleborough have the opportunity to serve several potential market segments: ! Residents of the Surrounding Area ! Resident Sub-segment – Oak Point 55+ Community ! Employees Working in and Nearby Downtown ! Massasoit Community College Students ! Visitors/Users/Attendees of Nearby Attractions and Events Residents of the Surrounding Area�The major potential customer base for the Downtown is the adjacent residential population. The identified primary trade area (where most of the repeat business is expected to be derived) is a 3-mile radius containing approximately 22,600 residents. The secondary trade area is identified as the 6-mile radius, containing approximately 44,800 residents. The rationale for the trade area delineation and the demographic and consumer characteristics of the population in each trade area are is described in detail later in this report. Resident Sub-Segment – Oak Point Residents�The residents of Oak Point represent a sub-segment of the surrounding resident market with a concentration of newer residents. This master-planned community within Middleborough, dedicated to people 55 and over, contains over 900 offers newly built custom manufactured homes in a 1,000 acre wooded setting. Employees of Area Businesses�In addition to the residential customer base, there are over 500 employees who work in the 146 establishments within close proximity to the business district. This segment represents an opportunity for meal and snack purchases as well as other convenience goods and services purchased before and after work. A few large employers located nearby include: High Point Treatment Center (over 200 employees), the Town (approximately 75 employees including Town departments and Library) and Massasoit Community College (approximately 50 employees). Massasoit Community College Students�A satellite location of Massasoit Community College is located right in the Downtown. The college has approximately 500 students with a growing enrollment.��Visitors/Users/Attendees of Nearby Attractions and Events�People are drawn to events and attractions that bring them into or within very close proximity to downtown. This creates potential opportunities for downtown restaurants, retailers and service providers. Market segments include: ! Visitors to Burt Wood Performing Arts School and Alley Theater ! Visitors and Users of the Downtown Athletic Fields ! Visitors to the Historic/Cultural Sites (Middleborough Historical Museum, Robbins Museum of Archaeology) These market segments will be described in more detail in the following sections of this report.

Prepared by: Peg Barringer, FinePoint Associates, in collaboration with the Downtown Middleborough Working Group www.FinePointAssociates.com 6
Middleborough Downtown Business District� Market Analysis (cont’d)�
�
B. Resident Market Segment� 1. Trade Area Delineation�Defining the trade area is the first step in determining market potential for a commercial district. Once the trade area is defined, we can quantify the amount of potential customers that live within the area as well as examine their characteristics and purchasing habits to provide a picture of the potential market. The term retail trade area refers to the geographic area from which a retail entity generates its sales. The primary trade area for a commercial center, such as a downtown, business district or shopping plaza is the area from which most of the steady, repeat business is derived (typically, where 65-80% of the total sales are generated). A combination of factors determines the size and boundaries of the primary trade area: travel time and distance for shoppers, travel patterns, location of competing commercial centers, physical barriers that might effect access, socio economic characteristics, and the size and scope of the commercial center itself. (Generally, the larger the variety, breadth and uniqueness of the merchandise offerings, the greater distance customers are willing to travel, and therefore, the larger the trade area will be.) The competing commercial facilities surrounding Downtown Middleborough are identified on the following page (see Figure 3). (Note that this map is intended to be illustrative of key competitors; not all commercial facilities are shown.) The competition becomes greater beyond a 4-mile radius from the center of Downtown. Figure 4 shows computer-generated drive times. The 4-mile radius is roughly equivalent to an 8-10 minute drive time. After discussing consumers patterns with local business owners and residents and reviewing the location of existing commercial facilities, travel times and circulation routes, it was determined that the likely potential Primary Trade Area for the Business District is a 4-mile radius (see Figure 5). There may also be potential to attract some customers from a Secondary Trade Area, the area included in a 6-mile radius from the District (see Figure 5). This secondary trade area was identified because it represents a relatively reasonable travel time to acquire goods and services. However, it is expected that capture rate would be significantly less than in the primary trade area and would depend on the uniqueness and quality of the merchandise or services being offered. The demographic and consumer characteristics of the population in these trade areas are described throughout the following section. �
Sources: The Nielsen Company, U.S. Census, InfoUSA, American Community Survey, Primary Data Collection, FinePointAssociates

Prepared by: Peg Barringer, FinePoint Associates, in collaboration with the Downtown Middleborough Working Group www.FinePointAssociates.com
Downtown/Village Center Business Districts Taunton Downtown
" Downtown Bridgewater " Downtown Plymouth
" Downtown Middleborough " Downtown Taunton
Other Commercial Small Shopping Plazas (few stores, typically Marshalls, T.J. Maxx)
Walmart, Walmart Supercenter
Major Supermarkets
7
Regional Malls (apparel, home goods, restaurants, etc.) " Kingston Collection " Silver City Galleria
Lifestyle Centers (restaurants, entertainment, apparel, home goods, specialty chains, in open-air, town center-like setting, etc.)
" Colony Place " Wareham Crossing
Performing Arts Theatres/Companies " Applause Academy " Burt Wood School of Performing Arts/Alley
Theatre/Nemasket River Productions " BSU Theater " Kreative Kidz Theatre " Rogue Theatre Company/Roseland Ballroom " Spire Center for Performing Arts
Figure 3. Location of Surrounding Commercial Facilities�
Middleborough Downtown Business District � Market Analysis (cont’d) �
* Note: This listing and map is intended to be illustrative not exhaustive. All commercial facilities are not shown.
Downtown Middleborough •
4-Mile Radius

Prepared by: Peg Barringer, FinePoint Associates, in collaboration with the Downtown Middleborough Working Group www.FinePointAssociates.com
8
Figure 4. Drive Time (computer –generated) �
Middleborough Downtown Business District � Market Analysis (cont’d) �
Figure 5. Trade Areas�
Drive Time (computer-generated)
5 minutes 10 minutes
Primary Trade Area (TA1)
4 mile radius - - - - - Secondary Trade Area (TA2)
6 mile radius - - - - -

Prepared by: Peg Barringer, FinePoint Associates, in collaboration with the Downtown Middleborough Working Group www.FinePointAssociates.com 9
Middleborough Downtown Business District� Market Analysis (cont’d)�
B. Resident Market Segment (cont’d)� 2. Trade Area Consumer Characteristics��Primary Trade Area (TA1)�There are approximately 22,601 people living within the primary trade area. The population is predominantly White with average or above average income. Educational attainment rate is similar to the United States but lower than Massachusetts. The estimated median household income for 2015 is $71,541, which is 5% higher than the statewide median. There is a significant upper income segment – 31% of the households earn over $100,000 per year. The population is predominantly white (95%), with a small portion comprised of Asians (1%), Black/African Americans (1%) and other races. Only 2% of the population is Hispanic compared to 11% in the State. The most significant cultural concentrations are Irish (21%) Italian (15%), English (11%) and Portuguese (6%) and compared concentration in the United States of 7%, 4%, 5% and <1% respectively. Approximately 35% of the population over the age of 25 has at least an Associates Degree or higher (compared to 47% in Massachusetts and 37% in the United States). Compared to Massachusetts overall, the primary trade area population, on average, is older, more likely to be married, have children under 18 in the household, own their home and have a car. The median age is 43.3, about 9% higher than in Massachusetts and 14% higher than in the US. 19% of the population is 65 years of age or older compared to 15% in the state and the U.S. The population is comprised predominantly of family households (71%), meaning more than one person in the household related by blood or marriage, with an average percentage of single parent households. 34% of the households contain children under 18 compared to 31% statewide and 33% in the U.S. About 22% of the households contain only one person, compared to 29% statewide. Homeownership is significantly higher --76% of the occupied homes are owner-occupied compared to 62% statewide. The vast majority of the market is mobile with access to a private vehicle for acquiring goods and services. Only a very small portion of households (4%) do not own a vehicle and therefore represent a market segment dependent on public transportation or walking to acquire goods and services. In fact, two-thirds of the households have 2 cars or more. Projected Growth - The population and the number of households in the Primary Trade Area has been growing at a substantially higher rate than Massachusetts overall. Between 2000 and 2010, population grew by 15% and the number of households grew by 20%, compared to statewide rates of 3% and 4%. According to projections obtained from Nielsen, between 2010 and 2020, the population is expected to grow annually by approximately .91% and the number of households by 1.0%, while the statewide projections are .67% and .74%. These projections are based on data from the American Community Survey (conducted more frequently than the decennial census), data from the United States Post Office, new construction data, and the Nielsen Master Address File. Secondary Trade Area (TA2)�There are approximately 44,761 people living within the secondary trade area. The characteristics of this population are fairly similar to the primary trade area, however median household of $78,597 is about 10% higher.
�A summary analysis of primary and secondary trade area consumer characteristics, expenditures and sales leakage is presented in the following sections of this report.
�
Sources: The Nielsen Company, U.S. Census, InfoUSA, American Community Survey, Social Explorer

Prepared by: Peg Barringer, FinePoint Associates, in collaboration with the Downtown Middleborough Working Group www.FinePointAssociates.com 10
Middleborough Downtown Business District� Market Analysis (cont’d)�
B. Resident Market Segment(cont’d)���
3. Market Demand and Sales Leakage��Market Demand - Trade Area Resident Expenditures Given the demographic, lifestyle and other consumer characteristics of the trade area population (presented in the previous section), their total annual expenditures for a variety of retail goods and services can be estimated.
Table 1. Resident Annual Expenditures
TA1 TA2 Furniture & Home Furnishings Stores-442 $8,211,036 $16,022,583
Furniture Stores-4421 $4,349,534 $8,504,618 Home Furnishing Stores-4422 $3,861,502 $7,517,965
Electronics & Appliances Stores-443 $7,395,629 $14,348,371 Building Material, Garden Equipment Stores -444 $44,482,758 $86,740,886
Building Material & Supply Dealers-4441 $38,184,169 $74,400,732 Lawn/Garden Equipment/Supplies Stores-4442 $6,298,590 $12,340,154
Food & Beverage Stores-445 $53,576,669 $101,229,145 Grocery Stores-4451 $34,939,719 $66,075,392 Specialty Food Stores-4452 $4,306,150 $8,156,934 Beer, Wine & Liquor Stores-4453 $14,330,800 $26,996,819
Health & Personal Care Stores-446 $22,311,639 $41,960,549 Pharmacies & Drug Stores-44611 $17,758,918 $33,314,860 Cosmetics, Beauty Supplies, Perfume Stores-44612 $1,538,727 $2,882,999 Optical Goods Stores-44613 $1,032,313 $2,043,850 Other Health & Personal Care Stores-44619 $1,981,681 $3,718,840
Clothing & Clothing Accessories Stores-448 $19,188,533 $37,858,210 Clothing Stores-4481 $10,021,328 $19,781,848 Shoe Stores-4482 $1,432,896 $2,813,260 Jewelry, Luggage, Leather Goods Stores-4483 $7,734,309 $15,263,102
Sporting Goods, Hobby, Book, Music Stores-451 $7,191,194 $14,129,626 Sporting Goods, Hobby, Musical Instrument Stores-4511 $6,229,749 $12,232,607 Book, Periodical & Music Stores-4512 $961,445 $1,897,020
General Merchandise Stores-452 $47,757,421 $91,794,998 Department Stores, Excluding Leased Departments-4521 $20,014,298 $38,874,691 Other General Merchandise Stores-4529 $27,743,123 $52,920,308
Miscellaneous Store Retailers-453 $11,415,680 $21,821,673 Florists-4531 $435,228 $845,773 Office Supplies, Stationery, Gift Stores-4532 $5,287,302 $10,205,203 Used Merchandise Stores-4533 $817,445 $1,611,766 Other Miscellaneous Store Retailers-4539 $4,875,705 $9,158,932
Eating & Drinking Places-722 (not including special foodservice) $44,949,710 $85,514,169 Full-Service Restaurants-7221 $20,308,655 $38,660,245 Limited-Service Eating Places-7222 $17,893,081 $34,021,300 Drinking Places -Alcoholic Beverages-7224 $1,824,918 $3,466,742
$261,557,213 $502,054,329
Table 1 represents the annual retail market demand by category. Note: These expenditures are currently being made by residents at a variety of locations both inside and outside of the identified trade areas.
Sources: The Nielsen Company, U.S. Census, InfoUSA, American Community Survey, Social Explorer

Prepared by: Peg Barringer, FinePoint Associates, in collaboration with the Downtown Middleborough Working Group www.FinePointAssociates.com 11
Middleborough Downtown Business District� Market Analysis (cont’d)�
B. Resident Market Segment (cont’d)���
Sales Leakage Analysis - General�A sales leakage analysis estimates the amount and type of annual purchases that residents are currently making outside of the trade area. If the analysis shows significant leakage within certain retail categories, it might point to possible opportunities for new or existing businesses within those categories.
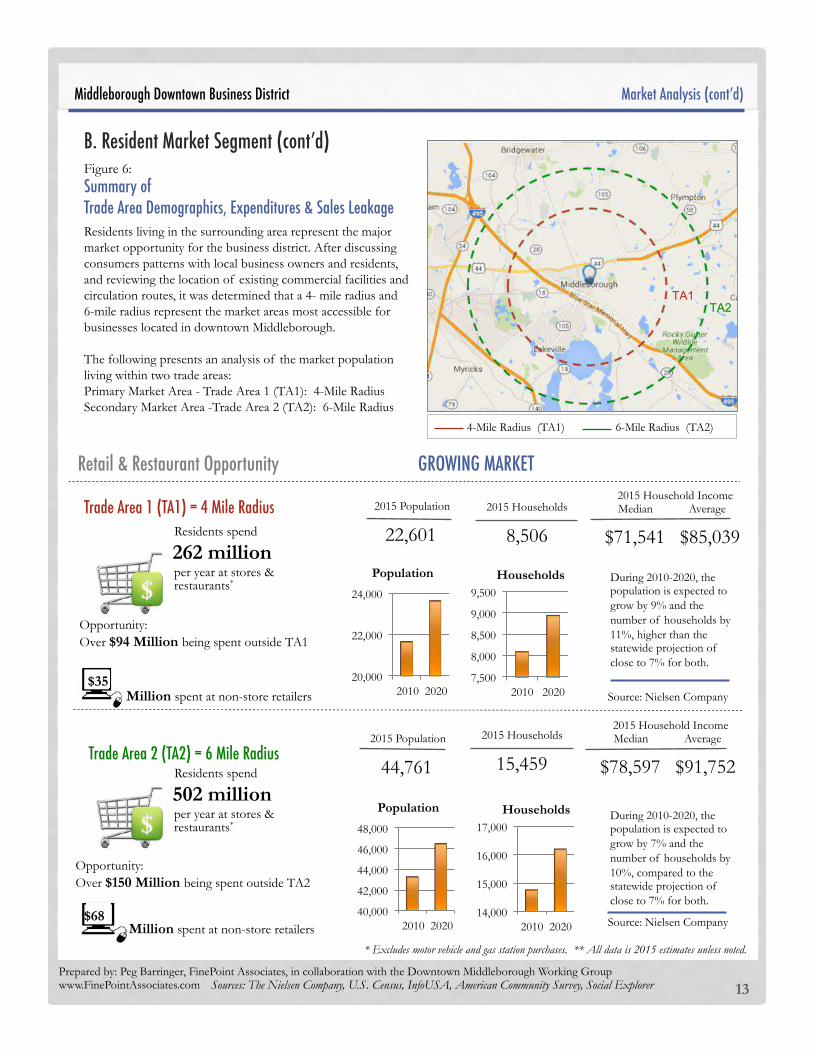
! More than 22,000 residents live within the 4-mile primary trade area (TA1) and they spend over $262 million per year at stores and restaurants. Currently, more than $94 million (36%) is being spent outside of the primary trade area. There is sales leakage in most categories, the most significant sales leakage is in the following categories: Specialty Food Stores, Liquor, Sporting Goods/Hobby, Gifts/Novelty, Other Misc. Stores (pets/supplies, art, other) and Electronics. For the purposes of this analysis, “most significant” is defined as the categories in which a 60% market capture in the trade area would be sufficient to support at least one new business. There is no sales leakage in the categories of Drug Stores, Clothing, Limited Service Restaurants, Furniture, Jewelry and Florists. Note: In categories showing little or no leakage, it does not necessarily mean that there is no opportunity, however, success would depend heavily on the ability to attract expenditures from non-resident market segments and/or overtake trade from existing competition within the trade area by offering more desirable products or services.
! Close to 45,000 residents live within the 6-mile trade area (TA2); these residents spend over $502 million per year at retail stores and restaurants. Currently, more than $150 million (30%) is being spent outside of the trade area. A smaller potential market capture would be expected within this secondary trade area, however, depending on the uniqueness of the offering, there may be some opportunity for capturing expenditures especially for specialty retail or services.
Table 2. Sales Leakage in Selected Categories (millions)
TA1 TA2 Other General Merchandise Stores-4529 $25.65 $43.68 Department Stores Ex Leased Depts-4521 $20.01 $18.25 Supermarkets, Groc. (Ex Conv)-44511 $13.28 $12.66 Beer, Wine and Liquor Stores-4453 $9.88 $19.13 Electronics and Appliance Stores-443 $5.49 $10.70 Sporting Goods, Hobby Stores-4511 $5.21 $9.83 Specialty Food Stores-4452 $4.26 $5.03 Hardware Stores-44413 $2.68 $4.46 Home Furnishing Stores-4422 $2.65 $1.79 Office Supplies and Stationery -45321 $2.58 $3.72 Full-Service Restaurants-7221 $2.49 $10.19 Other Miscellaneous Store Retailers-4539 $2.39 $5.82 Gift, Novelty and Souvenir Stores-45322 $1.97 $4.03 Drinking Places- Alcoholic Beverages-7224 $1.82 $0.81 Cosmetics, Beauty Supplies-44612 $1.40 $2.50 Shoe Stores-4482 $1.06 $2.10 Book, Periodical and Music Stores-4512 $0.96 $1.84 Convenience Stores-44512 $0.81 $1.21 Optical Goods Stores-44613 $0.51 $1.35 Used Merchandise Stores-4533 $0.43 $1.14 Paint and Wallpaper Stores-44412 $0.40 $0.78 Other Health/Personal Care Stores-44619 $0.01 -$1.32 Florists-4531 $0.00 $0.23 Jewelry Stores-44831 -$1.97 $2.35 Furniture Stores-4421 -$2.21 -$0.87 Limited-Service Eating Places-7222 -$3.63 -$1.90 Clothing Stores-4481 -$6.41 -$3.27 Pharmacies and Drug Stores-44611 -$26.91 -$35.15
The presence of sales leakage indicates a retail gap and a geographic advantage for new businesses within TA1 (as residents are currently traveling significant distances to acquire goods and services). However, some caveats should be noted as follows. 1) The potential for new businesses in downtown to capture this sales leakage would be dependent on their ability to offer comparable quality goods, services and shopping environment to change existing consumer patterns. 2) Some businesses (e.g., shoes/clothing/accessories) do well when they are clustered with related businesses that offer comparative and/or crossover options for consumers; therefore if there is no existing similar or related establishments already in the district to build on, there might be less potential to recruit these types of businesses. 3) Although, there may be leakage in certain categories, there might not be adequate footprint or infrastructure (e.g., parking) to support the type of store in the business district. This might include stores such as department stores, large electronic stores or supermarkets.
Sources: The Nielsen Company, U.S. Census, InfoUSA, American Community Survey, Social Explorer
Prepared by: Peg Barringer, FinePoint Associates, in collaboration with the Downtown Middleborough Working Group www.FinePointAssociates.com 12
Middleborough Downtown Business District� Market Analysis (cont’d)�
B. Resident Market Segment (cont’d)��
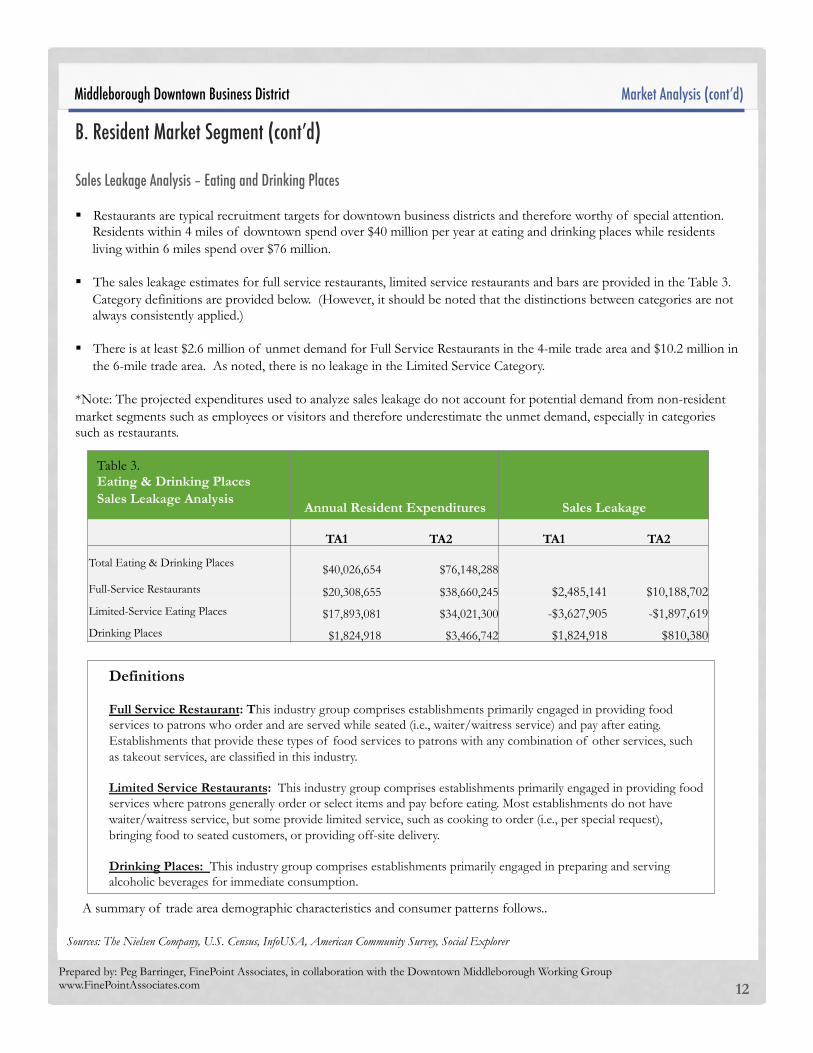
�Sales Leakage Analysis – Eating and Drinking Places� ! Restaurants are typical recruitment targets for downtown business districts and therefore worthy of special attention.
Residents within 4 miles of downtown spend over $40 million per year at eating and drinking places while residents living within 6 miles spend over $76 million.
! The sales leakage estimates for full service restaurants, limited service restaurants and bars are provided in the Table 3. Category definitions are provided below. (However, it should be noted that the distinctions between categories are not always consistently applied.)
! There is at least $2.6 million of unmet demand for Full Service Restaurants in the 4-mile trade area and $10.2 million in the 6-mile trade area. As noted, there is no leakage in the Limited Service Category.
*Note: The projected expenditures used to analyze sales leakage do not account for potential demand from non-resident market segments such as employees or visitors and therefore underestimate the unmet demand, especially in categories such as restaurants.
Sources: The Nielsen Company, U.S. Census, InfoUSA, American Community Survey, Social Explorer
Table 3. Eating & Drinking Places Sales Leakage Analysis
Annual Resident Expenditures Sales Leakage
TA1 TA2 TA1 TA2
Total Eating & Drinking Places! $40,026,654 $76,148,288 Full-Service Restaurants! $20,308,655 $38,660,245 $2,485,141 $10,188,702 Limited-Service Eating Places! $17,893,081 $34,021,300 -$3,627,905 -$1,897,619 Drinking Places! $1,824,918 $3,466,742 $1,824,918 $810,380
Definitions
Full Service Restaurant: This industry group comprises establishments primarily engaged in providing food services to patrons who order and are served while seated (i.e., waiter/waitress service) and pay after eating. Establishments that provide these types of food services to patrons with any combination of other services, such as takeout services, are classified in this industry.
Limited Service Restaurants: This industry group comprises establishments primarily engaged in providing food services where patrons generally order or select items and pay before eating. Most establishments do not have waiter/waitress service, but some provide limited service, such as cooking to order (i.e., per special request), bringing food to seated customers, or providing off-site delivery.
Drinking Places: This industry group comprises establishments primarily engaged in preparing and serving alcoholic beverages for immediate consumption. A summary of trade area demographic characteristics and consumer patterns follows..
Prepared by: Peg Barringer, FinePoint Associates, in collaboration with the Downtown Middleborough Working Group www.FinePointAssociates.com
* Excludes motor vehicle and gas station purchases. ** All data is 2015 estimates unless noted.
Residents living in the surrounding area represent the major market opportunity for the business district. After discussing consumers patterns with local business owners and residents, and reviewing the location of existing commercial facilities and circulation routes, it was determined that a 4- mile radius and 6-mile radius represent the market areas most accessible for businesses located in downtown Middleborough. The following presents an analysis of the market population living within two trade areas: Primary Market Area - Trade Area 1 (TA1): 4-Mile Radius Secondary Market Area -Trade Area 2 (TA2): 6-Mile Radius
13
Trade Area 2 (TA2) = 6 Mile Radius�
2015 Population
22,601
2015 Households
8,506
2015 Household Income Median Average
$71,541 $85,039
2015 Population
44,761
2015 Households
15,459
2015 Household Income Median Average
$78,597 $91,752
Opportunity: Over $150 Million being spent outside TA2
7,500
8,000
8,500
9,000
9,500
2010 2020
Households
20,000
22,000
24,000
2010 2020
Population
GROWING MARKET�Retail & Restaurant Opportunity�
Residents spend
262 million per year at stores & restaurants*
Residents spend
502 million per year at stores & restaurants*
Opportunity: Over $94 Million being spent outside TA1 $35
Million spent at non-store retailers
Trade Area 1 (TA1) = 4 Mile Radius �
B. Resident Market Segment (cont’d)��
Figure 6: Summary of �Trade Area Demographics, Expenditures & Sales Leakage�
Middleborough Downtown Business District� Market Analysis (cont’d)�
14,000
15,000
16,000
17,000
2010 2020
Households
40,000
42,000
44,000
46,000
48,000
2010 2020
Population
$68 Million spent at non-store retailers
During 2010-2020, the population is expected to grow by 9% and the number of households by 11%, higher than the statewide projection of close to 7% for both.
Source: Nielsen Company
Source: Nielsen Company
4-Mile Radius (TA1) 6-Mile Radius (TA2)
During 2010-2020, the population is expected to grow by 7% and the number of households by 10%, compared to the statewide projection of close to 7% for both.
TA1 TA2
*
Sources: The Nielsen Company, U.S. Census, InfoUSA, American Community Survey, Social Explorer

Prepared by: Peg Barringer, FinePoint Associates, in collaboration with the Downtown Middleborough Working Group www.FinePointAssociates.com
- 1 2 3 4
<$25,000
$25 - $49,999
$50 - $74,999
$75 - $99,999
$100 - $149,999
$150,000 +
Thousands
Households by Income
TA1 TA2 Households not in TA1
- 1,000 2,000 3,000 4,000 5,000 6,000
Other nonfamily
One person
Other family
Married couple
Single parent
Married couple
Households by Composition
TA1 TA2 Households not in TA1
Market Analysis (cont’d)�
Middleborough Downtown Business District�
14
Median age is in TA1 and in TA2 compared to 39.7 statewide and 37.9 in U.S.
43.3 � 42.9�
of households in TA1 and in TA2 contain children compared to 31% statewide and 33% U.S.
34% �
36% �
Race & Ethnicity
TA1 TA2 MA
White Alone 95% 94% 79% Black/African American 1% 3% 7% Asian 1% 1% 6% Other/More than 1 Race 3% 3% 8% Latino/Hispanic 2% 3% 11%
76%� Homeowners in TA1, in TA2, 62% in MA 82%�
2.6�Persons per Household in TA1 and 2.7 in TA2 compared to 2.5 statewide
0%
10%
20%
30%
40%
0-14 15-24 25 - 44 45 - 64 65 +
Population by Age TA1 TA2 U.S.
35%�of TA1 and 38% of TA2 residents have Associates Degree or higher; 47% statewide, 37% in the U.S.
6% of TA1 and 7% of TA2 residents speak a language besides English at home
Asian/Pacific Island Language: 1%, Indo/European Language: 4%, Spanish: 1 - 2%, Other: <1%
CU
LT
UR
AL
MIX
Residents
Lifestyle
Kid
s N
o K
ids households in TA1 have income > $75,000; Median
household income is $71,541 and $78,597 in TA1 & TA2; $67,928 statewide, $53,706 in U.S.
3,988�
71% Families TA1 66% in U.S.
. . . 4% car-free households in TA1 and
3% in TA2 -- these residents are likely to shop close to home Foot Traffic� . . . �
Cultural Concentration/Ancestry TA1 TA2 US
Irish 21% 20% 7% Italian 15% 13% 4% English 11% 10% 5% Portuguese 6% 7% ,1%
Figure 6 (cont’d): Summary of Demographics, Expenditures & Sales Leakage�
Sources: The Nielsen Company, U.S. Census, InfoUSA, American Community Survey, Social Explorer

Prepared by: Peg Barringer, FinePoint Associates, in collaboration with the Downtown Middleborough Working Group www.FinePointAssociates.com
Expenditures TA1 TA2
$8.2 $16.0
$7.4 $14.3
$44.5 $86.7
$53.6 $101.2 $22.3 $42.0
$19.2 $37.9
$7.2 $14.1
$47.8 $91.8
$11.4 $21.8
$40.0 $76.1 $ millions
Market Analysis (cont’d)�Middleborough Downtown Business District�
15
-100% -80% -60% -40% -20% 0% 20% 40% 60% 80% 100%
Furniture & Home Furnishings
Electronics & Appliances
Bldg. Materials, Garden Equip. & Supply*
Food & Beverage Stores
Health & Personal Care Stores
Clothing & Accessories
Sporting Gds., Hobby, Books, Music
General Merchandise
Misc. Store Retailers
Food Service & Drinking (excl. spec. foodservices)
Local Demand Compared to Local Business Sales
TA1 TA2 Sales Leakage/Opportunity�
Est. Sales Leakage - Select Categories
TA1
TA2
Furniture Stores-4421 ($2.21) ($0.87) Home Furnishing Stores-4422 $2.65 $1.79 Electronics and Appliance Stores-443 $5.49 $10.70 Paint and Wallpaper Stores-44412 $0.40 $0.78 Hardware Stores-44413 $2.68 $4.46 Supermarkets, Groc. (Ex Conv)-44511 $13.28 $12.66 Convenience Stores-44512 $0.81 $1.21 Specialty Food Stores-4452 $4.26 $5.03 Beer, Wine and Liquor Stores-4453 $9.88 $19.13 Pharmacies and Drug Stores-44611 ($26.91) ($35.15) Cosmetics, Beauty Supplies-44612 $1.40 $2.50 Optical Goods Stores-44613 $0.51 $1.35 Other Health/Personal Care Stores-44619 $0.01 ($1.32) Clothing Stores-4481 ($6.41) ($3.27) Shoe Stores-4482 $1.06 $2.10 Jewelry Stores-44831 ($1.97) $2.35 Sporting Goods, Hobby Stores-4511 $5.21 $9.83 Book, Periodical and Music Stores-4512 $0.96 $1.84 Department Stores Ex Leased Depts-4521 $20.01 $18.25 Other General Merchandise Stores-4529 $25.65 $43.68 Florists-4531 ($0.00) $0.23 Office Supplies and Stationery -45321 $2.58 $3.72 Gift, Novelty and Souvenir Stores-45322 $1.97 $4.03 Used Merchandise Stores-4533 $0.43 $1.14 Other Miscellaneous Store Retailers-4539 $2.39 $5.82 Full-Service Restaurants-7221 $2.49 $10.19 Limited-Service Eating Places-7222 ($3.63) ($1.90) Drinking Places- Alcoholic Beverages-7224 $1.82 $0.81
Opportunity Gap (Sales Leakage) The retail categories with high sales leakage may suggest opportunity for local businesses (existing and/or new businesses). To determine the feasibility of capturing the leakage, it is necessary to evaluate the strength of the competing businesses outside of the trade area that are currently attracting resident expenditures.
In categories showing little or no leakage, it does not necessarily mean that there is no opportunity. There might be opportunity depending on the ability of local businesses to attract expenditures from non-resident market segments (i.e., employees and visitors) and/or overtake trade from existing competition by offering more desirable products or services. Negative Sales Leakage (Surplus) Categories with negative sales leakage indicate that businesses are currently meeting more than just local demand. Businesses in these categories are generating sales from customers that live outside of the identified trade area which may include employees of nearby businesses or visitors travelling into the district from beyond the immediate area because of attractions or destination businesses. *Note: Sales leakage calculations include all businesses in the trade area, not just the business in the commercial district.
Spen
ding P
ower�
$ millions The most significant TA1 sales leakage is in the following categories: Specialty Food Stores, Beer/Wine/Liquor, Sporting Goods/Hobby, Gifts/Novelty, Other Miscellaneous Stores and Electronics.
Figure 6 (cont’d): Summary of Demographics, Expenditures & Sales Leakage�
Sources: The Nielsen Company, U.S. Census, InfoUSA, American Community Survey, Social Explorer

Prepared by: Peg Barringer, FinePoint Associates, in collaboration with the Downtown Middleborough Working Group www.FinePointAssociates.com
Market Analysis (cont’d)�Middleborough Downtown Business District�
16
Table 4. Additional Demographics Data
Est. Population by Age TA1 TA2 MA U.S.
22,601 % 44,761 % % %
Age 0 - 4 1,197 5 2,190 5 5 6
Age 5 - 9 1,317 6 2,407 5 6 6
Age 10 - 14 1,444 6 2,828 6 6 6
Age 15 - 17 944 4 1,907 4 4 4
Age 18 - 20 815 4 1,685 4 5 4
Age 21 - 24 990 4 2,144 5 6 6
Age 25 - 34 2,340 10 4,833 11 13 13
Age 35 - 44 2,723 12 5,531 12 12 13
Age 45 - 54 3,530 16 7,601 17 15 14
Age 55 - 64 3,050 13 6,457 14 13 13
Age 65 - 74 2,641 12 4,603 10 9 8
Age 75 - 84 1,120 5 1,809 4 4 4
Age 85 and over 489 2 766 2 2 2
Est. Population Age 25+ by Education
TA1-% TA2-% MA % US %
Less than 9th grade 3 3 5 6
Some High School 5 6 6 8
High School Grad/GE) 36 34 26 28
Some College, no degree 21 20 17 21
Associate Degree 10 10 8 8
Bachelor's Degree 17 19 22 18
Master's Degree 6 7 12 8
Professional School Degree 1 1 3 2
Doctorate Degree 0 1 2 1
Avg. Length of Residence (Years) TA1 TA2 MA US
Homeowners 17 17 19 17 Renters 8 8 9 8
Est. Population 16+ by Occupation TA1-% TA2-% MA % US %
Architect/Engineer 1 1 2 2 Arts/Entertain/Sports 1 2 2 2 Building Grounds Maint 3 3 3 4 Business/Financial Ops 6 6 6 5 Community/Soc Svcs 1 1 2 2 Computer/Math 3 3 4 3 Construction/Extract 6 6 4 5 Edu/Training/Library 6 6 7 6 Farm/Fish/Forestry 0 0 0 1 Food Prep/Serving 7 6 5 6 Health Practitioner/Tec 7 7 7 6 Healthcare Support 2 3 3 3 Maintenance Repair 4 4 3 3 Legal 0 1 1 1 Life/Phys/Soc Science 1 1 2 1 Management 9 10 11 10 Office/Admin Support 13 13 13 14 Production 6 5 4 6 Protective Svcs 4 3 2 2 Sales/Related 10 10 10 11 Personal Care/Svc 3 4 4 4 Transportation/Moving 7 6 4 6
Est. Population 16+ by Employment Status TA1-% TA2-% MA % US %
In Labor Force 70 97 67 64 Employed 63 61 61 58 Self-employed 9 10 9 10 Unemployed 7 6 6 6
Est. Households by Size TA1 TA2 MA U.S.
8,506 % 15,459 % % %
1-persons 1,911 22 2,986 19 29 27
2-persons 2,946 35 5,191 34 32 32
3-persons 1,536 18 2,904 19 16 16
4-persons 1,256 15 2,614 17 14 13
5-persons 570 7 1,191 8 6 6
6 or more 286 3 574 4 3 5
Est. Households by Income TA1 TA2 % MA % U.S.%
< $15,000 647 8 996 6 12 13
$15,000 - $24,999 474 6 803 5 9 11
$25,000 - $34,999 576 7 915 6 8 10
$35,000 - $49,999 905 11 1,491 10 11 14
$50,000 - $74,999 1,916 23 3,160 20 16 18
$75,000 - $99,999 1,327 16 2,531 16 13 12
$100,000 - $124,999 981 12 1,963 13 10 8
$125,000 - $149,999 750 9 1,499 10 7 5
$150,000 - $199,999 576 7 1,311 8 8 5
$200,000 - $249,999 176 2 403 3 3 2
$250,000 - $499,999 157 2 341 2 4 2
$500,000+ 21 0 46 0 2 1
Med. Household Income 71,541 78,597 67,928 53,706
Sources: The Nielsen Company, U.S. Census, InfoUSA, American Community Survey, Social Explorer

Prepared by: Peg Barringer, FinePoint Associates, in collaboration with the Downtown Middleborough Working Group www.FinePointAssociates.com
Market Analysis (cont’d)�Middleborough Downtown Business District�
17
Est. Population by Ancestry TA1 TA2 MA U.S.
22,601 % 44,761 % % % Arab 115 0.5 319 0.7 0.9 0.5 Czech 0 0.0 11 0.0 0.1 0.3 Danish 0 0.0 8 0.0 0.1 0.2 Dutch 32 0.1 143 0.3 0.3 0.8 English 2,544 11.3 4,593 10.3 6.3 5.5 French (exc. Basque) 1,067 4.7 2,089 4.7 4.7 1.6 French Canadian 813 3.6 1,449 3.2 2.8 0.5 German 1,094 4.8 1,982 4.4 3.3 10.4 Greek 57 0.3 164 0.4 1.0 0.3 Hungarian 11 0.0 11 0.0 0.2 0.3 Irish 4,758 21.1 9,118 20.4 16.1 6.8 Italian 3,290 14.6 5,918 13.2 10.1 4.2 Lithuanian 150 0.7 268 0.6 0.5 0.1 U.S./American 1,112 4.9 2,118 4.7 3.8 6.7 Norwegian 53 0.2 116 0.3 0.3 0.9 Polish 756 3.3 1,358 3.0 3.2 2.0 Portuguese 1,314 5.8 3,090 6.9 3.7 0.3 Russian 170 0.8 344 0.8 1.3 0.6 Scottish 419 1.9 839 1.9 1.3 1.1 Scotch-Irish 69 0.3 322 0.7 0.5 0.8 Slovak 0 0.0 0 0.0 0.1 0.1 Subsaharan African 208 0.9 377 0.8 1.7 0.9 Swedish 352 1.6 778 1.7 1.0 0.8 Swiss 41 0.2 85 0.2 0.1 0.2 Ukrainian 0 0.0 7 0.0 0.3 0.2 Welsh 0 0.0 5 0.0 0.2 0.3 West Indian (exc Hisp groups) 52 0.2 283 0.6 1.7 0.8 Other ancestries 2,214 9.8 5,205 11.6 26.3 40.7
Est. Population-Asian Alone by Category TA1 TA2 MA U.S.
22,601 % 44,761 % % %
Not Asian Alone 22,383 99 44,330 99 94 95
Asian Alone 218 1 431 1 6 5 Chinese, except Taiwanese 14 6 52 12 35 22
Filipino 142 65 147 34 3 17
Japanese 1 1 3 1 2 5
Asian Indian 28 13 57 13 21 19
Korean 3 2 37 9 7 10
Vietnamese 17 8 28 7 13 11
Cambodian 2 1 57 13 8 2
Hmong 2 1 3 1 0 2
Laotian 0 0 1 0 1 1
Thai 1 1 3 1 1 1
Other 8 4 44 10 9 10
Est. Hispanic Population by Origin TA1 TA2 MA U.S.
22,601 % 44,761 % % %
Not Hispanic or Latino 22,151 98 43,571 97 89 82
Hispanic or Latino: 450 2 1,190 3 11 18
Mexican 72 16 140 12 6 63
Puerto Rican 204 45 424 36 42 9
Cuban 28 6 44 4 2 3
Other 146 32 583 49 50 25
= Cultural Concentrations
Table 4. (cont’d) Additional Demographics Data
Sources: The Nielsen Company, U.S. Census, InfoUSA, American Community Survey, Social Explorer

Prepared by: Peg Barringer, FinePoint Associates, in collaboration with the Downtown Middleborough Working Group www.FinePointAssociates.com 18
C. Sub-segments and Non-Resident Market Segments
The Downtown has several other potential market segments that offer opportunities for downtown businesses. The working group collaborated with FinePoint to obtain information about these segments and discuss potential opportunities. 1. Employees of Area Businesses�In addition to the residential customer base, there is a daytime population of employees who work in close proximity to the business district. This segment represents an opportunity for meal and snack purchases as well as other convenience goods and services purchased before and after work. This segment might be interested in goods and services such as dry cleaning, tailoring, hair and nail services, dental services, banking services, coffee, snacks, breakfast, lunch, prepared foods, cards & gifts, etc.
We estimate there are over 500 employees working in the downtown area. Some of the larger employers include: High Point Treatment Center, the Town (government, police, library, etc.) and Massasoit Community College. It should be noted that High Point has an internal cafeteria which may compete for meal and snack purchases. We surveyed downtown employees and received 126 responses. The results are summarized in the following charts. A few highlights are included below.
! 40% of employees go to Downtown establishments several times per week. 28% go once per week and 28% go less than once per week. The most frequently visited establishments include restaurants, Benny’s and the Post Office.
! The respondents were least satisfied with the physical appearance of Downtown and the goods and services available.
! Respondents offered up a long list of establishments they would like to see in Downtown. The most frequent response, by far, were restaurants, followed by gift/card shops, entertainment & recreation establishments (movie theater, bowling, yoga, arcade, live music, fitness), bookstores (books, comics), clothing & accessories stores and more. Respondents that cited restaurants often indicated they were looking for more variety in dining options. They most frequently mentioned “sit-down”, “nice” restaurants, and also often cited fast casual restaurants (soup, sandwich, salad), Asian restaurants (Chinese, Thai), coffee shops and pub style establishments.
! Based upon survey responses concerning consumer behavior, it appears that employees in the downtown area may be spending over $1.5 million per year on coffee and meal purchases, during and after their work day. However, they are currently making the vast majority of these purchases elsewhere (not at downtown establishments) which could represent a potential market opportunity. Plus, employees might increase their meal purchasing if more options were available.
Middleborough Downtown Business District� Market Analysis (cont’d)�
Estimated Employee Spending at Restaurants and Carryout Places Before, During or After Work
Opportunity
Current Annual Estimated Work Day Expenditures by Downtown Area Employees
(assuming 500 employees)
Estimated % Being Spent Elsewhere (Not at
Downtown Businesses)
Estimated $ Being Spent Elsewhere (Not at Downtown Businesses)
Breakfast/Coffee $311,760 69% $215,114
Lunch $446,457.50 74% $330,379
Dinner $750,476.25 83% $622,895
Total $1,508,694 77% $1,168,388
Table 5. Estimated Employee Work Day Food Purchases and Market Opportunity (Based on Survey Results)

Prepared by: Peg Barringer, FinePoint Associates, in collaboration with the Downtown Middleborough Working Group www.FinePointAssociates.com 19
0%
10%
20%
30%
40%
50%
Several Times per
Week
About Once per
Week
2 to 3 Times per
Week
Once per Month
Less than Once per Month
Frequency of Downtown Patronage
Figure 7. Downtown Employee Survey Results (Residency, Patronage & Satisfaction) Survey Conducted July 2016
Market Analysis (cont’d)�Middleborough Downtown Business District�
Middle borough
58%
Bridgewater 5%
Lakeville 5%
Brockton 3%
Plymouth 2%
Other 27%
Where Employees Live
0% 20% 40% 60% 80% 100%
Eating & Drinking Places (restaurants, coffee/donut
Benny's
Post Office
Convenience/Food Stores
Banks
Library
Bakery
Hair, Skin or Nail Service (salon, barber, tanning, tattoo.
Gift Shop, Jewelry Stores
% of Employees that Have Visited Establishments (within last 3 months)
0% 10% 20% 30% 40% 50% 60% 70%
I feel businesses, goods & services available in Downtown Middleborough are adequate to meet the type of purchasing, services
& other errands I would like to do before, during or after work.
I find that Downtown Middleborough businesses and establishments are open the hours that meet my needs.
I am aware of all the businesses, goods and services that Downtown Middleborough has to offer.
I find access and parking in the Downtown to be adequate.
I am satisfied with the physical appearance of Downtown Middleborough.
Employee Satisfaction Level with Downtown Attributes
Strongly Disagree/Disagree Neither Agree or Disagree Agree/Strongly Agree

Prepared by: Peg Barringer, FinePoint Associates, in collaboration with the Downtown Middleborough Working Group www.FinePointAssociates.com 20
Businesses that Employees would Like to See in Downtown – Most Frequent Responses
(open-ended question)
Market Analysis (cont’d)�Middleborough Downtown Business District�
0% 20% 40% 60% 80%
Restaurant
Gifts & Cards
Entertainment/Recreation (movies, bowling, yoga, arcade, music)
Bookstore (books, comics)
Clothing & Accessories
Discount Department Store (Target, Walmart, Job Lot)
Fruit & Vegetable Market/Stand
Specialty Food (butcher, bakery, candy)
Drugstore
Grocery (Market Basket, Trader Joes, Whole Foods)
Office Supply
Sporting Goods
Arts & Craft
Teens & Children Classes/Entertainment
Flower Shop
Bank
Department Store
Dry Cleaner
Pet Supply
Desired Restaurants Cited by Employees – Most Frequent Responses
(open-ended question)
Specific Restaurants Mentioned: Panera Bread, Dunkin Donuts, P.F. Chang’s, Mary Lou’s Coffee, Extreme Pita, Cosi, Sub Galley (Abington), Maria's (Scituate), Mamma Mia’s, Marcello’s, Venus Café, KFC, Wendy’s, Taco Bell, Cheesecake Factory, and Emma’s.
0% 5% 10% 15% 20% 25%
Sit-down Restaurant
Restaurants - General
Fast Casual, Soup, Sandwich, Salad
Asian (Chinese, Thai)
Coffee Shop, Bagel, Donuts
Pub (Irish Pub, Brew Pub)
Subs, Pizza
Ice Cream/Frozen Yogurt
Mexican
Other Ethnic (Indian Greek, Mediteranean)
Fast Food
Smoothie/Juice
Figure 8. Downtown Employee Survey Results (Desired Businesses) Survey Conducted July 2016

Prepared by: Peg Barringer, FinePoint Associates, in collaboration with the Downtown Middleborough Working Group www.FinePointAssociates.com 21
C. Sub-segments and Non-Resident Market Segments (cont’d)
Middleborough Downtown Business District� Market Analysis (cont’d)�
2. Massasoit Community College Students ��
Massasoit Community College (MCC) has 500 students with enrollment growing each semester. Daytime students comprise the largest group with classes from 9am until 2pm., mostly 18 – 22 year olds. Evening students attend classes from 5:50pm until 10 pm. This group is mostly adult learners who work full time with a small portion of daytime students taking an occasional evening class. Most drive, but there are a few who walk, bike or take the Gatra bus. According to MCC representatives, this population likes cheap and fast food, because they do not have a lot of expendable income, and are very busy. Goods/services of potential interest if available Downtown:
! Place to buy books for classes and Massasoit swag such as t-shirts, etc. (Massasoit Brockton uses Barnes & Noble.) ! Local affordable, quality sandwich/sub shop ! Entertainment (bowling, Dave & Buster-type) ! Downtown Food Court with 3-4 options and free wifi ! Food Truck Rotation in the Town Hall Parking Lot Ideas to capture more of the College Student market segment include:
! Massasoit Student Incentive Program – Students receive discounts or special student coupons for their patronage when they present their Massasoit ID
! Market Saturday Farmer’s Market to Massasoit Saturday students. ! Distinctive environment, more social gathering spots/atmosphere. ! Direct marketing efforts 3. Visitors/Users/Attendees of Nearby Attractions and Events�People are drawn to events and attractions that bring them in or within very close proximity to downtown. This creates potential opportunities for downtown restaurants, retailers and service providers. Market segments are described below. Attendees of Performances at the Alley Theater�Two local theater companies perform at the Alley Theater along with comedy and musical acts, fundraisers and student productions. Nemasket River Productions puts on 3 shows per year (7 performances) and Theater One Productions also puts on 3 shows per year (2 weekends each). A representative from Theater One indicated that 40% of the audience comes from out of town and most attendees go out to dinner before or after the show (not necessarily in Middleborough) and close to 100% of the actors and crew go out after each show (often at Central Café or The Hideaway). Visitors to the Robbins Museum of Archeology and the Middleborough Historical Museum The Robbins Museum is open Wednesdays and Saturdays (in addition to events) and hosted close to 1,000 visitors last year with an estimated 80% from outside of Middleborough. The Middleborough Historical Museum is open seasonally from July to September (Wednesdays and Saturdays) and had 245 visitors last year, about 35% were from out of town. Users of the Downtown Athletic Field/Pierce Playground The Middleborough Cobras, a semi-pro football team, play about 7 games per year at Battis Field, typically at 7:30 on Saturday evenings. The athletic fields and playgrounds are also actively used by 10-20,000 children and parents each year during daytime and some evening hours throughout the week. Attendees of the football games as well as the young families might be potential customers for Downtown eating and drinking establishments.

Prepared by: Peg Barringer, FinePoint Associates, in collaboration with the Downtown Middleborough Working Group www.FinePointAssociates.com 22
C. Sub-segments and Non-Resident Market Segments (cont’d)
Middleborough Downtown Business District� Market Analysis (cont’d)�
Ideas to capture more of the Visitor/Attendee market segment include:
! More eating establishments ! Restaurant guide/marketing material ! Better way-finding signage for parking and directory of businesses ! Improve the lighting so the downtown looks more vital and safer during evening (stores with lights on) ! Advertise with the Parks department ! Promotion (Yankee magazine, AAA newsletter)
4. Resident Sub-segment - Oak Point Residents�The residents of Oak Point comprise a sub-segment worth noting because this “Over 55” community contains a somewhat homogeneous concentrated population of about 1,400 residents, (about one-half are in their 70s and one-quarter are in their 60s). Many residents moved from other communities as they approached or entered retirement and may still have consumer patterns associated with their previous location. Representatives of this population indicate this group shows a preference for name-brand restaurants (e.g., Applebees, Olive Garden, Dunkin Donuts, McDonalds) and it takes referrals from friends and neighbors to get new residents to try local spots. The residents currently patronize some downtown businesses such as the Post Office, Benny’s, The Hideaway, Egger’s Furniture and hair salons. Many were loyal customers of Maria’s gift shop and miss that type of store now that it has closed. This customer group would like to see a wider variety in the businesses in downtown in order to give them more options. Ideas to capture more of this market segment include:
! Driving at night is an issue so early bird dining specials may be appealing to this group ! Product demonstrations, classes, and pop-up sale events held at Oak Point to acquaint potential customers to businesses
(For example, a workshop on “Tips for Home Decorating” put on by The Custom Decorator or Egger’s Furniture, a pop-up sale booth featuring gifts by Dymond Treasures or demonstration by downtown hair salon.)
! Sponsorship or providing food for Oak Point events (e.g., charity events organized by residents, social events) ! Providing additional services such as delivery and direct marketing for special in-store sales/events
Prepared by: Peg Barringer, FinePoint Associates, in collaboration with the Downtown Middleborough Working Group www.FinePointAssociates.com
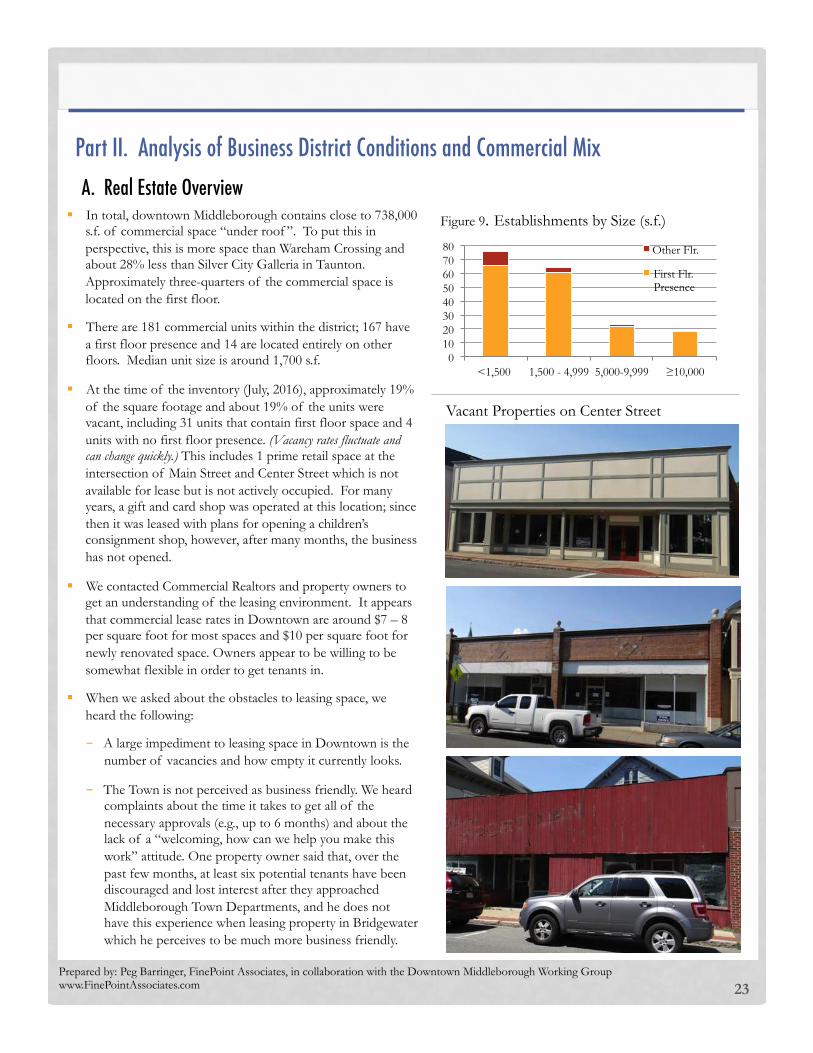
! In total, downtown Middleborough contains close to 738,000 s.f. of commercial space “under roof ”. To put this in perspective, this is more space than Wareham Crossing and about 28% less than Silver City Galleria in Taunton. Approximately three-quarters of the commercial space is located on the first floor.
! There are 181 commercial units within the district; 167 have a first floor presence and 14 are located entirely on other floors. Median unit size is around 1,700 s.f.
! At the time of the inventory (July, 2016), approximately 19% of the square footage and about 19% of the units were vacant, including 31 units that contain first floor space and 4 units with no first floor presence. (Vacancy rates fluctuate and can change quickly.) This includes 1 prime retail space at the intersection of Main Street and Center Street which is not available for lease but is not actively occupied. For many years, a gift and card shop was operated at this location; since then it was leased with plans for opening a children’s consignment shop, however, after many months, the business has not opened.
! We contacted Commercial Realtors and property owners to get an understanding of the leasing environment. It appears that commercial lease rates in Downtown are around $7 – 8 per square foot for most spaces and $10 per square foot for newly renovated space. Owners appear to be willing to be somewhat flexible in order to get tenants in.
! When we asked about the obstacles to leasing space, we heard the following:
- A large impediment to leasing space in Downtown is the number of vacancies and how empty it currently looks.
- The Town is not perceived as business friendly. We heard complaints about the time it takes to get all of the necessary approvals (e.g., up to 6 months) and about the lack of a “welcoming, how can we help you make this work” attitude. One property owner said that, over the past few months, at least six potential tenants have been discouraged and lost interest after they approached Middleborough Town Departments, and he does not have this experience when leasing property in Bridgewater which he perceives to be much more business friendly.
23
Part II. Analysis of Business District Conditions and Commercial Mix�
0 10 20 30 40 50 60 70 80
<1,500 1,500 - 4,999 5,000-9,999 ≥10,000
Figure 9. Establishments by Size (s.f.)
Other Flr.
First Flr. Presence
A. Real Estate Overview�
Vacant Properties on Center Street

Prepared by: Peg Barringer, FinePoint Associates, in collaboration with the Downtown Middleborough Working Group www.FinePointAssociates.com
! One Realtor indicated that lately there has been interest from a few restaurants, specialty food, catering, nail salons and a brewery. She leased space to a flower shop that will open in October and is currently working with a potential pub restaurant tenant. And, on the bright side, this is the first time in 7 years that 48 Center Street, a multi-tenant building in the heart of the district has been fully leased.
! The tax rate for commercial property in Middleborough is $16.94 per $1,000 in valuation which ranks close to the middle among the cities and towns in Massachusetts. Compared to the surrounding communities, Middleborough’s tax rate is somewhat higher than most, except for Taunton.
! The District can be viewed as comprised of three subareas – the Downtown Core Area, Western Section and Eastern Section as illustrated by the Downtown Sub Area Map. The Downtown Core Area has the largest amount of commercial units. It is the most compact, walkable node with the highest commercial density. The Western Section contains about one-third as many commercial units as the Core Area, more sparsely located and mixed in with residential units and churches. The Eastern Section also contains about one-third as many units as the Core and the uses tend to be more production or office spaces with less walk-in trade businesses along Wareham Street and athletic fields and school facilities on Jackson Street and North Main.
24
Commercial Units Estabs
# Avg. sf Median sf Vacant #
Core 111 3,757 1,765 19 92 Western 36 4,994 1,807 10 26 Eastern 34 4,144 1,600 6 28 All 181 4,076 1,700 35 146
Figure 9. Downtown Sub Areas
Notes: 1.) Square footage is estimated gross leasable area (GLA). 2.) Inventory results may be less complete for commercial space and businesses not located on the first floor due to difficulty obtaining data
Table 6. Units & Establishments by Sub Area
Downtown Core
Western Section
Eastern Section
$-
$5
$10
$15
$20
$25
$30
$35
$40
Figure 10. Commercial Tax Rate Analysis
Leased but Inactive Storefront on Center Street
Business District Assessment (cont’d)�
Prepared by: Peg Barringer, FinePoint Associates, in collaboration with the Downtown Middleborough Working Group www.FinePointAssociates.com
Middleborough Downtown Business District�
25
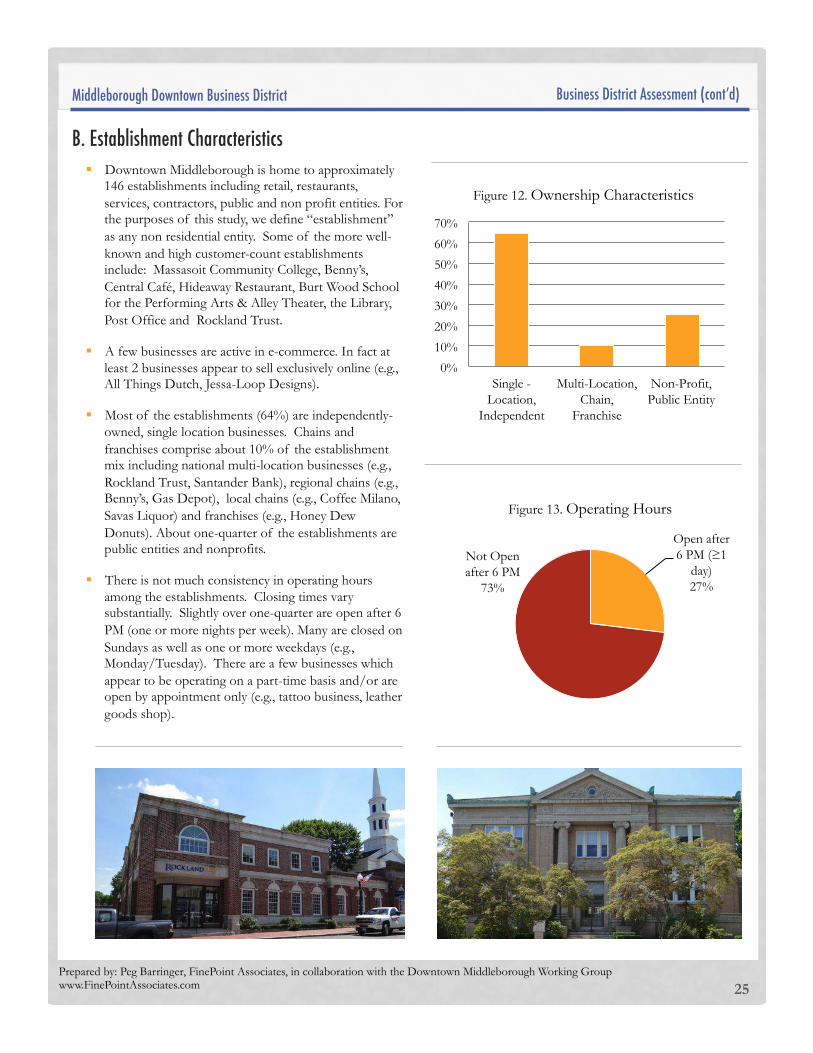
! Downtown Middleborough is home to approximately 146 establishments including retail, restaurants, services, contractors, public and non profit entities. For the purposes of this study, we define “establishment” as any non residential entity. Some of the more well-known and high customer-count establishments include: Massasoit Community College, Benny’s, Central Café, Hideaway Restaurant, Burt Wood School for the Performing Arts & Alley Theater, the Library, Post Office and Rockland Trust.
! A few businesses are active in e-commerce. In fact at least 2 businesses appear to sell exclusively online (e.g., All Things Dutch, Jessa-Loop Designs).
! Most of the establishments (64%) are independently-owned, single location businesses. Chains and franchises comprise about 10% of the establishment mix including national multi-location businesses (e.g., Rockland Trust, Santander Bank), regional chains (e.g., Benny’s, Gas Depot), local chains (e.g., Coffee Milano, Savas Liquor) and franchises (e.g., Honey Dew Donuts). About one-quarter of the establishments are public entities and nonprofits.
! There is not much consistency in operating hours among the establishments. Closing times vary substantially. Slightly over one-quarter are open after 6 PM (one or more nights per week). Many are closed on Sundays as well as one or more weekdays (e.g., Monday/Tuesday). There are a few businesses which appear to be operating on a part-time basis and/or are open by appointment only (e.g., tattoo business, leather goods shop).
Business District Assessment (cont’d)�
B. Establishment Characteristics�
0%
10%
20%
30%
40%
50%
60%
70%
Single - Location,
Independent
Multi-Location, Chain,
Franchise
Non-Profit, Public Entity
Figure 12. Ownership Characteristics
Open after 6 PM (≥1
day) 27%
Not Open after 6 PM
73%
Figure 13. Operating Hours

Prepared by: Peg Barringer, FinePoint Associates, in collaboration with the Downtown Middleborough Working Group www.FinePointAssociates.com
Business District Assessment (cont’d)�Middleborough Downtown Business District�
26
! Most of the establishments are small with the median size at around 1,600 s.f., however, downtown also contains several large medical, financial and community institutions.
15,000 – 19,999 s.f.
Town Hall
Rockland Trust
Church of Our Saviour Episcopal
Massasoit Community College
Town Hall Annex
10,000 – 14,999 s.f.
Elks Lodge
Robbins Museum of Archaeology
Meeting House Baptist Church
Enterprise Design
Eggers Furniture
Fire Dept.
R.E.A.D.S. Academy
United Methodist Church
Over 20,000 s.f.
High Point Treatment Center
Middleborough Early Childhood Center
Middleborough Public Library
Establishment Type # S.F.
Retail 23 49,500 Motor Vehicle & Parts 1 1,626 Furniture & Furnishings 3 12,421 Electronics & Appliances 0 - Building Mat. & Garden Equip 1 2,000 Food & Beverage Stores 3 5,186 Health & Personal Care Stores 0 - Gasoline Stations 3 5,150 Clothing and Accessories 2 3,692 Sporting Goods, Hobby, Books 0 - General Merchandise Stores 1 5,611 Misc. Retail Stores 9 13,814
Eating, Drinking & Lodging 13 38,876 Arts, Entertainment & Recreation 4 22,653 Accommodation 0 - Eating and Drinking Places 9 16,223
Services 84 368,258 Finance & Insurance 5 26,790 Real Estate and Rental/Leasing 7 11,114 Professional, Scientific & Tech. 8 13,013 Educational Services 9 90,863 Health Care & Social Assist. 8 80,456 Repair & Maintenance 6 9,595 Personal Care & Laundry 21 24,725 Relig., Grant, Civic, Prof. Orgs. 20 111,702
Other 26 139,092 Agric., Forest, Fishing, Mining 1 1,166 Util., Const., Mfg., Wholesale 14 37,603 Transport, Postal & Warehouse 2 11,900 Information 3 30,017 Admin./Sup. & Waste Mgmt 1 1,600 Public Administration 5 56,806 Total 146 595,726
Table 7.
Retail 16%
Eat, Drink, Entertain
9%
Services 57%
Other 18%
Figure 14. Composition of Uses (# of establishments)

Prepared by: Peg Barringer, FinePoint Associates, in collaboration with the Downtown Middleborough Working Group www.FinePointAssociates.com
Business District Assessment (cont’d)�Middleborough Downtown Business District�
27
! Approximately one-half of the establishments in the corridor are services while about 45% are retail, restaurant and entertainment establishments.
! The most represented industry subsectors (based on the number of establishments include: Eating & Drinking Places, Personal Care & Laundry and Health Care & Social Assistance. The subsector occupying the largest amount of gross leasable area (GLA) is Health Care & Social Assistance.
Top Ten Most Frequently Found Establishments
Rank Industry Subsector No.!!
1 Personal Care & Laundry 21
2 Religious, Grant, Civic & Prof. Organizations 20
3 Utilities, Construction, Mfg., Wholesale 14
4 Misc. Retail 9
5 Eating and Drinking Places 9
6 Educational Services (incl. arts education) 9
7 Professional, Scientific & Tech. 8
8 Health Care & Social Assist. 8
9 Real Estate and Rental/Leasing 7
10 Repair & Maintenance 6
0 5 10 15 20 25
Motor Vehicle & Parts Furniture & Furnishings
Electronics & Appliances Building Mat. & Garden Equip
Food & Beverage Stores Health & Personal Care Stores
Gasoline Stations Clothing and Accessories
Sporting Goods, Hobby, Books General Merchandise Stores
Misc. Retail Stores & Nonstore Arts, Entertainment & Rec.
Accommodation Eating and Drinking Places
Finance & Insurance Real Estate and Rental/Leasing Professional, Scientific & Tech.
Educational Services Health Care & Social Assist.
Repair & Maintenance Personal Care & Laundry
Relig., Grant, Civic, Prof. Orgs. Agric., Forest, Fishing, Mining Util., Const., Mfg., Wholesale
Transport, Postal & Warehouse Information
Admin./ Sup. & Waste Mgmt Public Administration
Commercial District Business Mix
! More than one-half of the establishments (57%) in downtown are services, 16% are retailers, 9% are restaurants and 18% other.
! The most represented industry subsectors (based on the number of establishments include: 1)Personal Care, 2)Religious, Grant, Civic & Professional Organizations, and 3)Utilities, Construction, Manufacturing & Wholesale.
Creative Economy Cluster�There is a substantial cluster of arts and culture related industries and facilities located in the downtown.
Historic Sites/Museums - Middleborough Historical Society Museum - Robbins Museum of Archaeology
Performing Arts Theaters, Arts Instruction, Theater Companies, Art Gallery, Artists - Burt Wood School for the Performing Arts & Alley
Theater - Town Hall Theater/Event Space - Rachel Park Dance Studio - Theater One (performs at Alley Theater) - Nemasket River Productions (performs at Alley
Theater) - True Grit Art Gallery - Otto's Underground (band & rehearsal studio) - Blue Anchor Studios (artist shows work at True
Grit Art Gallery & hosts paint party nights) - Jennifer Prisco Photography - Captured Memories (photographer)
Artisan/Craft Businesses - Jessa-Loop Designs - Monstor Kolor Studio
C. Business District Composition Assessment�Table 8.
Figure 15.

Prepared by: Peg Barringer, FinePoint Associates, in collaboration with the Downtown Middleborough Working Group www.FinePointAssociates.com
Middleborough Downtown Business District�
28
Retail Establishments�� ! The Downtown is home to 23 retail establishments.
! Benny’s is a well known regional chain general store offering home & garden products, automotive supplies, hardware, toys and more.
! There are 3 furnishings stores including the long time Downtown retailer, Egger;s Furniture, a window treatment store and a fairly recent addition of a store that sells new, used and refurbished home accessories (Dymond Treasures). There is also an auction house that handles furnishings, as well as collectibles and other items. (During auction events, bids are received from onsite customers as well as online and telephone bidders.)
! The district hosts 2 specialty food stores (a seafood store and a bakery) along with a liquor store and convenience store. The bakery serves coffee and tea in a café atmosphere, in addition to offering custom baked goods, and is planning an expansion and move to a new site on Wareham Street.
! The True Grit Art Gallery showcases original artwork.
! There are no clothing stores. There is a jewelry store (Gregory Scot Jewelers) and a leatherworks store open part time that has some custom products and also specializes in repair.
! The downtown has a small cluster of thrift and second time around shops.
! Monster Kolor sells screen printed t-shirts and other apparel for businesses, teams, schools, etc.
! There are two gift retailers which sell only online.
Business District Assessment (cont’d)�

Prepared by: Peg Barringer, FinePoint Associates, in collaboration with the Downtown Middleborough Working Group www.FinePointAssociates.com
Middleborough Downtown Business District�
29
! There are 9 eating and drinking places in the district, ranging from pizza and coffee shops to full service dining plus Battistini’s which serves as a bakery and café. Except for a few pizza places, there is no ethnic cuisine.
! There are only 2 “full service” restaurants where customers can enjoy a meal with table service. 5 of the eating places offer more casual dining options and fall into the category of “limited service”, meaning that customers order and/or pay at a counter rather than at a table.
! There are 3 establishments that serve alcohol, one that is primarily a bar and 2 restaurants where customers have the option to get a meal with a glass of wine or cocktail.
Eating & Drinking Establishment Type #
Full Service Restaurants 2
Limited Service Restaurants 5
Snack & Non-Alcoholic Beverage Bars 1
Bars (Alcoholic) 1 Establishments that Serve Alcohols 3
Business District Assessment (cont’d)�
Restaurants, Entertainment & Recreation
! The Alley Theater associated with the (Burt Wood School of Performing Arts) hosts many events (student performances, comedy nights, fundraisers, etc.) and shows performed by two Theatre companies (i.e., Theater One and Nemasket River Productions).
! In addition, at least one restaurant occasionally offers live music and entertainment (e.g., Central Cafe).
! With regard to recreation, there is a performing arts school, dance school and 2 martial arts studios (categorized under educational services) as well as Town recreational facilities and Parks Department programming. The downtown has no fitness centers.
Table 9.

Prepared by: Peg Barringer, FinePoint Associates, in collaboration with the Downtown Middleborough Working Group www.FinePointAssociates.com
Middleborough Downtown Business District�
30
! There are 84 service establishments in the business district including a large array of personal services. In all, there are 19 businesses that offer hair, skin, massage and nail services along with a laundry and tailor shop.
! There are 9 gas and auto service businesses.
! There is also a very strong compliment of professional services including 2 major banks, 2 insurance agencies, 7 real estate companies, 3 legal firms, 2 accounting/billing firms and 3 others (photography, web design).
! 8 establishments offer healthcare services (e.g., dentist, acupuncture) and social assistance (e.g., autism services, counseling, senior home care) plus the High Point Treatment Center, an in-patient facility for the treatment of substance abuse.
! Downtown features a host of educational services including Massasoit Community College, Middleborough Early Childhood Center, and READS Academy. Other educational services include tutoring, performing arts, dance, martial arts, and driving.
Business District Assessment (cont’d)�
Service Establishments

Prepared by: Peg Barringer, FinePoint Associates, in collaboration with the Downtown Middleborough Working Group www.FinePointAssociates.com
Middleborough Downtown Business District�
31
! Downtown is home to several community institutions and government offices including the Town Hall, Town Hall Annex, Library, Post Office and several churches.
! There are many non-traditional uses in downtown including 14 manufacturing enterprises, contractors or wholesalers, 3 information related establishments, 2 transportation enterprises, 1 administration support and 1 agriculture enterprise.
Business District Assessment (cont’d)�
Community Institutions and Other Establishments

Prepared by: Peg Barringer, FinePoint Associates, in collaboration with the Downtown Middleborough Working Group www.FinePointAssociates.com
Middleborough Downtown Business District�
32
Furnishings & Furniture Eggers Furniture Dymond Treasures The Custom Decorator Food & Beverage Battistini's Bakery Mike Carver's Sea Food Savas Liquor Gifts All Things Dutch Jessa-Loop Designs Clothing, Jewelry & Shoes Gregory Scot Jewelers Jen's Leatherworks General Merchandise, Used Goods & Other Retail Benny's Middleborough Smoke Shop Monstor Kolor Nearly New/Our Savior Thrift Shop Sacred Heart Thrift Shop True Grit Art Gallery Twice As Nice White's Auctions Eating & Drinking Places Crown Café Central Café Coffee Milano Hideaway Restaurant Honey Dew Donuts Lindo's Pizza Main Drag Café Middleboro House of Pizza Pizza Pirate Banks, Mortgage & Other Credit Rockland Trust RMS Mortgages Santander Bank
Insurance & Real Estate Roger Keith & Sons Insurance AEC Property Management Carey Real Estate Chace Real Estate Fieldstone Property Management P&S Preferred Properties T.M. Ryder Insurance Agency Uptown Realtors Value Tech Legal Services Adam Bond Atty. At Law Decas Murray & Decas Atty at Law Stewart Dube Atty at Law Accounting, Tax & Other Services Balanced Books Bookkeeping Bridgewood, Benoit & Co., CPA Captured Memories EV Event Jennifer Prisco Photography Shot Gun Flat Studio Academic & Other Educational Massasoit Community College Middleborough Early Childhood Center R.E.A.D.S. Academy T&C Driving School Tutoring Arts & Recreation Educational Burt Wood School for the Performing Arts & Alley Theater Brazilian Jiu Jitsu Rachel Park Dance Studio Shaolin Martial Arts Artists Blue Anchor Studios Otto's Underground Museums Middleborough Historical Society Museum Robbins Museum of Archaeology
Healthcare Services Brewster Ambulance Family Acupuncture and Herbals High Point Treatment Center Peter Messier & Assoc., Dentistry Hair, Skin & Nail Services Anna & Company Body Zonez massage Center Street Tattoos Corsini's Hair Salon Crafty Cuts Darkside Kustoms David Alan Salon Denny's Barber Shop Head Quarters Lucky Nails Marra's New Concepts Hair Salon Old Ghosts Tattoos Peaceful Escape Pushin Ink Tattoo Rachel's Hair Salon Amour Serenity Hair Salon Sun-Sational Sun Tanning Dry Cleaning, Laundry, Tailor The Empty Hamper Middleborough Alterations Auto & Gas AL Prime Gas Gas Depot Mattie Tire Auto Glass Centre Stop n Save Willy's Auto Parts Public/Government Institutions Fire Dept. Middleborough Public Library Parks Dept./Town Pool Police Station Town Hall and Town Hall Annex US. Post Office
Business District Assessment (cont’d)�
Business Listing by Category

Prepared by: Peg Barringer, FinePoint Associates, in collaboration with the Downtown Middleborough Working Group www.FinePointAssociates.com
Middleborough Downtown Business District�
33
Civic/Community Organizations American Legion Church of Our Saviour Episcopal Cranberry Country Chamber of Commerce Elks Lodge EMS Council First Unitarian Universalist Church Fr. Shea Community Center Horizons for Homeless Children Meeting House Baptist Church Methodist Church Rectory Middleborough VFW Middleborough Youth Building Nathan Hale Foundation New Life Baptist Church Our Savior Community Building Sacred Heart Church Sacred Heart Church Rectory Social Assistance Associated Home Care Middleborough Counseling Piece of Mind Counseling Piecing The Puzzle Other Winnetuxet Cranberry Co. Abair Plumbing AEC-PEM Manufacturing Atlantic Carpentry Automotion Brian's Auto Budge It Drains City Wide Auto Glass DMI Marine Egger Funeral Home Enterprise Design Eric Guertin Middleborough Electric Light Station Northern Pine Woodworkers RHS Roofing Systems Safer Places Sage Renovations Under Pressure Under Pressure Hood Cleaning Verizon
Willow Spring Wood working & Re-wine it
Business District Assessment (cont’d)�
5. Business Listing by Category

Prepared by: Peg Barringer, FinePoint Associates, in collaboration with the Downtown Middleborough Working Group www.FinePointAssociates.com
Middleborough Downtown Business District��
34
Figure 16. Comparison with Shopping Centers and Commercial Districts (by number of establishments)
0% 10% 20% 30% 40% 50% 60% 70% 80% 90%
100%
Est
ablis
hmen
ts
Retail Mix (*excludes professional services and other non-retail)
Eating, Drinking & Entertainment/Recreation
Comparison Goods (General, Apparel, Furniture & Other - GAFO)
Convenience Goods & Personal Services
D. Comparative Business Mix Analysis �
Business District Assessment (cont’d)�
! A few downtown centers were used for comparison. When analyzing only the retail component (not including professional office and other), downtown Middleborough has a slightly larger proportion of convenience goods and personal services and a slightly smaller portion of comparison goods (such as apparel, furnishings, and electronics) and eating, drinking entertainment and recreation compared to most of the other downtown commercial centers.
! Compared to typical shopping centers, Downtown Middleborough has a much smaller portion of comparison goods stores, and compared to typical lifestyle centers, a much smaller proportion of comparison goods stores and eating places, entertainment and recreation.
! Figure 15 illustrates the number of establishments in selected categories among the downtowns selected for analysis. A few significant differences are apparent. In comparison, downtown Middleborough has less of the following:
- Health & Personal Care Stores - Clothing and Accessories - Sporting Goods, Hobby, Books
- Eating and Drinking Places - Finance & Insurance - Professional, Scientific & Technical Services - Health Care

Prepared by: Peg Barringer, FinePoint Associates, in collaboration with the Downtown Middleborough Working Group www.FinePointAssociates.com
Middleborough Downtown Business District��
35
Figure 17. Comparison with Other Commercial Centers (Selected Categories by Number of Establishments)
Business District Assessment (cont’d)�
C. Comparative Business Mix Analysis � 0 10 20 30 40 50 60 70
441 - Motor Vehicle & Parts
442 - Furniture & Furnishings
443 - Electronics & Appliances
444 - Building Materials & Garden Equip
445 - Food & Beverage Stores
446 - Health & Personal Care Stores
447 - Gasoline Stations
448 - Clothing and Accessories
451 - Sporting Goods, Hobby, Books
452 - General Merchandise Stores
453/454 - Misc. Retail Stores & Nonstore Retail
71 - Arts, Entertainment & Recreation
721 - Accommodation
722 - Eating and Drinking Places
52 - Finance & Insurance
53 - Real Estate and Rental and Leasing
54 - Professional, Scientific & Technical Services
61 - Educational Services
62 - Health Care & Social Assistance
811 - Repair and Maintenance (incl. auto)
812 - Personal Care & Laundry Services
813 - Religious, Grantmaking, Civic, Prof. & Similar
Downtown Middleborough
Melrose Center
Downtown Wakefield
Wellesley Center
Downtown Greenfield

Prepared by: Peg Barringer, FinePoint Associates, in collaboration with the Downtown Middleborough Working Group www.FinePointAssociates.com
Middleborough Downtown Business District��
36
Given the findings of the market analysis and business district assessment, we offer the following suggestions for consideration. These are recommendations from the consultant and have not been sanctioned by any authority.
Overview 1. Designate/Establish an Entity to Focus on Revitalization of the Downtown with Dedicated Staff Assistance
2. Market the Downtown and Assist in Recruiting Businesses ! Create a marketing campaign and materials that focus on the advantages of Downtown as a business
location ! Focus on expanding the existing creative economy cluster, restaurants, recreation/entertainment and other
targeted niches. ! Activate and improve the appearance of vacant properties in the short term with temporary uses.
3. Ensure that Middleborough is Business Friendly for Small and Large Businesses and Promote a Positive Image ! Assess and improve municipal approvals and permitting process. ! Create a “Middleborough Welcomes Business” or at least “For Businesses” page on the town website. ! Cultivate a cooperative partnership with downtown property owners and real estate brokers. ! Celebrate and promote the new quality tenants that landlords successfully sign.
4. Improve the Aesthetic Appeal of Downtown
! Implement a storefront improvement financing program. ! Develop incentive programs to promote redevelopment and renovation.
5. Increase Foot Traffic/Potential Customers in Downtown
6. Work with SRPEDD to Evaluate Potential Downtown Tools and Funding Sources
Recommendation #1: Designate/establish an Entity to Focus on Revitalization of the Downtown with Dedicated Staff Assistance There are several organizations that are involved in Downtown revitalization activities in some way (e.g., Middleborough on the Move, Middleborough Friends, Cranberry Chamber of Commerce, Tourism Committee, Cultural Council, Middleborough Downtown Business Coalition, etc.), however, there does not appear to be one Downtown committee/task force/organization that serves as a lead entity and coordinating body focusing specifically on Downtown. ! Create/designate a single committee or task force with established leadership that can work to develop a
Downtown strategy and coordinate its implementation. This entity could include representatives from key organizations, Massasoit Community College as well as business and property owners and should have a clear specific mission.
! Middleborough’s Director of Community and Economic Development has recently left and the position has not yet been filled. When this position is filled, the Town should dedicate a portion of the Director’s time specifically to Downtown activities and to providing staff assistance to staffing this entity.
Part III. Recommendations for Consideration�

Prepared by: Peg Barringer, FinePoint Associates, in collaboration with the Downtown Middleborough Working Group www.FinePointAssociates.com
Middleborough Downtown Business District��
37
Top 5 Reasons to Locate your Business in Downtown Middleborough�
1. Gain Access to a Growing Resident Market with Above Average Incomes. 23,000 people live within a 4-mile trade area and the population is growing at a significantly higher rate than Massachusetts overall. Median household income is above the statewide level, in fact close to one-third of the households earn over $100,000 per year. Residents spend over $260 million per year at stores and restaurants.
2. Capitalize on the Opportunity to Serve Other Market Segments – Nearby Employees, College Students & Visitors to Downtown Attractions. Downtown Middleborough has an estimated 600 employees that represent potential market for meal and snack purchases as well as other shopping before, during and after work hours. Massasoit Community, located right in Downtown has 500 students with enrollment growing each semester. There are also several attractions in Downtown that attract visitors to the area including the Alley Theater with numerous musical, drama, comedy and student performances, two museums and an athletic field that hosts a semi-professional football league as well as student teams.
3. Be Part of an Expanding Creative Economy Cluster. Join the many performing artists, visual artists, art schools, musicians, craftsman and other creative professionals that have found a home in Downtown Middleborough. Creative synergy abounds with a performing arts school, two theater companies, two performance/event spaces, an art gallery, band rehearsal space, dance school, photographers, painter studio and other artisan businesses.
4. Operate your Business in an Nationally Recognized Historic District. The Downtown Area is home to many attractive historically significant structures and is listed on the National Register of Historic Places. Qualifying rehabilitation costs may be eligible for Federal Historic Tax Credits.
5. Enjoy Lower Development and Utility Costs. All of the Downtown properties are serviced by Town sewer and water eliminating the need for on-site waste water treatment. Municipally-owned gas and electric make for lower utility costs.
Recommendation #2: Market the Downtown and Assist in Recruiting Businesses. Create a marketing campaign and materials that focus on the advantages of Downtown as a business location. Simple marketing materials can be provided to property owners and Realtors. The following represents five locational advantages that could be promoted along with business recruitment goals, who to contact and other information.
Focus on expanding the existing creative economy cluster, restaurants, recreation/entertainment and other targeted niches. ! Additional arts and culture establishments would help to build the cluster (e.g., art/artisan cooperative with locally
made products, artisan work space, etc.) ! There appears to be some opportunity for additional eateries, illustrated by sales leakage within the resident market
segment (for full service sit-down restaurants) as well as the employee segment. In addition, 72% of the Employee Survey respondents indicated they wanted to see more restaurants and a wider variety of dining options in Downtown.
! Other establishment categories which might make good business recruitment targets (because they appear under-represented compared to other commercial centers and/or show sales leakage) include: gifts, entertainment/recreation including fitness facilities (yoga, gym), specialty food, sporting goods/hobby, pet grooming/supplies, additional health care and additional professional office (professional, technical, financial services).
! Another potential opportunity uncovered during the market research was the need for a business that could take on the role of a bookstore for Massasoit Community College handling the selling of textbooks as well as college t-shirts and other items. At the Brockton Massasoit Campus, the local Barnes & Noble plays this role. Perhaps, a local artisan cooperative could be developed to sell local products as well as play this role for Massasoit.
Recommendations (cont’d)�
Prepared by: Peg Barringer, FinePoint Associates, in collaboration with the Downtown Middleborough Working Group www.FinePointAssociates.com
Middleborough Downtown Business District��
38
Activate and improve the appearance of vacant properties in the short term with temporary uses. Businesses, especially restaurants, services and retailers, want to locate in a bustling Downtown. The large number of obvious vacancies in Downtown is impeding the attraction of new businesses. One Realtor called it the “ghost town” effect. Temporary uses could include exhibits, art displays, temporary pop-up retail businesses, anything that would bring some vitality. In Turners Falls and other communities, temporary downtown art galleries have been set up using empty store windows for displays of pottery, paintings and other creative exhibits. This could help build the brand for Downtown as an arts and cultural center. Plus, it would give local residents and visitors (attending events held at the Alley Theater or visiting museums) a reason to walk around downtown. Perhaps local art associations, Massasoit Community College, Middleborough Tourism Committee or other cultural groups might be willing to curate exhibits. Develop a business directory, map and kiosk. A kiosk in the the downtown with a map showing attractions such as the two museums, Massasoit Community College, etc. and possibly including a business listing could help increase the image of Downtown as a destination and awareness of the goods and service available in Downtown.
Recommendation #3: Ensure that Middleborough is Business Friendly for Small and Large Businesses and Promote a Business Positive Image Assess and improve municipal approvals and permitting process. The amount of time and difficulty involved in receiving approvals needed to open a business in Middleborough was cited as one of the obstacles to leasing space in Downtown. In particular, small independent businesses and start-up enterprises like the kind that would be potential tenants for Downtown, are likely to need more assistance with navigating the approval process. They also need to be assured that the process will be speedy, with clear rules and the outcomes easily predicted. If business prospects are discouraged by initial encounters with Town regulatory entities or if the outcomes are very unpredictable, potential business owners may decide that pursuing the location is not worth the risk.
! Have a private sector panel review the approvals and permission process and make recommendations for improvement.
! Designate a staff person that can serve as a business ombudsmen that can help shepherd potential businesses through the process.
! Provide simple instructions regarding a list of permits and approvals that will be needed and information about where to go and what to do to get them. Summarize this information in a simple, easy to follow document.
Create a “Middleborough welcomes Business” or at least “For Businesses” page on the town website. Currently, the only information for businesses is a link to the Cranberry Chamber of Commerce and under “Department Listing” there is a listing for Community Development but not Office of Economic and Community Development. Provide information about doing business in Middleborough (requirements, obtaining approvals, etc.), available business incentive and financing programs, relevant Town Departments, civic organizations, state agencies and designated Downtown revitalization committee/task force along with other other helpful information.
Cultivate a cooperative partnership with downtown property owners and real estate brokers. Convene a meeting(s) with downtown landlords and real estate professionals. Seek participation and cooperation while reaching out to show that the Town is willing to help. Inquire about their goals and perceived obstacles in recruiting quality tenants that would be good for the whole Downtown. Identify ways that property owners and Middleborough’s Office of Economic and Community Development might work together. Celebrate and promote the new quality tenants that landlords successfully sign. Send a press releases to Middleborough Gazette and Wicked Local Middleborough online newspaper to get publicity for new businesses and help to promote the Downtown to customers and prospective business tenants.
Recommendations (cont’d)�

Prepared by: Peg Barringer, FinePoint Associates, in collaboration with the Downtown Middleborough Working Group www.FinePointAssociates.com
Middleborough Downtown Business District��
39
Recommendation #4: Improve the Aesthetic Appeal of Downtown. Implement a storefront improvement financing program. Many of the storefronts and facades in the downtown appear tired looking or are in need of repair. Current conditions might be impeding the attraction of businesses and customers. A storefront/façade improvement program that provides a matching grant or forgivable loan could help entice property owners to make an investment that could benefit the entire area. This type of program might also serve as an enticement for new businesses considering locating in the district. Develop incentive programs to promote redevelopment and renovation. Consider creating a redevelopment district in downtown and offer incentives for projects that will have significant impact. Middleborough’s commercial tax rate is somewhat higher than most of the surrounding communities with the exception for Taunton, tax incentives could help to motivate investment (e.g., stabilizing taxes for a period of time after renovation, partial tax abatement for a specified period). Contact local banks to explore the potential for their participation in creating special targeted financing programs to entice redevelopment. There appears to be interest among at least one business owner to expand their business and redevelop an eyesore property. CDBG funding could be explored to provide low interest loan in situations such as this.
Recommendation #5: Increase Foot Traffic/Potential Customers in Downtown. Bringing more people into downtown helps existing businesses as well as increase the attractiveness of the area to new businesses. Strategies could include the following. ! Continue to promote residential development in and near Downtown. More residents nearby will create additional
market potential for Downtown businesses. ! Continue to sponsor existing events (e.g., Krazy Days, Ghost Tour, Holiday Pop-Up) and increase the amount of
events in the Downtown that attract customers for businesses and increase the awareness of goods and services available in Downtown.
! Develop a historic walking tour in and around Downtown that shows historic sites and properties with basic information and a map that could be reproduced in hard copy as well as posted online.
Recommendation #5: Work with SRPEDD to Evaluate Potential Downtown Tools and Funding Possibilities. The Southeastern Regional Planning and Economic Development District (SRPEDD) has committed to provide technical assistance as a follow-up to this Market Analysis and Business District Assessment. It would be very helpful if one of the services provided by SRPEDD would be to provide a description and evaluation of various tools and funding programs that can be used to encourage reinvestment and attract businesses to downtowns, along with an evaluation of appropriateness (pros and cons) for Middleborough. These tools and financing source might include the following, as well as others:
! 40Q DIF (District Improvement Financing Tax Incentive) ! Pre-permitting properties ! 40R development ! 43D Expedited permitting ! Urban Renewal District ! Cultural District Designation ! Community Benefit District ! Zoning Bonuses ! Community Development Block Grant Funding
Recommendations (cont’d)�