Market Analysis - Desert Healthcare District
115
Market Analysis Desert Healthcare District March 14, 2017 ©2017 Premier Inc.
-
Upload
khangminh22 -
Category
Documents
-
view
0 -
download
0
Transcript of Market Analysis - Desert Healthcare District

Market AnalysisDesert Healthcare DistrictMarch 14, 2017
©2017 Premier Inc.

©2017 Premier Inc.
2
Table of ContentsSection Page
Engagement Overview 3
Executive Summary 5
Service Area Overview 11
Healthcare Provider Profiles 44
Projected Service Area Inpatient Utilization 58
Projected Service Area Emergency Department Utilization 71
Desert Regional Medical Center Seismic Compliance Analysis
78
Appendix:A. Individuals Interviewed Regarding Community Health
Status/Demographic TrendsB. Industry TrendsC. Supplemental Inpatient Market Share Analyses
89
91109

©2017 Premier Inc.
Engagement Overview

©2017 Premier Inc.
4
Desert Healthcare District (the “District”) engaged Premier, Inc. (“Premier”) to assess the current and future healthcare service needs in the greater Coachella Valley for a ten-year planning horizon. The scope of this engagement includes evaluation of the following:
• Current service offerings of Desert Regional Medical Center (“DRMC”) and other area hospitals and healthcare organizations
• Services residents seek from organizations located outside of the service area• Existing gaps in services provided in the service area• Service area demographics and health status trends• Factors that will influence demand for inpatient and outpatient healthcare
services• Services that are likely to be needed by residents over a ten-year planning
horizon• DRMC’s existing infrastructure, and implications related to seismic compliance
Engagement Overview

©2017 Premier Inc.
Executive Summary

©2017 Premier Inc.
6
On a national level, inpatient utilization is projected to decrease as the value-based care environment pressures hospitals and providers to reduce inpatient utilization and unnecessary procedures (inpatient and outpatient), and there is an increased focus on chronic disease management and prevention for patients. Within the District’s service area, total inpatient discharges decreased by 2.0 percent between calendar years (“CY”) 2012 and 2015, while the overall use rate (discharges per 1,000 population) decreased by 5.5 percent during this same time period. This trend will continue due to the following:
• Continued rise of high-deductible insurance plans that constrain medical use• Impact of value-based care models (e.g., accountable care organizations, bundled
payments, patient-centered medical homes [e.g., Comprehensive Primary Care Plus (“CPC+”)], risk-based payment contracts, and performance-based physician incentives) that seek to achieve enhanced coordination of care, better quality outcomes, and reduced costs across care settings
• Patients treated under these models typically have lower lengths of stay and less readmissions
• Providers are seeking to reduce preventable hospitalizations for acute and chronic conditions, and preventable readmissions by ensuring patients receive home-based disease management programs and outpatient care, instead of accessing hospital care
Executive Summary

©2017 Premier Inc.
7
• Shift in volumes from inpatient to observation status through the two-midnight census rule implemented by the Centers for Medicare & Medicaid Services (“CMS”) in October, 2013, and the continued shift in inpatient volume to outpatient care settings for ambulatory case-sensitive admissions (e.g., uncontrolled diabetes, hypertension, dehydration)
• Providers are aggressively increasing intensive medical management for chronic conditions on an outpatient basis
However, within District’s service area, demand for healthcare services is projected to continue to exist for the following reasons:
• Service area demographic and health status trends imply that demand for healthcare services will increase during the projection period.
• The service area’s population age cohort 65 years and older is projected to grow rapidly over the next ten years. As the population ages, the community and its hospitals are likely to experience an increased demand for services such as internal medicine, cardiovascular services, gastroenterology, neurosciences, oncology, orthopedics, pulmonary medicine, and urology, and higher needs for chronic disease management. Further, growth is projected in the population age cohorts 0-14 years, 15-44 years overall and for those whom are female, and 45-64 years. As a result, demand for pediatric (inpatient and outpatient), obstetrics, and elective sub-specialty care will continue to grow in the District’s service area.
Executive Summary

©2017 Premier Inc.
8
• When compared to state, the District’s service area has worse health status outcomes for almost all metrics. Additionally, portions of the District’s service area population are underserved, and opportunities exist to improve the overall health of the community with a focus on wellness and prevention through increased access to coordinated primary and specialty care services. This implies an increased demand for inpatient and outpatient healthcare services in the service area.
• Portions of the service area are designated as a Health Professional Shortage Area, Medically Underserved Area, or both, thereby implying that a shortage of primary care physicians exists in this geographic region.
• Most of the healthcare facilities are located in and around the surrounding communities of Palm Springs and Indio. When considering the healthcare needs of the broader service area, there is a geographic misdistribution of these facilities, and patient access limitations exist in the outlying communities (e.g., Mecca, Thermal/Oasis).
Based upon the service area bed need projections provided on pages 58 through 70 of this report, there is adequate inpatient capacity to support community demand in the service area for general acute care services. However, these projections do not account for in-migration and the regional draw each hospital has for clinical services. When considering each hospital’s inpatient volume that originates from the service area, market share, and scope of clinical services provided:
• DRMC is near- or over-capacity for the following inpatient licensed bed types: critical care, obstetrics, and pediatrics.
Executive Summary

©2017 Premier Inc.
9
• There is a significant shortage of inpatient psychiatric beds at both Eisenhower Medical Center and Telecare Riverside County Psychiatric Health Facility, and there are no inpatient psychiatric providers for pediatric and adolescent patients. Further, the scope of inpatient and outpatient psychiatric services provided by each facility is limited. Gaps in culturally-appropriate inpatient and outpatient psychiatric clinical programs exist for the following patient cohorts:
• Pediatric and adolescents • Veterans• Lesbian, gay, bisexual, and transgenders• Geriatrics• Latinos
• Patients age 0-14 years represent approximately eight percent (3,475 inpatient discharges) of the service area’s total inpatient volume in CY 2015. While DRMC was the market share leader for inpatient pediatric services overall (39.6 percent), almost 28 percent of the service area’s pediatric patients left the area for care. This trend implies a need for increased access to pediatric sub-specialty providers across almost all medical and surgical specialties in the District’s service area.
Executive Summary

©2017 Premier Inc.
10
There is a shortage of ED stations in the District’s service area, as well as at DRMC specifically. Given the successful implementation of the Medi-Cal expansion program and the roll-out of the Covered California Healthcare Exchange, demand for ED services in the service area will continue as patients continue to use this modality as a form of primary care, and population growth will result in increased demand for instant access to care.
Based upon quantitative analyses and qualitative input received from interviewees:• Patient access to primary care services provided by community-based clinics is limited.
Outpatient clinics operate at- or near-capacity (e.g., facility, provider), and long wait times exist for patients to be seen. Similar to psychiatric services, opportunities exist to provide culturally-appropriate primary care services for the following patient cohorts:
• Pediatric and adolescents • Veterans• Lesbian, gay, bisexual, and transgenders• Geriatrics• Latinos
• Given that the outpatient clinics are at- or near-capacity, there is very little patient care coordination and chronic disease management services provided.
• Access to acute rehabilitation, skilled nursing, home health, ambulatory surgery, and imaging services is adequate to meet community needs in the District’s service area.
Executive Summary

©2017 Premier Inc.
Service Area Overview

©2017 Premier Inc.
12
Service Area OverviewThe service area was defined by the District as the 25 ZIP Codes located in the Coachella Valley.A series of maps are provided on the following pages, including:
• Service area geographic boundaries
• Service area overview identifying portions of the geographic region that are designated by the Federal Government as a Health Professional Shortage Area (“HPSA”) or Medically Underserved Area (“MUA”)
• Service area overview illustrating healthcare facilities located within this geographic region by facility type
Desert Healthcare DistrictCoachella Valley Service Area Definition
Desert Healthcare District East of the DistrictZIP Code City ZIP Code City
92234 Cathedral City 92201 Indio92235 Cathedral City 92202 Indio92240 Desert Hot Springs 92203 Indio92241 Desert Hot Springs 92210 Indian Wells92255 Palm Desert 92211 Palm Desert92258 North Palm Springs 92236 Coachella92260 Palm Desert 92247 La Quinta92261 Palm Desert 92248 La Quinta92262 Palm Springs 92253 La Quinta92263 Palm Springs 92254 Mecca/North Shore92264 Palm Springs 92274 Thermal/Oasis92270 Rancho Mirage92276 Thousand Palms92282 White Water
Source: Desert Healthcare District
https://share.premierinc.com/sites/pcs/ICD/Folder/West_Coast_Advisory_Services/Clients/Desert_Healthcare_District/Needs_Assessment/Analysis/[Desert_Healthcare_Patient_Origin_Table.xlsx]DHCD

©2017 Premier Inc.
13
Service Area Overview
Source: Desert Healthcare District, Definitive Healthcare, Maptitude

©2017 Premier Inc.
14
The Federal Government defines a HPSA as an area, facility, or population group with a shortage of primary care physicians, as defined by a population-to-primary care physician ratio greater than 3,500:1. Other factors taken into consideration include the poverty rate, infant mortality rate, fertility rate, and indicators of insufficient capacity to meet area need. A MUA is defined as an area, facility, or population group with an Index of Medical Underservice (“IMU”) less than or equal to 62 out of 100. The IMU is calculated by taking into consideration the ratio of primary medical care physicians per 1,000 population, infant mortality rate, percentage of the population with an income below the poverty level, and the percentage of people age 65 or older. These factors are converted to weighted values and then summed to obtain an IMU score for a particular area. Portions of the District’s service area have been designated as a HPSA, MUA, or both. Maps illustrating these analyses are provided on the following two pages.
Health Professional Shortage Areas and Medically Underserved Areas

©2017 Premier Inc.
15
Health Professional Shortage Area
Source: Desert Healthcare District, Definitive Healthcare, Maptitude, Health Resources and Services Administration

©2017 Premier Inc.
16
Medically Underserved Area
Source: Desert Healthcare District, Definitive Healthcare, Maptitude, Health Resources and Services Administration

©2017 Premier Inc.
17
Service Area Overview Illustrating Skilled Nursing Facilities
Source: Desert Healthcare District, Definitive Healthcare, Maptitude, Health Resources and Services Administration
3
1
4

©2017 Premier Inc.
18
Service Area Overview Illustrating Ambulatory Surgery Centers
Source: Desert Healthcare District, Definitive Healthcare, Maptitude, Health Resources and Services Administration
2
41
1
3
3
911
4
8

©2017 Premier Inc.
19
Service Area Overview Illustrating Imaging Centers
Source: Desert Healthcare District, Definitive Healthcare, Maptitude, Health Resources and Services Administration

©2017 Premier Inc.
20
Service Area Overview Illustrating Health Clinics and Urgent Care Centers
9
8
92
7
2
23
4
5
8
11
143 3
22
424
17
15
20
21
1
2
Source: Desert Healthcare District, Definitive Healthcare, Maptitude, Health Resources and Services Administration

©2017 Premier Inc.
21
The population for the District’s service area is projected to experience moderate growth over the next ten years.
• The table provided on the following page illustrates the projected growth in population for each age cohort (e.g., 0-14 years, 15-44 years, 45-64 years, and 65 years and older) in the District’s service area and for the state of California overall.
Premier validated the District’s service area population, and growth trends thereof, by comparing the Claritas, Inc. projection data to the latest data available from the following agencies as of July, 2016: Health Resources and Services Administration, Migration Policy Institute, Clinton Foundation, Health Assessment and Research for Communities, Inc., and the University of Southern California Sol Price Center for Social Innovation. Information collected from these sources indicates that the total population estimated by Claritas, Inc. is understated due to the impact of seasonal residents (e.g., snowbirds) and undocumented, migrant workers. Therefore, Premier adjusted the population statistics in this report to account for these two population cohorts as follows:
• Undocumented Residents and Migrant Workers: The District’s service area is located in the Riverside, San Bernardino, and Ontario metropolitan statistical area (“MSA”). According to the Migration Policy Institute, there were 258,214 undocumented residents in this geographic region in CY 2015. Premier calculated the number of undocumented residents in the District’s service area based upon the proportion of the population this geographic represented within the overall MSA, and adjusted the annual population upwards to include these residents (26,926 undocumented residents in CY 2015).
• Seasonal Residents: Snowbirds account for an additional 100,000 residents during the winter season. “High” (e.g., winter season) and “low” (e.g. summer season) population estimates were calculated to reflect the shifts in population and seasonal demand for healthcare services within the service area.
Population Profile

©2017 Premier Inc.
22
Population ProfileThe service area’s population age cohort 65 years and older is projected to grow at a rapid compound annual rate (2.4 percent).
• As the population ages, the community and its hospitals are likely to experience an increased demand for services such as internal medicine, cardiovascular services, gastroenterology, neurosciences, oncology, orthopedics, pulmonary medicine, and urology, and higher needs for chronic disease management.
The population age cohort 15-44 years overall, and for those whom are female, is projected to grow at moderate rates over the next ten years. This implies that the demand for elective sub-specialty care and obstetrics will continue to grow in the District’s service area for the duration of the projection period.The population age cohorts 0-14 is projected to increase slowly over the next ten years. As a result, demand for inpatient and outpatient pediatric services will continue to exist in the District’s service area over the ten-year projection period.
Desert Healthcare DistrictService Area vs. the State of California - Population by Age Cohort
Calendar Years 2016 to 2026
Estimated 2016 Projected 2021 Projected 2026
Age Cohort CAGR(1) NumberPercent of Total Number
Percent of Total Number
Percent of Total
Service Area - High Estimate (2)
0 - 14 0.5% 114,029 19.4% 117,181 18.8% 120,419 18.1% 5.6%15 - 44 1.4% 210,958 35.9% 225,618 36.1% 241,296 36.3% 14.4%45 - 64 0.4% 138,432 23.5% 141,282 22.6% 144,190 21.7% 4.2%65 + 2.4% 124,917 21.2% 140,854 22.5% 158,825 23.9% 27.1%
Total 1.2% 588,336 100.0% 624,934 100.0% 664,731 100.0% 13.0%
Women 15 - 44 1.3% 101,462 17.2% 108,490 17.4% 116,005 17.5% 14.3%
Median Age 0.2% 40.3 40.7 40.8 1.2%
Service Area - Low Estimate (3)
0 - 14 0.5% 95,883 19.4% 98,492 18.8% 101,172 18.1% 5.5%15 - 44 1.3% 177,387 35.9% 189,635 36.1% 202,729 36.3% 14.3%45 - 64 0.4% 116,402 23.5% 118,749 22.6% 121,144 21.7% 4.1%65 + 2.4% 105,038 21.2% 118,390 22.5% 133,440 23.9% 27.0%
Total 1.2% 494,710 100.0% 525,266 100.0% 558,484 100.0% 12.9%
Women 15 - 44 1.3% 85,316 17.2% 91,188 17.4% 97,463 17.5% 14.2%
Median Age 0.2% 40.3 40.7 40.8 1.2%
California0 - 14 0.3% 7,680,367 19.5% 7,792,956 18.9% 7,907,195 18.2% 3.0%15 - 44 0.4% 16,495,947 41.9% 16,854,986 40.9% 17,221,840 39.7% 4.4%45 - 64 0.8% 9,944,666 25.3% 10,371,255 25.1% 10,816,143 24.9% 8.8%65 + 3.5% 5,235,493 13.3% 6,229,524 15.1% 7,412,286 17.1% 41.6%
Total 0.9% 39,356,473 100.0% 41,248,721 100.0% 43,357,464 100.0% 10.2%
Women 15 - 44 0.4% 8,057,276 20.5% 8,205,868 19.9% 8,357,200 19.3% 3.7%
Median Age 0.7% 36.4 37.7 38.0 4.3%
/West_Coast_Advisory_Services/Clients/Desert_Healthcare_District/Needs_Assessment/Analysis/[Desert_Healthcare_Demographic_Tables_High_Low_Estimate.xlsx]Pop_Table
Source: Claritas, Inc., Health Resources and Services Administration, Migration Policy Institute, Clinton Foundation, Health Assessment and Research for
Communities, Inc., Southern California Sol Price Center for Social Innovation
(1) CAGR is the compound annual growth rate, or the percent change in each year
(2) High estimate includes seasonal residents
(3) Excludes seasonal residents.
Percent Change
2016 - 2026

©2017 Premier Inc.
23
Projected Population by ZIP CodeDesert Healthcare District
Service Area Population by ZIP CodeCalendar Years 2016 to 2026
High Estimate (2) Low Estimate (3)
ZIP Code Community Name CAGR(1) 2016 2021 2026
Percent Change
2016 - 2026
Service Area
Population, CY 2016 2016 2021 2026
Percent Change
2016 - 2026
Service Area
Population, CY 2016
92201 Indio 1.1% 82,695 87,130 91,897 11.1% 14.1% 69,535 73,239 77,214 11.0% 14.1%92202 Indio* - - - - - 0.0% - - - - 0.0%92203 Indio 2.0% 39,330 43,406 47,955 21.9% 6.7% 33,071 36,472 40,278 21.8% 6.7%92210 Indian Wells 0.6% 6,785 7,008 7,245 6.8% 1.2% 5,706 5,892 6,088 6.7% 1.2%92211 Palm Desert 1.5% 33,893 36,592 39,548 16.7% 5.8% 28,499 30,752 33,222 16.6% 5.8%92234 Cathedral City 0.9% 68,353 71,627 75,136 9.9% 11.6% 57,475 60,210 63,134 9.8% 11.6%92235 Cathedral City* - - - - - 0.0% - - - - 0.0%92236 Coachella 1.5% 57,101 61,595 66,511 16.5% 9.7% 48,014 51,764 55,873 16.4% 9.7%92240 Desert Hot Springs 1.4% 49,002 52,616 56,556 15.4% 8.3% 41,204 44,221 47,512 15.3% 8.3%92241 Desert Hot Springs 2.0% 13,040 14,433 15,991 22.6% 2.2% 10,965 12,127 13,430 22.5% 2.2%92247 La Quinta* - - - - - 0.0% - - - - 0.0%92248 La Quinta* - - - - - 0.0% - - - - 0.0%92253 La Quinta 1.4% 52,293 55,985 60,000 14.7% 8.9% 43,972 47,053 50,407 14.6% 8.9%92254 Mecca/North Shore 1.4% 17,601 18,824 20,152 14.5% 3.0% 14,800 15,821 16,930 14.4% 3.0%92255 Palm Desert* - - - - - 0.0% - - - - 0.0%92258 North Palm Springs - - - - - 0.0% - - - - 0.0%92260 Palm Desert 0.6% 40,507 41,711 42,994 6.1% 6.9% 34,061 35,068 36,132 6.1% 6.9%92261 Palm Desert* - - - - - 0.0% - - - - 0.0%92262 Palm Springs 1.1% 35,392 37,397 39,556 11.8% 6.0% 29,760 31,434 33,235 11.7% 6.0%92263 Palm Springs* - - - - - 0.0% - - - - 0.0%92264 Palm Springs 0.6% 24,708 25,467 26,276 6.3% 4.2% 20,776 21,411 22,082 6.3% 4.2%92270 Rancho Mirage 1.0% 23,379 24,592 25,896 10.8% 4.0% 19,658 20,672 21,759 10.7% 4.0%92274 Thermal/Oasis 1.0% 32,510 34,157 35,924 10.5% 5.5% 27,337 28,712 30,185 10.4% 5.5%92276 Thousand Palms 1.1% 10,067 10,632 11,240 11.7% 1.7% 8,465 8,937 9,444 11.6% 1.7%92282 White Water 1.0% 1,679 1,764 1,855 10.5% 0.3% 1,412 1,483 1,559 10.4% 0.3%
Total 1.2% 588,336 624,934 664,731 13.0% 100.0% 494,710 525,266 558,484 12.9% 100.0%
/West_Coast_Advisory_Services/Clients/Desert_Healthcare_District/Needs_Assessment/Analysis/[Population_by_zip_code.xlsx]Population by ZIP
* Represents a ZIP code for P.O. Boxes(1) CAGR is the compound annual grow th rate, or the percent change in each year(2) Includes seasonal residents(3) Excludes seasonal residents
Source: Claritas, Inc., Health Resources and Services Administration, Migration Policy Institute, Clinton Foundation, Health Assessment and Research for Communities, Inc., Southern California Sol Price Center for Social Innovation

©2017 Premier Inc.
24
Population Profile by Service Area: High EstimateDesert Healthcare District
Current District vs. East Valley - Population by Age CohortHigh Estimate(2)
Calendar Years 2016 to 2026
Estimated 2016 Projected 2021 Projected 2026
Age Cohort CAGR(1) NumberPercent of Total Number
Percent of Total Number
Percent of Total
Current District Service Area0 - 14 0.7% 45,991 15.3% 47,732 15.1% 49,507 14.8% 7.6%15 - 44 1.4% 91,907 30.6% 98,308 31.0% 105,074 31.4% 14.3%45 - 64 -0.3% 76,334 25.4% 75,092 23.7% 73,828 22.0% -3.3%65 + 2.2% 85,788 28.6% 95,699 30.2% 106,638 31.8% 24.3%
Total 1.1% 300,020 100.0% 316,831 100.0% 335,047 100.0% 11.7%
Women 15 - 44 1.4% 44,842 14.9% 48,161 15.2% 51,823 15.5% 15.6%
Median Age 0.1% 48.3 48.6 48.9 1.2%
East Valley Service Area0 - 14 0.4% 66,891 23.2% 68,309 22.2% 69,775 21.2% 4.3%15 - 44 1.3% 118,679 41.2% 126,672 41.1% 135,216 41.0% 13.9%45 - 64 1.3% 62,856 21.8% 67,179 21.8% 71,805 21.8% 14.2%65 + 2.9% 39,890 13.8% 45,944 14.9% 52,888 16.0% 32.6%
Total 1.3% 288,316 100.0% 308,104 100.0% 329,684 100.0% 14.3%
Women 15 - 44 1.3% 56,875 19.7% 60,521 19.6% 64,408 19.5% 13.2%
Median Age 0.5% 33.7 34.6 35.5 5.4%
/West_Coast_Advisory_Services/Clients/Desert_Healthcare_District/Needs_Assessment/Analysis/Rev_Demographics/[Desert_Demographic_Tables_High_Estimate.xlsx]Pop_Table
Source: Claritas, Inc., Health Resources and Services Administration, Migration Policy Institute, Clinton Foundation, Health Assessment and Research for
Communities, Inc., Southern California Sol Price Center for Social Innovation
Note: The total for each age cohort for the Current District Service Area and the East Valley Service Area when calculated separately may not foot to the
combined service area population table by age cohort due to rounding.
(1) CAGR is the compound annual growth rate, or the percent change in each year
(2) High estimate includes seasonal residents
Percent Change
2016 - 2026

©2017 Premier Inc.
25
Population Profile by Service Area: Low EstimateDesert Healthcare District
Current District vs. East Valley - Population by Age Cohort"Low Estimate(2)
Calendar Years 2016 to 2026
Estimated 2016 Projected 2021 Projected 2026
Age Cohort CAGR(1) NumberPercent of Total Number
Percent of Total Number
Percent of Total
Current District Service Area0 - 14 0.7% 38,673 15.3% 40,122 15.1% 41,596 14.8% 7.6%15 - 44 1.3% 77,281 30.6% 82,634 31.0% 88,284 31.4% 14.2%45 - 64 -0.3% 64,186 25.4% 63,119 23.7% 62,030 22.0% -3.4%65 + 2.2% 72,136 28.6% 80,440 30.2% 89,598 31.8% 24.2%
Total 1.1% 252,276 100.0% 266,314 100.0% 281,509 100.0% 11.6%
Women 15 - 44 1.4% 37,706 14.9% 40,482 15.2% 43,542 15.5% 15.5%
Median Age 0.1% 48.3 48.6 48.9 1.2%
East Valley Service Area0 - 14 0.4% 56,246 23.2% 57,412 22.2% 58,620 21.2% 4.2%15 - 44 1.3% 99,793 41.2% 106,464 41.1% 113,598 41.0% 13.8%45 - 64 1.3% 52,853 21.8% 56,462 21.8% 60,325 21.8% 14.1%65 + 2.9% 33,542 13.8% 38,615 14.9% 44,432 16.0% 32.5%
Total 1.3% 242,434 100.0% 258,952 100.0% 276,975 100.0% 14.2%
Women 15 - 44 1.2% 47,824 19.7% 50,866 19.6% 54,110 19.5% 13.1%
Median Age 0.5% 33.7 34.6 35.5 5.4%
/West_Coast_Advisory_Services/Clients/Desert_Healthcare_District/Needs_Assessment/Analysis/Rev_Demographics/[Desert_Demographic_Tables_Low_Estimate.xlsx]Pop_Table
Source: Claritas, Inc., Health Resources and Services Administration, Migration Policy Institute, Clinton Foundation, Health Assessment and Research for
Communities, Inc., Southern California Sol Price Center for Social Innovation
Note: The total for each age cohort for the Current District Service Area and the East Valley Service Area when calculated separately may not foot to the
combined service area population table by age cohort due to rounding.
(1) CAGR is the compound annual growth rate, or the percent change in each year
(2) Excludes seasonal residents
Percent Change
2016 - 2026

©2017 Premier Inc.
26
Ethnicity Profile Desert Healthcare District
Service Area vs. the State of California - Ethnic ProfileCalendar Years 2016 to 2026
Estimated 2016 Projected 2021 Projected 2026
Ethnicity CAGR(1) NumberPercent of Total Number
Percent of Total Number
Percent of Total
Service Area - High Estimate (2)
Hispanics 1.5% 272,735 46.4% 293,583 47.0% 316,398 47.6%
Non-HispanicsWhite 0.9% 284,102 48.3% 297,747 47.6% 312,415 47.0%Black 1.1% 11,495 2.0% 12,129 1.9% 12,813 1.9%American Indian/Alaskan/Aleutian 0.1% 1,742 0.3% 1,752 0.3% 1,764 0.3%Asian/Hawaiian/Pacific Islander 1.2% 11,952 2.0% 12,666 2.0% 13,438 2.0%Other 2.3% 6,310 1.1% 7,057 1.1% 7,902 1.2%
Subtotal 1.0% 315,601 53.6% 331,351 53.0% 348,333 52.4%
Total 1.2% 588,336 100.0% 624,934 100.0% 664,731 100.0%
Service Area - Low Estimate (3)
Hispanics 1.5% 272,735 55.1% 293,583 55.9% 316,365 56.6%
Non-HispanicsWhite 0.8% 190,476 38.5% 198,079 37.7% 206,206 36.9%Black 1.1% 11,495 2.3% 12,129 2.3% 12,812 2.3%American Indian/Alaskan/Aleutian 0.1% 1,742 0.4% 1,752 0.3% 1,764 0.3%Asian/Hawaiian/Pacific Islander 1.2% 11,952 2.4% 12,666 2.4% 13,437 2.4%Other 2.3% 6,310 1.3% 7,057 1.3% 7,901 1.4%
Subtotal 0.9% 221,975 44.9% 231,683 44.1% 242,120 43.4%
Total 1.2% 494,710 100.0% 525,266 100.0% 558,484 100.0%
CaliforniaHispanics 1.6% 15,372,373 39.1% 16,635,860 40.3% 18,014,072 41.5%
Non-HispanicsWhite -0.2% 14,846,542 37.7% 14,691,869 35.6% 14,547,591 33.6%Black 0.2% 2,198,666 5.6% 2,224,149 5.4% 2,251,287 5.2%American Indian/Alaskan/Aleutian 0.2% 163,906 0.4% 165,455 0.4% 167,120 0.4%Asian/Hawaiian/Pacific Islander 2.1% 5,565,571 14.1% 6,177,171 15.0% 6,860,122 15.8%Other 2.3% 1,209,415 3.1% 1,354,217 3.3% 1,517,272 3.5%
Subtotal 0.5% 23,984,100 60.9% 24,612,861 59.7% 25,343,391 58.5%
Total 0.9% 39,356,473 100.0% 41,248,721 100.0% 43,357,464 100.0%
lthcare_Distric t/Needs_Assessment/Analysis/[Desert_Healthcare_Demographic_Tables_High_Low_Estimate.xlsx]Ethnicity_Table
Source: Claritas, Inc., Health Resources and Services Administration, Migration Policy Institute
(1) CAGR is the compound annual growth rate, or the percent change in each year
(2) High estimate includes seasonal residents
(3) Excludes seasonal residents.
A large portion of the service area population is Hispanic. Given the projected growth and the fact that statistically, Hispanics have higher incidence rates of diabetes, heart disease, and obesity, it is anticipated that there will be an increased demand for cardiovascular services, endocrinology, gastroenterology, and orthopedics in the District’s service area.

©2017 Premier Inc.
27
Socioeconomic Profile Desert Healthcare District
Service Area vs. the State of California - Socioeconomic ProfileCalendar Years 2016 to 2026
Estimated Projected Projected
Socioeconomic Indicator CAGR(1) 2016 2021 2026
Service AreaMedian Household Income 1.1% $47,296 $49,904 $52,656 11.3%
Average Household Income 1.4% $70,294 $75,354 $80,778 14.9%
Income DistributionUnder $25,000 -0.2% 26.3% 24.6% 22.8% -1.7%$25,000 - $49,999 0.6% 26.3% 25.5% 24.7% 6.2%$50,000 - $99,999 1.4% 27.2% 27.4% 27.6% 15.2%$100,000 + 3.5% 20.2% 22.5% 25.0% 40.5%
CaliforniaMedian Household Income 1.5% $63,566 $68,640 $74,119 16.6%
Average Household Income 1.8% $90,633 $99,054 $108,257 19.4%
Income DistributionUnder $25,000 -0.8% 20.2% 18.5% 16.8% -8.0%$25,000 - $49,999 -0.1% 20.9% 19.8% 18.6% -1.2%$50,000 - $99,999 0.4% 28.3% 27.5% 26.6% 4.2%$100,000 + 3.2% 30.6% 34.2% 38.0% 37.6%
sory_Services/Clients/Desert_Healthcare_District/Needs_Assessment/Analysis/[Desert_Healthcare_Demographic_Tables_High_Low_Estimate.xlsx]Household_Table
Source: Claritas, Inc.(1) CAGR is the compound annual growth rate, or the percent change in each year
Percent Change
2016 - 2026
A large proportion of household incomes in the District’s service area are estimated to be below $50,000 in CY 2016 (52.6 percent). During this same time period, the service area is expected to have lower median and average household incomes in comparison to the State.
• It is likely that a large portion of the service area population is covered by Medi-Cal since the program’s eligibility was extended to 138 percent of the Federal Poverty Level.

©2017 Premier Inc.
28
Health Status OutcomesDesert Healthcare DistrictHealth Status Indicators
Calendar Years 2006 - 2014
Riverside ImperialHealth Status Indicator Year County County California
Age-Adjusted Mortality (Per 100,000 Population)All cancers 2010-2014 153.5 132.9 149.9 Breast cancer 2010-2014 20.6 16.3 20.6 Colorectal cancer 2010-2014 15.2 12.7 13.7 Lung, trachea, and bronchus cancer 2010-2014 36.4 28.1 33.4 Prostate cancer 2010-2014 21.2 23.2 20.5 Melanoma of the skin 2009-2013 2.7 Not Reported 2.5 Diabetes 2010-2014 19.1 30.6 20.4 Alzheimer's disease 2010-2014 31.0 11.7 30.4 Coronary heart disease 2010-2014 119.5 106.3 101.7 Unintentional injuries (excluding motor vehicle) 2010-2014 21.8 25.5 20.3 Stroke 2010-2014 35.3 33.5 35.7 Influenza and Pneumonia 2010-2014 11.6 13.7 15.9 Suicide 2010-2014 10.3 7.2 10.3 Motor vehicle 2010-2014 10.0 11.1 7.9
Cancer IncidenceBreast Cancer 2009-2013 115.5 101.4 121.7Colorectal Cancer 2009-2013 39.5 33.9 38.3Lung and Bronchus Cancer 2009-2013 47.3 44.5 46.6Prostate Cancer 2009-2013 120.3 127.7 119.0
y_Services/Clients/Desert_Healthcare_District/Needs_Assessment/Analysis/[Desert_Healthcare_Health_Status_Indicators.xlsx]Table
Sources: Health Indicators Warehouse, California Cancer RegistryIndicates county metric is less than the respective state metric by more than five percentIndicates county metric is within five percent of the respective state metricIndicates county metric is greater than the respective state metric by more than five percent
All ZIP Codes in the service area except one (ZIP Code 92274, which is partially located in Imperial County) are located in Riverside County. In general, this geographic region has higher mortality rates for cancer, Alzheimer’s disease, coronary heart disease, unintentional injuries, stroke, suicide, motor vehicle accidents, and infants when compared to the State overall. Further, the service area also has higher rates of cancer (e.g. colorectal, lung and bronchus, prostate), obesity, diabetes, high blood pressure, smoking, and low birth weight infants.
• This implies an increased demand for services such as primary care, cardiovascular, neurosciences, oncology, general surgery, orthopedics, pulmonary medicine, urology, obstetrics and perinatology, neonatology, and chronic disease management.

©2017 Premier Inc.
29
Health Status Outcomes (continued)Desert Healthcare DistrictHealth Status Indicators
Calendar Years 2006 - 2014
Riverside ImperialHealth Status Indicator Year County County California
Health Risk FactorsPercent of adults with obesity 2006-2012 28.7% 28.7% 24.9%Percent of adults with diabetes 2006-2012 9.6% 11.4% 8.7%Percent of adults with high blood pressure 2006-2012 27.2% 32.8% 26.2%Percent of adults who smoke 2006-2012 14.6% 12.4% 12.8%
Age-Adjusted Quality of Life and Social SupportPercent of adults reporting fair or poor health 2006-2012 19.5% 29.0% 18.4%Percent of adults, no exercise in last month 2006-2012 24.1% 29.0% 21.3%
Maternal and Child HealthBirth rate 2013 64.1 87.7 62.5 Infant mortality: all races (1) 2009-2013 5.0 3.4 4.7 Percent of low birth weight infants 2010-2014 6.5% 5.5% 6.7%Births to mothers aged 15-19 (2) 2010-2014 27.0 50.1 26.4
CensusPercent of persons under 18 in poverty 2014 23.5% 31.3% 22.6%Percent uninsured population (<65 years old) 2013 21.9% 21.5% 19.4%
y_Services/Clients/Desert_Healthcare_District/Needs_Assessment/Analysis/[Desert_Healthcare_Health_Status_Indicators.xlsx]Table (2)
Sources: Health Indicators Warehouse, California Cancer RegistryIndicates county metric is less than the respective state metric by more than five percentIndicates county metric is within five percent of the respective state metricIndicates county metric is greater than the respective state metric by more than five percent
(1) Metric reported rate is per 1,000 live births(2) Metric reported rate is per 1,000 women age 15 - 19 years old

©2017 Premier Inc.
30
Health Status Outcomes (continued)The Health Assessment Resource Center’s 2016 “Coachella Valley Community Health Survey” further illustrates that portions of the District’s service area population are underserved, and opportunities exist to improve the overall health of the community with a focus on wellness and prevention through increased access to coordinated primary and specialty care services.
Key findings from this study are summarized on the following five pages based on the key themes listed below:
• Insurance coverage• Adult general health status and access to care• Adult health screening and utilization of other preventative services• Pediatric general health status and access to care• Pediatric health screening and utilization of other preventative services

©2017 Premier Inc.
31
Indicator Key Findings
Health Coverage • 14% of adults between 18 and 64 have no health insurance, and 5% of children do not have any kind of health insurance coverage.
• Most common reasons for lacking healthcare coverage include a lack of documentation to prove legal residency (15.9%) and the inability to pay premiums (13.7%).
Prescription Coverage Percent of population that lacks prescription coverage:• Adults: 14.5% • Children: 10.7%
Vision Coverage Percent of population that lacks vision coverage:• Adults: 40.1% • Children: 18.2%
Dental Coverage Percent of population that lacks dental coverage:• Adults: 39.8% • Children: 25.1%
Mental Health Coverage • Adults: 22.3% of adults 18 to 64 have been diagnosed with a mental health disorder; 10.1% of adults 18 to 64 with mental health issues could not get mental healthcare in the past year
• Children: 29.8% of children have been diagnosed with a mental health disorder;61.4% of these children have not visited a mental health professional
Insurance Coverage
Source: Health Assessment Resource Center’s 2016 “Coachella Valley Community Health Survey”

©2017 Premier Inc.
32
Indicator Key Findings
General Health Status • 20% of adults in the Coachella Valley rate their health as "fair or "poor".
Utilization • 85.4% of Coachella Valley adults have visited a healthcare provider within the past year, compared to 83% nationally, with an increasing trend in area residents using urgent care facilities as their usual source of care (10.7% increase since 2013, to 23.7%). 10.5% of adults use the ER or hospital.
Barriers to Receiving Care
• Common barriers to receiving care include understanding what is covered, healthcare provider hours, taking time off work, and not having authorization from an HMO.
Chronic Disease • The three most common chronic diseases in Coachella Valley adults are hypertension, high cholesterol, and arthritis.
Obesity • 60.5% of Coachella Valley adults are overweight or obese.
Disability • 11.0% of Coachella Valley adults have a health problem that requires them to use assistive technology.
Mental Health Concerns • 25.9% of Coachella Valley adults have had an emotional, mental, or behavioral problem that concerned them in the past year; over half of these (55.5%) felt that their problem was severe enough to require professional help. 19.4% of these people did not know who to contact for help with their problem.
Adult Key Findings: General Health Status and Access to Care
Source: Health Assessment Resource Center’s 2016 “Coachella Valley Community Health Survey”

©2017 Premier Inc.
33
Indicator Key Findings
Cholesterol Screening • Over 22.4% of Coachella Valley adults have never had their blood cholesterol checked.
Prostate‐SpecificAntigen (“PSA”) Test
• 37.1% of men age 40 years and over have never had a PSA test. 62.8% of Hispanic men have never had a PSA test.
Digital Rectal Exam • 35.8% of men age 40 years or over have never had a digital rectal exam.
Mammography • 7.1% of women age 40 years and over have never had a mammogram. 17.4% of women have not had a mammogram within the past two years
Pap Test • 7.2% of adult women in Coachella Valley have never had a Pap smear.
Most Recent Pap Test • 17.9% of adult women who have had a Pap smear have not had one within the past five years.
Human Papillomavirus(“HPV”) Vaccination
• The majority of Coachella Valley adults between the ages of 18 and 33 (78.5%) have not received the HPV vaccine.
Influenza Vaccination • Approximately half of Coachella Valley adults (56.1%) have not had a flu vaccine within the past year.
Adult Key Findings: Screening and Other Preventative Services
Source: Health Assessment Resource Center’s 2016 “Coachella Valley Community Health Survey”

©2017 Premier Inc.
34
Indicator Key Findings
General Health Status • 3.1% of children have health that is “fair” or “poor”.
Utilization • 11% of Coachella Valley children have not visited a healthcare provider in the past year
Obesity • 49% of children 2 to 17 have a BMI percentile that places them in the “overweight” or “obese” category.
Asthma • 13.7% of children have been diagnosed with asthma.
Mental Health Concerns • One‐quarter of children age 3 and older (24.4%) have trouble with emotions, concentration, behavior, and getting along with others.
• Additionally, over 9% of children age 3 and over have been diagnosed with ADD or ADHD.
Mental Health Treatment
• 61.4% of children 3 to 17 with mental health problems have not seen a mental health professional for treatment in the past year.
• 13.7% of children 3 to 17 with mental health problems have taken medication for the issue within the past year; 30.5% of children 3 to 17 with mental health problems have received psychological counseling for the issue within the past year.
Pediatric Key Findings: General Health Status and Access to Care
Source: Health Assessment Resource Center’s 2016 “Coachella Valley Community Health Survey”

©2017 Premier Inc.
35
Indicator Key Findings
Delay or Denial of Medical Testing
• 5.8% of children had to have a test or treatment delayed or denied in the past year
Child Dental Visits • 13.7% of children have never been to a dentist.
Frequency of Child Dental Visits
• 92.2% of children who have been to the dentist have been there within the past year.
Child Hearing Test • 12.1% of children age 5 and under have never had a hearing test.
Child Vision Exam • 37.6% of children age 3 and older have not had a vision exam in the past year.
Child HPV Vaccination • 51.5% of children ages 11 and over have not had the HPV vaccination.
Child Helmet Use • 14.3% of children age 2 and over never wear a helmet.
Pediatric Key Findings: Screening and Other Preventative Services
Source: Health Assessment Resource Center’s 2016 “Coachella Valley Community Health Survey”

©2017 Premier Inc.
36
Service Area Inpatient Use Rate and Market Share Trends, CY 2012 ‐ 2015Between CY 2012 and 2015, total inpatient discharges in the District’s service area decreased by 2.0 percent, while the use rate (discharges per 1,000 population) decreased by 5.5 percent. This trend will continue due to the following:
• Continued rise of high-deductible insurance plans that constrain medical use• Impact of value-based care models (e.g., accountable care organizations, bundled payments,
patient-centered medical homes [e.g., Comprehensive Primary Care Plus (“CPC+”)], risk-based payment contracts, and performance-based physician incentives) that seek to achieve enhanced coordination of care, better quality outcomes, and reduced costs across care settings
• Patients treated under these models typically have lower lengths of stay and less readmissions
• Providers are seeking to reduce preventable hospitalizations for acute and chronic conditions, and preventable readmissions by ensuring patients receive home-based disease management programs and outpatient care, instead of accessing hospital care
• Shift in volumes from inpatient to observation status through the two-midnight census rule implemented by the Centers for Medicare & Medicaid Services (“CMS”) in October, 2013, and the continued shift in inpatient volume to outpatient care settings for ambulatory case-sensitive admissions (e.g., uncontrolled diabetes, hypertension, dehydration)
• Providers are aggressively increasing intensive medical management for chronic conditions on an outpatient basis
During this same time period, DRMC’s market share increased by 1.3 percent, and is likely attributed to the Hospital recapturing a portion of the service area’s inpatient volume from John F. Kennedy Memorial Hospital (“JFK”), who experienced a 3.1 percent decrease in market share over the four-year time period.

©2017 Premier Inc.
37
Service Area Historical Use Rates by Inpatient Service Line, CY 2012 ‐ 2015
Service Line 2012 2013 2014 2015
Cardiology - Diagnostic/Interventional 2.9 2.5 2.3 2.3 -19.8%Cardiology - Medical 7.0 6.3 5.9 5.7 -18.2%Cardiology - Surgery 0.7 0.7 0.7 0.8 4.2%Chemical Dependency 0.3 0.3 0.3 0.4 50.1%Endocrine 2.1 1.8 1.8 1.9 -9.7%ENT 0.6 0.5 0.5 0.5 -9.1%Gastroenterology 6.6 6.1 6.0 6.2 -6.4%General Medicine 6.2 6.0 6.3 7.1 14.5%General Surgery 6.4 6.4 6.4 6.0 -7.3%Gynecology 3.4 3.0 2.6 2.7 -18.4%Neonatal Intensive Care 225.7 203.6 211.5 215.2 -4.7%Neurology 4.3 3.9 3.9 3.8 -11.9%Neurosurgery 0.8 0.8 0.7 0.5 -35.9%Obstetrics & Deliveries 62.6 58.5 58.3 57.2 -8.7%Oncology 2.8 2.6 2.6 2.6 -6.9%Ophthalmology 0.1 0.1 0.1 0.1 -36.9%Orthopedics 6.8 6.8 7.0 7.0 2.9%Others NC - - 0.1 - 0.0%Plastic Surgery 0.5 0.5 0.4 0.5 -4.6%Psychiatry 0.3 0.2 0.2 0.3 8.8%Pulmonary Medicine 5.9 6.2 5.6 5.5 -7.1%Rehabilitation 0.0 0.0 0.0 0.0 -51.8%Spine Surgery 1.0 1.0 1.1 1.3 30.3%Thoracic & Vascular Surgery 1.4 1.4 1.4 1.2 -18.7%Transplant 0.1 0.1 0.1 0.0 -21.1%Urology 3.4 3.4 3.6 3.8 12.7%
Total 75.3 71.5 70.9 71.1 -5.5%
Source: OSHPD 2012, 2013, 2014, 2015. Excludes normal newborns. Note: Use rate calculation based on projected population in service area, and reflects consideration of seasonal and migrant populations.(1) Use rate defined as discharges per 1,000 population.https://share.premierinc.com/sites/pcs/ICD/Folder/West_Coast_Advisory_Services/Clients/Desert_Healthcare_District/Needs_Assessment/Analysis/[Inpat
ient_Model.xlsx]Use Rate Analysis
Desert Healthcare DistrictService Area Historical Use Rates by Inpatient Service Line
Calendar Years 2012 - 2015
Percent Change, CY 2012 - 2015
Use Rate Based on High Population Estimate (1)

©2017 Premier Inc.
38
Service Area Inpatient Market Share and Outmigration Trends, CY 2012 ‐ 2015
Hospital DischargesPercent
Market Share DischargesPercent
Market Share DischargesPercent
Market Share DischargesPercent
Market Share
Service Area Hospitals: Eisenhower Medical Center 15,045 35.7% 14,820 36.5% 14,586 35.8% 15,724 38.0%Desert Regional Medical Center 13,527 32.1% 13,037 32.1% 13,649 33.5% 13,793 33.4%John F Kennedy Memorial Hospital 8,529 20.2% 7,995 19.7% 7,574 18.6% 7,081 17.1%
Subtotal, Service Area Hospitals 37,101 87.9% 35,852 88.3% 35,809 88.0% 36,598 88.5%
Outmigration: Loma Linda University Medical Center 1,385 3.3% 1,322 3.3% 1,381 3.4% 1,374 3.3%Riverside County Regional Medical Center 858 2.0% 686 1.7% 483 1.2% 330 0.8%Cedars Sinai Medical Center 183 0.4% 177 0.4% 201 0.5% 184 0.4%City of Hope Helford Clinical Research Hospital 149 0.4% 144 0.4% 164 0.4% 171 0.4%Kaiser Foundation Hospital - Riverside 102 0.2% 111 0.3% 113 0.3% 137 0.3%Ronald Reagan UCLA Medical Center 144 0.3% 120 0.3% 163 0.4% 131 0.3%University of California San Diego Medical Center 81 0.2% 74 0.2% 112 0.3% 129 0.3%Keck Hospital of USC 116 0.3% 80 0.2% 150 0.4% 112 0.3%University of California Irvine Medical Center 110 0.3% 101 0.2% 106 0.3% 109 0.3%Kaiser Foundation Hospital - Fontana 65 0.2% 61 0.2% 101 0.2% 95 0.2%Others 1,906 4.5% 1,868 4.6% 1,932 4.7% 1,978 4.8%
Subtotal, Outmigration 5,099 12.1% 4,744 11.7% 4,906 12.0% 4,750 11.5%
Total 42,200 100.0% 40,596 100.0% 40,715 100.0% 41,348 100.0%
Source: California Office of Statewide Health Planning and Development Inpatient Database, 2012, 2013, 2014, 2015. Acute care, excludes normal newborns. https://share.premierinc.com/sites/pcs/ICD/Folder/West_Coast_Advisory_Services/Clients/Desert_Healthcare_District/Needs_Assessment/Analysis/[Coachella OSHPD Tables.xlsx]Table 1A
2012 2013 2014
Desert Healthcare DistrictService Area Inpatient Market Share
Calendar Years 2012 - 2015
2015

©2017 Premier Inc.
39
Service Area Inpatient Market Share Trends by Service Line, CY 2015In CY 2015, 11.5 percent of patients left the service area for inpatient care. Service lines with high levels of out-migration (greater than 25.0 percent) for inpatient services are identified as follows:
• ENT – 40.4 percent• Gynecology – 29.3 percent• Neurosurgery – 41.4 percent• Oncology – 25.9 percent• Ophthalmology – 31.4 percent• Spine Surgery – 31.3 percent• Transplant – 100.0 percent
The table provided on the following page illustrates market share by inpatient service line for each hospital in the service area, and the proportion of patients that received care outside of this geographic area for each service line in CY 2015.

©2017 Premier Inc.
40
Service Area Total (All Ages) Inpatient Market Share, CY 2015
Service Area
Service Line Discharges
Percent of Total
Discharges
Eisenhower Medical Center
Desert Regional Medical Center
John F Kennedy Memorial Hospital
Loma Linda University Medical Center Others Total
Cardiology - Diagnostic/Interventional 1,341 3.2% 47.7% 37.4% 7.3% 1.3% 6.3% 100.0%Cardiology - Medical 3,342 8.1% 47.0% 32.4% 14.9% 1.0% 4.7% 100.0%Cardiology - Surgery 444 1.1% 55.0% 24.5% 0.2% 8.6% 11.7% 100.0%Chemical Dependency 221 0.5% 43.4% 32.6% 10.4% 1.4% 12.2% 100.0%Endocrine 1,115 2.7% 39.0% 29.9% 16.6% 6.5% 8.0% 100.0%ENT 309 0.7% 28.8% 23.0% 7.8% 26.5% 13.9% 100.0%Gastroenterology 3,600 8.7% 46.0% 31.8% 10.4% 4.1% 7.7% 100.0%General Medicine 4,152 10.0% 47.9% 26.9% 13.6% 2.7% 8.9% 100.0%General Surgery 3,467 8.4% 43.4% 26.8% 16.9% 3.7% 9.3% 100.0%Gynecology 632 1.5% 15.3% 41.1% 14.2% 9.7% 19.6% 100.0%Neonatal Intensive Care 1,609 3.9% 0.1% 66.7% 27.6% 2.9% 2.7% 100.0%Neurology 2,183 5.3% 48.8% 32.9% 6.5% 4.5% 7.2% 100.0%Neurosurgery 307 0.7% 25.4% 32.6% 0.7% 11.1% 30.3% 100.0%Obstetrics & Deliveries 5,736 13.9% 0.5% 53.1% 43.3% 0.7% 2.4% 100.0%Oncology 1,488 3.6% 44.6% 24.3% 5.2% 7.4% 18.5% 100.0%Ophthalmology 51 0.1% 21.6% 35.3% 11.8% 19.6% 11.8% 100.0%Orthopedics 4,074 9.9% 52.8% 24.3% 11.1% 3.0% 8.8% 100.0%Plastic Surgery 268 0.6% 48.1% 17.2% 20.1% 4.1% 10.4% 100.0%Psychiatry 168 0.4% 45.8% 31.0% 7.1% 3.0% 13.1% 100.0%Pulmonary Medicine 3,187 7.7% 40.4% 29.0% 20.6% 2.5% 7.5% 100.0%Rehabilitation 1 0.0% 0.0% 100.0% 0.0% 0.0% 0.0% 100.0%Spine Surgery 735 1.8% 55.1% 13.6% 0.0% 2.9% 28.4% 100.0%Thoracic & Vascular Surgery 683 1.7% 53.4% 29.7% 5.1% 2.2% 9.5% 100.0%Transplant 27 0.1% 0.0% 0.0% 0.0% 37.0% 63.0% 100.0%Urology 2,208 5.3% 51.6% 24.5% 12.4% 3.4% 8.1% 100.0%
Total 41,348 100.0% 38.0% 33.4% 17.1% 3.3% 8.2% 100.0%
Source: California Office of Statewide Health Planning and Development Inpatient Database, 2015. Includes acute care across all ages; excludes normal newborns. https://share.premierinc.com/sites/pcs/ICD/Folder/West_Coast_Advisory_Services/Clients/Desert_Healthcare_Distric t/Needs_Assessment/Analysis/[Coachella OSHPD Tables.xlsx]Table 2C
Outmigration
Desert Heathcare DistrictService Area Inpatient Market Share by Service Line - All Ages
Calendar Year 2015
Service Area Mix Percent Market Share

©2017 Premier Inc.
41
Service Area Inpatient Market Share Trends, CY 2012 ‐ 2015Patients age 0-14 years represent 8.4 percent of the service area’s total inpatient volume in CY 2015. While DRMC was the market share leader for inpatient pediatric services overall (39.6 percent), almost 28 percent of the service area’s pediatric patients left the area for care.
• Notably, Loma Linda University Medical Center was the dominant provider of most pediatric sub-specialty services during this time period. This trend implies a need for increased access to pediatric sub-specialty providers across almost all medical and surgical specialties in the District’s service area.
The table provided on the following page illustrates pediatric-specific market share by inpatient service line for each hospital in the service area, and the proportion of pediatric patients that received care outside of this geographic area for each in CY 2015.

©2017 Premier Inc.
42
Service Area Pediatric Inpatient Market Share, CY 2015
Service Area
Service Line Discharges
Percent of Total
Discharges
Eisenhower Medical Center
Desert Regional Medical Center
John F Kennedy Memorial Hospital
Loma Linda University Medical Center Others Total
Cardiology - Diagnostic/Interventional 3 0.1% 0.0% 0.0% 0.0% 66.7% 33.3% 100.0%Cardiology - Medical 17 0.5% 0.0% 5.9% 0.0% 76.5% 17.6% 100.0%Cardiology - Surgery 17 0.5% 0.0% 0.0% 0.0% 88.2% 11.8% 100.0%Endocrine 106 2.9% 5.7% 4.7% 34.0% 46.2% 9.4% 100.0%ENT 100 2.7% 14.0% 19.0% 11.0% 46.0% 10.0% 100.0%Gastroenterology 186 5.0% 9.1% 15.6% 22.6% 44.6% 8.1% 100.0%General Medicine 195 5.3% 7.7% 20.0% 19.5% 36.9% 15.9% 100.0%General Surgery 207 5.6% 21.7% 26.6% 22.7% 23.7% 5.3% 100.0%Gynecology 8 0.2% 12.5% 25.0% 0.0% 62.5% 0.0% 100.0%Neonatal Intensive Care 1,609 43.5% 0.1% 66.7% 27.6% 2.9% 2.7% 100.0%Neurology 104 2.8% 0.0% 3.8% 3.8% 62.5% 29.8% 100.0%Neurosurgery 18 0.5% 0.0% 0.0% 0.0% 72.2% 27.8% 100.0%Obstetrics & Deliveries 7 0.2% 0.0% 14.3% 85.7% 0.0% 0.0% 100.0%Oncology 91 2.5% 0.0% 1.1% 4.4% 69.2% 25.3% 100.0%Ophthalmology 8 0.2% 0.0% 25.0% 12.5% 37.5% 25.0% 100.0%Orthopedics 116 3.1% 0.9% 13.8% 6.9% 56.9% 21.6% 100.0%Plastic Surgery 14 0.4% 7.1% 0.0% 28.6% 35.7% 28.6% 100.0%Psychiatry 10 0.3% 0.0% 20.0% 10.0% 50.0% 20.0% 100.0%Pulmonary Medicine 562 15.2% 10.3% 19.4% 53.0% 13.0% 4.3% 100.0%Spine Surgery 11 0.3% 0.0% 0.0% 0.0% 81.8% 18.2% 100.0%Thoracic & Vascular Surgery 8 0.2% 0.0% 12.5% 0.0% 87.5% 0.0% 100.0%Transplant 1 0.0% 0.0% 0.0% 0.0% 100.0% 0.0% 100.0%Urology 77 2.1% 11.7% 22.1% 29.9% 27.3% 9.1% 100.0%
Total 3,475 94.0% 4.9% 39.6% 27.8% 20.5% 7.2% 100.0%
Source: OSHPD 2015. Ages 0-14, acute care, excludes normal newborns. Loma Linda includes Children's Hospital.https://share.premierinc.com/sites/pcs/ICD/Folder/West_Coast_Advisory_Services/Clients/Desert_Healthcare_District/Needs_Assessment/Analysis/[Coachella OSHPD Tables.xlsx]Table 2CP
Outmigration
Desert Healthcare DistrictService Area Inpatient Pediatric Market Share by Service Line - Pediatric (Ages 0 - 14 Years)
Calendar Year 2015
Service Area Mix Percent Market Share

©2017 Premier Inc.
43
Service Area Inpatient Market Share by Payer, CY 2015
Hospital HMO FFS HMO FFS HMO PPO Other Total
Eisenhower Medical Center 33.5% 62.8% 26.2% 13.6% 34.9% 77.1% 11.1% 38.0%Desert Regional Medical Center 52.1% 18.3% 36.7% 37.2% 33.8% 13.6% 56.9% 33.4%John F Kennedy Memorial Hospital 4.9% 9.0% 29.4% 32.0% 16.8% 1.4% 15.8% 17.1%Loma Linda University Medical Center 0.1% 0.6% 2.6% 8.1% 2.1% 0.9% 3.4% 2.3%Riverside County Regional Medical Center 0.0% 0.2% 0.2% 3.0% 1.3% 0.1% 2.0% 0.8%Cedars Sinai Medical Center 0.2% 0.9% 0.1% 0.2% 0.6% 0.2% 0.1% 0.4%City of Hope Helford Clinical Research Hospital 0.0% 0.5% 0.0% 0.7% 0.6% 0.1% 1.3% 0.4%Kaiser Foundation Hospital - Riverside 1.0% 0.0% 0.1% 0.0% 0.9% 0.0% 0.1% 0.3%Ronald Reagan UCLA Medical Center 0.1% 0.5% 0.1% 0.1% 0.4% 0.8% 0.5% 0.3%University of California San Diego Medical Center 0.0% 0.5% 0.3% 0.3% 0.3% 0.0% 0.6% 0.3%Keck Hospital of USC 0.5% 0.4% 0.0% 0.1% 0.3% 0.0% 1.0% 0.3%University of California Irvine Medical Center 0.2% 0.4% 0.2% 0.1% 0.3% 0.2% 0.2% 0.3%Kaiser Foundation Hospital - Fontana 0.8% 0.0% 0.0% 0.0% 0.6% 0.0% 0.0% 0.2%Others 4.3% 5.5% 3.1% 3.8% 5.7% 6.4% 6.7% 4.8%
Total 100.0% 100.0% 100.0% 100.0% 100.0% 100.0% 100.0% 100.0%
N = 5,254 11,196 8,292 5,351 8,073 1,303 1,879 41,348Payer Mix = 12.7% 27.1% 20.1% 12.9% 19.5% 3.2% 4.5% 100.0%
Source: California Office of Statewide Health Planning and Development Inpatient Database, 2015. Acute care, excludes normal newborns. https://share.premierinc.com/sites/pcs/ICD/Folder/West_Coast_Advisory_Services/Clients/Desert_Healthcare_District/Needs_Assessment/Analysis/[Coachella OSHPD Tables.xlsx]Table 3C
Desert Healthcare DistrictService Area Inpatient Market Share by Payer
Calendar Year 2015
Medicare Medi-Cal Private

©2017 Premier Inc.
Healthcare Provider Profiles

©2017 Premier Inc.
45
Service Area Hospital Profiles, CY 2015Desert Healthcare District
Profile of Service Area HospitalsCY 2015
Desert Regional Medical Center
Eisenhower Medical Center
John F. Kennedy Memorial Hospital
Telecare Riverside
County Psychiatric
Health Facility
Total Inpatient Beds (1) 385 489 156 16Total Discharges 19,725 19,375 7,228 789Total Patient Days 88,849 79,283 22,421 5,036Average Length of Stay 4.5 4.1 3.1 6.4Average Daily Census 243.4 217.2 61.4 13.8Occupancy Rate 63.2% 44.4% 39.4% 86.2%
Licensed ED Level Comprehensive Basic Basic N/AED Stations 28 43 12 N/AED Visits 71,937 78,070 42,085 N/AED Visits per Station 2,569.2 1,815.6 3,507.1 N/AAdmissions through ED 11,176 14,315 3,759 N/APercent Admissions through ED 15.5% 18.3% 8.9% N/ATrauma Designation Level II N/A N/A N/A
Number of ORs - Non-Cardiac 10 16 7 N/AInpatient OR Cases 5,258 6,801 2,444 N/AOutpatient OR Cases 2,476 15,294 1,733 N/A
Number of ORs - Cardiac 1 2 0 N/ACardiovascular Surgeries - Adult 175 2,990 0 N/ACardiovascular Surgeries - Pediatrics 0 0 0 N/A
Cardiac Cath Labs 3 2 1 N/ACardiac Cath Procedures 2,295 1,320 306 N/A
Total Live Births 3,214 0 2,180 N/A
Source: California Automated Licensing Information and Report Tracking System and Premier, Inc.(1) Includes all bed types (general acute care and other).N/A indicates service is not provided by hospital.https://share.premierinc.com/sites/pcs/ICD/Folder/West_Coast_Advisory_Services/Clients/Desert_Healthcare_District/Needs_Assessment/Analysis/[Premier_Coac
hella_Inpatient_Capacity_Analysis.xlsx]Hospital Analysis
There are three general acute care hospitals, and one psychiatric facility, located within the service area. The table provided to the right illustrates key statistics for each facility in CY 2015.
• Given that DRMC is the only facility that operates a comprehensive emergency department and a Level II Trauma Center, it can be implied that a portion of DRMC’s patients require higher levels of care (e.g., higher acuity) when compared to those treated at other hospitals in the service area.
• Additionally, DRMC is the market leader for obstetrics (deliveries) in the service area.
©2017 Premier Inc.
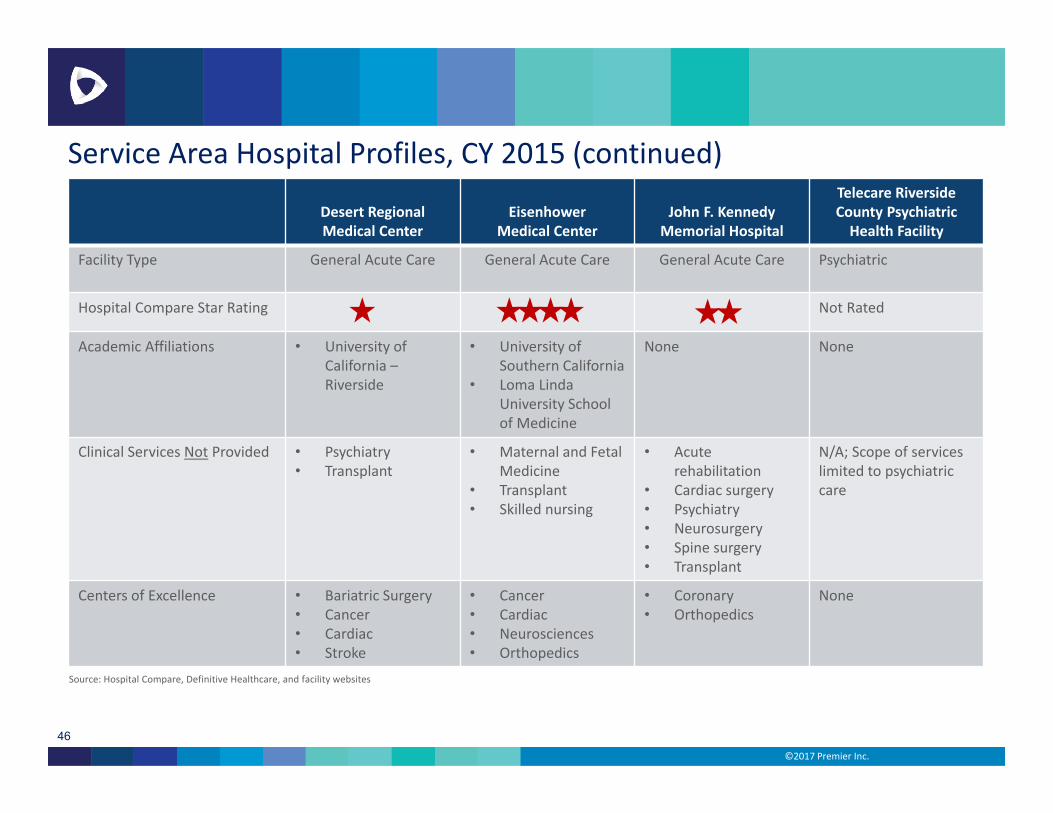
46
Desert Regional Medical Center
EisenhowerMedical Center
John F. Kennedy Memorial Hospital
Telecare Riverside County Psychiatric Health Facility
Facility Type General Acute Care General Acute Care General Acute Care Psychiatric
Hospital Compare Star Rating Not Rated
Academic Affiliations • University of California –Riverside
• University of Southern California
• Loma Linda University School of Medicine
None None
Clinical Services Not Provided • Psychiatry• Transplant
• Maternal and Fetal Medicine
• Transplant• Skilled nursing
• Acute rehabilitation
• Cardiac surgery• Psychiatry• Neurosurgery• Spine surgery• Transplant
N/A; Scope of services limited to psychiatric care
Centers of Excellence • Bariatric Surgery• Cancer• Cardiac• Stroke
• Cancer• Cardiac• Neurosciences• Orthopedics
• Coronary• Orthopedics
None
Service Area Hospital Profiles, CY 2015 (continued)
Source: Hospital Compare, Definitive Healthcare, and facility websites

©2017 Premier Inc.
47
Desert Regional Medical Center
EisenhowerMedical Center
John F. Kennedy Memorial Hospital
Telecare Riverside County Psychiatric Health Facility
Other Certifications • American College of Surgeons Commission on Cancer
• American Heart Association
• American Society for Respiratory Care
• Metabolic and Bariatric Surgery Accreditation and Quality Improvement Program
• Society for Chest Pain Centers
• American College of Surgeons Commission on Cancer
• American Association of Cardiovascular and PulmonaryRehabilitation
• California Mammography Quality Standards Accreditation
• American Heart Association
• Blue Cross Distinction Center for Hip & Knee Replacement Surgery
• Commission on Accreditation of Rehabilitation Facilities
Service Area Hospital Profiles, CY 2015 (continued)
Source: Hospital Compare, Definitive Healthcare, and facility websites

©2017 Premier Inc.
48
Inpatient General Acute Care Capacity Analysis by Hospital and Licensed Bed Type, CY 2015
Although an excess of inpatient beds existed in the service area in CY 2015 (all hospitals combined), DRMC experienced a shortage of inpatient capacity for obstetrics and critical care services. This is attributed to: 1) the Hospital’s Emergency Department (“ED”) and trauma designations; 2) DRMC operates the largest obstetrics program in the service area; and 3) the large regional draw DRMC has for inpatient services, and the number of patients that seek care at the Hospital from outside of the service area (e.g., in-migration).
Total Service Area Inpatient General Acute Care
Bed Type
Total Licensed
Beds
Total Patient Days
Average Daily
Census Bed NeedOccupancy Percentage
Bed (Need)/Surplus
Medical/Surgical 696 134,586 368.7 434 53.0% 262Obstetrics 54 12,946 35.5 48 65.7% 6Pediatric 42 2,927 8.0 11 19.1% 31Critical Care 117 19,198 52.6 71 45.0% 46Neonatal Intensive Care 41 8,060 22.1 30 53.9% 11Rehabilitation 35 7,457 20.4 25 58.4% 10
Total 985 185,174 507.3 619 51.5% 366
Source: California Automated Licensing Information and Report Tracking System and Premier, Inc.ory_Services/Clients/Desert_Healthcare_District/Needs_Assessment/Analysis/[Premier_Coachella_Provider_Analysis.xlsx]Hospital Summary (2)
Desert Healthcare DistrictService Area Hospital Inpatient General Acute Care Capacity Analysis by Licensed Bed Type
CY 2015
Desert Regional Medical Center Eisenhower Medical Center John F. Kennedy Memorial Hospital
Bed Type
Total Licensed
Beds
Total Patient Days
Average Daily
CensusOccupancy Percentage
Bed (Need)/Surplus
Total Licensed
Beds
Total Patient Days
Average Daily
CensusOccupancy Percentage
Bed (Need)/Surplus
Total Licensed
Beds
Total Patient Days
Average Daily
Census Bed NeedOccupancy Percentage
Bed (Need)/Surplus
Medical/Surgical 238 52,535 143.9 60.5% 68 377 68,393 187.4 49.7% 156 81 13,658 37.4 45 46.2% 36Obstetrics 28 8,480 23.2 83.0% (3) 0 0 0.0 N/A 0 26 4,466 12.2 17 47.1% 9Pediatric 14 1,431 3.9 28.0% 8 6 207 0.6 9.5% 5 22 1,289 3.5 5 16.1% 17Critical Care 31 10,138 27.8 89.6% (7) 70 6,052 16.6 23.7% 47 16 3,008 8.2 11 51.5% 5Neonatal Intensive Care 30 8,060 22.1 73.6% 0 0 0 0.0 N/A 0 11 0 0.0 0 0.0% 11Rehabilitation 12 2,826 7.7 64.5% 2 23 4,631 12.7 55.2% 8 0 0 0.0 0 N/A 0
Total 353 83,470 228.7 64.8% 68 476 79,283 217.2 45.6% 216 156 22,421 61.4 78 39.4% 78
Note: Utilization statistics for each hospital reflect total inpatient volume (e.g., patients that originate from inside and outside of the service area).

©2017 Premier Inc.
49
Service Area Skilled Nursing Facilities, CY 2015
Desert Healthcare DistrictService Area Skilled Nursing Facility Inpatient Capacity Analysis
CY 2015
Facility Name
Total Licensed
Beds
Total Patient Days
Average Daily
CensusOccupancy Percentage
Bed (Need)/Surplus
Brookdale Rancho Mirage 45 11,638 31.9 70.9% 11Desert Regional Medical Center - Skilled Nursing Facility 32 5,379 14.7 46.1% 16Desert Springs Health and Wellness Center 68 21,690 59.4 87.4% 5Indio Nursing and Rehab Center 99 32,227 88.3 89.2% 6ManorCare Health Services Palm Desert 178 49,751 136.3 76.6% 34Monterey Palms Healthcare Center 99 36,125 99.0 100.0% (6)Palm Springs Healthcare Center 99 34,387 94.2 95.2% (1)Premier Care Center for Palm Springs 99 33,174 90.9 91.8% 3Rancho Mirage Health and Rehabilitation Center 99 30,457 83.4 84.3% 11The Fountains at the Carlotta 59 15,153 41.5 70.4% 15
Total 877 269,981 739.7 84.3% 98
Source: California Automated Licensing Information and Report Tracking System and Premier, Inc.Note: Statistics reflect total patient utilization, defined as those patients that originate from inside and outside of the service area.https://share.premierinc.com/sites/pcs/ICD/Folder/West_Coast_Advisory_Services/Clients/Desert_Healthcare_District/Needs_Assessment/Analysis/[Premier_Coachella
_Provider_Analysis.xlsx]SNF Summary
The table provided below identifies the skilled nursing facilities located in the service area. Based upon a review of each facility’s CY 2015 utilization statistics, excess skilled nursing facility capacity exists in the District’s service area.

©2017 Premier Inc.
50
Psychiatric ServicesAccording to the Health Assessment Resource Center, in CY 2013 nearly 90,000 Coachella Valley adults reported some sort of mental, emotional, or behavioral concern, and nearly 19,000 parents reported similar concerns for their children. Further, a recent study published by the Regional Access Project Foundation concluded that a significant shortage of mental health providers (e.g., facilities, professionals) and crisis centers existed throughout the Coachella Valley. The study specifically cited long wait times for outpatient services for adults, limited outpatient access for pediatric and adolescent patients, and a severe shortage of inpatient psychiatric services for adult, pediatric, and adolescent patients combined.
• Patients with mild symptoms often go untreated, and patients with severe conditions seek treatment in the service area’s three hospital emergency rooms. According to a 2016 article published by the Desert Sun, nearly 5,000 psychiatric patients were treated across the three emergency departments in CY 2013.
• Inpatient Access: Eisenhower Medical Center and Telecare Riverside County Psychiatric Health Facility are the only providers of inpatient psychiatric services in the District’s service area. In CY 2015, both facilities experienced a shortage of inpatient capacity. This trend is likely attributed to the growing demand and large regional draw for inpatient psychiatric services, with a large portion of each facility’s patients originating from outside of the District’s service area (e.g., in-migration).
• Eisenhower Medical Center operates the inpatient Center for Geropsychiatry, a voluntary inpatient program for seniors 65 years and older who are experiencing symptoms of depression, anxiety, bipolar disorder, psychotic disorder, or other behavioral problems.

©2017 Premier Inc.
51
Psychiatric Services (continued)• Telecare Riverside County Psychiatric Health Facility is the only crisis stabilization
unit in the service area. The facility, which is funded by the Riverside County Department of Mental Health, provides treatment to patients age 18 years and older who have been diagnosed with a serious mental illness.
• There are no inpatient providers of psychiatric services for pediatric and adolescent patients.
• Outpatient Access: Outpatient psychiatric services are fragmented, and are provided by a variety of providers, including hospitals, outpatient centers, and community clinics.
• Eisenhower Medical Center treats approximately 500 to 800 commercially insured patients per month on an outpatient basis through its mental health clinic for disorders related to depression and anxiety.
• San Gorgonio Memorial Hospital Behavioral Center, which recently relocated to Indio, provides outpatient mental health services to adults.
• Community-based clinics provide some outpatient mental health care services. However, in addition to overall access being limited, gaps in culturally-appropriate services exist for the following psychiatric patient cohorts:
• Pediatric and adolescents • Veterans• Lesbian, gay, bisexual, and transgenders• Geriatrics• Latinos

©2017 Premier Inc.
52
Service Area Inpatient Psychiatric Capacity, CY 2015
Desert Healthcare DistrictService Area Inpatient Psychiatric Capacity Analysis by Licensed Bed Type
CY 2015
Facility Name
Total Licensed
Beds
Total Patient Days
Average Daily
CensusOccupancy Percentage
Bed (Need)/Surplus
Eisenhower Medical Center 13 4,745 13.0 100.0% (3)Telecare Riverside County Psychiatric Health Facility 16 5,036 13.8 86.2% (1)
Total 29 9,781 26.8 92.4% (3)
Source: California Automated Licensing Information and Report Tracking System and Premier, Inc.Note: Statistics reflect total patient utilization, defined as those patients that originate from inside and outside of the service area.https://share.premierinc.com/sites/pcs/ICD/Folder/West_Coast_Advisory_Services/Clients/Desert_Healthcare_District/Needs_Assessment/Analysis/[Premier_Coachella
_Provider_Analysis.xlsx]Psych

©2017 Premier Inc.
53
Service Area Community Clinics Overview, CY 2015 Desert Healthcare District
Service Area Community Clinics OverviewCY 2015
Barbara Sinatra Childrens Center at
Eisenhower
Borrego Health Specialty Care
Center
Central City Community
Health Center, Inc.
Centro Medico, Cathedral City
Centro Medico, Coachella
Centro Medico, Oasis
Coachella Health Clinic
Desert AIDS Project
Desert Hot Springs
Community Health Center
Desert Hot Springs Health
& Wellness Center
License Category Psychology FQHC FQHC FQHC FQHC FQHC FQHC FQHC FQHC FQHCRural Health Clinic No No No No No No No No No No
Health Services Provided:Medical Dental Vision Mental Health Substance Abuse Domestic ViolenceBasic Lab Radiological ServicesUrgent Care Pharmacy Women's Health (OB/GYN, Family Planning, Midwives)
Total Patients Treated 480 Not Reported 1,069 55,208 4,232 3,965 3,680 2,261 7,804 2,906Total Patient Encounters 6,027 Not Reported 2,266 125,323 16,125 12,688 8,937 23,139 23,912 8,407Average Encounters per Patient 12.6 Not Reported 2.1 2.3 3.8 3.2 2.4 10.2 3.1 2.9Provider FTEs (1) Not Reported Not Reported 2.0 31.3 5.0 3.8 3.0 16.1 7.9 2.7Encounters per Provider FTE N/A Not Reported 1,133.0 4,002.7 3,225.0 3,330.2 2,989.0 1,434.5 3,038.4 3,113.7
Spanish as Primary Language (% of Patients) Not Reported Not Reported 70.0% 56.0% 73.0% 88.0% 39.0% 35.0% 29.0% 46.0%
Federal Poverty Level - Percent of Patients:Under 100% Not Reported Not Reported 76.6% 43.7% 64.2% 77.6% 34.9% 32.7% 0.0% 70.2%100-138% Not Reported Not Reported 0.5% 10.9% 17.9% 18.4% 2.9% 17.5% 64.5% 17.5%139-200% Not Reported Not Reported 0.0% 2.7% 2.0% 2.6% 1.1% 10.6% 16.0% 5.6%201-400% Not Reported Not Reported 15.2% 0.0% 0.0% 0.0% 0.2% 8.9% 5.9% 0.0%Above 400% Not Reported Not Reported 0.0% 0.0% 0.0% 0.0% 0.5% 3.4% 0.0% 0.0%Unknown Not Reported Not Reported 7.8% 42.6% 15.9% 1.4% 60.4% 26.8% 13.6% 6.7%
Source: US Department of Health & Human Services, California Automated Licensing Information and Report Tracking System, facility websites, and Premier, Inc.Note: Excludes Kaiser because scope of services are not reported, and these facilities are not available to the general public.(1) Reflects physicians, advanced practice clinicians, certified nurse midwives, dentists, registered dental hygienists, psychiatrists, clinical psychologists, licensed clinical social workers, chiropractors, physical therapists, optometrists, and any other professional who is able to be reimbursed through the Medi-Cal program.
https://share.premierinc.com/sites/pcs/ICD/Folder/West_Coast_Advisory_Services/Clients/Desert_Healthcare_District/Needs_Assessment/Analysis/[Premier_Coachella_Provider_Analysis.xlsx]Clinic Summary

©2017 Premier Inc.
54
Service Area Community Clinics Overview, CY 2015 (continued) Desert Healthcare District
Service Area Community Clinics OverviewCY 2015
Desert Oasis Women's Health
Center
Desert Services,
Outreach, and Shelter (Roy's
Resource Center)
Health to Hope Clinics,
Coachella Valley Rescue Mission
Indio Family Care Center
Mecca Health Clinic
(91275 66th Ave, Suite 300, Mecca,
CA 92254)
Mecca Health Clinic
(91275 66th Ave, Suite 500, Mecca,
CA 92254)
Palm Springs Family Care
Center
Planned Parenthood -
Coachella Valley
Planned Parenthood -
Rancho Mirage Center
Santa Rosa Del Valle
Stonewall Medical Center
License Category FQHC FQHC FQHC FQHC FQHC FQHC FQHC Other Other No FQHCRural Health Clinic No No No No No No No No No Yes No
Health Services Provided:Medical Dental VisionMental Health Substance Abuse Domestic ViolenceBasic Lab Radiological Services Urgent CarePharmacyWomen's Health (OB/GYN, Family Planning, Midwives)
Total Patients Treated 2,065 Not Reported Not Reported Not Reported 2,259 6,445 Not Reported 6,165 7,954 Not Reported Not ReportedTotal Patient Encounters 6,379 Not Reported Not Reported Not Reported 4,882 18,354 Not Reported 12,265 15,212 Not Reported Not ReportedAverage Encounters per Patient 3.1 Not Reported Not Reported Not Reported 2.2 2.8 Not Reported 2.0 1.9 Not Reported Not ReportedProvider FTEs (1) 3.5 Not Reported Not Reported Not Reported 1.1 4.6 Not Reported 2.0 2.5 Not Reported Not ReportedEncounters per Provider FTE 1,827.8 Not Reported Not Reported Not Reported 4,358.9 4,016.2 Not Reported 6,102.0 6,012.6 Not Reported Not Reported
Spanish as Primary Language (% of Patients) 39.0%
Not Reported Not Reported Not Reported39.0% 72.0%
Not Reported21.0% 5.0% Not Reported Not Reported
Federal Poverty Level - Percent of Patients:Under 100% 64.1% Not Reported Not Reported Not Reported 44.9% 65.0% Not Reported 64.8% 62.4% Not Reported Not Reported100-138% 19.6% Not Reported Not Reported Not Reported 3.4% 4.9% Not Reported 8.8% 13.3% Not Reported Not Reported139-200% 9.8% Not Reported Not Reported Not Reported 0.8% 1.4% Not Reported 4.1% 7.8% Not Reported Not Reported201-400% 0.0% Not Reported Not Reported Not Reported 0.4% 0.6% Not Reported 1.3% 4.0% Not Reported Not ReportedAbove 400% 0.0% Not Reported Not Reported Not Reported 0.2% 0.6% Not Reported 0.4% 1.1% Not Reported Not ReportedUnknown 6.5% Not Reported Not Reported Not Reported 50.4% 27.4% Not Reported 20.6% 11.5% Not Reported Not Reported
Source: US Department of Health & Human Services, California Automated Licensing Information and Report Tracking System, facility websites, and Premier, Inc.Note: Excludes Kaiser because scope of services are not reported, and these facilities are not available to the general public.(1) Reflects physicians, advanced practice clinicians, certified nurse midwives, dentists, registered dental hygienists, psychiatrists, clinical psychologists, licensed clinical social workers, chiropractors, physical therapists, optometrists, and any other professional who is able to be reimbursed through the Medi-Cal program.
https://share.premierinc.com/sites/pcs/ICD/Folder/West_Coast_Advisory_Services/Clients/Desert_Healthcare_District/Needs_Assessment/Analysis/[Premier_Coachella_Provider_Analysis.xlsx]Clinic Summary (2)

©2017 Premier Inc.
55
Service Area Ambulatory Surgery Centers Overview
Desert Healthcare DistrictOverview of Service Area Ambulatory Surgery Centers
CY 2015
Services Provided
Facility Car
diol
ogy
Den
tal
Der
mat
olog
y
Gas
troe
nter
olog
y
Gen
eral
Sur
gery
Gyn
ecol
ogy
Neu
rolo
gy
Oph
thal
mol
ogy
Ora
l Sur
gery
Ort
hope
dics
Oto
lary
ngol
ogy
Pain
M
anag
emen
t
Plas
tic S
urge
ry
Podi
atry
Rad
iatio
n O
ncol
ogy
Uro
logy
Vasc
ular
Sur
gery
Number of Operating
Rooms
Estimated Number of
Procedures, CY 2014
Average Procedures
per Operating
Room
Aaronson Plastic Surgery Center 2 N/A N/A Aurora Surgery Center 2 602 301Eisenhower Desert Orthopedic Center 2 N/A N/A El Mirador Surgical Center 6 12,432 2,072Eye Surgery Center of the Desert 3 N/A N/A
Indio Surgery Center, Inc.
(Peds) 3 N/A N/A La Quinta Surgery Center 1 N/A N/A Mirage Endoscopy Center, LP 2 7,050 3,525Rancho Mirage Surgery Center 3 1,756 585Sedona Surgery Center 3 N/A N/A Sternlieb Outpatient Surgery Center 2 N/A N/A The Morrow Institute Medical Group, Inc. 2 N/A N/A
Total Ambulatory Surgery Center Operating Rooms 31
Source: Definitive Healthcare, facility websitesNote: Excludes procedure rooms located in physician offices. https://share.premierinc.com/sites/pcs/ICD/Folder/West_Coast_Advisory_Services/Clients/Desert_Healthcare_District/Needs_Assessment/Analysis/[Premier_ASC_Overview.xlsx]ASC Summary

©2017 Premier Inc.
56
Service Area Imaging Centers OverviewDesert Healthcare District
Overview of Service Area Imaging CentersCY 2015
Imaging Services Provided
FacilityBone Density Scans (DXA) CT
Interventional Radiology Mammography MRI
Nuclear Medicine PET
Radiation Therapy Ultrasound X-Ray
Desert Medical Imaging - Indian Wells Desert Medical Imaging - Indio Desert Medical Imaging - Palm Springs Desert Regional Medical Center Imaging (El Mirador Imaging Center) Eisenhower Medical Center Imaging Health Scan Imaging - La Quinta Health Scan Imaging - Palm Desert Health Scan Imaging - Palm Springs John F. Kennedy Memorial Hospital Imaging Center RadNet - Desert Advanced Imaging - Bermuda Dunes RadNet - Desert Advanced Imaging - Breast Care Imaging Center of the Desert RadNet - Desert Advanced Imaging - El Cielo RadNet - Desert Advanced Imaging - Indio RadNet - Desert Advanced Imaging - Palm Desert RadNet - Desert Advanced Imaging - Palm Springs
RadNet - Desert Advanced Imaging - Vascular Center
(Vascular Ultrasound
Only)
RadNet - Desert Advanced Imaging Palm Desert X-Ray RadNet - Rancho Mirage Interventional Radiology and Advanced Imaging Center The PET Center Truly Open MRI-Palm Desert
Source: Definitive Healthcare, facility websiteshttps://share.premierinc.com/sites/pcs/ICD/Folder/West_Coast_Advisory_Services/Clients/Desert_Healthcare_District/Needs_Assessment/Analysis/[Premier_Imaging_Center_Analysis.xlsx]Summary

©2017 Premier Inc.
57
Service Area Home Health Agencies OverviewDesert Healthcare District
Overview of Service Area Home Health AgenciesCY 2015
Accepts
Home Health AgencyNumber of Patients
Number of Visits
Average Visits per Patient Medicare Medi-Cal
Addus HomeCare - Palm Desert Not Reported Not Reported N/A Yes YesCare Dimensions of the Desert 975 10,435 10.7 Yes YesDesert Home Health Services, Inc. 1,955 2,161 1.1 Yes NoDesert Oasis Healthcare 2,457 22,600 9.2 Yes NoGuardian Angel Home Care, Inc. 263 3,678 14.0 Yes YesHealthy Living at Home Palm Desert, LLC Not Reported Not Reported N/A Yes NoHome Health Angels 223 3,352 15.0 Yes NoLive Life Home Health, LLC 98 1,485 15.2 Yes NoMaxim Healthcare Services Palm Desert Not Reported Not Reported N/A No YesMaxim Healthcare Services Rancho Mirage 149 33,169 222.6 No YesMission Home Health of Rancho Mirage 1,788 26,833 15.0 Yes YesResCare HomeCare Greater Palm Springs Area Not Reported Not Reported N/A Yes YesSanrose Home Health Services, Inc. 51 695 13.6 Yes YesVNA California - Palm Desert 2,845 41,546 14.6 Yes Yes
Source: California Automated Licensing Information and Report Tracking System, Definitive Healthcare, facility websites, and Premier, Inc.https://share.premierinc.com/sites/pcs/ICD/Folder/West_Coast_Advisory_Services/Clients/Desert_Healthcare_District/Needs_Assessment/Analysis/[Premier_Coachella_Provider_Analysi
s.xlsx]Home Health

©2017 Premier Inc.
Historical and Projected Inpatient Utilization Trends

©2017 Premier Inc.
59
Assumptions: Use Rates by Service LineOverall inpatient use rates (discharges per 1,000 population) for the service area decreased between CY 2012 and 2015. This trend is expected to continue across most medical and surgical inpatient service lines for the duration of the projection period, and is attributed to the following:
• Continued rise of high-deductible insurance plans that constrain medical use• Impact of value-based care models (e.g., accountable care organizations, bundled
payments, patient-centered medical homes [e.g., Comprehensive Primary Care Plus (“CPC+”)], risk-based payment contracts, and performance-based physician incentives) that seek to achieve enhanced coordination of care, better quality outcomes, and reduced costs across care settings
• Patients treated under these models typically have lower lengths of stay and less readmissions
• Providers are seeking to reduce preventable hospitalizations for acute and chronic conditions, and preventable readmissions by ensuring patients receive home-based disease management programs and outpatient care, instead of accessing hospital care
• Shift in volumes from inpatient to observation status through the two-midnight census rule implemented by the Centers for Medicare & Medicaid Services (“CMS”) in October, 2013, and the continued shift in inpatient volume to outpatient care settings for ambulatory case-sensitive admissions (e.g., uncontrolled diabetes, hypertension, dehydration)
• Providers are aggressively increasing intensive medical management for chronic conditions on an outpatient basis

©2017 Premier Inc.
60
Assumptions: Use Rates by Service Line (continued)Between CY 2007 and 2015, the number of births in the United States for women ages 15-44 years decreased by 7.9 percent. According to the Centers for Disease Control and Prevention, national fertility rates experienced a sharp decline across all ethnic cohorts during this time period, specifically: white fertility rates decreased by 8 percent, black fertility rates decreased by 6 percent, and Hispanic fertility rates decreased by 13 percent. Additionally, the teen childbirth rate also decreased by 46 percent during this same time period. Similarly, birth rates in the service area have decreased over the time period, CY 2012 through 2015. This trend will likely continue due to:
• Changing social behaviors and lifestyle choices, including delaying marriage and parenthood to accommodate advanced schooling and careers
• Increased access to contraception• Recovery from the recent economic downturn • Leveling off of the number of Mexican immigrants and their share of the total United
States population. According to the National Center for Health Statistics, annual births to foreign-born women account for the largest driver of birth-related volume since 1970, with immigrants from Mexico representing the largest national-origin group in the United States. However, the number of Mexican immigrants and their proportion of the total United States immigrant population has decreased since the economic downturn in 2008, thereby resulting in a decrease in the number of reported births.

©2017 Premier Inc.
61
Assumptions: Use Rates by Service Line (continued)While the total number of new cancer cases is expected to increase from 1.5 million per year in CY 2010 to 1.9 million per year in CY 2020 throughout the United States, the incidence rate for new diagnoses is expected to remain relatively flat, and the increase in new cases is attributed to an aging population.(1) Use rates for oncology and hematology services are expected to increase slightly over the projection period because:
• Cancer patients are living longer and will experience an increased use of healthcare services
• The service area has higher mortality rates for cancer when compared to the State overall, thereby implying increased demand for these services
(1) Centers for Disease Control and Prevention

©2017 Premier Inc.
62
Total Service Area Inpatient Discharges by Service LineAlthough use rates are projected to decrease for almost all inpatient medical and surgical service lines, total volume in the service area is expected to increase due to population growth and aging of the population.
Desert Healthcare DistrictService Area Inpatient Discharges by Service Line
CY 2012 - 2026
Service Lines 2012 2013 2014 2015 2016 2021 2026
Cardiology - Diagnostic 1,612 1,434 1,341 1,341 1,344 1,375 1,439Cardiology - Medical 3,942 3,571 3,371 3,342 3,349 3,426 3,586Cardiology - Surgery 411 369 411 444 445 455 476Chemical Dependency 142 165 194 221 224 238 253Endocrine 1,191 1,040 1,055 1,115 1,127 1,192 1,261ENT 328 294 304 309 312 330 350Gastroenterology 3,709 3,479 3,432 3,600 3,626 3,756 3,896General Medicine 3,497 3,384 3,635 4,152 4,161 4,256 4,455General Surgery 3,606 3,606 3,680 3,467 3,474 3,554 3,720Gynecology 744 674 598 632 638 666 695Neonatal Intensive Care 1,660 1,506 1,573 1,609 1,613 1,635 1,672Neurology 2,389 2,199 2,229 2,183 2,199 2,278 2,363Neurosurgery 462 451 382 307 308 315 329Obstetrics & Deliveries 6,058 5,721 5,770 5,736 5,748 5,878 6,143Oncology 1,542 1,495 1,465 1,488 1,506 1,602 1,705Ophthalmology 78 68 65 51 52 55 58Orthopedics 3,819 3,859 4,038 4,074 4,103 4,250 4,409Others NC 0 0 48 0 0 0 0Plastic Surgery 271 282 243 268 269 275 288Psychiatry 149 124 141 168 170 181 192Pulmonary Medicine 3,311 3,518 3,233 3,187 3,210 3,333 3,517Rehabilitation 2 2 2 1 1 1 1Spine Surgery 544 548 619 735 737 762 807Thoracic & Vascular Su 810 820 807 683 684 700 733Transplant 33 33 39 27 27 29 31Urology 1,890 1,954 2,040 2,208 2,218 2,298 2,425
TOTAL 42,200 40,596 40,715 41,348 41,543 42,838 44,803
Source: OSHPD Inpatient Database and Premier, Inc.
Historical Inpatient Discharges Projected Inpatient Discharges
https://share.premierinc.com/sites/pcs/ICD/Folder/West_Coast_Advisory_Services/Clients/Desert_Healthcare_District/Needs_Assessment/Analysis/[Inpatient_Model.xlsx]Service Area Volume

©2017 Premier Inc.
63
DRMC: Projected Inpatient Market Share by Service LineIn order to evaluate DRMC’s capacity while considering community need for inpatient healthcare services, Premier assumed that the Hospital would experience a three percentage point increase in overall market share by CY 2021. DRMC’s market share levels were projected to remain flat each year thereafter.
Desert Regional Medical CenterInpatient Discharge Market Share by Service Line
CY 2012 - 2026
Projected Inpatient Market ShareService Lines 2012 2013 2014 2015 2016 2021 2026
Cardiology - Diagnostic/Interventional 33.4% 34.2% 36.5% 37.4% 38.4% 40.4% 40.4%Cardiology - Medical 29.0% 31.9% 31.7% 32.4% 33.4% 35.4% 35.4%Cardiology - Surgery 24.8% 26.0% 24.3% 24.5% 25.5% 27.5% 27.5%Chemical Dependency 30.3% 41.2% 23.2% 32.6% 33.6% 35.6% 35.6%Endocrine 23.4% 25.9% 29.8% 29.9% 30.9% 32.9% 32.9%ENT 17.4% 16.3% 18.4% 23.0% 24.0% 26.0% 26.0%Gastroenterology 27.4% 28.0% 31.3% 31.8% 32.8% 34.8% 34.8%General Medicine 28.0% 25.3% 28.5% 26.9% 27.9% 29.9% 29.9%General Surgery 27.0% 24.7% 26.1% 26.8% 27.8% 29.8% 29.8%Gynecology 48.3% 42.1% 44.3% 41.1% 42.1% 44.1% 44.1%Neonatal Intensive Care 58.6% 60.2% 63.3% 66.7% 67.7% 69.7% 69.7%Neurology 32.1% 33.9% 33.8% 32.9% 33.9% 35.9% 35.9%Neurosurgery 26.0% 23.9% 28.5% 32.6% 33.6% 35.6% 35.6%Obstetrics & Deliveries 52.6% 52.7% 54.0% 53.1% 54.1% 56.1% 56.1%Oncology 19.3% 16.9% 22.3% 24.3% 25.3% 27.3% 27.3%Ophthalmology 28.2% 23.5% 32.3% 35.3% 36.3% 38.3% 38.3%Orthopedics 24.5% 25.8% 25.3% 24.3% 25.3% 27.3% 27.3%Others NC 0.0% 0.0% 0.0% 0.0% 0.0% 0.0% 0.0%Plastic Surgery 24.4% 19.1% 17.7% 17.2% 18.2% 20.2% 20.2%Psychiatry 28.9% 27.4% 23.4% 31.0% 32.0% 34.0% 34.0%Pulmonary Medicine 28.1% 28.5% 29.6% 29.0% 30.0% 32.0% 32.0%Rehabilitation 0.0% 50.0% 0.0% 100.0% 100.0% 100.0% 100.0%Spine Surgery 8.3% 9.5% 12.4% 13.6% 14.6% 16.6% 16.6%Thoracic & Vascular Surgery 25.8% 32.3% 32.3% 29.7% 30.7% 32.7% 32.7%Transplant 0.0% 0.0% 0.0% 0.0% 0.0% 0.0% 0.0%Urology 23.2% 24.2% 25.4% 24.5% 25.5% 27.5% 27.5%
Total 32.1% 32.1% 33.5% 33.4% 34.3% 36.3% 36.2%
Source: OSHPD Inpatient Database and Premier, Inc.
https://share.premierinc.com/sites/pcs/ICD/Folder/West_Coast_Advisory_Services/Clients/Desert_Healthcare_Distric t/Needs_Assessment/Analysis/[Inpatient_Model.xlsx]Market Share Adjustments
Historical Inpatient Market Share

©2017 Premier Inc.
64
DRMC: Projected Hospital Discharges Originating from the Service AreaThe table provided to the right illustrates total projected discharges originating from the service area for DRMC. This projected utilization excludes in-migration (patients receiving care at DRMC who originate from outside of the service area).
Desert Regional Medical CenterService Area Inpatient Discharges by Service Line
CY 2012 - 2026
Projected Inpatient DischargesService Lines 2012 2013 2014 2015 2016 2021 2026
Cardiology - Diagnostic/Interventional 539 491 490 502 516 556 582Cardiology - Medical 1,144 1,140 1,069 1,084 1,120 1,214 1,271Cardiology - Surgery 102 96 100 109 114 125 131Chemical Dependency 43 68 45 72 75 85 90Endocrine 279 269 314 333 348 392 414ENT 57 48 56 71 75 86 91Gastroenterology 1,017 975 1,075 1,145 1,189 1,307 1,356General Medicine 979 856 1,036 1,118 1,162 1,274 1,333General Surgery 975 889 962 930 967 1,060 1,109Gynecology 359 284 265 260 269 294 307Neonatal Intensive Care 973 906 995 1,073 1,092 1,139 1,165Neurology 767 745 753 719 746 818 849Neurosurgery 120 108 109 100 103 112 117Obstetrics & Deliveries 3,188 3,017 3,115 3,044 3,108 3,296 3,444Oncology 297 253 326 361 381 437 465Ophthalmology 22 16 21 18 19 21 22Orthopedics 934 996 1,022 989 1,037 1,159 1,203Others NC 0 0 0 0 0 0 0Plastic Surgery 66 54 43 46 49 55 58Psychiatry 43 34 33 52 54 61 65Pulmonary Medicine 931 1,002 957 923 962 1,065 1,124Rehabilitation 0 1 0 1 1 1 1Spine Surgery 45 52 77 100 108 127 134Thoracic & Vascular Surgery 209 265 261 203 210 229 240Transplant 0 0 0 0 0 0 0Urology 438 472 519 540 565 631 666
TOTAL 13,527 13,037 13,643 13,793 14,268 15,544 16,238
Source: OSHPD Inpatient Database and Premier, Inc.
https://share.premierinc.com/sites/pcs/ICD/Folder/West_Coast_Advisory_Services/Clients/Desert_Healthcare_District/Needs_Assessment/Analysis/[Inpatient_Model.xlsx]DRMC Volume
Historical Inpatient Discharges

©2017 Premier Inc.
65
Average Length of StayPremier projected a small decrease in the service area’s average length of stay (“ALOS”) for most inpatient service lines to reflect the pending impact of value-based care models and risk-based contracts.
Desert Healthcare DistrictService Area Inpatient Average Length of Stay by Service Line
CY 2012 - 2026
Projected Inpatient ALOSService Lines 2012 2013 2014 2015 2016 2021 2026
Cardiology - Diagnostic/Interventional 2.9 3.2 3.1 3.2 3.2 2.9 2.9Cardiology - Medical 2.5 2.6 2.7 2.9 2.8 2.7 2.7Cardiology - Surgery 7.7 7.8 7.5 7.6 7.5 7.3 7.3Chemical Dependency 3.4 3.2 3.7 3.7 3.7 3.7 3.7Endocrine 3.4 3.3 3.2 3.1 3.0 2.8 2.8ENT 3.3 3.1 3.1 3.2 3.1 2.9 2.9Gastroenterology 3.5 3.5 3.5 3.4 3.4 3.1 3.1General Medicine 5.2 5.2 5.4 5.2 5.1 4.9 4.9General Surgery 6.3 6.0 6.3 6.1 6.1 5.7 5.7Gynecology 2.5 2.6 2.7 2.9 2.9 2.6 2.6Neonatal Intensive Care 6.5 6.8 6.6 5.6 5.6 5.6 5.6Neurology 3.5 3.4 3.6 3.4 3.4 3.2 3.2Neurosurgery 5.3 6.1 6.8 8.1 8.1 6.4 6.4Obstetrics & Deliveries 2.1 2.2 2.2 2.1 2.1 2.1 2.1Oncology 6.1 6.0 5.7 5.1 5.1 5.1 5.1Ophthalmology 2.5 3.6 4.4 4.1 4.0 3.6 3.6Orthopedics 3.6 3.6 3.6 3.5 3.4 3.0 3.0Others NC 0.0 0.0 3.4 0.0 0.0 0.0 0.0Plastic Surgery 5.1 5.8 5.9 6.3 6.3 5.3 5.3Psychiatry 3.1 4.7 5.0 4.4 4.4 4.4 4.4Pulmonary Medicine 4.6 4.4 4.4 4.9 4.9 4.9 4.9Rehabilitation 17.0 19.0 8.0 3.0 3.0 3.0 3.0Spine Surgery 4.0 4.1 4.2 3.9 3.8 3.5 3.5Thoracic & Vascular Surgery 5.6 5.8 5.2 5.5 5.5 5.1 5.1Transplant 18.5 16.6 18.8 14.0 14.0 14.0 14.0Urology 3.7 3.8 3.8 3.7 3.6 3.2 3.2
Source: OSHPD Inpatient Database and Premier, Inc.https://share.premierinc.com/sites/pcs/ICD/Folder/West_Coast_Advisory_Services/Clients/Desert_Healthcare_District/Needs_Assessment/Analysis/[Inpatient_Model.xlsx]ALOS
Historical Inpatient Average Length of Stay

©2017 Premier Inc.
66
Percent of Inpatient Days Allocated by Bed Type Desert Healthcare District
Service Area Inpatient Discharges and Patient Days by Service Line - Cross Walk by Bed TypeCY 2015
Service LinesMed/Surg
(Acute)
Critical Care (ICU and CCU) Pediatrics
OB (Perinatal) NICU Rehab Psych TOTAL
Cardiology - Diagnostic/Interventional 74.8% 25.0% 0.2% 0.0% 0.0% 0.0% 0.0% 100.0%Cardiology - Medical 74.4% 25.0% 0.6% 0.0% 0.0% 0.0% 0.0% 100.0%Cardiology - Surgery 74.5% 25.0% 0.5% 0.0% 0.0% 0.0% 0.0% 100.0%Chemical Dependency 75.0% 25.0% 0.0% 0.0% 0.0% 0.0% 0.0% 100.0%Endocrine 71.8% 25.0% 3.2% 0.0% 0.0% 0.0% 0.0% 100.0%ENT 87.2% 10.0% 2.8% 0.0% 0.0% 0.0% 0.0% 100.0%Gastroenterology 85.1% 10.0% 4.9% 0.0% 0.0% 0.0% 0.0% 100.0%General Medicine 84.3% 10.0% 5.7% 0.0% 0.0% 0.0% 0.0% 100.0%General Surgery 68.1% 25.0% 6.9% 0.0% 0.0% 0.0% 0.0% 100.0%Gynecology 89.7% 10.0% 0.3% 0.0% 0.0% 0.0% 0.0% 100.0%Neonatal Intensive Care 0.0% 0.0% 25.0% 0.0% 75.0% 0.0% 0.0% 100.0%Neurology 81.0% 15.0% 4.0% 0.0% 0.0% 0.0% 0.0% 100.0%Neurosurgery 74.5% 25.0% 0.5% 0.0% 0.0% 0.0% 0.0% 100.0%Obstetrics & Deliveries 0.0% 0.0% 0.0% 100.0% 0.0% 0.0% 0.0% 100.0%Oncology 87.3% 10.0% 2.7% 0.0% 0.0% 0.0% 0.0% 100.0%Ophthalmology 97.2% 2.5% 0.3% 0.0% 0.0% 0.0% 0.0% 100.0%Orthopedics 86.9% 10.0% 3.1% 0.0% 0.0% 0.0% 0.0% 100.0%Others NC 75.0% 25.0% 0.0% 0.0% 0.0% 0.0% 0.0% 100.0%Plastic Surgery 89.7% 10.0% 0.3% 0.0% 0.0% 0.0% 0.0% 100.0%Psychiatry 0.0% 0.0% 0.0% 0.0% 0.0% 0.0% 100.0% 100.0%Pulmonary Medicine 57.0% 25.0% 18.0% 0.0% 0.0% 0.0% 0.0% 100.0%Rehabilitation 0.0% 0.0% 0.0% 0.0% 0.0% 100.0% 0.0% 100.0%Spine Surgery 89.6% 10.0% 0.4% 0.0% 0.0% 0.0% 0.0% 100.0%Thoracic & Vascular Surgery 74.6% 25.0% 0.4% 0.0% 0.0% 0.0% 0.0% 100.0%Transplant 74.9% 25.0% 0.1% 0.0% 0.0% 0.0% 0.0% 100.0%Urology 95.2% 2.5% 2.3% 0.0% 0.0% 0.0% 0.0% 100.0%
Source: Premier, Inc.https://share.premierinc.com/sites/pcs/ICD/Folder/West_Coast_Advisory_Services/Clients/Desert_Healthcare_District/Needs_Assessment/Analysis/[Inpatient_Model.xlsx]Days to Bed Type Cross
Walk
In order to project utilization by licensed bed type, Premier allocated patient days by bed type for each inpatient service line.
• Note: Actual patient days by bed type by inpatient service line were not available for the market or DRMC. In the absence of this data, Premier assigned these allocations based upon our experience and understanding of the marketplace.

©2017 Premier Inc.
67
Occupancy Rates by Bed Type
Bed Type Occupancy RateMedical/Surgical 85%
Critical Care (Intensive Care, Coronary Care) 75%
Obstetrics (Perinatal) 75%
Neonatal Intensive Care 75%
Pediatrics 75%
Psychiatric 75%
Rehabilitation 75%

©2017 Premier Inc.
68
Projected Service Area Bed NeedDesert Healthcare District
Service Area Projected Bed NeedCY 2012 - 2026
Projected2012 2013 2014 2015 2016 2021 2026
Medical SurgicalService Area:
Total Licensed Beds in Service Area 696 696 696 696 696 696 696Bed Need at Optimal Occupancy (Rounded Up) 361 353 359 363 360 349 366Total Service Area Bed (Need)/Surplus 335 343 337 333 336 347 330
DRMC:Total Licensed Beds at DRMC 238 238 238 238 238 238 238Bed Need at Optimal Occupancy (Rounded Up) 96 93 100 101 104 108 113Total Bed (Need)/Surplus at DRMC 142 145 138 137 134 130 125
Critical CareService Area:
Total Licensed Beds in Service Area 117 117 117 117 117 117 117Bed Need at Optimal Occupancy (Rounded Up) 90 87 87 88 87 85 89Total Service Area Bed (Need)/Surplus 27 30 30 29 30 32 28
DRMC:Total Licensed Beds at DRMC 31 31 31 31 31 31 31Bed Need at Optimal Occupancy (Rounded Up) 25 24 25 25 26 27 28Total Bed (Need)/Surplus at DRMC 6 7 6 6 5 4 3
PediatricsService Area:
Total Licensed Beds in Service Area 42 42 42 42 42 42 42Bed Need at Optimal Occupancy (Rounded Up) 37 36 37 36 36 36 38Total Service Area Bed (Need)/Surplus 5 6 5 6 6 6 4
DRMC:Total Licensed Beds at DRMC 14 14 14 14 14 14 14Bed Need at Optimal Occupancy (Rounded Up) 14 13 14 14 14 15 15Total Bed (Need)/Surplus at DRMC 0 1 0 0 0 (1) (1)
Obstetrics (Perinatal)Service Area:
Total Licensed Beds in Service Area 54 54 54 54 54 54 54Bed Need at Optimal Occupancy (Rounded Up) 48 46 46 45 45 46 48Total Service Area Bed (Need)/Surplus 6 8 8 9 9 8 6
DRMC:Total Licensed Beds at DRMC 28 28 28 28 28 28 28Bed Need at Optimal Occupancy (Rounded Up) 25 24 25 24 25 26 27Total Bed (Need)/Surplus at DRMC 3 4 3 4 3 2 1
Source: OSHPD Inpatient Database and Premier, Inc.Note: Projected bed need is based on volume that originates from the service area only, and does not consider in-migration.
https://share.premierinc.com/sites/pcs/ICD/Folder/West_Coast_Advisory_Services/Clients/Desert_Healthcare_District/Needs_Assessment/Analysis/[Inpatient_Model.xlsx]Total Bed Need Summary
Historical

©2017 Premier Inc.
69
Projected Service Area Bed Need (continued)Desert Healthcare District
Service Area Projected Bed NeedCY 2012 - 2026
Projected2012 2013 2014 2015 2016 2021 2026
Neonatal Intensive CareService Area:
Total Licensed Beds in Service Area 41 41 41 41 41 41 41Bed Need at Optimal Occupancy (Rounded Up) 30 29 29 25 25 26 26Total Service Area Bed (Need)/Surplus 11 12 12 16 16 15 15
DRMC:Total Licensed Beds at DRMC 30 30 30 30 30 30 30Bed Need at Optimal Occupancy (Rounded Up) 18 17 19 17 17 18 18Total Bed (Need)/Surplus at DRMC 12 13 11 13 13 12 12
RehabilitationService Area:
Total Licensed Beds in Service Area 35 35 35 35 35 35 35Bed Need at Optimal Occupancy (Rounded Up) 1 1 1 1 1 1 1Total Service Area Bed (Need)/Surplus 34 34 34 34 34 34 34
DRMC:Total Licensed Beds at DRMC 12 12 12 12 12 12 12Bed Need at Optimal Occupancy (Rounded Up) 0 1 0 1 1 1 1Total Bed (Need)/Surplus at DRMC 12 11 12 11 11 11 11
PsychiatricService Area:
Total Licensed Beds in Service Area 29 29 29 29 29 29 29Bed Need at Optimal Occupancy (Rounded Up) 2 3 3 3 3 3 4Total Service Area Bed (Need)/Surplus 27 26 26 26 26 26 25
DRMC:Total Licensed Beds at DRMC 0 0 0 0 0 0 0Bed Need at Optimal Occupancy (Rounded Up) 1 1 1 1 1 1 2Total Bed (Need)/Surplus at DRMC (1) (1) (1) (1) (1) (1) (2)
Source: OSHPD Inpatient Database and Premier, Inc.Note: Projected bed need is based on volume that originates from the service area only, and does not consider in-migration.
https://share.premierinc.com/sites/pcs/ICD/Folder/West_Coast_Advisory_Services/Clients/Desert_Healthcare_District/Needs_Assessment/Analysis/[Inpatient_Model.xlsx]Total Bed Need Summary (2)
Historical

©2017 Premier Inc.
70
Summary of Projected Service Area Bed (Need)/SurplusDesert Healthcare District
Service Area Projected Bed Need Summary by Licensed Bed TypeCY 2016 - 2026
Service Line 2016 2021 2026
Service AreaMedical Surgical 336 347 330Critical Care 30 32 28Pediatrics 6 6 4Obstetrics (Perinatal) 9 8 6Neonatal Intensive Care 16 15 15Rehabilitation 34 34 34Psychiatric 26 26 25
Total Bed (Need)/Surplus in the Service Area 457 468 442
Desert Regional Medical CenterMedical Surgical 134 130 125Critical Care 5 4 3Pediatrics 0 (1) (1)Obstetrics (Perinatal) 3 2 1Neonatal Intensive Care 13 12 12Rehabilitation 11 11 11Psychiatric (1) (1) (2)
Total Bed (Need)/Surplus at Desert Regional Medical Center 165 157 149
Desert_Healthcare_Distric t/Needs_Assessment/Analysis/[Inpatient_Model.xlsx]Overview
Source: OSHPD Inpatient Database and Premier, Inc.
Projected Bed (Need)/Surplus
Note: Projected bed need is based on volume that originates from the service area only, and does not consider in-migration.

©2017 Premier Inc.
Emergency Department Utilization Trends

©2017 Premier Inc.
72
Historical Service Area Emergency Department Utilization and Market Share Trends, CY 2013 ‐ 2015
Total ED visits increased by almost 16 percent between CY 2013 and 2015. Given the successful implementation of the Medi-Cal expansion program and the roll-out of the Covered California Healthcare Exchange, demand for ED services in the service area will continue as patients continue to use this modality as a form of primary care, and population growth will result in increased demand for instant access to care.
• It should be noted that while the impact of healthcare reform and the expansion of coverage through Covered California resulted in increased access to providers who are willing to treat patients who were previously uninsured, there is a shortage of primary care providers and limited access to such services within the District’s service area (evidenced by the HPSA and MUA analyses). Combined with the fact that residents in the District’s service area have worse health status outcomes when compared to the State overall, it is likely that patients in this community will continue to utilize the ED as their primary source for healthcare services, particularly for conditions that could have been treated in a clinic or primary care physician office.
The table provided on the following page illustrates the service area’s total ED visits for the three-year time period, CY 2013 through 2015, and each facility’s market share thereof.

©2017 Premier Inc.
73
Historical Service Area Emergency Department Utilization and Market Share Trends, CY 2013 – 2015 (continued)
Desert Healthcare DistrictService Area Emergency Department Utilization and Market Share Trends
CY 2013 - 2015
Total Emergency Department Visits Emergency Department Visits Market Share
Facility 2013 2014 2015
Percent Change, CY 2013 - 2015 2013 2014 2015
Change, CY 2013 -
2015
Desert Regional Medical Center 62,916 67,971 71,937 14.3% 37.9% 37.8% 37.4% -0.5%Eisenhower Medical Center 66,964 73,259 78,070 16.6% 40.4% 40.8% 40.6% 0.3%John F. Kennedy Memorial Hospital 36,018 38,427 42,085 16.8% 21.7% 21.4% 21.9% 0.2%
Total 165,898 179,657 192,092 15.8% 100.0% 100.0% 100.0%
Use Rate (Visits per 1,000 Population) 292.4 312.8 330.5 13.0%
Source: California Automated Licensing Information and Report Tracking Systemhttps://share.premierinc.com/sites/pcs/ICD/Folder/West_Coast_Advisory_Services/Clients/Desert_Healthcare_District/Needs_Assessment/Analysis/[Premier_Emergency_Department_Analysis.xlsx]Utilizati
on Trends

©2017 Premier Inc.
74
Historical Service Area Emergency Department Capacity Analysis, CY 2013 ‐ 2015
Within the service area, there is an overall shortage of ED capacity (e.g., stations), with capacity constraints existing at both DRMC and John F. Kennedy Memorial Hospital.
Desert Healthcare DistrictService Area Emergency Department Capacity Analysis
CY 2013 - 2015
Calendar Year2013 2014 2015
Total ED VisitsDesert Regional Medical Center 62,916 67,971 71,937Eisenhower Medical Center 66,964 73,259 78,070John F. Kennedy Memorial Hospital 36,018 38,427 42,085
Total Emergency Department Visits 165,898 179,657 192,092
Service Area ED Capacity Analysis:Total ED Stations in Service Area 81 83 83
ED Station Need @ 2,000 Visits per Station 83 90 97Service Area ED Station (Need)/Surplus (2) (7) (14)
ED Station Capacity and Need by Facility:Desert Regional Medical Center - Total Existing Stations (1) 28 28 28
ED Station Need @ 2,000 Visits per Station 32 34 36Desert Regional Medical Center ED Station (Need)/Surplus (4) (6) (8)
Eisenhower Medical Center - Total Existing Stations 41 43 43ED Station Need @ 2,000 Visits per Station 34 37 40
Eisenhower Medical Center ED Station (Need)/Surplus 7 6 3
John F. Kennedy Memorial Hospital - Total Existing Stations 12 12 12ED Station Need @ 2,000 Visits per Station 19 20 22
John F. Kennedy Memorial Hospital ED Station (Need)/Surplus (7) (8) (10)
Source: California Automated Licensing Information and Report Tracking System and Premier, Inc.Note: Numbers may not foot due to rounding.(1) Excludes planned expansion of Desert Regional Medical Center Emergency Department, resulting in 8 incremental emergency department stations in the future.https://share.premierinc.com/sites/pcs/ICD/Folder/West_Coast_Advisory_Services/Clients/Desert_Healthcare_District/Needs_Assessment/Analysis/[
Premier_Emergency_Department_Analysis.xlsx]Capacity Analysis

©2017 Premier Inc.
75
Factor AssumptionUse Rate (ED Visits per 1,000 population)
• Historical utilization for ED services (e.g. visits) for the service area was identified using the OSHPD ALIRTS database
• To project ED visits for CY 2016 and beyond, the CY 2015 use rate was held constant for the duration of the projection period. This is based upon the following assumptions:• Recent increases in ED utilization resulting from expanded access to
healthcare services through healthcare reform have stabilized• No major changes to the local healthcare delivery system (e.g.,
significant expansion of primary care and/or urgent care centers that would redirect use of the ED) are anticipated
• Care management models (e.g., care coordination, patient navigation, and education) that temper ED utilization are not widely deployed throughout the community
• It should be noted that in the future, providers will be incentivized to reduce unnecessary utilization of the ED. Thus, should one or of these models be deployed in the service area on a large enough scale, the community would likely experience a decrease in its ED use rate
Projected Emergency Department Utilization and Resource Needs: Assumptions

©2017 Premier Inc.
76
Factor AssumptionService Area Population Growth Rate
• 1.2 percent per year
Growth in Service Area ED Visits
• Total ED visits in the service area are projected to increase at the rate of population growth (1.2 percent annually)
Market Share • Market share for DRMC is projected to increase by three percentage points for the three‐year time period, CY 2016 – 2018, and will remain flat for each year thereafter
ED Visits per Station • 2,000 visits per station per year
Projected Emergency Department Utilization and Resource Needs: Assumptions (continued)

©2017 Premier Inc.
77
Projected Emergency Department Utilization and Resource Needs
Desert Healthcare DistrictService Area Projected Emergency Department Utilization and Station Need
CY 2013 - 2026
Historical Projected2013 2014 2015 2016 2021 2026
Service Area UtilizationTotal ED Visits 165,898 179,657 192,092 194,431 206,526 219,678
Visits per 1,000 Population 292.4 312.8 330.5 330.5 330.5 330.5
Total ED Stations in the Service Area (All Hospitals) 81 83 83 83 83 83ED Station Need @ 2,000 Visits per Station 83 90 97 98 104 110Service Area ED Station (Need)/Surplus (2) (7) (14) (15) (21) (27)
Desert Regional Medical CenterTotal ED Visits 62,916 67,971 71,937 74,757 83,538 88,858
Percent Market Share 37.9% 37.8% 37.4% 38.4% 40.4% 40.4%
Total Existing ED Stations (1) 28 28 28 28 28 28ED Station Need @ 2,000 Visits per Station 32 34 36 38 42 45DRMC ED Station (Need)/Surplus (4) (6) (8) (10) (14) (17)
Source: California Automated Licensing Information and Report Tracking System and Premier, Inc.(1) Excludes planned expansion of Desert Regional Medical Center Emergency Department, resulting in 8 incremental emergency department stations in the future.https://share.premierinc.com/sites/pcs/ICD/Folder/West_Coast_Advisory_Services/Clients/Desert_Healthcare_District/Needs_Assessment/Analysis/[Premier_Emergency_De
partment_Analysis.xlsx]ED Projections

©2017 Premier Inc.
Desert Regional Medical CenterSeismic Compliance Summary

©2017 Premier Inc.
79
Seismic Compliance SummaryIn the most recent available “Seismic Evaluation Report and Hazus Supplemental Evaluation Report” for Building 1 (Main Hospital and Additions) last revised in January, 2010, three items requiring additional field observation and five items reported as a deficiency were noted in the main hospital and its additions:
• Items requiring additional field observation:• Structural separations• Partition bracing• Parapets, cornices, ornamentation, and appendages
• Items reported as a deficiency:• Adjacent buildings• Pre-Northridge Earthquake Welded Moment Frame Joints• Brace connection strength• Plan irregularities• Steel columns

©2017 Premier Inc.
80
Seismic Compliance Summary (continued)According to the SB 1953 Seismic Evaluation Compliance Plan, revised in 2006:
• Buildings 1, 2, and 4 were also determined to need retrofitting before the 2013 deadline. Evidence of completion has been submitted to Premier for Building 1 only (Main Hospital and Additions)
• The structural retrofit strategy for Building 2 (East Tower) involves the removal of the existing exterior curtain wall system and replacing it with a system that can accommodate the expected lateral displacements of the building
• Buildings 1, 2, and 4 are scheduled for demolition and replacement by 2030 to meet Seismic Performance Category (“SPC”)-5 guidelines. All other buildings will receive nonstructural upgrades
• The seismic status by 2013 should be: • Building 1: Main Hospital and Additions; SPC-2• Building 2: East Tower; SPC-2• Building 3: Women and Infants Hospital; SPC-3• Building 4: North Wing; SPC-2 • Building 5: Central Plant; SPC-4 • Building 6: Shipping and Receiving; SPC-4

©2017 Premier Inc.
81
Seismic Compliance Summary (continued)• The seismic status by 2013 should be (continued):
• Building 7: Surgery Wing; SPC-4• Building 8: West Tower; SPC-3• Building 9: Lobby; SPC-3• Building 10: Admitting; SPC-4• Building 11: Elevator Tower; SPC-4• Building 12: Dinah Shore Waiting Area; SPC-3
In the most recent available “Seismic Evaluation Report and Hazus Supplemental Evaluation Report” for Building 4 (North Wing) last revised in May, 2008, the structure failed to achieve qualification for SPC-2 licensing. As of the date of this report, documentation was not provided to Premier to indicate if the building met the 2013 deadline of reaching this license.
In the most recent available “Seismic Evaluation Report and Hazus Supplemental Evaluation Report” for Building 2 (East Tower) last revised in June, 2008, the structure failed to achieve qualification for SPC-2 licensing. As of the date of this report, documentation was not provided to Premier to indicate if the building met the 2013 deadline of reaching this license.
A detailed summary of the areas that must be addressed to meet SPC criteria for Buildings 1, 2, and 4 are provided on the following pages. As of the date of this report, documentation for the remaining buildings summarizing the detail required to meet SPC criteria was not provided to Premier.

©2017 Premier Inc.
82
Summary of Seismic Evaluation Criteria That Did Not Pass Inspection:
Area That Did Not Pass Inspection Criteria/Requirement
Adjacent Buildings There is no immediately adjacent structure that is less than half as tall or has floors/levels that do not match those of the building being evaluated. A neighboring structure is considered to be “immediately adjacent” if it is within two inches times the number of stories away from the building being evaluated
Pre‐Northridge Earthquake Welded Moment Frame Joints
Welded steel moment frame beam‐column joints are designed and constructed in accordance with recommendations in FEMA 267, Interim Guidelines: Evaluation, Repair, modification, and Design of Welded Steel moment Frame structures, August 1995
Connection Strength All the brace connections are able to develop the yield capacity of the diagonals
Plan Irregularities There is significant tensile capacity at re‐entrant corners or other locations of plan irregularities
Steel Columns The columns in the lateral force resisting frames are substantially anchored to the building foundation
Structural Separations
At structural separations, partitions in exit corridors have seismic or control joints
Building 1: Main Hospital and Additions (Source: OSHPD Report Dated January, 2010)

©2017 Premier Inc.
83
Summary of Seismic Evaluation Criteria That Did Not Pass Inspection:
Area That Did Not Pass Inspection Criteria/Requirement
Partition Bracing In exit corridors, the tops of partitions that only extend to the ceiling line have lateral bracing
Parapets, Cornices, Ornamentation, and Appendages
There are no laterally unsupported unreinforced masonry parapets or cornices above the highest anchorage level with height/thickness ratios greater than 1.5. Concrete parapets with height/thickness ratios greater than 1.5 have vertical reinforcement. Cornices, parapets, signs, and other appendages that extend above the highest anchorage level or cantilever from exterior wall faces and other exterior wall ornamentation are reinforced and well anchored to the structural system
Building 1: Main Hospital and Additions (Source: OSHPD Report Dated January, 2010) (continued)

©2017 Premier Inc.
84
Summary of Seismic Evaluation Criteria That Did Not Pass Inspection:
Area That Did Not Pass Inspection Criteria/Requirement
Beam Penetrations All openings in frame‐beam webs have a depth less than ¼ of the beam depth and are located in the center half of the frame beams
Joint Webs All web thicknesses within joints of moment resisting frames meet the American Institute for Steel Construction (“AISC”) criteria for web shear
Girder Flange Continuity Plates
There are girder flange continuity plates at joints
Pre‐Northridge Earthquake Welded Moment Frame Joints
Welded steel moment frame beam‐column joints are designed and constructed in accordance with recommendations in FEMA 267, Interim Guidelines: Evaluation, Repair, modification, and Design of Welded Steel moment Frame structures, August 1995
Plan Irregularities There is significant tensile capacity at re‐entrant corners or other locations of plan irregularities
Building 2: East Tower (Source: OSHPD Report Dated June, 2008)

©2017 Premier Inc.
85
Summary of Seismic Evaluation Criteria That Did Not Pass Inspection:
Area That Did Not Pass Inspection Criteria/Requirement
Masonry Partitions There are no unbraced unreinforced masonry or hollow clay tile partitions in critical care areas, clinical laboratory service spaces, pharmaceutical service spaces, radiological service spaces, and central and sterile supply areas, exit corridors, elevator shafts, or stairwells
Structural Separations
At structural separations, partitions in exit corridors have seismic or control joints
Partition Bracing In exit corridors, the tops of partitions that only extend to the ceiling line have lateral bracing
Masonry Veneer Masonry veneer is connected to the back‐up with corrosion‐resistant ties spaced 24 inches on center maximum with at least one tie for every 2‐2/3 square feet
Cladding Panels in Moment Frame Buildings
For moment frame buildings of steel or concrete, panels are isolated form the structural frame to absorb predicted inter‐story drift without collapse
Building 2: East Tower (Source: OSHPD Report Dated June, 2008) (continued)

©2017 Premier Inc.
86
Summary of Seismic Evaluation Criteria That Did Not Pass Inspection:
Area That Did Not Pass Inspection Criteria/Requirement
Cladding Panel Condition
Cladding panel connections appear to be installed properly. No connection element is severely deteriorated or corroded. There is no cracking in the panel materials indicative of substantial structural distress. There is no substantial damage to exterior cladding due to water leakage. There is no substantial damage to exterior wall cladding due to temperature movements
Metal Stud Back‐Up Systems, General
Additional steel studs frame window and door openings. Corrosion of veneer ties, tie screws, studs, and stud tracks is minimal. Stud tracks are adequately fastened to the structural frame
Masonry Veneer with Stud Back‐Up
Masonry veneer more than 30 feet above the ground is supported by shelf angles or other elements at each floor level. Masonry veneer is adequately anchored to the back‐up at locations of through‐wall flashing. Masonry veneer is connected to the back‐up with corrosion‐resistant ties spaced 24 inches on center maximum and with at least one tie for every 2‐2/3 square feet
Building 2: East Tower (Source: OSHPD Report Dated June, 2008) (continued)

©2017 Premier Inc.
87
Summary of Seismic Evaluation Criteria That Did Not Pass Inspection:
Area That Did Not Pass Inspection Criteria/Requirement
Vertical Discontinuities
All shear walls, infilled walls, and frames are continuous to the foundation
Adjacent Buildings There is no immediately adjacent structure that is less than half as tall or has floors/levels that do not match those of the building being evaluated. A neighboring structure is considered to be “immediately adjacent” if it is within two inches times the number of stories away from the building being evaluated
Reinforcing The total vertical and horizontal reinforcing steel in reinforced masonry walls is greater than 0.002 times the gross area of the wall with a minimum of 0.0007 in either of the two directions; the spacing of reinforcing steel is less than 48 inches; and all vertical bars extend to the top of the walls
Masonry Partitions There are no unbraced unreinforced masonry or hollow clay tile partitions in critical care areas, clinical laboratory service spaces, pharmaceutical service spaces, radiological service spaces, and central and sterile supply areas, exit corridors, elevator shafts, or stairwells
Structural Separations
At structural separations, partitions in exit corridors have seismic or control joints
Building 4: North Wing (Source: OSHPD Report Dated May, 2008)

©2017 Premier Inc.
88
Summary of Seismic Evaluation Criteria That Did Not Pass Inspection:
Area That Did Not Pass Inspection Criteria/Requirement
Partition Bracing In exit corridors, the tops of partitions that only extend to the ceiling line have lateral bracing
Parapets, Cornices, Ornamentation, and Appendages
There are no laterally unsupported unreinforced masonry parapets or cornices above the highest anchorage level with height/thickness ratios greater than 1.5. Concrete parapets with height/thickness ratios greater than 1.5 have vertical reinforcement. Cornices, parapets, signs, and other appendages that extend above the highest anchorage level or cantilever from exterior wall faces and other exterior wall ornamentation are reinforced and well anchored to the structural system
Building 4: North Wing (Source: OSHPD Report Dated May, 2008) (continued)

©2017 Premier Inc.
Appendix A: Interviews Completed Regarding Community Health Status/Demographic Trends

©2017 Premier Inc.
90
Name Title/Organization
Tricia Gehrlein Associate Director, Clinton Foundation
Jenna LeComte‐Hinely, PhD Chief Executive Officer, Health Assessment and Research for Communities, Inc.
Gary Painter, PhD Director of Social Policy, University of Southern California Sol Price Center for Social Innovation
Appendix A: Interviews Completed Regarding Health Status/Demographic Trends

©2017 Premier Inc.
Appendix B: Industry Trends

©2017 Premier Inc.
92
Overall Covered California Enrollment
Statewide, over 1.5 million individuals selected health plans through Covered California during its fourth open enrollment period, ending in February, 2017
• Over 360,000 new enrolleesIn 2016, Blue Shield of California was the market share leader for Covered California enrollment. The table below illustrates the Covered California plans and their respective market share as of June 2016 (most recent data available)
Health Plan Market Share
Blue Shield of California 29.4%
Anthem Blue Cross of California 25.1%
Kaiser Permanente 23.0%
Health Net 11.8%
Other 10.8%
http://news.coveredca.com/2017/02/covered‐california‐finishes‐fourth‐open.html

©2017 Premier Inc.
93
Covered California Enrollment – Riverside County
70,310 enrollees had active coverage in Riverside County through Covered California as of June, 2016. Of these enrollees, 71.7% were at or below 250% of the federal poverty level The tables below illustrate the Covered California health plans and metal tiers in Riverside County in 2016
Health Plan Market Share
Blue Shield of California 31.0%
Molina Healthcare 20.8%
Health Net 20.0%
Kaiser Permanente 17.7%
Anthem Blue Cross of California 10.5%
http://news.coveredca.com/2017/02/covered‐california‐finishes‐fourth‐open.html
Metal Tier Market Share
Minimum Coverage 0.7%
Bronze 22.8%
Silver 66.7%
Gold 5.6%
Platinum 4.3%

©2017 Premier Inc.
94
Medi‐Cal and Covered California Enrollment
0
1,500,000
3,000,000
4,500,000
6,000,000
7,500,000
9,000,000
10,500,000
12,000,000
13,500,000
15,000,000
2000 2005 2010 2015 2020 2025
Medi‐CalEnrollment
Covered CaliforniaEnrollment
(estimated) (estimated)
*
Pre‐expansion Level

©2017 Premier Inc.
95
Medi‐Cal expansion is driving increased demandMore than 200,000 additional Medi‐Cal inpatients4 million more Medi‐Cal outpatient visits
Demand for Health Services Surges
Source: CHA, C. Duane Dauner, March 18, 2016

©2017 Premier Inc.
96
Demand for care increased Medi‐Cal ED visits by 1 millionLow payments to doctors have reduced accessMedi‐Cal patients turn to overcrowded hospital EDs
Coverage Does Not Equal Access
Source: CHA, C. Duane Dauner, March 18, 2016

©2017 Premier Inc.
97
Medi‐Cal Funding and Accountability Act(CHA Medi‐Cal Hospital Fee Protection)
Extends current lawLocks in protections for hospitals and the state (24% net benefit)Prohibits Legislature from changing protections$10 billion (2014‐2016)$18 billion (2009‐2016)
Source: CHA, C. Duane Dauner, March 18, 2016
November 8, 2016 Ballot Initiative ‐ Passed

©2017 Premier Inc.
98
November 8, 2016 Ballot Initiative ‐ Passed
The California Children’s Education and Health Care Protection Act of 2016
Extends the Proposition 30 income tax increase through 2030Funds Proposition 2, Proposition 98, state budget and Medi‐CalProvides up to $2 billion for Medi‐CalBenefit to hospitals
Source: CHA, C. Duane Dauner, March 18, 2016

©2017 Premier Inc.
99
HHS Goals: Aggressive Shift to Value‐Based Payments – Still the Future?

©2017 Premier Inc.
100
Track 2:Alternative payment models*
Track 1:Value‐based payments 85% of all Medicare payments 90% of all Medicare payments
30% of all Medicare payments 50% of all Medicare payments
2016 2018
HHS Goals Description
Incentives
Promote value‐based payment systems ─ Test new alternative payment models─ Increase linkage of Medicaid, Medicare FFS, and other payments to value
Bring proven payment models to scale
Care Delivery Encourage the integration and coordination of clinical care services Improve population health Promote patient engagement through shared decision making
Information Create transparency on cost and quality information Bring electronic health information to the point of care for meaningful use
Volume to ValueBetter Care. Smarter Spending. Healthier People.
Still the Future?

©2017 Premier Inc.
101
Retail, Outpatient, Grass Roots Access
Points
Primary Care
Medical/Surgical Specialties
Community Hospital
Tertiary/Quaternary
Commercial
HMO, PPO Direct to Employers Federal, State, Commercial Exchanges
Bundle Payment
CMS
ACO – Pioneer, MSSP, NextGen
Medicare Advantage Bundled Payment Medicaid HMO Medicaid Fee‐for‐Service Dual Eligible (HMO, other managed care)
• Urgent Care Centers• Emergency Dept.
• Retail Clinics• Health Plans
• Physician offices • FQHCs
Population Health Continuum and Access Points

©2017 Premier Inc.
102
Transparency
Quality will be tracked more vigilantly and quality scores will be readily available to the consumer
• Hospital Consumer Assessment of Healthcare Providers and Systems (“HCAHPS”) Measures
• CAHPS Clinician and Group Surveys Physician Quality Reporting System Outcome Measures
• CMS measures• Hospital Compare• Star Ratings

©2017 Premier Inc.
103
Initiated in seven markets in 2012• Goal: Alter volume incentives in FFS by paying the PCP a monthly management fee to coordinate care
• Risk stratify patients• Offer a care management plan (multiple chronic conditions)• Develop plan for patient and caregiver engagement
• Health insurers signed on:• 38 insurers• 500 practices• 2,200 physicians• 2.7 million patients
Has Not Worked Yet
CMS: Comprehensive Primary Care Initiative (CPCI)

©2017 Premier Inc.
104
CMS: CPCI Expansion (5‐Year Demonstration)
Comprehensive Primary Care Plus (CPC+)• Expansion (Target)
• 20 regions• 5,000 practices• 20,000 physicians• 25 million patients• Added incentives:
• Quality• Utilization
• Pay a monthly fee for patient care management• Track 1 – Medicare FFS and managed fee/patient (risk stratified)• Track 2 – Reduced Medicare FFS and higher management fee (stimulates alternative delivery models, not just visits)
Problems: State laws/regulations Bad experiences with earlier pilot Conflict with APM? Doctors don’t share in savings,
return money if targets are not achieved
Health plans need to participate

©2017 Premier Inc.
105
Clinic walk‐ins at big box retail stores is expected to increase by 30 percent per year
Usually staffed by Nurse Practitioners other advanced practice nurses, or Physician Assistants
Cost:• $110 in a retail clinic, compared to over $160 in a physician office, and $570 in an Emergency Department
Retail Health
Source: The Advisory Board Company, National Institutes of Health “Comparing costs and quality of care at retail clinics,” Mehrotra, 2009

©2017 Premier Inc.
106
More Mobile, More Accessible, More Connected

©2017 Premier Inc.
107
Telehealth Drives Volume, Increases Quality of Care and Access, and Reduces Costs (e.g., Readmissions, Unnecessary Emergency Department Visits)
AudiologyBehavioral HealthCardiologyChronic Care ManagementDentistryDermatologyEmergency CareGastroenterologyHepatology
Home MonitoringIntensive Care (e‐ICU)Long‐term CareObstetricsOphthalmologyPharmacyRadiologyStroke Interventions
Common Examples of Telehealth in Rural Communities

©2017 Premier Inc.
108
Project ECHO (Extension for the Community Healthcare Outcomes) was created to increase the capacity for better chronic condition management in rural New Mexico
The ECHO model™ is designed to extend specialty care to rural patients through area providers. ECHO utilizes videoconferencing to provide the following:
• Direct support from specialists to primary care providers (PCPs) on patient cases
• Increased knowledge for PCPs through shared case‐based learning and mentorship
• Assistance with patient treatment plan development and monitoring
• Opportunities to participate in research are provided, but are not mandatory
Services offered: endocrinology, diabetes, HIV/AIDS, child and youth epilepsy, dementia, palliative care, high‐risk pregnancy, chronic pain and headache management, Hepatitis C, integrated addictions and psychiatry, rheumatology, behavioral health, community health worker specialist training
Case Study: Expansion of Access to Specialty Care in Rural Communities

©2017 Premier Inc.
Appendix C: Supplemental Inpatient Market Share Analyses

©2017 Premier Inc.
110
Service Area Inpatient Market Share, CY 2014
Service Area
Service Line Discharges
Percent of Total
Discharges
Eisenhower Medical Center
Desert Regional Medical Center
John F Kennedy Memorial Hospital
Loma Linda University Medical Center Others Total
Cardiology - Diagnostic/Interventional 1,341 3.3% 47.6% 36.5% 8.2% 1.0% 6.7% 100.0%Cardiology - Medical 3,371 8.3% 47.1% 31.7% 15.2% 1.1% 4.9% 100.0%Cardiology - Surgery 411 1.0% 49.9% 24.3% 0.0% 6.6% 19.2% 100.0%Chemical Dependency 194 0.5% 48.5% 23.2% 18.6% 0.0% 9.8% 100.0%Endocrine 1,055 2.6% 37.6% 29.8% 20.2% 5.5% 6.9% 100.0%ENT 304 0.7% 24.3% 18.4% 14.8% 22.7% 19.7% 100.0%Gastroenterology 3,432 8.4% 45.6% 31.3% 9.8% 3.8% 9.4% 100.0%General Medicine 3,635 8.9% 45.7% 28.5% 13.8% 2.9% 9.0% 100.0%General Surgery 3,680 9.0% 42.0% 26.1% 19.6% 2.9% 9.3% 100.0%Gynecology 598 1.5% 17.6% 44.3% 12.4% 7.9% 17.9% 100.0%Neonatal Intensive Care 1,573 3.9% 0.3% 63.3% 30.1% 3.4% 3.1% 100.0%Neurology 2,229 5.5% 46.1% 33.8% 8.4% 4.3% 7.4% 100.0%Neurosurgery 382 0.9% 36.1% 28.5% 0.8% 9.2% 25.4% 100.0%Obstetrics & Deliveries 5,770 14.2% 0.4% 54.0% 42.8% 0.4% 2.3% 100.0%Oncology 1,465 3.6% 43.1% 22.3% 6.6% 11.3% 16.7% 100.0%Ophthalmology 65 0.2% 26.2% 32.3% 4.6% 21.5% 15.4% 100.0%Orthopedics 4,038 9.9% 44.3% 25.3% 15.7% 3.4% 11.3% 100.0%Other/NC 48 0.1% 47.9% 12.5% 0.0% 2.1% 37.5% 100.0%Plastic Surgery 243 0.6% 35.0% 17.7% 30.0% 5.3% 11.9% 100.0%Psychiatry 141 0.3% 48.2% 23.4% 8.5% 8.5% 11.3% 100.0%Pulmonary Medicine 3,233 7.9% 36.6% 29.6% 24.2% 2.8% 6.8% 100.0%Rehabilitation 2 0.0% 50.0% 0.0% 0.0% 0.0% 50.0% 100.0%Spine Surgery 619 1.5% 52.8% 12.4% 0.0% 4.5% 30.2% 100.0%Thoracic & Vascular Surgery 807 2.0% 46.8% 32.3% 8.9% 3.3% 8.6% 100.0%Transplant 39 0.1% 0.0% 0.0% 0.0% 35.9% 64.1% 100.0%Urology 2,040 5.0% 49.8% 25.4% 10.4% 3.6% 10.7% 100.0%
Total 40,715 100.0% 35.8% 33.5% 18.6% 3.4% 8.7% 100.0%
Source: California Office of Statewide Health Planning and Development Inpatient Database, 2014. Includes acute care across all ages; excludes normal newborns. https://share.premierinc.com/sites/pcs/ICD/Folder/West_Coast_Advisory_Services/Clients/Desert_Healthcare_District/Needs_Assessment/Analysis/[Coachella OSHPD Tables.xlsx]Table 2C
Outmigration
Desert Heathcare DistrictService Area Inpatient Market Share by Service Line - All Ages
Calendar Year 2014
Service Area Mix Percent Market Share

©2017 Premier Inc.
111
Service Area Inpatient Market Share, CY 2013
Service Line Discharges
Percent of Total
Discharges
Eisenhower Medical Center
Desert Regional Medical Center
John F Kennedy Memorial Hospital
Loma Linda University Medical Center Others Total
Cardiology - Diag/Intervention 1,434 3.5% 52.4% 34.2% 7.7% 1.1% 4.5% 100.0%Cardiology - Medical 3,571 8.8% 46.5% 31.9% 14.7% 1.0% 5.9% 100.0%Cardiology - Surgery 369 0.9% 52.6% 26.0% 0.0% 5.1% 16.3% 100.0%Chemical Dependency 165 0.4% 35.8% 41.2% 12.7% 0.0% 10.3% 100.0%Endocrine 1,040 2.6% 38.0% 25.9% 22.5% 5.7% 8.0% 100.0%ENT 294 0.7% 29.6% 16.3% 12.6% 29.9% 11.6% 100.0%Gastroenterology 3,479 8.6% 45.7% 28.0% 13.5% 3.2% 9.6% 100.0%General Medicine 3,384 8.3% 47.4% 25.3% 14.3% 2.8% 10.2% 100.0%General Surgery 3,606 8.9% 42.9% 24.7% 21.4% 2.9% 8.1% 100.0%Gynecology 674 1.7% 18.7% 42.1% 13.9% 7.9% 17.4% 100.0%Neonatal Intensive Care 1,506 3.7% 0.1% 60.2% 33.9% 3.5% 2.3% 100.0%Neurology 2,199 5.4% 47.6% 33.9% 7.1% 4.3% 7.1% 100.0%Neurosurgery 451 1.1% 38.4% 23.9% 0.7% 10.2% 26.8% 100.0%Obstetrics & Deliveries 5,721 14.1% 0.6% 52.7% 44.1% 0.6% 1.9% 100.0%Oncology 1,495 3.7% 47.7% 16.9% 7.2% 9.1% 19.1% 100.0%Ophthalmology 68 0.2% 23.5% 23.5% 13.2% 13.2% 26.5% 100.0%Orthopedics 3,859 9.5% 40.9% 25.8% 19.8% 3.3% 10.2% 100.0%Plastic Surgery 282 0.7% 37.2% 19.1% 23.8% 4.6% 15.2% 100.0%Psychiatry 124 0.3% 46.8% 27.4% 8.1% 4.8% 12.9% 100.0%Pulmonary Medicine 3,518 8.7% 39.7% 28.5% 23.5% 2.3% 6.0% 100.0%Rehabilitation 2 0.0% 0.0% 50.0% 0.0% 50.0% 0.0% 100.0%Spine Surgery 548 1.3% 50.2% 9.5% 0.0% 5.8% 34.5% 100.0%Thoracic & Vascular Surgery 820 2.0% 49.5% 32.3% 7.6% 2.7% 7.9% 100.0%Transplant 33 0.1% 0.0% 0.0% 0.0% 39.4% 60.6% 100.0%Urology 1,954 4.8% 51.2% 24.2% 10.6% 3.6% 10.4% 100.0%
Total 40,596 100.0% 36.5% 32.1% 19.7% 3.3% 8.4% 100.0%
Source: California Office of Statewide Health Planning and Development Inpatient Database, 2013. Acute care, excludes normal newborns. https://share.premierinc.com/sites/pcs/ICD/Folder/West_Coast_Advisory_Services/Clients/Desert_Healthcare_District/Needs_Assessment/Analysis/[Coachella OSHPD Tables.xlsx]Table 2B
Desert Heathcare DistrictService Area Inpatient Market Share by Service Line
Calendar Year 2013
Service Area Mix Percent Market Share

©2017 Premier Inc.
112
Service Line Discharges
Percent of Total
Discharges
Eisenhower Medical Center
Desert Regional Medical Center
John F Kennedy Memorial Hospital
Loma Linda University Medical Center Others Total
Cardiology - Diag/Intervention 1,612 3.8% 49.4% 33.4% 9.7% 1.3% 6.2% 100.0%Cardiology - Medical 3,942 9.3% 50.1% 29.0% 14.5% 0.7% 5.7% 100.0%Cardiology - Surgery 411 1.0% 46.2% 24.8% 0.0% 10.5% 18.5% 100.0%Chemical Dependency 142 0.3% 34.5% 30.3% 21.1% 1.4% 12.7% 100.0%Endocrine 1,191 2.8% 43.5% 23.4% 21.3% 5.1% 6.6% 100.0%ENT 328 0.8% 29.0% 17.4% 15.9% 24.7% 13.1% 100.0%Gastroenterology 3,709 8.8% 44.3% 27.4% 14.4% 3.2% 10.7% 100.0%General Medicine 3,497 8.3% 42.0% 28.0% 16.4% 3.3% 10.4% 100.0%General Surgery 3,606 8.5% 41.8% 27.0% 18.8% 3.2% 9.2% 100.0%Gynecology 744 1.8% 20.4% 48.3% 10.8% 7.0% 13.6% 100.0%Neonatal Intensive Care 1,660 3.9% 0.3% 58.6% 35.4% 2.7% 3.0% 100.0%Neurology 2,389 5.7% 46.8% 32.1% 10.1% 4.0% 7.0% 100.0%Neurosurgery 462 1.1% 38.5% 26.0% 1.1% 9.3% 25.1% 100.0%Obstetrics & Deliveries 6,058 14.4% 0.4% 52.6% 44.5% 0.5% 2.0% 100.0%Oncology 1,542 3.7% 46.1% 19.3% 6.4% 10.1% 18.2% 100.0%Ophthalmology 78 0.2% 37.2% 28.2% 6.4% 6.4% 21.8% 100.0%Orthopedics 3,819 9.0% 41.6% 24.5% 19.2% 3.4% 11.3% 100.0%Plastic Surgery 271 0.6% 33.6% 24.4% 23.6% 8.9% 9.6% 100.0%Psychiatry 149 0.4% 36.9% 28.9% 16.8% 4.7% 12.8% 100.0%Pulmonary Medicine 3,311 7.8% 36.4% 28.1% 25.4% 2.3% 7.8% 100.0%Rehabilitation 2 0.0% 0.0% 0.0% 0.0% 0.0% 100.0% 100.0%Spine Surgery 544 1.3% 55.3% 8.3% 0.2% 4.8% 31.4% 100.0%Thoracic & Vascular Surgery 810 1.9% 52.2% 25.8% 8.6% 3.3% 10.0% 100.0%Transplant 33 0.1% 0.0% 0.0% 0.0% 42.4% 57.6% 100.0%Urology 1,890 4.5% 48.7% 23.2% 12.5% 3.8% 11.9% 100.0%
Total 42,200 100.0% 35.7% 32.1% 20.2% 3.3% 8.8% 100.0%
Source: California Office of Statewide Health Planning and Development Inpatient Database, 2012. Acute care, excludes normal newborns. https://share.premierinc.com/sites/pcs/ICD/Folder/West_Coast_Advisory_Services/Clients/Desert_Healthcare_District/Needs_Assessment/Analysis/[Coachella OSHPD Tables.xlsx]Table 2A
Service Area Mix Percent Market Share
Calendar Year 2012
Desert Heathcare DistrictService Area Inpatient Market Share by Service Line
Service Area Inpatient Market Share, CY 2012

©2017 Premier Inc.
113
Service Area Inpatient Market Share by Payer, CY 2014
Hospital HMO FFS HMO FFS HMO PPO Other Total
Eisenhower Medical Center 33.2% 59.9% 22.5% 12.4% 24.6% 47.2% 29.8% 35.8%Desert Regional Medical Center 53.1% 19.1% 37.2% 35.3% 41.1% 26.3% 40.2% 33.5%John F Kennedy Memorial Hospital 4.7% 10.1% 32.1% 36.1% 17.8% 15.3% 13.0% 18.6%Loma Linda University Medical Center 2.2% 1.1% 4.4% 7.8% 3.2% 3.2% 2.9% 3.4%Riverside County Regional Medical Center 0.0% 0.2% 0.8% 3.6% 2.7% 0.2% 2.4% 1.2%Cedars Sinai Medical Center 0.0% 1.4% 0.1% 0.1% 0.2% 0.5% 0.3% 0.5%City of Hope Helford Clinical Research Hospital 0.0% 0.7% 0.0% 0.5% 0.2% 0.7% 0.5% 0.4%Ronald Reagan UCLA Medical Center 0.1% 0.7% 0.0% 0.2% 0.2% 1.1% 0.5% 0.4%Keck Hospital of USC 0.5% 0.7% 0.0% 0.0% 0.3% 0.7% 0.2% 0.4%Kaiser Foundation Hospital - Riverside 1.1% 0.0% 0.0% 0.0% 1.2% 0.1% 0.1% 0.3%University of California San Diego Medical Center 0.1% 0.5% 0.3% 0.2% 0.0% 0.3% 0.2% 0.3%University of California Irvine Medical Center 0.2% 0.4% 0.3% 0.1% 0.3% 0.1% 0.3% 0.3%Kaiser Foundation Hospital - Fontana 0.6% 0.0% 0.0% 0.0% 1.5% 0.0% 0.1% 0.2%Others 4.3% 5.4% 2.3% 3.6% 6.6% 4.5% 9.4% 4.7%
Total 100.0% 100.0% 100.0% 100.0% 100.0% 100.0% 100.0% 100.0%
N = 5,291 10,943 6,932 6,163 4,008 4,438 2,940 40,715Payer Mix = 13.0% 26.9% 17.0% 15.1% 9.8% 10.9% 7.2% 100.0%
Source: California Office of Statewide Health Planning and Development Inpatient Database, 2014. Acute care, excludes normal newborns. https://share.premierinc.com/sites/pcs/ICD/Folder/West_Coast_Advisory_Services/Clients/Desert_Healthcare_District/Needs_Assessment/Analysis/[Coachella OSHPD Tables.xlsx]Table 3C
Desert Healthcare DistrictService Area Inpatient Market Share by Payer
Calendar Year 2014
Medicare Medi-Cal Private

©2017 Premier Inc.
114
Service Area Inpatient Market Share by Payer, CY 2013
Hospital HMO FFS HMO FFS HMO PPO Other Total
Eisenhower Medical Center 36.8% 61.8% 17.7% 8.7% 26.1% 43.5% 25.2% 36.5%Desert Regional Medical Center 50.0% 18.3% 36.4% 34.8% 39.8% 27.9% 37.3% 32.1%John F Kennedy Memorial Hospital 4.7% 11.1% 37.8% 39.9% 21.0% 17.5% 15.6% 19.7%Loma Linda University Medical Center 1.7% 1.0% 3.9% 9.1% 2.5% 3.2% 3.7% 3.3%Riverside County Regional Medical Center 0.0% 0.1% 1.8% 3.4% 1.5% 0.3% 8.4% 1.7%Cedars Sinai Medical Center 0.3% 0.9% 0.1% 0.1% 0.1% 0.7% 0.3% 0.4%City of Hope Helford Clinical Research Hospital 0.0% 0.5% 0.0% 0.6% 0.1% 1.0% 0.1% 0.4%Ronald Reagan UCLA Medical Center 0.1% 0.5% 0.1% 0.1% 0.1% 0.7% 0.3% 0.3%Kaiser Foundation Hospital - Riverside 1.0% 0.0% 0.0% 0.0% 1.3% 0.0% 0.1% 0.3%University of California Irvine Medical Center 0.3% 0.3% 0.3% 0.1% 0.2% 0.2% 0.2% 0.2%Keck Hospital of USC 0.3% 0.4% 0.0% 0.0% 0.1% 0.3% 0.0% 0.2%University of California San Diego Medical Center 0.1% 0.3% 0.1% 0.2% 0.0% 0.3% 0.1% 0.2%Kaiser Foundation Hospital - Fontana 0.4% 0.0% 0.0% 0.0% 0.9% 0.0% 0.0% 0.2%Providence Saint John's Health Center 0.0% 0.3% 0.0% 0.0% 0.0% 0.4% 0.1% 0.1%Others 4.2% 4.7% 1.7% 3.0% 6.3% 4.0% 8.7% 4.5%
Total 100.0% 100.0% 100.0% 100.0% 100.0% 100.0% 100.0% 100.0%
N = 5,453 12,110 5,073 5,691 3,989 4,428 3,852 40,596Payer Mix = 13.4% 29.8% 12.5% 14.0% 9.8% 10.9% 9.5% 100.0%
Source: California Office of Statewide Health Planning and Development Inpatient Database, 2013. Acute care, excludes normal newborns. https://share.premierinc.com/sites/pcs/ICD/Folder/West_Coast_Advisory_Services/Clients/Desert_Healthcare_District/Needs_Assessment/Analysis/[Coachella OSHPD Tables.xlsx]Table 3B
Desert Healthcare DistrictService Area Inpatient Market Share by Payer
Calendar Year 2013
Medicare Medi-Cal Private

©2017 Premier Inc.
115
Service Area Inpatient Market Share by Payer, CY 2012
Hospital HMO FFS HMO FFS HMO PPO Other Total
Eisenhower Medical Center 37.8% 59.7% 18.2% 8.1% 22.8% 40.8% 22.8% 35.7%Desert Regional Medical Center 50.3% 18.5% 38.5% 35.7% 40.6% 29.9% 35.3% 32.1%John F Kennedy Memorial Hospital 4.5% 12.5% 37.4% 40.2% 21.8% 18.2% 13.8% 20.2%Loma Linda University Medical Center 1.8% 1.2% 3.7% 9.4% 2.8% 3.2% 2.8% 3.3%Riverside County Regional Medical Center 0.0% 0.2% 0.0% 2.9% 2.2% 0.5% 14.0% 2.0%Cedars Sinai Medical Center 0.2% 0.9% 0.0% 0.1% 0.1% 0.7% 0.3% 0.4%City of Hope Helford Clinical Research Hospital 0.0% 0.7% 0.0% 0.3% 0.1% 0.7% 0.1% 0.4%Ronald Reagan UCLA Medical Center 0.0% 0.5% 0.0% 0.2% 0.1% 0.8% 0.4% 0.3%Keck Hospital of USC 0.1% 0.4% 0.0% 0.2% 0.3% 0.5% 0.1% 0.3%University of California Irvine Medical Center 0.3% 0.3% 0.4% 0.1% 0.3% 0.2% 0.1% 0.3%Kaiser Foundation Hospital - Riverside 0.6% 0.0% 0.0% 0.0% 1.5% 0.0% 0.0% 0.2%University of California San Diego Medical Center 0.0% 0.2% 0.1% 0.2% 0.0% 0.4% 0.2% 0.2%Kindred Hospital Riverside 0.0% 0.4% 0.0% 0.1% 0.0% 0.0% 0.6% 0.2%Pioneers Memorial Healthcare District 0.1% 0.1% 0.1% 0.3% 0.0% 0.1% 0.4% 0.2%Others 4.3% 4.2% 1.7% 2.3% 7.3% 3.8% 9.1% 4.3%
Total 100.0% 100.0% 100.0% 100.0% 100.0% 100.0% 100.0% 100.0%
N = 4,832 13,203 5,003 5,994 4,169 5,154 3,845 42,200Payer Mix = 11.5% 31.3% 11.9% 14.2% 9.9% 12.2% 9.1% 100.0%
Source: California Office of Statewide Health Planning and Development Inpatient Database, 2012. Acute care, excludes normal newborns. https://share.premierinc.com/sites/pcs/ICD/Folder/West_Coast_Advisory_Services/Clients/Desert_Healthcare_District/Needs_Assessment/Analysis/[Coachella OSHPD Tables.xlsx]Table 3A
Desert Healthcare DistrictService Area Inpatient Market Share by Payer
Calendar Year 2012
Medicare Medi-Cal Private