Eutrophication and Aquatic Plant Management in ... - Mass.gov
514
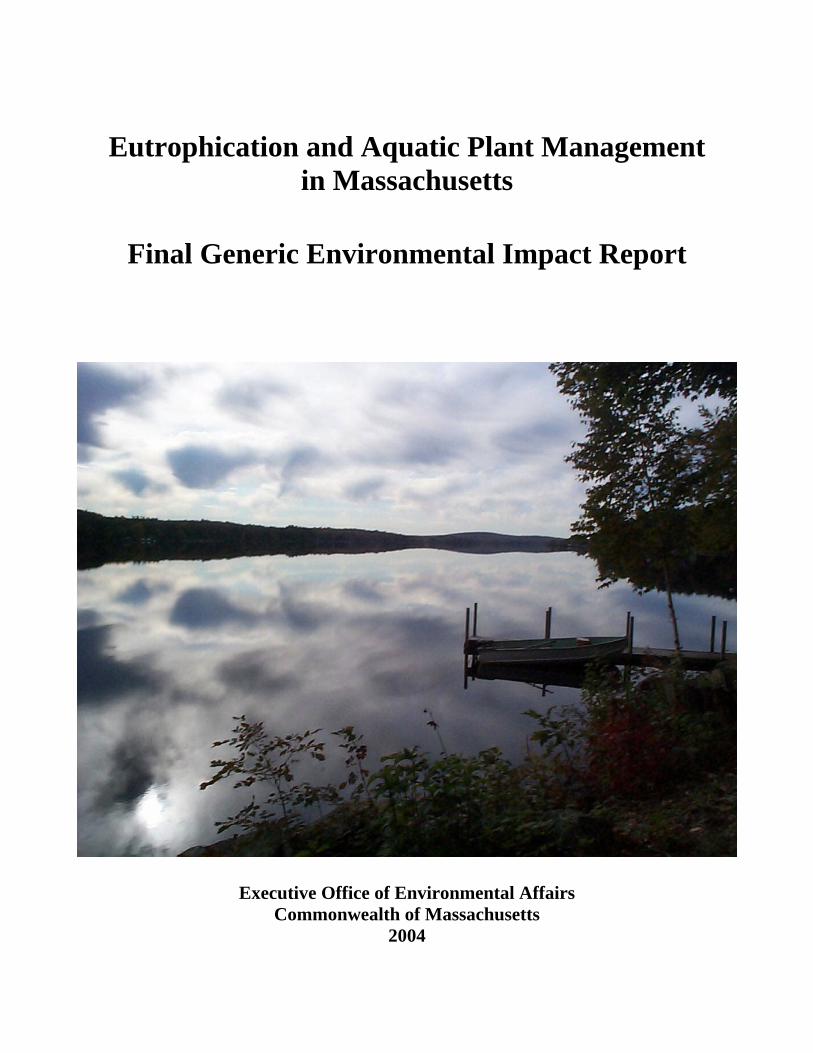
Eutrophication and Aquatic Plant Management in Massachusetts Final Generic Environmental Impact Report Executive Office of Environmental Affairs Commonwealth of Massachusetts 2004
-
Upload
khangminh22 -
Category
Documents
-
view
0 -
download
0
Transcript of Eutrophication and Aquatic Plant Management in ... - Mass.gov
Eutrophication and Aquatic Plant Management
in Massachusetts
Final Generic Environmental Impact Report
Executive Office of Environmental Affairs Commonwealth of Massachusetts
2004
Eutrophication and Aquatic Plant Management in Massachusetts
Final Generic Environmental Impact Report
June 2004
Prepared by
Mark D. Mattson and Paul J. Godfrey Regina A. Barletta and Allison Aiello
Water Resources Research Center University of Massachusetts
Amherst MA 01003-0820
Final Revisions by Kenneth J. Wagner ENSR International
for
The Department of Environmental Protection
and The Department of Conservation and Recreation
Executive Office of Environmental Affairs Commonwealth of Massachusetts

Eutrophication and Aquatic Plant Management in Massachusetts
i
TABLE OF CONTENTS ACKNOWLEDGEMENTS ________________________________________________________ xi
DISCLAIMER __________________________________________________________________ xii
INFORMATION SOURCES ______________________________________________________xiii
EXECUTIVE SUMMARY ________________________________________________________ xiv
PROJECT BACKGROUND ______________________________________________________ xxi
CERTIFICATES _______________________________________________________________xxiii
1.0 INTRODUCTION________________________________________________________1-1 1.1 BACKGROUND ____________________________________________________________1-1
1.1.1 The Commonwealth’s Policy on Lake and Pond Management ____________________________ 1-1 1.1.2 The Audience __________________________________________________________________ 1-1 1.1.3 The Purpose ___________________________________________________________________ 1-1
1.2 UNDERSTANDING THE LAKE ECOSYSTEM _________________________________1-3 1.2.1 Overview _____________________________________________________________________ 1-3 1.2.2 Water ________________________________________________________________________ 1-4 1.2.3 Hydraulic Residence_____________________________________________________________ 1-5 1.2.4 Mixing _______________________________________________________________________ 1-6 1.2.5 Nutrients ______________________________________________________________________ 1-9 1.2.6 Other Non-living Components ____________________________________________________ 1-21 1.2.7 Living Components ____________________________________________________________ 1-21
1.3 BIOLOGY OF MASSACHUSETTS AQUATIC PLANTS _________________________1-31 1.3.1 Introduction___________________________________________________________________ 1-31 1.3.2 Submerged Plants ______________________________________________________________ 1-32 1.3.3 Floating Attached Plants_________________________________________________________ 1-34 1.3.4 Floating Unattached Plants _______________________________________________________ 1-35 1.3.5 Emergent Plants _______________________________________________________________ 1-35 1.3.6 Algae________________________________________________________________________ 1-37 1.3.7 Managed Plants Present in Other States _____________________________________________ 1-39 1.3.8 Managed Plants in Massachusetts__________________________________________________ 1-40
1.4 LAKE MANAGEMENT AND THE MASSACHUSETTS WATERSHED INITIATIVE 1-49 1.5 LAKE AND WATERSHED MANAGEMENT PLANNING _______________________1-51
1.5.1 The Lake and Watershed Management Plan__________________________________________ 1-51 1.5.2 Components of a Lake and Watershed Management Plan _______________________________ 1-53 1.5.3 Eutrophication Models __________________________________________________________ 1-58 1.5.4 Aquatic Plant Growth Models ____________________________________________________ 1-61
2.0 CASE HISTORIES OF LAKE MANAGEMENT IN MASSACHUSETTS_________2-1 2.1 TRENDS IN EUTROPHICATION AND MANAGEMENT NEEDS__________________2-1 2.2 LAKE MANAGEMENT COSTS AND FUNDING PROGRAMS ____________________2-4 2.3 PROGRAMS FOR LAKE MANAGEMENT IN MASSACHUSETTS ________________2-5 2.4 CASE STUDIES IN MASSACHUSETTS ________________________________________2-5
2.4.1 Non-Point Source Pollution - Best Management Practices________________________________ 2-6 2.4.2 Point Source Control- Advanced Wastewater Treatment _________________________________ 2-9 2.4.3 Hydrologic Controls - Diversion __________________________________________________ 2-13 2.4.4 Phosphorus Inactivation/Precipitation – Alum Treatment _______________________________ 2-16 2.4.5 Aeration – Artificial Circulation and Hypolimnetic Aeration ____________________________ 2-20
Eutrophication and Aquatic Plant Management in Massachusetts
ii
2.4.6 Dredging – Sediment Removal____________________________________________________ 2-23 2.4.7 Drawdown – Water Level Control _________________________________________________ 2-30 2.4.8 Harvesting, Hydroraking and Hand Pulling – Direct Plant Removal _______________________ 2-36 2.4.9 Biological Control – Milfoil Weevil Stocking ________________________________________ 2-44 2.4.10 Benthic Barriers - Plant Covering _______________________________________________ 2-46 2.4.11 Herbicide Treatment – Chemical Control _________________________________________ 2-48 2.4.12 Dyes and Surface Covers – Light Limitation_______________________________________ 2-58
3.0 METHODS TO CONTROL NUTRIENTS ___________________________________3-1 3.1 INTRODUCTION ___________________________________________________________3-1 3.2 NON-POINT SOURCE NUTRIENT CONTROL _________________________________3-9
3.2.1 The Nature and Control of Non-Point Source Pollution__________________________________ 3-9 3.2.2 Source Controls _______________________________________________________________ 3-13 3.2.3 Pollutant Trapping _____________________________________________________________ 3-16 3.2.4 Effectiveness__________________________________________________________________ 3-22 3.2.5 Impacts to Non-Target Organisms _________________________________________________ 3-27 3.2.6 Impacts to Water Quality ________________________________________________________ 3-28 3.2.7 Applicability to Saltwater Ponds __________________________________________________ 3-28 3.2.8 Implementation Guidance________________________________________________________ 3-28 3.2.9 Regulations ___________________________________________________________________ 3-30 3.2.10 Costs______________________________________________________________________ 3-31 3.2.11 Future Research Needs________________________________________________________ 3-33 3.2.12 Summary __________________________________________________________________ 3-33
3.3 POINT SOURCE NUTRIENT CONTROL _____________________________________3-34 3.3.1 The Nature and Control of Point Source Pollution _____________________________________ 3-34 3.3.2 Effectiveness__________________________________________________________________ 3-36 3.3.3 Impacts to Non-Target Organisms _________________________________________________ 3-37 3.3.4 Impacts to Water Quality ________________________________________________________ 3-38 3.3.5 Applicability to Saltwater Ponds __________________________________________________ 3-38 3.3.6 Implementation Guidance________________________________________________________ 3-38 3.3.7 Regulations ___________________________________________________________________ 3-40 3.3.8 Costs ________________________________________________________________________ 3-41 3.3.9 Future Research Needs __________________________________________________________ 3-41 3.3.10 Summary __________________________________________________________________ 3-42
3.4 HYDRAULIC CONTROLS __________________________________________________3-42 3.4.1 Overview ____________________________________________________________________ 3-42 3.4.2 Diversion ____________________________________________________________________ 3-43 3.4.3 Dilution and Flushing ___________________________________________________________ 3-43 3.4.4 Selective Withdrawal ___________________________________________________________ 3-44 3.4.5 Effectiveness__________________________________________________________________ 3-45 3.4.6 Impacts to Non-Target Organisms _________________________________________________ 3-47 3.4.7 Impacts to Water Quality ________________________________________________________ 3-48 3.4.8 Implementation Guidance________________________________________________________ 3-49 3.4.9 Regulations ___________________________________________________________________ 3-50 3.4.10 Costs______________________________________________________________________ 3-51 3.4.11 Future Research Needs________________________________________________________ 3-52 3.4.12 Summary __________________________________________________________________ 3-52
3.5 PHOSPHORUS PRECIPITATION AND INACTIVATION _______________________3-53 3.5.1 Overview ____________________________________________________________________ 3-53 3.5.2 Use of Aluminum Compounds ____________________________________________________ 3-54 3.5.3 Use of Iron Compounds _________________________________________________________ 3-57 3.5.4 Use of Calcium Compounds ______________________________________________________ 3-57 3.5.5 Use of Nitrate Compounds _______________________________________________________ 3-58
Eutrophication and Aquatic Plant Management in Massachusetts
iii
3.5.6 Effectiveness__________________________________________________________________ 3-58 3.5.7 Impacts to Non-Target Organisms _________________________________________________ 3-60 3.5.8 Impacts to Water Quality ________________________________________________________ 3-63 3.5.9 Applicability to Saltwater Ponds __________________________________________________ 3-63 3.5.10 Implementation Guidance _____________________________________________________ 3-63 3.5.11 Regulations ________________________________________________________________ 3-65 3.5.12 Costs______________________________________________________________________ 3-66 3.5.13 Future Research Needs________________________________________________________ 3-67 3.5.14 Summary __________________________________________________________________ 3-68
3.6 ARTIFICIAL CIRCULATION AND AERATION _______________________________3-68 3.6.1 Overview ____________________________________________________________________ 3-68 3.6.2 Effectiveness__________________________________________________________________ 3-71 3.6.3 Impacts to Non-Target Organisms _________________________________________________ 3-73 3.6.4 Impacts to Water Quality ________________________________________________________ 3-74 3.6.5 Applicability to Saltwater Ponds __________________________________________________ 3-75 3.6.6 Implementation Guidance________________________________________________________ 3-75 3.6.7 Regulations ___________________________________________________________________ 3-78 3.6.8 Costs ________________________________________________________________________ 3-79 3.6.9 Future Research Needs __________________________________________________________ 3-79 3.6.10 Summary __________________________________________________________________ 3-79
3.7 DREDGING _______________________________________________________________3-80 3.7.1 Overview ____________________________________________________________________ 3-80 3.7.2 Dry Dredging _________________________________________________________________ 3-82 3.7.3 Wet Dredging _________________________________________________________________ 3-83 3.7.4 Hydraulic (and Pneumatic) Dredging _______________________________________________ 3-83 3.7.5 Reverse Layering ______________________________________________________________ 3-84 3.7.6 Effectiveness__________________________________________________________________ 3-85 3.7.7 Impacts to Non-Target Organisms _________________________________________________ 3-86 3.7.8 Impacts to Water Quality ________________________________________________________ 3-90 3.7.9 Impacts in the Disposal Area _____________________________________________________ 3-91 3.7.10 Applicability to Saltwater Ponds ________________________________________________ 3-94 3.7.11 Implementation Guidance _____________________________________________________ 3-94 3.7.12 Regulations _______________________________________________________________ 3-100 3.7.13 Costs_____________________________________________________________________ 3-101 3.7.14 Future Research Needs_______________________________________________________ 3-102 3.7.15 Summary _________________________________________________________________ 3-102
3.8 ADDITIONAL TECHNIQUES ______________________________________________3-103 3.8.1 Bacterial Additives ____________________________________________________________ 3-103 3.8.2 Removal of Bottom-Feeding Fish_________________________________________________ 3-103
3.9 NO MANAGEMENT ALTERNATIVE FOR NUTRIENTS ______________________3-104 3.9.1 Overview ___________________________________________________________________ 3-104 3.9.2 Effectiveness_________________________________________________________________ 3-105 3.9.3 Impacts to Non-Target Organisms ________________________________________________ 3-105 3.9.4 Impacts to Water Quality _______________________________________________________ 3-106 3.9.5 Applicability to Saltwater Ponds _________________________________________________ 3-106 3.9.6 Implementation Guidance_______________________________________________________ 3-106 3.9.7 Regulations __________________________________________________________________ 3-107 3.9.8 Costs _______________________________________________________________________ 3-107 3.9.9 Future Research Needs _________________________________________________________ 3-108 3.9.10 Summary _________________________________________________________________ 3-108
4.0 METHODS TO CONTROL AQUATIC PLANTS _____________________________4-1 4.1 OVERVIEW________________________________________________________________4-1
Eutrophication and Aquatic Plant Management in Massachusetts
iv
4.2 DRAWDOWN _____________________________________________________________4-11 4.2.1 Water Level Lowering __________________________________________________________ 4-11 4.2.2 Effectiveness__________________________________________________________________ 4-12 4.2.3 Impacts to Non-Target Organisms _________________________________________________ 4-16 4.2.4 Impacts to Water Quality ________________________________________________________ 4-20 4.2.5 Applicability to Saltwater Ponds __________________________________________________ 4-21 4.2.6 Implementation Guidance________________________________________________________ 4-21 4.2.7 Regulations ___________________________________________________________________ 4-26 4.2.8 Costs ________________________________________________________________________ 4-28 4.2.9 Future Research Needs __________________________________________________________ 4-28 4.2.10 Summary __________________________________________________________________ 4-28
4.3 HARVESTING_____________________________________________________________4-29 4.3.1 Overview ____________________________________________________________________ 4-29 4.3.2 Effectiveness__________________________________________________________________ 4-31 4.3.3 Impacts to Non-Target Organisms _________________________________________________ 4-36 4.3.4 Impacts to Water Quality ________________________________________________________ 4-38 4.3.5 Applicability to Saltwater Ponds __________________________________________________ 4-39 4.3.6 Implementation Guidance________________________________________________________ 4-39 4.3.7 Regulations ___________________________________________________________________ 4-41 4.3.8 Costs ________________________________________________________________________ 4-42 4.3.9 Future Research Needs __________________________________________________________ 4-43 4.3.10 Summary __________________________________________________________________ 4-44
4.4 BIOLOGICAL CONTROL __________________________________________________4-44 4.4.1 Overview ____________________________________________________________________ 4-44 4.4.2 Effectiveness__________________________________________________________________ 4-55 4.4.3 Impacts to Non-Target Organisms _________________________________________________ 4-60 4.4.4 Impacts to Water Quality ________________________________________________________ 4-65 4.4.5 Applicability to Saltwater Ponds __________________________________________________ 4-66 4.4.6 Implementation Guidance________________________________________________________ 4-66 4.4.7 Regulations ___________________________________________________________________ 4-68 4.4.8 Costs ________________________________________________________________________ 4-69 4.4.9 Future Research Needs __________________________________________________________ 4-70 4.4.10 Summary __________________________________________________________________ 4-70
4.5 BENTHIC BARRIERS ______________________________________________________4-71 4.5.1 Sediment, Porous Screens, Non-Porous Sheet Materials ________________________________ 4-71 4.5.2 Effectiveness__________________________________________________________________ 4-73 4.5.3 Impacts to Non-Target Organisms _________________________________________________ 4-75 4.5.4 Impacts to Water Quality ________________________________________________________ 4-76 4.5.5 Applicability to Saltwater Ponds __________________________________________________ 4-76 4.5.6 Implementation Guidance________________________________________________________ 4-76 4.5.7 Regulations ___________________________________________________________________ 4-78 4.5.8 Costs ________________________________________________________________________ 4-79 4.5.9 Future Research Needs __________________________________________________________ 4-79 4.5.10 Summary __________________________________________________________________ 4-80
4.6 HERBICIDES AND ALGAECIDES ___________________________________________4-80 4.6.1 Overview ____________________________________________________________________ 4-80 4.6.2 Effectiveness__________________________________________________________________ 4-86 4.6.3 Impacts to Non-Target Organisms _________________________________________________ 4-89 4.6.4 Impacts to Water Quality ________________________________________________________ 4-93 4.6.5 Applicability to Saltwater Ponds __________________________________________________ 4-96 4.6.6 General Implementation Guidance _________________________________________________ 4-96 4.6.7 Copper ______________________________________________________________________ 4-98 4.6.8 Diquat ______________________________________________________________________ 4-104
Eutrophication and Aquatic Plant Management in Massachusetts
v
4.6.9 2,4-D_______________________________________________________________________ 4-107 4.6.10 Glyphosate ________________________________________________________________ 4-110 4.6.11 Fluridone _________________________________________________________________ 4-113 4.6.12 Endothall _________________________________________________________________ 4-119 4.6.13 Triclopyr _________________________________________________________________ 4-122 4.6.14 Costs_____________________________________________________________________ 4-124 4.6.15 Regulations _______________________________________________________________ 4-125 4.6.16 Future Research Needs_______________________________________________________ 4-126 4.6.17 Summary _________________________________________________________________ 4-126
4.7 DYES AND SURFACE COVERS ____________________________________________4-128 4.7.1 Dyes and Surface Covers _______________________________________________________ 4-128 4.7.2 Effectiveness_________________________________________________________________ 4-128 4.7.3 Impacts to Non-Target Organisms ________________________________________________ 4-129 4.7.4 Impacts to Water Quality _______________________________________________________ 4-130 4.7.5 Applicability to Saltwater Ponds _________________________________________________ 4-131 4.7.6 Implementation Guidance_______________________________________________________ 4-131 4.7.7 Regulations __________________________________________________________________ 4-132 4.7.8 Costs _______________________________________________________________________ 4-133 4.7.9 Future Research Needs _________________________________________________________ 4-134 4.7.10 Summary _________________________________________________________________ 4-134
4.8 DREDGING ______________________________________________________________4-134 4.9 ADDITIONAL TECHNIQUES ______________________________________________4-137
4.9.1 Introduction__________________________________________________________________ 4-137 4.9.2 Flooding ____________________________________________________________________ 4-137 4.9.3 Filtration ____________________________________________________________________ 4-137 4.9.4 Settling Agents _______________________________________________________________ 4-138 4.9.5 Sonication ___________________________________________________________________ 4-138
4.10 NO MANAGEMENT ALTERNATIVE FOR AQUATIC PLANTS ________________4-138 4.10.1 Effectiveness ______________________________________________________________ 4-139 4.10.2 Impacts to Non-Target Organisms ______________________________________________ 4-139 4.10.3 Impacts to Water Quality _____________________________________________________ 4-139 4.10.4 Applicability to Saltwater Ponds _______________________________________________ 4-140 4.10.5 Implementation Guidance ____________________________________________________ 4-140 4.10.6 Performance Guidelines______________________________________________________ 4-140 4.10.7 Regulations _______________________________________________________________ 4-141 4.10.8 Costs_____________________________________________________________________ 4-141 4.10.9 Future Research Needs_______________________________________________________ 4-141 4.10.10 Summary _________________________________________________________________ 4-142
5.0 SUMMARY AND GUIDELINES ___________________________________________5-1 5.1 INTRODUCTION ___________________________________________________________5-1 5.2 PREVENT EUTROPHICATION ______________________________________________5-1 5.3 PREVENT THE INTRODUCTION OF NON-NATIVE PLANTS ___________________5-1 5.4 ESTABLISH A MANAGEMENT PLAN ________________________________________5-3 5.5 EVALUATE PROJECT EFFECTIVENESS _____________________________________5-3 5.6 EVALUATE IMPACTS TO NON-TARGET SPECIES ____________________________5-3 5.7 EMPHASIZE NUTRIENT CONTROLS FOR ALGAE MANAGEMENT ____________5-4 5.8 CHOOSE AQUATIC PLANT CONTROL TECHNIQUES CAREFULLY ____________5-5

Eutrophication and Aquatic Plant Management in Massachusetts
vi
5.9 APPLY INTEGRATED NUTRIENT AND PLANT CONTROL_____________________5-7 5.10 FOSTER INTERACTIONS BETWEEN AGENCIES______________________________5-8 5.11 SUPPORT APPROPRIATE LEGISLATIVE, REGULATORY AND POLICY CHANGES
___________________________________________________________________________5-8 5.12 SUPPORT PUBLIC OUTREACH_____________________________________________5-10 5.13 FACILITATE FUTURE DATA COLLECTION AND RESEARCH ________________5-11 5.14 RECOGNIZE LIMITATIONS IMPOSED BY NATURE AND HUMAN ACTIONS ___5-12
6.0 CAC LAKE MANAGEMENT RECOMMENDATIONS _______________________6-1 6.1 INTRODUCTION ___________________________________________________________6-1 6.2 PLANNING AND POLICY ___________________________________________________6-1 6.3 PERMITTING ______________________________________________________________6-3 6.4 FUNDING__________________________________________________________________6-4 6.5 EDUCATION _______________________________________________________________6-4
7.0 REFERENCES __________________________________________________________7-1 7.1 JOURNAL ARTICLES AND REPORTS ________________________________________7-1 7.2 VERBAL CORRESPONDENCE AND PRESENTATIONS________________________7-42
Eutrophication and Aquatic Plant Management in Massachusetts
vii
APPENDICES APPENDIX I – WATER QUALITY PROGRAMS ................................................................. A-1 APPENDIX II – REGULATIONS ............................................................................................. A-2 LOCAL PERMITS AND REGULATIONS................................................................... A-8 II.1 SSC- STATE SANITARY CODE and TITLE 5 (BOH).................................... A-8 II.2 ZONING - ZONING REGULATIONS (ZC)..................................................... A-9 II.3 WPA- WETLANDS PROTECTION ACT (Conservation Commission) .......... A-9 II.4 RPA- RIVERS PROTECTION ACT (Conservation Commission) ................. A-12 STATE PERMITS AND REGULATIONS.................................................................. A-13 II.5 ACEC AREAS OF CRITICAL ENVIRONMENTAL CONCERN (DCR) .... A-13 II.6 ODS-OFFICE OF DAM SAFETY (DCR) ...................................................... A-14 II.7 DRINKING WATER PROTECTION (DEP) ................................................. A-14 II.8 GWDP-GROUND WATER DISCHARGE PERMIT (DEP) ......................... A-16 II.9 SECP-SEWER EXTENSION OR CONNECTION PERMIT (DEP) ............. A-16 II.10 WMA-WATER MANAGEMENT ACT (DEP) .............................................. A-17 II.11 NPDES-NATIONAL POLLUTANT DISCHARGE ELIMINATION
SYSTEM PERMIT (DEP) ............................................................................... A-17 II.12 SWP-SOLID WASTE PERMIT (DSW) ......................................................... A-18 II.13 ORW- OUTSTANDING RESOURCES WATERS (DWM) .......................... A-18 II.14 LAC-LICENSE TO APPLY CHEMICALS (DWM) ...................................... A-19 II.15 WPP-WETLAND PROTECTION PROGRAM (DWW) ............................... A-19 II.16 WRP-WETLAND RESTRICTION PROGRAM (DWW) .............................. A-20 II.17 C.91-WATERWAYS REGULATIONS CHAPTER 91 (DWW) ................... A-21 II.18 401- 401 WATER QUALITY CERTIFICATION (DWW) ............................ A-22 II.19 PBL- PESTICIDE BUREAU LICENSE (DAR).............................................. A-23 II.20 DFW-DIVISION OF FISHERIES AND WILDLIFE (DFW) ......................... A-24 II.21 NHESP NATURAL HERITAGE ENDANGERED SPECIES ACT (DFW) . A-25 II.22 CZM-MASSACHUSETTS COASTAL ZONE MANAGEMENT (EOEA) .. A-26 II.23 MEPA-MASSACHUSETTS ENVIRONMENTAL POLICY ACT (EOEA) . A-27 II.24 MDC-METROPOLITAN DISTRICT COMMISSION (MDC) ...................... A-29 II.25 MHC-MASSACHUSETTS HISTORICAL COMMISSION (MHC) ............. A-29 II.26 NPDES- NATIONAL POLLUTANT DISCHARGE ELIMINATION
PERMIT, U.S. ENVIRONMENTAL PROTECTION AGENCY (EPA) ....... A-31 II.27 404-U.S. ARMY CORPS OF ENGINEERS, SECTION 404 PERMIT
(ACOE) ............................................................................................................ A-31 REFERENCES FOR APPENDIX II ............................................................................ A-33 APPENDIX III – AQUATIC HERBICIDE TOXICOLOGICAL AND ENVIRONMENTAL
FATE PROFILES ......................................................................................................... A-34 III.0 INTRODUCTION ............................................................................................ A-35 III.1 COPPER and COPPER COMPLEXES............................................................ A-36 III.2 DIQUAT ........................................................................................................... A-46

Eutrophication and Aquatic Plant Management in Massachusetts
viii
III.3 2,4-D ................................................................................................................. A-59 III.4 GLYPHOSATE ................................................................................................ A-76 III.5 FLURIDONE.................................................................................................... A-86 III.6 ENDOTHALL .................................................................................................. A-96 III.7 AQUASHADE................................................................................................ A-110 III.8 TRICLOPYR .................................................................................................. A-116 III.9 ADJUVANTS................................................................................................. A-126 APPENDIX IV – CLEAN LAKES PROGRAM PROJECTS ............................................... A-134 APPENDIX V – RARE AND ENDANGERED SPECIES LIST .......................................... A-140 APPENDIX VI – NON-NATIVE PLANT DISTRIBUTION................................................ A-158 APPENDIX VII – LAKE AND POND MANAGEMENT ACTION PLAN......................... A-173 APPENDIX VIII – GLOSSARY............................................................................................ A-177
Eutrophication and Aquatic Plant Management in Massachusetts
ix
LIST OF TABLES Table 1-1 Concentration of essential elements for growth of freshwater plants
(requirements), mean concentration in world rivers (supply), and the approximate ratio of requirements to available supply*.................................... 1-10
Table 1-2 Phosphorus budgets based on measured inputs from Diagnostic/Feasibility studies in Massachusetts. ................................................................................... 1-15
Table 1-3 Phosphorus budgets estimated from land use from Diagnostic/Feasibility studies in Massachusetts. ................................................................................... 1-17
Table 1-4 Comparison of phosphorus loading estimated from land use versus measured from inputs. Loading rates are also shown per lake surface area (g/m2/yr)....... 1-19
Table 1-5a Number and percent of 320 lakes surveyed in 1993-1994 with non-native aquatic plant species (R. McVoy, MDEP, unpublished data)............................ 1-27
Table 1-5b Aquatic non-native species abundance in Massachusetts lakes surveyed between 1994 and 2003.................................................................................................... 1-28
Table 1-6 Spawning conditions for common Massachusetts fish species (Everhart et al., 1975 and M. Ross, personal communication).......................................... 1-30
Table 1-7 Historically managed plant species in Massachusetts. Inclusion on the list does not imply that the species requires control in any given circumstance. .... 1-41
Table 1-8 Plant taxonomy glossary .................................................................................... 1-47 Table 1-9 Developing and implementing a lake management plan (modified from
Olem and Flock, 1990) ...................................................................................... 1-52 Table 3-1 Options for control of algae. (Adapted from Wagner 2001). .............................. 3-2 Table 3-2 Range and median () for expected removal (%) for nutrients by selected
management methods, Compiled from literature sources for actual projects and best professional judgment upon data review by K. Wagner...................... 3-23
Table 3-3 Massachusetts regulatory sediment quality values of importance to dredged material disposal. Mean lake and pond sediment metal values from MDEP D/F studies (Rojko, 1992) are included where available for comparison.......... 3-93
Table 3-4 Key Considerations for Dredging ...................................................................... 3-96 Table 4-1 Management options for control of aquatic plants. (Adapted from
Wagner, 2001)...................................................................................................... 4-3 Table 4-2 Anticipated response off some aquatic plants to winter drawdown.
(After Cooke et al., 1993a) ................................................................................ 4-14 Table 4-3 Key Considerations for Drawdown ................................................................... 4-23 Table 4-4 Aquatic herbicides and algaecides. .................................................................... 4-82 Table 4-5 Aquatic plants controlled in Massachusetts by herbicide active ingredients..... 4-87 Table 4-6 Massachusetts aquatic herbicide acute toxicity ................................................. 4-92 Table 4-7 Herbicide toxicity summary (Manganaro, MDEP, unpublished compilation
of data) ............................................................................................................... 4-94 Table 4-8 Copper bioconcentration factors. ..................................................................... 4-102
Eutrophication and Aquatic Plant Management in Massachusetts
x
LIST OF FIGURES Figure 1-1 The hydrologic cycle (From Olem and Flock, 1990). ......................................... 1-5 Figure 1-2 Seasonal patterns in the thermal stratification of north temperate lakes
(From Olem and Flock, 1990). ............................................................................ 1-7 Figure 1-3 A cross-sectional view of a thermally stratified lake in mid-summer. Solid
circles represent the dissolved oxygen profile in eutrophic lakes; open circles represent oligotrophic lakes (From Olem and Flock, 1990). ............................... 1-8
Figure 1-4 Influences of photosynthesis and respiration-decomposition processes and organic matter sedimentation on the distribution of nutrients, organic matter, and dissolved oxygen in a stratified lake (From Olem and Flock, 1990). ........... 1-9
Figure 1-5 Statewide map of general total phosphorus levels based on spring/fall data from the University of Massachusetts Water Resources Research Center (Spring 1993), USEPA National Lake Survey (Fall 1984), and USEPA EMAP (Summer 1991-1992) (From Griffith et al., 1994)................................. 1-12
Figure 1-6 Elements of a phosphorus budget (from Olem and Flock, 1990). ..................... 1-20 Figure 1-7 A typical seasonal succession of lake phytoplankton groups. Diatoms
dominate in the spring and autumn, green and blue-green algae in summer (From Olem and Flock, 1990). .......................................................................... 1-23
Figure 1-8 Measurement of Secchi disk transparency (From Olem and Flock, 1990)........ 1-25 Figure 1-9 Typical aquatic plant zones in lakes and ponds (From Kishbaugh et al. 1990). 1-25 Figure 1-10 Examples of non-native aquatic plants in Massachusetts .................................. 1-44 Figure 1-11 Further examples of non-native aquatic plants in Massachusetts ...................... 1-45 Figure 1-12 Additional examples of non-native aquatic plants in Massachusetts................. 1-46 Figure 1-13 Phosphorus loading versus hydraulic load. Data from 30 Massachusetts
lakes are plotted with lines of expected lake total phosphorus based on Vollenweider (1975) .......................................................................................... 1-59
Figure 1-14 Generalized relationship between average summer surface total phosphorus and Secchi disk transparency (based on data from Massachusetts lakes). Note the variability in transparency at any phosphorus level; this is a function of additional factors that influence water clarity, including non-algal turbidity, grazing by zooplankton, and limitation by other nutrients. Range approximately represents the 95% confidence level.......................................... 1-60
Figure 1-15 Carlson’s Trophic State Index related to perceived nuisance conditions (Heiskary and Walker, 1987). Lengths of arrows indicate range over which a greater than 10 percent probability exists that users will perceive a problem. .. 1-62
Figure 1-16 Summary of the probability of finding chlorophyll and transparency within specific trophic state ranges when median total phosphorus levels are in one of six intervals (Olem and Flock, 1990). Graph is based on a survey of 894 lakes and reservoirs (USEPA, 1978) ................................................................. 1-63
Figure 3-1 Methods of artificial circulation and aeration (from Wagner, 2001)................. 3-69 Figure 3-2 Dry, wet and hydraulic dredging approaches (from Wagner, 2001). ................ 3-82 Figure 4-1 The role of fish community structure in determining plankton features
and water clarity (from Wagner, 2001).............................................................. 4-47 Figure 5-1 Sample public education sign for use at boat launches........................................ 5-2
Eutrophication and Aquatic Plant Management in Massachusetts
xi
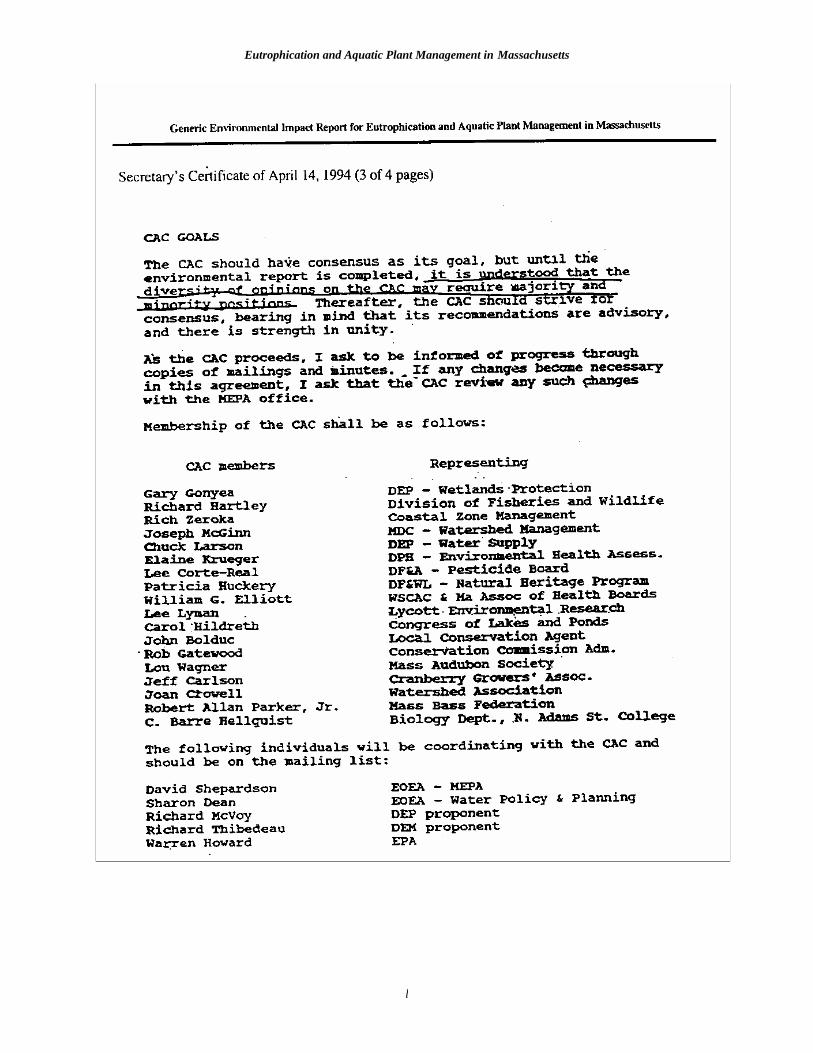
ACKNOWLEDGMENTS Mark Mattson and Paul Godfrey prepared several drafts of the GEIR while employed by the Water Resources Research Center at the University of Massachusetts. They were assisted by Regina Barletta and Allison Aiello, also of the Water Resources Research Center. After review of these drafts by the Citizens Advisory Committee (CAC), the EOEA agencies, and the public, the GEIR was revised into its current form by Kenneth J. Wagner of ENSR International, an environmental consulting firm headquartered in Massachusetts. Editorial input was received from many sources, but changes were primarily based upon the comments provided through the EOEA MEPA review process and the information provided in Managing Lakes and Reservoirs, a guide published by the USEPA in late 2001. Dr. Wagner is one of the authors of that publication. The Final GEIR also enjoyed the advantage of progress made by the Watershed Teams formed under the EOEA to manage land and water resources on a watershed basis. Organization of regulatory functions and stakeholder involvement on a watershed basis through the Massachusetts Watershed Initiative set the stage for more effective management of lakes and other resources of the Commonwealth. Finally, the development of the Lakes and Ponds Initiative under the EOEA with the involvement of virtually all relevant governmental departments, public organizations, and lake management practitioners in Massachusetts provided a framework for progress in lake management and initiated action of recommendations in the Draft GEIR. Preparation of the GEIR was guided and assisted by the Citizen’s Advisory Committee (CAC) on Eutrophication and Aquatic Weed Control. The CAC was chaired by Richard Thibedeau and later, by Mike Gildesgame of the Department of Conservation and Recreation. MDCR and MDEP served as project proponents. The CAC members and their affiliations include: Rick McVoy (MDEP), Gary Gonyea (MDEP-DWW), Richard Hartley (MDFG), Carol Hildreth (COLAP), Joseph McGinn (MDC), Rob Gatewood, (Barnstable ConComm), Jeff Carlson (Cranberry Grower’s Assoc.), Joan Crowell (Leesville Pond Watershed Assoc.), Robert Parker Jr. (MASS BASS Fed.), C. Barre Helquist (MA College of Liberal Arts), Chuck Larson (MDEP-DWS), Lou Wagner (Mass. Audubon), John Bolduc, (MSMCP, Brookline ConComm.), Rick Zeroka, (CZM), Elaine Kruger (DPH), Pat Huckery (MDFG-NHESP), Lee Corte-Real (MDAG), Bill Elliott (WSCAC), Lee Lyman (Lycott Env. Research). Other informal members of the CAC and their affiliations include: Bob Hartzel (GeoSyntec), Arthur Screpetis (MDEP- DWM), Alexandra Dawson (MACC/WSCAC), Sally Zielinski (MACC), Elaine Purdy (Billington Sea Assoc.), David Shepardson (EOEA, MEPA Unit), Peter Gagnon (MDPH), Jeffrey La Fleur (Cape Cod Cranberry Growers’ Assoc.), Russell Isaac (MDEP-DWM), Gerry Smith (Aquatic Control Tech. Inc.), Sharon McGregor (EOEA), Warren Howard (USEPA), Michael Hutcheson and Diane Manganaro (MDEP ORS), and Paul DiPietro (MDC). We are grateful to consultants who provided examples of case studies, unpublished reports, personal communications and detailed review of various aspects of this work. We also acknowledge the staff of the Commonwealth agencies that put so much effort into this document, including the MDCR, MDEP, MDFG, MDPH and MDAG.
Eutrophication and Aquatic Plant Management in Massachusetts
xii
DISCLAIMERS The mention of product names, trade names, registered trade marks, companies or individuals does not constitute an endorsement or recommendation for use. No statement herein should be construed as a policy or opinion of ENSR, an environmental consulting firm, and this document should in no way be construed as an endorsement of ENSR, which is involved in lake and watershed management in Massachusetts. Tables and figures from other documents were used with permission of the publishers or authors if not in the public domain, and are referenced accordingly. Any modifications made for use in this publication should not be construed to constitute approval or endorsement by the original developers of those graphic aids. Lake management is a highly interdisciplinary science, incorporating watershed management, geology and soil science, atmospheric and groundwater hydrology, chemical fate and transport, biological interactions, regulatory policy, economics, and human ecology. There is a great deal of opinion to be had on management approaches, each of which can find some support in the scientific or popular literature, but much of which is somewhat subjective. We have endeavored to separate comments based on strong scientific or experiential support from those that are more theoretical or hypothetical, and to identify the latter, but this may not always be apparent to the reader. Be advised that this document should be read carefully and kept in the context of its intent, which is to provide as complete and balanced a picture of the current state of lake management in Massachusetts as possible, but with acknowledgement that much remains to be learned. ____________________
NOTE: Since the original publication of this document, several state agencies have been reorganized and renamed. The Department of Environmental Management has merged with the Metropolitan District Commission to form the Department of Conservation and Recreation (DCR). The Department of Food and Agriculture now is the Department of Agricultural Resources (DAR) and the Department of Fisheries, Wildlife and Environmental Law Enforcement now is the Department of Fish and Game (DFG). Every attempt has been made to insert the new designations.
Eutrophication and Aquatic Plant Management in Massachusetts
xiii
INFORMATION SOURCES A wide variety of sources of information were used in the preparation of this document. These included books, reports, and journal articles as well as unpublished manuscripts, commercial publications and personal communication. A substantial amount of the material in the GEIR was summarized from three reviews:
Olem, H. and G. Flock, eds. 1990. Lake and Reservoir Restoration Guidance Manual. 2nd. Ed. EPA 440/4-90-006.
Cooke, G.D., E.B. Welch, S.A. Peterson, and P.R. Newroth. 1993. Restoration and Management of Lakes and Reservoirs. Second Edition. Lewis Publishers, Boca Raton, FL. 548 pp.
Kishbaugh, S., J. Bloomfield and A. Saltman. 1990. Diet For a Small Lake. New York Department of Environmental Conservation and the Federation of Lake Associations, Inc. Albany and Rochester, NY.
Many of the recent scientific studies were obtained from reviews of articles from specialty journals such as Lake and Reservoir Management and the Journal of Aquatic Plant Management. Other recent journal articles were located by computer searches of the following databases:
University of Massachusetts Library Computer at Amherst, MA Current Contents via Ovid laser disk Agricola via Silverplatter Information laser disk Aquatic Plant Information Retrieval System (APIRS) via Univ. Of Florida Center for
Aquatic plants at Gainesville (also see web sites below). Additional references and reports and proceedings of annual meetings were obtained from the Aquatic Plant Control Research Program of the U.S. Army Corps of Engineers Waterways Experiment Station in Vicksburg, MS. Other handbooks and manuals are available for purchase from the Terrene Institute in Washington DC. Electronic information was gathered from computer internet services and email. These include:
ponds-L: Bulletin board via [email protected] (discussion for pond owners) lakes-L: Bulletin board via [email protected] (discussion for limnologists) http://www.epa.gov/OWOW/LAKES/: (Information sources, Clean Lakes Program) http://www.epa.gov/OWOW/NPS/npsie.html: (Information sources, non-point source data) http://www.humboldt.kent.edu/~dipin/: (Information on secchi disk transparency) http://aquat1.ifas.ufl.edu/: (APIRS database and aquatic plant information ) http://www.nalms.org/: (North American Lake Management Society information).
The Final GEIR took advantage of late 2001 publication of Managing Lakes and Reservoirs, written by multiple authors under the guidance of the North American Lake Management Society, with editorial support from the Terrene Institute and review and publication service from the USEPA. This guide is a completely revised version of the Lake and Reservoir Restoration Guidance Manual, last edited by Olem and Flock in 1990. Managing Lakes and Reservoirs is the most up to date reference on lake management written for educated laypersons.
Eutrophication and Aquatic Plant Management in Massachusetts
xiv
EXECUTIVE SUMMARY This report was developed by the authority granted in 301 CMR 11.12(3) and the certificate of the Secretary of Environmental Affairs dated April 14, 1994 which requires the preparation of this update of the 1978 GEIR and designates the project as Major and Complicated (EOEA #0011 and #6934). The Secretary established the Citizens’ Advisory Committee (CAC) to advise the Department of Conservation and Recreation (previously MDEM) and the Department of Environmental Protection (MDEP) in the preparation of the update and to assist the Secretary's office in conducting the environmental review. This report and recommendations should be viewed as part of the Commonwealth's Watershed Approach, the aim of which is to assess water quality and resource management problems and develop solutions in the context of all activities and concerns in each watershed. Lakes are valuable resources for water supply, recreation and wildlife habitat. In many cases these resources are threatened by cultural eutrophication and/or excessive weed growth, such that intensive management is required to maintain their designated uses. Cultural eutrophication is the acceleration of the natural process of lake aging and increased fertility by human activities. Excessive weed growth is defined as standing crops of vascular plants that impair designated functions of lakes, such as habitat or recreation. Pristine natural lakes should be protected from development and excessive management that may impair valued uses such as rare species habitat. The degree of management as well as the specific management approach should be carefully chosen to be appropriate to the range and priority of lake uses, affordable, and directed to the maximum practical extent to provide long-term improvement and protection by addressing the causes of the problems. The management plan should recognize that some goals are incompatible, such as supporting extensive power boating on shallow lakes where water clarity for swimming is important. Balanced uses should be sought in management planning, but establishment of use priorities may often be essential to guide decisions where use incompatibility exists. This report presents a brief summary of the science of limnology (the study of freshwater ecosystems), describes procedures for lake management, and reviews case studies of lake management in Massachusetts. The major focus of the report involves problem identification, problem prevention and successful management of lakes. The report reviews lake management techniques for effectiveness and impacts and provides a summary and general recommendations. It should be noted that lake management is not a “one size fits all” process, and apparent conflicts between uses, goals, techniques and policies do exist and must be considered on a case by case basis. Where general truths appear evident, we endeavor to highlight them, but a cookbook approach to problem resolution is seldom possible in lake management. This document should be cited as follows: Mattson, M.D., P.J. Godfrey, R.A. Barletta and A. Aiello. 2004. Eutrophication and Aquatic Plant Management in Massachusetts. Final Generic Environmental Impact Report. Edited by Kenneth J. Wagner. Department of Environmental Protection and Department of Conservation and Recreation, Executive Office of Environmental Affairs, Commonwealth of Massachusetts.
Eutrophication and Aquatic Plant Management in Massachusetts
xv
SUMMARY OF FINDINGS The lake management techniques reviewed here are grouped into two major categories: control of nutrients and control of aquatic plants. Control of nutrients is used to achieve control of algae and associated water quality problems (e.g., oxygen depletion, taste and odor), but as algae tend to be the symptom and nutrients constitute the real problem, the focus is on nutrient control. For the control of nutrients the management techniques include non-point source control, point source control, hydraulic controls, phosphorus precipitation/inactivation, artificial circulation/aeration and dredging. The report compares these to the option of no nutrient management.
Control of nutrients will not alleviate all aquatic plant problems, however, especially those rooted in or growing directly upon sediments. Since the plants themselves can be more than just a symptom, additional methods for direct control of aquatic plants are considered. Reviewed techniques for the control of aquatic plants include drawdown, harvesting, biological controls, benthic barriers, herbicides and algaecides, dyes and surface covers, and dredging. These are compared to the option of no management for aquatic plants.
The impacts of nutrient and aquatic plant control techniques range widely depending upon the features of the system to which the techniques are applied, the extent of application, and the appropriateness of the technique to the situation. In most cases negative impacts are temporary and can be mitigated, but management of nutrients or aquatic plants may involve choices that require trade-offs between lake uses or specific groups of organisms in the lake. Most aquatic organisms have the ability to recover from the impacts of lake management, but the degree to which initial harm can be tolerated (under ecological or regulatory constraints) must be carefully considered when planning management actions. Rare species and unique habitats may require special protection that limits management options or necessitates intensive mitigation effort.
Some specific problems with lakes are not addressed here. Shallowness caused by infilling from external or internal sources over many years may be a problem with only limited links to current watershed inputs or in-lake plant problems. Dredging is the typical method of restoring water depth and is addressed in this document as a means for controlling nutrient inputs and plant growths. Less used but competing methods such as sediment digestion or raising the water level are not covered. Problems with specific nuisance fauna such as mosquitoes, invertebrate parasites that cause swimmer’s itch, leeches, or excessive goose populations are not addressed. Methods of resolving recreational conflicts among lake users constitute another timely area of activity that is beyond the scope of this document. The reader may seek initial help with such problems through the literature cited in this document or any of the referenced governmental agencies or consulting firms. Suggestions and guidelines for the use of each technique are presented in the text; however, the following recommendations apply generally to lake management: 1. Prevention of eutrophication and excessive growth of aquatic plants is the most desirable
approach. Particular emphasis is placed on limiting inputs of nutrients from the watershed and on the prevention of the establishment of populations of non-native plant species.
Eutrophication and Aquatic Plant Management in Massachusetts
xvi
2. Where prevention has not been successful or implemented in time to protect the lake, an integrated management plan should be developed on a case by case basis. Integrated management uses the most appropriate elements of a variety of lake management techniques to enhance the effectiveness of management over the long-term while minimizing adverse impacts. The choice of which techniques will work together appropriately will vary depending on water quality conditions, target species, the presence of rare species and protected habitat, and the goals of the program.
3. Emphasize nutrient control for prevention of algal blooms. Excess algal growth is possible only if nutrient levels are adequate, and thus nutrient control is recommended as the best long-term strategy. Nutrient controls include non-point source controls, point source controls, hydraulic controls, phosphorus precipitation and inactivation, artificial circulation and aeration, and dredging.
4. Choose aquatic plant control techniques with careful attention to both short-term and long-term effectiveness and possible adverse impacts. How much control as well as the type of control must be considered. Plants play a vital role in the ecology of lakes and some level of plant coverage is essential for a healthy lake. In all cases it is important to determine a reasonable level of control for aquatic plants. The need for frequent re-application of a technique should prompt an evaluation of alternative long-term approaches.
5. The public should become involved in lake management in the early planning stages to assure greater acceptance of the chosen management plan. The public should also be invited to join in lake monitoring programs that will increase public awareness while providing valuable data on lake conditions from citizen volunteers. Involvement of all stakeholders in goal formulation, management plan development, and tracking of progress is in the best interest of the lake and its users.
6. The effects of lake management actions should be studied as part of each management program, at a scale appropriate to the problem and lake. Much of the difficulty in selecting the appropriate lake management technique is due to the lack of organized, quantifiable data on the effectiveness and impacts of lake management projects in the past. Current data collection on effectiveness and impacts in Massachusetts is largely limited to cursory examination and anecdotal information, although some more intensive efforts have been made and Conservation Commissions now often require follow-up monitoring. Documentation of benefits and adverse impacts, or the lack thereof, with reliable data would be a great aid to future lake management planning and permitting.
7. Recognize the limitations imposed by nature and human activities. Not all lakes are suited to all uses, and existing regulations will restrict management options in some cases. Lake management goals should be formulated with an understanding of the constraints under which management must operate, including natural features, competing uses, regulatory processes and economic reality.
SUMMARY OF RECOMMENDATIONS FOR FUTURE ACTION Based on discussion of the state of lake management in Massachusetts and needs for enhancing future management, recommendations have been developed in seven main categories, with individual recommendations prioritized within each category. Recommendations represent a majority opinion of the CAC unless otherwise noted.
Eutrophication and Aquatic Plant Management in Massachusetts
xvii
Planning and Policy 1. Designate, empower and support a technical review group from representatives of
Commonwealth agencies with the appropriate expertise in lake assessment and management to assist citizen groups and Conservation Commissioners in the planning, permitting and execution of lake management programs and to promote a more uniform approach to lake management statewide.
2. Institute stronger policies and measures to assure implementation of best management practices for the domestic and agricultural use of fertilizers, particularly in the critical zone bordering lakes and streams.
3. Prohibit the sale and distribution (including mail order, wholesale, and retail) of aquatic herbicides and algaecides other than to applicators licensed through the Massachusetts Department of Agricultural Resources.
4. Develop a statewide comprehensive plan for the control of non-native aquatic vegetation, and pass legislation that gives an appropriate Commonwealth agency the authority to restrict import and transport of invasive species.
5. Facilitate the creation of lake/watershed districts without need for individual legislation. 6. Agencies involved in implementing a watershed approach to environmental management in
Massachusetts should be instructed to develop and incorporate nutrient loading analyses and lake response analyses as part of their efforts. Furthermore, the Surface Water Quality Standards Committee should develop phosphorus loading performance standards and site criteria to reduce loading from various non-point sources.
7. The importance of open water bodies in the balance of ecosystems should be recognized in planning and permitting activities relating to lakes. At the same time, the role of other wetland resource areas in overall ecosystem health should be recognized in all lake management planning and permitting efforts.
8. Technologies that reduce the export of nutrients from on-site wastewater disposal systems should be encouraged, with closed systems (tight tanks) allowed where control is essential but not achievable by other means. Municipalities may need to pass ordinances to maximize effectiveness of statewide Title 5 regulations on a local basis to limit nutrient inputs.
9. The environmental agencies of the Commonwealth and the CAC have carefully considered further study of triploid grass carp under tightly controlled conditions. However, due to the risk of environmental impacts and the difficulty of predicting effectiveness, and given the available information, the state agencies and the CAC have made the final recommendation to prohibit introduction of all grass carp at this time.
Permitting 1. When requested by municipalities, state agencies, or other groups potentially affected by
proposed complex lake management projects, a review should be conducted by the Lake Management Technical Review Group to provide a technical opinion on the issues raised for consideration by the permitting authority. Final approval for any permit still resides with the appropriate permitting agency, but such consultation might solve some problems associated with issues noted below.
Eutrophication and Aquatic Plant Management in Massachusetts
xviii
2. The Lake Management Technical Review Group should work with the MDEP Division of Wetlands and Waterways to revise abutter notification legislation to be based on distance from the activity, not distance from the property containing the activity.
3. Where projects occur in more than one municipality, joint public hearings should be held and, whenever possible, identical Orders of Conditions should be written.
4. There is divided opinion regarding the appropriateness of maintaining Conservation Commission approval for permits to apply herbicides. The agencies and a majority of the CAC recommend that Conservation Commissions should retain their current authority to approve or deny aquatic pesticide and chemical treatments. A minority of the CAC members recommends that the Conservation Commission authority over projects involving aquatic pesticide and chemical treatments be limited to review and comment.
5. The existing home rule authority of communities to enact bylaws that restrict or impose fees on lake management activities should be maintained.
6. The Lake Management Technical Review Group should review all permitting thresholds (e.g., MEPA thresholds for Appeals of Orders of Conditions) for lake restoration projects to determine whether thresholds are triggered at appropriate levels and to determine at what point a project would not require any other permits beyond an Order of Conditions.
7. There is not an overriding need to change the Wetlands Protection Act and associated regulations to add additional interests of recreation and public safety. Some local bylaws already include these interests, and municipalities may do so if a need is perceived. There is a need to balance the eight interests of the Act among themselves (e.g., drawdown to provide flood protection affecting a private water supply well, use of herbicide or mechanical harvesting to restore desirable habitat affecting rare or endangered species). The trade-offs implicit in many lake management programs are not always obvious, but need to be explored within the context of management intent and regulatory constraints in each case.
8. Maintenance of open water as part of a functioning aquatic system is encouraged, but should not outweigh unreasonable impacts to any one of the eight interests of the Wetlands Protection Act. Determination of what constitutes reasonable or unreasonable impact must be made in each case, based on system features, designated uses of the lake, and the regulatory intent to prevent loss of resources.
Funding 1. A steady, reliable source of funding should be provided to implement and sustain lake
assessment and management programs. In particular, funding should be designated to develop and implement a statewide comprehensive management plan for invasive non-native species.
2. All lake management projects funded through federal or Commonwealth sources should go through a competitive process to evaluate their potential for success, cost/benefit ratio and environmental impact.
3. When providing funding to lake management projects, the agencies should provide adequate funds to conduct appropriate pre- and post-implementation monitoring that would assess the effectiveness of the technique(s) utilized. Activities by citizen lake monitoring programs should be included to the extent possible. Results of the assessments should be reported to a designated agency to facilitate a centralized collection of results of lake management activities. The Commonwealth should encourage and fund sufficient impact studies for each
Eutrophication and Aquatic Plant Management in Massachusetts
xix
type of lake management technique, including pre- and post-treatment biological surveys, to assess the range of likely outcomes and impacts and facilitate development of further guidelines for application of each technique.
Education 1. Education about problems associated with introduction and proliferation of non-native and/or
invasive species and options for prevention and control should be increased. 2. Commonwealth environmental agencies should implement a public education program that
provides lake associations and citizens with the knowledge and guidance necessary to effectively manage lakes and their watersheds.
3. Lakeshore homeowner groups should become actively involved in initiatives targeting lakes and ponds and the watershed approach to management.
4. Following a review of available materials, a library should be established and maintained to provide lake management information to agencies, municipalities, and the public. On-line resources should be made available to the public, and new resources should be developed and added as warranted to increase public awareness and empowerment.
5. The network of stakeholder groups should be increased and an information service should be provided for stakeholders, including a newsletter for receiving agency updates and news. This effort would be best coordinated through the Congress of Lake and Pond Associations.
Data Collection 1. Carry out a systematic data collection survey of 100 lakes each year for chlorophyll,
transparency, total phosphorus, total nitrogen and dissolved oxygen, and, at a smaller number of lakes, for aquatic macrophyte diversity and density to document the range of non-native species and nuisance conditions. Continued support is needed to achieve long-term goals.
2. To fully evaluate the effectiveness of various lake management techniques, conduct surveys of pre- and post-management conditions resulting from each type of treatment. These studies, noted as a need under the Summary of Findings and Recommendations for Funding, should incorporate surveys as warranted to quantify the level of success in achieving the objective of each implementation, any impacts to non-target species or habitat, and the specific effects on regulatory interests, such as the 8 interests of the Wetlands Protection Act.
3. Orders of Conditions for lake, shoreline or adjacent wetlands management should require an appropriate biological survey before and after treatment in order to guide future management plans toward maximizing effectiveness of the technique, while minimizing impacts to non-target organisms. Surveys for large and/or complex projects should be intensive enough to quantify impacts and of sufficient duration to detect more than catastrophic effects, but should be efficient to the extent that they minimize cost.
4. Copies of the Order of Conditions for lake management operations should be maintained by the Lake Management Technical Review Group to provide a record of which types of management are being conducted in all areas of the state, and the types of governing orders established for each.
5. Additional information on herbicide usage should be included in the application for the License to Apply Chemicals, specifically identifying the target species, the USEPA registration number, the maximum environmental concentration, and relevant water

Eutrophication and Aquatic Plant Management in Massachusetts
xx
chemistry. Inclusion of information on how control of target species will be maintained following herbicide application should be strongly encouraged. Also include exact location as latitude/longitude and/or PALIS number.
6. Continued emphasis should be placed on public involvement through volunteer surveys and educational programs. The state should encourage active involvement of citizens in long-term monitoring to foster information transfer within the community. The Lakes and Ponds Initiative is currently supporting such efforts.
Training 1. Train local Conservation Commissions and members of the local Board of Health regarding
lake management issues to both help explain regulations and ensure well informed decision making at the local level. The Conservation Commissions and local communities should be advised and assisted in developing lake management plans and the use of this GEIR. Training also should include staff from DEP’s wetlands staff.
2. Stakeholders (e.g., lake associations, COLAP) and local municipal boards and commissions should receive training on the current extent of the problem of non-native invasive aquatic species, nutrient loading from non-point sources, and recognized measures of prevention that can be applied on the local level.
Research 1. Future research on nutrient control should focus on effective techniques to reduce
phosphorus and nitrogen inputs. Development of approaches for preventing nutrient inputs is preferable to addressing resultant problems on an in-lake basis.
2. Future research on plant management should focus on integrated management approaches that maintain control after infestations are initially addressed. Research on individual techniques should emphasize greater specificity for target species and less impact to non-target organisms.
3. Adequate assessment of management impacts should be pursued as a research function.
Eutrophication and Aquatic Plant Management in Massachusetts
xxi
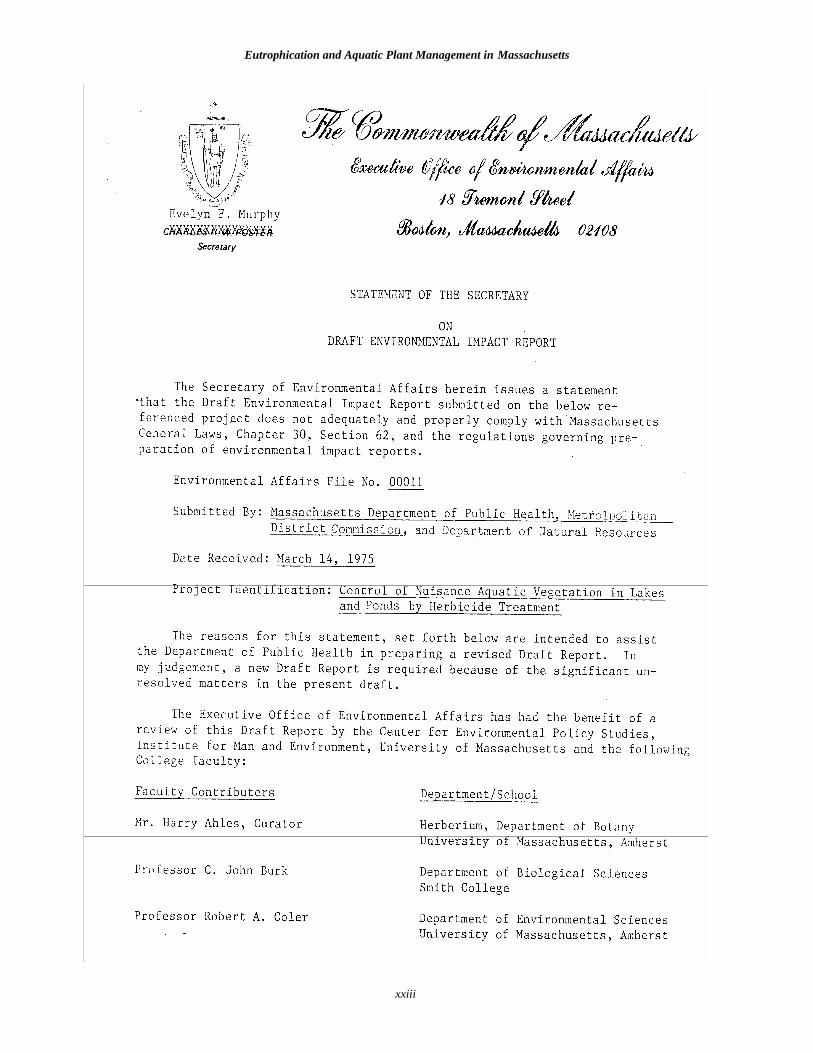
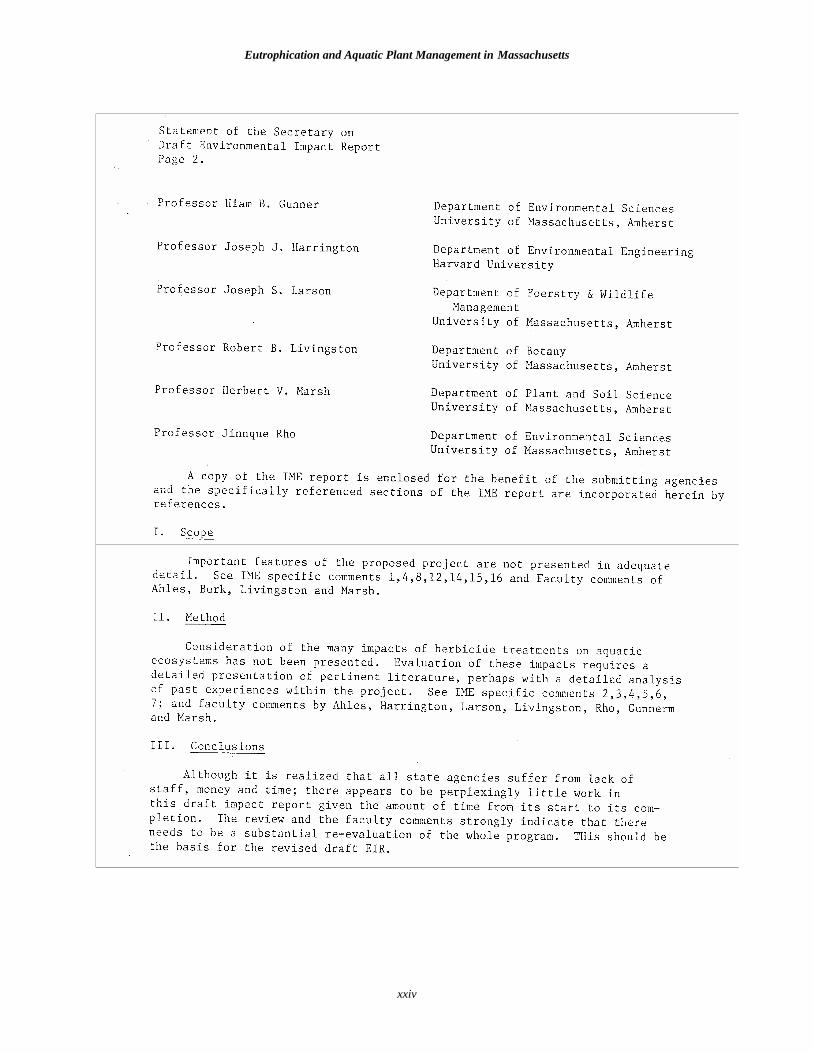
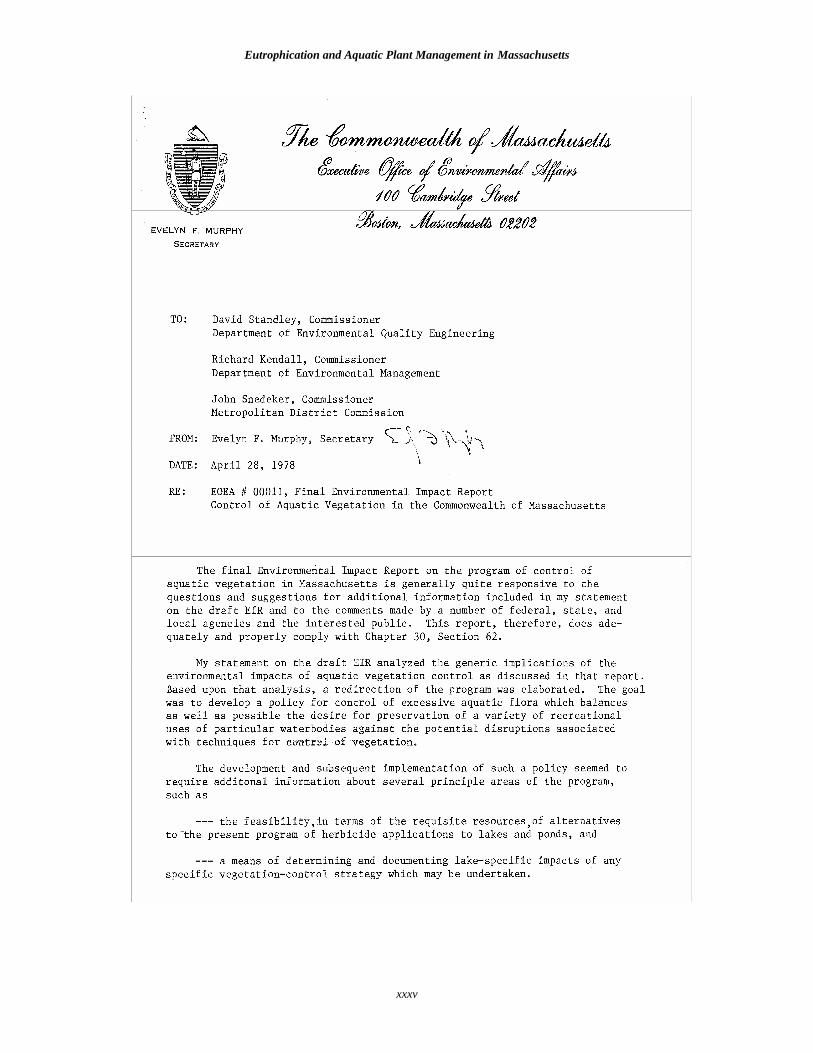
PROJECT BACKGROUND With enactment of the Massachusetts Environmental Policy Act (MEPA) and establishment of its regulations in 1973, the Division of Environmental Health proposed to prepare a combined Environmental Impact Report (EIR) for its program for Control of Aquatic Nuisance Vegetation. The Secretary’s Statement on the Environmental Assessment Form (EOEA #0011), issued August 22, 1973 concurred with that decision. REVIEW OF THE 1978 GEIR A Draft Environmental Impact Report, entitled Control of Nuisance Aquatic Vegetation in Lakes and Ponds by Herbicide Treatment, was submitted by the Massachusetts Department of Public Health, Metropolitan District Commission and Department of Natural Resources in 1975. The Secretary’s Statement on the Draft EIR, issued May 5, 1975, determined that the report did not adequately comply with G.L. c.30, s.62 and the regulations governing preparation of environmental impact reports. A second Draft EIR, entitled Control of Aquatic Vegetation in the Commonwealth of Massachusetts, was submitted by the Department of Environmental Quality Engineering (DEQE) now the Department of Environmental Protection, Metropolitan District Commission (MDC) and Department of Environmental Management (MDCR), now the Department of Conservation and Recreation, in 1977. The Secretary’s Statement on the Draft EIR, issued January 20, 1978, determined that the report was adequate. The Final EIR was submitted in 1978. The Secretary’s Statement on the Final EIR, issued April 27, 1978, determined that the final report was inadequate. A redirection of the program was developed in the EIR review. Emphasis was shifted from chemical control to long-term lake management with physical control of vegetation by harvesting and dredging. Requirements for lake evaluations and pre- and post-treatment monitoring were established. The 1978 Generic Environmental Impact Report was intended as a “comprehensive overview of the causes and effects of eutrophication and as an impact report on the combined projects of aquatic vegetation control in the Commonwealth of Massachusetts” (NERI, 1978). The three major objectives were to summarize the causes of extensive aquatic vegetation growth, to examine the latest aquatic vegetation control techniques and to report on programs to control aquatic vegetation in the Commonwealth of Massachusetts. The goal of the report was to make it accessible to both the scientist and the lay person. The 1978 GEIR was successful in fulfilling the objectives of the report, but provided limited decision-making criteria. Listed in the report are many of the causes and treatments for lake eutrophication and nuisance aquatic vegetation, but there are no connections drawn between the problems and which treatments would be least costly or have the least undesirable impact on the environment. General criticisms of the report at the time were that the approach was oversimplified and ambiguous. It was suggested that the report needed clarification in regard to long-term vs. short-term solutions. The current effort is a more holistic approach, taking into

Eutrophication and Aquatic Plant Management in Massachusetts
xxii
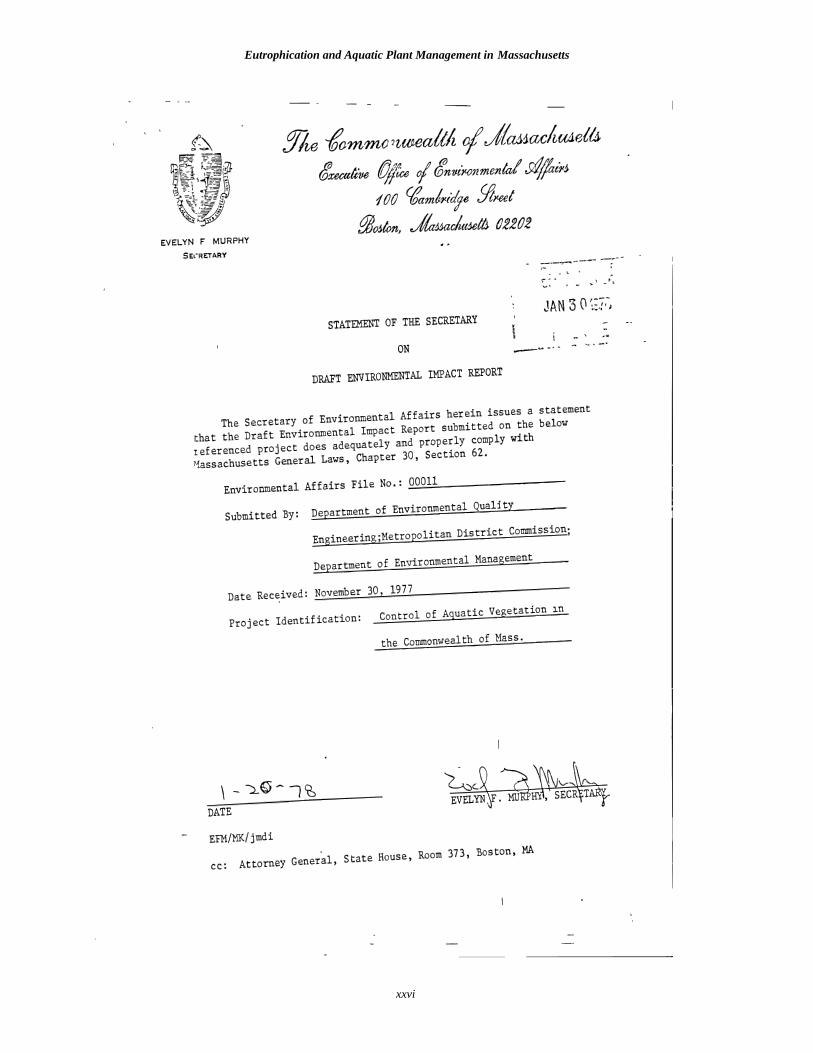
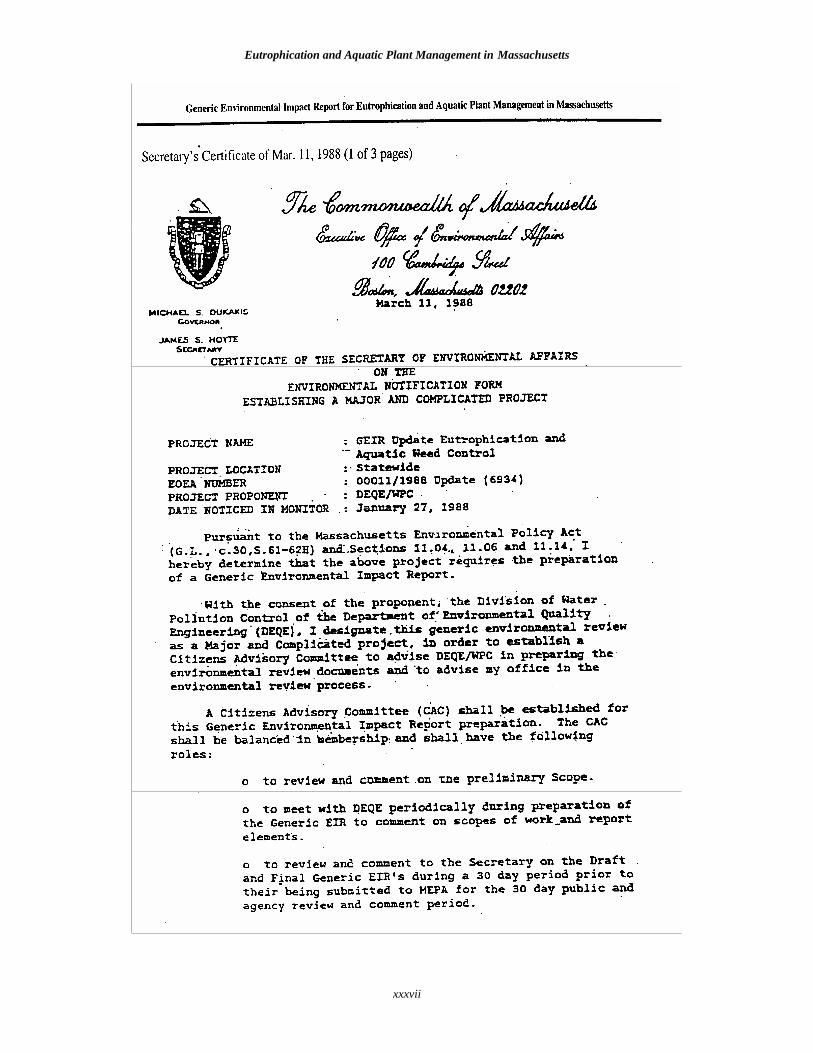
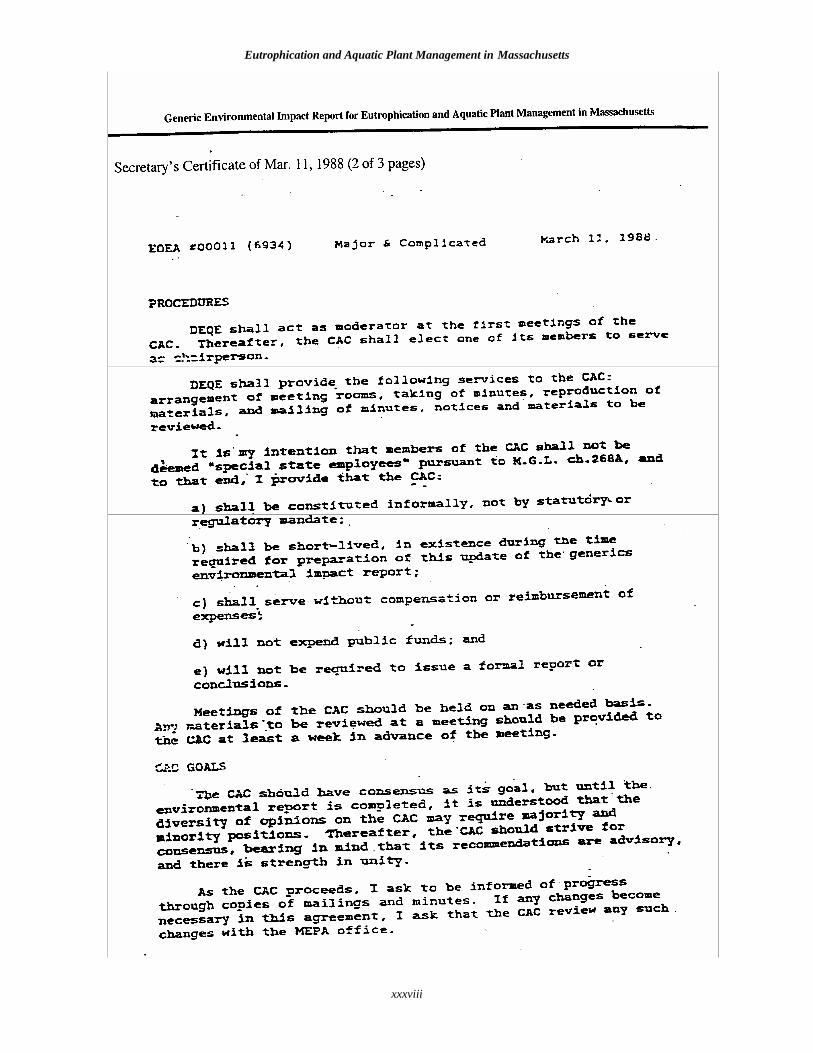
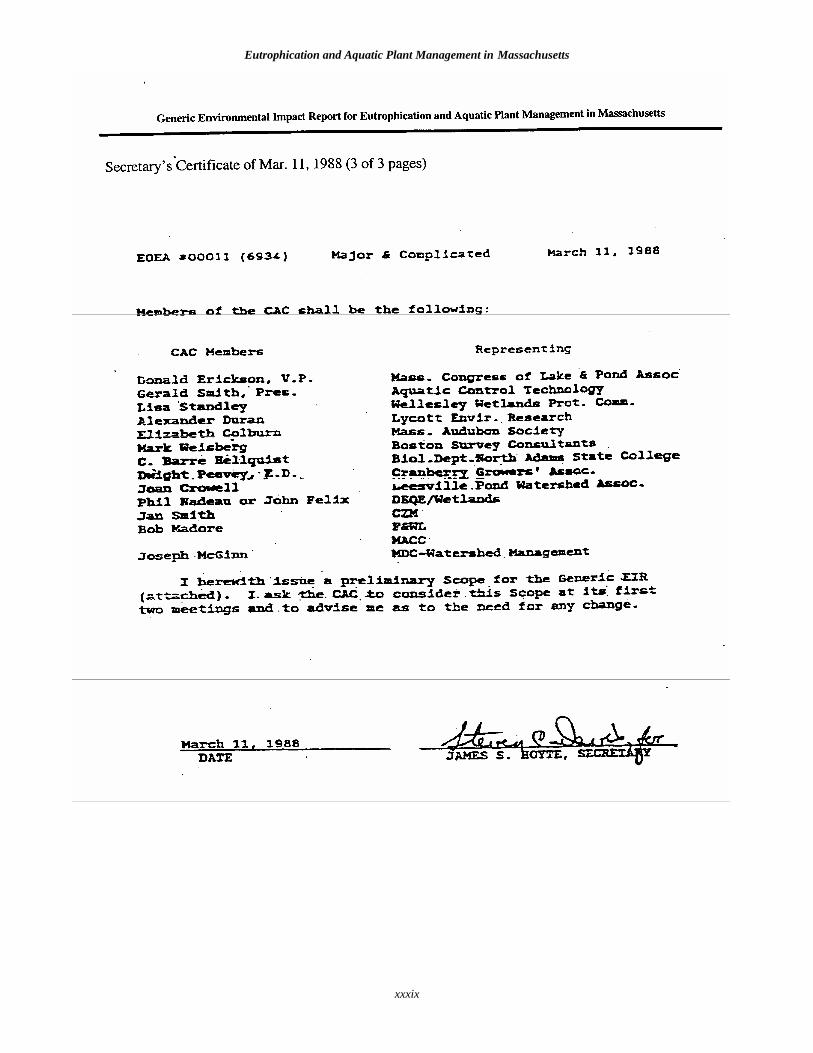
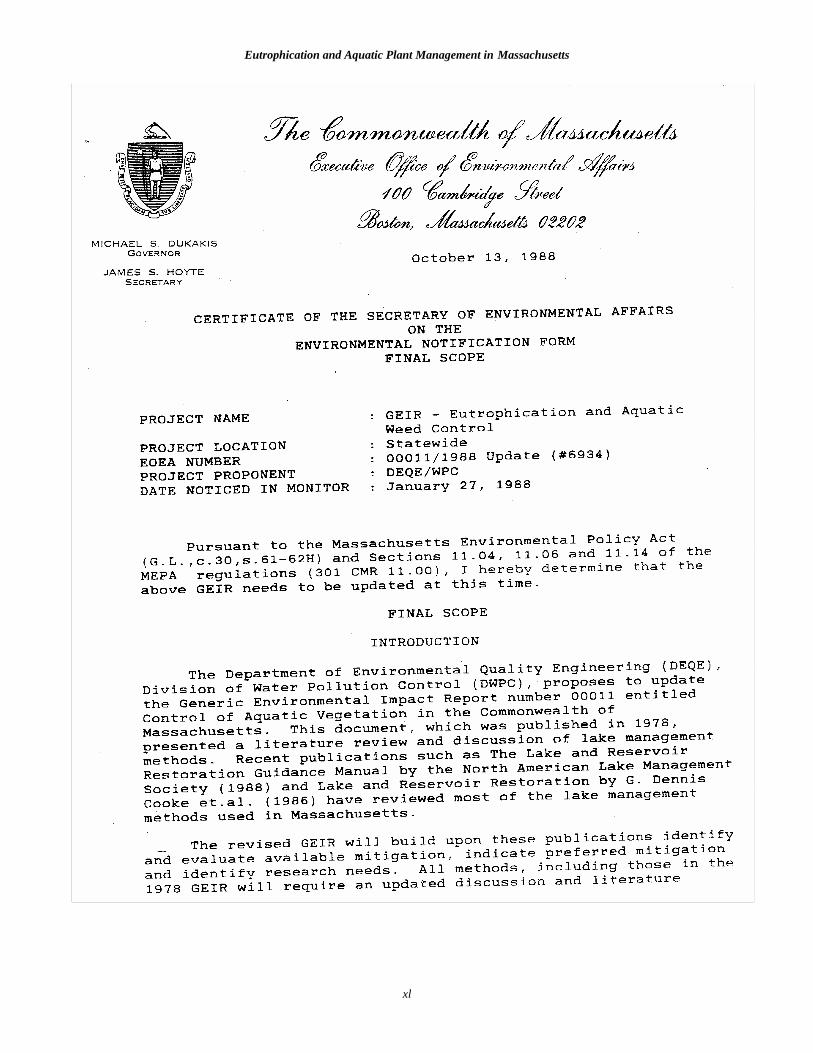
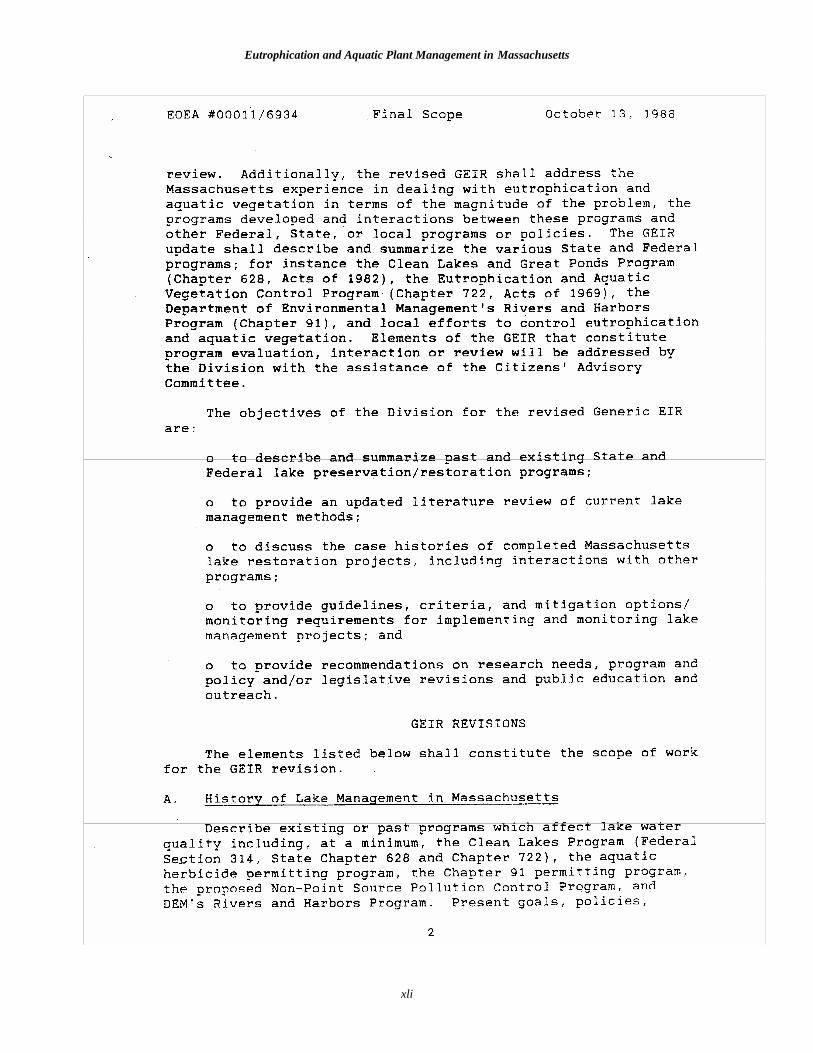
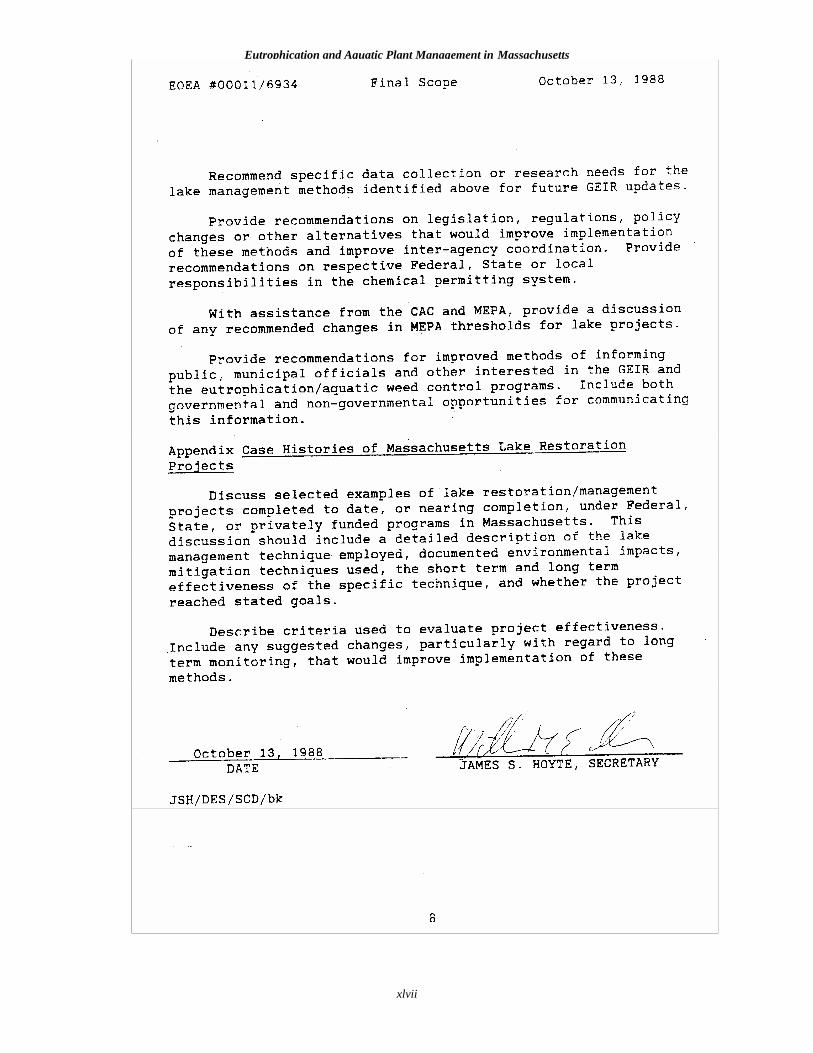
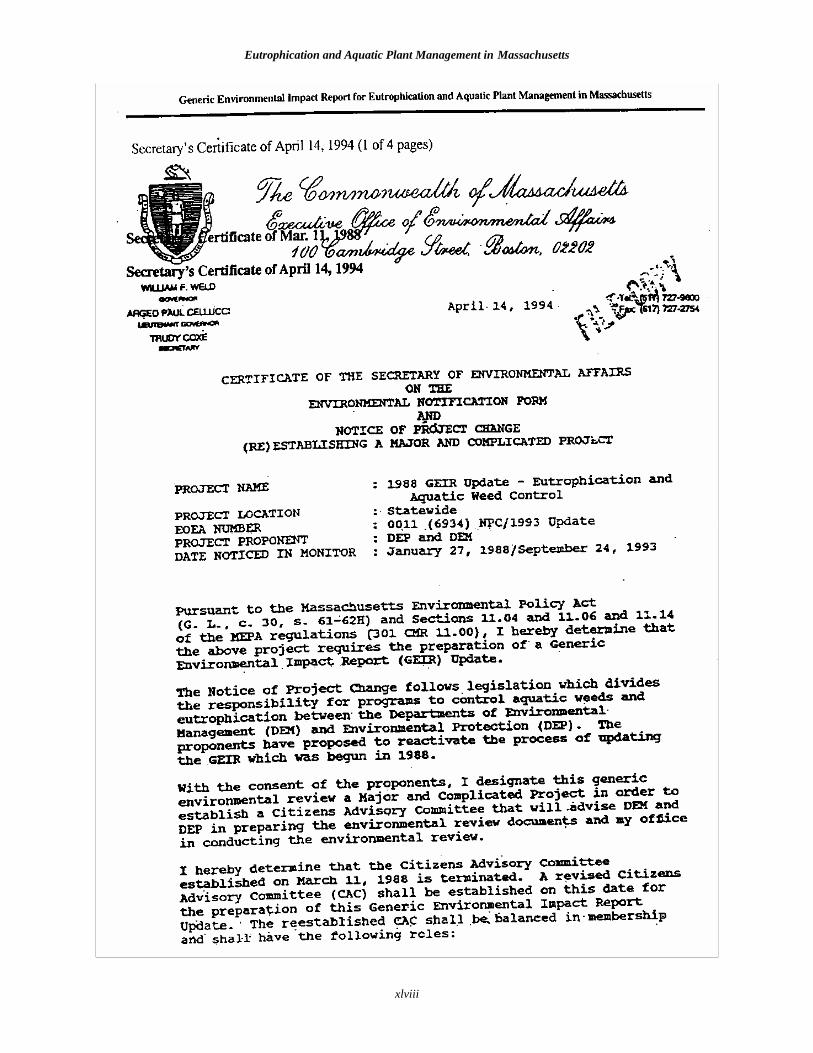
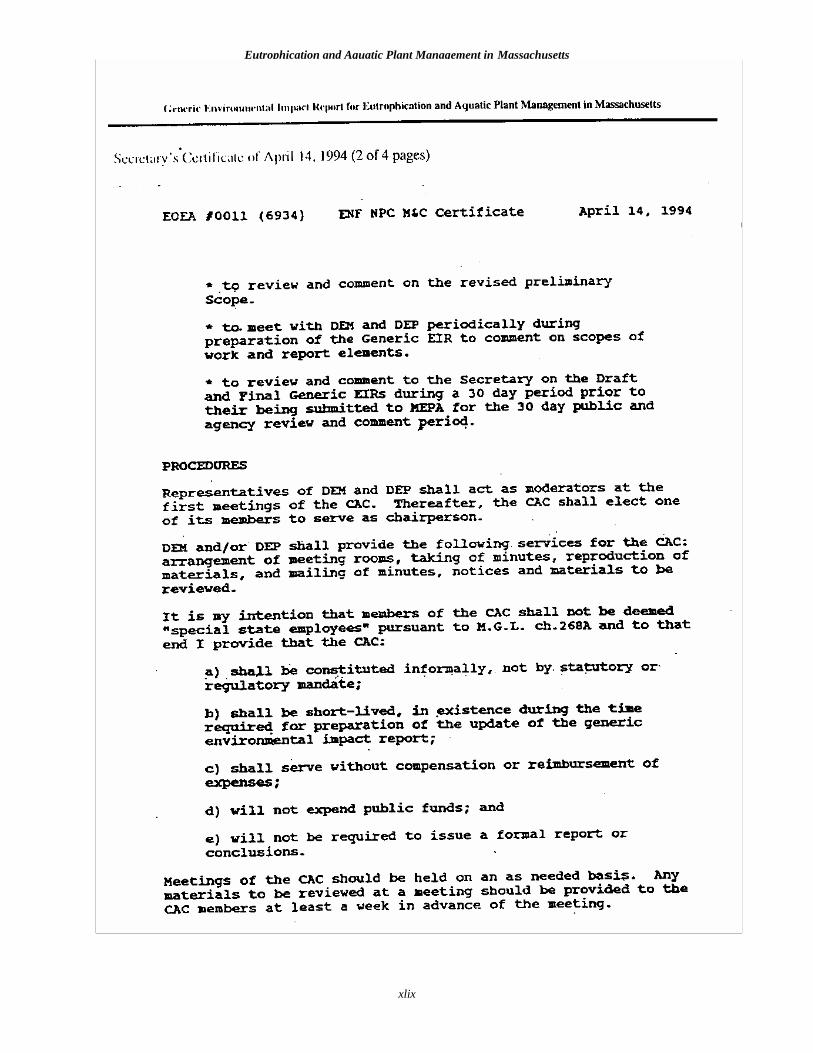
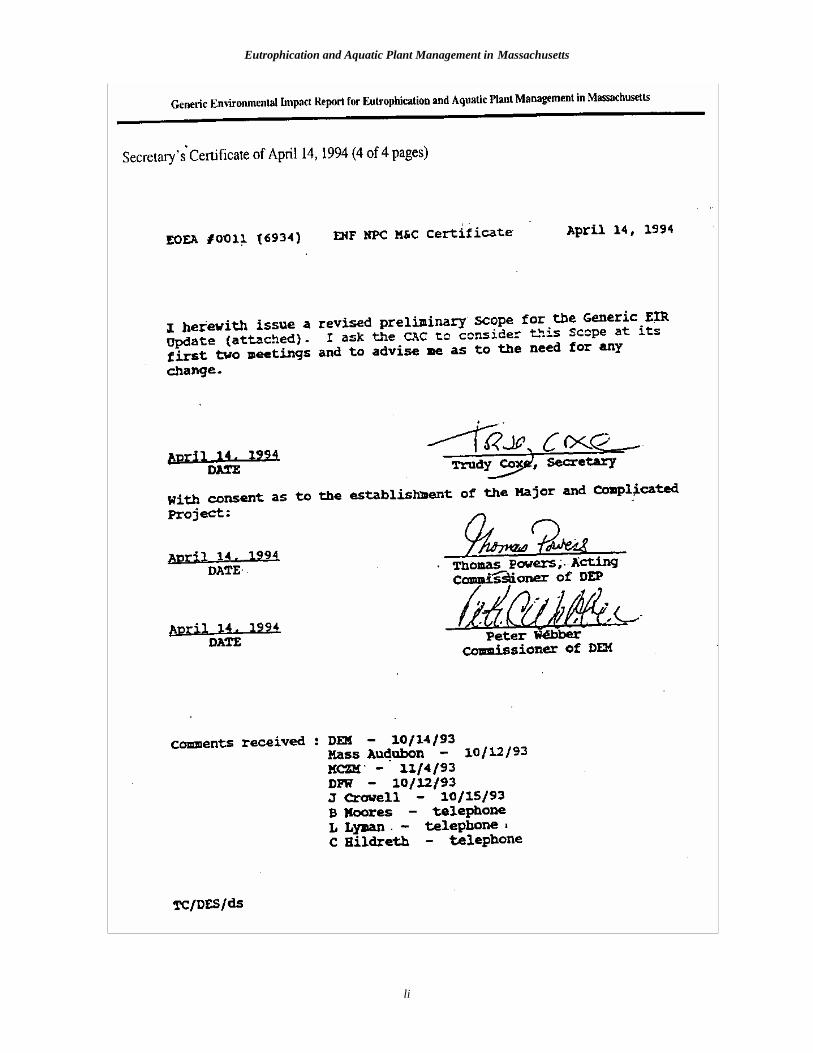
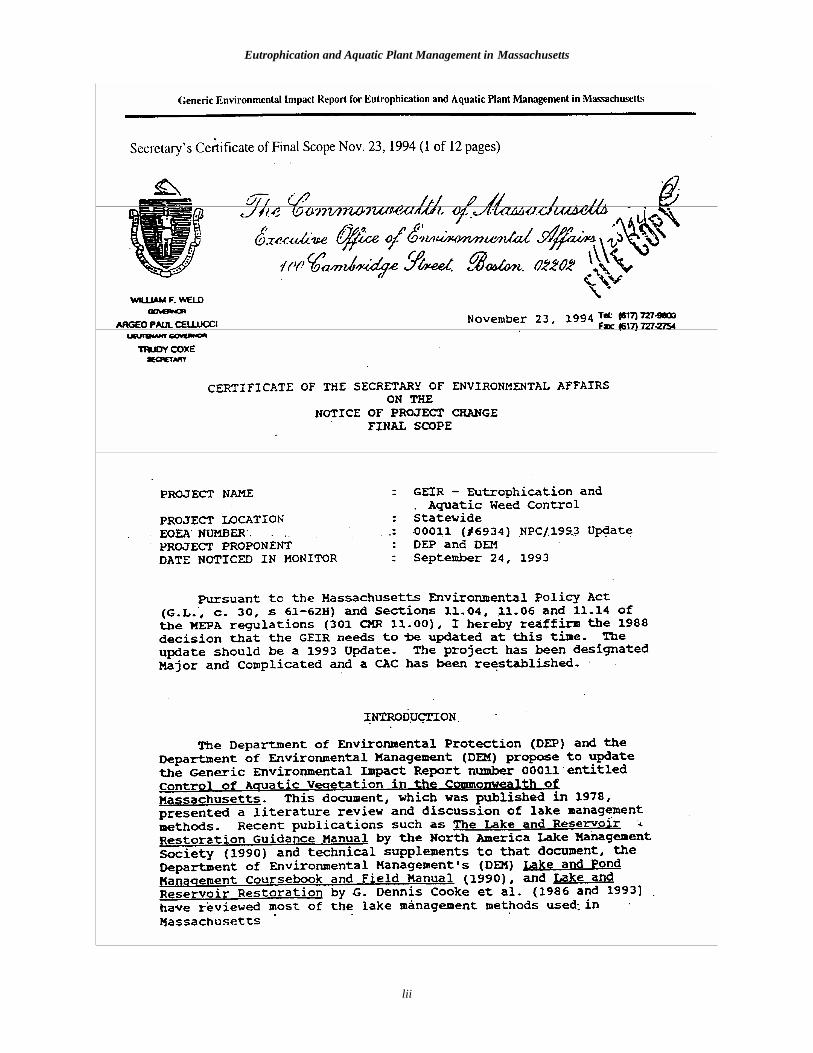
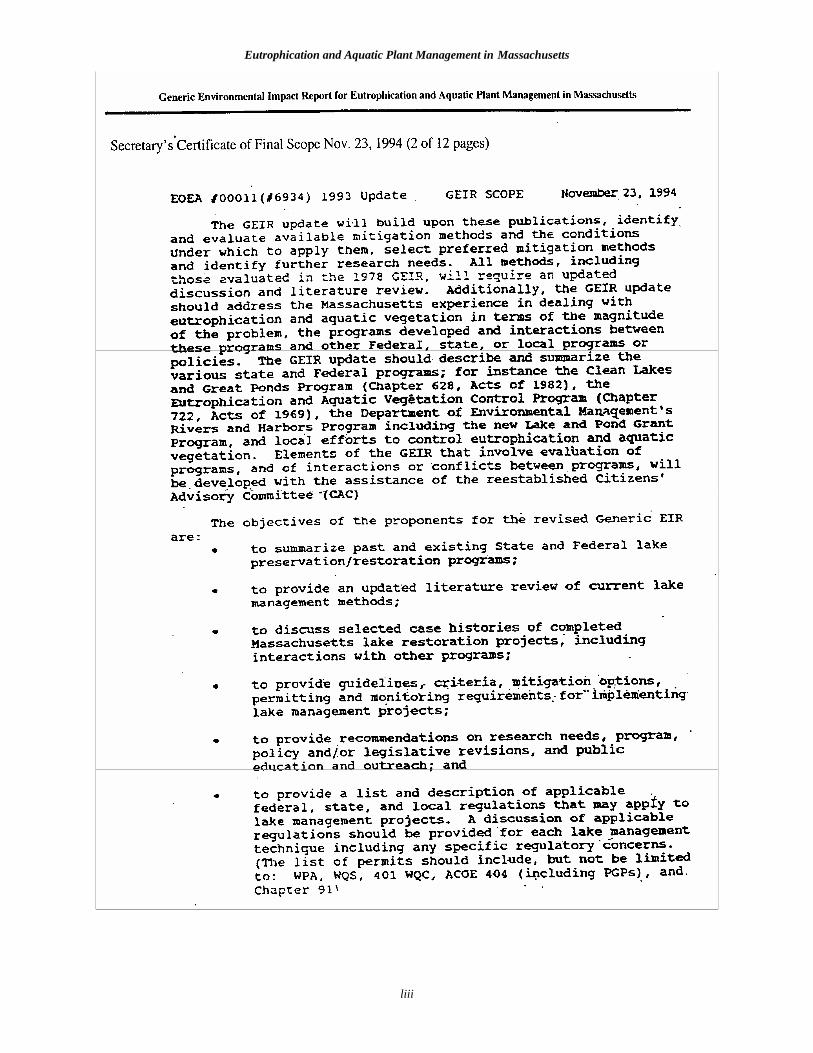
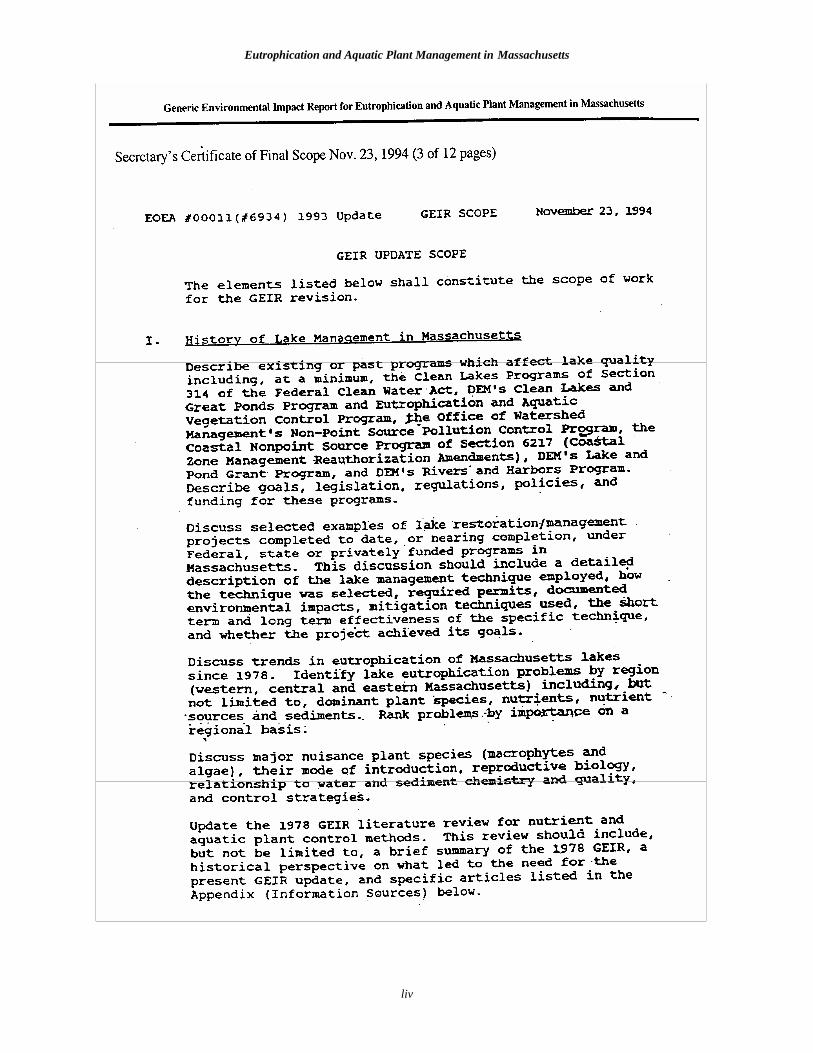
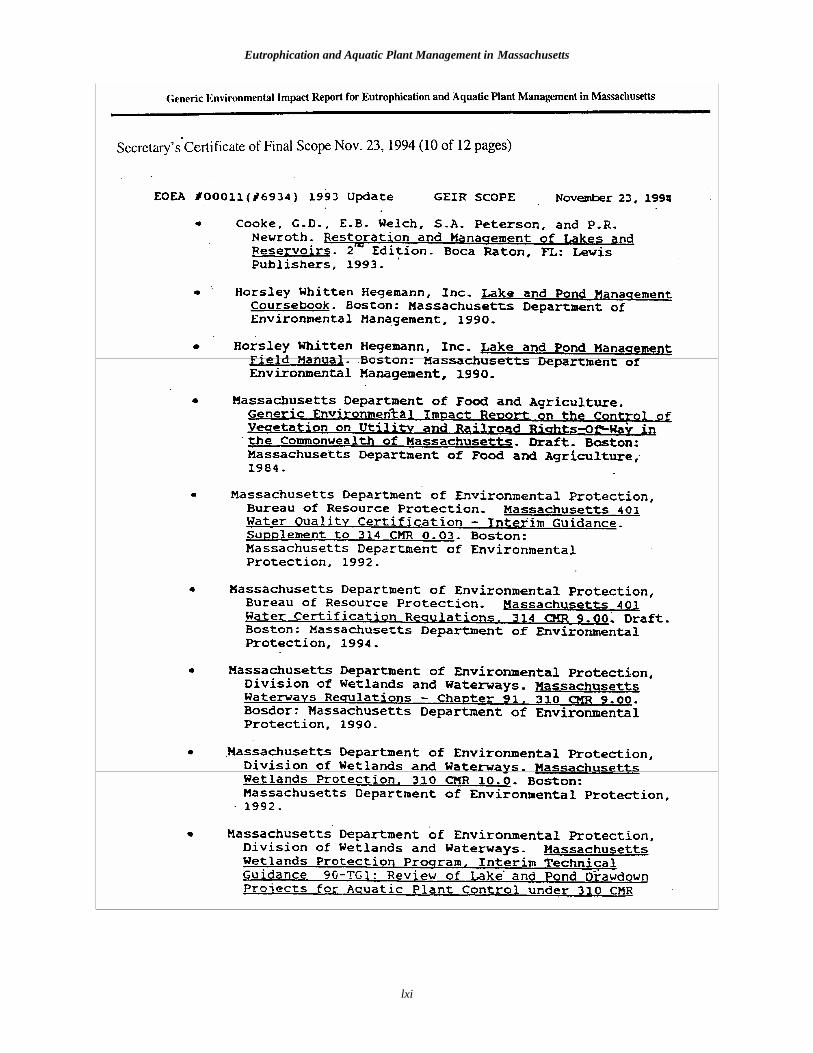
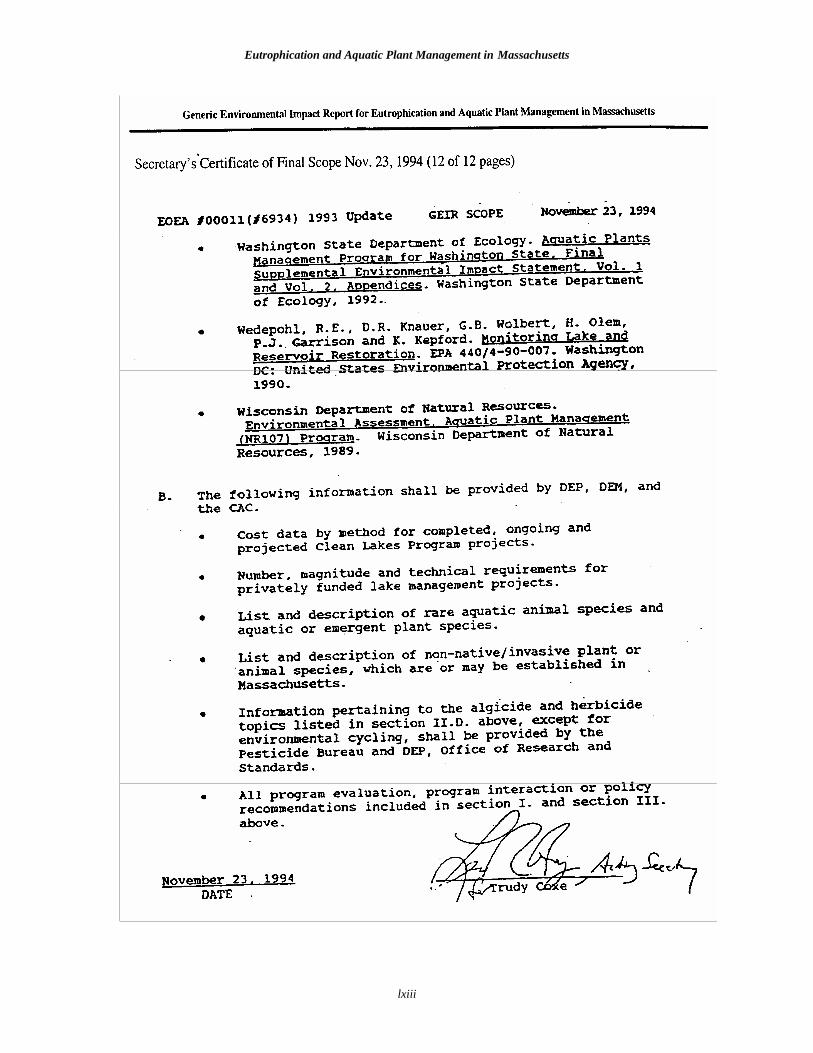
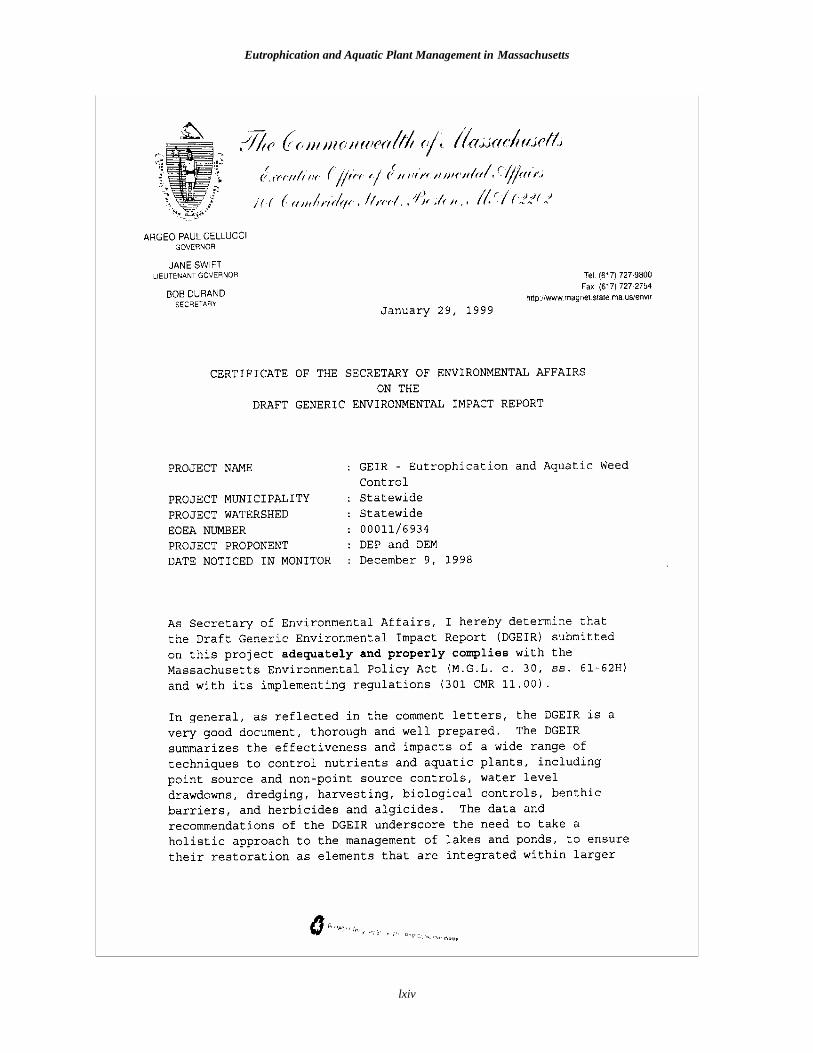
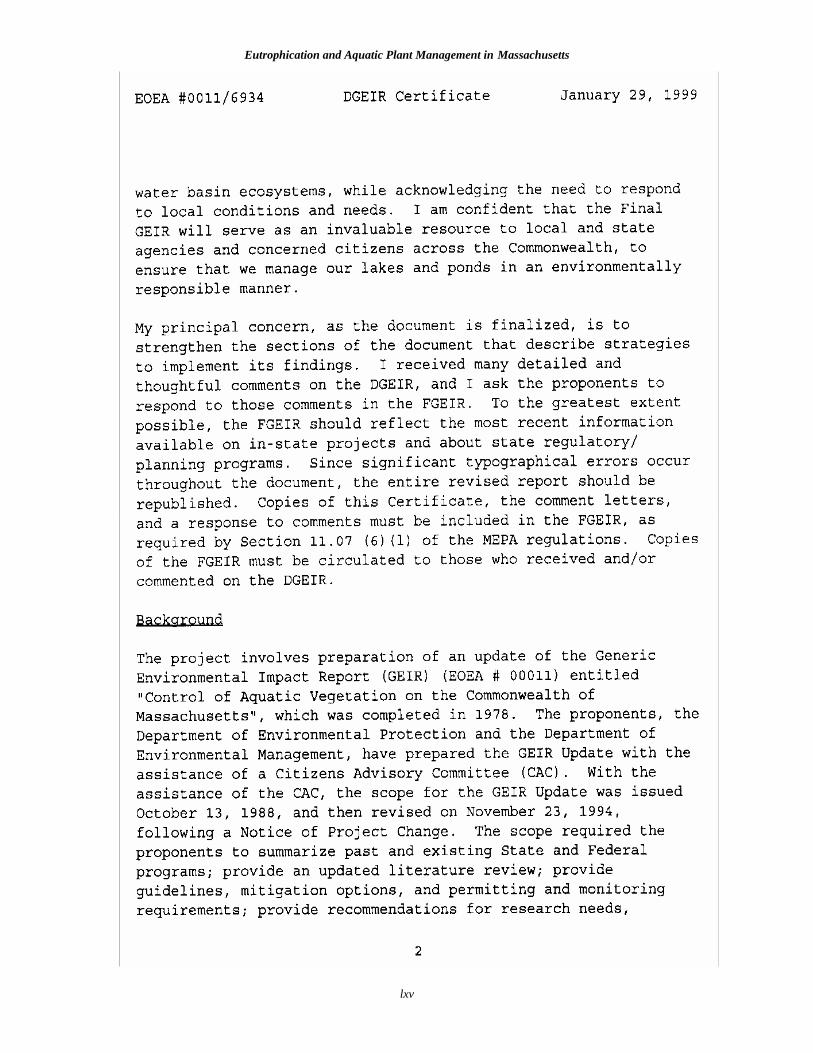
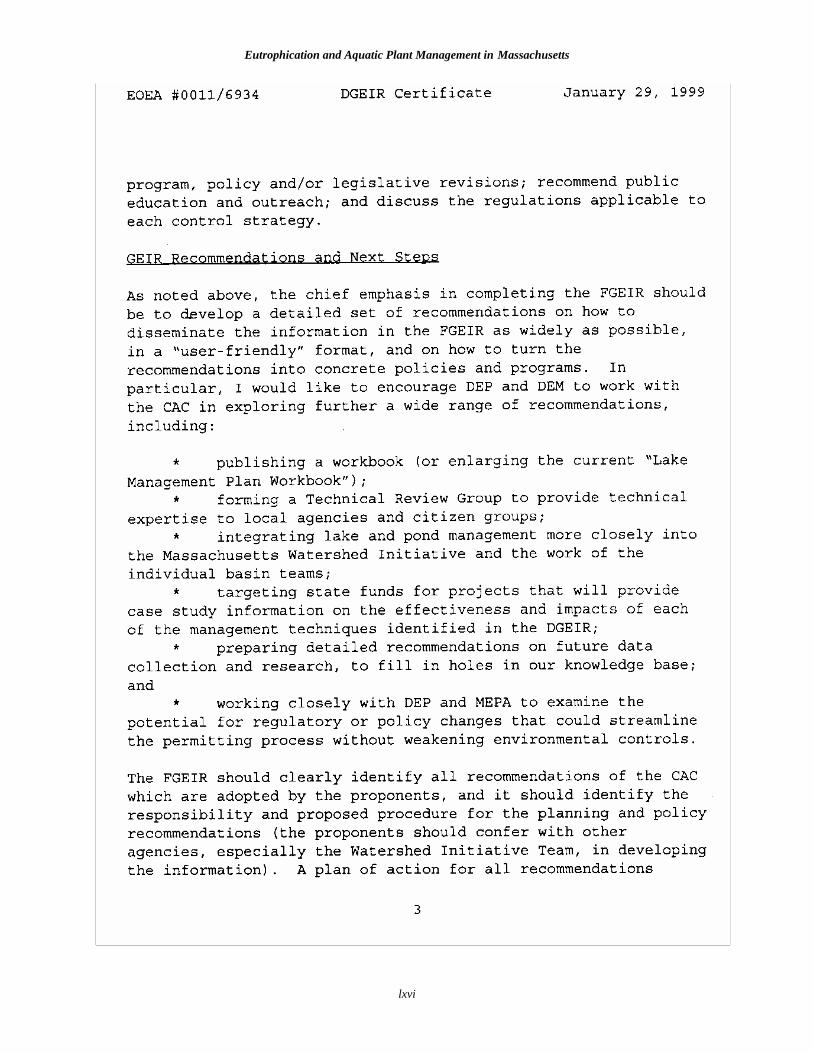
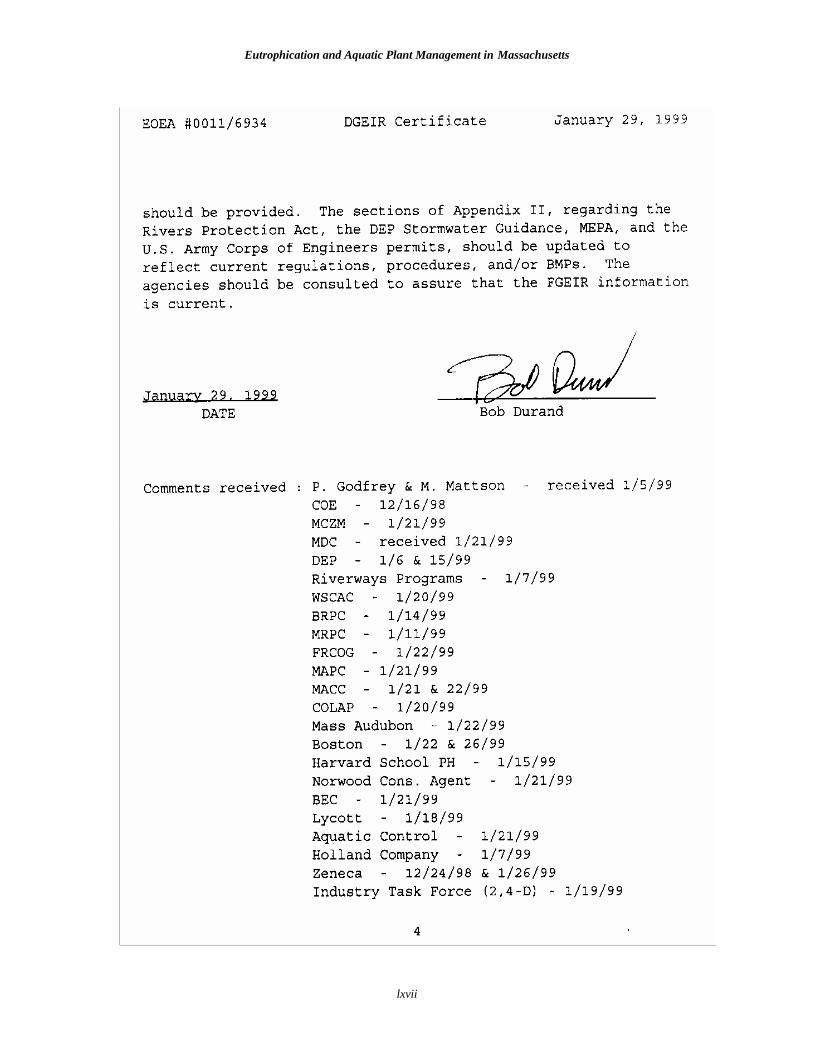
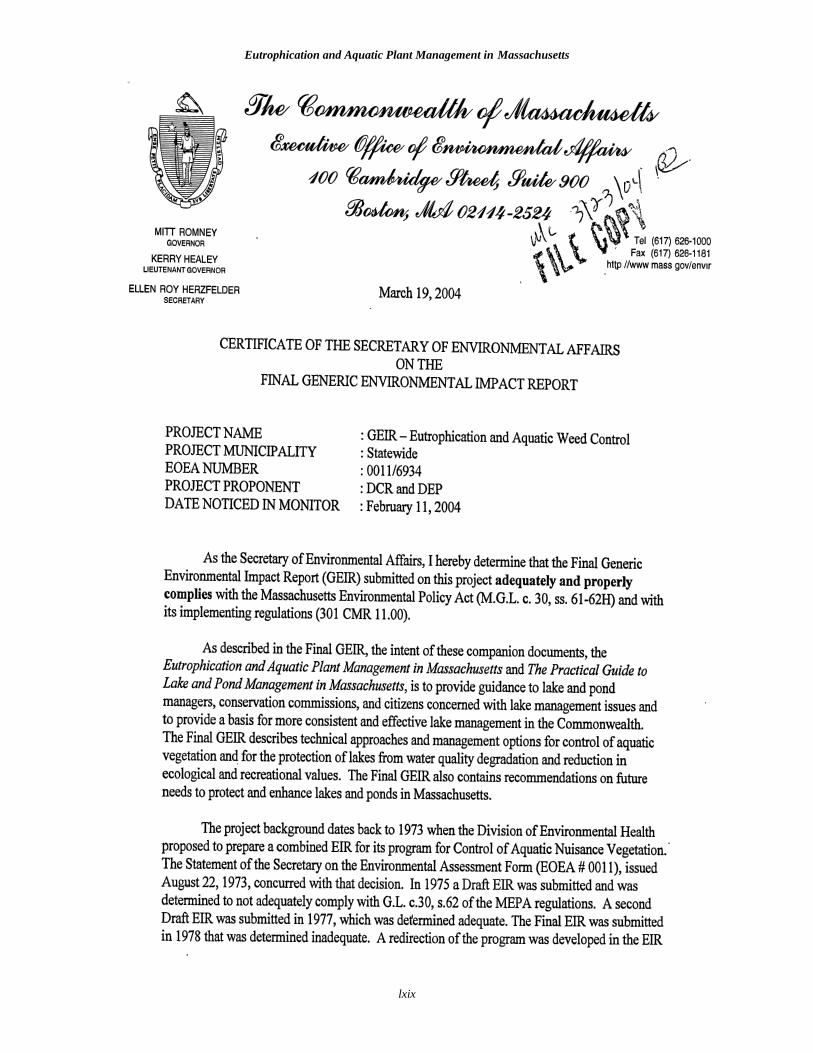
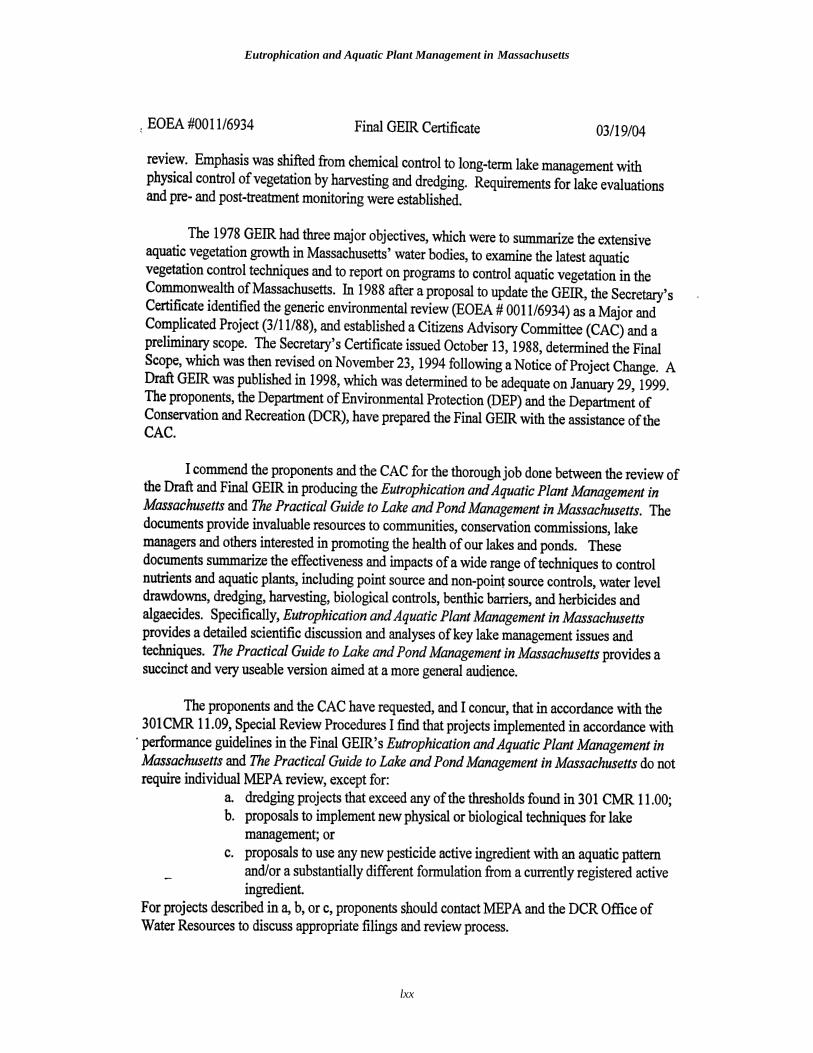
account the numerous factors that affect the growth of aquatic plants, as well as the impacts of treatments on the lake environment and non-target species. In addition to the need for a more holistic approach to aquatic plant control, other reasons for updating the GEIR include the availability of new methods, the need to distribute current information on old methods and the need to update summaries of policies and programs. In 1978, very few lakes and ponds in Massachusetts had been treated for nuisance vegetation. The most frequently used technique was chemical control through the Aquatic Nuisance Control Program of the Environmental Health Division of the Department of Environmental Quality Engineering (now Department of Environmental Protection). Other types of control had been used in Massachusetts at the time, but they were not affiliated with the control program sponsored by the Commonwealth. Thus, they were only briefly described in the GEIR. Since that time, research has been substantially augmented on many control alternatives, such as dredging, drawdown, nutrient inactivation and biological controls. UPDATE OF THE GEIR In 1988 the Clean Lakes Program of the DEQE Division of Water Pollution Control proposed to update the Generic EIR for Eutrophication and Aquatic Vegetation Control. With the consent of the proponent, the Secretary’s Certificate, issued March 11, 1988, identified the generic environmental review (EOEA #0011/6934) as a Major and Complicated Project, and established a Citizens Advisory Committee (CAC) and a preliminary scope. The Secretary’s Certificate, issued October 13, 1988, determined the Final Scope. In 1993, following enactment of legislation which divided the responsibility for control of aquatic weeds and eutrophication programs between the Department of Environmental Protection (MDEP, formerly the MDEQE) and the Department of Environmental Management (MDEM, now the Department of Conservation and Recreation, DCR), the MDEP and MDEM submitted a Notice of Project Change (NPC) to the Secretary. The Secretary’s Certificate on the NPC, issued April 14, 1994, reestablished the review as a Major and Complicated Project and re-established a CAC. The Final Scope of the GEIR was established in the Secretary’s Certificate issued November 23, 1994. Since that date, the MDCR and MDEP, with the assistance of the CAC, have been preparing the Update of the GEIR. Outside technical help has been applied, with an extensive review process that has slowed development of the update but is expected to result in a superior product. A draft GEIR was published in 1998 and extensively reviewed by EOEA agencies and the public over a prolonged period ending in 1999. On January 29, 1999 the Secretary issued a Certificate of Compliance, with comments to be addressed in the final GEIR. This version of the GEIR reflects comments received throughout its development. Copies of the Secretary’s Certificates follow.
Eutrophication and Aquatic Plant Management in Massachusetts
xxiii
Eutrophication and Aquatic Plant Management in Massachusetts
xxiv

Eutrophication and Aquatic Plant Management in Massachusetts
xxv
Eutrophication and Aquatic Plant Management in Massachusetts
xxvi
Eutrophication and Aquatic Plant Management in Massachusetts
xxvii
Eutrophication and Aquatic Plant Management in Massachusetts
xxviii
Eutrophication and Aquatic Plant Management in Massachusetts
xxix
Eutrophication and Aquatic Plant Management in Massachusetts
xxx
Eutrophication and Aquatic Plant Management in Massachusetts
xxxi

Eutrophication and Aquatic Plant Management in Massachusetts
xxxii
Eutrophication and Aquatic Plant Management in Massachusetts
xxxiii

Eutrophication and Aquatic Plant Management in Massachusetts
xxxiv
Eutrophication and Aquatic Plant Management in Massachusetts
xxxv

Eutrophication and Aquatic Plant Management in Massachusetts
xxxvi
Eutrophication and Aquatic Plant Management in Massachusetts
xxxvii
Eutrophication and Aquatic Plant Management in Massachusetts
xxxviii
Eutrophication and Aquatic Plant Management in Massachusetts
xxxix
Eutrophication and Aquatic Plant Management in Massachusetts
xl
Eutrophication and Aquatic Plant Management in Massachusetts
xli

Eutrophication and Aquatic Plant Management in Massachusetts
xlii
Eutrophication and Aquatic Plant Management in Massachusetts
xliii
Eutrophication and Aquatic Plant Management in Massachusetts
xliv
Eutrophication and Aquatic Plant Management in Massachusetts
xlv
Eutrophication and Aquatic Plant Management in Massachusetts
xlvi
Eutrophication and Aquatic Plant Management in Massachusetts
xlvii
Eutrophication and Aquatic Plant Management in Massachusetts
xlviii
Eutrophication and Aquatic Plant Management in Massachusetts
xlix
Eutrophication and Aquatic Plant Management in Massachusetts
l
Eutrophication and Aquatic Plant Management in Massachusetts
li
Eutrophication and Aquatic Plant Management in Massachusetts
lii
Eutrophication and Aquatic Plant Management in Massachusetts
liii
Eutrophication and Aquatic Plant Management in Massachusetts
liv

Eutrophication and Aquatic Plant Management in Massachusetts
lv
Eutrophication and Aquatic Plant Management in Massachusetts
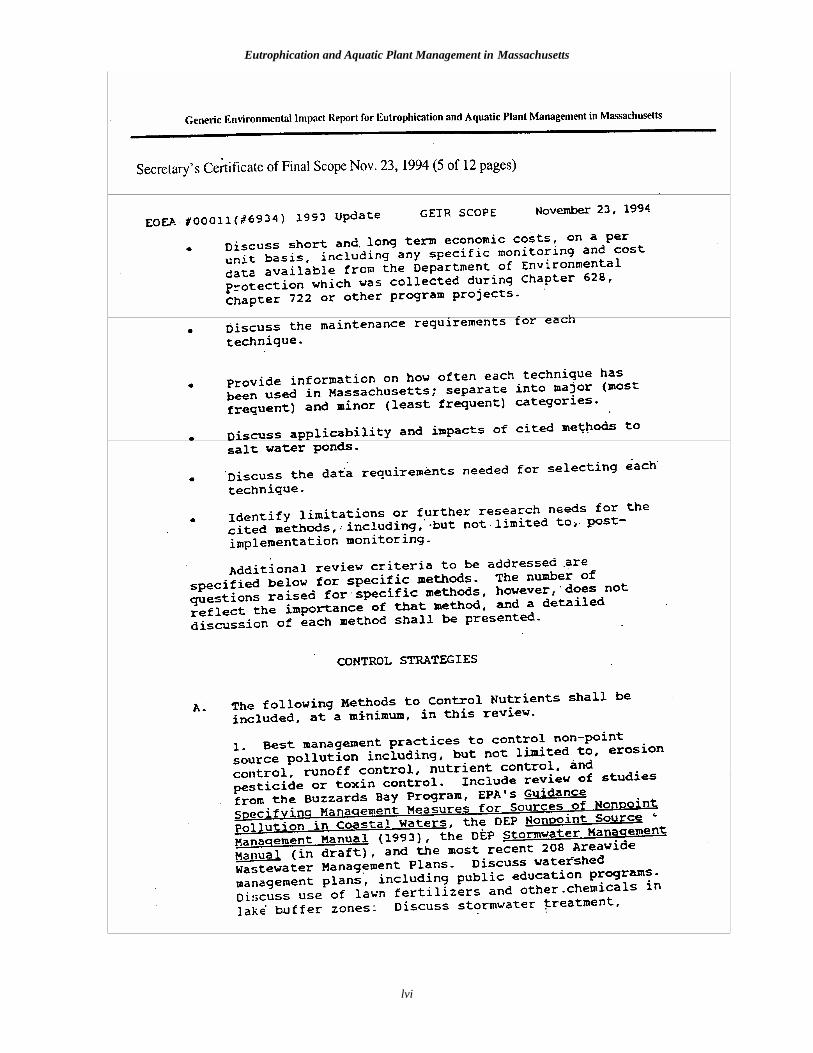
lvi
Eutrophication and Aquatic Plant Management in Massachusetts
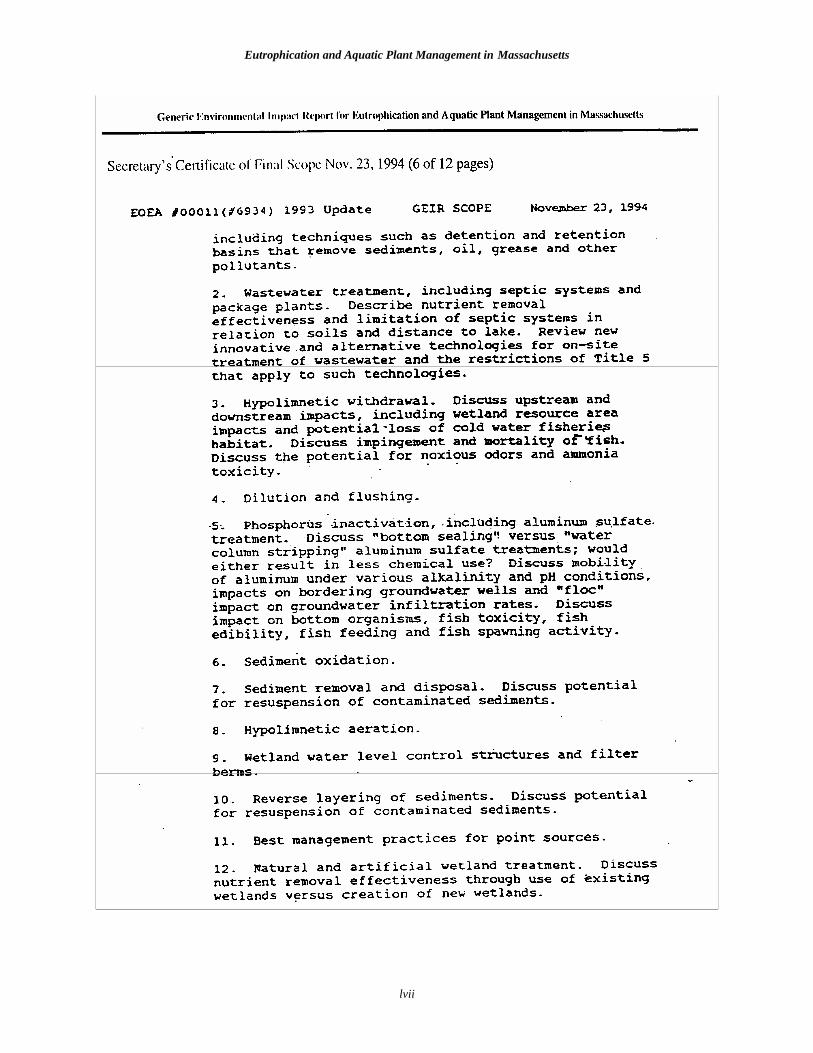
lvii

Eutrophication and Aquatic Plant Management in Massachusetts
lviii
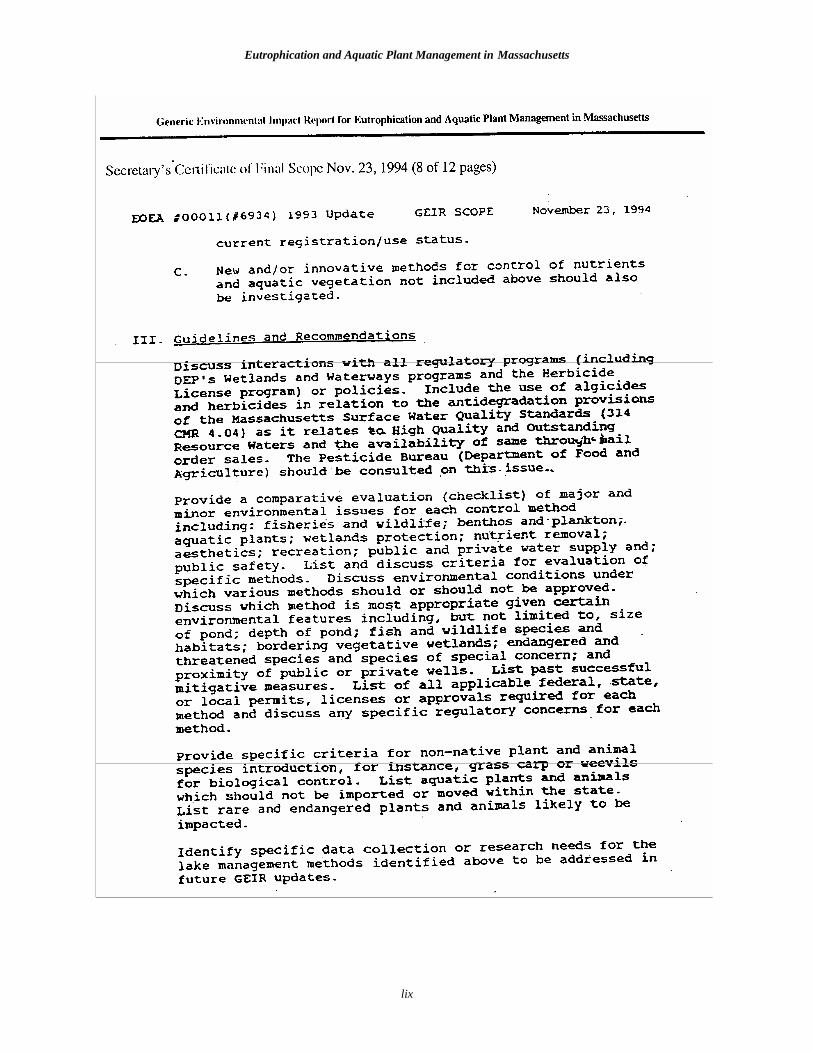
Eutrophication and Aquatic Plant Management in Massachusetts
lix
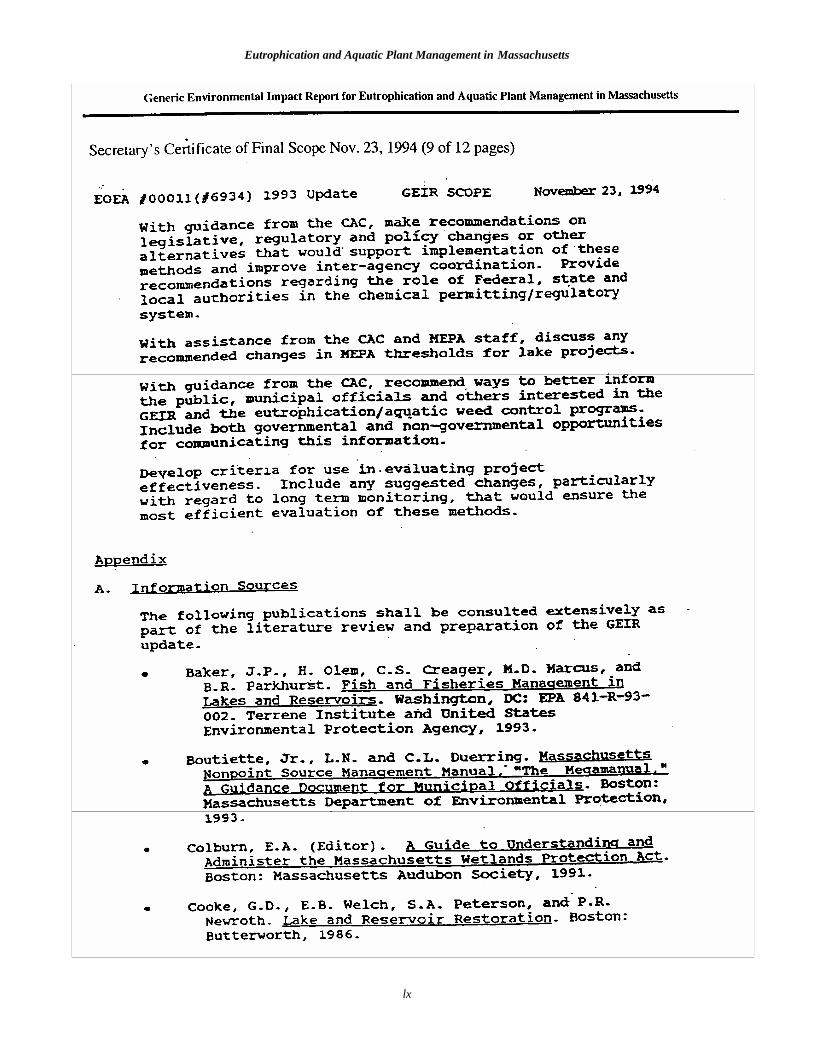
Eutrophication and Aquatic Plant Management in Massachusetts
lx
Eutrophication and Aquatic Plant Management in Massachusetts
lxi

Eutrophication and Aquatic Plant Management in Massachusetts
lxii
Eutrophication and Aquatic Plant Management in Massachusetts
lxiii
Eutrophication and Aquatic Plant Management in Massachusetts
lxiv
Eutrophication and Aquatic Plant Management in Massachusetts
lxv
Eutrophication and Aquatic Plant Management in Massachusetts
lxvi
Eutrophication and Aquatic Plant Management in Massachusetts
lxvii

Eutrophication and Aquatic Plant Management in Massachusetts
lxviii
Eutrophication and Aquatic Plant Management in Massachusetts
lxix
Eutrophication and Aquatic Plant Management in Massachusetts
lxx

Eutrophication and Aquatic Plant Management in Massachusetts
lxxi
Eutrophication and Aquatic Plant Management in Massachusetts
lxxii
Eutrophication and Aquatic Plant Management in Massachusetts
lxxiii
Eutrophication and Aquatic Plant Management in Massachusetts
lxxiv
Eutrophication and Aquatic Plant Management in Massachusetts
lxxv
Eutrophication and Aquatic Plant Management in Massachusetts
lxxvi
Eutrophication and Aquatic Plant Management in Massachusetts
1.0 Introduction Page 1-1
1.0 INTRODUCTION
1.1 BACKGROUND
1.1.1 The Commonwealth’s Policy on Lake and Pond Management The focus of this Generic Environmental Impact Report is to fully evaluate available lake management techniques for the control of nutrients and aquatic plants in order to support the Commonwealth’s 1994 Policy on Lake and Pond Management. That policy is: Massachusetts advocates a holistic approach to lake and pond management and
planning which integrates watershed management, in-lake management, pollution prevention and education. Lake management in Massachusetts will be designed with consideration of the quality of the lake’s ecosystem, its designated uses and other desired uses, the ability of the ecosystem to sustain those uses, and the long term costs, benefits and impacts of available management options.
The policy has the following goals:
To promote a holistic approach to lake management which is based on sound scientific principles and emphasizes the integrated use of watershed management, in-lake management, pollution prevention and education.
To promote sound planning and management of lakes and their surrounding watersheds by providing guidance to municipal agencies, local organizations, and the public.
To streamline the permitting process for in-lake management projects To promote the importance of lakes within ecosystems, acknowledging all associated
wetland habitats, including open water, and the biological resources they support. To assure that decisions on the use of lake and watershed management techniques to
remediate the impacts of eutrophication and non-native/invasive species consider long-term issues as well as immediate costs, benefits and impacts of available management options.
1.1.2 The Audience The expected audience includes a diverse array of people who are involved in planning and implementing lake management and includes professional lake managers, community and state officials, and citizens concerned about the quality of specific lakes and ponds. For the purposes of brevity in this review, use of the term “lake” also includes “pond” and “impoundment”.
1.1.3 The Purpose Lakes are important resources. They provide for basic human needs of drinking water, irrigation, generation of electricity, and flood protection, as well as other needs such as fishing, boating, swimming, tourism, and aesthetic enjoyment. Lakes are also vital elements in the biodiversity of

Eutrophication and Aquatic Plant Management in Massachusetts
1.0 Introduction Page 1-2
the environment, providing crucial habitat for many species. There are many reasons for managing lakes, including restoration of natural conditions disturbed by human impacts; enhancement or maintenance of recreation, water supply, irrigation or other uses; enhancement or protection of fisheries, habitat or endangered species; maintenance of public health and safety, or control of non-native species. However, there is no simple formula that guarantees successful lake management. Lakes are also home to many non-human users whose use of these lakes might be severely curtailed in the absence of any controls on how humans manage lakes. At the same time, many of our lakes would not even exist without prior human effort in damming streams. Thus, many lakes are already heavily “managed” systems, even though most of the “management” is not planned in a methodical way. Lake management should be guided by principles that protect the wide variety of potential uses and established priorities in each case. Our purpose is to seek a rational approach to managing lakes in Massachusetts. Lake management should protect public and environmental health, encourage ecological diversity and diverse human use, and preserve the quality of aquatic life that we recognize as an important part of Massachusetts. This almost certainly means that most lakes need more management than they currently receive, especially if we include protection from further impacts as one of the management goals. The alternative to intelligent management is unplanned and often undesirable changes in lake water quality. Lake management is not based on science alone, but requires a blend of understanding of interrelated and complex natural processes and balancing societal needs and desires. The best lake management plan will incorporate a balance between local needs and the concerns of resource managers at the state level. Understanding the ecology of lakes in general and that of the specific lake is crucial to the development of an effective strategy for lake management. Section 1.2 describes key elements in the structure and function of lakes that bear strongly on the choices available to the prospective lake manager and form the basis of the recommendations in this report. Management must also consider the human alterations that have occurred, the degree to which either cultural or natural conditions can be changed and at what cost, and the natural and cultural ramifications of management. Sound lake management must focus on the possible, not the perfect. Lake management will seek to: (1) be effective, (2) be inexpensive, or at least affordable, (3) cause few adverse impacts, and (4) be socially, politically and scientifically feasible. Section 1.4 describes the process of developing a lake management plan. The plan incorporates information on the lake ecosystem, the designated and desired uses, the ability of the lake ecosystem to sustain those uses and the long term costs, benefits and impacts of the available management options. Sections 1.2-1.4 are not intended to be comprehensive treatments of the science of limnology (the study of freshwater ecosystems), the tools available to lake managers for problem diagnosis and evaluation, or the techniques for developing a lake management plan. Other texts provide a more thorough treatment of the science of limnology (Horne and Goldman, 1994; Kalff, 2002), available tools (Holdren et al., 2001; Cooke et al., 1993a; Kishbaugh et al., 1990), developing
Eutrophication and Aquatic Plant Management in Massachusetts
1.0 Introduction Page 1-3
resource priorities and organizing community support (Holdren et al., 2001), or monitoring (Tetra Tech, 1998; Simpson, 1991). Rather, this introduction provides a basic overview of each so that all parties in the decision process may share a basic common understanding. The principal function of this GEIR is to create a resource that documents existing lake management practices and determines the conditions under which their use is acceptable in Massachusetts. This information will promote rational lake problem assessment and successful lake management. It does not sanction the indiscriminant selection or rejection of any of the accepted methods without reasonable evidence that the lake to be managed meets the criteria for use or non-use of that particular management practice. Meeting this burden of proof can be accomplished through the process of developing a management plan and will probably require water quality monitoring, assistance by professional lake managers, community involvement, and significant funding. There is no generic lake management plan; each lake is a special case made unique by the many interrelated natural and cultural factors that must be considered. By providing a summary of the techniques, a review of the scientific literature and local experience, guidance for use, and review of relevant regulations, the GEIR will make portions of that process much easier. For very small ponds or limited treatment, the task may be relatively simple; for large lakes or complex treatments, the task will require significant time and effort.
1.2 UNDERSTANDING THE LAKE ECOSYSTEM
1.2.1 Overview The lakes in Massachusetts were created in two principal ways. Many lakes resulted from glacial activity approximately 12,000 years ago. Others were created by damming streams or by enhancing a small lake by damming its outflow. Most damming occurred during the early industrial age of the country when water power was a critical resource. Through natural processes, most lakes become shallower and more eutrophic (nutrient-rich) and eventually fill in with sediment until they become wet meadows. The aging process is not identical for all lakes, however, and not all start out in the same condition. Many lakes that were formed by the glaciers no longer exist while others have changed little in 12,000 years. Yet lake aging is reversible. The rate of aging is determined by many factors including the depth of the lake, the nutrient richness of the surrounding watershed, the size of the watershed relative to the size of the lake, erosion rates, and human induced inputs of nutrients and other contaminants. Existing lakes can be subdivided into four categories. Nutrient-poor lakes are termed oligotrophic, nutrient-rich lakes are eutrophic, and those in between are mesotrophic. A fourth category includes lakes following a different path; these typically result in peat bogs and are termed dystrophic lakes. They are often strongly tea colored. Lakes in one part of the Commonwealth may share many characteristics (depth, hydrology, fertility of surrounding soils) that cause them to be generally more nutrient-rich while another region may generally have nutrient-poor lakes. Lakes that are created by damming streams often follow a different course of aging than natural lakes. At first, they may be eutrophic as nutrients in the previous stream’s floodplain are released to the water column. Over a period of decades, that source of productivity tends to decline until the impoundment takes on conditions governed more by the entire watershed, just as for natural

Eutrophication and Aquatic Plant Management in Massachusetts
1.0 Introduction Page 1-4
lakes. Impoundments in Massachusetts are commonly shallower than natural lakes, have larger watersheds (relative to lake area), and the pre-existing nutrient-rich bottom sediments may provide nutrients for abundant aquatic plant growth early in the life of the lake. The Quabbin Reservoir is a rather large exception to this characterization, and there are others. However, most impoundments in Massachusetts are smaller, shallower systems with high watershed to lake area ratios. Human activity can accelerate the process of lake aging or, in the case of introduced species or substances, force an unnatural response. Examples of unnatural response include the elimination of most aquatic species as a result of acid deposition, noxious algal blooms resulting from excessive nutrient enrichment, or the development of a dense monoculture of a non-native aquatic plant and elimination of native aquatic plants. However, it would be unrealistic to assume that managing cultural impacts on lakes can convert them all into oligotrophic basins of clear water, and this would not be an appropriate goal for many lakes. Understanding the causes of individual lake characteristics (i.e., understanding the lake ecosystem) is a fundamental part of determining appropriate management strategies. An ecosystem is a system of interrelated organisms living in a defined physical-chemical environment (Hutchinson, 1967). An ecosystem might be the entire earth or a drop of water. We need an operational unit that can be reasonably studied and will help explain all or most of the characteristics of the lake. The lake is primarily dependent on the water in the hydrologic cycle, and the most useful definition of the lake ecosystem is the lake and its watershed because the watershed defines the terrestrial sources of the lake’s water (Figure 1-1). Most impacts on lakes can be related to characteristics of the watershed, although acid rain has shown that not everything impacting lakes occurs within the watershed. Lakes host a web of interactions between hundreds of biological species, chemical compounds, hydrological processes and human actions, all in constant change. A tug on any part of the web ripples throughout the rest of the ecosystem. Ecology is the scientific study of these interrelationships (Ricklefs, 1973).
1.2.2 Water Water - its properties and movement - dominates the ecology of lakes. Water is one of the best solvents available and many compounds dissolve in it. Water is very abundant both on earth and in all living organisms. Water has properties that make life in lakes possible, particularly lakes in the northern parts of the world. Unlike most other compounds, water does not become increasingly denser as it becomes colder. Instead, water increases in density as it is cooled until it reaches 4oC (39oF). Upon further cooling to 0oC (32oF), it becomes lighter and floats on the surface until it has cooled sufficiently to freeze. If this were not true, lakes would freeze solid in a typical New England winter. Water also has a high specific heat and high latent heat of fusion; thus they are slow to thaw in spring and slow to cool in winter, thereby providing a relatively stable thermal environment for aquatic life. Water also vaporizes at temperatures common to our climate, producing water vapor and beginning the hydrological cycle of precipitation, runoff and infiltration, evaporation and transpiration. These properties help to explain much of what we observe in lakes.
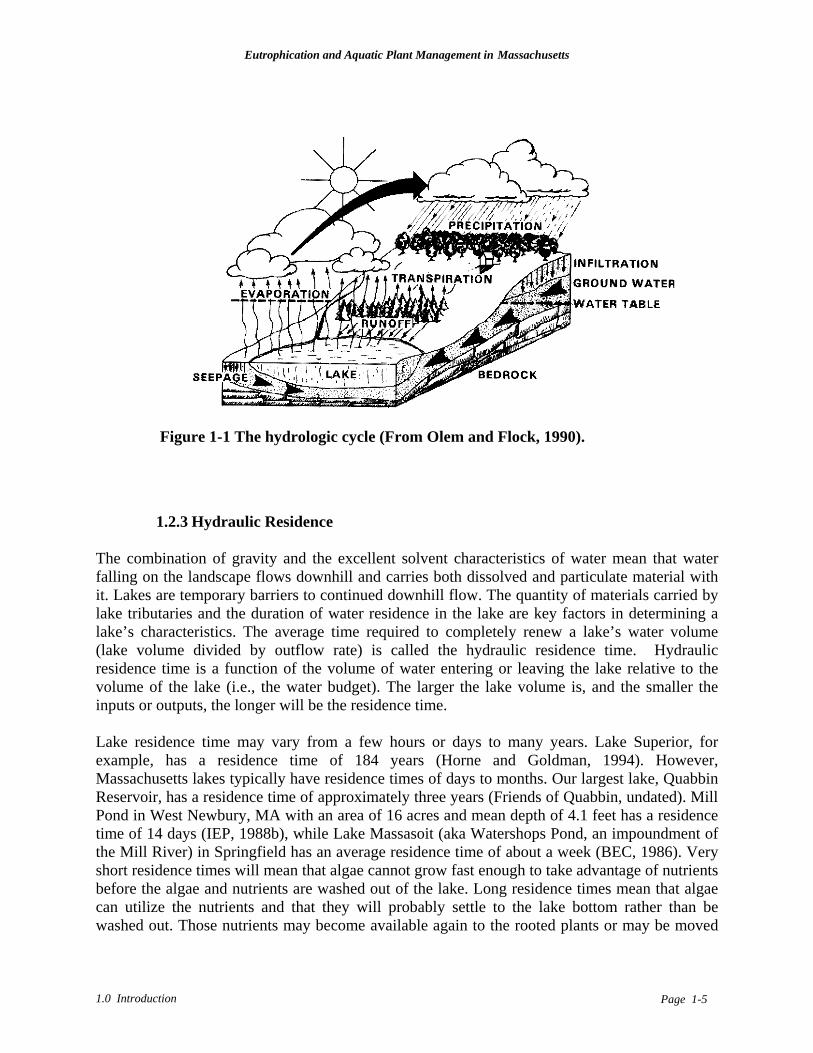
Eutrophication and Aquatic Plant Management in Massachusetts
1.0 Introduction Page 1-5
1.2.3 Hydraulic Residence The combination of gravity and the excellent solvent characteristics of water mean that water falling on the landscape flows downhill and carries both dissolved and particulate material with it. Lakes are temporary barriers to continued downhill flow. The quantity of materials carried by lake tributaries and the duration of water residence in the lake are key factors in determining a lake’s characteristics. The average time required to completely renew a lake’s water volume (lake volume divided by outflow rate) is called the hydraulic residence time. Hydraulic residence time is a function of the volume of water entering or leaving the lake relative to the volume of the lake (i.e., the water budget). The larger the lake volume is, and the smaller the inputs or outputs, the longer will be the residence time. Lake residence time may vary from a few hours or days to many years. Lake Superior, for example, has a residence time of 184 years (Horne and Goldman, 1994). However, Massachusetts lakes typically have residence times of days to months. Our largest lake, Quabbin Reservoir, has a residence time of approximately three years (Friends of Quabbin, undated). Mill Pond in West Newbury, MA with an area of 16 acres and mean depth of 4.1 feet has a residence time of 14 days (IEP, 1988b), while Lake Massasoit (aka Watershops Pond, an impoundment of the Mill River) in Springfield has an average residence time of about a week (BEC, 1986). Very short residence times will mean that algae cannot grow fast enough to take advantage of nutrients before the algae and nutrients are washed out of the lake. Long residence times mean that algae can utilize the nutrients and that they will probably settle to the lake bottom rather than be washed out. Those nutrients may become available again to the rooted plants or may be moved
Figure 1-1 The hydrologic cycle (From Olem and Flock, 1990).
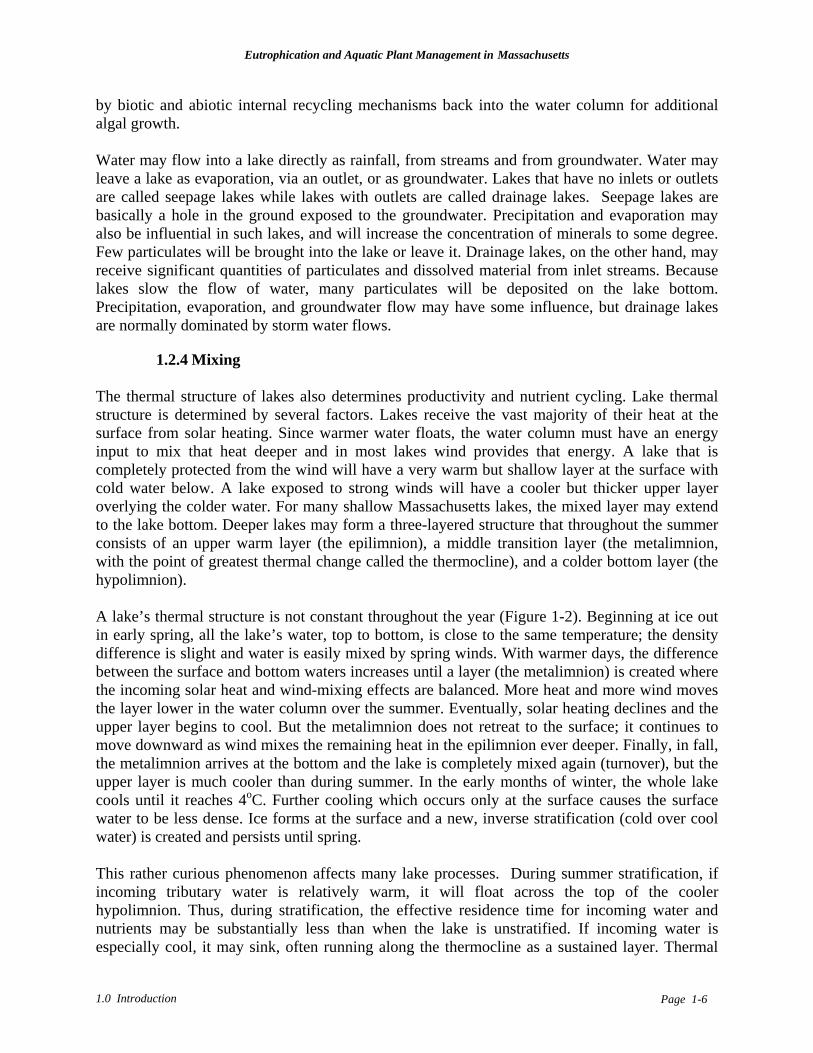
Eutrophication and Aquatic Plant Management in Massachusetts
1.0 Introduction Page 1-6
by biotic and abiotic internal recycling mechanisms back into the water column for additional algal growth. Water may flow into a lake directly as rainfall, from streams and from groundwater. Water may leave a lake as evaporation, via an outlet, or as groundwater. Lakes that have no inlets or outlets are called seepage lakes while lakes with outlets are called drainage lakes. Seepage lakes are basically a hole in the ground exposed to the groundwater. Precipitation and evaporation may also be influential in such lakes, and will increase the concentration of minerals to some degree. Few particulates will be brought into the lake or leave it. Drainage lakes, on the other hand, may receive significant quantities of particulates and dissolved material from inlet streams. Because lakes slow the flow of water, many particulates will be deposited on the lake bottom. Precipitation, evaporation, and groundwater flow may have some influence, but drainage lakes are normally dominated by storm water flows.
1.2.4 Mixing The thermal structure of lakes also determines productivity and nutrient cycling. Lake thermal structure is determined by several factors. Lakes receive the vast majority of their heat at the surface from solar heating. Since warmer water floats, the water column must have an energy input to mix that heat deeper and in most lakes wind provides that energy. A lake that is completely protected from the wind will have a very warm but shallow layer at the surface with cold water below. A lake exposed to strong winds will have a cooler but thicker upper layer overlying the colder water. For many shallow Massachusetts lakes, the mixed layer may extend to the lake bottom. Deeper lakes may form a three-layered structure that throughout the summer consists of an upper warm layer (the epilimnion), a middle transition layer (the metalimnion, with the point of greatest thermal change called the thermocline), and a colder bottom layer (the hypolimnion). A lake’s thermal structure is not constant throughout the year (Figure 1-2). Beginning at ice out in early spring, all the lake’s water, top to bottom, is close to the same temperature; the density difference is slight and water is easily mixed by spring winds. With warmer days, the difference between the surface and bottom waters increases until a layer (the metalimnion) is created where the incoming solar heat and wind-mixing effects are balanced. More heat and more wind moves the layer lower in the water column over the summer. Eventually, solar heating declines and the upper layer begins to cool. But the metalimnion does not retreat to the surface; it continues to move downward as wind mixes the remaining heat in the epilimnion ever deeper. Finally, in fall, the metalimnion arrives at the bottom and the lake is completely mixed again (turnover), but the upper layer is much cooler than during summer. In the early months of winter, the whole lake cools until it reaches 4oC. Further cooling which occurs only at the surface causes the surface water to be less dense. Ice forms at the surface and a new, inverse stratification (cold over cool water) is created and persists until spring. This rather curious phenomenon affects many lake processes. During summer stratification, if incoming tributary water is relatively warm, it will float across the top of the cooler hypolimnion. Thus, during stratification, the effective residence time for incoming water and nutrients may be substantially less than when the lake is unstratified. If incoming water is especially cool, it may sink, often running along the thermocline as a sustained layer. Thermal
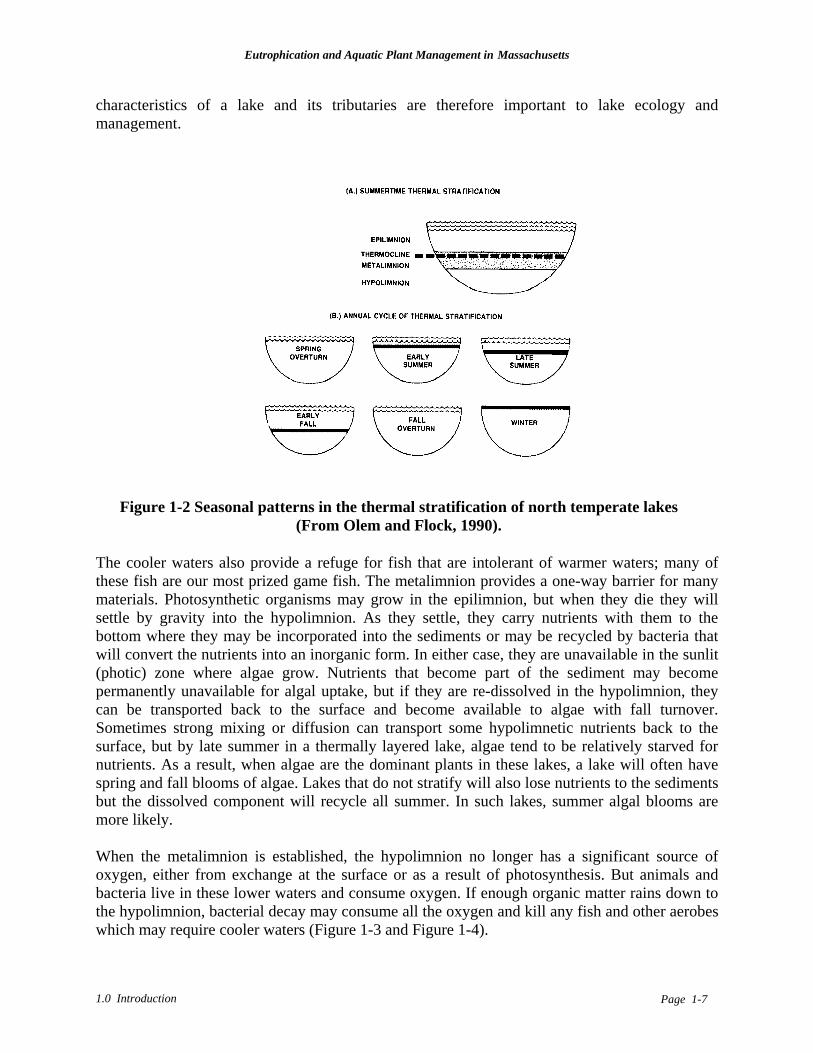
Eutrophication and Aquatic Plant Management in Massachusetts
1.0 Introduction Page 1-7
characteristics of a lake and its tributaries are therefore important to lake ecology and management.
The cooler waters also provide a refuge for fish that are intolerant of warmer waters; many of these fish are our most prized game fish. The metalimnion provides a one-way barrier for many materials. Photosynthetic organisms may grow in the epilimnion, but when they die they will settle by gravity into the hypolimnion. As they settle, they carry nutrients with them to the bottom where they may be incorporated into the sediments or may be recycled by bacteria that will convert the nutrients into an inorganic form. In either case, they are unavailable in the sunlit (photic) zone where algae grow. Nutrients that become part of the sediment may become permanently unavailable for algal uptake, but if they are re-dissolved in the hypolimnion, they can be transported back to the surface and become available to algae with fall turnover. Sometimes strong mixing or diffusion can transport some hypolimnetic nutrients back to the surface, but by late summer in a thermally layered lake, algae tend to be relatively starved for nutrients. As a result, when algae are the dominant plants in these lakes, a lake will often have spring and fall blooms of algae. Lakes that do not stratify will also lose nutrients to the sediments but the dissolved component will recycle all summer. In such lakes, summer algal blooms are more likely. When the metalimnion is established, the hypolimnion no longer has a significant source of oxygen, either from exchange at the surface or as a result of photosynthesis. But animals and bacteria live in these lower waters and consume oxygen. If enough organic matter rains down to the hypolimnion, bacterial decay may consume all the oxygen and kill any fish and other aerobes which may require cooler waters (Figure 1-3 and Figure 1-4).
Figure 1-2 Seasonal patterns in the thermal stratification of north temperate lakes (From Olem and Flock, 1990).
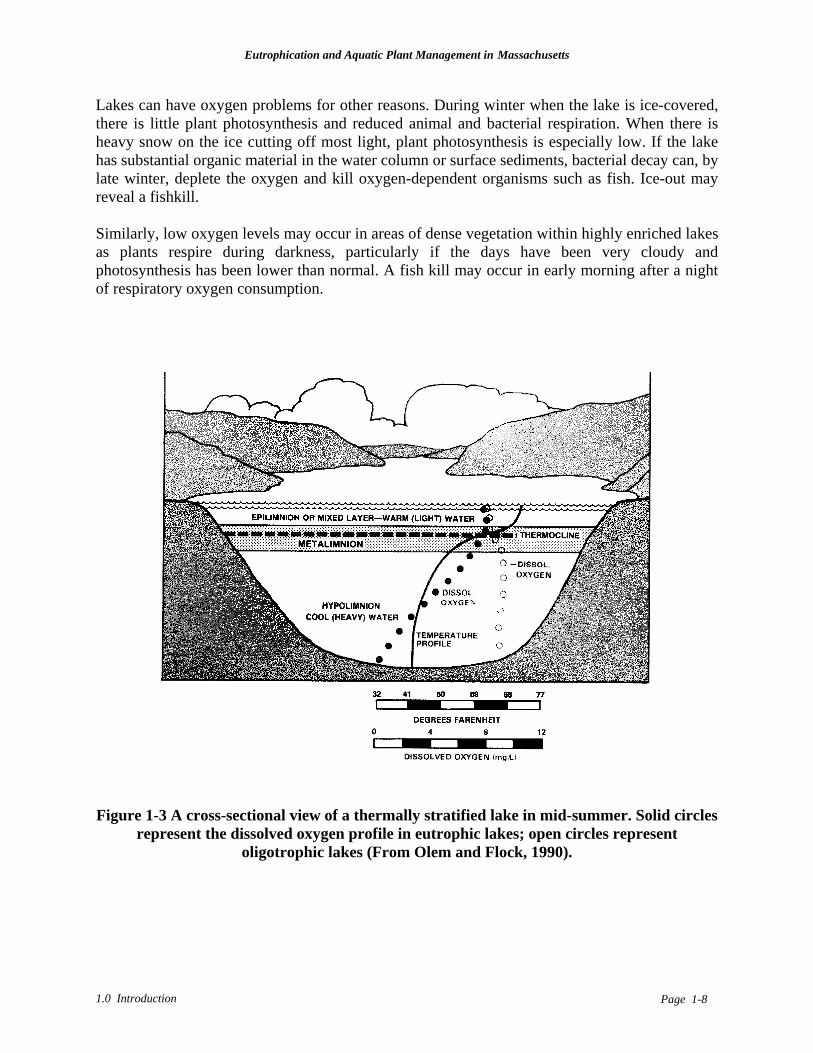
Eutrophication and Aquatic Plant Management in Massachusetts
1.0 Introduction Page 1-8
Lakes can have oxygen problems for other reasons. During winter when the lake is ice-covered, there is little plant photosynthesis and reduced animal and bacterial respiration. When there is heavy snow on the ice cutting off most light, plant photosynthesis is especially low. If the lake has substantial organic material in the water column or surface sediments, bacterial decay can, by late winter, deplete the oxygen and kill oxygen-dependent organisms such as fish. Ice-out may reveal a fishkill. Similarly, low oxygen levels may occur in areas of dense vegetation within highly enriched lakes as plants respire during darkness, particularly if the days have been very cloudy and photosynthesis has been lower than normal. A fish kill may occur in early morning after a night of respiratory oxygen consumption.
Figure 1-3 A cross-sectional view of a thermally stratified lake in mid-summer. Solid circles represent the dissolved oxygen profile in eutrophic lakes; open circles represent
oligotrophic lakes (From Olem and Flock, 1990).
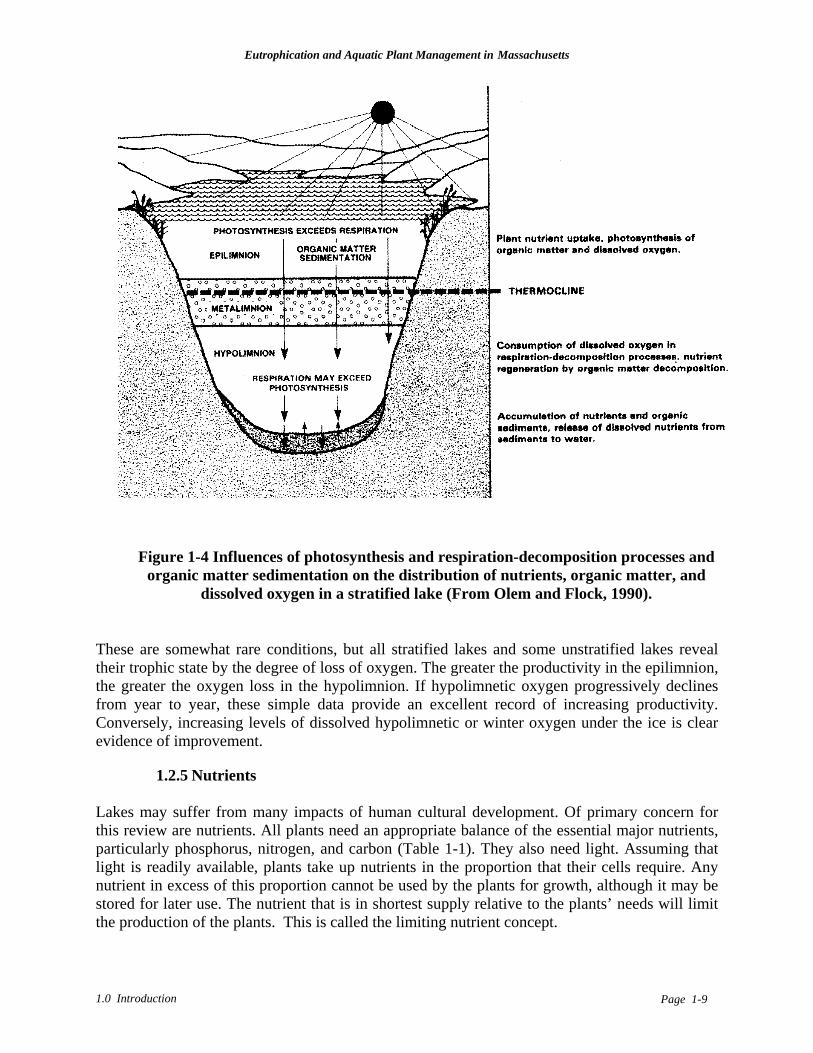
Eutrophication and Aquatic Plant Management in Massachusetts
1.0 Introduction Page 1-9
These are somewhat rare conditions, but all stratified lakes and some unstratified lakes reveal their trophic state by the degree of loss of oxygen. The greater the productivity in the epilimnion, the greater the oxygen loss in the hypolimnion. If hypolimnetic oxygen progressively declines from year to year, these simple data provide an excellent record of increasing productivity. Conversely, increasing levels of dissolved hypolimnetic or winter oxygen under the ice is clear evidence of improvement.
1.2.5 Nutrients Lakes may suffer from many impacts of human cultural development. Of primary concern for this review are nutrients. All plants need an appropriate balance of the essential major nutrients, particularly phosphorus, nitrogen, and carbon (Table 1-1). They also need light. Assuming that light is readily available, plants take up nutrients in the proportion that their cells require. Any nutrient in excess of this proportion cannot be used by the plants for growth, although it may be stored for later use. The nutrient that is in shortest supply relative to the plants’ needs will limit the production of the plants. This is called the limiting nutrient concept.
Figure 1-4 Influences of photosynthesis and respiration-decomposition processes and organic matter sedimentation on the distribution of nutrients, organic matter, and
dissolved oxygen in a stratified lake (From Olem and Flock, 1990).
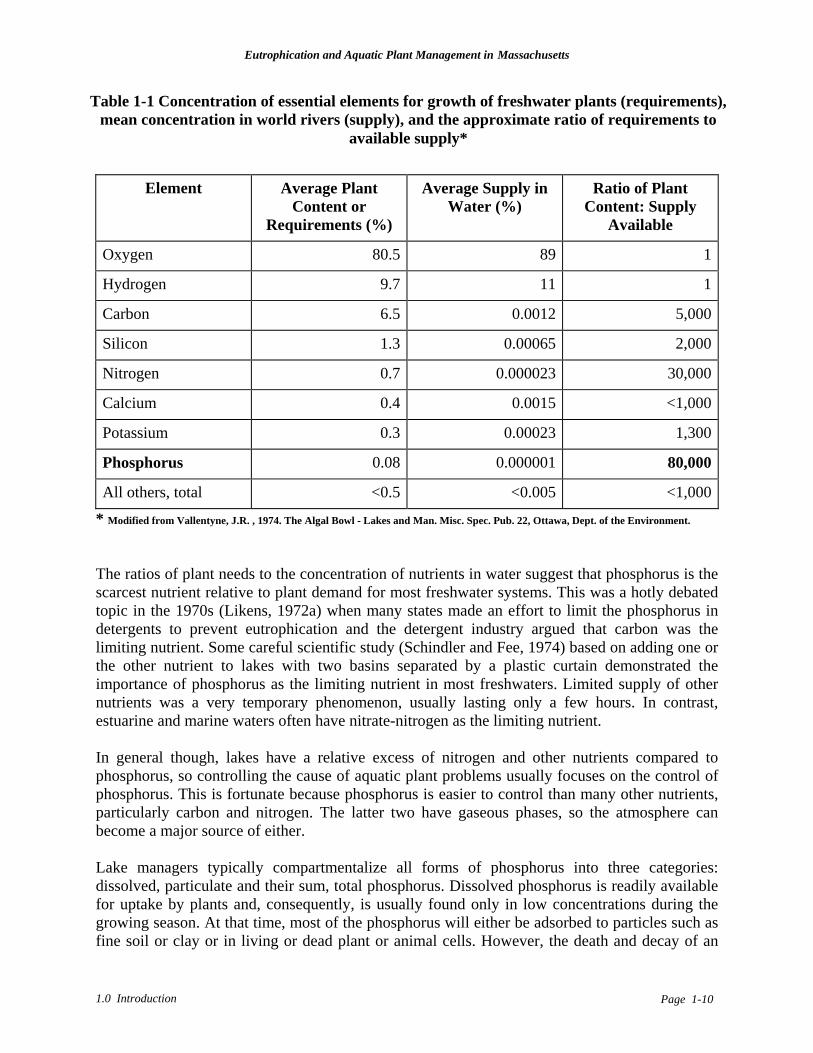
Eutrophication and Aquatic Plant Management in Massachusetts
1.0 Introduction Page 1-10
Element Average Plant Content or
Requirements (%)
Average Supply in Water (%)
Ratio of Plant Content: Supply
Available
Oxygen 80.5 89 1
Hydrogen 9.7 11 1
Carbon 6.5 0.0012 5,000
Silicon 1.3 0.00065 2,000
Nitrogen 0.7 0.000023 30,000
Calcium 0.4 0.0015 <1,000
Potassium 0.3 0.00023 1,300
Phosphorus 0.08 0.000001 80,000
All others, total <0.5 <0.005 <1,000
* Modified from Vallentyne, J.R. , 1974. The Algal Bowl - Lakes and Man. Misc. Spec. Pub. 22, Ottawa, Dept. of the Environment. The ratios of plant needs to the concentration of nutrients in water suggest that phosphorus is the scarcest nutrient relative to plant demand for most freshwater systems. This was a hotly debated topic in the 1970s (Likens, 1972a) when many states made an effort to limit the phosphorus in detergents to prevent eutrophication and the detergent industry argued that carbon was the limiting nutrient. Some careful scientific study (Schindler and Fee, 1974) based on adding one or the other nutrient to lakes with two basins separated by a plastic curtain demonstrated the importance of phosphorus as the limiting nutrient in most freshwaters. Limited supply of other nutrients was a very temporary phenomenon, usually lasting only a few hours. In contrast, estuarine and marine waters often have nitrate-nitrogen as the limiting nutrient. In general though, lakes have a relative excess of nitrogen and other nutrients compared to phosphorus, so controlling the cause of aquatic plant problems usually focuses on the control of phosphorus. This is fortunate because phosphorus is easier to control than many other nutrients, particularly carbon and nitrogen. The latter two have gaseous phases, so the atmosphere can become a major source of either. Lake managers typically compartmentalize all forms of phosphorus into three categories: dissolved, particulate and their sum, total phosphorus. Dissolved phosphorus is readily available for uptake by plants and, consequently, is usually found only in low concentrations during the growing season. At that time, most of the phosphorus will either be adsorbed to particles such as fine soil or clay or in living or dead plant or animal cells. However, the death and decay of an
Table 1-1 Concentration of essential elements for growth of freshwater plants (requirements), mean concentration in world rivers (supply), and the approximate ratio of requirements to
available supply*
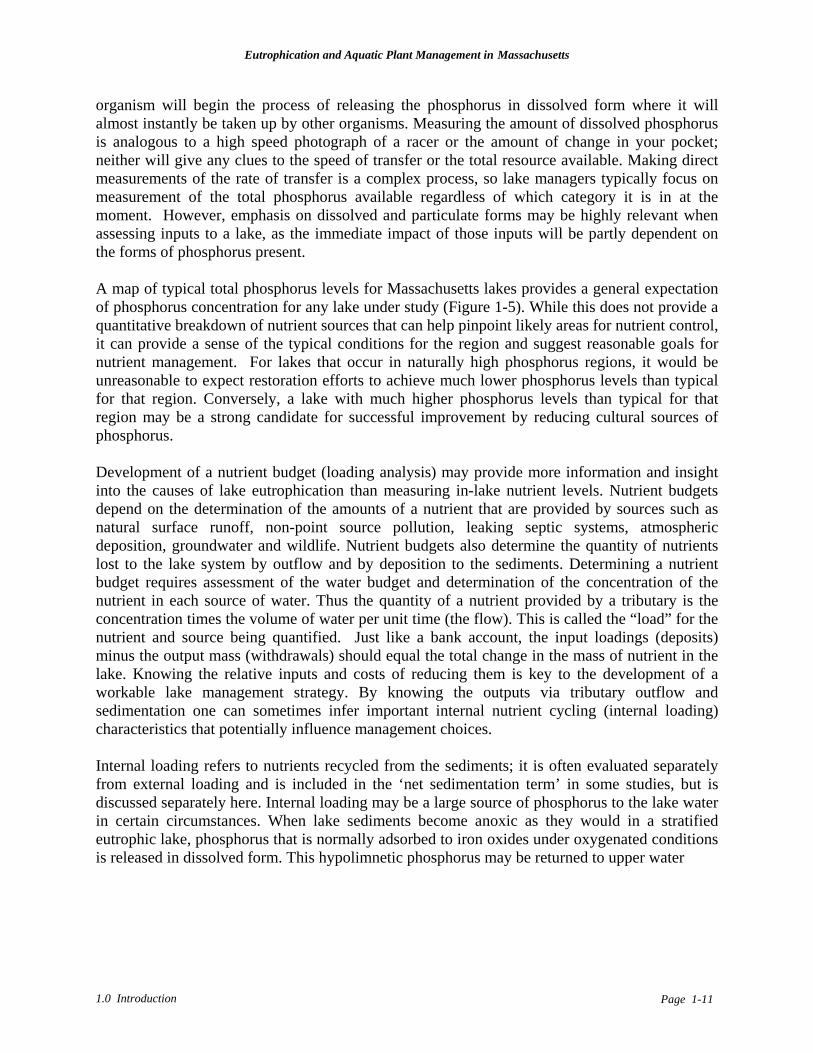
Eutrophication and Aquatic Plant Management in Massachusetts
1.0 Introduction Page 1-11
organism will begin the process of releasing the phosphorus in dissolved form where it will almost instantly be taken up by other organisms. Measuring the amount of dissolved phosphorus is analogous to a high speed photograph of a racer or the amount of change in your pocket; neither will give any clues to the speed of transfer or the total resource available. Making direct measurements of the rate of transfer is a complex process, so lake managers typically focus on measurement of the total phosphorus available regardless of which category it is in at the moment. However, emphasis on dissolved and particulate forms may be highly relevant when assessing inputs to a lake, as the immediate impact of those inputs will be partly dependent on the forms of phosphorus present. A map of typical total phosphorus levels for Massachusetts lakes provides a general expectation of phosphorus concentration for any lake under study (Figure 1-5). While this does not provide a quantitative breakdown of nutrient sources that can help pinpoint likely areas for nutrient control, it can provide a sense of the typical conditions for the region and suggest reasonable goals for nutrient management. For lakes that occur in naturally high phosphorus regions, it would be unreasonable to expect restoration efforts to achieve much lower phosphorus levels than typical for that region. Conversely, a lake with much higher phosphorus levels than typical for that region may be a strong candidate for successful improvement by reducing cultural sources of phosphorus. Development of a nutrient budget (loading analysis) may provide more information and insight into the causes of lake eutrophication than measuring in-lake nutrient levels. Nutrient budgets depend on the determination of the amounts of a nutrient that are provided by sources such as natural surface runoff, non-point source pollution, leaking septic systems, atmospheric deposition, groundwater and wildlife. Nutrient budgets also determine the quantity of nutrients lost to the lake system by outflow and by deposition to the sediments. Determining a nutrient budget requires assessment of the water budget and determination of the concentration of the nutrient in each source of water. Thus the quantity of a nutrient provided by a tributary is the concentration times the volume of water per unit time (the flow). This is called the “load” for the nutrient and source being quantified. Just like a bank account, the input loadings (deposits) minus the output mass (withdrawals) should equal the total change in the mass of nutrient in the lake. Knowing the relative inputs and costs of reducing them is key to the development of a workable lake management strategy. By knowing the outputs via tributary outflow and sedimentation one can sometimes infer important internal nutrient cycling (internal loading) characteristics that potentially influence management choices. Internal loading refers to nutrients recycled from the sediments; it is often evaluated separately from external loading and is included in the ‘net sedimentation term’ in some studies, but is discussed separately here. Internal loading may be a large source of phosphorus to the lake water in certain circumstances. When lake sediments become anoxic as they would in a stratified eutrophic lake, phosphorus that is normally adsorbed to iron oxides under oxygenated conditions is released in dissolved form. This hypolimnetic phosphorus may be returned to upper water
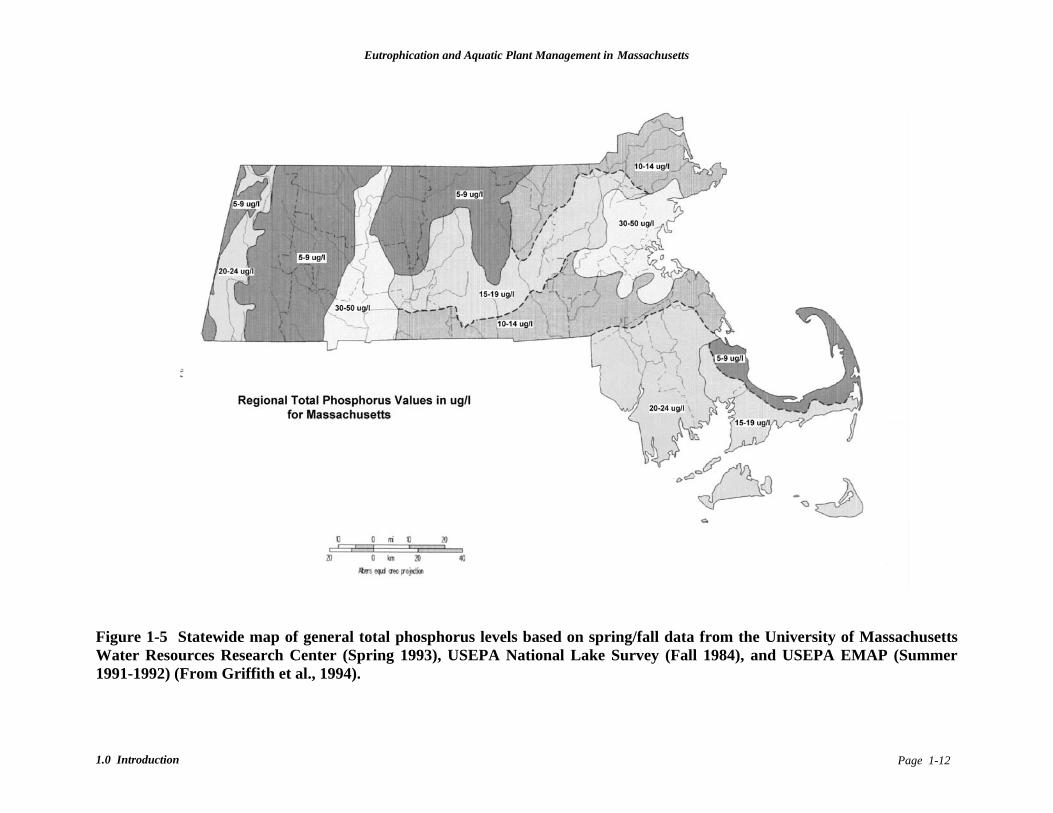
Eutrophication and Aquatic Plant Management in Massachusetts
1.0 Introduction Page 1-12
Figure 1-5 Statewide map of general total phosphorus levels based on spring/fall data from the University of Massachusetts Water Resources Research Center (Spring 1993), USEPA National Lake Survey (Fall 1984), and USEPA EMAP (Summer 1991-1992) (From Griffith et al., 1994).
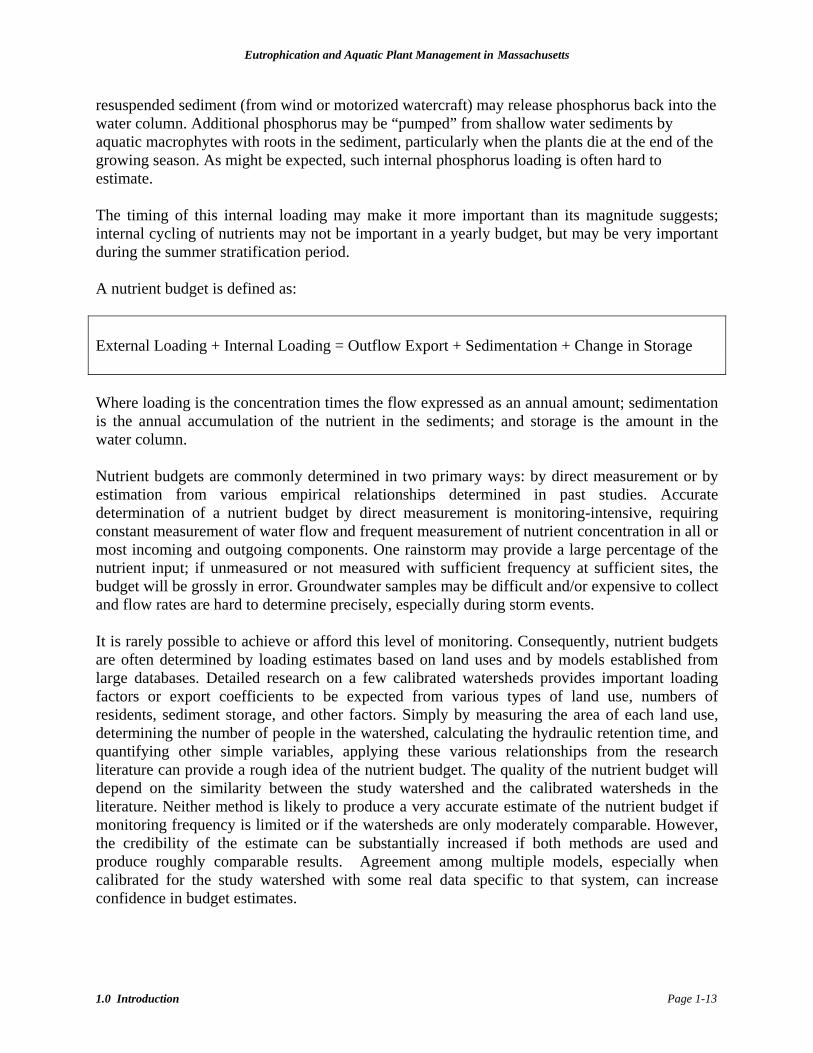
Eutrophication and Aquatic Plant Management in Massachusetts
1.0 Introduction Page 1-13
resuspended sediment (from wind or motorized watercraft) may release phosphorus back into the water column. Additional phosphorus may be “pumped” from shallow water sediments by aquatic macrophytes with roots in the sediment, particularly when the plants die at the end of the growing season. As might be expected, such internal phosphorus loading is often hard to estimate. The timing of this internal loading may make it more important than its magnitude suggests; internal cycling of nutrients may not be important in a yearly budget, but may be very important during the summer stratification period. A nutrient budget is defined as: External Loading + Internal Loading = Outflow Export + Sedimentation + Change in Storage Where loading is the concentration times the flow expressed as an annual amount; sedimentation is the annual accumulation of the nutrient in the sediments; and storage is the amount in the water column. Nutrient budgets are commonly determined in two primary ways: by direct measurement or by estimation from various empirical relationships determined in past studies. Accurate determination of a nutrient budget by direct measurement is monitoring-intensive, requiring constant measurement of water flow and frequent measurement of nutrient concentration in all or most incoming and outgoing components. One rainstorm may provide a large percentage of the nutrient input; if unmeasured or not measured with sufficient frequency at sufficient sites, the budget will be grossly in error. Groundwater samples may be difficult and/or expensive to collect and flow rates are hard to determine precisely, especially during storm events. It is rarely possible to achieve or afford this level of monitoring. Consequently, nutrient budgets are often determined by loading estimates based on land uses and by models established from large databases. Detailed research on a few calibrated watersheds provides important loading factors or export coefficients to be expected from various types of land use, numbers of residents, sediment storage, and other factors. Simply by measuring the area of each land use, determining the number of people in the watershed, calculating the hydraulic retention time, and quantifying other simple variables, applying these various relationships from the research literature can provide a rough idea of the nutrient budget. The quality of the nutrient budget will depend on the similarity between the study watershed and the calibrated watersheds in the literature. Neither method is likely to produce a very accurate estimate of the nutrient budget if monitoring frequency is limited or if the watersheds are only moderately comparable. However, the credibility of the estimate can be substantially increased if both methods are used and produce roughly comparable results. Agreement among multiple models, especially when calibrated for the study watershed with some real data specific to that system, can increase confidence in budget estimates.
Eutrophication and Aquatic Plant Management in Massachusetts
1.0 Introduction Page 1-14
A review of 32 phosphorus budgets from Diagnostic/Feasibility studies of lakes in Massachusetts (Tables 1-2 and 1-3) found that several types of phosphorus budgets were calculated. The two most common approaches used either a “land use” technique based on published nutrient export coefficients for various types of land uses, or a hydrologic transport “mass balance” approach based on direct measurements of water flows and related nutrient concentrations. Some types of sources, such as septic inputs, internal phosphorus sources and other highly specific sources such as birds or wastewater treatment plants are usually calculated separately for both types of budgets. Note that for measured nutrient budgets, care should be taken to avoid measuring the same input twice (e.g. septic and groundwater inputs) although both may be reported. Similarly for budgets estimated from land use loading, inputs such as septic leachate and low density residential land use sources may overlap and should not be double counted. Urban land use can be included as a separate category in urban watersheds although this is not shown in Table 1-3. The relative importance (percent contribution) of sources of phosphorus to the 32 lakes is presented in Tables 1-2 and 1-3. A blank indicates no data reported. Table 1-4 presents a side-by-side comparison of estimates derived from measured inputs versus estimates based on land use factors. In some cases, the disagreement between methods may be attributable to the authors not including all sources in each estimate, not just errors in assumptions of land-use loading coefficients. As a check against the accuracy of either budget estimation, it is advisable to apply one of several eutrophication models (see Section 1.4.2) relating loading to one of several lake measurements such as total phosphorus, chlorophyll or Secchi disk transparency. These may reveal errors in estimation or neglect of important components. This method utilizes data from calibrated watersheds. Nutrient loading has been statistically related to the average or spring (depending on the study) concentration of lake total phosphorus or other eutrophication measures by regression analysis. Thus, the other procedures for estimation of nutrient loading should reasonably predict the measured levels of total phosphorus, chlorophyll or transparency. For lakes without major aquatic plant growth, yearly average total phosphorus will usually be the best choice for comparison. For lakes with significant aquatic plant growth, an average of total phosphorus values collected prior to plant growth (i.e., early spring) may be more representative. Nutrient budget information is necessary to evaluate causes and effects in a lake and to develop a picture of what to expect from the implementation of a range of lake management procedures. Key parts of a nutrient budget are shown in Figure 1-6.
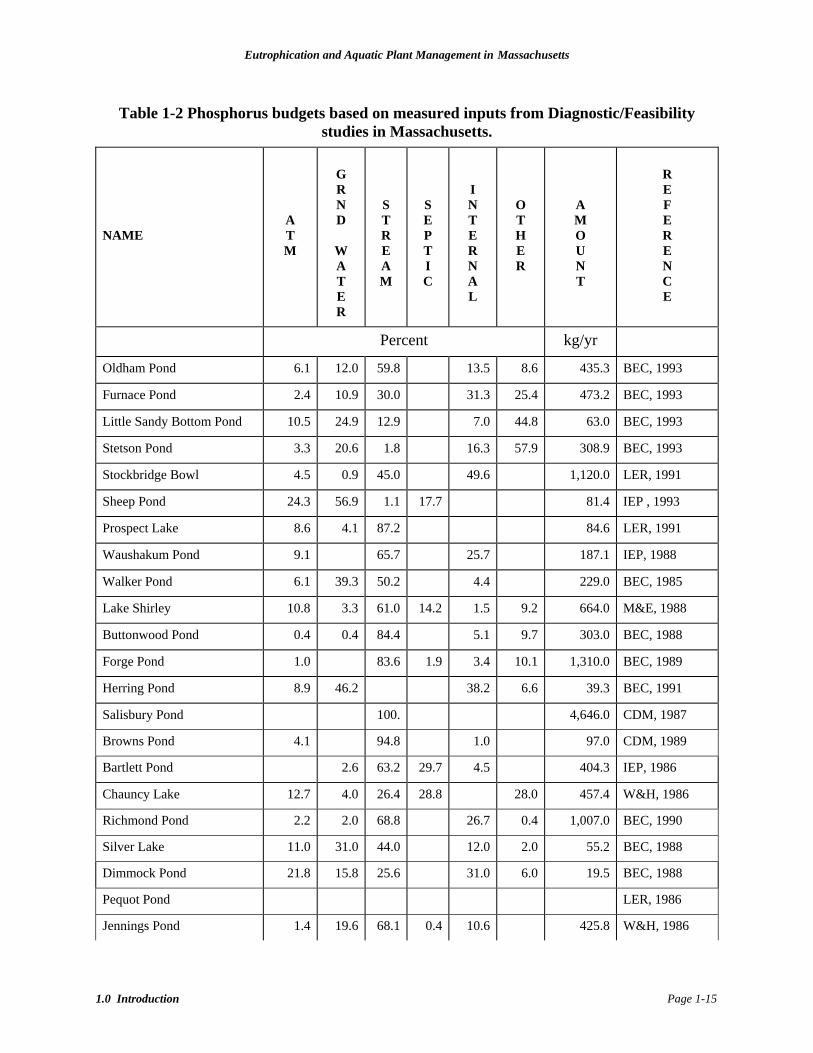
Eutrophication and Aquatic Plant Management in Massachusetts
1.0 Introduction Page 1-15
Table 1-2 Phosphorus budgets based on measured inputs from Diagnostic/Feasibility studies in Massachusetts.
NAME
A T M
G R N D
W A T E R
S T R E A M
S E P T I C
I N T E R N A L
O T H E R
A M O U N T
R E F E R E N C E
Percent kg/yr
Oldham Pond 6.1 12.0 59.8 13.5 8.6 435.3 BEC, 1993
Furnace Pond 2.4 10.9 30.0 31.3 25.4 473.2 BEC, 1993
Little Sandy Bottom Pond 10.5 24.9 12.9 7.0 44.8 63.0 BEC, 1993
Stetson Pond 3.3 20.6 1.8 16.3 57.9 308.9 BEC, 1993
Stockbridge Bowl 4.5 0.9 45.0 49.6 1,120.0 LER, 1991
Sheep Pond 24.3 56.9 1.1 17.7 81.4 IEP , 1993
Prospect Lake 8.6 4.1 87.2 84.6 LER, 1991
Waushakum Pond 9.1 65.7 25.7 187.1 IEP, 1988
Walker Pond 6.1 39.3 50.2 4.4 229.0 BEC, 1985
Lake Shirley 10.8 3.3 61.0 14.2 1.5 9.2 664.0 M&E, 1988
Buttonwood Pond 0.4 0.4 84.4 5.1 9.7 303.0 BEC, 1988
Forge Pond 1.0 83.6 1.9 3.4 10.1 1,310.0 BEC, 1989
Herring Pond 8.9 46.2 38.2 6.6 39.3 BEC, 1991
Salisbury Pond 100. 4,646.0 CDM, 1987
Browns Pond 4.1 94.8 1.0 97.0 CDM, 1989
Bartlett Pond 2.6 63.2 29.7 4.5 404.3 IEP, 1986
Chauncy Lake 12.7 4.0 26.4 28.8 28.0 457.4 W&H, 1986
Richmond Pond 2.2 2.0 68.8 26.7 0.4 1,007.0 BEC, 1990
Silver Lake 11.0 31.0 44.0 12.0 2.0 55.2 BEC, 1988
Dimmock Pond 21.8 15.8 25.6 31.0 6.0 19.5 BEC, 1988
Pequot Pond LER, 1986
Jennings Pond 1.4 19.6 68.1 0.4 10.6 425.8 W&H, 1986
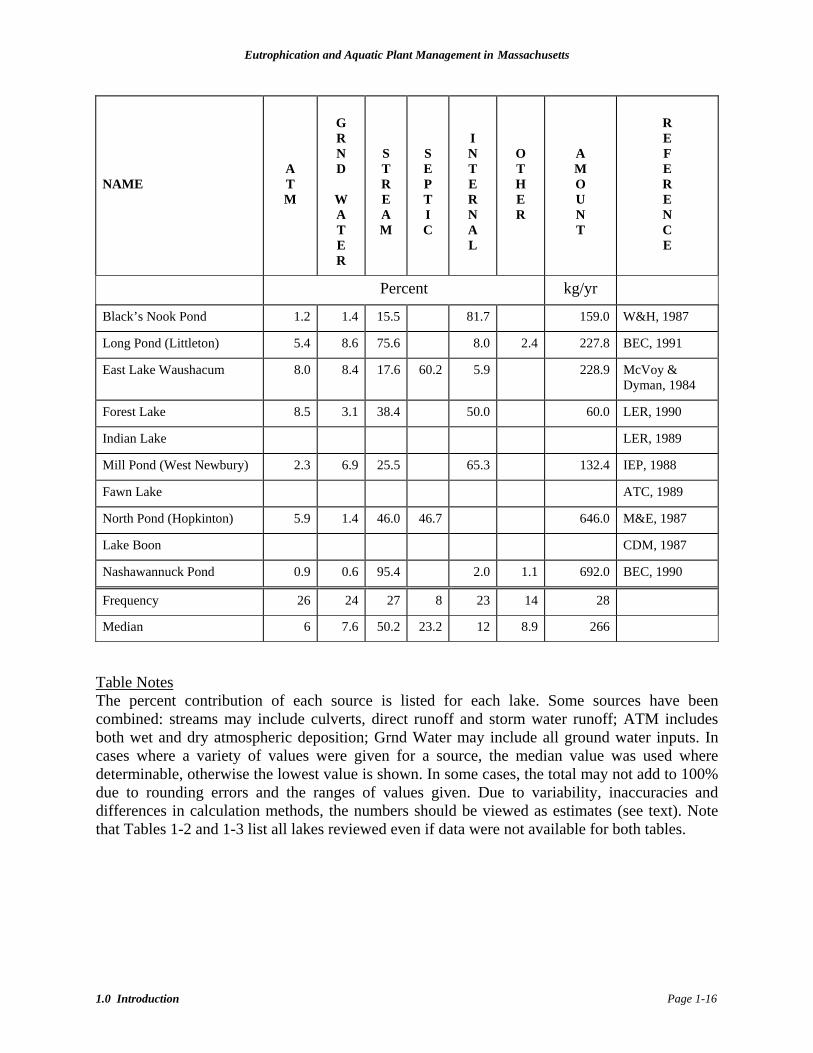
Eutrophication and Aquatic Plant Management in Massachusetts
1.0 Introduction Page 1-16
NAME
A T M
G R N D
W A T E R
S T R E A M
S E P T I C
I N T E R N A L
O T H E R
A M O U N T
R E F E R E N C E
Percent kg/yr
Black’s Nook Pond 1.2 1.4 15.5 81.7 159.0 W&H, 1987
Long Pond (Littleton) 5.4 8.6 75.6 8.0 2.4 227.8 BEC, 1991
East Lake Waushacum 8.0 8.4 17.6 60.2 5.9 228.9 McVoy & Dyman, 1984
Forest Lake 8.5 3.1 38.4 50.0 60.0 LER, 1990
Indian Lake LER, 1989
Mill Pond (West Newbury) 2.3 6.9 25.5 65.3 132.4 IEP, 1988
Fawn Lake ATC, 1989
North Pond (Hopkinton) 5.9 1.4 46.0 46.7 646.0 M&E, 1987
Lake Boon CDM, 1987
Nashawannuck Pond 0.9 0.6 95.4 2.0 1.1 692.0 BEC, 1990
Frequency 26 24 27 8 23 14 28
Median 6 7.6 50.2 23.2 12 8.9 266
Table Notes The percent contribution of each source is listed for each lake. Some sources have been combined: streams may include culverts, direct runoff and storm water runoff; ATM includes both wet and dry atmospheric deposition; Grnd Water may include all ground water inputs. In cases where a variety of values were given for a source, the median value was used where determinable, otherwise the lowest value is shown. In some cases, the total may not add to 100% due to rounding errors and the ranges of values given. Due to variability, inaccuracies and differences in calculation methods, the numbers should be viewed as estimates (see text). Note that Tables 1-2 and 1-3 list all lakes reviewed even if data were not available for both tables.

Eutrophication and Aquatic Plant Management in Massachusetts
1.0 Introduction Page 1-17
Table 1-3 Phosphorus budgets estimated from land use from Diagnostic/Feasibility studies in Massachusetts.
NAME
F O R E S T
R E S I D E N T I A L
S E P T I C
A G R I
O P E N
C O M M I N D
A T M
I N T E R N A L
O T H E R
A M O U N T
R E F E R E N C E
Percent Kg/yr
Oldham Pond BEC, 1993
Furnace Pond BEC, 1993
Little Sandy Bottom Pond
BEC, 1993
Stetson Pond BEC, 1993
Stockbridge Bowl 26.7 15.4 3.1 10.5 3.7 40.7 1,363.8 LER, 1991
Sheep Pond IEP , 1993
Prospect Lake 28.2 13.3 11.5 39.3 7.8 94.1 LER, 1991
Waushakum Pond 18.7. 30.5 7.6 37 6.2 274.5 IEP, 1988
Walker Pond 59.9 20.2 3.7 3.3 4.1 8.7 242 BEC, 1985
Lake Shirley M&E, 1988
Buttonwood Pond 1.3 77.8 7.3 5.2 0.2 8.2 464 BEC, 1988
Forge Pond 28.2 25.8 36 8.1 0.7 1.2 2,128 BEC, 1989
Herring Pond 1.5 10.9 48.2 2.2 2.9 29.2 5.1 137 BEC, 1991
Salisbury Pond CDM, 1987
Browns Pond 2.7 92.2 5.1 126 CDM, 1989
Bartlett Pond 26.8 31.1 9.9 21.3 10.9 112.4 IEP, 1986
Chauncy Lake 5.6 14.1 22.3 6.5 17.2 9 25.4 572.9 W&H, 1986
Richmond Pond BEC, 1990
Silver Lake 0.4 16.8 77 1.2 2.1 2.3 0.3 280.1 BEC, 1988
Dimmock Pond 2.5 61.7 6.2 8.6 4.9 14.8 1.2 81 BEC, 1988
Pequot Pond 6.3 2.4 65.7 1.6 11.1 13.0 219.0 LER, 1986
Percent Kg/yr
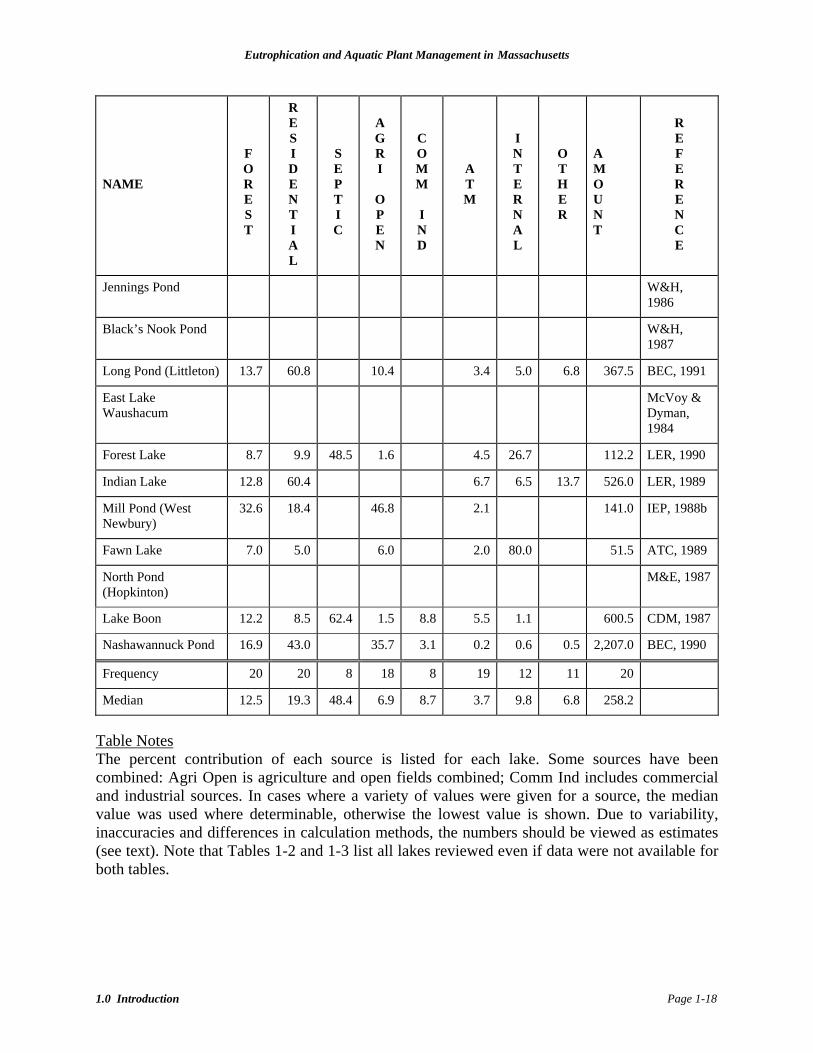
Eutrophication and Aquatic Plant Management in Massachusetts
1.0 Introduction Page 1-18
NAME
F O R E S T
R E S I D E N T I A L
S E P T I C
A G R I
O P E N
C O M M I N D
A T M
I N T E R N A L
O T H E R
A M O U N T
R E F E R E N C E
Jennings Pond W&H, 1986
Black’s Nook Pond W&H, 1987
Long Pond (Littleton) 13.7 60.8 10.4 3.4 5.0 6.8 367.5 BEC, 1991
East Lake Waushacum
McVoy & Dyman, 1984
Forest Lake 8.7 9.9 48.5 1.6 4.5 26.7 112.2 LER, 1990
Indian Lake 12.8 60.4 6.7 6.5 13.7 526.0 LER, 1989
Mill Pond (West Newbury)
32.6 18.4 46.8 2.1 141.0 IEP, 1988b
Fawn Lake 7.0 5.0 6.0 2.0 80.0 51.5 ATC, 1989
North Pond (Hopkinton)
M&E, 1987
Lake Boon 12.2 8.5 62.4 1.5 8.8 5.5 1.1 600.5 CDM, 1987
Nashawannuck Pond 16.9 43.0 35.7 3.1 0.2 0.6 0.5 2,207.0 BEC, 1990
Frequency 20 20 8 18 8 19 12 11 20
Median 12.5 19.3 48.4 6.9 8.7 3.7 9.8 6.8 258.2
Table Notes The percent contribution of each source is listed for each lake. Some sources have been combined: Agri Open is agriculture and open fields combined; Comm Ind includes commercial and industrial sources. In cases where a variety of values were given for a source, the median value was used where determinable, otherwise the lowest value is shown. Due to variability, inaccuracies and differences in calculation methods, the numbers should be viewed as estimates (see text). Note that Tables 1-2 and 1-3 list all lakes reviewed even if data were not available for both tables.
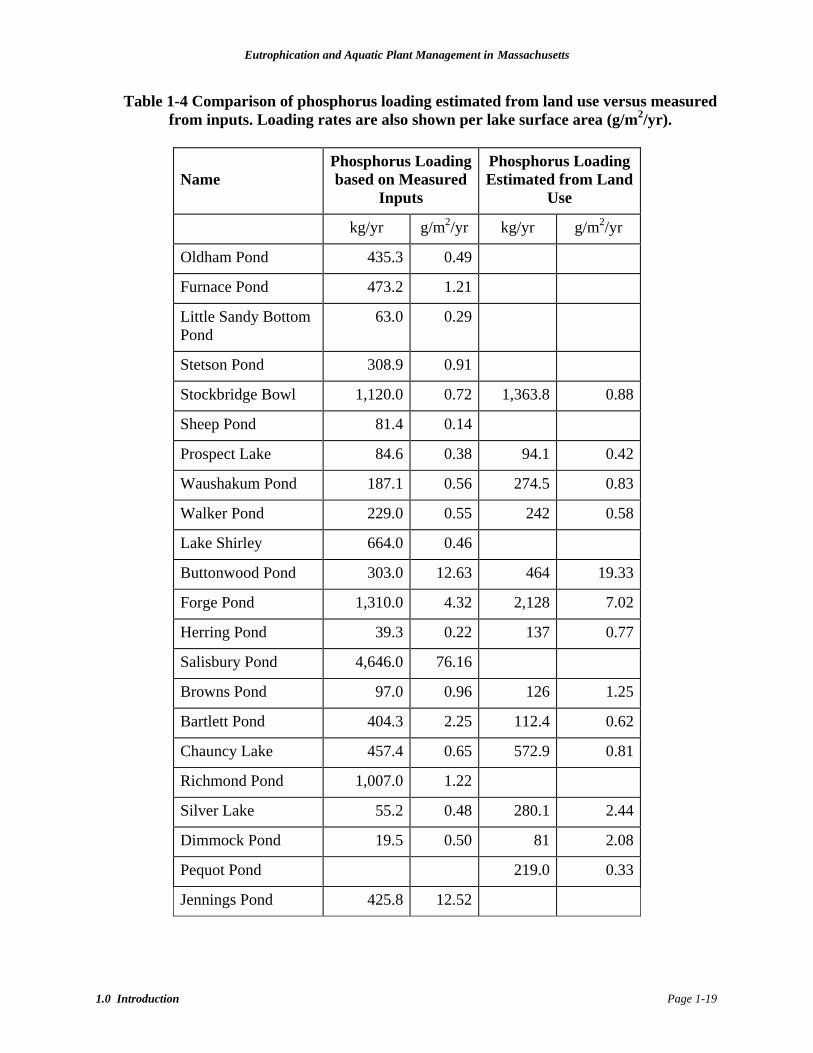
Eutrophication and Aquatic Plant Management in Massachusetts
1.0 Introduction Page 1-19
Name
Phosphorus Loading based on Measured
Inputs
Phosphorus Loading Estimated from Land
Use
kg/yr g/m2/yr kg/yr g/m2/yr
Oldham Pond 435.3 0.49
Furnace Pond 473.2 1.21
Little Sandy Bottom Pond
63.0 0.29
Stetson Pond 308.9 0.91
Stockbridge Bowl 1,120.0 0.72 1,363.8 0.88
Sheep Pond 81.4 0.14
Prospect Lake 84.6 0.38 94.1 0.42
Waushakum Pond 187.1 0.56 274.5 0.83
Walker Pond 229.0 0.55 242 0.58
Lake Shirley 664.0 0.46
Buttonwood Pond 303.0 12.63 464 19.33
Forge Pond 1,310.0 4.32 2,128 7.02
Herring Pond 39.3 0.22 137 0.77
Salisbury Pond 4,646.0 76.16
Browns Pond 97.0 0.96 126 1.25
Bartlett Pond 404.3 2.25 112.4 0.62
Chauncy Lake 457.4 0.65 572.9 0.81
Richmond Pond 1,007.0 1.22
Silver Lake 55.2 0.48 280.1 2.44
Dimmock Pond 19.5 0.50 81 2.08
Pequot Pond 219.0 0.33
Jennings Pond 425.8 12.52
Table 1-4 Comparison of phosphorus loading estimated from land use versus measured from inputs. Loading rates are also shown per lake surface area (g/m2/yr).
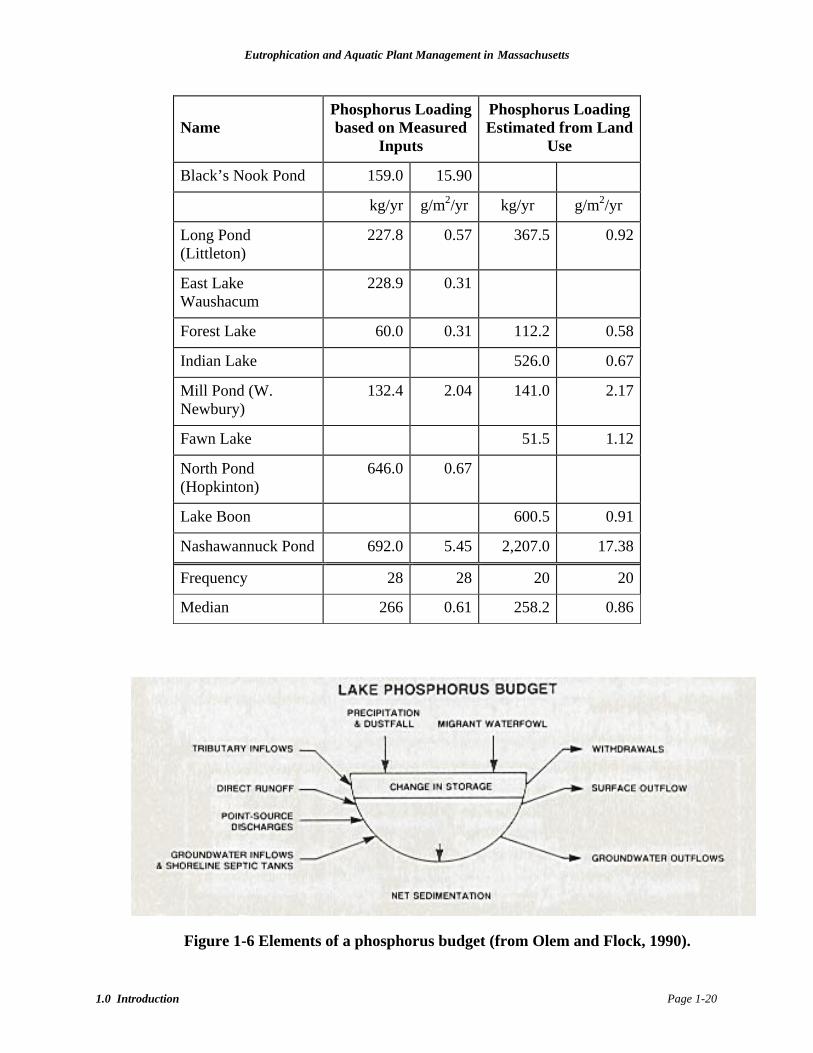
Eutrophication and Aquatic Plant Management in Massachusetts
1.0 Introduction Page 1-20
Name
Phosphorus Loading based on Measured
Inputs
Phosphorus Loading Estimated from Land
Use
Black’s Nook Pond 159.0 15.90
kg/yr g/m2/yr kg/yr g/m2/yr
Long Pond (Littleton)
227.8 0.57 367.5 0.92
East Lake Waushacum
228.9 0.31
Forest Lake 60.0 0.31 112.2 0.58
Indian Lake 526.0 0.67
Mill Pond (W. Newbury)
132.4 2.04 141.0 2.17
Fawn Lake 51.5 1.12
North Pond (Hopkinton)
646.0 0.67
Lake Boon 600.5 0.91
Nashawannuck Pond 692.0 5.45 2,207.0 17.38
Frequency 28 28 20 20
Median 266 0.61 258.2 0.86
Figure 1-6 Elements of a phosphorus budget (from Olem and Flock, 1990).
Eutrophication and Aquatic Plant Management in Massachusetts
1.0 Introduction Page 1-21
1.2.6 Other Non-living Components
1.2.6.1 Particulates
Particulates may be either inorganic or organic, but lake managers typically define them as any object larger than 0.45 thousandths of a millimeter (0.45 micrometers). Larger particles will not stay suspended in water for long, but smaller particles may settle very slowly or not at all. Colloids are fine particles with almost the same density as water that remain suspended. Larger or heavier particles such as algae, bacteria, aquatic animals and silt will eventually settle to the bottom, although some of these may actively swim or possess flotation devices to counter the effects of gravity.
1.2.6.2 Inorganic Particulates
Inorganic particles are relevant to the discussion about aquatic plants and algae because they can contribute nutrients that have been adsorbed onto the particles. In addition they can accelerate the process of filling the lake to the point where a shallow, soft and nutrient-rich bottom is widely available for rooted aquatic plant growth. Most inorganic particulates will have originated from terrestrial sources, although wave action and human activity can stir up lake bottom sediments and redeposit them.
1.2.6.3 Organic Particulates
Organic particles, sometimes referred to as detritus, are living or dead biota - plants, animals and bacteria. These eventually settle to the bottom where they decompose and release their nutrients.
1.2.7 Living Components
1.2.7.1 Bacteria
Although never seen by most people, bacteria play a pivotal role in the life of lakes. They are the most abundant group of organisms in a lake and most of them are critical in converting any organic material to inorganic form. They may be free-floating in the water column, attached to a substrate or in the sediments. Many are aerobic, requiring oxygen for the conversion of organic material to inorganic forms and energy. Many others are anaerobic, using other chemical pathways to derive energy. One such group, the sulfate reducing bacteria, are instrumental in converting inorganic mercury to the highly toxic organic form, methyl mercury, as a byproduct of their growth. Some bacteria are photosynthetic (e.g., cyanobacteria, also called blue-green algae). Some bacteria create human health problems or have proven to be useful indicators of the likely presence of human health problems. Escherichia coli is usually an innocuous bacterium found in our intestines, but its abundance in a lake indicates sewage, manure or other fecal contaminants and the potential for the transfer of human bacterial and viral disease.
Eutrophication and Aquatic Plant Management in Massachusetts
1.0 Introduction Page 1-22
1.2.7.2 Algae
Algae are mostly microscopic plants that may be free-floating (phytoplankton) or attached to a substrate (periphyton). They may be single-celled or have many cells. In most lakes there could be dozens of species of algae in a tablespoonful of lake water. In a eutrophic lake, there may be millions of cells in a gallon of water. Algae are divided into several major groups, principally based on photosynthetic pigments, characteristics of the cell wall, food storage form, and flagella, but each group has particular characteristics that often contribute to lake problems. More detailed descriptions are provided in Section 1.3, but an overview is offered here. The blue-greens are evolutionary intermediates between heterotrophic bacteria and algae. They are considered to be bacteria (Cyanobacteria) with the photosynthetic pigment, chlorophyll. Blue-greens often form nuisance blooms, appearing like thick green paint on the lake’s surface and causing taste and odor problems in drinking water. Many blue-greens, particularly certain troublesome species, have the ability to “fix” nitrogen. While other algae must obtain their nutrients from ammonium or nitrate in the water, these blue-greens can use atmospheric nitrogen that is dissolved in the water. A shortage of inorganic nitrogen can give nitrogen-fixing blue-greens a competitive edge, and they use other characteristics (flotation) to maintain it. Many of them have a gelatinous sheath or toxin that makes them undesirable to microscopic grazers. Three genera of blue-greens are so commonly associated with problems in lakes that lake managers have given them nicknames: Annie for Anabaena, Fannie for Aphanizomenon and Mike for Microcystis. Conversely, some of the golden-browns (Chrysophyta), the diatoms, are rarely problems in recreational lakes and usually form an important part of the food chain. They construct silica shells of intricate patterns and shapes. A hundred years ago, it was quite the fad to view slides of different diatom shells under a microscope. Electron microscopy has made the view even more spectacular. Despite their glass shells, these algae are easily eaten by small aquatic animals called zooplankton. Common planktonic diatoms include Asterionella, Fragilaria, Tabellaria, Aulacoseira and Cyclotella. Other chrysophytes live in shells that look like wine glasses or spiny shells with whipping flagella to move them about. Some of these non-diatom chrysophytes can cause taste and odor problems in drinking water reservoirs, but are rarely a problem in recreational lakes. Green algae (Chlorophyta) are an incredibly diverse group ranging from single-celled to complex multicellular organisms that may be on the main evolutionary line to vascular plants. They are important constituents in the food chain, but some species can cause blooms in eutrophic lakes. They prefer a higher ratio of nitrogen to phosphorus than blue-green algae. The dinoflagellates (Pyrrophyta) tend to be less abundant than the above groups but are interesting because some of the dinoflagellates cause harmful algal blooms (formerly known as “red tides”) in marine environments. One dinoflagellate species has been found to exude enough poison to kill potential predators, a “pre-emptive strike” by algae. Freshwater forms are not known to be toxic, but are often associated with high organic content waters where they supplement photosynthesis with particle consumption. Cryptomonads, a related group of flagellates, are capable of photosynthesis but may prey upon bacteria. Because all are motile, they can often dramatically change their position in the water column to take advantage of local

Eutrophication and Aquatic Plant Management in Massachusetts
1.0 Introduction Page 1-23
conditions. Often, they are found at the top of the thermocline where sinking organic material is slowed by the denser water but light is still sufficient to support some photosynthesis.
Figure 1-7 A typical seasonal succession of lake phytoplankton groups. Diatoms dominate in the spring and autumn, green and blue-green algae in summer (From Olem and
Flock, 1990). Euglenoids are another mostly flagellated group that share pigment composition with the green algae, but make use of organic particles and dissolved compounds more like the dinoflagellates and cryptomonads. They can form surface scums that vary in color from green to red, and at high abundance are normally indicators of very poor water quality. Most other algal groups are relatively rare in freshwater lakes and occur mainly in marine environments (i.e., red and brown algae). Each of the above groups has species with characteristics that may allow them to become very abundant and troublesome. Sometimes, knowing which species is in “bloom” can be very diagnostic, revealing the cause of the bloom. For example, certain blue-green algae often bloom when phosphorus is abundant and nitrate is low because they can fix nitrogen from dissolved air. They often prefer a period of calm water because they float and consequently shade out competing species. The concurrence of these conditions will usually result in blue-greens, but the absence of one element may shift the balance to another species or another algal group. The diatoms tend to prefer times of high mixing, cooler temperatures and higher silica availability - conditions found at spring and fall turnover. Many dinoflagellates seem to prefer conditions with above average organic material. The dynamics of the thermal, light and nutrient regimes in lakes cause a fairly predictable pattern in the seasonal succession of algal species (Figure 1-7), but there may be surprises at any time. Typically, though, spring and fall turnover favor the diatoms which may become very abundant but usually do not cause severe impacts on human use, although some species cause taste and odor problems in drinking water reservoirs and can clog filters. After thermal stratification, green
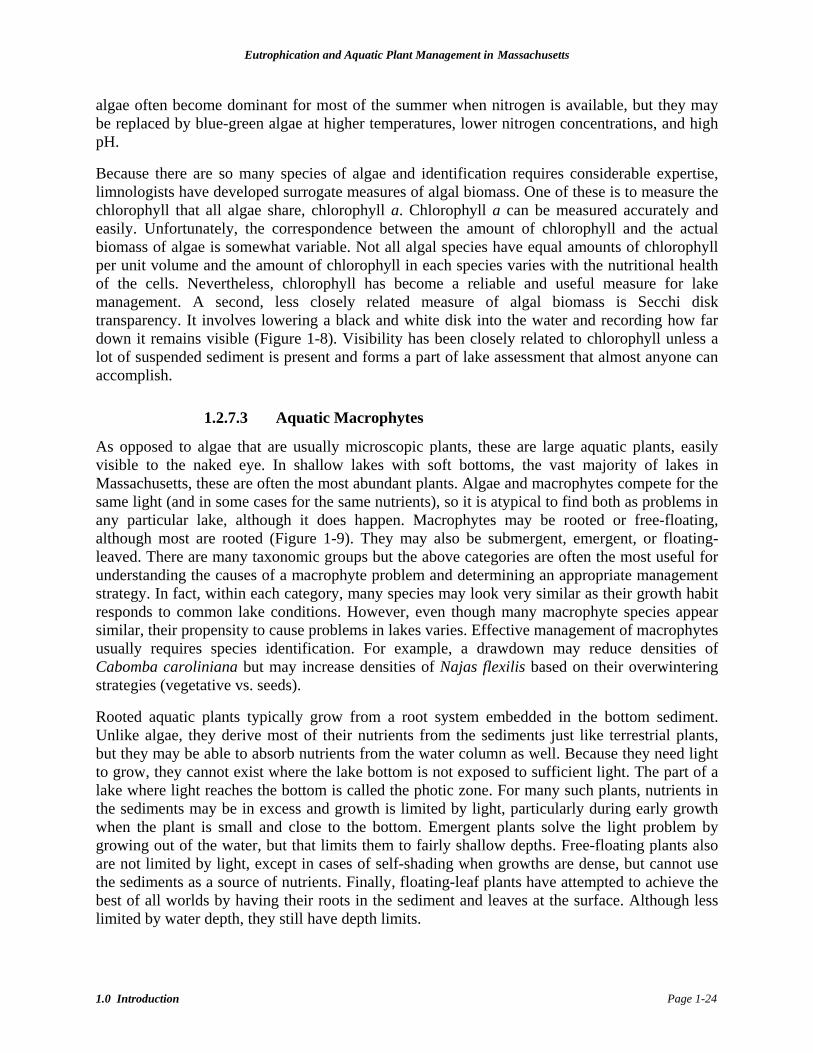
Eutrophication and Aquatic Plant Management in Massachusetts
1.0 Introduction Page 1-24
algae often become dominant for most of the summer when nitrogen is available, but they may be replaced by blue-green algae at higher temperatures, lower nitrogen concentrations, and high pH.
Because there are so many species of algae and identification requires considerable expertise, limnologists have developed surrogate measures of algal biomass. One of these is to measure the chlorophyll that all algae share, chlorophyll a. Chlorophyll a can be measured accurately and easily. Unfortunately, the correspondence between the amount of chlorophyll and the actual biomass of algae is somewhat variable. Not all algal species have equal amounts of chlorophyll per unit volume and the amount of chlorophyll in each species varies with the nutritional health of the cells. Nevertheless, chlorophyll has become a reliable and useful measure for lake management. A second, less closely related measure of algal biomass is Secchi disk transparency. It involves lowering a black and white disk into the water and recording how far down it remains visible (Figure 1-8). Visibility has been closely related to chlorophyll unless a lot of suspended sediment is present and forms a part of lake assessment that almost anyone can accomplish.
1.2.7.3 Aquatic Macrophytes
As opposed to algae that are usually microscopic plants, these are large aquatic plants, easily visible to the naked eye. In shallow lakes with soft bottoms, the vast majority of lakes in Massachusetts, these are often the most abundant plants. Algae and macrophytes compete for the same light (and in some cases for the same nutrients), so it is atypical to find both as problems in any particular lake, although it does happen. Macrophytes may be rooted or free-floating, although most are rooted (Figure 1-9). They may also be submergent, emergent, or floating-leaved. There are many taxonomic groups but the above categories are often the most useful for understanding the causes of a macrophyte problem and determining an appropriate management strategy. In fact, within each category, many species may look very similar as their growth habit responds to common lake conditions. However, even though many macrophyte species appear similar, their propensity to cause problems in lakes varies. Effective management of macrophytes usually requires species identification. For example, a drawdown may reduce densities of Cabomba caroliniana but may increase densities of Najas flexilis based on their overwintering strategies (vegetative vs. seeds).
Rooted aquatic plants typically grow from a root system embedded in the bottom sediment. Unlike algae, they derive most of their nutrients from the sediments just like terrestrial plants, but they may be able to absorb nutrients from the water column as well. Because they need light to grow, they cannot exist where the lake bottom is not exposed to sufficient light. The part of a lake where light reaches the bottom is called the photic zone. For many such plants, nutrients in the sediments may be in excess and growth is limited by light, particularly during early growth when the plant is small and close to the bottom. Emergent plants solve the light problem by growing out of the water, but that limits them to fairly shallow depths. Free-floating plants also are not limited by light, except in cases of self-shading when growths are dense, but cannot use the sediments as a source of nutrients. Finally, floating-leaf plants have attempted to achieve the best of all worlds by having their roots in the sediment and leaves at the surface. Although less limited by water depth, they still have depth limits.
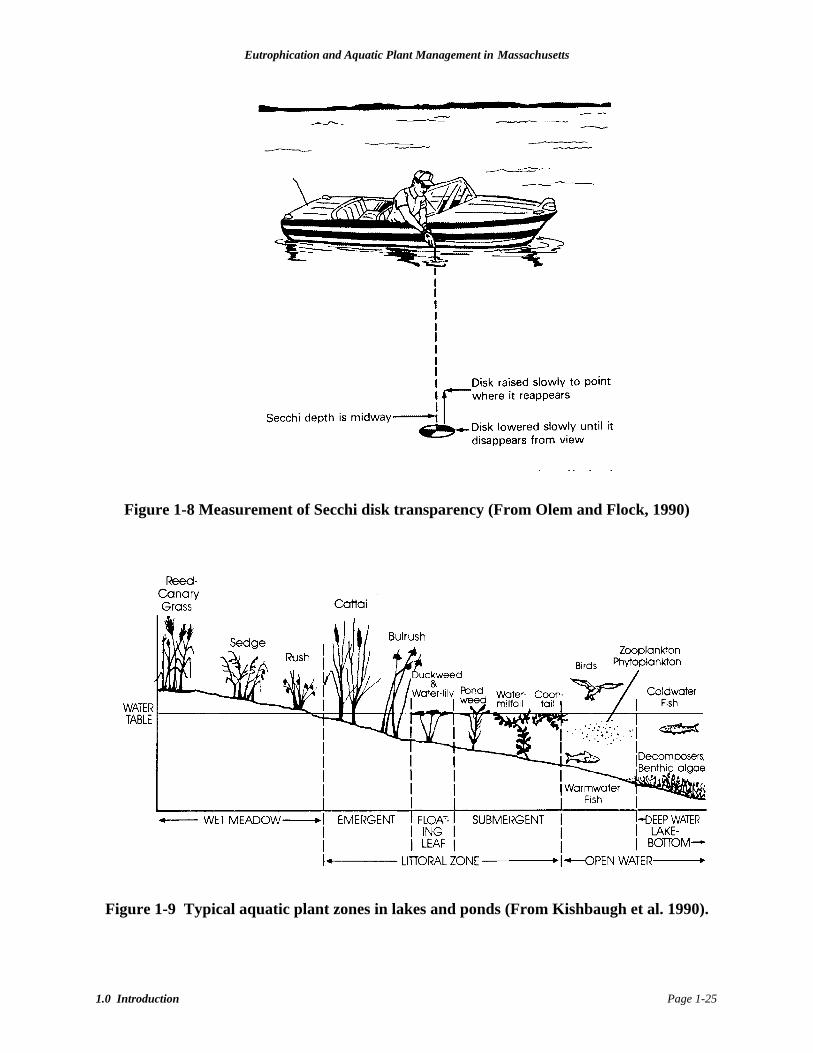
Eutrophication and Aquatic Plant Management in Massachusetts
1.0 Introduction Page 1-25
Figure 1-8 Measurement of Secchi disk transparency (From Olem and Flock, 1990)
Figure 1-9 Typical aquatic plant zones in lakes and ponds (From Kishbaugh et al. 1990).
Eutrophication and Aquatic Plant Management in Massachusetts
1.0 Introduction Page 1-26
1.2.7.4 Non-native Species
As a gateway for settlement of the country and as part of the modern trans-world travel network, Massachusetts is highly susceptible to introductions of non-native species. Non-native species, unlike the natural biota and even the non-native biota introduced more than a hundred years ago, have few or no enemies, and are often invasive pests that can totally dominate and eliminate native populations. They are easily introduced in a variety of ways, such as through the aquarium and horticulture trades. Once established in a lake, waterfowl and boats may facilitate their spread to other locations. In many situations where a non-native species has been introduced, a near monoculture of that species develops, reducing recreational utility and habitat value. Introduced non-native species can displace a healthy and desirable aquatic community and produce economically and recreationally severe impacts even though no other change has occurred in the watershed. The introduction of a non-native and undesirable species can result from the actions of a single person who does not realize the eventual impact and may not be aware that he/she has introduced the non-native species. Consider some examples. Introductions of Eurasian milfoil (Myriophyllum spicatum) in Lake Champlain (Vermont/New York), Lake George (New York), Okanagan Lake (British Columbia) and many lakes in Massachusetts and other states threaten otherwise healthy lakes. Within just a few years, a small patch of the introduced species can grow to fill the lake, top to bottom, within the photic zone. Another nuisance species, fanwort (Cabomba caroliniana), is a popular aquarium plant. Many believe it was introduced from freshwater aquariums (Les, 2002). Purple loosestrife, a beautiful non-native wetland plant, completely crowds out native species and creates stands so dense that wildlife habitat is degraded. It was introduced by horticulturists and gardeners desiring the beauty of the plant for their area (Les, 2002). There are many non-native species of concern, not all as invasive as these examples, with further descriptions in Section 2. In most cases, introduced species demand special attention. While an overabundance of native species and diminution of desired uses can be managed over time, introduced species generally require quick action if eradication is to be achieved. The environmental cost of delay is usually higher than the risk of immediate use of most control options. The quicker the response, the smaller the degree of intervention needed to protect the environment. It may be difficult to impossible to actually eradicate an invasive species, but the probability of achieving and maintaining control is maximized through early detection and rapid response. The Massachusetts Department of Environmental Protection developed a database of non-native (i.e., introduced) aquatic plants based on surveys in 1993-94. The database does not represent a comprehensive listing of all lakes with non-native species and is not a complete listing of known non-native species occurrences, but is considered representative of conditions at the time. Of the 320 lakes surveyed, 64% had introduced species, with a breakdown by species provided in Table 1-5a. The most commonly observed introduced species in these surveys were Myriophyllum (milfoil), Cabomba (fanwort) and Lythrum (loosestrife). The DCR updated this listing based on several sources in Appendix VI contains the surveyed lake names and presence/absence listings for non-native species. Table 1-5b updates the information to 2003.
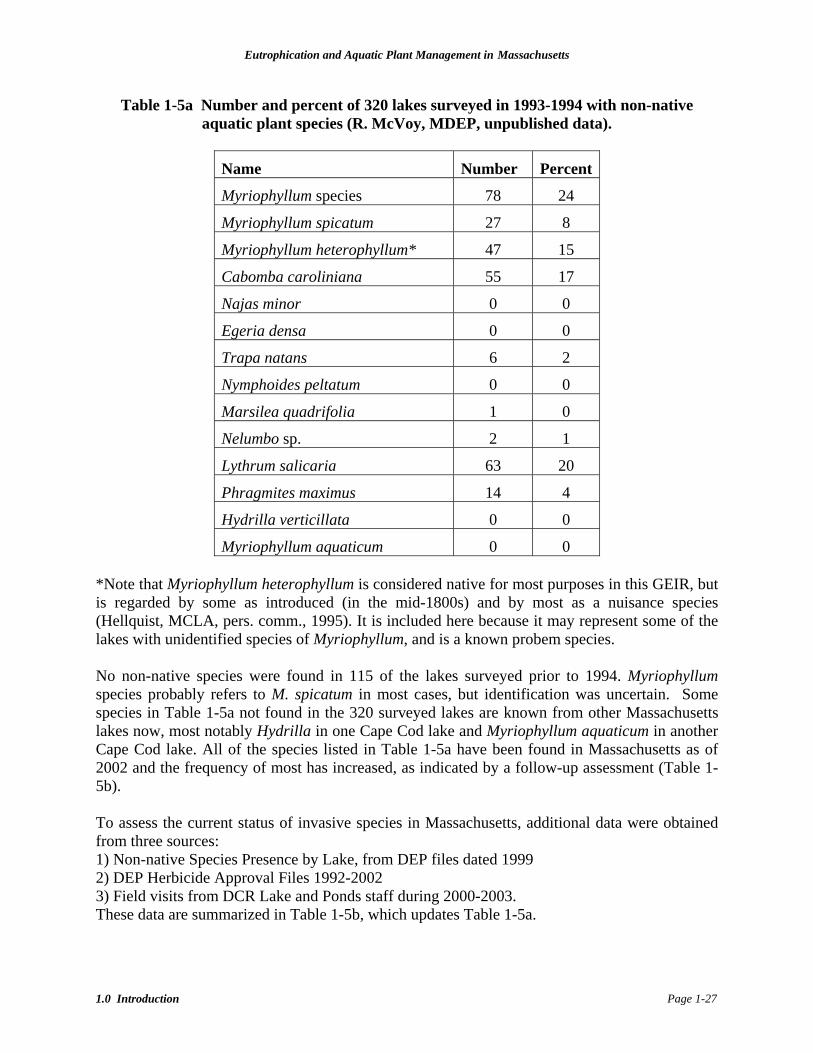
Eutrophication and Aquatic Plant Management in Massachusetts
1.0 Introduction Page 1-27
Table 1-5a Number and percent of 320 lakes surveyed in 1993-1994 with non-native aquatic plant species (R. McVoy, MDEP, unpublished data).
Name Number Percent
Myriophyllum species 78 24
Myriophyllum spicatum 27 8
Myriophyllum heterophyllum* 47 15
Cabomba caroliniana 55 17
Najas minor 0 0
Egeria densa 0 0
Trapa natans 6 2
Nymphoides peltatum 0 0
Marsilea quadrifolia 1 0
Nelumbo sp. 2 1
Lythrum salicaria 63 20
Phragmites maximus 14 4
Hydrilla verticillata 0 0
Myriophyllum aquaticum 0 0 *Note that Myriophyllum heterophyllum is considered native for most purposes in this GEIR, but is regarded by some as introduced (in the mid-1800s) and by most as a nuisance species (Hellquist, MCLA, pers. comm., 1995). It is included here because it may represent some of the lakes with unidentified species of Myriophyllum, and is a known probem species. No non-native species were found in 115 of the lakes surveyed prior to 1994. Myriophyllum species probably refers to M. spicatum in most cases, but identification was uncertain. Some species in Table 1-5a not found in the 320 surveyed lakes are known from other Massachusetts lakes now, most notably Hydrilla in one Cape Cod lake and Myriophyllum aquaticum in another Cape Cod lake. All of the species listed in Table 1-5a have been found in Massachusetts as of 2002 and the frequency of most has increased, as indicated by a follow-up assessment (Table 1-5b). To assess the current status of invasive species in Massachusetts, additional data were obtained from three sources: 1) Non-native Species Presence by Lake, from DEP files dated 1999 2) DEP Herbicide Approval Files 1992-2002 3) Field visits from DCR Lake and Ponds staff during 2000-2003. These data are summarized in Table 1-5b, which updates Table 1-5a.

Eutrophication and Aquatic Plant Management in Massachusetts
1.0 Introduction Page 1-28
Table 1-5b Aquatic non-native species abundance in Massachusetts lakes surveyed between 1994 and 2003
Scientific Name Number of Waterbodies
Myriophyllum spicatum 85
Myriophyllum heterophyllum 140
Cabomba caroliniana 141
Najas minor 9
Egeria densa 1
Hydrilla verticillata 1
Trapa natans 17
Lythrum salicaria 342
Phragmities sp. 76
Based on the newer data, the most common non-native submergent aquatic plant is now fanwort (Cabomba caroliniana), followed closely by variable milfoil (Myriophyllum heterophyllum) and Eurasian milfoil (Myriophyllum spicatum). Purple Loosestrife (Lythrum salicaria) was the most common non-native emergent species. Hydrilla (Hydrilla verticillata) is a new introduction to Massachusetts and was identified in one pond on Cape Cod in 2001. So far it is the only established population known in Massachusetts and it is currently being treated. The list of non-native plants is constantly evolving and an updated version is available at www.mass.gov/lakesandponds. The complete table depicting the water bodies that are known to be infested with non-native species as of 2002 is provided in Appendix VI. It is important to note that water bodies that are not included in this list are not necessarily free of non-native, invasive species. Rather, no data are available regarding the presence or absence of non-native species in water bodies that are absent from the list.
1.2.7.5 Animals
Plants provide the habitat and food for many forms of animal life ranging from microscopic rotifers that filter tiny algae to zooplankton that hunt larger algae, to insects, to fish and aquatic mammals that eat even larger plants or animals. A change in any part of this trophic web ripples throughout the system in subtle or even dramatic ways. As a vastly simplified example, consider the following. Certain algal species may be preyed upon by a species of zooplankton. That zooplankter is preyed upon by planktivorous fish species such as golden shiners (Notemigonus crysoleucas) which are then preyed upon by a larger piscivorous species such as largemouth bass (Micropterus salmoides). Reducing the algal population by some other form of control may also reduce the zooplankton, the planktivorous fish and the piscivorous fish. Conversely, adding more piscivorous fish or increasing their ability to find their prey may reduce the planktivorous fish and, consequently, reduce predation on zooplankton. The zooplankton can then increase in abundance and reduce the algae through grazing. Usually, the interrelationships are much more
Eutrophication and Aquatic Plant Management in Massachusetts
1.0 Introduction Page 1-29
complicated, and it is often difficult to predict the outcome. For example, increasing the piscivorous fish population may increase zooplankton predation on edible algae but give relatively inedible algae (e.g., blue-greens) an advantage. Alternatively, the piscivorous fish may switch food sources and start preying on insects, thereby reduce the grazing pressure on macrophytes. Alterations, even temporary ones, may have serious effects on the biota. For example, one of the most critical periods in the life history of fish is during spawning. Some lake management practices may be relatively benign except when they coincide with the spawning period for fish that occur in the lake. Depending on the species, fish spawning generally occurs in spring or fall (Table 1-6). Care must be taken to evaluate possible impacts of the timing and magnitude of lake management actions. Note also that some animals are introduced species, ranging from many fish species stocked for angling purposes to invertebrates that may represent a disruption of energy flow in the aquatic food web. Angling is a major lake use, and a major role of the Division of Fish and Game is managing lake fisheries for the enjoyment of the angling public. Both largemouth and smallmouth bass and both brown and rainbow trout are non-native species. Many baitfish species have been introduced as well, either intentionally to form a forage base for growing game fish or accidentally as escapees from bait buckets. It was a common management practice in the late 1800s and first half of the 1900s to move fish from lake to lake, introducing a range of species to each lake and allowing “nature” to decide what would become abundant. It was also common to “reclaim” a lake (poison the existing fish and restock) when fishing was considered very poor over an extended period of years, usually as a consequence of overabundant panfish. Stocking is much more focused and tightly controlled these days, and can be part of an overall management plan for each lake and region of the Commonwealth. Reclamation by poisoning followed by stocking is no longer practiced in Massachusetts. Other possible introductions of greater concern include zebra mussels (Dreissenia polymorpha) and various non-native relatives. These bivalve molluscs (small freshwater clams) can out-compete all other molluscs, cover rocks, docks and other hard substrates, and filter the water to the extent that the open water food web may collapse. Zebra mussels have not been found in Massachusetts as of this writing, but are known from the region and pose a great threat to water supplies and recreational lakes, as well as to the overall ecology of lakes. Introduced species of fish, non-native zooplankton, crayfish, and other invertebrates may threaten native biodiversity, but as of yet have not proven to disrupt overall lake ecology in Massachusetts.
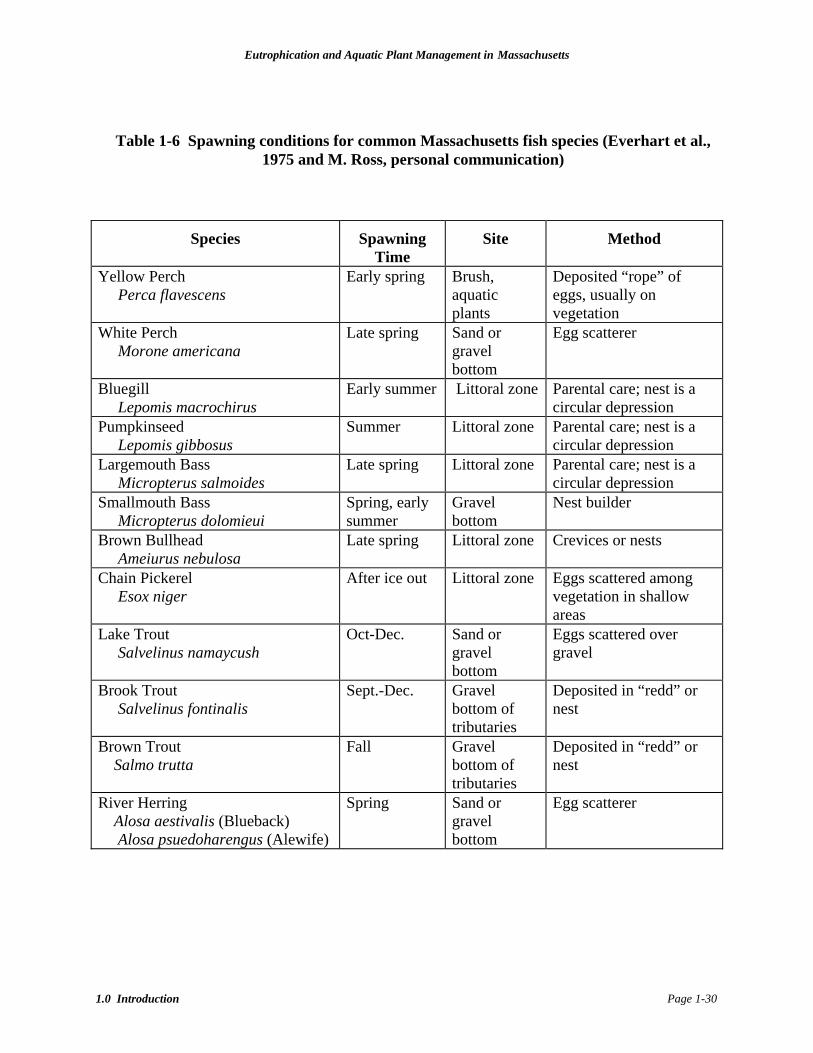
Eutrophication and Aquatic Plant Management in Massachusetts
1.0 Introduction Page 1-30
Species Spawning Time
Site Method
Yellow Perch Perca flavescens
Early spring
Brush, aquatic plants
Deposited “rope” of eggs, usually on vegetation
White Perch Morone americana
Late spring Sand or gravel bottom
Egg scatterer
Bluegill Lepomis macrochirus
Early summer Littoral zone Parental care; nest is a circular depression
Pumpkinseed Lepomis gibbosus
Summer Littoral zone Parental care; nest is a circular depression
Largemouth Bass Micropterus salmoides
Late spring Littoral zone Parental care; nest is a circular depression
Smallmouth Bass Micropterus dolomieui
Spring, early summer
Gravel bottom
Nest builder
Brown Bullhead Ameiurus nebulosa
Late spring Littoral zone Crevices or nests
Chain Pickerel Esox niger
After ice out Littoral zone Eggs scattered among vegetation in shallow areas
Lake Trout Salvelinus namaycush
Oct-Dec. Sand or gravel bottom
Eggs scattered over gravel
Brook Trout Salvelinus fontinalis
Sept.-Dec. Gravel bottom of tributaries
Deposited in “redd” or nest
Brown Trout Salmo trutta
Fall Gravel bottom of tributaries
Deposited in “redd” or nest
River Herring Alosa aestivalis (Blueback) Alosa psuedoharengus (Alewife)
Spring Sand or gravel bottom
Egg scatterer
Table 1-6 Spawning conditions for common Massachusetts fish species (Everhart et al., 1975 and M. Ross, personal communication)
Eutrophication and Aquatic Plant Management in Massachusetts
1.0 Introduction Page 1-31
1.3 BIOLOGY OF MASSACHUSETTS AQUATIC PLANTS
1.3.1 Introduction Excessive aquatic plant growth can interfere with recreational lake uses such as boating, swimming and fishing. It can also impede navigation, block pumps and sluices and cause encroachment, silting and flooding (Seagrave, 1988), and can affect the overall health and aesthetics of a lake. Bathing beaches must meet a 4 foot minimum Secchi depth requirement to provide adequate visibility and prevent swimmer entanglement, although more recent public health statutes have adopted a less objective narrative standard. In addition to impeding recreational uses, excessive aquatic plant growth can also result in the degradation of fish and wildlife habitat, strong fluctuations in dissolved oxygen concentrations and pH, an increase of phosphorus release from sediments and an acceleration of sediment deposition. Excessive algal growth can clog filters, cause odors and cause fish kills. There is a great need in many systems for control of rooted non-native plants. The introduction of these species can be detrimental to native species of plants and to wildlife that rely on those native species. The native plant communities in the ecosystem have evolved under long-term conditions and relationships including interspecific and intraspecific competition for nutrients, space and sunlight; presence of natural enemies like insects, waterfowl and fish; and a range of environmental conditions such as temperature, pH and mineral content. These relationships tend to keep any one native species from dominating and encourage a diverse plant community. Introduced species are often able to out-compete native vegetation because of the absence of natural enemies and competitive pressures and, in some instances such as purple loosestrife (Lythrum salicaria), can result in a monoculture of the introduced species. When considering management of an aquatic plant it is important that it and all members of the plant community be correctly identified and mapped at sufficient detail. This can be difficult as there are sometimes discrepancies between experts as to which plants are present in the state and which are in need of management, and methods for plant mapping are not standardized. Correct identification is essential in order to prevent the eradication of rare and endangered species and to document the plant population so that it can be monitored over time (Hellquist, 1993). A listing of plants and animals considered rare, threatened or endangered in Massachusetts is available in Appendix V. Management techniques often target specific plant species and an incorrect identification of the target plant or non-target plants could result in eradication or negative impacts on a desirable species or ineffective control of the target species. The ability of a plant to become a nuisance is dependent on the interactions of many factors, among them reproductive and dispersal mechanisms, growth rate, competitive abilities for light and nutrients, presence of natural biological controls, resistance to and presence of pathogens and favorable abiotic conditions. Favorable abiotic conditions for a particular plant can include nutrient abundance, preferred water depth and sediment type, hardness or softness of water and pH. Occasionally a cycle of invasion and decline is observed in aquatic plants, attributable to the presence of pathogens (Shearer, 1994), the presence of herbivorous insects (Sheldon, 1994), competition between plant species (Titus, 1994), or a change in abiotic conditions (Shearer, 1994).
Eutrophication and Aquatic Plant Management in Massachusetts
1.0 Introduction Page 1-32
There are four growth forms of aquatic plants that are commonly recognized: floating unattached, floating attached, submersed and emergent (Riemer, 1984).Some plants consist of both submerged and floating leaves, and some have different growth forms under different abiotic conditions (submersed and emergent forms), so the groupings are not quite so distinct. The following descriptions are of historically managed plant species in Massachusetts.
1.3.2 Submerged Plants
1.3.2.1 Myriophyllum spp. (milfoils)
Myriophyllum is a genus of plants with submersed leaves that generally occur in 1 to 4 meters (3 to 13 feet) of water, with optimum growth occurring at 3 meters (10 feet) (Hartleb et al., 1993). Deeper and shallower populations are certainly known, but fluctuating nearshore water levels will inhibit this species, as will low light at greater depths. Reproduction occurs both sexually and vegetatively (as it does in many aquatic plants) (Muhlberg, 1982), but vegetative reproduction and dispersal of vegetative propagules are considered the most significant means of expansion (Madsen et al., 1988). The inflorescence is often borne above the water surface and is probably wind-pollinated (Smith and Barko, 1990). Common in Massachusetts is Myriophyllum spicatum, also known as Eurasian watermilfoil. It is an introduced species that is exceedingly successful due to its ability to out-compete native species, mainly by forming a shading canopy. Eurasian watermilfoil is able to tolerate a wide variety of environmental conditions and because it is an introduced species from Europe, natural biological controls here are few. M. spicatum was originally confined to hardwater lakes of western Massachusetts but is becoming common in the central and eastern part of the state as well. Other species of Myriophyllum that have also been managed as a nuisance in Massachusetts are M. humile and M. heterophyllum, which are both presumed to be native species (NERI, 1978; B. Hellquist, MCLA, pers. comm., 1995). M. heterophyllum, or variable milfoil, may have been introduced in the 1800s. Fairly new to Massachusetts is parrotfeather, M. aquaticum, which has been popular in the aquatic garden trade and has now escaped into a small, private pond on Cape Cod (J. Straub, MDCR, pers. comm., 2002). Parrotfeather is likely to be found in the Berkshire region as well, owing to its frequency in the Hudson River valley.
1.3.2.2 Potamogeton spp. (pondweeds)
This genus contains plants with floating and submersed leaves (Riemer, 1984). A plant may have both submerged or floating leaves on the same plant or only submersed leaves may be present. Propagation from rhizomes or cuttings of shoots is very successful. Once the cuttings take root they send out new rhizomes which are able to reproduce as well (Muhlberg, 1982). However, nearly all species are annuals that produce seeds as an overwintering strategy. There are many native species of Potamogeton present in Massachusetts (NERI, 1978), and they can be found in nearly all lakes. Growth forms and general appearance varies substantially across this genus. The introduced curly leaf pondweed, Potamogeton crispus, is considered a nuisance species and overwinters mainly as winter buds, a hard structure resistant to most treatments. P. crispus germinates early in spring, forms dense growths, and usually dies back by early to mid-summer. The native species of pondeed that has most often been managed historically as a
Eutrophication and Aquatic Plant Management in Massachusetts
1.0 Introduction Page 1-33
nuisance is P. amplifolius (broad leaf pondweed). Several pondweed species are on the protected list for Massachusetts and surrounding states.
1.3.2.3 Najas spp. (bushy pondweeds)
Najas, or bushy pondweeds closely resemble Potamogetons, but they differ in that Najas spp. have only submerged leaves arranged in opposite order (Riemer, 1984). N. guadalupensis, N. flexilis, N. gracillima and N. minor are present in Massachusetts (B. Hellquist, MCLA, pers. comm., 1995). Note that N. minor is an introduced species. This annual genus is characterized by the use of water as a pollination mechanism, and produces many seeds per plant. Reproduction also occurs by propagation of cuttings and submerged shoots (Muhlberg, 1982).
1.3.2.4 Elodea spp. (waterweeds)
Elodea is the genus known as the waterweeds. This genus consists of submerged plants rooted to the bottom. Pollen floats on the water where it can come in contact with the female flowers, which float at the surface (Muhlberg, 1982). The small flowers rise on thread-like stalks that originate in the leaf axils (Riemer, 1984). Waterweeds are also capable of reproduction by broken lateral shoots (Muhlberg, 1982). Species present in Massachusetts include E. canadensis and E. nuttallii.
1.3.2.5 Egeria densa (Brazilian elodea)
Egeria densa is an introduced perennial plant that grows in fresh water. It has sessile leaves that grow in whorls and staminate flowers that are enclosed by a large bract. Pistillate flowers are unknown in New England (Crow and Hellquist, 1982). Egeria densa can reproduce by broken lateral shoots. Sexual reproduction is less likely as male and female flowers usually don't occur together (Muhlberg, 1982).
1.3.2.6 Utricularia spp. (bladderworts)
Utricularia is a member of the bladderwort family. The family is unusual in that its members have the ability to entrap and digest invertebrates in "catching bladders" anchored among their leaves (Muhlberg, 1982). The bladderworts are submerged plants with limited root systems and often grow horizontally forming dense mats that can drift free of the sediment. Purple or yellow flowers are borne on a scape that rises above the water (Riemer, 1984). Utricularia can also reproduce from submerged shoots (Muhlberg, 1982). U. purpurea, U. radiata and U. vulgaris are species native to Massachusetts that have been historically managed as potential nuisances.
1.3.2.7 Ceratophyllum spp. (coontail)
Ceratophyllum is a genus of submerged plants with minimal roots. Two species have been historically managed in Massachusetts, C. demersum and C. echinatum (B. Hellquist, MCLA, pers. comm., 1995). Sexual reproduction occurs when stamens are released from the male flower and float to the surface. The anthers split and release the pollen, which sinks to the bottom and may contact and pollinate female flowers. They may also reproduce from submerged shoots (Muhlberg, 1982).
Eutrophication and Aquatic Plant Management in Massachusetts
1.0 Introduction Page 1-34
1.3.2.8 Cabomba caroliniana (fanwort)
Cabomba caroliniana, or fanwort, is a rooted submerged plant that has submerged, opposite leaves that are fine and fan-like; oval floating leaves are known but rare in Massachusetts (Riemer, 1984). It is an introduced species and is becoming widespread in Massachusetts (B. Hellquist, MCLA, pers. comm., 1995), mostly in acidic ponds with sandy to mucky sediments. Flowers originate in leaf axils and extend to the surface where they are insect-pollinated. They can also propagate from cuttings or fragments (Muhlberg, 1982), which appears to be the more common mechanism for expansion.
1.3.2.9 Hydrilla verticillata (hydrilla)
Hydrilla looks much like waterweed (Elodea), but has more visible teeth on the leaves, which are in whorls of 4-6 instead of the 3 found in waterweed. Hydrilla has recently invaded New England and was known from isolated locales in Connecticut before 2001, when it was found in Long Pond in Barnstable on Cape Cod (J. Straub, MDCR, pers. comm., 2002). It is considered to be a major nuisance species that could greatly impact habitat value and recreational utility. Eradication has not been successful in Connecticut, but a major control effort has been directed at Long Pond on Cape Cod in 2002.
1.3.3 Floating Attached Plants
1.3.3.1 Nuphar spp., Nymphaea spp., (water lilies)
Nuphar spp. and Nymphaea spp. are in the water lily family (Gleason and Cronquist, 1991). The two can be distinguished from one another by the elyptical, somewhat heart shaped leaf, semi-circular stem and distinctive mid-rib found in Nuphar. Additionally, Nuphar has yellow flowers while Nymphaea has white or pink flowers (Crow and Hellquist, 2000). Nuphar and Nymphaea can reproduce sexually and from rhizomes (Muhlberg, 1982), the latter of which can form dense mats in muck sediments. These root mats sometimes break free of the sediment, creating floating islands. Attractive plants at low densities, these species can cover the entire water surface and create habitat and recreational impairment in shallow lakes.
1.3.3.2 Brasenia schreberi (water shield)
Brasenia schreberi is a member of the Cabombaceae, the family that includes fanwort, although they look nothing like each other. The plant is coated with slimy mucilage that protects the plant from desiccation, saturation and freezing temperatures. It has elliptical shaped floating leaves and a small reddish flower (Crow and Hellquist, 2000). B. schreberi reproduces by ramets (new plants sprout from rhizomes at some distance from the parent plant) (Muhlberg, 1982). This plant can reach nuisance densities and functions ecologically much like water lilies.
1.3.3.3 Marsilea quadrifolia (pepperwort)
Marsilea is a genus of fern. Marsilea quadrifolia is found in lakes and quiet streams, was introduced from Europe and is spreading rapidly (Fernald, 1950). It can reproduce from small
Eutrophication and Aquatic Plant Management in Massachusetts
1.0 Introduction Page 1-35
sections of shoots or from seed-like sporocarps (Muhlberg, 1982). It is not a common species yet, and has not been a nuisance in most systems.
1.3.3.4 Nymphoides spp. (floating heart)
Nymphoides is a member of the Gentian family. Nymphoides cordata is a native species with white flowers and heart shaped leaves, while N. peltata is an introduced species with yellow flowers and roundish leaves (Fernald, 1950). Nymphoides spp. can grow adventitious plants from the petioles and can reproduce from rhizomes (Gleason and Cronquist, 1991). An attractive plant at low densities, it can form a dense cover on the water surface, usually in smaller ponds.
1.3.3.5 Nelumbo lutea (lotus)
Nelumbo lutea (American lotus) has large, circular leaves that either float or extend above the water. It is a perennial that can reproduce from seed as well as from rhizomes (Hellquist and Crow, 1984). Nelumbo nucifera is another member of the lotus family and is a non-native species, but has not been a known nuisance in Massachusetts.
1.3.3.6 Trapa natans (water chestnut)
Trapa natans is an introduced plant with floating leaves that are arranged in a dense rosette and can form large floating mats, anchored to the bottom by a long stem with different submersed leaves scattered along it (Crow and Hellquist, 1983). Trapa natans is an annual that reproduces and overwinters entirely by nut-like seeds with large spines. It produces a seed bank in the sediment containing seeds that retain their viability for multiple years, sometimes in excess of five years (Methé et al., 1993).
1.3.4 Floating Unattached Plants
1.3.4.1 Lemna minor, Spirodela polyrhiza, Wolffia columbiana (duckweeds)
Duckweeds, or plants from the family Lemnaceae, are floating unattached plants and are the world's smallest flowering plants. They rapidly multiply vegetatively and are probably dispersed by migrating waterfowl. They have globular bodies called fronds and can have small roots that extend into the water column, depending on the genus (Riemer, 1984). Three species that have caused problems in Massachusetts lakes are Lemna minor (duckweed), Spirodela polyrhiza (big duckweed) and Wolffia columbiana (watermeal) (NERI, 1978).These species appear to be indicators of high dissolved nitrogen levels, especially of nitrate.
1.3.5 Emergent Plants Historically managed species listed in Table 1-7 include Typha angustifolia, T. latifolia, T. glauca, Pontederia cordata, Sagittaria latifolia, Phragmites australis, Polygonum amphibium and Lythrum salicaria ( NERI, 1978; B. Hellquist, MCLA, pers. comm., 1995). Emergent plants are restricted to shallow water and shorelines.
Eutrophication and Aquatic Plant Management in Massachusetts
1.0 Introduction Page 1-36
1.3.5.1 Typha spp. (cattail)
Typha spp., or cattail, are perennials with rhizomes that inhabit bogs, marshes and the edges of lakes and streams in shallow water (Riemer, 1984). They can live in both fresh and saline water. Cattails grow from creeping rhizomes (Crow and Hellquist, 1981) and can be propagated from seeds or the division of roots from the base (Muhlberg, 1982).
1.3.5.2 Pontederia cordata (pickerelweed)
Pontederia cordata has flowers in terminal spikes and heart shaped leaves that all originate from basal petioles. Flowers are blue or violet-blue and the stems that bear flowers have a single leaf below the flower (Riemer, 1984). Propagation is from seeds, the division of roots from the base and from lateral shoots (Muhlberg, 1982).
1.3.5.3 Sagittaria latifolia (arrowhead)
Sagittaria latifolia has arrow shaped basal leaves and flowers in clusters of three. The leaf shapes vary from a narrow to a broadly shaped arrowhead (Hellquist and Crow, 1981). This plant overwinters with tubers at the ends of rhizomes. In the spring it grows from the tubers or from seeds (Muhlberg, 1982).
1.3.5.4 Phragmites australis (reed grass)
Phragmites australis (P. communis, P. maximus) is an introduced species characterized by a feathery panicle, stolons and long creeping rhizomes (Fernald, 1950; Riemer, 1984). It is a tall grass that grows in colonies and can withstand low saline conditions (Magee, 1981). Phragmites can be controlled by increasing the salinity in tidal ponds (G. Gonyea, MDEP, pers. comm., 1995). Phragmites can propagate from stolons and rhizome fragments (Riemer, 1984); it seldom produces seeds (Gleason and Cronquist, 1991).
1.3.5.5 Polygonum amphibium (water smartweed)
Polygonum amphibium is a perennial that has rhizomes, stolons and rooting stems from which it can reproduce (Fernald, 1950). The inflorescences consist of rose colored racemes (Newcomb, 1977). There are aquatic and terrestrial forms of this species. Male and female flowers occur on separate individuals and the aquatic form of P. amphibium flowers only when in water (Gleason and Cronquist, 1991).
1.3.5.6 Lythrum salicaria (purple loosestrife)
Lythrum salicaria is an emergent species that was introduced from Europe. Lythrum aggressively chokes out native vegetation and can produce a monoculture. It produces more than a million seeds per plant and is not a food source for waterfowl (Weatherbee, 1994). Flowers are magenta and grow in spikes (Fernald, 1950). Reproduction is from seeds or division of the plant at the base (Muhlberg, 1982).
Eutrophication and Aquatic Plant Management in Massachusetts
1.0 Introduction Page 1-37
1.3.6 Algae
1.3.6.1 Introduction
The algae are a group of photosynthetic plants having no true roots, stems or leaves. For the most part, they are microscopic. The taxonomy of algae can be confusing and for this discussion we will follow an abbreviated outline based on the most recent taxonomic reference (Wehr and Sheath, 2003), which is not all that different from that applied in a much older classic text (Prescott, 1968). Nine phyla are described, including Cyanophyta, Chlorophyta, Bacillariophyta, Euglenophyta, Chrysophyta, Cryptophyta, Pyrrhophyta, Phaeophyta and Rhodophyta. Here we are concerned only with the common nuisance algae. The three most common taxonomic groups of algae are the diatoms (Bacillariophyta), the green algae (Chlorophyta) and the blue-greens (Cyanophyta). Species in the latter group, the blue-green Cyanophyta, are not true algae, but are photosynthetic bacteria (cyanobacteria). They will be considered for discussion and management together with the true algae. Although other groups of algae are present in most lakes, these three groups are the most abundant and most often create nuisance blooms within a lake. Some algae can cause problems in drinking water reservoirs without a visible bloom. The species Synura in the Chrysophyta, for example, can cause taste and odor problems at relatively low densities (Prescott, 1968) and may need to be controlled in drinking water reservoirs. The ability to bloom is related to the ability to grow quickly and out-compete other species for nutrients, to maintain position in the photic zone where light is available, and to resist grazing by zooplankton. Typically, there is a seasonal succession of algae. The seasonal cycle commonly seen in north temperate lakes is a diatom bloom in the spring during mixing, with replacement by greens and blue-greens in the summer and often into the fall, and often a fall bloom of diatoms. Further descriptions of these groups and other algae, as well as information on ecological characteristics, is available in Lund and Lund (1995), Graham and Wilcox (2000) and Wehr and Sheath (2003).
1.3.6.2 Cyanophyta (Cyanobacteria; Blue-Green Photosynthetic Bacteria)
Many of the problems associated with algae in lakes are due to the group known as the blue-greens, which are named for their characteristic color, although they may also appear purple, red or lime green rather than blue-green. The blue-greens have a prokaryotic type of cellular organization and, as such, are considered to be photosynthetic bacteria. They lack sexual reproduction and many species have the ability to overwinter and withstand unfavorable environments by the production of resting cells called akinetes. As a group they have a number of other characteristics which increase their ability to cause nuisance blooms. Many species in the group have the ability to fix atmospheric nitrogen, can produce toxic exo- and endo-toxins and can control buoyancy by means of gas vacuoles and thus float at the surface or maintain position at intermediate depths. In addition, most species form long filaments or other large masses of cells, often with a slimy mucus coating, both characteristics that tend to inhibit consumption by zooplankton. A large bloom can result in strong odors, especially during decay, but taste and odor compounds may be emitted by healthy cells as well. Because some species
Eutrophication and Aquatic Plant Management in Massachusetts
1.0 Introduction Page 1-38
can fix nitrogen, they have a distinct competitive advantage during periods of low nitrogen availability, most often summer. Nitrogen fixation is generally related to the numbers of heterocysts, which are specialized cells in which fixation occurs via the nitrogenase enzyme. This enzyme, which is only found in prokaryotes, has the element molybdenum as the central component of the enzyme. Blue-greens often become dominant when nitrogen is limiting (e.g. under high phosphorus conditions), and this is usually the case when the molecular ratio of total nitrogen to total phosphorus concentrations in the water is less than 29:1 (Smith, 1983). This equates to a weight ratio of about 12:1, as a molecule of phosphorus is slightly more than two times heavier than a nitrogen molecule. They may also become dominant when both nitrogen and phosphorus are plentiful, suggesting no limitation by these two primary nutrients. Shapiro (1990) reviewed six hypotheses regarding dominance by blue-greens (high temperature, low light, low N/P ratio, buoyancy, zooplankton grazing and CO2/pH). Shapiro points out that many studies indicate blue-greens can assimilate CO2 efficiently at low concentrations found typically in water conditions above pH 8.5, possibly via bicarbonate uptake and that is why they dominate such lakes. Another hypothesis suggests viruses which kill blue greens are not active at high pH (see discussion in Cooke et al., 1993a). The three most common nuisance species are Aphanizomenon, Anabaena and Microcystis, which are found in eutrophic lakes during the summer and fall and may form surface scums during blooms. The first two are nitrogen fixers, while the latter is not. Other genera known to cause blooms and related water quality problems include Oscillatoria, Lyngbya, and Coelosphaerium, the first two of which are non-heterocystous filamentous forms and the last of which is a globular colony of cells similar to Microcystis. Recent reclassification of Oscillatoria and Lyngbya has created a number of new genera that further complicate taxonomic discussion, but these more familiar names still exist.
1.3.6.3 Chlorophyta (Green Algae)
The green algae are a very diverse group, ranging from very small unicellular forms through filamentous groups to the Charophyceae, which includes larger macroscopic forms such as stonewort or muskgrass. The green algae depend upon asexual and sexual reproduction. Susceptibility to grazing by zooplankton appears to be size dependent, with larger species being more resistant to grazing. However, gelatinous sheaths on some smaller forms also convey resistance to digestion. Common species include the macroscopic stonewort or muskgrass (Chara spp, the most common of which is C. vulgaris) and Nitella (the most common species being Nitella flexilis), various filamentous algae like Spirogyra, Cladophora and Oedogonium, single cells or small colonial forms like Chlorella, Scenedesmus and Pediastrum, as well as flagellated types such as Chlamydomonas and Volvox. They may cause nuisance blooms in nitrogen- and organic-rich environments such as barnyard ponds or downstream of domestic wastewater discharges. With less toxins and odor-forming compounds, green algae are not regarded to be as great a human or ecological health threat as the blue-greens. However, the formation of dense mats or high concentrations in the water column can cause deleterious shifts in pH or oxygen, and decay of blooms can produce objectionable odors. Dense algal mats can physically restrict recreational

Eutrophication and Aquatic Plant Management in Massachusetts
1.0 Introduction Page 1-39
uses, as with surficial mats of Rhizoclonium or Hydrodictyon. Although water quality is the primary determinant of which green algae will be present and at what density, many species start out as resting cells in the sediment, and mats may form at the sediment-water interface, utilizing sediment-derived nutrients and trapping enough photosynthetic gases to rise toward the surface.
1.3.6.4 Bacillariophyta (Diatoms)
The diatoms are another common group of algae found in nearly all lakes. They are often the dominant alga in oligotrophic and cold lakes and are not usually considered to possess the nuisance potential of blue-greens or greens. These algae have a distinctive siliceous cell wall and undergo normal (asexual) cell division in addition to sexual reproduction. The silica cell walls require less energy to produce and thus the diatoms have a competitive advantage over other algae until the supply of silica is depleted. Diatoms have a high maximum growth rate, but also require relatively high nutrient levels. They often bloom in the spring following mixing, when nutrient levels are high, as they store food as oils that metabolize better than other storage products at colder temperatures. Despite the silica cell wall, the diatoms are readily grazed by zooplankton. In addition, the heavy cell wall may promote sinking in calm waters. Although the following genera are common they rarely cause nuisance blooms from the perspective of recreational or ecological lake use: Asterionella, Synedra/Fragilaria, Tabellaria, Cyclotella, Melosira/Aulacoseira, Stephanodiscus, Navicula and Nitzschia. Diatoms can become a nuisance in domestic water supplies, where they can impart odor to the water and clog filters.
1.3.6.5 Other Algae
Blooms of Euglenophytes, most notably Euglena or Trachelomonas, are known from organically enriched ponds where they can turn the water red or green. Certain chrysophytes such as Synura, Dinobryon, Mallomonas, Ochromonas and Chrysosphaerella can become abundant (usually in colder waters) and add color or odor to the water. Dinoflagellates (Pyrrhophyta) are better known as toxic bloom formers in saltwater, but can become abundant enough in freshwater to discolor water brown or black. However, no toxins are expected in the freshwater forms, which include Ceratium, Peridinium and Gymnodinium.
1.3.7 Managed Plants Present in Other States Other plants to be aware of that are not currently present in Massachusetts as permanent populations are Hydrocharis morsus-ranae (frogbit), Eichornia crassipes (water hyacinth), Pistia stratiotes (water lettuce), Alternanthera philoxeroides (alligator weed) and Butomus umbellatus (flowering rush). These plants are problem species in other states and could eventually spread to Massachusetts. Butomus umbellatus is of particular interest to Massachusetts because it is present in both Connecticut and Vermont (Crow and Hellquist, 1982). Summer populations of water hyacinth and water lettuce have been found in a few Massachusetts lakes (e.g., the Hingham skating pond in 1994), but do not appear to survive the winter. Escape from aquarium activities or horticultural endeavors appear to be the cause of these growths.
Eutrophication and Aquatic Plant Management in Massachusetts
1.0 Introduction Page 1-40
1.3.8 Managed Plants in Massachusetts The following list of plants (Table 1-7) contains species that have been managed in Massachusetts. Inclusion of a plant on the managed plant species list does not mean it requires management, nor does it mean that a plant absent from the list is never in need of management. The list is intended as a guideline and includes those plants that have commonly been considered as problem species in at least some instances. Where the species is introduced, there may be greater support for management or even attempted eradication. The species list in Table 1-7 is adapted from Table 5 in the 1978 GEIR (NERI, 1978) and from a personal communication with Dr. C. Barre Hellquist (MCLA, pers. comm., 1995). Examples of non-native plants are shown in Figures 1-10, 1-11 and 1-12. A glossary of terms is available in Table 1-8.
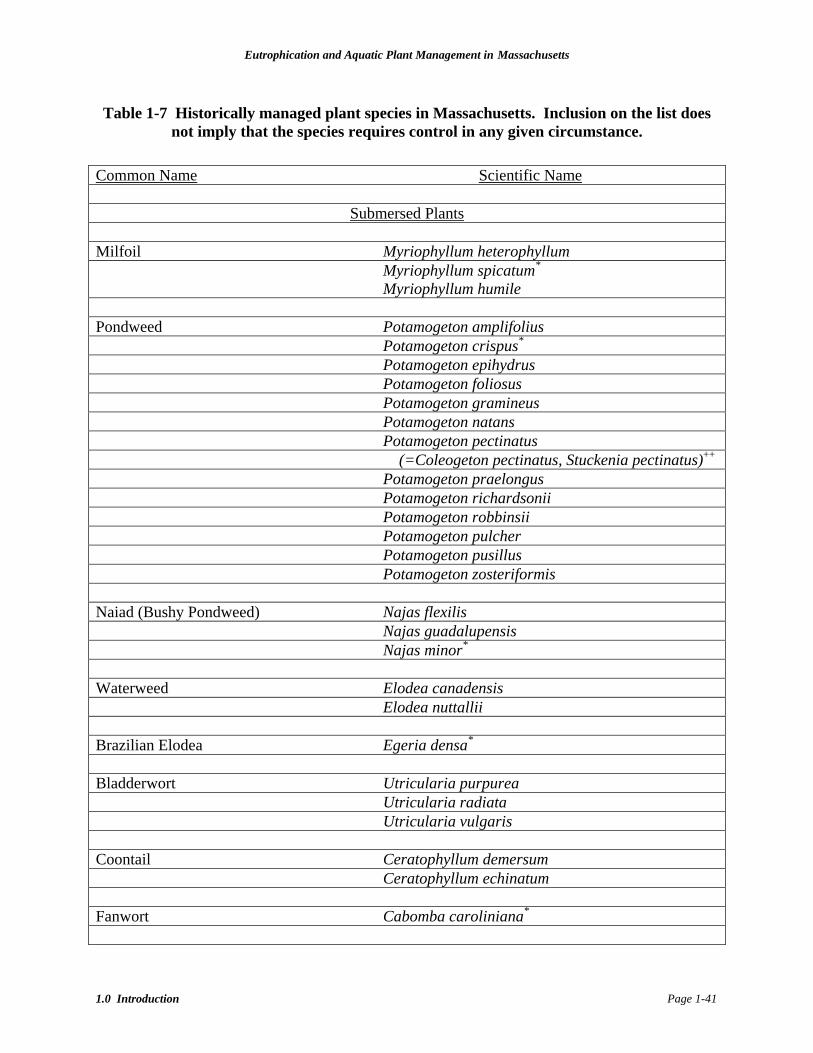
Eutrophication and Aquatic Plant Management in Massachusetts
1.0 Introduction Page 1-41
Table 1-7 Historically managed plant species in Massachusetts. Inclusion on the list does not imply that the species requires control in any given circumstance.
Common Name Scientific Name Submersed Plants Milfoil Myriophyllum heterophyllum Myriophyllum spicatum* Myriophyllum humile Pondweed Potamogeton amplifolius Potamogeton crispus* Potamogeton epihydrus Potamogeton foliosus Potamogeton gramineus Potamogeton natans Potamogeton pectinatus (=Coleogeton pectinatus, Stuckenia pectinatus)++ Potamogeton praelongus Potamogeton richardsonii Potamogeton robbinsii Potamogeton pulcher Potamogeton pusillus Potamogeton zosteriformis Naiad (Bushy Pondweed) Najas flexilis Najas guadalupensis Najas minor* Waterweed Elodea canadensis Elodea nuttallii Brazilian Elodea Egeria densa* Bladderwort Utricularia purpurea Utricularia radiata Utricularia vulgaris Coontail Ceratophyllum demersum Ceratophyllum echinatum Fanwort Cabomba caroliniana*
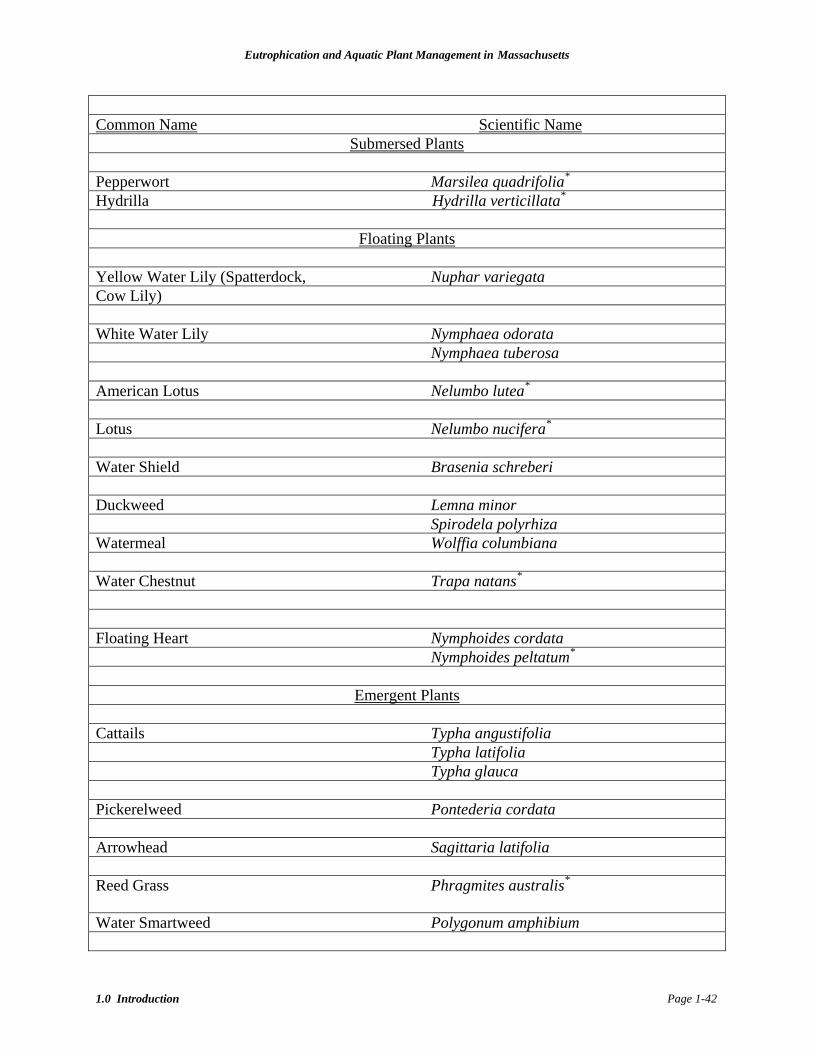
Eutrophication and Aquatic Plant Management in Massachusetts
1.0 Introduction Page 1-42
Common Name Scientific Name
Submersed Plants Pepperwort Marsilea quadrifolia* Hydrilla Hydrilla verticillata*
Floating Plants Yellow Water Lily (Spatterdock, Nuphar variegata Cow Lily) White Water Lily Nymphaea odorata Nymphaea tuberosa American Lotus Nelumbo lutea* Lotus Nelumbo nucifera* Water Shield Brasenia schreberi Duckweed Lemna minor Spirodela polyrhiza Watermeal Wolffia columbiana Water Chestnut Trapa natans* Floating Heart Nymphoides cordata Nymphoides peltatum* Emergent Plants Cattails Typha angustifolia Typha latifolia Typha glauca Pickerelweed Pontederia cordata Arrowhead Sagittaria latifolia Reed Grass Phragmites australis* Water Smartweed Polygonum amphibium
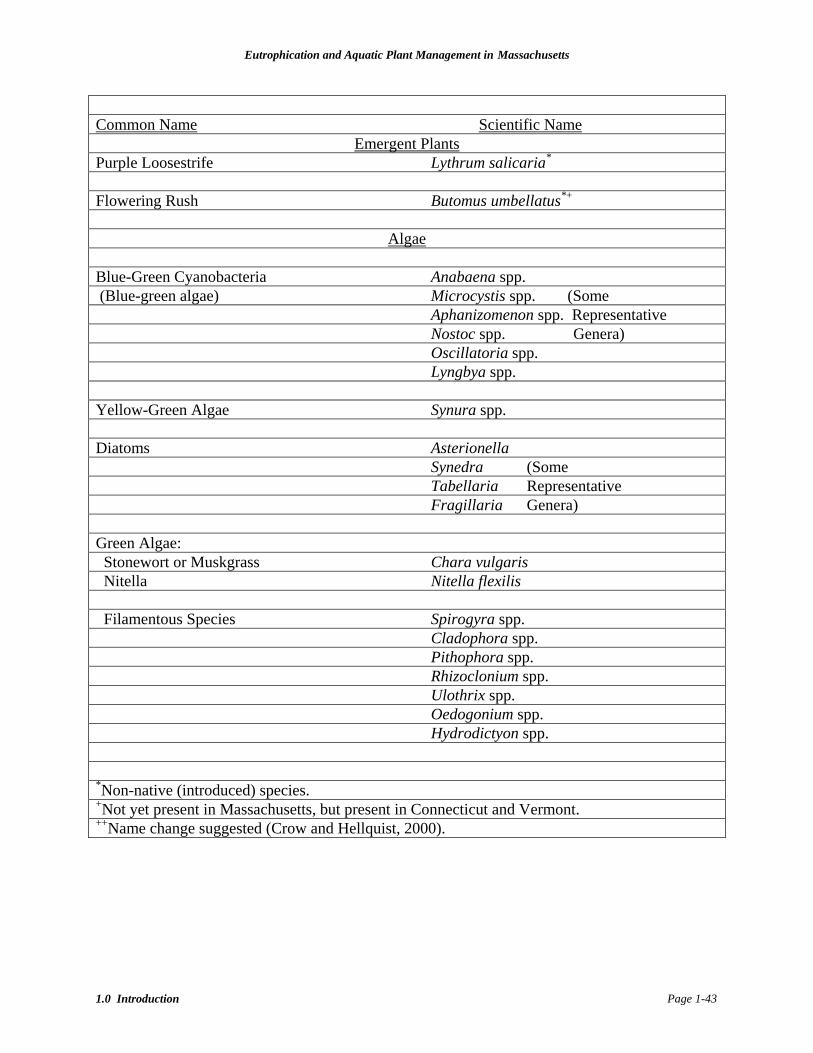
Eutrophication and Aquatic Plant Management in Massachusetts
1.0 Introduction Page 1-43
Common Name Scientific Name
Emergent Plants Purple Loosestrife Lythrum salicaria* Flowering Rush Butomus umbellatus*+ Algae Blue-Green Cyanobacteria Anabaena spp. (Blue-green algae) Microcystis spp. (Some Aphanizomenon spp. Representative Nostoc spp. Genera) Oscillatoria spp. Lyngbya spp. Yellow-Green Algae Synura spp. Diatoms Asterionella Synedra (Some Tabellaria Representative Fragillaria Genera) Green Algae: Stonewort or Muskgrass Chara vulgaris Nitella Nitella flexilis Filamentous Species Spirogyra spp. Cladophora spp. Pithophora spp. Rhizoclonium spp. Ulothrix spp. Oedogonium spp. Hydrodictyon spp.
*Non-native (introduced) species. +Not yet present in Massachusetts, but present in Connecticut and Vermont. ++Name change suggested (Crow and Hellquist, 2000).

Eutrophication and Aquatic Plant Management in Massachusetts
1.0 Introduction Page 1-44
Myriophyllum spicatum (Hellquist and Crow, 1983)
Potamogeton crispus (Hellquist and Crow, 1980) Najas minor
(Hellquist and Crow, 1980)
Cabomba caroliniana (Hellquist and Crow, 1984)
Figure 1-10 Examples of non-native aquatic plants in Massachusetts
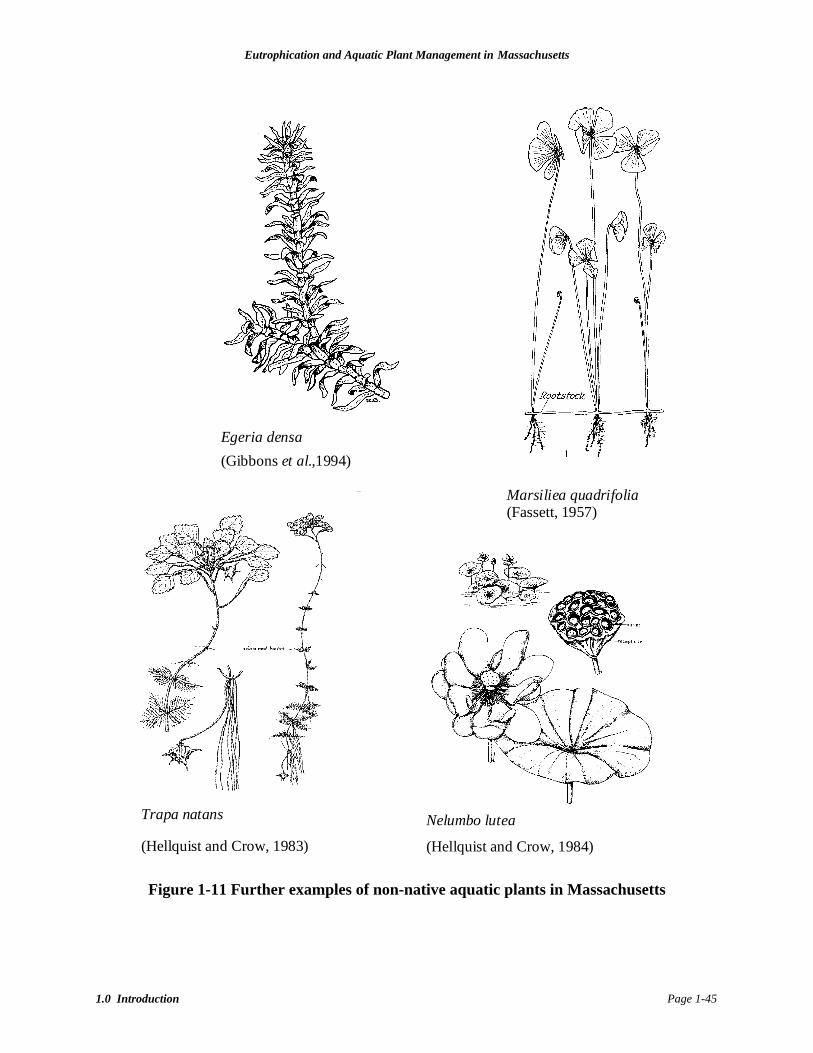
Eutrophication and Aquatic Plant Management in Massachusetts
1.0 Introduction Page 1-45
Egeria densa (Gibbons et al.,1994)
Marsiliea quadrifolia (Fassett, 1957)
Nelumbo lutea
(Hellquist and Crow, 1984)
Trapa natans
(Hellquist and Crow, 1983)
Figure 1-11 Further examples of non-native aquatic plants in Massachusetts
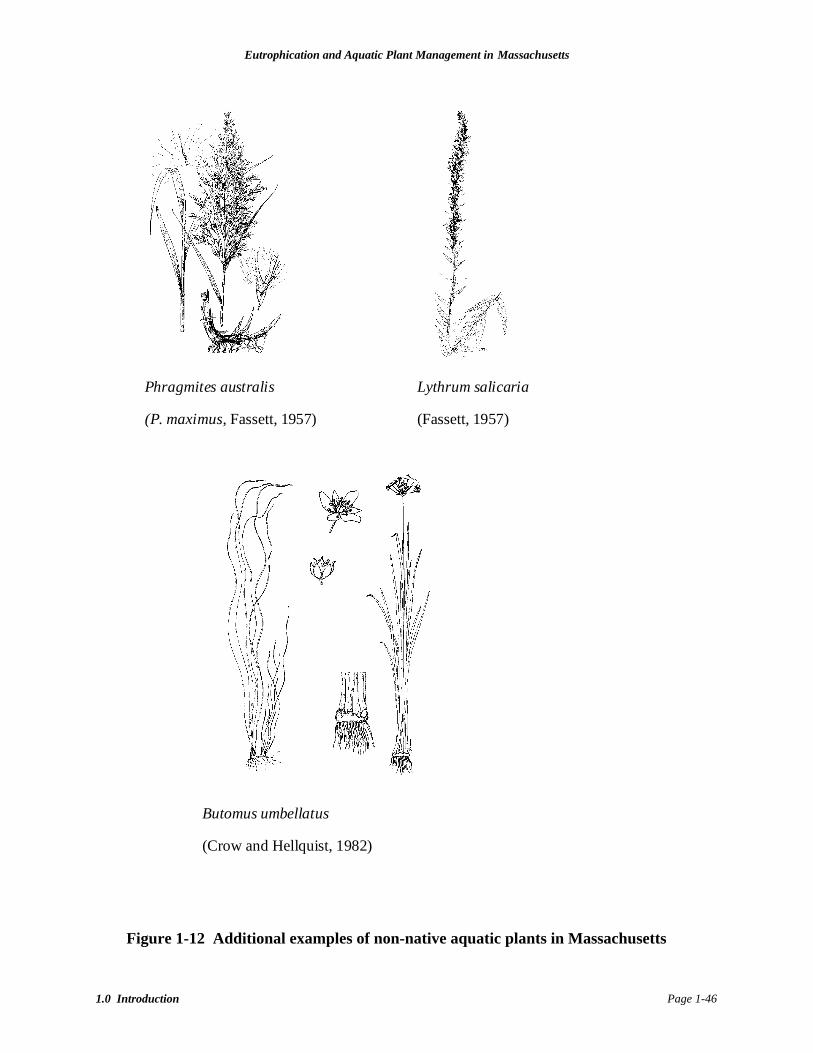
Eutrophication and Aquatic Plant Management in Massachusetts
1.0 Introduction Page 1-46
Butomus umbellatus
(Crow and Hellquist, 1982)
Phragmites australis
(P. maximus, Fassett, 1957)
Lythrum salicaria
(Fassett, 1957)
Figure 1-12 Additional examples of non-native aquatic plants in Massachusetts
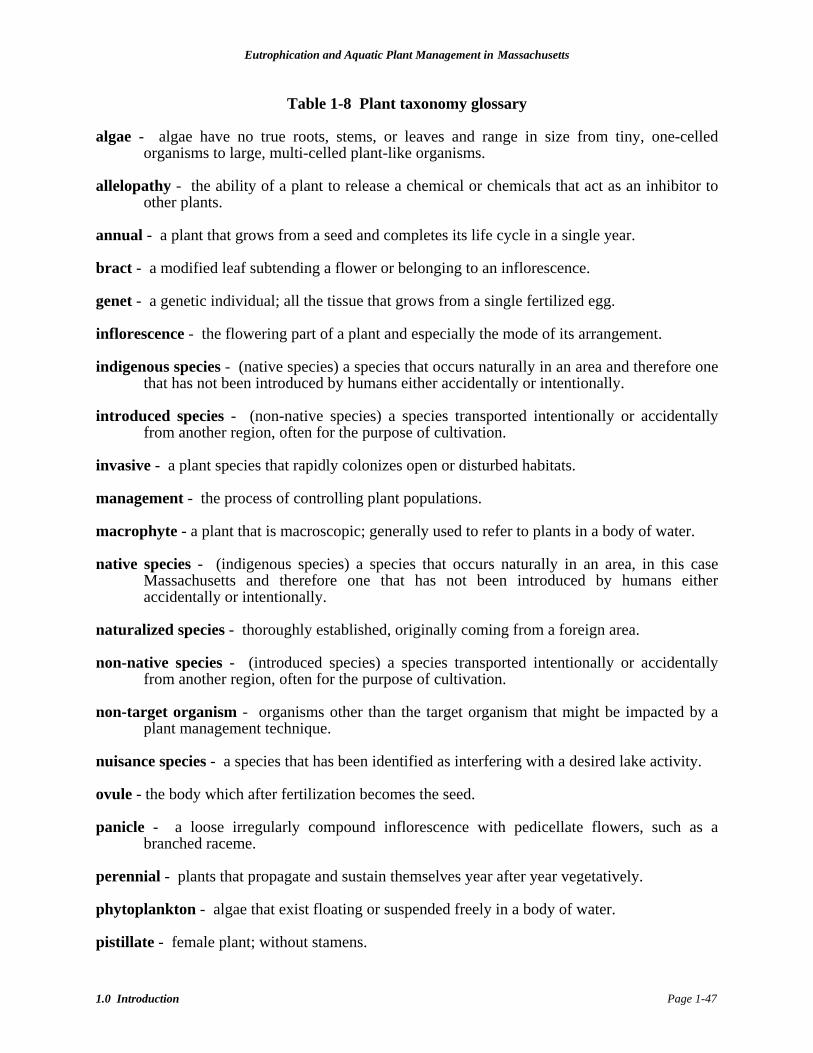
Eutrophication and Aquatic Plant Management in Massachusetts
1.0 Introduction Page 1-47
Table 1-8 Plant taxonomy glossary algae - algae have no true roots, stems, or leaves and range in size from tiny, one-celled
organisms to large, multi-celled plant-like organisms. allelopathy - the ability of a plant to release a chemical or chemicals that act as an inhibitor to
other plants. annual - a plant that grows from a seed and completes its life cycle in a single year. bract - a modified leaf subtending a flower or belonging to an inflorescence. genet - a genetic individual; all the tissue that grows from a single fertilized egg. inflorescence - the flowering part of a plant and especially the mode of its arrangement. indigenous species - (native species) a species that occurs naturally in an area and therefore one
that has not been introduced by humans either accidentally or intentionally. introduced species - (non-native species) a species transported intentionally or accidentally
from another region, often for the purpose of cultivation. invasive - a plant species that rapidly colonizes open or disturbed habitats. management - the process of controlling plant populations. macrophyte - a plant that is macroscopic; generally used to refer to plants in a body of water. native species - (indigenous species) a species that occurs naturally in an area, in this case
Massachusetts and therefore one that has not been introduced by humans either accidentally or intentionally.
naturalized species - thoroughly established, originally coming from a foreign area. non-native species - (introduced species) a species transported intentionally or accidentally
from another region, often for the purpose of cultivation. non-target organism - organisms other than the target organism that might be impacted by a
plant management technique. nuisance species - a species that has been identified as interfering with a desired lake activity. ovule - the body which after fertilization becomes the seed. panicle - a loose irregularly compound inflorescence with pedicellate flowers, such as a
branched raceme. perennial - plants that propagate and sustain themselves year after year vegetatively. phytoplankton - algae that exist floating or suspended freely in a body of water. pistillate - female plant; without stamens.
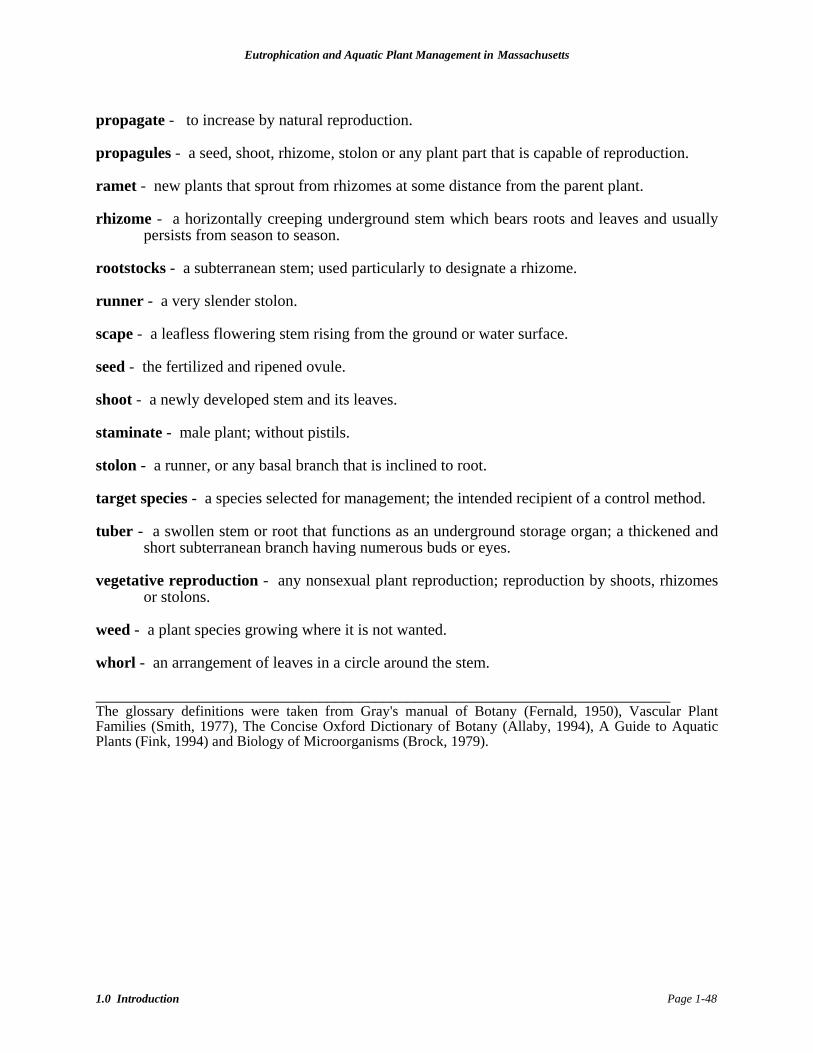
Eutrophication and Aquatic Plant Management in Massachusetts
1.0 Introduction Page 1-48
propagate - to increase by natural reproduction. propagules - a seed, shoot, rhizome, stolon or any plant part that is capable of reproduction. ramet - new plants that sprout from rhizomes at some distance from the parent plant. rhizome - a horizontally creeping underground stem which bears roots and leaves and usually
persists from season to season. rootstocks - a subterranean stem; used particularly to designate a rhizome. runner - a very slender stolon. scape - a leafless flowering stem rising from the ground or water surface. seed - the fertilized and ripened ovule. shoot - a newly developed stem and its leaves. staminate - male plant; without pistils. stolon - a runner, or any basal branch that is inclined to root. target species - a species selected for management; the intended recipient of a control method. tuber - a swollen stem or root that functions as an underground storage organ; a thickened and
short subterranean branch having numerous buds or eyes. vegetative reproduction - any nonsexual plant reproduction; reproduction by shoots, rhizomes
or stolons. weed - a plant species growing where it is not wanted. whorl - an arrangement of leaves in a circle around the stem. ________________________________________________________________________ The glossary definitions were taken from Gray's manual of Botany (Fernald, 1950), Vascular Plant Families (Smith, 1977), The Concise Oxford Dictionary of Botany (Allaby, 1994), A Guide to Aquatic Plants (Fink, 1994) and Biology of Microorganisms (Brock, 1979).
Eutrophication and Aquatic Plant Management in Massachusetts
1.0 Introduction Page 1-49
1.4 LAKE MANAGEMENT AND THE MASSACHUSETTS WATERSHED INITIATIVE
Because of the complex interrelationships and the difficulty of understanding them all, lake management is not an exact science. A successful management technique in one lake may have very different results in another lake because the ecosystem characteristics are slightly different. Consequently, a detailed review of the science cannot adequately provide perfect directions for successful lake management. The chances of success are vastly improved when the specific characteristics of the lake and the priorities of the lake users can be factored into the equation, but they will still not be perfect. Unfortunately, many lakes do not have adequate historical water quality data for this purpose and many of the management efforts planned under the state’s Clean Lakes Program were left unfunded before follow-up studies could be completed. For this reason, it is critical to follow a process beginning with discovering as much as possible about the characteristics of the lake in question, and then comparing the lake characteristics to the information in this review. Relate the combination to the goals of the resource users in the process of developing a lake management strategy, and finally document the results of that strategy. That process is briefly outlined below, but a much more thorough elucidation may be found in a number of available documents. The reader is especially referred to publications sponsored by the USEPA that detail the process of management strategy development, creating ongoing monitoring programs and partnering with concerned agencies (USEPA, 1990; Olem and Flock, 1990; Holdren et al., 2001) and to the publication “Diet for a Small Lake” (Kishbaugh et al., 1990). In Massachusetts, substantial inexpensive help for local interest groups can be obtained through the Massachusetts Water Watch Partnership. Additional help can be obtained from lake associations, non-profit monitoring support groups such as COLAP (Congress of Lakes and Ponds), state agency representatives and University of Massachusetts personnel. For-profit consulting firms have accrued most of the experience with the specifics of Massachusetts lake management. That experience should also be an important part of the development of a lake management strategy. These resources should be used fully, but ultimately the development of an appropriate strategy should be the product of the informed decisions by concerned and knowledgeable local groups. Arriving at that level of readiness will not only produce better decisions, but will feed back into an improved guideline for future management decisions. A full diagnostic/feasibility study for a lake may cost $50,000 to $100,000 or even more, based on the Clean Lakes Program studies in Appendix IV. A simple nutrient budget and lake management plan may cost as little as $10,000 to $20,000, based on the more recent MDCR Lakes and Ponds Program studies. The Commonwealth reorganized the management and regulation of lakes and rivers to emphasize the importance of watersheds. The Massachusetts Watershed Initiative (MWI) was launched in December 1993 at a special forum of environmental, business, municipal and government interests. The forum called for a working group, the Watershed Initiative Steering Committee (WISC), to develop a model approach, or methodology, for watershed-based environmental assessment, planning, and decision making, to get at the ever-elusive non-point sources and other intractable environmental problems. The organizational aspects of the MWI
Eutrophication and Aquatic Plant Management in Massachusetts
1.0 Introduction Page 1-50
were altered in 2003, but the emphasis on watersheds as the basis for planning and management remains. Central to the success of the watershed approach is a shift from top-down, federal- and state-driven environmental management to bottom-up, locally focused environmental management. The watershed vision has municipal governments, businesses, and citizens joining with watershed associations in becoming actively engaged in preventing and remediating environmental pollution in their own back yards and neighborhoods. Each would be a full partner in prioritizing needs. Limited federal, state, municipal and private dollars would be targeted to the locally determined priorities. The goal is protection and restoration of environmental quality, including restoration of Massachusetts' waters to fishable and swimmable quality. Although the Watershed Initiative has not continued as a separate program, the watershed perspective remains a key component of resource planning and management. The process of watershed management is seen as consisting of a series of steps in an iterative (and therefore repetitive) process. Each step builds on the others and is carried out in sequential fashion by the Watershed Community Council, Stream Teams, EOEA Basin Teams or other cooperative groups, municipal governments, and businesses. The steps include outreach, education and technical assistance; resource assessment; water resources planning; and plan implementation (including permitting, compliance and enforcement). Through these steps, watershed stakeholders collaborate in the identification of environmental problems, and in the development of Sub-watershed Action Plans and Watershed Action Plans. The Action Plans describe protection and restoration measures, assign responsibilities for these measures, and establish a schedule for implementation. An important component of the strategy is funding and technical assistance to expedite watershed management. With state funding provided by the Open Space Bond Bill and local matching funds, two types of assistance have been envisioned: (1) "capacity building assistance", for watersheds whose stakeholders will benefit from education about watershed concepts and the watershed approach; and (2) "comprehensive assistance" for watersheds that are ready to establish the structure and commence the process of watershed management. Another key component of the strategy is reorientation of EOEA agencies to serve watershed-based decision making. This is an important component of EOEA's regulatory and programmatic streamlining initiative, to achieve "more protection with less process". The final component of the strategy is the provision of technology services to watersheds. The services will include water resource modeling, data analysis, and Geographic Information System (GIS) mapping. With periodic governmental re-organization and changes in priorities, it is not clear how all services will be delivered over a prolonged period of time, but the components and process remain valid. As a separate but closely linked effort, the EOEA established the Lakes and Ponds Initiative in early 2001. The Massachusetts Lakes and Ponds Watershed Action Strategy, a report of the Blue Ribbon Committee on Lakes and Ponds, outlined six major recommendations for addressing major issues in lake and watershed management. The primary issues have been categorized as

Eutrophication and Aquatic Plant Management in Massachusetts
1.0 Introduction Page 1-51
water quality, water quantity, biodiversity and habitat, invasive species, dam maintenance or removal, and natural and human uses. The recommendations include:
Provide demonstration grants for implementation of restoration and protection projects Support local stewardship through expanded grant funding, guidance and training, and an
awards program Establish an invasive species response team to minimize the introduction and spread of
problem species Target land acquisition and protection efforts to protect water resources Develop a lake and pond classification/assessment system to facilitate matching management
approaches to problems Review and make necessary changes to regulations, policies and guidance to facilitate proper
lake and watershed management Funding was secured for FY02-04 and progress has been made on each of these recommendations. An active Lakes and Ponds Advisory Committee meets with the staff of Commonwealth agencies to provide insight and guidance to this developing process. Issues of continued adequate funding, regulatory reform, development of educational programs, and implementation of demonstration projects will require ongoing effort for multiple years. Yet the open discussions among a wide range of stakeholders and genuine commitment by the Commonwealth agencies constitute a very positive force in support of the watershed approach to lake and pond management in Massachusetts.
1.5 LAKE AND WATERSHED MANAGEMENT PLANNING
1.5.1 The Lake and Watershed Management Plan Lake and watershed management planning is a key process for selecting management techniques. Detailed planning may not be necessary in all cases, but is always appropriate for setting management goals and laying out the techniques that will be used to achieve those goals. Small projects, such as the installation of benthic barriers around a boat launch or swimming area, do not require a detailed lake management plan, but at a lake-wide scale, application would benefit from such a plan. In some cases it may not appear to make sense for a town or state agency to develop a detailed plan for a system which they do not control unless cooperation of other towns, agencies or landowners is obtained. However, having the framework of a plan in place may facilitate that cooperation, and development of management plans by multiple towns in a watershed is encouraged. The flow chart shown in Table 1-9 shows the process of developing and implementing a lake management plan and the parties that should be involved at each step. Like any sound construction, the foundation must be secure before the next level can be supported.

Eutrophication and Aquatic Plant Management in Massachusetts
1.0 Introduction Page 1-52
Table 1-9 Developing and implementing a lake management plan (modified from Olem and Flock, 1990)
Common Lake Problems
Planning Steps Participants
- Abundant algae - Excessive plant
growth - Sediment
accumulation - Low oxygen - Fishkills
Complaints/Issue Recognition - Impaired recreation (scums, weed
infestation, poor fishing) - Impaired water supply (filter clogging,
taste and odor, high Fe, Mn and/or TOC) - Health & safety issues (illness, visibility) - Aesthetic degradation - Undesirable change in historic use
- Lake users - Lake associations - State environmental agencies
Problem Statement - Perception - Measurement
- Lake users - Lake monitors - Environmental agencies or
consultants Problem Prioritization
- Goal setting - Compatability evaluation - Priority setting
- Lake users - Lake associations - Community/municipality
Problem Diagnosis - Available data - Data collection - Modeling/indices
- Citizen monitors - Consultants - Environmental agencies - Academic researchers
Evaluation of Possible Strategies - Effectiveness - Applicability - Feasibility - Cost
- Consultants - Conservation Commissions - Contractors
Development of a Lake Management Plan - Short-term - Long-term
- Consultants - Lake associations - Conservation Commissions
Implementation - Funding - Design - Regulatory Review - Construction/application of technique
- Consultants - Local and State agencies - Community departments - Contractors
Follow-up - Monitoring - Program adjustment
- Citizen monitors - Consultants - Contractors
Eutrophication and Aquatic Plant Management in Massachusetts
1.0 Introduction Page 1-53
Items I through IX below represent the most common components of a lake and watershed management plan. It is very important to keep in mind that:
Not all plans need to have each of the components fully developed, and depending on the management issues, plans may not need to address some of the components at all. Carefully consider resources and uses when prioritizing plan elements.
The size and detail of the plan should reflect the complexity of the lake and its management issues. In general, a plan may range from a couple of pages for a small privately owned pond to several hundred pages for a large public lake with many uses and management issues.
The outline and examples included below provide a menu of options, but should not necessarily be adopted verbatim. They are best evaluated in consultation with an experienced lake management professional.
As a general rule, thorough data for these components will enable the production of a more valuable lake and watershed management plan and will increase the likelihood of successful protection and/or restoration of the water body. The other general rule is that the greater potential impact or expense of a proposed management technique, the greater the need for complete information.
1.5.2 Components of a Lake and Watershed Management Plan I. Problem Statement State the issues/problems that should be addressed; why is management being considered? If available, summarize previous reports, data, historic management actions and past recommendations. If available for the lake or pond, it may also be useful to review lake TMDL (Total Maximum Daily Load) reports. They are available on the web at http://www.state.ma.us/dep/brp/wm/wmpubs.htm. II. Management Goals This is perhaps the most important step as it will define the plan’s data needs and scope of work. It is very important to get public input by all stakeholders when developing management goals. Provide a concise statement of goals, addressing items such as what you want to accomplish for your lake/pond, and desired future uses and characteristics. Goals should be specific, measurable, and realistic/feasible. Current and desired uses need to be defined. This section should include a map showing current and proposed use areas of the water body (e.g., swimming, fishing, power and non-power boating, boating channels, and vegetated areas for wildlife habitat etc.) III. Watershed and Lake Characteristics These can be compiled from previous studies or current data collection efforts. Depending on the complexity of the lake/watershed and its management issues, this section could include some or all of the following. It is worth repeating that not all plans need to have each of the components, depending on the lake management issues. A more detailed discussion of key characteristics is provided in Section 1.2.

Eutrophication and Aquatic Plant Management in Massachusetts
1.0 Introduction Page 1-54
Watershed Characteristics
Maps showing the watershed and subwatershed boundaries. Maps showing watercourses (tributaries and drainage conduits to the lake). Maps and discussion of current and historical land use within the watershed. Maps and discussion of potential future land use (zoning) in the watershed. Maps and discussion of geology and soils in the watershed. Wastewater Inventory - Wastewater can be a source of major nutrients and pathogens;
however, if properly treated, wastewater can be an important source of groundwater recharge. Determine what types of wastewater systems are present – municipal treatment facilities, septic systems, small package treatment facilities, or tight tanks. To evaluate the potential of the wastewater system as a source of nutrients/pathogens and groundwater recharge, gather available information on the age and condition of the wastewater system(s). Information on wastewater systems should be available from the Board of Health.
Storm Water Inventory - Gather or develop maps of the storm water drainage system and determine how the system is connected to the lake or pond. Estimate how much storm water is entering the lake and evaluate its quality through storm water monitoring or estimates based on land use. Check with local Engineering Departments or Departments of Public Works for availability of storm water system mapping.
Potable Water Supply Inventory - Nearby wells may draw water from the lake or may be influenced by the water levels in the lake. Information on public and private wells near the lake is useful for evaluating in-lake management options that may affect wells, such as drawdown. Information on public wells is available on the MassGIS website at http://www.state.ma.us/mgis/pws.htm. Information on private wells may be available from the Board of Health or local well drillers.
Physical Lake Characteristics
Lake area, bathymetry, mean and maximum depths. Inflows, outflows and other hydrologic features (e.g., detention time). Water budget - A water budget is an assessment of how much water comes into and leaves
the water body. Inputs include groundwater inseepage, surface water runoff (direct and via streams, often divided into baseflow and stormflow), direct rainfall, and any discharges to the lake or its tributaries. Outflows include surface overflow, groundwater outseepage, evaporation and any withdrawals.
General features of the lake bottom. Chemical Lake Characteristics
In-lake and tributary water quality - Variables measured and frequency and location of measurements will vary significantly depending on system features and management goals. Commonly assessed variables include forms of phosphorus and nitrogen, temperature, dissolved oxygen, pH, alkalinity, conductivity or dissolved solids, Secchi transparency and/or turbidity or suspended solids, and apparent and/or true color. Monitoring should be conducted under an approved Quality Assurance Project Plan (QAPP) or Standard Operating
Eutrophication and Aquatic Plant Management in Massachusetts
1.0 Introduction Page 1-55
Procedures (SOPs). Guidance on developing monitoring programs and QAPPs/SOPs is available from Mass Water Watch Partnership, COLAP, LAPA-West, and state and private lake management professionals.
Nutrient budget - A nutrient budget identifies the sources of a nutrient in the lake watershed and estimates how much each source contributes to the lake over a given period of time (usually annually). Phosphorus and nitrogen are priority nutrients because they are commonly limit plant growth in fresh and salt water systems respectively. Nutrient sources can come from within a lake (internal loading) or from the lake’s watershed (external loading). Nutrient budgets are typically created by modeling, measurement, or a combination of both. A nutrient budget can be roughly estimated by land use type and export coefficients. Budgets can be created by measuring actual inputs and outputs, assigning concentrations to the hydrologic budget terms to derive loads. Additional sources to be considered include waterfowl and internal loading. This approach typically requires significant monitoring.
Biological Lake Characteristics
Biological Surveys – Assessment of relevant biological components of the lake, potentially include bacteria, algae, vascular plants, zooplankton, invertebrates, fish, reptiles, amphibians, birds and mammals. This might be a brief description of species which are dominant and should note any species that is invasive. More detailed information may be required depending on management goals and the biological components potentially affected by management actions. Lakes with a mixed assemblage of protected and invasive species may need extensive biological data to craft an appropriate management plan.
Estimated and Priority Habitats of Rare and Endangered Species - Consult the Natural Heritage and Endangered Species Program maps for rare and endangered species, and priority habitats, available on the web at: http://www.state.ma.us/dfwele/dfw/nhesp/nhesp.htm.
Additional Information for Plans Focused on Rooted Aquatic Plant Management
A map showing species, locations, and densities (percent cover and/or biomass) of aquatic plants.
A written characterization of aquatic plants with special attention to non-native species and invasive species.
A map showing proposed vegetation control areas in the lake and thresholds for control (e.g., 100% eradication may be targeted for species in a designated swimming area, while some growth may be tolerated in boating areas, while other areas are left alone for wildlife habitat and natural areas).
Additional information for plans focused on algae or nutrient management
Current nitrogen/phosphorus ratios, type of algae (or plants not rooted in sediment) that are dominant.
Model predictions of in-lake total phosphorus concentrations in response to specific management actions.
Eutrophication and Aquatic Plant Management in Massachusetts
1.0 Introduction Page 1-56
Itemized inputs from land uses, “non-flow” sources such as internal sediment release or waterfowl, and specifically identifiable sources (e.g. wastewater treatment facilities, septic systems, gravel pit operations, green lawns, animal feedlots, cranberry bogs, highway or urban storm water discharges) with discussion of the relative importance of each.
Choice of target for in-lake TP concentration, Secchi disk transparency, and chlorophyll content, based on desired uses and the relation among these variables for the specific lake. This effort usually requires the use of predictive models (Section 1.5.3).
Discussion of expected dominance of algae vs. rooted macrophytes (achieving transparent water in shallow lakes may exacerbate rooted macrophyte problems).
Additional information for plans focused on sediment management and dredging
Sediment maps (depth of soft sediment over the lake area). Sediment quality – This analysis can be very expensive and is performed mainly when
dredging or nutrient inactivation is being considered. A long list of possible contaminants may be measured (see Table 3-3 in Section 3.7, where further discussion is provided). A less expensive analysis of available phosphorus is important to nutrient inactivation planning.
Areas to be dredged. Areas in the watershed for sediment control Best Management Practices and any forebays to
be created at inlet points. Areas for potential equipment access, containment area(s) and reuse/final disposal of
sediments (see Section 3.7 and Table 3-4 for more details). IV. Review of Past In-Lake Management Techniques Review all physical, chemical and biological controls and any other in-lake management techniques that have been implemented over the past five to ten years or longer, if adequate records exist. V. Review of Existing Watershed Management Techniques Review all regulatory and non-regulatory (i.e., educational, procedural and structural) management techniques that are in place and being used within the watershed. Regulatory
Zoning and Land Use Planning - Tools include overlay protection districts, purchase and transfer of development rights, Subdivision Control Rules and Regulations, and prohibition of various land uses.
Health Regulations - Authority includes underground fuel storage systems, and septic system maintenance.
Resource Protection Bylaws - Towns may adopt local bylaws that provide additional protection beyond that provided by state and federal environmental regulations. Examples include local bylaws for wetlands protection, wildlife habitat protection, erosion and sedimentation control, tree clearing, and restrictions on pesticides and fertilizers.
Eutrophication and Aquatic Plant Management in Massachusetts
1.0 Introduction Page 1-57
Non-Regulatory
Land Protection - Options include donations, taxation deferments, conservation easements and outright sale of land. Numerous groups including non-profits and government at the local, state and federal levels are involved in land protection efforts and can provide assistance.
Education and Outreach - Evaluate existing programs and efforts including topics covered, approach (e.g., brochures, newsletters, workshops, signage, media coverage), message and target audiences.
Structural
Buffer strips, inlet devices, detention basins, infiltration systems, and any other engineered means to capture pollutants before they enter the lake.
VI. Evaluation of In-Lake and Watershed Management Alternatives In-lake and watershed management options should be evaluated for feasibility, impacts, costs, and effectiveness to attain the goals. Section 3.0 and 4.0 include an extensive review of management alternatives for nutrients and aquatic plants. Refer to the publications described in Section 3.2.1 for guidance on Watershed Management Techniques. VII. Management Recommendations Recommendations should include both short- and long-term management options for in-lake and watershed management, and time frames. Recommendations should also include a focus on preventive measures. A description of the monitoring and evaluation process to be used for all proposed actions should be included. Monitoring should include pre- and post-management monitoring of not only the key variables associated with management goals (e.g., water clarity, plant coverage), but also the system components necessary to assess probable impacts of the proposed management. VIII. Plan Approval Arrange to present the plan at one or more well-publicized public meeting, and offer an opportunity for comment. Typically a draft plan is presented, comments are received, revisions are made as necessary, and a final plan is also presented at a public meeting. Emphasize stakeholder involvement; the plan will be better and more accepted. IX. Implementation There are five phases to implementation: funding, design, regulatory review, construction or application and follow up monitoring and evaluation. Each of these will be lake- and community-specific, but may involve considerable interaction with outside agencies and consultants. Earlier efforts in the development of a management plan should be rewarded by
Eutrophication and Aquatic Plant Management in Massachusetts
1.0 Introduction Page 1-58
easier accomplishment of these tasks. Action strategies should include naming a person or organization in charge of planning, implementation, monitoring, education, fundraising, and any other actions associated with implementation of management recommendations. This review, within the limits of available science and in-state experience, attempts to identify management techniques that are not threats to human or environmental health and have worked well in Massachusetts. Lake management controls that are consistent with this review have a reasonable chance of success, based on our present knowledge. Controls that are not recommended by this review either have a seriously limited chance of success, often have major negative impacts, or represent a change in scientific knowledge and experience since this report was written. In the latter case, the burden of proof must fall on those proposing the strategy. However, regulatory agencies need to keep up with the science and recognize the value of experimentation in lake management. Few impacts to lakes are irreversible. The lake management plan represents the assimilation of all the previous steps into one understandable written document describing long-term goals for the lake and ways to achieve those goals, along with their ecological and financial implications. Sufficient information should be provided to describe the problems and their importance, explain the probable causes of the problems, and justify the management (or non-management) that is proposed. The plan should also spell out the short-term goals for the lake, the benefits and costs of achieving those goals, and the steps needed to achieve them. The lake management plan will probably become the principal basis for meeting regulatory requirements and obtaining funding for implementation. The complexity of the plan will reflect the complexity of the lake ecosystem, documented problems, and the proposed management approach. If properly developed, it should be useful for a long time, modified as more is learned about the lake and progress is made.
1.5.3 Eutrophication Models In lake management planning, it is important to have some idea of the magnitude of management necessary to achieve water quality goals in a lake. Section 1.2.4 introduced the concept of simple budgets and empirical models to help diagnose lake problems and predict lake management results. Many studies have produced scientific literature statistically comparing nutrient inputs with average lake nutrient concentration, average chlorophyll concentration and Secchi disk transparency. Knowledge of any one of these parameters provides a rough estimate of all the others for temperate lakes without dominant rooted plant growth. For other lakes, particularly lakes with abundant plant growth, they will not work as well and may not work at all. These statistical models are collectively known as “empirical eutrophication models,” and allow prediction of the direction and magnitude of change to be expected in response to distinct management activities. Quite a few of these models have been developed; all are remarkably consistent and suggest that the general models are robust even though the confidence one can place in a specific prediction for a particular lake is limited. A complete review of lake and watershed models is beyond the scope of this document. However, practitioners of lake management should become familiar with the range of models and know when and how to apply them to aid management planning.
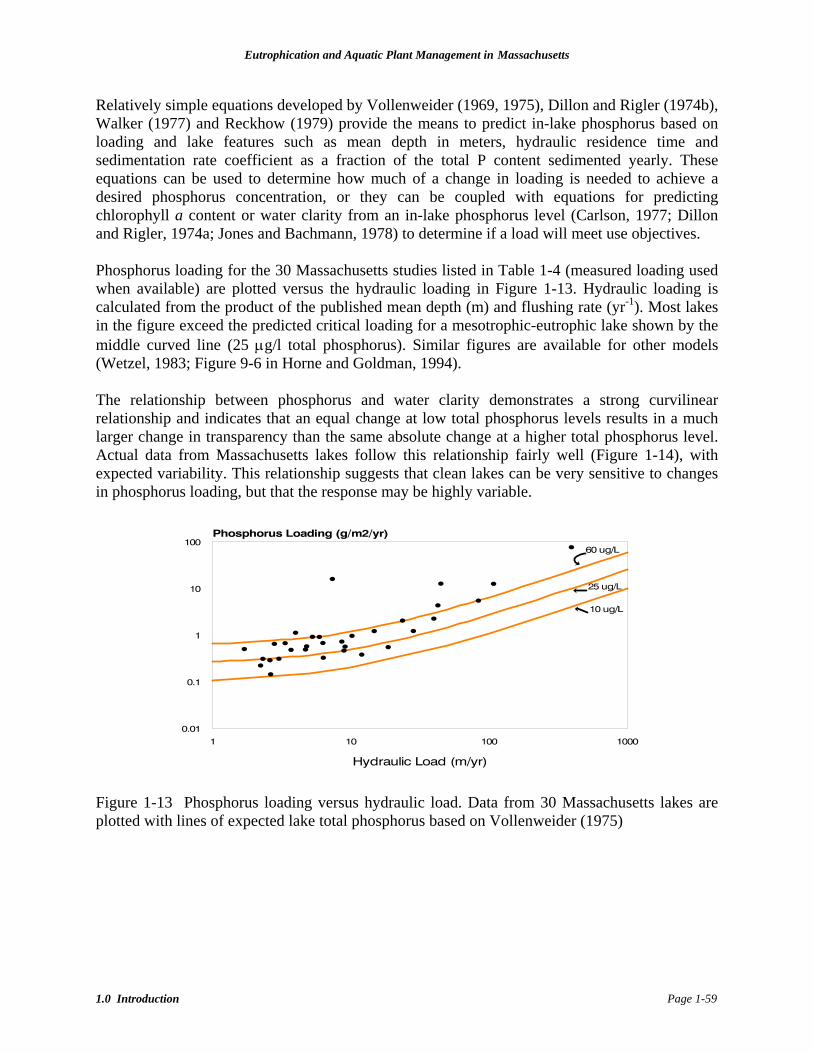
Eutrophication and Aquatic Plant Management in Massachusetts
1.0 Introduction Page 1-59
Relatively simple equations developed by Vollenweider (1969, 1975), Dillon and Rigler (1974b), Walker (1977) and Reckhow (1979) provide the means to predict in-lake phosphorus based on loading and lake features such as mean depth in meters, hydraulic residence time and sedimentation rate coefficient as a fraction of the total P content sedimented yearly. These equations can be used to determine how much of a change in loading is needed to achieve a desired phosphorus concentration, or they can be coupled with equations for predicting chlorophyll a content or water clarity from an in-lake phosphorus level (Carlson, 1977; Dillon and Rigler, 1974a; Jones and Bachmann, 1978) to determine if a load will meet use objectives. Phosphorus loading for the 30 Massachusetts studies listed in Table 1-4 (measured loading used when available) are plotted versus the hydraulic loading in Figure 1-13. Hydraulic loading is calculated from the product of the published mean depth (m) and flushing rate (yr-1). Most lakes in the figure exceed the predicted critical loading for a mesotrophic-eutrophic lake shown by the middle curved line (25 µg/l total phosphorus). Similar figures are available for other models (Wetzel, 1983; Figure 9-6 in Horne and Goldman, 1994). The relationship between phosphorus and water clarity demonstrates a strong curvilinear relationship and indicates that an equal change at low total phosphorus levels results in a much larger change in transparency than the same absolute change at a higher total phosphorus level. Actual data from Massachusetts lakes follow this relationship fairly well (Figure 1-14), with expected variability. This relationship suggests that clean lakes can be very sensitive to changes in phosphorus loading, but that the response may be highly variable.
Figure 1-13 Phosphorus loading versus hydraulic load. Data from 30 Massachusetts lakes are plotted with lines of expected lake total phosphorus based on Vollenweider (1975)
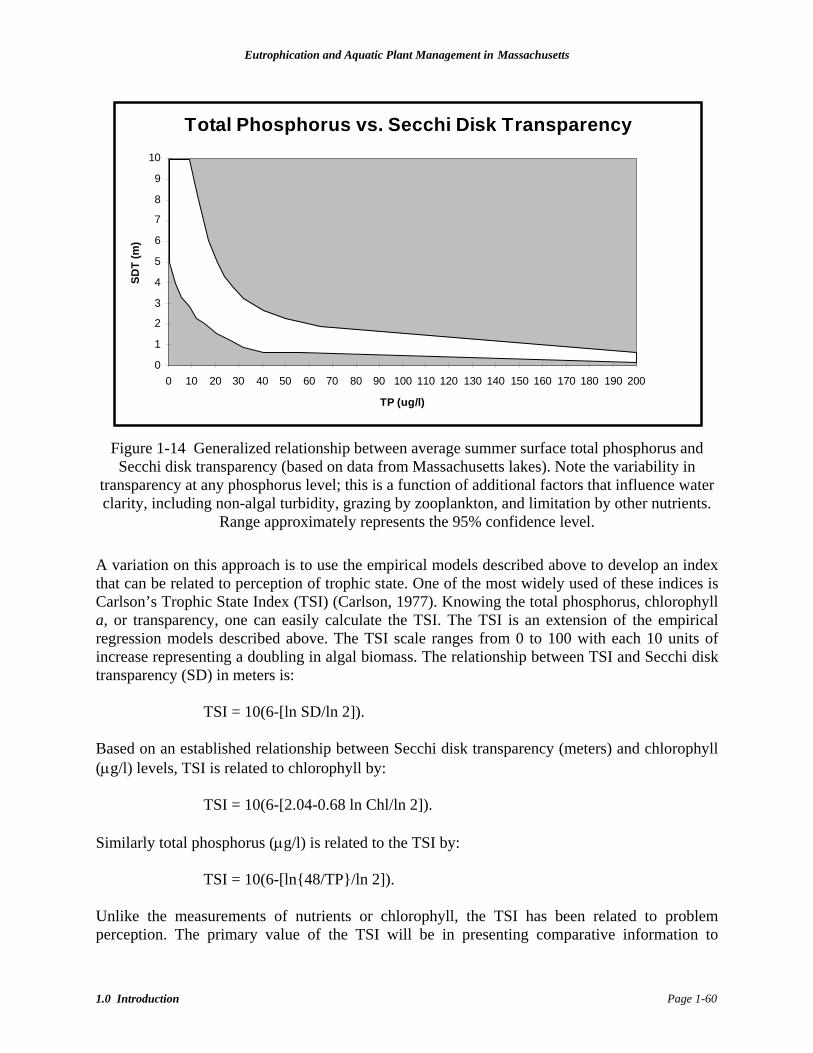
Eutrophication and Aquatic Plant Management in Massachusetts
1.0 Introduction Page 1-60
Figure 1-14 Generalized relationship between average summer surface total phosphorus and Secchi disk transparency (based on data from Massachusetts lakes). Note the variability in
transparency at any phosphorus level; this is a function of additional factors that influence water clarity, including non-algal turbidity, grazing by zooplankton, and limitation by other nutrients.
Range approximately represents the 95% confidence level. A variation on this approach is to use the empirical models described above to develop an index that can be related to perception of trophic state. One of the most widely used of these indices is Carlson’s Trophic State Index (TSI) (Carlson, 1977). Knowing the total phosphorus, chlorophyll a, or transparency, one can easily calculate the TSI. The TSI is an extension of the empirical regression models described above. The TSI scale ranges from 0 to 100 with each 10 units of increase representing a doubling in algal biomass. The relationship between TSI and Secchi disk transparency (SD) in meters is: TSI = 10(6-[ln SD/ln 2]). Based on an established relationship between Secchi disk transparency (meters) and chlorophyll (µg/l) levels, TSI is related to chlorophyll by: TSI = 10(6-[2.04-0.68 ln Chl/ln 2]). Similarly total phosphorus (µg/l) is related to the TSI by: TSI = 10(6-[ln{48/TP}/ln 2]). Unlike the measurements of nutrients or chlorophyll, the TSI has been related to problem perception. The primary value of the TSI will be in presenting comparative information to
Total Phosphorus vs. Secchi Disk Transparency
0
1
2
3
4
5
6
7
8
9
10
0 10 20 30 40 50 60 70 80 90 100 110 120 130 140 150 160 170 180 190 200
TP (ug/l)
SDT
(m)
Eutrophication and Aquatic Plant Management in Massachusetts
1.0 Introduction Page 1-61
decision-makers in an easy to visualize, non-technical form (Heiskary and Walker, 1987). Options for presentation include various histograms that relate measured variables to perceived conditions or the probability of problems like algal blooms (Figures 1-15, 1-16). While these classifications are simplified, they do provide a sense of what to expect if nutrient loading changes occur. Increasing levels of modeling sophistication are warranted when the choices to be made based on modeling results carry major costs. It is quite appropriate, however, to use simpler models to generate results for potential management scenarios for comparative purposes and to elucidate the level of management needed. It is extremely frustrating to conduct a program to reduce nutrient loading by 50%, only to find that no visible change in water clarity is gained because the system was out in the right hand portion of the graph in Figure 1-11 (high load, low clarity). It is very helpful to know the general order of magnitude of the loading reduction needed to meet program objectives before embarking on a load reduction campaign. Exact numerical predictions from models should not be believed in most cases, but the models do reliably indicate the direction and approximate degree of change to be expected.
1.5.4 Aquatic Plant Growth Models Models relating aquatic plant growth to nutrient inputs are not very well developed relative to nutrient-chlorophyll/transparency models. There are several difficulties in developing such models. First, aquatic plants generally rely on the sediments for their nutrients, although some unattached species are limited to nutrients in the water and many attached species can use either source to some extent. Second, there is no simple but accurate measurement analogous to chlorophyll and transparency to determine macrophyte. Third, aquatic plants and algae compete for light, and light is often a more critical determinant of macrophyte growth than nutrients. Canfield et al. (1985) developed a model to predict the depth of macrophyte colonization from water transparency. As a result of all of these factors, the prediction of long-term results of lake management on aquatic macrophytes is complicated and difficult. Experience with similar water bodies is often the best resource available.
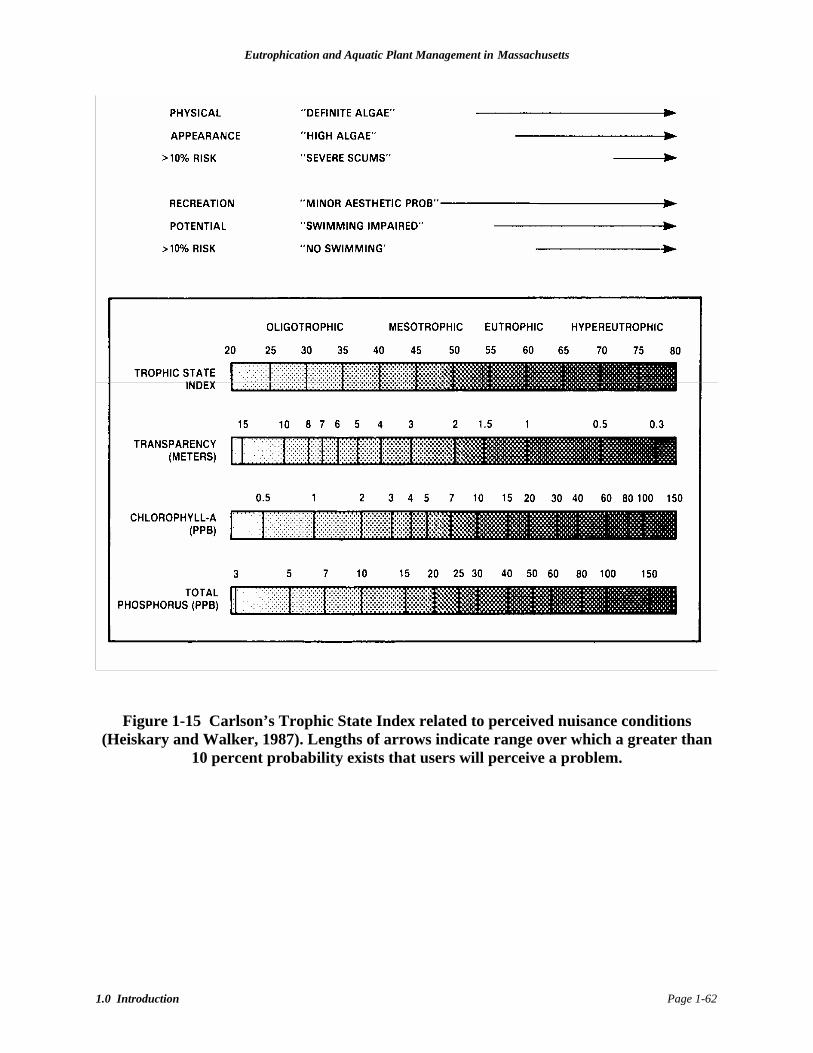
Eutrophication and Aquatic Plant Management in Massachusetts
1.0 Introduction Page 1-62
Figure 1-15 Carlson’s Trophic State Index related to perceived nuisance conditions (Heiskary and Walker, 1987). Lengths of arrows indicate range over which a greater than
10 percent probability exists that users will perceive a problem.
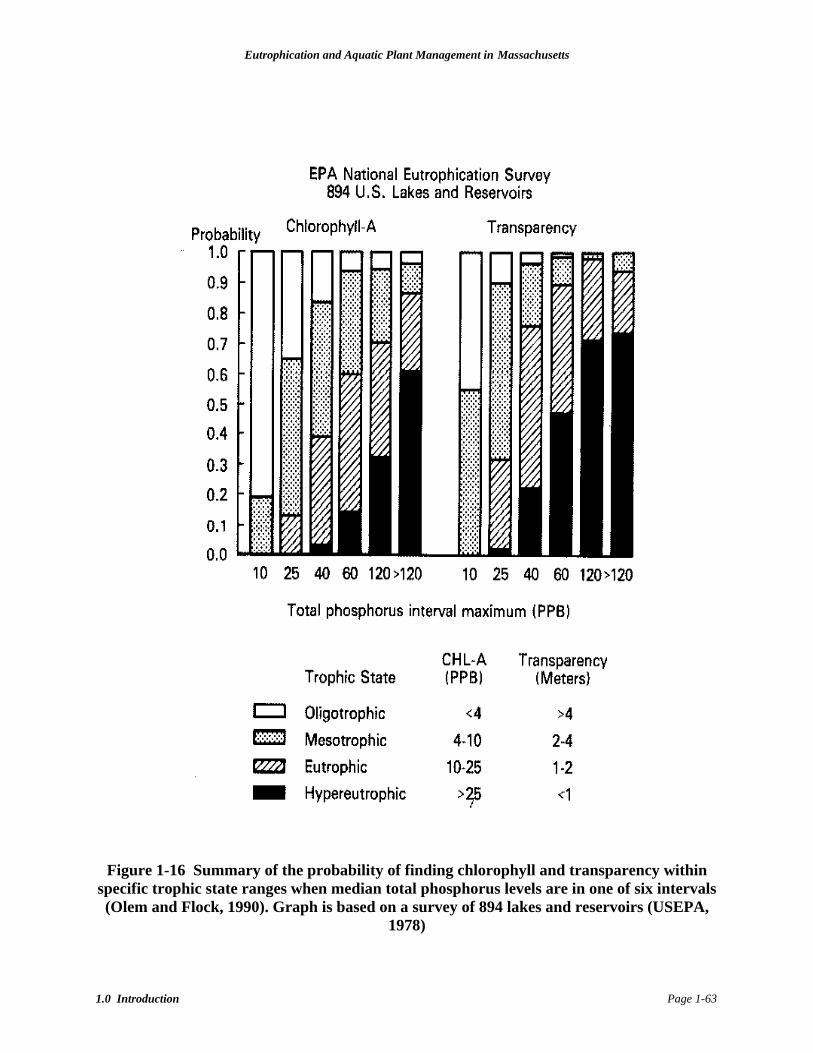
Eutrophication and Aquatic Plant Management in Massachusetts
1.0 Introduction Page 1-63
Figure 1-16 Summary of the probability of finding chlorophyll and transparency within
specific trophic state ranges when median total phosphorus levels are in one of six intervals (Olem and Flock, 1990). Graph is based on a survey of 894 lakes and reservoirs (USEPA,
1978)
Eutrophication and Aquatic Plant Management in Massachusetts
2.0 Case Histories of Lake Management in Massachusetts Page 2-1
2.0 CASE HISTORIES OF LAKE MANAGEMENT IN MASSACHUSETTS
2.1 TRENDS IN EUTROPHICATION AND MANAGEMENT NEEDS Trends and patterns in eutrophication in individual Massachusetts lakes are difficult to determine due to the lack of extensive long-term data sets in nearly all cases. Some conclusions can be drawn from the overall body of lake data over the past 30+ years, but these will not necessarily reflect what happens over time in any single lake. The Federal Clean Water Act (CWA) requires that each state monitor its surface and ground water and prepare a 305b report every two years, and this assessment is used to determine the level to which surface waters are supporting the uses for which each was designated. The CWA-designated uses include aquatic life, swimming, fish consumption, and secondary contact recreation. Use of 305b reports may provide the most comprehensive view of lake status over time, although these reports do not embody detailed statistical analysis. In Massachusetts, water quality is assessed for suitability for uses that include aquatic life, swimming, fish consumption and secondary contact recreation such as boating. The possible levels of support for these uses are full support, threatened, partial support and non-support. The latest 305b report (MDEP, 2000) lists the status of 48,967 lake acres (608 lakes). Of this area, 30% is listed as fully supporting (includes supporting but threatened) all designated uses, 23% partially support all designated uses, and 47% do not support one or more of the designated uses. Non-native (introduced) plant species are listed as the cause for impairment on 38% of the acreage and noxious plants (including rooted natives and/or algae) are listed for 15%. The spatial distribution of eutrophic lakes can be inferred from their location and the underlying geology. Griffith et al. (1994) examined the distribution of lakes within different ranges of total phosphorus concentrations. High concentrations (>25 µg/l TP) were found in the marble and limestone areas of western Massachusetts, in the Connecticut Valley and in the Boston area. Lowest concentrations (<5 µg/l TP) were found in the Berkshire Mountains, the North Central region and the northern half of Cape Cod (Griffith et al., 1994). Total phosphorus appears to be correlated with lake alkalinity and bedrock geology (comparing Griffith et al., 1994 to Mattson et al., 1992). Eighty-three full Diagnostic/Feasibility Studies (D/F Studies) were conducted on Massachusetts lakes (Appendix IV), mostly in 1980s, and these should provide a large source of data for evaluation of the status of eutrophication in Massachusetts during that time period. Unfortunately, the reports do not provide a random sample of lakes. Rather, the lakes selected for D/F studies are usually those with significant eutrophication problems already. Thus, it is impossible to extrapolate statistical summaries to the lakes in the state as a whole. Summarizing eutrophication for the sub-population of lakes for which D/F studies conducted is hindered by a lack of uniformity of reported lake data. Nutrient budgets, which are generally included in all reports as a vital aspect of the management of lake eutrophication, provide an illustration of the problem. The nutrient loading analysis does not always follow a consistent format or approach, depending on which contractor did the analysis. Some reports used a land use approach (Table 1-3) while other reports used a measured loading approach (Table 1-2)
Eutrophication and Aquatic Plant Management in Massachusetts
2.0 Case Histories of Lake Management in Massachusetts Page 2-2
Many reports used loading models (Section 1.5.2) as a check on the budget estimates. The best studies included all three approaches and compared the results. Because of these differences, it is difficult to assess the relative sources of nutrients to lakes as a whole, and it is not clear that this would be meaningful to any individual lake anyway. Even for a single study, estimates for loading could vary by greatly. Estimates of nutrient loading have improved over the last decade, but the variability of past studies limits the statistical power of any trend analysis. In the land use analysis the largest factor was septic inputs, amounting to a median of 48.4 percent of inputs when this was included as a separate item (septic inputs were included as an undifferentiated part of residential land use in some cases). This may be a reasonable indication of nitrogen contribution, but is a poor estimation of phosphorus load, as natural attenuation in soils and inactivation in aquatic systems were rarely addressed properly. Excluding septic system inputs, residential inputs were the largest loads at 19.3 percent (Table 1-3). Based on measured input pathways, the largest source was stream water (50.2 percent) which included both dry and wet weather inputs and reflects storm drainage discharges. Internal inputs amounted to 30 percent or more of all measured inputs in 7 of the 23 cases where internal loads were estimated, but as with septic systems, mechanisms of attenuation that tend to reduce the effective internal load were not properly addressed in many cases. The D/F studies do provide useful information on nutrient levels and eutrophication at a given point in time and will be very useful for historical comparison in future reports. Each is of immense value in developing the management plan for the target aquatic system and associated watershed. However, their collective value is primarily as a learning experience on what we need to know to effectively manage lakes. Variability in methods and the quality of work will continue to affect results, but D/F studies produced in recent years tend to reflect a much more detailed knowledge of how lakes function. Recent studies appear to integrate the analyses that support lake management decisions to a greater degree than did the many studies of the 1970s and 1980s, when a broader but less focused approach was applied to supply the data required by government programs. Some of these D/F studies have already been used in comparisons with more recent work on the same lakes, providing clear documentation of changes in conditions in at least some lakes. Some water quality changes have been noted, but by far the greatest difference over time is the proliferation of invasive, introduced species of plants. Although the bulk of the available data do not support statistically valid trend analyses, the large body of lake and watershed data does support some general conclusions about the condition of lakes in Massachusetts and the processes that affect that condition:
Discharges from wastewater treatment facilities, while generally safe from a human health viewpoint, can have major ecological impacts on lakes unless extremely advanced nutrient removal techniques are applied or dilution is high (>100X and preferably >1000X). This is not a common source for lakes, but where it is a source, it is usually the dominant one, given the magnitude of inputs and the highly available form of most nutrients in wastewater.
Storm water runoff is, on average, the major mode of delivery for nutrients and most other pollutants to lakes in Massachusetts. Not all lakes have problems with runoff from developed areas or agriculture, but nearly all those with productivity problems receive
Eutrophication and Aquatic Plant Management in Massachusetts
2.0 Case Histories of Lake Management in Massachusetts Page 2-3
substantial amounts of contaminated runoff. Dry weather stream flow, even in urban areas, is usually a minor source.
Inputs of nutrients from urbanized areas, via storm water runoff, tend to be high. Variability among areas as a function of management practices can be high, but is often overshadowed by variability within urban drainage basins, driven by fluctuations in activities and precipitation. Considerable sampling is necessary to characterize urban runoff for an area, but reasonable assumptions for longer term loading can be made based on past extensive studies.
Agricultural sources of nutrients are more limited in Massachusetts than in many other states, but include inputs from upland cropland, cranberry bogs, orchards and animal feedlots and pastures. Potential inputs from each can be high, but actual inputs should be assessed rather than making assumptions about the magnitude of inputs. Management practices can have a major effect on loading from agricultural lands, and can vary greatly among farms.
Ground water is typically not a major source of phosphorus, even though septic systems represent potentially large sources. Adsorption onto soil particles and co-precipitation with iron in aerobic aquatic systems tends to remove much of this phosphorus before it can become a problem. Exceptions might be expected where many very old septic systems are involved (due to exhausted leachfields) in sandy soils close to the ground water table and the lake (least adsorption potential). Septic systems are often a major source of nitrogen, however, which is attenuated in the ground mainly by dilution.
Direct atmospheric inputs tend to be a minor component of nutrient loading. For kettlehole lakes with no tributaries, atmospheric contributions may represent a larger percentage of nutrient loads, but lakes in this situation tend to be in a desirable condition.
Internal loading can vary widely in lakes, and the effective load (portion of the load that is actually expressed by the lake) is difficult to predict. Effective internal loading tends to be highest for lakes with strong anoxia (higher sediment phosphorus release rates) and hydrogen sulfide production (inactivates iron that might otherwise bind phosphorus).
Lakes with higher land area to lake area ratios tend to receive greater pollutant loads, but also flush more frequently. Lake and watershed features are critical to the generation, routing, attenuation and expression of loads, and should be studied carefully when developing management plans. Dominant processes in most impoundments differ radically from those in kettlehole lakes, so lake origin and history are critical elements in lake function.
Pollutant loading tends to rise with the percentage of developed land in the watershed, and more specifically with the degree of imperviousness. Relationships developed in other states suggest discernible impacts once imperviousness exceeds 10% and major impacts at more than 25% imperviousness (CWP, 2003) appear applicable to Massachusetts, but do not consider the effects of BMPs that are becoming more frequently applied.
Models provide predictive capability that facilitates assessment of the direction and approximate magnitude of change in response to management actions. However, the relatively simple models applied in most cases do not represent reality in lakes and watersheds sufficiently to be relied upon without verification. Strong follow-up monitoring is needed in association with most lake management activities and is the greatest shortcoming of past management efforts.
Planktonic algae problems are usually related to watershed problems and require action on a watershed basis to achieve desired long-term conditions. The primary exception is found in lakes with major past inputs from sources that have ceased to exist, but still experience the
Eutrophication and Aquatic Plant Management in Massachusetts
2.0 Case Histories of Lake Management in Massachusetts Page 2-4
impact of those loads through internal recycling. Knowing the source of nutrients is therefore critical to planning effective algal management.
Problems with aquatic plants rooted in the sediment are nearly always a function of adequate light and suitable substrate, and are not directly related to current water quality. Management requires in-lake activity, and desired long-term conditions are rarely if ever achieved by watershed management alone.
2.2 LAKE MANAGEMENT COSTS AND FUNDING PROGRAMS The costs for various lake management techniques vary from treatment to treatment as described in the following sections. In comparing costs it is important to consider not only the initial costs, but also the maintenance expense and the length of time between treatments (e.g., cost per acre over some target number of years, often 10 or 20). Also included in the overall cost is the cost of developing a lake management plan. A simple plan with a nutrient budget for the lake typically costs about $10,000 - $20,000. A full diagnostic feasibility study for a lake may cost $50,000 to $100,000 or more as shown for Clean Lakes Program studies in Appendix IV. Hiring a consultant to compare treatments for a given lake may cost $5,000 to $8,000. A pre- and post- treatment biological survey with chemistry may range from $10,000 to $30,000. Costs for preparing and filing the required permits range from $1,500 for a simple herbicide treatment to $20,000 or more for a dredging operation. Some of the simple permits could be prepared by a lake association or town, but larger more complex techniques generally require a professional contractor. In the end, there are few methods that offer distinct cost advantages over others (Holdren et al., 2001). Where a drawdown is already technically feasible, it offers the lowest cost method for controlling susceptible plants within the area that can be affected. Grass carp can remove vegetation at a reduced cost over several years. Herbicides are usually the least expensive approach when only a one-time application is considered, but in virtually every case in Massachusetts multiple applications will be needed. Where algae blooms are a direct result of internal recycling, an alum treatment can provide dramatic control for more than a decade at reasonable cost. However, in the vast majority of cases, watershed management is necessary to control algae, and the associated long-term cost can be quite high. The major sources of funding in the past were the Federal Clean Lakes Program and the State Clean Lakes Program, both of which provided monies for lake management and rehabilitation. Currently there is no specific lake project funding at the Federal level or in the State Clean Lakes Program, in its original MDEP-managed form. Some funds from the Federal Section 319 program (non-point source control) can be devoted to lake restoration. Limited funding has been available for lake management from the Lake and Pond Grant Program and the Harbors, Rivers and Inland Waterways Program. Funds available through the MDCR were increased through the Lakes and Ponds Initiative in 2002 but decreased in 2003. EOEA acquired funding in FY02 for demonstration projects, outreach programs, and additional staffing to promote sound lake management. Funding programs are also available for planning (Appendix I.6) and for other types of pollution control such as non-point source pollution (see Appendix I.4 for description of the 319 Program), septic system upgrades (Appendix I.9) and pollution in the coastal zone (Appendix I.6). A description of these and other funding programs is available in Appendix I.
Eutrophication and Aquatic Plant Management in Massachusetts
2.0 Case Histories of Lake Management in Massachusetts Page 2-5
Responsibility for the protection and restoration of the ecological and economic values of lakes requires a partnership between local and state efforts. Considering the economic value of lakes for local and regional jurisdictions, and the value of water-based recreation for the state economy, these efforts are worthy of significant attention.
2.3 PROGRAMS FOR LAKE MANAGEMENT IN MASSACHUSETTS Prior to the 1978 Environmental Impact Report on the Control of Aquatic Vegetation in the Commonwealth of Massachusetts (NERI, 1978) there was little regulation or oversight of lake management practices other than the issuing of permits for herbicide application. During the 1950s and 1960s chemical control was the principal method used to manage macrophytes in lakes. In 1969 the Eutrophication and Aquatic Vegetation Control Program (Chapter 722, Acts of 1969) provided state funding to towns for this type of management. The 1978 GEIR provided some guidance on herbicide use and reviewed this and other management alternatives. State funding was expanded in The Massachusetts Clean Lakes and Great Ponds Program (Chapter 628, Acts of 1981). Both of these programs were combined into The State Clean Lakes Program which was initiated in fiscal year 1983 and operated for about 7 years before funding, cut in 1988, ran out. The State Clean Lakes Program (summarized in Appendix I.2) provided funding for diagnostic/feasibility studies as well as implementation and final project reporting. By using a well designed outline which emphasized scientific data gathering and evaluation, funds could be directed toward the most cost effective projects and valuable data on pre- and post implementation conditions, effectiveness and impacts could be documented. The State Clean Lakes Program tried to promote a proactive watershed approach to address the causes of lake eutrophication and required scientific documentation and evaluation of causes, treatments, effectiveness and impacts. Many of these programs were directed at long-term solutions (diversion, dredging, nutrient reduction) to lake management problems rather than restricting management to short-term controls, like most herbicide treatments. Unfortunately, budget cuts in the late 1980's resulted in no funding for the program since 1988, and most projects underway at the time were completed within a couple of years. In 1993, the legislature transferred most of the remaining Clean Lakes projects to MDCR Lakes and Ponds Program, and the two agencies continue to cooperate on many aspects of lake management. The remaining sources of lake management funding are the MDCR Lake and Pond Grant Program (summarized in Appendix I.3) and the Harbors, Rivers and Inland Waterways Program (summarized in Appendix I.8). The former was limited to projects of $10,000 or less until FY02, when the Lakes and Ponds Initiative roughly doubled that funding. Overall funds for all current government sponsored lake management programs are too limited to support large scale projects. Ongoing legislative efforts to increase lake management funding demonstrate a commitment to lake management in Massachusetts, but fiscal constraints have limited progress.
2.4 CASE STUDIES IN MASSACHUSETTS Selected case studies for various lake management techniques have been chosen to illustrate the range of management applications in Massachusetts. The case studies were not chosen specifically to characterize the technique as a success or failure, and technique should not be judged from any single case study. Cases illustrate targeted problems and issues for application,
Eutrophication and Aquatic Plant Management in Massachusetts
2.0 Case Histories of Lake Management in Massachusetts Page 2-6
and offer insights into the Massachusetts experience in lake management. Consideration of cases outside Massachusetts is warranted for many techniques, but is not the purpose of this review. More detailed case study outlines and shorter summaries of additional projects are provided.
2.4.1 Non-Point Source Pollution - Best Management Practices
2.4.1.1 Case Study
NAME: Pontoosuc Lake LOCATION: Pittsfield, MA DATE: 1992-1994 LAKE SURFACE AREA: 467 acres PROBLEM: Excess macrophyte growth in shallow areas and high nutrient concentrations in the water have been documented. Watershed inputs, especially from agricultural operations, were considered high. TREATMENT: In the watershed of Pontoosuc Lake, Pittsfield, Best Management Practices (BMPs) have been used specifically to control lake eutrophication. BMPs are being used in many locations throughout the state, but no data on the impacts on lakes are readily available in most cases. The Department of Environmental Protection, Division of Watershed Management and the Natural Resources Conservation Service (formerly Soil Conservation Service) conducted studies on BMPs in the Pontoosuc Lake watershed in Berkshire County (B. Philbrick, pers. comm., 1995). The study consisted of eight cooperating farms that implemented BMPs from 1992 through 1994. The BMPs included nutrient management, strip crops, cover crops and minimum till practices. Some funding was provided from section 314 grants (Federal Clean Lakes Program), which included money for monitoring results in the impacted streams feeding into the lake. The lake itself was not included in the monitoring plan. The agricultural Best Management Practices for non-point source nutrient control were applied in combination with a variety of other in lake treatments, including drawdown and harvesting, but only the BMPs are discussed here. EFFECTIVENESS: A post-implementation study report completed by ENSR in 2000 indicated no statistically significant change in water quality in the lake, but low phosphorus levels in tributaries during storms were noted. Development of new nutrient budgets for the lake, a prime example of the recommended process of study, planning, implementation, and evaluation described in Section 1.3, indicated that storm water inputs from 20 to 30 direct discharges were now the dominant force influencing water quality in Pontoosuc Lake. A Section 319 grant was secured in 2001 to begin the process of addressing direct storm water inputs. Management of larger watersheds such as this one typically involves multiple phases in which pollutant sources are individually addressed. Had monitoring focused on the actual runoff from the managed agricultural operations, greater impact of the program would probably have been documented. However, since the lake is the focus of management in this case, its quality is the ultimate determinant of management success. ADVERSE IMPACTS: No adverse impacts from the implementation of BMPs were detected, and none would be expected.
Eutrophication and Aquatic Plant Management in Massachusetts
2.0 Case Histories of Lake Management in Massachusetts Page 2-7
PERMITS: None were required for the BMPs. In addition to the BMPs, Pontoosuc Lake is actively managed with a variety of management techniques including drawdown, harvesting, and hydroraking with plant biomass composting and public education. Failure to apply for and obtain necessary wetland permits for drawdown was a problem initially (G. Gonyea, MDEP, pers. comm. 1996), but the 2000 ENSR report confirmed the value of this technique and provided data to support future permitting. COSTS: Data are not available for the BMPs, but typical agricultural operational improvements (e.g., conservation tillage) carry little direct cost, while structural controls (e.g., manure storage facilities) can cost several tens of thousands of dollars to over $100,000. REFERENCES: The above information on the treatment has been summarized from a personal communication with personnel from several state agencies and consulting firms as noted above and information on water quality conditions (Chesebrough and Screpetis, 1978; ITC, 1989; ENSR 2000a).
2.4.1.2 Case Study
NAME: Sevenmile River LOCATION: North Attleboro, MA. DATE: 1989 to present PROBLEM: Storm water runoff from the construction and operation of the Emerald Square Mall was expected to impact the Sevenmile River. The river flows into Luther Reservoir and Orr Pond and is classified as a public drinking water supply. The mall site is 58 acres and located within the river's watershed. It was the responsibility of the developer, New England Development of Newton, MA, to insure that the water quality of the river and public drinking water supply would be preserved, that the quantity of water flow within the watershed would be maintained, and that storm water runoff would not cause downstream flooding. TREATMENT: Runoff from the upper watershed and lower watershed are directed along two different paths. The storm water runoff from the upper watershed is diverted through a box culvert to a wet detention pond and three constructed wetland basins south of the mall site. After wetland treatment the runoff is routed back under the mall and discharged to an existing pond. From the pond the flow is directed through a wooded swamp before discharge to the Sevenmile River. The runoff from the lower watershed and partial drainage from Rt. 295 are directed into two detention ponds on the mall site. Discharge from the ponds is routed under Rt. 1 and flows through a natural wetland site. From there the discharge flows through three constructed wetlands to a wooded swamp that flows to the Sevenmile River. Additionally, best management practices were utilized such as catch basins with oil and grease traps, parking lot sweeping, sodium-free deicing salts and the restricted use of herbicides, pesticides and fertilizers.

Eutrophication and Aquatic Plant Management in Massachusetts
2.0 Case Histories of Lake Management in Massachusetts Page 2-8
EFFECTIVENESS: Wetlands improve water quality by sedimentation, adsorption of chemicals to the organic soils, uptake of nutrients by vegetation and biochemical processes. In this case, runoff is first treated in a detention pond that allows for sedimentation and the dissipation of kinetic energy before the runoff reaches the wetland. This system seems to be very effective at reducing contaminant levels to acceptable levels. Compared to raw inflow that exceeds target limits routinely, there have been only two permit limit violations in over 10 years, less than most chemical treatment systems applied in water and wastewater treatment facilities. ADVERSE IMPACTS: No formal survey was conducted to determine impacts beyond discharge water quality. No evidence of adverse downstream impacts has been reported or would be expected with the current system. The area used for the wetland was upland prior to construction, so some wildlife were undoubtedly displaced and habitat was created for other wildlife. PERMITS: This project was permitted under the NPDES program before the storm water permit system was put into place. Consequently, this facility is subject to an individual permit, which is much more involved than the general permits now available for construction and industrial operations under the storm water permit system. COSTS: The cost was estimated at about $2 million, which includes land acquisition, permitting, and construction. Compliance monitoring has cost on the order of $30,000/year. REFERENCES: Information is summarized from a paper by Daukas et al., 1989, NPDES monitoring data collected by Fugro East, Inc. and obtained from Dennis Lowry of ENSR.
2.4.1.3 Additional Non-Point Source Control Projects:
Willow Pond, Northampton (erosion control with gabions and shoreline armoring) – The inlet and parts of the shoreline of this popular paddle boating park lake were armored with riprap and gabions to minimize damage from waves and sporadically high inflows from the Mill River.
Porter Lake, Springfield (erosion and runoff control) – Discharge of storm water at the top of
highly erosion-prone slopes had resulted in major infilling of the lake, and storm flows through the heavily used park added many contaminants to the system. Drop inlets and energy dissipators were installed to carry the storm water downhill without erosion, and selected storm flows were routed through gravel troughs that both controlled erosion and improved water quality. The lake was also dredged to remove some of the accumulated sediment.
Hills Pond, Arlington (storm water detention) – A swirl concentrator (Vortechnics unit) and
wetland detention basin were installed to handle the primary storm water discharge to a 3-acre pond that had also been dredged. Storm water from a roughly 10-acre area was routed through a Vortechnics chamber to remove coarse sediment and then subjected to detention in a constructed wetland. Measured phosphorus in the discharge declined by tenfold from 200 µg/L to 20 µg/L in the first year of operation (Fugro East, 1996c).
Eutrophication and Aquatic Plant Management in Massachusetts
2.0 Case Histories of Lake Management in Massachusetts Page 2-9
Lake Lorraine, Springfield (storm water infiltration) – Eight simple infiltration basins were installed in association with storm water drainage systems in residential areas on the north side of the lake. These basins were intended to capture and infiltrate the first half-inch of runoff, although variability in ground water levels resulted in higher and lower capacities among the basins. Basins were installed in-line, meaning that all associated storm flow pass through them. Removal rates for solids, bacteria and phosphorus proved difficult to quantify, but follow-up monitoring indicated a substantial decrease in inputs to the lake from treated storm water drainage systems (ENSR, 1997b).
Dunns Pond, Gardner (wetland detention/filter berm) – After dredging the pond thoroughly,
the investment was protected by establishing a wetland detention system with a filter berm at the main inlet. Water is detained in a wetland with both open water and emergent vegetation, and then passes through a constructed berm to filter out particulates. Extremely high flows can overtop the berm. Maintenance has been an issue, but the wetland and berm function well when the berm is not clogged. Data for lake water quality suggest that the system is effective at reducing storm water contaminants (MDEP, 1994a).
Polaroid Complex, Hobbs Brook (Cambridge) Reservoir, Weston, MA (linear wetland
detention with filter berm) – Storm water that would otherwise directly enter Cambridge Reservoir is routed into a low grade ditch with a control structure at the downstream end, creating a linear wetland detention system. Water that overflows the control structure enters a smaller detention basin that outlets through a filter berm. No quantitative data are readily available for this system, so its effectiveness is unknown.
Lake Cochituate, Natick/Framingham (filter berms) – Filter berms have been used to clean
incoming storm water and to create backwater wetland treatment cells. Clogging and other maintenance problems have been reported by DEM park staff, but no quantitative data are available. Effectiveness of the berms appears limited, but the detention and wetland treatment function of the backwater wetland areas could be substantial.
2.4.2 Point Source Control- Advanced Wastewater Treatment
2.4.2.1 Case Study
NAME: Forge Pond LOCATION: Granby, MA DATE: Construction of WWTF completed in 2001 LAKE SURFACE AREA: 75 acres PROBLEMS: The wastewater treatment plant in Belchertown discharges secondary treated effluent into Lamson Brook in Belchertown which flows into Forge Pond (via Weston Brook) in Granby. This release of effluent results in excessive nutrient loading to Forge Pond which is now in a state of advanced cultural eutrophication (K. Brooks, Granby CC, pers. comm., 1995; BEC, 1989). The high phosphorus loadings result in high total phosphorus in the lake (77 µg/l) with late summer blooms of the blue-green Anabaena and a mean Secchi disk depth of 1.2 meters (the lake is 2.2 meters deep). Growth of macrophytes is also extensive and severely interferes with shoreline fishing (BEC, 1989).

Eutrophication and Aquatic Plant Management in Massachusetts
2.0 Case Histories of Lake Management in Massachusetts Page 2-10
TREATMENT: An upgrade of the plant to incorporate advanced wastewater treatment was completed in 2001. Phosphorus is now removed by biological treatment (activated sludge) and the addition of alum. The effluent phosphorus limit is currently 0.25 mg/L. EFFECTIVENESS: At completion the treatment upgrade was expected to reduce nutrient loading to the lake by 54 to 73 percent (BEC, 1989). Actual discharge monitoring reports indicate an average monthly effluent phosphorus value of 0.17 mg/L, well within the permit limit. Forge Pond still suffers use impairment, however. To improve the quality of the lake and restore it for recreational uses, other lake management techniques will need to be employed and the WWTF effluent phosphorus concentration may need to be lowered even more. Unfortunately, the typical concentration of phosphorus in wastewater is over two orders of magnitude higher than the desirable concentration in lakes, and 99+% removal is rarely achieved. Dilution or diversion (preferably with application to forested land or subsurface disposal in a suitable area) is usually required to reach a target in-lake phosphorus level of around 20 µg/l. ADVERSE IMPACTS: No adverse impacts are expected with advanced treatment in this case, but no follow-up study has been conducted. PERMITS: A NPDES permit for discharge has been issued, with a phosphorus limit of 0.25 mg/L (250 µg/l). The trend in wastewater management in Massachusetts through USEPA permitting (MA does not issue NPDES permits, but collaborates with the USEPA) through the mid-1990s was to target a discharge concentration of 1.0 to 0.1 mg/l when there is a lake downstream, possibly with a seasonal (April-October) limit on phosphorus removal. However, this is not easily achievable and may still not be adequate. An interative approach of issuing 5-year permits, performance evaluation, and re-permitting with new limits is being applied in most cases, with target effluent limits typically in the range of 0.3 to 0.1 mg/L. However, values as low as 0.03 mg/L are under consideration. COSTS: Projected costs for operation are estimated at $300,000 per year (P. Dombrowski, T&B, pers. comm., 1995). This would increase substantially if a lower permit limit for phosphorus was imposed. REFERENCES: The above information has been summarized from personal communications/observations (K. Brooks, Granby CC, 1995; P. Dombrowski, T&B, 1995; K. Wagner, ENSR, 2002) and a Diagnostic/Feasibility study (BEC, 1989).
Eutrophication and Aquatic Plant Management in Massachusetts
2.0 Case Histories of Lake Management in Massachusetts Page 2-11
2.4.2.2 Case Study
NAME: Quaboag Pond LOCATION: Brookfield/East Brookfield, MA DATE: Changes occurred between 1987 and 1994 LAKE SURFACE AREA: 537 acres PROBLEMS: Quaboag Lake received high loads of phosphorus from the Spencer Wastewater Treatment Facility and from non-point sources (especially dairy farms) in its large (77 square mile) watershed (BEC 1986). Summer algal blooms were a common problem in this natural lake. Macrophytes are the main issue of concern in Quaboag Lake, while Secchi disk readings averaged 1.8 meters for June 2003. TREATMENT: Advanced wastewater treatment was added to the Spencer WWTF, and a 2003 permit has a summer limit of 0.3 mg.l interim with a final limit of 0.2 mg/l to TP. Additionally, over half of the dairy farms in the watershed ceased operation by 1990, and a watershed-wide education program was implemented. EFFECTIVENESS: Average phosphorus concentration in the Spencer WWTF effluent declined from 3.3 mg/L in 1985 to 0.6 mg/L in 1992. A follow up monitoring program in 1991-1992 (Lycott, 1994) indicated a significant change in the level of phosphorus downstream of the WWTF discharge into Cranberry Brook, at the main inlet to the lake, and in the lake itself. Some of this decrease is undoubtedly due to reduced dairy farm activity and improved residential management practices resulting from education, but the WWTF upgrade was critical to improved water quality. The total reduction in phosphorus load was 56%, while a 39% reduction is attributable to reduced WWTF loading alone. Water clarity increased markedly in Quaboag Pond. ADVERSE IMPACTS: Quaboag Pond is shallow (mean depth = 7 ft, maximum depth = 12 ft) and the increased water clarity facilitated excessive growths of rooted aquatic plants, especially Eurasian watermilfoil. Algae problems have been traded for rooted plant problems, although not everyone finds the rooted plants objectionable. PERMITS: The WWTF received a new NPDES permit, but no other permits were involved. Although water clarity has increased to the point where rooted plant growth is abundant, the USEPA is planning to reduce the effluent phosphorus level to 0.2 mg/L in the next issued permit for the Spencer WWTF. COSTS: The WWTF upgrade cost on the order of $7 million. The annual operational cost is not precisely known, but is certainly in excess of $100,000. REFERENCES: The above information has been summarized from the Diagnostic/Feasibility study (BEC, 1986), the NPDES permit issued to Spencer by the USEPA in 1993 and 2003, and the follow up report (Lycott, 1994).

Eutrophication and Aquatic Plant Management in Massachusetts
2.0 Case Histories of Lake Management in Massachusetts Page 2-12
2.4.2.3 Additional Point Source Control Projects:
Housatonic River Impoundments - The Pittsfield Wastewater Treatment Plant releases effluent to the Housatonic River that flows into downstream impoundments in Massachusetts and Connecticut. It serves approximately 52,000 people from the towns of Pittsfield, Hinsdale, Dalton and North Lenox and treats approximately 17 MGD (million gallons per day). The plant has a seasonal phosphorus limit of 1.0 mg/L from May through September. The treatment plant began phosphorus removal in the late 1970s and phosphorus limits were included in the facility’s discharge permit in 1982. The treatment process includes primary treatment for settling out solids, trickling filter aeration, chlorination and dechlorination. Phosphorus removal is achieved by the addition of sodium aluminate on a seasonal basis. Annual operating costs are $1.6 million (T. Landry, City of Pittsfield, pers. comm., 1995).
Assabet River Impoundments - In another case, there are four wastewater treatment plants
releasing secondary treated effluent to the 32-mile Assabet River. The combined phosphorus load from these four plants is 430 lbs of phosphorus per day. Average phosphorus levels during the summer range from 0.8 mg/L near the discharge (with a high of 2.0 and a low of 0.4) to 0.6 mg/L halfway downstream within the study area and 0.45 mg/L downstream in Maynard and Concord (ENSR, 2001a). The decreasing phosphorus levels further down the river are a result of biological uptake and possibly natural chemical precipitation. In drought conditions, like those experienced in the summer of 1995 and again in 1999, the combined input of effluent by all four treatment plants is greater than the natural stream flow. There are 7 dams along the 32 miles of river,each forming an impoundment. All of the impoundments have been impacted by high phosphorus levels and have dense populations of algae, duckweed and submerged vegetation during most summers. Since spring of 1996 the four plants on the Assabet have phosphorus limits of 1.5 mg/L maximum and 1.0 mg/L average concentration. Phosphorus will be removed by the ferrous salt precipitation method seasonally from April to October. Treatment plant upgrades are intended to reduce the combined input of phosphorus from the four plants to 100 lbs per day (B. Offenhartz, OAR, pers. comm., 1995). A study by ENSR in 2000-2001 in support of establishing an appropriate TMDL for phosphorus in the Assabet River revealed continued poor conditions in the impoundments, with dense filamentous algal mats and floating plants such as duckweed and watermeal on the surface where water velocity was low. Achieving an appropriate effluent quality when the discharges represent such a large portion of the stream flow is extremely difficult. In renewing permits, however, the USEPA is now targeting effluent limits <0.1 mg/L where downstream impoundments exist.
Hop Brook Impoundments - ENSR conducted a study of Hop Brook in Marlborough and Sudbury in 2000, in support of an appropriate TMDL for phosphorus and nitrogen in the brook and to assist in setting new permit limits for nutrients in the discharge from the Marlborough East wastewater treatment facility. Extensive past studies were summarized and a model of the river and its impoundments was created with newly generated data. Wastewater discharge from the Marlborough East WWTF constitutes as much as 90% of the stream flow during extended dry periods, and while discharge concentrations average <0.5 mg/L already, the nutrient inputs from the WWTF result in elevated levels in four downstream impoundments and cause associated productivity problems.
Eutrophication and Aquatic Plant Management in Massachusetts
2.0 Case Histories of Lake Management in Massachusetts Page 2-13
Of particular concern is the generation of dense mats of Hydrodictyon (water net), a nuisance green alga associated with high levels of available nutrients. Reduction of phosphorus in the discharge to a level of <0.1 mg/L, at an operational cost of as much as $700,000 per year, appears necessary to substantially reduce productivity. Even then, non-point source inputs may still be sufficient to maintain high algal production, although a change in the types of algae is expected (ENSR, 2000b). Additionally, accumulated nutrients in the bottom sediments of the impoundments will support dense rooted plant growths if light is more available (as a consequence of reduced shading by algal mats). Although the impoundments have existed for several centuries, their presence is largely incompatible with the use of the brook for wastewater and storm water disposal.
Ashfield Wastewater Treatment Facility – Although not associated with any impoundment,
this WWTF is of interest as a consequence of innovative design and focus on nutrient removal. It serves a small population in the center of Ashfield, handling mainly domestic sewage at around 20,000 gpd, and applies the Solar Aquatics system developed by John Todd on Cape Cod. The cost to build this innovative tertiary treatment plant was approximately $2.6 million, much of which was supported by a special grant. The projected operating cost for fiscal year 1997 was $65,000 (Ward, Town of Ashfield, pers. comm., 1995).
A variety of plants are used in this treatment system, many of which are non-native. While the focus is on biological uptake, physical and chemical processes are at work as well. Aeration is used in association with the primary reactor tanks, and adsorption occurs both in the treatment wetland (which emphasizes subsurface flow) and in the soil beyond the subsurface discharge.
After about 3 years of operation and monitoring, it was determined that the plants had only a nominal effect on water quality, and it was the microbial processes (e.g., activated sludge, denitrification) that were providing most of the benefit. The WWTF is now operated as an activated sludge facility with subsurface wetland polishing and discharge to a leachfield. Just the same, output levels for phosphorus and nitrogen have been very low, and surveys of the stream into which the discharge leaches indicate excellent conditions (K. Wagner, Springfield College, unpublished data, 1998 and 2000).
2.4.3 Hydrologic Controls - Diversion
2.4.3.1 Case Study
NAME: Long Pond LOCATION: Dracut, MA. LAKE SURFACE AREA: 136 acres. DATE: 1995 PROBLEM: Long Pond in Dracut was believed to be experiencing excessive nutrient loading from septic systems, the residential watershed and internal loading from sediments. Long Pond was overgrown with naiad (Najas sp.) that was interfering with recreational lake uses. TREATMENT: The Town of Dracut constructed sewers in 1988 and 1989, diverting septic system flows to a treatment plant. Homeowners were encouraged to hook up to the sewer
Eutrophication and Aquatic Plant Management in Massachusetts
2.0 Case Histories of Lake Management in Massachusetts Page 2-14
system as soon as possible. In conjunction with the diversion project, additional recommendations included encouraging homeowners to forego the use of phosphate detergents, food grinders and fertilizers and to maintain septic systems in areas inaccessible to sewers. Also recommended were buffer strips to reduce loading from storm water runoff, alum treatments to reduce internal loading from lake sediments and diquat application for macrophyte control. EFFECTIVENESS: The normal phosphorus loading to Long Pond before the diversion was 334.1 kg/yr, including 43.6 kg/yr internal loading. Connecting homes to the sewer system was expected to reduce yearly loading to 241.0 kg. There has been a reduction in the growth of naiad, although this is likely due to an application of diquat rather than due to nutrient reduction alone. Data describing overall effectiveness of the diversion to Long Pond are not available, however, so actual impacts remain unquantified. ADVERSE IMPACTS: No formal survey was conducted to determine impacts. PERMITS: A sewer extension or connection permit (SECP) was needed (See Regulations in Appendix II.22) COSTS: Costs for installation of sewer pipes including planning, digging sewer trenches, laying the pipe, resurfacing roads and connecting to each home was estimated by Lycott Environmental Research, Inc. at $133 per foot. The typical cost per home was therefore on the order of $10,000 to $15,000. REFERENCES: The above information has been summarized from a personal communication with Lee Lyman of Lycott Environmental Research, Inc. and personal communication with Glen Edwards, the Conservation Agent for the Town of Dracut.
2.4.3.2 Case Study
NAME: Quacumquasit Pond LOCATION: Brookfield/East Brookfield, MA. LAKE SURFACE AREA: 218 acres. DATE: 1991 PROBLEM: Quacumquasit Pond is a sub-watershed of the Quaboag Pond system, but has only a small watershed. It is much deeper than Quaboag Pond (32 ft mean depth vs. 7 ft) and has roughly twice the volume of Quaboag Pond, resulting in a much longer detention time (548 days vs. 18 days). When flows of nutrient-rich water enter Quaboag Pond after storms of more than about 0.25 inches of rain, flow reverses and Quaboag Pond water enters Quacumquasit Pond. This was found to be the main source of nutrients to Quacumquasit Pond and the cause of periodic algal blooms (BEC, 1986). TREATMENT: A flow control structure was installed in 1991 at the interbasin connector between the two ponds, allowing flow from Quaboag into Quacumquasit to be curtailed up to the point where flooding might occur around Quaboag Pond, at which point the water would overtop the structure and enter Quacumquasit Pond. This structure has been operated in different fashions over the years, depending on precipitation pattern, seasonal water level, and quality of Quaboag water, but always with the intent of minimizing nutrient inputs to Quacumquasit Pond.
Eutrophication and Aquatic Plant Management in Massachusetts
2.0 Case Histories of Lake Management in Massachusetts Page 2-15
It is estimated that 63% of the Quaboag water formerly entering Quacumquasit was diverted in 1991-1992. EFFECTIVENESS: The follow-up study (Lycott, 1994) indicated that while the phosphorus concentrations before and after flow control structure installation were not statistically different at a high degree of confidence, the difference between the pre-treatment mean of 0.032 mg/L and the post-treatment mean of 0.019 mg/L suggested a 40% reduction in loading. Factoring in the change in water quality in Quaboag Pond as a consequence of point and non-point source reductions (see Quaboag Pond example of point source control above), the diversion of Quaboag waters from Quacumquasit is believed to be responsible for about a 26% reduction in phosphorus loading. Data were insufficient to reliably evaluate changes in water clarity, but there are anecdotal reports of an increase in clarity in Quacumquasit Pond since the diversion, and rooted plant growths have become more extensive. ADVERSE IMPACTS: Increased water clarity has led to denser and more expansive rooted plant growths in Quacumquasit Pond, but with a mean depth of 32 ft, most of the pond surface is unaffected. PERMITS: The flow control structure required permits under the Wetlands Protection Act (issued by the local Conservation Commission and accepted by MDEP), Chapter 91 (structures permit, issued by MDEP), Section 404 (wetlands impact section of the Federal Clean Water Act, issued by the Army Corps of Engineers) and Section 401 (also part of the Federal Clean Water Act, issued by MDEP to certify that the action is consistent with state law). COSTS: Costs for installation of the flow control structure were $65,500. REFERENCES: The above information has been summarized from the Diagnostic/Feasibility study (BEC, 1986) and the follow up report (Lycott, 1994).
2.4.3.3 Additional Diversion Projects:
Sassaquin Pond, New Bedford (sewering) - This pond experienced algal blooms in the 1970s, but cleared up remarkably in the 1980s after a sewer was installed and wastewater was diverted from septic systems in very sandy soils with a high ground water table. No other actions were taken. Some residual internal recycling was observed, but not enough to be a major source. Ground water inflow was measured as “clean” in a post-treatment study (BEC, 1987a). No report or data set is available, however, for the pre-sewer period, so only anecdotal information could be provided.
Forest Lake, Methuen (hypolimnetic withdrawal) – A pipe was installed in 1992 to route
water from deep water to the outlet. Flow is driven by head differential; higher water on the upstream side of the dam creates pressure that is relieved by water flowing through the submerged pipe from deep water and through the dam. The intent is to discharge deep water instead of surface water, ideally to keep the hypolimnion from becoming anoxic, but also to discharge the poorer quality water first if there is anoxia. No data are available regarding the success or impacts of this system.
Eutrophication and Aquatic Plant Management in Massachusetts
2.0 Case Histories of Lake Management in Massachusetts Page 2-16
2.4.4 Phosphorus Inactivation/Precipitation – Alum Treatment
2.4.4.1 Case Study
NAME: Hamblin Pond LOCATION: Marstons Mills, MA. LAKE SURFACE AREA: 120 acres. DATE: 1995 PROBLEM: Hamblin Pond (120 acre) is moderately deep (average depth = 27 feet, maximum depth = 63 ft) and should be able to support a trout fishery. The pond suffered from high phosphorus concentrations (average 69 µg/l) which led to spring green algae blooms and summer blue-green blooms. The Secchi disk transparencies were as low as 0.9 meters (average 2.8 meters) and the pond suffered from low oxygen in the hypolimnion, limiting trout habitat. The nutrient budget indicated 67 percent of phosphorus loading was due to internal recycling. The problem was traced to strong internal phosphorus loading derived from duck farm inputs between about 1920 and 1954 (BEC, 1993a). TREATMENT: Aluminum was used to bind phosphorus in the sediment, to reduce internal recycling. Low alkalinity necessitated addition of a buffering agent as well as aluminum sulfate (alum). The additions were made as 15,456 gallons of alum (7,549 lb. Al) and 9,276 gallons of sodium aluminate (11,650 lb. Al) applied over 86 acres (25 g/m2, 2.5 mg/L). Sodium aluminate both acts as a buffer for the alum and provides additional aluminum for phosphorus inactivation. Aluminum compounds were applied over two days under windy conditions, with injection only 10 ft below the surface, resulting in generally complete mixing to the surface. The GPS guidance system on the application vessel failed, resulting in uneven coverage. EFFECTIVENESS: Water clarity increased rapidly following treatment. Secchi transparency has exceeded 4 m over 7 years since treatment, with an average of 5.8 m and peaks near 9 m (Derdarian, unpublished data, 1995-2001). High detection limits for phosphorus and apparent imprecision in measurements limited reliable evaluation of changes in surface phosphorus levels for the five years after treatment, but a major decline in hypolimnetic dissolved phosphorus is obvious since the treatment. More recent data from the Massachusetts Watershed Watch Program indicate surface phosphorus levels <10 µg/L. No reduction in clarity has been observed since the year of treatment, and given low external loading to Hamblin Pond, the effect of the treatment could have the longevity of the best alum treatments known to date (25-30 years). ADVERSE IMPACTS: Despite the testing of application rates to monitor pH response and toxicity testing with jar tests prior to application, a large fish kill occurred on May 26, 1995, the second day of treatment (R. Gatewood, Barnstable CC, pers. comm., 1995). The fish most impacted appeared to be yellow perch (Perca flavescens), although signficant numbers of rainbow trout (Onchorhynchus mykiss), smallmouth bass (Micropterus dolomieui) and brook trout (Salvilinus fontinalis) were also killed. State officials reported an estimate of the kill at 16,900 fish, not including thousands of fish potentially on the bottom (R. Keller, MDFG, pers. comm., 1995). Invertebrates (chironomids and mollusks, but not mayflies) and turtles were also reportedly killed. The MDFG Fish Kill Investigation Form (FK-2) notes the pH on May 25 ranged from 6.8 to 9.4.

Eutrophication and Aquatic Plant Management in Massachusetts
2.0 Case Histories of Lake Management in Massachusetts Page 2-17
Evidence suggests aluminum toxicity was the cause of the fish kill, but it is difficult to separate the effects of aluminum vs. the effects of the pH shock (R. Keller, MDFG, pers. comm., 1995). Typically, aluminum toxicity is observed at low pH. However, aluminum can also become toxic at high pH, where soluble anionic aluminum (Al(OH)4
-) forms (see Section 3.5). Tissue analysis of fish gills showed highly elevated aluminum levels. Water samples collected on subsequent days had a median aluminum concentration of 220 µg/l, well above the safe limit of 50 µg/l, but the form of aluminum is critical to toxicity and was not adequately assessed. Subsequent lab work in association with another aluminum-induced fishkill in Connecticut revealed that a ratio of alum to aluminate much below 2.0 can cause elevated pH and fish stress or death after only a few hours of exposure (ENSR, 2001b). Lower ratios may not cause stress or death if the dose is low enough or the pH remains below 8.0. The pre-treatment testing and jar tests led to a selection of an improper ratio of alum to sodium aluminate, (too much sodium aluminate) (T. Eberhardt, Sweetwater, Inc., pers. comm., 1995). The high aluminate concentration raised the pH from a background of 6.88 to over 9.0 and this resulted in the fish kill. Poor weather, equipment failures, rapid application and inadequate monitoring and management contributed to the observed problems with the project (K. Wagner, ENSR, pers. obs., 1995). PERMITS: A license to apply chemicals from the MDEP and an Order of Conditions under the Wetlands Protection Act through the local Conservation Commission were obtained. The MEPA unit was satisfied with the Environmental Notification Form; no Environmental Impact Report was required, although chemical and biological monitoring was requested. COSTS: The treatment cost $47,000 in 1995, or about $500/acre. A commitment to 10 years of monitoring is expected to cost about $40,000. REFERENCES: The review above is based on the D/F study (BEC, 1993a), and unpublished data from the Barnstable Conservation Commission, MDFG, and a volunteer monitor (Robert Derdarian, Vol. Mon., pers. comm., 1995-2001).
2.4.4.2 Case Study
NAME: Dug Pond LOCATION: Natick, MA. LAKE SURFACE AREA: 48 acres. DATE: 1983- 2001 (ongoing, annual treatment). PROBLEM: Algal blooms reduced transparency of Dug Pond in violation of the swimming guidance level of 4 ft, such that on occasion the municipality had closed its beach for several weeks at a time. TREATMENT: A low-dose annual treatment of aluminum sulfate (alum) has been applied for many years. In 1995, for example, a total of 4,102 gallons of alum was applied, producing an estimated concentration of around 1 mg/L. The alum was applied as a phosphorus precipitation (flocculation) treatment to remove phosphorus from the water column during the late spring (June), after spring flows have subsided. As such it is considered a short-term treatment, counteracting recent inputs to the lake but not attacking the source of the problem (inputs from
Eutrophication and Aquatic Plant Management in Massachusetts
2.0 Case Histories of Lake Management in Massachusetts Page 2-18
the watershed or release from sediments). Such low-dose treatments have not worked well in relatively clean waters, but have enjoyed some success in the treatment of solids-laden storm water. Effectiveness appears to be increased by strong mixing during application, but more commonly higher doses (>10 mg/L) are applied to ensure floc formation. In the case of Dug Pond, floc is observed with only 1 mg/L, and phosphorus is sufficiently reduced to control algae. EFFECTIVENESS: The alum treatment was reported as effective at maintaining clear water for the summer. Re-treatment is performed each spring, under the untested assumption that the sources of phosphorus are significant, but the town is satisfied with the results. The primary inlet supplies phosphorus at a range of 25 to 200 µg/L. Prior to treatment in 2001, in-lake concentrations ranged from 10-13 µg/L, a level not typically associated with algal blooms but at which blooms sometimes occur. Following treatment, the concentration was 7-8 µg/L in June and July. Dug Pond shows long term effectiveness of repeated low dose alum treatments (M. Mattson, Pers. Comm. August 2003). ADVERSE IMPACTS: No post-treatment data are available. No formal survey was conducted to determine impacts. Water clarity is considered acceptable each year, but the condition that would result from the absence of treatment is not known. PERMITS: Alum treatment of Dug Pond requires an Order of Conditions from the local Conservation Commission pursuant to the Wetlands Protection Act and a license to apply chemical (alum) from the Department of Environmental Protection. COSTS: The funding for treatment of Dug Pond comes entirely by the Town of Natick. The cost for alum treatment of Dug Pond has been cited as $15,000 per year. REFERENCES: The above information was summarized from a personal communication with Lee Lyman and from the newsletter "Lycott Update," Volume 3, No. 1, published in 1984 by Lycott Environmental Research, Inc., and a follow-up interview with Lee Lyman of Lycott (Lyman, Lycott, pers. comm., 2002). Additional information was provided by G. DeCesare (MDEP, pers. comm., 1995).
2.4.4.3 Additional Phosphorus Inactivation Projects:
Ashumet Pond, Mashpee – Treated in September 2001, this project was designed to reduce internal phosphorus loading from anoxic sediments while avoiding the toxicity problem encountered at Hamblin Pond. A total of 28 acres in this 216-acre lake were treated with alum and aluminate at a volumetric ratio of 2:1 and injection at a depth of 35 ft during stratification. The total dose was 43 g/m2, which was applied to a hypolimnion with a depth of 1.5 to 6 m, resulting in an aluminum concentration of 7.2 to 28.7 mg/L in that deep zone. As the hypolimnion was anoxic, interaction with aquatic life was expected to be minimal.
Treatment of a 5-acre pilot parcel was conducted and the whole lake was monitored for water quality changes for several days before continuing the treatment (when no adverse impacts were detected). Three more days of treatment were required to cover the 28-acre area. No toxicity effects were detected in a comprehensive monitoring program. Although it is not certain that all applied safeguards were necessary to avoid toxicity, this project demonstrated

Eutrophication and Aquatic Plant Management in Massachusetts
2.0 Case Histories of Lake Management in Massachusetts Page 2-19
that aluminum addition can be made to low alkalinity lakes without causing direct damage to the aquatic fauna. It is too early to evaluate effectiveness of treatment in controlling internal phosphorus loading to Ashumet Pond. The cost of this project was $337,000, or more than $12,000/acre, about 24 times the cost of the Hamblin Pond project on a per unit area basis. However, a substantial portion was attributable to development of the deep application equipment ($20,000), permitting and project management ($41,000), monitoring and lab analysis ($76,000), and a high degree of oversight by multiple parties ($110,000); these costs could be greatly reduced in the future. Actual treatment cost was about $90,000, or about $3200/acre. The higher cost of actual treatment (per unit area) for Ashumet Pond vs. Hamblin Pond is mainly a function of the slower pace of deeper application of the buffered aluminum and the need to monitor results in each area before further treatment. Information was provided by David Mitchell of ENSR, Spence Smith of the US Air Force, and Gerry Smith of ACT. A summary report for the year of treatment is available (ENSR, 2002e).
Martins Pond, North Reading – Short-term increase in clarity was reported in Martins Pond
in North Reading where water column stripping (flocculation) with alum was effective for only three weeks (G. Gonyea, MDEP, pers. comm., 1996).
Congamond Lakes, Southwick – An early 1980s alum treatment in which a tanker was
mounted on a barge to facilitate application to the lake, this treatment appears to have provided short-term water clarity improvement. However, watershed management was inadequate to control elevated loading from the watershed that eventually counteracted the improvement.
Morses Pond, Wellesley – Alum treatments in the late 1970s reportedly aided water clarity
for up to a season, much as in the Dug Pond example above, but did not address the high watershed loading and were discontinued out of fear that aluminum might migrate into nearby town wells. Alternative approaches proved ineffective over the next two decades, and an experimental dosing of the largest tributary during storms with calcium or aluminum compounds was attempted in 1996 (ENSR, 1997a). Removal was highly variable over time with each compound, and was rarely >50% when a 60+% removal rate was considered necessary to rate the treatment as effective enough to pursue further. Variability in storm water quality complicates this approach. The alternative of treating the northern basin of the lake with a permanent aeration/alum dosing system may be viable, and has been successfully applied at two New Jersey lakes, but has yet to be attempted in Massachusetts.
Spy Pond, Arlington – Alum addition was used to improve water clarity in the 1980s, but
high loading from storm water negated effects rather quickly. A more elaborate treatment system is currently under consideration, as part of a Lakes and Ponds Demonstration Grant administered by the EOEA.

Eutrophication and Aquatic Plant Management in Massachusetts
2.0 Case Histories of Lake Management in Massachusetts Page 2-20
2.4.5 Aeration – Artificial Circulation and Hypolimnetic Aeration
2.4.5.1 Case Study
NAME: Lake Cochituate LOCATION: Natick, Massachusetts LAKE SURFACE AREA: 225 acres. DATE: 1970-1972. PROBLEM: Lake Cochituate (both North and South Ponds, in a state park) has had symptoms of eutrophication since the 1950s. Excessive algal growths during the summer months have prompted studies and control projects since 1969. Past projects included both chemical treatment and artificial circulation methods to control algal growth and restore visibility. Low concentrations of dissolved oxygen can impact fisheries and benthic organisms, so aeration/destratification was viewed as a multi-benefit approach. This is one of the earliest documented aeration projects in Massachusetts. TREATMENT: In 1970 aeration/destratification equipment was installed to the South Pond portion of Lake Cochituate. The equipment consisted of a 5 horsepower compressor, a 200-foot perforated hose and 1200 feet of air feed line. The perforated hose burst in May, of 1971 and was replaced with a vertical aerator in September of that year. The treatment was interrupted when the equipment was tampered with and later destroyed by vandals. EFFECTIVENESS: The project had problems due to vandalism and equipment failure and these problems persisted in the absence of equipment monitoring. Thus, it was difficult to determine the true effectiveness potential of aeration/destratification as a method to reduce algal populations in this case. The system does appear to have been undersized. Complete destratification was not achieved and oxygen levels remained low at the deepest depths during the summer, allowing accumulation of dissolved phosphorus and ammonium. Dense populations of phytoplankton and cyanobacteria were present throughout the project, which limited visibility. However, the lack of pre-treatment visibility data and the use of copper sulfate treatments beginning in 1969 made it difficult to determine if the aeration treatment resulted in any change in water quality. Based on biological data (Cortell Associates, 1973), some benefit was achieved. Impacts to benthic organisms, zooplankton and fisheries were favorable. In August of 1970 bottom sampling in South Pond found no organisms in deep waters, but in October of 1972 the same area was found to be recolonized by phantom midge larvae (Chaoborus sp.). Zooplankton were found at greater densities during the 1972 season than for any previously sampled year. In South Pond where zooplankton were previously restricted to the epilimnion, they were found throughout the water column during aeration. Aeration proved beneficial to benthic fauna and zooplankton populations, which showed increased species diversity during aeration. Fish such as white perch were reported to be increasingly numerous in the area of rising air bubbles. Fish samples taken by electroshocking in 1971 and 1972 found many species of warmwater fish in South Pond, but a lack of pre-treatment data prevents a valid analysis of any community changes.
Eutrophication and Aquatic Plant Management in Massachusetts
2.0 Case Histories of Lake Management in Massachusetts Page 2-21
ADVERSE IMPACTS: None are indicated, and none would be expected, but no focused study was conducted for this purpose. PERMITS: If conducted today, such a project would require an Order of Conditions under the Wetlands Protection Act. The Order of Conditions would be reviewed by the Department of Environmental Protection regional office, and notification would be provided to the Division of Fisheries and Wildlife, Natural Heritage and Endangered Species Program for possible project review. A Chapter 91 Permit may be required for installation of equipment (see Appendix II). Small privately owned ponds may only require a Negative Determination of Applicability in response to the Request for Determination submitted to the Conservation Commission. COSTS: Funding information was not included in the report (Cortell and Associates, 1973). In general, costs include the initial purchase and installation of the pumps, pipes and diffusers as well as annual maintenance costs and annual electricity costs. A review of numerous projects suggests that initial costs range from about $290 to $3,406/ha (median $718/ha or $291/acre) and annual costs range from $86 to $1641/ha (median $320/ha or $130/acre) in 1990 dollars (Cooke et al., 1993a). Actual costs depend on the amount of air required, which is related to lake area in the case of artificial circulation projects. REFERENCES: Information for the Lake Cochituate project was summarized from a report entitled "Algae Control By Artificial Mixing" (Cortell and Associates, 1973).
2.4.5.2 Case Study
NAME: Fresh Pond LOCATION: Cambridge, Massachusetts LAKE SURFACE AREA: 155 acres. DATE: 1993 to present PROBLEM: Fresh Pond is the terminal water supply reservoir in the Cambridge system. Water from Hobbs Brook and Stony Brook Reservoirs is routed to Fresh Pond prior to treatment. Low oxygen in deeper waters of Fresh Pond allowed manganese to build up to an unacceptable level, with accumulation of iron, ammonium and phosphorus to a less critical but still undesirable degree. TREATMENT: To maximize raw water quality, a destratifying aeration unit was installed and operated during the potential stratification period (May-September) to mix the lake and maintain higher oxygen throughout the water column. Some experimentation is underway to determine the optimal operational strategy (timing and duration). Flood damage to the compressor caused a shutdown for the 2001 season, but the system operated again in 2002. EFFECTIVENESS: Monitoring between May and September in 1993, 1994 and 1995 detected an oxygen low of 3.2 mg/L with very few values <5 mg/L. Accumulation of undesirable compounds has been minimal, reducing treatment costs. While the compressor was out of service in 2001, values for deep water were <1 mg/L. Manganese levels have been below the secondary drinking water standard of 0.05 mg/L while the aerator is in operation, and have risen to as high as 2 mg/L when the aerator was off for an extended period.
Eutrophication and Aquatic Plant Management in Massachusetts
2.0 Case Histories of Lake Management in Massachusetts Page 2-22
ADVERSE IMPACTS: None are indicated or expected from this treatment, but mixing may eliminate trout water by raising the temperature of the deep waters. However, Fresh Pond is not a recreational resource and is not managed for fishing. PERMITS: No permits were required for aeration in this water supply reservoir. COSTS: Approximately $100,000 was spent on the original equipment, with limited maintenance costs since then. The original hose and diffuser apparatus is still in use. Operational costs are on the order of $5,000/yr. REFERENCES: Information came from the files of the Cambridge Water Department, with a summary contained in a report entitled “Limnological Investigations of the Cambridge Reservoir System: Impacts of Watershed Inputs and Alum Sludge Discharge” (Fugro East, 1996b). Tim MacDonald (City of Cambridge, pers. comm., 2002) of the Cambridge Water Department also supplied recent data.
2.4.5.3 Case Study
NAME: Notch Reservoir LOCATION: North Adams, Massachusetts LAKE SURFACE AREA: 11 acres. DATE: 1989 PROBLEM: High levels of iron and manganese in late summer created taste and aesthetic problems for the city water supply. Algal abundance was also elevated as a consequence of high available phosphorus from internal loading. Maximum depth was 45 ft and daily withdrawal averaged 0.8 MGD, and the economics of treatment after withdrawal were not favorable. An in-lake solution was sought. TREATMENT: A hypolimnetic aeration unit was installed, providing enough oxygen to counteract demand in the hypolimnion. A compressor in a shoreline housing supplied air to the single unit, deployed at the deepest point in the reservoir. A diffuser ring at the bottom of the unit created an upward water flow within the unit, aerating hypolimnetic waters over a distance of about 20 ft. Aerated water then runs back down through an outside chamber and is discharged at the intake depth, while excess air is vented to the lake surface. EFFECTIVENESS: Stratification was undisturbed. Oxygen was >2 mg/L throughout the hypolimnion, and sometimes as high as 6 mg/L during stratification. Iron, manganese and algae concentrations were reduced to acceptable levels. Copper sulfate treatments were unnecessary, and taste/aesthetic problems with the water supply were markedly reduced. ADVERSE IMPACTS: None are indicated, and none are expected from this technique, but no specific surveys were conducted for this purpose. PERMITS: None were required for this water supply application. An Order of Conditions under the Wetlands Protection Act would typically be required for application to a recreational lake. It is also possible that the placement of a structure (the aeration tower) could trigger permits under
Eutrophication and Aquatic Plant Management in Massachusetts
2.0 Case Histories of Lake Management in Massachusetts Page 2-23
Section 404 (Clean Water Act wetlands protection provision), Section 401 (state-federal consistency review) and Chapter 91 (MDEP approval for structures in Great Ponds). COSTS: The total system cost was not available, but would be expected to be on the order of $80,000. Annual operational costs for larger applications are often on the order of $5,000 to $10,000, but this smaller system could be operated for $1,000 to $2,000 per year. REFERENCES: A project summary sheet from General Environmental Systems, Inc. supplied most of the information for this review. Personal observations by K. Wagner of ENSR and discussions with Rich Geney (GES, pers. comm., 2002) were also helpful.
2.4.5.4 Additional Aeration Projects:
Choate Pond (Park Pond), Medway - An artificial circulation project was conducted in Choate Pond, Medway, Massachusetts in 1973. Filamentous algae and bacterial growth were a problem in this recreational pond. An aerator consisting of two weighted air diffusion tubes with two aerator pumps was used. Aeration did not control the filamentous algae and the Town now uses chemical treatment for algae control, but the aerators continue to operate during the summer months (F. Sibley, Town of Medway, pers. comm., 1997). Noise from the compressors presented a problem for lake residents. The cost of running the electricity amounted to $20 to $50 per month. The project was supported through the Land and Water Conservation Fund, the Massachusetts Department of Natural Resources, and the Town of Medway, but th exact cost is unknown.
Sunset Lake, Braintree – Artificial circulation was used to mix and exchange the swimming
area water with the intent of maximizing dilution and die-off of bacteria believed to be entering the area from several nearby storm drains and geese frequenting the beach area (Fugro East, 1995a). A simple blower unit was installed in 1996 and monitoring documented a decline in fecal coliform levels, allowing continuous operation of the swimming area during summer.
Mt. Williams Reservoir, North Adams - High levels of iron and manganese in late summer
created taste and aesthetic problems for this 57-acre city water supply with a maximum depth of only 25 ft. Some algae problems were also noted. Daily withdrawal ranged from 0.5 to 1.5 MGD, and the economics of treatment after withdrawal were not favorable. A diffused aeration/destratification unit was installed in 1990, providing enough mixing to keep the whole lake aerated. Manganese and iron declined dramatically, and algal abundance was also reduced. Information was supplied by Rich Geney (GES, pers. comm., 2002).
2.4.6 Dredging – Sediment Removal
2.4.6.1 Case Study
NAME: Nutting Lake LOCATION: Billerica, Massachusetts DATE: 1978-1986 LAKE SURFACE AREA: 78 acres.
Eutrophication and Aquatic Plant Management in Massachusetts
2.0 Case Histories of Lake Management in Massachusetts Page 2-24
PROBLEM: Nutting Lake has suffered from algal blooms and abundance of floating and rooted macrophytes. The lake was only 2.1 meters deep (average depth 1.3 meters) and water quality was poor with variable Secchi depths averaging about 1.2 meters (Chesebrough and Screpetis, 1976). Eutrophic conditions in the lake resulted from dense housing development, year round use of formerly seasonal housing, small and inadequate septic systems and until recently, unpaved roads. The lake also had large volumes of soft sediments that promoted growth of aquatic macrophytes. Recreational uses of the lake were severely impaired. By deepening the lake by dredging, it was hoped that internal loading would be curtailed to the extent that algal blooms might be minimized and depth and/or substrate limitations might be imposed on rooted plant growth. Worth (1980) states “The goal was to remove nutrient-laden sediment and macrophyte growth”. However, inland dredging was not a well-known technology at the time, and the project was funded as a demonstration effort. A report on the project notes that the primary goals of the state and federal funding agencies were to research and develop inland hydraulic dredging as a lake management technique (BEC, 1987). Funding was adequate to demonstrate the efficacy of dredging, but was not sufficient to remove enough sediment to create a widespread substrate or depth limitation. TREATMENT: A Mud Cat dredge was purchased and the town provided a crew to operate it. A seven-hour detention time was required to settle the dredged material and two non-continuously operating basins were constructed (65,000 cubic yard and 63,000 cubic yard capacity) just downstream of the lake on a 17 acre parcel of land purchased by the town. The dredge created a slurry of bottom muck and lake water with a variable solids content <20% and pumped that slurry to the containment basins. When one basin filled the other basin was used while the first was dewatered and the sediments were removed for ultimate disposal. The supernatant from either basin was piped to a flocculation basin where a low weight cationic polymer was added to coagulate and clarify the water to less than 10 NTU. This produced a satisfactory effluent when it was operated properly (BEC, 1987), and that water was discharged to the outlet stream. Originally planned as a two year project, the actual dredging took eight years (BEC, 1987). Worth (1980) states “Once the initial bugs were worked out of the system, the dredging proceeded smoothly”. Dredging was delayed, however, until contractors could be found to remove sediment from the containment area. Removal of the partially dewatered sediment was a constant problem and six different contractors were involved over the course of the project to remove the sediment. The BEC (1987) report describes many of the problems in crew operations, inadequate dredge maintenance, vandalism and equipment breakdowns. There were problems with the containment area and silt began accumulating in Honeywell Pond, just downstream of the containment area. Other problems included a breach of the sedimentation berm and poor dewatering of the dredged material. The effluent from the containment area reportedly averaged 2 NTU, similar to turbidity in the lake itself, and BEC (1987) concluded that there was no substantial adverse impact on water quality. Purcell and Taylor (1981, as cited in BEC, 1987) recommended the removal of 360,000 cubic yards of sediment. A total of 361,000 cubic yards were removed according to the dredging logs, which were based on pumping rates and assumed solids content. However, the actual volume of
Eutrophication and Aquatic Plant Management in Massachusetts
2.0 Case Histories of Lake Management in Massachusetts Page 2-25
sediment removed by dredging was estimated to be as low as 224,000 cubic yards based on comparison of pre- and post-dredging lake volume. Overall mean depth was 1.8 meters in 1987 (BEC, 1987). EFFECTIVENESS: The water quality of Nutting Lake has not greatly improved as a result of dredging, with Secchi disk depths at the end of the dredging project averaging about 1.5 meters. Retrospectively, insufficient dredging was conducted to produce dramatic water quality improvement. ). Additionally, planned watershed management activities were not completed along with the dredging, and the load reduction represented by removing nutrient-rich sediments was minor. Relative to pre-dredging conditions, the macrophytes appear to have been reduced in density by 50-75 percent, but plant growths appeared to be expanding and the lake still had many dense beds of macrophytes (BEC, 1987). In terms of method development, the project was a success and provided valuable insights into the proper design, execution and management of future inland dredging projects such as at Dunns Pond (see below). According to Carranza (BEC, pers. comm., 1996): “The Nutting Lake experience created a realization that the now standard method for hydraulic dredging of inland lakes and ponds in Massachusetts was both technically and economically feasible. No other conclusions relative to the success or failure of dredging, should be accruable to this ‘ancient’ 1977-1978 project”. The BEC (1987) report suggests an alternative to purchase of a dredge is to hire a dredging contractor with a carefully written contract; payment by volume of sediment actually removed is preferable. The total cost may be greater than for a town-operated dredge, but many problems and delays could be avoided. A summary of additional recommendations from BEC (1987) includes:
1) perform detailed tests on the sediments, 2) weigh option of purchase vs. hiring a dredge carefully, 3) prepare contracts with careful attention to performance incentives, 4) predict project duration accurately (e.g., 60,000 cubic yards per year), 5) provide greatest possible sediment disposal capacity; disposal elsewhere should be
minimized, 6) carefully design sedimentation basins to increase permeability, strength, and flexibility of
operation, 7) if sedimentation basin volume is limited, then provide two or more basins and minimize
delays in dredging, 8) provide security for the area, 9) provide supervision, training and monitoring for the project.
One unexpected success of the project was that the containment area, purchased inexpensively ($17,000) prior to the project, was sold later for over $400,000 in profit, offsetting some of the dredging costs and providing funds for beach improvements. ADVERSE IMPACTS: As reviewed by BEC (1987), some data were collected on physical, chemical and biological impacts of the dredging operation. There were no obvious adverse impacts, although the project failed by itself to rehabilitate Nutting Lake to the extent desired. Considerable quantities of soft sediment remain in the lake. Total suspended solids were less than 25 mg/L in both the east and west basins. Storm water inputs and dredging appear to have
Eutrophication and Aquatic Plant Management in Massachusetts
2.0 Case Histories of Lake Management in Massachusetts Page 2-26
destabilized the system during the project; water quality was more variable and not appreciably better than before the program. Only dissolved oxygen showed a significant change, increasing at the surface of the east basin and throughout the west basin. Changes in phytoplankton quantity or quality are difficult to determine due to discontinuous and semi-quantitative data. Many changes may be due to seasonal or random environmental effects. Cell counts appear to rise during the dredging program but returned to normal after the dredging was halted. Apparently no formal study of impacts to fish and other aquatic animals was conducted. There were some downstream impacts associated with the siltation of the Honeywell Pond, just downstream of the containment area. The dredge was later moved to Honeywell Pond and 12,500 cubic yards of soft sediment were removed, but this was not all sediment from the Nutting Lake project. PERMITS: Permits included an Army Corps of Engineers Section 404 Permit, an Order of Conditions from the local Conservation Commission, Division of Fisheries and Wildlife Approval, and a Ground Water Discharge Permit Program and a Section 401Water Quality Certificate from the MDEP. COSTS: The original estimate of cost was $522,000 or approximately $1.45 per cubic yard (Worth, 1980). Funding was through USEPA's 314 Clean Lakes Program, the Massachusetts Water Resources Commission's Research and Demonstration Program and through cash and in-kind contributions from the Town of Billerica. The estimated total cost at the end of the project was $1,065,167, or about $4.75 per cubic yard as implemented (more than three times expected costs). However, the Town of Billerica was able to sell a small amount of the dredged material for $18,000, and later sold the containment area to an industrial park for $450,000 (BEC, 1987). REFERENCES: Much of the information presented here is from the BEC summary report for the project (BEC, 1987). Additional details were provided by the Billerica Parks and Recreation Department and personal communications from Lee Lyman (Lycott Environmental Research, Inc.), Leslie Lewis (MDCR) and Harry Jones and Carlos Carranza (Baystate Environmental Consultants, Inc.). Information on the early phases of the project was taken from Worth (1980), and Chesebrough and Screpetis (1976).
2.4.6.2 Case Study
NAME: Dunn Pond LOCATION: Gardner, Massachusetts DATE: 1984-1985 LAKE SURFACE AREA: 25 acres. PROBLEM: Once a favorite spot for recreation in Gardner, by the late 1970s Dunns Pond was heavily impacted by urban storm water, dump leachate and sewer overflows and was shallow, muck floored and weed infested. The lake had minimal depth and virtually no recreational value, although it undoubtedly served as habitat for many forms of water-dependent life. Slated to be a recreational resource in a Heritage Park being established in Gardner, a major overhaul was deemed necessary. TREATMENT: Dredging and cleanup of Dunns Pond and nearby Stump Pond was started in 1984 and completed in 1985. Dredging after draining the lake removed 220,362 cubic yards of
Eutrophication and Aquatic Plant Management in Massachusetts
2.0 Case Histories of Lake Management in Massachusetts Page 2-27
accumulated muck and peat to create a hard-bottom pond of about 25 acres with a maximum depth of over 20 ft. What was a flooded meadow of some habitat value but limited recreational potential in an urban area became a focal point for recreation and different habitat value in a Heritage Park. Rocks and other natural debris were placed in the pond after dredging to establish fish habitat, but there was very little soft sediment after this very thorough dredging job. Upstream Stump Pond was also dredged, but was used as a detention area and forebay prior to entry of the main inlet flow to Dunns Pond, complete with a filter berm through which low to moderate flows could pass and be further purified. MDCR ran the project and provided on-site supervision, while consultants provided design and on-call technical support. EFFECTIVENESS: The change in Dunns Pond is among the most striking of any lake management effort in Massachusetts. Although initially very sterile after project completion, the pond now supports trout and is considered a “jewel in the landscape” of Gardner (MDEP, 1994). Sediment features and water depth were drastically altered to the benefit of human and many non-human pond users. Plant and algae problems were solved, water quality improved in most respects, and recreational facilities were established and maintained. ADVERSE IMPACTS: Complete loss of plants and much lower nutrient inputs resulted in a sterile aquatic habitat for several years after project completion. The pH was <5.0 in some samples, and recovery was slow in the absence of any introductions or stocking. The pond was allowed to develop a new biota on its own, largely as an experiment, but also because there was little guidance available on how to proceed. Eventually trout were stocked, but little other effort was put into resetting the biological assemblage after dredging. While there was no regulatory outcry at the time, it is difficult to imagine such a project being approved in its original form today, despite the highly praised results. PERMITS: The project received an Order of Conditions from the local Conservation Commission, a Section 404 permit from the Army Corps of Engineers, and a Section 401 Water Quality Certificate from the MDEP. COSTS: This project cost $1,264,000 (about 50% federal USEPA funding). Some costs were recovered from sale of excavated peat ($0.50 per cubic yard, but not all material was sold). Cost of additional improvements such as the beach facility and a boat livery were not included as part of this project. Maintenance of the filter berm has been limited and also not accounted for in this project. No in-lake follow-up costs have been necessary. REFERENCES: Information was provided by C. Carranza (BEC, pers. comm., 1996) and a MDEP summary report (1994).
2.4.6.3 Additional Dredging Projects:
Puffers Pond, Amherst - A dry dredging project was implemented at Puffers Pond, Amherst, MA, in 1989 and 1990. The pond had accumulated sediments for a long period of time and pond depth was significantly decreased. An Order of Conditions was issued by the Amherst Conservation Commission in January of 1989. Additional permits and approvals were obtained from the Army Corps of Engineers, the Massachusetts Division of Fisheries and Wildlife and the Massachusetts Division of Wetlands and Waterways.
Eutrophication and Aquatic Plant Management in Massachusetts
2.0 Case Histories of Lake Management in Massachusetts Page 2-28
Beginning in October 1989, a sediment trap was constructed at the inlet of Cushman Brook to Puffers Pond. Approximately 8,200 cubic yards of material were removed to construct the trap. The pond was drained and an average of approximately 10 feet of sediment was excavated; 74,238 cubic yards of sediment were removed from January through March of 1990. The pond was refilled at the end of March and reached normal water levels in May of 1990. The sediment trap was profiled after four years in May of 1994 and contained approximately 3,600 cubic yards of solids. Based on the profile, the estimated per year accumulation is 900 cubic yards. At this rate of accumulation, the design capacity of 8,200 cubic yards will be reached in 1999. Tighe & Bond (1994) recommended monitoring the accumulation of solids in the sediment trap and cleaning it as warranted. Comparisons between measurements of water depths in May of 1994 and measurements taken when dredging was completed indicate that the sediment trap has been effective (Tighe and Bond, 1994).
Hills Pond (Menotomy Rocks Park), Arlington - About 15,000 cubic yards of sediment were
removed from a 3 acre artificial pond in an intensely used park, despite technical and permitting difficulties. An artificial blue clay liner from the turn of the century was exposed as a result of dry dredging. Growths of invasive water chestnut (Trapa natans) and Brazilian elodea (Egeria densa) were eliminated. Ballfields were raised and leveled with some dredged material, and additional sediment was taken away for use elsewhere. A new outlet was installed to control the water level and a well and pump for summer make-up water were installed as well. Fish were restocked in 1995. A storm water management system was implemented, involving an underground vortexing sedimentation chamber, a wetpond and a constructed wetland. This system reduced nutrient loading by about 90% through one year of operation with monitoring.
Re-colonization by macrophytes at moderate densities occurred over about a three year period, with an uncommon species of pondweed and the invasive Eurasian watermilfoil as dominants. A follow-up treatment with fluridone controlled the milfoil. A blue-green bloom occurred in late summer at the same time as the milfoil appeared, suggesting that nutrients were gradually accumulating in the pond despite the storm water management system. A follow-up alum treatment was applied to lower phosphorus levels. Local citizens formed the Friends of Menotomy Rocks Park to help direct and fund the project and were rewarded with a Technical Excellence Award from the North American Lake Management Society in 1995 for Volunteer Effort in a Successful Project. Dredging cost was about $75,000 and storm water management expenses totaled about $50,000. Additional park expenses relating to design work, grading, permit changes, construction supervision and additional construction activities totaled about another $125,000. Information was provided by a Fugro East (1996c) summary report and later personal observations by K. Wagner of ENSR.
Bulloughs Pond and City Hall Pond, Newton – These two ponds, a combined 9 acres in area,
were drained and dredged, with about 30,000 cubic yards of soft sediment removed. Catch

Eutrophication and Aquatic Plant Management in Massachusetts
2.0 Case Histories of Lake Management in Massachusetts Page 2-29
basins in the very large and urban watershed were cleaned, as were large box culverts leading into City Hall Pond. Additional outlet and shoreline treatments enhanced the overall project. Major algal mat problems disappeared for at least 6 years after dredging, despite continued poor inflow quality, suggesting the power of dredging to control growths that depend on in place sediments more than water quality (K.Wagner, ENSR, pers. obs., 1998). Total cost approached $400,000.
Porter Lake and Barney Pond (Forest Park), Springfield – Multiple ponds in highly used
Forest Park were dredged over about five years, Porter Lake by hydraulic means and Barney Pond by conventional excavation methods. Depth was restored and progress was made in controlling sediment inputs, but incoming water is still primarily storm water runoff from urbanized areas and both algae and rooted plant problems have returned, prompting a 2002 NOI from the Park Department for use of herbicides to control nuisance growths in these ponds.
Willow Pond (Look Park), Northampton – This constructed pond in Look Park depends on
flows from the Mill River for flushing, and had filled in substantially over many years, at least partly from eroding banks. Dredging restored depth and limited fine sediments that might resuspend and create unappealing conditions in this park setting. Bank treatments minimized future infilling. Dye was used to create the illusion of depth in this pond, largely a scenic amenity but also popular for rented paddleboating.
Whitings Pond, North Attleboro – This lake was dredged at minimal cost, as a contractor
wanted access to sand and gravel deposits underneath the muck that fostered rooted plant growths and supplied phosphorus for algal blooms through internal loading. The lake was deepened considerably, and its physical attributes were markedly changed. However, failure to remove all muck and continued high loading from the watershed have allowed algal blooms to continue to form. Rooted plant growths are limited, however.
Red Lily Pond, Barnstable (reverse layering of sediments) – This project differs from the
others above in that dredged material is neither surficial sediment nor removed from the pond. This process, developed by William Kerfoot of KV Associates on Cape Cod, involves pumping a slurry of sand and water from beneath accumulated muck deposits and layering it on top of that muck. Placement of enough clean sand on top of the nutrient-rich muck can alter sediment water interactions and rooted plant growth potential. The key to successful reverse layering is finding an appropriate sand layer under the less desirable sediment and bringing it to the surface. Further pilot testing of this technique continues at Red Lily Pond. Permitting for this technique has thus far involved only an Order of Conditions, as the Corps of Engineers has declined to require a Section 404 permit and lack of a federal or other state permit eliminates the need for a Section 401 permit.

Eutrophication and Aquatic Plant Management in Massachusetts
2.0 Case Histories of Lake Management in Massachusetts Page 2-30
2.4.7 Drawdown – Water Level Control
2.4.7.1 Case Study
NAME: Lake Lashaway LOCATION: East and North Brookfield, Massachusetts. DATE: 1986- present LAKE SURFACE AREA: 270 acres. PROBLEM: Nutrient and solids loading contributed to the degraded condition of Lake Lashaway over many years. Deposition of suspended sediments noticably reduced depth in several areas of the lake. In addition to loss of lake volume, loading of sediments and nutrients accelerated the growth of macrophyte populations that covered over 40% of Lake Lashaway. The dominant nuisance plants were fanwort (Cabomba caroliniana) and bushy pondweed (Najas flexilis). TREATMENT: The outlet structure at the south end of the lake was modified to allow subsurface water release and a temporary retention dam was constructed along the narrow portion of the Fivemile River at the north end of Lake Lashaway to protect bordering wetlands. A winter drawdown of up to eight feet is implemented yearly via a constructed subsurface drain. Localized dredging was conducted to get rid of accumulated sediment in a limited area, but drawdown is the primary influence on rooted plants. In order to minimize the impacts of lake drawdown, the Brookfield Athletic Shoe Company's fire protection system (dependent on Lake Lashaway) was modified. Additionally, contingency plans to mitigate the impact of drawdown on the East Brookfield municipal well and homeowner wells within 500 feet of the lake were implemented. A check dam was installed to protect upstream wetlands from dewatering. EFFECTIVENESS: After three consecutive years of plant density decline, the main body of the lake was essentially free of dense macrophytes for three more sequential growing seasons and through 2000 there is no indication that any macrophyte species population has exhibited accelerated growth and distribution within the drawdown zone in response to winter drawdowns. There was noticeable improvement in water quality, plant control and recreational use of the lake (Haynes, 1990). The drawdown creates and maintains a coarse peripheral substrate, valued habitat to many fish and invertebrates and generally inhospitable to rooted plants. This project received a Technical Merit Award from the North American Lake Management Society in 1990. ADVERSE IMPACTS: It appeared that drawdown generated a brief surge of suspended solids that was discharged through the outlet culvert. However, there have been no recorded or observed adverse effects of this restoration project on wetlands adjacent to the Fivemile River upstream or the Brookfield River downstream. Flows out of Quacumquasit Pond into Quaboag Pond were reversed by elevated flows into Quaboag Pond during early drawdowns, but careful flow management has minimized this effect, and Quacumquasit Pond now has a flow control structure at the connector channel that links it to Quaboag Pond. Testimonies from several sources cited in Haynes (1990) state that the lake is greatly improved, and that no elevation of available nutrients or other water quality problems have been caused by the drawdown. In contrast, pre- and post-drawdown fish surveys indicate a decline in abundance
Eutrophication and Aquatic Plant Management in Massachusetts
2.0 Case Histories of Lake Management in Massachusetts Page 2-31
of several native fish species dependent on submersed vegetation after the drawdown (DFW, unpublished data, 1985-1990). Although plant surveys were conducted, no formal studies were conducted to assess impacts on zooplankton, benthic invertebrate, bird or mammal species. It was reported that the check dam stoplogs had not been removed for many summers, and residents complained of upstream sedimentation and impaired boat navigation due to the dam. In 2003, DEP ordered the check dam to be replaced and operated as per the original order (open in summer). It was removed and a new check dam with a hand cranked vertical gate is to be installed for $5,000, based on local design and construction (M. Mattson, Pers. Comm. August 2003). PERMITS: The appropriate permits and certificates for the restoration of Lake Lashaway included a road cut permit issued by the Massachusetts Department of Public Works, an Order of Conditions for constructing the outlet structure issued by the East Brookfield Conservation Commission, a certificate stating that the Final Environmental Impact Report for the Lake Lashaway Drawdown Project and Outlet Construction issued by the Massachusetts Executive Office of Environmental Affairs, and a permit to construct the outlet structure as a temporary sandbag cofferdam, issued by the Army Corps of Engineers. This permit was amended to allow construction of a concrete barrier with stop logs to allow lake drawdown. COSTS: The federal share of funding for the Lake Lashaway Phase II project was provided through Section 314 of the Clean Water Act of 1977. Financial assistance was provided in the form of a cooperative agreement between the USEPA and the Commonwealth's Department of Environmental Protection, Division of Water Pollution Control. The total estimated project cost was $397,600. The actual expenditure of funds to complete this project was $298,400 and the federal contribution was $149,200. The 50% non-federal share ($149,200) of the actual project cost was derived from state and local sources. The Commonwealth's Chapter 628 (Acts of 1981) Clean Lakes and Great Ponds Program was the source of the state share, as authorized by the Water Pollution Control and Water Conservation Loan Act of 1982 (Chapter 286). The Towns of East Brookfield and North Brookfield each appropriated $25,000 toward the Phase II Restoration Project of Lake Lashaway. REFERENCES: The information for the Lake Lashaway Drawdown was summarized from a MDEP 1990 report by Robert C. Haynes entitled “Section 314 Phase II Restoration Project of Lake Lashaway.” Additional information was provided by Tom Lacaire and Robert Munyon of the Lake Lashaway Association.
Eutrophication and Aquatic Plant Management in Massachusetts
2.0 Case Histories of Lake Management in Massachusetts Page 2-32
2.4.7.2 Case Study
NAME: Otis Reservoir LOCATION: Otis and Tolland, Massachusetts. DATE: 1960s to present LAKE SURFACE AREA: 985 acres PROBLEM: While there is concern over proliferation of rooted plants, there is no evidence that this has ever been a major problem at this lake, created from three shallower lakes by construction of a dam at the outlet of the downstream-most pond. A proliferation of non-floating docks and other permanent structures within the high water line of the lake is the more immediate issue, as high winter water levels and associated ice movement could cause great property damage. TREATMENT: Annual drawdown is initiated on weekends in early October, with elevated outflows supporting canoe and kayak races downstream on the Farmington River. A lesser outflow on a daily basis from mid-October until late November or early December lowers the water level by a total of 8 ft 3 inches. Water is held at that level until early February, at which time the water level is gradually raised to about 4 ft below normal full level until the ice goes out. After ice-out, little water is discharged from the lake until the lake reaches full level, typically by Memorial Day but sometimes not until June. EFFECTIVENESS: Where there is any appreciable slope from shoreline, the substrate in Otis Reservoir is very coarse, with rocks and gravel dominant and almost no silt. Muck deposits are present in two large coves with minimal slope and a few smaller shoreline areas. This suggests that over 30 years of drawdown has fostered a coarse substrate where slopes are appreciable. Plant growths are restricted to areas with muck sediments: the two large coves and a peripheral band between 8 and 15 ft of water depth, below which light is inadequate for plant growth. No non-native plant species were found within the lake, despite high levels of boat traffic and many “non-resident” boats launched at the state facility or two private marinas. Smallmouth bass habitat is excellent as a consequence of a very rocky nearshore zone, and this species is the dominant nearshore fish. ADVERSE IMPACTS: High variability in outflow, and particularly the negligible outflow during spring, minimizes fish and invertebrate populations in Fall River, the short connector stream between Otis Reservoir and the Farmington River. Drawdown may be affecting peripheral wetlands, as several invasive species that prefer drier conditions are present, but these are not dominant and habitat value remains high. Oxygen levels are somewhat depressed in deeper waters, but are usually >2 mg/L; movement of organic sediments from shallow to deep areas as a consequence of drawdown has not caused anoxia or associated negative water quality changes. Water level fails to reach full level by Memorial Day about 2 in 10 years, as the upper 4 ft of the reservoir can not be filled until after ice-out without causing damage to docks and other structures. Resultant impacts on fish, invertebrates, waterfowl and other wildlife are uncertain but not evident from work done to date. PERMITS: An Order of Conditions would normally be required, but the MDCR has operated the dam and managed the drawdown for about 30 years with limited interaction with local or state regulatory agencies. A recent study (ENSR 2001c) was intended to provide the information
Eutrophication and Aquatic Plant Management in Massachusetts
2.0 Case Histories of Lake Management in Massachusetts Page 2-33
necessary to file under the Wetlands Protection Act and receive an Order of Conditions in support of continued drawdown. COSTS: The recent study of Otis Reservoir cost $85,000, but extended beyond drawdown issues. Some expenditures have been made on the Otis Reservoir dam, but there is no explicit cost associated with this drawdown. Small permitting costs may be expected in most cases, however, and monitoring requirements are likely to result in additional costs. REFERENCES: A detailed D/F report by ENSR (2001c) provided information for this review.
2.4.7.3 Additional Drawdown Projects:
Indian Lake, Becket – This 54-acre constructed lake with a maximum depth of 10 ft has suffered from dense growths of watershield (Brasenia schreberi) and bladderwort (Utricularia spp.). The dam was originally constructed to allow the lake to be nearly drained. Three years of pre-drawdown data collection (1997-1999) have been followed by three years of post-drawdown assessment (2000-2002), with a 4-ft drawdown in winter 1999-2000 and a 5-ft drawdown in winters 2000-2001 and 2001-2002. Drawdown is initiated in mid-October and terminated in late January to late February, allowing both a period of drying/freezing and active ice damage to plants during refill. Monitoring results to date (ENSR, 2002c) indicate variable and weather-dependent effects of drawdown, with no clearly negative consequences observed. The mild 1999-2000 drawdown did not reduce species that overwinter in a vegetative state, but did stimulate seeds of other species to germinate, increasing both plant species richness and overall abundance. The more severe winter of 2000-2001 resulted in no loss of species, actually increased percent cover (more deep growths), but greatly reduced the biomass of species that overwinter in a vegetative state. The plant community was more diverse in 2001, covered more of the lake bottom, but at lower biomass, resulting in both improved recreational conditions and enhanced habitat. Plant conditions were maintained by the 2001-2002 drawdown; winter conditions were not especially cold, but were very dry, and the drawdown was held until late February. Spring refill has occurred within 6 weeks of drawdown termination, even during a very dry spring. No drawdown was conducted in 2002-2003, to evaluate longevity of results to date. Water quality appears stable, although winter dissolved oxygen depression has been observed under the ice. Despite the potential for drawdown to harm reptiles, amphibians and furbearers, 2001 populations were substantial and consistent with expectations from other area lakes and wetlands not subject to drawdown (ENSR, 2002c). However, there was a decline in green frog abundance in Indian Lake in 2002, while green frogs remained common in nearby wetlands. Fish abundance was not obviously altered, but surveys were only semi-quantitative.
Richmond Pond, Richmond and Pittsfield - Results of a drawdown are presented in a 1990
D/F report by Baystate Environmental Consultants (BEC, 1990a). For years Richmond Pond has been subject to about a 6 ft drawdown, under the auspices of flood control. Limited permitting has been performed. Eurasian watermilfoil in shallow water has been controlled,

Eutrophication and Aquatic Plant Management in Massachusetts
2.0 Case Histories of Lake Management in Massachusetts Page 2-34
but the shallow water harbors abundant beds of annual species such as Potamogeton spp. Concern by the Pittsfield Conservation Commission and Natural Heritage and Endangered Species Program over potential impacts to protected species in contiguous wetlands resulted in discontinuation of drawdown in the late 1990s. It is not clear how such impact was determined, as the species are present and drawdown had been conducted for over 30 years, but information requirements have thus far prevented permitting of drawdown. Chemical controls are being considered as an alternative.
Lake Garfield, Monterey - Eurasian watermilfoil was greatly reduced in shallow areas by
annual drawdown of up to 8 ft, but the drawdown-resistant annual species Potamogeton amplifolius achieved high densities in the lake (BEC, 1992b). Milfoil weevils have been more recently augmented in this lake, with some indication of milfoil control (Hartzel, GeoSyntec, pers. comm. 2002).
Onota Lake, Pittsfield – Prior to the mid-1980s, drawdown was applied to manage rooted
aquatic plants in Onota Lake, along with harvesting. Drawdown ceased as a consequence of structural dam problems, channel infilling and environmental regulations, leaving harvesting as the primary control method. Comparison of plant distribution in the 1986-1987 D/F study (ITC 1991) with similar mapping in 1996 (Fugro East, 1996a) demonstrates the spread of Eurasian watermilfoil over the decade in between the studies and suggests that drawdown was an effective management tool. Dam reconstruction facilitated a return to drawdown at a slightly lesser severity (4 ft vs 6 ft), but concerns by the Pittsfield Conservation Commission limited the drawdown to <3 ft and results were similarly limited. The City turned to a major fluridone treatment to regain control over the milfoil in 1999, with annual follow-up treatments using 2,4-D or diquat (Smith, ACT, pers. comm., 2002).
Pontoosuc Lake, Pittsfield – Pontoosuc Lake has been subjected to drawdowns for rooted
plant control for many years, although the record of activities and impacts is sketchy. A 1990 report (ITC, 1990) recommended greater drawdown, finding adequate control of Eurasian watermilfoil in water up to 3 ft deep from past drawdowns. A study conducted in 1997 (ENSR, 2000a) recommended drawdown of 3 – 6 ft, but acknowledged that this technique may involve trade-offs between plant control and other biological components of the system. The inadequacy of current knowledge of actual impacts to aquatic vertebrates was noted. The Pittsfield Conservation Commission has not favored drawdown as a plant management technique in recent years, so this approach has not been re-instated.
Lost Lake/Knopps Pond, Groton – A relatively small drawdown of about 2 ft has been
implemented on a roughly annual basis for many years at these contiguous lakes. Variable milfoil (Myriophyllum heterophyllum) is controlled in the drawdown zone but freshwater clams are more limited in this area than in deeper zones (BEC, 1992a). Greater drawdown potential appears limited by the outlet configuration and possible impacts to private wells around the lake.
Forge Pond, Westford – Drawdowns in the first half of the twentieth century were reported
anecdotally to have controlled rooted plant proliferation, especially in conjunction with dragging logs, bedsprings and other materials around in the exposed area behind vehicles.

Eutrophication and Aquatic Plant Management in Massachusetts
2.0 Case Histories of Lake Management in Massachusetts Page 2-35
Change in dam ownership and lack of effort to maintain the drawdown resulted in its termination as an annual event sometime around 1950. A 1986 D/F study by BEC recommended resumption of the drawdown for fanwort control. Alteration of the dam and associated outlet channel to facilitate greater drawdown was accomplished at a cost of around $40,000. It was known that there were as many as 17 shallow private wells around the lake (out of several hundred residences) (BEC, 1990b), but it came as a surprise when water supply interruption occurred in two wells after a drawdown of only 18 inches. The drawdown was discontinued.
Lake Massasoit, Springfield – Drawdown has been applied several times since this lake was
formed by order of President George Washington, most recently in the 1990s to control extensive growths of coontail (Ceratophyllum demersum). Growths appear to be reduced within the drawdown zone (up to 8 ft, but more often 4 to 6 ft) after severe winters, but regrowth is substantial after mild winters and remains dense in areas beyond the drawdown zone to a depth of up to 10 ft (K. Wagner, Springfield College, pers. obs., 1999-2002). Aesthetics and shoreline fishing success are improved in the nearshore area. No studies of impacts to non-target organisms are known.
Bare Hill Pond, Harvard – Drawdown was applied in the late 1990s to help control rooted
plants in shallow areas. The drawdown was limited to 4 ft, the height of the dam that expanded the lake area many years ago. A large downstream wetland limits further drawdown until technical and permitting issues can be addressed. Conditions have been reported by the Lake Committee to have improved in the drawdown zone, which is dominated by water lilies and variable milfoil, prompting interest in further drawdown. A review of possible impacts suggests that further drawdown may be feasible, but substantial monitoring and impact assessment will be needed (ENSR, 2002d).
Cedar Lake, Sturbridge – A small drawdown aided shoreline maintenance and kept some
plants out of very shallow areas. A deeper drawdown was desired, but caused problems with some nearshore wells. Subsequent replacement of wells allowed a drawdown of up to four feet, with acceptable control of variable milfoil in the drawdown zone (Lyman, Lycott, pers. comm., 2002a).
Fort Meadow Reservoir, Marlborough – A plant survey in 2000 (ENSR, 2000f) revealed
substantial coverage by Eurasian watermilfoil, a species that was absent in surveys from the 1980s. Plans were made to treat with an herbicide, but a 4 ft drawdown was conducted as an interim measure over the winter of 2000-2001, a winter with weather conducive to desirable drawdown results. A cursory spring survey in 2001 by town staff revealed lesser coverage by milfoil and the herbicide treatment was not performed. Herbicide treatment for localized control was conducted in 2002 (Ryder, Marlborough CC, pers. comm., 2002), as some deeper beds remain and winter 2001-2002 was less conducive to drawdown control of plants.
Eutrophication and Aquatic Plant Management in Massachusetts
2.0 Case Histories of Lake Management in Massachusetts Page 2-36
2.4.8 Harvesting, Hydroraking and Hand Pulling – Direct Plant Removal
2.4.8.1 Case Study
NAME: Big Bear Hole Pond DATE: 1987 LAKE SURFACE AREA: 40 acres. LOCATION: Taunton, Massachusetts (Massasoit State Park) PROBLEM: Big Bear Hole Pond is primarily used for recreational fishing and non-motorized boating, and provides aesthetic enjoyment for campers at Massasoit State Park. Extensive growths of the introduced nuisance species Eurasian watermilfoil (Myriophyllum spicatum) and fanwort (Cabomba caroliniana) severely impaired recreational and habitat value. TREATMENT: Harvesting machinery was used to cut, capture and remove aquatic plants from the pond. EFFECTIVENESS: This technique provided only temporary relief from dense growths of milfoil and fanwort. The plants needed to be harvested seasonally, in most cases twice a year. Conditions were improved for some time after harvesting, but only in the top 5 ft of the water column. The nuisance vegetation in Big Bear Hole Pond grew back to the same excessive state within a season after implementation of harvesting methods. Plant mapping conducted by ENSR in 2000 indicated dense macrophyte growths much like those that prompted harvesting to be implemented a decade earlier. A shift in dominance from Eurasian watermilfoil to fanwort was attributed to the 1999 herbicide treatment with fluridone, not to harvesting. ADVERSE IMPACTS: No formal studies of non-target organisms were conducted along with the original harvesting. A review of available data in 2000 (ENSR, 2000c) indicated invertebrate and fish densities lower than expected, but after a decade and alternative management methods, it seems unlikely that this is related to harvesting. PERMITS: A Notice of Intent was submitted to the local Conservation Commission and an Order of Conditions was obtained under the Wetlands Protection Act. COSTS: The Department of Conservation and Recreation funded this project. A state grant of $42,000 was awarded, with a local match of $18,000 for the restoration of Big Bear Hole Pond. Plant harvesting typically costs from $350 to $1000 per acre. Typical costs for an aquatic harvester range between $60,000 and $100,000. Annual maintenance and operation of the harvester may cost from $3,000 to $10,000, exclusive of operator salary and benefits. REFERENCES: Information for Big Bear Hole Pond was summarized from personal communication with Bob Hartzel (then of the MDEM), Carol Hildreth of COLAP and Jerry Ross of the Massasoit State Park Headquarters in Taunton. Follow-up information was contained in the ENSR (2000c) study report.

Eutrophication and Aquatic Plant Management in Massachusetts
2.0 Case Histories of Lake Management in Massachusetts Page 2-37
2.4.8.2 Case Study
NAME: Charles River Impoundments LOCATION: Waltham and Newton, Massachusetts DATE: 1995 to present LAKE SURFACE AREA: 210 acres PROBLEM: Water chestnut (Trapa natans) invaded the Charles River impoundments sometime after 1983, based on its absence in a 1983 study (Lycott, 1984). By 1995 it was the dominant plant in these impoundments, covering about 56 acres completely and impacting additional areas to a lesser extent. Habitat and recreational value were greatly impaired. TREATMENT: Mechanical harvesting commenced in 1995. Approximately 45 acres were harvested the first year, but regrowth was complete the next year and even greater total coverage was observed. A survey of the bottom sediment revealed substantial numbers of viable seeds from this annual plant. More harvesting in 1996 opened areas for the summer, but regrowth was again complete in 1997. An increase in funding allowed 85 acres (virtually all areas dominated by water chestnut) to be harvested in 1997, and in 1998 only 68 acres required harvesting. Only 20 acres of coverage were noted and harvested in 1999. Continued harvesting in 2000 and 2001 was limited to handpulling in the main river channel and mechanical harvesting of small patches in a backwater cove area. Continued maintenance harvesting has involved less effort to keep water chestnut under control. EFFECTIVENESS: Initial harvesting appeared to provide only seasonal relief, but given the presence of water chestnut for over a decade and the deposition of seeds with extended viability, this was not surprising. Continued harvesting prior to release of seeds (typically in August) both removed plants and prevented the deposition of new seeds. After 3 years of harvesting, growth of this annual plant declined. Some viable seeds remain, necessitating follow-up harvesting, but at a reduced rate after the initial 3 years and a relatively low maintenance level after 5 years. ADVERSE IMPACTS: No detailed study of any component of the system other than water chestnut has been conducted. Habitat has changed as a result of harvesting, with more open water available. One habitat type has been traded for another, with potential benefits and detriments. Whether the improved recreation and aesthetic conditions represent an adverse impact on aquatic species is unknown, however. PERMITS: An Order of Conditions was required under the Wetlands Protection Act from Waltham and Newton. COSTS: Expenses averaged about $1500 per acre, with greater total cost in years of greater coverage. Expense per unit area harvested does not decline greatly at lower coverage, however, as search time actually increases and mobilization and hauling time remains significant. The maximum harvest was around 30 tons per acre. REFERENCES: Reports filed with the MDC by ACT (1999, 2000a, 2001a) and discussions with ACT staff (G. Smith, ACT, pers. comm., 2002) provided the information for this review.
Eutrophication and Aquatic Plant Management in Massachusetts
2.0 Case Histories of Lake Management in Massachusetts Page 2-38
2.4.8.3 Case Study
NAME: Lake Buel LOCATION: Monterey, Massachusetts. DATE: 1984 to present LAKE SURFACE AREA: 190 acres PROBLEM: Eurasian watermilfoil has grown to excessive density in about 100 acres of this lake, growing from the shoreline out as far as 500 ft and extending to the surface in much of this area. Native plant species populations are depressed and habitat value for many forms of aquatic fauna is impaired. Boating and contact recreation are severely compromised when milfoil forms a surface canopy. TREATMENT: Lack of water level control and regulatory issues associated with excavation of a channel through a wetland or pumping have prevented implementation of a drawdown. Concern over non-target chemical impacts has prevented herbicide application. Mechanical harvesting was viewed as a reasonable maintenance technique and has been implemented by the Lake Buel District for many years. The District owns its own harvester, offloading equipment and truck, and the same operator has run this equipment for about a decade. EFFECTIVENESS: Although written records are limited, having the same people involved in the operation for the last decade has resulted in a consistent base of knowledge regarding the harvesting. A single harvester operating about 40 hours per week can not keep up with milfoil growth over a 100-acre area. Cutting at a 5-ft depth in water >5 ft deep provides about 3 weeks of relief, after which milfoil has reached the surface again. Growths in very shallow water (<2 ft) near the shoreline are not accessible to the harvester. However, at depths between 2 and 5 ft it has been noticed that cutting close to the sediment or using the cutter bar to “plow” the sediment can result in replacement of milfoil with stonewort (Chara) or pondweeds (Potamogeton spp.). An experiment in 2000 involved actively transplanting Chara into areas harvested in this manner (ENSR, 2000d). A small plot in a much larger milfoil-dominated area remained stable for about a year, but is gradually being overrun by milfoil again. A cove area with milfoil only along the outside edge fared much better, and was dominated by Chara through two summers with only limited recolonization by milfoil. Areas from which Chara was harvested experienced regrowth with mainly Chara and Najas and only a few stems of milfoil were observed after two summers. Expansion of this approach to larger scale plots is being planned. ADVERSE IMPACTS: Small fish have been observed getting caught in the harvester and are hauled away with the plants. The impact of this inadvertent bycatch on fish populations is largely unknown, but many fish have been harvested. Turtles are also sometimes captured. PERMITS: An Order of Conditions is required under the Wetlands Protection Act through the Monterey Conservation Commission. COSTS: The annual budget for the harvesting program is about $60,000, including operator salary, insurance and maintenance. The original harvester, purchased in 1984, is still in use. Replacement cost would be about $150,000.
Eutrophication and Aquatic Plant Management in Massachusetts
2.0 Case Histories of Lake Management in Massachusetts Page 2-39
REFERENCES: A summary report by ENSR (2000d) and discussion with the harvester operator (Lewis, LBRPD, pers. comm., 2002) and Prudential Committee Chairman (Andrus, LBRPD, pers. comm., 2002) provided information for this review.
2.4.8.4 Case Study
NAME: Red Lily Pond/Lake Elizabeth LOCATION: Barnstable, Massachusetts. DATE: 1979 to present LAKE SURFACE AREA: 10 acres PROBLEM: An abundance of water willow (Decodon verticillatus), water lilies (Nymphaea and Nuphar) and watershield (Brasenia) impaired fishing and aesthetics in this lake with an average depth of only several feet. TREATMENT: Hydroraking was used to remove rooted vegetation, with the most recent major effort in 1997. Over 20 days, covering 150 hydroraking hours, 1470 cubic yards of plants and root material were removed over about 6 acres of the pond area. Hydroraking prior to 1997 was not so intense, and hydroraking since then has been for “touch up” purposes. EFFECTIVENESS: Reducing the high density of rhizomes was viewed to be a prerequisite for successful reverse layering (see Red Lily Pond under dredging projects above), but also provided immediate relief from dense plant growths. Reverse layering is now proceeding at Red Lily Pond. ADVERSE IMPACTS: No detailed studies have been performed, but adverse impacts have not been noted by project participants. PERMITS: An Order of Conditions was received from the Barnstable Conservation Commission under the Wetlands Protection Act. COSTS: Removal, trucking and disposal of hydroraked material cost $103,000. This also included use of a harvester and shore conveyor to clean up after the hydrorake. Costs were considered higher than usual as a consequence of wage rate requirements imposed through the town on contractors. REFERENCES: Information for this review was supplied by G. Smith of ACT from project files.
2.4.8.5 Case Study
NAME: Dudley Pond LOCATION: Wayland, Massachusetts. DATE: 1995-2000 LAKE SURFACE AREA: 90 acres PROBLEM: Eurasian watermilfoil growths impair habitat and recreational value. Physical and chemical methods have been employed for over a decade to control the milfoil, with some experimentation to determine the most effective approach, determined as a combination of reduced densities and longevity of results.
Eutrophication and Aquatic Plant Management in Massachusetts
2.0 Case Histories of Lake Management in Massachusetts Page 2-40
TREATMENT: Previous control efforts included a fluridone treatment in 1992, but the pond was extensively repopulated with milfoil within two years. In the interest of attempting an approach considered by many to be ecologically less intrusive, and that could potentially supplement herbicide use, a hand-harvesting program was implemented in 1995. Divers pulled milfoil plants, let them float until collected by a separate crew, and loaded them into trucks for disposal outside the lake. Although 15 truckloads of milfoil were hauled away, substantial amounts of milfoil were not collected and regrowth was complete within a year. After a 1996 fluridone treatment, regrowth was found to be limited in April of 1997 but substantial by the end of May. Hand pulling by divers with an effort of 15 man-days was enhanced by bagging the plants immediately after pulling them, but growth of milfoil exceeded the rate at which hand pulling could eliminate plants. Fluridone was used in fall of 1997 as an experimental treatment and again in spring of 1999, taking advantage of lessons learned to date and achieving >99% milfoil removal. Re-growth was again evident, however, and was substantial over about 12 acres of the pond by late 2001. In May of 2002 a group of volunteers set up a well-organized hand pulling effort for two successive Saturdays. Reports of participants (K. Wagner, ENSR, pers. obs ; J. Madnick and T. Fuist, DPA, pers. comm., 2002) indicate that over 13,000 pounds (wet weight) of Eurasian watermilfoil and curly-leaf pondweed were harvested from two coves of about an acre apiece. The effort involved up to 100 hours of diver and snorkeler time, with about two volunteer bag transporters or fragment controllers per diver/snorkeler (150 people participated). This suggests an overall pulling rate of 40 lbs/hr with plants at a moderate to high density, although the range per person was high and experienced pullers may have handled ten times the average amount. Harvested plants were composted and made available to the community as compost with the intent of reducing fertilizer use. Fragment control was achieved by sequestering the pulling area with a homemade floating boom with mesh extending 0.5 ft above water and about 2 ft below water, volunteers in boats with dip nets, and a boat with a bagging device mounted on the front (somewhat like a plow, but with capture capability). Turbidity during hand pulling was substantially higher than away from the operation, and plant fragments were observed on the bottom after pulling was completed. Pre- and post-pulling plant surveys suggested some immediate relief (35-40% removal), but regrowth was fairly rapid; a July plant mapping by ACT suggests 25-75% cover in the harvested areas. Later in May of 2002, a modified gold dredge was used to perform a pilot suction harvesting operation in another area of dense milfoil growth (Mattson, MDEP, pers. comm., 2002). A two-man crew can reportedly clear 500 square feet per hour. Fragment escape was evident, as was a turbidity plume near the vacuum dredge, but >95% removal was obtained and regrowth was nominal 2 months later (J. Madnick, DPA, pers. comm., 2002). EFFECTIVENESS: Hand pulling of dense or extensive milfoil infestations requires more manpower than is typically available, and is a highly inefficient method of removing dense growths. Two efforts to control dense milfoil growths over multiple acres failed, and the more recent effort, while highly organized, does not appear to have been as effective as chemical
Eutrophication and Aquatic Plant Management in Massachusetts
2.0 Case Histories of Lake Management in Massachusetts Page 2-41
methods. However, use of hand pulling to remove individual and scattered plants following other control efforts (fluridone in this case) has proven useful in extending the life of the treatment. After almost a decade of experience with Dudley Pond, ACT (2001) generated recommendations for when to use herbicides, bottom barriers, and hand pulling to control milfoil in that lake. Hand pulling was found to be most efficient when coverage was by widely scattered plants at a density of <400 plants/acre. ADVERSE IMPACTS: No detailed study was conducted, but at elevated milfoil and curly-leaf pondweed density, it would have been easy to accidentally harvest other species as well. Impacts from suction dredging would be similar, plus the potential for the turbidity plume to affect pond biota. The localized nature of hand pulling and suction harvesting does not suggest that widespread impacts to non-target organisms would be likely, however. PERMITS: An Order of Conditions under the Wetlands Protection Act was acquired through the Wayland Conservation Commission for each operation. COSTS: Hand pulling costs for the scattered plant scenario range from $200 to $1000/acre. Hand pulling of denser growths carries a higher cost and is less effective. The most recent Dudley Pond hand pulling was a volunteer effort with excellent community support, but based just on minimum wage for 300 hours of effort, the cost would have been about $900/acre. The suction dredge has a clearance rate of about 500 square feet per hour and a cost of about $14,500/acre. This is higher than reported for such efforts in other states, and might be expected to decline to around $10,000/acre on a larger scale or as the equipment is perfected. REFERENCES: Reports filed with the Dudley Pond Association by ACT (2000b; 2000c; 2001b) discussion G. Smith (ACT, pers. comm., 2002), personal observation by K. Wagner and discussions with J. Madnick and T. Fuist during and after 2002 hand pulling, and correspondence with M. Mattson of the MDEP (who observed the suction dredging) provided information for this review.
2.4.8.6 Additional Mechanical Harvesting Projects:
Island Creek Pond, Duxbury – Harvesting has been used annually at Island Creek Pond to control dense growths or rooted plants at this 39-acre swimming, boating, fishing and sailing lake. The primary problem plants are variable milfoil, fanwort and bladderwort, and dominance seems to alternate after each harvesting. Harvesting does enhance recreational utility and is not perceived by fishermen to hurt the fish community, based on interviews at the lake (K. Wagner, ENSR, pers. obs., 2000-2002), but no studies have been performed to carefully evaluate impacts to non-target organisms. Given that control is only temporary, Duxbury used a MDCR grant in 2000 to attempt a plant replacement program similar to that described for Lake Buel above. Robbins pondweed (Potamogeton robbinsii) was planted in plots isolated by porous limnocurtains after fall harvesting and a period of bottom barrier placement. The pondweed survived, but was slow to expand and did not prevent growth by resurgent variable milfoil, fanwort and bladderwort (ENSR, 2000e). More intensive harvesting in 2000 through 2002 appears to have reduced
Eutrophication and Aquatic Plant Management in Massachusetts
2.0 Case Histories of Lake Management in Massachusetts Page 2-42
vegetation markedly, and regrowth has been more limited than observed in many other harvested lakes (J. Grady, Duxbury CC, pers. comm., 2002).
Morses Pond, Wellesley – Mechanical harvesting has been used to control milfoil and
fanwort in selected areas of Morses Pond for over a decade. Harvesting allows boating in areas that would otherwise be very weed-choked, but nearly complete regrowth is observed each year. Dominance by nuisance species may vary in response to harvesting, but the target introduced species have not been eliminated or reduced in abundance relative to native species.
Stockbridge Bowl, Stockbridge – Mechanical harvesting has been used to control milfoil in
Stockbridge Bowl for over a decade. Repeated harvesting during the growing season prevents milfoil from reaching the surface in water between 4 and 15 ft deep, while drawdown appears to limit milfoil growth in water <4 ft deep. Two harvesters have been in operation for about 5 years, increasing the coverage per month, but not eliminating the target species.
Pontoosuc Lake, Pittsfield – Mechanical harvesting has been used in combination with
drawdown to control Eurasian watermilfoil and curly-leaf pondweed for over a decade. Temporary relief is provided, but regrowth occurs every year.
Bare Hill Pond, Harvard – Harvesting has been used for over a decade as a maintenance
technique, opening areas for boating and fishing where a variety of rooted plants have choked the lake. Repeated harvesting of areas of water chestnut effectively eliminated it as a problem species. Repeated harvesting of areas dominated by variable milfoil may have opened areas for colonization by fanwort, which is now present in the lake and expanding its coverage, based on surveys over 15 years (ENSR, 1998; 2002).
Little Harbor Pond, Cohasset – A floating boom was used to remove thick algal mats, but no
evaluation of effectiveness is available.
Webster Lake, Webster – Harvesting was conducted for several years in the 1980s, providing temporary relief.
Wyman Pond, Westminster – The lake association purchased a harvester around 1990 and
uses it to control milfoil and other plants as needed.
Congamond Lakes, Southwick – The association owns two harvesters, but still could not keep up with milfoil growth in this large lake. A fluridone treatment was conducted in 2001.
Lower Pond, Mt. Holyoke College, South Hadley – Harvesting of water chestnut has brought
that species under control. A smaller program of native plant harvesting maintains desirable habitat and aesthetics.
Eutrophication and Aquatic Plant Management in Massachusetts
2.0 Case Histories of Lake Management in Massachusetts Page 2-43
2.4.8.7 Additional Hydroraking Projects:
Lost Lake/Knopps Pond – Hydroraking of lilies and debris in the northern cove of Lost Lake in the late 1980s resulted in replacement of lilies by Potamogeton robbinsii, a species of pondweed that forms a dense but unobtrusive carpet on the lake bottom. As the public boat launch and numerous homes are located in this area, the project was considered a success.
Beaver Pond, Franklin - Annual hydroraking has been applied to selected areas of Beaver
Pond in Franklin to maintain suitable swimming conditions and reduce swimmer entanglement.
Chandler Pond, Boston - Hydroraking effectively controlled cattails at Chandler Pond,
Boston, on a temporary basis, for many years (G. Gonyea, MDEP, pers. comm., 1996).
Jackson Pond, Dedham - Hydroraking was used at Jackson Pond in Dedham in 1990 and 1992 to reduce encroachment of waterlilies and cattails in some areas. No active management was required between 1992 and at least 1995 (G. Smith, ACT, pers. comm., 1996).
Chauncy Lake, Westborough – Hydroraking was used to minimize native plant densities in
the swimming area until milfoil became established. Herbicides are now used to achieve plant density control, as further harvesting was expected to foster the spread of milfoil.
Leverett Pond, Leverett – Hydroraking removed vegetation and floating islands to maintain
channels of open water, and was very successful at maintaining a mix of desirable habitat and recreational options. This is part of a more comprehensive lake management effort.
Long Pond, Nantucket – Hydroraking was used to reduce encroaching Phragmites growths
that were forming mats that extended out into the lake.
Jackson Pond, Dedham – Hydroraking was used to control cattails that were encroaching on this very shallow pond. Islands of buttonbush were left in place, and a cattail fringe was preserved.
2.4.8.8 Additional Hand Pulling Projects:
Charles River Impoundments, Waltham/Needham – Hand pulling of scattered water chestnut supplements an aggressive harvesting program that brought this invasive nuisance species under control.
Morses Pond, Wellesley – Hand pulling of water chestnut during early infestation has kept
this invasive species from proliferating for over a decade. The pattern of water chestnut arrival in Morses Pond strongly suggests avian origin, with repeated introduction in fall and spring in an area frequented often by waterfowl and rarely by boats. Plants must be recognized among dense growths of other species, requiring some education of anyone performing hand pulling, but the quantity of plants to be pulled is usually minimal (<10-20 plants per year).
Eutrophication and Aquatic Plant Management in Massachusetts
2.0 Case Histories of Lake Management in Massachusetts Page 2-44
Leverett Pond, Leverett – Hand pulling of scattered milfoil following herbicide treatment has
extended the life of treatments and enhanced a diverse assemblage of native pondweeds.
Goldman/Borden Ponds, Concord – Hand pulling of scattered water chestnut following herbicide treatment has extended the life of treatments. The ponds total about 20 acres, adjacent to Great Meadows National Wildlife Refuge, and are managed for wildlife habitat. No herbicide addition has been necessary for 4 years since the last treatment, attributed to successful hand pulling of scattered new growths.
2.4.9 Biological Control – Milfoil Weevil Stocking
2.4.9.1 Case Study
NAME: Mansfield Lake LOCATION: Great Barrington, Massachusetts LAKE SURFACE AREA: 31 acres DATE: 1995-2001 PROBLEM: Lake Mansfield has experienced dense stands of Eurasian watermilfoil (Myriophyllum spicatum) for several decades. The 1990 D/F study by BEC indicated milfoil coverage over about 25 acres with densities up to 1.55 kg/sq.m (wet weight). Habitat and recreational value have been severely impaired. TREATMENT: The native milfoil weevil, Euhrychiopsis lecontei, has been used experimentally as an agent of biological control for Eurasian watermilfoil with favorable results by investigators at Middlebury College in Vermont, and has become a commercially applied technique over the last 5 years. It should be stressed that this native weevil was present in the pond prior to treatment and thus this was a weevil augmentation rather than an introduction. Weevils were added to Lake Mansfield on ten dates from June 6 to August 8 in 1995. In all, a total of 12,046 weevils were added as eggs, larvae or adults. Augmentation was repeated in two subsequent years prior to 2001 by a consulting firm following up on the experimental work by Middlebury College, sponsored by the MDCR. EFFECTIVENESS: Weevil damage to Eurasian watermilfoil was evident on August 21, 1995 in Lake Mansfield. Damage by weevils to apical meristems prevented flowering. Stems were blackened and the weevil abundance increased from 0.07 per stem to 0.70 /stem. Previous natural declines of Eurasian watermilfoil in response to weevil activity were all preceded by a lack of flowering. A lakewide crash of milfoil was not observed, however, and recovery was observed in the following year. Yet after three augmentations over five years, a major crash did occur in summer 2001. It seems likely that the weevils are responsible, but monitoring data may not be sufficient to clearly document this development. Longevity of results remains to be seen. ADVERSE IMPACTS: Experiments in Vermont and elsewhere have shown that weevils do not feed on most common native plants. There was evidence of some feeding on native watermilfoil species, but these exhibited positive growth rates even at high weevil densities. Weevil populations have declined as Eurasian watermilfoil populations have declined. No formal
Eutrophication and Aquatic Plant Management in Massachusetts
2.0 Case Histories of Lake Management in Massachusetts Page 2-45
studies on impacts to other aquatic animals or to phytoplankton in Mansfield Lake through milfoil loss have been conducted. PERMITS: Because the weevil is a native species, only a Notice of Intent needed to be filed with the Conservation Commission and an Order of Conditions was obtained under the Wetlands Protection Act. If it were a non-native species, further permits would be required. The Division of Fisheries and Wildlife must be contacted in each case. COSTS: Weevil introductions were funded by the MDCR and the Town of Great Barrington, at a cost of approximately $1/weevil. Total project costs are not available in a convenient form, but appear to be on the order of $50,000 for this 31-acre lake. REFERENCES: Information is summarized from personal communications with and a presentation by Bob Hartzel, who was the original MDCR contact for this project and then went into private consulting and supervised the subsequent augmentations. Some information was also obtained from permit requests and a project summary from the Massachusetts Department of Conservation and Recreation. Additional information was provided by a personal communication with Holly Crosson of the Vermont Department of Environmental Conservation and from Sheldon ( Middlebury College, pers. comm., 1995) and Hanson et al. (1995), along with the original D/F study (BEC, 1990c).
2.4.9.2 Case Study
NAME: Goose Pond LOCATION: Lee/Tyringham, Massachusetts LAKE SURFACE AREA: 225 acres DATE: 1995-2001 PROBLEM: Goose Pond supports dense but scattered stands of Eurasian watermilfoil (Myriophyllum spicatum). The problem was more severe in the smaller Upper Goose Pond. Some habitat and recreational impairment have been evident, but there is more concern over possible future expansion of milfoil and further use impairment. TREATMENT: The native weevil, Euhrychiopsis lecontei, has been used experimentally as an agent of biological control for Eurasian watermilfoil with favorable results and is now a commercially applied technique, although much remains to be learned about successful use. It should be stressed that this native weevil was present in Goose Pond prior to treatment and thus this was a weevil augmentation rather than an introduction. Permitting issues resulted in weevil addition to only Upper Goose Pond in 1995, where weevils were added on a total of nine dates from June 13 to August 8. A total of 17,163 weevils were added in 1995. Additional augmentation was performed in Lower Goose Pond more recently, in the Cooper Creek inlet area. EFFECTIVENESS: Weevil damage was apparent in Upper Goose Pond in 1995, although the sites were extensively disturbed by humans. Monitoring efforts have been inadequate to clearly document the impact of these augmentations, but a 2001 plant survey (ENSR, 2001e) shows much reduced milfoil coverage in Upper Goose Pond and a change in distribution in Lower
Eutrophication and Aquatic Plant Management in Massachusetts
2.0 Case Histories of Lake Management in Massachusetts Page 2-46
Goose Pond. The weevils could be responsible for the observed changes. This method is still in the experimental stage. ADVERSE IMPACTS: Weevils feed almost exclusively on Eurasian watermilfoil. There has been evidence of some feeding on native watermilfoil species, but these species exhibited positive growth rates even at high weevil densities. Weevil populations have declined as Eurasian watermilfoil populations have declined. No formal studies on impacts of milfoil loss to non-target organisms in Goose Pond have been conducted. PERMITS: Only a Notice of Intent needed to be filed with the Conservation Commission for use of this native species and an Order of Conditions was obtained under the Wetlands Protection Act. There was some controversy regarding the use of weevils at Goose Pond, with an appeal by one abutter threatened if weevils were placed in the Lee portion of the lake, so augmentation was originally restricted to Upper Goose Pond in Tyringham. The Division of Fisheries and Wildlife must be contacted in each case as well, but this is mainly for notification and comment purposes as part of the Order of Conditions. COSTS: Initial weevil augmentation was funded by MDCR, with subsequent augmentation funded by the Goose Pond Maintenance District. Exact costs are not readily available, but are believed to be on the order of $40,000. REFERENCES: Information is summarized from personal communications with and a presentation by Bob Hartzel, who was the original MDCR contact for this project and then went into private consulting and supervised the subsequent augmentations. Some information was also obtained from permit requests and a project summary from the Massachusetts Department of Conservation and Recreation. Additional information was provided by a personal communication with Holly Crosson of the Vermont Department of Environmental Conservation and from Sheldon (Middlebury College, pers. comm., 1995) and Hanson et al. (1995), along with the Fugro and ENSR plant maps (Fugro East, 1995b; ENSR, 2001e).
2.4.10 Benthic Barriers - Plant Covering
2.4.10.1 Case Study
NAME: Great Pond LOCATION: Eastham, Massachusetts DATE: 1988 to 1992. LAKE SURFACE AREA: 108 acres PROBLEM: The pond hosted a native assemblage that included 11 species with limited nuisance potential. However, high coverage and elevated densities in two public swimming areas fostered complaints and created a perception of liability that the town wished to address. It was recommended that control measures be employed in the swimming areas only (BEC, 1991). TREATMENT: One roll of Aquascreen (fiberglass fabric coated with polyvinyl chloride), measuring 4.3 m by 30.5 m, was installed in each swimming area in 1988 by divers as a test of applicability, and the results were encouraging. A total of 46 rolls of Aquascreen, providing 50,000 square feet of coverage, were installed in spring 1989 before there was significant early

Eutrophication and Aquatic Plant Management in Massachusetts
2.0 Case Histories of Lake Management in Massachusetts Page 2-47
season plant growth. Aquascreen was prepared by attaching chains to the edges as weights and rolling the screen onto a PVC pipe prior to installation, which involved rolling the screen out just above the bottom. Additional weights (mostly patio block) were added as warranted to hold the screen in place in response to wave action. Screen panels were overlapped by 1 ft. Depth of installation varied from 2 to 12 ft. In the first year, the barriers remained in place until September when a winch and manpower were used to remove them for cleaning and winter storage. In 1990 the barriers were placed in late April and removed prior to the start of the swimming season in late June. In 1991 the barriers were not placed and plants were monitored. The 1990 approach was again applied in 1992. Application was terminated after 1992 as a result of a combination of funding limits and insurance requirements placed on potential applicators. EFFECTIVENESS: The barriers were very effective in the swimming areas, reducing stem densities and biomass per stem to very low levels and increasing the perception of swimming safety markedly. Two species, Gratiola lutea and Sagittaria teres, appeared to be eliminated from the treated areas in the first year, but these were uncommon in the control areas as well. No species increased as a result of the barriers, and no non-native species became established. The removal of the screens in June allows macrophytes in deeper water (>6-8 ft) to attain about 1/3 of their normal height. In shallower water, foot traffic appears to keep plant biomass minimal during the summer. This reduction in growth is enough to eliminate the risk of swimmer entanglement without impacting the diversity of the plant community. Aquascreen has proven to be very durable and the same material used in 1989 was still usable at the end of the 1992 season. Application of the screen in depths over 3 meters is unnecessary and may actually promote denser growth of plants by providing a stable substrate on top of unstable muck. It was noted that signs explaining the purpose of the treatment appeared to minimize vandalism, but some bathers felt it detracted from the natural experience; yet virtually all preferred the cover to the previous and adjacent dense plant growths. Experiments with frequency of application were recommended. ADVERSE IMPACTS: No formal survey of impacts to aquatic animals was conducted, but observations by divers involved in the study suggested that the wall of plants at the edge of the cover provided edge habitat preferred by many fish, and substantial fish activity was observed on and around the cover. The anticipated reduction of bivalve mollusks (clams of the family Unionidae) was not apparent upon removal of the screens (BEC, 1991). PERMITS: A notice of Intent was filed with the Eastham Conservation Commission requesting approval for the installation of benthic barriers under the Massachusetts Wetlands Protection Act. Following a public hearing an Order of Conditions was issued. No special conditions were imposed. COSTS: The project began with about $30,000 in funding from the State Clean Lakes Program for the first year. The costs in subsequent years have been funded by the Town of Eastham and were approximately $3,000 for each year of application.
Eutrophication and Aquatic Plant Management in Massachusetts
2.0 Case Histories of Lake Management in Massachusetts Page 2-48
REFERENCES: Information is summarized from a January 1991 report prepared by Baystate Environmental Consultants (BEC, 1991), personal communications with Henry Lind of the Eastham Conservation Commission, and a presentation by Tim Clear of ENSR in 1998.
2.4.10.2 Additional Benthic Barrier Projects:
Lake Mansfield, Great Barrington – Both Aquascreen (PVC coated fiberglas) and Palco Liner (a PVC sheet material) were installed in Lake Mansfield in Great Barrington and provided effective plant control in the swimming area in the 1980s and early 1990s. There was less billowing with the Aquascreen. Some vandalism was reported.
Stockbridge Bowl, Stockbridge – Palco Liner, a non-porous covering, was installed in a
beach and boat launch area associated with the White Pines Condominium facility on Stockbridge Bowl in the 1980s. It curtailed plant growth, especially Eurasian watermilfoil, but the liner billowed up and had to be weighted down with sand, upon which more milfoil grew. Aquascreen was applied in 1992, and the screen billowed up in multiple locations in successive weeks until it was uninstalled prior to the start of the swimming season in mid-June. Milfoil growth was suppressed for most of the season, but the problems with billowing resulted in no follow-up application in subsequent years.
Benton Pond, Otis – The association uses Aquascreen to control rooted plants in beach and
boat launch areas, and is satisfied with the results over about a decade.
Chebacco Lake, Essex/Hamilton – Bottom barrier was installed in the late 1980s but not maintained, and growth of plants on top of the porous barrier eventually became extensive.
Lake Winthrop, Holliston – Aquascreen and Aquatic Weed Net have been used in beach and
boat launch areas to control rooted plant growths with apparent success by the local lake association.
Goose Pond, Lee/Tyringham – Aquascreen was installed over several milfoil beds and
moved to new areas after 1-2 months. All plants under the screen were killed, but many invertebrates were still present, and regrowth of plants was observed within a year.
2.4.11 Herbicide Treatment – Chemical Control
2.4.11.1 Case Study
NAME: Todd Pond LOCATION: Lincoln, Massachusetts DATE: 1989 to present LAKE SURFACE AREA: 8 Acres. PROBLEM: Extensive cover by white water lilies (Nymphaea sp.) diminished habitat value for some aquatic species and virtually eliminated recreational use of the pond. Peripheral growths of purple loosestrife (Lythrum salicaria), patches of yellow water lily (Nuphar sp), and submergent growths of variable milfoil (Myriophyllum heterophyllum) developed later and diminished habitat value as well. The abundance of the plants enhances the rate of sediment deposition,
Eutrophication and Aquatic Plant Management in Massachusetts
2.0 Case Histories of Lake Management in Massachusetts Page 2-49
which combines with natural sediment nutrient release to degrade the visual quality and the biodiversity of the pond. Studies on the lake concluded that this cycle leads to high variability of water chemistry and accelerated infilling, with localized oxygen depletion and increasingly excessive plant populations. TREATMENTS: A chemical treatment with the herbicide Sonar (fluridone) was used for control of the lilies in 1989. This is one of the earlier uses of fluridone in Massachusetts, and it was not applied as a selective control as in many subsequent treatments for Eurasian watermilfoil or fanwort. Retreatment in 1994 and 2001 with Sonar was performed. In 2000 the plant community had diversified considerably, with several species of pondweeds and yellow water lilies present as well as past nuisance species. To provide area selective treatment and minimize impacts to desirable plants, a combination of Reward (diquat) and Rodeo (glyphosate) was applied, with emphasis on controlling purple loosestrife, lilies and milfoil (which has arrived over the previous four years). EFFECTIVENESS: The herbicide treatment with fluridone at Todd Pond was very effective according to observations by residents (A. Eschenroeder, TPRA, pers. comm., 1997). After four years the lilies again became a nuisance, but retreatment in 1994 provided control. Application of diquat in 2000 controlled milfoil and some pondweeds in that year. Application of glyphosate in 2000 and 2001 appears to have successfully reduced loosestrife from a coverage of several acres to just a few small, inaccessible patches. Retreatment with fluridone in 2001 reduced submergent and floating leaved forms, suggesting about 5-7 years of relief per fluridone treatment. ADVERSE IMPACTS: No formal studies of impacts were conducted. Both the original treatment and the retreatment were followed by algae blooms in some areas of the pond. Anecdotal observations by residents suggest the fishery in the pond has improved (A. Eschenroeder, TPRA, pers. comm., 1997), but this may be more a function of access and fishing success than actual fish community changes. PERMITS: An Order of Conditions from the Lincoln Conservation Commission was required under the Wetlands Protection Act. In addition, the Department of Environmental Protection issued a License to Apply Chemicals. COSTS: The cost of applying Sonar was approximately $300 to $800 per acre for a single treatment, with recent chemical cost reductions pushing current costs to the low end of the range. The Homeowners Association of Todd Pond Residents funded the initial treatment project for approximately $4,000. Application of glyphosate cost about $500/acre, while the cost for diquat application was $200 to $300/acre. A separate evaluation of environmental health risks associated with the use of fluridone treatment at Todd Pond was conducted prior to treatment as part of the permitting process at an undisclosed cost to the Todd Pond group. REFERENCES: A report prepared by Alan Eschenroeder in 1989 for the Todd Pond Residents Association provided some background information. Additional information was provided through discussions with A. Eschenroeder and L. Lyman (Lycott, pers. comm., 1995; 2002a).
Eutrophication and Aquatic Plant Management in Massachusetts
2.0 Case Histories of Lake Management in Massachusetts Page 2-50
2.4.11.2 Case Study
NAME: Sunset Lake LOCATION: Braintree, Massachusetts. DATE: 1994 to present LAKE SURFACE AREA: 57 acres PROBLEM: Eurasian watermilfoil had become dominant in Sunset Lake by 1995 and threatened both habitat value and recreational utility. Coontail was also common, but was not considered to be as great a threat as milfoil. Preservation of other vegetation in most of the lake was desired. The lake is 8 ft deep on average with a maximum depth of 22 ft. TREATMENT: Fluridone was applied as an aqueous solution on one day to the entire lake at a target concentration of 20 µg/L on May 10, 1994. The lake level was lowered by about six inches to increase detention time, as fluridone requires an extended contact period to be effective. EFFECTIVENESS: Fluridone treatment of Sunset Lake in Braintree provided > 99% control of milfoil and partial control of coontail. No milfoil was observed in August 1995, and overall plant biomass in the lake was much reduced, but native plants remained evident. Annual monitoring detected only occasional milfoil plants until 1997, when about 15 acres were spot treated with diquat to control milfoil. Treatment of up to 25 acres on an annual basis has been necessary since 1997. ADVERSE IMPACTS: Follow-up monitoring has been limited to plant surveys and general observations of lake conditions. Initial reduction of some native species at the target concentration of 20 µg/L was greater than might be expected under more recent fluridone treatments of other lakes at levels <12 µg/L, but recovery was complete within two years. PERMITS: An Order of Conditions from the local Conservation Commission under the Wetlands Protection Act and a License to Apply Chemicals from the MDEP were required for treatment. COSTS: Initial treatment of 57 acres with fluridone cost about $24,500. Follow-up treatments with diquat have cost $4,000 to $6,000 annually. REFERENCES: Information for this review was obtained from the staff of ACT (G. Smith, ACT, pers. comm., 2002).
2.4.11.3 Case Study
NAME: Onota Lake LOCATION: Pittsfield, Massachusetts DATE: 1999 to present LAKE SURFACE AREA: 620 acres PROBLEM: Eurasian watermilfoil infestation has plagued this popular lake for many years, and has been the subject of other control efforts involving techniques such as limited drawdown and
Eutrophication and Aquatic Plant Management in Massachusetts
2.0 Case Histories of Lake Management in Massachusetts Page 2-51
harvesting. After considerable discussion among local interest groups and the City of Pittsfield, it was decided to attempt a whole lake fluridone treatment for milfoil control. TREATMENT: Fluridone was applied on June 1,1999 at a dose of 6-8 µg/L. Booster applications were performed on June 17th and July 9th to maintain a target level of 6 µg/L. Over the 54-day period of concentration monitoring, the average fluridone level was just over 5 µg/L. Since that initial treatment, spot treatments were conducted in 2000 using 2,4-D over 100 acres and in 2001 and 2002 using diquat over about 25 acres. EFFECTIVENESS: Reduction in biomass in response to the initial treatment was >95%, but cover remained detectable over 20% of the area. Damaged stems were observed, and some of these plants survived the initial low dose treatment. Regrowth in 2000 covered about 100 acres, which was treated with 2,4-D, while regrowth in 2001 covered only 25 acres and was treated with diquat. Recovery from 2,4-D was lower than for the low-dose fluridone treatment. The distribution of native plants, especially pondweeds, has expanded greatly since 1999. Curly leaf pondweed was reduced in abundance by each treatment, but remains widespread. ADVERSE IMPACTS: No detailed study of impacts to aquatic animals has been conducted. Adverse impact to non-target plant species has been temporary and minimal, based on plant surveys conducted by ACT (G. Smith, ACT, pers. comm., 2002). PERMITS: An Order of Conditions from the local Conservation Commission under the Wetlands Protection Act and a License to Apply Chemicals from the MDEP were required for treatment. COSTS: The fluridone treatment and follow-up 2,4-D treatment were covered under a single contract for $125,000. The diquat treatment in 2001 cost $16,500. REFERENCES: Information for this review was obtained from the staff of ACT (G. Smith, ACT, pers. comm., 2002).
2.4.11.4 Case Study
NAME: Upper Mystic Lake LOCATION: Winchester and Arlington, Massachusetts. DATE: 1994 to present LAKE SURFACE AREA: 50 acres (Forebays only) PROBLEM: The Upper Mystic Lake Forebays comprise approximately 50 acres of the 220-acre system and have a mean depth of about 4 ft. Waterweed (Elodea), coontail (Ceratophyllum), naiad (Najas) and waterlilies (Nymphaea and Nuphar) have achieved nuisance densities at times, and algal blooms have occurred. Sailing, boating and fishing have been compromised, and the forebays have been aesthetically unappealing. TREATMENT: Some combination of diquat, endothall, glyphosate and copper have been used since 1994 in Upper Mystic Lake Forebays in Winchester using area- and species-selective treatments. About half of the forebay area is treated each year, leaving the other half as wildlife refuge.
Eutrophication and Aquatic Plant Management in Massachusetts
2.0 Case Histories of Lake Management in Massachusetts Page 2-52
EFFECTIVENESS: Some areas continue to provide fish and wildlife habitat and cover while sailing and other uses are facilitated in other areas. The work is performed for the MDC, which is satisfied with the results. ADVERSE IMPACTS: No detailed studies have been conducted, but no obvious adverse impacts (e.g., fish or invertebrate kills, new species invasions) have been reported. PERMITS: An Order of Conditions from the Winchester Conservation Commission under the Wetlands Protection Act has been obtained and a License to Apply Chemicals from the MDEP is required for treatment. Approval by the MDC is also required. COSTS: $8,000 to $11,000 per year is expended on treatment. REFERENCES: Information was obtained from the staff of ACT (G. Smith, ACT, pers. comm., 2002).
2.4.11.5 Case Study
NAME: Big Alum Lake LOCATION: Sturbridge, Massachusetts. DATE: 1990 - 1993 LAKE SURFACE AREA: 189 acres PROBLEM: A patch of variable milfoil appeared near the boat launch in 1990 and could not be successfully eliminated with benthic barrier. This small patch persisted for 3 years. TREATMENT: In 1993, 25 pounds of 2,4-D were applied to the patch. EFFECTIVENESS: The variable milfoil was eliminated and this plant has not been detected in annual surveys since that time. ADVERSE IMPACTS: No detailed studies were performed, but the localized nature of the treatment does not suggest any widespread impacts. PERMITS: An Order of Conditions was obtained from the Sturbridge Conservation Commission and a License to Apply Chemicals was granted by the MDEP. COSTS: This spot treatment cost only $500, but prevented potentially much greater expense if the milfoil had expanded. REFERENCES: L. Lyman (Lycott, pers. comm., 2002a) provided this information from project files and personal observation.

Eutrophication and Aquatic Plant Management in Massachusetts
2.0 Case Histories of Lake Management in Massachusetts Page 2-53
2.4.11.6 Case Study
NAME: Singletary Lake LOCATION: Sutton/Millbury, Massachusetts. DATE: 1988 to present LAKE SURFACE AREA: 330 acres PROBLEM: With an average depth of 12 ft, this lake has suffered from dense growths of Eurasian watermilfoil and lesser but still problematic beds of variable milfoil. Native plant diversity was limited. Recreation and habitat were impaired by the existing growths, but there was greater concern over the likely spread of these nuisance species to an area of up to 150 colonizable acres. TREATMENT: Spot treatments with 2,4-D granular have been applied annually over 20 to 50 acres, with decreasing areal needs in successive years. EFFECTIVENESS: Total coverage by milfoil species has been reduced, but these species keep appearing in new areas each year, necessitating continued treatment. The program is considered to have held the overall infestation in check. ADVERSE IMPACTS: No studies of non-target impacts have been conducted, but no obvious adverse impacts have been reported. PERMITS: An Order of Conditions was obtained from both local Conservation Commissions and a License to Apply Chemicals was granted by the MDEP. COSTS: $6,000 to $15,000 per year is expended on spot treatments. REFERENCES: The information for this review was supplied by G. Smith (ACT, pers. comm., 2002) from project files.
2.4.11.7 Case Study
NAME: Wachusett Reservoir LOCATION: Boylston, Massachusetts. DATE: 1989-1996 LAKE SURFACE AREA: 4135 acres PROBLEM: Periodic blooms of blue-green algae and chrysophytes are known to produce taste and odor and may cause other problems in this unfiltered water supply. TREATMENT: Copper has been used to eliminate blooms on a localized basis when necessary, and various dosing approaches have been proposed and tested over seven years. Problems with the chrysophyte Synura under the ice present difficulty for copper addition, which would require an expensive under-ice distribution system that has not been deployed. EFFECTIVENESS: Algal densities often decline in response to copper addition, but studies of algal dynamics suggest that patterns of succession may not be altered by copper in many cases.
Eutrophication and Aquatic Plant Management in Massachusetts
2.0 Case Histories of Lake Management in Massachusetts Page 2-54
Timing of doses to coincide with early increases in algal density may prevent blooms, but copper additions after blooms have formed may not be effective. There is evidence that blooms arise and crash with the same frequency with or without copper additions. ADVERSE IMPACTS: Monitoring focuses on drinking water considerations, not ecological impacts, and no detailed studies of impacts on non-target organisms have been conducted. Water quality is not negatively affected, based on routine MWRA monitoring data. PERMITS: No permits are required for copper use in drinking water supplies, as long as application restrictions are met. For non-water supply use, copper addition requires an Order of Conditions and a License to Apply Chemicals. COSTS: Cost per unit area is generally low, at $10-100/acre, but the large size of the reservoir limits area of application. Under-ice delivery of copper would cost considerably more, but has not been attempted on a substantial scale. REFERENCES: A presentation by B. Kolb of CDM at the 1996 NALMS conference provided most information for this review.
2.4.11.8 Additional Herbicide/Algaecide Projects:
Ware’s Cove, Newton – Treatment with the pelletized form of fluridone in this 8-acre cove of the Charles River in 1992 resulted in no measurable concentration of fluridone in the water column, yet there was a nearly complete kill of the targeted fanwort. Limited damage to water lilies and other non-emergent vegetation was observed, but those populations recovered in the year of treatment or the year after treatment. Acceptable control of fanwort was achieved for three years, but pre-treatment densities of fanwort were regained in the fourth year after treatment. An evaluation of impacts to water quality, vascular plants, phytoplankton, and macroinvertebrates (Fugro East, 1994) revealed no direct adverse impacts other than to the target plants, and only indirect impacts to macroinvertebrates as a function of loss of dense plant cover.
Bearse Pond, Barnstable – Fluridone was added at a targeted concentration of 15 µg/L to control fanwort that grew throughout the littoral zone of this 59-acre lake (L. Lyman, Lycott, pers. comm., 2002b). As Bearse Pond is connected to Wequaquet Lake by an open channel (with no flow control structure), a limnocurtain was installed across this channel to keep the herbicide in Bearse Pond. This maintained the concentration in Bearse Pond, avoiding dilution from the much larger Wequaquet Lake and meeting permit conditions. The measured concentration over a 5-week period averaged 12 µg/L and appears to have effectively eliminated the fanwort in 2001. This represents the first sequestered treatment in Massachusetts (use of a curtain to isolate a target area).
Elm Park Pond, Worcester – Elm Park Pond had dense growths of milfoil and a benthic
moss. The pond was treated with a light dose of 2,4-D in July of 1987, which removed the milfoil without injuring the moss. Subsequent treatments have been required to address other plant problems, with copper and diquat used as well as 2,4-D.
Eutrophication and Aquatic Plant Management in Massachusetts
2.0 Case Histories of Lake Management in Massachusetts Page 2-55
Pratt Pond, Upton – A dose of 50 ppb of pelletized fluridone applied to less than half the pond in 1994 was successful at controlling fanwort with no regrowth until 2000. A follow-up treatment with aqueous fluridone was applied in 2001.
Whitings Pond, North Attleboro - Copper sulfate has been applied 1-3 times/year in Whitings
Pond in North Attleborough to control algae. The pond was dredged some years ago but the main inlet has high phosphorus concentrations.
Hoosac Lake, Cheshire/Lanesboro – The 255-acre northern basin of this lake was treated
annually in the 1960s and 1970s with 2,4-D for control of Eurasian watermilfoil (Myriophyllum spicatum) and with endothall for control of curly leaf pondweed (Potamogeton crispus). Purchase of the lake by a private entity precluded plant management for more than a decade. The Commonwealth of Massachusetts acquired the lake in 2000, after which it was treated with diquat for control of milfoil and pondweed at about 1 gallon/acre. The treatment was very effective within two weeks, and only slight regrowth was noted in 2000. Early spring treatment in 2001 with diquat at one half gallon/acre achieved acceptable control through summer 2001. Follow-up treatments with copper were applied to control algae, especially filamentous green forms. Similar treatment occurred in 2002, with application of 1275 lbs of copper added as copper sulfate, additional copper as Captain (a chelated copper complex), and diquat as Reward.
Gore Pond, Dudley/Charlton – Diquat has been used to treat nearshore variable milfoil
growths, and copper has been used to control microscopic algae.
Dudley Pond, Wayland – Treatment on 3 occasions with fluridone has controlled Eurasian watermilfoil for two to three years each time. An additional experimental fall treatment in 1997 had only marginal success. Experience over time enhanced treatment success such that the 1999 treatment provided 3 years of relief and continues to provide benefits. Dense regrowth since 1999 has been limited to a drawdown zone (for construction purposes) that was not treated. Handpulling and suction harvesting have been used to prolong treatment benefits, but milfoil densities have exceeded the practical range of physical controls and additional fluridone use is planned.
Thompson Pond, Spencer - Diquat and 2,4-D have been used to control variable milfoil and
pondweeds, with decreasing areal application needs as control has been achieved.
Spy Pond, Arlington – Treated with various herbicides many years ago, this pond was more recently treated with fluridone in 2001 for Eurasian watermilfoil and coontail, with effective results for milfoil in 2001. Delays in the permitting process resulted in a later treatment than desired, and effects on coontail were not as strong as desired. Follow-up treatment with diquat controlled coontail later that summer.
Chauncy Lake, Westboro – Diquat is used to control plants in the swimming area only.
Eutrophication and Aquatic Plant Management in Massachusetts
2.0 Case Histories of Lake Management in Massachusetts Page 2-56
Musquashicut Pond, Scituate – This salt pond was treated in the late 1960s and early 1970s with endothall, then was untreated for about 7 years, after which diquat and chelated copper have been used annually to control pondweeds and filamentous algae.
Cedar Lake, Sturbridge – Coupled with annual drawdown, 2,4-D and later diquat have been
used to control variable milfoil in this 146-acre lake over as much as 20 acres each year. Initial control needs extended to 100 acres. The drawdown reduces the amount of area in need of herbicide application.
Dorothy Pond, Millbury – Eurasian watermilfoil and curly leaf pondweed have been
controlled with annual treatment with low doses (0.5 to 1.0 gallon/acre) of diquat. Milfoil regrowth has been light, while curly leaf pondweed returns annually to higher densities.
Lake Sabrina, Wellesley/Needham – Fluridone was used in the early 1990s to control
submergent vegetation. Glyphosate has been used for spot treatments of water lilies. Copper is used to control frequent algal blooms.
Weld Pond, Dedham – Diquat and glyphosate have been used since the late 1980s to control
variable watermilfoil and water lilies. Only part of the lake is treated, preserving the rest as habitat while opening areas for recreation.
Silver Hill Pond, Concord – This constructed pond, dredged in the 1980s, is maintained with
spot treatments using diquat, fluridone, glyphosate and copper.
Robinhood Lake, Becket – Granular 2,4-D was applied for Eurasian watermilfoil control in 1993. Excellent control was observed with no further treatment until 1999, when a partial retreatment was performed. Native pondweeds appear to have been unaffected. An MDEP ruling that 2,4-D can not be used in surface waters with possible connections to ground water used for water supply (i.e., wells) has precluded use of this herbicide as planned in 2003. Diquat or fluridone will likely be substituted.
Lower Naukeag Lake, Ashburnham – Treatment for a native milfoil (M. humile) and
bladderwort every other year with diquat minimizes nuisance conditions.
Goldman/Borden Ponds, Concord – Annual treatment with 2,4-D between 1990 and 1998 eliminated dense growths of water chestnut and allowed handpulling to be implemented as the primary means of control since 1998.
Webster Lake, Webster – Annual treatment of the Treasure Island Marina, an area of about
2.5 acres, for variable leaf milfoil, water lilies and watershield with diquat and glyphosate achieved control in the 1990s. A porous benthic barrier was applied in 1999 as a demonstration project, but milfoil grew on top of the barrier within two months. Subsequently suction harvesting was attempted, but did not work well. Treatment with diquat and glyphosate for control of the previously mentioned plants plus some pondweeds was continued thereafter. In 2000, fanwort was found and treatment with fluridone was added in 2000 and 2001 to control this highly invasive species.
Eutrophication and Aquatic Plant Management in Massachusetts
2.0 Case Histories of Lake Management in Massachusetts Page 2-57
Lyman Pond, Dover – Diquat is used to control little floating heart, and purple loosestrife is
treated with glyphosate for habitat maintenance.
Cocasset Lake, Foxboro – An initial treatment with fluridone in the early 1990s failed to control variable leaf milfoil, but diquat has been used annually since then to successfully reduce milfoil coverage in this 35-acre lake.
Cranberry Meadow Lake, Spencer/Charlton – Eurasian watermilfoil, waterlilies, watershield,
and some pondweeds were treated with Aquathol-K and 2,4-D in the 1980s. In the 1990s diquat and glyphosate were substituted for Aquathol-K. Milfoil has disappeared, but the other species require annual treatment in this 63-acre lake.
Glen Echo Lake, Charlton – Coupled with drawdown, diquat is used to control variable leaf
milfoil. Treatments are performed no more than every other year, with plant surveys conducted in the off year.
Heritage Park Pond, E. Longmeadow – Dredging has removed soft sediment from this small
park pond, but did not control dense growths of coontail (Ceratophyllum) and both filamentous and microscopic green algae. Diquat and chelated copper have been used since the 1970s to control these plants. Reduction in coontail abundance eliminated the use of diquat, but 2-4 copper treatments for algae control are still performed each year.
Indian Lake, Worcester – A TMDL was prepared for this lake by the MDEP in 1999. It has a
long history of herbicide treatment, with supplementation by drawdown. The TMDL report states: “Due to the high total phosphorus loading from the watershed the lake is experiencing nuisance algae blooms with associated high turbidity and low dissolved oxygen. The lake has a long history of management. According to Symmes (1975), the lake has been treated four times a year annually since the early 1960’s with about 500 kg of copper sulfate and the lake now has relatively high copper deposits in the lake sediments (ranging from 25 to 200 mg/kg) as well as high arsenic and lead in the sediments which may place restrictions on proposed dredging. In a 1975-76 DWPC lake survey report (Chesebrough et al., 1978) it was noted that the lake had a history of algal blooms ‘until copper sulfate treatment began’, at which time apparently a shift occurred, and the report noted the major problem in 1975-76 being dense growths of macrophytes, especially the pondweed Potamogeton pusillus.”
“According to Lycott, (1989), Elodea became the dominant nuisance plant in the lake in 1984-85, and a drawdown with a late spring refill in the spring of 1986 allowed Elodea to spread to deep water. A large herbicide treatment was conducted in the summer of 1986 at a cost of close to $100,000 (diquat and copper sulfate) which controlled the deep water Elodea. That apparently caused a shift back to algae. Since that time the transparency has been so limited by algae that macrophytes are no longer a major problem, most likely due to light limitation as algae became dominant again.” “According to DEP herbicide permit application records, between 1993 and 1996 the pond has no records of herbicide treatment, but it was treated in both 1997 and 1998 with small
Eutrophication and Aquatic Plant Management in Massachusetts
2.0 Case Histories of Lake Management in Massachusetts Page 2-58
amounts of Sonar (Fluridone), K-TEA (copper) and Reward (diquat), apparently as spot treatments. The lake has been drawn down in winter by several feet each year, apparently for the past 10 years and according to residents this has also helped control macrophytes in shallow areas (R. Gates, pers. comm. 1998). Residents suggested Elodea beds have expanded during 1999, possibly due to lower water levels associated with the drought (R. Gates, pers. comm. 1999). This has led to a local desire for more chemical treatment to reduce Elodea again, but this is likely to further shift dominance to favor more algal blooms.”
Mark Mattson of the MDEP provided an update of 1999-2002 management activities at Indian Lake. According to permit records, the lake was spot treated in 1999. In 2000 much of the lake was treated with Reward (150 gallons) and copper sulfate (1250 pounds) to control Elodea and algae. The lake was further spot treated in 2001 with K-Tea (copper) and Sonar (fluridone). Apparently there was another filamentous algal bloom and the entire lake was treated in 2002 with another 1250 pounds of copper sulfate and minor amounts of other herbicides. After such a treatment to kill the algae the macrophytes are now expected to take over again as the lake clears up and light reaches the bottom again. This lake appears to be a prime example of herbicide-driven switching between algal dominance and macrophyte dominance.
2.4.12 Dyes and Surface Covers – Light Limitation The use of dyes and surface covers has not been widespread at recreational lakes in Massachusettts. Golf courses often apply dyes to course ponds to inhibit light penetration and provide an aesthetically appealing color. In some cases rooted plant production is curtailed, while in others the blue color simply masks the green of algal blooms. Willow Pond in Northampton, described above as a dredging and erosion control project, has used dyes to create the illusion of depth in a shallow pond and to restrict rooted plant growths. Surface covers are used in some water supply situations, mainly in small terminal reservoirs, to prevent contamination by wildlife (especially waterfowl) in accordance with the Safe Drinking Water Act of 1996. The light inhibition caused by covers may also restrict rooted plant and algae growth, but there are no readily available studies that document such impacts or effects on other system biota.
Eutrophication and Aquatic Plant Management in Massachusetts
3.0 Methods to Control Nutrients Page 3-1
3.0 METHODS TO CONTROL NUTRIENTS
3.1 INTRODUCTION One of the most effective ways to control algal populations is by limiting the nutrient supply to the lake, and thus limiting growth of algae. This approach may work with some rooted aquatic plants as well, but as most rooted plants acquire most of their nutrition from the sediment (Barko and Smart, 1981), control of nutrients in the water column is far more effective as an algal management strategy. As previously discussed in Section 1, phosphorus is the best nutrient to control, and the discussion of this section will deal primarily with phosphorus control methods. In nutrient rich lakes, the growth of algae may be limited by light, and reduction in nutrient concentrations may not have a significant effect until the nutrient concentrations are lowered sufficiently to induce nutrient limitation (Section 1).
One must usually identify the sources of nutrients before an effective control strategy can be determined. To do this, an accurate phosphorus budget is required (Section 1.2). Once the relative importance of the sources of phosphorus is determined, one can examine the control techniques identified below for applicability and feasibility, and compare them to the “No Management Alternative” for nutrients:
3.1 Non-Point Sources – control of diffuse nutrient sources from the watershed 3.2 Point Sources – control of point sources, usually piped discharges 3.3 Hydraulic Controls – diversion, dilution, flushing, and hypolimnetic withdrawal strategies 3.4 Phosphorus Inactivation – chemical binding of phosphorus to limit availability 3.5 Artificial Circulation and Aeration – mixing and oxygen addition 3.6 Dredging – removal of nutrient-laden sediments 3.7 Additional Techniques – bacterial additives and removal of bottom feeding fish
The expected reduction in phosphorus loading should be modeled as described in Section 1 to predict the change in trophic status. In general, algal problems will be minimized at loadings less than Vollenweider’s permissible level, but algal abundance in response to nutrient loading is a probability distribution, not a threshold function. Consequently, algal blooms may be expected at some reduced frequency, even at fairly low nutrient levels, and lakes will not respond identically to changes in loading. Acceptable results might be achieved at loadings higher than the permissible level, but unacceptable conditions can be expected where loading exceeds Vollenweider’s critical limit. Managers should be prepared to adjust strategies in response to resultant lake conditions; algal control through nutrient limitation is often an iterative process.
Additional ways to directly limit the density of algae may be needed on an interim or supplemental basis, and include the use of biocidal chemicals, dyes or biocontrol agents. These are addressed in Section 4. A summary table of available techniques is presented in Table 3-1, adapted from Wagner (2001). Techniques that address nutrient levels are mixed with methods aimed more directly at the algae, providing a complete summary of algae control approaches, including the nutrient controls that are the subject of this section
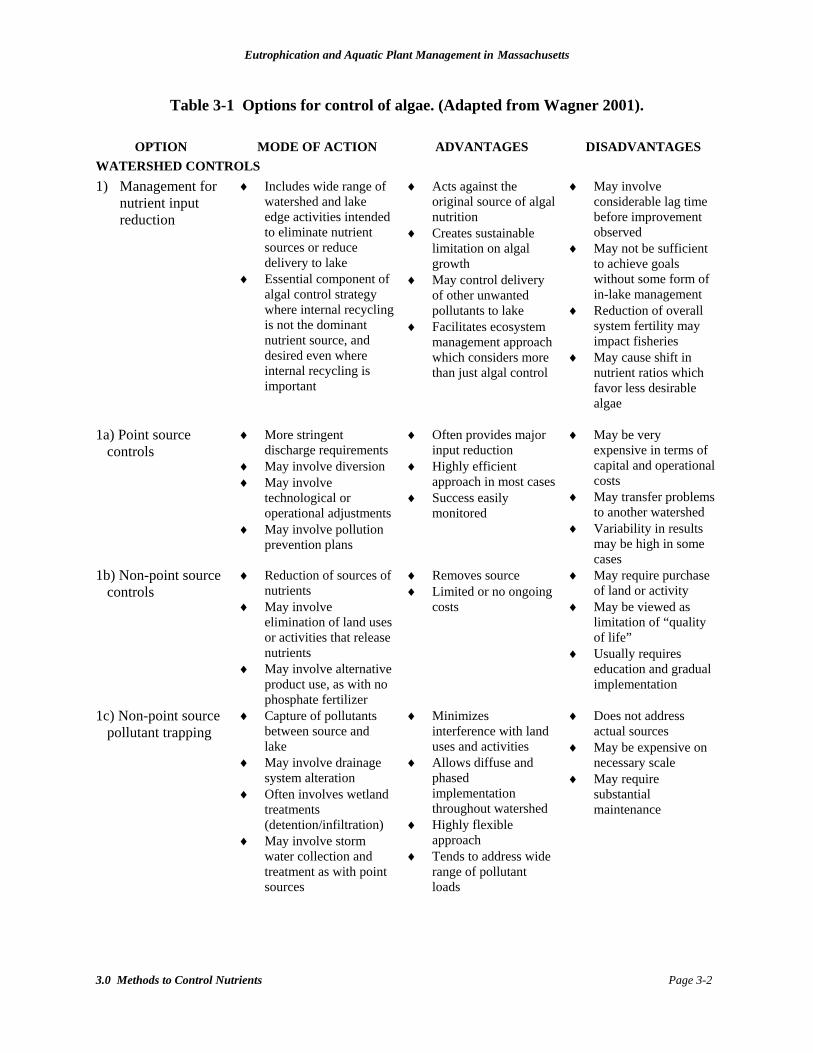
Eutrophication and Aquatic Plant Management in Massachusetts
3.0 Methods to Control Nutrients Page 3-2
Table 3-1 Options for control of algae. (Adapted from Wagner 2001).
OPTION MODE OF ACTION ADVANTAGES DISADVANTAGES WATERSHED CONTROLS 1) Management for
nutrient input reduction
♦ Includes wide range of watershed and lake edge activities intended to eliminate nutrient sources or reduce delivery to lake
♦ Essential component of algal control strategy where internal recycling is not the dominant nutrient source, and desired even where internal recycling is important
♦ Acts against the original source of algal nutrition
♦ Creates sustainable limitation on algal growth
♦ May control delivery of other unwanted pollutants to lake
♦ Facilitates ecosystem management approach which considers more than just algal control
♦ May involve considerable lag time before improvement observed
♦ May not be sufficient to achieve goals without some form of in-lake management
♦ Reduction of overall system fertility may impact fisheries
♦ May cause shift in nutrient ratios which favor less desirable algae
1a) Point source
controls ♦ More stringent
discharge requirements ♦ May involve diversion ♦ May involve
technological or operational adjustments
♦ May involve pollution prevention plans
♦ Often provides major input reduction
♦ Highly efficient approach in most cases
♦ Success easily monitored
♦ May be very expensive in terms of capital and operational costs
♦ May transfer problems to another watershed
♦ Variability in results may be high in some cases
1b) Non-point source controls
♦ Reduction of sources of nutrients
♦ May involve elimination of land uses or activities that release nutrients
♦ May involve alternative product use, as with no phosphate fertilizer
♦ Removes source ♦ Limited or no ongoing
costs
♦ May require purchase of land or activity
♦ May be viewed as limitation of “quality of life”
♦ Usually requires education and gradual implementation
1c) Non-point source pollutant trapping
♦ Capture of pollutants between source and lake
♦ May involve drainage system alteration
♦ Often involves wetland treatments (detention/infiltration)
♦ May involve storm water collection and treatment as with point sources
♦ Minimizes interference with land uses and activities
♦ Allows diffuse and phased implementation throughout watershed
♦ Highly flexible approach
♦ Tends to address wide range of pollutant loads
♦ Does not address actual sources
♦ May be expensive on necessary scale
♦ May require substantial maintenance
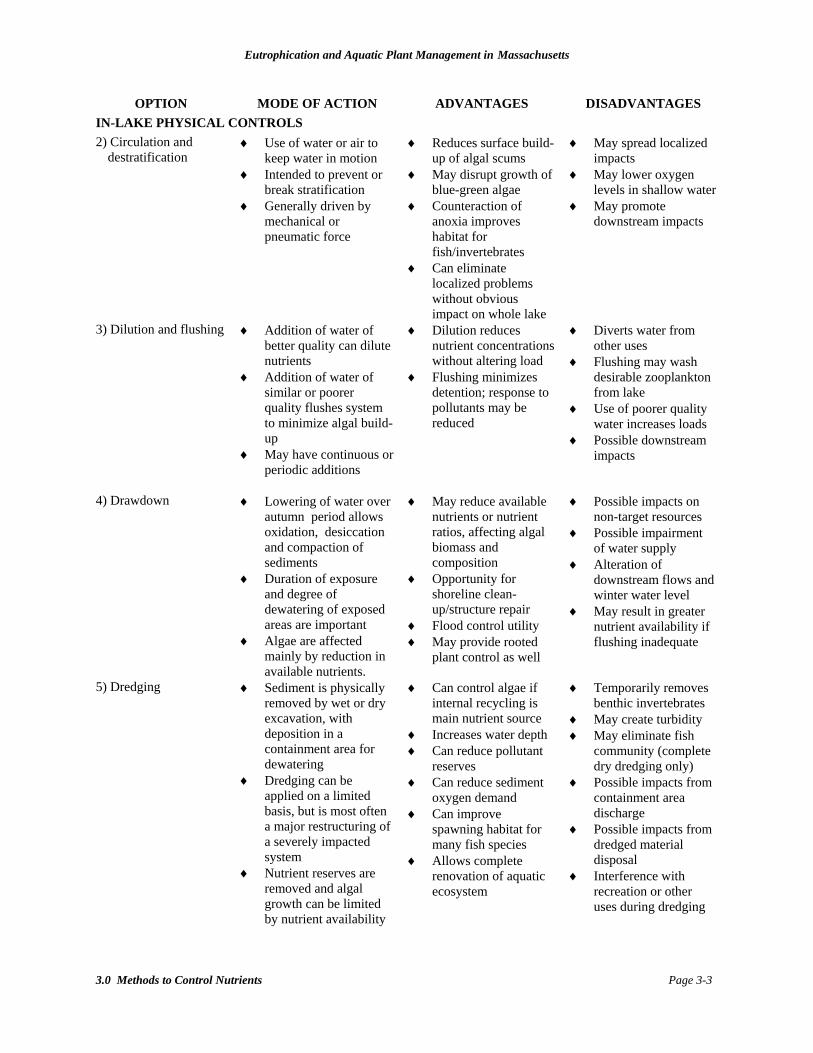
Eutrophication and Aquatic Plant Management in Massachusetts
3.0 Methods to Control Nutrients Page 3-3
OPTION MODE OF ACTION ADVANTAGES DISADVANTAGES IN-LAKE PHYSICAL CONTROLS 2) Circulation and
destratification ♦ Use of water or air to
keep water in motion ♦ Intended to prevent or
break stratification ♦ Generally driven by
mechanical or pneumatic force
♦ Reduces surface build-up of algal scums
♦ May disrupt growth of blue-green algae
♦ Counteraction of anoxia improves habitat for fish/invertebrates
♦ Can eliminate localized problems without obvious impact on whole lake
♦ May spread localized impacts
♦ May lower oxygen levels in shallow water
♦ May promote downstream impacts
3) Dilution and flushing
♦ Addition of water of better quality can dilute nutrients
♦ Addition of water of similar or poorer quality flushes system to minimize algal build-up
♦ May have continuous or periodic additions
♦ Dilution reduces nutrient concentrations without altering load
♦ Flushing minimizes detention; response to pollutants may be reduced
♦ Diverts water from other uses
♦ Flushing may wash desirable zooplankton from lake
♦ Use of poorer quality water increases loads
♦ Possible downstream impacts
4) Drawdown ♦ Lowering of water over autumn period allows oxidation, desiccation and compaction of sediments
♦ Duration of exposure and degree of dewatering of exposed areas are important
♦ Algae are affected mainly by reduction in available nutrients.
♦ May reduce available nutrients or nutrient ratios, affecting algal biomass and composition
♦ Opportunity for shoreline clean-up/structure repair
♦ Flood control utility ♦ May provide rooted
plant control as well
♦ Possible impacts on non-target resources
♦ Possible impairment of water supply
♦ Alteration of downstream flows and winter water level
♦ May result in greater nutrient availability if flushing inadequate
5) Dredging ♦ Sediment is physically removed by wet or dry excavation, with deposition in a containment area for dewatering
♦ Dredging can be applied on a limited basis, but is most often a major restructuring of a severely impacted system
♦ Nutrient reserves are removed and algal growth can be limited by nutrient availability
♦ Can control algae if internal recycling is main nutrient source
♦ Increases water depth ♦ Can reduce pollutant
reserves ♦ Can reduce sediment
oxygen demand ♦ Can improve
spawning habitat for many fish species
♦ Allows complete renovation of aquatic ecosystem
♦ Temporarily removes benthic invertebrates
♦ May create turbidity ♦ May eliminate fish
community (complete dry dredging only)
♦ Possible impacts from containment area discharge
♦ Possible impacts from dredged material disposal
♦ Interference with recreation or other uses during dredging

Eutrophication and Aquatic Plant Management in Massachusetts
3.0 Methods to Control Nutrients Page 3-4
OPTION MODE OF ACTION ADVANTAGES DISADVANTAGES 5a) “Dry” excavation ♦ Lake drained or
lowered to maximum extent practical
♦ Target material dried to maximum extent possible
♦ Conventional excavation equipment used to remove sediments
♦ Tends to facilitate a very thorough effort
♦ May allow drying of sediments prior to removal
♦ Allows use of less specialized equipment
♦ Eliminates most aquatic biota unless a portion left undrained
♦ Eliminates lake use during dredging
5b) “Wet” excavation ♦ Lake level may be lowered, but sediments not substantially exposed
♦ Draglines, bucket dredges, or long-reach backhoes used to remove sediment
♦ Requires least preparation time or effort, tends to be least cost dredging approach
♦ May allow use of easily acquired equipment
♦ May preserve aquatic biota
♦ Usually creates extreme turbidity
♦ Normally requires intermediate containment area to dry sediments prior to hauling
♦ May disrupt ecological function
♦ Use disruption 5c) Hydraulic removal ♦ Lake level not reduced
♦ Suction or cutterhead dredges create slurry which is hydraulically pumped to containment area
♦ Slurry is dewatered; sediment retained, water discharged
♦ Creates minimal turbidity and impact on biota
♦ Can allow some lake uses during dredging
♦ Allows removal with limited access or shoreline disturbance
♦ Often leaves some sediment behind
♦ Cannot handle coarse or debris-laden materials
♦ Requires sophisticated and more expensive containment area
6) Light-limiting dyes and surface covers
♦ Creates light limitation ♦ Creates light limit on algal growth without high turbidity or great depth
♦ May achieve some control of rooted plants as well
♦ May cause thermal stratification in shallow ponds
♦ May facilitate anoxia at sediment interface with water
6.a) Dyes ♦ Water-soluble dye is mixed with lake water, thereby limiting light penetration and inhibiting algal growth
♦ Dyes remain in solution until washed out of system.
♦ Produces appealing color
♦ Creates illusion of greater depth
♦ May not control surface bloom-forming species
♦ May not control growth of shallow water algal mats
♦ Altered thermal regime
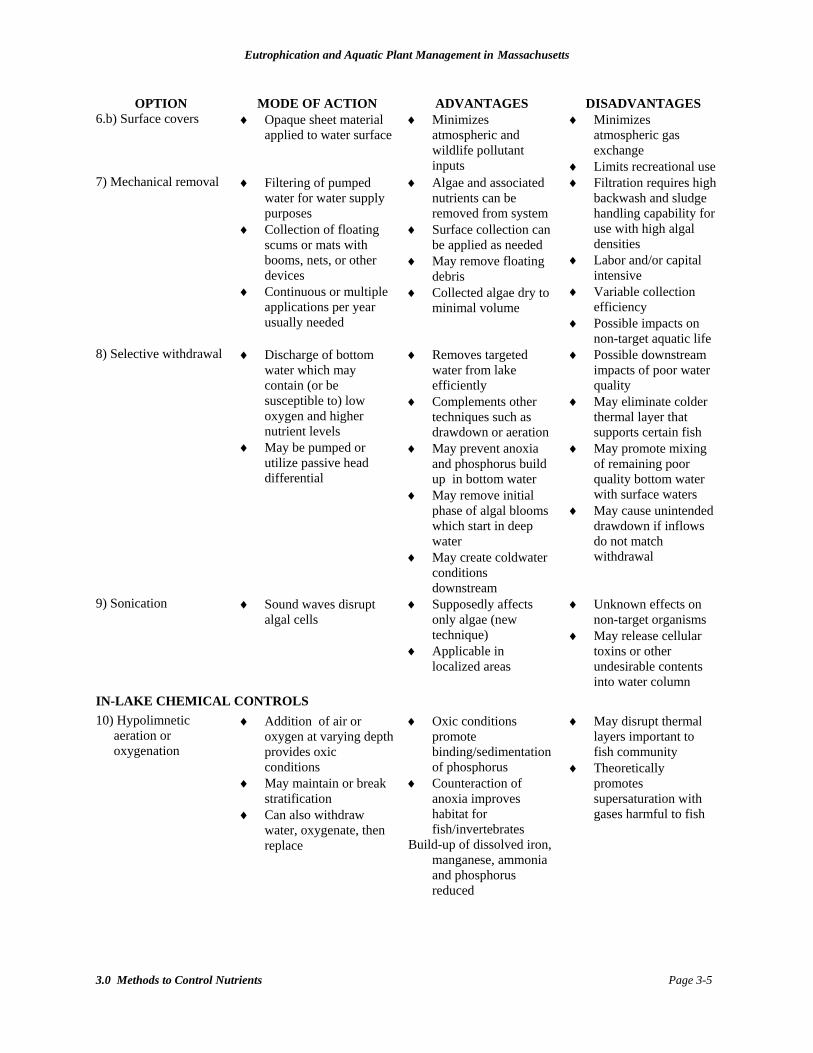
Eutrophication and Aquatic Plant Management in Massachusetts
3.0 Methods to Control Nutrients Page 3-5
OPTION MODE OF ACTION ADVANTAGES DISADVANTAGES 6.b) Surface covers ♦ Opaque sheet material
applied to water surface ♦ Minimizes
atmospheric and wildlife pollutant inputs
♦ Minimizes atmospheric gas exchange
♦ Limits recreational use 7) Mechanical removal
♦ Filtering of pumped water for water supply purposes
♦ Collection of floating scums or mats with booms, nets, or other devices
♦ Continuous or multiple applications per year usually needed
♦ Algae and associated nutrients can be removed from system
♦ Surface collection can be applied as needed
♦ May remove floating debris
♦ Collected algae dry to minimal volume
♦ Filtration requires high backwash and sludge handling capability for use with high algal densities
♦ Labor and/or capital intensive
♦ Variable collection efficiency
♦ Possible impacts on non-target aquatic life
8) Selective withdrawal
♦ Discharge of bottom water which may contain (or be susceptible to) low oxygen and higher nutrient levels
♦ May be pumped or utilize passive head differential
♦ Removes targeted water from lake efficiently
♦ Complements other techniques such as drawdown or aeration
♦ May prevent anoxia and phosphorus build up in bottom water
♦ May remove initial phase of algal blooms which start in deep water
♦ May create coldwater conditions downstream
♦ Possible downstream impacts of poor water quality
♦ May eliminate colder thermal layer that supports certain fish
♦ May promote mixing of remaining poor quality bottom water with surface waters
♦ May cause unintended drawdown if inflows do not match withdrawal
9) Sonication ♦ Sound waves disrupt algal cells
♦ Supposedly affects only algae (new technique)
♦ Applicable in localized areas
♦ Unknown effects on non-target organisms
♦ May release cellular toxins or other undesirable contents into water column
IN-LAKE CHEMICAL CONTROLS 10) Hypolimnetic
aeration or oxygenation
♦ Addition of air or oxygen at varying depth provides oxic conditions
♦ May maintain or break stratification
♦ Can also withdraw water, oxygenate, then replace
♦ Oxic conditions promote binding/sedimentation of phosphorus
♦ Counteraction of anoxia improves habitat for fish/invertebrates
Build-up of dissolved iron, manganese, ammonia and phosphorus reduced
♦ May disrupt thermal layers important to fish community
♦ Theoretically promotes supersaturation with gases harmful to fish
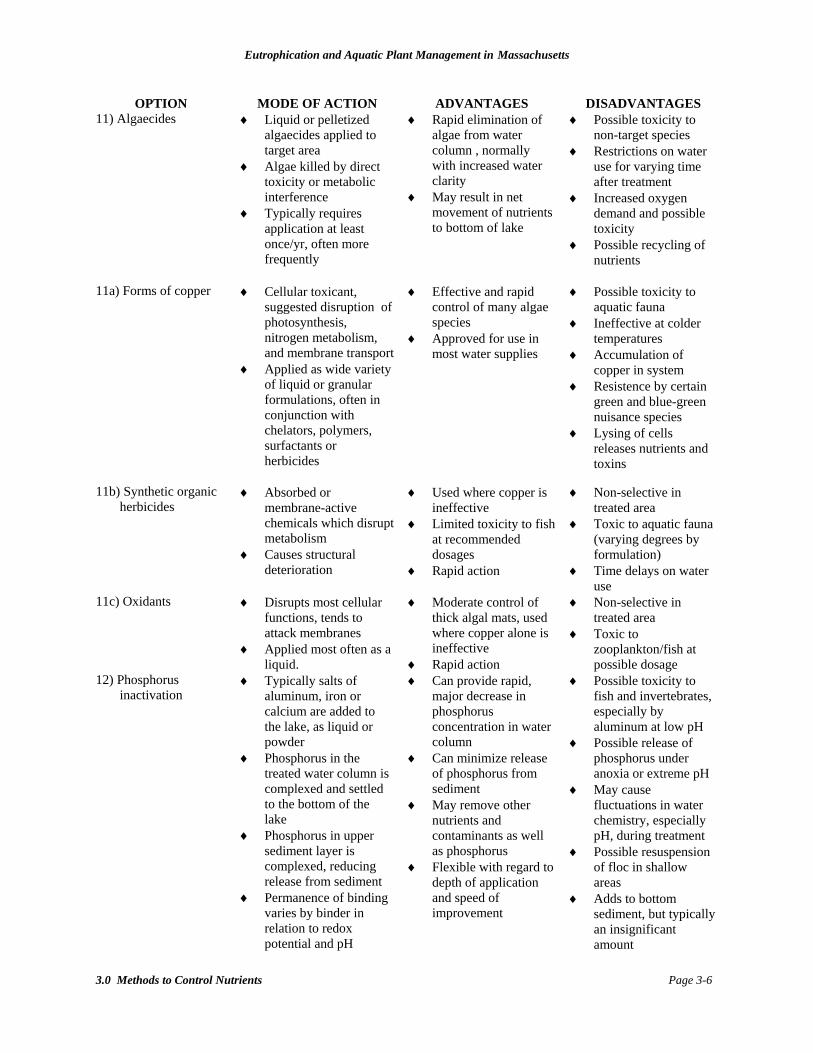
Eutrophication and Aquatic Plant Management in Massachusetts
3.0 Methods to Control Nutrients Page 3-6
OPTION MODE OF ACTION ADVANTAGES DISADVANTAGES 11) Algaecides ♦ Liquid or pelletized
algaecides applied to target area
♦ Algae killed by direct toxicity or metabolic interference
♦ Typically requires application at least once/yr, often more frequently
♦ Rapid elimination of algae from water column , normally with increased water clarity
♦ May result in net movement of nutrients to bottom of lake
♦ Possible toxicity to non-target species
♦ Restrictions on water use for varying time after treatment
♦ Increased oxygen demand and possible toxicity
♦ Possible recycling of nutrients
11a) Forms of copper
♦ Cellular toxicant, suggested disruption of photosynthesis, nitrogen metabolism, and membrane transport
♦ Applied as wide variety of liquid or granular formulations, often in conjunction with chelators, polymers, surfactants or herbicides
♦ Effective and rapid control of many algae species
♦ Approved for use in most water supplies
♦ Possible toxicity to aquatic fauna
♦ Ineffective at colder temperatures
♦ Accumulation of copper in system
♦ Resistence by certain green and blue-green nuisance species
♦ Lysing of cells releases nutrients and toxins
11b) Synthetic organic herbicides
♦ Absorbed or membrane-active chemicals which disrupt metabolism
♦ Causes structural deterioration
♦ Used where copper is ineffective
♦ Limited toxicity to fish at recommended dosages
♦ Rapid action
♦ Non-selective in treated area
♦ Toxic to aquatic fauna (varying degrees by formulation)
♦ Time delays on water use
11c) Oxidants
♦ Disrupts most cellular functions, tends to attack membranes
♦ Applied most often as a liquid.
♦ Moderate control of thick algal mats, used where copper alone is ineffective
♦ Rapid action
♦ Non-selective in treated area
♦ Toxic to zooplankton/fish at possible dosage
12) Phosphorus inactivation
♦ Typically salts of aluminum, iron or calcium are added to the lake, as liquid or powder
♦ Phosphorus in the treated water column is complexed and settled to the bottom of the lake
♦ Phosphorus in upper sediment layer is complexed, reducing release from sediment
♦ Permanence of binding varies by binder in relation to redox potential and pH
♦ Can provide rapid, major decrease in phosphorus concentration in water column
♦ Can minimize release of phosphorus from sediment
♦ May remove other nutrients and contaminants as well as phosphorus
♦ Flexible with regard to depth of application and speed of improvement
♦ Possible toxicity to fish and invertebrates, especially by aluminum at low pH
♦ Possible release of phosphorus under anoxia or extreme pH
♦ May cause fluctuations in water chemistry, especially pH, during treatment
♦ Possible resuspension of floc in shallow areas
♦ Adds to bottom sediment, but typically an insignificant amount
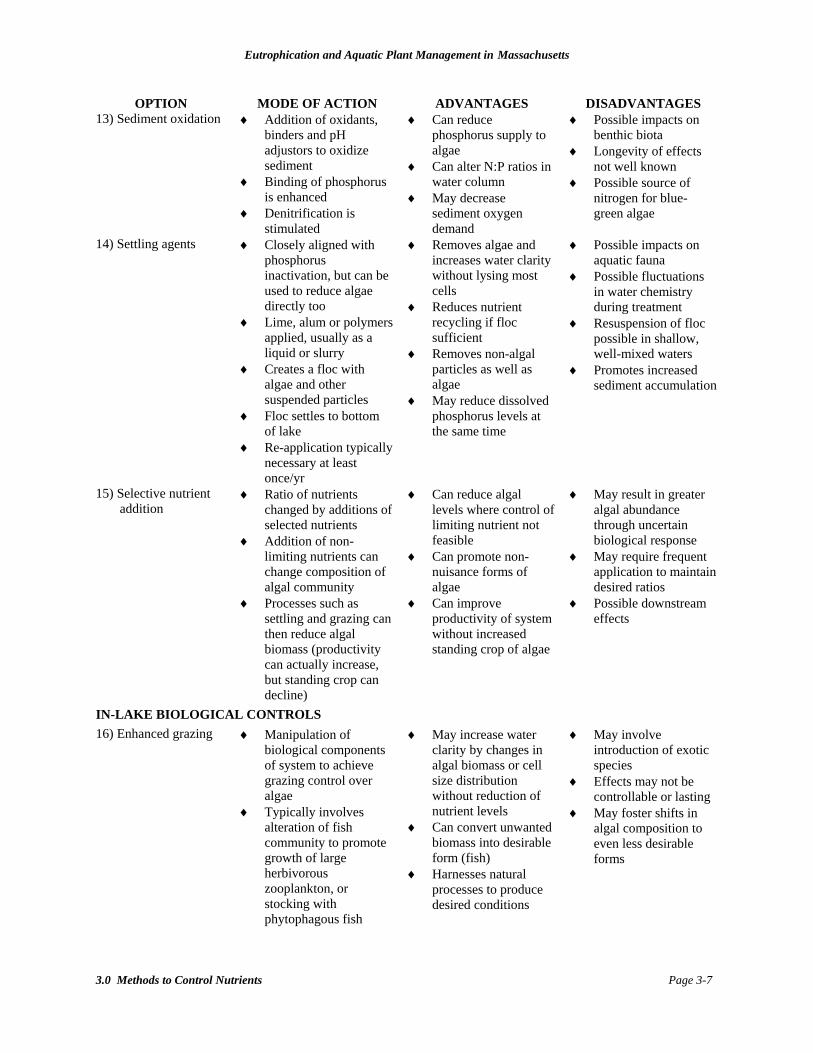
Eutrophication and Aquatic Plant Management in Massachusetts
3.0 Methods to Control Nutrients Page 3-7
OPTION MODE OF ACTION ADVANTAGES DISADVANTAGES 13) Sediment oxidation ♦ Addition of oxidants,
binders and pH adjustors to oxidize sediment
♦ Binding of phosphorus is enhanced
♦ Denitrification is stimulated
♦ Can reduce phosphorus supply to algae
♦ Can alter N:P ratios in water column
♦ May decrease sediment oxygen demand
♦ Possible impacts on benthic biota
♦ Longevity of effects not well known
♦ Possible source of nitrogen for blue-green algae
14) Settling agents ♦ Closely aligned with phosphorus inactivation, but can be used to reduce algae directly too
♦ Lime, alum or polymers applied, usually as a liquid or slurry
♦ Creates a floc with algae and other suspended particles
♦ Floc settles to bottom of lake
♦ Re-application typically necessary at least once/yr
♦ Removes algae and increases water clarity without lysing most cells
♦ Reduces nutrient recycling if floc sufficient
♦ Removes non-algal particles as well as algae
♦ May reduce dissolved phosphorus levels at the same time
♦ Possible impacts on aquatic fauna
♦ Possible fluctuations in water chemistry during treatment
♦ Resuspension of floc possible in shallow, well-mixed waters
♦ Promotes increased sediment accumulation
15) Selective nutrient addition
♦ Ratio of nutrients changed by additions of selected nutrients
♦ Addition of non-limiting nutrients can change composition of algal community
♦ Processes such as settling and grazing can then reduce algal biomass (productivity can actually increase, but standing crop can decline)
♦ Can reduce algal levels where control of limiting nutrient not feasible
♦ Can promote non-nuisance forms of algae
♦ Can improve productivity of system without increased standing crop of algae
♦ May result in greater algal abundance through uncertain biological response
♦ May require frequent application to maintain desired ratios
♦ Possible downstream effects
IN-LAKE BIOLOGICAL CONTROLS 16) Enhanced grazing ♦ Manipulation of
biological components of system to achieve grazing control over algae
♦ Typically involves alteration of fish community to promote growth of large herbivorous zooplankton, or stocking with phytophagous fish
♦ May increase water clarity by changes in algal biomass or cell size distribution without reduction of nutrient levels
♦ Can convert unwanted biomass into desirable form (fish)
♦ Harnesses natural processes to produce desired conditions
♦ May involve introduction of exotic species
♦ Effects may not be controllable or lasting
♦ May foster shifts in algal composition to even less desirable forms
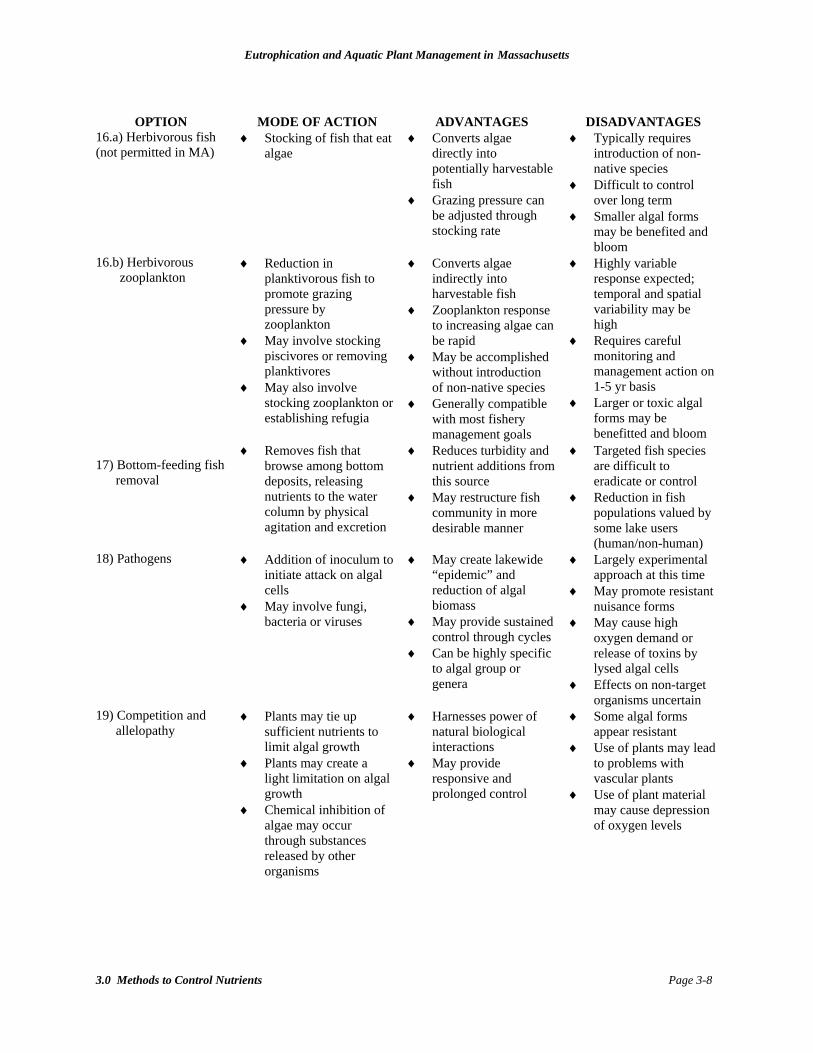
Eutrophication and Aquatic Plant Management in Massachusetts
3.0 Methods to Control Nutrients Page 3-8
OPTION MODE OF ACTION ADVANTAGES DISADVANTAGES
16.a) Herbivorous fish (not permitted in MA)
♦ Stocking of fish that eat algae
♦ Converts algae directly into potentially harvestable fish
♦ Grazing pressure can be adjusted through stocking rate
♦ Typically requires introduction of non-native species
♦ Difficult to control over long term
♦ Smaller algal forms may be benefited and bloom
16.b) Herbivorous zooplankton
♦ Reduction in planktivorous fish to promote grazing pressure by zooplankton
♦ May involve stocking piscivores or removing planktivores
♦ May also involve stocking zooplankton or establishing refugia
♦ Converts algae indirectly into harvestable fish
♦ Zooplankton response to increasing algae can be rapid
♦ May be accomplished without introduction of non-native species
♦ Generally compatible with most fishery management goals
♦ Highly variable response expected; temporal and spatial variability may be high
♦ Requires careful monitoring and management action on 1-5 yr basis
♦ Larger or toxic algal forms may be benefitted and bloom
17) Bottom-feeding fish removal
♦ Removes fish that browse among bottom deposits, releasing nutrients to the water column by physical agitation and excretion
♦ Reduces turbidity and nutrient additions from this source
♦ May restructure fish community in more desirable manner
♦ Targeted fish species are difficult to eradicate or control
♦ Reduction in fish populations valued by some lake users (human/non-human)
18) Pathogens ♦ Addition of inoculum to initiate attack on algal cells
♦ May involve fungi, bacteria or viruses
♦ May create lakewide “epidemic” and reduction of algal biomass
♦ May provide sustained control through cycles
♦ Can be highly specific to algal group or genera
♦ Largely experimental approach at this time
♦ May promote resistant nuisance forms
♦ May cause high oxygen demand or release of toxins by lysed algal cells
♦ Effects on non-target organisms uncertain
19) Competition and allelopathy
♦ Plants may tie up sufficient nutrients to limit algal growth
♦ Plants may create a light limitation on algal growth
♦ Chemical inhibition of algae may occur through substances released by other organisms
♦ Harnesses power of natural biological interactions
♦ May provide responsive and prolonged control
♦ Some algal forms appear resistant
♦ Use of plants may lead to problems with vascular plants
♦ Use of plant material may cause depression of oxygen levels
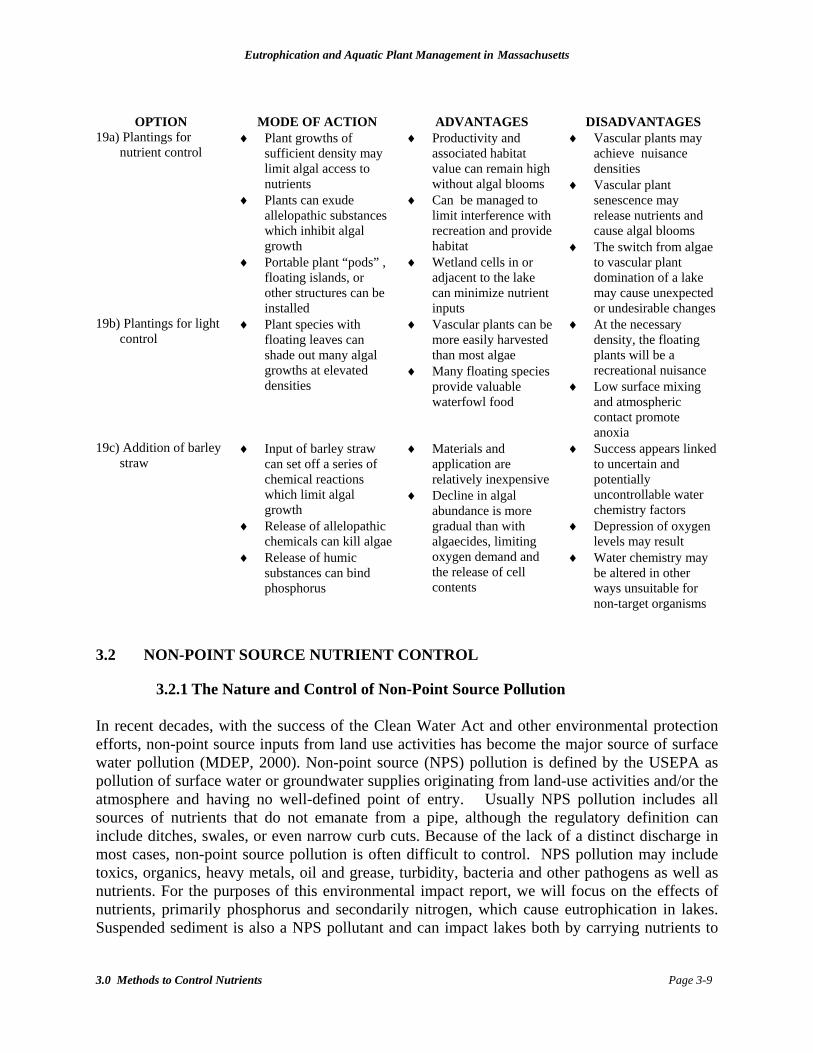
Eutrophication and Aquatic Plant Management in Massachusetts
3.0 Methods to Control Nutrients Page 3-9
OPTION MODE OF ACTION ADVANTAGES DISADVANTAGES
19a) Plantings for nutrient control
♦ Plant growths of sufficient density may limit algal access to nutrients
♦ Plants can exude allelopathic substances which inhibit algal growth
♦ Portable plant “pods” , floating islands, or other structures can be installed
♦ Productivity and associated habitat value can remain high without algal blooms
♦ Can be managed to limit interference with recreation and provide habitat
♦ Wetland cells in or adjacent to the lake can minimize nutrient inputs
♦ Vascular plants may achieve nuisance densities
♦ Vascular plant senescence may release nutrients and cause algal blooms
♦ The switch from algae to vascular plant domination of a lake may cause unexpected or undesirable changes
19b) Plantings for light control
♦ Plant species with floating leaves can shade out many algal growths at elevated densities
♦ Vascular plants can be more easily harvested than most algae
♦ Many floating species provide valuable waterfowl food
♦ At the necessary density, the floating plants will be a recreational nuisance
♦ Low surface mixing and atmospheric contact promote anoxia
19c) Addition of barley straw
♦ Input of barley straw can set off a series of chemical reactions which limit algal growth
♦ Release of allelopathic chemicals can kill algae
♦ Release of humic substances can bind phosphorus
♦ Materials and application are relatively inexpensive
♦ Decline in algal abundance is more gradual than with algaecides, limiting oxygen demand and the release of cell contents
♦ Success appears linked to uncertain and potentially uncontrollable water chemistry factors
♦ Depression of oxygen levels may result
♦ Water chemistry may be altered in other ways unsuitable for non-target organisms
3.2 NON-POINT SOURCE NUTRIENT CONTROL
3.2.1 The Nature and Control of Non-Point Source Pollution In recent decades, with the success of the Clean Water Act and other environmental protection efforts, non-point source inputs from land use activities has become the major source of surface water pollution (MDEP, 2000). Non-point source (NPS) pollution is defined by the USEPA as pollution of surface water or groundwater supplies originating from land-use activities and/or the atmosphere and having no well-defined point of entry. Usually NPS pollution includes all sources of nutrients that do not emanate from a pipe, although the regulatory definition can include ditches, swales, or even narrow curb cuts. Because of the lack of a distinct discharge in most cases, non-point source pollution is often difficult to control. NPS pollution may include toxics, organics, heavy metals, oil and grease, turbidity, bacteria and other pathogens as well as nutrients. For the purposes of this environmental impact report, we will focus on the effects of nutrients, primarily phosphorus and secondarily nitrogen, which cause eutrophication in lakes. Suspended sediment is also a NPS pollutant and can impact lakes both by carrying nutrients to
Eutrophication and Aquatic Plant Management in Massachusetts
3.0 Methods to Control Nutrients Page 3-10
lakes and by reducing lake depth (which tends to increase the rate of eutrophication). Further discussion of sediments can be found in Section 3.7 (Dredging). Although both phosphorus and nitrogen are essential nutrients (fertilizers) for aquatic plant growth, phosphorus is the nutrient most often associated with cultural eutrophication and the focus of most lake restoration efforts. NPS pollution is most often associated with urban runoff, agricultural operations (including crops, livestock and silviculture), forest industries (especially logging), domestic on-site wastewater disposal (septic) systems, construction activities, and a variety of other land use activities of lesser overall impact (but still potentially important in individual cases). In some cases nutrients may come from natural sources, such as high concentrations of birds such as gulls, ducks and geese. Excess nutrients have been identified as the cause of not attaining the designated use support in Massachusetts for 27 percent of lake acres that have been assessed (MDEP, 2000). Urban runoff is often considered to be the major source of NPS pollution (MDEP, 2000), although in rural areas agricultural practices may be a greater concern for eutrophication. Urban development in watersheds has been the greatest threat (Robbins et al., 1991), however, with both construction activities and post-construction runoff as major issues. The 2000 305b report on water quality in Massachusetts indicates that only 30% of the assessed lakes in the state fully support their designated uses, and many of these are considered threatened (MDEP, 2000). Proliferation of aquatic plants and excess nutrients are cited as causative agents in over half the cases of non-support, and NPS are prominent in many of these cases. Combined sewer overflows are another significant source of nutrients, but are considered under point sources. Commercial fertilizers are the major source of agricultural NPS nutrients. Application of P and N in the United States has increased by 3-fold and 20-fold, respectively, between the years 1945 and 1993 (Puckett, 1995). Perhaps because most farmers are more concerned with achieving adequate nitrogen levels, current fertilizer and manure application rates have led to a build up of soil phosphorus levels in the northeastern United States (Sharpley et al., 1994). Although it is not harmful to the crop to have extra phosphorus, it does result in eutrophication of surface waters. This important issue is thoroughly reviewed in Sharpley et al. (1994). In many urbanized areas of Massachusetts, the residential use of fertilizers is a larger source of nutrients than agricultural fertilizers, and the process is the same. A review of 32 Diagnostic/Feasibility studies (Tables 1-2 and 1-3) shows an extremely wide range of values for most sources. From land use analysis, the major sources were residential. Based on measured inputs, the major transport of phosphorus to lakes was from streams, ground water and internal sources, although wide differences in inputs were observed from lake to lake. The importance of septic systems in phosphorus loading may be overstated, as attenuation in soil between the tank and the lake was seldom assessed, but septic systems remain a major source of nitrogen in lakes. Storm water runoff, assessed from only a few storm measurements, may have been underestimated in many cases. Agricultural/open field inputs accounted for a median of only about 7 percent in this survey, which may be a reflection of relatively high housing density and relatively few agricultural acres within the watersheds of the studied lakes.
Eutrophication and Aquatic Plant Management in Massachusetts
3.0 Methods to Control Nutrients Page 3-11
Control measures are summarized under two processes, source controls and pollutant trapping. Within the pollutant trapping process, approaches applicable to urban landscapes, recreational facilities, agriculture, forestry, wastewater disposal, and non-human sources are briefly addressed. There is an extensive literature base for this subject, one that is too great to cover completely in this GEIR, and readers are encouraged to review the materials contained in a wide variety of works on the topic of NPS control. These include:
Schueler, T. 1987. Controlling Urban Runoff: A Practical Manual for Planning and Designing Urban BMPs. Metropolitan Washington Council of Governments, Washington, DC. One of the original works calling attention to urban runoff problems and how to solve them, this reference provides a foundation upon which other references build. Many references by Schueler and colleagues can be obtained through the Center for Watershed Protection on the internet at www.cwp.org.
Dennis, J., J. Noel, D. Miller, and C. Eliot. 1989. Phosphorus Control in Lake Watersheds: A Technical Guide to Evaluating New Development. ME DEP, Augusta, ME. While developed to provide support for meeting the development regulations in Maine, this document provides useful estimates of performance and constraints associated with detention facilities and buffers. Available from ME DEP in Augusta, ME.
Wisconsin Department of Agriculture and Trade and Consumer Protection. 1989. Best Management Practices for Wisconsin Farms. WDATCP, Madison, WI. Prepared in cooperation with many state agencies and the University of Wisconsin Extension Service, this manual provides detailed information on why and how to manage P and N in agricultural operations. It does not appear readily available at this date, but might be obtained through the Extension Service on the internet at [email protected].
Sage, K. 1990. Implementation Strategies for Lake Water Quality Protection: A Handbook of Model Ordinances and Non-Regulatory Techniques for Controlling Phosphorus Impacts from Development. North Kennebec Regional Planning Commission, Kennebec, ME. This compendium of ordinances and operational controls provides the basis for many community efforts to manage impacts from developments. Advances since 1990 have been substantial, but this document provides a useful starting point. Available from ME DEP, Augusta, ME.
Schueler, T., P. Kumble and M. Heraty. 1992. A Current Assessment of Urban Best Management Practices: Techniques for Reducing Non-Point Source Pollution in the Coastal Zone. Metropolitan Washington Council of Governments, Washington, DC. This review of performance of various BMPs provides much useful design information and performance data. It is available from the Center for Watershed Protection at www.cwp.org.
Boutiette, L. and C. Duerring. 1993. Nonpoint Source Management Manual. MDEP, Boston, MA. Often called "The Mega-Manual", this guide to techniques provides a discussion of each technique and its applicability to categories of NPS pollution. Available through the MDEP, although it has been out of stock multiple times since original publication.
USEPA. 1993. Guidance Specifying Management Measures for Sources of Nonpoint Pollution In Coastal Waters. Document 840-B-92-002, USEPA, Washington, DC. Although developed as a coastal management guide, chapters on agricultural, forestry and urban areas are highly appropriate to any watershed management effort. Can be accessed on the internet at www.epa.gov/owow/nps/MMGI/index.html.
New Hampshire Department of Environmental Services. 1994. Best Management Practices to Control Non-Point Source Pollution: A Guide for Citizens and Town Officials. NHDES-

Eutrophication and Aquatic Plant Management in Massachusetts
3.0 Methods to Control Nutrients Page 3-12
WSPCD – 94-2, NHDES, Concord, NH. This layperson’s guide provides guidance for managing NPS pollution in a straightforward, simplified, outline form. It may be out of stock by now, but has been available from the NHDES in Concord, NH.
Lobdell, R. 1994. A Guide to Developing and Re-Developing Shoreland Property in New Hampshire. North Country Resource Conservation and Development, Inc. Meredith, NH. This layperson’s guide provides guidance for evaluating and preventing impacts from shoreland property. It may be out of stock by now, but has been available from the NHDES in Concord, NH.
Schueler, T. 1995. Site Planning for Urban Stream Protection. Center for Watershed Protection, Ellicot City, MD. This manual describes techniques for minimizing development impacts through storm water controls. Available through the Center for Watershed Protection at www.cwp.org.
Claytor, R. and T. Schueler. 1996. Design of Storm Water Filtering Systems. Center for Watershed Protection, Ellicot City, MD. Center for Watershed Protection, Ellicot City, MD.This manual provides detailed engineering guidance for 11 different filtering systems applicable in storm water management, along with performance and applicability information. Available through the Center for Watershed Protection at www.cwp.org.
Kadlec, R. and R. Knight. 1996. Treatment Wetlands. CRC Press, Boca Raton, FL. This very thick textbook provides extensive background on the use of wetlands to treat storm water and wastewater. Chapters are devoted to concepts, specific pollutants of interest, system design, and system maintenance. Available through CRC Press/Lewis Publishers.
MDEP. 1997a. Storm Water Management. Volume One: Storm water Policy Handbook, and Volume Two: Storm Water Technical Handbook. Publ. # 17871-250-1800-4/97-6.52-C.R. MDEP, Boston, MA. This two volume set lays out the premises for the MA storm water policy and provides technical support for the design of storm water BMPs to meet the policy. It is essential background and support information for storm water management efforts in MA. Available from MDEP in Boston.
MDEP. 1997b. Massachusetts Erosion and Sediment Control Guidelines for Urban and Suburban Areas. A Guide for Planners, Designers and Municipal Officials. MDEP, Boston, MA. This guide describes conservation BMPs and is intended to be a companion to the “Mega-Manual”.
Heufelder, G. and S. Rask. 1997. A Compendium of Information on Alternative Onsite Septic System Technology in Massachusetts. A special issue of Environment Cape Cod. Barnstable County Department of Health and the Environment, Barnstable, MA. Covering a wide range of approved and experimental technologies, this compendium provides useful information for uses of such systems on Cape Cod.
Wisconsin Department of Natural Resources. 1997a. Wisconsin’s Forestry BMPs for Water Quality: A Field Manual for Loggers, Landowners and Land Managers. WDNR, Madison, WI. This manual covers BMPs for road building, timber harvesting, prescribed burning, and chemical applications to forests. Available through the WDNR, but not online.
Wisconsin Department of Natural Resources. 1997b. Wisconsin’s Forestry BMPs for Water Quality: The 1995-1997 BMP Monitoring Report. WDNR, Madison, WI. This companion report to the BMP manual provides a review of effectiveness based on actual data. Available through the WDNR, but not online.
The Federal Interagency Stream Restoration Working Group. 1998. Stream Corridor Restoration: Principles, Processes and Practices. USEPA, Washington, DC. This publication
Eutrophication and Aquatic Plant Management in Massachusetts
3.0 Methods to Control Nutrients Page 3-13
deals with stream corridors and how to protect and restore them. It relates to all forms of land use that impact streams and downstream lakes. Information on availability was not provided, but the USEPA website may be helpful (www.epa.gov).
USDA-NRCS and MA Community Assistance Partnership. 1998. Innovative and Alternative On-Site Wastewater Technologies. USEPA, Boston, MA. This guide to products and services provides information on 21 disposal systems that differ from conventional tank and leaching facilities, including performance data. Availability unknown.
USEPA. 1999. Preliminary Data Summary of Urban Storm Water Best Management Practices. EPA-821-R-99-012. USEPA, Washington, DC. This document provide background on pollutant levels in urban storm water and effectiveness of control by various BMPs. Available through www.epa.gov.
Winer, R. 2000. National Pollutant Removal Performance Database for Storm Water Treatment Practices, 2nd Edition. Center for Watershed Protection, Ellicot City, MD. This collection and synthesis of pollutant removal data is the most up-to-date compendium of what can be expected from various storm water management techniques.
Washington State Department of Ecology. 2000. Storm Water Management Manual for Western Washington. Publication 99-14, WA DOE, Olympia, WA. This five-volume set of documents includes volumes on minimum technical requirements, construction pollution prevention, hydrologic analysis/flow control, source controls and runoff treatment BMPs in a concise format applicable almost anywhere in the USA.
Thornton, K. and C. Creager. 2001. Watershed Management. Chapter 6 in Managing Lakes and Reservoirs, edited by Holdren, Jones and Taggart. USEPA/NALMS, Madison, WI. This chapter covers watershed management needs and approaches from a lake management perspective. It also provides an annotated bibliography of BMP manuals for various land uses. Available through NALMS on the internet at www.NALMS.org.
USEPA. 2002. Onsite Wastewater Treatment Systems Manual. EPA/625/R-00/008. USEPA, Washington, DC. This revised version of the 1980 manual provides details for many onsite systems, with performance standards and related data.
3.2.2 Source Controls
Source controls consist of techniques that eliminate or reduce the potential for pollutants (in this case especially nutrients) to be released from a source. The most reliable way to do this is to eliminate the source, but this may not be practical in many cases. Successful source elimination examples include the 1994 ban on the sale in Massachusetts of laundry detergents containing more than a trace amount of phosphorus, exclusion of certain land use activities from the Zone II area of contribution to water supplies, and purchase of land for open space that might otherwise be developed. Potential successes await us in the areas of lawn fertilizers, where phosphorus is almost unnecessary after a lawn has become established or where lawns are avoided (in favor of natural vegetation). Success in long urbanized areas may be elusive, however, as a consequence of both the difficulty in gaining compliance and the long-term build up (and gradual release) of phosphorus in soils. Source controls are therefore the first line of defense, but will rarely be successful as the only line of defense. Most source control is achieved through laws, mostly local bylaws or ordinances that restrict product contents or use. Where a feasible alternative product exists, this can be a very successful approach. Note that after enough states banned phosphorus in laundry detergents in 1995, the
Eutrophication and Aquatic Plant Management in Massachusetts
3.0 Methods to Control Nutrients Page 3-14
industry ceased production of phosphate-enriched detergents altogether. Where education reveals both an environmental and economic value by source elimination, success may also be achieved. As established lawns require very little added phosphorus, homeowners should be able to save money and protect water quality while maintaining lawns. However, the cost of no-phosphorus fertilizer is not less than phosphorus-rich brands, and a cultural shift is needed to get people to put water quality ahead of their lawns or their pocketbooks. Pet Waste Management An additional area of residential nutrient control is pet waste management. Education is again a key element in making a cultural shift toward minimizing nutrient loading from this source. For both lawn care and pet waste management, a survey by the Center for Watershed Protection (UNEP, 1999) found that understanding of issues and options by residents was limited, while funding and staffing of programs to combat these sources were inadequate. More effective outreach was recommended, involving television, newspapers, and the internet. Wildlife Management Management of wildlife can be a source control effort, especially if populations are to be reduced. Most often the focus is on waterfowl, especially geese, ducks and gulls. Resident populations supported by human actions, including direct feeding and maintenance of lawns, fields or waste disposal facilities that provide food, can be a major source of nutrients on a seasonal or even year-round basis. Habitat alteration that discourages their use of a lake may also serve as pollutant trapping mechanisms, as in the case of densely vegetated buffer strips. There is a limit to this approach, however, as alteration of habitat to suppress the population of one species may help support elevated populations of other species. A focus on ecological balance is desirable in these cases. More direct techniques include scare tactics, egg addling, and hunting to reduce populations or use of an area by a local population. Product Use Restrictions Product use may be allowed with restrictions, as opposed to use bans. Timing of application of fertilizers is important, as is the form in which it is applied. Location of application is another form of source control that does not eliminate the source, but will minimize its escape from the initial area of use. Minimizing the use of any nutrient-laden product over any impervious surface is a valuable use restriction that does not eliminate the product or its benefits, except for deicers and other pavement treatments intended to be used on impervious surfaces. However, deicers and sand may themselves contain substantial amounts of phosphorus and can be a threat to water quality. Use of low phosphorus deicers and “clean” sand (washed to eliminate fines) is advisable. Eliminating the impervious surface may have merit in many instances, but is more of a pollutant trapping mechanism than source control. Activity Restrictions Source control can also involve activity restrictions. Siting of septic systems only in suitable soils and construction of dwellings outside of wetland buffers are examples. Water supplies are accorded special protection, with activities inside one-quarter mile of the supply or its tributaries restricted to minimize pollution potential. Use of gasoline engines is prohibited in some cases, and is usually forbidden within some set distance of intakes. Placement of fertilizer only outside a buffer zone around lakes and tributaries would seem to be a worthwhile addition, but a cultural
Eutrophication and Aquatic Plant Management in Massachusetts
3.0 Methods to Control Nutrients Page 3-15
shift is again needed to gain support for such an approach. Restricting activities within the watersheds of recreational lakes is a much greater stretch, and stirs up enough legal opposition to minimize the value of source control in many areas. Lake and watershed management districts, empowered entities formed in only a few places across the USA, have met with limited success in achieving source control. The Lake Tahoe Planning Authority is among the most powerful, and yet the clarity of Lake Tahoe has declined by 30% over the last four decades (Chilton, 2002). Zoning Zoning is perhaps the most well known form of source control on a large scale, and involves assigning activities or uses to certain areas and banning them from others. Zoning regulations are largely controlled at the town level and are thus specific to each town. Commonly, zoning regulations limit land use within certain areas of the town. The types of land use being regulated may be industrial use, housing development and on land disposal sites. By limiting such activities in areas adjacent to lakes and streams, nutrient inputs may be reduced compared to areas of unrestricted development. However, zoning has only recently been used to manage water quality, and has been more of an economic and quality of life management tool in the past. Used to benefit a town instead of a watershed, its success in protecting water quality is often limited. Where rural communities are developing and where a watershed level approach is applied, water quality-based zoning could be a major asset, but where the watershed has already become urbanized, the potential for zoning to aid water quality is limited. Enlightened zoning may move a community in the right direction over time, but is unlikely to yield major water quality benefits in the short-term and may meet with considerable public opposition. Wastewater Diversion Source control may include diversion of discharges considered detrimental to the receiving water. Wastewater discharges, even when treated to the maximum practical (but not possible) extent, contain so much phosphorus (>100 ppb, usually >400 ppb, and often >1000 ppb, when values <20 ppb are desirable) that diversion of such discharges has resulted in dramatic improvement of receiving water quality. This only re-locates the problem in many cases, however, and is not truly source elimination. Elimination of septic systems in favor of a wastewater collection and treatment system may have similar consequences when the discharge for the wastewater treatment facility is out of the watershed where the septic systems were located. Only if superior treatment of collected wastewater is rendered can the actual load of nutrients be decreased overall, although the location of discharge may change to the benefit of some resources and the detriment of others. Erosion Control A more active form of source control is erosion control. Stabilization of stream banks or sloped soils prone to erosion and a variety of hydraulic techniques for reducing peak flows and velocities may be applied. The best way to prevent sedimentation of water resources is to prevent erosion in the first place. A certain amount of sediment loss is expected even under natural conditions, but losses one to two orders of magnitude higher are common in agricultural and developed watersheds. Stabilization may include “hard” methods such as riprap, concrete, or wooden structures, or may incorporate “soft” approaches involving more porous media and plantings. Each has its place, with advantages and disadvantages relating to site conditions,
Eutrophication and Aquatic Plant Management in Massachusetts
3.0 Methods to Control Nutrients Page 3-16
future use, longevity, and cost. In general, the steeper the slope, the higher the water velocity, and the less porous the natural soils, the more likely that “hard” techniques will be needed. Street Sweeping and Catch Basin Cleaning The transition from source control to pollutant trapping options is represented by street sweeping and catch basin cleaning. These techniques acknowledge the build-up of nutrients on impervious surfaces and attempt to remove them before they can reach streams or lakes. To be effective, streets must be swept often. Ideally, this means before every storm, but this is neither predictable nor practical, and sweeping every few weeks is about the maximum frequency observed. Catch basin cleaning renews the trapping capacity of catch basins and prevents high flows from resuspending and moving previously trapped pollutants. This practice could also be performed regularly, but almost never exceeds a frequency of twice per year, with many catch basins going years between cleanings. An additional limitation is that a majority of pollutants are associated with the smallest particle size fractions, and these smaller particles are not effectively collected by conventional brush street sweepers or detained in conventional catch basins. There is value in street sweeping and catch basin cleaning associated with maximizing the capacity and efficiency of downstream trapping systems. However, maximized nutrient capture requires the use of vacuum sweeping equipment and advanced catch basin design with at least annual cleaning. One problem with source control is that a potentially large portion of nutrient loads may arrive via the atmosphere from other watersheds. In a forested watershed with typical Massachusetts soils, these nutrients would be incorporated into the forest floor and only a small fraction would be carried with runoff. With increasing impervious surface area, through development of the watershed, a greater portion of these nutrients and many other airborne pollutants are washed into streams and lakes. Inability to control the sources, coupled with alteration of the watershed that limits natural trapping mechanisms, requires that we do more than attempt to minimize sources under our control to protect water quality.
3.2.3 Pollutant Trapping
3.2.3.1 Pollutant Trapping Applications
Pollutant trapping BMPs include a wide variety of techniques that may be applied to:
Urban landscapes – buffer strips, minimizing imperviousness, advanced catch basins, swales, detention ponds and infiltration systems to capture runoff from impervious surfaces and hold that runoff until pollutants can be removed by physical, chemical and/or biological processes. Handling the potentially high volume of runoff is a key consideration. Chemical treatment of runoff for nutrient inactivation, as with phosphorus binding by aluminum, can also be applied.
Recreational facilities – approaches much like those for urban landscapes, but with lower runoff generation and high potential to make productive use of runoff to maintain the recreational facility. Parks, ball fields and golf courses are the most common facilities addressed, and maintaining utility despite wet weather is a key factor in successful management.
Eutrophication and Aquatic Plant Management in Massachusetts
3.0 Methods to Control Nutrients Page 3-17
Agriculture – planting schemes, conservation tillage, manure handling systems, manure treatment systems, buffers, swales, detention ponds and infiltration systems to limit runoff generation and keep nutrients on the farm. Demonstrating a favorable economic trade-off between runoff management and intensity of land use is a key factor in achieving success.
Forestry – cutting schemes, road construction and drainage, buffers, swales, detention ponds and infiltration systems to minimize sediment and associated nutrient transport to streams. Facilitating access while minimizing impact on water quality is a key consideration.
Wastewater disposal – proper siting, construction, and maintenance of an appropriate system to maximize capture of wastewater nutrients. Maximizing performance of conventional tank and leaching systems or substituting alternative advanced on-site disposal systems is essential to minimizing impact on water resources. While additives have not been documented to be especially effective, a variety of chemical and biological additives have been applied.
Non-human sources – wildlife management, most notably for waterfowl, to minimize impacts on water quality. This may involve efforts to relocate populations or alter habitat to trap pollutants.
3.2.3.2 Technique Summary
Applicable techniques can be summarized as follows:
Buffer strips - Buffer strips (or vegetated filter strips or grassed buffers) are areas of grass or other dense vegetation that separate a waterway from an intensive land use. These vegetated strips allow overland flow to pass through vegetation that filters out some percentage of the particulates and decreases the velocity of the storm water. Particulate settling and infiltration of water often occurs as the storm water passes through the vegetation. Buffer strips need to be at least 25 ft wide before any appreciable benefit is derived, and superior removal usually requires a width >100 ft (Dennis et al., 1989), although a well designed system can be very effective at widths <100 ft (Lee et al., 2003). Wide buffers can create land use conflicts, but creative planting and use of buffer strips can be a low cost, low impact means to minimize inputs to the aquatic environment.
Minimization of impervious surfaces – Water quality response to runoff has been clearly
linked to the portion of the watershed that is impervious. While natural surfaces such as clay soil, muck soils, and exposed rock are functionally impervious, human derived surfaces such as roads, parking lots, driveways and roofs are major sources of runoff in developing watersheds. Once imperviousness exceeds 10% of the watershed area, water quality problems are often observed, and at levels in excess of 25%, water quality impairment almost always occurs (CWP, 2003). Imperviousness can be minimized by narrowing roadways, limiting development footprints, and incorporating porous pavement wherever feasible.
Advanced catch basins - Deep sump catch basins equipped with hooded outlets can be
installed as part of a storm water conveyance system. Deep sumps provide capacity for sediment accumulation and hooded outlets prevent discharge of floatables. Catch basins are usually installed as pre-treatment for other BMPs and are not generally considered adequate storm water treatment as a sole system. Volume and outlet configuration are key features
Eutrophication and Aquatic Plant Management in Massachusetts
3.0 Methods to Control Nutrients Page 3-18
that maximize particle capture, but it is rare that more than the coarsest fraction of the sediment/nutrient load is removed by these devices. A number of more advanced chamber designs are currently on the market. These self-contained units include an initial settling chamber for sediment removal, typically have hooded internal passages to trap oil and other floatables, and often incorporate some form of outlet pool to control exit velocity. Several rely on a vortex design to enhance sediment removal, while others rely on filtering mechanisms to augment the settling process. Such systems are most applicable as pre-treatment for other BMPs, but can trap much of the particulate nutrient load and are generally well suited as retrofits for relatively small areas in developed watersheds. Installing these devices as off-line systems may enhance nutrient removal, but their more common use as on-line pre-treatment devices can be very beneficial.
Swales – Engineered ditches can provide detention and infiltration while transporting runoff
to a planned discharge point. Use of dense vegetation and stone or wood check dams within the confines of a channel designed to handle substantial flows of runoff can slow water velocity, allow particulate nutrients to settle, and provide infiltration of a substantial fraction of the dissolved nutrient load. Less removal may occur during higher flows, but such flows do not often carry more of the total nutrient load than smaller storms in most watersheds as a consequence of the first flush phenomenon. Swales may be adequate for nutrient removal if large and long enough, but are more effective as pre-treatment devices before discharge to detention systems.
Detention ponds – Detention ponds are basins that are designed to hold a portion of storm
water runoff for at least 12-24 hours and preferably longer. Pollutant removal is accomplished mainly through settling and biological uptake, although incorporation of infiltration capacity can add substantial adsorptive capacity as well. Design features are extremely varied and depend on pollutant removal goals, regional climate, and localized site conditions. Detention facilities can be large ponds with multiple forms of aquatic habitat or small “rain gardens”. Wet detention ponds are often more effective than dry detention ponds as the latter have a greater risk of sediment re-suspension and generally do not provide adequate soluble pollutant removal. Although potentially very effective, the land requirement is typically large; the area should be at least 2% of the drainage area it serves, and preferably as much as 7% of that area.
Detention systems tend to be created wetlands, but design features that combine open water and emergent wetlands tend to provide superior nutrient removal (Kadlec and Knight, 1996). These systems maximize pollutant removal through vegetative filtration, nutrient uptake, soil binding, bacterial decomposition, and enhanced settling. Much of the effectiveness of the treatment is related to microbial action; the plants are more substrate than active pollutant removers, but removal rates are higher in the presence of plants. Detention systems are suitable for on-line or off-line treatment, but maintenance of adequate hydrology with off-line systems is necessary to support the complete wetland features that maximize effectiveness. Constructed treatment wetlands can function effectively in cold environments, mainly as a function of subsurface flow and related microbial uptake, adsortion, and filtration processes. Presence of aerobic and anaerobic conditions in sequential portions of the system
Eutrophication and Aquatic Plant Management in Massachusetts
3.0 Methods to Control Nutrients Page 3-19
is essential to reduction in nitrogen through sequential oxidation and reduction of nitrogen forms to convert organic forms to nitrogen gas.
Infiltration systems – Infiltration systems may include trenches, basins or dry wells, and
involve the passage of water through soil or an artificial medium such as a constructed berm. Particles are filtered by the soil matrix and many soluble compounds are adsorbed to soil particles. Such systems require sufficient storage capacity to permit the gradual infiltration of runoff into suitable soils or through the constructed medium (Claytor and Schueler, 1996). Pre-treatment of the runoff removes larger particles before filtration, thereby aiding in the prevention of infiltration system failure due to clogging and sediment accumulation. Phosphorus removal is maximized by infiltration, but dissolved forms of nitrogen may be only minimally affected.
Site constraints such as shallow depth to groundwater or bedrock and poorly drained soils often limit the effective use of infiltration, so detailed knowledge of the site is essential when planning infiltration facilities. In sites with suitable conditions, off-line infiltration systems are generally preferred. One key to successful infiltration is providing adequate pre-infiltration settling time or other treatment to remove particles that could clog the interface at which infiltration occurs. Another key is having sufficient runoff detention capacity to allow delivery of runoff to the infiltration surface at a rate that maximizes performance. Both key factors can be met by combining adequate detention capacity with infiltration systems.
Planting plans – The spatial and temporal features of planting, coupled with the actual crops
chosen, can greatly affect the movement of nutrients off farm fields. Cover crops stabilize soils, and may be used as interim cover or as a supplemental crop in association with plants that grow up through the cover crop to form another layer above it. Interspersing of crops can create buffer zones such that potential nutrient losses after harvest of one crop are held by the other. The basic philosophy of the planting plan is to minimize bare soil and create buffer zones that have economic as well as ecological value.
Conservation tillage – The pattern of plowing on a farm can be a great aid to minimizing the
movement of nutrients. Contouring, terracing, and related approaches minimize the peak velocity attained by runoff and maximize infiltration of rainwater. Coupled with an effective planting plan, the quantity of runoff generated from the field can be greatly reduced; this translates into reduced nutrient loading to area waterways.
Manure handling systems – Livestock operations have the potential to contribute nutrient
loads that overshadow most other sources, and represent a distinct health hazard as well. Manures are of special concern as they are relatively high in phosphorus relative to nitrogen and attempts to meet the nitrogen requirements by application of manure may result in losses of phosphorus to the adjacent surface waters. Handling manure in a manner that limits interaction with precipitation and incorporation into runoff is essential to protecting aquatic habitats. The Natural Resource Conservation Service, NRCS, (formerly the Soil Conservation Service, SCS) suggests that manure application be kept as far away as possible from streams and lakes, and that the application of manure be avoided during the winter months when frozen soils result in large losses to the streams in runoff (Diane Leone, NRCS,
Eutrophication and Aquatic Plant Management in Massachusetts
3.0 Methods to Control Nutrients Page 3-20
pers. comm., 1995). Covered feeding areas, manure collection systems, covered storage, and proper spreading on farm fields or disposal by other means are all necessities of best management for livestock facilities.
Even with proper spreading practices, the capacity of fields to adsorb and utilize the phosphorus provided by manure is often inadequate. In Wisconsin, a practice of phosphorus build up in soils by overfertilizing has resulted in an excess of phosphorus being applied to the field in the form of manure and inorganic fertilizers (Wedepohl, 1995). This practice was designed to optimize crop production, but it results in eutrophication of sensitive waters, and this practice appears to be occurring in Massachusetts as well. For example, soils tested from silage cornfields in Massachusetts show fairly high levels of phosphorus and thus do not require large additional amounts of phosphorus fertilizers (S. Bodine, UMASS, pers. comm. 1995). Therefore, extensive and creative systems are needed to effectively manage manure from livestock operations. Recent studies suggest alum and other chemical additives may reduce phosphorus leaching from poultry litter and manure (Moore and Miller, 1994; Shreve et al., 1995). Conversion of manure to energy is a novel approach most recently advanced in Maryland.
Chemical additions – The use of phosphorus binders has long been practiced in water and wastewater treatment, but has only recently been extended to storm water treatment, manure management, and septic systems. Aluminum compounds have been most popular, as they bind and hold phosphorus in a biologically unavailable form under the widest range of conditions. Storm water treatment systems have been developed most extensively in Florida (Harper et al., 1999), but systems are in operation in New Jersey (S. Souza, PHydro, pers. comm., ) and pilot testing has been completed in Massachusetts, albeit with limited success (ENSR, 1997a). Manure treatment with alum is being researched in several areas with high concentrations of poultry, swine and cattle (J. DeWolfe, Sear Brown, pers. comm., 2002). The addition of alum to septic tanks does not appear to have moved beyond the conceptual stage (Brandes, 1977).
Cutting plans – Forestry operations usually involve cutting trees, and loss of this vegetation
destabilizes the forest ecosystem and often results in increased nutrient losses. A proper cutting plan can minimize those losses, and incorporates thinning instead of clearcutting, cutting patterns that maintain buffer zones, and use of waste vegetation to stabilize cut areas to the extent possible.
Road construction and drainage – Although road management is important in all areas,
proper construction and maintenance of logging roads is critical to minimizing nutrient inputs from forestry operations. Access is essential to the industry, but the temporary roads often represent a major threat to nearby streams. Road routing, slope, surface treatment, and drainage characteristics are important features. The basic objective is to prevent erosion and to direct runoff into stable areas for detention or infiltration. Stream crossings need to be stabilized to the maximum practical extent.
Conventional septic systems – Most on-site domestic sewage treatment consists of either the
older cesspool (single chamber, open bottom pit type, no longer in construction) or the newer
Eutrophication and Aquatic Plant Management in Massachusetts
3.0 Methods to Control Nutrients Page 3-21
septic tank with leaching field or chamber. Most septic systems consist of a subsurface chambered tank where scum and settleable solids are removed from the liquid by gravity separation, and a subsurface drain system where the clarified liquid effluent percolates into the soil. Regular inspection of the system is recommended, with pumping as experience dictates or according to calculations based on the number of people served and the size of the tank.
For conventional septic systems, the management techniques are detailed in Title 5 of the State Environmental Code 310 CMR 15.00 et. sec. (see State Sanitary Code in Appendix II). These regulations were revised in 1995, but allow older cesspools (pit type sewage tanks with open bottoms and sludge retention in the pit) to remain unless they fail inspection criteria outlined in CMR 15.00. Any new septic systems must comply with design and construction standards given in 310 CMR 15.00, which specifies the leach field must have a minimum setback of 50 feet from surface waters. To protect resources, additional restrictions on septic systems may be imposed by local ordinance. Phosphorus is removed to a moderate degree in both the septic tank and the leachfield, owing to chemical reactions that tend to convert phosphorus into particulate forms. Even beyond the leaching field or chamber, soils adsorb phosphorus at high rates. With low adsorption rates on the order of 1 microgram per gram of soil, even sand will capture much of the phosphorus load from a septic system as long as the soil is aerated and past loading has not exhausted the adsorptive capacity. Where the system is in fractured rock or compacted soil with fissures, such removal may not be realized. Likewise, where system failure results in a breakout of septic effluent at the ground surface, removal of phosphorus will be severely reduced. Yet overall, the data from the more detailed D/F studies (those involving direct measurement of inseepage quality) indicate very limited impacts from phopshorus loading from septic systems on most lakes. Septic systems should be managed for long-term successful operation, but it should not be assumed that they are major sources of phosphorus without supporting data. However, even a properly sited, well-maintained, conventional septic system will release a substantial amount of nitrogen into the ground. Much of the nitrogen in a septic system is in a soluble form or becomes soluble. Physical and chemical soil processes do little to reduce discharge concentrations, which may exceed 50 mg/L. Site limitations and the inability of conventional septic systems to capture more than about 10% of the nitrogen load has fostered a variety of alternative systems (Heufelder and Rask, 1997; USEPA, 2002).
Advanced on-site wastewater disposal systems – In cases where a septic system fails and/or
the site can not accommodate a conventional system due to size or performance needs, there are many approved alternate technologies for septic systems in Massachusetts. These include the recirculating sand filter, composting toilets, Bioclere system, Eljen in-drain system, Environchamber, Ruck system, and the Saneco intermittent sand filter, to name just a few. More recently tested systems include the Smith and Loveless system, the Amphidrome process and the Krofta compact clarifier (MDEP, 1995). A variety of concepts are put to work in these systems, but most take advantage of multi-stage processes to enhance the treatment methods at work in conventional systems or add new treatment approaches. Some
Eutrophication and Aquatic Plant Management in Massachusetts
3.0 Methods to Control Nutrients Page 3-22
systems are designed to enhance infiltration in low permeability sites, but most focus on achieving better overall effluent quality.
Many of these are designed to remove nitrogen, but apparently none have a demonstrated ability to remove significantly more phosphorus than conventional systems. This is not surprising, given the generally acceptable performance of conventional systems with regard to phosphorus. Research into enhancing phosphorus removal in septic systems is ongoing.
Habitat alteration for wildlife control – As waterfowl like geese and ducks are often the
primary target of such management, and these animals prefer open shorelines with easy access from water to land and vice versa, control is often a function of dense buffer establishment. This is entirely consistent with buffer use for runoff control. Additional controls often involve choosing plantings that decrease habitat value for species considered undesirable. Elimination of habitat is almost never the goal, as this leads to conditions that facilitate other undesirable inputs (e.g., clearcutting with impervious surfaces or fertilized lawns). Ecological balance should be sought, although this is sometimes an elusive concept and is rarely a stable condition.
3.2.4 Effectiveness
3.2.4.1 Short-Term
In general, NPS nutrient control techniques are not expected to be effective in controlling lake eutrophication in the short-term. The soils and groundwater may have high levels of nutrients that continue to runoff or leach into the lake even if source controls and pollutant trapping are fully and properly implemented. Zoning is basically a preventive measure to reduce NPS pollution before it is created. NPS control methods are not considered as effective short-term treatments for eutrophic waters.
3.2.4.2 Long-Term
NPS controls are intended to provide long-term benefits with proper implementation and maintenance. Strong and widespread evidence for long-term effects is not common, but then most NPS control efforts are no more than three decades old and are still gaining momentum. The case for long-term benefits is supported by data for drainage areas where NPS pollution is a dominant influence and has been addressed to a substantial degree, but the record is by no means complete enough to make strong generalizations about effectiveness; the range of results is quite large. Based on the many publications reviewed, Table 3-2 presents expected removal rates for N and P for various storm water management devices. Variability can be high, but the values do provide a general impression of the removal rates achievable. Techniques not listed in Table 3-2 are more difficult to evaluate in terms of effectiveness.
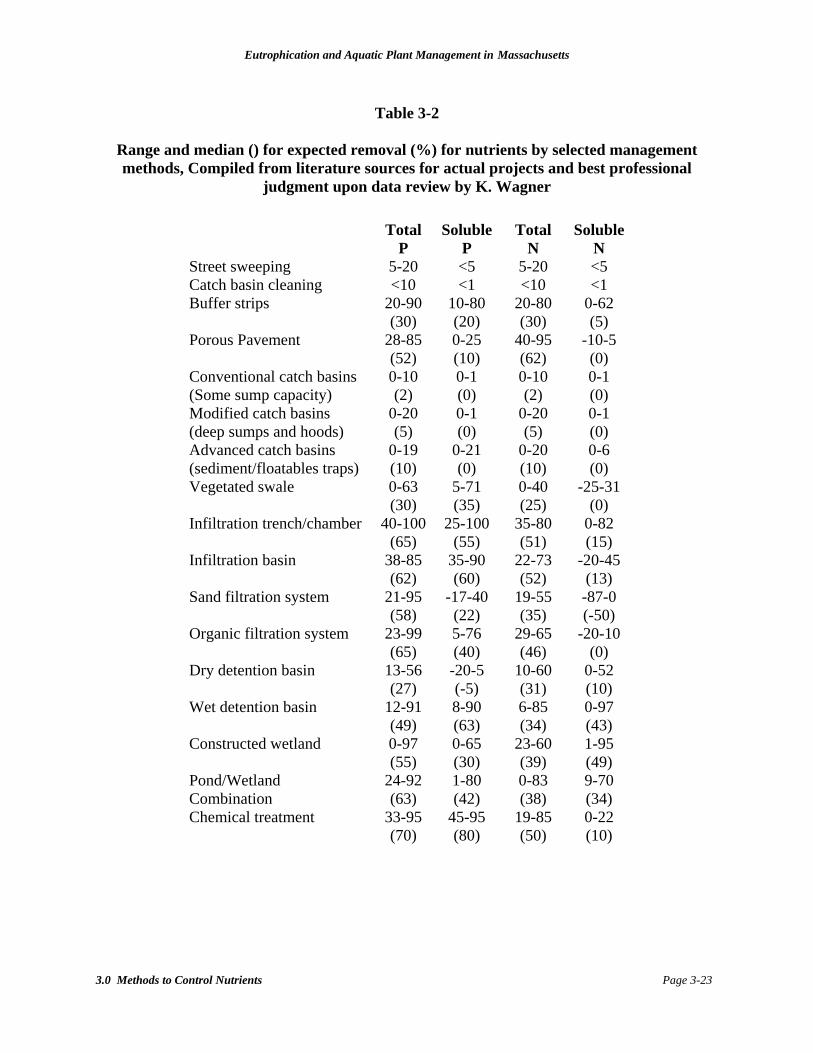
Eutrophication and Aquatic Plant Management in Massachusetts
3.0 Methods to Control Nutrients Page 3-23
Table 3-2
Range and median () for expected removal (%) for nutrients by selected management methods, Compiled from literature sources for actual projects and best professional
judgment upon data review by K. Wagner
Total P
Soluble P
Total N
Soluble N
Street sweeping 5-20 <5 5-20 <5 Catch basin cleaning <10 <1 <10 <1 Buffer strips 20-90
(30) 10-80 (20)
20-80 (30)
0-62 (5)
Porous Pavement
28-85 (52)
0-25 (10)
40-95 (62)
-10-5 (0)
Conventional catch basins (Some sump capacity)
0-10 (2)
0-1 (0)
0-10 (2)
0-1 (0)
Modified catch basins (deep sumps and hoods)
0-20 (5)
0-1 (0)
0-20 (5)
0-1 (0)
Advanced catch basins (sediment/floatables traps)
0-19 (10)
0-21 (0)
0-20 (10)
0-6 (0)
Vegetated swale 0-63 (30)
5-71 (35)
0-40 (25)
-25-31 (0)
Infiltration trench/chamber 40-100 (65)
25-100 (55)
35-80 (51)
0-82 (15)
Infiltration basin 38-85 (62)
35-90 (60)
22-73 (52)
-20-45 (13)
Sand filtration system 21-95 (58)
-17-40 (22)
19-55 (35)
-87-0 (-50)
Organic filtration system 23-99 (65)
5-76 (40)
29-65 (46)
-20-10 (0)
Dry detention basin 13-56 (27)
-20-5 (-5)
10-60 (31)
0-52 (10)
Wet detention basin 12-91 (49)
8-90 (63)
6-85 (34)
0-97 (43)
Constructed wetland 0-97 (55)
0-65 (30)
23-60 (39)
1-95 (49)
Pond/Wetland Combination
24-92 (63)
1-80 (42)
0-83 (38)
9-70 (34)
Chemical treatment 33-95 (70)
45-95 (80)
19-85 (50)
0-22 (10)
Eutrophication and Aquatic Plant Management in Massachusetts
3.0 Methods to Control Nutrients Page 3-24
Documentation Issues Although NPS pollution is thought to be the major source of nutrients to surface waters in Massachusetts, evaluation of management results has been a shortcoming in many lake and watershed management programs. The title of a 2001 report by a committee to congress, “Better Data and Evaluation of Urban Runoff Programs Needed to Assess Effectiveness” (GAO, 2001), also acts as a concise summary. The problem stems partly from scale of application, as NPS pollution is widespread by nature in most watersheds and NPS controls have not been exercised on a watershed-wide basis. On a smaller scale there are plenty of examples of BMPs reducing nutrient loading, but typically other sources of nutrients within the watershed of the lake still contribute to eutrophication in the lake(s) downstream. The recently instituted demonstration projects in lake management, sponsored by the Executive Office of Environmental Affairs, represent a more comprehensive effort to apply NPS controls on a whole watershed basis and to document the results. The Long Pond (Littleton, MA) project involves a variety of Low Impact Development techniques being applied on a larger scale than in most watersheds (S. Roy, GeoSyntec, pers. comm., 2002). In many cases it is difficult to discern changes in lake water quality resulting from NPS controls in only a part of the watershed. This is a function of both the level of monitoring needed and the detection limits often achieved for phosphorus. Livestock and related agricultural BMPs applied to the Pontoosuc Lake watershed appear to have reduced inputs to area streams, but any changes in the lake itself could not be detected at the relatively low levels of phosphorus observed (<40 ppb in most samples, pre- and post-application) with only a few storms sampled (ENSR, 2000a). Likewise, the reduction in phosphorus loading to Lake Lorraine after multiple storm drains were tied into leaching chambers was apparent from individual storm discharge data, but the change in the lake during the first year of infiltration was not statistically significant for this relatively clean lake (ENSR, 1997b). Claytor and Brown (1996) provide a framework for evaluating the success of NPS programs aimed at storm water, including physical, chemical and biological measures. For lakes, water quality indicators and biological indicators are suggested as the most useful evaluation factors, applied close to the management action as well as in the target lake. Urban Runoff BMPs Where the portion of the watershed subject to NPS controls has been monitored, or the NPS pollution addressed is the dominant influence on the lake, evidence of success has been gathered. The Emerald Square Mall storm water management project in North Attleboro, MA, included over 10 years of discharge monitoring that revealed water quality suitable for discharge into a drinking water supply (D. Lowry, ENSR, pers. comm., 2000; unpublished DMR data on file with USEPA). There is a great deal of literature documenting reduction of nutrient export in streams associated with BMPs (Schueler, 1997; WDNR, 1997b, USEPA, 1999; Winer, 2000). The actual amount of nutrient reduction will depend on the type of treatment and the percent of the watershed under management. In general, BMPs are thought to be effective at preventing further deterioration and enhancing the effectiveness of other nutrient control techniques. Effectiveness of techniques aimed at urban storm water is highly dependent upon the extent and details of application. Urban BMPs such as porous pavement can reduce TP by 40 to 80%

Eutrophication and Aquatic Plant Management in Massachusetts
3.0 Methods to Control Nutrients Page 3-25
(Schueler, 1987). However, Schueler et al. (1992) caution that some BMPs such as porous pavement have poor longevity unless well designed and maintained. Generally, street sweeping does not produce significant reductions in pollutants such as phosphorus that are associated with fine particles (Robbins et al., 1991), but is a valuable pre-treatment step before infiltration, which can potentially decrease phosphorus levels by over 90%. Riparian forests have been shown to reduce groundwater nitrate concentrations by 36 to 80 percent (Simmons et al., 1992). Peterjohn and Correll (1984) found riparian forests to be effective at trapping nutrient runoff and leaching from agricultural fields. However, buffer width of at least 15 meters was determined to be necessary under most conditions (Castelle et al., 1994). Welsh (1991) provides a useful overview of buffer effectiveness and controlling factors. In terms of overall effectiveness, a study by the Center for Watershed Protection (Caraco et al., 1998) indicated 46 to 60% reduction in P and 42 to 46% reduction in N when storm water BMPs were applied (termed “innovative site design”) versus a conventional development approach. The study included comparisons of medium density residential, rural subdivision, shopping center, and office park developments, and also found that the cost of development was lower by 5 to 20% with the innovative site design techniques. Much of the benefit was derived by the 18 to 35% reduction in impervious cover. Agricultural Runoff BMPs Agricultural BMPs generally do not show dramatic reductions in loading except in small subwatersheds where phosphorus loading has been shown to be reduced by 26-44 percent (Meals, 1993). Stafford Pond, a drinking water supply and recreational resource in Tiverton, RI, was impacted by a dairy farm in one small sub-watershed. That dairy farm was subjected to operational and structural controls, and conditions in Stafford Pond improved dramatically over a single year (ENSR, 1997c; K. Wagner, ENSR, pers. obs., 1996-2000; RI Watershed Watch Program, unpublished data, 1990-2000). Preliminary results from agricultural BMPs in the Lake Murray watershed of South Carolina suggest significant reductions of nutrients entering the lake (USEPA, 1996). Participation can be a major factor in agricultural BMP success. Another study of the effectiveness of BMPs found that low participation by farmers in the project area prevented the BMPs from achieving the desired phosphorus reduction goals (Johengen et al., 1989). A five year study in Lake Hermon, South Dakota found that voluntary BMPs (sediment control structures) reduced sediment and nutrient loads. However, no reduction was seen in the lake nutrient levels even though 87 percent of the land area had been treated with BMPs (Payne and Bjork, 1984). At some sites Payne and Bjork (1984) found that sediment control structures did reduce concentrations of total phosphorus and inorganic nitrogen, but the cumulative effect was not measurable within the constraints of the program. In theory, nutrient management programs can be effective at reducing nutrient loadings from agricultural fields to surface waters while saving fertilizer costs. A review of agricultural pollution reduction programs indicates reductions of 22.8 to 84.2 pounds per acre for phosphorus and 11 to 44.7 pounds of nitrogen per acre (USEPA, 1993).
Eutrophication and Aquatic Plant Management in Massachusetts
3.0 Methods to Control Nutrients Page 3-26
On-Site Wastewater Disposal Systems Septic systems are most effective at reducing nutrients when they are properly sited, designed and maintained, but even then the control of nitrogen is limited. The potential for groundwater and surface water contamination increases as the density of septic systems increases (Scalf et al., 1977). A study by the USGS on Cape Cod (Persky, 1986) found a strong correlation between housing density (and by extension, septic system density) and nitrate levels in the groundwater, but also found septage disposal sites and fertilization practices to be influential. This study found no relation of sodium, ammonium, or pH to housing density. Septic systems may fail if underdesigned or if they are constructed in areas where soils are not sufficiently permeable and where the water table is too high (Robbins et al., 1991). If not pumped regularly (typically about every 2 to 4 years) solids may accumulate in the tank and eventually clog the leach field, causing failure. In such cases the effluents may appear at the ground surface and reach surface waters with runoff. Nitrogen is higher in concentration than phosphorus in septic tanks, averaging about 40 mg/L for total nitrogen and reaching levels as high as 70 mg/L. Septic tanks are generally ineffective at removing nitrogen, but generally cause conversion of organic nitrogen to ammonium ions (Cantor and Knox, 1985). The ammonium is then converted to nitrate in the soil and may affect nearby lakes. In zones designated as nitrogen sensitive areas (see 310 CMR 15.215), regulations limit the size of new systems. For details, exceptions and information on enhanced nitrogen removal systems see 310 CMR 15.214 et seq. Removal of about half the nitrogen is possible on average with advanced systems, with removal rates ranging from 22 to 80% (Heufelder and Rask, 1997) In Massachusetts, phosphorus content of laundry detergents was restricted as of 1994 (105 CMR 680). Estimates of potential reduction in phosphorus loading to lakes from a reduction of phosphorus in septic system effluent range from 0 to 25%, with an average of 8.5% (IEP and Walker, 1991). However, it was noted that estimation of attenuation of phosphorus between the leachfield and the lake may not have been adequate, suggesting that these estimates are high. Follow-up analysis of more recent data for lakes used in the IEP/Walker study indicates that no change in phosphorus loading from septic systems is detectable as a result of the phosphate detergent ban, mainly as a consequence of monitoring and methodological constraints (ENSR, 2003). Untreated domestic wastewater may contain between 4 and 15 mg/L of total phosphorus (Metcalf and Eddy, 1979). Much of this is in particulate form and will be trapped in the tank. It would not be unusual to find 1 to 3 mg/L in the wastewater entering the leaching system, however. The concentration of phosphorus entering the leachfield is reduced by about 50% by the adsorption system in the immediate vicinity of the leachfield (Cantor and Knox, 1985), and will decline further in accordance with soil properties as the effluent moves through the soil. As phosphate is adsorbed onto iron and aluminum oxides in acid and neutral soils and calcium tends to bind with phosphates in alkaline soils, transport to surface waters may not be a major concern in most cases. However, when septic systems are located near a water body or in sandy or gravelly soils with poor cation exchange capacity, there may be transport to nearby surface waters. The variability
Eutrophication and Aquatic Plant Management in Massachusetts
3.0 Methods to Control Nutrients Page 3-27
in potential impacts is too great to depend upon generalizations from the literature, and site specific studies are needed. A review of septic system impacts at the watershed level (Swann, 2001) indicates a lack of scientific support for claims of major impacts or lack of impact. Septic systems are believed to be a major source of coastal pollution and groundwater contamination, but this is a function of nitrogen discharge, and there is little evidence to suggest that septic systems contribute appreciably to phosphorus loading at the watershed level. Preventive Zoning The effectiveness of zoning is difficult to assess because zoning laws differ in each town and zoning is by nature a preventative measure rather than a treatment. In this respect, zoning effectiveness at reducing lake eutrophication is similar to BMPs; the effectiveness will depend on the methods and extent of application. One method to assess the effectiveness of zoning is by modeling the export of nutrients under different land-use scenarios as suggested by Harper et al. (1992). Reviews of nutrient export studies indicate that urban areas export the most phosphorus per unit area (0.1 g/m2/yr), followed by agriculture at 0.05 g/m2/yr and forests at 0.005 to 0.01 g/m2/yr, while atmospheric deposition directly to the lake is estimated at 0.025 g/m2/yr (Rast and Lee, 1983). The same study reported that nitrogen export rates show smaller differences, with both urban and rural areas exporting 0.5 g/m2/yr, and forests exporting 0.3 g/m2/yr. These rates suggest that the best zoning strategy to reduce eutrophication is to limit urban development and promote forest lands. Simple calculations suggest how much phosphorus and nitrogen can be expected to be reduced under any proposed zoning regulations.
3.2.5 Impacts to Non-Target Organisms Few adverse impacts of using best management practices to reduce non-point source pollution are expected. Care must be taken at the point of application (e.g., where a detention basin, swale, or buffer strip is constructed) not to disturb sensitive habitat, especially for protected species. Most techniques have a tendency to create or protect habitat, however, and are perceived as beneficial to the overall ecosystem. Constructed detention areas may provide valuable wetland habitat, although the primary function of these systems should not be forgotten. Buffer strips provide habitat for a variety of species in addition to water quality benefits. Reduction in impervious surface preserves habitat. Methods for non-point source pollution abatement are generally intended to enhance conditions for a majority of species. However, reduced nutrient loading means lower overall fertility in the receiving lakes, which usually means lowered fish production. This may produce a ripple effect throughout the lake ecosystem, with quantitative decreases in species that eat fish, such as certain waterfowl and mammals. Qualitative aspects of the ecosystem are expected to improve, and may offset any quantitative losses, but lower productivity is not consistent with all management goals. In some cases there may be temporary and limited adverse effects such as increased erosion during construction of structural controls for erosion (e.g. terraces) or in construction of manure holding tanks, but these adverse impacts are small in comparison to the expected benefits. In the long-term, most non-target organisms should benefit from most of these methods. As with any management program, however, there may be some trade-off between habitats and species, and the goals of the project should be stated clearly and be consistent with regulatory constraints.
Eutrophication and Aquatic Plant Management in Massachusetts
3.0 Methods to Control Nutrients Page 3-28
3.2.6 Impacts to Water Quality There may be some short-term increase in suspended sediments during construction of structures, but this is expected to be small and easily controlled in most cases. Over the long-term, water quality should improve, although it may take more than a year to discern improvements.
3.2.7 Applicability to Saltwater Ponds Although no literature is available on the use of NPS nutrient controls specifically for saltwater ponds there is no reason that they could not be used successfully. The USEPA (1999) manual for management measures for NPS in coastal waters contains considerable applicable guidance. Saltwater ponds may be limited by nitrogen rather than phosphorus and nutrient testing should be conducted prior to beginning NPS nutrient reduction. If the emphasis is to be placed on nitrogen, the relative value of many techniques may be altered (Table 3-2). In many cases, septic system management will become a prime concern, as on-site wastewater disposal is a major nitrogen source. Improving septic systems may also improve the possibility for shellfishing in saltwater ponds due to the reduction in fecal coliform bacteria levels.
3.2.8 Implementation Guidance
3.2.8.1 Key Data Requirements
Data requirements for this type of nutrient control include an accurate nutrient budget including both a measured mass balance and a land-use source analysis. Nutrient budgets should include analysis of all inputs, including internal sources (recycle within the lake, Section 1). Nutrient control should target enough of the load to attain the desired reduction in loading to the lake, with estimates of effectiveness made for lake recovery in terms of total phosphorus levels and Secchi disk transparency. Models of watershed loading and lake response are helpful in this regard, but only mimic reality; the use of several modeling approaches is recommended. For most structural techniques in NPS control, knowledge of the expected water load is essential to proper sizing and other treatment considerations. Systems must have adequate capacity to handle inflows up to the point at which lowered treatment efficiency is not considered a problem for achieving nutrient loading reduction goals and the system itself will not be damaged. Undersizing NPS controls is the primary cause of failure to achieve treatment objectives. Flow considerations include total volume, distribution of volume over time, peak flows, and the distribution of nutrient loads in the flow over time. Storm water is notoriously variable in quantity and quality, but effective treatment must account for that variability. Because of the potential for long-term benefits and minimal adverse impacts, non-point source nutrient control should be encouraged in the watersheds of all lakes. However, additional techniques may be necessary to achieve desired conditions.
Eutrophication and Aquatic Plant Management in Massachusetts
3.0 Methods to Control Nutrients Page 3-29
3.2.8.2 Factors That Favor This Approach
The following considerations are indicative of appropriate application of NPS controls for reductions in nutrient concentrations in lakes: 1. A substantial portion of the P and/or N load is associated with NPS pollution. 2. Studies have demonstrated the impact of identifiable sources (e.g., piped runoff, septic
systems) on the lake. 3. Water associated with NPS inputs is important to lake hydrology. 4. Sizing and pollutant removal functions have been properly calculated. 5. Jurisdiction can be claimed over areas of NPS contribution. 6. Land is available for placement of BMPs. 7. Detention capacity is available to hold a substantial portion of the targeted runoff. 8. Detention and/or infiltration will not cause local flooding problems, wet basements, or
structural damage. 9. Infiltration will not cause groundwater quality deterioration. 10. Zoning or other restrictions on uses of land are properly justified and consistent with
applicable state and local laws.
3.2.8.3 Performance Guidelines
Planning and Implementation Perhaps the most significant problem involved with BMPs is convincing farmers and landowners that it is in their best interest to reduce non-point source pollution. Usually an agency such as the Natural Resources Conservation Service works with farmers and landowners on a one to one basis, but this takes time and it is difficult to get all of the landowners in the entire watershed to cooperate. Major educational efforts appear essential to success, but are rarely supported to the extent necessary. Implementation of NPS control on a watershed level is therefore typically a slow process of many small steps. Monitoring on the proper spatial and temporal scale is essential to demonstrating success, and success builds upon success. Long-term vision, public relations and funding are as important as science in accomplishing NPS control goals. An effective lake association can help in getting property owners to reduce NPS pollution. The area adjacent to the lake is the most critical for phosphorus loading in most cases, as there is less opportunity for pollutant trapping. Simple measures such as not using phosphorus fertilizers on lawns and using phosphorus free cleaning agents may reduce the local sources of phosphorus to the lake. More involved actions such as buffer strip creation and maintenance, installation of detention or infiltration systems, and minimization of impervious surface area are likely to provide even greater benefits, but may be more difficult to achieve. Funding incentives are often needed. Upgrading septic systems can be expensive. Regular maintenance and pumping add additional costs, and surveys of watershed residents during many of the D/F studies of the 1980s suggested that most systems are not properly maintained. The new Title V creates disincentives for allowing systems to fail, and educational programs have raised awareness in specific watersheds, but more effort is needed. Nitrogen loading can be modeled fairly reliably as a consequence of many past studies. However, as the impact of septic systems on phosphorus loading is highly variable, lake-specific studies may be needed to determine the value of septic system
Eutrophication and Aquatic Plant Management in Massachusetts
3.0 Methods to Control Nutrients Page 3-30
management or alternative wastewater disposal arrangements. The economic impact of a failed septic system is severe enough to warrant at least regular inspection and pumping (1-4 years depending on size and use features), and cooperation in this regard should be largely a matter of public education. Zoning regulations can be seen as excessive governmental control over private lands, and thus are often resisted by landowners. Where development has already occurred, this may not be a very fruitful approach, but when a rural area is expected to be developed, a master plan can preserve the very characteristics that make the community so desirable for development. Monitoring and Maintenance For many of the BMPs to remain effective, they must be maintained. However, design of many BMPs attempts to minimize the frequency of maintenance needed. Most detention facilities need not be cleaned out more than once every 5-10 years. Most catch basin systems should be inspected at least annually, with annual cleaning likely to be necessary. Infiltration systems will lose capacity and eventually clog, with maintenance frequency dependent upon loading characteristics. For each NPS project, a monitoring and maintenance plan should be developed at the start. Monitoring of the nutrient concentrations in water entering and leaving areas under management by BMPs should be conducted both before and after implementation to estimate the effectiveness of the BMPs. Monitoring should also be conducted in the lake to measure effectiveness on an ongoing basis, but immediate improvement with small scale BMPs in any but the smallest watersheds should not be expected. Mitigation No mitigative measures are typically required except erosion control during construction of structures, but there are exceptions. For example, the application of phosphorus inactivators to storm water may require pH control, and deposition of residuals formed by precipitation has been raised as a concern. Again, monitoring on appropriate spatial and temporal scales is necessary to assess any need for mitigation.
3.2.9 Regulations
3.2.9.1 Applicable Statutes
Runoff BMPs In general there are no regulations that limit the use of BMPs, unless work is being conducted in wetland resources or alters them by discharge. There are exemptions in the Wetlands Protection Act for some agricultural activities (see WPA, Appendix II). In cases where wetlands are being threatened by erosion, nutrient runoff or other poor land management techniques, the local Conservation Commission may require BMPs under the Wetland Protection Act. The Massachusetts Storm Water Policy provides guidance on types of BMPs and targets for runoff control in association with new development or re-development. Provisions of this policy generally encourage infiltration, but may restrict it if certain pollutants are involved and will increase costs in most cases (simple infiltration without any pre-treatment is discouraged).

Eutrophication and Aquatic Plant Management in Massachusetts
3.0 Methods to Control Nutrients Page 3-31
BMPs are required during forest harvesting to reduce NPS pollution as stated in MGL C. 132 s.40-46 the Massachusetts Forest Cutting Practices Act. An approved Forest Cutting Plan is required and a Notice of Intent must be sent to the Conservation Commission with a copy to the Department of Environmental Protection Regional Office. If the proposed project occurs within an Estimated Habitat of Rare Wildlife in the most recent version of the Natural Heritage Atlas, a copy of the Notice of Intent must be submitted to the Natural Heritage and Endangered Species Program (NHESP) within the MDFG for review (Appendix II). If the proposed project occurs within a Priority Habitat of Rare Species in the most recent version of the Natural Heritage Atlas, the project proponent must submit project plans to the NHESP for an impact determination. Notification must be mailed to abutters within 200 feet of the harvest area (Kittredge and Parker, 1995). Septic Systems Under Title 5 approved septic systems are required for sewage disposal in areas where sewer connections are not available. For details see the State Sanitary Code (Appendix II). Zoning Zoning regulations differ in each town. Generally, most towns have minimum limitations on lot sizes. The state has passed further restrictions on development within 200 feet of rivers and streams (Rivers Protection Bill, Appendix II).
3.2.9.2 Impacts Specific to Wetlands Protection Act
The following overall impact classification is offered as a generalization of impacts, with clarifying notes and caveats as warranted: 1. Protection of public and private water supply – Benefit (surface water quality enhanced), but
possible detriment to groundwater from infiltration. 2. Protection of groundwater supply - Benefit to neutral (reduced runoff may mean greater
infiltration), but possible detriment to groundwater from infiltration (groundwater quality issues).
3. Flood control - Benefit (reduced runoff volume or detention capacity increase). 4. Storm damage prevention - Benefit (based on flood control and erosion avoidance). 5. Prevention of pollution - Benefit (water quality enhancement). 6. Protection of land containing shellfish - Neutral, but possible benefit through water quality
enhancement. 7. Protection of fisheries - Benefit (water quality enhancement), but possible detriment through
reduced fertility. 8. Protection of wildlife habitat – Benefit (water quality enhancement and habitat creation), but
possible detriment through reduced fertility.
3.2.10 Costs The actual costs of the BMPs vary depending on the method, and it would be best to express costs on the basis of $/lb of P removed or $/acre of watershed. This has rarely been done, however, making cost comparisons difficult. While cost is always a factor in resource management decisions, in NPS control efforts it may be better to decide first on the most appropriate approach and then work out the costs.
Eutrophication and Aquatic Plant Management in Massachusetts
3.0 Methods to Control Nutrients Page 3-32
Perhaps the most effective, simple and inexpensive BMP is a simple soil test for nitrogen and phosphorus. The soil test requires only a cup of soil (preferably collected by combining many small samples from various areas of the field), and usually costs about $10 per sample. The Soil and Plant Testing Laboratory at the University of Massachusetts will test the soil and make fertilizer recommendations for the lawn or farm. Other simple BMPs that carry minimal cost include use of non-phosphate fertilizers, leaving a buffer zone along a stream (where it already exists), minimizing impervious surface (this may also save money in construction), conservation tillage, following a forest cutting plan, and inspection of septic tanks. Pumping of septic tanks typically costs $150 to $250, a small cost compared to the expense of system replacement after failure (typically >$4000 and possibly as high as $20,000). Zoning regulations do not cost money per se, but they may have economic impacts on land values and property taxes, depending on how they are implemented. Likewise, costs associated with passage of local ordinances are largely internalized within the community, but the economic impact is highly variable and may be substantial. Educational efforts have frequently been conducted in watersheds for $2000 to $20,000, but these have been cited as underfunded relative to the need. The cost of structural controls is somewhat site specific, and any estimate of “typical” costs will have a high confidence interval around it. Detention basins tend to cost on the order of $20 per cubic yard of detention, with the volume of needed detention dependent upon watershed size and expected storm water flows. For a detention basin serving a 10-acre drainage area with type C (moderately low permeability) soils and a design storm of 2 inches, the target capacity would be around 1750 cy at a cost of about $35,000. A lower cost may be possible if the topography minimizes excavation needs, and a higher cost might be incurred if there are issues with ledge or discharge to sensitive receiving waters. Land costs are also extra, and may be substantial. Infiltration structure costs depend largely on needed capacity, which is a function of both the rate of incoming runoff and the infiltration rate of the soil or bermed medium. Simple manhole or catch basin replacements, which involve installing a perforated chamber to allow leaching before overflow, can be put in place for about $6,000 to $10,000 each. A drainage system for a typical residential street might be served by 1-3 of these leaching structures. More sophisticated offline systems, whereby runoff up to some design capacity (preferably the first 0.5 inches or more of runoff from the drainage area) is diverted to a chamber or set of pipes for infiltration, can be considerably more expensive. Such an arrangement for the same “typical” residential street might cost more than $50,000, and might require an additional detention area if the soils are not porous enough to keep up with runoff generation. Combined systems (e.g., pond/wetland, detention/infiltration) may cost as much as the individual total for each system, but some economy of scale and design is often achieved. Overall costs for projects provide some feel for the range of likely costs. The simple leaching chambers installed in drainage systems discharging into Lake Lorraine in Springfield cost about $10,000 each in 1996 and served about 5 acres each. The rain gardens planned in conjunction with the demonstration project in the watershed of Long Pond, Littleton, cost about $1,000 each and handle up to a half acre of drainage area. The advanced grease and grit trap and wet
Eutrophication and Aquatic Plant Management in Massachusetts
3.0 Methods to Control Nutrients Page 3-33
pond/wetland combination at Hills Pond in Arlington cost about $45,000 and served 10 acres. The detention ponds and constructed treatment wetlands serving about 250 acres at the Emerald Square Mall cost nearly $2 million. Capital costs therefore ranged from $2,000 to $8,000 per acre served for these projects. Maintenance costs have been limited in each case, but periodic removal of accumulated sediment is needed. Annualized maintenance costs of perhaps $50 to $100 per acre served might be expected. On a large scale within a watershed, it might be possible to push the capital cost down to around $1,000 per acre served, but lower costs than this should not be assumed. For large watersheds like that of Lake Massasoit in Springfield, at 34 square miles of urban/suburban land use, the costs become very high and progress is slow. NPS control is best practiced near the source; costs will be minimized and localized. Attempting to handle NPS pollution at just a few locations within a larger watershed may require an area as big or bigger than the lake being protected. In the case of Lake Massasoit, the 200-acre lake is less than half of the minimum size it needs to be to provide adequate detention of runoff from the 22,000-acre watershed. Competition for the lowest cost watershed management solution to eutrophication problems in Lake Massasoit by the Springfield College watershed management class has been won in recent years at levels ranging from $50-100 million. In constrast, an alum dosing station on each of the two major inlets could be constructed for about $2 million and operated for about $1 million per year.
3.2.11 Future Research Needs NPS management programs need to conduct scientifically credible monitoring of surface waters both before and after implementation in order to assess effectiveness in a manner that can guide future planning. Current estimates are useful (Table 3-2), but variability in results is rather high. Additional studies should be conducted to assess control of phosphorus inputs from manures and commercial fertilizers, as these are potentially very large sources. Actual inputs from septic systems may require assessment on a lake-specific basis to determine management needs and efficacy. Additional research is needed to determine the effectiveness of alternate sewage disposal systems in reducing nitrogen and phosphorus inputs to lakes. More research into alum dosing of storm water in cold climates is needed to determine the potential for this technique in this region. Cost estimation on a consistent scale is needed to facilitate realistic economic planning and cost-benefit analyses.
3.2.12 Summary NPS controls are recommended as preventive measures for all lakes to reduce eutrophication rates. In cases where NPS nutrients are identified as the major source of nutrients to the lake, the discussed measures are necessary, but they may have to be combined with in-lake treatments such as dredging or alum treatment to effect a recovery to desirable conditions. There are no serious ecological disadvantages to the application of storm water controls, the sensible implementation of zoning laws, or septic system management/upgrade. The advantages of most BMPs are that they are environmentally sound conservation practices often in the best interest of the land owners. The most significant drawback is that these measures are difficult to implement on a watershed wide scale, mainly as a function of cost. Partial implementation of BMPs may achieve local reductions in nutrient export, but if other sources are significant, there may be no observable improvement in the lake. NPS controls are intended to prevent problems, not reverse

Eutrophication and Aquatic Plant Management in Massachusetts
3.0 Methods to Control Nutrients Page 3-34
them, although some measure of ecosystem recovery can be expected with successful NPS control.
3.3 POINT SOURCE NUTRIENT CONTROL Point source pollution is defined as originating from a pipe or other distinct conveyance under federal regulations. Originally intended to deal with wastewater treatment discharges from industrial or municipal operations, the definition of a point source was extended in 1990 to include storm water discharges where the delivery was an observable pipe, ditch, swale, curb cut, or other delivery device that could be construed as meeting the federal definition. Certain activities, such as concentrated animal feedlot operations (CAFOs), have also been classified as point sources in this manner. This piece of legal maneuvering created the federal storm water program under the National Pollutant Discharge Elimination System, or NPDES. Many states have been authorized to administer this program, but Massachusetts is still governed by the federal program and does not issue NPDES permits by itself. The MDEP is involved in NPDES issues, however, jointly issuing NPDES permits with the USEPA and providing considerable guidance on meeting NPDES requirements. For the purposes of this GEIR, storm water has been addressed under NPS pollution, so the focus of this section will be actual wastewater treatment facility (WWTF) discharges. Storm water will be addressed where the NPS discussion did not cover salient point source issues.
3.3.1 The Nature and Control of Point Source Pollution Although industry and other activities may have point source discharges of pollutants, most of the nutrient sources are from municipal WWTFs and the discussion here will focus on this type of point source. Advanced wastewater treatment as a lake management technique has been a difficult and expensive endeavor which is currently enjoying renewed vigor as a consequence of USEPA scrutiny of NPDES permits that have come up for renewal. In general, however, improved treatment has not been overly successful to date in making a marked difference in lake condition. This is a consequence of treatment limits and the high influent P levels in WWTFs, relative to the rather low levels necessary to constrain productivity in most Massachusetts lakes. As a result, control of point source nutrient loading has in some cases involved diverting the discharge away from the lake (see Section 3.4 Hydraulic Controls). The current thrust of WWTF permitting emphasizes meeting effluent concentrations that will protect lakes with reasonable dilution. Domestic wastewater enters a WWTF with P in excess of 3 mg/L and sometimes as high as 15 mg/L. N levels can exceed 40 mg/L, with values up to 70 mg/L not uncommon. Wastewater treatment in Massachusetts involves primary and secondary treatment and in some cases, tertiary treatment. Primary treatment involves the settling out of suspended solids in sedimentation tanks. Secondary treatment usually involves a biological component to oxidize and convert organic wastes. The two most common methods of secondary treatment are activated sludge reactors (Hanel, 1988) and trickling filters. Effluent is treated with chlorine, ultraviolet light, or ozone before discharge in order to destroy pathogenic organisms (Sundstrom and Klei, 1979). Resulting P concentrations can be as low as 0.3 mg/L, but are more often >1 mg/L and often as high as 3-4 mg/L. N levels of 10-15 mg/L are common, with concern directed toward the fraction of the N
Eutrophication and Aquatic Plant Management in Massachusetts
3.0 Methods to Control Nutrients Page 3-35
load that is present as toxic un-ionized ammonia. Well functioning secondary treatment WWTFs tend to convert nearly all ammonia/ammonium to nitrate. Advanced waste treatment, or tertiary treatment, usually involves the removal of phosphorus and/or nitrogen. Phosphorus compounds are most often removed by coagulation with chemicals, particularly the addition of alum (see Section 3.5 Phosphorus Precipitation and Inactivation). Occasionally, iron or lime is used. Phosphorus may also be removed by biological processes such as the Anaerobic/Oxic (A/O) process that uses bacteria to remove phosphorus (Bowker and Stensel, 1987). There are many methods to remove nitrogen compounds, including ammonia stripping by air and nitrification-denitrification in biological reactors. Other tertiary treatment methods include adsorption of residual organic and color compounds on activated carbon and the use of reverse osmosis and electrodialysis to remove dissolved solids (Sundstrom and Klei, 1979). Dissolved air flotation (DAF) can also greatly reduce P concentrations, but is more commonly used in drinking water treatment than wastewater situations. Wetland treatment has become popular for nutrient control as a polishing step in WWTFs (Kadlec and Knight, 1996), and some WWTFs are based mainly on biological activity as a mainstay of wastewater treatment. Achievement of concentrations <1.0 mg/L requires advanced treatment, with attainment of levels as low as 0.02-0.05 mg/L currently sought in several WWTFs, although achievement of levels <0.5 mg/L on a routine basis is rare. The USEPA is reducing effluent concentrations for P as NPDES permits come up for renewal; limits >1.0 mg/L are rarely issued, and targets as low as 0.03 mg/L are being discussed. With a target lake P level of <0.02 mg/L and preferably <0.01 mg/L to minimize algal blooms, WWTF inputs require either greatly enhanced treatment or substantial dilution to avoid eutrophication impacts on lakes. For Massachusetts WWTFs with advanced P removal, monthly mean effluent concentrations ranged from 0.03 to 1.40 mg/L from 1995 to 2001, with annual means (including data only from times with active advanced treatment) ranging from 0.16 to 0.92 mg/L. Where advanced P removal is not practiced, effluent concentrations exceed 1.0 mg/l and are as high as 6.3 mg/L as a monthly mean. Advanced wastewater treatment has not been implemented as often as desired because of the added cost (J. Dupuis, MDEP, pers. comm., 1995), but has been applied where less stringent treatment has failed to achieve desired results in downstream lakes. Advanced treatment was applied to reduce impacts on Shagawa Lake, Minnesota, as a test project funded by the USEPA. More recently, pilot programs to reduce effluent P to <0.02 mg/L have been conducted, most notably in Syracuse, NY. Advanced wastewater treatment has been used more often in Europe where discharges have been made to a lake, often with results comparable to the diversion of treated effluent (Cooke et al., 1993a). Application in Massachusetts has involved half year (April-October) or full year operation, depending upon the nature of the receiving water; lakes with short detention times have been candidates for half-year advanced treatment requirements. Note that storm water that is conveyed through any type of drainage system is defined by the USEPA as a point source and subject to NPDES permits. Section 402(p) of the Clean Water Act establishes permit requirements for certain municipal and industrial storm water discharges, and further regulations may apply in the coastal zone (see Coastal Zone Non-Point Pollution Program in Appendix I). The most salient provision of the NPDES program for storm water is the
Eutrophication and Aquatic Plant Management in Massachusetts
3.0 Methods to Control Nutrients Page 3-36
requirement for a Storm Water Pollution Prevention Plan (SWPPP), which is a site- and activity-specific management guide for minimizing impacts on runoff from the site. The emphasis is on prevention of pollution, not treatment or remediation. The SWPPP includes provisions for managing potential pollutants stored or used on site, limiting exposure of potentially polluting activities to precipitation and runoff, and responding to spills, leaks, or other releases. Monitoring provisions are industry-specific and not overly stringent, but the whole process is a major step toward minimizing contamination of runoff and documenting that effort. In some cases inflows to wastewater treatment plants are combined with urban storm water flow. This is most often a result of underdesign of conveyance systems in the face of expanding user populations, with combined manholes for easy access to both sanitary and storm sewers being the primary point of mixing. This situation leads to excess hydraulic loading to the drainage system and/or WWTF during storms that may result in untreated or incompletely treated wastes being discharged to streams or lakes. Separating these Combined Sewer Systems (CSS) to avoid Combined Sewer Overflow (CSO) has been emphasized by the USEPA and MDEP for about two decades now, and substantial progress has been made. One less well-known point source that has become a problem in Massachusetts is drinking water treated to comply with anti-corrosion provisions of the federal Safe Drinking Water Act of 1996. The most common chemical used to inhibit corrosion in distribution pipes is calcium phosphate, with concentrations of P in excess of 1 mg/L in many cases and sometimes as high as 5 mg/L, not much different than secondary treated sewage! Blowdown from boilers or hydrants, discharged directly to storm water drainage systems, or leaks from water mains can provide a substantial input of P to downstream lakes. Use of potable water for make-up water in smaller ponds and swimming facilities can actually cause an algal bloom. Alternatives to calcium phosphate, such as a variety of silicates, are more expensive.
3.3.2 Effectiveness
3.3.2.1 Short-Term
Secondary treatment of wastewater is generally ineffective in controlling eutrophication; unless dilution is very high from other water sources, excessive productivity in downstream lakes can be expected. Effectiveness of tertiary treatment of effluent discharged to a lake system will depend on local conditions, especially hydraulic detention time and internal recycling. Where detention time is short and internal recycling is limited, response may be rapid. However, nutrients present in the lake sediments and water column often continue to cause eutrophication and associated algal blooms and plant growth after improved treatment of wastewater, and other techniques may be required to achieve water quality goals.
3.3.2.2 Long-Term
Tertiary point source treatment is often an effective method for nutrient control, and where the discharge from a WWTF is a dominant component of phosphorus loading, it may be an essential step in lake restoration/rehabilitation. Primary treatment removes approximately 10% of total phosphorus (Metcalf & Eddy, 1979). Phosphorus removal by secondary treatment is typically 20-40% of total phosphorus (Sundstrom and Klei, 1979), although higher removal rates are now
Eutrophication and Aquatic Plant Management in Massachusetts
3.0 Methods to Control Nutrients Page 3-37
being achieved fairly routinely. Addition of alum can result in 95% removal of phosphorus during tertiary treatment, but alum is not as effective at removing phosphorus at low (<5oC) temperatures. Additions of lime at pH values near 10 SU can result in 65-80% removal of phosphorus. Chemical removal of phosphorus is best accomplished following the secondary phase of treatment because the phosphorus present at this point is nearly all orthophosphorus, a soluble form of phosphorus that is more easily removed by coagulation reactions (Metcalf & Eddy, 1979). However, simple coagulant addition at key points in the secondary process can reduce the effluent P concentration below 1.0 mg/L without the need for an additional clarifier or filtration step. Advanced P removal in Massachusetts WWTFs has resulted in mean effluent concentrations of 0.16 to 0.92 mg/L in recent years, while WWTFs without treatment or during winter periods of non-treatment have average effluent levels of 1.7 to 3.8 mg/L. Various biological methods are used for the removal of phosphorus, some of which remove total phosphorus down to 1 mg/L or lower (see various reports in Ramadori, 1987; Bowker and Stensel, 1987). Recent experiments as part of a storm water management program intended to lower P levels in discharges to the Everglades have succeeded in approaching the 0.01 mg/L level through biological control, but the process requires extended detention in large basins and is less reliable than chemical means. Approximate removal rates for nitrogen from primary and secondary treatment are 5-10% and 10-30%, respectively. Of the many applications for tertiary removal of nitrogen, the most effective include denitrification (70-90% removal), breakpoint chlorination (80-90% removal), selective ion exchange for ammonium (70-95% removal), and ammonia stripping (50-90% removal) (Metcalf & Eddy, 1979). Removing a nutrient point source is sometimes not enough to reverse the eutrophication process of a nutrient-rich lake. Additional nutrient and plant control measures may be needed. In Lake Shagawa, Minnesota, it was found that even with advanced wastewater treatment, recovery from eutrophication was very slow due to internal nutrient loading. Significant internal nutrient loading was still occurring 16 years after treatment, but summer total phosphorus levels had decreased from a range of 35 to 50 µg/l to a range of 20 to 30 µg/l (Cooke et al., 1993a). The key point is to know the relative importance of internal and external sources and the total reduction necessary to achieve desired conditions.
3.3.3 Impacts to Non-Target Organisms Adverse impacts to non-target organisms are not expected except possibly for impacts associated with construction of upgraded WWTFs. In addition to removing nutrients, controlling a nutrient point source may reduce oxygen demand and improvements in downstream oxygen concentration may be expected. Long-term improvements in the overall health of the lake would be expected. One exception to the beneficial nature of point source controls is the potential for nutrient loads to increase, even if the concentration decreases. This can happen if the reduced effluent concentration facilitates greater inflow capacity and more wastewater is passed through the WWTF. Diverting wastewater from local septic systems to a WWTF that discharges to a tributary of a lake could result in more P entering the lake than was delivered from those septic
Eutrophication and Aquatic Plant Management in Massachusetts
3.0 Methods to Control Nutrients Page 3-38
systems. Expansion of the area served by the WWTF can have the same result. Consequently, permit limits need to be expressed as both concentrations and loads to be truly effective.
3.3.4 Impacts to Water Quality
3.3.4.1 Short-Term
An improvement in water quality is expected with tertiary treatment, but may not be observable in the short-term. The rate of water quality improvement will be a function of the magnitude of other sources and the detention time of the lake.
3.3.4.2 Long-Term
Eutrophic conditions and poor water quality may not be reversible by point source nutrient controls (other than diversion, addressed elsewhere) unless tertiary treatment is applied and effluent limits are set well below the common standard of 1 mg/L. It may also be necessary to treat for more than the summer half of the year. Phosphorus levels in wastewater are simply too high and discharges comprise too much of annual low flows to achieve in-lake concentrations <0.02 mg/L without extreme treatment and/or dilution. Nitrogen removal may also improve water quality, but great care must be taken to avoid lowering nitrogen much more than phosphorus, as a shift to nitrogen limitation will often foster blooms of certain very objectionable blue-green algae. Chlorination, used for disinfection and nitrogen removal, may pose a problem by creating chlorinated organic compounds believed to be health threats. Most of the treatment plants in Massachusetts use chlorination, although some use ultraviolet light or ozone.
3.3.5 Applicability to Saltwater Ponds Although no literature is available on the use of point source nutrient controls specifically for saltwater ponds, point source controls certainly appear applicable. Saltwater ponds may be limited by nitrogen rather than phosphorus and nutrient testing should be conducted prior to beginning point source nutrient reduction. In cases where nitrogen is the limiting nutrient, the emphasis on treatment processes may change from the more typical phosphorus-focused approach. In addition to nutrient issues, high fecal coliform levels from insufficiently disinfected WWTF effluent or untreated storm water delivered as a point source may threaten shellfish beds and result in closure of shellfishing areas.
3.3.6 Implementation Guidance
3.3.6.1 Key Data Requirements
Data requirements for this type of nutrient control include an accurate nutrient budget including both a measured mass balance and a land-use source analysis. Nutrient budgets should include analysis of all inputs, including internal sources (recycle within the lake, Section 1). Nutrient control should target enough of the load to attain the desired reduction in loading to the lake, with estimates of effectiveness made for lake recovery in terms of total phosphorus levels and
Eutrophication and Aquatic Plant Management in Massachusetts
3.0 Methods to Control Nutrients Page 3-39
Secchi disk transparency. Models of watershed loading and lake response are helpful in this regard, but only mimic reality; the use of several modeling approaches is recommended. Because of the potential for long-term benefits and minimal adverse impacts, point source nutrient control should be encouraged in the watersheds of all lakes. As such discharges must have valid NPDES permits, there is a defined process for setting limits on effluent concentrations and total load that must be followed. Given the high nutrient levels in most point sources, additional techniques may be necessary to achieve desired in-lake conditions.
3.3.6.2 Factors that Favor this Approach
The following considerations are indicative of appropriate application of point source controls for reductions in nutrient concentrations in lakes: 1. A substantial portion of the P and/or N load is associated with point source pollution. 2. Studies have demonstrated the impact of identifiable discharges on the lake. 3. Water associated with point sources is important to lake hydrology. 4. Pollutant removal expected from treatment upgrade has been properly calculated and is
achievable. 5. Jurisdiction can be claimed over point sources.
3.3.6.3 Performance Guidelines
Planning and Implementation Careful consideration should be given to phosphorus removal and to where the effluent is discharged. Ultimately, a desirable target P concentration for point source effluents would be close to 0.02 mg/L, requiring little additional dilution to be acceptable in a downstream lake. This level of treatment has been obtained in some storm water management cases, but is not in use on a full scale basis at any WWTF. Limits of 0.1-0.2 mg/L have the potential to create acceptable downstream conditions with dilution and limited additional inputs, but there is no evidence yet that these limits will stop or reverse eutrophication downstream of the discharge. Additional in-lake methods of nutrient and/or algae control may therefore be necessary. Because most algal blooms and problems occur during the warmer months, only seasonal phosphorus removal may be required for lakes with short retention times (e.g. <2-3 months). However, retention of some portion of the P load and internal recycling suggest that except where detention time is very short (several weeks), this may be an unwise practice. The key to successful point source control, from the perspective of lake management, is to construct a detailed and reliable nutrient budget and carefully evaluate what any change in load attained by point source control will mean for lake condition. Models of lake behavior in response to nutrient loading are useful in this regard, but as these models are simplifications of reality, the use of multiple modeling approaches is recommended. Monitoring and Maintenance Maintenance of WWTFs is an ongoing function of the wastewater authority. Operational errors occur, to be sure, but training and performance of operators is generally high and WWTFs tend to perform to specifications on a fairly regular basis. Those specifications may not have been developed with protection of downstream resources in mind, but most WWTFs meet the

Eutrophication and Aquatic Plant Management in Massachusetts
3.0 Methods to Control Nutrients Page 3-40
assigned permit limits. The primary exception involves facilities with significant infiltration and inflow problems. That is, where storm water can enter the sanitary sewer system, capacity of the WWTF may be overrun during wet weather and treatment effectiveness plummets. Remedial action within the collection system is then needed before treatment reliability can be maintained. Monitoring nutrient levels in WWTF discharges and in some storm water discharges covered by NPDES is required in some cases, but should not be assumed to be in place. WWTFs with permit limits for specific elements or compounds (ammonium, nitrate, phosphorus) will monitor for those constituents on a weekly to monthly basis in most cases. Over many years, a reliable data base will accrue, but daily information is often lacking. Monitoring the water chemistry of lakes, ponds, or impoundments impacted by a wastewater treatment plant before and after an upgrade is highly recommended. More intensive studies that follow discharges through the system may be very helpful in understanding the magnitude and extent of impacts. Mitigation Mitigation for point source discharges is usually a matter of increased treatment to minimize downstream impacts. Unfortunately, the level of treatment for many wastewater discharges is insufficient to avoid substantial impacts, leading to controversy over the siting and management of point source discharges.
3.3.7 Regulations
3.3.7.1 Applicable Statutes
In addition to the standard checklist for projects described in Appendix II, the following specific restrictions and permits include:
If the discharge may alter or affect a wetland resource, a Notice of Intent must be sent to the Conservation Commission with a copy to the Department of Environmental Protection Regional Office. If the proposed project occurs within an Estimated Habitat of Rare Wildlife in the most recent version of the Natural Heritage Atlas, a copy of the Notice of Intent must be submitted to the Natural Heritage and Endangered Species Program (NHESP) within the MDFG for review (Appendix II). If the proposed project occurs within a Priority Habitat of Rare Species in the most recent version of the Natural Heritage Atlas, the project proponent must submit project plans to the NHESP for an impact determination. An Order of Conditions must be obtained prior to work.
Any discharge to surface waters in Massachusetts requires a NPDES permit (3.14 CMR 3.0), issued by the USEPA but reviewed by the MDEP. Discharge under this permit does not allow discharge to low flowing or standing waters like lakes and ponds with no outflow (3.14 CMR 4.04). Discharges are generally restricted to large streams or rivers that can handle the flow of effluent. If the available streams are not large enough, a permit to discharge to groundwater may be granted (Appendix II).
Simple extensions or connections to existing WWTFs will require a Sewer Extension or Connection Permit (SECP). Discharges to waters may exceed MEPA thresholds, but a MEPA review may be required. For further information on these permits see Appendix II.

Eutrophication and Aquatic Plant Management in Massachusetts
3.0 Methods to Control Nutrients Page 3-41
In essence, no environmental agency is likely to oppose an effort to reduce the nutrient concentrations and loads discharged from point sources, but there are distinct procedures to be followed and a lengthy review process should be expected. It is more likely that owners of WWTFs will be looking for ways to avoid lowering nutrient levels to meet downstream needs, mainly as a function of cost, and the NPDES process becomes a long-term, iterative process for achieving a desirable discharge limit.
3.3.7.2 Impacts Specific to Wetlands Protection Act
The following overall impact classification is offered as a generalization of impacts, with clarifying notes and caveats as warranted: 1. Protection of public and private water supply – Benefit (surface water quality enhanced). 2. Protection of groundwater supply – Neutral, unless there is a discharge to groundwater, in
which case the impact would be a benefit. 3. Flood control - Neutral 4. Storm damage prevention - Neutral 5. Prevention of pollution - Benefit (water quality enhancement). 6. Protection of land containing shellfish - Neutral, but possible benefit through water quality
enhancement. 7. Protection of fisheries - Benefit (water quality enhancement), but possible detriment through
reduced fertility. 8. Protection of wildlife habitat – Benefit (water quality enhancement), but possible detriment
through reduced fertility.
3.3.8 Costs Advanced wastewater treatment is very expensive to implement. The construction cost in 1973 associated with Lake Shagawa in Ely, Minnesota, was $1.9 million ($6.6 million adjusted to 2000 dollars), and yearly operating costs have averaged about $389,000. Tertiary treatment for WWTF effluent discharged to Lake Zürich, Switzerland, had construction costs of $36 million ($102 million adjusted to 2000 dollars) and yearly operating costs of $1.5 million (Cooke et al., 1993a). Projected costs for operation of the Belchertown wastewater treatment plant are estimated at $300,000 per year (P. Dombrowski, T&B, pers. comm., 1995). Annual operating costs for the Pittsfield wastewater treatment plant, which serves Pittsfield, Hinsdale, Dalton, and North Lenox and handles approximately 17 MGD (million gallons per day) are $1.6 million (T. Landry, City of Pittsfield, pers. comm., 1995). Costs vary with choice of advanced treatment technique, the targeted nutrients, and the desired effluent concentration. As a rough estimating tool, capital cost of tertiary treatment for phosphorus and nitrogen removal will cost at least a million dollars per million gallons treated per day and the operational cost will be at least $100,000 per year per million gallons treated per day. Much higher costs are certainly possible.
3.3.9 Future Research Needs Less costly methods to reduce N and P in wastewater are needed to make widespread implementation of advanced treatment affordable. A better understanding of aquatic system response to reduced point source loads would aid prediction of management results and enhance planning efforts to reverse eutrophication from point source inputs.
Eutrophication and Aquatic Plant Management in Massachusetts
3.0 Methods to Control Nutrients Page 3-42
3.3.10 Summary Wastewater and certain storm water discharges are considered point sources under federal law, which governs the issuance of discharge permits in Massachusetts. Concentrations of N and P in wastewater that has undergone either primary or secondary treatment processes are still at least two orders of magnitude higher than what would be acceptable in most lakes to prevent eutrophication. Concentrations in storm water and in potable water treated to conform with anti-corrosion regulations may also be high enough to warrant major concern. Permit limits under the NPDES program have tended to allow P concentrations of 1 mg/L, and some permits have restricted discharge concentrations only during the growing season. The USEPA is currently reducing discharge limits as permits are renewed. Considerable treatment or dilution is necessary to reduce inputs to acceptable concentrations, and in many cases the WWTF discharge represents a dominant component of flow during extended dry periods. Mounting evidence from aquatic studies and advancing technology in water treatment indicate that permit limits are too high and that lower concentrations can be achieved. More recently proposed P limits are in the 0.1 to 0.2 mg/L range, with discussion of limits as low as 0.03 mg/L, and with year-round restriction unless detention time is very short. Cost is the major factor preventing implementation of tertiary treatment at more WWTFs. Modeling should be used to estimate the phosphorus reduction in the lake on a case by case basis. Improvement of conditions will depend upon the portion of the load reduced and the detention time in downstream lakes. The timing of load reductions may also be a factor. There are no significant environmental disadvantages to upgrading to tertiary treatment. However, care must be taken in permit development to restrict both concentration and load of targeted nutrients, as WWTF expansion could result in an increased nutrient load, even with a lower effluent concentration. Monitoring of the receiving waters and associated impoundments for total phosphorus is recommended before and after upgrading treatment. Monitoring of actual effluent quality will be the responsibility of the wastewater authority, but care should be taken to ensure an appropriate frequency of measurements.
3.4 HYDRAULIC CONTROLS
3.4.1 Overview There are four basic methods that can be used to take advantage of the flow of water to alter the nutrient concentration in lakes and thus control algal populations. Usually these are used only for algal control because most macrophytes obtain most of their nutrients from the sediments and would not be greatly affected by these methods. The four methods include:
Diverting nutrient rich wastewater before it reaches the lake. Lowering nutrient concentrations in the lake by dilution with low nutrient water. Frequently flushing the system with any source of water to minimize the expression of
nutrient loads. Withdrawal of nutrient-rich water from the bottom of the lake (hypolimnion) before it can
interact with surface waters (epilimnion, or the photic zone, where algae grow).
Eutrophication and Aquatic Plant Management in Massachusetts
3.0 Methods to Control Nutrients Page 3-43
For all four treatments, consideration should be given to alterations in the hydraulic regime of the lake so that inadvertent drawdown or flooding does not result. The nutrient rich water that is diverted, flushed or withdrawn from the lake must be discharged to another location, usually a stream or river somewhere downstream from the lake. Only in the case of dilution is the quality of downstream discharge likely to increase without additional treatment of the discharge.
3.4.2 Diversion Diverting water from a lake makes sense if the associated nutrient load is undesirable and the loss of the hydrologic load will not have undue negative impacts. Ideally, diversion involves a small amount of water with a large amount of nutrients in it. Diversion is most often practiced in association with wastewater or storm water discharges to lakes with adequate alternative water supplies. It suffers from the philosophical drawback of sending contaminated water elsewhere without addressing the source of nutrients, and may be difficult to permit, but it can be a very effective means of reducing nutrient inputs. Some additional discussion has been provided in conjunction with point source controls (Section 3.3).
3.4.3 Dilution and Flushing Lake waters that have low concentrations of an essential nutrient are unlikely to exhibit algal blooms. While it is preferable to reduce nutrient loads to the lake, it is possible to lower (dilute) the concentration of nutrients within the lake by adding sufficient quantities of nutrient-poor water from some additional source. High amounts of additional water, whether low in nutrients or not, can also be used to flush algae out of the lake faster than they can reproduce. However, complete flushing is virtually impossible in many lake systems; small, linear impoundments are the primary candidates for such treatment. Phosphorus is normally the nutrient that limits algal growth. Its concentration in lake water is a function of its concentration in incoming water, the flushing rate or residence time of the lake, and the net amount lost to the sediments as particles settle during water passage through the system. When water low in phosphorus is added to the inflow, the actual phosphorus load will increase, but the mean phosphorus concentration should decrease. The mechanisms associated with this technique are much more complicated than is initially apparent. In-lake concentration could actually increase under some circumstances (Uttormark and Hutchins, 1980), and significant internal phosphorus release can further compromise effectiveness, but dilution has been effective in some cases (Cooke et al. 1993a). A thorough understanding of the phosphorus budget for the lake is necessary to evaluate dilution as a potential algae control method. Dilution or flushing washes out algal cells, but since the reproductive rate for algae is high (blooms form within days to a few weeks), only extremely high flushing rates will be effective without a significant dilution effect. A flushing rate of 10 to 15% of the lake volume per day is appropriate (Cooke et al., 1993a). Development of reliable water and nutrient budgets are necessary to an evaluation of flushing as an algae control technique. Very few documented case histories of dilution or flushing exist, in part because additional water is not often available, especially water that is low in nutrients. The best documented case is that
Eutrophication and Aquatic Plant Management in Massachusetts
3.0 Methods to Control Nutrients Page 3-44
of Moses Lake, Washington (Welch and Patmont, 1980; Cooke et al. 1993a), where low-nutrient Columbia River water was diverted through the lake. Water exchange rates of 10 to 20% per day were achieved, algal blooms dramatically decreased, and transparency was markedly improved, illustrating the potential effectiveness of this method. Outlet structures and downstream channels must be capable of handling the added discharge for this approach to be feasible. Qualitative downstream impacts must also be considered. Water used for dilution or flushing should be carefully monitored prior to use in the lake. Application of this technique is most often limited by the lack of an adequate supply of low nutrient water.
3.4.4 Selective Withdrawal For recreational lake management, the intent of selective withdrawal is usually to remove the poorest quality water from the lake, which is normally the water at the bottom of the lake unless an intense surface bloom of algae is underway. It is desirable to discharge water at a rate that prevents anoxia near the sediment-water interface, resulting in both improved lake conditions and an acceptable discharge quality. This can be accomplished in impoundments with small hypolimnia and/or large inflows. In most lake management cases, however, selective withdrawal will involve waters of poor quality and treatment may be necessary before discharge downstream. Where phosphorus has accumulated in the hypolimnion through release from the sediments, selective discharge of hypolimnetic waters prior to fall turnover can reduce effective phosphorus loading. However, unless late summer inflows are substantial, this may result in a considerable drawdown of the lake level. Where a drawdown is planned, selective discharge may increase the benefit. Often an outlet structure must be retrofitted to facilitate selective withdrawal, but the one-time capital cost confers permanent control with minimal operation and maintenance costs. Nurnberg (1987) reviewed results for 17 lakes with 1 to 10 years of hypolimnetic withdrawal and concluded that reduced epilimnetic phosphorus concentrations did result, presumably leading to lowered algal biomass. However, concerns over summer drawdown, disruption of stratification, and downstream water quality must all be addressed in a successful program. In some large western reservoirs, hypolimnetic discharges constitute a major outflow and are responsible for maintenance of very productive downstream coldwater fisheries. Aeration or other treatment of discharged water may be necessary, but the removal of phosphorus and other contaminants from the lake can be beneficial. Detailed knowledge of system morphometry, thermal structure, hydrology and phosphorus loading is essential to proper application of this technique. Selective withdrawal for water supply means locating the intake at the depth where water quality is most advantageous for the intended use. It can be used in any system where vertical water density gradients are sufficiently stable, but is most often applied to more strongly stratified lakes. For potable water use of productive lakes, the choice is often between high algae concentrations in the epilimnion and high iron and/or manganese in the hypolimnion. Intakes located near the thermocline sometimes get both high algae and high metals. A choice of intake depths is preferred, allowing adjustment of intake depth in accordance with the best available
Eutrophication and Aquatic Plant Management in Massachusetts
3.0 Methods to Control Nutrients Page 3-45
water quality. For cooling water supply, cold hypolimnetic withdrawal is preferred, as long as it does not contain high levels of corrosive sulfides.
3.4.5 Effectiveness Generally these techniques have been shown to be effective where applicable, but the opportunities for these techniques are limited in Massachusetts. The effectiveness of each technique depends mainly on how much the nutrient levels in the lake can be reduced by the method, except in the case of flushing, where algae are physically removed from the lake and nutrient concentration effects are less important. The effectiveness of each of these methods should be estimated by nutrient budget calculations and simulations of lake response under each treatment method (Section 1). By predicting the nutrient concentrations and detention times resulting from each approach, the potential utility of each can be evaluated.
3.4.5.1 Short-Term Effectiveness of Diversion
The length of time required to observe effects is dependent on such factors as the nutrient input rates and the relative hydraulic detention time of the lake. In lakes with short detention times the response should be quick. In lakes with long detention times the response may be delayed. Additionally, lakes with high internal nutrient recycling rates may have a slow recovery (Cooke et al., 1993a). Diversion has worked successfully to recover lake quality in cases where external loading dominates the nutrient cycle, but is not usually a fast process.
3.4.5.2 Long-Term Effectiveness of Diversion
The long-term response of a lake to diversion is usually favorable if the diversion is effective at reducing nutrient concentrations. Results from several diversion projects have shown that there is a high probability for lake recovery. The Lake Washington example is probably the most well documented case where the diversion of Metropolitan Seattle secondary treated domestic sewage from Lake Washington to Puget Sound resulted in a dramatic improvement in water quality over time. In this case 88% of the external phosphorus loading was diverted and the TP in the lake declined from about 64 µg/l to about 17 µg/l after five years (Edmondson, 1977). Lake Washington has maintained desirable water quality for many years following diversion in 1967 (Edmondson and Lehman, 1981). Lake Sammamish (Issaquah, WA) showed a very slow response to wastewater diversion, with little response in the first 7 years even though the flushing rate was similar to Lake Washington. This was attributed to high internal loading of phosphorus, which was reduced in later years as the hypolimnetic oxygen deficit rate improved and the more oxic conditions inhibited phosphorus release from the sediments (Welch et al., 1984). Lake Norrviken is another example of a diversion project that required a longer time period to recover than Lake Washington and recovered to a lesser degree. The maximum concentration in the lake at turnover declined from approximately 450 µg/l to 150 µg/l and summer levels of total phosphorus decreased from 263 to 174 µg/l between 1970 and 1979. This change resulted in a
Eutrophication and Aquatic Plant Management in Massachusetts
3.0 Methods to Control Nutrients Page 3-46
reduction in chlorophyll a (chl a) and an improvement in transparency. Although Norrviken is considered a success by many because of the resultant transparency, the lake is still eutrophic (Ahlgren, 1978).
3.4.5.3 Short-Term Effectiveness of Dilution and Flushing
The effects of dilution and flushing can reduce algal abundance in two ways. The first is by direct dilution of nutrient concentrations in the lake by the addition of low nutrient water, resulting in nutrient limitation of algal growth. The second is by the physical removal of algae in the discharge water. In the latter case, it is possible to reduce algal abundance even if the nutrient level in the inflow is higher than the lake's nutrient level, but only if the cells are flushed out of the lake at a rapid rate. How quickly the nutrients can be diluted or the algae removed depends on the flushing rate. One might reasonably assume that if these techniques are going to be effective, the results will be detectable within a few weeks of initiation.
3.4.5.4 Long-Term Effectiveness of Dilution and Flushing
As previously mentioned, few studies are available on dilution and flushing as a treatment for lakes. These treatments are expected to be effective for as long as they are applied. It should be noted that in Green Lake, Washington, effectiveness declined after initial success, due to the reduction in inflow dilution water. The cost of using city water to dilute the lake was simply too expensive to continue for a long time period (Cooke et al., 1993a).
3.4.5.5 Short-Term Effectiveness of Selective Withdrawal
Hypolimnetic waters in eutrophic lakes are often anoxic. The lack of oxygen promotes the release of phosphorus from the sediment, resulting in high concentrations that can be entrained and transferred to the epilimnion during a later mixing event. If this hypolimnetic water is removed and replaced by epilimnetic water that is higher in oxygen, the periods of anoxia should decrease and the rate of sediment release of phosphorus is expected to be reduced. This reduction in internal phosphorus inputs, combined with the flushing of nutrient-rich hypolimnetic water out of the system, is expected to result in decreases in epilimnetic nutrient concentrations. The effectiveness of this treatment is not expected to be significant in the short-term (weeks to months) however, because stratified lakes usually do not mix significant amounts nutrients from the hypolimnion to the epilimnion until fall turnover occurs. As a result, reduction of epilimnetic concentrations may not be observed until the following spring.
3.4.5.6 Long-Term Effectiveness of Hypolimnetic Withdrawal
Hypolimnetic withdrawal is one technique that appears to become more effective the longer it is used. Nürnberg (1987) found that several years are generally needed to show significant improvements in epilimnetic TP following the initiation of hypolimnetic withdrawal. In a review of case studies of hypolimnetic withdrawal, Cooke et al. (1993) reported that epilimnetic P decreased in 8 of 12 lakes for which there were one or more years of data. Lake Wononscopomuc and Lake Waramaug in Connecticut showed some improvement in water quality following hypolimnetic withdrawal, but only Lake Wononscopomuc showed a significant decrease in epilimnetic P, while Lake Waramaug showed no significant trend (Nürnberg et al.,
Eutrophication and Aquatic Plant Management in Massachusetts
3.0 Methods to Control Nutrients Page 3-47
1987). Later calculations revealed that the P export via the withdrawal pipe in Lake Waramaug decreased the internal load by only 10-20% due to sub-optimum pipe placement (Nürnberg et al., 1987).
3.4.6 Impacts to Non-Target Organisms
3.4.6.1 Short-Term
All of these techniques involve discharging more nutrients in to another location, usually downstream of the lake. It is expected that there will be improved conditions in the lake for most non-target organisms, but this may not be the case downstream or wherever diverted flows are discharged. Most organisms will tolerate minor short-term fluctuations in flow and water quality, so short-term impacts are not expected to be severe. An exception would be the possible short-term impacts associated with a discharge of low oxygen water that dominates downstream hydrology and suffocates aquatic life. For this reason, some hypolimnetic discharges from large reservoirs are aerated by spraying the water into the air as it is discharged. The hypolimnetic discharge from Lake Waramaug was aerated in a raceway before discharge and treated to reduce selected contaminant levels. In the case of selective withdrawal, caution must be exercised not to induce summer drawdown. Should such a drawdown occur, the potential impacts associated with drawdown (Section 4.2) must be considered.
3.4.6.2 Long-Term
Long-term impacts in the lake are likely to be positive, based on reduced nutrient availability. Long-term downstream impacts will be a function of the duration, magnitude and quality of discharges, plus the sensitivity of downstream biota. For Lake Washington, the wastewater entering from eleven small secondary treatment plants located around the lake was collected, treated and eventually discharged at depth into Puget Sound where it was assumed to have less impacts (Edmondson and Lehman, 1981). This may not be the case in all systems, however, and downstream studies appear necessary before attempting any of these methods. In most cases it is advisable to aerate the discharge water in order to raise the dissolved oxygen content, remove any toxic hydrogen sulfide gas, and reduce concentrations of ammonium, iron and other metals that may otherwise exceed regulatory limits for discharges (Nürnberg et al., 1987). Stream flow can have an impact on fish populations as different species habitats are dictated by depth, current velocity and area, as well as stability of flow (Lewis, 1969; Bain et al., 1988). For example, a group of small fish species in the Deerfield River, Massachusetts and the West River in Vermont are restricted to a microhabitat of shallow, slow waters along stream margins (Bain et al., 1988). Alteration of flow and water quality may affect such assemblages, and similar impacts on invertebrate communities might be expected. Increased turbidity resulting from increased flows may also pose a potential impact in the receiving waters. Some impacts are to be expected during the placement of pipes, particularly during the construction period, but this depends on the scale of the diversion and the distance to reach the discharge location.
Eutrophication and Aquatic Plant Management in Massachusetts
3.0 Methods to Control Nutrients Page 3-48
For hypolimnetic withdrawal there may be entrainment of small organisms, or impingement on the screens of the intake pipe, assuming the organisms can withstand the anticipated low oxygen levels in the hypolimnion where the intake pipe would be located.
3.4.7 Impacts to Water Quality
3.4.7.1 Short-Term
For properly applied dilution and diversion, water quality should improve rapidly the lake. Delays may result from long detention time or excessive internal loading, but these techniques may not be the best choices in such circumstances. Short-term in-lake improvement is not expected from hypolimnetic withdrawal. Chemical water quality may not change appreciably for flushing strategies, although reduced algal abundance may induce some changes (e.g., suspended solids, pH). Negative impacts to downstream water quality (or wherever discharges are diverted) may be rapidly manifest unless the discharged water is treated or otherwise shown to have acceptable quality. Impacts from elevated flow should not occur in a properly planned program, as flows should be kept within the natural range for downstream channels, but some potential exists for flushing as a consequence of higher overall flows. In the case of dilution, if the dilution water is from deep water wells, the water may be low in dissolved oxygen and have high metals or sulfide content, which may adversely impact some aspects of water quality (HWH, 1990a).
3.4.7.2 Long-Term
Long-term impacts on water quality are similar to the short-term impacts described above. One notable exception is that with hypolimnetic withdrawal treatments, improvements in lake water quality are sometimes delayed for several years (Nürnberg, 1987). Under ideal conditions, hypolimnetic withdrawal can maintain improved conditions in the hypolimnion, removing water at a rate fast enough to prevent anoxia. Increased temperature or destratification could result, however, with variable impacts on water quality and biota.
3.4.7.3 Applicability to Saltwater Ponds
These techniques could be applied to saltwater ponds although there are no reports of saltwater application in the literature. In theory, diversion treatments could be applied to divert wastewater inputs to the ocean, although the diversion of wastewater anywhere is a difficult proposition. In many cases, nitrogen rather than phosphorus may be the limiting element in saltwater ponds, but this is less of a factor in these techniques than many others. Sea water itself may be used to dilute and flush eutrophic saltwater ponds isolated from the ocean by barrier sand dunes by dredging open a new connection to the sea (Section 3.7, Dredging). As stated in the Division of Wetlands and Waterways Policy 91-2, this will only be permitted if the purpose is to maintain an existing or historically viable marine fishery and steps are taken to minimize adverse impacts associated with the project. Hypolimnetic waters in eutrophic saltwater ponds may have high sulfide concentrations that may cause toxicity problems and require treatment prior to discharge.

Eutrophication and Aquatic Plant Management in Massachusetts
3.0 Methods to Control Nutrients Page 3-49
3.4.8 Implementation Guidance
3.4.8.1 Key Data Requirements
Data requirements include accurate hydrologic and nutrient budgets, an assessment of probable in-lake effects, and an evaluation of downstream impacts. In most cases where these techniques were ineffective, the cause was inaccurate nutrient budgets that overestimated the treated source and underestimated other sources of nutrients. If the major input of nutrients to the lake is from a point source, diversion of this source should be effective if such diversion is feasible. If nutrient-poor water is available in sufficiently large quantities, then dilution may be effective. If enough water is available to reduce detention to <2 weeks, flushing may be effective. If the nutrient budget reveals that much of the nutrient load is being recycled from nutrient-rich hypolimnetic waters, then hypolimnetic withdrawal may be effective. For all these methods calculations should be presented to show the volumes of water and nutrient concentrations involved, and how the changes in lake discharge may affect habitat and downstream flow rates. Estimates of effectiveness should be made for lake recovery in terms of total phosphorus levels and Secchi disk transparency.
3.4.8.2 Factors that Favor this Approach
The following considerations are indicative of appropriate application of hydraulic controls for reductions in nutrient concentrations and control of algae in lakes: 1. A substantial portion of the P and/or N load is associated with sources that can be diverted,
diluted or preferentially discharged. 2. Studies have demonstrated the impact of identifiable sources (e.g., a discharge, hypolimnetic
load) on the lake. 3. Water associated with sources to be diverted or discharged is not important to lake
hydrology; water level fluctuation will not differ greatly from pre-treatment conditions. 4. Adequate water of a suitable quality is available for dilution or flushing. 5. Downstream problems with water quantity or quality will not be caused. 6. Actual reduction in nutrient inputs from identifiable sources is not practical, either for
technical or jurisdictional reasons.
3.4.8.3 Performance Guidelines
Planning and Implementation It is imperative that reliable nutrient and water budgets be developed to obtain a reasonable prediction of improvements in nutrient content in the lake before any of these techniques are used. Seasonal application (e.g., during the late spring and summer) may be sufficient to reduce nutrient and algae concentrations in the lake. Effects of diversions on the lake water budget should be considered in the planning stage. BMPs can be employed to limit environmental impacts associated with any necessary construction. The diverted water (typically wastewater) can be treated more thoroughly prior to discharge to minimize impacts on the discharge site.
Eutrophication and Aquatic Plant Management in Massachusetts
3.0 Methods to Control Nutrients Page 3-50
Acquiring and controlling the amount of water used to dilute and flush the lake is the primary consideration for these techniques. An adequate source of water must remain to keep the lake water budget in balance, in order to avoid an unintended water level decrease. Hypolimnetic withdrawal is more often applied in the fall to cause a drawdown, accomplishing two goals at once. It is possible to remove sufficient cold water from the hypolimnion such that the lake could become thermally unstable and destratify, perhaps eliminating cold water fisheries. Generally, this has not been observed, as the hypolimnion remains somewhat cooler than the epilimnion in most cases. If this is suspected to be a problem however, it can be counteracted by input of cold stream or well water directly into the hypolimnion in conjunction with hypolimnetic withdrawal (see Figure 7-1 in Cooke et al., 1993a). In the case of Lake Waramaug, the depth of the intake pipe in the hypolimnion had to be raised during summer stratification because the concentration of nutrients, iron and hydrogen sulfide were too high to be discharged. Unfortunately, this also limited the effectiveness of the treatment for removing nutrients (Nürnberg et al., 1987). Monitoring and Maintenance Maintenance requirements may be high for systems that involve large amounts of pipe, canals and pumps, but these techniques are not typically implemented if maintenance needs are high. Very little maintenance is required for hypolimnetic withdrawal unless treatment is necessary before discharge. Diversion will normally involve additional piping, but gravity flow systems with minimal maintenance needs are strongly preferred. Dilution or flushing water may be piped and/or pumped, with periodic maintenance needed, but successful systems are as simple as possible. All treatments require monitoring to make sure that excessive amounts of water are not removed or added. Monitoring would include periodic measurement of discharge volumes and water quality of both the discharge water and the receiving waters. Such monitoring should include nutrients, dissolved oxygen, iron, sulfide, temperature, pH and turbidity to insure that no adverse impacts are occurring. If pollutant content is high, further monitoring of downstream conditions may be warranted. In the case of hypolimnetic withdrawal, periodic measurements of hypolimnetic nutrient content, oxygen content and stability of the hypolimnion are recommended. Mitigation Undesired effects are most often mitigated by simply ceasing the hydraulic control. Additional mitigative measures should be considered on a case by case basis. Mitigative measures for hypolimnetic withdrawal include aeration and treatment of the water prior to discharge.
3.4.9 Regulations
3.4.9.1 Applicable Statutes
These methods will involve a Notice of Intent being sent to the Conservation Commission with a copy to the Department of Environmental Protection Regional Office. If the proposed project occurs within an Estimated Habitat of Rare Wildlife in the most recent version of the Natural Heritage Atlas, a copy of the Notice of Intent must be submitted to the Natural Heritage and Endangered Species Program (NHESP) within the MDFG for review (Appendix II). If the proposed project occurs within a Priority Habitat of Rare Species in the most recent version of
Eutrophication and Aquatic Plant Management in Massachusetts
3.0 Methods to Control Nutrients Page 3-51
the Natural Heritage Atlas, the project proponent must submit project plans to the NHESP for an impact determination. An Order of Conditions must be obtained prior to work. A Chapter 91 Permit may be required for structural alterations in Great Ponds. For any alteration involving a dam, a MDCR Office of Dam Safety Permit may be required (Appendix II). Withdrawal, discharge, or diversion of water in excess of 100,000 gpd may require a permit under the Water Management Act (Appendix II). Any of these techniques may also require a 401 WQ permit, but jurisdiction of the MDEP will depend upon which other permits are required and funding sources. Approval from the Army Corps of Engineers ACOE (Appendix II) is not typically required for these techniques. Diversion and possibly flushing or withdrawal projects will be subject to NPDES permitting; water to be diverted will most likely already be subject to NPDES, while the need for NPDES permits for flushing or withdrawal will depend upon the quality of water involved.
3.4.9.2 Impacts Specific to Wetlands Protection Act
The following overall impact classification is offered as a generalization of impacts, with clarifying notes and caveats as warranted: 1. Protection of public and private water supply – Variable (depends on location of supply
relative to discharge and detention time). 2. Protection of groundwater supply – Neutral, unless there is a discharge to groundwater or a
major withdrawal for dilution/flushing, in which case the impact could be detrimental. 3. Flood control - Neutral (added flow must remain within tolerance limits for lake and
downstream receiving waters) 4. Storm damage prevention – Neutral (added flow must remain within tolerance limits for lake
and downstream receiving waters) 5. Prevention of pollution - Benefit in the lake (water quality enhancement), but possible
detriment downstream (possible poor quality discharges). 6. Protection of land containing shellfish - Possible benefit through water quality enhancement
in the lake and possible detriment with any downstream water quality degradation. 7. Protection of fisheries - Benefit (water quality enhancement), but possible detriment through
reduced fertility and possible detriment downstream with any water quality degradation. 8. Protection of wildlife habitat – Benefit (water quality enhancement), but possible detriment
through reduced fertility.
3.4.10 Costs All of these techniques usually have potentially high capital costs due to construction, with variable maintenance costs, (high for pumping, low for gravity flow). Cost factors to consider include the location and relative elevation of the water source or discharge point in relation to the lake and the discharge site. Costs will depend on the volumes of water to be moved and the distances involved. If a favorable drop in elevation is not present, pumping costs may be substantial. If dilution or flushing water must be purchased, costs will escalate.
Eutrophication and Aquatic Plant Management in Massachusetts
3.0 Methods to Control Nutrients Page 3-52
3.4.10.1 Diversion
The cost of diversion varies greatly from each site. The cost is primarily based on the required distance for transport and associated construction costs. If the water must be treated prior to discharge, that cost should also be included. Estimates for diversion of various wastewater discharges in Massachusetts (Belchertown WWTF/Forge Pond and Spencer WWTF/Quaboag Pond) have exceeded $5 million; these diversions were not implemented, in favor of improved treatment.
3.4.10.2 Dilution and Flushing
The cost of dilution and flushing varies mainly with the volume and availability of water. The primary costs for Moses Lake were $497,000 (2000 dollars) according to Cooke et al. (1993). As mentioned above, the costs for flushing Green Lake became too expensive; the use of city water was projected to cost $17.7 million dollars over 20 years (Cooke et al., 1993a). If a nearby upstream source of clean water could be diverted to a lake by gravity, or if a short canal can be constructed to provide a connection to a larger stream or river, actual water costs may be considerably less. However, the cost of permitting and constructing the connection to deliver the water may be substantial. Wagner (2001) suggests a cost of $500-2500/acre for application of these techniques, inclusive of permitting and monitoring, when a source of water is readily available. Costs may rise to $5,000-25,000/acre if water is purchased, piped and/or pumped.
3.4.10.3 Hypolimnetic Withdrawal
Installation costs for withdrawal pipes typically range between $3,000 and $45,000, although in Lake Ballinger (Seattle, WA) the cost was $304,000, due to additional construction of a stream water inlet diversion to the hypolimnion (HWH, 1990a; Cooke et al., 1993a). Costs for treating withdrawn water prior to discharge could be substantial, but in most cases where this technique has been applied, treatment has consisted mainly of aeration by passive means at limited capital and minimal operational cost. Wagner (2001) suggests a cost of <$100 per acre where structures are in place and no major downstream impacts are expected. The cost may rise to $1000-3000/acre where structural alterations and/or treatment of discharged water become necessary.
3.4.11 Future Research Needs These techniques have been applied on only a very limited basis in Massachusetts, and indeed elsewhere as well. More experience with implementing hydraulic controls and mitigating possible negative impacts is needed.
3.4.12 Summary Diversion and dilution can be very effective in reducing nutrient levels and resultant algal concentrations, but it is rare to find an approved disposal site or source of clean water required for successful application. Flushing will not typically reduce nutrient levels, but may reduce algal density if detention time is lowered to <2 weeks. Hypolimnetic withdrawal may be effective in lakes with nutrient-rich bottom waters, and may even eliminate poor water quality at
Eutrophication and Aquatic Plant Management in Massachusetts
3.0 Methods to Control Nutrients Page 3-53
the bottom. However, issues with poor downstream water quality may require treatment before discharge and maintenance of acceptable hypolimnetic water quality requires a high removal rate during summer. Where drawdown is not intended or tolerable, a compensatory increase in inflow will be needed to allow adequate withdrawal. As summer flows are often low, hypolimnetic withdrawal is normally applied in conjunction with fall drawdown. In lakes with high nutrient inputs from accumulated sediments, the effectiveness may be somewhat less and somewhat delayed. In general, researchers have been fairly successful at predicting the response of a lake to these types of treatments. The major disadvantages are potentially high capital costs to facilitate these techniques and the potential for downstream impacts. Maintenance of lake level during summer may restrict the utility of diversion and withdrawal. Need for a major water source usually restricts dilution and flushing.
3.5 PHOSPHORUS PRECIPITATION AND INACTIVATION
3.5.1 Overview The release of phosphorus stored in lake sediments can be so extensive in some lakes and reservoirs that algal blooms persist even after incoming phosphorus has been significantly lowered. Phosphorus precipitation by chemical complexing removes phosphorus from the water column and can control algal abundance until the phosphorus supply is replenished. Phosphorus inactivation typically involves some amount of phosphorus precipitation, but aims to achieve long-term control of phosphorus release from lake sediments by adding as much phosphorus binder to the lake as possible within the limits dictated by environmental safety. It is essentially an “anti-fertilizer” addition. This technique is most effective after nutrient loading from the watershed is sufficiently reduced, as it acts only on existing phosphorus reserves, not new ones added post-treatment. In-lake treatments are used when phosphorus budget studies of the lake indicate that the primary source of the phosphorus is internal (i.e., recycled from lake sediments). Such techniques have been used for several decades, but we are still learning how to best apply them. Such nutrient control generally does not reduce macrophyte abundance (Mesner and Narf, 1987). On the contrary, the increased light penetration may cause an increase in macrophyte populations. Macrophyte control techniques may be used in combination with phosphorus precipitation and inactivation (Morency and Belnick, 1987; Cooke et al., 1993a). The three most common treatments for lakes employ salts of aluminum, iron, or calcium compounds. Nitrate treatments are very rare and are used to enhance phosphorus binding to natural iron oxides in sediments. For the aluminum, iron and calcium treatments, the typical compounds used include aluminum sulfate (Al2(SO4)3 xH2O), sodium aluminate (Na2Al2O4
xH2O), iron as ferric chloride (FeCl3) or ferric sulfate (Fe2(SO4)3), and calcium as lime (Ca(OH)2) or calcium carbonate (CaCO3). Additional forms of aluminum are becoming more common, but these are the normally encountered phosphorus inactivators. These are applied to the surface or subsurface, in either solid or liquid form, normally from a boat or barge. These compounds dissolve and form hydroxides, Al(OH)3, Fe(OH)3, or in the case of calcium, carbonates such as calcite (CaCO3). These minerals form a floc that can remove
Eutrophication and Aquatic Plant Management in Massachusetts
3.0 Methods to Control Nutrients Page 3-54
particulates, including algae, from the water column within minutes to hours and precipitate reactive phosphates. Because aluminum and iron added as sulfates or chlorides dissolve to form acid anions along with the formation of the desired hydroxide precipitates, the pH will tend to decrease in low alkalinity waters unless basic salts such as sodium aluminate or lime are also added. Conversely, calcium is usually added as carbonates or hydroxides that tend to raise pH. This is especially true for hydroxides that have high solubility (Stumm and Morgan, 1981). In addition to precipitation from the water column, the floc can inactivate phosphorus in the sediments. The floc settles on the sediment surface, gradually mixes with the upper few centimeters of sediment, reacts with available phosphorus, and prevents the release of phosphorus back into the water column. The resulting nutrient limitation in the surface waters prevents algal blooms from forming. The various floc minerals behave very differently under high or low dissolved oxygen and they also differ in their response to changes in pH. Because of its ability to continue to bind phosphorus under the widest range of pH and oxygen levels, aluminum is usually the preferred phosphorus inactivator. Other binders are applied under specific conditions that favor their use, but not as commonly as aluminum.
3.5.2 Use of Aluminum Compounds Aluminum has been widely used for phosphorus inactivation, mostly as aluminum sulfate (alum) and sometimes as sodium aluminate (aluminate), as it binds phosphorus well under a wide range of conditions, including anoxia. However, concentrations of reactive aluminum (AL+3) are strongly influenced by pH. Aluminum is toxic to fish at levels of 100 to 200 µg/L at pH of 4.5 to 5.5 SU, typically via gill membranes (Baker, 1982). The safe level of dissolved aluminum is considered to be 50 µg/L (Kennedy and Cooke, 1982), but this is not a sharp threshold. Common application rates are in the range of 5,000 to 40,000 µg Al/L (5 to 40 mg/L, see review in Cooke et al., 1993b), but nearly all of this forms an insoluble precipitate (called “floc”) and is quickly removed from the water column. A pH of between 6.0 and 7.5 virtually ensures that the 50 µg/L limit will not be reached, although it was thought that a pH of up to 8.5 could be tolerated until recently (ENSR, 2001b). Yet aluminum sulfate addition can reduce the pH well below a pH of 6.0 in poorly buffered waters, and overbuffering can raise the pH above this safe range. Sodium aluminate, which raises the pH while providing more aluminum, has been successfully used in combination with aluminum sulfate (Cooke et al., 1993b), but has also caused fishkills in two New England lakes (Hamblin Pond in 1995 and Lake Pocotopaug in 2000) due to an improperly low ratio of alum to aluminate. It is also possible to add other buffering agents to the lake prior to aluminum sulfate addition, such as lime, sodium hydroxide, or sodium carbonate. The key is to balance the acids and bases to cause minimal change in pH; fishkills have resulted from a failure to do this. Jar testing is usually employed to evaluate the best ratio of acid and base compounds, but results of lab tests can sometimes be misleading. A fine level of detail is needed to arrive at the correct ratio. Field tests with careful monitoring appear in order for larger scale projects. A volumetric ratio of aluminum sulfate to sodium aluminate of 2:1 is expected to
Eutrophication and Aquatic Plant Management in Massachusetts
3.0 Methods to Control Nutrients Page 3-55
cause no change in system pH. Maintenance of the ambient pH is an appropriate goal, unless the pH is especially high as a consequence of excessive algal photosynthesis. In practice, aluminum compounds are added to the water and colloidal aggregates of aluminum hydroxide are formed. These aggregates rapidly grow into a visible, brownish white floc, a precipitate that settles to the sediments over the following hours, carrying sorbed phosphorus and bits of organic and inorganic particulate matter in the floc. After the floc settles to the sediment surface, the water will usually be very clear. If enough alum is added, a layer of 1 to 2 inches of aluminum hydroxide floc will cover the sediments, mix with the upper few centimeters, and significantly retard the release of phosphorus into the water column as an internal load. Aluminum sulfate is often applied near the thermocline depth (even before stratification) in deep lakes, providing a precautionary epilimnetic refuge for fish and zooplankton that could be affected by dissolved reactive aluminum. Application near the surface provides no refuge, but strips phosphorus from the whole water column and provides more immediate removal of phosphorus. Application methods include modified harvesting equipment, outfitted pontoon boats, and specially designed barges made for this purpose. Good candidate lakes for this procedure are those that have had external nutrient loads reduced to an acceptable level and have been shown, through a diagnostic-feasibility study, to have a high internal phosphorus load (release from sediment). High natural alkalinity is also desirable to provide buffering capacity. Highly flushed impoundments are usually not good candidates because of an inability to limit phosphorus inputs. Treatment of lakes with low doses of alum may effectively remove phosphorus from the water column, but may be inadequate to provide long-term control of phosphorus release from lake sediments and will not affect later inputs of phosphorus from the watershed. High doses are needed to effectively bind phosphorus in the upper few inches of sediment and retard release (Rydin and Welch, 1998); high initial alkalinity, added buffering capacity, or sequential dosing are needed to control water column pH in such treatments. Nutrient inactivation has received increasing attention over the last decade as long lasting results have been demonstrated in multiple projects, especially those employing aluminum compounds (Welch and Cooke, 1999). Annabessacook Lake in Maine suffered algal blooms for 40 years prior to the 1978 treatment with aluminum sulfate and sodium aluminate (Cooke et al., 1993b). Low buffering capacity necessitated the use of sodium aluminate. A 65% decrease in internal phosphorus loading was achieved, blue-green algae blooms were eliminated, and conditions have remained much improved for nearly 20 years. Similarly impressive results have been obtained in Cochnewagon Lakes in Maine using the two aluminum compounds together (Connor and Martin, 1989a; Monagle, Cobbossee Watershed District, pers. comm., 1995). Kezar Lake in New Hampshire was treated with aluminum sulfate and sodium aluminate in 1984 after a wastewater treatment facility discharge was diverted from the lake. Both algal blooms and oxygen demand were depressed for several years, but began to rise more quickly than expected (Connor and Martin, 1989a; 1989b). Additional controls on external loads (wetland treatment of inflow) reversed this trend and conditions have remained markedly improved over
Eutrophication and Aquatic Plant Management in Massachusetts
3.0 Methods to Control Nutrients Page 3-56
pre-treatment conditions for almost 15 years. No adverse impacts on fish or benthic fauna have been observed despite careful monitoring. Aluminum sulfate and sodium aluminate were again employed with great success at Lake Morey, Vermont (Smeltzer, 1990). A pretreatment average spring total phosphorus concentration of 37 µg/L was reduced to 9 µg/L after treatment in late spring of 1987. Although epilimnetic phosphorus levels have varied since then, the pretreatment levels have not yet been approached. Hypolimnetic phosphorus concentrations have not exceeded 50 µg/L. Oxygen levels increased below the epilimnion, with as much as 10 vertical feet of suitable trout habitat reclaimed. Some adverse effects of the treatment on benthic invertebrates and yellow perch were observed immediately after treatment (e.g., smothering of some invertebrates by the floc layer and poor growth by yellow perch for a season), but these proved to be transient phenomena and conditions have been acceptable and stable for over a decade (Smeltzer et al., 1999). Phosphorus inactivation has also been successful in some shallow lakes (Welch et al., 1988; Gibbons, 1992; Welch and Schrieve, 1994), but has been unsuccessful in cases where the external loads have not been controlled prior to inactivation (Barko et al., 1990; Welch and Cooke, 1999). Successful dose rates have ranged from 3 to 30 g Al/m3 (15 to 50 g Al/m2) with pH levels remaining between 6.0 and 8.0 SU. Considerable advances in dose determination and treatment approaches have been made in the last few years, and continued advances are expected. Low doses (1-5 mg Al/L) can be used to strip phosphorus out of the water column with limited effects on pH or other water quality variables, even in many poorly buffered waters. Mixing with aeration systems can increase treatment efficiency and lower the necessary dose. At the other extreme, determination of available phosphorus in sediments has revealed that higher doses (often in excess of 100 g/m2) than normally applied are needed to thoroughly inactivate phosphorus reserves and maximize treatment longevity (Rydin and Welch, 1998; 1999). Doses around 10 mg Al/L are typically applied to storm water discharges, which can be automatically dosed in response to storm flows (Harper et al., 1999). Current efforts in storm water management with alum focus on capturing the floc in detention areas prior to discharge to the lake or stream. Areal doses (g/m2) convert to volumetric doses (g/m3 or mg/L) simply by dividing the areal dose by the water depth in meters. However, this means that an areal dose of 50 g/m2 applied to a 10 ft (3 m) deep section of lake will yield a volumetric dose of 16.7 g/m3 if added all at once. Without careful buffering, doses of >5-10 g/m3 have been associated with fishkills, so such high doses require one or more mitigative measures. In the re-worked Lake Pocotopaug treatment of 2001, the alum:aluminate ratio was maintained at 2:1, the dose was split in half (25 g/m2 or 4 g/m3 applied twice), and a minimum one-day lag time was alotted between treatments of any one area (ENSR, 2001b). In the 2001 Ashumet Lake treatment, alum:aluminate ratio was also carefully controlled at 2:1, application was made below the thermocline (35 ft, where it was anoxic and no fish or invertebrate life was expected), a pilot treatment was conducted with several days of monitoring afterward, and extensive monitoring was conducted during treatment (ENSR, 2002e). All of these precautions may not be necessary in any one treatment, and greatly increase the cost, but they have facilitated clear demonstration of the success of inactivation without toxic impacts.

Eutrophication and Aquatic Plant Management in Massachusetts
3.0 Methods to Control Nutrients Page 3-57
3.5.3 Use of Iron Compounds Iron works very much like aluminum, forming hydroxides that bind phosphorus and make it unavailable for algal uptake. Iron is more common naturally than aluminum, and is abundant in most Massachusetts waters. However, the results of treatment with iron salts are very sensitive to dissolved oxygen levels. Under oxic conditions the ferric hydroxide floc is stable at normal pH conditions (pH>5). Under anoxic conditions, however, the iron in ferric hydroxide is reduced to soluble ferrous iron (Fe+2) and the floc dissolves, releasing the adsorbed phosphorus (Mortimer, 1941; 1942). Therefore, while iron acts as a natural binder in well-oxygenated systems, loss of oxygen in eutrophic lakes may disrupt this natural phosphorus inactivation process. Inactivation of phosphorus by iron will become very ineffective where anoxia is so strong that sulfate reduction occurs. In such cases, iron is preferentially bound by sulfides released as hydrogen sulfide when oxygen is removed from sulfates by anaerobic bacteria. Iron sulfides are minimally soluble and precipitate out of the water column, further disrupting the natural process of iron-mediated phosphorus control. If oxygen is restored to the system, natural levels of iron may be adequate to bind available phosphorus. Where iron concentrations are inadequate, iron can be added to the system. Consequently, iron is only used in well-aerated systems with naturally low iron levels, but may be the inactivator of choice as a supplement to an aeration system. Iron is used in conjunction with aeration in the water supply of St. Paul, MN, and appears to be successful (Walker et al., 1989). Iron is generally not toxic at levels applied to lakes but direct information on effects on non-target organisms is lacking. No long-term impacts are reported. Impacts to water quality are expected to be beneficial. Excessive iron can cause rust stains in laundry and sinks, but the added iron is expected to rapidly precipitate out of solution. Excess iron in a water supply may be an issue, as taste and aesthetic aspects of water delivered to customers are important. However, in recreational lakes such concerns are minimal, and iron can provide control of phosphorus where oxygen levels are adequate.
3.5.4 Use of Calcium Compounds The stability of calcite is highly sensitive to pH, calcium, and carbonate concentrations. Consequently, treatment with calcium is effective only if pH is maintained at a relatively high level (8 SU or above). Such pH levels are found naturally only in the Berkshire region (Mattson et al., 1992), and elevating the pH by chemical addition to facilitate calcium effectiveness may have many adverse impacts on natural systems adjusted to lower pH. Calcium is more commonly used in alkaline lake regions, such as Alberta, Canada, and has not been applied in Massachusetts or the northeastern USA except on a pilot basis (ENSR, 1997a). A general discussion and graph of calcite stability is presented in Section 5.3 of Stumm and Morgan (1981). Calcium treatments have been effective in reducing algae and total phosphorus in extremely eutrophic lakes that are also hardwater lakes. For example, Halfmoon Lake in Alberta (101 acres, pH of 8.9-9.2 SU, alkalinity of 139 mg/L) was treated with 188 metric tons of Ca(OH)2 and 58 metric tons of CaCO3 over two years for a rate of 120 g Ca/m2 in 1988 and 182 g Ca/m2 in 1989 (Babin et al., 1994). This treatment reduced the total phosphorus and chlorophyll a by an estimated 54 and 24 percent, respectively, and sediment phosphorus loading was also reduced. It
Eutrophication and Aquatic Plant Management in Massachusetts
3.0 Methods to Control Nutrients Page 3-58
should be noted that pretreatment concentrations of total phosphorus and chlorophyll a were very high, 124 µg/l and 50 µg/l , respectively, and even with the reduction the post-treatment concentrations were still rather high. Application involves spreading a powdered form or slurry made from the powder. Most applications have been made at the surface with spray or gravity feed systems.
3.5.5 Use of Nitrate Compounds Nitrate treatments such as Ca(NO3)2, known also by the trade name Riplox, are included here, but nitrates neither precipitate nor inactivate phosphorus directly. Nitrates are injected directly into the surface sediments as a sediment oxidation treatment, which in this case refers to maintaining a high redox (reduction-oxidation) potential and thus maintaining the stability of natural iron oxides in the sediments. That is, nitrate is consumed to yield oxygen before iron oxides, by preference of the active bacteria. Thus nitrates act indirectly to enhance and stabilize the ability of natural iron oxides to bind phosphorus in the sediments. In this manner, nitrate treatment is analogous to hypolimnetic aeration by providing an alternative source of oxygen. Nitrate treatment is sometimes combined with iron and/or calcium hydroxide treatments to increase effectiveness (Cooke et al., 1993a; 1993b). In Lake Lillesjön, Sweden a harrow was used to distribute the chemicals into the lake bottom. Three chemicals were used: 13 tons FeCl3 (146 g Fe/m2), 5 tons of slaked lime (180 g Ca/m2) and 12 tons of Ca(NO3)2 (141 g N/m2). All nitrate was denitrified in 1.5 months, but desirable results persisted. A similar treatment was conducted in Lake Trekanten, Sweden, but without the iron and lime (Ripl, 1980). Of the few published accounts, only one (Lake Lillesjön) has shown long-term (ten year) effectiveness (Ripl, 1986). Nitrate concentrations may increase in the waters where nitrate salts are added. The upper limit for water supplies is 10 mg/L nitrate nitrogen as established by the USEPA. Algal stimulation by nitrate addition is not expected in lakes where phosphorus controls algal growth. In fact, the addition of nitrate may be beneficial even without the stabilizing effect on sediments in some cases, as it would increase the nitrogen to phosphorus ratio, thus benefiting other algal species over the nuisance blue-greens. This is, however, not a widely used technique.
3.5.6 Effectiveness
3.5.6.1 Short-Term
The short-term effectiveness relates to phosphorus precipitation and clarification of the water column. The surface application of the flocculent chemicals (aluminum, iron and calcium) usually has dramatic short-term results. Within hours significant increases in transparency are evident as the floc clears the water of algae and other particulates and concentrations of total phosphorus and reactive phosphorus decline (Jacoby et al., 1994). Where buoyant blue-green algae are abundant, it may take several weeks for these algae to die off, but water clarity improvement will still be noticeable within hours to days. If the lake is stratified, results of injections to the hypolimnion or directly to the sediments may not be apparent until after turnover because the phosphorus in the epilimnetic water is not immediately removed.
Eutrophication and Aquatic Plant Management in Massachusetts
3.0 Methods to Control Nutrients Page 3-59
3.5.6.2 Long-Term
In cases where P inactivators are added as a flocculation technique, stripping P from the water column, the effectiveness has not been long lasting. This is not surprising, as replacement of the P would be expected with incoming water, with an estimated duration of effects of no more than five times the detention time, based on the standard engineering model of a lake (Metcalf and Eddy, 1972; Weber, 1972). Where detention time is short or treatment is not complete, rapid return to pre-treatment conditions is to be expected. In Martin’s Pond for example, water quality data collected by the DWPC indicated that phosphorus levels rebounded to pre-treatment levels within three weeks, while Dug Pond requires annual treatments (L. Lyman, Lycott, pers. comm., 2002a). Beginning in 1989 and in subsequent years, less alum was needed an the water clarity remains at 15-18 feet, thus showing long-term effectiveness of repeated low doses (Lycott Update 2003, Lycott Environmental, Inc.). Where P inactivation of the sediments is practiced, longevity will depend upon the portion of the total load attributable to internal recycling. Use of alum has provided ten years of improved conditions in shallow lakes and over 15 years of improvement in deep (stratified) lakes (Welch and Cook, 1999) with no follow-up treatment. Cases where alum has failed to provide the desired improvement have universally involved relatively high external loading of P. Iron treatments can remain effective as long as oxygen is present, so use of iron is usually combined with an aeration system. Calcium effectiveness has been less well studied, but results from work in Alberta, Canada suggest that while improvements can last multiple years, the level of improvement is not as large as can be delivered by aluminum or iron/oxygen additions. Long-term effectiveness relates to how well the phosphorus in the sediment is inactivated and prevented from entering the water column again. This is dose-dependent and varies between methods and lakes, but proper assessment of available phosphorus in the sediment, its flux into the overlying water column, and calculation of an appropriate dose of P inactivators should yield long-lived results. For all treatments, if external nutrient loading is relatively high, none of these sediment P inactivation treatments may be very effective. Another effectiveness issue relates to the availability of hypolimnetic P to the epilimnion over the summer. Cooke et al. (1993b) suggest that strongly stratified lakes may not mix significant phosphorus from the deep bottom waters into the surface during the summer, and thus phosphorus inactivation could have little effect. They conclude that P inactivation is best suited to lakes with an Osgood Index (mean depth in meters/square root of area in km2) of 6 or less. However, where anoxia is strong enough to produce hydrogen sulfide, a substantial portion of the hypolimnetic phosphorus (typically around 10%, but variable) may diffuse across the thermocline and into the epilimnion. Additionally, where wind is strong, mixing at the boundary of the surficial and deep waters can be a significant source of phosphorus. Consequently, the Osgood Index should not be the sole factor determining applicability. Wind mixing and redistribution of the floc has been suggested to possibly leave areas of the sediment uncovered (Garrison and Knauer, 1984) or allow inactivated sediment to be buried by new sediment containing available P (Barko et al., 1990). Observations in New England lakes (K. Wagner, ENSR, pers. obs., 1999-2002) indicate that at depths greater than 15 ft, wind processes have minimal effect on alum floc stability. Upon treatment, the floc accumulates on
Eutrophication and Aquatic Plant Management in Massachusetts
3.0 Methods to Control Nutrients Page 3-60
the bottom like a layer of fluffy snow, but gradually condenses and reacts with surficial sediments. In most cases, the floc combines with surficial sediments within a month or two and is not present as a visible layer. Lakes with high sedimentation rates may experience burial of the floc, and new sediment may release phosphorus and reduce the longevity of treatment results. Likewise, wind resuspension in shallow areas may also cause such burial and reduced treatment effects.
3.5.7 Impacts to Non-Target Organisms
3.5.7.1 Short-Term
Aluminum is one of the most common elements on earth, and most organisms are exposed to fairly high levels of aluminum on a regular basis. However, the form of aluminum is especially critical to potential impacts. Reactive aluminum typically undergoes hydrolysis, whereby OH- radicals are added and a series of tetrahedral compounds are formed. As the molecule grows, it incorporates many other elements and compounds, including the phosphorus that treatments are intended to inactivate. Reactive aluminum has toxic properties, but does not last long in the aquatic environment at pH levels between about 6 and 8 standard pH units. At higher and lower pH values, the potential for toxicity can be significant. Acidic conditions are more common than basic conditions, so aluminum toxicity at low pH is more commonly noted in the literature. Once reacted, however, the resultant aluminum compounds are non-toxic and rather stable. Short-term effects are therefore more likely than long-term impacts, and involve aluminum toxicity at low or high pH. Iron and calcium are not known to be toxic at any encountered level. In fact, calcium concentrations above about 3 mg/L are known to reduce the toxicity of aluminum (Baker et al., 1993). The median calcium concentration in Massachusetts is about 5.5 mg/l, but many lakes with calcium less than 3 mg/l are found in the southeast and Cape Cod regions of Massachusetts; the highest values are found in the Berkshires. Silica at levels of 93 µM (5.5 mg/L as SiO2) has also been suggested to dramatically reduce the toxicity of aluminum (Birchall et al., 1989), although Baker et al. (1990) questioned the results. No detectable impacts on vertebrates or invertebrates have been observed from calcium treatments (Prepas et al., 1990). Murphy et al. (1988) caution that pH could be elevated to harmful levels if Ca(OH)2 is used as a source of calcium to surface waters. Calcium compounds such as lime are routinely added to domestic water supplies to raise pH (Weber, 1972) and thus no adverse effects are expected from the use of basic calcium compounds in lakes provided that pH remains near the natural level of the receiving waters. However, to get adequate P control with calcium, very high quantities of calcium might have to be added; use of calcium is therefore not appropriate in most Massachusetts lakes, with water bodies in the Berkshires as the only plausible candidates. Nitrate can displace oxygen attached to hemoglobin molecules at levels >10 mg/L, causing, methemoglobenemia, or blue-baby syndrome. The water quality standard for drinking water has been set at 10 mg/L, although many towns have a more stringent standard for well water at 2-5 mg/L.
Eutrophication and Aquatic Plant Management in Massachusetts
3.0 Methods to Control Nutrients Page 3-61
In some cases dissolved aluminum concentrations have exceeded the safe level (50-100 µg/L in reactive form), but in most cases detectable fish and invertebrate kills have been avoided. In low alkalinity Kezar Lake, New Hampshire, dissolved aluminum concentrations were as high as 400 µg/L after application of alum and sodium aluminate, but no fish kills were observed. In Lake Morey, Vermont, dissolved aluminum reached concentrations as high as 200 µg/l in the epilimnion where the pH was 8.0 or higher. Despite the high aluminum concentrations, no direct fish mortality was observed. However, the condition of adult yellow perch declined significantly and losses of benthic invertebrates were reported (Smeltzer, 1990). (See section 2.4.4.1). Yet investigations over 14 years since treatment document recovery and marked improvement in the Lake Morey biota, suggesting only temporary impacts (Smeltzer et al., 1999). Laboratory tests indicate very high aluminum levels (80 mg Al/L) can kill invertebrates, possibly by smothering or trapping toxic gases under the heavy floc (Narf, 1990). The eventual incorporation of the floc into the surficial sediments may explain the transient impacts on benthic invertebrates. A substantial fish kill was reported on May 26, 1995 (Keller, 1995) following aluminum sulfate and sodium aluminate addition to Hamblin Lake in Barnstable, Massachusetts. DFW staff reported an estimate of 16,900 fish killed (Keller, 1995). The fish most impacted appeared to be yellow perch, although rainbow trout, smallmouth bass and brook trout were also killed. The smaller perch were not affected as much as the larger perch and many small perch were observed in schools near the surface after the application. Invertebrates (chironomids and mollusks, but not mayflies) and turtles were also reported. The kill resulted from overbuffering and high pH (values as high as 9.3 SU), leading to aluminum toxicity or possibly pH shock. A kill similar to that at Hamblin Pond occurred at Lake Pocotopaug in Connecticut in June, 2000, during the early stages of a treatment with a similarly overbuffered mix of alum and aluminate. Fish bioassays revealed behavioral anomalies and up to 30% mortality of juvenile fish after an hour of exposure at pH values as low as 7.5 to 8.0 (ENSR, 2001b). Altering the treatment protocols to set the alum:aluminate ratio at 2:1 (by volume), with application such that total aluminum levels at any point in time were <10 mg/L, resulted in no fish mortality in the lake during completion of the treatment in May 2001. Initial precautions involving the alum:aluminate ratio and application below the thermocline under anoxic conditions resulted in no fish mortality in the 2001 treatment of Ashumet Pond in Mashpee, MA. It now appears possible to perform treatments on low alkalinity lakes without inducing aluminum toxicity. Other fish kills, much earlier in time, have resulted from lack of buffering of alum treatments. In these cases, the pH dropped to well below 6.0. This has become a rare occurrence, however, as dose adjustments or buffering of treatments in low alkalinity lakes has become standard. The precipitation of the floc may also carry many other organisms, such as algae and small zooplankton, to the bottom. Changes in the algal community are expected. However, no studies indicate any major shift in zooplankton immediately following treatment. Data for zooplankton in several Maine lakes treated between 1978 and 1986 and monitored before treatment and just after treatment suggest no adverse impacts on zooplankton community composition, density or mean size (Cobbossee Watershed District, unpublished data, 1993).
Eutrophication and Aquatic Plant Management in Massachusetts
3.0 Methods to Control Nutrients Page 3-62
No adverse impacts on aquatic plants rooted in the sediment have been reported. With increased water clarity, growth of rooted plants at greater depths has been observed. Reduction in the density of plants that depend upon the water column for phosphorus (e.g., duckweed and watermeal) is possible. However, Prepas et al. (1990) reported that some macrophytes were replaced by Lemna trisulca after treatment with calcium.
3.5.7.2 Long-Term
Suggested links between aluminum and various diseases have been the subject of debate among toxicologists (Flaten, et al., 1996; Savory, et al., 1996), with no clear consensus regarding the level of risk. There is no active or specific pathway for uptake and retention by man (Duffield and Williams, 1989). Normal ingestion rates for humans are expected to range from 1 to 10 mg per day (Sherlock, 1989), and some aluminum salts are used in commonly available stomach antacids, but nearly all ingested aluminum is biologically unavailable (Duffield and Williams, 1989). If small amounts do enter the blood stream, they are rapidly excreted by normal renal mechanisms (Duffield and Williams, 1989). Aluminum may be a health problem in people with kidney dysfunction (Stewart, 1989), as a function of its coagulant properties while in a reactive form. Aluminum has been associated with a 1.5x increase in Alzheimer’s disease in areas where aluminum exceeded 0.11 mg/L in the public water supply (Martyn, 1989), but this is a correlation, not a cause and effect relationship. Note that alum and aluminum salts are commonly used for coagulation and flocculation processes to clarify water supplies and in wastewater treatment (Weber, 1972). Although some short-term effects have been noted, there do not seem to be any significant long-term impacts on benthic invertebrates (Smeltzer et al., 1999; K. Wagner, ENSR, pers. obs., 1999-2002). As an exception, short-term toxicity testing showed no effects on midge larvae, while chronic tests over 55 days showed 37% mortality at a 10 mg Al/L dose compared to 5.4% in the control. Yet the mechanism of mortality was unknown (Lamb and Bailey, 1983), and this is a high dose for that duration of study. Despite the potential toxicity, and considering the high alum application rates, few adverse effects are reported (e.g. Jacoby et al., 1994). Benthic invertebrate density may actually increase within a season (Narf, 1990; Smeltzer et al., 1999). In one case of long-term alum treatment upstream of Lake Rockwell, Ohio, alum caused reductions in invertebrates either by toxicity or downstream drift of the organisms in the river (Barbiero et al., 1988), but in this case the treatments were repetitive and frequent. Bioaccumulation of aluminum has not been reported. No impacts on trout were observed over one month (Lamb and Bailey, 1983). A long-term study following treatment of Kezar Lake, New Hampshire found some changes in zooplankton as cladoceran crustacea declined (Connor and Martin, 1989). Such changes may be naturally expected if algal food supplies decline and visual predation increases following treatment. Reducing algal production might be expected to reduce fish production as well. On the other hand, increased transparency may allow macrophytes to increase and extend their depth distribution into deeper waters as sunlight penetration increases.
Eutrophication and Aquatic Plant Management in Massachusetts
3.0 Methods to Control Nutrients Page 3-63
3.5.8 Impacts to Water Quality
3.5.8.1 Short-Term
The chemistry of aluminum in treated water has been reviewed by Driscoll and Letterman (1988). Alum is acidic and can drive pH down below 6 SU, causing dissolved aluminum concentrations remain high for a longer period of time than at more moderate pH. Sodium aluminate is basic and drives pH upward beyond pH 9 where dissolved aluminum concentrations may remain high for a longer period of time than at more moderate pH. All other effects of aluminum on water chemistry are related to the removal of a variety of contaminants from solution by coagulation and precipitation. Aluminum is used extensively in the water treatment industry for its rapid coagulant benefits to water quality. As long as oxygen levels are suitably high, iron behaves much like aluminum sulfate in terms of its effects on pH and water quality contaminant levels. Calcium compounds raise the pH, but also are expected to remove many contaminants.
3.5.8.2 Long-Term
No direct adverse long-term impacts on water quality are expected and none have been reported for any of these treatments. Indirect changes are expected to be beneficial; the intended long-term change is a reduction in available phosphorus, which in turn should improve water quality by reducing algal production and associated fluctuations in pH, oxygen and solids in the water column.
3.5.9 Applicability to Saltwater Ponds While these treatments may work in saltwater ponds, little information is available on any such experience. Saltwater ponds may be highly stratified with saltwater below and freshwater above. In such cases, mixing estimates may be required to calculate the potential for mixing of phosphorus to the surface waters and to evaluate the applicability of such treatments. Potential effects of flocs on shellfish in saltwater ponds would be a primary concern.
3.5.10 Implementation Guidance
3.5.10.1 Key Data Requirements
This nutrient control method requires an accurate nutrient budget that includes both a measured mass balance and a land-use source analysis, and it should include a detailed analysis of internal sources of phosphorus (Section 1). If the nutrient budget shows that the major source of phosphorus is from the sediments, then these types of nutrient controls may be effective. Even in lakes where there are large external sources, these treatments (especially alum and calcium) will clarify the water. However, the effectiveness may not last more than a year or two (possibly as short as a few weeks depending on detention time) if the external sources are not controlled as well. Alum, iron and calcium treatments require recent information on pH and alkalinity at all depths to properly predict potential changes in pH and to minimize impacts. Knowledge of lake oxygen regime and biotic components is helpful in planning treatments. An accurate depth map
Eutrophication and Aquatic Plant Management in Massachusetts
3.0 Methods to Control Nutrients Page 3-64
of the lake is required to properly evaluate dosing. In addition to jar tests to establish doses and ratios of chemicals, toxicity tests with a sensitive fish species such as fathead minnow may be desirable to ensure the safety of the treatment. Estimates of effectiveness should be made for lake recovery in terms of total phosphorus levels and Secchi disk transparency. For deep lakes, hypolimnetic dissolved P concentration should decrease dramatically and should be checked.
3.5.10.2 Factors that Favor this Approach
The following considerations are indicative of appropriate application of phosphorus inactivation for reductions in nutrient concentrations and control of algae in lakes: 1. A substantial portion of the P load is associated with sediment sources within the lake. 2. Studies have demonstrated the impact of internal loading on the lake. 3. External P load has been controlled to the maximum practical extent or is documented to be
small; historic loading may have been much greater than current loading. 4. Inactivation of phosphorus in the water column is expected to provide interim relief from
algal blooms and turbidity while a prolonged watershed management program is conducted to reduce external loading.
5. The lake is well buffered or buffering can be augmented to prevent major changes in pH during treatment.
6. Assays indicate no toxic effects during simulated treatment. 7. Where iron is to be used as an inactivator, oxygen is adequate at the bottom to maintain iron-
phosphorus bonds. 8. Where calcium is to be used as an inactivator, normal background pH is high enough to
maintain calcium-phosphorus bonds. Where nitrate is to be used to alter redox potential and limit P release, nitrate can be effectively injected into the sediment without major release to the water column.
3.5.10.3 Performance Guidelines
Planning and Implementation Treatments for phosphorus inactivation need to be carefully planned and executed to achieve the desired goal without undue impact to non-target organisms. In most cases the primary goal will be long-term reduction in internal P recycling, but may be short-term reduction of P in the water column until watershed management can reduce P loading. If short-term reduction is to be a repetitive process for an indefinite number of years, further consideration of impacts may be warranted and cost comparison with watershed management over a longer period (10-20 years) is encouraged. Access and a staging area for loading of chemicals is needed for efficient treatment, and project size will determine many other needs. Broadcasting powdered inactivators is possible but generally restricted to smaller applications (<10 acres). Application of liquids usually involves loading one or more tanks on a boat, barge, or modified harvester with frequent refills. Targeted treatment areas should be clearly laid out. Geographic positioning systems are now commonly used, but demarcation with buoys is still a desirable back-up plan. Equipment for injecting the chemicals well below the water surface may be needed.
Eutrophication and Aquatic Plant Management in Massachusetts
3.0 Methods to Control Nutrients Page 3-65
Alum, iron and calcium compounds can all be injected into the hypolimnion of deeper lakes to minimize impacts to the surface waters. Alternatively, the lake can be treated in sections over time to maintain refuge areas for fish, or the lake could be treated multiple times with lower doses. Buffers can be added to maintain appropriate pH in low alkalinity lakes treated with alum or iron, and for treatments in which aluminum sulfate is buffered by sodium aluminate, a 2:1 ratio of alum to aluminate by volume is recommended. Calcium or silica additions may be considered to reduce aluminum toxicity during alum treatments. Calcium additions for phosphorus inactivation may be difficult to perform effectively in many Massachusetts lakes, given low pH in all but the lakes of the Berkshires. Iron treatments may require aeration to maintain oxic conditions. Nitrate treatments are generally injected directly into the sediments and thus should not impact surface waters in any major way. Monitoring and Maintenance Chemical samples for total phosphorus, dissolved cations (aluminum, iron or calcium, depending upon the treatment), alkalinity and pH should be collected and analyzed before, during and after treatment at several depths (typically 10 ft intervals). Nitrate levels should be monitored in the case of a nitrate treatment. Shifts in alkalinity and pH are most important to track during treatment, the former providing a warning of possible impacts to the latter. Dissolved oxygen might also be monitored during treatment and as part of a long-term monitoring program; temporary decreases in deeper water dissolved oxygen may occur, followed by longer term increases. Long-term monitoring of water clarity is the simplest measure of treatment effectiveness and longevity. Pre- and post-treatment biological sampling should include identification and enumeration of algae and zooplankton and a visual survey for any large impacts (e.g., macroinvertebrate or fish kills). Where sensitive populations reside in the treatment area and have little opportunity to vacate the area during treatment, some pre- and post-treatment monitoring of those populations may be warranted. Generally little maintenance is required for these treatments. Ideally, treatments for inactivation of sediment P are one-time efforts for any lake within the lifetime of the applicants. For maintenance water column treatments, re-application is the only maintenance activity. Mitigation Once a treatment is applied, there is little opportunity for mitigation. Performing a treatment over time, with sections of lake treated on separate days with a period of evaluation in between, can allow adjustment of cancellation of treatment where adverse impacts are detected. This is a reasonable approach on larger projects, but may not be effective for small lake treatments and adds considerably to the cost.
3.5.11 Regulations
3.5.11.1 Applicable Statutes
In addition to the standard check for site restrictions or endangered species (see Appendix II.), a Notice of Intent must be sent to the Conservation Commission with a copy to the Department of Environmental Protection Regional Office. If the proposed project occurs within an Estimated
Eutrophication and Aquatic Plant Management in Massachusetts
3.0 Methods to Control Nutrients Page 3-66
Habitat of Rare Wildlife in the most recent version of the Natural Heritage Atlas, a copy of the Notice of Intent must be submitted to the Natural Heritage and Endangered Species Program (NHESP) within the MDFG for review (Appendix II). If the proposed project occurs within a Priority Habitat of Rare Species in the most recent version of the Natural Heritage Atlas, the project proponent must submit project plans to the NHESP for an impact determination. An Order of Conditions must be obtained prior to work. Check threshold requirements for MEPA review (Appendix II). A License to Apply Chemicals is required, but the applicator is not required to be licensed by the Massachusetts Department of Agricultural Resources. A Chapter 91 Permit is not required for phosphorus inactivation treatments (Appendix II) and the Corps of Engineers does not regard nutrient inactivation as a filling of wetland resources, so no Section 404 permit is required. A Section 401 permit is sometimes required from the MDEP, depending upon funding source and the details of other permits.
3.5.11.2 Impacts Specific to Wetlands Protection Act
The following overall impact classification is offered as a generalization of impacts, with clarifying notes and caveats as warranted: 1. Protection of public and private water supply – Benefit (water quality improvement). 2. Protection of groundwater supply – Neutral (no significant interaction). 3. Flood control - Neutral (no significant interaction). 4. Storm damage prevention – Neutral (no significant interaction). 5. Prevention of pollution - Benefit (water quality enhancement). 6. Protection of land containing shellfish - Possible benefit through water quality enhancement
in the lake and possible detriment by direct toxicity unless treatment is properly buffered. 7. Protection of fisheries - Possible benefit through water quality enhancement in the lake and
possible detriment by direct toxicity unless treatment is properly buffered, plus possible detriment through reduced fertility.
8. Protection of wildlife habitat – Benefit (water quality enhancement), but possible detriment through reduced fertility.
The most serious impact is the possibility for fish or invertebrate kills following treatment in low alkalinity lakes. This can be avoided with proper planning and implementation. Minimal adverse impacts are expected to either surface or groundwater supplies. Aluminum, iron and calcium are commonly added in water and wastewater treatment facilities with no significant adverse impacts (and generally a marked improvement in water quality). However, nitrate could adversely impact water supplies if levels in the water approach the 10 mg/L limit, and could disrupt lake ecology at levels as low as 0.5 to 1.0 mg/L. Yet nitrate treatment acts directly on sediment and is not expected to raise nitrate levels in the water column.
3.5.12 Costs Costs vary by the amount (dose) applied, the total area treated, and by the precautions necessary to avoid unintended impacts.
Eutrophication and Aquatic Plant Management in Massachusetts
3.0 Methods to Control Nutrients Page 3-67
3.5.12.1 Aluminum
Aluminum treatment costs typically range from $500-$1,00/acre, with the areal cost decreasing for larger treatments, unbuffered treatments, and lesser monitoring requirements (Wagner, 2001). Total cost was $47,000 for treatment of 86 acres ($546/acre) of Hamblin Pond in Barnstable, MA. This was a fairly typical inactivation effort, but one that resulted in a fish kill due to improper buffering, application near the surface, and inadequate monitoring. Treatment of Ashumet Pond cost $337,000 for 28 acres ($12,000/acre), owing to extensive pre-treatment planning, permitting, and testing, treatment at 35 ft of water depth, an extreme amount of monitoring during treatment, and oversight by three consulting firms. This level of treatment cost is simply not sustainable by most applicants. Costs for treatment of Dug Pond are about $300 to $400/acre, but this is a low-dose, annual maintenance treatment that does not provide long-term P control. Costs for treating Mountain and Cranberry Lakes in NJ with lime and alum on a maintenance basis range from $200 to $1,000/acre on annualized scale, depending on the frequency of treatments (every other year to 2/yr). The treatment of 177 acres of Lake Pocotopaug in CT cost about $220,000 (about $1,250/acre), including a thorough investigation of the initial fish kill and extensive monitoring.
3.5.12.2 Iron
Costs for iron treatments are similar to those for alum treatment; the chemical is less expensive to purchase but higher doses are recommended (100 g Fe/m2) (Cooke et al., 1993a). However, iron is best applied in conjunction with aeration systems, so total project cost is likely to be substantially higher.
3.5.12.3 Calcium
Calcium costs are slightly less expensive than alum, especially in hard water lakes where this technique is most likely to be applied. The cost is estimated at $10 per metric ton for CaCO3 and $100 per metric ton of Ca(OH)2 from work done in Alberta, Canada. Due to the nature of calcite solubility, more of the former was required to achieve the desired results. Thus, the cost of materials is about $200/acre. Labor has been a non-commercial cost in most calcium treatments, conducted by University of Alberta researchers.
3.5.12.4 Nitrate
Nitrate application to sediments is an expensive treatment. At White Lough the costs were estimated to be 80% higher than alum treatment, even at nitrate doses 5 times lower than that applied at Lake Lillesjön (Foy, 1986). This is largely due to the high cost to inject the chemical into the sediment.
3.5.13 Future Research Needs Evaluation of the right level of precaution and monitoring is needed to make inactivation both safe and affordable. Application of all discussed precautions will tend to be overprotective and greatly adds to treatment cost. Further testing is needed on the use of calcium and silica to ameliorate possible impacts of alum treatments, if this approach is to be developed.
Eutrophication and Aquatic Plant Management in Massachusetts
3.0 Methods to Control Nutrients Page 3-68
3.5.14 Summary Phosphorus inactivation offers one of the most effective long-term management options for eutrophic lakes suffering from algal blooms if the source of the phosphorus is the lake sediments. In cases where large inputs of phosphorus are coming from watershed or point sources, these should be addressed first. However, interim inactivation of phosphorus in the water column on a seasonal basis may be an appropriate maintenance technique while prolonged watershed management actions are underway. Of the four types of treatments, alum (with or without buffers) has the most proven record of effectiveness. Iron, calcium and nitrate treatments may be applicable under certain circumstances, but suffer from limitations that affect the level of success and longevity of results. In lakes where sediments are a major source of phosphorus, a single large treatment (inactivation of sediment phosphorus) can provide rapid and lasting relief from elevated phosphorus and algae levels. Although alum treatments can have adverse impacts, including fish or invertebrate kills, the method can be used if proper precautions are taken. Extra precautions are needed in low alkalinity lakes (< 20 mg/L).
3.6 ARTIFICIAL CIRCULATION AND AERATION
3.6.1 Overview
Whole lake circulation and hypolimnetic aeration are two related techniques for management of algae that tend to affect nutrient levels. The central process is the introduction of more oxygen, intended to limit internal recycling of phosphorus, thereby controlling algae. Other potentially important processes may be at work here as well, however. Circulation strategies minimize stratification, while hypolimnetic aeration maintains stratification (Figure 3-1). Whole lake artificial circulation is also referred to as destratification or whole lake aeration. Circulation affects mixing and the uniformity of lake conditions. Thermal stratification and features of lake morphometry such as coves create stagnant zones that may be subject to loss of oxygen, accumulation of sediment, or algal blooms. Artificial circulation minimizes stagnation and can eliminate thermal stratification or prevent its formation. Movement of air or water is normally used to create the desired circulation pattern in shallow (<20 ft) lakes, and this has been accomplished with surface aerators, bottom diffusers, and water pumps. Algae may simply be mixed more evenly in the available volume of water in many cases, but turbulence, changing light regime and altered water chemistry can cause shifts in algal types.

Eutrophication and Aquatic Plant Management in Massachusetts
3.0 Methods to Control Nutrients Page 3-69
Figure 3-1 Methods of artificial circulation and aeration (from Wagner, 2001)
Stratification is broken or prevented in deeper lakes through the injection of compressed air into lake water from a diffuser at the lake bottom. The rising column of bubbles, if sufficiently powered, will produce lakewide mixing at a rate that eliminates temperature differences between top and bottom waters. The use of air as the mixing force also provides some oxygenation of the water, but the efficiency and magnitude of this transfer are generally low. In some instances, wind driven pumps have been used to move water. For air mixed systems, the general rule is that an air flow rate of 1.3 cubic feet per minute per acre of lake (9.2 m3/min/km2) will be needed to maintain a mixed system (Lorenzen and Fast, 1977). However, there are many factors that could require different site specific air flow rates, and undersizing of systems is the greatest contributor to failure for this technique. Algal blooms are sometimes controlled by destratification through one or more of the following processes:
Introduction of dissolved oxygen to the lake bottom may inhibit phosphorus release from sediments, curtailing this internal nutrient source.
In light-limited algal communities, mixing to the lake's bottom will increase the time a cell spends in darkness, leading to reduced photosynthesis and productivity.
Rapid circulation and contact of water with the atmosphere, as well as the introduction of carbon dioxide-rich bottom water during the initial period of mixing, can increase the carbon

Eutrophication and Aquatic Plant Management in Massachusetts
3.0 Methods to Control Nutrients Page 3-70
dioxide content of water and lower pH, leading to a shift from blue-green algae to less noxious green algae.
Turbulence can neutralize the advantageous buoyancy mechanisms of blue-green algae and cause a shift in algal composition to less objectionable forms such as diatoms.
When zooplankton that consume algae are mixed throughout the water column, they are less vulnerable to visually feeding fish. If more zooplankters survive, their consumption of algal cells may also increase.
Some of the early applications of artificial circulation were to prevent winterkills of fish in eutrophic lakes that become anoxic during the winter. On a smaller scale, artificial circulation can be used to prevent ice formation around docks or other structures. The technique is also used to maintain acceptable water quality in drinking reservoirs as the oxic conditions created by the circulation reduce concentrations of nuisance substances such as hydrogen sulfide, ammonia, iron and manganese. For these types of problems artificial circulation has been very successful. Hypolimnetic aeration typically uses an air compressor as described for whole lake circulation above, but in this case the upward plume is controlled to avoid mixing with the epilimnetic waters, and thus thermal stratification of the lake is maintained. The maintenance of stratification is often desirable as it maintains coldwater fish habitat and reduces transport of nutrients from the hypolimnion into the epilimnion where they may stimulate further algal blooms. Aeration puts air into the aquatic system, increasing oxygen concentration by transfer from gas to liquid and generating a controlled mixing force. The oxygen transfer function is used to prevent hypolimnetic anoxia. By keeping the hypolimnion from becoming anoxic during stratification, aeration should minimize the release of phosphorus, iron, manganese and sulfides from deep bottom sediments and decrease the build-up of undecomposed organic matter and oxygen-demanding compounds (e.g., ammonium). Hypolimnetic aeration can also increase the volume of water suitable for habitation by zooplankton and fish, especially coldwater forms. Pure oxygen can be used in place of air to maximize oxygen transfer at an increased cost. A full lift hypolimnetic aeration approach moves hypolimnetic water to the surface, aerates it, and replaces it in the hypolimnion. Bringing the water to the surface can be accomplished with electric or wind-powered pumps, but is most often driven by pneumatic force (compressed air). Return flow to the hypolimnion is generally directed through a pipe to maintain separation of the newly aerated waters from the surrounding epilimnion. To provide adequate aeration, the hypolimnetic volume should be pumped and oxygenated at least once every 60 days. Another hypolimnetic aeration system is the partial lift system, in which air is pumped into a submerged chamber in which exchange of oxygen is made with the deeper waters. The newly oxygenated waters are released back into the hypolimnion without destratification. A shoreline site for a housed compressor is needed, but the aeration unit itself is submerged and does not interfere with lake use or aesthetics. An alternative approach involves a process called layer aeration (Kortmann et al. 1994). Water can be oxygenated by full or partial lift technology, but by combining water from different (but carefully chosen) temperature (and therefore density) regimes, stable oxygenated layers can be

Eutrophication and Aquatic Plant Management in Massachusetts
3.0 Methods to Control Nutrients Page 3-71
formed anywhere from the upper metalimnetic boundary down to the bottom of the lake. Each layer acts as a barrier to the passage of phosphorus, reduced metals and related contaminants from the layer below. Each layer is stable as a consequence of thermally mediated differences in density. The whole hypolimnion may be aerated, or any part thereof, to whatever oxygen level is deemed appropriate for the designated use. The mechanism of phosphorus control exercised through hypolimnetic aeration is the maintenance of high oxygen and limitation of phosphorus release from sediments. Out of the processes listed for artificial circulation, the only other applicable mechanism for hypolimnetic aeration is provision of a zooplankton refuge, potentially increasing grazing potential. To successfully aerate a hypolimnion, the continuous oxygen demand of the sediments must be met, and experience dictates that the oxygen input needs to be about twice the measured oxygen demand (Cooke et al., 1993a). This demand may be reduced over time under aeration, but is unlikely to be eliminated. It is also essential that an adequate supply of phosphorus binder, usually iron or calcium, be available to combine with phosphorus under oxic conditions. Sediments are likely to be anoxic below the surface, even with a well-oxygenated water column above, so some release is to be expected unless phosphorus binders are sufficient to immediately combine with phosphorus at the anoxic-oxic interface. In many cases iron will be solubilized with the phosphorus, and can recombine with it upon oxygenation. However, where sulfate reduction is active, iron may be scavenged by sulfides and be unavailable for binding phosphorus (Gachter and Muller, 2003). In such cases, additional phosphorus binders may have to be added for aeration to have maximum effectiveness on phosphorus inactivation.
3.6.2 Effectiveness The success of circulation or aeration in controlling algae is largely linked to reducing available phosphorus, which in turn depends on detailed aspects of system respiration and the chemical content of the water and bottom sediment. Enough oxygen must be added to meet the oxygen demand, and there must be an adequate supply of phosphorus binders present. If phosphorus binding agents are naturally insufficient, results can be improved by adding reactive aluminum or iron compounds to the process. Circulation may provide additional benefits through altered pH or other water chemistry in surface waters, or by subjecting algae to variable light regime and physical stresses associated with mixing. Both circulation and hypolimnetic aeration can foster more desirable zooplankton communities, increasing grazing on algae.
3.6.2.1 Short-Term
Short-term effectiveness may be achieved if oxygen levels near the bottom rise quickly and adequate phosphorus binders are present. Even then, a month or more of lag time might be expected for existing algae to suffer nutrient limitation or other stresses that reduce abundance. The control of phosphorus in surface waters may not be effective until the following year for hypolimnetic aeration. The use of artificial circulation to control algal blooms has had varied results. A review by Pastorok et al. (1982, as cited in Cooke et al., 1993a) of many whole lake artificial circulation
Eutrophication and Aquatic Plant Management in Massachusetts
3.0 Methods to Control Nutrients Page 3-72
treatments found that in more than half of the cases conditions became worse. Total phosphorus increased or did not change in 65% of the cases, Secchi disk depth worsened in 53% of the cases and phytoplankton decreased in less than half of the cases. The technique is sometimes effective at shifting phytoplankton composition from blue-greens to green algae or diatoms. Despite the lack of consistent evidence of lake improvement, aeration is a popular technique for owners of small ponds, where it is claimed to reduce algae in addition to providing additional oxygen for fish populations (Matson, 1994). Destratification has been a very successful technique for drinking water reservoirs, as evidenced by Fresh Pond in Cambridge, but there it is the build-up of manganese under anoxic conditions that is being counteracted in this generally low-nutrient system. Several reasons for failure of whole lake circulation to achieve consistent algal reduction have been suggested, mostly related to improper design or placement of pneumatic mixing systems. In Silver Lake, Ohio, Brosnan and Cooke (1987) found that artificial circulation failed to improve the eutrophic conditions. Insufficient mixing caused by an underpowered air compressor was suggested as a possible reason for the failure; the airflow was only three percent lower than the calculated target rate of 3.5 m3/min/ km2, but the target rate itself may have been low. High mixing rates are reported to be more effective than low mixing rates, with the recommended air-flow rate of 9.2 m3/min/km2 (Lorenzen and Fast, 1977) marking the boundary between high and low rates. The higher mixing rates prevent microstratification that can allow algae to remain in the photic zone and result in an algal bloom (Brosnan and Cooke, 1987). Another reason suggested to explain the increases in total phosphorus has been resuspension of nutrient-rich sediments caused by improper placement of the diffusers directly on the sediment surface (Brosnan and Cooke, 1987). Hypolimnetic aeration has had generally positive results, but effectiveness has been variable. Cooke et al. (1993) review a number of examples and note that available phosphorus tends to decline by one to two thirds during aeration, but often rises quickly to pre-aeration levels when treatment ceases. Aeration promotes binding activity and has been most effective when phosphorus binders have been added. Sedimentation of previously available phosphorus in a Canadian lake increased by almost an order of magnitude after aeration with the addition of iron to a Fe:P ratio of 10:1 (McQueen et al., 1986a), and the combination of iron and oxygen was similarly successful in a Minnesota Reservoir (Walker et al., 1989). Aluminum can minimize phosphorus availability even in the absence of oxygen. The process of nutrient inactivation is covered separately in this document, but the synergy of these techniques is notable, and aeration depends to a large degree on the availability of phosphorus binders to reduce phosphorus levels. Hypolimnetic aeration has been reported to be reasonably successful (Kishbaugh et al., 1990; Wagner, 2001), but in many cases little improvement has been reported. Multiple factors may be responsible, one of which is continued metalimnetic anoxia, where organic particles accumulating near the thermocline create an anoxic layer above the aerated hypolimnion. A successful example of an increase in transparency and reduction in blue-green algae in a Connecticut lake is described in Kortmann et al. (1994) who used layer aeration within the thermocline of a eutrophic water supply lake. The authors suggest that layer aeration (where the oxygenated water is used to create a stable layer instead of aerating the entire hypolimnion) can
Eutrophication and Aquatic Plant Management in Massachusetts
3.0 Methods to Control Nutrients Page 3-73
eliminate the problem of metalimnetic anoxia that allows rapid phosphorus recycle and can act as a barrier to fish migration. Any aeration system can make a marked improvement in lake conditions, but it should be noted that practical experience has demonstrated that effects are not uniform or consistent within and among aquatic systems. Zones of minimal interaction will often occur, possibly resulting in localized anoxia and possible phosphorus release. Partial lift hypolimnetic aeration systems may allow a band of anoxic water to persist near the top of the metalimnion, allowing nutrient cycling and supply to the epilimnion and discouraging vertical migration by fish and zooplankton. Phosphorus binders must be available for aeration to facilitate phosphorus inactivation. Uniformity of results should be achievable with careful design and operation, but probably with increased cost.
3.6.2.2 Long-Term
Since aeration is an active treatment, the pumps must be kept running year after year, at least during the summer months, but it seems plausible that effectiveness can be maintained over many years with this method. Certainly the Fresh Pond destratification system in Cambridge has yielded positive results over a period approaching a decade. Notch Reservoir in North Adams has also experienced improvement over about a decade with a hypolimnetic aeration system. Kortmann et al. (1994) describe a successful long-term treatment of Lake Shenipsit, Connecticut with a layer aeration method. In this case, aeration was conducted for several years between 4.7 and 10.7 meters in a lake with a maximum depth of 20.7 meters. Adequate aeration of the metalimnion in this 212 ha lake was achieved with compressor systems totaling 60 HP that delivered 240 CFM or 6.8 m3/min/km2. Total phosphorus was reduced marginally while blue-green algae decreased and the algal community shifted to green algae and diatoms. The lake experienced a large increase in transparency after 2 years of layer aeration. The increase was associated with an increase in zooplankton, particularly Daphnia, that were assumed to be grazing on the algae (Kortmann et al., 1994) and may have used the newly oxygenated zone as a daytime refuge from fish predation.
3.6.3 Impacts to Non-Target Organisms
3.6.3.1 Short-term
There are very few negative impacts expected from hypolimnetic aeration but several potentially adverse impacts from circulation. In general, however, these techniques have limited potential to cause any harm if properly designed. Since oxygen levels are increased in previously anoxic area, many organisms that require oxygen such as fish, aquatic insects and zooplankton are expected to increase for both whole lake circulation and hypolimnetic aeration (Pastorok et al., 1980). Ashley (1983) noted an increase in some zooplankton species following hypolimnetic aeration, despite little effect on algae. The greatest risk from artificial circulation involves transport of nutrients and other substances from the bottom to the top of a lake. If the bottom waters are rich in nutrients and the epilimnion low in nutrients, whole lake circulation may transport nutrients (and possibly silt) to the surface and stimulate unwanted algal blooms and reduce transparency in the surface waters (Cooke et al.,
Eutrophication and Aquatic Plant Management in Massachusetts
3.0 Methods to Control Nutrients Page 3-74
1993a; Brosnan and Cooke, 1987). Algal blooms could lower epilimnetic carbon dioxide, raise pH and possibly lead to blue-green dominance as suggested by Cooke et al. (1993). Changes in zooplankton and algal communities could have an effect on the fish populations in the higher trophic levels. Another risk from artificial circulation involves altered thermal regime. For whole lake circulation, the temperature increase in the bottom waters may be considered an adverse effect since it may eliminate cold water fishery habitat from the lake if the water becomes too warm. However, it is expected that this method would be used in eutrophic lakes with anoxic hypolimnia, where no significant cold water fishery was present due to the lack of oxygen. The need to continue to aerate or circulate is an important consideration. While cessation may not result in worse conditions than encountered before treatment, adjustment of system biota to the new oxygen or thermal regime could be a problem. In one case a fish kill was reported in a water supply reservoir (Mt. Williams Reservoir, North Adams, MA) during a period of high turbidity when a destratifying aerator was turned off in 1993 (DFW, unpublished data, 1993).
3.6.3.2 Long-Term
Long-term impacts to biota such as zooplankton and fish may occur following any changes in algal abundance or species composition. Cold water fisheries may be harmed if the cold thermal refuge is eliminated by mixing. Oxygen or nitrogen supersaturation could theoretically become a problem for fish in deep waters during aeration due to gas bubble disease, but formation of the right size bubbles from aeration is not expected (Cripe and Phipps, 1999). Gas bubble disease is most often a function of creation and entrapment of very fine air bubbles associated with hydropower facilities; aeration systems have not been observed to produce bubbles small enough to induce this disease. Cooke et al. (1993) suggest that nitrogen supersaturation represents a greater risk than oxygen levels, but that no gas bubble disease has been detected in lakes with hypolimnetic aeration. Although gas bubble disease is known to occur near deep groundwater springs and below large hydropower dams (Marking, 1987), no cases of gas bubble disease have been reported in the many lakes and reservoirs where aeration is used. Direct impacts on humans are mostly safety and noise related. If aerators are operated during the winter months (to prevent fish kills or protect structures) then the aeration sites should be clearly marked as thin ice or no ice areas to minimize the hazard to winter lake users. Deaths from drowning have been known to occur under such circumstances (NRC, 1992). Ellis and Stefan (1994) have proposed and tested a method to preserve ice cover during aeration operations that would reduce this hazard. Noise from compressors or pumps can be an issue for nearby residents, and usually is mitigated by placing these machines in buildings that suppress noise.
3.6.4 Impacts to Water Quality
3.6.4.1 Short-Term
In most cases water quality improves as elevated oxygen levels reduce the concentrations of phosphorus, hydrogen sulfide, iron and manganese that are commonly found in anoxic waters. Algal production should decline as a function of reduced phosphorus availability, but this has not
Eutrophication and Aquatic Plant Management in Massachusetts
3.0 Methods to Control Nutrients Page 3-75
always been the case, especially with circulation systems that mix the lake to varying degrees and may actually increase nutrient availability. If installed too close to the sediments, diffusers may resuspend sediments causing increases in turbidity and an increase in total phosphorus. Even when properly installed, turbidity may increase somewhat.
3.6.4.2 Long-Term
Long-term impacts on water quality are essentially the same as the short-term impacts, with an intended improvement in water quality as described above (Verner, 1984; Boehmke, 1984). It is unlikely that a circulation or aeration system would be operated for more than a few years if such a water quality improvement was not observed.
3.6.5 Applicability to Saltwater Ponds This technique could be applied to saltwater ponds, although no such applications have been reported. In some saltwater ponds, very strong density gradients can occur if relatively fresh water is present over a saltwater hypolimnion, and additional calculations would be required to determine how much energy would be required to circulate such a system. In addition, a whole lake circulation may have adverse impacts associated with the osmotic shock that would occur when freshwater biota become mixed into saltwater and vice versa. Suspended sediments may interfere with filter feeding of shellfish if care is not taken during installation. Overall, however, there is no reason to believe that the addition of oxygen to saltwater ponds would not be beneficial.
3.6.6 Implementation Guidance
3.6.6.1 Key Data Requirements
Ideally, data related to each of the five possible control mechanisms (oxygenation/P inactivation, light limitation, pH/carbon source adjustment, buoyancy disruption, and enhanced grazing) should be analyzed and evaluated in terms of potential algal control. Specifically: 1. Is there anaerobic release of phosphorus that can be mitigated by oxygenation of deep
waters? 2. Is the supply of phosphorus binders adequate to inactivate most phosphorus upon
oxygenation? 3. Is the mixing zone deep enough to promote light limitation of algae? 4. Is there a large amount of carbon dioxide in the bottom waters that could be mixed to the
surface to favor the growth of algae other than blue-greens? 5. Is mixing predicted to counteract the buoyancy advantage of blue-greens over other algae? 6. Will a dark, oxygenated refuge be created for zooplankton? Of the five mechanisms, oxygenation to prevent sediment release of phosphorus is the best documented and should be the focus of most treatments of this type. If the nutrient budget does not indicate a large source of phosphorus-rich, anaerobic water in the hypolimnion, these methods are not as likely to be successful. Data requirements for this type of nutrient control therefore include an accurate nutrient budget with a detailed analysis of internal sources of phosphorus (Section 1) and availability of potential phosphorus binders.
Eutrophication and Aquatic Plant Management in Massachusetts
3.0 Methods to Control Nutrients Page 3-76
The most critical information for designing an aeration system is the oxygen demand that must be met by the system. Oxygen demand is normally calculated from actual data for the lake. For stratified lakes, the hypolimnetic oxygen demand (HOD, often a function of sediment oxygen demand, or SOD) can be calculated as the difference in oxygen levels at the time stratification formed and one or more points in time later during stratification. However, measurements obtained when the oxygen levels are <2 mg/L are deceiving, as oxygen consumption is not linear and will decline markedly as oxygen supply declines. Oligotrophic lakes typically have oxygen demands <250 mg/m2.day, while eutrophic lake values are >550 mg/m2.day (Hutchinson 1957). Hutchinson suggests that 1400 mg/m2.day is the upper boundary for eutrophic lakes; values of 2000 to 4000 mg/m2.day have been measured in hypereutrophic lakes (K. Wagner, ENSR, pers. obs., 1996-2000). There are a number of other factors complicating the assessment of oxygen demand; calculations and related interpretation for design purposes are best performed by experienced professionals.
3.6.6.2 Factors that Favor this Approach
The following considerations are indicative of appropriate application of artificial circulation and hypolimnetic aeration for reductions in nutrient concentrations and control of algae in lakes: 1. A substantial portion of the P load is associated with anoxic sediment sources within the lake. 2. Studies have demonstrated the impact of internal loading on the lake. 3. External P load has been controlled to the maximum practical extent or is documented to be
small; historic loading may have been much greater than current loading. 4. Hypolimnetic or sediment oxygen demand is high (>500 mg/m2/day). 5. In addition to phosphorus management, control of other reduced compounds such as
hydrogen sulfide, ammonia, manganese and iron, is desired. 6. Adequate phosphorus inactivators are present for reaction upon addition of oxygen. 7. Shoreline space for a compressor or pump is available where access is sufficient and noise
impacts will be small. 8. Power is available to run all machinery. 9. The lake is bowl shaped, or at least not highly irregular in bathymetry (few separate basins
and isolated coves). 10. Long-term application of the technique is accepted. 11. For artificial circulation, coldwater fishery habitat is limited or not a concern. 12. For hypolimnetic aeration, coldwater fishery habitat is abundant or an important goal.
3.6.6.3 Performance Guidelines
Planning and Implementation Although the risk of adverse impacts is limited, the successful use of whole lake circulation or hypolimnetic aeration requires a thorough study of the lake to determine if the method is likely to succeed, what type of treatment to employ, and the size and type of pumps required. Unacceptable results have routinely been traced to inadequate equipment or operation thereof, although chemical features of the target lake may also be responsible. Whole lake circulation requires an air compressor and pipes (usually metal for the first 30 meters to prevent damage, thereafter cheaper plastic pipe can be used if properly weighted). Plastic pipes can also be easily perforated to create a diffuser in the deepest part of the lake, with care taken to suspend the
Eutrophication and Aquatic Plant Management in Massachusetts
3.0 Methods to Control Nutrients Page 3-77
diffuser section about one meter above the bottom. Scuba divers may be required to install pipes and the diffuser. Calculations can be performed to determine if the mixed depth will exceed the critical depth where light limitation is predicted to result in zero net production of algae. Descriptions on the use of these calculations are summarized in Cooke et al. (1993). A discussion of aerator sizing, aeration efficiency and general theory is presented in Kortmann et al. (1994). Bubble size and distribution and overall air delivery rate are important considerations for diffusers, and some careful engineering will greatly improve efficiency Hypolimnetic aeration can be complicated to apply, given the need to deliver and distribute the appropriate amount of oxygen without destroying stratification. The size of the pumps is generally smaller than that required for whole lake circulation, but effectiveness is linked to oxygen transfer, not mixing. Calculating the transfer of oxygen is a technical task, but a general rule is that 2.5% of the oxygen is transferred for each vertical meter of contact. As most Massachusetts lakes have hypolimnia of much less than 10 meters thickness, this suggests that only a small part of the injected oxygen will be transferred. The chamber for partial lift systems must be carefully designed and use of a full lift system must avoid mixing hypolimnetic water with the epilimnion. Generally this technique is suggested only for lakes with large hypolimnetic volumes, relative to the epilimnetic volume, as exchange between layers will be more influential in these cases. Caution should be exercised with aeration and mixing in lakes during winter, as these techniques may cause thin ice and dangerous conditions. In some cases the prevention of ice formation is desired, as with marina areas and some structures in northern lakes. Holes or areas of thin ice can occur, however, and represent a hazard for ice use by winter recreation enthusiasts. Monitoring and Maintenance In addition to electricity, the compressor or other machinery will require maintenance as specified by the manufacturer. Frequent monitoring of oxygen concentrations and temperature at various depths in the lake may be required to determine the minimum pumping rate required for each method. Additional biological monitoring should be conducted to determine how the algae, zooplankton and fish have responded to the treatment, and to suggest ways of regulating circulation or hypolimnetic aeration to maximize benefits and minimize costs. Although careful design will surmount most problems, expect to make adjustments to optimize performance. Equipment failure and vandalism have been the most commonly reported maintenance issues. The artificial circulation of Lake Cochituate in Natick in 1971 and 1972 failed to control algae because of equipment failure, vandalism, and failure to monitor and maintain equipment (Cortell and Associates, 1973). Well maintained systems should operate for at least a decade, however, and some have been in use that long with limited parts replacement. Mitigation Other than mitigative measures to ensure that the diffusers are properly suspended above the sediments to reduce the possibility of sediment resuspension, the primary mitigative measure is to shut the system off if it is not working properly. It may be necessary to run the system for the
Eutrophication and Aquatic Plant Management in Massachusetts
3.0 Methods to Control Nutrients Page 3-78
whole growing season, not just to maintain desirable conditions, but to mitigate problems that may result from shutting it off (e.g., the fish kill in Mt. Williams Reservoir, North Adams).
3.6.7 Regulations
3.6.7.1 Applicable Statutes
In addition to the standard check for site restrictions or endangered species (Appendix II.), several permits may be applicable. A Notice of Intent must be sent to the Conservation Commission with a copy to the Department of Environmental Protection Regional Office. If the proposed project occurs within an Estimated Habitat of Rare Wildlife in the most recent version of the Natural Heritage Atlas, a copy of the Notice of Intent must be submitted to the Natural Heritage and Endangered Species Program (NHESP) within the MDFG for review (Appendix II). If the proposed project occurs within a Priority Habitat of Rare Species in the most recent version of the Natural Heritage Atlas, the project proponent must submit project plans to the NHESP for an impact determination. An Order of Conditions must be obtained prior to work. A Chapter 91 Permit may be required for installation of equipment (Appendix II) in Great Ponds. Small privately owned ponds may only require a Negative Determination of Applicability from the Conservation Commission.
3.6.7.2 Impacts Specific to Wetlands Protection Act
The following overall impact classification is offered as a generalization of impacts, with clarifying notes and caveats as warranted: 1. Protection of public and private water supply – Benefit (water quality improvement). 2. Protection of groundwater supply – Neutral (no significant interaction). 3. Flood control - Neutral (no significant interaction). 4. Storm damage prevention – Neutral (no significant interaction). 5. Prevention of pollution - Benefit (water quality enhancement). 6. Protection of land containing shellfish - Benefit (through water quality enhancement) with
rare detriment by water quality variability induced by whole lake circulation. 7. Protection of fisheries - Benefit (through water quality enhancement) with rare detriment by
water quality variability and loss of coldwater habitat induced by whole lake circulation. 8. Protection of wildlife habitat – Benefit (water quality enhancement). Adverse impacts to the eight interests of the Wetland Protection Act are not expected with the exception that in rare cases deleterious substances like hydrogen sulfide or ammonia may be circulated to the surface and cause temporary adverse impacts to fish and wildlife. In general, aeration is expected to improve habitat for fish and other organisms in lakes with anoxic hypolimnia, but artificial circulation can reduce or eliminate coldwater habitat for trout. If the management project is successful at reducing nutrients and algal blooms in the lake there may be long-term benefits to some of the interests of the Wetlands Protection Act.
Eutrophication and Aquatic Plant Management in Massachusetts
3.0 Methods to Control Nutrients Page 3-79
3.6.8 Costs
3.6.8.1 Whole Lake Circulation
Costs include the initial purchase and installation of the pumps, pipes and diffusers as well as annual maintenance costs and annual electricity costs. A review of numerous projects suggests initial costs range from about $365 to $4,292/ha (median $905/ha or $367/acre), and annual costs range from $108 to $2,068/ha (median $403/ha or $164/acre) in 2000 dollars (Cooke et al., 1993a). Actual costs depend on the amount of air required, which is related to lake area. Wagner (2001) indicates an all-inclusive cost range of $300 to $5,000/acre for circulation systems in 2000 dollars, with an estimated range for 20 years of application at a hypothetical 100-acre lake of $70,000 to $400,000.
3.6.8.2 Hypolimnetic Aeration
Cooke et al. (1993) report costs on a per kg oxygen basis as approximately $2.50/kg O2 with operating costs of $0.072/kg O2. Assuming a need to counteract an oxygen demand of 500 to 2000 mg/m2/day for 120 days per year, this suggests a capital cost of $756 to $3024/acre and an annual operational cost of $55 to $218/acre in 2000 dollars. Wagner (2001) indicates an all-inclusive cost range of $500 to $3,000/acre for circulation systems in 2000 dollars, with an estimated range for 20 years of application at a hypothetical 100-acre lake of $120,000 to $400,000. The layer aeration system for Lake Shenipsit in Connecticut cost approximately $180,000 to install ($340/acre) in the early 1990s and costs approximately $15,000-20,000 per year ($28-$38/acre/year) to operate (R. Kortmann, ECS, pers. comm., 1996). Another layer air system cost $280,000 ($2,545/acre) in the mid-1990s and is used to aerate the 110-acre Bear Creek Reservoir in Denver (R. Kortmann, ECS, pers. comm., 1996).
3.6.9 Future Research Needs Additional review of the existing cases should be conducted to try to explain what variable (e.g. nutrient concentration of hypolimnion vs. epilimnion, critical depth for light limitation, etc.) can best be used to predict the ecosystem response to circulation. Pastorok and Grieb (1984) used multiple discriminate analysis to examine how such variables as aeration rates, lake area, volume and depth could be used to predict management success. However their models correctly predicted success or failure in only 67 to 85 percent of the cases, and many comparisons were not statistically significant. Future implementation and statistical models should include detailed data on before and after concentration profiles for nutrients, temperature, oxygen, pH, dissolved CO2, algae and zooplankton so that the effective mechanisms can be determined in each case. Impacts of aeration on fisheries could use some additional investigation, mainly as a function of monitoring programs for lakes with aeration.
3.6.10 Summary Artificial circulation and hypolimnetic aeration offer potential for reduced phosphorus and algal abundance by minimizing internal recycling and fostering better zooplankton habitat through
Eutrophication and Aquatic Plant Management in Massachusetts
3.0 Methods to Control Nutrients Page 3-80
oxygen addition. Artificial circulation may also disrupt blue-greens by physical mixing and impact a wider range of algae through variation in light and shifts in pH brought on by mixing. Typically there are significant improvements in hypolimnetic water quality, and increases in oxygenated habitat for zooplankton, fish and other organisms. However, actual reductions in phosphorus concentration and algal abundance have not been consistent or reliable. Phosphorus declines in lakes with hypolimnetic aeration by one to two thirds on average, while artificial circulation has caused increased phosphorus levels about as often as it has decreased fertility. These techniques are commonly applied in drinking water reservoirs, where management of deep water quality is often an important consideration. These methods have also been popular in small ponds, where effectiveness in reducing phosphorus availability and algal abundance has not been clearly documented, but where mixing does tend to improve the visual appeal of the pond even with no change in algal biomass. There have been relatively few applications to recreational lakes, but these techniques are applicable. There are few if any adverse effects expected from hypolimnetic aeration. Whole lake circulation may cause adverse impacts if the bottom waters are nutrient-rich compared to surface waters, and the technique may eliminate coldwater fisheries as the lake is mixed. Both methods can be controlled to minimize negative impacts by adjusting air flow or shutting them off. It is difficult to predict if these methods will control algae or cause a shift to more desirable species in any individual case without some experimentation. Knowledge gained over the last decade has improved system design and may allow more effective use of these techniques in the future. Combination with phosphorus inactivators, especially iron, has produced positive results.
3.7 DREDGING
3.7.1 Overview Dredging is perhaps best known for maintaining navigation channels in rivers, harbors and ports or for underwater mining of sand and gravel, but dredging can also be an effective lake management technique for the control of excessive algae and invasive growth of macrophytes (Holdren et al., 2001). The management objectives of a sediment removal project are usually to deepen a shallow lake for boating and fishing, or to remove nutrient rich sediments that can cause algal blooms or support dense growths of rooted macrophytes. Dredging is discussed here in its role as a nutrient control strategy, but the discussion of available approaches is relevant to later discussion of macrophyte controls (Section 4). The release of algae-stimulating nutrients from lake sediments can be controlled by removing layers of enriched materials. This may produce significantly lower in-lake nutrient concentrations and less algal production, assuming that there has been adequate diversion or treatment of incoming nutrient, organic and sediment loads from external sources. Even where incoming nutrient loads are high, dredging can reduce benthic mat formation and related problems with filamentous green and blue-green algae, as these forms may initially depend on nutrient-rich substrates for nutrition. Dredging also removes the accumulated resting cysts deposited by a variety of algae. Although recolonization would be expected to be rapid, changes in algal composition can result.
Eutrophication and Aquatic Plant Management in Massachusetts
3.0 Methods to Control Nutrients Page 3-81
Dredging can be accomplished by multiple methods that can be conveniently grouped into five categories:
Dry excavation, in which the lake is drained to the extent possible, the sediments are dewatered by gravity and/or pumping, and sediments are removed with conventional excavation equipment such as backhoes, bulldozers, or draglines.
Wet excavation, in which the lake is not drained or only partially drawn down (to minimize downstream flows), with excavation of wet sediments by various bucket dredges mounted on cranes or amphibious excavators.
Hydraulic dredging, requiring a substantial amount of water in the lake to float the dredge and provide a transport medium for sediment. Hydraulic dredges are typically equipped with a cutterhead that loosens sediments that are then mixed with water and transported as pumped slurry of 80 to 90% water and 10 to 20% solids through a pipeline that traverses the lake from the dredging site to a disposal area.
Pneumatic dredging, in which air pressure is used to pump sediments out of the lake at a higher solids content (reported as 50 to 70%). This would seem to be a highly desirable approach, given containment area limitation in many cases and more rapid drying with higher solids content. However, few of these dredges are operating within North America, and there is little freshwater experience upon which to base a review. Considerations are much like those for hydraulic dredging, and pneumatic dredging will not be considered separately from hydraulic dredging for further discussion.
Reverse layering, which is grouped with dredging because it involves the movement of sediment, but differs in that the sediment is not actually removed from the lake. Sandy substrates beneath layers of muck are pumped upward and spread over the muck, burying the nutrient-rich material and creating a new top layer of presumably low-nutrient sand.
Dry, wet and hydraulic methods are illustrated in Figure 3-2. Cooke et al. (1993) provides a discussion of dredging considerations that will be helpful to some readers. Recent developments, methods, impact assessment and methods for handling dredged material can be found in McNair (1994). No technique requires more up front information about the lake and its watershed, and there are many engineering principles involved in planning a successful dredging project. No technique is more suitable for true lake restoration, but there are many potential impacts that must be considered and mitigated in the dredging process. Failed dredging projects are common, and failure can almost always be traced to insufficient consideration of the many factors that govern dredging success. A properly conducted dredging program removes accumulated sediment from a lake and effectively sets it back in time, to a point prior to significant sedimentation. Partial dredging projects are possible, but for algal control it is far better to remove all nutrient-rich sediment, as interaction between sediments and the water column in one area can affect the entire lake. Many benefits beyond algal control are accrued from a proper dredging of a lake, including increased water depth, control of rooted plant growths, and reduced sediment-water interactions. The cost of dredging is often prohibitive, however, and an investment in dredging should be protected by an active watershed management program.
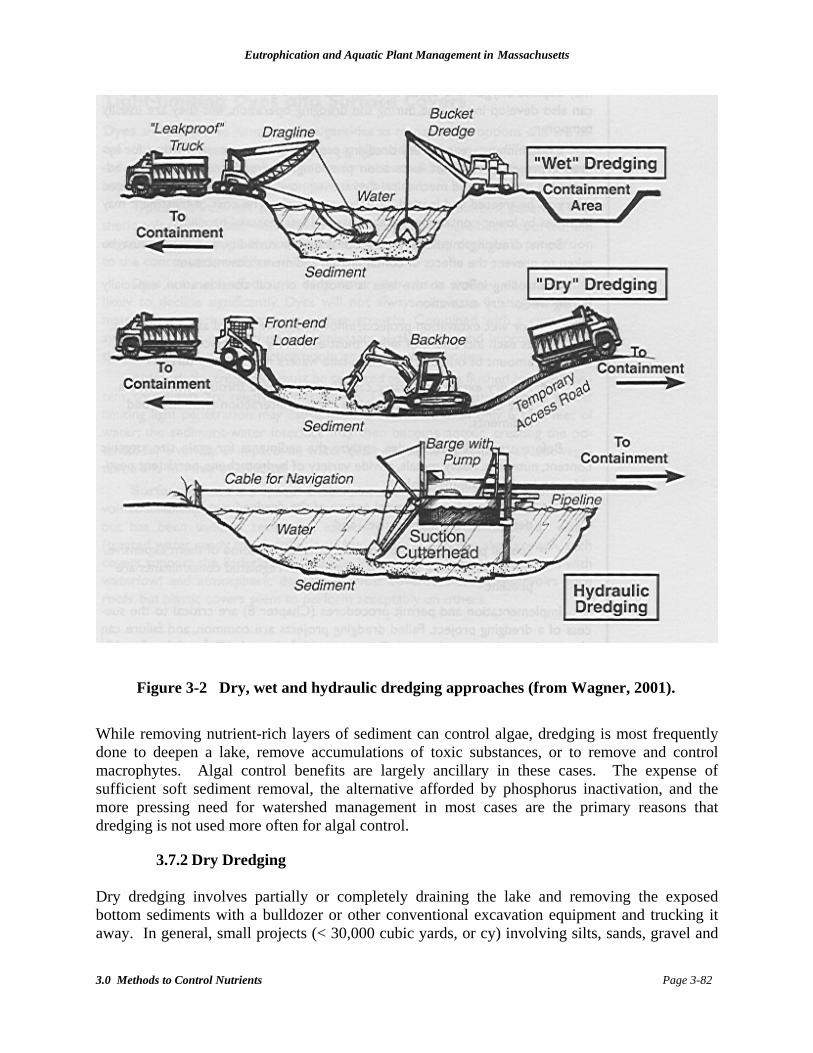
Eutrophication and Aquatic Plant Management in Massachusetts
3.0 Methods to Control Nutrients Page 3-82
While removing nutrient-rich layers of sediment can control algae, dredging is most frequently done to deepen a lake, remove accumulations of toxic substances, or to remove and control macrophytes. Algal control benefits are largely ancillary in these cases. The expense of sufficient soft sediment removal, the alternative afforded by phosphorus inactivation, and the more pressing need for watershed management in most cases are the primary reasons that dredging is not used more often for algal control.
3.7.2 Dry Dredging Dry dredging involves partially or completely draining the lake and removing the exposed bottom sediments with a bulldozer or other conventional excavation equipment and trucking it away. In general, small projects (< 30,000 cubic yards, or cy) involving silts, sands, gravel and
Figure 3-2 Dry, wet and hydraulic dredging approaches (from Wagner, 2001).
Eutrophication and Aquatic Plant Management in Massachusetts
3.0 Methods to Control Nutrients Page 3-83
larger obstructions and possessing manageable water level controls (i.e., pond drains), favor conventional, dry methodology (C. Carranza, BEC, pers. comm., 1996). Although ponds rarely dry to the point where equipment can be used without some form of support (e.g., railroad tie mats or gravel placed to form a road), excavating under “dry” conditions allows very thorough sediment removal and a complete restructuring of the pond bottom. Even without convenient water level control, pumping is sometimes employed to create the driest conditions possible. Short-term impacts will often be high, unless the pond is divided into sections and dewatered and refilled sequentially, but the long-term benefits of complete restoration are prized where the habitat has become severely degraded. Control of inflow to the lake is critical during dry excavation. For dry excavation, water can often be routed through the lake in a sequestered channel or pipe, limiting interaction with disturbed sediments. Water added from upstream or directly from precipitation will result in solids content rarely in excess of 50% and often as low as 30%. Consequently, some form of containment area is needed before material can be used productively in upland projects. Where there is an old gravel pit or similar area to be filled, one-step disposal is facilitated, but most projects involve temporary and permanent disposal steps.
3.7.3 Wet Dredging Wet dredging may involve a partial drawdown, especially to avoid downstream flow of turbid water, but sediment will be excavated from areas overlain by water in such projects. Such sediment will be very wet, often only 10 to 30% solids unless sand and gravel deposits are being removed. Clamshell dredges, draglines, and other specialized excavation equipment are used in wet dredging operations. Excavated sediment must usually be deposited in a bermed area adjacent to the pond or into tight tanks or other water-holding structures until dewatering can occur. This approach may be necessary in association with dry dredging projects when water level control is not complete, and is most often practiced on only a small scale (<10,000 cy). An exception is harbor dredging, as has been practiced in Boston and New Bedford, where large quantities of sediment are removed by wet dredging since no water level control is possible. Conventional wet dredging methods create considerable turbidity, and steps must be taken to prevent downstream mobilization of sediments and associated contaminants. For wet excavation projects, inflows must normally be routed around the lake, as each increment of inflow must be balanced by an equal amount of outflow, and the in-lake waters may be very turbid. It should be noted, however, that more recent bucket dredge designs greatly limit the release of turbid water and have been approved for use in potentially sensitive aquatic settings.
3.7.4 Hydraulic (and Pneumatic) Dredging A more advanced form of wet dredging, hydraulic dredging usually involves a suction type of dredge that has a cutter head. Agitation combined with suction removes the sediments as a slurry containing approximately 15-20 percent solids by volume, although this may increase to as high as 30 to 40 percent in some cases or be as low as 5% with especially watery sediments in difficult areas. This slurry is typically pumped (or barged in rare cases) to a nearby containment area on shore where the excess water can be separated from the solids by settling (with or without augmentation). The supernatant water can be released back to the lake or some other
Eutrophication and Aquatic Plant Management in Massachusetts
3.0 Methods to Control Nutrients Page 3-84
waterway. The containment area for a hydraulic dredging project is usually a shallow diked area that is used as a settling basin. The clarified water may be treated with flocculation and coagulation techniques to further reduce the suspended solids in the return water (Church et al., 1994). Hydraulic dredging is normally favored for removal of large amounts of sediments, particularly highly organic sediments with few rocks, stumps or other obstructions and where water level control is limited (C. Carranza, BEC, pers. comm., 1996). This type of project does require a containment area to be available where removed sediments are separated from water, and may involve secondary removal of the dried sediment from the containment area for ultimate disposal elsewhere. Usually the containment area is not far from the lake, but in several cases the slurry has been pumped as far as 8 miles to a suitable disposal area (Weathersbee, C&B, pers. comm., 1998). Innovations in polymers and belt presses for sediment dewatering have reached the point where a hydraulically dredged slurry can be treated as it leaves the lake to the extent necessary to load it directly onto trucks for transport to more remote sites. Solids content of the resultant material is still too low for many uses without further drying or mixing with sand, but the need for a large containment area can be avoided with this technology. The cost of coagulation and mechanical dewatering may be at least partially offset by savings in containment area construction and ultimate material disposal.
3.7.5 Reverse Layering An alternative method to dredging that is believed to provide some of the same benefits is the reverse layering of sediments. It is a still largely experimental procedure that is being tested in small areas of Red Lily Pond in Barnstable, Massachusetts. It is believed to be especially applicable to the glacial "kettle hole" ponds that are common to Cape Cod and Southeastern Massachusetts because of a layer of glacial sand that lies beneath the accumulated muck layer. The purpose is to extract glacial sand that underlies the nutrient-rich, anaerobic, organic sediments of a eutrophic lake and place it on top of those less desirable sediments. Reverse layering is accomplished by hydraulic jetting. Water is pumped down below the muck and/or peat layer to the deep layer of glacial sand. The glacial sand is forced up through pipes and spread over the bottom sediments. A cavity is created by the removal of glacial sand, which causes the bottom sediments to subside and fill the cavity. The purpose of this method is to retard or reverse the process of eutrophication, and to restore the lake bottom to the original sediment type that will promote a more diverse plant and animal community (K-V Associates, Inc., 1991). This method does not require disposal of dredge materials, nor does it deepen the lake. It simply switches the location of existing sediment layers. Reverse layering is not considered dredging by some groups, most notably the US Army Corps of Engineers, which therefore does not require a permit under Section 404 of the Clean Water Act as it normally does for dredging projects. It is certainly a very different technique than the other methods of actual sediment removal, but the underlying goal is the same with regard to nutrient and algae control; limit the availability of nutrients from accumulated muck sediments.
Eutrophication and Aquatic Plant Management in Massachusetts
3.0 Methods to Control Nutrients Page 3-85
3.7.6 Effectiveness Dredging can be a very successful lake management technique for reducing the occurrence of algal blooms under the right circumstances. Dredging controls nutrients by removing nutrient-rich sediments and increasing depth. The increase in depth may lessen the occurrence of summer turnover in shallow lakes and slow the release of sediment phosphorus (see Stephan and Hanson, 1980). Increased volume allows greater dilution of nutrients from a stable or reduced load. Immediate post-dredging results are usually striking. However, for this technique to have long-term effectiveness, methods for control of nutrients entering the lake from external sources must be implemented.
3.7.6.1 Short-Term
Immediately after dredging, with most or all soft sediment removed, release of nutrients back into the water column will be minimized and desired results should be maximized. If sediments were not the primary nutrient source, results may be less dramatic, but usually the short-term results of dredging are quite acceptable in terms of water quality and algal abundance. Given the cost and effort involved, however, short-term effectiveness is not as critical as long-term effectiveness.
3.7.6.2 Long-Term
Sediment removal to retard nutrient release has been effective in documented cases. An example is provided by Lake Trummen in Sweden (Andersson 1988) where the upper 3.3 feet of sediments were extremely rich in nutrients. This layer was removed and the total phosphorus concentration in the lake dropped sharply and remained fairly stable. The dredging began in 1970 when one half meter of sediment was removed, followed by an additional half meter the following year. Between 1968 and 1973 the Shannon diversity index of phytoplankton rose from 1.6 to 3.0, and Secchi disk transparency rose from 23 to 75 cm, indicating a more diverse algal population and increased transparency. The benthic community was recolonized within a year, with a slight change in species composition. Dredging greatly increased the quality of Lake Trummen both ecologically and recreationally. There has been little deterioration of the lake quality over the past 20 years (Cooke et al., 1993a; Peterson, 1982). Algal abundance also decreased and water clarity increased in Hills Pond in Massachusetts after all soft sediment was removed and a storm water treatment wetland was installed in 1994 (K. Wagner, ENSR, pers. obs., 1996). Dredging of 6-acre Bulloughs Pond in Massachusetts in 1993 has resulted in abatement of thick green algal mats for eight years now, despite continued high nutrient loading from urban runoff (K, Wagner, ENSR, pers. obs., 1994-2001). These mats had previously begun as spring bottom growths, then floated to the surface in mid-summer. The effectiveness of a sediment removal project as a nutrient control strategy depends largely on the pre-dredging assessment of the problem, the amount of sediment that is removed, and control of external nutrient and sediment loading. If any of these factors are inaccurately assessed, the treatment may be less successful. An example of this is Lake Henry, WI, where the infilling rate was severely underestimated, resulting in an underestimation of the post dredging sedimentation rate (Cooke et al., 1993a). The list of failed dredging projects is long, but in nearly all cases the
Eutrophication and Aquatic Plant Management in Massachusetts
3.0 Methods to Control Nutrients Page 3-86
failure is related to incomplete application of the technique or an incomplete lake management program. Dredging can correct past sedimentation impacts on lakes, but does not prevent future inputs. The dredging of Liberty Lake in Washington was not successful at reducing the available phosphorus in the sediments because of the non-uniform trenching pattern used for dredging. Instead of removing all of the surface sediments, the contractor removed all sediments in spaced trenches and this allowed undredged adjacent surface sediments to slump into the trenches. The lake was deepened but not all of the phosphorus rich surface sediments were removed in the dredged areas. This demonstrates the importance of communicating to the contractor the purpose of the operation (to remove phosphorus rich surface sediments, rather than simply to make the lake deeper) (Moore et al., 1988). The dredging at Lake Trehorningen in Sweden used a hydraulic dredge to move the loose topmost half-meter of sediment into a sequestered bay of the lake that was used as the settling pond. The effluent was treated by flocculation and chemical coagulation before return to the lake. The dredging treatment reduced total phosphorus in the lake by 50 percent (from about 436 µg/l to 226 µg/l in the eastern basin). Yet the phosphorus levels were still too high to see any decrease in algae chlorophyll a and the Secchi disk transparency remained at about 0.4 meters (Ryding, 1982). This poor response is to be expected when phosphorus levels are very high. Dry dredging of Dunn Pond in Gardner successfully reduced profuse growths of macrophytes, but also eliminated a thick layer of nutrient-rich muck that had influenced water quality. The post-dredging bottom was coarse sand, gravel and placed rock (for habitat). A detention system with a filter berm was installed to clean incoming waters. The post-restoration chlorophyll a concentrations were mostly less than 3 µg/L and the lake is considered to be oligotrophic; the lake now supports a put-and-take trout fishery and extensive recreational opportunity in the form of boating and swimming (MDEP, 1994) Reverse layering was shown to be effective in the short-term in Red Lily Pond for macrophytes, but no assessment of water quality effects has been conducted. Laboratory work suggests that reduced phosphorus release and algal growth should result. As work is still progressing at Red Lily Pond, and only small areas have been treated, it is difficult to assess long-term effectiveness of this technique in terms of water quality throughout a lake.
3.7.7 Impacts to Non-Target Organisms The risk of negative impacts by dredging on the lake and surrounding area is a function of the type of dredging, project design, and project implementation. Many possible problems are short-lived, however, and can be minimized with proper planning. It should be kept in mind that dredging represents a major re-engineering of a lake, and should not be undertaken without clear recognition of its full impact, positive and negative. Impacts to non-target organisms are discussed here by type of dredging.
Eutrophication and Aquatic Plant Management in Massachusetts
3.0 Methods to Control Nutrients Page 3-87
3.7.7.1 Short-Term Impacts of Hydraulic (and Pneumatic) Dredging
Since the dredge can only operate in a small area at any one time and the lake is maintained as an aquatic habitat during dredging, short-term impacts to mobile species are minimal and impacts to non-mobile organisms are localized. A reduction of benthic dwellers, a decrease in benthic fish food, loss of habitat for benthic dwellers, and removal of non-target aquatic plants are all expected in hydraulically dredged areas as the sediment and any associated biota are removed. If the sediments are anoxic, few biota will be present, but in shallow areas the impact to non-target flora and fauna can be substantial. Even if the biota are not directly impacted, the intent of such dredging is usually to change the nature of the substrate, so conditions inhospitable to pre-existing biota would be expected. Recolonization of dredged areas is usually gradual and the new community may represent an improvement on pre-dredging biota, so dredging impacts on benthic biota are often considered acceptable. Where protected species or other biota of interest are involved, impacts should be considered on a lakewide basis to determine if dredging is an acceptable approach. Impacts associated with sediment resuspension, high turbidity, release of nutrients and toxic substances from the sediments and lowered dissolved oxygen concentrations have been postulated but are rarely an issue for hydraulic dredging. Disturbed sediments are sucked into the pipeline and turbidity is rarely above ambient background for the lake outside of 10 to 20 ft from the cutterhead. The potential for impacts to fish eggs or fry by siltation and smothering during spawning periods is minimal, although actual dredging of spawning areas during or shortly after spawning could certainly cause impacts. Increases in nutrient concentrations are possible as a function of mixing of sediment and water when the water is later returned to the lake. Coagulation of the dredged slurry (often with alum) to sufficiently clarify it before discharge back to the lake (or other water body) should reduce nutrient levels to an acceptable level, but some impact is possible. Any resultant increase in phytoplankton productivity is generally short-lived (Cooke et al., 1993a; Olem and Flock, 1990; Peterson, 1982). Likewise, the release of other contaminants into the water during mixing with sediment in the pipe and containment area could result in a contaminated discharge to the lake, but proper operation of the containment area will prevent such impacts. Impacts observed in past dredging projects have typically been related to improper design or operation. It is also possible to cause lake drawdown if pumping rates are high relative to inflow rates and the overflow from the containment area is not returned to the lake. There are possible impacts associated with the deposition of sediments in the containment area as the habitat is buried under large amounts of wet sediments. However, containment areas permitted in Massachusetts for hydraulic dredging are usually highly engineered and disturbed upland sites where no biota of concern would be present at the time of dredging. Restoration of the containment area usually results in habitat enhancements.
3.7.7.2 Long-Term Impacts of Hydraulic (and Pneumatic) Dredging
The impacts to benthic organisms are generally expected to be short-term. Benthic organisms are able to move from other undisturbed areas of the lake and recolonize the dredged area. If the lake is completely dredged, re-establishment of benthic fauna could take 2 to 3 years (Cooke et al.,
Eutrophication and Aquatic Plant Management in Massachusetts
3.0 Methods to Control Nutrients Page 3-88
1993a), and may involve a community of different composition. Dredging is typically conducted in degraded habitats of low species diversity that dredging may improve in the long run. Potential long-term impacts to fisheries and other wildlife are largely a function of altered habitat, and for most dredging projects, habitat is considered to be improved for the majority of species. Still, the intended change in bottom conditions will represent a negative change for some species. In a review of several dredging studies Cooke et al., (1993) suggests most impacts are short lived and generally acceptable relative to long-term benefits of the technique. Impacts at the containment area and at the final disposal site are due to direct impact of burial under wet sediments and possible contamination of soil and groundwater if toxins or heavy metals are present in the dredged material. Impacts can be mediated to some extent by spreading material in thin layers, mixing with other soils, and burial under other material. However, where a real threat of contamination exists, dredged material disposal is tightly regulated and may make dredging uneconomical.
3.7.7.3 Short-Term Impacts of Dry Dredging
Because the lake is drained and much of the bottom scraped, widespread impact to non-mobile and water dependent species are expected in the short-term. Short-term impacts to non-target organisms would include impacts listed above for wet dredging, plus those listed for lake drawdown in Section 4. Wildlife that get food from the lake may find conditions during dredging advantageous, as food items are exposed, but this short-term benefit may become a disadvantage if the dredging project is prolonged. Dry dredging is generally undertaken to restore a degraded habitat to a former condition, and would not typically be recommended or approved if protected species are present or the biological community is considered highly desirable. Where dry dredging is proposed, some evaluation of recolonization should be provided, or an active re-population program should be proposed. Algae and invertebrates rarely need any help in recolonizing an area, but fish and rooted plant introductions may be desirable. Where the water body is isolated, natural recolonization will take longer than for lakes connected to other water bodies by streams. If the lake is only partially drawn down to gain access to nearshore areas for partial dredging, less impact is expected. Dry dredging represents a major overhaul of lake conditions, and can greatly improve conditions for the future where properly applied, but short-term impacts may be substantial and unavoidable. Deposition of dredged material in a containment area and/or ultimate disposal area involves less water than for hydraulic dredging, and the prepared area is usually devoid of species of concern. Consequently, quality of return water is not usually an issue, except possibly for groundwater near the containment site, and impacts to biota in the containment area are expected to be minimal.
3.7.7.4 Long-Term Impacts of Dry Dredging
The time needed for re-establishment of flora and fauna is dependent on to what extent the lake bottom is dredged and the proximity of sources of these biota (Cooke et al., 1993a). If some areas are left undisturbed, benthic organisms can recolonize the dredged areas if those areas are
Eutrophication and Aquatic Plant Management in Massachusetts
3.0 Methods to Control Nutrients Page 3-89
hospitable in their post-dredging condition. If the entire bottom is dredged, then benthic species as well as fish and other pelagic species may recolonize from appropriate refuge habitats either upstream or downstream of the lake. If areas are dredged to a very different condition, colonizing species may constitute a community quite different from that present before dredging (and this may be part of the intent of dredging). Restoration of all species could take years if no suitable refuge habitat is available nearby. Where dry dredging of an entire lake is planned, consideration of what biota are expected or desired is strongly encouraged. The value of dredging can be enhanced by selected introductions with follow-up monitoring and control of invasive species.
3.7.7.5 Short-Term Impacts of Wet Dredging
Wet dredging maintains some water in the lake like hydraulic dredging, but usually involves some degree of drawdown like dry dredging. Wet dredging does not typically control turbidity, so impacts associated with high turbidity, relocated siltation, drastically changed and variable water quality, and direct impacts on biota are all possible. Use of newer wet dredge designs may minimize turbidity, however. Wet dredging should generally be practiced only where the habitat is extremely degraded prior to dredging, and active restoration of habitat and desirable communities is planned. Short-term disruption of populations in the lake is likely, but wildlife that get food from the lake may find conditions improved during dredging as food items are disturbed or exposed. It is important to avoid downstream transport of the water in the lake during wet dredging, as downstream impacts would be probable. The containment area for a wet dredging project may be much like that for hydraulic dredging, and the quality of return water and eventual restoration of the containment area should be addressed in the planning stage of the project to minimize impacts.
3.7.7.6 Long-Term Impacts of Wet Dredging
Wet dredging projects tend not to be as complete as dry dredging, and may leave more material than a hydraulic dredging project. As such, recolonization to conditions more similar to pre-dredging conditions is likely, except where newly created depth limits growth of emergent macrophytes. Impacts during the wet dredging process may delay recovery, and the re-established communities will undoubtedly differ to some degree from pre-dredging biota (again, often by intent of the project), but long-term impacts from wet dredging are rarely adverse.
3.7.7.7 Short-Term Impacts of Reverse Layering
Short-term impacts are expected to be similar to those for hydraulic dredging, as water is maintained in the lake but the nature of the sediment is changed. Immobile benthic organisms are not removed, but may be buried to the point where impacts occur. The technique is often intended to reduce rooted plant growths by changing the substrate and burying existing populations. Turbidity may be higher than for hydraulic dredging, but will not be as high as for wet dredging with conventional excavation equipment, as the sand that is moved is less prone to resuspension than disturbed muck sediments. This technique has not been applied on a large enough scale to examine any lakewide effects.
Eutrophication and Aquatic Plant Management in Massachusetts
3.0 Methods to Control Nutrients Page 3-90
3.7.7.8 Long-Term Impacts of Reverse Layering
Long-term impacts are expected to be similar to those listed for hydraulic dredging, although there is insufficient evidence to make any reliable predictions at this time.
3.7.8 Impacts to Water Quality Dredging may impact water quality by removing sediment and reducing the interactions between sediment and water (usually a goal of the project) or by resuspending sediment and increasing the interaction between sediment and water (generally a negative impact to be avoided). Impacts to water quality vary by dredging type and are discussed by technique below.
3.7.8.1 Short-Term Impacts of Hydraulic Dredging
The sediment removal process can cause a short-term increase in turbidity on a localized basis, but widespread impact should not occur if equipment is functioning properly. Failure to properly settle and treat the slurry (if necessary) before discharge it from the containment area presents a substantial risk of impact, but is avoidable. The dredging of Lake Springfield, a very large (1,635 hectare = 4,038 acre) reservoir in Illinois was subject to intense opposition until it was demonstrated that the sediments were not significantly contaminated by pesticides. Large scale settling tests of the sediments were conducted in accordance with the U.S. Army Corps of Engineers Technical Report DS-78-10 “Guidelines for Design, Operating and Managing Dredging Material Containment Area” as cited in Buckler et al. (1988). Two oversized settling ponds (160 acre and 72 acre) with a retention period of 8.7 days were constructed to meet the 15 mg/L total suspended solids requirement for the effluent (Cooke et al., 1993a). Although the ammonia concentrations were as high as 25 mg/L in the slurry, no problems in the return effluent were reported (Buckler et al., 1988). The hydraulic dredging of Liberty Lake in Washington resulted in minimal and transitory impacts to water quality. A sediment plume was created near the auger but did not affect transparency near the surface and changes in total solids, total phosphorus and chemical oxygen demand during the dredging operation were negligible (Breithaupt and Lamb, 1983). Similarly, there have been few instances of any turbidity or nutrient problems associated with dredging in southern New England (K. Wagner, ENSR, pers. obs., 1985-2002).
3.7.8.2 Long-Term Impacts of Hydraulic Dredging
The long-term effects of dredging on water quality are usually expected to include an increase in water clarity. If dredging removes organic sediment and leaves inorganic sediment as the new bottom, then there will be less release of nutrients from the bottom and less potential for resuspension by wind action. If dredging is incomplete in a large portion of the lake, this benefit may be compromised, but dramatic improvement in water quality is possible where soft sediments are completely removed. This is most often accomplished in dry dredging projects, although all forms of dredging have the potential to provide this benefit.

Eutrophication and Aquatic Plant Management in Massachusetts
3.0 Methods to Control Nutrients Page 3-91
3.7.8.3 Short-Term Impacts of Dry Dredging
Water quality impacts should be limited by the absence of water during dry dredging, although complete control of water is rare. As the lake is drawn down during dry dredging, impacts associated with lack of water are generally of greater concern than water quality impacts.
3.7.8.4 Long-Term Impacts of Dry Dredging
An increase in water clarity is expected over the long-term. For thorough dry dredging projects, dramatic improvement in water quality is possible, with lower nutrients and solids and more stable dissolved oxygen and pH.
3.7.8.5 Short-Term Impacts of Wet Dredging
Bucket dredges and drag lines can generate substantial suspended solids levels in the lake, with average levels less than 200 mg/L for watertight buckets and less than 300 mg/L for open buckets (Mongomery, 1984). Some types of conventional wet excavation equipment are more specialized to reduce suspended solids and are useful for dredging contaminated sediments. Greatly increased interaction between sediments and the water column is expected, however, and increases in water column concentrations for any contaminants present are possible.
3.7.8.6 Long-Term Impacts of Wet Dredging
As with other forms of dredging, improved water quality is expected as a consequence of removal of soft sediment. However, unless the lake is “overdredged” (material removed beyond the soft sediment layer) or coarse material is added after dredging (capping, as performed in Boston Harbor), at least a fine layer of soft sediment is likely to remain and may reduce water quality benefits.
3.7.8.7 Short-Term Impacts of Reverse Layering
Readings taken during reverse layering in Red Lily Pond showed a slight increase in turbidity at the lake outflow (0.9 to 2.0 NTU), and a decrease in pH, soluble phosphorus, total phosphorus, and total nitrogen concentrations. The decrease in phosphorus and nitrogen concentrations indicates that the nutrient rich, "mucky" top sediments were not releasing nutrients to the water column (K-V Associates, Inc., 1991). Insufficient information is available for further evaluation.
3.7.8.8 Long-Term Impacts of Reverse Layering
Water clarity is expected to improve over the long-term by reducing interaction of organic sediments with the water column, although no data are available to support this assumption.
3.7.9 Impacts in the Disposal Area All dredged sediments must have a disposal area. The ideal situation is the use of the dredged material to reclaim damaged upland parcels, like old gravel pits. Some dredged material can also be used as cover for landfills, and especially clean material can be applied to agricultural fields or mixed with sand to make a topsoil-like fill used in landscaping. In rare cases, contractors
Eutrophication and Aquatic Plant Management in Massachusetts
3.0 Methods to Control Nutrients Page 3-92
want the dredged material and its value can partially offset the cost of dredging, but more often it is necessary to find a disposal site for unwanted dredged material. In most cases it is necessary to have both a temporary containment area in which dredged material is dewatered and a permanent disposal location (or multiple locations). Although many disposal arrangements have been made in the past, current regulations tightly control the manner in which dredged material is handled. The primary regulations governing the disposal of lake sediments are the Massachusetts Contingency Program and various MDEP regulations and policies intended to minimize impacts from disposal (e.g., Interim Policy #COMM-94-007, Interim Policy for Sampling, Analysis, Handling and Tracking Requirements for Dredged Sediment Reused or Disposed at Massachusetts Permitted Landfills). Table 3-3 lists many of the thresholds relevant to dredged material disposal. The average concentrations for selected metals in Massachusetts lake sediments, from the many D/F studies conducted in the 1980s (Rojko, 1992), are also shown. It is particularly striking that the average level for most metals exceeds the 90th percentile for background soil conditions. This means that use in surficial landscaping will only be possible for lake sediments that are cleaner than average. Most urban lake sediments will not be so clean, although some are. Metals and hydrocarbons (especially benzene compounds) are most often problematic in urban lake sediments. Agricultural sediments may contain components of pesticides (e.g., arsenic, DDT derivatives) that exceed these thresholds. Sediment quality issues are not unique to Massachusetts. The sampling of sediments from Hamlet City Lake in North Carolina revealed aliphatic and aromatic hydrocarbon contamination as well as elevated concentrations of some metals. A series of leaching tests was conducted and it was found that hydrocarbons should not be a problem, but the metals may adversely impact the groundwater (Brannon et al., 1993). Testing of sediments from Flint Pond in Hollis, NH in preparation for a possible dredging project revealed high levels of arsenic that may have come from nearby orchards many years ago. Although all other sediment features were favorable for disposal on agricultural fields, the arsenic levels were considered too high to proceed (K. Wagner, ENSR, pers. obs., 2002). Actual impacts on containment and disposal areas have not been well documented. As temporary containment areas are usually highly disturbed and engineered parcels, biotic impacts should be minimal. Possible leaching of contaminants into groundwater is one issue, and possible impacts on vegetation and biota once the containment area is restored may require consideration. Ultimate disposal impacts depend on the use of the material, with most regulations focused on preventing impacts to human health. Again, it is not clear that most contaminants are mobile enough or sufficiently reactive to cause ecological or human health impacts, but the potential for impact exists. Mitigation measures include prohibition on use within 500 ft of residences or in recreational settings, covering of dredged material with at least 18 inches of clean fill, and various blending schemes. Thin-layer disposal of dredge material has been promoted, as this is believed to reduce impacts to biota in the disposal area (Wilber, 1992).
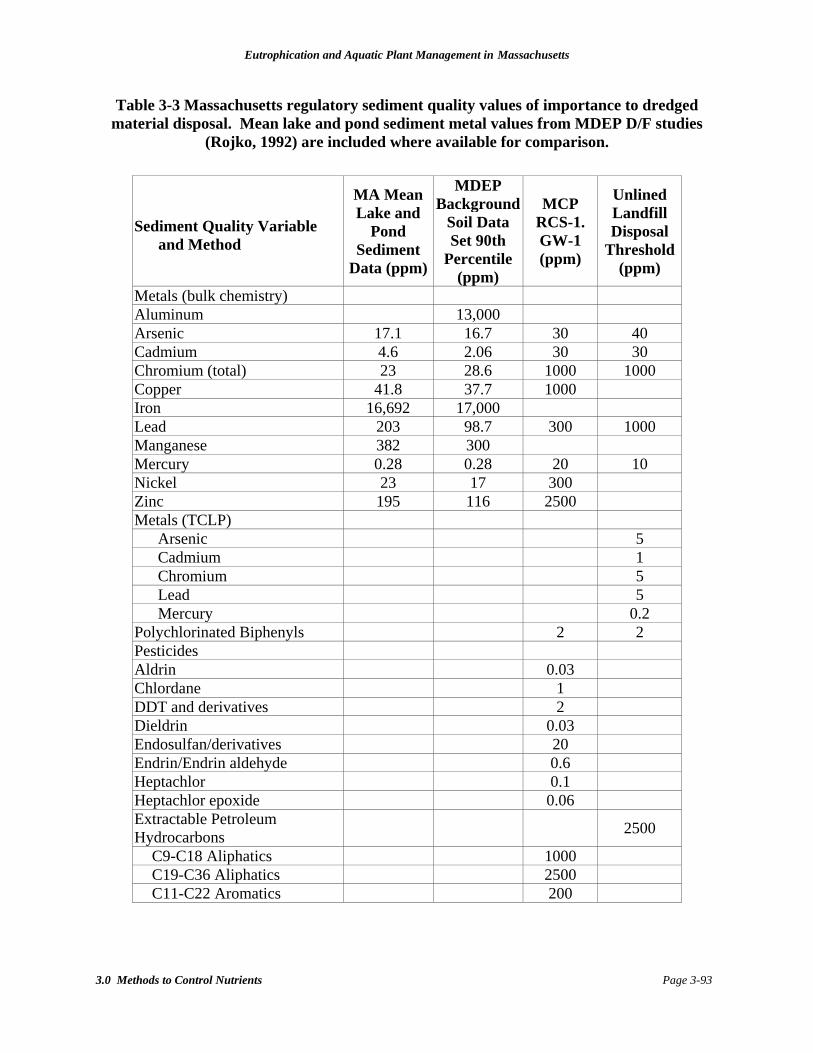
Eutrophication and Aquatic Plant Management in Massachusetts
3.0 Methods to Control Nutrients Page 3-93
Table 3-3 Massachusetts regulatory sediment quality values of importance to dredged material disposal. Mean lake and pond sediment metal values from MDEP D/F studies
(Rojko, 1992) are included where available for comparison.
Sediment Quality Variable and Method
MA Mean Lake and
Pond Sediment
Data (ppm)
MDEP Background
Soil Data Set 90th
Percentile (ppm)
MCP RCS-1. GW-1 (ppm)
Unlined Landfill Disposal
Threshold (ppm)
Metals (bulk chemistry) Aluminum 13,000 Arsenic 17.1 16.7 30 40 Cadmium 4.6 2.06 30 30 Chromium (total) 23 28.6 1000 1000 Copper 41.8 37.7 1000 Iron 16,692 17,000 Lead 203 98.7 300 1000 Manganese 382 300 Mercury 0.28 0.28 20 10 Nickel 23 17 300 Zinc 195 116 2500 Metals (TCLP)
Arsenic 5 Cadmium 1 Chromium 5 Lead 5 Mercury 0.2
Polychlorinated Biphenyls 2 2 Pesticides Aldrin 0.03 Chlordane 1 DDT and derivatives 2 Dieldrin 0.03 Endosulfan/derivatives 20 Endrin/Endrin aldehyde 0.6 Heptachlor 0.1 Heptachlor epoxide 0.06 Extractable Petroleum Hydrocarbons 2500
C9-C18 Aliphatics 1000 C19-C36 Aliphatics 2500 C11-C22 Aromatics 200
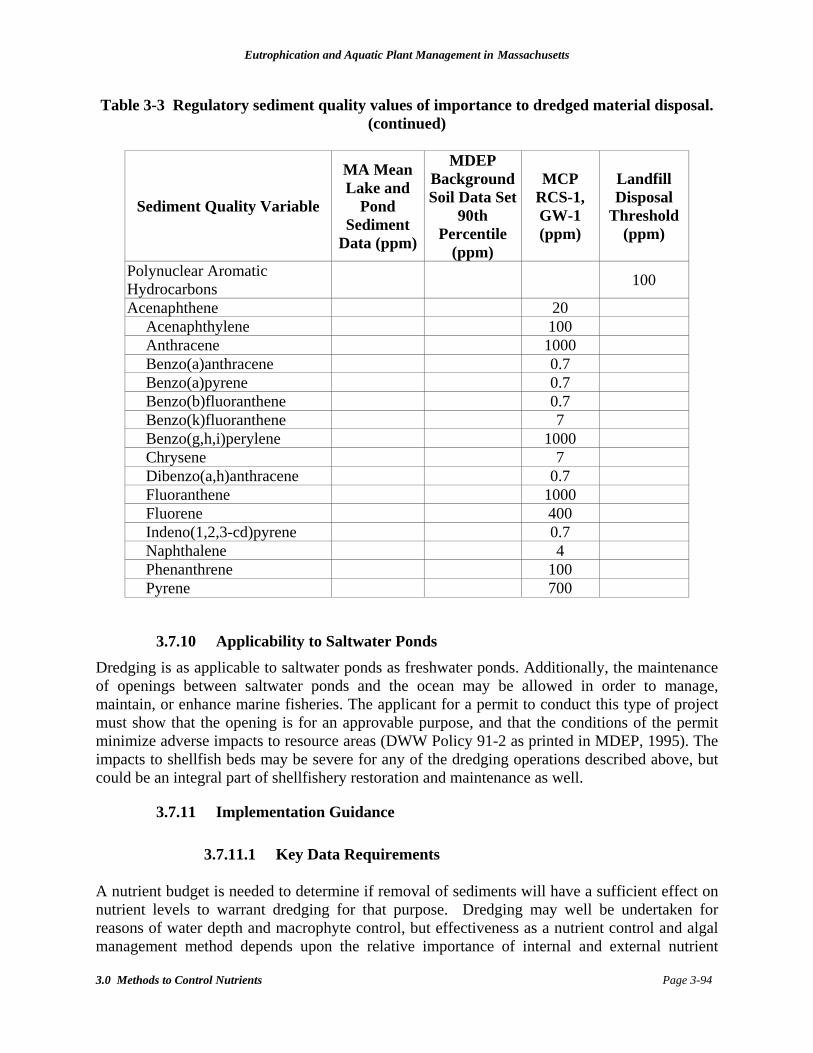
Eutrophication and Aquatic Plant Management in Massachusetts
3.0 Methods to Control Nutrients Page 3-94
Table 3-3 Regulatory sediment quality values of importance to dredged material disposal. (continued)
Sediment Quality Variable
MA Mean Lake and
Pond Sediment
Data (ppm)
MDEP Background Soil Data Set
90th Percentile
(ppm)
MCP RCS-1, GW-1 (ppm)
Landfill Disposal
Threshold (ppm)
Polynuclear Aromatic Hydrocarbons 100
Acenaphthene 20 Acenaphthylene 100 Anthracene 1000 Benzo(a)anthracene 0.7 Benzo(a)pyrene 0.7 Benzo(b)fluoranthene 0.7 Benzo(k)fluoranthene 7 Benzo(g,h,i)perylene 1000 Chrysene 7 Dibenzo(a,h)anthracene 0.7 Fluoranthene 1000 Fluorene 400 Indeno(1,2,3-cd)pyrene 0.7 Naphthalene 4 Phenanthrene 100 Pyrene 700
3.7.10 Applicability to Saltwater Ponds Dredging is as applicable to saltwater ponds as freshwater ponds. Additionally, the maintenance of openings between saltwater ponds and the ocean may be allowed in order to manage, maintain, or enhance marine fisheries. The applicant for a permit to conduct this type of project must show that the opening is for an approvable purpose, and that the conditions of the permit minimize adverse impacts to resource areas (DWW Policy 91-2 as printed in MDEP, 1995). The impacts to shellfish beds may be severe for any of the dredging operations described above, but could be an integral part of shellfishery restoration and maintenance as well.
3.7.11 Implementation Guidance
3.7.11.1 Key Data Requirements
A nutrient budget is needed to determine if removal of sediments will have a sufficient effect on nutrient levels to warrant dredging for that purpose. Dredging may well be undertaken for reasons of water depth and macrophyte control, but effectiveness as a nutrient control and algal management method depends upon the relative importance of internal and external nutrient

Eutrophication and Aquatic Plant Management in Massachusetts
3.0 Methods to Control Nutrients Page 3-95
loads. Data requirements for planning a successful dredging project are so extensive that a professional analysis is generally required. Table 3-4 summarizes most needs. Sediment quality is the most critical information need, followed by sediment quantity and containment/disposal area options.

Eutrophication and Aquatic Plant Management in Massachusetts
3.0 Methods to Control Nutrients Page 3-96
Table 3-4 Key Considerations for Dredging Reasons For Dredging: Existing and Proposed Bathymetry: Increased depth/access Existing mean depth Removal of nutrient reserves Existing maximum depth Control of aquatic vegetation Proposed distribution of lake area over depth range Alteration of bottom composition Proposed mean depth Habitat enhancement Proposed maximum depth Reduction in oxygen demand Proposed distribution of area over depth range Volume Of Material To Be Removed: Physical Nature of Material To Be Removed: In-situ volume to be removed Grain size distribution Distribution of volume among sediment types Solids and organic content Distribution of volume over lake area (key sectors) Settling rate Bulked volume (see below) Bulking factor Dried volume (see below) Drying factor Residual turbidity Nature of Underlying Material To Be Exposed: Chemical Nature of Material To Be Removed: Type of material Metals levels Comparison with overlying material Petroleum hydrocarbon levels Nutrient levels Dewatering Capacity of Sediments: Pesticides levels Dewatering potential PCB levels Dewatering timeframe Other organic contaminant levels Methodological considerations Other contaminants of concern (site-specific) Protected Resource Areas: Flow Management: Wetlands System hydrology Endangered species Possible peak flows Habitats of special concern Expected mean flows Species of special concern Provisions for controlling water level Regulatory resource classifications Methodological implications Equipment Access: Relationship To Lake Uses: Possible input and output points Impact on existing uses during project Land slopes Impact on existing uses after project Pipeline routing Facilitation of additional uses Property issues Potential Disposal Sites: Dredging Methodologies: Possible containment sites Hydraulic (or pneumatic) options Soil conditions Wet excavation Necessary site preparation Dry excavation Volumetric capacity Property issues Long term disposal options
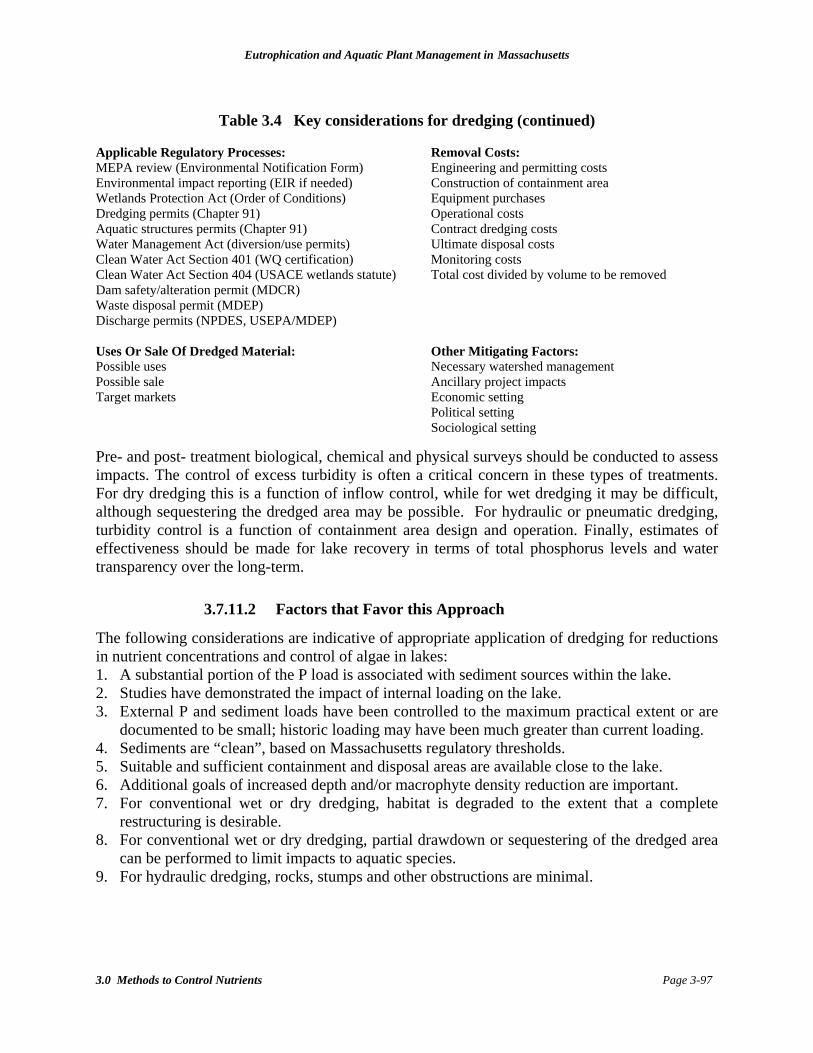
Eutrophication and Aquatic Plant Management in Massachusetts
3.0 Methods to Control Nutrients Page 3-97
Table 3.4 Key considerations for dredging (continued)
Applicable Regulatory Processes: Removal Costs: MEPA review (Environmental Notification Form) Engineering and permitting costs Environmental impact reporting (EIR if needed) Construction of containment area Wetlands Protection Act (Order of Conditions) Equipment purchases Dredging permits (Chapter 91) Operational costs Aquatic structures permits (Chapter 91) Contract dredging costs Water Management Act (diversion/use permits) Ultimate disposal costs Clean Water Act Section 401 (WQ certification) Monitoring costs Clean Water Act Section 404 (USACE wetlands statute) Total cost divided by volume to be removed Dam safety/alteration permit (MDCR) Waste disposal permit (MDEP) Discharge permits (NPDES, USEPA/MDEP) Uses Or Sale Of Dredged Material: Other Mitigating Factors: Possible uses Necessary watershed management Possible sale Ancillary project impacts Target markets Economic setting Political setting Sociological setting
Pre- and post- treatment biological, chemical and physical surveys should be conducted to assess impacts. The control of excess turbidity is often a critical concern in these types of treatments. For dry dredging this is a function of inflow control, while for wet dredging it may be difficult, although sequestering the dredged area may be possible. For hydraulic or pneumatic dredging, turbidity control is a function of containment area design and operation. Finally, estimates of effectiveness should be made for lake recovery in terms of total phosphorus levels and water transparency over the long-term.
3.7.11.2 Factors that Favor this Approach
The following considerations are indicative of appropriate application of dredging for reductions in nutrient concentrations and control of algae in lakes: 1. A substantial portion of the P load is associated with sediment sources within the lake. 2. Studies have demonstrated the impact of internal loading on the lake. 3. External P and sediment loads have been controlled to the maximum practical extent or are
documented to be small; historic loading may have been much greater than current loading. 4. Sediments are “clean”, based on Massachusetts regulatory thresholds. 5. Suitable and sufficient containment and disposal areas are available close to the lake. 6. Additional goals of increased depth and/or macrophyte density reduction are important. 7. For conventional wet or dry dredging, habitat is degraded to the extent that a complete
restructuring is desirable. 8. For conventional wet or dry dredging, partial drawdown or sequestering of the dredged area
can be performed to limit impacts to aquatic species. 9. For hydraulic dredging, rocks, stumps and other obstructions are minimal.
Eutrophication and Aquatic Plant Management in Massachusetts
3.0 Methods to Control Nutrients Page 3-98
Planning and Implementation Dredging is an expensive technique, and while improvements can be spectacular, mistakes can be costly and impact-laden. Consideration of project feasibility, careful planning and anticipation of possible problems are crucial to success. Best management practices should be employed in the watershed to reduce nutrient and sediment loading before a dredging project with nutrient control as a goal is implemented, unless it is certain that the watershed is not a significant source of nutrients. Before dredging is planned, it is important to conduct an analysis of the sediments for grain size, organic content, nutrients, heavy metals, a wide variety of hydrocarbons, persistent pesticides, and other potentially toxic or otherwise regulated materials. The physical and chemical nature of the dredged material will determine its potential uses and regulatory restrictions on its handling and disposal. Special precautions and disposal limitations, some of them expensive, will be required if certain substances are present above threshold concentrations. Implementation and permit procedures are critical to the success of a dredging project, and current project feasibility is controlled mainly by sediment quality. Although dredging is rarely applied solely to control nutrients, an accurate nutrient budget including both a measured mass balance and a land-use source analysis should be conducted if nutrient control is a goal. Detailed analysis of internal sources of phosphorus, relative to external sources, is especially important. If the nutrient budget indicates the sediments as the major source of phosphorus, then dredging may be effective. Dredging may reduce the density of aquatic macrophytes and algae by removing nutrient-rich substrate or by increasing the depth, thereby inducing light limitation, and these are usually goals of dredging as well. However, to achieve lasting results for nutrient control, the nutrients removed with sediments must be the primary source of nutrients to the lake. Some of the general lake characteristics that indicate the applicability of sediment removal as a control method are expansive deposits of organic sediment, low sedimentation rates, and long hydraulic residence times. Sediment quantity is almost as critical a consideration for dredging projects as sediment quality. It is possible to be successful while removing only a portion of the sediment if a low-nutrient layer can be exposed or the remaining sediment is not enough to have a major impact on water quality. However, most successful dredging projects target complete removal of nutrient-rich sediments, which is usually equated with all organic sediments. The depth of “soft” nutrient-rich sediments can be roughly determined by pushing a rod or pipe into the sediments until firm resistance is felt, usually indicating the depth to coarse sand, gravel or rock. Coring surveys (vertical samples of the sediments) on a smaller scale than sediment probing are vital to confirm sediment depth and characterize any sediment horizons as part of the pre-dredging planning (Moore et al., 1988). The use of ground-penetrating sound waves and related higher technology has been successfully employed in some cases, but confirmation with cores is still recommended. Incorrect assessment of soft sediment depth and underestimate of volume to be removed has been a problem for some past dredging projects, leading to either failure to achieve goals or greater expense than initially expected. There are many factors to consider in choosing a containment area. The primary factors controlling containment area selection and design are the amount of material to be disposed, the

Eutrophication and Aquatic Plant Management in Massachusetts
3.0 Methods to Control Nutrients Page 3-99
ability to maintain required effluent quality, distance and access routes for getting sediment to the area, and the potential for restoration after disposal is complete. Among the most serious dredging problems is the failure to have a disposal area of adequate size to handle the necessary volume of sediment or turbid, nutrient-rich water that often accompanies the sediments. Containment area discharge control from dry dredging projects is less a concern than for wet or hydraulic projects. If the containment area can also serve as the ultimate disposal area, costs are usually greatly reduced. Guidance on containment and disposal is available (USACE, 1987, cited in Cooke et al., 1993a), but the help of experienced professionals is strongly advised. The productivity of actual dredging depend upon the technique, but a typical dredging year will not involve the removal of more than 100,000 cubic yards (cy) of sediment without multiple pieces of excavation equipment or hydraulic dredges with pumping capacities larger than normal for freshwaters (typically about 1 cy/min). Projects involving 60,000 cy/yr are more typical. Hydraulic or pneumatic dredging is limited to ice-free periods, while other forms of dredging can be conducted anytime. Monitoring and Maintenance To assess impacts, biological, chemical and physical monitoring should be performed before, during and after dredging, to document the effectiveness, impacts, and to indicate any changes in water quality. Of particular importance is the monitoring of turbidity or total suspended solids both in the lake and in the discharge water. A monitoring program should be crafted to meet the circumstances of each project. One of the advantages of dredging is that once the dredging is finished, there is little maintenance required. In cases where there is significant sediment input to the lake, a detention basin or forebay might be constructed to trap the incoming sediments and prolong the benefits of dredging. The detention basin or forebay will have to be cleaned out periodically, and fine sediments will probably still reach the lake. At one site in Wisconsin the sediment traps were filled within 8 years after dredging, indicating that ongoing maintenance was required (Garrison and Ihm, 1991, as cited in Cooke et al., 1993a). Mitigation Mitigative measures include partial dredging whereby areas of the lake are dredged while other areas are not. This approach can be used to restore open water while leaving other areas undisturbed. Dredging plans should consider the preservation of fish spawning and nursery areas, waterfowl feeding areas and other sensitive or valuable habitat. In most cases this can be achieved by maintaining some shallow water habitat along the shoreline and in coves. Several mitigative measures can be used for wet dredging. If bucket dredging is used then a watertight bucket helps reduce the resuspension of sediments. A silt curtain prevents sediments from floating to other areas of the lake (Cooke et al., 1993a). For dry dredging, the restocking of fish and other organisms may be required if migration to and from refuge areas is limited. For reverse layering it is recommended that a boom silt curtain be used to prevent turbidity in areas other than the application site. Additionally, a silt separator may be needed to remove silt from the glacial sand (K-V Associates, Inc., 1991).

Eutrophication and Aquatic Plant Management in Massachusetts
3.0 Methods to Control Nutrients Page 3-100
A rarely applied but potentially valuable post-dredging mitigative technique is an alum treatment, as it can inactivate any remaining surficial sediment phosphorus and counteract any undesirable inputs from containment area return flow. Of course, alum treatment may be a viable alternative to dredging for inactivating surficial sediment phosphorus, but if dredging is conducted to restore depth or control rooted plants as well as nutrients and algae, phosphorus inactivation can be a valuable final step. It is more likely to be needed with wet or hydraulic dredging than for dry dredging. Careful management of the containment area is important to minimizing such mitigative needs.
3.7.12 Regulations
3.7.12.1 Applicable Statutes
Most dredging projects require multiple permits. A MEPA review is required where applicable thresholds (Appendix II) are exceeded, and will help determine permit needs. If state funds are being used, or if other MEPA thresholds (Appendix II) are exceeded, an Environmental Impact Report may be required. A Notice of Intent must be sent to the Conservation Commission with a copy to the Department of Environmental Protection Regional Office. If the proposed project occurs within an Estimated Habitat of Rare Wildlife in the most recent version of the Natural Heritage Atlas, a copy of the Notice of Intent must be submitted to the Natural Heritage and Endangered Species Program (NHESP) within the MDFG for review (Appendix II). If the proposed project occurs within a Priority Habitat of Rare Species in the most recent version of the Natural Heritage Atlas, the project proponent must submit project plans to the NHESP for an impact determination. An Order of Conditions must be obtained prior to work. A Chapter 91 permit (Appendix II) is required for dredging and structure installation in Great Ponds. All dredging projects over 100 cubic yards will normally require a Section 401 Water Quality Certificate from the Department of Environmental Protection, and if dredged materials are to be disposed of on land, a Solid Waste Permit is also required from Department of Environmental Protection. There are multiple means for justifying a disposal location, but the most prevalent is a Beneficial Use Determination (BUD), whereby the disposal is categorized as an improvement to the disposal site. If a dam is present and may suffer structural damage or be otherwise altered during drawdown or dredging operations, a permit from the MDCR Office of Dam Safety may be required. If over 100,000 gpd of water is being diverted during the project, a Water Management Act permit may be required through MDEP. A Section 404 permit from the U.S. Army Corp of Engineers (ACOE) may be required, depending upon the interpretation of this section of the Clean Water Act that prevails at the time of application. In general, any activity associated with dredging that results in filling of federal wetland resources will require a Section 404 permit, but whether or not removal of sediment can be accomplished without any such filling has been the subject of considerable regulatory debate and is still somewhat unsettled. If there is a distinct discharge from the containment area to a surface water, a permit may be required under the National Pollutant Discharge Elimination System (NPDES), administered by the USEPA with input from MDEP.

Eutrophication and Aquatic Plant Management in Massachusetts
3.0 Methods to Control Nutrients Page 3-101
Depending on site location and scope of work, additional permits and approvals may be required as specified in A-II.1. As it should appear, permitting a dredging project can be a complicated and protracted process, and professional help is strongly advised.
3.7.12.2 Impacts Specific to Wetlands Protection Act
The following overall impact classification is offered as a generalization of impacts, with clarifying notes and caveats as warranted: 1. Protection of public and private water supply – Benefit (water quality improvement); may
also affect water quantity by uncapping springs and seepage areas. Short-term limitation on available water is possible during dredging.
2. Protection of groundwater supply – Generally neutral (no significant interaction), although uncapping of springs and seepage areas may increase interaction. Possible adverse impacts below containment area if contaminants leach.
3. Flood control – Generally neutral (no significant interaction), although greater depth could be an asset if drawdown is later practiced for flood control. Possible short-term benefit or detriment during dredging, depending upon technique and flow controls applied.
4. Storm damage prevention – Generally neutral (no significant interaction) ), although greater depth could be an asset if drawdown is later practiced for damage control. Possible short-term benefit or detriment during dredging, depending upon technique and flow controls applied.
5. Prevention of pollution – Expected benefit (water quality enhancement), although short-term detriment is possible during unsequestered wet dredging or hydraulic dredging with containment area problems.
6. Protection of land containing shellfish – Possible long-term benefit through water quality enhancement, but potential short-term detriment by direct removal or water quality impacts.
7. Protection of fisheries - Possible long-term benefit through water quality and physical habitat enhancement, but potential short-term detriment by habitat loss during dry dredging or water quality impairment during wet dredging. No major adverse impacts expected from hydraulic dredging.
8. Protection of wildlife habitat –Expected long-term benefit (water quality enhancement, invasive plant control), but possible short-term detriment by habitat loss during dry dredging or water quality impairment during wet dredging. No major adverse impacts expected from hydraulic dredging.
Impacts to interests of the Wetlands Protection Act from a specific dredging project are highly dependent upon site-specific features and project design.
3.7.13 Costs Because the cost per acre varies depending on the volume of material removed, costs are usually expressed per cubic yard (cy) of material removed. Generally, the larger the project, the smaller the cost per cubic yard, with costs being higher in eastern Massachusetts (C. Carranza, BEC, pers. comm., 1996). The proper way to estimate dredging costs is to consider each element of the project, which may vary dramatically among projects. The total cost can be divided by the total yardage to get a cost per cy, but this may not be especially meaningful in estimating other dredging projects. Nevertheless, a typical range of costs for dredging projects in recent years is
Eutrophication and Aquatic Plant Management in Massachusetts
3.0 Methods to Control Nutrients Page 3-102
$7 to $20/cy, with $10/cy suggested as a rough estimator for considering the general magnitude of a project under initial consideration. It is important, however, to develop a more careful estimate during further project planning. Dry dredging expenses for several Massachusetts projects illustrate the range of costs. The total project cost for the restoration of Puffers Pond (Factory Hollow Pond) in Amherst, MA in the 1980s was $338,800. Ten feet of sediments were removed across the 9.6-acre pond (74,238 cubic yards) for a cost of $4.56/cy. Included in this cost was the project design, construction of a sediment trap, draining of the pond, and sediment removal (Tighe & Bond, 1994). Over 220,000 cy of sediment were removed from Dunns Pond in Gardner, MA in the early 1980s at a cost of $1,264,000 ($5.74/cy), although a filter berm for cleaning incoming storm water was also included in this cost. About 30,000 cy was removed from Bulloughs and City Hall Ponds in Newton in 1993 at a total cost of about $400,000 ($13.33/cy), although this included additional watershed work and landscaping. Dredging of 15,000 cy from Hills Pond in Arlington, MA in 1995 cost $278,000 ($18.53/cy), including engineering, permitting, dredging and park restoration. The storm water management system to protect Hills Pond was a separate cost. Halls Pond in Brookline could not be dredged affordably, given contamination with benzene compounds; the estimated cost of disposal of those contaminated sediments was in excess of $50/cy. Total cost can be reduced if the dredged material is clean enough to be sold as a soil amendment. In the case of Lake Trummen, Sweden, the dredged material was sold as topsoil for about $3.43/cy (Cooke et al., 1993a). Lesser revenues were realized from more local projects, including Bantam Lake in CT ($1.00/cy) and Dunns Pond in MA ($0.50/cy), both conducted in the 1980s. Costs for reverse layering of sediments were estimated at $10,000/acre in 1991 (K-V Associates, Inc., 1991). This technique has not been used enough to provide any general estimate of costs.
3.7.14 Future Research Needs Research should be continued on the reverse layering of sediments to determine the effectiveness, impacts, and feasibility of implementing this technique. Further investigation of the actual risk from contaminated sediment disposal is needed to determine the appropriate level of protection in dredged sediment disposal. Additional research on long-term impacts of dredging on biota would also be helpful to document the severity of impacts and rate of recovery.
3.7.15 Summary If properly applied to a shallow lake with significant internal supplies of phosphorus, dredging can produce dramatic improvement in water clarity as well as satisfy the more common goals of increased depth and reduced macrophyte density. In some cases, dredging is the only solution to restoring a pond that is filling in and losing depth. Due to the cost and potential for impacts from some approaches, dredging is usually applied only if less costly or intrusive options are ineffective or infeasible. If applicable and properly applied, dredging can be very effective for the control of nutrients, and can provide control of algae and macrophytes.
Eutrophication and Aquatic Plant Management in Massachusetts
3.0 Methods to Control Nutrients Page 3-103
Dredging can be accomplished with water still in the lake or with the lake in a dry state. Potential adverse impacts will vary with the method chosen, and the choice of method will depend upon the ability or desire to drain the lake. Dry dredging tends to facilitate the most complete removal of sediment and allows complete physical restructuring of the aquatic habitat, but will impact most lake biota at least temporarily. Excavation with conventional equipment under wet conditions leaves some aquatic habitat during dredging, but will usually create a high level of disturbance in that habitat unless it is somehow sequestered from the active dredging area. Hydraulic or pneumatic dredging minimizes unwanted impacts, but is limited by rocks, stumps and other obstructions, and requires a more sophisticated containment area. The most significant limitations to sediment removal are sediment quality, finding a suitable location for disposal of the sediments, and the high cost of implementing this technique. The long and potentially difficult process of obtaining all of the permits and acquiring land for sediment disposal should not be underestimated. Contaminated sediments pose additional problems for permitting dredging and can greatly increased costs. Constructing and properly maintaining the containment area is critical to minimizing adverse impacts. Ultimate disposal in the initial containment area can minimize costs, but movement from the dewatering area to a more final disposal area is more common.
3.8 ADDITIONAL TECHNIQUES Two additional techniques warrant mention here in connection with control of nutrients and associated algal production. Neither has enjoyed substantial application in Massachusetts, but either could be practiced more, has been used in some cases, and may provide benefits. Specific information on each is insufficient to provide a review similar to the other techniques in this section, but future research and application may expand our knowledge of these approaches.
3.8.1 Bacterial Additives The use of bacterial additives in lakes and ponds has received some attention in recent years, but little detailed scientific study. The theory is simple: add natural or engineered bacteria to the aquatic environment that will out-compete algae for nutrients, binding up the supply of N or P and reducing available concentrations in the lake. In practice, most bacterial additives focus on nitrogen, which would seem to favor blue-green algae that can fix gaseous nitrogen. As nitrogen-fixing blue-greens include some of the most objectionable bloom-forming algae, the value of this approach is unproven. Likewise, it is not clear that a bacterial community capable of precluding algal blooms would not itself constitute an impairment of aquatic conditions. In some cases, practitioners claim bacteria additives consume organic sediments, thus “dredging” the pond, albeit anecdotally with limited supporting data.
3.8.2 Removal of Bottom-Feeding Fish Biomanipulation to reduce nutrient availability and improve lake transparency includes elimination of fish such as the common carp or bullheads that are bottom browsers. Browsing has been shown to release significant amounts of nutrients to the water column as these fish feed and digest food, and harvesting these fish has resulted in increased clarity in some cases (Baker

Eutrophication and Aquatic Plant Management in Massachusetts
3.0 Methods to Control Nutrients Page 3-104
et al., 1993). It has been suggested that alternative stable equilibria exist for lakes, based on biological structure (Scheffer et al., 1993), and removal of bottom feeding fish could shift the balance. Removing such fish, however desirable, can be very difficult since they tolerate very low levels of dissolved oxygen and high doses of fish poisons. Labor intensive programs appear necessary to achieve substantial reductions in bottom-feeding fish populations (McComas 1993), unless the entire fish population can be sacrificed through complete drawdown, complete freezing, or high doses of rotenone or other fish poisons. A permit to remove any fish species would be required from the MDFG.
3.9 NO MANAGEMENT ALTERNATIVE FOR NUTRIENTS
3.9.1 Overview The no management alternative for nutrients would exclude all active lake and watershed management programs, but could include monitoring and assessment, and would include normal operation of sewage treatment facilities and other pollution control activities as required by law. As explained in Section 1, the normal tendency for lakes is to gradually accumulate sediments and associated nutrients and to generally become more eutrophic. In consideration of this, the no management alternative would allow lakes to become ever more eutrophic in the future. Eutrophication is expected eventually, even if no human additions of nutrients were involved, but the time scale is greatly reduced by human activities. Most lakes in Massachusetts are influenced by human activities in the watershed, accelerating the eutrophication process in the absence of management. Thus, lack of active lake management will not control eutrophication and can be expected to facilitate acceleration of the process. The need for management is highly dependent on the ratio of the watershed area to lake area and on the degree of development in the watershed. The predominant natural lake type in Massachusetts is the kettlehole lake, a glacial pothole formed by a stranded block of ice, usually in a sandy outwash plain. Kettlehole lakes have small watershed to lake area ratios, usually <10:1, and great water depth (maximum >30 ft, average >15 ft) relative to lake area (usually <100 acres, although larger ones exist). Water enters naturally as precipitation or groundwater flow, with limited surficial runoff. Human development in the watersheds of kettlehole lakes leads to greater storm water runoff that becomes the primary mode of pollutant entry. As impervious area approaches 10%, water quality impacts are usually detectable (CWP, 2003). As impervious area exceeds 25%, water quality impacts are usually obvious. There are some natural lakes in Massachusetts formed by natural blockages of stream or river flow, and these normally have watershed to lake area ratios >20:1 and shallow depth (maximum <30 ft, average <15 ft). As the watershed to lake area ratio rises, even natural watershed processes can have an impact on water quality in the lake. At ratios >100:1 it is likely that the lake will become naturally eutrophic in a much shorter time than normally envisioned in the classic lake aging process (lake ontogeny). Where natural processes have caused eutrophication, some support for the no action alternative could be offered. However, all designated uses are unlikely to be fully supported, so even a naturally eutrophic lake might be put on the 303d list. It should be noted that over half of the lakes in Massachusetts, by area or volume (even excluding Quabbin and Wachusett Reservoirs), exist because of human action (Corbin, ENSR, unpublished data, 1998). Natural processes work to fill in and eutrophy natural lakes over
Eutrophication and Aquatic Plant Management in Massachusetts
3.0 Methods to Control Nutrients Page 3-105
centuries to eons, but many of our created lakes do not have the advantage of great depth or a small watershed to lake area ratio. Quabbin Reservoir, created by human action, has both great depth and a small watershed to lake area ratio, but this is an exception. Small dug ponds may have small watershed to lake area ratios, but will seldom have great depth. Run of the river impoundments will have large watershed to lake area ratios and shallow depth, and are at great risk from accelerated eutrophication. As they were created for human use or as habitat amenities (or both), value is lost if no management occurs.
3.9.2 Effectiveness The effectiveness of doing nothing to control eutrophication is variable, depending on the condition of the lake and the surrounding watershed. In remote areas with little development, oligotrophic lakes may remain oligotrophic for the foreseeable future. Such lakes are often deep lakes associated with hard bedrock where the weathering rates are low. Nutrient supplies and sedimentation rates are relatively low and such lakes would be expected to remain oligotrophic for a long time in the absence of human influence (Likens, 1972b). However, most Massachusetts lakes are not deep water bodies in isolated areas of forest. Impacts are therefore expected in the vast majority of cases unless management actions are taken. Lakes will not accept elevated levels of nutrients for very long without showing signs of ecological stress and use impairment. The no management alternative is not effective at preventing or controlling eutrophication, and will lead to undesirable conditions in a matter of years to decades, except in the rare case of a low-nutrient lake in an undeveloped watershed. The impact of doing nothing in lakes that are already eutrophic may not be all that noticeable over a period of several years, and people may adjust their use of the lake accordingly. As habitat for some species diminishes, so will their populations, but other species may take their place until conditions become too severe (e.g., extremely low oxygen, release of toxins from algal blooms). Conditions in the absence of management can indeed get worse, and almost undoubtedly will deteriorate further over a period of years to decades, with high variability in conditions among seasons and years. Where uses have been lost, doing nothing may not have a clearly negative consequence, but the lost opportunity (along with tax revenues and biodiversity) will continue. The no management option in such cases is ineffective at restoring or rehabilitating the lake, but it may not have the obvious negative consequences of no action for a threatened lake that is not yet eutrophic.
3.9.3 Impacts to Non-Target Organisms In the cases where the no management alternative leads to eutrophication, there can be adverse impacts on a variety of organisms. The most obvious of these occur when the lake reaches a level of eutrophication such that blue-green blooms form and the lake experiences depletion of dissolved oxygen under the ice cover in winter, in the hypolimnion, and/or in areas of dense macrophyte beds during the summer. Such depletion of oxygen can result in fish and invertebrate kills. Dense algal blooms will limit rooted plant cover and diversity. Dense rooted plant growths will affect fish community stability and invertebrate community composition. Highly eutrophic lakes tend to be minimally rich and diverse settings.
Eutrophication and Aquatic Plant Management in Massachusetts
3.0 Methods to Control Nutrients Page 3-106
In some cases management for nutrient control is incompatible with other management objectives. For example, management for nutrients may reduce plankton and thus reduce fish production (Wagner and Oglesby, 1984). The nature of management focus shifts in accordance with use goals, but the need for management does not abate.
3.9.4 Impacts to Water Quality If nutrients and sediments are supplied to a lake at high rates due to anthropogenic activities, then water quality will decline. If left uncontrolled, nutrient inputs will result in algal blooms that impact recreation and habitat uses. Water supply use may be impaired by algal blooms that disrupt water treatment and produce toxins. The no action alternative is expected to have adverse impacts on water quality except where the lake is oligotrophic and there is no major loading from the watershed.
3.9.5 Applicability to Saltwater Ponds The no action alternative is as applicable to Saltwater Ponds as it is to Freshwaters.
3.9.6 Implementation Guidance
3.9.6.1 Key Data Requirements
To determine if the no management alternative has any applicability to a lake and watershed, the lake and watershed condition must be known. Only in rare cases of clean lakes in undeveloped watersheds is this approach usually justifiable. Temporary lack of management may be justified for lakes already in seriously degraded condition, while planning for management proceeds. Funding issues often dictate that no management be taken, but this is not a valid use of this “technique”.
3.9.6.2 Factors that Favor this Approach
The following considerations are indicative of appropriate application of no management for reductions in nutrient concentrations and control of algae in lakes:
The lake is in an acceptable condition for designated and desired uses. There are no apparent threats to lake condition. Compliance with all federal and state laws relating to pollution control has been achieved.
3.9.6.3 Performance Guidelines
Planning and Implementation No planning or implementation typically accompanies the no action alternative, although protective action would be warranted where the no action alternative was a valid approach. Monitoring and Maintenance No monitoring or maintenance typically accompanies the no action alternative, although data availability is critical to determining if this approach is valid.
Eutrophication and Aquatic Plant Management in Massachusetts
3.0 Methods to Control Nutrients Page 3-107
Mitigation No mitigative measures apply to the no management alternative.
3.9.7 Regulations
3.9.7.1 Applicable Statutes
Regulations do not apply directly to the no management alternative. It should be noted, however, that the Commonwealth is required to maintain and monitor water quality as specified under the federal Clean Water Act. In addition, towns are required to close swimming beaches if safe visibility can not be maintained or bacterial standards are exceeded. It is important to note also that no management in these cases runs counter to the USEPA water quality goals of attaining fishable and swimmable water bodies. Action may therefore be mandated by federal or state law, necessitating abandonment of the no management alternative. It should be noted that the no management alternative is generally practiced as a consequence of lack of funds or lack of knowledge, both of which can be substantial hurdles to successful lake management even when mandated by law.
3.9.7.2 Impacts Specific to Wetlands Protection Act
The following overall impact classification is offered as a generalization of impacts, with clarifying notes and caveats as warranted: 1. Protection of public and private water supply – Detriment (water quality deterioration),
although impacts may be neutral in rare cases. 2. Protection of groundwater supply – Detriment (if lake interacts with groundwater) or neutral
(if no significant interaction). 3. Flood control – Generally neutral (no significant interaction), although water holding
capacity may decline over time. 4. Storm damage prevention – Generally neutral (no significant interaction) ), although water
holding capacity may decline over time. 5. Prevention of pollution – Detriment (water quality deterioration). 6. Protection of land containing shellfish – Detriment (no protection afforded), but impacts may
be neutral in some cases. 7. Protection of fisheries - Possible benefit through increased fertility and production, but
potential detriment by habitat loss. 8. Protection of wildlife habitat – Detriment (no protection afforded), but impacts may be
neutral in some cases.
3.9.8 Costs Costs do not apply directly to the no management alternative, although there may be costs associated with the impacts to non-target organisms and water quality. For example, additional fish stocking may be required to maintain or replace fish populations due to fish kills. Additional costs may be incurred for additional filtration or other treatment of drinking water supplies when algal blooms form. Such costs are difficult to estimate and would vary on a case by case basis. The reduction in water clarity may also impact real estate values and property tax revenues
Eutrophication and Aquatic Plant Management in Massachusetts
3.0 Methods to Control Nutrients Page 3-108
(Boyle et al., 1997; Jobin, 1997). A study of Maine lakes indicates that this can amount to a loss of millions of dollars when aggregated for an entire lake (Michael et al., 1996).
3.9.9 Future Research Needs Evaluation of monitoring data for lakes that have not had any focused lake or watershed management would be helpful in underscoring the results of no management. Long-term data sets would be most desirable, spanning a range of at least 20 years and preferably 50 years. Limited data exist that might fulfill this need, but no detailed analysis has been conducted. It is perhaps more critical that long-term monitoring programs be maintained, to provide such baseline data in the future.
3.9.10 Summary In summary, the no management alternative may be justified in cases where the lake is relatively deep and oligotrophic and with little change anticipated in the watershed. It may also have limited short-term consequences where the lake is already eutrophic. It is most often practiced as a consequence of lack of funding or knowledge of impacts and causative agents. If, however, the lake is shallow and mesotrophic or eutrophic, and there are significant developed lands, agricultural operations or other nutrient sources within the watershed, then the no management alternative for nutrients will not be effective at limiting eutrophication. The trend toward accelerated eutrophication will have adverse impacts on the natural aquatic community and on human uses of the lake. This eutrophication can lead to reduced species richness and diversity, impaired recreational use or water supply, and lowered property values and tax revenues.
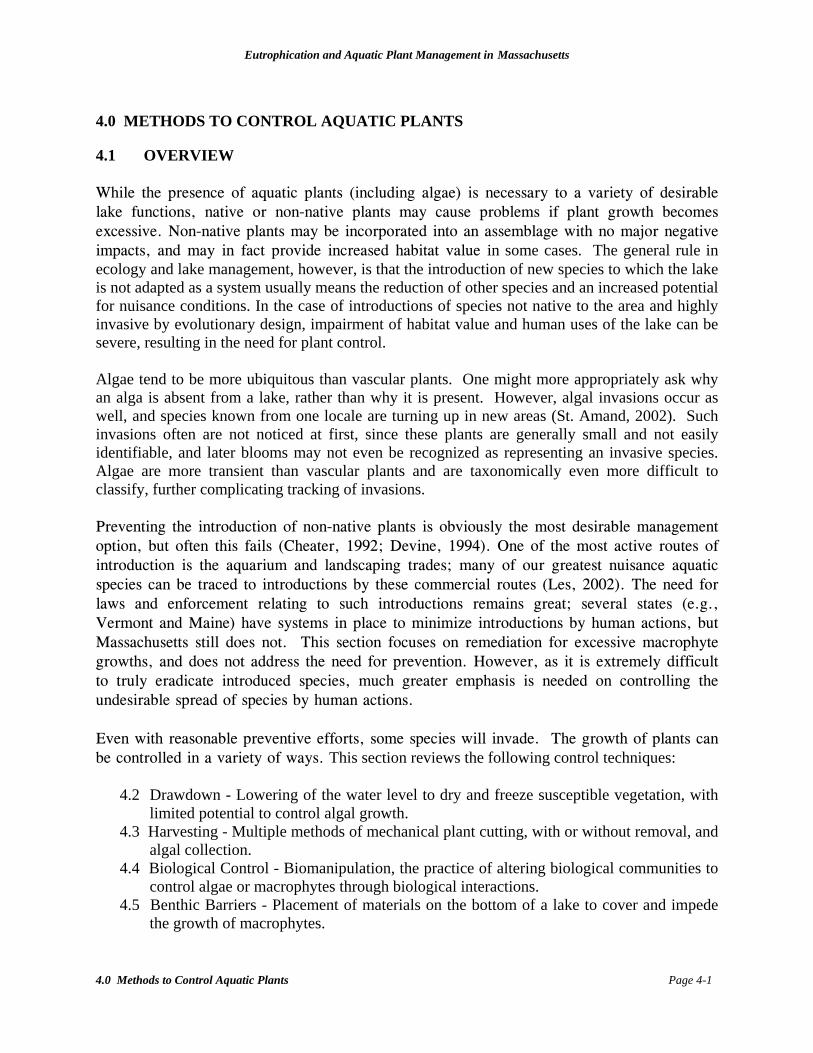
Eutrophication and Aquatic Plant Management in Massachusetts
4.0 Methods to Control Aquatic Plants Page 4-1
4.0 METHODS TO CONTROL AQUATIC PLANTS
4.1 OVERVIEW While the presence of aquatic plants (including algae) is necessary to a variety of desirable lake functions, native or non-native plants may cause problems if plant growth becomes excessive. Non-native plants may be incorporated into an assemblage with no major negative impacts, and may in fact provide increased habitat value in some cases. The general rule in ecology and lake management, however, is that the introduction of new species to which the lake is not adapted as a system usually means the reduction of other species and an increased potential for nuisance conditions. In the case of introductions of species not native to the area and highly invasive by evolutionary design, impairment of habitat value and human uses of the lake can be severe, resulting in the need for plant control. Algae tend to be more ubiquitous than vascular plants. One might more appropriately ask why an alga is absent from a lake, rather than why it is present. However, algal invasions occur as well, and species known from one locale are turning up in new areas (St. Amand, 2002). Such invasions often are not noticed at first, since these plants are generally small and not easily identifiable, and later blooms may not even be recognized as representing an invasive species. Algae are more transient than vascular plants and are taxonomically even more difficult to classify, further complicating tracking of invasions. Preventing the introduction of non-native plants is obviously the most desirable management option, but often this fails (Cheater, 1992; Devine, 1994). One of the most active routes of introduction is the aquarium and landscaping trades; many of our greatest nuisance aquatic species can be traced to introductions by these commercial routes (Les, 2002). The need for laws and enforcement relating to such introductions remains great; several states (e.g., Vermont and Maine) have systems in place to minimize introductions by human actions, but Massachusetts still does not. This section focuses on remediation for excessive macrophyte growths, and does not address the need for prevention. However, as it is extremely difficult to truly eradicate introduced species, much greater emphasis is needed on controlling the undesirable spread of species by human actions. Even with reasonable preventive efforts, some species will invade. The growth of plants can be controlled in a variety of ways. This section reviews the following control techniques:
4.2 Drawdown - Lowering of the water level to dry and freeze susceptible vegetation, with limited potential to control algal growth.
4.3 Harvesting - Multiple methods of mechanical plant cutting, with or without removal, and algal collection.
4.4 Biological Control - Biomanipulation, the practice of altering biological communities to control algae or macrophytes through biological interactions.
4.5 Benthic Barriers - Placement of materials on the bottom of a lake to cover and impede the growth of macrophytes.
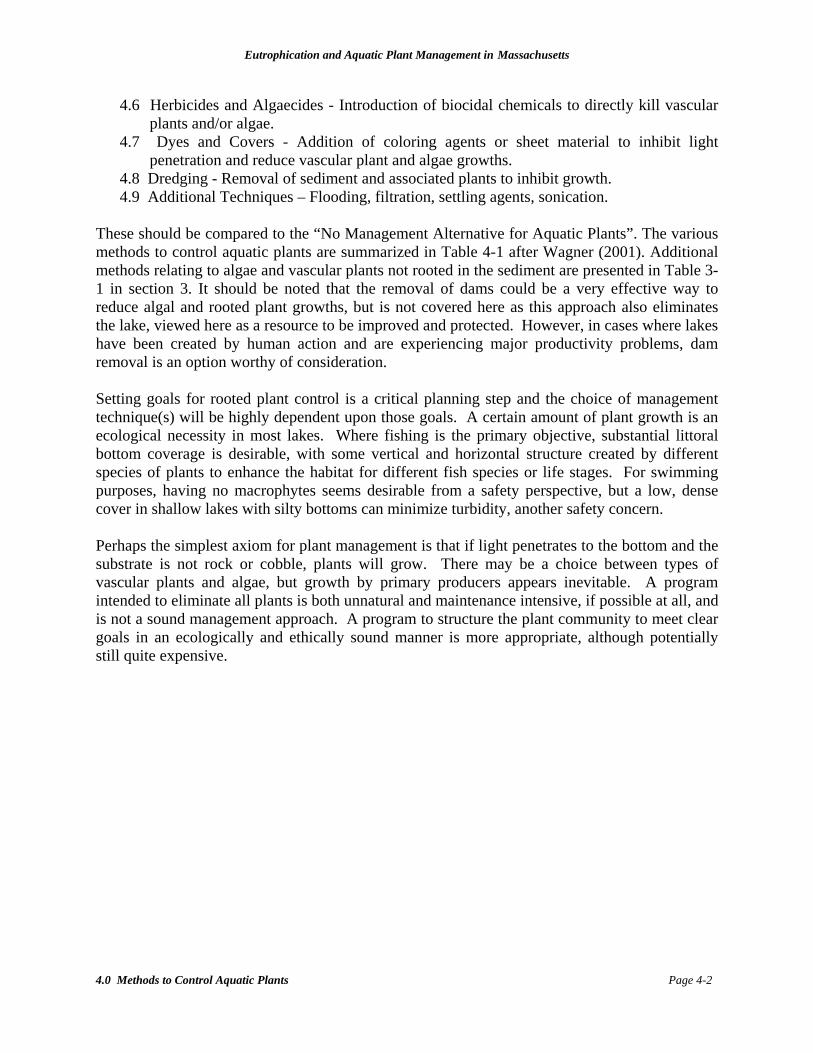
Eutrophication and Aquatic Plant Management in Massachusetts
4.0 Methods to Control Aquatic Plants Page 4-2
4.6 Herbicides and Algaecides - Introduction of biocidal chemicals to directly kill vascular plants and/or algae.
4.7 Dyes and Covers - Addition of coloring agents or sheet material to inhibit light penetration and reduce vascular plant and algae growths.
4.8 Dredging - Removal of sediment and associated plants to inhibit growth. 4.9 Additional Techniques – Flooding, filtration, settling agents, sonication.
These should be compared to the “No Management Alternative for Aquatic Plants”. The various methods to control aquatic plants are summarized in Table 4-1 after Wagner (2001). Additional methods relating to algae and vascular plants not rooted in the sediment are presented in Table 3-1 in section 3. It should be noted that the removal of dams could be a very effective way to reduce algal and rooted plant growths, but is not covered here as this approach also eliminates the lake, viewed here as a resource to be improved and protected. However, in cases where lakes have been created by human action and are experiencing major productivity problems, dam removal is an option worthy of consideration. Setting goals for rooted plant control is a critical planning step and the choice of management technique(s) will be highly dependent upon those goals. A certain amount of plant growth is an ecological necessity in most lakes. Where fishing is the primary objective, substantial littoral bottom coverage is desirable, with some vertical and horizontal structure created by different species of plants to enhance the habitat for different fish species or life stages. For swimming purposes, having no macrophytes seems desirable from a safety perspective, but a low, dense cover in shallow lakes with silty bottoms can minimize turbidity, another safety concern. Perhaps the simplest axiom for plant management is that if light penetrates to the bottom and the substrate is not rock or cobble, plants will grow. There may be a choice between types of vascular plants and algae, but growth by primary producers appears inevitable. A program intended to eliminate all plants is both unnatural and maintenance intensive, if possible at all, and is not a sound management approach. A program to structure the plant community to meet clear goals in an ecologically and ethically sound manner is more appropriate, although potentially still quite expensive.
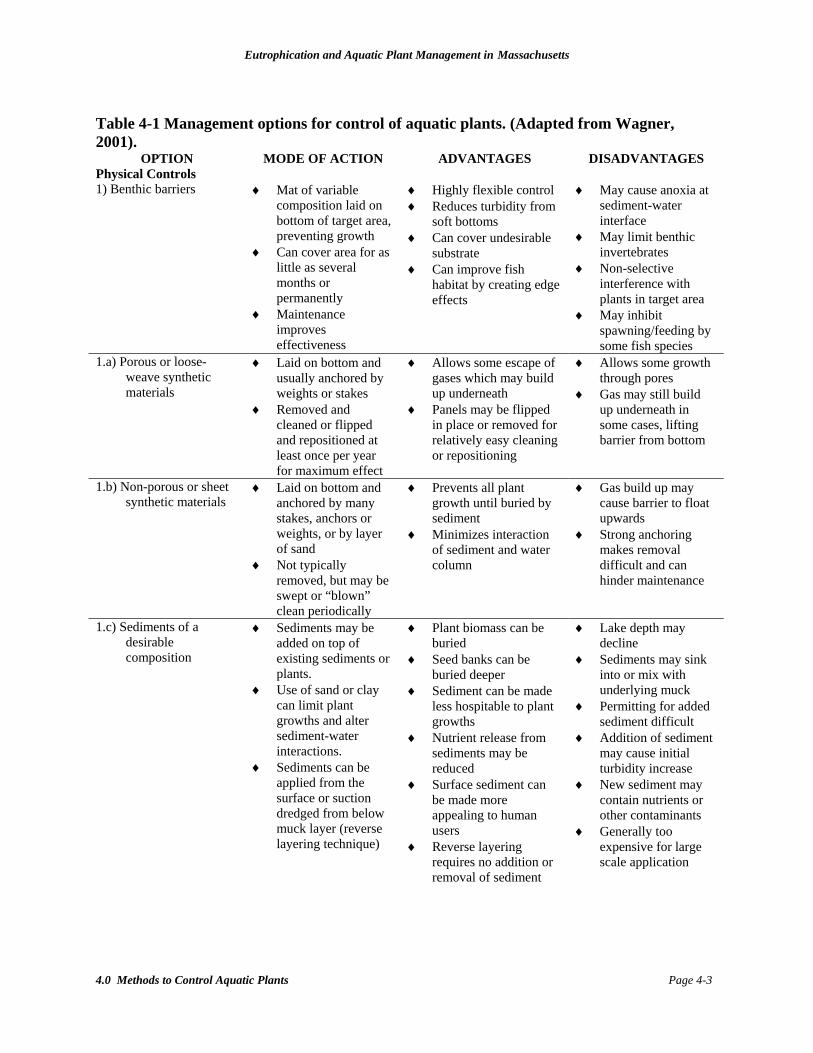
Eutrophication and Aquatic Plant Management in Massachusetts
4.0 Methods to Control Aquatic Plants Page 4-3
Table 4-1 Management options for control of aquatic plants. (Adapted from Wagner, 2001).
OPTION MODE OF ACTION ADVANTAGES DISADVANTAGES Physical Controls 1) Benthic barriers ♦ Mat of variable
composition laid on bottom of target area, preventing growth
♦ Can cover area for as little as several months or permanently
♦ Maintenance improves effectiveness
♦ Highly flexible control ♦ Reduces turbidity from
soft bottoms ♦ Can cover undesirable
substrate ♦ Can improve fish
habitat by creating edge effects
♦ May cause anoxia at sediment-water interface
♦ May limit benthic invertebrates
♦ Non-selective interference with plants in target area
♦ May inhibit spawning/feeding by some fish species
1.a) Porous or loose-weave synthetic materials
♦ Laid on bottom and usually anchored by weights or stakes
♦ Removed and cleaned or flipped and repositioned at least once per year for maximum effect
♦ Allows some escape of gases which may build up underneath
♦ Panels may be flipped in place or removed for relatively easy cleaning or repositioning
♦ Allows some growth through pores
♦ Gas may still build up underneath in some cases, lifting barrier from bottom
1.b) Non-porous or sheet synthetic materials
♦ Laid on bottom and anchored by many stakes, anchors or weights, or by layer of sand
♦ Not typically removed, but may be swept or “blown” clean periodically
♦ Prevents all plant growth until buried by sediment
♦ Minimizes interaction of sediment and water column
♦ Gas build up may cause barrier to float upwards
♦ Strong anchoring makes removal difficult and can hinder maintenance
1.c) Sediments of a desirable composition
♦ Sediments may be added on top of existing sediments or plants.
♦ Use of sand or clay can limit plant growths and alter sediment-water interactions.
♦ Sediments can be applied from the surface or suction dredged from below muck layer (reverse layering technique)
♦ Plant biomass can be buried
♦ Seed banks can be buried deeper
♦ Sediment can be made less hospitable to plant growths
♦ Nutrient release from sediments may be reduced
♦ Surface sediment can be made more appealing to human users
♦ Reverse layering requires no addition or removal of sediment
♦ Lake depth may decline
♦ Sediments may sink into or mix with underlying muck
♦ Permitting for added sediment difficult
♦ Addition of sediment may cause initial turbidity increase
♦ New sediment may contain nutrients or other contaminants
♦ Generally too expensive for large scale application
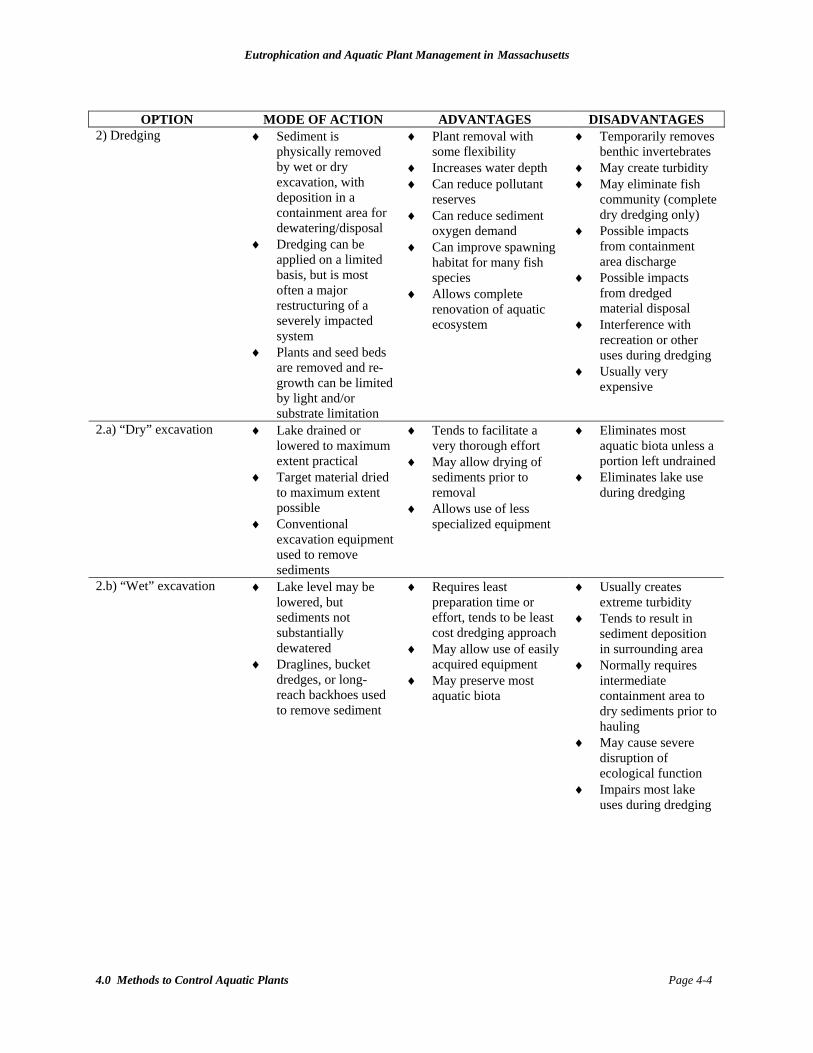
Eutrophication and Aquatic Plant Management in Massachusetts
4.0 Methods to Control Aquatic Plants Page 4-4
OPTION MODE OF ACTION ADVANTAGES DISADVANTAGES
2) Dredging ♦ Sediment is physically removed by wet or dry excavation, with deposition in a containment area for dewatering/disposal
♦ Dredging can be applied on a limited basis, but is most often a major restructuring of a severely impacted system
♦ Plants and seed beds are removed and re-growth can be limited by light and/or substrate limitation
♦ Plant removal with some flexibility
♦ Increases water depth ♦ Can reduce pollutant
reserves ♦ Can reduce sediment
oxygen demand ♦ Can improve spawning
habitat for many fish species
♦ Allows complete renovation of aquatic ecosystem
♦ Temporarily removes benthic invertebrates
♦ May create turbidity ♦ May eliminate fish
community (complete dry dredging only)
♦ Possible impacts from containment area discharge
♦ Possible impacts from dredged material disposal
♦ Interference with recreation or other uses during dredging
♦ Usually very expensive
2.a) “Dry” excavation ♦ Lake drained or lowered to maximum extent practical
♦ Target material dried to maximum extent possible
♦ Conventional excavation equipment used to remove sediments
♦ Tends to facilitate a very thorough effort
♦ May allow drying of sediments prior to removal
♦ Allows use of less specialized equipment
♦ Eliminates most aquatic biota unless a portion left undrained
♦ Eliminates lake use during dredging
2.b) “Wet” excavation ♦ Lake level may be lowered, but sediments not substantially dewatered
♦ Draglines, bucket dredges, or long-reach backhoes used to remove sediment
♦ Requires least preparation time or effort, tends to be least cost dredging approach
♦ May allow use of easily acquired equipment
♦ May preserve most aquatic biota
♦ Usually creates extreme turbidity
♦ Tends to result in sediment deposition in surrounding area
♦ Normally requires intermediate containment area to dry sediments prior to hauling
♦ May cause severe disruption of ecological function
♦ Impairs most lake uses during dredging
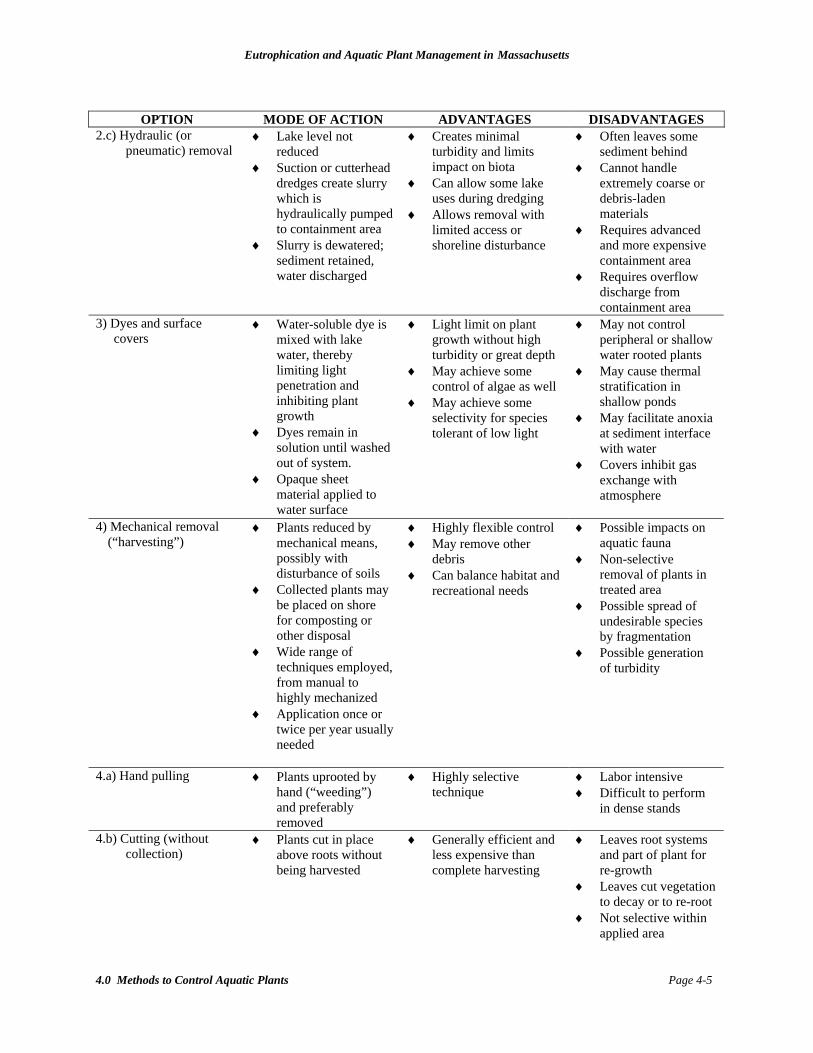
Eutrophication and Aquatic Plant Management in Massachusetts
4.0 Methods to Control Aquatic Plants Page 4-5
OPTION MODE OF ACTION ADVANTAGES DISADVANTAGES
2.c) Hydraulic (or pneumatic) removal
♦ Lake level not reduced
♦ Suction or cutterhead dredges create slurry which is hydraulically pumped to containment area
♦ Slurry is dewatered; sediment retained, water discharged
♦ Creates minimal turbidity and limits impact on biota
♦ Can allow some lake uses during dredging
♦ Allows removal with limited access or shoreline disturbance
♦ Often leaves some sediment behind
♦ Cannot handle extremely coarse or debris-laden materials
♦ Requires advanced and more expensive containment area
♦ Requires overflow discharge from containment area
3) Dyes and surface covers
♦ Water-soluble dye is mixed with lake water, thereby limiting light penetration and inhibiting plant growth
♦ Dyes remain in solution until washed out of system.
♦ Opaque sheet material applied to water surface
♦ Light limit on plant growth without high turbidity or great depth
♦ May achieve some control of algae as well
♦ May achieve some selectivity for species tolerant of low light
♦ May not control peripheral or shallow water rooted plants
♦ May cause thermal stratification in shallow ponds
♦ May facilitate anoxia at sediment interface with water
♦ Covers inhibit gas exchange with atmosphere
4) Mechanical removal
(“harvesting”)
♦ Plants reduced by mechanical means, possibly with disturbance of soils
♦ Collected plants may be placed on shore for composting or other disposal
♦ Wide range of techniques employed, from manual to highly mechanized
♦ Application once or twice per year usually needed
♦ Highly flexible control ♦ May remove other
debris ♦ Can balance habitat and
recreational needs
♦ Possible impacts on aquatic fauna
♦ Non-selective removal of plants in treated area
♦ Possible spread of undesirable species by fragmentation
♦ Possible generation of turbidity
4.a) Hand pulling ♦ Plants uprooted by hand (“weeding”) and preferably removed
♦ Highly selective technique
♦ Labor intensive ♦ Difficult to perform
in dense stands
4.b) Cutting (without collection)
♦ Plants cut in place above roots without being harvested
♦ Generally efficient and less expensive than complete harvesting
♦ Leaves root systems and part of plant for re-growth
♦ Leaves cut vegetation to decay or to re-root
♦ Not selective within applied area
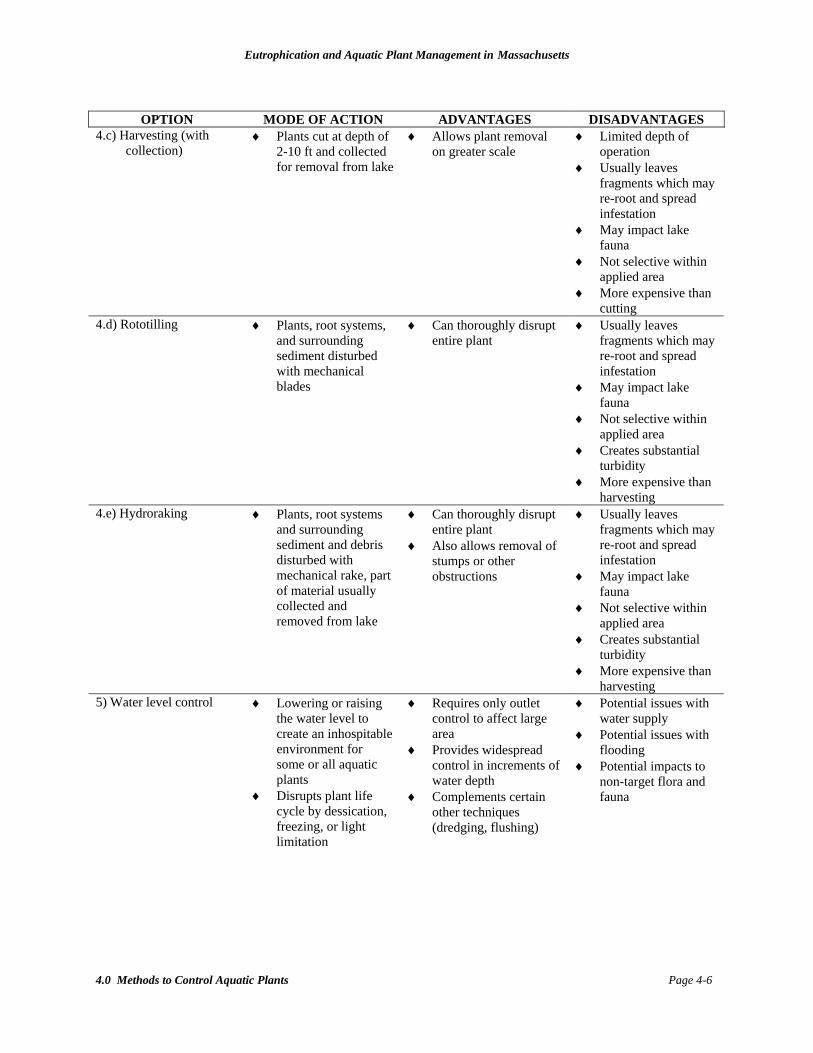
Eutrophication and Aquatic Plant Management in Massachusetts
4.0 Methods to Control Aquatic Plants Page 4-6
OPTION MODE OF ACTION ADVANTAGES DISADVANTAGES
4.c) Harvesting (with collection)
♦ Plants cut at depth of 2-10 ft and collected for removal from lake
♦ Allows plant removal on greater scale
♦ Limited depth of operation
♦ Usually leaves fragments which may re-root and spread infestation
♦ May impact lake fauna
♦ Not selective within applied area
♦ More expensive than cutting
4.d) Rototilling ♦ Plants, root systems, and surrounding sediment disturbed with mechanical blades
♦ Can thoroughly disrupt entire plant
♦ Usually leaves fragments which may re-root and spread infestation
♦ May impact lake fauna
♦ Not selective within applied area
♦ Creates substantial turbidity
♦ More expensive than harvesting
4.e) Hydroraking ♦ Plants, root systems and surrounding sediment and debris disturbed with mechanical rake, part of material usually collected and removed from lake
♦ Can thoroughly disrupt entire plant
♦ Also allows removal of stumps or other obstructions
♦ Usually leaves fragments which may re-root and spread infestation
♦ May impact lake fauna
♦ Not selective within applied area
♦ Creates substantial turbidity
♦ More expensive than harvesting
5) Water level control ♦ Lowering or raising the water level to create an inhospitable environment for some or all aquatic plants
♦ Disrupts plant life cycle by dessication, freezing, or light limitation
♦ Requires only outlet control to affect large area
♦ Provides widespread control in increments of water depth
♦ Complements certain other techniques (dredging, flushing)
♦ Potential issues with water supply
♦ Potential issues with flooding
♦ Potential impacts to non-target flora and fauna
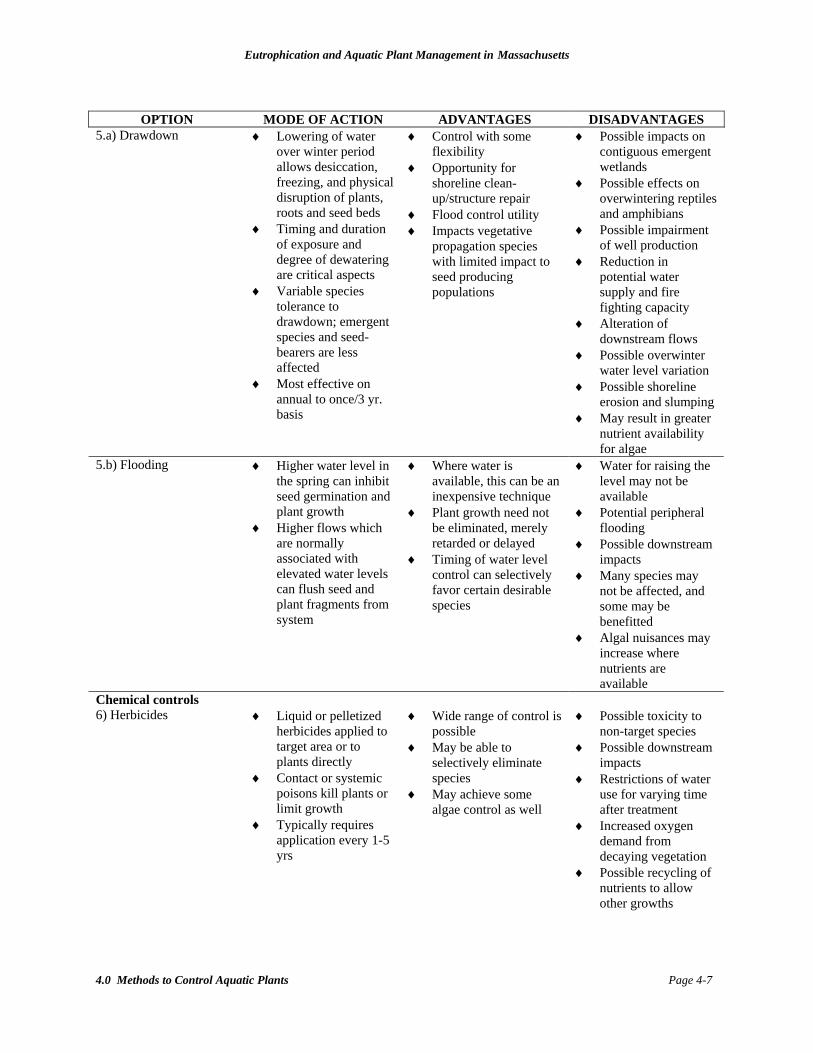
Eutrophication and Aquatic Plant Management in Massachusetts
4.0 Methods to Control Aquatic Plants Page 4-7
OPTION MODE OF ACTION ADVANTAGES DISADVANTAGES
5.a) Drawdown ♦ Lowering of water over winter period allows desiccation, freezing, and physical disruption of plants, roots and seed beds
♦ Timing and duration of exposure and degree of dewatering are critical aspects
♦ Variable species tolerance to drawdown; emergent species and seed-bearers are less affected
♦ Most effective on annual to once/3 yr. basis
♦ Control with some flexibility
♦ Opportunity for shoreline clean-up/structure repair
♦ Flood control utility ♦ Impacts vegetative
propagation species with limited impact to seed producing populations
♦ Possible impacts on contiguous emergent wetlands
♦ Possible effects on overwintering reptiles and amphibians
♦ Possible impairment of well production
♦ Reduction in potential water supply and fire fighting capacity
♦ Alteration of downstream flows
♦ Possible overwinter water level variation
♦ Possible shoreline erosion and slumping
♦ May result in greater nutrient availability for algae
5.b) Flooding ♦ Higher water level in the spring can inhibit seed germination and plant growth
♦ Higher flows which are normally associated with elevated water levels can flush seed and plant fragments from system
♦ Where water is available, this can be an inexpensive technique
♦ Plant growth need not be eliminated, merely retarded or delayed
♦ Timing of water level control can selectively favor certain desirable species
♦ Water for raising the level may not be available
♦ Potential peripheral flooding
♦ Possible downstream impacts
♦ Many species may not be affected, and some may be benefitted
♦ Algal nuisances may increase where nutrients are available
Chemical controls 6) Herbicides ♦ Liquid or pelletized
herbicides applied to target area or to plants directly
♦ Contact or systemic poisons kill plants or limit growth
♦ Typically requires application every 1-5 yrs
♦ Wide range of control is possible
♦ May be able to selectively eliminate species
♦ May achieve some algae control as well
♦ Possible toxicity to non-target species
♦ Possible downstream impacts
♦ Restrictions of water use for varying time after treatment
♦ Increased oxygen demand from decaying vegetation
♦ Possible recycling of nutrients to allow other growths
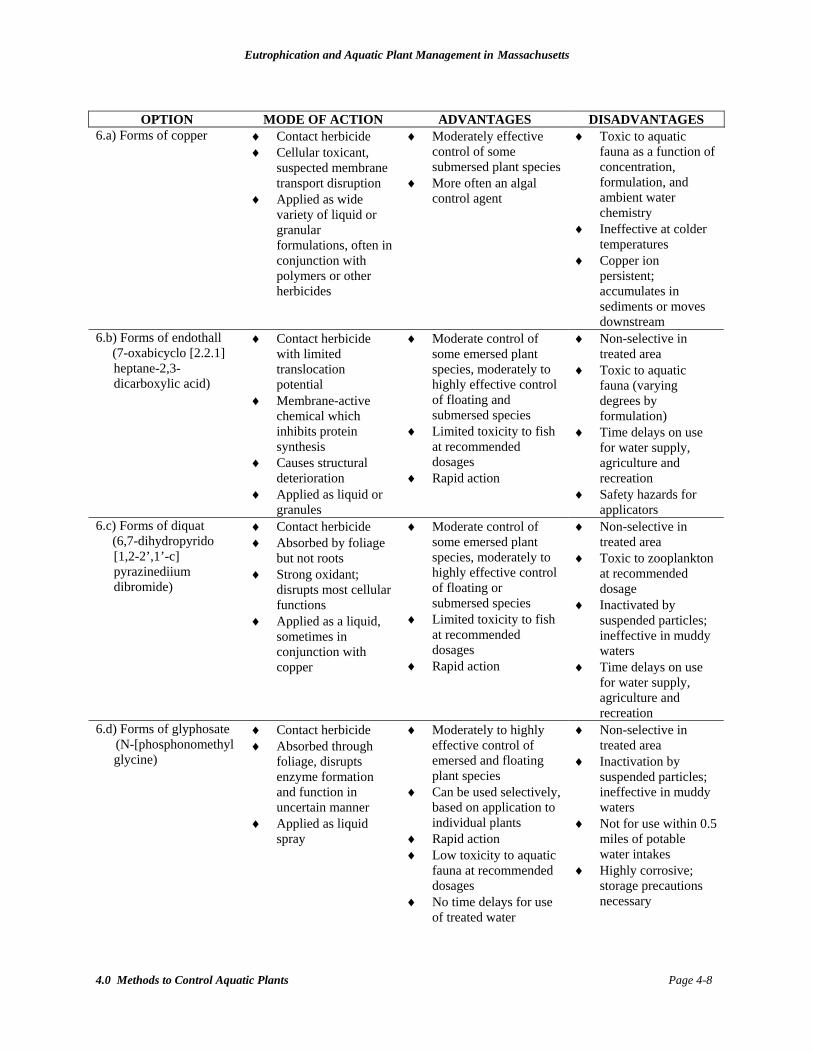
Eutrophication and Aquatic Plant Management in Massachusetts
4.0 Methods to Control Aquatic Plants Page 4-8
OPTION MODE OF ACTION ADVANTAGES DISADVANTAGES
6.a) Forms of copper
♦ Contact herbicide ♦ Cellular toxicant,
suspected membrane transport disruption
♦ Applied as wide variety of liquid or granular formulations, often in conjunction with polymers or other herbicides
♦ Moderately effective control of some submersed plant species
♦ More often an algal control agent
♦ Toxic to aquatic fauna as a function of concentration, formulation, and ambient water chemistry
♦ Ineffective at colder temperatures
♦ Copper ion persistent; accumulates in sediments or moves downstream
6.b) Forms of endothall (7-oxabicyclo [2.2.1]
heptane-2,3-dicarboxylic acid)
♦ Contact herbicide with limited translocation potential
♦ Membrane-active chemical which inhibits protein synthesis
♦ Causes structural deterioration
♦ Applied as liquid or granules
♦ Moderate control of some emersed plant species, moderately to highly effective control of floating and submersed species
♦ Limited toxicity to fish at recommended dosages
♦ Rapid action
♦ Non-selective in treated area
♦ Toxic to aquatic fauna (varying degrees by formulation)
♦ Time delays on use for water supply, agriculture and recreation
♦ Safety hazards for applicators
6.c) Forms of diquat (6,7-dihydropyrido
[1,2-2’,1’-c] pyrazinediium dibromide)
♦ Contact herbicide ♦ Absorbed by foliage
but not roots ♦ Strong oxidant;
disrupts most cellular functions
♦ Applied as a liquid, sometimes in conjunction with copper
♦ Moderate control of some emersed plant species, moderately to highly effective control of floating or submersed species
♦ Limited toxicity to fish at recommended dosages
♦ Rapid action
♦ Non-selective in treated area
♦ Toxic to zooplankton at recommended dosage
♦ Inactivated by suspended particles; ineffective in muddy waters
♦ Time delays on use for water supply, agriculture and recreation
6.d) Forms of glyphosate (N-[phosphonomethyl
glycine)
♦ Contact herbicide ♦ Absorbed through
foliage, disrupts enzyme formation and function in uncertain manner
♦ Applied as liquid spray
♦ Moderately to highly effective control of emersed and floating plant species
♦ Can be used selectively, based on application to individual plants
♦ Rapid action ♦ Low toxicity to aquatic
fauna at recommended dosages
♦ No time delays for use of treated water
♦ Non-selective in treated area
♦ Inactivation by suspended particles; ineffective in muddy waters
♦ Not for use within 0.5 miles of potable water intakes
♦ Highly corrosive; storage precautions necessary
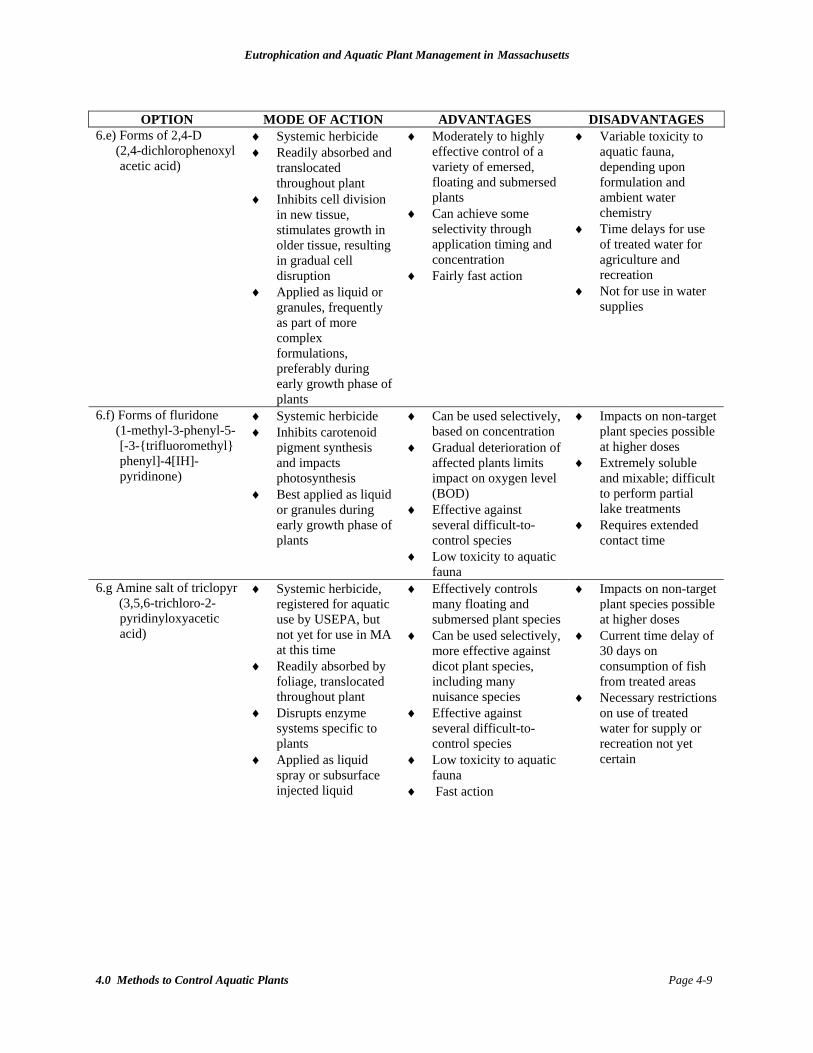
Eutrophication and Aquatic Plant Management in Massachusetts
4.0 Methods to Control Aquatic Plants Page 4-9
OPTION MODE OF ACTION ADVANTAGES DISADVANTAGES
6.e) Forms of 2,4-D (2,4-dichlorophenoxyl
acetic acid)
♦ Systemic herbicide ♦ Readily absorbed and
translocated throughout plant
♦ Inhibits cell division in new tissue, stimulates growth in older tissue, resulting in gradual cell disruption
♦ Applied as liquid or granules, frequently as part of more complex formulations, preferably during early growth phase of plants
♦ Moderately to highly effective control of a variety of emersed, floating and submersed plants
♦ Can achieve some selectivity through application timing and concentration
♦ Fairly fast action
♦ Variable toxicity to aquatic fauna, depending upon formulation and ambient water chemistry
♦ Time delays for use of treated water for agriculture and recreation
♦ Not for use in water supplies
6.f) Forms of fluridone (1-methyl-3-phenyl-5-
[-3-{trifluoromethyl} phenyl]-4[IH]-pyridinone)
♦ Systemic herbicide ♦ Inhibits carotenoid
pigment synthesis and impacts photosynthesis
♦ Best applied as liquid or granules during early growth phase of plants
♦ Can be used selectively, based on concentration
♦ Gradual deterioration of affected plants limits impact on oxygen level (BOD)
♦ Effective against several difficult-to-control species
♦ Low toxicity to aquatic fauna
♦ Impacts on non-target plant species possible at higher doses
♦ Extremely soluble and mixable; difficult to perform partial lake treatments
♦ Requires extended contact time
6.g Amine salt of triclopyr (3,5,6-trichloro-2-
pyridinyloxyacetic acid)
♦ Systemic herbicide, registered for aquatic use by USEPA, but not yet for use in MA at this time
♦ Readily absorbed by foliage, translocated throughout plant
♦ Disrupts enzyme systems specific to plants
♦ Applied as liquid spray or subsurface injected liquid
♦ Effectively controls many floating and submersed plant species
♦ Can be used selectively, more effective against dicot plant species, including many nuisance species
♦ Effective against several difficult-to-control species
♦ Low toxicity to aquatic fauna
♦ Fast action
♦ Impacts on non-target plant species possible at higher doses
♦ Current time delay of 30 days on consumption of fish from treated areas
♦ Necessary restrictions on use of treated water for supply or recreation not yet certain
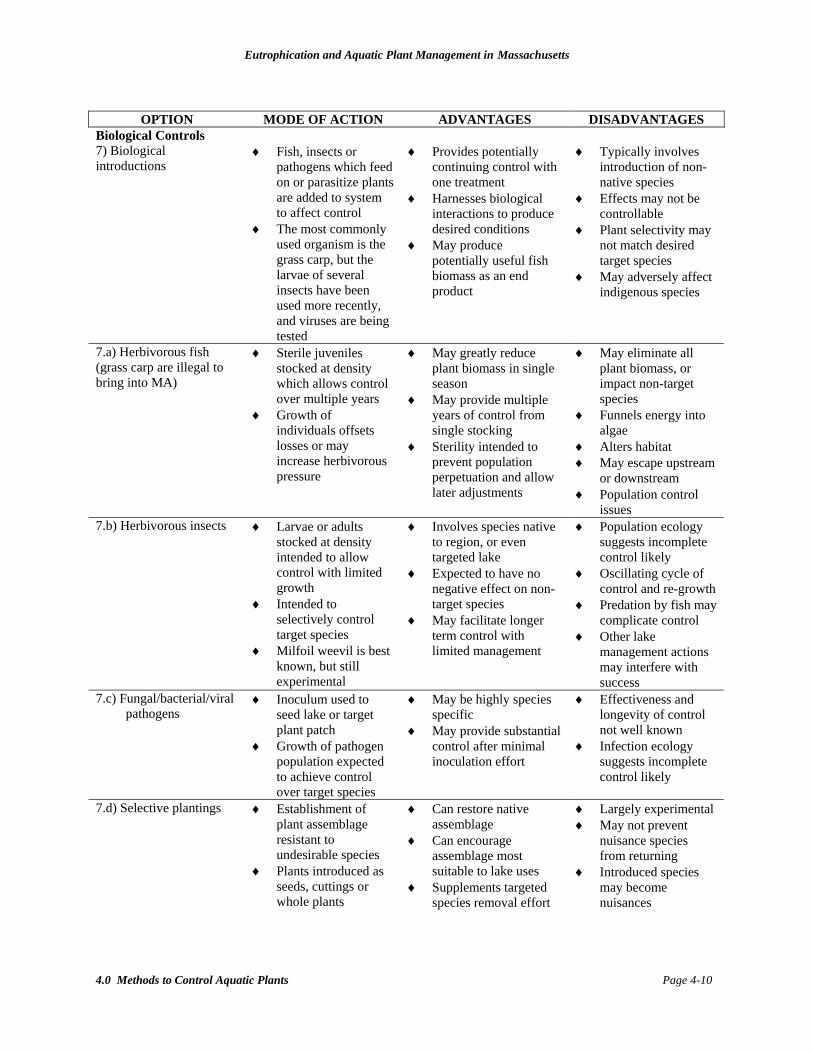
Eutrophication and Aquatic Plant Management in Massachusetts
4.0 Methods to Control Aquatic Plants Page 4-10
OPTION MODE OF ACTION ADVANTAGES DISADVANTAGES
Biological Controls 7) Biological introductions
♦ Fish, insects or pathogens which feed on or parasitize plants are added to system to affect control
♦ The most commonly used organism is the grass carp, but the larvae of several insects have been used more recently, and viruses are being tested
♦ Provides potentially continuing control with one treatment
♦ Harnesses biological interactions to produce desired conditions
♦ May produce potentially useful fish biomass as an end product
♦ Typically involves introduction of non-native species
♦ Effects may not be controllable
♦ Plant selectivity may not match desired target species
♦ May adversely affect indigenous species
7.a) Herbivorous fish (grass carp are illegal to bring into MA)
♦ Sterile juveniles stocked at density which allows control over multiple years
♦ Growth of individuals offsets losses or may increase herbivorous pressure
♦ May greatly reduce plant biomass in single season
♦ May provide multiple years of control from single stocking
♦ Sterility intended to prevent population perpetuation and allow later adjustments
♦ May eliminate all plant biomass, or impact non-target species
♦ Funnels energy into algae
♦ Alters habitat ♦ May escape upstream
or downstream ♦ Population control
issues 7.b) Herbivorous insects ♦ Larvae or adults
stocked at density intended to allow control with limited growth
♦ Intended to selectively control target species
♦ Milfoil weevil is best known, but still experimental
♦ Involves species native to region, or even targeted lake
♦ Expected to have no negative effect on non-target species
♦ May facilitate longer term control with limited management
♦ Population ecology suggests incomplete control likely
♦ Oscillating cycle of control and re-growth
♦ Predation by fish may complicate control
♦ Other lake management actions may interfere with success
7.c) Fungal/bacterial/viral pathogens
♦ Inoculum used to seed lake or target plant patch
♦ Growth of pathogen population expected to achieve control over target species
♦ May be highly species specific
♦ May provide substantial control after minimal inoculation effort
♦ Effectiveness and longevity of control not well known
♦ Infection ecology suggests incomplete control likely
7.d) Selective plantings ♦ Establishment of plant assemblage resistant to undesirable species
♦ Plants introduced as seeds, cuttings or whole plants
♦ Can restore native assemblage
♦ Can encourage assemblage most suitable to lake uses
♦ Supplements targeted species removal effort
♦ Largely experimental ♦ May not prevent
nuisance species from returning
♦ Introduced species may become nuisances
Eutrophication and Aquatic Plant Management in Massachusetts
4.0 Methods to Control Aquatic Plants Page 4-11
4.2 DRAWDOWN
4.2.1 Water Level Lowering Drawdown is a multipurpose lake management tool that can be used for aquatic plant control. The water level is lowered by pumping, siphoning, or opening a pipe or gate in the dam. Historically, water level drawdown has been used in waterfowl impoundments and wetlands for periods of a year or more, including the growing season, to improve the quality of wetlands for waterfowl breeding and feeding habitat (Kadlec, 1962; Harris and Marshall, 1963). It has also been a common fishery management method. Until a few decades ago, drawdowns of recreational lakes were primarily for the purpose of flood control and allowing access for near-shore clean ups and repairs to structures, with macrophyte control as an auxiliary benefit. While this technique is not effective on all submergent species, it does decrease the abundance of some of the chief nuisance species, particularly those that rely on vegetative propagules for overwintering and expansion (Cooke et al., 1993a). If there is an existing drawdown capability, lowering the water level provides an inexpensive means to control some macrophytes. Additional benefits may include opportunities for shoreline maintenance and oxidation or removal of nutrient-rich sediments. The ability to control the water level in a lake is affected by area precipitation pattern, system hydrology, lake morphometry, and the outlet structure. The base elevation of the outlet or associated subsurface pipe(s) will usually set the maximum drawdown level, while the capacity of the outlet to pass water and the pattern of water inflow to the lake will determine if that base elevation can be achieved and maintained. In some cases, sedimentation of an outlet channel or other obstructions may control the maximum drawdown level. Several factors affect the success of drawdown with respect to plant control. While drying of plants during drawdowns may provide some control, the additional impact of freezing is substantial, making drawdown a more effective strategy during late fall and winter. However, a mild winter or one with early and persistent snow may not provide the necessary level of drying and freezing. The presence of high levels of groundwater seepage into the lake may mitigate or negate destructive effects on target submergent species by keeping the area moist and unfrozen. The presence of extensive seed beds may result in rapid re-establishment of previously occurring plant species, some of which may be undesirable. Recolonization from nearby areas may be rapid, and the response of macrophyte species to drawdown is quite variable. Aside from direct impact on target plants, drawdown can also indirectly and gradually affect the plant community by changing the substrate composition in the drawdown zone. If there is sufficient slope, finer sediments will be transported to deeper waters, leaving behind a coarser substrate. If there is a thick muck layer present in the drawdown zone, there is probably not adequate slope to allow its movement. However, where light sediment has accumulated over sand, gravel or rock, repetitive drawdowns can restore the coarse substrate and limit plant growths. Desirable side effects associated with drawdowns include the opportunity to clean up the shoreline, repair previous erosion damage, repair docks and retaining walls, and search for septic
Eutrophication and Aquatic Plant Management in Massachusetts
4.0 Methods to Control Aquatic Plants Page 4-12
system breakouts. (Nichols and Shaw, 1983; Cooke et al., 1993a; WDNR, 1989). Some authors (Cooke 1980) have reported that game fishing often improves after a drawdown, but this is not the case in Massachusetts or New England. Since emergent shoreline vegetation tends to be favored by drawdowns, populations of furbearers are expected to benefit (WDNR 1989), although direct negative impacts may be caused if lodges and food caches are exposed. The consolidation of loose sediments and sloughing of soft sediment deposits into deeper water is perceived as a benefit by shoreline homeowners (Cooke et al., 1993a; WDNR 1989). The actual conduct of a drawdown involves facilitating more outflow than inflow for a sustained period on the order of several weeks or months. After the target water level is reached, outflow is roughly matched to inflow to maintain the drawdown for the desired period, usually at least a month and often up to 3 months, usually over the winter. At a time picked to allow refill before any undesirable spring impacts can occur, outflow is reduced (although it should not be eliminated) and “excess” inflow causes the water level to rise. In some cases, refill is commenced after an inch or two of ice forms, ripping up plants and bottom material. This “extreme disturbance” approach may be a preferable alternative where sediments will not dewater sufficiently to provide the level of freezing and desiccation desired. It also should be noted that this approach may disturb overwintering organisms. Impacts and effectiveness have not been documented, although observations by practitioners seem to favor this approach as more effective than just freezing.
4.2.2 Effectiveness
4.2.2.1 Short-Term
The factors that determine the effectiveness of a drawdown for rooted plant control include: 1. Sensitivity of species to dehydration (Nichols, 1975); see Table 4-2 for sample tolerance
listings. 2. Sediment composition and slope. Clay or muck soils will dry out much slower than sandy
soil. The rate and degree of desiccation achieved will limit effectiveness (Pieterse and Murphy, 1990). Steeper slopes allow movement of finer sediment out of the area, leaving a less hospitable substrate for growth of plants.
3. The depth of the drawdown; in lakes that have macrophyte beds at varying depths, greater effectiveness is achieved on macrophyte beds that are completely exposed during the drawdown (Siver et al., 1985).
4. Weather during drawdown. Some species, such as Nuphar, may require a prolonged period of frost in order for the drawdown to be effective (Cooke et al., 1993a). Repeated rain will offset dewatering. Mild winter temperatures will limit freezing effects. Snowfall can insulate plants, preventing adequate freezing and desiccation.
5. Pattern and rate of groundwater seepage into lake sediments (Cooke, 1980). Groundwater inputs can offset dewatering.
6. Plant density at the time of drawdown. When the canopy dries out it can form a covering over other plants and root systems and prevent dehydration (Pieterse and Murphy, 1990).
To reduce impacts to non-target plants and animals during the growing season, drawdowns in Massachusetts are normally conducted in fall and winter. Most of these factors act upon success over several months, with successful drawdowns resulting in reduced plant density the following
Eutrophication and Aquatic Plant Management in Massachusetts
4.0 Methods to Control Aquatic Plants Page 4-13
growing season. Consequently, short-term impacts are not readily noticeable in most cases. If the following growing season is considered to represent “short-term” effects, then drawdown has variable effectiveness in accordance with the above-listed factors. The effectiveness of drawdown as an aquatic plant control technique depends foremost on the susceptibility of the target species to drawdown. Some species are sensitive to drawdown, while others are resistant or even stimulated by it (Table 4-2). Species that depend upon vegetative propagation and overwintering strategies (most perennials) will likely to be impacted, while species that depend upon seed reproduction (annuals) may not be impacted. Seeds are not adversely impacted, and germination may be stimulated. If the root systems of perennials can be dried and frozen, density reductions can be striking. Drawdown has been applied for many years in lake management and tends to reduce rooted plant density in the drawdown zone, even if not always intended as a plant control technique (Dunst et al., 1974; Wlosinski and Koljord, 1996). Winter drawdowns of Candlewood Lake in Connecticut (Siver et al., 1986) reduced nuisance species by as much as 90% after initial drawdown. Drawdowns in Wisconsin lakes have resulted in reductions in plant coverage and biomass of 40 to 92% in targeted areas (Dunst et al., 1974). In one Wisconsin case, Beard (1973) reported that winter drawdown of Murphy Flowage opened 64 out of 75 acres to recreation and improved fishing. The effect of drawdown on plants is not always predictable or desirable, however. Reductions in plant biomass of 44% to 57% were observed in Blue Lake in Oregon (Geiger, 1983) following drawdown, but certain nuisance species actually increased and herbicides were eventually applied to regain control. Drawdown of Lake Bomoseen in Vermont (VANR, 1990) caused a major reduction in many species, many of which were not targeted for biomass reductions. The Lake Bomoseen drawdown was effective at reducing Eurasian watermilfoil in the areas exposed (down to four feet), but most of the milfoil was present in deeper areas and quickly recolonized. A slow refill of Indian Lake in Worcester in the spring (refill started in May) allowed plants at deeper depths to grow and reach the surface, hindering recreational use (G. Gonyea, MDEP, pers. comm., 1996). Reviewing drawdown effectiveness in a variety of lakes, Nichols and Shaw (1983) noted the species-specific effects of drawdown, with a number of possible benefits and drawbacks. A system-specific review of likely and potential impacts is highly advisable prior to conducting a drawdown. Algal control by drawdown is dependent upon oxidation of sediments to reduce the potential for internal recycling in subsequent growing seasons. Unfortunately, increases in available nutrients have been as common as decreases, as decomposition makes nutrients more readily available. Where flushing is high, the released nutrients may be out of the lake by the next growing season, but highly flushed systems usually have problems with external loading and may have reduced algal biomass just by virtue of the flushing activity. Short-term impacts of drawdown on algae are therefore not reliably predictable.
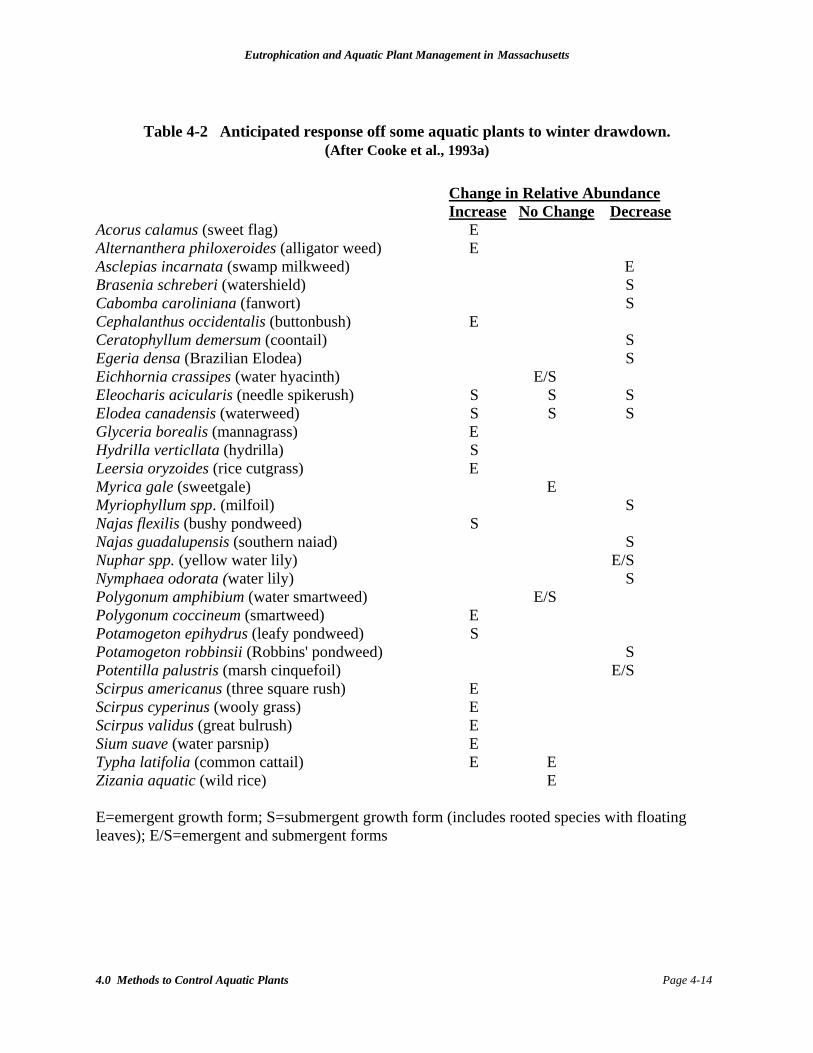
Eutrophication and Aquatic Plant Management in Massachusetts
4.0 Methods to Control Aquatic Plants Page 4-14
Table 4-2 Anticipated response off some aquatic plants to winter drawdown. (After Cooke et al., 1993a)
Change in Relative Abundance Increase No Change Decrease Acorus calamus (sweet flag) E Alternanthera philoxeroides (alligator weed) E Asclepias incarnata (swamp milkweed) E Brasenia schreberi (watershield) S Cabomba caroliniana (fanwort) S Cephalanthus occidentalis (buttonbush) E Ceratophyllum demersum (coontail) S Egeria densa (Brazilian Elodea) S Eichhornia crassipes (water hyacinth) E/S Eleocharis acicularis (needle spikerush) S S S Elodea canadensis (waterweed) S S S Glyceria borealis (mannagrass) E Hydrilla verticllata (hydrilla) S Leersia oryzoides (rice cutgrass) E Myrica gale (sweetgale) E Myriophyllum spp. (milfoil) S Najas flexilis (bushy pondweed) S Najas guadalupensis (southern naiad) S Nuphar spp. (yellow water lily) E/S Nymphaea odorata (water lily) S Polygonum amphibium (water smartweed) E/S Polygonum coccineum (smartweed) E Potamogeton epihydrus (leafy pondweed) S Potamogeton robbinsii (Robbins' pondweed) S Potentilla palustris (marsh cinquefoil) E/S Scirpus americanus (three square rush) E Scirpus cyperinus (wooly grass) E Scirpus validus (great bulrush) E Sium suave (water parsnip) E Typha latifolia (common cattail) E E Zizania aquatic (wild rice) E E=emergent growth form; S=submergent growth form (includes rooted species with floating leaves); E/S=emergent and submergent forms
Eutrophication and Aquatic Plant Management in Massachusetts
4.0 Methods to Control Aquatic Plants Page 4-15
4.2.2.2 Long-Term
The intended overall effect of a drawdown is a change in the composition of the plant community and a reduction in assemblage biomass. The former goal is usually achieved if the target species are sensitive to drawdown. Achieving the latter goal is partly a function of sediment type and slope, but can be achieved with careful drawdown management in many cases. Annual drawdowns maximize long term effectiveness, although repeated drawdowns may result in dominance of drawdown resistant species which could limit the long term effectiveness of this control method (Nichols, 1975). Nuisance conditions caused by drawdown resistant species usually occur in shallow, minimally sloped areas where the substrate is hospitable. Lake Garfield in Monterey is a good example of the switch from drawdown sensitive to drawdown tolerant species. An 8 ft drawdown limits Eurasian watermilfoil growth but promotes dense stands of the seed-producing, annual, broad-leaf pondweed (Potamogeton amplifolius) in that lake (BEC, 1992b). In Candlewood Lake, CT, however, two species of the seed producing, annual, naiad (Najas) increased following drawdown, but have not impeded lake uses. After two winter drawdowns during 1983-84 and 1984-85 the biomass of Myriophyllum spicatum (Eurasian watermilfoil) was significantly reduced (Siver et al., 1985) and remains an effective control method for milfoil in Candlewood Lake (R. Larsen, NE Utilities, pers. comm., 1995). Drawdowns at Lake Lashaway (East and North Brookfield, Massachusetts) in the mid-1980s were successful at reducing plant growth for six sequential growing seasons (Haynes, 1990). Previous attempts to control fanwort (Cabomba caroliniana) and naiad (Najas flexilis) with chemicals had been inadequate in Lake Lashaway, while the drawdowns controlled both species (Haynes, 1990). Drawdown has been applied to many lakes in the Berkshire region since the 1960s or earlier, and plant composition and density in the drawdown zone clearly indicates that species such as Eurasian watermilfoil can be controlled at the lake periphery by this technique. In Stockbridge Bowl there is little milfoil out to a water depth of 3 to 4 ft, owing to an 18-inch drawdown and about 2 ft of ice contact (ENSR, 2002b). Drawdown kept areas of Richmond Pond <6 ft deep largely free of milfoil for over 30 years (BEC, 1990a). Lake Buel, by comparison, has no water level controls and has dense milfoil growth right to the shoreline. It is also true, however, that milfoil grows at depths much greater than drawdown can typically reach, so recolonization after cessation of drawdown may only take a few years. Otis Reservoir was studied in detail in 2000 (ENSR, 2001c). It has experienced a drawdown of 8 ft, 3 inches on an annual basis for several decades. The drawdown is conducted by the MDCR with a primary goal of protecting structures around the lake from ice damage, but the plant control effect is striking. Where the slope is more than about 1:4 (at least 1 ft of vertical change for every 4 ft of horizontal change), there is almost no soft sediment in the drawdown zone, and the habitat is rock, sand and gravel with few plants. Where the slope is lower, muck sediments are present and seed-producing annual plants native to the area are abundant but not overly dense, creating excellent habitat for fish and invertebrates. Below the drawdown zone, a band of plants encircles the lake, again providing desirable habitat but not interfering with recreation. No invasive species of aquatic plants were found in the lake, despite high levels of boating by visitors.
Eutrophication and Aquatic Plant Management in Massachusetts
4.0 Methods to Control Aquatic Plants Page 4-16
Indian Lake in Becket has been the subject of six years of study, three pre-drawdown and three post-drawdown (ENSR, 2001d). This drawdown targeted a number of native species that were perceived as expanding toward nuisance levels. The first winter drawdown in 1999-2000 stimulated seed producers but failed to kill vegetative propagators, given the mild winter. The second drawdown in the better suited winter of 2000-2001 greatly reduced the biomass of the plant assemblage, but left areal coverage similar to past years. No species were lost, and overall diversity was higher. Recreation and habitat value were both considered to have been enhanced, based on fewer impediments to sailing and swimming by lower plant growths that had expanded coverage and added species in this lake. From the data available, it can be concluded that sensitive species (i.e., those overwintering and reproducing by vegetative means) can be controlled within the drawdown zone by exposure over a period of at least a month to drying and freezing conditions. To maintain control, a successful drawdown is needed every other to every third year. However, as success is partly weather dependent, it is generally desirable to plan for annual drawdown and to abort plans when conditions have been acceptable for the previous year or when weather conditions suggest little benefit. When first using drawdown as a management technique, it may be necessary to apply it for several consecutive years, and use of drawdown for certain other purposes (e.g., protection of structures from ice damage, flood prevention) may dictate annual drawdown. The ability of drawdown to reduce overall assemblage density is largely a function of sediment features and regrowth rates. Where a coarse substrate is maintained by drawdown, plant growth is likely to be limited. Where soft sediment is abundant, drawdown-resistant plants can be expected to grow. Whether those resistant plants create nuisance conditions will be a function of which species become dominant. Long-term control of algae by drawdown depends on reduced release of nutrients from the sediment to the water column. This is only likely when the sediment in the drawdown zone is converted from nutrient-rich muck to sand or coarser substrates. This is sometimes accomplished by focusing of sediments into deeper areas, but only where the slope is adequate. There have been claims that this focusing has negative water quality impacts, but this is unlikely; oxidized sediment arriving in deep waters buries other sediment that was interacting with the water column, and the area of sediment-water interaction is largely unchanged. However, unless a major drawdown is conducted, one in which most of the lake sediment is exposed and altered, it seems unlikely that this approach will yield major algal benefits.
4.2.3 Impacts to Non-Target Organisms
4.2.3.1 Short-Term
Undesirable possible side effects of drawdown include loss or reduction of desirable plant species, facilitation of invasion by drawdown-resistant, undesirable plants, reduced attractiveness to waterfowl (considered an advantage by some), possible fish kills if oxygen demand exceeds re-aeration during a prolonged drawdown, altered littoral habitat for fish and invertebrates, mortality among hibernating reptiles and amphibians, impacts to connected wetlands, shoreline erosion during drawdown, loss of aesthetic appeal during drawdown, more frequent algal blooms after refill in some cases, reduction in water supply, impairment of recreational access during the drawdown, and downstream flow impacts (Nichols and Shaw, 1983; Cooke et al., 1993a).

Eutrophication and Aquatic Plant Management in Massachusetts
4.0 Methods to Control Aquatic Plants Page 4-17
Careful planning can often avoid at least some of these negative side effects, but managers should be aware of the potential consequences of reduced water level. Non-target species of plants that depend on vegetative means of overwintering or reproducing may indeed be reduced in abundance along with the targeted species. Resistant species, mainly those overwintering by seed, or species abundant below the drawdown zone, may become more abundant in the drawdown zone. Open substrate created through drawdown may be colonized by invasive species, although most of the problematic nuisance species are sensitive to drawdown. Drawdown for nuisance plant control is intended to cause shifts in plant assemblage composition and abundance, but not all shifts will necessarily be desirable. The impact of drawdowns on wetlands that are hydraulically connected to the lake is often a major concern of environmental agencies. Available data do not suggest major effects, positive or negative, from winter drawdowns (Van der Valk and Davis, 1980; ENSR, 2002c; 2001d). This is believed to be a result of dormancy by most plants and frozen soil conditions is some areas; wetlands are generally adapted to fluctuating water levels and fluctuations in the winter are of least concern. Hydrology is generally considered the master variable of wetland ecosystems (Carter, 1986), controlling recruitment, growth and succession of wetland species (Conner et al., 1981). It is apparent that the depth, timing, duration and frequency of water level fluctuations are important with regard to severity of impacts to adjacent wetlands (Kusler and Brooks, 1988). It is also apparent that the specific composition of a wetland plant community prior to drawdown plays a role in determining impacts. The naturally-occurring hydrologic regime is probably the single most important determinant for the establishment and maintenance of specific types of wetlands and wetland processes. Hydroperiod is the seasonal pattern of water levels in a wetland and is like a hydrologic signature of each wetland type. It is unique to each type of wetland and its constancy from year to year ensures reasonable stability for that wetland (Mitsch and Gosselink, 1986). Significant changes in hydroperiod can produce significant changes in vegetative species zonation in non-forested wetlands (Brinson et al., 1981). However, most drawdowns for lake management purposes constitute only a temporary influence on hydrologic regime, and will not necessarily have a detectable, widespread effect as evidenced in recent studies (ENSR, 2000c; 2000d). Duration and timing of the drawdown are important factors in limiting impacts to associated wetlands. Drawdown of the water level in summer, if more than a week or two in duration, leads to desiccation and stress of wetland species in most cases. In contrast, a similar drawdown practiced during late fall or early winter is expected to have little impact on dormant emergent plants, but should have a destructive effect on exposed littoral zone. Most wetland plants are very well adapted for existence during conditions of fluctuating water level. In fact, a prolonged stable water level is known to lead towards dominance by single species in emergent wetland communities; nearly pure stands of common cattail or sedges/grasses are the most common manifestations of this phenomenon (Van der Valk and Davis, 1980). Some water level fluctuation is required for elevated species diversity.
Eutrophication and Aquatic Plant Management in Massachusetts
4.0 Methods to Control Aquatic Plants Page 4-18
The nature of the wetland soils will influence wetland response to a drawdown. Generally the water table in a peat or muck soil is within one or two feet of the average ground surface (Bay, 1966). The upper layer of a peat soil has been termed the active layer, the layer in which plant roots exist and the layer with the greatest water level fluctuation (Romanov, 1968). The total porosity of the undecomposed raw peat moss horizon exceeds 95%, but the porosity of decomposed peat is only 83%. While this may not seem to be a major difference, lowering the water table in loose, porous, undecomposed peat removes 60 to 80% of the water in a given horizon, but an equal lowering in a decomposed peat removes only approximately 10% of the water (Bay, 1966). Where a substantial layer of decomposing organic matter underlies the wetland, as is expected in most wetlands associated with Massachusetts lakes, dewatering will be very slow and impacts from winter drawdown will be minimized. In the lake itself, lowering of the water level results in a temporary loss of habitat and possible impacts to fish, invertebrates and algae (Manuel, 1994). Frogs, turtles, beavers and other vertebrates may also be impacted, but there is little scientific documentation. One study of Lake Sebasticook, Maine, found that a large population of freshwater mussels largely disappeared after a lake drawdown (Samad and Stanley, 1986). After a second drawdown in the same lake the only area with live mussels was a small area near the inlet. Although the movement rate of mussels of 1 to 16 mm/min would have allowed escape as the water receded, the direction of movement of mussels was random (Samad and Stanley, 1986). Similar impacts on mollusks (clams and snails) were observed in the Lake Bomoseen drawdown in Vermont (VANR, 1990). Paterson and Fernando (1969) reported that much of the benthic fauna (mostly oligochaete worms, nematodes and chironomid fly larva) was destroyed following drawdown of the Laurel Creek Reservoir in Ontario. Drawdown has been reported to alter the movement and behavior of predatory fish such as northern pike and largemouth bass (Rogers and Bergersen, 1995), and the range of possible impacts on spawning success is wide. Muskrat houses left exposed during drawdowns may also lead to increased predation on muskrats. Likewise, exposure of beaver lodges and food caches cannot be interpreted as a benefit to the beavers. Post-refill algal blooms, lowered dissolved oxygen, poor access to spawning areas, desiccation of eggs, sedimentation impacts on eggs, and lowered food resources have all been cited as possible causes of damage to fishery resources from drawdowns (R. Hartley, L. Daley and R. Keller, MDFG, pers. comm., 1995). However, no scientific studies have been conducted in Massachusetts, and the literature for other states suggests mixed benefits and detriments (Wlosinski and Koljord, 1996). Observations by L. Daley suggest that Richmond Pond in Richmond suffered a loss of rainbow smelt and depletions of largemouth bass, brown trout and crayfish populations coincident with drawdowns in the 1970's (MDFG, pers. comm., 1995). Smelt runs were noticeably absent in both Goose Pond in Lee and Greenwater Pond in Becket following drawdowns. Drawdown could indeed have caused such effects, especially since these drawdowns have a flood control component and were held as long as possible in the spring, but scientific study to document cause and effect has been lacking.
Eutrophication and Aquatic Plant Management in Massachusetts
4.0 Methods to Control Aquatic Plants Page 4-19
It is certainly possible to cause negative impacts to lake fauna through drawdown if the program is not carefully planned and implemented, and it is true that some impacts may occur even with the best of planning, given the dependency of the technique on weather conditions. The timing of the drawdown and refill is critical to the ability of fish to spawn successfully, but cannot be tightly controlled in most cases. Loss of fish through unscreened outlets is possible, and the MDFG recommends half-inch grates at the outflow during drawdowns to minimize fish escape. Minimally mobile invertebrates such as molluscs would seem to be susceptible to drawdowns initiated while they are in shallow water. However, many invertebrates (particularly snails) move offshore for the winter (Jokinen, 1992), limiting impacts if drawdown is delayed. There are few scientific studies that document impacts from later drawdowns, so it is essential to consider each aspect of the ecology of the targeted lake when planning a drawdown. There may be impacts downstream as a result of increased flows during drawdown, but a properly conducted drawdown should not involve flows outside the normal range for the stream channel. Of greater concern are reduced spring flows during refill, although a properly conducted drawdown should allow for continued downstream flow during refill. Changes in streamflow can have an impact on fish populations as different species habitats are dictated by depth, current velocity and area, as well as stability of flow (Bain et al., 1988; Lewis, 1969). Obviously, a lack of flow during spring could be very detrimental. Impairment of water supply during a drawdown is a primary concern. Processing or cooling water intakes may be exposed, reducing or eliminating intake capacity. The water level in wells with hydraulic connections to the lake will decline, with the potential for reduced yield, altered water quality and pumping difficulties. Drawdowns of Cedar Lake and Forge Pond in Massachusetts in the late 1980s resulted in impairment of well water supplies (K. Wagner, ENSR, pers. obs.1987-1989), but there is little mention of impairment of well production in the reviewed literature. Recreational facilities and pursuits may be adversely impacted during a drawdown. Swimming areas will shrink and beach areas will enlarge during a drawdown. Boating may be restricted both by available lake area and by access to the lake. Winter drawdown will avoid most of these disadvantages, although lack of control over winter water levels can make ice conditions unsafe for fishing or skating. Additionally, outlet structures, docks and retaining walls may be subject to damage from freeze/thaw processes during overwinter drawdowns, if the water level is not lowered beyond all contact with structures.
4.2.3.2 Long-Term
Although there have been claims of devastating effects following a single drawdown (e.g., VANR, 1990), aquatic biota tend to be very resilient and impacts from any one drawdown are usually only temporary (Wlosinski and Koljord, 1996). Even complete loss of a year class of fish or elimination of molluscs from part of a lake will have little impact on overall lake ecology on a one-time basis. However, repetition of such impacts on an annual basis could alter biological communities in an undesirable and more prolonged manner, and for drawdown to be effective, it must be applied on a repetitive basis. Short-term impacts may therefore result in long-term impacts if drawdown is conducted on an annual or regular basis.
Eutrophication and Aquatic Plant Management in Massachusetts
4.0 Methods to Control Aquatic Plants Page 4-20
Fish populations can suffer from a loss of plant cover, changes in plant species composition, a loss of invertebrate food sources, and by a loss of annual recruitment if the timing of the drawdown overlaps and impacts spawning. Non-target organisms from the lake, downstream and adjacent wetlands could be impacted if there is difficulty refilling the lake in the spring (Haynes, 1990; Cooke et al., 1993a). Impacts may be highly system-specific, necessitating evaluation of possible impacts during the planning stage and follow-up monitoring to document any impacts. Very few studies have been conducted over an extended period of time on lakes in Massachusetts that have experienced drawdown over multiple years. Three years of post-drawdown evaluation of Indian Lake in Becket, coupled with three years of pre-drawdown assessment (ENSR, 2002c) is the best available example of an extended study, but it does not cover all possible impacts. The ability of drawdown to control certain nuisance species in the drawdown zone has been well documented through multiple studies at individual lakes (e.g., Onota Lake in Pittsfield, Lake Lashaway in Brookfield). However, avoidance or prevention of impacts to non-target species has not been documented in a scientific fashion. Lakes such as Richmond Pond in Richmond and Otis Reservoir in Tolland have thriving fish, reptile, amphibian, avian and mammal communities, based on observations included in the D/F studies for these lakes (BEC, 1990a; ENSR, 2001c) but it cannot be definitively stated that there have been no negative impacts to the fauna from drawdown. The overall effect of drawdown appears positive in many cases, but negative impacts to specific components of system biology are plausible and probable. In summary, there are a variety of possible negative consequences of drawdown for non-target species. Potential adverse impacts of an individual drawdown may not be manifest or may be temporary, yet repetitive application of drawdown could induce long-term impacts if temporary impacts are caused repeatedly. Therefore, drawdown should be preceded by an evaluation of possible impacts. If drawdown appears feasible under regulatory constraints, an appropriate monitoring plan should be developed that will signal adverse impacts if they occur and facilitate mitigative action. Assumption of impacts without a system-specific evaluation is unjustified, but prevention of unacceptable impacts is likely to require careful planning, implementation and monitoring, and may be difficult in some situations.
4.2.4 Impacts to Water Quality
4.2.4.1 Short-Term
Drawdown may affect water quality, particularly the parameters of clarity and dissolved oxygen concentration. Clarity will be a function of algal production and suspension of non-living particles. Algal production is most often related to phosphorus availability. By oxidizing exposed sediments, later release of phosphorus may be reduced through binding under oxic conditions, although post-drawdown algal blooms suggest that this mechanism may not be effective for all lakes. Decomposition during drawdown could make nutrients more available for release, but this is not a routinely observed phenomenon (Cooke et al., 1993a). It is likely that binding of iron and phosphorus influences phosphorus availability after drawdown, and the interplay between oxygen and levels of iron, sulfur and phosphorus is likely to vary among aquatic systems, resulting in variable nutrient availability. Calcium may also play a role in variable phosphorus availability in Berkshire lakes. Furthermore, the degree of flushing in the
Eutrophication and Aquatic Plant Management in Massachusetts
4.0 Methods to Control Aquatic Plants Page 4-21
spring may be an important variable; lakes that require most of the spring flow to refill after drawdown have a higher probability of experiencing an increase in nutrient levels than those that flush once or more after spring refill. Turbidity induced by sediment resuspension is likely during refill at rapid rates, but in many lakes the rise in water level is not fast enough to resuspend sediments by itself. Wind action in shallow waters (previously exposed areas) could promote increased short-term turbidity, if sediments are not consolidated after drawdown. Compaction of sediment during drawdown varies with sediment type and dewatering potential, but any resulting compaction tends to last after refilling, reducing resuspension potential and post-drawdown turbidity (Kadlec, 1962; Bay, 1966; Cooke et al., 1993a). Interaction between unexposed sediments and the lesser volume of water in the lake during drawdown can lead to depressed oxygen levels if oxygen demand exceeds aeration and sources of inflow are slight (Cooke et al., 1993a; WDNR, 1989). Under ice, this can lead to fish kills, but such occurrences appear rare in Massachusetts, based on fish kill reports on file with the MDFG. Decreased detention time in response to lower lake volume and colder water temperatures may be countering the potentially elevated impact of sediment oxygen demand on a smaller lake volume.
4.2.4.2 Long-Term
Impacts to water quality are likely to be temporary, unless drawdown causes an actual change in sediment features. Drawdown may consolidate sediments or cause fine sediment to move into deeper water, thereby reducing turbidity in response to wind action (Cooke et al., 1993a). Such sediment changes may also reduce internal recycling, as flux is related to the area of nutrient-rich sediment interacting with the overlying water column. To achieve such benefits, however, a large portion of the lake area must be exposed, and this may lead to detrimental impacts that are likely to limit the application of drawdown. However, detailed studies of long-term water quality changes that might be linked to drawdown of lakes in Massachusetts have not been conducted.
4.2.5 Applicability to Saltwater Ponds Drawdown is generally not applicable to saltwater ponds due to the low elevation relative to the ocean and the need to use pumps to remove water from the pond. Shellfish may be destroyed in a saltwater pond drawdown.
4.2.6 Implementation Guidance
4.2.6.1 Key Data Requirements
The listing of key considerations provided in Table 4-3 indicates the extensive data needs for proper implementation of this technique. Maps should be produced to show the areas affected and the present distribution of aquatic macrophytes. Expected ice depth should also be considered when determining the volume of water in the lake during drawdown. Biological surveys will undoubtedly be needed where non-target populations are perceived to be at risk from drawdown. Drawdown should not be conducted unless there is sufficient inflow to fill the
Eutrophication and Aquatic Plant Management in Massachusetts
4.0 Methods to Control Aquatic Plants Page 4-22
lake by early spring, necessitating a thorough hydrologic evaluation. Correct identification of plant species is essential, as some species are reduced by lake drawdown, while others are unaffected or can increase. A carefully crafted monitoring program is critical to overall project success.
4.2.6.2 Factors that Favor this Approach
The following considerations are indicative of appropriate application of drawdown for the control of plants in lakes: 1. The lake periphery is dominated by undesirable species that are susceptible to drying and
freezing. 2. Drawdown can be achieved by gravity outflow via an existing outlet structure, or such a
structure can be established for a reasonable cost. 3. Drawdown can reach a depth that impacts enough of the targeted plants to detectably
improve recreation (e.g., allow more access, increase safety) and enhance habitat (provide nearshore open water, reduce density of invasive species of limited habitat value).
4. Areas to be exposed have sediments and slopes that facilitate proper draining and freezing. 5. Drawdown and refill can be accomplished within a few weeks under typical flow conditions
and without causing downstream flows outside the natural range. 6. Drawdown can be timed to avoid key migration and spawning periods for non-target
organisms. 7. Populations of molluscs or other nearshore-dwelling organisms of limited mobility are not
significant. 8. The lake is not used for water supply, and nearby wells are deep. 9. Flood storage capacity generated by drawdown prevents downstream flood impacts.
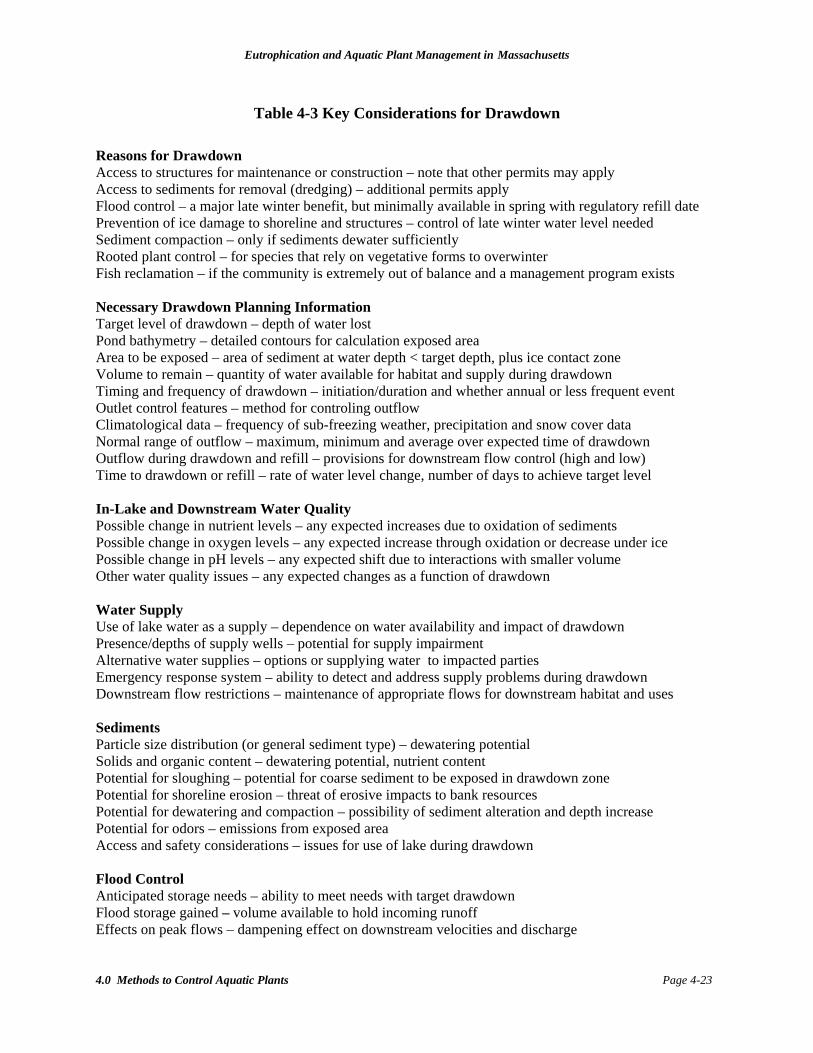
Eutrophication and Aquatic Plant Management in Massachusetts
4.0 Methods to Control Aquatic Plants Page 4-23
Table 4-3 Key Considerations for Drawdown Reasons for Drawdown Access to structures for maintenance or construction – note that other permits may apply Access to sediments for removal (dredging) – additional permits apply Flood control – a major late winter benefit, but minimally available in spring with regulatory refill date Prevention of ice damage to shoreline and structures – control of late winter water level needed Sediment compaction – only if sediments dewater sufficiently Rooted plant control – for species that rely on vegetative forms to overwinter Fish reclamation – if the community is extremely out of balance and a management program exists Necessary Drawdown Planning Information Target level of drawdown – depth of water lost Pond bathymetry – detailed contours for calculation exposed area Area to be exposed – area of sediment at water depth < target depth, plus ice contact zone Volume to remain – quantity of water available for habitat and supply during drawdown Timing and frequency of drawdown – initiation/duration and whether annual or less frequent event Outlet control features – method for controling outflow Climatological data – frequency of sub-freezing weather, precipitation and snow cover data Normal range of outflow – maximum, minimum and average over expected time of drawdown Outflow during drawdown and refill – provisions for downstream flow control (high and low) Time to drawdown or refill – rate of water level change, number of days to achieve target level In-Lake and Downstream Water Quality Possible change in nutrient levels – any expected increases due to oxidation of sediments Possible change in oxygen levels – any expected increase through oxidation or decrease under ice Possible change in pH levels – any expected shift due to interactions with smaller volume Other water quality issues – any expected changes as a function of drawdown Water Supply Use of lake water as a supply – dependence on water availability and impact of drawdown Presence/depths of supply wells – potential for supply impairment Alternative water supplies – options or supplying water to impacted parties Emergency response system – ability to detect and address supply problems during drawdown Downstream flow restrictions – maintenance of appropriate flows for downstream habitat and uses Sediments Particle size distribution (or general sediment type) – dewatering potential Solids and organic content – dewatering potential, nutrient content Potential for sloughing – potential for coarse sediment to be exposed in drawdown zone Potential for shoreline erosion – threat of erosive impacts to bank resources Potential for dewatering and compaction – possibility of sediment alteration and depth increase Potential for odors – emissions from exposed area Access and safety considerations – issues for use of lake during drawdown Flood Control Anticipated storage needs – ability to meet needs with target drawdown Flood storage gained – volume available to hold incoming runoff Effects on peak flows – dampening effect on downstream velocities and discharge
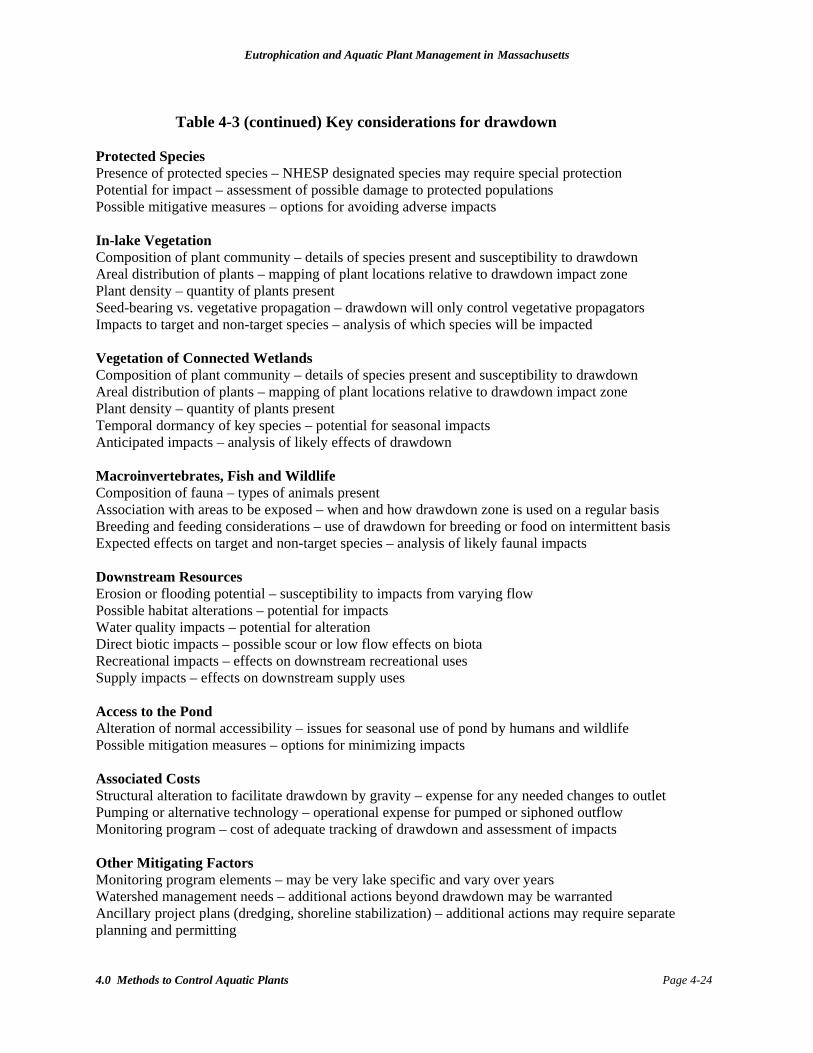
Eutrophication and Aquatic Plant Management in Massachusetts
4.0 Methods to Control Aquatic Plants Page 4-24
Table 4-3 (continued) Key considerations for drawdown Protected Species Presence of protected species – NHESP designated species may require special protection Potential for impact – assessment of possible damage to protected populations Possible mitigative measures – options for avoiding adverse impacts In-lake Vegetation Composition of plant community – details of species present and susceptibility to drawdown Areal distribution of plants – mapping of plant locations relative to drawdown impact zone Plant density – quantity of plants present Seed-bearing vs. vegetative propagation – drawdown will only control vegetative propagators Impacts to target and non-target species – analysis of which species will be impacted Vegetation of Connected Wetlands Composition of plant community – details of species present and susceptibility to drawdown Areal distribution of plants – mapping of plant locations relative to drawdown impact zone Plant density – quantity of plants present Temporal dormancy of key species – potential for seasonal impacts Anticipated impacts – analysis of likely effects of drawdown Macroinvertebrates, Fish and Wildlife Composition of fauna – types of animals present Association with areas to be exposed – when and how drawdown zone is used on a regular basis Breeding and feeding considerations – use of drawdown for breeding or food on intermittent basis Expected effects on target and non-target species – analysis of likely faunal impacts Downstream Resources Erosion or flooding potential – susceptibility to impacts from varying flow Possible habitat alterations – potential for impacts Water quality impacts – potential for alteration Direct biotic impacts – possible scour or low flow effects on biota Recreational impacts – effects on downstream recreational uses Supply impacts – effects on downstream supply uses Access to the Pond Alteration of normal accessibility – issues for seasonal use of pond by humans and wildlife Possible mitigation measures – options for minimizing impacts Associated Costs Structural alteration to facilitate drawdown by gravity – expense for any needed changes to outlet Pumping or alternative technology – operational expense for pumped or siphoned outflow Monitoring program – cost of adequate tracking of drawdown and assessment of impacts Other Mitigating Factors Monitoring program elements – may be very lake specific and vary over years Watershed management needs – additional actions beyond drawdown may be warranted Ancillary project plans (dredging, shoreline stabilization) – additional actions may require separate planning and permitting
Eutrophication and Aquatic Plant Management in Massachusetts
4.0 Methods to Control Aquatic Plants Page 4-25
4.2.6.3 Performance Guidelines
Planning and Implementation Drawdown is a relatively simple technique, but there are many considerations that must be addressed before it can occur. Table 4-3 lists a range of issues to be addressed. Logistics of drawdown will vary somewhat from lake to lake, but the basic pattern involves increasing the outflow during the fall to a level greater than the inflow within the constraints of what the downstream system can handle. This elevated outflow is held until the target water level is reached, with a target rate of water level decline typically of no more than about 2-3 inches per day. Ideally, the drawdown process will take 2 weeks to a month. Once the target level is reached, outflow is matched to inflow to the maximum extent practical for at least one month of freezing conditions. Holding the drawdown until spring ice-out may be an option, as might refill after an inch or two of ice has formed, depending upon project goals and constraints. Refill by early April is usually desired. Refill is accomplished by restricting outflow to a level lower than inflow, but not so low as to impact downstream resources. Restricted outflow continues until full lake level is achieved, ideally several weeks to 2 months later. Water fluctuations generally are greater in man-made impoundments, thus permitting restrictions can be more relaxed for these water bodies, as biotic communities are somewhat adapted to water level variations. The relatively stable lakes (particularly natural lakes) should be more protected from unnatural drawdowns so as to protect endemic species which may be less tolerant of water level fluctuations. The MDFG has offered the following guidelines to meet fish and wildlife management goals where drawdowns have been determined to have desired benefits:
Limit drawdown to 3 ft or contact the MDFG for assistance in evaluating impacts of greater drawdown; however, exceeding this level may meet DFG guidelines if justified in the NOI or lake management plan. The DFG policy is to review drawdowns in excess of three feet.
Commence drawdown after the beginning of November. Achieve the target drawdown depth by the beginning of December. Achieve full lake level by the beginning of April. Keep outflow during drawdown below a discharge equivalent to 4 cfs per square mile of
watershed. Once the target water level is achieved, match outflow to inflow to the greatest extent possible, maintaining a stable water level.
Keep outflow during refill above a discharge equivalent to 0.5 cfs per square mile of watershed.
Monitoring and Maintenance Monitoring of lake level is required to maintain effectiveness and minimize impacts. Any potential water supply impairment needs to be monitored and addressed quickly. Additional monitoring requirements will vary with the lake, but would be expected to include a quantitative pre- and post-drawdown plant community survey and similar assessment of representative populations considered at risk from the drawdown. Certain populations of fish, aquatic benthic invertebrates (especially molluscs), reptiles, amphibians, birds and mammals (especially beaver and muskrat) may be at risk. Some water quality monitoring might also be required, most often involving summer nutrient concentrations and winter oxygen levels. There is a need for detailed
Eutrophication and Aquatic Plant Management in Massachusetts
4.0 Methods to Control Aquatic Plants Page 4-26
scientific investigation of possible drawdown impacts, and a need to develop inexpensive monitoring techniques that can signal impending impacts before they become too severe. Drinking water wells around the lake should be evaluated to predict whether drawdown will limit water supply, as this is an impact that may halt a drawdown immediately. The threat of drawdown to water supplies has restricted the depth of drawdown in many systems and eliminated drawdown as a viable option in several cases (e.g., Forge Pond in Westford, Lower Chandler Mill Pond in Duxbury and Pembroke). Very shallow wells that may go dry should be replaced by deeper wells for health reasons, but there is little regulatory impetus to force such changes at the homeowner’s expense. Slightly deeper wells will not go dry, but may have reduced production capacity as a function of a shorter water column in the well. If the well pump is sized for the original water depth, it may pump the well to the point at which the water level drops below the intake depth, causing an interruption of service until the water level in the well recovers. If the residence has a large enough storage tank, no supply limitation may be felt. However, where the residence is served by a small tank or no tank at all, elevated or even normal water use may result in a temporary water shortage. Provisions for water supply will be necessary in such cases, if drawdown is to be applied. Maintenance needs are variable and generally limited for this technique. Dams (including berms, concrete walls and outlet structures) should be kept in good repair (see Office of Dam Safety regulations). Any areas of shoreline erosion should be stabilized. Mitigation Mitigation measures to minimize undesirable environmental impact from this method focus on maintaining the water level in non-target areas where feasible and adjusting the timing and duration of drawdown to minimize impacts on sensitive organisms. Water level can be maintained in inlet streams and along emergent wetland interfaces with temporary dams (e.g., sandbags, jersey barriers) if necessary, but blocking access by fish and wildlife may be an issue in such cases. Starting and ending the drawdown at times that minimize interference with migration and spawning activities is desirable, but not all biota will move or mate at the same time, creating possible conflicts. The MDFG suggests that many impacts can be lessened by controlling the timing and rate of drawdown and refill to permit spawning, or staggering drawdowns every other year or more to lessen impacts on fish recruitment. Restricting drawdown to late fall and winter will minimize impacts to many species. Maintenance of an adequate pool with sufficient oxygen will be critical to successful overwintering by most organisms. Water can be provided to anyone whose well is impaired during the drawdown, but ultimately a deeper well will be needed if drawdown is to be applied repeatedly.
4.2.7 Regulations
4.2.7.1 Applicable Statutes
In addition to the standard check for site restrictions or endangered species (Appendix II.), a Notice of Intent must be sent to the Conservation Commission with a copy to the Department of Environmental Protection Regional Office. If the proposed project occurs within an Estimated Habitat of Rare Wildlife in the most recent version of the Natural Heritage Atlas, a copy of the Notice of Intent must be submitted to the Natural Heritage and Endangered Species Program
Eutrophication and Aquatic Plant Management in Massachusetts
4.0 Methods to Control Aquatic Plants Page 4-27
(NHESP) within the MDFG for review (Appendix II). If the proposed project occurs within a Priority Habitat of Rare Species in the most recent version of the Natural Heritage Atlas, the project proponent must submit project plans to the NHESP for an impact determination. An Order of Conditions must be obtained prior to work. The Department of Environmental Protection has issued a document (DEP, 2004) entitled “Guidance for Aquatic Plant Management in Lakes and Ponds as it relates to the Wetlands Protection Act” (Policy/SOP/Guideline# BRP/DWM/WW/GO4-1, effective April 8, 2004). This document provides guidance on preparation and review of Notices of Intent and includes information about projects subject to Wetlands Protection Act regulations, a description of limited projects and estimated habitats of rare wildlife. In addition it provides:
Information required to evaluate impacts for all projects Additional information required for draw down projects Additional information required for herbicide/algaecide projects Additional information required for harvesting projects Additional information required for dredging projects Managing pioneer infestations of invasive plants Other related permits/licenses/certifications
Appendices provide sample conditions that conservation commissions can use in approving projects subject to the Wetlands Protection Act, guidance for complying with a wildlife habitat evaluation, and protocols for application of the herbicide 2,4-D to lakes and ponds. For further information on all permits see Appendix II.
4.2.7.2 Impacts Specific to Wetlands Protection Act
The following overall impact classification is offered as a generalization of impacts, with clarifying notes and caveats as warranted: 1. Protection of public and private water supply – Potential detriment (if adequate water for
supply is not maintained), but can be neutral in some cases with proper management. 2. Protection of groundwater supply – Potential detriment (if lowered lake level lowers
groundwater), but can be neutral (if adequate groundwater level is maintained or there is no significant interaction).
3. Flood control – Benefit (flood storage potential increased). 4. Storm damage prevention – Benefit (flood storage potential increased), but possible
detriment as exposed areas may be subject to potentially damaging storm impacts. 5. Prevention of pollution – May provide benefit (water quality enhancement) or detriment
(water quality deterioration), but impacts generally limited. 6. Protection of land containing shellfish – Detriment (shellfish potentially exposed), but
impacts may be neutral in some cases, and shellfish habitat may be improved overall. 7. Protection of fisheries - Potential detriment by temporary habitat loss, potential benefit by
habitat improvement (may have benefit and detriment to different species in same lake from same drawdown). Possible detriment to downstream fisheries from high or low flows.
8. Protection of wildlife habitat - Potential detriment by temporary habitat loss, potential benefit by habitat improvement (may have benefit and detriment to different species in same lake from same drawdown).
Eutrophication and Aquatic Plant Management in Massachusetts
4.0 Methods to Control Aquatic Plants Page 4-28
4.2.8 Costs Drawdown is a relatively inexpensive lake management technique, if the means to conduct a drawdown are present. Where an outlet structure facilitates drawdown, the cost may be as little as what is required to obtain permits, open and close the discharge structure, and monitor. If pumps are required to lower the water level, the drawdown will be more expensive. The total project cost for the restoration of Lake Lashaway was $397,600, covering mainly the construction of an outflow structure (Haynes, 1990). The cost of a new outlet structure to facilitate drawdown of Forge Pond in Westford was about $80,000, including engineering and permitting costs (Turner, Westford CC, pers. comm., 1995). It is unusual to alter a dam these days for less than $100,000, but if the structure already supports water level control, costs of $3,000 to $10,000 per year would be a reasonable expectation for permitting and monitoring. Drawdowns of the past few decades had no monitoring requirement, but Conservation Commissions, the MDEP and the MDFG are requesting pre- and post-drawdown monitoring more often now. Where protected species are present, permitting may be difficult and monitoring and mitigation costs can escalate.
4.2.9 Future Research Needs Evaluation of drawdown impacts on non-target species is a serious shortcoming in drawdown planning and permitting, and requires a major effort involving many species in multiple lakes over multiple drawdowns. A major program of study is needed at the state level. All referenced data from the MDFG on negative or positive impacts should be put in a report format and reviewed. Additional field studies should be sponsored by the Executive Office of Environmental Affairs as part of its Lake and Pond Initiative.
4.2.10 Summary Drawdown is an effective and relatively inexpensive method to control susceptible rooted plants, and many lakes in Massachusetts have been lowered annually for decades. However, it also has substantial potential to cause adverse impacts to non-target organisms. Although it may need to be implemented on an annual or biennial basis in order to maintain effectiveness, the cost is limited to permitting and monitoring expenses, provided there is an existing outflow structure in place. Where the outflow structure must be altered, siphons installed, or pumps deployed, the cost will rise but may still be tolerable. Regulatory acceptance depends on identifying and minimizing potential impacts to a wide variety of aquatic resources and uses. Drawdown can be an advantageous method for aquatic plant control where the target plants depend upon vegetative structures for reproduction and overwintering. It is not labor intensive and when performed in the winter will not interrupt most recreational lake uses or interfere with most ecological functions. Drawdown presents an opportunity for repairing docks and boat ramps, or employing other methods of lake management such as dredging or benthic barriers. The disadvantages of drawdown are linked to reduced areal coverage by water and lowered water volume. Water supply from the lake or wells may be impaired, and species that depend upon the exposed area may be affected. Changes in exposed sediment features may affect water quality after refill. Downstream resources may be impacted as well. Repeated drawdown may
Eutrophication and Aquatic Plant Management in Massachusetts
4.0 Methods to Control Aquatic Plants Page 4-29
result in the invasion of plants that are resistant to drawdowns, some of which may be nuisance species. Failure to refill the lake in time for spring spawning may affect fish populations. None of these impacts may be manifest, and various mitigative means may avoid or minimize them. However, it is difficult to predict the ecological impact to many non-target organisms, due largely to the lack of published information and site-specificity of many possible impacts. As the Wetlands Protection Act requires assurance that resources will not be significantly and adversely impacted, applicants must learn much about the targeted lake system. Monitoring can indicate impending impacts, but more scientific research is needed to answer long-standing questions about drawdown effects.
4.3 HARVESTING
4.3.1 Overview Harvesting of nuisance aquatic plants includes a suite of techniques that vary in sophistication and cost from simply hand pulling of weeds to large-scale mechanical cutting and collection of plants. Harvesting can be an effective short-term treatment to control the growth of aquatic plants. With repeated application at appropriate intervals, it can produce long-term shifts in the plant community, but it is unlikely to reduce long-term plant density substantially. Harvesting is generally used seasonally to remove vegetation that limits lake uses such as boating and swimming. A significant nutrient reduction resulting from macrophyte harvest is rare (Engel, 1990, Cooke et al., 1993a). Harvesting is occasionally used to remove algal mats from water, but this is usually a very short-term method and is not practical on a large scale (McComas, 1993). There are many variations on mechanical removal of macrophytes. Table 4-1 breaks these varied techniques into hand pulling, suction harvesting, cutting without collection, harvesting with collection, rototilling, and hydroraking. These techniques are often cited as being analogous to mowing the lawn (cutting or harvesting), weeding the garden (hand pulling), or tilling the soil (rototilling or hydroraking), and these are reasonable comparisons. Mechanical management of aquatic plants is not much different from managing terrestrial plants, except for the complications imposed by the water. Hand pulling is exactly what it sounds like; a snorkeler or diver surveys an area and selectively pulls out unwanted plants on an individual basis. This is a highly selective technique, and a labor intensive one. It is well suited to vigilant efforts to keep out invasive species that have not yet become established in the lake or area of concern. Hand pulling can also effectively address non-dominant growths of undesirable species in mixed assemblages, or small patches of plants targeted for removal. This technique is not suited to large-scale efforts, especially when the target species or assemblage occurs in dense or expansive beds. Hand pulling can be augmented by various tools, including a wide assortment of rakes, cutting tools, water jetting devices, nets and other collection devices. McComas (1993) provides an extensive and enjoyable review of options. Use of these tools transitions into the next two categories, macrophyte cutting and harvesting. Suction dredging is also used to augment hand pulling, allowing a higher rate of pulling in a targeted area, as the diver/snorkeler does not have to carry pulled plants to a disposal point.
Eutrophication and Aquatic Plant Management in Massachusetts
4.0 Methods to Control Aquatic Plants Page 4-30
Cutting is also exactly what it appears to be. A blade of some kind is applied to plants, severing the active apical meristem (location of growth) and possibly much more of the plant from the remaining rooted portion. Regrowth is expected, and in some species that regrowth is so rapid that it negates the benefits of the cutting in only a few weeks. If the plant can be cut close enough to the bottom, or repeatedly, it will sometimes die, but this is more the exception than the rule. Cutting is defined here as an operation that does not involve collecting the plants once they are cut, so impacts to dissolved oxygen and nutrient release are possible in large-scale cutting operations. The most high technology cutting technique involves the use of mechanized barges normally associated with harvesting operations, in which plants are normally collected for out-of-lake disposal. In its use as a cutting technology, the “harvester” cuts the plants but does not collect them. A modification in this technique employs a grinding apparatus that ensures that viable plant fragments are minimized after processing. There is a distinct potential for dissolved oxygen impacts and nutrient release as the plant biomass decays, much like what would be expected from many herbicide treatments. Harvesting may involve collection in nets or small boats towed by the person collecting the weeds, or can employ smaller boat-mounted cutting tools that haul the cut biomass into the boat for eventual disposal on land. It can also be accomplished with larger, commercial machines with numerous blades, a conveyor system, and a substantial storage area for cut plants. Offloading accessories are available, allowing easy transfer of weeds from the harvester to trucks that haul the weeds to a composting area. Choice of equipment is really a question of scale, with most larger harvesting operations employing commercially manufactured machines built to specifications suited to the job. Some lake associations choose to purchase and operate harvesters, while others prefer to contract harvesting services to a firm that specializes in lake management efforts. Cutting rates for commercial harvesters tend to range from about 0.2 to 0.6 acres per hour, depending on machine size and operator ability, but the range of possible rates is larger. Even at the highest conceivable rate, harvesting is a slow process that may leave some lake users dissatisfied with progress in controlling aquatic plants. Weed disposal is not usually a problem, in part because lakeshore residents and farmers often will use the weeds as mulch and fertilizer. Also, since aquatic plants are more than 90 percent water, their dry bulk is comparatively small. Key issues in choosing a harvester include depth of operation, volume and weight of plants that can be stored, reliability and ease of maintenance, along with a host of details regarding the hydraulic system and other mechanical design features. Rototilling (or rotovation) and the use of cultivation equipment are highly disruptive procedures with a limited track record (Newroth and Soar, 1986). A rototiller is a barge-like machine with a hydraulically operated tillage device that can be lowered to depths of 10 to 12 feet for the purpose of tearing up roots. Also, if the water level in the lake can be drawn down, cultivation equipment pulled behind tractors on firm sediments can achieve 90 percent root removal. Potential impacts to non-target organisms and water quality are substantial, but where severe weed infestations exist, this technique could be appropriate.
Eutrophication and Aquatic Plant Management in Massachusetts
4.0 Methods to Control Aquatic Plants Page 4-31
Hydroraking involves the equivalent of a floating backhoe, usually outfitted with a york rake that looks like certain farm implements for tilling or moving silage. The tines of the rake attachment are moved through the sediment, ripping out thick root masses and associated sediment and debris. A hydrorake can be a very effective tool for removing submerged stumps, water lily root masses, or floating islands. Use of a hydrorake is not a delicate operation, however, and will create substantial turbidity and plant fragments. Hydroraking in combination with a harvester can remove most forms of vegetation encountered in lakes.
4.3.2 Effectiveness
4.3.2.1 Effectiveness of Hand Harvesting
Hand pulling of localized populations can be extremely effective in removing small populations of nuisance plants provided the plant fragments are removed from the water. This method is impractical for application to most large areas, although it may be feasible for swimming areas and boat channels (Nicholson, 1981). Experiments conducted at Chautauqua Lake in New York showed that one year after manual harvesting, milfoil biomass was 29% lower than biomass levels prior to harvest in plots where milfoil only was removed. In plots where all plants were removed, milfoil biomass was 25% less than pretreatment levels one year after treatment (Nicholson, 1981). For newly arriving invasive species, where just a few plants are established, pulling those plants by hand can be an effective approach with minimal impact to any non-target organisms. Repetition of this approach is likely to be needed, as not all targeted plants may be found during the initial effort, and regrowth from incompletely harvested plants (if roots are left behind) or plants that drop seeds is to be expected. Also, reinfestation is always a possibility, so this approach becomes part of a monitoring and maintenance program. Annual hand harvesting of water chestnut in Morses Pond in Wellesley has kept that species from becoming established in that lake. It appears to be brought in periodically by waterfowl, but has never been allowed to achieve a significant density through the hand harvesting effort. Hand harvesting records for Eurasian watermilfoil in Lake George in New York for 1989-91 (DFWI 1991), as part of a program to detect and eliminate new areas of growth, reveal the following: 1. First time harvest averaged 90 plants per person-hour 2. Second time harvest (re-visit of harvested sites the next year) averaged 41 plants per person-
hour 3. Except for one site that experienced substantial regrowth, the year after initial harvest
regrowth was 20-40% of the initial density 4. Regrowth two years after initial harvest averaged <10% of the initial density 5. Although plant density and total harvesting effort declines with successive harvesting, effort
declines more slowly; harvest time per plant therefore increases with decreasing density, mainly as a function of search time.
6. Actual harvesting effort directed at 12 sites was 169 hours for first time harvest and 90 hours for second time harvest
Eutrophication and Aquatic Plant Management in Massachusetts
4.0 Methods to Control Aquatic Plants Page 4-32
As the density or coverage of a target species increases, hand harvesting becomes more difficult to perform effectively or without impacts on other species. Efforts to hand harvest milfoil at densities of more than a few hundred plants per acre were abandoned at Lake George (Eichler, RPI, pers. comm., 1996). A 2002 effort to hand harvest Eurasian watermilfoil and curly leaf pondweed in just two one-acre parcels in Dudley Pond resulted in the removal of about 6 tons of plants, but many plants of these species were left behind (K. Wagner, ENSR, pers. obs., 2002). Turbidity generated during the pulling made it difficult to achieve a thorough harvest of these dense growths. Certainly conditions were improved by the effort, but substantial regrowth occurred within the season. Martin (Cedar Eden, pers. comm., 2002) reports success at reducing Eurasian watermilfoil density in parts of Saranac Lake by hand harvesting, but the distribution of milfoil in the lake is expanding in the absence of a focused effort to detect and eliminate new infestations. In addition to addressing early invasions by nuisance plants, hand harvesting is well suited as a follow-up technique after initial control is achieved by other means (e.g., dredging, chemical treatment). Hand harvesting has been used to follow up the mechanical harvesting of water chestnut in the Charles River Lakes District. Some areas of South Lake Champlain in Vermont and New York that were repetitively mechanically harvested for 3 to 4 years in the 1970s and 1980s are now kept free of water chestnut through limited hand pulling operations (Smith, ACT, pers. comm., 1997). Hand harvesting has also been successful at minimizing regrowth of Eurasian watermilfoil in Snyder Lake in New York after treatment with fluridone several years ago (S. Kishbaugh and J. Sutherland, NYSDEC, pers. comm., 2002). Where a snorkeler or diver can cruise an area and pull out the occasional nuisance plant, hand harvesting has minimized the need for other control techniques. However, where growths are already dense, this is not a very efficient approach, and would appear to be less effective than most alternatives.
4.3.2.2 Effectiveness of Suction Harvesting
Suction harvesting, or suction dredging, can allow faster hand harvest by providing a conveyance system for plants pulled by divers. It can also remove plants directly, with the aiming help of a diver, and may remove substantial amounts of sediments as well. Effectiveness is largely a matter of operator skill, and more skillful operation tends to be slower. Suction harvesting can extend the utility of hand harvesting to more dense assemblages, but cannot cover as large an area per unit time. Recent application on a test basis at Dudley Pond was viewed favorably (Madnick, DPA, pers. comm., 2002), but did result in many free-floating fragments and the suspension of significant amounts of sediment (J. Straub, DEM, pers. comm., 2002; M. Mattson, MDEP, pers. comm., 2002). Effectiveness is also dependent upon the collection system; fine enough mesh to capture all plant fragments is essential to a highly effective operation, but seeds are unlikely to be captured by any suction harvesting system. Suction harvesting can decrease biomass over time. Data were collected from suction harvesting one year, followed by hand harvesting the following year at seven sites on Lake George, New York. The study compared the weight of milfoil removed, the number of days needed to harvest the site and the biomass and percent cover data from the two harvests. Significant decreases were observed in each of the parameters measured and only minimal effort was required for hand pulling the following year (Eichler et al., 1993). The results of this study show that suction

Eutrophication and Aquatic Plant Management in Massachusetts
4.0 Methods to Control Aquatic Plants Page 4-33
harvesting is effective in reducing biomass over time. Although populations are not eliminated, the decline is significant and subject to yearly upkeep that is less intense than the initial harvest.
4.3.2.3 Effectiveness of Mechanical Cutting and Harvesting
Most mechanical plant removal operations are successful in producing at least temporary relief from nuisance plants and in removing organic matter and nutrients without the addition of a potentially deleterious substance. Plant regrowth can be very rapid (days or weeks), especially for Eurasian watermilfoil. Harvesting may reduce plant diversity in some cases, and resultant open areas are candidates for colonization by invasive species, but most potential problems can be avoided by proper program planning. Mechanically aided hand cutting of plants, usually without very effective collection of cuttings, is the simplest form of mechanical harvesting. In Leverett Pond, Leverett, MA, harvesting with a scythe suspended from a boat has been used to control of water lilies. It must be repeated several times per season and the work is highly labor intensive, suitable only to clear stems and foliage on a temporary basis in small areas (M. Mulholland, LPA, pers. comm., 1995). A long-term manual control method for Typha is to cut the part of the plant that is above the ice in winter (this is sometimes combined with a partial drawdown). In the spring when water levels generally rise, the shoots are submerged, preventing the transport of oxygen to the roots. The drowning may result in the death of the plant and has been shown to be effective for more than one year (McComas, 1993). A variety of cutters, rakes and other hand-held devices are reviewed by McComas (1993), who finds this approach suitable for small areas by physically fit practitioners. Larger, boat mounted harvesters occupy the transition between hand cutters and commercial harvesters. Not many data are available regarding effectiveness, but some level intermediate to hand and commercial techniques is expected. Collection, if attempted, is generally inefficient and will greatly slow the process. Simply cutting the plants and leaving them in the lake will speed up the cutting process over hand held devices. Use of commercial harvesters has a well-documented track record and is generally effective where applied, but usually only on a short-term basis. A bay of LaDue Reservoir (Geauga County, Ohio) was harvested in July 1982 by the traditional method in which the operator treats the weed bed like a residential lawn and simply mows the area. Stumps of Eurasian watermilfoil plants about 0.5 to 3 inches in height were left, and complete regrowth occurred in 21 days. In contrast, the slower method of lowering the cutter blade about 1 inch into the soft lake mud produced season-long control of milfoil by tearing out roots (Conyers and Cooke, 1983). However, this cutting technique is of little value where sediments are very stiff or in deeper water where the length of the cutter bar can not reach the mud. Many lakes in Massachusetts are subjected to harvesting for annual control of nuisance vegetation each summer. Many lake associations are actively seeking alternatives, suggesting that the long-term success of this technique is not favorable. However, it is a viable maintenance technique that provides open water over many acres that would otherwise have very limited recreational value.
Eutrophication and Aquatic Plant Management in Massachusetts
4.0 Methods to Control Aquatic Plants Page 4-34
There is evidence of a carry-over effect (less growth in the subsequent year), especially if an area has had multiple harvests in one season, but the effect is not known to last more than two growing seasons and may not be dramatic (Thayer and Ramey, 1986). Decreased milfoil density and increased abundance of stonewort and pondweeds has been noticed in Lake Buel following intensive harvesting of milfoil at or below the sediment level, but harvesting is unable to keep up with lakewide milfoil growth (D. Lewis, LBRPD, pers. comm., 2001). A four-year study in Buckhorn Lake, Ontario, in which milfoil was harvested in June and September of each year, showed that although there was a reduction in biomass, shoot weight and plant density, milfoil continued to reach the water surface throughout the four year study (Painter, 1988). The effectiveness of harvesting beyond a single growing season is partly a function of the timing and frequency of harvest. If a harvest is done before carbohydrates are translocated to the roots for overwintering, or the plant is repeatedly stressed by multiple harvests in a season, there may be a significant reduction in biomass the following year (Thayer and Ramey, 1986). Another important factor is the depth of harvest. The deeper the harvest, the more effective in controlling regrowth (Livermore and Koegel, 1979). Some harvesters can operate in contact with bottom sediments and harvest at the root crown level, which has been successful in the control of Myriophyllum spicatum for more than one season (Cooke et al., 1993a). Long-term effectiveness of harvesting is also a function of plant sensitivity, which is largely a consequence of reproductive mode. Timely harvesting of species that depend upon seeds for annual re-establishment can eventually limit the extent of those species, but the viability of seeds placed in the sediment over years prior to harvesting can minimize impacts for several years. Extensive harvest of water chestnut in impounded sections of the Charles River in Boston in 1996 had no observable effect on 1997 growths of that plant. Harvesting was repeated in 1997, and growths in 1998 were much reduced. Follow-up harvesting has been applied on a maintenance basis to progressively smaller areas as control has been achieved (G. Smith, ACT, pers. comm., 2001). Nicholson (1981) has suggested that harvesting was actually responsible for spreading milfoil in Chautauqua Lake, New York, because the harvester spread fragments of plants from which new growths could begin. At Lake Mamanasco in Ridgefield, CT, a program of repetitive harvesting over a five to eight year period was successful in providing long-term control of seed reproducing naiad (Najas sp.) and several pondweeds (Potamogeton spp.), but Eurasian watermilfoil became established over a subsequent two-year period (G. Smith, per. comm., 2000). A report from British Columbia states that harvesting appeared to stimulate the growth of milfoil (Nichols, 1991). Yet where milfoil has become the dominant plant, there seems to be little harm in harvesting to maintain open water. Mechanical harvesting is generally not a very selective technique at the time of cutting, although regrowth by surviving species may be variable, leading to changed dominance within the plant assemblage. Limited selectivity is possible, however, where the operator is skillful. In cases where the target species has a tall growth form, the cutter can be raised to select taller plants, while leaving behind the shorter, non-target plants. Harvesting can be intensified in areas with dense populations of target species, while avoiding areas of more desirable assemblage composition. At that point, boat propellers typically produce so many plant fragments that it is a
Eutrophication and Aquatic Plant Management in Massachusetts
4.0 Methods to Control Aquatic Plants Page 4-35
moot point and the plant already occupies most areas of potential growth. In these cases, harvesting will not significantly increase the spread of the plant. Commercial harvesting, with collection and removal of the plant biomass, can remove many tons of plant biomass in a season, but has not proven to have a major effect on nutrient levels. Nutrient content is very low in most plants, and most of the biomass is actually water. Theoretically, if nutrient inputs are moderate and weed density is high, a significant portion of net annual phosphorus loading could be removed with intense harvesting. However, as most of the nutrients in the plants came from the sediment and would return to the sediment, it is not clear that this will have any major effect on water column concentrations, algal growth or water clarity. The direct removal of phosphorus that results from harvesting macrophytes, particularly milfoil, suggests that harvesting can reduce the availability of nutrients needed for algal production in some cases (Loucks and Weiler, 1979; Olem and Flock, 1990), but these appear to be rare. Sediment reserves of nutrients are too high in most cases to be exhausted by harvesting, and represent only a small portion of annual loading to the water column.
4.3.2.4 Effectiveness of Rotovating
Derooting can be an effective method for the short-term control of Eurasian watermilfoil due to the buoyancy of its root crown. The degree of effectiveness is often dependent on the type of substrate. Silt and clays do not allow the roots to become as easily dislodged as sand or gravel. Some other factors that can determine the effectiveness of rotovating are the condition of the equipment and operator expertise, physical conditions of the treatment site (rocks, slope), pretreatment plant densities, closeness of viable, untreated milfoil populations and the frequency of rotovating (Cooke et al., 1993a; Gibbons and Gibbons, 1988). This technique has not been applied in Massachusetts or frequently anywhere, so data on effectiveness are limited. The milfoil biomass was reduced by 80-97 % in 7 lakes in British Columbia immediately after treatments from 1977 to 1985 (Cooke et al., 1993a). Although rotovating presents the risk of spreading milfoil through plant fragmentation, Gibbons and Gibbons (1988) reported second season milfoil stem counts that ranged from 25 to 70% less than counts prior to treatment, indicating a potential for control beyond the year of treatment.
4.3.2.5 Effectiveness of Hydroraking
Hydroraking is effective in the short-term in that it removes plants immediately. It is not an especially thorough or selective technique, and is therefore not well suited to submergent species that can re-root from fragments (e.g., milfoil) or mixed assemblages with desirable species present at substantial densities. It is particularly effective for water lilies (white or yellow) and other species with dense root masses. Hydroraking is also often used to remove subsurface obstructions such as stumps or logs. Hydroraking effectively controlled cattails at Chandler Pond in Boston for many years with repeated application (G. Gonyea, MDEP, pers. comm., 1996), although the City dredged the lake in the mid-1990s to restore depth and address overall excessive plant abundance. Hydroraking has removed floating islands (usually formed by water lilies) in a number of lakes, and has been used on dense water lily growths in many cases without floating islands (G. Smith, ACT, pers.
Eutrophication and Aquatic Plant Management in Massachusetts
4.0 Methods to Control Aquatic Plants Page 4-36
comm., 1996). In Lost Lake in Groton, hydroraking removed dense lily growths and stumps in one large cove near the boat ramp, and ribbon leaf pondweed (Potamogeton robbinsii, a highly desirable submergent species) became dominant afterward (K. Wagner, ENSR, pers. obs., 1988). Regrowth rates in hydroraked areas are difficult to predict, but where appropriately applied, this technique might reasonably be expected to provide 3-5 years of relief from targeted species. Growth by other plants in place of the hydroraked species is to be expected, and whether new nuisance conditions will arise is a function of which species become dominant.
4.3.3 Impacts to Non-Target Organisms Impacts to non-target organisms vary with the form of harvesting applied and the size of the area to which it is applied.
4.3.3.1 Impacts of Hand Harvesting
A great degree of selectivity can be achieved with hand harvesting, minimizing impacts to non-target plants and other organisms. Few short-term and virtually no long-term impacts on non-target species would be expected from a well-designed hand harvesting program (Nicholson, 1981). Temporary impacts might be expected from attempted hand harvesting of dense vegetation beds, mainly due to the inability to be very selective or to see what is being impacted once harvesting has begun (turbidity can be very high). As this technique is almost never applied over large and densely vegetated areas, impacts would not be extensive and no major long-term impacts are expected.
4.3.3.2 Impacts of Suction Harvesting
Possible suction harvesting impacts include the removal of non-target plant species removed with the target species, disturbance of sediment and therefore benthic organisms, and impacts to fish that may feed on or around the removed plant species. Poor timing of suction harvesting could remove fish eggs or affect spawning areas, but this technique is not expected to affect large areas in any short period of time. Eichler et al. (1993) reported that following the suction harvest of Eurasian watermilfoil, six of their seven sites had a greater number of species present than before the harvest. Their results indicate that suction harvesting promotes a more diverse plant community and would not have long-term negative impacts to non-target species.
4.3.3.3 Impacts of Mechanical Harvesting
Cutting without collection of vegetation may have impacts on water quality that might translate into impacts on non-target organisms, especially if oxygen levels are depressed through decomposition. Major impacts of this type have not been documented in the few cases where large scale cutting has been practiced (e.g., Lake Champlain in VT and several lakes in Texas). Commercial harvesting with collection of cut vegetation will generally avoid impacts from decaying plants, but may remove non-target organisms with those plants. In Halverson Lake, Wisconsin it was reported that fish and macroinvertebrates were removed during harvesting. In this case, 90% of the fish were young-of-the-year, and the fry that were lost (21,000 to 31,000 per year) were estimated to be one fourth of all fry in the lake (Engel, 1990). At Saratoga Lake,
Eutrophication and Aquatic Plant Management in Massachusetts
4.0 Methods to Control Aquatic Plants Page 4-37
New York, it was reported that an August harvest impacted 2.9% more juvenile fish than for the same area during a June harvest in 1982, while adult fish appeared to be unaffected (Mikol, 1984). It appears that timing may be critical to avoid impacts to spawning fish, but impacts to fish fry and young of the year may be unavoidable. Turtles and many invertebrates have also been observed going up the conveyor belt and into the storage hopper, but the impact on lake populations has not been quantified. Harvesting with large machines is relatively non-selective, removing all plants in its path at the depth at which cutting occurs. Removal of desirable plants may result in a spread of undesirable species into the area cleared, or may simply leave the area devoid of substantial cover for fish and wildlife until regrowth occurs. Given the portion of lake area typically impacted over any period of several weeks, loss of habitat is not likely to be a major issue in any but the smallest lakes. Habitat improvement is far more likely, especially where plant assemblages fill much of the water column. The spread of both target plants is possible if the fragments are not properly removed. Use of the harvester like a harrow in the sediment may create high turbidity and disturb benthic organisms, but as this is done mainly in dense stands of undesirable vegetation, short-term impacts may be offset by habitat improvement (although such improvement may also only be a short-term phenomenon). The desired ratio between open water habitat and dense aquatic macrophyte beds should be considered prior to harvesting operations. The long-term impacts of mechanical harvesting are difficult to predict. Impacts on plant communities have ranged from higher diversity to no change to a decrease in species (Nichols and Lathrop, 1994). In a review of studies, Cooke et al., (1993a) state that there is little evidence of significant damage to fisheries in the long-term provided that not all vegetation is removed and that harvesting avoids areas or times of spawning and egg incubation.
4.3.3.4 Impacts of Rotovation
Rotovation tends to cause a major disturbance in areas to which it is applied. The benthic fauna is impacted by the physical disturbance of the bottom sediments, removal of plants that provide habitat and the disruption and redistribution of fine sediment through resuspension and drift. Due to the lack of selectivity of derooting, non-target plant species are also removed, and invasive species that propagate from fragments may be placed at a competitive advantage. Impacts to fish can be minimized by timing the treatments to be either before spawning or after juvenile fish have left the spawning grounds (Cooke et al., 1993a), but the high turbidity induced by this technique makes it generally unsuitable for use over large areas in a lake. Following rotovation it is expected that benthic invertebrates and plants will re-colonize the treatment area from nearby untreated areas. Lakes in British Columbia have shown an immediate post-treatment response by species such as Potamogeton crispus, P. pectinatus (now Stuckenia pectinatus), Elodea canadensis and Chara sp. However, the densities of these plants have declined in the long run due to the increasing growth of milfoil (Cooke et al., 1993a). Impacts of this technique therefore also appear to be primarily short-term.
Eutrophication and Aquatic Plant Management in Massachusetts
4.0 Methods to Control Aquatic Plants Page 4-38
4.3.3.5 Impacts of Hydroraking
Hydroraking can kill and remove some benthic invertebrates during operation, and non-target plants will also be impacted in treated areas. This technique is applied on a very limited areal scale in the vast majority of cases, however, and is not expected to have a lakewide effect on non-target organisms.
4.3.4 Impacts to Water Quality
4.3.4.1 Short-Term
Most forms of harvesting can cause a temporary increase in turbidity from resuspension of detritus and organic materials. In many cases, much of the resuspended solids load rapidly settles to the bottom (Cooke et al., 1993a), but residual turbidity can be detected for days where the disturbance is widespread. Hand harvesting has limited potential for lakewide turbidity effects, and plumes have been noted from suction harvesting operations, but again lakewide effects are limited. Mechanical harvesting will dislodge fine sediment from plants as they are cut, and may stir up the bottom in shallow area or where cutting is intentionally focused on the bottom to attack root systems. The resultant turbidity may be noticeable near the site, and may have a slight effect on a larger area of the lake. Rotovation and hydroraking will greatly increase turbidity in the work area, and may have a more noticeable impact on the whole lake if the work area is not sequestered with silt curtains. Resuspension brings the potential for water quality changes in addition to turbidity, but such changes have generally been slight. A Vermont study on the Lake Bomoseen hydroraking project (Crosson, 1988) reports that small increases in total phosphorus, total suspended sediments, and turbidity decreased to pre-treatment levels within 24 hours. In addition, a post-treatment report letter to the Long Pond Property Owners in Nantucket, MA (Smith, 1994) states that monitoring of water quality (total phosphorus and turbidity) did not show any appreciable difference after hydroraking of Phragmites reeds when erosion barriers and turbidity curtains were deployed. Lakes in close proximity to industrial sources must consider the possibility of the release of toxic materials from the sediment, potentially impacting the water quality of the lake (Gibbons and Gibbons, 1988). Initial decreases in oxygen may accompany plant cutting when the biomass is left in the lake to decay, but may also occur when the biomass is removed as photosynthetic oxygen inputs by day will decline. Of particular concern is the potential oxygen demand of large plant grinding or shredding operations, whereby harvested vegetation is ripped up and dumped back into the lake to speed up the plant reduction operation and avoid removal costs and logistical difficulties. A study of water chestnut shredding in Lake Champlain (James et al., 2002) found that oxygen actually increased as a function of reduced surface canopy and increased mixing in a shallow area. However, the study also noted marked increases in nitrogen and phosphorus concentrations over a two-week period in the treatment area, compared to a control area, resulting in an algal bloom. While removal of harvested plants has not been found to cause major reductions in lake nutrient levels, leaving cut or shredded vegetation in place appears likely to cause increases in nutrient concentrations. This phenomenon relates to the utilization of sediment nutrients by most plants, with release of those nutrients to the water column through decomposition.

Eutrophication and Aquatic Plant Management in Massachusetts
4.0 Methods to Control Aquatic Plants Page 4-39
Algal blooms and algal mats have sometimes been observed after major harvesting programs, presumably as available nutrients increase and shading is reduced, and these may affect water quality. The potential exists for fuel or oil spills from engine or hydraulic systems with mechanized methods of harvesting.
4.3.4.2 Long-Term
Changes in water quality are expected to be short-term in all cases, with no lasting effects. Repeated application of the technique might alter water quality for a longer period of time, but the nature of harvesting operations as seasonal efforts on an annual basis limits impacts of this type. Repeated removal of vegetation should reduce available nutrients in the sediment, and could eventually result in lower concentrations of nutrients in the water column where sediment-water interactions are significant, but such an effect has rarely been found.
4.3.5 Applicability to Saltwater Ponds A search of the literature produced no published reports on the application of harvesting to saltwater ponds, but this suite of techniques is applicable and some methods have been applied. In one case a floating boom was used in the saltwater Little Harbor Pond in Cohasset to remove thick algal mats (G. Gonyea, MDEP, pers. comm., 1996). Phragmites harvest has been practiced in ponds on Nantucket and Martha’s Vineyard (G.Smith, ACT, pers. comm., 2001). Techniques such as rotovating, hydroraking and suction harvesting may have adverse effects on shellfish beds.
4.3.6 Implementation Guidance
4.3.6.1 Key Data Requirements
Data requirements for this management technique vary depending on the target species and type of harvesting intended. For simple manual harvesting of plants that do not spread by fragmentation, such as water lilies, a simple vegetation survey with density estimates should be sufficient. For fragmenting species, information on the distribution of that species and a plan for fragment control would be needed. For other, larger treatments, a more detailed plant survey should be conducted to identify the plant species and coverage or biomass, efficacy of control, potential for harvesting to increase the distribution by fragmentation, and likely species to become dominant over time. Commercial harvesting is not recommended for species that fragment, unless the susceptible area of the lake is already infested. Care should be taken to avoid areas of protected plant species unless the harvesting can be conducted in a manner that avoids damage to these plants. For a harvesting program aimed at a major portion of the lake plant assemblage, a management plan should be prepared and should include areas to be harvested, timing and pattern of harvest, and means to dispose of the plant material. The lake should be evaluated to determine if underwater obstructions (e.g., rocks or submerged tree stumps) could cause a problem for harvesting equipment. Information should be generated to assess effectiveness and the required frequency of harvesting to maintain benefits. In assessing the timing and pattern of harvesting operations, it is helpful to have a realistic estimate of the rate of cutting that can be achieved.
Eutrophication and Aquatic Plant Management in Massachusetts
4.0 Methods to Control Aquatic Plants Page 4-40
This rate is dependent upon vegetation density, distance to offloading points, harvester specifications, and operator experience. Consultation with other groups that have been using harvesting for multiple years is advised.
4.3.6.2 Factors that Favor this Approach
The following considerations are indicative of appropriate application of harvesting for the control of plants in lakes: 1. The target species is not well established and exists as sparse plants or as moderate growths
in only a small part of the lake (hand or suction harvesting). 2. The lake is dominated by undesirable annual species that propagate by seeds (mechanical
harvesting). 3. Overall density of macrophytes is excessive throughout the littoral zone (mechanical
harvesting). 4. Surficial and underwater obstructions in targeted areas are minimal (mechanical harvesting
or rotovating). 5. The target species has dense root masses but occupies only a small part of the lake
(hydroraking or rotovating). 6. Suspended sediments resettle quickly and leave minimal residual turbidity. 7. Convenient access for equipment and trucks and a nearby location for plant disposal are
available.
4.3.6.3 Performance Guidelines
Planning and Implementation Some of the details to be considered when selecting a harvesting technique and planning a harvesting program include the extent of the plant infestation, disposal of harvested plant materials, and accessibility for any harvesting machinery to the lake. The potential to spread the problem species by commercial harvesting, hydroraking and rotovating is very real if the species reproduces by fragmentation, but suction harvesting and manual removal could still be effective if the infestation does not include dense and expansive beds. The disposal of harvested plant material could be costly if it must be hauled any substantial distance, but its use as compost can make it attractive to farmers and gardeners (Wile et al., 1978). Mechanical harvesters and rotovators may have limited ability to function in some sites due to shallow or deep water, confined spaces, submerged rocks and other obstructions or irregularities. Harvesting may also be limited by weather conditions. Maintenance and repairs can be time consuming and costly, and reduce active harvesting time during the growing season. Careful calculation of the range of cutting rates likely to be achieved is advised, providing a realistic expectation of the amount of relief that can be gained through a harvesting program. Equipment should be inspected before it enters the lake to prevent the spread of unwanted non-native plants such as Eurasian watermilfoil. After harvesting, thoroughly clean equipment to prevent spread of vegetation to other sites. For manual harvest and suction harvesting, care should be taken to remove the complete plant and all plant fragments (Nicholson, 1981).

Eutrophication and Aquatic Plant Management in Massachusetts
4.0 Methods to Control Aquatic Plants Page 4-41
Monitoring and Maintenance To maintain the desired level of macrophyte control, harvesting often needs to be implemented more than once during a season and will be needed almost every year. Major hydroraking programs will be an exception, rarely being conducted more than once every 3-5 years in the same target area. Until a track record documenting a lack of adverse impacts is developed, it is desirable to monitor for basic water quality variables (e.g., oxygen, turbidity, nutrients) several times during the harvesting season. This will be more important during hydroraking, rotovation and suction dredging than during hand or mechanical harvesting, but nutrient monitoring appears essential if vegetation is not removed from the lake (cutting, grinding or shredding operations). Annual monitoring should focus on macrophyte surveys of species type and densities to document effectiveness and to detect any population changes. Assessment of rate of regrowth by nuisance species during a season of harvesting will help with future control planning. If especially sensitive fish, turtle or invertebrate populations are present, some documentation of losses from mechanical harvesting may be necessary to obtain permits. Mitigation Methods to mitigate any expected impacts to non-target organisms like fish, benthic fauna and beneficial plants should be considered, and costs should be evaluated over an extended timeframe (as repetitive harvest is likely to be necessary). Mitigation usually consists of planning the harvesting operation to miss key areas or times of the year when operations could impact sensitive species. A certain amount of small fish loss is to be expected, however, and is almost unavoidable. Planning the pattern of harvest to maximize benefits to human users while minimizing impacts on non-target species is highly desirable and can be a mitigative measure. The MDFG recommends that cutting without removal of plant material from the lake not be practiced during July and August to minimize impacts on oxygen levels and possible effects on fish and invertebrates. Use of silt curtains around areas of hydroraking or rotovation where excessive turbidity is expected is a possible mitigative measure, but small increases in turbidity outside the general work area are usually not a major concern.
4.3.7 Regulations
4.3.7.1 Applicable Statutes
In addition to the standard check for site restrictions or endangered species (Appendix II), a Notice of Intent must be sent to the Conservation Commission with a copy to the Department of Environmental Protection Regional Office. If the proposed project occurs within an Estimated Habitat of Rare Wildlife in the most recent version of the Natural Heritage Atlas, a copy of the Notice of Intent must be submitted to the Natural Heritage and Endangered Species Program (NHESP) within the MDFG for review (Appendix II). If the proposed project occurs within a Priority Habitat of Rare Species in the most recent version of the Natural Heritage Atlas, the project proponent must submit project plans to the NHESP for an impact determination. An Order of Conditions must be obtained prior to work. For hand harvesting, a Negative Determination of Applicability might be obtained from the Conservation Commission, but an Order of Conditions could be required.

Eutrophication and Aquatic Plant Management in Massachusetts
4.0 Methods to Control Aquatic Plants Page 4-42
Additional permit needs are highly dependent on the details of the project and the features of the lake, and to some extent, are a function of MDEP policies under review. Usually no MEPA review is required (Appendix II). Under current regulations a 401 Water Quality Certificate may be required for some types of harvesting, but this depends on ACOE policy implementation. In some cases an ACOE 404 permit and 401 Water Quality Certificate may be required for hydroraking projects (contact the Army Corps of Engineers for current policy). A Chapter 91 Permit is generally not required for harvesting in Great Ponds, provided that sediments are not removed (other than incidental amounts attached to roots of plants) or water depths altered. Hydroraking or rotovating in a Great Pond, however, may require a Chapter 91 permit by virtue of potentially major sediment disturbance; the need for this level of regulation is under discussion.
4.3.7.2 Impacts Specific to Wetlands Protection Act
The following overall impact classification is offered as a generalization of impacts, with clarifying notes and caveats as warranted: 1. Protection of public and private water supply – Generally neutral (no significant interaction),
although reduced plant density may benefit taste and odor control and minimize clogging of intakes.
2. Protection of groundwater supply – Generally neutral (no significant interaction). 3. Flood control – Generally neutral (no significant interaction). 4. Storm damage prevention – Generally neutral (no significant interaction). 5. Prevention of pollution – Generally neutral (no significant interaction), but could be a
detriment if sediment disruption and resultant turbidity are high, or if cut vegetation is left in the lake to decay.
6. Protection of land containing shellfish – Generally neutral (no significant interaction) for hand pulling, suction harvesting and mechanical harvesting, but could be a detriment where hydroraking or rotovation are applied to areas containing shellfish.
7. Protection of fisheries – Detriment from mechanical harvesting (direct fish removal), but with potential benefit by habitat improvement (may have benefit and detriment to different species in same lake from same harvesting effort). Other methods of harvesting are generally beneficial (habitat improvement) or neutral (no significant interaction).
8. Protection of wildlife habitat - Potential benefit by habitat improvement, but may have benefit and detriment to different species in same lake from same harvesting effort.
4.3.8 Costs Many hand harvesting efforts are volunteer programs, so costs are difficult to estimate. Projects in the Adirondack Park region of NY provide the best cost accounting available. The cost of hand harvesting when targeted plant density is sparse is estimated at $150-$300/acre (Eichler et al., 1991). Wagner (2001) reports a range of $100 to $500/acre, but notes that the cost for hand harvesting dense stands would be much higher. Costs for suction harvesting were estimated in one study to be $160 per day, based on an 8-hour day. This estimate translates to approximately $15,800 per hectare, or $6,300/acre (Eichler et al., 1993). A more recent estimate from the Dudley Pond demonstration program was $165 to $225
Eutrophication and Aquatic Plant Management in Massachusetts
4.0 Methods to Control Aquatic Plants Page 4-43
per day, equating with costs of $14,500 per acre. The higher per acre cost at Dudley Pond is partly a function of new equipment testing; a cost of about $7,000-$8,000/acre was projected once the customized equipment was perfected. Wagner (2001) reports a range of $5,000 to $10,000/acre. Commercial harvesting costs vary depending on the target plant, the density of growth, travel distance including distance needed for disposal of harvested plants and the amount of obstructions present. The harvesting cost per acre usually ranges from $350 to $550, including trucking and disposal. An exception to this range is in the case of Trapa natans (water chestnut). Due to the density of this plant’s growth, the cost ranges from $1,000 - $1,500/acre. The cost per acre of a harvesting treatment is inversely proportional to the size of the area harvested. In other words, for a small harvesting project, the cost per acre (assuming a 10-acre minimum) would be closer to the $550 per acre figure. As the size of the job increases, the cost per acre will decrease as fixed costs for permitting and mobilization are spread over the area treated. A 30-acre harvesting project in Lake Attitash, Amesbury/Merrimac, MA, for the control of naiad (Najas sp.) in July 1994 cost $424 per acre including trucking and disposal (G. Smith, ACT, pers. comm., 1995). Wagner (2001) reports a cost range of $200 to $600 per acre for mechanical harvesting at typical densities and $1,000 to $5,000 per acre for very high densities of plants. Wagner (2001) reports a range of $2,000 to $4,000 per acre for typical submergent operations and costs of $6,000 to $10,000 per acre for emergent growths, large floating mats and dense root masses. The costs for rotovating vary depending on the density of the macrophytes, size of treatment and substrate type. Rotovating costs in 1989 in British Columbia ranged from $804 - $2,550/ha ($325 to $1,032/acre) (Cooke et al., 1993a). This would equate to a cost of about $420 to $1,330/acre in 2000 dollars. Wagner (2001) reports a range for rotovating similar to that for hydroraking.
4.3.9 Future Research Needs Long-term impacts and effectiveness of repeated harvesting should be investigated further. In particular, the benefits of carefully timed harvesting to eliminate seed production by a target species and the potential for more lasting benefits with multiple or more intensive harvests in a single year warrant more careful investigation. The potential to augment harvesting with planting to establish desirable vegetation is being investigated, but needs more effort. The role of harvesting with vegetative removal in nutrient load reduction has been investigated, and no major reductions observed in the vast majority of cases. However, the potential for nutrient increases if cut vegetation is left in place deserves additional examination. Controversy over benefits and drawbacks of harvesting as relates to the fish community warrants more definitive investigation. Anecdotal evidence put forth by groups favoring or opposing harvests have not been appropriately documented. Fish surveys of harvested vs. unharvested lakes that are otherwise similar would be helpful in this regard. Also, comparative surveys among lakes with different types or degrees of harvesting (large-scale removal vs. creation of boating lanes or open patches) could help guide future harvest planning to maximize fishery benefits.
Eutrophication and Aquatic Plant Management in Massachusetts
4.0 Methods to Control Aquatic Plants Page 4-44
4.3.10 Summary Macrophyte harvesting can be an effective short-term management technique to reduce macrophyte biomass that is inhibiting lake uses like boating and swimming, and can provide habitat benefits associated with open water. Mechanical harvesting, rotovating and hydroraking have in some cases reduced the growth of plants in the year subsequent to the year of harvest, but in general, harvesting is rarely effective as a long-term treatment because it does not address the causes of excessive plant growth. Harvesting methods do have the potential for long-term control of invasive, annual, seed-producing plants like water chestnut, and will differentially impact some plants more than others. Intensive harvesting can therefore produce long-term changes in plant assemblage composition, but is less likely to control areal coverage. Using a mechanical harvester in a lake with a localized infestation of vegetatively propagating plants may spread the problem. Although long-term benefits may be limited, harvesting can be a useful technique with more benefit than detriment in a lake that is completely overgrown with macrophytes. Hand harvesting is best suited to eliminating new and low-density growths of nuisance species. Multiple hand harvests are likely to be necessary, even when the target species is sparse. As densities increase, the probability of success with hand harvesting declines and costs escalate. Suction dredging can enhance a hand harvesting effort, but is costly on an areal basis and not well suited to widespread infestations. The primary impact of harvesting on water quality is increased turbidity, which may be accompanied by increases in nutrient content or other contaminant levels, depending upon the features of the disturbed sediment. Most turbidity impacts are short-term, localized, and of relatively little consequence to overall lake ecology. However, repeated application of harvesting techniques could produce impacts that are more than temporary, but no major impacts have been documented. Impacts to non-target organisms center on changing plant community features, sediment disturbance, and small fish capture. Selectivity in harvesting varies greatly with the type of harvesting applied, but can be minimally selective with mechanical harvesting, hydroraking or rotovation. Only mechanical harvesting is typically applied on a large scale, and impacts can be minimized by timing, depth and pattern of harvester use. Changes in the plant community over time should be desirable if harvesting is to be continued. Commercial harvesters may entrain and kill fish (mostly small young of the year fish) particularly when harvesting dense vegetation, but major impacts to fisheries have not been documented.
4.4 BIOLOGICAL CONTROL
4.4.1 Overview Any introduction of organisms may have impacts on the aquatic community structure and food web, however imperceptible. Greater impact occurs when the introduced species becomes abundant or affects another species that is or was abundant. Understanding the nature of these interactions can allow manipulation of system biology to produce a desired effect, but therein lies the biggest pitfall of biomanipulation: we seldom fully understand all of the relevant
Eutrophication and Aquatic Plant Management in Massachusetts
4.0 Methods to Control Aquatic Plants Page 4-45
interactions. Nevertheless, biological controls may provide plant control benefits and represent another tool in addition to physical and chemical controls. Biological control has the objective of achieving control of plants without introducing toxic chemicals or using machinery. It suffers from one ecological drawback; in predator-prey (or parasite-host) relationships, it is rare for the predator to completely eliminate the prey. Consequently, population cycles or oscillations are typically induced for both predator and prey. It is not clear that the magnitude of the upside oscillations in plant populations will be acceptable to human users, and it seems likely that a combination of other techniques with biocontrols may be necessary to achieve lasting, predictable results. Interest has grown in biological control methods over the last two to three decades. Most methods are still experimental and have a limited degree of achieved effectiveness. Most methods have the potential to inflict negative impacts on the environment. Biological methods differ from other plant control methods in that there are more variables to consider and usually a longer time span needed to evaluate effectiveness. These methods are unusual in that the treatments consist of either altering conditions to favor certain organisms or introducing live organisms that may be difficult or impossible to control or recall once introduced. For this reason non-native introductions are restricted in most cases. Biological control has the advantage that it is perceived as a more “natural” or “organic” plant control option, but it still represents human interference within an ecological system. The potential for long-term effectiveness with limited maintenance is attractive, but has been largely illusive with biological controls. Various options are discussed here for both algae and macrophyte control.
4.4.1.1 Food Web Biomanipulation
Biomanipulation can refer to any induced alteration of the biota of a lake, but is used here to refer to algal control options usually involving fish community structure (Shapiro, 1990). It is used in lakes where an abundance of algae is believed to be caused by a lack of zooplankton that graze on the algae. The lack of zooplankton in turn is thought to be a result of an overabundance of small fish that prey on zooplankton. By introducing or augmenting piscivorous fish such as largemouth bass that eat the small fish, planktivorous fish are reduced in numbers and the populations of large-bodied zooplankton such as Daphnia pulex can increase and graze on the algae, thus clearing the water (Hosper and Meijer, 1993; Meijer et al., 1994a and 1994b; Dettmers and Stein, 1996). In theory, better fishing and clearer water result. Although some algae are resistant to grazing, continual strong grazing pressure will tend to depress the overall algal abundance and increase transparency (McQueen et al., 1986b). Excessive nutrients may allow growth by resistant algae to overcome this grazing effect, but for any given level of fertility, the presence of large-bodied grazers will maintain the lowest possible algal biomass and highest possible clarity (Lathrop et al., 1999). Where non-algal turbidity is substantial, such grazing may have no observable effect, but where algae are the primary determinants of clarity, a variety of benefits are possible. Figure 4-1 depicts relevant food web interactions, which are subject to considerable spatial and temporal variability. This form of biomanipulation is known as “top down” control.
Eutrophication and Aquatic Plant Management in Massachusetts
4.0 Methods to Control Aquatic Plants Page 4-46
In order to increase the density of large-bodied zooplankton, the density of zooplankton-eating fish must be reduced. Where piscivore stocking is performed, some control of piscivorous fish removal by anglers may be necessary to maintain stocked piscivorous fish density. Harvesting planktivorous fish is another way to reduce predation on zooplankton without stocking piscivores, and has been successful in smaller lakes and ponds. Netting and electroshocking are the preferred harvest methods. It is difficult to collect enough planktivores in a single season to make a difference in larger lakes. Fishing derbies can be an enjoyable way to reduce small fish abundance, but a major reduction has almost never been achieved in this manner (McComas, 1993). Problems associated with overabundance of panfish can be viewed as a consequence of inadequate piscivore populations; piscivores can control panfish density while producing desirable gamefish biomass. Common management goals of clear water and desirable fishing are usually better served by focusing on the enhancement of piscivorous fish populations. Another method to reduce the numbers of small planktivorous fish is to treat the lake with rotenone, a poison which can kill all fish, large and small (McComas, 1993). This is a highly disruptive technique used only to reclaim the entire lake when the fish community has become very unsatisfactory. It was popular in Massachusetts in the 1960s and is still used in some other northeastern states, but rotenone currently is not registered for use in Massachusetts, so this option is not available within the Commonwealth. However, planktivorous fish form an essential food web link between production occurring at lower and higher trophic levels. Controlling the density of stunted panfish has successfully improved both water clarity and fishing satisfaction (Shapiro and Wright, 1984; Wagner, 1986).
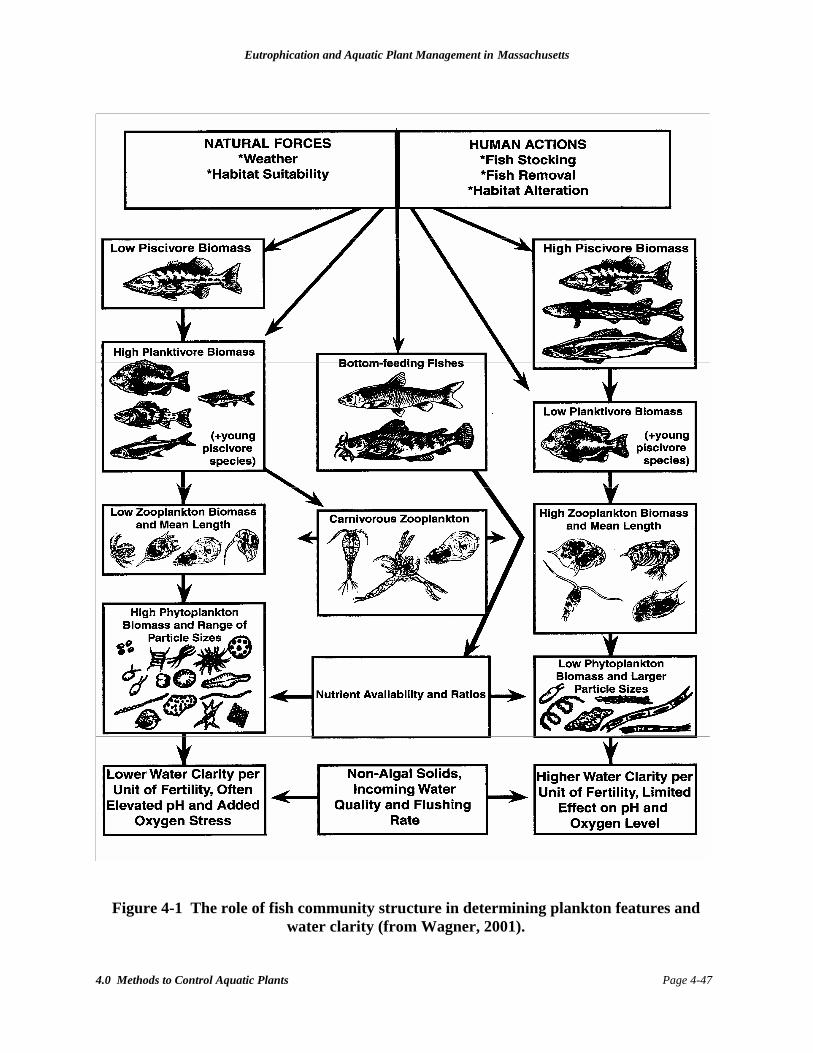
Eutrophication and Aquatic Plant Management in Massachusetts
4.0 Methods to Control Aquatic Plants Page 4-47
Figure 4-1 The role of fish community structure in determining plankton features and water clarity (from Wagner, 2001).
Eutrophication and Aquatic Plant Management in Massachusetts
4.0 Methods to Control Aquatic Plants Page 4-48
Other conditions that might affect the population of zooplankton grazing on algae include an anoxic metalimnion or hypolimnion, common in eutrophic lakes, that eliminates these zones as daytime refuges for zooplankton from visually feeding fish and thus enhances zooplankton mortality. An appropriate aeration program can solve this problem. Another cause of zooplankton mortality is the toxic effect of pesticides that enter the lake with agricultural or urban runoff. The use of copper sulfate for temporary algal control can also produce significant zooplankton mortality at doses below those needed for algae control. Severe mortality of zooplankton appears at least partly responsible for the commonly observed rebound of algae following a copper treatment (Cooke and Kennedy, 1989). It has also been suggested that algae-eating fish might control algal biomass if stocked in sufficient quantities. As there are no native species of fish in the USA that consume sufficient quantities of algae as their diet, this would involve introduction of a non-native species (e.g., certain species of Tilapia or the silver carp). Given the track record of introduced species (Mills et al., 1994), this does not appear to be a desirable approach, and many states have banned such introductions. Additionally, the excreted nutrients from such a fish population might support the growth of as much algae as those fish could consume. Furthermore, no fish can efficiently feed on the smallest algal cells, potentially resulting in a shift toward smaller cell size and greater turbidity per unit of biomass present. Finally, tropical species such as Tilapia are unlikely to overwinter in Massachusetts, limiting the duration of any effect. In lakes with blue-green blooms, it may be possible to favor the growth of diatoms and other desirable species of algae by adding silica and/or by adding nitrate. Alteration of nutrient ratios have been demonstrated to cause shifts in algal assemblage composition in accordance with algal group preferences (Tilman, 1982). Low ratios of N to P (<12 to 24 on a molecular basis, < 5 to 11 on a weight basis) tend to favor nitrogen fixing blue-greens, while high ratios (>50 to 70 by molecule or 22 to 30 by weight) favor the green algae (Tilman, 1982). Addition of nutrients to lakes is perceived as very risky, and it is generally preferable to raise the N:P ratio by lowering phosphorus. This approach to controlling algal assemblages is often called “bottom up” control.
4.4.1.2 Herbivore Stocking
Many of the plants that become nuisance weeds are species introduced from different regions. Because they lack natural enemies, plants introduced into favorable environments can increase rapidly, outcompeting the native vegetation for resources and habitat. One strategy of biological control is the introduction of a natural enemy, for instance a herbivorous invertebrate or fish from the native habitat of the introduced species, to counter the rapid growth rate of the introduced plant species. If a native species can be found that will attack the nuisance species, its populations may be artificially augmented to accelerate the process. Herbivorous fish can be divided into two groups: those that consume plankton and those that consume macrophytes. The use of planktivores to remove plankton (specifically, algae) directly has not been very successful. Gizzard shad (Dorosoma cepedianum) have been used in the southern United States to reduce large algae. Gizzard shad also eat zooplankton, however, and as a result the algal component of the plankton tends to increase rather than decrease (Opuszynski and Shireman, 1995). Other planktivores include silver carp (Hypophthalmichthys molitrix) and bighead carp (H. nobilis), both exotic fish from China that eat zooplankton, phytoplankton and
Eutrophication and Aquatic Plant Management in Massachusetts
4.0 Methods to Control Aquatic Plants Page 4-49
detritus. The effectiveness of these species is limited and some evidence suggests that algae might increase as zooplankton are consumed by silver and bighead carp (Opuszynski and Shireman, 1995). There are several species of fish that consume macrophytes. The cichlids (Tilapia) include various African species that eat macrophytes. Tilapia sp. can only survive in water temperatures greater than 10°C and are therefore unlikely candidates for macrophyte control in Massachusetts (Cooke et al., 1993a; Crutchfield et al., 1992). The introduction of herbivorous fish therefore generally centers on grass carp (Ctenopharyngodon idella), although this species does not meet the criteria for an ideal candidate for introduction to aquatic systems (Cooke et al., 1993a). Grass Carp Grass carp are not approved for introduction in Massachusetts, however the following information is provided in the interest of complete coverage of techniques. The Massachusetts Department of Fish and Game (MDFG) has a mandate to conserve, restore, and manage the biological resources of the Commonwealth. The policy relative to the introduction of non-native species, as approved by the Fisheries and Wildlife Board on August 30, 1984, states that introduction of rare or exotic species will be permitted only if: 1. There appears to be an established, unfilled niche; 2. Research findings indicate the species will not impair the value of existing populations; and 3. A specific justification and statement of intent is submitted in writing and is approved in
writing by the director of the Division of Fisheries and Wildlife following consultation with the Non-game Advisory Committee and approval by the Board.
Relative to this policy, the introduction and use (including experimental use) of grass carp in this state has been reviewed by the MDFG, its Natural Heritage and Endangered Species Advisory Committee, and the Fisheries and Wildlife Board (Jones, 1986). This review concluded that introduced grass carp would pose a significant environmental risk to native wildlife and their habitats in Massachusetts. As a result, the Massachusetts Fisheries and Wildlife Board has not issued any permits to introduce grass carp. The following reasons are given: 1. Grass carp can decimate native plant communities, resulting in severe impacts to waterfowl,
invertebrate, and fish habitats. 2. Grass carp stocking can result in major impacts to water quality, including algae blooms,
increased turbidity, and decreased dissolved oxygen and pH. 3. Grass carp have a low feeding preference for some nuisance non-native plants (including
Eurasian watermilfoil), and have the potential to decimate native flora. 4. By reducing some species of macrophytes, grass carp reduce interspecific competition and
lead to increased growth of other species. 5. Grass carp are long-lived and nearly impossible to remove from a system once introduced. 6. Grass carp are highly migratory and can easily escape over spillways or through bar grates to
impact waters other than those intended. 7. Grass carp are known disease carriers that can transmit diseases to other fish species. 8. Grass carp do not remove nutrients from the system, but instead recycle them from one form
to another. 9. The impacts and effectiveness of grass carp are highly variable and unpredictable.
Eutrophication and Aquatic Plant Management in Massachusetts
4.0 Methods to Control Aquatic Plants Page 4-50
The grass carp (Ctenopharyngodon idella), also known as the white amur, is another species of fish that is used to control aquatic macrophytes. The native range of grass carp includes the Pacific slope of Asia from the Amur River of China and Siberia, south to the West River in southern China and Thailand. They are typically found in low gradient reaches of large river systems. Grass carp can grow to 4 feet long and attain weights of over 100 pounds, making them the largest member of the cyprinid family. They have a very high growth rate, with a maximum at about 6 pounds per year (Smith and Shireman, 1983). They typically grow to a size of 15-20 pounds in North American waters and have adapted quite well to life in reservoirs where they are stocked for aquatic vegetation control (Blankenship 1992). As with all carp species, they are tolerant of wide fluctuations in water quality, including water temperatures from 0 to 35°C; salinities up to 10 ppt; and oxygen concentrations approaching 0 mg/L (Lee et al., 1980). Grass carp do not feed when water temperatures drop below 11°C (52°F) and feed heavily when water temperatures are between 20°C and 30°C (68°F and 86°F) (Sanders et al., 1991). Spawning occurs in turbulent reaches of rivers such as tailwaters and river confluences where the fish congregate in large numbers. An individual female can release a million free floating eggs which can drift as far as 100 miles before settling and hatching (Tomelleri and Eberle, 1990). Diploid grass carp require flowing water (exceeding about 0.8 m/s) of large rivers at temperatures between 63°F and 86°F for successful reproduction (Stanley et al., 1978). Dietary preference is an important aspect of grass carp, as pertains to their use as a plant control mechanism. Grass carp have exhibited a wide variety of food choices from study to study. Grass carp have been reported to have a low feeding preference for Myriophyllum spicatum, one of the common invasive aquatic plants in Massachusetts, but eat other non-native plants such as Cabomba caroliniana and Egeria densa as well as various native species. Pine and Anderson (1991) found that grass carp preferred Potamogeton pectinatus and Chara sp. over M. spicatum. Another study by Pine et al. (1989) found M. spicatum was equal in preference to pondweeds during the summer; this was attributed to the fact that the fish avoid the lower, tough stems of M. spicatum, but eat the young new growth at the tip of the plants. A recently completed 6-year study in Connecticut (G. Benson, Benson Environmental, pers. comm., 2002) has found that grass carp did consume milfoil as readily as most other submergent species. In some cases grass carp will also eat and control filamentous algae (e.g., Pithophora) (Lewis, 1978). Generally, grass carp avoid cattails, spatterdock, and water lily. Feeding preferences are listed in Nall and Schardt (1980), Van Dyke et al. (1984), and Cooke and Kennedy (1989), but the high level of variability among lakes should be kept in mind. Grass carp were first introduced to the United States in 1963 by the Bureau of Sport Fisheries and Wildlife to the Fish Farming Experimental Station in Stuttgart, Arkansas and Auburn University, Alabama, for research purposes. Expansion of their range since that time has largely been a result of stocking for macrophyte control. Reproduction of diploid grass carp has been documented in the United States for over twenty years. Pflieger (1978) stated that the large numbers of grass carp found in the central Mississippi could only be accounted for through natural reproduction or vast and unchecked escape from
Eutrophication and Aquatic Plant Management in Massachusetts
4.0 Methods to Control Aquatic Plants Page 4-51
waters where they had been stocked. Stanley (1976) confirmed that grass carp had established naturally reproducing populations in many North American systems, including the Mississippi River system. Grass carp fry have been documented in the Missouri River and its tributaries, suggesting that they reproduce in central Missouri and might be established in smaller river systems throughout the Mississippi River basin (Brown and Coon, 1991). A recent report provides evidence that diploid grass carp are reproducing in rivers as far north as the Illinois and Upper Mississippi Rivers (Raibley et al., 1995). However, the presence of sterile triploid grass carp will tend to reduce the spawning success of any diploid fish because the cross of triploid males with diploid females produces inviable offspring. Triploid females do not even produce eggs, eliminating any problems with diploid male x triploid female crosses. Conditions appear to be suitable for spawning of diploid grass carp in some of the larger rivers in Massachusetts. Grass carp have been reported in the Hudson River of New York (D. Stang, NYSDEC, pers. comm., 1997), to which the Hoosic River of Massachusetts is tributary. Additionally, some illegal introductions to Massachusetts waters have occurred (M. Tisa, MDFG, pers. comm., 1997). In response to the threat of diploid reproduction, a sterile triploid grass carp was first developed for commercial use in 1984. The majority of grass carp currently stocked in North America are triploids. Triploidy, the condition where fish have three sets of chromosomes instead of the usual two, interferes with gamete production, making natural reproduction of triploid fish extremely unlikely (Allen and Wattendorf, 1987). According to a review of studies by the Washington Department of Wildlife (WDW, 1990), the triploid status can be tested on individual fish and sterility is virtually guaranteed, although usually only a small number of fish (120) in each triploid batch are tested by the U.S. Fish and Wildlife scientists. If any of the 120 fish are diploid, the entire batch fails and all fish in the batch must be retested before a new certification inspection is conducted (Griffin, 1991). In its official "Biological Opinion" for the state of South Carolina (Stevens, 1985, as cited in Woltman, 1986), the U.S. Fish and Wildlife Service states that certified triploid grass carp will not reproduce and will result in no adverse impact to the environment as a result of population expansion. Grass carp are long lived and grow rapidly in introduced waters. Mitzner (1978) documented growth of stocked grass carp from 380 grams to 6,847 grams in a three-year period. Hill (1986) also documented that grass carp are long-lived, fast growing (2 kg per year in the USA), and experience extremely low mortality (2-8% annual mortality), even when stocked as fingerlings in the presence of largemouth bass (Micropterus salmoides). Fish are usually stocked in the size range of 200 mm to 300 mm (8 to 12 inch). The most common stocking rates are at 80 to 100 fish per acre for plant eradication and 25 to 80 fish per acre for plant control with higher rates recommended for cool waters (WDW, 1990). New York state officials have found that lower stocking rates are sufficient for macrophyte reduction, and stocking rates there average 12.7 fish per acre (Stang, 1994). In Connecticut, the stocking rate of triploid fish is based on an equation that includes climatic zone, percentage of pond area covered with macrophytes and percentage of pond area less than 10 feet deep (CTDEP, 1995).
Eutrophication and Aquatic Plant Management in Massachusetts
4.0 Methods to Control Aquatic Plants Page 4-52
The major difficulty in using grass carp to control aquatic plants is determining what rate will be effective and yet not so high as to eradicate the plants completely. The fish usually live ten or more years but the typical plant control period is reported to be 3 to 4 years and some restocking may be required. Cooke et al. (1993) reports they are difficult to capture and remove unless the lake is treated with rotenone which will kill other fish species as well. Numerous studies on the use of grass carp in the Southern United States are available in ACOE (1994), and a general review is presented in Opuszynski and Shireman (1995). Cassini (1996) recently reviewed the information necessary to predict effective grass carp stocking rates, which typically includes grass carp mortality, water temperature, plant species composition, plant biomass and desired level of control. Three models for estimating desirable stocking density have been developed for ponds in the north temperate zone, including Wiley et al. (1987), Swanson and Bergersen (1988), and Bonar (1990). Invertebrates Biological control using invertebrates (mainly insects) from the same region as the introduced target plant species include the root boring weevil (Hylobius transversovittatus) and two leaf beetles (Galerucella calmariensis and G. pusilla) for the control of purple loosestrife (Lythrum salicaria) (Blossey et al., 1994a and 1994b; Malecki et al., 1994), the tuber feeding weevil (Bagous affinis) and the leaf-mining fly (Hydrellia pakistanae), both for the control of Hydrilla verticillata in Florida (Center and Dray, 1990). Augmentation of a native insect population has been studied in British Columbia with the milfoil midge (Cricotopus myriophylli) (Kangasniemi et al., 1993) and in Vermont with the milfoil weevil (Euhrychiopsis lecontei) (Sheldon, 1995; Sheldon and Creed, 1995). Releases in Massachusetts of the native weevil (Euhrychiopsis lecontei) for the control of Eurasian milfoil have occurred since 1995, and we may be seeing signs of success in two of the original test lakes (R. Hartzel, GeoSyntec, pers. comm., 2002). The native crayfish (Orconectes immunis) was used experimentally in Conesus Lake, New York, but did not prove effective (Letson and Makarewicz, 1994). Euhrychiopsis lecontei is a native North American species believed to have been associated with northern watermilfoil (Myriophyllum sibericum), a species largely replaced by non-native, Eurasian watermilfoil (M. spicatum) since the 1940’s. The weevil is able to switch plant hosts within the milfoil genus, although to varying degrees and at varying rates depending upon genetic stock and host history (Solarz and Newman, 1996). It does not utilize non-milfoil species. Its impact on Eurasian watermilfoil was been documented (Creed and Sheldon, 1995; Sheldon and Creed, 1995; Sheldon and O’Bryan, 1996a) through five years of experimentation under USEPA sponsorship. In controlled trials, the weevil clearly has the ability to impact milfoil plants through structural damage to apical meristems (growth points) and basal stems (plant support). Adults and larvae feed on milfoil, eggs are laid on it, and pupation occurs in burrows in the stem. Field observations link the weevil to natural milfoil declines in nine Vermont lakes. Additional evidence of weevil-induced crashes without introduction or population augmentation exists for lakes outside Vermont (Creed, 1998). Lakewide crashes have generally not been observed in cases where the weevil has been introduced into only part of the lake, although localized damage has been substantial and such widespread control may require more time than current research and monitoring has allowed. As with experience with introduced insect species in the south, the
Eutrophication and Aquatic Plant Management in Massachusetts
4.0 Methods to Control Aquatic Plants Page 4-53
population growth rate of the weevil is usually slower than that of its host plant, necessitating supplemental stocking of weevils for more immediate results. Just what allows the weevil to overtake the milfoil population in the cases where natural control has been observed is still unknown. Densities of 1-3 weevils per stem appear to collapse milfoil plants, and raising the necessary weevils is a major operation. The State of Vermont devoted considerable resources to rearing weevils for introduction over a two-year period, using them all for just a few targeted sites (Hanson et al., 1995). Weevils are now marketed commercially as a milfoil control, with a recommended stocking rate of 3000 adults per acre. Release is often from cages or onto individual stems; early research involved attaching a stem fragment with a weevil from the lab onto a milfoil plant in the target lake, which was highly labor-intensive. Although weevils may be amenable to use within an integrated milfoil management approach, interference from competing control techniques has been suggested as a cause for sub-optimal control by weevils (Sheldon and O’Bryan, 1996b). Harvesting may directly remove weevils and reduce their density during the growing season. Also, adults are believed to overwinter in debris along the edge of the lake, and techniques such as drawdown, bottom barriers, or sediment removal could negatively impact the weevil population. Extension of lawns to the edge of the water and application of insecticides also represent threats to these milfoil control agents. Other insects used for plant control are mainly southern species used to control invasive species not typically found in Massachusetts. The primary exception is the loosestrife beetle (Galerucella spp.), used to control purple loosestrife (Lythrum salicaria). The Association of Massachusetts Wetland Scientists has a beetle-rearing program that allows interested groups to raise these biocontrol agents for placement in targeted growths of purple loosestrife (Reiner, AMWS, pers. comm., 2002). Success has been reported in New York with this approach (B. Blossey, Cornell Univ., pers. comm., 1997) and could be expected in Massachusetts as this program expands.
4.4.1.3 Pathogens
Another strategy for biocontrol is the release of pathogens (disease causing organisms) to the water to suppress the target plant population (CoFrancesco, 1993). Plant pathogens remain largely experimental, despite a long history of interest from researchers. Properties of plant pathogens that make them attractive (Freeman, 1977) include:
High abundance and diversity High host specificity Non-pathogenicity to non-target organisms Ease of dissemination and self-maintenance Ability to limit host population without elimination
Fungi are the most common plant pathogens investigated, and control of water hyacinth, hydrilla and Eurasian watermilfoil by this method has been extensively evaluated (Charudattan et al., 1989; Theriot, 1989; Gunner et al., 1990; Joye, 1990). Results have not been consistent or predictable in most cases, and problems with isolating effective pathogens, overcoming
Eutrophication and Aquatic Plant Management in Massachusetts
4.0 Methods to Control Aquatic Plants Page 4-54
evolutionary advantages of host plants, and delivering sufficient inoculum have limited the utility of this approach to date. However, combination of fungal pathogens and herbicides has shown some recent promise as an integrated technique (Nelson et al., 1998). Viral, bacterial and fungal pathogens have each been explored as possible control methods for algae. Ideally, a lake would be inoculated with a pathogen developed to target either a broad spectrum of algal types, or more likely one or a few species of especially obnoxious algae. Such pathogens have been tried experimentally over the years (Lindmark 1979), but none has proven effective and controllable. In dealing with algae, humans may have technological superiority, but we are at an evolutionary disadvantage. The complexity of biological interactions appears beyond our sustained control, and although we can set processes in motion that may produce desired conditions in a lake, those conditions tend to be temporary.
4.4.1.4 Plant Interactions
The introduction of plants as a biological control agent is based on two general concepts that may act independently of each other or simultaneously. The first is to introduce native plants that may have the ability to outcompete the target plant for habitat and resources. The second is to introduce plants with allelopathic ability, which is the ability to release chemicals that act as an inhibitor to other plants (Jones, 1993). The planting of native plants is suggested to prevent the invasion of disturbed areas by nuisance aquatic plants such as watermilfoil (Doyle and Smart, 1993). The addition of barley straw or barley straw extract is largely an allelopathic technique. Although invasive nuisance plant species are just what the name implies, there is evidence that the presence of a healthy, desirable plant community can minimize or slow infestation rates. Most invasive species are favored by disturbance, so a stable plant community should provide a significant defense. Unfortunately, natural disturbances abound, and almost all common plant control techniques constitute disturbances. Therefore, if native and desirable species are to regain dominance after disturbance, it may be necessary to supplement their natural dissemination and growth with seeding and plantings. The use of seeding or planting of vegetation is still a highly experimental procedure, but if native species are employed it should yield minimal controversy. Experiments conducted in Texas (Doyle and Smart, 1995) indicate that the addition of dried seeds to an exposed area of sediment will result in rapid germination of virtually all viable seeds and rapid cover of the previously exposed area. However, if this is not done early enough in the growing season to allow plants to mature and produce seeds of their own, the population of annual plants will not sustain itself into the second growing season. Transplanting mature growths into exposed areas was found to be a more successful means of establishing a seed producing population. The use of cuttings gathered by a harvester (Helsel et al., 1996) was not successful in establishing native species in areas previously covered by benthic barrier in Wisconsin. In Lake George, New York, where the native plant community is diverse and dense, colonization by Eurasian watermilfoil has been much slower than in many other area lakes (Fugro East, 1996d). Sediment features provide an alternative explanation for inhospitality to milfoil, but it has also been noted that when milfoil is cleared from an area and a native assemblage restored,
Eutrophication and Aquatic Plant Management in Massachusetts
4.0 Methods to Control Aquatic Plants Page 4-55
regrowth by milfoil is greatly diminished (Eichler et al., 1995). More research is needed in this area, but establishment of desired vegetation is entirely consistent with the primary plant management axiom: if light and substrate are adequate, plants will grow. Control of rooted plants should extend beyond the limitation of undesirable species to the encouragement of desirable plants. Plantings for reduced light penetration might also control algae, but there could be many negative side effects of such an effort. Surface-covering growths of duckweed, water hyacinth, or water chestnut could provide such a light barrier, but at great expense to habitat and water quality. Although senescence of rooted plants often releases nutrients that can support algal blooms, release of allelopathic substances during the more active growth phase of macrophytes may inhibit algal growth. Mat-forming algae found in association with rooted plant beds appear unaffected, but many more planktonic algal species are not abundant when rooted plant growths are dense. Again, this may represent a trade-off between an algal nuisance and a rooted plant nuisance, and many lakes have both. The use of rotting barley straw (Hordeum vulgare) to control algae blooms has received considerable attention over the last decade, and appears to be at least partly an allelopathic technique. The use of barley as a treatment to improve water clarity in ponds has been tested, but is not well understood (McComas, 1993). Barley straw can control algal densities in some cases (Barrett et al., 1996; Kay, 1996; Newman and Barrett, 1993; Ridge and Pillinger, 1996; Wynn and Langeland, 1996). Preferably added to shallow, moving water or from pond-side digesters, decaying barley straw gives off substances that inhibit algal growth and seem to be particularly effective against blue-green algae. Although this is not a thoroughly understood or widespread technique at this time, research conducted mainly in England has demonstrated that the decomposition of the barley straw produces allelopathic compounds that act as algaecides. Also, competition for nutrients between heterotrophic decomposers and autotrophic algae appears to favor the heterotrophs after barley straw addition. Stagnant water reduces production of the essential compounds and uptake of nutrients as low oxygen levels in the straw slow decomposition, and highly turbid water also reduces effectiveness. Doses of barley straw under well-oxygenated conditions are typically around 2.5 g/m2 of pond surface, with doses of 50 g/m2 or more necessary where initial algal densities are high or flow is limited. Doses of 100 g/m2 may cause oxygen stress in the pond as decomposition proceeds, but this can be minimized by the use of a land-based digester into which straw is deposited and through which water is pumped as the straw decays.
4.4.2 Effectiveness There are many factors that determine effectiveness of biological control methods, many of which are not easily controlled during implementation. Whereas physical and chemical methods tend to have relatively well defined expected outcomes, biological approaches have much greater uncertainty and variability. This is an inherent property of biological processes, known well to
Eutrophication and Aquatic Plant Management in Massachusetts
4.0 Methods to Control Aquatic Plants Page 4-56
wastewater treatment engineers and lake management practitioners, but is a source of frustration for those expecting immediate and predictable results. Biological techniques are very appealing to many people, however, as they avoid chemical additions and physical disruption in many cases. Actual effectiveness varies by technique, so further discussion will divide the techniques described above.
4.4.2.1 Short-Term Effectiveness of Food Web Manipulation
In a review of dozens of studies, Shapiro (1990) suggests that biomanipulation generally has positive effects where it has been applied. It was thought that the direct import of Daphnia pulex as a lake treatment would be impractical because it would require the introduction of an enormous number of animals (Vanni, 1987), but on a small scale it can be successful. D. pulex was introduced to the Valley Pond Association's swimming pond in Lincoln, MA to control algae in June of 1995. The introduction, along with natural colonization, did in fact appear to be effective at controlling algae for a short period of time. However, within a month many young of the year sunfish were observed (apparently from an introduction) and subsequently D. pulex populations were reduced and algae populations increased (K. Wagner, ENSR, pers. obs., 1995). Such dynamics illustrate how difficult it is to achieve long-term control by biomanipulation, but short-term impacts are easier to achieve. Removal of planktivorous fish and stocking of piscivores in a small pond in New Jersey resulted in much higher densities of Daphnia and a definite increase in water clarity in just a few months (Wagner, 1986). Shapiro and Wright (1984) obtained similar results in Minnesota.
4.4.2.2 Long-Term Effectiveness of Food Web Manipulation
The effectiveness of biomanipulation depends on many factors and will vary over time. Realistically, changes in fish populations would not be expected to last longer than about 5 years, and the duration of effect could be much shorter. Rotenone was used to kill fish in Round Lake, Minnesota, where prior to treatment planktivores outnumbered piscivores 165 to 1 (Shapiro and Wright, 1984). After treatment the lake was restocked with a ratio of 2.2 planktivorous bluegill (Lepomis macrochirus) to every piscivore (largemouth bass and walleye, Stizotedion vitreum). Some channel catfish (Ictalurus punctatus) were also stocked. The treatment resulted in algae free conditions in the lake for at least two years. Daphnia had been very small in number prior to treatment, but the following year it became the dominant genus of the crustacean zooplankton community. The nutrient levels in the lake were lowered over the two years following treatment, and it is unclear as to whether the algal decrease occurred due to the increased herbivory or lower nutrient levels, but it is assumed that the lower nutrient levels were related to the treatment. At the end of two years the lake was beginning to show signs of reverting to its previous condition. Experiments done at Rice Lake in Ontario, Canada suggest that algal production and biomass were strongly influenced by bottom-up factors (nutrients) and that top-down food web manipulations (predators and herbivores) were unlikely to be effective in controlling algae biomass (Badgery et al., 1994). Carpenter et al. (1995) suggest that piscivorous fish may be able to control algal biomass but not what species of algae dominate. Shifts in species composition may eventually overrun biomass control. In his study of Square Lake, Minnesota, a lake in which control of algae by Daphnia has been observed, Osgood (1984) suggests that, when
Eutrophication and Aquatic Plant Management in Massachusetts
4.0 Methods to Control Aquatic Plants Page 4-57
considering biomanipulation, an assessment must be made of the environmental conditions. If the lake lacks the conditions to support the desired species for algae control, reduction in algal biomass is unlikely to occur. Shapiro (1990) describes the concept of a refuge, such as a region of low dissolved oxygen concentration that is not inhabited by planktivorous fish, in which the herbivorous zooplankton such as Daphnia could retreat from predators. Although Shapiro has some hope that this concept can be utilized in biomanipulation strategies, seasonal lake condition changes and other fluctuating conditions make this concept unpredictable and difficult to implement. It does not appear that long-term results can be achieved by a one-time manipulation, but repeated application of the technique may maintain desired conditions.
4.4.2.3 Short-Term Effectiveness of Herbivores
The amount of time it takes to see results of grass carp introduction can vary depending on stocking rate, feeding rate and growth rate. In some instances it can take several years to see any results of grass carp stockings. In other cases, complete eradication of the vegetation can occur within a year (Cooke et al., 1993a). Ideally, a low stocking rate will take several years to achieve control without causing eradication. A study by McKnight and Hepp (1995) in Guntersville Reservoir, Alabama, indicated that M. spicatum was not controlled by grass carp, and native vegetation was reduced in some areas. Most studies report that grass carp will eat other vegetation before eating M. spicatum. Triploid grass carp controlled submergent vegetation in small New York ponds when stocked at 15 to 40 fish per acre (Woltmann, 1986). During the course of the study, floating leaved species such as white water lily (Nyphaea odorata) and water shield (Brasenia schreberi) tended to increase as other macrophytes were eaten. Many ponds stocked with grass carp in Connecticut now have dense growths of Wolffia and filamentous algae (G. Smith, ACT, pers. comm., 1996); one fertility problem has been traded for another. A survey of 712 pond owners in New York who used triploid grass carp in their ponds reported that 85 percent of pond owners noticed reductions in aquatic vegetation within 2 years of grass carp introductions (Stang, 1994). Of the respondents, 65 percent had used other treatments in the past (harvesting, chemicals or dyes) and 77 percent reported that the grass carp were better than the previous treatments. Twenty percent of the stocked ponds had all plants eliminated, 45% had most vegetation removed, and 35% had only some vegetation consumed. The results of this survey showed that incremental stocking of triploid grass carp in small ponds at low densities (e.g. 5 fish per acre) with monitoring for two years before additional stocking (up to 15 fish per acre) achieved intermediate densities of aquatic plants and some degree of control was achieved by the removal or addition of a few fish (Stang, 1994). Grass carp most effectively control new plant growth. Fish stocked in the spring or following other macrophyte control methods such as herbicides or harvesting will be more likely to reduce plant biomass than fish stocked over mature, developed vegetation (Baker et al., 1993). In the rare situations where cichlids are able to survive in North American waters, they have the potential to cause considerable impacts. In one case they escaped from an experimental cage in a North Carolina power plant cooling pond and rapidly established a reproducing population that eliminated the submergent macrophyte community in less than two years (Crutchfield et al., 1992).
Eutrophication and Aquatic Plant Management in Massachusetts
4.0 Methods to Control Aquatic Plants Page 4-58
With regard to insect herbivores, the annual cycle in the predator-prey relationship observed by Sheldon and Creed (1993) suggests that the response to introduced insects can be as quick as one year. Previous experiments in Vermont by Creed and Sheldon (1993; 1994) have evaluated the viability of two insects, the native weevil Euhrychiopsis lecontei and the naturalized moth Acentria ephemerella (= Acentria nivea) and particularly their larvae as biological control agents. The weevil is believed to have switched its food source from native watermilfoils to Eurasian watermilfoil and has not been shown to impact non-target plant species. The larvae burrow into the stem and destroy the lacunal system and vascular tissue, disrupting gas exchange and the flow of nutrients to the entire plant. The moth effectively reduced watermilfoil growth in two experiments by cutting the stem and removing leaves. Although A. ephemerella was more consistent in experiments than E. lecontei, the weevil seems to be more damaging to watermilfoil in the field because they impact the physiology of the plant while the moth damages the plant by cutting stems and consuming leaves (Creed and Sheldon, 1994). Field observations suggest that weevils further damage watermilfoil by reducing it’s buoyancy (Creed et al., 1992). The 1995 augmentation of the native weevil, Euhrychiopsis lecontei, in two Massachusetts lakes showed promising early results. Reduction in watermilfoil biomass was observed within three months of adding the weevils (S. Sheldon, Middlebury College, pers. comm., 1995). However, lakewide impacts required multiple additional years and repeated stocking. Variability of results with weevil introductions has been very high (Hartzel, GeoSyntec, pers. comm., 2002).
4.4.2.4 Long-Term Effectiveness of Herbivores
The long-term effectiveness of this control method often depends on the management objective. The introduction of herbivorous fish can result in the eradication of all lake vegetation. In some cases, such as golf course ponds or ornamental ponds, this may be the intended result. But to maintain a multi-use lake, eradication of all vegetation is undesirable. The stocking rate, growth rate, feeding rate and feeding preferences of the fish are key factors to consider. These factors may be difficult to predict, however, because environmental conditions such as water quality may affect the feeding preferences and growth rate (Leslie et al., 1987; Bonar et al., 1990). Only the stocking rate and size of the fish are under the control of the lake manager and grass carp can be difficult to remove once introduced. It appears plant preference of grass carp may depend on the presence of new growth, the presence of other more palatable species, and the size of the lake or reservoir. Over the long term, the structure of the plant community may shift toward less preferred plant species as the preferred plant species are removed. Although grass carp usually live ten or more years, the typical plant control period is reported to be 3 to 4 years. In small Lake Parkinson in New Zealand, grass carp eradicated the invasive, non-native Brazilian elodea (Egeria densa), were themselves then removed by netting and rotenone poisoning, and a native flora was naturally re-established from the existing seed bed (Tanner et al., 1990). Long-term success is therefore achievable under the right conditions with sufficient effort and compatible goals. Failure of this technique to yield desirable results has generally been a function of unrealistic goals, fish diet not matching targeted plant species, inappropriate
Eutrophication and Aquatic Plant Management in Massachusetts
4.0 Methods to Control Aquatic Plants Page 4-59
stocking rates, and lack of patience (essential with biological techniques) before taking additional action. With regard to herbivorous insects, long-term results may be achievable with reasonable goals and enough effort and patience. In their observations of Brownington Pond Vermont, Creed and Sheldon (1993; 1994) observed declines in the biomass of Eurasian watermilfoil that correlated with increases in the abundance of the native weevil, Euhrychiopsis lecontei. As would be expected, the following year brought a decline in the weevil population followed by an increase in the watermilfoil biomass, which in turn provided a food source for an increase in the weevil population. Experiments in field enclosures support their observations and the hypothesis that the weevils are a viable option for long-term management of Myriophyllum spicatum (Creed and Sheldon, 1993; Sheldon, 1995), but the predator-prey population oscillations expected from classical population biology (Ricklefs, 1973) do appear to apply. Weevil stocking is not likely to provide the density of weevils necessary to achieve short-term results throughout larger lakes (or even many smaller ones), but repeated stocking under favorable conditions (e.g., limited predation by fish, adequate overwintering habitat) may generate a substantial milfoil decline. Such appears to be the case in 2001 in Lake Mansfield after 3 stockings over 5 years (R. Hartzel, GeoSyntec, pers. comm., 2002). Late summer milfoil crashes in a number of New York lakes may be related to a seasonal peak in weevil density (R. Johnson, Cornell Univ., pers. comm., 2002). Natural weevil populations have established a cycle of increase and decline that tracks milfoil density. This means that plant densities may exceed levels desired by humans before herbivory can have a major effect on the target population.
4.4.2.5 Short-Term Effectiveness of Pathogens
Effectiveness of pathogens should be rapid, but there are not enough data to perform a valid evaluation. They are expected to establish faster and impact target populations more quickly in dense macrophyte beds and at warm temperatures. Experiments using the fungal pathogen Mycoleptodiscus terrestris to control watermilfoil suggest that it is host specific and can significantly reduce watermilfoil biomass in field and laboratory experiments after a short exposure period (Gunner et al., 1990).
4.4.2.6 Long-Term Effectiveness of Pathogens
There is insufficient evidence to determine the effectiveness of a large-scale field release.
4.4.2.7 Short-Term Effectiveness of Plant Interactions
The ability of native plants to become established in disturbed areas or areas adjacent to established populations of watermilfoil is dependent on many factors such as water depth and herbivory (Doyle and Smart, 1993), most of which cannot be easily controlled. Plant assemblage development is not typically a short-term endeavor, so short-term effects would not be expected. For additions of barley straw, results tend to be fairly rapid, but are not consistent among lakes or over time within a lake. The algaecidal properties may produce short-term results, while

Eutrophication and Aquatic Plant Management in Massachusetts
4.0 Methods to Control Aquatic Plants Page 4-60
competition for nutrients by heterotrophic bacteria may take a longer period to achieve any measureable results.
4.4.2.8 Long-Term Effectiveness of Plant Interactions
A dense cover of native plants may be an effective long term management method to prevent an invasion by plants such as watermilfoil, as watermilfoil tends to invade disturbed areas. There is little information available that suggests that native plants can exclude nuisance vegetation, and the information that is available suggests that the nuisance plants are more often the superior competitors and can eventually overrun a lake once introduced (R. McVoy, MDEP, pers. comm., 1995). However, failure of nuisance species to overrun some lakes where they have been present for many years (e.g., Lake George, NY) may in part be due to a healthy native community. Certainly the presence of a carpet-like native assemblage is less favorable than open substrate or disturbed areas (Doyle and Smart, 1993). Experimental enclosures in an embayment in Guntersville Reservoir, Alabama were used to establish populations of Vallisneria americana and Potamogeton nodosus. The effectiveness of establishing these populations to prevent the invasion of watermilfoil appears real, but is not completely understood. There was an unexplained decline in watermilfoil at the beginning of this experiment and it was virtually absent from the embayment for the remainder of the experiment (Doyle and Smart, 1993). Establishing native plant species to compete with infestations of the cyanobacteria Lyngbya have also been evaluated in Guntersville Reservoir. Three of the seven species tested, Pontederia cordata, Nelumbo lutea and Potamogeton nodosus, are considered good candidates for long-term establishment and competition in Lyngbya management studies. These three species were able to establish in the presence of Lyngbya mats and minimized the existence of mats in the experimental plots (Doyle and Smart, 1993). Use of barley straw is not likely to produce long-term results without repeated application, and the consistency of results is not especially reliable. However, where such additions have prevented algal blooms, repetitive treatment could be successful in the long-term.
4.4.3 Impacts to Non-Target Organisms Impacts to non-target organisms are difficult to reliably predict and vary by treatment as described below. A variety of impacts is possible, but may or may not be manifest over a range of cases. Important factors to consider are native vs. non-native introductions, ability to reproduce, target plant specificity, and role in nutrient cycling. Because of the inherent risks involved, a foreign biological control agent must be thoroughly evaluated for host specificity and potential for adverse impacts before approval is granted by the U.S. Department of Agriculture, Animal Plant Health Inspection Service (USDA-APHIS) (CoFrancesco, 1993; Cooke et al., 1993a). Species transport across state borders is also regulated by the Massachusetts Division of Fisheries and Wildlife and the Massachusetts Department of Agricultural Resources. Augmentation of native or naturalized biocontrol agents are preferred over the introduction of foreign biocontrol agents because there is less chance of irreversible adverse impacts to non-target species and a lower probability of the biocontrol agent becoming a nuisance species as well. The track record for biological problem-solving through introduced,
Eutrophication and Aquatic Plant Management in Massachusetts
4.0 Methods to Control Aquatic Plants Page 4-61
non-native species is poor (as many problems seem to have been created as solved), and governmental agencies tend to prefer alternative controls unless there is no practical choice. Some biocontrol agents are generalists like the grass carp, which feeds on a wide variety of plant species. Other biocontrol agents are specialists, such as the weevil Euhrychiopsis lecontei, which restricts its feeding to the watermilfoil family (Creed and Sheldon, 1993; 1994). The generalist is less predictable than a specialist in terms of ecological impact on the lake environment. Whether or not the biocontrol agent can reproduce in its new environment will determine the duration of any impact in many cases. Whether the biocontrol agent sequesters nutrients for an extended period of time or converts them into a readily available form will also affect the level of impact on lake productivity. The biotic assemblage of each lake is to some extent unique, and predictability is also lowered by uncertainty about how each biotic component will react to the introduction and how the lake will respond as a whole.
4.4.3.1 Short-Term Impacts to Non-Target Organisms by Food Web Biomanipulation
Biomanipulation has had some success, but implementing this method can result in unanticipated impacts due to the complexity of the food web (Shapiro, 1990). If rotenone is used to kill fish as part of community restructuring, this would obviously have dramatic impacts on not only the fish community but probably the zooplankton and insect populations as well. Alteration of the fish community by other means will have lesser but not necessarily insignificant impacts. These impacts may indeed be considered positive in many cases, but some species must be the “loser” in an introduction, and it is not always the targeted species. Impacts to non-target organisms may not be immediately apparent due to the long time periods needed to evaluate the impact to the food web (Carpenter and Kitchell, 1993).
4.4.3.2 Long-Term Impacts to Non-Target Organisms by Food Web Biomanipulation
With the introduction of large piscivorous fish, the entire fish community may be impacted (by design). Too high a stocking rate may reduce populations of smaller fish more than desired and this could lead to adverse impacts on the overall fish community over a period of several years. Eventually, the system would be expected to revert to original conditions in most cases, but some lasting changes are possible. Long-term predictability is low.
4.4.3.3 Short-Term Impacts to Non-Target Organisms by Herbivore Introduction
When introducing grass carp to a system, adverse impacts are expected on nearly all plants, especially those that are a preferred food source. It is often difficult to predict which plants will be preferred because grass carp are generalists, and their feeding preferences can be determined by differences in water temperature, softness of plants, size of the fish and nutritional properties of the plant (Pine and Anderson, 1991). If only one or a few species of plants are targeted for reduction, non-target impacts should be expected. Algae may bloom following macrophyte removal due to increased nutrient levels in the lake (Hestand and Carter, 1978). Impacts are
Eutrophication and Aquatic Plant Management in Massachusetts
4.0 Methods to Control Aquatic Plants Page 4-62
likely to be expressed over several years; classification as short- or long-term is therefore somewhat subjective. Introduction of 3-5 fish per acre into Lake Conway in Florida resulted in greatly reduced densities of hydrilla, nitella and pondweeds after two years, while non-targeted water celery (Vallisneria) was largely unaffected (Miller and King 1984). However, algal biomass increased, indicating the potential of fish to affect productivity in the water column. In contrast, stocking of about 13 fish per acre (30/acre if only vegetated acres are counted) in Lake Conroe, Texas, eliminated all submersed plants in under 2 years, increased algal biomass, and changed the algal composition to less desirable forms (Martyn et al., 1986; Maceina et al., 1992). The use of grass carp is likely to drastically alter the ecology of a lake. Stocked to reduce vascular plant density, grass carp typically cause a shift toward algal blooms and increased turbidity that becomes a self-sustaining alternative lake condition. This condition may be unsuitable for desirable gamefish production and may be more objectionable to human users than the original rooted plant problem. Few short-term impacts to non-target organisms are expected when adding host-specific insect herbivores to a lake. Work with the milfoil weevil and the loosestrife beetle to date do not indicate any non-target impacts within the year of treatment. Even impacts to target species are limited in the short-term.
4.4.3.4 Long-Term Impacts to Non-Target Organisms by Herbivore Introduction
Changes in the plant community brought about by grass carp introductions have been shown to significantly alter other components of the ecosystem over several years. Much research has been conducted on fish community impacts. Betolli et al. (1991) documented a dramatic reduction in the brook silverside population (Labidesthes sicculus) and a concurrent increase in the population of inland silversides (Menidia beryllina) after removal of vegetation by grass carp. Prior to vegetation removal, the two species of silverside had coexisted. The removal of significant quantities of rooted aquatic macrophytes caused a dramatic decrease in available microcrustaceans and increased competition between the two silverside species for food. Additionally, two other insectivores, blacktail shiner (Notropis venustus) and bullhead minnow (Pimephales vigilax) also became more abundant after vegetation removal, thus increasing competition. Bluegill (Lepomis macrochirus) standing crop has been shown to decrease in study ponds stocked with grass carp possibly due to interference with reproduction (Forester and Lawrence 1978). Bailey (1978) reports that total standing crop, shad biomass, numbers of catchable largemouth bass, sunfish, crappie, and young-of-the-year largemouth bass and sunfish both increased and decreased in grass carp stocked lakes with no clear trend in either direction. Baur et al. (1979) demonstrated that if vegetation was drastically depleted by grass carp, the vulnerability of young fish to predation increased, resulting in reduced survival of age 0 largemouth bass and bluegills. However, Baur et al. also notes that grass carp had no apparent detrimental effect on the survival of age 0 largemouth bass or bluegills unless the vegetation was drastically depleted. Additionally, grass carp schooling activity was cited as being responsible for decreasing bluegill spawning activity, thereby significantly reducing their standing crop.
Eutrophication and Aquatic Plant Management in Massachusetts
4.0 Methods to Control Aquatic Plants Page 4-63
Ware and Gasaway (1976) documented significant deleterious effects to the fish populations in two Florida lakes after high density stocking of grass carp (123 and 73 grass carp per acre). Total number and standing crop of largemouth bass was reduced by 91 percent. Additionally, largemouth bass exhibited weak recruitment. The population of warmouth (Lepomis gulosus) was also reduced. Conversely, bluegill, brown bullhead (Amieurus nebulosus) and lake chubsucker (Erimyzon sucetta) all showed substantial increases in population levels. Other impacts included: 1) a noticeable reduction in the number of fish species, 2) shifts in species dominance, and 3) a reduction in biomass for several fish species. It should be noted that impacts to fish documented by Ware and Gasaway may be in part due to a rotenone treatment used during the study which unintentionally killed some sportfish. Kirk (1992) determined that, in order to avoid interfering with balanced communities of largemouth bass and bluegill in farm ponds, grass carp stocking densities should not exceed 20 fish per acre. Grass carp stocked at this density achieved control of target vegetation in only 9 of 29 test ponds, although the study reported unusually poor grass carp survival (57-72 percent survival in all ponds after one month). One of the largest studies of the impacts of grass carp introductions on native fish populations included 31 Arkansas lakes which had data for both pre- and post-stocking of grass carp that removed most of the vegetation in those lakes (Bailey, 1978). The responses were highly variable from lake to lake and the study concluded that the introduction of grass carp resulted in neither consistent improvement nor a consistent decline in the quality of fish populations. Plant removal by grass carp did appear to improve the condition factor of largemouth bass, bluegill and redear sunfish (Bailey, 1978). A study of fisheries impacts in Lake Conroe, a very large (8,100 ha, 20,000 acre) reservoir in Texas, found that many of the small littoral species of fish such as bluegill and crappie declined after grass carp eliminated most of the vegetation (Bettoli et al., 1993). Fish behavior may also be altered as a result of dramatic changes in aquatic vegetation abundance. For example, Colle et al. (1989) observed that when aquatic vegetation was severely reduced, one segment of a largemouth bass population in their study lake that once lived in beds of vegetation, switched to docks and piers. Another segment of the bass population migrated to open waters devoid of underwater structure. Grass carp are known to have over 100 diseases and parasites. Among them is the Asian tapeworm (Bothriocephalus gowkongensis) which is also hosted by other fish species such as the golden shiner and the fathead minnow (J. Schachte as cited in Woltmann, 1986; Hoffman and Mitchell, 1986). As noted in Opuszynski and Shireman (1995), the spread of parasites can be counteracted by using parasite-free fish fry. The Washington Department of Wildlife (1990) also notes that the importation of the Asian tapeworm can be eliminated by importing grass carp over 8 inches in length. As noted by Woltmann (1986), since the introduction of grass carp into the United States in 1963, there have been no reports of grass carp diseases or parasites having an adverse effect on native fishes. Reasonable levels of precautions, however, should be taken for all non-native fish stocking. Grass carp are not the only organisms in a lake, pond, or river that rely on plant matter for dietary needs. Forester and Avault (1978) documented a significant decrease in the average

Eutrophication and Aquatic Plant Management in Massachusetts
4.0 Methods to Control Aquatic Plants Page 4-64
number and total weight of crawfish after grass carp were stocked due to direct competition for food. After vegetation was depleted by the grass carp, the amount of animal matter found in the stomachs of the grass carp increased. Additionally, Betolli et al. (1991) recorded a dramatic decrease in numbers of microcrustaceans as a result of reduced plant biomass after grass carp introduction. The vegetation eaten by grass carp is also eaten by various waterfowl and thus waterfowl may be negatively impacted by grass carp (WDW, 1990). In reviewing studies on the impacts caused by grass carp, Leslie et al., (1987) note that many species of aquatic plants are eaten by ducks and that waterfowl habitat deteriorated in three of four small Florida lakes after grass carp were introduced (Gasaway and Drda, 1976, as cited in Leslie et al., 1987). They also suggest that benthic invertebrates may increase, but invertebrates inhabiting plants will decline. In a New York pond with heavy stocking of grass carp, no post-stocking trends in the condition of other fish were noted except for a decline in condition of large (>6 inch) bluegills and improved growth for bluegill and other panfish (Woltmann, 1986). Woltmann concludes the impacts to native fish communities were varied and subtle and in certain cases improved the fish growth and stock structure, but warned that complete elimination of vegetation would be expected to adversely impact species such as the chain pickerel, which is dependent on vegetated habitats. The 712 respondents to the pond owner survey of New York grass carp introductions by Stang (1994) reported that fishing for other species was the same (48 percent) or better (9 percent) and only 2 percent reported worse fishing. The remaining 41% did not know, or the pond was not used for fishing. There have been no reports of adverse impacts to waterfowl habitat and no reports of fish diseases in New York State as a result of the triploid fish stocking program (D. Stang, NYSDEC, pers. comm. 1997). In contrast to the potential impacts of grass carp on non-target organisms, long-term impacts to non-target organisms by weevils have not been observed (S. Sheldon, Middlebury College, pers. comm., 1995). Impacts must be determined separately for each species used, but there is no reason to expect long-term impacts to non-target organisms from the loosestrife beetle either. Changes in the plant community are intended, and these may have some impact on other plant-dependent species, but overall cover is not expected to be altered, and any resultant non-target impacts will probably be subtle.
4.4.3.5 Short-Term Impacts to Non-Target Organisms by Pathogens
The impacts of pathogens introduced for plant control on non-target plant and animal species would need to be evaluated individually for each pathogen. As there are no pathogens in widespread use at this time, information is insufficient to draw conclusions. However, as the pathogens are intended to be highly host-specific, no major non-target impacts would be expected from a successful program.
4.4.3.6 Long-Term Impacts to Non-Target Organisms by Pathogens
Impacts will depend on host specificity, which is supposed to be high. This would suggest minimal long-term non-target impacts, but data are insufficient to properly evaluate such impacts.
Eutrophication and Aquatic Plant Management in Massachusetts
4.0 Methods to Control Aquatic Plants Page 4-65
4.4.3.7 Short-Term Impacts to Non-Target Organisms by Plant Interactions
No substantial impacts are expected if native vegetation is used, but there are insufficient data to evaluate possible impacts.
4.4.3.8 Long-Term Impacts to Non-Target Organisms by Plant Interactions
No adverse impacts are expected if native plants are used, but there are insufficient data to evaluate possible impacts.
4.4.4 Impacts to Water Quality Water quality impacts caused by biological control are mostly indirect, induced as a result of changes in algae or vascular plant communities. Where algal blooms are prevented, water quality would be considered to have improved; such improvement might be expected from food web biomanipulation (whereby zooplankton grazing on algae is enhanced) or barley straw addition (with apparent allelopathic impact on algae). Where vascular plants are reduced, available nutrients may be funneled into algal production, leading to what most people would consider a decline in water quality. A reduction in macrophytes may also stabilize oxygen levels at a desirable level, however, and can reduce taste and odor in the water. Host-specific plant pathogens or herbivores would not be expected to alter the plant community sufficiently to have a major impact on water quality. Plant replacement efforts, whereby a desirable native species is encouraged after removal of a nuisance species, also would not be expected to yield major impacts to water quality. The most dramatic impacts are induced by grass carp, although not on a consistent basis. Increases in alkalinity (Mitzner, 1978), turbidity, and potassium concentrations and significant reductions in dissolved oxygen levels (Lembi et al., 1978) have all been documented in waters stocked with grass carp. Leslie et al. (1983) recorded an increase in turbidity, reduction in chlorophyll a and long term increases in nutrient-related variables. Woltmann (1986) noted that phosphorus and chlorophyll a increased (chlorophyll a increased from 2.3 µg/l to 29.0 µg/l during the study period in one pond), but concluded that overall increases in total phosphorus and chlorophyll a were similar to those reported following herbicide treatments in other lakes. However, a review of many studies has surprisingly revealed a decrease, or at least no increase, in the rate of nutrient cycling or productivity despite elimination of submersed macrophytes (Cassini, 1996). Cassini suggests the following three potential explanations as to why this may occur: 1) grass carp assimilate a large percentage (up to 90%) of the phosphorus they ingest (Chapman et al., 1987; Leslie et al. 1987), 2) when vegetation is reduced, greater "mixing" may occur that leads to increased dissolved oxygen levels near the sediment/water interface and less recycling, and 3) littoral plant communities may function as a means of "pumping" nutrients from the sediment to the water column and when they are substantially reduced or eliminated by grass carp there are less pumped nutrients available for phytoplankton (Terrell, 1976). The actual impact of grass carp on phosphorus and algae production is likely to be dependent on the rate of macrophyte removal, with fast removal favoring algae growth.
Eutrophication and Aquatic Plant Management in Massachusetts
4.0 Methods to Control Aquatic Plants Page 4-66
A seven-year limnological survey following introduction of grass carp indicated an increase in the concentration of chlorophyll a, a decrease in Secchi transparency attributed to an increase in algal biomass and a negative correlation between the nutrient levels of the lake during the summer months and the densities of macrophyte coverage in June of each year (Maceina et al., 1992). In a review of water quality changes following grass carp introduction in 16 lakes, Opuszynski and Shireman (1995) report that total phosphorus was found to increase in five lakes, decrease in one and remain unchanged in 10 lakes. They also report that pH decreased in six lakes and remained unchanged in 10; chlorophyll a increased in five, decreased in one and remained unchanged in nine. Turbidity increased in seven, decreased in one and remained unchanged in four. Most of the lakes studied were densely vegetated Florida lakes where grass carp were stocked at rates high enough to nearly eliminate vegetation. The high degree of variability in water quality response is likely due to the amount of vegetation controlled and other factors that vary from lake to lake. Opuszynski and Shireman (1995) also note that temperature and oxygen values are relatively unchanged after the introduction of grass carp.
4.4.5 Applicability to Saltwater Ponds Most of the species mentioned here would not survive in saltwater ponds, but other species may be available. The approaches discussed appear applicable, but there is no documented experience with biological control in saltwater ponds.
4.4.6 Implementation Guidance
4.4.6.1 Key Data Requirements
Data requirements are difficult to summarize, as the requirements vary depending on what type of biocontrol agent is involved. Generally, the important items to consider are whether the species is native or non-native, the host or dietary specificity to the target plant species, the effect of the species on nutrient cycling, and the ability to control the biocontrol agent, either by limiting its reproduction or dispersal. For food web biomanipulation, a biological survey and analysis of the present food web would be essential. For many herbivores, the stocking rate will depend on the density (biomass) and extensiveness (cover) of the target plant species. For plant replacement programs, water depth, light and substrate will be important features of the lake. Biological controls are still largely experimental. This is to some extent an inherent property of biological systems; variability in results should be expected. Having more information available for a target lake increases the likelihood that variability can be reduced, or at least predicted, but will not guarantee results.
4.4.6.2 Factors that Favor this Approach
The following considerations are indicative of appropriate application of biological controls for the management of plants in lakes: 1. The biocontrol agent is a native species that is highly host-specific for the target species. 2. Relationships between the introduced species and the lake are understood from studies at
other lakes.

Eutrophication and Aquatic Plant Management in Massachusetts
4.0 Methods to Control Aquatic Plants Page 4-67
3. The biocontrol agent can be removed from the lake if necessary, or has limited powers of reproduction, migration, or longevity.
4. Small scale field tests can be run to examine likely effectiveness and non-target impacts before moving to full scale introduction.
5. Rearing procedures allow cost effective propagation of the biocontrol agent, or natural increases in abundance can be stimulated.
6. Other techniques are available to augment biocontrol as needed. 7. A gradual transition to more desirable conditions is acceptable. 8. A higher degree of uncertainty and variability of results is tolerable.
4.4.6.3 Performance Guidelines
Planning and Implementation Generally, a full biological survey and study should be conducted to determine what type of manipulation is best suited to achieve the desired goals while minimizing possible adverse impacts. Because of the experimental nature of most biological methods, results are not assured to the same degree as for other methods such as harvesting or herbicide treatment. With all biological control methods, the many lake conditions acting in concert must be considered and various scenarios for impacts anticipated. Those employing these techniques should be prepared to adjust and repeat treatments over several years to achieve the desired results. The details of actual introductions (or removals) will depend on the species involved, but usually involve a high degree of care to ensure target densities are met. This may be a labor-intensive and time consuming process. Sources of organisms should be reputable and knowledgeable. The sequencing of implementation steps may be important too. To prevent unanticipated impacts by the introduced species, foreign insects and pathogens must undergo a quarantine period and extensive testing for host specificity and other factors (Cooke et al., 1993a). Introducing a native plant species requires less regulatory involvement, but must still be considered carefully. Any introduction of fish requires a permit from the MDFG. Water bodies considered for triploid grass carp introductions in New York and Connecticut are typically small, privately owned ponds that are managed by the owners. They typically have excessive macrophyte growth and have used other management options such as harvesting or herbicides previously. In New York, the effectiveness of grass carp must be assessed after two years before new additions of grass carp are permitted (D. Stang, NYSDEC, pers. comm., 1997). There is the potential for grass carp to become a nuisance species themselves, and once released, they cannot easily be retrieved and are difficult to kill. The use of fish management bait (fish food pellets poisoned with rotenone) to eliminate grass carp while leaving non-target fish unharmed has been tried, but has been only partially effective (Mallison et al., 1994). Woltmann (1986) notes that recapture in several New York ponds by various methods (electrofishing, angling, gillnetting) was difficult, but also notes that in one pond (Arrowhead Pond, New York) where vegetation was essentially eliminated, the fish were caught on hook and line with a minimal degree of effort. While angling, iceberg lettuce was the most effective bait. Electrofishing and herding into nets with noise have also achieved some success (Bonar et al., 1993)
Eutrophication and Aquatic Plant Management in Massachusetts
4.0 Methods to Control Aquatic Plants Page 4-68
Introductions of organisms might be tried on a small scale, using enclosures, to test for effectivenss and unintended impacts before moving to a larger scale introduction. Having the ability to remove or eradicate an introduced species would be a valuable mitigative tool, but is seldom available with biological introductions. Alternatively, being prepared to counteract possible impacts with other techniques (e.g., phosphorus inactivation, alternative plant controls) is advisable. Monitoring and Maintenance Piscivorous or herbivorous fish may require multiple stockings to establish a population large enough for effective management. It appears that multiple stockings may be necessary for herbivorous insects as well. Additional introduction of pathogens, plants or barley straw might also be needed. Generally, no maintenance beyond restocking is required as the system is usually left alone after the manipulation has taken place. Continued removal of planktivores may be needed, as spawning may naturally upset the balance established by initial removal. Monitoring should focus on the target species or condition, but will also have to provide some indication of any non-target impacts. Water clarity will be important to programs targeting algae, while plant coverage, biomass and assemblage composition will be important in plant control efforts. Additional components of likely concern are the fish, benthic invertebrates, and overall water quality (e.g., nutrients, oxygen, pH, temperature). Variables, stations and frequency of monitoring should all be chosen to track progress and provide early warning of any problems. Mitigation Little mitigation is possible once a species is introduced. If sterile, time will eliminate the species from the lake, but where reproduction is possible, the species may become established. Stocking of non-native species is therefore closely regulated and generally discouraged. Even the introduction of native species must be properly permitted.
4.4.7 Regulations
4.4.7.1 Applicable Statutes
In addition to the standard check for site restrictions or endangered species (see Appendix II), a Notice of Intent must be sent to the Conservation Commission with a copy to the Department of Environmental Protection Regional Office. If the proposed project occurs within an Estimated Habitat of Rare Wildlife in the most recent version of the Natural Heritage Atlas, a copy of the Notice of Intent must be submitted to the Natural Heritage and Endangered Species Program (NHESP) within the MDFG for review (Appendix II). If the proposed project occurs within a Priority Habitat of Rare Species in the most recent version of the Natural Heritage Atlas, the project proponent must submit project plans to the NHESP for an impact determination. An Order of Conditions must be obtained prior to work. A MEPA review may also be required, depending upon interpretation of the impact thresholds. In addition to approval of the Conservation Commission, the importation or liberation of fish or wildlife requires permits from the Division of Fisheries and Wildlife. Generally, native
Eutrophication and Aquatic Plant Management in Massachusetts
4.0 Methods to Control Aquatic Plants Page 4-69
species (native to Massachusetts) do not require extensive testing and quarantine as non-native species do. Introduction of foreign species would require additional testing, approval of Division of Fisheries and Wildlife and Massachusetts Department of Agricultural Resources. It may require quarantine and approval of the federal U.S. Department of Agriculture, Animal Plant Health Inspection Service (USDA-APHIS). Most states do not permit the introduction of diploid grass carp. According to a review by Opuszynski and Shireman (1995), only nine states allow stocking of both diploid and triploid grass carp, and 27 states allow only triploids to be stocked. Nine states allow triploids for research only. Thirteen states, including Massachusetts, New Hampshire, Vermont, and Maine, prohibit grass carp altogether.
4.4.7.2 Impacts Specific to Wetlands Protection Act
The following overall impact classification is offered as a generalization of impacts, with clarifying notes and caveats as warranted: 1. Protection of public and private water supply – Generally neutral (no significant interaction),
although reduced plant density may benefit taste and odor control. 2. Protection of groundwater supply – Generally neutral (no significant interaction). 3. Flood control – Generally neutral (no significant interaction). 4. Storm damage prevention – Generally neutral (no significant interaction). 5. Prevention of pollution – Generally neutral (no significant interaction), but could be a
detriment if nutrient cycling promotes algal blooms. 6. Protection of land containing shellfish – Generally neutral (no significant interaction). 7. Protection of fisheries – Possible benefit (habitat enhancement) and possible detriment (food
source alteration, loss of cover). 8. Protection of wildlife habitat - Potential benefit by habitat improvement, but may have
benefit and detriment to different species in same lake from same harvesting effort.
4.4.8 Costs Costs vary substantially among and within treatments classified as biological control. Choice of introduced organism, magnitude of application, necessary mitigative measures, and monitoring can each have a major impact on cost, even when standardized to an areal unit (i.e., $/acre). Food web biomanipulation costs will depend on the labor cost for removing planktivores or the stocking cost of added piscivores. Costs of $1 to $20/fish are common for stocked piscivores. Wagner (2001) suggests a cost of $500 to $1,500/acre for piscivore stocking and a cost of $1,000 to $5,000/acre for planktivore removal. Costs for 8-10 inch grass carp vary widely between $4 and $13 depending on the source. At stocking rates of 7 to 15 fish per acre this would amount to a cost of $28 - $195 per acre, and the treatment typically lasts about five years. Wagner (2001) suggests a cost of $50 to $300/acre for grass carp stocking. Milfoil weevils are sold for $1 each, with a recommended stocking density of 3,000 per acre. Loosestrife beetles are available for a similar price, but the Association of Massachusetts
Eutrophication and Aquatic Plant Management in Massachusetts
4.0 Methods to Control Aquatic Plants Page 4-70
Wetland Scientists recommends that interested groups raise the beetles themselves at a reduced cost. Wagner (2001) suggests insect introduction costs of $300 to $3,000 per acre. Costs for pathogens and plant introductions are not readily available, these techniques having been used so seldom to date. The plant replacement experiments at Lake Buel and Island Creek Pond sponsored by the MDCR in 2000 were each $20,000 projects, and less than an acre was addressed in each case. However, these were research projects with considerable monitoring and start-up costs that might be avoided in the future. Barley straw can be obtained in sufficient quantity for treatment at about $20/acre, but the labor costs are the greatest portion of total cost and have not been reported.
4.4.9 Future Research Needs More than most other methods, biocontrol requires much additional research to evaluate effectiveness and reduce the chance of unwanted impacts to Massachusetts lakes. Considering the potential for this method to control plants and algae with relatively little cost, further research is warranted and careful, restricted studies of a variety of agents should be encouraged. The current status of our knowledge of these techniques is not adequate to allow cost effective application on a large scale at this time. Most research in the past has focused on plant species preferences and appropriate biocontrol density to achieve the desired results. These are critical topics, but when the only option is to stock large numbers of a biocontrol agent, costs escalate rapidly. The Vermont experience with the milfoil weevil is a clear example of large expense for relatively little benefit, but this was all part of the research effort. Research on the weevil has not advanced, however, to the point of allowing us to stimulate natural increases in weevil populations, and expensive stocking is still necessary to get results from this technique. Once the potential for a biocontrol agent has been established, research should focus on how to minimize the need for expensive rearing operations and maximize natural growth processes in the target lakes. The experience with the loosestrife beetle is an example of how the rearing process has been fine tuned to allow volunteers to perform this function, making the technique more affordable. The ability to stimulate natural increases in biocontrol agents remains elusive, however.
4.4.10 Summary Biological control has the potential to effectively reduce algae or vascular plants, but also has some potential for adverse impacts on non-target organisms. Impacts can be direct, but are far more often indirect results of induced changes in plant communities. Historically, the introduction of non-native species has caused more harm than good. For this reason, the safest biocontrol technique is to augment populations of naturally occurring biocontrol agents. Biological control methods used experimentally in Massachusetts have shown generally favorable results, or at least no negative impacts, but we have too little experience with the range of biological control methods to use these techniques effectively to their full potential. Grass carp have not been allowed in Massachusetts and there are no pathogens currently in use here.
Eutrophication and Aquatic Plant Management in Massachusetts
4.0 Methods to Control Aquatic Plants Page 4-71
Encouraging populations of piscivores, which are also the primary gamefish, will both enhance grazing on algae by zooplankton and please the great majority of fishermen. It may not be possible to prevent algal blooms in excessively fertile lakes, but a large population of large-bodied zooplankton will minimize the algal biomass for the level of fertility experienced. Maintaining the stability of the system under food web manipulation is difficult. Plant replacement, whereby an invasive species is reduced in abundance by any means possible, and a native assemblage is encouraged in its place, is receiving increased attention. It may not be possible to prevent invasions by nuisance species, but their rise to dominance might be slowed substantially by a healthy native assemblage. If a biocontrol method is chosen, lake conditions must be evaluated to minimize negative impacts and determine the ability of introduced species to be successful. Biological control methods are often perceived by the public as a more natural alternative to physical or chemical control methods. However, biological control is often difficult to achieve and maintain and thus the technique is best applied in conjunction with the other management techniques in an integrated approach. Biological control is intended to impact trophic relationships in a lake, but impacts to non-target organisms are expected to be limited in most cases. The major exception is the use of grass carp, which can have a major but inconsistent effect on the entire lake. Herbivorous insects and potential pathogens are generally host specific with little adverse impacts on non-target organisms. Tests can be conducted in the laboratory or with small enclosures in lakes before proceeding with a full-scale introduction where considerable uncertainty exists. Grass carp are herbivorous fish that may dramatically alter aquatic habitats by eliminating plant biomass. The body of literature provided in this GEIR about grass carp clearly illustrates that the impacts and effectiveness of grass carp are highly variable and difficult to predict. Although grass carp can be an effective means of reducing plant biomass, they can cause negative impacts to wildlife habitat and water quality. Diploid (potentially reproducing) grass carp are banned in most states, as they possess the potential for negative impacts, range expansion and potential long-term establishment. Some case studies from neighboring states have shown that triploid (sterile) grass carp have the potential for aquatic plant control with limited negative impacts. The environmental agencies of the Commonwealth and the CAC have carefully considered further study of triploid grass carp under tightly controlled conditions. However, due to the risk of environmental impacts and the difficulty of predicting effectiveness, and given the available information, the state agencies and the CAC have made the final recommendation to prohibit introduction of all grass carp at this time.
4.5 BENTHIC BARRIERS
4.5.1 Sediment, Porous Screens, Non-Porous Sheet Materials The use of benthic barriers, or bottom covers, is predicated upon the principles that rooted plants require light and cannot grow through physical barriers. Applications of clay, silt, sand, and gravel have been used for many years, although plants often root in these covers eventually, and current environmental regulations can make it difficult to gain approval for such deposition of
Eutrophication and Aquatic Plant Management in Massachusetts
4.0 Methods to Control Aquatic Plants Page 4-72
fill. However, natural benthic barriers such as coarse sand and pea stone have been used to create swimming beaches, to provide public access for recreation and for shoreline stabilization in many areas. As long as the sand or other material is low in nutrients and fairly thick (about 6 inches) macrophyte growth may be inhibited. These natural materials also have potential for use in the creation of boat channels through thick weed beds, especially if underlain by filter fabric. The use of sand on beaches is often referred to as ‘beach nourishment’. Sand from beaches tends to migrate into the swimming area and may control plant growth to some extent. Such filling is not explicitly permitted when beach sand is applied, but it is a physical reality in most beach situations. An interesting version of this approach is the reverse layering technique (KVA, 1991), in which sand is pumped from underneath a muck or silt layer and deposited as a new layer on top of the muck or silt. This is technically a re-organizing of the sediments, not new filling. This technique is covered under dredging for nutrient reduction, but may provide some relief from plant nuisances as well. Artificial sediment covering materials, including polyethylene, polypropylene, fiberglass, and nylon, have been developed over the last three decades. A variety of solid and porous forms have been used. Manufactured benthic barriers are negatively buoyant materials, usually in sheet form, which can be applied on top of plants to limit light, physically disrupt growth, and allow unfavorable chemical reactions to interfere with further development of plants (Perkins et al., 1980). Various plastics and burlap have also been used, but are not nearly as durable or effective in most cases. In theory, benthic barriers should be a highly effective plant control technique, at least on a localized, area-selective scale. In practice, however, there have been difficulties with the deployment and maintenance of benthic barriers, limiting their utility over the broad range of field conditions. Benthic barriers can be effectively used in small areas such as dock spaces and swimming beaches to completely terminate plant growth. The creation of access lanes and structural habitat diversity is also practical. Large areas are not often treated, however, because the cost of materials and application is high and maintenance can be problematic (Engel 1984). Benthic barrier problems of prime concern include long-term integrity of the barrier, billowing caused by trapped gases, accumulation of sediment on top of barriers, and growth of plants on porous barriers. Successful use is related to selection of materials and the quality of the installation. As a result of field experience with benthic barriers, several guidelines can be offered:
Porous barriers will be subject to less billowing, but will allow settled plant fragments to root and grow; annual maintenance is therefore essential.
Solid barriers will generally prevent rooting in the absence of sediment accumulations, but will billow after enough gases accumulate; venting and strong anchoring are essential in most cases.
Plants under the barrier will usually die completely after one to two months, with solid barriers more effective than porous ones in killing the whole plant; barriers of sufficient tensile strength can then be moved to a new location, although continued presence of solid barriers restricts recolonization.
Eutrophication and Aquatic Plant Management in Massachusetts
4.0 Methods to Control Aquatic Plants Page 4-73
Proper application requires that the screens be placed flush with the sediment surface and staked or securely anchored. This may be difficult to accomplish over dense plant growth, and a winter drawdown can provide an ideal opportunity for application in exposed areas. Late spring application has also been effective, however, despite the presence of plant growths at that time. Barriers applied in early May have been removed in mid-June with no substantial plant growth through the summer (BEC, 1991b). Scuba divers normally apply the covers in deeper water, which greatly increases labor costs. Bottom barriers will accumulate sediment deposits in most cases, which allow plant fragments to root. Barriers must then be cleaned, necessitating either removal or laborious in-place maintenance. Despite application and maintenance issues, benthic barriers can be a very effective tool. Benthic barriers are capable of providing control of milfoil on at least a localized basis (Engel, 1984; Perkins et al., 1980; Helsel et al., 1996), and have such desirable side benefits as creating more edge habitat within dense plant assemblages and minimizing turbidity generation from fine bottom sediments.
4.5.2 Effectiveness
4.5.2.1 Short-Term
Barriers are an effective and fairly rapid method to achieve a plant free water column in localized areas. In Union Bay, an embayment at the outlet of Lake Washington in Washington State, Perkins et al. (1980) found that the water column remained free of plants while the barriers were in place. The screens (Aquascreen) were removed from the study sites after one, two and three months, with maximum biomass reduction occurring by two months. Myriophyllum spicatum was the dominant plant in the embayment and was significantly injured by placement of the screens, but still represented at least 83 percent of the total plant material collected from any one plot later. Three species of Potamogeton and Najas flexilis survived one month of coverage, but were virtually eliminated by two months of coverage. There was no significant change in the populations of Ceratophyllum demersum and Elodea canadensis in response to placement of the screens, but both were present only as sparse populations. The rate of regrowth for many plants was also found to be somewhat diminished. Because laboratory experiments have shown that M. spicatum can grow under low light conditions, the study concluded that compressing the plant against the bottom sediments rather than the reduction in light for photosynthesis was the critical factor that determines the effectiveness of the barriers (Perkins et al., 1980). Benthic barriers have been used at Lake George since 1986 (Madsen et al., 1989; Eichler et al., 1995). Dartek was initially installed over 3 acres of milfoil in two areas, and was successful in controlling milfoil within the treated area for about 3 years. No supplementary management actions were conducted, however, and peripheral growths expanded and achieved bed densities in 1989. Sediment accumulation in one area exposed to frequent traffic by large boats was sufficient to allow dense growths of milfoil on portions of the barrier in 1990; those growths were still present in 1995. Aquascreen (a fine mesh material) and Palco Pond Liner (an impermeable membrane) were installed at 8 sites in Lake George in 1990 (Eichler et al., 1995). Both barrier types were initially
Eutrophication and Aquatic Plant Management in Massachusetts
4.0 Methods to Control Aquatic Plants Page 4-74
successful in eliminating targeted beds, although recolonization of Aquascreen left in place without annual maintenance was far greater than for the solid Palco material. Dartek and several other brands of benthic barrier are no longer commercially available, and Aquascreen was unavailable for some time, but is now back on the market. A mesh product very similar to Aquascreen, called Aquatic Weed Net, is also now available. Palco is now made by a different supplier, but can be obtained. An additional product, Texel, is a felt-like sheeting material that has not been tried in Lake George but is potentially applicable and is slightly less costly than the other materials. The tendency of products to come and go without much stability in the market has been a hindrance to benthic barrier use. Few of the barrier materials on the market at any time continue to be available for more than 5 to 10 years; most need to be made in bulk to keep costs down, yet cost remains high enough to hinder demand and reduce bulk use. Where sand or other natural materials are applied, the immediate effect is to bury the existing plants and seed bank. The effectiveness depends on the site and preparation. In cases of an organic, muck bottom the sand may simply settle into the muck and be covered by new silt and organic material. In large lakes where the onshore waves may strike the target beach at an angle, the sand may be removed by wave action and transported by lateral shore currents. In cases where the slope of the lakebed and beach is steep, waves may wash the sand into deeper areas of the lake and reduce effectiveness. The DEM beach at Walden Pond has a slope of approximately one foot vertical for every three foot horizontal and applied sand has quickly been lost to deep water (D. Morrissey, DEM, pers. comm., 2002).
4.5.2.2 Long-Term
Benthic barriers can be effective over an extended period of time with proper application and maintenance. Over time, sediments can accumulate on the surface of the barriers and act as a substrate for attachment of rooted plants (Engel, 1984; Perkins et al., 1980). A benthic barrier at Chebacco Lake in Essex and Hamilton was ineffective because it was not adequately maintained. As a result, the barrier experienced siltation problems (G. Gonyea, MDEP, pers. comm., 1996). A comparison of fiberglass screens (Aquascreen) and filter mats made of woven polypropylene fibers (Terratrack T2415) showed that although the former were easy to install, they were only effective for one season. After the first season the fiberglass screen was covered with sediments and difficult to locate. Terratrack T2415, on the other hand, was difficult to install due to its buoyancy, but was effective for several seasons (Lewis et al., 1983). Study of recolonization of areas of Lake George where benthic barrier has been removed (Eichler et al., 1995) reveals that both native species and milfoil were found to colonize exposed areas, but that milfoil dominance was not regained for at least two growing seasons. However, milfoil recolonization was not completely prevented in most cases. In Lake George, cover by plants was sparse for at least the first month after removal of the barrier and did not typically exceed 74% after two growing seasons, providing a low density of plants but ample opportunity for milfoil invasion. Recolonization of plants following benthic barrier application and removal in two swimming areas in Great Pond, Massachusetts, has also been studied (BEC, 1991b). These applications were for the purpose of improving swimming safety, and did not involve control of any invasive
Eutrophication and Aquatic Plant Management in Massachusetts
4.0 Methods to Control Aquatic Plants Page 4-75
non-native species. In one swimming area, a plant community not differentiable from the original assemblage was restored mainly from seed germination within one to two years after barrier removal. Only one new species was detected, a native plant found in neighboring ponds, and then only as a very minor component of the post-treatment plant community. In the other swimming area, foot traffic in sections that were considered unusable prior to treatment resulted in continued minimal plant growth. Maintenance involves removing accumulated sediment and any plant fragments or newly growing plants, and making sure the target area remains covered. Although various jetting or brushing systems have been applied underwater, it is best to remove and reinstall the barrier. Not all barriers can be moved once they are installed, but where removal and redeployment is possible, effectiveness can be increased. It is possible to flip some barriers over in place, while redeployment to a new area both cleans the barrier and extends the benefits. In general, screen materials (Aquascreen, Aquatic Weed Net) are removed or repositioned, while solid sheets (Palco Liner, Texel) are left in place permanently. Barriers can be installed anytime during the growing season and removed in the fall (Engel, 1982), although permanent installation of barriers is common and removal of porous barriers at the start of the swimming season can still provide the desired relief. Barriers do not attack the actual source of plant productivity problems (shallow depth and nutrient-rich substrate), and are not generally expected to produce long-term results without repeated application and/or maintenance, which can be labor intensive. However, barrier materials tend to last for many years, so initial capital costs can be offset by perhaps a decade of effectiveness with proper maintenance. Plants may start to root in areas where sand or gravel is placed, but new growths should be sparse and may be controlled by hand pulling. In cases where wave erosion is expected, 3/8 inch pea gravel has much less tendency to be washed away. In the long-term silt and organic matter may accumulate on the sand and gravel. This can be minimized if the area is elevated above the surrounding sediments, but this may require more expensive containment structures. In this case natural wave turbulence will tend to resuspend and sweep the fine material away, or this can be facilitated by the turbulence of swimmers or boats.
4.5.3 Impacts to Non-Target Organisms
4.5.3.1 Short-Term
Benthic barriers are not species selective; virtually all covered plants will be harmed. Barriers may inhibit spawning and feeding by some fish species and can cause low dissolved oxygen concentrations in the sediments under the barriers (Cooke et al., 1993a; Engel, 1982). They may interfere with benthic invertebrates living under the cover, through a combination of physical and chemical effects. Some fish and invertebrates are attracted to the barrier, as it creates open water habitat and edge effect desired by some predators. Snails graze on algae that can grow as a film on the barrier. While the density and diversity of the benthic invertebrate community may be altered by barrier placement, recovery is rapid once the barrier is removed (Ussery et al., 1997).
Eutrophication and Aquatic Plant Management in Massachusetts
4.0 Methods to Control Aquatic Plants Page 4-76
4.5.3.2 Long-Term
Because barriers are generally installed in small areas, any impacts to non-target organisms are localized. When barriers are removed, organisms can re-invade the area previously covered by the screens. While the barriers are in place, some fish and invertebrates will find the created habitat more attractive than the pre-treatment conditions, while others will not, but overall impacts on lake ecology should be imperceptible. Long-term impacts tend to be negligible if the barrier is removed. With the barrier in place permanently or reinstalled each year, changes in the plant assemblage in the treated area will be maintained, along with any associated effects on other biota.
4.5.4 Impacts to Water Quality
4.5.4.1 Short-Term
There are only minimal and temporary impacts on water quality from bottom barriers. Some turbidity may be induced during installation and removal. The increased turbidity from installation may complicate application by divers or snorkelers. Oxygen depression and related chemical changes under the barrier are likely, at least during plant die-off and decay, but any lakewide effect is not expected as only small areas in any given lake are typically treated.
4.5.4.2 Long-Term
No long-term impacts to water quality are expected where barriers are installed and removed. If barriers are left in place, some impact on localized overall oxygen regime may result, but no lakewide effects are expected unless a very large portion of the lake bottom is covered.
4.5.5 Applicability to Saltwater Ponds Use of benthic barrier in several saltwater ponds on Cape Cod had similar effects as in freshwater ponds for submergent vegetation, but did not work well on emergent plants (Spartina spp.) (K. Wagner, ENSR, pers. obs.). It is expected that results on emergent vegetation would be similarly poor in freshwater lakes, but there is little experience in this regard. Benthic barriers could impact shellfish beds by smothering, so application to areas of significant shellfish concentrations is not advised.
4.5.6 Implementation Guidance
4.5.6.1 Key Data Requirements
Data requirements for the use of benthic barriers over small areas, such as swimming beaches and boat launches, are limited to an assessment of the physcial and biological features of the target area. Presence of protected species and extensive obstructions are the key factors preventing use of this technique in small areas. The potential for sediment accumulation and ballooning should be evaluated by an experienced installer. Plans for maintenance should be made prior to installation.
Eutrophication and Aquatic Plant Management in Massachusetts
4.0 Methods to Control Aquatic Plants Page 4-77
4.5.6.2 Factors that Favor this Approach
The following considerations are indicative of appropriate application of benthic barriers for the management of plants in lakes: 1. The target area has dense plant growths of undesirable species. 2. The target area is small (<1 acre) and relatively free of obstructions (stumps, logs, boulders,
pilings and moorings). 3. The target area represents only a small portion of the whole lake (<10%). 4. Long-term control is sought over a small area with a recognition of necessary maintenance
needs. 5. Inexpensive labor is available. 6. No significant shellfish resources or are present in the target area.
4.5.6.3 Performance Guidelines
Planning and Implementation Considerations for the installation of benthic barriers include the size of the area to be treated, bottom features and possible obstructions, the cost of the product, application and maintenance costs, and possible impacts to non-target organisms in the installation area. Sheeting materials come in a variety of dimensions, from about 20 ft by 50 ft to 7 ft by 100 ft, although custom sizes of a wider range are possible. Deployment is therefore a function of manpower and cleverness by the installer. Careful consideration of site conditions is essential to maximizing effectiveness, as barriers must remain in place for at least a month and preferably two months to kill the target plants. There are many ways to install barriers, ranging from spreading them out with the lake drawn down to underwater positioning by divers. In water less than about 10 ft. deep, snorkeling may be sufficient to get the barrier properly positioned. One aid to application involves rolling the barrier onto PVC pipe with a slightly longer wooden or metal pole inside the PVC pipe, allowing the barrier to be rolled out like a paper towel. Anchoring systems vary with barrier type, but most forms do require staking or weighting. Sleeves can be sewn into sheet materials to allow rebar to be inserted, pieces of chain can be attached to edges, or patio blocks can be dropped onto the barrier to hold it in place. Burial under sandy sediments has been tried, but may allow more rapid plant recolonization. Where removal at a later date is desired, the weighting system should be simple and reversible (the patio block weights are very convenient in this regard). One way to extend the benefits of benthic barrier involves flipping the barrier over into the adjacent area after one to two months. Plants are killed over that time period, and the barrier can be re-deployed to the adjacent plot as part of normal maintenance. In this manner, two or three times the area of the benthic barrier can be treated in a single growing season. If plant elimination is not necessary, and simply reducing plant biomass is acceptable, it may be possible to move the barrier on a biweekly schedule. This could allow a linear band of nuisance vegetation to be managed over the first few months of the growing season, creating acceptable conditions over a larger area with a smaller barrier. Manpower is the primary limiting factor in this approach.
Eutrophication and Aquatic Plant Management in Massachusetts
4.0 Methods to Control Aquatic Plants Page 4-78
Monitoring and Maintenance Maintenance requirements for sediment covers include cleaning the accumulated sediments from the surface of the covers, insuring that they don't "balloon" from the accumulation of gases beneath the screen, removal of any plant fragments that may root through porous barriers, and prevention of barriers becoming dislodged from the bottom. Removal of barrier during or after the swimming season is the best way to maintain it, but increases costs and is difficult with some types of barriers. Billowing from trapped gases can be eliminated by extra weighting, staking or cutting slits in the material to allow gases to escape. Monitoring includes checking the barrier periodically to be sure it remains over the target area and evaluating the plant community in response to barrier placement. Neither task is very difficult, as a properly installed barrier moves very little and plants will be virtually eliminated with the barrier in place. Pre-treatment assessment of the biota of the target area is usually necessary to meet permit needs, and post-removal colonization studies may be desirable if barrier is to be placed only intermittently. Measurement of oxygen under the barrier may be desirable if the installation is large, but seems unnecessary for typical (<1 acre) applications. Mitigation Mitigation usually consists of simply removing the barrier where control is not being achieved or other undesirable effects arise. Interference with swimmers has not been a serious problem, but many people do not like the artificial feel of barriers underfoot. Many people do find it preferable to soft muck substrates, but not to clean sand. Fishing lures may snag on barrier material. Ecological impacts are highly localized and generally temporary while the barrier is in place. When barrier is removed, an open area suitable for colonization will be present. Colonization by invasive species is likely unless there is a seed bed present that can initiate colonization by natives within the growing season, or the area is actively planted with desirable species.
4.5.7 Regulations
4.5.7.1 Applicable Statutes
In addition to the standard check for site restrictions or endangered species (Appendix II.), a Notice of Intent must be sent to the Conservation Commission with a copy to the Department of Environmental Protection Regional Office. If the proposed project occurs within an Estimated Habitat of Rare Wildlife in the most recent version of the Natural Heritage Atlas, a copy of the Notice of Intent must be submitted to the Natural Heritage and Endangered Species Program (NHESP) within the MDFG for review (Appendix II). If the proposed project occurs within a Priority Habitat of Rare Species in the most recent version of the Natural Heritage Atlas, the project proponent must submit project plans to the NHESP for an impact determination. An Order of Conditions must be obtained prior to work. A Chapter 91 permit is generally not required for benthic barriers in Great Ponds, provided that sediments are not removed or deposited and navigation is not obstructed. Most other permitting and approval processes are inapplicable. No large scale installations have been attempted in Massachusetts, most likely due to high cost and the difficulty of maintaining multiple acres of barrier.
Eutrophication and Aquatic Plant Management in Massachusetts
4.0 Methods to Control Aquatic Plants Page 4-79
4.5.7.2 Impacts Specific to Wetlands Protection Act
The following overall impact classification is offered as a generalization of impacts, with clarifying notes and caveats as warranted: 1. Protection of public and private water supply – Generally neutral (no significant interaction),
although reduced plant density may benefit taste and odor control. 2. Protection of groundwater supply – Neutral (no significant interaction). 3. Flood control – Neutral (no significant interaction). 4. Storm damage prevention – Neutral (no significant interaction). 5. Prevention of pollution – Neutral (no significant interaction), but could be a detriment if
nutrient cycling promotes algal blooms. 6. Protection of land containing shellfish – Generally neutral (no significant interaction), but
covering of significant shellfish resources must be avoided. 7. Protection of fisheries – Possible benefit (habitat enhancement) and possible detriment (food
source alteration, loss of cover), but over a relatively small area with no lakewide effects expected.
8. Protection of wildlife habitat - Potential benefit by habitat improvement, but may have benefit and detriment to different species in the same relatively small area.
4.5.8 Costs The most commonly used materials for benthic barriers and the cost (material only) include Texel at $0.25/sq.ft, Palco at $0.40/sq.ft, and Aquascreen or Aquatic Weed Net at $0.60/sq.ft. Less expensive substitutes can be found, but usually lack the properties that make these barriers as effective as they are. Such substitution will save initial material costs, but may require more material over the long-term and may increase labor costs to achieve the same effectiveness. Aquascreen (comparable in price to Aquatic Weed Net) was installed over 22,000 sq.ft. of Crystal Lake in Middletown, Connecticut, in October 1993. The cost of $1.13/sq.ft. included fabric, anchoring materials and installation (G. Smith, ACT, pers. comm., 1995). Installation of Aquascreen over about one acre split between two swimming areas in Great Pond in Eastham, MA cost about $18,000 for materials and $4,000 for labor in each of two years (1990 – 1991). Labor included installation and removal each year (BEC, 1991b). Palco was installed over 15,000 sq.ft. of Brant Lake in Brant Lake, New York, in August 1994. The cost of $0.80 per sq.ft. included labor and materials (G. Smith, ACT, pers. comm., 1995). Costs have risen only slightly since these example installations, and Wagner (2001) reports a per acre cost of $20,000 to $50,000 for benthic barrier installation, including design, permitting, materials and labor for a year. The initial capital cost is substantial, but the annual cost diminishes greatly after original installation, as material costs are minimal after initial purchase.
4.5.9 Future Research Needs Little additional research is needed for benthic barriers. Future studies could include experimentation with other types of materials, long-term impacts to target and non-target organisms, and methods to increase the viability of this method for long-term control. However, the general approach is well established as a maintenance technique for small areas of dense plant growth that interfere with recreation.

Eutrophication and Aquatic Plant Management in Massachusetts
4.0 Methods to Control Aquatic Plants Page 4-80
4.5.10 Summary Benthic barriers can be an effective treatment for the control macrophytes in small, localized areas of a lake like a dock, boat launch or a swimming beach, but are generally not practical for use in large areas (greater than several acres) as a consequence of cost and maintenance requirements. Materials have included sand and gravel, but the addition of such fill to lakes is not commonly permitted these days, so barriers in use today include mainly porous screen materials and solid sheeting of inert materials. Barriers can be difficult to install, carry substantial initial capital cost, and are labor intensive (particularly if removed, cleaned and replaced for long-term control). Plant control is virtually complete, however, and can enhance overall lake habitat as well as recreational access and safety. Barriers may impact non-target organisms, especially benthic dwellers, and will affect chemistry at the sediment-water interface, but the impacts are limited to the area of installation. As only small areas of lakes are typically exposed to benthic barriers, lake-wide impacts are not expected and have not been observed. Benthic barriers have many advantages for plant control in small areas. They are unobtrusive and can be installed in areas that are not easily accessible by harvesters, although they can be difficult to apply to areas with obstructions. They are non-toxic, removable and very effective, and usually do not require extensive permitting. The major drawbacks are that they are expensive on an areal basis and require maintenance to be effective for multiple seasons. Gases can get trapped beneath them and cause them to billow up into the water column, but this can be handled by cutting slits or extra weighting. They may impact invertebrates and fish within the treated area, but act as an attractant to many fish and invertebrates.
4.6 HERBICIDES AND ALGAECIDES
4.6.1 Overview Chemical treatment is one of the oldest methods used to manage nuisance aquatic weeds, and is still the most frequently applied approach. Other than perhaps drawdown, few alternatives to herbicides were widely practiced until relatively recently. With the range of plant management techniques now available, integrated programs are being encouraged by the MDEP and Conservation Commissions. Herbicide use remains a powerful tool in invasive and nuisance plant control, but can be supplemented with other techniques to prolong benefits and minimize adverse effects. There are few aspects of plant control that breed more controversy than chemical control through the use of herbicides, which are a subset of all chemicals known as pesticides. The controversy is largely a function of perceptions regarding toxicity to non-target organisms, which is a very complicated subject not amenable to generalization. Toxicity is only a part of the equation when discussing pesticides. Exposure potential based on formulation, dilution factors, application rates and application method and the associated risks need to be considered. Risk is a function of product toxicity and the potential for exposure. The registration process employed by the USEPA and the Pesticide Bureau within the Commonwealth of Massachusetts is based on an understanding of the risks posed by these products. The basis for pesticide regulation is that the pesticide does not present an unreasonable risk of adverse impacts to human health or the environment when used in accordance with its label restrictions.

Eutrophication and Aquatic Plant Management in Massachusetts
4.0 Methods to Control Aquatic Plants Page 4-81
This section will attempt to provide a balanced perspective, but interested readers should seek out additional references on this topic to learn more. References with some depth include Shireman et al. (1982), Westerdahl and Getsinger (1988a; 1988b), WDNR (1989) and Hoyer and Canfield (1997). Herbicides and algaecides contain active ingredients that provide the toxicity to target plants. For convenience, we will refer to this collective group of chemicals as herbicides in this section, with inclusion of algaecides inferred. Herbicides also contain inert ingredients or auxiliary compounds that aid application or effectiveness but may not themselves provide any toxicity. Consequently, different formulations may contain different percentages of active ingredient. For example, Sonar SRP contains 5% fluridone, the active ingredient, while Sonar AS contains 42% fluridone. Markedly different exposure scenarios can result from use of these two formulations. Herbicides are typically classified as contact or systemic herbicides based on the action mode of the active ingredient. Contact herbicides are toxic to plants by uptake in the immediate vicinity of external contact, while systemic herbicides are taken up by the plant and are translocated throughout the plant. In general, contact herbicides are more effective against annuals than perennials because they may not kill the roots, allowing perennials to grow back. Seeds are also not likely to be affected, but with proper timing and perhaps several treatments, growths can be eliminated much the same way harvesting can eliminate annual plants. Systemic herbicides tend to work more slowly than contact herbicides because they take time to be translocated throughout the plant. Systemic herbicides generally provide more effective control of perennial plants than contact herbicides, as they kill the entire plant under favorable application circumstances. Systemic herbicides will also kill susceptible annual species, but regrowth from seeds will require additional treatments as with contact herbicides. Another way to classify herbicides is by whether the active ingredients are selective or broad spectrum. Selective herbicides are more effective on certain plant species than others, with control of that selectivity normally dependent on dose (Langeland, 1993). Plant factors that influence selectivity include plant morphology, physiology and the stage of growth. Even a selective herbicide can kill most plants if applied at high rates. Likewise, contact herbicides may show some selectivity based on dose and plant features, but tend to be more broad spectrum in their effects. There are only six active ingredients currently approved for use in aquatic herbicides in Massachusetts, with one additional ingredient (triclopyr) recently registered under the federal approval process and likely to be given consideration in Massachusetts soon. Herbicides often come in terrestrial and aquatic formulations, creating some confusion among laypersons over which trade name is applicable to which medium. Examples of aquatic herbicides registered for use in Massachusetts are listed in Table 4-4, grouped by active ingredient. All active ingredients allowable in Massachusetts as of July of 2002 are covered in Table 4-4. However, as products may be registered in any month and must be renewed each June, the list of products in Table 4-4 will probably be incomplete by the time this document is released. An updated list of registered herbicides can be obtained from the Department of Agricultural Resources. Application of

Eutrophication and Aquatic Plant Management in Massachusetts
4.0 Methods to Control Aquatic Plants Page 4-82
herbicides to lakes in Massachusetts is limited to licensed applicators except under special circumstances. Additional compounds, mostly peroxides and other membrane-active substances, are in use in some states. These compounds basically rupture algal cell membranes and are marketed as algaecides with low toxicity to other plants and animals. Experience with these compounds in Massachusetts is limited to additions of potassium persulfate and related strong oxidants in the 1970s, and was generally unfavorable. Newer formulations may be more effective and have less impact on non-target organisms, but are not yet registered for use in Massachusetts and are not covered here. Various formulations of the common active ingredients are also in use in other states, but unless they are registered in Massachusetts they can not be used here.
Table 4-4 Aquatic herbicides and algaecides.1
USEPA #
USEPA PRODUCT NAMES (% Active Ingredient)
MAX.
RATE2,3 34704-120 34704-606 71368-1 71368-4 228-61 71368-4-8959
2,4-D (2,4-dichlorophenoxyacetic acid) CLEAN CROP AMINE (46.5% DMA) SAVAGE DRY SOLUBLE HERBICIDE (95% DMA) WEEDAR® 64 (46.8% DMA) AQUA-KLEEN® (27.6% BEE) RIVERDALE 2,4-D GRANULES (28.9% IOE) NAVIGATE (27.6% BEE)
1.0 g 4.0 p
10.0 g 150 p 200 p 150 p
67690-3 67690-4 1812-435 1812-447
fluridone SONAR™ SRP (5% fluridone) SONAR™ A.S. (41.7% fluridone) AVAST™ SRP (5% fluridone) AVAST™ A.S (41.7% fluridone)
per 2 ft.
16.0 p 0.2 g
16.0 p 0.2 g
524-343 524-343-71368
glyphosate RODEO® AQUATIC HERBICIDE (53.8% IPA) AQUANEAT (53.8% IPA)
0.94 g 0.94 g

Eutrophication and Aquatic Plant Management in Massachusetts
4.0 Methods to Control Aquatic Plants Page 4-83
Table 4-4 Aquatic herbicides and algaecides1 (continued)
USEPA # USEPA PRODUCT NAMES (% Active Ingredient)
MAX.
RATE2,3 1278-8 64962-1
copper sulfate (99% CuSO45H2O) TRIANGLE BRAND COPPER SULFATE CRYSTAL EARTHTEC® (20% CuSO45H2O)
per 2 ft.
10.6 p 10.8 g
8959-12 AA 8959-12- 10404 8959-10 AA 1812-307 1812-312
copper complexes CUTRINE®-PLUS GRANULAR (3.7% CU EA) LESCOCIDE-PLUS GRANULAR (3.7% CU EA) CUTRINE®-PLUS (9% CU EA) K-TEA™ ALGAECIDE (8% CU TEA) KOMEEN® AQUATIC HERBICIDE (8% CU EDA)
60.0 p 60.0 p
per 2 ft. 6.0 g 6.8 g 8.0 g
10182-356- 10807 10182-353 10182-353
diquat dibromide MISTY WEEDTROL (4.35%) DIQUAT HERBICIDE (35.3%) REWARD® (35.3%)
20.0 g
2.0 g 2.0 g
4581-172 4581-174 4581-201 4581-204
endothall HYDROTHOL® 191 GRANULAR (11.2% Amine salt) HYDROTHOL® 191 (53.0% Amine salt) AQUATHOL® GRANULAR (10.1% DP salt) AQUATHOL® K (40.3% DP salt)
per 2 ft.
550 p 13.6 g 269 p 6.4 g
1 Other aquatic herbicides are available but are not officially registered, or are not designated for use in
lakes (see label instructions) and as such are illegal for use in Massachusetts. Triclopyr is not yet registered for aquatic use in Massachusetts.
2 The maximum application rate is in pounds or gallons of product per acre. If a variable rate per depth is indicated, a 2-foot depth is assumed, but higher rates may be allowed in deeper depths. For Komeen the rate given is for 1-3 foot depths. Additionally, 2,4-D is in pellet form and is applied in accordance with the number of pounds per surface acre, regardless of the depth; as such, the concentration is not applicable.
3 The maximum application rate is for soft water. See the label for rates in hard water.
Eutrophication and Aquatic Plant Management in Massachusetts
4.0 Methods to Control Aquatic Plants Page 4-84
It is important to reiterate that only products registered for use in Massachusetts through the Department of Agricultural Resources (DFA) may be used in Massachusetts, and then only by licensed applicators with proper permits (except in some water supply cases and ponds with no outlets). Products registered by the federal government or by other state agencies are not necessarily accepted for registration in Massachusetts. Availability from mail order operations does not signify acceptability for use in Massachusetts or confer approval for unlicensed individuals or organizations to apply such herbicides. Included are herbicides and algaecides registered in Massachusetts as of July 2002. Note that new products may be added monthly and allowed rates or restrictions may change as products are re-registered. Included are the USEPA registration numbers, the product name, the % active ingredient and the maximum application rate based on one method of calculation. Various salts and complexes are abbreviated: DMA = dimethylamine salt; IOE = isooctyl ester; BEE = butoxyethyl ester; IPA = isopropylamine salt; EA = copper-ethanolamine complexes; EDA = copper-ethylenediamine complex; DP = dipotassium salt. The maximum application rates of the product are from product labels, expressed in either gallons (g) or pounds (p) per acre. When volumetric rates are indicated on the product label, a 2-foot depth is assumed1. Herbicides may also contain adjuvants. An adjuvant is any chemical added to the herbicide to increase the effectiveness of the application. There are different classes of adjuvants, which generally function to increase the uptake of the herbicide by the plant, spread the herbicide through the water column, or help the herbicide adhere to the plant. Activator adjuvants include surfactants, wetting agents and oils. These adjuvants can help spread the herbicide in the water, as well as aid in the uptake of the herbicide by the plant. A second class of adjuvants include the spray-modifier adjuvants, which include spreaders, stickers and spreader-stickers. These adjuvants aid in spreading the herbicide and increasing adherence to the plant. Foaming agents, polymers and inverting oils are also included in this group and are used primarily to control the drift of the herbicide from the target application area. The final class of adjuvants encompasses the utility-modifier adjuvants. Included in this group are buffering agents, used to increase the dispersion and solubility of an herbicide and anti-foaming agents, used to reduce foam inside the spray tank (McWhorter, 1982; Langeland, 1993). Adjuvants are not expected to be toxic to the target species, but increase the toxicity of the herbicide or otherwise allow the active ingredient to be used more effectively. Aquatic herbicides must be registered by the USEPA and the Massachusetts Department of Agricultural Resources. The criteria addressed in the registration process include data on forms of toxicity, impacts to non-target organisms, environmental persistence, breakdown products and fate of the herbicide constituents in the aquatic environment (Schmidt, 1984; Appendix III). Herbicide toxicology reports generally report toxicity in terms of LC50 or LD50. The LC50 is usually defined as the concentration (in ppm or mg/L of active ingredient) in water that will result in 50 percent mortality of the test species within the time period (usually 424 to 96 hours) and conditions of the test. The LD50 is defined as the amount of pesticide administered per kg of body weight of the test organism that will result in 50 percent mortality of the test species within
Eutrophication and Aquatic Plant Management in Massachusetts
4.0 Methods to Control Aquatic Plants Page 4-85
the time period (usually 24 to 96 hours) and conditions of the test. The LC50 tests are usually conducted for aquatic species such as fish and zooplankton, where uptake is generally via gills or direct adsorption. The LD50 tests are usually conducted for birds and/or mammals such as rats or mice, and the tests usually refer to oral doses of the herbicide. Toxicology data are usually given in metric units of parts per million (ppm), which is equivalent to mg/L. In some toxicology reports, only the mass (weight) of the active cation or the equivalent mass of the acid form of the active anion is considered when reporting units of concentration. The nature and variability in toxicity reporting lend themselves to confusion and ambiguity in herbicide evaluations, and allow both proponents and detractors to make seemingly definitive but opposite statements based on the same data. Detailed information on toxicity and environmental fate of registered herbicides is provided in Appendix III. Additional general information on toxicity tests and ecotoxicology can be found in Hoffman et al. (1995). While it is generally considered prudent to avoid contact with water immediately after treatment, and some states have their own use restrictions, there are no federal label swimming restrictions for any active ingredient currently in use. Irrigation restrictions of several days or more are common, and prohibition of use in drinking water is applied to all herbicides except copper and fluridone products. Treated waters must be posted as such in accordance with MDEP regulations. The choice of herbicide to manage an undesirable plant population depends on the properties of the herbicide, the relative sensitivity of the target and non-target plants and other organisms that will be exposed, water use restrictions after herbicide use, and cost. Effectiveness in controlling the target plant species is normally the primary consideration, with the other factors determining a possible choice between two or more potentially effective herbicides, dose, and whether a treatment is actually feasible. As many as 300 or more Massachusetts lakes were treated per year in the late 1960s and early 1970s, after which the number of treatments fell sharply (G. Smith, ACT, pers. comm., 1996). Concern over possible unintended impacts and availability of alternative techniques and funding were factors. From 1983 through 1991, roughly coinciding with the years of the MDEP Clean Lakes Program, permits for herbicide treatments ranged from 18 to 97, with an increasing trend observed over time (G. Gonyea, MDEP, pers. comm., 1996). From 1992 through 2002, the number of permits ranged from 77 to 231, with continuation of the increasing trend on a yearly basis (G. DeCesare, MDEP, pers. comm., 2003). Each License to Apply Chemicals may authorize one or more chemicals (average of between 2 and 3/license) to be applied to the lake. In 1995, when treatments involved 257 individual applications of chemicals in Massachusetts, the frequency of use among chemicals was as follows: 2,4-D (10%), endothall as Aquathol K (5%), endothall as Hydrothol 191 (1%), copper sulfate or complexes (31%), diquat (30%), glyphosate (13%), fluridone (7%) and alum compounds and buffering agents (3%) (G. DeCesare, MDEP, pers. comm., 1995). Note that alum is not a herbicide, but requires a License to Apply Chemicals and is therefore included in this database. Copper and diquat accounted for more than half of the treatments in 1995.
Eutrophication and Aquatic Plant Management in Massachusetts
4.0 Methods to Control Aquatic Plants Page 4-86
In 2002, when treatments involved 605 individual applications of chemicals, the frequency of use among chemicals was as follows: 2,4-D (3%), endothall as Aquathol K (5%), endothall as Hydrothol 191 (1%), copper sulfate or complexes (29%), diquat (29%), glyphosate (19%), fluridone (10%), and alum compounds and buffering agents (4%) (G. DeCesare, MDEP, pers. comm., 2003). Copper and diquat again accounted for over half the treatments. Reduced use of 2,4-D is probably related to the MDEP ruling that limits use of 2,4-D in lakes near active wells. Increased use of fluridone is probably related to advances in formulation and application, with some gain related to the 2,4-D restriction. Increased glyphosate use is probably a function of efforts directed at peripheral emergent or floating leaved plants (e.g., loosestrife, lilies). For comparison, the State of New York grants an estimated 300 or more permits for lake treatments per year. Fluridone has been used on at least 25 lakes of more than 20 acres with increasing frequency in New York state following 1995 approval for use there (S. Kishbaugh, NYSDEC, pers. comm., 2003). New Jersey issues over 700 permits annually for lake and pond treatments and Connecticut issues over 400 such permits (G. Smith, ACT, pers. comm., 2002).
4.6.2 Effectiveness Aquatic plants controlled by commonly used herbicides are listed in Table 4-5. The list is not all-inclusive and effective control depends on the rate of application and other factors. Copper, which is primarily an algaecide, is not included in Table 4-5, and triclopyr (pending registration for use in Massachusetts) is also excluded. Herbicide effectiveness may be influenced by such factors as timing, rate and method of application, type of species present and weather conditions. Additionally, dose determination should consider basin detention time, morphometry and water hardness to maximize effectiveness Data in the table are from Nichols (1986), Appendix III and herbicide labels, with the assistance of the staff of ACT, Inc. See labels and text for additional information. C = consistent control (with correct dose, proper formulation and suitable conditions), P = partial control (control sometimes achieved, but may require a higher dose or be affected by conditions that are difficult to control). Re-growth or re-infestation may occur at some time after treatment, but usually not within the same year. The ability to control a plant with a herbicide does not necessarily indicate that the plant requires control in Massachusetts. NE indicates that there is no experience with the management of this species in Massachusetts, while NNM signifies that the species is not normally managed. The effectiveness of some herbicides, for instance glyphosate, can be increased by the addition of an adjuvant (Harman, 1995). The addition of adjuvants, which may have toxic properties themselves, may increase the toxicity of the herbicide either by an additive or a synergistic effect. Adjuvants may be included under inert ingredients and not be listed explicitly on the label information. Often it is difficult to obtain information regarding adjuvants and truly inert ingredients used in commercial products as it is sometimes considered proprietary information. Toxicological information for many commonly used adjuvants is listed in Appendix III. Approval of an herbicide for use is normally dependent upon testing the complete formulation, however, so surprise toxicity to non-target organisms should be a rare occurrence.
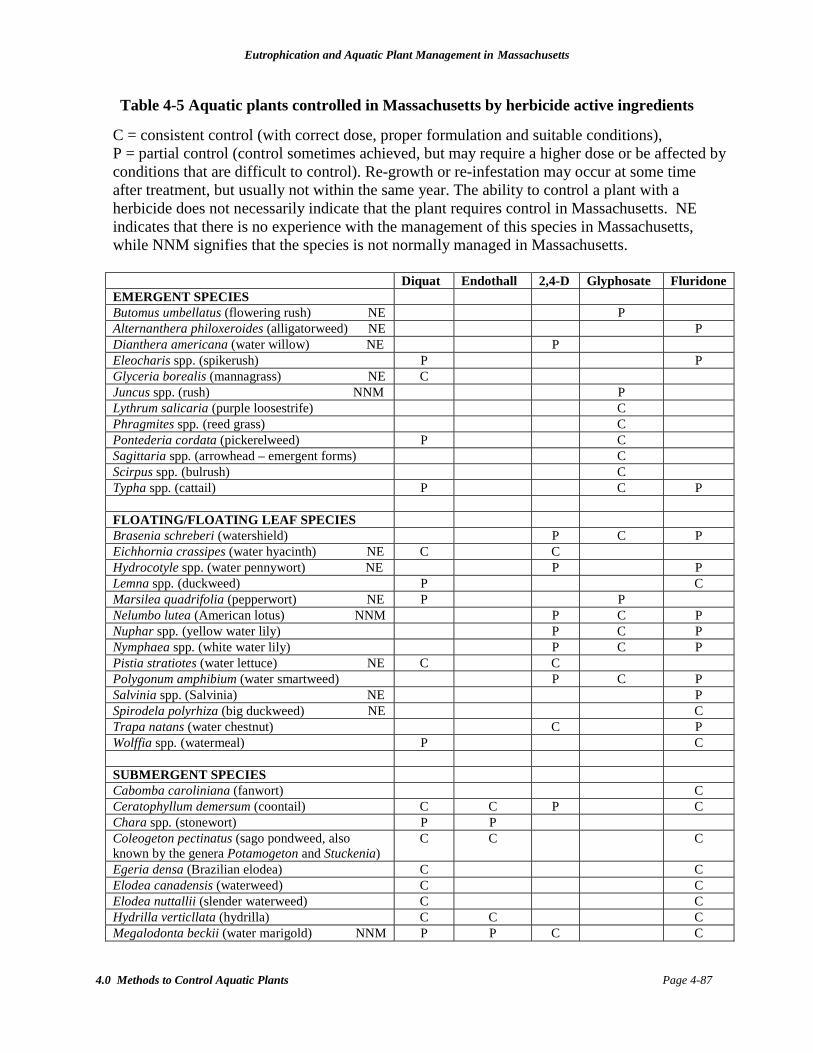
Eutrophication and Aquatic Plant Management in Massachusetts
4.0 Methods to Control Aquatic Plants Page 4-87
Table 4-5 Aquatic plants controlled in Massachusetts by herbicide active ingredients
C = consistent control (with correct dose, proper formulation and suitable conditions), P = partial control (control sometimes achieved, but may require a higher dose or be affected by conditions that are difficult to control). Re-growth or re-infestation may occur at some time after treatment, but usually not within the same year. The ability to control a plant with a herbicide does not necessarily indicate that the plant requires control in Massachusetts. NE indicates that there is no experience with the management of this species in Massachusetts, while NNM signifies that the species is not normally managed in Massachusetts. Diquat Endothall 2,4-D Glyphosate Fluridone EMERGENT SPECIES Butomus umbellatus (flowering rush) NE P Alternanthera philoxeroides (alligatorweed) NE P Dianthera americana (water willow) NE P Eleocharis spp. (spikerush) P P Glyceria borealis (mannagrass) NE C Juncus spp. (rush) NNM P Lythrum salicaria (purple loosestrife) C Phragmites spp. (reed grass) C Pontederia cordata (pickerelweed) P C Sagittaria spp. (arrowhead – emergent forms) C Scirpus spp. (bulrush) C Typha spp. (cattail) P C P FLOATING/FLOATING LEAF SPECIES Brasenia schreberi (watershield) P C P Eichhornia crassipes (water hyacinth) NE C C Hydrocotyle spp. (water pennywort) NE P P Lemna spp. (duckweed) P C Marsilea quadrifolia (pepperwort) NE P P Nelumbo lutea (American lotus) NNM P C P Nuphar spp. (yellow water lily) P C P Nymphaea spp. (white water lily) P C P Pistia stratiotes (water lettuce) NE C C Polygonum amphibium (water smartweed) P C P Salvinia spp. (Salvinia) NE P Spirodela polyrhiza (big duckweed) NE C Trapa natans (water chestnut) C P Wolffia spp. (watermeal) P C SUBMERGENT SPECIES Cabomba caroliniana (fanwort) C Ceratophyllum demersum (coontail) C C P C Chara spp. (stonewort) P P Coleogeton pectinatus (sago pondweed, also known by the genera Potamogeton and Stuckenia)
C C C
Egeria densa (Brazilian elodea) C C Elodea canadensis (waterweed) C C Elodea nuttallii (slender waterweed) C C Hydrilla verticllata (hydrilla) C C C Megalodonta beckii (water marigold) NNM P P C C
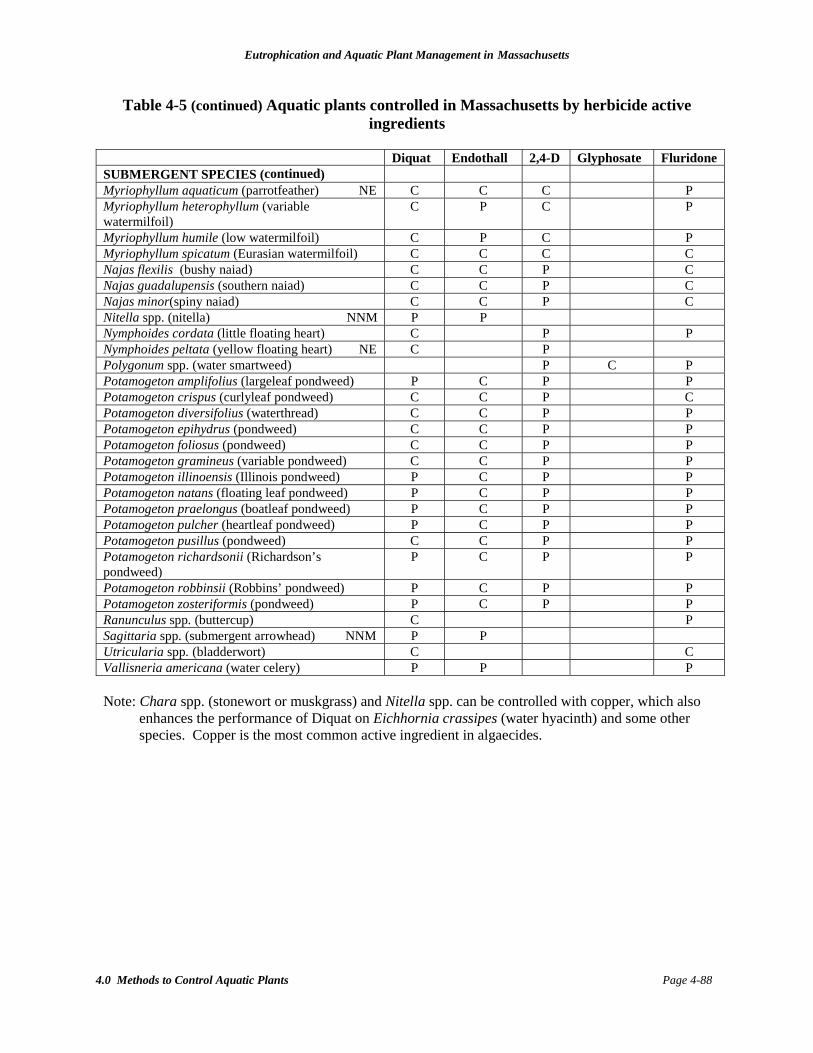
Eutrophication and Aquatic Plant Management in Massachusetts
4.0 Methods to Control Aquatic Plants Page 4-88
Table 4-5 (continued) Aquatic plants controlled in Massachusetts by herbicide active ingredients
Diquat Endothall 2,4-D Glyphosate FluridoneSUBMERGENT SPECIES (continued)Myriophyllum aquaticum (parrotfeather) NE C C C PMyriophyllum heterophyllum (variablewatermilfoil)
C P C P
Myriophyllum humile (low watermilfoil) C P C PMyriophyllum spicatum (Eurasian watermilfoil) C C C CNajas flexilis (bushy naiad) C C P CNajas guadalupensis (southern naiad) C C P CNajas minor(spiny naiad) C C P CNitella spp. (nitella) NNM P PNymphoides cordata (little floating heart) C P PNymphoides peltata (yellow floating heart) NE C PPolygonum spp. (water smartweed) P C PPotamogeton amplifolius (largeleaf pondweed) P C P PPotamogeton crispus (curlyleaf pondweed) C C P CPotamogeton diversifolius (waterthread) C C P PPotamogeton epihydrus (pondweed) C C P PPotamogeton foliosus (pondweed) C C P PPotamogeton gramineus (variable pondweed) C C P PPotamogeton illinoensis (Illinois pondweed) P C P PPotamogeton natans (floating leaf pondweed) P C P PPotamogeton praelongus (boatleaf pondweed) P C P PPotamogeton pulcher (heartleaf pondweed) P C P PPotamogeton pusillus (pondweed) C C P PPotamogeton richardsonii (Richardson’spondweed)
P C P P
Potamogeton robbinsii (Robbins’ pondweed) P C P PPotamogeton zosteriformis (pondweed) P C P PRanunculus spp. (buttercup) C PSagittaria spp. (submergent arrowhead) NNM P PUtricularia spp. (bladderwort) C CVallisneria americana (water celery) P P P
Note: Chara spp. (stonewort or muskgrass) and Nitella spp. can be controlled with copper, which alsoenhances the performance of Diquat on Eichhornia crassipes (water hyacinth) and some otherspecies. Copper is the most common active ingredient in algaecides.
Eutrophication and Aquatic Plant Management in Massachusetts
4.0 Methods to Control Aquatic Plants Page 4-89
An herbicide treatment can be an effective short-term management procedure to produce a rapid reduction in algae or vascular plants for periods of weeks to months. Although long-term effectiveness from herbicide treatments is possible, in most cases herbicide use is considered a short-term control technique. Herbicides are generally applied seasonally to every two years to achieve effective control. Systemic herbicides, which kill the entire plant including the roots, generally provide results with greater longevity than contact herbicides, which can leave roots alive to regrow. In many cases, use of a herbicide will reduce the amount of regrowth the following season. In some cases involving fluridone or 2,4-D, as many as five years of control can be gained (G. Smith, ACT, pers. comm., 1995). In other cases, however, several applications per year may be necessary to achieve control goals. Herbicide treatments are presently the most viable means of opening the vast acreage of water infested with the exotic water hyacinth (Eichhornia crassipes) in Florida and other southeastern states (Shireman et al. 1982). This is a case in which chemicals for management are a necessity until some other more long-term control, such as plant-eating insects, can be established. A similar case could be made for control of Eurasian watermilfoil or fanwort in Massachusetts. The use of herbicides to get a major plant nuisance under control is a valid element of long-term management when other means of keeping plant growths under control are then applied. However, failure to apply alternative techniques on a smaller scale once the nuisance has been abated places further herbicide treatments in the cosmetic maintenance category; such techniques tend to have poor cost-benefit ratios over the long-term. Effectiveness of individual herbicidal active ingredients in use today is further discussed in association with each active ingredient in subsequent sub-sections of this herbicide review.
4.6.3 Impacts to Non-Target Organisms Herbicides are intended to reduce the abundance of at least one plant species, and will usually cause a reduction in overall algal or plant biomass on at least a temporary basis. By their very nature then, herbicides may have an indirect impact on species dependent upon the affected plants for food or cover. This is no different than the corresponding impact of any other plant control technique. Where such changes in the plant community are temporary, only minor effects on non-target organisms are expected. Where the change in the plant community is more permanent, greater impacts are possible and represent a trade-off for conditions perceived to be more favorable to other lake users, human and non-human. If such indirect impacts to non-target species are considered intolerable, the project may not be permitted, but the desirability of plant control where an invasive species or excessive plant biomass is present is usually accepted. Concern over impacts to non-target flora centers on protected species and overall impacts to the plant community that may affect habitat for fish and wildlife. Herbicides are intended to kill plants, and while advances in selectivity have been achieved through new or altered formulation, reduced dose, or timing and location of application, more plants than just the target species are normally at risk. In cases of excessive native plant growth, the herbicide may be intended to reduce the overall abundance of plants without targeting one species above all others. Usually, however, the herbicide is matched with the dominant species, and impacts to at least some other species will be less.
Eutrophication and Aquatic Plant Management in Massachusetts
4.0 Methods to Control Aquatic Plants Page 4-90
Where light and nutrients are sufficient, plants will grow. This applies to planktonic algae or floating vascular plants in the water column and rooted vascular plants and algal mats associated with benthic habitat. This will limit the longevity of benefits and the duration of impacts derived from herbicide use. Where protected plant species are threatened or even temporary loss of cover is viewed as an unacceptable impact, herbicide use may not be permitted, but usually the benefits of plant control by herbicides are perceived to outweigh temporary impacts to non-target flora. Of greater concern with respect to herbicides is the potential for direct toxic effects on non-target fauna. To eliminate direct impacts to non-target organisms, the application rate must be below the rate that will impact the most sensitive non-target organism. While long-term chronic toxicity studies may be suitable to evaluate the impacts of repeated application of herbicides, most short-term effects are usually evaluated by means of the common LC50 lethality tests on fish, invertebrates and sometimes other aquatic organisms (see Appendix III). Note that the fish used in the tests may be less sensitive than those found in the lake to be treated. In most cases aquatic herbicides have relatively short aquatic half-lives and thus the standard 96-hour (or sometimes 24-hour) LC50 is commonly used. It is difficult to judge sub-lethal effects or estimate the No Observable Effects Level or the Maximum Acceptable Toxicant Concentration based on LC50 data alone. Commonly the Maximum Acceptable Toxicant Concentration is set at <10% of the LC50 for any given herbicide to provide a margin of safety. Other mitigating factors such as the form (granular or liquid), timing, temperature, water hardness and other environmental conditions are taken into account in testing and dose planning. The comparison of the initial environmental herbicide concentrations to the LC50 levels assumes there is no reduction in herbicide concentration due to adsorption to sediments or degradation during the 24- or 96-hour period after introduction. Larval or juvenile fish and invertebrates are often used in testing to maximize the effect, as older organisms tend to have higher resistance to impacts. A number of other conservative assumptions are typically made and are intended to result in allowable doses being lower than those that would actually cause observable effects on fauna in the aquatic environment. Field experience is taken into consideration during the re-registration process that herbicides must periodically undergo. The degree of safety increases as the applied concentration decreases relative to the LC50. Each herbicide is evaluated individually based on the formulation and the expected concentration as a function of the percent active ingredient, application rate and depth of water. It is important to note that the concentrations allowed as application rates are much higher than those to which the public would be exposed under normal circumstances. The granular products may only slowly dissolve in the water over time and dissipate. Many of the compounds are rapidly removed from the water. Use in accordance with label instructions and restrictions is therefore not expected to result in toxicity to non-target fauna, including humans, other mammals, waterfowl, fish and invertebrates. Only in rare cases have herbicide treatments induced mortality in Massachusetts (R. Hartley, MDFG, pers. comm., 2003), but the chronic effects of frequent exposure are not truly known in many cases. Chemical improvements of the last 30 years have greatly reduced non-target faunal toxicity, and testing advancements have allowed much more detailed evaluation of possible impacts. Fish kills are very rarely observed with use of herbicides today. Herbicide-induced fish kills that have

Eutrophication and Aquatic Plant Management in Massachusetts
4.0 Methods to Control Aquatic Plants Page 4-91
occurred in the US in recent years have mainly been a consequence of lowered oxygen during plant die-off, although overapplication in confined waters has also occurred (Hoyer and Canfield, 1997). Human error cannot be eliminated, and we can never be sure that chronic impacts will not occur, but herbicide formulations and applications have been greatly improved since the 1950s and 1960s. Acute toxicity data for fish bioassays and rat ingestion studies are presented in Table 4-6, along with expected half-life in the aquatic environment, limits on maximum concentration and use restrictions. This simple table does not take the place of more detailed information available for each compound, and should not be taken out of context. Key points to be gleaned from this table include: 1. The maximum applicable concentration is less than the most sensitive fish LC50 for all but
one 2,4-D formulation and two copper formulations. This does not mean that 2,4-D and copper will be toxic to fish, but that the possibility exists under the most extreme conditions tested. Toxicity of herbicides as assessed by the most sensitive fish bioassy is within an order of magnitude of the maximum applicable concentration.
2. The maximum applicable concentration is far less than the rat LD50 in every case. A 0.25 kg rat (about half a pound) would have to consume 5 liters of water containing the maximum concentration of endothall as the Aquathol-K salt (the ingredient in Table 4-6 most toxic to rats) to get a toxic reaction. For fluridone, the least toxic ingredient in Table 4-6, a 0.25 kg rat would have to consume more than 16,700 liters of water to get a toxic reaction.
3. Limitation on use in drinking water supplies generally follows the rat LD50 results. Restrictions apply to all herbicides, but greater restrictions or prohibition applies to those with lower ratios of LD50 to maximum concentration.
4. Half-life tends to be a matter of days for herbicides. The half-life is the time necessary for the concentration to be cut in half by natural degradation processes. Consequently, some herbicides may remain in the lake at low concentrations for many weeks if flushing is low. No impacts from chronic exposure to low doses of herbicides are generally known, and the synergistic effects of low doses of herbicides and other stresses in the aquatic environment are difficult to study in detail.
5. Aquashade is not an herbicide, but as it is treated as one in the regulatory process, toxicity information is provided here. It is interesting to note that the blue dye most responsible for the properties of Aquashade is more toxic to rats than some of the active ingredients in herbicides.
By way of further comparison, the rat LD50 values for two commonly ingested household chemical compounds are: table salt (NaCl), 3750 mg/kg (Merck, 1983); and aspirin (salicylic acid acetate), 1,500 mg/kg (Merck, 1983). Risk is a function of both toxic properties of the compound and exposure; information on either toxicity or exposure alone is insufficient to make risk predictions. It is important to consider both toxicity of the compound and likely level of exposure when evaluating herbicide risks.
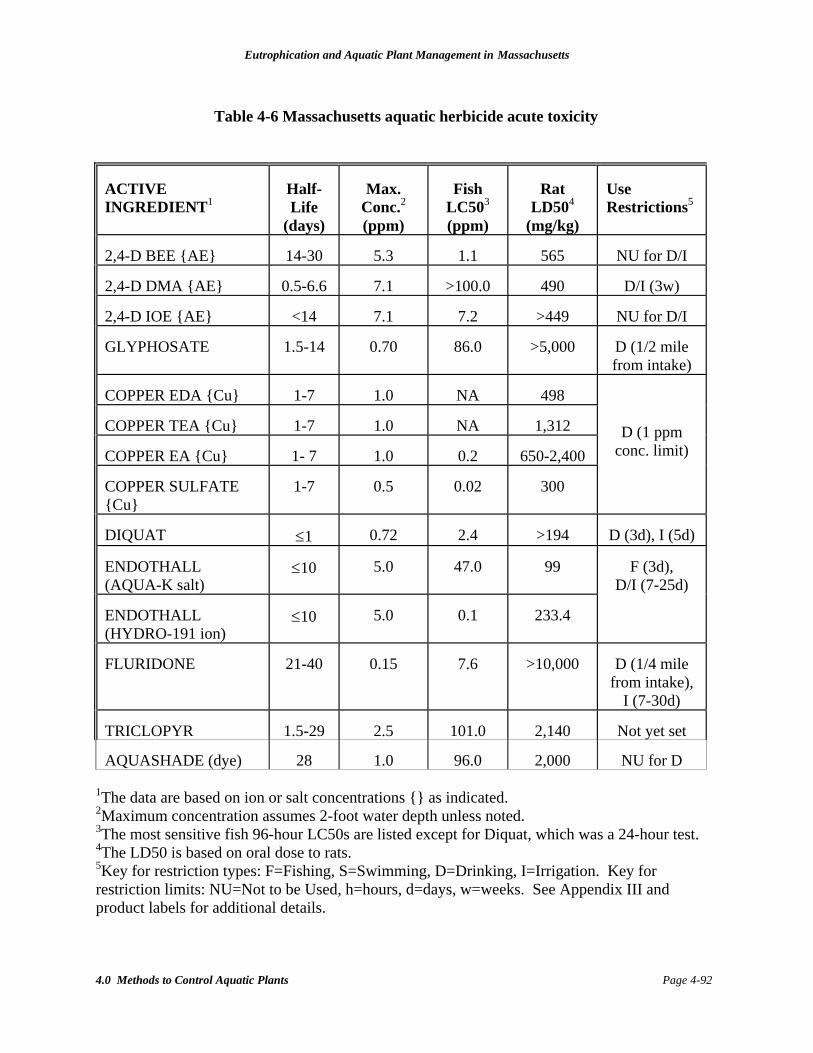
Eutrophication and Aquatic Plant Management in Massachusetts
4.0 Methods to Control Aquatic Plants Page 4-92
ACTIVE INGREDIENT1
Half- Life
(days)
Max.
Conc.2 (ppm)
Fish
LC503 (ppm)
Rat
LD504 (mg/kg)
Use Restrictions5
2,4-D BEE {AE}
14-30
5.3
1.1
565
NU for D/I
2,4-D DMA {AE}
0.5-6.6
7.1
>100.0
490
D/I (3w)
2,4-D IOE {AE}
<14
7.1
7.2
>449
NU for D/I
GLYPHOSATE
1.5-14
0.70
86.0
>5,000
D (1/2 mile from intake)
COPPER EDA {Cu}
1-7
1.0
NA
498
COPPER TEA {Cu}
1-7
1.0
NA
1,312
COPPER EA {Cu}
1- 7
1.0
0.2
650-2,400
COPPER SULFATE {Cu}
1-7
0.5
0.02
300
D (1 ppm conc. limit)
DIQUAT
≤1
0.72
2.4
>194
D (3d), I (5d)
ENDOTHALL (AQUA-K salt)
≤10
5.0
47.0
99
ENDOTHALL (HYDRO-191 ion)
≤10
5.0
0.1
233.4
F (3d),
D/I (7-25d)
FLURIDONE
21-40
0.15
7.6
>10,000
D (1/4 mile
from intake), I (7-30d)
TRICLOPYR
1.5-29
2.5
101.0
2,140
Not yet set
AQUASHADE (dye)
28
1.0
96.0
2,000
NU for D
1The data are based on ion or salt concentrations {} as indicated. 2Maximum concentration assumes 2-foot water depth unless noted. 3The most sensitive fish 96-hour LC50s are listed except for Diquat, which was a 24-hour test. 4The LD50 is based on oral dose to rats. 5Key for restriction types: F=Fishing, S=Swimming, D=Drinking, I=Irrigation. Key for restriction limits: NU=Not to be Used, h=hours, d=days, w=weeks. See Appendix III and product labels for additional details.
Table 4-6 Massachusetts aquatic herbicide acute toxicity
Eutrophication and Aquatic Plant Management in Massachusetts
4.0 Methods to Control Aquatic Plants Page 4-93
Information on the nature of toxicity from herbicides is provided in Table 4-7. This summary, prepared by D. Manganaro of the MDEP, provides an appraisal of the mutagenicity and carcinogenicity of active ingredients and breakdown residuals and the level of certainty of possible effects. Note that no active ingredient in aquatic herbicides approved for use in Massachusetts is rated as having sufficient or substantial evidence of mutagenicity, and only three even qualify with suggestive evidence. Five active ingredients have limited or non-positive evidence of such effects. With regard to human carcinogenicity, no active ingredients or their breakdown residuals are known to be probable or possible carcinogens. The Oral Reference Dose (RfD) indicates the amount that can be ingested per kg of body weight on a daily basis without apparent effect. RfDs for active ingredients in Massachusetts are far in excess of what a person or aquatic animal might be expected to consume on a daily basis. Risk of effects appears very low, but cannot be considered non-existent, however. Additional information on the Oral Reference Dose, the mutagenicity, carcinogenicity and developmental and reproductive effects of the herbicides are described in Appendix III and in documents prepared by the MDEP (1990) and USEPA (1986; 1995). Fish impacts garner the most attention after herbicide treatments, but are rarely a function of direct toxicity. Most often it is low oxygen caused by decaying vegetation that leads to an herbicide-induced fish kill (Hoyer and Canfield, 1997). Invertebrate impacts are rarely reported, but may occur. Dead snails have been observed after treatments in some cases (e.g., Hoosac Lake in 1988, G. Gonyea, MDEP, pers. comm., 2002), but it should be noted that die off of snails is very common in eutrophic water bodies (L. Lyman, Lycott, pers. comm., 1997), partly as a function of abundance and the annual life cycle of some species (Jokinen, 1992). The difficulty in assigning causes to faunal mortality can be substantial.
4.6.4 Impacts to Water Quality Direct impacts to water quality vary with the type of chemical and are discussed for each herbicide separately below. A general summary of usage restrictions for waters used for swimming, fishing, drinking and irrigation is provided in Appendix III. Most restrictions are based on potential toxicity to non-target organisms, especially humans, and may vary among formulations. Some herbicide labels warn about the depletion of oxygen in water bodies after treatment due to the decomposition of dead plants. The potential for major oxygen depression in Massachusetts waters is limited by the lower average water and air temperatures in the northern United States, but oxygen depletion is still possible. Increases in suspended solids and many dissolved constituents are possible as plants decay, with impacts varying with the amount of vegetation killed and specific lake features. Shireman et al. (1982) caution that the following lake characteristics can produce undesirable water quality changes after treatment with herbicides for weed control, especially when they occur in combination:
High water temperature High plant biomass to be controlled Shallow, nutrient-rich water

Eutrophication and Aquatic Plant Management in Massachusetts
4.0 Methods to Control Aquatic Plants Page 4-94
COMPOUND
RfD 1
MUT.2
CARC.3
DEVELOPMENTAL/REPRODUCTIVE4
SUMMARY
Aquashade
---
---
ID5
----------
slightly irritating to skin and eyes; GI tract effects; not well characterized
Copper Sulfate
---
C
D (Cu salts)
(Copper) increased fetal mortality, developmental abnormalities, fertility effects in lab animals
(Cu) GI tract, liver, kidney effects; suggestive evidence of mutagenicity; not classifiable as to human carcinogenicity; some evidence of developmental or reproductive effects
2,4-D
0.003 mg/kg/day
D
D
embryotoxic, fetotoxic, weakly teratogenic in laboratory animals
effects on GI tract, liver, kidney, brain, pituitary, adrenal, lung, thyroid, CNS; limited evidence of mutagenicity; not classifiable as to human carcinogenicity; some evidence of developmental effects
Diquat
0.005 mg/kg/day
C
E
no significant teratogenicity in rats, mice or rabbits although teratogenic effects produced in animals dosed intravenously (iv) or intraperitoneally (ip); fetotoxicity in rats and mice given a single iv or ip dose
cataract formation; decreased organ weights; suggestive evidence of mutagenicity; no evidence of carcinogenicity in humans; some evidence of developmental effects
Endothall
0.02 mg/kg/day
D
ID5
fetotoxicity in mice at 40 mg/kg/day (gavage) in presence of maternal toxicity; rat NOAELs (oral) of 12.5 mg/kg/day for maternal effects, 25 mg/kg/day for fetal effects; rat NOAEL of 150 ppm for maternal reproductive effects in a 2-generation study
effects on GI tract, liver, kidney; limited evidence of mutagenicity; insufficient data on carcinogenicity; inconclusive evidence of developmental or reproductive effects
Fluridone
0.08 mg/kg/day
E
E
no teratogenic effects noted at levels to 2000 ppm; fetotoxicity (in the presence of maternal toxicity) in rats at 1000 mg/kg/day and in rabbits at 300 mg/kg/day
skin and eye irritation; effects on kidney, testes; liver enzyme changes; organ/body weight changes; keratitis of eye; no positive evidence of mutagenicity; no evidence of carcinogenicity in humans; inconclusive evidence of developmental or reproductive effects
Glyphosate
2.0 mg/kg/day
E
D
fetal toxicity in male 3rd generation rat pups with parents exposed to 30 mg/kg/day; no teratogenicity in absence of maternal toxicity; fetal toxicity (in presence of maternal toxicity) at 3500 mg/kg/day
organ/body weight changes; no positive evidence of mutagenicity; not classifiable as to human carcinogenicity; inconclusive evidence developmental or reproductive effects
Triclopyr
0.005 mg/kg/day
C
ID5
mild fetotoxic effects in offspring of rats dosed with 200 mg/kg/day (gavage); not teratogenic to rabbits at 100 mg/kg/day (gavage)
liver and kidney effects; suggestive evidence of mutagenicity; insufficient data on carcinogenicity; some evidence of developmental effects
Table 4-7 Herbicide toxicity summary (Manganaro, MDEP, unpublished compilation of data)
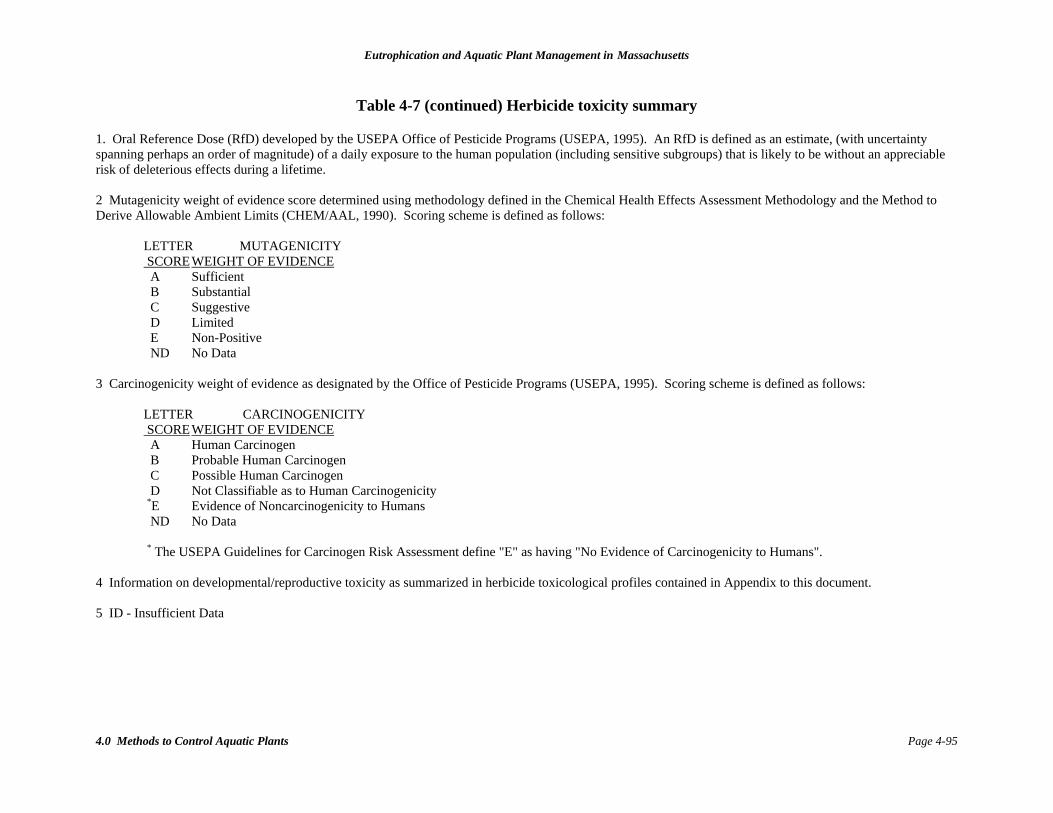
Eutrophication and Aquatic Plant Management in Massachusetts
4.0 Methods to Control Aquatic Plants Page 4-95
Table 4-7 (continued) Herbicide toxicity summary
1. Oral Reference Dose (RfD) developed by the USEPA Office of Pesticide Programs (USEPA, 1995). An RfD is defined as an estimate, (with uncertainty spanning perhaps an order of magnitude) of a daily exposure to the human population (including sensitive subgroups) that is likely to be without an appreciable risk of deleterious effects during a lifetime. 2 Mutagenicity weight of evidence score determined using methodology defined in the Chemical Health Effects Assessment Methodology and the Method to Derive Allowable Ambient Limits (CHEM/AAL, 1990). Scoring scheme is defined as follows: LETTER MUTAGENICITY
SCORE WEIGHT OF EVIDENCE A Sufficient B Substantial C Suggestive D Limited E Non-Positive ND No Data
3 Carcinogenicity weight of evidence as designated by the Office of Pesticide Programs (USEPA, 1995). Scoring scheme is defined as follows:
LETTER CARCINOGENICITY SCORE WEIGHT OF EVIDENCE A Human Carcinogen
B Probable Human Carcinogen C Possible Human Carcinogen D Not Classifiable as to Human Carcinogenicity *E Evidence of Noncarcinogenicity to Humans ND No Data
* The USEPA Guidelines for Carcinogen Risk Assessment define "E" as having "No Evidence of Carcinogenicity to Humans".
4 Information on developmental/reproductive toxicity as summarized in herbicide toxicological profiles contained in Appendix to this document. 5 ID - Insufficient Data
Eutrophication and Aquatic Plant Management in Massachusetts
4.0 Methods to Control Aquatic Plants
Page 4-96
High percentage of lake area treated Closed or non-flowing system
These conditions occur in many Massachusetts waters that are treated, but various mitigative strategies have been developed over the last two decades to facilitate treatment while minimizing risk of adverse water quality impacts.
4.6.5 Applicability to Saltwater Ponds Little information was found on the use of herbicides in saltwater ponds. Glyphosate is sometimes used on reed grass, but aqueous applications of other herbicides are uncommon. It would be expected that application would be comparable to freshwater systems, although toxicity to organisms (and possibly effectiveness) may be reduced somewhat as a function of increased dissolved solids content.
4.6.6 General Implementation Guidance
4.6.6.1 Key Data Requirements
Data requirements will vary depending on the nature of the problem and the specifics of each situation. Data collected prior to treatment should include accurate plant identification during the initial biological survey, with distributions and plant densities indicated on a map of the lake. The area to be treated should be clearly indicated. Adequate oxygen levels and relatively cool water temperature should ideally be present to avoid rapid plant decomposition and associated depletion of dissolved oxygen. Other data requirements include whether the water is used for drinking, swimming or irrigation and the proximity of drinking water wells. These issues should also be evaluated downstream in a lake with a flowing outlet. Many herbicides (especially copper) vary in toxicity with hardness (calcium and magnesium content) of the water, so this should be evaluated prior to setting dose rates. Estimates of short- and long-term effectiveness should be provided in terms of percent cover or biomass of target and non-target species.
4.6.6.2 Factors that Favor this Approach
The following considerations are indicative of appropriate application of herbicides and algaecides for the management of plants in lakes: 1. Periodic algal blooms impair recreation or water supply use, but are not a frequent
occurrence (algaecides, mainly copper). 2. An invasive plant species has been detected at non-dominant levels but is not amenable to
physical control techniques. 3. An invasive plant species has become dominant and is greatly reducing the diversity of
native species, affecting habitat and water uses. 4. Overall vegetative density is excessive over a large portion of the lake, negatively affects
habitat and water uses, is not amenable to alternative control methods, but requires management to meet reasonable intended uses. In such cases it is recommended that herbicides be considered as part of a long-term plan that seeks to prolong the benefits of an individual treatment.
Eutrophication and Aquatic Plant Management in Massachusetts
4.0 Methods to Control Aquatic Plants
Page 4-97
4.6.6.3 Performance Guidelines
Planning and Implementation There are many factors to consider when choosing and applying an herbicide that will determine the effectiveness and impacts of the application. Key factors to consider include the type and distribution of plants, water chemistry, lake area and volume, water depth, depth to any thermocline, sediment type, turbidity, fish populations, benthic and planktivorous fauna, presence of rare or endangered species and recreational uses. Based on these lake conditions, a careful evaluation of herbicide formulation, application rates, adjuvant addition, timing of the treatment and application method should be adjusted to increase effectiveness and minimize impacts. Important questions to be answered before adopting a management program involving herbicides include:
What is the acreage and volume of the area(s) to be treated? Proper dosage is based upon these facts.
What plant species are to be controlled? This will determine the herbicide and dose to be used.
How is this water body used and does the management plan have reasonable goals that balance the uses? Many herbicides have restrictions of a day to two weeks on water use following application, and most cannot be used in water supplies.
What will the long-term costs of this decision be? Most herbicides must be reapplied annually, with a range of about two times per growing season to once per five years possible.
Where application of some herbicides (such as 2,4-D and diquat) to lakes heavily infested with plants has a clear potential for lakewide impacts to water quality and habitat, it may be recommended that the lake be treated in strips or sectors and that about 14 days be allowed between treatments. This method of application will minimize oxygen depletion from decomposing plants (RCC Undated a,b,c; National Chemsearch, 1987), and untreated areas can offer a refuge for fish. If desired, partial treatment of a lake might be done in a cross-hatch pattern to provide both open water and plant cover for fish. Such partial treatment approaches depend on low mobility of the herbicide, however. Active ingredients such as fluridone are highly mobile and not well suited to partial lake treatment unless the lake can be partitioned in some fashion, usually with limno-curtains. It is often appropriate to dilute liquid herbicides and apply them evenly over the area to be treated in order to avoid areas of high concentrations that could impact non-target organisms. Pelletized formulations should also be spread evenly over the target area, but cannot be diluted prior to application. Competent applicators have developed approaches to meet a variety of plant management goals. Lake managers who choose herbicidal chemicals need to exercise all proper precautions. As shown in Table 4-5, effectiveness of a given herbicide varies by plant species and therefore the nuisance plants must be carefully identified. Users should follow the herbicide label directions carefully, use only a herbicide registered by USEPA and the Massachusetts Pesticide Bureau for aquatic use, wear personal protective equipment as appropriate during application, and protect
Eutrophication and Aquatic Plant Management in Massachusetts
4.0 Methods to Control Aquatic Plants
Page 4-98
desirable plants to the extent practical. Most states, including Massachusetts, require applicators to be licensed and to have adequate insurance. Monitoring and Maintenance Monitoring of the concentration of fluridone is becoming standard, but no such monitoring of other herbicides is commonly practiced. Most of the effort goes into planning and conducting the actual treatment. This is especially necessary for effective algaecide use, as the types and density of algae should be tracked to determine the appropriate treatment type and timing. A visual survey for any large impacts (e.g., macroinvertebrate or fish kills) should be carried out and reported. MDEP should work with applicators to develop case studies to inform subsequent decisions on the appropriateness of various herbicides for specific applications. Depending on the scope and nature of the problem to be addressed, case study information might include the USEPA registration number, the maximum expected concentration of the active ingredient, and vegetation surveys (species and density). Surveys should be conducted before and after treatment to assess effectiveness. Where algaecides are used, assessments should include species identification and densities of algae and zooplankton. Basic water quality (pH, dissolved solids, temperature, and dissolved oxygen) should also be assessed. Where sensitive fauna are present, assessment of selected indicator populations would be helpful. The cost issue for case history development is a bigger obstacle for herbicide treatment than most other techniques. While it is possible to perform at least a rudimentary assessment as noted above for <$10,000, the cost of most chemical treatments is less than anticipated monitoring costs for such assessments. Herbicides are chosen not just for effectiveness, but based on cost, and a doubling of that cost is not well received by lake associations or others financing the project. An organized effort at the state level is necessary to gather the desired data for an overall evaluation of treatment impacts in Massachusetts, both for purposes of affordability and to achieve an appropriate level of coverage for treatment types and plant problems. Other than possible re-application, there is little maintenance involved in herbicide treatments. Mitigation Once an herbicide is applied, there is little opportunity for mitigation. However, applicators can mitigate impacts during application by varying the timing of application to treat during times of active target plant growth, cool water, and higher oxygen content, as well as staggering the applications in space and time, applying a different application form of the herbicide (e.g., pellets, spray, wiper) to specific target areas or by using selective herbicides when this is an option.
4.6.7 Copper Copper is a contact herbicide that is generally considered non-selective (Langeland, 1993). However, when copper is used at a continuous low dose it can be considered selective in some cases (Hansen et al., 1983). The active ingredient in copper sulfate and copper complexes is the copper ion. The mode of action of copper is to inhibit photosynthesis and may affect nitrogen metabolism (Kishbaugh et al., 1990; Olem and Flock, 1990). Copper is by far the most used active ingredient in algaecides. Copper is one of the only algaecides approved for use in potable
Eutrophication and Aquatic Plant Management in Massachusetts
4.0 Methods to Control Aquatic Plants
Page 4-99
water supplies (Ross and Lembi, 1985), and is considered essential to maintaining swimmable waters in many lakes within the Commonwealth (G. Smith, ACT, pers. comm., 1997). While copper is generally used for the control of algae (Ross and Lembi, 1985; Kishbaugh et al., 1990), in some cases it is also used for macrophyte control (usually in chelated form), particularly for Hydrilla verticillata (Westerdahl and Getsinger, 1988) and for some Potamogeton spp. (Hansen et al., 1983). Copper is sometimes part of a broad spectrum formulation intended to reduce the biomass of an entire plant assemblage, especially if it includes a substantial algal component. Also, certain copper formulations are also used on particular vascular plants when the water use restrictions of other herbicides prevent their use. Copper concentrations should not exceed 1 mg/L in the treated waters.
4.6.7.1 Effectiveness of Copper
While copper sulfate is used at concentrations up to 1 ppm (Seagrave, 1988), it appears that control is often achieved at a dose of only 0.1 ppm and that some particularly sensitive algae can be killed at copper levels as low as 0.010 mg/L, as reviewed by McKnight et al. (1983). Blue-green algae (actually cyanobacteria) appear to be more sensitive to copper than many true algae. Effectiveness of low doses depends on monitoring algal densities and adding low doses prior to the formation of an algal bloom (McKnight et al., 1983). Once a bloom has formed, higher doses may be required and may still be ineffective if adequate contact with algal cells cannot be achieved. In general, bright sunlight appears to enhance the effectiveness of the treatment. Product labels for Phelps Dodge Triangle Brand copper sulfate indicate most species of blue-greens are sensitive to copper and are controlled by 0.25 - 0.5 ppm copper sulfate pentahydrate (0.06 to 0.125 ppm copper). Some species of Calothrix and Nostoc are more resistant, however, and resistant strains of the more troublesome Aphanizomenon and Anabaena have been encountered with increasing frequency (Kishbaugh et al., 1990). The cyanobacterium Phormidium was found to be resistant to both copper sulfate and chelated copper algaecides (Zimmerman et al., 1995). Labels for copper products also indicate that while many green algae such as Spirogyra, Closterium and Ulothrix are sensitive to copper, species of the group Chlorococcales such as Scenedesmus are resistant. The mat-forming, filamentous green algae Cladophora, Rhizoclonium and Pithophora are notoriously resistant to copper, mainly as a function of limited copper mobility in the thick tangle of filaments that often forms. Other species such as Asterionella and Navicula (both diatoms) and Dinobryon, Synura and Uroglena (flagellated golden algae) are also listed as sensitive; most diatoms and golden algae are very susceptible to control with copper, as are nearly all species of dinoflagellates, cryptomonads and euglenoids. Beyond the susceptibility of the algal species present, the effectiveness of copper-containing aquatic herbicides is dependent in particular on the alkalinity, dissolved solids content, suspended matter and water temperature. McKnight et al. (1983) suggest that low doses of copper sulfate (less than 0.10 mg/L) may be effective in acidic waters. In cases where the alkalinity is high, however, carbonate and bicarbonate ions and water react with copper and form a precipitate that prevents the uptake of copper by algal cells. In such cases chelated copper compounds are used instead of copper sulfate. Suspended solids provide additional substrates on which copper sorption can occur, removing it from the water column. These conditions that

Eutrophication and Aquatic Plant Management in Massachusetts
4.0 Methods to Control Aquatic Plants
Page 4-100
reduce the toxicity of copper as an algaecide/herbicide also reduce the toxicity to non-target organisms. Additionally, algae do not respond as well to copper treatments in water less than 10º C (50ºF) (Gangstad, 1986). In a study of Mill Pond Reservoir in Burlington Massachusetts, McKnight (1981) found that the toxicity of copper sulfate to the dinoflagellate Ceratium hirundinella was controlled by the complexation of humic substances in the lake. The concentration of copper after 24 hours was approximately 0.0825 mg/L, but most of this was complexed by natural organic agents such as humic acids. The resulting free cupric ion activity of 0.006 mg/L was toxic to the dinoflagellate, but other algal species such as Nannochloris sp. and Ourococcus sp., both green algae, were resistant to the copper at such low levels and soon became dominant. Copper sulfate effectiveness can be compromised by the impact of copper sulfate on zooplankton. Daphnia, a common grazer of algae, is highly sensitive to copper. In the absence of grazers, algal biomass can quickly return to pretreatment levels (Cooke et al., 1993a). Impact to zooplankton will tend to last longer than impact on algae, so short-term gains can become long-term detriments if the dose is too high for desirable zooplankton.
4.6.7.2 Specific Short-Term Impacts on Non-Target Organisms by Copper
According to data provided by the Department of Environmental Protection, (G. DeCesare, MDEP, pers. comm., 1995; 2003), the median copper sulfate pentahydrate application rate in Massachusetts waters in 1994 was 0.78 lb per acre foot with an estimated concentration of 0.07 ppm of copper ion, while in 2002 it was 0.80 lb per acre with the same concentration. Maximum label rates vary by product, but the maximum level of copper allowed by label is 1.0 ppm as elemental copper and 4.4 ppm as copper sulfate. Most algaecide applications in Massachusett use copper sulfate application rates of about 0.25 to 0.30 ppm (G. Smith, ACT, pers. comm., 1997). Copper is a heavy metal that is naturally occurring but also present in industrial pollution and urban runoff. Treatments with copper can cause fish kills, particularly in lakes where alkalinity is low. Since the early 1970s, fish kills occurred following copper sulfate treatment of at least three lakes in Massachusetts: Arcade Pond in Northbridge in 1989; Little Indian Pond in Worcester in 1980 and 2002; and Framingham Reservoir II in Framingham in 1977 (DFW, unpublished data, 1977-2002). Most fish kills associated with copper treatments occur because of oxygen depletion from decomposing algae or other vegetation rather than direct toxic effects (Ross and Lembi, 1985). Fish kills following copper sulfate treatment are rare, considering the hundreds of applications made to drinking water reservoirs and lakes in Massachusetts over the past several decades. Copper toxicity decreases as hardness (calcium and magnesium concentration) increases. For example the copper LC50 for rainbow trout (Onchorhynchus mykiss) varies from approximately 0.05 ppm at a hardness of 15 ppm to approximately 0.5 ppm at a hardness of 300 ppm (Moore and Ramamoorthy, 1984). The State of Washington limits copper treatments to concentrations less than 0.05 ppm in trout waters with hardness less than 50 ppm (WSDOE, 1992; Appendix G). Based on the calcium and magnesium data from Mattson et al. (1992), the hardness in Massachusetts lakes ranges from a median of 10 ppm in the Southeast (including Cape Cod)
Eutrophication and Aquatic Plant Management in Massachusetts
4.0 Methods to Control Aquatic Plants
Page 4-101
region of Massachusetts to a median of 109 ppm in the limestone region in Western Massachusetts, with a statewide median of approximately 20 ppm. A range of hardness-based toxicity is therefore possible in Massachusetts. In addition, copper is more toxic at low pH (Moore and Ramamoorthy, 1984), and lakes in the Cape Cod region tend to be acidic with a median pH of 6.00 (Mattson et al., 1992). Thus copper toxicity is highly dependent on water chemistry and the greatest toxicity would be expected to occur in soft water lakes, especially in the Cape Cod region. However, the toxicity of copper is significantly reduced by the presence of organic chelators such as humic acids or EDTA (Moore and Ramamoorthy, 1984). Humic acids may be higher (coincident with high color) in many southeastern Massachusetts lakes. Copper chelates are generally considered to be less toxic than copper sulfate (Ross and Lembi, 1985). Copper sulfate is highly toxic to zooplankton such as Daphnia sp., one of the most common grazers of algae. The impact to the zooplankton may cause the rapid reoccurrence of algal growth after treatment (Cooke et al., 1993a). Most fish kills associated with copper treatments occur because of oxygen depletion from decomposing algae rather than direct toxic effects (Ross and Lembi, 1985). The Cutrine-Plus granular label states the product should not be used in trout waters if hardness does not exceed 50 ppm. Copper sulfate is also used to kill snails in order to control blood flukes (Trematoda schistosomatidae) which cause swimmer's itch. Application of 1.5 kg/100 m2 is recommended by the Minnesota Department of Natural Resources for treatment of the swimming area out to the edge of the littoral zone. This dosage, however, will kill most invertebrates and may significantly contaminate sediments (Cooke et al., 1993a). Sublethal effects on snails were noted during treatment with low levels (0.3 ppm or more) of Cutrine-Plus (Christian and Tesfamichael, 1990). Rat LD50 values for copper range from 300-2400 mg/kg, depending on the formulation of copper sulfate or copper complexes (see Appendix III for further toxicity information). One other possible negative consequence of treating algae with copper bears special mention. The release of cellular contents upon death by copper has possible negative consequences for the aquatic environment. Release of hepatotoxins by Microcystis and neurotoxins by Aphanizomenon have been observed, and blue-green algal toxins have been linked to the death of livestock and gastrointestinal problems in humans following consumption (Kenefick et al., 1993). While the existence of these toxins has been known for many decades, recent improvements in detection levels has revealed more widespread occurrence than previously assumed (Haynes 1988, Kotak et al. 1993). The potential for human illness has not been well quantified to date. The risk of exposure to blue-green algal toxins in recreational lakes may not be increased by treatment with copper, as either ingestion of the algal cells or toxin-containing water could cause medical problems. However, the threat to drinking water supplies would appear to be increased by treatment, as simple filtration does not remove toxins. The use of activated carbon in water treatment does remove these toxins. Despite the potential for toxic effects, the most likely short-term impacts are due to simple oxygen stress. This is caused by consumption of dissolved oxygen by decaying algae and vegetation following treatment. A review of dose effectiveness and environmental impacts is found in Cooke and Carlson (1989).
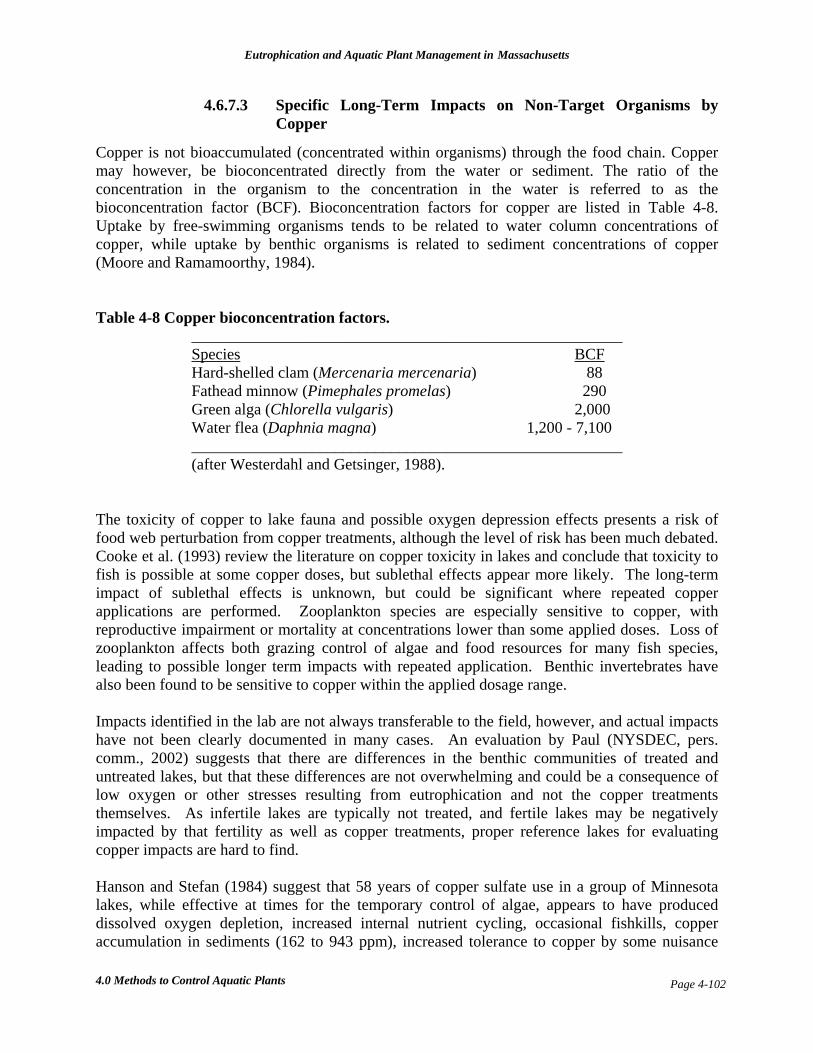
Eutrophication and Aquatic Plant Management in Massachusetts
4.0 Methods to Control Aquatic Plants
Page 4-102
4.6.7.3 Specific Long-Term Impacts on Non-Target Organisms by Copper
Copper is not bioaccumulated (concentrated within organisms) through the food chain. Copper may however, be bioconcentrated directly from the water or sediment. The ratio of the concentration in the organism to the concentration in the water is referred to as the bioconcentration factor (BCF). Bioconcentration factors for copper are listed in Table 4-8. Uptake by free-swimming organisms tends to be related to water column concentrations of copper, while uptake by benthic organisms is related to sediment concentrations of copper (Moore and Ramamoorthy, 1984). Table 4-8 Copper bioconcentration factors. ______________________________________________________ Species BCF Hard-shelled clam (Mercenaria mercenaria) 88 Fathead minnow (Pimephales promelas) 290 Green alga (Chlorella vulgaris) 2,000 Water flea (Daphnia magna) 1,200 - 7,100 ______________________________________________________ (after Westerdahl and Getsinger, 1988). The toxicity of copper to lake fauna and possible oxygen depression effects presents a risk of food web perturbation from copper treatments, although the level of risk has been much debated. Cooke et al. (1993) review the literature on copper toxicity in lakes and conclude that toxicity to fish is possible at some copper doses, but sublethal effects appear more likely. The long-term impact of sublethal effects is unknown, but could be significant where repeated copper applications are performed. Zooplankton species are especially sensitive to copper, with reproductive impairment or mortality at concentrations lower than some applied doses. Loss of zooplankton affects both grazing control of algae and food resources for many fish species, leading to possible longer term impacts with repeated application. Benthic invertebrates have also been found to be sensitive to copper within the applied dosage range. Impacts identified in the lab are not always transferable to the field, however, and actual impacts have not been clearly documented in many cases. An evaluation by Paul (NYSDEC, pers. comm., 2002) suggests that there are differences in the benthic communities of treated and untreated lakes, but that these differences are not overwhelming and could be a consequence of low oxygen or other stresses resulting from eutrophication and not the copper treatments themselves. As infertile lakes are typically not treated, and fertile lakes may be negatively impacted by that fertility as well as copper treatments, proper reference lakes for evaluating copper impacts are hard to find. Hanson and Stefan (1984) suggest that 58 years of copper sulfate use in a group of Minnesota lakes, while effective at times for the temporary control of algae, appears to have produced dissolved oxygen depletion, increased internal nutrient cycling, occasional fishkills, copper accumulation in sediments (162 to 943 ppm), increased tolerance to copper by some nuisance
Eutrophication and Aquatic Plant Management in Massachusetts
4.0 Methods to Control Aquatic Plants
Page 4-103
blue-green algae, loss of macrophytes and undesirable impacts on fish and zooplankton. Short-term control (days) of algae may have been traded for long-term degradation of the lakes, although the scientific rigor of this study has been criticized. After years of copper sulfate use, officials decided to halt treatments due to high concentrations in the lake sediments, oxygen depletion following treatment and lack of cost effectiveness (Hanson and Stefan, 1984). Alternatives to copper-based algaecides are few. Simazine, an organic formulation that was highly effective against copper-resistant green algae, was not re-registered for use as of 1996. Endothall (as the hydrothol formulation) and diquat are still used with some success against hard-to-kill greens and blue-greens, but irrigation use is restricted for multiple days after application, and possible toxicity to lake invertebrates is a concern in some cases. New formulations of copper are more common than new non-copper-based algaecides, and low cost and general effectiveness will keep copper popular until an appropriate substitute is found.
4.6.7.4 Specific Short-Term Impacts on Water Quality by Copper
Copper sulfate and copper complex product labels indicate that copper may be toxic to fish and other aquatic organisms. Water concentrations should not exceed 0.5 ppm for copper sulfate and 1.0 ppm for copper complexes. There are no general restrictions for fishing, swimming, drinking, irrigation and watering of livestock, but some labels state that metallic copper should not exceed 1 ppm if water is used as a source of potable water. As noted above, the largest short-term impact to water quality is usually oxygen loss due to oxygen consumption caused by the decay of the algae. Any significant reduction in dissolved oxygen below Massachusetts Surface Water Quality Standards could increase the likelihood of a fish kill.
4.6.7.5 Specific Long-Term Impacts on Water Quality by Copper
Copper will eventually sorb to sediments, where it can persist indefinitely. In a review of heavy metals in natural waters, Moore and Ramamoorthy (1984) note that copper is rapidly sorbed onto sediments, resulting in high residue levels. The aqueous half-life is generally from 1 to 7 days (Westerdahl and Getsinger, 1988). Long-term water quality impacts are therefore unlikely unless application is frequent, but accumulation in sediments may be a problem. While unpolluted sediments generally contain copper at ≤20 mg/kg, in a study of copper in Massachusetts lake sediments, 94 lakes had an average concentration of 267.5 mg/kg (Rojko, 1990). Some of the highest levels were associated with industrially contaminated impoundments (773-3663 mg/kg), sediments while 14 lakes known to have been treated with copper sulfate averaged 99 mg/kg. It is possible that sediments contaminated with copper may pose a problem for disposal if dredging is later proposed for the lake, based on Massachusetts Contingency Plan threshold concentrations and MDEP regulations governing disposal of soil and sediments.
4.6.7.6 Implementation Guidance for Copper
Adhere to all label restrictions. Licensed professionals must perform most treatments. Copper sulfate can be applied by towing burlap or nylon bags filled with granules (which dissolve) behind a boat. Other formulations can be applied as broadcast granules or sprayed liquids. A copper slurry can be delivered to an intended depth by a weighted hose. The method of delivery is not as important as the duration of effectiveness, however. In alkaline waters (150 mg calcium
Eutrophication and Aquatic Plant Management in Massachusetts
4.0 Methods to Control Aquatic Plants
Page 4-104
carbonate per liter, or more) or in waters high in hardness or organic matter, copper can be quickly lost from solution and thus rendered ineffective. In these cases, a liquid chelated form is often used. This formulation allows the copper to remain dissolved in the water long enough to kill algae. Dilution is another important factor, as copper is often applied to only the upper 10 ft of water to provide a deeper refuge for zooplankton and sensitive fish species. Vertical or horizontal mixing can rapidly decrease doses below an effective level. Depending on individual circumstances, it may be recommended that the lake or pond be treated in sections to minimize oxygen depletion from the decomposition of dead algae, allowing 1 to 2 weeks between treatments so that oxygen levels can recover. Algaecide should be distributed as evenly as possible over the treated area. Once applied there is little mitigative potential. Careful planning and implementation are needed to avoid undesirable impacts. Given the many potentially negative aspects of algaecide applications, especially those involving copper, such treatments should only be used as the last line of defense. Frequent need for algaecides should be taken as an indication that a more comprehensive management plan is needed. Where algaecides are used, effectiveness is enhanced through improved timing of application. Algaecides should be applied early in the exponential growth phase, when algal sensitivity is greatest and the impacts of lysing cells on the aquatic environment are minimized. Proper timing of application requires daily to weekly tracking of algal populations, potentially at greater annual expense than the actual annual treatment cost.
4.6.8 Diquat Diquat is a fast acting contact herbicide, producing results within 2 weeks of application through disruption of photosynthesis. It is a broad-spectrum herbicide with potential risks to aquatic fauna, but laboratory indications of invertebrate toxicity have not been clearly documented in the field. A domestic water use restriction of 7 days is normally applied. Regrowth of some species has been rapid (often within the same year) after treatment with diquat in many cases, but two years of control have been achieved in some instances. Concentrations in treated water should not exceed 2 mg/L.
4.6.8.1 Effectiveness of Diquat
Diquat is a relatively non-selective, contact herbicide that acts by interfering with photosynthesis (Langeland, 1993). It is the active ingredient in five herbicides registered in Massachusetts (Table 4-7, Appendix III). Diquat can provide effective but temporary control of a number of species, including Eurasian watermilfoil (Myriophyllum spicatum). Diquat is used as a general purpose aquatic herbicide, both as a primary control agent for a broad range of macrophytes and as a follow-up treatment chemical for control of plants (especially milfoil) missed by other herbicides or physical control techniques. Treatment with diquat is recommended early in the season to impact early growth stages, but can be applied any time. Usage in Massachusetts has shown that the effects of diquat are generally visible after 2-3 days and plants are controlled within 7-10 days (G. Smith, ACT, pers. comm., 1995). Diquat is less effective in turbid, muddy water due to adsorbance onto sediments and other particles (Westerdahl and Getsinger, 1988).
Eutrophication and Aquatic Plant Management in Massachusetts
4.0 Methods to Control Aquatic Plants
Page 4-105
With the addition of an adjuvant, diquat can also be effective in flowing water. In experiments on the River Eden in Columbia, England, the use of diquat with the adjuvant sodium alginate (allowing the herbicide to stick to plants) was shown to effectively control Ranunculus in moving water. Plant control in rivers is generally difficult to achieve with herbicides because the flowing water often disperses the herbicide before it can affect the target plants. This study showed that diquat with sodium alginate effectively treated localized plant growth in a fast flowing river (Barrett, 1981). Recent studies in the United States suggested that this formulation was not consistently effective and further development was dropped (K. Getsinger, USACE, pers. comm., 1996).
4.6.8.2 Specific Short-Term Impacts on Non-Target Organisms by Diquat
Since diquat is a broad spectrum herbicide, it can be expected to impact non-target plants when they are present. Loss of vegetative cover may have some impact on aquatic animals, but short-term effects are not expected. The acute toxicity of diquat for fish is highly variable depending on species, age, and hardness of water. For example, bluegills (Lepomis macrochirus) are resistant to diquat with a 96-hour LC50 of 72 ppm in soft water (Surber and Pickering, 1962), while walleyes (Stizostedion vitreum) and smallmouth bass (Micropterus dolomieui) are more sensitive with LC50s ranging from 0.75 to 2.4 ppm (Paul et al., 1994; Gilderhus, 1967; Skea et al., 1987). A review of such studies suggests young fish are more sensitive than older fish. Field concentrations of diquat are hard to maintain because diquat rapidly sorbs to the sediments (WSDOE, 1992). Maximum concentrations based on the Reward label are currently 0.72 ppm as the cation, based on the maximum rate of 2 gallons per acre in areas deeper than 2 feet. For water less than or equal to 2 feet in average depth, a maximum of 1 gallon of Reward is allowed. However, the only time Reward is used at its maximum application rate is in small private ponds. Normally Reward is used at a rate of 1 gallon per surface area in Massachusetts waters with an average depth of 4 feet. This renders a concentration of 0.1 ppm of active ingredient (L. Lyman, Lycott, and G. Smith, ACT, pers. comm., 1997). Treatment doses are therefore not expected to exceed thresholds for potential toxicity. As Shaw and Hamer (1995) point out, diquat is rapidly sorbed and the maximum application concentration may be considerably higher than field conditions over 96 hours. To address this concern, 24-hour LC50 tests are considered adequate and more appropriate than 96-hour tests (Paul et al., 1994). Table 4-6 lists 24-hour LC50s of 2.4 ppm for smallmouth bass (Skea et al., 1987), which is a species common to Massachusetts. Other studies report LC50s as high as 245 ppm (Appendix III). Sublethal effects on fish are possible at rates lower than those listed above. For example, Bimber et al. (1976) noted respiratory stress in yellow perch (Perca flavescens) at concentrations of 1 ppm. Invertebrates may be even more sensitive to diquat. Diquat was toxic to Daphnia pulex at 1 ppm (Gilderhus, 1967). Amphipods (Hyalella azeteca) are particularly sensitive with a mean LC50 of 0.048 ppm (Wilson and Bond, 1969), well below the maximum application rate. Acute toxicity of diquat for mammals is moderate. Oral LD50 in rats is >194 but <274 mg/kg (see Table 4-6 and 4-7 and Appendix III for further toxicity information for non-aquatic organisms).

Eutrophication and Aquatic Plant Management in Massachusetts
4.0 Methods to Control Aquatic Plants
Page 4-106
A fish kill of 5,000 fish was reported in 1975 in Wyman Pond, Westminster Massachusetts following diquat application (Hartley, MDFG, pers. comm., 1996). Minimal information is available about the dose or other contributing factors in this fish kill. However, at the median concentration expected from current use in Massachusetts (0.21 ppm) no fish kills are expected, and effects determined in the lab have very rarely been observed in the field. Because of the potential toxicity of diquat to fish and other organisms, the use of diquat has been further restricted in New York State to a maximum concentration of 0.5 ppm cation and New York State restricts its use to depths over 1 meter (3 feet). Paul et al. (1995) calculated that this provided an increased margin of safety. It should be noted that these New York requirements are more stringent than those of nearly all other states and are based on lab studies and calculations, not field experience. Even then, most Massachusetts diquat treatments meet the NY standards.
4.6.8.3 Specific Long-Term Impacts on Non-Target Organisms by Diquat
Because diquat can be toxic to young fish and aquatic invertebrates, diquat could disrupt the food chain for game fish if high rates were applied in shallow water. Impacts are rarely reported for invertebrates and fish fry, and it is uncertain whether such impacts do not occur in the field or are not noticed. Paul et al. (1995) noted that the muskellunge (Esox masquinongy) fishery began to collapse in Chautauqua Lake, NY after 5 years of diquat use, but loss of vegetative cover may have been more responsible than any faunal toxicity. Further research is needed to establish the effects of diquat, if any, on food chain organisms. Bioconcentration factors for fish were relatively low (< 2.5X), but ranged up to 62X for other organisms (Appendix III). Oral doses of diquat to rats, mice and rabbits did not produce teratogenic effects. Teratogenic effects were produced, however, in rats and mice when administered intraperitoneally or intravenously. Mutagen studies have been contradictory and carcinogenic risk assessment was inconclusive. Additional information regarding long-term toxicity of diquat for mammals is reported in Appendix III.
4.6.8.4 Specific Short-Term Impacts on Water Quality by Diquat
Older labels stated that treated water should not be used for human or animal consumption, or for irrigation for 14 days (National Chemsearch, 1987; ICI Americas, Inc., 1992), but the label approved for Reward in 1995 indicates variable restrictions up to 3 days for drinking and up to 5 days for irrigation of food crops, with no swimming restrictions (Zeneca, 1995). The weight of evidence over years of use favored lesser restrictions.
4.6.8.5 Specific Long-Term Impacts on Water Quality by Diquat
The half-life for removal of diquat from the water column is 2 weeks or less. Diquat binds tightly to clay, but may take up to 10 times longer to bind to sand particles. Diquat is biologically unavailable when bound with sediments and is unlikely to impact long-term water quality (WSDOE, 1992). Diquat was shown in one study to persist in the sediments for over 160 days (Frank and Comes, 1967), but no impact to water quality was shown. A build up of diquat can occur in lake sediments from repeated diquat treatments, but diquat is biologically unavailable in

Eutrophication and Aquatic Plant Management in Massachusetts
4.0 Methods to Control Aquatic Plants
Page 4-107
those sediments and represents no significant threat to aquatic life or people using the water. Further studies on the accumulation and environmental fate of this compound would be useful, but no long-term impacts are expected based on available information.
4.6.8.6 Implementation Guidance for Diquat
Adhere to all label restrictions. Licensed professionals must perform the treatments. Application rates for Reward, an herbicide containing the active ingredient diquat, vary depending on type of vegetation to be controlled and depth of the water body. The recommended application rate for submersed plants and algae is 1-2 gal/surface acre, while floating plants can be treated with a lower application rate, generally from 1/2 to 3/4 gal/surface acre. If the average depth is less than two feet, 1 gal/surface acre is the maximum amount that is normally used. The maximum concentration expected in the water would be 0.71 ppm. Half of the water body is normally treated at a time, with several days before the other half is treated. For submersed plants, diquat products are normally applied by injecting the herbicide into the water column or by dispersing the herbicide evenly over the treatment area. For plants with floating leaves application from a sprayer is usually effective (Westerdahl and Getsinger, 1988). For greater effect on some species, the use of adjuvants is recommended. The manufacturers of Reward recommend that 16 oz. of a 75% non-ionic spreader be added to 150 to 200 gal of herbicide solution (Zeneca, 1993).
4.6.9 2,4-D 2,4-D is the active ingredient in a variety of commercial herbicide products and has been in use for over 30 years. This is a systemic herbicide; it is absorbed by roots, leaves and shoots and disrupts cell division throughout the plant. Vegetative propagules such as winter buds, if not connected to the circulatory system of the plant at the time of treatment, are generally unaffected and can grow into new plants. It is therefore important to treat plants early in the season, after growth has become active but before such propagules form. 2,4-D is sold in liquid or granular forms as sodium and potassium salts, as ammonia or amine salts, and as an ester. Doses of 50 to 150 pounds per acre are usual for submersed weeds, most often of the dimethylamine salt (DMA) or the butoxyethanolester (BEE) in granular formulation. This herbicide is particularly effective against Eurasian watermilfoil (granular BEE applied to roots early in the season) and as a foliage spray against water hyacinth. 2,4-D has a short persistence in the water but can be detected in the mud for months. Experience with granular 2,4-D in the control of nuisance macrophytes has been generally positive, with careful dosage management providing control of such non-native nuisance species as Eurasian watermilfoil with only sublethal damage to many native species (Miller and Trout, 1985; Helsel et al., 1996). Recovery of the native community from seed has also been successful. 2,4-D has variable toxicity to fish, depending upon formulation and fish species. The 2,4-D label does not permit use of this herbicide in water used for drinking or other domestic purposes, or for irrigation or watering of livestock.

Eutrophication and Aquatic Plant Management in Massachusetts
4.0 Methods to Control Aquatic Plants
Page 4-108
Experiments with plastic curtains to contain waters treated with 2,4-D revealed a loss of only 2-6% of the herbicide to areas outside the target area (Helsel et al., 1996). This approach marks the beginning of a new wave of more areally selective treatments and integrated rooted plant management.
4.6.9.1 Effectiveness of 2,4-D
2,4-D is a selective, systemic herbicide. It has been used in Massachusetts to control Myriophyllum spicatum and M. heterophyllum at relatively low application rates with little impacts on other plants. When taken up by the plant it mimics a plant growth hormone, auxin, and results in abnormal tissue development (Langeland, 1993). There are multiple registered herbicides in Massachusetts that are formulated with 2,4-D. A laboratory study was conducted to determine the efficacy of different exposure times and concentrations of 2,4-D to Eurasian watermilfoil (Myriophyllum spicatum). The results showed that increasing exposure times and concentrations increased damage to plants. Control can be achieved at a low application rate of 0.5 mg/L (as acid equivalent) if the concentration is maintained for 72 hours. An application rate of 1.0 mg/L can provide control if the concentration is maintained for 48 hours. A concentration of 2.0 mg/L will provide control if maintained for 24 hours (Green and Westerdahl, 1990). 2,4-D product labels advise that adding a surfactant may increase effectiveness against plants, but may decrease the selectivity. For aerial applications a thickening agent is recommended (Rhône-Poulenc Ag Company, 1994).
4.6.9.2 Specific Short-Term Impacts to Non-Target Organisms by 2,4-D
There are three different formulations of 2,4-D available. By far the most common 2,4-D product used in Massachusetts waters is the butoxyethyl ester (BEE) form. This granular formula is easy to apply for spot treatments and the active ingredient is slowly released near the root zone (G. Smith, ACT, pers. comm., 1996). The BEE form is typically more toxic to both plants and fish than the amine salts (Westerdahl and Getsinger, 1988), but toxicity is rarely observed at normal application rates of any formulation. The maximum application rate for Aqua-Kleen is 200 lb/acre with a maximum concentration of 3.4 ppm, assuming 4-foot water depth. According to data provided by the Department of Environmental Protection, (G. DeCesare, MDEP, pers. comm., 1995; 2003), the median 2,4-D application rate in Massachusetts waters in 1994 was 67 pounds per acre with an estimated concentration of 1.14 ppm active ingredient, assuming 4-foot water depth. Application rates were similar in 2002. The LC50 level for sensitive fish species such as the bluegill is 1.1 ppm from the BEE formulation in static 96-hour tests (Westerdahl and Getsinger, 1988). Westerdahl and Getsinger (1988) also note that toxicity may increase under acid conditions. However, lack of fishkills in 2,4-D treated lakes suggests that either the lab results overestimate toxicity or field concentrations are not as high as calculated. The 2,4-D BEE may hydrolyze to form less toxic 2,4-D acid and the hydrolysis appears to be more rapid under basic conditions. The hydrolysis half-life of the acid form of 2,4-D under neutral pH conditions is 1.6 days (Westerdahl and Getsinger, 1988). Toxicity tests are commonly conducted as static tests and are considered to be representative of field toxicity, but the lab is simply not the lake. Tests conducted in flow
Eutrophication and Aquatic Plant Management in Massachusetts
4.0 Methods to Control Aquatic Plants
Page 4-109
through systems may overestimate toxicity in the field as a function of differing exposure (continuous concentration with no refuge). The granular ester formulations are less hazardous to aquatic life than the liquid esters (Ross and Lembi, 1985). The amine formulation (DMA), however, is far less toxic than either ester form. The 2,4-D DMA formulation exhibits an LC50 of 123-230 ppm for the bluegills and as high as 458 ppm for fathead minnows (Westerdahl and Getsinger, 1988). Rat LD50s are between 720 and 1090 mg/kg for the various formulations of 2,4-D (see Appendix III for further toxicity information), far in excess of any plausible aquatic exposure level.
4.6.9.3 Specific Long-Term Impacts on Non-Target Organisms by 2,4-D
Studies indicate that 2,4-D is weakly teratogenic or non-teratogenic and is non-mutagenic (Appendix III). The primary issue in recent years with 2,4-D is that it is a growth hormone simulator, and could therefore be an endocrine disruptor. Concern over low levels of hormones or hormone-like substances in the aquatic environment appears justified, but research into actual effects has not progressed to the stage where definitive recommendations can be made. As with other herbicides, 2,4-D is intended to change the plant community, and such changes could have longer term effects on fish and wildlife. The potentially more selective use of 2,4-D at lower doses is perceived to lessen undesirable effects.
4.6.9.4 Specific Short-Term Impacts on Water Quality by 2,4-D
Monitoring conducted after 2,4-D treatment of the Robert S. Kerr Reservoir in Oklahoma in 1978 showed that the treatment did not degrade the water quality. Slight changes included an increase in total phosphorus concentrations at three of the eight sites monitored and a decrease of ammonium nitrogen in one site. The herbicide was only detected at one site four hours after treatment and the by-product, 2,4-dichlorophenol, was never detected (Morris and Jarman, 1981). Label instructions from 2,4-D warn not to use treated water for domestic or irrigation purposes for varying amounts of time (RCC Undated a,b,c). The label of Aqua-Kleen (2,4-D BEE) states that the product is not to be used in irrigation or for dairy or domestic water supplies. The maximum recommended concentration of the BEE formulation is 5.3 ppm, while maximum recommended concentration for the IOE and DMA formulations is 7.1 ppm. K. Getsinger (USACE, pers. comm., 1996) states that the concentration should not exceed 0.1 ppm in potable water.
4.6.9.5 Specific Long-Term Impacts on Water Quality by 2,4-D
The derivatives of 2,4-D are rapidly degraded by hydrolysis, photolysis and by microbial degradation. The half-life for 2,4-D formulations range from 2.2 to 14 days (Westerdahl and Getsinger, 1988). Long-term effects on water quality are therefore not expected.

Eutrophication and Aquatic Plant Management in Massachusetts
4.0 Methods to Control Aquatic Plants
Page 4-110
4.6.9.6 Implementation Guidance for 2,4-D
Adhere to all label restrictions. Licensed professionals must perform the treatments. When applying 2,4-D granules (IOE formulation) it is recommended that treatment begin along shore and proceed outward to allow fish to migrate to untreated areas. When treating a heavily infested lake, the label recommends treating part of the lake in any one period of several weeks to reduce the amount of decomposing plant material. Wait until treated plants are thoroughly decomposed before treating the rest of the lake (RCC Undated a,b,c). When applying the amine salt (DMA formulation), partial treatments are again recommended to reduce oxygen loss to decomposing plants and to allow fish to migrate to untreated water. This formulation can be sprayed or poured from a boat in bands beginning at the shoreline and proceeding outward (RCC Undated a,b,c). Once applied to a lake, impacts of 2,4-D are unlikely to be mitigated, so careful planning and implementation are essential. MDEP has released “Guidance for Aquatic Plant Management in Lakes and Ponds as it relates to the Wetlands Protection Act (DEP 2004) which includes an appendix detailing the protocol for application of 2,4-D to lakes and ponds in Massachusetts.
4.6.10 Glyphosate Glyphosate, the active ingredient in Rodeo and AquaNeat, is a systemic, broad spectrum herbicide. Its mode of action is to disrupt the plant's shikimic acid metabolic pathway. Shikimic acid is a precursor in the biosynthesis of aromatic amino acids. The disruption in the pathway prevents the synthesis of aromatic amino acids and the metabolism of phenolic compounds. The net effect is that the plant is unable to synthesize protein and produce new plant tissue. Glyphosate penetrates the cuticle of the plant and moves to the phloem where it is translocated throughout the plant, including the roots (Harman, 1995). Its aquatic formulation is effective against most emergent or floating-leaved plant species, but not against most submergent species. Rainfall shortly after treatment can negate its effectiveness, and it readily adsorbs to particulates in the water column or to sediments and is inactivated. It is relatively non-toxic to aquatic fauna at recommended doses, and degrades readily into non-toxic components in the aquatic environment. The maximum concentration for treated water is typically about 0.7 mg/L, but a dose of no more than 0.2 mg/L is usually recommended.
4.6.10.1 Effectiveness of Glyphosate
The most common aquatic use of glyphosate is for control of emergent and floating leaf species, in particular Nuphar spp., Nymphaea spp., Phragmites australis, Lythrum salicaria and Typha spp. Glyphosate is not effective for control of submerged macrophytes because it is water soluble and the concentration after dilution would be insufficient to control a submergent plant. It is, however, recommended for control of many wetland and floodplain species that include trees, shrubs and herbs (Gangstad, 1986; Harman, 1995). Glyphosate effectiveness is greater in soft water. Additives such as ammonium phosphate (NH4H2PO4 ) are recommended for hard water glyphosate applications (Shilling et al., 1990). A study done by Comes and Kelley (1989) showed that glyphosate applied at the rate of 3.3 kg/ha (2.9 lb/acre) to control cattails (Typha) was as effective or more effective than other herbicides tested. Solberg and Higgins (1993) conducted a study for the control of cattails in a waterfowl habitat. Glyphosate was effective for 2 years and did not negatively impact waterfowl.
Eutrophication and Aquatic Plant Management in Massachusetts
4.0 Methods to Control Aquatic Plants
Page 4-111
A non-ionic surfactant is recommended for use with glyphosate to increase the absorption by the plant cuticle (Harman, 1995). A study was conducted that tested the efficacy of three different surfactants combined with glyphosate applied to torpedograss (Panicum repens). The surfactants tested were Improve, Mon-0818 and X-77. Surfactants applied without glyphosate failed to inhibit growth. Of the three surfactant/glyphosate combinations tested, Improve was the only one shown to increase effectiveness of glyphosate applied without surfactant. Glyphosate applied alone at a concentration of 0.56 kg/ha (0.5 lb/acre) inhibited shoot and root-rhizome growth by 22 and 23%, respectively. When applied at the same rate with 0.05% Improve added, shoot and root-rhizome growth was inhibited by 17 and 61%, respectively. The addition of Improve enhanced the ability of glyphosate to be translocated to the roots, which increased control of torpedograss (Shilling et al., 1990). The level of detail necessary to understand herbicide function and effectiveness is underscored.
4.6.10.2 Specific Short-Term Impacts on NonTarget Organisms by Glyphosate
The concentration of glyphosate in the water using the maximum application rate of 0.94 gallons per acre in an average depth of 2 ft. of water is 0.70 ppm. A concentration this high would not be expected in the field under normal conditions of application because when properly applied, most of the spray hits and remains on the emergent or surface leaves of the target plants, not the water. According to data provided by the Department of Environmental Protection, (G. Decesare, MDEP, pers. comm., 1995; 2003), the median glyphosate application rate in Massachusetts waters in 1994 was 0.09 gallons per acre with an estimated concentration of 0.07 ppm active ingredient, assuming 2 foot depth. In 2003, the median application rate was about double the 1994 rate. The aquatic concentration is not particularly relevant, however, as this herbicide is applied directly to targeted plants above the water level. Because it is a broad spectrum herbicide, glyphosate should be expected to impact non-target emergent or floating leaf plants if the spray contacts them. Control of the spray can therefore greatly limit impacts to non-target vegetation. The LC50 levels for fish species vary widely (Westerdahl and Getsinger, 1988), probably due to variations in formulations tested (i.e., with or without surfactant). Most applications would result in aquatic concentrations far lower than any toxic threshold. Glyphosate is used to control emergent vegetation and to create open areas for waterfowl. Solberg and Higgins (1993) found that the waterfowl inhabited the treated areas more than untreated areas and there was no indication of any impact on the success of nesting waterfowl. Additionally, although there were fewer invertebrates present in glyphosate treated areas, it was not clear whether the invertebrates had been impacted directly by the herbicide or had simply migrated to a more vegetated area. Previous studies have suggested that invertebrates were not harmed directly by the herbicide, but were impacted by the alteration of vegetation (Solberg and Higgins, 1993). Further information on the toxicity of glyphosate to invertebrates is discussed in Appendix III. An assessment of the acute toxicity to aquatic invertebrates of the combination of Rodeo, X-77 Spreader (a surfactant), Chem-trol (a drift retardant) and water was conducted both in the field
Eutrophication and Aquatic Plant Management in Massachusetts
4.0 Methods to Control Aquatic Plants
Page 4-112
and in the laboratory. The species tested were Daphnia magna (water flea), Chironomus spp. (midge), Hyalella azteca (amphipod), Stagnicola elodes (pond snail) and Nephelopsis obscura (leech). In the field study an application rate for Rodeo of 0.62 gallons per acre was used, two thirds of the maximum dose but more than twice the recommended dose and six times the median Massachusetts dose. The mixture of Rodeo, X-77 Spreader and Chemtrol was applied from a plane at a concentration ratio of 36:3:1. Field results showed that the mixture was not acutely toxic to the aquatic invertebrates evaluated. Laboratory results showed that the X-77 Spreader was 83-136 times more toxic than Rodeo, which was approximately 24 times more toxic than Chem-trol. The combined toxicity of the herbicide mixture components were additive and Daphnia was more sensitive to both the X-77 Spreader and Rodeo than other species tested (Henry et al., 1994). The laboratory results suggest that the addition of a surfactant to glyphosate can increase the toxic effects to non-target organisms, but that field toxicity was not evident. For further information on the toxicity of surfactants, see Appendix III. Glyphosate has a low order of toxicity in the case of acute exposure in mammals. Rat LD50s are >5,000 mg/kg. LC50 values for various types of fish are relatively high (Appendix III).
4.6.10.3 Specific Long-Term Impacts on Non-Target Organisms by Glyphosate
Glyphosate is not classified as a mutagen, teratogen, or carcinogen. Laboratory studies have shown that in cases of chronic or subchronic exposure, glyphosate is not very toxic and does not tend to bioaccumulate in fish tissue (Appendix III). Use of glyphosate to alter an entire plant community could have long-term impacts on fish and wildlife, but usually this herbicide is used to control emergent or floating vegetation that is excessive from both a recreational and habitat viewpoint. Regrowth of plants is expected where light and substrate allow, so long-term impacts are not expected to be major.
4.6.10.4 Specific Short-Term Impacts on Water Quality by Glyphosate
Glyphosate should not be applied within 1/2 mile of a potable water intake (Monsanto, 1985). Impacts on water quality tend to be restricted to localized decreases in oxygen and increases in suspended solids as vegetation decays.
4.6.10.5 Specific Long-Term Impacts on Water Quality by Glyphosate
There are three pathways that lead to the dissipation of glyphosate in the aquatic environment: microbiological degradation, photolysis and adsorption onto sediment. Glyphosate can be biodegraded by microorganisms in the soil, water and sediment under both aerobic and anaerobic conditions. Aminomethylphosphonic acid (AMPA) is the most significant metabolite of glyphosate. AMPA is not considered to be a dangerous compound in the environment and may be used as a source of phosphorus by some organisms (Bronstad and Friestad, 1985). In most lakes this is not expected to represent a significant source of phosphorus as application rates are low and phosphorus represents only about 20 percent by weight of the glyphosate. The half-life of glyphosate varies with sediment type. It is suspected that the variance has more to do with microbial activity of the soil than a particular soil characteristic. The half-life can vary from a
Eutrophication and Aquatic Plant Management in Massachusetts
4.0 Methods to Control Aquatic Plants
Page 4-113
few days to months or years (Torstensson, 1985). Long-term water quality impacts are not expected.
4.6.10.6 Implementation Guidance for Glyphosate
Adhere to all label restrictions. Licensed professionals must perform the treatments. To increase the effectiveness of glyphosate, there are various factors to consider such as dose, timing and method of application, type of species present and weather conditions. It is recommended that glyphosate be applied while the plant is in a vulnerable stage of growth for maximum longevity of effects. For annuals this is usually an early growth stage. For perennials, it is generally when the plant has reached reproductive maturity (Gangstad, 1986). Application methods include broadcast spray (ground-rig or aerial), handgun and backpack sprayers, wiper (used especially in cranberry bogs), application to cut stems or stumps and tree injection. The method will depend on the number and location of target plants. Broadcast spray methods are used when control is desired over a large area, while handgun and backpack sprayers are effective methods for localized areas. The wiper can provide selective management of target species without impact to non-target species (Harman, 1995). Weather conditions should be considered to prevent drifting of the herbicide due to strong winds. More importantly, rain can wash the herbicide from the plant before it has a chance to be absorbed into the plant tissue. If rain is in the forecast the application should be delayed for better weather (Harman, 1995). At least two hours of dry conditions are necessary after treatment to allow uptake, and preferably 4-6 hours. Wind-induced waves can have the same effect as rain for floating leafed species like water lilies. The use of Glyphosate for the control of water lilies (Nuphar spp. and Nymphaea spp.) has been associated with the formation of floating islands (M. Mulholland, LPA, pers. comm., 1995). These islands are believed to form after plants have been killed as decomposition gases build up. Such islands may form without any herbicide treatment, however, so the correlation does not necessarily represent cause and effect. The rate of application must be determined based on the target species and the method of application. Rodeo contains 53.8% glyphosate. The remaining 46.2% is made up of “inert” ingredients. The recommended rate of application for cattails is a 3/4% solution (1 oz. of Rodeo to 1 gallon of water) if applied by a hand held sprayer or 4 1/2 to 6 pints of Rodeo per acre if a broadcast spray application is used. The maximum application rate is 7 1/2 pints per acre.
4.6.11 Fluridone Fluridone is a systemic herbicide introduced in 1979 (Arnold 1979) and in widespread use since the mid-1980’s, although some states have been slow to approve its use. Fluridone currently comes in two formulations, an aqueous suspension and a slow release pellet, although several forms of pellets are now on the market. This chemical inhibits carotene synthesis, which in turn exposes the chlorophyll to photodegradation (Gangstad, 1986; Langeland, 1993). Most plants are negatively sensitive to sunlight in the absence of protective carotenes, resulting in chlorosis of tissue and death of the entire plant with prolonged exposure to a sufficient concentration of
Eutrophication and Aquatic Plant Management in Massachusetts
4.0 Methods to Control Aquatic Plants
Page 4-114
fluridone. When carotene is absent the plant is unable to produce the carbohydrates necessary to sustain life (Eshenroeder, 1989). Some plants, including Eurasian watermilfoil, are more sensitive to fluridone than others, allowing selective control at low doses. For susceptible plants, lethal effects are expressed slowly in response to treatment with fluridone. Existing carotenes must degrade and chlorosis must set in before plants die off; this takes several weeks to several months, with 30-90 days given as the observed range of time for die off to occur after treatment. Fluridone concentrations should be maintained in the lethal range for the target species for at least 6 weeks and preferably 9 weeks. This presents some difficulty for treatment in areas of substantial water exchange. Fluridone is considered to have low toxicity to invertebrates, fish, other aquatic wildlife, and humans. The USEPA has set a tolerance limit of 0.15 ppm for fluridone or its degradation products in potable water supplies, although some state restrictions are sometimes lower. Control of Eurasian watermilfoil has been achieved for at least a year without significant impact on non-target species at doses <0.01 mg/L (Netherland et al., 1997; Smith and Pullman, 1997). The slow rate of plant die-off minimizes the risk of oxygen depletion. If the recommended 40-60 days of contact time can be achieved, the use of the liquid formulation of fluridone in a single treatment has been very effective. Where dilution is potentially significant, the slow release pellet form of fluridone has generally been the formulation of choice. Gradual release of fluridone, which is 5% of pellet content, can yield a relatively stable concentration. However, pellets have been less effective in areas with highly organic, loose sediments than over sandy or otherwise firm substrates (Haller, Univ. FL, pers. comm., 1996). A phenomenon termed “plugging” has been observed, resulting in a failure of the active ingredient to be released from the pellet. While some success in soft sediment areas has been achieved (ACT, 1994; Bugbee and White, 2002), pellets may be less efficient than multiple, sequential treatments with the liquid formulation in areas with extremely soft sediments and significant flushing. It may also be possible to sequester a target area with limno-curtains to reduce dilution effects in the target area (T. McNabb, AquaTechnex, pers. comm., 2001; G. Smith, ACT, pers. comm., 2002; L. Lyman, Lycott, pers. comm., 2002b).
4.6.11.1 Effectiveness of Fluridone
Fluridone is the active ingredient in the registered herbicide Sonar and also in the newer competitor product, Avast, both of which have liquid and pelletized formulations. Fluridone can be a broad spectrum herbicide when applied at full label recommendations (Pullman, 1994). In most cases, however, fluridone is used as a selective herbicide. For example, treating Myriophyllum spicatum (Eurasian watermilfoil) or Potamogeton crispus (curly leaf pondweed) at a low dose (0.005-0.010 mg/L) may have little impact on surrounding vegetation (Pullman, 1994; Harman, 1995; Langeland, 1993; Getsinger et al., 2000). Application rates recommended for control of non-native species such as Eurasian watermilfoil and curly leaf pondweed range from 0.007 to 0.015 ppm for a whole lake treatment (Pullman, 1994), although even lower doses have been tried with some success. The selectivity of fluridone for the target species depends on the timing and the rate of application (G. Smith, ACT, pers. comm., 1995; Harman, 1995). Early treatment (April/early
Eutrophication and Aquatic Plant Management in Massachusetts
4.0 Methods to Control Aquatic Plants
Page 4-115
May) with fluridone effectively controls overwintering perennials before some of the beneficial species of pondweed and naiad begin to grow (G. Smith, ACT, pers. comm., 1995). Additionally, M. spicatum begins growing earlier in the season than many native plants (Smith and Barko, 1990) and is thus susceptible to an early season treatment while native species are still dormant (Harman, 1995). For a complete list of plants that can be controlled by fluridone see Table 4-5 and Appendix III. Experience with fluridone since 1995 has included a wide range of treatments at more dosages, and the susceptibility and tolerance of many species has been determined. Variability in response has also been observed as a function of dose, with lower doses causing less impact on non-target species. However, lesser impact on target plants has also been noted in some cases, so dose selection involves balancing risk of failure to control target plants with risk of impact to non-target species. Eurasian watermilfoil has been reduced with fluridone at average concentrations as low as 4 ppb in whole lake treatments for at least a year, and doses above 20 ppb appear unnecessary as long as dilution is not a serious influence (Pullman, 1993; Netherland et al., 1997; Smith and Pullman, 1997). As fluridone works slowly, it is essential that an adequate concentration be maintained for multiple weeks. This presents a challenge to application where dilution effects are appreciable, but multiple approaches have been developed to enhance effectiveness. Many native species will survive these doses, which are well below the maximum of 50 ppb (liquid form) or 150 ppb (pellet form) set for use in Massachusetts waters. Additionally, seeds are unaffected, and many of the desirable native species are seed-producing annuals. Such annuals include the highly desirable macroalgae Chara and Nitella, carpet forming species of Najas, and nearly all desirable Potamogeton species. Multiple low dose treatments with fluridone have been successfully applied to whole lakes in an effort to minimize the effects on the native plant assemblage. An outdoor mesocosm evaluation concluded that fluridone concentrations between 5 and 10 ppb (residues remaining above 2 ppb) for an exposure period of >60 days effectively controlled Eurasian watermilfoil during the year of treatment while minimally affecting non-target species such as Elodea canadensis, Potamogeton nodosus, P. pectinatus and Vallisneria americana (Netherland et al. 1997). Data from Michigan provided in Getsinger 2001 suggest that many species do respond differently to fluridone at different doses, and that response may vary the year after treatment as well. The response of species the year after treatment at <6 ppb was variable but not extreme; no species remained in consistent decline, indicating recovery of many susceptible populations. However, this also applies to Eurasian watermilfoil, which showed signs of resurgence in a significant number of cases where the dose was <6 ppb. Experience in Vermont (G. Garrison and H. Crosson, VTDEC, pers. comm., 2001) with low dose treatments indicates that recovery of Eurasian watermilfoil was substantial the year after treatment with an average of 6 ppb (range = 2 to 11 ppb over 6 weeks). A fluridone assay was used to track concentrations to the nearest 0.5 ppb. There was minimal damage to non-target flora, but relief from Eurasian watermilfoil infestation may be short-lived for a substantial cost. Use of the low dose was driven by concerns by the fishery agency in VT over loss of vegetative cover in the year of treatment.
Eutrophication and Aquatic Plant Management in Massachusetts
4.0 Methods to Control Aquatic Plants
Page 4-116
By comparison, a 12 ppb treatment of Snyders Lake in New York (S. Kishbaugh and J. Sutherland, NYSDEC, pers. comm., 2002) with one booster treatment to raise the concentration back to near 12 ppb after a month resulted in near eradication of Eurasian watermilfoil and restoration of a highly desirable native community, based on four years of monitoring. Damage to some non-target species was indeed observed in the year of treatment, but substantial recovery of native species was observed the same year. Both an increase in taxonomic richness and expansion of coverage were observed during the year after treatment. Subsequent plant community changes have been more subtle, and hand harvesting of sporadic Eurasian watermilfoil stems has maintained control. Fluridone is also applied for the control of fanwort (Cabomba caroliniana), but typically at higher doses that used for Eurasian watermilfoil control (G. Bugbee and J. White, CT Agric. Exper. Station, pers. comm., 2002; G. Smith, ACT, pers. comm., 2002, L. Lyman, Lycott, pers. comm., 2002b). Doses >10 ppb are almost always applied for fanwort control, with doses of 12-15 ppb showing signs of success and doses near 20 ppb providing nearly complete fanwort kill. Unfortunately, at doses approaching 20 ppb, nearly all other submergent vegetation will be impacted as well.
4.6.11.2 Specific Short-Term Impacts on Non-Target Organisms by Fluridone
Maximum label application rates are 8 lb per acre-foot and 0.4 quarts per acre foot for the Sonar SRP and Sonar AS formulations, respectively. The maximum concentrations of fluridone expected would be 0.15 ppm, but since the mid-1990s it has been extremely rare to have a target concentration greater than 0.02 ppm. With target levels as low a 0.006 ppm, impacts on the target species are not always achieved, and only the most sensitive non-target vegetation (e.g., water marigold, Megalodonta beckii) is impacted. At application rates more certain to kill milfoil, partial damage to many non-target plants has been observed, but recovery within 1-2 years is typical. Research on degradation products of fluridone initially suggested some possible effects, but further testing indicated no significant threat. The potential formation of N-methylformamide (NMF), a compound that is toxic to humans, was investigated in field experiments by Smith et al. (1991) in Uxbridge and Grafton, Massachusetts, after it was observed as a breakdown product of fluridone in laboratory experiments. Their findings agreed with the results of a similar study by Osborne et al. (1989), in that no NMF was detected in the field. The laboratory experiments were conducted in the absence of aquatic plants and sediments. The contrasting results suggest that either fluridone behaves differently in the laboratory than it does in the field or that NMF is broken down rapidly in natural aquatic environments (Smith et al., 1991). Substantial bioaccumulation has been noted in certain plant species, but not to any great extent in animals. The USEPA has designated a tolerance level of 0.5 ppm (mg/L or mg/kg) for fluridone residues or those of its degradation products in fish or crayfish. The LC50 for sensitive fish species (excluding walleye, which is not common in the state) is 7.6 ppm (Paul et al., 1994), which is 50 times higher than the expected maximum concentrations and about 500 times higher
Eutrophication and Aquatic Plant Management in Massachusetts
4.0 Methods to Control Aquatic Plants
Page 4-117
than typical doses used today. Other studies report LC50s as high as 22 ppm (Westerdahl and Getsinger, 1988), but generally there is little variation from species to species. Fluridone was not found to impact non-target organisms at concentrations of 0.1 to 1.0 ppm in contained field experiments. Mosquitofish (Gambusia affinis) were added to each container to evaluate the impacts of fluridone on the fish at concentrations of 4.0, 2.0, 1.0, 0.5 and 0.25 ppm. G. affinis survived and reproduced at all concentration levels. Additionally, fluridone did not accumulate in the fish tested. The fluridone level in pumpkinseed (Lepomis gibbosus) detected 7 days after an application of 0.1 ppm was 0.023 ppm. No detectable residue was found in L. gibbosus 27 days after application. Other non-target organisms present included bluegills, catfish, crayfish, frogs and water snakes. No adverse impacts to these organisms were observed (McCowen et al., 1979). Fluridone has a low order of toxicity to mammals. Rat LD50s are >10,000 mg/kg (Appendix III).
4.6.11.3 Specific Long-Term Impacts on Non-Target Organisms by Fluridone
Fluridone has not been identified as a carcinogen or mutagen. A “No Observed Effects Level” for teratogenic effects for fluridone is greater than 100 mg/kg/day (see appendix III for further toxicity information). Long-term negative impacts to non-target organisms are not expected from the use of fluridone. To the contrary, Schneider (2000) found that fluridone use at low doses in Michigan lakes resulted in improved fishery conditions, but not all species have been studied and a long-term loss of vegetation could be expected to alter the fish community.
4.6.11.4 Specific Short-Term Impacts on Water Quality by Fluridone
Fluridone did not affect water quality in contained field experiments. The parameters measured included pH, BOD, color, dissolved solids, hardness, nitrate nitrogen, total phosphorus and turbidity (McCowen et al., 1979; Arnold, 1979). The slow die-off of plants susceptible to fluridone minimizes the potential for any water quality impacts. Fluridone should not be applied within 1/4 mile of a potable water intake at levels greater than 0.02 ppm. Water treated with fluridone should not be used for irrigation for 7 to 30 days (irrigation restrictions vary depending on the size of the lake or pond, type of vegetation to be irrigated and which form of the product is used). Federal and Massachusetts registered Sonar labels do not include restrictions for swimming and fishing (SePRO, 1994a; 1994b). However, labels for use in New York prohibit swimming for 24 hours after application (Harman, 1995). Because this product has a relatively long environmental half-life and is not readily sorbed to the sediments, it has a greater tendency to disperse from the treated area than other herbicides. However, the apparent lack of impact on non-target fauna has allowed use of this herbicide in places where others are prohibited, and dispersion is more an issue for treatment effectiveness than impacts on water quality.

Eutrophication and Aquatic Plant Management in Massachusetts
4.0 Methods to Control Aquatic Plants
Page 4-118
4.6.11.5 Specific Long-Term Impact on Water Quality by Fluridone
The degradation of fluridone is dependent on sunlight and temperature. The half-life of fluridone in Pout Pond, Uxbridge, Massachusetts was 40 days, but fluridone was more persistent in winter than in summer (Smith et al., 1991). Half-life values as short as 20 days have been recorded.
4.6.11.6 Implementation Guidance for Fluridone
Adhere to all label restrictions. Licensed professionals must perform the treatments. Most treatments with fluridone are conducted in the spring, when target plants are most actively growing. Treatment could occur as early as late March, with an early ice-out, with booster treatments occurring several weeks after as needed in order to maintain the desired average concentration for 40-60 days. The physiological advantage of this time period is sometimes offset by the logistical disadvantage of higher flows and dilution effects during spring. In some cases, treatment has been postponed until summer or even autumn to minimize the volume of water that must be treated. Some successes have been achieved in this manner (Burns, SePRO, pers. comm., 2001), but it has also been suggested that residues remaining until the next spring are an important cause of target plant decline. Starting at a lower dose (<0.02 ppm) and tracking the concentration has been made possible by immunoassay technology. This allows the herbicide concentration to be “bumped” or “boosted” as needed if dilution and degradation are substantial, while minimizing herbicide use and associated costs and possible unwanted impacts (Getsinger et al., 2002; Madsen et al., 2002). The level of sophistication achieved with fluridone has moved herbicide treatments into a new era, with flexible applications and considerable creativity on the part of experienced applicators. Licensed professionals must perform the treatments. Holding the chemical within a target area smaller than the lake remains a challenge, but progress has been made there as well. Sequestered treatments were conducted in 2000 in a Washington lake (T. McNabb, AquaTechnex, pers. comm., 2001), in which a 20 acre area and a 5 acre area impacted by Eurasian watermilfoil were surrounded with an impermeable barrier and treated with fluridone at 0.01-0.03 ppm. Follow-up monitoring has indicated success through 2002. Dilution and degradation of fluridone were still factors, but much less so than for partial lake treatments or whole lake treatments where flushing is high. A higher initial concentration of fluridone is normally used (>20 ppb) in such treatments to ensure that the milfoil is killed. It is assumed that nearby native plants will colonize the area once the milfoil is gone. A treatment in Connecticut for Eurasian watermilfoil (G. Smith, ACT, pers. comm., 2002) and another in Massachusetts for fanwort (L. Lyman, Lycott, pers. comm., 2002b) applied limno-curtains to sequester a section of each lake. In these cases, the lakes had hourglass shapes, making division of the lake at the isthmus much simpler than attempting to isolate major portions of a lake without such a constriction. Both treatments appear to have been successful through the year of treatment, with doses of 0.006 (CT) to 0.012 (MA) ppm. Fluridone is still sometimes used for partial lake treatments without sequestration, but the risk of failure is higher. At issue are the high diffusion and dilution factors for fluridone, which reduce the concentration in the target area in most cases. Usually a pelletized form of fluridone is used
Eutrophication and Aquatic Plant Management in Massachusetts
4.0 Methods to Control Aquatic Plants
Page 4-119
for such treatments, providing gradual release of fluridone into the target area to offset diffusion and dilution. Results have been quite variable. Application to two 100-acre plots in Saratoga Lake in 2000 provided minimal relief from milfoil in the year of treatment and only limited effects in 2001 (G. Smith, ACT, pers. comm., 2001). Treatment of a 5 acre cove in a lake in CT with Sonar SRP in 2000 (Bugbee and White, CT Ag. Exp. Station, pers. comm., 2002) showed no effects for 60 days after treatment, but provided a complete kill of target plants by 90 days after treatment. Newer pellet formulations (Sonar PR or Sonar Q) may improve predictability of such treatments. However, increased cost and continued dilution impacts remain impediments to application. Re-infestation from untreated areas may quickly ameliorate whatever benefits are realized, and partial lake treatments do not appear to be an efficient way to address extensive growths.
4.6.12 Endothall Endothall is a contact herbicide, attacking a wide range of plants at points of contact. The method of action of endothall is not completely understood, but it is suspected to inhibit the use of oxygen for respiration (MacDonald et al., 1993). Only portions of the plant with which the herbicide can come into contact are killed. There are two forms of the active ingredient; the inorganic potassium salt which is found in the products Aquathol Granular and Aquathol K, and the alkylamine salt formulation found in Hydrothol 191 Granular and Hydrothol 191. As a consequence of toxicity of the amine salts of endothall in Hydrothol, the potassium salt formula contained in Aquathol is used far more frequently in Massachusetts, although endothall-based herbicides are not as commonly used in Massachusetts as herbicides based on other active ingredients. Effectiveness can range from weeks to months. Most endothall compounds break down readily and are not persistent in the aquatic environment, disappearing from the water column in under 10 days and from the sediments in under 3 weeks. Endothall acts quickly on susceptible plants, but does not kill roots with which it can not come into contact, and recovery of many plants is rapid. Rapid death of susceptible plants can cause oxygen depletion if decomposition exceeds re-aeration in the treated area, although this can be mitigated by conducting successive partial treatments. Toxicity to invertebrates, fish or humans is not expected to be a problem at the recommended dose, but endothall is not used in drinking water supplies.
4.6.12.1 Effectiveness of Endothall
Hydrothol 191 is one of the few organic herbicides which is effective against algae, although it is rarely used except when copper treatments may not be effective. Endothall is primarily a broad spectrum vascular plant control chemical. The effectiveness of endothall against Eurasian watermilfoil increases with both increased concentration and exposure time (Netherland et al., 1991), although relative to many herbicides, the necessary exposure time is very brief. To achieve 85% reduction of milfoil biomass, based on laboratory studies, Netherland et al., (1991) recommend a concentration of 0.5 ppm for at least 48 hours, 1.0 ppm for at least 36 hours, 3.0 ppm for at least 18 hours and 5.0 ppm for at least 12 hours. Use in the field should follow this general relationship, but would likely produce less effective control for the same concentrations due to water-exchange characteristics, thermal

Eutrophication and Aquatic Plant Management in Massachusetts
4.0 Methods to Control Aquatic Plants
Page 4-120
stratification, dispersion, plant uptake, adsorption to suspended particulates and microbial degradation. Additionally, field plants may be larger and more resistant to endothall treatments than laboratory grown plants. The Massachusetts experience is that endothall has not been very effective against milfoil, but works well on most species of pondweeds, coontail and naiads (G. Smith, ACT, pers. comm., 1995). For a complete list of species that are controlled by endothall, see Table 4-5 and Appendix III. It is used less than most other herbicides in Massachusetts, mainly due to dose limits that are observed to avoid impacts to non-target fauna.
4.6.12.2 Specific Short-Term Impacts on Non-Target Organisms by Endothall
Hydrothol 191 is an alkylamine salt formulation of endothall. This formulation is effective against algae as well as macrophytes, but is much more toxic to fish than Aquathol K. If applied at the maximum label rate, the expected initial concentration could be as high as 5 ppm, compared to the static 96-hour LC50 of 0.1-0.3 ppm for largemouth bass (Westerdahl and Getsinger, 1988). Other reports indicate higher LC50s, up to 0.94 ppm (Appendix III). The environmental hazards listed on the Hydrothol 191 (dimethylalkylamine endothall granular and liquid) labels warn that fish may be killed by dosages in excess of 0.3 ppm. Additional recommendations for avoiding fish kills are to use the granular formulation that has been shown to be less toxic to fish, or to apply the herbicide in strips and from the shoreline out so as not to trap them in the treated areas. Hydrothol 191 may be preferred in cool water (<65oF) where it is less toxic to fish (Moore, 1991). However, Hydrothol 191 granular is rarely used in Massachusetts because of potential dust problems and possible toxicity to the applicator (G. Smith, ACT, pers. comm., 1997). Aquathol K is much less toxic and is used more frequently in Massachusetts than Hydrothol 191. Aquathol K application rates vary with water depth. Although usually applied at lower rates, the maximum rate of 269 lbs/2 acre feet (6.4 gallons per 2 acre-feet) for spot treatment would result in a maximum concentration of 5 ppm according to the product labels. According to data provided by the Department of Environmental Protection, (G. DeCesare, MDEP, pers. comm., 1995; 2003), the median Aquathol K application rate in Massachusetts waters in 1994 was 0.59 gallons per acre foot with an estimated maximum concentration of about 0.92 ppm active ingredient. In 2002 the median rate was 0.99 gallons per acre foot, with a corresponding concentration of 1.54 ppm. The LC50 for a sensitive species (smallmouth bass) was determined to be 47 ppm (Paul et al., 1994), which is much higher than the expected concentrations. Other studies report LC50 values as high as 450 ppm or 740 ppm (Appendix III). In concentrated form, endothall is highly toxic to mammals (MacDonald et al., 1993) and may cause health problems at high concentrations. Respective rat LD50s for Aquathol and Hydrothol are 99 and 233 mg/kg (Appendix III), thus appropriate safety precautions should be taken by the applicator.
Eutrophication and Aquatic Plant Management in Massachusetts
4.0 Methods to Control Aquatic Plants
Page 4-121
4.6.12.3 Specific Long-Term Impacts on Non-Target Organisms by Endothall
Widespread loss of vegetation through endothall application on a lakewide basis will alter habitat and possibly affect fish and wildlife. However, there are few studies that examine long-term impacts of endothall to aquatic organisms. No long-term impacts on the reproduction and survival of bluegills were noted in a three-year study from a one-time application of dipotassium endothall (State of Wisconsin, 1990 as cited in WSDOE, 1992). Long term exposure to animals affects the liver and stomachs of beagle dogs at a dose rate of 14.4 mg/kg/day. There is no conclusive evidence of teratogenic, fetotoxic, mutagenic, or carcinogenic effects (see Appendix III for further toxicological information and for references).
4.6.12.4 Specific Short-Term Impacts on Water Quality by Endothall
Impacts to turbidity and dissolved and suspended solids are possible as a result of decaying vegetation killed by this fast-acting herbicide. Lowered oxygen level is likely, but oxygen depletion severe enough to affect aquatic fauna is only rarely observed in Massachusetts. The currently registered label of Aquathol (the dipotassium salt granular) recommends that swimming be restricted for 24 hours and that fish not be taken from treated water for 3 days after treatment. Restrictions for watering livestock, food crop spraying, irrigation and domestic uses are variable: up to 0.5 ppm dipotassium salt (0.35 ppm acid equivalent (ae)), wait 7 days; up to 4.25 ppm (3.0 ppm ae) wait 14 days; and up to 5.0 ppm (3.5 ppm ae) wait 25 days (Elf Atochem, 1992a; 1995b). The restrictions for Hydrothol 191 are the same as above (Elf Atochem, 1992c). New labels for endothall products drop the swimming restrictions of older labels.
4.6.12.5 Specific Long-Term Impacts on Water Quality by Endothall
The alkylamine formulation of endothall found in Hydrothol 191 and Hydrothol Granular is more persistent in the environment than the potassium and sodium salt formulations found in Aquathol Granular and Aquathol K. The potassium and sodium salt formulations generally have a half-life of 2 to 3 days in the aquatic environment, while the alkylamine salts have a half-life of 14 to 21 days (MacDonald et al., 1993). The biodegradation half-life is 8.35 days (Appendix III). Still, unless application is frequent, long-term impacts on water quality should be minimal.
4.6.12.6 Implementation Guidance for Endothall
Adhere to all label restrictions. Licensed professionals must perform the treatments. Aquathol K is most effective when applied in water >65oF. Partial treatments 5-7 days apart are recommended for ponds or lakes that have dense macrophyte beds to prevent low dissolved oxygen concentrations. The herbicide can be applied by sprayer or injected below the water surface and should be applied as evenly as possible on a day with little wave action. Time of application should be as early as possible after target vegetation is present. Aquathol K should not be applied before plants are present. Aquathol Granular application should follow the same recommendations, but due to its granular form, should be scattered as evenly as possible over treatment area. A cyclone seeder is recommended by the manufacturer (Elf Atochem, 1992a; 1992b). The Application of Hydrothol 191 granular and aqueous formulations is recommended

Eutrophication and Aquatic Plant Management in Massachusetts
4.0 Methods to Control Aquatic Plants
Page 4-122
to be as a partial lake treatment only, due to possible fish toxicity. It is recommended that no more than 1/10 of the lake be treated at one time with 1.0 ppm or less (Elf Atochem, 1992c). Once applied to the lake, there is little mitigation possible for endothall treatments. Careful planning and implementation is therefore strongly advised.
4.6.13 Triclopyr The active herbicidal ingredient triclopyr received federal registration for aquatic habitats at the end of 2002. It is not currently registered for aquatic use in Massachusetts, but registration may occur in the near future. Registration has been approved in a large number of states already, and a registration request has been submitted to the Pesticide Bureau. Triclopyr has been registered by the USEPA for terrestrial use as Garlon 3A and Garlon 4. Garlon 3A contains 44% triclopyr (3,5,6-trichloro-2-pyridinyloxyacetic acid) as the triethylamine salt and 55.6% inert ingredients (31.8% triclopyr acid equivalent). Garlon 4 contains 61.6% triclopyr and 34.4% inert ingredients (44.3% triclopyr acid equivalent). These herbicides are used for vegetation control in rights-of-way in some states, but are not registered for use in Massachusetts. The trade name for the aquatic formulation is Renovate, with 3 pounds of triclopyr per gallon (about 35% triclopyr). Triclopyr is a systemic herbicide. Its mode of action is to prevent synthesis of plant-specific enzymes, resulting in disruption of growth processes. It provides selective control of Eurasian watermilfoil (Myriophyllum spicatum) and other non-native dicotyledenous species. All lethal effects on tested animal populations have occurred at concentrations over 100 times the recommended dosage rate. The experimental label called for concentrations in potable water of no more than 0.5 mg/L, suggesting that care must be taken to allow sufficient dilution between the point of application and any potable water intakes.
4.6.13.1 Effectiveness of Triclopyr
Various studies have shown triclopyr to be an effective herbicide for macrophyte control. It is highly selective and effective against Eurasian watermilfoil and other dicotyledonous plants at a dose of 1 to 2.5 mg/L. The recommended dose appears to be about 1.5 mg/L for most applications. Experimental treatments of aquatic environments (Netherland and Getsinger, 1993) have revealed little or no effect on most monocotyledonous naiads and pondweeds, which are mostly valued native species. This herbicide is most effective when applied during the active growth phase of young plants. A laboratory study that measured the efficacy of triclopyr on Eurasian watermilfoil showed that effectiveness increased as both concentration and exposure time increased (Netherland and Getsinger, 1992). Control (defined as 85% reduction in biomass) was achieved with the following combinations of concentration (active ingredient) and exposure times: 0.25 ppm for 72 hours, 0.5 ppm for 48 hours, 1.0 ppm for 36 hours, 1.5 ppm for 24 hours and 2.0 and 2.5 ppm for 18 hours. Treatment at these concentrations for less than the indicated exposure times will provide less reduction in biomass. Ineffective control resulted when the following combinations of concentration and exposure times were applied; 2.5 ppm for 2 hours, 1.0 ppm for 6 hours and 0.25 and 0.5 ppm for 12 hours. Still, the exposure times at which control was achieved are far
Eutrophication and Aquatic Plant Management in Massachusetts
4.0 Methods to Control Aquatic Plants
Page 4-123
less than that necessary with fluridone, the preferred herbicide for most Eursasian watermilfoil control efforts.
4.6.13.2 Specific Short-Term Impacts to Non-Target Organisms by Triclopyr
The ester formulation (BEE, Garlon 4) is much more toxic to fish than either the amine salt formulation (TEA, Garlon 3A) or triclopyr acid (Swadener, 1993). The lowest LC50 for the BEE formulation is 0.36 ppm for bluegill (Lepomis macrochirus) (Woodburn et al., 1993). In contrast, the lowest LC50 for fathead minnows (Pimephales promelas) is much higher, between 101 and 120 ppm for the TEA (ethyl amine) formulation (Mayes et al., 1984). LC50s for Atlantic salmon (Salmo salar) range from 1.4 ppm for Garlon 4 to 7.8 ppm for triclopyr acid and 275 ppm for Garlon 3A (Swadener, 1993). Garlon 4 is also toxic to aquatic insects. The caddisfly Dolophilodes distinctus showed mortality at 3.2 ppm (Kreutzweiser et al., 1992, as cited in Swadener, 1993). The LC50 for Daphnia pulex is 1.2 ppm (Servizi et al., 1987). It was also reported that brood size of Daphnia magna was reduced because of exposure to triclopyr (Gersich et al., 1985). Consequently, only the TEA formulation is being considered for use in aquatic environments and is the active ingredient in Renovate. No Massachusetts label information is available on allowed maximum application rates at this time because the herbicide is not yet registered for aquatic use in Massachusetts. Typically, rates up to 2.5 ppm active ingredient of Garlon 3A (triclopyr TEA) have been reported for the treatment of watermilfoil (Getsinger and Westerdahl, 1984) and this is much lower than the reported LC50 values cited above. Oral LD50's for rats range from 630 mg/kg for females to 729 mg/kg for males. Further toxicity information is available in Appendix III.
4.6.13.3 Specific Long-Term Impacts on Non-Target Organisms by Triclopyr
Few studies that consider long-term impacts of triclopyr to aquatic organisms are available. Triclopyr was found to be a weakly positive mutagen in a study with rats, but was non-mutagenic in bacterial assays, cytogenic assays and mouse-dominant lethal studies. Carcinogenicity studies yielded a positive result only in females and only at the highest dose (135 mg/kg/day), but the terrestrial formulations were denied registration in Massachusetts partly based on this possible carcinogenicity. Teratogenic studies in rabbits showed limited teratogenic effects (see Appendix III for further details and references).
4.6.13.4 Specific Short-Term Impacts on Water Quality by Triclopyr
Lowered oxygen levels are possible as a function of vegetation decay after treatment. No major water quality effects are expected at the recommended dosage.
Eutrophication and Aquatic Plant Management in Massachusetts
4.0 Methods to Control Aquatic Plants
Page 4-124
4.6.13.5 Specific Long-Term Impacts on Water Quality by Triclopyr
The half-life for triclopyr can range from 12 hours to 29 days (Woodburn et al., 1990). In Lake Seminole, Georgia, the residue half-life for the amine salt formulation (Garlon 3A) was less than 4 days and the accumulation of triclopyr residue in sediment, plants and fish was insignificant (Green and Westerdahl, 1989). The ester formulation (Garlon 4), however, is more persistent with a half-life in water that is six times that of triclopyr acid (McCall and Gavit, 1986). Additionally, there is evidence that the ester formulation can accumulate in the sediment. Residues have been reported following application from one week to two years (Stark, 1983, as cited in Swadener, 1993). Again, only the amine salt formulation (Garlon 3A) is under consideration for aquatic use (as Renovate), and no adverse long-term impacts appear evident at this time.
4.6.13.6 Implementation Guidance for Triclopyr
The present product labels of Garlon 3A and Garlon 4 restrict its use to terrestrial plant control. In fact, the current label specifically prohibits use in lakes and ponds, and the terrestrial formulations are not registered in Massachusetts. An aquatic label has been issued for triclopyr as Renovate by the USEPA, but this product is not yet registered for use in Massachusetts. If registered, it is likely that Renovate will be used for spot treatments of milfoil and other partial lake treatments.
4.6.14 Costs Herbicide application costs are dependent on the chemical used, the volume and area of the lake, dosage, application strategy and travel distance for the applicator. The cost per acre can vary from $50 to $2000, which includes permitting, chemicals, labor, flyer posting and pre- and post-treatment inspections (Wagner, 2001). Copper application is least expensive, but has the least applicability to the range of problems encountered and must usually be repeated several times a season just to control target algae. Fluridone application involving sequential treatments is about the most expensive approach, but provides some of the best benefits with minimal non-target impacts. Use of sequestration curtains can result in an even higher cost than indicated here, but the curtains are re-useable and cost may decline over time as the capital expense is spread over multiple treatments. Costs cited do not include a thorough monitoring program, which has not usually been required in Massachusetts. It is important, however, to at least have a thorough knowledge of the biological resources of a targeted lake, and especially to know the plant community to the species level. Follow-up monitoring does not have to be an expensive endeavor, but some quantitative assessment of impacts on target and key non-target plants is desirable, and where sensitive fish and invertebrates are present, pre- and post-treatment assessments may be warranted.
Eutrophication and Aquatic Plant Management in Massachusetts
4.0 Methods to Control Aquatic Plants
Page 4-125
4.6.15 Regulations
4.6.15.1 Applicable Statutes
The Federal Insecticide, Fungicide and Rodenticide Act (FIFRA) Public Law 92-516, as amended, regulates the testing, labeling and Federal registration of aquatic herbicides and algaecides. Each product registered must have a unique USEPA registration number. Under the Massachusetts Pesticide Control Act (Chapter 132B), the Massachusetts State Department of Agricultural Resources reviews product labels and all other available information regarding toxicity and fate of proposed herbicides prior to registration of products for use in Massachusetts. Only herbicides registered by the Massachusetts Department of Agricultural Resources may be used by licensed applicators in Massachusetts (see Table 4-4 but note that registered products change annually and the MDAR should be consulted for current registrations). The product must be used only in accordance with label instructions (see individual herbicides above). Sale of non-registered herbicides (including by mail order) is illegal in Massachusetts; it is the responsibility of project sponsors and applicators to ascertain that any herbicide considered for application is registered by the Pesticide Bureau. Applicators must be licensed by the Massachusetts Department of Agricultural Resources. The application of chemicals (including herbicides, algaecides, alum and dyes) to bodies of water within the Commonwealth is regulated by the Department of Environmental Protection under state law (Chapter 111 section 5E). Privately owned ponds with no flowing outlets and water supply agencies are exempted. The Department of Environmental Protection issues the Licenses to Apply Chemicals and may establish rules and regulations relative to the application of chemicals for the control of algae, plants and other aquatic nuisances. In accordance with MDEP regulations, public notices may need to be placed in visible locations around the lake giving notice of the herbicide application and stating any use restrictions. With specific regard to 2,4-D, the MDEP has recently reaffirmed (Langley, 2003) its policy (Rowan and Hutcheson, 1999) discouraging the use of 2,4-D in lakes that constitute a water supply or may substantially contribute to groundwater that might serve as a drinking water source. Where it can be documented that 2,4-D would not be a significant threat to water supply, its use can be allowed, but the effort necessary to demonstrate the lack of threat is high and perceived as too costly for most applications (G. Smith, ACT, pers. comm., 2003; L. Lyman, Lycott, pers. comm., 2003). A Notice of Intent must be sent to the Conservation Commission with a copy to the Department of Environmental Protection Regional Office. If the proposed project occurs within an Estimated Habitat of Rare Wildlife in the most recent version of the Natural Heritage Atlas, a copy of the Notice of Intent must be submitted to the Natural Heritage and Endangered Species Program (NHESP) within the MDFG for review (Appendix II). If the proposed project occurs within a Priority Habitat of Rare Species in the most recent version of the Natural Heritage Atlas, the project proponent must submit project plans to the NHESP for an impact determination. An Order of Conditions must be obtained from the Conservation Commission prior to work.
Eutrophication and Aquatic Plant Management in Massachusetts
4.0 Methods to Control Aquatic Plants
Page 4-126
It should be noted that a US Circuit Court of Appeals decision in the Northwestern USA in 2000 declared an herbicide to be a pollutant that requires a NPDES permit. Herbicide use is clearly regulated by FIFRA and has not been regulated under the CWA previously. While the USEPA has indicated its unwillingness to issue permits for herbicide treatments that it views as outside its jurisdiction, the threat of further lawsuits remains. As of this writing, no NPDES permit is required for herbicide use in Massachusetts, but those interesting in the application of herbicides should be aware of this issue. A suit was threatened over follow-up herbicide application at Lake Boon in Hudson and Stow in 2002 on these grounds.
4.6.15.2 Impacts Specific to Wetlands Protection Act
The following overall impact classification is offered as a generalization of impacts, with clarifying notes and caveats as warranted: 1. Protection of public and private water supply – Detriment (prohibition of many herbicides
from drinking water supplies) or neutral (as a function of use restrictions). 2. Protection of groundwater supply – Detriment (prohibition of some herbicides, notably 2,4-
D, within the recharge zone of wells) or neutral (as a function of use restrictions). 3. Flood control - Neutral (no significant interaction). 4. Storm damage prevention – Neutral (no significant interaction). 5. Prevention of pollution – Generally neutral (no significant interaction), but could be a
detriment if plant die-off causes low oxygen in the lake. 6. Protection of land containing shellfish – Generally neutral (no significant interaction), but
reduced algae might reduce food resources for shellfish, and direct toxicity is possible under unusual circumstances.
7. Protection of fisheries – Possible benefit (habitat enhancement) and possible detriment (food source alteration, loss of cover).
8. Protection of wildlife habitat – Possible benefit (habitat enhancement) and possible detriment (food source alteration, loss of cover).
4.6.16 Future Research Needs The Massachusetts Pesticide Bureau periodically reviews the labeling of herbicides and algaecides. This practice should be continued with input from the Lake and Pond Technical Review Group (see Recommendations). More field studies would be useful to further clarify impacts of herbicides to non-target plants and organisms. Replicate studies of effectiveness and impacts of each type of registered herbicide should be made under different conditions (e.g., high and low rates, high and low hardness). Additional studies on sediment accumulation and environmental fate and impacts of diquat and copper would also be useful.
4.6.17 Summary Herbicides can be very effective in controlling target plant species in lakes. In some cases they can provide selective control without significantly impacting most non-target plant species, but often they are used to achieve an overall reduction in plant community biomass. Usually herbicides are considered a short-term control method that requires annual or biannual application. As long as light and nutrient conditions are favorable, regrowth of vascular plants and algae is expected. Costs of herbicide applications are generally less expensive than other
Eutrophication and Aquatic Plant Management in Massachusetts
4.0 Methods to Control Aquatic Plants
Page 4-127
control techniques on an annual basis, but may not compare so favorably with other control techniques when viewed over a period of 20 years or more. Herbicides have advantages over most techniques when getting a problem species under control is an immediate goal. No other technique can address infestations over a wider area faster and at lower cost. Herbicides may also be particularly applicable in cases of recent invasions by non-native plants, as more complete control can often be exercised with herbicides before invasive species become widespread. Herbicides can play a role in ecosystem management as part of a broader strategy that relies upon multiple tools, including physical and biological techniques and education. They should not be viewed as a sole solution to plant problems, but offer distinct advantages under certain circumstances. Herbicides tend to be most applicable in getting a widespread plant problem under control or for providing spot or selective control of invasive species in a mixed assemblage. Results will be temporary unless follow-up techniques are applied to prolong the benefits. The negative aspects of herbicide treatment include its tendency to be a short-term solution when used alone and potential impacts to non-target organisms. To some extent, impacts to fish and wildlife habitat are unavoidable as a consequence of intentionally reducing plant density. Potentially significant impacts may be avoidable when only part of the lake is treated, and long-term negative impacts are unlikely unless repeat applications are frequent. A few fish kills have occurred as a result of herbicide treatments, but observed mortality represents very few incidents considering the number of treatments that have been conducted (R. Hartley, DFW, pers. comm., 2003). Invertebrate kills may be more common but are rarely noticed or reported, and there is no indication that herbicide use according to label instructions will result in significant mortality of any lake fauna. Nevertheless, potential for impacts exists and applicator error can occur. The licensing of applicators and reviews of treatment plans prior to approving the License to Apply Chemicals help to minimize adverse impacts. In comparing herbicides, the absolute toxicity is not as important as comparing the expected concentration (based on depth and the application rate and the environmental half-life) to the concentration and exposure times believed to cause adverse effects. Herbicides approved by the USEPA and Massachusetts Pesticide Bureau do not represent an imminent threat to aquatic fauna when applied in accordance with the label instructions and restrictions. However, Hydrothol 191, 2,4-D BEE, diquat, and copper products could approach or exceed the LC50 levels for sensitive organisms if applied at maximum rates to lakes with certain features. Proper assessment of lake conditions, choice of herbicide, and knowledgeable application can minimize non-target impacts. The potential for non-target impacts and diminished effectiveness increases as copper is used repeatedly to control algae. The need for frequent copper additions should be taken as an indication that nutrient controls are needed, and alternative control methods should be pursued. Similarly, the frequent need to apply herbicides to control floating vascular plants not anchored in the sediment suggests that nutrient controls should be sought. Control of vascular plants rooted in the sediment is another issue, however; where light and substrate are favorable, plants will grow independently of inputs from the watershed. Alternative control methods may be
Eutrophication and Aquatic Plant Management in Massachusetts
4.0 Methods to Control Aquatic Plants
Page 4-128
desirable, but herbicides can play a valuable role in gaining and maintaining control of extensive infestations.
4.7 DYES AND SURFACE COVERS
4.7.1 Dyes and Surface Covers The use of dyes as algal or vascular plant control agents is often grouped with herbicides in lake management evaluations, but this can be very misleading with regard to how dyes work. Dyes are used to limit light penetration and therefore restrict the depth at which rooted plants can grow or the total amount of light available for algal growth. They are only selective in the sense that they favor species tolerant of low light or with sufficient food reserves to support an extended growth period (during which a stem could reach the lighted zone). Dyes are generally non-toxic to all aquatic species, including the target species of plants. In lakes with high transparency but only moderate depth and ample soft sediment accumulations, dyes may provide open water where little would otherwise exist. Repeated treatment may be necessary, as the dye can flush out of the system, but dyes are not normally applied in Massachusetts to ponds with active outlets. Dyes are typically permitted under the same process as herbicides, despite their radically different mode of action. Surface shading has received little attention as a rooted plant control technique, probably as a function of potential interference with recreational pursuits that are a goal of most rooted plant control programs. This procedure should be a useful and inexpensive alternative to traditional methods of weed control in small areas such as docks and beaches, and could be timed to yield results acceptable to summer human users with minimal negative impacts to system ecology. The shading effect of bottom barriers is well known, and would be at work with surface covers. Likewise, the tendency of docks, floats, and other surface structures to shade out plants underneath is recognized by most lake users. However, the compression effect of benthic barriers would not be applicable to surface covers, so eliminating existing growths would be expected to be a slow process. Surface covers would be more likely to be used to prevent growths than to eliminate existing plants, and would therefore be more applicable to seed-producing annual plants. Still, extended cover use could shade out most vegetation, depending upon tolerance to low light, if physical interference with lake use was not an issue.
4.7.2 Effectiveness Aquashade is the trade name of one of several available dyes, a blue dye that is made up of 23.63% Acid Blue 9, 2.39% Acid Yellow 23 and 73.98% inert ingredients. (Aquashade, 1981). It is registered with the USEPA in the same manner a herbicide would be registered, but there are no toxic processes at work. The dye works by absorbing sunlight and effectively limiting photosynthesis below about two feet of water depth (Clean Lakes Incorporated, 1982). Based on laboratory experiments with Aquashade, Spencer (1984) concluded that the dye reduces available light and is able to reduce the rate of photosynthesis of algae. He also noted that the dye is not toxic to plants, is equally effective on blue-greens and green algae and had no impact on the phosphorus uptake of the algal species tested (Spencer, 1984). Other dyes observed in the
Eutrophication and Aquatic Plant Management in Massachusetts
4.0 Methods to Control Aquatic Plants
Page 4-129
laboratory include rose bengal, methylene blue, zinc phthalocyaninetetrasulfonate (ZPS) and erythrosin. These dyes were examined by Martin et al. (1987), who studied the effects that the dyes had on the growth of the filamentous blue-green alga, Lyngbya majescula. The results of their study showed that rose bengal and methylene blue were the most effective, while ZPS and erythrosin were significantly less effective. Although dyes can be an effective method of algae and plant control in small ornamental and golf course ponds, dyes have not provided consistently acceptable control in larger systems and are not generally applied as a control method for either rooted aquatic plants or algae in larger lakes. Aquashade was ineffective against curly leaf pondweed (Potamogeton crispus) in Woodridge Lake, West Hartford, Connecticut and has been used in Valley Pond in Lincoln, MA for algae management without lasting success (G. Smith, ACT, pers. comm., 2001). On the other hand, the Adirondack Lake Association reported "remarkable" results when Aquashade was used to control Potamogeton amplifolius in Indian Lake (Purdue, 1984). It has provided effective control of both algae and unwanted mixing (by causing solar heat to be adsorbed at the surface) in a small ornamental pond in Gay Head, Massachusetts (A. Lane, Town of Gay Head, pers. comm., 1995). The dye should be applied early in the growing season for greatest effectiveness. Dyes can usually only be used in lakes and ponds without a flowing outlet, making it a logical choice for small, contained ornamental ponds. There is insufficient information available to evaluate field applications of dyes other than Aquashade, but the light attenuating mechanism is the same for other commercially available dyes. Polyethylene sheets, floated on the lake surface, were used by Mayhew and Runkel (1962) to shade weeds. They found that two to three weeks of cover were sufficient to eliminate all species of pondweeds (Potamogeton spp.) for the summer if the sheets were applied in spring before plants grew to maturity. Coontail was also controlled, but the generally desirable macroalga Chara was not. Surface covers are used in many distribution storage reservoirs for drinking water. While the purpose is mainly to minimize inputs from birds and other wildlife that would find the water surface attractive but may add contaminants to this treated water, growth of algae and rooted plants is also minimized. As most such water has been treated with chlorine, the effect may not be entirely a function of the covers, but the impact of restricted light on plant growth is well known. No cases of surface cover use specifically for control of vascular plants and algae are known for Massachusetts lakes.
4.7.3 Impacts to Non-Target Organisms
4.7.3.1 Short-Term Impacts
Aquashade is non-toxic to plants (Spencer, 1984), fish and wildlife (Aquashade, 1982). Rat LD50 information for the dye mixture was unavailable. The rat LD50 for Acid Blue 9 is 2,000 mg/kg (see Appendix III for further toxicity information). Although dye addition may impact visual feeding by fish, no major direct impacts are expected from addition of the dye to the water. Dye use in water bodies with an outflow is usually prohibited to prevent the spread of dye to areas downstream, but it is not clear just what resources are being protected. The most obvious impact is increased surface water temperature, and this may lead to stratification in
Eutrophication and Aquatic Plant Management in Massachusetts
4.0 Methods to Control Aquatic Plants
Page 4-130
rather shallow ponds that would not otherwise stratify. It is not clear that this has any major impact on lake ecology, but impacts to multiple populations are possible. The blue color tends to mask algal blooms, even if it does not prevent them. Surface covers represent a physical impediment to lake use by people and waterfowl, but may provide cover for many fish and invertebrates. As surface cover materials should be inert, no toxicity or other adverse impacts other than light restriction are expected. The light restriction might interfere with visually feeding fish and invertebrates, but unless a large portion of the lake was covered, no significant impact would be expected.
4.7.3.2 Long-Term Impacts
Plants that live in shallow water (2 feet or less) and floating plants may not be impacted, but those that live in deeper water may be replaced over time by species more tolerant to low light. Growths may be stunted in some cases. Organisms that depend on sight for predation may also be restricted to shallower water due to lower light levels, and loss of plants will change the physical habitat in ways that may affect fish and invertebrate populations. Where a part of a lake is treated with surface covers, no long-term lakewide impact to non-target organisms is expected. Where dyes are used, the change in light regime and the plant community may be substantial enough to cause shifts in faunal communities.
4.7.4 Impacts to Water Quality
4.7.4.1 Short-Term Impacts
Common dyes will turn the water to some shade of blue ranging from very light to very dark, depending on the concentration and decrease transparency. The public perception of the water color after a dye application can be negative; some people don't want to swim in it, either out of fear of low visibility or an expectation that their skin may be discolored. The dyes do not typically affect skin or clothing, but do decrease visibility. This loss of visibility is desirable for aesthetic reasons in cases where the illusion of great depth is desired, but for swimming areas this can be a detriment. Dyes may cause surprisingly strong stratification in shallow waters that may lead to low oxygen near the bottom where sediment oxygen demand is substantial. In a study by Boyd and Noor (1982), Aquashade® was used to treat channel catfish ponds. Upon comparison with an untreated control pond, chlorophyll a concentrations did not differ significantly over a 6-month period. Additionally, dissolved oxygen concentrations were significantly lower in the dye treated ponds. No change in most other water quality variables is expected. Surface covers are not expected to cause major changes in water quality, although limitation of atmospheric interaction with the water in large-scale installations (e.g., reservoir covers) could affect oxygen levels and related water quality.
Eutrophication and Aquatic Plant Management in Massachusetts
4.0 Methods to Control Aquatic Plants
Page 4-131
4.7.4.2 Long-Term Impacts
Where covers are removed or dye addition is halted, long-term effects are unlikely. Where application is repeated or continual, the short-term effects would persist and become long-term impacts, both positive and negative.
4.7.5 Applicability to Saltwater Ponds Dyes and surface covers could be used in saltwater ponds with much the same restrictions and results as in freshwater situations. Benthic barriers have been used in some saltwater ponds to control rooted plant growths. No records of dye use in saltwater ponds have been found.
4.7.6 Implementation Guidance
4.7.6.1 Key Data Requirements
Data requirements for the use of surface covers over small areas, such as swimming beaches and between docks, are limited to an assessment of the physical and biological features of the target area. Presence of protected species, extensive obstructions, and strong wave effects are the key factors preventing use of this technique in small areas. Use of dyes requires knowledge of pond bathymetry and hydrology, to facilitate calculation of the amount of dye needed and to ensure the lack of an active surface outflow.
4.7.6.2 Factors that Favor this Approach
The following considerations are indicative of appropriate application of dyes or surface covers for the management of plants in lakes: 1. The target area has dense plant growths of undesirable species that require a high light
regime. 2. There is normally no surface outflow from the lake or pond if dyes are being considered. 3. Increased surface temperature and possible stratification of shallow areas pose no obvious
ecological threat where dyes are being considered. 4. The target area is shielded from high winds or waves and has convenient means to anchor
surface covers. 5. Access for humans or waterfowl is not an issue during the time surface covers will be in
place.
4.7.6.3 Implementation Guidance
Planning and Implementation Application can be during any season. During the winter Aquashade can be applied to ice or snow cover. The dye melts through the ice and spreads throughout the lake, providing early protection against unwanted plant or algal growth. Anecdotal evidence suggests early application is required to prevent algal blooms, and would be preferable to minimize annual plant growths as well. During the spring, summer and fall the dye can be poured directly from the bottle to the lake (Aquashade, 1982) and should be allowed to disperse before the lake or pond is used for swimming, but there is no set restriction on the product label (Aquashade, 1981). After one to
Eutrophication and Aquatic Plant Management in Massachusetts
4.0 Methods to Control Aquatic Plants
Page 4-132
four weeks an additional application of dye is recommended (Aquacide Company Bulletin, 1995). Many of the lakes in Massachusetts have active outflows and short detention times, and would therefore not be considered for dye treatments. Once applied to a lake, dyes cannot be practically removed other than by flushing. As application to lakes without active outlets is synonomous with long detention time, dye will be present in the system for a long time without practical mitigation options. Surface covers must be deployed and kept in place for weeks to months. Deployment and anchoring are the primary logistic issues. Wooden or plastic frames have been used, with anchoring by ropes and weights like cinderblocks. Pool covers have been used in some cases, with anchoring at the edges. Benthic barrier materials are negatively buoyant, but can be floated with Styrofoam strips or attached soda bottles for simple installations. Where applied around a dock or in a swimming area, use of existing structures to hold the cover in place may be possible and sufficient. There is a lot of opportunity for creativity in the use of surface covers, but these have not typically been applied in Massachusetts to date. Monitoring and Maintenance Dyes require no real maintenance, although if monitoring showed a rapidly declining concentration, additional inputs might be necessary. The product literature suggests follow-up treatment several weeks after initial treatment. Surface covers are likely to require frequent surveillance and adjustment as necessary to maintain the desired cover. Movement from wind and waves could be a significant issue in some nearshore installations. Mitigation Mitigation would involve simply removing the covers if results were in some way unsatisfactory.
4.7.7 Regulations
4.7.7.1 Applicable Statutes
Dyes are treated like herbicides under Massachusetts regulations, while surface covers are treated like benthic barriers. Dyes are not typically approved for application to drinking water supplies or in water bodies that have an active outflow. For dye application to public lakes, an Order of Conditions under the Wetlands Protection Act may be required from the local Conservation Commission and a License to Apply Chemicals may be needed from the MDEP. MEPA review and other approval processes could apply, depending upon the size of the lake and the presence of any protected species. A copy of the Notice of Intent, which is the application for the Order of Conditions, should be sent to the MDEP at the same time it is filed with the Conservation Commission. If the proposed project occurs within an Estimated Habitat of Rare Wildlife in the most recent version of the Natural Heritage Atlas, a copy of the Notice of Intent must be submitted to the Natural Heritage and Endangered Species Program (NHESP) within the MDFG for review (Appendix II). If the proposed project occurs within a Priority Habitat of Rare Species in the most recent version of the Natural Heritage Atlas, the project proponent must submit project plans to the NHESP for an impact determination. For a private pond with no flowing outlet outside of any Estimated
Eutrophication and Aquatic Plant Management in Massachusetts
4.0 Methods to Control Aquatic Plants
Page 4-133
Habitat, the License to Apply Chemicals is not required and the Conservation Commission can issue a negative Determination of Applicability (i.e., no Order of Conditions required). Surface covers would be expected to require an Order of Conditions under the Wetlands Protection Act from the local Conservation Commission, with copies of the Notice of Intent sent to the MDEP at the same time it is filed with the Conservation Commission. If the proposed project occurs within an Estimated Habitat of Rare Wildlife in the most recent version of the Natural Heritage Atlas, a copy of the Notice of Intent must be submitted to the Natural Heritage and Endangered Species Program (NHESP) within the MDFG for review (Appendix II). If the proposed project occurs within a Priority Habitat of Rare Species in the most recent version of the Natural Heritage Atlas, the project proponent must submit project plans to the NHESP for an impact determination. If the installation is to occur in a Great Pond, a Chapter 91 license for structures may be required as well. Unusually large installations may be subject to MEPA review or other approval processes, but this is more likely a small scale technique for docks and swimming areas in the off-season.
4.7.7.2 Impacts Specific to Wetlands Protection Act
The following overall impact classification is offered as a generalization of impacts, with clarifying notes and caveats as warranted: 1. Protection of public and private water supply – Generally neutral (no significant interaction)
for surface covers, detrimental (not allowed) for dyes, although reduced plant density may benefit taste and odor control.
2. Protection of groundwater supply – Neutral (no significant interaction). 3. Flood control – Neutral (no significant interaction). 4. Storm damage prevention – Neutral (no significant interaction). 5. Prevention of pollution – Neutral (no significant interaction), but could be a detriment if dyes
cause stratification that then causes low oxygen at the bottom of the lake. 6. Protection of land containing shellfish – Generally neutral (no significant interaction), but
reduced algae might reduce food resources for shellfish. 7. Protection of fisheries – Possible benefit (habitat enhancement) and possible detriment (food
source alteration, reduced visual predation success, loss of cover). For surface covers applied over a relatively small area, no lakewide effects are expected.
8. Protection of wildlife habitat – Dyes may reduce predation success by predatory birds and mammals that feed by sight. Surface covers applied to small areas are not expected to have lakewide effects on wildlife habitat.
4.7.8 Costs The cost of Aquashade is about $70 per gallon or $250 for a 4 x 1 gallon case. One gallon treats 4 acre-feet (Aquacide Company Bulletin, 1995). Wagner (2001) reports a cost of $100 to $500 per acre, including planning, permitting, materials and labor. Costs have not been reported for any surface cover installations, but assuming the use of bottom barrier materials, the cost would be at least $20,000/acre for materials. Assuming the use of simple black plastic sheeting, material costs would be largely a function of frame and anchoring materials. It seems likely that a cost of $2,000 to $5,000 per acre could be achieved, but the materials would not be durable.
Eutrophication and Aquatic Plant Management in Massachusetts
4.0 Methods to Control Aquatic Plants
Page 4-134
4.7.9 Future Research Needs Little additional research is needed for dyes. Considerable experimentation with surface covers appears warranted, with monitoring of results on target and non-target organisms.
4.7.10 Summary Dyes and surface covers can restrict light and reduce algae and plant growths as a result. Dyes are applied as a liquid that will mix throughout the lake, or at least the upper layer if the lake is stratified. Surface covers are applied on a localized basis around docks or in swimming areas for recreational improvement, but have also been applied to entire reservoirs to minimize interaction of wildlife with treated water supplies. Light penetration will minimize effectiveness of dyes in water less than about 2 ft deep, and plants tolerant of low light may survive at greater depths. Algal blooms may be masked by a more appealing color even if they are not prevented by dye addition. Surface covers will restrict access by people and waterfowl, and are therefore likely to be used only during spring in recreational settings, but can prevent substantial spring growths and reduce summer plant density to a tolerable level. Dyes are treated like herbicides in the regulatory system, but are non-toxic and operate in an entirely different manner. Surface covers are treated like benthic barriers in the regulatory system, and possess the same light inhibition features, but lack the ability to compress plant growths against the sediment. Dyes are applied on a lakewide basis to water bodies that have no active surface outflow, and remain in the system for an extended period. Surface covers are more typically applied on a localized basis, and are removed after several weeks to two months. Neither technique is used over extensive acreage in Massachusetts, but dyes are popular for ornamental ponds where appearance (including color and the illusion of depth) is important. Other than use in water supplies to meet requirements of the Safe Drinking Water Act (in which case algae and vascular plant control may result as a byproduct), surface covers have the potential to control localized rooted plant nuisances and offer an opportunity for creativity that has been largely untapped in Massachusetts.
4.8 DREDGING Sediment removal was described in some detail in Section 3 as it relates to nutrient reductions, but use as a macrophyte control technique is more common. As the details of types of dredging, impacts to non-target organisms and water quality, regulatory requirements and costs have been covered in Section 3, only the considerations and effectiveness related to macrophyte control will be addressed here. Dredging works as a plant control technique when either a light limitation on growth is imposed through increased water depth or when enough “soft” sediment (muck, clay, silt and fine sand) is removed to reveal a less hospitable substrate (typically rock, gravel or coarse sand). The amount of sediment removed, and hence the new depth and associated light penetration, is critical to successful long-term control of rooted, submerged plants. There appears to be a direct relation between water transparency, as determined with a Secchi disk, and the maximum depth of colonization (MDC) by macrophytes. Canfield et al. (1985) provided equations to estimate MDC in Florida and Wisconsin from Secchi disk measurements:
Eutrophication and Aquatic Plant Management in Massachusetts
4.0 Methods to Control Aquatic Plants
Page 4-135
State Equation Florida log MDC = 0.42 log SD + 0.41 Wisconsin log MDC = 0.79 log SD + 0.25 where SD = Secchi depth in meters For a Florida lake with a Secchi disk transparency of about 6 feet (1.8 meters), we would expect some submergent plants in 11 feet (3.4 meters) of water and more plants in progressively shallower water. Very large amounts of sediment might have to be removed to create large areas of the lake with depths of 11 feet or more. Examination of a bathymetric map will allow calculation of the likely quantity of sediment that would have to be removed to create a light limitation on macrophyte growth over a target area. These equations also indicate that actions that greatly improve water clarity, such as erosion control or phosphorus inactivation, may enhance plant distribution and abundance, increasing the necessary depth for light limitation through dredging. Partial deepening may limit the amount of vegetation that reaches the surface, but may also favor species tolerant of low light, some of which are non-native species with high nuisance potential, such as Eurasian watermilfoil. Where funding is insufficient to remove all soft sediment, it is more effective to create a depth or substrate limitation in part of the lake than to remove some sediment from all target areas of the lake, if rooted plant control is the primary objective of dredging. If the soft sediment accumulations that are supporting rooted plant nuisances are not especially thick, it may be possible to create a substrate limitation before a light-limiting depth is reached. If dredging exposes rock ledge or cobble, and all soft sediment can be removed, there will be little rooted plant growth. Yet such circumstances are rare to non-existent; either the soft sediment grades slowly into coarser materials, or it is virtually impossible to remove all fine sediments from the spaces around the rock or cobble. Consequently, some degree of regrowth is to be expected when light penetrates to the bottom. With successful dredging, this regrowth may be only 25% of the pre-dredging density or coverage, and will not contain more recently invading species at a dominant level. Yet some rooted plant regrowth is expected, and is indeed desirable for proper ecological function of the lake as a habitat and for processing of future pollutant inputs. Experience with dredging for rooted plant control has had mixed results. As with dredging for nutrient and algal control, failures are usually linked to incomplete pre-dredging assessment and planning. Control through light limitation appears more successful than control through substrate limitation, largely as a function of the difficulty of removing all soft sediment from shallow areas and the tendency for more soft sediment to accumulate. Dry dredging projects appear to result in more thorough soft sediment removal, mainly because equipment operators can visually observe the results of dredging as it takes place. Hydraulic dredging in areas with dense weed beds can result in frequent clogging of the pipeline to the slurry discharge area, suggesting the need for some form of temporary plant control (most often herbicides or harvesting) prior to hydraulic dredging. Hydraulic dredging has less overall impact on lake
Eutrophication and Aquatic Plant Management in Massachusetts
4.0 Methods to Control Aquatic Plants
Page 4-136
ecology during the dredging process, however, and can still produce depth and substrate limitations. If depth or substrate limitations can be achieved, sediment removal can be an effective method for the control of aquatic macrophytes. The entire plant is extirpated, seed beds are eliminated, nutrient-rich sediments are removed, and a lower light regime may be established. Tobiessen et al. (1992) reported a decrease in the biomass of Potamogeton crispus following hydraulic dredging to a three-meter (ten-foot) depth in Collins Lake, NY that has been sustained for ten years. A few plants were able to grow even at the ten-foot depth, but they were scattered and sparse. The effectiveness in Collins Lake is attributed to increased depth allowing less light penetration to plants. The authors concede that a lake with greater water clarity may not have the same results (Tobiessen et al., 1992). Dry dredging of Dunns Pond in Gardner successfully reduced profuse growths of macrophytes such as Myriophyllum sp., Utricularia radiata, Potamogeton spp., Nuphar variegata, and Sparganium sp. Some areas along the shorelines were not extensively excavated and these areas have moderate (25 to 50 percent) coverage of essentially the same macrophytes as before, but the majority of the pond became open water with limited plant growth (MDEP, 1994). In this case it was the removal of all soft sediment that established plant control. Dredging of Bulloughs Pond in Newton, MA in 1993 eliminated mats of filamentous green algae that covered the lake in most summers. Watershed management efforts have been limited to catch basin cleaning and dredging of City Hall Pond upstream for aesthetic and detention purposes, and incoming water is still rich in nutrients. However, the elimination of the substrate that harbored resting stages of these algae and supported early growths (before mats rose to the surface) has apparently been sufficient to prevent growths from attaining nuisance levels for almost a decade. Where dredging is conducted to restore depth, regrowth of plants may not be a major consideration. However, if plant growths are thick enough to threaten swimmers or boat passage, the increased depth may not provide the desired recreational value. In Porter Lake in Forest Park in Springfield, where depth had restricted the use of paddle boats, dredging was able to meet the goals of the management program for multiple years (C. Carranza, BEC, pers. comm., 1996). However, more recent growths of rooted plants in this shallow lake with substantial inputs of sediment and urban runoff have caused the Park Department to seek additional plant control measures. Engel and Nichols (1984) report that shallow dredging was ineffective for long-term control of aquatic macrophytes in Marion Millpond, Wisconsin. All sites had macrophytes present after two years. By the seventh year, all of the sites were overgrown with coontail, pondweeds, watermilfoil and other plants. Excessive regrowth of plants in Nutting Lake in Billerica, MA and 1860 Reservoir in Wethersfield, CT can be traced to inadequate removal of soft sediments and failure to achieve a depth limitation. Water depth was increased, but not enough to keep plants from growing to the surface. The role of dredging in a complete lake restoration project is illustrated by Hills Pond in Arlington, MA. Removal of accumulated soft sediment down to the clay liner established when the pond was constructed in the 19th century eliminated growths of invasive Brazilian elodea (Egeria densa) and water chestnut (Trapa natans) and blooms of bluegreen algae for several
Eutrophication and Aquatic Plant Management in Massachusetts
4.0 Methods to Control Aquatic Plants
Page 4-137
years. Eventually an uncommon species of pondweed (Potamogeton vaseyi) and Eurasian watermilfoil (Myriophyllum spicatum) appeared in the pond, most likely carried in by waterfowl (there is no boating on this park pond). The pondweed was a welcome addition, but the milfoil was not. Gradual accumulation of nutrients, despite installation of a storm water treatment wetland, allowed mild bluegreen blooms to form again. Treatment with the herbicide fluridone eliminated the milfoil, while treatment with alum reduced algal abundance. Both treatments were a minor expense in this 3-acre pond, and conditions would have been far worse without the dredging. However, dredging by itself cannot be expected to completely prevent future growths of plants or algae without additional management effort. No other technique will set a lake back in time the way dredging can, restoring depth and eliminating nutrients, other contaminants, vegetation and seed beds that threaten lake uses. The thoroughness of dredging will have great bearing on the magnitude and longevity of results, yet even the most thorough dredging project will probably require follow-up management efforts to protect and enhance the investment. Restoring the lake to a former condition does not negate the need for management going forward.
4.9 ADDITIONAL TECHNIQUES
4.9.1 Introduction Four additional techniques not commonly applied in Massachusetts bear mention, as they may have future utility. Specific information on each is insufficient to provide a review similar to the other techniques in this section, but future research and application may expand our knowledge of these approaches.
4.9.2 Flooding Filling a lake to beyond the normal water level can also impact plants. Raising the water level above the tops of cut cattail stems can “drown” the stems by inhibiting oxygen uptake. Dilution of nutrients may occur, reducing algal growths. Deeper water may result in insufficient light reaching submergent plants, preventing dense growths. However, potential benefits are generally perceived to be far fewer than likely negative impacts of flooding the lake periphery, especially where shoreline residences are present. This technique may have some applicability in actual flood control reservoirs, such as those built by the US Army Corps of Engineers, but common usage elsewhere seems unlikely.
4.9.3 Filtration Water for consumptive use is usually filtered as a requirement of the Safe Drinking Water Act, and a variety of technologies have arisen to meet this need. Most are applicable to lake management in theory, but the cost of performing such filtration on the scale necessary to reduce algal biomass in a eutrophic lake is very high. It may be possible to apply some form of filtration to small ponds, as is done with swimming pools, but if water is to be withdrawn and treated, it makes more sense to remove phosphorus. Dissolved Air Flotation (DAF) is a highly regarded technique in water treatment that may remove both algae and phosphorus, but again the cost is usually prohibitive.

Eutrophication and Aquatic Plant Management in Massachusetts
4.0 Methods to Control Aquatic Plants
Page 4-138
4.9.4 Settling Agents In association with filtration, settling agents are often added to increase particle size and enhance the filtration process. In many cases, algae can be coagulated and settled without actually filtering, greatly reducing the cost. Additions of calcium to lakes in Alberta, Canada for phosphorus control also caused algae to settle out of the water column without rupturing. This removal of algae minimizes the recycling of nutrients usually associated with treatments to kill algae. Alum also coagulates and settles most algae (and many other particles) in phosphorus inactivation treatments, and it is likely that iron treatments have a similar effect. Various polymers might be used to settle algae without binding phosphorus in the water column. Direct coagulation and settling of algae within the lake may still allow nutrients to be recycled, however, if phosphorus binders are not present. It seems unlikely that this approach would be applied for the purpose of settling algae alone, but in conjunction with phosphorus inactivation, it provides additional benefits, and could be of use alone where pH issues hinder other treatments.
4.9.5 Sonication Sonication is used to break up algae in laboratory samples for better analysis, but is a new technique on an application scale for lake management. A floating sonicator is now available commercially, and product literature claims that it will break up algae and cause them to sink to the lake bottom over target areas that range from 150 to 15,500 square meters, depending upon the model installed. Power consumption is a maximum of 45 watts, and the sonic waves reportedly have no effect on zooplankton or fish. The product literature warns that some algae may float after sonication, but that they will eventually sink. No scientific tests of this apparatus have been reported in the lake management literature, and this product is likely to provide only short-term relief, but it may be a viable option for smaller lakes and ponds. Impacts to non-target organisms bear further investigation.
4.10 NO MANAGEMENT ALTERNATIVE FOR AQUATIC PLANTS The no management alternative for aquatic plants would exclude all active lake management programs, but would include normal monitoring and would also include normal operations such as drawdowns for flood control or dam repair and other activities as permitted or required by law. As stated in Section 1, the normal tendency for lakes is to gradually accumulate sediments and associated nutrients and to generally become more eutrophic. Although macrophytes may be excluded from deeper areas of the lake due to light limitation, as sediments fill in the lake a greater proportion of the lake area becomes suitable for aquatic macrophytes. In consideration of this, the no management alternative would allow lakes to become ever more eutrophic in the future, even if no human additions of nutrients, sediments or non-native plants were considered. In cases where there is development in the watershed leading to increased erosion and sediment transport to the lake, the rate of infilling and expansion of macrophyte beds would be expected to increase more rapidly. In addition, activities that involve boat transport among lakes may introduce non-native plant species into lakes that previously did not have infestations. Introductions have occurred in many Massachusetts lakes (Appendix VI), and one of the major modes of introduction is assumed to be boating activities. The no management alternative would provide neither prevention nor

Eutrophication and Aquatic Plant Management in Massachusetts
4.0 Methods to Control Aquatic Plants
Page 4-139
remediation efforts other than those required by current laws, which contain minimal provisions intended to stop the spread of invasive species or preserve the desirable features of lakes.
4.10.1 Effectiveness There are cases where nuisance conditions caused by aquatic plants have abated with no active management by humans, as reviewed in several articles in Lake and Reservoir Management (Barko et al., 1994; Shearer, 1994; Sheldon, 1994). The same issue also contains articles that document declines in aquatic plants attributed to management or unknown causes (Madsen, 1994; Titus, 1994; Nichols, 1994). In many cases non-native plants will expand and native plants will decline if no management is taken (Bates and Smith, 1994). In Massachusetts lakes, invasive species have been observed to quickly overrun a lake if control measures are not applied (R. McVoy, MDEP, pers. comm., 1995). It is difficult to predict the population dynamics in any given lake, but in general, both native and non-native aquatic plants will flourish in shallow water systems where light can reach nutrient-rich sediments. In deeper lakes or in lakes with nutrient-poor, inorganic sediments, the plant biomass is expected to be limited. Effectiveness of no management is therefore a function of initial conditions and chance occurrences that may have positive or negative consequences. Ultimately, it is expected that conditions will deteriorate over an extended time period of years to decades unless human influence on the lake is negligible.
4.10.2 Impacts to Non-Target Organisms The impacts of the no management alternative for aquatic plants depend on the lake. In lakes with forested watersheds and little erosion and sediment inputs, there may be few adverse impacts if non-native plant introductions do not occur. Changes to the lake system will occur, but these are assumed to be the natural course of events and are not considered to be adverse impacts here. In lakes which have large inputs of nutrients and sediments, the expected impacts will be much greater. As macrophyte densities increase, open water habitat decreases and gas exchange with the atmosphere can be inhibited. Such conditions can have an adverse impact on fish and invertebrate populations as anaerobic conditions may develop beneath dense macrophyte beds (Moore et al., 1994). Such conditions may also favor zooplankton such as rotifers and fish species such as carp that can tolerate the higher water temperatures and low oxygen levels. Large shifts in biotic composition are possible over time; whether or not those changes are perceived as adverse impacts will depend on lake uses. Excessive plant growth can interfere with swimming and boating by entanglement. The impacts to fisheries noted above can also impact recreational fishing. Certain wildlife species will be negatively affected, while others may benefit.
4.10.3 Impacts to Water Quality Excessive aquatic plant growth can have adverse impacts on water quality. Plant metabolism in dense stands of vegetation can produce wide daily fluctuations of oxygen that may be harmful to aquatic fauna. Natural die-off of aquatic plants may also cause decreased levels of oxygen. In other situations, plants such as duck weed or filamentous algae, which form dense mats on the surface of the water, may cause oxygen depletion. Temperature gradients may be affected, nutrient cycling may be substantially altered, and pH fluctuations can be appreciable on daily to
Eutrophication and Aquatic Plant Management in Massachusetts
4.0 Methods to Control Aquatic Plants
Page 4-140
seasonal scales. How these changes affect lake biota and lake uses will depend to some extent on how fast they occur and how they are perceived by lake users. In general, the no management alternative will eventually lead to decreased water quality in the lake.
4.10.4 Applicability to Saltwater Ponds The no action alternative is as applicable to Saltwater Ponds as it is to Freshwaters.
4.10.5 Implementation Guidance
4.10.5.1 Key Data Requirements
To determine if the no management alternative has any applicability to a lake and watershed, the lake and watershed condition must be known. Only in rare cases of clean lakes in undeveloped watersheds is this approach usually justifiable. Temporary lack of management may be justified for lakes already in seriously degraded condition, while planning for management proceeds. Funding issues often dictate that no management actions be taken, but this is not a valid use of this “technique”.
4.10.5.2 Factors that Favor this Approach
The following considerations are indicative of appropriate application of no management for control of vascular plants and algae in lakes: 1. The lake is in an acceptable condition for designated and desired uses. 2. There are no apparent threats to lake condition. 3. Existing compliance with all federal and state laws relating to vascular plants and algae. 4. Wildlife habitat is the primary goal of management, with species of primary concern
preferring dense aquatic vegetation. Management of features or processes separate from plant density may be needed, and any threat of the spread of invasive species to other lakes should be addressed.
4.10.6 Performance Guidelines Planning and Implementation No planning or implementation typically accompanies the no action alternative, although protective action would be warranted where the no action alternative was a valid approach. Monitoring and Maintenance No monitoring or maintenance typically accompanies the no action alternative, although data availability is critical to determining if this approach is valid. Mitigation No mitigative measures apply to the no management alternative.
Eutrophication and Aquatic Plant Management in Massachusetts
4.0 Methods to Control Aquatic Plants
Page 4-141
4.10.7 Regulations
4.10.7.1 Applicable Statutes
Regulations do not apply to the no management alternative. It should be noted that the Commonwealth is required to maintain and monitor water quality as specified under the Federal Clean Water Act. In addition, towns are required to close swimming beaches if safe conditions cannot be maintained. However, these regulations are not typically interpreted to require action to rehabilitate lakes damaged by lack of management.
4.10.7.2 Impacts Specific to Wetlands Protection Act
The following overall impact classification is offered as a generalization of impacts, with clarifying notes and caveats as warranted: 1. Protection of public and private water supply – Detriment (water quality deterioration),
although impacts may be neutral in rare cases. 2. Protection of groundwater supply – Detriment (if lake interacts with groundwater) or neutral
(if no significant interaction). 3. Flood control – Generally neutral (no significant interaction), although water holding
capacity may decline over time. 4. Storm damage prevention – Generally neutral (no significant interaction) ), although water
holding capacity may decline over time. 5. Prevention of pollution – Detriment (water quality deterioration). 6. Protection of land containing shellfish – Detriment (no protection afforded), but impacts may
be neutral in some cases. 7. Protection of fisheries - Possible benefit through increased fertility and production, but
potential detriment by habitat loss. 8. Protection of wildlife habitat – Detriment (no protection afforded), but impacts may be
neutral in some cases, and some species may benefit from dense vegetation.
4.10.8 Costs Direct costs do not apply to the no management alternative, although there may be hidden or opportunity costs associated with the impacts to non-target organisms and water quality. Such costs are difficult to estimate and would vary on a case by case basis. If excess growth of aquatic plants results in a decrease in perceived water quality, then this may adversely impact property values around a lake, as a recent study of Maine lakes has shown (Michael et al., 1996).
4.10.9 Future Research Needs Evaluation of monitoring data for lakes that have not had any focused lake or watershed management would be helpful in underscoring the results of no management. Long-term data sets would be most desirable, spanning a range of at least 20 years and preferably 50 years. Some plant data exist that might fulfill this need, but no detailed analysis has been conducted. It is perhaps more critical that long-term monitoring programs be maintained, to provide such baseline data in the future.

Eutrophication and Aquatic Plant Management in Massachusetts
4.0 Methods to Control Aquatic Plants
Page 4-142
4.10.10 Summary The no management alternative is variable in effectiveness; impacts depend upon the initial conditions within the lake and chance occurrences over an extended period of time. If the lake is relatively deep (averaging greater than 10 feet) and has nutrient-poor inorganic sediments, then aquatic macrophytes are unlikely to become a nuisance because light and nutrient limitation will keep plant growth in check. If, however, the lake is shallow with nutrient-rich, organic sediments, then it is likely that the lake will develop excessive growths of aquatic plants. Where invasive species become established, major changes in lake ecology may result. In such cases, the no-management alternative will probably not be effective at limiting plant growth, and an increased rate of eutrophication can be expected. In rare cases, plant population collapses have occurred, possibly in response to natural herbivore action or abiotic climate factors (long, cold winter or natural water level lowering). However, over the long-term the no action alternative can be expected to lead to increased abundance of vascular plants and algae, with concurrent declines in recreational utility and habitat value for many species.
Eutrophication and Aquatic Plant Management in Massachusetts
5.0 Summary and Guidelines
Page 5-1
5.0 SUMMARY AND GUIDELINES
5.1 INTRODUCTION It is difficult to make concise recommendations for lake management in a document such as this, as each lake presents different problems and constraints. In general, prevention is the best approach to aquatic plant and algae control. Unfortunately, there is very limited money available for prevention, and cultural eutrophication continues largely unchecked. When a problem does arise it is recommended that an expert on lake management be consulted to give advice. This GEIR is not intended as a substitute for experience. A lake management plan should be developed for each lake, with the size and detail of the plan reflecting the size and complexity of the lake and its management issues. This GEIR provides background information that will allow interested laypersons municipal and state agency staff, and lake groups to evaluate options for themselves and to converse productively with lake management professionals. Guidance for the application of each possible technique is provided to the extent possible in the respective discussions of those techniques, but more general guidance is offered here.
5.2 PREVENT EUTROPHICATION Preventing nutrient inputs is the best control method for algae and some problems with aquatic macrophytes. Prevention means controlling nutrient inputs before the lake becomes eutrophic, although reversing the process of eutrophication by reducing nutrient inputs may be possible. Also included in this category is the prevention of erosion that leads to increased sedimentation rates and infilling of lakes. The best prevention of excess nutrients involves establishing Best Management Practices (BMPs) for forestry, agriculture, and urbanization to control excess nutrient runoff to streams and lakes. While such measures often are not effective at reversing lake eutrophication, they may be able to prevent or delay it. Because storm water discharges impact lakes in many areas, storm water BMPs should be employed in nearly all watersheds. Watershed management is paramount to protection of lake resources, and can result in rehabilitation where watershed inputs are the driving force behind lake problems.
5.3 PREVENT THE INTRODUCTION OF NON-NATIVE PLANTS In order to prevent the spread of non-native plant species, a combination of approaches is needed. These include aquatic vegetation monitoring, posting of signs at boat launches to encourage removal of plants from boats and trailers, removal of plants from equipment such as hydrorakes and harvesters, immediate treatment of small areas of infestation with herbicides or physical means (as appropriate to local conditions) before the plants spread within the lake, and public education. The Commonwealth installs plant control signs (Figure 5-1) at all public boat launches and makes them available to all interested parties. Additional state support is needed for lake monitoring and public education.
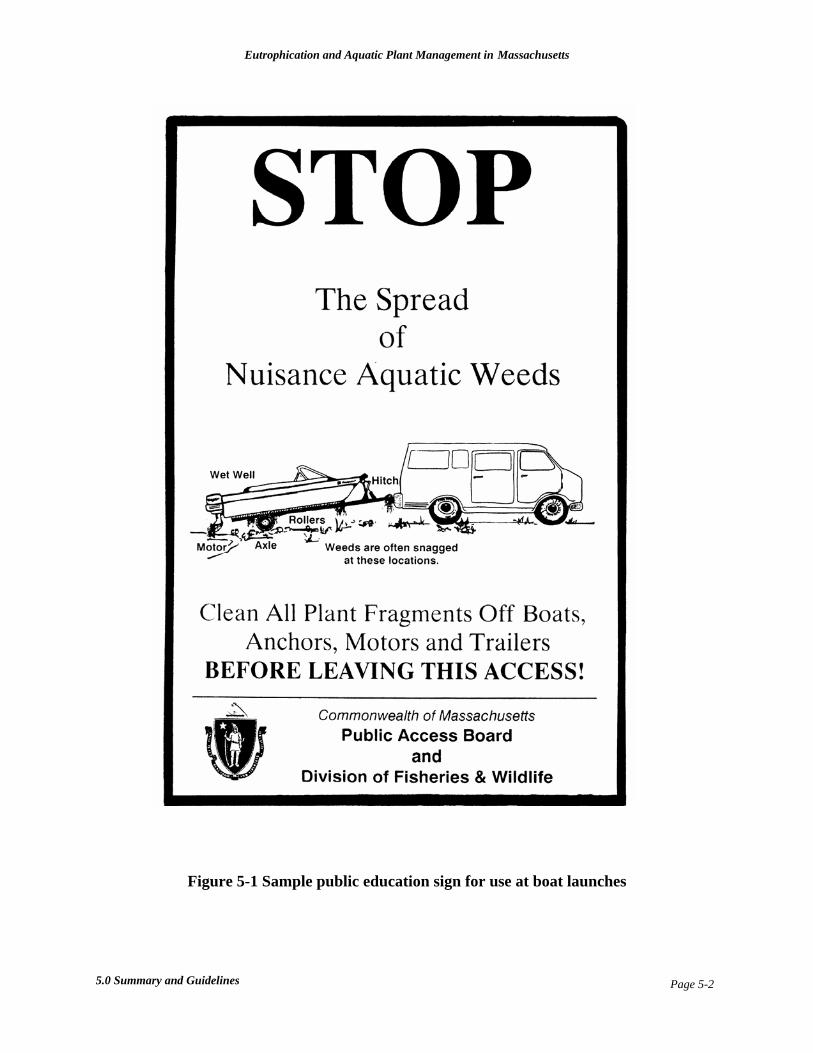
Eutrophication and Aquatic Plant Management in Massachusetts
5.0 Summary and Guidelines
Page 5-2
Figure 5-1 Sample public education sign for use at boat launches
Eutrophication and Aquatic Plant Management in Massachusetts
5.0 Summary and Guidelines
Page 5-3
The Massachusetts Lakes and Ponds Program has made progress in the prevention of new invasions and the management of existing problem species. Much work remains to be done, but the objectives of this program are consistent with recommendations made here regarding the management of invasive species. Strong support for this effort is needed to continue its work.
5.4 ESTABLISH A MANAGEMENT PLAN As discussed in Section 1 and noted elsewhere, a lake management plan should be developed for each lake. The plan should include a description of the problem(s), a scientific evaluation of the probable cause(s) and a plan to implement a solution. Careful consideration should be given to deciding what is a reasonable level of management for a given lake. While intensive management may be appropriate for urban lakes with high recreation use and constant threats to water quality and biological resources, other remote and relatively pristine lakes should be left as natural areas with as little direct management as possible. Most lakes are managed as multi-use resources, but not all goals of lake management are compatible. For example, the elimination of aquatic plants is incompatible with maintaining wildlife habitat for some species, and power boating may resuspend sediments in shallow lakes, adversely affecting visibility for contact recreation. The management options chosen should reflect the desired goals, realistic costs, long-term effectiveness, environmental impacts, and current laws and regulations. The level of detail in the plan should be commensurate with the size and complexity of the lake and its problem(s).
5.5 EVALUATE PROJECT EFFECTIVENESS The criteria used to judge project effectiveness depend on the types of management goals. These goals should be explicitly stated (e.g., Secchi transparency averaging 3 meters). All projects need quantitative information on pre-treatment conditions to compare to post-treatment conditions, although the level of detail will depend on the nature of the problem and the actions proposed. Nutrient control projects (Section 3) should address nutrient concentrations at or near the source as well as in the lake itself. Secchi disk transparencies and/or algal counts or chlorophyll a concentrations should be collected and monitored on an ongoing basis. Aquatic plant control projects (Section 4) should have pre-treatment data that include a species list with relative abundances and percent cover, preferably in tabular and map form. If funds are available, some quantitative measure of biomass can be included, but inexpensive presence/absence or cover data can suffice. The data survey should be repeated to collect post-treatment results to evaluate effectiveness. The greatest shortcoming in past lake management efforts has been the failure to collect post-implementation data. This shortcoming has caused project failures through lack of timely or critical adjustments, and has limited our ability to accurately predict the effectiveness and longevity of management results. We must find the funding or the creativity to develop and implement effective monitoring programs that provide data on the progress and results of management efforts.
5.6 EVALUATE IMPACTS TO NON-TARGET SPECIES Few reports on lake management projects mention impacts on non-target organisms. In addition, few adverse impacts are ever reported to state officials; only highly visible impacts such as fish
Eutrophication and Aquatic Plant Management in Massachusetts
5.0 Summary and Guidelines
Page 5-4
kills appear to get attention. It is important to note that there are an average of 40-60 fish kills reported in Massachusetts each year (R. Hartley, MDFG, pers. comm., 2003). Most of these are of “natural causes” such as oxygen depletion, but such natural causes may in fact be exacerbated by cultural eutrophication that leads to oxygen depletion. In the past ten years, only eight fish kills were attributed to lake management. Four of these were associated with drawdowns, two with copper sulfate addition, one with cessation of aeration, and one with alum treatment. Earlier records indicate six additional fish kills were attributed to herbicide use according to records from the 1970s and early 1980s. Of these, two were attributed to copper sulfate, one to diquat, one to Silvex (no longer registered) and two others were unspecified. This is considered to be a very low frequency of fish kills, considering the number of lake management projects involving herbicide applications. According to information provided by the MDFG, drawdowns may have impacted fisheries (particularly spawning areas) in 5 lakes, although fish kills were not generally reported. Much can be learned from lake management errors when the right information is available. The complete lack of faunal mortality associated with alum treatments at Ashumet Pond in Mashpee, MA (ENSR, 2002e) and Lake Pocotopaug in East Hampton, CT (ENSR, 2001b) in 2001 is directly linked to fishkills and lessons learned at Hamblin Pond in Barnstable, MA in 1995 and Lake Pocotopaug in 2000. Similarly, improvements in dredging programs have been made as a result of rather expensive mistakes in the past, and herbicide use has evolved greatly from its early years of highly toxic chemical introductions to an almost surgical use to attack invasive species in sensitive environments. Just as a technique should not be categorized as a failure based on a single instance of poor performance in the past, lake managers should not ignore problems through lack of assessment after treatment. Long-term impacts will not always be predictable from short-term impacts and need much more study. For example, the entrainment and death of small or immature fish by commercial harvesting equipment may not impact the fish population in the long-term if enough of the fish survive to grow to maturity, because mortality rates are naturally high among small and immature fish. However, a series of short-term impacts may result in the elimination of a rare species, loss of habitat, or the long-term accumulation of a pollutant. The greatest impacts of any of the lake management techniques may relate to changes in habitat and impacts to less visible organisms, such as benthic invertebrates and tiny zooplankton. Without additional study it is impossible to determine whether such impacts are occurring. The Commonwealth should encourage and support (with funding) multiple impact studies for each type of lake management treatment, although the cost of a detailed biological survey prohibits its application for all projects. This would include pre- and post- treatment biological surveys to the extent necessary to adequately characterize impacts and aid future planning. Note that it is possible that the greatest impacts may be caused by the “no management alternative” when cultural eutrophication and non-native plants create drastic changes in habitat and community structure. Routine monitoring of unmanaged lakes is also needed.
5.7 EMPHASIZE NUTRIENT CONTROLS FOR ALGAE MANAGEMENT The best management option, when available, is prevention. Management to control nutrient inputs should be implemented for all watersheds. This may include a wide array of options, with
Eutrophication and Aquatic Plant Management in Massachusetts
5.0 Summary and Guidelines
Page 5-5
implementation tailored to individual watersheds. As mentioned previously, monies are typically not available for preventive measures and even the best prevention will not prevent all inputs in a developing watershed. When problems do arise, the management options discussed in Sections 3 and 4 should be considered. In many cases there may not be a single best strategy, but rather a best combination of strategies. Ideally, the best method will be an effective, low cost, long-term solution that has a minimum of adverse impacts on non-target organisms. Such a solution may only rarely be possible, however, and cost/benefit decisions will have to be made.
Excess algal growth is possible only if nutrient levels are adequate, and thus nutrient control is recommended as the best long-term strategy. Nutrient controls that have been discussed in previous sections include non-point source controls, point source controls, hydraulic controls, phosphorus precipitation and inactivation, artificial circulation and aeration, and dredging. Suggestions for how to choose the most appropriate method are found in Section 1 and supplemented by observations in Sections 3 and 4. Basically, the diagnostic study should identify sources of nutrients to the lake and the management plan should target those sources with an emphasis on controlling phosphorus. Attempts to control nitrogen inputs may be counterproductive, as this may favor the growth of nuisance blue-greens. This does not mean that nitrogen control is unimportant, but rather that nitrogen control without phosphorus control may not yield the desired results except in salt ponds and estuarine situations. If the sediments are a major source of phosphorus, watershed management may not provide the desired results by itself. Dredging, aeration or phosphorus inactivation can each reduce internal loading enough to make a difference, although dredging is rarely attempted for this purpose alone due to cost. Control of internal loading should be supported by watershed management, since the vast majority of nutrients most likely reached the lake from the watershed. However, control of internal loading by itself can often lead to a major reduction in algal production, at least temporarily. Methods to control algae directly are not as certain to be effective as nutrient control. Dilution would be effective if a large source of clean water was available, but such sources of water are generally not available. Flushing can also reduce algal biomass, but only at very short detention times not achievable in most lakes. Dyes can be effective, or at least mask algal blooms, but are a highly cosmetic solution and are generally restricted to small ponds with no running outlets. Surface covers can make a difference, but only on a large scale that is likely to restrict lake use by people. Although copper can be applied for temporary control of algae, it is not an effective long-term control and may have a variety of adverse impacts. It may be possible to use biological controls to reduce algal densities, mainly by enhancing zooplankton grazing, but this is an inherently unstable approach with highly variable results. A number of benefits are possible with these more direct and usually temporary approaches, but the cost-benefit ratio over long periods favors nutrient controls if algal problems are persistent.
5.8 CHOOSE AQUATIC PLANT CONTROL TECHNIQUES CAREFULLY The best management option is prevention, although prevention cannot be the whole solution in most cases. Even though most aquatic plant problems may not be solved by controlling nutrients in the water column, nutrient control may help minimize future plant problems. The control and

Eutrophication and Aquatic Plant Management in Massachusetts
5.0 Summary and Guidelines
Page 5-6
attempted elimination of non-native plant species should be a primary goal for all lake management programs. If prevention fails to keep non-native species out or if natural vegetation becomes a nuisance, then other management options should be considered. The level of control as well as the type of control must be considered. Plants play a vital role in the ecology of lakes and some level of plant coverage is essential for a healthy lake. In some cases, it is unreasonable to fight the natural tendency for aquatic plants to thrive in shallow (less than 10 feet) lakes with nutrient-rich substrates. In such cases, a limited control plan may be recommended. This can be done in cases where sections of the lake are designated and managed for different activities. As an example, areas can be managed to limit nuisance vegetation for swimming, boat launching and boat channels; some areas of deep water can be maintained as open water habitat, and some areas left unmanaged as “natural” areas. In urban lakes or lakes that have high recreational demands, more intensive management may be desired. In very shallow lakes with nutrient-rich sediments and abundant plant growth, the only long term solutions may be the two extremes of dredging or letting nature run its course. The only other alternative is continuous management, which implies continuous costs, impacts, and cumulative effects of such management. The direct control of aquatic plants includes methods discussed in the Section 4 of this report. These include dredging, drawdown, harvesting, biological controls, sediment covers, and herbicides. Non-native plants should be managed aggressively, especially when they are first discovered and still restricted to localized infestations within the lake. Due to the possibility of fragmentation spreading of some species, such as Eurasian watermilfoil, the best treatment is with a selective herbicide unless the growths are extremely localized and amendable to simple physical techniques (hand pulling at low density, benthic barriers at high density). If treatment is delayed, the lake may become rapidly infested and herbicides may be needed on a larger scale. All of the techniques to control plants have their unique advantages and disadvantages. Although still experimental at this time, biological controls may offer effective and low cost controls once properly developed. Because biological control is one of the most powerful techniques, it must be approached with some caution and respect. Any testing of these techniques should be conducted in cooperation with the state Department of Environmental Protection and Division of Fish and Game. Controlled studies in Massachusetts could include additional investigations of the milfoil weevil. Until each biocontrol agent is proven effective and the impacts become known, other techniques should be given higher priority for field use. Benthic barriers appear to be effective on a small scale with no appreciable lake-wide impacts. The relatively high cost and maintenance limits their use to small areas such as swimming areas and boat docks. Harvesting is effective for plants that do not spread from cutting or fragmentation, but this nearly always requires ongoing treatment to remove the plants. Harvesting is an effective option in areas with very dense macrophytes. Some small fish and other organisms may be killed during operation, but it is often more acceptable to the public than other treatments. In some cases, manual harvesting can keep small areas clear and is ideally suited to first strike efforts against invading species (where the species can be detected as individual plants).
Eutrophication and Aquatic Plant Management in Massachusetts
5.0 Summary and Guidelines
Page 5-7
Water level drawdown can be effective for some species and, if a dam with a subsurface outfall and control structure is present, the costs may be minimal. However, drawdowns can have substantial impacts on non-target organisms as well as the targeted plants. Drawdowns should be conducted with great care after consultation with lake management professionals and careful assessment of existing conditions and consideration of possible detrimental impacts. Herbicides can be highly effective and relatively inexpensive compared to other techniques, at least in the short-term. In some cases, herbicides can be used to selectively kill certain nuisance species while leaving others largely unharmed. Most herbicides registered for use in Massachusetts present minimal risk in the hands of professionals if label directions are followed. Herbicide active ingredients approved for use in Massachusetts include copper, diquat, endothall, fluridone, 2,4-D and glyphosate. In general, the margin of safety can be increased by limiting application rates, but effectiveness should not be compromised. Herbicides are recommended to stop early infestations of non-native plants before they become widespread in a lake. Herbicides are also recommended to get a large scale infestation under control and facilitate control by other techniques on an ongoing basis. The effectiveness of herbicides is rather short lived, however, and in general, applications must usually be repeated yearly or every other year. Dredging is an extreme measure, but if properly conducted can be effective as a long-term treatment for shallow lakes if enough sediment is removed. By creating open water habitat, dredging can increase recreational opportunities such as swimming, boating and fishing and provide improved habitat for many species in the long-term. The initial costs are high and impacts can be severe, but even in this case recovery is usually rapid. In some cases, it may be desirable to dredge a limited area of the lake to maintain open water habitat while leaving other areas undisturbed. Reverse layer dredging may be used in lakes where nutrient-rich sediments are underlain by sandy nutrient-poor sediments, but this is still an experimental method more like benthic barriers than dredging. The major operational drawbacks to dredging are disposal of the dredged material and obtaining all of the required permits.
5.9 APPLY INTEGRATED NUTRIENT AND PLANT CONTROL Often the most appropriate long-term management approach involves integrated nutrient and plant control methods. Although the management techniques have been evaluated separately, integrated management should be emphasized in practice. In most cases the best management option is to combine two or more of the control techniques. Just which controls to combine is a highly case-specific question, but it is rare to meet all lake management objectives with a single technique, and there is no limit to the combinations and degrees of application that can be implemented. Where appropriate, lake management plans should address watershed nutrient control. This will not only benefit the resource, but will protect the investment made in in-lake controls. Watershed management will be an integral part of solving in-lake problems, and is almost always a good investment. In-lake controls will typically be necessary if internal loading of phosphorus is significant or rooted vascular plants are a problem. More than one in-lake technique may be applicable and desirable, especially where plants with different reproductive strategies (vegetative propagators vs. seed producers) are abundant.
Eutrophication and Aquatic Plant Management in Massachusetts
5.0 Summary and Guidelines
Page 5-8
5.10 FOSTER INTERACTIONS BETWEEN AGENCIES It is sometimes difficult for citizens to obtain assistance from the Commonwealth for lake management when different agencies are responsible for different types of management. It would be helpful to establish and maintain a statewide lake management team incorporating staff from within MDCR, MDEP, MDFG and possibly other agencies to assist citizen groups and Conservation Commissioners in the planning, permitting and execution of lake management techniques. In many cases the Conservation Commission may need experienced and independent advice from a state lake management team to establish a lake management plan that will be effective, affordable, and comply with state regulations. The Lakes and Ponds Program in DCR has made progress along these lines, and cooperation among government agencies has improved under EOEA leadership, but there is a long way to go to achieve the level of communication and cooperation necessary to meet lake management challenges. More emphasis on the “big picture” is needed within agencies or divisions charged with managing only part of the lake or watershed. Additional cooperative work should be encouraged between the Division of Fisheries and Wildlife, the Department of Environmental Protection and the Department of Conservation and Recreation to begin testing some of the biocontrol techniques described in Section 4 and examining the impacts of the other treatment methods.
5.11 SUPPORT APPROPRIATE LEGISLATIVE, REGULATORY AND POLICY CHANGES
Specific recommendations are offered here based on CAC discussion and the body of evidence provided in this GEIR: 1. A stronger policy is recommended to control the domestic and agricultural use of phosphorus
fertilizers (including the use of manure) near lakes and their tributaries. Such applications are unnecessary where a soil test shows no deficiency in phosphorus. Restraint is especially needed with regard to the management of lawns and other turfgrass areas. Manure should not be applied to fields in areas of potential runoff unless proper containment is provided for that runoff. Phosphorus fertilizer application to cranberry bogs or other flooded lands should be managed to insure that phosphorus does not escape to adjacent surface waters.
2. Laws should regulate or prohibit the sale and transport of non-native freshwater aquatic plants such as those commonly sold in the aquarium and horticulture trades. Many other states have such laws already, and the absence of a strong legal base for preventing the distribution of invasive species hinders management efforts in Massachusetts.
3. The laws (Chapter 132B) should be strengthened to eliminate the purchase of aquatic herbicides through the mail. Mail order sales of herbicides should be prohibited for at least aquatic herbicides classed as Restricted Use herbicides by the Department of Agricultural Resources. Laws should be strengthened to restrict the possession of such herbicides by unauthorized individuals.
Eutrophication and Aquatic Plant Management in Massachusetts
5.0 Summary and Guidelines
Page 5-9
4. Municipalities may need to consider local ordinances to strengthen protection in areas where lakes are in danger of eutrophication, in order to tailor the statewide Title 5 program to address local needs. For example, nutrient load reduction may be enhanced by increasing setbacks to surface water bodies, employing nutrient reducing technology, mandating strict system operation and maintenance, requiring more frequent system inspections, or, in extreme circumstances, using tight tanks where proper disposal can be provided. While such measures can reduce nutrient loading to surface waters over the long-term, they may not achieve dramatic improvements in the short-term due to the challenges of bringing existing systems into compliance with new standards and the variability in travel time of nitrogen and phosphorus through groundwater to surface water bodies.
5. Policy changes should be implemented to establish justifiable thresholds for permitting
management techniques. The permitting of hydroraking under Chapter 91 regulations provides an example. Chapter 91 regulations were originally written to control access and maintain navigation within large waterways, and hydroraking does not infringe on the intent of the law when applied to inland lakes as long as water depth is not reduced. Sufficient regulatory protection for small scale hydroraking in lakes is already provided for in the Wetlands Protection Act and other state regulations. A review of the applicability of the ACOE 404 and 401 regulations to hydroraking is also warranted. Other lake management techniques should also be considered for possible threshold levels in the permitting process, consistent with guidance offered in Sections 3 and 4.
6. For large, complex projects, an Order of Conditions for lake, shoreline or adjacent wetland
management should include provisions for biological surveys both before and after treatment. For such projects, quantitative information and species identifications from the survey should be included for key species or indicator populations to assess the potential and actual impacts on the target and non-target species. The Order of Conditions should include information on the plant or algae species composition, abundance and distribution and also include basic water quality data (pH, dissolved oxygen, transparency) in order to provide information necessary to evaluate the project. Such a policy will aid in guiding future management plans to maximize effectiveness, while minimizing impacts to non-target species. However, state level support for these efforts is needed to ease the financial burden of major assessments of lake management techniques.
7. Additional information on herbicide usage should be included in the application for the
License to Apply Chemicals. Specifically, the major target species of vascular plant or algae should be identified by scientific name to the species level, aiding determination of species-specific effectiveness of the various treatments. Chemicals to be applied should be specified with the USEPA registration number and percent active ingredient or complete chemical composition (in the case of alum treatments) in addition to the name and amount of the herbicide or chemical used. Registered product labels should be kept on file at the Department of Environmental Protection, minimizing confusion regarding application rates. If repeat applications within a single year are requested, the number of days between treatments should also be stated. The maximum environmental concentration of the active ingredient should be calculated and provided based on the application rate and the volume of water treated. Finally, relevant water chemistry such as pH and alkalinity (and/or hardness)
Eutrophication and Aquatic Plant Management in Massachusetts
5.0 Summary and Guidelines
Page 5-10
data should be included in the application, aiding the Department of Environmental Protection in assessing the permit request and enhancing any future analysis of effectiveness and impacts. The application for the License to Apply Chemicals should also be provided to the Conservation Commission for possible input and for consideration during formulation of the Order of Conditions, with the intent of producing more informed and consistent decisions.
8. Information files on lake management projects should be maintained by the state. Policies
regarding the Wetlands Protection Act should be amended to state that all Notices of Intent involving lake management operations should be forwarded to a designated lake management team. This will provide a valuable record of which types of management are being conducted in all areas of the state. Standardizing that record should also have a high priority.
9. The Conservation Commissions and local communities should be advised and assisted with
the development of lake management plans and the use of this GEIR. Every effort should be made to obtain input from local citizens in the planning stages to avoid later appeals to the MDEP. The management method chosen should not be in conflict with available scientific evidence. In particular, no lake treatment should be used, or excluded from use, without adequate scientific justification. Further, no exceptional restrictions should be placed in the Order of Conditions that are not supported by the GEIR or other scientific evidence.
5.12 SUPPORT PUBLIC OUTREACH Public outreach is especially important for effective non-point source nutrient control and to reduce the spread of non-native plants. Additional measures to educate the public on these issues include increased use of informational signs and brochures posted and available at public access points. Increased use of the Internet is recommended to disseminate information and foster communication among interested parties. Additional emphasis should be placed on public involvement through such activities as state coordinated volunteer surveys and educational programs. The Commonwealth should encourage active involvement of citizens in long-term monitoring as a good way to maintain information transfer within the community. A good example of this is the distribution of Secchi disks to volunteers to aid in monitoring lake transparency across the state. This program was funded by the Department of Conservation and Recreation and carried out in cooperation with the Mass Water Watch Partnership. Additional funding and support for volunteer monitoring through the MDCR and MDEP should be continued and expanded to the extent possible. Educational programs would also be beneficial for members of local Conservation Commissions and members of local Boards of Health to both help explain regulations and ensure well informed decision making at the local level. Public involvement is critical in the planning stages of lake management to set goals and to minimize later conflict.
Eutrophication and Aquatic Plant Management in Massachusetts
5.0 Summary and Guidelines
Page 5-11
5.13 FACILITATE FUTURE DATA COLLECTION AND RESEARCH Specific recommendations are offered here based on CAC discussions and the body of evidence supplied in this GEIR. 1. The recommendations of the previous GEIR for lake management issued nearly twenty years
ago have not been followed with regard to the collection of data. According to the laws establishing the Aquatic Nuisance Control Program (Appendix I.12), the Commonwealth was to conduct extensive biological surveys and establish restrictions prior to any control programs being initiated. Apparently this was not done. It is impossible to accurately assess the status and trends of lake eutrophication without a systematic data collection effort involving a large number of lakes each year. The Commonwealth’s Clean Lakes Program was successful at collecting these data during assessment of more than 80 lakes before funding was cut. The Department of Environmental Protection still conducts numerous lake assessments (nearly 550 since 1974, with more limited assessments in recent years) as part of the 305b process and this should be continued. Funding for the functions fulfilled by the Clean Lakes Program should be restored and research programs should be initiated.
2. A minimum of one hundred lakes should be surveyed each year for chlorophyll, transparency
(as Secchi disk depth), total phosphorus, total nitrogen and dissolved oxygen. A smaller number of lakes should be surveyed, perhaps on a rotating basis, for aquatic macrophyte diversity and density with an emphasis on documenting the present range of non-native plants. Such surveys could be used to focus educational efforts on high-risk areas, initiate coordinated control plans and encourage additional surveys by citizen volunteers and lake associations. The cost of implementing such surveys can be substantially reduced with the use of citizen volunteer groups to perform the field work of the water quality survey. Teams of trained volunteers and professionals may be required to conduct the plant surveys. The state should make a commitment to participate in training of volunteers. Funding should be provided to support volunteer programs through coordinating groups such as the Congress of Lakes and Ponds (COLAP), the Massachusetts Water Watch Partnership (MassWWP) at the University of Massachusetts and the North American Lake Management Society (NALMS).
3. The effectiveness of the various lake management techniques can be fully evaluated only if
pre- and post-management surveys are conducted for each treatment. Because of funding cuts to the Clean Lakes Program, no rigorous follow-up studies are being conducted and such surveys are now largely voluntary and cursory. A small number of selected lakes should be chosen for additional intensive studies of the impacts on non-target organisms for each of the management techniques. Up to now, most reports for lake management techniques have either ignored non-target species or simply reported that no adverse impacts were observed. Such casual observation is inadequate to determine impacts on rare species, or on species that are not readily observed, such as benthic invertebrates, zooplankton, early life stages of fish, and phytoplankton. The Commonwealth should fund a formal, scientific study with statistical sampling of both pre- and post- treatment impacts to target and non-target organisms for each treatment type, preferably with multiple examples of each technique evaluated.
Eutrophication and Aquatic Plant Management in Massachusetts
5.0 Summary and Guidelines
Page 5-12
4. Future research on nutrient control should focus on new techniques to reduce phosphorus inputs. In particular, further research is needed to examine the use of alum to control the leaching of phosphorus from manures and septic tanks. Such studies should be expanded to investigate the use of alum and slow release phosphate fertilizers within critical areas bordering surface waters and in areas of sandy soil.
5. Future research on plant management should focus on biological control techniques using
host-specific native insects or pathogens. Research should also be conducted on the use of triploid grass carp to evaluate their use for control of aquatic macrophytes. Recent case studies and policies on triploid grass carp from states such as Connecticut, New York and Washington should be evaluated to determine how and if such use may be allowed in Massachusetts.
5.14 RECOGNIZE LIMITATIONS IMPOSED BY NATURE AND HUMAN ACTIONS Not all lakes are created equal. Shallow lakes are more prone to eutrophication, and many of the lakes in Massachusetts were created or augmented by damming small streams. Except for major public works like Quabbin and Wachusett Reservoirs, these lakes are nearly all shallow, and comprise over half of the area and volume of lakes in the Commonwealth. It is natural that these systems would fill in more rapidly than larger, natural lakes with limited drainage areas. That does not mean that they do not warrant management. Indeed, the value of these resources has been recognized for decades to centuries, and active management is necessary to preserve that value. However, there cannot realistically be enough public funding to manage them all well, and management goals for each will vary, resulting in different management needs. Seeking a balance of lake uses is encouraged, on both the individual lake and regional levels, but priorities of some uses over others in some lakes (e.g., water supply, protected species habitat) must be recognized. Our institutional framework for managing lakes is not as advanced as our ability to determine management needs and evaluate management options. Implementation will lag behind assessment. Likewise, our regulatory system is not geared toward quick solution of lake problems, even when the problems are clearly defined and the solution seems obvious. Competing interests create conflicts and act to slow the process down. This is not necessarily inappropriate; many management mistakes have been made in the name of rapid response to problems. However, inability to reach consensus or render a decision based on a balance of interests, even after years of study and discussion, does not serve our lakes well, and has been a problem in multiple instances. There is no perfect solution to lake problems. Nearly all solutions require some trade-off between uses and resources. Short-term improvements may not foster long-term stability. Long-term management may not provide for short-term enhancement, causing support for long-term actions to falter. A clear and comprehensive management plan for the lake and its watershed is essential, but the limitations of our knowledge, the system that governs our actions, and the achievable conditions in the lake must be recognized by all involved parties to reach informed decisions, make progress and minimize frustration.
Eutrophication and Aquatic Plant Management in Massachusetts
6.0 CAC Lake Management Recommendations
Page 6-1
6.0 CAC LAKE MANAGEMENT RECOMMENDATIONS
6.1 INTRODUCTION The Citizens Advisory Committee (CAC) for this GEIR makes the following recommendations based on the authority granted in 301 CMR 11.12(3) and in the certificate of the Secretary of Environmental Affairs, dated April 14, 1994, which requires the preparation of an update to the GEIR and designates the project as Major and Complicated (EOEA #0011 and #6934). The Secretary established the CAC to advise MDCR and MDEP in the preparation of the update and the Secretary's office in conducting the environmental review. Specifically, the CAC was established to review and comment on the revised preliminary scope; to meet with MDCR and MDEP periodically during preparation of the generic EIR to comment on the scopes of work and report elements; and to review and comment to the Secretary on the draft and final generic EIRs during a 30-day period prior to their being submitted to MEPA for the 30-day public and agency review and comment period. These recommendations are made following the goals, objectives and action items of the Policy on Lake and Pond Management Action Plan (Appendix VII), but are organized below according to major headings for clarity. Statements represent the unanimous or majority opinion of the CAC unless otherwise indicated. Finally, it should be noted carefully that these recommendations were developed over a period of time, and were completed up to two years prior to the publication of this document. During the interim, a number of the recommendations already have been implemented, some have been superceded by state actions or changes in regulations, while others remain to be accomplished.
6.2 PLANNING AND POLICY 1. EOEA should designate, empower and support a technical review group, which has the
appropriate technical expertise in lake assessment and lake management, to review projects and to ensure completion of several lake and pond related tasks (listed below) within the context of the Commonwealth's Watershed Approach to water resource management. All stakeholders (federal and state agencies with advisory and permitting authority, boards of health, etc.) would be eligible as members of the group. The establishment of this group recognizes all existing state and federal statutes and regulations and does not diminish the legal authorities of any state, federal, or municipal governmental body relative to management and protection of lakes, watersheds, fisheries, and wildlife. Its key role is to provide technical guidance to Conservation Commissions and other bodies regarding the appropriate management of lakes and ponds and to promote a more uniform approach to lake management techniques statewide. Specific responsibilities of this lake management technical review group are to:
a) Act as a central clearinghouse to provide for technical assistance/training to citizen lake
monitoring programs for direct monitoring of lakes/ponds, for the identification of nonnative and other nuisance plant infestations, and for technical assistance to
Eutrophication and Aquatic Plant Management in Massachusetts
6.0 CAC Lake Management Recommendations
Page 6-2
communities and lake and pond associations for the development of comprehensive, integrated lake and watershed management plans.
b) Act as the central clearinghouse for technical reviews on permits related to lake and pond management projects. This function should not be set up as another "level of permitting," but rather should stand as the authoritative review on such projects and act to coordinate and streamline existing permit reviews.
c) Develop action steps to ensure that information developed in the GEIR and from the Lake
Management Plan Workbook is used as the basis to identify the most appropriate methods of lake management for achieving and/or maintaining designated uses.
2. EOEA should designate an agency or group to be responsible for actively developing a "use
sustainability" analysis method (such as the current research based on ecoregions, or subregion delineations) to relate current conditions at a lake or pond to potential conditions as a basis for reviewing proposed lake use designations (e.g., contact recreation, coldwater fishery) and for developing use criteria.
3. EOEA should conduct a review of legislation from other states to facilitate the creation of
lake watershed districts on a statewide basis, without need for individualized legislation. The goal of a watershed district is to provide revenues for water quality and lake management issues specific to individual water bodies.
4. The current extent of the problem of the introduction and proliferation of non-native and/or
invasive aquatic plant species should be determined by MDCR and MDEP with coordination from MDFG. Also, MDCR and MDEP should train other stakeholders (i.e., Lake Associations, COLAP etc.) to conduct quality-assured aquatic plant monitoring surveys.
5. The MDFG, as the state agency with the requisite biological expertise, should develop and
periodically revise a list of invasive non-native and native species for which management procedures will be allowed following guidance provided in the GEIR and a list for which introduction to a lake ecosystem will be allowed. Legislation should be passed that gives MDFG the authority to restrict import and transport of invasive non-native plant and animal species.
6. Based on information provided in Sections 1, 2 and 3 of the GEIR, EOEA should instruct its
agencies involved in the Massachusetts Watershed Initiative or any successor programs with a watershed emphasis to develop and incorporate nutrient (particularly phosphorus in freshwater and nitrogen in salt water ponds) loading analyses and lake response analyses as part of their efforts, recognizing that lake systems react differently than rivers to nutrient loading.
7. The EOEA Secretary should direct the Surface Water Quality Standards Committee to
develop phosphorus and nitrogen loading performance standards and site criteria to reduce loading from various non-point sources.

Eutrophication and Aquatic Plant Management in Massachusetts
6.0 CAC Lake Management Recommendations
Page 6-3
8. All lake management planning and permitting activities should incorporate recognition of the importance of open water in the balance of the ecosystem and that open water provides unique ecological, economic, recreational, aesthetic, and tourism opportunities in the Commonwealth.
9. The sales and distribution (including mail order, wholesale, and retail) of aquatic herbicides
and algaecides should be prohibited other than to applicators licensed through the Massachusetts Department of Agricultural Resources.
6.3 PERMITTING 1. When requested by municipalities, state agencies or other groups potentially affected by
proposed complex lake management projects, a review should be conducted by the lake management technical review group with final approval for any permit still residing with the appropriate permitting agency.
2. The lake management technical review group should work with the MDEP, Division of
Wetlands and Waterways to revise guidance, dated April 8, 1994, concerning abutter notification legislation that took effect on April 13, 1994 (Appendix VIII) so that notification is based on distance from the activity, not distance from the property containing the activity. MDEP's interpretation is that abutters whose properties are within 100 feet of the property containing the activity should be notified. Lakeshore property owners across a lake (if more than 100 feet away from the property containing the activity) do not need to be notified in the vast majority of cases.
3. Where projects occur in more than one municipality, joint public hearings should be held
and, whenever possible, identical Orders of Conditions should be written. 4. A minority of the CAC members recommends that the Conservation Commissions should not
have authority to approve or deny aquatic pesticide and chemical treatments, and that the Conservation Commissions' role should be limited to review and comment on permit applications under state review that might include, for example, inputs on sensitive resources, suggested conditions, or, in some cases, reasons for denial. The majority opinion of the CAC is that Conservation Commissions should retain their authority.
5. A more thorough review, including multi-jurisdictional inputs (e.g., Conservation
Commissions, MDFG), should be conducted on applications for Licenses to Apply Chemicals for Control of Nuisance Vegetation (BRP WM 04) before they are approved. Additional resources should be provided to MDEP for this purpose.
6. A minority from the CAC recommends that local bylaws should not be permitted to restrict
or impose fees on lake management activities. The majority opinion is that home rule should not be abrogated in this way.
7. The lake management technical review group should review all permitting thresholds (e.g.,
MEPA thresholds for Appeals of Orders of Conditions) for lake restoration projects to

Eutrophication and Aquatic Plant Management in Massachusetts
6.0 CAC Lake Management Recommendations
Page 6-4
determine whether thresholds are triggered at appropriate levels and to determine at what point a project would not require any other permits beyond an Order of Conditions.
8. A minority of the CAC recommends that the Water Resources Commission designate a
group to explore the possibility of adding the supplementary interests of recreation and public safety to the Wetlands Protection Act. The majority opinion of the CAC is that this would require undesirable changes to the Wetland Protection Act and Regulations. It was noted that some local bylaws already include these interests, but it is not clear how consideration of such interests is received at the state level.
9. A minority of the CAC recommends that nuisance weed control should not be denied if the
project can demonstrate a clear improvement in a majority of the eight interests, along with clear improvements in recreation, public safety, aesthetics, and maintenance of open water resources. The majority opinion of the CAC is that open water should not outweigh impacts to any one of the eight interests. This is a major point of contention that requires additional discussion at higher levels of government.
6.4 FUNDING 1. Funding should be provided to implement and sustain lake assessment and management
programs (i.e., Clean Lakes Program, Lake and Pond Grant Program, Aquatic Nuisance Control Program, and citizen lake monitoring programs). Such funding should provide an annual, steady source of revenue as might be generated by (1) increasing or taking a portion of the boat registration tax, (2) canoe registration and tax, or (3) dedicating a portion of the gasoline tax to the programs.
2. The Commonwealth should move away from legislative line item appropriations that fund
individual lake management projects with public monies. All lake management projects should first go through a competitive process to evaluate their potential for success, cost/benefit and environmental impact.
3. The EOEA agencies should provide adequate funds for agency personnel to keep current in
their technical expertise. 4. The EOEA agencies should provide adequate funding in all state funded lake management
projects to conduct appropriate pre- and post-implementation monitoring that would assess the effectiveness of the technique(s) utilized. Activities by Citizen Lake monitoring programs should be included to the extent possible. Results of the assessments must be reported to the agency that provided the funding.
6.5 EDUCATION 1. A workbook based on the GEIR and the MDCR Lake Management Plan Workbook should
be developed to aid the public in the development of lake management plans. Emphasis should be placed on which techniques are most appropriate for achieving and/or maintaining designated uses for given lake conditions. A table showing common lake problems, the
Eutrophication and Aquatic Plant Management in Massachusetts
6.0 CAC Lake Management Recommendations
Page 6-5
appropriate herbicide and its toxicity (relative to other herbicides) or other treatment would be helpful to all interested parties.
2. A public education program that provides lake associations and citizens with the knowledge
and guidance necessary to effectively manage lakes and their watersheds should be carried forward by EOEA agencies in the context of the Massachusetts Watershed Initiative. The Lake and Pond Management Policy, GEIR and accompanying workbook should be supplemented by watershed management information for use by local boards. EOEA agencies, MACC, RPAs, Conservation Districts and others should hold regional workshops for Conservation Commissions, Boards of Health, and other local and regional agencies to ensure that this information is disseminated.
3. Following a review of available materials, a library should be established to provide
information to agencies, municipalities, and the public. To the extent possible, materials should be made available in electronic format.
4. Through the COLAP, the network of stakeholder groups should be increased and an
information service should be provided for stakeholders, including a newsletter for receiving agency news and updates.
5. Education about the problem of the introduction and proliferation of non-native and/or
invasive species and their control should be increased via contacts between MDCR, MDEP, and COLAP by the technical review group. State agencies (such as MDFG and Registry of Motor Vehicles) and other stakeholder groups (angler groups, boating groups, wildlife groups, etc.) should be targeted for an increased role in educating the public about identifying and stopping the spread of non-natives and advancing watershed and lake protection measures.
6. EOEA watershed teams should work with watershed associations to post signs highlighting
ways to avoid the spread of aquatic vegetation at each boat access in its watershed. Additional funds, as needed, should be provided by EOEA for manufacture of the signs.
7. Lakeshore homeowner groups should become actively involved in the Massachusetts
Watershed Initiative in order to ensure their interests are recognized. "Watershed Councils" should be educated to the interests of these groups as they are forming within individual watersheds.

Eutrophication and Aquatic Plant Management in Massachusetts
7.0 References
Page 7-1
7.0 REFERENCES
7.1 Journal Articles and Reports ACOE. 1994. Proceedings of the Grass Carp Symposium. Gainesville, FL. U.S. Army Corps of Engineers, Vicksburg, MS 39180-6199. ACT. 1994. An Evaluation of Plant Control in Ware’s Cove, Charles River, Newton and Waltham, MA. ACT, Northborough, MA. ACT. 1999. Project Completion Report: Mechanical Harvesting Program to Control Water Chestnut in the Charles River Lakes District. ACT, Sutton, MA. ACT. 2000a. Project Completion Report: Mechanical Harvesting Program to Control Water Chestnut in the Charles River Lakes District. ACT, Sutton, MA. ACT. 2000b. Dudley Pond 1999 Milfoil Treatment Report. ACT, Sutton, MA. ACT. 2000c. Report on Aquatic Plant Survey of Dudley Pond – August 2000. ACT, Sutton, MA. ACT. 2001a. Project Completion Report: Mechanical Harvesting Program to Control Water Chestnut in the Charles River Lakes District. ACT, Sutton, MA. ACT. 2001b. Nuisance Aquatic Plant Management Recommendations for Dudley Pond. ACT, Sutton, MA. Ahlgren, I. 1978. Response of Lake Norrviken to reduced nutrient loading. Verh. Int. Verein. Limnol. 20:846-850. Allaby, M., editor. 1994. The Concise Oxford Dictionary of Botany. Oxford University Press, Oxford, England. 442 pp. Andersson, G. 1988. Restoration of Lake Trummen, Sweden: effects of sediment removal and fish manipulation. In Balvay, G. (ed). Eutrophication and Lake Restoration. Water Quality and Biological Impacts. Thonon-les-Bains. Aquacide Company Bulletin. 1995. Product Catalog. White Bear Lake, MN. Aquashade®, Inc. 1981. Aquashade® Aquatic Plant Growth Control. Product Label. USEPA Reg. No. 33068-1. Eldred, NY. Aquashade®, Inc. 1982. Aquashade Can Make Your Serene Pond or Lake so Beautiful, Without Harm to Humans. Fish, Wildlife and Turf. Informational Flyer. Arnold, W.R. 1979. Fluridone-A new aquatic herbicide. J. Aquat. Plant Manage. 17:30-33.

Eutrophication and Aquatic Plant Management in Massachusetts
7.0 References
Page 7-2
Ashley, K.I. 1983. Hypolimnetic aeration and functional components of the lake ecosystem: Phytoplankton and zooplankton effects. pp 31-39 in Lake Restoration, Protection and Management. EPA440/5-83-001. USEPA, Washington, DC. ATC. 1989. Fawn Lake Final Report. Prepared for Town of Bedford. Alliance Technologies Corp., Bedford, Massachusetts. Babin, J., E.E. Prepas, T.P. Murphy, M. Serediak, P.J. Curtis, Y. Zhang and P.A. Chambers. 1994. Impact of lime on sediment phosphorus release in hardwater lakes: The case of hypereutophic Halfmoon Lake, Alberta. Lake and Reservoir Management 8(2):131-142. Badgery, J., D.J. McQueen, K. Nicholls and P.R. Schaap. 1994. Biomanipulation at Rice Lake, Ontario, Canada. Lake and Reservoir Management 10(2):163-173. Bailey, W.M. 1978. A comparison of fish populations before and after grass carp stocking. Trans. Amer. Fish. Soc. 107(1):181-206. Bain, M.B., J.T. Finn and H.E. Booke. 1988. Streamflow Regulation and Fish Community Structure. Ecology 69(2):382-392. Baker, J.P. 1982. Effects on Fish of Metals Associated with Acidification. In R.E. Johnson, (ed.). Acid Rain/Fisheries. Amer. Fish. Soc. Bethesda, MD. pp. 165-176. Baker, J.P., D.P. Bernard, M.J. Sale and S.W. Christensen. 1990. Biological Effects of Changes in Surface Water Acid-Base Chemistry. NAPAP Report 13. National Acid Precipitation Assessment Program, Acidic Deposition: State of Science and Technology. Vol. II. Baker, J.P., H. Olem, C.S. Creager, M.D. Marcus, and B.R. Parkhurst. 1993. Fish and Fisheries Management in Lakes and Reservoirs. EPA 841-R-93-002. Terrene Inst./USEPA, Washington, DC. Barbiero, R., R.E. Carlson, G.D. Cooke and A.W. Beals. 1988. The effects of a continuous application of aluminum sulfate on lotic benthic invertebrates. Lake and Reservoir Management. 4(2)63-72. Barko, J., W.F. James, W.D. Taylor and D.G. McFarland 1990. Effects of alum treatment on phosphorus and phytoplankton dynamics in Eau Galle Reservoir: A synopsis. Lake Reserv. Manage. 6:1-8. Barko, J.W. and R.M. Smart. 1981. Sediment-based nutrition of submersed macrophytes. Aquatic Bot. 10:339-352. Barko, J.W., C.S. Smith and P.A. Chambers. 1994. Perspectives on submersed macrophyte invasions and declines. Lake and Reservoir Management 10(1):1-3.
Eutrophication and Aquatic Plant Management in Massachusetts
7.0 References
Page 7-3
Barrett, P., J. Curnow and J. Littlejohn. 1996. The control of diatoms and cyanobacterial blooms in reservoirs using barley straw. In: Caffrey, J. and P. Barrett (eds). Management and Ecology of Freshwater Plants, Proceedings of the 9th International Symposium on Aquatic Weeds, Kluwer Academic Publishers, London. Barrett, P.R.F. 1981. Diquat and sodium alginate for weed control in rivers. J. Aquat. Plant Manage. 19:51-52. Bates, A.L., and C.S. Smith. 1994. Submersed plant invasions and declines in the southeastern United States. Lake and Reservoir Management, 10(1):53-55. Bay, R.R. 1966. Factors influencing soil-moisture relationships in undrained forested bogs. In W.E. Sopper and H.W. Lull (eds). International Symposium on Forest Hydrology. Pergamon Press, Oxford. Beard, T.D. 1973. Overwinter Drawdown: Impact on the Aquatic Vegetation in Murphy Flowage, Wisconsin. Tech. Bull. #61, WDNR, Madison, WI. BEC. 1985. Diagnostic/Feasibility Study of Walker Pond, Sturbridge, Massachusetts. Baystate Environmental Consultants, Inc. East Longmeadow, MA. BEC. 1986a. Diagnostic/Feasibility Study of Lake Massasoit. BEC, East Longmeadow, MA. BEC. 1986b. Diagnostic/Feasibility Study for the Management of Quaboag and Quacumquasit Lakes. BEC, E. Longmeadow, MA. BEC. 1987a. A Preliminary Evaluation of Sassaquin Pond and its Watershed. Baystate Environmental Consultants, Inc. East Longmeadow, MA. BEC. 1987b. Evaluation of the Nutting Lake Dredging Program. Final Report. Baystate Environmental Consultants, Inc. East Longmeadow, MA. BEC. 1988a. Diagnostic/Feasibility Study for the Management of Buttonwood Pond, New Bedford, Massachusetts. Baystate Environmental Consultants, Inc. East Longmeadow, MA. BEC. 1988b. Diagnostic/Feasibility Study for the Management of Silver Lake, Wilmington, Massachusetts. Baystate Environmental Consultants, Inc. East Longmeadow, MA. BEC. 1988c. Diagnostic/Feasibility Study for the Management of Dimmock Pond, Springfield, Massachusetts. Baystate Environmental Consultants, Inc. East Longmeadow, MA. BEC. 1989. Diagnostic/Feasibility Study for the Management of Forge Pond, Granby, Massachusetts. Baystate Environmental Consultants, Inc. East Longmeadow, MA.

Eutrophication and Aquatic Plant Management in Massachusetts
7.0 References
Page 7-4
BEC. 1990a. Diagnostic/Feasibility Study for the Management of Richmond Pond, Richmond/Pittsfield, Massachusetts. Baystate Environmental Consultants, Inc. East Longmeadow, MA. BEC. 1990b. A Diagnostic/Feasibility Study for the Management of Nashawannuck Pond, Easthampton, Massachusetts. Baystate Environmental Consultants, Inc. East Longmeadow, MA. BEC. 1990c. Final Environmental Impact Report, Drawdown of Forge Pond, Westford and Littleton, Massachusetts. BEC, E. Longmeadow, MA. BEC. 1990d. A Diagnostic/Feasibility Study for the Management of Mansfield Lake, Great Barrington, Massachusetts. BEC, E. Longmeadow, MA. BEC. 1991a. Diagnostic/Feasibility Study for the Management of Herring Pond, Eastham, Massachusetts. Baystate Environmental Consultants, Inc. East Longmeadow, MA. BEC. 1991b. Implementation Project for the Management of Great Pond, Eastham, Massachusetts: Aquatic Plant Control Program. Baystate Environmental Consultants, East Longmeadow, MA. BEC. 1991c. Long Pond Diagnostic/Feasibility Study. Prepared for the Town of Littleton, Massachusetts. Baystate Environmental Consultants, Inc. East Longmeadow, MA. BEC. 1992a. Pre-Drawdown Inventory, Lost Lake/Knopps Pond System, Groton, Massachusetts. BEC, East Longmeadow, MA. BEC. 1992b. Lake Garfield Investigative Survey. BEC, East Longmeadow, MA. BEC. 1993a. Diagnostic/Feasibility Study of Hamblin Pond, Barnstable, Massachusetts. Baystate Environmental Consultants, Inc. East Longmeadow, MA. BEC. 1993b. Diagnostic/Feasibility Study for the Management of the Pembroke Ponds, Oldham, Furnace, Little Sandy Bottom, and Stetson, Pembroke, Massachusetts. Baystate Environmental Consultants, Inc. East Longmeadow, MA. Bettoli, P.W., M.J. Maceina, R.L. Noble, and R.K. Betsill. 1993. Response of a reservoir fish community to aquatic vegetation removal. N. Amer. J. Fisheries Manage. 13:110-124. Bimber, D.L., R.W. Boenig and M.L. Sharma. 1976. Respiratory distress in yellow perch induced by subtoxic concentrations of Diquat. Ohio J. Sci. 76(2): 87-90. Bingham, D.R. 1994. Wetlands for storm water treatment. In Donald M. Kent, ed. Applied Wetlands Science and Technology. Lewis Publishers, Boca Raton. pp 243-262. Birchall, J.D., C. Exley, J.S. Chappell and M.J. Phillips. 1989. Acute toxicity of aluminum to fish eliminated in silicon-rich acid waters. Nature 338:146-148.

Eutrophication and Aquatic Plant Management in Massachusetts
7.0 References
Page 7-5
Blaha, D.W. and T.J. LoVullo. 1998. Sebago Lake: Source protection through water level management. In: Watershed Management: Moving from Theory to Implementation. A conference in Denver, CO, May 1998, WEF, Alexandria, VA. Blossey, B., D. Schroeder, S.D. Hight and R.A. Malecki. 1994a. Host specificity and environmental impact of the weevil Hylobius transversovittatus, a biological control agent of purple loosestrife (Lythrum salicaria). Weed Science 42:128-133. Blossey, B., D. Schroeder, S.D. Hight and R.A. Malecki. 1994b. Host specificity and environmental impact of two leaf beetles (Galerucella calmariensis and G. pusilla) for biological control of purple loosestrife (Lythrum salicaria). Weed Science 42:134-140. Boehmke, J.R. 1984. Effects of aeration on Lake Cachuma, California 1980-1982. In Lake and Reservoir Management. EPA 440/5/84-001. United States Environmental Protection Agency, Washington, D.C. pp542-548. Bonar, S.A., H.S. Sehgal, G.B. Pauley, and G.L. Thomas. 1990. Relationship between the chemical composition of aquatic macrophytes and their consumption by grass carp, Ctenopharyngodon idella. Journal of Fisheries Biology, 36:149-157. Bonar, S.A., S.A. Vecht, C.R. Bennett, G.B. Pauley and G.L. Thomas. 1993. Capture of grass carp from vegetated lakes. J. Aquat. Plant Manage. 31:168-174. Boutiette, L.N. Jr. and C.L. Duerring. 1994. Massachusetts Non-Point Source Management Manual “The Megamanual”: A Guidance Document for Municipal Officals. Massachusetts Department of Environmental Protection, Office of Watershed Management, Non-Point Source Program, Boston, MA. Pub. No. 17356-500-500-6/93-67.00. Bowker, R.P.G. and H.D. Stensel. 1987. Design Manual: Phosphorus Removal. EPA/625/1-87/001 U.S.E.P.A. Cincinnati OH. Boyd, C.E. and M.H.M. Noor. 1982. Aquashade treatment of catfish ponds. North American Journal of Fisheries Management 2:193-196. Brandes, M. 1977. Effective phosphorus removal by adding alum to septic tank. JWPCF 49(11):2285-2296. Brannon, J.M, T.E. Myers and C.R. Lee. 1993. Hamlet City Lake leaching studies. In: Environmental Effects of Dredging. Vol D-93-2. U.S. Army Corps of Engineers Waterways Experiment Station, Vicksburg, MS. Breithaupt, S.A. and D.S. Lamb. 1983. The dredging of Liberty Lake and its immediate environmental impact. In Lake Restoration, Protection and Management. EPA-440/5-83-001. USEPA, Washington, DC.
Eutrophication and Aquatic Plant Management in Massachusetts
7.0 References
Page 7-6
Brinson, M., A. Lugo and S. Brown. 1981. Primary productivity, decomposition and consumer activity in freshwater wetlands. Ann. Rev. Ecol. Syst. 12:123-161. Brock, T.D. 1979. Biology of Microorganisms. 3rd edition. Prentice-Hall, Inc., Englewood Cliffs, N.J. 802 pp. Bronstad, J.O. and H.O. Friestad. 1985. Behavior of Glyphosate in the Aquatic Environment. In The Herbicide Glyphosate. Butterworths, London. 490 pp. Brosnan, T.M. and G.D. Cooke. 1987. Response of Silver Lake trophic state to artificial circulation. Lake and Reservoir Management 3:66-75. Buckler, J.H., T.M. Skelly, M.J. Luepke and G.A. Wilken. 1988. Case study: The Lake Springfield sediment removal project. Lake and Reservoir Mangement 4(1):143-152. Canfield, D.E., K. Langeland, S. Linda and W. Haller. 1985. Relations between water transparency and maximum depth of macrophyte colonization in lakes. J. Aquat. Plant Manage. 23:25-28. Cantor, L.W. and R.C. Knox. 1985. Septic tank system effects on ground water quality. Lewis Pub., Chelsea, MI. 336pp. Caraco, D., R. Claytor and J. Zielinski. 1998. Nutrient Loading from Conventional and Innovative Site Development. Center for Watershed Protection, Ellicot City, MD. Carlson, R.E. 1977. A trophic state index for lakes. Limnol. Oceanogr., 22(2):361-369. Carpenter, S.R. and others. 1995. Biological Control of Eutrophication in Lakes. Environ. Sci. Tech. 29(3):784-786. Carpenter, S.R. and J.F. Kitchell. 1993. The Trophic Cascade in Lakes. Cambridge University Press, Cambridge MA. 385 pp. Carson, R. 1962. Silent Spring. Houghton Mifflin Co., NY. Castelle, A.J., A.W. Johnson and C. Conolly. 1994. Wetland and stream buffer size requirements - A review. J. Environ. Qual. 23:878-882. CDM. 1987a. Final Report Diagnostic/Feasibility Study of Salisbury Pond, City of Worcester, Massachusetts. Camp Dresser & McKee Inc. CDM. 1987b. Final Report Diagnostic/Feasibility Study Lake Boon, Towns of Hudson/Stow, MA. Camp Dresser & McKee Inc. CDM. 1989. Final Report Brown's Pond Diagnostic/Feasibility Study Peabody, Massachusetts. Massachusetts. Camp Dresser & McKee Inc.
Eutrophication and Aquatic Plant Management in Massachusetts
7.0 References
Page 7-7
Center, T.D. and F.A. Dray. 1990. Release, establishment, and evaluation of insect biocontrol agents for aquatic plant control. pp. 39-49 in Proceedings, 24th Annual Meeting, Aquatic Plant Control Research Program, 13-16 November 1989, Huntsville, AL. Miscellaneous Paper A-90-3. U.S. Army Corps of Engineers, Vicksburg, MS. Center for Watershed Protection. 2003. Impacts of Impervious Cover on Aquatic Systems. Watershed Protection Research Monograph #1, CWP, Ellicot City, MD. Charudattan, R., J. DeValerio and V. Prange. 1989. Special problems associated with aquatic weed control. In: Baker, R. and E. Dunn (eds). New Directions in Biological Control. Alan Liss Inc., NY. Cheater, M. 1992. Alien Invasion. Nature Conservancy. Sept./Oct. 92:24-29. Chesebrough, E.W. and A.J. Screpetis. 1976. Nutting Lake Water Quality Study April 1974 - April 1975. Massachusetts Department of Environmental Protection, Division of Water Pollution Control. Westborough, MA. Publication #13377-68-50-9-83-CR. Chesebrough, E.W. and A.J. Screpetis. 1978. Pontoosuc Lake Water Quality Study April 1975 - April 1976. Massachusetts Department of Environmental Quality Engineering, Division of Water Pollution Control. Westborough, MA. Publication No. 10,376-58-175-4-78-CR. Chilton, S. 2003. Implementing marine standards on Lake Tahoe. Lake Reserv. Mgmt. In review. Christian, F.A. and Tesfamichael, T.M. 1990. Oxygen uptake of Pseudosuccinea columella and Fossaria cubensis treated with sublethal concentrations of Cutrine-Plus, an algicide. Bull. Environ. Contam. Toxicol. 45:336-342. Church, R.H., C.W. Smith and B.J. Scheiner. 1994. Flocculation techniques used for dredging operations. pp. 1497-1506 in McNair, C.E. (Ed.) 1994. Dredging ‘94. Proceedings of the 2nd International Conference on Dredging and Dredged Material Placement. Volume 2. ASCE, New York. 1561pp. Claytor, R. and T. Schueler. 1996. Design of Storm Water Filtering Systems. Center for Watershed Protection, Ellicot City, MD. Center for Watershed Protection, Ellicot City, MD. Claytor, R. and W. Brown. 1996. Environmental Indicators to Assess Storm Water Control Programs and Practices. Center for Watershed Protection, Ellicot City, MD. Clean Lakes Incorporated. 1982. Aquashade®. Informational Pamphlet. CoFrancesco, A.F. Jr., 1993. Biological Control. pp 71-78 in Proceeedings, 27th Annual Meeting, Aquatic Plant Control Research Program, 16-19 November 1992, Bellevue, WA. Miscellaneous Paper A-93-2. U.S. Army Corps of Engineers, Vicksburg, MS.
Eutrophication and Aquatic Plant Management in Massachusetts
7.0 References
Page 7-8
Colburn, T., D. Dumanoski and J.P. Myers. 1997. Our Stolen Future. NAL/Dutton, NY. Comes, R.D. and A.D. Kelley. 1989. Control of common cattail with post-emergence herbicides. J. Aquat. Plant Manage. 27:20-23. Connor, J. and M. Martin 1989a. An assessment of sediment phosphorus inactivation, Kezar Lake, NH. Water Resources Bulletin 25:845-853. Connor, J. and M. Martin 1989b. An Assessment of Wetlands Management and Sediment Phosphorus Inactivation, Kezar Lake, NH. NH Dept. of Environmental Services, Concord, NH. Connor, W.H., J. Gosselink, and R. Parrando. 1981. Comparison of the vegetation of three Louisiana swamp sites with different flooding regimes. Amer. J. Bot. 68:320-331. Conyers, D.L. and G.D. Cooke. 1983. A comparison of the costs of harvesting and herbicides and their effectiveness in nutrient removal and control of macrophyte biomass. In: Lake Restoration, Protection and Management. EPA 440/5-83-001. USEPA, Washington, DC. Cooke, G. D. 1980. Lake level drawdown as a macrophyte control technique. Water Resources Bulletin 16(2):317-322. Cooke, G.D. and R.E. Carlson. 1989. Reservoir Management for Water Quality and THM Precursor Control. AWWA Res. Foundation, Denver, CO. Cooke G.D., and R.H. Kennedy. 1981. Precipitation and Inactivation of Phosphorus as a Lake Restoration Technique. EPA-600/3-81-012. Corvallis, OR. 41pp. Cooke, G.D. and R.H. Kennedy. 1989. Water Quality Management for Reservoirs and Tailwaters. Report 1. In-Lake Reservoir Water Quality Management Techniques. Tech. Rept. E-89-1. US Army Corps of Engineers, Vicksburg, MS. Cooke, G.D., E.B. Welch, S.A. Peterson and P. R. Newroth. 1993a. Restoration and Management of Lakes and Reservoirs. Second Edition. Lewis Publishers, Boca Raton, FL. 548 pp. Cooke, G.D., E.B. Welch, A.B. Martin, D.G. Fulmer, J.B. Hyde, and G.D. Schrieve. 1993b. Effectiveness of Al, Ca, and Fe salts for control of internal phosphorus loading in shallow and deep lakes. Hydrobiologia 253:323-335. Cortell and Associates. 1973. Algae Control by Artificial Mixing. Lake Cochituate, Natick, MA. Research and Demonstration Project 70-29. Final Report. Jason M. Cortell & Associates Environmental Consultants. Wellesley Hills, MA. Creed, R. 1998. A biogeographic perspective on Eurasian watermilfoil declines: Additional evidence for the role of herbivorous weevils in promoting declines? J. Aquat. Plant Manage. 36:16-22
Eutrophication and Aquatic Plant Management in Massachusetts
7.0 References
Page 7-9
Creed, R., and S. Sheldon. 1993. The effect of feeding by a North American weevil, Euhrychiopsis lecontei, on Eurasian watermilfoil (Myriophyllum spicatum). Aquatic Botany 45:245-256. Creed, R., and S. Sheldon. 1994. The effect of two herbivorous insect larvae on Eurasian watermilfoil. J. Aquat. Plant Manage. 32:21-26. Creed, R. and S. Sheldon. 1995. Weevils and a watermilfoil decline: Did a North American herbivore cause a decline in an exotic weed in a Vermont lake? Ecological Applications 5:1113-1121. Creed, R.P., S.P. Sheldon and D.M. Cheek. 1992. The effect of herbivore feeding on the bouyancy of Eurasian watermilfoil. J. Aquat. Plant Manage. 30:75-76. Cripe, E. and M. Phipps. 1999. Gas bubble disease and popeye. Breeders Registry, May 26, 1999. Crosson, H. 1988. Vermont Eurasion Milfoil Control Program. Vermont Dept. Environmental Conservation, Waterbury, VT. 44 p. + app. Crow, G.E. and C.B. Hellquist. 1981. Aquatic Vascular Plants of New England: Part 2. Typhaceae and Sparganiaceae. New Hampshire Agricultural Experiment Station, University of New Hampshire, Durham. 21 pp. Crow, G.E. and C.B. Hellquist. 1982. Aquatic Vascular Plants of New England: Part 4. Juncaginaceae, Scheuchzeriaceae, Butomaceae, Hydrocharitaceae. New Hampshire Agricultural Experiment Station, University of New Hampshire, Durham. 20 pp. Crow, G.E. and C.B. Hellquist. 1983. Aquatic Vascular Plants of New England: Part 6. Trapaceae, Haloragaceae, Hippuridaceae. New Hampshire Agricultural Experiment Station, University of New Hampshire, Durham. 26 pp. Crow, G.E. and C.B. Hellquist. 2000. Aquatic and Wetland Plants of Northeastern North America. Vol. I and II. Univ. Wisconsin Press, Madison, WI. Crutchfield, J.U.Jr., D.H. Schiller, D.D. Herlong and M.A. Mallin. 1992. Establishment and impact of redbelly Tilapia in a vegetated cooling reservoir. J. Aquat. Plant Manage. 30:28-35. Daukas, P., D. Lowry and W.W. Walker, Jr. 1989. Design of wet detention basins and constructed wetlands for treatment of storm water runoff from a regional shopping mall in Massachusetts. In D.A. Hammer, ed. Constructed Wetlands for Wastewater Treatment. Lewis Publishers, Chelsea, Michigan. Dennis, J., J. Noel, D. Miller, and C. Eliot. 1989. Phosphorus Control in Lake Watersheds: A Technical Guide to Evaluating New Development. ME DEP, Augusta, ME.
Eutrophication and Aquatic Plant Management in Massachusetts
7.0 References
Page 7-10
Dettmers, J. and R. Stein. 1996. Quantifying linkages among gizzard shad, zooplankton and phytoplankton in reservoirs. Trans. Amer. Fish. Soc. 125:27-41. Devine, R. 1994. Botanical Barbarians. Sierra. Jan/Feb. 94:50-57,71. Dillon, P.J. and F.H. Rigler. 1974a. The phosphorus-chlorophyll relationship in lakes. Limnol. Oceanogr. 19(4): 767-773. Dillon, P.J. and F.H. Rigler. 1974b. A test of a simple nutrient budget model predicting the phosphorus concentration in lake water. J. Fish. Res. Board Can. 31:1771-1778. Doyle, R.D. and R.M. Smart. 1993. Potential Use of Native Aquatic Plants for Long-Term Control of Problem Aquatic Plants in Guntersville Reservoir, Alabama. Report 1 Establishing Native Plants. US Army Corps of Engineers, Vicksburg, MS. Driscoll, C.T. Jr. and R.D. Letterman. 1988. Chemistry and fate of Al(III) in treated drinking Water. J. Environ. Eng. Div. ASCE 114:21-37. Duffield, J.R. and D.R. Williams. 1989. Aluminium in food and the environment. p. 1-5 in Aluminium in Food and the Environment. Massey, R. and D. Talyor, (Eds.). Special Pub. No. 73. Royal Society of Chemistry, Cambridge, Great Britain. 108pp. Dunst, R., S. Born, P. Uttormark, S. Smith, S. Nichols, J. Peterson, D. Knauer, S. Serns, D. Winter and T. Wirth. 1974. Survey of Lake Rehabilitation Techniques and Experiences. Tech. Bull. #75, WDNR, Madison, WI. Edmondson, W.T. 1977. Trophic Equilibrium of Lake Washington. EPA-600/3-77-087. Corvallis, OR Edmondson, W.T. and J.T. Lehman. 1981. The effect of changes in the nutrient income on the condition of Lake Washington. Limnol. Oceanogr. 26(1):1-29. Eichler, L.W., R.T. Bombard, J.W. Sutherland, and C.W. Boylen. 1991. Report on Hand Harvesting of Eurasian Watermilfoil in Lake George, New York, January 1989-December 1990. Rensselaer Fresh Water Institute Report #91-7, Rensselaer Polytechnic Institue, Troy, NY 27pp. Eichler, L.W., R.T. Bombard, J.W. Sutherland, and C.W. Boylen. 1993. Suction harvesting of Eurasian watermilfoil and it's effect on native plant communities. J. Aquat. Plant Manage. 31:144-148. Eichler, L.W., R.T. Bombard, J.W. Sutherland, and C.W. Boylen. 1995 Recolonization of the littoral zone by macrophytes following the removal of benthic barrier material. J. Aquat. Plant Manage. 33:51-54.
Eutrophication and Aquatic Plant Management in Massachusetts
7.0 References
Page 7-11
Elf Atochem. 1992a. Aquathol® Granular Aquatic Herbicide. Product Label. USEPA Reg. No. 4581-201. Philadelphia, PA. Elf Atochem. 1992b. Aquathol® K Aquatic Herbicide. Product Label. USEPA Reg. No. 4581-204. Philadelphia, PA. Elf Atochem. 1992c. Hydrothol® 191 Aquatic Algicide and Herbicide. Product Label. USEPA Reg. No. 4581-174. Philadelphia, PA. Elf Atochem. 1994. Hydrothol® 191 Granular Aquatic Algicide and Herbicide. Product Label. USEPA Reg. No. 4581-172. Philadelphia, PA. Ellis, C.R., and H.G. Stefan. 1994. Design and testing of two ice-preserving winter lake aeration systems. In: Cotroneo, G.V. and Rumer, R.R. (Eds.) Hydraulic Engineering ‘94, Volume 2. ASCE, New York. Engel, S. 1982. Evaluating Sediment Blankets and a Screen For Macrophyte Control in Lakes. Final Report for the Wisconsin Dept. of Natural Resources. 33 pp. Engel, S. 1984. Evaluating Stationary Blankets and Removable Screens for Macrophyte Control in Lakes. J. Aquat. Plant Manage., 22:43-48. Engel, S. 1990. Ecological Implications of Harvesting Macrophytes in Halverson Lake, WI. J. Aquat. Plant Manage. 28:41-45. Engel S. and Nichols, S.A. 1984. Lake Sediment Alteration for Macrophyte Control. J. Aquat. Plant Manage. 22:38-41. ENSR. 1997a. Bogle Brook Phosphorus Inactivation Pilot Program. ENSR, Northborough, MA. ENSR. 1997b. Storm Water Infiltration Program for Lakes Lorraine and Fivemile Pond. ENSR, Northborough, MA. ENSR. 1997c. Limnological Investigation of Stafford Pond, Tiverton, RI. ENSR, Northborough, MA. ENSR. 1998. Bare Hill Pond Water Quality and Aquatic Plant Evaluation. ENSR, Northborough, MA. ENSR. 2000a. Post-Implementation Study of Pontoosuc Lake. ENSR, Northborough, MA. ENSR. 2000b. A Nutrient Impact Evaluation of Hop Brook in Marlborough and Sudbury, MA. ENSR, Acton, MA. ENSR. 2000c. Diagnostic/Feasibility Study of Big Bear Hole Pond, Massasoit State Park, Taunton, Massachusetts. ENSR, Northborough, MA.
Eutrophication and Aquatic Plant Management in Massachusetts
7.0 References
Page 7-12
ENSR. 2000d. Lake Buel Plant Replacement Program: Final Report to MDEM. ENSR, Northborough, MA. ENSR. 2000e. Island Creek Pond Plant Replacement Program: Final Report to MDEM. ENSR, Northborough, MA. ENSR. 2000f. Survey of the Submerged Aquatic Vegetation and Vegetation Management Recommendations for Fort Meadow Reservoir, Marlborough, MA. ENSR, Northborough, MA. ENSR. 2000g. Collection and Evaluation of Ambient Nutrient Data for Lakes, Ponds, and Reservoirs in New England. ENSR, Acton, MA. ENSR. 2001a. SUASCO Watershed, Assabet River TMDL Study, Phase I: Assessment. ENSR, Westford, MA. ENSR. 2001b. Analysis of Phosphorus Inactivation Issues at Lake Pocotopaug, East Hampton, CT. ENSR, Willington, CT. ENSR. 2001c. Diagnostic/Feasibility Study of Otis Reservoir, Otis and Tolland, Massachusetts. ENSR, Willington, CT. ENSR. 2001d. Goose Pond Vegetation Survey, October 2001. ENSR, Westford, MA. ENSR. 2002a. Evaluation of Expanded Drawdown Potential for Bare Hill Pond, Harvard, Massachusetts. ENSR, Willington, CT. ENSR. 2002b. Notice of Intent for Drawdown of Stockbridge Bowl, Stockbridge, MA. ENSR, Willington, CT. ENSR. 2002c. Cumulative Report of the Indian Lake Water Level Drawdown, Becket, Massachusetts, 1997-2002. ENSR, Willington, CT. ENSR. 2002d. Notice of Intent for Drawdown of Bare Hill Pond, Harvard, MA. ENSR, Westford, MA. ENSR. 2002e. Short-Term Monitoring Program for the Ashumet Pond Phosphorus Inactivation project. ENSR, Westford, MA. ENSR. 2003. Inputs of Phosphorus to Aquatic Systems from Machine Dishwashing Detergents: An Analysis of Measured and Potential Loading. ENSR, Willington, CT. Eschenroeder, A. 1989. An Assessment of the Environmental Health Risk of Fluridone Application For Vegetation Control in Todd Pond in Lincoln, Massachusetts. Todd Pond Residents Association, Lincoln, MA.

Eutrophication and Aquatic Plant Management in Massachusetts
7.0 References
Page 7-13
Everhart, W.H., A.W. Eipper and W.D. Youngs. 1975. Principles of Fishery Science. Cornell University Press, Ithaca, NY. 288pp. Fasseett, N.C. 1966. A Manual of Aquatic Plants. The University of Wisconsin Press. Madison, WI. 405pp. Federal Interagency Stream Restoration Working Group. 1998. Stream Corridor Restoration: Principles, Processes and Practices. USEPA, Washington, DC. Fernald, M.L. 1950. Gray's Manual of Botany. American Book Company, Inc. Boston, MA. 1632 pp. Fink, D.F. 1994. A Guide to Aquatic Plants. Minnesota Department of Natural Resources. 52 pp. Flaten, T.P., A.C. Alfrey, J.D. Birchall, J. Savory, and R.A. Yokel. 1996. Status and future concerns of clinical and environmental aluminium toxicology. J.Toxic. & Environ. Health. 48(6):527-541. Foy, R.H. 1986. Suppression of phosphorus release from lake sediments by the addition of nitrate. Wat. Res. 11:1345-1351. Frank, P.A. and R.D. Comes. 1967. Herbicidal residues in pond water and hydrosoil. Weeds 16:210-213. Freeman, T.E. 1977. Biological control of aquatic weeds with plant pathogens. Aquat. Botany 3:175-184. Fugro East, Inc. 1995a. Investigation of Bacteria Contamination at Sunset Lake Beach Area, Braintree, MA. Fugro East, Northborough, MA. Fugro East, Inc. 1995b. Results of the 1995 Limnological Investigation of Goose Pond – Lee/Tyringham, Massachusetts. Fugro East, Northborough, MA. Fugro East, Inc. 1996a. Environmental Impact Review and Management Implications for a Proposed Drawdown of Onota Lake. Fugro East, Northborough, MA. Fugro East, Inc. 1996b. Limnological Investigations of the Cambridge Reservoir System: Impacts of Watershed Inputs and Alum Sludge Discharge. Fugro East, Northborough, MA. Fugro East, Inc. 1996c. Summary Report on the Restoration of Hills Pond in Menotomy rocks Park, Arlington, MA. Fugro East, Northborough, MA. Fugro East. 1996d. Lake George Milfoil Control Evaluation. Fugro East, Northboro, MA.
Eutrophication and Aquatic Plant Management in Massachusetts
7.0 References
Page 7-14
Gachter, R. and B. Muller. 2003. Why the phosphorus retention of lakes does not necessarily depend on the oxygen supply to their sediment surface. Limnol. Oceanogr. 48:929-933. Gangstad, E.O. 1986. Freshwater Vegetation Management. Thomas Publications, Fresno, CA. 380 pp. Garrison, P.J. and D.M. Ihm. 1991. Final Annual Report of Long Term Evaluation of Wisconsin Clean Lake Projects. Part B: Lake Assessment. Wisconsin Dept. Nat. Res., Madison, WI. Garrison, P.J., and D.R. Knauer. 1984. Long-term evaluation of three alum treated lakes. In: Lake and Reservoir Management. EPA/440/5/84-001. Washington, DC. Gasaway, R.D. and T.F. Drda. 1976. Effects of grass carp introduction on waterfowl habitat. North Am. Wildl. Nat. Resour. Conf. 42:73-85. Geiger, N.S. 1983. Winter drawdown for control of Eurasian water milfoil in an Oregon oxbow lake. In: Lake Restoration, Protection and Management, EPA 440/5-83-001. Washington, DC. General Accounting Office. 2001. Better Data and Evaluation of Urban Runoff Programs Needed to Assess Effectiveness. GAO-01-679, GAO, Washington, DC. General Environmental Systems. Undated. Notch Reservoir Summary Sheet. GES, Raleigh, NC. Gersich, F.M., D.L. Hopkins, S.L. Applegath, C.G. Mendoza, and D.P. Milazzo. 1985. The Sensitivity of Chronic Endpoints Used in Daphnia magna Straus Life-Cycle Tests. pp 245-252 in R.C. Bahner and D.J. Hansen, eds. Aquatic Toxicology and Hazard Assessment. Eighth Symposium. Getsinger, K.D. and H.E. Westerdahl. 1984. Field Evaluation of Garlon 3A (Triclopyr) and 14-ACE-B (2,4-D BEE) for the Control of Eurasian Watermilfoil. Aquatic Plant Control Research Program Misc. Paper A-84-5. Dept. of the Army, USACOE, Vicksburg, MS. Getsinger, K.D., J.D. Madsen, T.J. Koschnick, M.D. Netherland. 2002. Whole lake fluridone treatments for selective control of Eurasian watermilfoil: I. Application strategy and herbicide residues. Lake Reserv. Manage. 18:181-190. Getsinger, K.D., J.D. Madsen, T.J. Koschnick, M.D. Netherland, R.M. Stewart, D.R. Honnell, A.G. Staddon, and C.S. Owens. 2001. Whole-Lake Applications of Sonar® for Selective Control of Eurasian Watermilfoil Tech. Rep. ERDC/EL TR-01-7. US Army Corps of Engineers, Vicksburg, MS. Gibbons, M.V. and H.L. Gibbons. 1988. Efficacy of rotovation in controlling Eurasian watermilfoil in the Pend Oreille River, Washington. Lake and Reservoir Management 4(1):153-160.
Eutrophication and Aquatic Plant Management in Massachusetts
7.0 References
Page 7-15
Gibbons, M.V., H.L. Gibbons, and M.D. Sytsma. 1994. A Citizen’s Manual for Developing Integrated Aquatic Vegetation Management Plans. Washington State Dept. of Ecology. Gilderhus, P.A. 1967. Effects of Diquat on bluegills and their food organisms. The Progressive Fish-Culturist 29:67-74. Gleason, H.A. and A. Cronquist. 1991. Manual of Vascular Plants of Northeastern United States and Adjacent Canada. The New York Botanical Garden, Bronx, NY. 910 pp. Gonyea, G. 1996. Unpublished Data from 1983-1991. Massachusetts Department of Environmental Protection. Boston, MA. Graham, L.E. and L.W. Wilcox. 2000. Algae. Prentice Hall, Upper Saddle River, NJ. Green, W.R. and H.E. Westerdahl. 1989. Triclopyr (Garlon 3A) Dissipation in Lake Seminole, Georgia. Miscellaneous Paper A-89-2, U.S. Army Engineer Waterways Experiment Station, Vicksburg, MS. Green, W.R. and H.E. Westerdahl. 1990. Response of Eurasian watermilfoil to 2,4-D concentrations and exposure times. J. Aquat. Plant Manage. 28:27-32. Griffin, B.R. 1991. The U.S. Fish and Wildlife Service’s Triploid Grass Carp Inspection Program. Brochure reprinted from Aquaculture Magazine January/Feburary, 1991 p. 1-2. Griffith, G.E., J.M. Omernik, S.M. Pierson and C.W. Kiilsgaard. 1994. Massachusetts Ecological Regions Project. Publication No. 17587-74-70-6/94-DEP. United States Environmental Protection Agency Environmental Research Laboratory. Corvallis, Oregon. Gunner, H., Y. Limpa-Amara, B. Bouchard, P. Weiterstein and M. Taylor. 1990. Microbiological Control of Eurasian Watermilfoil. Tech. Rep. A-90-2. US Army Corps of Engineers, Vicksburg, MS. Hanel, K. 1988. Biological Treatment of Sewage by the Activated Sludge Process. Ellis Horwood Ltd. Chichester. 299 pp. Hansen, G.W., F.E. Oliver and N.E. Otto. 1983. Herbicide Manual. U.S. Department of the Interior, Bureau of Reclamation. Denver, CO. 346 pp. Hanson, M.J. and H.G. Stefan. 1984. Side effects of 58 years of copper sulfate treatment in the Fairmont Lakes, Minnesota. Wat. Res. Bull. 20:889-900. Hanson, T., C. Eliopoulos and A. Walker. 1995. Field Collection, Laboratory Rearing and In-lake Introductions of the Herbivorous Aquatic Weevil, Euhrychiopsis lecontei, in Vermont. Prepared for Region 1 U.S. Environmental Protection Agency, Boston, MA.
Eutrophication and Aquatic Plant Management in Massachusetts
7.0 References
Page 7-16
Harman, C.R. 1995. Use of the Registered Aquatic Herbicide Fluridone (Sonar®) and Use of the Registered Aquatic Herbicide Glyphosate (Rodeo® and Accord®) in the State of New York. Final Generic Environmental Impact Statement. New York Department of Environmental Conservation, Albany, N.Y. Harper, C.R., W.J. Goetz, and C.E. Willis. 1992. Groundwater protection in mixed land-use aquifers. Environmental Management 16(6):777-783. Harper, H.H., J.E. Herr and E. Livingston. 1999. Alum treatment of storm water: The first ten years. Pages 159-180 in James, W. (ed). Modeling Urban Water Systems, Computational Hydraulics International, Guelph, Ontario. Harris, S.W. and W.H. Marshall. 1963. Ecology of water-level manipulations on a northern marsh. Ecology 44:331-343. Hartleb, C.F., J.D. Madsen and C.W. Boylen. 1993. Environmental factors affecting seed germination in Myriophyllum spicatum L. Aquatic Botany, 45:15-25. Haynes, R.C. 1988. An Introduction to the Blue-green Algae (Cyanobacteria) with an Emphasis on Nuisance Species. NALMS, Washington, DC. Haynes, R.C. 1990. The Restoration of Lake Lashaway. Massachusetts Department of Environmental Protection, Division of Water Pollution Control, Technical Services Branch. Westborough, MA. Publication # 16,520-114-35-11-90 CR. Heiskary, S. and W.W. Walker. 1987. Developing phosphorus criteria for Minnesota lakes. Lake and Reservoir Management 4(1):1-9. Hellquist, C.B. 1993. Taxonomic considerations in aquatic vegetation assessments. Lake and Reservoir Management, 7(2):175-183. Hellquist, C.B. and G.E. Crow. 1981. Aquatic Vascular Plants of New England: Part 1. Potmogetonacae. Bull. 515. New Hampshire Agricultural Experiment Station, University of New Hampshire, Durham. 68 pp. Hellquist, C.B. and G.E. Crow. 1982. Aquatic Vascular Plants of New England: Part 5. Lemnaceae, Xyridaceae, Eriocaulaceaee, and Pontederiaceae. Bull. 523. New Hampshire Agricultural Experiment Station, University of New Hampshire, Durham. 46 pp. Hellquist, C.B. and G.E. Crow. 1984. Aquatic Vascular Plants of New England: Part 7. Cabombaceae, Nymphaeaceae, Nelumbonaceae, and Ceratophyllaceae. New Hampshire Agricultural Experiment Station, University of New Hampshire, Durham. 27 pp. Helsel, D.R., D.T. Gerber and S. Engel. 1996. Comparing spring treatments of 2,4-D with bottom fabrics to control a new infestation of Eurasian watermilfoil. J. Aquat. Plant Manage. 34:68-71.

Eutrophication and Aquatic Plant Management in Massachusetts
7.0 References
Page 7-17
Henry, C.J., K.F. Higgins and K.J. Buhl. 1994. Acute toxicity and hazard assessment of Rodeo®, X-77 Spreader ®, and Chem-Trol ® to aquatic vertebrates. Arch. Environ. Contam. Toxicol. 27:392-399. Hestand, R.S. and C.C. Carter. 1978. Comparative effects of grass carp and selected herbicides on macrophyte and phytoplankton communities. J. Aquatic Plant Man. 16:43-50. Heufelder, G. and S. Rask. 1997. A Compendium of Information on Alternative Onsite Septic System Technology in Massachusetts. A special issue of Environment Cape Cod. Barnstable County Department of Health and the Environment, Barnstable, MA. Hoffman, D.J, B.A. Rattner, G.A. Burton and J. Cairns. 1995. Handbook of Ecotoxicology. Lewis Publishers, Boca Raton. 755pp. Hoffman, G.L. and A.J. Mitchell. 1986. Some Parasites and Diseases of Warmwater Fishes. U.S. Dept. Int. Fish and Wildlife Leaflet 6. Holaday, S. 1997. Wisconsin’s Forestry Best Management Practices for Water Quality: Field Manual. Wisconsin DNR, Madison, WI. Horne, A.J. and C.R. Goldman. 1994. Limnology, 2nd edition. McGraw-Hill, Inc. New York, NY. 576 pp. Hosper, H. and M-L. Meijer. 1993. Biomanipulation, will it work for your lake? Ecol Engr. 2:63-72. Hoyer, M.V. and D.E. Canfield (eds). 1997. Aquatic Plant Management in Lakes and Reservoirs. NALMS/APMS/USEPA, Washington, DC. Hutchinson, G.E. 1957. A Treatise on Limnology. Volume I, Part 2 - Chemistry of Lakes. John Wiley and Sons, New York. Hutchinson, G.E. 1967. A Treatise on Limnology. Volume 2 – Introduction to Lake Biology and the Limnoplankton. John Wiley and Sons, New York. HWH. 1990. Lake and Pond Management Coursebook. Publication No. 16,620-183-100-3-91-C.R. Department of Environmental Management. Boston, MA. ICI Americas, Inc. 1992. Diquat Herbicide. Product Label. EPA Reg. No. 10182-353. Wilmington, DE. IEP and W. Walker. 1991. Phosphorus in Massachusetts Waters. Soap and Detergent Association, Washington, DC. IEP. 1986. Bartlett Pond Northborough, Massachusetts. Diagnostic/Feasibility Study Final Report. IEP, Inc. Northborough, MA.
Eutrophication and Aquatic Plant Management in Massachusetts
7.0 References
Page 7-18
IEP. 1988a. Waushakum Pond Diagnostic/Feasibility Study, Framingham/Ashland, Massachusetts. Final Report. IEP, Inc. IEP. 1988b. Mill Pond Diagnostic/Feasibility Study West Newbury, Massachusetts. Final Report. IEP, Inc. Northborough, MA. IEP. 1993. Final Report Diagnostic/Feasibility Study of Sheep Pond, Brewster. IEP, Inc. Sandwich, MA. ITC. 1989. Technical and Environmental Evaluation of Lake Level Control or Aquatic Plant Management in Pontoosuc Lake, Berkshire County, Massachusetts. IT Corp., Edison, NJ. ITC. 1991. Diagnostic/Feasibility Study for Onota Lake, Pittsfield, Massachusetts. IT Corp., Edison, NJ. Jacoby, J.M., Gibbons, H.L., Stoops, K.B., Bouchard, D.D. 1994. Response of a shallow, polymictic lake to buffered alum treatment. Lake and Reservoir Management 10(2):103-112. James, W., J. Barko and H. Eakin. 2002. Water quality impacts of mechanical shredding of aquatic macrophytes. J. Aquat. Plant Manage. 40:36-42. Johengen, T.H., A.M. Beeton and D.W. Rice. 1989. Evaluating the effectiveness of best management practices to reduce agricultural nonpoint source pollution. Lake and Reservoir Man. 5(1):63-70. Jokinen, E. 1992. The Freshwater Snails of New York State. NY State Museum Bulletin 482, Albany, NY. Jones, H. L. 1993. The allelopathic ability of three species of aquatic plants to inhibit growth of Myriophyllum spicatum. pp. 124-127 in Proceedings, 27th Annual Meeting Aquatic Plant Control Research Program, 16-19 November 1992, Bellevue WA. Miscellaneous Paper A-93-2. U.S. Army Corps of Engineers, Vicksburg, MS. Jones, W.W. 1988. Balancing competing uses for water resources - A Griffey Lake example. Lake Reserv. Manage. 4:73-80. Joye, G.F. 1990. Biocontrol of the Aquatic Plant Hydrilla verticillata (L.f.) Royce with an Endemic Fungal Disease. Unpublished report of the Environment Lab, Waterways Experiment Station, US Army Corps of Engineers, Vicksburg, MS. Kadlec, J.A. 1962. Effects of a drawdown on a waterfowl impoundment. Ecology 43:267-281. Kadlec, R. and R. Knight. 1996. Treatment Wetlands. CRC Press, Boca Raton, FL. Kalff, J. 2002. Limnology. Prentice Hall, Upper Saddle River, NJ.
Eutrophication and Aquatic Plant Management in Massachusetts
7.0 References
Page 7-19
Kangasniemi, B., H. Speier and P. Newroth. 1993. Review of Eurasian watermilfoil biocontrol by the milfoil weevil. pp. 17-22 in Proceedings, 27th Annual Meeting Aquatic Plant Control Research Program, 16-19 November 1992, Bellevue WA. Miscellaneous Paper A-93-2. U.S. Army Corps of Engineers, Vicksburg, MS. Kay, S.H. 1996. Barley straw for algae control - a North Carolina experience. Aquatics 18:9-10. Keller, R. 1995. Hamblin Pond, Barnstable Fish Kill Report. DFW, Westboro, Massachusetts Kenefick, S.L., S.E. Hrudey, H.G. Peterson and E.E. Prepas. 1993. Toxin release from Microcystis aeruginosa after chemical treatment. Wat. Sci. Tech. 27:433-440. Kennedy, R.H., and G.D. Cooke. 1982. Control of lake phosphorus with aluminum sulfate: dose determination and application techniques. Water Resources Bulletin 18(3):389-395. Kishbaugh, S., J. Bloomfield, and A. Saltman. 1990. Diet For a Small Lake. New York Department of Environmental Conservation and the Federation of Lake Associations, Inc. Albany and Rochester, NY. Kittredge, D.B. Jr. and M. Parker. 1995. Massachusetts Forestry Best Management Practices Manual. Mass. Dept. Environmental Proection, Office of Watershed Management, and USEPA. 56pp. Kortmann, R.W., G.W. Knoecklein and C.H. Bonnell. 1994. Aeration of stratified lakes: Theory and practice. Lake and Reservoir Management 8(2):99-120. Kotak, B.G., S.L. Kenefick, D.L. Fritz, C.G. Rousseaux, E.E. Prepas and S.E. Hrudey. 1993. Occurrence and toxicological evaluation of cyanobacterial toxins in Alberta lakes and farm dugouts. Wat. Res. 27:495-506. Kusler, J. and G. Brooks (eds.). 1988. Wetland Hydrology. Proc. Nat. Wetland Symp. Association of State Wetland Managers. Tech. Report 6. Berne, NY. KVA. 1991. Reverse Layering, An Alternative Approach to Dredging for Lake Restoration. Technical Report, Research and Demonstration Program, MDEP, Boston, MA. Lamb, D.S. and G.C. Bailey. 1983. Effects of aluminum sulfate to midge larvae (Diptera: Chironomidae) and rainbow trout (Salmo gairdneri). Lake Restoration, Protection and Management. EPA-440/5-83-001. EPA, Washington, DC. Langeland, K.A. (ed). 1993. Training Manual for Aquatic Herbicide Applicators in the Southeastern United States. Center for Aquatic Plants, University of Florida, Gainsville. Langley, L. 2003. Review of Policy Relating to 2,4-D Application to Potential Drinking Water Supplies. MDEP, Worcester, MA.
Eutrophication and Aquatic Plant Management in Massachusetts
7.0 References
Page 7-20
Lathrop, R.C., S.R. Carpenter and D.M. Robertson. 1999. Summer water clarity responses to phosphorus, Daphnia grazing, and internal mixing in Lake Mendota. Limnol. Oceanogr. 44:137-146. Lee, K.H., T.M. Isenhart and R.C. Schultz. 2003. Sediment and nutrient removal in an established multi-species riparian buffer. J. Soil Water Cons. 58:1-8. Lembi, C.A., B.G. Ritenour, E.M. Iverson and E.C. Forss. 1978. The effects of vegetation removal by grass carp on water chemistry and phytoplankton in Indiana ponds. Trans. Amer. Fish. Soc. 107(1):161-171. LER, 1984. Causes and Probable Solutions to the Aquatic Plant Problem in the Charles River Lakes District, Waltham-Newton, Massachusetts. Lycott, Inc., Southbridge, MA. LER, 1986. Pequot Pond Diagnostic/Feasibility Study Westfield and Southampton, Massachusetts, Final Report. Lycott Environmental Research, Inc. Southbridge, MA. LER, 1989. Diagnostic/Feasibility Study for the Management of Indian Lake, Worcester, Massachusetts. Lycott Environmental Research, Inc. Southbridge, MA. LER, 1990. Diagnostic/Feasibility Study, Forest Lake Methuen, Massachusetts. Lycott Environmental Research, Inc. Southbridge, MA. LER, 1991a. Stockbridge Bowl Diagnostic/Feasibility Study Report. Lycott Environmental Research, Inc. Southbridge, MA. LER, 1991b. Prospect Lake Diagnostic/Feasibility Study, Egremont, MA. Lycott Environmental Research, Inc. Southbridge, MA. LER. 1994. Final Report to the Town of Brookfield Regarding the Phase II Implementation Project for Quaboag and Quacumquasit Ponds. Lycott Environmental Research, Inc. Southbridge, Massachusetts. Les, D. 2002. Non-indigenous aquatic plants: A garden of earthly delight? LakeLine 22 (2):20-24. Leslie, A.J. Jr., J.M. Van Dyke, R.S. Hestand and B.Z. Thompson. 1987. Lake and Reservoir Management. Vol. III:266-276. Letson, M.A. and J.C. Makarewicz. 1994. An experimental test of crayfish (Orconectes immunis) as a control mechanism for submersed aquatic macrophytes. Lake and Reservoir Management 10(2):127-132. Lewis, D.H., I. Wile and D.S. Painter. 1983. Evaluation of Terratrack and Aquascreen for control of aquatic macrophytes. J. Aquat. Plant Manage. 21:103-104.
Eutrophication and Aquatic Plant Management in Massachusetts
7.0 References
Page 7-21
Lewis, S.L. 1969. Physical factors influencing fish populations in pools of a trout stream. Trans. Am. Fish. Soc. 98(1):14-19. Lewis, W.M. 1978. Observations on the grass carp in ponds containing fingerling channel catfish and hybrid sunfish. Trans. Amer. Fish. Soc. 107(1):153-155. Likens, G.E. (ed.). 1972a. Nutrients and Eutrophication: The Limiting Nutrient Controversy. Limnology and Oceanography, Special Symposia Volume I. 328 pp. Allen Press, Lawrence, KS. Likens, G.E. 1972b. Eutrophication and Aquatic Systems. pp.3-13 in Likens, G.E. (ed.). 1972. Nutrients and Eutrophication: The Limiting Nutrient Controversy. Limnology and Oceanography, Special Symposia Volume I. 328 pp. Allen Press, Lawrence, KS. Lindmark, G. 1979. Interaction between LPP-1 virus and Plectonema boryanum. Ph.D. Dissertation, Univ. Lund, Sweden. Livermore, D.F. and R.G. Koegel. 1979. Mechanical harvesting of aquatic plants: An assessment of the state of the art. In: J.E. Breck, R.T. Prentki and O.L. Loucks. Eds. Aquatic Plants, Lake Management, and Ecosystem Consequences of Lake Harvesting. University of Wisconsin, Madison. 435 pp. Lobdell, R. 1994. A Guide to Developing and Re-Developing Shoreland Property in New Hampshire. North Country Resource Conservation and Development, Inc. Meredith, NH. Lorenzen, M.W. and A.W. Fast. 1977. A Guide to Aeration/Circulation Techniques for Lake Management. EPA-600/3-77-004. USEPA, Washington, DC. Loucks, O.L. and P.R. Weiler. 1979. The effects of harvest removal of phosphorus on remineralized phosphorus sources in a shallow lake. In: J.E. Breck, R.T. Prentki and O.L. Loucks. Eds. Aquatic Plants, Lake Management, and Ecosystem Consequences of Lake Harvesting. University of Wisconsin, Madison. 435 pp. Lund, H.C. and J.W.G. Lund. 1995. Freshwater Algae: Their Microscopic World Explored. Biopress Limited, Bristol, England. MacDonald, G.E., Shilling, D.G., and Bewick, T.A. 1993. Effects of Endothall and Other Aquatic Herbicides on Clorophyll Fluorescence, Respiration and Cellular Integrity. J. Aquat. Plant Manage. 31:50-55. Maceina, M, M. Cichra, R. Betsill and P. Bettoli. 1992. Limnological changes in a large reservoir following vegetation removal by grass carp. J. Freshw. Ecol. 7:81-95. Madsen, J.D. 1994. Invasions and declines of submersed macrophytes in Lake George and other Adirondack lakes. Lake and Reservoir Management, 10(1):19-23.
Eutrophication and Aquatic Plant Management in Massachusetts
7.0 References
Page 7-22
Madsen, J.D., Eichler, L.W., and Boylen, C.W. 1988. Vegetative Spread of Eurasian Watermilfoil in Lake George, New York. J. Aquat. Plant Manage. 26:47-50. Madsen, J.D. , K.D. Getsinger, R.M. Stewart and C.S. Owens. 2002. Whole lake fluridone treatments for selective control of Eurasian watermilfoil: II. Impacts on submersed plant communities. Lake Reserv. Manage. 18:191-200. Madsen, J.D., J.W. Sutherland, J.A. Bloomfield, K.M. Roy, L.W. Eichler and C.W. Boylen. 1989. Lake George Aquatic Plant Survey: Final Report. NYSDEC, Albany, NY. May 1989. Magee, D.W. 1981. Freshwater Wetlands: A Guide to Common Indicator Plants of the Northeast. The University of Massachusetts Press. Amherst, MA. 245 pp. Malecki, R.A., B. Blossey, S.D. Hight, D. Schroeder, L.T. Kok and J.R. Coulson. 1994. Biological control of purple loosestrife. BioScience 43(10):680-686. Mallison, C.T., R.S. Hestand and B.Z. Thompson. 1994. Removal of tripoild grass carp with fish management bait (FMB). Lake and Reservoir Management. 9(2):95. Manuel, K. 1994. Drawdown: A Useful Aquatic Plant Management Tool. Duke Power Company. Marking, L.L. 1987. Gas Supersaturation in Fisheries: Causes, Concerns and Cures. U.S. Dept. Int. Fish and Wildlife Leaflet 9. Martin, B.B., D.F. Martin, and M.J. Perez-Cruet. 1987. Effect of selected dyes on the growth of the filamentous blue-green alga, Lyngbya majescula. J. Aquat. Plant Manage. 25:40-43. Martyn, C.N. 1989. An Epidemiological Approach to Aluminium and Alzheimer’s Disease. p. 37-39. In: Aluminium in Food and the Environment. Massey, R. and D. Talyor, (Eds.). Special Pub. No. 73. Royal Society of Chemistry, Cambridge, Great Britain. 108pp. Martyn, R., R. Noble, P. Bettoli and R. Maggio. 1986. Mapping aquatic weeds with aerial color infrared photography and evaluating their control by grass carp. J. Aquat. Plant Manage. 24:46-56. Massachusetts Department of Environmental Protection. No date. Your Septic Tank and the Reasons to Pump It Out. MDEP, Grafton/Worcester, MA. Massachusetts Department of Environmental Protection (DEQE). 1989. Pollutant Reductions from Wastewater Treatment Plant Upgradings in Massachusetts 1978-1988. Publication # MSR2. Department of Environmental Protection. Grafton/Worcester, MA. Massachusetts Department of Environmental Protection. 1990a. Wetlands Protection Program Interim Technical Guidance 90-TG1: Review of Lake and Pond Drawdown Projects for Aquatic Plant Control Under 10.53(4). Department of Environmental Protection. Boston, MA.
Eutrophication and Aquatic Plant Management in Massachusetts
7.0 References
Page 7-23
Massachusetts Department of Environmental Protection. 1990b. Chemical Health Effects Assessment Methodology and the Method to Derive Allowable Ambient Limits. Massachusetts Department of Environmental Protection. Boston, MA. Massachusetts Department of Environmental Protection. 1990c. 314 CMR 3.00: Surface Water Discharge Permit Program. Division of Water Pollution Control, Department of Environmental Protection. Boston, MA. Massachusetts Department of Environmental Protection. 1990d. 314 CMR 4.00: Massachusetts Surface Water Quality Standards. Division of Water Pollution Control, Department of Environmental Protection. Boston, MA. Massachusetts Department of Environmental Protection. 1994a. The Restoration of Dunns Pond. Department of Environmental Protection. Pub. No. 17537-140-30-3/94-2.59 Massachusetts Department of Environmental Protection. 1994b. Commonwealth of Massachusetts Summary of Water Quality 1994. Massachusetts Dept. of Environ. Protection, Division of Water Pollution Control and Office of Watershed Management. Pub. No. 17640-180-200-11-94-4.44-C.R. Massachusetts Department of Environmental Protection. 1995a. Wetlands Protection Program Policies. Massachusetts Department of Environmental Protection, Division of Wetlands and Waterways. Massachusetts Department of Environmental Protection. 1995b. Innovative/Alternate Technologies for Subsurface Disposal Database. Department of Environmental Protection, Boston, MA. Massachusetts Department of Environmental Protection. 1995c. Indicative Project Summaries Addressing Title 5 and Innovative On-site Septic Systems. Section 319 Nonpoint Source Program, Department of Environmental Protection and Office of Watershed Management. North Grafton/Worcester, MA. 11pp. Massachusetts Department of Environmental Protection. 1997a. Storm Water Management. Volume One: Policy Handbook, and Volume Two: Storm Water Technical Handbook. Publ. # 17871-250-1800-4/97-6.52-C.R. MADEP, Boston, MA. Massachusetts Department of Environmental Protection. 1997b. Massachusetts Erosion and Sediment Control Guidelines for Urban and Suburban Areas. A Guide for Planners, Designers and Municipal Officials. MDEP, Boston, MA. Massachusetts Department of Environmental Protection. 2000. Commonwealth of Massachusetts Summary of Water Quality 2000. MDEP, Div. Water Management, Worcester, MA.

Eutrophication and Aquatic Plant Management in Massachusetts
7.0 References
Page 7-24
Massachusetts Department of Environmental Protection. 2001. Massachusetts Volunteers Guide for Surveying a Lake Watershed and Preparing an Action Plan. MDEP, Div. Water Management, Worcester, MA. Massachusetts Department of Environmental Protection. 2204. Guidance for Aquatic Plant Management in Lakes and Ponds as it relates to the Wetlands Protection Act. (Policy/SOP/ Guideline# BRP/DWM/WW/GO4-1, effective April 8, 2004). MDEP Division of Wetlands, Boston, MA. Massachusetts Division of Fisheries and Wildlife. 1995. Unpublished data. MDFW, Westboro, MA. Massachusetts Executive Office of Environmental Affairs. 2001. The Massachusetts Lakes and Ponds Watershed Action Strategy. EOEA, Boston, MA. Matson, T. 1994. Earth Ponds. 2nd. Ed. Countryman Press, Woodstock VT. 150pp. Mattson, M.D., P.J. Godfrey, M.F. Walk, P.A. Kerr, and O.T. Zajicek. 1992. Regional chemistry of lakes in Massachusetts. Water Resources Bulletin. 28(6):1045-1056. Mayes, M.A., D.C. Dill, K.M. Bodner and C.G. Mendoza. 1984. Triclopyr triethylamine salt toxicity to life stages of the fathead minnow (Pimephales promelas Rafinesque). Bull. Environ. Contam. Toxicol. 33:339-347. Mayhew, J.K. and S.T. Runkel. 1962. The control of nuisance aquatic vegetation with black polyethylene plastic. Proc. Iowa Acad. Sci. 69:302-307. McComas, S. 1993. Lake Smarts. The First Lake Maintenance Handbook. Terrene Insitute and the United States Environmental Protection Agency. Washington, D.C. McCowen, M.C., C.L. Young, S.D. West, S.J. Parka and W.R. Arnold. 1979. Fluridone, a new herbicide for aquatic plant management. J. Aquat. Plant Manage. 17:27-30. McKnight, D.M. 1981. Chemical and biological processes controlling the response of a freshwater ecosystem to copper stress: A field study of the CuSO4 treatment of Mill Pond Reservoir, Burlington, Massachusetts. Limnology and Oceanography 26(3):518-531. McKnight, D.M., S.W. Chisholm and D.R.F. Harleman. 1983. CuSO4 treatment of nuisance algal blooms in drinking water reservoirs. Environmental Management 7(4):311-320. McKnight, S.K. and G.R. Hepp. 1995. Potential effect of grass carp herbivory on waterfowl foods. J. Wildl. Manage. 59(4): 720-727. McNair, C.E. (Ed.) 1994. Dredging ‘94. Proceedings of the 2nd International Conference on Dredging and Dredged Material Placement. Volumes 1 and 2. ASCE, New York. 1561pp.
Eutrophication and Aquatic Plant Management in Massachusetts
7.0 References
Page 7-25
McQueen, D.J., D.R.S. Lean and M.N. Charlton 1986. The effects of hypolimnetic aeration on iron-phosphorus interactions. Water Research 20:1129-1135. McQueen, D.J., J.R. Post and E.L. Mills. 1986. Trophic relationships in freshwater pelagic ecosystems. Can. J. Fish. Aquat. Sci. 43:1571-1581. McVoy, R.S. and U. Dymon. 1984. East Lake Waushacum Diagnostic/Feasibility Study, April 1980-March 1981. Massachusetts Department of Environmental Quality Engineering Divison of Water Pollution Control, Westborugh, Massachusetts. McWhorter, C.G. 1982. The Use of Adjuvants. In: Adjuvants For Herbicides, published by The Weed Science Society of America, Champaign, IL. 144 pp. Meals, D.W., 1993. Assessing nonpoint phosphorus control in the LaPlatte River Watershed. Lake and Reservoir Management 7(2):197-207. Meijer, M-L., E. Jeppeson, E. Lammens, R. Gulati, M. Grimm, J. Backx, P. Hoolebeek, E. Blaauw and A. Breukelaar. 1994. The consequences of a drastic fish stock reduction in the large and shallow Lake Wolderwijd, the Netherlands. Hydrobiologia 275/276:31-42. Meijer, M-L., E. van Nes, E. Jeppeson, E. van Donk, B. Moss, M. Scheffeer, E. Lammens, J. van Berkum, G. de Jong, B. Faafeng and J. Jensen. 1994. Long-term responses to fish-stock reduction in small shallow lakes: interpretation of five-year results of four biomanipulation cases in the Netherlands and Denmark. Hydrobiologia 275/276:457-466. Merck. 1983. Merck Index. 10th Edition. M. Windholtz, ed. Merck & Co. Inc., Rahway, NJ. Mesner, N. and R. Narf. 1987. Alum injection into sediments for phosphorus inactivation and macrophyte control. Lake and Reservoir Management 3:256-265. Metcalf & Eddy, Inc. 1979. Wastewater Engineering: Treatment/Disposal/Reuse. Second Edition. McGraw-Hill Book Company, New York, NY. 920 pp. Metcalf & Eddy, Inc. 1986. Final Report to the Town of Yarmouth on the Diagnostic/Feasibility Study of Long Pond, Yarmouth, Massachusetts. Metcalf & Eddy, Inc. Wakefield, MA. Metcalf & Eddy, Inc. 1987. Final Report to the Town of Hopkinton on the Diagnostic/Feasibility Study of North Pond, Hopkinton, Massachusetts. Metcalf & Eddy, Inc. Wakefield, MA. Metcalf & Eddy, Inc. 1988. Final Report to the Town of Lunenburg Diagnostic/Feasibility Study of Lake Shirley, Lunenburg, Massachusetts. Metcalf & Eddy, Wakefield, MA. Methé, B.A., R.J. Soracco, J.D. Madsen and C.W. Boylen. 1993. Seed production and growth of waterchestnut as influenced by cutting. J. Aquat. Plant Manage. 31:154-157.

Eutrophication and Aquatic Plant Management in Massachusetts
7.0 References
Page 7-26
Michael, H.J., K.J. Boyle and R. Bouchard. 1996. Water Quality Affects Property Prices: A Case Study of Selected Maine Lakes. Misc. Report 398. Maine Agriculture and Forest Experiment Station, University of Maine. Mikol, G.F. 1984. Effects of mechanical control of aquatic vegetation on biomass, regrowth rates, and juvenile fish populations at Saratoga Lake, New York. Lake and Reservoir Management 1:456-462. Miller, A.C. and H.R. King. 1984. Large-scale Operations Management Test of Use of the White Amur for Control of Problem Plants. Report 5: Synthesis Report. Tech. Re. A-78-2. US Army corps of Engineers, Vicksburg, MS. Miller, G.L. and M.A. Trout. 1985. Changes in the aquatic plant community following treatment with the herbicide 2,4-D in Cayuga Lake, New York. In: L.W.J. Anderson (ed.). Proceedings of the First International Symposium on Watermilfoil (Myriophyllum spicatum) and related Haloragaceae Species. Aquat. Plant Manage. Soc., Vicksburg, MI. Mills, E.L., J.H. Leach, J.T. Carlton and C. Secor. 1994. Exotic species and the integrity of the Great Lakes. BioSci. 44:666-676. Mitsch, W. and J. Gosselink. 1986. Wetlands. Van Nostrand Reinhold Company, New York, NY. Mitzner, L. 1978. Evaluation of biological control of nuisance aquatic vegetation by grass carp. Trans. Amer. Fish. Soc. 107(1):135-145. Monsanto. 1985. Rodeo® Aquatic Herbicide. Product Label. EPA Reg. No. 524-343. St. Louis, MO. Montgomery, R.L. 1984. Dredging and dredged material disposal techiques for contaminated sediments. pp 586-591 In: Lake and Reservoir Management. EPA 440/5/84-001. Washington, DC. Moore, B. 1991. No one wants a fish kill: Fish can live when using hydrothol 191 in weed and algae control. Aquatics 13(3):16-17. Moore, B.C., W.H. Funk and J. Lafer. 1988. Long-term effects of dredging on phosphorus availability from Liberty Lake sediments. Lake and Reservoir Mangement 4(2):293-301. Moore, B.C., W.H. Funk, and E. Anderson. 1994. Water quality, fishery, and biologic characteristics in a shallow, eutrophic lake with dense macrophyte populations. Lake and Reservoir Management 8(2):175-188. Moore, J.W., and s. Ramamoorthy. 1984. Heavy Metals in Natural Waters: Applied Monitoring and Impact Assessment. Springer-Verlag, New York. 268 pp.

Eutrophication and Aquatic Plant Management in Massachusetts
7.0 References
Page 7-27
Moore, P.A.Jr. and D.M. Miller. 1994. Decreasing phosphorus solubility in poultry litter with aluminum, calcium and iron amendments. J. Environ. Qual. 23(2):325-330. Morency, D.A., and T.J. Belnick. 1987. Control of internal phosphorus loading in two shallow lakes by alum and aquatic plant harvesting. Lake and Reservoir Management 3:31-37. Morris, K. and R. Jarman. 1981. Evaluation of water quality during herbicide applications to Kerr Lake, OK. J. Aquat. Plant Manage. 19:15-18. Mortimer, C.H. 1941. The exchange of dissolved substances between mud and water in lakes. J. Ecology 29(1):280-329. Mortimer, C.H. 1942. The exchange of dissolved substances between mud and water in lakes. J. Ecology 30(1):147-201. Mühlberg, H. 1982. The Complete Guide to Water Plants. E.P Publishing Limited. German Democratic Republic. 391 pp. Murphy, T.P., K.G. Hall and T.G. Northcote. 1988. Lime treatment of a hardwater lake to reduce eutrophication. Lake and Reservoir Management 4(2):51-62. Nall, L. and J. Schardt. 1980. Large-scale Operations Management Test Using the White Amur at Lake Conway, Fl. Misc. Paper A-80-3. US Army Corps of Engineers, Vicksburg, MS. Narf, R.P. 1990. Interactions of Chironomidae and Chaoboridae (Diptera) with aluminum sulfate treated lake sediments. Lake and Reservoir Management 6(1):33-42. National Chemsearch. 1987. WATROL Herbicide. Product Label. EPA Reg. No. 1769-174. Irving TX. National Research Council. 1992. Restoration of Aquatic Ecosystems. National Research Council. National Academy of Sciences. 552pp. Nelson, L., J. Shearer and M. Netherland. 1998. Mesocosm evaluation of integrated fluridone-fungal pathogen treatment of four submersed species. J. Aquat. Plant Manage. 36:73-77. Netherland, M.D. and K.D. Getsinger. 1992. Efficacy of Triclopyr on Eurasian watermilfoil: Concentration and exposure time effects. J. Aquat. Plant manage. 30:1-5. Netherland, M.D. and K.D. Getsinger. 1993. Control of Eurasian watermilfoil using triclopyr. Down to Earth 48:1-5. Netherland, M.D., K.D. Getsinger and J.D. Skogerboe. 1997. Mesocosm evaluation of the species-selective potential of fluridone. J. Aquat. Plant Manage. 35:41-50.
Eutrophication and Aquatic Plant Management in Massachusetts
7.0 References
Page 7-28
Netherland, M.D., W.R. Green and K.D. Getsinger. 1991. Endothall concentration and exposure time relationships for the control of Eurasian watermilfoil and hydrilla. J. Aquat. Plant Manage. 29:61-67. New England Research, Inc. 1978. Final Environmental Impact Report: Control of Aquatic Vegetation in the Commonwealth of Massachusetts. Volume I (137 p.) Volume II (24 p.) + App. Submitted by the Department of Environmental Quality Engineering, Metropolitan District Commission, and the Department of Environmental Management. New England Research, Inc. Worcester, MA. New Hampshire Department of Environmental Services. 1994. Best Management Practices to Control Non-Point Source Pollution: A Guide for Citizens and Town Officials. NHDES-WSPCD – 94-2, NHDES, Concord, NH. Newcomb, L. 1977. Newcomb's Wildflower Guide. Little, Brown, and Company, Boston, MA. 490 pp. Newman, J.R. and P.R.F. Barrett. 1993. Control of Microcystis aeruginnosa by decomposing barley staw. J. Aquat. Plant Manage. 31:203-206. Newroth, P. and R. Soar. 1986. Eurasian watermilfoil management using newly developed technologies. Lake Reserv. Manage. 2:252-257. Nichols, S. 1975. The use of overwinter drawdown for aquatic vegetation management. Water Resources Bulletin 11(6):1137-1148. Nichols, S. 1986. Community manipulation for macrophyte management. Lake Reserv. Manage. 2:245-251. Nichols, S. 1991. The interaction between biology and the management of aquatic macrophytes. Aquatic Botany 41:225-252. Nichols, S. and R. Lathrop 1994. Impact of harvesting on aquatic plant communities. J. Aquat. Plant Manage. 32:33-36. Nichols, S. and B. Shaw. 1983. Review of management tactics for integrated aquatic weed management. In: Lake Restoration, Protection and Management, EPA 440/5-83-001, USEPA, Washington, DC. Nicholson, S.A. 1981a. Changes in submersed macrophytes in Chautauqua Lake, 1937-75. Freshwater Biol. 11:523-530. Nicholson, S.A. 1981b. Effects of uprooting on Eurasian watermilfoil. J. Aquat. Plant Manage. 19: 57-59.
Eutrophication and Aquatic Plant Management in Massachusetts
7.0 References
Page 7-29
Nürnberg, G.K. 1987. Hypolimnetic withdrawal as lake restoration technique. J. Environ. Eng. 113(5):1006-1017. Nürnberg, G.K., R. Hartley and E. Davis. 1987. Hypolimnetic withdrawal in two North American lakes with anoxic phosphorus release from the sediment. Wat. Res. 21(8):923-928. Olem, H. and G. Flock (eds.). 1990. Lake and Reservoir Restoration Guidance manual, 2nd edition. EPA 440/4-90-006. Prep. by N. Am. Lake Manage. Soc. for U.S. Environ. Prot. Agency, Washington, D.C. Opuszynski, K, and J.V. Shireman. 1995. Herbivorous Fishes. Culture and Use for Weed Management. CRC Press, Ann Arbor. 223p. Osborne, J.A., S.D. West, R.B. Cooper and D.C. Schmitz. 1989. Fluridone and N-methylformamide residue determinations in ponds. J. Aquat. Plant Manage. 27:74-78. Osgood, R.A. 1984. Long-term grazing control of algal abundance: A case history. In: Lake and Reservoir Management. EPA 440/5-84-001. United States Environmental Protection Agency. Washington, DC. pp 144-150. Painter, D.S. 1988. Long-term effects of mechanical harvesting on Eurasian watermilfoil. J. Aquat. Plant Manage. 26:25-29. Pastorok, R.A. and T.M. Grieb. 1984. Prediction of lake response to induced circulation. In: Lake and Reservoir Management. EPA 440/5-84-001. United States Environmental Protection Agency. Washington, DC. pp 531-536. Pastorok, R.A., T.C. Ginn and M.W. Lorenzen. 1980. Evaluation of aeration/circulation as a lake restoration technique. In: Restoration of Lakes and Inland Waters. EPA-600/3-81-014. United States Environmental Protection Agency, Washington, D.C. pp. 124-133. Pastorok, R.A., M.W. Lorenzen and T.C. Ginn. 1982. Environmental Aspects of Artificial Aeration/and Oxygenation of Reservoirs: A Review of Theory, Techniques, and Experiences. Tech. Rept. No. E-82-3, U.S. Army Corps Engineers. Patterson, C.G. and C.H. Fernando. 1969. The effect of winter drainage on reservoir benthic fauna. Can. J. Zool. 47:589-595. Paul, E.A., H.A. Simonin, J. Symula and R.W. Bauer. 1994. The Toxicity of Diquat, Endothall, and Fluridone to the Early Life Stages of Fish. Journal of Freshwater Ecology 9(3):229-239. Paul, E.A., H.A. Simonin, J. Symula and R.W. Bauer. 1995. Authors' response to Shaw and Hamer 1995. Journal of Freshwater Ecology 10(3):303-310.
Eutrophication and Aquatic Plant Management in Massachusetts
7.0 References
Page 7-30
Payne, F.E., and T.M. Bjork. 1984. The effectiveness of BMP's and sediment control structures and their relationship to in-lake water quality. In: Lake and Reservoir Management, Proceedings of the NALMS third annual conference. EPA 440/5-84-001. Washington, DC. pp. 82-86 Payne, F.E., C.R. Laurin, K. Thornton and G. Saul. 1991. A Strategy for Evaluating In-Lake Treatment Effectiveness and Longevity. NALMS, Alachua, FL. Perkins, M.A. 1984. An evaluation of pigmented nylon film for use in aquatic plant management. In: Lake and Reservoir Management. EPA 440/5-84-001. United States Environmental Protection Agency. Washington, DC. pp. 467-471. Perkins, M.A., H.L. Boston, and E.F. Curren. 1980. The use of fiberglass screens for control of Eurasian watermilfoil. J. Aquat. Plant Manage. 18:13-19. Persky, J. 1986. The Relation of Ground-Water Quality to Housing Density, Cape Cod, Massachusetts. USGS/Cape Cod Planning Commission, Boston, MA. Peterjohn, W.T. and d.L. Correll. 1984. Nutrient dynamics in an agicultural watershed: Observations on the role of a riparian forest. Ecology 65(5):1466-1475. Peterson, S.A. 1981. Sediment Removal as a Lake Restoration Technique. EPA 600/3-81-013. USEPA, Washington, DC. Peterson, S. A. 1982. Lake restoration by sediment removal. Water Resources Bulletin 18(3):423-435. Pieterse, A.H., and K.J. Murphy, Editors. 1990. Aquatic Weeds: The Ecology and Management of Nuisance Aquatic Vegetation. Oxford University Press, Oxford, England. 593 pp. Pine, R.T. and W.J. Anderson. 1991. Plant preferences by triploid grass carp. J. Aquat. Plant Manage. 29:80-82. Pine, R.T., W.J. Anderson and S.S.O. Hung. 1989. Effects of static versus flowing water on aquatic plant preferences of triploid grass carp. Trans. Amer. Fish. Soc. 118(3):336-344. Prepas, E.E., T. Murphy, J. Crosby, D. Walty, J. Lim, J. Babin and P. Chambers. 1990. Reduction of phosphorus and chlorophyll a concentrations following CaCO3 and Ca(OH)2 additions to hypereutrophic Figure Eight Lake, Alberta. Environ. Sci. Technol. 24:1252-1258. Prescott, G.W. 1968. The Algae: A Review. Houghton Mifflin Co. Boston. 436pp. Puckett, L.J. 1995. Identifying the major sources of nutrient water pollution. Environ. Sci. and Tech. 29(9):408A-414A. Pullman, G.D. 1994. Dose rate calculations for selective plant control with SONAR aquatic herbicide. Lake and Reservoir Management 9(2):106.
Eutrophication and Aquatic Plant Management in Massachusetts
7.0 References
Page 7-31
Purdue, R.B. 1984. Aquatic Weed Control in a Recreational Lake. Report of the Supervisor, Indian Lake, NY. Raibley, P.T., D. Blodgett and R.E. Sparks. 1995. Evidence of grass carp (Ctenopharyngodon idella) reproduction in the Illinois and Upper Mississisppi Rivers. J. Freshwater Ecology 10(1):65-74. Ramadori, R. 1987. Biological Phosphate Removal from Wastewaters. Proceeding of an IAWPRC Specialized Conference. Pergamon Press, Oxford. 379 pp. Rast, W. and G.F. Lee. 1983. Nutrient loading estimates for lakes. J. Environ. Eng. 109(2):502-517. RCC Undated a. 2,4-D L.V.4 Ester. Product Label. EPA Reg. No. 228-139. Riverdale Chemical Company. Glenwood, IL. RCC Undated b. Weedestroy AM-40 Amine Salt. Product Label. EPA Reg. No. 228-145. Riverdale Chemical Company. Glenwood, IL. RCC Undated c. 2,4-D Granules. Product Label. EPA Reg. No. 228-61. Riverdale Chemical Company. Glenwood, IL. Reckhow, K.H. 1979. Empirical Lake Models for Phosphorus: Development, Applications, Limitations, and Uncertainty. In: Perspectives on Lake Ecosystem Modeling. Scavia, D. and Robertson, A. (Eds.). Ann Arbor Science. Ann Arbor, MI. pp. 193-221 Rhône-Poulenc Ag Company. 1992. Aqua-Kleen. Granular Herbicide for Controlling Water Weeds. Product Label. EPA Reg. No. 264-109-AA. Research Triangle Park, NC. Rhône-Poulenc Ag Company. 1994. Weedar 64 Broadleaf Herbicide. Product Label. EPA Reg. No. 264-2. Research Triangle Park, NC. Ricklefs, R.E. 1973. Ecology. Chiron Press, Newton, MA. Ridge, I. and J. Pillinger. 1996. Towards understanding the nature of algal inhibitors from barley straw. In: Caffrey, J. and P. Barrett (eds). Management and Ecology of Freshwater Plants, Proceedings of the 9th International Symposium on Aquatic Weeds, Kluwer Academic Publishers, London. Riemer, D.N. 1984. Introduction to Freshwater Vegetation. AVI Publishing Company, Inc. Westport CT. 207 pp. Ripl, W. 1980. Lake restoration methods developed and used in Sweden. In: Restoration of Lake and Inland Waters: Proc. of an International Symposium on Inland Waters and Lake Protection. EPA 440/5-81-010, USEPA, Washington, DC.
Eutrophication and Aquatic Plant Management in Massachusetts
7.0 References
Page 7-32
Ripl, W. 1986. Internal phosphorus recycling mechanisms in shallow lakes. Lake & Reserv. Manage. 2:138-142. Robbins, R.W., J.L. Glicker, D.M. Bloem and B.M. Niss. 1991. Effective Watershed Management for Surface Water Supplies. AWWA Research Foundation, Denver, CO. 401pp. Rogers, K.B. and E.P. Bergersen. 1995. Effects of fall drawdown on movement of adult Northern pike and largemouth bass. N. Amer. J. Fish. Man. 15:596-600. Rohm, C.M., J.M. Omernik, and C.W. Kiilsgaard. 1995. Regional patterns of total phosphorus in lakes of the northeastern United States. Lake Reserv. Manage. 11:1-14 Rojko, A.M. 1990. Heavy Metals in the Sediments of Massachusetts Lakes and Ponds. Master’s Report. Northeastern University. Boston, MA. Romanov, V.V. 1968. Hydrophysics of Bogs. Translated from Russian. Israel Program for Scientific Translations, Jerusalem, 00 22-32. Ross, M.A. and C.A. Lembi. 1985. Applied Weed Science. Burgess Publishing Company, Minneapolis, MN. 340 pp. Rowan, C. and . Hutcheson. 1999. ORS Recommendations on Requests to Use 2,4-D Aquatic Herbicides for Milfoil Control on or near Drinking Water Resources. MDEP, Office of Research and Standards, Boston, MA. Rydin, E. and E.B. Welch. 1998. Aluminum dose required to inactivate phosphate in lake sediments. Wat. Res. 32:2969-2976. Rydin, E. and E.B. Welch. 1999. Dosing alum to Wisconsin lake sediments based on in vitro formation of aluminum bound phosphate. Lake Reserv. Manage. 15:324-331. Ryding, S.O. 1982. Lake Trehorningen restoration project. Changes in water quality after sediment dredging. Hydrobiologia 92:549-558. Sage, K. 1990. Implementation Strategies for Lake Water Quality Protection: A Handbook of Model Ordinances and Non-Regulatory Techniques for Controlling Phosphorus Impacts from Development. North Kennebec Regional Planning Commission, Kennebec, ME. Samad, F. and J.G. Stanley. 1986. Loss of freshwater shellfish after water drawdown in Lake Sebasticook, Maine. J. Freshwater Ecology 3(4):519-523. Sanders, L. J.J. Hoover and K.J. Kilgore. 1991. Triploid Grass Carp as a Biological Control of Aquatic Vegetation. Aquatic Plant Control Res. Prog. Vol A-91-2 ACOE.
Eutrophication and Aquatic Plant Management in Massachusetts
7.0 References
Page 7-33
Savory, J., C. Exley, W.F. Forbes, Y. Huang, J.G. Joshi, T. Kruck, D.C.R. McLachlan, and I. Wakayama. 1996. Resolved- What are the suggested approaches to the controversy and methodological issues to be considered. J.Toxic. & Environ. Health. 48(6):615-635. Scalf, M.R., W.J. Dunlap and J.F. Kreissl. 1977. Environmental effects of septic tank systems. EPA-600/3-77-096. USEPA. Ada, OK. 35pp. Scheffer, M., S.H. Hosper, M-L. Meijer, B. Moss and E. Jeppeson. 1993. Alternative equilibria in shallow lakes. Trends in Ecology and Evolution 8:275-279. Schindler, D.W. and E.J. Fee. 1974. Experimental Lakes area: Whole-lake experiments in eutrophication. J. Fish. Res. Bd. Can. 31: 937-953. Schmidt, J.C. 1984. An overview of chemicals for aquatic plant control. Lake and Reservoir Management 1:453-455. Schneider, J.C. 2000. Evaluation of the Effects of the Herbicide SONAR on Sport Fish Populations in Michigan Lakes. MIDNR Fisheries Division Tech. Report No. 2000-2, Ann Arbor, MI Schueler, T. 1987. Controlling Urban Runoff: A Practical Manual for Planning and Designing Urban BMPs. Metropolitan Washington Council of Governments, Washington, DC. Schueler, T. 1995. Site Planning for Urban Stream Protection. Center for Watershed Protection, Ellicot City, MD. Schueler, T., P. Kumble and M. Heraty. 1992. A Current Assessment of Urban Best Management Practices: Techniques for Reducing Non-Point Source Pollution in the Coastal Zone. Metropolitan Washington Council of Governments, Washington, DC. Seagrave, C. 1988. Aquatic Weed Control. Fishing News Books Ltd., Farnham, England. 154 pp. SePro. 1994a. Sonar AS. Product Label. EPA Reg. No. 67690-4. Carmel, IN. SePro. 1994b. Sonar SRP. Product Label. EPA Reg. No. 67690-3. Carmel, IN. Servizi, J.A., R.W. Gordon and D.W. Martens. 1987. Acute toxicity of Garlon 4 and Roundup herbicides to salmon, Daphnia, and trout. Bull. Environ. Contam. Toxicol. 39:15-22. Shapiro, J. 1990. Biomanipulation: The next phase - Making it stable. Hydrobiologia 200/201:13-27. Shapiro, J. 1990. Current beliefs regarding dominance by blue-greens: The case for the importance of CO2 and pH. Verh. Internat. Verein. Limnol. 24:38-54.
Eutrophication and Aquatic Plant Management in Massachusetts
7.0 References
Page 7-34
Shapiro, J. and D. Wright 1984. Lake restoration by biomanipulation: Round Lake, MN, the first two years. Freshwater Biology 14:371-383. Sharpley, A.N., S.C. Chapra, R. Wedpohl, J.T. Sims, T.C. Daniel and K.R. Reddy. 1994. Managing agricultural phosphorus for protection of surface waters: Issues and options. J. Environ. Qual. 23:437-451. Shaw, J.L., and M.J. Hamer. 1995. A rebuttal to: “The toxicity of Diquat, Endothall, and Fluridone to the early life stages of fish." Journal of Freshwater Ecology 10(3):303-310. Shearer, J.F. 1994. Potential role of plant pathogens in declines of submersed macrophytes. Lake and Reservoir Management, 10(1):9-12. Sheldon, S. 1994. Invasions and declines of submersed macrophytes in New England, with particular reference to Vermont Lakes and herbivorous invertebrates in New England. Lake and Reservoir Management, 10(1):13-17. Sheldon, S. 1995. The Potential for Biological Control of Eurasian Watermilfoil (Myriophyllum spicatum) 1990-1995. Prepared for Region 1 U.S. Environmental Protection Agency, Boston, MA. Sheldon, S. and L. O’Bryan. 1996a. The life history of the weevil, Euhrychiopsis lecontei, a potential biological control agent of Eurasian watermilfoil. Entomological News 107:16-22. Sheldon, S. and L. O’Bryan. 1996b. The effects of harvesting Eurasian watermilfoil on the aquatic weevil Euhrychiopsis lecontei. J. Aquat. Plant Manage. 34:76-77. Sheldon, S. and R. Creed. 1995. Use of a native insect as a biological control for an introduced weed. Ecological Applications 5:1122-1132. Sherlock, J.C. 1989. Aluminium in Foods and the Diet. In: Aluminium in Food and the Environment. Massey, R. and D. Talyor, (Eds.). Special Pub. No. 73. Royal Society of Chemistry, Cambridge, Great Britain. p.68-76. Shilling, D.G., W.T. Haller, T.R. Willard and M.A. Mossler. 1990. Influences of surfactants and additives on phytotoxicity of glyphosate to torpedograss. J. Aquat. Plant Manage. 28:23-27. Shireman, J, W. Haller, D. Canfield and V. Vandiver. 1982. The Impact of Aquatic Plants and their Management Techniques on the Aquatic Resources of the United States: An Overview. EPA 660/3-83-098. USEPA, Washington, DC. Shreve, B.R., P.A. Moore, T.C. Daniel, D.R. Edwards and D.M. Miller. 1995. Reduction of phosphorus in runoff from field-applied poultry litter using chemical amendments. J. Environ. Qual. 24:106-111.
Eutrophication and Aquatic Plant Management in Massachusetts
7.0 References
Page 7-35
Simmons, R.C., A.J. Gold and P.M. Groffman. 1992. Nitrate dynamics in riparian forests: Groundwater studies. J. Environ. Qual. 21:659-665. Simpson, J.T. 1991. Volunteer Lake Monitoring: A Methods Manual. EPA 440/4-91-002. USEPA, Washington, DC. Siver, P.A., A.M. Coleman, G.A. Benson and J.T. Simpson. 1986. The effects of winter drawdown on macrophytes in Candlewood Lake, Connecticut. Lake Reserv. Manage. 2:69-73. Skea, J., Neuderfer, G., Symula, J., Aylesworth, G., and Miccoli, J. 1987. The Toxicity of Ortho-diquat to the Fry of Several Species of Warm Water Fish. Technical Report 87-1. New York Department of Environmental Conservation. Rome, NY. Smeltzer, E. 1990. A successful alum/aluminate treatment of Lake Morey, VT. Lake Reserv. Manage. 6:9-19. Smith, C.R. and J. Shireman. 1983. White Amur Bibliography. Misc. Paper A-83-7. US Army Corps of Engineers, Jacksonville, FL. Smith, C.S., and J.W. Barko. 1990. Ecology of Eurasian watermilfoil. Journal of Aquatic Plant Management, 28:55-64. Smith, C.S. and G.D. Pullman. 1997. Experience using SONAR A.S. aquatic herbicide in Michigan. Lake Reserv. Manage. 13:338-346. Smith, D.W., L.D. Lyman and R.L. LeBlanc. 1991. Potential formation of N-methylformamide (NMF) from fluridone in New England. J. Aquat. Plant Manage. 29:115-116. Smith, G. 1994. Letter to Tristam’s Long Pond Property Owners Association, Nov. 30, 1994. Aquatic Control Technology, Northborough, MA. Smith, V.H. 1983. Low nitrogen to phosphorus ratios favor dominance by blue-green algae in lake phytoplankton. Science. 221:669-671. Solarz, S. and R. Newman. 1996. Oviposition specificity and behavior of the watermilfoil specialist Euhrychiopsis lecontei. Oecologia 106:337-344. Solberg, K.L., and K.F. Higgins. 1993. Effects of glyphosate herbicide on cattails, invertebrates, and waterfowl in South Dakota wetlands. Wildlife Society Bulletin 21:299-307. Sotir & Associates. 1995. Massachusetts Streambank Protection Guide: A Handbook for Controlling Erosion in Western Massachusetts Streams. Robbin B. Sotir & Associates, Marietta, Georgia. Spangler, F.L., W.E. Sloey and C.W. Fetter. 1976. Wastewater Treatment by Natural and Artificial Marshes. EPA-600/2-76-207.
Eutrophication and Aquatic Plant Management in Massachusetts
7.0 References
Page 7-36
Spencer, D.A. 1984. Influence of aquashade on growth, photosynthesis, and phosphorus uptake of microalgae. J. Aquat. Plant Manage. 22:80-84. St. Amand, A. 2002. Cylindrospermopsis: An invasive toxic alga. LakeLine 22:36-38. Stang, D.L. 1994. Job 106: Control and Evaluation of Grass Carp Introductions. Final Job Completion Report. New York State Department of Environmental Conservation Division of Fish and Wildlife, Bureau of Fisheries. Stanley, J.G., W.W. Miley and D.L. Sutton. 1978. Reproductive requirements and the likelihood for naturalization of escaped grass carp in the United States. Trans. Amer. Fish. Soc. 107(1):119-128. Stark, J. 1983. Persistence of herbicides in forest soils. Weeds and Weed Control 24(1):275-286. Stefan, H.G. and M.J. Hanson. 1980. Predicting dredging depths to minimize internal nutrient recycling in shallow lakes. In: Restoration of Lakes and Inland Waters EPA 440/5-81-010. U.S.E.P.A. Washington DC. pp. 79-85. Stewart, W.K. 1989. Aluminium toxicity in individuals with chronic renal disease. In: Aluminium in Food and the Environment. Massey, R. and D. Talyor, (Eds.). Special Pub. No. 73. Royal Society of Chemistry, Cambridge, Great Britain. p. 6-19. Stumm, W. and J.J. Morgan. 1981. Aquatic Chemistry: An Introduction Emphasizing Chemical Equilibria in Natural Waters. 2nd Edition. John Wiley & Sons, New York. 780 pp. Sundstrom, D.W. and H.E. Klei. 1979. Wastewater Treatment. Prentice-Hall, Inc. Englewood Cliffs, NJ. 444 pp. Surber, E.W., and Q.H. Pickering. 1962. Acute toxicity of Endothal, Diquat, Hyamine, Dalapon, and Silvex to fish. Progressive Fish-Culturist, 24(4):164-171. Swadener, C. 1993. Triclopyr. Journal of Pesticide Reform, 13(3):29-35. Swann, C. 2001. The Influence of Septic Systems at the Watershed Level. Watershed Protection Techniques 3:821-834. Tanner, C., R. Wells and C. Mitchell. 1990. Re-establishment of native macrophytes in Lake Parkinson following weed control by grass carp. N.Z.J. Mar. Freshw. Res. 24:181-186. Tetra Tech, Inc. 1998. Lake and Reservoir Bioassessment and Biocriteria: Technical Guidance Document. EPA 841-B-98-007. USEPA, Washington, DC. Thayer, D., and V. Ramey. 1986. Mechanical Harvesting of Aquatic Weeds. Center For Aquatic Weeds, University of Fla., Gainesville
Eutrophication and Aquatic Plant Management in Massachusetts
7.0 References
Page 7-37
Theriot, E. 1989. Biological control of aquatic plants with plant pathogens. In: Proceedings of a Workshop on Management of Aquatic Weeds and Mosquitoes in Impoundments. Water Resources Research Institute, Univ. North Carolina, Charlotte, NC. Thornton, K. and C. Creager. 2001. Watershed Management. Chapter 6 in Managing Lake and Reservoirs, edited by Holdren, Jones and Taggart. USEPA/NALMS, Madison, WI. Tighe and Bond Consulting Engineers. 1994. Final Report for Puffers Pond Restoration Project, Amherst, Massachusetts. Westfield, MA. Tilman, D. 1982. Resource Competition and Community Structure. Princeton University Press, Princeton, NJ. Titus, J.E. 1994. Submersed plant invasions and declines in New York. Lake and Reservoir Management, 10(1): 25-28.2 Tobiessen, P., J. Swart and S. Benjamin. 1992. Dredging to control curly-leaved pondweed: A decade later. J. Aquat. Plant Manage. 30:71-72. Torstensson, L. 1985. Behavior of Glyphosate in Soils and it's Degradation. In: The Herbicide Glyphosate. Butterworths, London. 490 pp. UNEP. 1999. Survey of Residential Nutrient Behavior. Center for Watershed Protection, Ellicot City, MD. USACE, 1987. Confined Disposal of Dredged Material. Engineer Manual 1110-2-5027. U.S. Army Corps of Engineers, Washington, DC. USDA-NRCS and MA Community Assistance Partnership. 1998. Innovative and Alternative On-Site Wastewater Technologies. USEPA, Boston, MA. USEPA. 1978. National Eutrophication Survey, Working Pap. 474, 475, 476, 477. Corvallis Environ. Res. Lab. and Las Vegas Environ. Monitor. Support Lab. Washington, D.C. USEPA. 1990. Monitoring Lake and Reservoir Restoration. Technical Supplement to The Lake and Reservoir Restoration Guidance Manual. EPA-440/4-90-007. US Environmental Protection Agency, Office of Water, Washington, D.C. USEPA. 1993. Guidance specifying management measures for sources of nonpoint pollution in coastal waters. EPA 840-B-92-002. United States Environmental Protection Agency. Washington, DC. USEPA. 1995. Office of Pesticide Programs Reference Dose Tracking Report. Environmental Protection Agency, Washington, D.C.

Eutrophication and Aquatic Plant Management in Massachusetts
7.0 References
Page 7-38
USEPA 1996. Nonpoint Source News-Notes. Terrene Inst., Alexandria, VA. October, November, 1996 46:12-13. USEPA. 1999. Preliminary Data Summary of Urban Storm Water Best Management Practices. EPA-821-R-99-012. USEPA, Washington, DC. USEPA. 2002. Onsite Wastewater Treatment Systems Manual. EPA/625/R-00/008. USEPA, Washington, DC. Ussery, T., H. Eakin, B. Payne, A. Miller and J. Barko. 1997. Effects of benthic barriers on aquatic habitat conditions and macroinvertebrate communities. J. Aquat. Plant Manage. 35:69-73. Uttormark, P.D. and M.L. Hutchins, 1980. Input output models as decision aids for lake restoration. Water Res. Bull. 16:494-500. Vallentyne, J.R. 1974. The Algal Bowl - Lakes and Man. Misc. Spec. Pub. 22. Ottowa, Dept. Of the Environment. Van der Valk, A.G. and C.B. Davis. 1980. The impact of a natural drawdown on the growth of four emergent species in a prairie glacial marsh. Aquatic Botany 9:301-322. Van Dyke, J., A. Leslie and L. Nall. 1984. The effects of grass carp on the aquatic macrophytes of four Florida lakes. J. Aquat. Plant. Manage. 22:87-95. Vanni, M.J. 1987. Biological control of nuisance algae by Daphnia Pulex: Experimental studies. Lake and Reservoir Management Vol. III, 151-156. Vermont Agency of Natural Resources. 1990. The Lake Bomoseen Drawdown: An Evaluation of its Effects on Aquatic Plants, Wildlife, Fish, Invertebrates and Recreational Uses. Vermont Agency of Natural Resources, Waterbury, VT. Verner, B. 1984. Long-term effect of hypolimnetic aeration of lakes and reservoirs, with special consideration of drinking water quality and preparation costs. In: Lake and Reservoir Management. EPA 440/5/84-001. USEPA. Washington, DC. pp. 134-138. Vollenweider, R.A. 1969. Possibilities and limits of elementary models concerning the budget of substances in lakes. Arch. Hydrobiol. 66(1):1-36. Vollenweider, R.A. 1975. Input-output models with special reference to the phosphorus Loading Concept in Limnology. Sch. Zeit. Hydrologic 37:53-84. Vollenweider, R.A. 1976. Advances in defining critical loading levels for phosphorus in lake eutrophication. Mem. Ist. Ital. Idrobiol. 33:53-83.
Eutrophication and Aquatic Plant Management in Massachusetts
7.0 References
Page 7-39
W&H 1986a. Diagnostic/Feasibility Study Jennings Pond Natick, Massachusetts. Whitman and Howard, Inc. W&H, 1986b. Diagnostic/Feasibility Study of Chauncy Lake, Westborough, Massachusetts. Whitman & Howard, Inc. Wellesley, MA. W&H, 1987. Diagnostic/Feasibility Study of Black’s Nook Pond Cambridge, Massachusetts. Whitman & Howard, Inc. Wellesley, MA. Wagner, K.J. 1990. Assessing the impacts of motorized watercraft on lakes: issues and perceptions. In: Enhancing the States’ Lake Management Programs 1990, Northeast Illinois Planning Commission, Chicago, IL. Wagner, K.J. 2001. Management Techniques Within the Lake or Reservoir. Chapter 6 in Managing Lake and Reservoirs, edited by Holdren, Jones and Taggart. USEPA/NALMS, Madison, WI. Wagner, K.J. and R.T. Oglesby 1984. Incompatibility of common lake management objectives. In: Lake and Reservoir Management. EPA 440/5-84-001, USEPA, Washington, DC. Walker, W. 1977. Some Analytical Methods Applied to Lake Water Quality Problems. Ph.D. dissertation, Harvard University. Walker, W., C.E. Westerberg, D.J. Schuler and J.A. Bode 1989. Design and evaluation of eutrophication control measures for the St. Paul water supply. Lake Reserv. Manage. 5:71-83. Washington State Department of Ecology. 1992. Aquatic Plant Management Program for Washington State. Vol 1: Final Supplemental Environmental Impact Statement and Responsiveness Summary; and Vol. 2: Final Supplemental Environmental Impact Statement: Vol. 2: Appendices. Olympia, Washington. Washington State Department of Ecology. 2000. Storm Water Management Manual for Western Washington. Publication 99-14, WA DOE, Olympia, WA. Washington Department of Wildlife, 1990. Grass Carp use in Washington. Washington Dept. Of Wildlife, Fisheries Management Division. F.M. No. 90-4. Weatherbee, P.B. 1994. The most unwanted plants. Massachusetts Wildlife, Vol. XLIV No. 2. Weber, W.J. 1972. Physicochemical Processes for Water Quality Control. John Wiley and Sons, New York. 640pp. Wedepohl, R.E. 1994. Phosphorus management in the watershed: Are we making progress? Lake and Reservoir Mangement 9(2):122.
Eutrophication and Aquatic Plant Management in Massachusetts
7.0 References
Page 7-40
Wehr, J.D. and R.G. Sheath. 2003. Freshwater Algae of North America: Ecology and Classification. Academic Press, Boston, MA. Welch, E.B., M.V. Brenner, and K.L. Carlson. 1984. Control of algal biomass by inflow nitrogen. p 493-497. In: Lake and Reservoir Management EPA-440/5-84-001. US Environmental Protection Agency, Washington, D.C. Welch, E.B. and G.D. Cooke. 1999. Effectiveness and longevity of phosphorus inactivation with alum. Lake Reserv. Manage. 15:5-27. Welch, E.B., C.L. DeGasperi, D.E. Spyridakis and T.J. Belnick 1988. Internal phosphorus loading and alum effectiveness in shallow lakes. Lake Reserv. Manage. 4:27-33. Welch, E.B. and C.R. Patmont. 1980. Lake restoration by dilution: Moses Lake, Washington. Wat. Res. 14:1317-1325. Welch, E.B. and G.D. Schrieve. 1994. Alum treatment effectiveness and longevity in shallow lakes. Hydrobiologia 276:423-431. Welsh, D.J. 1991. Riparian Forest Buffers. Function and Design for Protection and Enhancement of Water Resources. USDA. Radnor, PA Na-PR-07-91, 20pp. Welsh, J.S. 1993. Constructed Wetlands Design Guidelines for Wastewater Treatment and Wildlife Enhancement. Master's Thesis. University of Massachusetts, Amherst. 86 pp. Westerdahl, H.E. and K.D. Getsinger (eds). 1988a. Aquatic Plant Identification and Herbicide Use Guide. Volume 1: Aquatic Herbicides and Application Equipment. Waterways Experiment Station, Corps of Engineers, Vicksburg, MS. Westerdahl, H.E. and K.D. Getsinger (eds). 1988b. Aquatic Plant Identification and Herbicide Use Guide. Volume 2: Aquatic Plants and Susceptibility to Herbicides. Waterways Experiment Station, Corps of Engineers, Vicksburg, MS. Wetzel, R.G. 1983. Limnology. 2nd ed. Saunders College Publishing, Philadelphia, 767pp. Wilber, P. 1992. Thin-Layer Disposal: Concepts and Terminology. In: Environmental Effects of Dredging. Vol D-92-1. U.S. Army Corps of Engineers Waterways Experiment Station, Vicksburg, MS. Wile, I., J. Neil, G. Lumis and J. Pos. 1978. Production and utilization of aquatic plant compost. J. Aquat. Plant Manage. 16:24-27. Wilson, D.C. and C.E. Bond. 1969. The effects of the herbicides Diquat® and Dichlobenil (CASORON®) on pond invertebrates. Part I: Acute toxicity. Trans. Amer. Fish. Soc., No. 3:438-443.
Eutrophication and Aquatic Plant Management in Massachusetts
7.0 References
Page 7-41
Winer, R. 2000. National Pollutant Removal Performance Database for Storm Water Treatment Practices, 2nd Edition. Center for Watershed Protection, Ellicot City, MD. Wisconsin Department of Agriculture and Trade and Consumer Protection. 1989. Best Management Practices for Wisconsin Farms. WDATCP, Madison, WI. Wisconsin Department of Natural Resources. 1989. Environmental Assessment of Aquatic Plant Management (NR 107) Program. WDNR, Madison, WI. Wisconsin Department of Natural Resources. 1997a. Wisconsin’s Forestry BMPs for Water Quality: A Field Manual for Loggers, Landowners and Land Managers. WDNR, Madison, WI. Wisconsin Department of Natural Resources. 1997b. Wisconsin’s Forestry BMPs for Water Quality: The 1995-1997 BMP Monitoring Report. WDNR, Madison, WI. Wlosinski, J.H., and E.R. Koljord. 1996. Effects of Water Levels on Ecosystems: An Annotated Bibliography. USGS, LTRMP 96-T007. Env. Mgmt. Tech. Center, Onalaska, WI. Woltmann, E.F. 1986. Final Environmental Impact Statement for Experimental Stocking of Sterile Grass Carp in Three Long Island Ponds. Dept. Environmental Conservation, Div. Fish and Wildlife, Stoney Brook, NY. Woodburn, K.B., F.R. Batzer, F.R. White and M.R. Schultz. 1990. The Aqueous Photolysis of Triclopyr: Unpublished Report of Dow Elanco. G4-C2434. Woodburn, K.B., J.M. Huge and H.D. Kirk. 1993. Triclopyr-BEE: Acute 96-hr. Flow Through Toxicity to the Blue-gill, Leopomis macrochirus. Rafinesque. DowElanco. Worth, D.D., Jr. 1980. Nutting lake restoration project: A Case Study. In Restoration of Lakes and Inland Waters. EPA 440/5-81-010. United States Environmental Protection Agency, Washington, D.C. pp. 89-92. Wynn, E. and K. Langeland. 1996. Barley straw for algae control. Aquatics 18:4-6. Zeneca Professional Products. 1993. REWARD® Aquatic and Noncrop Herbicide. Product Label. EPA Reg. No. 10182-353. Wilmington, DE. Zeneca Professional Products. 1995. REWARD® Aquatic and Noncrop Herbicide. Supplemental Label for Aquatic Use Directions. EPA Reg. No. 10182-353. Wilmington, DE Zimmerman, W.J., C.M. Soliman and B.H. Rosen. 1995. Growth and 2-methylisoborneol production by the cyanobacterium Phormidium LM689. Wat. Sci. Tech. 31(11):181-186.
Eutrophication and Aquatic Plant Management in Massachusetts
7.0 References
Page 7-42
7.2 Verbal Correspondence and Presentations Aarrestad, P.J. 1996. Personal Communication. Fisheries Division, Department of Environmental Protection, Old Lyme, CT. Andrus, D. 2002. Personal Communication. Lake Buel Restoration/Preservation District Prudential Committee member, Monterey, MA. Benson, G. 2002. Control of plants with grass carp in Ball Pond CT. Presented at the 2002 NECNALMS conference, Springfield, MA. Benson Environmental, CT. Bodine, S. 1995. Personal communication. Soil and Plant Testing Lab. Univ. of Mass. Amherst. Bogue, G. 1995. Personal Communication. Department of Environmental Protection, Office of Watershed Management, N. Grafton/Worcester, MA. Boyle, K., J. Scheutz and J. Kahl. 1997. Unpublished data from “Great Ponds play an integral role in Maine’s economy”, presented at the 17th NALMS Symposium. Univ. ME, Orono, ME. Brandt, S. 1998. Impacts of alewife introduction on plankton and water quality. Presented at the NEC NALMS Conference, June 1998, UNH, Durham, NH. Brooks, Kevin. 1995. Personal Communication. Granby Conservation Commission. Granby, MA. Brougham, G.L. 1995. Personal Communication. Director, Belchertown Department of Public Works. Belchertown, MA. Bugbee, G. and J. White. 2002. Control of Cabomba and Eurasian watermilfoil with spot applications of fluridone and 2,4-D. Presented at the 3rd NEAPMS Symposium, Sturbridge, MA. CT Agric. Exper. Station, New Haven, CT. Carranza, C. 1996. Personal Communication. Baystate Environmental Consultants, Inc. East Longmeadow, MA. Clear, T. and K. Wagner. 1998. Use of a Porous Benthic Barrier to Control Aquatic Plants. Presented at the 18th NALMS Symposium, Banff, Alberta, Canada. ENSR, Westford, MA. Cobbossee Watershed District. 1993. Unpublished zooplankton data for Annabessacook and Cochnewagon Lakes. CWD, Winthrop, ME. Corbin, W. and K. Wagner. 1998. The Origin and History of Lakes as Factors in Management Needs. Presented at the 18th NALMS Symposium, Banff, Alberta, Canada. ENSR, Westford, MA. Connor, J. 1995. Personal Communication. N.H. Dept. Environ. Services, Concord, NH.
Eutrophication and Aquatic Plant Management in Massachusetts
7.0 References
Page 7-43
Corte-Real, Lee. 1995. Personal Communication. Massachusetts Department of Food and Agriculture. Boston, Massachusetts. Crosson, H. 1995. Personal Communication. Vermont Department of Environmental Conservation, Waterbury, VT. Daley, L. 1995. Personal Communication. Massachusetts Division of Fisheries and Wildlife. Pittsfield, MA. DeCesare, G. 1995. Personal Communication. Massachusetts Department of Environmental Protection. Worcester, MA. DeCesare, G. 2003. Personal Communication. Massachusetts Department of Environmental Protection. Worcester, MA. DeWolfe, J. 2002. Personal Communication. Sear Brown Consultants, State College, PA. Derdarian, R. 1995-2001. Unpublished volunteer monitoring data for Hamblin Pond. Barnstable, MA. DFW. 1993. Unpublished data for fishkills. DFW, Westborough, MA. Dombrowski, P. 1995. Personal Communication. Tighe & Bond Consulting Engineers. Westfield, MA. Doyle, R.D. amd R.M. Smart. 1995. Restoration and Rehabilitation of Texas Reservoirs: The Role of Native Aquatic Macrophytes. Presented at the 15th Annual Symposium on Lake, Reservoir and Watershed Management, Toronto, Ontario. USACE, Waterways Exper. Station, Lewisville, TX. Dupuis, Joseph. 1995. Personal Communication. Department of Environmental Protection, Millbury Treatment Center Technical Assistance, Millbury, MA. Eberhardt, T. 1995. Personal Communication. Sweetwater, TeeMark Corp, Aitkin, MN. Edwards, G. 1995. Personal Communication. Conservation Agent, Town of Dracut, MA. Eichler, L. 1996. Personal Communication. Darrin Fresh Water Institute, RPI, Bolton’s Landing, NY. Eschenroeder, A. 1997. Personal Communication. Todd Pond Residents Association, Lincoln, MA. Fuist, T. 2002. Personal Communication. Dudley Pond Association, Wayland, MA.
Eutrophication and Aquatic Plant Management in Massachusetts
7.0 References
Page 7-44
Garrison, V. and H. Crosson. 2001. Personal Communication. VTDEC, Waterbury, VT. Gatewood, R. 1995. Personal Communication. Barnstable Conservation Agent. Barnstable, MA. Geney, R. 2002. Personal Communication. General Environmental Systems. Raleigh, NC. Getsinger, K. 1996. Personal Communication. Waterways Experiment Station. Army Corps of Engineers. Vicksburg, MS. Godfrey, P.J. 1995. Personal Communication. University of Massachusetts. Amherst, MA. Gonyea, G. 1996. Personal Communication. Massachusetts Department of Environmental Protection. Boston, MA. Gonyea, G. 2002. Personal Communication. Massachusetts Department of Environmental Protection. Boston, MA. Grady, J. 2002. Personal Communication. Conservation Commission, Duxbury, MA. Haller, W.T. 1996. Personal Communication. Univ. Florida, Gainesville, FL. Harris, J. 1996. Personal Communication. Conservation Commission. Belchertown, MA. Hartley, R. 1995. Personal Communication. Division of Fisheries and Wildlife. Westborough, MA. Hartley, R. 1996. Personal Communication. Division of Fisheries and Wildlife. Westborough, MA. Hartley, R. 2003. Fish Kill Response in Massachusetts. Presented at the 4th NEAPMS Symposium, Sturbridge, MA. Division of Fisheries and Wildlife. Westborough, MA. Hartzel, R. 1995. Personal Communication. Department of Environmental Management. Boston, MA. Hartzel, R. 2002. Biological Control of Eurasian Milfoil with the Aquatic Weevil: Lessons from the Lakes – the Good, the Bad…and the Inconclusive. Presented at the 2002 NECNALMS conference, Springfield, MA. GeoSyntec, Boxborough, MA. Hellquist, C.B. 1995. Personal Communication. Massachusetts College of Liberal Arts (formerly North Adams State College). North Adams, MA. Hellquist, C.B. 2000. Taxonomy and Origin of Nuisance Plants. Presented at the First LAPA-West Symposium, Dalton, MA. Massachusetts College of Liberal Arts (formerly North Adams State College). North Adams, MA.
Eutrophication and Aquatic Plant Management in Massachusetts
7.0 References
Page 7-45
Hogan, P. 1995. Personal Communication. Surface Water Discharge Permit Program. Department of Environmental Protection. Grafton/Worcester, MA. Hurley, S. 1995. Personal Communication. Massachusetts Department of Fish and Game. Wareham, MA. Jobin, W. 1997. Economic Losses from Industrial Contamination of Lakes in New England, presented at the 17th NALMS Symposium, Houston, TX. Colorado Valley Ecologists, Dolores, CO. Johnson, R. 2002. Eurasian watermilfoil control by insect herbivory: a review of past and ongoing research. Presented at the 3rd NEAPMS Symposium, Sturbridge, MA. Cornell Univ., Ithaca, NY. Jones, H. 1995. Personal Communication. Baystate Environmental Consultants, Inc. East Longmeadow, MA. Keller, R. 1995. Personal Communication. Division of Fisheries and Wildlife. Westboro, MA. Kishbaugh, S. 2003. Personal Communication. New York State Department of Environmental Conservation. Albany, NY. Kishbaugh, S. and J. Sutherland. 2002. Assessment of Eurasian watermilfoil control at Snyders Lake, NY with Sonar: 1998-2001. Presented at the 3rd NEAPMS Symposium, Sturbridge, MA. New York State Department of Environmental Conservation. Albany, NY. Kolb, B., A. Ayuso and K. Thornton. 1996. Understanding Algal Dynamics in Wachusett Reservoir to Manage Taste and Odor Algae. Presented at the 16th Annual International Symposium of NALMS, Minneapolis, MN. CDM, Cambridge, MA. Kortmann, R.W. 1996. Personal Communication. Ecosystem Consulting Service Inc., Coventry CT. Lacaire, Tom. 1995. Personal Communication. Lake Lashaway Association. N. Brookfield, MA. Landry, Tom. 1995. Personal Communication. Superintendent, Pittsfield Wastewater Treatment Plant. Pittsfield, MA. Lane, A. 1995. Personal Communication. Town of Gay Head, MA. Larsen, R. 1995. Personal Communication. Northeast Utilities Environmental Laboratory. Hadley, MA. Leone, D. 1995. Personal communication. Natural Resources Conservation Service NRCS, Greenfield, MA.

Eutrophication and Aquatic Plant Management in Massachusetts
7.0 References
Page 7-46
Lewis, D. 2001. Personal Communication. Lake Buel Restoration/Preservation District. Monterey, MA. Lewis, L. 1995. Personal Communication. Program Director. Department of Environmental Management. Boston, MA. Lind, H. 1995. Personal Communication. Eastham Conservation Commission. Eastham, MA. Lowry, D. 2000. Personal Communication. ENSR. Willington, MA. Lyman, L. 1995. Personal Communication. Lycott Environmental Research, Inc. Southbridge, MA. Lyman, L. 1996. Personal Communication Lycott Environmental Research Inc. Southbridge, MA. Lyman, L. 2002a. Personal Communication Lycott Environmental Research Inc. Southbridge, MA. Lyman, L. 2002b. Use of a Limno-Barrier Curtain to Aid the Aquatic Plant Control Program at Bearse Pond, MA. Presented at the 2002 NEAPMS conference, Sturbridge, MA. Lycott, Southbrdige, MA. Lyman, L. 2003. Personal Communication Lycott Environmental Research Inc. Southbridge, MA. MacDonald, T. 2002. Personal Communication. Cambridge Water Department Water Quality Manager, Cambridge, MA. Madnick, J. 2002. Personal Communication. Dudley Pond Association, Wayland, MA. Mattson, M. 2002. Personal Observation. MDEP, Worcester, MA. Martin, M. 2002. Personal Communication. Cedar Eden Environmental. Saranac, NY. McNabb, T. 2001. Shoecraft Lake Sequestered Fluridone Treatment. AquaTechnex Newsletter, AquaTechnex, Washington. McVoy, R. 1995. Personal Communication. Massachusetts Department of Environmental Protection. Boston/Worcester, MA. McVoy, R. 1999. Unpublished data for invasive plant surveys of Massachusetts lakes. MDEP, Worcester, MA. Monagle, W. 1995. Personal Communication. Cobbossee Watershed District, Winthrop, ME.
Eutrophication and Aquatic Plant Management in Massachusetts
7.0 References
Page 7-47
Morrissey, D. 2002. Personal Communication. MDEM, Boston, MA. Mulholland, M. 1995. Personal Communication. Leverett Pond Association, Leverett, MA. Munyon, Robert. 2000. Personal Communication. Lake Lashaway Association. N. Brookfield, MA. Offenhartz, Barbara. 1995. Personal Communication. Technical Director, Organization for the Assabet River. Wellesley, MA. Paul, E. 2002. Impacts of long-term copper sulfate use on the sediment of treated lakes. Presented at the 3rd NEAPMS Symposium, Sturbridge, MA. NYSDEC, Rome, NY. Philbrick, B. 1995. Personal Communication SCS/NRCS. Amherst, MA. Reiner, R. 2002. Raising Galerucella beetles for use in biological control of purple loosestrife. Presented at the 2002 NECNALMS conference, Springfield, MA. AMWS, Billerica, MA. Rhode Island Watershed Watch. 1990-2000. Unpublished data for Stafford Pond, Tiverton, RI. URI, Kingston, RI. Rider, J. 1996. Personal Communication New York State Department of Environmental Conservation, Albany, NY. Ross, J. 1995. Personal Communication. Taunton Park Headquarters. Taunton, MA. Roy, S. 2002. Using Low Impact Development (LID) Storm Water Controls; Lessons learned from a Massachusetts Lakes and Ponds Initiative Demonstration Project to restore and protect water quality in 303(d) listed Long Pond, Littleton MA. Presented at the 2002 NECNALMS conference, Springfield, MA. AMWS, Billerica, MA. GeoSyntec, Boxborough, MA. Ryder, P. 2002. Personal Communication. Marlborough Conservation Administrator, Marlborough, MA. Sheldon, S. 1995. Personal Communication. Middlebury College, Middlebury, VT. Sibley, F., 1997. Personal Communication. Medway Parks and Recreation Department, Medway, MA. Smith, G. 1995. Personal Communication. Aquatic Control Technology, Inc. Northborough, MA. Smith, G. 1996. Personal Communication. Aquatic Control Technology, Inc. Northborough, MA. Smith, G. 2001. Personal Communication. Aquatic Control Technology, Inc. Sutton, MA.
Eutrophication and Aquatic Plant Management in Massachusetts
7.0 References
Page 7-48
Smith, G. 2002. Personal Communication. Aquatic Control Technology, Inc. Sutton, MA. Smith, G. 2003. Personal Communication. Aquatic Control Technology, Inc. Sutton, MA. Souza, S. 2002. Personal Communication. Princeton Hydro, Lambertville, NJ. Stang, D.L. 1997. Personal communication. Bureau of Fisheries, New York State Department of Environmental Conservation, Albany, NY. Straub, J. 2002. Personal Communication. MDEM, Boston, MA. Tisa, M. 1997. Personal Communication. Division of Fisheries and Wildlife. Westboro, MA. Turner, W. 1995. Personal Communication. Westford Conservation Commission, Westford, MA. Wagner, K. 1996-2000. Personal observations of Stafford Pond, Tiverton, RI. ENSR, Willington, CT. Wagner, K.J. 1998. The Restoration of Hamblin Pond, Barnstable, MA, by Phosphorus Inactivation. Presented at the 18th Symposium of NALMS, Banff, Alberta, Canada. ENSR, Westford, MA. Wagner, K.J. 1998-2000. Unpublished data from Springfield College field trips. ENSC 310, Springfield College. Wagner, K. 1999-2002. Personal observations of Lake Massasoit, Springfield College, Springfield, MA. Ward. 1995. Personal Communication. Accountant, Ashfield Town Hall. Ashfield, MA. Weathersbee, B. 1998. Déjà vu at White Rock Lake: The 1997-98 dredging project. Presented at the 18th Symposium of NALMS, Banff, Alberta, Canada. Carter and Burgess, Dallas, TX.