Reduction of aquaculture wastewater eutrophication by phytotreatment ponds system
Upload
khangminh22Category
view
3download
0
Nioz-rapport 1988-4
EUTROPHICATION IN THE NORTH SEA
P.H.M. Nelissen, J. Stefels
Nederlands Instituut voor Onderzoek der Zee

144 cr>• 0 LO
H roH C 1z o 00
•H- 0 -p ror ro rQ <0
(0 • u ••at tr> •P •H ,r—sw •H cn CN
lp P cu£ z e 0 rH+J p '--- 'p 0 z 4-> LOI0 rQ X 3 c o |2 Q) w
■p Q •(1) U) 2 * rH
Æ Q ■3 in O4-> B r oo 0
a> INC z • • »—I
•H CN 2 •• 0
Q tJ» i—1 •0 •H CU S3 •
•H lp rQ rQ4-> r •* 4-)CÖ B fd 0ü • • 0 M Z•r-t 0 P 4J•C Q lp U) •CU •H O w0 i—1 0 CU pp Q 04-1 B •H • • 4->3 0 i—1 0 fdw -P -P £
-P rQ O0 ■P Q r—1
rQ LO cdT i 4J
i V T i U)co c P cd fdco § 9 Ocn p 3 0t-H r—1 i— i Eh
0 0 w rQ+J U o H uP PI 4-)0 4-) -p QCU rQ ip w Qcu tp 0 urö •H iH 2MI P
S1N *. O wO CO bH • •S CU CU s
© 1988This report is not to be cited without the consent of: Netherlands Institute for Sea Research RO. Box 59, 1790 AB DEN BURG,Texel, The Netherlands
This is published as NIOZ - report 1988 - 4 This series was formerly called:Interne VerslagenNederlands Instituut voor Onderzoek der Zee Texel

Instituut ww ZiewtemdwTK*^ wntenofk Institute for Hanne Mientëit Sco tti
Prinses E lisab e th iae 69 8401 Eredene -B e lg iu m -T e l. 0 5 9 /8 0 57 15
EUTROPHICATION IN THE NORTH SEA a literature survey
P.H.M. Nelissen, J. Stefels
Study under the supervision of Prof. Dr. H. Postma and Dr. Ir. H.G. Fransz
Nederlands Instituut voor Onderzoek der Zee
JIOZ - rapport 1988 - 4

1
PREFACE
The prelude to this booklet was a literature study (doktoraalskriptie) by two biology students at the University of Amsterdam, by order of the (then) Deltadienst of the Ministry of Transport and Public Works. It was commenced in February 1985 under supervision of prof. dr. H. Postma and dr. ir. H.G. Fransz of the Netherlands’ Institute for Sea Research (NIOZ), Texel. After it and our studies were finished, our former supervisors suggested we'd try and rework it into a NIOZ-report, to be made available as a poster-session contribution at the Symposium on the Ecology of the North Sea, 15-21 May 1988. This was undertaken in the first months of 1988.The study is not a comprehensive review on whichever of the partial subjects presented. It still bears witness to our learning process in basic matters of oceanography. But our hopes are that it provides some general overview on recent publications concerning eutrophication in the North Sea and (possibly) related subjects. As such it may be of use to those working in specialized areas of the problem field (or intending so), providing them with some general information on adjacent areas.This literature study covers many, though not all, aspects of marine eutrophication. Essential aspects may have received too little attention. Among these, i) the possible progression of over-year accumulation of organic matter in the problem area; ii) the discussion about when and where which nutrients limit primary production if at all; iii) the influences upon the North Sea nitrogen budget to be expected from denitrification, and iv) the role of the "small food web" in recycling of nutrients urgently await further study.
ACKNOWLEDGEMENT
In the stage that this work was still a students' study we had some particularly fruitful discussions with dr. M.M. Rutgers van der Loeff at the NIOZ. In that period drs. B. Wetsteyn (Deltadienst) read our manuscrips and gave valuable comments. Throughout the work, the concepts were read and commented upon by prof. dr.H. Postma and dr. ir. H.G. Fransz, our supervisors, who continued to coach us during the work at the book. Dr. D. Eisma (NIOZ) read a draft version of section II.5. His comments are greatly appreciated. Conversations with dr. H.M. van Aken on physical aspects of water movements, with dr. A.J. van Bennekom about the fates of nutrients and with many other NIOZ researchers are gratefully acknowledged. We are indebted to mr. M.A. van Arkel for arranging the production of the book, and to ms. J. Schröder who took care of typing out the reference list. Finally, our special thanks extend to ms. I. de Maaker, without whose excellent typescript the project couid not have succeeded in time, and who greatly encouraged us on the way.
Amsterdam, 9 May 1988.Piet-Hein Nelissen Jacqueline Stefels

2
I. INTRODUCTION
Eutrophication, the enrichment ot natural waters with plant nutrients, was initially only known as a problem in fresh-water environments. There, an increased loading with inorganic nutrient salts, notably N and P compounds, may strongly increase algal biomass in which especially blue-green algae predominate. This can have serious consequences for the ecosystem concerned: dense blooms of algae and duckweed diminish light penetration and seriously hamper the growth of green plants in deeper layers. Local oxygen deficiencies may occur under the influence of enhanced aerobic mineralization (i.e. organic matter decomposition by heterotrophic organisms). When diatoms - nutritious for higher links in the food chain - have to make way for the blue-green algae, which have less nutritive value, the food supply for Zooplankton decreases. Moreover, some species of blue-greens excrete toxins that may damage other species.The result may be an impoverishment of communities (in biomass and/or diversity): the bottom vegetation, the bottom fauna, fish, and even water birds. (Stortelder eta!., 1981).In certain parts of the North Sea and in other marine coastal areas similar phenomena have been reported, e.g. species shifts and anoxia near the sea bed. Here too, increases in chemical input, most likely N and P, are thought to bring about large-scale changes in autotrophic production. (Van Bennekom et al., 1975; G e r la ch , 1984 and 1987; Ra c h o r , 1985; Rosenberg , 1985; Brockmann et al., in press).The increased availability of N and P to marine phytoplankton, it can be argued, should become visible in higher concentrations of these elements in the water. The relation between man-made nutrient inputs and concentrations in the sea, however, is far from simple. A sea area can experience external nutrient supplies from advection (currents), from land run-off (via rivers, coastal run-off and direct discharges) and from the atmosphere. Then there are "internal" sources such as mineralization in the water column, and fluxes from the sediment (which is usually a net source in one season, and a net sink in the other). All inputs (and outputs) exhibit temporal and spatial variation.The first major difficulty is to relate inputs and concentrations unequivocally. However, with knowledge about processes and budgets, estimates of the influence of inputs upon concentrations can be carried out. This is attempted in Ch. Ill, by dividing the sea into systems (subareas), on the basis of the more or
less fixed positions of the eight or so large-scale water masses in the North Sea (presented in Ch. II).This division enabled us to designate a "problem area", in which most of the reported N and P enrichments and consecutive biological problems are observed. A summary of these biological problems as reported in the literature is given in Ch. IV and V.
The aim of this literature study is to try to unravel some of the tangled eutrophication problems. In doing this we were aware of the complicating "naturalness" of the processes involved, in contrast with toxicity effects of most other man-made pollutants. Consequently, the larger part of this study will cover natural phenomena with their own man-independent and unavoidable ups and downs, in which we'll try to elucidate, as far as possible, the part attributable to anthropogenic eutrophication.

3
Il RELEVANT ASPECTS OF HYDROGRAPHY AND SEDIMENTATION
11.1 W A TE R MASSES AND GEOGRAPHIC BOXES
When surveying measured parameters, such as salinity and temperature, in the surface water of the North Sea, an arrangement in more or less homogeneous regions with ungradual transitions is readily noticed. In these regions the water masses, or water bodies, are situated.Laevastu (1963) divided the North Sea water in eight water masses (fig. 1). In broad lines this division is still agreed upon, although separate features need correction (e.g. O tto , 1983b; FTNS, 1983).Lee (1980), on the basis of S, T and concentrations of nutrients and trace elements, distinguishes among these six primary water masses; the remaining two (r.rs. 1 and 8 in fig. 1) he calls mixtures (see table 1). Water masses can be distinguished at
Fig. 1. The water masses in the North Sea in summer ( — ) and winter ( - - - ) (after LAEVASTU, 1963).
smaller and at larger scales than in fig. 1 ; a few examples of subdivision will follow later on.There are seasonal variations in the positions of the water masses:1.The Channel has a maximal inflow (and so, far
thest penetration) into the North Sea in November, and a minimum in April (amplitude - 20% of yearly averaged discharge). P ra n d le (1978) indicates seasonal wind field variations as the main cause.
2.The fresh to brackish outflow of Baltic water via Kattegat to Skagerrak is maximal in Spring (just as the Scandinavian run-off) and minimal late in the autumn; at that time there is even a small net flow from the North Sea to the Baltic (D ie tr ic h , 1950; O tto , 1983a).
3.The Norwegian Coastal Current occupies a somewhat larger surface area in winter than in summer; this may be caused by the then larger proportion of fresh water in the Current, which will affect density. However, seasonal fluctuations in the total outflow volume have not been demonstrated (O tto , 1983b).
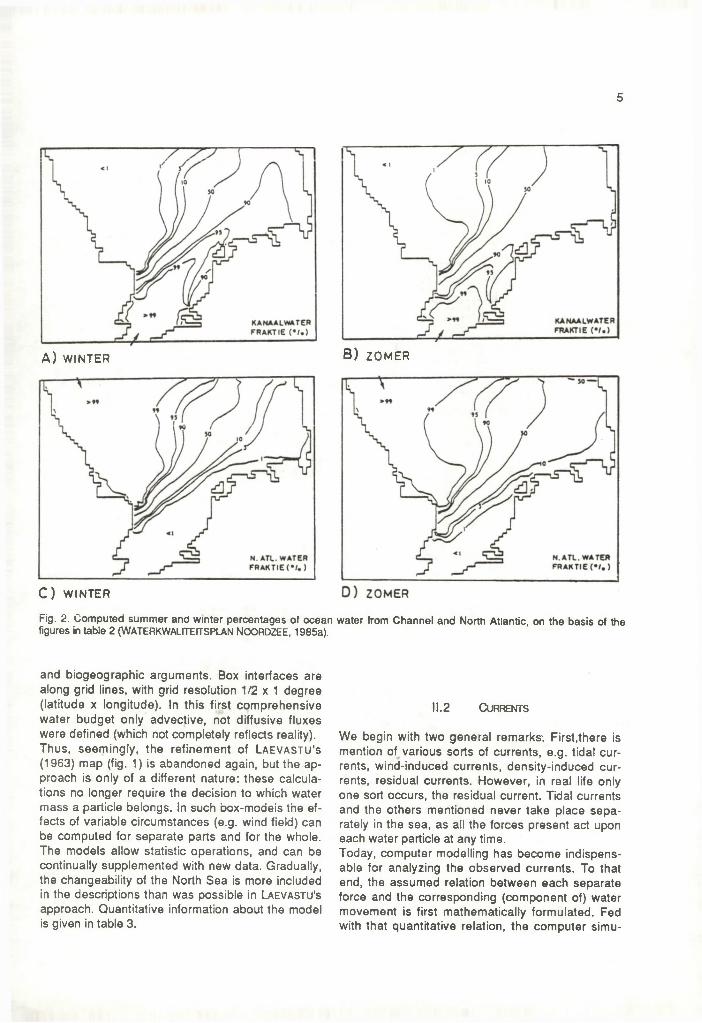
4.Seasonal variations in the large North Atlantic Inflow appear to be like those in the Channel, but much less pronounced, if present; measurements are scarce. In spring the inflow may be relatively weak. There are strong short-term variations (scale of days) due to wind changes but long-term averages are remarkably constant (D o o le y , in FTNS, 1983). The wind susceptibility could imply maximum inflow values in autumn and winter. Table 2 gives an impression of the variations in oceanic inflows to the North Sea south of 56°N (to be called "southern North Sea" from here). The (substantial) seasonal variation in river d ischarges has been neglected here, assuming this does not really influence the relative positions of the North Sea water masses. On the basis of the numbers in table 2 the summer and winter percentages of oceanic water in the southern North Sea were computed (W aterkw alite itsp lan N o o rd zee, 1985a) (fig. 2).
All over the North Sea, many short-term changes in current direction and velocity occur, in which particularly the wind plays an important role. In the first instance, this transports water of the upper layer only. Therefore, the water mass distribution will be less well-defined, according as more superficial layers are observed. A few other decisive "external" influences on this geographic distribution are the volumes of the above mentioned inflows and outflows. Dominant "internal" influences are the topography and the temperature- and salinity- induced density

4
TABLE 1. Characteristics of the water masses in the North Sea (LEE, 1980).
Water mass Temperature Salinity Winter maximum: inorganic(°C) (°/oo) nutrients (umol.l” ')
Summer minimum: inorganic nutrients (umol.l-1)
winter summer free nitrate- soluble free nitrate- solublephosphate nitrogen silicate phosphate nitrogen silicate
no3- n SiC,-Si PO.-P4 NO.-N Si 0 y Si
North Atlantic 6-8 12-14 35 0.6-0.8 10 4-6 0.1-0.4 1-4 2Channel 5-7 16-17 34.75 0.3-0.5 7 6 0.1 1 1Skagerrak 2-5 14-17 34 0.4 7 4 0.1-0.2 - -Scottish Coastal 4-6 12-14 34-35 0.6 - - 0.2 0.5-1 2English Coastal 4-6 14-18 34-34.5 0.7-1.2 35 14 0.1-0.4 1-4 1Continental Coastal 2-4 17-19 34 2.0-3.0 45 20-30 0.1-0.4 10-20 1-2
TABLE 2. !n- and outflowing water discharges for the North Sea south of 56° N in summer and winter: estimates used in model simulations (cf. figs. 2 & 24) (WATER-KWALTE ITS-PLAN NOORDZEE, 1985a).
Discharge (1000 m 3 s"1)Inflows: Winter: Summer:Channel 196.2 107.3North Atlantic 195.4 178.7Rivers 5.8 5.8Outflow:North Atlantic 397.4 291.8
TABLE 3. Volumes and surface areas of North Sea regions of fig. 3 (DAVIES, 1982).
Area
Totalvolume( 1 0 ' l ! m3|
Surface area (1 0 *M mJ)
1 7.86 0.622 5.33 0.543 3.68 0.804 1.18 0.445 0.89 .0.406 12.60 0.68r 6.57 0.987" 2.86 0.74
differences which cause differences in physical behaviour, which in turn cause and maintain the relative isolation among the WM's.As a consequence of these separate integrities, the sea can, more or less, be viewed as an assemblage
of "rivers" strongly differing in size, that partly form each other's "beds".One of these is the Continental Coastal Water (nr. 6, fig. 1) flowing from the Belgian Coast to the Skagerrak. Various fresh water streams end up in this "river's" water when they leave the land. With all their burdens of solutes and suspensions, they intermingle with virtually only this water and the sediments beneath it. Dilution takes place with the water of this water mass, instead of with all the North Sea water, which is about 10 times as much. In fact, with regard to dilution, such a thing as "the" North Sea does not exist. This confinement is the general rule, although indeed, both advection and diffusion maintain a varying degree of lateral exchange.
Geographic bpkesThe increased need of quantitative descriptions of the processes in the sea (and the capacity to computerize) led to the Introduction of a new functional unit supplementary to / replacing the water mass: the geographic box. A box is a rectangular volume of space - not an amount of water - with precisely defined outside faces and volume. Fluxes (flowing amounts per unit time) through the faces can be reconstructed in mathematical models. Boxes are also chosen at various scales and subdivided at will. Because basically the same processes and parameters have remained objects of study, box divisions often resemble water mass divisions.The North Sea as an assemblage of interconnected boxes: that is the ICES model (FTNS, 1983) (fig. 3) with which a first complete water budget was drawn up for both the system as a whole and each separate box. The division was based on hydrographic
5
KANAALWATER FRA KT I E ( • / • )
KANAALWATER FRAKTIE ( • / • )
A) W INTER B ) ZOM ER
N. ATL. WATER FRAKTIE < • /• )
C) WINTER
Fig. 2. Computed summer and winter percentages of ocean figures in table 2 (WATERKWALITEfTSPLAN NOORDZEE, 1985a).
and biogeographic arguments. Box interfaces are along grid lines, with grid resolution 1/2 x 1 degree (latitude x longitude). In this first comprehensive water budget only advective, not diffusive fluxes were defined (which not completely reflects reality). Thus, seemingly, the refinement of L a e v a s tu 's (1963) map (fig. 1) is abandoned again, but the approach is only of a different nature: these calculations no longer require the decision to which water mass a particle belongs. In such box-modeis the effects of variable circumstances (e.g. wind field) can be computed for separate parts and for the whole. The models allow statistic operations, and can be continually supplemented with new data. Gradually, the changeability of the North Sea is more included in the descriptions than was possible in Laevastu's approach. Quantitative information about the model is given in table 3.
D) ZOMER
water from Channel and North Atlantic, on the basis of the
II.2 Currents
We begin with two general remarks. First,there is mention of various sorts of currents, e.g. tidal currents, wind-induced currents, density-induced currents, residual currents. However, in real life only one sort occurs, the residual current. Tidal currents and the others mentioned never take place separately in the sea, as all the forces present act upon each water particle at any time.Today, computer modelling has become indispensable for analyzing the observed currents. To that end, the assumed relation between each separate force and the corresponding (component of) water movement is first mathematically formulated. Fed with that quantitative relation, the computer simu-

6
62*
60*
56*
56*
Fig. 3. ICES-flushing time areas of the North Sea (DAVIES, 1982).
Fig. 4. Tidal lines for high water at indicated hours within a tidal period (after: VEENSTRA, 1976).
lates the water movements for values of the force that have been measured in the field. This is done for the forces suspected influential. In a combined simulation, all these forces together yield a residual, which is compared with field current measurements. In this way the hypothesized relations are tested and adjusted.A second general remark: The "residual current velocity" Is the net distance covered, divided by the corresponding time interval. That is why there are just as many residual currents as there are time scales. According as the net distance is measured over longer time intervals, the therefrom calculated values for the residual current velocity will more and more approach a constant value. At a certain moment a value is found that does not (or hardly) change anymore with further increasing intervals. This value is subsequently expressed again in, e.g., c m -s '\ which gives a deceptively constant impression, for the thus found "residual" can very well be absent for an hour, a day or a month, without this influencing "the" velocity value.The residual current can be resolved into a few constantly present components (in order of quantitative importance):1. The wind- and airpressure-induced part.2. The net contributions by the tides (so called "non
linear effects", caused by irregular phase differences between vertical and horizontal tides).
3. Differences in sea surface level between the oceanic entrances: between Channel and Scotland, and between Norway and Scotland; and those brought about in the North Sea itself.
4. The baroclinie component (i.e. produced by density differences in the water).
11.2.1 Water displacement by the tides
The North Sea receives its semi-diurnal tidal wave from the northern and southern oceanic entrances; the former strongly predominates in the spatial pattern.It is the fluctuation in the ocean surface that is passed on to the shelf sea; the fluctuation that the moon and the sun achieve directly within the North Sea is in comparison negligibly small. Due to the dimensions of the North Sea, a resonant wave is brought about, which intensifies the oscillation (Z immerman, 1978). The tides in the North Sea bring the whole water column into a motion with complex dynamics. Due to the Coriolis effect, the tidal wave is passed on around the sea counter-clockwise, around a few "amphidromic points" where the surface level variation remains zero (fig. 4). The irregular topography further complicates the pattern.

7
ùO 100
•60
<20
55*
■<60>101
100
¿1i0Á/j'<100- 60 -
"»Oí
Fig. 5. Maximurntidal current velocity (surface, springtide) in cnvs'1 (Dietrich , 1950).
Scale of vectors
•— 7 cm/s •— 4 c m/s * = 6 cm/s
Fig. 6. Tidal induced component of residual current at the sea surface computed with the three-dimensional shelf model (DAVIES, 1983b).
Although the tidal current velocity (some 0.25 - 2nrs"^) is in the order of 10 times as high as that of the total residual (which is expressed in cm .s'1), the corresponding net displacement is small, as the transported water particles almost return to their starting-point after finishing a (horizontal) ellipsoid trajectory ("tidal ellipse”).In the pattern of maximal tidal velocities, largest values are found in Strait Dover, the inner German Bight and some coastal areas (fig. 5). These maxima are important, for they decide e.g. the bottom morphology (Eisma eta!., 1979), the transport and settling of certain sediment fractions (S tr id e , 1973), the horizontal (D ie tr ic h , 1950) and the vertical (DiETRfCH, 1954; Simpson, 1981) mixing.In measurements it is difficult to discern the weak tidal residual component from the fierce tidal currents. By measuring water go by from points fixed to the sea bottom (Eulerian residual), measuring sea bottom go by from devices floating (at different depths) in the water column, and measuring water level oscillations, the Lagrangean residual (i.e. the geographic displacement of a certain water particle by the tides) is reconstructed.This component of the total residual has been computed by (a.o.) Davies (1983b) (fig. 6). In this picture, the movements very near the coasts and in the Irish Sea are not physically realistic (as a consequence of the grid used) but those away from the coast in the southern and central North Sea are. Backhaus and Boehlich(1 985) computed the circulation due to combined tidal and baroclinie forcing and achieved essentially the same pattern as in fig. 6. Davies (1983b) notes that* tidal residual directions at the sea surface and at
the sea bed are about the same, only surface velocities are larger than bottom velocities;
* directions of the tidal induced and the meteorologically induced residuals (to be discussed later) are also essentially the same in the central and southern North Sea.
Two examples illustrate the importance of the tidal currents in horizontal mixing:- West of the island of Texel, strong on- and offshore
water movements occur in the course of a tidal period, visible in the nearly round shape of the tidal ellipse there (W aterkw alite itsp lan Noordzee, 1985a). Water masses here are first shoved over each other (haline density differences), then intensively vertically mixed (rapid flow, shallow water). This combination of movements ("Texel Mühle"; D ie tr ic h , 1953) ensures an effective lateral mixing. O t t o (1983b) stresses that this process is geographically limited, and indicates 4

8
more or less permanent water masses in front of the Belgian-Dutch coast (submasses of nr. 6 in Fig. 1).
- Backhaus (1980) reports a turning around, over the water column, of the rotational direction of the flow vector in the Elbe-Weser-estuary. Large velocity differences are also found at different depths over the "Elbe valley" outside the estuary, with ebb- and flood currents running simultaneously in opposite directions, the one over the other, around the moment of the turn of the tides.
II.2.2 Wind influences on advection
Probably the most important, and at any rate the most capricious, influence on the flow pattern in the North Sea is the wind. Although its direct action is upon the surface layer only, it exerts an indirect influence on deep transports in at least two ways. Firstly, deeper layers will be dragged along (with a Coriolis deflection to the right, increasing with depth); secondly, the wind driven surface water transports can give rise to "mounds" in the sea surface when they converge in (semi-) enclosed areas, or "valleys" when directed away from such areas. This in turn generates compensatory flow of deeper water masses (geostrophic flow).Wind and surface currents are extremely unpredictable on short term. Averaging out over successively longer periods yields ever more regular and predictable seasonal features. The prime external influence on North Sea-scale circulation is the North Atlantic Inflow (not to be confused with the tidal wave). As all oceanic surface currents, this is itself generated by atmospheric circulation over the Atlantic (S to w e , 1983). Fluctuations in ocean- and North Sea-water circulation are closely linked (D o o le y , 1974); thus, the ocean winds - via the
ocean water - strongly influence North Sea circulation. The same goes for the wind over the Baltic (O tto , 1983a).
North Sea 3? a whpjt?
Davies (1982, 1983) developed a three-dimensional model to simulate the meteorologically induced residual currents of the North Sea. With the aid of seasonal averaged wind fields he computed corresponding seasonal patterns of the flow through different levels of the water column.Fig. 7 shows only the annual averages of two layers and the column average. Davies’ (1982) presentations exhibit a maximum flow in autumn-winter, and a minimum in summer. He gives turn-over times for each of the ICES geographic boxes (virtually the same as in fig. 2): annual averages are in table 4.
Area
Surfacelayer
Sea bed layer
Totalvolume
5 m 10 m 5 m 10 m 2D 3D
1 31 43 767 608 583 3332 27 32 387 351 152 1393 90 97 545 495 153 1174 28 37 89 75 93 715 20 30 68 61 55 46
27 39 218 117 369 23745 51 230 212 302 16632 49 143 130 141 89
TAtsLfc 4. Turn-over time (days) computed with meteorological forcing averaged over a year. 2D, Turn-over time computed using depth mean current; 3D, taking into account changes in current direction through the water column. 3D is considered the more realistic (DAVIES, 1982).
NV\\\-VÏ'
VnnnXVW^wv\\N\N\Vvsxww
Fig. 7. Meteorologically induced residual current component at surface (S), sea bed (B), and depth mean (M) for an annual period. (DAVIES, 1982).

9
Davies' main conclusions from the modelling results: The persistence of the major spatial features of the North Sea circulation from season to season is particularly interesting and reflects the dominance of the westerly wind component in each seasonal wind field, and also the influence of bottom topography. The short turn-over time (of the order of days, see Table 4) for the surface layer, clearly shows that it is the magnitude of the wind stress on a daily, and not a seasonal basis which will determine how long it takes a pollutant in the surface layer to leave a particular sea area. Particularly in winter the turn-over time for some areas even for the bottom layer, can be shorter than the three month period over which the wind stresses have been averaged. In view of this, and of the changeability of the wind field (each 3 to 5 days completely different) the author expresses doubt as to whether the seasonal averages can be used to predict real-life turn-over times and transports. To this we add: The numbers of days in table 4 give an order of magnitude indication, besides proportions between the boxes. Actual turnover times must be shorter (locally much shorter), as only the wind component is presented here. In the larger part of the North Sea the wind is paramount in deciding the residual, but especially in the Southern Bight in summer the tidal component can reach similar or greater importance. (Davies, pers. comm.)
Backhaus and B o eh lich (1985) computed the response of the North Sea circulation to wind forcing, on shorter time scales than above. The response time of the North Sea (i.e. the time it takes the current pattern to adjust to a new wind direction and achieve steady state) is 1-2 days for the southern North Sea and 3 -5 days for the deeper northern North Sea. This implies that wind events in the southern North Sea achieve significant transports provided their duration is three days or longer.For all possible wind directions (and three wind velocities, 5, 10 and 15 nvs '1) the steady-state responses were investigated. From this, four types of circulation emerged (fig. 8), each resulting from a specified range of wind directions:1. Cyclonic. The best known, and average, North
Sea circulation. It is counter-clockwise and produces the strongest "flushing" of the North Sea (fig. 7 M agrees with this one).
2. Stirring West. Smaller-scale features than the previous (meso-scale eddies). No significant wind-induced inflow from either Atlantic entrance. Stagnation.
3. Antlcyclonic. Directed opposite to nr. 1, but always weaker, because permanent tidal and
baroclinie residual components are cyclonically directed (that is, in the southern North Sea). Again, nearly no Atlantic imports.
4. Stirring East. Same as 2. Atlantic inflow through Channel only.
Southern North Sea
C a rru th e rs (1925) drew residual current maps for four types of wind over the southern North Sea, each of which he considered characteristic of a season ("the winter type" etc.). Ram ster (1965) did a similar thing for the near-bottom water layer. In cases where C a rru th e rs ' wind data agreed with more recent data (namely, Höhn, 1973), i.e. in winter and in spring, we combined both authors' maps to form fig. 9 (Ramster's "early summer" pattern being combined with C a rru th e rs ' "spring" map). This produces an image in which the wind appears to influence
1.
X
3.
XX
> ■ '
Fig. 8. Modelling results of overall North Sea circulatory response to wind forcing (see text). Type 1 : Cyclonic (winds from 155-305°); 2: Stirring West (305-15°); 3: Anticyclonic (15-105°); 4: Stirring East (105-155°). S, Scotland; D, Denmark; C, Channel (After: BACKHAUS & BOEHLICH, 1985).

10
62' -
6 0 —
bet*—
54* -
Fig. 9. Combined depth mean currents ( — , after: C a rru th e rs , 1925) and near-bottom currents (— , after: Ram ster, 1965) for a) winter; b) spring. Inserts: dominant wind directions (C a rru th e rs , 1925) (see text).
near-bottom currents via those at the surface. The situation resembles that in the German Bight (see Annex), especially if the wind comes from NNW. This wind produces an accumulation of surface water in the Southern Bight. Conceivable is the occurrence of a "corner mound" causing geostrophic flow: surplus water escapes via the bottom, so that the residual is reversed there. This is comparable to what happens in the German Bight with NW wind, when escape occurs via the "Elbe valley" bottom, it can be noted that in the Southern Bight (fig. 9) as well as in the German Bight (Backhaus & Boeklich, 1985; see Annex), and in the North Sea as a whole (Davies, 1982), the turn-overtime is at its longest in spring, I.e. stagnation is maximal in that season, apparently due to the dominant NW component in the wind field.
II.2.3 Water displacement resulting from density differences
A high specific-weight liquid tends to spread out evenly under a lighter liquid, and light-weight liquids try to spread out evenly over heavier ones. From these tendencies results density-induced flow. This flow is essential in the formation of different "water types", the very large-scale oceanic water masses (S to w e , 1983). However, the importance of such flow decreases with increasing surface-to-volume ratio of water bodies (i.e. when they become shallower), and in that order, influences acting upon the surface (like windforcing) gain significance. This is why density-induced flow is far less important in the North Sea in bringing about (box-scale) water displacement, than it is in the ocean. In general, its influence on inter-box water exchanges (fig.3) is insignificant (O t to , pers.comm.). On a still smaller

Fig. 10. Estuarine circulation (After: STOWE, 1983).
scale (intra-box), however, density-induced flow is again very important, not in the last place because the fresh (brackish) water that is most widely dispersed by this flow type, contains very high concentrations of, inter alia, nutrients. Only very small amounts of such water need to be mixed in with sea water in order to strongly influence the concentrations there. And as this light water always remains near the sea surface, its influence can extend way out over the sea without the water being found back in large scale water fluxes.It might be asked: why, then, in the southern North Sea, do the winter-time geographic distributions of salinity (and many other dissolved substances) resemble so closely their summer distributions; shouldn’t they be totally different, in view of the freshwater discharges that are roughly twice the summer volume? Our answer is: because the seasonal variability in the Channel water discharge (which is also in the order of 50%) runs parallel to that In the fresh water discharges (more or less coincidentally). For this causes the percentages of Channel- vs. riverwater in the area to be about equally proportioned throughout the year. This explanation is supported by the computed turn-over time for the southern Bight (box 4) which in summer is 2 -3 times as long as in winter. (Davies , 1982) Eutrophication-relevant types of density-induced flow are:
Estuarine circulation
In river mouths and other fresh-water outflows, low- sallnity (hence, low-density) water is continuously added to the sea water and flows out over it, as if it were an oil spot (fig. 10). Through the interface between salt and fresh water, a permanent mixing occurs: salt water is taken up In the fresh "tongue",
and the brackish mixture flows out to sea in the surface layer. This salt water is replaced by a continuous influx from the sea. As a consequence, two flows constantly run opposite, one above the other. With the tides the salt wedge shuttles to and fro in the estuary. In combination with typically estuarine processes of particle formation and aggregation, this circulation accomplishes the accumulation of organic and inorganic particulate matter at and near the bottom of estuaries, at the end of the salt wedge.
Coastal water circulation
As the freshwater tongue Is carried northward by the residual along the continental coast, this process continues; in this area there is mention of a "river plume". Various river plumes are mixed with coastal run-off and sea water, to form the brackish coastal water, In which a similar circulation exists as the one sketched for the estuary (now perpendicular to the coast).If eastern winds blow, they enhance this process; and also the Coriolis deflection to the right with respect to the depth mean (coastparallel) residual, a deflection increasing with depth, may play a part. At any rate, shoreward residuals dominate the nearbottom pattern in the coastal areas (Po s tm a , 1978). Like in the estuaries, this brings about particulate matter accumulation in that direction. Postma (1984) indicates that this mechanism will be active as far offshore as density differences capable of creating an undercurrent occur, and draws a "line of no return" beyond which particulates will escape from the coastal trapping mechanisms, and landwards of which sinking particles (among them, particulate nutrients) tend to be transported shoreward. He draws this line in the North Sea between 52-56°N at ap
12
proximately the position of the (winter) boundary of the Continental Coastal Water Mass (fig. 1, nr. 6). This presents us with an extra argument to view this water mass as a physical unit, and its boundary as an appropriate circumscription of a "eutrophication problem area" (see § III.2.2).
II.3 Stratification and vertical mixing
In the North Sea there is a variety of types and Intensities of layering (stratification) in the water column. The importance of this phenomenon for problems of eutrophication seems to lie, firstly, in the degree of oxygen supply to the near-bottom water in coastal areas, which is decisive for the life chances of species living there; secondly, in its influence on regional production and species composition (PiNGREE eta!., 1978).A general survey, after D ietrich (1950):In the larger part, the centra! and northern North Sea, thermal stratification occurs in summer, just like in the Atlantic at the same geographic latitudes. The most important modifying influences on this:- the tidal mixing in the shallow coastal areas, an
influence gradually decreasing on the route North Sea - Kattegat - Baltic;
1.03
355Ú sa lin ity
1.02
£I ! 1.01aíO
Maxim um
1.00Fresh water
0.99
3020100Temperature (°C)
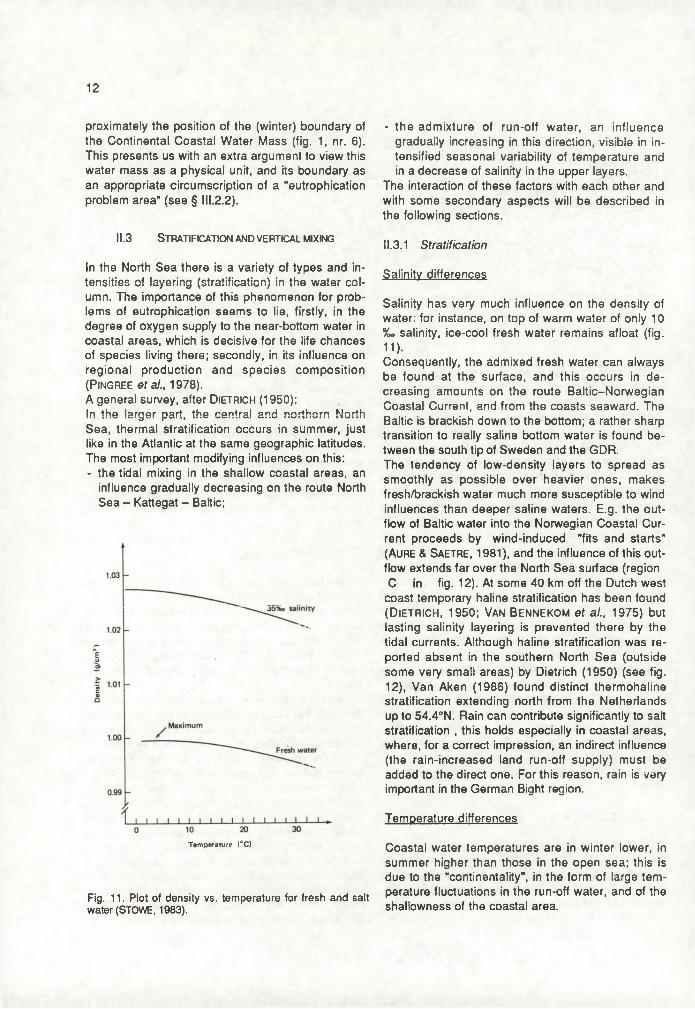
Fig. 11. Plot of density vs. temperature for fresh and salt water (STOWE, 1983).
- the admixture of run-off water, an influence gradually increasing in this direction, visible in intensified seasonal variability of temperature and in a decrease of salinity in the upper layers.
The interaction of these factors with each other and with some secondary aspects will be described in the following sections.
11.3.1 Stratification
Salinity differences
Salinity has very much influence on the density of water: for instance, on top of warm water of only 10 %o salinity, ice-cool fresh water remains afloat (fig. 11).Consequently, the admixed fresh water can always be found at the surface, and this occurs in decreasing amounts on the route Baltic-Norwegian Coastal Current, and from the coasts seaward. The Baltic is brackish down to the bottom; a rather sharp transition to really saline bottom water is found between the south tip of Sweden and the GDR.The tendency of low-density layers to spread as smoothly as possible over heavier ones, makes fresh/brackish water much more susceptible to wind influences than deeper saline waters. E.g. the outflow of Baltic water into the Norwegian Coastal Current proceeds by wind-induced "fits and starts" (Aure & S ae tre , 1981), and the influence of this outflow extends far over the North Sea surface (region C in fig. 12). At some 40 km off the Dutch west
coast temporary haline stratification has been found (D ie tr ic h , 1950; Van Bennekom et a i, 1975) but lasting salinity layering is prevented there by the tidal currents. Although haline stratification was reported absent in the southern North Sea (outside some very small areas) by Dietrich (1950) (see fig. 12), Van Aken (1986) found distinct thermohaline stratification extending north from the Netherlands up to 54.4°N. Rain can contribute significantly to salt stratification , this holds especially in coastal areas, where, for a correct impression, an indirect influence (the rain-increased land run-off supply) must be added to the direct one. For this reason, rain is very important in the German Bight region.
Temperature differences
Coastal water temperatures are in winter lower, in summer higher than those in the open sea; this is due to the "continentality", in the form of large temperature fluctuations in the run-off water, and of the shallowness of the coastal area.

13
Ñ T
Fig. 12. Hydrographie regions in terms of stratification. A, homothermal and homohaline throughout the year. B, seasonal thermal stratification in homohaline water. C, seasonal thermal stratification and permanent (weak) haline stratification. D, permanent strong haline stratification. After DIETRICH ( I 950 ). Broken lines: some fronts and frontlike situations (see text § II.3.3). after: PlNGREE et al. (1978), FURNES & MORK (1983), DIETRICH (1950), BECKER & P RAHM-RODEWALD (1980), AURE & SAETRE (1981).
Fig. 13. Distribution of E = log 10 £. where e is the tidal energy dissipation per unit mass (erg-g"' - s ' ' ). The continuous line E = -1 .5 represents the predicted position of frontal boundaries. Horizontally shaded and stippled regions show, respectively, water that is stratified in the summer and water that remains well-mixed throughout the year. The transitional zone between well-mixed and stratified waters (-2 .0 < E <1.0) is indicated by heavy shading (PlNGREE eta!.. 1978).
The thermal stratification in the open North Sea, on the other hand, has nothing to do with land influence; this is only a continuation of the oceanic regime.Heat means buoyancy, and a strong temperature gradient provides a large thermal resistance to vertical mixing (fig. 14).At the end of winter, windmixing keeps the whole column mixed, virtually over all of the North Sea.With intensifying solar radiation (early summer) the depth of wind mixing (the thickness of the wind- mixed layer) is progressively reduced: starting from a homogeneously mixed situation, heat supply to the surface goes faster than heat transport to the deepest water (or to the top of the tidally mixed bottom water layer).At this depth, then, a faint thermocline arises and
begins to divide the (non-tidally-mixed) water into two layers. The subsequent hamperings in water exchange and heat exchange between the new layers intensify each other. Until midsummer, insolation increasing, the thermocline tends to climb, and sharpen.Relative thermal resistance in the discontinuity layer increases during this period (fig. 14); buoyancy is stored and concentrated above this layer.The amount of solar heat added, on average, to the surfacewater of the North Sea and the Baltic, does not vary strongly geographically (It does vary with the weather and the season, and from year to year). Whereas the sunshine decides the amount of heat added, the mixing by wind and waves decides the thickness of the homogenized top layer and thus its heat capacity. Hence it is the extent of this mixing

14
T E M P E R A T U R E ( °C )0 10 20
2 - ______R.T.R.
4 -
£ N—'II- 8 -
CL
S ’ ° -1 2 -
14-
1640 60200
R E L A T I V E T H E R M A L R E S I S T A N C E
Fig. 14. A summer temperature profile (single line) and relative ihetmai resistance (RTR) io mixing (bars), iur columns of water 0.5 m deep in Little Round Lake, Ontario (one unit of RTR = 8 x 10"®, i.e. the density difference between water at 5°C and at 4°C). RTR is expressed as density difference between water at top and at bottom of each 0.5 m column, in units (WETZEL, 1983).
that controls the temperature rise due to the added insolation, and thus the surface temperature.
II.3.2 Vertical Mixing
From below
Synonymous with mixing is “turbulent diffusion", to b9 distinguished from the (micro-scale and slow) molecular diffusion (R u tg e rs van d er L o e ff, 1980, 1981). The whirls involved are generally larger-scale in horizontal mixing (diameters ranging up to tens of km) than those in vertical mixing. In this section interest is focused on the degree of vertical mixing that these turbulences achieve. Decisive in that respect is the maximum tidal current velocity, surface values of which are given in fig. 5.These are springtide maxima; those at neaptide are about 0.6 times as high (D ietrich , 1954). The nearer to the ses floor the lower sre these velocities* sn increasing share of the tidal energy, namely, is converted into bottom friction. From this friction results turbulence, which is passed on aloft; so tidal mixing takes place from the bottom upwards.The influence of tidal mixing on the water column as a whole at a certain place is reflected in the thickness of the homogenized water layer at the bottom. This is limited by the tidal current velocity, but also
by the vertical density gradient, if there is one: the stronger this gradient, the more energy tidal mixing takes (D ie tr ic h , 1954). Stratifying influences from the water surface downwards, leading to "storage of buoyancy", consequently also limit the thickness of the mixed bottom layer, in other words, they modify the degree of tidal mixing.
From above
The extent of wind mixing, acting upon the surface, is subject to a stronger seasonal variation than tidal mixing. In the stratified situation, wind mixing usually extends down to about 20 m (D ie tr ic h , 1950, 1954). Oceanic long waves, also a wind-induced phenomenon, can mix the water much deeper (30- 50 m; D ie tr ic h , 1950), but in the North Sea these occur only north of the Dogger Bank (Eisma, 1975). As vertical salinity differences contribute to density differences, these limit the extent of wind mixing, like they did with tidal mixing. In the German Bight this, together with regional conditions (to be discussed in II.4), helps create the strong tendency for thermohaline stratification in summer (Goedecke, 1968). It generally applies to the east half of the southern North Sea that salinity layering (Van Aken, 1986) and variations in wind mixing (Van Aken, pers. comm.) may greatly modify the extensiveness of summer stratification.
11.3.3 Fronts and hydrographic regions
It is the unequal distribution over the water column of solar heat (hence, of buoyancy) that controls the presence or absence of summer stratification. It was tried to formulate the principles governing the buildup and the breakdown of this stratification in terms of a competition between the stratifying and the mixing influences described above. Furthermore, it was intended to predict from these principles the geographic position of the boundary between stratified and mixed areas (e.g. Simpson, 1981; PlNGREE et al., 1978).In this work, use was made of:i) high resolution satellite thermographs of the sea surface; ii) the expectation that the border line would be marked by a relatively intense horizontal temperature gradien; iii) the observation in literature that such border lines occupy nearly constant positions in the shelf seas (Simpson, 1981); iv) the assumption that the mixing power of the wind is negligible with respect to that of the tides, in deciding the geographic pattern; v) the positions of fronts from the literature.
15
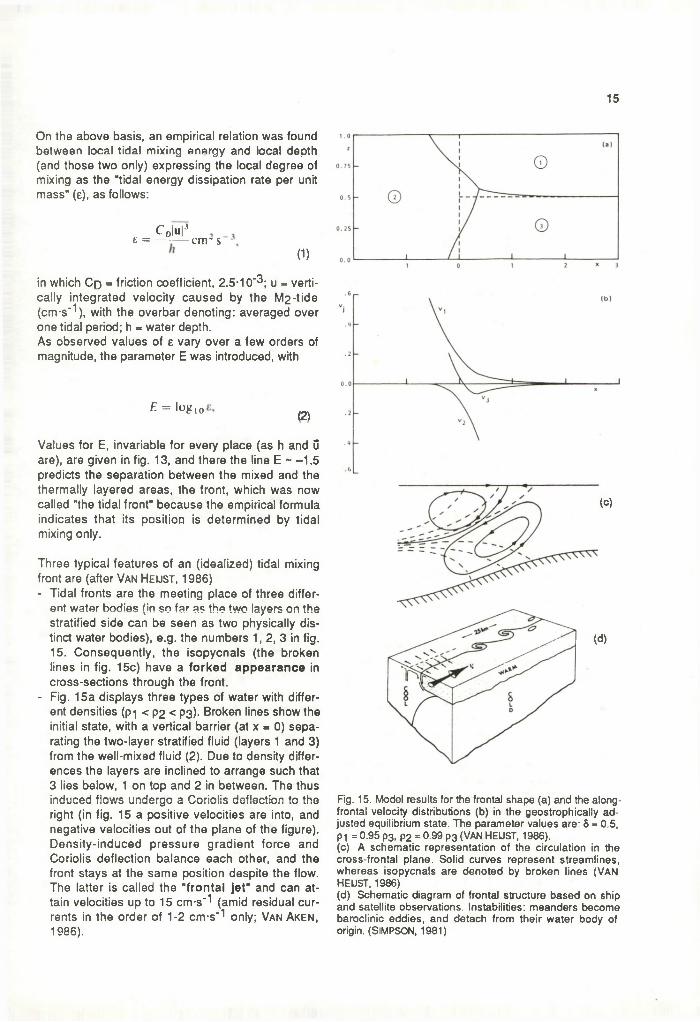
On the above basis, an empirical relation was found between local tidal mixing energy and local depth (and those two only) expressing the local degree of mixing as the "tidal energy dissipation rate per unit mass" (e), as follows:
e =CD|u|J
c n r s(1)
in which Cd = friction coefficient, 2.5-10"^; u = vertically integrated velocity caused by the M2-tide (cm-s'1), with the overbar denoting: averaged over one tidal period; h = water depth.As observed values of e vary over a few orders of magnitude, the parameter E was introduced, with
£ = log i o(2)
Values for E, invariable for every place (as h and ü are), are given in fig. 13, and there the line E ~ -1.5 predicts the separation between the mixed and the thermally layered areas, the front, which was now called "the tidal front" because the empirical formula indicates that its position is determined by tidal mixing only.
Three typical features of an (idealized) tidal mixing front are (after Van He u s t , 1986)- Tidal fronts are the meeting place of three differ
ent water bodies (in so far as the two layers on the stratified side can be seen as two physically distinct water bodies), e.g. the numbers 1, 2, 3 in fig. 15. Consequently, the isopycnals (the broken lines in fig. 15c) have a forked appearance in cross-sections through the front.
- Fig. 15a displays three types of water with different densities (pi < P2 < P3)- Broken lines show the initial state, with a vertical barrier (at x - 0) separating the two-layer stratified fluid (layers 1 and 3) from the well-mixed fluid (2). Due to density differences the layers are inclined to arrange such that 3 lies below, 1 on top and 2 in between. The thus induced flows undergo a Coriolis deflection to the right (in fig. 15 a positive velocities are into, and negative velocities out of the plane of the figure). Density-induced pressure gradient force and Coriolis deflection balance each other, and the front stays at the same position despite the flow. The latter is called the "fronta l jet" and can attain velocities up to 15 cm-s' 1 (amid residual currents in the order of 1-2 cm-s'^ only; Van Aken, 1986).
1 . 0
i0.75
0.5
0.25
0 . 0 x2 311 0
6(b )
2
0 . 0
2
4
*»
(c)
(d)
Fig. 15. Model results for the frontal shape (a) and the along- frontal velocity distributions (b) in the geostrophically adjusted equilibrium state. The parameter values are: 8 = 0.5, P1 = 0.95 p3, p2 = 0.99 p3 (VAN HEUST, 1986).(c) A schematic representation of the circulation in the cross-frontal plane. Solid curves represent streamlines, whereas isopycnals are denoted by broken lines (VAN HEUST, 1986)(d) Schematic diagram of frontal structure based on ship and satellite observations. Instabilities: meanders become baroclinie eddies, and detach from their water body of origin. (SIMPSON, 1981)

16
- There is also a weak flo w In the cross-frontal plane, arising from "slow frictional spreading of the front under gravity" (Van H e ijs t, 1986) (fig. 15c). It has a two-cell structure, with the circulation in the upper and the lower cell directed opposite. As can be seen from fig. 15c, the results are:* a convergence at the surface (often visible by
the floating material that accumulates there) and
* an upwelling flow on the mixed side of the front. The latter tends to bring dense (cold) bottom water from the stratified side to the surface at the mixed side (Van Aken ef a/., 1987).
At this point we extend the discussion from the tidal mixing type front to the more general category "fronts", i.e. vertical or inclined boundaries separating water masses. A front, thus defined, can also be the interface between two water masses instead of three. In this case the isopycnals may aii terminate at the water surface (far end of floating light water mass) or run into the bottom (far end of underlying heavy tongue). Two additional flow phenomena can now be mentioned, observed near tidal as well as other fronts:- Cross-frontal upwelling. Wind forcing may
indirectly transport deeper water from stratified areas , through a tidal front, to the mixed side of the front. Pingree et al. (1978) exemplify this with a SSE wind over the southern North Sea, lasting for a few days. This wind will blow the top water layer to the east (Coriolis deflection to the right relative to driving force) and thus generate compensatory geostrophic flow in deeper layers, which causes upwelling along the British coast. The reversed wind and flow directions, on the other hand, may cause upwelling in front of the Danish coast. The upwelling waters are usually colder and nutrient-richer. The result can be: a new primary production impulse for receiving areas if these are subject to nutrient limitation (Pingree et al., 1978).
- Baroclinie eddies are considered the most important cross-frontal exchange mechanism of water and substances on a somewhat smaller geographic scale than the previous transport type. An initial perturbation of the along-front flow grows as a wave-like disturbance which eventually curls up (fig. 15d) (Simpson, 1981). These curls are visible in high-resolution satellite thermographs, and their reported sizes vary from 5-20 km in the German Bight (K rause et al., 1986), via 20-40 km in the western Channel (Simpson, 1981), to some 50 km at the edge of the Norwegian Coastal Current
(Au dunson et al., 1981). They are often observed in series along fronts. They occur on both sides of fronts and are expressions (just as the observed frontal meanders are) of the fronts' instability (Van Heijst, 1986).
Although a very good agreement was found between, on the one hand, fronts observed around the British Isles, and on the other, their predicted positions inferred from formulae (1) and (2) (fig. 13), this does not apply to the southern North Sea north of the Netherlands. Firstly, fronts found there are in the order of 100 km to the north of their predicted position and their course seems in no way related to the E contours there (V an Ak e n , 1986). Secondly, although they exhibit typically frontal dynamic features, they lack forked isopycnals; all of these run into the bottom, indicating a (permanently present) cold bottom layer.Consequently, P in g r e e ’s et al. (1978) prediction, if valid, is complicated considerably by local conditions in the southern central North Sea. The ins and outs of these fronts and their implications with respect to eutrophication require further investigation.
In fig. 13 only the tidal mixing front regions have been indicated; not all the fronts or front-like situations. In transitional areas between water masses that move more or less independent of one another, frontal phenomena are observed as well. For example, neighbouring residual currents of opposite direction achieve salinity and temperature fronts between the Norwegian Coastal Current and the central North Sea water (Fu rnes & Mo r k , 1983). Salinity fronts have been reported off (40 km) the Dutch coast (D ie t r ic h , 1950), in the inner German Bight (Becker & P r ah m -R o d e w a ld , 1980) and in the Skagerrak (Aure & Saetre, 1981).The relative isolation between water masses is always expressed in temperature and/or salinity differences. D ietrich (1950) reviewed observations of horizontal and vertical gradients of temperature, and separately of salinity, in the North Sea and the Baltic.From the spatial distributions of these two, he inferred the mixing regime in various parts, which resulted in his division in five Hydrographic Regions of the two seas. Fig. 12 presents a simplified cut-out of this map, and the frontal regions mentioned above have been drawn in.

17
-55 '
- 5¿
Fig. 16. The different water bodies and mixing areas in the eastern German Bight, a, water of the Elbe estuary; b, water of the Wadden Sea; c-|, North Frisian coastal water; C2 , southern mixing area; d, water of the North Sea. (MARTENS, 1978)
II.4 Hydrography o f the German Bight
A separate section is dedicated to the hydrography of the German Bight, because relatively many details of it have been reported about, which would lose much of their significance had they been scattered over the thematic sections.The German Bight has as its central structure the previous bed of the Elbe river, that discharged into the North Sea near the Dogger Bank some 14 thousand years ago. This "Elbe Valley" is a wedge- shaped depression, approximately circumscribed by the 30-meter line. Its main axis lies in a plain gradually widening and sloping down to WNW, between Helgoland (30 meter deep) and the White Bank (50 m deep). Of the two slopes that enclose this valley the north-east one is the steepest. These slopes are in turn flanked by two more dimly sloping higher plains in the south and east, situated between 25 and 5 m water depth. These plains are interconnected near Helgoland and are called the East Friesian and the North Friesian Shelf, respectively; the latter is about twice as wide as the former. Landward of the 5 meter line the shallow Wadden belt forms the coastal edge of the region.
o
Fig. 17. Salinity fronts in the German Bight, 16-20 8-1979.Position of the frontal systems:------, S strongly increasestowards the west;— , S strongly decreases towards the west (BECKER & PRAHM-FtOOENWALD, 1980)
11.4.1 W a te rM a s s e s
The eastern German Bight is the stage of intensive mixing of North Sea water with lighter coastal water. Furthermore, Elbe water causes strong inhomo- geneity in this area, visible in the distributions of dead and living suspended material and nutrients. In this area the formation of relatively stable water masses takes place (G oedecke, 1968; M a rte n s , 1978) (fig. 16). On the basis of physical, chemical and biological differences the latter author (1978) distinguished, in November 1976:- water of the Elbe estuary (a) with low salinity,
highly variable temperature, high nutrient concentrations and suspension load;
- North Sea water (d) with high salinity, comparably small seasonal temperature changes and low nutrients and suspension values;
- northern Wadden Sea water (b) and- mixing area water (c), both intermediate in these
parameters, c is divided in North Friesian Coastal water (c1), the area of most intensive mixing- proportion of river water is at its highest; and southern mixing area (c2)
d, the most dominant water body, can, concentrated by the flanks of the Elbe valley, penetrate deep into the inner German Bight, and force intensive mixing

with the lighter coastal water, which is expressed in large-scale residual gyres (B ö h n e c k e , 1922; G o ed ec ke , 1968), and /or extensive frontal systems (fig. 17) (see below).There is a large variability in the extent to which the fresh/brackish water spreads out over the sea water, respectively, remains pinched against the North Friesian coast, as a consequence of which the water mass boundaries can be diverted somewhat (Backhaus, 1980).
II.4.2 Mixing and stratification
In the "convergence zone" (C-j -C2 in fig. 16) over the shelves (5-25 m deep) the tidal currents causes a permanent mixing over the column; there are virtually never vertical gradients, only (exceptionally strong) horizontal ones. Over the Elbe Valley there Is stratification: haline in winter, thermohaline in summer.In the outer German Bight the permanent halocline runs skewly up towards the water surface and there ends the salt stratification; in summer, however, the regional thermocline contacts the stable central North Sea thermocline (Goedecke, 1968). A density stratification, pronounced over the Elbe Valley and weakening towards the sea, is the result.A few frontal areas are distinguished by Krause et al. (1986) ( fig. 18): In the middle of area A usually a (5-10 km wide) zone of relatively cold and salt water Is found, with thermal (i.e., tidal) fronts along both its landward and its seaward edge. This "cold belt" is present throughout summer; it is a "warm belt" in winter.Region B, near the beginning of the old Elbe Valley, exhibits occasional upwelling "bells" with fronts at
O
7»
Fig. 18 Areas of the German Bight with predominant occurrence of: A, thermal fronts; B, fronts caused by upwelling; C, river plume type of fronts (KRAUSE eta!., 1986)
the edges; these occur mainly during easterly winds (see later).In region C, river plume fronts are found. They are ribbon shaped, and many, with life-times of 2-4 weeks (Becker & P r a h m -R o d e w a l d , 1980), all of them directed roughly north-south and typically 5-20 km long (Krause et al., 1986).
II.4.3 Water transports
The net water displacement (residual currents) is influenced by (in order of importance): i) the wind field; ii) the density distribution and iii) the tides.Wind influence is extremely large, and this is primarily due to the extensiveness and shallowness of the shelves, especially the North Friesian. It is also the topography that maintains the density distribution with its strong horizontal gradients (In this area, the influence of the tides on the residuals is about an order of magnitude smaller than that of the density differences; Backhaus, 1980).Owing to the topography, wind and density effects are conducive to the observation that the German Bight is something of a dead angle in the large-scale North Sea residual circulation (German Bight and Dogger Bank have the longest residence time of the whole North Sea; W a te rk w a lite its p la n No o r d ze e , 1985a). Consequently, the influence of the many freshwater sources on water composition is relatively large, especially between the Jade and Sylt (Postma, 1982).B ackhaus & B o e h lic h (1985) investigated the circulatory response of the waters in the area to wind forcing, just like they did for the North Sea as a whole ( § II.2.2). Their leading question was: Does the weather of the preceding winter influence the area's oxygen budget during the following growth season? Assuming the coastal Input of nutrients to be constant, one should find higher nutrient concentrations in a spring following a winter period with much "stirring", than after a winter with good "flushing". This then, it was argued, could have induced excessive organic matter production in the area in the following season, and thus, oxygen depletion. Using the data collected in computing the wind-induced circulation in the North Sea as a whole (i.e., which wind directions cause "flushing" and which "stirring"; see § II.2.2 and fig. 8), and using continuous wind measurements data for the winters 1968/69 - 1981/82, they computed the degrees of "flushing " and "strirring" likely to have taken place in each of those winters.The following step was to investigate whether the extent of "stirring" in the winters was somehow cor-

19
related with the extent of oxygen depletion in the following summers.There appeared, however, no correlation: 1980/81 and 1981/82 were winters with short and "normal" turnover times, resulting in "low" and "normal" nutrient contents of the German Bight in spring.The following oxygen depletions in the summers of these years could, consequently, not be explained with the circulation in the winter season. The authors conclude that other factors are decisive for oxygen depletions in summer, e.g. the enrichment of nutrients in the sediment, and/or the circulation during the summer season itself.
This calls attention to the possible importance of stagnation on shorter than seasonal time scales. Backhaus (1980) stressed the vital importance of the baroclinie pressure gradient for residual patterns in deep water layers in the region. (Baroclinie effects are effects resulting from density differences of water bodies." Barotropic effects" is the general denominator for all effects that result from non-baro- clinic influences of whatever nature). The salt tongue in the Elbe Valley is subject to a permanent baroclinie pressure gradient, which under all circumstances is directed to the southeast. The denser North Sea water continually tends to form a level layer under the lighter coastal water, all over the area. Consequently it exerts a constant upward pressure, over the Elbe Valley floor towards the convergence zone, where it meets a permanent influx of light water.In situations of oxygen deficiency, renewal of the near-bottom water is important. This renewal is tightly connected with the presence and extent of flow along the Elbe Valley floor. If, namely, this flow stagnates, that is also what happens with near-bottom flow on either side of the Valley, the shelves. Irrespective of whether the Valley floor flow is directed outward (NW) or inward (SE), in both cases renewal of deep layers occurs throughout the area. In all cases, the wind field is - indirectly - essential:- With NW wind the lighter coastal water over both
shelves is blown towards the Elbe-Weser estuary. In that corner a (barotropic) sea level rise results (a few cm). The wind prevents the superficial flow-off of the "water mound", which takes a deeper escape route: the Valley floor. The residual there will set off in a NW direction: renewal takes place. The barotropic pressure gradient is in this case directed opposite to the baroclinie one, and tips the scales.
- with winds from the east half of the compass rose, the wind and the barotropic pressure nradien! ars diractad offshorô! thô coasta! watsr
is spread out maximally over the North Sea water. Water coming from deeper parts (i.e., the Elbe Valley) takes the place of the dislodged water; mixing takes place. The Valley floor residual is directed SE. In this case, too, renewal takes place, accompanied by upwelled water "bells" (Krause et al., 1986). Baroclinie and barotropic pressure gradients are in the same direction.
- with SW wind (provided it is weak to moderate) the barotrophic pressure gradient (to the NE) is perpendicular to the baroclinie one. Along-floor transport in either direction in the Valley is prevented. Some "corner accumulation" of coastal surface water arises, but this flows off superficially over the North Friesian Shelf, to the north. There is also some compensating upwelling at the Valley's SW flank, but the enormous salt water tongue comes largely to a standstill. At wind velocities around 5 m-s' 1 the resulting near-bottom stagnation over the whole area is maximal.
As in the German Bight the SW wind component prevails, stagnation in deeper waters is likely to occur regularly and hence also the retardation of oxygen replenishment from the atmosphere. Combined with a high biological oxygen demand near the bottom in summer, this might cause oxygen depletion. It may be recommendable to compute the dura tions/intensities of "stirring" vs. "flushing" events near the Elbe Valley bottom over the past summers, on the basis of knowledge about favourable/unfavorable wind directions as described above. Nevertheless, the other mentioned possible explanation, nutrient enrichment of the sediment (and this in the form of over-year organic matter accumulation) also seems to us to be very plausible.
II.5 Suspension and sedimentation o f fine m atter
As the probably most important eutrophication problem, near-bottom anoxia, is associated with excess amounts of organic matter that have settled from the water column, this settling is itself very influential.The organic matter is not necessarily produced in the settling area itself. As the finest suspended matter is usually also the richest in organic substances, especially the settling areas of fine matter are sites of organic matter accumulation. Such sites are likely to exhibit effects when the production area supplying them with organic matter is nutrient-enriched. It is important to trace these sedimentation areas, all the more as other forms of pollution are likely to be concentrated there as well, and interac

20
tions of effects are to be expected. In this section the suspended matter transport, accumulation and deposition in especially the problem area will be outlined.
11.5.1 Description of suspended matter
What is usually called suspended matter has by convention minimal dimensions of 0.45 pm; smaller particles are considered dissolved (in fact there is not a sharp but a gradual transition from material in true solution, via complexes, via large organic molecules to colloids and, finally, real "particles" - Eisma, 1981b). The transportable range of the particle size spectrum depends on current velocity and particle densities. The living, planktonic, proportion of the suspended matter is highest in the oceans (> 90%) and varies in the shelf seas between 10 - 90% (De Lange & Hummel, 1978).In suspended matter samples this proportion cannot be separated from the non-living, which hampers the drawing up of budgets. That is why budget calculations are based on winter samples that contain hardly any living plankon.The mineral proportion of the non-living suspended matter in shallow coastal waters is found in all size classes below 70 pm: fine sand (> 50 pm), silt (2-50 pm) and lutum or clay (< 2 pm). With increasing distance from the coast, sinking out removes an increasing proportion of the size spectrum, from the coarse side down, until only the finest fractions remain.The composition varies with the dimensions: clay minerals, organic matter and coccoliths are in general < 5 pm; quartz, feldspars and hard exoskeletons normally larger. Furthermore, the degree of aggregation is size-dependent: the finest material consists of loose grains, at about 5 pm approximately half is aggregated, and over 70 pm virtually all particles are aggregates (Eisma, 1981b). Approaching the coasts, the share of non-living organic matter coming from the benthos becomes more and more important, notably faecal pellets, often aggregated with minerals to particles in the size class 50-700 pm.
The organic proportion in suspended matter varies with the seasons. In the growing season it can amount to more than 90%. In winter, 10-20% of the suspended matter in the Southern Bight is organic (mainly the above mentioned benthic-faecal and mineral aggregates) (Eisma & K a lf, 1979). Upon settling, 50-75% of this organic matter is decomposed by the benthos, so that the thus formed contribution to the sediment contains 5% or less organic matter
(De Lange & Hummel, 1978). The organic matter in North Sea sediments is virtually of completely marine origin (Eisma, pers. comm.)
II.5.2 Aggregates
Two main types of suspended aggregates are distinguished (Eisma, 1986):- Microflocs, with sizes up to 125 pm, made up of
mineral particles and organic matter, strongly bonded and tightly packed (it takes ultrasonic treatment to disintegrate them). The size of microflocs can be as large as the largest mineral particles in suspension.
- Macroflocs, larger than 125 pm, up to a few mm. Very fragile and easily destroyed by sampling. They are formed by physical processes under conditions of viscous flow (the size of the smallest turbulent whirl being that of the largest possible macrofloc). When formed in quiet coastal waters they consist originally of organic matter to which gradually more inorganic particles are attached. In estuaries, where they are formed under similar conditions, they are aggregates of microflocs and single mineral particles. There seem to be no major size differences between coastal and estuarine macroflocs.
The organic matter, the glue in the aggregates, is crucial for the size of the floes and their internal binding strength. In that way it also regulates floe size and suspension behaviour. Kranck and M illigan (1980) made artificial floes up to a few mm in size by mixing fine-grained organic detritus and fine mineral particles in a slow flowing system. In these experiments they also demonstrated that a 1:1 mixture of organic matter and mineral particles (a normal ratio for coastal seas), via this flocculation, settles on the bottom much faster than either the organic matter or the mineral particles alone.
Microflocs are in a continuous cycling from river water through filter feeders (pelagic and benthic), into faecal pellets, and down onto the bottom where they soon fall apart (bacterial activity), and the fragments often undergo resuspension. The organic matter in them continually changes in composition.So in every reach of the river, the estuary and the coastal sea the microflocs are cemented with by and large autochthonous organic matter. This is viewed by Eisma (1986) as the cause of their general size decrease at the upper estuary, the estuarine organic matter being less "sticky" than the fluvial . Whereas it was previously thought that here a "salt flocculation" occurs (enhanced down-estuary flocculation by addition of salts in the medium), at pre-
21
wmd»
SCOTLANO
résultentcurrentdirection
SHETLAND ISL.
SCOTLANO
ENGLANO
m q /l v jsptTUlfl«
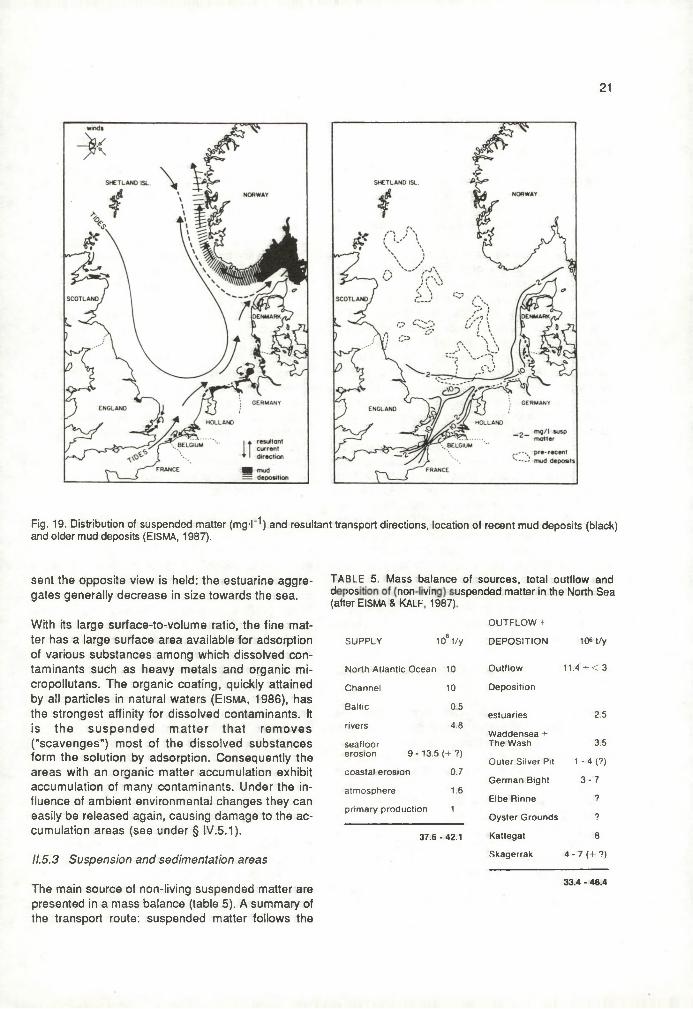
Fig. 19. Distribution of suspended matter (mg-l- '*) and resultant transport directions, location of recent mud deposits (black) and older mud deposits (EISMA, 1987).
sent the opposite view is held: the estuarine aggre- TABLE 5. Mass balance of sources, total outflow and
gates generally decrease in size towards the sea. faft^BSMA & ^ L F V'in987)US n< d matter 'n the Norttl ^ea
With its large surface-to-volume ratio, the fine mat O U TFLO W t
ter has a large surface area available for adsorption SUPPLY 106 t/y DEPO SIT IO N 10® t/y
of various substances among which dissolved contaminants such as heavy metals and organic mi- North Atlantic Ocean 10 Outflow 1 1 .4 + < 3
cropollutans. The organic coating, quickly attained Channel 10 Depositionby all particles in natural waters (E isma, 1986), has Polfin 0 5the strongest affinity for dissolved contaminants. It
Dal IIL-estuaries 2.5
is the suspended m atter tha t rem oves rivers 4.8Waddensea +
("scavenges") most of the dissolved substances seafloor The Wash 3.5
form the solution by adsorption. Consequently the erosion 9 - 1 3 .5 ( + ? )Outer Silver Pit 1 - 4 (?)
areas with an organic matter accumulation exhibit coastal erosion 0.7
accumulation of many contaminants. Under the in atmosphere 1.6German Bight 3 - 7
fluence of ambient environmental changes they can Elbe Rinne ?
easily be released again, causing damage to the acprimary production 1
Oyster Grounds ?cumulation areas (see under § IV.5.1). 37.6 -42.1 Kattegat 8
11.5.3 Suspension and sedimentation areas Skagerrak 4 - 7 (+ ?)
The main source of non-living suspended matter are33.4 - 46.4
presented in a mass balance (table 5). A summary of the transport route: suspended matter follows the

22
counter-clockwise residual direction from the English, Belgian, Dutch, German and Danish coastal areas to the Skagerrak, from where it flows out into the Norwegian Sea along the Norwegian coast. Dominant features on this route are (fig. 19)- uptake of material from the gradually rising sea
floor by the water of the North Atlantic Inflow;- a general tendency to concentrate in coastal wa
ters ;- progressing concentration in a few small areas,
involving temporary or permanent deposition of pari of the suspended matter;
- a gradual decrease in concentrations in the transport direction along the east side of the North Sea.
The North Sea is a terminus for suspended matter as such, that is mineralized, deposited, or dissolved. There are strong indications that the amount of suspended matter flowing out of the North Sea into the Norwegian Sea along the Norwegian coast is only little more, or the same, as the amount coming in from ine North Atlantic, aithough its composition may be different (Eisma & K a lf, 1987).A few factors modifying the suspended amounts are i) variations in tidal current velocity, that influence the bottom friction. Thus constantly varying amounts of material are stirred up and kept in suspension; ii) variations in wave activity, also determining the stirring up. Consequently in winter, the season with the strongest wind forcing (D avies, 1983a) the suspended concentrations are on average higher than in summer; iii) due to lower temperature, winter time sea water has a higher viscosity. Other things being equal, S tr id e (1973) estimates this influence alone to double or triple the wintertime suspension transports in comparison to summer transports.
Local accumulation of suspended matter in the water column
North Sea areas where relatively high concentrations of suspended matter occur in the water - not to be confused with deposition areas - are:- In front of the Belglan-Dutch coast near Os
tende, on the flank of a vortex in the residual pattern (N ihou l & R onday, 1975), where different residual transport directions of suspended matter meet (fig. 20). The suspended matter is in part supplied by local erosion of old clay banks, partly from the Channel, and partly from the Scheldt estuary (Eisma & K a lf, 1979). Patches of net erosion and net deposition alternate, with overall a small net erosion. Storms especially make this area a source of dispersed suspended matter.
- off East Anglia (fig. 20) where, likewise, old clay banks are eroded, which is transported to the Thames estuary and, across the Southern Bight, in the direction of the Oyster Grounds (fig. 21). Deposition in the area itself occurs only in small amounts (Eisma, pers. comm.) The exported suspension loads are likely to contain part of the sewage sludge and dredge in the source area.
- The German Bight, southeast of Helgoland, where very high suspended concentrations are built up by a tidal mechanism. Here the suspended matter preferentially remains in the near-bottom waters in a depression in the bottom topography, where it is gathered by exceptionally strong flood- currents. Although the ebb-current is very strong as well, this is on the return at a higher level in the water column, due to haline density differences. Because there is a very strong concentration gradient down from the surface (4 m gT1) to the bottom (> 20 mg-M), flood transports by far exceed ebb transports, and the water in the depression holds high concentrations of suspended matter (Eisma & K a lf, 1987).
- The deep waters of the Skagerrak, not so relevant in relation to eutrophication (for more information : Van W eering, 1981).
b. Recent sedimentation of fine-arained matter
For studies concerning marine eutrophication it is essential to be able to discern the areas where presently fine material is deposited. For that aim it does not suffice to go after the areas that have "mud" (< 70 pm) lying on the sea floor. These, namely, include areas where no recent sedimentation has occured (mud patches in the central and northern North Sea) or where this is uncertain (patches along the Scottish and English coast, Outer Silver Pit) (fig 19b).High suspended matter concentrations are an important indication, but there too, in some instances no, very little (East Anglia), or only temporary (Dutch west coast) deposition takes place.The aforementioned concentrating of suspended matter in coastal waters enhances coastal deposition in lagoons, river mouths, the coastal strip and tidal flats. Tidal asymmetries (flood suspension transports exceeding ebb transports) and local reductions in wave activity are conducive. For the North Sea all this results in permanent deposition of fine-grained matter in a few restricted areas along its main transport route (fig. 19a):- the estuaries in the south and in the German
Bight, were both terrigenous and marine mud settle down, and where in total ca. 5% of all North Sea

23
Fig. 20. Generalized picture of the transport of suspended matter in the Southern Bight showing: suspended matter content (m gT1 ; isopleths); residual current pattern (small arrows); mud deposits (> 50% < 50 pm; black) and areas with > 2% < 50 pm in bottom sediment: dotted (EISMA & KALF, 1979).
deposition takes place (Me Cave, 1973). (This percentage would be higher if it weren't for dredging). In the inner German Bight this trapping process is enhanced by the flood convergence (i.e., funnel- ing) towards the Elbe-Weser estuary.In the Scheldt, Rhine, Ems and Weser estuaries, the supply from the sea exceeds that from the land. The very finest particles are not deposited, but flow out to sea. Deposition occurs near the end of the shuttling salt wedge, partly by sinking out, partly by diffusion (Eisma & K a lf, 1987)
- the Wadden Sea, trapping region as well. This is estimated to receive 9-15% of the total North Sea deposition. The largest deposition rates are at the tidal watersheds and in the large embay- ments such as the Dollard, Leybucht and Jade (Eisma, 1981a). The main indirect source of finegrained matter is the Rhine. There is direct supply from the rivers discharging into the Wadden Sea ("direct" does not exclude that an unknown part of the material makes a roundabout way through the neighbouring North Sea). The North Sea, consequently, serves as both a source and a transport route (Postma, 1982).
54°.
N orw ich
H O L L A N D
52°.
Extinction (against distilled water)
I I 0 . 2 - 0 . 4 CU 0 . 4 - 0 . 6 IIS 0 .6 - 0 . 8
I I 0 . 8 - 1 . 5 ( > 0 .8 a lo n g D u tc h c o a s t) d > 1 .5
R esidua l cu rren ts
Fig. 21. Turbidity (light extinction) with the residual current pattern in the southern North Sea. This illustrates two ad- vective mud streams, one crossing from the English to the Dutch side of the area, the other running up the Dutch coast. Actual sediment concentrations are higher in the latter stream (MC CAVE, 1983).
Large amounts of particulate organic carbon are deposited in the Wadden Sea; this is generally <150 pm, preferentially made up of microflocs in the 5-20 pm range. The recent offshore increase in particulate organic matter production (Postma,1978) caused a marked increase in influx in the western and East-Friesian, but much less in the North Friesian Wadden Sea. This may be due to the aforementioned flood convergence, as this runs to the inner German Bight along a WNW axis (Postm a, 1982), closer to the former than to the latter areas.Deposition mechanisms chiefly amount to i) the estuarine and coastal circulation (§ II.2.3) capturing both terrigenous and marine mud; ¡i) tidal asymmetry combined with settling-lag effects, which as a rule make flood-current deposition exceed the ebb-current erosion.The presence of flora and fauna exerts a strong mud-consolidating Influence, through e.g. burrowing, algal mass and aggregation in faecal pellets. The trapping mechanisms are also sorting influences: the finest material is deposited in the shallowest parts (tidal watersheds and mainland

24
coast) and towards tidal outlets gradually coarser sediment Is found.Fine-grained matter from the southern rivers is found back until near the Ems estuary. Up to 50% of the Rhine silt discharge may end up in the western Wadden Sea (Postma & Van Be n n e k o m ,1974). 10-20% of the mud deposited in the area originates from the Rhine (E isma & Kalf , 1979). Of the fraction < 2 pm, 10-20% stems from Rhine and Meuse together (V an B en nek o m & Sa l o m o n s ,1981).
- the mud patch sou th -east o f Helgoland:here 6-20% of the North Sea total, mud settles ( E is m a , 1981a), its main sources being the residual transport from the west and an Elbe contribution amounting to a quarter or less of the deposition (Me Ca v e , 1973). This, according to E isma (pers. comm.) may be an underestimate, because much dredge spoils from the Elbe is dumped in the area. Deposition: the near-bottom water has suspended matter concentrations of 20 mgT ' and more (see above). At calms, deposition results, by diffusion even more than by settling. Periodical disturbance by storm waves does occur, but does not counterbalance net mud deposition in the mud patch, in the long run (E isma & Kalf , 1987).
- the O yster G rounds (fig. 55), on the southern edge of which there has long been observed a sharp transition between sandy and very fine sediment (C relttzberg & Po s tm a , 1979, and ref. therein). These authors demonstrated sedimentation of silt and organic matter. Crossing this boundary in a northward direction the bottom profile drops relatively steeply and the tidal currents suddenly decrease strongly, which is the primary cause of deposition. In tank experiments involving sediment from the area the authors studied the process of progressive consolidation of mud once it has settled. They showed that at depths below 30 m neither tidal currents, nor wave action can counterbalance this process, whereas in the surrounding waters, these influences keep on stirring up the same material time and again. In the shallower areas to the south the tidal currents violently scour the bottom; in the deeper more northerly regions, oceanic long waves are active, which forcefully disturb the sediments at depths below 30 m. The Oyster Grounds themselves are sheltered from these long waves by their situation under the lee of the Dogger Bank (E isma, 1975). The relative calm of the area is reflected in the presence of some benthic species that are very susceptible to disturbance (C reutzberg & Postm a ,1979). The fact that, still, very little minerals are deposited (and hence, the geological insignifi
cance of the deposition) is attributed to the very low inorganic proportion of the suspended matter load. Organic deposition, however, is generous, witness i) the high organic C concentrations in the fine sediment; ¡i) the very rich and diverse benthic fauna (C reutzberg eta/., 1984) (see also IV.5.2 ) the S kagerrak-N orw eg lan Trench complex, in which 50-70% of all mud deposited in the North Sea finds its final destination. Sources: rivers and sea floor of the entire North Sea, North Atlantic Ocean, Baltic, Norwegian and Swedish rivers, atmosphere, and organic matter produced in the North Sea. (R o h d e , 1973; E is m a , 1981a; V an W eering , 1981 ; E isma & Kalf , 1987).

25
III THE FATES OF A FEW MACRONUTRIENTS
111.1 Introduction
The inorganic nutrients that are essential for marine phytoplankton (and thus for subsequent levels in marine food webs) are essentially the same as for land plants.Some of them are needed in far greater amounts than others by most phytoplankters, so there is a distinction between "macronutrients" (e.g. the elements C, H, O, N, Si, P, Mg, K, Ca) and "micronutrients" (as Fe, Mn, Cu, Zn, B, Na, Mo, Cl, V, and Co). Furthermore, algal growth can be dependent on organic "growth factors" such as vitamins, organic carbon (in sugars, alcohols, organic acids such as fatty acids and organic N-compounds (Pa r s o n s et al., 1984).In relation to the requirements of the phytoplankton community P and N are often (and Si is at times), least available or "limiting". At least, so it is assumed, judging from the increases/decreases of plant growth, observed upon additions/removals of these substances. Alternatively, various micronutrients (e.g. Br, I, B, Cu, Zn, Fe) have been proposed as limiting in specific situations, which we have no intention to dispute. But as* the limiting roles of P, N, Si have been most widely
accepted and documented;* their space and time distributions in the North Sea
have been well mapped, and* the increased man-made inputs, of, notably, P and
N have been clearly associated with regional plant production increases, we follow the above assumption and restrict this chapter to these three.
Some of their general characteristics will first be discussed.Distributions over the North Sea as a whole follow.Finally we will go into more details about the southern North Sea and its continental coastal area, with special attention to changes arising from human activities in the past few decades.The importance of insight in geographic and seasonal patterns of nutrients is not only in documenting their enrichments and pathways; it also adds to the existing knowledge about species and systems in their reactions to these enrichments.
111.1.1 Phosphorus
Phosphorus is present in the seas in the main forms i) dissolved inorganic P, mainly ortho- and polyphosphate; ii) dissolved organic P; iii) particulate P.
Phytoplankton derives its P preferentially from ortho- posphate; sometimes from dissolved organic P (DOP), in which case the aid of an enzyme is needed. This enzyme (alkaline phosphatase) is only produced when inorganic P is relatively scarce and primary producers have to resort to DOP, which can still be present in significant amounts.Variation among these producers, in the capacity to switch on this enzyme, is at present considered a key regulator of primary productivity (and probably, species composition) in many marine environments (V e ld h u is et al., 1987, and ref. cited therein) (see also § IV.1).In organically loaded water high concentrations of polyphosphate and DOP can occur. Some diatoms and flagellates in coastal areas can use polyphosphate as a P source, provided excess nitrate is present; in such cases the turnover often exceeds utilization, and they cause an ambient accumulation of orthophosphate. (P a r s o n s ef a/., 1984, and references).Orthophosphate, DOP and particulate P represent varying proportions of total P in the North Sea; their relative proportion becomes more irregular when approaching the coasts.In midsummer the largest part of the present P is fixed in organic matter (OM), both in the North Sea (Johnston & Jo n e s , 1965) and in the neighbouring Atlantic Ocean (Pa r s o n s et a!., 1984). Phosphate (PO43-) serves, in biological cycles, mainly as a building block (as in poly-P-RNA) and as "energy smallcoin" (in the ADP-ATP chain). Upon uptake, ions are transported through the cell membranes and built into key compounds like glucose-, sugar-, lipid- and adenosine-phosphates. Upon the death of an organism (animal or plant), readily at hand within the cell are a number of enzymes, which can speedily liberate free phosphate and any organic phosphates. These can be rapidly mineralized by bacteria (Johnston , 1973).As a consequence, within the total P utilization by marine phytoplankton, the ratio (supplied from pelagic mineralization): (supplied from bottom sediments) is, in shallow seas, higher than for N, and much higher than for Si. In other words: P is recycled faster than N, and N faster than Si (P o s t m a , 1976). This fast regeneration is the cause that P is seldom the limiting nutrient (Helder ,1978).In marine phytoplankton the atomic ratio P:N is on average 1:10, varying between 1:3 and 1:30 (R yther & Du nstan , 1970). In North Sea phytoplankton, P:N is 1:15 (Postma). Dissolved P:N species, averaged over all ocean water, are 1:15, but they have an unequal vertical distribution: in the oceanic euphotic zone and the shelf seas, N is as a rule less available

26
than P. It is N that fluctuates most strongly in those areas, and is often depleted near the detection limit. P is virtually always present in excess with respect to requirements, rather constant and almost ubiquitous.As a rule (of thumb) N is limiting in salt water and P in fresh, with 2 %o < S < 15 %> as transition salinities (G r a y , 1984). An exception is the southern North Sea by the relatively high N : P ratio of its rivers (Van Bennekom & Salom ons, 1981). Here, in Dutch coastal waters, P appears to be able to periodically limit phytoplankton growth, namely the late spring blooms of Phaeocystis pouchetii (Van Ben nek o m et ai., 1975; G ie s k e s ä Kraay, 1975; Veldhuis eta!., 1987).
III. 1.2 Nitrogen
Nitrogen seems to have more forms and more complex processes than P. The main N compounds are, in concentrations characteristic of oceanic surface water (and of the northern North Sea) (in pM): nitrate (NO3- ): 0.01-50; nitrite (NO2-): 0.01-5; ammonium (NH4+): 0.1-5; urea: 0.1-5; aminoacids:0.2-2; and N2 gas: 370-800 (dependent upon salinity) (Parsons et al., 1984).Neritic phytoplankton prefers N compounds in the order NH4+ - urea - NO2' - NO3-: the more reduced the better (Po s t m a et al., 1984). As with P, the sources of N-rich water are the ocean , for the central and northern North Sea (predominantly in the form of NO3-), and the rivers for the southern North Sea (NO3- and NH4+) (Johnston & Jones , 1965).N uptake by phytoplankton implies that the molecule (in whatever form) is decomposed and then rebuilt into amines and amino acids, the building materials of nucleic acids and proteins. When the cell dies, N is released in many (soluble, colloidal and unsoluble) organic forms. Remineralization, by way of various passages through bacteria and other microorganisms, gradually gives rise to anorganic forms in which eventually NO3- predominates; NO2- and N H 4 + are unstable intermediate forms (Johnston,1973).A summing up of N transformations that prominently influence the North Sea nutrient state is as follows.
Ammonification (organic N - NH4+)
Ammonium, the first N product released in the mineralization of various organic substances, is supplied by* processes in the water column (mainly animal ex
cretion) which as a rule provide 30% or more of the phytoplankton requirements in coastal seas and estuaries;
* processes in the bottom (predominantly organic matter decomposition) usually providing a similar percentage. This decomposition is predominantly aerobic; a small part occurs anaerobically with sulphate reduction. Benthic ammonification is a function of temperature, is enhanced by fauna activity, and greatly influences local primary production in the growth season (Postma etal., 1984).
Advection (and atmosphere) supply the remaining 40% or less. As a consequence, the ammonium concentration, one of the most obvious indicators of the extent of organic matter decomposition, usually strongly increases in the direction of the coast.
Nitrification (NH4+ - (1 ) - NO2' - (2) - NO3')
Occurs in coastal waters by the pelagic bacteria Nitrosomonas (reaction 1) and Nitrobacter (2). In the growth season in the eufotic zone, the ammonium concentration being generally low (<10 pM), phytoplankton, owing to its high affinity (i.e. low Ks, see Ch. IV) for ammonium , dominates bacteria in the competition for ammonium, so that no significant nitrification occurs there. Under the eufotic zone, and during winter months (light limitation) also at the surface, the algae lose this competition and nitrification does occur.In organically polluted situations ([NH4+] > 10 pM) phytoplankton growth and nitrification coincide. Nitrification can then go on until oxygen is depleted (G o e r in g , 1972). In North Sea sediments nitrification, requiring oxygen, only occurs in the uppermost centimetres or millimetres, depending on oxygen penetration.
Denitrification (NO3 ' - NO2' - N2O and N2 )
In this study the term refers to dissimilatory reduction of nitrate, which serves as a hydrogen acceptor for bacterial growth, mainly inside sediments. Presence of oxygen, already in low concentrations, inhibits the process.Areas sufficiently shallow for benthic photosynthesis (producing oxygen) show diurnal cycling of the oxygen penetration depth in the sediment, and this brings about a reverse diurnal cycling in sediment denitrification, which reaches peaks at night (A n d e r s o n ef a/., 1984). Variation on a seasonal scale, on the other hand, appears to be controlled by allochthonous input of nitrate, resulting in maximum denitrification in early spring (S o r e n s e n , 1984). In summer, in situ nitrification is often the only source of nitrate; denitrification is is relatively minimal, and the day-night difference is only faint. Ideally, nitrification and denitrification occur on opposite sides of

27
an oxic-anoxic boundary, located at a very shallow depth (only a few mm or cm) In the sediment. Biotur- batlon can considerably enhance these (and other) N transformations (Blackburn & Hendriksen , 1983). Denitrification can be a major loss post in annual N budgets. Rö n n e r (1985) estimated 55% of the total external N input into the Baltic to be removed by denitrification in deep water, low in oxygen. A similar percentage of N inputs into the Scheldt is estimated to be thus removed in anoxic reaches of the river water (see "Southern Rivers").The main denitrification site in the North Sea, however, seems to be the sediment. It may be the cause of the often observed low N:P ratio in coastal waters, compared to the "Redfield" ratio of 16:1 (see Ch.IV) (Postma eta!., 1984).Although it counteracts eutrophication, its effectiveness as such depends on hydrographic conditions, and in general it is considered inadequate to cope with presently observed N enrichments in many areas (R ö n n e r , 1985; Se itz in g e r & N ix o n , 1985; D e V ries et a!., 1988).
Nitrogen fixation (N2 - particulate organic N)
Fixation of molecular N (by Cyanophyceae, sometimes by bacteria) usually occurs to a small extent in shelf seas and coastal ecosystems; less than e.g. in lakes, or in tropical oceans. Why so little is not yet clear.In this extent, it does not counterbalance the N limitation often observed in these environments.
Assimilation of organic N compounds
Although in general these compounds are of little importance as phytonutrients, they can serve for that purpose directly, especially when inorganic N salts are scarce. This situation arises each growth season and can be a (partial) explanation of species succession (Butler et a!., 1979; see Ch.IV). The order of preference is, in that case: urea - amides - various amino acids (again, the most reduced is preferred). Most of the organic N compounds in sewage water discharge have to be transformed bacterially into peptides, amino acids and ammonium first; the latter two are directly uptakeable for phytoplankton (Go e r in g , 1972).
III.1.3 Silicon
Silicate dissolved in sea water probably exists as a nonionic polyhydrated silica (H 4 S ÍO 4 ) (Johnston , 1973). There are particulate forms (biogenic and mineral), which strongly differ in solubility. It is rela
tively abundant in deep sea water, in river water (rock erosion product) and in coastal water. Just as with phosphate and nitrate the main sources are the ocean and the big rivers. Silicon (Si) is incorporated by diatoms, silicoflagellates, radiolaria and some sponges. Diatoms, among these the only important class in the North Sea, take up the dissolved form and it is deposited on their surface as hydrated silica. Upon the death of diatoms, pelagic remineralization of the frustules occurs slowly, compared to that in the sediments. The cause of this difference may be a protective coating of aluminosilicates, which prevents dissolution in the aerobic water phase. In the anoxic sediments, then, the coating would be removed by the formation of organic Al-complexes (Van Bennekom et al., 1974, and ref. therein). Moreover, the pelagic grazing upon diatoms somewhat enhances Si rem ineralization in suspension (Johnston , 1973)."Unprotected" particulate Si, as e.g. in clay minerals, dissolves more easily, because sea water is virtually never Si-saturated (R utgers van der Lo e f f , 1981 ).As a rule the frustules are settled before being dissolved, or transported in suspension. Depletion of dissolved silicates yearly causes the diatoms to make way for other species. They generally need Si in a 1:1 atomic ratio with N (Redfield et a i, 1963). In ocean water these elements are usually present in about this ratio, so that either nutrient can become limiting. In coastal seas and estuaries, Si should be relatively abundant, owing to the proximity of the supplying rivers. However, this supply is in certain areas hampered by human activities (§ III.3.1), e.g. in northwestern Europe. And, even more important: anthropogenic Si is not added to the rivers in a significant degree, wheres N and P are, in very large quantities. As a consequence, each spring in the southern North Sea, after an initial bloom the diatoms are strongly limited by Si depletion and other species take over the lead - although they cannot reduce the diatoms to ecologically negligible quantities (V an Bennekom et a i, 1975; Of f ic e r s Ryther , 1980).
111.2 A BIRD'S EYE VIEW ON CONCENTRATIONS IN THE
North S ea
A global representation of the development of nutrients through the seasons was given by Jo h n s to n (1973); three maps (fig. 22) show the winter situation for dissolved phosphate, nitrate and silicate (surface values are representative for the column then).This season shows the most regular pattern. The summer, with minimal concentrations, is the opposite. Summer minima and winter maxima are given in

28
W IN T E RSolub l« S ilic a t«
suríacc n> «otto« KT'
W IN T E RN it ra t« N itro g e n
tu»«ACI TO «OTTO* 10“ ' *
04-
0555
06
i pv p! SURFACE : WINTER
0 6
tab le l, for the six large water masses in the North Sea. Based on the large-scale water movements (Ch.I), the distributions in these maps will now be discussed.
III.2.1 Survey
Oceanic influence upon the continental coastal and offshore water occurs primarily and almost exclu-
Fig. 22. Winter concentrations of soluble silicate, nitrate-ni- trogen and phosphate-phosphorus in the North Sea (JOHNSTON, 1973 and POSTMA, 1978).
sively via the Channel water. The dissolved nutrient loads supplied in this water are only crudely determinable and rather irregular, under the influence of plankton growth; the farther east in the Channel, the stronger this irregularity. The Si supply (slow mineralization) will be most strongly influenced by this growth. As a consequence, the Channel water is poor in phosphate and nitrate, and very poor in reactive silicate throughout the growth season. The

29
amounts of total P and N in this water vary little through the year; only, the chemical forms of both are almost purely organic in summer and inorganic in winter (Johnston & Jo n es , 1965; Butler et al., 1979). In winter, contributions to the increased supply of the inorganic forms are given by the enhanced mixing and the increased flux from the sediments in the Channel, besides the interruption in primary production.
North Atlantic oceanic influence upon the water in the central and northern North Sea is exerted via the three northern entrances Shetland-Norway (largest volume, farthest offshore), Fair Isle Gap, and Pent- land Firth (smallest volume, most neritic). In this order the oceanic share of the water masses decreases and the coastal share increases.In the waters of the North Atlantic ocean brought to the edge of the North Sea by the North Atlantic Drift Current (Gulf Stream) the nutrients in the upper layers undergo successive cycles of uptake and remineralization on the way. These processes result in the progressive downwards transport of nutrients during the growth season; the rejuvenation of the surface layers is dictated by the winter mixing (reaching some 500 m) which recycles the richer deeper waters. Consequently, water of the upper ocean layers varies in nutrient richness throughout the seasons, and in the growth season there tends to be a strong downwardly increasing nutrient gradient over these 500 m (St o w e , 1983). In the ocean there is relatively much flow along, and little across the depth contours, so ocean water entering the North Sea is predominantly derived from layers above the "threshold" depth.As the thresholds are successively shallower in the three mentioned entrances, the nutrient content of the ocean component in their water mixtures is, on an annual averaged basis, successively lower.The S h e tla n d -N o rw a y water mass, containing water from the upper 500 m, is, in spite of having the largest volume and the largest nutrient loads, the least influential of the three upon conditions in the central and southern North Sea: most of it, namely, is quickly short-cycled back out of the North Sea. The influence of this "source" is mainly confined to the eastern half of the sea north of about 57°N and the deeper part of the Norwegian coastal current (via a loop-shaped route through the deep Skagerrak) (Doo ley , 1974; Davies , 1982 ,1983).The Fair Isle water mass, a mixture of oceanic water from the continental slope northwest of the UK and coastal water from the same region (partly originating from the ocean itself) is less nutrient-rich than the previous mass: due to threshold depth, it mainly
contains ocean water from the upper 200 m or so. Its influence is predominantly restricted to the central North Sea (between 54-58°N) and, to a lesser extent, the southern North Sea. Thus the largest part of the North Sea derives its chemical character from the upper 200 m ocean layer; consequently, "the" North Sea is by nature nutrient-poor compared to the neighbouring Atlantic. On an annual basis, central North Sea surface values for phosphate and nitrate are about half those of the Atlantic (QSR.1986). Through the third and smallest entrance, the Pent- land F irth , enters the Scottish coastal water, which flows south along the UK coast (turning into English coastal water), splitting up - south of ± 55°N - into a varying number of subcurrents that cross the southern North Sea.Owing to the prevailing westerly winds that steer strong ocean surface currents against the northwest coast of the UK (Davies , 1983), this water mass will, when entering, also have a large oceanic proportion, which, derived from the far upper layers (shallowest threshold) must again be less fertile, on an annual basis, than the ocean water in the previous mass.Its coastal component is either very small, or relatively poor (for coastal waters) in N and P, or both. At any rate, the result is that this water mass, at its entrance, is the poorest of the three throughout the year (Joh n sto n , 1973).Its poverty remains largely unchanged until near the Humber estuary; trom there follows, in the counterclockwise residual direction, a gradually increasing terrigenous enrichment.The N orw eg ian C oasta l C u rren t, receiving contributions from i) the Jutland Current, ii) the Orkney-Shetland Flow, and iii) the North Atlantic water flowing into the Norwegian Trench over the western edge, is as a whole (16-10^ km ^-a'1), some six times as large as the "Baltic Outflow" which is a part of it; this, in turn, is some six times the volume of the Baltic Proper Water that it contains (QSR, 1986). The amounts of nutrients discharged into the Baltic Outflow, do apparently influence the nutrient loads in the Skagerrak, but not anymore further north in the Norwegian Coastal Current. Probably the brackish Baltic water gets gradually depleted during its long journey, relatively isolated as it remains from the underlying water masses. At any rate, this water mass remains relatively nutrient-poor in the course of the Coastal Current (Jo h n sto n &Jo n e s , 1965). Its low salinity stabilizes the stratification, so that the (mainly North Atlantic) nutrients remain effectively locked away in the deeper water layers (Po s t m a , 1978). Indeed in the Banken area (off mid-Norway) spring blooms occur, but these obtain their nutrients neither from the Skagerrak (too poor) nor from the nutrient-accumu

30
lating fjords (enriched, but relatively too small flux owing to small water volume). The origin here is the northernmost of the three Atlantic flows, which flows out into the Norwegian French and undergoes regional upwelling (Foyn & Rey, 1980).
In the open centra l and northern North Sea,the summer thermocline dominantly influences the nutrient image. From the moment in spring that this has established itself - differing from year to year under the influence of the weather (D ietrich , 1950) - in the upper layer a progressive nutrient exhaustion begins: dead organisms sink through the thermocline and thus take along fixed nutrients, which in the deep compartment are mineralized again.Above the thermocline there is also a considerable release of dissolved organic substances in the course of primary production (by phytoplankton itself, and by grazing and decomposition), some of which are recycled up there.At thermocline depth dissolved (and certain particulate) organic substances accumulate and there an intensified mineralization occurs, products of which are reutilized in the mixed layer as well (Br<xkmann et al., in press).All this recycling is rapid, so an increase of nutrients is not detected; the net flow of nutrients to the deeper layers is maintained, incidentally intermitted by local upwelling phenomena. The autumn mixing, beginning September-October, lifts the separation again. The fact that the nutrients stay at sube- uphotic depth during most of the growth season imposes a strong limitation upon primary production in the central and northern North Sea (Postm a , 1978).
In the waters of the Southern B ight, finally, well mixed vertically by the tides throughout the year, the nutrient gradients are horizontal. To begin with the coastal edge on the continental side: here nutrient concentrations are extremely high, owing to the runoff inputs (fig. 23).The concomitant high turbidity permanently imposes a light limitation on primary production all along the Belgian-Dutch coast, and hence causes spreading of the nutrient discharges from the estuaries to larger areas due to reduced uptake. This may partly explain that phytoplankton development is often highest in the northern Dutch zone (also influenced by the Wadden Sea) although the nutrient levels are lower there than in the south (B rockm an n et al., 1987).Approaching the centre of the Southern Bight, one "descends" into a nutrient gradient "pit" (the bottom of which is the right-hand end of the graphs in fig. 23). Here the water is virtually only Channel import
(see computed proportion in fig. 2 ) and at its clearest, so that light limitation is minimal. As early as February, the diatom growth season begins here (GIESKES& Kraay, 1975) resulting rapidly in a P:N:Si ratio of 1:14:2, against 1:15:7 in the margins, the latter being normal for the northern North Sea and generally for the ocean surface waters. This means that in the area nitrate and especially reactive silicate are at a minimum throughout the growth season (Po stm a , 1978). In winter this minimum is sometimes not, giving no clear clue about its origin (Van B e n n e k o m , pers. comm.). The presence of this minimum was attributed by Postma (1978) to the continuous removal, by tidal currents, of particulate organic matter to coastal areas. Thus, a large part of mineralization (and of its products, the nutrients) would be continually removed from the production area, depleting it. This process no doubt occurs, but its magnitude (and hence, its importance in causing the minimum) has not yet been assessed. Regionally intensified primary production - i.e. particularization - is an additional explanation (Van Bennekom , pers.comm.). As a whole, the Southern Bight is exceptionally nutrient-rich and quite productive (2 0 0 -2 5 0 gC-m‘ 2-a‘ 1, Fr a n s z& G ieskes , 1984) compared with the North Sea average (130 gC-m‘ 2-a"’ ) (Jo n e s , 1984).
III.2.2 The importance of man-made inputs; marking out a problem area
Before descending for a closer look at the continental coastal areas, we will try to outline the man-made nutrient loads and to fit them into the large perspective. For an impression of their importance for biological productivity (and hence, for eutrophication effects) in the North Sea, these inputs should be compared with all the other'inputs.But if that comparison is not drawn at an appropriate scale, it will likely produce a false impression.Human nutrient contributions to the North Sea as a whole are on average 10% of total P and 11% of total N inputs. One might wonder why the system shouldn't be able to cope with such relatively small increases. However, it is totally unrealistic to view the North Sea as one homogeneously mixable water body. The previously mentioned example of the North Atlantic nutrient load - by far dominating the total input budget, and yet insignificant for the southern North Sea"productivity - illustrates this. Another example is the enormous continental contribution, virtually none of which ever reaches the west half of the North Sea.In the first chapter, the fixed geographic distribution and relatively isolated courses of the North Sea wa

31
mol km*’-s’ * mol km' 1 s*’
50
b. phosphorusQ nitrogen40
30
20
ChonnelIO' Chonnel
otmosphereoi
m ol hm ' s ' m ol hm '
12'C. s ilica . sum m er d silica .w in te r
efloor
4sea floor
Chonnel
o-
Fig. 23. Composition of nutrient inputs (mol-km'f -s" ) to Southern Bight waters off Holland as a function of offshore distance; river and English Channel inputs are flow rates at a section normal to the coast at IJmuiden (the increase in the river input from O to about 7 km offshore is related to the increase in water depth). Inputs from the sea floor (s, summer; w, winter) and from atmospheric deposition are the total inputs during the transit of the water over the study area (longshore length 120 km). (RUTGERS VAN DER LOEFF, 1980b).
ter masses in normai circumstances were pointed out, the boundaries between them being major physical barriers to mixing. This hydrography defines the scale of the individual water masses (fig. 1) as the largest scale at which nutrient input contributions can be expected to represent productivity contributions. On that basis, the Continental Coastal Water Mass and the sediments beneath it (fig. 1) were chosen as the problem area of this study. It is presented in fig 58 (numbers 3 + 4).In agreement with literature (see Annex) we estimate 75% of total N, and 85% of total P from "coastal inputs" (the combined category of run-off, direct discharges and dumping) to be anthropogenic. With these percentages, the calculable man-made contributions to the input total into the problem area are 45% for N and 49% for P. Then there are a few contributions not quantifiable but not negligible either; these, we roughly estimate, can make up for 5% or more (see Annex). We conclude that half of all inputs and therefore half of all N and P present in the water and the sediments of the problem area - living
and non-living, dissolved and particulate - originates from human activities. This is an average; in a 20 km wide coastal strip the values are 69% (N) and 78% (P); and in far offshore parts they may be some 30- 35% (cf.fig. 24). The many details of this estimate have been included in a separate Annex.
111.3 A CLOSER LOOK AT THE CONTINENTAL COASTALA reas
After the nutrient outline for the North Sea as a whole, the eastern half of the Southern Bight, and the continuation of this zone along the Wadden Sea, the German Bight and the Danish coastal waters, will now be considered in more detail.The discerning and tracing out of human influences in this area, the past decades, has advanced together with the sifting and mapping of "natural" processes. It has become clear enough that, totally apart from human influences, the nutrient-involved processes and concentrations produce an image

32
O 200 10 30
EO0 .4 0
O 10
•20,
O 20O 10O 60;
O 10,0.20
O 70
O *0
Fig. 24. Calculated anthropogenic fractions for N and P in the southern North Sea, discharge situation 1980 (VAN PAGEE & POSTMA, 1986).
Coto
cQJocoo Nutrients
Fig. 25 Cycle of organic matter and nutrients in nearshore waters (POSTMA, 1967).
differing strongly from that in open sea - and that steep gradients exist between the two environments. Van Bennekom & Salomons (1981): ■ The coastal zone may act as a sedimentation area for the rivers; (...) after sedimentation, the interstitial waters become enriched in reactive silicate, ammonium and phosphate. Bioturbation, consolidation and diffusion are responsible for a flux of nutrients from the sediments to the overlying waters. Thus, particulate matter (...) provides an additional source of dissolved nutrients."
The shoreward transport of bottom water in coastal areas tends to bring along, and accumulate, particulate organic matter formed offshore. Fig. 25 summarizes the gradients of process intensities and concentrations, and the secondary transports, generally resulting from this accumulation. Thus, small average changes in offshore productivity may be passed on shoreward in an amplified way. Subsequently, they are transformed and modified by conditions differing from region to region along the coast.This is why developments in production, mineralization and the like in the coastal area should be viewed against the background of the productive state of the open sea, and human contributions to it, however masked. For study into eutrophication effects this means: budgets of total-element P, N and Si for every area under consideration.In the coastal area a host of processes occur, involving these elements in ever changing shapes. In so far as the man-derived share in these processes has been determined, it will of course be reported. But as all processes are so tightly interwoven, we will also discuss processes in which the human share has not (yet) been mapped. Consequently, in the following description anthropogenic and non-anthro- pogenic aspects will often pass without a clear distinction.
111.3.1 Nutrient Contributions from the SouthernRivers
Causes of Natural Variation
The most important seasonal influence on nutrient loads in rivers is the variation in water discharge. In the southern rivers the summer minima are of the
‘«af/'on
primary
Distance from shore ----- ►
Net transport of_ nutrients
Net transport of _particulate organic matter

33
order of 0.5 times the winter maxima (Po s t m a, 1982; WKP, 1985a). This variation influences the volume of the loads that reach the sea. An inverse correlation between annually averaged Rhine water discharges and total-P concentrations, both at Lobith (German- Dutch border) (fig. 26) indicates a discharge-proportional dilution, which appears to keep total annual P loads rather constant. There are at least two complications to this relation. Firstly, in the lower courses of rivers, particulate nutrients sink to the sediments, due to decreasing flow velocity. Consequently, the large year-to-year variation in average water discharge causes the degree of nutrient retention in the river bed to vary as well. O l s t h o o r n (1985) estimates the P retention in the Dutch Rhine bed to vary from some 29% of the total Lobith P load in years of low discharge, to some 9% in high-discharge years. The river Meuse shows a similar variation. Thus, larger water discharges carry larger river loads of P to the sea.Second complication: the composition of the Rhine discharge (namely, the ratio glacier water: rain water) varies seasonally and influences the P load. In summer, this ratio is 1:3 at Lobith, in winter 1:6. This causes the contributions of ground water and surface run-off ("diffuse sources") to be largest in winter, and hence the diffuse P concentration component in winter (0.08 m gT 1 total-P) is larger than in summer (0.06). (L. Po stm a , 1981). Consequently, in the steady downstream rise of this diffuse component from 0.02 m gT1 (yearly average in Swiss part) to 0.09 m gT 1 (same in Dutch Rhine) there is also a natural component besides the man-made. At Lobith, the diffuse P concentration is estimated about half "human", half "natural" in both summer and winter (L. Po s t m a , 1981). Still, this diffuse P concentration is rather low compared to the total P concentration (cf. values in fig. 26). In general, more rain means larger total P loads carried to the sea, both from man-made and "natural" sources. The same, via similar mechanisms, is observed for total N in the Elbe river (to be discussed in: German Bight) and this probably applies to N in the Rhine as well.In general the influence of phytoplankton growth on the nutrient regime in a river is larger according as the water is less turbid, i.e. particularly in rivers with large lakes interrupting the upper course. Diatom growth Lake Konstanz, which accumulates particulate Si in its sediments, keeps the Rhine summer concentrations of reactive silica at a low level (Van Bennekom & Salom o n s, 1981).The Meuse - which, unlike the partially glacier-fed Rhine, is merely a rain river - shows very low summer discharges with high nutrient concentrations, leading to diatom blooms in the lower course, and small Si
0.9
0.9
0.7
0.6
0.9
Q(m3s'1)
Fig. 26. Annually averaged total P concentrations (surface measurements), against annually averaged discharge, in the Rhine at Lobith (OLSTHOORN, 1985)
TABLE 6 . 1976-1982 average of discharges of the Southern Rivers (see text), distributed over the quarters as percentages of annual discharge. (WATERKWALtTEITSPLAN, 1985a)
quarterly distribution (#) 1 2 3 4
Si 198,6 ta-1 47 17 8 28N 296,9 ta-1 35 24 16 25P 27,4 ta-1 29 22 21 28
loads to sea in that season (Van Be n n e k o m et al., 1975). The Scheldt has a similar nature as the Meuse. Discharge and concentration cycles result in a strong seasonal variability in the sea-bound nutrient loads. Table 6 gives an impression of this for the southern rivers.
Human influences on River Nutrient Loads
Despite many difficulties it is tried to quantify the human contribution to nutrient bads. A reconstruction of "natural" concentrations of various elements (inter alia P and N) in the rivers flowing to the southern North Sea, was attempted with the aid of Rhine measurements dating from the 1930s (assuming they were wholly "natural" by then) (Van Eck et al.,1983). From these values, reference values for Dutch brackish and salt waters were inferred, as values to be aimed at in river management. The "anthropogenic fraction" in tables 7 and 8 (see An

34
nex) was calculated from the above "natural concentrations".The following survey (from Van Bennekom & Salom ons, 1981) gives an idea of the various difficulties surrounding the estimates of human contributions In river nutrient loads. Direct Influences are:* D ischarges / dum ping into rivers, particularly
in densely populated and Industrialized areas, raising the concentrations of phosphate, nitrate and ammonium.
Indirect Influences:* D e fo re s ta tio n . Each removal of vegetation
leads to leaching of Inorganic N; cutting down of temperate forests extremely increases the NOß" concentration In nearby rivers. P is also released in considerable amounts in the process; this is predominantly transported In suspension.
* A g ric u ltu re , In which the often applied excess amounts of P and (especially) N end up in nearby rivers. Cropped land releases far more nutrients than natural soils.
* H ydrau lic eng ineering. Lakes retain P, N and Si from rivers flowing through, In their sediments. The many artificial lakes created the past few decades thus decrease the nutrient loads carried to the sea.
To this survey we add:* O rganic matter d ischarges, which If they are
large enough may cause anaerobic conditions in the sediments and even in the water, resulting in bacterial dénitrification. This process may represent a significant N sink. Examples are the Scheldt river and estuary, and the Dollard estuary (both to be discussed later).
These sources must have contributed considerably to the trends visible in fig. 27.
Sources and long-term Trends
SiliconThe development of Si concentrations In Rhine water In recent decades was relatively simple. There were and are no significant anthropogenic Inputs. The slight decrease over the years Is indirectly anthropogenic: it was caused by hydraulic works in the upper Rhine and by P and N eutrophication there. Because Si is under represented in the river nutrient loads the Dutch coastal waters are Si-depleted each spring. According to Me C ave (1973) the Scheldt mouth Is often totally bare from dissolved SI, due to eutrophication.
PhosphorusBetween 1932-1978 the Rhine P load to the North Sea increased by approximately a factor 10 (Postma,
300 • NOj-N* * pori N
• — • n h 4- n
200
1 00
1970 19801850 1900 1950 1960
20
10
01970 198019601850 1900
Fig. 27. Concentrations of PO43 particulate P, NH4+, NO3' and particulate N (all in pM) in the river Rhine. Data before 1900 after CLARKE (1920). Data between 1928 and 1945 annual averages measured at Rhenen, the Netherlands, calculated after BlEMOND's reports "De Watervoorziening van Amsterdam", 1940 I, p. 210 and 1948 p. 110. Data after 1955, annual averages measured at Lobith (German-Dutch border) calculated from the yearbooks of the International Commission for protection of the Rhine against pollution. Values until 1978: VAN BENNEKOM & SALOMONS (1981); 1978 and later: (VAN BENNEKOM, pers. comm.)
1978). The main causes are population growth and Increasing industrialization. Around 1960 the introduction of phosphate d e te rgen ts for domestic and Industrial use led to a strong P Increase (Lobith data) which went on until around 1981 (O lts th o o rn , 1985). Since then there appears to be a slight decrease (see 1982, 1983 values In fig. 26). This may be related to German Federal government regulations reducing P in detergents (by which P utilization In detergents In the FRG decreased by some 40% between 1975-1983 (O ls th o o rn , 1985). Still, detergent industry representatives (De Jong & De Oude, 1987) estimate that in 1986 some 25% of all P reaching the North Sea In Rhine water originated from detergents.Around 1970 the sewage treatm ent In the FRG began to be centralized. Due to the technology applied (Including secondary treatment removing 30% P, but lacking tertiary treatment removing 90% P) a substantial proportion of the original phosphate (mainly dissolved species) is still present In the puri

35
TABLE 9. Annual N and P consumption in fertilizer 1970-1985 for countries in the North Sea catchment, a few southern North Sea countries grouped together (extracted from: OECD, 1987 )
N ( I 0 3 t a - 1 ) P ( 1 0 3 t a - 1 )
1970 1975 1980 1 9 8 5 1) 1970 1975 1980 1985
UK 894 1059 1240 1600 110 88 88 95BE2 ^ 178 183 194 195 33 26 22 20
NL 405 453 483 500 24 18 18 20
FRG 1131 1228 1551 1516 199 170 183 161DEN 289 339 374 3 82 28 28 24 23
T o ta l 2897 3 2 6 2 3842 4193 394 331 336 319SNS
FR 1453 1708 2147 2409 395 363 387 320
SW 226 258 244 246 32 31 27 18
NO 78 98 110 106 12 12 14 11
1) in c lu d e s e s t im a te s ; 2 ) in c lu d e s Luxemburg
tied water. Before 1970 this phospate was partly accumulated in the sediments of many scattered local streams; since the treatment centralization it is transported directly to sea by a few large rivers (predominantly the Rhine) with fewer losses to the sediment (Van Bennekom & Salom ons, 1981). This may have contributed to the observed increase between 1970-1980 of the ratio ortho-phosphate / particulate P from 0.34 tn n 64 (Lobith) (O ls th o o rn , 1985).The averaged P consumption in fe r t i l iz e rs in countries in the North Sea catchment area between 1977-1987 remained about equal (L idgate, 1987) (see also table 9). In the Netherlands, where since ± 1975 the P fertilizer consumption stabilized as well (O ls th o o rn , 1985), the amount of P produced in m a n u re s increased considerably (fig. 28). The Dutch livestocks of horned cattle, pigs and poultry increased streadily over the years 1970-1986 (CBS, 1987). Finding satisfactory manure disposal sites has become a major problem for Dutch farmers, especially in the intensive pig-breeding trade. Virtually all animal manures in the North Sea catchment end up on agricultural land (Lidgate, 1987).For the whole of the Netherlands, the total annual P a ccum u la tion on land (100-110-103 t-a"1 P) and In freshw ate r and its sed im en ts (24 - 27-10^ t-a '1P) (i.e., total inputs minus total outputs) did not change much since 1970 (O ls th o o rn , 1985). This implies a strong charging of the soil with P.
200 200 l
iso.150.
100100
50
'80 '60 '80'70 '70'60 19501950
Fig. 28. Production of N and P in manures of total Dutch livestock, 1950-1984. Area under lower graphs: horned cattle. Area between lower and upper graphs: calves and pigs in intensive breeding industry, plus poultry. Interrupted line is the actual estimate (drawn line 1974-1984 reflects a change in calculation methods, and trend break thus suggested is non-existent) (CBS, 1987). Vertical axis: index (1965=100).
The soil has a great binding capacity for inorganic P (i.e., adsorption and/or precipitation with e.g. clay minerals, aluminium- and iron oxydes, carbonates and calcium) but not infinite. If saturation is reached, P may leak through to the deep groundwater, which at present it still appears virtually not to have done (Steenvoorden & de Heus, 1984), but which is feared for some agricultural areas in the foreseeable future (Nuboer, 1986).Because P is as yet so efficiently accumulated in soils and fresh water sediments, the Rhine water P

36
load undergoes little magnitude change during Its journey through the Netherlands, even a small decrease (O ls th o o rn , 1985). Another consequence is that the Influence of the Indirect (diffuse) P sources fertilizer and manure on this river toad is relatively small, compared to the direct (point) sources like domestic and Industrial waste water discharges. The authors are not aware of an accurate partitioning between these two categories In river P loads to the sea.
NitrogenEstimates of the Increase of N concentrations in the Rhine amount to a factor 7 between 1932-1975 (Van Bennekom eta/., 1975); D e V ries etal. (1988) report an Increase with a factor 2-4 for the total N load between 1950-1987.Van Bennekom & S alom ons (1981) attributed the gradual Increase In Rhine concentrations NO3' and NH4+ (Lobith data, 1950-1970) to population growth and increased fertilizer consumption in the FRG, which caused N leaching to soil and transport to the river. The above mentioned centralization of waste water treatment, around 1970, was the probable cause of a shift: Lobith NH4+ concentration decreased, and NO3' Increased with a similar amount, while total N concentrations appeared not to change much In 1970-1978. Unlike the P situation, N supplies to river water from diffuse sources (notably agricultural) are of prime importance. Between 1977- 1987, N consum ption in fe rtilize r in the North Sea catchment countries Increased by an average 25% (ranging from a small decline In Sweden to a 50% Increase in the UK). This is part of a long increasing trend from 1950-1984 (Lidgate, 1987) (see also table 9).Present EEC policies designed to curb surplus agricultural production are expected to decrease fertilizer use. Dutch fertilizer N consumption appears to have stabilized since about 1980. As yet, the Dutch livestock still Increasing, the total-N addition to Dutch soil still showed a rise In 1986 (C e n tra l Bureau o f S ta tis tic s , 1987; most recent figures at our disposal) owing to the continuing Increase of N production in manures, (fig. 28).On the basis of a range of literature data for losses, by way of leaching, of P and N from European soils (differentiated by type of land use), Lidgate (1987) drew up an estimate of potential losses to water systems within the North Sea catchment, multiplying averaged losses per unit area with total area of land type. We converted his figures into percentages, to facilitate comparison (table 10) (Note that "natural" N and P losses are included as well). The resulting total Loss Potentials for the whole North Sea catchment
Indicate the far greater importance of N from diffuse sources, compared to P.Lidgate calculates that a major part of the anthropogenic rlverborne N load to the North Sea derives from agriculture: about 60%. For P this Is some 25% (Note: comparison of table 10 with table 15a Is not possible because Scandinavian contributions were excluded from the latter).As to N utilization In detergents: the present use Is not significant in terms of eutrophication. Replacing detergent phosphate with the alternative NTA would add approximately 1% to the current N loading of the Rhine (De Jong & De Oude, 1987).Of all human N loading of the Rhine (point sources plus diffuse sources) these authors estimate 23% to originate from d o m e s tic e fflu e n ts . However, they remark that the Rhine N load to the North Sea (300-500-103 t-a"^- relatively constant since 1979) Is only about half of that total anthropogenic loading (± 650-103 t-a '1).This Indicates a significant loss of N from the Rhine water. They propose effective dénitrification processes In the river as an explanation. De Vries et al. (1988) point out the potential Importance of dénitrification in rivers, particularly in the lower courses and estuaries, In reducing the N loads carried to the sea. An extreme example of this may be the highly polluted Scheldt, according to B illen et al. (1986a,b): River systems act as "variable filters" for N which they receive from land and pass on to the sea. Dénitrification Is the filtering agent, which Billen et al. quantified In a N budget for the Scheldt (fig. 29). According to the budget, dénitrification In the river removes over 60% of the total N load, which escapes as N2 gas. Primary production eliminates only 8% of total N (largely recycling this), but is of great Indirect Importance owing to Its Input of rapidly biodegradable C Into the system, which results in masses of decaying fresh water phytoplankton in the upper estuary. This causes a high heterotrophlc activity, which enhances anaerobic conditions In the water column there. These conditions cause some 40%of total N entering the estuary to be removed by denitrification. Thus in total only 28% of all N that enters the Scheldt reaches the sea (27-103 t-a" 1 ). On the basis of these findings. B ille n et al. (1986b) subsequently calculated the implications of the Introduction of secondary waste water purification without a tertiary stage (That is: 90% of the organic matter would be removed, but only 30% of total N, dissolved NO3 remaining largely in the water):Certainly, river water quality would Improve but the river’s "N filtering capacity" would practically disappear. Due to the expected decrease in organic matter supply, a great deal of the river's anaerobic

37
TABLE 10. Land use and potential losses of N and P to water systems within the North Sea catchment. After LIDGATE (1987). 1) Based on data from FAO Agricultural Production Year Book 1984, for land use in Bel/Lux, Denmark, Germany FR, Netherlands, Norway, Sweden and UK. Land areas of Norway, Sweden and UK abated by factors of 0.25, 0.25 and 0.5 to allow for likely proportion of the land area affecting the North Sea.
Landuse
Annual N loss (kg.ha-1)
Annual P loss
(kg.ha-1)
Landarea
Loss Potential
N P
Crops 40 1.0 26 H 82 * 62 tPasture 8 0.5 19 13 24Forest 1 0.1 28 2 7Rest 1 0.1 27 2 7
100 * 100 * 100 *Total Catchment ' 66.106 788.103 26.103
ha t.a-1 t.a-1
reaches would disappear, and so, largely, would denitrification. Then, the N2 export to the atmosphere would decrease, and export to the sea would be more than doubled (from the present 27-103 to 70-1 O '*fa "-'). Hence, the authors state, introduction of restricted purification would, paradoxically enough, result in an increased N supply to the sea. This development may presently be taking place, witness the Belgian report to the 1987 Ministers’ Conference on the North Sea (QSR, 1987), that in recent years BOD levels in the Scheldt estuary have been reduced, and O2 levels are improving.For more details on river nutrient loads, see WKP (1985a), QSR (1987) and B rockm ann et al. (in press).
III.3.2 Belgian and Dutch Coastal Area
The above mentioned "desirable" or "reference" values for Dutch coastal waters under the influence of the Southern Rivers, make a useful tool in developing quality standards, and in obtaining a rough estimate of the present nutrient status of these waters. Varying reference values were drawn up for specified salinity ranges, thus allowing for variation in the degree of intermixing between fresh and salt water. They provide a yardstick with which recent trends can be observed: table 11 suggests a rise, over the 1980s, in phosphate and nitrate concentrations, and a decrease in dissolved Si, up to the most recent data (1986). Over this period there also appears to have been a decrease in ammonium. In the following sections, some general backgrounds of these concentrations will be discussed.
> s"
Fig. 29. Diagrammatic representation of nitrogen transfers in the Scheldt watershed. Fluxes expressed in 103 t Na'1. Values in brackets inferred by substraction (BILLEN et al., 1985).
Phosphorus
The increase, over the past 25 years, of winter PO43 concentrations in Dutch coastal waters is visible in fig. 30. Part of this PO43 goes northward with the residual current; another part increases the plankton production. Part of the plankton settles on the bottom and enriches it. Aerobic mineralization leads to precipitation (as iron (III) phosphate), and anaerobic mineralization leads to dissolution in the pore water, from where mechanical can release it. Phosphate ions in the water phase can also be adsorbed by suspended clay minerals. If the phos-
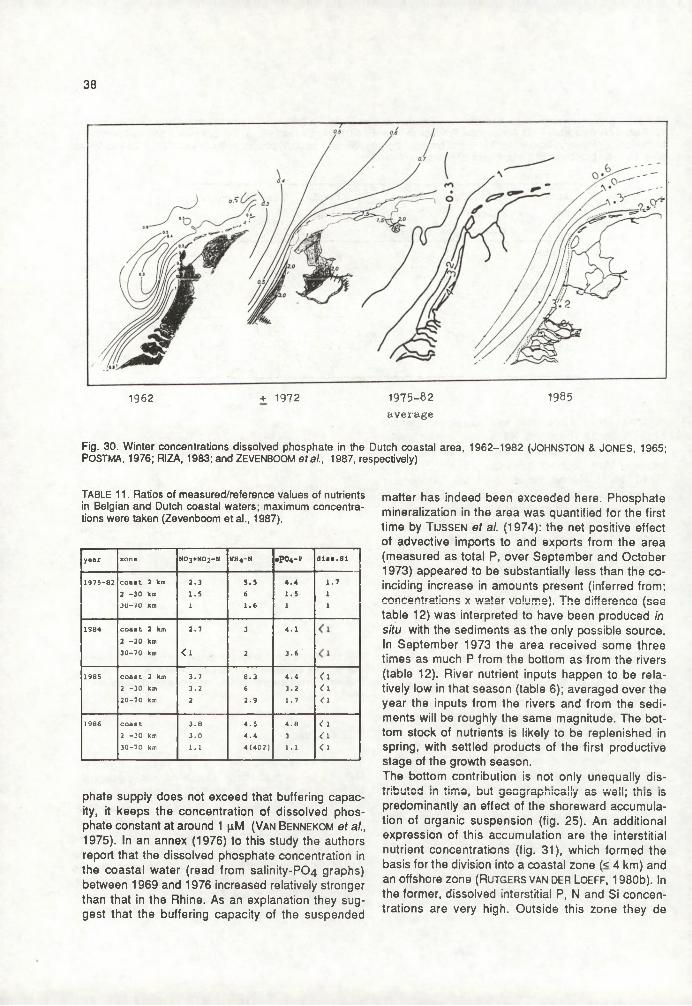
38
1962 + 1972 1975-82 1985average
Fig. 30. Winter concentrations dissolved phosphate in the Dutch coastal area, 1962-1982 (JOHNSTON & JONES, 1965; POSTMA, 1976; RIZA, 1983; and ZEVENBOOM et al., 1987, respectively)
TABLE 11. Ratios of measured/reference values of nutrients in Belgian and Dutch coastal waters; maximum concentrations were taken (Zevenboom et al., 1987).
phate supply does not exceed that buffering capacity, it keeps the concentration of dissolved phosphate constant at around 1 p.M (Van Bennekom et al.,1975). In an annex (1976) to this study the authors report that the dissolved phosphate concentration in the coastal water (read from salinity-PC>4 graphs) between 1969 and 1976 increased relatively stronger than that in the Rhine. As an explanation they suggest that the buffering capacity of the suspended
matter has indeed been exceeded here. Phosphate mineralization in the area was quantified for the first time by Tussen et al. (1974): the net positive effect of advective imports to and exports from the area (measured as total P, over September and October1973) appeared to be substantially less than the coinciding increase in amounts present (inferred from: concentrations x water volume). The difference (see table 12) was interpreted to have been produced in situ with the sediments as the only possible source. In September 1973 the area received some three times as much P from the bottom as from the rivers (table 12). River nutrient inputs happen to be relatively low in that season (table 6); averaged over the year the inputs from the rivers and from the sediments will be roughly the same magnitude. The bottom stock of nutrients is likely to be replenished in spring, with settled products of the first productive stage of the growth season.The bottom contribution is not only unequally distributed in time, but geographically as well; this ís predominantly an effect of the shoreward accumulation of organic suspension (fig. 25). An additional expression of this accumulation are the interstitial nutrient concentrations (fig. 31), which formed the basis for the division into a coastal zone (< 4 km) and an offshore zone (R u tg ers van d er Loe ff, 1980b). In the former, dissolved interstitial P, N and Si concentrations are very high. Outside this zone they de
year zona NO3+NO2-N NH4-N •PO4-P diss.Si
1975-82 coast 2 Km 2.3 5.5 4.4 1.72 -30 Km 1.5 6 1.5 1
3U-/U Km 1 1 . 6 1 1
1984 coast 2 Km 2.7 3 4.12 -30 Km30-70 Km <1 2 3.6
1985 coast 2 Km ‘3.7 8.3 4.4 < 12 -30 Km 3.2 6 3.2 < 120-70 Km 2 2.9 1.7 <1
1986 coast 3.8 4.5 4.8 < 12 -30 Km 3.0 4.4 3 ¿130-70 Km 1.1 4(40?) 1 . 1 <1

39
TABLE 12 a. In situ production of P,N and Si in the east half of the Southern Bight, September and October 1973 (in 103 t upper rows, and in 10"3gm "2 lower rows);b. Supply of nutrients (in 103 1) to the Southern Bight, by Southern Rivers (Rhine, Meuse, Scheldt) in September and October 1973 (TUSSEN etal., 1974).
PO -P 4 tot P n o2-n n o 3-n NV N H4S104s i o2
Sept. ♦ 3,4 + 4,6 4- 1,9 4- 8,7 ♦ 0,6 ♦ 314- 220 + 310 4- 130 4- 580 4- 40 4- 2100
Oct. + 0,4 ♦ 1,4 + 0,4 ♦ 13,3 - 11,3 4- 19+ 30 + 90 4- 30 4- 890 - 750 4- 1300
■P04-P tot P NV N N03-N n b3-n V i04Si02
Sept. 1.1 1.5 0,9 6,6 4,7 6,6Oct. 1.4 1.9 0,4 8,5 6.8 11,5
crease exponentially with increasing distance from the coast. In the coastal strip, pore water P is present in relative excess (P;N:Si»1:10:4), with respect to requirements of average southern North Sea phytoplankton (1:15:7). Postm a (1982) proposed that sandy sediments in this area and the western Wadden Sea as a rule contain these nutrients in the former ratio, and at the same time release them in a 1:15:7 ratio.The difference for P should then be attributed to the extra (chemical) barrier that phosphate has to take in its transition from pore water to overlying water. In the thin aerobic top layer of the sediment, namely, part of the dissolved P, arriving from anaerobic deeper layers as iron (II) phosphate turns into the poorly soluble iron (III) phosphate and precipitates, thus hindered in its release to the water column. For this flux reducing effect the thin aerobic layer is probably indispensable. An indication for this disproportionate release is the observation that the Si:P ratio in coastal waters is higher than the pore water concentrations would lead one to expect (Postm a, 1978).The interstitial PO4 concentrations in the coastal strip are not detectably different in summer and in winter (Rutgers van der Loeff, 1980b); for the offshore area we are not aware of unambiguous data.
Nitrogen
The budget study by Tussen et al. (1974) indicated the bottom as a source of N as well, in September and October 1973, without giving certaintly about this (not all N forms were measured). For both the ammonium and the nitrite concentrations, there is a seaward decreasing gradient in the water throughout
/imol • r* Si73-
SO-50
25-
30-
20 -
1 0 -
50-
50400 10 20
Fig. 31. Average values with 95% confidence intervals (vertical bars) of pore water parameters as a function of offshore distance, grouped in parallel zones (width of zones Indicated by horizontal bars), a . Silica in the pore water of box cores (0 to 15 cm averages; pm olT'); tu idem for phosphate; c, idem for ammonia (RUTGERS VAN DER LOEFF, 1980b).

40
-) /f0 ,
/ / • V • • *
11 0 /
1 » I
: ¥* * #/ // /* / s /
?* 3 . '
• V •
/ • / . ■ ■ y y y y . .»/« 0
i
¡ C ¡ . v
Fig. 32. Spatial distribution of nitrate ( pg N-l'1) in (a) October 1973 and (b) May 1974, and of ammonia ( pg N-l'1) in (c) October 1973 and (d) May 1974 in the Southern Bight (BAEYENS et al., 1984).
the year, with coastal maxima in October (fig. 32). Here the increased ammonium can be seen as the cause, and the increased nitrite as an expression, of pelagic nitrification. This occurs in autumn and in winter in the column, and throughout the year in the oxic sediment top layer. Table 12 shows net nitrification in situ in October, normal for that season [H e ld e r , 1978], in the east half of the Southern Bight.The pelagic nitrate is, consequently, relatively high in October, and it keeps on increasing to a maximum in March-April (Johnston & Jones, 1965), probably owing to river contributions (cf. table 6). h also has a shoreward increasing gradient. In winter along the coast the interstitial concentration is much lower than that in the overlying water, causing a flux Into the sediment. There denitrification occurs, which in winter (with values around 20 nmol-m"2-s‘ ') is much stronger than in summer (4 nmol-rrf2-s-1), owing to high nitrate advection and low phytoplankton uptake (R u tg ers van d er Loe ff, 1980b). In the offshore area
this value is some 1nmol-m-'2 -s"1 throughout the year. Rates of denitrification in the range of 4-60 nmol-m"2-s‘ 1 were reported in Belgian, Dutch and Danish coastal sediments representing 8-23% of the amount of N mineralized in the benthos (Brockmann et al., in press).In the previously described mud area near the Belgian coast (§ II.5.3) and neighbouring areas, N transformations were studied by B aeyens et al. (1984), who drew up a DIN-budget (DIN *= dissolved inorganic N). They concluded that in that area the variation of DIN concentrations is virtually only caused by internal interactions, and that advective Influences are very secondary. The course of DIN (i.e. ammonium and nitrate) through the year appears to be primarily determined by the two antagonists, phytoplankton uptake and bottom regeneration. Only directly upon spring bloom and in October extra DIN supplies to the water column are detectable. In this, pelagic bacterial remineralization of phytoplankton products plays the leading part, and excretion by

41
grazing Zooplankton comes next. Within some 12 km from the coast the DIN concentrations vary most strongly; outside that zone the DIN is exhausted at the end of spring (May) and limiting for the rest of the season. In the coastal zone, DIN is never exhausted and consequently not limiting (light is).
Silicon
Considerable in situ production of reactive silicate was found in the east half of the southern Bight, in September 1973 (five times the river input in that month) and October 1973 (three times the river input) (table 12). Similar values were found by R u tg ers van der L o e ff (1980b) who inferred the diffusive flux from the sediments from measurements of concentration gradients (the comparison is in table 13). According to Tussen et al. (1974) weathering of minerals in suspension may have contributed a minor part, but far less than the bottom, in view of the large in situ production. On the dissolution of silicate, both in the water and in the sediment, temperature probably exerts a dominant influence (compare September with October in table 12). The Si concentration in the pore water in summer is higher than in winter, in the offshore part of the eastern Southern Bight. (41 against 25 pM, averaged over upper 15 cm layer).No such significant seasonal difference is found in the coastal area in summer; here pore water concentrations are permanently high (fig. 31) which results in a high release (fig. 23).
Nutrient s/w Nutrient flux out o f the sediment Nutrient( nmol -m- * - j -1) incorporation
~Z rate by primaryrrom pore water From budget production
____________‘ |W |'* (omoiCoastal Offshore Sept. Oct.
zone zone '73 '73
NH«* 54.4 9.9N O ,- +
0z
s - 3.8 4.0w -1 8 .9 0.5
n h 4* + NO *- + NO *- sw
50.635.5
13.910.4 22 5 100
PO43- 3.8 2.6 2.9 0.4 6.2Si s
w27.515.9
13.07.5 14.5 9.0 137
TABLE 13. Estimated diffusive flux of nutrients (nmol-m'^-s- ') out of the sediments in the eastern part of the Southern Bight as calculated from diffusive flux estimates (s for summer, w for winter), compared with flux values calculated from budget studies of TUSSEN et al. (1974) and with nutrient incorporation rates by primary production of 250 g-C-m'2-a"' at more than 20 km offshore (GlESKES, 1977; RUTGERS VAN DER LOEFF, 1980b).
Furthermore, a north-south gradient was observed in the coastal zone (of 4 km): correlated with the northwards coarsening of the sediments, a decrease in interstitial Si concentrations, from 87 ± 16 pM (Hoek van Holland) to 32 ± 26 pM (near Den Helder) (R u tgers van der Loe ff, 1980b). A corresponding decrease of the amounts produced in situ over this track is likely to be the effect.
111.3.3 Dutch Wadden Sea
We begin this section with a few lines about the Us- selmeer, a lake which is most influential on the Wadden Sea nutrient regime. This lake used to be a North Sea embayment (the Zuiderzee); it was secluded from the sea in 1930. The lake receives Rhine nutrients from the Ussel (a Rhine branch) but in the outgoing water it has substantially lower dissolved nutrient concentrations than in the incoming. The cause is fixation in plankton cells which settle on the bottom. Here, too, mineralization occurs, accompanied by the release of dissolved nutrients in the interstitial water, as in the coastal sea. Mechanical exchange between interstitial and overlying waters, however, occurs much less than in the coastal areas, and less than it used to do in the Zuiderzee, so that this basin now is a sink for particulate Rhine nutrients. It is an example of the artificial lakes that store riverborne nutrients, especially Si, in their sediments. This storage process is less effective in winter and early spring when - due to reduced uptake - large amounts of dissolved N0 3 " and PO43 pass the sluices to the Wadden Sea (P o s tm a , 1976; H elder, 1978).Annually, some 60% of the P coming in from the Ussel is retained in the lake; around 1969 this was estimated 75% and in 1949, 80% (Postma, 1985). The retention is expected to decrease further in the future, but it may take many more years before the lake bottom reaches equilibrium with the water column.Table 14 shows that in the outgoing water Si is relatively deficient, with respect to the requirements of the phytoplankton community in the southern North Sea (1:14:7; Postma, 1978), especially for diatoms, who need Si and P in a ratio of far more than 7. Consequently, Si is the prime limiting nutrient. In the course of a season, different nutrients can subsequently limit different phytoplankton blooms in the Wadden Sea. To N and P this applies locally and to a limited degree (H e ld er,1978; R u tg ers van d er L o e ff et al., 1981b; H e ld e r et al., 1983); it has been demonstrated, though, that the Si limitation lasts longer and is the most extensive (Gieskes & Van Bennekom, 1973).

42
TABLE 14. Concentrations (pmolT1) and ratios of total dissolved P and N, and of reactive silicate. The Wadden Sea mixture (S=29.7%o) consists of 85% North Sea, 7.5% Rhine, and 7.5% Usselmeer water (in brackets the ratio in a mixture with 5% Rhino and 10% Ussolmoer water). After POSTMA & VAN BENNEKOM (1874). (POSTMA, 1982)
WINTER SUMMER ANNUALP N Si P N Si P N Si
Rhine 18 380 130 18 380 501 : 21 : 7 1 s 21 : 3 1 : 21 : 5
IJ sselmeer 3. 5 250 40 2 100 71 : 70 : 11 1 : 50 : 3.5 1 : 60 : 7
North Sea 0 . 4 5.'6 2.8 0 . 1 1.4 0.71 : 14 : 7 1 : 14 : 7 1 : 14 : 7
Wadden Sea 2 52 15 1.6 37 5( calculated) 1 : 26 : 7.6 1 : 33 : 3
(1 : 31 : 8) (1 : 25 : 3.2)
(measured) 1 ; 20 : 13 1 : 15 : 3
An interesting difference between expectations and measurements of Wadden Sea nutrient ratios, furthermore, is that both the N:P ratio and the N:Si ratio remain substantially lower than calculated throughout the year, which could not be explained in 1974. Recent observations, however (see under "denitrification" in Introduction to this chapter), indicate that denitrification in Wadden Sea sediments may be a significant N loss post in the Wadden Sea budget.
Phosphorus
The increase of the nutrient loads of Rhine, Meuse and Scheldt of the past decades led to an increase in the primary productivity in the North Sea. Between 1950-1970 the amount of particulate organic matter produced in the North Sea per growth season, increased by perhaps 50% (Postm a, 1982). In 1950 the western Wadden Sea received some 80 gC-m'^-a"1 from the North Sea, transported by the tidal currents; in 1970 this amount had tripled (Postma & De Jonge, 1974). The Wadden Sea, by nature a “trap" for particulates from the North Sea, receives mainly Dutch coastal water in which the nutrient enrichment makes itself felt most strongly, hence this more than proportional increase. This became visible in the changing development of summer phosphate concentrations: In 1950 the course over a year had the shape of a sinus, with the minimum in summer, as in the North Sea coastal water. In 1970 an extra maximum had replaced this low, due to rapid
PO«-Pm gai.irf®
2 0 -
1970-1971
10
OS
Fig. 33. Seasonal cycle of phosphate in the western Dutch Wadden Sea (Marsdiep tidal inlet area) in 1950-1951 and 1970-1971. After DE JONGE & POSTMA (1974). (POSTMA, 1982)
regeneration of P from a surplus of organic matter (fig. 33).In fig. 34 the relation between Wadden Sea concentrations and those in the Continental Coastal Strip is depicted: In summer, phosphate uptake by phytoplankton occurs in the North Sea, and at the same time, mineralization of organic matter in the Wadden Sea. In winter both processes are delayed. As a consequence, the North Sea has relatively low PO4 concentrations in summer and high concentrations in winter, whereas in the Wadden Sea the opposite applies (Postm a, 1976). The highest concentrations

43
Fig. 34. Surface concentrations orthophosphate in summer1976)
occur in summer in the innermost (shallowest) parts of the Dutch Wadden Sea (Postm a & De Jonge,1974).Although it is not yet clear what proportion of the supplied organic matter is mineralized in the water column, and what proportion in or at the bottom, the latter is no doubt considerable (they could be of about equal magnitude; Postma, 1982). Here, as in the Dutch coastal sediments (see above) the thin aerobic top layer of the sediment may regulate the flux of dissolved P to the overlying water.If this layer would become thinner or even disappear - e.g., as a result of an increased oxygen demand, after enlarged supply of organic matter - then the phosphate flux from the sediment might expand very strongly. POSTMA (1982) predicts that in that case a chemical seasonal cycle of inorganic phosphate may occur, which would run parallel to the biological phosphate cycle, peaking in summer (fig. 33). Such a thing could arise in the southeast corner of the Dollard, which is heavily loaded with organic matter discharged by regional industries, each November.
Nitrogen
As stated in the introduction, more different N than P compounds serve as phytonutrients; each has its own time and space distributions, and they shade off into one another. Changes in their concentrations are caused by advective processes, but also by
and winter (right) in the continental coastal area. (POSTMA,
chemical addition to, or withdrawal from the solution at a particular place. A distinction between "advective" and "chemical" influences is made using "baselines" and/or "concentration anomalies". In order to do this, first the question is asked: how would the compound's concentration evolve along the investigated track, if it were to behave conservatively,i.e. undergo no chemical changes, and remain in the same compartment (the water phase)? In the example of the Wadden Sea: the water composition gradually changes in the residual (eastward) direction: percentages Channel and Rhine water decrease, percentages from other sources increase. The actual composition at any place is inferred from the concentration development of undisputedly conservative parameters, like salinity. Once the composition of the water mixture has been decided, a calibration line of conservative concentrations (a baseline) is constructed for the compound under investigation, on the basis of its concentrations in the separate constituents of the water mixture. If at a certain site along the track, the measured concentration of the (non-conservative) compound appears to be above the baseline (the concentration anomaly is positive) this indicates that some of it has been "newly made", or "produced in situ " ("production" in a broader sense than just biological). If, on the other hand, the measured value is under the baseline (negative anomaly), in situ consumption, i.e. any kind of withdrawal from the solution, must have taken

44
pgai/i
40.
%oV
b
%o'
Nor
Fig. 35. Relation between average yearly salinity and average concentrations of N species in the western Dutch Wadden Sea. Solid symbols: 1960-1962; open symbols: 1971— 1972. After HELDER (1974). (POSTMA, 1982)
place. This approach has proved particularly useful In studies of N-involved processes (fig. 35).The surplus of organic matter that the Wadden Sea has imported from the North Sea in the past decades, leads first of all to extra in situ production of ammonium. Fig 35a shows in situ production both in 1961 and in 1971. It also shows that this production increased strongly over the decade just as was demonstrated for phosphate mineralization. Ammonium, which is crucial for the N-budget of the Wadden Sea, is preferred to the two other main forms as a phytonutrient.Unlike in the Dutch coastal waters, it has virtually always the highest concentration of the three, with a peak in September (this two months’ delay with respect to the phosphate peak (fig. 33) illustrates the slower proceeding of N mineralization compared with that of P). Ammonium is partly oxidized to nitrite - in situ production of which increased also over the observed period (fig. 35b) - but not yet nitrate, due to the short residence time of the water in the western
Wadden Sea. Nitrate already supplied as such, passes through this region in the coastal water, without either being significantly taken up or produced (fig. 35c). Postm a (1982) points to the fact that throughout these years the N:P ratio in the nutrients produced in situ remained 16, the ratio to be expected from plankton decomposition.In autumn and winter, the NH4+ concentration exceeds 10 pM, the threshold value for pelagic bacterial nitrification, which consequently develops (fig. 36). In that season nitrite and nitrate concentrations reach maxima, as a consequence. In the growth season phytoplankton uptake keeps the NH4+ concentration below 10 pM, preventing any significant pelagic nitrification (H e ld er, 1978). R u tg ers van der L o e ff efa/. (1981b) made an inventory of processes that remove N from the solution on tidal flats in the Dollard, an environment characterized by long emersion periods and a rich nutrient supply. These processes were* primary production, largely by benthic algae
(uptake mainly as NH4+);* utilization (also NH4+) by heterotrophic bacteria,
that feed on N-poor organic matter, discharged into the area each autumn by the Westerwoldse Aa, as an effect of industrial activity. The incorporated N partly increases the biomasses concerned in the estuary, and is partly exported from it by tidal currents, to increase the organic loading of the German Bight waters "downstream". The only real N-sink found was:
* denitrification. Denitrifying bacteria turn NO3 into N2 or N2O. The source is nitrification of NH4+. If the latter proceeds at the same rate as the former, denitrification can occur without any apparent NC>2‘ or NO3- consumption, but with detectable NH4+ consumption. In this investigation, all three compounds were consumed throughout the year, with a maximum denitrification in late summer of 58 nmol-m‘ 2-s'1, a value which is among the highest found in the whole Continental Coastal Area (4-60 nmol-m‘2-s‘ 1 ; Br<xkmann et al., in press).
Silicon
Almost all silicon in the Dutch Wadden Sea originates from the Rhine, via coastal waters and Usselmeer; about half arrives as reactive silicate (with a maximum in winter and negligible amounts in May and September), the rest arrives fixed in diatom frustules. Of these frustules less than a third, on an annual basis, is mineralized, the rest is buried in the sediment or exported to the North Sea or the German Bight. The Dutch Wadden Sea is, in relation to the North Sea as a whole, a net sink for frustules and a

45
.200
NH* JUNE NHÎ DEC.
n o ; DEC.n o ; JUNE
Fig. 36. Distributions of dissolved inorganic N species in the Dutch Wadden Sea for June and December 1971. Concentrations in pmolT1. After HELDER (1974). (POSTMA, 1982)
net source of reactive silicate (Van Bennekom et al.,1974). In the western part, these authors report silicate mineralization in the period May to December, with a peak in September/October. 15% is estimated to be produced from weathering of material in suspension, the rest comes from the sediments; in particular the muddy surface sediment in shallow parts. In the Ems-Dollard estuary weathering of suspension is likely to contribute more than 15%, due to the higher suspended load (R u tg e r s van d e r LoEFF,1981b). On the tidal flats of the inner Dollard, on the one hand, there is a net Si consumption by benthic diatoms, but at the same time this is more than compensated for by dissolution of silicate on the bottom of the channels and in the turbid water. The resulting net year production of the Dollard is even larger than that of the western Wadden Sea.
The cyclical diatom production in the Wadden Sea interacts with the reactive silicate concentration and is strongly influenced by local depth. In the Marsdiep area (western-most inlet) reactive silicate is reduced to concentrations of -0.5 pM (considered growth limiting) in April, June and September. In the shallow areas there is an almost complete exhaustion by then (Van Bennekom et al., 1974). This illustrates the central importance of Si as a limiting factor for phytoplankton growth.
III.3.4 German Bight
Winter maps of surface nutrient concentrations (representing depth average values, and moreover, relatively free from complicating biological influences) most clearly show the German Bight as a

46
"gradient region" (G e r ia c h , 1984) of marine and coastal waters in every conceivable relative proportion. Estuarina water from the southern rivers is transported close to the Belgian and Dutch coasts, and then along (and through) the Dutch and East Frisian Wadden Sea, due east. This flow receives nutrients by coastal and Wadden Sea mineralization of organic matter, and from Ems, Weser, Elbe and Eider. It proceeds northwards along the Danish west coast, appreciably widened by the shallow topography and the admixture of sea water in the inner German Bight.A continuous series of measurements of sea water parameters at the isle of Helgoland, performed five times per week since 1962 (Jahresberichte Biologische Anstalt Helgoland, since 1978; Hagmeier, 1978) has been statistically analyzed: linear trends over the period 19 62 -198 5 , and non-linear trends over shorter periods of over two years were reported and evaluated (Berg & Radach. 1985).A main problem in this work was that the large fresh water tongue from the Weser and Elbe estuaries can be blown in all directions (§ II.4) by the wind, undergoing a highly variable degree of mixing with sea water.Helgoland finds itself inside this tongue one moment (time scale of days), outside it another (Brockmann, 1984). Therefore B erg & Radach made a global distinction between measurements inside tongue water (to be called "coastal" in this section) and those outside it ("salt"; this distinction is in some instances of course arbitrary). Summarizing the trends 1 9 6 2 - 1985;1. Salinity. A significant 23-year linear increase in Elbe water discharge was inferred (from other data). Helgoland waters show a general salinity decrease, possibly correlated. Shorter-term fluctuations of these two parameters strongly correlated. No significant increase of rain since 1962.2. Temperature. No trend in salt water, long-term increase in coastal water, both in winter and in summer. Air temperature rose parallel with water temperature. Possibility of slight climatic change at present under investigation.3.Phosphate-P. 23-year linear increase from 0.6 to 1.0 pM in yearly averaged concentration (both coastal and salt water) (+ 67%). Increase stronger in coastal water. On a smaller time scale: the concentration increased up to 1981, stagnated since.4. Nltrate-N. 23-year linear increase from 5 to 16 pM in yearly averaged concentration (+ 220%). Increase stronger in coastal water. Increase in 1985 still going on.5. Nitrite-N. 23-year linear increase from 0.7 to 1.1pM in yearly averaged concentration (+ 57%). Al
though highest concentrations were found in the coastal water throughout the year over the whole period, it is remarkable that salt water (winter) concentration increased more than that in coastal water. Recent years: nitrite-N increased up to 1978 and is strongly fluctuating since.6. Ammonlum-N. 23-year linear decrease from 10 to 5 pM in yearly averaged concentration (-50%). In 1962 winter values in coastal water much higher than in salt water. Decrease in coastal (winter) values much stronger over 23 years than in salt (winter) values, so that winter concentrations are at present about equal in both water types. No clear trend in present years.7. Silicate. 23-year linear decrease from 9 to 3 pM in yearly averaged concentrations (-67%). Winter values in coastal water were in 1962 much higher than in salt water; decreased strongly since, and are at present about equal. Continues to decrease in 1985.8. P h y to p la n k to n . Total biomass increased strongly; increase consisted of flagellates only (cf. Ch.IV), diatoms decreased. Since about 1979 flagellates stagnated.
A few remarks: As an explanation for the increased river water discharge the authors propose the extension of Elbe drainage systems and the regulation of river systems. The temperature trend in coastal water, and absence of it in salt water, is explained by the authors as caused by anthropogenic warming of river water.Tho tronH Qf jpcr9asincj phytcplap.kton biomass was especially visible in the spring blooms. In the years 1979, 1981, 1982 and 1983, furthermore, excessive summer blooms occurred (R ach o r& A lb rec h t, 1983; DETHLEFSEN& VON WESTERNHAGEN, 1983). HAGMEIER (1978) and G illb r ic h t (1982, 1983) called attention to the correlation between nutrient and phytoplankton trends (see further § IV.2.1).
SPhosphorus
G e rla c h (1984) attributes the increased river PO4 loads to the same causes as in the case 0' the Rhine: introduction of phosphate detergents and centralization of sewage water purification in the FRG. Yet he considers the increase in anthropogenic input alone not a sufficient explanation for the strong increase in coastal phosphate concentrations, especially in the inner German Bight. He puts forward a similar suggestion as was reported above for the Dutch coastal waters: the increase of the bottom flux was rather sudden, because the sediment does not "buffer" anymore, and consequently the dissolved

47
concentra tions increased d isp roportionate ly strongly, compared to the P inputs into the area. However, unlike Van Bennekom et al. (1975, annex1976), he does not mention a possible buffering action by suspension. Extra complicating feature is the enhanced phosphate mobilization from oxygen-poor sediments, previously mentioned, also observed in the German Bight (Brockmann, 1984). The release of nutrients and toxic substances from Kiel Bight sediment in anoxic conditions is briefly described in §IV.5.1. These are some of the effects likely to have happened in the German Bight as well, and likely to spread if the anoxia does.
Silicon
The reported decrease may be an expression of a more abundant diatom growth due to N and P eutrophication. The diatoms, with their relatively high growth rate (vmax, in terms of nutrient kinetics), will be limited by silicate alone, to a higher degree than previously; this most probably applies to both the Dutch coastal waters and the Wadden Sea (see the sections concerned). The corresponding increasingly efficient Si depletion in the source area and the slow mineralization characteristic of Si may already have been sufficient to decrease the reactive silicate concentration in the German Bight; this exhaustion receives a further impulse from various run-off sources on the way, which are generally enriched in N and P, but not in Si.
Nitrogen
Since 1970 the use of N in fertilizer and liquid manures on cropped land increased (G e r la c h , 1984) which resulted in an increasing river N supply to the sea.A remarkable natural feature is that the amounts of N via this route are crudely proportional to the freshwater discharge to the German Bight. Because an increase in this discharge can only imply dilution of the point source contributions, apparently the contribution from other sources must increase, together with discharge. Heavy rainfall appears to lead to an intensified erosion of soil N compounds. Koeve & G e rla c h (1984) found this correlation for the Elbe and Danish (M iljo s ty r e ls e n , 1984) and Swedish (N a t.S w ed .E nv .P ro t.B oard , 1984) authorities found it for their own territories. In connection with this there seems to be a correlation between coastal water N concentrations (measured in winter) and annual fresh water supply. In the summer of 1981 (summer of a Ceratium bloom, see § IV.5.2) the German Bight had a high N concentration, correlated with a riverine
N supply of twice the normal amount (H ickel, 1984). This correlation does not link the concentration increase exclusively to the riverine N: most likely the heavy rains removed extra N from the low lying marsh areas bordering the German Bight, as well. In the same study Hickel investigated the quantitative connection between the particulate N formed in primary production and the oxygen consumption in the German Bight. To this end, a "potential oxygen demand" of 20 g C>2 was attached to 1 g of particulate N on the basis of total aerobic decomposition of an organic molecule in which the N was present in an average ratio with the other elements. Thus the potential oxygen demand of the organic matter formed in the German Bight was calculated, assuming that all of it was to be decomposed under the thermocline (set at 15 m, with an average water depth of 30 m). In normal years, then, the sinking seston appears to be able to consume about half of the oxygen present under the thermocline; under phytoplankton blooms often all of it. The Ceratium bloom of August 1981 had a potential oxygen demand that exceeded the oxygen stock of the deep water under it.There is an atmospheric N input of some importance (around 5% of total N inputs) to the German Bight and (fig. 37) Danish waters, which is discussed in the Annex (p. 80).
111.3.5 Danish waters
The positive correlation between fresh water discharge and N transport to the sea is confirmed by Danish investigations over the period 1967-1980, in four rivers: the Skjern A, Karup A and Gudenà on Jutland, and the Odense A on the isle of Fyn in the Belt Sea (H a g e b ro et al., 1983). In this period the water discharge, the nitrate concentration, and the N load increased significantly in each of these rivers. This trend went parallel with that of rainfall, which is viewed by the authors as the factor dominating the N load that reaches the sea. If this weather effect was "filtered out" by calculations, then among the four only the Skjern A and the Karup A still showed a significantly positive N trend in time. This was attributed to structural changes in agricultural use of the catchment areas of the two rivers, notably the trend to over-fertilization with either fertilizer or manure (the use increased from 7.8 t N-km'^-a' 1 in 1967, to13.5 t N-km"2-a'1 in 1979). In both cases the addition of surplus N to the soil above a certain "critical" dose (11 t N-km'^-a"1) was reported to have led to a more than proportionally increased nitrate leaching by run-off water (Van Bennekom & Salom ons, 1981, mention literature which generally confirms this). The two rivers were under strong influence of ground

48
2 0 ' kg N / h a / ár
la lt
A m m o n iu m - N
N i t ra t - N
1955 1960 1965 1970 1975 1980
Fig. 37. Atmospheric input of nitrate and ammonium at Askov (mid south Jutland, Denmark), 1955-1977 (J0RGENSEN, 1987).
water from agricultural areas, and less of sewage water. In the Odense A, on the other hand, where this source proportion is reverse due to the population density in the catchment, the above mentioned "hidden" trend was not observed. From this, the authors conclude that agricultural changes of the past decades exerted a much greater influence on the N trend than did the waste water. Moreover, this study shows 1980-1981 as an extremely wet season with very high discharges and high N loads; in the following summer the serious oxygen depletion occurred in the Danish coastal water (W esternhagen & D e th le f- SEN, 1983).Recently published nitrate trends in Danish ground water (Jorgensen, 1987) confirm this N loading of the soil: average groundwater nitrate concentrations for the country as a whole, fluctuated around 4 mgN0 3 - r 1 in the period 1940-1960; from then on this value began to rise and gradually tripled to a13.3 mg-l' 1 in 1985. Furthermore, a map in the same publication (fig. 38) shows that in a few western Danish estuaries, influenced by the Skjern A and Karup A, a phosphorus limitation is effective in the growth season, which must have arisen from the disproportionate N enrichment in the inflowing rivers. In fig. 38, limitation types are depicted: "n" stands for
PN
PM
PH
PN
PN
r ?
L i m i t i n g n u t r i e n t h Nitrogen - low eutrophication.
Nitrogen - nutrient influenced macrophyte covered areas
High eutrophication
Fig. 38 Mapping of marine areas around Denmark according to their annual cycle in nutrient concentrations, n, normal situation; N, eutrophicated, N limitation; P, eutrophicated, P limitation; PN, eutrophicated, annually successive P and N limitations (for further explanation see text). (JORGENSEN, 1987).
areas where low N concentrations in the growth season are thought to limit primary production: this is considered normal in the open non-eutrophicated sea. The capitals indicate areas in various states of eutrophication where either N ("N"), P ("P"), or P in spring and N in the rest of the growth season ("PN") are considered limiting to primary production. As the above example shows, nutrient inputs from the land are very influential in determining the limitation type. The Kattegat area has also been heavily enriched with N. Since 1981 here, too, serious oxygen deficiencies have affected ever larger areas and often resulted in fish and benthos kills (Jorgensen, 1987) (see § IV.5.2).


50
IV BIOLOGICAL PHENOMENA AS EXPRESSIONS OF EUTROPHICATION
The main problem of eutrophication is its great variety in appearances both in relations among and within trophic levels. Although in a strict sense life begins with nutrients and an increase in nutrients consequently will cause an increase in biomass which, in theory, can be followed throughout the foodweb, the phenomena emerging at us are not that unequivocal.The biological components and processes that can be measured are only a few links within the foodweb (fig. 39). To find out the implications of eutrophication in the marine environment, in fact one should measure all links simultaneously. It's very well possible that not all of them are affected, but which of them is is very hard to tell, for it can differ from place to place and from season to season.For instance it can occur that an increase in nutrient concentrations is followed by an increase in algal biomass which is subsequently transferred to the next trophic level and so forth. The effect of eutrophication will fade away and the only consequence is a hardly detectable increase of the top predator biomass.
Things will be different when the wave of increased biomass get stuck in one or only a few links of the foodweb. This can be the case when there are no predators due to the inedibility of the 'sticked link' (e.g. jelly fish, toxic algae), or when the hydrografie and/or climatic circumstances are such that the next trophic level is out of reach or out of phase with the sticked link. Possible consequences are a complete disorder of the foodweb and an increased sedimentation of organic matter, with various impacts.In addition, the complexity of coastal ecosystems makes it even more difficult to assess eutrophication. Highly variable hydrodynamics give rise to a flexible ecosystem used to sudden changes. As a result natural variations are high and hard to distinguish from man-made effects. Nevertheless perturbation of the ecosystem becomes more and more evident, though sometimes it may be felt in regions distant from the eutrophication source In this chapter biological phenomena as expressions of eutrophication are viewed separately, together with some remarks on the shortcomings of measurements. In the next chapter we will combine these views into a season dependent model, to try to elucidate the interdependence of different species and their development and what this means for eutrophication impacts.
Fig. 39. General scheme of the relations between the different groups of organisms in the North Sea (WATERKWAUTEITSPLAN NOOHUZEE, 1985a).
INORGANIC
MATTER
PHYTOPLANKTON
MINERALIZATION
PELAGICFISH
FISHERIES. PREDATORS
ZOOPLANKTON
MICROORGANISMS
DEMERSALFISH
FISHERIES. PREDATORS
MACRO ZOOBENTHOS r V V T
M INERALIZATION
ORGANIC
MATTER
M ICRO AND MEIO
ZOOBENTHOS
CONSUMERS DEAD ORGANIC
MATTER
1
PRODUCTION
2
MATTER
5

51
IV. 1 P rimary production
IV. 1.1 Some general remarks
Organisms capable of synthesizing energy-rich organic compounds from energy-poor inorganic compounds (e.g. H2O and CO2) are called 'autotrophs'. The energy source they use is either light or chemical energy derived from the oxydation of inorganic compounds. The processes involved are called photosynthesis and chemosynthesis, respectively. Because these autotrophs don't use organic compounds as an energy source (although some do use growth factors and vitamins), they are the only producers of original autochthonous organic matter and therefore are referred to as primary producers.In marine ecosystems the main representatives of primary productivity are photo-autotrophic algae. However in the deep sea and in sediments under anaerobic circumstances chemo-autotrophic bacteria may also play an important role. In shallow areas benthic algae and macroalgae sometimes overrule the phytoplankton: in the Wadden Sea, for instance, the mean benthic primary production is of the same magnitude as the phytoplankton production (Po stm a , 1982).
Primary production is not the same as growth. To understand this one should distinguish three different but interrelated phases within the process of cell material formation: the capture of external energy laid down in chemical forms; the formation of simple carbohydrates out of inorganic compounds using the chemical energy derived in the first phase; and actual growth based on these carbohydrates, nutrients from the environment and chemical energy. The first two phases are the light and dark reactions of the photosynthesis, respectively (for a more extensive view see Parsons et al., 1984).At daylight, energy for growth and cell maintenance is derived from the light reaction or from respiration. When nutrients are available carbohydrates will be transferred into proteins and lipids. In the dark, however, when there is no photosynthesis, energy can only be gained from the oxydation of formerly produced carbohydrates. Consequently part of the biomass produced at day-time is decomposed at night-time.Without nutrients growth is impossible, whereas photosynthesis may proceed for some time with only water and carbon dioxide. If nutrients are limiting this will reduce the ce ll's capacity to transform photosynthetic products into cell constituents in the
same rate as they are formed. A kind of overflow mechanism will be put into force and excess will be released as extracellular products. This fraction can amount up to 40% of the total fixed carbon in olig- otrophic waters ^Fo g g , 1980 and 1983; Joiris et al.,1982).Referring to their experiments in the open olig- otrophic Atlantic in 1982, GiESKES & Kraay (1984a) concluded that individual algae there produced maximally compared with algae in the Central North Sea: a chlorophyll-a concentration of 0.1 mg-m' 3 in the Atlantic produced 10 mg C-m‘3-day'^ (measured from sunrise till sunset), while in the Central North Sea 1-2 mg Chl-a-m' 3 (G ieskes & Kraay, 1984 b) produced 80 mg C-m"3 -day" 1 (P ostm a & R o m m e t s ,1984). The total primary production in the Atlantic, however, was limited due to a limited standing-stock. This was the consequence of low nutrient concentrations: primary products formed at daylight, mainly carbohydrates, are largely used as an energy source and not transformed into cell material. Especially the respiration of microflagellates is high, because of their active lifestyle: while searching for nutrients in deeper waters, their respiration is about 3-6 times as high as for passively living algae (Parso ns et al., 1984). Increase of the nutrient concentration would immediately result in an increase of the standing stock, whereas the 12 hour primary production at daylight might not necessarily be affected.
It can be concluded that the two essential factors for primary productivity are light and nutrients.Light is the ultimate source of energy for photo-autotrophs and will govern the onset and ending of the growing season. G ieskes & Kraay (1975) observed in dutch coastal waters that the onset of the growing season was related to a mean light intensity over the mixed water column of 0,03 gcal-cm‘ 3-min‘ ^. In general this is attained in February-March in offshore waters, but in the more turbid coastal waters it will last until April-May.Light penetration in the water column is determined by three factors: absorption and scattering due to the water itself, due to suspended and dissolved matter and due to plankton. It's obvious that river discharge, currents, weather conditions, but also algal biomass, will govern turbidity and thus light penetration.Nutrients can be divided into two groups: macronutrients (C, H, O, N, Si, P, Mg, K, and ¿a) which are needed in relatively large quantities and micronutrients (Fe, Mn, Cu, Zn, B, Na, Mo, Cl, V, Co) required in very small amounts (Parsons et al., 1984). For algal growth marine environments contain ample concen

52
trations for most of the elements. The most troublesome elements are considered to be N, P and SI. N Is the limiting nutrient in most saline waters, while usually P plays this role In fresh waters and brackish waters such as the Baltic. However, due to the Increased effluent of terrestrial nutrients some coastal waters seem to exhibit P-limitation: this has been observed for Dutch coastal waters (V an Bennekom et al., 1975; G ieskes & Kr a a y , 1975; V eldhuis et al.,1987) and for Danish waters, mainly In Kattegat and Belt Sea (So m er , 1987).It should be emphasized that different algal species need nutrients In different relative proportions; therefore, ambient nutrient ratios alone do not permit general statements on the water body's nutrient-related capacity to support primary production (to be called Its "fertility status" from now on) (see also § IV.3.1). In the case of the Dutch coastal waters the flagellate Phaeocystis pouchetii was assumed to be P-llmlted. Diatoms, of course, are a special category as they are exceptional In their need for silicate. After the spring bloom they become limited by SI, a limitation that seems to have Intensified In the past decades (§ IV.3.1 ).In addition to this species-speclflclty, question marks can be put on the knowledge of other nutrients, especially the mlcronutrlents or trace elements. Whether they are growth limiting, growth reducing or mortality Inducing is still unknown (F ransz, 1986). Considering the cocktail of elements discharged by the rivers, knowledge of these factors is urgently required.
IV. 1.2 Factors influencing primary production
In judging factors influencing primary production, two different groups should be distinguished; one directly Imposing limits on the photosynthetic capacity of the phytoplankton, and another not directly of Influence on the photosynthetic capacity but obscuring the relationship between primary production and nutrient concentration. They are referred to as direct and Indirect factors, respectively.
Direct factors
Winds, tides, freshwater run-off, alr-ocean heat exchange, they all are of influence on primary productivity. Lately these factors are considered to be sources of mechanical energy, Interfering with the ecosystem and therefore summarized as "auxiliary energy" (Legendre et al., 1986). The Input of auxiliary energy, which will cause turbulence In the water column, does not directly influence photosynthesis, but It does set the stage for it. In the first place it deter
mines the light Intensity experienced by the algae. And secondly It's of great importance for the nutrient distribution In the water column.To begin with light, we will first Introduce some terms. The water column In which light conditions are sufficient for photosynthesis is called the euphotic zone. The depth receiving a light intensity of 1% of the surface radiation is regarded as the bottom of the euphotic zone. At this depth respiration of the phytoplankton counterbalances photosynthesis and is therefore called the compensation depth (De).More of Interest however is the critical depth (Der). When phytoplankton Is mixed over a water column due to turbulence, they experience an average light intensity. Their survival as a population will be determined by the total productivity and respiration of this column. At the critical depth photosynthesis of the overlying water colum will equal the respiration of this column (fig 40). Is the critical depth below the depth of mixing (Dm), conditions for growth are established. It can be deduced from the above that species with relatively high productivity to respiration ratios will experience greater critical depths than species with low ratios and thus will be In favour under turbulent circumstances. (In early spring this might be the case for the fast growing Inert diatoms relative to the active flagellates).Turbulence Is also of great Importance for the distribution of nutrients In the water column (more exten-
O 51.
It-CLLUO
Dc , Com pensation depth IPC=RC) I c , Compensation light in ten sity
D er. C r it ic a l depth ( Pw =RW )
Dm , Depth of m ixing
Fig. 40. Diagram showing the relationship between the compensation and critical depths, and the depth of mixing (PARSONS eta/., 1984).

53
sively discussed in § 11.3). Nutrients have the tendency to accumulate at the bottom due to sedimentation of organic matter. If the bottom water is below the depth of mixing this nutrient source will be inaccessible for phytoplankton, except, to a limited extent, for vertically migrating flagellates. In such a case upwelling of bottom water into the poor surface waters, due to turbulence resulting from the input of auxiliary energy, may be of vital importance for the plankton.Here two interests of the phytoplankton are conflicting: the need to stay near the water surface for optimal radiation and the need for nutrients. The first requires low turbulence and the second high. The optimal situation for primary productivity seems to be an alternating stabilization and destabilization of the water column. If the spatial and time scales of this oscillation match with biological requirements, enhanced biological production will occur. Such conditions can be found at so called 'ergoclines', a term introduced by LEGENDRE et al. (1986) ("Ergoclines are aquatic interfaces which have the common characteristic of involving spatial and/or temporal gradients where physical processes can produce structures associated with enhanced biological production") Examples of ergoclines are water-sediment interfaces, the pycnocline and (tidal) fronts. Especially biological activity at tidal fronts has been studied extensively (P ing ree et al., 1978; Holligan et al., 1984a & b; F r o n t ie r , 1986; Krause et al., 1986).
At this place we should also mention temperature as an influence factor on primary production. Temperature is a species specific factor and in the North Sea only of importance for a few species. The onset of the diatom spring bloom seems not to be influenced by temperature, but only by light (G ieskes & Kraay ,1975) and also the second spring bloom, consisting mainly of the m ic rof I ag e 11 at e P/ia eocys tis pouchetii, shows no relationship (Cadee & H egeman , 1986). Di- noflagellates, however, seem to be more susceptible to temperature (R eid , 1977).
Indirect factors
Some factors obscuring the relationship between primary productivity and nutrient concentrations are briefly discussed. More extensive information is given by Fogg (1980) and Parsons et al. (1984).* The phenomenon 'Luxury consumption' enables algae to replenish their nutrient supply, under nutrient rich conditions, sufficient for the next few generations to survive under sudden poor conditions. This is particularly perceptible with flagellates migrating
from poor surface waters into rich deeper waters and back. The internal nutrient concentration of the cell may therefore be a better indication for growth than the concentration in the medium(C0LL0S & S law yk , 1976).Phaeocystis pouchetii exhibits a different type of luxury consumption. In the growing season this mi- croflagellate forms colonies surrounded by excreted mucus. This mucus secretion can amount up to 50% of the carbon fixed and represents an important energy source during the night. It is also suggested that the mucus acts as a reservoir for phosphorus (Lancelot et al., 1987).* When the concentrations of several nutrients are close to limitation simultaneously, change in any one of them may change growth.* There still is uncertainty about the effective concentration of a nutrient. It is assumed that the atomic ratio of N : P in phytoplankton is 16 : 1 (R edfield , 1934). This Redfield ratio is often taken as a label for the fertility status of a water body: deviation from this ratio would mean limitation of one of the nutrients (assuming that no other factor would be limiting). However, ratios used are often based on nitrate and phosphate measurements. Especially in eutrophic waters this could mean an underestimate of the available nutrients. In general terms Fo g g
(1980) already mentioned the uptake of dissolved organic compounds by algae in water polluted by sewage. Brockmann et al. (in press) refer to the presumed availability of organic N-compounds as a nitrogen source. And V eldhuis et al. (1987) observed that Phaeocystis pouche tii is able to use hy- drolysable organic phosphate compounds when inorganic phosphate is scarce.In addition, the Redfield ratio is a mean value for phytoplankton communities and can differ between species considerably (Ry t h e r S D u nstan , 1971; see also § IV.3.1).* In addition to the last item, the Redfield-ratio does not take the turnover rate of nutrients into consideration. Under limiting conditions this turnover rate will determine the nutrients' availability. A better indication of the nutrient supply would therefore be a ratio between fluxes (Brockmann et al., in press).
IV.1.3 Some comments on the methods of primary production measurement
The most common methods for primary production measurement are the 14C-method (S t e e m a n n N ie l s e n , 1952) and the 0 2 -method (B ryan et al.,1976). In the past their validity has often been discussed (P e te r s o n , 1980; T u s s e n , 1981; C olijn et al., 1983; G ieskes & Kr a a y , 1984 a) . As the com

54
p a r t i c u l a t e p h a s e — * d i s s o l v e d p h a s e
CO,
Fig. 41. Major pools and fluxes of particulate and dissolved matter in a seawater sample incubated in a bottle (MOMMAERTS in GIESKES & KRAAY, 1984a).
ments had often rather dramatic implications, we should be aware of them when interpreting primary production measurements. The debate around these measurements can be divided into two groups: one discussing failures as a consequence of sample treatment, and another discussing the interpretation of the data.As far as sample treatment is concerned, G ieskes & Kraay (1984 a) mentioned dramatic underestimations (up to 10 to 20 times) in the oligotropha tropical Atlantic, using the 14C-method, as a consequence of the confinement in glass bottles of too small samples for too long periods of time. Intoxication by trace metals from the glass bottles and 14C-ampoules was considered to be the cause in the commonly used bottles. In addition the authors mentioned the vulnerability of the picoplankton to handling and the resultant underestimation of primary production if this was overlooked. Partly these problems of course also count for other incubation methods.T ussen (1979) and T ussen & Eygenraam (1982) circumvented these problems by using an in situ O2 method in which primary production was estimated from diurnal changes in the oxygen concentration. A
source of error in this method might be the assumption that oxygen consumption at night is the same as during the day.In discussing the interpretation of the data one should be aware of the complicated microcosm enclosed in a sample (fig. 41 ; G ieskes & Kraay, 1984a). Considering that most of the processes depicted in this figure may take place within a few hours, incubations which last too long will show a spreading of the 14C throughout the organic pool and give no correct indication of real primary production.As we saw in § IV. 1.1, DOC excretion in oligotrophic waters can amount up to 40% of the total fixed carbon. Since measurements are often done with only particulate production, this could lead to a serious underestimation of net primary production. However large amounts of DOC will be consumed within several hours by heterotrophic bacteria (W illiams & G ray, 1970) and subsequently respired for approximately 50%. The longer the incubations, the more recyclings may have taken place and the more difficult it will become to calculate gross or net (gross minus respiration) production.Too short incubations, however, may overestimate net production, because
îé c v c lT ^
p h y t o p l a n k t o n
h e t e r o t r .
b a c t .
c i l i a t e sp r o t o z o a
Z o o p l a n k t o n
g r o s s p h o t o s )
a n a p l e r o t i c
r e a c t i o n s i____

55
in respiration 'old', n o n - labeled, carbon may be used.Besides these problems of estimating true primary production within the sample itself, it's questionable whether these data represent reality. Complicating factors such as diurnal variations in photosynthetic capacity, the effects of turbulence, the fysiological state of the population (i.e. will the fixed carbon be transferred into proteins or used as an energy source for cell maintenance; see § IV.1.1) and many others should also be taken into account (G ieskes & Kraay, 1984 a).
To summarize, it can be stated that besides the method specific problems, there is still confusion about what the data indicate: gross, net or net particulate production.When judging the fertility status of different water bodies from a comparison of primary production measurements, it's insufficient to take diurnal measurements. Whereas primary production in olig- otrophic waters will mainly be used for cell maintenance, in eutrophic waters it will become part of the algal biomass, detritus or another link in the foodweb. A 24-hour measurement of primary production will therefore be indispensable.
IV. 1.4 Primary production measurements in the North Sea
An overview of primary production estimates from the seventies has been given by Jo n e s (1984). Based on these data, the author assumes the overall mean primary production for the North Sea to be 130 g C m ‘ 2'yr"1, which is an upgrading of Steele's estimate with approximately 30 g C-m‘ 2-yr' 1 (S t e e l e , 1974). Fransz & G ieskes (1984) present some estimations of primary production in different areas of the North Sea and in different seasons (table 17). Although these data are far to rough to draw conclusions on eutrophication, they give some insight in general trends of phytoplankton production. As can be seen from table 17, annual primary production in
the coastal zone of the Southern Bight, which is most influenced by river discharge, is less than in offshore waters. This can be attributed to light limitation, which shortens the growing season along the coast. Despite the fact that summer production in this area is higher than offshore, the overall estimate will be less.As this coastal area will hardly ever suffer from nutrient limitation, an increase of nutrients will not immediately lead to an increased production. More likely the surplus will diffuse towards open waters. As a result the production area will be extended (G ieskes & Kraay, 1975; Fransz & V erhagen , 1985), which can also be the case for the production period (Cadée & Hegeman , 1986).We conclude from the above that primary production measurements are not the obvious method to assess eutrophication effects, but that it should be used at least jointly with biomass measurements, preferably of several trophic levels. In the next section we will examine some biomass implications of eutrophication.
IV. 2 C hanges of floral and faunal biomass
As nutrient increases will flow through the algal community, whether or not detectable in primary production measurements, eventually we'll find an increase in organic matter. The level at which this increase will be detected, as detritus or within the foodchain, may be diverse, if at all. Impacts on community may be positive or negative. Although studying these changes is difficult due to lack of data in the past and due to natural variability, several examples are known from the literature. Here we'll mention a few of them.
IV. 2.1 Phytoplankton
Although nutrients are sufficient in coastal waters and primary production may be high, a comparably high biomass of phytoplankton is not detected in on
TABLE 17. Estimates of primary production (mgC-m-2 day" ) in different seasons based on measurements between 1971 and 1981 in the North Sea (FRANSZ & GIESKES, 1984).
Jan —Feb M a r - M a y J u n -S e p O c t -D e c A nnual estimate(g C m-J y r 1)
Southern Bight, coast ................................................. 1(10 I 0(10 I 0 00 loo 200Southern Bight, offshore .......................................... 100 1 2 0 0 700 5 00 250C entra l N orth Sea. 19X1 .......................................... 100 1 0 0 0 800 400 2 0 0 - 2 5 0N orthern North Sea ( F L E X ) 300 1 0 0 0 - - > > 1 0 0

56
shore waters. In spring this seems to be the consequence of light limitation with subsequent low primary production, but in summer diffusion from algae towards open, and at that time nutrient limited, waters may be of influence as well (F ransz & V e r h a g e n ,1985). An increase in nutrients therefore will be more influential on phytoplankton biomass in offshore waters (which still may be regarded as 'coastal') than in onshore waters: either as a result of extended plankton diffusion, or as a result of extended nutrient diffusion.Since the forties changes in the phytoplankton stock of the North Sea, and adjacent Atlantic waters, have been followed using Continuous Plankton Recorders (CPR) (Rada c h , 1984; Colebrook et al., 1984; D ickson et al., 1988). G ieskes & Kraay (1977 b) studied CPR data from the North Sea collected in the period 1948-1975, with special emphasis on the development in Dutch coastal waters in relation to open North Sea waters.The latter authors suggest that greenness of the silk used in CPR's, is roughly indicative of the phytoplankton standing crop and biomass. Between 1950 and 1970 this silk colour increased by a factor 2.4 in Dutch coastal waters. In other parts of the southern North Sea they observed an increase as well, although appreciably less. More recent publications of Colebroo k et al. (1984) and D ickson et al. (1988), however, established an overall decrease in greenness from 1950 - 1980, with only now and then slight increases during a few years (fig. 48). These findings might strengthen the conclusion of G ieskes & Kraay (1977b), that eutrophication effects might be involved in the observed increase in Dutch coastal waters (see also §IV.3.1).In Addition, long-term measurements (1968 - 1985) have been performed in the westernmost tidal inlet of
the W adden Sea and on an adjacent tidal flat (Cadée, 1984 and 1986 a; Cadée & Hegem an , 1986). Algal biomass as well as primary production roughly doubled during this period, which was comparable to the increases in the outer Ems estuary, eastern Dutch Wadden Sea.At station Helgoland Reede, within the inner G erman Bight, long-term measurements of physical, chemical and biological parameters have been performed from 1962 on (Radach & Ber g , 1986). In this Elbe-influenced water phytoplankton biomass had increased two to three times on the average during the period 1962 - 1984: from 8.9 pg C-M to 36.6 pg C T ' (fig. 42). This was mainly due to 10- to l 5-fold increase of the flagellate biomass, whereas the diatom population slightly decreased. This shift in species composition was in accordance with the changed nutrient ratios. While nitrate increased nearly fourfold and phosphate by a factor of more than 1.5, silicate dropped to one fifth, which is disadvantageous for diatoms.The above examples all show a general shift from diatoms towards flagellates, which raises some concern with regard to the availability for next trophic levels. This item will be discussed in § IV.3.1.
IV.2.2 Heterotrophlc micro-organisms
In the past decade the discussion concerning the role of microorganisms within the foodweb has become increasingly important (W illiams, 1981; Azam et al., 1983; Hobbie & W ill ia m s , 1984). It is currently believed that these microorganisms - bacteria, protozoa, microflagellates, ciliates, together making up the 'small foodweb' - constitute an important pathway for primary products, which may be in the same order of magnitude as through the mesozooplankton.
- M11 lí ) inu mi 111.) i ; tui1........ini n ii f m i jin i i i i n i i i i i i ii ii ih i|ii i im i i i i | ii i i ii ii i m u 11............ur u i m i 11111 ihi 1111 n 11........... inu i i i i . i ............mii m . i n n ;n. m un.-n i rrrr n ir, m n rrrrTTTTT' .---- rTm rm r81 I 83 I 8<t I 8$ I 66 I S7 I 88 I 69 I 70 I 71 I 72 I 73 I 7t| I 7S ! 76 I 77 I 78 I 79 I 60 i 6 l 82 I B 1 8 «
PHYTOPLANKTON - C EXP. TRENO ♦ N O N L IN . TRENO FREO. < 0 . 5 /Y E A R
Fig. 42. Trends in phytoplankton concentrations in water from Helgoland-Reede station (1962-1984); log scale (RADACH & BERG, 1986).

57
To gain insight in the fate of nutrients, knowledge ot the small foodweb is recommendable. However, due to the rather premature state of knowledge many questions are still unanswered. We'll try to elucidate some aspects of the small foodweb on the basis of a few of these questions.
What are possible substrates for het- erotrophic bacteria?Organic matter directly available to bacteria is in general in the size range of <500 dalton, which represents about 10% or less of the total dissolved organic matter (DOM) and is referred to as UDOM (directly utilizable DOM). Larger molecules and particulate matter (POM) are made available by exoen- zymatic hydrolysis. Due to their high growth rate (generation time of several hours) bacteria respond immediately on an impulse of substrate, keeping the substrate at subnanomolar concentrations. In other words: the importance of DOM as a food source for bacteria, lies in its turnover, or flux, and not in its concentration (W illiams & G ray, 1970; Hagström et al., 1984; W right, 1984).On a global scale, total organic matter input to the sea is mainly derived from phytoplankton (84%), with macrophytes (6%) and rivers (4%) only of local importance. Phytoplanktonic DOM, as an accessible source for bacteria, is released in the medium via several mechanisms of which the quantitative contribution is still disputed. These mechanisms are:- extracellular excretion by algae: 5-40% of total
primary production (W il l ia m s , 1981; La n c e l o t , 1983; Fo g g , 1983; LARSSON& Hagström , 1979 and 1982);
- lysis of dead phytoplankton cells: the most important mechanism, according to S harp (1984);
- dissolved organic excretion by Zooplankton: 6% of total primary production, according to W illiam s(1981);
- sloppy feeding of Zooplankton when consuming algae: 1 0 % of total primary production, according to W illiam s (1981);
- decomposition of POM (detritus of Zooplankton and dead algae): 10% of total primary production, according to W illiam s (1981).
In general organic matter concentrations (we only refer to the non-living organic matter) in coastal waters are about 10 times higher than in oceanic waters, while the DOM : POM ratio is approximately 10. Temporarily, during algal blooms, organic matter concentrations may increase considerably, accompanied by a decrease of the DOM : POM ratio due to the large amounts of decaying cells.Although in general the larger part of DOM is refractory and the available part is, thus, quantitatively
comparible with POM, 80-90% of bacterial production can be attributed to free living bacteria (<1pm) (Azam & Fuhrm an , 1984). Bacterial activity on POM, due to so called epibacteria is only of importance at high POM concentrations, such as after an algal bloom. Bacteria on and in the particles are grazed by protozoa and together this package of POM, bacteria and protozoa, will form a useful food source for grazers.In trying to elucidate bacterial activity in relation to food supply, Azam & Fu hr m a n (1984) proposed the "cluster hypothesis". It postulates that during daytime bacteria are provided with UDOM exudated by algae, which would be visualized by their clustering in the vicinity of these algae. At night-time, when UDOM production has ceased, as a result of ceased photosynthetic activity, bacterial clusters may disperse in search of other food sources such as the remainders of sloppy feeding, which may increase at night, and decomposing particles. Bacterial activity was observed to be maximal in the afternoon or evening, followed by a 30-50% decrease during the night (NB. these differences in bacterial activity during periods of light and dark, may complicate primary production estimates).
What is the bacterial role in mineralization?There is much discussion about growth efficiency of bacteria. Experiments reveal efficiencies between 10 and 70%. Bacterial activity as well as growth efficiency depends on several environmental parameters (W illiams, 1981 ; Azam et al., 1983; Linley et al., 1983; Hagström & Larsson , 1984; La n c e lo ts Billen, 1984; M eyer -R eil , 1984; Ba u e r fe in d , 1985). For instance differences can be found between bacteria inhabiting the sediment and those restricted to the water column, with regard to substrate preferences and their subsequent efficiencies. In general it can be stated that substrates with low C:N ratio's are more efficiently consumed than those with high C:N ratio's (Fukami et al., 1985). In media with complex substrate constitutions, a lot of energy is needed for the production of exoenzymes, which consequently means a reduced growth efficiency. Productive coastal waters, with their complex detritus, are such waters.Many scientists dispute the mineralizing capacity of bacteria. Especially in poor environments, in which high growth efficiencies are revealed and thus low mineralization, bacterial contribution to mineralization is restricted to the fact that they serve as food for less efficient, higher trophic levels. The extent of mineralization will then depend on the number of levels involved. This is more extensively discussed by Azam et al. (1983), who expanded the 'microbial-loop'

58
lOO^im 'O inm I Om
M I C R O - O R G A N I S M S 2 0 0 - F I S Ht o o P L A N K T O N •
/OOP' 2oopi fu »
S enn-q uan tita tive m odel of p lankton ic food chains. Solid arrows represent flow of energy and m aterials; open arrows, flow of m ateria ls alone. It is assumed that 25 % of the net prim ary production is channe lled through D O M and the "m icro b ia l loop", bacteria (B a d .), flage llates (Flag.) and other m icro-zoop lankton (e.g c iliates). It is further assumed that the most e ffic ient predator prey size ratio is 10:1, hence the slope of the lines rela ting trophic status to log body length is 1:1. T h e food chain base represents a size range 3 orders of m ag nitu de (smallest bacteria 0.2 pm, largest diatoms 200 pm; therefore, any trophic leve l w i ll have a s ize-range factor of IO3 and conversely each size class of organisms (100 pm) w ill represent at least 3 troph ic levels. The thickness of open arrows (left) represents the approx im ate re la tive m agnitude of m inera ls released in excretion at each trophic level; corresponding organic losses (faeces, mucus, etc.) are shown on the
right hand side
concept (fig. 43). G oldman & Caron (1985) proposed a modification of this concept, to meet the believed 90% nutrient recycling in surface waters. They suggest a more flexible size ratio between predator and prey and herbivory among microflagellates.
How to measure heterotrophic activity?Bacterial production in coastal waters is assumed to be between 2 and 250 (ig C-M -d'^, with decreasing values towards offshore waters. Methods, however, are still disputed, as has been pointed out by Az a m & Fu h r m a n (1984), who discussed a few criteria for measurement. According to these criteria the method should: be specific for bacteria, be applicable in a variety of growth states, not significantly change the growth rate and have demonstrable reliability, precision and sensitivity. The authors concluded that the Frequency of Dividing Cells method is probably the most suitable one.We would like to stress the criteria of specificity here. The presence of photo-autotrophs within all size classes (table 18) may disturb non-specific methods considerably. In ATP measurements for in
C A R B O N 14 UPTAKE RATES
2 0 -
Í 1 .5-ÍNÍN , -
E , 0 -0en 0 5“
P H Y T O P L A N K T O NB IO M A S S6 -
E4 -U
CD
BACTERIALB IO M A S S0 .6 -
EUo>
0 .2-
CILIATEB IO M A S S0 .4 -
0 .1-
Z O O P L A N K T O NB IO M A S S0 .5 -
0 .4 -<NE0CD
0 .2-
0 .1-
Fig. 44. Dynamics of four major trophic components in thepelagic ecosystem of the northern Baltic proper as reflected by standing crops and phytoplankton primary production (shaded area represents the biomass of the autotrophic ciliate Mesodinium rubrum) (HAGSTROM & LARSSON, 1984).
stance, small algae might pass the 3 pm filter and thus add to the ATP determinated.Besides methodological problems, the existence of micro habitats with different DOM and POM content - such as the phycosphere and surface film - may hamper production estimates (Es & M e y e r -R f 'l ,1982).
What is the importance of micro-organisms as a food source for higher trophic levels?This might be illustrated by an investigation of Hagstrôm & Larsso n (1984) in the Baltic. They observed a close covariation between bacterial and ciliate biomass, while both were negatively correlated to Zooplankton (>90 pm) biomass (fig. 44):

59
TABLE 18. Summary of the trophic and size categories of plankton (SlEBURTH, 1984).
Plankton Diameter (-m)+Trophic Types 0.2 Picoplankton 2.0 Nanoplankton 20 Microplankton 200
H-pico H-nano H-mlcro
Heterotrophs
(fluorochromed)bacteria
smaller flagellates
smaller rhlzopods
smaller ciliates
larger flagellates
larger rhizopods
larger ciliates
P-pico P-nano P-micro
Phototrophs (autofluorescent)
chroococcoldcyanobacteria
bacterial-si zed eucaryotes
smaller flagellates
smaller diatom and dinoflagellates
larger flagellates
larger diatoms and dinoflagellates
* In practice, totals of each size category are obtained from fluorochromed preparations and the phototrophic counts obtained by autofluorescence are subtracted to yield the hetero- trophic counts by difference (Davis and Sieburth 1982).
+ As determined by ocular micrometer.
In spring, when DOM production by phytoplankton is growing, bacteria and ciliates reveal low growth rates - ’waking up' from dormancy after the winter period (W right, 1984) - and an increase in biomass will follow the phytoplankton with a few days delay. In this period their biomass will increase up to a maximum, due to the absence of grazing Zooplankton.In summer, when phytoplankton exhibits stationary growth, DOM production will be maximal. The bacterial community is now in a more active state than at the onset of the growing season, and will respond faster on substrate fluctuations (V an Es & M e y e r - Re il , 1982). Their increased activity is immediately followed by an increase in grazing ciliates (also: Larsso n & Ha g s t r ô m , 1982; R h e in h e in ie r , 1984). Nevertheless both biomasses decrease, which illustrates the existence of one or more groups of organisms, effectively grazing on them. At the same time mineralization appears to be most efficient, which might indicate that bacteria merely serve as a food source and mineralization takes place through other organisms. Especially in situations of low nourishment for Zooplankton, for instance when toxic algae dominate, this food source may be very valuable (also: Ga st , 1985).
In an attempt to distil a general overview of the role and functioning of the small foodweb one might speculate the following situation:Eutrophic coastal waters and estuaries exhibit high DOM and POM concentrations, with relatively low DOM : POM ratio's. Going towards offshore waters, concentrations will progressively decrease while this ratio increase. Parallel, a decrease in total biomass of pico and nanoplankton will be observed (table 19); numbers of picoplankton will increase with respect to numbers of nanoplankton, and also within the picoplankton an increase in small sized cells can be observed. This is to be expected as the shift in DOM : POM ratio is in favour of the small, free living bacteria, with respect to the larger epibacteria.The complex composition of organic matter in coastal waters enforces low growth efficiencies of bacteria, which means good mineralization. In addition low grazing effort, due to adequate food supply from phytoplankton in these environments, enables bacterial biomass to grow. It is suggested by Newell & Linley (1984) that a rapid decline and dissipation of organic matter at the end of phytoplankton blooms is largely due to bacterial activity, whereas in offshore steady-state situations mineralization of bacteria and protozoa may be of less importance.

60
TABLE IO. a comparison of the relative biomass of phototrophic and heterotrophic microorganisms < 20 pm along the Atlantic Seaboard (SIEBURTH, 1984).
_________ Biomass ug wet weight L 1*______
Phototroph Heterotroph
Province -pico -nano subtotal -pico -nano subtota
Shelf 12 74 86 115 72 187(5%) (2 77.) (322) (42%) (26%) (682)
Open ocofin 1 14 1 ') 20 13 3 3(2%) (29%) (31%) (42%) (27%) (69%)
* This assumes a specific gravity of 1.0, that the biovolumes of attached bacteria are 0.3 pm-*, li-pico are 0.09 pm-* in nearshore waters hut 0.04 pm * In oceanic waters. P-pico procaryotes are 0.2 ura*, P-pico eucaryotes are 0.4 pm^, and that both P-nano and H-nano have a mean blovolume of 24 pm-*. Data from 3 shelf and 3 ocean stations, EN-009.
It seems plausible to conclude that micro- heterotrophic activity plays an important role in the recycling of organic matter, produced in situ as well as discharged by rivers, in eutrophied environments. This conclusion is supported by the observations of several investigators: G ieskes & Kraay (1977a) observed high consumption rates close to the Rhine outflow even before the vegetative season had started. In front of the Belgian coast Jo ir is et al.,(1982) observed that 40% of total primary production (particulate and dissolved) was consumed by micro- heterotrophs. This was confirmed by La nc elo t & B illen (1983), who found even higher rates from April to June (up to 68 %). Larsso n & Hag str ö m (1982) estimated a bacterial consumption in a Baltic eutrophication gradient, of 35-45% of primary production.
IV. 2.3 Macro fauna
In recent years it has become increasingly clear that the benthic fauna consumes a considerable part of primary production. It is now assumed that the sedimentation of the spring phytoplankton bloom acts as a triggering mechanism for their lifecycle. (D avies & P a y n e , 1984; G raf et al., 1985; De W ilde et al., 1984). An increase in primary production is therefore
likely to result, among other things, in an increase in benthic biomass, which subsequently might result in an increased fish stock. On the other hand, in several occasions perturbation of the environment due to eutrophication has led to a reduced faunal stock. A few examples of both effects will be briefly discussed here.
In the Southern Bight of the North Sea, during the first half of the growing season, approximately 75% of primary production is mineralized (G iesk es & Kraay, 1977a). The remaining 25% will result in an increase in biomass or be transported northward. As an important part of humanly influenced primary production takes place in front of the Dutch coast, a considerable part of it will be flushed into and affect the Wadden Sea.In the western part of the Wadden Sea, a doubling of particulate P in suspended matter was observed between 1950 and 1970 (D e Jonge & Po s t m a , 1974; Po s t m a , 1981), which was suggested to be derive primarily from the spring phytoplankton bloom. This rise was accompanied by a triple increase in phosphate, due to the enhanced mineralizaton of imported organic matter. As primary production is light limited in the inner parts of the Wadden Sea, an increase in nutrients is not likely to affect phytoplank

BIOMASS
g m '*
61
8 0 -
6 0 -
12 T R A N S E C T S
4 0 -3 S Q U A R E S
20 -
2 .0 «• Nereis
Heterom
0 8
0 6 -
•6 û Scoloplos0 4
0 2 -
7 0 7 2 74 7 6 78 8 0 8 2 8 4 Y E A R
1000
KO
I '°
I 0S
I 1000■J 100
7 0 7 2 7 4 7 6 7 8 8 0 8 2 8 4 Y E A R
Fig. 45. Changes in total macrozoobenthos production (in g AFDW m'^ yr“^) in a tidal flat area in the western Wadden Sea. Estimates based on samples taken along 12 transects (open points) and in three squares (solid points) (a). Increasing standing stocks (in weight units) in three species of worms in the same area (b). (BEUKEMA, 1987 and BEUKEMA & CADEÉ, 1986).
ton biomass. However, this should be expected in the tidal inlets, where light conditions are more favourable (Po stm a , 1984). It lasted until the seventies for phytoplankton to increase, resulting in a doubling in primary production and biomass in the eighties (Ca dée , 1984 and 1986a; Cadée & Hegem an ,1986).Simultaneously an increase in m acrozoobenthos biomass and production was observed, which strongly suggested causal relationships (Beukema &Ca d é e , 1986; Be u k e m a , 1987). Between 1970 and 1985 total biomass roughly doubled, which was particularly manifest in deposit feeders, especially worms (fig. 45). Although the authors are prudent in stating a cause-effect relationship with eutrophication, many observations point in that direction.Long-term measurements have also been performed in the German Bight (Ra c h o r , 1980 and 1985). Here, a decrease in macrobenthic biomass was observed in a silt area close to the Elbe estuary, surrounded by a more sandy area with increased biomasses (fig.46). Both effects were related to eutrophication. The first as a result of regular anoxic conditions near the bottom due to a surplus of imported and locally produced, decaying organic matter. The second as an example of the advantage taken from organic matter enrichment. The recurrent oxygen deficiencies in German and Danish coastal waters since 1980 have severely affected the bentic community, including demersal fish (W esternhagen & Dethlefsen, 1983)In the Kattegat, Kieler Bucht and Baltic increases of F¡9- 46- Changes in the standing stock of Nucula nitidosamacrozoobenthos have been found, comparing the (Nussmuschel) and Abra nitida (glänzende Pfeffermuschel)
. . ... i, . . . . j in two different areas of the German Bight. An increase issixties and eighties, as well as incidences of reduc- observed in the sandy area; a decrease in the silty areation. The latter resulting from oxygen deficiencies in (Rachor, 1985).
g lf ln z tn d * P ftfftrm u sc fi* !1000
100
*60
11=
I 1000
19691 70 I 71

62
enclosed areas, such as Laholm Bay (B rey , Rumohr & G erlach in: G erlach 1984; Rosenberg, 1985).
Boddeke (1978) and Boddeke et al. (1986) studied the development of the standing stock of the b row n sh rim p Crangon crangon along the Dutch coast. Recruitment to the adult stock In autumn depends to a large extent on the abundance of ripe eggs and postiarval shrimps in settlement areas in May - July. Until June prey of C. crangon along the Dutch coast consists mainly of calanoid copepods, whereas in July - when copepod biomass collapses - foraminifers and polychaetes gradually become the main food source.The authors observed great differences In C. crangon production between the coastal zones Hook of Holland - IJmuiden and Vlieland - Terschelling, the former revealing a higher production than the latter. They related this to eutrophication: nutrients discharged by the river Rhine were channeled to the shrimps via mlcroflagellates and copepods.However, one might suppose the higher production of shrimps near the Rhine to be a normal phenomenon. As the onset of algal bloom Is about a month later than offshore, copepods and phytoplankton fit in better and it is very well possible that food limitation for copepods, also in earlier days, never occurred during spring (F ransz , pers. comm.), in addition in the seventies a decrease in copepod biomass was observed (G ieskes & Kr aay , 1977b), followed by a slight increase In the eighties, which, however, was noticed throughout the North Sea (Fransz , pers. comm.).As the recovery of shrimp fishing in Dutch coastal waters in 1973 and 1974 coincided with measures taken to protect the stock of undersized shrimps - the withdrawal of small inshore shrimp vessels (Boddeke , 1978) - an additional effect of eutrophication is hard to distinguish.
The qualification of the North Sea being one of the most productive continental sea areas of the world, is visualized by the 2.5 million tons of fish that are yearly brought ashore. This is a twofold increase compared with the forties, which was attributed to increases in demersal as well as industrial fisheries, while pelagic fisheries declined (Daan , 1986). Whether this increase is completely due to more sophisticated techniques or additional impacts are involved, is unknown. More favourable conditions in nursery grounds such as the Wadden Sea and German Bight, due to increased food supply, may have stimulated growth of juvenile fish (Boddeke, pers. comm.). On the other hand these areas are also susceptible for excessive organic matter import,
which might result in oxygen deficiencies and subsequent mass mortalities (W esternhagen & Dethlef- sen , 1983; Rosenberg , 1985).
I V .3 Some effects on community composition
IV .3.1 Recent changes in phytoplankton composition
As already mentioned, nutrient ratios of a water body are not sufficient to predict its fertility; a consequence of the fact, among others, that different algal species need different nutrient ratios. Because of this, ratios may change, resulting in a shift in species dominance without change in total phytoplankton biomass. We'll examine this feature on the basis of Pa r s o n s ' discussion of the "Paradox of the Plankton" (Parsons et a i, 1984). Secondly we'll present some observed changes of the phytoplankton in the North Sea according to CPR data, supplemented with some local findings.
Pa-radQ,xoLLhe.BlanktQQ
The simultaneous existence of many species of phytoplankton in an apparently uniform body of water is referred to as the "Paradox of the Plankton". A possible explanation in which coexisting species are limited by different nutrients, was discussed by Par sons et al. (1984) and runs as follows:When a species exhibits constant growth rate, it can be followed from the Michaelis Menten equation (transformed for growth rates) that:
[S i]/[S 2] = k-|/k2
where [S-|] and [S2] are steady-state concentrations of two nutrients, and K i and K2 are the species- specific concentrations for nutrients 1 and 2, at which the growth rate is half-maximal. It follows from the above equation that if [S-|]/[S2] < K-|/K2 , the species is limited by nutrient 1. Considering two species of which K-]-species A < K-|-species B and K2-species A > K2-species B, then if [S-| ] is limiting, species A will dominate, while if [S2 ] is limiting, species B will dominate. Suppose K-]/K2 for species A is 100 and for B is 10, then A and B will coexist, each being limited by different nutrients, when [S i]4S2] lies in between 100 and 10 (fig. 47).Applying this to the seasonal succession of species in coastal waters, one might suggest the following situation:Diatoms need SI and N in approximately a 1:1 ratio (R edfield eta!., 1963), whereas most other species

63
N U T R IE N T R A T IO ( S , / S 2 )
Swz
iz
sm
Fig. 47. Relative abundance of two phytoplankton species, A and B, plotted against the log of the ratio of limiting nutrients, S i and S2 (PARSONS & HARRISON in: PARSONS et al., 1984).
are not in need of Si. As diatoms in general have high growth rates (O fficer & Ryther , 1980; Parsons et al., 1984), they gain competitive advantage at the onset of the growing season, when nutrient concentrations are still high. A diatoms-dominated phytoplankton community will be the result. However, the slow regeneration of Si relative to N, will soon end up in a Si deficiency and result in a shift of the [Si]/[N] ratio favouring a non-diatom community usually dominated by flagellates.In temperate coastal areas this succession is a natural phenomenon, in which the [Si]/[N] ratio in general will maintain a state of coexistence. In eutro- phied waters, however, a further shift towards the flagellates can be observed. Firstly, as a result of the antropogenically increased N concentration in contrast to Si (cf. § III.3). Secondly, by the fact that Si is further depleted by diatoms now that N is in excess.O fficer & Ryther (1980) pointed at the implications of an extended flagellate dominance. As many of them are known to be poor food for grazers, and motile species are able to form excessive blooms, their extended dominance may severely affect the ecosystem. H untley et al. (1986) found that five out of thirteen species of dinoflagellates were rejected by copepods, which seemed to be chemically mediated. Although this competitive advantage of inhibited predation is paid with a reduction in growth rates, it enables them, under particular circumstances, to form excessive blooms. According to Huntley et al. (1986) four out of five species are known to form monospecific blooms.
A short view on CPR data
Data from Continuous Plankton Recorders are mainly concerned with the larger plankton species: diatoms, dinoflagellates, sometimes the m icroflagellate Phaeocystis pouchetii and Zooplankton species. Apart from these groups the silk colour intensity is used as an overall plankton index, in which also unidentified species are represented. Because of this procedure a shift in diatoms or flagellates will not always be translated in the silk colour and vice versa.In the past, changes in phytoplankton composition have often been related to climatic changes, associated with shifts in the position of the Gulf Stream (R ussell et al., 1971; R e id , 1975; Ra d a c h , 1984). Lately, underlying mechanisms seem to become more and more clear. D ickson et a!. (1988), looking back on an apparently climate-induced long-term decline of Zooplankton abundance from 1950-1980, inferred from CPR-data, found a similar but inverse trend in upwelling index off the Portuguese coast. These authors argue that both phenomena are separate manifestations of a single atmospheric cause: the establishment and subsequent intensification of a pressure-anomaly ridge over the eastern Atlantic between the 1950s and 1970s. This resulted in an increased northerly airflow along the European littoral, from the North Sea to northwest Africa, accompanied by a progressive increase in storminess over the northeastern Atlantic and European shelf, with its greatest increase in the west-central North Sea.As already discussed in §IV.1.2, the extent of mixing depth governs the average light intensity experienced by phytoplankton and, thus, the onset of the growing season. The increased wind mixing between 1950 and 1980 was suggested to have been responsible for the delay in initiation of the spring bloom and for a reduced bloom development. This resulted in a progressive reduction of the Zooplankton growing season, visible in a decreased trend in annual abundance (fig. 48). From 1980 on, a partial recovery seems to have set in (C olebrook et al., 1984; D ickson et al., 1988).The progressive reduction in Zooplankton abundance was observed in all CPR Standard Areas around the British Isles (fig. 7 in D ic k s o n et al.,1988). According to these authors this also counted for phytoplankton abundance, based on 24 species. However, this is not confirmed by earlier observations of R eid (1977) and G ieskes & K raay (1977) based on silk coloration. These authors indeed did find a downward trend in diatom abundance, but not in silk coloration, which increased considerably in C

64
Zooplankton
•>COrae
2
Phytoplankton1
0
1
2 80706050
A
B4B5
60B2
C5 C1C2
,0 2
D5
D450
o 1020 10
Fig. 48. Mean trends in the abundance of Zooplankton (based on 12 areas, 24 species, 247 series) and phytoplankton (12 areas, 24 species, 263 series), 1948-1983 (COLEBROOK et ai., 1984).
and D areas (fig. 49). Which species are responsible for the silk coloration is still unknown. Reid (1977) suggested microflagellates to be of most importance, but G ieskes & Kraay (1983), applying HPLC techniques for pigment analyses, observed high abundances of Cryptophyceae in the central North Sea and suggested these algae to be responsible. Probably these species were not involved in the above mentioned 24 species.
From CPR aaia it became obvious that, although seasonal fluctuations may be large, patterns of longterm variability in the plankton were remarkably uniform throughout the North Sea and the adjacent North Atlantic (making man-made impact difficult to perceive).G ieskes & Kraay (1977b) observed an increasing trend in silk coloration in all D areas, particularly in Dutch coastal waters. Presumably this was related to eutrophication: the silk coloration in these waters increased more sharply, between 1950 and 1970, than in other parts of the North Sea (resp. 2.4 and 1.7 times), and the decrease of diatoms and copepods was iess dramatic.With regard to onshore waters the apparent increase of the second spring bloom consisting of Phaeocystis pouchetii colonies, should be mentioned (Cadée & Hegem an , 1986). The increase in microflagellates at the expense of diatoms in the German Bight is another example that seems to be related with eutrophication (Radach & Ber g , 1986).
B P h y t o p l a n k t o nI n d e x c e r a t i u m spp
N o r t h e r n n o r t h e a s t e r n A t l a n t i c
A r e a B 5
S o u t h e r n n o r t h e a s t e r n A t l a n t i c
A r e a 0 5
N o r t h S e a A r e a 0 2
D utch Coastal W aters
A rea Ow
58 62 66 70
62 66 70 «
1558
58 62 66 70 7L 58 62 66 70 7L
70 74 58 62 66 70 74
7 S H
Fig. 49. Standard areas for Continuous Plankton Recorder Surveys; hatched area = area Ow (a) Annual mean abundance of phytoplankton in areas B5 , D5 D2 and Ow (b) (after GIESKES & KRAAY, 1977b and REID, 1977).
IV.3.2 Reduction of species diversity
At the beginning of this chapter we already stressed the variation in routes a pollutant or its effects may follow throughout the food web. This feature arouses the necessity to measure different links within the ecosystem when investigating ecological impacts of eutrophication. As expressions of these impacts are often vague or concealed, a better understanding of the reactions of an ecosystem as a whole is recommendable.Discussing the effects of pollutants on marine ecosystems, G ray (1982) gives a description of the

65
functioning of marine food webs. A, to his view, healthy natural system lacks structure over large areas, as a result of fluctuating environmental parameters and patchiness of the plankton. On a local scale there may be a strongly structured preda- tor-prey relationship, but as a general rule for sediment and plankton assemblages, links in the food web are weak and unstructured. Consequently, in unstructured, open areas a great species diversity can be observed without predominance of one predator, whereas in enclosed systems (laboratory experiments, enclosures, but also confined natural areas and patches) the predator completely controls prey density and reduced species diversity can be observed. In the latter situation the predator structures the system.Pollution also tends to give structure to an assemblage. Moreover, this may cover large areas. In discussing this, G ray postulates that the composition of a community is based on a log normal distribution of individuals among species. Unpolluted areas have large numbers of rare species with only few individuals (fig. 50). The half-normal curve representing the structure of such an assemblage may be the result of a few component curves of groups of species. Moderate pollution will favour groups of better adapted species, while less adapted species decrease. The resultant separation of the component curves will become visible in the summed curve. Under gross pollution most of the rare species will be eliminated and a few opportunists will continue to increase, resulting in a more distinct separation of the component curves. Typical opportunists have small body size, rapid turn-over rates and planktonic larvae, giving rise to the reduced mean size of the whole assemblage as their numbers increase.Thus the result of pollution may be a change from an unstructured and diverse system to a simplified and highly predictable community in which the existence of species is highly governed by the disturbing factor. The removal of this factor, c.q. the pollutant or the predator in small scale systems, or the introduction of another factor will change the assemblage and thus offbalance the ecosystem. Such an impact would have been absorbed in healthy, unstructured ecosystems.
G ray stresses that to his knowledge only organic enrichm ents have shown to produce such widespread effects, and therefore should be regarded as the most serious marine pollutant. When stating this, G ray especially had the inner part of the Oslofjord in mind.In the North Sea a reduction of species diversity is only observed in the silty part of the inner German
n u m b e r o f spec ies
Q. u n p o l l u t e d
S u m m e d c u r 1
C o m p o n e n t c u rv e s
Few speciese lim in a te d
b . m o d e r a t e l y p o l l u t e d
S om e less w e ll a d o p te d spe c ies
d e c re a s e a b u n d a n c e
G ro u p s o f b e t te r a d a p te d sp e c ie s in c re a s e a b u n d a n c e
C . g r o s s l y p o l l u t e d
M a n y s p e c ie s d e c re a se a b a n d o n e e
M any species e lim in a te d in d iv id u a ls pe r sp e c ie s
(g e o m e tr ic c la sse s )
Fig. 50. Suggested models of effects of pollutants on lognormal distribution of individuals among species (in geometric classes) (Gray, 1982).
Bight, which suffers from oxygen deficiencies and H2S-formation (Rachor , 1980). In the German Wadden Sea near Sylt, Reise (1982) observed a shift towards a greater dominance of polychaetes. 11 out of 18 increased polychaetes were found to have characteristics of opportunists and were adapted to disturbed habitats. Long-term measurements in the Dutch Wadden Sea did not reveal a reduction in species diversity, but the overall increase in benthic biomass was particularly pronounced in a few species of worms (Beukema , 1987; Beukema & Cadée , 1986; fig. 45).
IV .4 E xceptional phytoplankton blooms
As fisheries and recreation became increasingly important activities in and around the North Sea, exceptional algal blooms were more and more regarded as a common nuisance. Several of the blooming species were found to be toxic to shellfish and fish, whereas the discolouration of the surface water, due to a dense layer of algae, seriously hinders recreation. In the past, blooms were regularly reported as well and it is still uncertain to what extent the currently observed increase is the result of an increased observation effort, or the result of man-

66
made pollution (B rockm ann et al., in press). There might also be a relation with long-term cycles, such as the Russeli cycle, which appears to be a cycle of 40-60 years (Bo a l c h , 1984), or the mooncycle of 18.6 years (W h ite , 1982).Exceptional blooms are built up by one species; predominantly an autotrophic flagellate, although also the heterotrophic dinoflagellate Noctiluca is regularly observed to form blooms (Le Fevre & G rall, 1970; Boalch , 1984; Krause eta!., 1986). The colour of the bloom depends on the pigment content of the species involved and is often yellow-brown, brown or bright red. Such blooms are often referred to as "red tides". The chlorophyll concentration in the surface water can be used as a measure for bloom intensity: at 10 mg-m*^ the coloration of the water will become visible and at 100 mg-m"^ the bloom can be regarded as exceptional (Te tt , 1984). T ett excludes diatoms and coccolithophorids from this rule.
Ta n g e n (1377) summarized a few conditions conducive to blooms. These are:- nutrients should be available in sufficient
amounts;- an initial population should exist to trigger off the
bloom;- grazing by Zooplankton should be moderate.
Blooms may extend to excessive proportions under stable environmental conditions. The prevention from being mixed over the water column and the optimal light conditions promote algal growth. However, these environments are often poor in nutrients and the iniiiaiion of a bioom is therefore preceded by a temporary destabilization of the water column, resulting in an upwelling of nutrient-rich bottom water. In this initial, turbulent phase of a bloom, slight differences between species in, among other things, nutrient uptake, photosynthetic abilities, ability of vertical migration and nutritious value for Zooplankton, may favour one of them, resulting in a dominance of that species within the bloom.Such a sequence of hydrographic conditions is often observed at ergoclines, already discussed in § IV.1.2. If an ergocline exists in the proximity of enclosed coastal waters, it may occur that the inoculum of the bloom is built up in offshore waters, is transported by currents towards these enclosed areas and thereupon will develop excessively.P ingree et al. (1975 and 1978) already denoted the importance of fronts in the development of phytoplankton blooms. They tried to explain the chlorophyll distribution around the British Isles in terms of turbulence and waterdepth (cf. § II.3.3). Upon these findings a "Light-Nutrient-Vertical Mixing" model was
based, with which one was able to explain the summer distribution of the phytoplankton (T e t t , 1981; T ett & Edw ards , 1984). The addition of terms of nutrient-dependent vertical migration, might give further insight in the developm ent of exceptional blooms (Tett , 1984).As the dominance of a species depends on peculiar aspects of its physiology and life history, the composition of a bloom is often hard to explain by eco- physiological models. Especially the existence of dinoflagellate cysts appears to be of great importance, because they may act as the inoculum that starts a bloom.
In conclusion one might state that the causes of exceptional blooms are normal, but that their frequency and intensity, in some areas, seem to be increased due to eutrophication with subsequent unusual effects. Some of the consequences are shellfish poisoning (not with all species), fish mortalities due to a toxin or to clogging of the gills and oxygen deficiencies. The latter situation results from the sedimentation of the declining bloom, which subsequently will be bacterially mineralized in the, at that time often still isolated, near-bottom waters.Some examples in the North Sea will be briefly discussed.* Phaeocystis pouchetii : blooms in May-June; brown coloration; causes clogging of fish gills and excessive foam layers on beaches; common in the Southern Bight of the North Sea (fig. 51). This mi- croflagellate thrives especially in eutrophied coastal areas. During the bloom huge colonies are formed, which will disintegrate again after the bloom. It is suggested that the remaining microflagellates serve as an inoculum for late summer and autumn blooms and/or may be regarded as survival cells. The colonies strongly influence the marine ecosystem: their large size prevents them from being grazed by most of the Zooplankton species. Also the extent to which they are used as a food source after the bloom, is uncertain. More than 50% of their production is stored in mucus, which forms the foam after disintegration. This mucus seems to contain a toxic component (acrylic acid?) that reduces bacterial activity and thus decomposition. However, there are some indications that the microflagellates, after the bloom, are grazed by tintinnids (Boalch , 1984; Eber- lein et a i, 1985; Admiraal & V en eka m p , 1986; V eldhuis et a i, 1986b; Lancelot et a i, 1987).* Gonyaulax sp.: blooms from June until October; brown coloration; causes Paralytic Shellfish Poisoning (PSP); observed in British coastal waters. The appearance of this dinoflagellate seems to be associated with fronts. Winter cysts may form an im-

67
Annual recurrent bloom# = 106- 1 0 7 cell • L '• = 105- 106 • = < 105Occasional occurrence O = 1 0 5-1 0 6 O = <105 o = sporadic
Fig. 51. Geographical distribution of Phaeocystis pouchetii. Maximum numbers are recorded at a few stations in the Channel and Southern Bight of the North Sea (LANCELOT ef a/., 1987).
portant inoculum in the following growing season (Ayers & C ullum , 1981; W h ite , 1982; Boalch, 1984).* Gyrodinium aureolum : blooms from July until November; reddish brown coioration; often associated with oxygen deficiencies, toxins are speculative, although injury of fish gills due to a toxin seems to be associated with these blooms; observed in the Channel, German Bight, Danish west coast and lately also at the Norwegian south coast, presumably transported from the south via the Jutland current. They develop mainly at fronts were they have ecological advantage due to their ability to adapt at different light intensities. Low growth rates, which means that they may survive under nutrient-poor conditions, and migration capacity will further support them (Ta n g en , 1977; Boalch , 1984; Dahl et al., 1984).* Dinophysis acuminata : blooms in August- September; since 1981 known to cause Diarrhetic Shellfish Poisoning (DSP) in Dutch coastal waters, which was at first thought to be caused by another dinoflagellate, Prorocentrum sp.; widespread in European coastal waters. Culmination of a bloom of D. acuminata appears to be associated with low salinity coastal waters (30-33%») and calm weather (wind
speed of less then 2 on the scale of Beaufort, at least during one week) (Kat, 1984).* Ceratium sp.: blooms in late summer; yellow- brown coloration; often involved in oxygen deficiencies, due to massive sedimentation of the bloom, non-toxic; common in the Southern Bight of the North Sea, German Bight and Skagerrak. Its development is often correlated with climatic changes; they are found at front systems, from which they may float into enclosed waters (Sw anson & S inderm ann , 1979; Lindahl & Hernroth , 1982; G illbricht, 1983).
IV .5 O xygen deficiency
IV.5.1 Some general remarks
In theory, mineralization of organic matter takes as much oxygen as has been released during the production of it. Of course this does not count for anoxic habitats in which organic and inorganic compounds, instead of oxygen, are used as H-accep- tors. When stratification starts to build up and the created bottom layer lies underneath the euphotic zone, no oxygen production will take place within this layer. Moreover, as stratification is completed, a firm diffusive boundary separates surface and bottom waters and oxygen replenishment ceases, resulting in an oxygen deficiency in the bottom layer.This situation may worsen during exceptional blooms. Although during day-time enormous amounts of oxygen are produced in the surface layer, resulting in a supersaturation, at night-time consumption of oxygen by the same algae plus their predators and bacteria, will be enormous too. In addition the culminated bloom may cause a situation of 'seIf-shading', in which primary production decreases and oxygen consumption even at day-time may overrule production. In such situations when primary production is not sufficient to count for the energy demand of the algae, it has been observed that the blooming dinoflagellate migrates to the pyc- nocline or just below it and "switches" its lifestyle from autotrophic to heterotrophic (in: Swanson & S in derm ann , 1979). Oxygen demand in the bottom layer by these organisms and from the mineralization of organic matter, may then result in oxygen depletion within a few hours. This depletion will last until the break-up of stratification.The high organic matter concentration in the sediment, with which the benthic microbial activity is proportional (M e y e r -R e il , 1984), and poor diffusion of O 2 into the sediment will make that oxygen deficiency starts from the sediment and spread into the water above. In the anoxic sediment the reduction of

68
YELLOWNO¿GRE»
BLACK
CH.
Fig. 52. Diagrammatic vertical profiles of chemical conditions within marine sediments with oxic toplayer. (FENCHEL in PARSONS eta!., 1984).
inorganic compounds results in the formation of H2S or, in the case that all sulphate is already used, of CH4 (R ic h a rd s , 1984). These processes are reflected in the redox potential (Eh), which therefore, provides an integrative measure of ecological conditions within the sediment (fig. 52; P arso n s et a i, 1984).In stratified areas, wave activity will be low and consequently aeration of the top sediment layer due to this activity will also be low. Aeration then is mainly dependent on bioturbation. The responsible benthic macrofauna will stay alive and active above an oxygen concentration of 1 m IT 1 (G e r l a c h , 1984) although surf clams were observed to exhibit stress already at 2 mH' 1 (Thurberg & G o o d le t , 1979). A further decrease in oxygen concentration will result in mass mortalities. As bioturbation ceases, oxygen concentration will immediately drop to zero and H2S wili diffuse into the water above, poisoning the environment (Gerlach, 1984).
The extent of the oxygen deficient area depends on a few processes:- mortality of the benthic fauna, which will add to the
mineralizable organic matter and thus increase oxygen demand;
- possibly increasing phytoplankton production due to an increased nutrient flux from the anoxic sediment (cf. § III.3.4), which, after deposition, may again contribute to the organic matter load of the sediment;
- anthropogenic organic matter input;- duration of the stratification;- population density and vitality of the heterotrophic
organisms.If, after the break-up of stratification, recolonization by benthic fauna does not succeed before winter, the sediment will stay anoxic during that winter. Due to slow mineralization in anoxic sediments, bacteria may not be able to mineralize the next spring bloom,
which largely settles down, and organic matter concentrations may build up. Due to recolonization by some opportunists in spring and summer, bioturbation, and thus aeration of the sediment, will increase again. However, the organic matter left over from the previous year and from spring, will favour a new oxygen deficiency in the following autumn (G e r l a c h , 1984).
In conclusion one might say that the condition of the sediment in winter will define, up to a certain degree, the potential for oxygen deficiency in the next summer or autumn. The intensity and duration of stratification and the amount of organic matter input resulting in oxygen deficiencies, are largely influenced by climatic conditions. Eutrophication, however, will worsen the situation, which may end up in a disaster. Besides fish and benthic fauna mortalities, one should also be aware of the consequences of reduced sediments.In this context the findings of B a lz e r et al. (1983) should be mentioned. In a "Bell Jar experiment" on the bottom (20 m) of the Kiel Bight, carried out in late summer (T*12°C) they observed the succession of oxygen consumption, denitrification and sulphate reduction resulting from the isolation of a volume of bottom water (fig. 53). In the course of the experiment, PO4-P was released to an increasing extent: from 73 p.mol-m'2-day' 1 in oxic conditions, to 677 in anoxia. The ammonium concentration increased rapidly as well, probably indicating rapid decomposition of organisms killed by the anoxia. PO4-P underwent the fastest exchange, but upon the return of oxygen, appeared to be rapidly readsorbed to the sediment, whereas ammonium was then oxidated to nitrite and (to a lesser degree) to nitrate. The exchange between sediment and overlying water of reactive silicate seemed to be both Eh- and pH-inde- pendent. The anoxia brought about a strong increase (0-100 pM in the course of 36 anoxic days) of the toxic H2S.Besides these effects, various toxic heavy metals tend to go into solution from the sediment under anoxic bottom water conditions.
IV.5.2 Soma field examples
The first case of oxygen depletion leading to mass mortalities of extreme dimension (8,600 km2), has been observed in the New York B igh t, 1976. Causes and consequences have been thoroughly studied, providing us with more insight in such events (Swanson & S indermann, 1979). The New York Bight incident appeared to be made up of a concurrence of circumstances: high river discharge, strati

69
100 \
50
200
7 13 19 25 31 37 43 49 53 63 [days]
SiO-Si
N H -NPO-P
PO-P
7 13 19 25 31 37 43 49 5 5 61 days
Fig. 53. Processes in the isolated water of a Bell-jar experiment, on the bottom of the Kiel Bight (20 m deep) (Balzer et al1983).
fication that started earlier and ended up later than usual, unusual wind directions, reversed bottom currents, excessive blooms of the dinoflagellate Ceratium tripos and high organic matter input from dumpings in the Apex. These very unusual circumstances lead to strong stratification and aggregation of organic matter in the Apex. This resulted in oxygen depletion in July, after the bloom of C. tripos, and lasted until October when storms broke up stratification. It was concluded that although the cause of this incident was climatic, anthropogenic discharges had accelerated it. In vulnerable areas like the New York Bight, a slight unbalance of the normal cycle of environmental factors may cause severe oxygen depletions.In the North Sea the most prominent examples of oxygen depletion have been found in the German B ig h t and Danish coasta l waters. Large areas depleted of oxygen and exhibiting mass mortalities of fish and benthic fauna, were observed in 1981, 1982 and 1983 (fig. 54; Dyer et at., 1983; G illbricht, 1983; FIachor & Albrecht, 1983; V on W esternhagen & Dethlefsen , 1983; G erlach , 1984; Brockmann et a!., in press). These events were preceded by exceptional blooms of dinoflagellates, Ceratium spp. In
1979 such a bloom was observed as well, which, however, did not culminate in oxygen depletion.There seems to be a general trend of progressively calmer and warmer summers, which might have influenced the development of exceptional blooms (G e r la c h , 1984). Such climatic circumstances will consolidate stratification, which subsequently will favour dinoflagellate blooms. Extra fresh water discharge from rivers or heavy rainfall will add to this situation (see also §ll.3). When these favourable circumstances are established, additional nutrient input will intensify the bloom.Although they were not situated in the North Sea, we would like to mention a few events in adjacent waters, because of their alleged relations with eutrophication.The K a tte g a t and Be lt Sea appear to suffer gravely from eutrophication. So m e r (1987) reports that fish kills and toxic algal blooms are regular events almost every year since 1981; 1986 was particularly severe. According to newspaper information in the Netherlands, mass mortalities in 1987 were severe as well. The Danish government does not question the cause of these events, which it believes to be eutrophication.
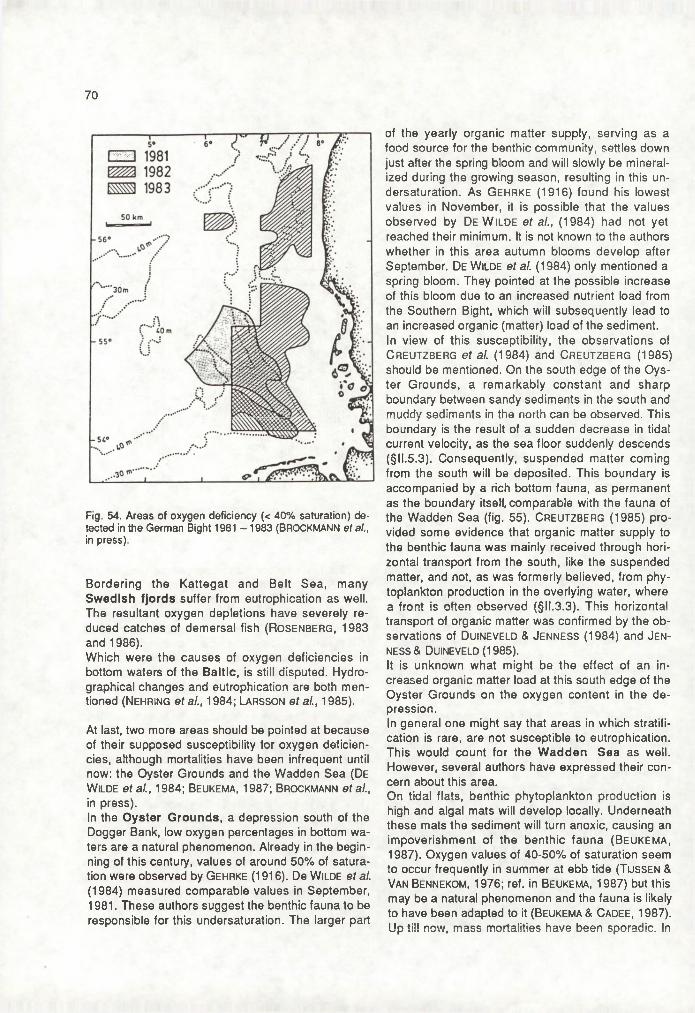
70
Fig. 54. Areas of oxygen deficiency (< 40% saturation) detected in the German Bight 1981 -1 9 8 3 (BROCKMANN et al., in press).
Bordering the Kattegat and Belt Sea, many Swedish fjo rds suffer from eutrophication as well. The resultant oxygen depletions have severely reduced catches of demersal fish (Ro s e n b e r g , 1983 and 1986).Which were the causes of oxygen deficiencies in bottom waters of the Baltic, is still disputed. Hydro- graphical changes and eutrophication are both mentioned (Nehring era/., 1984; Larsso n eta/., 1985).
At last, two more areas should be pointed at because of their supposed susceptibility for oxygen deficiencies, although mortalities have been infrequent until now: the Oyster Grounds and the Wadden Sea (De W ilde et al., 1984; Beukema, 1987; Brockmann era/., in press).In the Oyster Grounds, a depression south of the Dogger Bank, low oxygen percentages in bottom waters are a natural phenomenon. Already in the beginning of this century, values of around 50% of saturation were observed by G ehrke (1916). De W ilde et al. (1984) measured comparable values in September, 1981. These authors suggest the benthic fauna to be responsible for this undersaturation. The larger part
of the yearly organic matter supply, serving as a food source for the benthic community, settles down just after the spring bloom and will slowly be mineralized during the growing season, resulting in this undersaturation. As G e hrke (1916) found his lowest values in November, it is possible that the values observed by D e W ilde et al., (1984) had not yet reached their minimum. It is not known to the authors whether in this area autumn blooms develop after September. De W ilde eta!. (1984) only mentioned a spring bloom. They pointed at the possible increase of this bloom due to an increased nutrient load from the Southern Bight, which will subsequently lead to an increased organic (matter) load of the sediment.In view of this susceptibility, the observations of CREUTZBERG et a!. (1984) and CREUTZBERG (1985) should be mentioned. On the south edge of the Oyster Grounds, a remarkably constant and sharp boundary between sandy sediments in the south and muddy sediments in the north can be observed. This boundary is the result of a sudden decrease in tidal current velocity, as the sea floor suddenly descends (§ll.5.3). Consequently, suspended matter coming from the south will be deposited. This boundary is accompanied by a rich bottom fauna, as permanent as the boundary itself, comparable with the fauna of the Wadden Sea (fig. 55). C r eu tzb er g (1985) provided some evidence that organic matter supply to the benthic fauna was mainly received through horizontal transport from the south, like the suspended matter, and not, as was formerly believed, from phytoplankton production in the overlying water, where a front is often observed (§!l.3.3). This horizontal transport of organic matter was confirmed by the observations of D uineveld & Jen ness (1984) and Jen- NESS& Duineveld (1985).It is unknown what might be the effect of an increased organic matter load at this south edge of the Oyster Grounds on the oxygen content in the depression.In general one might say that areas in which stratification is rare, are not susceptible to eutrophication. This would count for the W adden Sea as well. However, several authors have expressed their concern about this area.On tidal flats, benthic phytoplankton production is high and algal mats will develop locally. Underneath these mats the sediment will turn anoxic, causing an impoverishment of the benthic fauna (B e u k e m a ,1987). Oxygen values of 40-50% of saturation seem to occur frequently in summer at ebb tide (T ussen & Van Bennekom , 1976; ref. in Beukema , 1987) but this may be a natural phenomenon and the fauna is likely to have been adapted to it (Beukema & Ca dee , 1987). Up till now, mass mortalities have been sporadic. In
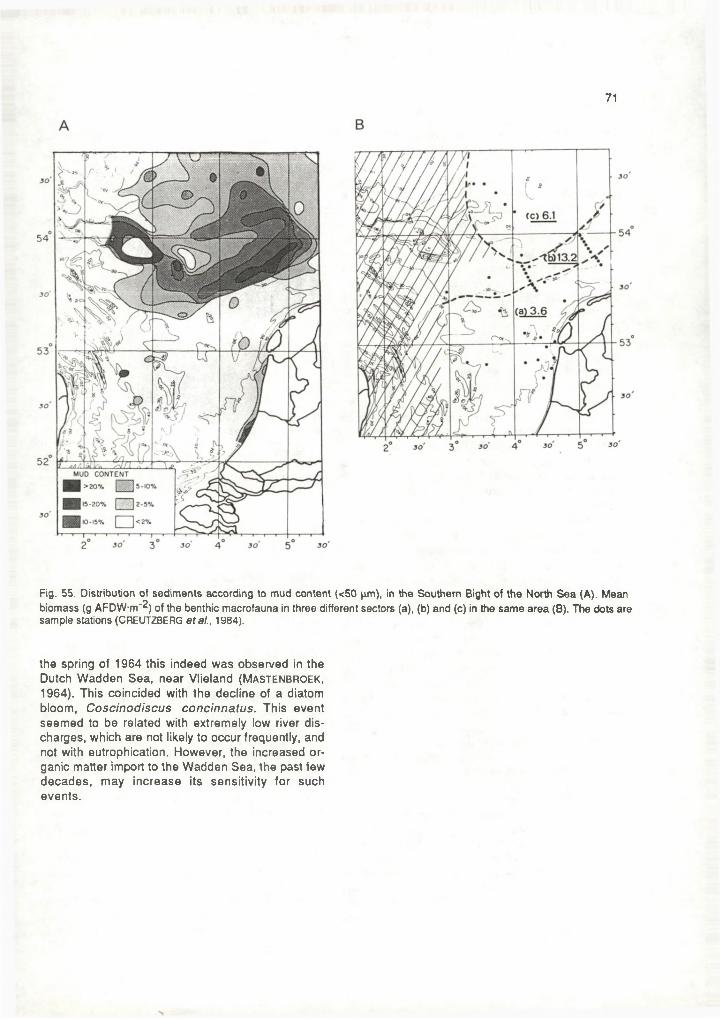
71
MUD CONTENT
Fig. 55. Distribution of sediments according to mud content (<50 pm), in the Southern Bight of the North Sea (A). Mean biomass (g AFDW-m'2) of the benthic macrofauna in three different sectors (a), (b) and (c) in the same area (B). The dots are sample stations (CREUTZBERG etal., 1984).
the spring of 1964 this indeed was observed in the Dutch Wadden Sea, near Vlieland (M a s te n b r o e k , 1964). This coincided with the decline of a diatom bloom, Coscinodiscus concinnatus. This event seemed to be related with extremely low river discharges, which are not likely to occur frequently, and not with eutrophication. However, the increased organic matter import to the Wadden Sea, the past few decades, may increase its sensitivity for such events.

72
V. SEASON-DEPENDENT SUSCEPTIBILITY OF THE FOODWEB FOR EUTROPHICATION
As it Is impossible to judge the exceptional if one is not acquainted with the usual, a large part of the preceding chapters dealt with natural processes and phenomena. It was tried to complement these with cases in which eutrophication had an additional effect. Such a compilation might have a puzzling effect on the reader, especially when he asks himself: When and where can I expect what? The next sections will deal with this question on the basis of a season-dependent ecosystem model, presented by SMETACEK et al. (1984).
Since long, investigators have tried to describe the ecosystem by means of models. These models often pretend to give an overall energy budget, using yearly means, without taking the changing relationships within the food web during the growth season into account (Steele , 1974; Jones , 1984; Peterson , 1984). Although they give an interesting view on the ultimate fate of primary products, which might be of interest for commercial fisheries, they use crude generalizations of the processes and relations within an ecosystem.The changes in these processes and relations are governed by a variety of physical, chemical and biological factors, all fluctuating throughout the year. W illiams (1981) already recognized three possible episodes in which the relationships between phytoplankton, Zooplankton, micro hete rotrophs and externa! organic and inorganic pools differed. However, he did not connect them with physical and chemical factors of the habitat, and thus did not try to situate them in the course of the growth season.This, indeed, was done by S metacek et al. (1984) on the basis of data collected in Kiel Bight over a ten- year period. These authors present an approach of the ecosystem in which they divide the growth season of the pelagic system into four stages (fig. 56). This perspicuous approach makes it possible to recognize the changing of relationships during the growth season and to evaluate the role of the small food web. In this way italso seems possible to trace the effects of eutrophication through the ecosystem, and where and when these will become visible.It should be stressed that the model given by S metacek et al. (1984) is not generally applicable, as it is based only on Kiel Bight data. Each area has its own characteristic topography, climat, geochemistry and biology, which all affect the course of the stages. However, it may be deduced from the next sections that this approach can also be a useful tool
LATE SPRING
--------------- PYCNOCLINE
SEDIMENT
PYCNOCLINE
PHYTO PLAN KTO N O B A C T E R IA AP R 0 T 0 Z 0 0 P L A N K T 0 N □ N U T R IE N T S ©M E TAZO O PLAN KTO N O SEDIM EN TATIO N •
Fig. 56 Semiquantitative flow diagrams representing the four stages of the pelagic system during the growth season. Arrows indicate input of new nutrients and output of sediment- ing matter respectively. Quantitative relationships are denoted by the thickness of the arrow and size of the symbols representing the four major components of the system respectively (SMETACEK etal., 1984).
in other stratified areas. Many similarities are observed, in which only the period of transition between the stages should not be taken too strict. Although based on the model of S m eta c ek et al. (1984), the next sections will go somewhat beyond that and speculate on several relationships within the four stages.
V. 1 Stage I : early spring
Stage I is the period starting at the onset of the spring diatom bloom and ending after its sedimentation; it will take 5-8 weeks (fig. 57). The initiation of the spring bloom results from changes in the physical environment: a calming down of the weather causes a diminution of the vertical mixing depth, while light intensity and temperature increase. Nutrient concentrations, built up in winter, decrease as the phytoplankton biomass increases and, eventually, will get depleted when the phytoplankton reaches its maximum.Upon relations between components of the food web during this stage, one might speculate the following situation:As nutrient concentrations will decrease and light intensity increase during the course of the bloom, this might create a situation for the algae in which they
SUMMER [ 1 AUTUMN
SEDIMENT

73
will Involve the overflow mechanism, discussed in §IV.1.1. Consequently, exudate production might increase, followed - with several days' time-lag due to their dormant state in winter - by increased activity of bacteria and protozooplankton (a.o. protozoa, mi- croflagellates, ciliates and copepod nauplii) grazing on the bacteria. The subsequent decline of the bloom when nutrients are depleted, may result in a further increase of DOM, as decaying cells exhibit autolysis; the remaining cell debris will add to the POM load. This valuable nourishment for bacteria will favour their activity and, consequently, that of the grazers on bacteria as well. As a result, the protozooplankton will reach its maximum several days after the maximum of the phytoplankton bloom. Comparable situations have been observed in the Kiel Bight (Smetacek et a i, 1984; Rh einheim er , 1984; G a st , 1985), the Baltic (Hagström & Larsso n , 1984; Elm g r e n , 1984; Ga st , 1985), in front of the Belgian coast and in the Channel (Jo ir is et al., 1982; Lancelo t & B illen , 1984) and in front of the Dutch coast (G ieskes & Kraay , 1977a).Remarkable about this period is the apparent unbalance between phytoplankton and metazooplankton (mostly copepods); the spring bloom declines when the metazooplankton is still in its early stages (F ransz & G iesk es , 1984). This was observed in the northern North Sea (F ransz & Van Arkel , 1980), as well as in the central North Sea (Baars & F r a n s z , 1984), the Southern Bight (F r a n s z , 1976), the Belgian coastal waters (Jo ir is et al., 1982), the Kiel Bight (S m e t a c e k et al., 1984) and the Baltic (Elm g r e n , 1984; Hagström & La r s s o n , 1984). Presumably, the Zooplankton will take advantage of the phytoplankton, as might be deduced from the existence of large amounts of eggs, juvenile stages and fecal pellets, but their secondary production is not enough to explain for the decline of the phytoplankton (Fransz & Van Arkel, 1980; Daro & Van G usegem ,1984).When the spring bloom declines, the pelagic het- erotrophs will not be able to deal with the excess organic material and the larger part will settle down or be transported by currents. Lately it has become clear, that this replenishment of organic matter to the benthic community probably triggers off its development. Several investigators observed thai, on a yearly base, 20-40% of primary production will settle down, the larger part in spring. These observations came from the northern North Sea (Davies & Payne , 1984; D e W ilde et a i, 1986), the central North Sea (POSTMA & Rom m ets , 1984; De W ilde et al., 1984), the Belgian coastal waters (Jo ir is et a l„ 1982), the Kiel Bight (S m e t a c e k ef al., 1984) and the Baltic (Elm g ren , 1984). One should be aware, however, of
the possibly large yearly fluctuations, as was found by Cadée (1986b) in the northern North Sea.
Summarizing, stage I is characterized by predominantly "new" primary production, stemming from the winter nutrient pool. Lancelo t & B illen (1984), however, calculated that the utilization of nitrogen in front of the Belgian coast was twice as much as the entire winter pool and consequently nutrient recycling must have taken place. These authors suggested the microheterotrophs to be responsible for this. The development of the metazooplankton is still in its early stages. The larger part of the primary production settles down, triggering off the benthic fauna (table 20).A nutrient enrichment in this stage will, in first instance, result in an increased spring bloom (provided no other factor than nutrients is limiting, which might be the case in turbid, onshore waters). As by nature primary products are already in excess, this increase will not influence the pelagic system. However, after settling down, effects on the benthic fauna are to be expected (cf. §IV.2.3).
V.2 Stage II: late spring
Stage II is the period following the sedimentation of the spring bloom (fig. 57h) up to the decline of the first copepod maximum (fig. 57g); it takes 6-8 weeks. In the course of this period, stratification starts to develop (fig. 57a). Due to the spring bloom in the preceding stage, the water column is nutrient- poor and replenishment of nutrients will come mainly from mineralization of sedimented material. This mineralization will result in enrichment of the bottom water (fig. 57d), which will exchange with the surface water to a decreasing degree, due to stratification, as the stage progresses. This situation is particularly favourable for small flagellates, migrating between the nutrient rich bottom waters and the depth at which light intensity is sufficient. This results in a shift of the production maximum from the surface to the pycnocline (fig. 57e).The copepod maximum, characteristic of this stage, seems surprising, as their preferential food source (diatoms) largely diminishes after the spring bloom. The maximum, however, is remarkably constant throughout the years, in contrast to the phytoplankton stock of this stage. Apparently the copepods' standing stock is not governed by these algae, but triggered off in some way by the (similarly constant) spring bloom. Probably, favourable conditions during the development of the eggs and juvenile stages in

Fig. 57. Schematic annual cycles deduced from Kiel Bight data, collected over a ten-year period: (a) temperature distribution in the water column; (b) average weekly integrated values for radiant energy input; (c) oxygen distribution in the water column; (d) depth distribution of dissolved inorganic phosphate; (e) depth distribution of primary production; (f) integrated values over the 20 m water column for particulate organic carbon (< 300 pm) subdivided into phytoplankton carbon (PPC) and particulate detrital carbon (tripton carbon = TC); (g) Zooplankton biomass of the 20 m water column differentiated into protozooplankton (>20 pm, PZC) and metazooplankton (MZC); (h) sedimentation of particulate organic carbon as collected by multisample sediment traps at 18 m depth, differentiated into primary sedimenting matter and resuspended sediment.A crude indication of the transition between stages is given by vertical lines (after: SMETACEK eta/., 1984).
spring, are more important than the food source during their maturity in the second stage.It has been suggested that during this stage the adult copepods switch their feeding behaviour from herbivory to omnivory (La n d r y , 1981; Hagström & La r s s o n , 1984; S m eta c ek eta/., 1984). Their food source is probably phytoplankton, as well as protozooplankton and packages of detritus colonized by bacteria and protozoa. Consequently, one might propose a chain in which bacteria bring down the DOM concentration and part of the POM, followed by grazing protozoa, microflagellates, ciliates and eventually copepods, or some other variant on the microbial loop concept.These close links within the small food web provide a very efficient recycling of nutrients within the pelagic system, which is also reflected in the steady increase of the phytoplankton and low sedimentation values (lowest of the year) (Fig. 57f and h; table 20). The decine of the copepod standing stock might be the result of less suitable food; mature stages will be able to survive but not to produce eggs S m e ta c e k et al. (1984) conclude that the highest year-to-year variation in the phytoplankton takes place in stage II. This is caused by different factors: the rate of nutrient recycling from sedimented material; the intensity and frequency of vertical mixing, important in the development of the thermocline; and the development of the pelagic heterotrophic community, decisive in nutrient recycling.The characteristic copepod maximum mainly consists of mature stages, stemming from the first stage. They graze on different kinds of food sources. The recycling of organic matter through the small food web runs efficiently.An increased nutrient load will therefore, most probably, become visible in the phytoplankton as well as in the pelagic heterotrophs. The degree of phytoplankton increase will depend on its edibility. It is not

75
Table 20. Quantitative relationships expressed as approximations between inputs, outputs, and production within the system as well as range in biomass ratios of some of the major planktonic compartments characteristic of the four stages of the growth (SMETACEK eta!., 1984).
Slagc Duration(weeks)
Total primary
production (g C m-2 stage"
Average primary
production ') (g C m"2 d"1)
New total production
(% )
Sedimentation of total
production (% )
Phytoplankton:total
Zooplanktonbiomass
Metazooplankton:protozooplankton
biomass
I ........ . . . . 6 - 8 - 20 0 -4 > 75 > 50 > 10 0 - 3 - 0 1-> . . . . 6 - 8 ~ 20 0-4 ~ 50 < 25 3 - 1 5 - 0 - 33 ............. . . . . I2 - 1 4 ~ 70 0 -8 < 25 < 25 6 - 3 2 - 54 ............. 6 - 8 ~ 30 0 -6 > 75 > 7 5 > 10 1 - 0 -3
surprizing, therefore, that the colony-forming flagellate Phaeocystis pouchetii dominates in this stage of the year (La n c e l o t et al., 1987). It is uncertain whether copepods will benefit, because, as we already saw, their maximum seems to be independent of the algal biomass at the same time. Moreover, the harvest of an increased nutrient load will be spread over the pelagic heterotrophs and little will be left for them.
V.3 Stage III: summer
Stage III is typically a steady-state phase and will last 12-14 weeks. In stratified areas a stable ther- mocline has developed (fig. 57a), through which exchange of dissolved compounds, such as nutrients and oxygen, is minimized. Incidentally, some up- welling may occur resulting from storms or horizontal displacements of the surface iayer. The released nutrients will give rise to incidental algal blooms in the surface water, part of which will settle down again, while another part will contribute to the algal standing stock As dinoflagellates are able to migrate between bottom and surface water, and are best adapted to nutrient-poor situations, they can be observed most in this stage, alternated by diatoms now and then.Besides these upwelling events and the migrating activity of flagellates, no new nutrient input will be observed. Consequently, most of the nutrients involved in primary production will have to come from pelagic heterotrophic activity. Loss of essential elements from the surface layer will be minimal due to the close connection between autotrophic and heterotrophic communities; sedimentation will be minimal. In general .this will result in a continued increase of the plankton biomass, zoo- and phytoplankton, with dispersed peaks of phytoplankton.At the end of the stage, dinoflagellates may culminate in excessive blooms (cf. §IV.4). As they are of
ten not grazed upon, they largely settle down. At that time the near-bottom water already suffers from oxygen deficiency, due to the mineralization of organic matter during the preceding period. The settlement of such blooms may therefore result in anoxia (fig.57c; cf. §IV.5). These anoxic conditions will cause accelerated release of nutrients from the sediment, resulting in an enrichment of the, still isolated, bottom layer.The species composition of the pelagic system is the most complicated of the year, as a consequence of which it is difficult to evaluate trophic relationships. The metazooplankton reveals many different species, among which copepods, different kinds of larvae and jelly-fish. During this period, due to nutrient limitation, the phytoplankton will exhibit station- airy growth in which extracellular release is probably at its annual maximum. Bacteria and protozooplank- ton will thrive in such a situation, keeping DOM concentrations low. However, they will be effectively grazed on, especially when inedible phytoplankton species dominate, which also keeps their biomass low. Apparently they represent an useful food source in this time of the growth season (Ha gstrôm & La r s s o n , 1984; R h e in h e im e r , 1984; G a s t , 1985).The cause of the decline of the metazooplankton at the end of the stage is unknown to us.Differences in ecological structure between hydro- graphically different areas will be most pronounced during this stage.
As differences between areas are large, it is hardly possible to conceive of the outcome of an increased nutrient load. In a diverse, unstructured system the effects will probably be spread throughout the ecosystem, whereas in structured systems they might add to the dominance of an already dominating species.It has regularly been observed, that at the end of the stage some inedible species gained the upper hand. Such observations were: dinoflagellates in the Ger

76
man Bight (G erlach , 1984) and Kiel Bight (Smetacek et a!., 1984), cyanobacteria in the Baltic (Fdler et at,1985) and jellies in the Gullmar Fjord (Lindahl & Her n - roth , 1982). As these species represent a dead end of the food chain, they will finally settle down and may contribute to anoxic conditions.
V.4 Stage IV: autumn
This last stage of the growth season starts at the break-up of stratification (fig. 57a) and ends after the sedimentation of the autumn bloom; it will take 4-8 weeks. The break-up is in most cases a gradual process, completed at the end of the stage. Upwelling of nutrient-loaded bottom water (see stage III) in the beginning of the stage will give rise for the development of autumn blooms, often consisting of a characteristic dinoflagellate species. Sometimes these blooms are succeeded by a last diatom bloom.The roie of pelagic heterotrophic activity in replenishing nutrients for the phytoplankton has become less important, as upwelling events increase. In addition, the disappearence of most metazooplankton, which often exhibit low growth efficiency (i.e. high mineralization efficiency), diminishes the mineralization capacity of the heterotrophs. Therefore, primary production in this time of the year may predominantly be regarded as 'new' (table 20).The drastic and poorly understood decline of the metazooplankton may even be regarded as more characteristic of the transition between stages III and IV, than the break-up of the thermocline. This decline resuits again, iike in eariy spring, in a mismatch between them and the developing autumn bloom. Due to their high growth rates, the protozoo- plankton do react immediately on this bloom. Their biomass will increase considerably, as grazing by metazooplankton fails to occur (fig. 57g). The proto- zooplankton, however, will not be capable to consume a substantial proportion of the bloom and consequently the larger part of it will settle down (fig. 57h).The local break-up of the thermocline will not only cause an upwelling of nutrients, but also a down- welling of oxygen. However, if the break-up of the thermocline has not yet been completed, sedimentation of the autumn bloom may cause an increase of the oxygen demand to such an extent, that oxygen depletion will be the result (fig. 57c).The transition between stages III and IV is often hard to establish. Usually a shift from one dominating flagellate species into another can be observed, but this does not always coincide with a break-up of the thermocline. Whether a late summer or autumn bloom
is involved, should therefore be descded on the basis of Zooplankton data.Besides having been observed in the Kiel Bight (S metacek eta/., 1984), the above described situation was also found in the central North Sea: in September 1981 a shift in flagellate dominance (which exhibited no exceptional proportions; G ieskes & Kraay , 1984b) coincided with a halved mesozoo- plankton biomass, compared with July data, (F ransz et al., 1984) and a doubled bacterial biomass (Van der W erf & N ieuwland , 1984). However, no sedimentation was observed (yet?) (P ostm a & Ro m m e t s , 1984), while the thermocline was still present (T ussen & W etsteyn , 1984). Whether sedimentation has taken place after September is unknown, but seems likely, considering the constitution of the pelagic community.Occasions of exceptional blooms have already been discussed in section IV.4. Dinoflagellate blooms predominantly occur in stage III or IV.
The distinction between stages III and IV is particularly of interest when considering the role of the pelagic heterotrophs. Whereas in stage III blooms can often be attacked by heterotrophs, and therefore sedimentation is minimal, in stage IV heterotrophs can not cope with these blooms. An increased bloom intensity due to eutrophication will therefore mainly result in increased sedimentation, adding to the oxygen demand.

77
VI CONCLUSIONS
In chapter II and III the subdivision of the North Sea into a number of systems - on the basis of La e v - astu 's (1963) water mass division (fig. 1) - has been presented. Among these water bodies, the ones that border on land have more or less fixed residual current directions and widths, and restricted (and fairly accurately mapped) "entrances" and "exits". Virtually all inputs and outputs of water can be estimated on the basis of measurements at these "gates". The constantly present and natural boundaries of the water masses provide the circumscription of coastal systems, facilitating various (though crude) calculations about them.A system, in this view, consists of a (more or less) physically uniform water body and its bottom sediment, and all that they contain. The water, the bottom, the organisms and the suspended particulates can all be viewed as compartments of the system.In a vivid interaction within the system, fluxes between the compartments incessantly alter the distribution of the nutrient atoms over them, without, however, changing the total nutrient stock of the system.Concentrations measured in the water reflect the nutrient status of the system only in an incomplete and indirect way. Rather than the nutrient stock of only one compartment, it is that of the whole system that decides its nutrient status. Therefore, to investigate "the eutrophication of a water body" seems less fruitful than to try and trace the eutrophication of the system.Various reports indicate the Dutch coastal waters, the (inner and outer) German Bight and the Danish offshore waters as areas where P and N enrichments are expressed in very high concentrations and /or biological problems.In view of the above, we aimed at marking out a system of which these areas are integral parts, and thus arrived at the area of the Continental Coastal Water Mass (Fig. 1; Fig. 58). This system was designated as "the problem area".Of land-derived substances released into it, by far the larger part remains confined in the system right until the exit, at the Skagerrak border. The load of nutrients that takes one season to enter the system (the "annual load") may, furthermore, take many seasons to leave it, in the course of which the nutrients are constantly recycled within the system. This causes an accumulation of nutrients, a season-dependent part of which is in the form of particulate organic matter.
In the extensive shallow offshore parts of the problem area, water stratification (in summer) inhibits the admixture of oxygen from the atmosphere into nearbottom water layers. The restricted volume of these thin deeper layers allows only limited oxygen reserves to be stored in non-stratified periods, a stock which appears to be increasingly insufficient with respect to the amounts of organic matter supplied for decomposition.It has been inferred in the Annex, that averaged over the problem area, roughly half of all N and half of all P present is "human input". This, combined with the susceptibility of the area, leads to the assumption that a considerable decrease of anthropogenic nutrient input is likely to improve the situation there.After relating inputs and nutrient stocks, the second, and greater, problem is to demonstrate a relation between the inputs and undesirable effects like the ones mentioned. As the North Sea water is in a constant process of traversing the area, any time lapse of a few days or more between a chemical impulse and its consequences brings about a geographic remoteness between them. Dependent on among other
Fig. 58. North Sea and subareas. A few boxes of the ICES- model (FTNS, 1983) have been drawn in. Relating to table 15: a. whole North Sea (1+2+3+4); b. North Sea south of 56°N (2+3+4); c. Continental Coastal Water Mass (see text; cf. fig. 1) (3+4); d, Continental Coastal Water Strip (4).

78
things the moment of discharge and the weather in the following few days, the contribution may be dispersed over highly variable volumes of water within the problem area. Effects of specific nutrient inputs cannot be observed separately; usually, right from the beginning the discharged N or P atom distinguishes itself in nothing from its sister atoms in the sea. It is not the substance itself but the surplus beyond a certain maximally tolerable amount of it that harms the system, regardless of its origin.Now, nutrient loads from natural sources in the sea vary strongly. There is even a strong year-to-year variability which can be in the order of dozens of percents (Ch. III). The same goes for biological phenomena: abundances of species, shifts in dominance; many large natural fluctuations still go unaccounted for. Only to the extent that this poorly understood natural variability is exceeded, can there be mention of man-inflicted damage to natural systems. Eutrophication damage, in view of the nutrients' "naturalness", occurs in the form of deformations of natural processes: d isproportionate "swellings' or "shrinkings" of links within chains of natural events, or diversions of (parts of) such chains. These will not likely be recognized by a degree of "unnaturalness", which presents a crucial difference from pollution with e.g. PCB's, radio-active, or otherwise traceable substances of a xenobi- otic and purely man-made nature. In those cases anthropogenic damage to the biota can often be traced back to accumulations of such substances in organisms or their (micro-) environments. Such tracers provide a "smoking gun", whereas in anthropogenic eutrophication damage, no smoking gun will be found. In the latter case, the only useful criterion seems to be the extent of damage, and standards should be established. It is widely accepted that real damage is inflicted by, e.g., mass mortality, by a lowering of species diversity, and by loss of functions (fishery, fish nursery, recreation) of sea areas. Such standards should of course be aimed at the prevention of, rather than at combating, such damage.
To approximate the effects of anthropogenic eutrophication embedded in natural variability we thought it necessary to discuss among other things a number of fundamentals of marine production-and- consumption biology, because in this research field there are many fronts in motion; proposed cause-ef- fect relationships are most often uncertain and still disputed. Especially in, by nature, eutrophic coastal waters, susceptible to strong fluctuations in environmental parameters, the community exhibits complex and flexible ways to respond. Biomass changes
and shifts in species dominance in such environments may very well result from natural causes, although anthropogenic nutrient enrichment in several cases appears to have influenced their intensity and extension.We have attempted to portray the living community’s susceptibility for eutrophication effects in recurrent stages of its seasonal development. One of the above mentioned research fronts in motion is that of the microheterotroph level in the food-web (also referred to as "small food web"), which features prominently in the description of the seasonal development. Its importance is only recently being appreciated.The small food web (bacteria, protozoa, microflagel- lates, ciliates and copepod nauplii) is extremely important in nutrient recycling: especially in late spring and summer it will serve as an important food source for metazooplankton. Together, their mineralization activity is the main nutrient source for the pelagic North Sea phytoplankton. It is this category, furthermore, that consumes most of the oxygen in its decomposition of organic matter in and at the bottom sediment.The description of the seasonal cycle indicates that coastal North Sea systems receive a strong impulse of particulate organic matter each spring, emanating from the early phytoplankton blooms. Due to a mismatch in developmental stages between producers and predators within the pelagic zone, the larger part of the organic matter will precipitate and "trigger" the development of a benthic community that is engaged in mineralization (micro- and macroheterotrophs).In the course of summer the downward flux of particulates decreases. In late summer, excessive blooms may develop dependent on weather conditions. At that time strong and extensive stratification may still occur, while near-bottom oxygen concentrations are near their annual minimum. If these conditions coincide with a new particulate organic matter pulse, avalanche-like interactions of anoxic mortality and explosions of oxygen consuming heterotrophic activity may culminate in mass mortalities and extensive anoxia. Damage caused by previous organic loading of the system may not become manifest until at this most susceptible stage. Moreover, the extinction of (parts of) the benthic fauna, may hamper thorough mineralization. The resultant over-year accumulation of organic matter may thus perpetuate these yearly anoxic conditions.In conclusion, the effects of eutrophication may be regarded as a range progressing from positive towards negative; a harmless increase in biomass may end up in mass mortalities. If such negative effects are felt in vulnerable areas such as the German

79
Bight, which also is one of the most productive areas to man, one can state that there is little flexibility left for the North Sea as a whole. As this is currently the case, we should not hesitate to bring down our nutrient discharges.

80
ANNEX
T he relative importance of man-made nutrient
CONTRIBUTIONS
Why summaries of annual imputs ?
In order to gain insight in the relative importance of man-made nutrient imputs, table 15 has been drawn up; first for the North Sea as a whole (a); then, in three steps, progressively smaller areas, each a cutout from the preceding, are portrayed (b-d).In order to portray the nutrient composition in the waters of each of them, input summaries were chosen, because that information is most completely available, and because it is assumed that contributions to the measured nutrient concentrations (hence, to productivity) will be in approximately the same proportion as the input contributions.This approach seems useful only if realistic spatiai scales are chosen, e.g. the scale of a water body that can be considered a physical unit, more or less homogeneously mixable. Therefore we consider the scale of the individual North Sea water masses (fig. 1) as the largest scale over which this "levelling out" can possibly be justified. (This choice remains disputable, and future insights may necessitate a further reduction of the scale).The order of decreasing area of the subtables in table 15, from left to right, is also the order of increasing accuracy and increasing significance. Even if the figures in table 15a are exactly correct, there is not a single area in the North Sea for which the resulting percentages are realistic! To a slightly lesser extent the same applies to the southern North Sea (15b). The "Continental Coastal Strip" (d) proportions are the most accurate, but in view of the above we also consider the "Continental Coastal Mass" (c) a realistic subtable. This "extension" from (d) to (c) is important, because it permits the inclusion of the area of real eutrophication problems (see e.g. fig. 54).A budget post "bottom sediments" was not included in table 15, assuming that the bottom is neither a net donor nor a net receptor of nutrients, in other words, that in the long run inputs equal outputs. Fluxes to and from the bottom reflect previous and present loads in the overlying water, and are therefore considered an input-derived phenomenon.
The drawing up of table 15
Water flux values given in table 15 give an impression of the relative volumes. The "Coastal Strip flux"
(table 13d) is a crude estimate inferred from streamline figures in the W aterkw aliteitsplan N o o rd zee (1985a). The water flux through the Continental Coastal Water Mass (CCWM) (subtable c) was taken to be as large as the total flux out of ICES-box nr. 5 (see fig. 3) because that is the only exit for this water mass.Our problem area, the CCWM, is taken to be the water present in box 5 plus half of that in box 4 (the south-east half). The CCWM receives the greater part of all Channel water that enters the North Sea, partly via Channel - box 4 - box 5 (this we estimate 75% of the Channel water, in agreement with FTNS, 1983); and partly via Channel - box 4 - box 7" - box 5 (say, x% of the Channel water).The water supply box 7" - box 5 is considered a nonspecified mixture of Channel, North Atlantic, and English Coastal Waters.As to nutrients: In table a the exchanges between North Sea and Skagerrak were not included. The effects of Skagerrak water are virtually restricted to the Norwegian Coastal Current. Consequently, table a in fact concerns the North Sea minus the Norwegian Coastal Current and Skagerrak.Nutrient loads were quantified as follows. North Atlantic loads to the North Sea (table a), by multiplying the water flux concerned (FTNS, 1983) by winter concentrations nitrate (for total-N) and phosphate (for total-P) (both from Le e , 1980; see table 1). It was assumed that total N and P are present in constant concentrations throughout the year, and virtually wholly in these inorganic forms in winter. Therefore they are thought to give the best approximation, in agreement with Butler et al. (1979). The Channel loads to the North Sea are the product of the net residual transport (5.3-103 km3-a"1; P randle , 1984) and mean annual total-P (0.5 pM), and total-N (9.5 pM) concentrations, respectively (B rockmann et al., 1987).The atmospheric load of P in table a was based on an average estimate of 35 kg-km"3-a'^ for the North Sea as a whole. This is speculative; for the southern North Sea (table b) the value is 45 kg-km '3 -a'^ (W aterkw aliteitsplan No o r d z e e , 1985a); our assumption was inferred from this and serves merely to indicate the order of magnitude, which makes it a very secondary contribution, at all rates."Runoff" represents rivers and coastal runoff, excluding direct (sewage and industrial) discharges from the coast. Phosphorus contributions to the North Sea from direct discharges and dumping (table a) is a speculative estimate like that for atmospheric loading: it is based on corresponding P value in table b, multiplied by the ratio table a / table b for nitrogen (direct discharges and dumping).

81
TABLE 15. Composition of external inputs of total N and total P (each in 103 t a '1) to the North Sea and subareas (each a section of the preceding). DD+D, Direct Discharges and Dumping. See also fig. 58 and text (p. 77).
to: North Sea Continental Coastal Water
sources ofa.
whole (8)t>.
south of 56°NC.
Massa .
stripNITROGEN Input * input * input i* inputN.Atl.Inflow 7000 (1) 75 767 (5) 27 J 7 4 2 ( 1) 4 3
- -Channel 705 (2) 8 705 (2) 25 88 ( 1 ) 9Atmosphere 400 (3) 4 220 (5) 8 5 3 ( 1 ) 3 17 (6) 2Runoff 1073 (2) 12 1000 (6) 36 890 (6) 52 890 (6) 86DD + D 129 (4) 1 114 (6) 4 28 (6) 2 28 (6) 3Total 9307 100 2 8 O 6 100 1 7 1 3 1 0 0 1023 100PHOSPHORUSN.Atl.Inflow 1085 (1) 8 1 112 (5) 34 J 92 (1) 47 _Channel 82 (2) 6 82 (2) 25 10 (1) 9Atmosphere 20 (1) 2 10 (5) 3 2.4(1) 1 0.8(6) 1Runoff 111 (2) 8 96 (6) 29 92 (6) 47 92 (6) 83DD 4 D 35 (1) 3 31 (6) 9 8 (6) 5 8 (6) 7Total 1333 100 331 100 194.4 100 110.8 100Water Flux 60.10 3 11.103 5670 600( km3, a-1 ) (7) (5) (1) (1)
1) Estimate; see text 5) Waterkwaliteitsolan Noordzee (1985a)2) Brockmann et al. (in press) 6) idem (1985b) 7) Otto ( 1983a)3) QSR (1987) 8) Norwegian Coastal Current and Ska-4) Grogan (1984) gerrak not included
So much for table a, which no doubt is the least accurate. Southern North Sea values (table b) originate wholly from literature, and coastal strip values (table d) largely. The Channel values in table d were calculated on the basis of the above mentioned water budget assumptions and figures, one-eighth of the Channel flux entering the 20 km wide "strip" assumed to carry one-eighth of Channel total-P and N. Table c is the most important one, designated to completely represent the "problem area". Assuming all runoff, direct discharges and dumping sources to be located in the "coastal strip" (table d), these loads are the same as in table d. Atmospheric contributions are the product of surface area (51-103 km2) x deposition values for the southern North Sea (WATERKWALrTEiTSPLAN NOORDZEE, 1 985a).CCWM imports from North Atlantic and Channel could only be summed, not separately estimated. The CCWM receives (75 + x)% of the Channel water flux to the North Sea (see above): 75% into (the southeastern half of) box 4, the unknown rest, from box 4 (north-western half), via box 7". Consequently, we assume 75% of the Channel nutrient loads to the North Sea to reach box 5 straight from box 4. The remaining x% enter the CCWM from box 7", mixed with equally unknown contributions from the North Atlantic and English coastal nutrients. The latter
contribution, being uncalculable and probably small, is neglected here and considered oceanic for the time being (we will return to it later on). The resulting totals of oceanic nutrients entering from box 7" were taken to be the product of winterconcentrations nitrate and phosphate in box 7", respectively (Jo h n s to n , 1973), times the annually averaged ad- vective flux from box 7" to box 5 (FTNS, 1983).The resulting load is composed of Channel and North Atlantic nutrients in an unknown relative proportion. Added to the previous, straight from box 4, it gives us the total of oceanic nutrient loads (N and P) entering the CCWM (table c).It should be stressed that most of the budget posts in table 15 are variable by as much as 50% or so, due to predominantly meteorological circumstances, even on a year-to-year basis.
The atmosphere as a source of nitrogen
Whereas atmospheric inputs of P and, certainly, Si are negligible with respect to eutrophication, N atmospheric inputs are of some importance, as table 15 shows. The reason is not N2 fixation which, unlike in lakes or tropical oceans, is quantitatively unimportant in the North Sea. The estimate for atmospheric N deposition for the North Sea as a whole (gradually

82
decreasing from about 1.2 gN-m‘ 2 -a" 1 in Strait Dover, to 0.1 gN- r r f2-a' 1 in the northern North Sea, with an average value of about 0.8 gN-m'2-a' 1 ) was introduced at the North Sea Ministers’ Conference 1984 (QSR, 1986), and was maintained at its sequel in 1987 (QSR, 1987). It was inferred from land measurements in south Norway. The main forms are NO3- and NH4+. Man-emitted N oxides in the air predominantly originate from power stations and motor transport, although other Industrial activity and domestic heating contribute significantly. Agriculture is the main source of airborne anthropogenic NH4+ (QSR,1987). Still, in the total atmospheric N deposition, the human contribution has not been determined yet (neither on land nor at sea), because natural emissions are as yet unknown and have not been modeled (pers.comm. Bu is m a n , Laboratory of Air Research, RIVM-Bilthoven). On the other hand, comparison of historic data (fig. 37) indicates a very important man-made proportion in total N deoosition on land (> 50%; estimated by P ierson & C h a n g ,1986); it may also be substantial at sea. Obviously, the atmospheric N contribution will be much more evenly spread over the North Sea than that In run-off.
The approximating of anthropogenic contributions
Percentages In table 16 have been inferred from the loads in table 15, on the basis of two assumptions:i) in the combined category of "coastal inputs"
(runoff, direct discharges and dumping) 85% of to tal-P and 75% of total-N are anthropogenic (in agreement with V an Be n n e k q m s í a/., 1975; Van Pagee & Postma ,1986; De V ries et al., 1988).
ii)in the Channel nutrient loads, 15% is anthropogenic. The English south coast contributes 40-1O2 t-a' 1 N and 5-102 t-a"^ P to the Channel water (G rogan , 1984), an amount equal to 6% of both the N and P loads from the Channel to the North Sea. Furthermore, the Seine and the Somme together release 100-102 t-a '1N (La n c e lo t et al., 1987) (P data not available), which equals 14% of the Channel N load to the North Sea. If total coastal contributions are some 20% of Channel nutrient loads, the anthropogenic fraction may well be 15% (see under i).
The mentioned large anthropogenic fraction in coastal inputs is not surprising against the background of globally averaged human contributions in river inputs to ocean systems: 81% of total N and 75% of total P (Van Bennekom & Salomons, 1981 ). Especially in the problem area, the anthropogenic fraction may well be a few per cent higher:- N and P contributions from the English east coast
(mainly Humber & Thames) have not been included
TABLE 16. Anthropogenic percentages in total N and P inputs to North Sea and subareas (see fig. 58), calculated solely on the basis of values in column e (coastal inputs is sum of run off, direct discharges and dumping).
North SeaContinental
Coastal WaterCoastalInputs
a. b. c. d. e.whole south of 56°N Mass strip
N 11 34 45 69 75P 10 36 49 78 85
as anthropogenic nutrients, although in part they are. They make up an unknown proportion of the N and P loads in central North Sea water (going from box 7" to box 5) (of course, in tables 15a,b and 16a,b, these Inputs have not been excluded).
- Direct atmospheric deposition to the problem area (that is, from the atmosphere over the problem area alone) amounts to 1.2% (P) and 3% (N) of total inputs (table 15c). However, an indirect atmospheric input is hidden in the oceanic inputs in this table: the water masses concerned have, namely, already been charged from the atmosphere on the way through North Sea and Channel. If, to take this into account, the atmospheric percentages in table 15c are - arbitrarily - doubled (and the "oceanic" percentages correspondingly decreased), then, especially for N, the man-made contribution via atmospheric deposition may amount up to a few per cent of total inputs to the problem area. This argument applies, to a varying extent, to all four subtables of table 15. Most
tUiA ¡a nnft a in U nnrJ n • in ikn K j n H inOUOl l ljr LIHO IO II IO OOOO III KJ CAI IKJ Vs, III IIIO iNU lili
Sea as a whole It will be overruled by the dominance of deep advective imports; in the coastal strip by that of runoff inputs.
Because they could not be calculated, the antropogenic atmospheric nutrient inputs have been left out of table 16 entirely. But this is not meant to imply that they are negligible.Conclusion: a fair estimate seems that half of all P and half of all N annually entering the problem area is of anthropogenic origin. Fig. 24, computed by Van Pagee & Postma (1986) appears to agree well with our estimate. Our input tables 15 and 16 were likewise drawn up to give information about the relative contributions to the concentrations observed, and thus to the formation of organic matter In the problem area, which - at its present excessive rate - is the prime expression of eutrophication.The conclusion is that half of all N and P present in the water and sediments of the problem area - living and non-living, dissolved and particulate - originates from human activities.

TABLE 7. Survey table of loading with N for the North S ea south of 56°N in 1980 (103 t a ' 1) (WATERKWALITEITSPLANNOORDZEE, 1985b)
Kust vak.rivieren
directelozingen
lozing per schip verbrand . chem.afval
scheepvaart
offshore
totaal excl. atmosfeer
atmosfeer
totaa 1 rana
nat. antrop. totaal bagger lndust r. slib nat. antrop. totaal
NI IO A7 57 2 0 0 0 0 ? 0 10 49 59 1 60N2 113 265 380 0 2,6 0 0 0 ? 0 115 268 383 1 384N3 A 15 20 8 0 0 0 0 Î 0 5 23 28 2,2 30NA 32 88 120 2 0 0 0 0 Î 0 32 90 122 3,2 125
Totaal Ned. kust 160 A20 580 12 2,6 0 0 0 7 0 160 430 590 7.4 600
El 6,3 2.3 8,6 25 0 0 0,6 0 7 0 6 28 34 4 38E2 16 A6 62 14 0 0 0.2 0 7 0 16 60 76 5 81E3 7 34 41 34 0 0 10 0 7 0 7 78 85 4 89
Totaal Eng. kust 30 80 110 75 0 0 11 0 7 0 30 165 195 13 210
Totaal Belg. kust 1 4 5 1,6 0 0 0 0 7 0 1 6 7 2 9
Tot. Duitse kust 78 226 304 0,4 0 0 4,3 0 7 0 78 230 310 5 315
Tot. Deense kust A 0 4 6 0 0 0 0 7 0 4 6 10 3 13
Tot. kustwater 270 730 1000 96 2.6 0 15 0 7 0 270 840 1110 30 1140e « (24) (73) (97) (3)
overig Noordzee< 36' NB 0 0 0 0 7 0,02 0 0,02 0,02 190 190 1700
Totaal Noordzee 270 730 1000 96 2.6 0 15 0 7 0,02 270 840 ino 220 1300 1700X 20 55 75 7 0 0 1 0 7 0 20 63 83 17 130
00oo

TABLE 8. Survey table of loading with P for the North S ea south of 56°N in 1980 (1 03 t -a '1) (WATERKWAl ITEITSPLANNOORDZEE, 1985b).
Kustvakrivleren
directelozingen
lozing per schip verbrand • chen.afval
scheepvaart
offshore
totaal excl. ataosfeer
atmosfeer
totaa1 rand
nat. antrop. CoC.al bagger Induet r. 8 11 b nat. antrop. totaal
HI 0.7 6,9 7,6 1.7 0 0,6 0 0 ? 0 0,7 9,2 9,9 0,05 10,0N2 7.6 38,4 46 0 2.2 0 0 0 ? 0 7.6 40,6 48,2 0,05 48,3N3 0,3 2.4 2.7 1.5 0 0 0 0 Î 0 0,3 3.9 4.2 0,10 4,3N4 2,1 8.3 10.4 0,2 0 0 0 0 ? 0 2,1 8,5 10,6 0,15 10.8
Totaal Ned. kuat 11 56 67 3,4 2.2 0,6 0 0 7 0 11 62 73 0,35 73
El 0.4 1,0 1.4 2,6 0 0 0,1 0 7 0 0,4 3.7 4,1 0,2 4.3E.2 1.0 0,7 1.7 8.7 0 0 0,05 0 7 0 1.0 9.4 10 0,25 10E3 0,5 0.2 0,7 9,8 0 0 2.3 0 7 0 0,5 12 13 0,15 13
Totaal Eng. kuat 2 2 4 21 0 0 2.5 0 7 0 2 25 27 0.6 28
Totaal Belg. kuat o.i 0,9 1.0 0,2 0 0 0 0 7 0 0.1 1,1 1.2 0,1 1.3
Tot. Dult8e ku8t 5 19 24 0 0 0 1.1 - 0 7 0 5 20 25 0,25 25
Tot. Deense ku8t 0.3 0 0,3 0 0 0 0 0 7 0 0.3 0 0,3 0.1 0,4
Tot. kustwater 18 78 96 25 2,2 0,6 3.6 0 7 0 18 110 130 1.4 131(X) (14) (84) (99) (1)
overig Noordzee< 56* NB 0 0 0 0 7 0,04 0 0,04 0,04 8,5 8.5 230
Totaal Noordzee 18 78 96 25 2.2 0,6 3.6 0 ? 0,04 18 110 130 10 140 230X 13 56 69 18 2 0 3 0 7 0 13 79 93 7 160

REFERENCES
Admiraal, W. & L.A.H. Venekamp, I986. Significance of tintinnidgrazing during blooms of Phaeocystis pouchetii (Haptophyceae) in Dutch coastal waters. Neth. J. Sea Res. 20(1): 6I-66.
Aken, H.M. van, I986. The onset of seasonal stratification in shelf seas due to differential advection in the presence of a salinity gradient. Cont. Shelf Res. 5(4): 475-485*
Aken, H.M. van, G.J.F. van Heist & L.M.R. Maas, 1987* Observations of fronts in the North Sea. J. Mar. Res. 45: 579"600.
Andersen, T.K., M.H. Jensen & J. Sorensen, 1984. Diurnal variation of nitrogen cycling in coastal marine sediments. I. Denitrification. Mar. Biol. 83: 171-176.
Andersen, et al., 1983* Some observations of ocean fronts, waves and currents in the surface along the Norwegian coast from satellite images and drifting buoys. In: R. Saetre & M. Mork (eds.) I98O:The Norwegian Coastal Current. University of Bergen, Norway.
Aure, J & R. Saetre, I98I. Wind effects on the Skagerrak outflow. In: R. Saetre &. M. Mork (eds.): The Norwegian Coastal Current. Proc. Norwegian Coastal Current Symposium, Geilo, 9-12 Sept. I98O.
Ayers, P.A. & M.L. Cullum, I98I. Paralytic shellfish poisoning in Britain I978-I98O with notes on preliminary observations. ICES CM/1981, K:13 .
Azam, F. & J.A. Fuhrman, 1984. Measurement of bacterioplankton growth in the sea and its regulation by environmental conditions. In:J.E. Hobbie & P.J.LeB. Williams (eds): Heterotrophic Activity in the Sea. Plenum Press.
Azam, F, T. Fenchel, J.G. Field, J.S. Gray, L.A. Meyer-Reil & F.Thingstad, 1983* The ecological role of water-column microbes in the sea. Mar. Ecol. Prog. Ser. 10: 257-263-
Baars, M.A. & H.G. Fransz, 1984. Grazing pressure of copepods on the phytoplankton stock of the central North Sea. Neth. J. Sea Res. 18(1/2): 120-142.
Backhaus, J.O., I98O. Simulation von Bewegungsvorgängen in der Deutschen Bucht. Dt. hydrogr. Z. Erg.-H.B., I5 : 7“56.
Backhaus, J.O., 1985- A three-dimensional model for the simulation of shelf-sea dynamics. Dt. hydrogr. Z. 38: I65-I87.
Backhaus, J.O., M.J. Boechlich, I985. Estimates of the circulation and turn-over times of the German Bight during winter with respect to eutrophication. Abslussbericht für das Teilvorhaben 12 im Rahmen des Themas "Eutrophierung in Nord- und Ostsee" des Forschungsvorhabens Wasser 102 04 215 des Umweltbundesamtes.
Baeyens, W. et al., 1984. Dynamic patterns of dissolved nitrogen in the Southern Bight of the North Sea. Estuar. Coast. Shelf Sei. 18:499-5IO.
Balzer, W., K. Grasshoff, P. Dieckmann, H. Haardt & U. Petersohn,1983. Redox-turnover at the sediment/water interface studied in a large bell-jar system. Oceanologica Acta 6(4): 337~344.
Bauerfeind, S., 1985- Degradation of phytoplankton detritus bybacteria: estimation of bacterial consumption and respiration.Mar. Ecol. Prog. Ser. 21(1/2): 27~37*

86
Becker, G.A. & G. Prahm-Rodewald, I98O. Fronten im Meer.Salzgehaltsfronten in der Deutschen Bucht. Seewart 4l(l): 12-21.
Bennekom, A.J. van, W.W.C. Gieskes & S.B. Tijssen, 1975 (annex 1976). Eutrophication of Dutch coastal waters. Proc. R. Soc. B l89: 359“ 374.
Bennekom, A.J. van, E. Krijgsman-van Hartingsveld, G.C.M. van der Veer & H.F.J. van Voorst, 1974. The seasonal cycles of reactive silicate and suspended diatoms in the Dutch Wadden Sea. Neth. J. Sea Res. 8(2/3): 174-207-
Bennekom, A.J. van, & W. Salomons, I98I. Pathways of nutrients and organic matter from land to ocean through rivers. SCOR Working Group 46. River Inputs to Ocean Systems. Rome, 1979*
Beukema, J.J., I986. Eutrophication of the North Sea: reason for satisfaction or concern? In: Proc. 2nd North Sea Seminar,Werkgroep Noordzee Amsterdam 27~38.
Beukema, J.J. & G.C. Cadée, I986. Zoobenthos responses toeutrophication of the Dutch Wadden Sea. Ophelia 26: 55~64.
Billen, G., M. Somville, E. de Becker & P. Servais, 1985- A nitrogen budget of the Scheldt hydrographical basin. Neth. J. Sea Res. 19(2/3): 223-230.
Billen, G., C. Lancelot, E. de Becker & P. Servais, I986. Theterrestrial-marine interface: modelling nitrogen transformations during its transfer through the Scheldt river system and its estuarine zone. In: J.C.J. Nihoul (ed.): Marine Interfaces Ecohydrodynamics. Elsevier Oceanography Series, 42: 429-452.
Blackburn, T.H. & K. Henriksen, I983. Nitrogen cycling in different types of sediments from Danish waters. Limnol. Oceanogr. 28(3):477-493.
Boalch, G.T., 1984. Recent blooms in the western English Channel. ICES (special meeting on the causes, dynamics and effects of exceptional marine blooms and related events) A9, 6 pp.
Boddeke, R., 1978. Changes in the stock of brown shrimp (Crangon crangon) L. in the coastal area of the Netherlands. Rapp. P.-v. Réun. Cons. int. Explor. Mer 172: 239“249.
Boddeke, R., G. Driessen, W. Doesburg & G. Ramaekers, I986. Foodavailability and predator presence in a coastal nursery area of the brown shrimp (Crangon crangon). Ophelia 26: 77"90.
Boehlich, M. & J. Backhaus, 1984. Simulation of wind induced currents in the system North Sea-Baltic Sea to interpret biological and chemical processes which influence eutrophication effects in the German Bight. In: S.A. Gerlach (ed.): Oxygen depletion I98O-I983 in coastal waters of the F.R.G. Berichte aus dem Inst, für Meereskd., Kiel, nr. I30.
Brockmann, U., 1984. Summer concentrations of nutrients in the German Bight 1979-1982. In: S.A. Gerlach (ed.): Oxygen depletion I98O- 1983 in coastal waters of the F.R.G. Berichte aus dem Inst, für Meereskd., Kiel, nr. I30.
Brockmann, U., G. Billen & W.W.C. Gieskes (in press): North Sea nutrients and eutrophication. In: W. Salomon, B. Bayne, E.K. Duursma & U. Förstner (eds.): North Sea pollution: an assessment. Springer Verlag, Berlin, Heidelberg, New York.
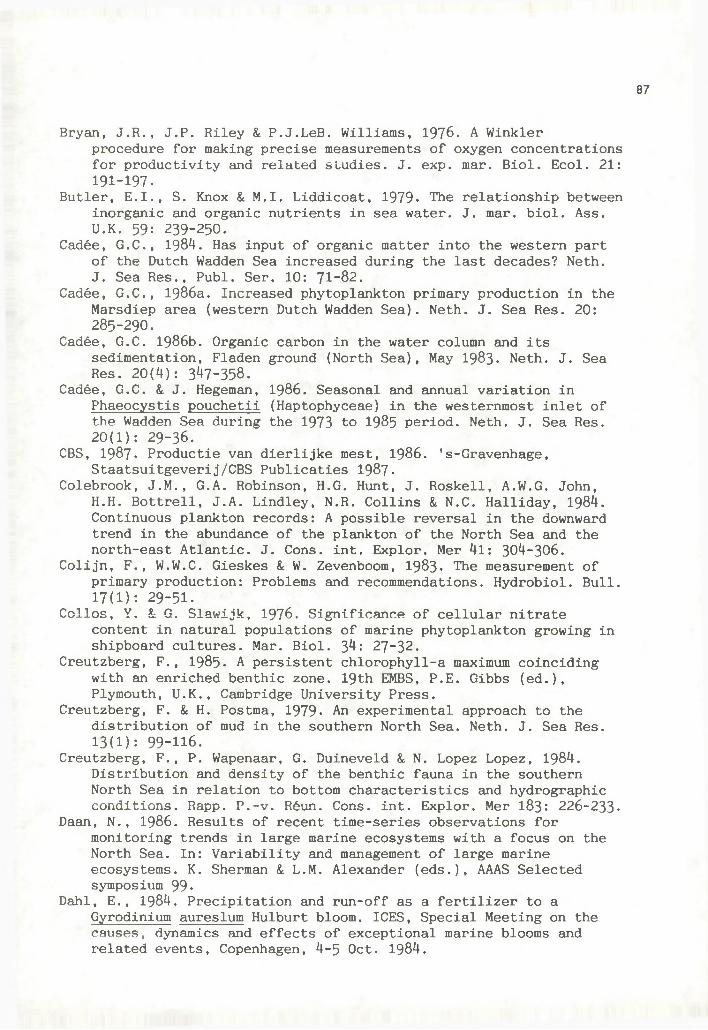
87
Bryan, J.R., J.P. Riley & P.J.LeB. Williams, 1976. A Winklerprocedure for making precise measurements of oxygen concentrations for productivity and related studies. J. exp. mar. Biol. Ecol. 21: I9I-I97.
Butler, E.I., S. Knox & M.I. Liddicoat, 1979* The relationship between inorganic and organic nutrients in sea water. J. mar. biol. Ass.U.K. 59: 239-250.
Cadée, G.C., 1984. Has input of organic matter into the western part of the Dutch Wadden Sea increased during the last decades? Neth.J. Sea Res., Puhi. Ser. 10: 71-82.
Cadée, G.C., 1986a. Increased phytoplankton primary production in the Marsdiep area (western Dutch Wadden Sea). Neth. J. Sea Res. 20:285-290.
Cadée, G.C. 1986b. Organic carbon in the water column and itssedimentation, Fladen ground (North Sea), May 1983- Neth. J. Sea Res. 20(4): 347-358.
Cadée, G.C. & J. Hegeman, 1986. Seasonal and annual variation inPhaeocystis pouchetii (Haptophyceae) in the westernmost inlet of the Wadden Sea during the 1973 to I985 period. Neth. J. Sea Res. 20(1): 29- 36.
CBS, 1987. Productie van dierlijke mest, 1986. 's-Gravenhage, Staatsuitgeverij/CBS Publicaties 1987-
Colebrook, J.M., G.A. Robinson, H.G. Hunt, J. Roskell, A.W.G. John,H.H. Bottrell, J.A. Lindley, N.R. Collins & N.C. Halliday, 1984. Continuous plankton records: A possible reversal in the downward trend in the abundance of the plankton of the North Sea and the north-east Atlantic. J. Cons. int. Explor. Mer 4l: 304-306.
Colijn, F., W.W.C. Gieskes & W. Zevenboom, I983. The measurement of primary production: Problems and recommendations. Hydrobiol. Bull. 17(1): 29-51.
Collos, Y. & G. Slawijk, 1976. Significance of cellular nitratecontent in natural populations of marine phytoplankton growing in shipboard cultures. Mar. Biol. 34: 27~32.
Creutzberg, F., 1985- A persistent chlorophyll-a maximum coinciding with an enriched benthic zone. 19th EMBS, P.E. Gibbs (ed.), Plymouth, U.K., Cambridge University Press.
Creutzberg, F. & H. Postma, 1979- An experimental approach to the distribution of mud in the southern North Sea. Neth. J. Sea Res. 13(1): 99-116.
Creutzberg, F., P. Wapenaar, G. Duineveld & N. Lopez Lopez, 1984. Distribution and density of the benthic fauna in the southern North Sea in relation to bottom characteristics and hydrographic conditions. Rapp. P.-v. Réun. Cons. int. Explor. Mer I83: 226-233-
Daan, N., I986. Results of recent time-series observations formonitoring trends in large marine ecosystems with a focus on the North Sea. In: Variability and management of large marine ecosystems. K. Sherman & L.M. Alexander (eds.), AAAS Selected symposium 99-
Dahl, E., 1984. Precipitation and run-off as a fertilizer to aGyrodinium aureslum Hulburt bloom. ICES, Special Meeting on the causes, dynamics and effects of exceptional marine blooms and related events, Copenhagen, 4-5 Oct. 1984.

88
Daro, M.H., & B. Gijsegem, 1984. Ecological factors affecting weight, feeding and production of five dominant copepods in the Southern Bight of the North Sea. Rapp. P.-v. Réun. cons. int. Explor Mer 183: 226-233.
Davies, A.M., I982. Meteorologically-induced circulation on the northwest European continental shelf: from a three-dimensional numerical model. Oceanologica Acta 5(3): 269-28O.
Davies, A.M., 1983a. Outcome of mathematical models. In: FTNS, 1983. ICES Cooperative Research Report no. 123, Copenhagen.
Davies, A.M., 1983b. Application of a three-dimensional shelf model to the calculation of North Sea currents. In: North Sea dynamics, ed. by Sündermann/Lenz, Springer Verlag, Berlin, Heidelberg.
Davies, J.M. & R. Payne, 1984. Supply of organic matter to thesediment in the northern North Sea during a spring phytoplankton bloom. Mar. Biol. 78: 315“324.
Dickson, R.R., P.M. Kelly, J.M. Colebrook, W.S. Wooster & D.H.Cushing, 1988. North winds and production in the eastern north Atlantic. J. Plankt. Res. 10: 151-169-
Dietrich, G., 1950. Die natürlichen Regionen von Nord- und Ostsee auf hydrographisher Grundlage. Kieler Meeresf. 7-
Dietrich, G., 1953- Verteilung, Ausbreitung und Mermischung der Wasserkörper in der südwestetl;ichen Nordsee auf Grund der Ergebnisse der "Gauss" Fahrt in Febr.-März 1952. Ber. Dtsch. Komm. Meeresforsch. N.F. 13(2).
Dietrich, G., 1954. Einfluss der Gezeitenstromturbulenz auf die hydrographische Schuchtung der Nordsee. Aus: Archiv für Meteorologie, Geophysik und Bioklimatologie, Serie A: Meteorologie und Geophysik, Band 7. 1954, Springer Verlag, Wien.
Dooley, H.D., 1974. Hyphotheses concerning the circulation of the northern North Sea, J. Cons. Int. Explor. Mer 36(1): 54-61.
Duineveld, G.C.A. & M.I. Jenness, 1984. Differences in growth rates of the sea urchin Echinocardium cordatum as estimated by the parameter W of the von Bertalauffy equation applied to skeletal rings. Mar. Ecol. Prog. Ser. 19: 65~72.
Dyer, M.F., J.G. Pope, P.D. Fry, R.J. Law & J.E. Portmann, 1983-Changes in fish and benthos catches off the Danish coast inSeptember 198I. J. Mar. Biol. Ass. U.K. 63: 767-775-
Eberlein, K., M.T. Leai, K.D. Hammer & W. Hickel, 1985- Dissolved organic substances during a Phaeocystis pouchetii bloom in the German Bight (North Sea). Mar. Biol. 89, 3 H -3l6.
Eck, B. van, E. Turkstra & H. van 't Sant, 1983- Voorstelreferentiewaarden Nederlandse zoute wateren; discussiestuk Ministerie van VROM, oktober 1983-
Edler, L., S. Ferno, M.G. Lind, R. Lundberg & P.O. Nilsson, 1985- Mortality of dogs associated with a bloom of the Cyanobacterium Nodularia spumigena in the Baltic Sea. Ophelia 24(2): IO3-IO9 .
Eisma, D., 1973- Sediment distribution in the North Sea in relation to marine pollution. In: E.D. Goldberg (ed.): North Sea Science, MIT Press, pp. I3I-I5O.
Eisma, D., 1975- Holocene sedimentation in the Outer Silver Pit Area (Southern North Sea). Mar. Sei. comm. 1(6): 407-426.

89
Eisma, D., 1978, Areas of present mud deposition in the North Sea.Int. publ. NIOZ Nr. 5520/78.
Eisma, D., 1981a. Supply and deposition of suspended matter in the North Sea. In: Spec. Pubis, int. Ass. Sediment 5: 4l5~428.
Eisma, D., 198lb. Suspended matter as a carrier for pollutants in estuaries and the sea. In: Mar. Envir. Pollution, 2. R.A. Geyer (ed.): Mixing and dumping. Elsevier Scient. Publ. Comp., Amsterdam
Eisma, D., 1981c. The mass balance of suspended matter and associated pollutants in the North Sea. Rapp. P.-v. Réun. Cons. int. Explor. Mer 181: 7-14.
Eisma, D. I986. Flocculation and deflocculation of suspended matter in estuaries. Neth. J. Sea Res. 20(2/3): 183-199-
Eisma, D. & J. Kalf, 1979. Distribution and particle size of suspended matter in the Southern Bight of the North Sea and the eastern Channel. Neth. J. Sea Res. 13(2): 298-324.
Eisma, D. & J. Kalf, 1987- Dispersal, concentration and deposition of suspended matter in the North Sea. J. Geol. Soc. London 144: I6I-178.
Eisma, D. et al., I983. Observations on macro-aggregates, particle size and organic composition of suspended matter in the Ems Estuary. SCOPE/UNEP Sonderband, Heft 55. PP- 295“3l4.
Elmgren, R., Trophic dynamics in the enclosed, brackish Baltic Sea. Rapp. P.-v. Réun. Cons. int. Explor. Mer 183: 152-169.
Es, F.B. van & L.A. Meyer-Reil, I982. Biomass and metabolic activity of heterotrophic bacteria. Adv. microb. Ecol. 6: HI-170.
Fogg, G.E., I98O. Phytoplanktonic primary production. In: Fundamentals of aquatic ecosystems, R.S.K. Barnes & K.H. Mann (eds.). Blackwell Scientific Publications, pp. 24-45.
Fogg, G.E., 1982. Marine plankton. In: The biology of Cyanobacteria, N.G. Carr & B.A. Whitton (eds.). Botanic Monographs I9 .
Fogg, G.E., 1983. The ecological significance of extracellularproducts of phytoplankton photosynthesis. Botanic Marina 26: 3“l4.
F0yn, L. & F. Rey, I98I. Nutrient distribution along the Norwegian coastal current. In: The Norwegian Coastal Current, Proceedings from the NCC Symposium, R. Saetre & M. Mork (eds.), Geilo, 9_12 September I98O. Bergen.
Fransz, H.G., 1976. The spring development of calanoid copepod populations in the Dutch coastal waters as related to primary production. Proc. 10th EMBS, Ostend, Belgium, 17~23 September, I975, 2 : 247-269.
Fransz, H.G., I986. Effects of freshwater inflow on the distribution, composition and production of plankton in the Dutch coastal waters of the North Sea. In: The role of freshwater outflow in coastal marine ecosystems, S. Skreslet (ed.), NATO ASI Series, Vol. G7.
Fransz, H.G. & W.G. van Arkel, I98O. Zooplankton activity during and after the phytoplankton spring bloom at the special reference to the calanoic copepod Calanus finmarchicus (Gunn.). "Meteor"Forsch. Ergebnisse A22: II3-I2I.
Fransz, H.G. & W.W.C. Gieskes, 1984. The unbalance of phytoplankton and copepods in the North Sea. Rapp. P.-v. Réun. Cons. int.Explor. Mer 183: 218-225.

90
Fransz, H.G. & J.H.G. Verhagen, 1985* Modelling research on theproduction cycle of phytoplankton in the Southern Bight of the North Sea in relation to riverborne nutrient loads. Neth. J. Sea Res. 19(3/4): 241-250.
Fransz, H.G., J.C. Miquel & S.R. Gonzalez, 1984. Mesozooplankton composition, biomass and vertical distribution and copepod production in the stratified central North Sea. Neth. J. Sea Res. 18(1/2): 82-96.
Frontier, S., 1986. Studying fronts as contact ecosystems. In: Marine interfaces ecohydrodynamics, J.C.J. Nihoul (ed.). Elsevier Oceanography Series 42.
FTNS, 1983" Flushing Times of the North Sea, Cooperative Research Report nr. 123, International Council for the Exploration of the Sea, Copenhagen.
Fukami, K., U. Simidu & N. Taga, 1985* Microbial decomposition ofphyto- and Zooplankton in seawater. I. Changes in organic matter. Mar. Ecol. Prog. Ser. 21(1/2): 1-5*
Furness, G. & M. Mork, 1983- Norwegian Trench Inflow-Outflow. In:FTNS, 1983. ICES, Cooperative Research Report no. 123, Copenhagen.
Gast, V, 1985- Bacteria as a food source for microzooplankton in the Schlei Fjord and Baltic Sea with special reference to ciliates. Mar. Ecol. Prog. Ser. 22: 107“120.
Gehrke, J., I916. über die Sauerstoffverhältnisse der Nordsee. Ann. d. Hydr. usw. 44 Jahrg., Heft IV: 177-193*
Gerlach, S.A. (ed.), 1984. Oxygen depletion I98O-I983 in coastal waters of the Federal Republic of Germany. First Report of the Working Group "Eutrophication of the North Sea and the Baltic". Berichte aus dem Institut für Meereskunde, Kiel, nr. I30.
Gerlach, S.A., I987. Nutrients - An overview. Int. Conf. onEnvironmental Protection of the North Sea, London, 24-27 March 1987. Session Two: Nutrients.
Gieskes, W.W.C., 1977* Primaire produktie en eutrofiëring in de zuidelijke Noordzee. Vakbl. Biol. 57(16): 267-27O.
Gieskes, W.W.C. & A.J. van Bennekom, 1973* Unreliability of the 1 C method for estimating primary production in eutrophic Dutch coastal waters. Limnol. Oceanogr. l8: 494-495*
Gieskes, W.W.C. & G.W. Kraay, 1975* The phytoplankton spring bloom inDutch coastal waters of the North Sea. Neth. J. Sea Res. 9(2):I66-I96.
Gieskes, W.W.C. & G.W. Kraay, 1977a* Primary production andconsumption of organic matter in the southern North Sea during thespring bloom of 1975* Neth. J. Sea Res. 11(2): 146-167.
Gieskes, W.W.C. & G.W. Kraay, 1977b. Continuous Plankton Records: Changes in the plankton of the North Sea and its eutrophic Southern Bight from 1948 to 1975* Neth. J. Sea Res. 11(3/4): 334- 364.
Gieskes, W.W.C. & G.W. Kraay, 1983* Dominance of Cryptophyceae during the phytoplankton spring bloom in the central North Sea detected by HPLC analysis of pigments. Mar. Biol. 75: 179“l85*
Gieskes, W.W.C. & G.W. Kraay, 1984a. State-of-the-art in the measurement of primary production. In: Flows of energy and materials in marine ecosystems, M.J.R. Fasham (ed.), Plenum Publ.

91
Corp.Gieskes, W.W.C. & G,W. Kraay, 1984b. Phytoplankton, its pigments, and
primary production at a central North Sea station in May, July and September I98I. Neth. J. Sea Res. 18(1/2): 51“70.
Gieskes, W.W.C. & G.W. Kraay, I986. Analysis of phytoplankton pigments by HPLC before, during and after mass occurrence of the microflagellate Corymbellus aureus during the spring bloom in the open northern North Sea in 1983* Mar. Biol. 92: 45-52.
Gillbricht, M., 1983- Eine "Red-tide" in der südlichen Nordsee und ihre Beziehungen zur Umwelt. Helg. wiss. Meeresunters. 36: 393“ 426.
Goedecke, E., I968. Uber die hydrographische Struktur der Deutschen Bucht im Hinblick auf die Verschmutzung in der Konvergenzzone. Helgol. wiss. Meeresunters. 17: 108-125.
Goering, J., 1972. The role of nitrogen in eutrophic processes. In: Water Pollution Microbiology, R. Mitchell (ed.), Wiley- Interscience, Wiley & Sons Inc.
Goldman, J.C. & D.A. Caron, 1985- Experimental studies on anomnivorous microflagellate: implications for grazing and nutrient regeneration in the marine microbial food chain. Deep Sea Res. 30(8): 899-915.
Graf, G., W. Bengtsson, A. Faubel, L.A. Meyer-Reil, R. Schulz, H. Theede, &. H. Thiel, 1984. The importance of the spring phytoplankton. Rapp. P.-v. Réun. Cons. int. Explor. Mer I83: I36-143.
Gray, J.S., I982. Effects of pollutants on marine ecosystems. Neth. J. Sea Res. 16:424-443.
Gray, & W. Paasche, 1984. On marine eutrophication. Mar. Poll. Bull. 15(10): 349-350.
Grogan, Wells C., 1984. Input of contaminants to the North Sea from the United Kingdom. Final Report. Institute of Offshore Engineering, Heriot-Watt University, Edinburg.
Hagebro, C., S. Bang & E. Somer, 1983- Nitrate load/dischargerelationships and nitrate load trends in Danish rivers. Proc. of the Hamburg Symp., Aug. 1983. IAHS Publ. no. l4l.
Hagmeier, E., 1978. Variations in phytoplankton near Helgoland. Rapp. P.-v. Réun. Cons. int. Explor. Mer 172: 361-363.
Hagström, A. & U. Larsson, 1984. Diel and seasonal variation in growth rates of pelagic bacteria. In: Heterotrophic activity in the sea, J.E. Hobbie & P.J.LeB. Willisms (eds.). Plenum Press.
Hagström, A., J.W. Ammermann, S. Henrichs & F. Azam, 1984: Bacterioplankton growth in seawater: II. Organic matter utilization during steady-state growth in seawater cultures. Mar. Ecol. Prog. Ser. 18: 41-48.
Heijst, G.J.F. van, I986. On the dynamics of a tidal mixing front. In: Marine interfaces ecohydrodynamics, J.C.J. Nihoul (ed.). Elsevier Oceanography Series 42: 165-194. Amsterdam.
Helder, W., 1974. The cycle of dissolved inorganic nitrogen compounds in the Dutch Wadden Sea. Neth. J. Sea Res. 8(2): 154-173«
Helder, W., 1978. De Waddenzee. Voedingsstoffen en algengroei. Natuur en Techniek 46(9)•

92
Helder, W., R.T.P. de Vries & M.M. Rutgers van der Loeff, I983. Behaviour of nitrogen nutrients and silica in the Ems-Dollard Estuary. Can. J. Fish. Aquat. Sei. 40, suppl. 1: 188-200.
Hertweck, G., 1983. Das Schlickgebiet in der inneren Deutschen Bucht. Aufnahme mit dem Sedimentechographen. Senckenb. marit. 15: 219- 249.
Hickel, W., 1984. Particulate nitrogen in the German Bight and itspotential oxygen demand. In: S.A. Gerlach (ed.): Oxygen depletion I98O-I983 in coastal waters of the F.R.G. Berichte aus dem Inst, für Meereskd., Kiel, nr. I30.
Hobbie, J.E. & P.J.LeB. Williams (eds.), 1984. Heterotrophic activity in the sea. NATO Conference series, IV, Marine Sciences, vol. 15, Plenum Press.
Holligan, P.M., R.P. Harris, R.C. Newell, D.S. Harbour, R.N. Head, E.A.S. Linley, M.T. Lucas, P.R.G. Tranter & C.M. Weekley, 1984a. Vertical distribution and partitioning of organic carbon in mixed, frontal and stratified waters of the English Channel. Mar. Ecol. Prog. Ser. 14: 111-127.
Holligan, P.M., P.J.LeB. Williams, D. Purdie & R.P. Harris, 1984b. Photosynthesis, respiration and nitrogen supply of plankton populations in stratified, frontal and tidally mixed shelf waters. Mar. Ecol. Progr. Ser. 17: 201-213.
Huntley, M., P. Sykes, S. Rohan & V. Marin, I986. Chemically-mediated rejection of dinoflagellate prey by the copepods Calanus pacificus and Paracalanus parvus : mechanism, occurrence and significance. Mar. Ecol. Prog. Ser. 28: 105-120.
Jenness, M.I. & G.C.A. Duineveld. 1985* Effects of tidal currents on the chlorofyll-a content of sandy sediments in the southern North Sea. Mar. Ecol. Prog. Ser. 21: 283-287 *
Johnson, P.W. & J.McN. Sieburth, 1979* Chroococcoid cyanobacteria in the sea: a ubiquitous and diverse phototrophic biomass. Limnol. Oceanogr. 24(5): 928-935*
Johnson, P.W. &. J.McN. Sieburth, I982. In situ morphology andoccurrence of eucaryotic phototrophs of bacterial size in the picoplankton of estuarine and oceanic waters. J. Phycol. 18: 318- 327*
Johnston, R. & P.G.W. Jones, 1965* Inorganic nutrients in the North Sea. Ser. Atlas mar. envir. 11. Am. Geogr. Soc.
Johnston, R., 1973* Nutrients and metals in the North Sea. In: E.D. Goldberg (ed.) North Sea Science. MIT Press, pp. 326-334.
Joiris, C., G. Billen, C. Lancelot, M.H. Daro, J.P. Mommaerts, A. Bertels, M. Bossicart, J. Nijs & J.H. Hecq, 1982. A budget of carbon cycling in the Belgian coastal zone: Relative roles of Zooplankton bacterioplankton and benthos in the utilization of primary production. Neth. J. Sea Res. 16: 260-275*
Jones, R., 1984. Some observations on energy transfer through theNorth Sea and Georges Bank food webs. Rapp. P.-v. Réun. Cons. int. Explor. Mer I83: 204-217.
Jong, A.L. de & N.T. de Oude, 1987* Detergents industry. Int. Conf. on environmental protection of the North Sea, London, 24-27 March 1987* Session Two: Nutrients.

93
Jonge, V.N. de & H. Postma, 1974. Phosphorus compounds in the Dutch Wadden Sea. Neth. J. Sea Res. 8(2-3): 139-153-
Jörgensen, H.M., 1987- Eutrophication - some Danish comments.Contribution to North Sea Minister's Conference, London, November 1987-
Kalle, K., 1937- NährstoffUntersuchungen als hydrographischesHilfsmittel zur Unterscheidung von Wasserkörpern. Annln Hydrogr. Beri. 65: 1-48.
Kat, M., 1984. Diarrhetic mussel poisoning. Measures and consequences in the Netherlands. ICES Special Meeting on exceptional blooms.C : 3 - *.
Klein, H., I986. On the diffusion of Rhodamine B on both sides of a river plume front. Dt. hydrogr. Z. 39-' 225-234.
Koeve, W. & S.A. Gerlach, 1984. River flow, nitrogen conditions and nitrogen loads of the Elbe 1978-1982. In: S.A. Gerlach (ed.): Oxygen depletion I98O-I983 in coastal waters of the F.R.G.Berichte aus dem Inst, für Meereskd., Kiel, nr. I30.
Kranck, K. & T. Milligan, I98O. Macroflocs: Production of marine snow in the laboratory. Mar. Ecol. Prog. Ser. 3: 19-24.
Krause, G., G. Budeus, D. Gerdes, K. Schaumann & K. Hesse, I986. Frontal systems in the German Bight and their physical and biological effects. In: Marine interfaces ecohydrodynamics, J.C.J. Nihoul (ed.). Elsevier Oceanography Series 42: 119-140, Amsterdam.
Laevastu, T., 1963- Serial Atlas of the marine environment, vol. 4.Am. Geogr. Soc., New York.
Lancelot, C., 1983* Factors affecting phytoplankton extraccelular release in the Southern Bight of the North Sea. Mar. Ecol. Prog. Ser., vol. 12: 115-121.
Lancelot, C. & G. Billen, 1984. Activity of heterotrophic bacteria and its coupling to primary production during the spring phytoplankton bloom in the Southern Bight of the North Sea. Limnol. Oceanogr. 29(4): 721-730.
Lancelot, C., G. Billen, A. Sournia, T. Weisse, F. Colijn, M.J.W. Veldhuis, A. Davies & P. Wassman, 1987- Phaeocystis blooms and nutrient enrichment in the continental coastal zones of the North Sea. Ambio 16(1): 38-46.
Landry, M.R., I98I. Switching between herbivory and carnivory by the planktonic marine copepod Calanus pacificus. Mar. Biol. 65(1): 77-82.
Lange, G.J. de & H. Hummel, 1978. Beschrijving van het abiotisch en biotisch milieu van het Nederlands Continentaal Plat. STUNET. Intern rapport NIOZ 1978-3-
Larsson, U. & A. Hagström, 1979- Phytoplankton exudate release as an energy source for the growth of pelagic bacteria. Mar. Biol.52(3): 199-206.
Larsson, U. & A.Hagström, 1982. Fractionated phytoplankton primary production, exudate release and bacterial production in a Baltic eutrophication gradient. Mar. Biol. 67(1): 57~70.
Larsson, U., R. Elmgren & F. Wulff, 1985- Eutrophication and the Baltic Sea: Causes and consequences. Ambio 14(1): 9~l4.

94
Lee, A.J., I98O. North Sea: Physical oceanography. In: The north west European shelf seas; Tlie sea bed and the sea in motion. II. rhys. Chem. Oceanogr. Phys. Resour. Elsevier Oceanogr. Ser. B24: 467" 492.
Lee, A.J. & A.R. Folkard, 1969* Factors affecting turbidity in the southern North Sea. J. Cons. perm. int. Explor. Mer 32(3): 291- 302.
Le Fevre, J. & J.R. Graii, 1977* On the relationships of Noctiluca swarming off the western coast of Brittany with hydrological features and plankton characteristics of the environment. J. exp. mar. Biol. Ecol. 4: 287-306.
Legendre, L., S. Demers & D. Lefaivre, I986. Biological production of marine ergoclines. In: Marine interfaces ecohydrodynamics, J.C.J. Nihoul (ed.), Elsevier oceanography Series 42.
Lidgate, H.J., 1987- Nutrients in the North Sea - A fertilizerindustry view. Int. Conf. on Envir. Protection of the North Sea,London, 24-27 March 1987- Session Two: Nutrients.
Lindahl, 0. & L. Hernroth, I982. The coastal waters of western Sweden - An ecosystem off balance? ICES Coop. Res. Rep. II8 : 118-128.
Linley, E.A.S., R.C. Newell, M.T. Lucas, 1983* Quantitativerelationships between phytoplankton, bacteria and heterotrophic microflagellates in shelf waters. Mar. Ecol. prog. Ser. 12: 77-89-
Martens, P., 1978. Contribution to the hydrographical structure of theeastern German Bight. Helgol. wiss. Meeresunters. 31: 414-424.
Mastenbroek, P., 1964. Mortaliteit onder wad-evertebraten na Pinksteren 1964. Het Zeepaard 24: 71-72.
McCave, J.N., 1973- Mud in the North Sea. In: E.D. Goldberg (ed.): North Sea Science, MIT Press, pp. 75-100•
Meyer-Reil, L.-A., 1984. Bacterial biomass and heterotrophic activity in sediments. In: J.E. Hobbie & P.J.LeB. Williams (eds.) Heterotrophic activity in the sea. Plenum Press.
Milj0styrelsen, 1984. Htsvind og fisked0d i I98I. Omfang og ârsager. Milj0styrelsen K0benhavn, 1-247-
National Swedish Environment Protection Board, 1984. Eutrophication in the marine environment - a research programme. National Swedish Env. Prot. Board, Stockholm (mimeo), pp. 1-100.
Nehring, D., S. Schulz & W. Kaiser, 1984. Long-term phosphate and nitrate trends in the Baltic Proper and some biological consequences: A contribution to the discussion concerning the eutrophication of these waters. Rapp. P.-v. Réun. Cons. int. Explor. Mer 183: 193-203.
Newell, R.C. & E.A.S. Linley, 1984. Significance of microheterotrophs in the decomposition of phytoplankton: Estimates of carbon and nitrogen flow based on the biomass of plankton communities. Mar. Ecol. Prog. Ser. 16: 105-119-
Nijboer, L.F., I986. Uit- en afspoeling van fosfor en stikstofafkomstig van bemesting in de landbouw. ICW-nota 1742. Inst. voor Cultuurtechniek en Waterhuishouding, Wageningen.
Norton, R.L., 1982. Assessment of pollution loads to the North Sea. Technical Report TR 182. WRC Environmental Protection, Medmenham laboratory, Medmenham (Bucks.), UK.

95
OECD, 1987. Environmental data compendium I987. OECD, Paris.Officer, C.B. & J.M. Ryther, I98O. The possible importance of silicon
in marine eutrophication. Mar. Ecol. Prog. Ser 3: 83—91•Officer, C.B., T.J. Smayda & R. Mann, 1982. Benthic Filter Feeding: a
natural eutrophication control. Mar. Ecol. Prog. Ser. 9: 203-210.Olsthoorn, C.S.M., I985. Fosfor in Nederland 1970-1983* Centraal
Bureau voor de Statistiek, afd. natuurlijk milieu.Staatuitgeverij, 's-Gravenhage.
Olsthoorn, C.S.M., I986. Fosforbalans voor Nederland, 1983* Kwartaalberichten milieu (CBS), 86/2 Staatsuitgeverij,'s-Gravenhage.
Otto, L., 1983a. Currents and water balance in the North Sea. In:Sündermann/Lenz (eds): North Sea Dynamics. Springer-Verlag Berlin Heidelberg, 26-43-
Otto, L., 1983b. Box 4. In: FTNS, 1983* ICES, Cooperative Research Report nr. 123, Copenhagen.
Pagee, J.A. van & L. Postma, 1987* North Sea pollution: the use of modelling techniques for impact assessment of waste inputs. In: Reasons for concern. Proceedings of the 2nd North Sea Seminar '86, Rotterdam, I-3 October I986. Published by Werkgroep Noordzee, Amsterdam.
Parsons, T.R., M. Takahashi & B. Hargrave, 1984. Biological Oceanographic Processes. 3rd edition, Pergamon Press.
Peterson, B.J., I98O. Aquatic primary productivity problem. Ann. Rev. Ecol. Syst. 11: 359"385.
Peterson, B.J., 1984. Synthesis of carbon stocks and flows in the open ocean mixed layer. In: Hobbie, J.E. & P.J.LeB. Williams: Heterotrophic activity in the sea. Plenum Press.
Pierson, W.E. & T.Y. Chang, I986. Acid rain in western Europe and Northeastern United States - a technical appraisal. In: CRC Critical Reviews in Environ. Control 16(2): I67-I9 2.
Pingree, R.D., P.R. Pugh, P.M. Holligan & G.R. Foster, 1975* Summer phytoplankton blooms and red tides along tidal fronts in the approaches to the English Channel. Nature 258: 672-677.
Pingree, R.D., P.M. Holligan & G.T. Mardell, 1978. The effects ofvertical stability on phytoplankton distributions in the summer on the northwest European Shelf. Deep Sea Res. 25: 1011-1028.
Postma, H., 1973* Transport and budget of organic matter in the North Sea. In: E.D. Goldberg. North Sea Science, MIT Press: 326-334.
Postma, H., 1976. Samenstelling van het water in de Waddenzee. In: Waddenzee, natuurgebied van Nederland, Duitsland en Denemarken. Land. Ver. tot Behoud van de Waddenzee en Vr. tot Behoud Natuurmonumenten in Nederland.
Postma, H., 1978. The nutrient contents of North Sea water: changes in recent years, particularly in the Southern Bight.— Rapp. P.-v. Réunion Cons. perm. int. Explor. Mer 172: 350-357*
Postma, H., I98I. Exchange of materials between the North Sea and the Waddensea. Mar. Geol. 40: 199“215*
Postma, H. (ed.), I982. Hydrography of the Wadden Sea: Movements and properties of water and particulate matter.- Final report on "hydrography" of the Wadden Sea Working Group. Stichting Veth tot steun aan Waddenonderzoek, Leiden.

96
Postma, H., 1984. Introduction to the Symposium on Organic Matter in the Wadden Sea. Neth. Inst, for Sea Res.-Publ. series 10: 15-22.
Postma, H. & A.J. van Bennekom, 1974. Budget aspects of biologically important chemical compounds in the Dutch Wadden Sea. Neth. J.Sea Res. 8(2/3): 312-318.
Postma, H. & J.W. Rommets, 1984. Variations of particulate organiccarbon in the central North Sea. Neth. J. Sea Res. 18(1/2): 31-50.
Postma, H., et al., 1984. Nutrient cycling in estuarine and coastal marine ecosystems. In: M.J.R. Fastham (ed): Flows of energy and materials in marine ecosystems. Plenum Publ. Corp.
Postma, L., I98I. Waterkwaliteitsmodel Rijn. Diffuse bronnen; aard en omvang van de diffuse belasting met nutriënten in het stroomgebied van de Rijn. Rapport nr. S 321-V/R IO56-V. Waterloopkundig Laboratorium, Delft.
Prandle, D., 1978. Monthly-mean residual flows through the Dover Strait, 1949-1972. J. mar. biol. Ass. UK 58: 965~973-
Prandle, D., 1984. Monthly-mean residual flows through the Dover Strait, I949-I98O. J, mar. Biol. Ass. UK 64: 722-724.
QSR, 1986. Quality status report of the North Sea. Carlson H. (ed.). Deutsche Hydrographische Zeitschrift, Ergänzungsheft Reihe B. nr. 16; Hamburg.
QSR, 1987. Quality status report of the North Sea -secondinternational conference on the protection of the North Sea.
Rachor, E., I98O. The inner German Bight - an ecologically sensitive area as indicated by the bottom fauna. Helgol. Meeresunters. 33: 522-530.
Rachor, E., 1985. Eutrophierung in der Nordsee: Bedrohung durch Sauerstoffmangel. Abh. Naturw. Verein Bremen 40/3: 283-292.
Rachor, E. & M. Albrecht, 1983* Sauerstoff-mangel im Bodenwasser der Deutschen Bucht. Veröff. Inst, Meeresforsch. Bremerh. 19: 209-227-
Radach, G., 1984. Variations in the plankton in relation to climate. Rapp. P.-v. Réun. Cons. int. Explor. Mer I85: 234-254.
Radach, G. & J. Berg, 1984. Trends in concentrations of plantnutrients at Helgoland Reede 1962-I98I. In: S.A. Gerlach (ed.): Oxygen depletion I98O-I983 in coastal waters of the FRG. Berichte aus dem Inst, für Meereskd., Kiel I30.
Radach, G. & J. Berg, I986. Trends in den konzentrationen der nährstoffe und des phytoplantons in der Helgoländer Bucht (Helgoland Reede Daten). Ber. Biol. Anst. Helgoland 2: I-63.
Ramster, J.W. I965. Studies with the woodhead seabed drifter in the southern North Sea. Fish. Lab. Lowestoft Lab leaflet (NS) 6.
Redfielu, A.C., 1934. On the proportions of organic derivatives in sea water and their relation to the composition of plankton. James Johnstone memorial volume (Liverpool) pp I76.
Redfield, A.C., B.H. Ketchum & F.A. Richards, 1963* The influence of organisms on the composiiton of sea water. In: Hill, M.N. (ed.): The sea vol. II John Wiley, New York.
Reid, P.C., 1977* Large scale changes in North Sea phytoplankton. Nature 257: 217-219.
R.eid, P.C., 1977- Continuous plankton records: changes in thecomposition and abundance of the phytoplankton of the Northeastern Atlantic Ocean and North Sea, 1958-1974. Mar. Biol. 40:

97
337-339.Reineck, H.E., W.F. Gutmann & G. Hertweck, 1967* Das Schlickgebiet
südlich Helgoland als Beispiel rezenter Schelfablagerungen. Senckenb. Leth. 48: 219-275*
Reise, K., I982. Long-term changes in the macrobenthic invertebrate fauna of the Wadden Sea: Polychaetes about to take over? Neth. J. Sea Res. l6 : 29-36.
Rheinheimer, G., 1984. The role of small heterotrophs (bacteria and protozoa) in a shelf ecosystem. Rapp. P.-v. Réun. cons. int. Explor. Mer. I83: 144-151.
Richards, F.A., 1984. Nutrient interactions and microbes. In: J.E. Hobbie & P.J.LeB. Williams (eds.): Heterotrophic activity in the sea. Plenum press.
Rijkswaterstaat, I98O. Project Group WAKWON. Monitoring water quality North Sea. Series I: time series summer 1975-winter 1978/79* Rijswijk.
Ringelberg, J., I98O. Eutrophication: Introduction to the process and some ecological implications. Hydrobiol Bull. 14 (1/2): 30-35*
RIZA, 1983* De waterkwaliteit van de Noordzee 1975“1982: resultaten van het routinematig onderzoek. Nota nr. 83*084.
Rönner, U., 1985* Nitrogen transformations in the Baltic Proper:Denitrification counteracts eutrophication. Ambio 14(3)t 13^-138.
Rosenberg, R., 1983* Gödning av havsomrâder kring Sverige, inKunskapsoversikt (Eutrophication in marine waters surrounding Sweden. A review) - Report to SNV (Mimeogr. In Swedish, English summary).
Rosenberg, R., 1985* Eutrophication - the future marine coastal nuisance? Mar. Poll. Bull. 16(6): 227-231.
Russell, F.S., A.J. Southward, G.T. Boulch & E.T. Butter, 1971*Changes in biological conditions in the English Channel off Plymouth during the last half century. Nature 234: 468-470.
Rutgers van der Loeff, M.M., 1980a. Time variation in interstitial nutrient concentrations in an exposed subtidal station in the Dutch Wadden Sea. Neth. J. Sea Res. 14(2): 123-143.
Rutgers van der Loeff, M.M., 1980b. Nutrients in the interstitalwaters of the Southern Bight of the North Sea. Neth. J. Sea Res.14(2): 144-171*
Rutgers van der Loeff, M.M., 1981a. Wave effects on sediment water exchange in a submerged sandbed. Neth. J. Sea Res. 15: 100-112.
Rutgers van der Loeff, M.M., 1981b. Sediment water exchanges ofnutrients and oxygen on tidal flats in the Ems-Dollard estuary. Neth. J. Sea Res. 15(1): 113-129.
Rutgers van der Loeff, M.M., 1981c. Regeneration of nutrients in Dutch coastal sediments. Inleiding bij proefschrift. Brill, Leiden.
Ryther, J.H. & W.M. Dunstan, 1970. Nitrogen phosphorus andeutrophication in the coastal marine environment. Science I7I:IOO8-IOI3.
Seitzinger, S.P. & S.W. Nixon, I985. Eutrophication and the rate of denitrification and N 0 production in coastal marine sediments. Limnol. Oceanogr. 3 0 ( è ) : 1332-1339.

98
Sharp, J.H., 1984. Inputs into microbial food chains. In: J.E. Hobbie & P.J.LeB. Williams (eds.): Heterotrophic activity in the sea. Plenum Press.
Sieburth, J.McN., 1984. Protozoan bacterivory in pelagic marine water. In: J.E. Hobbie & P.J.LeB. Williams (eds.): Heterotrophic activity in the sea. Plenum Press.
Simpson, J.H., I98I. The shelf-sea fronts: implications of theirexistence and behaviour. Phil. Trans. R. Soc. Lond. A302: 531-54l.
Smetacek, V. , B. von Bodungen, B. Knoppers, R. Peinert, F. Polleline,P. Stegman & B. Zeitzschel, 1984. Seasonal stages characterizing the annual cycle of an inshore pelagic system. Rapp. P.-v. Réun. Cons. int. Explor. mer 183: 126-135*
Somer, E., 1987* Control options for nutrients. In: Intern. Conf. on Environment protection of the North Sea. Paper 13: 1-21.
Steele, J.H., 1974. The structure of marine ecosystems. Harvard Univ.Press, Cambridge, Mass., 128 pp.
Steeman Nielsen, E., 1952. The use of radioactive carbon ( C) for measuring organic production in the sea. J. Cons. perm. int. Explor. Mer 18: 117_l40.
Steenvoorden, J.H.A.M. & M.J. de Heus, 1984. Fosfaatbalansstudies en de bijdrage van diffuse bronne. ICW-rapport 8. Inst, voor Cultuurtechniek en Waterhuishouding, Wageningen.
Sterteider, P.B.M., S.H. Hosper & M. Knoester, I98I.Eutrofiëringsonderzoek Rijkswaterstaat. RIZA, DDMI.
Stowe, K., 1983* Ocean Science (second ed.). John Wiley & Sons, Inc. 673 PP*
Stride, A.H., 1973* Sediment transport by the North Sea. In: E.D.Goldberg (ed.): North Sea Science. MIT Press, pp. 101-
Stumm, W., 1972. The role of phosphorus in eutrophication. In: R.Mitchell (ed.): Water Pollution microbiology, Wiley-Interscience, Wiley & Sons Inc.
Swanson, R.L. & C.J. Sindermann (eds.), 1979* Oxygen depletion and associated benthic mortalities in New York bight, 1976. NOAA Professional Paper 11, 345 PP*
Tangen, K., 1977* Blooms of Gyrodinium aureolum (Dinophyceae) in North European waters, accompanied by mortality in marine organisms. Sarsia 63: I23-I33.
Tett, P., I98I. Modelling phytoplankton production at shelf seafronts. Philosophical Transactions of the Royal Society of London,A302, 6O5-6I5.
Tett, P., 1984. The ecophysiology of exceptional blooms. ICES (Special meeting on the causes, dynamics and effects of esceptional marine blooms and related events), BÍ, 18 pp.
Tett, P., & A. Edwards, 1984. Mixing and plankton: aninterdisciplinary theme in oceanography. Oceanography and marine biology, an annual review 22: 99~123*
Thurberg & Goodlet, 1979* Impact on clams and scallops: Part 2. Low dissolved oxygen concentrations and surf clams - A laboratory study. In: R.L. Swanson & C.J. Sindermann (eds.): Oxygen depletion and associated benthic mortalities in New York Bight, 1976, pp. 277-280. NOAA Professional Paper 11.

99
Tijssen, S.B., I968. Hydrographic and chemical observations in the Southern Bight, August and November 1967- Ann. Biol. vol. xxiv (1967), Part 1: Hydrography.
Tijssen, S.B., 1979- Diurnal oxygen rhythm and primary production in the mixed layer of the Atlantic Ocean at 20 N. Neth. J. Sea Res. 13:79-84.
Tijssen, S.B., I98I. Anmerkungen zur PhotometrischeWinkler/Sauerstofftitration und ihre Anweundung zur Schatzung der Primärproduktion im Meer. Int. hydromikrobiol. Symp., Smolenice (CSSR): 343-353.
Tijssen, S.B. & A.J. van Bennekom, 1976. Lage zuurstofgehaltes in het water op het Balgzand. H 0 9 ( 2 ) : 28-31.
Tijssen, S.B. & A. Eygenraam, I982. Primary and community production in the Southern Bight of the North Sea deduced from oxygenconcentration variations in the spring of I98O. Neth. J. Sea Res.16: 247-259.
Tijssen, S.B. & F.J. Wetsteijn, 1984. Hydrographic observations near a subsurface drifter in the Oyster Ground, North Sea. Neth. J. Sea Res. 18(1/2): 1-12.
Tijssen, S.B., A.J. van Bennekom & W. Helder, 1974. Contribution of in situ production to the budget of dissolved inorganic nutrients (P, N and Si) in the eastern part of the Southern Bight of the NorthSea. ICES C.M. 1974/C26: I-5.
Veenstra, H., 1976. Getijdenlandschap: structuur en dynamiek. In: J. Abrahamse, W. Joenje & N. van Leeuwen-Seelt (eds.), Waddenzee, Natuurgebied van Nederland, Duitsland en Denemarken. Land. Ver. tot Behoud van de Waddenzee, Harlingen; Ver. tot Behoud van Natuurmonumenten in Nederland, 's-Graveland.
Veldhuis, M.J.W., F. Colijn & L.A.H. Venekamp, 1986a. The spring bloom of Phaeocystis pouchetii (Haptophyceae): Observations in Dutch coastal waters of the North Sea. Neth. J. Sea Res. 20(1): 49-60.
Veldhuis, M.J.W., F. Colijn & L.A.H. Venekamp, 1986b. The spring bloom of Phaeocystis pouchetii (Haptophyceae) in Dutch coastal waters. Neth. J. Sea Res. 20(1): 37-48.
Veldhuis, M.J.W., L.A.H. Venekamp & T. Ietswaart, 1987- Availability of phosphorus sources for blooms of Phaeocystis pouchetii (Haptophyceae) in the North Sea: Impact of the river Rhine. Neth. J. Sea Res. 21(3): 219-229.
Vries, I. de, W. van Raaphorst & N. Dankers (in press). Extra voedingsstoffen in zee: Gevolgen, voordelen, nadelen. Waterloopkundig Laboratorium, Delft.
Wangersky, P.J., 1984. Organic particles and bacteria in the ocean.In: J.E. Hobbie & P.J.LeB. Williams (eds.): Heterotrophic activity in the sea. Plenum Press.
Waterbury, J.B., S.W. Watson, R.R.L. Guillard & L.E. Brand, 1979. Widespread occurrence of a unicellular, marine, planktonic, Cyanobacterium. Nature 277: 293“294.
Waterkwaliteitsplan Noordzee, 1985a. Verslag van Onderzoek, deel 2: De ecologie van de Noordzee, b: analyse. Rapport R2000-2b, Rijkswaterstaat & Waterloopkundig Lab.

100
Waterkwaliteitsplan Noordzee, 1985b. Harmonisatie Noordzeebeleid.Waterkwaliteitsplan Noordzee, Achtergronddocument 3: activiteiten en bronnen van verontreiniging. Rijkswaterstaat & Waterloopkundig Lab.
Weering, Tj.C.E. van, I98I. Recent sediments and sediment transport in the northern North Sea: Surface sediments of the Skagerrak. Spec. Publ. int. Ass. Sedimentol. 3 ' 335“359-
Weichart, G., I986. Nutrients in the German Bight, a trend analysis. Dt. hydrogr. Z. 39. 197“206.
Werf, B. van der & G. Nieuwland, 1984. Bacterial biomass andrespiratory electron transport system activity in the Oyster Ground area (North Sea) in I98I. Neth. J. Sea Res. 18 (1/2): 71- 81.
Westernhagen, J. v. & V. Dethlefsen, I983. North Sea oxygen deficiency 1982 and its effects on the bottom fauna. Report Ambio vol. 12, no. 5. 264-266.
Wetzel, R.G., 1983- Limnology (2nd edition). Saunders College Publishing, Philadelphia.
White, A.W., 1982. Toxic dinoflagellate blooms in the Bay of Fundy since 1944. ICES C.M. 1982/L:13, I3 pp.
Wilde, P.A.W.J. de, E.M. Berghuis & A. Kok, 1984. Structure and energy demand of the benthic community of the Oyster Ground, Central North Sea. Neth. J. Sea Res. 18(1/2): 143-159-
Wilde, P.A.W.J. de, E.M. Berghuis & A. Kok, I986. Biomass and activity of benthic fauna on the Fladen Ground (northern North Sea). Neth. J. Sea Res. 20(2/3): 313~323-
Williams, P.J.LeB., 1970. heterotrophic utilization of dissolvedorganic compounds in the sea. Size distribution of population and relationship between respiration and incorporation of growth substrates. J. mar. biol. Ass. U.K. 5O: 859-87O.
Williams, P.J.LeB., I98I. Incorporation microheterotrophic processes into the classical paradigm of the planktonic food web. Kieler Meeresforsch. Sonderh. 5. P- 1-28.
Wiliams, P.J.LeB. & R.W. Gray, 1970. Heterotrophic utilization of dissolved organic compounds in the sea. Observations on the responses of heterotrophic marine populations to abrupt increases in amino acid concentration. J. mar. biol. Ass. U.K. 5O: 87I-88I.
Wright, R.F., 1984. Dynamics of pools of dissolved organic carbon. In: J.E. Hobbie & P.J.LeB. Williams (eds.): Heterotrophic activity in the sea. Plenum Press.
Zevenboom, W., H.R. Bos & R.J. de Vreugd, 1987- Spatial distribution of nutrients in the North Sea, and their natural background and reference values. Nota nr. NZ-N-87_30t Rijkswaterstaat, Directie Noordzee, Rijswijk.
Zimmerman, J.T.F. 1978. De Waddenzee. Getijden en getijstromen. Natuur en Techniek 46(4): 234-249-

NIOZ - RAPPORT 1988 - 4
CONTENTSPreface ................................................................................................................................................................. 1Acknowledgement .............................................................................................................................................. 1
I. Introduction ..................................................................................................................................................... 2
II Relevant aspects of hydrography and sedimentation .................................................................................... 311.1 Water masses and geographic boxes .................................................................................................. 311.2 Currents .................................................................................................................................................. 511.3 Stratification and vertical mixing .......................................................................................................... 1211.4 Hydrography of the German B ig h t........................................................................................................ 1711.5 Suspension and sedimentation of fine m a tte r..................................................................................... 13
III The fates of a few macronutrients ............................................................................................................ 25111.1 Introduction ............................................................................................................................................ 25111.2 A bird’s eye view on concentrations in the North S e a ...................................................................... 27111.3 A closer look at the Continental Coastal A re a s .................................................................................. 31
IV Biological phenomena as expressions of eutrophication ....................................................................... 50IV.1 Primary production................................................................................................................................. 51IV.2 Changes of floral and faunal b iom ass................................................................................................ 55IV.3 Some effects on community com position........................................................................................... 62IV.4 Exceptional phytoplankton blooms ...................................................................................................... 65IV.5 Oxygen deficiency ................................................................................................................................. 67
V Season-dependent susceptibility of the foodweb for eutrophication ......................................................... 72V.1 Stage 1: early spring ............................................................................................................................ 72V.2 Stage II: late spring .............................................................................................................................. 73V.3 Stage III: sum m er.................................................................................................................................. 75V.4 Stage IV: autumn .................................................................................................................................. 76
VI Conclusions ................................................................................................................................................... 77
Annex. The relative importance of man-made nutrient contributions ..................................................... 80
References .................................................................................................................................................... 85
Copyright © 2022 FDOKUMEN