Ecosystem assessment of the North-Central Adriatic Sea: towards a multivariate reference framework
18
MARINE ECOLOGY PROGRESS SERIES Mar Ecol Prog Ser Vol. 417: 193–210, 2010 doi: 10.3354/meps08800 Published November 4 INTRODUCTION The Northern and Central Adriatic Sea constitutes the widest continental shelf in the Mediterranean Sea (Pinardi et al. 2006), and presents a high diversity of environmental conditions and a high biodiversity (Ott 1992). It is also a valuable fishing area within Europe (Bombace 1992). Changes of pelagic and benthic ma- rine communities have been described in the Adriatic Sea (e.g. Juki ´ c-Peladi ´ c et al. 2001, Vrgo´ c et al. 2004). These changes are, at least in part, related to fishing (e.g. Pranovi et al. 2001, Bombace & Grati 2007), envi- ronmental factors (e.g. Marasovi´ c et al. 1995, Dul<i´ c et al. 1999, Santojanni et al. 2006a, Grbec et al. 2008), and other anthropogenic impacts such as eutrophication (e.g. Barmawidjaja et al. 1995, Sangiorgi & Donders 2004). An ecosystem model representing the North- Central (NC) Adriatic Sea during the 1990s showed © Inter-Research 2010 · www.int-res.com *Email: [email protected], [email protected] Ecosystem assessment of the North-Central Adriatic Sea: towards a multivariate reference framework Marta Coll 1, 2, * Alberto Santojanni 3, 4 , Isabel Palomera 1 , Enrico Arneri 3, 4 1 Institut de Ciències del Mar (ICM-CSIC), Passeig Marítim de la Barceloneta 37–49, 08003 Barcelona, Spain 2 Department of Biology, Faculty of Science, Dalhousie University, 1355 Oxford Street, Halifax NS B3H4J1, Canada 3 Istituto di Scienze Marine (CNR), Sede di Ancona, Largo Fiera della pesca 2, 60125 Ancona, Italy 4 Present address: FAO AdriaMed and MedSudMed projects, Viale delle Terme di Caracalla, 00153 Rome, Italy ABSTRACT: We analyzed data from catch statistics, scientific surveys and results from ecosystem models to assess main changes in marine resources of the North-Central Adriatic Sea (Central Mediterranean) from the mid 1970s to the early 2000s. We then quantified food-web changes using these datasets and trophodynamic indicators. We applied time series trends and a Principal Compo- nent Analysis (PCA) to reduce the number of multivariate dimensions and to define ecosystem refer- ence directions. To assess the correlation between ecological indicators and abiotic (human or environ- mental) factors, we used the non-parametric BIO-ENV procedure. Results illustrated a general decrease in the biomass and catch of target species with time, with a first phase of increasing catch and biomass of some organisms from the 1970s to the 1980s, a ‘fishing down the food web’ process during the 1980s, and a clear trend towards biomass and catch reductions during the late 1990s and early 2000s. These changes occurred in parallel with an increase in fishing effort and human development in the basin and changes in environmental factors such as an increase in the average annual sea water temperature, a decrease in the inflow of highly saline Mediterranean water into the Adriatic Sea, and changes in the atmospheric pressure at sea level. We found a high and significant correlation between ecological indicators and abiotic factors (in particular with human factors: fishing effort and the human development index). Results from the PCA summarized main ecosystem trends and could be used as a reference framework. These results complement traditional single-species fisheries assessments and inform on past trajectories and present ecological status of the North-Central Adriatic Sea. KEY WORDS: Food-web model · Catch statistics · Biomass surveys · Trophodynamic indicators · Fishing impact · Environmental factors · Ecosystem-reference directions · Adriatic Sea · Mediterranean Resale or republication not permitted without written consent of the publisher
-
Upload
independent -
Category
Documents
-
view
4 -
download
0
Transcript of Ecosystem assessment of the North-Central Adriatic Sea: towards a multivariate reference framework

MARINE ECOLOGY PROGRESS SERIESMar Ecol Prog Ser
Vol. 417: 193–210, 2010doi: 10.3354/meps08800
Published November 4
INTRODUCTION
The Northern and Central Adriatic Sea constitutesthe widest continental shelf in the Mediterranean Sea(Pinardi et al. 2006), and presents a high diversity ofenvironmental conditions and a high biodiversity (Ott1992). It is also a valuable fishing area within Europe(Bombace 1992). Changes of pelagic and benthic ma-rine communities have been described in the Adriatic
Sea (e.g. Jukic-Peladic et al. 2001, Vrgoc et al. 2004).These changes are, at least in part, related to fishing(e.g. Pranovi et al. 2001, Bombace & Grati 2007), envi-ronmental factors (e.g. Marasovic et al. 1995, Dul<ic etal. 1999, Santojanni et al. 2006a, Grbec et al. 2008), andother anthropogenic impacts such as eutrophication(e.g. Barmawidjaja et al. 1995, Sangiorgi & Donders2004). An ecosystem model representing the North-Central (NC) Adriatic Sea during the 1990s showed
© Inter-Research 2010 · www.int-res.com*Email: [email protected], [email protected]
Ecosystem assessment of the North-Central Adriatic Sea: towards a multivariate
reference framework
Marta Coll1, 2,* Alberto Santojanni3, 4, Isabel Palomera1, Enrico Arneri3, 4
1Institut de Ciències del Mar (ICM-CSIC), Passeig Marítim de la Barceloneta 37–49, 08003 Barcelona, Spain2Department of Biology, Faculty of Science, Dalhousie University, 1355 Oxford Street, Halifax NS B3H4J1, Canada
3Istituto di Scienze Marine (CNR), Sede di Ancona, Largo Fiera della pesca 2, 60125 Ancona, Italy
4Present address: FAO AdriaMed and MedSudMed projects, Viale delle Terme di Caracalla, 00153 Rome, Italy
ABSTRACT: We analyzed data from catch statistics, scientific surveys and results from ecosystemmodels to assess main changes in marine resources of the North-Central Adriatic Sea (CentralMediterranean) from the mid 1970s to the early 2000s. We then quantified food-web changes usingthese datasets and trophodynamic indicators. We applied time series trends and a Principal Compo-nent Analysis (PCA) to reduce the number of multivariate dimensions and to define ecosystem refer-ence directions. To assess the correlation between ecological indicators and abiotic (human or environ-mental) factors, we used the non-parametric BIO-ENV procedure. Results illustrated a generaldecrease in the biomass and catch of target species with time, with a first phase of increasing catch andbiomass of some organisms from the 1970s to the 1980s, a ‘fishing down the food web’ process duringthe 1980s, and a clear trend towards biomass and catch reductions during the late 1990s and early2000s. These changes occurred in parallel with an increase in fishing effort and human developmentin the basin and changes in environmental factors such as an increase in the average annual sea watertemperature, a decrease in the inflow of highly saline Mediterranean water into the Adriatic Sea, andchanges in the atmospheric pressure at sea level. We found a high and significant correlation betweenecological indicators and abiotic factors (in particular with human factors: fishing effort and the humandevelopment index). Results from the PCA summarized main ecosystem trends and could be used as areference framework. These results complement traditional single-species fisheries assessments andinform on past trajectories and present ecological status of the North-Central Adriatic Sea.
KEY WORDS: Food-web model · Catch statistics · Biomass surveys · Trophodynamic indicators · Fishing impact · Environmental factors · Ecosystem-reference directions · Adriatic Sea · Mediterranean
Resale or republication not permitted without written consent of the publisher

Mar Ecol Prog Ser 417: 193–210, 2010
high fishing impacts on the ecosystem (Coll et al.2007). The fitting of this model to data was used tohindcast changes of the ecosystem from 1975 to 2002(Coll et al. 2009b).
Changes in marine resources due to natural oranthropogenic factors can be perceived at the food-web level, and have the potential to affect the structureand function of marine ecosystems with consequencesfor the management of natural resources. Therefore,there is an increasing need for ecosystem-based stud-ies to inform marine resources management. In thepresent study, we combined available data from theNC Adriatic Sea to describe the main changes of thisMediterranean ecosystem from the mid-1970s to theearly 2000s. Our goals were (1) to summarize majorpatterns of species abundance using complementarydata sources and describe food-web structure andfunctioning changes using trophodynamic indicators,(2) to assess ecosystem change patterns defining amultivariate framework, and (3) to explore the evolu-tion of these changes in relation to additional abioticindicators (such as fishing effort, human development,and environmental factors).
This study presents novel results that complementprevious work (Coll et al. 2007, 2009b) with the analy-sis and integration of temporal changes of the NCAdriatic Sea food web using complementary datasources. The availability of different data sets and theexistence of ecological models provide an ideal oppor-tunity to explore ecological patterns and chances inthis Mediterranean Sea ecosystem, while accountingfor differences in the data quality and datafeatures. This work constitutes an importanteffort in terms of recent historical data col-lection from the 1970s for the Adriatic Sea.The reconstruction of historical food-webchanges in the long-exploited and biologi-cally rich Mediterranean ecosystems, whiletrying to determine the role played byecosystem drivers and key species, presentsthe opportunity to determine responses ofMediterranean marine ecosystems to hu-man impacts and climatic change.
MATERIALS AND METHODS
Area of study. The Northern and CentralAdriatic Sea study area (Fig. 1; south limit ofVieste harbour) constitutes a wide continen-tal shelf. The substrate is characterized bymuddy to sandy bottoms. Owing to riverrunoff and oceanographic conditions, theregion exhibits a decreasing trend of nutri-ent concentration and production from
north to south and from west to east (Fonda Umani1996). Numerous studies describe the distribution andabundance of marine fauna and flora of the AdriaticSea (e.g. Riedl 1983, 5upanovic & Jardas 1989, Jukic-Peladic et al. 2001). It is an important area for thereproduction of small pelagic fish (Agostini & Bakun2002, Morello & Arneri 2009) and a strategic region formarine vertebrate conservation (e.g. Zotier et al. 1999,Bearzi et al. 2004).
Datasets. Catch statistics: Landing statistics from1975 to 2000 were obtained from official Italian sources(Istituto Nazionale Italiano di Statistica [ISTAT] andIstituto Ricerche Economiche per la Pesca e l’Acqua-coltura [IREPA]). This dataset was corrected by incor-porating discard information (Wieczorek et al. 1999,Cingolani et al. 2000, Cooper et al. 2000, Affronte &Scaravelli 2001, Santojanni et al. 2005) and estimatesof illegal, unregulated or unreported landings (Mattei& Pellizzato 1996, Santojanni et al. 2001, 2005, Cin-golani et al. 2002a,b, E. Arneri et al. unpubl. data). Theestimates were also corrected using independent catchdata collected from the Istituto di Scienze Marine-Sededi Ancona (ISMAR-CNR) to consider anchovy andsardine catches from 1975 to 2005 from the easternAdriatic coast (Slovenia and Croatia) (Santojanni et al.2005, 2006a,b). Aquaculture and catches from arti-sanal fisheries in the immediate coastal area werealso excluded from the analysis. Demersal catch datafrom 2001 to 2005 were not included due to the dif-ferent taxonomic resolution compared to the previousavailable data.
194
Fig. 1. Northern and Central Adriatic Sea. Study area: light grey

Coll et al.: Ecosystem assessment of the Adriatic Sea
Abundance and biomass time seriesdata: Independent data on benthicdiversity and biomass estimates wereobtained from scientific trawl surveysconducted from 1982 to 2005 (GRUNDsurveys). These data were collectedfrom the Adriatic basin covering theItalian territorial and internationalwaters of the Adriatic Sea from 0 to200 m depth and were conducted in theautumn using the Italian commercialfishing net (Vrgoc et al. 2004). Speciesreported included demersal and pe-lagic fish, crustaceans and molluscs(Table A1). Estimates of total biomassfor anchovies and sardines from 1975 to2005 were included in the analysis ofspecies trends as well. These data were calculated bythe ISMAR-CNR using a virtual population analysistuned with echo-survey data (Santojanni et al. 2005,2006a,b).
Modelling outputs: The mass-balance model des-cribing an annual average situation for the NC AdriaticSea during the mid-1990s (Coll et al. 2007) was adap-ted to represent the ecosystem in 1975 and was fittedto the available time series of data for 1975 to 2002(Coll et al. 2009b). The trophic modelling tool Ecopathwith Ecosim (EwE) version 5.1 (Christensen & Walters2004) was used to ensure the energy balance of thenew model and to fit the model to data.
The ecological model of the NC Adriatic Sea com-prised 40 functional groups or trophic species span-ning the main benthic and pelagic components of theecosystem from primary producers to top predators,including invertebrates, fish, birds, reptiles and marinemammals, and 2 detritus groups. The principal fishingactivities in the area were included in the model: mid-water trawling, bottom trawling, beam trawling, purseseine and tuna fisheries. Detailed description of theNC Adriatic model is provided in (Coll et al. 2007,2009b). Time series of catch and biomass resultingfrom the model, and trophodynamic indicators wereobtained using the model from 1975 to 2002, or thesnapshot models from 1970s and 1990s (in the case ofthe keystoneness indicator) (Table 1).
Abiotic factors: Abiotic parameters included in theanalysis were the following environmental factors: (1)sea surface water temperature (annual and wintermean °C; Smith & Reynolds 2004); (2) Po River runoff(annual mean, hm3 yr–1) (SINAPSI project, Italian Min-istry for research [MIUR]); (3) the North Atlantic Oscil-lation (NAO) Index (www.cgd.ucar.edu), both annualand winter values; (4) the Mediterranean OscillationIndex (MOI; Grbec et al. 2007); and human factors: (5)the Human Development Index (HDI; UNDP: http://
hdr.undp.org/en/statistics/data/); and (6) nominal fish-ing effort. Time series of nominal fishing effort ofbottom trawling (including both beam and bottomtrawling), mid-water trawling and purse seining wereavailable in units of horse power (HP) and the numberof boats per fishing harbour (ISTAT, IREPA andISMAR-CNR). We aggregated the data to representthe NC Adriatic fleets. Trawling data were availablefrom 1975 to 1995 through ISTAT and from 1996 to2002 through IREPA. The 2 datasets did not align per-fectly, so we extended the ISTAT series through 2002,extrapolating the general trend of the series observedin IREPA (see data in Coll et al. 2009b). Reliability ofour procedure of interpolating ISTAT and IREPA dataseries was confirmed during the calibration process ofour NC Adriatic model (Coll et al. 2009b).
Trophodynamic indicators. We used the above data-sets to calculate selected trophodynamic indicatorsand to describe the food-web of the NC Adriatic Seathrough time (Table 1). The first 6 indicators describedbelow were applied to time series, while the last 2were used to characterize different time periods of theecosystem. These indicators were applied to catch sta-tistics, scientific surveys and modelling results becausewe compared their trajectories, although their absolutevalues are not necessarily comparable between themsince they may sample different fractions of the ecosys-tem. However, they can inform on similar or differenttrends. For example, the primary production requiredto sustain the catch (%PPR) indicates the total amountof catch extracted from the system when calculatedfrom fisheries data and modelling catch results, andinforms on the total surveyed catch when calculatedfrom scientific surveys. But a decreasing trend on thisindicator from these 3 data sources may inform on asimilar ecosystem process of depletion.
Biomass and catch trends and ratios: We analyzedbiomass estimates from scientific surveys and those
195
Table 1. Ecological indicators and data sources. Ecological models are biomassand catch results. –: no data
Indicators Fisheries Scientific Ecological data surveys models
A. Trend analysisBiomass and catch data and ratios X X XMean trophic level of the community (mTLco) – X XMean trophic level of the catch (mTLc) X – XFishing in balance (FIB) index X X XPrimary production required to sustain X X X
the catch (%PPR)The loss in production index (L index) X – XKempton’s index of biodiversity (Q’ index) X X X
B. Analysis at different time stepsTrophic spectra (TS) X X XThe keystoneness of trophic species (KS) – – X

Mar Ecol Prog Ser 417: 193–210, 2010
resulting from the model to explore species biomasstrends (t km–2), and compared them with catch statis-tics (t km–2 yr–1). We analyzed separately the data bycommercial species (such as hake, Norway lobster andanchovy), while we analyzed the rest of the species indifferent ecological groups following Coll et al. (2007),such as crabs, shrimps, and benthic cephalopods. Thisaggregation enabled us to compare model results withscientific surveys and catch data due to the differentaggregation of species in the 3 datasets.
In addition, we calculated the total demersal biomassto pelagic biomass ratio (D/P) as an indicator of theprocesses benefiting demersal or pelagic compart-ments. We included the total invertebrate to fish bio-mass ratio (Inv/Fish) as an indicator of change in thefish community. This ratio was expected to increasewith fishing impact (Coll et al. 2009a), while D/P wasexpected to decrease with fishing, although it is alsolinked with other factors such as bottom-up effects (deLeiva Moreno et al. 2000) and changes in the pelagiccompartment due to changes in the small pelagic fishpopulations.
Mean trophic level of the community and meantrophic level of the catch: The trophic level (TL) wasfirst defined as an integer identifying the position oforganisms within food webs (Lindeman 1942) and itwas later modified to be fractional (Odum & Heald1975). Following an established convention, a TL of 1 isgiven to primary producers and detritus, the TL is for-mulated as follows:
(1)
where j is the predator of prey i, DCji is the fraction ofprey i in the diet of predator j, and TLi is the trophiclevel of prey i.
The mean trophic level of the catch (mTLc) reflectsthe fishing strategy in terms of selected food-web com-ponents, and was defined as the weighted average TLof harvested species (Pauly et al. 1998). The meantrophic level of the community (mTLco) reflects thestructure of the community and was defined as theweighted average trophic levels (TL) of all species(Jennings et al. 2002). Both indicators generally de-crease with increased fishing impact due to a reductionin the number of large predators and a relative in-crease in lower TL organisms. We calculated both indi-cators from modelling results, catch and biomass esti-mates. Moreover, we plotted total catches and themTLc together following Pauly et al. (1998).
Fishing in balance index: The fishing-in-balance(FIB) index assesses whether catch rates are in balancewith ecosystem trophic production due to catch at agiven TL being related to assimilation efficiency of the
ecosystem (Christensen 2000, Pauly et al. 2000).Therefore, one can expect higher catches at lower TLdue to higher production at lower trophic levels. TheFIB index is formulated as follows:
(2)
where Yik is the catch of species i during the year k; Yi0
is the catch of species i during the year at the start of atime series and which serves as an anchor; TLi is thetrophic level of species i, and 10 represents the by-default mean transfer efficiency of the ecosystem, i.e.that 10% of the production of one trophic level is con-verted into the production of the next trophic level. AFIB index of zero indicates higher production at lowerTL, so fishing is in balance. A positive FIB value indi-cates that the fishery has expanded, or that bottom-upeffects are occurring, so there is more catch thanexpected. The FIB index falls below zero when dis-carding occurs and discarding is not considered in theanalysis, or when the fishing impact is so high that theecosystem function is impaired (Christensen 2000,Pauly et al. 2000).
Primary production required to sustain the catch:The PPR typically measured as t km–2 yr–1, is obtainedby back-calculating the flows, and is expressed in pri-mary production and detritus equivalents for all path-ways from the exploited species down to the primaryproducers and detritus (Pauly & Christensen 1995):
(3)
where Yi is the catch of a given group (i ), TE is themean transfer efficiency, TLi is the trophic level of agroup (i) and factor 1/9 is taken as the average conver-sion coefficient from wet wt to gC. This index can beexpressed per unit of catch relative to primary produc-tion and detritus of the ecosystem (%PPR). Due to thefact that we were interested in the trajectory of thisindicator but not the absolute value, we applied it tocatch statistics, scientific surveys and predicted catchfrom modelling results (Table 1).
Loss in production index: The loss-in-productionindex (L index) quantifies the theoretical depletion ofsecondary production due to fishing in an exploitedecosystem and increases with fishing impacts (Libra-lato et al. 2008). This index was proposed as a proxy tocharacterize the effects of fishing on the ecosystem,and to estimate the probability that the ecosystem isbeing fished in a sustainable manner. The index takesinto account both the properties of the ecosystem (theprimary production [PP] and transfer efficiency [TE])as well as the characteristics of fishing activity (mTLc
PPR19
1TE
TL 1
= ⋅ ⋅⎛⎝
⎞⎠
⎡
⎣⎢
⎤
⎦⎥
−
∑ Yii
i
FIB TL TLlog= ⎛⎝⎜
⎞⎠⎟
⎛⎝⎜
⎞⎠⎟∑ ∑Y Yik
ii
i
i i10 100⎡⎡⎣⎢
⎤⎦⎥
TL 1 DC ·TL1
n
j ji ij
= +=
∑
196

Coll et al.: Ecosystem assessment of the Adriatic Sea
and %PPR; Lindeman 1942, Pauly & Christensen 1995,Pauly et al. 1998) as:
(4)
The L index can be used to estimate the probabilitythat the ecosystem is being sustainably fished (Psust;Libralato et al. 2008). We applied this index to catchstatistics and catch from modelling results (Table 1).
Modified Kempton’s index of biodiversity: The mo-dified Kempton’s index of biodiversity (Q’ index), ormodified biomass diversity index, measures the rela-tive index of biomass diversity based on the calcula-tions proposed by Kempton’s index expressing speciesdiversity (Kempton & Taylor 1976, Ainsworth & Pitcher2006). This index represents the slope of the cumula-tive species abundance curve between the 10th and90th percentile, but since it is applied using functionalgroups and biomasses, the functional groups are con-sidered equivalent to ‘species’, and their biomass thenumber of individuals (Ainsworth & Pitcher 2006). Theindex is formulated as:
(5)
where S is the number of functional groups in themodel or time series, and R1 and R2 are the biomassvalues of the 10th and 90th percentiles in the cumula-tive distribution curve. This indicator is expected to de-crease with increasing fishing impacts.
Trophic spectra: Trophic spectra were calculatedusing TL per species or groups in ecological models,biomass estimates from scientific surveys, and frommodelling results and catch statistics following Gas-cuel et al. (2005). This analysis provides a representa-tion of an ecological property of the ecosystem (such asbiomass or catch) per interval of TL by aggregatingfixed TL intervals (0.1 TL) of data and then using aweighted smoothing function over a fixed range of TL(0.7 TL) to distribute the values of the data (Φx):
(6)
where Φx is the spectrum value of an ecological prop-erty (such as catch or biomass), TL’ is a TL interval andX is the ecological property.
The keystoneness of trophic species: The keystone-ness of trophic species (KS) was calculated for the mid-1970s and mid-1990s using a method derived from theMTI analysis (Libralato et al. 2006) and the availableecosystem models (Coll et al. 2009b). The keystonespecies are those that show relatively low biomass but
have a major structuring role in the ecosystem (Poweret al. 1996). Keystone species can be identified by plot-ting the relative overall effect (εi), calculated from theMTI, against KSi. The overall effect (εi) is described as:
(7)
where mij is calculated from the MTI analysis. Then,KSi of a functional group is calculated as:
(8)
where pi is the contribution of the functional group tothe total biomass of the food web. This index is highwhen functional groups (species or groups of species)have both low biomass proportions within the ecosys-tem and high overall effects, in line with the keystonespecies definition.
Statistical analysis and comparison of indicators.We applied a simple linear trend analysis applyinggeneralized least-squares regression following Coll etal. (2008b) to assess the significance of the increases ordecreases in standardized ([indicator value in year-mean]/SD) time series of species abundance, tropho-dynamic indicators, and abiotic indicators. Time seriesof indicators are frequently characterized by strongautocorrelation, imposed as a consequence of the eco-system dynamics. Thus, we fit a linear trend model toeach of the time series using a generalized least-squares regression framework, which models the tem-poral correlations in the error using a 2-stage estima-tion procedure to take into account the autocorrelationin the residuals and to satisfy regression assumptions.We then assessed the significance of the estimatedtrend (whether the predicted slope was significantlydifferent from zero). This allowed for valid inference toassess the significance of the trend and compare theindicators.
We compared results from the KS and trophic spec-tra between the periods analyzed: 1970s and 1990s. Inaddition and to integrate the rest of the availableecosystem information, we applied a principal compo-nent analysis (PCA) on the correlation matrix (Jong-man et al. 1999) using biotic metrics to reduce thenumber of multivariate dimensions to a smaller set oflinear combinations that explained the most variance.This analysis provided further delineation of key pro-cesses affecting the ecosystem through time andtracked major trends across the ecosystems. Changesin the PCA scores through time were evaluated asgraphical ecosystem-reference directions followingLink et al. (2002). Some model results had been ob-tained using the ecosystem model and forcing it withfishing effort and fitted to biomass series (Coll et al.
KS log 1 pi i i= −( )[ ]ε
ε i ijj i
m 2n
=≠
∑
Φx TL X X XTL TL( ') ' . ' .= ⋅ + ⋅ + ⋅− −127
327
6270 3 0 2 TTL
TL TL TLX X X
' .
' ' . ' .
−
+ ++ ⋅ + ⋅ + ⋅
0 1
0 1 0 2727
627
327
++ ⋅ +127 0 3XTL' .
QS
R R'
.log
= ⋅( )0 8
2 1
LPPR TE
PP TE
mTLc
ln≅ − ⋅
⋅
−1
197

Mar Ecol Prog Ser 417: 193–210, 2010
2009b); thus, some of the time series were not indepen-dent from catch statistics and scientific surveys. There-fore, to avoid the redundancy in the data and comparethe results of these 2 analyses, we first applied the PCAto catch statistics and scientific surveys (1982–2000),and after, to modelling results (1975–2002).
Finally, and to include in our analysis availableinformation from abiotic indicators, we looked into thecorrelation between the ecological indicators and abi-otic factors using the non-parametric statistical proce-dure BIO-ENV from PRIMER (Clarke & Warwick2001). This routine enabled us to identify the abioticfactors that globally best explained variability of theecological indicators. This procedure calculated thecorrelation coefficients between similarity matrices ofboth ecological and abiotic indicators, and identifiedthe combination of abiotic factors that maximized thecorrelation between ecological and abiotic similaritymatrices.
Because the indicators represented different mea-sures, we normalized the data prior to the constructionof the Euclidean distance matrices (Clarke & Gorley2006). We then assessed skewness by constructing adraftsman plot (matrix of plots of each food-web prop-erty against the other) and the individual correlationsbetween abiotic indicators examining the resultingSpearman rank correlations. We removed one of eachpair of properties that were significantly correlated (ρ ≥0.95), thereby reducing redundancy and dimensional-ity of the data. Total fishing effort and fishing effort bytrawling were highly correlated, as well as fishingeffort by trawling and HDI. We removed fishing effortby trawling from the analysis.
RESULTS
Biomass and catch trends by species
Scientific surveys covering the period 1982–2005showed a significant decline in crabs (Table A2) andbenthic cephalopods and a significant increase inshrimps (Table A2, Fig. 2a). Catch statistics (1975–2000) showed a significant increase in crabs (Fig. 2c),while modelled biomass (1975–2002) of cephalopods,Norway lobster and ‘other benthic invertebrates’group (Table A2) first increased and then decreasedsignificantly (Fig. 2e).
Gadiforms, anglerfish, conger eels, demersal skates,demersal sharks and ‘other demersal fish’ group werefound to decrease through time in various time series(Table A2, Fig. 2a,c,e,g), and for the group composedof ‘other demersal fish’, all the trends were signifi-cantly negative. Demersal skates, flatfish and angler-fish showed significant negative trends in 3 datasets.
Other gadiformes, conger eels, hake, red mullets anddemersal sharks declined significantly with time in 2 ofthe time series analyzed. Anchovy, sardine, and themixed group of small pelagic fish, horse mackerel andbenthopelagic fish generally showed declining trendstoo (Table A2, Fig. 2b,d,f,h).
The time series for demersal skates and ‘other dem-ersal fish’, including all the data sources (scientificsurveys, catch statistics, and modelled biomass andcatches) showed significant declining trends (Table A2).Moreover, benthic cephalopods, hake and other gadi-forms, anglerfish, conger eel, flatfish, red mullets,‘other demersal fish’, demersal sharks, horse mackerel,mackerel and benthopelagic fish showed significantdecreasing trends in 2 time series of data from differ-ent data sources. Using the scientific surveys and catchstatistics, we found a significant increasing trend in2 data sets (Table A2): shrimps in scientific surveys andcrabs in catch statistics.
Trend analyses showed that nearly all of the dataseries were highly auto-correlated and that in somecases, the normality and linearity assumptions wereviolated (Table A2). Although we only assessed lineartrends, in general, catch statistics and modelled bio-mass and catches first showed an increasing trenduntil the early 1980s and then a decreasing trend(Fig. 2). Data from scientific surveys beginning in theearly 1980s generally showed the decreasing trend(Fig. 2a,b).
Total biomass and catch ratios, trophic levels anddiversity index
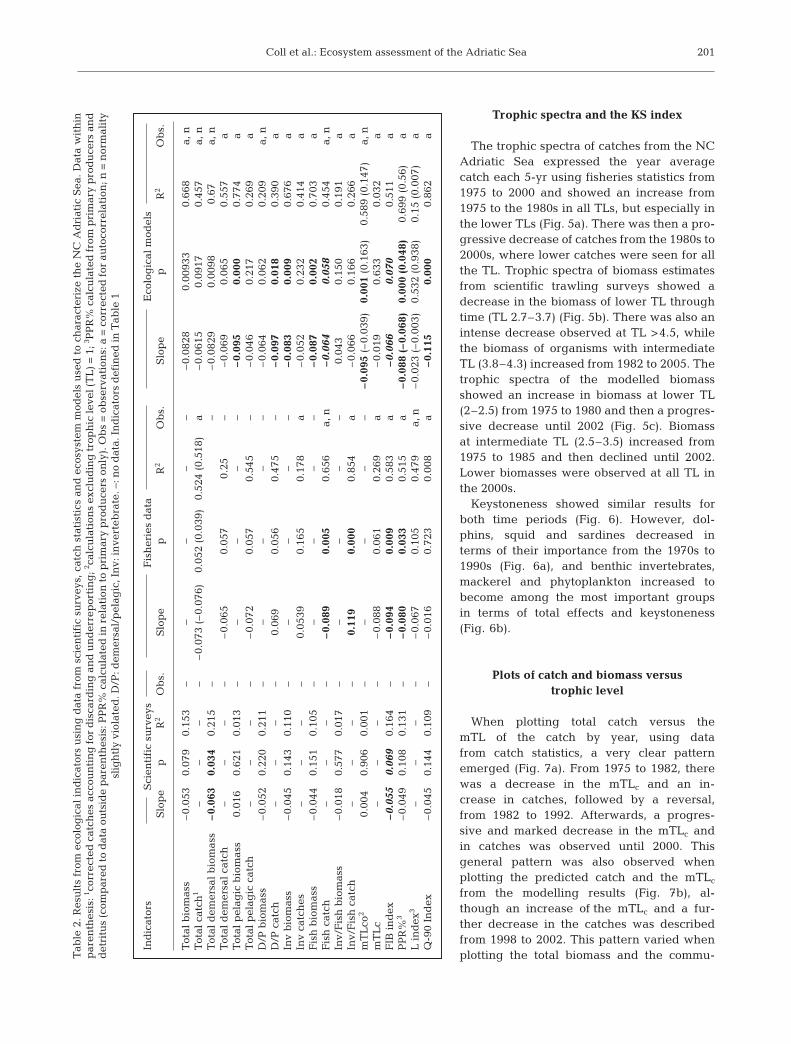
Total biomass and catch ratios reflected previousresults and were found to decline with time (Fig. 3a).These declines were significant for total demersal bio-mass and catches from surveys and fisheries statistics,as well as for total pelagic catch and total catch fromfisheries statistics, and total pelagic biomass from mod-elling simulations (Table 2).
The D/P catch ratio trend increased significantlywhen calculated from catch statistics (Fig. 3b, Table 2).The total invertebrate and fish biomass followed adeclining trend that was significant when using model-ling results. The Inv/Fish ratio showed a significantincrease through time calculated from catch data(Fig. 3c). Total biomass and catch trends increaseduntil the early 1980s and then decreased (Fig. 3).
The mTLco showed a significant decline through timewhen calculated from modelled biomass (Table 2,Fig. 3d). Both the mTLc from statistics and modellingresults showed declines through time, although thesetrends were non-significant (Fig. 3e) and mTLc firstincreased from the early 1980s to the early 1990s.
198

Coll et al.: Ecosystem assessment of the Adriatic Sea 199
–4
–3
–2
–1
0
1
2
3
4
No
rmal
ized
cat
ch
AnchovySardineHorse mackerel
AnchovySardineHorse mackerel
AnchovySardineHorse mackerel
–4
–3
–2
–1
0
1
2
3
4
No
rmal
ized
cat
ch
–4
–3
–2
–1
0
1
2
3
4
No
rmal
ized
cat
ch
–4
–3
–2
–1
0
1
2
3
4
1975 1980 1985 1990 1995 2000 2005
No
rmal
ized
bio
mas
s
Benthic cephalopods HakeAnglerfish Red mulletsFlatfish
Benthic cephalopodsAnglerfishFlatfish
Benthic cephalopodsAnglerfishFlatfish
Benthic cephalopodsAnglerfishFlatfish
Demersal skates
HakeRed mulletsDemersal skates
HakeRed mulletsDemersal skates
HakeRed mulletsDemersal skates
–4
–3
–2
–1
0
1
2
3
4
No
rmal
ized
cat
ch
–4
–3
–2
–1
0
1
2
3
4
No
rmal
ized
cat
ch
–4
–3
–2
–1
0
1
2
3
4
No
rmal
ized
bio
mas
s
–4
–3
–2
–1
0
1
2
3
4
1975 1980 1985 1990 1995 2000 2005
No
rmal
ized
bio
mas
s
Anchovy SardineHorse mackerel Anchovy (VPA)Sardine (VPA)
Demersal species Pelagic species
Scientific surveys
a
c
e
g g
f
d
b
Catch statistics
Modelling results: biomass
Modelling results: catch
Fig. 2. (a,c,e,g) Demersal and (b,d,f,h) pelagic target species. Biomass and catch estimated from scientific surveys. (c,d) Catch statistics. (e,f) Modelled biomass. (g,h) Modelled catches. Statistical tests presented in Table A2

Mar Ecol Prog Ser 417: 193–210, 2010
The Q’ index declined in all time series (Fig. 3f), andthese declines were significant when calculated frommodelling results.
Primary production required, fishing in balance andloss of production
The %PPR calculated from scientific surveys data,catch statistics and modelling outputs showed a de-cline through time that was significant for both catchand modelling data (Table 2, Fig. 4a).
The FIB index showed significant declining trends inall cases (Table 2, Fig. 4b). The FIB index from catchdata and modelling outputs also showed an increasethrough time until the early-mid 1980s, when it pro-gressively declined until becoming negative in the mid1990s. The FIB index was negative for all years whencalculated from scientific surveys.
The L index also declined with time, although not sig-nificantly (Table 2, Fig. 4c). The probabilities Psust were<75% and 50% when results were calculated frommodelling and catch data, respectively, showing an in-creasing trend until the early 1980s and then a decrease.
200
–3
–2
–1
0
1
2
31975 1980 1985 1990 1995 2000 2005
Nor
m. b
iom
ass
and
cat
ch
Total biomass scientific trawlingTotal official catchTotal corrected catchTotal modelled biomassTotal modelled catch
–3
–2
–1
0
1
2
3
Nor
m. d
emer
sal /
pel
agic
rat
ios
D/P biomass scientific trawlingD/P corrected catchD/P modelled biomassD/P modelled catch
–3
–2
–1
0
1
2
3
Nor
m. i
nver
teb
rate
/ F
ish
bio
mas
s
Inv/Fish biomass scientific trawlingInv/Fish corrected catchInv/Fish modelled biomassInv/Fish modelled catch
–4
–3
–2
–1
0
1
2
3
41975 1980 1985 1990 1995 2000 2005
Nor
m. T
L co
TLco scientific trawlingTLco modeled biomassTLco (excl. TLI) modelled biomass
–4
–3
–2
–1
0
1
2
3
4
Nor
m. T
L c
TLc catch dataTLc modelled catch
–4
–3
–2
–1
0
1
2
3
4
Nor
m. Q
' ind
ex
Q' index scientific trawlingQ' index from catch dataQ' index from modelled biomass
a
b
c
d
e
f
Fig. 3. (a,b,c) Normalized (norm.) total biomass and catch ratios estimated from scientific surveys, catch statistics, modelled bio-mass estimates, and modelled catches. D: demersal, P: pelagic, Inv: invertebrates. Mean trophic levels of (d) community (mTLco)and (e) catch (mTLc). (f) Kempton’s modified index of biodiversity (Q’ index), estimated using scientific surveys, catch statistics,
and results from modelling
Coll et al.: Ecosystem assessment of the Adriatic Sea
Trophic spectra and the KS index
The trophic spectra of catches from the NCAdriatic Sea expressed the year averagecatch each 5-yr using fisheries statistics from1975 to 2000 and showed an increase from1975 to the 1980s in all TLs, but especially inthe lower TLs (Fig. 5a). There was then a pro-gressive decrease of catches from the 1980s to2000s, where lower catches were seen for allthe TL. Trophic spectra of biomass estimatesfrom scientific trawling surveys showed adecrease in the biomass of lower TL throughtime (TL 2.7–3.7) (Fig. 5b). There was also anintense decrease observed at TL >4.5, whilethe biomass of organisms with intermediateTL (3.8–4.3) increased from 1982 to 2005. Thetrophic spectra of the modelled biomassshowed an increase in biomass at lower TL(2–2.5) from 1975 to 1980 and then a progres-sive decrease until 2002 (Fig. 5c). Biomassat intermediate TL (2.5–3.5) increased from1975 to 1985 and then declined until 2002.Lower biomasses were observed at all TL inthe 2000s.
Keystoneness showed similar results forboth time periods (Fig. 6). However, dol-phins, squid and sardines decreased interms of their importance from the 1970s to1990s (Fig. 6a), and benthic invertebrates,mackerel and phytoplankton increased tobecome among the most important groupsin terms of total effects and keystoneness(Fig. 6b).
Plots of catch and biomass versus trophic level
When plotting total catch versus themTL of the catch by year, using datafrom catch statistics, a very clear patternemerged (Fig. 7a). From 1975 to 1982, therewas a decrease in the mTLc and an in-crease in catches, followed by a reversal,from 1982 to 1992. Afterwards, a progres-sive and marked decrease in the mTLc andin catches was observed until 2000. Thisgeneral pattern was also observed whenplotting the predicted catch and the mTLc
from the modelling results (Fig. 7b), al-though an increase of the mTLc and a fur-ther decrease in the catches was describedfrom 1998 to 2002. This pattern varied whenplotting the total biomass and the commu-
201
Tab
le 2
. Res
ult
s fr
om e
colo
gic
al i
nd
icat
ors
usi
ng
dat
a fr
om s
cien
tifi
c su
rvey
s, c
atch
sta
tist
ics
and
eco
syst
em m
odel
s u
sed
to
char
acte
rize
th
e N
C A
dri
atic
Sea
. Dat
a w
ith
in
par
enth
esis
: 1 cor
rect
ed c
atch
es a
ccou
nti
ng
for
dis
card
ing
an
d u
nd
erre
por
tin
g; 2 c
alcu
lati
ons
excl
ud
ing
tro
ph
ic le
vel (
TL
) =
1; 3 P
PR
% c
alcu
late
d f
rom
pri
mar
y p
rod
uce
rs a
nd
det
ritu
s (c
omp
ared
to
dat
a ou
tsid
e p
aren
thes
is: P
PR
% c
alcu
late
d in
rel
atio
n t
o p
rim
ary
pro
du
cers
on
ly).
Ob
s =
ob
serv
atio
ns:
a =
cor
rect
ed f
or a
uto
corr
elat
ion
; n =
nor
mal
ity
slig
htl
y vi
olat
ed. D
/P: d
emer
sal/
pel
agic
, In
v: in
vert
ebra
te. –
: no
dat
a. I
nd
icat
ors
def
ined
in T
able
1
Ind
icat
ors
Sci
enti
fic
surv
eys
Fis
her
ies
dat
aE
colo
gic
al m
odel
sS
lop
ep
R2
Ob
s.S
lop
ep
R2
Ob
s.S
lop
ep
R2
Ob
s.
Tot
al b
iom
ass
–0.
053
0.07
90.
153
––
––
––
0.08
280.
0093
30.
668
a, n
Tot
al c
atch
1–
––
– –
0.07
3 (–
0.07
6)0.
052
(0.0
39)
0.52
4 (0
.518
)a
–0.
0615
0.09
170.
457
a, n
Tot
al d
emer
sal
bio
mas
s–
0.06
30.
034
0.21
5–
– –
0.08
290.
0098
0.67
a, n
Tot
al d
emer
sal
catc
h–
––
– –
0.06
50.
057
0.25
––
0.06
90.
065
0.55
7a
Tot
al p
elag
ic b
iom
ass
0.01
60.
621
0.01
3–
– –
––
–0.
095
0.00
00.
774
aT
otal
pel
agic
cat
ch–
––
– –
0.07
20.
057
0.54
5–
–0.
046
0.21
70.
269
aD
/P b
iom
ass
–0.
052
0.22
00.
211
– –
––
––
0.06
40.
062
0.20
9a,
nD
/P c
atch
––
––
0.06
90.
056
0.47
5–
–0.
097
0.01
80.
390
aIn
v b
iom
ass
–0.
045
0.14
30.
110
– –
––
––
0.08
30.
009
0.67
6a
Inv
catc
hes
––
––
0.05
390.
165
0.17
8a
–0.
052
0.23
20.
414
aF
ish
bio
mas
s–
0.04
40.
151
0.10
5–
– –
––
–0.
087
0.00
20.
703
aF
ish
cat
ch–
––
– –
0.08
90.
005
0.65
6a,
n–
0.06
40.
058
0.45
4a,
nIn
v/F
ish
bio
mas
s–
0.01
80.
577
0.01
7–
– –
––
0.04
30.
150
0.19
1a
Inv/
Fis
h c
atch
––
––
0.11
90.
000
0.85
4a
–0.
066
0.16
60.
266
am
TL
co2
0.00
40.
906
0.00
1–
– –
––
–0.
095
(–0.
039)
0.00
1(0
.163
)0.
589
(0.1
47)
a, n
mT
Lc
––
––
–0.
088
0.06
10.
269
a–
0.01
90.
633
0.03
2a
FIB
in
dex
–0.
055
0.06
90.
164
– –
0.09
40.
009
0.58
3a
–0.
066
0.07
00.
511
aP
PR
%3
–0.
049
0.10
80.
131
– –
0.08
00.
033
0.51
5a
–0.
088
(–0.
068)
0.00
0 (0
.048
)0.
699
(0.5
6)a
L i
nd
ex3
––
––
–0.
067
0.10
50.
479
a, n
–0.
023
(–0.
003)
0.53
2 (0
.938
)0.
15 (
0.00
7)a
Q-9
0 In
dex
–0.
045
0.14
40.
109
– –
0.01
60.
723
0.00
8a
–0.
115
0.00
00.
862
a

Mar Ecol Prog Ser 417: 193–210, 2010
nity’s mTLco obtained from modelling results (Fig. 7c).The mTLco and biomass increased from 1975 to 1984,and afterwards there was a progressive decline inboth until 2002. We did not observe any patternwhen plotting scientific surveys data and the mTLco
(results not shown).
Ecosystem assessment
The first 2 factors of a PCA applied to all time seriesof catch statistics and scientific surveys reported inTable 2 & A2, in which data were available for each yearfrom 1982 to 2000, explained the 72.9% of the total vari-ance (Fig. 8a). The first factor was mainly defined bylower values of fish and invertebrate biomass and
202
–3
–2
–1
0
1
2
Nor
mal
ized
PP
R%
PPR% scientific trawlingPPR% catch statisticsPPR% modelling (a)PPR% modelling (b)
–1.5
–1
–0.5
0
0.5
1
1.5
2
FIB
ind
ex
FIB index scientific trawlingFIB index modellingFIB index catch data
0.00
0.02
0.04
0.06
0.08
0.10
1975 1980 1985 1990 1995 2000 2005
L in
dex
L index modelling (b)
L index modelling (a)
L index catch statistics
50%
75%
95%
a
b
c
Fig. 4. (a) Primary production required to sustain theobserved catch (PPR%); (b) fishing in balance (FIB) index; and(c) loss in production due to fishing (L index), respectively,estimated from scientific surveys, catch statistics, modelledbiomass, and modelled catches. L index was calculated fromthe modelling exercise considering: production from (1) pri-mary producers and (2) primary producers and detritus. Ref-erence levels of 50, 75 and 95% probability that system is
sustainably fished: dashed lines for (a), solid line for (b)
0
12
24
36
48
60
2 2.5 3 3.5 4TL
Traw
l bio
mas
s (t
km–2
)M
odel
led
bio
mas
s (t
km–2
)
1975198019851990199520002002
0
10000
20000
30000
40000
2 2.5 3 3.5 4 4.5 5 5.5
Cat
ch (t
) 197519801985199019952000
0.00
0.03
0.06
0.09
2 2.5 3 3.5 4 4.5 5 5.5
198219871992199720022005
a
b
c
Fig. 5. Trophic spectra of the NC Adriatic Sea expressed byintervals representing average years of (a) corrected catchdata (t) from 1975–2000; (b) trawl biomass (t km–2) for1982–2005; and (c) modelled biomass (t km–2) for 1975–2002

Coll et al.: Ecosystem assessment of the Adriatic Sea
catches, but high levels of crab catch, shrimp and an-chovy biomasses and high Invertebrate/Fish catch ratio(Fig. 8b). The first PC axis scores increased with timefrom 1982 to 2000, thus mainly highlighting the decreaseof catch and biomass for most of the groups and prolifer-ation of invertebrates. The second factor was defined byhigh L index (thus low Psust) and total demersal biomass,
high biomass of benthopelagic fish,gadoids, cephalopods and FIB index.The second PC axis scores decreasedfrom 1982 to 1987, then increased till1998 and decreased again in 2000. ThePC scores of the first 2 axes plottedthroughout time showed a trend fromthe upper left to the upper right quadrat(Fig. 8a).
The first 2 factors of a PCA applied toall time series derived from modelling re-sults reported in Table 2 & A2 and abioticindicators, with data available for eachyear from 1975 to 2002, explained the88.4% of the total variance (Fig. 8c). Thefirst factor was mainly associated withlower values of biomass and catch of fishand invertebrates, and lower values of alltrophodynamic indicators (Fig. 8d). Thefirst PC axis scores increased with timefrom 1975 to 2002, highlighting a generaldecline in biomass and catch. The sec-ond factor was mainly associated withhigh biomasses of anglerfish, flatfish, an-chovy, benthopelagic fish, other smallpelagic fish and catches of variousgroups, while there was a decrease in Lindex, FIB, TLco, and catch and bio-masses of various groups as well. Thesecond PC axis scores decreased from1975 to 1986 and then increased until2002. The PC scores of the first 2 axesplotted through time showed a trajectoryfrom the upper left to the upper rightquadrate (Fig. 8c) as observed in the pre-vious analysis (Fig. 8a).
Abiotic indicators
The regression model applied to thehuman and environmental indicatorsshowed a significant increase of sea sur-face temperature (SST) (p = 0.000), and adecrease of MOI with time (p = 0.001)and SST in winter (p = 0.042). In parallel,there was an increase of the human de-velopment index (HDI) (p = 0.000) and of
fishing effort in the NC Adriatic Sea; the total fishing ef-fort and the fishing effort of the trawling fleet increasedsignificantly from 1975 to 2000 (p = 0.000).
The first 2 factors of the PCA applied to all timeseries of abiotic indicators (1975–2002) explained the51.8% of the total variance (Fig. 9a) and the first factorwas mainly characterized by fishing effort (with higher
203
a) Adriatic Sea 1970s
b) Adriatic Sea 1990s
–6.0
–5.0
–4.0
–3.0
–2.0
–1.0
0.00.0 0.2 0.4 0.6 0.8 1.0
Relative overall effect
Key
sto
nene
ss
405
2
8
35
2814
29
1
N_KSi FG N_KSi FG N_KSi FG1 Suprabenthos (5) 14 Polychaetes 27 Mullets2 Zooplankton (2) 15 Mackerel 28 Jellyfish3 Dolphins (35) 16 Demersal fish (1) 29 Anglerfish4 Detritus (40) 17 Macrozooplankton 30 Haike (2)5 Benthic invetebrates (8) 18 Flatfish 31 Demersal sharks6 Anchovy (28) 19 Hake (1) 32 Mantis shrimp7 Squids (14) 20 Large pelagic fish 33 Turbot and Brill8 Sardine (29) 21 Benthopelagic fish 34 Norway lobster9 Phytoplankton 22 Octopus 35 Seabirds10 Horse mackerel 23 Small tunids 36 Commercial invertebrates11 Demersal skates 24 Small pelagic fish 37 Conger eel12 Crabs 25 Demersal fish (2) 38 Marine turtles13 Shrimps 26 Gadids 39 Discards1
–3.5
–3.0
–2.5
–2.0
–1.5
–1.0
–0.5
0.00.0 0.2 0.4 0.6 0.8 1.0
Relative overall effect
Key
sto
nen
ess
4085235
28
1
32
N_KSi FG N_KSi FG N_KSi FG1 Suprabenthos (5) 14 Shrimps 27 Norway lobster2 Zooplankton (2) 15 Macrozooplankton 28 Gadids3 Benthic invertebrates (8) 16 Demersal fish (1) 29 Hake (2)4 Dolphins (35) 17 Large pelagic fish 30 Mantis shrimp5 Detritus (40) 18 Small tunids 31 Discards16 Anchovy (28) 19 Flatfish 32 Anglerfish7 Mackerel (32) 20 Hake (1) 33 Turbot and Brill8 Phytoplankton 21 Octopus 34 Demersal sharks9 Squids 22 Benthopelagic fish 35 Demersal skates10 Sardine 23 Jellyfish 36 Seabirds11 Crabs 24 Small pelagic fish 37 Commercial invertebrates12 Horse mackerel 25 Mullets 38 Conger eel13 Polychaetes 26 Demersal fish (2) 39 Marine turtles
Fig. 6. Keystoneness index (KSi) and overall effect (εi) of each functional group(i ) from the ecological model of the Adriatic Sea (Coll et al. 2009b) during (a)mid-late 1970s and (b) mid-late 1990s. Keystone groups are those with higher εi
and KSi values (no species had KS close to or >0, Libralato et al. 2006). Numbers in parenthesis: functional groups (FG) identified in figure

Mar Ecol Prog Ser 417: 193–210, 2010
values of total, trawling and purse seine fish-ing effort), by high values of annual SST(SSTt) and winter NAO (NAOw), and by lowvalues of MOI and SSTw. The second factorwas mainly characterized by environmentalfactors (higher values of NAO and SST, andlower of Po river runoff) (Fig. 9b). The PCscores of the first 2 axes plotted through timeshowed a trajectory from the upper leftquadrate to the low right quadrate (Fig. 9a),and presented similarities with the previousones observed in Fig. 8.
When correlating these abiotic data with theecological indicators using the BIO-ENV test,we found positive significant correlations us-ing both catch statistics and scientific surveysor modelling results (BIO-ENV test, correla-tion coefficient ρ = 0.862 and 0.811, and p =0.01 and 0.01, respectively). The similarity ma-trices obtained with human indicators (fishingeffort of purse seine, trawling and the HDI)correlated highest with the similarity matrix ofecological indicators from catch statistics andscientific surveys, illustrating that these abi-otic indicators may be good predictors of thebiotic indicators. Other environmental indica-tors such as Po river runoff, salinity and MOIcontributed to the correlation matrix but low-ering the overall correlation (ρ = 0.668). Thesimilarity matrices of the human indicators ob-tained with total fishing effort and the HDIcorrelated highest with the similarity matrix ofecological indicators from modelling results.Other environmental indicators such as MOIor SSTt contributed to the correlation matrixbut again lowered the overall correlation (ρ =0.661). These similarities are in line with thesimilar trends in the PCAs scores.
DISCUSSION
Changes and drivers of biomass and catchin the NC Adriatic Sea
The Adriatic Sea is one of the Mediter-ranean areas with a relative high availabilityof data. However, each data source used herehad limitations that should be consideredwhen interpreting results. Data from landingstatistics were corrected to account for under-reporting and discards, although the esti-mates were conservative (Coll et al. 2007).The scientific trawl biomasses were mainlydemersal, and thus not adequate to capture
204
3.24
3.27
3.30
3.33
3.36
3.39
3.42
3.45
0.5 1.0 1.5 2.0 2.5 3.0
Total catch (105 t)
Total catch (105 t)
mTL
c
1990
2000
1999
1998
1997
1996
1995
19941993
1992
1991
19891988
1987 19861985
19841983
19821981
1980
1979
1978
1977
1976
1975
2001
2002
3.15
3.18
3.21
3.24
3.27
3.30
3.33
3.36
0.5 1.0 1.5 2.0 2.5
mTL
c
1990
2000
1999
1998
1997
19961995
1994
1993 1992
19911989
19881987
1986
1985
1984
19831982
1981
1980
1979
197819771976
1975
1.23
1.26
1.29
1.32
1.35
1.38
1.41
1.44
1.47
1.50
0.0 0.5 1.0 1.5 2.0
Total biomass (102 t km–2)
mTL
co
1990
2000
1999
1998
1997
1996
1995
19941993
1992 1991
1989 19881987
19861985
1984
19831982
19811980
19791978
19771976
1975
2001
2002
a
b
c
Fig. 7. Total catch and mean trophic level of the catch (mTLc) from (a) fish-eries statistics, and (b) modelled catches. Total biomass and mean trophic
level of the community (mTLco) from (c) modelled biomass

Coll et al.: Ecosystem assessment of the Adriatic Sea
changes in pelagic species. They were mainly focusedon fish species and a few commercial invertebrate spe-cies likely due to changes in protocol over the years(Table A1), so these data were not sufficient for analyz-ing changes in the lower trophic level organisms. Onthe contrary, these data were valuable for analyzingchanges in the demersal fish community.
Main limitations on the modelling exercise are dis-cussed in Coll et al. (2009b). The modelling data haveby definition a ‘built in’ interpretation of the realityaccording to the Ecopath with Ecosim assumptions(Christensen & Walters 2004). Therefore, it is not sur-prising that the analysis of trends of indicators from themodelling data series gave more clear and unambigu-ous results (Table 2 & A2). Nevertheless, the 2 inde-pendent data sets (scientific surveys and official catchstatistics) did not provide opposite signals to modellingresults (see Figs. 2 to 5, 7 & 8, and Tables 2 & A2), high-lighting that modelling can provide additional hints on
the ecosystem status when we face complex situationssuch as the one in the Adriatic Sea. Moreover, we useda basic linear model to assess the trend of time seriesand correct for autocorrelation. Our results suggestedthat most of the data were in fact autocorrelated, andonly few trends showed violations of the regressionassumptions in terms of non-stationarity and nonlin-earity. A more sophisticated trend analysis could com-plement these results and show more details in thespecies patterns complementing the ecosystem assess-ment.
Despite these limitations, our results showed thatthere were important changes taking place in the NCAdriatic Sea from the mid-1970s to the early-mid2000s. In several cases, 2 or 3 datasets showed de-creasing trends in target species (illustrated by the firstaxis in the PCA analysis of Fig. 8). These results are inline with results from stock assessments indicating thatseveral target and non-target demersal species are
205
–5
–4
–3
–2
–1
0
1
2
3
4
–6 –2 2 6
PC
2 (1
4.8%
)
19841985
1983
1986
1987
1988
1982
1998
1991
1992 1994
1993
1995
1997
20001996
–0.4
–0.3
–0.2
–0.1
0
0.1
0.2
0.3
0.4
–0.3 –0.2 –0.1 0 0.1 0.2 0.3
PC 1 (58.1%)
PC
2 (1
4.8%
)
Lindex
AnchovyB
BenthopFB
TPC
DSkatesB
TDB
FlatFishCHMackC
CephBB
CrabsC
GadidB
FlatFishBAnglerFB ODemB
CongerCHakeB MulletsB
CrabsB
FIBB
InvFisCD/PC
ShrimpB
DSkatesC
TLcFishC TDC
PPRFIBC ODemFC
SardineBMackC
–5
–4
–3
–2
–1
0
1
2
3
4
–8 –6 –4 –2 0 2 4 6 8
PC
2 (1
0.6%
)
19751976
1977
1978
1979
1980
1981 19821983
19841985
1986
1987
19891988
1990
1991
1992
199319941995
1996
1997
199920001998
2001
2002
–0.3
–0.2
–0.1
0
0.1
0.2
0.3
–0.2 –0.1 0
PC 1 (77.8%)
PC
2 (1
0.6%
)D/P C
GadidBFishB
DSharksB
FIB
Fish & Inv. B and C
AnglerfishBFlatfishB
AnchovyBBenthopFishB
Q90DemFishB
AnglerfishCFlatfishC
OSPB
MulletsB
Lindex b
Lindex a
TLco
HMackB
PPROSPCHakeBCongerB
TPB
CephBB
MackB
FishC
a
b
c
d
Fig. 8. Principal component (PC) analysis of NC Adriatic Sea indicators that illustrates temporal ecosystem changes. Analysis in-cludes catch, biomass and trophodynamic indicators calculated with (a,b) catch statistics and scientific surveys (1982–2000), or(c,d) with modelling predictions (1975–2002). Scores: 1st and 2nd PC indicating (a,c) trajectory of ecosystem with time, and (b,d)indicators included in the analysis and their contributions to both PC. B: biomass, C: catch, OSP: other small pelagic fish, ODem:other demersal fish, TD: total demersal, TP: total pelagic, Inv: invertebrates, D/P: demersal/pelagic ratio, Q: Kempton's index

Mar Ecol Prog Ser 417: 193–210, 2010
overexploited in the area (e.g. Jukic-Peladic et al.2001, Vrgoc et al. 2004, Bombace & Grati 2007).
Our results suggest that these trends occurred inparallel with a steady increase in fishing effort, as wellas an increase in the HDI and changes in the environ-ment, such as an increase in sea water temperatureand changes in regional (e.g. MOI) and global (e.g.NAO) factors. These results are in line with previousstudies in the Adriatic Sea analyzing some of theseenvironmental indicators with more detail (e.g. Mara-sovic et al. 1995, Dul<ic et al. 1999, Grbec et al. 2002,2003, 2007, 2008).
In addition to the general decreasing trends, wecould observe that several biomass and catch series in-
creased from the mid-1970s to the early 1980s, il-lustrated by the second axis of the PCA analysisof Fig. 8, before a strong decline was registered.This first increase could be due to indirect trophiceffects such as trophic cascades (i.e. decrease incompetition and predator release) as was de-scribed for the Catalan Sea (Coll et al. 2008b).The increase in catch and biomass during the1970s could also be due to the increasing fishingeffort, changing target species (e.g. towards in-vertebrate species), and/or to an increase of nu-trient enrichment in the area. The eutrophicationin the northern Adriatic Sea began in the 20thcentury, reached a maximum in the late 1970s,and levels were still high during the early 1990s(Sangiorgi & Donders 2004). Barmawidjaja et al.(1995) analyzed benthic foraminifera records inthe Northern Adriatic basin and described in-tense and prolonged anoxic events during the1980s due to eutrophication. The eutrophicationpeak between 1978 and 1980 coincided with thepeak in most of our time series (early 1980s); thus,the increase in biomass and catches up to thispoint and their consequent decrease could in partreflect patterns in eutrophication. During this pe-riod, the significant increase in fishing effort mayhave been compensated with higher productiondue to nutrient loading. A similar trend, an initialincrease followed by a decrease, was observed incatch data from the Venice lagoon (Libralato etal. 2004) and was correlated with changes in nu-trient loading.
Changes in trophodynamics and ecologicalroles
The changes of species biomass noted abovehad perceptible changes on the trophic relation-ships and ecological roles of species in the NCAdriatic ecosystem. Although no clear keystone
species were identified during the study period (nospecies had KS ≈ 0 or KS > 0; Libralato et al. 2006),modelling results underlined the increasing impor-tance of low and medium TL organisms in the AdriaticSea ecosystem (e.g. suprabenthos, zooplankton, ben-thic invertebrates) due to their essential role in trans-fering energy to the higher TL. Anchovy was identifiedas an important species in the food web during bothtime periods analyzed; however, the importantdecrease of sardine with time was likely due to thedecrease of biomass (Santojanni et al. 2003). Theseresults are similar to the ones observed for the South-ern Catalan Sea, NW Mediterranean from the late1970s to the early 2000s (Coll et al. 2009a).
206
–0.4
–0.2
0
0.2
0.4
0.6–0.4 –0.2 0 0.2 0.4 0.6
PC 1 (32.9%)
PC
2 (1
8.9%
)
FE purse seine
SSTt
NAOwNAOt
HDI
FE total
FE trawl
SSTwMOI
FE midwater trawl
Salinity
PoRiver
–4
–3
–2
–1
0
1
2
3
4
–4 –3 –2 –1 0 1 2 3 4
PC
2 (1
8.9%
)
1978–79 1981
1976
1977
1980
19821975
1983
1987
19861994
1990
19841991
1985
1988
1992
19931995
1996
1997
19981999
2000
2001 2002
a
b
Fig. 9. Principal component (PC) analysis of abiotic indicators of the NCAdriatic Sea (1975–2002) including fishing effort (FE) by fleet, humandevelopment index (HDI) and environmental parameters such as Poriver runoff (PoRiver), salinity, sea surface temperature (SST), Mediter-ranean Oscillation Index (MOI), and North Atlantic Oscillation Index(NAO) (annual = t; in winter = w). Scores: (a) 1st and 2nd PC indicatingtrajectory of all these indicators with time, and (b) indicators included
in the analysis and their contributions to both PCs

Coll et al.: Ecosystem assessment of the Adriatic Sea
Another interesting result was the decrease of ceta-ceans as keystone group in the ecosystem, which hasalso been observed in other marine ecosystems (e.g.California upwelling and Catalan Sea; Libralato et al.2006, Coll et al. 2009a). This could be related to thedecreasing population of these organisms in the Adri-atic Sea (Bearzi et al. 2004).
Keystone analyses also showed the higher impor-tance of phytoplankton in the mid-1990s in comparisonto the mid-1970s, indicating that the ecosystem likelybecame more sensitive to changes in primary produc-tion and environmental forcing. The Adriatic Sea pri-mary production is partially limited (Bosc et al. 2004)and is under the influence of local enrichment by riverrunoff, or changes in current circulation and in salinitythat produce temporal upwelling areas associated withhigher productivity (Agostini & Bakun 2002). As previ-ously discussed, overexploitation and simplification offood webs decrease the resilience of marine ecosys-tems and increase their vulnerability to environmentalchange (Hughes et al. 2005). This may also be the casefor the Adriatic Sea.
Food-web structure and fishing impacts
In addition to the changes in abundance and ecolo-gical roles of marine species with time, we also docu-mented changes in the structure and functioning of theNC Adriatic Sea ecosystem. Time series showed a gen-eral decrease in biomass and the mTLco, suggestingthat the ecosystem progressed from low abundance oflarge slow-growing organisms towards higher impor-tance of small and fast growing organisms. This wasalso illustrated by the lower mTLc with time, lower Q’index, higher Invertebrate/Fish catch and biomassratios, and changes in the trophic spectra of the bio-mass and catch.
The indices (FIB, %PPR, L) calculated using fishingstatistics and model predictions increased throughtime due to fishery expansion and likely bottom-upeffects (Christensen 2000) associated with eutrophica-tion until the early-mid 1980s (Sangiorgi & Donders2004). A posterior decrease due to increased fishingeffects on the ecosystems was observed in the FIBindex, while negative values from the middle 1990smost likely indicated that the functioning of theecosystem in terms of the upward transfer of produc-tion from low to high TL changed importantly (Pauly &Watson 2005). Similar trends were shown for the FIBindex when analyzing data from scientific surveys.
The bending backwards curve (Pauly et al. 2000)observed when plotting both the total catch and mTLc
using fisheries statistics and modelling predictionsillustrated a ‘fishing down the Adriatic food web’ pro-
cess during the mid 1970s to 1980s that was shownwhen higher catches were obtained in parallel with adecline in mTLc. Although a sequential addition mech-anism due to the addition of new fisheries sensu Ess-ington et al. (2006) may also have occurred (i.e. due tothe increasing value of several invertebrate speciesand the number of boats that target them), the fishing-down process may have occurred mainly due to adecrease of demersal fish and an increase of inverte-brates and small pelagic fish (Coll et al. 2007). Thisprocess could have been mitigated by the enrichmentof the system due to nutrient loading until at least theearly 1980s. These results regarding mTLc contrastwith those reported for the Western Mediterraneanfishery (Pinnegar et al. 2003). In this case, mTLc wasreported to have decreased mainly due increasinglandings of bivalve molluscs from mariculture and notdue to changes in landings from fisheries.
Results highlighted changes in ecosystem function-ing during the 1990s: decreasing nutrient input due tochanges in environmental policy may have influencedthe decline in biomass and catches during this period(although eutrophication was still high during the1990s; Sangiorgi & Donders 2004), in parallel with acontinuous increase in fishing effort. Trophic spectracalculated from catch and data also showed thisimpoverishment of ecosystem biomass.
Unlike models and catch data, biomass estimatesfrom scientific trawl surveys between 1982 and 2005did not show the decrease in the mTLco, probably dueto the fact that fewer benthic invertebrate species wereincluded in the database (Table A1). Commercialcatches mainly include commercial invertebrate spe-cies, and also data from beam trawlers, which samplebenthic invertebrates much more efficiently than ottertrawls (used for scientific surveys). Beam trawlers haveincreased in number and engine power in the past(Pranovi et al. 2003).
In general, these results demonstrate that fishingimpacts have increased in the Adriatic Sea over thelast 30 yr, while the ecosystem has progressedtowards an altered and depleted state. Correlationanalysis confirmed the relationship between thesechanges and a fishing effort increase in the ecosys-tem, in addition to changes in the environment. Thissupports the Adriatic Sea being ranked as one of theecosystems most impacted by fishing in a comparisonwith 19 other ecosystems when using multiple indica-tors, accounting for current states and recent trends(Coll et al. 2010, Link et al. 2010). The application ofthe L index, a new index of the ecosystem effects offishing, to modelling results and global datasets(Libralato et al. 2008) also evidenced a high probabil-ity of ecosystem overfishing for the Adriatic Sea dur-ing the last 3 decades.
207

Mar Ecol Prog Ser 417: 193–210, 2010
Multivariate framework for an ecosystem assessment
The trajectory of PCA scores was similar under theanalysis of both modelling results and surveys andcatch data, and the combination of these data within amultivariate framework enabled us to delineate sev-eral key processes affecting the Adriatic Sea ecosys-tem at once and through time. These results showedthat the main trajectory in the last 3 decades was char-acterized by a general decrease in biomass and catch,with some records of species proliferations. Thesechanges happened in parallel with an increase in fish-ing effort and changes in various environmental para-meters, such as an increase in the SST, decline in theinflow of highly saline Mediterranean water into theAdriatic Sea, and changes in the atmospheric pressureat sea-level (and most likely also changes in nutrientenrichment although not included in this analysis dueto lacking data). Our study shows that the combinationof multiple biotic and abiotic indicators is thus essentialto understanding main changes on this marine ecosys-tem. These results can be complementary to traditionalsingle-species fisheries assessments, while mechanis-tic tools such as modelling exercises may be useful inassessing whether this marine ecosystem could bebrought to previous states or could be changed in spe-cific ways (Link et al. 2002).
Acknowledgements. The authors acknowledge all colleagueswho provided data and technical advice for of this work, inparticular from the Istituto di Scienze Marine (CNR), Sede diAncona (Italy): A. Artegiani, M. Azzali, N. Cingolani, G. Fabi,C. Froglia, M. E. Gramitto, and B. E. Morello; and A. Russo(Università Politecnica delle Marche), A. Di Natale (Aqua-studio), S. Fonda Umani (Università di Trieste), D. Holcer(Natural History Museum of Zagreb), S. Libralato (IstitutoNazionale di Oceanografia e di Geofisica Sperimentale, Tri-este), C. Piccinetti (Università di Bologna), R. Santolini (Uni-versità di Urbino), M. Zavatarelli (Università di Bologna) andB. Grbec (Institute of Oceanography and Fisheries of Split,Croatia). This work was made possible by a bilateral Co-operative-Agreement between the CNR (Italy) and the CSIC(Spain). The EU project SESAME contract no. 036949-2 thatallowed the continuation of this work is greatly acknow-ledged. M.C. was supported financially by a postdoctoralfellowship from the Spanish Ministry of Science and Tech-nology, and by the European Community Marie-Curie Post-doctoral Fellowship through the International Outgoing Fel-lowships (Call: FP7-PEOPLE-2007-4-1-IOF) to ECOFUN.
LITERATURE CITED
Affronte M, Scaravelli D (2001) Analysis of stranded sea tur-tles in the north-western Adriatic Sea. Zool Middle East24:101–108
Agostini VN, Bakun A (2002) ‘Ocean triads’ in the Medi-terranean Sea: physical mechanisms potentially structur-ing reproductive habitat suitability (with example applica-tion to European anchovy, Engraulis encrasicolus). FishOceanogr 11:129–142
Ainsworth CH, Pitcher TJ (2006) Modifying Kempton’s spe-cies diversity index for use with ecosystem simulationmodels. Ecol Indic 6:623–630
Barmawidjaja DM, Vanderzwaan GJ, Jorissen FJ, Puskaric S(1995) 150 years of eutrophication in the northern AdriaticSea: evidence from a benthic foraminiferal record. MarGeol 122:367–384
Bearzi G, Holcer D, Notarbartolo di Sciara GN (2004) The roleof historical dolphin takes and habitat degradation inshaping the present status of northern Adriatic cetaceans.Aquat Conserv Mar Freshw Ecosyst 14:363–379
Bombace G (1992) Fisheries of the Adriatic Sea. In: ColomboG, Ferrari I, Ceccherelli VU, Rossi R (eds) Marine eutroph-ication and population dynamics. 25th Eur Mar Biol Symp.Olsen & Olsen, Fredensborg, p 379–389
Bombace G, Grati F (2007) Che succede alle risorse di pescadel Mediterraneo? Not Soc Ital Biol Mar 51:29–38
Bosc E, Bricaud A, Antoine D (2004) Seasonal and interannualvariability in algal biomass and primary production in theMediterranean Sea, as derived from 4 years of SeaWiFSobservations. Global Biogeochem Cycles 18 GB1005 doi:10.1029/2003GB002034
Christensen V (2000) Indicators for marine ecosystemsaffected by fisheries. Mar Freshw Res 51:447–450
Christensen V, Walters C (2004) Ecopath with Ecosim: meth-ods, capabilities and limitations. Ecol Modell 172:109–139
Cingolani N, Kirkwood G, Arneri E, Santojanni A and others(2000) Discards from the Adriatic small pelagic fishery.Final report on European Community funded project, EU97/065, IX
Cingolani N, Santojanni A, Arneri E, Belardinelli A, GiannettiG, Colella S, Donato F (2002a) Valutazione degli stockspelagici di alici e sardine in Adriatico con metodi didinamica di popolazione. Rapporto per il Ministero per lePolitiche Agricole e Forestali, Rome
Cingolani N, Santojanni A, Arneri E, Belardinelli A, GiannettiG, Colella S, Donato F (2002b) Stock assessment of sardine(Sardina pilchardus, Walb.) in the Adriatic Sea. Biol MarMediterranea 9:82–88
Clarke KR, Gorley RN (2006) PRIMER v6: user manual/tutor-ial (Plymouth routines in multivariate ecological research).Primer-E, Plymouth
Clarke KR, Warwick RM (2001) A further biodiversity indexapplicable to species lists: variation in taxonomic distinct-ness. Mar Ecol Prog Ser 216:265–278
Coll M, Santojanni A, Palomera I, Tudela S, Arneri E (2007)An ecological model of the Northern and Central AdriaticSea: analysis of ecosystem structure and fishing impacts.J Mar Syst 67:119–154
Coll M, Lotze HK, Romanuk TN (2008a) Structural degrada-tion in Mediterranean Sea food webs: testing ecologicalhypotheses using stochastic and mass-balance modelling.Ecosystems 11:939–960
Coll M, Palomera I, Tudela S, Dowd M (2008b) Food-webdynamics in the South Catalan Sea ecosystem (NWMediterranean) for 1978–2003. Ecol Model 217:95–116
Coll M, Palomera I, Tudela S (2009a) Decadal changes in aNW Mediterranean Sea food web in relation to fishingexploitation. Ecol Model 220:2088–2102
Coll M, Santojanni A, Palomera I, Arneri E (2009b) Food-webchanges in the Adriatic Sea over the last three decades.Mar Ecol Prog Ser 381:17–37
Coll M, Shannon LJ, Yemane D, Link JS and others (2010)Ranking the ecological relative status of exploited marineecosystems. ICES J Mar Sci 67:769–786
Cooper J, Borg JJ, Belda EJ, Papaconstantinou C, Sánchez A(2000) Mortalidad de aves marinas en palangres del mar
208

Coll et al.: Ecosystem assessment of the Adriatic Sea
mediterráneo y región Macaronésica: revisión y reco-medaciones para el futuro, Vol 6. Simposio Mediterráneosobre aves marinas. Conferencia sobre pesquerías, pro-ductividad marina y conservación de aves marinas. 11–15Oct 2000, Benidorm
de Leiva Moreno JI, Agostini VN, Caddy JF, Carocci F (2000)Is the pelagic-demersal ratio from fishery landings a use-ful proxy for nutrient availability? A preliminary dataexploration for the semi-enclosed seas around Europe.ICES J Mar Sci 57:1091–1102
Dul<ic J, Grbec B, Lipej L (1999) Information on the Adriaticichthyofauna: effect of water warming? Acta Adriat 40:33–43
Essington TE, Beaudreau AH, Wiedenmann J (2006) Fishingthrough marine food webs. Proc Natl Acad Sci USA 103:3171–3175
Fonda Umani S (1996) Pelagic production and biomass in theAdriatic Sea. Sci Mar 60:65–77
Gascuel D, Bozec YM, Chassot E, Colomb A, Laurans M(2005) The trophic spectrum: theory and practical applica-tions. ICES J Mar Sci 62:443–452
Grbec B, Dulcic J, Morovic M (2002) Long-term changes inlandings of small pelagic fish in the eastern Adriatic —possible influence of climate oscillations over the North-ern Hemisphere. Clim Res 20:241–252
Grbec B, Morovi M, Zore-Armanda M (2003) Mediterraneanoscillation and its relationship to salinity fluctuation in theAdriatic Sea. Acta Adriat 44:61–76
Grbec B, Vilibic I, Bajic A, Morovic M, Bec Paklar G, Matic F,Dadic V (2007) Response of the Adriatic Sea to the atmos-pheric anomaly in 2003. Ann Geophys 25:835–846
Grbec B, Morovi M, Dul i J, Marasovic I, Ninevi 5 (2008)Impact of the climatic change on the Adriatic Sea ecosys-tem. Fresenius Environ Bull 17:1–7
Hughes TP, Bellwood DR, Folke C, Steneck RS, Wilson J(2005) New paradigms for supporting the resilience ofmarine ecosystems. Trends Ecol Evol 20:380–386
Jennings S, Greenstreet S, Hill L, Piet G, Pinnegar J, Warr KJ(2002) Long-term trends in the trophic structure of theNorth Sea fish community: evidence from stable-isotopeanalysis, size-spectra and community metrics. Mar Biol141:1085–1097
Jongman RHG, ter Braak CJF, van Tongeren OFR (1999) Dataanalysis in community and landscape ecology. CambridgeUniversity Press, Cambridge
Jukic-Peladic S, Vrgoc N, Krstulovic-Sifner S, Piccinetti C,Piccinetti-Manfrin G, Marano G, Ungaro N (2001) Long-term changes in demersal resources of the Adriatic Sea:comparison between trawl surveys carried out in 1948 and1998. Fish Res 53:95–104
Kempton RA, Taylor LR (1976) Models and statistics for spe-cies diversity. Nature 262:818–820
Libralato S, Pranovi F, Raicevich S, Da Ponte F and others(2004) Ecological stages of the Venice Lagoon analysedusing landing time series data. J Mar Syst 51:331–344
Libralato S, Christensen V, Pauly D (2006) A method for iden-tifying keystone species in food web models. Ecol Model195:153–171
Libralato S, Coll M, Tudela S, Palomera I, Pranovi F (2008)Novel index for quantification of ecosystem effects of fish-ing as removal of secondary production. Mar Ecol ProgSer 355:107–129
Lindeman RL (1942) The trophic-dynamic aspect of ecology.Ecology 23:399–418
Link JS, Brodziak JKT, Edwards SF, Overholtz WJ and others(2002) Marine ecosystem assessment in a fisheries man-agement context. Can J Fish Aquat Sci 59:1429–1440
Link JS, Yemane D, Shannon LJ, Coll M and others (2010)Relating marine ecosystem indicators to fishing and envi-ronmental drivers: an elucidation of contrasting responses.ICES J Mar Sci 67:787–795
Marasovic I, Grbec B, Morovi M (1995) Long-term productionchanges in the Adriatic. Neth J Sea Res 34:267–273
Mattei N, Pellizzato M (1996) A population study on threestocks of a commercial Adriatic pectinid (Pecten jaco-baeus ). Fish Res 26:49–65
Morello EB, Arneri E (2009) Anchovy and sardine in the Adri-atic Sea: an ecological review. Oceanogr Mar Biol AnnuRev 47:209–256
Odum WE, Heald EJ (1975) The detritus-based food web foran estuarine mangrove community. In: Cronin LE (ed)Estuarine research, Vol 1. Academic Press, New York, NY
Ott J (1992) The Adriatic benthos: problems and perspectives.In: Colombo G, Ferrari I, Ceccherelli VU, Rossi R (eds)Marine eutrophication and population dynamics. 25th EurMar Biol Symp. Olsen & Olsen, Fredensborg, p 367–378
Pauly D, Christensen V (1995) Primary production required tosustain global fisheries. Nature 374:255–257
Pauly D, Watson R (2005) Background and interpretation ofthe ‘Marine Trophic Index’ as a measure of biodiversity.Philos Trans R Soc B Biol Sci 360:415–423
Pauly D, Christensen V, Dalsgaard J, Froese R, Torres F (1998)Fishing down marine food webs. Science 279:860–863
Pauly D, Christensen V, Walters C (2000) Ecopath, Ecosim,and Ecospace as tools for evaluating ecosystem impact offisheries. ICES J Mar Sci 57:697–706
Pinardi N, Arneri E, Crise A, Ravaioli M, Zavatarelli M (2006)The physical, sedimentary and ecological structure andvariability of shelf areas in the Mediterranean Sea. In:Robinson AR, Brink KA (eds) The Sea, Vol 14. HarvardUniversity Press, Cambridge, MA, p 1245–1331
Pinnegar JK, Polunin NVC, Badalamenti F (2003) Long-termchanges in the trophic level of western Mediterraneanfishery and aquaculture landings. Can J Fish Aquat Sci60:222–235
Power ME, Tilman D, Estes JA, Menge BA and others (1996)Challenges in the quest for keystones. Bioscience 46:609–620
Pranovi F, Raicevich S, Franceschini G, Torricelli P, Gio-vanardi O (2001) Discard analysis and damage to non-target species in the ‘rapido’ trawl fishery. Mar Biol 139:863–875
Pranovi F, Libralato S, Raicevich S, Granzotto A, Pastres R,Giovanardi O (2003) Mechanical clam dredging in Venicelagoon: ecosystem effects evaluated with a trophic mass-balance model. Mar Biol 143:393–403
Riedl R (1983) Fauna and flora of the Mediterranean: a sys-tematic marine guide for biologists and nature lovers. Ver-lag Paul Parey, Hamburg
Sangiorgi F, Donders TH (2004) Reconstructing 150 years ofeutrophication in the north-western Adriatic Sea (Italy)using dinoflagellate cysts, pollen and spores. Estuar CoastShelf Sci 60:69–79
Santojanni A, Arneri E, Belardinelli A, Cingolani N, GiannettiG (2001) Fishery and stock assessment of sardine Sardinapilchardus (WALB.) in the Adriatic Sea. Acta Adriat 42:151–168
Santojanni A, Arneri E, Barry C, Belardinelli A, Cingolani N,Giannetti G, Kirkwood G (2003) Trends of anchovy(Engraulis encrasicolus, L.) biomass in the northern andcentral Adriatic Sea. Sci Mar 67:327–340
Santojanni A, Cingolani N, Arneri E, Kirkwood G and others(2005) Stock assessment of sardine (Sardina pilchardus,Walb.) in the Adriatic Sea, with an estimate of discards. Sci
209

Mar Ecol Prog Ser 417: 193–210, 2010
Mar 69:603–617Santojanni A, Arneri E, Bernardini V, Cingolani N, Di Marco
M, Russo A (2006a) Effects of environmental variables onrecruitment of anchovy in the Adriatic Sea. Clim Res 31:181–193
Santojanni A, Cingolani N, Arneri E, Belardinelli A, GiannettiG, Colella S, Donato F (2006b) Recruitment of sardine (Sar-dina pilchardus Walbaum 1792) in the Adriatic Sea and en-vironmental factors. Biol Mar Mediterranea 13:158–166
Smith TM, Reynolds RW (2004) Improved extended recon-struction of SST (1854–1997). J Clim 17:2466–2477
Vrgoc N, Arneri E, Jukic-Peladic S, Krstulovic 2ifner S andothers (2004) Review of current knowledge on shared
demersal stocks of the Adriatic Sea, Vol 12. GCP/RER/010/ITA/TD-12. AdriaMed Technical Documents
Wieczorek SK, Campagnuolo S, Moore PG, Froglia C, Atkin-son RJA, Gramitto ME, Bailey N (1999) The compositionand fate of discards from the Nephrops norvegicus trawl-ing in Scottish and Italian waters. Final report on Euro-pean Community funded project, 96/092, Ancona
Zotier R, Bretagnolle V, Thibault JC (1999) Biogeography ofthe marine birds of a confined sea, the Mediterranean.J Biogeogr 26:297–313
5upanovic S, Jardas I (1989) Fauna i flora Jadrana: JabuckaKotlina, Vol 4. Institut za Oceanografiju i Ribarstvo, Logos,Split
210
Appendix. Table A1. Number of species collected during scientific demersal trawl surveys (GRUND) by water depth and year, and by principal group (fish, crustaceans [crust] and mollusks [moll])
Year 0–50 m 50–100 m 100–200 m >200 m MeanFish Crust Moll Total Fish Crust Moll Total Fish Crust Moll Total Fish Crust Moll Total
1982 72 4 8 84 56 7 6 69 59 1 13 73 43 3 9 55 701987 62 4 13 79 54 4 10 68 59 6 11 76 33 1 7 41 661992 68 4 10 82 59 3 9 71 40 2 7 49 12 1 2 15 541997 74 5 11 90 76 8 14 98 63 3 17 83 33 2 9 44 792002 93 10 13 116 81 7 10 98 66 6 18 90 43 11 13 67 93
Table A2. Linear trends of biomass estimates from scientific surveys, catch statistics and ecosystem models by species or group ofspecies for the NC Adriatic Sea from 1975–1980 to early 2000s. Data in ( ): related to VPA estimates. Obs: observations, a = cor-rected for autocorrelation, l = normality violated, n = normality slightly violated. Ceph.: cephalopods, benthop.: benthopelagic,
dem: demersal, inv: invertebrate. Significant values in bold
Species Biomass Catch Modelsor group surveys statistics Biomass Catch
Slope p R2 Obs Slope p R2 Obs Slope p R2 Obs Slope p R2 Obs
InvertebratesCrabs –0.09 0.01 0.50 a 0.10 0.00 0.76 a –0.07 0.06 0.46 a 0.02 0.76 0.00 a, lShrimps 0.08 0.00 0.39 n 0.02 0.56 0.02 a, n –0.07 0.07 0.48 a –0.03 0.58 0.08 a, lNorway lobster –0.04 0.23 0.08 0.00 0.97 0.00 a –0.08 0.03 0.59 a 0.00 0.93 0.01 a, lBenthic ceph. –0.06 0.03 0.23 –0.02 0.61 0.02 a –0.09 0.00 0.81 a –0.06 0.12 0.53 aBenthop. ceph. 0.02 0.51 0.05 a –0.04 0.33 0.16 a,n –0.08 0.01 0.66 a –0.05 0.21 0.39 aOther benthic inv –0.01 0.70 0.01 n 0.04 0.43 0.09 a –0.08 0.01 0.66 a –0.05 0.22 0.44 a
Demersal fishHake 0.05 0.35 0.04 a –0.10 0.00 0.62 –0.11 0.00 0.84 a –0.05 0.17 0.26 a, lOther gadiforms –0.06 0.03 0.21 n –0.03 0.48 0.02 a, n –0.10 0.00 0.75 a, n –0.06 0.18 0.31 a, lAnglerfish –0.09 0.01 0.36 a –0.06 0.16 0.37 a –0.11 0.00 0.85 a –0.11 0.00 0.92 aConger eel –0.02 0.62 0.02 a –0.09 0.00 0.47 –0.11 0.00 0.88 a –0.06 0.09 0.35 a, nFlatfish –0.09 0.00 0.43 –0.07 0.06 0.29 a –0.11 0.00 0.87 a –0.11 0.00 0.95 aRed mullets 0.04 0.16 0.10 n –0.05 0.05 0.16 –0.10 0.00 0.82 a –0.05 0.20 0.37 a, n, lOther dem. fishes –0.07 0.02 0.41 a –0.09 0.00 0.56 –0.12 0.00 0.90 a, n –0.08 0.01 0.71 aDem. sharks –0.01 0.85 0.00 a, l –0.07 0.06 0.38 a –0.11 0.00 0.90 a –0.06 0.13 0.41 aDem. skates –0.06 0.05 0.19 –0.09 0.00 0.45 a –0.09 0.00 0.72 a –0.03 0.61 0.09 a
Pelagic fishAnchovy 0.003 0.927 0.000 (a, n, l) 0.00 0.97 0.09 a –0.10 0.00 0.73 a –0.04 0.31 0.18 a
(–0.037) (0.395) (0.186)Sardine 0.011 0.729 0.006 (a, n, l) –0.05 0.08 0.45 a –0.06 0.10 0.51 a, l –0.04 0.25 0.19 a, n
(–0.051) (0.135) (0.537)Other small –0.03 0.34 0.05 –0.05 0.29 0.28 a –0.10 0.00 0.84 a –0.10 0.00 0.77 a
pelagic fishHorse mackerel –0.05 0.07 0.16 –0.11 0.00 0.64 a –0.10 0.00 0.75 a –0.03 0.37 0.07 aMackerel 0.06 0.08 0.30 a, n –0.10 0.00 0.58 a –0.07 0.02 0.31 a, n 0.05 0.11 0.17 aBenthop. fish –0.71 0.04 0.22 a, n –0.05 0.24 0.31 a –0.10 0.00 0.70 a –0.03 0.15 0.083
Editorial responsibility: Konstantinos Stergiou, Thessaloniki, Greece
Submitted: February 23, 2010; Accepted: September 1, 2010Proofs received from author(s): October 18, 2010