TRANS ADRIATIC PIPELINE (TAP) PROJECT ITALIAN ...
69
FUGRO OCEANSISMICA S.p.A. – OFFSHORE DIVISION Via Charles Lenormant, 268, 00126 Rome, Italy Phone: 39-06-5219291 - Fax 39-06-5219297, E-mail: [email protected] Prepared for: Statoil ASA N- 4035 Stavanger Forus Øst G-4 Att: Sølvi Elisabeth Valheim Final Issued as Final G. Saporito D. Taliana 10 April 2014 0C Issued for client acceptance S. Polizzi D. Taliana 07 April 2014 0B Issued for client acceptance S. Polizzi D. Taliana 21 March 2014 0A Issued for client comments S. Polizzi D. Taliana 10 February 2014 Rev Description Prepared Checked Date TRANS ADRIATIC PIPELINE (TAP) PROJECT ITALIAN NEARSHORE GEOPHYSICAL SURVEY Italian Landfall - San Foca - Italy FINAL REPORT OPL00 – FOC- 150 – Y – TRG - 0001 Client Ref: ST 13573
-
Upload
khangminh22 -
Category
Documents
-
view
1 -
download
0
Transcript of TRANS ADRIATIC PIPELINE (TAP) PROJECT ITALIAN ...

FUGRO OCEANSISMICA S.p.A. – OFFSHORE DIVISION
Via Charles Lenormant, 268, 00126 Rome, Italy Phone: 39-06-5219291 - Fax 39-06-5219297, E-mail: [email protected]
Prepared for: Statoil ASA
N- 4035 Stavanger Forus Øst G-4 Att: Sølvi Elisabeth Valheim
Final Issued as Final G. Saporito D. Taliana 10 April 2014
0C Issued for client acceptance S. Polizzi D. Taliana 07 April 2014
0B Issued for client acceptance S. Polizzi D. Taliana 21 March 2014
0A Issued for client comments S. Polizzi D. Taliana 10 February 2014
Rev Description Prepared Checked Date
TRANS ADRIATIC PIPELINE (TAP) PROJECT ITALIAN NEARSHORE GEOPHYSICAL SURVEY
Italian Landfall - San Foca - Italy
FINAL REPORT OPL00 – FOC- 150 – Y – TRG - 0001
Client Ref: ST 13573

TAP- TRANS ADRIATIC PIPELINE Italian Nearshore Geophysical Survey
OPL00 – FOC – 150 Y TRG – 001 –Rev 0B Page i
KEYPLAN

TAP- TRANS ADRIATIC PIPELINE Italian Nearshore Geophysical Survey
OPL00 – FOC – 150 Y TRG – 001 –Rev 0B Page ii
CONTENTS
Page
1 INTRODUCTION 1
1.1 General 1
1.2 Definitions and Abbreviations 2
1.3 References 3
1.4 Revision Record Sheet 5
2 SURVEY DESCRIPTION 6
2.1 Scope of Work (SOW) 6
2.2 Performed Work 7
2.2.1 RV Astrea Survey Program 7
2.2.2 MB Vector Survey Program 7
2.3 GPS and Survey Geodetic Parameters 10
3 SUMMARY OF RESULTS 11
4 DETAILED RESULTS 13
4.1 Geological Setting 13
4.2 Bathymetry 17
4.2.1 Seabed Features 20
4.3 Shallow Geology 23
4.4 Shallow Geohazards and Installation Constrains 34
4.4.1 Cavity Survey 34
4.4.2 Bioturbated Seabed: 34
4.4.3 Seismic Anomalies 34
4.4.4 Fractures/Faults 34
4.4.5 Objects/Obstructions and Existing Infrastructures 34
5 ROUTE DETAILS 35
6 EQUIPMENT 36
6.1 Survey Vessels 36
6.2 Survey Equipment – RV Astrea 36
6.2.1 Surface Positioning 37
6.2.2 Heading 37
6.2.3 Single Beam Echo Sounder 37
6.2.4 Multibeam Echo Sounder 38
6.2.5 Motion Compensation 39
6.2.6 Sound Velocity Profiler 39
6.2.7 Side Scan Sonar 39
6.2.8 Sub-Bottom Profiler 40

TAP- TRANS ADRIATIC PIPELINE Italian Nearshore Geophysical Survey
OPL00 – FOC – 150 Y TRG – 001 –Rev 0B Page iii
6.2.9 Boomer 40
6.2.10 Sediment Sampling (Day Grab) 41
6.2.11 Underwater Video Camera 41
6.3 Survey Equipment – MB Vector 41
6.3.1 Surface Positioning 41
6.3.2 Single Beam Echo Sounder 41
6.4 Analogue Instrument Offsets 42
7 SURVEY OPERATIONS 44
7.1 Calibrations 44
7.1.1 Surface Positioning 45
7.1.2 Multibeam Echo Sounder 45
7.1.3 Acoustic Velocity 46
7.2 Data Reduction and Processing 47
7.2.1 Positioning and Navigation 47
7.2.2 Bathymetry - Tides 47
7.2.3 Single Beam Echo Sounder 47
7.2.4 Multibeam Echo Sounder 47
7.2.5 Side Scan Sonar 47
7.2.6 Sub-Bottom Profiler/Boomer 48
7.3 Accuracy of Navigation, Bathymetric and Seabed Data 48
7.3.1 Positioning and Navigation 48
7.3.2 Bathymetry 48
7.3.3 Side Scan Sonar 49
7.4 Accuracy of Sub Seabed Data 49
7.4.1 Horizontal Accuracy 49
7.4.2 Vertical Accuracy 50
8 DATA INDEX 51
8.1 Digital Report Delivery 51
8.2 Chart Index 52
8.3 Target Listing Index 53

TAP- TRANS ADRIATIC PIPELINE Italian Nearshore Geophysical Survey
OPL00 – FOC – 150 Y TRG – 001 –Rev 0B Page iv
APPENDICES
A. GEODETIC PARAMETERS
B. CALIBRATIONS
C. SURVEY LOGS
D. DAILY PROGRESS REPORTS
E. VESSEL SPECIFICATIONS
F. DETAILED EQUIPMENT
G. MBES PROCESSING
H. SERVICE WARRANTY
I. CHARTS

TAP- TRANS ADRIATIC PIPELINE Italian Nearshore Geophysical Survey
OPL00 – FOC – 150 Y TRG – 001 –Rev 0B Page v
TABLES
Page
Table 2.1:Topographic survey co-ordinates 8
Table 2.2: Proposed Landfall Co-ordinates 8
Table 2.3: Project Geodetic and Projection Parameters 10
Table 5.1: Pipeline Route Coordinates 35
Table 6.1: RV ASTREA Vessel Specifications 36
Table 6.2: MB Vector Specifications 36
Table 6.3: RV ASTREA Equipment 36
Table 6.4: MB Vector Equipment 41
Table 6.5: Instrument Offsets relative to the CRP position 42
Table 7.2: EM 2040 Multibeam Calibration Results 45
Table 7.3: Mean Acoustic Velocity as determined from SVP measurement 46
FIGURES
Page
Figure 2.1: Nearshore Geophysical Survey corridor and route. 9
Figure 4.1: Geological map (Ref 7). 14
Figure 4.2: Intermediate and bottom current circulation in the central Mediterranean Sea (REF 17). 16
Figure 4.3: MBES data – Evidences of slow mass movement. 18
Figure 4.4: MBES data – Example of Even seabed, probably due to biocostruction patch reef 18
Figure 4.5: MBES data – Example of undulated seabed: probable sand waves. 19
Figure 4.6: SSS data (Line TAPM04H) – Sandy GRAVEL 21
Figure 4.7: SSS data (Line TAPM04H) – Biocostructions. 22
Figure 4.8: SSS data (Line TAPMCLH) – Megaripples 22
Figure 4.9: Example boomer data (Line TAPMCL) – Centre line TAPMCL_BOM_202. 26
Figure 4.10: Example boomer data (Line TAPMCL) – Centre line TAPMCL_BOM_202. 27
Figure 4.11: Example of boomer data – Centre line TAPMCL_BOM_202. 28
Figure 4.12: Example of boomer data – Centre line TAPMCL_BOM_202. 29
Figure 4.15: Example of boomer data – Line TAPM11_BOM_201 and DTM. 32
Figure 4.16: Example of Boomer data – Centre Line TAPMCL_BOM_202 and DTM. 33
Figure 6.1: Instrument Offsets – RV ASTREA 43
Figure 6.2: Configuration of equipment on board – RV ASTREA 43

TAP- TRANS ADRIATIC PIPELINE Italian Nearshore Geophysical Survey
OPL00 – FOC – 150 Y TRG – 001 –Rev 0B Page 1
1 INTRODUCTION
1.1 General
Statoil for TAP (Client) has contracted Fugro Oceansismica S.p.A to perform the Detailed Marine
Survey (DMS) for the Submarine Pipeline section of the TAP Project. In particular, Fugro
Oceansismica S.p.A. is responsible for execution of the Nearshore Geophysical Surveys in Italian
territories.
The work was conducted at nearshore location in south-east Italy, north of San Foca (Lecce). The
TAP Project has changed the Italian landfall location.
This Geophysical Survey Final Report shows the Italian nearshore results of MBES, SSS, SBP and
Boomer data. In particular, it provides results and main features affecting the nearshore pipeline route
in a 4000 m long corridor.
This Final Report includes all data acquisition and processing, charting and reporting to facilitate, with
the nearshore geotechnical survey, the required engineering analysis for the shore approaches to the
landfall.
All coordinates in this report are based on the WGS84 (ETRF 1989) Datum, WGS84 Spheroid. Grid
coordinates are in metres on the Universal Transverse Mercator Projection, Zone 34 N, Central
Meridian 21°E.
The final interpretation is based upon all the available data and it is illustrated with figures in the text
and with charts (Appendix I).

TAP- TRANS ADRIATIC PIPELINE Italian Nearshore Geophysical Survey
OPL00 – FOC – 150 Y TRG – 001 –Rev 0B Page 2
1.2 Definitions and Abbreviations
UVC Underwater video camera
CRP Centre Reference Point
CTD Conductivity, Temperature and Depth
DGPS Differential Global Positioning System
DPR Daily Progress Report
DTM Digital Terrain Model
FOSPA Fugro Oceansismica S.P.A.
GEOS Fugro Global Environmental and Ocean Sciences
GPS Global Positioning System
HF High Frequency
HP High Precision
HSE Health, Safety and the Environment
Hz - kHz Hertz – kiloHertz
J - kJ Joule – kiloJoule
KP Kilometre Post
LAT Lowest Astronomical Tide
LF Low Frequency
m - km Metres – kilometres
MBES Multibeam echo sounder
MSL Mean Sea Level
MRU Motion Reference Unit
QC Quality Control
RTK Real Time Kinematic
s - ms seconds – milliseconds
SBES Single beam echo sounder
SBP Sub-bottom profiler
SPK Sparker
SSS Side scan sonar
SVP Sound Velocity Profiler
TWTT Two Way Travel Time
UCF Unconformity
UTM Universal Transverse Mercator
wd water depth
WGS84 World Geodetic System 84

TAP- TRANS ADRIATIC PIPELINE Italian Nearshore Geophysical Survey
OPL00 – FOC – 150 Y TRG – 001 –Rev 0B Page 3
1.3 References
REF 1 Aiello, G., Bravi, S., Budillon, F., Cristofalo, G.C., D’Argenio, B., De Lauro, M., Ferraro, L.,
Marsella, E., Molisso, F., Pelosi, N., Tramontano, M.A., 1995. Giornale di Geologia, vol 57, no 1.2, 17-
40.
REF 2 Artegiani A., Azzolini R. and Salusti E., 1989, On the dense water in the Adriatic Sea.
Oceanoligica Acta, 12, 151-160.
REF 3 Ciaranfi N., Pieri P. and Ricchetti G., 1992, Note alla carta geologica delle Murge e del Salento
(Puglia centro-meridionale). Memorie Società Geologica Italiana, 41, 449-460.
REF 4 Chiocci, F. L., D’Angelo, S., Romagnoli, C., 2004, Atlas of submerged Depositional Terrace
along the italian coasts. Memorie descrittive della carta d’Italia, Volume LVIII, pp 120.
REF 5 D'Argenio B., Pescatore T. and Scandone P., 1973, Schema geologico dell'Appennino
meridionale (Campania e Lucania). Proc. Congr. " Moderne vedute sulla geologia dell'Appennino".
Accademia Nazionale dei Lincei, 183, 49-72.
REF 6 D'Argenio B. and Horvath F., 1984, Some remarks on the deformation history of Adria, from the
Mesozoic to the Tertiarty. Ann. Geophys. 2, 143-146.
REF 7 Doglioni C., Mongelli F. & Pieri P., 1994, The Apulia Uplift (SE Italy): An anomaly in the
foreland of the Apenninic subduction due to buckling of a thick continental lithosphere. Tectonics, 13
vol 5, pp. 1309-1321.
REF 8 Emery, D. and Myers, K.J., 1996, Sequence Stratigraphy, Blackwell Science Ltd., pp.297.
REF 9 Geletti R., Del Ben A., Beseti M., Ramella R. and Volpi V., 2008, Gas seeps linked to salt
structures in the Central Adriatic Sea. Basin Research 1-15.
REF 10 Malanotte - Rizzoli P. and Bergamasco A., 1983. The dynamics of the costal region of the
Northern Adriatis Sea. Journal Physical Oceanography, 13, 1105-1130.
REF 11 Margiotta, S. and Negri, S., 2005, Geophysical and stratigraphical research into deep
groundwater and intruding seawater in the Mediterranean area (the Salento Peninsula, Italy). Natural
Hazards and Earth System Sciences, vol 5, pp. 127–136.
REF 12 Newton R. and Stefanon A., 1982, Side Scan Sonar and subbottom profiling i the northern
Adriatic Sea. Marine Geology, 46, 279-306.
REF 13 Pieri, P., Festa, V., Moretti, M. Tropeano, M., 1997, Quaternary tectonic activity of the Murge
area (Apulian foreland - Southern Italy). Annali di Geofisica, vol.XL, no 5, October, pp. 1395-1404.

TAP- TRANS ADRIATIC PIPELINE Italian Nearshore Geophysical Survey
OPL00 – FOC – 150 Y TRG – 001 –Rev 0B Page 4
REF 14 Ricchetti G., Ciaranfi N., Luperto Sinni E., Mongelli F. and Pieri P., 1992. Geodinamica ed
evoluzione stratigrafico-tettonica dell'avampaese apulo. Memorie Società Geologia Italiana, 41, 57-82.
REF 15 Ridente D. and Trincardi F., 2006, Active foreland deformation evidenced by shallow folds and
faults affecting late Quaternary shelf-slope deposits (Adriatic Sea, Italy). Basin Research 18, 171 -
188.
REF 16 Selleri, G., 2007, Karstic landscape evolution of southern Apulia Foreland during the
Pleistocene. Geogr. Fis. Dinam. Quat., vol 30, pp. 77-86.
REF 17 Verdicchio G. and Trincardi F., 2008, Mediterranean shelf-edge muddy contourites: examples
from the Gela and South Adriatic basins. Geo-Mar Lett 28:137-151.

TAP- TRANS ADRIATIC PIPELINE Italian Nearshore Geophysical Survey
OPL00 – FOC – 150 Y TRG – 001 –Rev 0B Page 5
1.4 Revision Record Sheet
0C Issued for client acceptance S. Polizzi D. Taliana 07 April 2014
0B Issued for client acceptance S. Polizzi D. Taliana 21 March 2014
0A Issued for client comments S. Polizzi D. Taliana 10 February 2014
Rev Description Prepared Checked Date

TAP- TRANS ADRIATIC PIPELINE Italian Nearshore Geophysical Survey
OPL00 – FOC – 150 Y TRG – 001 –Rev 0B Page 6
2 SURVEY DESCRIPTION
2.1 Scope of Work (SOW)
The Trans Adriatic Pipeline Project (TAP) aims to construct a submarine pipeline to transport natural
gas from Albania to Italy across the Strait of Otranto.
The TAP Project has changed the landfall location in Italy and this is not covered by the previous
detailed surveys performed in the area.
The investigations provide data for the design and the Environmental Impact Assessment of the
pipeline shore approach.
Furthermore this geophysical survey defined a shallow geology and a stratigraphy along the
microtunnel axis channel.
In particular, the objectives of the nearshore geophysical route survey were to:
• obtain accurate bathymetry, locate all seabed obstructions and identify other seabed factors
which may affect the laying and stability of the pipeline;
• identify and map geological and/or biological features or phenomena that may have the
potential to influence the routing, architecture, construction or operation of the proposed
pipelines;
• develop a DTM, contour plan and seabed charts with particular emphasis on any rock outcrops
and seabed slopes;
• perform a geophysical survey of the route to identify the shallow sub-seabed structural geology
for geo-hazard analysis and pipeline stability;
• locate and identify any other obstructions in the vicinity of the selected pipeline route
• locate all existing pipelines and cables, both operational and redundant, within the survey
corridor.
Acquisition was correctly performed all along the route, with sufficient information gathered to allow an
interpretation along the surveyed corridor.
At the time of the survey, all bathymetric data were reduced to LAT (Lowest Astronomical Tide)
utilizing the ISPRA Otranto Tide Gauge DATA, during the survey period.

TAP- TRANS ADRIATIC PIPELINE Italian Nearshore Geophysical Survey
OPL00 – FOC – 150 Y TRG – 001 –Rev 0B Page 7
2.2 Performed Work
The Italian nearshore geophysical survey was carried out using the RV ASTREA and MB Vector for
12-hour operations from 16 December 2013 to 04 January 2014.
RV ASTREA was mobilized in Otranto harbour from 16 to 18 December 2013 and MB Vector was
mobilized in Otranto harbour on 24 December 2013.
The Italian side corridor surveyed during the Nearshore Geophysical Survey was approximately 4000
m long (from KP 104 to KP 99.5) and about 200 m wide. The KP 0 is Albania nearshore. In particular,
the corridor between -4 and -93 m depth was carried out using the RV ASTREA with MBES, SBES,
SSS, SBP, and Boomer; and the survey corridor between -4 m and the shoreline (surf zone) was
carried out using MB Vector equipped with SBES.
2.2.1 RV Astrea Survey Program
The survey was carried out utilizing the following equipment: single beam echo sounder (SBES) and
multibeam echo sounder (MBES), side scan sonar (SSS), sub-bottom profiler (SBP) and Boomer.
The nearshore pipeline survey was a corridor 200 m wide centred on the theoretical pipeline route. In
order to cover the corridor, the proposed grid consisted of 20 lines centred on the pipeline route and
10 m spaced and 9 tie lines 500 m spaced.
The grids run with SBP, Boomer, SBES and MBES consisted of:
• 11 main lines over the corridor (from KP 104.1 to KP 99.5), approximately 4000 m long, NE-SW
oriented, with an average line-spacing of 10 m and 10 main additional lines over the corridor
(from KP 103.4 to KP 99.5), approximately 3000 m long, NE-SW oriented, with an average line-
spacing of 10 m.
• 9 cross lines, approximately 200 m long and NW-SE oriented, run approximately every 500 m
(from KP 104.1 to KP 99.5).
• 10 additional infilling SBP and Boomer lines run from KP 103.6 to KP 1033,, oriented NE.SW
and 5 cross additional line, oriented NW-SE.
The grid run with SSS consisted of:
• 7 main SSS lines over the corridor (from KP 104.1 to KP 99.5), approximately 4000 m long, NE-
SW oriented, with an average line-spacing of 25 m and 2 main additional lines over the corridor
(from KP 103.4 to KP 99.5), approximately 3000 m long, NE-SW oriented, with an average line-
spacing of 25 m.
2.2.2 MB Vector Survey Program
The survey was carried out utilizing the single beam echo sounder.
The grid run with SBES consisted of:

TAP- TRANS ADRIATIC PIPELINE Italian Nearshore Geophysical Survey
OPL00 – FOC – 150 Y TRG – 001 –Rev 0B Page 8
• 3 main lines approximately 230 m long, NW-SE oriented , with an average line-spacing of 5 m.
• 21 cross lines approximately 100 m long, NE-SW oriented , with an average line-spacing of 5
m, and 13 cross lines approximately 100 m long, with an average line-spacing of 10 m.
The nearshore geophysical survey grid performed by RV ASTREA and by MB Vector is shown in
Figure 2.1
The coordinates of the nearshore geophysical survey area are the following (Table 2.1; Table 2.2):
Table 2.1:Topographic survey co-ordinates
Latitude N: Longitude E: Easting (m): Northing (m):
A 40°18'40.99" 18°23'32.58" 278416.54 4465582.42
B 40°18'38.36" 18°23'35.06" 278472.72 4465499.63
C 40°18'54.23" 18°24'03.75" 279164.40 4465969.01
D 40°18'52.91" 18°24'04.99" 279192.47 4465927.63
E 40°19'21.06" 18°24'55.92" 280419.90 4466760.45
F 40°19'19.74" 18°24'57.13" 280447.37 4466718.68
G 40°19'56.86" 18°25'51.52" 281764.32 4467825.99
H 40°20'00.52" 18°25'44.53" 281602.75 4467943.88
Table 2.2: Proposed Landfall Co-ordinates
Latitude N: Longitude E: Easting (m): Northing (m):
Landfall 40°18'27.36" 18°23'11.54" 277907.489 44651 76.606
Co-ordinates are WGS84 DATUM, UTM ZONE 34 North

TAP- TRANS ADRIATIC PIPELINE Italian Nearshore Geophysical Survey
OPL00 – FOC – 150 Y TRG – 001 –Rev 0B Page 9
Figure 2.1: Nearshore Geophysical Survey corridor a nd route.
TAP- TRANS ADRIATIC PIPELINE Italian Nearshore Geophysical Survey
OPL00 – FOC – 150 Y TRG – 001 –Rev 0B Page 10
2.3 GPS and Survey Geodetic Parameters
The following Table 2.3 contains the geodetic parameters used to perform the Nearshore Geophysical
Survey. These parameters were checked and accepted by Client on board.
Table 2.3: Project Geodetic and Projection Paramete rs
Global Positioning System Geodetic Parameters 1)
Spheroid: World Geodetic System 1984
Datum: World Geodetic System 1984 (WGS84)
Semi major axis: a = 6378137.000 m
Inverse Flattening: 1/f = 298.257223563
Local Datum Geodetic Parameters 2)
Spheroid: World Geodetic System 1984 (WGS84)
Datum: World Geodetic System 1984
Semi major axis: 6 378 137.000 m
Inverse Flattening: 1/f = 298.257 223 563
Datum Transformation Parameters 3) from WGS84 to Hayford 1909 - International 1924
Shift dX: 0.00 M Rotation rX: 0.00 arcsec Scale Factor: 0.00 ppm
Shift dY: 0.00 M Rotation rY: 0.00 arcsec
Shift dZ: 0.00 M Rotation rZ: 0.00 arcsec
Project Projection Parameters
Grid Projection: Universal Transverse Mercator, Northern Hemisphere
UTM Zone: 34 N
Central Meridian: 21° 00’ 00” E
Latitude of Origin: 0° 00’ 00” Equator
False Easting: 500 000 m
False Northing: 0 m
Scale factor at Central Meridian 0.9996
Unit: Metre
Notes:
1. Fugro Starfix navigation software always uses WGS84 geodetic parameters as a primary datum for any geodetic
calculations.
2. Source: Client .
3. This is the right-handed co-ordinate frame rotation convention used by the Fugro Starfix navigation software.

TAP- TRANS ADRIATIC PIPELINE Italian Nearshore Geophysical Survey
OPL00 – FOC – 150 Y TRG – 001 –Rev 0B Page 11
3 SUMMARY OF RESULTS
Project
Geodesy:
WGS 84 Datum, Wgs84 Spheroid . All data co-ordinates are in metres on the Universal Transverse Mercator Projection, Zone 34N, Central Meridian 21° E,
Survey
corridor
Coordinates
Latitude N: Longitude E: Easting (m): Northing (m):
A 40°18'40.99" 18°23'32.58" 278416.54 4465582.42
B 40°18'38.36" 18°23'35.06" 278472.72 4465499.63
C 40°18'54.23" 18°24'03.75" 279164.40 4465969.01
D 40°18'52.91" 18°24'04.99" 279192.47 4465927.63
E 40°19'21.06" 18°24'55.92" 280419.90 4466760.45
F 40°19'19.74" 18°24'57.13" 280447.37 4466718.68
G 40°19'56.86" 18°25'51.52" 281764.32 4467825.99
H 40°20'00.52" 18°25'44.53" 281602.75 4467943.88
Landfall
Coordinates
Latitude N: Longitude E: Easting (m): Northing (m):
Landfall 40°18'27.36" 18°23'11.54" 277907.489 44651 76.606
Minimum Depth: -2 m (KP 104.2) Maximum Depth: -93 m (KP 100.3). Minimum Gradient along Route: 0.5° (at 101.9) Maximum Gradient along Route: 4.8° (at KP 103.4)
Bathymetry:
Kp (m): Bathymetric Feature
Note
103.67 Elongated depression
66 m length x 18 m wide x -13.5 m depth ; NNE-SSW oriented
103.4 Break of slope depth -20.5 m
103.3
Elongated depression (probably due to slow mass movement)
long 120 m, wide 20 m and 5 m depth. NNE-SSW and NW-SE oriented
103.1 Break of slope depth -31 m
101.87 Break of slope depth - 77.5 m

TAP- TRANS ADRIATIC PIPELINE Italian Nearshore Geophysical Survey
OPL00 – FOC – 150 Y TRG – 001 –Rev 0B Page 12
Kp (m): Bathymetric Feature
Note
101.5 Crest of sand waves
depth -79 m with height 1 m NNW-SSE oriented
101.2 Crest of sand waves
depth -81 m, with height 1 m. NNW-SSE oriented
101 Crest of sand waves
depth -85 m, with height 1 m. NNW-SSE oriented
Seabed Features
Kp range (m): Seabed Feature Note
104.24 - 103.4 Patch reefs of dense SAND
55-60 m length and 40-45 m wide
103.4 - 103.1 Gravelly SAND patches
110 m length and 90 m wide,
103.1 - 101.87 Pinnacles (probably biocostructions)
diameter 2-10 m and a height 0.5-3 m.
101.87 - 100.27 Megaripples field length wave 2.5-3 m and WNW-ESE and NE-SW oriented.
Shallow Geology:
The geology throughout the TAP Pipeline route is expected to comprise a number of three Units, Holocene to lower Pleistocene age: Unit A, Unit B and Unit C.
Age Unit/ Horizons
Depth of Base (m bLAT)
Depth of Base (m bsb)
Predominant Lithology
HOLOCENE
A (Seabed-
H10)
17- 110 (KP 103.9 - KP
100.15)
7 -12 (KP 103.9 - KP
100.15)
Loose to dense calcareous silica slightly silty fine
SAND, with shell fragments and shells
PLEISTOCENE upper-middle
B (H10 -H20)
67- 157 (KP 103.1- KP
100.15)
34- 59 (KP 103.1 - KP
100.15)
Medium dense siliceous carbonate sandy SILT,
with few shells and shell fragments
PLEISTOCENE lower
C (< H20)
Below Record lenght
Below Record lenght
SAND and calcareous GRAVEL
Shallow Geo-
hazard and
Installation
constraints :
Cavity Survey: No cavities were recognized within the survey area. Bioturbated Seabed: From KP 103.1 to KP 101.87 the TAP Pipeline route runs on bioturbated sediments and bioconstructions field. Shallow Gas No seismic anomalies were recognized within the survey area Faulting Evidences of faults have not been detected within Unit A. Obstructions No infrastructures were recognized close the pipeline route.

TAP- TRANS ADRIATIC PIPELINE Italian Nearshore Geophysical Survey
OPL00 – FOC – 150 Y TRG – 001 –Rev 0B Page 13
4 DETAILED RESULTS
4.1 Geological Setting
The geodynamic and sedimentary history of the Adriatic basin records the evolution from a passive
margin, during the Mesozoic, to a foreland basin system, during the Cenozoic (REF 6).
The geology of the southern Adriatic Sea indicates the presence of the foreland relative to the
southern Apennines ("Avampaese Apulo-Gargano" Aut.), and the foredeep relative to the Dinarids and
Hellenids, Tertiary-Quetarnary in age. The foreland is the seaward prolongation of Mesozoic shallow
water carbonates cropping out in the Apulian region ("Apulian carbonate platform"; REF 5).
The Apulian foreland is a wide antiformal structure, WNW-ESE trending, block faulted (Gargano,
Murge and Salento blocks) and uplifted differentially during the Plio-Quaternary (REF 14). Early and
middle Pleistocene neritic sandstones cropping out in Murge and Salento were probably deposited
over morphostructural lineaments. The presence of a regressive, Upper Pleistocene depositional
sequence overlying an erosional surface, suggests an uniform upflit of the Apulian area during the
Pleistocene, as confirmed also by the regional distribution of fossil shorelines (REF 3 - 14).
The Salento region is the southernmost part of Apulian foreland, and is made of a thick carbonatic
basement which comprises different units whose age ranges from the Upper Cretaceous to the Lower
Pleistocene. These units are covered by diffuse thin marine terrigenous sediments referred to the
Middle-Upper Pleistocene (REF 16; Figure 4.1). These sediments were formed during several marine
transgressions, are up to 15-20 meters thick and are indicated as Marine terraced deposits (REF 16),
actually located from about 200 m above the present shoreline to sea level REF 3).
The recent geomorphic evolution of the South Adriatic continental shelf was mainly controlled by
eustatic sea-level oscillations during the middle-late Pleistocene and the Holocene.
Seaward, the Salento continental shelf shows a strathigraphic architecture characterized by
progradational sediment wedges unconformably overlying a basal unit made by Plio-stocene sands
and calcarenites. The internal organization of the wedges is characterized by progradational and
retrogradational parasequences, separated by transgressive surfaces (REF 1-8). The thick prograding
sequence testify a strong and continuous sea-level fall occurred during Middle Pleistocene, and the
large amount of sediment supplied is linked to the recent tectonic phase involving the Apulian foreland
and the consequent uplift (REF 7). The proposed Italian Landfall is close to S. Foca, about 20 km east
of Lecce. The oucropping geology in the area is characterized by Pliocene sediments of the Uggiano
la Chiesa Formation (up to 50 m), covered the Miocene deposits of “Pietra leccese” and “Andrano
Calcarenite”. The Uggiano la Chiesa Formation is made up of detritic and carbonatic sediments and
crops out along the coast, with maximum thickness just over 50 m (REF 11).
The oceanography of the south Adriatic Sea is influenced by the climate, the sea-floor morphology
and the exchange of waters with both Ionian and central Adriatic seas. In the south Adriatic sea, both
deep local waters and waters coming from the Mediterranean sea (Levantine Intermediate Water) and
from the north Adriatic Sea (North Adriatic Deep Water NADW) are present (REF 2).

TAP- TRANS ADRIATIC PIPELINE Italian Nearshore Geophysical Survey
OPL00 – FOC – 150 Y TRG – 001 –Rev 0B Page 14
LIW enter the south Adriatic Sea through the eastern sector of the Otranto Channel, while the outflow
westward of the Otranto Channel occurs across a less wide section. Down to the 100 m isobath, the
oceanographic circulation westward of the Otranto Channel is characterized by relatively salt less
water, coming from the northern Adriatic Sea (REF 10) (Figure 4.2).
Figure 4.1: Geological map (Ref 7).
Studies conducted in the Salento shelf show that this area is characterized by the presence of the
Biomounds. These structures often have a regular, flat and circular appearance and are composed of
many small elements with strong backscattering. These organic structures, all unburied and
presumably alive, were built by three types of colonial organisms: calcareous algae, madreporaria and
bryozoa (REF 12).The biomounds have a diameter of 70m and height of less than 1 m and were found

TAP- TRANS ADRIATIC PIPELINE Italian Nearshore Geophysical Survey
OPL00 – FOC – 150 Y TRG – 001 –Rev 0B Page 15
at water depths ranging between 80 m and 110m.The regular shape of the biomounds reflect a growth
on local accumulations of coarse sediment. (REF 1 - 9).
In the Salento Shelf the sediment waves and related bedforms were recognized. They were found as
either (a) local occurrence of two or three waves with moderate backscattering and medium spacing or
more closely-spaced, high backscattering fields of waves (b). Type (a) bedforms have a crest length of
100 m on average, with crest amplitude of less than 1 m. Crest are typically 10 m apart. Waves are
orientated E-W, sub-parallel to the coast and occur in water depth of 90m. Type (b) bedforms have a
crest length of over 100-200 m, and occur in larger fieldss; crest height is again lesse than 1 m. Crests
are typically <10 m apart. Waves are oriented N-S, again parallel to the coast and occur in water depth
of 75 m (REF 1).

TAP- TRANS ADRIATIC PIPELINE Italian Nearshore Geophysical Survey
OPL00 – FOC – 150 Y TRG – 001 –Rev 0B Page 16
Figure 4.2: Intermediate and bottom current circul ation in the central Mediterranean Sea (REF 17).

TAP- TRANS ADRIATIC PIPELINE Italian Nearshore Geophysical Survey
OPL00 – FOC – 150 Y TRG – 001 –Rev 0B Page 17
4.2 Bathymetry
The study of the seabed was carried out integrating MBES, SBES and SSS data.
All bathymetric data are referred to the Lowest Astronomical Tide (LAT).
Depth range along the proposed pipeline route: -2 m (KP 104.2) to -93 m (KP 100.3).
Minimum gradient: 0.5° (at 101.9)
Maximum gradient : 4.8° (at KP 103.4)
The survey area is characterized by numerous seabed features, which were formed during the last
change of sea level and by the action of bottom currents. Some of these features are submarine
terraces, dunes, landslide and creeping movement.
At the end of the surveyed corridor, approximately KP 104.2 to KP 103.4, the seabed deepens from to
-2 w.d. to -20.5 m w.d., with an average gradient of 1.2°. In this sector, several elongated NNE-SSW
depressions were detected. The two main depressions are: 1) 66 m long x 18 m wide x -13.5 m deep;
2) 52 long x 17.5 wide x -14.5 m deep (Figure 4.3). The main one crosses the proposed pipeline route
at KP 103.68. This area is bounded by a break of slope at a depth -20.5 m (4.8°).
From KP 103.4 to KP 103.1, the seabed deepens from -20.5 w.d. to -32 m w.d., with an average
gradient of 2.20. From KP 103.5 to KP 103.3 two reliefs were detected at a depth of 21.2 m. These
reliefs are 55-60 m long and 40-45 m wide.
From KP 103.3 to KP 103.2 the route crossed an area characterized by elongated depressions,
probably indicating a slow mass movement. These structures are NNE-SSW and NE-SW oriented and
approximately 120 m long, 20 m wide and 5 m deep: (Figure 4.3). At KP 103.1 this sector is bounded
by a break of slope at a depth -31 m.
From KP 103.1 to KP 101.9, the seabed deepens from to - 31 w.d. to -77.5 m w.d., with an average
gradient of 2.15°. This sector is characterized by even articulated area with many pinnacles. These
structures have a circular and regular shape and show a diameter ranging between 2-10 m and a
height ranging between 0.5-3 m. This area is bounded by a break of slope at a depth - 77.5 m (3°)
(Figure 4.4).
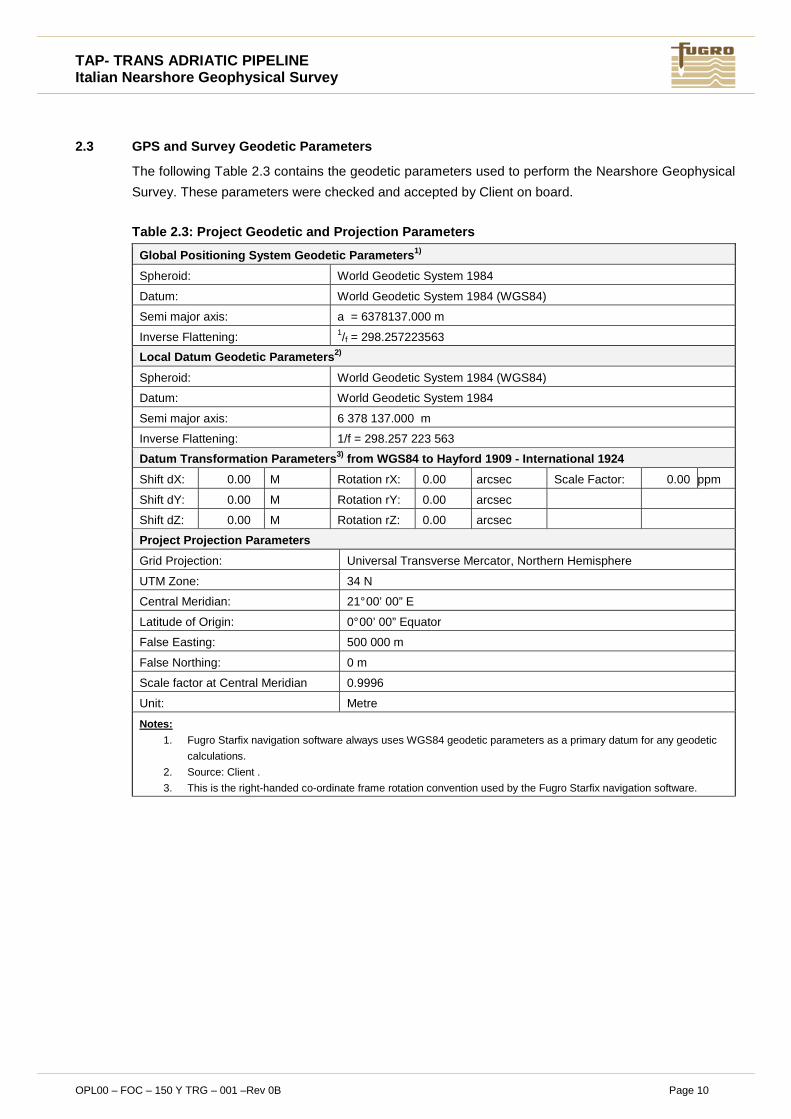
From KP 101.9 to KP 100.3, the seabed deepens from to -77.5 m w.d. to -93 m w.d., with an average
gradient of 0.5°. Almost the entire sector is chara cterized by an undulated seafloor. Between KP 101.7
and KP 100 five crests were detected: three NNW-SSE crests, respectively at a depth of -79 m, -81 m
and -85 m, 1 m height; and two NNE-SSW crests, at a depth of -79.3 m and -80.5 m, 2 m height.
(Figure 4.5).

TAP- TRANS ADRIATIC PIPELINE Italian Nearshore Geophysical Survey
OPL00 – FOC – 150 Y TRG – 001 –Rev 0B Page 18
Figure 4.3: MBES data – Evidences of slow mass move ment.
Figure 4.4: MBES data – Example of Even seabed, p robably due to biocostruction patch reef
TAP- TRANS ADRIATIC PIPELINE Italian Nearshore Geophysical Survey
OPL00 – FOC – 150 Y TRG – 001 –Rev 0B Page 19
Figure 4.5: MBES data – Example of undulated seabed : probable sand waves.

TAP- TRANS ADRIATIC PIPELINE Italian Nearshore Geophysical Survey
OPL00 – FOC – 150 Y TRG – 001 –Rev 0B Page 20
4.2.1 Seabed Features
The interpretation of the seabed features was carried out integrating MBES, SBES, and SSS data,
analogue seismic data (SBP and Boomer) and supported by three core samples collected within the
corridor and provided by D'Appolonia S.p.A. The boreholes positions are shown in the following Table
4.1.
Table 4.1: Boreholes within the survey area.
Latitude N: Longitude E: Easting (m): Northing (m): Depth (m)
TAP231S 40°18'58.34" 18°24'15.01" 279433.65 4466087.8 9 6
TAP2018 40°18'55.59" 18°24'08.47" 279276.87 4466007.7 7 27
TAP2019-2019a 40°18'54.85" 18°24'06.59" 279232.01 446 5986.31 26
The analysis of Side Scan Sonar data was based on the acoustic facies characteristics, including
overall pattern, shape, dimensions, backscattering strength, orientation, depth ecc.
Numerous of facies were recognized:
From the end of the surveyed corridor, approximately KP 104.2 (-2 m w.d.) to KP 103.4 (-20.5 m w.d.),
the seafloor is characterized by a moderate backscatter. Patch reefs of dense SAND were detected
(boreholes: TAP 231S- TAP2018- TAP2019-2019a) (Figure 4.6). The dense cemented SAND patches
are 55-60 m long and 40-45 m wide. This area is bounded by a break of slope at KP 103.4.
From KP 103.4 (-20.5 m w.d.) to KP 103.1 (-31 m w.d.) the route crosses an area with moderate
backscatter, characterized by gravelly SAND patches (Figure 4.6). This area is bounded by a break of
slope at KP 103.1.
From KP 103.1 (-31 m w.d) to KP 101.9 (-77.5 m w.d.), the seafloor is characterized by an area with
moderate to high backscatter than could be correlated with the presence of pinnacles and probable
biocostructions (Table 4.2). These structures show a regular and circular shape. They have a diameter
of 2-10 m and height 0.5-3 m (Figure 4.7). At KP 101.9 this area is bounded by a break of slope.
From KP 101.87 (-77.5 m w.d.) to KP 100.3 (-93 m w.d.), the seafloor is characterized by an area with
low to moderate backscatter than could be correlated to the presence of SAND (boreholes: TAP 231S-
TAP2018- TAP2019-2019a). This area is characterized by undulated seafloor, probably indicating the
present of megaripples field with length wave of 2.5-3 m and a main direction NNW-SSE (Figure 4.8).

TAP- TRANS ADRIATIC PIPELINE Italian Nearshore Geophysical Survey
OPL00 – FOC – 150 Y TRG – 001 –Rev 0B Page 21
All these features were confirmed by EBS videos and imagines. The location EBS videos and
imagines within the survey area are show in the following table.
Table 4.2: EBS video and imagines within the survey area.
Latitude N: Longitude E: Easting (m): Northing (m):
Depth (m)
ES01 40°18'55.73" 18°24'03.60" 279163.85 4466046.43 - 21.2
ES03 40°18'54.09" 18°24'06.08" 279220.00 4465963.68 - 20.8
ES04 40°18'59.60" 18°24'08.83" 279289.01 4466131.35 - 30.18
ES06 40°18'56.97" 18°24'11.29" 279345.16 4466048.60 - 29.5
ES07 40°19'04.78" 18°24'19.92" 279555.76 4466283.19 - 37.4
ES08 40°19'13.85" 18°24'37.47" 279978.35 4466550.41 - 60.8
ES09 40°19'22.37" 18°24'55.46" 280410.95 4466801.13 - 76.7
ES10 40°19'30.92" 18°25'13.48" 280843.22 4467052.41 - 79.8
ES11 40°19'40.81" 18°25'30.23" 281247.81 4467345.26 - 86.8
ES12 40°19'52.60" 18°25'44.73" 281247.81 4467699.28 - 92
Figure 4.6: SSS data (Line TAPM04H) – Sandy GRAVEL

TAP- TRANS ADRIATIC PIPELINE Italian Nearshore Geophysical Survey
OPL00 – FOC – 150 Y TRG – 001 –Rev 0B Page 22
Figure 4.7: SSS data (Line TAPM04H) – Biocostructio ns.
Figure 4.8: SSS data (Line TAPMCLH) – Megaripples

TAP- TRANS ADRIATIC PIPELINE Italian Nearshore Geophysical Survey
OPL00 – FOC – 150 Y TRG – 001 –Rev 0B Page 23
4.3 Shallow Geology
The geology along the pipeline route was interpreted from the sub bottom and boomer data loaded
onto a PC running SMT’s Kingdom Suite Interpretation Software. A velocity of 1600 m/s was applied
to the sub-bottom profiler and boomer data to convert time to depth (m).
The interpretation was based on the seismic attributes of the seismic sections, and supported by three
boreholes stratigraphy supplied by D'Appolonia S.p.A (Table 4.1). The results of the interpretation are
displayed as figures in the text and charts (Appendix I).
Because of the presence of dense SAND, the sub-bottom profiler achieved a penetration of
approximately 5 m (6 ms) below seabed with a vertical resolution of approximately 50 cm where
possible. The boomer system achieved a penetration of approximately 36 m (45 ms) below the
seabed with a vertical resolution of 1.5 m.
The geology throughout the TAP Pipeline Route is expected to comprise three Units, Holocene to
lower Pleistocene in age: Unit A, Unit B and Unit C. The geological summary along the pipeline route
is summarized in Table 4.3:
Table 4.3: Geological summary along the TAP Pipelin e route
Age Unit/ Horizons
Depth of Base (m bLAT)
Depth of Base (m bsb)
Predominant Lithology
HOLOCENE A
(Seabed-H10)
17 - 110 (KP 103.9 - KP
100.15)
7 - 12 (KP 103.9- KP
100.15)
Loose to dense calcareous silica slightly
silty fine SAND, with shell fragments and
shells
PLEISTOCENE upper-middle
B (H10-H20)
67 - 157 (KP 103.1 – KP
100.15)
34 - 59 (KP 103.1 - KP
100.15)
Medium dense siliceous carbonate sandy SILT,
with few shells and shell fragments
PLEISTOCENE lower
C (< H20)
Below Record lenght
Below Record lenght SAND and calcareous
GRAVEL
Unit A (Seabed to H10):
From the seabed to the Horizon H10, the seismic unit (Unit A) is characterized by moderate amplitude,
continuous and prograding reflectors and medium frequency.
Unit A is composed by dense calcareous silica, slightly silty, fine SAND, with shells and shell
fragments and could be correlated with the Holocene age (REF. 7).
From KP 103.9 to 100.4 a continuous reflector, Horizon H02, was detected within Unit A. Horizon H02
is composed by loose calcareous silica slightly silty fine SAND, with shell fragments. Horizon H02 has

TAP- TRANS ADRIATIC PIPELINE Italian Nearshore Geophysical Survey
OPL00 – FOC – 150 Y TRG – 001 –Rev 0B Page 24
a depth that ranges between 2.5 m bsb (15 ms bLAT) to 1 m bsb (32 ms bLAT) (Fig. 4.9). Horizon H02
was confirmed by boreholes log (Table 4.1).
From KP 101.1 to 100.1 a sub-horizontal reflector (H05) was detected within Unit A. Horizon H05
could correspond to an erosional surface (probably an erosional terrace) partly covered by sandwaves
deposits (Figure 4.10, Figure 4.11). The depth of Horizon H05 ranges between 119 ms bLAT (7 m
bsb) to 126 ms bLAT (3 m bsb). Below H05, Unit A is characterized by clinostratified to sub-horizontal
reflectors.
From KP 102.7 to KP 101.9, many small conic bodies, characterized by transparent acoustic facies
were detected at the top of Unit A, probably corresponding to biocostruction (Figure 4.15).
From KP 101.67 to KP 100.79 Unit A is characterised by a lenticular configuration delimited by a sharp
base and undulated top, probably due to the presence of sandwaves (Figure 4.16)
Unit A is characterized by variable thickness; along the route it shows two depocenters, one at the
start (KP 103.5) and one at the end (KP100.15) of the survey route.
The thickness of Unit A along the pipeline route is described in details in the Table 4.4:
Table 4.4: Thickness of Unit A along the TAP Pipeli ne Route.
Interval (from KP to KP) Thickness in m bsb Note
103.9 – 103.5 6 – 12 12 m is the first depocenter
103.5 – 103 12 – 2.5
103 – 102.7 2.5. - 4.5
102.7 – 102.4 4.5 – 1.5
102.4 -102.2 1.5 – 2.5
102.2 - 101.9 2.5 – 0.5 0.5 m is the minimum thickness
101.9 – 101.3 0.5 - 9
101.3 - 101.2 9 – 12.5 12.5m is the second depocenter
The base of Unit A is Horizon H10, which is a medium to high amplitude and continuous reflector and
has a depth that ranges between 7 m bsb (20 ms bLAT) and 12 m bsb (140 ms bLAT) as shown in the
Alignment Sheets (Appendix I). This reflector is an erosional surface that could have formed during the
sea level fall occurred during Pleistocene.
Unit B (H10 to H20)
Unit B can be divided in two sub-units, B1 and B2, delimited by an unconformity, Horizon H15.
Subunit B1, that goes from Horizon H10 to Horizon H15, is characterized by medium to high
amplitude, discontinuous reflectors and medium frequency.

TAP- TRANS ADRIATIC PIPELINE Italian Nearshore Geophysical Survey
OPL00 – FOC – 150 Y TRG – 001 –Rev 0B Page 25
The base af Subunit B1, Horizon 15, is a medium amplitude and continuous reflector and has a depth
that ranges between 10 m bsb (47 ms bLAT) to 3 m bsb (105 ms bLAT) as shown in Figure 4.12 and
the Alignment Sheets (Appendix I).
From Horizon H15 to Horizon H20, Subunit B2 is characterized by medium to high amplitude, medium
frequency and folded and faulted reflectors.
The folds system and the main faults detected in Subunit B2 are NW-SE oriented.
Unit B is composed by medium dense siliceous carbonate sandy SILT, probably upper-middle
Pleistocene in age (REF. 7).
The base of Unit B is Horizon H20, which has a low amplitude and frequency reflection and has a
depth that ranges between 34 m bsb (82 ms bLAT) and 59 m bsb (197 ms bLAT).
Unit C (H20 to the end of data)
Below Horizon H20, Unit B is characterized by low to medium amplitude, discontinuous reflectors and
low frequency.
This interval is expected to be comprised of SAND and calcareous GRAVEL and probably Low
Pleistocene in age (REF. 7)
From KP 102.4 to KP 101, Unit C is characterized by chaotic reflectors that probably indicating the
presence of a palaeo-landslide deposit (Figure 4.10; Figure 4.11).
Examples boomer data are shown in Figure 4.9 to Figure 4.16.

TAP- TRANS ADRIATIC PIPELINE Italian Nearshore Geophysical Survey
OPL00 – FOC – 150 Y TRG – 001 –Rev 0B Page 26
Figure 4.9: Example boomer data (Line TAPMCL) – Cen tre line TAPMCL_BOM_202.

TAP- TRANS ADRIATIC PIPELINE Italian Nearshore Geophysical Survey
OPL00 – FOC – 150 Y TRG – 001 –Rev 0B Page 27
Figure 4.10: Example boomer data (Line TAPMCL) – Ce ntre line TAPMCL_BOM_202.

TAP- TRANS ADRIATIC PIPELINE Italian Nearshore Geophysical Survey
OPL00 – FOC – 150 Y TRG – 001 –Rev 0B Page 28
Figure 4.11: Example of boomer data – Centre line TAPMCL_BOM_202.

TAP- TRANS ADRIATIC PIPELINE Italian Nearshore Geophysical Survey
OPL00 – FOC – 150 Y TRG – 001 –Rev 0B Page 29
Erosional Surface (H05)
Figure 4.12: Example of boomer data – Centre line TAPMCL_BOM_202.

TAP- TRANS ADRIATIC PIPELINE Italian Nearshore Geophysical Survey
OPL00 – FOC – 150 Y TRG – 001 –Rev 0B Page 30
Figure 4.13:Example of boomer data –TAPM13_BOM_201 with three boreholes.

TAP- TRANS ADRIATIC PIPELINE Italian Nearshore Geophysical Survey
OPL00 – FOC – 150 Y TRG – 001 –Rev 0B Page 31
Figure 4.14: Example of boomer data – APM13_BOM_20 1 with boroholes TAP 2019-2019a.

TAP- TRANS ADRIATIC PIPELINE Italian Nearshore Geophysical Survey
OPL00 – FOC – 150 Y TRG – 001 –Rev 0B Page 32
Figure 4.15: Example of boomer data – Line TAPM11_B OM_201 and DTM.

TAP- TRANS ADRIATIC PIPELINE Italian Nearshore Geophysical Survey
OPL00 – FOC – 150 Y TRG – 001 –Rev 0B Page 33
Figure 4.16: Example of Boomer data – Centre Line T APMCL_BOM_202 and DTM.

TAP- TRANS ADRIATIC PIPELINE Italian Nearshore Geophysical Survey
OPL00 – FOC – 150 Y TRG – 001 –Rev 0B Page 34
4.4 Shallow Geohazards and Installation Constrains
4.4.1 Cavity Survey
No cavities were recognized within the survey area.
4.4.2 Bioturbated Seabed:
From KP 103.1 to KP 101.87 the TAP Pipeline route runs on bioturbated sediments and
bioconstructions field.
4.4.3 Seismic Anomalies
No seismic anomalies were recognized within the survey area.
4.4.4 Fractures/Faults
Evidences of faults have not been detected within Unit A.
In Unit B the detected NW-SE, fold and fault system was correlated with the tectonic deformations
along the Salento region. This tectonic system corresponds to shallow faults that affect relatively thin
stratigraphic units and appears to be associated with folds that deform recent deposits. Several of the
faults associated with anticlines on the south Adriatic shelf propagate through Holocene deposits and
offset the seafloor. These faults show reduced vertical displacements, further decreasing to less than
1 m within Holocene units (REF 15).
4.4.5 Objects/Obstructions and Existing Infrastruct ures
No infrastructures were recognized close the pipeline route.

TAP- TRANS ADRIATIC PIPELINE Italian Nearshore Geophysical Survey
OPL00 – FOC – 150 Y TRG – 001 –Rev 0B Page 35
5 ROUTE DETAILS
The coordinates of the Proposed Pipeline Route (TAP Central 05) are listed in Table 5.1.
Table 5.1: Pipeline Route Coordinates
Pipeline Route Coordinates (Route: TAP Central 05)
Point Easting [m] Northing [m] Latitude [N] Longitude [E]
Albania LTE 363424.10 4517167.905 40°47'38.97104" 19°22'52.022 27"
TG’ V.1 360055.384 4516919.810 40°47'28.88698" 19°20'28.52890"
V.1 359052.238 4516919.810 40°47'28.26956" 19°19'45.74194"
TG”V.1 358296.377 4516182.280 40°47'03.89299" 19°19'14.10499"
TG’V.2 341668.231 4501582.280 40°38'59.72194" 19°07'38.27372"
V.2 339615.680 4499780.496 40°37'59.89299" 19°06'12.57566"
TG”V.2 337059.617 4498817.550 40°37'26.87974" 19°04'24.72171"
TG’V.3 334351.485 4497797.314 40°36'51.87254" 19°02'30.48434"
V.3 332498.795 4497099.350 40°36'27.90594" 19°01'12.35178"
TG”V.3 330519.921 4497159.959 40°36'28.41872" 18°59'48.13482"
TG’V.4 329500.554 4497191.181 40°36'28.67615" 18°59'04.75271"
V.4 328033.880 4497236.102 40°36'29.03861" 18°58'02.33 469"
TG”V.4 326596.675 4496940.140 40°36'18.36565" 18°57'01.50780"
TG’V.5 323961.341 4496397.449 40°35'58.77226" 18°55'09.98670"
V.5 319684.434 4495516.711 40°35'26.91108" 18°52'09.03954"
TG”V.5 316548.511 4492478.024 40°33'45.94900" 18°49'58.90117"
TG’V.6 309660.798 4485803.880 40°30'04.06260" 18°45'13.44 737"
V.6 307483.920 4483694.501 40°28'53.89649" 18°43'43.33761"
TG”V.6 304658.777 4482595.936 40°28'15.92150" 18°41'44.65576"
TG’V.7 304462.721 4482519.699 40°28'13.28482" 18°41'36.42087"
V.7 302109.956 4481604.820 40°27'41.63226" 18°39'57.61493"
TG”V.7 299585.778 4481636.961 40°27'40.49645" 18°38'10.48805"
TG’V.8 294807.256 4481697.808 40°27'38.27092" 18°34'47.69284"
V.8 293054.157 4481720.131 40°27'37.42953" 18°33'33.29535"
TG”V.8 291748.038 4480550.555 40°26'58.35775" 18°32'39.26772"
TG’V.9 290838.822 4479736.389 40°26'31.15493" 18°32'01.66815"
V.9 289897.071 4478893.089 40°26'02.97548" 18°31'22.73226"
TG”V.9 289532.230 4477682.742 40°25'23.42525" 18°31'08.70345"
TG’V.10 289216.194 4476634.301 40°24'49.16538" 18°30'56.55452"
V.10 288779.904 4475186.922 40°24'01.86885" 18°30'39.78833"
TG”V.10 287495.388 4474389.881 40°23'34.86700" 18°29'46.30436"
TG’V.11 285429.668 4473108.104 40°22'51.42955" 18°28'20.31798"
V.11 284405.194 4472472.419 40°22'29.88109" 18°27'37.68519"
TG”V.11 283783.035 4471439.675 40°21'55.83917" 18°27'12.58791"
TG’V.12 281803.532 4468153.825 40°20'07.51961" 18°25'52.78081"
V.12 281463.495 4467589.384 40°19'48.91089" 18°25'39.07896"
TG”V.12 280918.212 4467219.405 40°19'36.40930" 18°25'16.44989"
Italian LTE 277907.489 4465176.606 40°18'27.36051" 18°23'11.55007"

TAP- TRANS ADRIATIC PIPELINE Italian Nearshore Geophysical Survey
OPL00 – FOC – 150 Y TRG – 001 –Rev 0B Page 36
6 EQUIPMENT
6.1 Survey Vessels
The vessels used by Fugro Oceansismica S.p.A. for the Italian Nearshore Geophysical Survey of the
TAP Project were the RV ASTREA and MB Vector. Both the vessels were used for 12-hour
operations.
The main characteristics of these vessels are given below (Table 6.1; Table 6.2). These vessels
proved to be a stable platform from which to conduct geophysical operations.
Table 6.1: RV ASTREA Vessel Specifications
Type Passenger professional, pleasure
Flag Italy
Gross Tonnage 87.35
Length Overall 23.78 m
Breadth 5.90 m
Maximum Draft 2.86 m
Table 6.2: MB Vector Specifications
Type Fiberglass boat
Flag Italy
Length 5.5 m
Breadth 2.3 m
Maximum Draft ~1.75 m
Equipment list mobilized on board of RV ASTREA and MB Vector are presented in Table 6.1 and
Table 6.2.
6.2 Survey Equipment – RV Astrea
All the survey equipment as agreed in the scope of work was installed on board of RV ASTREA.
The equipment utilized to carry out the survey is shown in Table 6.3.
Table 6.3: RV ASTREA Equipment
Positioning RTK Leica GPS 1200 and Starfix 8200 HP positioning with Fugro Starfix.Seis navigation suite
SBES Odom Echotrac CV 200
Gyro compass and MRU Anschutz Standard 22
MBES Hull mounted Kongsberg EM 2040
SBES Odom Echotrac CV 200; GLog/GPlot acquisition system
MRU Anschutz Standard 22

TAP- TRANS ADRIATIC PIPELINE Italian Nearshore Geophysical Survey
OPL00 – FOC – 150 Y TRG – 001 –Rev 0B Page 37
SSS Edgetech 4200SF towel fish
SBP Datasonics 3710 Pole mounted 4 transceiver + Triton SB Logger
USBL Link Quest
Boomer Applied Acoustic Boomer + Applied Acoustic CSPUnit + Applied Acoustic ministreamer + Triton SB Logger
SVP CTD Sea – Bird Electronic SBE 911 plus
Nav Processing 1 PC with Starfix Suite 9.1 for Nav Proc
MBES Processing 1 PC with CARIS
6.2.1 Surface Positioning
Leica GPS 1200 dual-frequency, geodetic, real time kinematic receiver was used as primary
positioning system and HP Starfix 8200 was used as secondary positioning system.
The navigation systems were reliable and performed within specifications.
Operational parameters for the equipment used during the survey are given in the following
paragraph.
The position was sent to the Starfix.Seis Version 10.1 navigation software and was logged during the
acquisition of the survey.
The Starfix Suite software performed all the usual navigation tasks and generated fix marks during the
acquisition (50 metres interval distance); in addition the software was used to QC the navigation data.
6.2.2 Heading
Heading values were provided by an Anschutz Standard 22 motion reference unit interfaced with the
online navigation suite
6.2.3 Single Beam Echo Sounder
The RV ASTREA was equipped with an Odom Hydrotrac single beam echo sounder, set to operate
with a frequency of at 200 kHz. The same frequency was configured in Starfix.Seis and recorded
during the survey. The single beam echo sounder data were acquired along all the lines.
The echo sounder transducer was mounted on keel of the vessel. Transducer depth (draft) was
measured and the value was inserted into the echo sounder recording unit. The horizontal offsets of
the transducer from the navigation antenna were also measured and inputted into Starfix.Seis
navigation software, which calculated true positions for each reading. The accuracy of the draft and
offsets were checked periodically.
The echo sounder was calibrated using an average speed of sound derived from a CTD Sea – Bird
Electronic SBE 911 plus probe measurements undertaken during the survey. These velocities were
applied throughout all the acquisition in the survey area.

TAP- TRANS ADRIATIC PIPELINE Italian Nearshore Geophysical Survey
OPL00 – FOC – 150 Y TRG – 001 –Rev 0B Page 38
SBES bathymetric data were corrected for heave and the corrected depths recorded digitally by
Starfix.Seis navigation software and on the echo sounder trace.
Each trace was annotated at start and end of each survey line with line name and relevant details.
Marks detailing fix number and time were annotated each 10 m distance.
Single beam echo sounder data were printed on-line. SBES main parameters are reported below:
• Frequency: 33-200 kHz
• Scale: 0-80 m
• Y Offset from CRP: -1.670 m
• X Offset from CRP: +0.710 m
• Z Offset from CRP: -2.266 m
6.2.4 Multibeam Echo Sounder
Swathe bathymetry was acquired using a Kongsberg EM 2040 multibeam echo sounder operating
with a frequency of 200-400 kHz. This system comprises of 400 individual beams in a swath corridor
with a width up to 2 times the measured water depth.
Odom Hydrotrac single beam echo sounder data indicates that depth accuracy of each system meets
specification. During the post-processing phase, noise spikes and data gaps due to positioning jumps
were removed from data.
Multibeam echo sounder parameters are reported below:
• Frequency: 200 kHz to 400 kHz
• Beam width: 1*10 at 400kHz
• Max ping rate: 50 Hz
• Swath Coverage: 130° (single head) / 200° (dual he ad)
• Sounding patterns:Equiangular, equidistant and high density
• Number of Beams: 400
• No of sounding per ping: 400 (single head, single swath), 800 (single head, dual swath), 1600
(dual head, dual swath)
• Roll stabilized beams: +/- 150
• Pich stabilized beams: +/- 100
• Pulse length: 25 µs to 12 ms
• X Offset to CRP: -0.155 m
• Y Offset to CRP: +3.112 m
• Z Offset to CRP: -2.616 m
Sound velocity calibration is of primary importance both for SBES and MBES systems in order to
provide the necessary accuracy. RV ASTREA is equipped with a CTD Sea – Bird Electronic SBE 911
plus probe which measure salinity, temperature and depth (pressure). Data are downloaded by means

TAP- TRANS ADRIATIC PIPELINE Italian Nearshore Geophysical Survey
OPL00 – FOC – 150 Y TRG – 001 –Rev 0B Page 39
of a software package that computes sound velocity for each depth interval and these profiles are then
entered into the multibeam and single beam systems to correct ray bending.
6.2.5 Motion Compensation
Primary motion compensation was provided by a Anschutz Standard 22 motion reference unit. The
MRU was interfaced to the online navigation system in order to provide precise roll, pitch and heave
measurements to enable the motion compensation of multibeam and single beam echo sounder
systems.
The MRU achieves the high reliability and precision motion measurements by using solid state
sensors with no moving parts and a proven electrical and mechanical construction.
6.2.6 Sound Velocity Profiler
In order to calibrate the single beam and multibeam echo sounders, SVP measurements were
undertaken during the survey using a CTD Sea – Bird Electronic SBE 911 plus. The corrected speed
of sound was applied to the single beam and multibeam echo sounder to have true bathymetric
readings. (Table 7.2).
The acoustic velocity profiles are presented in Appendix A.
6.2.7 Side Scan Sonar
Seabed Features data were acquired using a Discovery side scan sonar dual frequency towfish with
its transceiver unit.
The side scan fish was towed from the vessel stern. As positioning system for tow fish, the Starfix
Variable Offset alogoritm was used. In order to achieve the maximum accuracy of positioning, cable
length, water depth and towfish altitude values were applied in the system.
The SSS equipment was linked to navigation system by its proper acquisition System. Side scan
sonar data were recorded in digital XTF.
SSS operational Data
The range used was 25 m per channel, to ensure a minimum 100% coverage. The overlap between
lines is 25 m. The recommended height for best performance on a normal seabed is 10% of the range
used.
The side scan sonar records were examined for targets and for the general level of back scattering
from the seabed. The SSS operated at a frequency of 100/400 kHz.
Operating characteristics and offsets of the Discovery side scan sonar are reported (Reference point
CRP antenna):
• Frequency: 100-400 kHz low/high frequency

TAP- TRANS ADRIATIC PIPELINE Italian Nearshore Geophysical Survey
OPL00 – FOC – 150 Y TRG – 001 –Rev 0B Page 40
• Range: 25 m
• Altitude: about 10% of Range
• Cable out: 5-90 m
• X Offset from CRP: 0.000 m
• Coverage 100% of the entire route corridor
6.2.8 Sub-Bottom Profiler
A Datasonics 3710 sub-bottom profiler system was used for the detailed investigation of the shallow
soils. The system transmitted with a frequency of 3.5 kHz.
The equipment was mounted on a pole over the starboard side of the vessel and is fitted with a
Anschutz Standard 22heave compensator.
The SBP equipment was linked to Navigation system by the GLog/GPlot System. The GLog/GPlot
digital acquisition system was used throughout the survey. Sub-bottom profiler data were recorded in
digital SEG-Y format.
SBP operational Data
The Sub-bottom profiler system was used for the detailed investigation of the shallow sub-bottom
sediments. Operating characteristics and offsets of the sub-bottom profiler are reported below:
• Trigger delay: variable
• Range: 250 ms
• Frequency: 3.5 kHz
• Rate shot: 300 ms
• Y Offset from CRP: -1.670 m
• X Offset from CRP: +2.530
• Z Offset from CRP: -2.630 m
6.2.9 Boomer
A Boomer source was used to acquire shallow single channel seismic data. The system consisted of
an Applied Acoustic multi tip source, a CSP 1500 Applied Acoustic power supply and a 10 element
single channel mini-streamer as a receiver.
The GLog/GPlot digital acquisition system was used throughout the survey. Boomer data were
recorded in digital SEG-Y format. The system was operated using the following parameters:
• Power 300 J
• Range 300 ms
• Rate shot: 700 ms
• Delay 0 ms
• Filter Frequency: Low 500 Hz
High 2000 Hz

TAP- TRANS ADRIATIC PIPELINE Italian Nearshore Geophysical Survey
OPL00 – FOC – 150 Y TRG – 001 –Rev 0B Page 41
6.2.10 Sediment Sampling (Day Grab)
The sediment sampling equipment operated on the MV ASTREA consisted of a Day Grab and Double
Day Grab which will be deployed from stern of the vessel.
Twenty- sampling stations will be performed during the survey for a total amount of 20 grabs.
In those twenty stations will be performed: physical sediment analysis) macroscopic aspect,
granulometry and mineralogy); chemical sediment analysis and microbiological sediment analysis.
6.2.11 Underwater Video Camera
The OE 14 208 Underwater Camera system will be utilized on site to confirm the presence of
Posidonia in the areas. The camera will be towed from stern of the vessel.
The camera will be operated from the surface via a KLevlar sheathed umbilical, with the software
allowing control over every aspect of the camera from shutter speed and aperture width, to advanced
settings such as flash intensity, fixed focal lengths, auto bracketing and macro shots.
6.3 Survey Equipment – MB Vector
All the survey equipment as agreed in the scope of work was installed on board of MB Vector.
The equipment utilized to carry out the survey is shown in Table 6.4
Table 6.4: MB Vector Equipment
Positioning RTK Leica GPS1200 with Fugro Starfix.Seis navigation suite
SBES Odom Echotrac CV 200
6.3.1 Surface Positioning
Leica GPS 1200 real time kinematic receiver was used as positioning system on board of MB Vector.
Positioning was provided using a unit and managed by Starfix.Seis navigation software.
The navigation systems was proved as reliable and performed within specifications.
The position was sent to the Starfix.Seis Version 10.1 navigation software and was logged during the
acquisition of the survey.
6.3.2 Single Beam Echo Sounder
MB Vector was equipped with a Odom Echotrac CV 200 kHz single beam echo sounder, set to
operate at 200 kHz. The frequency was configured in Starfix.Seis and recorded during the survey. The
single beam echo sounder data were acquired along all the lines.

TAP- TRANS ADRIATIC PIPELINE Italian Nearshore Geophysical Survey
OPL00 – FOC – 150 Y TRG – 001 –Rev 0B Page 42
The echo sounder transducer was mounted over the starboard side of the vessel. Transducer depth
(draft) was measured for input to the echo sounder. The horizontal offsets of the transducer from the
navigation antenna were also measured and inputted into Starfix.Seis navigation software, which
calculated true positions in correspondence with each reading. The accuracy of the draft and offsets
were checked periodically. The echo sounder was calibrated using an average speed of sound
derived from SVP measurements undertaken during the RV ASTREA survey. These velocities were
applied throughout the survey area. Bathymetric data were corrected for heave and the corrected
depths recorded digitally by Starfix.Seis navigation software and on the echo sounder trace. Single
beam echo sounder data were printed on-line.
6.4 Analogue Instrument Offsets
The instrument offsets are presented in the Table 6.5. Horizontal offsets were referenced to the CRP
position. Vertical offsets were referenced to the sea level. All equipment offsets were measured using
the Leica Total station from a benchmark on the quay.
Table 6.5: Instrument Offsets relative to the CRP p osition
RV ASTREA
Device description X [m] [+ve Starboard]
Y [m] [+ve Forward Z [m] [+ve Downwards]
CRP (Central Reference Point) 0.000 m 0.000 m 0.000 m
MRU 0.00m 0.00m 0.0m0
RTK Leica GPS 1200 I NAV -0.230 m 4.330 m 9.040 m
MBES-Kongsberg EM 2040 -0.155 m 3.112 m -2.616 m
SBES Odom Echotrac CV 200 0.710m -1.670 m -2.266 m
Anschutz Standard 22 Gyro 0.610 m 4.530 m 6.170 m
Side scan sonar (SSS) -0.950 m -10.730 VO Manual
Sub-bottom profiler (SBP) 2.530 m -1.670 m -2.630 m
Boomer +1.200 m -9.730 m 0.00 m
MB Vector
Device description X [m] [+ve Starboard]
Y [m] [+ve Forward Z [m] [+ve Downwards]
RTK Leica 1200 0.000 m 0.000 m 0.000 m
SBES Odom Hydrotrac 0.000 m 0.000 m -2.3 m
GPS -1.25 m 0.430 m 0.000 m
Diagram showing the analogue equipment offsets relative to CRP (Central Reference point) and
equipment layout of RV ASTREA are presented in Figure 6.1 and Figure 6.2

TAP- TRANS ADRIATIC PIPELINE Italian Nearshore Geophysical Survey
OPL00 – FOC – 150 Y TRG – 001 –Rev 0B Page 43
Figure 6.1: Instrument Offsets – RV ASTREA
Figure 6.2: Configuration of equipment on board – R V ASTREA

TAP- TRANS ADRIATIC PIPELINE Italian Nearshore Geophysical Survey
OPL00 – FOC – 150 Y TRG – 001 –Rev 0B Page 44
7 SURVEY OPERATIONS
7.1 Operations Summary:
RV ASTREA and MB Vector were used by Fugro Oceansismica S.p.A. between 15 December 2013
and 05 January 2014 to perform the Italian Nearshore Geophysical Survey of the Statoil Pipeline
survey.
The mobilisation of the RV ASTREA took place from 16 to 18 December 2013, as the mobilisation of
MB Vector took place on 24 December 2013. Both the vessels were mobilized in Otranto harbour.
During the mobilization all instruments were tested and GPS/DGPS and gyro compass calibrations
were performed
On 21 December, after the multibeam calibration the RV ASTREA acquisition started with SSS, SBP
and MBES.
A complete report of multibeam echo sounder calibration is given in Appendix B.
The nearshore geophysical acquisition with RV ASTREA start on 22 December.
On 24 and 25 December, MB Vector acquired SBES data in the surf zone.
Demobilization of MB Vector took place on 25 December in Otranto harbour.
The nearshore geophysical acquisition with RV ASTREA end on 04 January.
The nearshore geophysical demobilization and environmental mobilization of RV ASTREA took place
on 05 January in Otranto harbour.
During the survey seven SVP measurements were undertaken in order to check the value of the
speed of sound in the water.
Full details of operations can be found in the Daily Progress Reports, Appendix C.
7.2 Calibrations
The following calibrations and checks were performed in Otranto harbour:
• DGPS Health check
• DGPS verification to a known point
• Side scan sonar rub-testing
• Sub-bottom profilers testing alongside
On 21 December, the following calibrations were performed on site:
• SVP and CTD profile

TAP- TRANS ADRIATIC PIPELINE Italian Nearshore Geophysical Survey
OPL00 – FOC – 150 Y TRG – 001 –Rev 0B Page 45
• MBES echo sounder calibration (Details are given in Appendix B)
• Test line acquisition and quick QC check to confirm that acquired data meet requirements
within the scope of work
• MBES calibration lines.
7.2.1 Surface Positioning
Leica1200 GPS RTK and Fugro Starfix 8200HP were used for positioning throughout the survey.
On 21 December calibrations and measurements were performed by FUGRO personnel and land
surveyors against official benchmarks on the harbour, using a LEICA total station and a reflector
installed on the Leica RTK antenna on board.
The readings from the benchmark and the data logged into the navigation system gave an absolute
difference of 0.02 m, which is in the range of the RTK system error.
Coordinates of benchmarks and reference station are listed in Table 7.1
Table 7.1: Coordinates of benchmarks and reference station
Geographical coordinates WGS84 Metric coordinates
WGS84 UTM 34 Elevation (m)
Benchmark
Latitude Longitude Northing Easting Ellipsoidal Geodetic
SF01 40° 18’ 38.12165’’ 18° 23’ 33.58711’’ 4465493.1 1 278437.52 39.16 0.57
SF02 40° 18’ 50.98323’’ 18° 23’ 14.99961’’ 4465902.6 7 278010.43 42.43 3.84
SF03 40° 19’ 00.90719’’ 18° 23’ 04.65721’’ 4466215.9 1 277775.33 42.51 3.92
SF04 40° 18’ 46.49797’’ 18° 23’ 04.65721’’ 4465769.0 3 277848.08 53.53 15.94
SF05 40° 18’ 46.23936’’ 18° 23’ 08.22553’’ 4465763.9 1 277847.36 48.720
Details of reference benchmarks used for the gyro compass and positioning system calibrations
(Benchmarks) are given in Appendix B.
The readings of the RTK against Total station and the comparison between the first (Leica 1200 RTK)
and the second (Fugro Starfix HP 8200) positioning systems are detailed in Appendix B.
7.2.2 Multibeam Echo Sounder
The first MBES calibration was performed on 21 December 2013. The calibration was performed over
an area with a break of slope close to the survey area at the following coordinates:
The computed calibration parameters are shown in the following table (Table 7.2).
Table 7.2: EM 2040 Multibeam Calibration Results
Calibration Date
Motion Sensor Pitch Error ( ° ) Roll Error ( ° ) Heading Error ( ° )
21/12/13 Anschutz Standard 22 -0.7 -1.5 -0.8

TAP- TRANS ADRIATIC PIPELINE Italian Nearshore Geophysical Survey
OPL00 – FOC – 150 Y TRG – 001 –Rev 0B Page 46
MBES Calibration lines have to be performed in order to remove possible device head installation
misalignments and processors time delay. Calibration lines must be performed following a given
acquisition geometry and over a proper seafloor, in order to allow spatial misalignments and time
delay detection.
Time, pitch and yaw calibration lines must be run over a target on the seabed while roll calibration
lines must be run over a flat seabed.
If, in case of misalignments and delays, the target or seabed are detected in different ways by the
calibration lines, then angles (pitch, roll, yaw) and delays (time) that cause the differences must be
corrected by the calibration procedure.
Calibration values computation was performed by means of Starfix Suite acquisition and processing
software using calibration lines.
The calibration parameters are the results of the calibration procedure and they were used to set the
real time acquisition software before the beginning of the survey.
The results are reported in Appendix A.
7.2.3 Acoustic Velocity
Four (4) acoustic velocity measurements were carried out prior to the commencement and during the
survey in order to calibrate the single beam and multibeam echo sounders. Results are shown in the
following (Table 7.3).
Table 7.3: Mean Acoustic Velocity as determined fro m SVP measurement
Name Easting [m] Northing [m] Latitude [N] Longitude [E]
Max Water Depth [m]
Mean Velocity [m/s]
211213_7.00 2800633 4465790 40° 18' 49.30'' 18° 24' 42.00" 48.9 1509.24
221213_7.00 279952 4466584 40° 19' 14.90'' 18° 24' 36.33" 61.1 1509.90
221213_15.00 281954 4468155 40° 20' 07.72'' 18° 25' 59.19" 81.7 1511.91
040114_7.30 281815 4468234 40° 20' 10'' 18° 25' 53" 62 1512.65
Details of acoustic velocity profiles are presented in Appendix B.

TAP- TRANS ADRIATIC PIPELINE Italian Nearshore Geophysical Survey
OPL00 – FOC – 150 Y TRG – 001 –Rev 0B Page 47
7.3 Data Reduction and Processing
7.3.1 Positioning and Navigation
All raw DGPS data were edited to remove erroneous fixes. No smoothing filters were applied to the
position data during acquisition.
The antenna position was corrected to the vessel common reference point position during the
acquisition of data using measured offsets. The position of the antenna during the acquisition was
corrected for layback of side scan sonar by applying the offset along the vessel track.
Real time logging of navigation and bathymetric sounding (water depth) data was acquired using
Fugro’s Starfix.Seis navigation system.
The processing of the acquired navigation data was carried out using the Starfix.Proc software.
Data were processed using offsets from the vessel datum for all sensors.
Sounding (water depth) data were processed at multibeam and echo sounder transducer positions (x,
y and z).
7.3.2 Bathymetry - Tides
The bathymetry data were reduced to LAT in order to carry out a final interpretation of the seafloor
during the survey operations. During the on board bathymetry processing, the predicted tidal values
were applied.
7.3.3 Single Beam Echo Sounder
The single beam echo sounder data were processed and stored in XYZ format then converted to
binary format for gridding and contouring.
The echo sounder was interfaced to the navigation system, which computed the position of each
sounding using the offset. The bathymetric data were monitored and checked against the echo
sounder paper records to confirm the data accuracy.
7.3.4 Multibeam Echo Sounder
Vertical datum for bathymetric data is Lowest Astronomical Tide (LAT) and the predicted tides were
applied.
Data were processed using the Caris. The field processing sequences are reported in Appendix G
7.3.5 Side Scan Sonar
Data were digitally recorded in digital format (.xtf) onto hard disk using the Discovery software of
acquisition.

TAP- TRANS ADRIATIC PIPELINE Italian Nearshore Geophysical Survey
OPL00 – FOC – 150 Y TRG – 001 –Rev 0B Page 48
The *.xtf files were played back using Sonar Wiz 5 where a full QC of each line was carried out. At the
same time, data were analysed and checked for discrete sonar contacts.
The records were corrected for slant-range distortion before the interpretation and the main target are
presented on the Bathy-morphological Chart (Appendix I).
The side scan sonar records were examined both for significant targets and for the general level of
backscatter from the seabed. The nature of the seabed sediments was interpreted from the acoustic
facies, i.e. the textural appearance combined with the acoustic reflectivity of the sonar records. The
tag files containing the good interpretation from individual sonar.
7.3.6 Sub-Bottom Profiler/Boomer
Data were recorded in digital format (seg-y).
The sub-bottom profiler and Boomer data were examined for significant horizons. For interpretation of
the SBP and Boomer data an assumed acoustic velocity of 1600 m/s (considered reasonable for the
interpreted sediment types) within shallow sediments was used in the conversion from two-way
reflection time to depth. All the dataset was interpreted with the Kingdom-32 software (Version 8.6
Seismic Micro Technology).
7.4 Accuracy of Navigation, Bathymetric and Seabe d Data
7.4.1 Positioning and Navigation
The RTK and Starfix.HP systems performed well throughout the survey. The number of available
satellites may affect the data accuracy; the minimum quality is four satellites. The accuracy for the
RTK Leica GPS 1200+ (Primary system) is >0.05 m and for the Starfix 8200HP (Secondary system) is
>0.2 m.
7.4.2 Bathymetry
The single beam and multibeam echo sounder data were good throughout the survey, but several
factors influence the accuracy of the bathymetric data. Errors in the depth measurement can result
from:
• Variations in sound velocity
• Weather effects
• Instrument accuracy (0.2% of depth)
• Vessel movement
• Morphology of seabed
Further details about tide gauge deployment and calibration are given in Appendix B.
The bathymetric data were reduced to LAT, during acquisition, to allow a field interpretation and
reporting.

TAP- TRANS ADRIATIC PIPELINE Italian Nearshore Geophysical Survey
OPL00 – FOC – 150 Y TRG – 001 –Rev 0B Page 49
The single beam and multibeam echo sounder data were processed and stored in XYZ format to be
used for gridding and contouring.
7.4.3 Side Scan Sonar
The quality of the side scan sonar data was good. The lateral resolution of the 300 kHz dual frequency
data is approximately 0.2-0.3 m. Obstructions smaller than the resolution of the sonar may not have
been detected.
Height of seabed obstructions estimated from the side scan sonar data are considered to have an
accuracy of 0.2-0.3 m. Seabed features smaller than those values cannot be detected The positional
accuracy of features, interpreted from the side scan sonar data, depends on a combination of the
vessel positioning, acoustic positioning of the towfish relative to the vessel and interpretation of
position relative to the towfish. For this dataset the overall positional accuracy is estimated as ± 5 m.
7.5 Accuracy of Sub Seabed Data
7.5.1 Horizontal Accuracy
• Positional accuracy of sub-seabed data is dependent on several factors:
• Accuracy in position of vessel
• Motion of vessel
• Accuracy in position of towed equipment
• Horizontal resolution of seismic data
A reflection on seismic data is produced from an area rather than a single point. This area is called the
Fresnel Zone. The radius of the Fresnel Zone can be calculated from the frequency of the seismic
data and provides an estimate of the horizontal accuracy of the seismic data at different depths.
The minimum line spacing is approximately 5 m for the along tracks and approximately 50 m for the
across tracks; sub-seabed features smaller than those values and present between the lines may not
have been detected. Depths and positions of soil layers between survey lines are based on
interpolation, the reliability of which depends on the complexity of the geology.
The sub-seabed depths were estimated using an assumed acoustic velocity of 1600 m/s, which is
considered reasonable for the interpreted sediment types, but has not been calibrated. The accuracy
of depth estimates depends on the vertical resolution of the data and the acoustic velocity used to
convert two-way reflection times to depth and is considered to be approximately ±1% of sub-seabed
depth.

TAP- TRANS ADRIATIC PIPELINE Italian Nearshore Geophysical Survey
OPL00 – FOC – 150 Y TRG – 001 –Rev 0B Page 50
7.5.2 Vertical Accuracy
Sub-bottom profiler
A useful acoustic penetration of about 6 ms or approximately 5 m below seabed was generally
achieved over the survey area. The vertical resolution of the data is estimated as 0.5 m for sub-bottom
profiler; soil layers thinner than this may not have been detected.
Boomer
The penetration of the Boomer dataset is limited to approximately 45 ms or approximately 36 m below
seabed with the vertical resolution of the data estimated as 1.5 m; soil layers thinner than this may not
have been detected.

TAP- TRANS ADRIATIC PIPELINE Italian Nearshore Geophysical Survey
OPL00 – FOC – 150 Y TRG – 001 –Rev 0B Page 51
8 DATA INDEX
8.1 Digital Report Delivery

TAP- TRANS ADRIATIC PIPELINE Italian Nearshore Geophysical Survey
OPL00 – FOC – 150 Y TRG – 001 –Rev 0B Page 52
8.2 Chart Index
Drawing No. Description KP Range Scale
OPL00-FOC-150-Y-DYG-0003-01 rev.0A Bathy-morphological chart 104.92-99.54 1:5000
OPL00-FOC-150-Y-DYG-0004-01 rev.0A Hill shade with sea bed features 104.92-99.54 1:5000
OPL00-FOC-150-Y-DYG-0005-01 rev.0A Backscatter with seabed features targets
104.92-99.54 1:5000
OPL00-FOC-150-Y-DYG-0006-01 rev.0A SSS mosaic with seabed features 104.92-99.54 1:5000
OPL00-FOC-150-Y-DYG-0007-01 rev.0A Isopach of Interpreted Units
(Boomer data) (H10) 104.92-99.54 1:5000
OPL00-FOC-150-Y-DYG-0007-02 rev.0A Isopach of Interpreted Units
(Boomer data) (H20) 104.92-99.54 1:5000
OPL00-FOC-150-Y-DYG-0008-01 rev.0A Interpreted Profile (Boomer data) 103.90-100.14 1:5000
OPL00-FOC-150-Y-DYG-0009-01 rev.0A Alignment sheet A 1 04.24-102.28 1:5000
OPL00-FOC-150-Y-DYG-0009-02 rev.0A Alignment sheet B 1 02.66-100.27 1:5000

TAP- TRANS ADRIATIC PIPELINE Italian Nearshore Geophysical Survey
OPL00 – FOC – 150 Y TRG – 001 –Rev 0B Page 53
8.3 Target Listing Index
No iron-magnetometric and anthropogenic targets were recognized within the survey area.

TAP- TRANS ADRIATIC PIPELINE Italian Nearshore Geophysical Survey
OPL00 – FOC – 150 Y TRG – 001 –Rev 0B Appendices
APPENDICES

TAP- TRANS ADRIATIC PIPELINE Italian Nearshore Geophysical Survey
OPL00 – FOC – 150 Y TRG – 001 –Rev 0B Appendix A
A. GEODETIC PARAMETERS

TAP- TRANS ADRIATIC PIPELINE Italian Nearshore Geophysical Survey
OPL00 – FOC – 150 Y TRG – 001 –Rev 0B Appendix B
B. CALIBRATIONS

TAP- TRANS ADRIATIC PIPELINE Italian Nearshore Geophysical Survey
OPL00 – FOC – 150 Y TRG – 001 –Rev 0B Appendix C
C. SURVEY LOGS

TAP- TRANS ADRIATIC PIPELINE Italian Nearshore Geophysical Survey
OPL00 – FOC – 150 Y TRG – 001 –Rev 0B Appendix D
D. DAILY PROGRESS REPORTS

TAP- TRANS ADRIATIC PIPELINE Italian Nearshore Geophysical Survey
OPL00 – FOC – 150 Y TRG – 001 –Rev 0B Appendix E
E. VESSEL SPECIFICATIONS

TAP- TRANS ADRIATIC PIPELINE Italian Nearshore Geophysical Survey
OPL00 – FOC – 150 Y TRG – 001 –Rev 0B Appendix F
F. DETAILED EQUIPMENT

TAP- TRANS ADRIATIC PIPELINE Italian Nearshore Geophysical Survey
OPL00 – FOC – 150 Y TRG – 001 –Rev 0B Appendix G
G. MBES PROCESSING

TAP- TRANS ADRIATIC PIPELINE Italian Nearshore Geophysical Survey
OPL00 – FOC – 150 Y TRG – 001 –Rev 0B Appendix H
H. SERVICE WARRANTY

TAP- TRANS ADRIATIC PIPELINE Italian Nearshore Geophysical Survey
OPL00 – FOC – 150 Y TRG – 001 –Rev 0B Appendix I
I. CHARTS