Massachusetts Ocean Management Plan - Mass.gov
227
Massachusetts Ocean Management Plan Volume 2 Baseline Assessment and Science Framework December 2009
-
Upload
khangminh22 -
Category
Documents
-
view
2 -
download
0
Transcript of Massachusetts Ocean Management Plan - Mass.gov

Massachusetts OceanManagement Plan
Volume 2
Baseline Assessmentand Science Framework
December 2009


Introduction Volume 2 of the Massachusetts Ocean Management Plan focuses on the data and scientific aspects of the plan and its implementation. It includes these two separate documents:
• Baseline Assessment of the Massachusetts Ocean Planning Area - This Oceans Act-mandated product includes information cataloging the current state of knowledge regarding human uses, natural resources, and other ecosystem factors in Massachusetts ocean waters.
• Science Framework - This document provides a blueprint for ocean management-related science and research needs in Massachusetts, including priorities for the next five years.
i


Baseline Assessment of the Massachusetts Ocean Management
Planning Area


Acknowledgements The authors thank Emily Chambliss and Dan Sampson for their help in preparing Geographic Information System (GIS) data for presentation in the figures. We also thank Anne Donovan and Arden Miller, who helped with the editing and layout of this document. Special thanks go to Walter Barnhardt, Ed Bell, Michael Bothner, Erin Burke, Tay Evans, Deb Hadden, Dave Janik, Matt Liebman, Victor Mastone, Adrienne Pappal, Mark Rousseau, Tom Shields, Jan Smith, Page Valentine, John Weber, and Brad Wellock, who helped us write specific sections of this assessment. We are grateful to Wendy Leo, Peter Ralston, and Andrea Rex of the Massachusetts Water Resources Authority for data and assistance writing the water quality subchapter. Robert Buchsbaum, Becky Harris, Simon Perkins, and Wayne Petersen from Massachusetts Audubon provided expert advice on the avifauna subchapter. Kevin Brander, David Burns, and Kathleen Keohane from the Massachusetts Department of Environmental Protection and Robin Pearlman from the U.S. Environmental Protection Agency provided data for the wastewater subchapter. Lastly, we’d like to thank the Science Advisory Council members (Priscilla Brooks, Carlton Hunt, Scott Krauss, Jack Looney, Frank Muller-Karger, Bill Schwab, and David Terkla) for their input on the framing, writing, and editing of this document.
Todd Callaghan
Kathryn Ford
Prassede Vella


Table of Contents Chapter 1 - Introduction ..................................................................................................... BA-1 Data Collection.................................................................................................................... BA-1 Geographic Focus .............................................................................................................. BA-2 Weather Conditions ............................................................................................................ BA-4 References .......................................................................................................................... BA-5
Chapter 2 - Water Column Features .............................................................................. BA-7 North of Cape Cod .............................................................................................................. BA-7 South of Cape Cod ............................................................................................................. BA-8 Upwelling, Fronts, and Waves ............................................................................................ BA-9 Riverine Inputs .................................................................................................................. BA-11 Sea Temperature .............................................................................................................. BA-11 Seasonal Changes ........................................................................................................... BA-12 Water Quality .................................................................................................................... BA-13 Biological Features ........................................................................................................... BA-20 References ........................................................................................................................ BA-21
Chapter 3 - Seabed Features .......................................................................................... BA-27 Geomorphology ................................................................................................................ BA-27 Sediment Transport .......................................................................................................... BA-28 Sediment Quality .............................................................................................................. BA-29 Biological Features ........................................................................................................... BA-30 References ........................................................................................................................ BA-31
Chapter 4 - Habitat ............................................................................................................ BA-35 Primary and Secondary Producers ................................................................................... BA-36 Benthic Communities ........................................................................................................ BA-39 Fisheries Resources, Shellfish, and Habitat ..................................................................... BA-41 Seafood Quality/Chemical Contaminants ......................................................................... BA-44 Avifauna ............................................................................................................................ BA-45 Marine Mammals and Reptiles ......................................................................................... BA-49 Invasives ........................................................................................................................... BA-52 Man-Made Habitat, Mitigation, and Restoration ............................................................... BA-55 References ........................................................................................................................ BA-57
Chapter 5 - Archeological and Cultural Sites ........................................................... BA-67 Native American Sites ...................................................................................................... BA-67 Shipwrecks and Other Historic Resources ....................................................................... BA-69 References ........................................................................................................................ BA-72
Chapter 6 - Human Uses .................................................................................................. BA-75 Commercial Fishing .......................................................................................................... BA-75 Aquaculture ....................................................................................................................... BA-76 Recreational Uses ............................................................................................................ BA-77

Chapter 6 - Human Uses (continued) Transportation ................................................................................................................... BA-82 Energy Generation ............................................................................................................ BA-93 Telecommunication and Power Cables ............................................................................ BA-98 Pipelines ......................................................................................................................... BA-100 Water, Stormwater, and Industrial Discharges ............................................................... BA-101 Military Training, Defense, and Law Enforcement .......................................................... BA-104 Ocean Disposal............................................................................................................... BA-105 Protected Areas .............................................................................................................. BA-107 Education and Research ................................................................................................ BA-110 Aesthetics ....................................................................................................................... BA-111 Shoreline Protection and Floodplain Management ........................................................ BA-112 Extraction for Beach Nourishment .................................................................................. BA-113 References ...................................................................................................................... BA-114
Chapter 7 - Economic Valuation ................................................................................. BA-119 Economic Impact of the Marine Economy in Massachusetts ......................................... BA-119 Employment .................................................................................................................... BA-120 Marine Transportation ..................................................................................................... BA-120 Coastal Tourism and Recreation .................................................................................... BA-121 Commercial and Recreational Seafood .......................................................................... BA-122 Aquaculture ..................................................................................................................... BA-124 Marine Science and Technology .................................................................................... BA-124 Marine-Related Construction and Infrastructure ............................................................. BA-125 References ...................................................................................................................... BA-125
Chapter 8 - Climate Change .......................................................................................... BA-127 Temperature Change ...................................................................................................... BA-127 Changes in Precipitation ................................................................................................. BA-128 Sea Level Rise ................................................................................................................ BA-129 Changes in Wind Patterns .............................................................................................. BA-131 Increasing Frequency and Intensity of Storms ............................................................... BA-131 Ocean Acidification ......................................................................................................... BA-132 References ...................................................................................................................... BA-132

List of Tables Chapter 2
Table 2.1 - Major oceanographic characteristics in the Massachusetts ocean management planning area (MCZM 2008)
Table 2.2 - Sea temperature in the Massachusetts ocean management planning area (GoMOOS 2008)
Table 2.3 - Relative noise source levels (SL) from different large vessel types transiting Stellwagen Bank National Marine Sanctuary (SBNMS) in 2006 (Table modified from Hatch et al. 2008.)
Chapter 4 Table 4.1 - Eelgrass trends in four regions of Massachusetts Table 4.2 - Trends in commercially harvested groundfisheries (from NOAA 2008) Table 4.3 - Habitat features of importance to fisheries resources Table 4.4 - Bird species with special state or federal protection that use the Massachusetts
ocean management planning area Table 4.5 - Marine mammal and reptile species found in the Massachusetts ocean
management planning area Table 4.6 - Marine introduced species in intertidal and subtidal waters of Massachusetts
Chapter 5 Table 5.1 - Historic major storm events off of the Massachusetts coast (adapted from Luther
1958; Mastone 2002)
Chapter 6 Table 6.1 - Commercial vessels and other traffic entering or leaving the Port of Boston in
2005 (adapted from Table 23 in Stellwagen Bank National Marine Sanctuary Draft Management Plan. 2008. U.S. Dept. of Commerce. NOAA. National Marine Sanctuary Program)
Table 6.2 - Passenger vessels transiting between Cape Cod and the Islands Table 6.3 - Energy generating facilities adjacent to the Massachusetts ocean management
planning area Table 6.4 - Proposed and approved renewable energy projects in Massachusetts Table 6.5 - Permitted discharges to Massachusetts Bay by sector and their actual (as
opposed to permitted) monthly discharge flow from August 2007-July 2008 Table 6.6 - Areas of Critical Environmental Concern in and adjacent to the Massachusetts
ocean management planning area
Chapter 8 Table 8.1 - Tide gauge sea level trends in Massachusetts


List of Figures For production purposes, all color figures and maps are placed at the end of the baseline assessment.
Chapter 1 Figure 1.1 - The Massachusetts ocean management planning area Figure 1.2 - Municipalities adjacent to the Massachusetts ocean management planning area Figure 1.3 - Major biogeographic regions within the Massachusetts ocean management
planning area Figure 1.4 - The Gulf of Maine Figure 1.5 - Massachusetts waters north of Cape Cod Figure 1.6 - Massachusetts waters south of Cape Cod
Chapter 2 Figure 2.1 - Currents in the Gulf of Maine (from Anderson et al. 2007)
Chapter 4 Figure 4.1 - Surficial sediments and protected benthic habitats in the Massachusetts ocean
management planning area Figure 4.2 - Eelgrass in the Massachusetts ocean management planning area Figure 4.3 - Distribution of unique seafloor habitat classes in the Massachusetts ocean
management planning area Figure 4.4 - Areas important to fisheries resources in the Massachusetts ocean
management planning area Figure 4.5 - Roseate Tern nesting and staging areas in and adjacent to the Massachusetts
ocean management planning area Figure 4.6 - Roseate Tern foraging habitat in and adjacent to the Massachusetts ocean
management planning area Figure 4.7 - Important habitat for Long-tailed Duck in the Massachusetts ocean management
planning area Figure 4.8 - Interpolation of North Atlantic right whale sightings-per-unit-effort (SPUE) data
for all seasons Figure 4.9 - Interpolation of fin whale sightings-per-unit-effort (SPUE) data for all seasons Figure 4.10 - Interpolation of humpback whale sightings-per-unit-effort (SPUE) data for all
seasons
Chapter 5 Figure 5.1 - Submerged wrecks in the Massachusetts ocean management planning area
Chapter 6 Figure 6.1 - Commercial fisheries activity in the Massachusetts ocean management planning area Figure 6.2 - Recreational fishing areas classified as “high importance” in the Massachusetts
ocean management planning area Figure 6.3 - Recreational boating and fishing areas identified by a Massachusetts Marine
Trades Association (MMTA) survey
Chapter 6 (continued) Figure 6.4 - Popular dive sites in and adjacent to the Massachusetts ocean management
planning area Figure 6.5 - Infrastructure, navigation lanes, and transportation routes Figure 6.6 - Wind power potential off of the Massachusetts coast Figure 6.7 - Protected areas in and adjacent to the Massachusetts ocean management
planning area Figure 6.8 - Locations of the five Ocean Sanctuaries in Massachusetts

Chapter 1 - Introduction As directed by the Oceans Act of 2008, the Massachusetts Executive Office of Energy and Environmental Affairs (EEA) developed a comprehensive ocean management plan for Commonwealth waters. The Oceans Act required the establishment of an ocean Science Advisory Council (SAC) of nine members with expertise in marine sciences to support the Secretary of Energy and Environmental Affairs in the development of the ocean management plan. The Oceans Act tasked the SAC with creating a baseline assessment and obtaining any other scientific information necessary for plan development. Specifically, the SAC assisted in the development of the baseline assessment by approving the outline, reviewing data sources provided by the authors, providing additional data sources, and editing drafts for clarity and content.
This document is the baseline assessment portion of the Massachusetts Ocean Management Plan. It is intended to be an information base for ocean management plan development and implementation and to provide a science-based context for the plan. The introduction covers how the data were assembled for the assessment and the geographic focus for the ocean management plan. Chapters 2 through 8 describe the current knowledge and status of resources, uses, and conditions in the Massachusetts ocean management planning area.
DATA COLLECTION
Many sections of this baseline assessment are informed by The Massachusetts Ocean Management Task Force Technical Report (Commonwealth of Massachusetts 2004). In addition, the baseline assessment incorporates new information produced by the six ocean management plan work groups that were formed to help inventory and synthesize available data for the development of the ocean management plan (i.e., the habitat; fisheries; renewable energy; transportation, navigation, and infrastructure; regional sediment resource management; and ocean recreational and cultural services work groups). These work groups were organized following the signing of the Oceans Act and worked through the summer and fall of 2008. The work groups included a core of state agency staff that compiled existing data and spatial information on the various topics. After the initial data collection phase, the work groups were expanded to include expertise from beyond state government that included academia, federal agencies, non-profit organizations, and industry. The work group process resulted in a series of reports that describe and analyze existing data for each of the six topic areas. While the work group reports are stand-alone products, as appropriate, data and analysis results have been incorporated into this baseline assessment.
Data variability is a readily apparent issue with this baseline assessment. Within the ocean management planning area (planning area), available data varies spatially, temporally, and in
BA-1

terms of depth, precision, and accuracy for most subjects covered in this baseline assessment. In the future, one of the important ocean management activities will be addressing data variability and filling data gaps, particularly for priority issues and management concerns.
For purposes of this document, “baseline” is not intended to connote a description of the planning area in an unaltered or undeveloped state. Instead, this baseline assessment is an inventory and characterization of the physical description, natural communities, and human interactions within the planning area as we understand them today, in 2009. With that said, it is also important to note the importance of variability in the ocean environment, across various temporal and spatial scales, and to recognize that perturbations such as climate change are affecting the ocean environment in ways that we do not yet fully understand.
GEOGRAPHIC FOCUS
The geographic focus for this document is the planning area mandated by the Oceans Act (as depicted in Figure 1.11), which in most areas extends from approximately 0.5 kilometers (km) (0.3 miles) from Mean High Water to the seaward extent of state jurisdiction. Certain resources and issues in the planning area are affected by processes and activities outside of the planning area, including activities in other states (such as Rhode Island’s wind energy facility siting study), and vice versa. Therefore, while the baseline assessment focuses on the planning area, topics in the baseline assessment also include a greater geographical context where appropriate.
Pursuant to the Oceans Act of 2008, the ocean management planning area includes waters and associated submerged lands of the ocean, including the seabed and subsoil, lying between the line designated as the “Nearshore Boundary of the Ocean Management Planning Area” and the seaward boundary of the Commonwealth, as defined in 43 U.S.C. § 1312 (Figure 1.1). The nearshore boundary follows the contour of the Massachusetts coast, approximately 0.5 km (0.3 mile) from shore, except across closure areas at the mouths of certain embayments (e.g., Boston Harbor). The total watersheet surface area is 5,549 km2 (2,142 miles2). With the exception of navigational aids and fishing or research buoys, the planning area does not currently contain permanent emergent or floating structures. With the exception of moorings, fixed fishing gear, and sunken vessels, the ocean bottom in the planning area contains few man-made structures (although three natural gas pipelines and several electrical and communications cables are buried below the surface of the ocean bottom).
The following communities have waters and submerged lands in the planning area: Salisbury, Newbury, Newburyport, Rowley, Ipswich, Essex, Rockport, Gloucester, Manchester-by-the-
1 For production purposes, all color figures and maps are placed at the end of the baseline assessment.
BA-2

Sea, Beverly, Salem, Marblehead, Swampscott, Lynn, Nahant, Saugus, Revere, Winthrop, Boston, Hull, Cohasset, Scituate, Marshfield, Duxbury, Plymouth, Sandwich, Barnstable, Yarmouth, Dennis, Brewster, Eastham, Wellfleet, Truro, Provincetown, Orleans, Chatham, Harwich, Mashpee, Falmouth, Gosnold, Bourne, Nantucket, Edgartown, Oak Bluffs, Tisbury, West Tisbury, Chilmark, Wareham, Marion, Mattapoisett, Fairhaven, New Bedford, Dartmouth, and Westport (Figure 1.2).
The planning area is located at the intersection of two major biogeographic regions, the Gulf of Maine, which is part of the Acadian province, and the Southern New England-New York Bight, which is part of the Virginian province (Figure 1.3). These two regions have distinct physical characteristics that in turn underpin characteristic biological communities. The waters of Massachusetts north of Cape Cod are influenced by the relatively cold Gulf of Maine currents, while the waters to the south and east of Cape Cod are influenced by the relatively warmer water from the Southern New England-New York Bight.
North of Cape Cod—Gulf of Maine, Acadian Province
Two major bays define the planning area north of Cape Cod: Massachusetts and Cape Cod Bays. These bays are found in the southern end of the Acadian Province, in the southwestern Gulf of Maine. The Gulf of Maine is a semi-enclosed sea bordered by Massachusetts, New Hampshire, Maine, New Brunswick, and Nova Scotia (Figure 1.4). In general, the southwestern Gulf of Maine is characterized by cold water flowing in a counter-clockwise circulation west and south along the Maine, New Hampshire, and Massachusetts coasts, called the Western Maine Coastal Current. River inputs, particularly during spring runoff, also influence flow (Comm. Mass. 2004).
Massachusetts and Cape Cod Bays are partially isolated from the major circulation patterns of the Gulf of Maine by Stellwagen Bank (Figure 1.5). Two channels separate Stellwagen Bank from Cape Ann in the north and Race Point, Provincetown, in the south. Stellwagen Basin separates the Bank from the western portion of Massachusetts Bay and has the deepest waters north of Cape Cod with a maximum depth of 89 meters (m) (292 feet [ft]) (Comm. Mass. 2004).
Massachusetts Bay has a variable seafloor topography including submerged geomorphic features related to the last stages of continental glaciation (e.g., drumlins, moraines). In Massachusetts Bay, bedrock outcrops are found predominantly off Cape Ann, Boston Harbor, and the South Shore just south of Boston. Cape Cod Bay, the southernmost portion of the Gulf of Maine, has a relatively flat topography with larger expanses of sandy and soft sediments (Comm. Mass. 2004).
BA-3
South of Cape Cod—Mid-Atlantic Bight, Virginian Province
Southern Massachusetts borders the northern edge of the Mid-Atlantic Bight. This area contains Buzzards Bay, Vineyard Sound, Nantucket Sound, and the Great South Channel (Figure 1.6). The islands of Martha’s Vineyard and Nantucket mark the southern edge of Nantucket Sound, which is characterized and formed by the marine reworking of the large outwash plain and lake deltas deposited during glacial retreat roughly 18,000 years ago. Sediments within Nantucket Sound are a wide mix of well to poorly sorted sand and gravel, while generally softer sediments are common in Buzzards Bay. In both bodies of water, large boulders are common in certain areas. Unlike Massachusetts Bay, no bedrock outcroppings have been identified, but they likely exist.
Currents within Nantucket Sound are currently being defined by modeling and groundtruthing studies by Massachusetts Institute of Technology (MIT) Sea Grant and the Woods Hole Oceanographic Institute (Beardsley 2008). The area is dominated by semidiurnal tide-generated currents, and influenced by southwesterly winds (Comm. Mass. 2004). To the east, the Great South Channel carries colder, more saline Gulf of Maine waters southward past the eastern portion of Cape Cod. Buzzards Bay is a relative shallow, tidally dominated, well-mixed estuary.
WEATHER CONDITIONS
Continental air masses from the south and west, and warm air from the Gulf of Mexico, influence the Massachusetts climate. Weather conditions in the North Atlantic region are controlled by the Bermuda high-pressure system. This condition results in frequent showers, thunderstorms, high humidity, and low wind speeds in the spring and summer and, in the winter, can result in frequent and abrupt day-to-day variations in pressure, wind, and weather when combined with faster moving and more intense winter pressure systems (Field 1980).
Generally, winds vary seasonally in Massachusetts. Summer winds typically are weak from the southwest or southeast and bring warm, moist air that can contribute to fog formation; winds from the north or northwest are typical for autumn and winter (GoMOOS 2008). Spring and summer southwesterlies may drive hurricanes northward from across Atlantic or Caribbean tracks and have the potential to harm the Commonwealth’s south-facing shores along Buzzards Bay and the south coast of Cape Cod. The storms of autumn or winter, “nor’easters,” also have particularly strong winds and may drive winter storms into northeastern-facing shores (e.g., Massachusetts Bay and the outer Cape) (MCZM/MME 1992). Storm surge is another hazard characterized by elevated sea level along a coast caused by storms. Coastline shape, nearshore depth, and wind strength and direction all determine the severity of storm surges (GoMOOS 2008).
BA-4

BA-5
The North Atlantic Oscillation (NAO) is a hemispheric fluctuation in atmospheric mass between the Azores high and the Icelandic low. The NAO is thought to have a significant influence on climate on the northern Atlantic Ocean, from the east coast of the United States to Europe and as far south as the subtropical Atlantic. For example, when there is a large pressure difference between the Icelandic low and Azores high, a strong southwesterly air flow can arise, resulting in relatively mild, wet winters in the eastern United States (Hurrell et al. 2003). Consequently, the NAO affects wind speed and direction and storm frequency, intensity, and tracks, which in turn affect various oceanic processes including current strength and direction (particularly at the surface) and surface temperature.
REFERENCES
Beardsley, R. 2008. Woods Hole Oceanographic Institution. Personal communication with Kathryn Ford, Massachusetts Division of Marine Fisheries.
Commonwealth of Massachusetts (Comm. Mass.). 2004. Oceanography, weather patterns, and climate change. Massachusetts Ocean Management Task Force Technical Report. http://www.mass.gov/czm/oceanmanagement/waves_of_change/index.htm. Accessed 11/21/08.
Field, J.R. 1980. Environmental Report Exploration, Georges Bank Lease Block 366, Lease Sale Area No. 42. For Getty Oil Company, TX.
Gulf of Maine Ocean Observing System (GoMOOS). 2008. Wind direction. http://www.gomoos.org/gnd/. Accessed 11/18/08.
Hurrell, J.W., Y. Kushnir, G. Ottersen, and M. Visbeck. 2003. An overview of the North Atlantic Oscillation. In The North Atlantic Oscillation: Climate Significance and Environmental Impact: Geophysical Monograph 134, American Geophysical Union, pp. 1-35.
Massachusetts Coastal Zone Management and Massachusetts Marine Educators (MCZM/MME). 1992. Charting Our Course: The Massachusetts Coast at an Environmental Crossroads.


Chapter 2 - Water Column Features
The coast of Massachusetts is unique in that it is situated at the boundary of two major biogeographic regions. The waters of Massachusetts north of Cape Cod are influenced by the relatively cold Gulf of Maine currents, while the waters to the south of Cape Cod are influenced by relatively warmer waters from the Gulf Stream and the Southern New England-New York Bight. In addition, the state waters to the north of Cape Cod are deeper and have different landside influences than the waters south of Cape Cod. Waters in both biogeographic regions are similarly affected by regional climatological changes that result in seasonal shifts in temperature, dissolved oxygen, stratification, plankton communities, and primary productivity.
The sections below describe the general water column features for these two major regions in the Massachusetts ocean management planning area (planning area). It should be noted that there has not been a recent systematic effort to describe the physical oceanographic features of the planning area. What is known is the result of locally applied projects that may or may not represent the planning area as a whole. For example, much of what is known about Massachusetts and Cape Cod Bays is the result of work done by the Massachusetts Water Resources Authority (MWRA) and its partners to determine if the MWRA sewage outfall is affecting the bay (e.g., Werme et al. 2008). While MWRA monitoring provides a relatively rich data set where it occurs (Massachusetts and Cape Cod Bays), the effort does not include waters north of Cape Ann. Relatively less is known about the waters to the south of Cape Cod; what is known is being driven by institutional research projects or infrastructure projects such as Cape Wind. The paucity of data in some large portions of the planning area speaks to the need for a more coordinated approach to characterizing and understanding the oceanographic processes and drivers in the Commonwealth’s ocean waters.
NORTH OF CAPE COD
Ipswich Bay, Massachusetts Bay, and Cape Cod Bay are connected to the larger Gulf of Maine system via the Maine Coastal Current (MCC) (Bisagni et al. 1996). The so-called western branch of the MCC, or WMCC (Lynch et al. 1997), derives in part from water flowing east to west over the Scotian Shelf, but also from the major rivers in the Gulf of Maine—the St. John, Penobscot, Kennebec, Androscoggin, Saco, and Merrimack (Figure 2.1). The WMCC splits south of Cape Ann where one branch flows east of Stellwagen Bank, splitting again near Nantucket where one branch exits the Gulf of Maine through the Great South Channel and the other branch circles clockwise around George’s Bank (Geyer et al. 1992). The part of the WMCC that enters Massachusetts Bay forms a counterclockwise current that varies seasonally regarding its direction and intensity. For example, Warner et al. (2008) found that the winds from directions greater than 60 degrees (e.g., from the east or south) produce a clockwise circulation in Massachusetts Bay. In addition, there are many
BA-7

smaller currents in Massachusetts Bay that branch off of and may run opposite to the main counterclockwise current (Lermusiaux 2001; Jiang et al. 2007a; Jiang et al. 2007b). The branch of the WMCC that enters Massachusetts Bay flows south through most of the bay, then exits north of Race Point in Provincetown. Further south, the currents in Cape Cod Bay are fairly weak, except during strong freshwater run-off periods when the current from Massachusetts Bay flows along the southern coast to Cape Cod Bay, expanding its counterclockwise gyre, before exiting past Race Point (Comm. Mass. 2004; Pettigrew et al. 2005; Anderson et al. 2007).
While the above descriptions generally characterize the major surface currents north of Cape Cod, on a more local scale, three dimensional currents are likely to be more complex and driven by varied forces such as storms, wind, and tides. For example, in most locations the variability because of these factors is as large as the mean flow (see Geyer et al. 1992, Figures 2.2-17 through 2.2-19).
Owing to the shape of the Gulf of Maine, the waters of Ipswich Bay, Massachusetts Bay, and Cape Cod Bay are macrotidal, experiencing a semidiurnal tidal range of up to 4.1 meters (m) (13.4 feet [ft]). The maximum depth is 89 m (292 ft), found in Stellwagen Basin, while the average depth is 30 m (98 ft). Changing tides and the flow of freshwater from the large rivers to the north generate the currents in the Gulf of Maine, but they can also be influenced by winds, especially out of the northwest or northeast (Lynch et al. 1997; Warner et al. 2008). Most of the planning area north of Cape Cod is in open, unrestricted water with currents less than 1.8 kilometers per hour (km/hr or roughly 1 knot). However, at the mouth of Boston Harbor, currents can be as high as 2.6 km/hr (1.4 knots) during the full and new moon cycles (White and White 2007). In addition, currents greater than 1.8 km/hr (1 knot) can be found off of Cape Ann and the tip of Cape Cod (White and White 2007). The movement of water in Massachusetts and Cape Cod Bays has been modeled successfully by several researchers. A recent model is maintained by Mingshun Jiang of University of Massachusetts Boston and can be queried for surface temperature, salinity, and currents.2
SOUTH OF CAPE COD
The waters south of Cape Cod include Buzzards Bay, Vineyard Sound, Nantucket Sound, and the Great South Channel. The waters of Buzzards Bay and the sounds are largely influenced by tidal currents, while waters to the east of Cape Cod are influenced by both the tides and the Gulf of Maine waters flowing around Provincetown (Geyer et al. 1992). In contrast to the waters to the north, waters to the south of Cape Cod can generally be described as microtidal, dominated by semidiurnal tide-generated currents, and influenced by southwesterly winds (Buzzards Bay Project 1991). However, a recent modeling effort
2 http://www.harbor1.umb.edu/forecast/model.html.
BA-8

identified that winds play a more dominant role than tides in the generation of Buzzards Bay currents and that the combination of wind stress and large bathymetric gradients induced many vortices (Sankaranarayanan 2007). The currents within Buzzards Bay are less than 1.8 km/hr (1 knot), except at the mouth, between Cuttyhunk Island and Westport, where currents can be as great as 2.6 km/hr (1.4 knots) on the flood tide (White and White 2007). In Vineyard Sound, maximum currents are 7.2 km/hr (3.9 knots) and average currents are 2.9 km/hr (1.6 knots) (Limeburner and Beardsley, unpublished data). White and White (2007) report that the average maximum current velocity between Nonamesset Island and Woods Hole is 8.3 km/hr (4.5 knots) on a flood tide and 6.7 km/hr (3.6 knots) on an ebb tide and that velocities can exceed 13 km/hr (7 knots). In the Nantucket Sound area, the currents in Muskeget Channel and Pollock Rip Channel southeast of Monomoy Island are 8.1 km/hr (4.4 knots) and 4.4 km/hr (2.4 knots), respectively (White and White 2007). On an ebb tide, currents in the Cape Cod Canal can be as great as 7.4 km/hr (4 knots) (White and White 2007).
The maximum tidal range of the planning waters south of Cape Cod is 2.0 m (6.4 ft). The maximum depth is 65 m (213 ft) and due to significant shoaling, especially within the sounds, the average depth is only 14 m (46 ft). An effort to model the circulation, current velocity, temperature, and salinity of Nantucket and Vineyard Sounds is currently underway by researchers from Massachusetts Institute of Technology (MIT) Sea Grant and Woods Hole Oceanographic Institution (R. Beardsley, personal communication).
Table 2.1 Major oceanographic characteristics in the Massachusetts ocean management planning area (MCZM 2008)
North of Cape Cod South of Cape Cod
Ocean Surface Area 2,697 km2 (1,041 miles2) 2,852 km2 (1,101 miles2) Maximum Depth 89 m (292 ft) 65 m (213 ft) Average Depth 30 m (98 ft) 14 m (46 ft) Tidal Range 4.1 m (13.4 ft) 2.0 m (6.4 ft)
UPWELLING, FRONTS, AND WAVES
Upwelling is a hydrodynamic phenomenon whereby sustained winds push warm, nutrient-poor surface waters offshore, inducing the upward motion of deeper, cooler, and nutrient-rich waters along the adjacent shoreline. Upwelling influences the growth and blooms of phytoplankton due to this advection of nutrients into the photic zone and may result in periods of increased primary productivity in the ocean.
Oceanic fronts are areas where two water masses meet. The sharp gradients in temperature or salinity that define a front may result in the upwelling of nutrients that promote primary productivity (however, some fronts result in downwelling). Like wind-driven upwelling areas,
BA-9

fronts are typically sites of increased primary and secondary productivity and concentrate filter feeding organisms, such as clupeid fishes (Friedland et al. 2006). Because these oceanographic features can be used as predictive tools to find concentrations of marine mammals, fish, and phytoplankton (Friedland et al. 2006), oceanic fronts may be part of important trophic interactions (Schick et al. 2004). The location and duration of fronts are not very well understood in the planning area; however, one persistent front that has been documented near the planning area is on the eastern portion of Nantucket Shoals, where more saline Gulf of Maine waters meet fresher Nantucket Sound waters (Limeburner and Beardsley 1982).
Surface waves are generated by winds passing over the ocean. Their height is dependent upon the velocity of air moving above the ocean, the fetch over which it moves, and the density of the water. From 2001 to 2008, the Massachusetts Bay “A” buoy (42° 31’ 21” N, 70° 33’ 57” W) recorded an average wave height of 1.0 m (3.3 ft), ranging from 0.04 m to 9.95 m (0.13 to 32.6 ft). Wave period at the A buoy varied from 4.3-9.3 seconds and averaged 7.2 seconds. The Boston Harbor buoy 44013 (42° 21’ 00” N, 70° 41’ 24” W) recorded an average wave height of 0.9 m (3.0 ft), ranging from 0.2 m to 8.5 m (0.7 to 28 ft) (GoMOOS 2008). Wave period at the Boston Harbor buoy was slightly greater than at the A buoy, ranging from 4.2 to 8.3 seconds and averaging 6.4 seconds. Wave height and period data are not available for the planning area north of Cape Ann or south of Cape Cod.
Internal waves are sub-surface, oceanic waves that propagate either obliquely when the ocean is uniformly stratified or horizontally when the ocean’s stratification is confined to discrete, narrow bands. The momentum and energy distributed by internal waves can de-stratify or mix the ocean waters and its associated sediments, nutrients, and plankton. This mixing may be important to sustaining deep-water communities that are otherwise sequestered from the productivity at the surface by persistent stratification. Internal waves have also been shown to transport plankton onshore (Shanks and Wright 1987). Researchers speculate that internal waves may also be important in large-scale, deep-ocean circulation due to the transfer of heat from the surface (Zimmerman et al. 2008). Research by Butman et al. (2006) has identified internal wave activity over Stellwagen Bank as well as in northern Cape Cod Bay and the waters northeast of Cape Ann. Their key findings were that: 1) the near-bottom currents associated with large internal waves (LIWs), in concert with the tidal currents, resuspended bottom sediments; 2) sediments may be resuspended for as long as five hours each tidal cycle; and 3) at 85 m deep (279 ft), the duration of resuspension associated with LIWs is estimated to occur for about the same amount of time as caused by surface waves (Butman et al. 2006).
Knowing the location of upwelling and fronts is important to the ocean planning process because of the expectation that these areas will, at certain times of the year, concentrate organisms that are important to society for their economic value (e.g., herring, sportfish) or their cultural value (e.g., whales). Permanent structures placed in these areas may interrupt or
BA-10

affect circulation of ocean waters and negatively affect the organisms that use them. The role of internal waves is less known, but the risks associated with placement of permanent structures may be the same. Knowing the areas of high surface wave height and frequency may help avoid or mitigate wave-induced structural damage, may lead to better understanding of bottom stress and sediment resuspension, and will be important for any future siting of wave energy devices.
RIVERINE INPUTS
Rivers carry freshwater, nutrients, and pollutants throughout their watersheds, from uplands to coastal wetlands and the ocean. The coastal watersheds that drain to the planning area are the Merrimack, Parker, Ipswich, North Coastal, Mystic, Charles, Neponset, Weymouth/Weir, South Coastal, Cape Cod Bay, Cape Cod (draining the southern and eastern portions of Cape Cod), and Buzzards Bay.
The Merrimack River is the largest river in coastal Massachusetts with a 10-year average flow of 245 cubic meters per second (m3s) or 8,746 cubic feet per second (cfs). During the spring snowmelt and runoff, flows may be up to 616 m3s (22,000 cfs). The greatest runoff event in the last decade occurred in May 2006, when the Merrimack discharged at a rate greater than 2,520 cms (90,000 cfs) (USGS 2008). Other than the Merrimack, there are no large rivers entering Massachusetts Bay. The next largest river, the Charles, has an average discharge of only 14 m3s (487 cfs). There are also no large rivers draining to Cape Cod Bay, Nantucket Sound, Vineyard Sound, or Buzzards Bay. For comparison, there are several large rivers north of Massachusetts that influence the Gulf of Maine and thus the planning area, including the St. John River, Penobscot River, Kennebec River, Androscoggin River, and Saco River in Maine. Interestingly, the second largest freshwater input to the planning area is the MWRA outfall, which discharges treated sewage and stormwater from the metropolitan Boston area at a rate of 16 m3s (565 cfs) to a diffuser outfall 15.3 km (9.5 miles) from the Deer Island Treatment Plant.
Submarine groundwater discharge is also an important mechanism for carrying pollutants into coastal waters (Weiskel and Howes 1992). In fact, nutrient inputs from submarine groundwater discharges can rival river inputs in some regions (Slomp and Van Cappellen 2004). Along the southeastern Massachusetts coast, nitrogen transport via groundwater to coastal rivers and embayments is a significant issue that has spurred extensive monitoring and modeling to identify alternatives for reducing nitrogen loads.
SEA TEMPERATURE
As noted above, Cape Cod forms a physical boundary between two major ocean regions, and distinctly different temperatures are found north and south of this division. According to the Gulf of Maine Ocean Observing System (GoMOOS 2008), the average surface
BA-11

BA-12
temperature at the Massachusetts Bay A buoy (42° 31’ 24” N, 70° 33’ 56” W) from 2001 to 2008 was 10.8 C (51.4 F), while the average surface temperature at the National Data Buoy Center’s “BUZM3” buoy at the mouth of Buzzards Bay (41° 24’ 00” N, 71° 01’ 48” W) over the same time period was almost two degrees warmer at 12.6 C (54.6 F) (Table 2.2).
Sea temperature in the planning area is an important feature to track because from a biological perspective it influences many aspects of organism life history, such as the timing of breeding and spawning, migration, rates of development, predator/prey relationships, and basic physiological functions that determine where a species may be located at a given point in time. From a physical perspective, sea water temperature affects the density and viscosity of the ocean and its behavior in various models (Jirka et al. 1996).
Table 2.2 Sea temperature in the Massachusetts ocean management planning area (GoMOOS 2008)
Max temp oC (oF) Min temp oC (oF) Average temp oC (oF)
Massachusetts Bay -Surface
23.9 (74) 1.1 (34) 10.8 (51.4)
Massachusetts Bay -50 m
13.4 (56.1) 1.9 (35.4) 6.3 (43.4)
Buzzards Bay -Surface
23.2 (73.8) 2.1 (35.8) 12.6 (54.6)
In Woods Hole, Falmouth, winter sea temperature increased ~1.5 oC (2.7 oF) from 1965-2005 (Nixon et al. 2004). Oviatt (2004 and references therein) notes that a winter warming trend of 1-3 oC (2.8-5.4 oF) above average sea temperature in the 1980s and 1990s caused ecological changes on both sides of the Atlantic. Oviatt found evidence that increased ocean temperature caused the seasonal plankton cycle to shift from a “cold” regime (with a distinct winter/spring phytoplankton bloom) to a “warm” regime (with increased zooplankton grazing preventing the formation of the winter/spring phytoplankton bloom and allowing only a summer bloom). Further, Oviatt (2004) sees evidence that these plankton regime changes may have affected abundances of polychaetes, decapods, ctenophores, and pelagic fish in Narragansett and Massachusetts Bays.
SEASONAL CHANGES
Due to the location of Massachusetts in temperate latitudes, the planning area experiences seasonal shifts in temperature. As noted above, sea surface temperature in the planning area varies up to 22 oC (30 oF) seasonally. The most recent seven years of air temperature data collected at the GoMOOS A Buoy indicate that average air temperature was 10 oC (50 oF), and ranged between -18.9 oC and 26.7 oC (-2 oF and 80 oF; GoMOOS 2008). In summer, the air mass above the planning area waters is generally warmer than the ocean. Heat is

transferred from the air to the upper layer of the ocean. As this upper layer of the ocean becomes significantly warmer than the water beneath it, a definitive boundary called the thermocline forms where the transition from relatively warm water to relatively cold water is abrupt. This boundary persists throughout the summer months, then weakens and disappears in the fall as the air mass cools. Stratification is important because nutrients become trapped in the bottom waters, and phytoplankton deplete the nutrients in the upper layer, which are not replenished until stratification breaks down (due to storms, upwelling events, or the onset of cold weather). Freshwater runoff also contributes nutrients to the upper layer, but the effect would be smaller and more localized during the stratified period compared to the contribution during spring rains and snowmelt. Thus seasonal stratification influences phytoplankton biomass by restricting the availability of nutrients. Stratification also affects dissolved oxygen levels as deeper waters below a thermocline have less opportunity to mix with oxygen-rich waters at the surface resulting in seasonally lower summer concentrations as microbial respiration uses organic matter and dissolved oxygen. In Massachusetts Bay, dissolved oxygen levels are highest between January and March (9-12 milligrams/liter [mg/l] or parts per million [ppm]), decrease steadily to 6-8 mg/l (ppm) between September and November, and then begin increasing again after stratification breaks up (Werme et al. 2008). Wind, waves, upwelling, and the seasonal decrease in ocean surface temperature that arrives typically in October or November all contribute to destratification.
WATER QUALITY
Examples of water quality characteristics that can be affected by anthropogenic activities, or can impact ecosystem services, include pathogens, chlorophyll, dissolved oxygen, harmful algae blooms, nutrients, pH, salinity, water clarity, noise, and contaminants or pollutants such as toxic chemicals, solids, and organic matter. As the Massachusetts Ocean Management Plan is implemented, indicators of water quality will be monitored to help identify if the management decisions made in the planning area, away from shore, and in the upland watersheds, are degrading marine habitats and adversely affecting marine communities.
Pathogens
Infectious diseases caused by pathogenic bacteria, viruses, parasites, and fungi can be spread in the water to humans (or animals) that use the ocean’s resources. Potential sources of pathogens include wastewater discharges from treatment plants or combined sewer overflows, contaminated runoff in rivers and streams, discharges from boats (sewage and ballast water), aquaculture, and animals living in the marine ecosystem. Additionally, there are some human pathogens found normally in the marine environment, including Vibrio species. Generally, treated wastewater is disinfected to a level that controls pathogens, although in fresh water there have been rare outbreaks of water-borne disease spread by treated effluent caused by disinfection-resistant pathogens, such as the parasite
BA-13

Cryptosporidium. Contaminated ocean water can infect people (and animals) by direct contact, ingestion, or by consumption of contaminated seafood. There have been few studies of the presence of pathogens in the water column in the planning area. Studies in coastal waters that aim at measuring health risk from infectious disease have used bacterial indicators of sewage pollution, such as fecal coliform, Enterococcus, and E. coli. Massachusetts water quality criteria include limits on fecal colifom levels for shellfish-growing waters and limits on Enterococcus levels for marine recreational waters.
The planning area is adjacent to several wastewater facilities that discharge treated wastewater to Commonwealth waters; the MWRA’s outfall is within the planning area. Discharges from boats likely occur within the planning area, despite the designation of large areas of Massachusetts waters as No Discharge Areas, and rivers are also a potential source of contaminated runoff to the planning area. Most monitoring of indicator bacteria is at beaches and shellfish-growing waters that are outside the planning area. However, MWRA has regularly sampled within the Massachusetts Bay planning area for fecal coliform and Enterococcus since 1998. Of 2,018 samples, 1,798 were negative for fecal coliform and 1,842 were negative for Enterococcus. The highest fecal coliform count was 50 colonies/100 milliliter (ml) (0.03 gallon) and the maximum Enterococcus count was 303 colonies/100 ml with the remaining positive samples having 38 colonies/100 ml or less. These results suggest that the planning area waters in Massachusetts Bay are relatively free of the bacteria that are indicators of pathogen contamination. There is not any systematic sampling for bacteria in the planning area north of Cape Ann, in Cape Cod Bay, or south of Cape Cod.
Chlorophyll a
Chlorophyll a is a pigment found in plants that allows them to photosynthesize. Chlorophyll a levels in a water column are used as indicators of the presence of phytoplankton. When phytoplankton densities increase to high levels (i.e., during a bloom) chlorophyll a levels will also be high. In the planning area, spring and fall blooms are annual events. Data from MWRA monitoring in Massachusetts Bay (Werme et al. 2008) indicate that during the March/April bloom, chlorophyll a levels average just about 2.5 mg/l (ppm). Levels decrease to less than 2 mg/l (ppm) and then increase again in September through November to about 4 mg/l (ppm). However, chlorophyll levels substantially higher than this (ranging up to about 12 mg/l or ppm) sometimes occur, especially during regional Phaeocystis blooms and, occasionally, during fall blooms. In Nantucket Sound, data collected in 2006 and 2007 by the Nantucket Soundkeeper (2008) indicate that summer-time levels of chlorophyll a average 3.6 mg/l (ppm) at the surface and 3.9 mg/l (ppm) at the bottom. The timing and magnitude of spring and fall blooms are highly variable among years, and among different parts of the planning area. For example, Buzzards Bay and Nantucket Sound bloom before Cape Cod Bay, which blooms before Massachusetts Bay (e.g., see Libby et al. 2008, Figures. 3-4 and 3-5).
BA-14

Satellite-derived chlorophyll a concentration (as well as sea surface temperature, ocean color, and surface winds) maps for the Gulf of Maine, including the planning area, have been created by the University of Maine.3
Dissolved Oxygen
Dissolved oxygen is a measure of the amount of oxygen dissolved in a water column, and thus the amount available for plants and animals to perform the necessary function of respiration (the oxidation of sugars to create energy). In Massachusetts and Cape Cod Bays, Libby et al. (2008) report that bottom water dissolved oxygen is lowest at around 7 mg/l (ppm) in October, increases steadily to about 11 mg/l (ppm) in March/April, and then decreases steadily through the summer months. In the summers of 2006 and 2007, the average dissolved oxygen level in Nantucket Sound was greater than 7 mg/l (ppm) (Nantucket Soundkeeper 2008). Dissolved oxygen levels in the nearshore environment, which is outside of the planning area, are typically lower than in Massachusetts Bay and Nantucket Sound, largely because of the nearshore’s proximity to sources of anthropogenic nitrogen and its relatively lower flushing and mixing characteristics.
The Massachusetts Water Quality Standards (314 CMR 4.00) require a minimum dissolved oxygen level to protect biota of 6 mg/l (ppm) for SA waters, 5 mg/l (ppm) for SB waters, and 4 mg/l (ppm) for SC waters. The dissolved oxygen levels in both Massachusetts Bay and Nantucket Sound are above the minimum State Water Quality Standard.
Harmful Algae Blooms
Harmful algae blooms (HABs) are dense and sometimes regionally widespread concentrations of planktonic algae or dinoflagellates that can produce chemicals that are toxic to humans, birds, and aquatic biota. HABs originate when a combination of physical and chemical ocean properties supports rapid growth and can have profound financial and ecological implications. For example, researchers have determined that blooms of the dinoflagellate Alexandrium fundyense are related to concentrations of dissolved inorganic nitrogen, a nutrient required by photosynthesizing organisms, and silicate, a compound needed to build the exoskeletons of diatoms that may compete with A. fundyense (Townsend et al. 2005). The persistence of blooms and their capacity to move onshore may also depend upon physical factors, such as wind velocities and water temperature. Recent work in Europe also suggests that dinoflagellate blooms can be controlled by cyclical host-specific parasitoid infections (Chambouvet et al. 2008).
3 http://wavy.umeoce.maine.edu/sat_ims.htm.
BA-15

In 2005, Massachusetts Bay experienced a massive Alexandrium bloom, and the neurotoxin that produces Paralytic Shellfish Poison (PSP) was widespread (Anderson et al. 2007). The regional impact and the economic loss to the shellfish industry due to bed closures spurred new research into the dynamics of Alexandrium blooms in the Gulf of Maine and, in particular, the causes of the 2005 bloom. A conceptual model (Anderson et al. 2005; McGillicuddy et al. 2005; Anderson et al. 2007 Figure 1-2) describes cysts that germinate within the so-called Bay of Fundy seedbed, causing localized, recurrent blooms in that area that are self-seeding and may serve to propagate blooms downstream as cells escape the Bay of Fundy retention zone and enter the Eastern Maine Coastal Current (EMCC). Some EMCC cells are entrained into the Western Maine Coastal Current (WMCC), while others eventually deposit cysts offshore of Penobscot and Casco Bays in Maine, creating another large, offshore cyst seedbed in that area. The Maine cyst beds are thought to act as seed populations for blooms that are transported to the south and west by the WMCC, before the cells are ultimately either lost due to mortality or encystment, or are advected out of the region (Anderson et al. 2007). While strong winds out of the northeast and higher than normal river flow in the spring of 2005 allowed the Alexandrium bloom to enter Massachusetts Bay earlier than it would have otherwise, a sensitivity analysis of the importance of wind, freshwater flows, and the abundance of overwintering cysts demonstrated that a large gulfwide bloom would have occurred in 2005 even without the influence of the unusual wind and water flow (Anderson et al. 2007).
More recently, between April and July of 2007, more than 600,000 acres of shellfish areas on the North Shore and South Shore, Cape Cod, and Boston Harbor, as well as offshore surf clam beds, were closed to shellfish harvesting due to an extensive Alexandrium bloom that spread from Maine to Massachusetts. The economic impact of these closures was projected to be $1.5-7.0 million (DMF 2008). The direct economic impact of the 2005 Alexandrium bloom in Massachusetts was estimated to be as high as $18 million (Hoagland and Jin 2007). Other species of toxic algae in New England (that may or may not form blooms) include Gymnodinium catenatum and Pyrodinium bahamense var. compressum, both of which cause paralytic shellfish poisoning (WHOI 2008), and species of cyanobacteria (e.g., Microcystis).
Given their widespread spatial extent and the magnitude of their ecological and economic impacts, continued research toward identifying, predicting, and avoiding toxic blooms in the ocean management planning area will be necessary. Because they have demonstrated that impact estimates are affected by baseline values of non-HAB years and an accurate impact estimate requires a relatively stable baseline using data from recent years, Hoagland and Jin (2007) recommend gathering data sufficient to construct a “stable” baseline of monthly shellfish landings so that HAB impact assessments may focus on the relevant months.
Nutrients
Concentrations of nutrients, such as ammonium and nitrate (forms of nitrogen most readily used by phytoplankton) are monitored by MWRA in Massachusetts Bay and Cape Cod Bay.
BA-16

Nitrate concentrations vary geographically and are generally highest in the north of Massachusetts Bay (average 5-7 μM or 0.31-0.43 ppm), and lowest in Cape Cod Bay (0.5-3 μM or 0.03-0.19 ppm), while concentrations of ammonium are on average similar throughout Massachusetts Bay/Cape Cod Bays (0.5-1 μM or 0.01-0.02 ppm). (Concentrations of ammonium in MWRA’s outfall nearfield are on average about 0.25 μM [0.005 ppm] higher than background [Libby et al. 2008] and range from less than 1 μM [0.02 ppm] to greater than 3 μM [0.06 ppm].) On top of this spatial pattern are large seasonal variations in nutrient concentrations. For example, in early spring, nitrate in the northern part of Massachusetts Bay peaks at around 12 μM (0.74 ppm), and in Cape Cod Bay at around 4 μM (0.25 ppm). As phytoplankton grow, the nutrients are quickly drawn down so that by April nitrate concentrations in northern Massachusetts Bay have dropped to about 2 μM (0.12 ppm), and to less than 0.25 μM (0.005 ppm) in Cape Cod Bay. Nutrient levels stay relatively low through the summer, and increase in the fall. The 16-year data series also suggests that there was a general increase in nitrate in the 1990s to early 2000s in Massachusetts and Cape Cod Bays, but that concentrations have leveled off in the last five years (Werme et al. 2008). In Nantucket Sound, the average ammonium concentration over the summers of 2006 and 2007 was 0.011 mg/l (ppm) and the average nitrate+nitrite concentration was 0.001 mg/l (ppm). Average total nitrogen over this same time period was 0.290 mg/l (ppm) at the surface and 0.295 mg/l (ppm) at the bottom (Nantucket Soundkeeper 2008).
pH
pH has not been routinely monitored by regional monitoring programs, such as GoMOOS or the National Data Buoy Center, however, MWRA measures pH in some of its surveys in Massachusetts Bay. Of 591 pH measurements since June 2004, the median pH was 7.9 and the range was 7.0-8.4 (MWRA, unpublished data). In June 2009, MWRA added a pH sensor to NOAA buoy 44013 in Massachusetts Bay. It may be prudent to pay closer attention to annual surveys of pH, as it has been predicted that ocean pH will decrease with increasing global ocean temperatures and atmospheric carbon dioxide (CO2) concentrations (IOC of UNESCO 2005). Ocean pH is important to organisms with calcium carbonate shells (e.g., bivalves and gastropods) because lower pH values are indicative of greater ocean acidity, which affects the formation and durability of carbonate shells (Fabry et al. 2008). At the 2009 Geochemistry Meeting, Justin Ries of the University of North Carolina presented data that suggested that several types of ocean organisms with calcium carbonate shells suffered when seawater pH decreased below 8.2 (summarized in Kerr 2009). Most of the 18 species investigated (including periwinkles, oysters, and calcareous algae) formed less calcium carbonate under conditions of greater acidification. However, one species of mussel was not affected and all of the crustaceans investigated (shrimp, American lobster, blue crab) grew thicker shells under the most severe acidification. Only one species of tube-building worm was found to have the ability to protect itself from acidification by producing a greater proportion of acid-resistant carbonate mineral. Recognizing the importance of ocean acidification, the U.S. Congress in
BA-17

2009 introduced a bill (H.R. 17) that would provide funding for the National Oceanographic and Atmospheric Administration (NOAA) and the National Science Foundation (NSF) for long-term monitoring of ocean acidification and the development of adaptation strategies for conserving marine ecosystems in the face of ocean acidification.
Salinity
In general, salinity is lower near freshwater sources, such as rivers, than offshore. During the spring runoff and large storms, the freshwater input from the Merrimack River can noticeably change the surface salinity of Massachusetts Bay (e.g., see Werme et al. 2008, Figure 3-7). Salinity data from the Massachusetts A buoy collected between 2001 and 2008 (GoMOOS 2008) document an average surface salinity of 31.2 practical salinity units (psu) (range 20.7-33.2 psu), while at the 50 m depth (164 ft) salinity was 32.4 psu (range 29.7-33.4 psu). Salinity data collected by volunteers in Nantucket Sound over the summers of 2006 and 2007 (Nantucket Soundkeeper 2008) document a much more consistent average salinity of 31.6 psu (range 31.2-31.7 psu). There was no difference between the average salinity at the surface of Nantucket Sound (-0.3 m to -0.6 m; -1 ft to -2 ft) and the average salinity at the bottom (-6.6 m to -16.4 m; -22 ft to -54 ft).
Water Clarity
Sunlight availability is a major driver of primary productivity in marine ecosystems. One way to measure light penetration through the water column is to measure the maximum depth of visibility of a Secchi disk. Secchi disk depth gives a relative measure of the amount of particles (e.g., suspended solids and plankton) in the water column. Low Secchi disk depths are associated with poor water quality because they indicate that relatively less light is available for photosynthesizers below the turbid water or because they indicate high densities of phytoplankton that may exude toxic substances or lead to low dissolved oxygen levels symptomatic of eutrophication. Mean Secchi disk depth in Massachusetts Bay from 2001 to 2005 as measured by MWRA was 7.3 m (24 ft). Values ranged from a mean of 2.9 m (9.5 ft) +/- 0.7 standard deviation (SD) at the mouth of the Inner Harbor to a mean of 9.3 m (31 ft) +/0 2.9 SD at the monitoring site north of Provincetown. Cape Cod Bay had a mean Secchi disk depth of 7.7 m (25 ft) +/- 2.2 SD (MWRA, unpublished data). Mean Secchi depth in planning area waters off of Salem Sound in 1997 (Chase et al. 2002) was 3.8-4.7 m (12.5-15 ft). A survey of water quality in Buzzards Bay from 1987-1990 (Turner and Borkman 1993) reported that Secchi disk depths ranged from 0.75-9.0 m (2.5-30 ft) with a mean of 3.7 m (12 ft). Turner and Borkman (1993) also found that since most of Buzzards Bay is < 10 m (32.8 ft) deep, the majority of the Bay’s waters are in the euphotic zone most of the time (i.e., in the area with > 1% of surface light level). Mean Secchi depth in Nantucket Sound in 2007 was 4.0 m (13 ft) +/- 0.7 SD, with values ranging from 2.9 m (9.5 ft) in Vineyard Sound to 4.8 m (16 ft) in the center of Nantucket Sound (Nantucket Soundkeeper 2008).
BA-18

In addition to Secchi disk depth data, there are measurements of photosynthetically active radiation (PAR) by MWRA in Massachusetts and Cape Cod Bays (unpublished data), and satellite measurements of PAR in southern Massachusetts estuaries (Keith and Kiddon 2006). In addition, measurements of transmissivity of the water to light with a wavelength of 660 nanometers are frequently made as part of hydrographic profiles.
Sound
While not typically thought of as a water quality parameter, the amount of sound in the water column is an important feature for communication among marine mammals and fish and is impacted by the noise associated with human activities (e.g., military operations, blasting, propeller use, drilling, etc.). Currently there is no systematic monitoring of sound in the planning area, except for the acoustic detection array managed by Cornell University in the area of the liquefied natural gas (LNG) deepwater ports east of Boston Harbor. The purpose of the array is to detect and locate marine mammal vocalizations to help prevent vessel strikes. While not in the planning area, a recent study performed over the Stellwagen Bank National Marine Sanctuary, east of the planning area, analyzed vessel traffic in relation to noise (Hatch et al. 2008). This study found that of the large vessels (> 300 gross tons [272 tonnes] or carrying > 165 people) crossing the Sanctuary (excluding fishing vessels), oil/chemical product tankers produced the largest acoustic energy to the region’s annual noise budget, with LNG tankers and cargo/container ships having almost as great an impact (Table 2.3).
Table 2.3 Relative noise source levels (SL) from different large vessel types transiting Stellwagen Bank National Marine Sanctuary (SBNMS) in 2006 (SL estimates in the last column are normalized to the vessel type with the lowest decibel [dB] contribution to the total annual noise budget. Table modified from Hatch et al. 2008.)
Vessel Type # Average SL w/in
SBNMS (dB) Time w/in SBNMS (h)
Total SL w/in SBNMS (dB)
Relative SL w/in SBNMS (dB)
Oil/chemical tanker
4 182 1,702 214 24
Liquefied Natural Gas Tanker
1 182 1,065 212 22
Cargo/container vessel
3 179 1,481 211 21
Tug 3 172 2,956 207 17 Cruise Ship 2 181 394 207 17 Private Yacht 1 162 2,343 196 6 Research Vessel 2 160 999 190 0
These data are instructive in that the NOAA Fisheries Office of Protected Resources requires permits under the Marine Mammal Protection Act (1972) for human activities that could lead to baleen whales experiencing continuous sound levels greater than 120 dB. However, this regulation does not apply to vessels in transit. Regardless, Hatch et al. (2008)
BA-19

determined that the average area ensonified over 120 dB by a single oil/chemical products tanker transiting SBNMS is 2,166 km2 (632 nautical m2), roughly the area of the entire Sanctuary. Given that 793 of these tankers transited SBNMS in 2006 (Hatch et al. 2008), the existing and future impact of vessel noise to baleen whales, and other organisms, is a reasonable concern and area of future study.
Contaminants
Most contaminants, such as metals, organic chemicals, oil and grease, solids, and organic matter, are not systematically monitored in the water column in the planning area, although total suspended solids (TSS) data are available from MWRA in Massachusetts and Cape Cod Bays. Understanding the distribution and concentration of these contaminants in the planning area may be important for certain projects. Such constituents are modeled and monitored in the vicinity of dredging projects on a site-specific basis (e.g., when building pipelines or cables) and are monitored through the National Pollutant Discharge Elimination System (NPDES) program in industrial and municipal discharges that are within and outside of the planning area. The Massachusetts Water Quality Standards at 314 CMR 4.00 prohibit TSS discharges in concentrations greater than 100 mg/l (ppm), oil and grease above 15 mg/l (ppm), and dissolved metals in toxic concentrations. Metals, organic chemicals, and petroleum constituents in discharges are regulated based on criteria established by the U.S. Environmental Protection Agency to protect human health and aquatic life (EPA 2008). These criteria are incorporated into the Massachusetts Surface Water Discharge Permit Program at 314 CMR 3.10(5) and (6).
BIOLOGICAL FEATURES
An important feature of the ocean’s water column is that it is habitat for many species of fish, crustaceans, mollusks, marine mammals, reptiles, birds, and numerous other organisms. While some of these species are actively mobile through the water column (e.g., nekton, mammals, reptiles, birds), the movement of others (e.g., plankton) is completely dependent upon physical water characteristics, such as currents and stratification. The mobility of water-column organisms and their ability to avoid man-made disturbances (e.g., blasting, dredging plumes) or infrastructure (e.g., intakes, vessels, monopiles, mooring lines) is an important consideration for all aspects of ocean planning. Likewise, the fact that the water column is the location for breeding, foraging, migration, and all aspects of life history for many organisms speaks to its inherent importance as a near-shore habitat (described further in Chapter 4).
While primarily attached to the seafloor, submerged aquatic vegetation (e.g., eelgrass, kelp and other algae) is another important feature of the water column, performing ecosystem functions such as habitat formation, nutrient cycling, wave attenuation, and sediment trapping. Eelgrass distribution data for Massachusetts is included in the next chapter.
BA-20

REFERENCES
Anderson D.M., C. Stock, B.A. Keafer, A. Bronzino, B. Thompson, D.J. McGillicuddy, M. Keller, P.A. Matrai, and J. Martin. 2005. Alexandrium fundyense cyst dynamics in the Gulf of Maine. Deep-Sea Research II 52 (19-21), 2522-2542.
Anderson, D.M., P.S. Libby, M.J. Mickelson, D.G. Borkman, R. He, and D.J. McGillicuddy. 2007. The 2005 New England red tide of Alexandrium fundyense: observations, causes, and potential outfall linkages. Boston: MWRA Report 2007-10. http://www.mwra.state.ma.us/harbor/enquad/pdf/2007-10.pdf. Accessed 1/16/09.
Beardsley, R. 2006. Woods Hole Oceanographic Institution. Personal communication with Todd Callaghan, MA Coastal Zone Management (12/27/06 email).
Bisagni J.J., D.J. Gifford, and C.M. Ruhsam. 1996. The spatial and temporal distribution of the Maine coastal current during 1982. Continental Shelf Research 16: 1-24.
Butman, B., P.S. Alexander, A. Scotti, R.C. Beardsley, and S.P. Anderson. 2006. Large internal waves in Massachusetts Bay transport sediments offshore. Continental Shelf Research 26: 2029-2049.
Buzzards Bay Project. 1991. Buzzards Bay Comprehensive Conservation and Management Plan. U.S. Environmental Protection Agency and Massachusetts Executive Office of Environmental Affairs.
Chambouvet, A., P. Morin, D. Marie, and L. Guillou. 2008. Control of toxic marine dinoflagellate blooms by serial parasitic killers. Science 322 (5905): 1254-1257.
Chase, B.C., J.H. Plouff, and W.M. Castonguay. 2002. The Marine Resources of Salem Sound, 1997. Massachusetts Division of Marine Fisheries Technical Report TR-6.
Commonwealth of Massachusetts (Comm. Mass.). 2004. Oceanography, weather patterns, and climate change. Massachusetts Ocean Management Task Force Technical Report. http://www.mass.gov/czm/oceanmanagement/waves_of_change/index.htm. Accessed 11/21/08.
Fabry, V.J., B.A. Seibel, R.A. Feely, and J.C. Orr. 2008. Impacts of ocean acidification on marine fauna and ecosystem processes. ICES Journal of Marine Science 65(3): 414-432.
Friedland K.D., J.E. O’Reilly, J.A. Hare, G.B. Wood, W.J. Overholtz, and M.D. Cieri. 2006. Environmental preferences of Atlantic herring under changing harvest regimes. U.S. Department of Commerce, Northeast Fisheries Science Center Reference Document 06-18.
BA-21

Geyer W., G.B. Gardner, W. Brown, J. Irish, B. Butman, T. Loder, and R.P. Signell. 1992. Physical Oceanographic Investigation of Massachusetts and Cape Cod Bays, Technical Report MBP-92-03. Massachusetts Bays Program, U.S. EPA Region I/Massachusetts Coastal Zone Management Office, Boston, Massachusetts.
Gulf of Maine Ocean Observing System (GoMOOS). 2008. Historical Data. http://www.gomoos.org/gnd/. Accessed 11/18.08.
Hatch, L., C. Clark, R. Merrick, S. Van Parijs, D. Ponirakis, K. Schwehr, M. Thompson, and D. Wiley. 2008. Characterizing the relative contributions of large vessels to total ocean noise fields: A case study using the Gerry E. Studds Stellwagen Bank National Marine Sanctuary. Environmental Management 42(5): 735-752.
Hoagland, P. and D. Jin. 2007. Economic Impact of the 2005 Red Tide Event: A Spatial and Dynamic Analysis. Woods Hole Oceanographic Institution. http://www.whoi.edu/page.do?pid=19475&tid=282&cid=39848. Accessed 12/23/08.
Intergovernmental Oceanographic Commission of the United Nations Educational, Scientific and Cultural Organization (IOC of UNESCO). 2005. Climate Change. http://ioc.unesco.org/iocweb/climateChange.php. Accessed 11/18/2008.
Jiang, M., M. Zhou, P.S. Libby, and C.D. Hunt. 2007a. Influences of the Gulf of Maine intrusion on the Massachusetts Bay spring bloom: A comparison between 1998 and 2000. Continental Shelf Research: 2465-2485.
Jiang, M., G.T. Wallace, M. Zhou, S. Libby, and C.D. Hunt. 2007b. Summer formation of a high-nutrient low-oxygen pool in Cape Cod Bay, USA, Journal of Geophysical Research 112: C05006, doi:10.1029/2006JC003889.
Jirka, G.H., R.L. Doneker, and S.W. Hinton. 1996. User’s Manual for CORMIX: A hydrodynamic mixing model and decision support system for pollutant discharges into surface waters. Office of Science and Technology, U.S. Environmental Protection Agency, Washington, DC.
Keith, D.J. and J.A. Kiddon. 2006. The determination of water clarity in Southern New England estuaries using multispectral in situ and aircraft remote sensing and the USEPA National Coastal Assessment (NCA) program guidelines, Eos Trans. AGU: 87(36), Ocean Sci. Meet. Suppl., Abstract OS15K-15.
Kerr, R.A. 2009. The many dangers of greenhouse acid. Science 333: 458.
BA-22

Lermusiaux, P.F.J. 2001. Evolving the subspace of the three-dimensional multiscale ocean variability: Massachusetts Bay. Journal of Marine Systems, special issue on “Three-dimensional ocean circulation: Langrangian measurements and diagnostic analyses, May 1999.” 29(1-4): 385-422.
Libby, P.S., D. Borkman, W.R. Geyer, A.A. Keller, J.T. Turner, M.J. Mickelson, and C.A. Oviatt. 2008. Water column monitoring in Massachusetts Bay 1992-2007: Focus on 2007 results. Boston: Massachusetts Water Resources Authority. Report 2009-4. 168 pp.
Limeburner, R. and R.C. Beardsley. 1982. The seasonal hydrography and circulation over Nantucket Shoals. Journal of Marine Research, Supplement to 40, 371-406.
Lynch D.R., M. J. Holboke, and C.E. Naimie. 1997. The Maine coastal current: Spring climatological circulation. Continental Shelf Research 17: 605-634.
Massachusetts Division of Marine Fisheries (DMF). 2008. Governor Patrick Requests Federal Disaster Aid for Massachusetts Shellfish Industry. DMF Press Release. http://www.mass.gov/dfwele/dmf/programsandprojects/pspmoni.htm#shelsani. Accessed 12/23/08.
Massachusetts Office of Coastal Zone Management (MCZM). 2008. Unpublished, mosaicked data: se_5mbath -Nahant to Gloucester, Swath Bathymetry (5 meter/pixel) of the South Essex Survey Area (USGS 2006); bh_2mmbbath: Multibeam Bathymetry 2 meter/pixel of Boston Harbor and Approaches from NOAA Hydrographic Surveys (USGS 2006); CABATH5M - 5 meter/pixel ArcRaster Bathymetric grid of both the inshore and offshore area of Cape Ann - Salisbury Beach Survey Area (USGS 2008); Buzzards Bay, MA (M010) Bathymetric Digital Elevation Model (30 meter resolution) Derived From Source Hydrographic Survey Soundings Collected by NOAA (NOAA NOS 1998); Massachusetts Bay, MA (N170) Bathymetric Digital Elevation Model (30 meter resolution) Derived From Source Hydrographic Survey Soundings Collected by NOAA (NOAA NOS 1998); Cape Cod Bay, MA (N180) Bathymetric Digital Elevation Model (30 meter resolution) Derived From Source Hydrographic Survey Soundings Collected by NOAA (NOAA NOS 1998); Coastal Relief Model, Volume 1 (U.S. Northeast Atlantic Coast) (NOAA NGDV 2001).
Massachusetts Water Resources Authority (MWRA). 2008. Massachusetts Bay Bacteria Monitoring. http://www.mwra.state.ma.us/harbor/html/mb_bacteria.htm. Accessed 11/18/08.
McGillicuddy, D.J., Jr., D.M. Anderson, A.R. Solow, and D.W. Townsend. 2005. Mechanisms regulating the large-scale seasonal fluctuations in Alexandrium fundyense populations in the Gulf of Maine: results from a physical-biological model. Deep-Sea Research II 52: 2843-2855.
BA-23
Nantucket Soundkeeper. 2008. Water Quality-Results. http://www.nantucketsoundkeeper.org/water-quality-results.asp. Accessed. 11/18/2008.
Nixon, S.W., S. Granger, B.A. Buckley, M. Lamont, and B. Rowell. 2004. A one hundred and seventeen year coastal water temperature record from Woods Hole, Massachusetts. Estuaries 27: 397-404.
Oviatt, C.A. 2004. The changing ecology of temperate coastal waters during a warming trend. Estuaries 27: 895-904.
Pettigrew N.R., J.H. Churchill, C.D. Janzen, L. J. Mangum, R.P. Signell, A.C. Thomas, D.W. Townsend, J.P. Wallinga, and H. Xue. 2005. The kinematic and hydrographic structure of the Gulf of Maine Coastal Current. Deep-Sea Research II 52 (19-21): 2369-2391.
Sankaranarayanan, S. 2007. Modeling the tide and wind-induced circulation in Buzzards Bay. Estuarine, coastal and shelf science 73(3-4):467-480.
Schick, R.S., J. Goldstein, and M.E. Lutcavage. 2004. Bluefin tuna (Thunnus thynnus) distribution in relation to sea surface temperature fronts in the Gulf of Maine (1994-96). Fisheries Oceanography 13: 225-238.
Shanks, A L. and W.G. Wright. 1987. Internal-wave-mediated shore-ward transport of cyprids,megalopae, and gammarids and correlated long-shore differences in the settling rate of intertidal barnacles. J. Exp. Mari. Biol. Ecol., 114, 1.
Slomp, C.P. and P. Van Cappellen. 2004. Nutrient inputs to the coastal ocean through submarine groundwater discharge: controls and potential impact. Journal of Hydrology 295: 64-86.
Townsend, D.W., N.R. Pettigrew, and A.C. Thomas. 2005. On the nature of Alexandrium fundyense blooms in the Gulf of Maine. Deep Sea Research II 52: 2603-2630.
Turner, J.T. and D.G. Borkman. 1993. Plankton Studies in Buzzards Bay, Massachusetts, USA. I. Hydrography and bacterioplankton, 1987-1990. Marine Ecology Progress Series 100: 17-26.
U.S. Environmental Protection Agency (EPA). 2008. Current National Recommended Water Quality Criteria. http://www.epa.gov/waterscience/criteria/wqctable/. Accessed 11/18/08.
U.S. Geological Survey (USGS). 2008. Surface Water data for USA: USGS Surface-Water Annual Statistics. http://waterdata.usgs.gov/nwis/. Accessed 11/19/08.
BA-24

BA-25
Warner, J.C., B. Butman, and P.S. Dalyander. 2008. Storm-driven sediment transport in Massachusetts Bay. Continental Shelf Research 28: 257-282. Weiskel, P.K. and B.L. Howes. 1992. Differential transport of sewage-derived nitrogen and phosphorus through a coastal watershed. Environmental Science & Technology. 26(2): 352-360.
Werme, C., A. Rex, M. Hall, K. Keay, W. Leo, M. Mickelson, and C.D. Hunt. 2008. 2007 outfall monitoring overview RESULTS. Boston: Massachusetts Water Resources Authority. Report 2007-17.
White, R.E., Jr. and L.F. White. 2007. Eldridge Tide and Pilot book 2008. Robert Eldridge White, Jr. and Linda Foster White, publishers, Medfield, MA.
Woods Hole Oceanographic Institution (WHOI). 2008. Harmful algae website. http://www.whoi.edu/redtide/page.do?pid=12777. Accessed 1/13/09.
Zimmerman, J., C. Veth, H. van Aken, L. Maas, and H. van Haren. 2008. Processes near continental slopes, internal waves and mixing. Royal Netherlands Institute for Sea Research website. http://www.nioz.nl/nioz_nl/96c2fef59006052f14ce21ce8530b77f.php. Accessed 11/19/08.


Chapter 3 - Seabed Features
The seabed within the Massachusetts ocean management planning area (planning area) is comprised of various sediments (e.g., mud, sand, gravel, cobble), larger three-dimensional features (e.g., ledges, banks, and basins), and organic matter (e.g., eelgrass, macroalgae, shell hash). At spatial scales of kilometers or miles, the major seabed features are the result of glaciation and glacial retreat over thousands of years. Daily currents and wind and wave regimes form sandwaves, reorder surficial sediments, and form windrows of unattached algae. Storms and their associated winds, waves, and river discharges also result in the resuspension, transport, and relayering of seabed sediments. At spatial scales from 100s of meters (or feet) down to the smallest patches of seafloor, a variety of sediments and organisms generate a teeming seafloor mosaic. Seagrasses and macroalgae form patchy or continuous beds that provide habitat for numerous species, trap sediments, and reduce wave energy. Bioturbating infauna aerate surficial sediments, deposit organic matter on the seafloor, and form mounds around their burrows. Shell hash, pebbles, and cobble form habitats that are vital for the survival of young crustaceans, mollusks, and fish, while attached algae, sponges, bryozoans, and cnidarians form living habitats that augment the ecological niches formed by geological structures and processes.
GEOMORPHOLOGY
The general configuration of the Massachusetts coast shoreline and inner shelf is controlled by the structure and composition of the regional bedrock framework. Bedrock in the region consists of complexly deformed metamorphic and intrusive rocks produced by multiple orogenic (mountain-building) events that have occurred since the Precambrian Era (> 540 million years ago) and the opening of the modern Atlantic Ocean (~250 million years ago) (Zen 1983; Robinson et al. 1998).
Surficial geologic features throughout Massachusetts were largely shaped during the Laurentide glaciation, which reached its most southern advance around 21,000 years ago, and during post-glacial fluctuations in relative sea level. Three glacial ice lobes occupied the present sites of Buzzards Bay, Cape Cod Bay, and the Great South Channel to the east of Cape Cod. The southern limit of glaciation is marked by moraines on Martha’s Vineyard and Nantucket (Schlee and Pratt 1970; Oldale 2001; Uchupi et al. 1996; Poppe et al. 2007). Cape Cod was formed by glacial outwash plains as the glaciers receded. During the glacial retreat, large lakes were formed in Nantucket Sound and Cape Cod Bay (Poppe et al. 2007; Oldale 2001). Tundra-like conditions existed at the ice edge, as evidenced by peat deposits.
Following deglaciation, the Holocene marine transgression (sea level rise) is thought to have started around 10-12,000 years ago and has been the most important process shaping the
BA-27

Massachusetts coastal region, nearshore areas, and the large banks in the Gulf of Maine. When Paleo-indians first arrived in Massachusetts between 11,000 and 8,000 years ago, sea level was 20-40 m (66-131 ft) lower than present, thus the shoreline was located seaward from where it is today (Oldale 2001). Therefore, submerged archeological sites may be found in the Massachusetts ocean management planning area if they were in an area relatively sheltered from wave action during subsequent sea level transgression. Since then, the ongoing sea level rise has caused the shoreline to migrate landward. Waves and currents have reworked the older glacial and post-glacial deposits along the coast, leaving behind coarse-grained sediment and bedrock in many areas of shallow seafloor, and depositing finer-grained muddy sediment in deeper basins offshore.
There are seven regions with distinct geomorphology within the planning area: 1) north of Cape Ann, 2) Massachusetts Bay, 3) Stellwagen Basin, 4) Cape Cod Bay, 5) Outer Cape Cod, 6) Nantucket and Vineyard Sounds, and 7) Buzzards Bay. North of Cape Ann is dominated by the influence of the Merrimack River and is generally characterized by a sandy seafloor with interspersed areas of hard bottom and dynamic sand wave fields. Within Massachusetts Bay, distinctive elongate ridges composed of glacial till (drumlins) define the seafloor. Stellwagen Basin is a deep, depositional basin with finer grained silts and clays, including hard clay nodules. Cape Cod Bay is a relatively featureless seafloor with large regions of sand and mud in the central portion. Outer Cape Cod is defined by the strong currents that rapidly winnow soft sediment, leaving a seafloor dominated by coarse unstratified glacial till. Nantucket and Vineyard Sounds, south of Cape Cod, are dominated by large shoals and sand wave fields. Buzzards Bay is an estuarine system that is dominated by sand and mud with rocky outcrops. Throughout these areas, softer sediment has a characteristically higher organic content than coarser sediment.
While the foregoing text gives a basic description of the major seafloor regimes within the planning area, it is important to note that the complicated underlying geology has led to high variability in seafloor composition. A collaboration between the U.S Geological Survey and the Massachusetts Office of Coastal Zone Management is in the process of characterizing the seafloor in high resolution using state-of-the-art acoustic and sampling techniques throughout the state to better define the seafloor geologic framework. This geospatial information will be the backbone of any concerted seafloor mapping, habitat mapping, or management exercise.
SEDIMENT TRANSPORT
Sediment transport is a highly complex geologic/physical oceanographic topic because the four key components for calculating sediment transport—water flow, seafloor roughness, sediment grain size and density, and sediment grain shape (morphology)—are highly variable. Over 100 years of research have examined sediment transport because it is important in relation to shoreline protection and the establishment of offshore mining sites,
BA-28

as well as several engineering topics, including erosion around structures, backfilling of dredged channels, and nearshore morphological change (Zhou 2001).
The major depositional basins in the planning area are Stellwagen Basin, Cape Cod Bay, and Buzzards Bay. Modeling and long-term monitoring have confirmed that sediment transport in the planning area north of Cape Cod occurs primarily during storms (Bothner and Butman 2007). Typically, waves during storms with winds from the northeast resuspend sediments, which are transported by shallow currents from western Massachusetts Bay toward Cape Cod Bay and by deeper currents to Stellwagen Basin. Tidal currents, wind-driven currents, and currents associated with spring runoff are insufficient to resuspend sediments (Werme and Hunt 2007).
Another important consideration is the sediment transport and shoreline retreat along the coast. Although the Massachusetts shoreline is technically outside of the planning area, the planning area will likely see increased pressure on its mineral resources for shoreline armoring. Without repeated monitoring and the development of verifiable numerical models, it is hard to predict long-shore and cross-shore sediment transport. There are engineering formulas and models designed to do this, but the variability of the nearshore is such that the formulas and models are at best approximations. Additionally, storm events can be a primary sediment transport mechanism on the coast. Although there is no statewide, high-resolution modeling, there are localized shoreline evolution studies and transport models (Miselis et al. 2008). The need for regional sediment management planning is well known. For example, the U.S. Army Corps of Engineers and the Massachusetts Department of Conservation and Recreation are planning on a regional transport study from the New Hampshire border to the tip of Cape Ann; however, these studies tend to ignore the linkage of the adjacent offshore areas to coastal evolution.
SEDIMENT QUALITY
Regional studies of Massachusetts coastal waters have documented the spatial distribution of several classes of contaminants, including trace metals, chlorinated pesticides, polychlorinated biphenyls (PCBs), and polycyclic aromatic hydrocarbons (PAHs) in sediment and biota (NRC 1995; McDowell 1997; Buchholtz ten Brink et al. 2002; Hunt et al. 2006; NCCOS 2006; EPA 2006; Bothner and Butman 2007). These contaminants preferentially bind to sediments that are fine-grained and contain high organic carbon, and as a result, the distribution of contaminants is strongly controlled by the distribution of fine-grained sediments. While there are generally decreasing contaminant concentrations in sediments with distance from land-based contaminant sources, the variable and generally coarse sediment texture in Massachusetts Bay and coastal Cape Cod Bay complicates the trend. For example, in central Cape Cod Bay, where finer sediments are found,
BA-29
concentrations of contaminants derived from Boston are elevated compared to their levels in coarse sediments closer to the source (Ravizza and Bothner 1996).
The area anticipated to have the highest levels of contamination in an offshore location is the Massachusetts Industrial Waste Site (IWS), which was used for the disposal of radiological wastes through 1959 and chemical wastes through 1977. Contaminants at the IWS and the adjacent Massachusetts Bay Disposal Site are typically found at concentrations below sediment quality guidelines for moderate likelihood of adverse effects to marine organisms (NOS 1996; Liebman and Brochi 2008). Both disposal sites are outside of the planning area. Within the planning area, sediment quality has been addressed in two published time-series studies in the vicinity of the Massachusetts Bay Outfall for greater Boston’s treated sewage effluent (Dahlen et al. 2006; Bothner and Butman 2007). These studies describe an environmentally insignificant increase in silver and the bacterium spore Clostridium perfringens (a benign indicator of sewage particles) in surface sediments at stations closest to the outfall. Other areas off eastern Massachusetts were found to have contaminant concentrations below sediment quality guidelines (Long et al. 1995).
The only other contaminant and toxicological studies available in the planning area have been done for dredging and construction activities. The data is contained within reports generated for permits so it can be hard to extract, but it is part of the public record. Based on the results from research done for the outfall and for the disposal sites, it is assumed that contaminants within sediments throughout the planning area are generally at levels that are not expected to cause adverse effects to marine organisms, or to bioaccumulate through the food chain. All disposal sites within the planning area are only used for clean material.
The planning area does encompass two smaller bays where chemical contaminants, bacteria, and low oxygen conditions may be significant factors governing the health of the seafloor community: Wellfleet Harbor and outer New Bedford Harbor. However, for the majority of the planning area, sediment quality is not likely to be impaired.
BIOLOGICAL FEATURES
Seabed features of biological origin can play a unique and significant role in the ecosystem of an area. Some remarkable examples of such features include coral reefs and deep-sea vent communities. Within Massachusetts, the only surveyed biological feature is eelgrass. Eelgrass (Zostera marina) is a key structure-forming species and is an important refuge for many fish. Eelgrass coverage has declined sharply from estimated historical coverage, and the decline is thought to be linked to impaired water quality and impacts related to boating, such as moorings, docks and piers, and wake scour. While once abundant throughout shallow coastal waters, the major beds are now found around Cape Cod and in Buzzards Bay. Buzzards Bay eelgrass has declined by more than half since 1988 (Costa 2003).
BA-30

The Massachusetts Department of Environmental Protection (MassDEP) eelgrass mapping project identified 16,570 hectares (40,946 acres) of eelgrass along the Massachusetts coast in 1995. Remapping the same areas in 2001, MassDEP identified a net loss of eelgrass of 15% (2,486 hectares or 6,142 acres). Over 40% of the lost eelgrass area between 1995 and 2001 was in Nantucket Sound. Roughly another 25% was lost in Buzzards Bay (MassDEP 2008). In its most recent eelgrass mapping effort in 2006, MassDEP calculated the net loss of eelgrass area in four regions in Massachusetts (North Shore [including Boston Harbor], South Shore, Buzzards Bay, Nantucket, and Martha’s Vineyard), where there were data from all three surveys (1995, 2001, and 2006). The North Shore (from Gloucester to Plymouth) lost 216 hectares (534 acres) or 16% at a rate of 20 hectares (49 acres) per year. The South Shore (the south side of Cape Cod from Pleasant Bay to Waquoit Bay) lost 231 hectares (571 acres) or 25% at a rate of 21 hectares (52 acres) per year. Buzzards Bay lost 178 hectares (440 acres) or 28% at a rate of 16 hectares (40 acres) per year. Nantucket and Martha’s Vineyard lost 149 hectares (368 acres) or 19% at a rate of 14 hectares (33 acres) per year (C. Costello, MassDEP, unpublished data).
Kelp (Laminaria and Alaria) is an alga and does not have roots as in the case of eelgrass, but it is a structure-forming species found usually in deeper waters. Kelp is known to occur in large beds based on observational data, but the distribution of kelp has not been mapped. Shellfish also form large seafloor features. This includes large populations of infaunal species, such as quahogs, as well as large piles of encrusting shellfish, such as blue mussels. While these features have not been surveyed, habitat suitability maps have been produced for shellfish. Also of potential importance are regions with large concentrations of sulfur sponge. There are other features, such as clay nodules and clay “pipes,” that could be of bacterial origin, and as such would be considered important biological features of the seafloor. Due to the difficulty of mapping such features, there is little known about their extent and importance. The Massachusetts Division of Marine Fisheries is currently working on an effort to catalog the occurrence of sulfur sponge.
REFERENCES
Bothner, M.H. and B. Butman (eds.). 2007. Processes influencing the transport and fate of contaminated sediments in the coastal ocean—Boston Harbor and Massachusetts Bay. U.S. Geological Survey Circular 1302. http://pubs.usgs.gov/circ/2007/1302/. Accessed 11/21/08.
Buchholtz ten Brink, M.R., F.T. Manheim, E.L. Mecray, M.E. Hastings, and J.M. Currence. 2002. Contaminated Sediments Database for the Gulf of Maine. U.S. Geological Survey Open-File Report 02-403. http://pubs.usgs.gov/of/2002/of02-403/index.htm. Accessed 11/21/08.
BA-31

Costa, J. 2003. Historical changes of eelgrass in Buzzards Bay. Buzzards Bay National Estuary Program. Wareham, MA. http://www.buzzardsbay.org/eelgrass-historical.htm. Accessed 11/21/08.
Dahlen, D., C. Hunt, S. Emsbo-Mattingly, and K. Keay. 2006. Are toxic contaminants accumulating in Massachusetts coastal sediments following startup of the Massachusetts Bay outfall: A comprehensive comparison of baseline and post-diversion periods. Marine Pollution Bulletin 52: 1372-1388.
Division of Marine Fisheries (DMF). In review. Sediment composition in Massachusetts: Report on consolidated point datasets. Division of Marine Fisheries Technical Report Series.
Hunt C.D., M. Hall, S. Pala, and D.T. Dahlen. 2006. A Review and summary of toxic contaminants in Boston Harbor and Massachusetts Bay: 1990 to 2005. Massachusetts Water Resources Authority, Boston, MA. Report ENQUAD 2006-23.
Liebman, M. and J. Brochi. 2008. U.S. EPA Survey at the Massachusetts Bay Disposal Site and Industrial Waste Site July 2006. Draft September 12, 2008. U.S. EPA New England, Office of Ecosystem Protection, Ocean and Coastal Protection Unit.
Long, E.R., D.D. MacDonald, S.L. Smith, and F.D. Calder. 1995. Incidence of adverse biological effects within ranges of chemical concentrations in marine and estuarine sediments. Environmental Management 19(1): 81-97.
Massachusetts Department of Environmental Protection (MassDEP). 2008. Data compiled from MassDEP eelgrass interactive map at http://www.mass.gov/dep/water/resources/maps/eelgrass/eelgrass.htm. Accessed 1/8/09.
McDowell, J.E. 1997. Biological effects of toxic chemical contaminants in the Gulf of Maine. In G.T. Wallace and E. F. Braasch (eds.), Proceedings of the Gulf of Maine Ecosystem Dynamics, A Scientific Symposium and workshop. Regional Association for Research on the Gulf of Maine, RARGOM Report 97-1.
Miselis, J.L., P.T. Gayes, J. McNinch, J. Goff, and A. Rodriguez. 2008. Synthesizing shallow-water geophysical data for shoreline evolution models. EOS 89(41): 393.
National Research Council (NRC). 1995. Improving Interactions Between Coastal Science and Policy, Proceedings of the Gulf of Maine Symposium. National Academy Press, Washington, DC.
National Oceanographic and Atmospheric Administration (NOAA) National Ocean Service (NOS). 1996. The Massachusetts Bay Industrial Waste Site: A Preliminary Survey of Hazardous Waste Containers and an Assessment of Seafood Safety. May and June 1992. NOAA Technical Memorandum NOS ORCA 99. Edited by John Lindsay.
BA-32

BA-33
NOAA National Centers for Coastal Ocean Science (NCCOS). 2006. An Ecological Characterization of the Stellwagen Bank National Marine Sanctuary Region: Oceanographic, Biogeographic, and Contaminants Assessment. Prepared by NCCOS’s Biogeography Team in cooperation with the National Marine Sanctuary Program. Silver Spring, MD. NOAA Technical Memorandum. NOS NCCOS 45.
Oldale, R.N. 2001. The Geologic Story: Cape Cod, Martha’s Vineyard, and Nantucket. On Cape Publications, Yarmouth Port, MA.
Poppe, L.J., S.D. Ackerman, D.S. Foster, D.S. Blackwood, B. Butman, M.S. Moser, and H.F. Stewart. 2007. Sea-floor character and surface processes in the vicinity of Quicks Hole, Elizabeth Islands, Massachusetts. U.S. Geological Survey Open-File Report 2006-1357.
Ravizza, G.E. and M.H. Bothner. 1996, Osmium isotopes and silver as tracers of anthropogenic metals in sediments from Massachusetts and Cape Cod Bays. Geochimica et Cosmochimica Acta 60: 2753-2763.
Robinson, P., R.D. Tucker, D. Bradley, H.N. Berry IV, and P.H. Osberg. 1998. Paleozoic orogens in New England, USA. GFF, Geologiska Föreningen 120: 119-148.
Schlee, J.S. and R.M. Pratt. 1970. Atlantic continental shelf and slope of the United States - gravels of the northeastern part: U.S. Geological Survey Professional Paper 529-J.
Uchupi, E., G.S. Giese, D.G. Aubrey, and D.J. Kim. 1996. The Late Quaternary construction of Cape Cod, Massachusetts—a reconsideration of the W.M. Davis model: Geological Society of America Special Paper 309.
U. S. Environmental Protection Agency (EPA) Office of Water/Office of Research and Development (EPA). 2006. National Estuary Program Coastal Condition Report. EPA-842/B-06/001. Washington, DC.
Werme, C. and C.D. Hunt. 2007. 2006 outfall monitoring overview. Boston: Massachusetts Water Resources Authority. Report 2007-12.
Zen, E. 1983. Exotic terranes in the New England Appalachians—limits, candidates, and dates: a speculative essay. In Hatcher, R.D., H. Williams, and I. Zietz (editors). Contributions to the tectonics and geophysics of mountain chains. Geological Society of America, Memoir 158.
Zhuo, L. 2001. Sediment Transport. Hydraulics and Coastal Engineering Laboratory, Aalborg University, Denmark. http://lvov.weizmann.ac.il/lvov/LiteratureOnline/Literature/Books/2001_Sediment_Transport.pdf. Accessed 6/4/09.


Chapter 4 - Habitat
Habitat is the place where an organism is found (Ricklefs 1990), and is often characterized by a dominant plant (e.g., salt marsh or seagrass) or physical characteristic (e.g., cobble fields, reefs, and wrecks). While one typically thinks of habitat as these types of biotic or abiotic structures, it is important to recognize that the ocean water itself, throughout the water column, is habitat for countless organisms. Likewise, the air above the ocean, and the sediments beneath it, provide important habitat in the form of shelter, forage opportunities, breeding locations, migration corridors, and other ecological services.
Describing habitat involves issues of scale and the inherent variability of natural resources. For example, whale habitat is described in terms of thousands of kilometers (hundreds of miles) of ocean, while juvenile fish habitat is described by unique seafloor characteristics or microhabitats on the scale of centimeters to meters (inches to feet). In addition to these spatial ranges, in the temperate northeast, there are large variations in the physical properties of the ocean and coastal environment that can affect the temporal nature of habitats. The most obvious change within the Massachusetts ocean management planning (planning area) is the temperature shift from summer to winter, but there are also seasonal changes in salinity, dissolved oxygen, suspended sediment concentrations, the depth of stratification of the water column, the presence or absence of certain plant species, and the concentration of nutrients and minerals in the water column. Owing to these spatial and temporal variations, the ocean environment in Massachusetts contains a diverse suite of habitats that support many resident and migratory organisms and their life history stages.
Changes to ocean habitats through the addition of man-made structures, the disturbance of sediments, or the addition of pollutants, can have profound effects upon how an organism fulfills its life history and can cause the weakening or breakage of vital food web links. There is scientific evidence to suggest that as food webs become weakened, either through disturbance (Altman and Whitlatch 2007; Didham et al. 2007) or the addition of non-native species (Cohen and Carlton 1993), native species are more likely to be replaced by non-native species, further changing ecosystem dynamics. In some cases, mitigation efforts may restore habitat, but experience has shown that these efforts are expensive and often fail to replicate the original habitat.
Within and outside of the planning area, pollution (Valiela and Bowen 1991), coastal alteration (Barrett et al. 2006), and fishing practices (Auster et al. 1996; Auster and Langton 1999) have already dramatically altered the extent and quality of estuarine and marine habitats. For example, many estuaries on the south side of Cape Cod and in Buzzards Bay are eutrophied (i.e., have high nutrient content and low bottom dissolved oxygen) and have seen the replacement of native eelgrass (Zostera marina) beds by macroalgae that provide relatively less habitat (e.g., see the Massachusetts Department of Environmental Protection
BA-35

[MassDEP] Estuaries Project Reports).4 In deeper waters, much of the bottom has been scoured by trawling gear, greatly changing the complexity and habitat quality of the seafloor. Any future uses of the planning area should consider existing habitat and ecological services that are provided by the ocean and whether the new uses will diminish the existing habitat quality (which is often already affected by human alterations). This section of the baseline assessment documents the various uses of the planning area as habitat for plants and animals across the marine food web, discusses the identification of important habitats, and describes measures that may be used to mitigate for habitat conversion or fragmentation.
PRIMARY AND SECONDARY PRODUCERS
Primary production is the accumulation of energy and nutrients by photosynthesizers and other autotrophs (Ricklefs 1990). Primary producers perform the important role of capturing the sun’s energy and transforming it to a form that other organisms can utilize. For the most part, primary producers are plants or cyanobacteria, either attached or free-floating; it should also be noted that there are some primary producers, called chemosynthesizers, which do not photosynthesize. Within the planning area, there are widespread areas that support attached plant life. For example, eelgrass (Zostera marina) has been observed near Great Misery and Bakers Islands in Salem Sound, Great Island in Wellfleet, the Weepecket Islands in Gosnold, and in the shoals of Cape Cod Bay off of Brewster and Orleans (see Figures 4.1 and 4.2; MassDEP 2008; EEA 2008a). Additionally, macroalgae can be found on sand, cobble, ledges, and man-made structures throughout the planning area, wherever there is enough light on the bottom to support photosynthesis (see more on this below). One important macroalga is kelp, a brown alga represented by three genera (Agarum, Alaria, and Laminaria) in Massachusetts.
The distribution and abundance of kelp and other macroalgae is not well known in the planning area. However, Maciolek et al. (2008) report that coralline red algae, Ptilota serrata (a filamentous red alga), Palmaria palmate (dulse), and Agarum cribosum (shotgun kelp), were observed on cobbles and boulders on drumlins at the Massachusetts Water Resources Authority’s (MWRA) nearfield (i.e., near the outfall diffuser) monitoring sites in Massachusetts Bay in 2007. Coralline red algae were the most abundant algal taxon observed at these sites. Over 14 years of study, Maciolek et al. (2008) have observed that since the MWRA outfall has come online, sediment drape at the sites north of the outfall has increased slightly while coralline algae cover has decreased (though this pattern does not necessarily hold in particular years, for example, 2005). They also observed a decrease in upright algae in the post discharge years (2003 in particular) that they surmise is the results of disturbance. MWRA possesses a significant amount of data on hard bottom cover by algae
4 http://www.oceanscience.net/estuaries/reports.htm.
BA-36
that could be useful toward ocean planning efforts, such as groundtruthing models of sediment-biota associations.5
While seagrasses and macroalgae may be the most obvious primary producers, the major contributors to primary production in the ocean are free-floating photosynthesizing algae known as phytoplankton. The abundance of photosynthesizers in a certain area is sometimes used to estimate primary productivity. Data collected by the Sea-viewing Wide Field-of-View Sensor (SeaWiFS) and Moderate-resolution Imaging Spectroradiometer (MODIS), satellite-mounted sensors designed to monitor chlorophyll a, can be used to monitor algal concentrations on the ocean’s surface and detect algal blooms (Cracknell et al. 2001). Satellite-derived chlorophyll data are available for the planning area.
While traditional descriptions of the marine ecosystem often describe phytoplankton at the base of the food chain, it is important to recognize that the most abundant and diverse organisms in the ocean are bacteria and viruses (DeLong et al. 2006). Marine microbes play fundamental roles in the marine ecosystem, as they do in terrestrial systems: in nutrient cycling, primary production, controlling water quality, and causing diseases. Although the inability to see, describe, or grow most of the species in the ocean has hampered their study, new genetic methods are rapidly increasing the understanding of functions of microbial communities in the ocean; potential impacts on microbial communities may be considered part of planning in the future.
Monitoring by MWRA has demonstrated that there are distinct peaks (“blooms”) in phytoplankton abundance in early spring (April), summer (June), and fall (October) in Massachusetts Bay. The phytoplankton species assemblage in Massachusetts Bay includes microflagellates and cryptomonads, which are numerically dominant throughout the year, but reach peak abundances in summer (Werme et al. 2008). Diatoms are another major phytoplankton species that are abundant in fall, winter, and spring. Early spring blooms of the potentially nuisance alga Phaeocystic pouchetti occur annually and are apparently not related to the MWRA outfall in Massachusetts Bay. There is some evidence to suggest that the length of the P. pouchetti bloom is related to the day of year at which ocean temperatures first reach 14 °C (57 °F)—with bloom durations around 100 days when temperatures warm to 14 °C in June, while blooms end earlier when temperatures warm to 14°C in April (Werme et al. 2008). There have also been regular blooms of the toxic dinoflagellate Alexandrium fundyense in the late spring and summer. Before 2005, Alexandrium densities typically ranged from 1-100 cells per liter (cells/l or cells/1.1 quart) in Massachusetts Bay and Cape Cod Bay when they are present, but cell densities were as high as 39,000 cells/l in 2005, 17,000 cells/l in
5 Chapter 6 of http://www.mwra.state.ma.us/harbor/enquad/pdf/2008-20.pdf.
BA-37

2006, and 60,000 cells/l in 2008 (Anderson et al. 2007; Libby et al. 2007; unpublished MWRA data.) Anderson et al. (2007) have suggested that the 2005 Alexandrium bloom was a result of a high abundance of Alexandrium cysts in Gulf of Maine sediments in 2004. Winds from the northeast increased the Massachusetts Bay/Cape Cod Bay bloom by driving Alexandrium patches toward the shore and into Massachusetts Bay. Alexandrium blooms, which can cause paralytic shellfish poisoning (PSP) in shellfish consumers, are monitored closely and have led to large seasonal closures of shellfish harvesting areas along the Massachusetts coast, from the border with New Hampshire to Cape Cod.
Secondary productivity is a measure of the transfer of primary producer biomass into other forms, for example, when organisms graze upon primary producers. Secondary productivity is a measure of the amount of energy ingested minus the sum of the amount of energy used for cellular respiration and the amount of energy eliminated by an organism. In the planning area, zooplankton are one group of primary consumers from which secondary productivity can be measured. In the waters of the planning area, zooplankton (e.g., copepods and fish and crustacean larvae) graze upon phytoplankton, and each other, while actively or passively moving through the water column. Together the two types of plankton form the foundation of most marine food webs.
Zooplankton graze on phytoplankton and are, in part, responsible for the periodic subsidence of phytoplankton blooms. Changing climatological patterns and cycles of nutrients and other resources affect phytoplankton cycles as well. The zooplankton community in Massachusetts Bay in 2006 was dominated by the copepods Oithona similis and Pseudocalanus spp. Other copepod species typical of the Gulf of Maine include: Calanus finmarchius, Paracalanus parvus, Centropages typicus, and Centropages hamatus (Libby et al. 2007). Early life stages of bivalves, gastropods, barnacles, polychaetes, crustaceans, and fish are also important components of the zooplankton community. MWRA has documented a decrease in total zooplankton abundance from the 1992-2000 period to the 2001-2006 period (Libby et al. 2007). Copepod abundance in particular was found to be lower in Massachusetts Bay and offshore, with the most abundant species, O. similes, showing the most dramatic decrease. Notably, the relatively larger copepod C. finmarchius has not decreased in abundance and in fact has increased in abundance since 2000 (Libby et al. 2007). While it is not the most abundant, the size of C. finmarchius relative to other zooplankton makes it the most important contributor to the zooplankton biomass cycle on Georges Bank (Bourne 1987). Within Cape Cod Bay, C. finmarchius aggregations are also important as they are associated with high probabilities of right whale (Eubalaena glacialis) occurrence and feeding activity (Jiang et al. 2007).
There have been suggestions across the globe that zooplankton abundances may be lower due to an increase in filter feeders, especially ctenophores (comb jellies) and jellyfish. Anecdotal and quantitative evidence from power plant intake monitoring along coastal Massachusetts suggests that ctenophore and jellyfish are becoming impinged at higher rates than in the past (T. Callaghan, personal observation).
BA-38
BENTHIC COMMUNITIES
Benthic communities are diverse in Massachusetts, and they inhabit all of the seafloor types in the planning area (Figure 4.1). Some communities in effect create the seafloor: structure-forming plants, algae, and shellfish are ubiquitous. The species that typify the soft bottom benthic communities in Massachusetts include polychaete worms and amphipods (e.g., Eucone incolor, Aricidea quadrilobata, Levinsenia gracilus, Exogenes spp., Crassicorophium crassicorne, and Cossura longocirrata), sand dollars, bivalves, and sea anemones. The most robust dataset examining benthic community species composition, spatial, and temporal trends in the planning area has been collected by MWRA during impact assessment and environmental quality monitoring for the Deer Island Treatment Plant outfall, located in Massachusetts Bay (Werme and Hunt 2006). There are smaller studies with benthic infaunal information in Buzzards Bay associated with construction projects. The U.S. Environmental Protection Agency’s (EPA) Environmental Monitoring and Assessment Program (EMAP),6 and National Coastal Assessment (NCA)7 projects have collected data throughout the planning area at very coarse resolution.
The most surveyed biological features are eelgrass and hard bottom communities. Eelgrass (Zostera marina) is a key structure-forming species and is well known as an important refuge for many fish (e.g., Stauffer 1937; Heck et al. 1989; Hughes et al. 2002; Lazarri and Tupper 2002; Orth et al. 2006). Eelgrass coverage has declined sharply from estimated historical coverage, and the decline is thought to be linked to impaired water quality and impacts related to boating, such as moorings, docks and piers, and wake scour (Rasmussen 1977; Duarte 1995; Short et al. 2002; MacFarlane et al. 2000; Park et al. 2009; Reed and Hovel 2006). While once abundant throughout shallow coastal waters, the major beds are now found around Cape Cod and in Buzzards Bay (Figure 4.2). Buzzards Bay eelgrass has declined by more than half since 1988 (Costa 2003).
The MassDEP eelgrass mapping project identified 16,570 hectares (40,946 acres) of eelgrass along the Massachusetts coast in 1995. Remapping the same areas in 2001, MassDEP identified a net loss of eelgrass of 15% (2,486 hectares or 6,142 acres). Over 40% of the lost eelgrass area between 1995 and 2001 was in Nantucket Sound. Roughly another 25% was lost in Buzzards Bay (MassDEP 2008). In its most recent eelgrass mapping effort in 2006, MassDEP calculated the net loss of eelgrass area in four regions in Massachusetts (North Shore including Boston Harbor, South Cape, Buzzards Bay, and Islands) where there were data from all three surveys (1995, 2001, and 2006) (Table 4.1).
6 http://www.epa.gov/emap/. 7 http://www.epa.gov/emap/nca/.
BA-39

Table 4.1 Eelgrass trends in four regions of Massachusetts
Area 1995
(hectare/acre) 2006
(hectare/acre) Difference
(hectare/acre) %
Lost Rate
(hectare/acre/yr)
North Shore
1,392/3,440 1,176/2,906 - 216/534 16 -20/49
South Cape
922/2,278 691/1,707 - 231/571 25 -21/52
Buzzards Bay
637/1,574 459/1,134 - 178/440 28 -16/40
Islands 773/1,910 624/1,542 - 149/368 19 -14/33 North Shore = Gloucester to Plymouth, South Cape = Falmouth to Orleans, and Islands = Nantucket and Martha’s
Vineyard.
Hard bottom communities in Massachusetts are comprised of encrusting and emergent infauna and epifauna, including algae, sponges, bryozoans, and sea anemones (Maciolek et al. 2008). These are important habitats for a number of fish species. Some species exhibit high dependence on structured seafloor for survival and reproduction, including cod, lobster, cusk, and wolffish (e.g., Sogard and Able 1991; Able et al. 1995; Auster et al. 1995, 1997; Langton et al. 1995; Szedlmayer and Howe 1997). Because of their contributions to diversity and ecosystem services, hard bottom communities are recognized as highly valuable biological features (Wahl in press). These communities are also reported to be particularly vulnerable to repeated disturbance, including from fishing gear, storms, and anchor dragging (Auster and Langton 1999; NRC 2002).
It is known that areas of soft coral and kelp, both important benthic communities, exist within the planning area, but they have not been mapped (MCZM 2004). Kelp (Laminaria) is an alga and does not have roots as eelgrass does, but it is a structure-forming species found in large beds, usually in deeper waters.
Shellfish also form or influence large seafloor features. This includes large populations of infaunal species, such as quahogs, as well as large piles of encrusting shellfish, such as blue and horse mussels. There is no formal resource assessment survey for shellfish, but habitat suitability maps have been produced for shellfish, representing expert opinion on the potential location of major shellfish beds. Also of potential importance are regions with large concentrations of epifauna, including sponges, anemones, tunicates, and amphipods. Epifauna add complexity to the seabed and often serve as important habitat for mobile fishes and crabs. The Massachusetts Division of Marine Fisheries (MarineFisheries) is currently working on an effort to catalog the occurrence of sulfur sponge that is observed in the resource assessment inshore trawl survey. There are other features, such as clay nodules and clay “pipes,” that could be of bacterial origin, and as such would be considered important biological features of the seafloor. Due to the difficulty of mapping such features, there is little known about the extent and importance of such features. Bottom photographs and
BA-40

video collected during groundtruth surveys of acoustic seafloor mapping data could also be used to identify and describe the presence of seabed features of biological origin.
Benthic communities are structured by major physical parameters including depth, water flow, oxygen penetration, and grain size (Biles et al. 2003; Diaz and Rosenberg 1995). Therefore, preliminary work was conducted to characterize the physical parameters in the planning area. Benthic terrain modeling (BTM) was utilized to map bathymetric position (crests, depressions, flats, and areas of low and high slope) within planning area. The BTM was then combined with surficial seafloor geologic composition and seafloor roughness and the analysis defined 51 unique combinations of seafloor habitat classes within the planning area (Figure 4.3). Although the correlation of benthic community to grain size can be strong, the degree of variability in the seafloor composition in the planning area supports the need for improved characterization of the planning area by utilizing high resolution acoustic data. More than half of the planning area still remains to be mapped using high resolution acoustic methods coupled with groundtruthing as part of the U.S. Geological Survey and Massachusetts Office of Coastal Zone Management Seafloor Mapping Cooperative. The importance of such mapping cannot be overstated. Seafloor mapping is the cornerstone of any habitat assessment, and is similar to topography and soils mapping on land. Complete mapping of the seafloor communities in Massachusetts will also enable assessments of ecosystem uniqueness, vulnerability, and resiliency.
FISHERIES RESOURCES, SHELLFISH, AND HABITAT
There are over 200 species of fish that utilize the planning area, and all of state waters are important to marine fisheries in some manner, by either directly or indirectly supporting a species. Massachusetts is fortunate to have a consistent multi-season, multi-year, stratified-random trawl survey dataset with which to examine trends in fisheries relative abundance. The federal stock assessment survey utilizes the results of the state survey as part of a dataset used to generate biomass estimates of commercially fished stocks, and recommend the amount of sustainable mortality on those stocks. The most recent information about trends for groundfish is provided in Table 4.2, as summarized from the most recent Groundfish Assessment Review Meeting (NOAA 2008). The rebuilt stocks are Gulf of Maine and George’s Bank haddock. The most overfished stock is Southern New England/Mid Atlantic winter flounder, for which a zero possession limit will be in place as of May 1, 2009 (NOAA 2009).
There are important caveats to the analysis of fisheries resources in Massachusetts. First, only species vulnerable to the survey method (an otter trawl towed at 2.5 knots or 4.6 kilometers per hour [km/hr]) are captured; many pelagic species and shellfish species, as well as some ecosystem indicator species such as forage fish, are not vulnerable to capture. Second, the survey occurs only in May and September during daylight hours, so important seasonal fisheries and habitat use are not captured. Third, portions of the planning area are
BA-41

undersampled due to the inability of the sampling gear to sample in complex topography and shallow water. These areas likely represent some of the more critical habitat types for population bottlenecks of some species. Fourth, there is no statewide survey of the distribution of shellfish species. Lastly, it is important to note that the survey was designed to examine relative abundance of species, not spatial distribution. Therefore, spatial distribution information is currently limited to the resolution of the survey.
Table 4.2 Trends in commercially harvested groundfisheries (from NOAA 2008)
Stock Status 2004 2007
Stock is overfished and overfishing is occurring
● Georges Bank Cod ● Gulf of Maine Cod ● Georges Bank Yellowtail ● Southern New England/ Massachusetts Yellowtail ● Gulf of Maine/Cape Cod Yellowtail ● Southern New England/ Massachusetts Winter Flounder ● White Hake
● Georges Bank Cod ● Georges Bank Yellowtail ● Southern New England/ Massachusetts Yellowtail ● Gulf of Maine/Cape Cod Yellowtail ● Southern New England/ Massachusetts Winter Flounder ● White Hake ● Pollock ● Witch Flounder ● Georges Bank Winter Flounder ● Gulf of Maine Winter Flounder ● Northern Windowpane
Stock overfished but overfishing is not occurring
● Georges Bank Haddock ● Gulf of Maine Haddock ● Southern Windowpane ● Plaice ● Ocean Pout
● Ocean Pout ● Halibut
Stock not overfished and overfishing is occurring
● Georges Bank Winter Flounder ● Gulf of Maine Cod ● Southern Windowpane
Stock not overfished and overfishing is not occurring
● Pollock ● Redfish ● Northern Windowpane ● Gulf of Maine Winter Flounder ● Witch Flounder
● Redfish ● Plaice ● Georges Bank Haddock ● Gulf of Maine Haddock
No change: redfish, ocean pout, white hake, Southern New England/ Massachusetts winter flounder, Gulf of Maine /Cape Cod yellowtail, Southern New England/ Massachusetts yellowtail, Georges Bank yellowtail, Georges Bank cod Positive change: haddock, southern windowpane, Gulf of Maine Cod, plaice Negative change: pollock, northern windowpane, Gulf of Maine winter flounder, witch, Georges Bank winter flounder
With an end goal of determining what areas of the planning area are important to marine fisheries as a whole, the dataset was first used to map the relative importance of different parts of the planning area to 22 species of commercial or recreational value vulnerable to the survey method. In general, the major areas of importance are inner Massachusetts Bay,
BA-42

Ipswich Bay, Nantucket Sound, and outer Vineyard Sound (Figure 4.4). This is an oversimplification of the areas “important” to fisheries resources, and the analysis by necessity eliminated considerable detail. Even areas of “low importance” can have resources not found elsewhere and that have particular vulnerability to impact. The dataset was next used to map the relative importance of different parts of the planning area for species with very limited spatial distributions, species of concern, and species of regional importance as part of the Ecological Valuation Index (EVI) analysis.8 The data as analyzed consolidated 30 years of data, and therefore ignored temporal trends in both abundance and distribution. Species shifts due to climate events, such as the North Atlantic Oscillation or warming temperatures, would be worthwhile to identify. Lastly, additional potential uses of these data may include examining additional biological indicators, such as community composition, abundance, and diversity (including species richness and evenness).
In the planning area, the shellfish in order of highest abundance based on landings data are surf clams (Spisula solidissima), ocean quahogs (Arctica islandica), and sea scallops (Plactopecten magellanicus). Inshore of the planning area, in order of highest abundance are quahogs (Mercenaria mercenaria), soft shell clams (Mya arenaria), blue mussels (Mytilus edulis), razor clams (Ensis directus), oysters (Crassostrea virginica), and bay scallops (Argopecten irradians) (MA DMF 2008). Although there is no statewide resource assessment for shellfish, shellfish suitability maps were updated in 2009 to illustrate areas of known or anticipated shellfish resource. Some of the regions with shellfish resources that could be considered more vulnerable, or at greater risk of impact in general include: Nantucket Shoals (surf clams), Nantucket Sound (quahogs), Cape Cod Bay (ocean quahogs and sea scallops), and the North Shore (sea scallops) (Dave Whitaker, personal communication). As with other resources, the risk of impact is highly dependent on the proposed use. With the recent advances in oceanographic data collection and a push toward ecosystem-based management, there is considerable interest in the fisheries research and management community to better couple biological and physical parameters. One way to describe this type of mapping is “potential habitat mapping.” The idea is to define habitats using the life history characteristics of fish, and then model several physical parameters to predict where those habitats are, and by association, where particular species or species groups are located. The major habitat features of critical importance to marine fisheries resources in Massachusetts are listed in Table 4.3. (This list may be incomplete since some areas in the ocean may appear “featureless,” but still be an important part of the ecosystem.) In order to map these habitats, a variety of datasets are currently being assembled. These data include depth, sediment composition, biotic structure forming organisms, temperature, salinity, wave base, near bed shear stress, light attenuation, primary and secondary productivity, frontal
8 See Chapter 6 of the “Development of an Ecological Valuation Index for the Massachusetts Ocean Management Plan” document in Volume 2 of the Ocean Management Plan.
BA-43

probability, and water column stratification. Important steps that need to be taken once these data are assembled are to examine linkages between the physical habitats and the species distributions and quantify habitat concepts, such as vulnerability and resiliency.
Table 4.3 Habitat features of importance to fisheries resources
Habitat Features Species
3D Structure: Abiotic (Cobble/rocky/boulder/ledge bottom [not shell] often called “rock piles”)
Many species utilize this type of bottom due to the 3D structure, which provides shelter. Some species’ life histories require this type of habitat (e.g., juvenile cod and lobster).
3D Structure: Biotic (SAV, kelp, and structure-forming inverts)
Many species utilize this type of bottom due to the 3D structure, which provides shelter. Some species’ life histories require this type of habitat.
Upwelling Important to driving productivity by bringing in nutrients; may not be a major feature in Massachusetts but could be important on a local scale.
Deeper waters (channels, depressions) Temperature and storm wave refugia. Estuaries, river mouths Turbidity front at fresh-salt water interface can
influence productivity. Shell habitat Settling habitat for invertebrates, may provide
shelter. Shallow waters (<5 feet); mud flats; salt marshes Critical nursery areas; mud flats are of high value
to infauna. Frontal boundaries Represent important “edge” habitat for a wide
variety of resident and migratory pelagic species. Tide rips
Smaller frontal boundary features; sportfishing species; variety of species utilize these features and are popular fishing spots.
Mud bottom Has potential to provide abundant forage; lower resiliency to recurrent impacts in cold/deep mud bottom.
SEAFOOD QUALITY/CHEMICAL CONTAMINANTS
There are two main types of contaminants that can adversely impact seafood quality in Massachusetts: chemical pollutants such as mercury and PCBs and bacteriological biotoxins such as paralytic shellfish poisoning. There are at least four programs that monitor the quality of seafood in Massachusetts. MarineFisheries routinely conducts shellfish quality testing; MWRA monitors flounder liver disease and contaminants in flounder and lobster tissue, hard- and soft-bottom benthic communities, and zooplankton; the Gulf of Maine Council Gulfwatch maintains a mussel contaminant monitoring program; and the National Coastal Assessment conducts measurements of bioaccumulation in tissues (EPA 2008). In addition, the EPA studied seafood quality surrounding the Industrial Waste site. Harvesting of contaminated seafood is controlled by fisheries management recommendations and the
BA-44

Massachusetts Department of Public Health produces a Fish Consumption Advisory for the public.9 The advisory suggests pregnant women, women who may become pregnant, nursing mothers, and children under 12 years old should not eat: bluefish caught off the Massachusetts coast; lobster from New Bedford Harbor; lobsters, flounder, soft-shell clams, and bivalves from Boston Harbor; or swordfish, shark, king mackerel, tilefish, and tuna steak caught anywhere. No one should eat fish and shellfish from the closed areas of New Bedford Harbor, or lobster tomalley caught anywhere. The advisory contains information regarding freshwater fish consumption as well. The state advisory contains the National Advice Concerning Mercury in Fish from EPA and the U.S. Food and Drug Administration (FDA) (http://www.epa.gov/fishadvisories/advice/).
AVIFAUNA
The beaches, marshes, estuaries, rocky outcrops, and islands along the Massachusetts coastline, as well as the ocean waters themselves, provide valuable habitat for the reproduction and foraging of resident and migratory bird species. While most of these areas are outside the planning area, it is impossible for birds to access these important habitats without flying through the planning area, so the species that utilize them are considered in this baseline assessment. Furthermore, there are several islands of importance to avifauna actually within the planning area (e.g., off of Rockport, Beverly, Boston Harbor, Wellfleet, and within Buzzards Bay) that must be acknowledged.
Since a large part of the Massachusetts coastline (i.e., Cape Cod) juts into the Atlantic flyway, one of four major north American migration routes, the Massachusetts coastline and its waters provide habitat for thousands of migrating ducks, shore birds, predatory birds, and songbirds. Waters and islands within the planning area regularly serve as staging grounds or stopovers for migrating birds, providing shelter from winds and waves, and in some cases also important high-calorie foods needed for migration or to survive New England’s harsh winters. Given the importance of the planning area as part of an international flyway, it is critical to consider how any new, large, structural obstacles might possibly affect the safe passage of migratory birds.
Shorebirds
Shorebirds utilizing the planning area in late spring and early summer feast on a variety of invertebrates, such as amphipods, small mollusks, marine worms, and possibly horseshoe crab eggs. The migrant shorebirds most common in coastal Massachusetts during spring migration are Black-bellied and Semipalmated Plover, Greater Yellowlegs, Ruddy Turnstone, Red Knot, Sanderling, Least Sandpiper, Dunlin, and Short-billed Dowitcher. Of the few species that breed in Massachusetts, Piping Plover, American Oystercatcher, and Willet are
9 http://www.mass.gov/Eeohhs2/docs/dph/environmental/exposure/statewide_fish_advisory_poster.pdf.
BA-45

the most numerous. The Piping Plover is a threatened species and a significant proportion of the population breeds in Massachusetts. During autumn migration, the species above are joined by varying numbers of Lesser Yellowlegs, Whimbrel, Hudsonian Godwit, and Semipalmated and White-rumped Sandpipers. Less common fall migrants include American Golden-Plover, Marbled Godwit, and Western, Baird’s, Pectoral, and Buff-breasted Sandpipers (USFWS 2001).
Many of these species fly thousands of miles in each direction during their annual migration—some going as far south as the southern tip of South America (e.g., Hudsonian Godwit, Red Knot, White-rumped Sandpiper) and as far north as the Canadian arctic or western Greenland. To support their epic migrations, most shorebirds typically make several stops at key locations to replenish their fat reserves. Adjacent to the planning area are several key shorebird stopover sites, most notably the Parker River National Wildlife Refuge and the Great Marsh Important Bird Area (IBA) on the North Shore, Duxbury and Plymouth Bay IBA on the South Shore, Monomoy National Wildlife Refuge/South Beach IBA in Chatham, and several key sites on the Cape Cod National Seashore (e.g., Nauset Marsh and First Encounter Beach in Eastham). In 1999, the Monomoy National Wildlife Refuge was designated a Western Hemispheric Shorebird Reserve Network (WHSRN) site of regional importance. WHSRN sites represent critical feeding and resting areas for hemispheric-wide conservation of shorebirds. The Monomoy National Wildlife Refuge received this designation largely due to the fall migration of shorebirds (which actually starts in July and continues through October) during which more than 30,000 shorebirds stage on the refuge.
Colonial Waterbirds
Small, off-shore islands provide important nesting areas for colonial nesting waterbirds including: Leach’s Storm-Petrel, Double-crested Cormorant, egrets, herons, Glossy Ibis, gulls, terns, and Black Skimmers (e.g., see Figures 7-12 in EEA 2008a). Because some of these species are ground nesters (e.g., gulls, terns, and skimmers) they are at a great risk from trampling by foot traffic or predation by mammals that may occur on their nesting islands. Long-legged wading bird nests are usually built in trees and shrubs, which gives them increased protection from trampling and predation from exclusively ground predators; however, because they occur in dense aggregations of up to dozens of nesting pairs, entire colonies may be affected if they are disturbed by human activities.
There are several islands within the planning area that support large nesting waterbird colonies (e.g., Ram and Bird Islands in Buzzards Bay). In addition to the importance of Massachusetts coastal areas and surrounding waters for breeding, several sites are essential post-breeding staging habitat for terns. The majority of the entire North American population of endangered Roseate Terns uses Cape Cod, South Shore, and Buzzards Bay sites for nesting and for resting (Figure 4.5) and foraging (Figure 4.6) before migrating to South America. Thousands of Common Terns, hundreds of Forster’s Terns, and Black
BA-46

Terns also use these staging sites. Based on color-band re-sighting information, it is known that individual Roseate Terns (in mixed flocks with Common Terns) often make repeated transits across open ocean throughout the project area, moving from site to site throughout the July-September staging period (Becky Harris and Jeff Spendelow, unpublished data).
The Habitat Work Group identified known Roseate Tern breeding and staging sites within the planning area as belonging to the category of habitat designated as the highest priority (EEA 2008a). Roseate Tern foraging areas and other colonial waterbird nesting areas received the second highest ranking (EEA 2008a).
Waterfowl
The many coves, coastal ponds, and estuaries in and adjacent to the planning area regularly harbor waterfowl during the spring and fall migration, as well as during the winter, and a few also support foraging and nesting habitat for resident species. From late summer through fall, Gadwall, American Widgeon, American Black Duck, Mallard, Northern Shoveler, Northern Pintail, and Green-winged Teal, migrate through the planning area, while mid- to late fall brings huge numbers of coastally migrating eiders, scoters, and Long-tailed Ducks.
Recent data collected by Mass Audubon suggest that the waters around Nantucket probably hold the densest winter aggregations of Long-tailed Ducks in the world (Simon Perkins, personal communication). Long-tailed Ducks apparently forage on amphipods and mollusks from the south side of Nantucket out to Nantucket Shoals during the day, only to return to more protected waters north of Nantucket Sound for the night (Figure 4.7). The largest aggregations of eiders and scoters in New England have also been documented overwintering in the waters near Nantucket and Martha’s Vineyard. Analysis of gut contents suggest that eiders are usually foraging on mussels along the western side of Muskeget Channel (Simon Perkins, personal communication).
Songbirds
During fall migration, northwesterly winds following cold fronts periodically drift migrating songbirds over the planning area, most notably in the Cape Cod region. Under normal conditions, the presence of these birds in the study area is minimal; however, under adverse migration conditions during fog or light rain, many birds could be affected by a combination of winds, lighted towers, or other obstructing objects in their course of migration (e.g., lighthouses, wind turbines, etc.).
BA-47

Pelagic Seabirds
The near coastal waters of the Stellwagen Bank National Marine Sanctuary and the waters to the east of Cape Cod routinely host an abundance of seabirds in many of the same locations that are important for marine mammals. Seabirds, such as shearwaters, storm-petrels, Northern Gannet, and jaegers, spend the majority of their lives at sea; however, during extreme weather events, such as hurricanes and nor’easters, very large numbers regularly enter the study area, especially the waters bounded by Cape Cod Bay. The unusual coastal configuration of Cape Cod makes the waters of Cape Cod Bay of considerable significance, even if only under episodic conditions.
Raptors and Other Predatory Birds
Several species of migratory raptors regularly follow the Massachusetts coastline. These primarily include Northern Harrier, Sharp-shinned Hawk, Osprey, Bald Eagle, and falcons of three species. The Northern Harrier is listed as a threatened species in Massachusetts due to a loss of appropriate nesting habitat; however, the explanation for the precipitous decline in American Kestrel numbers is currently unclear. Other predators, such as owls, may hunt in or migrate through the planning area. The Habitat Work Group identified that there currently are insufficient data to map flyways or staging areas for raptors and owls that use the planning area (EEA 2008a).
Species with Special Protection
Sixteen species of protected birds use coastal habitats in Massachusetts for at least part of their life cycle (Table 4.4). In particular, significant numbers of federally listed species, including Roseate and Least Terns and Piping Plovers, nest on beaches and small islands within Massachusetts coastal areas. The breeding habitats of these species have special protection under state and federal laws. In particular, no habitat alterations that result in a “take” (i.e., killing, maiming, or harassment) of these species are allowed. In addition to these habitats that are protected by state and federal regulations, there has been an effort to identify and conserve areas that provide habitat of significance to avifauna in Massachusetts. The Important Bird Area Program, a national effort coordinated in Massachusetts by Mass Audubon, lists 28 coastal sites in Massachusetts as IBAs for their value as feeding, nesting, and migration locations. Mass Audubon is currently cooperating with other interested parties to develop conservation plans for future habitat management in designated sites.
BA-48

Table 4.4 Bird species with special state or federal protection that use the Massachusetts ocean management planning area
Common name Species Name Planning Area
Use State Listing
*Federal Listing
Common Loon Gavia immer M, F Special Concern Pied-billed Grebe Podilymbus podiceps M, F Endangered Leach’s Storm-Petrel Oceanodroma leucorhoa M, F, N Endangered Piping Plover Charadrius melodus M Threatened* Upland Sandpiper Bartramia longicauda M Endangered Roseate Tern Sterna dougallii M, F, N Endangered* Common Tern Sterna hirundo N, M, F Special Concern Arctic Tern Sterna paradisaea M, F Special Concern Least Tern Sterna antillarum M, F Special Concern Golden-winged Warbler Vermivora chrysoptera M Endangered Northern Parula Parula americana M Threatened Blackpoll Warbler Dendroica striata M Special Concern Mourning Warbler Oporornis philadelphia M Special Concern Vesper Sparrow Pooecetes gramineus M Threatened Grasshopper Sparrow Ammodramus savannarum M Threatened Henslow’s Sparrow Ammodramus henslowii M Endangered N = Nesting, M = Migration, F = Foraging
MARINE MAMMALS AND REPTILES
Massachusetts waters provide excellent feeding and nursery habitat for a variety of marine mammals and reptiles (CETAP 1982). All of these species are either protected under the Marine Mammal Protection Act (MMPA) or listed as threatened or endangered under the Endangered Species Act (ESA). Many are also listed under the Massachusetts Endangered Species Act (MESA) (Table 4.5).
Between systematic survey effort and whale-watching reports, a great deal of information is available on many species. However, nearly all data suffers from the lack of survey effort (and consequent lack of data) on the distribution and abundance of marine mammals in some months, and there is very little survey effort for examining the spatial distribution of sea turtles.
BA-49

Table 4.5 Marine mammal and reptile species found in the Massachusetts ocean management planning area
Common name Species name Federal State Use of Planning Area
Right whale Eubalaena glacialis MMPA, ESA MESA Seasonal feeding, nursery, common February-May, occasional year round
Humpback whale Megaptera novaeangliae MMPA, ESA MESA Seasonal feeding, nursery, common May-October, rare in the winter
Fin whale Balaenoptera physalus MMPA, ESA MESA Seasonal feeding, nursery, year round, more abundant in summer
Minke whale Balaenoptera acutorostrata
MMPA none Seasonal feeding, not well studied
Harbor porpoise Phocoena phocoena MMPA none Seasonal feeding, present November-June
Atlantic white-sided dolphin
Lagenorhyncus acutus MMPA none Seasonal feeding, nursery, usually present spring and fall
Gray seal Halichoerus grypus MMPA none Year-round feeding, pupping Harbor seal Phoca vitulina MMPA none Seasonal feeding Loggerhead sea turtle
Caretta caretta ESA MESA Seasonal feeding
Green sea turtle Chelonia mydas ESA MESA Seasonal feeding Hawksbill sea turtle Eretmochelys imbricata ESA MESA Seasonal feeding Kemp’s Ridley sea turtle
Lepidochelys kempii ESA MESA Seasonal feeding, frequent winter stranding and cold stun mortality
Leatherback sea turtle
Dermochelys coriacea ESA MESA Seasonal feeding, summer entanglements in fishing gear
MMPA: Marine Mammal Protection Act; ESA: Endangered Species Act; MESA: Massachusetts Endangered Species Act
The endangered North Atlantic right whale, the official state mammal of Massachusetts, is common in state waters around Cape Cod Bay from February through early May (Figure 4.8), although sightings have occurred nearly year-round (Hamilton and Mayo 1990; Nichols, et al. 2008). The population numbers approximately 400 whales, and its status is uncertain due to significant anthropogenic threats to its survival (Fujiwara and Caswell 2001; Kraus et al. 2005; Kraus and Rolland 2007). MarineFisheries collaborates with the National Oceanographic and Atmospheric Administration (NOAA) National Marine Fisheries Service (NMFS), the Provincetown Center for Coastal Studies, Cornell University, and the Woods Hole Oceanographic Institution (WHOI) to run a program dedicated to tracking the right whale population from January through May, when the right whale feeds on abundant zooplankton in Cape Cod Bay. Between 20% and half of the population visits Cape Cod Bay annually (Hamilton and Mayo 1990; Nichols et al. 2008). Because Cape Cod Bay is an important aggregation and feeding area for this highly endangered population, almost the entire bay is federally designated as Right Whale Critical Habitat under the Endangered Species Act. Recently, acoustic monitoring buoys were deployed to better examine the spatial
BA-50

and temporal distribution of right whales throughout Cape Cod and Massachusetts Bays. These buoy systems provide real-time information about the presence of right whales, and is being used for population research and to minimize the incidence of vessel strikes.10
Other baleen whales, including fin (Figure 4.9), minke, and humpback whales (Figure 4.10), visit Massachusetts and adjacent waters in large numbers from April to October to feed on small schooling fish (CETAP 1982; Goddale, et al. 1982; Hain et al. 1982). Humpback whales show significant site fidelity, and the same individuals will return to the same Massachusetts waters year after year (Clapham et al. 1993). The North Atlantic population of humpback whales numbers around 11,000 and growing, but the Gulf of Maine feeding stock numbers only around 900 individuals (NMFS 2007). Estimates for finback and minke whales are out-of-date, and population trends are not known. While the food resources are mainly aggregated in federal waters around Stellwagen Bank and the Great South Channel, the whales do spend time feeding in Massachusetts waters, including Cape Cod Bay and Massachusetts Bay, and occasionally off of Gloucester. The Race Point area off Provincetown is an important large whale feeding area from late April through October. Fin, humpback, and right whales are all at risk from entanglements in fishing gear and vessel collision.
Many other seal, dolphin, and whale species depend on habitat in Massachusetts waters for all or part of their life cycles. For instance, gray seals are year-found residents in Massachusetts and have established colonies on Monomoy and Muskeget Islands, where they pup in the winter.
Five marine sea turtle species are found seasonally in Massachusetts waters, including the loggerhead, Kemp’s Ridley, leatherback, green, and hawksbill sea turtles. These species have ranges that cover the entire Atlantic Ocean basin and little is known about how they use Massachusetts waters. All five species are listed as either endangered or threatened under the ESA. The most abundant reptile is the leatherback sea turtle, which can grow to 2 meters (6 feet) in length. The leatherback feeds on jellyfish and other gelatinous zooplankton in areas including Nantucket Sound, Cape Cod Bay, and Buzzards Bay. In Cape Cod Bay, Nantucket Sound, and Vineyard Sound, researchers from the University of New Hampshire and Woods Hole Oceanographic Institution have been studying the movements and prey abundance of leatherback sea turtles. Information about distribution and habitat use of sea turtles within Massachusetts remains a key data gap.
The planning area plays a crucial role in the survival and health of a wide range of marine mammal and sea turtle species. The areas that these animals use for feeding, breeding, nursing, and socializing can be very widely separated, and vary both seasonally and annually. The range of many of these animals is much broader than the planning area, so one can consider individual offshore banks or basins and bays and sounds as neighborhoods within a human
10 http://www.listenforwhales.org/.
BA-51

city. The “neighborhoods” are relatively spatially explicit and whales can aggregate within these areas in large numbers for days or weeks at a time. However, marine mammals are difficult to track, and there are important gaps in understanding their distribution. Almost nothing is known about the relative value of the habitats that they utilize (i.e., which neighborhood they can’t live without), and what their adaptation strategies are in the face of habitat alteration and/or loss. Defining habitat requirements for these mobile species will be a scientific challenge for managers. Within the planning area, interactions such as entanglement in fishing gear, vessel strikes, and increasing ocean noise pose threats to these species.
INVASIVES
Invasive species are defined as non-native or cryptogenic (species with unresolved origins) species that are introduced by humans to a new location and cause harm to the ecosystem or economic resources of the area that they invade. Invasions can lead to negative impacts on native species from competition for food and/or habitat, physical overgrowth or smothering, spread of associated pathogens (or being a pathogen in itself), preying on native species, and habitat degradation. All of these factors individually or in combination may lead to a decline in the survival and population numbers of native organisms. The invading species may also foul structures, reduce navigation and recreational access, and appear unsightly. These additional side effects of invasive species can lead to negative impacts from loss of aesthetic, recreation, and resource values.
Most of the information known about invasive species presence in Massachusetts is reported through monitoring surveys of the low intertidal to shallow subtidal zone (Adrienne Pappal, personal communication; Pederson et al. 2005). We do not know as much about invasive species composition within the planning area specifically, but given the life history characteristics and aggressive nature of marine invasives, it is reasonable to assume that the majority of these species could inhabit or impact the planning area. Table 4.6 lists marine introduced species known to be present in Massachusetts. The table does not include cryptogenic species or species with only a general habitat range that includes Massachusetts. Given a lack of information about species origins and limited monitoring of all marine habitats of Massachusetts, the number of introduced species could number into the hundreds (Carlton 2003).
The majority of marine introduced species listed in Table 4.6 are native to Europe or Asia (Carlton 2003). The high number of European species present in Massachusetts reflects the well-traveled shipping routes between the east coast of the United States and southern England, while Asian species may be the result of secondary introductions from established populations in Europe (Pederson et al. 2005). This highlights the importance of shipping as a vector for marine invasive species transport in Massachusetts and elsewhere (Ruiz et al. 2000). Other possible introduction mechanisms include escapes and releases from the
BA-52

aquaculture and fisheries industry, the pet trade, intentional introductions for food sources, research, and educational supplies.
Table 4.6 Marine introduced species in intertidal and subtidal waters of Massachusetts
Taxonomic Species NSOS SEOS MB CCBOS CCOS CIOS Data Source Protista
Haplosporidium neloni (MSX oyster disease)
Hickey per. com. 2001
Chlorophycea Codium fragile ssp. tomentosoide (green fleece)
Pappal per. com. 2008; Pederson et al. 2005
Phodophyceae Grateloupia turuturu (red algae) Neosiphonia harveyi (red algae) Porphyra yezoensis f.yezoensis (nori, red alga) Porphyra katadae (nori, red algae)
Mathieson et al. 2008b Pederson et al.2005 Mathieson et al.2008a Mathieson et al.2008a
Porifera Halichondria howerhanki (sponge)
Pederson et al.2005
Nematoda Anguillicola crassus (eel nematode)
Aieta per. com. 2008
Cnidaria Diadumene lineate (orange striped anemone)
Sagartia elegancs (purple anemone)
Pappal per. com. 2008; Pederson et al. 2005 Pederson et al. 2005
Polychaeta Janua pagenstecheri (spirorbid worm)
Pederson et al. 2005
Mollusca Littorina littorea (common periwinkle) Ostrea edulis (flat oyster) Tritonia pleheia (sea slug)
Pappal per. com. 2008; Pederson et al. 2005 Pappal per. com. 2008; Pederson et al. 2005 Allmon and Sebens 1998
Arthropoda Laniropsis sp. (isopod) Caprella mutica (skeleton shrimp) Microdentopus gryllotalpa (amphipod) Carcinus maenus (green crab) Hemigrapsus sanguineus (Asian shore crab)
Pederson et al. 2005 Pederson et al. 2005 Pederson et al. 2005 Pappal per. com. 2008; Pederson et al. 2005 Delaney et al. 2008; Pappal per. com. 2008; Pederson et al. 2005
Bryozoa Alcyonidium sp. (bryozoans) Bagula neritima (purple bryozoan) Membranipora membranacea (lacy crust)
Pappal per. com. 2008 Pappal per. com. 2008; Pederson et al. 2005 Pappal per. com. 2008; Pederson et al. 2005
Tunicata Ascidiella aspersa (European sea aquirt) Botrylloides violaceus (sheath tunicate) Botryllus scholleri (star tunicate) Didemnum vexillum (mystery tunicate) Ciplosoma listerianum (compound tunicate) Styela canopus (rough tunicate) Styela clava (club tunicate)
Pappal per. com. 2008; Pederson et al. 2005 Pappal per. com. 2008; Pederson et al. 2005 Pappal per. com. 2008; Pederson et al. 2005 Pappal per. com. 2008; Pederson et al. 2005 Pappal per. com. 2008; Pederson et al. 2005 Pederson et al. 2005 Pappal per. com. 2008; Pederson et al. 2005
Locations: NSOS = North Shore Ocean Sanctuary, SEOS = South Essex Ocean Sanctuary, MB = Massachusetts Bay, CCBOS = Cape Cod Bay Ocean Sanctuary, CCOS = Cape Cod Ocean Sanctuary, CIOS = Cape Cod and Islands Ocean Sanctuary.
BA-53
Although many of the species listed in Table 4.6 have the potential to negatively impact ecosystems and economic resources of the planningrea, there are a few of particular concern:
• Didemnum vexillum (mystery tunicate) - D. vexillum is one of seven introduced tunicates present in Massachusetts. First discovered in the Gulf of Maine in 1988, it has since rapidly colonized both nearshore and subtidal habitats, including Stellwagen Bank, Tillies Bank, and portions of Georges Bank, potentially smothering critical habitat and competing with native species (Bullard et al. 2007). This species is abundant on the North Shore on both man-made and natural structures, at marinas in Buzzards Bay, on outer Cape Cod, in tidepools of Cape Cod Bay, and in the South Essex Ocean Sanctuary portion of the planning area (Adrienne Pappal, personal communication). In addition, there have been recent reports of D. vexillum colonizing eelgrass in areas around Martha’s Vineyard (Mary Carman, personal communication). This species has no known predators and currently there are no means to control its spread. Like many other species, D. vexillum can reproduce and spread from fragments (Bullard et al. 2007). Thus any activity within or outside the planning area that can fragment D. vexillum (trawls, dredges, power-washing) will facilitate its spread.
• Codium fragile ssp. tomentosoides (green fleece) - The green algae C. fragile ssp. tomentosoides was first documented in the Gulf of Maine in 1964 (Harris and Mathieson 1999). A native of Asia, C. fragile can be found in marinas, rocky intertidal, and subtidal habitats across Massachusetts. This species can colonize disturbed areas and displace native seaweeds, leading to a decrease in habitat function and impacts on economically important species of fish, sea urchins, and lobsters (Harris and Mathieson 1999; Scheibling 2001; Scheibling and Gagnon 2006). Once established, C. fragile becomes the dominant canopy species and prevents re-colonization by native species (Scheibling and Gagnon 2006). Similarly to D. vexillum, C. fragile can reproduce by fragmentation (Bégin and Scheibling 2003).
• Membranipora membranacea (lacy crust bryozoan) - A native of Europe, M. membranacea was first discovered in the Gulf of Maine in the late 1980s, most likely the result of a ballast water introduction due to long-lived planktonic larvae (Berman et al. 1992; Yoshioka 1982). M. membranacea colonizes and overgrows native kelp species, weakens the blades, and eventually leads to a decrease in density and size of kelp beds due to blade breakage (Lambert et al. 1992). Kelp beds are a critical habitat for native species such as juvenile cod (Gadus morhua), green sea urchin (Strongylocentrotus droebochiensis), and other invertebrates (Scheibling 2001). The reduction of kelp beds by M. membranacea not only reduces the amount of habitat available to native species, but also may facilitate colonization of the area by another invader, the green algae Codium fragile ssp. tomentosoides (Scheibling and Gagnon 2006), further decreasing habitat value.
BA-54

The Massachusetts Aquatic Invasive Species (AIS) Working Group (the AIS Working Group) is a collaborative of state agencies, federal agencies, and non-profits tasked with “implementing a coordinated approach to minimize the ecological and socio-economic impacts of Aquatic Invasive Species in the marine and freshwater environments of Massachusetts” (MCZM 2002). To meet these goals, the Massachusetts Aquatic Invasive Species Management Plan (the Management Plan) was developed to coordinate AIS management, prevention, monitoring, and control efforts across the Commonwealth. The Management Plan has become the primary guidance document for aquatic invasive species activities across Massachusetts and was approved by the Federal Aquatic Nuisance Species Task Force in 2002.
Recognizing that early detection is a critical tool in the battle against marine invasive species, the AIS Working Group included a task in the Management Plan to develop a regional Early Detection Network for marine invasive species, and in 2006 the Marine Invader Monitoring and Information Collaborative (MIMIC) was established. The collaborative is a partnership between agency staff, scientific experts, volunteers, and non-profits to monitor marine invasive species at over 50 sites across New England. MIMIC and other monitoring programs, such as the Rapid Assessment Survey (Pederson et al. 2005), provide critical information about the distribution of marine invasive species. However, additional monitoring within the planning area will be critical to further understand the presence and impacts of marine invasive species to the ecosystem and economic resources of Massachusetts.
MAN-MADE HABITAT, MITIGATION, AND RESTORATION
In Massachusetts, the construction of new, or the restoration of existing, marine habitat falls under the purview of MarineFisheries. The creation of new habitat (e.g., the installation of large, three-dimensional structures) may be for the purpose of increasing recreational fishing opportunities for species that are associated with hard structures, such as boulders and ledges, or it may be to replace, in-kind, habitat that was lost due to the construction of a marine project (e.g., pipelaying, pier construction, or channel widening). Restoration of existing habitats is usually undertaken as the result of compensatory mitigation for planned or unplanned impacts resulting from ocean activities. Examples of the three major classes of habitat creation and restoration projects are provided below.
Shellfish
There are several programs in state waters that involve shellfish seeding or movement for impact avoidance or depuration. The MarineFisheries Shellfish Stock Enhancement program is the only program that is set up to specifically restore impacted populations of shellfish. This program was created in 2003 under the HubLine gas pipeline mitigation efforts. The program goal is to restore and enhance existing populations of soft shell clams in Boston
BA-55

Harbor communities. Seeding projects are currently underway in five communities (Winthrop, Quincy, Weymouth, Hingham, and Hull). Other restoration projects with shellfish components include the construction of terraced concrete structures deployed as an artificial reef near Sculpin Ledge in Boston Harbor. The terrace design was intended to give hard bottom substrate for blue mussels (Mytilus edulis) as partial mitigation for impacts to blue mussel habitat filled during the capping of the Spectacle Island landfill. Another program designed to restore a shellfish resource is an oyster reef that the Town of Wellfleet, The Nature Conservancy, and the Audubon Society will be constructing in Wellfleet Harbor. All of these projects are outside of the planning area.
Artificial Reefs
Massachusetts defines an artificial reef as an area within the marine waters of the Commonwealth in which approved structures have intentionally been placed or constructed for the purpose of enhancing benthic relief. Structures may be designed to provide and/or improve opportunities for recreational and commercial fishing, aid in the management or enrichment of fishery resources and ecosystem services, or achieve a combination of these objectives. Because of the presence of existing hard bottom and patch habitats or because of existing uses, site selection has been identified as the critical issue for artificial reef development in Massachusetts (Barber et al. in press). However, with appropriate siting, several benefits of artificial reef development have been identified (e.g., a tool for mitigating habitat loss, increasing biodiversity through the use of more complex structure, and increasing commercial and recreational fishing opportunities) (Rousseau 2008).
Two artificial reefs have been used in Massachusetts since 1999 for mitigating cumulative environmental impacts resulting in the loss of fisheries habitat. The Sculpin Ledge reef was constructed in 1999 in Boston Harbor by the Massachusetts Bay Transit Authority (MBTA) to provide blue mussel (Mytilus edulis) and American lobster (Homarus americanus) habitat. In 2006, MarineFisheries constructed an artificial reef east of Lovell Island designed to target the habitat requirements of different life history stages of invertebrate and finfish species. At this reef, efforts to monitor the length of time it takes for an artificial reef to mimic the species abundance and diversity seen on nearby natural reefs is a primary research goal. Currently (2009), there is an artificial reef project proposed to mitigate for potential habitat loss resulting from a beach nourishment project on Nantucket and an artificial oyster reef proposed along the coast of Wellfleet.
Prior to 1999, artificial reef development consisted of efforts to increase recreational angling opportunities by deploying materials that provided vertical relief in featureless areas. The Yarmouth tire reef was deployed in 1978 and was designed to provide desirable habitat for finfish and lobsters in a relatively featureless area of Nantucket Sound. The Dartmouth artificial reef was deployed in 1998, and was designed to enhance recreational angling opportunities in Buzzards Bay. This reef, constructed of prefabricated concrete reef balls,
BA-56

was supported by state funds and implemented at the urging of local and state officials. Three of the four artificial reef sites are inside of the planning area. Artificial reefs are mapped in Figure 3 of the report of the Work Group on Transportation, Navigation, and Infrastructure (EEA 2008). These areas cannot be moved, and in many cases, allowing other activities in their locations would be hazardous (EEA 2008).
Eelgrass
Eelgrass (Zostera marina) beds were once a dominant subtidal feature in the coastal embayments of Massachusetts. A combination of habitat degradation and disease has hastened their decline over the past century (Orth et al. 2006). Because this important habitat continues to be threatened by anthropogenic impacts, efforts are made in the environmental permitting process to avoid, minimize, and mitigate for any proposed development related impacts to eelgrass habitat. Eelgrass mitigation attempts to off-set acreage lost due to dredge and fill projects by transplanting donor plants into a selected restoration site. In the Northeast United States efforts began to restore eelgrass in the late 1970s, but it wasn’t until the 1990s and 2000s that transplant success increased as transplant methods, site selection models, and success criteria were developed and refined (Short et al. 2002). In Massachusetts, several “test-plot” size restoration efforts of less than 0.03 acres have been attempted with varying degrees of success over the past decade, including sites on Martha’s Vineyard, Boston Harbor, and the Annisquam River. Successful, full-scale restoration and/or mitigation projects include sites in Boston Harbor, New Bedford, and Gloucester. The MarineFisheries Boston Harbor eelgrass restoration project is the largest successful restoration to date in Massachusetts, totaling greater than two hectares (five acres) of expanding eelgrass beds at four sites along Long Island and Peddocks Island in Boston Outer Harbor (Leschen et al. in preparation). The MarineFisheries effort was completed in 2007 as partial mitigation for impacts from the Hubline pipeline construction. In New Bedford, a NOAA-funded eelgrass habitat restoration project included sites in outer New Bedford Harbor and Clark’s Cove, totaling 1.6 hectares (four acres) at five sites. All eelgrass restoration sites are outside of the planning area.
REFERENCES
Aeita, A.E. and K.O. Oliveira. 2009. Distribution, prevalence, and intensity of the swim bladder parasite Anguillicola crassus in New England and eastern Canada. Diseases of Aquatic Organisms 84: 229-235.
Allmon, R.A. and K.P. Sebens. 1988. Feeding biology and ecological impact of an introduced nudibranch, Tritonia plebeia, New England, USA. Marine Biology 99: 375-385.
Altman, S. and R.B. Whitlatch. 2007. Effects of small-scale disturbance on invasion success in marine communities. Journal of Experimental Marine Biology and Ecology 342: 15-29.
BA-57
Anderson, D.M., P.S. Libby, D. Borkman, R. He, and D.J. McGillicuddy. 2007. 2005 New England red tide bloom of Alexandrium fundyense. Boston: Massachusetts Water Resources Authority. Report 2007-10.
Auster, P.J. and R.W. Langton. 1999. The effects of fishing on fish habitat. In L.R. Benaka (ed.), Fish Habitat: Essential Fish Habitat and Rehabilitation, American Fisheries Society, Symposium 22, Bethesda, MD.
Auster, P.J., R.J. Malatesta, and C.L.S. Donaldson. 1997. Distributional responses to smallscale habitat variability by early juvenile silver hake, Merluccius bilinearis. Env. Biol. Fish. 50: 195-200.
Auster, P.J., R.J. Malatesta, R.W. Langton, L. Watling, P.C. Valentine, C.L.S. Donaldson, E.W. Langton, A.N. Shepard, and I.G. Babb. 1996. The impacts of mobile fishing gear on seafloor habitats in the Gulf of Maine (Northwest Atlantic): implications for conservation of fish populations. Rev. Fish. Sci. 4(2):185-202.
Auster, P.J., R.J. Malatesta, and S.C. LaRosa. 1995. Patterns of microhabitat utilization by mobile megafauna on the southern New England (USA) continental shelf and slope. Mar. Ecol. Prog. Ser. 127:77-85.
Barber J.S., D.M. Chosid, R.P. Glenn, and K.A. Whitmore. In press. A systematic model for artificial reef site selection. New Zealand Journal of Marine and Freshwater Research.
Barrett, S.B., B.C. Graves, and B. Blumeris. 2006. The Mount Hope Bay Tidal Restriction Atlas: Identifying Man-made Structures which Potentially Degrade Coastal Habitats in Mount Hope Bay, Massachusetts. Northeastern Naturalist 13(4): 31-46.
Begin, C. and R.E. Scheibling. 2003. Growth and survival of the invasive green alga Codium fragile ssp. tomentosoides in tide pools on a rocky shore in Nova Scotia. Botanica Marina 46(5): 404-412.
Berman, J., L. Harris, W. Lambert, M. Buttrick, and M. Dufresne. 1992. Recent invasions of the Gulf of Maine: Three contrasting ecological histories. Conservation Biology 6: 435-441.
Biles, C.L., M. Solan, I. Isaksson, D.M. Paterson, C. Emes, and D.G. Raffaelli. 2003. Flow modifies the effect of biodiversity on ecosystem functioning: an in situ study of estuarine sediments. Journal of Experimental Marine Biology and Ecology. 285: 167-177.
Bourne, D.W. 1987. Zoology and Secondary Production. pp 252-255 in: “Georges Bank” (R.H. Backus and D.W. Bourne, eds.). MIT Press. http://www.at-sea.org/missions/maineevent/docs/copprimer.html. Accessed 11/19/08.
BA-58

Bullard, S.G., G. Lambert, M.R. Carman, J. Byrnes, R.B. Whitlatch, G. Ruiz, R.J. Miller, L. Harris, P.C. Valentine, J.S. Collie, J. Pederson, D.C. McNaught, A.N. Cohen, R.G. Asch, J. Dijkstra, and K. Heinonen. 2007. The colonial ascidian Didemnum sp. A: Current distribution, basic biology and potential threat to marine communities of the northeast and west coasts of North America. Journal of Experimental Marine Biology and Ecology 342: 99-108.
Carlton, J.T. 2003. A checklist of the introduced and cryptogenic marine and estuarine organisms from Nova Scotia to Long Island Sound. 2nd Edition. Williams College–Mystic Seaport, Maritime Studies Program. Mystic, CT.
Carman, M. 2008. Personal communication. Woods Hole Oceanographic Institute.
Cetacean and Turtle Assessment Program (CETAP) 1982. A characterization of marine mammals and turtles in the mid- and north-Atlantic areas of the U.S. outer continental shelf. University of Rhode Island.
Clapham, P.J., L.S., Baraff, C.A. Carlson, M.A. Christian, D.K. Mattila, C.A. Mayo, M.A. Murphy, and S. Pittman. 1993. Seasonal occurrence and annual return of humpback whales, Megaptera novaeangliae, in the southern Gulf of Maine. Canadian Journal of Zoology 71: 440-443.
Cohen, A.N. and J.T. Carlton. 1993. Accelerating invasion rate in a highly invaded estuary. Science 279(23): 555-558.
Commonwealth of Massachusetts. 2004. Estuarine and marine habitat. Massachusetts Ocean Management Task Force Technical Report.
Costa, J. 2003. Historical changes of eelgrass in Buzzards Bay. Buzzards Bay National Estuary Program. Wareham, MA. http://www.buzzardsbay.org/eelgrass-historical.htm. Accessed 11/21/08.
Cracknell, A.P., S.K. Newcombe, A.F. Black, and N.E. Kirby. 2001. The ABDMAP (Algal Bloom Detection, Monitoring and Prediction) Concerted Action. International Journal of Remote Sensing 22: 205-247.
Delaney D.G., C.D. Sperling, C.S. Adams, and B. Leung. 2008. Marine invasive species: validation of citizen science and implications for national monitoring networks. Biological Invasions 10(1): 117-128.
DeLong, E.F., C.M. Preston, T. Mincer, V. Rich, S.J. Hallam, N. Frigaard, A. Martinez, M.B. Sullivan, R. Edwards, B.R. Brito, S.W. Chisholm, and D.M. Karl. 2006. Community
BA-59

genomics among stratified microbial assemblages in the ocean’s interior. Science 311(5760): 496–503.
Diaz, R.J. and R. Rosenberg. 1995. Marine benthic hypoxia: A review of its ecological effects and the behavioral responses of benthic macrofauna. Oceanography and marine biology. An annual review. 33: 245-03.
Didham, R.K., R.M. Tylianakis, N.J. Gemmell, T.A. Rand, and R.M. Ewers. 2007. Interactive effects of habitat modification and species invasion on native species decline. Trends in Ecology and Evolution 22(9): 489-496.
Donovan, A. and M. Tyrrell. 2004. From dune to shining sea: The coastal and marine habitats of Massachusetts. http://www.mass.gov/czm/coastlines/2004-2005/habitat/lead_hab.htm. Accessed 11/21/08.
Duarte, C.M. 1995. Submerged aquatic vegetation in relation to different nutrient regimes. Ophelia 4: 87-112.
Evans, N.T. and F.T. Short. 2002. Functional Trajectory Models for Assessment of Transplanted Eelgrass, Zostera marina L., in the Great Bay Estuary, New Hampshire. Estuaries 28(6): 936-947.
Executive Office of Energy and Environmental Affairs (EEA). 2008a. Habitat Work Group Report. http://www.mass.gov/Eoeea/docs/eea/oceans/112608_oceanhabitat_wkgp_draft.pdf. Accessed 1/22/09.
Executive Office of Energy and Environmental Affairs (EEA). 2008b. Report of the Work Group on Transportation, Navigation, and Infrastructure. http://www.mass.gov/Eoeea/docs/eea/oceans/112108_navworkgroupreport.pdf. Accessed 1/8/09.
Fujiwara, M. and H. Caswell. 2001. Demography of the endangered North Atlantic right whale. Nature 414: 537-541.
Goodale, D.R. 1982. The temporal and geographical distribution of humpback, finback and right whale calves. In H.E. Winn (ed.) A characterization of marine mammals and turtles in the mid- and North Atlantic areas of the US outer continental shelf, annual report for 1980. Appendix C. pp. 1-68. Report to the U.S. Department of the Interior.
BA-60

Hain, J.H., G.R. Carter, S.D. Kraus, C.A. Mayo, and H.E. Winn. 1982. Feeding behavior of the humpback whale, Megaptera novaeangliae, in the western North Atlantic. Fishery Bulletin 80: 259-268.
Hamilton, P.K. and C.A. Mayo. 1990. Population characteristics of right whales (Eubalaena glacialis) observed in Cape Cod and Massachusetts Bays, 1978-1986. pp. 203-208. In Hammond, P.S., S.A. Mizroch, and G.P. Donovan (eds.). Individual Recognition of Cetaceans. Rept. of the Int. Whal. Commn. Special Issue No. 12.
Harris, L.G. and A.C. Mathieson. 1999. Patterns of range expansion, niche shift and predator acquisition in Codium fragile ssp. tomentosoides and Membranipora membranacea in the Gulf of Maine. In Judith Pederson (Ed.), Marine Bioinvasions: Proceedings of the First National Conference January 24-27, 1999. MIT Sea Grant College Program, Cambridge, MA, pp. 46-56.
Harris, B. and J. Spendelow. 2008. Unpublished data. Mass Audubon.
Heck, K.L., Jr., K.W. Able, M.P. Fahay, and C.T. Roman. 1989. Fishes and decapod crustaceans of Cape Cod eelgrass meadows: Species composition, seasonal abundance patterns and comparison with unvegetated substrates. Estuaries 12: 59-65.
Hughes, J.E., L.A. Deegan, J.C. Wyda, M.J. Weaver, and A. Wright. 2002. The effects of eelgrass habitat loss on estuarine fish communities of southern New England. Estuaries 25: 235-249.
Jiang, M., M.W. Brown, J.T. Turner, R.D. Kenney, C.A. Mayo, Z. Zhang, and M. Zhou. 2007. Springtime transport and retention of Calanus finmarchicus in Massachusetts and Cape Cod Bays, USA, and implications for right whale foraging. Marine Ecology Progress Series 349: 183-197.
Kraus, S.D. M.W. Brown, H. Caswell, C.W. Clark, M. Fujiwara, P.K. Hamilton, R.D. Kenney, A.R. Knowlton, S. Landry, C.A. Mayo, W.A. McLellan, M.J. Moore, D.P. Nowacek, D.A. Pabst, A.J. Read, and R.M. Rolland. 2005. North Atlantic Right Whales in Crisis. Science 309: 561-562.
Kraus, S.D. and R. M. Rolland (Eds.) 2007. The Urban Whale: North Atlantic Right Whales at the Crossroads. Harvard University Press. Cambridge, Massachusetts.
Lambert, W., P. Levin, and J. Berman. 1992. Changes in the structure of a New England (USA) kelp bed: the effects of an introduced species? Marine Ecology Progress Series 88: 303-307.
BA-61
Langton, R.W., P.J. Auster, and D.C. Schneider. 1995. A spatial and temporal perspective on research and management of groundfish in the northwest Atlantic. Rev. Fish. Sci. 3: 201-229.
Lazarri, M.A. and B. Tupper. 2002. Importance of shallow water habitats of demersal fishes and decapod crustaceans in Penobscot Bay, Maine. Environmental Biology of Fishes 63: 57-66.
Leschen, A., R.K. Kessler, and B.T. Estrella. In review. Successful eelgrass (Zostera marina) restoration in a formerly eutrophic estuary (Boston Harbor): Limitations, lessons learned and implications for future restoration.
Libby, P.S., D. Borkman, W.R. Geyer, A.A. Keller, A.D. Mansfield, J.T. Turner, D. Anderson, C.A Oviatt, and K. Hyde. 2007. Water column monitoring in Massachusetts Bay: 1992-2006. Boston: Massachusetts Water Resources Authority. Report 2007-11.
Macfarlane, S.L., J. Early, T. Henson, T. Balog, and A. Mcclennen. 2000. A resource-based methodology to assess dock and pier impacts on Pleasant Bay, Massachusetts. Journal of Shellfish Research. 19(1): 455-464.
Maciolek, N.J., S.A. Doner, D.T. Dahlen, R.J. Diaz, B. Hecker, C. Hunt, and W.K. Smith. 2008. Outfall benthic monitoring interpretive report: 1992–2007 results. Boston: Massachusetts Water Resources Authority. Report 2008-20.
Massachusetts Department of Environmental Protection (MassDEP). 2008. Eelgrass interactive map. http://www.mass.gov/dep/water/resources/maps/eelgrass/eelgrass.htm. Accessed 1/3/09.
Massachusetts Division of Marine Fisheries (MA DMF). 2008. Management Information Systems & Fisheries Statistics Program. http://www.mass.gov/dfwele/dmf/programsandprojects/statinfo.htm#st. Accessed 5/29/09.
Massachusetts Office of Coastal Zone Management (MCZM). 2002. Massachusetts Aquatic Invasive Species Management Plan, Massachusetts Aquatic Invasive Species Group. http://www.mass.gov/czm/invasives/docs/invasive_species_plan.pdf. Accessed 5/29/09.
Massachusetts Office of Coastal Zone Management (MCZM). 2004. Estuarine and marine habitat. Massachusetts Ocean Management Task Force Technical Report. http://www.mass.gov/czm/oceanmanagement/waves_of_change/pdf/wavesofchange.pdf. Accessed 5/29/09.
BA-62

Mathieson, A.C., J.R. Pederson, C.D. Neefus, C.J. Dawes, and T.L. Bray. 2008a. Multiple assessments of introduced seaweeds in the Northwest Atlantic. ICES Journal of Marine Science 65: 730-741.
Mathieson, A.C., C.J. Dawes, J. Pederson, R.A. Gladych, and J.T. Carlton. 2008b. The Asian red seaweed Grateloupia turuturu (Rhodophyta) invades the Gulf of Maine. Biological Invasions 10(7): 985-988.
National Research Council (NRC). 2002. Effects of Trawling and Dredging on Seafloor Habitat Committee on Ecosystem Effects of Fishing: Phase 1—Effects of Bottom Trawling on Seafloor Habitats. Ocean Studies Board, Division on Earth and Life Studies, National Academy Press, Washington, D.C.
Nichols, O.C., R.D. Kenney, and M.W. Brown. 2008 Spatial and temporal distribution of North Atlantic right whales (Eubalaena glacialis) in Cape Cod Bay, and implications for management. Fish. Bull. 108: 270-280.
National Oceanographic and Atmospheric Administration (NOAA) National Marine Fisheries Service (NMFS). 2007. Humpback Whale (Megaptera novaeangliae): Gulf of Maine Stock. Stock Assessment. http://www.nmfs.noaa.gov/pr/pdfs/sars/ao2007whhb-gme.pdf. Accessed 04/09.
NOAA Northeast Fisheries Science Center. 2008. Assessment of 19 Northeast Groundfish Stocks through 2007: Report of the 3rd Groundfish Assessment Review Meeting (GARM III), Northeast Fisheries Science Center, Woods Hole, Massachusetts, August 4-8, 2008. U.S. Department of Commerce, NOAA Fisheries, Northeast Fisheries Science Center Reference Document 08-15. http://www.nefsc.noaa.gov/nefsc/publications/crd/crd0815/. Accessed 04/09.
NOAA. 2009. Fisheries of the Northeastern United States; Northeast Multispecies Fishery; Secretarial Interim Action. http://www.nero.noaa.gov/nero/regs/frdoc/09/0648-AW87-4.pdf. Accessed 04/09.
Orth, R. J., T.J.B. Carruthers, W.C. Dennison, C.M. Duarte, J.W. Fourqurean, K.L. Heck, A.R. Hughes, G.A. Kendrick, W. J. Kenworthy, S. Olyarnik, F.T. Short, M. Waycott, and S.L. Williams. 2006. A global crisis for seagrass ecosystems. Bioscience 56(12): 987-996.
Pappal, A. 2008. Massachusetts Coastal Zone Management. Personal Communication.
Park, S.R., J.H. Kim, C.K. Kang, S. An, I.K. Chung, J.H. Kim, and K.S. Lee. 2009. Current status and ecological roles of Zostera marina after recovery from large-scale reclamation in
BA-63

the Nakdong River estuary, Korea. Estuarine, Coastal and Shelf Science. Vol. 81, no. 1, pp. 38-48.
Pederson, J., R. Bullock, J.T. Carlton, J. Dijkstra, N. Dobroski, P. Dyrynda, R. Fishers, L. Harris, N. Hobbs, G. Lambert, E. Lazo-Wasem, A. Mathieson, M. Miglietta, J. Smith, J. Smith III, and M. Tyrrell. 2005. Marine invaders in the northeast: Rapid assessment survey of non-native and native marine species of floating dock communities, report of the August 3-9, 2003 survey. Massachusetts Institute of Technology, Sea Grant College Program, Cambridge, MA. Publication No. 05-03.
Perkins, S. 2008. Personal communication. Mass Audubon.
Rasmussen, E. 1977. The wasting disease of eelgrass (Zostera marina) and its effects on environmental factors and fauna. In Seagrass ecosystems: A scientific perspective, eds. C.P. McRoy and C. Helfferich, 1-52. New York: Marcel Dekker.
Reed, B.J. and K.A. Hovel. 2006 Seagrass habitat disturbance: how loss and fragmentation of eelgrass Zostera marina influences epifaunal abundance and diversity. Marine Ecology Progress Series. 326: 133-143.
Ricklefs, R.E. 1990. Ecology. W.H. Freeman and Company, New York, NY.
Rousseau, M.A. 2008. Massachusetts Artificial Reef Plan. Fisheries Policy Report FP-3, Massachusetts Division of Marine Fisheries.
Ruiz, G.M., J.T. Carlton, M.J. Wonham, and A.H. Hines. 2000. Invasion of coastal marine communities in North America: Apparent patterns, processes and biases. Annual Review of Ecology and Systematics 31: 481-531.
Scheibling, R.E. 2001. Recent invaders alter the kelp bed ecosystem off Nova Scotia. Presentation to the Second International Conference on Marine Bioinvasions. New Orleans, LA.
Scheibling, R.E. and P. Gagnon. 2006. Competitive interactions between the invasive green alga Codium fragile ssp. tomentosoides and native canopy-forming seaweeds in Nova Scotia (Canada). Marine Ecology Progress Series 325: 1-14.
Short, F.T., R.C. Davis, B.S. Kopp, C.A. Short, and D.M. Burdick. 2002. Site-Selection model for optimal transplantation of eelgrass, Zostera marina, in the northeastern US. Marine Ecology Progress Series 227: 253-267.
BA-64

BA-65
Sogard, S.M. and K.W. Able. 1991. A comparison of eelgrass, sea lettuce macroalgae, and marsh creeks as habitats for epibenthic fishes and decapods. Estuarine, Coastal and Shelf Science 33: 501-519.
Stauffer, R.C. 1937. Changes in the invertebrate community of a lagoon after disappearance of the eelgrass. Ecology 18: 427-431.
Stevick, P.T., J. Allen, P.J. Clapham, N. Friday, S. Katona, F. Larsen, J. Lien, D. Mattila, P.J. Palsbøll, J. Sigurjønsson, T.D. Smith, N. Øien, and P.S. Hammond. 2003. North Atlantic humpback whale abundance and rate of increase four decades after protection from whaling. Marine Ecology-Progress Series 258: 263-273.
Szedlmayer, S.T. and J.C. Howe. 1997. Substrate preference in age-0 red snapper, Lutjanus campechanus. Env. Biol. Fish. 50: 203-207.
U.S. Environmental Protection Agency (EPA). 2008. National Coastal Condition Report III. http://www.epa.gov/owow/oceans/nccr3/downloads.html. Accessed 4/15/09.
U.S. Fish and Wildlife Service (USFWS). 2001. Monomoy National Wildlife Refuge brochure. http://www.fws.gov/northeast/easternmanwrcomplex/monomoy.pdf. Accessed 11/20/08.
Valiela, I. and J.L. Bowen. 1991. Nitrogen sources to watersheds and estuaries: Role of land cover mosaics and losses within watersheds. Environmental Pollution 118(2): 239-248.
Vigness-Raposa, K.J., R.D. Kenney, M.L. Gonzalez, and P.V. August. In review. Spatial patterns of Humpback Whale (Megaptera novaeangliae) sightings and survey effort: Insight into North Atlantic population structure. Marine Mammal Science.
Wahl, M. (in press) Marine Ecological Communities, Springer, Berlin.
Werme, C. and C. Hunt. 2006. 2006 outfall monitoring overview. Boston: Massachusetts Water Resources Authority. Report 2007-12.
Werme, C., A. Rex, M. Hall, K. Keay, W. Leo, M. Mickelson, and C.D. Hunt. 2008. 2007 outfall monitoring overview RESULTS. Boston: Massachusetts Water Resources Authority. Report 2007-17.
Whitaker, D. 2008. Personal communication. Massachusetts Division of Marine Fisheries shellfish biologist.
Yoshioka, PM. 1982. Role of planktonic and benthic factors in the population dynamics of the bryozoan Membranipora membranacea. Ecology 63(2): 457-468.


Chapter 5 - Archeological and Cultural Sites Through even the most casual observations, we readily see the region’s maritime heritage in the form of ship captains’ homes, lighthouses, fortifications, wharves, and boatyards. While these terrestrial resources reflect the seaward nature of this heritage, a maritime legacy can be found in the submerged reaches of this region as ancient Native American sites, historic and modern shipwrecks, disposal areas, and aircraft (CRC 1990; Mastone 1990, 1995, 2002; Bell 2009). Given Massachusetts’s long maritime heritage and its leadership in maritime activities, there exists a high probability that many of these shipwrecks may be historically important.
The management of cultural resources, including those submerged resources such as shipwrecks, involves a sequence of tasks (GAO 1987):
1. Inventory (discovery and recording). 2. Evaluation (scientific and public importance). 3. Planning (determine appropriate use). 4. Protection (safeguarding resources). 5. Utilization (accommodating proper use).
Within the Massachusetts ocean management planning area (planning area), and throughout state waters, underwater archeological sites are managed by the Commonwealth’s Board of Underwater Archaeological Resources. Under state law (312 CMR 2.03), “any person who has located a shipwreck or other underwater archaeological resource within inland or coastal waters of the Commonwealth or the lands beneath such waters shall secure a permit from the Board of Underwater Archaeological Resources prior to conducting any activities that may disturb the site or resource.” Similarly, under federal law (36 CFR 800), projects that require any federal licensing, funding, or permitting must consult with the State Historic Preservation Office, which is the Massachusetts Historical Commission (MHC), to take into account adverse effects to significant historic and archaeological resources. Any projects or activities in the planning area must anticipate the existence of underwater archeological resources and if they are found, must take steps to avoid them.
NATIVE AMERICAN SITES
Prior to the last marine transgression of the Holocene epoch, the now submerged land off the coast of Massachusetts was once uplands and coastal plain. During periods of lower sea level, terrestrial and coastal environments extended seaward occupying those areas formerly covered by the oceans (Emery and Edwards 1966). Similar to today, these bottomlands turned terrestrial landscapes would have been characterized by uplands and river valleys,
BA-67

sand dunes, springs, and lakes. The more seaward reaches of these exposed bottomlands were likely characterized as estuary-barrier island systems, which extended out into deeper water marine environments. The varied topography, fresh and saltwater resources, and abundant floral and faunal species together comprised a wide range of onshore ecozones that, when they were exposed, would have been an attractive landscape for occupation by early Native Americans and for exploitation of an abundance of plant and animal species.
There were two periods when this offshore area was not completely submerged and could support habitation and land use by ancient Native Americans. Between 12,000 and 9,000 before the present (BP), the area was a series of shoals and small islands. Seal and bird hunting, shellfish collecting, and fishing could have been major subsistence activities. Between 9,000 and 6,000 BP, areas such as Stellwagen Bank appear to have been one large continuous island able to support small Native American habitation sites with associated shell middens similar to the nearby Provincetown area (Barber 1979).
Ancient Native Americans may have hunted large marine mammals and birds, or fished at sea prior to European contact. Early explorers observed porpoises and seals being hunted in the open ocean. However, the exploitation of these mammals may have favored utilizing beached whales or hunting seals and birds, or shellfishing along the shore, rather than hunting in the open ocean. Archaeologists continue to debate the extent of deep ocean fishing and hunting by ancient Native Americans. There is little likelihood for Native American site remains more recent than 6,000 BP to be found away from the present shoreline. Closer to shore and in tidal rivers, the inundation process continued, so Native American site remains may be found in those now-submerged areas.
While only a few ancient Native American artifacts have been discovered in the region’s coastal waters, the potential for more extensive preserved, ancient archaeological sites underwater must be considered. Occasionally, Native American artifacts are recovered by scallopers working the deep waters of the Gulf of Maine, and some have been found in mudflats by clam diggers and even underneath peat deposits along tidal rivers and in estuarine wetlands in Massachusetts. In 1990, a mastodon or mammoth tooth was recovered by commercial fishermen several miles off of Provincetown. The occasional recovery of such remains suggests environmental conditions were present to support Paleo-Indian populations. Recently, an intact drowned forest with a freshwater marsh and pond dating circa 10,000 to 5,500 BP was found during the archaeological survey associated with the Cape Wind Project in Nantucket Sound (Robinson et al. 2004; Bell 2009). In general, the preservation of organic materials, items made of wood, bone, and natural fibers and hides, may be better preserved in now-submerged sites than at terrestrial sites. The highest density of terrestrial archaeological sites in Massachusetts, from both ancient and early historical periods, is found in coastal communities. It can be reasonably expected that the lands now submerged also contain evidence for settlement and land use prior to inundation (Mastone 2002; Bell 2008).
BA-68

SHIPWRECKS AND OTHER HISTORIC RESOURCES
The Age of European Exploration ushered in over four centuries of vessel traffic engaged in the exploitation of the marine environment and its resources. The lands and waters of the western North Atlantic were explored and colonized for their abundant resources, particularly cod and whales. The detailed depictions of Cape Ann, Cape Cod, and the rest of the Massachusetts shoreline on historic maps and charts are statements to the importance of the area and its waters to marine activities. This exploration and exploitation of Massachusetts’s waters was accompanied by the inevitable loss of vessels at sea that now have protection under the federal Abandoned Shipwreck Act of 1987 (43 U.S. C. 2101 et seq.) as well as state Underwater Archaeology Act (Acts of 1973, Chapter 989, as amended).
Looking seaward, the area between Cape Ann and Cape Cod is the gateway to Massachusetts’s maritime commerce. Historically, as today, the main shipping lanes crossed Stellwagen Bank. Oil tankers, colliers, container barges, trawlers, and pleasure boats ultimately replaced the coastal schooners, clipper ships, packets, and fishing schooners of the previous centuries. Until the opening of the Cape Cod Canal, the expanse of ocean between the two capes was the only access to the ports inside Massachusetts Bay, such as Boston, Plymouth, Salem, Gloucester, and Provincetown. Similarly, the area of Nantucket Sound was the main safe route for vessel traffic rather than south of Nantucket and Martha’s Vineyard Islands, with many of the nearby ports being designated officially as “safe harbors.” The late 19th century/early 20th century saw the highest level of coastal shipping in the Northeast.
The fisheries activities in this region are well established. Early whaling activity from long boats would have encompassed large ocean expanses off of Cape Cod. The shift from small boats to larger schooners moved the majority of fisheries further out to sea to Georges Bank, South Channel, and Grand Bank. Until the Civil War, nearshore fisheries were undertaken in a few small open boats engaged in market fisheries mainly in the winter months. Local banks and shoals were not initially heavily exploited by the schooner fisheries because Georges Bank fisheries were more lucrative. However, the growth of the 20th century trawler and dragger industries turned attention back to the nearer shore waters.
The records of the Massachusetts Board of Underwater Archaeological Resources indicate there are well over 3,500 shipwrecks off of the Massachusetts coast, out as far as Georges Bank. The earliest known and recovered shipwreck, Sparrowhawk (circa 1626), is now on display at the Cape Cod Maritime Museum in Hyannis. The primary causes of shipwrecks fall into four broad classes:
1. Acts of war - naval engagements, piracy, law enforcement. 2. Natural forces - storms (gales/hurricanes). 3. human error - seamanship, fire, collision. 4. Abandonment - above, plus vessel condition, economic.
BA-69

There is a strong relationship between high shipwreck frequency and major storms. By contrast, collisions and founderings are the major cause for loss during periods of low shipwreck frequency. Further, a strong seasonal distribution of shipwrecks within the peak period of November/December is exhibited off of Massachusetts (Fish 1989). Interestingly, these months are typified by lower traffic volume, except fishing activities.
Adverse and unpredictable weather conditions (severe gales and hurricanes) have been identified as the major cause of vessel loss. Table 5.1 depicts over 20 recorded major storm events with significant impact on shipping.
Table 5.1 Historic major storm events off of the Massachusetts coast (adapted from Luther 1958; Mastone 2002)
August 15, 1635 April 14, 1851 (Minots Ledge Lighthouse destroyed)
September 1676 January 19, 1857 February 22, 1723 September 8, 1869 December 1786 December 25, 1873 October 9, 1804 December 1886 September 23, 1815 November 25, 1888 December 14-15, 1839 September 9, 1896 December 17, 1839 (the “Triple Hurricanes of 1839”) November 26, 1898 (the “Portland Gale”) December 22, 1839 (the “Triple Hurricanes of 1839”) September 21, 1938 December 27, 1839 (the “Triple Hurricanes of 1839”) September 14-15, 1944 October 2, 1841 October 30, 1991 (the “Perfect Storm”)
The Triple Hurricanes of December 1839 and the Portland Gale of November 1898 were particularly devastating. The 1839 storms inspired Longfellow’s poem, “The Wreck of the Hesperus.” Contemporary accounts noted over 200 vessels sunk in Boston Harbor alone, but with comparable losses in the ports of Gloucester and Provincetown. By comparison, roughly 400 vessels were lost during the Portland Gale. The greatest number of shipwrecks to occur in one year for New England happened during 1898, with 90% of those shipwrecks taking place in just three days, November 25-27 (Fish 1989).
While research strongly indicates that there are more than 3,000 shipwrecks in Massachusetts waters, the quality of descriptive information and precision of locational data is severely lacking. A strong bias may exist in the historical and documentary record to selectively not record locational or other information on shipwreck sites that do not pose a hazard to navigation, involve human tragedy, or carry valuable cargo. Government data is aimed at identifying and locating man-made and natural objects that are hazards to navigation, but not all shipwrecks are important for reasons other than navigation. In many instances for deepwater shipwrecks, the reported locations are approximate and not verified because they do not pose a hazard to navigation. Further, reliable locational information is in private hands (e.g., sport divers,
BA-70

researchers, fishermen) whose varying purposes and needs generally preclude sharing this information (Mastone 1990, 2002).
Most available published sources of shipwreck information concentrate on romance of the sea and/or major calamities and disasters. Their audience is typically popular and not scholarly. Many of these works are laundry lists of shipwrecks often published without sources or evaluation of sources. Further, many works reflect a certain selective presentation of facts such as including only larger vessels or those carrying “valuable” cargo. Thus, vessel loss is under-recorded (Mastone 1990, 2002).
Unfortunately, the ambiguity of location given in documentary sources for most maritime disasters generally precludes establishing statements of impacts to specific resources. Ambiguity exists over the reported location of a shipwreck, particularly at sea, and the types of vessel losses that are reported. Typically, the presumed nearest landfall is used when the shipwreck does not occur at a recognized landmark—on shore, on rocks, near a buoy marker or lightship. References such as “off Provincetown,” “off Cape Ann,” “off Massachusetts coast,” “off New England,” or “left port never to be heard of again,” are frequently the only description. Further, the place of loss was far less important to record than “who and what was lost” for most colonial period writers. The precision of location that we require today was historically not as important to the recording of vessel losses (Mastone 1990, 2002).
Among the other historic resources on Massachusetts ocean bottomlands are: dumping grounds, communication cables (e.g., the trans-Atlantic telegraph cable at Marconi Beach), aids to navigation (e.g., the remains of the 1851 Minots Ledge Lighthouse), and aircraft. While several aircraft crash sites have been positively identified in Massachusetts waters (locations undisclosed), many others can be anticipated due to the numerous training bases in the region, as well as private and commercial flights.
Over the past decade, a number of major offshore development projects, ranging from dredging to submerged cables and pipelines to alternative energy proposals, have conducted archaeological sensitivity and preliminary site identification activities. For example, the Hubline, Northeast Gateway, and Neptune projects in Massachusetts Bay together located approximately 30 shipwreck sites along their main routes. Re-routing flexibility allowed the proponents to avoid impacts to these sites. Unfortunately, avoiding these sites obviated the need to determine the identity or assess the archaeological importance of these sites. As a result, little qualitative information was collected from these site locations (i.e., the site location is known, but the identity of the archeological resource at that site is unknown).
Often overlooked is the multiple usage value of submerged cultural resources. Beyond their heritage value is a recreational opportunity and economic value associated with recreational use (e.g., heritage tourism). Massachusetts maintains a list of shipwreck sites specifically preserved for the continued enjoyment of the recreational diving community. Known as “exempted
BA-71

sites,” 40 shipwreck sites have been designated since 1985 (Figure 5.1). Additionally, and possibly equally important, are the natural resource characteristics of cultural resources. Through the processes of structural deterioration and plant/animal colonization, shipwrecks and other resources are transformed from their original function into habitats. Their value no longer manifests itself in the cargoes carried or the functioning of the vessel, but rather in their ability to serve as habitat and thereby support the food web. Thus historic shipwrecks achieve dual historical/archaeological and biological values.
Finally, knowing precisely where submerged cultural resources are located may not fully address the management task of site inventory. The problems associated with this task are compounded by insufficiently detailed historical and spatial information on these sites. Similarly, the lack of qualitative site-specific information severely limits discussion of their potential historical importance. Advances in technology have made locating submerged resources easier, particularly for historical period shipwreck sites. Once identified, site-specific research and evaluation are required to evaluate significance and to develop site-specific management recommendations to consider their planning, protection, and appropriate utilization. Because of the importance of underwater archeological and cultural sites, projects proposed within the planning area will be required to provide site-specific assessments, and if resources are identified, either avoid or develop management plans to protect those resources.
REFERENCES
Barber, R. 1979. Volume II - Archaeology and Palaeontology, Summary and Analysis of Cultural Resources Information on the Continental Shelf from the Bay of Fundy to Cape Hatteras, Final Report. Institute for Conservation Archaeology, Harvard University, Cambridge, MA.
Bell, E.L. 2008. Cultural resources on the New England coast and continental shelf: Research, regulatory, and ethical considerations from a Massachusetts perspective. Manuscript accepted for publication in Coastal Management.
Bell, E.L. 2009 Cultural resources on the New England coast and continental shelf: Research, regulatory, and ethical considerations from a Massachusetts perspective. Coastal Management 37:17-53.
Cultural Resources Committee (CRC). 1990. Maritime Cultural Resources of Massachusetts Bay: The Present State of Identification and Documentation. Massachusetts Bay Marine Studies Consortium, Boston, Massachusetts.
Emery, K.O. and R.L. Edwards. 1966. Archaeological Potential of the Atlantic Continental Shelf. American Antiquity 31(5)(Part 1): 733-737.
BA-72

BA-73
Fish, J. S. 1989. Unfinished Voyages, A Chronology of Shipwrecks in the Northeastern United States. Lower Cape Publishing., Orleans, MA.
General Accounting Office (GAO). 1987. Cultural Resources: Problems Protecting and Preserving Archaeological Resources. Washington, D.C.: General Accounting Office.
Luther, B.W. 1958. Wrecks Below. Manuscript on file at Board of Underwater Archaeological Resources.
Mastone, V.T. 1990. Cultural Profile of Stellwagen Bank. pp. 17-22. In: Proceedings of the 1990 Conference on Stellwagen Bank, edited by Jack H. Archer. Urban Harbors Institute, University of Massachusetts, Boston.
Mastone, V.T. 1995. Vessel Traffic in Sanctuary Waters. pp 138-141. In: Nathalie Ward (ed.) Stellwagen Bank: A Guide. Center for Coastal Studies. Provincetown, MA.
Mastone, V.T. 2002. Massachusetts: The Devil to Pay and No Pitch Hot! pp. 43-51. In: International Handbook of Underwater Archaeology, edited by C. Ruppe and J. Barstad. Kluwer Academic/Plenum Publishers, New York.
Robinson, D.S., Ford, B., Herbster, H. and J.N. Waller, 2004. Marine Archaeological Reconnaissance Survey, Cape Wind Energy Project, Nantucket Sound, Massachusetts. Pawtucket, RI: Public Archaeology Laboratory, Inc.


Chapter 6 - Human Uses
This chapter presents a description of the main human uses that take place within and adjacent to the Massachusetts ocean management planning area (planning area). This information is pertinent to the development and implementation of the Massachusetts Ocean Management Plan, especially concerning minimizing conflicts that might arise among uses that compete for the same space. Below is a summary of the current status of the following activities: commercial fishing, aquaculture, recreational uses, transportation, energy generation, telecommunication and power cables, pipelines, wastewater discharge, military activities, ocean disposal, protected areas, education and research, aesthetics, shoreline protection and floodplain management, and extraction for beach nourishment.
COMMERCIAL FISHING
One of the dominant uses of the planning area is commercial fishing by means of mobile and fixed gear (trawls, dredges, longlines, pots, weirs, and gill nets). Major fisheries in Massachusetts include shellfish (including scallops, conch, quahogs, and surf clams), finfish, lobsters, crabs, and urchins. Commercial seafood was a $1.6 billion industry in Massachusetts in 2004, which includes the combined inshore/offshore landings (UMass 2006). The most valuable (by value of landings) port in the United States is New Bedford, which has held this designation for the past eight years (NMFS 2008a). Gloucester, Provincetown, and Boston also harbor major commercial fleets, and virtually all harbors and inlets in Massachusetts support some type of commercial fishing activity (CZM 2004). Individual species with more than $5 million in annual landed value in 2007 include sea scallop, lobster, monkfish, cod, haddock, winter flounder, Atlantic sea herring, yellowtail flounder, skates, and witch flounder (MA DMF 2009). Two species—scallop and lobster—combine to approach 50% of the total landed value of all species (MA DMF 2009).
Through an analysis of vessel trip reports and landings data, the dominant fishing effort and value of catch are found around Cape Ann, between Boston and Plymouth, Wellfleet Harbor, the western side of Monomoy Island, Vineyard Sound, and New Bedford Harbor (Figure 6.1). In nearly all fisheries, effort and landings are not homogenously distributed within a particular reporting area. Therefore, it is possible for distinct portions of a “low” activity area to support fishing effort and landings on par with “high” activity areas and vice versa. Also, since the majority of landed shellfish and sea scallops are caught outside of the planning area (both landward and seaward), further analysis is needed to remove the effect of shellfish landings from catches outside of the planning area on this assessment of fishing activity.
The Massachusetts Department of Fish and Game’s Division of Marine Fisheries (MarineFisheries) is the state agency responsible for managing commercial fishing. MarineFisheries works closely with the New England Fishery Management Council (NEFMC)
BA-75
and Atlantic States Marine Fisheries Commission (ASMFC) to manage species on a consistent basis across the region.
AQUACULTURE
Aquaculture is defined in Massachusetts as “the farming of aquatic marine organisms, but not limited to fish, mollusks, crustaceans, echinoderms, and plants. Farming implies some sort of intervention in the rearing process to enhance production including, but not limited to controlled propagation, feeding, protection from predators, etc.” (322 CMR 15.02). About 304 aquaculture permits are issued each year by MarineFisheries. By encouraging municipal oversight with technical assistance by MarineFisheries, Massachusetts has been successful at encouraging aquaculture while controlling for the introduction of shellfish diseases, non-native/exotic shellfish species and other pests, or predators into Massachusetts waters. Aquaculture is generally divided into three main types: commercial, research, and municipal propagation. Municipal propagation of shellfish is also regulated by MarineFisheries. Propagation is a method by which shellfish seed are grown out in town waters and then distributed for the benefit of recreational and commercial fishermen. It is similar to the stocking of lakes with trout, so is not considered a commercial aquaculture activity.
Currently in Massachusetts the exclusive form of commercial marine aquaculture in is bivalve molluscan culture, employing several methods of cultivation to grow quahogs (Mercenaria mercenaria), oysters (Crassostrea virginica), bay scallops (Argopecten irradians), soft shell clams (Mya arenaria), and to a lesser extent, surf clams (Spisula solidissima) and blue mussels (Mytilus edulis). In 2006, the Massachusetts aquaculture industry was comprised of 374 aquaculture farms on 378 hectares (935 acres) of tidelands worth an estimated $6.3 million in sales (MA DMF 2006). The shellfish aquaculture industry in Massachusetts has been steadily growing at a rate of 10% each year for the past decade (NOAA 2007). Permit holders utilize both on-bottom and off-bottom culturing techniques in 27 coastal communities throughout the state: Aquinnah, Barnstable, Brewster, Chatham, Chilmark, Dennis, Duxbury, Eastham, Edgartown, Essex, Fairhaven, Falmouth, Gosnold, Ipswich, Marion, Mashpee, Mattapoisett, Nantucket, Oak Bluffs, Orleans, Plymouth, Provincetown, Rowley, Wareham, Wellfleet, Westport, and Yarmouth. Aquaculture within the actual planning area is limited to within Wellfleet Harbor, which contains 47 licensed sites in the planning area as of 2006. Additionally, there are 30 hectares (75 acres) of blue mussel aquaculture sites in the early licensing stage at four locations within state waters located on Martha’s Vineyard in Aquinnah, West Tisbury, and Chilmark. These areas will be subdivided into individually licensed sites.
Offshore aquaculture has been proposed for Massachusetts, but due to market pressures, use conflicts, and the possibility of environmental impacts, there are currently no offshore commercial aquaculture activities within the planning area. However, due to technological advances and improved understanding of oceanographic conditions, offshore aquaculture has considerable promise for the future (NH Sea Grant 2006).
BA-76

There are two research aquaculture activities in Massachusetts: the Salem State experimental mussel aquaculture off of Gloucester and Rockport and the Wellfleet oyster restoration project by the Town of Wellfleet, The Nature Conservancy, and the Audubon Society. The Salem State facility is a research activity. The Wellfleet project is a restoration project and will be open to harvest in the future.
RECREATIONAL USES
The coastal and marine environment offer several opportunities for recreational use of resources. Such activities do not only have an environmental component but also have social, economic, and cultural implications that need to be considered in the development of an ocean management plan. The activities addressed in this section include recreational fishing, whale watching, and diving.
Recreational Fishing
Recreational fishing occurs throughout the planning area as identified by a survey of guides and other expert recreational fishermen (Figure 6.2). Over a million recreational anglers regularly use the waters of the planning area for fishing, primarily by hook and line. Recreational fishing for lobsters and crab using pots and recreational shellfishing with various handgears in the nearshore areas are also very popular. Recreational fishing is conducted from the shore and from vessels, including individually owned vessels and for-hire vessels (charter and party boats). Anglers target a variety of species including striped bass, black sea bass, bonito, bluefish, cod, cusk, false albacore, haddock, halibut, mackerel, pollock, scup, sharks, smelt, fluke, tautog, bluefin tuna, weakfish, winter flounder, and wolffish. Recreational fishing evolved from subsistence fishing, which was an important cultural tradition in coastal Massachusetts. The modern sport fishery includes a component of subsistence fishing, although in a reduced role that is not well documented. Additionally, there are indigenous fish rights on some creeks and streams.
Since 1983, the National Marine Fisheries Service (NMFS) has conducted random field intercept and telephone surveys to estimate recreational saltwater catch and effort. However, the area fished component of this survey is not of sufficient resolution to quantify the catch of specific watersheet areas important to the recreational fishery. All Massachusetts ports have access to excellent recreational fishing. The groundfisheries off Cape Ann and the flounder fishery off Boston Harbor are well known attractions that bring in visitors and support local business. The Cape and Islands striped bass fisheries are world renowned and a valuable contribution to the local tourist economy. A more quantitative assessment of this industry may be allowed in the future with the implementation of a new licensing and data collection system. Recreational lobster fishing effort and spatial distribution can be further analyzed in tandem with commercial lobster fishing effort utilizing the statistical reporting areas for the lobster fishery. This data is being collected for the first time in 2009.
BA-77

Recreational shellfishing is a major activity, but likely occurs almost entirely outside of the planning area. Exceptions may exist in the Wellfleet Harbor area and some areas where bay scallop is targeted, such as off of Falmouth and upper Buzzards Bay.
Recreational Boating
The Massachusetts Marine Trades Association (MMTA) conducted a survey of boating experts in early 2009 in order to map the approximate main recreational boating routes and recreational boating and fishing areas in state waters (Figure 6.3). According to MMTA, the total number of recreational vessels currently registered in Massachusetts is almost 200,000. The total number of motor boats in the United States is 11,966,627. Massachusetts ranks 29th with 145,496 motor boats registered in 2007, down from 148,640 in 2006 (USCG 2007).
There are 64 marinas and about 25,000 permitted public slips and moorings used for recreational boating along the coastline of Massachusetts. In addition, there are an estimated 10,000 privately maintained slips, moorings, and docks (MMTA 2008).
Vessel-based recreation is a widespread use within the planning area. MMTA has compiled information from the University of Michigan Recreational Marine Research Center’s database (UMSRMRC 2008) on the extent of recreational boating in Massachusetts. According to MMTA, up to 195,000 Massachusetts residents enjoy boating on a typical summer weekend and another 27,000 are employees of marine trade businesses, which make a substantial contribution to the overall state economy. MMTA calculated the total estimated economic significance of recreational boating in Massachusetts to be over $3 billion in 2007 (MMTA unpublished fact sheet).
There are approximately 186,000 boats registered in Massachusetts (MMTA unpublished fact sheet). In addition, there are potentially tens of thousands of recreational vessels home-ported but not necessarily registered in the state, the economic impacts of which are not captured in assessments derived from state registrations only (EEA 2008a). Data from boat sewage No Discharge Area (NDA) applications suggest that roughly 50,000 commercial and recreational vessels use coastal Massachusetts waters (T. Callaghan, personal communication).
MMTA estimates that the marine industry payroll in Massachusetts exceeds $0.5 billion per year—with nearly $40 million in taxes paid annually to state government—and that $1.7 billion in combined annual spending is attributable to the state recreational boating industry (MMTA unpublished fact sheet). Despite the robust economic value of vessel-based recreation, there is very little in the way of spatial planning data available for this sector. What does exist falls into three distinct categories:1) onshore infrastructure for boating, 2) offshore infrastructure for diving, and 3) on-water patterns of vessel recreation in the aggregate. Each is discussed more fully in the report by the Work Group on Ocean Recreational and Cultural Services (EEA 2008a).
BA-78

All of these data point to the importance of recreational boating as an existing use across all sectors of the planning area. Recognizing that the resolution of actual and prospective conflicts among multiple waterway uses is a topic of growing management concern in Massachusetts and around the country, the Commonwealth’s Work Group on Ocean Recreational and Cultural Services identified recreational boating as a topic of key importance (EEA 2008a). Both the Work Group on Ocean Recreational and Cultural Services and the Work Group on Transportation, Navigation, and Infrastructure recommended that a comprehensive spatial map of recreational vessel traffic patterns and concentrations be developed for the planning area (EEA 2008a; EEA 2008b).
Marine Mammal and Bird Viewing
Wildlife viewing is a significant component of coastal recreation and tourism opportunities in Massachusetts. Whale watching is the most prolific of these ventures and Massachusetts is often referred to as the “Whale Watching Capital of the World.” From April through October, humpback, fin, and minke whales congregate to feed on dense patches of schooling fish. The Race Point area off of Provincetown is an important large whale feeding area in late April and often throughout the summer months. Because the summer tourist season coincides with a time when whales are abundant in the planning area and in nearby federal waters, commercial and recreational whale watching has become a significant use in the planning area and in Stellwagen Bank National Marine Sanctuary. Approximately 10 whale watch companies operate out of Massachusetts and most conduct two trips per day, targeting humpbacks and fin whales. The industry mainly operates out of Newburyport, Gloucester, Boston, Plymouth, Barnstable, and Provincetown. The population of whales that visit Stellwagen Bank each year is fairly consistent and thus, over the course of a season and the course of a whale’s life (known to be at least 50 years), they are exposed to frequent interactions with this industry.
The Marine Mammal Protection Act (MMPA) prohibits harassing, hunting, capturing, or killing any species of marine mammal. Each of these acts is considered a “take.” The humpback and fin whales, which are targeted by the whale watch industry, are also listed as endangered species under the Endangered Species Act (ESA). Voluntary federal guidelines exist that govern how commercial whale watch vessels can operate around large whales. Right whales are highly endangered, and it is a violation of state and federal law to approach a right whale closer than 457 meters (m) (500 yards). Right whales are common in the late winter and spring, and are not a species targeted by the whale watch industry. Incidental vessel strikes have occurred between other large whale species and whale watch vessels. Between 1980 and 2004, nine whale strikes were reported due to collisions with whale watch boats (NMSP 2008).
BA-79
In addition to whales, gray and harbor seals are also the subject of wildlife viewing, particularly the population residing on Monomoy Island off Chatham. This is the only active seal watching area in the state. However, access to this site is particularly challenging.
Birding is a popular activity, with an estimated 45 million people in the United States considering themselves birders, and 18 million saying that they travel to watch birds (USFWS 2001). Massachusetts has a long tradition as a birding destination and draws not only its own residents but also birders from across the county. Although not specifically quantified, tourism-related birding does have an economic benefit to the Commonwealth, particularly to those communities that are located near birding hot spots, such as Newburyport. Unlike whale watching, birding is an all year activity; in fact some of the most interesting birding along the coast occurs in winter.
In state waters, the consistent draws are wintering sea ducks and other diving birds (loons, grebes), pelagic species (shearwaters, gannets, petrels, etc.), migratory and nesting shorebirds, and nesting terns. In addition to these species, birders are legendary for their willingness to travel across the country at any time of the year to see a rarity. The 1975 appearance of a Ross’s Gull in Newburyport and the subsequent crowds it drew is considered to have spawned the modern popularity of birding.
Much seabird viewing by birders takes place from vantage points on the shore. Popular locations include Plum Island, Halibut and Andrews Point on Cape Ann, Manomet Point in Plymouth, Sandy Neck in Barnstable, First Encounter Beach in Eastham, Race Point in Provincetown, and Nantucket. Monomoy National Wildlife Refuge and South Beach (Chatham) are popular destinations for boat tours, particularly in mid-July through September, during the height of shorebird migration. Birding clubs will occasionally offer charter boat tours to view pelagic birds, heading beyond state waters to Stellwagen Bank and even the continental slope. Birders will also go on their own on whale watch cruises in hopes of seeing pelagic species including shearwaters (Greater, Cory’s, Sooty, Manx), Wilson’s and Leach’s Storm-Petrels, Northern Gannets, phalaropes, Black-legged Kittiwakes, jaegers (Pomarine, Parasitic, and Long-tailed), skuas, Atlantic Puffins, and murres.
Diving
Recreational SCUBA diving is a popular activity with a long history in Massachusetts. Dive clubs, such as the Boston Sea Rovers, the South Shore Neptunes, and the North Shore Frogmen, have been established for 50 years or more and continue to flourish. The Bay State Council of Divers, an umbrella group of dive clubs, charter operators, and dive shop owners, reports that this region contains one of the five largest sport diving populations in the United States. Massachusetts is home to the nation’s longest running dive symposium, the Boston Sea Rovers’ Underwater Clinic, started in 1954. Ardent wreck divers and organizations such as the Historic Maritime Group of New England have discovered and identified many wrecks
BA-80

of significance to Massachusetts maritime history and aided in the conservation of artifacts. Massachusetts recreational divers have also aided in the development of oceanographic equipment, such as remote operated vehicles (ROVs), and assisted in numerous research projects conducted by Woods Hole Oceanographic Institution, Massachusetts Institute of Technology, Harvard University (Harvard University 2008), Stellwagen Bank National Marine Sanctuary, and the Massachusetts Board of Underwater Archeology (BUAR). Massachusetts’ divers also conduct underwater fish censuses for the Reef Environmental Education Foundation (Project REEF) and invasive species monitoring coordinated by the Massachusetts Office of Coastal Zone Management (CZM).
Diving is practiced throughout the planning area, and most recreational diving takes place in the inshore waters at depths ranging from 3-40 m (10-130 feet [ft]). CZM compiled a GIS datalayer that shows certain popular dive sites from the BUAR and web searches of popular diving locations listed by recreational and commercial groups (Figure 6.4). It is not a comprehensive list of all sites frequented by SCUBA divers. Exceptional shore-based diving can be found off Cape Ann, Marshfield, Plymouth, and Sandwich. Many people dive from private vessels of all sizes and charter boats catering to divers can be found in most of the major harbors.
Most diving activities tend to fall into one of five categories: instructional/training, research, wreck diving, photography, and the harvest of lobster and scallops. Some divers are content to simply explore and enjoy the diverse and productive marine environment. Harvest of lobster and shellfish is regulated and managed by the MarineFisheries and to a lesser extent by the municipalities. Wreck diving on commonly known sites is an open activity, although exploration of new sites is regulated by the BUAR. Instructional activities are organized through dive shops, college programs, dive clubs, and independent instructors; instructional standards are regulated through national training agencies. The economic contribution of recreational diving is not well known.
Hunting
Massachusetts has world-class sea duck hunting. Shooting and falconing for sea ducks (scoters, eiders, mergansers, and Long-tailed Ducks) and Atlantic Brant are done from land and from vessels from November 1-February 15. Other species that are hunted include Green and Blue-winged Teal, American Widgeon, mallards, Black Ducks, Wood Ducks, Gadwalls, pintails, shovelers, Ring-necked Ducks, Lesser and Great Scaup, Harlequin Ducks, Common and Barrows Goldeneye, Bufflehead, Ruddy Duck, Canada Goose, Snow Goose, and Ross’s Goose (Massducks.com 2008). This activity occurs along the coast, in the planning area (generally close to land), and likely on and near the islands contained within the planning area (such as Nomans Land Island). Additionally, hunters may pass through the planning area in vessels. There are no indigenous hunting rights in Massachusetts.
BA-81
Data on bird populations can be informed by hunting data, but abundance can be hard to measure due to vulnerability of a species to hunting (Stott and Olson 1972).
Hunting is regulated by the Department of Fish and Game, Division of Fish and Wildlife. The entire planning area is adjacent to the Coastal Waterfowl Hunting Zone as defined in Migratory Game Bird Regulations. Waterfowl are protected by the federal government under the Migratory Bird Treaty Act of 1918 and all bag limits are set by the U.S. Fish and Wildlife Service.
Gambling Boats
There is currently only one gambling boat in Massachusetts. Atlantic Casino Cruises (125 gaming machines, nine tables) operates out of Gloucester and runs daily from Rowes Square in Gloucester’s Inner Harbor.
TRANSPORTATION
The planning area provides access for a variety of commercial transportation uses. The ports of Boston, New Bedford, Fall River, and Gloucester, while technically outside of the planning area, are the destination and origin of vessels transporting people, food, fuel, liquid and dry bulk cargoes, and container goods through the planning area. The construction and maintenance of navigational pathways in the planning area to ensure the safe transit of these vessels and how these navigational lanes interact with other uses of the planning area is an important component of the ocean management plan. Figure 6.5 illustrates some of the major navigation and transportation related features in the planning area.
Shipping—Containers, Bulk Products, and Fish
Massachusetts is one of the main shipping destinations in the Atlantic Ocean and its ports provide the required facilities for commercial shipping and cargo handling. A brief description of the main harbors that handle fuel, container goods, fish, and other cargo is given below.
Boston (Including Everett, Chelsea, Revere, Quincy, and Weymouth)
The Port of Boston, which extends into Everett, Chelsea, Revere, Quincy, and Weymouth, is the most northerly, large, deep-draft port on the U.S. eastern seaboard with a container terminal, and is the closest port on northern shipping routes to Europe. The Port of Boston generates approximately 34,000 jobs and an annual economic impact of $2.4 billion and provides infrastructure and value-added services to enhance the competitiveness of New England’s trade-dependent companies (Deb Hadden, personal communication).
BA-82

Approximately 22 public and private cargo terminals operate within the Port of Boston and annually handle more than 15 million tons of liquid and dry bulk, containerized, and general cargo worth more than $10 billion. Bulk products, principally petroleum fuels, natural gas, cement, scrap metal, gypsum, and salt, are processed through facilities in the Mystic River, Chelsea Creek, and South Boston. Autos are imported and exported at the Boston Autoport on the Mystic River. Cruise ships call on the Black Falcon Terminal on the Reserved Channel in South Boston. Containerized cargo, which makes up about five percent of the Port’s volume, is handled at the Massachusetts Port Authority’s (Massport’s) Conley Terminal, which is also on the Reserved Channel in South Boston. In 2007, this containerized cargo had a value of more than $4.2 billion. The Port of Boston also includes key support facilities, such as the U.S. Coast Guard station on Commercial Street in Boston, Dry Dock #3 in South Boston, cargo warehouse facilities in South Boston, the East Boston Shipyard, the Boston Harbor Pilots, several tug companies, and the Boston Fish Pier. The Stellwagen Bank National Marine Sanctuary Program reported in its Draft Management Plan (U.S. Dept. of Commerce 2008) that in 2005, the U.S. Coast Guard recorded 58,559 commercial deep draft and other vessel transits entering and/or leaving the Port of Boston (Table 6.1), of which, shipping directly comprised about 6% and fishing vessels 87% of the transits.
Table 6.1 Commercial vessels and other traffic entering or leaving the Port of Boston in 2005 (adapted from Table 23 in Stellwagen Bank National Marine Sanctuary Draft Management Plan. 2008. U.S. Dept. of Commerce. NOAA. National Marine Sanctuary Program.)
Type of Vessel Displacement in
tonnes (tons) Top speed in km/hr
(knots) Transits per
year
Container ship 64,000 (70,400) 46 (25) 455 Bulk cargo carrier 32,000 (35,200) 28 (15) 244 Tanker 64,000 (70,400) 28 (15) 1,160 Liquefied natural gas (LNG) carrier
108,000 (118,800) 37 (20) 126
LNG deep water port support vessel
<1,000 (< 1,100) 24 (13) 240
Roll on-Roll off ship 37,500 (41,250) 46 (25) 41 Dredging tug 3,700 (4,070) 9 (5) 365 Petroleum barge tug 3,700 (4,070) 9 (5) 1,420 Fishing trawler 2,600 (2,860) 22 (12) 11,885 Lobster boat <1,000 (< 1,100) 28 (15) 39,000 Cruise ship 56,000 (61,600) 60 (32.5) 295 Whalewatch boat <1,000 (< 1,100) 74 (40) 3,328 Total 58,559
Massport has spent more than $100 million over the past decade to maintain and improve its public terminals in the Port of Boston. Massport recently completed a
BA-83

$25 million repaving and equipment purchasing program to improve productivity and efficiency at the Conley Terminal, and they are actively pursuing the acquisition of the abutting former Coastal Oil terminal to accommodate supporting uses, such as empty container storage and chassis maintenance and repair in the short term, and preserve future expansion options. A private developer plans to redevelop 12 hectares (30 acres) at the nearby Massport Marine Terminal as an approximately 46,451 m2 (500,000 ft2) state-of-the-art intermodal cargo logistics, bulk and break bulk facility. Massport’s efforts, as well as the U.S. Army Corps of Engineers proposal to increase the depth of the navigational channels and some berths in Boston Harbor, point to an anticipated increase in commercial vessels transiting through the planning area to reach the Port of Boston.
Fall River
Fall River and Mt. Hope Bay see a small amount of shipping activity with the coal and oil that are imported to support Brayton Point and Somerset Power Plants. There is also an oil terminal in North Tiverton, Rhode Island, adjacent to Fall River. At the time of this writing, Weaver’s Cove Energy has proposed to place a Liquefied Natural Gas terminal in Mt. Hope Bay. In addition, the Fall River State Pier has been identified as a site to meet the Commonwealth’s needs for short sea shipping infrastructure. Short sea shipping is shipping that does not transit the ocean; rather, it uses coastal and inland waterways. Short sea shipping is viewed as a way to reduce truck traffic on roadways and thus meet goals to make shipping more economical and to reduce greenhouse gases and roadway congestion. The Commonwealth will be providing additional berthage and other infrastructure at the pier to support new bulk and container cargo handling. While Fall River and the surrounding waters are not in the planning area, commercial vessel traffic through the Cape Cod Canal and the adjacent planning area currently exists and the proposed activities suggest that commercial traffic in this region may soon increase.
Gloucester
Gloucester Harbor is one of the most important commercial fishing ports in the United States. In 2007, the commercial fishery brought in 42.8 million kilograms (kg) (94.4 million pounds [lbs]) of fish valued at $46.8 million (NMFS 2008). Commercial fishermen bring their catch directly to the port from the planning area and beyond, to be sold and processed.
As groundfishing stocks decreased over the last two decades, the number of fishing vessels transiting the planning area to/from Gloucester Harbor also decreased. However, Gloucester is still the state’s second largest fishing port and is now the state’s leading port for lobster landings. Additionally, some businesses around
BA-84
Gloucester Harbor have diversified into other, non-fishing related marine industrial activities. Gloucester port supports approximately 225 deep water commercial fishing vessels up to 92 m (300 ft) in length (U.S. Department of Commerce 2008). Gloucester’s working waterfront, workforce, and proximity to offshore locations also make it a viable port for the staging and support of any future ocean development (City of Gloucester and Urban Harbors Institute 2006), which may increase vessel traffic through the planning area.
Nantucket
Nantucket Harbor receives 40 cruise ship visits each season with 75 passengers on each ship. American Cruise Lines runs trips from Providence and New Bedford that stop in Nantucket as well as Martha’s Vineyard and Block Island. In addition, the Windjammer Arebella runs trips to Nantucket out of Newport Rhode Island.
New Bedford
The Port of New Bedford is one of the most vibrant commercial/industrial ports in the Commonwealth. New Bedford has a history of seafaring traditions that continue today with one of the largest active fishing fleets on the East Coast, freight ferry service, and cruise ship docking. The port offers deepwater access for maritime vessels and has an authorized channel depth of 9.1 m (30 ft). New Bedford Harbor is one of the nation’s major fishing ports, having ranked first in the United States since 2000 based on value of product landed, and in the top five U.S. ports for weight of product landed (NMFS 2008b). In 2007, 67.8 million kg (149.5 million lbs) of fish and shellfish worth $268 million were landed in New Bedford (NMFS 2008b). Currently there are approximately 500 fishing vessels, rigged for catching groundfish and scallops, operating out of the port. In recent years, the port’s seafood processing industry has grown to become a nationally and internationally recognized industry center, having direct service from Norway calling at New Bedford’s Maritime International Terminal every two weeks to satisfy the needs of Massachusetts fish processors and distributors.
The Port of New Bedford is the largest breakbulk (goods packed in small, separable units) handler of perishable items in Massachusetts and adjacent states. In addition to fresh and frozen fish, refrigerated vessels also transport fresh fruit from around the world to New Bedford. New Bedford’s Maritime International Terminal is home to one of the largest U.S. Department of Agriculture-approved cold treatment centers on the East Coast for the use of restricted imported fruit, receiving approximately 25 vessels a year. Each vessel carries between 1,360-3,629 metric tons (1,500 and 4,000 tons) of fish or 1,814-2,722 metric tons (2,000 to 3,000 tons) of fruit. New Bedford is also home to a barge service, Packer Marine, which moves large and heavy
BA-85

materials (such as aggregate and fuel) between the mainland and the Islands. The Fairhaven side of New Bedford Harbor has extensive marine service and vessel repair industries that service not only the fishing fleet but also other large recreational and commercial vessel needs. The state is currently in the permitting process for upgrading the infrastructure at the New Bedford State Pier to better serve freight activities, short sea shipping activities, and cruise ship activities.
Salem
Salem Harbor is largely a recreational boating harbor but sees some commercial shipping activity with the importation of coal and petroleum products to support Salem Power Station. The harbor supports a fleet of approximately 44 commercial vessels.
Cruise Ships and Coastal Lines
Besides commercial shipping, the ports of Massachusetts also offer facilities for cruise ships and passenger handling, serving as important ports of call and providing facilities for the growing cruise ship industry.
Boston
The Port of Boston has a vibrant and growing cruise business that generates over $115 million annually toward the regional economy and provides numerous employment opportunities for vendors, suppliers, tour operators, hotels, restaurants and others. Cruise operations are managed by Massport at the Black Falcon Cruise Terminal in South Boston. This terminal handled 101 vessel calls and approximately 234,000 passengers in 2007. There were over 100 cruise vessel calls to the Port of Boston in 2009, bringing over 250,000 passengers to the city. Future cruise ship calls to the Port of Boston are likely to increase in the long-term as several cruise lines have expressed interest in expanding vessel calls beyond the current May through early November season (Deb Hadden, personal communication).
Boston is a very desirable location for ports of call as well as home port cruise vessels. Homeport calls typically include weekly Boston-Bermuda cruises; spring, summer and fall Canada/New England cruises; seasonal repositioning cruises to Miami and the Caribbean; and occasional transatlantic cruises to Europe. Cruise lines providing homeport calls from Boston in 2006 are Norwegian Cruise Line, Holland America Line, and Royal Caribbean Cruise Line. Port of call visits include Carnival, Princess, Celebrity, Cunard, Crystal Hapag Lloyd, Saga Holidays, and P&O Cruises.
BA-86

The Black Falcon Cruise Terminal, which was constructed in the mid-1980s, does not have the capacity or amenities to accommodate modern cruise ships. To better serve the Port of Boston cruise customers and allow the cruise business in Boston to continue to grow, Massport is seeking to construct a second terminal in the warehouse portion of Building 119 and to refurbish the existing terminal. Massport estimates that with a new cruise terminal capable of handling today’s larger ships, the current passenger level would likely increase to more than 400,000 passengers within two years of the opening of a new cruise terminal. With the expected improvements to the cruise terminals, cruise ships transiting the planning area will increase in both size and frequency (Deb Hadden, personal communication).
Fall River
The City of Fall River and the Commonwealth are in the process of a multi-million dollar rehabilitation and expansion of the Fall River State Pier. One intended future use is to provide berthing and passenger loading/offloading for ferries and large cruise ships.
Gloucester
In 2007, the City of Gloucester saw two ports of call by international cruise ships per year (City of Gloucester and Urban Harbors Institute 2006). In September and October, the 208-passenger Seabourn Pride of Seabourn Cruise Lines calls in the Port of Gloucester for its historic waterfront community and New England character. Gloucester Marine Terminal can accommodate cruise ships up to 152 m (500 ft) in length and drawing up to 5.5 m (18 ft). Larger Vessels, up to 244 m (800 ft) in length and drawing up to 7.9 m (26 ft), can be accommodated in the harbor inside the breakwater, while still larger vessels can be accommodated outside the breakwater. The 2006 Gloucester Harbor Plan suggested that the Port of Gloucester could receive several dozen cruise ship calls per year and that the Gloucester Harbor Plan Office has been actively promoting Gloucester as a cruise ship destination and seeking funds to improve infrastructure to facilitate cruise ships visits (City of Gloucester and Urban Harbors Institute 2006).
New Bedford
The Port of New Bedford saw 25 ports of call from cruise ships in 2007. Like cruise ships calling in Gloucester, American Cruise Lines delivers its passengers to New Bedford for its dynamic working waterfront and its iconic historic district.
BA-87

Ferries and Commuter Boats
The Commonwealth of Massachusetts includes a number of islands along its coast. The larger islands (e.g., Martha’s Vineyard, Nantucket) have a resident population and therefore are served with ferries and commuter boats all year round. In addition, these islands together with a number of smaller islands serve as popular tourist destinations and the ferry boat fleet has grown to cater to the needs of this thriving industry. The main passenger transportation industry is concentrated in Boston Harbor and Woods Hole and Hyannis on Cape Cod.
The location of ferry and commuter boat routes is a data layer that exists and has been mapped by the Work Group on Transportation, Navigation, and Infrastructure (EEA 2008b). While many of these routes are seasonal or may be subject to change in order to optimize safety or fuel consumptions, the route lines provide an indication of importance of these areas to transportation. Ferry and commuter boat routes are mapped in Figure 3 of the report of the Work Group on Transportation, Navigation, and Infrastructure (EEA 2008b). The Work Group determined that these areas were medium priority, meaning that they could potentially be moved, but that doing so would involve moving the activity to a less optimal location that will reduce the effectiveness of that activity compared to the present location (EEA 2008b).
Boston
Passenger water transportation in Boston Harbor includes commuter boats, Inner Harbor ferries, on-call water taxis, and charter/excursion vessel operations. Rowes Wharf and Long Wharf are the primary hub facilities for commuter boat and ferry services in the Inner Harbor. Most services transit among locations within Boston Harbor, however at least three services transit the planning area regularly. The first is a privately operated, seasonal (May-November), daily ferry from Long Wharf in downtown Boston to Blarney Street landing in Salem, serving commuters and tourists. The second is the Bay State Cruise Company, which operates a seasonal ferry (mid-May to mid-October) from the World Trade Center in South Boston to Provincetown. Bay State Cruise Company offers both a fast ferry and an excursion ferry. Third is Boston Harbor Cruises, offering a seasonal (May to early October) fast ferry from Long Wharf in downtown Boston to Provincetown. Lastly, the Island Alliance, a non-profit entity, provides service to various islands within the Boston Harbor Islands National Park, the outermost of which are in the planning area.
Cape Cod
Hy-Line Cruises, Freedom Cruise Line, and the Steamship Authority, offer ferry services that transit the planning area from Cape Cod to Nantucket and Martha’s Vineyard. Hy-Line Cruises runs a year-round high speed ferry, the Grey Lady, from
BA-88

Hyannis to Nantucket and the Lady Martha from Hyannis to Oak Bluffs. From May to October, it also operates traditional ferries, the Great Point and Brant Point, operating between Hyannis and Nantucket and between Hyannis and Oak Bluffs, respectively. The Freedom Cruise Line runs one vessel out of Harwich Port that passes through the planning area from May to October on its way to Nantucket Harbor. The Steamship Authority has a fleet of nine vessels. Table 6.2 describes the Steamship Authority’s fleet and its capacity.
Table 6.2 Passenger vessels transiting between Cape Cod and the Islands
Vessel Name
Vessel Length
Route Route Length Vessel Speed
Iyanough 47 m (154 ft) Hyannis-Nantucket 42 km (26 miles) 65 km/hr (35 knots)
Island Home 78 m(255 ft) Woods Hole-Martha’s Vineyard 11 km (7 miles) 30 km/hr (16 knots)
Martha’s Vineyard 70 m (230 ft) Woods Hole-Martha’s Vineyard 11 km (7 miles) 26 km/hr (14
knots)
Eagle 70 m (230 ft) Hyannis-Nantucket 42 km (26 miles) 26 km/hr (14 knots)
Nantucket 70 m (230 ft) Woods Hole-Martha’s VineyardHyannis-Nantucket
11 km (7 miles) 42 km (26 miles)
26 km/hr (14 knots)
Governor 74 m (242 ft) Woods Hole-Martha’s Vineyard 11 km (7 miles) 22 km/hr (12 knots)
Katama 72 m (235 ft) Woods Hole-Martha’s Vineyard Hyannis-Nantucket
11 km (7 miles) 42 km (26 miles)
25 km/hr (13.5 knots)
Gay Head 72 m (235 ft) Woods Hole-Martha’s VineyardHyannis-Nantucket
11 km (7 miles) 42 km (26 miles)
25 km/hr (13.5 knots)
Sankaty 60 m (197 ft) Woods Hole-Martha’s VineyardHyannis-Nantucket
11 km (7 miles) 42 km (26 miles)
23 km/hr (12.5 knots)
Fall River
The City of Fall River and the Commonwealth are in the process of a multi-million dollar rehabilitation and expansion of the Fall River State Pier. One intended future use is to provide berthing and passenger loading/offloading for ferries. It is not clear at this time if these services would enter the planning area.
Gloucester
The City of Gloucester currently has two passenger vessels: the Bostonian II and the James J. Doherty. The James J. Doherty is a 35 m (114 ft) vessel run by Boston Harbor Cruises that can accommodate up to 350 people. Boston Harbor Cruises runs a fast ferry from Gloucester’s cruise port to MacMillan Wharf in Provincetown from May 15 to October 10.
BA-89

New Bedford
The New England Fast Ferry operates out of the New Bedford State Pier and brings passengers to Vineyard Haven and Oak Bluffs on Martha’s Vineyard on two vessels named the Whaling City Express and the Martha’s Vineyard Express. These ferries pass through the planning area in Buzzards Bay and near the Islands. In addition, the M/V Cuttyhunk provides regular ferry service between New Bedford and Cuttyhunk Island located across Buzzards Bay. New Bedford Harbor is also home to the Steamship Authority’s maintenance and repair facility located on the Fairhaven side of the harbor.
Navigational Aids and Lanes
Navigational aids and designated shipping channels and lanes are important infrastructure components that are necessary to maintain the diverse commercial transportation uses of the Commonwealth. The products and passengers that transit the navigational lanes contribute significantly to the state’s economic portfolio.
The Work Group on Transportation, Navigation, and Infrastructure produced maps and prioritized uses within their purview. The navigational/transportation use areas are mapped in Figure 3 of the Work Group’s report (EEA 2008b). These areas are: anchorage areas, anchorage berths, areas to be avoided, ship channels, precautionary areas, prohibited areas, navigational aids (including environmental monitoring buoys), and lighthouses (pilot boarding areas were not included in the 11/21/08 report, but are important navigational areas. All of these areas can be found on nautical charts, and with the exception of anchorage areas (which were a medium priority—i.e., could potentially be moved), were deemed to be of high priority, that is they are uses that cannot be moved, and in many cases allowing other activities to occur in their locations would be hazardous (EEA 2008b). The priority areas are mapped in Figure 4 of the Work Group’s report (EEA 2008b). Additional data that the Work Group recommended be mapped are the Automatic Identification System (AIS) data that track commercial vessel traffic. These data do not currently exist in any of the Commonwealth’s databases and would be an asset to the ocean planning process.
Boston
The central, deep water harbor in Boston is comprised of the waterways of the Main Ship Channel, Reserved Channel, Mystic River, and Chelsea River. These channels provide access at a depth of 12.2 m (40 ft) at mean lower low water (MLLW) to the Port’s principal terminals, except for the Chelsea River, which currently has an authorized depth of 11.6 m (38 ft) MLLW. Deep water access to the harbor is provided by three entrance channels constructed and maintained by the U.S. Army Corps of Engineers (USACE): the Broad Sound North Channel in two lanes at 10.7
BA-90

m and 12.2 m (35 and 40 ft), the Broad Sound South Channel at 9.1 m (30 ft), and the Narrows Channel at 8.2 m (27 ft). The Broad Sound Channel extends into the planning area roughly 2.4 kilometers (km) (1.5 miles) and is demarcated by four pairs of lit buoys.
USACE and Massport have worked together for many years to plan and implement several dredging projects, and others are currently under construction or in the planning process. These projects include:
• The Boston Harbor Navigation Improvement Project (BHNIP) (1997-2001) included maintenance dredging and deepening of the Reserved Channel, Mystic River, and portions of the main shipping channel to -12.2 m (-40 ft), Chelsea River to -11.6 m (-38 ft), and Massport and certain private deep water berths throughout the Port to depths ranging from -10.7 to 12.2 m (-35 to -45 ft).
• The Outer Harbor Maintenance Dredging Project (2005-2006) restored portions of the North Channel and Broad Sound Channels to -12.2 m (-40 ft).
• The Inner Harbor Maintenance Dredging Project (2007 through present), will restore the main ship channel from beyond Castle Island into the Inner Confluence to its Congressionally authorized depth to -12.2 m (-40 ft). Maintenance dredging will also be conducted in the Reserved Channel and the access channel to the Navy Dry Dock in South Boston as part of this project.
• Massport and USACE are also working on a feasibility study and Environmental Impact Study/Report to deepen the navigation channels serving Conley Container Terminal to -14.6 m (-48 ft) and the Conley berths to at least -15.2 m (-50 ft) to accommodate the larger post Panamax ships, some of which are already calling Boston. The project also includes deepening Chelsea River and the channel to Massport’s Medford Street Terminal in Charlestown to -12.2 m (-40 ft) and the channel serving the Massport Marine Terminal to -13.7 m (-45 ft). The current schedule (if the project is found to be economically justified and funding is secured) is for dredging to begin in 2011.
These commitments to ensuring that Boston maintains its stature as a deepwater port in the Northeast suggest that larger vessels will be transiting the planning area waters in the future.
Within the planning area, and continuing seaward of the planning area, is a traffic separation scheme that includes two directed traffic shipping lanes (one inbound and one outbound form Boston Harbor), a defined separation zone, and two
BA-91
precautionary areas. The separation scheme has been designed to aid in the prevention of collisions. The outbound traffic lane (to the south and west) is 2.4 km (1.5 miles) wide and 200 km (124.5 miles) long. The inbound traffic lane is 2.4 km (1.5 miles) wide and 204 km (126.5 miles) long. The separation zone, a 1.6 km (1 mile) wide and 205 km long (127.5 miles) zone between the lanes, is intended to be free of ship traffic and is demarcated by lit buoys. There are two precautionary areas. One is south of Nantucket, well outside the planning area, with a radius of 30 km (15.5 miles) centered on 40° 35.01’ N, 68° 59.96’ W. The second has a radius of 9.9 km (6.17 miles) centered on 42º 22.71’ N, 70º 46.97’ W and is in the planning area in the approach to Boston Harbor.
Cape Cod Canal
The Cape Cod Canal is the world’s widest sea-level canal at 146 m (480 ft). It is approximately 28 km long (17.4 miles) and has authorized depth of 9.8 m (32 ft) at mean low water. The swift running current changes direction every six hours and can reach a maximum velocity of 8.4 km/hr (4.5 knots), during the ebb (westerly) tide. The three bridges that span the Canal were designed to allow for 41 m (135 ft) of vertical clearance above mean high tide.
The canal is operated by USACE, and according to their website more than 20,000 vessels pass through the canal annually. Many of these vessels are smaller recreational vessels, but in a busy 24-hour period perhaps 30 to 60 larger transport vessels including tankers, barges, tugs, ferries, fishing vessels, container vessels, cruise ships, and other transport vessels, pass through the canal. USACE data from 2006 show more than 2,600 large vessels reported passing through the canal that year. Vessels over 20 m (65 ft) in length must report while those less than 20 m (65 ft) are not required to report. Vessels up to 251 m (825 ft) in length are permitted to use the canal. In 2002, USACE noted that 7.2-7.6 x 10⁶ m3 to (1.9 to 2.0 billion gallons) of petroleum products were shipped through the Cape Cod Canal annually. (Frank Fedele, personal communication).
Use of the canal saves mariners an average of 217 km (135 miles) of coastwise travel instead of circumnavigating Cape Cod. The canal itself is not in the planning area but the channel approaching the canal extends into the planning area approximately 6.5 km (4 miles) into Buzzards Bay and about 0.5 km (0.3 mile) into Cape Cod Bay. The location of the canal between the Buzzards Bay and Cape Cod Bay regions of the planning area and its importance as a safety and time-saving measure ensures that significant commercial vessel traffic will continue to traverse the waters in this part of the planning area.
BA-92

Fall River
The approach channel to Fall River is not in the planning area.
Gloucester
The approach channel to Gloucester Harbor is not in the planning area.
Lynn
Approximately 1.3 km (0.8 mile) of the Lynn Harbor channel is in the planning area. The channel is 46 m (150 ft) wide and is dredged to a depth of 5 m (16 ft). The channel is demarcated by a series of lit and unlit buoys.
New Bedford
The navigational channel for New Bedford/Fairhaven Harbors extends into the planning area about 4 km (2.5 miles). The channel is approximately 9.1 m (30 ft) deep and 107 m (350 ft) wide and is demarcated by a series of lit buoys.
Salem
The navigational channel for Salem Harbor extends approximately 0.4 km (0.25 mile) into the planning area. The channel is 46 m (150 ft) wide and is dredged to a depth of 9 m (29 ft). The channel is demarcated by a series of lit and unlit buoys.
ENERGY GENERATION
There are 11 fossil fuel energy generating facilities and one nuclear facility adjacent to the planning area. The majority of these facilities use once-through cooling technology to cool their condensers (Table 6.3). The total generating capacity of these facilities is 7,942 megawatts (MW) and the total average permitted cooling water discharge is 1.48 x10⁷ cubic meters per day (m3d) or 3,897 million gallons per day (mgd). It should be noted that the Brayton Point facility will be required by the U.S. Environment Protection Agency (USEPA) and Massachusetts Department of Environmental Protection (MassDEP) to install natural draft cooling water technology, in effect decreasing its cooling water flow from 3.50 x 10⁶ m3d (925 mgd) to 2.12 x 10⁵ m3d (56 mgd) within three years of receiving all of the necessary construction and operating permits. In addition to the power plants in Massachusetts, there is also the 1,200 MW Seabrook Nuclear Power Station in Seabrook, New Hampshire, which is permitted to discharge 2.73 x 10⁶ m3d (720 mgd) into waters directly adjacent to the Massachusetts planning area.
BA-93

Table 6.3 Energy generating facilities adjacent to the Massachusetts ocean management planning area
Facility Location Fuel Capacity
(MW) Cooling Type
Permitted Flow (m3d)
(mgd) Brayton Point Somerset Coal, oil 1,600 Once-through; air-
cooled in future 3.50 x 10⁶
925 Braintree Electric Light
Braintree Natural gas 85 Air-cooled 1.51 x 10² 0.04
Canal Electric Sandwich Oil 1,120 Once-through 1.96 x 10⁶ 518 General Electric River Works
Lynn Oil 56 Once-through 3.48 x 10⁵ 92
Kendall Cambridge Oil, jet fuel 242 Once-through 2.65 x 10⁵ 70 Mystic Everett Natural gas,
oil 2,217 Air-cooled, once-
through 1.58 x10⁶ 418
New Boston South Boston
Oil 778 Once-through 1.85 x10⁶ 490
Pilgrim Nuclear Power Station
Plymouth Nuclear 670 Once-through 1.69 x 10⁶ 447
RESCO Saugus Waste 35 Once-through 2.27 x 10⁵ 60 Salem Salem Coal, oil 775 Once-through 2.53 x 10⁶ 669 Somerset Somerset Coal 229 Once-through 7.57 x 10⁵ 200 Taunton Municipal Lighting Plant
Taunton Oil, natural gas
135 Once-through, air-cooled
3.03 x 10⁴ 8
Renewable Energy
Recent warnings by the International Panel on Climate Change (IPCC 2007) on the looming effects of climate change, high energy prices, and diminishing oil and natural gas resources, have instigated a dramatic increase in focus on renewable energy in the United States over the last few years. Rising interest in alternative energy from renewable resources such as wind, solar, hydrokinetics and ocean thermal energy conversion has shifted focus onto ocean sources (Table 6.4). A comprehensive approach to developing marine renewable energy projects is crucial to the United States as rapidly evolving technology is aiming to facilitate offshore installations. Massachusetts has no fossil fuel reserves but has substantial renewable energy resources. The Massachusetts coast offers considerable wind power potential, classified as excellent to outstanding by the U.S. Department of Energy National Renewable Energy Laboratory (NREL).
BA-94

Table 6.4 Proposed and approved renewable energy projects in Massachusetts
Type Name Location Date Issued
Preliminary permit (FERC)
Cape Cod Tidal Energy Project
Cape Cod Canal 11/16/07
Preliminary permit (FERC)
Cape and Islands Tidal Energy
Vineyard Sound 5/31/07
Preliminary permit (FERC)
Cuttyhunk/Elizabeth Islands Tidal Project
Atlantic Ocean In process
Preliminary permit (FERC)
Edgartown-Nantucket Tidal Energy
Muskeget Channel 3/31/08
Minerals Management Services
Cape Wind Energy Project
Nantucket Shoals (Federal/State)
In process
Proposed Hull Offshore Wind Boston Harbor (Harding Ledge)
In process
FERC = Federal Energy Regulatory Commission
Energy Production, Consumption, and Needs in Massachusetts
Massachusetts is the most densely populated state in New England, but overall per capita energy consumption is low at 243 million Btu (British Thermal Unit) (48 U.S. Rank - U.S. DOE 2008). Massachusetts is vulnerable to fuel oil (used by 40% of households) shortages and price spikes during winter due to high demand for home heating. Natural gas is used mainly by electrical power generators and by more than 40% of the residential sector. It is received by pipeline from the U.S. Gulf Coast and Canada, and imported via liquefied natural gas (LNG) import terminals in Boston.
The Everett and Gateway LNG import facilities serve the Northeast, while a third facility (Neptune LNG) was recently approved. Natural gas-fired power plants generate more than two-fifths of energy in Massachusetts, while coal accounts for 25% of net electricity production. The Pilgrim Nuclear Power Plant in Plymouth also contributes about 12% of energy generation (U.S. DOE 2008). Massachusetts has several small hydroelectric facilities and is one of the nation’s leading producers of electricity from landfill gas and municipal solid waste (200,000 megawatt-hour [MWh]). Massachusetts generates 123 trillion Btu annually (0.2% of total U.S.), with a net electricity generation of 3.8 gigawatt-hour (GWh).
Massachusetts’s increasing dependence on natural gas and lack of fuel resources, its high population density along the coast, and lack of land resources for development of utility-scale land-based renewable energy facilities, make it a prime candidate in the pursuit of sustainable development of offshore wind resources. Utility deregulation legislation (M.G.L. 1997) mandates a Renewable Portfolio Standards (RPS) and System Benefit Charge setting targets for the amount of electricity generated from renewable sources to be sold on the retail market (4% by 2009 - U.S. DOE 2008). This translates into the need to develop up to 1,100 MW of new renewable energy capacity by 2009 (Rogers et al. 2003).
BA-95

Offshore Wind Development
The Work Group on Renewable Energy (EEA 2008c) reports that there is a solid consensus that Massachusetts has excellent resources for successful offshore wind energy generation, due to high wind speeds and relatively shallow water depths. There was also consensus within the Work Group that wind speeds are favorable in all locations within the planning area, although wind speeds tend to be higher further offshore. The Work Group identified average wind speeds above 7.0 meters per second (m/s) (23 ft/s) as minimally necessary, with higher average wind speeds being more desirable. The Work Group also identified the following additional factors that are relevant considerations for facility siting: seabed geology, wave heights, proximity to transmission lines, and proximity to areas suitable for marine construction and transportation. However, the Work Group concluded that none of these factors in and of themselves make any particular site conclusively favorable or unfavorable.
The Work Group identified preliminary areas as suitable for wind energy development based on two factors: wind speed and water depth (EEA 2008c). While seafloor composition is also very important to wind turbine siting, the Work Group identified a paucity of necessary geological information. However, the Work Group did not recommend that more data be gathered on seabed geology, because it does not appear feasible to gather data at a sufficiently large scale to be useful for determining suitable sites for a wind farm, and because it is not clear that seabed geology is a critical factor (EEA 2008c). Page 8 of the Renewable Energy Work Group report contains a figure of the most suitable areas for wind turbine development. While the majority of the planning area was labeled as medium priority or higher, the most suitable areas were: the southeastern portion of Cape Cod Bay, the nearshore area east of Cape Cod, most of Nantucket Sound and the coastal waters around the Islands, and most of Buzzards Bay, especially to the south and west (EEA 2008c).
Offshore (> 9 km or 5 nautical miles [nm]) wind turbines harness the kinetic energy of moving air over the oceans and convert it to electricity. Offshore winds are less turbulent and tend to flow at higher speeds than onshore, making them more attractive options to industry. The U.S. Department of Energy (USDOE) estimates that more than 900 gigawatts (GW) (close to the total current installed U.S. electrical capacity) of potential wind energy exists off the coast of the United States, with more than 50% located off the North Atlantic coastline. New England is an ideal location for wind farm development because of its high wind resource in shallow waters close to major electrical load (Figure 6.6).
The National Renewable Energy Laboratory has determined wind resources between 9 and 37 km (5 and 20 nm) off the New England coast to be 9,900 MW and 41,600 MW in <30m and > 30m (<98 and > 98 ft) of water respectively, and in areas 37-93 km (20-50 nm) to be 2,700 MW and 166,300 MW at the same depths (Musial and Butterfield 2004). These amounts are compelling even after excluding significant areas likely to be development-prohibitive due to environmental concerns and competing ocean uses, and may potentially
BA-96
provide up to 70,000 MW of domestic generating capacity to the nation’s electric grid by 2025 (Thresher 2005).
Mesoscale modeling developed by TrueWind Solutions provides estimates of wind resources 93 km (50 nm) offshore ranging between 7.0-8.4 m/s (23-28 ft/s) (Class 5, 6, and 7) at 60 m (197 ft) heights (Musial and Butterfield 2004; Westgate and DeJong 2005). Water depths less than 20 m (66 ft) extend up to 15 km (9.3 miles) in Cape Cod Bay, and up to 2-4 km (1.2-2.4 miles) in Buzzards Bay and Nantucket Sound. Offshore wind projects could thus produce up to 55,000 GWh (116%) of the state’s energy needs (Rogers et al. 2003; Westgate and DeJong 2005). For offshore wind turbine design, wave conditions are an important factor to consider. To date, there are no well-defined wave data for New England. Wave speeds of 1.3 m/s (2.5 knots) have been measured in Nantucket Sound, while maximum wave heights of 9.1 m (30 ft) were measured at the buoy at the mouth of Boston Harbor (Rogers et al. 2003).
Hydrokinetic Energy Development
Hydrokinetic refers to technologies for wave, current, and in-stream tidal energy. Hydrokinetic projects are in early stages of development. Pilot projects capture hydrokinetic energy by various technologies (buoys, attenuators, overtopping devices, terminators) varying in size, anchoring, spacing, interconnection, array patterns, and depth limitations.
Offshore wave energy potential is estimated to be 250-260 terawatts per year using 15% of wind resources available in Massachusetts, twice the potential estimated for tidal and ocean current (EPRI 2006b). According to the Electrical Power Research Institute (EPRI) hydrokinetics’ current renewable energy potential meets 10% of national demand. Annual average power density on the East Coast of the United States is 5-15 kilowatt per meter (KW/m) for wave energy. In 2006, six sites in Massachusetts with flood and ebb peak tidal current surface velocities averaging at least 1.5 ms-1 (3 knots) were assessed by EPRI (2006b) to identify the most promising site for a feasibility demonstration project, rated at 500 KW (producing 1,500 MWh/yr at 40% capacity), later to serve as the site for a first commercial plant, producing 30,000 MWh/yr at 40% capacity.
Although the Cape Cod Canal was found to have the highest power density of any potential tidal stream energy conversion site in Massachusetts, the site has insufficient space for the Tidal In-Stream Energy Conversion (TISEC) devices to fall within the navigation safety margins specified by USACE (EPRI 2006b). Hence, Muskeget Channel, located between Martha’s Vineyard and Nantucket, was deemed most appropriate from an annual average extractable power. The currents through the channel have a velocity of 7.0 km/hr (3.8 knots) and 6.1 km/hr (3.3 knots) on the flood and ebb respectively, providing an average of 13.8 MW of kinetic power (EPRI 2006a). About 2 MW (15%) can be extracted, reaching a peak capacity of just over 4 MW. According to EPRI, the relatively small generation potential
BA-97
could make the site appropriate as a distributed renewable energy source that benefits the local economy.
Based upon its annual average extractable power Muskeget Channel, located between Martha’s Vineyard and Nantucket, was deemed the most appropriate site for tidal current energy generation (EPRI 2006). The currents through the channel have a velocity of 8.1 km/hr (4.4 knots) and 6.9 km/hr (3.7 knots) on the flood and ebb respectively, providing an average of 13.8 MW of kinetic power. About 2 MW (15%) can be extracted, reaching a peak capacity of just over 4 MW. According to EPRI, the relatively small generation potential could make the site appropriate as a distributed renewable energy source that benefits the local economy. The Work Group on Renewable Energy (EEA 2008c) reports that scientists from UMass-Dartmouth have received a grant to find locations in Muskeget Channel where currents peak at five knots or more.
Massachusetts Tidal Energy Company (now called Oceana Energy Company) submitted a preliminary permit application to the Federal Energy Regulatory Commission (FERC), Docket no. 12670 in 2006. The proposed project would include 50-150 tidal turbines located in 12-23 m (40-75 ft) of water in Vineyard Sound, north of Martha’s Vineyard. This proposed project location is mapped in Figure 3 of the report of the Work Group on Transportation, Navigation, and Infrastructure (EEA 2008b).
In addition, the Work Group on Renewable Energy (EEA 2008c) reported that the Town of Edgartown and a private company, Natural Currents Energy Services LLC, are both pursuing separate projects in Muskeget Channel. The Town of Edgartown has received a preliminary permit for feasibility and impact studies, design, and testing in the Muskeget Channel, but not for construction of any tidal generating facilities. The Natural Currents Energy project is in the preliminary permitting phase, but the proponent is seeking to have tidal generators online by 2011 (EEA 2008c).
Based on the foregoing, the Work Group recommended designating Muskeget Channel, the Vineyard Sound area, and the area southeast of Nantucket (areas where tidal potential has also been identified) as tidal “demonstration zones,” in which tidal facilities would be encouraged (EEA 2008c). (This recommendation assumes that there are no conflicting uses in such areas. The Work Group felt that these demonstration projects are likely to provide useful information about the potential for tidal energy and the locations where tidal is most likely to be successful.
TELECOMMUNICATION AND POWER CABLES
Several telecommunications and power cables have been placed under Massachusetts seafloor sediments in the last 10 years. Some of these cables have provided municipal services to offshore islands, while others have been built by private companies to support
BA-98
the telecommunications industry. An emerging use that is currently (2009) being considered in several ocean projects is the placement of power cables to connect offshore or out-of-state renewable energy suppliers to the energy grid in Massachusetts.
The Work Group on Transportation, Navigation, and Infrastructure identified several datasets for mapping electrical cables, cable areas (where cables are strung between land masses or, as in the case between Westport and Gosnold, large swaths where the federal government prohibits other activities because of historic [e.g., World War II] desires to place communication cables), and cable lines (EEA 2008b). These areas are mapped in Figure 3 of the report of the Work Group on Transportation, Navigation, and Infrastructure (EEA 2008b). The Work Group determined that these areas were high priority, meaning that they could not be moved, and in many cases, allowing other activities in their locations would be hazardous (EEA 2008b). If uses other than cable placement are desired in the swath between Westport and Gosnold, one recommendation from the Work Group was to investigate how to re-designate the historic cable swath in the fashion of more recent designations, that is, as a line or series of lines, thus opening the area up for other uses (EEA 2008b).
Telecommunication Cables
Modern telecommunications cables consist of a “transmission core” of glass fibers with outer layers of various materials to strengthen, insulate, and protect the fibers. The degree of cable protection depends on the nature of the underwater environment. Shallow waters are generally more hazardous and cables in these waters have additional armoring, depending on the protection needed from fish and abrasion.
Hibernia Atlantic is a transatlantic submarine communications cable system connecting Canada, the United States, Ireland, and England. This fiber optic cable is a Dense Wavelength Division Multiplexing (DWDM) system; one that increases bandwidth by combining and transmitting multiple signals simultaneously at different wavelengths on the same fiber and transports information at 10 gigabits per second (Gbps). The full Hibernia Atlantic system consists of two separate cables traversing the Atlantic Ocean with four landing points, including Lynn, Massachusetts. When making landing in Lynn, it enters a manhole and connects to existing wires running beneath the Lynnway toward Commercial Street. The 5-centimeter (2-inch) diameter, shielded cable is buried about 1.2 m (4 ft) under the seabed. The cable was built in 2000 but did not become operational until 2005. In 2007, Hibernia Atlantic upgraded its cable between Halifax, Nova Scotia, and Boston from 10 Gbps to 40 Gbps (TRC 2006).
Power Cables
There are two areas where cables currently cross between Cape Cod and the islands. The first, connecting Harwich to Nantucket through Nantucket Sound, was built to improve the
BA-99

reliability of electric supply while stabilizing rates on Nantucket and made it possible for a generating facility on Nantucket to be dismantled. It is a 42-km (26-mile), 46 kilovolt (kV) submarine cable that was buried 2.4 m (8 ft) below the seabed using a jet plow. The second cable, linking Barnstable to Nantucket, consists of a 53-km (33-mile) long, 46 kV submarine cable that was designed to increase capacity on the island and provide redundancy to the cable from Harwich. In addition to these two known cables, National Oceanic and Atmospheric Administration (NOAA) chart 13237 depicts three “cable areas” stretching from Vineyard Haven to Falmouth. These cable areas depict regions where historically cables were known to exist, but their exact location is no longer known.
Cape Wind is the first proposed offshore wind energy project in the United States. The proposed 130-turbine wind farm would be located in federal waters in Nantucket Sound and have the capacity to generate 420 MW of energy. The cables from the individual turbines would be buried 1.8 m (6 ft) under the ocean floor and connect to a central electrical service platform. Two undersea cables would leave the electrical service platform and make landfall in Yarmouth, where they would connect to the electrical grid.
PIPELINES
Until recently, the Commonwealth’s seafloor was free of pipelines. Those that did exist were conveyances between islands and the mainland or were sewer and/or stormwater discharge points that were relatively close to shore. In 2000, the Massachusetts Water Resources Authority (MWRA) completed its outfall tunnel to Massachusetts Bay and the 2-km-long (6,600 ft), 400-port diffuser that rests on the bottom in roughly 30 m (100 ft) of water. In addition, a private company began construction on a natural gas conveyance that would transit Massachusetts Bay. Since that time, there have been two other major pipelines that have been constructed in the planning area.
Natural Gas Pipelines
There are currently three major natural gas pipelines that transect the planning area. The first of these to be built was the Hubline, a natural gas pipeline that brings product from landside sources, across Massachusetts Bay from Beverly to Weymouth, where it connects to another land-based distribution network. The other two pipelines and their accessory infrastructure bring natural gas from LNG ships, which are (or will be) moored at deepwater ports seaward of the planning area. These pipelines are mapped in Figure 3 of the report of the Work Group on Transportation, Navigation, and Infrastructure (EEA 2008b). In addition, the Work Group mapped areas labeled on NOAA charts as pipeline areas. The Work Group determined that these areas were high priority, meaning that they could not be moved, and in many cases, allowing other activities in their locations would be hazardous (EEA 2008b).
BA-100

Sewer Lines
Sewer lines and the MWRA outfall diffusers are reported on NOAA charts and are mapped in Figure 3 of the report of the Work Group on Transportation, Navigation, and Infrastructure (EEA 2008b). The Work Group determined that these areas were high priority, meaning that they could not be moved, and in many cases, allowing other activities in their locations would be hazardous (EEA 2008b).
WASTEWATER, STORMWATER, AND INDUSTRIAL DISCHARGES
There are 53 significant outfalls (i.e., outfalls discharging greater than 757 m3d [0.2 mgd]) that discharge millions of m3d of wastewater (greater than 2 billion gallons per day) to the waters adjacent to the planning area. There are 28 municipal wastewater facility discharges, 12 thermal discharges from power plants, six discharges from commercial/industrial facilities, and 11 stormwater discharges from oil terminals. The largest outfall is the MWRA’s 15-km (9.5-mile) pipe that discharges on average 1.38 x 10⁶ m3d (365 mgd) of treated municipal effluent and stormwater. Data are not currently stored in a manner where monthly average discharge rates can be quantified and sorted by sector, so the most recent data come from a targeted inquiry into the discharges to Massachusetts Bay, including the tidal waters of the Merrimack River to the Cape Cod Canal (Table 6.5).
Table 6.5 Permitted discharges to Massachusetts Bay by sector and their actual (as opposed to permitted) monthly discharge flow from August 2007-July 2008 (Note that these data do not include discharges from facilities located in Buzzards Bay, Nantucket Sound, or Mt. Hope Bay. There are an additional three commercial/industrial discharges, nine municipal wastewater systems, and two power plant discharges in Buzzards Bay, Nantucket Sound, and Mt. Hope Bay.)
Facility Type Monthly Average Discharge
Volume (m3d) Monthly Average Discharge
Volume (mgd)
Municipal wastewater (18) 1.94 x 10⁶ 513.09 Power Plant (8) 6.43 x 10⁶ 1,696.48 Commercial/Industrial (2) 1.35 x 10⁵ 35.59 Oil terminal stormwater (11) 1.37 x 10⁴ 3.61 Total (39) 8.52 x 10⁶ 2,248.77
Combined Sewer Overflows
A combined sewer is one that carries both stormwater and sewage in the same pipe. Under normal operating conditions, the combined flow is carried to a sewage treatment plant. During heavy rains, when stormwater flow entering the combined sewer can be several times larger than the sewage flow, the collection system becomes overloaded and must be relieved
BA-101

through one or a series of outfalls to the nearest waterbody to prevent system flooding and backups. These outfalls are called combined sewer overflows or CSOs.
CSO discharges can contain all of the same pollutants that are found in stormwater and unprocessed sewage, including nutrients, solids, bacteria, viruses, oils and grease, and metals (Roseen et al. 2007). While CSOs can be significant sources of pollution to nearshore waters or inland rivers (Coughlin 2008), their effects have only been studied locally and thus their contribution to the transport of pollutants to the planning area is unknown. In one of the few studies that reported on CSO contributions to marine waters, Wallace et al. (1991) estimated the contribution of the Fox Point (Boston) CSO to pollutant loadings in Savin Hill Cove (a subtidal depositional area for pollutants from throughout the Dorchester Bay part of Boston Harbor). The Fox Point CSO was found to contribute about 10% of the heavy metals that were accumulating in the Savin Hill Cove subtidal sediments. How and whether those pollutants would then transport out of Boston Harbor and into Massachusetts Bay is unknown.
In 2007, a year that saw 37 inches of rain in the Boston area, the Boston Water and Sewer Commission (BWSC) reported that its 33 CSOs activated 277 times for a total volume of 7.28 x 10⁵ m3 (192 million gallons) discharged to Boston Harbor. For the same year, MWRA reported that 24 other outfalls (individually operated by MWRA or the cities of Chelsea, Cambridge, or Somerville), discharged 93 times for a total volume of 1.32 x 10⁶ m3 (348 million gallons). Twenty-eight percent of the CSO discharges went untreated in 2007 (D. Kubiak, personal communication).
The MWRA CSO abatement plan closed 27 outfalls by 2007 and will close another nine outfalls when completed by 2015. Eleven of the 48 outfalls proposed to remain are predicted not to activate during the typical rainfall year. This leaves 37 outfalls that are projected to discharge 200 times in the typical rainfall year for a total average annual volume of 1.9 x 10⁶ m3 (505 million gallons), of which 473 million gallons (94%) will be treated. The greatest local change is that CSO discharges will be eliminated at 12 outfalls (BOS 081-BOS 090, BOS093, and BOS095) adjacent to or upstream of the Dorchester Bay (including South Boston) beaches will be eliminated. Six of these outfalls are already closed. At Constitution Beach in East Boston, CSO discharges were eliminated with the closing of outfall MWR207 in 2000 (D. Kubiak, personal communication).
The Lynn Water and Sewer Commission operates four CSOs, one to the Saugus River, two to Lynn Harbor, and one to Nahant Bay. In 2006, about 11% of the service area (Lynn, Saugus, Swampscott, and Nahant) was served by combined sewers. In 2007, there were 19 activations of outfall 003, 21 activations of 004, 56 activations of 005, and 12 activations of 006 for an annual total of 4.13 x 10⁵ m3 (109 million gallons). Lynn is in the process of implementing a long-term control plan for its CSOs. The plan includes separating stormwater and wastewater infrastructure (Kevin Brander, personal communication).
BA-102

In 2000, the City of Fall River had 19 CSOs, seven that discharged to Mt. Hope Bay, eight to the Quequechan River, and four to the Taunton River. Starting in 2007, the City of Fall River has been using wooden blocks placed on weirs downstream of interceptors within the City’s CSO system to determine if combined sewage has flowed over the weirs. The placement of the blocks is checked after rain events. Between February 14 and December 24, 2007, 23 weirs were monitored and it was determined that there were 536 overflows. The greatest number of overflows for one weir was 30. Between January 2 and November 7, 2008, 24 weirs were monitored and it was determined that there were 423 overflows. The greatest number of overflows for one weir was 23. The City of Fall River does not monitor flows at this time (David Burns, unpublished data).
The City of New Bedford has 27 CSOs, eight that discharge to Clarke’s Cove, six that discharge to New Bedford Outer Harbor (Buzzards Bay), and 13 that discharge to New Bedford Inner Harbor/Acushnet River. Between 2004 and 2008, the City reduced the number of active CSOs from 37 to 27. In 1996, after wastewater treatment plant and collection system upgrades, there was an annual total of 29 CSO activations to Clarks Cove for a total of 5.04 x 10⁵ m3 (133 million gallons), there were continuous discharges to the Outer Harbor for a total of 1.55 x 10⁶ m3 (409 million gallons), and continuous discharges to the Inner Harbor for a total of 7.99 x 10⁶ m3 (2.11 billion gallons). In 2005 (the most recent year of data), there was a slight reduction to 27 CSO activations to Clarks Cove to 4.13 x 10⁵ m3 (109 million gallons), there was a 94% reduction to 9.1 x 10⁴ m3 (24 million gallons) from 37 activations to the Outer Harbor, and a 84% reduction to 1.27 x 10⁶ m3 (334 million gallons) from 50 activations to the Inner Harbor. CSO discharge volume is expected to decrease by about another 25% by the end of the long-term CSO abatement implementation (2030) (David Burns, unpublished data).
In 2005, the City of Gloucester had five CSOs that, based upon computer modeling, discharged 113 times per year for a total volume of 9.5 x 10⁴ m3 (25 million gallons) to Gloucester Inner Harbor. The long-term CSO management plan is to perform sewer separation from stormwater infrastructure in the areas tributary to three of the CSOs (resulting in three new stormwater-only outfalls to Gloucester Harbor) and to modify the regulators in the other two drainage systems. Once the plan is implemented, the expected number of CSO activations is five, for a total annual volume of 1,327 m3 (0.35 million gallons). This is roughly a 96% reduction in activation frequency and 99% reduction in volume. Under a consent decree, the City of Gloucester must have the plan implemented by June 2012 (Kevin Brander, personal communication).
Desalination Plants
The Commonwealth currently has permitted two desalination plants, one on the Taunton River and one on the Palmer River, both of which are outside of the planning area. Both facilities use a reverse osmosis process to help turn low salinity river water into potable water.
BA-103

The Taunton River Desalination Plant (TRDP) has a permitted daily withdrawal of 37,850 m3 (10 mgd) to make 18,925 m3 (5 mgd) potable water available for sale. The TRDP is owned by a private company and currently has a contract to sell water to the City of Brockton. The Swansea Water District (SWD), in the town of Swansea, is currently building a 11,355 m3 (2 mgd) desalination facility on the Palmer River, which is designed to produce 4,921 m3 per day (1.3 mgd) to be used solely for the SWD rate payers. Both facilities were required to blend their effluent so that the salinity in the effluent is not more that 10% of what it is naturally at high tide at the plants’ locations. Both facilities were also required to build their intake structures in such a way as to minimize entrainment and impingement of ichthyoplankton.
MILITARY TRAINING, DEFENSE, AND LAW ENFORCEMENT
A diverse suite of military activities, from bombing to dredging to ports of call, have occurred in and over the planning area in the past. The amount of live ordinance used in the planning area has decreased or completely ceased, but military training exercises continue. The U.S. Air National Guard, Army Corps of Engineers, Coast Guard, and Navy all continue to conduct activities in the planning area.
U.S. Air National Guard
The airspace over the planning area is an active training area for pilots of aircraft originating from the Otis Air National Guard base and the U.S. Coast Guard air station on the Massachusetts Military Reservation in Sandwich.
U.S. Army Corps of Engineers
USACE is responsible for maintaining the navigational pathways to and from the ports that surround the planning area waters. In addition, USACE is responsible for reviewing and permitting dredging and disposal projects (e.g., underwater pipelines, cables) that occur within planning area waters and beyond.
U.S. Coast Guard
The U.S. Coast Guard has a regional Marine Safety Office (MSO) in Boston Harbor. While the MSO office is outside of the planning area, routine training activities (e.g., homeland security and emergency preparedness) occur within the planning area. The Coast Guard also has a primary role in search and rescue, vessel regulation and natural resource protection enforcement, oil spill response, assistance with marine mammal entanglement events, prevention of drug trafficking, escorting tankers, and navigational aid maintenance efforts within the planning area.
BA-104

U.S. Navy
Between the 1950s and the 1970s, the Navy performed target practice on the James Longstreet, a 127 m (417.7 ft) steel ship that now resides under 6 m (20 ft) of water off of Eastham. The waters around the James Longstreet are listed as a “restricted area” on charts due to unexploded ordinance.
South of Martha’s Vineyard, on Nomans Land Island, the Navy conducted bombing practice from aircraft between 1943 and 1996. Following an effort to clear the island of ordinance in 1997 and 1998, the entire island was transferred to the U.S. Fish and Wildlife Service for use as a wildlife refuge, primarily for migratory birds. Due to danger from unexploded ordinance, access is not permitted, and the island is closed to the public. In addition, two restricted airspace areas, R-4105A and R-4105B, currently occur over the island.
In addition to these remnants of past activities, the Navy has a presence in the planning area via ports of call visits to Massachusetts by various Navy vessels calling in Boston and Gloucester. The Navy tests and modifies new vessels, and trains staff on vessels that traverse Massachusetts waters. The Navy is also involved in research activities in Massachusetts coastal waters. For example, the Navy is a partner in the Martha’s Vineyard Coastal Observatory and has been involved in the whale acoustic monitoring program off the Massachusetts coast.
OCEAN DISPOSAL
The disposal of solid materials in Massachusetts waters can be characterized within one of the following categories: dredge material, nearshore disposal for shore protection, fish waste from processing, derelict vessels, and hazardous waste and ocean dumping.
Clean dredge material of appropriate grain size may be used for other purposes such as beach fill, dune enhancement, and habitat restoration projects. Clean material may also be used in situ as a “cap” for areas of contamination, such as has been done in New Bedford Outer Harbor to contain areas with low-level Polychlorinated Biphenyl (PCB) contamination. Clean material unsuitable for other uses or with no identified beneficial use may be taken offshore to designated areas for disposal. In Massachusetts, these areas are the Massachusetts Bay Disposal Site (MBDS), which is adjacent to the planning area, and the Cape Cod Bay Disposal Site (CCBDS), which is within the planning area. Designated disposal sites receive an extensive review before designation and their use in New England is monitored by the USACE Disposal Area Monitoring System (DAMOS). A third site in Buzzards Bay was used for many years, but was not designated for this use.
In addition to the two permitted Massachusetts disposal areas, several locations are or have been used by USACE for offshore disposal. These sites are located off Newburyport,
BA-105

Marshfield, Bourne, Dennis, and Cleveland’s Ledge in Buzzards Bay. These sites are and have been used by USACE for small amounts of dredge material taken from municipal navigation channels or the Cape Cod Canal. These sites generally lack a comprehensive review of habitat impacts.
One alternative to direct placement of fill material on beaches is to dispose of it in nearshore waters so that it may be dispersed by natural forces. With sufficient data, sediment transport models can be created to estimate the likelihood of success of this practice for a selected beach or coast line. This technique has been used to good effect in Rhode Island using research from the University of Rhode Island (Goulet, personal communication). The development of regional sediment management plans supported by data and modeling could be used to promote this beneficial reuse.
There have been incidents of waste from fish processing operations (gurry) being disposed of at sea. However, this practice is very limited and requires careful evaluation as it can result in high organic loading in the area of disposal. As with nutrient loading in embayments, a large mass of organic material can overwhelm the buffering capacity of the receiving waters and result in anoxic conditions.
At-sea disposal of derelict vessels has been used as a means to relieve congestion and open dock space in municipal harbors. As an example, the Office of Waterways in the Department of Conservation and Recreation cleaned and disposed of several abandoned vessels from New Bedford Harbor at Coxes Ledge located at the mouth of Buzzards Bay. Future efforts may not be permitted in Massachusetts waters since the New England office of the USEPA has enacted a requirement that such vessels be sunk in water depths of 91 m (300 ft) or greater. The practice of at-sea vessel disposal has often been described as artificial reef development. This practice does not commonly involve the monitoring necessary to evaluate the habitat value of these structures.
Ocean disposal areas are mapped in Figure 3 of the report of the Work Group on Transportation, Navigation, and Infrastructure (EEA 2008b). There are eight disposal sites in the planning area: one at the mouth of the Merrimack River, three in Massachusetts Bay (two off of Marblehead and one at the entrance to Boston Harbor), one off of Gurnet Point in Plymouth, one at the eastern end of the Cape Cod Canal, one off of Harwich/Chatham, and one in Buzzards Bay off of Falmouth. The Work Group determined that these areas were medium priority, meaning that they could potentially be moved, but that doing so would involve moving the activity to a less optimal location that will reduce the effectiveness of that activity compared to the present location (EEA 2008b). In addition, the Work Group mapped NOAA spoil areas, areas where dumping of contaminated fill was permitted at one time and which may be currently used for clean fill. These areas are mapped in Figure 3 of the report of the Work Group on Transportation, Navigation, and Infrastructure (EEA 2008b). The Work Group determined that these areas were high priority, meaning that they
BA-106
could not be moved, and in many cases, allowing other activities in their locations would be hazardous (EEA 2008b).
Dredged material disposal sites were ranked by suitability for possible beneficial uses by the Work Group on Regional Sediment Resource Management (EEA 2008d). Two disposal sites in particular were assessed (see p. 19 of the Regional Sediment Resource Management Work Group Report). The Cape Cod Bay disposal site was categorized as being “fine” sediment comprised of mud, sandy mud, and gravelly mud and ranked as low suitability for possible beneficial use. The Cape Cod Canal was categorized as “medium” sediment, comprised of sand and muddy sand, and ranked as high suitability for possible beneficial use.
PROTECTED AREAS
Figure 6.7 provides an overview of protected areas within and adjacent to the planning area.
Areas of Critical Environmental Concern
There are 14 Areas of Critical Environmental Concern (ACECs) in the Commonwealth of Massachusetts adjacent to the planning area (Table 6.6), totaling 30,186 hectares (74,590 acres). ACECs are areas designated by the Secretary of the Executive Office of Energy and Environmental Affairs where unique clusters of natural and human resource values exist. The purpose of the designation process is to determine if the nominated area is of regional, state, or national importance or contains significant ecological systems with critical interrelationships among a number of components. Once an ACEC is designated, regulations (301 CMR 12.00) require state agencies to preserve, restore, and enhance resources. Agencies are charged with giving closer scrutiny to activities proposed within the planning area that are adjacent to ACECs to ensure that environmental impacts within ACECs are avoided or minimized.
Cape Cod National Seashore
The Cape Cod National Seashore is a 17,646 hectare (43,604 acre) park that extends across the boundaries of Provincetown, Truro, Wellfleet, Eastham, Orleans, and Chatham. This national park includes wooded uplands, dunes, fields, recreational trails, salt and freshwater wetlands, many freshwater kettle ponds, and miles of shoreline, including a 64 km (40 mile) long stretch of pristine sandy beach. The authorized National Seashore boundary extends offshore into coastal waters roughly 0.4 km (0.25 mile). This leaves the park boundary just outside the planning area.
BA-107

Table 6.6 Areas of Critical Environmental Concern in and adjacent to the Massachusetts ocean management planning area
ACEC Hectares (Acres) Location/Communities
Bourne Back River 749 (1,850) Bourne Ellisville Harbor 243 (600) Plymouth Herring River Watershed 1,801 (4,450) Bourne, Plymouth Inner Cape Cod Bay 1,052 (2,600) Brewster, Eastham, Orleans Neponset River Estuary 526 (1,300) Boston, Milton, Quincy Great Marsh 10,320 (25,500) Essex, Gloucester, Ipswich, Newbury, Rowley Pleasant Bay 3,739 (9,240) Brewster, Chatham, Harwich, Orleans Pocasset River 65 (160) Bourne Rumney Marshes 1,133 (2,800) Boston, Lynn, Revere, Saugus, Winthrop Sandy Neck Barrier Beach System 3,695 (9,130) Barnstable, Sandwich
Waquoit Bay 1,044 (2,580) Falmouth, Mashpee Weir River 385 (950) Cohasset, Hingham, Hull Wellfleet Harbor 5,050 (12,480) Eastham, Truro, Wellfleet Weymouth Back River 385 (950) Hingham, Weymouth
National Estuarine Resource Reserve
The Waquoit Bay National Estuarine Research Reserve is a 1,125 hectare (2,780 acre) collection of wetlands and uplands located within the towns of Falmouth and Mashpee. The reserve is outside the planning area.
National Wildlife Refuges and National Wildlife Areas
The Mashpee, Monomoy, Nantucket, Nomans Land, and Parker River National Wildlife Refuges are all adjacent to the planning area and the Thacher Island National Wildlife Refuge off of Rockport is actually in the planning area. Together these protected areas cover 9,162 hectares (22,640 acres). The Monomoy and Parker River National Wildlife Refuges have received recognition internationally for their ecological diversity and importance to migrating shorebirds.
No Discharge Areas
The federal Clean Water Act allows states to prohibit the discharge of sewage, whether treated or not, from vessels in navigable coastal waters. In Massachusetts, No Discharge Areas have been designated for Waquoit Bay, Chatham’s Stage Harbor, all of Cape Cod Bay and Buzzards Bay, Salem Sound and adjacent coastal waters, Boston Harbor and adjacent coastal waters out to The Graves, the coastal waters from Winthrop to Lynn, the coastal waters from Scituate to Hull, and the coastal waters of Nantucket, Barnstable, and Harwich. Currently, there are 367,906 hectares (909,155 acres) of coastal waters protected as boat
BA-108

sewage No Discharge Areas. The Commonwealth has a goal of designating all state waters as a No Discharge Area by 2010.
Ocean Sanctuaries
There are five designated Ocean Sanctuaries in the planning area including Cape Cod, Cape Cod Bay, Cape and Islands, North Shore, and South Essex (Figure 6.8). Together these ocean sanctuaries cover 543,489 hectares (1,342,990 acres). Under MGL c. 132A, Section 14, CZM serves as a trustee of the resources of the Ocean Sanctuaries and Cape Cod National Seashore, with jurisdiction over any activity that could significantly alter or endanger the ecology or appearance of the ocean, the seabed, or subsoil in these areas.
Certain activities are prohibited in the Ocean Sanctuaries including: building of any structure on the seabed or under the subsoil, removal of any minerals and the drilling for oil or gas; discharge of commercial, municipal, domestic, or industrial wastes; commercial advertising; and incineration of wastes. The construction of off-shore or floating electric generating stations is also prohibited except: a) on an emergency and temporary basis for the supply of energy when the electric generating station is otherwise consistent with an ocean management plan; or b) for appropriate-scale renewable energy facilities, as defined by an ocean management plan promulgated pursuant to M.G.L. c.21C, section 4C, in areas other than the Cape Cod Ocean Sanctuary.
Permitted activities include: industrial cooling water intakes and discharges (except in the Cape Cod Ocean Sanctuary); municipal, industrial, or commercial facilities or discharges existing before December 30, 1976; telecommunications and power cables; channel and shore protection projects, navigational aids, and projects deemed to be of public necessity and convenience authorized under Chapter 91; harvesting and propagation of shellfish and finfish; temporary scientific or educational projects; extraction of sand and gravel for shore protection; wastewater treatment facilities in the South Essex Ocean Sanctuary if they are the only feasible alternative; and wastewater treatment facilities in the North Shore Ocean Sanctuary, only if construction of the facility commenced or the municipality received a federal or state grant for construction before January 1, 1978. In cases where the prohibition against discharges of municipal wastes into the ocean sanctuaries may not further the purposes of the Oceans Act, such discharges may be allowed; provided, however, that a suitable quality of effluent is achieved to protect the appearance, ecology, and marine resources of the sanctuary; and, provided further that MassDEP, in its discretion, upon application, grants a variance from the prohibitions.
Outstanding Resource Waters
MassDEP has designated certain waterbodies (e.g., Class A public water supplies and their tributaries, certain wetlands) to be Outstanding Resource Waters (ORWs) based on their
BA-109

outstanding socioeconomic, recreational, ecological and/or aesthetic values. State regulations (314 CMR 4.04) require that the quality of these waters be protected and maintained. At the time of the regulation’s inception, owners of discharges to ORWs were required to connect to a publicly owned wastewater facility, if feasible, or demonstrate that the discharges were treated with the highest and best practical method of waste treatment. New discharges to ORWs are prohibited unless: 1) the discharge is for the express purpose and intent of maintaining or enhancing the resource for its designated use, or 2) the discharge is dredged material for qualifying activities in limited circumstances. In Massachusetts there are 40,568 hectares (100,245 acres) of coastal waters designated as ORWs.
EDUCATION AND RESEARCH
There are over 120 universities and colleges in Massachusetts, with more than 430,000 students enrolled in these institutions offering degrees in a plethora of disciplines including business, health, arts, engineering, law, theology and sciences. The public higher education system includes 29 community colleges, nine state colleges, and five university campuses, serving about 260,000 students annually. In 2006, for example, 30,000 students were awarded degrees and certificates from state colleges. The total number of degrees awarded in 2006 by public and private institutions was just under 100,000, well above the national average of 68,322 (USDE 2006).
Massachusetts is the location of some of the best research institutions in the United States, indeed globally, especially for oceanography, biology, biomedical research, and technology. Thousands of scientists visit institutions such as Woods Hole Oceanographic Institution (WHOI), the Marine Biological Laboratory (MBL), Harvard University, Massachusetts Institute of Technology (MIT), Boston University and others in order to make use of the scientific and technological resources available, as well as experience innovative research techniques in their work.
Woods Hole is a veritable mecca of research institutions, offering opportunities to college students and scientists. MBL offers advanced, graduate-level courses in embryology, physiology, neurobiology, microbiology, and parasitology. This institution maintains year-round research programs in cell and developmental biology, ecology and environmental science, neurobiology, sensory physiology, microbiology, marine biomedicine, molecular evolution, and aquaculture. In addition, hundreds of distinguished biologists from around the world come to the MBL each summer to use marine organisms as model systems for biomedical research.
WHOI is comprised of research departments (physical oceanography, biology, marine chemistry, geology and geophysics, and applied ocean physics and engineering), ocean institutes (coastal ocean, deep ocean exploration, ocean life, and climate change), centers (Cooperative Institute for the North Atlantic Region; Center for Ocean, Seafloor and Marine
BA-110
Observing Systems; Cooperative Institute for Climate and Ocean Research; Marine Policy; Ocean and Human Health; and Marine Mammals), and laboratory facilities. The institution owns several research vessels and builds and operates underwater vehicles for ocean exploration. In 2006, WHOI housed 148 scientists, 206 technical staff, 183 scientific support staff, 107 marine crew, 152 graduate students, and 249 administrative staff (WHOI 2006). In addition, these institutions offer opportunities for elementary and secondary classes as well as collegiate courses through the Sea Education Association (SEA). For example, MBL offers a wide range of programs and resources for K-12 students and faculty that can be used to supplement a curriculum, as extracurricular activities, and field trips, or to enhance the classroom experience. WHOI provides professional development workshops for middle and high school teachers, resources for students, and links to local opportunities including science fairs and access to libraries. The Woods Hole Science and Technology Education Partnership, established in 1989, is a partnership of schools, scientific institutions, businesses, and community resources. Its purpose is to support, promote, and expand science and technology education and science literacy in the participating communities. Two other institutions with an oceans focus are the MIT and Woods Hole Sea Grant programs, which provide research and education on a variety of topics vital to human and environmental health (water quality, coastal hazards, and biotechnology). Woods Hole is also the location of other research centers such as the U.S. Geological Survey, the Woods Hole Research Center, and the NOAA Northeast Fisheries Science Center.
AESTHETICS
Compared to ocean-based resources and activities that can be directly observed, measured, and mapped, enjoyment of ocean scenery does not lend itself easily to data collection and analysis; indeed, it does not even take place for the most part within the planning area, but from the adjacent shorelands. Scenic enjoyment is also an important part of the recreational boating experience, but has not yet been examined. Recognition of the value of visual services is hardly new; Massachusetts was a pioneer in the field of land-based visual assessments with the Massachusetts Department of Environmental Management (DEM) Scenic Landscape Inventory effort in 1981/82. The Massachusetts Department of Conservation and Recreation (DCR, formerly DEM) engages in similar ongoing work with communities through the Heritage Landscape Inventory program. With the global interest in the development of wind farms in particular, other countries and coastal states in the United States are starting to develop visual impact analyses based upon traditional studies of viewshed across landscapes, adapting them to the seascape context and exploring ways to identify visual resource areas of high value (Maritime Ireland/Wales 2001; UK Department of Trade and Industry 2005). In the United States, some agencies are exploring the use of Geographical Information System (GIS) tools to model viewshed and assign values to them for mapping purposes through a variety of means (State of Connecticut 2007). Within
BA-111

Massachusetts, the Boston Harbor Islands have recently been the subject of a scenic analysis and assessment (Ryan and Taupier 2007).
Use of the ocean as a scenic resource occurs primarily in three ways: visitation to federal, state, and town beaches and other recreation properties open to the public (including bikeways and footpaths); patronage of waterfront hotels, restaurants, and other commercial facilities of public accommodation (FPAs); and ownership of private waterfront property. Use of scenic resources also occurs through driving, biking, and walking along non-recreational properties, such as shoreside roads, and even from workplaces with waterfront views. Currently, efforts are directed toward a better understanding of the first “vantage point,” because government and non-government organization (NGO) lands presumably provide the most public viewing opportunities in the aggregate and have been the subject of reasonably thorough data development efforts.
Beyond the scenic qualities of ocean resources, aesthetics also encompasses sounds, sensations, smells, and tastes. Indeed, the Massachusetts Water Quality Standards (314 CMR 4.05(4)) protect marine waters from color and turbidity in “concentrations or combinations that are aesthetically objectionable” or that would impair any designated use. The Water Quality Standards also require that marine waters have no taste and odor other than that of natural origin.
SHORELINE PROTECTION AND FLOODPLAIN MANAGEMENT
Dynamic coastal environments shift and change in response to increases in energy (wind and waves), alterations to regional sediment resources (sand, gravel, and cobble), and changing sea levels. Although the Massachusetts shoreline is technically outside of the planning area, activities within the planning area can directly and indirectly impact processes and activities on the shoreline. Coastal land loss and erosion, flooding, and inundation are already major challenges that coastal communities face. Erosion and flooding are the primary coastal hazards that lead to the loss of lives or damage to property and infrastructure in developed coastal areas. Therefore, proposed activities in the planning area should consider potential impacts on coastal areas as a result of changes in ocean circulation, marine sediment transport, and water levels. To address these concerns, the Commonwealth of Massachusetts, through the Coastal Hazards Commission (CHC), has initiated efforts to build a comprehensive shoreline protection plan. An accurate coastal sediment budget—a quantitative accounting of gains and losses of sediment within a defined boundary over a period of time—is needed to improve the effectiveness of coastal erosion mitigation efforts and is a recommendation of the CHC (CZM 2007). The Commonwealth provides recommendations to the many communities that conduct beach fill activities on a regular basis. While many projects in Massachusetts have used either upland sources of material or re-use sand dredged from navigation channels, two major beach fill projects using offshore sources of sediment have been proposed for Winthrop Beach and Siasconset Beach. The
BA-112

demand for offshore sediment sources from the planning area will likely increase. The CHC recommended the identification of upland and offshore sources of sand as well as an assessment of the environmental impacts of mining activities (CZM 2007).
EXTRACTION FOR BEACH NOURISHMENT
The Commonwealth considers non-structural measures such as beach nourishment (i.e., the active addition of sediment to a beach system) viable alternatives to protect coastal development while also maintaining recreational beaches. Beach nourishment projects require an adequate volume of compatible sediment. Massachusetts successfully completed a beach nourishment project on Revere Beach State Reservation in 1992 using an upland source of approximately 768,000 cubic yards of sediment. Smaller nourishment projects were also completed on Dead Neck Beach in Osterville (1998) and Long Beach in Plymouth (1999) using sediment from offshore sources. No extraction of sand for beach nourishment has yet been permitted in the planning area, but the possibility of this use is of particular interest with the increase threat of coastal erosion and inundation. For example, two major beach nourishment projects using offshore sources of sediment have been proposed for Winthrop Beach and Siasconset Beach. Sediment sources in the planning area may be used if these projects move forward. While successfully nourished beaches can minimize property and infrastructure damages, restore the vitality of communities, and energize local economies, maintenance of artificial beaches does require continued placement of sediment. These projects and the need to periodically re-nourish previously nourished beaches demonstrate that the demand for offshore sediment sources from the planning area will likely increase, and that conflicts and compatibilities between nourishment sites and other uses within the planning area will need to be considered. The current, proposed, and future uses, activities, and functions of mining in the planning area include: sand and gravel mining for shoreline protection or beach nourishment, mining for mineral extraction, and mining for commercial construction or fill material.
The potential for offshore mining was first explored in the New England Offshore Mining Study (NOMES) (Willet 1972) by Raytheon as part of the Massachusetts Coastal Mineral Inventory Survey conducted for the Massachusetts Department of Natural Resources, Division of Mineral Resources. Although substantial biological studies were planned as part of that effort, they were not conducted due to lack of funding. The need for better biological information was further emphasized in a study sponsored by CZM (Byrnes et al. 2000). Species that are found at various life stages associated with coarse sediment include Atlantic cod, yellowtail flounder, sea scallops, and American lobster. The best-known study that looked at fish as well as benthic infauna over multiple years was conducted by USACE off the coast of New Jersey (USACE 2001). Recovery of the fish habitat in the mining site was documented over a three-year period; however, the application of such data to projects in Massachusetts must take into account local conditions.
BA-113

REFERENCES
Boston University (BU). 2007. BU website. http://www.bu.edu/research/. Accessed 11/18/08.
Brander, K. 2008. Personal communication. MassDEP.
Bureau of Land Management (BLM). undated. Visual Resource Inventory. Manual H-8410-1. http://www.blm.gov/nstc/VRM/8410.html. Accessed 11/24/08.
Burns, D. 2008. Unpublished combined sewer overflow discharge data from City of Fall River: February 2007 to November 2008. MassDEP.
Byrnes, M.R., J.S. Ramsey, R.M. Hammer, and E.A. Wadman. 2000. Assessing potential environmental impacts of offshore sand and gravel mining. Final Report to the Commonwealth of Massachusetts, Executive Office of Environmental Affairs, Coastal Zone Management.
City of Gloucester and Urban Harbors Institute. 2006. Draft City of Gloucester Harbor Plan & Designated Port Area Master Plan 2006. http://www.uhi.umb.edu/pdf_files/Draft_Gloucester_Harbor_Plan.pdf. Accessed 11/24/08
Coughlin, K. 2008. Summary of CSO receiving water quality monitoring in Upper Mystic River/Alewife Brook and Charles River, 2007. Boston: Massachusetts Water Resources Authority. Report 2008-07. 42 pp. Disinger, J.F. and C.E. Roth. 1992. Environmental Education Research News. The Environmentalist 12(3): 165-168.
Electrical Power Research Institute (EPRI) 2006a. System level design, performance, cost and economic assessment–Massachusetts Muskeget Channel Tidal In-Stream power Plant. Electric Power Research Institute Inc.
Electrical Power Research Institute (EPRI) 2006b. Massachusetts Tidal In-Stream Energy Conversion (TISEC): Survey and characterization of potential project sites. Electric Power Research Institute Inc.
Executive Office of Energy and Environmental Affairs (EEA). 2008a. Report of the Work Group on Ocean Recreational and Cultural Services. http://www.mass.gov/Eoeea/docs/eea/oceans/112108_orc_report.doc. Accessed 1/8/09.
BA-114

Executive Office of Energy and Environmental Affairs (EEA). 2008b. Report of the Work Group on Transportation, Navigation, and Infrastructure. http://www.mass.gov/Eoeea/docs/eea/oceans/112108_navworkgroupreport.pdf. Accessed 1/8/09.
Executive Office of Energy and Environmental Affairs (EEA). 2008c. Report of the Work Group on Renewable Energy. http://www.mass.gov/Eoeea/docs/eea/oceans/120308_renewables.doc. Accessed 1/9/09.
Executive Office of Energy and Environmental Affairs (EEA). 2008d. Report of the Work Group on Regional Sediment Resource Management. http://www.mass.gov/Eoeea/docs/eea/oceans/112108_rsrm_report_draft.pdf. Accessed 1/9/09.
Fedele, F. 2009. Personal communication. U. S Army Corps of Engineers, Cape Cod Canal Field Office, Marine Traffic Control Section.
Hadden, D. 2008. Personal communication. Massachusetts Port Authority.
Harvard University. 2008. Harvard University website. http://www.environment.harvard.edu/index.htm. Accessed 11/24/08.
IPCC. 2007. Climate Change 2007: Synthesis Report. Contribution of Working Groups I, II and III to the Fourth Assessment Report of the Intergovernmental Panel on Climate Change [Core Writing Team, Pachuari, R.K. and Reisinger, A. (eds.)]. IPCC, Geneva, Switzerland. 104 pp.Kogan, I., C.K. Paull, L. Kuhnz, E.J. Burton, S. Von Thun, G.H. Greene, and J.P. Barry. 2003. Environmental Impact of the ATOC/Pioneer Seamount. Environmental Impact of the ATOC/Pioneer Seamount.
Kubiak, D. 2009. Personal communication via Andrea Rex. MWRA.
Lyn, C.L. Undated. NRCA guidelines for the construction, maintenance and monitoring of underwater pipelines and cables in the coastal zone. Natural Resources Conservation Authority. http://www.nrca.org/publications/guidelines/UnderwaterCablesPipelines/UnderseaCablesandPipelines-part1.html. Accessed 11/24/08.
Maritime Ireland/Wales. 2001. Guide to Best Practice in Seascape Assessment. INTERREG Report No. 5, March 2001.
Massachusetts Division of Marine Fisheries (MA DMF). 2006. Aquaculture report.
BA-115

Massachusetts Division of Marine Fisheries (MA DMF). 2008. Saltwater Recreational Fishing Guide.
Massachusetts Division of Marine Fisheries (MA DMF) 2009. Fisheries statistics project.
Massachusetts General Laws, Chap. 164, S. 50 and 190 of the Acts of 1997. An Act Relative to Restructuring the Electric Utility Industry in the Commonwealth, Regulating the Provisions of Electricity and Other Services, and Promoting Enhanced Consumer Protections Therein. Approved November 25, 1997.
Massachusetts Marine Trades Association (MMTA) 2008. http://www.boatma.com/boating_in_ma.html. Accessed 11/03/08.
Massachusetts Office of Coastal Zone Management (CZM). 2004. Characterization of ocean uses. Massachusetts Ocean Management Task Force Technical Report. http://www.mass.gov/czm/oceanmanagement/waves_of_change/index.htm. Accessed 11/20/08.
Massachusetts Office of Coastal Zone Management (CZM). 2007. Preparing for the storm: Recommendations for management of risk from coastal hazards in Massachusetts. Coastal Hazards Commission Final Report. http://www.mass.gov/czm/chc/recommendations/chc_final_report_2007.pdf. Accessed 1/14/08.
Massducks.com 2008. Website. http://massducks.com/. Accessed 11/24/08.
Michigan State University Recreational Marine Research Center (MSURMRC). 2008. http://www.prr.msu.edu/rmrc/boatresearch.asp. Accessed on 1/8/09.Musial, W. and S. Butterfield. 2004. Future for Offshore Wind Energy in the United States. Preprint for Energy Ocean 2004, Palm Beach, Florida, June 28-29, 2004. Available at http://www.nrel.gov/docs/fy04osti/36313.pdf. Accessed 10/1/08.
National Oceanic and Atmospheric Administration (NOAA) Aquaculture Program. 2007. Massachusetts Aquaculture. Fact Sheet. http://aquaculture2007.noaa.gov/pdf/Massachusetts_June262007.pdf. Accessed 11/21/08.
NOAA National Marine Fisheries Service (NMFS). 2008a. Dutch Harbor-Unalaska, Alaska, and New Bedford, Mass. Remain Top Fishing Ports. Press Release. July 17, 2008.
NOAA National Marine Fisheries Service (NMFS). 2008b. http://www.st.nmfs.noaa.gov/st1/commercial/landings/annual_landings.html. Accessed 11/21/08.
BA-116

NOAA National Marine Sanctuary Program (NMSP). 2008. Stellwagen Bank National Marine Sanctuary Draft Management Plan/Draft Environmental Assessment. Silver Spring, MD.
New Hampshire Sea Grant (NH Sea Grant). 2006. Growing Seafood in the Open Ocean: Offshore Aquaculture in the United States. NH Sea Grant publication UNHMP-TR-SG-06-22. http://extension.unh.edu/Marine/Docs/nhut06002_000.pdf. Accessed 11/19/08.
Rex, A. 2009. Personal communication. MWRA.
Rogers, A.L., J.F. Manwell, and J.G. McGowan. 2003. A year 2000 summary of offshore wind development in the United States. Energy Conversion and Management 44: 215-229.
Roseen, R., T. Ballestero, and J. Houle. 2007. University of New Hampshire Stormwater Center 2007 Annual Report. Available at: http://www.unh.edu/erg/cstev/2007_stormwater_annual_report.pdf. Accessed 1/4/09.
Ryan, R.L. and R.P. Taupier. 2007. Boston Harbor Islands National Park Area Scenic Analysis and Assessment: A Pilot Study. UMass (Amherst) Department of Landscape Architecture and Regional Planning.
State of Connecticut. 2007. Visual Impacts and Assessments: Coastal Connecticut. http://www.ct.gov/dep/lib/dep/long_island_sound/living_on_the_shore/visual_impacts_and_assessments.pdf. Accessed 11/24/08.
Stott, R.S. and D.P. Olson. 1972. Differential Vulnerability Patterns among Three Species of Sea Ducks. The Journal of Wildlife Management 36(3): 775-783.
Thresher, R. 2005. Offshore Energy Hearing. April 19, 2005. Dr. Robert Thresher, Director, National Wind Technology Center, National Renewable Energy Laboratory, Colorado. Prepared Statement.
TRC Environmental Corporation (TRC). 2006. Inventory of existing and proposed offshore energy facilities and associated infrastructure.
UK Department of Trade and Industry. 2005. Guidance on the Assessment of the Impact of Offshore Wind Farms: Seascape and Visual Impact Report.
University of Massachusetts (UMass). 2006. An Assessment of the Coastal and Marine Economies of Massachusetts. Report for the Massachusetts Office of Coastal Zone Management.
University of Massachusetts (UMass). 2008. UMass website. http://www.massachusetts.edu. Accessed 11/18/08.
BA-117

BA-118
U.S. Army Corps of Engineers Engineer (USACE) Research and Development Center. 2001. The New York District’s Biological Monitoring Program for the Atlantic Coast of New Jersey, Asbury Park to Manasquan Section Beach Erosion Control Project.
U.S. Coast Guard (USCG). 2007. Recreational boating statistics 2007. COMDTPUB P16754.21.
U.S. Department of Commerce. National Oceanic and Atmospheric Administration. National Marine Sanctuary Program. 2008. Stellwagen Bank National Marine Sanctuary Draft Management Plan/Draft Environmental Assessment. Silver Spring, MD.
U.S. Department of Education (USDE) Institute of Education Sciences. 2006. National Center for Environmental Statistics. http://nces.ed.gov/. Accessed 11/24/08.
U.S. Department of Energy (U.S. DOE). 2008. U.S. Department of Energy website. http://apps1.eere.energy.gov/states/state_specific_information.cfm/state=MA. Accessed 10/30/08.
U.S. Fish and Wildlife Service (USFWS). 2001. Birding in the United States: A Demographic and Economic Analysis. Addendum to the 2001 National Survey of Fishing, Hunting and Wildlife-Associated Recreation Report 2001-1. http://www.fs.fed.us/outdoors/naturewatch/start/economics/Economic-Analysis-for-Birding.pdf. Accessed 11/24/08.
Wallace, G.T., C.F. Krahforst, L.C. Pitts, J.P. Shine, M.M. Studer, and C.R. Bollinger. 1991. Assessment of the chemical composition of the Fox Point CSO effluent and associated subtidal and intertidal environments: Analysis of CSO effluents, receiving water and surface sediments for trace metals prior to CSO modification. Final Report to MA Dept. of Environmental Protection, Office of Research and Standards. 225 pp.Westage, Z.J. and J.T. DeJong. 2005. Geotechnical considerations of offshore wind turbines. Offshore Wind Collaborative, August 1, 2005.
Willett, C.F. 1972. Summary of the Massachusetts Coastal Mineral Inventory Survey. Raytheon Company Report.
Woods Hole Oceanographic Institute (WHOI). 2006. WHOI website. http://www.whoi.edu/page.do?pid=7122, http://www.whoi.edu/page.do?pid=7119. Accessed 11/18/08.

Chapter 7 - Economic Valuation
An economic valuation of the marine environment is based on the services it provides. Ecosystem services are defined as all benefits that humans receive from ecosystems (Daly 1997). The benefits of marine ecosystems, which include open ocean, coastal environment, and estuaries, can be direct (e.g., food production) or indirect, through the functioning of ecosystem processes that produce the direct services. Ecosystem services are critical to the function of coastal systems and contribute significantly to human well-being, representing a significant portion of the total economic value of the marine environment. According to Agardy et al. (2005), the best available data indicates that marketed and non-marketed marine ecosystem services have substantial economic value.
The total economic value (TEV) of marine ecosystem services is the sum of the values of direct-use resources, indirect-use resources, and non-use resources. Non-use resource value is made up of option value and existence value. Goods and services may be valued for potential future benefits, which constitute an option value (a person’s willingness-to-pay to have that resource available in the future). The concept of option value is rather controversial as it can refer to use and/or non-use resource valuation. Existence value reflects benefits from simply knowing that a certain good or service exists. People may be willing to pay for protection of habitats, even those located in remote, hard-to-access areas that they may never visit. Part of this willingness to pay may be driven by a bequest motive. People derive benefits from ensuring that certain goods will be preserved for future generations. For example, people concerned with future damages from global warming may be willing to pay to reduce them, despite the fact that the vast majority of the damage is expected to affect the earth long after they are gone.
ECONOMIC IMPACT OF THE MARINE ECONOMY IN MASSACHUSETTS
The maritime economy generated $14.8 billion in Massachusetts in 2004, including $6.1 billion in secondary output impacts (jobs created in the rest of the state through functioning of the maritime economy) (Donahue Institute 2006). The marine economic sectors in Massachusetts include Commercial Seafood, Transportation, Coastal Tourism and Recreation, Marine Science and Technology, and marine-related Construction and Infrastructure. The linkages among the various economic sectors affect the amount of revenue generated within the local economy.
The coastal tourism and recreation sector is the largest among marine-related businesses, consisting of 70% of marine businesses and employing 79% of people in marine-related businesses. However, it also offers the lowest wages. Marine science and technology businesses, on the other hand, belong to one of the smallest sectors but offer the highest wages (MOTT 2007). Marine economy employment has a moderate impact on job creation,
BA-119
with a multiplier effect of 1.47 (i.e., one job generates 0.47 jobs). Marine transportation and marine science and technology have the highest multiplier effects—2.83 and 2.27, respectively.
EMPLOYMENT
About 37% (1,161,326 persons) of the workforce in Massachusetts is employed in maritime sectors, which are of special value to the coastal communities that depend on these industries (EOLWD 2004). In 2004, the gross state product (GSP) of the coastal economy was $117 billion, or 37% of the GSP for all of Massachusetts (Donahue Institute 2006). Over 78% of employees in marine-related industries are employed in the coastal tourism and recreation sector, followed by marine-related construction and infrastructure (10%) and commercial seafood (7%).
In the past, the marine-related construction and the commercial seafood sectors contributed relatively more to the Commonwealth’s workforce. However, a decrease in demand by the U.S. Navy, improvements in productivity of the offshore oil and gas industry, as well as an increase in shipping efficiency and productivity to meet cargo demands have resulted in a reduction in the shipbuilding industry, formerly a major employer in New England. Over the last decades, there has also been a tendency for the U.S. maritime economy to shift away from extractive sectors, such as the mineral industry and commercial fishing, toward the service/tourism industry (Colgan 2003). The service industry operates at lower wages and the shift to these lower-paying jobs presents an economic challenge to coastal states. Further, increasing residential and commercial development has caused an increase in real estate value. The transition from traditional maritime to recreational industries, together with a concomitant increase in property values, may be the cause of additional pressure on development of coastal lands (MOMTF 2004).
MARINE TRANSPORTATION
Although transportation is not the largest sector in the marine industry in Massachusetts, it is an important contributor, and includes transportation of foreign and domestic freight, passengers, towing and tugboat services, as well as marine pipeline and gas transmission. In 2004, just over 2,000 individuals were employed in marine transportation in Massachusetts. This sector generated $529 million, with almost 50% from secondary output impacts (Donahue Institute 2006). Marine transportation contributed only 3% of the total marine industry employment in Massachusetts. About 75% came from passenger transportation (41%) and scenic and sightseeing transportation (35%). Despite its low input to the marine economy in Massachusetts, marine transportation has the highest multiplier (2.83) within the marine industry (Donahue Institute 2006).
BA-120

There are seven major customs ports in Massachusetts: Boston, Gloucester, Salem, New Bedford, Fall River, Plymouth, and Provincetown. Exports and imports increased state-wide between 1997 and 2004. However, port calls and port capacity have decreased between 2002 and 2004. This could have been the reason for the decline in foreign container imports by 50% since 1997. While port capacity in Boston decreased, general cargo capacity increased by 600%. As for the other ports, variations in weight and value also occurred, with decreases by 90% for Fall River and Gloucester. New Bedford saw a decrease in trade by weight by 50% and an increase in value of 500% (Donahue Institute 2006). Marine Transportation may be impacted by changes in transportation costs as well as channel depth. Channel depth limits growth in volume and weight traded. As vessels are becoming larger to transport greater volumes, navigational channel depth becomes a determining factor that has economic impacts (as discussed in the Transportation section of Chapter 6 - Human Uses).
COASTAL TOURISM AND RECREATION
The tourism and recreation sector employed 125,800 individuals in 2006. The sector comprises three subsectors: food, entertainment and recreation, and accommodations. Seventy-three percent of the people employed in this sector are in food service, 15% are in jobs related to accommodations, and 11% are in the entertainment and recreation sector. Although the tourism and recreation sector is the largest in the marine economy in terms of number of establishments, number of employees, and total wages paid, the average salary is the lowest. Altogether, $14.2 billion were generated in this sector in 2006, an increase of 8.6% over 2005. This represented 2% of all U.S. direct expenditures ($699.9 billion). Fifty-four percent of the visitors were from New England and 20% from the mid-Atlantic states. The 1.7 million international visitors were mainly from Canada, the United Kingdom, and Germany and accounted for 11.4% of money spent by visitors, indicating an increase of 16.6% over 2005 (MOTT 2007).
The top industries that benefited from tourists were transportation (43.7%), accommodation (22.6%), food (19.0%), and entertainment and recreation (6.1%). Sixty-nine percent of visitors traveled by car (MOTT 2007). This sector has the lowest employment multiplier effect of the marine industry (1.32), generating insignificant amounts of additional demand for goods and services within the state. However, due to its extensive size, the number of jobs it creates is over 70% of total jobs in the maritime industry and the total output generated is the highest of all sectors ($8.72 billion) in the state (Donahue Institute 2006).
Activities associated with this sector include recreational boating, saltwater angling, wildlife watching, and beach visits. At least 20% of visitors to Massachusetts visit Cape Cod and the Islands, the second most visited destination after Boston. Cape Cod has many coastal resources that make it attractive to visitors, mainly its beaches and bays. The main activities in which Massachusetts residents participate are swimming (44%), coastal viewing (34%), boating (19%), and diving (3%) (Donahue Institute 2006). Whale watching is a popular
BA-121

activity as a result of the proximity of Stellwagen Bank, with annual revenue of about $25 million ($21 million in 1996) (Donahue Institute 2006).
In 2007, 12,875,568 recreational vessels were registered in the United States, including motor boats, sail boats, canoes and kayaks, and rowboats (USCG 2008). According to the Massachusetts Marine Trades Association (MMTA), the total number of recreational vessels registered in Massachusetts is close to 186,000. The total number of motor boats in the United States is 11,966,627. Massachusetts ranks 29th with 145,496 motor boats registered in 2007, down from 148,640 in 2006 (USCG 2007). During the summer, as many as 195,000 residents go boating during the weekend (in fresh and salt water). Boat owners in this state spend $192,917,000 per year on new boats, engines, trailers, and accessories (MMTA 2008). The Donahue Institute study projected that recreational boat ownership has an employment multiplier of 1.37 and a spending multiplier of 1.33. The net effect on local communities from peripheral spending was $1,338,750,000 in 2007 (MMTA 2008).
An important aspect of recreational boating is the number of businesses and trades associated with it, including boat yards, marinas, boat manufacturing, sales and transportation, canvas makers, charters and excursions, dock management, harbormasters, marine surveyors and yacht brokers. There are 64 marinas and about 25,000 permitted public slips and moorings used for recreational boating along the coastline of Massachusetts. In addition, there are an estimated 10,000 privately maintained slips, moorings, and docks (MMTA 2008).
COMMERCIAL AND RECREATIONAL SEAFOOD
Massachusetts has always been a leading state in the fisheries sector. The commercial seafood sector comprises commercial fishing, seafood processing, and wholesale industries and employs 11,270 people in Massachusetts. Since the Fishery Conservation and Management Act extended the nation’s Exclusive Economic Zone to 37 kilometers (km) (20 nautical miles) in 1976, landing values have gone up from $239 million to $377 million in 1987, down to $210 million in 1998, and back up to $296 million in 2004 (out of a gross state product of $1.6 billion) (Donahue Institute 2006).
The commercial fishing industry in Massachusetts is one of the most valuable in the United States. Scallops, lobsters, and groundfish species are responsible for the highest revenue. Commercial and recreational fishing in Massachusetts contribute $2 billion to the economy, including fish sales (25%) and fishing support services (12%) (including fuel, bait, ice, food, insurance, mortgage). In Massachusetts 157,992 metric tons (174,156 tons) worth $437,048,000 and 137,443 metric tons (151,505 tons) worth $417,495,000 were landed in 2006 and 2007 respectively (Van Voorhees 2007). The top seaports in 2007 were New Bedford (122 million kilograms [kg] or 268 million pounds [lb]), Gloucester (21.2 million kg
BA-122
or 46.8 million lb), and Provincetown-Chatham (8.26 million kg or 18.2 million lb) (Van Voorhees 2007).
Scallops and lobsters constitute the highest value of landings. Scallops in particular, have allowed the port of New Bedford to prosper in comparison to other Massachusetts ports. Between 1995 and 1999, the value of lobster was higher than scallops, but by 2004 the number of scallops landed soared to yield $133 million in 2004 versus $50 million for lobster. In 2004, the total value of scallops and lobster was more than 50% of total landing, compared to $16 million for cod, mainly due to the amount of scallops caught and fishery regulations restricting cod catches (Donahue Institute 2006). A total of 12,915 commercial and recreational permits were issued for lobsters statewide in 2005, a decrease of 2.5% from 2004. Total landings went down slightly from 5,349,986 kg (11,784,110 lb) in 2004 to 5,175,551 kg (11,399,893 lb) in 2005, but value increased from $53,028,494 to $57,227,464 over the same years (Dean et al. 2007).
Decreasing fish stocks and increasing restrictions have caused the Massachusetts fishing industry to suffer and the effects are felt mostly by fishing communities. Ports such as Gloucester, where commercial fishing is the primary economic activity, are most affected. Various industries directly and indirectly associated with fishing are affected, and this increase in pressure causes a shift in the economic base of the community.
One sector that is affected by decreasing fish stocks and fish landings is fish processing. Employment in the fish processing sector declined as the number of plants decreased from 144 in 1976 to 50 in 2003. At the same time, employment in the seafood wholesale sector increased from 868 in 1976 to 2,779 in 2000, though there has been a decline over the past few years (Donahue Institute 2006). In 2004, less than 50% of the 11,270 people were employed in the commercial seafood sector, but they gained more than half the wages—mainly commercial fishermen versus workers in retail and aquaculture (Donahue Institute 2006). The economic output indicated $1 billion in fresh, frozen, and canned fish sales to supermarkets, food services, and restaurants, generating $329 million and $307 million in indirect and induced effects respectively (Georgianna 2000). Since 1980, per capita consumption of seafood rose from 5.7 kg (12.5 lb) to 7.5 kg (16.6 lb), though the value has remained constant since 1998. Moreover, seafood prices have increased less than for other food products, which could impact income and employment.
Over the past 15 years, recreational fishing in Massachusetts has expanded to be the second most valuable in the United States, especially for striped bass. Marine anglers in Massachusetts spent $850 million in 1998 (Steinback and Gentner 2001). Fifty-five percent of 1 million people who participated in marine recreational fishing in Massachusetts in 2002 were Massachusetts residents. In 2006, 7,049,258 kg (15,527,000 lb) were caught, but this number decreased slightly in 2007 to 6,096,312 kg (13,428,000 lb). In total, there were almost 5,000 anglers in Massachusetts in each of 2006 and 2007 (Van Voorhees 2007). The amount
BA-123

of lobster landing decreased by 1.5% to 88,101.246 kg (194,230 lb) from 2004 to 2005 for recreational permits and by 3.3% from 5,345,182.38 kg (11,784,110 lb) to 5,170,904.48 kg (11,399,893 lb) from 2004 to 2005 for commercial permits (Dean et al. 2007).
AQUACULTURE
Aquaculture is the smallest sector in the seafood industry, employing 267 individuals in 2004 and accounting for less than 3% of the seafood catch in Massachusetts. The industry depends mainly on hard shell clams and oysters, while soft shell steamers, razor and surf clams, bay and sea scallops, and blue mussels are gathered for a lesser demand. Although it is a relatively small industry compared to Maine and Connecticut, aquaculture in Massachusetts generated $3.6 million in 2002. Eighty percent of aquaculture takes places on Cape Cod, with the South and North Shores experiencing the greatest increase since 2000. Finfish and shellfish aquaculture generated 375 million metric tons (413 million tons) worth $1,115,115,000 in 2005 and 360 million metric tons (397 million tons) worth $1,244,145,000 in 2006 in the United States (Van Voorhees 2007).
MARINE SCIENCE AND TECHNOLOGY
This industry includes the construction of marine instruments, research, and environmental services and employs about 5,000 people—59% in marine engineering and technical services, 29% in production of instrumentation, and 10% in ship and boat building and repair. Moreover, 1,530 individuals worked in academic programs in marine science research institutions in 2004 (Donahue Institute 2006). The main outputs are mapping projects, monitoring, and surveying for offshore drilling. Users include industries such as commercial fishing, maritime shipping and transportation, environmental services, education, and research. In 2004, the annual production output for this sector in Massachusetts was $1.2 billion (Donahue Institute 2006).
Massachusetts is considered one of the 10 ten states for marine science and technology industry (Barrow et al. 2005). All the components of this sector play a key role in several marine activities and industries. Marine instrument and equipment includes instruments for use in oceanographic and geophysical research and remote sensing activities. Electronic instrumentation and platforms used in ship navigation, underwater research, and communications are also important. Other subsectors include design of software and systems to run navigational equipment and conduct monitoring; marine engineering and consulting groups; suppliers of marine materials such as paint, engines, machinery, and riggings; onshore marine activities; shipbuilding and design; research; and education. The study conducted by Barrow et al. (2005) estimated employment in Massachusetts in this sector to be 22,396 jobs with a total annual impact of $2.9 billion (1% of the GSP).
BA-124

MARINE-RELATED CONSTRUCTION AND INFRASTRUCTURE
This sector is the second largest marine industry component in Massachusetts and includes heavy construction such as coastal and offshore infrastructure, administration of management programs, and real estate development. This sector generates only 10% of employment but wages are twice the industry average. According to the Donahue Institute study (2006), 77% of the 15,000 people employed within this sector are involved in housing construction, while 23% are employed in marine-related development. Almost 12,000 jobs were created from secondary impacts in 2004. The sector employment multiplier is 1.82, and 1.56 for output. In total, $2.8 billion was generated from this sector in 2004.
REFERENCES
Agardy, T., J. Alder, P. Dayton, S. Curran, A. Kitchingman, M. Wilson, A. Catenazzi, J. Restrepo, C. Birkeland, S. Blaber, S. Saifullah, G. Branch, D. Boersma, S. Nixon, P. Dugan, and C. Vorosmarty. 2005. Coastal Systems and Coastal Communities. In: Millenium Ecosystem Assessment: Conditions and Trends, Volume 1. Washington DC. Island Press.
Barrow, C., R. Loveland, and D. Terkla. 2005. The Marine Science and Technology Industry in New England. University of Massachusetts Donahue Institute.
Colgan, C. 2003. The changing ocean and coastal economy of the United States: a briefing paper for conference participants. University of Southern Maine.
Daly, G. 1997. Introduction: What are ecosystem services? In: Nature’s Services: Societal Dependence on Natural Ecosystems, G.C. Daily (ed.), Island Press, Washington DC.
Dean, M.J., S.R. Reed, and T.B. Hoopes. 2007. 2005 Massachusetts Lobster Fishery Statistics. Massachusetts Division of Marine Fisheries Technical Report. TR-31.
Donahue Institute. 2006. An Assessment of the Coastal and Marine Economies of Massachusetts. Report I. Prepared for the Massachusetts Office of Coastal Zone Management. RFR#: ENV06 CZM09. University of Massachusetts Amherst. Donahue Institute.
Executive Office of Labor and Workforce Development (EOLWD). 2004. Employment and Wages website. http://lmi2.detma.org/lmi/lmi_es_a.asp#PERIOD_LOCATION. Accessed 12/4/2009.
Georgianna, D. 2000. Economic Impacts of the Marine Economy in Massachusetts. Economic Research Series 24. University of Massachusetts Economic Project. Center for Policy Analysis.
BA-125
BA-126
Massachusetts Marine Trades Association (MMTA) 2008. http://www.boatma.com/boating_in_ma.html. Accessed 11/03/08.
Massachusetts Office of Travel and Tourism (MOTT) 2007. Annual Report.
The Massachusetts Ocean Management Task Force (MOMTF) 2004. The Massachusetts Ocean Management Task Force Technical Report. March 2004.
Steinback, S. and B. Gentner. 2001. Marine Angler Expenditures in the Northeast Region, 1998. NOAA Technical Memorandum NMFS-F/SPO-47.
U.S. Coast Guard (USCG). 2007. Recreational boating statistics 2007. COMDTPUB P16754.21.
Van Voorhees, D. 2007. Fisheries of the United States. (E.S. Pritchard, ed.). National Marine Fisheries Service. Silver Springs, MD.
Chapter 8 - Climate Change
Over the next century, climate change is projected to profoundly impact coastal and marine ecosystems around the globe (IPCC 2007). A variety of impacts related to warming are already being seen in Massachusetts. Such trends as sea level rise, increased coastal flooding, oceanic acidification, and changes in ocean and atmospheric circulation (including increasing storm frequency and intensity) and changes in the extent, frequency, and severity of water quality problems are predicted to further impact Massachusetts (Frumhoff et al. 2007). There is abundant literature regarding temperature change and sea level rise. In contrast, less is known about the resulting impacts on oceanic ecosystems and storms. This is a complex field due to the number and diversity of feedback mechanisms. There are many uncertainties associated with predictions. Local effects could exacerbate or alleviate global impacts.
TEMPERATURE CHANGE
The average surface temperature of the earth has increased by about 0.74°C (1.3°F) between 1906 and 2005. Globally, the warmest years since instrumental recording began in 1861 are 1998 and 2005, and 11 of the 12 warmest years have occurred in the last 12 years (1995 to 2006) (IPCC 2007). In the Northern Hemisphere, seasonal changes are apparent. The ice season is shorter and the frost-free period is longer (IPCC 2007). In other words, spring comes earlier. Within Massachusetts, the rate of annual trends in atmospheric temperature change shows a 0.14-0.22°C (0.25-0.40°F) increase per decade over the past 30 years (NOAA NWS 2008). It is predicted that temperatures across the Northeast will rise 1.4-2.2°C (2.5-4.0°F) in winter and 0.83-1.9°C (1.5-3.5°F) in summer over the next few decades, regardless of the emissions choices we make now (Frumhoff et al. 2007). This warming of the earth is a function of a shifting balance between incoming short-wave radiation, outgoing long-wave radiation, and the reflection of solar radiation (albedo). Increases in greenhouse gases (e.g., carbon dioxide, methane, chlorofluorocarbons, water vapor, and nitrous oxide) reduce the outgoing long-wave radiation, resulting in warming. Other natural processes that can cause both climatological earth cooling (large volcanic eruptions) and warming (sun spot variation) occur over different, unpredictable time periods. Currently, the balance has tipped toward warming, and there is consensus that globally and locally temperatures have been warming over the past several decades. There is also consensus that ocean temperatures have also been warming over the past several decades, though the impacts of such warming on circulation patterns in both the ocean and atmosphere are under debate.
BA-127

Three of four identified temperature datasets in Massachusetts waters show evidence of warming in or near the Massachusetts ocean management planning area (planning area):
1. The Wood Hole Oceanographic Institute dock temperature monitoring has been measuring sea surface temperature (SST) in Great Harbor in Falmouth since 1886 with few gaps. The record shows significant warming from 1970-2002 at a rate of 0.04°C per year. This record does not show an “earlier spring.” The dates the water reach 10 and 20°C have not changed significantly, nor have the number of winter days below 1°C or above 5°C (Nixon et al. 2003).
2. The National Oceanographic and Atmospheric Administration (NOAA) monitors SST at Woods Hole (since 1995), Fall River (since 1900), Nantucket Island (since 1998), and Boston Harbor (since 1997). These records are available from the NOAA National Data Buoy Center and indicate increasing temperature over time.
3. The Massachusetts Division of Marine Fisheries (MarineFisheries) has long-term temperature monitoring stations at locations throughout the state. SST data are available since 1988 through the shellfish classification database, which contains sites primarily in embayments. The Fisheries Resource Assessment program includes measurement of the bottom temperature at all tow locations during assessment trawls in May and September (since 1978). There are also several bottom temperature datasets overseen by the Coastal Lobster Investigation program: Cleveland Ledge (continuous since 1990, in 10.67 meters [m] or 35 feet [ft] of water); Buzzards Bay (continuous since 1989, in 21.33 m [70 ft] of water); sites in Cape Cod Bay at 18.29 m (60 ft), 27.43 m (90 ft), and 36.58 m (120 ft) water depth (continuous since 1988); and temperature data on lobster traps (since 2006, summer only). Some datasets have received preliminary analysis, and show a general warming trend.
4. The Massachusetts Water Resources Authority (MWRA) conducts basic water quality monitoring throughout Boston Harbor and Massachusetts Bay. This dataset does not show evidence of warming, which may be due to the relatively short length of time the dataset has been monitoring temperature (continuous since 1996).
Warming can have major ecosystem effects, including alteration of the distribution and abundance of species. Within Massachusetts, such population-level effects are being seen in species at the southern edge of their range, like cod and smelt. Similarly, expanded ranges of more southerly species, such as summer flounder and lady crabs, are being seen. Based on preliminary analysis, the number of days above 20°C (68°F) seems to be an important biological driver. The degree of stratification is also likely to be important.
CHANGES IN PRECIPITATION
A potential consequence of warming is changing patterns of precipitation. Analyses of long-term trend data report an annual average increase of 38 millimeters (mm) (1.5 inches [in]) per
BA-128
decade over the past 30 years (NOAA NWS 2008) and 9.5 mm (0.37 in) per decade over the last century (Hayhoe et al. 2006). Changes in seasonal precipitation patterns are projected to result in wetter winters, and combined with warmer temperatures it is predicted that there may be “increases in winter runoff, decreases in spring runoff, and increases in annual runoff as peak runoff shifts to earlier in the year” (Hayhoe et al. 2006). The importance of water for human health, agriculture, and ecosystem functioning is significant enough that a higher resolution examination of precipitation trends is warranted. The U.S. Geological Survey Water Resource Center conducts stream gauge monitoring and is applying global climate model predictions to regional hydrologic models to examine potential impacts of increased temperature and precipitation on the watershed scale. There are potential impacts on the ecosystem governed by both the quantity of freshwater entering the planning area as well as the seasonality and intensity of rainfall events. For example, harmful algal blooms, such as Alexandrium fundyense, have been shown to be associated with more buoyant, fresher waters in the Gulf of Maine (Boesch et al. 1997). Species more tolerant of less saline conditions, such as American oyster (Crassostrea virginica), may also benefit. Changes in stream flow and drought could severely impact anadromous species.
SEA LEVEL RISE
Climate change and sea level rise are related. Increasing global temperature raises sea level in two ways: first, through thermal expansion, in which warming increases water volume, and second, through melting and flow of land-based snow and glacial ice into the sea. There may also be positive feedback mechanisms in the melting of glaciers that cause acceleration of ice sheet flow (Zwally et al. 2002). This effect may result in more rapid sea level rise (Pelto 2008). Massachusetts coastal sea level has been quite variable over geologic timescales. Following glacial melting after the Laurentide glaciation, during a period roughly 11,000 to 14,000 years ago, sea level was higher than at present due to isostacy. Between that period and about 6,000 years ago, sea level fell to about 20 m (66 ft) lower than it is today as a result of the balance between local isostatic effects and global sea level (Oldale 2001). Since 6,000 years ago, local sea level has risen to its present level. The rates have been variable over time, but estimates of the higher rates of change range from 9.1 mm/yr (0.36 in/yr) to 91 mm/yr (3.6 in/yr) (Oldale 2001). The rates of global warming-induced sea level rise can be either exaggerated or mitigated in local regions depending on the nature of the vertical movement of underlying geology (isostacy). Southern New England is subsiding in response to isostatic uplift in Canada from deglaciation over the past 10,000 years. The rate of subsidence is estimated to be between 1.0-6.0 mm/yr (0.04-0.24 in/yr) as measured by the Global Positioning System (Milne 2005).
BA-129
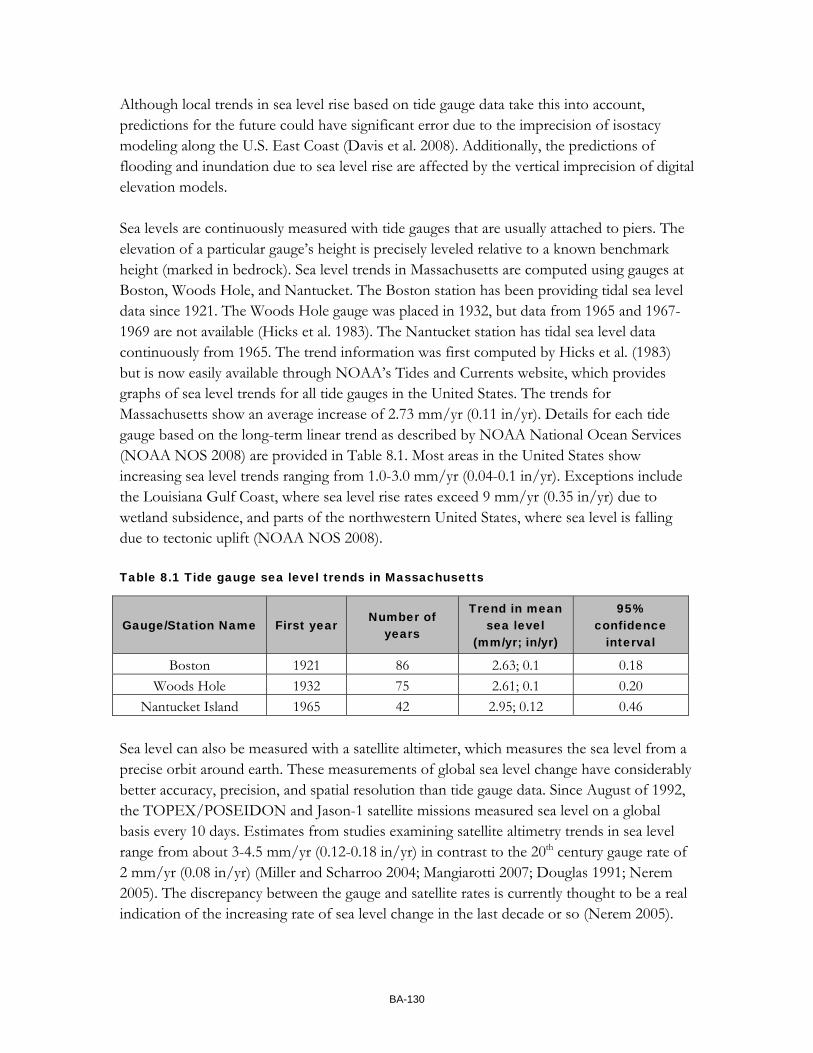
Although local trends in sea level rise based on tide gauge data take this into account, predictions for the future could have significant error due to the imprecision of isostacy modeling along the U.S. East Coast (Davis et al. 2008). Additionally, the predictions of flooding and inundation due to sea level rise are affected by the vertical imprecision of digital elevation models. Sea levels are continuously measured with tide gauges that are usually attached to piers. The elevation of a particular gauge’s height is precisely leveled relative to a known benchmark height (marked in bedrock). Sea level trends in Massachusetts are computed using gauges at Boston, Woods Hole, and Nantucket. The Boston station has been providing tidal sea level data since 1921. The Woods Hole gauge was placed in 1932, but data from 1965 and 1967-1969 are not available (Hicks et al. 1983). The Nantucket station has tidal sea level data continuously from 1965. The trend information was first computed by Hicks et al. (1983) but is now easily available through NOAA’s Tides and Currents website, which provides graphs of sea level trends for all tide gauges in the United States. The trends for Massachusetts show an average increase of 2.73 mm/yr (0.11 in/yr). Details for each tide gauge based on the long-term linear trend as described by NOAA National Ocean Services (NOAA NOS 2008) are provided in Table 8.1. Most areas in the United States show increasing sea level trends ranging from 1.0-3.0 mm/yr (0.04-0.1 in/yr). Exceptions include the Louisiana Gulf Coast, where sea level rise rates exceed 9 mm/yr (0.35 in/yr) due to wetland subsidence, and parts of the northwestern United States, where sea level is falling due to tectonic uplift (NOAA NOS 2008).
Table 8.1 Tide gauge sea level trends in Massachusetts
Gauge/Station Name First year Number of
years
Trend in mean sea level
(mm/yr; in/yr)
95% confidence
interval
Boston 1921 86 2.63; 0.1 0.18 Woods Hole 1932 75 2.61; 0.1 0.20
Nantucket Island 1965 42 2.95; 0.12 0.46
Sea level can also be measured with a satellite altimeter, which measures the sea level from a precise orbit around earth. These measurements of global sea level change have considerably better accuracy, precision, and spatial resolution than tide gauge data. Since August of 1992, the TOPEX/POSEIDON and Jason-1 satellite missions measured sea level on a global basis every 10 days. Estimates from studies examining satellite altimetry trends in sea level range from about 3-4.5 mm/yr (0.12-0.18 in/yr) in contrast to the 20th century gauge rate of 2 mm/yr (0.08 in/yr) (Miller and Scharroo 2004; Mangiarotti 2007; Douglas 1991; Nerem 2005). The discrepancy between the gauge and satellite rates is currently thought to be a real indication of the increasing rate of sea level change in the last decade or so (Nerem 2005).
BA-130
Therefore, the gauge rates might be significantly underestimating the rate of sea level change. A higher resolution examination of the rate and potential impacts of sea level rise in Massachusetts is possible with further analysis of satellite data.
The first effects of sea level rise are already being felt in Massachusetts: inundation of low-lying areas, increased area of inundation during storms, and increased shoreline erosion (NECIA 2006).
CHANGES IN WIND PATTERNS
Global climate change is often manifested by changes in general atmospheric circulation, i.e. winds, resulting in changing temperature and precipitation patterns. Sea surface temperatures affect the patterns in atmospheric pressure, which in turn are responsible for wind generation. Accelerated warming of the oceans may produce stronger winds in certain areas, and increase the frequency of extreme events such as storms and hurricanes. The threshold temperature for tropical storms could be reached more readily if the climate continues to change and such storms could spread from tropical to higher latitudes.
Changes in wind patterns will affect wind-generated surface currents, which in turn would cause changes in coastal and estuarine circulation patterns as well as alterations of the upwelling process that could result in serious effects on the marine ecosystem. This nutrient-rich deeper water is vital for primary production and if reduced in certain areas could seriously affect species distribution and abundance (UNEP-WCMC 2009).
INCREASING FREQUENCY AND INTENSITY OF STORMS
The increasing frequency and intensity of storms (i.e., increased storminess) is one of the hypothetical outcomes of increasing sea surface and atmospheric temperatures. There is debate surrounding the probability and spatial extent of this type of impact; in general, the empirical evidence based on the historical record suggests sea surface warming does not correlate with increased frequency of storms (number of storms per year), but does correlate to increased storm power (Emanuel 2005). However, the extent of future increases in storm power is still very uncertain (Emanuel et al. 2008). Additionally, coastal impacts can be out of proportion to the size of a given storm due to the impacts of hard-to-predict storm surges (Resio and Westerink 2008). A further complication regarding the impacts of increased storminess is the added effect of sea level rise.
The issue of storminess is very important for three reasons: 1) both hurricanes and northeasters play a key role in the ecosystem and the safety of coastal populations; 2) current demographic trends suggest continued population increases along the coast; and 3) the
BA-131

performance capabilities of offshore structures are defined using storminess (e.g., a North Sea oil rig).
OCEAN ACIDIFICATION
Dissolved carbon dioxide (CO2) in seawater also increases the hydrogen ion (H+) concentration in the ocean, and thus decreases ocean pH. A decrease in pH is known as acidification and below a pH of 7, conditions are described as acidic. pH is measured on a negative logarithmic scale, so a 0.1 point decrease means H+ has increased by about 30%. pH has decreased by 0.1 units since 1750 and there is consensus that ocean acidification will continue (IPCC 2007). By 2050, the surface ocean water pH is predicted to be between 0.3 and 0.7 units lower than pre-industrial levels due to the absorption of atmospheric CO2 (Orr et al. 2005; Caldeira and Wickett 2003). The planning area has a fairly wide range of pH values. At one station that MWRA has been measuring for more than 10 years, the range of values is 6.2-8.4 and there is no discernable trend over time (Ralston 2009). Streams in Massachusetts are showing improved water quality and increasing pH levels as a result of the Clean Water Act (Mattson et al. 1997). There is concern within the scientific community that a decrease in pH will have negative consequences for organisms with calcium carbonate in their exoskeletons, since pH values less than 7 can result in dissolution of calcium carbonate. Organisms that could be impacted in Massachusetts include lobsters, shellfish (including oysters, clams, quahogs, and scallops), and organisms at the base of the food chain (such as coccolithophores and foraminiferans). However, consensus regarding impacts related to ocean acidification is lacking since laboratory conditions suggest a strong influence of local conditions governing calcification (IPCC 2007). Nonetheless, impacts of decreasing pH levels in the planning area are feasible and might be significant due to our reliance on seafood both recreationally and commercially.
REFERENCES
Bamber, J.L., R.E.M. Riva, B.L.A. Vermeersen, and A.M. LeBrocq. 2009. Reassessment of the Potential Sea-Level Rise from a Collapse of the West Antarctic Ice Sheet: Science 324 (5929): 901-903. Boesch, D.F., D.A. Anderson, R.A. Horner, S.E. Shumway, P.A. Tester, and T.E. Whitledge. 1997. Harmful Algal Blooms in Coastal Waters: Options for Prevention, Control and Mitigation. National Oceanographic and Atmospheric Administration Coastal Ocean Program, Decision Analysis Series No. 10, Special Joint Report with the National Fish and Wildlife Foundation. February 1997. Caldeira, K. and M.E. Wickett. 2003. Anthropogenic carbon and ocean pH. Nature 425: 365.
BA-132
Commonwealth of Massachusetts. 2004. Oceanography, weather patterns, and climate change. Massachusetts Ocean Management Task Force Technical Report. http://www.mass.gov/czm/oceanmanagement/waves_of_change/index.htm. Accessed 11/14/2008. Davis, J.E., K. Latychev, J.X. Mitrovica, R. Kendall, and M.R. Tamisiea. 2008. Glacial isostatic adjustment in 3-D earth models: Implications for the analysis of tide gauge records along the U.S. east coast. Journal of Geodynamics. 46: 90-94. Douglas, B.C. 1991. Global sea level rise. Journal of Geophysical Research. 96: 6981-6992. Emanuel, K. 2005. Increasing destructiveness of tropical cyclones over the past 30 years. Nature Letters 436: 686-688. Emanuel, K., R. Sundararajan, and J. Williams. 2008. Hurricanes and Global Warming: Results from Downscaling IPCC AR4 Simulations. Bulletin of the American Meteorological Society. 89: 347-367. Frumhoff, P.C., J.J. McCarthy, J.M. Melillo, S.C. Moser, and D.J. Wuebbles. 2007. Confronting Climate Change in the U.S. Northeast: Science, Impacts, and Solutions. Synthesis report of the Northeast Climate Impacts Assessment (NECIA). Cambridge, MA: Union of Concerned Scientists (UCS). Hayhoe, K., C.P. Wake, T.G. Huntington, L. Luo, M.D. Schwartz, J. Sheffield, E.F. Wood, B. Anderson, J. Bradbury, A. DeGaetano, T. Troy, and D. Wolfe. 2006. Past and future changes in climate and hydrological indicators in the U.S. Northeast. Climate Dynamics. DOI 10.1007/s00382-006-0187-8. Hicks, S., H. Debaugh, and L. Hickman. 1983. Sea Level Variation for the United States 1855-1980. U.S. Department of Commerce, National Oceanic and Atmospheric Administration, National Ocean Service. Intergovernmental Panel on Climate Change (IPCC). 2007. Climate Change 2007-The Physical Science Basis. Contribution of Working Group I to the Fourth Assessment Report of the Intergovernmental Panel on Climate Change. [Solomon, S., D. Qin, M. Manning, Z. Chen, M. Marquis, K.B. Averyt, M. Tignor, and H.L. Miller (eds.)]. Cambridge University Press, Cambridge, UK, and New York, 996 pp. Hu, A., G.A. Meehl, W. Han, and J. Yin. 2009. Transient response of the MOC and climate to potential melting of the Greenland Ice Sheet in the 21st century: Geophys. Res. Lett. 36.
BA-133

Mangiarotti, S. 2007. Coastal sea level trends from TOPEX-Poseidon satellite altimetry and tide gauge data in the Mediterranean Sea during the 1990s. Geophysical Journal International. 170(1): 132. Mattson, M.D., P.J. Godfrey, M.F. Walk, P.A. Kerr, and O.T. Zajicek. 1997. Evidence of recovery from acidification in Massachusetts streams. Water, Air and Soil Pollution. 96(1-4): 211-232. Miller, L. and R. Scharroo. 2004. Global Sea Level Rise: A Decade of Multi-Satellite Altimeter Observations versus 100 Years of In-situ Observations. American Institute of Aeronautics and Astronautics Report 2004-5863. Space 2004 Conference and Exhibit 28-30 September 2004, San Diego, California. Milne, G.A. 2005. As referenced in R. S. Nerem. 2005. Nerem, R.S. 2005. The record of sea level change from satellite measurements: What have we learned? Bowie Lecture, American Geophysical Union Fall Meeting. Nixon, S.W., S. Granger, B.A. Buckley, M. Lamont, and B. Rowell. 2003. A one hundred and seventeen year coastal water temperature record from Woods Hole, Massachusetts. Estuaries and Coasts. 27(3): 397-404. National Oceanographic and Atmospheric Administration (NOAA) National Ocean Service (NOS). 2008. Tides and currents website: Sea level trends. http://co-ops.nos.noaa.gov/sltrends/sltrends.shtml. Accessed 11/14/2008. NOAA National Weather Service (NWS). 2008. Rate of long-term trend temperature and precipitation trends, full year. Climate prediction center. http://www.cpc.noaa.gov/anltrend.gif. Accessed 11/19/2008. Northeast Climate Impacts Assessment (NECIA). 2006. Climate Change in the U.S. Northeast. A Report of the Northeast Climate Impacts Assessment. Cambridge, Massachusetts: Union of Concerned Scientists (UCS). Oldale, R.N. 2001. The Geologic Story: Cape Cod, Martha’s Vineyard, and Nantucket. On Cape Publications, Yarmouth Port, MA. Orr, J.C., V.J. Fabry, O. Aumont, L. Bopp, S.C. Doney, and R.A. Feely. 2005. Anthropogenic ocean acidification over the twenty-first century and its impact on calcifying organisms. Nature 437 (7059): 681-686.
BA-134

BA-135
Pelto, M. 2008. Moulins, Calving Fronts and Greenland Outlet Glacier Acceleration. RealClimate. http://www.realclimate.org/index.php/archives/2008/04/moulins-calving-fronts-and-greenland-outlet-glacier-acceleration. Accessed 11/19/2008. Pfeffer, W.T., J.T. Harper, and S. O’Neel. 2008. Kinematic Constraints on Glacier Contributions to 21st-Century Sea-Level Rise: Science 321 (5894): 1340-1343. Rahmstorf, S. 2007. A Semi-Empirical Approach to Projecting Future Sea-Level Rise: Science 315(5810): 368-370. Ralston, P. 2009. Massachusetts Water Resources Authority (MWRA). Unpublished data. Resio, D.T. and J.J. Westerink. 2008. Modeling the physics of storm surges. Physics Today 61(9): 33-38.
UNEP World Conservation Monitoring Center 2009. Biodiversity and Climate Change 2000. http://www.unep-wcmc.org/climate/oceans/phys.aspx. Accessed 5/27/2009.
Yin, J., M.E. Schlesinger, and R.J. Stouffer. 2009. Model projections of rapid sea-level rise on the northeast coast of the United States: Nature Geoscience 2(4): 262-266.
Zervas, C. 2001. Sea Level Variations of the United States 1854-1999. NOAA technical report NOS CO-OPS 36. NOAA National Ocean Service, Silver Spring, MD, 186 pp. http://tidesandcurrents.noaa.gov/publications/techrpt36doc.pdf. Accessed 10/29/09. Zwally, H.J., W. Abdalati, T. Herring, K. Larson, J. Saba, and K. Steffen. 2002. Surface Melt-Induced Acceleration of Greenland Ice-Sheet Flow. Science 297(5579): 218-222.


Science Framework


Table of Contents Chapter 1 - Introduction ..................................................................................................... SF-1
Chapter 2 - Goals and Objectives ................................................................................... SF-3
Chapter 3 - Ecosystem Components and Drivers...................................................... SF-7 Physical Ocean ................................................................................................................... SF-7 Important Biotic Components ........................................................................................... SF-12 Land-Based Influences ..................................................................................................... SF-17 Human Uses of the Planning Area ................................................................................... SF-18 Climate Change ................................................................................................................ SF-31
Chapter 4 - Science Framework Actions ................................................................... SF-37 Priorities for the Next Five Years ...................................................................................... SF-37 Priorities beyond Five Years ............................................................................................. SF-49
References ........................................................................................................................... SF-59
Appendix A - Overview of Science Programs in Massachusetts and the Gulf of Maine Region ................................................................................................. SF-69
Appendix B - Supporting and Secondary Performance Indicators .................... SF-73


Chapter 1 - Introduction
The Oceans Act of 2008 (Act) required the development of the first integrated ocean management plan for the Commonwealth of Massachusetts. Working with the Ocean Advisory Commission (OAC), an advisory body established in the Act to provide policy guidance, the Executive Office of Energy and Environmental Affairs (EEA) developed specific strategies and targeted outcomes for the Massachusetts Ocean Management Plan, based on the goals of the Act. Along with integrated management and effective stewardship for marine ecosystems and human uses, a key principle for the plan is to ensure that it can adapt to evolving knowledge and understanding of the ocean environment. The Act acknowledged the need for plan evolution through its requirement for review of the plan and its implementation at least once every five years.
Because of the timeframe established in the Act for plan development, data analysis focused on existing data, as there was insufficient time to perform new research or develop and implement new monitoring programs. An important consideration throughout the development of the Massachusetts Ocean Management Plan was to ensure that the existing data and scientific information supported the level of sophistication of proposed management measures. For example, results of the Ecological Valuation Index were not incorporated completely into the plan, in part because of concerns that the available data were not sufficient to adequately characterize the ecological value of ocean areas. The work that went into this effort, however, helped lead to the identification of additional, data and research necessary to advance ocean management in Massachusetts in the future.
To be responsive to the Act way despite these limitations, EEA determined that the plan should include a description of the specific science and data necessary for the next generation of ocean management in Massachusetts. Consequently, the draft plan included a section defining a draft “science framework.” EEA developed the science framework in consultation with the Science Advisory Council (SAC), an advisory body established in the Act to advise EEA with plan development. This final version of the science framework, incorporating input received during the public comment period and additional discussions with the SAC, provides a blueprint for ocean management-related science and research needs in Massachusetts.
Following this introductory section, Chapter 2 outlines the goals and objectives for the science framework. Chapter 3 summarizes the major marine ecosystem components of the Commonwealth’s ocean management planning area, based on information from the baseline assessment, which is also presented in this volume of the Massachusetts Ocean Management Plan (Volume 2). Chapter 4 describes prioritized science and data actions to achieve the science framework’s conceptual objectives. Chapter 4 was in part developed by considering the question: “Where should ocean management in Massachusetts be in five years,
SF-1

SF-2
considering practical considerations related to funding, agency resources, and potential partnering opportunities?”
Inclusion of these actions in the science framework is not intended to imply that they will be implemented by state agencies alone. Rather, to make meaningful progress in executing these actions, other organizations and institutions will step forward as willing and capable partners to join the Commonwealth in lending their expertise and capabilities to address shared goals (see Appendix A for an overview of related science and programs currently operating in the Gulf of Maine region). A key partner in this effort will be the Massachusetts Ocean Partnership (MOP), which has been working closely with EEA on several aspects of the ocean management plan. Privately funded through a grant from the Moore Foundation, MOP’s resources provide an opportunity to immediately address the priorities included in this framework.
The science framework reflects the status of ocean management in Massachusetts in 2009. To ensure that the Massachusetts Ocean Management Plan continues to evolve, future versions of the plan are expected to include science framework revisions.

Chapter 2 - Goals and Objectives
Over the last two decades, great progress has been made in the understanding of estuarine and marine ecosystems, and there is now wide agreement that healthy and resilient ecosystems have more capacity to provide the scope and extent of benefits that citizens and visitors to Massachusetts need and appreciate. The Oceans Act of 2008 (Act) reflects this understanding and requires the Massachusetts Ocean Management Plan to meet these challenges by “adhering to sound management practices,” “respecting the interdependence of ecosystems,” and “fostering sustainable uses…without detriment to the ecology or natural beauty of the ocean.” In total, the Act requires a management structure that places an emphasis on maintaining healthy and resilient estuarine and marine ecosystems and the values, goods, and services that humans derive from them.
Methods that focus on the maintenance of ecosystem structure, functions, processes, and services through the management of human uses and activities are referred to as ecosystem-based management (EBM) approaches. A 2005 consensus statement defines the EBM approach as follows:
“Ecosystem-based management is an integrated approach to management that considers the entire ecosystem, including humans. The goal of ecosystem-based management is to maintain an ecosystem in a healthy, productive and resilient condition so that it can provide the services humans want and need. Ecosystem-based management differs from current approaches that usually focus on a single species, sector, activity or concern; it considers the cumulative impacts of different sectors. Specifically, ecosystem-based management:
• Emphasizes the protection of ecosystem structure, functioning, and key processes;
• Is place-based in focusing on a specific ecosystem and the range of activities affecting it;
• Explicitly accounts for the interconnectedness within systems, recognizing the importance of interactions between many target species or key services and other non-target species;
• Acknowledges interconnectedness among systems, such as between air, land and sea; and
• Integrates ecological, social, economic, and institutional perspectives, recognizing their strong interdependences.” (McLeod et al. [COMPASS] 2005)
SF-3
The requirements of the Act correspond to many of the specific elements of EBM. As the implementing mechanism of the Act, the ocean management plan furthers an ecosystem-based approach with its spatial nature, multi-species analysis, and incorporation of human uses. Actions in the science framework will help refine this approach by describing additional spatial data necessary to more fully characterize habitats, ecology, and human uses of the ocean, and will continue the evolution of ocean management in Massachusetts.
The overall goal of the science framework is to:
Identify and prioritize the scientific research and data acquisition necessary to advance ecosystem-based management in Massachusetts waters, and identify necessary steps and responsibilities for these tasks, based upon the Oceans Act and the ocean management plan.
This goal intentionally sets a broad, long-term vision to continue the science-basis for ocean management in Massachusetts. To achieve this broad goal, and as a next step to identify additional detail and priority research projects, EEA developed objectives for the science framework with input from the SAC. The general objectives for the science framework are to:
1. Further develop the approach to identifying special, sensitive, or unique estuarine or marine life and habitats by incorporating new and enhanced data resulting from targeted scientific research into habitat classification, ecological assessment models, and/or similar efforts;
2. Obtain/augment human use data for use in compatibility analysis, tradeoffs analysis, ecosystem services evaluation, or other aspects of ocean planning that require spatial information regarding human uses;
3. Increase the understanding of climate change effects on marine and coastal systems and the resulting implications and considerations for management actions;
4. Identify the impacts of anthropogenic stressors on coastal/marine ecosystems, with particular attention to cumulative impacts;
5. Develop an indicator framework (supported by appropriately temporally and spatially scaled monitoring) to assess and improve the effectiveness of management measures and enable status and trends analysis;
6. Enhance data availability for appropriate use in management by supporting: quality assurance/quality control during research, development of research plans at appropriate temporal and spatial scales, and data delivery protocols that maximize utility for managers and others; and
7. Inform managers and the public of scientific findings and provide for appropriate translation/dissemination vehicles.
Combined, these seven objectives describe how the overall goal of the science framework will be met. Importantly, these objectives were also used to help frame and prioritize specific research and data actions: projects that directly related to one or more of these objectives
SF-4

SF-5
were considered a greater priority for purposes of the science framework. These specific action items are provided in Chapter 4, along with additional detail (funding sources and areas of responsibility).
By design, the objectives are sufficiently broad that they should be interpreted as components of a long-term effort to achieve the overall science framework goal. In addition to this long-term effort, the objectives also directed shorter-term prioritization of scientific research and data acquisition, within an approximate five-year timeframe. Therefore, this science framework, particularly with the priority action items highlighted in Chapter 4, is also responsive to the following goal for the next five years:
Within an approximate five-year timeframe, the science framework will enable ocean management in Massachusetts to continue to evolve an ecosystem-based approach by:
• Providing enhanced information regarding benthic and pelagic habitats. • Developing enhanced spatial information regarding recreational uses and commercial fishing
activity. • Increasing human understanding of the ramifications of climate change upon the ocean
ecosystem in Massachusetts • Developing and implementing performance indicators to gauge the success of the ocean
management plan in achieving its goals. • Furthering a data and information network for scientists and managers.
The science framework objectives (long-term and within the next five years) are based on the current understanding of the ocean ecosystem, data and information availability, and existing policy issues. EEA anticipates that in the future these objectives will be revisited and revised as necessary in response to changes in understanding of the ocean ecosystem, alterations in patterns and concentrations of human use, and new policy issues, as well as through implementation of the Massachusetts Ocean Management Plan.

Chapter 3 - Ecosystem Components and Drivers There are several forces that operate across large spatial and temporal scales that affect the Massachusetts ocean management planning area (planning area). These forces are considered “drivers” in that they, in large part, drive the dynamics that underlie the abundance, distribution, and condition of the physical and natural resources subject to the Massachusetts Ocean Management Plan. Enhancing our understanding of these drivers, designing strategies to address predictable changes, and planning for unpredictable events will enhance the management of the various existing and future uses of the Commonwealth’s ocean resources. This chapter presents a brief account of the major components and drivers of ecosystem dynamics within and beyond the planning area and our current understanding of how these elements influence the Commonwealth’s physical and natural resources. Knowing how the physical and biotic components of the Massachusetts coastal waters interact within the planning area will help determine what additional scientific information is needed to meet the goals and objectives listed in Chapter 2 and ultimately inform management actions.
PHYSICAL OCEAN
Large-scale phenomena (on the scale of hundreds or thousands of kilometers) influence the wind, waves, currents, sediment transportation, water temperature, stratification, and nutrient and plankton concentrations throughout the planning area. Such external forces originate in the Gulf of Maine, Mid-Atlantic Bight, outer continental shelf, or open ocean to ultimately affect the Massachusetts ocean management planning area.
Wind
Currently, winds in Massachusetts Bay measured at the GoMOOS A buoy (and in the Gulf of Maine, in general) are predominantly from the southwest or southeast in summer, while fall winds are out of the north-northwest. Winter winds are predominantly out of the northwest; however, winter and spring storms can bring intense winds out of the northeast (GoMOOS 2009).
The North Atlantic Oscillation (NAO), the Atlantic analog of the Pacific El Nino-Southern Oscillation, is a periodic fluctuation in the relative strengths and positions of two permanent pressure systems called the Icelandic low and the Azores high. This oscillation in pressure controls the strength of westerly winds and storm tracks across the North Atlantic. The NAO can also affect the position of the Gulf Stream relative to the coastline of the Northeast. For example, when the NAO is in its “positive” or “high” phase, the Gulf Stream is closer to the coast. When it is in its “negative” or “low” phase, the Gulf Stream tracks
SF-7

further out to sea and allows cold Labrador Slope water to track closer to the coast and potentially enter the Gulf of Maine (Vakalopoulos et al. 2006). Kropp et al. (2003) have suggested that some components of the plankton community in Massachusetts and Cape Cod Bays (e.g., the copepod Calanus finmarchicus) may respond to large-scale factors such as the NAO. Variations in wind forcing in the Gulf of Maine (e.g., upwelling vs. downwelling) and resulting cell transport have been posited as a mechanism for annual differences in shellfish toxicity associated with Alexandrium blooms (Stock et al. 2007). To the extent that the NAO affects upwelling and downwelling winds, it may also affect the incidence of shellfish toxicity.
Winds are known to drive currents and surface wave height and thus affect storm surge and erosion and the transport of sediments and contaminants (Warner et al. 2008), as well as other processes driven by currents and surface waves. Storms with winds from the north cause transport of sediments, metals, and other particles southward along the western shore of Massachusetts Bay, while storms with winds from the south and east drive transport northerly along the shore (Warner et al. 2008). Knowing the direction and intensity of wind is an important piece of designing models that accurately predict conditions. These models are needed for determining management options (e.g., when to close shellfish beds in advance of wind- and current-driven harmful algal blooms).
Wind velocity (speed and direction) can have profound effects on the currents that circulate nutrients, contaminants, sediments, eggs and larvae, phytoplankton and zooplankton, and heat through the waters of the planning area. It has been established that Massachusetts Bay’s circulation pattern is in part dependent upon wind direction. For example, Warner et al. (2008) found that the winds from directions greater than 60 degrees (e.g., from the east or south) produce a clockwise circulation in Massachusetts Bay, whereas the predominant circulation otherwise is counterclockwise. Wind velocity also affects surface wave production and water level in Cape Cod Bay with winds from the east producing significant waves and winds blowing into large bays, increasing sea level (Warner et al. 2008). Less is known about how wind velocity forces or affects the circulation of Buzzards Bay and Nantucket and Vineyard Sounds, but it is predicted that high winds and waves from hurricanes tracking in line with the long axis of Buzzards Bay (northeast) can have considerable effects on wave height and storm surge (USACE 2006; Ramsey et al. 2005).
The most consistent wind data collections are at the Gulf of Maine Ocean Observing System (GoMOOS)/University of Southern Maine A buoy in Massachusetts Bay. NOAA buoy 44013 in Boston Harbor, NOAA buoy 44018 south east of Cape Cod, and NOAA station BUZM3 in Buzzards Bay have been collecting wind data since 2003 or 2004. Wind data collection at these sites should continue so that modelers have the opportunity to validate their models with long-term data.
SF-8

Temperature
Sea surface water heating and cooling is mainly due to seasonal cycles in air temperature with atmospheric forcing of Massachusetts waters via heat flux (Libby et al. 2009). Temperature is a major determinant of the speed of many physiological actions (e.g., metabolism, gonad development, cell division) and is a major cue for behavior (e.g., migration, egg laying). Intra-annual fluctuations in temperature are also implicated in strong seasonal patterns of zooplankton community structure in Massachusetts and Cape Cod Bays (Kropp et al. 2003).
The Merrimack River and the large rivers in Maine and New Brunswick provide a significant quantity of the freshwater inflow into Massachusetts and Cape Cod Bays (Manohar-Maharaj and Beardsley 1973). Spring freshets produce salinity stratification in Massachusetts Bay (see, for example, Jiang’s Massachusetts Bay Environmental Forecast System http://www.harbor1.umb.edu/forecast/index.html). Rising sea temperatures as the season progresses amplify that stratification (Geyer et al. 1992). In most years, strong stratification persists through summer months and into October, with occasional mixing by storm events (MWRA 2003).
Seasonal stratification is important because it can serve as a physical barrier to nutrients upwelling from the depths to the surface and thus can create a limit to the growth and reproduction of phytoplankton through nutrient limitation. While the issue of stratification has been well studied in Massachusetts and Cape Cod Bays, we are not aware of efforts to study system-wide stratification in Buzzards Bay and Nantucket and Vineyard Sounds.
Tides
Owing to the shape of the Gulf of Maine, the waters of Ipswich Bay, Massachusetts Bay, and Cape Cod Bay experience a semidiurnal tidal range of up to 4.1 meters (m) (13.4 feet [ft]). Changing tides and the flow of freshwater from the large rivers to the north generate the currents in the Gulf of Maine, but these currents can also be influenced by winds, especially out of the northwest or northeast (Lynch et al. 1997; Warner et al. 2008). Waters to the south of Cape Cod were thought generally to be dominated by semidiurnal tide-generated currents, and influenced by southwesterly winds; however, a recent modeling effort identified that winds play a more dominant role than tides in the generation of Buzzards Bay currents (Sankaranarayanan 2007).
Currents
Ipswich, Massachusetts, and Cape Cod Bays are connected to the larger Gulf of Maine system via the Maine Coastal Current (MCC) (Bisagni et al. 1996). The western branch of the MCC, or WMCC (Lynch et al. 1997), derives in part from water flowing east to west over the Scotian Shelf, but also from the major rivers in the Gulf of Maine—the St. John,
SF-9

Penobscot, Kennebec, Androscoggin, Saco, and Merrimac. The part of the WMCC that enters Massachusetts Bay forms a counterclockwise current, though its direction and intensity may vary seasonally. In addition, there are many smaller currents in Massachusetts Bay that branch off of and may run opposite to the main counterclockwise current (Lermusiaux 2001; Jiang et al. 2008a; Jiang et al. 2008b). The branch of the WMCC that enters Massachusetts Bay flows south through most of the bay, then exits north of Race Point in Provincetown. Further south, the currents in Cape Cod Bay are fairly weak, except during strong freshwater runoff periods (Pettigrew et al. 2005). While the above descriptions generally characterize the major surface currents north of Cape Cod, on a more local scale, three dimensional currents are likely to be more complex and driven by varied forces such as storms, wind, and tides. For example, in most locations, the variability is as large as the mean flow (Geyer et al. 1992). Most of the planning area north of Cape Cod is in open, unrestricted water with currents less than 1.8 kilometers per hour (km/hr or roughly 1 knot). However, at the mouth of Boston Harbor, currents can get as high as 2.6 km/hr (1.4 knots) during the full and new moon cycles (White and White 2007). In addition, currents greater than 1.8 km/hr (1 knot) can be found off of Cape Ann (White and White 2007).
Lacking the Gulf of Maine’s large riverine inputs, the waters south of Cape Cod (i.e., Buzzards Bay, Vineyard Sound, and Nantucket Sound) are largely influenced by tidal currents and wind (Sankaranarayanan 2007). Waters to the east of Cape Cod are influenced by both the tides and the Gulf of Maine waters flowing around Provincetown (Geyer et al. 1992). The currents within Buzzards Bay are less than 1.8 km/hr (1 knot), except at the mouth, between Cuttyhunk Island and Westport, where currents can be as great as 2.6 km/hr (1.4 knots) on the flood tide (White and White 2007). In Vineyard Sound, maximum currents are 7.2 km/hr (3.9 knots) and average currents are 2.9 km/hr (1.6 knots) (Limeburner and Beardsley, unpublished data). White and White (2007) report that the average maximum current velocity between Nonamesset Island and Woods Hole is 8.3 km/hr (4.5 knots) on a flood tide and 6.7 km/hr (3.6 knots) on an ebb tide and that velocities can exceed 13 km/hr (7 knots). In the Nantucket Sound area, the currents in Muskeget Channel and Pollock Rip Channel southeast of Monomoy Island are 8.1 km/hr (4.4 knots) and 4.4 km/hr (2.4 knots), respectively (White and White 2007). On an ebb tide, currents in the Cape Cod Canal can be as great as 7.4 km/hr (4 knots) (White and White 2007).
Upwelling, Fronts, and Waves
Upwelling is a hydrodynamic phenomenon whereby sustained winds push warm, nutrient-poor surface waters offshore, inducing the upward motion of deeper, cooler, and nutrient rich waters along the adjacent shoreline. Upwelling influences the growth and blooms of phytoplankton due to this advection of nutrients into the photic zone and may result in periods of increased primary productivity in the ocean.
SF-10

Oceanic fronts are areas where two water masses meet. The sharp gradients in temperature or salinity that define a front may result in the upwelling of nutrients that promote primary productivity (however, some fronts result in downwelling). Like wind-driven upwelling areas, fronts are typically sites of increased primary and secondary productivity and concentrate filter feeding organisms such as clupeid fishes (Friedland et al. 2006). Because these oceanographic features can be used as predictive tools to find higher than average concentrations of marine mammals, fish, and phytoplankton (Friedland et al. 2006), oceanic fronts may be part of important trophic interactions (Schick et al. 2004). The location and duration of fronts are not very well understood in the planning area. However, one persistent front that has been documented near the planning area is on the eastern portion of Nantucket Shoals, where more saline Gulf of Maine waters meet fresher Nantucket Sound waters (Limeburner and Beardsley 1982).
Surface waves are generated by winds passing over the ocean. Their height is dependent on the velocity of air moving above the ocean, the fetch over which it moves, and the density of the water. Wave height and period are measured at NOAA’s Massachusetts Bay A buoy (42° 31’ 21” N, 70° 33’ 57” W) and the Boston Harbor buoy 44013 (42° 21’ 00” N, 70° 41’ 24” W). Wave height and period data are not available for the planning area north of Cape Ann or South of Cape Cod.
Internal waves are sub-surface, oceanic waves that propagate either obliquely when the ocean is uniformly stratified or horizontally when the ocean’s stratification is confined to discrete, narrow bands. The momentum and energy distributed by internal waves can thus be used to de-stratify or mix the ocean waters and its associated sediments, nutrients, and plankton. This mixing may be important to sustaining deep-water communities that are otherwise sequestered from the productivity at the surface by persistent stratification. Internal waves have also been shown to transport plankton onshore (Shanks and Wright 1987). On one offshore bank in the Gulf of Maine, internal wave passage resulted in upward movement and concentration of euphausiids (krill) in these areas through a coupling of physical processes and euphausiid behavior, resulting in surface swarms. Thus, internal waves appear to provide a critical mechanism enhancing trophic energy transfer (Stevick et al. 2008). Researchers speculate that internal waves may also be important in large-scale, deep ocean circulation due to the transfer of heat from the surface (Zimmerman et al. 2008). Research by Butman et al. (2006) has identified internal wave activity over Stellwagen Bank as well as in northern Cape Cod Bay and the waters northeast of Cape Ann. Their key findings were that: the near-bottom currents associated with large internal waves (LIWs), in concert with the tidal currents, resuspended bottom sediments; sediments may be resuspended for as long as five hours each tidal cycle; and at 85 m (279 ft) deep, the duration of resuspension associated with LIWs is estimated to occur for about the same amount of time as caused by surface waves (Butman et al. 2006).
SF-11

Knowing the location of upwelling and fronts is important to the ocean planning process because of the expectation that these areas will, at certain times of the year, concentrate organisms that are important to society for their economic value (e.g., herring, sportfish) or their cultural value (e.g., whales). Permanent structures placed in these areas may interrupt or affect circulation of ocean waters and negatively affect the organisms that rely on the currents for larval dispersion, suspension feeding, or other important life cycle aspects. The role of internal waves is less known, but the risks associated with placement of permanent structures may be the same. Knowing the areas of high surface wave height and frequency in the planning area will help to predict the frequency and intensity of disturbance. It also may help in avoiding or mitigating wave-induced structural damage; may help improve our understanding of erosion, accretion, and sediment transport; and will certainly be important for any future siting of wave energy devices. Similarly, physical oceanographic characteristics could affect the transport of pollutants resulting from future ocean uses, such as waste disposal, construction, or aquaculture. Consequently, the capacity to predict these characteristics with some level of certainty will be important to ocean planning.
IMPORTANT BIOTIC COMPONENTS
The various living organisms inhabiting the planning area can themselves be considered drivers as they too affect the abundance, distribution, and condition of the physical and natural resources of the ocean.
Primary Producers
Primary producers are the fundamental underpinning to trophic interactions in the planning area. For the most part, these primary producers are attached or free-floating plants or cyanobacteria that perform the important role of capturing the sun’s energy and transforming it to a form that other organisms can utilize, although there are also chemosynthesizers, which do not photosynthesize. While seagrasses and macroalgae may be the most obvious primary producers, the major contributors to primary production in the ocean are free-floating photosynthesizing algae known as phytoplankton.
The abundance of photosynthesizers in a certain area is sometimes used to estimate primary productivity. Data collected by the Sea-viewing Wide Field-of-View Sensor (SeaWiFS) and Moderate-resolution Imaging Spectroradiometer (MODIS), satellite-mounted sensors designed to monitor chlorophyll-a, can be used to monitor algal concentrations on the ocean’s surface and detect algal blooms (Cracknell et al. 2001). Satellite chlorophyll data are available for the planning area, but have not yet been processed as part of the ocean planning effort.
SF-12

Zooplankton
Zooplankton graze on phytoplankton and are, in conjunction with climatological and nutrient cycles, responsible for the periodic subsidence of phytoplankton blooms. In a recent assessment, the zooplankton community in Massachusetts Bay was dominated by the copepods Oithona similis and Pseudocalanus spp. Other copepod species typical of the Gulf of Maine include Calanus finmarchicus, Paracalanus parvus, Centropages typicus, and Centropages hamatus (Libby et al. 2009). Early life stages of bivalves, gastropods, polychaetes, crustaceans, and fish are also important components of the zooplankton community. The Massachusetts Water Resources Authority (MWRA) has documented a decrease in total zooplankton abundance in Massachusetts Bay from the 1992-2000 period to the 2001-2006 period (Libby et al. 2009). Copepod abundance in particular was found to be lower in Massachusetts Bay and offshore, with the most abundant species, O. similes, showing the most dramatic decrease. Notably, the relatively larger copepod C. finmarchicus has in fact increased in abundance since 2000 (Libby et al. 2009). While it is not the most abundant, the size of C. finmarchicus relative to other zooplankton makes it the most important contributor to the zooplankton biomass cycle on Georges Bank (Backus and Bourne 1987). Within Cape Cod Bay, C. finmarchicus aggregations are also important as they are associated with high probabilities of North Atlantic right whale (Eubalaena glacialis) occurrence and feeding activity (Jiang et al. 2007).
Benthic Organisms
The species that typify the soft bottom benthic communities in Massachusetts include polychaete worms, amphipods, sand dollars, bivalves, and sea anemones. Hard bottom communities include algae, sponges, and sea anemones (Maciolek et al. 2008). A few areas of soft coral also exist within the planning area. The vast number of benthic organisms perform the important ecosystem functions of filtering the water column, aerating sediments, providing shelter, and serving as a food source for upper trophic level predators and their various life stages.
The most robust dataset examining benthic community species composition and spatio-temporal trends in the planning area has been collected by MWRA during impact assessment and environmental quality monitoring for the Deer Island Treatment Plant outfall (Werme and Hunt 2006; Maciolek et al. 2008). Other studies that cover many miles of seafloor are the pre- and post-construction benthic monitoring studies in the footprint of the Hubline, Northeast Gateway, and Neptune natural gas pipelines across Massachusetts Bay. There are also smaller studies with benthic infaunal information in Buzzards Bay and associated with the immediate vicinity of ocean construction projects. However, Massachusetts is lacking a comprehensive map of benthic habitats and communities.
SF-13

Nekton: Fish, Mollusks, Crustaceans, and Cnidarians
More than 200 species of fish utilize the Massachusetts ocean management planning area. Some of these fish school by the tens of thousands, providing an important food source for predators such as other fish, marine mammals, birds, and humans. In particular, the annual cycles of landward-migrating spawning adults and estuary-bound juveniles of alosids (herring, menhaden, and shad) and smelt form a relatively predictable bounty that is important to the life cycles of many predators. Other important seasonal migrations are the movement of striped bass and bluefish from the mid-Atlantic states into the Gulf of Maine in late spring and summer and the winter migration of winter flounder from deeper waters to their spawning areas in estuaries.
Several types of mollusks contribute to the Massachusetts ocean ecosystem, including bivalves (mussels, oysters scallops, and clams), gastropods (snails and whelks), and cephalopods (squid and octopus). In addition to their important ecosystem roles as water filterers, sediment bioturbators, grazers, and predators, mollusks serve as prey for fish, birds, crustaceans, mammals, and other mollusks, as well as humans. In the planning area, the shellfish of most importance to the commercial fishery are surf clams (Spisula solidissima), ocean quahogs (Arctica islandica), and sea scallops (Plactopecten magellanicus). Inshore of the planning area, the shellfish of most importance to the fishery are quahogs (Mercenaria mercenaria), soft shell clams (Mya arenaria), blue mussels (Mytilus edulis), razor clams (Ensis directus), oysters (Crassostrea virginica), and bay scallops (Argopecten irradians). There currently is no statewide resource assessment for shellfish.
Crustaceans include shrimp, crabs, lobsters, and horseshoe crabs, as well as smaller organisms such as barnacles, copepods, isopods, and amphipods. Crustaceans form an important trophic link between energy resources on the seafloor (e.g., infauna, epifauna, macroalgae, detritus, and dead organisms) and the free-moving predators above (e.g., fish, cephalopods, mammals, and birds). The spring and summer movement of large, sexually mature lobsters from offshore toward the shore is an important annual phenomenon that affects how and where lobstermen fish.
Free-floating cnidarians and ctenophores are predators that consume zooplankton and small fish. There have been suggestions across the globe that zooplankton abundances may be lower due to an increase in filter feeders, especially ctenophores and jellyfish. Evidence from power plant intake monitoring along coastal Massachusetts suggests that ctenophore and jellyfish are becoming impinged at higher rates than in the past. While cnidarians are not often monitored, their interaction with zooplankton, especially ichthyoplankton, may prove to be useful for understanding long-term trends in fish populations. In addition to their role of helping to crop the vast quantities of zooplankton in the ocean, cnidarians serve as an important food source for many types of sea turtles.
SF-14

Mammals: Whales, Porpoises, Dolphins, and Seals
Massachusetts waters provide excellent feeding and nursery habitat for a variety of marine mammals. All of these species are either protected under the federal Marine Mammal Protection Act or listed as threatened or endangered under the federal Endangered Species Act. Many are also listed under the Massachusetts Endangered Species Act (MESA). The marine mammals most frequently found in the planning area are: minke, right, and humpback whales; gray and harbor seals; harbor porpoises; and white-sided dolphins. In addition to their significance to humans as protected species, marine mammal viewing is an important component of the Massachusetts tourism industry. Within the ecosystem, marine mammals are top predators that impart top-down pressures on the abundance of forage species and their predators.
Birds
Shorebirds, colonial waterbirds, waterfowl, songbirds, and pelagic seabirds are all found within the planning area, as discussed below.
Shorebirds
The beaches, marshes, estuaries, rocky outcrops, and islands along the Massachusetts coastline, as well as the ocean waters themselves, provide valuable habitat for the reproduction and foraging of resident and migratory bird species. Shorebirds utilizing the planning area in late spring and early summer feast on a variety of invertebrates, such as amphipods, small mollusks, marine worms, and possibly horseshoe crab eggs. Many of these species fly thousands of miles in each direction during their annual migration—some going as far south as the southern tip of South America and as far north as the Canadian arctic or western Greenland. In order to support their epic migrations, most shorebirds typically make several stops at key locations to replenish their fat reserves. In the Commonwealth, there are several key shorebird stopover sites, most notably the Parker River National Wildlife Refuge and the Great Marsh Important Bird Area (IBA) on the North Shore, Duxbury and Plymouth Bay IBA on the South Shore, Monomoy National Wildlife Refuge/South Beach IBA in Chatham, and several key sites on the Cape Cod National Seashore (e.g., Nauset Marsh and First Encounter Beach in Eastham).
Colonial Waterbirds
Small, off-shore islands provide important nesting areas for colonial nesting waterbirds. Because some of these species are ground nesters (e.g., gulls, terns, and skimmers) they are at a great risk from trampling by foot traffic or predation by mammals that may occur on their nesting islands. There are several islands within the
SF-15

planning area that support large nesting waterbird colonies (e.g., Ram and Bird Islands in Buzzards Bay). In addition to the importance of Massachusetts coastal areas and surrounding waters for breeding, several sites are essential post-breeding staging habitat for terns. The majority of the entire North American population of endangered Roseate Terns uses Cape Cod, South Shore, and Buzzards Bay sites for nesting and for resting/foraging before migrating to South America. Thousands of Common Terns, hundreds of Forster’s Terns, and Black Terns also use these staging sites.
Waterfowl
The many coves, coastal ponds, and estuaries in and outside of the planning area regularly harbor waterfowl during the spring and fall migration, as well as during the winter, and a few also support foraging and nesting habitat for resident species. From late summer through fall, Gadwall, American Wigeon, American Black Duck, Mallard, Northern Shoveler, Northern Pintail, and Green-winged Teal migrate through the planning area, while mid to late fall brings huge numbers of coastally migrating eiders, scoters, and Long-tailed Ducks. Recent data collected by Mass Audubon suggest that the waters around Nantucket probably hold the densest winter aggregations of Long-tailed Ducks in the world (Perkins, Mass Audubon, personal communication). Long-tailed Ducks apparently forage on amphipods and mollusks from the south side of Nantucket out to Nantucket Shoals during the day, only to return to more protected waters north of Nantucket Sound for the night.
Songbirds
During fall migration, northwesterly winds following cold fronts periodically drift migrating songbirds over the planning area, most notably in the Cape Cod region. Under normal conditions the presence of these birds in the planning area is minimal; however, under adverse migration conditions during fog or light rain, many birds could be affected by a combination of winds, lighted towers, or other obstructing objects in their course of migration (e.g., lighthouses, wind turbines, etc.).
Pelagic Seabirds
The near-ocean waters of the Stellwagen Bank National Marine Sanctuary and the waters to the east of Cape Cod routinely host an abundance of seabirds in many of the same locations that are important for marine mammals. Seabirds such as shearwaters, storm petrels, Northern Gannet, and jaegers spend the majority of their lives at sea; however, during extreme weather events such as hurricanes and nor’easters, very large numbers regularly enter the study area, especially the waters bounded by Cape Cod Bay. The unusual coastal configuration of Cape Cod makes
SF-16
the waters of Cape Cod Bay of considerable significance, even if only under episodic conditions.
Reptiles
There are five main sea turtles that utilize the planning area: loggerhead, green, Kemp’s Ridley, leatherback, and hawksbill. As mentioned above, sea turtles are predators of jellyfish and may have an important role in regulating their abundances and their effects on their prey. Spatial information on the distribution and abundance of these animals is lacking.
LAND-BASED INFLUENCES
The Massachusetts coastline and its smaller embayments are not in the planning area itself, but they do influence the planning area as sources of contaminants (metals, nutrients, petroleum products, pharmaceuticals, pesticides, and bacteria), freshwater (from river discharges and surface runoff), sediments (from coastal erosion and river discharges), and solid organic and inorganic materials. While the fate and transport of some constituents from the nearshore to deeper waters can be modeled with a certain degree of confidence (e.g., metals and sediments in Warner et al. 2008) others are less well understood. In particular, nearshore erosion, resuspension, and transport of sediments are not well understood. As another example, the relative importance of the transportation of constituents from embayments to the ocean planning area is not well known, except for the heavily studied Boston Harbor system (e.g., Bothner 1997, 1998). Land-based sources of contaminants, freshwater, and sediments, while outside of the planning area, will be important to document in order to facilitate sound management of existing and future uses (e.g., aquaculture or sand-mining siting).
Precipitation and Freshwater Runoff
Data collected at the USGS Merrimack River gauge # 01100000 in Lowell from 1923-2008 show that fresh water runoff to Massachusetts Bay increases from October to April, on average, and then decreases in volume substantially in May and then again in June, remaining substantially below the annual average in July, August, and September (USGS 2009a). This pattern is consistent on an annual basis south of Cape Cod as well (as seen at the Taunton River gauge), although the river inputs are an order of magnitude or two less than those of the Merrimack (USGS 2009b).
Drought is defined as when monthly soil moisture is more than 10% below the long-term mean (NECIA 2006). Drought conditions are typically thought of as affecting agriculture and water supply, but they also affect freshwater runoff entering the ocean through watershed basins. To the extent that the large rivers in the Gulf of Maine affect circulation, the transport of particles, and other dynamics in Massachusetts and Cape Cod Bays, periodic
SF-17

droughts also affect these properties. Historically, short-term droughts (over one to three months) occur once every two years across the northeast United States (NECIA 2006). Droughts lasting more than six months occur once every 30 years (NECIA 2006).
Land-Based Sources of Pollutants and Contaminants
For the most part, conventional pollutants (e.g., metals, bacteria, chemicals, and petroleum products) emanating from land-based point sources and entering the ocean have been greatly reduced or eliminated due to environmental regulations and monitoring of wastewater treatment, power plant, and industrial discharges. Non-conventional pollutants such as nutrients continue to be major causal agents of cultural eutrophication, which results in habitat loss and serious impairment of designated water quality and use standards. Nutrients mainly enter estuaries, rivers, and bays from point sources, such as wastewater treatment facilities, and from nonpoint sources, such as subsurface sewage discharges (septic systems) and lawn fertilizer applications that travel through groundwater. Nonpoint sources of nutrients also enter marine waters via stormwater conveyed from impervious surfaces or flowing directly over farmland. These nonpoint sources of pollution can also be major contributors of bacteria to beaches, shellfish beds, and waterways.
Emerging science suggests that, in addition to surface runoff, freshwater can leave coastal watersheds as submarine groundwater discharge (SGD) (Kroeger et al. 2006). Advances in quantification techniques, including the development of radon and radium as SGD tracers (Burnett et al. 2001; Burnett and Dulaiova 2003), automated seepage meters (Taniguchi et al. 2003), and improved modeling efforts (Michael et al. 2003), have increased the number and accuracy of SGD estimates. Although there are still large gaps in the temporal and spatial distribution of observations, the data suggest that SGD on a regional scale may exceed riverine input of freshwater and nutrients (Taniguchi et al. 2003; Slomp and Van Cappellin 2004).
HUMAN USES OF THE PLANNING AREA
The baseline assessment, which is also included in Volume 2 of the Massachusetts Ocean Management Plan, identifies several categories of existing and potential human uses in the planning area (i.e., commercial fishing and aquaculture; recreation; transportation; infrastructure; military training, defense, and law enforcement; ocean disposal; environmental protection; education and research; and shoreline protection and floodplain management). The ocean planning work groups on fisheries, habitat, recreational and cultural uses, renewable energy, sediment management, and transportation and infrastructure made significant strides toward mapping many of the myriad human uses in the planning area. Many of these uses, because of their limited spatial and temporal extent in the planning area, cannot be considered drivers of the abundance, distribution, and condition of the physical and natural resources subject to the ocean management plan. However, some human uses can be strong drivers. For example, it is well documented that commercial fishing practices
SF-18

can affect large areas of bottom habitat (Messieh et al. 1991 and citations therein) and the abundance of individual fish populations; shipping activities can affect entire ecosystems by introducing foreign species and disrupting existing food webs (Cohen and Carlton 1998; Ruiz et al. 2000); and marine protected areas and no take zones can affect the density, diversity, and biomass of species within and outside of their boundaries (Halpern 2003). In addition, studies of underwater noise suggest that vessel noise may affect vocal activity and distribution of some species of whales (Erbe and Farmer 1998; Erbe and Farmer 2000; Erbe 2002; Nowacek et al. 2007; Cholewiak 2009) and marine fish (Codarin et al. 2007; Vasconcelos et al. 2007).
Commercial Fishing and Aquaculture
One of the dominant uses of the planning area is commercial fishing by means of mobile and fixed gear (trawls, dredges, longlines, pots, weirs, and gill nets). Major fisheries in Massachusetts include shellfish (including scallops, conch, quahogs, and surf clams), finfish, lobsters, crabs, and urchins. Commercial seafood was a $1.6 billion industry in Massachusetts in 2004, which includes the combined inshore/offshore landings (UMass 2006). The most valuable (by value of landings) port in the United States is New Bedford, which has held this designation for the past eight years (NMFS 2008a). Gloucester, Provincetown, and Boston also harbor major commercial fleets, and virtually all harbors and inlets in Massachusetts support some type of commercial fishing activity (MCZM 2004). Individual species with more than $5 million in annual landed value in 2007 include sea scallop, lobster, monkfish, cod, haddock, winter flounder, Atlantic sea herring, yellowtail flounder, skates, and witch flounder (MA DMF 2009). Two species—scallop and lobster—combine to approach 50% of the total landed value of all species (MA DMF 2009).
Currently in Massachusetts the exclusive form of commercial marine aquaculture is bivalve molluscan culture, employing several methods of cultivation to grow quahogs (Mercenaria mercenaria), oysters (Crassostrea virginica), bay scallops (Argopecten irradians), soft shell clams (Mya arenaria), and to a lesser extent, surf clams (Spisula solidissima) and blue mussels (Mytilus edulis). In 2006, the Massachusetts aquaculture industry was comprised of 374 aquaculture farms on 378 hectares (935 acres) of tidelands worth an estimated $6.3 million in sales (MA DMF 2006). The shellfish aquaculture industry in Massachusetts has been steadily growing at a rate of 10% each year for the past decade (NOAA 2007). Permit holders utilize both on-bottom and off-bottom culturing techniques in 27 coastal communities throughout the state: Aquinnah, Barnstable, Brewster, Chatham, Chilmark, Dennis, Duxbury, Eastham, Edgartown, Essex, Fairhaven, Falmouth, Gosnold, Ipswich, Marion, Mashpee, Mattapoisett, Nantucket, Oak Bluffs, Orleans, Plymouth, Provincetown, Rowley, Wareham, Wellfleet, Westport, and Yarmouth. Aquaculture within the actual planning area is limited to within Wellfleet Harbor, which contains 47 licensed sites in the planning area as of 2006. Additionally, there are 30 hectares (75 acres) of blue mussel aquaculture sites in the licensing
SF-19

stage at four locations within state waters located on Martha’s Vineyard in Aquinnah, West Tisbury, and Chilmark. These areas will be subdivided into individually licensed sites.
Offshore aquaculture has been proposed for Massachusetts, but due to market pressures, use conflicts, and the possibility of environmental impacts, there are currently no offshore commercial aquaculture activities within the planning area. However, due to technological advances and improved understanding of oceanographic conditions, offshore aquaculture has considerable promise for the future (NH Sea Grant 2006).
Clearly, the extraction component of commercial fishing is a driver of the abundance and distribution of the species that are caught. In addition, as explained above, the physical activity of trawling can affect the condition of bottom habitat. Secondary effects related to changes in trophic pressures can elicit cascading responses beyond the target species. Aquaculture probably does not currently play a large role in structuring local ecosystems in Massachusetts, although bivalve aquaculture has been the locus for the spread of invasive tunicates in Maine and Nova Scotia. In Maine and Canada, salmon aquaculture has been the target of criticism for perceived degradation of nearshore benthic habitats due to excess feed (which can decrease dissolved oxygen by increasing biochemical oxygen demand) and the release of antibiotics. In addition, there is the concern that farmed species will escape and affect native populations by spreading parasites and disease and changing the genetic structure of local populations.
Recreation
The coastal and marine environment offers many opportunities for recreational use of resources. Such activities have environmental, social, economic, and cultural implications important to the Massachusetts Ocean Management Plan. Recreational fishing, boating, marine mammal and bird viewing, diving, hunting, gambling boats, and aesthetics are discussed below.
Recreational Fishing
Recreational fishing occurs throughout the planning area. Over a million recreational anglers regularly use the waters of the planning area for fishing, primarily by hook and line. Recreational fishing for lobsters and crab using pots and recreational shellfishing with various handgears in the nearshore areas are also very popular. Recreational fishing is conducted from the shore and from vessels, including individually owned vessels and for-hire vessels (charter and party boats). Anglers target a variety of species including striped bass, black sea bass, bonito, bluefish, cod, cusk, false albacore, haddock, halibut, mackerel, pollock, scup, sharks, smelt, fluke, tautog, bluefin tuna, weakfish, winter flounder, and wolffish. Recreational fishing evolved from subsistence fishing, which was an important cultural tradition in coastal
SF-20

Massachusetts. The modern sport fishery includes a component of subsistence fishing, although in a reduced role that is not well documented. Additionally, there are indigenous fish rights on some creeks and streams.
Recreational shellfishing is a major activity, but likely occurs almost entirely outside of the planning area. Exceptions may exist in the Wellfleet Harbor area and some areas where bay scallop is targeted, such as off of Falmouth and upper Buzzards Bay.
Recreational Boating
The Massachusetts Marine Trades Association (MMTA) conducted a survey of boating experts in early 2009 in order to map the approximate main recreational boating routes and recreational boating and fishing areas in state waters. According to MMTA, the total number of recreational vessels currently registered in Massachusetts is almost 200,000. The total number of motor boats in the United States is 11,966,627. Massachusetts ranks 29th with 145,496 motor boats registered in 2007, down from 148,640 in 2006 (USCG 2007).
There are 64 marinas and about 25,000 permitted public slips and moorings used for recreational boating along the coastline of Massachusetts. In addition, there are an estimated 10,000 privately maintained slips, moorings, and docks (MMTA 2008).
Marine Mammal and Bird Viewing
Wildlife viewing is a significant component of coastal recreation and tourism opportunities in Massachusetts. Whale watching is the most prolific of these ventures and Massachusetts is often referred to as the “Whale Watching Capital of the World.” From April through October, humpback, fin, and minke whales congregate to feed on dense patches of schooling fish. Because the summer tourist season coincides with a time when whales are abundant in the planning area and in nearby federal waters, commercial and recreational whale watching has become a significant use in the planning area and in Stellwagen Bank National Marine Sanctuary. Approximately 10 whale watch companies operate out of Massachusetts and most conduct two trips per day, targeting humpbacks and fin whales. The industry mainly operates out of Newburyport, Gloucester, Boston, Plymouth, Barnstable, and Provincetown. The population of whales that visit Stellwagen Bank each year is fairly consistent and thus, over the course of a season and the course of a whale’s life (known to be at least 50 years), they are exposed to frequent interactions with this industry. In addition to whales, gray and harbor seals are also the subject of wildlife viewing, particularly the population residing on Monomoy Island off Chatham. This is the only active seal watching area in the state. However, access to this site is particularly challenging.
SF-21

Birding is a popular activity in the United States, with an estimated 45 million people considering themselves birders, and 18 million saying that they travel to watch birds (USFWS 2001). Massachusetts has a long tradition as a birding destination and draws not only its own residents but also birders from across the county. Although not specifically quantified, tourism-related birding does have an economic benefit to the Commonwealth, particularly to those communities that are located near birding hot spots, such as Newburyport. Unlike whale watching, birding is an all year activity; in fact some of the most interesting birding along the coast occurs in winter.
In state waters, the consistent draws are wintering sea ducks and other diving birds (loons, grebes), pelagic species (shearwaters, gannets, petrels, etc.), migratory and nesting shorebirds, and nesting terns. In addition to these species, birders are legendary for their willingness to travel across the country at any time of the year to see a rarity. The 1975 appearance of a Ross’s Gull in Newburyport and the subsequent crowds it drew is considered to have spawned the modern popularity of birding.
Much seabird viewing by birders takes place from vantage points on the shore. Popular locations include Plum Island, Halibut and Andrews Point on Cape Ann, Manomet Point in Plymouth, Sandy Neck in Barnstable, First Encounter Beach in Eastham, Race Point in Provincetown, and Nantucket. Monomoy National Wildlife Refuge and South Beach (Chatham) are popular destinations for boat tours, particularly in mid-July through September, during the height of shorebird migration. Birding clubs will occasionally offer charter boat tours to view pelagic birds, heading beyond state waters to Stellwagen Bank and even the continental slope. Birders will also go on their own on whale watch cruises in hopes of seeing pelagic species including shearwaters (Greater, Cory’s, Sooty, Manx), Wilson’s and Leach’s Storm-Petrels, Northern Gannets, phalaropes, Black-legged Kittiwakes, jaegers (pomarine, parasitic, and long-tailed), skuas, Atlantic Puffins, and murres.
Diving
Recreational SCUBA diving is a popular activity with a long history in Massachusetts. Dive clubs, such as the Boston Sea Rovers, the South Shore Neptunes, and the North Shore Frogmen, have been established for 50 years or more and continue to flourish. The Bay State Council of Divers, an umbrella group of dive clubs, charter operators, and dive shop owners, reports that this region contains one of the five largest sport diving populations in the United States.
Diving is practiced throughout the planning area, and most recreational diving takes place in the inshore waters at depths ranging from 3-40 m (10-130 ft). Most diving activities tend to fall into one of five categories: instructional/training, research, wreck diving, photography, and the harvest of lobster and scallops. Some divers are content
SF-22

to simply explore and enjoy the diverse and productive marine environment. The economic contribution of recreational diving is not well known.
Hunting
Massachusetts has world-class sea duck hunting. Shooting and falconing for sea ducks (scoters, eiders, mergansers, and Long-tailed Ducks) and Atlantic Brant are done from land and from vessels from November 1-February 15. Other species that are hunted include Green and Blue-winged Teal, American Widgeon, mallards, Black Ducks, Wood Ducks, Gadwalls, pintails, shovelers, Ring-necked Ducks, Lesser and Great Scaup, Harlequin Ducks, Common and Barrows Goldeneye, Bufflehead, Ruddy Duck, Canada Goose, Snow Goose, and Ross's Goose (Massducks.com 2008). This activity occurs along the coast, in the planning area (generally close to land), and likely on and near the islands contained within the planning area (such as Nomans Land Island). Additionally, hunters may pass through the planning area in vessels. There are no indigenous hunting rights in Massachusetts.
Gambling Boats
There is currently only one gambling boat in Massachusetts. Atlantic Casino Cruises (125 gaming machines, nine tables) operates out of Gloucester and runs daily from Rowes Square in Gloucester's Inner Harbor.
Aesthetics
Compared to ocean-based resources and activities that can be directly observed, measured, and mapped, enjoyment of ocean scenery does not lend itself easily to data collection and analysis; indeed, it does not even take place for the most part within the ocean planning area, but from the adjacent shorelands. Scenic enjoyment is also an important part of the recreational boating experience, but has not yet been examined. Recognition of the value of visual services is hardly new; Massachusetts was a pioneer in the field of land-based visual assessments with the Massachusetts Department of Environmental Management (DEM) Scenic Landscape Inventory effort in 1981/82. The Massachusetts Department of Conservation and Recreation (DCR, formerly DEM) engages in similar ongoing work with communities through the Heritage Landscape Inventory program. With the global interest in the development of wind farms in particular, other countries and coastal states in the United States are starting to develop visual impact analyses based upon traditional studies of viewshed across landscapes, adapting them to the seascape context and exploring ways to identify visual resource areas of high value (Maritime Ireland/Wales 2001; UK Department of Trade and Industry 2005). In the United States, some agencies are exploring the use of Geographical Information System
SF-23
(GIS) tools to model viewshed and assign values to them for mapping purposes through a variety of means (State of Connecticut 2007). Within Massachusetts, the Boston Harbor Islands have recently been the subject of a scenic analysis and assessment (Ryan and Taupier 2007).
The use of the ocean as a scenic resource occurs primarily in three ways: visitation to federal, state, and town beaches and other recreation properties open to the public (including bikeways and footpaths); patronage of waterfront hotels, restaurants, and other commercial facilities of public accommodation; and ownership of private waterfront property. Use of scenic resources also occurs through driving, biking, and walking along non-recreational properties such as shoreside roads and even from workplaces with waterfront views. Currently, efforts are directed toward a better understanding of the first “vantage point,” because government and non-government organization (NGO) lands presumably provide the most public viewing opportunities in the aggregate and have been the subject of reasonably thorough data development efforts.
Recreational uses in the planning area can be drivers of natural resource abundance, distribution, and condition in several ways. First, some recreational groups may have a strong conservation ethic (e.g., Mass Audubon, The Right Whale Consortium, Massachusetts Striped Bass Association) that supports policies and activities that seek to protect and enhance the populations of species that they enjoy. Second, some organizations (Massducks.com) are directly involved in wildlife extraction. Third, organizations that represent a large number of users (e.g., MMTA, dive associations) and even non-organized groups (e.g., boaters in general) can have effects on water quality and habitats by widespread changes in behavior (e.g., switching from two-stroke to four-stroke engines, taking care not to disturb sensitive resources such as bird rookeries, seal haul outs, eelgrass beds, or wrecks). While the changes due to any one individual are small relative to the scale of the planning area, the sheer number of recreational users in Massachusetts suggests that changes in human recreational behaviors can have widespread effects on coastal and ocean resources.
Transportation
The planning area provides access for a variety of commercial transportation uses. The ports of Boston, New Bedford, Fall River, and Gloucester, while technically outside of the planning area, are the destination and origin of vessels transporting people, food, fuel, liquid and dry bulk cargoes, and container goods through the planning area. The construction and maintenance of navigational pathways in the planning area to ensure the safe transit of these vessels and how these navigational lanes interact with other uses of the planning area is an important component of the Massachusetts Ocean Management Plan. The major transportation categories of shipping, cruise ships and coastal lines, ferries and commuter boats, and navigational aids and lanes are discussed below.
SF-24

Shipping: Containers, Bulk Products, and Fish
Massachusetts is one of the main shipping destinations in the Atlantic Ocean and its ports provide the required facilities for commercial shipping and cargo handling. The main harbors that handle fuel, container goods, fish, and other cargo are: Boston (including Everett, Chelsea, Revere, Quincy, and Weymouth), Fall River, Gloucester, New Bedford, and Salem.
Cruise Ships and Coastal Lines
Besides commercial shipping, the ports of Massachusetts also offer facilities for cruise ships and passenger handling, serving as important ports of call and providing facilities for the growing cruise ship industry. Boston by far is the largest port of call in Massachusetts for the cruise industry, having over 100 vessel calls and handling over 200,000 passengers in 2007 (Deb Hadden, Massport, personal communication). New Bedford (25 ports of call in 2007) and Gloucester (two ports of call in 2007) are also destinations that may have more ports of call in the future.
Ferries and Commuter Boats
The state of Massachusetts includes a number of islands along its coast. The larger islands (e.g. Martha’s Vineyard, Nantucket) have a resident population and therefore are served with ferries and commuter boats all year round. In addition, these islands together with a number of smaller islands serve as popular tourist destinations and a ferry boat fleet has developed to cater to the needs of this thriving industry. The main passenger transportation lines are to/from: Salem/Boston, Boston/Provincetown, Provincetown/Plymouth, Hyannis/Nantucket, Harwich/Nantucket, Martha’s Vineyard/Nantucket, Woods Hole/Martha’s Vineyard, New Bedford/Cuttyhunk, and New Bedford/Martha’s Vineyard.
Navigational Aids and Lanes
Navigational aids and designated shipping channels and lanes are important infrastructure components that are necessary to maintain the diverse commercial transportation uses of the Commonwealth. The products and passengers that transit the navigational lanes contribute significantly to the state’s economic portfolio.
For the most part, transportation vessels are not major drivers of the ecosystems in Massachusetts. However there are two exceptions. First, due to their size and speed, transportation vessels can affect the condition of individual whale species through propeller strikes. These vessels can also contribute to local water quality degradation through the discharge of oily bilge water, sewage, invasive species, and other pollutants.
SF-25

Infrastructure
The seabed within Massachusetts waters is host to a variety of infrastructure that supports the energy and telecommunications industries and municipal activities such as wastewater treatment. Energy generating facilities, renewable energy, telecommunication and power cables, pipelines, and sewer lines are discussed below.
Energy Generating Facilities
There are 11 fossil fuel energy generating facilities and one nuclear facility adjacent to the planning area. The majority of these facilities use once-through cooling technology to cool their condensers. The total generating capacity of these facilities is 7,942 megawatts (MW) and the total average permitted cooling water withdrawal and discharge is 1.48 x10⁷ cubic meters per day (m3d) or 3,897 million gallons per day (mgd). Along with the cooling water they withdraw, energy facilities entrain billions of planktonic organisms into their cooling systems and impinge tens of thousands of juvenile and adult fish and crustaceans on their intake screens. While these facilities are outside of the planning area, the sheer number of organisms that are killed at these facilities can have measurable effects on the populations of fish in the planning area (e.g., winter flounder in Cape Cod Bay).
Renewable Energy
Several renewable energy facilities or test facilities have been proposed in or adjacent to the planning area. While none of these has been built as of 2009, these structures (wind turbines, tidal turbines) have the potential to drive changes in the abundance of some organisms by providing new substrate for colonization and shelter for forage species. The size and placement of these structures may also drive shifts in species movements as well as physical processes such as sediment movements.
Telecommunication and Power Cables
Several telecommunications and power cables have been placed under Massachusetts seafloor sediments in the last 10 years. Some of these cables have provided municipal services to offshore islands, while others have been built by private companies to support the telecommunications industry. An emerging use that is currently (2009) being considered in several ocean projects is the placement of power cables to connect offshore or out-of-state renewable energy suppliers to the energy grid in Massachusetts.
SF-26

Pipelines
Up until the last decade, the Commonwealth’s seafloor was relatively free of pipelines. Those that did exist were conveyances between islands and the mainland or were sewer and/or stormwater discharge points that were relatively close to shore. In 2000, MWRA completed its outfall tunnel to Massachusetts Bay and the 2 km long (6,600 ft), 400-port diffuser that rests on the bottom in roughly 30 m (100 ft) of water. In addition, a private company began construction on a natural gas conveyance that would transit Massachusetts Bay. Since that time, there have been two other major pipelines that have been constructed in the planning area.
There are currently three major natural gas pipelines that transect the planning area. The first of these to be built was the Hubline, a natural gas pipeline that brings product from landside sources, across Massachusetts Bay from Beverly to Weymouth, where it connects to another land-based distribution network. The other two pipelines and their accessory infrastructure bring natural gas from liquefied natural gas ships, which are (or will be) moored at deepwater ports seaward of the planning area. These pipelines are mapped in Figure 3 of the report of the Work Group on Transportation, Navigation, and Infrastructure (EEA 2008).
Sewer Lines
Sewer lines and MWRA outfall diffusers are reported on National Oceanic and Atmospheric Administration (NOAA) charts and are mapped in Figure 3 of the report of the Workgroup on Transportation, Navigation, and Infrastructure (EEA 2008).
All of these structures have the potential to be drivers of local ecosystem dynamics by: creating new habitat for hard-substrate-colonizing species (e.g., tunicates, algae), creating habitat for structure-seeking forage species and predators (e.g., decapods, labrids, striped bass), changing local circulation and sediment transport, changing migration pathways, displacing existing habitats, affecting water quality and noise conditions, and increasing human presence in these areas. The construction of all of these structures and their placement in and on the seabed can also affect the local abundance, distribution, and condition of species, especially infauna, through sediment drape, physical movement, and avoidance. In addition, the presence of such infrastructure can affect the spatial distribution of other human uses, such as anchorage restrictions, construction-related effects on commercial fishing, and others.
Military Training, Defense, and Law Enforcement
A diverse suite of military activities occur in and over the planning area. The amount of live ordinance used in the planning area has decreased or completely ceased, but military training, defense, and law enforcement exercises continue. Of particular interest are two former U.S.
SF-27

Navy training areas where live ordinance still remains. Between the 1950s and the 1970s, the Navy performed target practice on the James Longstreet, a 127 m (417.7 ft) steel ship that now resides under 6 m (20 ft) of water off of Eastham. The waters around the James Longstreet are listed as a “restricted area” on charts due to unexploded ordinance. South of Martha’s Vineyard, on Nomans Land Island, the Navy conducted bombing practice from aircraft between 1943 and 1996. Following an effort to clear the island of ordinance in 1997 and 1998, the entire island was transferred to the U.S. Fish and Wildlife Service for use as a wildlife refuge, primarily for migratory birds. Due to danger from unexploded ordinance, access is not permitted, and the island is closed to the public. In addition, two restricted airspace areas, R-4105A and R-4105B, currently occur over the island. The U.S. Air National Guard, Coast Guard, and Navy all continue to conduct activities in the planning area. The U.S. Army Corps (USACE) of Engineers is responsible for maintaining the navigational pathways to and from the ports that surround the planning area waters and for reviewing and permitting dredging and disposal projects (e.g., underwater pipelines, cables, liquefied natural gas terminals) that occur within planning area waters and beyond. As with other human activities, current military activities can affect the abundance, distribution, and condition of organisms through noise and physical disruption, most importantly to marine mammals.
Ocean Disposal
Ocean disposal occurs within the planning area. Specifically, wastewater, stormwater, and industrial discharges, along with dredged material disposal, are discussed below.
Wastewater, Stormwater, and Industrial Discharges
There are 53 significant outfalls (i.e., outfalls discharging greater than 757 m3d [0.2 mgd]) that discharge millions of m3d of wastewater (greater than 2 billion gallons per day) to the waters adjacent to the planning area. There are 28 municipal wastewater facility discharges, 12 thermal discharges from power plants, six discharges from commercial/industrial facilities, and 11 stormwater discharges from oil terminals. The largest outfall is the MWRA’s 15 km (9.5 mile) pipe that discharges on average 1.38 x 10⁶ m3d (365 mgd) of treated municipal effluent and stormwater.
Dredged Material Disposal
The disposal of solid materials in Massachusetts waters can be characterized within one of the following categories: dredge material, nearshore disposal for shore protection, fish waste from processing, derelict vessels, and hazardous waste and ocean dumping.
SF-28

In Massachusetts, clean fill can be disposed of at one of two sites: the Massachusetts Bay Disposal Site (MBDS), which is adjacent to the planning area, and the Cape Cod Bay Disposal Site (CCBDS), which is within the planning area. Designated disposal sites receive an extensive review before designation and their use in New England is monitored by the USACE Disposal Area Monitoring System (DAMOS). A third site in Buzzards Bay was used for many years, but was not designated for this use.
In addition to the two permitted Massachusetts disposal areas, several locations are or have been used by USACE for offshore disposal. These sites are located off Newburyport, Marshfield, Bourne, Dennis, and Cleveland’s Ledge in Buzzards Bay. These sites are and have been used by USACE for small amounts of dredge material taken from municipal navigation channels or the Cape Cod Canal. These sites generally lack a comprehensive review of habitat impacts.
Disposal of solid or liquid wastes in the ocean, if done correctly, can have minimal or non-detrimental effects to natural resources on large spatial and temporal scales. However, there are local changes in water and sediment quality that occur at the dumping site itself. As an ongoing societal need, ocean disposal will continue and will need to be regulated to ensure that it does not become a significant driver in Massachusetts waters.
Environmental Protection
In addition to the protection conferred by environmental laws like the state and federal Clean Water Acts, Wetlands Protection Acts, and Endangered Species Acts, there are several geographic areas in and adjacent to the planning area that receive specific additional protection. There are 661,613 hectares (1,634,880 acres) of ocean, estuaries, and wetlands in Massachusetts collectively protected as Areas of Critical Environmental Concern, Cape Cod National Seashore, National Estuarine Research Reserve, National Wildlife Refuges, No Discharge Areas, Ocean Sanctuaries, and Outstanding Resource Waters. By definition, these regulated areas are implemented to improve the condition of physical and natural resources.
Education and Research
Massachusetts is the location of some of the best research institutions in the United States, indeed globally, especially for oceanography, biology, biomedical research, and technology. Institutions such as Woods Hole Oceanographic Institution (WHOI), the Marine Biological Laboratory (MBL), Harvard University, Massachusetts Institute of Technology (MIT), Boston University, the University of Massachusetts, and others conduct research in the planning area. Governmental organizations such as the U.S. Geological Survey (USGS), U.S. Environmental Protection Agency, MIT and WHOI Sea Grant Programs, MarineFisheries, and the NOAA Northeast Fisheries Science Center produce work that is necessary for greater ecological and oceanographic understanding and to inform management practices. At
SF-29

the local level, there are several nonprofit organizations that strive to educate the public about environmental issues and advocate for improvements. Research institutions and environmental groups can be drivers for change in natural resource conditions when the knowledge generated by them and their advocacy inform policy decisions that result in improved management and protection.
Shoreline Protection and Floodplain Management
Dynamic coastal environments shift and change in response to increases in energy (wind and waves), alterations to regional sediment resources (sand, gravel, and cobble), and changing sea levels. Although the Massachusetts shoreline is technically outside of the planning area, activities within the planning area can directly and indirectly impact processes and activities on the shoreline. One major challenge is to prevent or minimize sediment loss from construction of engineered structures and ensure that regional sediment supplies are managed effectively so that the functions of natural coastal processes are not lost.
Many public shoreline structures found along the shoreline of Massachusetts were originally constructed during the mid to late 1800s and early 1900s to provide protection to buildings, roadways, and utilities, and to facilitate commercial and general public access to the water. Such structures include seawalls (e.g., Lynn Shore Reservation and Blyman Canal in Gloucester); revetments (e.g., Point Allerton in Hull and Fourth Cliff in Scituate); breakwaters, jetties, and groins (e.g., the federal breakwater in Plymouth Harbor, East and West jetties in Green Harbor, Marshfield, and “The Five Sisters” groin in Broad Sound, Winthrop); piers and wharves (e.g., the timber pier on George’s Island, Boston Harbor, and the timber wharf in Lynn Heritage State Park); bulkheads (Green Harbor entrance channel in Marshfield); boardwalks (e.g., to the beaches on Plum Island); and flood control structures (e.g., the self regulating tidal gate in Revere and the stop log structure on Black’s Creek, Quincy).
The Commonwealth considers non-structural measures such as beach nourishment (i.e., the active addition of sediment to a beach system) viable alternatives to protect coastal development while also maintaining recreational beaches. Beach nourishment projects require an adequate volume of compatible sediment. Massachusetts successfully completed a beach nourishment project on Revere Beach State Reservation in 1992 using an upland source of approximately 768,000 cubic yards of sediment. Smaller nourishment projects were also completed on Dead Neck Beach in Osterville (1998) and Long Beach in Plymouth (1999) using sediment from offshore sources. No extraction of sand for beach nourishment has yet been permitted in the planning area, but the possibility of this use is of particular interest with the increase in threats of coastal erosion and inundation.
Shoreline protection efforts have localized effects on physical and natural resource distributions by converting habitat to hard substrate, affecting sediment transport (in the
SF-30

case of hard structures), and causing temporary water quality changes and sediment disturbance (in the case of sediment extraction). These activities may become more significant drivers of the abundance and distribution of organisms if their location and timing overlaps with habitats that are critical to a given species life history (e.g., spawning or nursery areas).
CLIMATE CHANGE
Climate change refers to the measurable transformation, across decades or longer, in the average state and/or variability of weather (IPCC 2007). The relevant measures are usually air temperature, sea surface temperature, wind velocity, and precipitation. In common usage, climate change also refers to measurable phenomena that are secondary indicators of long-term weather changes including: ice and snow extent, ocean acidity, mean sea level, and the frequency of intense storms. The following climate change impacts and influences are critical to ocean planning in Massachusetts: temperature changes, precipitation changes, ocean pH changes, and sea level rise.
Temperature Changes
Over the last 100 years, global average temperature has increased by about 0.74°C (90% confidence interval of 0.56-0.92°C) (IPCC 2007), with most of the increase occurring in the last 50 years. Temperature increases are greater at higher latitudes, with the Arctic experiencing an average temperature rise that is twice as great as the rest of the globe. South of Cape Cod, from data collected in Woods Hole, Nixon et al. (2004) have documented that yearly average sea surface temperature warmed at a rate of 0.04° C per year from 1970-2002, or 1.3°C (Nixon et al. 2004). During the 1990s, winter months (December-February) were found to be 1.7°C warmer than winter months from the time period 1890-1970. Summer months (June-August) were 1°C warmer. North of Cape Cod, sea surface temperature data have been collected by NOAA over several decades in Boston’s Fort Point Channel, but the data have not been analyzed for long-term trends. It is reasonable to assume that similar large-scale climatological changes driving sea surface temperature increases at Woods Hole are also acting in Massachusetts Bay, though the magnitude of that change may be different.
The implications for an increase in sea surface temperature of 1°C or 2°C are not well known for estuarine and marine water, but one can infer that temperature-dependent natural phenomena will be affected. The International Panel on Climate Change (IPCC) predicts that a global average temperature increase of 1.5°C to 2.5°C, in conjunction with an increase in carbon dioxide (CO2), will lead to “major changes in ecosystem structure and function, species’ ecological interactions and shifts in species’ geographical ranges, with predominantly negative consequences for biodiversity and ecosystem goods and services” (IPCC 2007). The magnitude and timing of spring blooms of phytoplankton, the timing of diadromous fish
SF-31

runs, the hatching success of benthic fish eggs, the metabolism and reproduction of microorganisms, and many other biological processes could potentially be affected. Further, physical oceanic processes like seasonal mixing, current strength, the ocean’s ability to hold dissolved gases, and ocean volume and elevation in coastal areas, may be subject to changes as well.
The number and range of important phenomena that are regulated by temperature and the relative ease with which temperature can be recorded and analyzed speaks to the high priority of continuing the long-term monitoring of this parameter and expanding its coverage, and/or integrating its analysis, across the planning area for specific management purposes (e.g., circulation models, models of how temperature changes will affect life histories, etc.).
Precipitation Changes
Rain, snow, and sleet may not seem to be major influences on the planning area, but their contribution to the Gulf of Maine (Manohar-Maharaj and Beardsley 1973), especially during the spring thaw and freshets, can be an important part of current strength (Geyer et al. 1992; Lynch et al. 1997), ocean stratification, ocean salinity (Blumberg et al. 1993), and nutrient and mineral transport across the Gulf of Maine, including Massachusetts and Cape Cod Bays.
Lynch et al. (1997) document that the strength of the Western Maine Coastal Current (WMCC) is influenced by the major rivers in the Gulf of Maine—the St. John, St. Croix, Penobscot, Kennebec, Androscoggin, Saco, and Merrimack. The WMCC in turn influences currents in the greater Massachusetts/Cape Cod Bay system, as far east as Stellwagen Bank, George’s Bank, and the Great South Channel (Geyer et al. 1992). In spring, when relatively fresh water enters Massachusetts Bay from the northeast (i.e., from the Merrimack River and the large rivers in Maine) and the prevailing winds are from the north, transport in Massachusetts and Cape Cod Bays follows a net counterclockwise path. In later spring and summer, Cape Cod Bay becomes isolated from this circulation (Geyer et al. 1992; MWRA 2003).
In addition to their inputs of fresh water, rivers are also conduits for nutrients and contaminants from terrestrial-based drivers (e.g., population, industrialization) to the ocean. While long-term changes in precipitation may affect Massachusetts and Cape Cod Bays (due to the influence of the large Gulf of Maine rivers), the planning area south of Cape Cod has significantly smaller rivers and is thus much less influenced by riverine inputs.
Wake et al. (2006) have reported that average annual precipitation across the Northeast has increased 7% from 1900-2002—from roughly 109-117 cm (43-46 in). Total annual precipitation in Massachusetts has increased more than that, with the Boston Harbor region increasing by 20-30 cm (8-12 in) from 1900-2002, and precipitation in the Buzzards Bay region
SF-32
increasing 30-40 cm (12-16 in). The IPCC (2007) predicts little to modest (< 10%) change in runoff in the Northeast by the end of this century. It is unknown how these changes in annual precipitation might affect the planning area, but continued monitoring of riverine discharges at the USGS gauges on the Merrimack (gauge # 01100000 in Lowell) and other rivers will help develop models to predict long-term responses to coastal precipitation changes.
While regional models predict small or modest increases in precipitation in the Gulf of Maine, IPCC analyses (2007) predict a large (25-50 cm or 10-20 in) increase in precipitation in the northern part of the northern hemisphere. This suggests that there will be a significant increase in freshwater inputs into high latitude marine ecosystems. Most Gulf of Maine water enters over the Nova Scotian shelf and through the Northeast Channel (Smith et al. 2001; Ji et al. 2007). It is known that in the 1990s, freshwater pulses out of the Arctic, due to increased glacial melting, precipitation, and river runoff (Peterson et al. 2006), brought lower salinity water into the region, which changed the Gulf of Maine’s physical structure by enhancing stratification (or layering) in the water column (Smith et al. 2001). Stratification occurs when denser cold and/or saltier water settles near the bottom, and less dense fresh or warm water sits on top, unless mixed by winds and tides. Stratification reduces the upwelling of nutrients and downward mixing of oxygen that support the base of the food web. Thus, if the IPCC predictions are accurate, increased precipitation may lead to increased freshwater stratification in the Gulf of Maine, which is known to strongly affect plankton production. For example, Ji et al. (2007) provide evidence that the freshening of Gulf of Maine waters from 1998-2006 may have enhanced the westward progression of spring phytoplankton biomass. Changes in the composition and annual cycles of lower levels of the marine food chain (phytoplankton and zooplankton) could affect the productivity of all upper levels, including fish (Platt et al. 2003), marine mammals, and seabirds. Since most phytoplankton productivity occurs within 20 m (66 ft) of the surface, it will be affected by stratification events, because the mixing of nutrients and sunlit surface waters is reduced (Ji et al. 2007). Strong stratification events can also lead to localized concentrations of algal blooms (including red tides) and “dead zones,” where oxygen depletion reaches extreme levels (Cloern et al. 1994).
In the 1990s, the Arctic water incursions leading to changes in salinity and stratification favored large increases in the populations of other smaller species of zooplankton (Greene and Pershing 2001; Pershing et al. 2004; Greene et al. 2008). Small fish depend on the timing and seasonality of particular species of plankton development to specific sizes that are good to eat. Temperature changes can lead to a poor match in space and time between the fish and their zooplankton food, which can mean starvation for the young fish (Pershing et al. 2005; Greene and Pershing 2007).
SF-33

Ocean pH Changes
The IPCC (2007) reports that since 1750, global ocean pH has decreased (i.e., become less alkaline) an average of 0.1 pH units. Since pH is a measure of hydrogen ions on a logarithmic scale, this signifies a 10-fold decrease. Increasing atmospheric CO2 concentrations are expected to lead to increased CO2 being dissolved in ocean waters, leading to further reductions in pH (i.e., because CO2 dissolved in seawater forms carbonic acid). IPCC predictions (2007) are that global ocean pH will decrease between 0.14 and 0.35 units by the end of the century.
Ocean pH has important influence on organisms with calcium carbonate shells (e.g., bivalves, gastropods, crustaceans, some polychaetes) because lower pH values are indicative of greater ocean acidity, which affects the formation and durability of carbonate shells (Fabry et al. 2008). Research presented at the 2009 Geochemistry Meeting suggests that several types of ocean organisms with calcium carbonate shells suffered when seawater pH decreased below 8.2 (summarized in Kerr 2009). Most of the 18 species investigated (including periwinkles, oysters, and calcareous algae) formed less calcium carbonate under conditions of greater acidification. However, one species of mussel was not affected and all of the crustaceans investigated (shrimp, American lobster, and blue crab) grew thicker shells under the most severe acidification. Only one species of tube-building worm was found to have the ability to protect itself from acidification by producing a greater proportion of acid-resistant carbonate mineral.
In Massachusetts, pH has not been routinely monitored by regional monitoring programs such as GoMOOS or the National Data Buoy Center, although MWRA recently installed a pH sensor on buoy 44013 in Massachusetts Bay. MWRA does routinely measure pH in some of its surveys in Massachusetts Bay. Of 591 pH measurements taken by MWRA since June, 2004, the median pH was 7.9 and the range was 7.0-8.4 (A. Rex, MWRA, unpublished data). The few data that are available in Massachusetts waters are insufficient to determine long-term trends.
As pH can affect the basic structure-forming processes of large classes of ecologically and economically important species (e.g., snails, clams, mussels, crabs, and lobsters), efforts should be made to support the pH sensor on buoy 44013 and to install pH probes on other ocean monitoring assets (e.g., buoys, gliders) and expand coverage with new instrumentation to monitor long-term changes throughout the planning area. In addition, models should be used to predict likely changes in pH in Massachusetts waters in the next century. Predictions on how the modeled changes will affect the biology of key organisms in the planning area with calcium carbonate shells should be made and tested via laboratory experiments. Finally, models should be used to identify the possible economic effects of decreasing pH on key fisheries and industries.
SF-34
Sea Level Rise
The IPCC (2007) reports with very high confidence (i.e., 90% chance of being correct based upon expert opinion) that sea level rise across the globe will result in increased erosion and flooding in coastal areas in the 21st century. Sea level trends in Massachusetts are computed utilizing gauges at Boston, Woods Hole, and Nantucket. At the Boston station, 86 years of sea level data from 1921-2007 demonstrate that mean sea level has increased 2.63 mm/year (0.104 in/year) or a total of 226 mm (8.94 in). At the Woods Hole gauge, 75 years of sea level data from 1932-2007 (minus data from 1965 and 1967-1969, which are not available [Hicks et al. 1983]) show an increase of 2.61 mm/year (0.103 in /year) or a total of 196 mm (7.72 in). At the Nantucket station, 42 years of data from 1965-2007 demonstrate an increase of 2.95 mm/year (0.116 in/year) or a total of 124 mm (4.88 in). The trend information was first computed by Hicks et al. (1983) but is now available through NOAA’s Tides and Currents website, which provides graphs of sea level trends for all tide gauges in the United States. The trends for Massachusetts show an average increase of 2.73 mm/yr (0.107 in/yr). Based on the existing rate of sea level rise, the average increase in Massachusetts is expected to be 248 mm (9.74 in) by the end of the 21st century. Even greater increases (up to 880 mm or 35 in) are predicted depending on the rate of glacial melt and thermal expansion of the oceans (Wake et al. 2006).
While it is difficult to imagine how sea level rise will affect resources within the planning area (which are predominantly > 0.3 nautical miles [nm] [2 miles] from shore by definition), landside subsidence, isostatic rebound, erosion, and inundation along the shoreline of Massachusetts are important issues that should continue to be monitored and modeled on a site-specific basis.
Frequency of Intense Storms
The IPCC (2007) reports that there is no clear existing trend in the annual number of tropical cyclones but predicts a future increase in “intense tropical cyclone activity.” Wake et al. (2006) report that extreme precipitation events (those resulting in >50 mm [2 in.] of precipitation) have increased from 1949-2002 in eastern Massachusetts. Given that intense storms are important drivers of coastal processes in Massachusetts (because they affect erosion, sediment transport, and waves) further study is warranted (e.g., through modeling efforts).
It is not clear at this point how intense storms and their frequency affect biotic and abiotic resources in the planning area. Warner et al. (2008) have documented that intense storms affect the transport of sediments (and thus any particles adsorbed to them) in Massachusetts Bay. We are not aware of any other studies that attempt to link other processes to intense storm frequency. Circulation patterns and their drivers in other parts of the planning area are less well known (e.g., Buzzards Bay, Nantucket Sound), thus the effect of intense storms on
SF-35

these areas is not known. One recommendation to address the threat of increasing intense storms in the long-term is to develop high resolution, validated circulation, sediment transport, and inundation models for all of the sub-regions of the ocean planning area.
SF-36

Chapter 4 - Science Framework Actions
Chapter 2 provides the goal and objectives for the science framework and Chapter 3 summarizes the physical condition, natural resources, and human uses of the Massachusetts ocean management planning area (planning area), based on our understanding as of 2009. Building on these chapters, this chapter details the specific research and data action items that have been incorporated as part of the science framework for the Massachusetts Ocean Management Plan.
This chapter includes longer-term actions that Executive Office of Energy and Environmental Affairs (EEA) will pursue as opportunity arises, as well as priority actions for the next five years. The priority actions were selected based on the following factors:
1. Direct relationship to the goals and objectives of the science framework (and by extension to the ocean management plan and, ultimately, the Oceans Act) as described in Chapter 2.
2. Consideration of the desired state of ocean management in Massachusetts in five years. 3. Practicality of completing identified tasks within a five year time frame (sufficiency of
available financial resources, agency staff time, and opportunity for partnership with entities outside of Massachusetts state government).
The five-year time frame corresponds with the requirement of the Oceans Act for five-year progress reports to the Legislature. While significant progress is expected within this timeframe, this chapter also includes longer term data gathering and analysis priorities. The science framework is intended to be adaptable: if opportunities arise to address these priorities in a shorter timeframe or if circumstances warrant a reconsideration of an action item’s priority, then EEA will revise the science framework as appropriate.
PRIORITIES FOR THE NEXT FIVE YEARS
The following eight priorities describe the actions expected to be undertaken within the next five years as part of the science framework for the Massachusetts Ocean Management Plan.
Priority 1 - Refine Fish Resource Special, Sensitive, or Unique Areas
The fisheries trawl data incorporated into the ocean management plan is a rich source of information and provides the basis for defining areas of “high fish resources” as a special, sensitive, or unique resource. The analysis of the trawl data included 22 species important to commercial and recreational fisheries in Massachusetts and vulnerable to the trawl survey gear. The survey strata were ranked by aggregating summary statistics of many species to determine which strata were relatively more “important” than other strata, largely based on the biomass of species caught in that stratum. Within individual high fish resource areas there are variations in the species composition. The approach to identifying special, sensitive,
SF-37

or unique areas (SSUs) relied on consideration of compatibility issues (i.e., potential sources of resource conflict based on the nature of a proposed human development).Therefore, it is important to assess the compatibility of various fish species and re-examine the species composition of high fish resource areas to appropriately apply the compatibility approach in the ocean management plan.
To address this issue, EEA will convene a working group to review the classification of high fish resource areas. The working group’s goal will be to define this SSU and then create a map identifying special, sensitive, and unique areas for fisheries resources relative to development types addressed in the ocean management plan. The working group should take into consideration the following steps: 1) identify the species present in each high fish resource area, particularly noting those that are responsible for the “high” classification, and 2) determine the significance of potential development impacts based on these specific species (i.e., compatibility issues) , and 3) identify additional species, measures of functionality, and other sources of information that should be considered to classify special, sensitive, and unique areas for fisheries resources. This working group will recommend to EEA revisions to the fish resource SSU maps. EEA intends that the working group will convene in early 2010 and develop its recommendations no later than the end of 2010.
Priority 2 - Classify Benthic and Pelagic Habitats
The Massachusetts Office of Coastal Zone Management (CZM) and the Division of Marine Fisheries (Marine Fisheries or DMF) are actively pursuing a marine habitat classification model. As a first step, the focus is on a physical classification scheme, but the ultimate goal is to integrate biotic data as they become available. Both the physical and biological classification efforts require high resolution maps of benthic and pelagic resources, as well as understanding of the temporal variability in their distributions, and their vulnerability to perturbations (e.g., due to ocean construction), and resilience (ability to recover after disturbance) (for more on vulnerability and resilience, see Priority 5, below). Several pieces of information are needed to develop these maps. First, both benthic and pelagic habitat data need to be developed and analyzed. Acoustic mapping, using towed or vessel-mounted sonar devices, provides the base information necessary for determining bathymetry and seafloor hardness and roughness. (In addition to their use in habitat classification, these foundational data support several other derived products, such as geologic interpretations for physiographic zones, surficial sediments/bottom texture, and subsurface geology/bottom structure). The surveys and analysis used to map geological characteristics of the planning area will also produce data that can be integrated to develop associations between species and seafloor types. Through a joint CZM/U.S. Geological Survey (USGS) partnership, the USGS has completed acoustic surveys of much of the deep (> 10 meters [m] or 30 feet [ft]) Massachusetts waters from the New Hampshire border south to the Cape Cod Canal. These ongoing efforts are a high priority, and new partnerships should be developed to do the same in adjacent federal waters.
SF-38

To date, only a first attempt at benthic habitat data characterization (relying on existing data) has been made. Bathymetric data have been combined with seafloor rugosity and coarse-scale sediment data from the USGS usSeabed program. The next step toward benthic habitat characterization is to ground truth these maps of surficial geology. To begin this process, CZM proposes a pilot project off the coast of Scituate in Cape Cod Bay. The results of this pilot will determine whether and how this methodology will be expanded throughout state waters. This work will be funded through the CZM seafloor mapping trust fund and will be conducted during the summer of 2010 or 2011.
A second piece of information needed to develop ocean habitat maps is a characterization of pelagic waters. To date, no classification of the Commonwealth’s pelagic waters has been attempted. As a complement to the benthic habitat mapping, CZM proposes to characterize the water column within Commonwealth waters through a suite of parameters (Table 1) that will be estimated utilizing the Finite-Volume Coastal Ocean Model (FVCOM) developed by Dr. Changshen Chen at the Marine Ecosystem Dynamics Modeling Research Laboratory at UMass-Dartmouth. The proposal is to use hindcast outputs over a 15- to 20-year timeframe produced by the highest spatial resolution model grid. The long-term mean values of these phenomena will be used to produce unique bins of information that will be utilized to classify Massachusetts waters into various regions. EEA and CZM are working with the Massachusetts Ocean Partnership (MOP) and UMass-Dartmouth to produce the desired FVCOM model outputs, compare the model outputs to actual observed data, and produce the data summaries required to move forward with pelagic waters characterization. This work will be funded by MOP and will be completed by December 2011.
A third piece of information needed to develop ocean habitat maps is to estimate the susceptibility of sediments and benthic habitats to natural oceanographic phenomena such as storms. Data from both the benthic sediment maps and the FVCOM outputs is proposed to be used to develop a seabed stress analysis. The purpose of this analysis is to determine the mobility of the different types of geological substrates found in Massachusetts waters. Assigning stability estimates to seabed substrates in specific locations will provide another dimension to habitat mapping and sensitivity analysis. CZM is working with MOP and USGS to develop the seabed stress analysis for coastal Massachusetts waters, a project that is estimated to be completed by the end of 2011.
Lastly, CZM is working with MOP, Marine Resources Assessment Group Americas (MRAG Americas), and an expert panel to discuss potential approaches for refining the methodology of the Ecological Valuation Index (EVI), or alternately developing a new process, to assign an ecological value to particular marine habitats and other resources in the planning area. The approach outlined in the draft Massachusetts Ocean Management Plan and potential alternative approaches have been the subject of public comment on the draft, continued conversation with the Science Advisory Council, and a workshop of national experts convened by MRAG Americas in the fall of 2009. Many approaches and models have been
SF-39

Table 1. Parameters that will be used to characterize the water column
Variable Parameter Rationale
Temperature (surface and bottom)
Mean and standard deviation Define seasonal cycle and variability
Salinity (surface and bottom)
Mean and standard deviation Define seasonal cycle and variability
Stratification Mean and standard deviation of [density at surface - density at 20 m (or at the bottom, whichever is shallower)]
Define seasonal cycle and variability in stratification
Current (surface and bottom)
Vector-averaged mean current Identify persistent residual flows
Current (surface and bottom)
Standard deviation Identify areas of current fluctuations, primarily due to tides
Current (surface and bottom)
Standard deviation of low-pass-filtered data
Identify areas of current fluctuations, primarily due to wind and density variations
Sea-surface height Standard deviation Identify areas of large surface fluctuations (primarily due to tides)
Sea-surface height Standard deviation of low-pass-filtered data
Identify areas of low-frequency currents
Wind stress Vector-averaged monthly mean and standard deviation
Define seasonal cycle and variability in wind stress
Waves Monthly mean significant wave height
Define seasonal cycle and variability in waves
Bottom stress (computed from bottom currents and waves)
Percentage of time greater than selected values (perhaps 0.1, 0.2, 0.3 N/m2)
Define seasonal cycle of stress and identify areas of sediment resuspension
proposed through these discussions, and thus additional work is necessary to understand the benefits, drawbacks, data needs, and other considerations of these options; MOP is already funding related work to examine ways to model ecosystem services. EEA will continue these discussions and evaluate the merits to such an approach in order to develop the appropriate methodology, criteria, data, and analysis.
Priority 3 - Develop New Spatial and Economic Data on Recreational Uses in Massachusetts Coastal Waters
The draft ocean management plan included survey-based information indicating important recreation areas. Information related to human uses, including recreational activity, is important to informing various aspects of ocean management, from use in compatibility analysis or similar types of tools to aiding in the determination of appropriate mitigation associated with a specific project, as described in Objective 2 of the science framework (see Chapter 2). This priority action will help address that objective by identifying and mapping spatial patterns of recreational use of Massachusetts waters, and associated economic
SF-40

information. Targeted recreational activities include recreational boating (large and small motor boats, sailboats, organized events such as regattas and races, and possibly other non-motorized vessel use such as kayaks and canoes) and recreational fishing, including fishing charters. If possible within the available budget, this study will also include other recreational uses, such as diving and whale watching/other types of wildlife viewing. This work will include identifying both destinations for recreational activity and important transit routes from harbors and marinas. It is anticipated that this work will have a statistically valid and scientifically defensible basis and will encompass the planning area and, as appropriate, adjacent waters. Results of this study will be mappable at suitable scale(s) for future incorporation into ocean management as appropriate. Accompanying the identification of these spatial patterns of recreational activity will be an attempt to identify the economic value associated with these patterns of human use, using an appropriately developed metric. If possible, the economic value of particular recreational activities will be correlated with their spatial patterns (e.g., destinations and departure points).
EEA anticipates that this work will be performed by a consultant or team of consultants, with CZM, Marine Fisheries, and MOP oversight.
Priority 4 - Develop New Spatial and Economic Data on Commercial Fishing in Massachusetts Coastal Waters
The draft ocean management plan included two main analyses of commercial fishing information: the Fisheries Work Group report prepared by Marine Fisheries and survey-based information indicating areas important to commercial fishing. Information related to commercial fishing was used in the ocean management plan in several ways, including in the compatibility analysis and as criteria used in considering the siting of human activities. Although the ocean management plan does not regulate commercial fishing, pursuant to the Act, consideration of commercial fishing is critically important in the ocean management plan, and this action will help address Objective 2 for the science framework (see Chapter 2).
As part of this task, spatial patterns of commercial fishing that occurs in Massachusetts waters, and associated economic information, will be identified and mapped for use in ocean management. Because the nature of the potential conflict between human development in the ocean varies according to type of fishing gear (mobile or fixed, e.g.), this task will attempt to discern types of fishing gear employed and target species. It is anticipated that this work will have a statistically valid and scientifically defensible basis and will encompass the planning area and, as appropriate, adjacent waters. Results of this study will enable mapping at the suitable scale(s) for future incorporation into ocean management as appropriate. Accompanying the identification of these spatial patterns of commercial fishing activity will be an attempt to identify the economic value of such activity, using an appropriately
SF-41

developed metric. If possible, the economic value of particular commercial activities will be correlated with their spatial patterns (e.g., destinations and home ports).
EEA anticipates that this work will be performed by a consultant or team of consultants, with CZM, Marine Fisheries, and MOP oversight.
Priority 5 - Understand Cumulative Impacts and Ocean Resource Vulnerability
In support of the Massachusetts Ocean Management Plan, MOP contracted scientists at the National Center for Ecological Analysis and Synthesis (NCEAS) to initiate work on the development of cumulative impact maps depicting the spatial extent and intensity of human activities in Massachusetts marine waters relative to marine habitats. This work followed the methodology of Halpern et al. (2008), which identifies how human activities are affecting marine ecosystems from the intertidal zone out to the boundary of the U.S. Exclusive Economic Zone, 370 kilometers (km) (200 nautical miles [nm]) offshore.
The first phase of the NCEAS work surveyed local ecological experts and asked them to assign vulnerability scores to 15 distinct marine ecosystems based on five criteria: spatial scale, frequency, trophic impact, percentage change, and recovery time. Vulnerability was assessed relative to 55 current and emerging anthropogenic drivers of change (i.e., human activities and associated stressors) as in Halpern et al. (2007). From these responses and maps of the spatial extent and intensity of 20 different anthropogenic activities across the study area, NCEAS created a cumulative impact map for each of the 15 ecosystems. Cumulative impact scores were then calculated for every 250 m2 area (0.62 acre) of the planning area.
The map derived from these results represents a snapshot in time based on current conditions (using data from the past 5 years), but at this point it does not incorporate historical changes to marine ecosystems, nor does it forecast future changes. Currently, NCEAS, again funded by MOP, has launched a second phase to this study to fill in specific data gaps in the first survey. MOP and NCEAS are currently working on this second phase and it is anticipated that it will be completed by early 2010. An important aspect of this study is that it is replicable: the model can be repeated as enhanced information on habitats and stressors is developed, and thus it is likely that further refinements to the study will continue beyond 2010. While the NCEAS model enables a visualization of cumulative effects, a valuable tool in and of itself, its component that assesses vulnerability (through expert survey) of particular habitats to individual stressors is also valuable information. Therefore, work performed under this action item will provide important information for use in compatibility analysis and potentially other aspects of ocean management, such as habitat classification.
SF-42
An important aspect of this work is scale, as the output of the model is dependent on the spatial scale of the habitat definitions and the resolution of stressor data. As benthic and pelagic habitat classification and higher resolution human impact data is developed, and since the model is replicable, EEA anticipates future refinement of the model results.
Priority 6 - Monitor Climate Change across Massachusetts Coastal Waters
The Act directs EEA to “address climate change and sea level rise” in the ocean management plan. The most easily attainable measures to respond to this charge are: sea surface and bottom temperature, seawater pH, seawater salinity, and sea level. In recent years, CZM and Marine Fisheries have been involved in regional efforts to develop ocean observing systems, which have many potential uses including establishing information for use in assessing climate change. CZM has also been involved in efforts to obtain data that could be used to develop precise measurements of sea level rise (e.g., through obtaining Light Detection and Ranging—LIDAR—data) and the development of models to determine sea level rise implications. Over the next five years, EEA and CZM will advocate for continuing monitoring of temperature, salinity, and sea level, and installing new sensors in Massachusetts waters for monitoring pH. CZM is active in organizations such as the Gulf of Maine Ocean Observing System (GoMOOS) and the Northeast Regional Association for Coastal Ocean Observing Systems (NERACOOS), which are the two main entities working on such issues. CZM has participated in issue scoping and tool development exercises with GoMOOS and NERACOOS, and will continue to advocate for the use of tools that can help managers utilize ocean monitoring information. Similarly, CZM will continue to advocate for and be involved in efforts to examine sea level rise in Massachusetts, through data development, modeling, and other efforts.
Priority 7 - Develop a Performance Evaluation Framework
To enhance future evaluation of the ocean management plan, EEA is developing a performance evaluation framework. This framework will include a list of indicators that will be used to: 1) examine trends and quantify any changes that may result from the implementation of management actions associated with the plan, 2) examine environmental and socioeconomic changes that may result from natural forces and anthropogenic drivers other than the plan, but which may have an effect on ocean management decisions, and 3) help assess the potential effects of climate change (see Priority 6, above).
With input from an expert working group, EEA, CZM, MOP, the Urban Harbors Institute (UHI) at UMass-Boston, and the Environmental, Earth and Ocean Sciences Department (EEOS) at UMass-Boston developed a performance evaluation process for the ocean management plan that relies on 18 governance, environmental, and socioeconomic
SF-43

indicators that are relevant to ocean management and the ocean management plan (see Tables 2a, b, and c).
Table 2a. Indicators for the Massachusetts Ocean Management Plan - Environmental
Indicator Data Sources Question
Change in location and/or extent of core and important habitat (e.g., feeding, nesting, breeding) of SSU species (whales, birds)
Natural Heritage and Endangered Species Program (NHESP), National Oceanic and Atmospheric Administration (NOAA)/National Marine Fisheries Service (NMFS), Right Whale Consortium, Provincetown Center for Coastal Studies, others
Have the locations and areal extents of whale and bird SSUs changed over time?
Change in abundance/population density of species within existing SSUs (whales, birds)
NHESP, NOAA/NMFS, Right Whale Consortium, Provincetown Center for Coastal Studies, others
Have the densities of whale and bird SSU species changed over time?
Change in areal extent of SSU resources (eelgrass, mudflats, hard/complex bottom)
USGS, Massachusetts Department of Environmental Protection (MassDEP)
Have the areal extents of SSU resources (eelgrass, mudflats, hard/complex bottom) changed over time?
Change in fish, mollusks, and crustacean species within existing SSUs: 1) change in total biomass/abundance; 2) change in distribution of biomass/abundance across species*
DMF trawl survey, NMFS Has the biomass of SSU fisheries species changed over time? Has the distribution of biomass across the 22 SSU fisheries species changed?
Expansion of the range of watched invasive species
Observational reports from the Aquatic Invasive Species program and other sources
How have invasive species ranges changed over time?
Fish Population Assessment (through use of metrics such as biomass of species, volume of fisheries landings, mean length of fish sampled, # individuals)
In-state trawl data and landings information; NOAA/NMFS data
What are the spatial and temporal trends in fisheries populations in the planning area?
Mean sea level rise Monitoring data (e.g., NERACOOS) and modeling efforts
What is the change in sea level in the planning area?
Sea surface, water column, and bottom temperature
Monitoring data (e.g., NERACOOS, Massachusetts Water Resources Authority [MWRA]) and modeling efforts
How has sea temperature changed over time in the planning area?
*There are species other than those used for the SSU that are captured in the MarineFisheries Trawl Survey. These species may be added to the analysis as necessary.
SF-44

Table 2b. Indicators for the Massachusetts Ocean Management Plan - Governance
Indicator Data Sources Question
Number and areal extent of management areas: SSUs, areas designated for a particular use, and areas designated for multi-use
EEA How has the apportionment of management areas in the planning areas changed over time and/or geographically?
Number of projects proposed/permitted in use areas and areal extent, by type
State permitting agencies What types of and how many new ocean uses have been allowed by the ocean plan?
Number of projects proposed/permitted in SSUs
State permitting agencies How many projects were allowed in SSUs because either: 1) the underlying SSU data did not accurately characterize the resource or use, or 2) the proponent demonstrated that no less damaging practicable alternative existed, that the project included substantial public benefit, and that there was no significant alteration of the SSU?
Number of actions in science framework initiated/implemented
EEA What progress has been made toward achieving the goals of the framework?
% of required state energy produced from renewable energy in planning area
EEA How has ocean-based renewable energy contributed to the state energy portfolio?
Resources expended for implementation of plan and science framework
EEA What is the financial cost of implementing the ocean management plan?
Mitigation funds paid to the Ocean Use Trust Fund
EEA How much has the Commonwealth been compensated for projects built on Commonwealth tidelands in the planning area?
SF-45

Table 2c. Indicators for the Massachusetts Ocean Management Plan - Socioeconomic
Indicator Data Sources Question
Economic value of fisheries (commercial)
DMF/NMFS (e.g., landings data, vessel license data, etc.)
Has the economic value of commercial fisheries changed over time?
Economic value and leased area of aquaculture operation
DMF, towns, aquaculture industry
What are the trends in economic value of offshore aquaculture?
Economic value of fisheries (recreational)
Use characterization work proposed in science framework; data from NOAA/NMFS, DMF
Has the economic value of recreational fisheries changed over time?
Economic value and total production capacity of offshore renewable energy
Individual project information; Department of Energy Resources (DOER); energy production industry
What are the trends in economic value of offshore renewable energy?
Economic value of recreational boating
Use characterization work proposed in science framework: U.S. Coast Guard
Has the economic value of recreational boating changed over time?
In this final list, indicators were classified as “primary,” “supporting,” or “secondary.” Primary indicators were selected to provide the best information to assess the degree of success of the Massachusetts Ocean Management Plan and are listed in Table 2. While data are available for some of these indicators, it will be necessary to determine if the current data are suitable and if the existing data gathering efforts need to be refined. Supporting indicators represent those that are not critical to assessing the success of the plan, but may provide valuable supporting information to better understand the context of the primary indicators (see Appendix B). Lastly, secondary indicators (also listed in Appendix B) are related to the ocean management plan but are not currently deemed critical to assessing plan success. However, secondary indicators may become critical in the future as new issues emerge or as projects are proposed in the ocean management areas. The data needed to develop primary and supporting indicators are currently being collected and efforts should be made to ensure that these data streams continue in a manner that will be useful for this performance evaluation process. In many cases, the data for secondary indicators are not currently being gathered but future efforts to gather these data should be made as the opportunity and need arises or as funding becomes available. Initially, EEA will focus on the primary indicators, as these are the ones considered to be most critical in terms of policy relevance and needs of the ocean management plan, data availability, and overall feasibility.
Next steps involve identification of a process for collecting, collating, and reporting the data. Existing programs will provide historic and current data that will be vital for the implementation of this performance evaluation. EEA and CZM will begin discussions with the agencies, research institutions, permittees, and organizations that collect monitoring data on how to best incorporate these data into the performance evaluation system. A detailed
SF-46

framework will be developed outlining these processes as well as how to report the results of the indicator analyses. As ocean management and the ocean environment evolve, the indicators themselves will also be evaluated to ensure the appropriate ones are being included. These indicators will provide the data necessary to adapt the ocean management plan to changing environmental and socioeconomic circumstances, as required by the Oceans Act.
Priority 8 - Develop a Data Network for Sharing Information about Massachusetts Ocean Resources and Uses
The planning process that resulted in the Massachusetts Ocean Management Plan and the five near-term research priorities listed above will continue to generate large quantities of new data on the status of ocean resources, uses, habitats, and oceanographic parameters. One challenge will be to store these data as they are collected and to make them readily available not only to managers in Massachusetts, but to the public and research community at large. EEA needs to carefully develop an integrated data management network that is, to the extent possible, robust, interoperable, and user friendly. The Massachusetts Ocean Resource Information System (MORIS), developed by CZM and MassGIS, will likely serve as one of the foundations for the network serving as a clearinghouse for most spatial data. MORIS is an online data mapping tool, built on the open source mapping engine GeoServer. All MORIS data have XML-based, Federal Geographic Data Committee (FGDC) compliant metadata. “Live” spatial data (non-static) will need to be addressed via alternative technologies that allow data to be streamed to the user.
While MORIS will be one of the elements of the data network, other sources will be required for data that does not fit neatly into the MORIS architecture. For example, MOP is funding personnel time and software development (with UMass-Dartmouth purchasing the hardware) to house the oceanographic data and data products, referred to in Priority 2 above, at the Marine Ecosystem Dynamics Modeling Research Laboratory at UMass Dartmouth. The intent of this server is to deliver hindcast and summary data from the FVCOM model to any researcher looking to do further analysis. The server will be installed by the end of 2010. EEA, CZM, and MOP will continue discussions of the acquisition of hardware to store and deliver ocean data as well as formal means to provide discovery metadata and summaries of scientific findings to other agencies, nonprofit organizations, and the public.
Summary of Priorities for the Next Five Years
Table 3 provides a summary of the science priorities for the next five years, along with the general timing for implementation, leads and partners, funding sources, and science framework objectives that will be fulfilled.
SF-47

Table 3. Summary of science priorities for the next five years
Priority Timing Lead Partners Funding Science
Framework Objective Fulfilled
1. Evaluate fisheries trawl data
2010 EEA, DMF, CZM
Work group N/A 1. Further develop the approach to identifying special, sensitive, or unique habitats
2.Classify benthic and pelagic habitats
Ongoing from 2010-2014 to obtain seafloor mapping data/develop and revise habitat classification; 2010-2011 to complete pilot ground-truthing project; 2010 for characterization of pelagic waters
CZM, DMF
USGS and UMass-Dartmouth (for 2010-2014 data/ classification work); MOP (for characterization of pelagic waters)
MOP, CZM Seafloor Mapping Trust, EEA Ocean Use Trust Fund
1. Further develop the approach to identifying special, sensitive, or unique habitats
3. Develop new spatial and economic data on recreational uses
Acquisition and analysis of new data from 2010-2011
CZM, DMF
MOP, appropriate state entities/ organizations
MOP 2. Obtain/augment human use data for use in compatibility analysis
4. Develop new spatial and economic data on commercial fishing
Acquisition and analysis of new data from 2010-2011
CZM, DMF
MOP, appropriate state entities/ organizations
MOP 2. Obtain/augment human use data for use in compatibility analysis
5.Understanding human impacts and ocean resource vulnerability
Acquisition and analysis of model results in 2010
CZM MOP, NCEAS MOP 4. Identify impacts of anthropogenic stressors on coastal/marine ecosystems
6. Monitor climate change across Massachusetts coastal waters
Ongoing CZM DMF, MWRA, National Data Buoy Center (NDBC), NERACOOS, USGS, Woods Hole Oceanographic Institution (WHOI), academic institutions
DMF, MWRA, NDBC, NERACOOS, USGS, WHOI, academic institutions
3. Increase understanding of climate change.
7. Develop and implement indicators
12/2009 for development; ongoing for implementation
CZM, MOP
UHI, EEOS at UMass Boston
MOP 5. Develop an indicator framework.
8. Develop a data network for sharing information about Massachusetts ocean resources and uses
Ongoing CZM MOP CZM, MOP 6. Enhance data availability; 7. Inform managers/ public of scientific findings
SF-48

PRIORITIES BEYOND FIVE YEARS
Beyond the immediate priorities described above, the efforts of several ocean planning work groups identified specific longer-term needs for effective ocean management. The science actions listed below capture the needs identified by the work groups and link them to the seven objectives identified in Chapter 2. These actions range from one-time data acquisitions that can be accomplished in a matter of weeks by EEA staff or contractors, to ongoing advocacy for data collection by organizations outside of EEA, to the development of models and methodologies that will need to be refined over months or years. Where possible, EEA will take advantage of opportunities to address these actions, even within a five year timeframe. These longer-term priorities are numbered and categorized below, but these numbers do not represent further prioritization.
Longer-Term Priority 1 - Ecosystem Mapping, Characterization, and Monitoring
As Chapter 3 demonstrates, there is a significant knowledge base that supports a solid understanding of key biotic and abiotic ecosystem components and drivers in the planning area. However, critical information gaps do exist, and filling these needs will have direct bearing on important management aspects of the Massachusetts Ocean Management Plan, such as identifying and protecting special, sensitive, or unique estuarine and marine life and habitats, developing a habitat evaluation methodology, quantifying ecosystem values and services, understanding the effects and pace of climate change, measuring and tracking indicators, reporting on status and trends, and supporting cumulative impact assessments.
As reflected above in Priority 2 for the next five years, accurate resource maps are a prerequisite for any ocean management study, regardless of the objectives. In terms of biotic components, understanding the distribution and habitat needs of important species, guilds, or communities in and beyond the planning area is very important. Key information needs for abiotic components and processes include the continuation of seafloor/benthic habitat mapping and classification (including surficial sediments, bottom structure, and subsurface geology) and monitoring of key water column parameters, atmospheric conditions, and sea-surface elevation and tide heights through surveys and observation systems (these are described above in Priority 2).
Such information is also needed to continue to pursue models of the ocean ecosystem, and additional information may also be desirable. For example, new modeling efforts to quantify light attenuation, wave base, and near-bed stress support the development of large-scale ecological maps as was done in the UKSeaMap program for the Irish Sea (JNCC 2004). The ability to combine biotic and abiotic data to determine characteristics of the seascape, water column, and sea surface/air interface will help to better understand biodiversity and identify
SF-49

rare habitat areas. The actions proposed below will combine with the priority actions above to provide data that will help further refine future identification of special, sensitive, or unique marine life or habitats and help identify the impacts of anthropogenic stressors on marine ecosystems as outlined in the science framework objectives in Chapter 2. Integrating these datasets will be an important step toward developing a comprehensive view of existing resources in the planning area.
Action 1.1 - Map the Massachusetts Seafloor in Shallow Waters
In shallow waters (those < 10 m or 30 ft deep) bathymetrical mapping via aircraft- or small-craft-mounted laser technology (e.g., light detection and ranging, or LIDAR) is more practical than ship-based sonar, since larger vessels with acoustic instruments are draft-limited in the shallows. Because these waters are highly productive and heavily influenced by human uses, it is important to construct seamless seafloor maps that include shallow waters that can be used for habitat mapping, navigation, and planning for sea level rise and storm surges. An offshoot of this work is to explore the capability of LIDAR data to reveal important seafloor characteristics such as eelgrass and macroalgae.
In addition to using LIDAR, novel methods to map the seafloor in shallow waters should be explored. A limitation of LIDAR for remote sensing is that it provides bathymetric data only; thus bottom hardness, sediment samples, and depth to bedrock, all important measures for seafloor mapping, are not recorded. EEA is aware that USGS has proposed a shallow water mapping pilot project west of Falmouth for 2010. EEA will monitor this and other shallow water mapping techniques as they emerge. Shallow water seafloor mapping via LIDAR or any other means would be performed by a contractor for EEA, or a federal agency, focusing initially on a small, pilot-scale area and then transitioning to a directed statewide effort as successful survey techniques are identified and become standardized.
Action 1.2 - Ground-Truth Benthic and Pelagic Habitat Maps
Building off of the pilot study detailed in Priority 2 above, an ongoing effort to survey seafloor sediments, vegetation, and organisms is needed to provide the necessary validation for interpretations of remotely sensed acoustic or LIDAR data. This work would be performed by a state agency or contractor and would include underwater photography, grab samples, and perhaps observations by divers. The ground-truthing protocols developed through Priority 2 will be applied statewide. These data will augment and refine what we understand about associations between remotely-sensed data and true geomorphic ground conditions, as well as linkages between species and seafloor types.
SF-50
Action 1.3 - Survey and Assess Key Species
Understanding the spatial and temporal distribution and habitat needs of marine animals and plants is important to effectively manage those diverse resources. Existing resource assessments—such as the Marine Fisheries Resource Assessment Bottom Trawl Survey, the Department of Environmental Protection’s eelgrass mapping, avifauna surveys by the Natural Heritage and Endangered Species Program and Mass Audubon, and marine mammal surveys by contributing members of the North Atlantic Right Whale Consortium—provided valuable data toward the current version of the Massachusetts Ocean Management Plan and should be continued. In addition, new efforts are necessary to characterize other important biotic components, especially endangered sea turtles, seabirds, major avifauna and bat migratory pathways, benthic communities of flora and fauna, pelagic fish habitats, locations of and spreading rates of invasive species, and areas of high primary and secondary productivity. Some of this research is currently underway through academic and private institutions or through work required for environmental permits (e.g., for Cape Wind). EEA’s role will be to advocate for research on these species on a spatial and temporal scale that can inform ocean planning, as well as to use the raw data to create habitat maps and perform compatibility analyses.
Action 1.4 - Identify Associations between Sediment Types, Water Column Types, and Species
By overlaying the data from Priority 2 and Actions 1.1-1.3, associations can be made between species and combinations of water column and seafloor types. It will be an ongoing effort to continue to expand the temporal and spatial resolution of species surveys to improve the accuracy of these potential habitat maps. The goal of this work is to have sufficient confidence in the predictive capability of the abiotic habitats to perform detailed scenario testing for ocean management alternatives. It is likely that this work will be conducted by CZM as the data become available.
Action 1.5 - Continue Observations of Key Oceanographic Parameters
Long-term surveys by organizations on fundamental physical and chemical parameters are critical to our understanding of abiotic ecosystem components. Oceanographic components such as sea water temperature, pH, salinity, dissolved oxygen, nitrogen, and chlorophyll, as well as wind, currents, and waves, influence large-scale physical, chemical, and biotic processes. Long-term records, with adequate spatial coverage, are critical for determining trends and predicting the effects of natural and anthropogenic variables, including climate change. These datasets are also necessary for building and validating physical and ecological models (see actions 3.1-3.4 below). The few existing efforts that routinely collect such data in
SF-51

the planning area (e.g., the NERACOOS and NOAA buoys, MWRA’s ship-based surveys) should be supported and augmented as needed. The buoys in particular provide a wide range of essential information for uses such as navigation and safety, as well as oceanographic modeling and forecasting.
Action 1.6 - Continue Observations of River Discharge and Tidal Height; Investigate Ground Water Discharge Importance
Long-term river discharge (as influenced by precipitation) has been predicted to increase in the Northeast and can potentially affect large-scale transport mechanisms between the land and the ocean, salinity structure, and currents. Monitoring of surface water discharge volume is being conducted by USGS via gauges but the continuity of these efforts is perennially threatened by funding shortages. EEA’s role will be to advocate for continued discharge monitoring at important USGS gauges. In addition, near-shore groundwater discharges need to be better understood for their role in transporting nutrients and contaminants and contributing to changes in pH and salinity.
Mean tidal height is known to be increasing in the Northeast and climate change models suggest that it will continue to increase. An increase in mean tidal height has profound implications for the extent of storm surges across floodplains, inundation depth and frequency, and the predicted and actual damage to coastal infrastructure resulting from storms. Continued data collection at the NOAA tide gauge stations in Boston (#8443970), Woods Hole (#8447930), Nantucket (#8449130), and Fall River (#8447386) will allow EEA to track sea level rise both north and south of Cape Cod and will allow for more accurate storm surge predictions.
Longer-Term Priority 2 - Characterization and Mapping of Human Uses and Interactions
As with our understanding of ecosystem components, an understanding of human uses of, and interactions with, the planning area is critical to an integrated management framework. While we have long-term, spatially explicit information on certain uses (e.g., navigation), there are others (e.g., recreational fishing, boating, and diving) that lack this level of data statewide. Additionally, for some of the newer uses/activities (e.g., renewable energy arrays), their effects on ecosystem components and functions are not well known. Data from these actions will support and advance such ecosystem-based management (EBM) principles as the understanding of interactions among uses, activities, and ecosystem components; the quantification of ecosystem values and services; and the assessment of cumulative impacts and trade-offs among ocean management scenarios. The actions below support science framework objective 2.
SF-52
Action 2.1 - Periodically Revise Spatial and Economic Data on Commercial and Recreational Uses
Priorities 3 and 4 for the next five years, above, discuss the need for identifying the locations of commercial and recreational uses in the planning area and determining their economic influence. It is possible that both the locations of these activities and their economic importance will change significantly over time (e.g., due to management or policy decisions, ecological shifts, or changes in human values and uses). Thus, EEA will ensure that this analysis is revised, as needed, to help better inform management decisions.
Action 2.2 - Develop a Marine Cadastre
In marine spatial planning, the nature and areal extent of human interests in property, value, and use of marine areas are of paramount importance. These interests are captured through a marine cadastre, an integrated submerged lands Geographical Information System (GIS) database containing legal, physical, and cultural information in a common, spatially referenced framework. Marine political boundaries share a common element with their land-based counterparts in that, in order to map a boundary, the relevant authority (state or federal law, rule, etc.) must be decoded and its spatial context delimited. In marine areas, there is typically no physical evidence of the boundary and because of this, there can be confusion, disagreement, and conflicting versions of marine boundaries. Resolving existing boundary issues in and adjacent to Massachusetts waters and developing an authoritative marine boundary atlas will be a significant asset to permitting, constructing, and providing compensatory mitigation for ocean construction projects. EEA will have a central role in overseeing this highly complex work and interacting with the affected entities.
Action 2.3 - Digitize and Import Shellfish Aquaculture Sites into MORIS
The locations of shellfish (bivalve) aquaculture sites in Massachusetts are currently available only on paper maps and need to be made available within a GIS spatial database and brought into the Massachusetts Ocean Resource Information System. This will make these data more useful in site compatibility analyses and use conflict analysis. Digitizing these maps will be an ongoing effort for MarineFisheries. Once they are prepared, CZM staff will load the maps into MORIS, where they will be publicly available.
SF-53

Action 2.4 - Update the Board of Underwater Archaeological Resources Database
The Board of Underwater Archaeological Resources (BUAR) database contains information on important archeological sites, such as shipwrecks and Native American sites. The database is currently missing data from NOAA’s Automated Wreck and Obstruction Information System (AWOIS) and private-sector shipwreck data. The data also need to be entered into the database in one consistent format. These refinements are required to develop a geo-referenced archeological resource map that will have more utility and applicability in compatibility analyses and use/activity siting. This work will be performed by CZM staff or a contractor managed by CZM.
Action 2.5 - Develop a Methodology for Assessing the Value of Ocean Viewsheds
The siting of certain uses and their supporting apparatus (e.g., emergent or floating structures) in the planning area has elicited concerns about obscuring historic or aesthetically pleasing viewsheds visible from adjacent shorelines or on the water. Developing and implementing a methodology of measuring ocean viewsheds from areas of public shoreline access would provide managers with another piece of information that could be used in siting and compatibility analyses. As budget allows, this work will be performed under a contract managed by CZM.
Longer-Term Priority 3 - Develop Models and Other Decision-Support Tools
The utility of information generated through the actions in the two previous longer-term priorities can be greatly enhanced through the development and application of models and other decision-support tools. Because ecosystems and their structures, functions, and processes are complex, models are designed to simplify multiple processes and allow the user to predict interactions and results under various scenarios. Over the past decade, there have been notable advances in the development of regional models for coastal ocean and ocean/atmosphere processes (Signell et al. 2000; Chen et al. 2005; Jiang et al. 2008). There has also been significant progress in the development of decision support tools like scenario analyses, cumulative impact evaluation, and ecological risk assessments (Ball et al. 2000; Bricker et al. 2006; Halpern et al. 2008).
Action 3.1 - Develop Coupled Hydrodynamic Models
Water circulation models allow one to forecast certain key variables at various locations, depths, and times. In ocean planning, hydrodynamic models that are coupled with other physical or ecological processes can be helpful in predicting the
SF-54

effects of certain natural or man-made phenomena such as: erosion/accretion and sediment transport resulting from permanent, hard structures; sediment plumes resulting from dredging, sand mining, or seafloor construction; fate and transport of oil spills; nutrient transport; and dissolved oxygen levels and biochemical oxygen demand (BOD) resulting from aquaculture. Additionally, these models can be used to predict long-term, climate-related and short-term, storm-related effects, such as changes in sea surface elevation, changes in the vertical and horizontal extent of spring tides, and storm surge footprints.
EEA’s role will be to continue to advocate for existing modeling efforts that cover the planning area (and beyond) to provide support for new components that will enable forecasting capabilities, such as sediment transport and primary/secondary productivity. In cases where existing hydrodynamic models and field work are being used to identify large-scale events that affect the planning area (e.g., harmful algae bloom outbreaks), EEA will advocate for this work to continue.
Action 3.2 - Develop Conceptual Ecological Models
While the coupling of certain biotic components with hydrodynamic models allows predictive capabilities, ecosystem models are complex and generally still in early development stages. Conceptual ecological models are necessary as the foundations for mapping the biotic and abiotic components and relationships of an ecosystem. Understanding the spatial and temporal habitat requirements of key species in their life histories will help identify habitats of particular importance and/or vulnerability, high diversity, and rarity. More work is needed to further define the needs of ecological modeling in support of the ocean management plan goals.
Action 3.3 - Determine the Economic Value of Ecosystem Goods and Services
Ocean managers need an objective way to value the goods and services provided by the ecosystems in and beyond the planning area. Many management decisions can be informed through a better understanding of ecosystem services, including siting of new uses/activities, deriving scale and scope of compensatory mitigation, and assessing cumulative pressures on ecosystem components. Establishing methods to determine the economic value of ecosystem goods and services will allow for comparisons to their ecological values and the tradeoffs that can be expected when preserving one over the other. This work will require the integration of elements from the natural, socio-political, and economic sciences. A major challenge of valuing ecosystem goods and services is the ability to develop accurate assessments of the links between the structures and functions of natural systems, society’s benefits, and the subsequent values. MOP is funding pilot efforts to develop a model or models to attempt to address these challenges and, for a discrete geographic area,
SF-55

develop information to determine the economic value of ecosystem services in this area and how such value could change under several hypothetical development scenarios. Through CZM, EEA will continue to be involved in this project, and will also work with its partners to identify funding to conduct this work.
Action 3.4 - Develop Risk, Impact, and Scenario-Support Tools
EBM decision-support tools can aid managers by integrating a wide range of ecosystem and human factors into decision making, exploring various alternatives through standardized processes, and incorporating stakeholder goals and concerns. Assessing the susceptibility of ecosystem components to certain ocean uses can help determine how pro-active and conservative management actions should be. The vulnerability of ecosystem components to human activity can be conducted through ecological risk management frameworks that include the identification of and relative quantification of cumulative impacts. Quantitative scenario analysis tools help to evaluate trade-offs between management options. There are several tools available that may be able to assists in ocean-use planning. EEA will evaluate these various tools and use them as needed.
Longer-Term Priority 4 - Adaptive Management
An integrated approach to management is based on an understanding of the ecosystem and its human services, such that management decisions incorporate ecosystem and human-use factors. To maintain the value of marine ecosystems, decision-makers need to monitor the effectiveness of management measures in achieving objectives (Hockings 2003; Rice and Rochet 2005). Using observations and monitoring to evaluate and improve the effectiveness of decision-making is a key component of adaptive management (Ehler 2003). An important part of the science framework is the development and implementation of an assessment/evaluation system using a series of indicators selected for their effectiveness and efficiency in tracking specific environmental and socioeconomic components and processes, and assessing selected management options to provide feedback in an adaptive management approach. See Priority 7 for more information on this evaluation system. Additional actions under this category are listed below.
Action 4.1 - Conduct Research on Species’ Sensitivity to Oceanographic Changes Associated with Climate Change
Investigations to increase our understanding of critical species-level, community-level, and/or trophic-level thresholds are important to inform decisions with long-term implications for the planning area. Some main thresholds include: shifts in species’ life histories and ranges due to seawater temperature changes, shifts in primary/secondary production due to ocean circulation and salinity changes related
SF-56

to temperature and rainfall increases, decreased survivorship and recruitment of organisms with calcium carbonate shells (such as shellfish) due to decreasing ocean pH, and changes in coastal wetlands distributions associated with temperature and sea level increases. EEA’s role will be to advocate for this type of applied research through local universities, institutions, and in some cases agencies.
Action 4.2 - Identify Technology and/or Best Management Practices to Improve Compatibility between Uses
One of the concerns with new ocean technologies is that the facilities (e.g., energy turbines, wave energy devices, deepwater natural gas terminals, and open ocean aquaculture pens and strings) will conflict with existing uses. As emerging technologies, industry “best practices” are still in the process of being developed for these new uses. EEA, through its agencies’ permitting processes, will require proponents of these new technologies to perform the appropriate amount of laboratory and field testing to demonstrate how the siting and operation of these facilities can avoid or minimize potential use conflicts (as well as minimize environmental impacts). In addition, EEA will investigate current industry standards to improve compatibility between new and existing management uses.
Longer-Term Priority 5 - Integrated Data Management and Communication Network
The importance of a data network is described in Priority 8 above. It is likely that that the data network will in reality be a series of different tools all with a specific task, as no technology currently exists that can aggregate all types of relevant data streams, store data, and allow a friendly user interface. The following actions are recommended to support data inventory, discoverability, integration, and interoperability.
Action 5.1 - Continue to Increase Data Discoverability
Building on the data network described in Priority 8, CZM will be engaged in ongoing efforts with Google or other relevant search technologies to improve data discoverability.
Action 5.2 - Ensure and Increase Data Interoperability
As the data network described in Priority 8 matures and the data reporting standards become institutionalized within the Commonwealth, ongoing efforts will be required to ensure that data useful to the ocean planning process, whether it be collected by government agencies, academia, non-profits, or the business sector, continues to be reported to CZM in a pre-approved format. It will be CZM’s role, working with
SF-57

other agencies and partners such as MOP, to develop, publicize, and in some cases require the appropriate data formats for in-state work—while CZM will have more of an advocacy role in data standards development at the national level. The efforts of the Northeast Coastal and Ocean Data Partnership (formerly the Gulf of Maine Ocean Data Partnership), which stresses standardization within disciplines and use of existing protocols for data sharing, can inform this effort.
Action 5.3 - Continue Activities to Communicate Information and Results
Communication of the results stemming from this science framework will be important to ensure that managers, scientists, user groups, and other stakeholders (including the general public) are connected to current science, policies, and management practices. EEA and its partners (e.g., MOP) will use existing communication modes (e.g., scientific reports and fact sheets, press reports, the MORIS database), as well as new education vehicles such as annual management updates and MOP workshops, to convey the results emerging from the implementation of the actions in this science framework. EEA will also have a lead role in establishing the agenda, identifying presenters, and moderating the annual updates and workshops.
SF-58

References
Backus, R.H. and D.W. Bourne. 1987. Georges Bank. MIT Press, Cambridge, USA.
Ball, I.R. and H.P. Possingham. 2000. MARXAN (V1.8.2): Marine Reserve Design Using Spatially Explicit Annealing, a manual prepared for the Great Barrier Reef Marine Park Authority. http://www.uq.edu.au/marxan/docs/marxan_manual_1_8_2.pdf. Accessed 6/5/09.
Bisagni J.J., D.J. Gifford, and C.M. Ruhsam. 1996. The spatial and temporal distribution of the Maine coastal current during 1982. Continental Shelf Research 16: 1-24.
Blumberg, A.F., R.P. Signell, and H.L. Jenter. 1993. Modeling transport processes in the coastal ocean. Journal of Marine Environmental Engineering 1: 31-52.
Bothner, M.H. 1997. Metal concentrations in sediments of Boston Harbor and Massachusetts Bay document environmental change: U.S. Geological Survey Fact Sheet FS 150-97. http://marine.usgs.gov/fact-sheets/fs150-97/. Accessed 4/10/09.
Bothner, M.H.1998. Predicting the long-term fate of sediments and contaminants in Massachusetts Bay: U.S. Geological Survey Fact Sheet FS 172-97. http://pubs.usgs.gov/fs/fs172-97/. Accessed 4/10/09.
Bricker, S., D. Lipton, A. Mason, M. Dionne, D. Keeley, C. Krahforst, J. Latimer, and J. Pennock. 2006. Improving Methods and Indicators for Evaluating Coastal Water Eutrophication: A Pilot Study in the Gulf of Maine. NOAA Technical Memorandum NOS NCCOS 20. National Ocean Service. National Centers for Coastal Ocean Science, Center for Coastal Monitoring and Assessment, Silver Spring, MD.
Burnett, W.C. and H. Dulaiova. 2003. Estimating the dynamics of groundwater input into the coastal zone via continuous radon-222 measurements. Journal of Radioanalytical Nuclear Chemistry 69(1-2): 21-35.
Burnett, W.C., G. Kim, and D. Lane-Smith, 2001. A continuous monitor for assessment of Rn-222 in the coastal ocean. Journal of Radioanalytical Nuclear Chemistry 249(1): 167-172.
Butman, B, P.S. Alexander, A. Scotti, R.C. Beardsley, and S.P. Anderson. 2006. Large internal waves in Massachusetts Bay transport sediments offshore. Continental Shelf Research 26: 2029-2049.
SF-59

Chen, C, R.C. Beardsley, S. Hu, Q. Xu, and H. Lin, 2005. Using MM5 to hindcast the ocean surface forcing fields over the Gulf of Maine and Georges Bank region. Journal of Atmospheric and Oceanic Technology 22(2): 131-145.
Cholewiak, D. 2009. Evaluating the impact of anthropogenic noise on cetacean vocal activity in Stellwagen Bank National Marine Sanctuary. Cape Cod Natural History Conference March 14, 2009.
Cloern, J.E., B.E. Cole, and S.W. Hager. 1994. Notes on a Mesodinium rubrum red tide in San Francisco Bay (California, USA). Journal of Plankton Research 16(9): 1269-1276.
Codarin, A., L.E. Wysocki, F. Ladich, and M. Picciulin. 2007. Hearing under ambient and ship noise conditions: a case study on fishes from a protected area in the Adriatic Sea. Bioacoustics 17(1-3): 197-199. http://www.blublog.net/media/4/20070903-048.pdf. Accessed 6/8/09.
Cohen A.N, and J.T. Carlton. 1998. Accelerating invasion rate in a highly invaded estuary. Science 279(5350): 555-558.
Cracknell, A.P., S.K. Newcombe, A.F. Black, and N.E. Kirby. 2001. The ABDMAP (Algal Bloom Detection, Monitoring, and Prediction) concerted action. International Journal of Remote Sensing 22: 205–247.
Derous, S., T. Agardy, H. Hillewaert, K. Hostens, G. Jamieson, L. Lieberknecht, J. Mees, I. Moulaert, S. Olenin, D. Paelinckx, M. Rabaut, E. Rachor, J. Roff, E.W.M. Stienen, J.T. Van der Wal, V. Van Lancker, E. Verfaillie, M. Vincx, J.M. Weslawski, and S. Degraer. 2007a. A concept for biological valuation in the marine environment. Oceanologia 49(1): 99-128.
Derous, S., M. Austen, S. Claus, N. Daan, J. Dauvin, K. Deneudt, J. Depestele, N. Desroy, H. Heesen, K. Hostens, A.H. Marboe, A. Lescrauwaet, M.P. Moreno, I. Moulaert, D. Paelinckx, M. Rabaut, H. Rees, A. Ressurreicao, J. Roff, P.T. Santos, J. Speybroeck, E.W.M. Stienen, A. Tatarek, R.T. Hofstede, M. Vincx, T. Zarzycki, and S. Degraer. 2007b. Building on the concept of marine biological valuation with respect to translating it to a protocol: viewpoints from a joint ENCORA-MARBEF initiative. Oceanologia 49(4): 1-8.
Ehler, C. 2003. Indicators to measure governance performance in integrated coastal management. Ocean & Coastal Management 46: 335-345.
Electric Power Research Institute (EPRI). 2006. System level design, cost and economic assessment—Massachusetts Muskeget Channel Tidal In-stream Power Plant. EPRI—TP—006—MA.
SF-60

Erbe, C. 2002. Underwater noise of whale-watching boats and potential effects on killer whales (Orcinus orca), based on an acoustic impact model. Marine Mammal Science 18: 394-418.
Erbe, C. and D.M. Farmer. 1998. Masked hearing thresholds of beluga whales (Delphinapterus leucas) in icebreaker noise. Deep Sea Research 45: 1373-1387.
Erbe, C. and D.M. Farmer. 2000. Zones of impact around icebreakers affecting beluga whales in the Beaufort Sea. Journal of the Acoustical Society of America 108: 1332-1340.
Executive Office of Energy and Environmental Affairs (EEA). 2008. Report of the Work Group on Transportation, Navigation, and Infrastructure. http://www.mass.gov/Eoeea/docs/eea/oceans/112108_navworkgroupreport.pdf. Accessed 1/8/09.
Fabry, V.J., B.A. Seibel, R.A. Feely, and J.C. Orr. 2008. Impacts of ocean acidification on marine fauna and ecosystem processes. ICES Journal of Marine Science 65(3): 414-432.
Friedland K.D., J.E. O’Reilly, J.A. Hare, G.B. Wood, W.J. Overholtz, and M.D. Cieri. 2006. Environmental preferences of Atlantic herring under changing harvest regimes. U.S. Department of Commerce, Northeast Fisheries Science Center Reference Document 06-18.
Geyer W., G.B. Gardner, W. Brown, J. Irish, B. Butman, T. Loder, and R.P. Signell. 1992. Physical Oceanographic Investigation of Massachusetts and Cape Cod Bays, Technical Report MBP-92-03. Massachusetts Bays Program, U.S. EPA Region I/Massachusetts Coastal Zone Management Office, Boston, Massachusetts.
Greene, C.H. and A.J. Pershing. 2001. The response of Calanus finmarchicus populations to climate variability in the Northwest Atlantic: basin-scale forcing associated with the North Atlantic Oscillation (NAO). ICES Journal of Marine Science 57: 1536-1544.
Greene, C.H. and A.J. Pershing. 2007. Climate drives sea change. Science 315(23): 1084-1085.
Greene, C.H., A.J. Pershing, T.M. Cronin, and N. Ceci. 2008. Arctic climate change and its impacts on the ecology of the North Atlantic. Ecology 89(11) Supplement: S24–S38.
Gulf of Maine Ocean Observing System (GoMOOS). 2009. http://www.gomoos.org/datatypes/WIND.html. Accessed 4/2/09.
Halpern, B.J. 2003. The impact of marine reserves: do reserves work and does reserve size matter? Ecological Applications 13, Supplement Marine Reserves: 117-137.
SF-61

Halpern, B.S., S. Walbridge, K.A. Selkoe, C.V. Kappel, F. Micheli, C. D'Agrosa, J.F. Bruno, K.S. Casey, C. Ebert, H.E. Fox, R. Fujita, D. Heinemann, H.S. Lenihan, E.M.P. Madin, M.T. Perry, E.R. Selig, M. Spalding, R. Steneck, and R. Watson. 2007. A global map of human impact on marine ecosystems. Science 319(5865): 948-952.
Halpern, B.S., K.L. McLeod, A.A. Rosenberg, and L.B. Crowder. 2008. Managing for cumulative impacts in ecosystem-based management through ocean zoning. Ocean & Coastal Management 51: 203-211.
Hicks, S., H. Debaugh, and L. Hickman. 1983. Sea Level Variation for the United States 1855-1980. U.S. Department of Commerce, National Oceanic and Atmospheric Administration, National Ocean Service.
Hockings, M. 2003. Systems for assessing the effectiveness of management in protected areas. BioScience 53(9): 823-832.
International Panel on Climate Change (IPCC). 2007. http://www.ipcc.ch/pdf/assessment-report/ar4/syr/ar4_syr.pdf. Accessed 4/2/09.
Ji, R., C.S. Davis, C. Chen, D.W. Townsend, D.G. Mountain, and R.C. Beardsley. 2007. Influence of ocean freshening on shelf phytoplankton dynamics. Geophysical Research Letters 34:1-5. L24607, doi: 10.1029/2007/GL032010.
Jiang, M.S., M.W. Brown, J.T. Turner, R.D. Kenney, C.A. Mayo, Z. Zhang, and M. Zhou. 2007. Springtime transport and retention of Calanus finmarchicus in Massachusetts and Cape Cod Bays, USA and implications to North Atlantic right whale foraging, Marine Ecology Progress Series 349: 183-197.
Jiang, M.S. and M. Zhou. 2008a. The Massachusetts Bay Hydrodynamic Model: 2005 Simulation. Boston: Massachusetts Water Resources Authority. Report 2008-12.
Jiang, M.S. and M. Zhou. 2008b. Massachusetts Bay Eutrophication Model: 2005 Simulation. Boston: Massachusetts Water Resources Authority. Report 2008-13.
Joint Nature Conservation Committee (JNCC). 2004. Irish Sea Pilot Final Report. http://www.jncc.gov.uk/page-2767. Accessed 4/16/09.
Kelly J.R., C.S. Davis, S.J. Cibik. 1998. Conceptual food web model for Cape Cod Bay, with associated environmental interactions. Boston: Massachusetts Water Resources Authority. Report 1998-04.
Kerr, R.A. 2009. The many dangers of greenhouse acid. Science 333:458.
SF-62

Kroeger, K.D., M.L. Cole, and I. Valiela. 2006. Groundwater-transported dissolved organic nitrogen exports from coastal watersheds. Limnology and Oceanography 51: 2248-2261.
Kropp, R.K., J.T. Turner, D. Borkman, S. Emsbo-Mattingly, C.D. Hunt, and K.E. Keay. 2003. A review of zooplankton communities in the Massachusetts Bay/Cape Cod Bay system. Boston: Massachusetts Water Resources Authority. Report ENQUAD 2003-06.
Lermusiaux, P.F.J. 2001. Evolving the subspace of the three-dimensional multiscale ocean variability: Massachusetts Bay. Journal of Marine Systems, special issue on “Three-dimensional ocean circulation: Langrangian measurements and diagnostic analyses.” 29/1-4: 385-422.
Libby P.S., D. Borkman, W.R. Geyer, A.A. Keller, J.T. Turner , M.J. Mickelson, and C.A. Oviatt. 2009. Water column monitoring in Massachusetts Bay 1992-2007: focus on 2007 results. Boston: Massachusetts Water Resources Authority. Report 2009-04.
Limeburner, R. and R.C. Beardsley. 1982. The seasonal hydrography and circulation over Nantucket Shoals. Journal of Marine Research, Supplement to 40: 371-406.
Lynch, D.R., M.J. Holboke, and C.E. Naimie. 1997. The Maine coastal current: spring climatological circulation. Continental Shelf Research 17: 605-634.
Maciolek N.J., S.A. Doner, R.J. Diaz, D.T. Dahlen, B. Hecker, I.P. Williams, C.D. Hunt, and W. Smith. 2008. Outfall benthic monitoring interpretive report 1992-2007. Boston: Massachusetts Water Resources Authority. Report 2008-20.
Manohar-Maharaj, V. and R.C. Beardsley. 1973. Spring run-off in Massachusetts Bay. MIT Sea Grant Report No. MITSG 74-9.
Maritime Ireland/Wales. 2001. Guide to Best Practice in Seascape Assessment. INTERREG Report No. 5, March 2001.
Massachusetts Division of Marine Fisheries (MA DMF). 2006. Aquaculture report.
Massachusetts Division of Marine Fisheries (MA DMF) 2009. Fisheries statistics project.
Massachusetts Marine Trades Association (MMTA) 2008. http://www.boatma.com/boating_in_ma.html. Accessed 11/03/08.
Massachusetts Office of Coastal Zone Management (MCZM). 2004. Estuarine and marine habitat. Massachusetts Ocean Management Task Force Technical Report. http://www.mass.gov/czm/oceanmanagement/waves_of_change/pdf/wavesofchange.pdf. Accessed 5/29/09.
SF-63

Massachusetts Water Resources Authority (MWRA). 2003. Briefing for OMSAP workshop on ambient monitoring revisions, June 18-19, 2003. 4. Physical and biological oceanography of Massachusetts Bay. Boston: Massachusetts Water Resources Authority. Report ENQUAD ms-085. http://www.mwra.state.ma.us/harbor/enquad/pdf/2003-ms-85.pdf. Accessed 4/9/09.
Massducks.com. 2008. Website. http://massducks.com/. Accessed 11/24/08.
McLeod, K.L., J. Lubchenco, S.R. Palumbi, and A.A. Rosenberg. 2005. Scientific Consensus Statement on Marine Ecosystem-Based Management. Signed by 221 academic scientists and policy experts with relevant expertise and published by the Communication Partnership for Science and the Sea. http://compassonline.org/?q=EBM. Accessed 6/5/09.
Messieh, S.N., T.W. Rowell, D.L. Peer, and P.J. Cranford. 1991. The effects of trawling, dredging and ocean dumping on the eastern Canadian continental shelf seabed. Continental Shelf Research 11(8-10):1237-1263.
Michael, H.A., J.S. Lubetsky, and C.F. Harvey. 2003. Characterizing submarine groundwater discharge: a seepage meter study in Waquoit Bay, Massachusetts. Geophysical Research Letters 30(6).
National Oceanic and Atmospheric Administration (NOAA) Aquaculture Program. 2007. Massachusetts Aquaculture. Fact Sheet. http://aquaculture2007.noaa.gov/pdf/Massachusetts_June262007.pdf. Accessed 11/21/08.
NOAA National Marine Fisheries Service (NMFS). 2008a. Dutch Harbor-Unalaska, Alaska, and New Bedford, Mass. Remain Top Fishing Ports. Press Release. July 17, 2008.
National Research Council of The National Academies: Committee on Assessing and Valuing the Services of Aquatic and Related Terrestrial Ecosystems. 2004. Valuing Ecosystem Services: Toward Better Environmental Decision-Making. Washington, D.C., The National Academies Press.
New Hampshire Sea Grant (NH Sea Grant). 2006. Growing Seafood in the Open Ocean: Offshore Aquaculture in the United States. NH Sea Grant publication UNHMP-TR-SG-06-22. http://extension.unh.edu/Marine/Docs/nhut06002_000.pdf. Accessed 11/19/08.
Nixon, S.W., S. Granger, B.A. Buckley, M. Lamont, and B. Rowell. 2004. A one hundred and seventeen year coastal water temperature record from Woods Hole, Massachusetts. Estuaries: 27(3): 397-404.
SF-64

Northeast Climate Impacts Assessment (NECIA). 2006. Climate change in the Northeast U.S. http://www.climatechoices.org/assets/documents/climatechoices/NECIA_climate_report_final.pdf. Accessed 4/9/09.
Nowacek, D.P., L.H. Thorne, D. Johnston, and P.L. Tyack. 2007. Responses of cetaceans to anthropogenic noise. Mammal Review 37: 81-115.
Pershing, A.J., C.H Greene, B. Planque, and J-M. Fromentin. 2004. The influence of climate variability on North Atlantic zooplankton populations. In Ecological Effects of Climatic Variations in the North Atlantic, pp. 59-69. Ed. by N.C. Stenseth, G. Ottersen, J. Hurrell, and A. Belgrano. Oxford University Press, New York.
Pershing, A.J., C.H. Greene, J.W. Jossi, L. O’Brien, J.K.T. Brodziak, and B.A. Bailey. 2005. Interdecadal variability in the Gulf of Maine zooplankton community, with potential impacts on fish recruitment. ICES Journal of Marine Science 62: 1511-1523.
Peterson, B.J., J. McClelland, M. Holmes, R. Curry, J. Walsh, and K. Aagaard. 2006. Trajectory shifts in the Arctic and Subarctic freshwater cycle. Science 313: 1061-1066.
Pettigrew N.R., J.H. Churchill, C.D. Janzen, L.J. Mangum, R.P. Signell, A.C. Thomas, D.W. Townsend, J.P. Wallinga, and H. Xue. 2005. The kinematic and hydrographic structure of the Gulf of Maine Coastal Current. Deep-Sea Research II 52 (19-21): 2369-2391.
Platt, T., C. Fuentes-Yaco, and K.T. Frank. 2003. Marine ecology: Spring algal bloom and larval fish survival. Nature 423: 398-399.
Ramsey, J.S., S.F. Griffee, M.S. Osler, and M.R. Byrnes. 2005. South Shore coastal hazards characterization atlas description of variables. Office of Coastal Zone Management. http://www.mass.gov/czm/hazards/ss_atlas/pdf/ss_atlas_variables_report.pdf. Accessed 4/8/09.
Rice, J.C. and M.J. Rochet. 2005. A framework for selecting a suite of indicators for fisheries management. ICES Journal of Marine Science 62: 516-527.
Ruiz, G.M., P.W. Fofonoff, J.T. Carlton, M.J. Wonham, and A.H. Hines. 2000. Invasion of coastal marine communities in North America: Apparent patterns, processes, and biases. Annual Review of Ecology and Systematics 31: 481-531.
Ryan, R.L. and R.P. Taupier. 2007. Boston Harbor Islands National Park Area Scenic Analysis and Assessment: A Pilot Study. UMass (Amherst) Department of Landscape Architecture and Regional Planning.
SF-65

Sankaranarayanan, S. 2007. Modeling the tide and wind-induced circulation in Buzzards Bay. Estuarine, coastal and shelf science 73(3-4): 467-480.
Schick, R.S., J. Goldstein, and M.E. Lutcavage. 2004. Bluefin tuna (Thunnus thynnus) distribution in relation to sea surface temperature fronts in the Gulf of Maine (1994-96). Fisheries Oceanography 13: 225-238.
Shanks, A.L. and W.G. Wright. 1987. Internal-wave-mediated shore-ward transport of cyprids, megalopae, and gammarids and correlated long-shore differences in the settling rate of intertidal barnacles. Journal of Experimental Marine Biology and Ecology 114: 1-13.
Signell, R.P., H.L. Jenter, and A.F. Blumberg. 1994. Modeling the seasonal circulation in Massachusetts Bay in Estuarine and Coastal Modeling, Proceedings of the 3rd International Conference, edited by M.L. Spaulding: American Society of Civil Engineers, New York.
Signell, R.P., H.L Jenter, and A.F. Blumberg. 2000. Predicting the Physical Effects of Relocating Boston's Sewage Outfall. Estuarine, Coastal and Shelf Science 50: 59-72.
Slomp, C.P., and P. Van Cappellen. 2004. Nutrient inputs to the coastal ocean through submarine groundwater discharge: controls and potential impact. Journal of Hydrology 295: 64-86.
Smith, P.C., R.W. Houghton, R.G. Fairbanks, and D.G. Mountain. 2001. Interannual variability of boundary fluxes and water mass properties in the Gulf of Maine and on Georges Bank: 1993-1997. Deep Sea Research Part II 48: 37-70.
State of Connecticut. 2007. Visual Impacts and Assessments: Coastal Connecticut. http://www.ct.gov/dep/lib/dep/long_island_sound/living_on_the_shore/visual_impacts_and_assessments.pdf. Accessed 11/24/08.
Stevick, P.T., L.S. Incze, S.D. Kraus, S. Rosen, N. Wolff, A. Baukus. 2008. Trophic relationships and oceanography on and around a small offshore bank Marine Ecology Progress Series 363: 15–28.
Stock, C.A., D.J. McGillicuddy, Jr., D.M. Anderson, A.R. Solow, and R.P. Signell. 2007. Blooms of the toxic dinoflagellate Alexandrium fundyense in the western Gulf of Maine in 1993 and 1994: A comparative modeling study. Continental Shelf Research 27(19): 2486-2512.
Taniguchi, M., W.C. Burnett, C.F. Smith, R.J. Paulsen, D. O'Rourke, S.L. Krupa, and J.L. Christoff. 2003. Spatial and temporal distributions of submarine groundwater discharge rates obtained from various types of seepage meters at a site in the Northeastern Gulf of Mexico. Biogeochemistry 66(1): 35-53.
SF-66

UK Department of Trade and Industry. 2005. Guidance on the Assessment of the Impact of Offshore Wind Farms: Seascape and Visual Impact Report.
University of Massachusetts (UMass). 2006. An Assessment of the Coastal and Marine Economies of Massachusetts. Report for the Massachusetts Office of Coastal Zone Management.
U. S. Army Corps of Engineers (USACE). 2006. Hurricane evacuation studies for New England. Hurricane surge inundation maps for New England. http://www.nae.usace.army.mil/projects/ma/hurricanemaps/mamaps.htm. Accessed 4/8/09.
U.S. Coast Guard (USCG). 2007. Recreational boating statistics 2007. COMDTPUB P16754.21.
U.S. Fish and Wildlife Service (USFWS). 2001. Birding in the United States: A Demographic and Economic Analysis. Addendum to the 2001 National Survey of Fishing, Hunting and Wildlife-Associated Recreation Report 2001-1. http://www.fs.fed.us/outdoors/naturewatch/start/economics/Economic-Analysis-for-Birding.pdf. Accessed 11/24/08.
U.S. Geological Survey (USGS). 2009a. http://waterdata.usgs.gov/usa/nwis/uv?site_no=01100000. Accessed 4/8/2009.
U.S. Geological Survey (USGS). 2009b. http://waterdata.usgs.gov/usa/nwis/uv?site_no=01108000. Accessed 4/8/2009.
Vakalopoulos C.C., M.J. Mickelson, and J. Pederson J (eds.). 2006. Summary of Symposium on the Alexandrium fundyense Red Tide of 2005. MIT Sea Grant College Program, MITSG #06-7, Cambridge, Massachusetts. http://seagrant.mit.edu/media/publications/MITSG_06-7.pdf. Accessed 4/9/09.
Vasconcelos, R.O., M.C.P. Amorim, and F. Ladich. 2007. Effects of ship noise on the detectability of communication signals in the Lusitanian toadfish. Journal of Experimental Biology 201: 2104-2112.
Wake, C., L. Burakowski, G. Lines, K. McKenizie, and T. Huntington. 2006. Cross border indicators of climate change over the past century: Northeastern United States and Canadian Maritime Region. The climate change task force of the Gulf of Maine Council on the Marine Environment in cooperation with Environment Canada and Clean Air-Cool Planet.
SF-67

SF-68
Warner, J.C., B. Butman, and P.S. Dalyander. 2008. Storm-driven sediment transport in Massachusetts Bay. Continental Shelf Research 28: 257-282.
Werme C. and C.D. Hunt. 2006. 2005 Outfall monitoring overview. Boston: Massachusetts Water Resources Authority. Report 2006-18.
White, R.E., Jr. and L.F. White. 2007. Eldridge Tide and Pilot book 2008. Robert Eldridge White, Jr. and Linda Foster White, publishers, Medfield, MA.
Woods Hole Oceanographic Institute (WHOI) 2009. GOMTOX; Dynamics of Alexandrium fundyense distribution is in the Gulf of Maine. http://www.whoi.edu/sbl/liteSite.do?litesiteid=13193&articleId=20408. Accessed 4/17/09.
Zimmerman, J., C. Veth, H. van Aken, L. Maas, H. van Haren. 2008. Processes near continental slopes, internal waves and mixing, Royal Netherlands Institute for Sea Research. http://www.nioz.nl/nioz_nl/96c2fef59006052f14ce21ce8530b77f.php. Accessed 11/19/08.

Appendix A - Overview of Science Programs in Massachusetts and the Gulf of Maine Region
Organization Project Name Project Description
Massachusetts Institute of Technology (MIT) Sea Grant 2008-ongoing
Gulf of Maine Regional Ocean Science Plan
Thematic priorities: Climate change, human health and the oceans, human activities and the oceans, coastal resiliency, management, and governance.
Woods Hole Oceanographic Institute (WHOI) Sea Grant 2008-2010
Estuarine and coastal processes
Measurement and modeling study of waves and currents in the coastal zone off Southeastern Massachusetts; Investigation of wave energy dissipation over muddy seafloors using large-eddy simulation driven and validated by field data; Whales and Waves: Zooplankton accumulation, fish and humpback whale foraging response, and shoaling of internal waves at Stellwagen Bank.
Fisheries and Aquaculture
Toxic Alexandrium Blooms in the Nauset Marsh System Salt Marsh Dieback in Cape Cod: Possible Mechanisms.
Coastal processes extension with U.S. Geological Survey (USGS), Massachusetts Office of Coastal Zone Management (CZM); funded by the Federal Emergency Management Agency (FEMA)
Shoreline Change: identification if erosion-prone areas and erosion control mitigation methods to reduce environmental and economic impacts of shoreline change; Beach and Dune Profile Monitoring: monitoring program for beach and dune profiling to document changes and make correlations to long-term shoreline changes.
Gulf of Maine Council on Marine Environment
Action Plan 2007-2012
Invasive species; Land-based activities; Habitat restoration; Marine habitat conservation.
Gulf of Maine Census of Marine Life 200-ongoing
Assessing biodiversity from resource trawl surveys
Explores spatial and temporal patterns of fish biodiversity by performing a variety of statistical analyses on the Northeast Fisheries Science Center trawl survey data.
Connecting biodiversity and process research to management
Using Stellwagen Bank as a case study to develop and illustrate a framework that connects knowledge of fundamental ecological processes with management-level goals based on ecosystem services (University of Southern Maine, University of Connecticut).
Human impacts on cod-dominated trophic cascades in Gulf of Maine
In a repeat of trials conducted in 1992, predation experiments were conducted using time-lapse imagery with a goal of documenting changes in fish populations and predation impacts in the Gulf of Maine (Brown University).
SF-69

Organization Project Name Project Description
Northeast Regional Association for Coastal Ocean Observing Systems (NERACOOS)
Buoys and Stations Collecting Weather and Ocean Data
Information from buoys deployed by (GoMOOS), National Oceanic and Atmospheric Administration (NOAA) (National Data Buoy Center [NDBC] buoys and C-Man Stations) on ocean (current speed and direction, wave height, water temp, salinity and density, chlorophyll concentration, Photosynthetically Active Radiation, dissolved oxygen, percent oxygen saturation) and weather conditions. Buoys included in Massachusetts Bay, Boston Harbor, Woods Hole, and Nantucket.
New England Aquarium, Edgerton Research Laboratory
Fisheries and Aquaculture Ocean Health
Sustainable fisheries, lobster, elasmobranchs, bycatch reduction; marine ecosystem health, disease, endocrinology, pathology, climate change, pollutants, stress responses and adaptation.
Martha’s Vineyard Coastal Observation System
Physical Forcing and Seasonal Variations in Phytoplankton in the Coastal Ocean
The overall objective of this project is to understand the processes controlling the seasonal variability of phytoplankton biomass over the inner shelf off the northeast coast of the United States (Funded by the National Aeronautics and Space Administration [NASA], WHOI, Rutgers University).
Optics acoustics ad stress in situ (OASIS)
To provide a critical evaluation of the dynamics of suspended particles and their effects on optical and acoustical characteristics of the water column.
Northeast Regional Ocean Council (NROC) 2009-2010
Ocean and coastal ecosystem health
Activities include (top high priority): increase the visibility of state-federal work groups, convene ocean ecosystem health and ecosystem-based management (EBM) marine spatial planning workshops.
Coastal hazards resilience
Activities include (highest priority): Promote regional dialogue on broad-scale adaptation strategies for responding to the effects of sea level rise.
Ocean energy planning and management
Identify the types and sources of contextual and baseline data and knowledge essential for ocean energy facility development, impact mitigation, and operations. Develop and maintain an inventory of projects devoted to renewable ocean energy resource development and maritime transportation and handling of fossil fuel supplies.
WHOI - Coastal Ocean Institute 2008-ongoing
Establishing a portable, high-resolution, shallow-water bathymetric capability. Deployment of a video plankton recorder at the Vineyard Coastal Observatory: Quantification of top-down controls on phytoplankton dynamics observed with imaging. Barrier response to sea-level rise: Is there a threshold rate of sea-level rise beyond which barriers simple cannot ‘keep up’ and will drown in place?
WHOI - Ocean & Climate Change
The North Atlantic Ocean’s role in abrupt climate change - A Scientific Strategy.
WHOI - GOMTOX 2006-2011
Dynamics of Alexandrium fundyense distributions in the Gulf of Maine: An observational and modeling study of nearshore and offshore shellfish toxicity, vertical toxin flux, and bloom dynamics in a complex shelf sea (Proposed).
SF-70

Organization Project Name Project Description
Coalition for Buzzards Bay
Bay Health Index Index is calculated from the scores of mean summertime water clarity, phytoplankton pigments, organic nitrogen, inorganic nitrogen, and lowest 20% of dissolved oxygen concentrations.
Baywatchers Program
The Buzzards Bay Water Quality Monitoring Program evaluates nitrogen-related water quality and long-term ecological trends in Buzzards Bay.
Natural Resource Monitoring
Project aims to track natural resources to provide a better understanding of ecological changes in the Bay and its watershed.
Nantucket Soundkeeper 2006-ongoing
Nantucket Sound Water Quality Monitoring Program
Program runs from June to October, nitrogen loading (with UMass Dartmouth School for Marine Science and Technology [SMAST]).
SMAST Ongoing
Nantucket Sound - Marine Ecosystem Dynamics Modeling
Integrated model system as a nested component in a Northeast Coastal Ocean Forecast System (NECOFS). The core of this model system is the Finite-Volume Coastal Ocean Model (FVCOM). Currently developing 3rd generation modeling system.
Massachusetts Bay - Marine Ecosystem Dynamics Modeling
3rd generation of FVCOM with a nested sub domain Massachusetts Bay model. Covers Boston Harbor, estuaries, Cape Cod Canal, and inner bays along Cape Cod. Provides an advanced model system in Massachusetts Bay for the use in coastal management and water quality monitoring (Funded by MIT Sea Grant).
Provincetown Center for Coastal Studies 2006-ongoing
Cape Cod Bay Monitoring Program
>40 stations are sampled bi-weekly (April-October): temperature, salinity, dissolved oxygen, turbidity, chlorophyll a, and nutrients, from Provincetown to Duxbury. To include research on eelgrass ecosystems, coastal geology, and salt marsh restoration.
USGS 2003-ongoing
High-Resolution Geologic Mapping of the Sea Floor Offshore of Massachusetts
Seafloor mapping to characterize surface and subsurface geologic framework offshore of Massachusetts. Mapping has been completed in the Stellwagen Bank National Marine Sanctuary (NMS) and Western Massachusetts Bay.
Buzzards Bay Naitonal Estuary Program (NEP) 2007-2009
Comprehensive Conservation and Management Plan
Includes a list of action plans based on goals and objectives to meet the environmental needs of Buzzards Bay and watershed.
NOAA- National Centers for Coastal Ocean Science (NCCOS)
Ecological Characterization of Stellwagen Bank
1) analyze geospatial distributions of selected fishes, seabirds, marine mammals, and contaminants, 2) identify biological and physical datasets to augment existing data for a comprehensive biogeographic assessment using GIS, 3) identify ecologically important areas, and 4) model physical and biological dependencies that may explain the temporal and spatial dynamics of the ecosystem.
Stellwagen Bank NMS Management Plan Action Plan targets: Ecosystem Protection, Ecosystem Alteration,
and Water Quality.
Cape Cod National Seashore
Cape Cod Ecosystem Monitoring Program
Water quality (nutrient dynamics, water chemistry), air quality, biological integrity (focal species or communities), hydrology.
SF-71

Organization Project Name Project Description
Whale Center of New England
Research on whales, seals, dolphins
Behavioral ecology, population monitoring, acoustic analysis, genetic research, behavior studies.
Regional Association for Research on the Gulf of Maine (RARGOM)
Gulf of Maine Research, Policy and Management Issues
Issues: Temporal and spatial trends in chemical and biological contaminants, “State of the Gulf” assessments, habitat identification, wetlands restoration, classification schemes, essential fish habitat, descriptions and functioning of banks, ledges, basins, estuaries, rocky shoreline, marshes, sandy beaches, and restoration.
Massachusetts Water Resources Authority (MWRA) Ongoing
Mass Bay Environmental Monitoring
Outfall monitoring as required by the National Pollutant Discharge Elimination System (NPDES) discharge permit. Effluent, water column, sea floor, and fish/shellfish samples are collected. Includes nutrients, organic material, toxic contaminants, pathogens, and solids.
Water quality monitoring in Boston Harbor & Tributary Rivers
Combined sewer overflows (CSOs) are a source of wet weather pollution to Boston Harbor and its tributary rivers. Monitoring of nutrients, pathogens, dissolved oxygen, temperature, & water clarity.
NPDES discharge monitoring
Under the NPDES permit, MWRA must monitor effluent from the Deer Island Wastewater Treatment Plant for nutrients, pathogens, metals, organics, solids, pH, oil and grease and toxicity.
Research Labs at Universities in the Northeast
Ongoing research on various issues relevant to the Massachusetts Ocean Partnership (MOP)-ecosystem structure and function, climate change, oceanographic studies, large pelagics, research on specific species, communities and habitats.
SF-72

SF-73
Appendix B - Supporting and Secondary Performance Indicators
Class Type Indicator
Supporting
Environmental Marine disease indices (e.g., MSX, dermo, shell disease) including Harmful Algal Blooms and other diseases (in shellfish, bivalves, fish etc.) Mussel tissue data or other measures of inorganic contaminants Water Chemistry (nitrates, dissolved oxygen, phosphate, salinity, chlorophyll a concentration /phytoplankton biomass, (pH/carbonate saturation) Annual rainfall Number of winds/storms per year (>x knots and directionality) Number of confirmed spills (including type, cause and volume)
Socioeconomic Number of employees in marine industry Number of registered vessels Number of whale watch trips and/or attendance on whale watch vessels Land use/land cover Mean coastal property value Population density in coastal “high hazard areas,” ”flood zone” Total cost of weather disasters/year Beach closing days (#, cost)
Secondary
Environmental Park attendance Average wave height
Socioeconomic % of coastal industry that is water dependent % coastal population not served by municipal wastewater treatment Number of moorings in the state Mean per capita income