Modelling the dusty universe - II. The clustering of submillimetre-selected galaxies
16
arXiv:1011.2300v1 [astro-ph.CO] 10 Nov 2010 Mon. Not. R. Astron. Soc. 000, 000–000 (0000) Printed 25 February 2013 (MN L A T E X style file v2.2) Modelling the dusty universe II: The clustering of submillimetre-selected galaxies C. Almeida 1 , C. M. Baugh 2 , C. G. Lacey 2 1 Key Laboratory for Research in Galaxies and Cosmology, Shanghai Astronomical Observatory, Chinese Academy of Sciences, Nandan Road 80, Shanghai 200030, China. 2 Institute for Computational Cosmology, Department of Physics, University of Durham, South Road, Durham, DH1 3LE, UK. 25 February 2013 ABSTRACT We combine the galform semi-analytical model of galaxy formation, which predicts the star formation and merger histories of galaxies, the grasil spectro-photometric code, which calculates the spectral energy distributions (SEDs) of galaxies self- consistently including reprocessing of radiation by dust, and artificial neural networks (ANN), to investigate the clustering properties of galaxies selected by their emission at submillimetre wavelengths (SMGs). We use the Millennium Simulation to predict the spatial and angular distribution of SMGs. At redshift z = 2, we find that these galaxies are strongly clustered, with a comoving correlation length of r 0 =5.6 ± 0.9 h -1 Mpc for galaxies with 850μm flux densities brighter than 5 mJy, in agreement with observa- tions. We predict that at higher redshifts these galaxies trace denser and increasingly rarer regions of the universe. We present the predicted dependence of the clustering on luminosity, submillimetre colour, halo and total stellar masses. Interestingly, we predict tight relations between correlation length and halo and stellar masses, inde- pendent of sub-mm luminosity. Key words: galaxies:high-redshift – galaxies-evolution – cosmology:large scale struc- ture – submillimetre – methods:N-body simulations 1 INTRODUCTION The discovery of a population of high-redshift galaxies selected by their emission at submillimetre wavelengths (submillimetre galaxies; SMGs) has opened a new win- dow on star formation in the high redshift Universe (e.g. Smail et al. 1997; Hughes et al. 1997; Barger et al. 1998; Chapman et al. 2000; Blain et al. 2002). The commonly held belief is that the submillimetre flux from these galax- ies is powered by prodigious star formation rates, which can reach up ∼ 500 − 1000 M⊙ yr −1 (Ivison et al. 2000; Smail et al. 2002; Chapman et al. 2005). The star forma- tion is so intense that a substantial fraction of the mass of the present day descendants of SMGs, bright ellipticals, is thought to have been put in place during this phase (Borys et al. 2005; Michalowski et al. 2010). A further con- straint on this picture would come from an estimate of the mass of the dark matter haloes which host SMGs. Measure- ments of the clustering of SMGs have so far proved challeng- ing (Scott et al. 2002; Blain et al. 2004; Borys et al. 2005; Scott et al. 2006; Weiß et al. 2009). This situation has re- cently improved with the launch of the Herschel telescope and will continue to get better with the commissioning of the new SCUBA-2 camera on the James Clerk Maxwell Tele- scope. In this paper we present predictions for the clustering of SMGs using a galaxy formation model set in the frame- work of the cold dark matter (CDM) cosmology. The self-consistent modelling of SMGs presents a num- ber of challenges. The sub-mm flux from a galaxy depends, often quite strongly, on a number of galaxy properties and parameters of the dust model, such as the star formation rate, the choice of the stellar initial mass function (IMF), the dust extinction (which is driven by the optical depth of the galaxy, which in turn depends on the metallicity of the cold gas and the size of the galaxy), the nature and composi- tion of the dust grains and the thermal equilibrium temper- ature reached by the dust grains when heated by starlight. Granato et al. (2000) introduced a hybrid model which com- bined a calculation of the star formation histories of galax- ies from the GALFORM semi-analytical galaxy formation model (Cole et al. 2000) with the spectro-photometric code GRASIL (Silva et al. 1998), which includes radiative transfer through a two-phase dust medium and a self-consistent prediction of dust temperatures. Using this model, a self-consistent cal- culation of the dust emission from galaxies can be made (Baugh et al. 2005; Lacey et al. 2008, 2010a). Constructing a galaxy formation model which can re-
-
Upload
independent -
Category
Documents
-
view
0 -
download
0
Transcript of Modelling the dusty universe - II. The clustering of submillimetre-selected galaxies

arX
iv:1
011.
2300
v1 [
astr
o-ph
.CO
] 1
0 N
ov 2
010
Mon. Not. R. Astron. Soc. 000, 000–000 (0000) Printed 25 February 2013 (MN LATEX style file v2.2)
Modelling the dusty universe II: The clustering of
submillimetre-selected galaxies
C.Almeida1, C.M. Baugh2, C. G. Lacey2
1Key Laboratory for Research in Galaxies and Cosmology, Shanghai Astronomical Observatory, Chinese Academy of Sciences,
Nandan Road 80, Shanghai 200030, China.2Institute for Computational Cosmology, Department of Physics, University of Durham, South Road, Durham, DH1 3LE, UK.
25 February 2013
ABSTRACT
We combine the galform semi-analytical model of galaxy formation, which predictsthe star formation and merger histories of galaxies, the grasil spectro-photometriccode, which calculates the spectral energy distributions (SEDs) of galaxies self-consistently including reprocessing of radiation by dust, and artificial neural networks(ANN), to investigate the clustering properties of galaxies selected by their emission atsubmillimetre wavelengths (SMGs). We use the Millennium Simulation to predict thespatial and angular distribution of SMGs. At redshift z = 2, we find that these galaxiesare strongly clustered, with a comoving correlation length of r0 = 5.6±0.9 h−1Mpc forgalaxies with 850µm flux densities brighter than 5 mJy, in agreement with observa-tions. We predict that at higher redshifts these galaxies trace denser and increasinglyrarer regions of the universe. We present the predicted dependence of the clusteringon luminosity, submillimetre colour, halo and total stellar masses. Interestingly, wepredict tight relations between correlation length and halo and stellar masses, inde-pendent of sub-mm luminosity.
Key words: galaxies:high-redshift – galaxies-evolution – cosmology:large scale struc-ture – submillimetre – methods:N-body simulations
1 INTRODUCTION
The discovery of a population of high-redshift galaxiesselected by their emission at submillimetre wavelengths(submillimetre galaxies; SMGs) has opened a new win-dow on star formation in the high redshift Universe (e.g.Smail et al. 1997; Hughes et al. 1997; Barger et al. 1998;Chapman et al. 2000; Blain et al. 2002). The commonlyheld belief is that the submillimetre flux from these galax-ies is powered by prodigious star formation rates, whichcan reach up ∼ 500 − 1000 M⊙ yr−1 (Ivison et al. 2000;Smail et al. 2002; Chapman et al. 2005). The star forma-tion is so intense that a substantial fraction of the massof the present day descendants of SMGs, bright ellipticals,is thought to have been put in place during this phase(Borys et al. 2005; Michalowski et al. 2010). A further con-straint on this picture would come from an estimate of themass of the dark matter haloes which host SMGs. Measure-ments of the clustering of SMGs have so far proved challeng-ing (Scott et al. 2002; Blain et al. 2004; Borys et al. 2005;Scott et al. 2006; Weiß et al. 2009). This situation has re-cently improved with the launch of the Herschel telescopeand will continue to get better with the commissioning ofthe new SCUBA-2 camera on the James Clerk Maxwell Tele-
scope. In this paper we present predictions for the clusteringof SMGs using a galaxy formation model set in the frame-work of the cold dark matter (CDM) cosmology.
The self-consistent modelling of SMGs presents a num-ber of challenges. The sub-mm flux from a galaxy depends,often quite strongly, on a number of galaxy properties andparameters of the dust model, such as the star formationrate, the choice of the stellar initial mass function (IMF),the dust extinction (which is driven by the optical depth ofthe galaxy, which in turn depends on the metallicity of thecold gas and the size of the galaxy), the nature and composi-tion of the dust grains and the thermal equilibrium temper-ature reached by the dust grains when heated by starlight.Granato et al. (2000) introduced a hybrid model which com-bined a calculation of the star formation histories of galax-ies from the GALFORM semi-analytical galaxy formation model(Cole et al. 2000) with the spectro-photometric code GRASIL(Silva et al. 1998), which includes radiative transfer througha two-phase dust medium and a self-consistent prediction ofdust temperatures. Using this model, a self-consistent cal-culation of the dust emission from galaxies can be made(Baugh et al. 2005; Lacey et al. 2008, 2010a).
Constructing a galaxy formation model which can re-

2 Almeida et al.
produce the observed number counts of SMGs is relativelystraightforward. It is more challenging to go a step furtherand to match the number counts and the redshift distribu-tion of SMGs at the same time. The task becomes muchmore difficult if, at the same time as matching the prop-erties of high redshift galaxies, the model is also requiredto reproduce observations of the local galaxy population.Baugh et al. (2005) argued that it is only possible to achieveboth of these goals by changing the slope of the IMF inepisodes of star formation triggered by galaxy mergers. Byadopting a top heavy IMF in starbursts, and by making theimplied changes to the yield of metals and the fraction of gasrecycled from dying stars, Baugh et al. were able to repro-duce basic properties of SMGs. At the same time, the samemodel matches the observed luminosity function of Lyman-break galaxies from z = 3 to z = 10 (Lacey et al. 2010b),as well as being in good agreement with many observationsof local galaxies. Nevertheless this model remains controver-sial and leads to conclusions which challenge the commonlyaccepted wisdom about SMGs. For example, Gonzalez et al.(2010b) investigated the nature of SMGs in the Baugh et al.model and found that the SMG phase is not responsible forthe formation of a significant amount of long lived stars.Here we present a further test of the model by presentingpredictions for the clustering of SMGs.
To date, there are suggestions that SMGs are stronglyclustered, with a correlation length that is substantiallylarger than that expected for the dark matter at the typicalredshift of SMGs (e.g. Blain et al. 2004). However, the clus-tering measurements are currently noisy as a result of thesmall volumes surveyed, with this scatter being exacerbatedby the strong clustering of the SMGs (Scott et al. 2002;2006; Borys et al. 2004; Weiss et al 2009). There is only lim-ited agreement between estimates of the angular clusteringof SMGs, and poor agreement in turn between these mea-surements and the clustering inferred in three dimensions.The first results from the Herschel mission demonstrate thechallenge of measuring the clustering of SMGs. Cooray et al.(2010) reported a detection of angular clustering in a sampleof galaxies selected at 250 µm from the Herschel HerMESsurvey, which they estimate to have a similar redshift dis-tribution to the “classical” SMGs selected at 850 µm, whileMaddox et al. (2010), on the other hand, found no evidencefor angular clustering for a galaxy sample selected in a simi-lar way from the Herschel ATLAS survey. However, this sit-uation is likely to improved rapidly as the Herschel surveysincrease in size and are analysed in more detail. Also, theSCUBA-2 camera is currently being installed at the JCMT.The Cosmology Legacy survey using SCUBA-2 will producea map of 35 deg2 at 850µm, substantially bigger than theSHADES Half-Degree Extragalactic Survey.
There are currently few predictions for the clustering ofSMGs. van Kampen et al. (2005) compiled predictions forthe angular clustering of SMGs from several groups. Thesecalculations were phenomenological and did not attempt topredict the sub-mm flux from galaxies. The models were con-strained by hand to match the SMG number counts. Herewe make a direct prediction of which galaxies satisfy the se-lection criteria to appear in an SMG sample. Gas dynamicsimulations are currently unable to provide meaningful pre-dictions as the box sizes used are too small to predict clus-tering robustly beyond a scale on the order of a megaparsec.
Furthermore, in many cases these calculations stop at highredshift (again due to the small box size) and so cannotbe tested against the local galaxy population. By using asemi-analytical approach, the computational resources canbe devoted to modelling the evolution of the dark mattercomponent, allowing us to use a representative cosmologicalvolume.
In this paper we use the galform+grasil model topopulate the Millennium Simulation of the evolution ofstructure in a cold dark matter universe (Springel et al.2005). This simulation occupies a volume of 500 h−1Mpc ona side and contains more than 20 million dark matter haloesat the present day. The CPU required by grasil makes itimpractical to compute the spectral energy distribution forevery galaxy directly in the Millennium Simulation. Instead,we apply a novel technique based on artifical neural net-works (ANN) which we introduced in Paper I to populatethe simulation with galaxies (Almeida et al. 2010).
The paper is organised as follows. In Section 2 we give abrief summary of the galform+grasil model and explainhow the artificial neural network is implemented. We showhow well the model can predict the submillimetre luminosityof galaxies in Section 3. In Section 4 we present the predic-tions for the spatial and angular clustering of SMGs. Thedependence of the clustering on selected galaxy propertiesis explored in Section 5. Finally, in Section 6, we present ourconclusions.
2 MODEL
Here we give a brief summary of the semi-analytical galaxyformation model, galform(§ 2.1), the spectro-photometricmodel used to compute galaxy SEDs, grasil(§ 2.2) andthe artificial neural network (ANN) technique used to pre-dict spectral properties for large samples of galaxies. Fur-ther details and tests of this approach can be found inAlmeida et al. (2010).
2.1 The galaxy formation model: GALFORM
In this paper we use the galform galaxy formation modelto follow the fate of baryons in a ΛCDM universe. The gen-eral methodology behind semi-analytical modelling is ex-plained in the review by Baugh (2006), and a more advancedoverview of galaxy formation physics is given by Benson(2010). galform was introduced by Cole et al. (2000). De-scriptions of subsequent extensions to the model are given inBenson et al. (2003); Baugh et al. (2005) and Bower et al.(2006).
A summary of the model used in this paper, that ofBaugh et al. (2005), can be found in Lacey et al. (2008,2010a) and Almeida et al. (2010), where the processes mod-elled are described and the parameters used to specify themodel are listed. Two changes from the original Baugh et al.set up are made as a result of the implementation of themodel in the Millennium Simulation of Springel et al. (2005).Firstly, the cosmological parameters of the Millennium aredifferent from those adopted in the Baugh et al. model. 1 We
1 The Millennium Simulation adopts a flat ΛCDM cosmology
Clustering of sub-mm galaxies 3
have found that by adjusting the baryon density parameterfrom the Baugh et al. value of Ωb = 0.045 to Ωb = 0.033to give the same baryon fraction, Ωb/Ωm, as used in theoriginal model, we obtain similar predictions for the galaxyluminosity function to those obtained in the original model.Secondly, we use the merger histories of the dark matterhaloes extracted directly from the Millennium, constructedusing the prescription described in Harker et al. (2006).
An important feature of the Baugh et al. model, partic-ularly for the properties of galaxies selected by their dustemission, is the form of the stellar initial mass function(IMF) adopted in different modes of star formation. Burstsof star formation, which in this model are triggered by cer-tain types of galaxy merger, are assumed to produce starswith a top-heavy IMF, where dN/dlnm ∝ m−x and x = 0.Bursts are initiated by all major mergers (i.e. those in whichthe mass in cold gas and stars of the accreted galaxy accountfor 30% or more of the primary’s mass) and by minor merg-ers in which the accreted satellite makes up at least 5% of theprimary’s mass and where the primary is gas rich (definedas 75% of the primary mass being in the form of cold gas;these figures are model parameters). Quiescent star forma-tion in galactic disks is assumed to produce stars accordingto a solar neighbourhood IMF, the Kennicutt (1983) IMF,with x = 0.4 for m < M⊙ and x = 1.5 for m > M⊙.
The adoption of a top-heavy IMF in starbursts is thekey to reproducing the observed number counts and redshiftdistribution of faint sub-mm galaxies (Baugh et al. 2005;Swinbank et al. 2008). While this choice is controversial, avariety of observational evidence suggests that in some en-vironments the IMF may have a higher proportion of high-mass stars than in the solar neighbourhood IMF (see thereview by Elmegreen 2009). Moreover, the semi-analyticalmodel is ideally placed to investigate the consequences forother predicted properties of assuming a top-heavy IMF inbursts. A number of predictions have been found to be inbetter agreement with observations following the use of dif-ferent IMFs in the burst and quiescent modes of star for-mation, such as the metallicities of intra-cluster gas and ofstars in early-type galaxies (Nagashima et al. 2005a,b). Theprecise form of the IMF is not important so long as a higherproportion of high mass stars are produced than would bethe case with a solar neighbourhood IMF. Similar predic-tions would be obtained for an IMF with a standard slopewhich is truncated below a few solar masses. With a largerfraction of massive stars produced relative to the KennicuttIMF, more energy is radiated in the UV and larger amountsof dust are produced due to the enhanced yield of metals.
In the next subsection we describe the grasil spectro-photometric code which generates a spectral energy distribu-tion for each galaxy across a wide range of wavelengths. gal-form itself makes an independent calculation of the spectralenergy distribution (SED) of starlight, including a modelfor dust extinction which is described in Cole et al. (2000).This calculation gives similar results to those obtained with
with a present-day matter density Ωm = 0.25, a cosmologicalconstant of ΩΛ = 0.75, a Hubble constant of h ≡ H0/(100 kms−1Mpc−1) = 0.73 and a perturbation amplitude given by thelinear rms fluctuation in spheres of radius 8h−1 Mpc of σ8 =0.9. The original Baugh et al. model also assumes a flat ΛCDMcosmology but with Ωm = 0.3, ΩΛ = 0.7, h = 0.7 and σ8 = 0.93.
grasil at optical wavelengths. The galform calculation ofthe V-band luminosity weighted age and optical depth areused as inputs to the ANN.
2.2 The spectro-photometric model: GRASIL
To accurately predict the SEDs of galaxies, from the far-UV to the radio, we use the spectro-photometric codegrasil (Silva et al. 1998). This code computes the stel-lar emission, absorption and emission of radiation by dust,and radio emission powered by massive stars (Bressan et al.2002). grasil carries out an accurate treatment of the ex-tinction and reprocessing of starlight by dust.
The combination of galform and grasil was describedby Granato et al. (2000) and has been exploited in a se-ries of papers (Baugh et al. 2005; Lacey et al. 2008, 2010a).The semi-analytical model calculates the star formation andmetal enrichment history for each galaxy, including the con-tribution from starbursts. galform also predicts the scale-lengths of the disk and bulge components of each galaxy, asdescribed in Cole et al. (2000) and tested by Almeida et al.(2007) and Gonzalez et al. (2009), and the cold gas mass(as compared against observations by Power et al. (2010)and Kim et al. (2010)). The dust is modelled as a two-phase medium, with a diffuse component and dense molec-ular clouds. The mass split between these components is amodel parameter. In the Baugh et al. model, 25 per cent ofthe dust is assumed to be in the form of dense clouds. Starsform within molecular clouds and escape on a timescale tesc,which is another model parameter; in Baugh et al. (2005), avalue of tesc = 1 Myr is adopted in both quiescent and burstmodes of star formation. The extinction of starlight by dustclouds depends on the star’s age relative to the escape time.High mass stars, which typically dominate the emission inthe UV, spend a significant fraction of their comparativelyshort lifetimes within molecular clouds. grasil calculatesthe radiative transfer of starlight through the dust and self-consistently solves for the temperature distribution of thedust grains at each point in the galaxy, based on the localradiation field. The temperature distribution of the grains isthen used to calculate the dust emission. The compositionand size of the dust grains are chosen to match the propertiesof the local ISM: a mixture of graphite and silicate grains, aswell as polycyclic aromatic hydrocarbon (PAH) molecules.The effects of temperature fluctuations in very small grainsand PAH molecules are taken into account. Emission fromPAHs is calculated using the cross-sections of Li & Draine(2001). Radio emission from ionised HII regions and syn-chrotron radiation is included as in Bressan et al. (2002).
The grasil model has been calibrated against lo-cal observational data for normal and starburst galaxies(Bressan et al. 2002; Vega et al. 2005; Panuzzo et al. 2007;Schurer et al. 2009). A limitation of grasil is that it as-sumes axisymmetric distributions for the gas and dust instarburst galaxies. There is observational evidence of morecomplex geometries and extraplanar dust in some galax-ies (see for example Engelbracht et al. 2006). This could beproblematic if this dust absorbed and emitted a significantfraction of radiation. However, there is little observationalevidence for this. Furthermore, observations of nearby star-bursts reveal that most of the absorption and emission ofradiation by dust takes place in a compact region of size ∼ 1

4 Almeida et al.
kpc or less. grasil has been shown to accurately predict theSEDs of both quiescent and starburst galaxies (Silva et al.1998; Bressan et al. 2002).
2.3 The artificial neural network approach to
predicting galaxy luminosities
The grasil code provides an accurate calculation of theabsorption and reemission of radiation by dust, predictingthe SED of a galaxy from the far-UV to radio. However,grasil is extremely CPU intensive, requiring several min-utes to compute the SED for a single galaxy, which pro-hibits its direct application to extremely large numbers ofgalaxies. In Almeida et al. (2010) we introduced a new tech-nique based on artificial neural networks (ANN) which canbe used to rapidly predict SEDs using a small set of galaxyproperties as input, once the ANN has been trained on a rel-atively small number (∼ 2000) of galaxies with SEDs com-puted using grasil. We demonstrated that, in the majorityof cases, this method can predict the luminosities of galaxiesto within 10 per cent of the values computed directly usinggrasil. We employ the same approach in this paper. Thegeneral methodology behind the ANN is set out in detail inAlmeida et al. (2010), so we give only a brief summary here.Silva et al. (2010) recently published a complementary ap-proach in which the explicit calculation of emission by dustwithin grasil is replaced by an ANN.
Artificial neural networks are mathematical models de-signed to replicate the behaviour of the human brain. Theyare similar to their biological counterparts in the sense thatANNs consist of simple computational units, neurons, whichare interconnected in a network. The neurons are usually or-ganized in layers: an input layer, one or more hidden layersand an output layer. Each neuron has a weight associatedwith it. In this paper we will use a multilayer, feed-forwardnetwork. The ANN is trained using a sample of galaxiesfor which grasil has been run to compute spectra. Dur-ing the training process, the neural network is presentedwith a set of inputs, comprised of selected galaxy proper-ties, and associated outputs, in our case the luminosity atdifferent wavelengths. The network weights are adjusted inorder to reproduce, as closely as possible, the desired out-put from the given set of inputs. In summary: (i) we startwith an untrained net (random weights); (ii) determine theoutput for a given input; (iii) compute the discrepancy orerror between the predicted and the target output; and (iv)adjust the weights in order to reduce this error. To adjustthe weights we use the resilient backpropagation learningalgorithm (Riedmiller & Braun 1993).
As in Almeida et al. (2010), we use 12 galaxy proper-ties predicted by galform as input to the ANN: the totalstellar mass, the stellar metallicity, the unextincted stellarbolometric luminosity, the disk and bulge half-mass radiiand the circular velocities measured at these two radii, theV-band weighted age, the optical depth of dust extinction inthe V-band, the metallicity of the cold gas, the mass of starsformed in the last burst and the time since the start of thelast burst of star formation. Almeida et al. (2010) showedthat the performance of the ANN is greatly improved if wepredict only one output property, the luminosity in a singleband-pass, instead of predicting the full SED of the galaxy(which typically covers 456 wavelength bins for a standard
Figure 1. Comparison between the ANN predicted luminos-ity, Lpredicted, and the true luminosity calculated using grasil,Ltrue, at 850 µm in the observer frame for galaxies at z = 2.Note that a flux of 1 mJy at z = 2 corresponds to a luminosityLν = 4.75× 1031h−2erg s−1Hz−1. The shading shows the distri-
bution of galaxies in the training sample. In the inset, we plotthe error distribution of the predicted luminosities, as given byLpredicted/Ltrue − 1, normalized to unit area.
grasil SED). We then train the ANN separately for eachband required. Here, we follow the same approach: we traintwo separate networks, one for each of the sub-mm wave-lengths at which we want to predict luminosities (450µmand 850µm). The network configuration adopted has 12 neu-rons in the input layer, two hidden layers with 30 neuronseach and one output neuron. We also found, in order tomaximise the accuracy of the ANN predictions, that it wasnecessary to train the ANN at each redshift of interest, andto train separately for galaxies whose star formation is dom-inated by starbursts or quiescent star formation in disks.
2.4 The performance of the ANN at sub-mm
wavelengths
We now demonstrate the how well the ANN performs whenpredicting galaxy luminosities in the sub-mm. Test at otherwavelengths were presented in Almeida et al. (2010).
In Fig. 1 we plot the comparison between the observerframe luminosity in the SCUBA 850µm band predicted bythe ANN for z = 2 galaxies and the true values calculateddirectly using grasil. In this plot we include all galaxiesregardless of their classification as quiescent or starburstgalaxies. Fig. 1 shows that there is excellent agreement be-tween the luminosities predicted by the ANN and the truevalues, with most of the predicted luminosities being within10 per cent of the grasil result (inset). Some statistics quan-tifying the error distribution at different redshifts are sum-marized in Table 1, for galaxies brighter than 1 mJy in thecorresponding band (either 450 or 850 µm). Here, the rootmean squared logarithmic error, εL, is defined by:

Clustering of sub-mm galaxies 5
450µm 850 µmRedshift Sample εL P|e|<10 per cent εL P|e|<10 per cent
z = 0.1Quiescent 0.04 97.1 0.04 98.6Burst 0.07 88.3 0.13 87.0
z = 0.5Quiescent 0.04 96.9 0.04 98.5Burst 0.05 94.8 0.05 96.7
z = 1Quiescent 0.06 94.9 0.04 97.0Burst 0.08 90.1 0.07 93.2
z = 2Quiescent 0.04 97.2 0.04 97.5Burst 0.05 92.1 0.05 95.1
z = 3Quiescent 0.05 96.0 0.03 97.8Burst 0.05 93.4 0.03 98.2
z = 4Quiescent 0.04 97.0 0.03 98.5Burst 0.05 93.2 0.03 97.9
Table 1. Statistics of the error distribution associated with the ANN prediction of 450 µm and 850µm observer-frame luminosities atselected redshifts. The statistics are computed using only galaxies with sub-mm fluxes brighter than 1 mJy in that band. Column 1 givesthe redshift, column 2 specifies whether the galaxy sample is made up of galaxies forming stars quiescently or starbursts; columns 3 and4 give εL (the root mean squared error defined by Eq. 1) and P|e|<10 per cent (percentage of galaxies with predicted luminosities within10% of the true value), respectively, for the 450µm predictions. For 850 µm selected galaxies, the same information is shown in columns5 and 6.
εL =
√
1/n
n∑
[ln(Lpredicted/Ltrue)]2 , (1)
where n is the number of galaxies considered. The quan-tity P|e|<10per cent is defined as the percentage of galaxieswith predicted luminosities which lie within 10 per cent ofthe true values. For quiescent SMGs, we are able to repro-duce the luminosities of more than 95 per cent of galaxieswith an accuracy of 10 per cent or better, for the redshiftrange considered, at both 450µm and 850µm. As shown byAlmeida et al. (2010), the performance of the ANN for burstgalaxies is somewhat poorer, which is a consequence of thewide range of spectra seen in bursts and the difficulty theANN experiences in reproducing this variety. Nonethelessthe technique returns more than 90% of predicted sub-mmluminosities within 10 per cent of the true values. It shouldbe noted that at z = 4, the highest redshift considered,the observer-frame 850µm luminosity probes the rest-frame170µm, which is approaching the peak in the dust emissionspectrum (typically around 100µm).
One important feature of the error distribution is shownin the inset of Fig. 1. The distribution of luminosity errorspredicted by the ANN appears to be Gaussian. Furthermore,we find that there is no correlation of the error with luminos-ity or other galaxy properties. This suggests that any sampleof SMGs built using the ANN method will have errors whichare decoupled from the structural and photometric proper-ties of the galaxy sample.
3 CLUSTERING OF SUB-MM GALAXIES
The clustering of galaxies is an important constraint on themasses of their host dark matter halos, and hence on theo-retical models of galaxy formation, as it depends upon howvarious physical processes vary with halo mass. In this sec-tion we present the model predictions for the clustering ofgalaxies selected by their flux at sub-mm wavelengths. In§3.1, we contrast the spatial distribution of galaxies withthat of dark matter haloes. In §3.2, we define the two-point
spatial correlation function. We demonstrate that our clus-tering predictions are insensitive to errors in the galaxy lu-minosities predicted by the ANN in §3.3. We present thepredictions for clustering in real space and redshift spacein §3.4 and §3.5 respectively. The evolution of the correla-tion function is presented in §3.6 and the angular correlationfunction is shown in §3.7.
3.1 The spatial distribution of SMGs
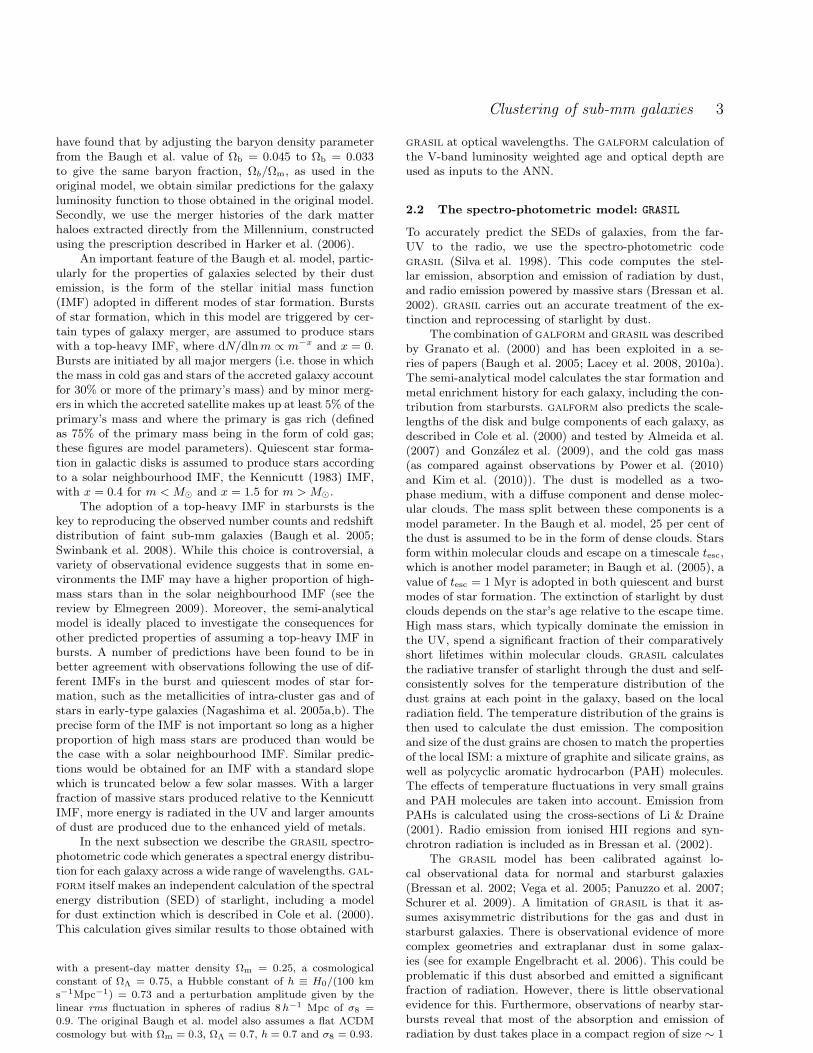
Before discussing the predictions for the two-point correla-tion function of SMGs, we first gain a visual impression oftheir spatial distribution. Fig. 2 shows dark matter haloesand sub-mm galaxies in a slice taken from the MillenniumSimulation. The slice measures 100 h−1 Mpc across and20h−1 Mpc thick in comoving units. The upper panels showhaloes and galaxies at z = 0.5 and the lower panels showthem at z = 2. Dark matter haloes are shown by the blueshading. The intensity of the shading is proportional to thetotal halo mass within each pixel. We show sub-mm galaxiesselected at 450µm and 850µm with fluxes brighter than 1mJy and 5 mJy. At a given flux limit, the 450µm sourcesare more numerous than the 850µm sources. The 850µmsources brighter than 1mJy tend to trace out the more mas-sive dark matter haloes and hence are expected to be biasedtracers of the dark matter distribution. The full Millenniumbox (500h−1Mpc across) subtends an angle of 7.5 degrees atz = 2. To put this into context, we note that the SCUBA-2 Cosmology Legacy Survey (SCLS)2 aims to map around35 deg2 at 850 µm in patches up to 3 deg across, and 1.3 deg2
at 450 µm in regions up to 0.5 deg across. The nominal 5σflux limits will be 3.5 mJy at 850 µm and 2.5 mJy at 450 µm.However, source confusion may result in the flux limits forreliable source identification being somewhat brighter thanthis; using the standard 20 beams per source criterion forconfusion (e.g. Lacey et al. 2008) together with the counts
2 http://www.jach.hawaii.edu/JCMT/surveys/Cosmology.html
6 Almeida et al.
Figure 2. Image of the simulated spatial distribution of SMGs and dark matter haloes at z = 0.5 (top panels) and z = 2 (bottom panels).The panels display a slice 100 h−1 Mpc wide with a depth of 20 h−1 Mpc (in comoving coordinates). The width of this slice correspondsto angular scales of 4.3 and 1.6 at z = 0.5 and z = 2 respectively. The dark matter haloes are plotted in blue, with the darker shadingcorresponding to regions of higher projected halo mass density. Galaxies with S450µm and S850µm > 1 mJy are represented by the orangedots. Brighter galaxies with S > 5 mJy are shown by the black dots. The left hand panels show galaxies selected by their 450µm flux,while the right hand side show galaxies selected by their emission at 850 µm.
predicted by the model, we expect confusion to become im-portant around 3.0 mJy at 850 µm and 5.3 mJy at 450 µm.
3.2 The two-point correlation function
To quantify the clustering of the galaxy distribution we usethe two-point correlation function, ξ(r), which gives the ex-cess probability, compared with a random distribution, offinding two galaxies at a separation r:
δP (r) = n2 [1 + ξ(r)] δV1 δV2, (2)
where n is the mean space density of galaxies and the δVi
are elements of volume. If ξ(r) > 0, then galaxies are more
clustered than a random distribution. On the contrary, ifgalaxies have a tendency to avoid one other, then ξ(r) < 0.
The two-point correlation function of galaxies is shapedby two main factors, which play different roles on differentscales. On large scales, the form of the correlation functionis controlled by the clustering of galaxies in distinct darkmatter haloes (referred to as the two-halo term), and thegalaxy and dark matter correlation functions have similarshapes but differ in amplitude (for an illustration of this seeAngulo et al. 2008). On smaller scales, up to the size of thetypical haloes which host galaxies, the form of the correla-tion function is driven by the number and radial distribu-tion of galaxies within the same dark matter halo, (calledthe one-halo term) (Benson et al. 2000; Seljak 2000).

Clustering of sub-mm galaxies 7
Figure 3. The impact of errors in the ANN predicted 850µmluminosities on the form of the real-space two-point correlationfunction. The correlation function is measured for galaxies se-lected with fluxes brighter than 1 mJy at z = 2 (ξpred). Thegalaxy fluxes are then perturbed using the error distribution of
the ANN 850µm luminosities and the correlation function is re-measured for the new sample of galaxies brighter than 1 mJy(ξpert). The plot shows the maximum deviation of ξpert fromξpred on constructing 20 different perturbed samples, expressed asa percentage. The spike around log(r/h−1Mpc) ≈ −0.8 is causedby noise due to the small number of galaxy pairs at that separa-tion.
We calculate the two-point correlation function of sub-mm selected galaxies, using both real and redshift spacecoordinates. We measure the correlation function using thestandard estimator (e.g. Peebles 1980):
ξ(r) =〈DD(r)〉
12Ngal n∆V (r)
− 1, (3)
where 〈DD(r)〉 is the number of distinct galaxy pairs withseparations between r and r+∆r, Ngal is the total numberof galaxies, and n is the mean number density of galaxies.∆V (r) is the volume of a spherical shell of radius r and thick-ness ∆r. We are able to compute the volume of this shellanalytically since we are dealing with galaxy pairs within aperiodic simulation volume. The clustering signal is gener-ated in redshift space using the distant observer approxima-tion, by electing one axis to be the line of sight direction,and adding the suitably scaled peculiar velocity of the galaxyalong this axis to its comoving position.
3.3 The impact of luminosity errors on the
predicted correlation function
We now look at the impact of errors on the ANN-predictedluminosities on the amplitude and shape of the two-point correlation function. First, the correlation function,ξpred(r), is measured using the ANN-predicted observer-frame 850 µm luminosities for a sample brighter than someflux limit, in this case 1 mJy. Next, these luminosities are
perturbed by drawing an offset from the distribution of er-rors expected for this band (see inset of Fig. 1 and Table 1).A new flux limited sample is constructed, which will containsome galaxies which were not included in the initial, un-perturbed sample, because their fluxes have been boosted.Moreover some galaxies which made it into the original sam-ple will no longer be included after their luminosities havebeen perturbed. We then repeat the measurement of thecorrelation function for this new sample, resulting in the es-timate ξpert(r). Comparing ξpert(r) with ξpred(r) provides anestimate of how ξ(r) is affected by the errors in the ANN-predicted luminosities. In Fig. 3 we plot the maximum devi-ation of the ratio ξpert(r)/ξpred(r) using 20 different ξpert(r)measurements for galaxies at z = 2 (i.e. after perturbing thegalaxy luminosities). This plot shows that ξpert(r)/ξpred(r)differs from unity by at most 4%, indicating that the clus-tering predictions are essentially unaffected by the errors inthe ANN luminosities. At z = 0.1, where the performanceof the ANN is poorer for galaxies undergoing a burst of starformation than it is at z = 2, the ratio ξpert(r)/ξpred(r) stilldeviates from unity by less than 10%.
3.4 The real space correlation function
In real space, the cartesian coordinates of the SMGs withinthe simulation box are used to calculate pair separations.Fig. 4 (top panel) shows the real space correlation functionfor sub-mm selected galaxies, for both λ = 850µm and λ =450µm, at redshift z = 2. The transition between the one-halo term and two-halo term occurs around r ∼ 0.6h−1Mpc.In this plot we consider samples of galaxies selected to bebrighter than 1 mJy or 5 mJy at both wavelengths. Theblack line shows the correlation function of the dark matter,ξDM, which was measured using a randomly chosen subsetof 106 dark matter particles out of the ten billion particlesin the Millennium Simulation.
As can be seen in Fig. 4, galaxies do not trace the massdistribution in the Universe, because the efficiency of galaxyformation depends on halo mass (e.g. Eke et al. 2004). Thedifference between the clustering of galaxies and the un-derlying dark matter is quantified in terms of the galaxyclustering bias, b:
b(r) =
(
ξgal(r)
ξDM(r)
)1/2
. (4)
Numerical simulations have demonstrated that the galaxybias is a function of scale (Smith, Scoccimarro & Sheth 2007;Angulo et al 2008). This scale dependence weakens on largescales, and the galaxy bias is typically approximated as aconstant. We plot the bias of SMGs in the lower panel ofFig. 4. The plot shows that at z = 2 the bias factor is gen-erally greater than unity, approaching a roughly constantvalue of b ≈ 1.8 for r & 2 h−1Mpc for all of the samplesshown. In the case of galaxies selected at 450µm, there isa small but clear difference in the bias predicted for brightand faint samples, with the bright galaxies being the morestrongly clustered. At 850µm the distinction is less clear,due in part to the relatively low number density of galaxiesin the bright sample, which results in a noiser prediction.
The effective bias parameter on large scales canalso be estimated analytically (Mo & White 1996;Sheth, Mo & Tormen 2001), using the mass function

8 Almeida et al.
Figure 4. The real space two-point correlation function of sub-mm selected galaxies in comoving coordinates at z = 2. The blueand orange dashed lines show the predicted correlation functionsfor galaxies with fluxes brighter than 5 mJy at 450 and 850 µmrespectively, while the green and red lines show the corresponding
results for a flux limit of 1 mJy. The black line shows the correla-tion function of dark matter. The errorbars show the 1σ Poissonerrors derived from the number of pairs in each bin of radial sep-aration, and are only shown for those samples with the lowesttotal number of galaxies. In the bottom panel, we plot the galaxybias, b(r), as a function of scale for the four samples of sub-mmselected galaxies. This is obtained by taking the square root ofthe ratio of the galaxy correlation function to the measured darkmatter correlation function.
of haloes which host sub-mm galaxies, N(z,M), (i.e. theproduct of the space density or mass function of darkmatter haloes and the halo occupation distribution ofSMGs) and the bias factor as a function of the halo massb(z,M) (e.g. Baugh et al. 1999):
beff(z) =
∫
MN(z,M ′) b(z,M ′) d lnM ′
∫
MN(z,M ′) d lnM ′
(5)
The integrals are taken over the full range of halo masses,with N(z,M) = 0 for haloes which do not host SMGs.To compute b(z,M) we use the prescription outlined bySheth, Mo & Tormen (2001). For galaxies at z = 2 withS850µm > 5 mJy, we find an effective bias of beff = 2.3, andbeff = 2.1 for sub-mm galaxies with S450µm > 5 mJy. Thesevalues are slightly larger than those estimated from the sim-ulation using Eq. 4. In fact, similar differences between theanalytical approach and simulations have been observed inother studies (see for example Gao et al. 2005; Angulo et al.2009).
On small scales, Fig. 4 shows that the effective biastakes on a range of values. The clustering on these scales isdriven by the typical number of galaxy pairs within a com-mon halo. The faint sample of galaxies selected at 450µmdisplays the strongest clustering on small scales. This samplecontains the largest number of pairs within common haloes.In the case of the bright sample at 850µm, the low number
density of galaxies makes it difficult to measure the correla-tion function on small scales.
A convenient measure of the strength of clustering fordifferent galaxy samples is provided by the correlation lengthr0, which we can define in a robust way as the pair separationat which the correlation function becomes unity:
ξ(r0) = 1. (6)
Applying this definition to model galaxies selected at850 µm, we find r0 = 5.6± 0.9 h−1Mpc for S850µm > 5 mJy,and r0 = 5.38 ± 0.02 h−1Mpc for a fainter sample withS850µm > 1 mJy. We also find that 450µm selected galax-ies are less clustered than 850µm selected galaxies at thesame flux limit: we obtain r0 = 5.38 ± 0.02 h−1Mpc and4.99 ± 0.01 h−1Mpc respectively for S450µm > 5 mJy and1 mJy. SMGs with S450µm > 5 mJy display a similar two-point correlation function to that of S850µm > 1 mJy (as wewill see later, this is mainly a consequence of the fact thatthe median S450µm/S850µm colour is approximately 3).
An alternative way to define the clustering length r0,commonly used in observational studies, is to fit the corre-lation function with a power law:
ξ(r) =
(
r
r0
)γ
. (7)
For optical galaxies at z ∼ 0, this is found observationallyto provide a good fit for 0.1 < r < 10h−1Mpc with γ closeto -1.8 (e.g. Norberg et al. 2001; Zehavi et al. 2005). Thetwo definitions of r0 (Eqs. 6 and 7) are obviously equiv-alent only if ξ(r) really is a power law. If ξ(r) actuallyhas a more complicated dependence on r, then the valueof r0 obtained by fitting a power law will depend on therange of r over which the fit is performed, and on the er-rors on the measurements at different r. If we fit ξ(r) forour model SMGs at z = 2 with a power law over the range0.1 < r < 10h−1Mpc, we find γ = −1.8 ± 0.2 and a cor-relation length of r0 = 6 ± 1 h−1Mpc for S850µm > 5 mJy,and γ = −1.61 ± 0.01 and r0 = 5.21 ± 0.05 h−1Mpc forS850µm > 1 mJy. For galaxies with S450µm > 5 mJy, we finda slope similar to that of 850µm galaxies, γ = −1.62±0.01,and r0 = 5.20±0.07 h−1Mpc. The values of r0 obtained fromthe power law fit are thus close to the values obtained fromthe more general definition (Eq. 6) in this case. However, wewill use Eq. 6 to define r0 unless stated otherwise.
Our predictions for the clustering of the brighter SMGsat 850 µm are in reasonable agreement with the observa-tional estimate by Blain et al. (2004) who, using a sample of73 SMGs with S850µm > 5 mJy and spectroscopic redshiftsat z ≈ 2−3, inferred a correlation length of 6.9±2.1 h−1Mpcusing a pair-counting approach rather than a direct measure-ment of ξ(r) (note this measurement is discussed further in§3.7).
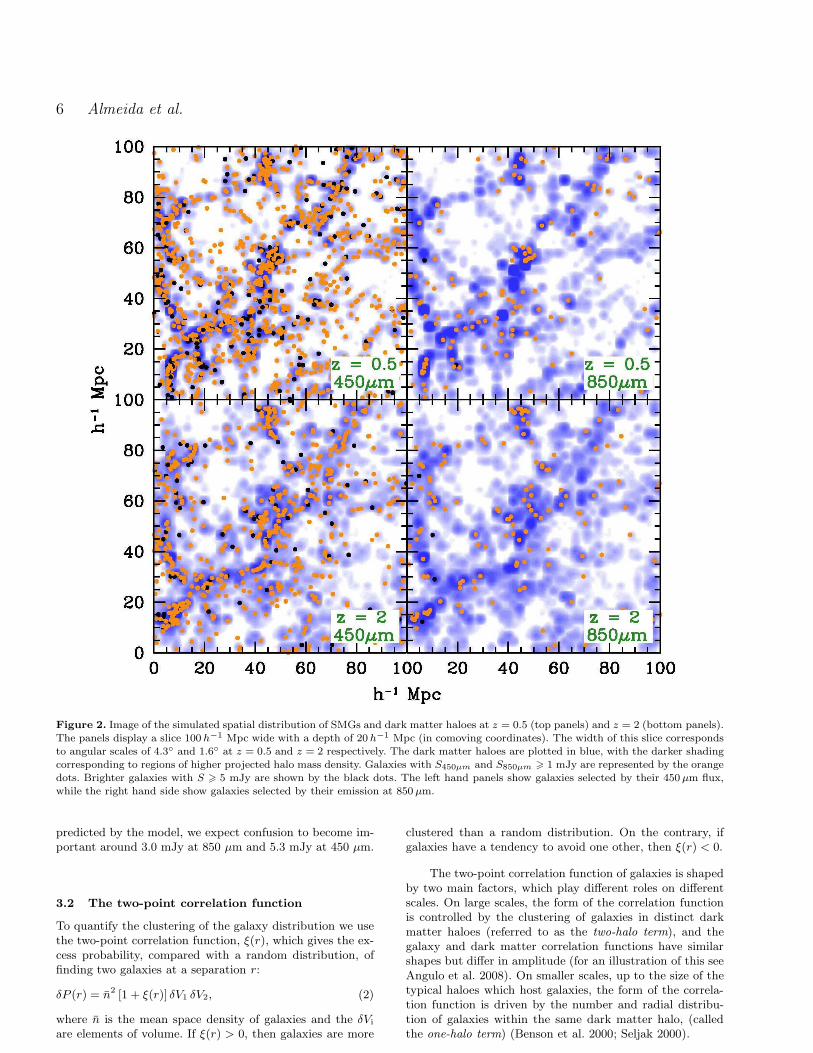
We gain further insight into the clustering predicted bythe model by plotting in Fig. 5 the mean number of sub-mm selected galaxies as a function of the halo mass, gener-ally refered to as the halo occupation distribution or HOD(Benson et al. 2000; Cooray & Sheth 2002; Berlind et al.2003). For completeness, we compute the median halo massof our samples: for SMGs with S850µm > 5 mJy and1 mJy, we find a median mass of 1.4 × 10¹²h−1 M⊙ and9.3×1011h−1 M⊙, respectively; whereas for S450µm > 5 mJy
Clustering of sub-mm galaxies 9
Figure 5. The predicted halo occupation distribution (HOD) ofz = 2 sub-mm selected galaxies. The dashed blue and orangelines show the HODs for galaxies brighter than 5 mJy at 450 and850 µm, while the green and red lines show the HODs for galaxiesbrighter than 1 mJy. The green dotted and dashed lines show
the HOD of satellite and central galaxies with S450µm > 1 mJy,respectively.
and 1 mJy selected galaxies, we determine 9.3×10¹¹h−1 M⊙
and 7.3 × 10¹¹h−1 M⊙. Fig. 5 shows that both our 850µmselected samples display a mean number of galaxies belowunity over most of the range of halo masses. For example, inour model we find on average one S850µm > 5 mJy sub-mm galaxy for every ∼ 100 dark matter haloes of mass∼ 1013 h−1 M⊙. This illustrates the need to consider a largenumber of halo merger histories in order to make robustpredictions, a point we made previously for luminous redgalaxies (Almeida et al. 2008). We also predict that thesemassive haloes, with Mhalo > 1013 h−1 M⊙, will accommo-date more than one SMG with S450µm > 1 mJy (in oursimulation, some haloes host more than 3 SMGs). If thiswas not the case, the two-point correlation function wouldtend to ξ ∼ −1 on scales smaller than the typical size ofthe host haloes (see Benson et al. 2000). For the case ofS450µm > 1 mJy we plot the contributions of central andsatellite galaxies to the HOD separately. The central galaxyHOD is seen to flatten above a certain mass, while the satel-lite HOD continues to rise and becomes a power law. It isinteresting to note in this case that the HOD for centralgalaxies does not reach unity for any halo mass; around 70%of haloes with masses > 1012h−1M⊙ contain central galaxiesbrighter than 1 mJy at 450µm.
3.5 The redshift-space correlation function
Galaxy surveys usually use redshift to infer the radial dis-tance to a galaxy, and the resulting measurement of clus-tering is said to be in redshift space. We therefore needto take into account the contribution of the peculiar ve-locity, induced by inhomogeneities in the galaxy’s surround-
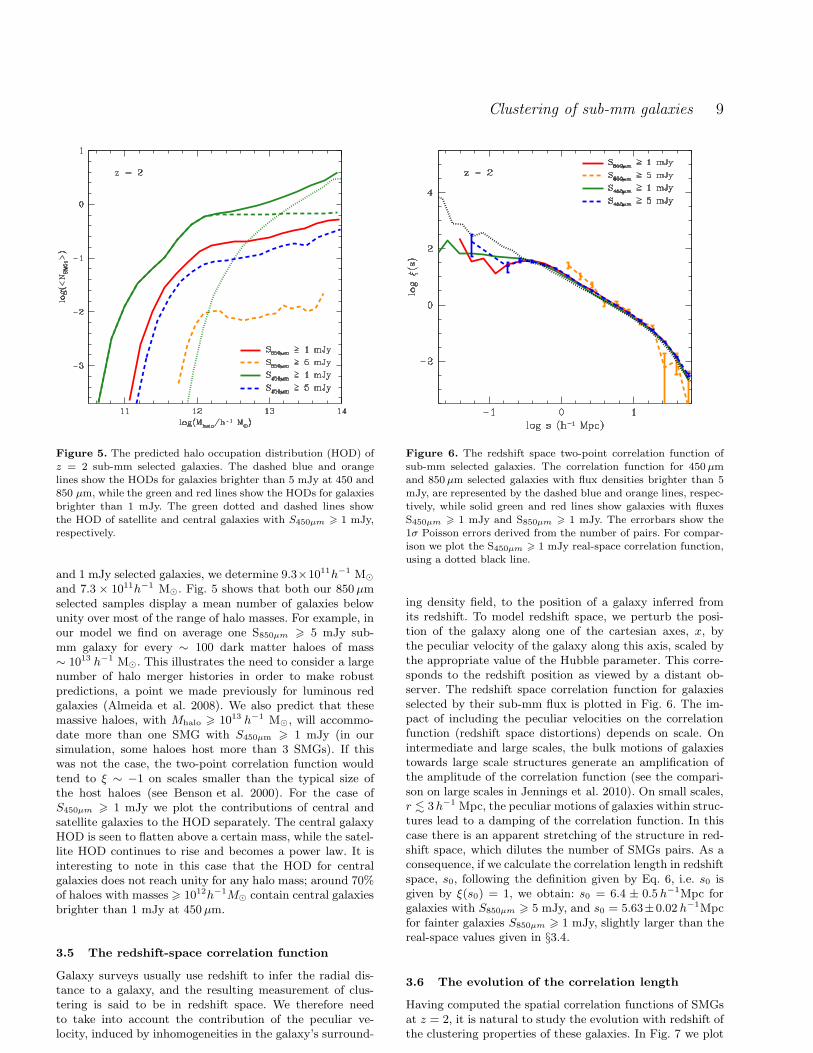
Figure 6. The redshift space two-point correlation function ofsub-mm selected galaxies. The correlation function for 450µmand 850 µm selected galaxies with flux densities brighter than 5mJy, are represented by the dashed blue and orange lines, respec-tively, while solid green and red lines show galaxies with fluxes
S450µm > 1 mJy and S850µm > 1 mJy. The errorbars show the1σ Poisson errors derived from the number of pairs. For compar-ison we plot the S450µm > 1 mJy real-space correlation function,using a dotted black line.
ing density field, to the position of a galaxy inferred fromits redshift. To model redshift space, we perturb the posi-tion of the galaxy along one of the cartesian axes, x, bythe peculiar velocity of the galaxy along this axis, scaled bythe appropriate value of the Hubble parameter. This corre-sponds to the redshift position as viewed by a distant ob-server. The redshift space correlation function for galaxiesselected by their sub-mm flux is plotted in Fig. 6. The im-pact of including the peculiar velocities on the correlationfunction (redshift space distortions) depends on scale. Onintermediate and large scales, the bulk motions of galaxiestowards large scale structures generate an amplification ofthe amplitude of the correlation function (see the compari-son on large scales in Jennings et al. 2010). On small scales,r . 3h−1 Mpc, the peculiar motions of galaxies within struc-tures lead to a damping of the correlation function. In thiscase there is an apparent stretching of the structure in red-shift space, which dilutes the number of SMGs pairs. As aconsequence, if we calculate the correlation length in redshiftspace, s0, following the definition given by Eq. 6, i.e. s0 isgiven by ξ(s0) = 1, we obtain: s0 = 6.4 ± 0.5 h−1Mpc forgalaxies with S850µm > 5 mJy, and s0 = 5.63±0.02 h−1Mpcfor fainter galaxies S850µm > 1 mJy, slightly larger than thereal-space values given in §3.4.
3.6 The evolution of the correlation length
Having computed the spatial correlation functions of SMGsat z = 2, it is natural to study the evolution with redshift ofthe clustering properties of these galaxies. In Fig. 7 we plot
10 Almeida et al.
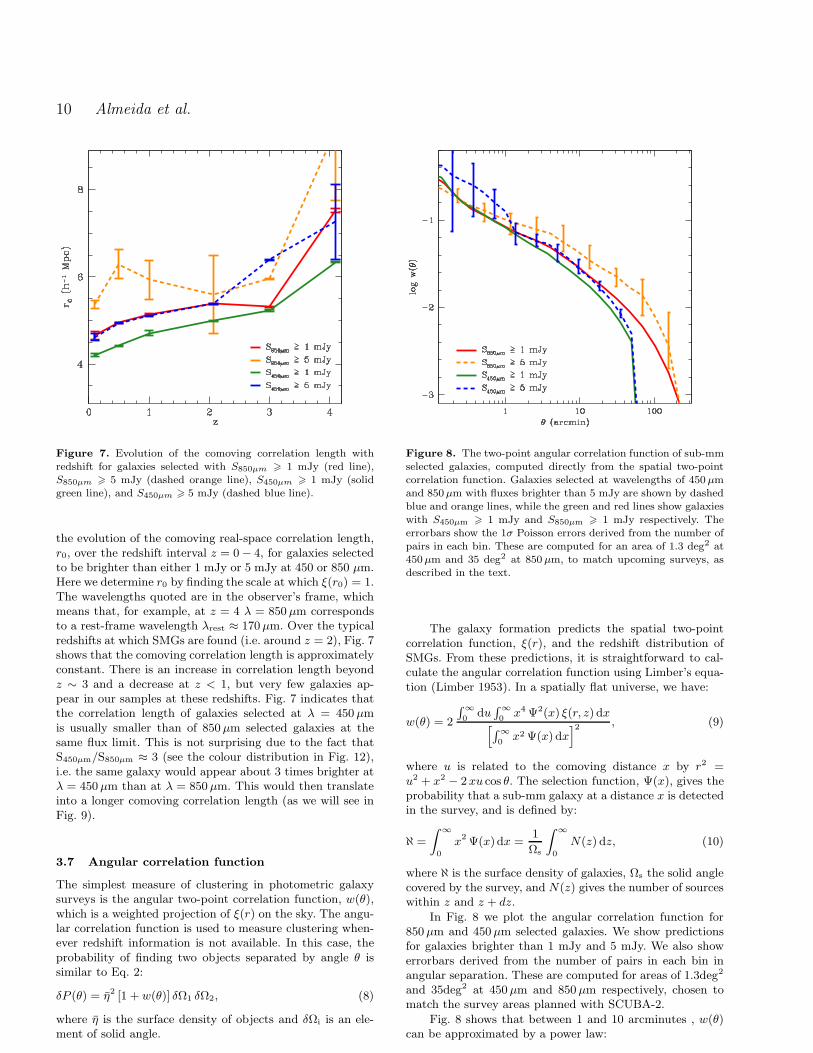
Figure 7. Evolution of the comoving correlation length withredshift for galaxies selected with S850µm > 1 mJy (red line),S850µm > 5 mJy (dashed orange line), S450µm > 1 mJy (solidgreen line), and S450µm > 5 mJy (dashed blue line).
the evolution of the comoving real-space correlation length,r0, over the redshift interval z = 0− 4, for galaxies selectedto be brighter than either 1 mJy or 5 mJy at 450 or 850 µm.Here we determine r0 by finding the scale at which ξ(r0) = 1.The wavelengths quoted are in the observer’s frame, whichmeans that, for example, at z = 4 λ = 850µm correspondsto a rest-frame wavelength λrest ≈ 170µm. Over the typicalredshifts at which SMGs are found (i.e. around z = 2), Fig. 7shows that the comoving correlation length is approximatelyconstant. There is an increase in correlation length beyondz ∼ 3 and a decrease at z < 1, but very few galaxies ap-pear in our samples at these redshifts. Fig. 7 indicates thatthe correlation length of galaxies selected at λ = 450µmis usually smaller than of 850µm selected galaxies at thesame flux limit. This is not surprising due to the fact thatS450µm/S850µm ≈ 3 (see the colour distribution in Fig. 12),i.e. the same galaxy would appear about 3 times brighter atλ = 450µm than at λ = 850µm. This would then translateinto a longer comoving correlation length (as we will see inFig. 9).
3.7 Angular correlation function
The simplest measure of clustering in photometric galaxysurveys is the angular two-point correlation function, w(θ),which is a weighted projection of ξ(r) on the sky. The angu-lar correlation function is used to measure clustering when-ever redshift information is not available. In this case, theprobability of finding two objects separated by angle θ issimilar to Eq. 2:
δP (θ) = η2 [1 + w(θ)] δΩ1 δΩ2, (8)
where η is the surface density of objects and δΩi is an ele-ment of solid angle.
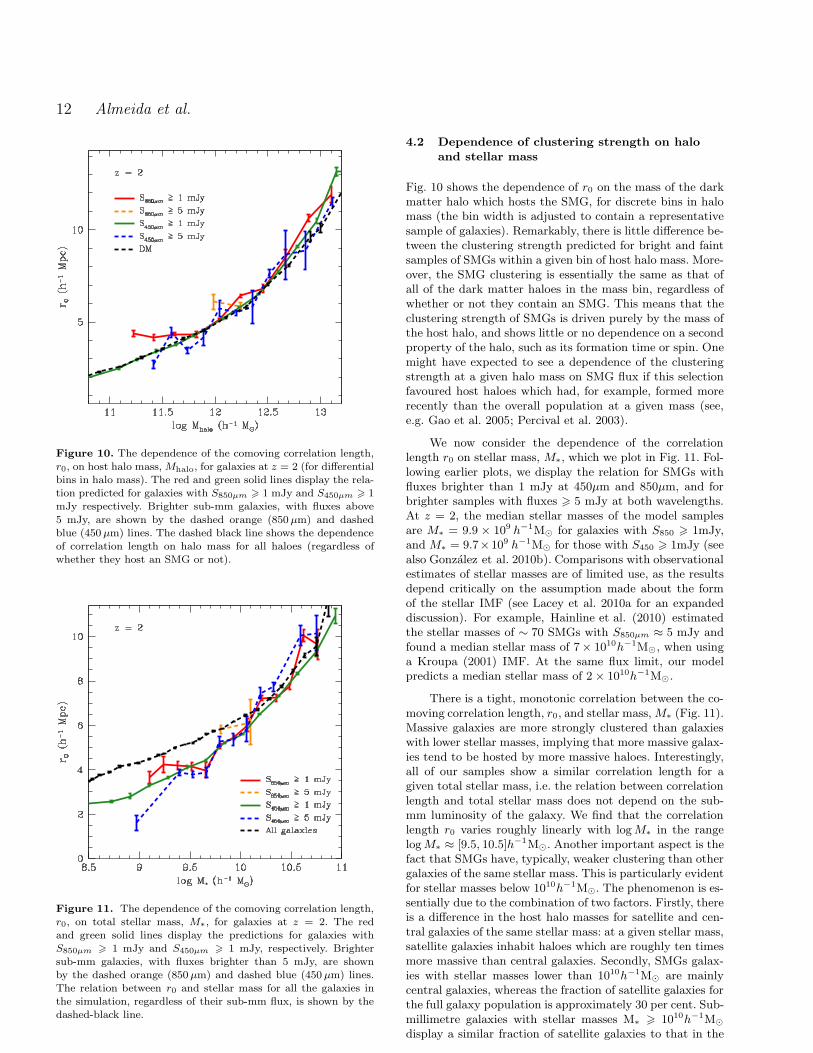
Figure 8. The two-point angular correlation function of sub-mmselected galaxies, computed directly from the spatial two-pointcorrelation function. Galaxies selected at wavelengths of 450 µmand 850µm with fluxes brighter than 5 mJy are shown by dashedblue and orange lines, while the green and red lines show galaxies
with S450µm > 1 mJy and S850µm > 1 mJy respectively. Theerrorbars show the 1σ Poisson errors derived from the number ofpairs in each bin. These are computed for an area of 1.3 deg2 at450µm and 35 deg2 at 850 µm, to match upcoming surveys, asdescribed in the text.
The galaxy formation predicts the spatial two-pointcorrelation function, ξ(r), and the redshift distribution ofSMGs. From these predictions, it is straightforward to cal-culate the angular correlation function using Limber’s equa-tion (Limber 1953). In a spatially flat universe, we have:
w(θ) = 2
∫∞
0du∫∞
0x4 Ψ2(x) ξ(r, z) dx
[
∫∞
0x2 Ψ(x) dx
]2, (9)
where u is related to the comoving distance x by r2 =u2 + x2 − 2xu cos θ. The selection function, Ψ(x), gives theprobability that a sub-mm galaxy at a distance x is detectedin the survey, and is defined by:
ℵ =
∫ ∞
0
x2 Ψ(x) dx =1
Ωs
∫ ∞
0
N(z) dz, (10)
where ℵ is the surface density of galaxies, Ωs the solid anglecovered by the survey, and N(z) gives the number of sourceswithin z and z + dz.
In Fig. 8 we plot the angular correlation function for850µm and 450µm selected galaxies. We show predictionsfor galaxies brighter than 1 mJy and 5 mJy. We also showerrorbars derived from the number of pairs in each bin inangular separation. These are computed for areas of 1.3deg2
and 35deg2 at 450µm and 850µm respectively, chosen tomatch the survey areas planned with SCUBA-2.
Fig. 8 shows that between 1 and 10 arcminutes , w(θ)can be approximated by a power law:

Clustering of sub-mm galaxies 11
w(θ) =
(
θ
θ0
)1+γ
, (11)
where γ is the same as in Eq. 7. The amplitude of clusteringis characterised by θ0. This scale can vary from one sam-ple to another because of differences in the intrinsic cluster-ing and the redshift distribution of galaxies. Chance pro-jections of galaxy pairs, as would occur more often in acatalogue which spanned a broad redshift interval, lead toa dilution of the clustering signal, which results in θ0 de-creasing with increasing survey depth (Peebles 1980). Thepredicted angular correlation function steepens slightly be-low ≈ 1arcmin. Fig. 8 shows that bright SMGs are moreclustered than faint SMGs. Fitting Eq. 11 to our samplesover the range of angular scales 1 < θ < 10 arcmin, with afixed γ = −1.7 (see previous section), we find a clusteringscale of θ0(S850µm > 5 mJy) = 0.028 ± 0.012 arcmin. Forgalaxies selected by λ = 450µm flux, we find θ0(S450µm > 5mJy) = 0.022 ± 0.007 arcmin.
Observational estimates of the angular correlation func-tion of SMGs suggest that these galaxies are strongly clus-tered. However, a consensus on the clustering amplitude ofSMGs is yet to be reached. For example, using a small sam-ple of SMGs observed with the SCUBA camera, Scott et al.(2002) found evidence of strong clustering on scales of 1 – 2arcmin. In a follow-up study, Scott et al. (2006) re-reducedand combined different SCUBA surveys to measure the an-gular clustering and inferred a clustering scale θ0 ≈ 0.6−0.8arcmin, depending on the precise choice of flux limit andsignal-to-noise cut-off used to construct maps of SMGs. Thechallenge of measuring the clustering signal with such smallsamples is apparent from the size of the integral constraintcorrection typically applied. The integral constraint takesinto account the fact that the true mean density of SMGs isnot known when estimating fluctuations in the galaxy dis-tribution. Instead, the density of the sample itself is usedas a substitute for the true mean density. If the sampledensity is different from the true mean then the fluctua-tion level is misestimated, leading to a bias in w(θ). Thiseffect is important for small samples and is even more se-vere if the galaxies are also strongly clustered. Scott et al.applied a correction of a factor of ≈ 2 to their measured clus-tering to account for the integral constraint. A subsequentmeasurement of clustering in a sample constructed with theLABOCA detector by Weiss et al. (2009) gives a correla-tion angle of θ0 = 0.23± 0.12 arcmin, which is substantiallyweaker that the Scott et al. result. The Weiss et al. estimateis still much larger than our model prediction, but differsfrom it by only 1.8σ. Blain et al. (2004) made an indirectmeasurement of the spatial correlation function using radialpair counts of SMGs with spectroscopic redshifts, and ob-tained r0 = 6.9± 2.1h−1 Mpc. For spatial clustering that isfixed in comoving coordinates, and using the observed red-shift distribution of SMGs (Chapman et al. 2004), the Blainet al. result implies θ0 = 0.04 ± 0.01 arcmin, which is com-parable to our model prediction However, the method usedby Blain et al. does not take into account fluctuations in thesample density, and should perhaps be viewed as providinga lower limit on the clustering strength.
Figure 9. The dependence of the comoving correlation length,r0, on sub-mm flux for galaxies at z = 2. The predictions forSMGs selected by their emission at 850 µm are shown by the redline, and those for 450 µm selected sub-mm galaxies are plotted inblue. The flux plotted on the x-axis is correspondingly at either
850 or 450 µm.
4 THE DEPENDENCE OF CLUSTERING
STRENGTH ON GALAXY PROPERTIES
Here we consider the dependence of clustering strength ongalaxy properties. We present the predictions for the two-point correlation function as a function of sub-mm flux, haloand stellar mass, S450µm/S850µm colour and the quiescent orstarburst nature of galaxies at z = 2.
4.1 Dependence of clustering on sub-mm flux
In Fig. 9 we plot the comoving correlation length, r0 (com-puted using Eq. 6), as a function of sub-mm flux, Sν , forgalaxies at z = 2. The plot shows that brighter galaxieshave larger correlation lengths (see also Figs. 4 and 8). How-ever, the dependence of clustering strength on luminosity isfairly weak, with a change of 50% in correlation length onchanging flux by a factor of a hundred. This behaviour canbe understood as a consequence of brighter galaxies beingfound predominately in more massive haloes, for which thebias is greater than unity and increases strongly with mass(Angulo et al. 2009). As already pointed out in relation toFig. 4, for the same flux limit, 450µm selected galaxies areless clustered than their 850µm counterparts, with correla-tion lengths that are typically smaller by ∆r0 ≈ 0.4 h−1Mpc.This difference remains roughly constant throughout therange of sub-mm fluxes explored (in Fig. 13 we will seethat this is a consequence of the fact that the medianS450µm/S850µm colour is approximately ≈ 3).
12 Almeida et al.
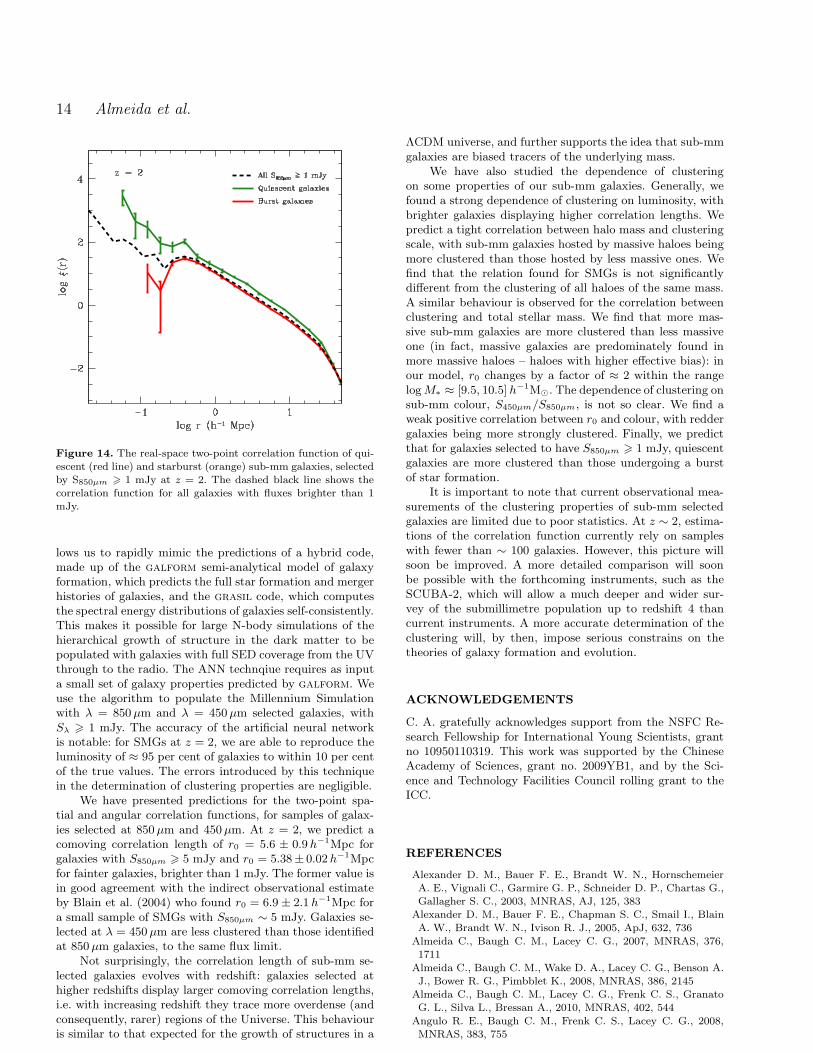
Figure 10. The dependence of the comoving correlation length,r0, on host halo mass, Mhalo, for galaxies at z = 2 (for differentialbins in halo mass). The red and green solid lines display the rela-tion predicted for galaxies with S850µm > 1 mJy and S450µm > 1mJy respectively. Brighter sub-mm galaxies, with fluxes above
5 mJy, are shown by the dashed orange (850 µm) and dashedblue (450µm) lines. The dashed black line shows the dependenceof correlation length on halo mass for all haloes (regardless ofwhether they host an SMG or not).
Figure 11. The dependence of the comoving correlation length,r0, on total stellar mass, M∗, for galaxies at z = 2. The redand green solid lines display the predictions for galaxies withS850µm > 1 mJy and S450µm > 1 mJy, respectively. Brightersub-mm galaxies, with fluxes brighter than 5 mJy, are shownby the dashed orange (850 µm) and dashed blue (450 µm) lines.The relation between r0 and stellar mass for all the galaxies inthe simulation, regardless of their sub-mm flux, is shown by thedashed-black line.
4.2 Dependence of clustering strength on halo
and stellar mass
Fig. 10 shows the dependence of r0 on the mass of the darkmatter halo which hosts the SMG, for discrete bins in halomass (the bin width is adjusted to contain a representativesample of galaxies). Remarkably, there is little difference be-tween the clustering strength predicted for bright and faintsamples of SMGs within a given bin of host halo mass. More-over, the SMG clustering is essentially the same as that ofall of the dark matter haloes in the mass bin, regardless ofwhether or not they contain an SMG. This means that theclustering strength of SMGs is driven purely by the mass ofthe host halo, and shows little or no dependence on a secondproperty of the halo, such as its formation time or spin. Onemight have expected to see a dependence of the clusteringstrength at a given halo mass on SMG flux if this selectionfavoured host haloes which had, for example, formed morerecently than the overall population at a given mass (see,e.g. Gao et al. 2005; Percival et al. 2003).
We now consider the dependence of the correlationlength r0 on stellar mass, M∗, which we plot in Fig. 11. Fol-lowing earlier plots, we display the relation for SMGs withfluxes brighter than 1 mJy at 450µm and 850µm, and forbrighter samples with fluxes > 5 mJy at both wavelengths.At z = 2, the median stellar masses of the model samplesare M∗ = 9.9 × 10⁹ h−1M⊙ for galaxies with S850 > 1mJy,and M∗ = 9.7×10⁹ h−1M⊙ for those with S450 > 1mJy (seealso Gonzalez et al. 2010b). Comparisons with observationalestimates of stellar masses are of limited use, as the resultsdepend critically on the assumption made about the formof the stellar IMF (see Lacey et al. 2010a for an expandeddiscussion). For example, Hainline et al. (2010) estimatedthe stellar masses of ∼ 70 SMGs with S850µm ≈ 5 mJy andfound a median stellar mass of 7× 10¹⁰h−1M⊙, when usinga Kroupa (2001) IMF. At the same flux limit, our modelpredicts a median stellar mass of 2× 10¹⁰h−1M⊙.
There is a tight, monotonic correlation between the co-moving correlation length, r0, and stellar mass, M∗ (Fig. 11).Massive galaxies are more strongly clustered than galaxieswith lower stellar masses, implying that more massive galax-ies tend to be hosted by more massive haloes. Interestingly,all of our samples show a similar correlation length for agiven total stellar mass, i.e. the relation between correlationlength and total stellar mass does not depend on the sub-mm luminosity of the galaxy. We find that the correlationlength r0 varies roughly linearly with logM∗ in the rangelogM∗ ≈ [9.5, 10.5]h−1M⊙. Another important aspect is thefact that SMGs have, typically, weaker clustering than othergalaxies of the same stellar mass. This is particularly evidentfor stellar masses below 1010h−1M⊙. The phenomenon is es-sentially due to the combination of two factors. Firstly, thereis a difference in the host halo masses for satellite and cen-tral galaxies of the same stellar mass: at a given stellar mass,satellite galaxies inhabit haloes which are roughly ten timesmore massive than central galaxies. Secondly, SMGs galax-ies with stellar masses lower than 1010h−1M⊙ are mainlycentral galaxies, whereas the fraction of satellite galaxies forthe full galaxy population is approximately 30 per cent. Sub-millimetre galaxies with stellar masses M∗ > 1010h−1M⊙
display a similar fraction of satellite galaxies to that in the

Clustering of sub-mm galaxies 13
Figure 12. Distribution of the S450µm/S850µm flux ratio orcolour for SMGs at z = 2, as a function of 850 µm flux density.The solid red and dashed orange histograms show the distributionfor quiescent and starburst galaxies, respectively, while the blackline displays the combined distribution. Quiescent galaxies only
make a significant contribution at the faintest fluxes (top left).The distributions are normalized to integrate to unity.
full sample. Currently, there are no observational determi-nations of this relation at the redshifts of interest for SMGs.
4.3 Dependence of clustering on sub-mm colour
Before studying the dependence of the correlation length, r0,on sub-mm colour, as given by the S450µm/S850µm flux ratio,it is informative to first plot the colour distribution itself,which we show in Fig. 12. Here, we separate galaxies intobins of S850µm flux and discriminate between quiescent andstarburst galaxies. In our model, the S450µm/S850µm colourdistribution of λ = 850µm selected galaxies peaks around≈ 3.2. Furthermore, we find that the mode and shape of thecolour distribution does not change significantly with S850µm
flux, i.e. the colour–luminosity relation of sub-mm galaxieswith S850µm > 1 mJy is roughly constant. Also, there isvery little difference between the colour distribution of star-burst and quiescent galaxies (note, however, that, at lowerfluxes, the fraction of sub-mm galaxies which are formingstars quiescently increases).
The observed distribution of 450µm/850µm coloursof SMGs has not yet been accurately measured, but the350µm/850µm colours of SMGs in the same model were in-vestigated by Swinbank et al. (2008), who found the pre-dicted colours to be in agreement with observed values.They also found that the median 350µm/850µm colour ofmodel SMGs could be fit by a modified blackbody spectrumLν ∝ Bν(T ) ν
β, with β = 1.5 and an effective dust tempera-ture of T = 32 K. This modified blackbody implies a colourS450µm/S850µm ≈ 3.5 for SMGs at z = 2, which agrees wellwith the distribution plotted in Fig. 13.
In Fig. 13 we plot the correlation length, r0, as a func-
Figure 13. Dependence of the correlation length, r0, onS450µm/S850µm colour for galaxies at z = 2. SMGs selected bytheir emission at λ = 850µm are represented by the red line, whilethe predictions for galaxies selected at λ = 450 µm are plotted inblue. Solid and dashed lines show the correlation length for galax-
ies split by sub-mm colour, S450µm/S850µm , as indicated by thekey.
tion sub-mm flux for two samples split at a sub-mm colour ofS450µm/S850µm = 3.2. The dependence of r0 on luminosity issimilar to that shown in Fig. 9. The figure also hints that red-der galaxies, i.e. those with S450µm/S850µm 6 3.2, are moreclustered than bluer galaxies with S450µm/S850µm > 3.2 (forboth λ = 850µm and λ = 450µm selected galaxies). Forexample, for S850µm ≈ 3 mJy galaxies, r0 can differ by afactor of ≈ 1.6 between the red and blue samples.
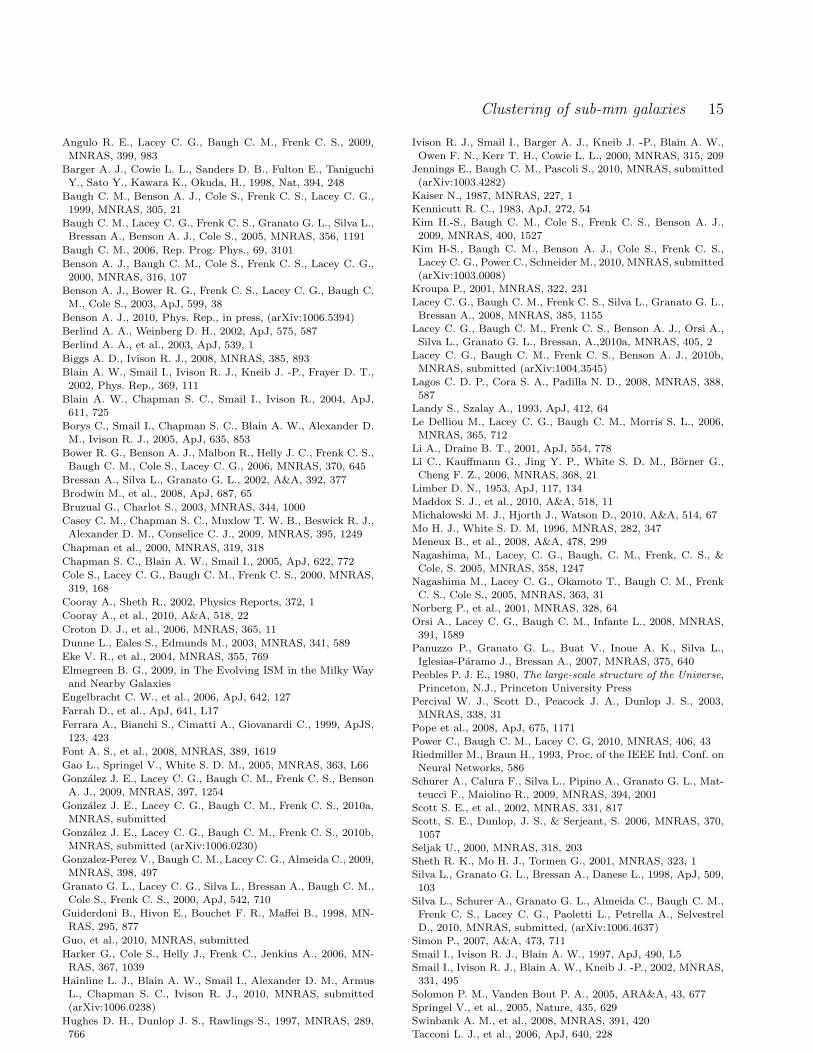
Having plotted the colour distributions of starburst andquiescent galaxies and the relation between r0 and sub-mmcolour, it is useful to study the clustering of quiescent andstarburst galaxies separately. As mentioned in connectionwith Fig. 12, quiescent galaxies only make a significant con-tribution at lower fluxes, S850µm 6 2 mJy. In Fig. 14, we plotthe two-point correlation function in real-space of sub-mmgalaxies selected by S850µm > 1 mJy at z = 2. We also plotthe correlation functions of quiescent and starburst galax-ies separately. Fig. 13 reveals that, in our model, quiescentgalaxies are more clustered than burst galaxies of similarsub-mm luminosities, on all scales. This is mostly due tothe fact that quiescent SMGs are more massive than burstSMGs, due to both the top-heavy IMF and shorter star for-mation timescale in bursts. We compute r0 = 5.2 h−1 Mpcfor burst galaxies with S850µm > 1 mJy, and r0 = 7.2h−1
Mpc for quiescent galaxies brighter than the same flux limit.
5 DISCUSSION AND CONCLUSIONS
In this paper we have applied the technique introduced byAlmeida et al. (2010), based on artificial neural networks,to predict the spatial and angular clustering of sub-mm se-lected galaxies (SMGs) in a ΛCDM universe. The ANN al-
14 Almeida et al.
Figure 14. The real-space two-point correlation function of qui-escent (red line) and starburst (orange) sub-mm galaxies, selectedby S850µm > 1 mJy at z = 2. The dashed black line shows thecorrelation function for all galaxies with fluxes brighter than 1mJy.
lows us to rapidly mimic the predictions of a hybrid code,made up of the galform semi-analytical model of galaxyformation, which predicts the full star formation and mergerhistories of galaxies, and the grasil code, which computesthe spectral energy distributions of galaxies self-consistently.This makes it possible for large N-body simulations of thehierarchical growth of structure in the dark matter to bepopulated with galaxies with full SED coverage from the UVthrough to the radio. The ANN technqiue requires as inputa small set of galaxy properties predicted by galform. Weuse the algorithm to populate the Millennium Simulationwith λ = 850µm and λ = 450µm selected galaxies, withSλ > 1 mJy. The accuracy of the artificial neural networkis notable: for SMGs at z = 2, we are able to reproduce theluminosity of ≈ 95 per cent of galaxies to within 10 per centof the true values. The errors introduced by this techniquein the determination of clustering properties are negligible.
We have presented predictions for the two-point spa-tial and angular correlation functions, for samples of galax-ies selected at 850µm and 450µm. At z = 2, we predict acomoving correlation length of r0 = 5.6 ± 0.9 h−1Mpc forgalaxies with S850µm > 5 mJy and r0 = 5.38± 0.02 h−1Mpcfor fainter galaxies, brighter than 1 mJy. The former value isin good agreement with the indirect observational estimateby Blain et al. (2004) who found r0 = 6.9± 2.1 h−1Mpc fora small sample of SMGs with S850µm ∼ 5 mJy. Galaxies se-lected at λ = 450µm are less clustered than those identifiedat 850µm galaxies, to the same flux limit.
Not surprisingly, the correlation length of sub-mm se-lected galaxies evolves with redshift: galaxies selected athigher redshifts display larger comoving correlation lengths,i.e. with increasing redshift they trace more overdense (andconsequently, rarer) regions of the Universe. This behaviouris similar to that expected for the growth of structures in a
ΛCDM universe, and further supports the idea that sub-mmgalaxies are biased tracers of the underlying mass.
We have also studied the dependence of clusteringon some properties of our sub-mm galaxies. Generally, wefound a strong dependence of clustering on luminosity, withbrighter galaxies displaying higher correlation lengths. Wepredict a tight correlation between halo mass and clusteringscale, with sub-mm galaxies hosted by massive haloes beingmore clustered than those hosted by less massive ones. Wefind that the relation found for SMGs is not significantlydifferent from the clustering of all haloes of the same mass.A similar behaviour is observed for the correlation betweenclustering and total stellar mass. We find that more mas-sive sub-mm galaxies are more clustered than less massiveone (in fact, massive galaxies are predominately found inmore massive haloes – haloes with higher effective bias): inour model, r0 changes by a factor of ≈ 2 within the rangelogM∗ ≈ [9.5, 10.5] h−1M⊙. The dependence of clustering onsub-mm colour, S450µm/S850µm, is not so clear. We find aweak positive correlation between r0 and colour, with reddergalaxies being more strongly clustered. Finally, we predictthat for galaxies selected to have S850µm > 1 mJy, quiescentgalaxies are more clustered than those undergoing a burstof star formation.
It is important to note that current observational mea-surements of the clustering properties of sub-mm selectedgalaxies are limited due to poor statistics. At z ∼ 2, estima-tions of the correlation function currently rely on sampleswith fewer than ∼ 100 galaxies. However, this picture willsoon be improved. A more detailed comparison will soonbe possible with the forthcoming instruments, such as theSCUBA-2, which will allow a much deeper and wider sur-vey of the submillimetre population up to redshift 4 thancurrent instruments. A more accurate determination of theclustering will, by then, impose serious constrains on thetheories of galaxy formation and evolution.
ACKNOWLEDGEMENTS
C. A. gratefully acknowledges support from the NSFC Re-search Fellowship for International Young Scientists, grantno 10950110319. This work was supported by the ChineseAcademy of Sciences, grant no. 2009YB1, and by the Sci-ence and Technology Facilities Council rolling grant to theICC.
REFERENCES
Alexander D. M., Bauer F. E., Brandt W. N., HornschemeierA. E., Vignali C., Garmire G. P., Schneider D. P., Chartas G.,Gallagher S. C., 2003, MNRAS, AJ, 125, 383
Alexander D. M., Bauer F. E., Chapman S. C., Smail I., BlainA. W., Brandt W. N., Ivison R. J., 2005, ApJ, 632, 736
Almeida C., Baugh C. M., Lacey C. G., 2007, MNRAS, 376,1711
Almeida C., Baugh C. M., Wake D. A., Lacey C. G., Benson A.J., Bower R. G., Pimbblet K., 2008, MNRAS, 386, 2145
Almeida C., Baugh C. M., Lacey C. G., Frenk C. S., GranatoG. L., Silva L., Bressan A., 2010, MNRAS, 402, 544
Angulo R. E., Baugh C. M., Frenk C. S., Lacey C. G., 2008,MNRAS, 383, 755
Clustering of sub-mm galaxies 15
Angulo R. E., Lacey C. G., Baugh C. M., Frenk C. S., 2009,
MNRAS, 399, 983
Barger A. J., Cowie L. L., Sanders D. B., Fulton E., TaniguchiY., Sato Y., Kawara K., Okuda, H., 1998, Nat, 394, 248
Baugh C. M., Benson A. J., Cole S., Frenk C. S., Lacey C. G.,1999, MNRAS, 305, 21
Baugh C. M., Lacey C. G., Frenk C. S., Granato G. L., Silva L.,Bressan A., Benson A. J., Cole S., 2005, MNRAS, 356, 1191
Baugh C. M., 2006, Rep. Prog. Phys., 69, 3101
Benson A. J., Baugh C. M., Cole S., Frenk C. S., Lacey C. G.,2000, MNRAS, 316, 107
Benson A. J., Bower R. G., Frenk C. S., Lacey C. G., Baugh C.M., Cole S., 2003, ApJ, 599, 38
Benson A. J., 2010, Phys. Rep., in press, (arXiv:1006.5394)
Berlind A. A., Weinberg D. H., 2002, ApJ, 575, 587
Berlind A. A., et al., 2003, ApJ, 539, 1
Biggs A. D., Ivison R. J., 2008, MNRAS, 385, 893
Blain A. W., Smail I., Ivison R. J., Kneib J. -P., Frayer D. T.,2002, Phys. Rep., 369, 111
Blain A. W., Chapman S. C., Smail I., Ivison R., 2004, ApJ,611, 725
Borys C., Smail I., Chapman S. C., Blain A. W., Alexander D.M., Ivison R. J., 2005, ApJ, 635, 853
Bower R. G., Benson A. J., Malbon R., Helly J. C., Frenk C. S.,Baugh C. M., Cole S., Lacey C. G., 2006, MNRAS, 370, 645
Bressan A., Silva L., Granato G. L., 2002, A&A, 392, 377
Brodwin M., et al., 2008, ApJ, 687, 65
Bruzual G., Charlot S., 2003, MNRAS, 344, 1000
Casey C. M., Chapman S. C., Muxlow T. W. B., Beswick R. J.,Alexander D. M., Conselice C. J., 2009, MNRAS, 395, 1249
Chapman et al., 2000, MNRAS, 319, 318
Chapman S. C., Blain A. W., Smail I., 2005, ApJ, 622, 772
Cole S., Lacey C. G., Baugh C. M., Frenk C. S., 2000, MNRAS,319, 168
Cooray A., Sheth R., 2002, Physics Reports, 372, 1
Cooray A., et al., 2010, A&A, 518, 22
Croton D. J., et al., 2006, MNRAS, 365, 11
Dunne L., Eales S., Edmunds M., 2003, MNRAS, 341, 589
Eke V. R., et al., 2004, MNRAS, 355, 769
Elmegreen B. G., 2009, in The Evolving ISM in the Milky Wayand Nearby Galaxies
Engelbracht C. W., et al., 2006, ApJ, 642, 127
Farrah D., et al., ApJ, 641, L17
Ferrara A., Bianchi S., Cimatti A., Giovanardi C., 1999, ApJS,123, 423
Font A. S., et al., 2008, MNRAS, 389, 1619
Gao L., Springel V., White S. D. M., 2005, MNRAS, 363, L66
Gonzalez J. E., Lacey C. G., Baugh C. M., Frenk C. S., BensonA. J., 2009, MNRAS, 397, 1254
Gonzalez J. E., Lacey C. G., Baugh C. M., Frenk C. S., 2010a,MNRAS, submitted
Gonzalez J. E., Lacey C. G., Baugh C. M., Frenk C. S., 2010b,MNRAS, submitted (arXiv:1006.0230)
Gonzalez-Perez V., Baugh C. M., Lacey C. G., Almeida C., 2009,MNRAS, 398, 497
Granato G. L., Lacey C. G., Silva L., Bressan A., Baugh C. M.,Cole S., Frenk C. S., 2000, ApJ, 542, 710
Guiderdoni B., Hivon E., Bouchet F. R., Maffei B., 1998, MN-RAS, 295, 877
Guo, et al., 2010, MNRAS, submitted
Harker G., Cole S., Helly J., Frenk C., Jenkins A., 2006, MN-RAS, 367, 1039
Hainline L. J., Blain A. W., Smail I., Alexander D. M., ArmusL., Chapman S. C., Ivison R. J., 2010, MNRAS, submitted(arXiv:1006.0238)
Hughes D. H., Dunlop J. S., Rawlings S., 1997, MNRAS, 289,766
Ivison R. J., Smail I., Barger A. J., Kneib J. -P., Blain A. W.,
Owen F. N., Kerr T. H., Cowie L. L., 2000, MNRAS, 315, 209Jennings E., Baugh C. M., Pascoli S., 2010, MNRAS, submitted(arXiv:1003.4282)
Kaiser N., 1987, MNRAS, 227, 1Kennicutt R. C., 1983, ApJ, 272, 54
Kim H.-S., Baugh C. M., Cole S., Frenk C. S., Benson A. J.,2009, MNRAS, 400, 1527
Kim H-S., Baugh C. M., Benson A. J., Cole S., Frenk C. S.,Lacey C. G., Power C., Schneider M., 2010, MNRAS, submitted(arXiv:1003.0008)
Kroupa P., 2001, MNRAS, 322, 231
Lacey C. G., Baugh C. M., Frenk C. S., Silva L., Granato G. L.,Bressan A., 2008, MNRAS, 385, 1155
Lacey C. G., Baugh C. M., Frenk C. S., Benson A. J., Orsi A.,Silva L., Granato G. L., Bressan, A.,2010a, MNRAS, 405, 2
Lacey C. G., Baugh C. M., Frenk C. S., Benson A. J., 2010b,MNRAS, submitted (arXiv:1004.3545)
Lagos C. D. P., Cora S. A., Padilla N. D., 2008, MNRAS, 388,587
Landy S., Szalay A., 1993, ApJ, 412, 64
Le Delliou M., Lacey C. G., Baugh C. M., Morris S. L., 2006,MNRAS, 365, 712
Li A., Draine B. T., 2001, ApJ, 554, 778Li C., Kauffmann G., Jing Y. P., White S. D. M., Borner G.,Cheng F. Z., 2006, MNRAS, 368, 21
Limber D. N., 1953, ApJ, 117, 134Maddox S. J., et al., 2010, A&A, 518, 11
Michalowski M. J., Hjorth J., Watson D., 2010, A&A, 514, 67
Mo H. J., White S. D. M, 1996, MNRAS, 282, 347Meneux B., et al., 2008, A&A, 478, 299
Nagashima, M., Lacey, C. G., Baugh, C. M., Frenk, C. S., &Cole, S. 2005, MNRAS, 358, 1247
Nagashima M., Lacey C. G., Okamoto T., Baugh C. M., FrenkC. S., Cole S., 2005, MNRAS, 363, 31
Norberg P., et al., 2001, MNRAS, 328, 64
Orsi A., Lacey C. G., Baugh C. M., Infante L., 2008, MNRAS,391, 1589
Panuzzo P., Granato G. L., Buat V., Inoue A. K., Silva L.,Iglesias-Paramo J., Bressan A., 2007, MNRAS, 375, 640
Peebles P. J. E., 1980, The large-scale structure of the Universe,Princeton, N.J., Princeton University Press
Percival W. J., Scott D., Peacock J. A., Dunlop J. S., 2003,MNRAS, 338, 31
Pope et al., 2008, ApJ, 675, 1171
Power C., Baugh C. M., Lacey C. G, 2010, MNRAS, 406, 43Riedmiller M., Braun H., 1993, Proc. of the IEEE Intl. Conf. onNeural Networks, 586
Schurer A., Calura F., Silva L., Pipino A., Granato G. L., Mat-teucci F., Maiolino R., 2009, MNRAS, 394, 2001
Scott S. E., et al., 2002, MNRAS, 331, 817Scott, S. E., Dunlop, J. S., & Serjeant, S. 2006, MNRAS, 370,1057
Seljak U., 2000, MNRAS, 318, 203Sheth R. K., Mo H. J., Tormen G., 2001, MNRAS, 323, 1
Silva L., Granato G. L., Bressan A., Danese L., 1998, ApJ, 509,103
Silva L., Schurer A., Granato G. L., Almeida C., Baugh C. M.,Frenk C. S., Lacey C. G., Paoletti L., Petrella A., SelvestrelD., 2010, MNRAS, submitted, (arXiv:1006.4637)
Simon P., 2007, A&A, 473, 711
Smail I., Ivison R. J., Blain A. W., 1997, ApJ, 490, L5Smail I., Ivison R. J., Blain A. W., Kneib J. -P., 2002, MNRAS,331, 495
Solomon P. M., Vanden Bout P. A., 2005, ARA&A, 43, 677
Springel V., et al., 2005, Nature, 435, 629Swinbank A. M., et al., 2008, MNRAS, 391, 420
Tacconi L. J., et al., 2006, ApJ, 640, 228

16 Almeida et al.
van Kampen E., et al., 2005, MNRAS, 359, 469
Vega O., Silva L., Panuzzo P., Bressan A., Granato G. L., ChavezM., 2005, MNRAS, 364, 1286
Weiß A., et al., 2009, ApJ, 707, 1201Wilman R. J., Gerssen J., Bower R. G., Morris S. L., Bacon R.,de Zeeuw P. T., Davies R. L., 2005, Nature, 436, 227
Zehavi I., et al., 2005, ApJ, 621, 22