Exploring compact binary merger host galaxies and ... - arXiv
35
MNRAS 000, 1–?? (2021) Preprint 1 July 2022 Compiled using MNRAS L A T E X style file v3.0 Exploring compact binary merger host galaxies and environments with zELDA S. Mandhai 1,2 ★ , G. P. Lamb 1 †, N. R. Tanvir 1 ‡, J. Bray 3,4 , C. J. Nixon 1 , R. A. J. Eyles-Ferris 1 , A. J. Levan 5,6 , B. P. Gompertz 7 . 1 School of Physics and Astronomy, University of Leicester, University Road, Leicester, LE1 7RH, United Kingdom 2 Jodrell Bank Centre for Astrophysics, Department of Physics and Astronomy, The University of Manchester, Manchester, M13 9PY, United Kingdom 3 Department of Physical Sciences, Robert Hooke Building, Kents Hill, Milton Keynes MK7 6AA, United Kingdom 4 Department of Physics, The University of Auckland, Private Bag 92019, Auckland, New Zealand 5 Department of Astrophysics/IMAPP, Radboud University, Nijmegen, Netherlands 6 Department of Physics, University of Warwick, Coventry, CV4 7AL, UK 7 School of Physics and Astronomy, University of Birmingham, Birmingham, B15 2TT, UK Accepted XXX. Received YYY; in original form ZZZ ABSTRACT Compact binaries such as double neutron stars or a neutron star paired with a black-hole, are strong sources of gravitational waves during coalescence and also the likely progenitors of various electromagnetic phenomena, notably short-duration gamma-ray bursts (SGRBs), and kilonovae. In this work, we generate populations of synthetic binaries and place them in galaxies from the large-scale hydrodynamical galaxy evolution simulation EAGLE. With our zELDA code, binaries are seeded in proportion to star formation rate, and we follow their evolution to merger using both the BPASS and COSMIC binary stellar evolution codes. We track their dynamical evolution within their host galaxy potential, to estimate the galactocentric distance at the time of the merger. Finally, we apply observational selection criteria to allow comparison of this model population with the legacy sample of SGRBs. We find a reasonable agreement with the redshift distribution (peaking at 0.5 << 1), host morphologies and projected galactocentric offsets (modal impact parameter . 10 kpc). Depending on the binary simulation used, we predict ∼ 16 - 35% of SGRB events would appear “host-less", i.e. sources that merge with high impact parameters or have hosts fainter than the detection limit (> 26). Key words: neutron star mergers, black hole - neutron star mergers, binaries: close, galaxies: general, gamma-ray burst: general 1 INTRODUCTION The orbits of compact binaries (containing neutron stars or stellar mass black holes) decay via gravitational wave emission, with in- spiral times ranging from a few Myr to many Hubble times. The final mergers have become of increasing interest following the first gravitational wave (GW) detections (Abbott et al. 2016). Where one or both of the components are a neutron star, such a coalescence can also produce detectable electromagnetic counterparts, opening the route to multi-messenger astrophysics (Branchesi 2016; Abbott et al. 2017b; Murase & Bartos 2019; Huerta et al. 2019; Mészáros et al. 2019). This was exemplified by the historic discovery of GW170817, and the accompanying emission from both a kilonova and relativis- tic jetted material (Abbott et al. 2017c; Tanaka et al. 2017; Levan et al. 2017; Im et al. 2017; Tanvir et al. 2017; Evans et al. 2017; ★ Contact e-mail: [email protected] † Contact e-mail:[email protected] ‡ Contact e-mail: [email protected] Pian et al. 2017; Alexander et al. 2017; Arcavi et al. 2017; Chornock et al. 2017; Coulter et al. 2017; Cowperthwaite et al. 2017; Haggard et al. 2017; Hallinan et al. 2017; Kasliwal et al. 2017; McCully et al. 2017; Margutti et al. 2017; Nicholl et al. 2017; Shappee et al. 2017; Smartt et al. 2017; Soares-Santos et al. 2017; Troja et al. 2017; Villar et al. 2017; Corsi et al. 2018; Lyman et al. 2018; Resmi et al. 2018; Mooley et al. 2018; Nynka et al. 2018; Hajela et al. 2019; Piro et al. 2019; Troja et al. 2019a; Lamb et al. 2019a; Troja et al. 2020). The kilonova is powered by the radioactive decay of newly synthesised heavy elements from ejected neutron star material, and may be the dominant site of r-process nucleosynthesis in the uni- verse. The kilonova accompanying GW170817 (AT2017gfo) was extensively studied from ultraviolet to infrared wavelengths, thanks to its relative proximity at ≈ 40 Mpc (Abbott et al. 2017c). How- © 2021 The Authors arXiv:2109.09714v2 [astro-ph.HE] 30 Jun 2022
-
Upload
khangminh22 -
Category
Documents
-
view
3 -
download
0
Transcript of Exploring compact binary merger host galaxies and ... - arXiv
MNRAS 000, 1–?? (2021) Preprint 1 July 2022 Compiled using MNRAS LATEX style file v3.0
Exploring compact binary merger host galaxies and environmentswith zELDA
S. Mandhai1,2★, G. P. Lamb1†, N. R. Tanvir1‡, J. Bray3,4, C. J. Nixon1,R. A. J. Eyles-Ferris1, A. J. Levan5,6, B. P. Gompertz7.1 School of Physics and Astronomy, University of Leicester, University Road, Leicester, LE1 7RH, United Kingdom2 Jodrell Bank Centre for Astrophysics, Department of Physics and Astronomy, The University of Manchester, Manchester, M13 9PY, United Kingdom3 Department of Physical Sciences, Robert Hooke Building, Kents Hill, Milton Keynes MK7 6AA, United Kingdom4 Department of Physics, The University of Auckland, Private Bag 92019, Auckland, New Zealand5 Department of Astrophysics/IMAPP, Radboud University, Nijmegen, Netherlands6 Department of Physics, University of Warwick, Coventry, CV4 7AL, UK7 School of Physics and Astronomy, University of Birmingham, Birmingham, B15 2TT, UK
Accepted XXX. Received YYY; in original form ZZZ
ABSTRACTCompact binaries such as double neutron stars or a neutron star paired with a black-hole,are strong sources of gravitational waves during coalescence and also the likely progenitorsof various electromagnetic phenomena, notably short-duration gamma-ray bursts (SGRBs),and kilonovae. In this work, we generate populations of synthetic binaries and place themin galaxies from the large-scale hydrodynamical galaxy evolution simulation EAGLE. Withour zELDA code, binaries are seeded in proportion to star formation rate, and we follow theirevolution to merger using both the BPASS and COSMIC binary stellar evolution codes. We tracktheir dynamical evolution within their host galaxy potential, to estimate the galactocentricdistance at the time of the merger. Finally, we apply observational selection criteria to allowcomparison of this model population with the legacy sample of SGRBs. We find a reasonableagreement with the redshift distribution (peaking at 0.5 < 𝑧 < 1), host morphologies andprojected galactocentric offsets (modal impact parameter . 10 kpc). Depending on the binarysimulation used, we predict ∼ 16−35% of SGRB events would appear “host-less", i.e. sourcesthat merge with high impact parameters or have hosts fainter than the detection limit (𝐻 > 26).
Key words: neutron star mergers, black hole - neutron star mergers, binaries: close, galaxies:general, gamma-ray burst: general
1 INTRODUCTION
The orbits of compact binaries (containing neutron stars or stellarmass black holes) decay via gravitational wave emission, with in-spiral times ranging from a few Myr to many Hubble times. Thefinal mergers have become of increasing interest following the firstgravitational wave (GW) detections (Abbott et al. 2016). Where oneor both of the components are a neutron star, such a coalescence canalso produce detectable electromagnetic counterparts, opening theroute tomulti-messenger astrophysics (Branchesi 2016;Abbott et al.2017b; Murase & Bartos 2019; Huerta et al. 2019; Mészáros et al.2019). Thiswas exemplified by the historic discovery ofGW170817,and the accompanying emission from both a kilonova and relativis-tic jetted material (Abbott et al. 2017c; Tanaka et al. 2017; Levanet al. 2017; Im et al. 2017; Tanvir et al. 2017; Evans et al. 2017;
★ Contact e-mail: [email protected]† Contact e-mail:[email protected]‡ Contact e-mail: [email protected]
Pian et al. 2017; Alexander et al. 2017; Arcavi et al. 2017; Chornocket al. 2017; Coulter et al. 2017; Cowperthwaite et al. 2017; Haggardet al. 2017; Hallinan et al. 2017; Kasliwal et al. 2017; McCully et al.2017; Margutti et al. 2017; Nicholl et al. 2017; Shappee et al. 2017;Smartt et al. 2017; Soares-Santos et al. 2017; Troja et al. 2017;Villar et al. 2017; Corsi et al. 2018; Lyman et al. 2018; Resmi et al.2018; Mooley et al. 2018; Nynka et al. 2018; Hajela et al. 2019;Piro et al. 2019; Troja et al. 2019a; Lamb et al. 2019a; Troja et al.2020).
The kilonova is powered by the radioactive decay of newlysynthesised heavy elements from ejected neutron star material, andmay be the dominant site of r-process nucleosynthesis in the uni-verse. The kilonova accompanying GW170817 (AT2017gfo) wasextensively studied from ultraviolet to infrared wavelengths, thanksto its relative proximity at ≈ 40Mpc (Abbott et al. 2017c). How-
© 2021 The Authors
arX
iv:2
109.
0971
4v2
[as
tro-
ph.H
E]
30
Jun
2022
2 S. Mandhai et al.
ever, more typically, the current generation of GW detectors 1 2finds neutron-star containing mergers at ∼ 200Mpc (Abbott et al.2018), which combined with the large (10s or 100s of sq-deg) er-ror regions, presents a significant challenge to counterpart searches(Mandhai et al. 2018; Dichiara et al. 2020).
The production of relativistic jets during mergers is less wellunderstood, but is believed to be responsible for the short-durationgamma-ray burst (SGRB) emission; these events have typical du-rations, 𝑇90 < 2 s (Mazets & Golenetskii 1981; Kouveliotou et al.1993). This emission is much brighter and can be seen at cos-mological distances, indeed, apart from GRB170817A accompa-nying GW170817, the nearest SGRB with a secure redshift isGRB080905A at 𝑧 = 0.1218 (Rowlinson et al. 2010) whilst themost distant SGRBs have been found at 𝑧 & 2 (e.g. Levan et al.2006; Fong et al. 2017; Selsing et al. 2018). The association ofSGRBs with compact binary mergers confirmed both by analysisof the non-thermal emission from AT2017gfo (Perego et al. 2017;Wang et al. 2017), and the evidence of kilonova emission followingother SGRBs (e.g. Tanvir et al. 2013; Jin et al. 2016; Gompertz et al.2018; Lamb et al. 2019b; Troja et al. 2019b; Jin et al. 2020).
SGRBs were first localised to arcsec precision in the NeilGehrels Swift Observatory (hereafter Swift) era, which resulted inthe identifications of host galaxies and hence redshifts (e.g. Gehrelset al. 2005; Bloom et al. 2006; Fox et al. 2005; Hjorth et al.2005). The typical redshifts for SGRBs at the the depth reachedby Swift/BAT is 𝑧 < 1 (Lien et al. 2016). These events originatefrom a wide range of host galaxies and environments, includingsome with little or no ongoing star formation (e.g. Fong et al. 2013;Fong & Berger 2013; Berger 2014). The Swift rate of SGRB dis-covery is ∼ 10 yr−1, in contrast, detectors with larger fields-of-viewsuch as the Fermi/GBM (Gamma-ray Burst Monitor) have a rate of∼ 40 yr−1, although the Fermi localisations are much worse (typi-cally a ∼ few× 10 deg2) , so redshifts are rarely obtained. Since theafterglows of SGRBs are also typically fainter than those from long-GRBs (𝑇90 > 2 s) , the net result is that the total sample of SGRBswith better constrained (∼arcsec–arcmin) sky-positions is ∼ 140,and only 25–30% of these have confident redshifts (e.g. Fong et al.2015a; Lien et al. 2016). It is worth cautioning that the assignationof a given GRB to the short-hard class is also uncertain in somecases (Bromberg et al. 2013), and also that a small proportion ofthe candidate host galaxies may be chance alignments rather thanthe real host (Levan et al. 2007). The existing sample should beunderstood to be incomplete and inhomogeneous, but still sufficientto show general trends.
Based on this observed population of SGRBs, a non-negligiblefraction (∼ 15%; Fong et al. 2013) appear to have no obvious hostgalaxy. These events are considered “host-less" and are typicallyseen at distances 30 − 75 kpc in projection from the nearest hostgalaxy candidate (Berger 2010; Tunnicliffe et al. 2014; Fong &Berger 2013). Studying the orbital evolution of the progenitor binarypairs relative to their host galaxy, before they merge, may allow usto investigate the frequency of progenitors migrating to distancessuch that they are classed host-less. Establishing constraints on theexpected projected offsets of SGRBs, and the fraction of host-lessevents, may also aid in the efforts to identify the original hostof the progenitor binary where it is uncertain, and by extensionan improved understanding of the distribution of these compactbinary mergers over the cosmological history. This combination of
1 Third Observing Run (O3)2 https://gracedb.ligo.org/superevents/public/O3/
properties supports the compact binary merger hypothesis, in whichthe binary systems can have long lifetimes before merger, and canreceive large kicks during the supernovae in which the compactremnants were formed (Hobbs et al. 2005; Nakar 2007).
In order to understand the relationship between the offsets ofdetected SGRBs and their host galaxies, we created a populationof synthetic binaries and evolved them within hydrodynamicallysimulated galaxies. The compact binaries of interest discussed inthis paper are primarily NSNS and BHNS as these are the mostlikely progenitors of SGRBs (Narayan et al. 1992, 2001; Katz &Canel 1996; Lee & Ramirez-Ruiz 2007). Previous studies have alsoexplored the relationship between galaxies and the offsets of GRBswithin static potentials (e.g. Bloom et al. 1999; Bulik et al. 1999;Bloomet al. 2002; Belczynski et al. 2006; Church et al. 2011). In thisstudy, we use updated stellar evolution prescriptions and evolvinggalaxy potentials to contrast with and predict observational SGRBoffsets. The search for host galaxies and EM counterparts to GWevents can be challenging as seen with the follow up of GW190814(Ackley et al. 2020; Morgan et al. 2020; Andreoni et al. 2020).Studies such as the aforementioned and the one detailed in this paperare beneficial in improving the efficiency of follow-up campaigns byenabling prediction of the most likely host populations and offsets.We also comment on the merger rates predicted by our analysis,scaled by LIGO/VIRGO gravitational wave constraints for NSNSsystems.
In this work, Section 2 introduces our code, zELDA, that is usedfor the majority of the data analysis; in Section 3, we outline theresults; in Section 4, we compare our results with observations ofSGRBs; in Section 5, we discuss the relationship of the host galaxiesand SGRB localisations; and finally, in Section 6, we summarise ourkey findings.
2 ZELDA: REDSHIFT ELECTROMAGNETICLOCALISATION & DEDUCTION ALGORITHM
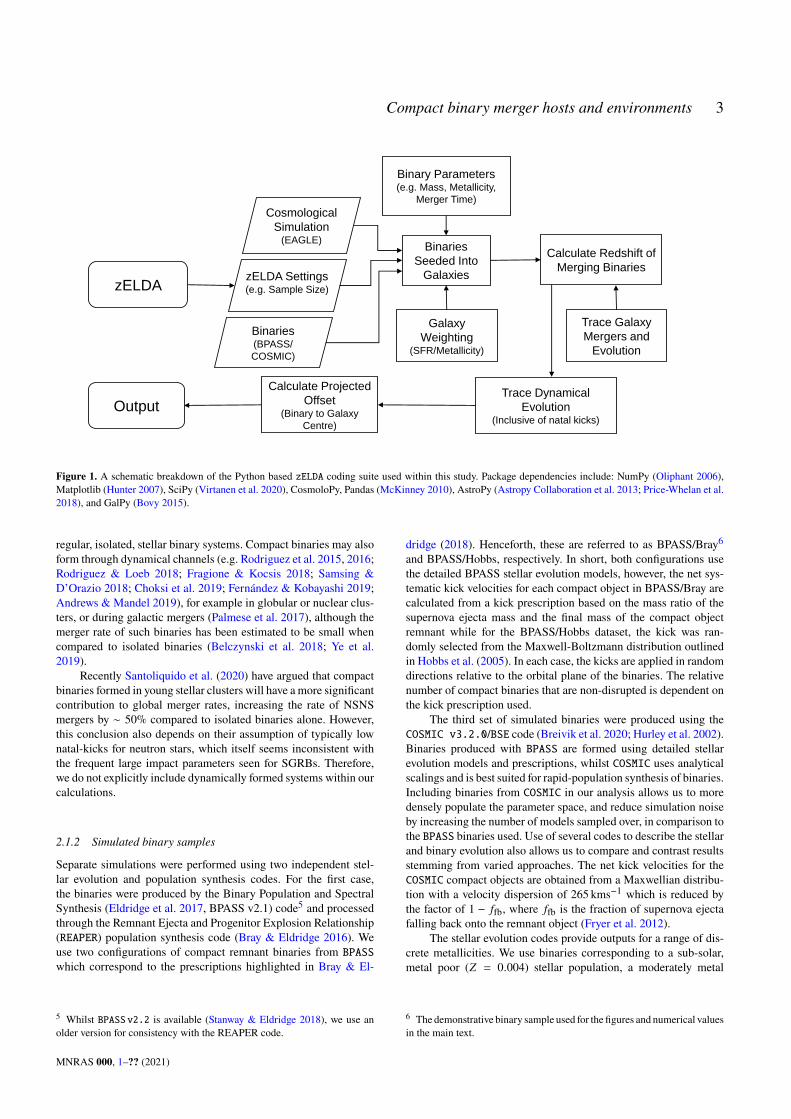
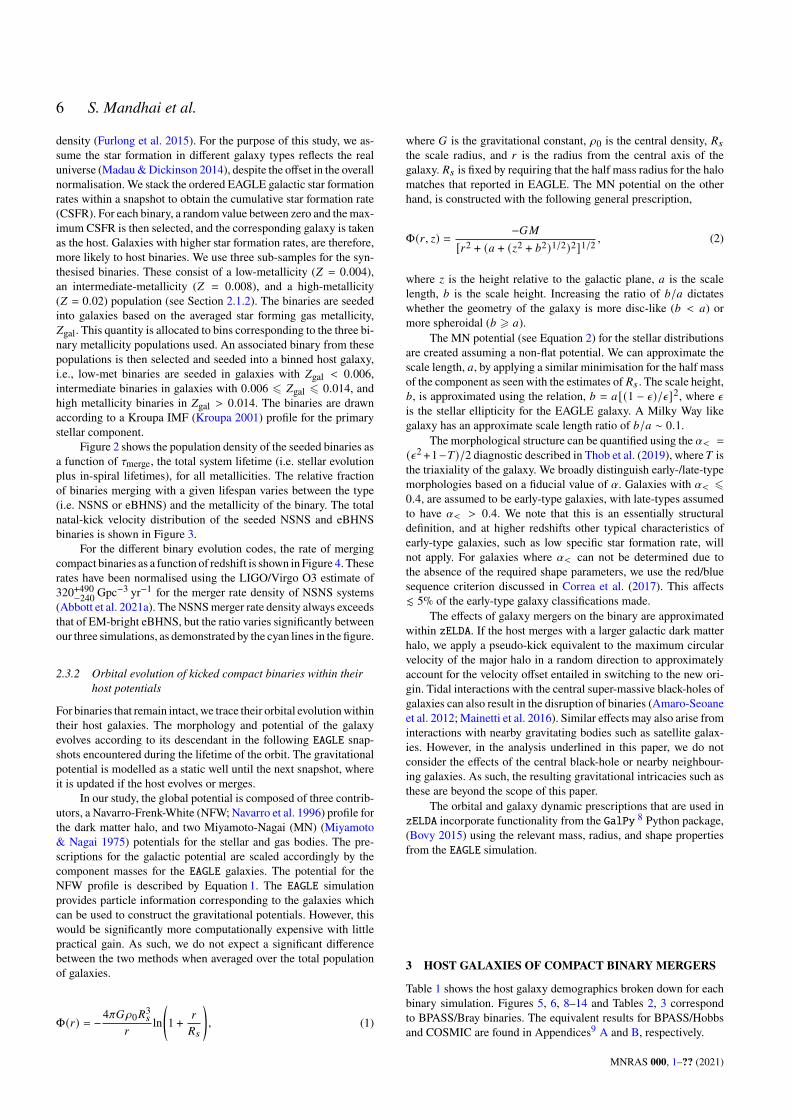
The Redshift Electromagnetic Localisation &Deduction Algorithm(zELDA)3 is a collection of scripts designed to process and evolvea population of compact binaries within synthetic galaxies. Anoverview of the zELDA code schematic is shown in Figure 1 4. Theobjective of zELDA is to determine the orbital and stellar evolutionof binaries relative to their host galaxy environment.
Throughout, we have adopted the same flat (𝑘 = 0), Λ Fried-mann cosmology as used for the EAGLE simulation. Specifically thedensity parameters for matter and dark energy are Ω𝑀0 = 0.307and ΩΛ0 = 0.693 respectively, and the value for the Hubble con-stant used is𝐻0 = 67.77 km s−1Mpc−1 (Planck Collaboration et al.2014; Furlong et al. 2015).
2.1 Compact Binaries
2.1.1 Formation channels
The evolution of binary stars with masses > 8M� may result in theformation of compact binary systems that consist of a neutron staror a black hole paired with a neutron star, i.e. neutron star-neutronstar (NSNS), or black hole-neutron star (BHNS).
For this study, we have simulated a population of syntheticcompact binaries that are formed from the end-point evolution of
3 Repository: https://github.com/hirizon/zELDA-COMBIN4 CosmoloPy: http://roban.github.io/CosmoloPy/
MNRAS 000, 1–?? (2021)
Compact binary merger hosts and environments 3
zELDA
Output
Cosmological
Simulation(EAGLE)
Binaries(BPASS/
COSMIC)
Binaries
Seeded Into
Galaxies
Calculate Redshift of
Merging Binaries
Trace Dynamical
Evolution (Inclusive of natal kicks)
Galaxy
Weighting (SFR/Metallicity)
Trace Galaxy
Mergers and
Evolution
Binary Parameters (e.g. Mass, Metallicity,
Merger Time)
Calculate Projected
Offset (Binary to Galaxy
Centre)
zELDA Settings(e.g. Sample Size)
Figure 1. A schematic breakdown of the Python based zELDA coding suite used within this study. Package dependencies include: NumPy (Oliphant 2006),Matplotlib (Hunter 2007), SciPy (Virtanen et al. 2020), CosmoloPy, Pandas (McKinney 2010), AstroPy (Astropy Collaboration et al. 2013; Price-Whelan et al.2018), and GalPy (Bovy 2015).
regular, isolated, stellar binary systems. Compact binaries may alsoform through dynamical channels (e.g. Rodriguez et al. 2015, 2016;Rodriguez & Loeb 2018; Fragione & Kocsis 2018; Samsing &D’Orazio 2018; Choksi et al. 2019; Fernández & Kobayashi 2019;Andrews & Mandel 2019), for example in globular or nuclear clus-ters, or during galactic mergers (Palmese et al. 2017), although themerger rate of such binaries has been estimated to be small whencompared to isolated binaries (Belczynski et al. 2018; Ye et al.2019).
Recently Santoliquido et al. (2020) have argued that compactbinaries formed in young stellar clusters will have a more significantcontribution to global merger rates, increasing the rate of NSNSmergers by ∼ 50% compared to isolated binaries alone. However,this conclusion also depends on their assumption of typically lownatal-kicks for neutron stars, which itself seems inconsistent withthe frequent large impact parameters seen for SGRBs. Therefore,we do not explicitly include dynamically formed systems within ourcalculations.
2.1.2 Simulated binary samples
Separate simulations were performed using two independent stel-lar evolution and population synthesis codes. For the first case,the binaries were produced by the Binary Population and SpectralSynthesis (Eldridge et al. 2017, BPASS v2.1) code5 and processedthrough the Remnant Ejecta and Progenitor Explosion Relationship(REAPER) population synthesis code (Bray & Eldridge 2016). Weuse two configurations of compact remnant binaries from BPASSwhich correspond to the prescriptions highlighted in Bray & El-
5 Whilst BPASS v2.2 is available (Stanway & Eldridge 2018), we use anolder version for consistency with the REAPER code.
dridge (2018). Henceforth, these are referred to as BPASS/Bray6and BPASS/Hobbs, respectively. In short, both configurations usethe detailed BPASS stellar evolution models, however, the net sys-tematic kick velocities for each compact object in BPASS/Bray arecalculated from a kick prescription based on the mass ratio of thesupernova ejecta mass and the final mass of the compact objectremnant while for the BPASS/Hobbs dataset, the kick was ran-domly selected from the Maxwell-Boltzmann distribution outlinedin Hobbs et al. (2005). In each case, the kicks are applied in randomdirections relative to the orbital plane of the binaries. The relativenumber of compact binaries that are non-disrupted is dependent onthe kick prescription used.
The third set of simulated binaries were produced using theCOSMIC v3.2.0/BSE code (Breivik et al. 2020; Hurley et al. 2002).Binaries produced with BPASS are formed using detailed stellarevolution models and prescriptions, whilst COSMIC uses analyticalscalings and is best suited for rapid-population synthesis of binaries.Including binaries from COSMIC in our analysis allows us to moredensely populate the parameter space, and reduce simulation noiseby increasing the number of models sampled over, in comparison tothe BPASS binaries used. Use of several codes to describe the stellarand binary evolution also allows us to compare and contrast resultsstemming from varied approaches. The net kick velocities for theCOSMIC compact objects are obtained from a Maxwellian distribu-tion with a velocity dispersion of 265 kms−1 which is reduced bythe factor of 1 − 𝑓fb, where 𝑓fb is the fraction of supernova ejectafalling back onto the remnant object (Fryer et al. 2012).
The stellar evolution codes provide outputs for a range of dis-crete metallicities. We use binaries corresponding to a sub-solar,metal poor (𝑍 = 0.004) stellar population, a moderately metal
6 The demonstrative binary sample used for the figures and numerical valuesin the main text.
MNRAS 000, 1–?? (2021)
4 S. Mandhai et al.
7.0 7.5 8.0 8.5 9.0 9.5 10.0log10( merge [yr])
0.00
0.05
0.10
0.15
0.20
0.25
0.30
Rela
tive
Frac
tion
0.76
NSNS [Z=0.004]BPASS/Bray (11362)BPASS/Hobbs (753)COSMIC (36619)
7.0 7.5 8.0 8.5 9.0 9.5 10.0log10( merge [yr])
0.00
0.05
0.10
0.15
0.20
0.25
0.30
Rela
tive
Frac
tion
0.58
BHNS [Z=0.004]BPASS/Bray (327)BPASS/Hobbs (100)COSMIC (255)
7.0 7.5 8.0 8.5 9.0 9.5 10.0log10( merge [yr])
0.00
0.05
0.10
0.15
0.20
0.25
0.30
Rela
tive
Frac
tion
0.74
NSNS [Z=0.008]BPASS/Bray (7401)BPASS/Hobbs (495)COSMIC (27043)
7.0 7.5 8.0 8.5 9.0 9.5 10.0log10( merge [yr])
0.00
0.05
0.10
0.15
0.20
0.25
0.30
Rela
tive
Frac
tion
0.65
BHNS [Z=0.008]BPASS/Bray (390)BPASS/Hobbs (64)COSMIC (74)
7.0 7.5 8.0 8.5 9.0 9.5 10.0log10( merge [yr])
0.00
0.05
0.10
0.15
0.20
0.25
0.30
Rela
tive
Frac
tion
0.37
NSNS [Z=0.02]BPASS/Bray (8113)BPASS/Hobbs (419)COSMIC (27083)
7.0 7.5 8.0 8.5 9.0 9.5 10.0log10( merge [yr])
0.00
0.05
0.10
0.15
0.20
0.25
0.30
Rela
tive
Frac
tion
0.61
BHNS [Z=0.02]BPASS/Bray (46)BPASS/Hobbs (9)COSMIC (1632)
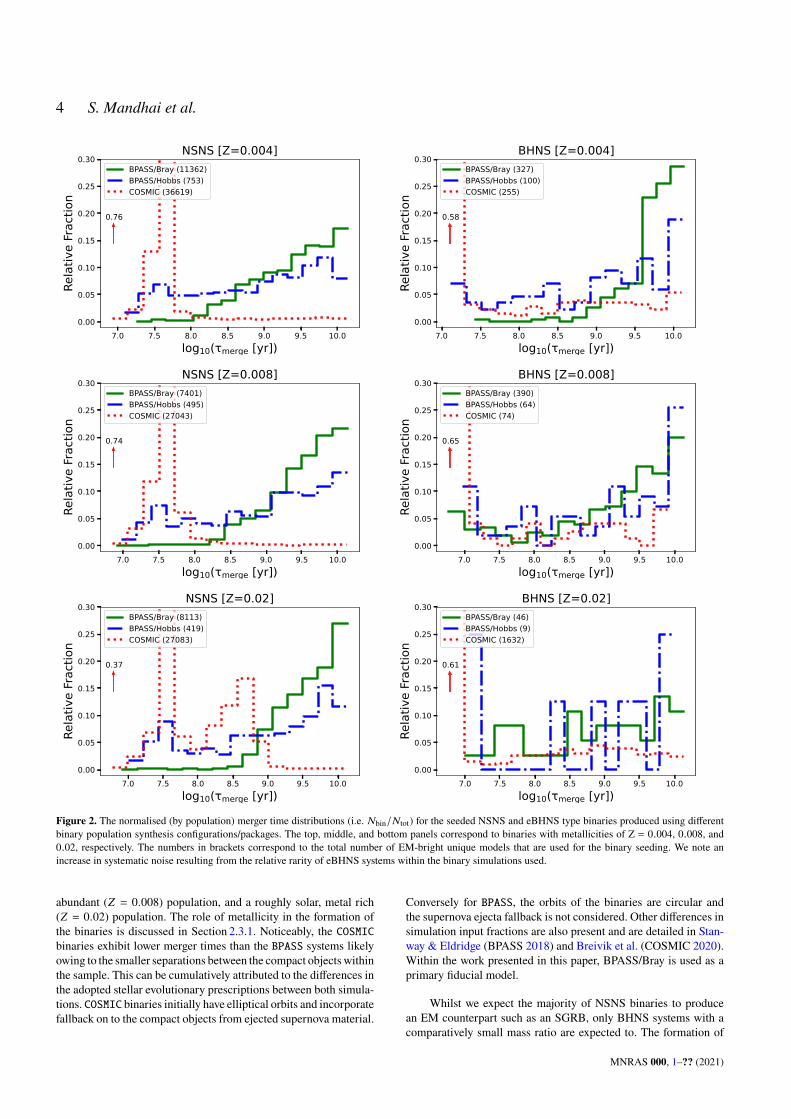
Figure 2. The normalised (by population) merger time distributions (i.e. 𝑁bin/𝑁tot) for the seeded NSNS and eBHNS type binaries produced using differentbinary population synthesis configurations/packages. The top, middle, and bottom panels correspond to binaries with metallicities of Z = 0.004, 0.008, and0.02, respectively. The numbers in brackets correspond to the total number of EM-bright unique models that are used for the binary seeding. We note anincrease in systematic noise resulting from the relative rarity of eBHNS systems within the binary simulations used.
abundant (𝑍 = 0.008) population, and a roughly solar, metal rich(𝑍 = 0.02) population. The role of metallicity in the formation ofthe binaries is discussed in Section 2.3.1. Noticeably, the COSMICbinaries exhibit lower merger times than the BPASS systems likelyowing to the smaller separations between the compact objectswithinthe sample. This can be cumulatively attributed to the differences inthe adopted stellar evolutionary prescriptions between both simula-tions. COSMIC binaries initially have elliptical orbits and incorporatefallback on to the compact objects from ejected supernova material.
Conversely for BPASS, the orbits of the binaries are circular andthe supernova ejecta fallback is not considered. Other differences insimulation input fractions are also present and are detailed in Stan-way & Eldridge (BPASS 2018) and Breivik et al. (COSMIC 2020).Within the work presented in this paper, BPASS/Bray is used as aprimary fiducial model.
Whilst we expect the majority of NSNS binaries to producean EM counterpart such as an SGRB, only BHNS systems with acomparatively small mass ratio are expected to. The formation of
MNRAS 000, 1–?? (2021)
Compact binary merger hosts and environments 5
0 100 200 300 400 500 600vsys [km/s]
0.00
0.05
0.10
0.15
0.20
0.25
0.30
Bina
ry P
opul
atio
n Fr
actio
n
NSNSBPASS/BrayBPASS/HobbsCOSMIC
0 100 200 300 400 500 600vsys [km/s]
0.00
0.05
0.10
0.15
0.20
0.25
0.30
Bina
ry P
opul
atio
n Fr
actio
n
BHNSBPASS/BrayBPASS/HobbsCOSMIC
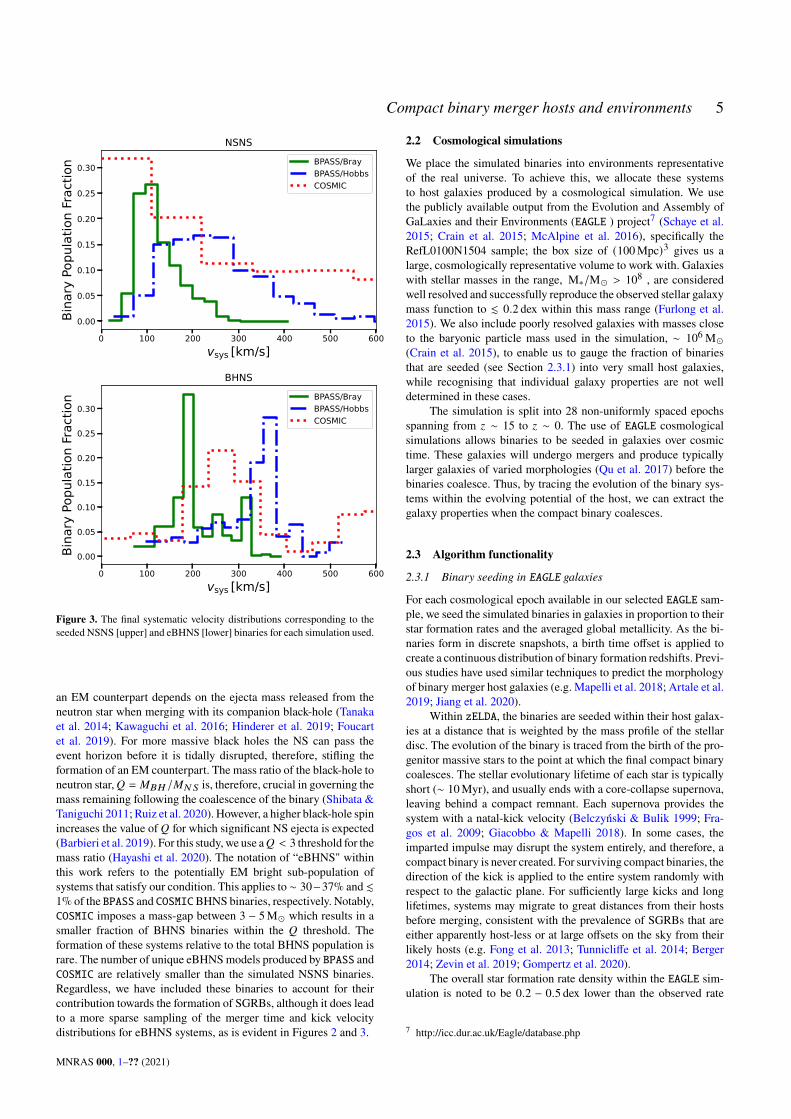
Figure 3. The final systematic velocity distributions corresponding to theseeded NSNS [upper] and eBHNS [lower] binaries for each simulation used.
an EM counterpart depends on the ejecta mass released from theneutron star when merging with its companion black-hole (Tanakaet al. 2014; Kawaguchi et al. 2016; Hinderer et al. 2019; Foucartet al. 2019). For more massive black holes the NS can pass theevent horizon before it is tidally disrupted, therefore, stifling theformation of an EM counterpart. The mass ratio of the black-hole toneutron star,𝑄 = 𝑀𝐵𝐻 /𝑀𝑁𝑆 is, therefore, crucial in governing themass remaining following the coalescence of the binary (Shibata &Taniguchi 2011; Ruiz et al. 2020). However, a higher black-hole spinincreases the value of 𝑄 for which significant NS ejecta is expected(Barbieri et al. 2019). For this study, we use a𝑄 < 3 threshold for themass ratio (Hayashi et al. 2020). The notation of “eBHNS" withinthis work refers to the potentially EM bright sub-population ofsystems that satisfy our condition. This applies to ∼ 30−37% and .1% of the BPASS and COSMICBHNS binaries, respectively. Notably,COSMIC imposes a mass-gap between 3 − 5M� which results in asmaller fraction of BHNS binaries within the 𝑄 threshold. Theformation of these systems relative to the total BHNS population israre. The number of unique eBHNSmodels produced by BPASS andCOSMIC are relatively smaller than the simulated NSNS binaries.Regardless, we have included these binaries to account for theircontribution towards the formation of SGRBs, although it does leadto a more sparse sampling of the merger time and kick velocitydistributions for eBHNS systems, as is evident in Figures 2 and 3.
2.2 Cosmological simulations
We place the simulated binaries into environments representativeof the real universe. To achieve this, we allocate these systemsto host galaxies produced by a cosmological simulation. We usethe publicly available output from the Evolution and Assembly ofGaLaxies and their Environments (EAGLE ) project7 (Schaye et al.2015; Crain et al. 2015; McAlpine et al. 2016), specifically theRefL0100N1504 sample; the box size of (100Mpc)3 gives us alarge, cosmologically representative volume to work with. Galaxieswith stellar masses in the range, M∗/M� > 108 , are consideredwell resolved and successfully reproduce the observed stellar galaxymass function to . 0.2 dex within this mass range (Furlong et al.2015). We also include poorly resolved galaxies with masses closeto the baryonic particle mass used in the simulation, ∼ 106M�(Crain et al. 2015), to enable us to gauge the fraction of binariesthat are seeded (see Section 2.3.1) into very small host galaxies,while recognising that individual galaxy properties are not welldetermined in these cases.
The simulation is split into 28 non-uniformly spaced epochsspanning from 𝑧 ∼ 15 to 𝑧 ∼ 0. The use of EAGLE cosmologicalsimulations allows binaries to be seeded in galaxies over cosmictime. These galaxies will undergo mergers and produce typicallylarger galaxies of varied morphologies (Qu et al. 2017) before thebinaries coalesce. Thus, by tracing the evolution of the binary sys-tems within the evolving potential of the host, we can extract thegalaxy properties when the compact binary coalesces.
2.3 Algorithm functionality
2.3.1 Binary seeding in EAGLE galaxies
For each cosmological epoch available in our selected EAGLE sam-ple, we seed the simulated binaries in galaxies in proportion to theirstar formation rates and the averaged global metallicity. As the bi-naries form in discrete snapshots, a birth time offset is applied tocreate a continuous distribution of binary formation redshifts. Previ-ous studies have used similar techniques to predict the morphologyof binary merger host galaxies (e.g. Mapelli et al. 2018; Artale et al.2019; Jiang et al. 2020).
Within zELDA, the binaries are seeded within their host galax-ies at a distance that is weighted by the mass profile of the stellardisc. The evolution of the binary is traced from the birth of the pro-genitor massive stars to the point at which the final compact binarycoalesces. The stellar evolutionary lifetime of each star is typicallyshort (∼ 10Myr), and usually ends with a core-collapse supernova,leaving behind a compact remnant. Each supernova provides thesystem with a natal-kick velocity (Belczyński & Bulik 1999; Fra-gos et al. 2009; Giacobbo & Mapelli 2018). In some cases, theimparted impulse may disrupt the system entirely, and therefore, acompact binary is never created. For surviving compact binaries, thedirection of the kick is applied to the entire system randomly withrespect to the galactic plane. For sufficiently large kicks and longlifetimes, systems may migrate to great distances from their hostsbefore merging, consistent with the prevalence of SGRBs that areeither apparently host-less or at large offsets on the sky from theirlikely hosts (e.g. Fong et al. 2013; Tunnicliffe et al. 2014; Berger2014; Zevin et al. 2019; Gompertz et al. 2020).
The overall star formation rate density within the EAGLE sim-ulation is noted to be 0.2 − 0.5 dex lower than the observed rate
7 http://icc.dur.ac.uk/Eagle/database.php
MNRAS 000, 1–?? (2021)
6 S. Mandhai et al.
density (Furlong et al. 2015). For the purpose of this study, we as-sume the star formation in different galaxy types reflects the realuniverse (Madau&Dickinson 2014), despite the offset in the overallnormalisation. We stack the ordered EAGLE galactic star formationrates within a snapshot to obtain the cumulative star formation rate(CSFR). For each binary, a random value between zero and themax-imum CSFR is then selected, and the corresponding galaxy is takenas the host. Galaxies with higher star formation rates, are therefore,more likely to host binaries. We use three sub-samples for the syn-thesised binaries. These consist of a low-metallicity (𝑍 = 0.004),an intermediate-metallicity (𝑍 = 0.008), and a high-metallicity(𝑍 = 0.02) population (see Section 2.1.2). The binaries are seededinto galaxies based on the averaged star forming gas metallicity,𝑍gal. This quantity is allocated to bins corresponding to the three bi-nary metallicity populations used. An associated binary from thesepopulations is then selected and seeded into a binned host galaxy,i.e., low-met binaries are seeded in galaxies with 𝑍gal < 0.006,intermediate binaries in galaxies with 0.006 6 𝑍gal 6 0.014, andhigh metallicity binaries in 𝑍gal > 0.014. The binaries are drawnaccording to a Kroupa IMF (Kroupa 2001) profile for the primarystellar component.
Figure 2 shows the population density of the seeded binaries asa function of 𝜏merge, the total system lifetime (i.e. stellar evolutionplus in-spiral lifetimes), for all metallicities. The relative fractionof binaries merging with a given lifespan varies between the type(i.e. NSNS or eBHNS) and the metallicity of the binary. The totalnatal-kick velocity distribution of the seeded NSNS and eBHNSbinaries is shown in Figure 3.
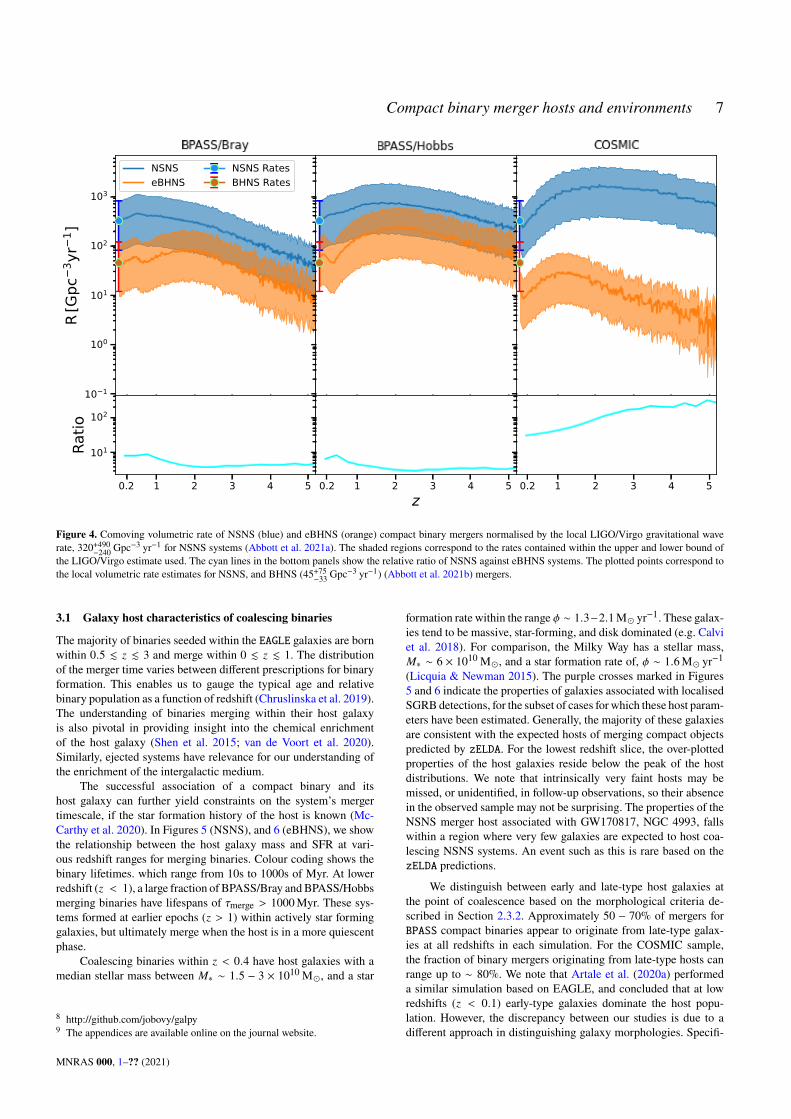
For the different binary evolution codes, the rate of mergingcompact binaries as a function of redshift is shown in Figure 4. Theserates have been normalised using the LIGO/Virgo O3 estimate of320+490−240 Gpc
−3 yr−1 for the merger rate density of NSNS systems(Abbott et al. 2021a). TheNSNSmerger rate density always exceedsthat of EM-bright eBHNS, but the ratio varies significantly betweenour three simulations, as demonstrated by the cyan lines in the figure.
2.3.2 Orbital evolution of kicked compact binaries within theirhost potentials
For binaries that remain intact, we trace their orbital evolutionwithintheir host galaxies. The morphology and potential of the galaxyevolves according to its descendant in the following EAGLE snap-shots encountered during the lifetime of the orbit. The gravitationalpotential is modelled as a static well until the next snapshot, whereit is updated if the host evolves or merges.
In our study, the global potential is composed of three contrib-utors, a Navarro-Frenk-White (NFW; Navarro et al. 1996) profile forthe dark matter halo, and two Miyamoto-Nagai (MN) (Miyamoto& Nagai 1975) potentials for the stellar and gas bodies. The pre-scriptions for the galactic potential are scaled accordingly by thecomponent masses for the EAGLE galaxies. The potential for theNFW profile is described by Equation 1. The EAGLE simulationprovides particle information corresponding to the galaxies whichcan be used to construct the gravitational potentials. However, thiswould be significantly more computationally expensive with littlepractical gain. As such, we do not expect a significant differencebetween the two methods when averaged over the total populationof galaxies.
Φ(𝑟) = −4𝜋𝐺𝜌0𝑅
3𝑠
𝑟ln
(1 + 𝑟
𝑅𝑠
), (1)
where 𝐺 is the gravitational constant, 𝜌0 is the central density, 𝑅𝑠
the scale radius, and 𝑟 is the radius from the central axis of thegalaxy. 𝑅𝑠 is fixed by requiring that the half mass radius for the halomatches that reported in EAGLE. The MN potential on the otherhand, is constructed with the following general prescription,
Φ(𝑟, 𝑧) = −𝐺𝑀
[𝑟2 + (𝑎 + (𝑧2 + 𝑏2)1/2)2]1/2, (2)
where 𝑧 is the height relative to the galactic plane, 𝑎 is the scalelength, 𝑏 is the scale height. Increasing the ratio of 𝑏/𝑎 dictateswhether the geometry of the galaxy is more disc-like (𝑏 < 𝑎) ormore spheroidal (𝑏 > 𝑎).
The MN potential (see Equation 2) for the stellar distributionsare created assuming a non-flat potential. We can approximate thescale length, 𝑎, by applying a similar minimisation for the half massof the component as seen with the estimates of 𝑅𝑠 . The scale height,𝑏, is approximated using the relation, 𝑏 = 𝑎[(1 − 𝜖)/𝜖]2, where 𝜖is the stellar ellipticity for the EAGLE galaxy. A Milky Way likegalaxy has an approximate scale length ratio of 𝑏/𝑎 ∼ 0.1.
The morphological structure can be quantified using the 𝛼𝑚 =
(𝜖2+1−𝑇)/2 diagnostic described in Thob et al. (2019), where𝑇 isthe triaxiality of the galaxy. We broadly distinguish early-/late-typemorphologies based on a fiducial value of 𝛼. Galaxies with 𝛼𝑚 60.4, are assumed to be early-type galaxies, with late-types assumedto have 𝛼𝑚 > 0.4. We note that this is an essentially structuraldefinition, and at higher redshifts other typical characteristics ofearly-type galaxies, such as low specific star formation rate, willnot apply. For galaxies where 𝛼𝑚 can not be determined due tothe absence of the required shape parameters, we use the red/bluesequence criterion discussed in Correa et al. (2017). This affects. 5% of the early-type galaxy classifications made.
The effects of galaxy mergers on the binary are approximatedwithin zELDA. If the host merges with a larger galactic dark matterhalo, we apply a pseudo-kick equivalent to the maximum circularvelocity of the major halo in a random direction to approximatelyaccount for the velocity offset entailed in switching to the new ori-gin. Tidal interactions with the central super-massive black-holes ofgalaxies can also result in the disruption of binaries (Amaro-Seoaneet al. 2012; Mainetti et al. 2016). Similar effects may also arise frominteractions with nearby gravitating bodies such as satellite galax-ies. However, in the analysis underlined in this paper, we do notconsider the effects of the central black-hole or nearby neighbour-ing galaxies. As such, the resulting gravitational intricacies such asthese are beyond the scope of this paper.
The orbital and galaxy dynamic prescriptions that are used inzELDA incorporate functionality from the GalPy 8 Python package,(Bovy 2015) using the relevant mass, radius, and shape propertiesfrom the EAGLE simulation.
3 HOST GALAXIES OF COMPACT BINARY MERGERS
Table 1 shows the host galaxy demographics broken down for eachbinary simulation. Figures 5, 6, 8–14 and Tables 2, 3 correspondto BPASS/Bray binaries. The equivalent results for BPASS/Hobbsand COSMIC are found in Appendices9 A and B, respectively.
MNRAS 000, 1–?? (2021)
Compact binary merger hosts and environments 7
10 1
100
101
102
103
R[G
pc3 y
r1 ]
NSNSeBHNS
NSNS RatesBHNS Rates
0.2 1 2 3 4 5
101
102
Ratio
0.2 1 2 3 4 5z
0.2 1 2 3 4 5
Figure 4. Comoving volumetric rate of NSNS (blue) and eBHNS (orange) compact binary mergers normalised by the local LIGO/Virgo gravitational waverate, 320+490−240 Gpc
−3 yr−1 for NSNS systems (Abbott et al. 2021a). The shaded regions correspond to the rates contained within the upper and lower bound ofthe LIGO/Virgo estimate used. The cyan lines in the bottom panels show the relative ratio of NSNS against eBHNS systems. The plotted points correspond tothe local volumetric rate estimates for NSNS, and BHNS (45+75−33 Gpc
−3 yr−1) (Abbott et al. 2021b) mergers.
3.1 Galaxy host characteristics of coalescing binaries
The majority of binaries seeded within the EAGLE galaxies are bornwithin 0.5 . 𝑧 . 3 and merge within 0 . 𝑧 . 1. The distributionof the merger time varies between different prescriptions for binaryformation. This enables us to gauge the typical age and relativebinary population as a function of redshift (Chruslinska et al. 2019).The understanding of binaries merging within their host galaxyis also pivotal in providing insight into the chemical enrichmentof the host galaxy (Shen et al. 2015; van de Voort et al. 2020).Similarly, ejected systems have relevance for our understanding ofthe enrichment of the intergalactic medium.
The successful association of a compact binary and itshost galaxy can further yield constraints on the system’s mergertimescale, if the star formation history of the host is known (Mc-Carthy et al. 2020). In Figures 5 (NSNS), and 6 (eBHNS), we showthe relationship between the host galaxy mass and SFR at vari-ous redshift ranges for merging binaries. Colour coding shows thebinary lifetimes. which range from 10s to 1000s of Myr. At lowerredshift (𝑧 < 1), a large fraction of BPASS/Bray andBPASS/Hobbsmerging binaries have lifespans of 𝜏merge > 1000Myr. These sys-tems formed at earlier epochs (𝑧 > 1) within actively star forminggalaxies, but ultimately merge when the host is in a more quiescentphase.
Coalescing binaries within 𝑧 < 0.4 have host galaxies with amedian stellar mass between 𝑀∗ ∼ 1.5 − 3 × 10¹⁰M� , and a star
8 http://github.com/jobovy/galpy9 The appendices are available online on the journal website.
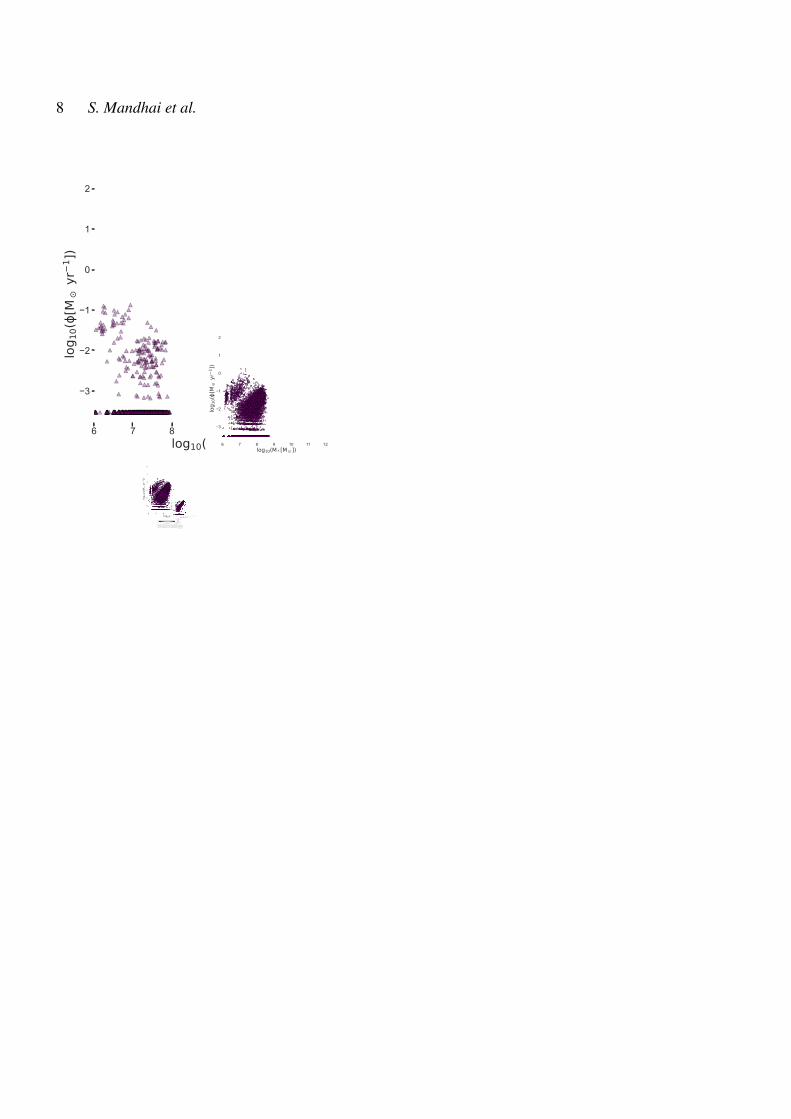
formation rate within the range 𝜙 ∼ 1.3−2.1M� yr−1. These galax-ies tend to be massive, star-forming, and disk dominated (e.g. Calviet al. 2018). For comparison, the Milky Way has a stellar mass,𝑀∗ ∼ 6 × 10¹⁰M� , and a star formation rate of, 𝜙 ∼ 1.6M� yr−1(Licquia & Newman 2015). The purple crosses marked in Figures5 and 6 indicate the properties of galaxies associated with localisedSGRBdetections, for the subset of cases for which these host param-eters have been estimated. Generally, the majority of these galaxiesare consistent with the expected hosts of merging compact objectspredicted by zELDA. For the lowest redshift slice, the over-plottedproperties of the host galaxies reside below the peak of the hostdistributions. We note that intrinsically very faint hosts may bemissed, or unidentified, in follow-up observations, so their absencein the observed sample may not be surprising. The properties of theNSNS merger host associated with GW170817, NGC 4993, fallswithin a region where very few galaxies are expected to host coa-lescing NSNS systems. An event such as this is rare based on thezELDA predictions.
We distinguish between early and late-type host galaxies atthe point of coalescence based on the morphological criteria de-scribed in Section 2.3.2. Approximately 50 − 70% of mergers forBPASS compact binaries appear to originate from late-type galax-ies at all redshifts in each simulation. For the COSMIC sample,the fraction of binary mergers originating from late-type hosts canrange up to ∼ 80%. We note that Artale et al. (2020a) performeda similar simulation based on EAGLE, and concluded that at lowredshifts (𝑧 < 0.1) early-type galaxies dominate the host popu-lation. However, the discrepancy between our studies is due to adifferent approach in distinguishing galaxy morphologies. Specifi-
MNRAS 000, 1–?? (2021)
8 S. Mandhai et al.
6 7 8 9 10 11 12log10(M * [M ])
3
2
1
0
1
2
log 1
0([M
yr1 ]
)
EARLY-TYPE : 40.88 %LATE-TYPE : 59.12 %-----------------------------------------------HOST-LESS : 15.49 %FAINT : 1.52 %
0
5
10
P[%
]
0 5 10P [%]
0.00 z < 0.40
6 7 8 9 10 11 12log10(M * [M ])
3
2
1
0
1
2
log 1
0([M
yr1 ]
)
EARLY-TYPE : 32.79 %LATE-TYPE : 67.21 %-----------------------------------------------HOST-LESS : 18.02 %FAINT : 4.43 %
0
5
10
P[%
]0 5 10
P [%]
0.40 z < 1.00
6 7 8 9 10 11 12log10(M * [M ])
3
2
1
0
1
2
log 1
0([M
yr1 ]
)
EARLY-TYPE : 31.50 %LATE-TYPE : 68.50 %-----------------------------------------------HOST-LESS : 24.42 %FAINT : 11.29 %
0
5
10
P[%
]
0 5P [%]
1.00 z < 2.00
6 7 8 9 10 11 12log10(M * [M ])
3
2
1
0
1
2
log 1
0([M
yr1 ]
)
EARLY-TYPE : 41.85 %LATE-TYPE : 58.15 %-----------------------------------------------HOST-LESS : 35.60 %FAINT : 24.84 %
0
5
P[%
]
0 5P [%]
2.00 z < 3.60
0.0 0.5 1.0 1.5 2.0 2.5 3.0 3.5 4.0log10( [Myr])
Resolved LimitFaint Galaxies [1 Region]Faint GalaxiesEjected BinariesHost GalaxiesSGRB HostsNGC 4993
merge > 1000 Myr 1000 merge > 100 Myr
merge 100 MyrHost-less
Figure 5. [BPASS/Bray - NSNS] The star formation rate (𝜙) against stellar mass (M∗) evolution of NSNS merger hosts. In each panel, the point coloursrepresent the binary merger time. The vertical dashed line indicates the resolved threshold for EAGLE galaxies (see Section 2.2). The hosts of ejected binariesare represented in grey. Galaxies that are considered observationally faint (apparent magnitude 𝐻 > 26) are depicted as purple triangles, the indicated hatchedregion within 1𝜎 deviation from the mean 𝜙 and M∗ of this population. The purple crosses indicate the host properties of localised SGRBs and their 𝜙 andM∗ uncertainties, (Berger 2014; Leibler & Berger 2010). The cyan point corresponds to the galaxy (NGC 4993) that is the known of host of SGRB 170817A(Levan et al. 2017; Im et al. 2017) - the EM counterpart of the binary neutron star GW detection, GW170817. In each panel, the percentage of predictedlate/early merger hosts are indicated. The estimated total population of host-less binaries (see Section 3.2.2) and faint hosts are also stated.
MNRAS 000, 1–?? (2021)
Compact binary merger hosts and environments 9
6 7 8 9 10 11 12log10(M * [M ])
3
2
1
0
1
2
log 1
0([M
yr1 ]
)
EARLY-TYPE : 45.18 %LATE-TYPE : 54.82 %-----------------------------------------------HOST-LESS : 26.23 %FAINT : 1.55 %
0
5
10
P[%
]
0 5 10P [%]
0.00 z < 0.40
6 7 8 9 10 11 12log10(M * [M ])
3
2
1
0
1
2
log 1
0([M
yr1 ]
)
EARLY-TYPE : 38.53 %LATE-TYPE : 61.47 %-----------------------------------------------HOST-LESS : 33.09 %FAINT : 6.13 %
0
5
P[%
]0 5 10
P [%]
0.40 z < 1.00
6 7 8 9 10 11 12log10(M * [M ])
3
2
1
0
1
2
log 1
0([M
yr1 ]
)
EARLY-TYPE : 41.87 %LATE-TYPE : 58.13 %-----------------------------------------------HOST-LESS : 33.40 %FAINT : 9.85 %
0
5
P[%
]
0 5P [%]
1.00 z < 2.00
6 7 8 9 10 11 12log10(M * [M ])
3
2
1
0
1
2
log 1
0([M
yr1 ]
)
EARLY-TYPE : 49.47 %LATE-TYPE : 50.53 %-----------------------------------------------HOST-LESS : 22.33 %FAINT : 9.20 %
0
5
P[%
]
0 5 10P [%]
2.00 z < 3.60
0.0 0.5 1.0 1.5 2.0 2.5 3.0 3.5 4.0log10( [Myr])
Resolved LimitFaint Galaxies [1 Region]Faint GalaxiesEjected BinariesHost GalaxiesSGRB HostsNGC 4993
merge > 1000 Myr 1000 merge > 100 Myr
merge 100 MyrHost-less
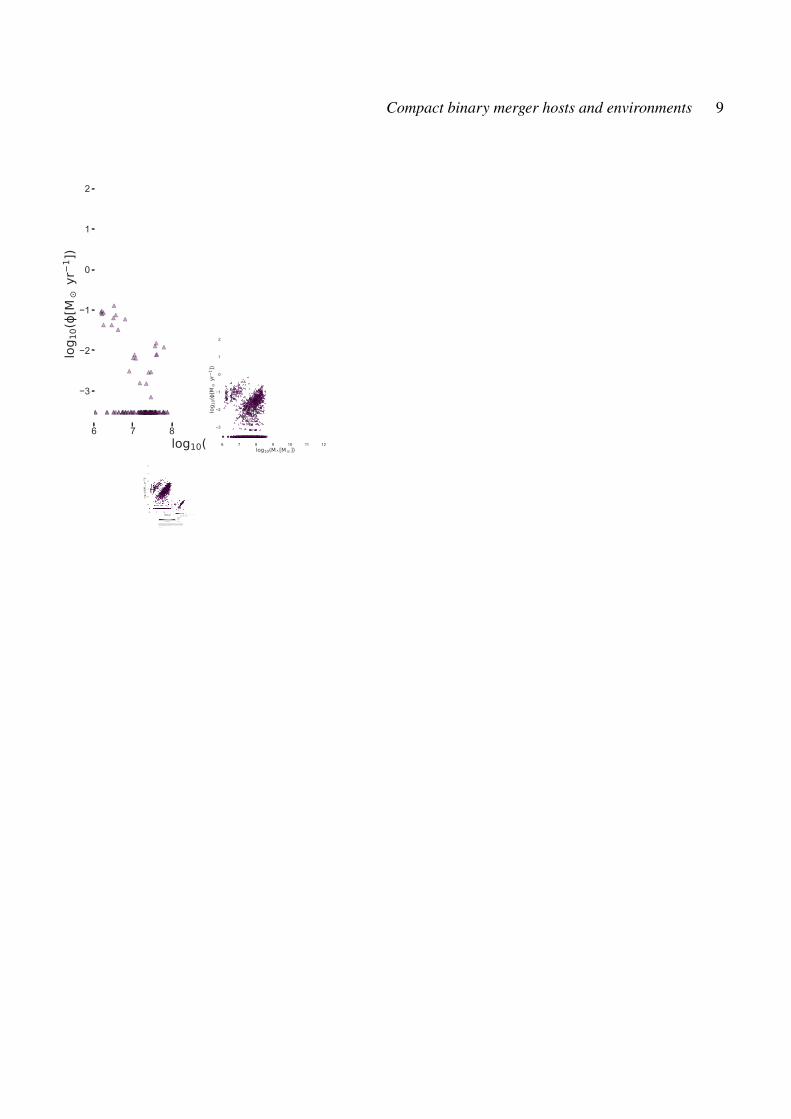
Figure 6. [BPASS/Bray - eBHNS] The star formation rate (𝜙) against stellar mass (M∗) evolution of eBHNS merger hosts. In each panel, the point coloursrepresent the binary merger time. The vertical dashed line indicates the resolved threshold for EAGLE galaxies (see Section 2.2). The hosts of ejected binariesare represented in grey. Galaxies that are considered observationally faint (apparent magnitude 𝐻 > 26) are depicted as purple triangles, the indicated hatchedregion within 1𝜎 deviation from the mean 𝜙 and M∗ of this population. The purple crosses indicate the host properties of localised SGRBs and their 𝜙 andM∗ uncertainties, (Berger 2014; Leibler & Berger 2010). In each panel, the percentage of predicted late/early merger hosts are indicated. The estimated totalpopulation of host-less binaries (see Section 3.2.2) and faint hosts are also stated.
MNRAS 000, 1–?? (2021)
10 S. Mandhai et al.
cally, they define early-type galaxies to have specific star formationrates, SFR/𝑀∗ < 10−10 yr−1. This means that many galaxies thatwe classify as late-type disks at low redshifts are considered early-types within their work based on their star formation rate criterion.
A non-negligible fraction of these binaries are shown to mi-grate to distances where they are considered to be host-less (elab-orated on in Section 3.2.2); the host galaxies for these systems aredepicted as grey squares in Figures 5 and 6. The figures also indicategalaxies that could be missed with an observational follow-up, asthey are faint (H>26; purple triangles). Small spiral/dwarf galax-ies, and more distant intrinsically brighter galaxies, are likely tofall into this category due to their low apparent luminosity. Theoverall galaxy demographics including the contribution of host-lesssystems is shown in Table 1.
3.2 Projected galactocentric distance at merger
3.2.1 The impact parameter
By following the evolution of binaries from their birth to theircoalescence, we are able to observe the overall migration distanceduring their lifetimes. In our simulations, these are turned intoprojected on-sky distances by choosing randomorientations for eachhost galaxy and calculating the corresponding impact parameter.
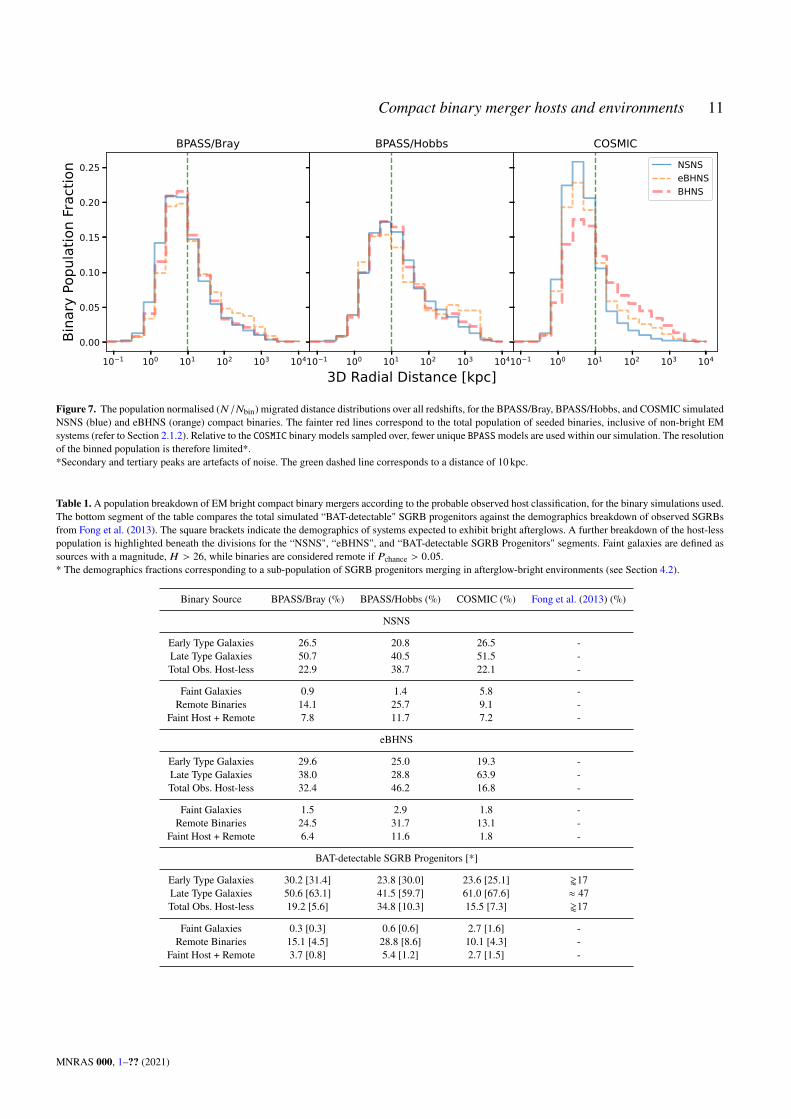
Figure 7 shows the global distribution of the migration dis-tances that the NSNS and eBHNS mergers exhibit for the var-ious population synthesis codes used. We find ∼ 60 − 70% ofNSNS and eBHNS mergers occur within . 10 kpc (indicated bythe vertical dashed line) from the centre of their host galaxies,for BPASS/Bray binaries. For BPASS/Hobbs binaries, ∼ 50% ofbinaries are retained within this distance. For COSMIC binaries,∼ 70 − 80% of systems merge within this distance. In extremecases, we find . 1% of these binaries merging at galactocentric dis-tances > 1Mpc for BPASS/Bray and COSMIC binaries, and . 5%for the BPASS/Hobbs population.
Figures 8 and 9 show the impact parameter distributions, wherethe impact parameter corresponds to the projected on-sky separa-tions, split by the host galaxy characteristics (stellar mass and starformation rate) and redshift. Generally, binaries with high velocitieshave a higher likelihood of overcoming the gravitational potential oftheir host galaxy and thus travelling further before coalescing. Forlow mass galaxies such as small disk or dwarf galaxies, the likeli-hood increases as the gravitational potential is weaker and therefore,easier to escape. As such, these galaxies are expected to retain veryfew binaries. We see this for both NSNS and eBHNS systems in thetop panels of both figures.
For binaries merging in larger galaxies such as large spirals(middle and bottom panels) or ellipticals (bottom panel), the co-alescence is likely to occur within ∼ 10 kpc and therefore, closeto or within the host galaxy. Tables 2 and 3, show the fractions ofbinaries merging in each panel per redshift slice, corresponding tothe aforementioned figures.
3.2.2 Chance alignment of binaries and their host galaxies
A binary is considered host-less if the offset from its host is likelyto be observationally registered as a chance alignment, with a prob-ability, 𝑃chance > 0.05 (e.g. Fong et al. 2013) and/or if the host isfainter than 𝐻 > 26. The 𝑃chance quantity is calculated using theprescription for chance alignments from Bloom et al. (2002) anddefined as
𝑃chance = 1 − 𝑒−[ , (3)
where
[ = 𝜋𝑟2𝑖 𝜎(6 𝑚). (4)
Here, 𝑟𝑖 is an angular distance that is determined based on the offsetof a binary merger relative to the centre of its host, and the sizeof the galaxy. Specifically, if a binary merger occurs at a projectedradius less than twice the projected half mass stellar radius (𝑅∗) ofits host galaxy, it is assumed to be “within" the host and 𝑟𝑖 is set to𝑟𝑖 = 2𝑅∗. For mergers occurring further out from their host galaxycentre 𝑟𝑖 =
√︃𝑅20 + 4𝑅
2∗ , where 𝑅0 is the angular offset between the
centre of the host and the site of the merger. 𝜎(< 𝑚) is the meansurface density of galaxies brighter than the 𝐻-band magnitude (𝑚)of the host galaxy.
Our procedure differs slightly from the original Bloom et al.(2002) prescription in that we use the projected half-mass stellarradius in place of the half-light radius; and we use 𝐻-band ratherthan 𝑟-band magnitudes as early-type galaxies in particular tend tobecome rapidly fainter in the 𝑟-band at 𝑧 & 1 due to the redshifting ofthe 4000Åbreak through the filter passband.𝐻-band number countsfor field galaxies are taken from Metcalfe et al. (2006); Frith et al.(2006), and we use a polynomial interpolation between the valuesto extract the mean surface density for any 𝐻-band magnitude. Inthe context of our simulations, we use the given apparent magnitudeof the host galaxies reported by EAGLE.
The 𝐻 > 26 criterion accounts for hosts that appear faint(particularly those at higher redshift) and therefore are likely to bemissedwhen following up SGRBs, resulting in thembeing classifiedas host-less by observers. Recognising the existence of these casesis essential when accounting for potential observational biases thatcan arise with SGRB samples.
The total fraction of NSNS and eBHNS that will appear tobe host-less is shown in Table 1 for each binary simulation used. Abreakdown of the fraction of binaries that fulfil our host-less criteriais shown for each panel of Figures 8 and 9within the second sectionsof Tables 2 and 3.
4 SIMULATING OBSERVATIONAL SELECTIONEFFECTS
4.1 Luminosity function and selection
We produce a simulated population of observable SGRBs assumingthe broken power-law intrinsic luminosity function for SGRB peakluminosities from Paul (2018),
Φ(𝐿) ∝
(
𝐿1052.18erg/s
)−0.5𝐿 6 1052.18erg/s,(
𝐿1052.18erg/s
)−1.86𝐿 > 1052.18erg/s.
(5)
A broken power-law is consistent with the findings in Wander-man & Piran (2015); Ghirlanda et al. (2016); alternatively, seeYonetoku et al. (2014); Sun et al. (2015) for examples of sin-gle power-law luminosity functions. As the distribution of in-trinsically low-luminosity SGRBs is poorly constrained, we fixthe cut-off at 1049 erg s−1 (Mogushi et al. 2019). As such, theluminosities, 𝐿, are drawn from a distribution within the range1049 6 𝐿 6 1055 erg s−1. The ascribed SGRB luminosity has nodependence on the binary characteristics, since we lack any theo-retical or observational mapping that would motivate this. Whilstsome SGRBs, such as GRB 170817A, exhibit luminosities belowour minimum, these events are expected to account for a small frac-tion of the cumulative observed population (Tan & Yu 2020). We
MNRAS 000, 1–?? (2021)
Compact binary merger hosts and environments 11
10 1 100 101 102 103 104
0.00
0.05
0.10
0.15
0.20
0.25
Bina
ry P
opul
atio
n Fr
actio
n
BPASS/Bray
10 1 100 101 102 103 104
3D Radial Distance [kpc]
BPASS/Hobbs
10 1 100 101 102 103 104
COSMICNSNSeBHNSBHNS
Figure 7. The population normalised (𝑁 /𝑁bin) migrated distance distributions over all redshifts, for the BPASS/Bray, BPASS/Hobbs, and COSMIC simulatedNSNS (blue) and eBHNS (orange) compact binaries. The fainter red lines correspond to the total population of seeded binaries, inclusive of non-bright EMsystems (refer to Section 2.1.2). Relative to the COSMIC binary models sampled over, fewer unique BPASSmodels are used within our simulation. The resolutionof the binned population is therefore limited*.*Secondary and tertiary peaks are artefacts of noise. The green dashed line corresponds to a distance of 10 kpc.
Table 1. A population breakdown of EM bright compact binary mergers according to the probable observed host classification, for the binary simulations used.The bottom segment of the table compares the total simulated “BAT-detectable" SGRB progenitors against the demographics breakdown of observed SGRBsfrom Fong et al. (2013). The square brackets indicate the demographics of systems expected to exhibit bright afterglows. A further breakdown of the host-lesspopulation is highlighted beneath the divisions for the “NSNS", “eBHNS", and “BAT-detectable SGRB Progenitors" segments. Faint galaxies are defined assources with a magnitude, 𝐻 > 26, while binaries are considered remote if 𝑃chance > 0.05.* The demographics fractions corresponding to a sub-population of SGRB progenitors merging in afterglow-bright environments (see Section 4.2).
Binary Source BPASS/Bray (%) BPASS/Hobbs (%) COSMIC (%) Fong et al. (2013) (%)
NSNS
Early Type Galaxies 26.5 20.8 26.5 -Late Type Galaxies 50.7 40.5 51.5 -Total Obs. Host-less 22.9 38.7 22.1 -
Faint Galaxies 0.9 1.4 5.8 -Remote Binaries 14.1 25.7 9.1 -Faint Host + Remote 7.8 11.7 7.2 -
eBHNS
Early Type Galaxies 29.6 25.0 19.3 -Late Type Galaxies 38.0 28.8 63.9 -Total Obs. Host-less 32.4 46.2 16.8 -
Faint Galaxies 1.5 2.9 1.8 -Remote Binaries 24.5 31.7 13.1 -Faint Host + Remote 6.4 11.6 1.8 -
BAT-detectable SGRB Progenitors [*]
Early Type Galaxies 30.2 [31.4] 23.8 [30.0] 23.6 [25.1] '17Late Type Galaxies 50.6 [63.1] 41.5 [59.7] 61.0 [67.6] ≈ 47Total Obs. Host-less 19.2 [5.6] 34.8 [10.3] 15.5 [7.3] '17
Faint Galaxies 0.3 [0.3] 0.6 [0.6] 2.7 [1.6] -Remote Binaries 15.1 [4.5] 28.8 [8.6] 10.1 [4.3] -Faint Host + Remote 3.7 [0.8] 5.4 [1.2] 2.7 [1.5] -
MNRAS 000, 1–?? (2021)

12 S. Mandhai et al.
10 1 100 101 102 103 1040.00
0.05
0.10
0.15
0.20
0.25 1) [M /yr] < 10 1
M [M ] < 108.5
10 1 100 101 102 103 104
2) 10 1 < [M /yr] < 101
M [M ] < 108.5
10 1 100 101 102 103 104
3) 101 < [M /yr] < 103
M [M ] < 108.5
0.0 < z < 0.4Host-less Threshold0.4 < z < 1.0Host-less Threshold1.0 < z < 2.0Host-less Threshold2.0 < z < 3.6Host-less Threshold
10 1 100 101 102 103 1040.00
0.05
0.10
0.15
0.20
0.25
0.30
0.35 4) [M /yr] < 10 1
108.5 < M [M ] < 1010.5
10 1 100 101 102 103 104
5) 10 1 < [M /yr] < 101
108.5 < M [M ] < 1010.5
10 1 100 101 102 103 104
6) 101 < [M /yr] < 103
108.5 < M [M ] < 1010.5
10 1 100 101 102 103 1040.00
0.05
0.10
0.15
0.20
0.25
0.30
0.35 7) [M /yr] < 10 1
M [M ] > 1010.5
10 1 100 101 102 103 104
8) 10 1 < [M /yr] < 101
M [M ] > 1010.5
10 1 100 101 102 103 104
9) 101 < [M /yr] < 103
M [M ] > 1010.5
Norm
alise
d Bi
nary
Frac
tion
Impact Parameter [kpc]
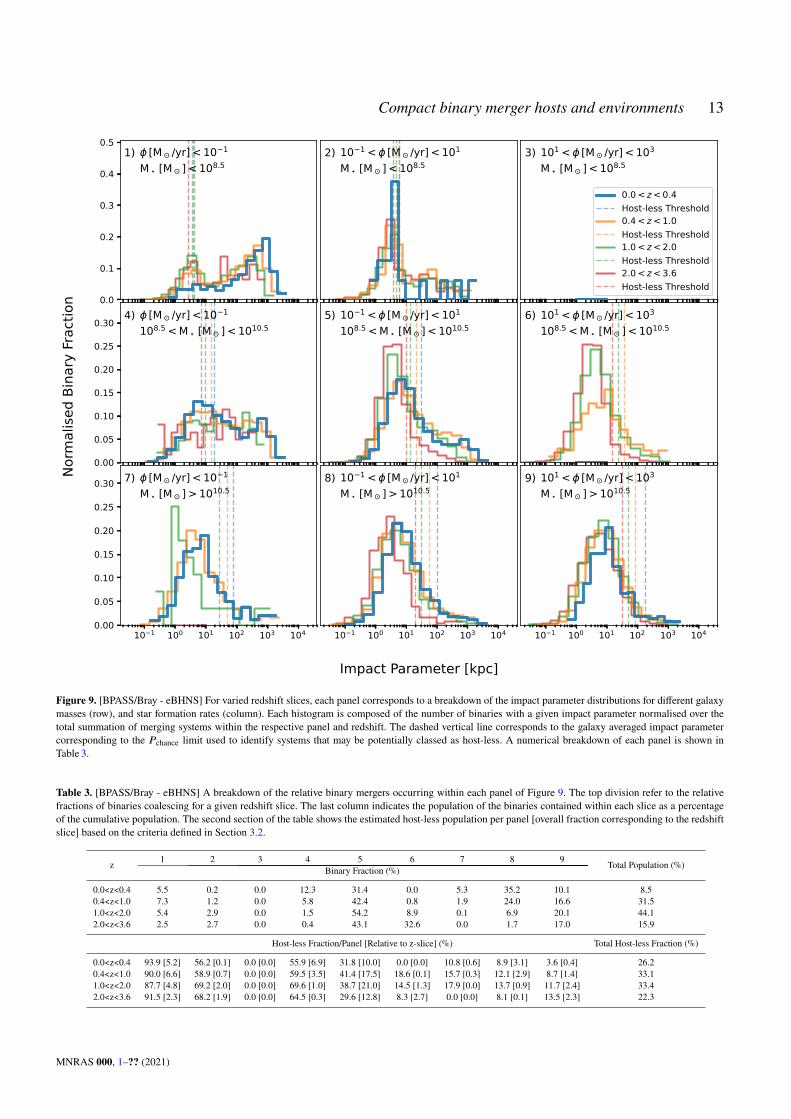
Figure 8. [BPASS/Bray - NSNS] For varied redshift slices, each panel corresponds to a breakdown of the impact parameter distributions for different galaxymasses (row), and star formation rates (column). Each histogram is composed of the number of binaries with a given impact parameter normalised over thetotal summation of merging systems within the respective panel and redshift. The dashed vertical line corresponds to the galaxy averaged impact parametercorresponding to the 𝑃chance limit used to identify systems that may be potentially classed as host-less. A numerical breakdown of each panel is shown inTable 2.
Table 2. [BPASS/Bray - NSNS] A breakdown of the relative binary mergers occurring within each panel of Figure 8. The top division refer to the relativefractions of binaries coalescing for a given redshift slice. The last column indicates the population of the binaries contained within each slice as a percentageof the cumulative population. The second section of the table shows the estimated host-less population per panel [overall fraction corresponding to the redshiftslice] based on the criteria defined in Section 3.2.
z 1 2 3 4 5 6 7 8 9 Total Population (%)Binary Fraction (%)
0.0<z<0.4 4.6 0.1 0.0 9.9 33.9 0.0 5.5 38.0 8.0 10.60.4<z<1.0 5.4 0.5 0.0 5.5 39.8 0.9 2.2 28.8 17.0 42.41.0<z<2.0 7.8 2.2 0.0 2.1 43.8 7.6 0.2 11.8 24.5 36.52.0<z<3.6 11.4 6.0 0.0 0.9 41.4 22.4 0.0 2.4 15.6 10.5
Host-less Fraction/Panel [Relative to z-slice] (%) Total Host-less Fraction (%)
0.0<z<0.4 86.8 [4.0] 67.9 [0.1] 0.0 [0.0] 34.2 [3.4] 14.9 [5.0] 13.3 [0.0] 14.8 [0.8] 5.3 [2.0] 2.8 [0.2] 15.50.4<z<1.0 90.5 [4.9] 65.9 [0.3] 0.0 [0.0] 40.8 [2.2] 18.9 [7.5] 9.4 [0.1] 12.1 [0.3] 6.3 [1.8] 5.2 [0.9] 18.01.0<z<2.0 93.1 [7.2] 76.8 [1.7] 0.0 [0.0] 51.3 [1.1] 25.9 [11.4] 7.8 [0.6] 6.0 [0.0] 7.3 [0.9] 6.5 [1.6] 24.42.0<z<3.6 96.5 [11.0] 86.2 [5.1] 25.0 [0.0] 67.9 [0.6] 37.3 [15.4] 8.5 [1.9] 0.0 [0.0] 6.8 [0.2] 8.7 [1.4] 35.6
MNRAS 000, 1–?? (2021)
Compact binary merger hosts and environments 13
10 1 100 101 102 103 1040.0
0.1
0.2
0.3
0.4
0.51) [M /yr] < 10 1
M [M ] < 108.5
10 1 100 101 102 103 104
2) 10 1 < [M /yr] < 101
M [M ] < 108.5
10 1 100 101 102 103 104
3) 101 < [M /yr] < 103
M [M ] < 108.5
0.0 < z < 0.4Host-less Threshold0.4 < z < 1.0Host-less Threshold1.0 < z < 2.0Host-less Threshold2.0 < z < 3.6Host-less Threshold
10 1 100 101 102 103 1040.00
0.05
0.10
0.15
0.20
0.25
0.30 4) [M /yr] < 10 1
108.5 < M [M ] < 1010.5
10 1 100 101 102 103 104
5) 10 1 < [M /yr] < 101
108.5 < M [M ] < 1010.5
10 1 100 101 102 103 104
6) 101 < [M /yr] < 103
108.5 < M [M ] < 1010.5
10 1 100 101 102 103 1040.00
0.05
0.10
0.15
0.20
0.25
0.30 7) [M /yr] < 10 1
M [M ] > 1010.5
10 1 100 101 102 103 104
8) 10 1 < [M /yr] < 101
M [M ] > 1010.5
10 1 100 101 102 103 104
9) 101 < [M /yr] < 103
M [M ] > 1010.5
Norm
alise
d Bi
nary
Frac
tion
Impact Parameter [kpc]
Figure 9. [BPASS/Bray - eBHNS] For varied redshift slices, each panel corresponds to a breakdown of the impact parameter distributions for different galaxymasses (row), and star formation rates (column). Each histogram is composed of the number of binaries with a given impact parameter normalised over thetotal summation of merging systems within the respective panel and redshift. The dashed vertical line corresponds to the galaxy averaged impact parametercorresponding to the 𝑃chance limit used to identify systems that may be potentially classed as host-less. A numerical breakdown of each panel is shown inTable 3.
Table 3. [BPASS/Bray - eBHNS] A breakdown of the relative binary mergers occurring within each panel of Figure 9. The top division refer to the relativefractions of binaries coalescing for a given redshift slice. The last column indicates the population of the binaries contained within each slice as a percentageof the cumulative population. The second section of the table shows the estimated host-less population per panel [overall fraction corresponding to the redshiftslice] based on the criteria defined in Section 3.2.
z 1 2 3 4 5 6 7 8 9 Total Population (%)Binary Fraction (%)
0.0<z<0.4 5.5 0.2 0.0 12.3 31.4 0.0 5.3 35.2 10.1 8.50.4<z<1.0 7.3 1.2 0.0 5.8 42.4 0.8 1.9 24.0 16.6 31.51.0<z<2.0 5.4 2.9 0.0 1.5 54.2 8.9 0.1 6.9 20.1 44.12.0<z<3.6 2.5 2.7 0.0 0.4 43.1 32.6 0.0 1.7 17.0 15.9
Host-less Fraction/Panel [Relative to z-slice] (%) Total Host-less Fraction (%)
0.0<z<0.4 93.9 [5.2] 56.2 [0.1] 0.0 [0.0] 55.9 [6.9] 31.8 [10.0] 0.0 [0.0] 10.8 [0.6] 8.9 [3.1] 3.6 [0.4] 26.20.4<z<1.0 90.0 [6.6] 58.9 [0.7] 0.0 [0.0] 59.5 [3.5] 41.4 [17.5] 18.6 [0.1] 15.7 [0.3] 12.1 [2.9] 8.7 [1.4] 33.11.0<z<2.0 87.7 [4.8] 69.2 [2.0] 0.0 [0.0] 69.6 [1.0] 38.7 [21.0] 14.5 [1.3] 17.9 [0.0] 13.7 [0.9] 11.7 [2.4] 33.42.0<z<3.6 91.5 [2.3] 68.2 [1.9] 0.0 [0.0] 64.5 [0.3] 29.6 [12.8] 8.3 [2.7] 0.0 [0.0] 8.1 [0.1] 13.5 [2.3] 22.3
MNRAS 000, 1–?? (2021)
14 S. Mandhai et al.
use a sensitivity of 0.2 ph s−1 cm−2 to estimate the fraction of GRBsthat would be detectable by Swift/BAT. We apply a Band function(Band et al. 1993) with an index 𝛼 = 0.5 and 𝛽 = 2.25 for the distri-bution below and above 𝐸𝑃 respectively, where 𝐸𝑝 is the spectralpeak energy given by the relation for SGRBs found by (Tsutsui et al.2013).
4.2 Afterglow dependence on environment
GRB afterglows are thought to arise when the relativistic jet im-pacts and shocks the external ambient medium, producing long-lived emission from radio to X-ray (Zhang et al. 2006, 2007). Iden-tification of candidate host galaxies, and hence redshifts and impactparameters, relies on the ∼arcsec localisations that come from X-ray and optical/nIR detections, rather than the ∼arcmin positionsthat are produced by the Swift/BAT. For some SGRBs, particularlythose with “extended soft emission” (Mészáros & Rees 1997; Sariet al. 1998), the X-ray localisation may be found independently ofafterglow detection, however, more commonly observations of theafterglow is necessary. Thus there is the possibility that SGRBsin low density environments may be selectively lost from the ob-servational sample we consider here. In this section we outline anapproach to introduce this into the simulations, which may indicatea plausible maximum size of this selection bias.
The average gas density, 𝑛, surrounding a galaxy will decreasewith increasing distance from the galaxy core, therefore, the after-glows from bursts at large separations from their host will typicallyhave fainter afterglow emission (Perna & Belczynski 2002). Themaximum luminosity distance, 𝐷max, for the peak afterglow emis-sions to be above a given threshold depends on the ambient densityas 𝐷max ∝ 𝑛(𝑝+1)/8 assuming slow-cooling and an observed fre-quency above the characteristic synchrotron frequency at the peak,where 𝑝 is the relativistic electron distribution index in the shock –typically 𝑝 ∼ 2.4 (Fong et al. 2015a). The afterglows of SGRBs canbe used to put constraints on the ambient density, where the earliestafterglow detection can be used to constrain the minimum density.Using this minimum ambient density and an assumed galaxy gasdensity profile, O’Connor et al. (2020) infer a maximum impactparameter distribution for the population of observed SGRBs.
For binaries capable of producing an SGRB e.g. NSNS, andeBHNS systems, (see Section 2.1.2), we estimate the fraction thatmerge in a very low-density environment, defined by Fong et al.(2015a) as 𝑛 < 10−4 cm−3. Based on the location of the mergerwith respect to its host galaxy, we estimate the ambient density byconsidering the gasmass containedwithin an EAGLE aperture. Theseapertures are composed of spheres with sizes of 1, 3, 5, 10, 20, 30,40, 50, 70, and 100 kpc. We split these spheres into shells basedon the radii of neighbouring apertures and calculate the sphericallyaveraged gas density. We added an additional hot gas component,similar to the approach described in O’Connor et al. (2020). Thissecondary component is described by the Maller & Bullock gasmodel (Maller & Bullock 2004; Fang et al. 2013),
𝜌𝑀𝐵𝑔 (𝑥) = 𝜌𝑣
[1 + 3.7
𝑥ln(1 + x) − 3.7
cvln(1 + cv)
]3/2, (6)
where 𝜌𝑣 is the density at the virial radius, 𝑟𝑣 (Carlberg et al. 1997),corresponding to an overdensity parameter of Δ𝑣 = 200; 𝑥 is theratio of 𝑟/𝑅𝑠 ; and 𝑐𝑣 is the concentration parameter, (e.g. Bullocket al. 2001; Comerford & Natarajan 2007). Using this prescription,we identify the fraction of the SGRB progenitor mergers that occurin environments with 𝑛 < 10−4 cm−3 as afterglow-faint. Mergers
0.0 0.5 1.0 1.5 2.0 2.5 3.0
z
0.00
0.25
0.50
0.75
1.00
1.25
1.50
1.75
N/(Ntotal∆z)
SGRB Sim. (Aft. Bright)
SGRB Sim.
Localised SGRBs
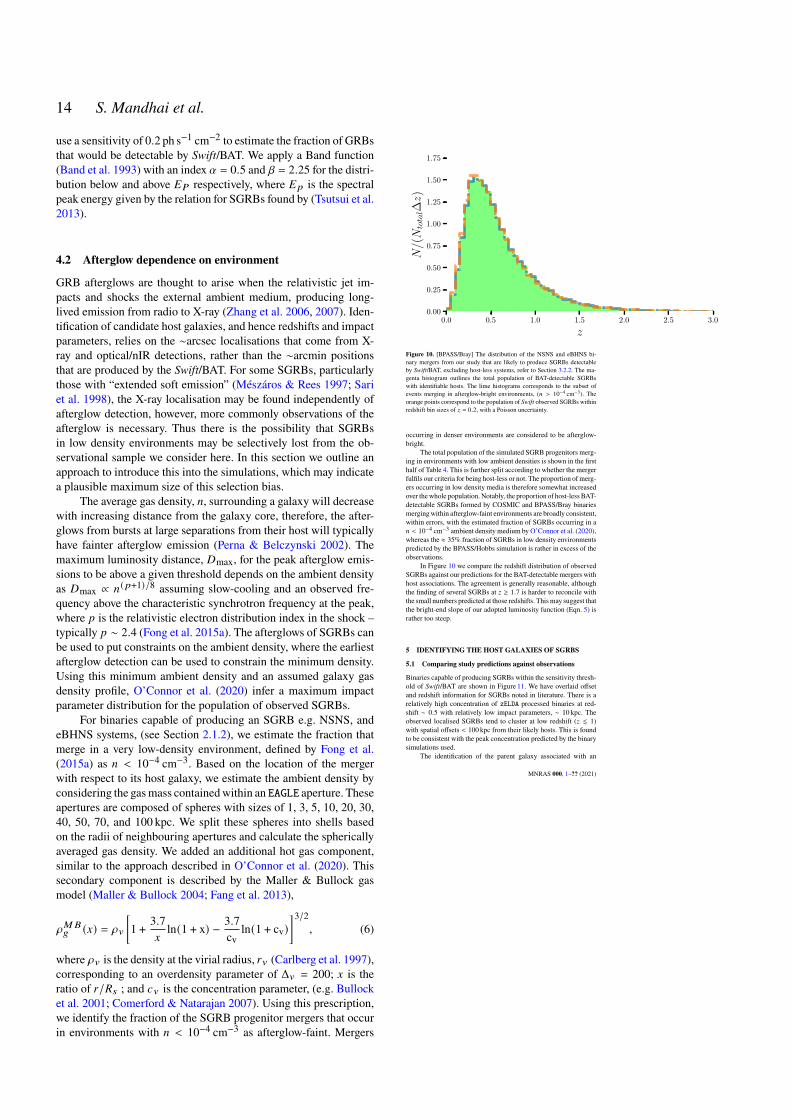
Figure 10. [BPASS/Bray] The distribution of the NSNS and eBHNS bi-nary mergers from our study that are likely to produce SGRBs detectableby Swift/BAT, excluding host-less systems, refer to Section 3.2.2. The ma-genta histogram outlines the total population of BAT-detectable SGRBswith identifiable hosts. The lime histograms corresponds to the subset ofevents merging in afterglow-bright environments, (𝑛 > 10−4 cm−3). Theorange points correspond to the population of Swift observed SGRBs withinredshift bin sizes of 𝑧 = 0.2, with a Poisson uncertainty.
occurring in denser environments are considered to be afterglow-bright.
The total population of the simulated SGRB progenitors merg-ing in environments with low ambient densities is shown in the firsthalf of Table 4. This is further split according to whether the mergerfulfils our criteria for being host-less or not. The proportion ofmerg-ers occurring in low density media is therefore somewhat increasedover thewhole population. Notably, the proportion of host-less BAT-detectable SGRBs formed by COSMIC and BPASS/Bray binariesmergingwithin afterglow-faint environments are broadly consistent,within errors, with the estimated fraction of SGRBs occurring in a𝑛 < 10−4 cm−3 ambient density medium by O’Connor et al. (2020),whereas the ≈ 35% fraction of SGRBs in low density environmentspredicted by the BPASS/Hobbs simulation is rather in excess of theobservations.
In Figure 10 we compare the redshift distribution of observedSGRBs against our predictions for the BAT-detectable mergers withhost associations. The agreement is generally reasonable, althoughthe finding of several SGRBs at 𝑧 & 1.7 is harder to reconcile withthe small numbers predicted at those redshifts. Thismay suggest thatthe bright-end slope of our adopted luminosity function (Eqn. 5) israther too steep.
5 IDENTIFYING THE HOST GALAXIES OF SGRBS
5.1 Comparing study predictions against observations
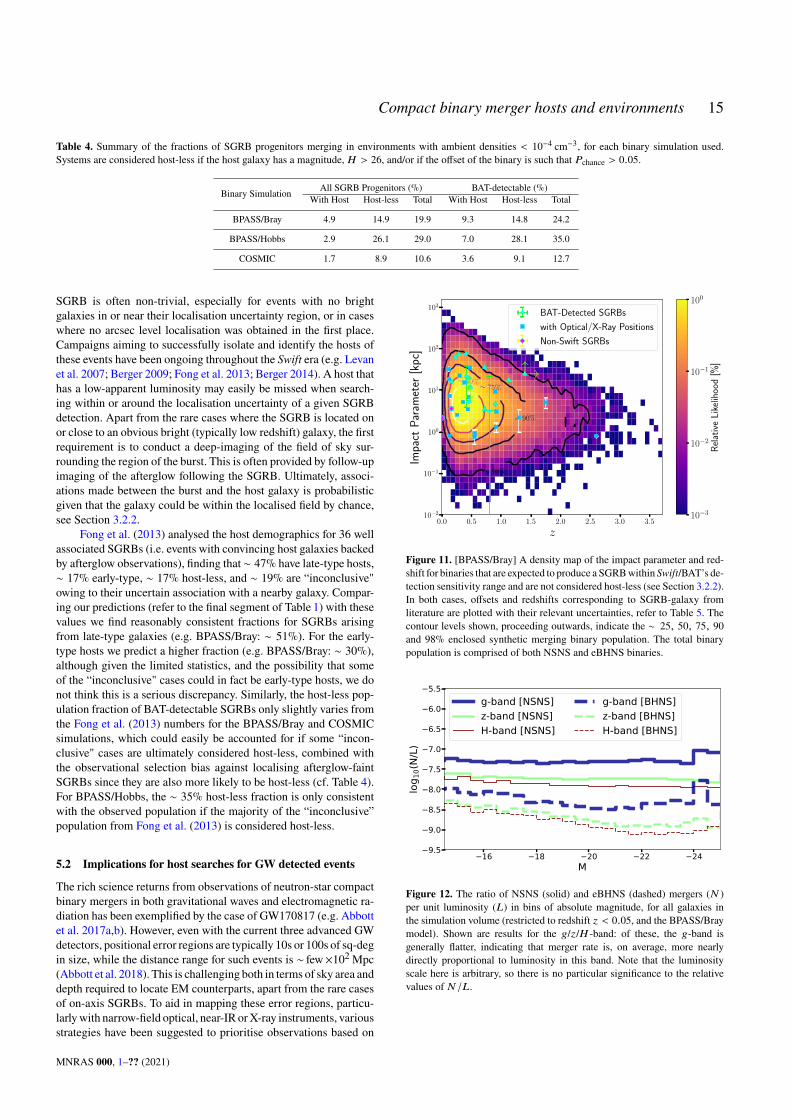
Binaries capable of producing SGRBs within the sensitivity thresh-old of Swift/BAT are shown in Figure 11. We have overlaid offsetand redshift information for SGRBs noted in literature. There is arelatively high concentration of zELDA processed binaries at red-shift ∼ 0.5 with relatively low impact parameters, ∼ 10 kpc. Theobserved localised SGRBs tend to cluster at low redshift (𝑧 . 1)with spatial offsets < 100 kpc from their likely hosts. This is foundto be consistent with the peak concentration predicted by the binarysimulations used.
The identification of the parent galaxy associated with an
MNRAS 000, 1–?? (2021)
Compact binary merger hosts and environments 15
Table 4. Summary of the fractions of SGRB progenitors merging in environments with ambient densities < 10−4 cm−3, for each binary simulation used.Systems are considered host-less if the host galaxy has a magnitude, 𝐻 > 26, and/or if the offset of the binary is such that 𝑃chance > 0.05.
Binary Simulation All SGRB Progenitors (%) BAT-detectable (%)With Host Host-less Total With Host Host-less Total
BPASS/Bray 4.9 14.9 19.9 9.3 14.8 24.2
BPASS/Hobbs 2.9 26.1 29.0 7.0 28.1 35.0
COSMIC 1.7 8.9 10.6 3.6 9.1 12.7
SGRB is often non-trivial, especially for events with no brightgalaxies in or near their localisation uncertainty region, or in caseswhere no arcsec level localisation was obtained in the first place.Campaigns aiming to successfully isolate and identify the hosts ofthese events have been ongoing throughout the Swift era (e.g. Levanet al. 2007; Berger 2009; Fong et al. 2013; Berger 2014). A host thathas a low-apparent luminosity may easily be missed when search-ing within or around the localisation uncertainty of a given SGRBdetection. Apart from the rare cases where the SGRB is located onor close to an obvious bright (typically low redshift) galaxy, the firstrequirement is to conduct a deep-imaging of the field of sky sur-rounding the region of the burst. This is often provided by follow-upimaging of the afterglow following the SGRB. Ultimately, associ-ations made between the burst and the host galaxy is probabilisticgiven that the galaxy could be within the localised field by chance,see Section 3.2.2.
Fong et al. (2013) analysed the host demographics for 36 wellassociated SGRBs (i.e. events with convincing host galaxies backedby afterglow observations), finding that ∼ 47%have late-type hosts,∼ 17% early-type, ∼ 17% host-less, and ∼ 19% are “inconclusive"owing to their uncertain association with a nearby galaxy. Compar-ing our predictions (refer to the final segment of Table 1) with thesevalues we find reasonably consistent fractions for SGRBs arisingfrom late-type galaxies (e.g. BPASS/Bray: ∼ 51%). For the early-type hosts we predict a higher fraction (e.g. BPASS/Bray: ∼ 30%),although given the limited statistics, and the possibility that someof the “inconclusive" cases could in fact be early-type hosts, we donot think this is a serious discrepancy. Similarly, the host-less pop-ulation fraction of BAT-detectable SGRBs only slightly varies fromthe Fong et al. (2013) numbers for the BPASS/Bray and COSMICsimulations, which could easily be accounted for if some “incon-clusive" cases are ultimately considered host-less, combined withthe observational selection bias against localising afterglow-faintSGRBs since they are also more likely to be host-less (cf. Table 4).For BPASS/Hobbs, the ∼ 35% host-less fraction is only consistentwith the observed population if the majority of the “inconclusive”population from Fong et al. (2013) is considered host-less.
5.2 Implications for host searches for GW detected events
The rich science returns from observations of neutron-star compactbinary mergers in both gravitational waves and electromagnetic ra-diation has been exemplified by the case of GW170817 (e.g. Abbottet al. 2017a,b). However, even with the current three advanced GWdetectors, positional error regions are typically 10s or 100s of sq-degin size, while the distance range for such events is ∼ few×102Mpc(Abbott et al. 2018). This is challenging both in terms of sky area anddepth required to locate EM counterparts, apart from the rare casesof on-axis SGRBs. To aid in mapping these error regions, particu-larlywith narrow-field optical, near-IR orX-ray instruments, variousstrategies have been suggested to prioritise observations based on
0.0 0.5 1.0 1.5 2.0 2.5 3.0 3.5
z
10−2
10−1
100
101
102
103
Impa
ctP
aram
eter
[kp
c]
∼ 98%
∼ 90%
∼ 75%∼ 50%
∼ 25%
BAT-Detected SGRBs
with Optical/X-Ray Positions
Non-Swift SGRBs
→↑↓↓
10−3
10−2
10−1
100
Rel
ativ
eL
ikel
ihoo
d[%
]
Figure 11. [BPASS/Bray] A density map of the impact parameter and red-shift for binaries that are expected to produce a SGRBwithin Swift/BAT’s de-tection sensitivity range and are not considered host-less (see Section 3.2.2).In both cases, offsets and redshifts corresponding to SGRB-galaxy fromliterature are plotted with their relevant uncertainties, refer to Table 5. Thecontour levels shown, proceeding outwards, indicate the ∼ 25, 50, 75, 90and 98% enclosed synthetic merging binary population. The total binarypopulation is comprised of both NSNS and eBHNS binaries.
2422201816M
9.5
9.0
8.5
8.0
7.5
7.0
6.5
6.0
5.5
log 1
0(N/
L)
g-band [NSNS]z-band [NSNS]H-band [NSNS]
g-band [BHNS]z-band [BHNS]H-band [BHNS]
Figure 12. The ratio of NSNS (solid) and eBHNS (dashed) mergers (𝑁 )per unit luminosity (𝐿) in bins of absolute magnitude, for all galaxies inthe simulation volume (restricted to redshift 𝑧 < 0.05, and the BPASS/Braymodel). Shown are results for the 𝑔/𝑧/𝐻 -band: of these, the 𝑔-band isgenerally flatter, indicating that merger rate is, on average, more nearlydirectly proportional to luminosity in this band. Note that the luminosityscale here is arbitrary, so there is no particular significance to the relativevalues of 𝑁 /𝐿.
MNRAS 000, 1–?? (2021)
16 S. Mandhai et al.
the known positions and properties of potential host galaxies (e.g.Gehrels et al. 2016; Evans et al. 2016; Artale et al. 2020b).
A question arises as to how to weight the galaxies in suchschemes, most simply by making use of their absolute luminositiesin some pass-band (since that information is more widely availablethan, for example, more detailed characterisation of their star for-mation histories). With this in mind, in Figure 12 we plot the ratioof the number of mergers (restricted to 𝑧 < 0.05) occurring perunit luminosity (averaged over all galaxies in the simulation box),as a function of host absolute luminosity, in various pass-bands. Asituation in which binary merger rate was exactly proportional toluminosity would result in completely flat curves in this diagram. Ascan be seen, this is most nearly the case for the 𝑔-band (both NSNSand eBHNS), which may reflect the balance between an enhancedrate of mergers from relatively young (and therefore bluer) stellarpopulations and the overall dominance of intermediate and older(redder) populations. In contrast, the (near-IR) 𝐻-band magnitudedoes not provide such a good tracer of merger likelihood, presum-ably due to large early-type (elliptical/lenticular) galaxies beingbright in that band, but producing comparatively few mergers.
5.3 Implications for SGRB host identification
Successfully ejected binaries with long lifespans are likely to mergefurther away from their hosts due to prolonged migration. Thegreater their galactocentric radius, the lower the likelihood of asuccessful association with their parent galaxy, which, as we haveseen in previous sections, will bias SGRB redshift samples, forexample. It is therefore interesting to ask, if a SGRB detected bySwift/BAT is found to be host-less, what can we say about its likelyredshift and offset from its parent galaxy, based solely on the peakgamma-ray luminosity?
Figure 13 shows the distribution of the resulting offsets withredshift for host-less merging systems. Each panel corresponds toa range of peak photon fluxes, Φ, that would be detected by BAT.The colour of each point corresponds to the 𝐻-band magnitude ofthe host galaxy. The majority of events with high photon fluxesΦ &100 cm−2s−1 occur between 0.1 . 𝑧 . 0.5. At all fluxes there aresome mergers that are low redshift and have large offsets (> 100′′)on the sky from their hosts, making association very challenging.For SGRBs with low photon fluxes (< 1 ph s−1 cm−2; refer to thefinal panel of Figure 13) close to the BAT detection threshold, thefraction of these events with faint host galaxies (𝐻 > 26) is foundto be ∼ 23%, ∼ 19%, and ∼ 38% for BPASS/Bray, BPASS/Hobbs,and COSMIC simulations respectively.
5.4 Impact Parameters of SGRBs
In Figure 14 we compare the impact parameters for an observedsample of 32 SGRBs with well-constrained offsets and redshifts(see Table 5) against our simulated BPASS/Bray SGRB progenitorsystems that are detectable by Swift/BAT (for the same comparisonwith BPASS/Hobbs, and COSMIC binaries see Figures A8, B8).The median of the observed SGRB impact parameters is ∼ 5.5 kpc.In comparison, for all simulated BAT-detectable SGRBs, we findmedian impact parameters of 6.1, 11.6, and 4.2 kpc forBPASS/Bray,BPASS/Hobbs, and COSMIC respectively. When the host-less pop-ulation of progenitors are excluded, these values are revised to 4.7,6.2, and 3.8 kpc.
In Table 6, we present the rejection levels for the two-sampleKolmogorov–Smirnov (KS) tests comparing impact parameters for
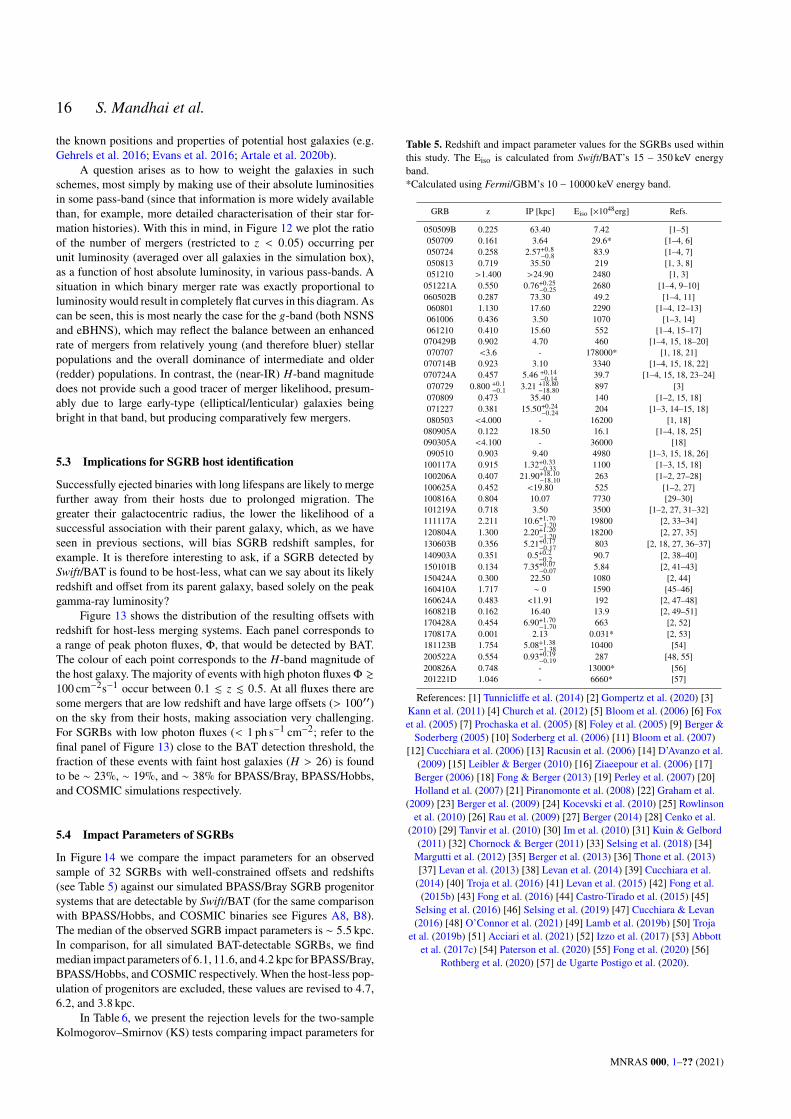
Table 5. Redshift and impact parameter values for the SGRBs used withinthis study. The Eiso is calculated from Swift/BAT’s 15 − 350 keV energyband.*Calculated using Fermi/GBM’s 10 − 10000 keV energy band.
GRB z IP [kpc] Eiso [×1048erg] Refs.
050509B 0.225 63.40 7.42 [1–5]050709 0.161 3.64 29.6* [1–4, 6]050724 0.258 2.57+0.8−0.8 83.9 [1–4, 7]050813 0.719 35.50 219 [1, 3, 8]051210 >1.400 >24.90 2480 [1, 3]051221A 0.550 0.76+0.25−0.25 2680 [1–4, 9–10]060502B 0.287 73.30 49.2 [1–4, 11]060801 1.130 17.60 2290 [1–4, 12–13]061006 0.436 3.50 1070 [1–3, 14]061210 0.410 15.60 552 [1–4, 15–17]070429B 0.902 4.70 460 [1–4, 15, 18–20]070707 <3.6 - 178000* [1, 18, 21]070714B 0.923 3.10 3340 [1–4, 15, 18, 22]070724A 0.457 5.46 +0.14
−0.14 39.7 [1–4, 15, 18, 23–24]070729 0.800 +0.1
−0.1 3.21 +18.80−18.80 897 [3]
070809 0.473 35.40 140 [1–2, 15, 18]071227 0.381 15.50+0.24−0.24 204 [1–3, 14–15, 18]080503 <4.000 - 16200 [1, 18]080905A 0.122 18.50 16.1 [1–4, 18, 25]090305A <4.100 - 36000 [18]090510 0.903 9.40 4980 [1–3, 15, 18, 26]100117A 0.915 1.32+0.33−0.33 1100 [1–3, 15, 18]100206A 0.407 21.90+18.10−18.10 263 [1–2, 27–28]100625A 0.452 <19.80 525 [1–2, 27]100816A 0.804 10.07 7730 [29–30]101219A 0.718 3.50 3500 [1–2, 27, 31–32]111117A 2.211 10.6+1.70−1.70 19800 [2, 33–34]120804A 1.300 2.20+1.20−1.20 18200 [2, 27, 35]130603B 0.356 5.21+0.17−0.17 803 [2, 18, 27, 36–37]140903A 0.351 0.5+0.2−0.2 90.7 [2, 38–40]150101B 0.134 7.35+0.07−0.07 5.84 [2, 41–43]150424A 0.300 22.50 1080 [2, 44]160410A 1.717 ∼ 0 1590 [45–46]160624A 0.483 <11.91 192 [2, 47–48]160821B 0.162 16.40 13.9 [2, 49–51]170428A 0.454 6.90+1.70−1.70 663 [2, 52]170817A 0.001 2.13 0.031* [2, 53]181123B 1.754 5.08+1.38−1.38 10400 [54]200522A 0.554 0.93+0.19−0.19 287 [48, 55]200826A 0.748 - 13000* [56]201221D 1.046 - 6660* [57]
References: [1] Tunnicliffe et al. (2014) [2] Gompertz et al. (2020) [3]Kann et al. (2011) [4] Church et al. (2012) [5] Bloom et al. (2006) [6] Foxet al. (2005) [7] Prochaska et al. (2005) [8] Foley et al. (2005) [9] Berger &Soderberg (2005) [10] Soderberg et al. (2006) [11] Bloom et al. (2007)[12] Cucchiara et al. (2006) [13] Racusin et al. (2006) [14] D’Avanzo et al.(2009) [15] Leibler & Berger (2010) [16] Ziaeepour et al. (2006) [17]Berger (2006) [18] Fong & Berger (2013) [19] Perley et al. (2007) [20]Holland et al. (2007) [21] Piranomonte et al. (2008) [22] Graham et al.(2009) [23] Berger et al. (2009) [24] Kocevski et al. (2010) [25] Rowlinsonet al. (2010) [26] Rau et al. (2009) [27] Berger (2014) [28] Cenko et al.(2010) [29] Tanvir et al. (2010) [30] Im et al. (2010) [31] Kuin & Gelbord(2011) [32] Chornock & Berger (2011) [33] Selsing et al. (2018) [34]Margutti et al. (2012) [35] Berger et al. (2013) [36] Thone et al. (2013)[37] Levan et al. (2013) [38] Levan et al. (2014) [39] Cucchiara et al.(2014) [40] Troja et al. (2016) [41] Levan et al. (2015) [42] Fong et al.(2015b) [43] Fong et al. (2016) [44] Castro-Tirado et al. (2015) [45]Selsing et al. (2016) [46] Selsing et al. (2019) [47] Cucchiara & Levan(2016) [48] O’Connor et al. (2021) [49] Lamb et al. (2019b) [50] Trojaet al. (2019b) [51] Acciari et al. (2021) [52] Izzo et al. (2017) [53] Abbottet al. (2017c) [54] Paterson et al. (2020) [55] Fong et al. (2020) [56]
Rothberg et al. (2020) [57] de Ugarte Postigo et al. (2020).
MNRAS 000, 1–?? (2021)
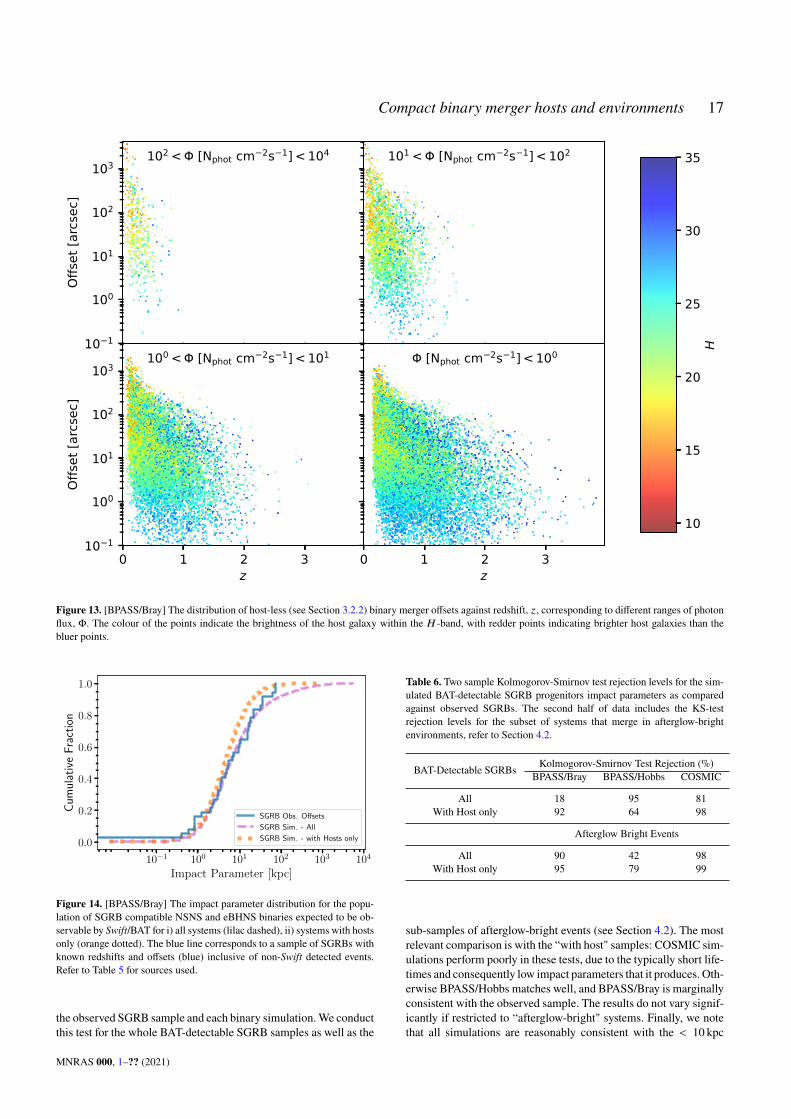
Compact binary merger hosts and environments 17
10 1
100
101
102
103
Offs
et [a
rcse
c]
102 < [Nphot cm 2s 1] < 104 101 < [Nphot cm 2s 1] < 102
0 1 2 3z
10 1
100
101
102
103
Offs
et [a
rcse
c]
100 < [Nphot cm 2s 1] < 101
0 1 2 3z
[Nphot cm 2s 1] < 100
10
15
20
25
30
35
H
Figure 13. [BPASS/Bray] The distribution of host-less (see Section 3.2.2) binary merger offsets against redshift, 𝑧, corresponding to different ranges of photonflux, Φ. The colour of the points indicate the brightness of the host galaxy within the 𝐻 -band, with redder points indicating brighter host galaxies than thebluer points.
10−1 100 101 102 103 104
Impact Parameter [kpc]
0.0
0.2
0.4
0.6
0.8
1.0
Cum
ulat
ive
Fra
ctio
n
SGRB Obs. Offsets
SGRB Sim. - All
SGRB Sim. - with Hosts only
Figure 14. [BPASS/Bray] The impact parameter distribution for the popu-lation of SGRB compatible NSNS and eBHNS binaries expected to be ob-servable by Swift/BAT for i) all systems (lilac dashed), ii) systems with hostsonly (orange dotted). The blue line corresponds to a sample of SGRBs withknown redshifts and offsets (blue) inclusive of non-Swift detected events.Refer to Table 5 for sources used.
the observed SGRB sample and each binary simulation.We conductthis test for the whole BAT-detectable SGRB samples as well as the
Table 6. Two sample Kolmogorov-Smirnov test rejection levels for the sim-ulated BAT-detectable SGRB progenitors impact parameters as comparedagainst observed SGRBs. The second half of data includes the KS-testrejection levels for the subset of systems that merge in afterglow-brightenvironments, refer to Section 4.2.
BAT-Detectable SGRBs Kolmogorov-Smirnov Test Rejection (%)BPASS/Bray BPASS/Hobbs COSMIC
All 18 95 81With Host only 92 64 98
Afterglow Bright Events
All 90 42 98With Host only 95 79 99
sub-samples of afterglow-bright events (see Section 4.2). The mostrelevant comparison is with the “with host" samples: COSMIC sim-ulations perform poorly in these tests, due to the typically short life-times and consequently low impact parameters that it produces. Oth-erwise BPASS/Hobbs matches well, and BPASS/Bray is marginallyconsistent with the observed sample. The results do not vary signif-icantly if restricted to “afterglow-bright" systems. Finally, we notethat all simulations are reasonably consistent with the < 10 kpc
MNRAS 000, 1–?? (2021)
18 S. Mandhai et al.
median SGRB galactocentric offset estimated by O’Connor et al.(2020).
6 SUMMARY
Using our new zELDA code suite along with binary population syn-thesis codes, specifically BPASS and COSMIC, in addition to thecosmological simulation, EAGLE, we have traced the orbital evolu-tion and host properties of a population of simulated isolated com-pact binaries from birth to coalescence. We use three binary sim-ulated populations with varied prescriptions which are referred toas, BPASS/Bray, BPASS/Hobbs, and COSMIC. The key differencebetween the samples is the employed natal-kick prescriptions andmerger time distributions.Most seeded BPASS/Bray binaries mergeon relatively long timescales of 1–10Gyrwith the majority of natal-kick velocities ranging between ∼ 100−300 km s−1; BPASS/Hobbssystems exhibit a broader range of lifespans with higher kick veloc-ities, with the modal velocity at 𝑣 ∼ 350 km s−1; COSMIC systemsmergewith comparatively short lifespans, < 100Myr and natal-kickvelocities that are typically < 100 km s−1. Despite these differences,we find some conclusions are common to all the models, specifi-cally:
• For NSNS and eBHNS SGRB progenitors at merger, we find∼ 50−70% of the hosts to be late-type galaxies, at all redshifts. ForCOSMIC binaries, the upper limit on this demographics estimatecan extend to ∼ 80%.
• A consequence of this is that, for low redshift events 𝑧 < 0.05(i.e. within the current range of GW detection), we find the ma-jority of mergers to arise from relatively blue, star forming hosts.Thus, we find the 𝑔 band to be best suited for predicting compactbinary merger rates in low redshift galaxies, and hence useful forweighting/prioritising galaxies for gravitational wave electromag-netic follow-up observations.
• The modal average of the radial offset from the centre ofthe host galaxy at the time of merger is . 10 kpc. For each bi-nary population used, these values range between ∼ 5 − 10 kpc forBPASS/Hobbs systems and eBHNS mergers from the BPASS/Braysample. For BPASS/Bray NSNS and COSMIC systems, this rangevaries between ∼ 2.5 − 5 kpc. Long-lived systems with 𝜏merge '1Gyr can potentially travel well beyond 100 kpc from their hostgalaxy provided that they have natal-kick velocities that are suf-ficient for them to escape the gravitational potential of their hostgalaxy.
To gauge the consistency of the zELDA processed binaries andtheir hosts we compare against the population of well-localisedshort-duration gamma-ray bursts (SGRBs) (i.e. events with con-vincing host galaxies and offsets). We achieve this by simulatingSwift/BAT observations of NSNS and eBHNS mergers from ourstudy, using an assumed luminosity function consistent with litera-ture estimates.
Observationally, some SGRBs have been found to be “host-less", in the sense that there is no clear association with a galaxy,presumably due to either large offsets at merger and/or because thehost is very faint. GRBs without a confident host association willtypically have no redshift and impact parameter estimates, biases ofthese cases must be considered in our comparison. To mimic this,we define simulated binaries to be "host-less" if either the parentgalaxy has a greater than 5% probability of being simply a chancealignment based on the impact parameter (i.e. projected radial offsetfrom galaxy centre) and apparent magnitude of the galaxy, and/or
has a host galaxywith a𝐻-bandmagnitude of𝐻 > 26 (i.e. requiringdeep follow-up observations, e.g. with HST to detect). Our findingsare:
• For both the BPASS/Bray and COSMIC simulations, we findthe hosts of the simulated SGRBs to be ∼50–60% late-type, and∼15–20% host-less, in reasonable agreement with the demographicdistribution of observed hosts (Fong et al. 2013). In contrast, theBPASS/Hobbs sample predicts a much higher proportion of host-less events (∼ 35%), due largely to the typically higher kick veloci-ties, which is likely in excess of the host-less fraction observed.
• The impact parameter distribution of the simulated BAT-detectable SGRBs for BPASS/Bray and BPASS/Hobbs are reason-ably consistent with the observed SGRB offsets. In this comparison,however, the COSMIC simulation under-predicts the offsets that areobserved, which is a consequence of the lower kick velocities andshorter lifetimes.
It is interesting to ask the question, if a SGRB is found to behost-less, can our simulations give a prior expectation for its mostlikely redshift, host and projected offset?
• For the brightest host-less simulated SGRBs (those with peakfluxes > 102 photons cm−2 s−1), the parent galaxies are found to bealways at redshifts 𝑧 < 1 and offsets are typically tens of arcsec,but can range up to in excess of ∼ 103 arcsec (as expected, theBPASS/Hobbs simulation typically results in rather larger offsets).
• At the other extreme, for bursts close to the Swift/BATdetectionthreshold, we find that the majority of events (for all simulations) tobe 𝑧 < 1, but with a significant tail to higher redshifts. Notably, forthese faint bursts, a sizable fraction of events (∼ 23%, ∼ 19%, and∼ 38% for BPASS/Bray, BPASS/Hobbs, and COSMIC populations,respectively) are found to be host-less by virtue of their hosts beingfaint (𝐻 > 26) rather than having large impact parameters.
As a final step, we also considered an additional selectioneffect, namely that bursts arising in a low ambient density medium(defined here as 𝑛 < 10−4 cm−3) are expected to have on averagefainter afterglows, and so would be selected against in observedsamples that rely on detection of X-ray or optical counterparts forprecise localisation.
• We estimate the fraction of BAT-detectable SGRBs aris-ing from such low density environments. For the BPASS/Bray,BPASS/Hobbs, and COSMIC samples these fractions are foundto be ∼ 24%, ∼ 35%, and ∼ 13%, respectively.
Overall, we conclude that of the three population synthesismodels considered, BPASS/Bray gives results most closely aligningwith the available observational constraints i.e. host demographics,and impact parameter distributions. This may be expected as it in-cludes the most sophisticated binary evolution modelling, althoughthis conclusion reflects most strongly the differences in kick velocitythan merger time distributions.
Our study does not include binaries that are formed throughdynamical processes, for example in globular or open clusters. Incomparison to isolated systems, the merger rate of dynamicallyformed binaries has generally been estimated to be significantlylower. As such, isolated EM-bright compact binaries are expectedto be the dominant channel for producing the observed populationof SGRBs. If these systems are found to be more common, forinstance due to their formation in young stellar clusters, then it willbe important to account for their contribution. With further hostassociations of SGRBs and/or with gravitational waves producedby NSNS and BHNS compact binary mergers, we will be able
MNRAS 000, 1–?? (2021)
Compact binary merger hosts and environments 19
to further refine and improve constraints on the demographic andoffset estimates derived and discussed in this work. Similarly, witha greater sample of observed SGRBs, predictions for the physicalinput parameters such as the total net-kick velocity and merger timedistributions can be tested from the comparison with associatedimpact parameters.
ACKNOWLEDGEMENTS
S.F.M. is supported by a PhD studentship funded by the Col-lege of Science and Engineering at the University of Leicester;G.P.L. is supported by STFC grant ST/S000453/1; N.R.T. acknowl-edge support from ERC Grant 725246 TEDE; C.J.N is supportedby the Science and Technology Facilities Council grant numberST/M005917/1 and has received funding from theEuropeanUnion’sHorizon 2020 research and innovation program under the MarieSkłodowska-Curie grant agreement No 823823 (Dustbusters RISEproject); R.A.J.E-F. is supported by an STFC PhD studentship. Fur-thermore, this research used the ALICE High Performance Com-puting Facility at the University of Leicester. We acknowledge theVirgo Consortium for making their simulation data available. TheEAGLE simulations were performed using the DiRAC-2 facility atDurham, managed by the ICC, and the PRACE facility Curie basedin France at TGCC, CEA, Bruyéres-le-Châtel.
We would like to extend our gratitude to the numerous col-leagues who have provided valuable comments and meaningful dis-cussion over the course of the work encapsulated within this paper.Wewould like to extend our gratitude to Rob Crain andAdrian Thobfor their useful discussions regarding EAGLE. We would also like tothank Kim Page for discussions regarding Swift/XRT observations.
DATA AVAILABILITY
The cosmological simulation data underlying this article are avail-able at EAGLE, for the galaxies used. The BPASS/Bray andBPASS/Hobbs datasets are derived using the BPASS models fromBPASS 2.1. The COSMIC binaries used are produced using theCOSMIC python package available at COSMIC Homepage.
REFERENCES
Abbott B. P., et al., 2016, Phys. Rev. Lett., 116, 061102Abbott B. P., et al., 2017a, Nature, 551, 85Abbott B. P., et al., 2017b, ApJ, 848, L12Abbott B. P., et al., 2017c, ApJ, 848, L13Abbott B. P., et al., 2018, Living Reviews in Relativity, 21, 3Abbott R., et al., 2021a, Physical Review X, 11, 021053Abbott R., et al., 2021b, ApJ, 915, L5Acciari V. A., et al., 2021, ApJ, 908, 90Ackley K., et al., 2020, arXiv e-prints, p. arXiv:2002.01950Alexander K. D., et al., 2017, ApJ, 848, L21Amaro-Seoane P., Miller M. C., Kennedy G. F., 2012, MNRAS, 425, 2401Andreoni I., et al., 2020, ApJ, 890, 131Andrews J. J., Mandel I., 2019, ApJ, 880, L8Arcavi I., et al., 2017, ApJ, 848, L33ArtaleM. C., Mapelli M., Giacobbo N., Sabha N. B., SperaM., SantoliquidoF., Bressan A., 2019, MNRAS, 487, 1675
Artale M. C., Mapelli M., Bouffanais Y., Giacobbo N., Pasquato M., SperaM., 2020a, MNRAS, 491, 3419
Artale M. C., Bouffanais Y., Mapelli M., Giacobbo N., Sabha N. B., San-toliquido F., Pasquato M., Spera M., 2020b, MNRAS, 495, 1841
Astropy Collaboration et al., 2013, A&A, 558, A33Band D., et al., 1993, ApJ, 413, 281Barbieri C., Salafia O. S., Perego A., Colpi M., Ghirlanda G., 2019, A&A,625, A152
Belczyński K., Bulik T., 1999, A&A, 346, 91Belczynski K., Perna R., Bulik T., Kalogera V., Ivanova N., Lamb D. Q.,2006, ApJ, 648, 1110
Belczynski K., et al., 2018, Astronomy & Astrophysics, 615, A91Berger E., 2006, GRB Coordinates Network, 5965, 1Berger E., 2009, ApJ, 690, 231Berger E., 2010, ApJ, 722, 1946Berger E., 2014, ARA&A, 52, 43Berger E., Soderberg A. M., 2005, GRB Coordinates Network, 4384, 1Berger E., Cenko S. B., Fox D. B., Cucchiara A., 2009, ApJ, 704, 877Berger E., et al., 2013, ApJ, 765, 121Bloom J. S., Sigurdsson S., Pols O. R., 1999, MNRAS, 305, 763Bloom J. S., Kulkarni S. R., Djorgovski S. G., 2002, AJ, 123, 1111Bloom J. S., et al., 2006, ApJ, 638, 354Bloom J. S., et al., 2007, ApJ, 654, 878Bovy J., 2015, ApJS, 216, 29Branchesi M., 2016, in Journal of Physics Conference Series. p. 022004,doi:10.1088/1742-6596/718/2/022004
Bray J. C., Eldridge J. J., 2016, MNRAS, 461, 3747Bray J. C., Eldridge J. J., 2018, Monthly Notices of the Royal AstronomicalSociety, 480, 5657
Breivik K., et al., 2020, ApJ, 898, 71Bromberg O., Nakar E., Piran T., Sari R., 2013, ApJ, 764, 179Bulik T., Belczyński K., Zbijewski W., 1999, MNRAS, 309, 629Bullock J. S., Kolatt T. S., Sigad Y., Somerville R. S., Kravtsov A. V., KlypinA. A., Primack J. R., Dekel A., 2001, MNRAS, 321, 559
Calvi R., Vulcani B., Poggianti B. M., Moretti A., Fritz J., Fasano G., 2018,MNRAS, 481, 3456
Carlberg R. G., et al., 1997, ApJ, 485, L13Castro-Tirado A. J., Sanchez-Ramirez R., Lombardi G., RiveroM. A., 2015,GRB Coordinates Network, 17758, 1
Cenko S. B., Bloom J. S., Perley D. A., Cobb B. E., Morgan A. N., MillerA. A., Modjaz M., James B., 2010, GRB Coordinates Network, 10389,1
Choksi N., Volonteri M., Colpi M., Gnedin O. Y., Li H., 2019, ApJ, 873,100
Chornock R., Berger E., 2011, GRB Coordinates Network, 11518, 1Chornock R., et al., 2017, ApJ, 848, L19Chruslinska M., Nelemans G., Belczynski K., 2019, MNRAS, 482, 5012Church R. P., Levan A. J., Davies M. B., Tanvir N., 2011, MNRAS, 413,2004
Church R. P., Levan A. J., Davies M. B., Tanvir N., 2012, Memorie dellaSocieta Astronomica Italiana Supplementi, 21, 104
Comerford J. M., Natarajan P., 2007, MNRAS, 379, 190Correa C. A., Schaye J., Clauwens B., Bower R. G., Crain R. A., SchallerM., Theuns T., Thob A. C. R., 2017, MNRAS, 472, L45
Corsi A., et al., 2018, ApJ, 861, L10Coulter D. A., et al., 2017, Science, 358, 1556Cowperthwaite P. S., et al., 2017, ApJ, 848, L17Crain R. A., et al., 2015, MNRAS, 450, 1937Cucchiara A., Levan A. J., 2016, GRB Coordinates Network, 19565, 1Cucchiara A., Fox D., Berger E., P.A. P., 2006, GRB Coordinates Network,5470, 1
Cucchiara A., Cenko S. B., Perley D. A., Capone J., Toy V., 2014, GRBCoordinates Network, 16774, 1
D’Avanzo P., et al., 2009, A&A, 498, 711Dichiara S., Troja E., O’Connor B., Marshall F. E., Beniamini P., CannizzoJ. K., Lien A. Y., Sakamoto T., 2020, MNRAS, 492, 5011
Eldridge J. J., Stanway E. R., Xiao L., McClelland L. A. S., Taylor G., NgM., Greis S. M. L., Bray J. C., 2017, Publ. Astron. Soc. Australia, 34,e058
Evans P. A., et al., 2016, MNRAS, 455, 1522Evans P. A., et al., 2017, Science, 358, 1565Fang T., Bullock J., Boylan-Kolchin M., 2013, ApJ, 762, 20
MNRAS 000, 1–?? (2021)
20 S. Mandhai et al.
Fernández J. J., Kobayashi S., 2019, MNRAS, 487, 1200Foley R. J., Bloom J. S., Chen H. W., 2005, GRB Coordinates Network,3808, 1
Fong W., Berger E., 2013, ApJ, 776, 18Fong W., et al., 2013, ApJ, 769, 56Fong W., Berger E., Margutti R., Zauderer B. A., 2015a, ApJ, 815, 102Fong W., Berger E., Fox D., Shappee B. J., 2015b, GRB Coordinates Net-work, 17333, 1
Fong W., et al., 2016, ApJ, 833, 151Fong W., et al., 2017, ApJ, 848, L23Fong W., et al., 2020, arXiv e-prints, p. arXiv:2008.08593Foucart F., Duez M. D., Kidder L. E., Nissanke S. M., Pfeiffer H. P., ScheelM. A., 2019, Phys. Rev. D, 99, 103025
Fox D. B., et al., 2005, Nature, 437, 845Fragione G., Kocsis B., 2018, Phys. Rev. Lett., 121, 161103Fragos T., Willems B., Kalogera V., Ivanova N., Rockefeller G., Fryer C. L.,Young P. A., 2009, ApJ, 697, 1057
Frith W. J., Metcalfe N., Shanks T., 2006, MNRAS, 371, 1601Fryer C. L., Belczynski K., Wiktorowicz G., DominikM., Kalogera V., HolzD. E., 2012, ApJ, 749, 91
Furlong M., et al., 2015, MNRAS, 450, 4486Gehrels N., et al., 2005, Nature, 437, 851Gehrels N., Cannizzo J. K., Kanner J., Kasliwal M. M., Nissanke S., SingerL. P., 2016, ApJ, 820, 136
Ghirlanda G., et al., 2016, A&A, 594, A84Giacobbo N., Mapelli M., 2018, MNRAS, 480, 2011Gompertz B. P., et al., 2018, ApJ, 860, 62Gompertz B. P., Levan A. J., Tanvir N. R., 2020, ApJ, 895, 58Graham J. F., et al., 2009, ApJ, 698, 1620Haggard D., Nynka M., Ruan J. J., Kalogera V., Cenko S. B., Evans P.,Kennea J. A., 2017, ApJ, 848, L25
Hajela A., et al., 2019, ApJ, 886, L17Hallinan G., et al., 2017, Science, 358, 1579Hayashi K., Kawaguchi K., Kiuchi K., Kyutoku K., Shibata M., 2020, arXive-prints, p. arXiv:2010.02563
Hinderer T., et al., 2019, Phys. Rev. D, 100, 063021Hjorth J., et al., 2005, ApJ, 630, L117Hobbs G., Lorimer D. R., Lyne A. G., Kramer M., 2005, MNRAS, 360, 974Holland S. T., de Pasquale M., Markwardt C. B., 2007, GRB CoordinatesNetwork, 7145, 1
Huerta E. A., et al., 2019, Nature Reviews Physics, 1, 600Hunter J. D., 2007, Computing in Science & Engineering, 9, 90Hurley J. R., Tout C. A., Pols O. R., 2002, MNRAS, 329, 897ImM., ParkW.K., Pak S., JeongH., KimE., Kim J., 2010, GRBCoordinatesNetwork, 11108, 1
Im M., et al., 2017, ApJ, 849, L16Izzo L., Cano Z., de Ugarte Postig A., Kann D. A., Thoene C., Geier S.,2017, GRB Coordinates Network, 21059, 1
Jiang Z., et al., 2020, MNRAS, 498, 926Jin Z.-P., et al., 2016, Nature Communications, 7, 12898Jin Z.-P., Covino S., Liao N.-H., Li X., D’Avanzo P., Fan Y.-Z., Wei D.-M.,2020, Nature Astronomy, 4, 77
Kann D. A., et al., 2011, ApJ, 734, 96Kasliwal M. M., et al., 2017, Science, 358, 1559Katz J. I., Canel L. M., 1996, ApJ, 471, 915Kawaguchi K., Kyutoku K., Shibata M., Tanaka M., 2016, ApJ, 825, 52Kocevski D., et al., 2010, MNRAS, 404, 963Kouveliotou C., Meegan C. A., Fishman G. J., Bhat N. P., Briggs M. S.,Koshut T. M., Paciesas W. S., Pendleton G. N., 1993, ApJ, 413, L101
Kroupa P., 2001, MNRAS, 322, 231Kuin N. P. M., Gelbord J. M., 2011, GRB Coordinates Network, 11575, 1Lamb G. P., et al., 2019a, ApJ, 870, L15Lamb G. P., et al., 2019b, ApJ, 883, 48Lee W. H., Ramirez-Ruiz E., 2007, New Journal of Physics, 9, 17Leibler C. N., Berger E., 2010, ApJ, 725, 1202Levan A. J., et al., 2006, ApJ, 648, L9Levan A. J., et al., 2007, MNRAS, 378, 1439
Levan A. J., Tanvir N. R., Wiersema K., Hartoog O., Kolle K., Mendez J.,Kupfer T., 2013, GRB Coordinates Network, 14742, 1
LevanA. J., Cenko S. B., CucchiaraA., PerleyD.A., 2014,GRBCoordinatesNetwork, 16784, 1
Levan A. J., Hjorth J., Wiersema K., Tanvir N. R., 2015, GRB CoordinatesNetwork, 17281, 1
Levan A. J., et al., 2017, ApJ, 848, L28Licquia T. C., Newman J. A., 2015, ApJ, 806, 96Lien A., et al., 2016, ApJ, 829, 7Lyman J. D., et al., 2018, Nature Astronomy, 2, 751Madau P., Dickinson M., 2014, Annual Review of Astronomy and Astro-physics, 52, 415–486
Mainetti D., Lupi A., Campana S., Colpi M., 2016, MNRAS, 457, 2516Maller A. H., Bullock J. S., 2004, MNRAS, 355, 694Mandhai S., Tanvir N., Lamb G., Levan A., Tsang D., 2018, Galaxies, 6,130
Mapelli M., Giacobbo N., Toffano M., Ripamonti E., Bressan A., Spera M.,Branchesi M., 2018, MNRAS, 481, 5324
Margutti R., et al., 2012, ApJ, 756, 63Margutti R., et al., 2017, ApJ, 848, L20Mazets E. P., Golenetskii S. V., 1981, Ap&SS, 75, 47McAlpine S., et al., 2016, Astronomy and Computing, 15, 72McCarthy K. S., Zheng Z., Ramirez-Ruiz E., 2020, arXiv e-prints, p.arXiv:2007.15024
McCully C., et al., 2017, ApJ, 848, L32McKinney W., 2010, in van der Walt S., Millman J., eds, Proceedings of the9th Python in Science Conference. pp 51 – 56
Mészáros P., Rees M. J., 1997, ApJ, 476, 232Mészáros P., FoxD. B., HannaC.,MuraseK., 2019, Nature Reviews Physics,1, 585
MetcalfeN., ShanksT.,Weilbacher P.M.,McCrackenH. J., FongR., Thomp-son D., 2006, MNRAS, 370, 1257
Miyamoto M., Nagai R., 1975, PASJ, 27, 533Mogushi K., Cavaglià M., Siellez K., 2019, ApJ, 880, 55Mooley K. P., et al., 2018, Nature, 561, 355Morgan R., et al., 2020, ApJ, 901, 83Murase K., Bartos I., 2019, Annual Review of Nuclear and Particle Science,69, 477
Nakar E., 2007, Phys. Rep., 442, 166Narayan R., Paczynski B., Piran T., 1992, ApJ, 395, L83Narayan R., Piran T., Kumar P., 2001, ApJ, 557, 949Navarro J. F., Frenk C. S., White S. D. M., 1996, ApJ, 462, 563Nicholl M., et al., 2017, ApJ, 848, L18Nynka M., Ruan J. J., Haggard D., Evans P. A., 2018, ApJ, 862, L19O’Connor B., Beniamini P., Kouveliotou C., 2020, MNRAS, 495, 4782O’Connor B., et al., 2021, MNRAS, 502, 1279Oliphant T. E., 2006, A guide to NumPy. Vol. 1, Trelgol Publishing USAPalmese A., et al., 2017, ApJ, 849, L34Paterson K., et al., 2020, ApJ, 898, L32Paul D., 2018, MNRAS, 477, 4275Perego A., Radice D., Bernuzzi S., 2017, ApJ, 850, L37Perley D. A., Bloom J. S., Modjaz M., Poznanski D., Thoene C. C., 2007,GRB Coordinates Network, 7140, 1
Perna R., Belczynski K., 2002, ApJ, 570, 252Pian E., et al., 2017, Nature, 551, 67Piranomonte S., et al., 2008, A&A, 491, 183Piro L., et al., 2019, MNRAS, 483, 1912Planck Collaboration et al., 2014, A&A, 571, A16Price-Whelan A. M., et al., 2018, AJ, 156, 123Prochaska J. X., Bloom J. S., Chen H. W., Hansen B., Kalirai J., Rich M.,Richer H., 2005, GRB Coordinates Network, 3700, 1
Qu Y., et al., 2017, MNRAS, 464, 1659Racusin J. L., Burrows D. N., Gehrels N., 2006, GRB Coordinates Network,5773, 1
Rau A., McBreen S., Kruehler T., 2009, GRB Coordinates Network, 9353,1
Resmi L., et al., 2018, ApJ, 867, 57Rodriguez C. L., Loeb A., 2018, ApJ, 866, L5
MNRAS 000, 1–?? (2021)
Compact binary merger hosts and environments 21
Rodriguez C. L., Morscher M., Pattabiraman B., Chatterjee S., Haster C.-J.,Rasio F. A., 2015, Phys. Rev. Lett., 115, 051101
Rodriguez C. L., Chatterjee S., Rasio F. A., 2016, Phys. Rev. D, 93, 084029Rothberg B., Kuhn O., Veillet C., Allanson S., 2020, GRB CoordinatesNetwork, 28319, 1
Rowlinson A., et al., 2010, MNRAS, 408, 383Ruiz M., Paschalidis V., Tsokaros A., Shapiro S. L., 2020, Phys. Rev. D,102, 124077
Samsing J., D’Orazio D. J., 2018, MNRAS, 481, 5445Santoliquido F., Mapelli M., Bouffanais Y., Giacobbo N., Di Carlo U. N.,Rastello S., Artale M. C., Ballone A., 2020, arXiv e-prints, p.arXiv:2004.09533
Sari R., Piran T., Narayan R., 1998, ApJ, 497, L17Schaye J., et al., 2015, MNRAS, 446, 521Selsing J., et al., 2016, GRB Coordinates Network, 19274, 1Selsing J., et al., 2018, A&A, 616, A48Selsing J., et al., 2019, A&A, 623, A92Shappee B. J., et al., 2017, Science, 358, 1574Shen S., Cooke R. J., Ramirez-Ruiz E., Madau P., Mayer L., Guedes J.,2015, ApJ, 807, 115
Shibata M., Taniguchi K., 2011, Living Reviews in Relativity, 14, 6Smartt S. J., et al., 2017, Nature, 551, 75Soares-Santos M., et al., 2017, ApJ, 848, L16Soderberg A. M., et al., 2006, ApJ, 650, 261Stanway E. R., Eldridge J. J., 2018, MNRAS, 479, 75Sun H., Zhang B., Li Z., 2015, ApJ, 812, 33Tan W.-W., Yu Y.-W., 2020, arXiv e-prints, p. arXiv:2006.02060Tanaka M., Hotokezaka K., Kyutoku K., Wanajo S., Kiuchi K., SekiguchiY., Shibata M., 2014, ApJ, 780, 31
Tanaka M., et al., 2017, PASJ, 69, 102Tanvir N. R., et al., 2010, GRB Coordinates Network, 11123, 1Tanvir N. R., LevanA. J., FruchterA. S., Hjorth J., Hounsell R.A.,WiersemaK., Tunnicliffe R. L., 2013, Nature, 500, 547
Tanvir N. R., et al., 2017, ApJ, 848, L27Thob A. C. R., et al., 2019, MNRAS, 485, 972Thone C. C., de Ugarte Postigo A., Gorosabel J., Tanvir N., Fynbo J. P. U.,2013, GRB Coordinates Network, 14744, 1
Troja E., et al., 2016, ApJ, 827, 102Troja E., et al., 2017, Nature, 551, 71Troja E., et al., 2019a, MNRAS, 489, 1919Troja E., et al., 2019b, MNRAS, 489, 2104Troja E., et al., 2020, MNRAS, 498, 5643Tsutsui R., Yonetoku D., Nakamura T., Takahashi K., Morihara Y., 2013,MNRAS, 431, 1398
Tunnicliffe R. L., et al., 2014, MNRAS, 437, 1495Villar V. A., et al., 2017, ApJ, 851, L21Virtanen P., et al., 2020, Nature Methods, 17, 261Wanderman D., Piran T., 2015, MNRAS, 448, 3026Wang H., et al., 2017, ApJ, 851, L18Ye C. S., Fong W.-f., Kremer K., Rodriguez C. L., Chatterjee S., FragioneG., Rasio F. A., 2019, arXiv e-prints, p. arXiv:1910.10740
Yonetoku D., Nakamura T., Sawano T., Takahashi K., Toyanago A., 2014,ApJ, 789, 65
Zevin M., Kelley L. Z., Nugent A., Fong W.-f., Berry C. P. L., Kalogera V.,2019, arXiv e-prints, p. arXiv:1910.03598
Zhang B., Fan Y. Z., Dyks J., Kobayashi S., Mészáros P., Burrows D. N.,Nousek J. A., Gehrels N., 2006, ApJ, 642, 354
Zhang B., et al., 2007, ApJ, 655, 989Ziaeepour H., et al., 2006, GRB Coordinates Network, 5948, 1de Ugarte Postigo A., Kann D. A., Izzo L., Thoene C. C., Blazek M., AguiFernandez J. F., Lombardi G., 2020, GRB Coordinates Network, 29132,1
van de Voort F., Pakmor R., Grand R. J. J., Springel V., Gómez F. A.,Marinacci F., 2020, MNRAS, 494, 4867
MNRAS 000, 1–?? (2021)
22 S. Mandhai et al.
APPENDIX A: BPASS/HOBBS BINARIES
Here we show the equivalent figures and tables from the main text,for BPASS/Hobbs simulated binaries.
MNRAS 000, 1–?? (2021)
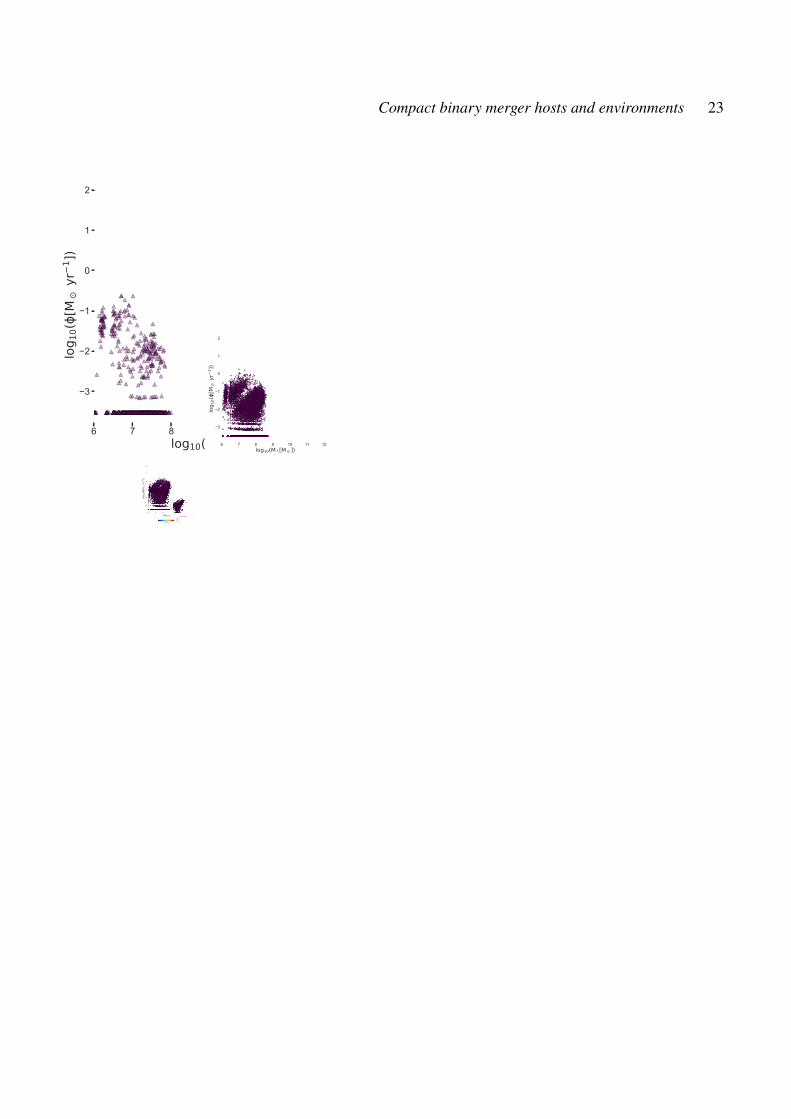
Compact binary merger hosts and environments 23
6 7 8 9 10 11 12log10(M * [M ])
3
2
1
0
1
2
log 1
0([M
yr1 ]
)
EARLY-TYPE : 39.88 %LATE-TYPE : 60.12 %-----------------------------------------------HOST-LESS : 28.59 %FAINT : 1.70 %
0
5
10
P[%
]
0 5 10P [%]
0.00 z < 0.40
6 7 8 9 10 11 12log10(M * [M ])
3
2
1
0
1
2
log 1
0([M
yr1 ]
)
EARLY-TYPE : 31.71 %LATE-TYPE : 68.29 %-----------------------------------------------HOST-LESS : 33.41 %FAINT : 5.77 %
0
5
P[%
]0 5
P [%]
0.40 z < 1.00
6 7 8 9 10 11 12log10(M * [M ])
3
2
1
0
1
2
log 1
0([M
yr1 ]
)
EARLY-TYPE : 32.67 %LATE-TYPE : 67.33 %-----------------------------------------------HOST-LESS : 36.52 %FAINT : 12.62 %
0
5
P[%
]
0 5P [%]
1.00 z < 2.00
6 7 8 9 10 11 12log10(M * [M ])
3
2
1
0
1
2
log 1
0([M
yr1 ]
)
EARLY-TYPE : 41.62 %LATE-TYPE : 58.38 %-----------------------------------------------HOST-LESS : 49.42 %FAINT : 30.97 %
0
5
P[%
]
0 5P [%]
2.00 z < 3.60
0.0 0.5 1.0 1.5 2.0 2.5 3.0 3.5 4.0log10( [Myr])
Resolved LimitFaint Galaxies [1 Region]Faint GalaxiesEjected BinariesHost GalaxiesSGRB HostsNGC 4993
merge > 1000 Myr 1000 merge > 100 Myr
merge 100 MyrHost-less
Figure A1. [BPASS/Hobbs - NSNS] Similar to Figure 5.
MNRAS 000, 1–?? (2021)
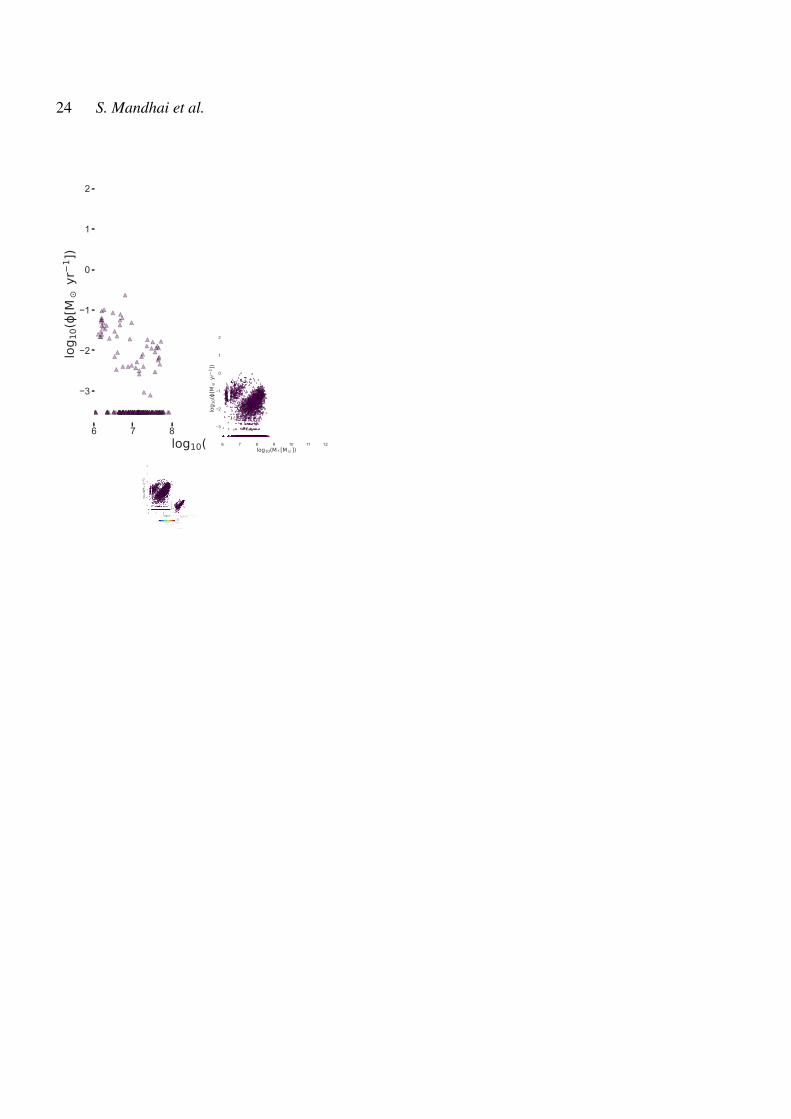
24 S. Mandhai et al.
6 7 8 9 10 11 12log10(M * [M ])
3
2
1
0
1
2
log 1
0([M
yr1 ]
)
EARLY-TYPE : 43.61 %LATE-TYPE : 56.39 %-----------------------------------------------HOST-LESS : 48.06 %FAINT : 3.58 %
0
5
P[%
]
0 5 10P [%]
0.00 z < 0.40
6 7 8 9 10 11 12log10(M * [M ])
3
2
1
0
1
2
log 1
0([M
yr1 ]
)
EARLY-TYPE : 34.42 %LATE-TYPE : 65.58 %-----------------------------------------------HOST-LESS : 52.13 %FAINT : 9.83 %
0
5
P[%
]0 5
P [%]
0.40 z < 1.00
6 7 8 9 10 11 12log10(M * [M ])
3
2
1
0
1
2
log 1
0([M
yr1 ]
)
EARLY-TYPE : 41.65 %LATE-TYPE : 58.35 %-----------------------------------------------HOST-LESS : 40.97 %FAINT : 13.84 %
0
5
P[%
]
0 5P [%]
1.00 z < 2.00
6 7 8 9 10 11 12log10(M * [M ])
3
2
1
0
1
2
log 1
0([M
yr1 ]
)
EARLY-TYPE : 49.47 %LATE-TYPE : 50.53 %-----------------------------------------------HOST-LESS : 38.71 %FAINT : 21.82 %
0
5
P[%
]
0 5P [%]
2.00 z < 3.60
0.0 0.5 1.0 1.5 2.0 2.5 3.0 3.5 4.0log10( [Myr])
Resolved LimitFaint Galaxies [1 Region]Faint GalaxiesEjected BinariesHost GalaxiesSGRB HostsNGC 4993
merge > 1000 Myr 1000 merge > 100 Myr
merge 100 MyrHost-less
Figure A2. [BPASS/Hobbs - eBHNS] Similar to Figure 6.
MNRAS 000, 1–?? (2021)
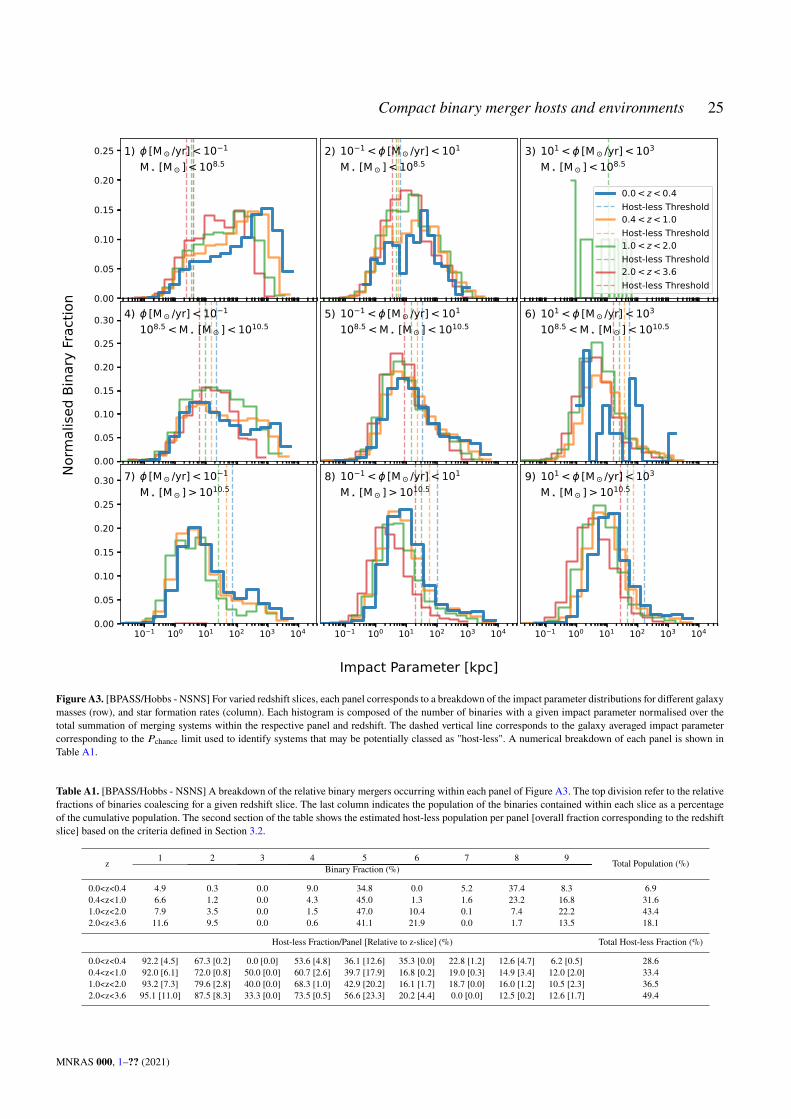
Compact binary merger hosts and environments 25
10 1 100 101 102 103 1040.00
0.05
0.10
0.15
0.20
0.25 1) [M /yr] < 10 1
M [M ] < 108.5
10 1 100 101 102 103 104
2) 10 1 < [M /yr] < 101
M [M ] < 108.5
10 1 100 101 102 103 104
3) 101 < [M /yr] < 103
M [M ] < 108.5
0.0 < z < 0.4Host-less Threshold0.4 < z < 1.0Host-less Threshold1.0 < z < 2.0Host-less Threshold2.0 < z < 3.6Host-less Threshold
10 1 100 101 102 103 1040.00
0.05
0.10
0.15
0.20
0.25
0.30 4) [M /yr] < 10 1
108.5 < M [M ] < 1010.5
10 1 100 101 102 103 104
5) 10 1 < [M /yr] < 101
108.5 < M [M ] < 1010.5
10 1 100 101 102 103 104
6) 101 < [M /yr] < 103
108.5 < M [M ] < 1010.5
10 1 100 101 102 103 1040.00
0.05
0.10
0.15
0.20
0.25
0.30 7) [M /yr] < 10 1
M [M ] > 1010.5
10 1 100 101 102 103 104
8) 10 1 < [M /yr] < 101
M [M ] > 1010.5
10 1 100 101 102 103 104
9) 101 < [M /yr] < 103
M [M ] > 1010.5
Norm
alise
d Bi
nary
Frac
tion
Impact Parameter [kpc]
Figure A3. [BPASS/Hobbs - NSNS] For varied redshift slices, each panel corresponds to a breakdown of the impact parameter distributions for different galaxymasses (row), and star formation rates (column). Each histogram is composed of the number of binaries with a given impact parameter normalised over thetotal summation of merging systems within the respective panel and redshift. The dashed vertical line corresponds to the galaxy averaged impact parametercorresponding to the 𝑃chance limit used to identify systems that may be potentially classed as "host-less". A numerical breakdown of each panel is shown inTable A1.
Table A1. [BPASS/Hobbs - NSNS] A breakdown of the relative binary mergers occurring within each panel of Figure A3. The top division refer to the relativefractions of binaries coalescing for a given redshift slice. The last column indicates the population of the binaries contained within each slice as a percentageof the cumulative population. The second section of the table shows the estimated host-less population per panel [overall fraction corresponding to the redshiftslice] based on the criteria defined in Section 3.2.
z 1 2 3 4 5 6 7 8 9 Total Population (%)Binary Fraction (%)
0.0<z<0.4 4.9 0.3 0.0 9.0 34.8 0.0 5.2 37.4 8.3 6.90.4<z<1.0 6.6 1.2 0.0 4.3 45.0 1.3 1.6 23.2 16.8 31.61.0<z<2.0 7.9 3.5 0.0 1.5 47.0 10.4 0.1 7.4 22.2 43.42.0<z<3.6 11.6 9.5 0.0 0.6 41.1 21.9 0.0 1.7 13.5 18.1
Host-less Fraction/Panel [Relative to z-slice] (%) Total Host-less Fraction (%)
0.0<z<0.4 92.2 [4.5] 67.3 [0.2] 0.0 [0.0] 53.6 [4.8] 36.1 [12.6] 35.3 [0.0] 22.8 [1.2] 12.6 [4.7] 6.2 [0.5] 28.60.4<z<1.0 92.0 [6.1] 72.0 [0.8] 50.0 [0.0] 60.7 [2.6] 39.7 [17.9] 16.8 [0.2] 19.0 [0.3] 14.9 [3.4] 12.0 [2.0] 33.41.0<z<2.0 93.2 [7.3] 79.6 [2.8] 40.0 [0.0] 68.3 [1.0] 42.9 [20.2] 16.1 [1.7] 18.7 [0.0] 16.0 [1.2] 10.5 [2.3] 36.52.0<z<3.6 95.1 [11.0] 87.5 [8.3] 33.3 [0.0] 73.5 [0.5] 56.6 [23.3] 20.2 [4.4] 0.0 [0.0] 12.5 [0.2] 12.6 [1.7] 49.4
MNRAS 000, 1–?? (2021)
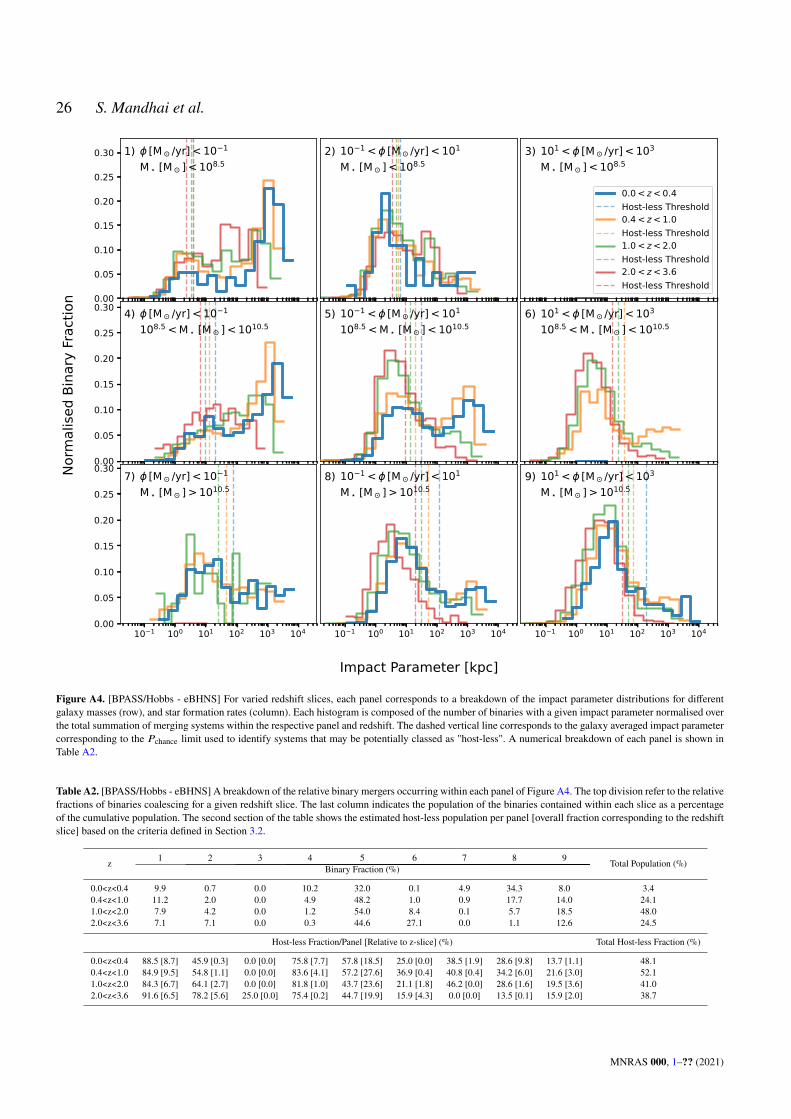
26 S. Mandhai et al.
10 1 100 101 102 103 1040.00
0.05
0.10
0.15
0.20
0.25
0.30 1) [M /yr] < 10 1
M [M ] < 108.5
10 1 100 101 102 103 104
2) 10 1 < [M /yr] < 101
M [M ] < 108.5
10 1 100 101 102 103 104
3) 101 < [M /yr] < 103
M [M ] < 108.5
0.0 < z < 0.4Host-less Threshold0.4 < z < 1.0Host-less Threshold1.0 < z < 2.0Host-less Threshold2.0 < z < 3.6Host-less Threshold
10 1 100 101 102 103 1040.00
0.05
0.10
0.15
0.20
0.25
0.30 4) [M /yr] < 10 1
108.5 < M [M ] < 1010.5
10 1 100 101 102 103 104
5) 10 1 < [M /yr] < 101
108.5 < M [M ] < 1010.5
10 1 100 101 102 103 104
6) 101 < [M /yr] < 103
108.5 < M [M ] < 1010.5
10 1 100 101 102 103 1040.00
0.05
0.10
0.15
0.20
0.25
0.30 7) [M /yr] < 10 1
M [M ] > 1010.5
10 1 100 101 102 103 104
8) 10 1 < [M /yr] < 101
M [M ] > 1010.5
10 1 100 101 102 103 104
9) 101 < [M /yr] < 103
M [M ] > 1010.5
Norm
alise
d Bi
nary
Frac
tion
Impact Parameter [kpc]
Figure A4. [BPASS/Hobbs - eBHNS] For varied redshift slices, each panel corresponds to a breakdown of the impact parameter distributions for differentgalaxy masses (row), and star formation rates (column). Each histogram is composed of the number of binaries with a given impact parameter normalised overthe total summation of merging systems within the respective panel and redshift. The dashed vertical line corresponds to the galaxy averaged impact parametercorresponding to the 𝑃chance limit used to identify systems that may be potentially classed as "host-less". A numerical breakdown of each panel is shown inTable A2.
Table A2. [BPASS/Hobbs - eBHNS] A breakdown of the relative binary mergers occurring within each panel of Figure A4. The top division refer to the relativefractions of binaries coalescing for a given redshift slice. The last column indicates the population of the binaries contained within each slice as a percentageof the cumulative population. The second section of the table shows the estimated host-less population per panel [overall fraction corresponding to the redshiftslice] based on the criteria defined in Section 3.2.
z 1 2 3 4 5 6 7 8 9 Total Population (%)Binary Fraction (%)
0.0<z<0.4 9.9 0.7 0.0 10.2 32.0 0.1 4.9 34.3 8.0 3.40.4<z<1.0 11.2 2.0 0.0 4.9 48.2 1.0 0.9 17.7 14.0 24.11.0<z<2.0 7.9 4.2 0.0 1.2 54.0 8.4 0.1 5.7 18.5 48.02.0<z<3.6 7.1 7.1 0.0 0.3 44.6 27.1 0.0 1.1 12.6 24.5
Host-less Fraction/Panel [Relative to z-slice] (%) Total Host-less Fraction (%)
0.0<z<0.4 88.5 [8.7] 45.9 [0.3] 0.0 [0.0] 75.8 [7.7] 57.8 [18.5] 25.0 [0.0] 38.5 [1.9] 28.6 [9.8] 13.7 [1.1] 48.10.4<z<1.0 84.9 [9.5] 54.8 [1.1] 0.0 [0.0] 83.6 [4.1] 57.2 [27.6] 36.9 [0.4] 40.8 [0.4] 34.2 [6.0] 21.6 [3.0] 52.11.0<z<2.0 84.3 [6.7] 64.1 [2.7] 0.0 [0.0] 81.8 [1.0] 43.7 [23.6] 21.1 [1.8] 46.2 [0.0] 28.6 [1.6] 19.5 [3.6] 41.02.0<z<3.6 91.6 [6.5] 78.2 [5.6] 25.0 [0.0] 75.4 [0.2] 44.7 [19.9] 15.9 [4.3] 0.0 [0.0] 13.5 [0.1] 15.9 [2.0] 38.7
MNRAS 000, 1–?? (2021)
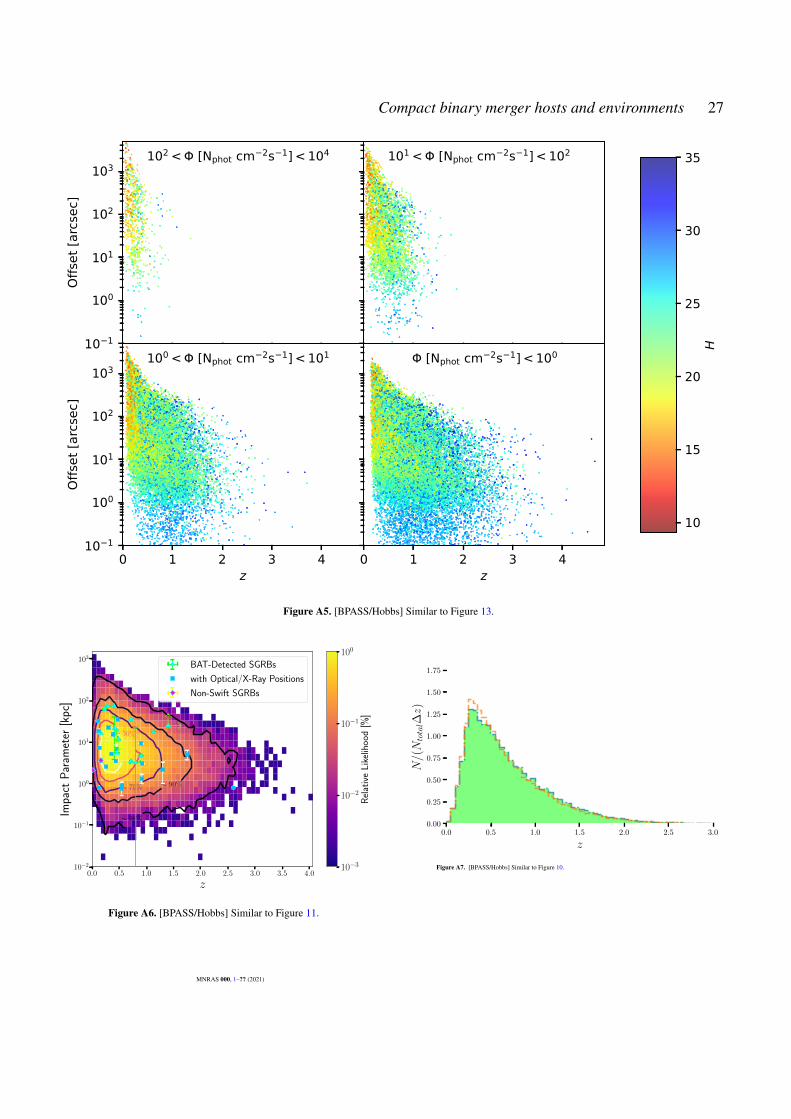
Compact binary merger hosts and environments 27
10 1
100
101
102
103
Offs
et [a
rcse
c]
102 < [Nphot cm 2s 1] < 104 101 < [Nphot cm 2s 1] < 102
0 1 2 3 4z
10 1
100
101
102
103
Offs
et [a
rcse
c]
100 < [Nphot cm 2s 1] < 101
0 1 2 3 4z
[Nphot cm 2s 1] < 100
10
15
20
25
30
35
H
Figure A5. [BPASS/Hobbs] Similar to Figure 13.
0.0 0.5 1.0 1.5 2.0 2.5 3.0 3.5 4.0
z
10−2
10−1
100
101
102
103
Impa
ctP
aram
eter
[kp
c]
∼ 98%
∼ 90%∼ 75%
∼ 50%∼ 25%
BAT-Detected SGRBs
with Optical/X-Ray Positions
Non-Swift SGRBs
→↑↓↓
10−3
10−2
10−1
100
Rel
ativ
eL
ikel
ihoo
d[%
]
Figure A6. [BPASS/Hobbs] Similar to Figure 11.
0.0 0.5 1.0 1.5 2.0 2.5 3.0
z
0.00
0.25
0.50
0.75
1.00
1.25
1.50
1.75
N/(Ntotal∆z)
SGRB Sim. (Aft. Bright)
SGRB Sim.
Localised SGRBs
Figure A7. [BPASS/Hobbs] Similar to Figure 10.
MNRAS 000, 1–?? (2021)
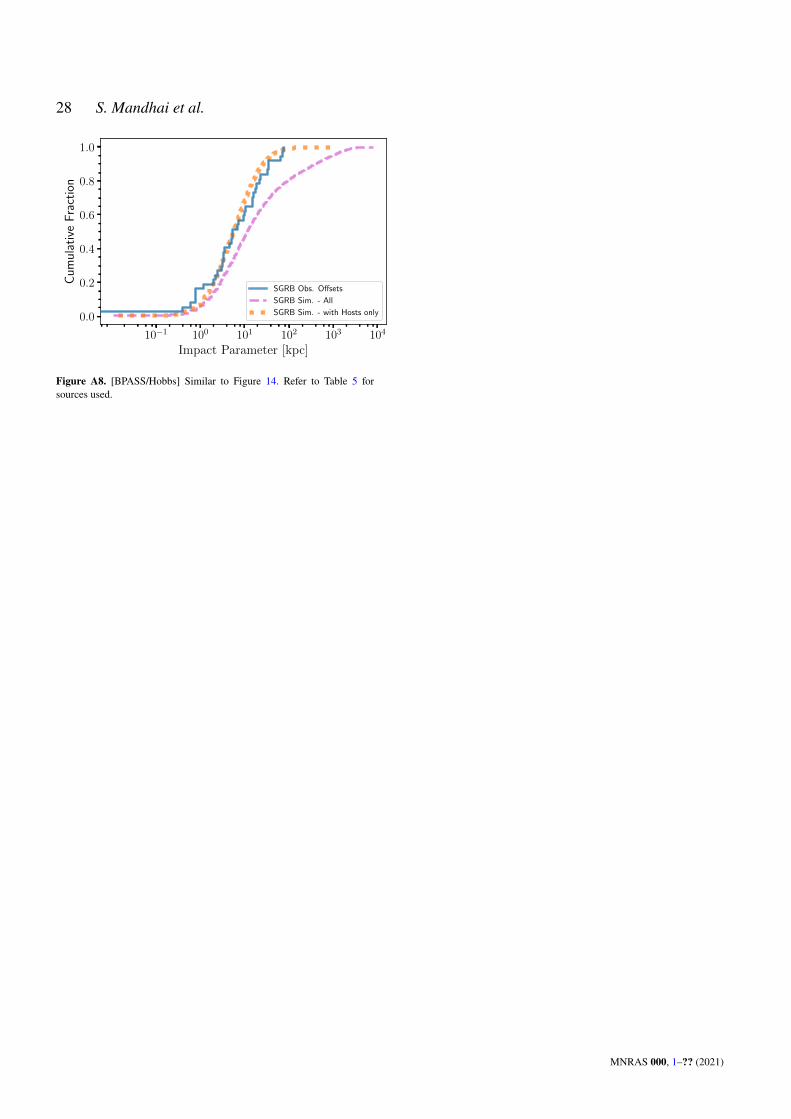
28 S. Mandhai et al.
10−1 100 101 102 103 104
Impact Parameter [kpc]
0.0
0.2
0.4
0.6
0.8
1.0
Cum
ulat
ive
Fra
ctio
n
SGRB Obs. Offsets
SGRB Sim. - All
SGRB Sim. - with Hosts only
Figure A8. [BPASS/Hobbs] Similar to Figure 14. Refer to Table 5 forsources used.
MNRAS 000, 1–?? (2021)
Compact binary merger hosts and environments 29
APPENDIX B: COSMIC BINARIES
Here we show the equivalent figures and tables from the main text,for COSMIC simulated binaries.
MNRAS 000, 1–?? (2021)
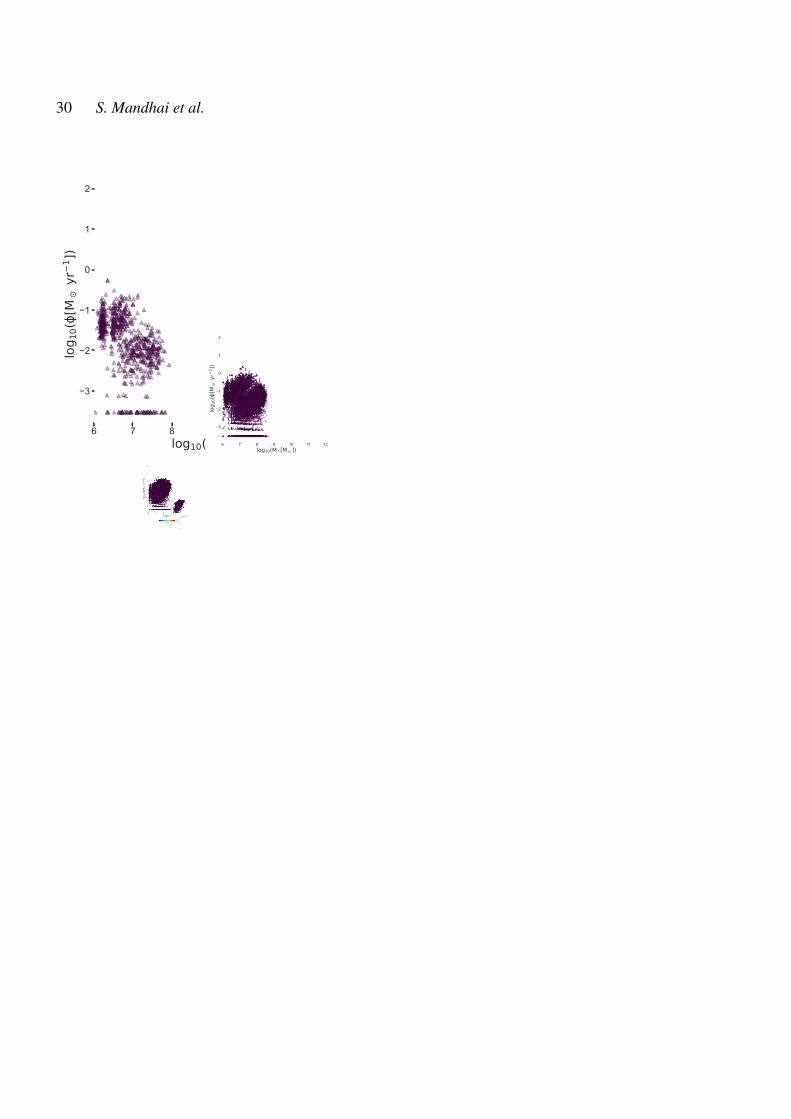
30 S. Mandhai et al.
6 7 8 9 10 11 12log10(M * [M ])
3
2
1
0
1
2
log 1
0([M
yr1 ]
)
EARLY-TYPE : 25.80 %LATE-TYPE : 74.20 %-----------------------------------------------HOST-LESS : 11.03 %FAINT : 1.43 %
0
5
P[%
]
0 5P [%]
0.00 z < 0.40
6 7 8 9 10 11 12log10(M * [M ])
3
2
1
0
1
2
log 1
0([M
yr1 ]
)
EARLY-TYPE : 26.02 %LATE-TYPE : 73.98 %-----------------------------------------------HOST-LESS : 12.74 %FAINT : 4.67 %
0
5
P[%
]0 5
P [%]
0.40 z < 1.00
6 7 8 9 10 11 12log10(M * [M ])
3
2
1
0
1
2
log 1
0([M
yr1 ]
)
EARLY-TYPE : 31.30 %LATE-TYPE : 68.70 %-----------------------------------------------HOST-LESS : 13.52 %FAINT : 10.81 %
0
5
P[%
]
0 5P [%]
1.00 z < 2.00
6 7 8 9 10 11 12log10(M * [M ])
3
2
1
0
1
2
log 1
0([M
yr1 ]
)
EARLY-TYPE : 42.97 %LATE-TYPE : 57.03 %-----------------------------------------------HOST-LESS : 26.34 %FAINT : 27.90 %
0
5
P[%
]
0 5 10P [%]
2.00 z < 3.60
0.0 0.5 1.0 1.5 2.0 2.5 3.0 3.5 4.0log10( [Myr])
Resolved LimitFaint Galaxies [1 Region]Faint GalaxiesEjected BinariesHost GalaxiesSGRB HostsNGC 4993
merge > 1000 Myr 1000 merge > 100 Myr
merge 100 MyrHost-less
Figure B1. [COSMIC - NSNS] Similar to Figure 5.
MNRAS 000, 1–?? (2021)
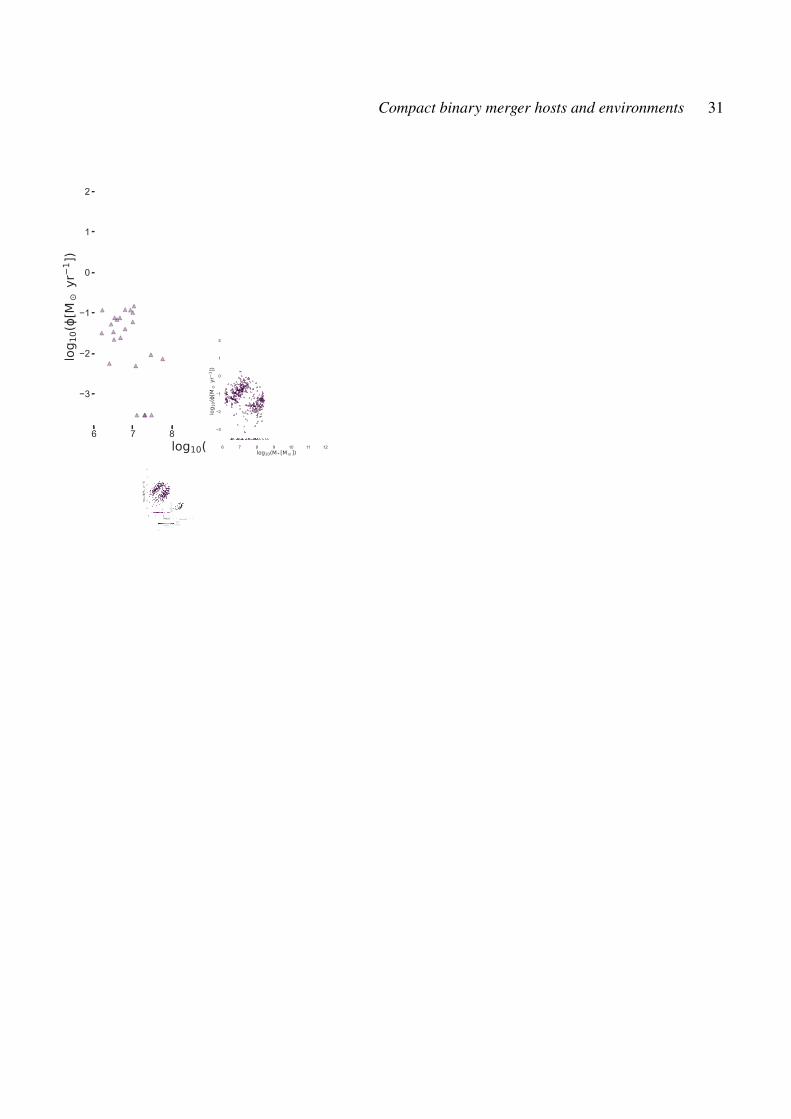
Compact binary merger hosts and environments 31
6 7 8 9 10 11 12log10(M * [M ])
3
2
1
0
1
2
log 1
0([M
yr1 ]
)
EARLY-TYPE : 27.96 %LATE-TYPE : 72.04 %-----------------------------------------------HOST-LESS : 19.22 %FAINT : 0.79 %
0
5
P[%
]
0 5P [%]
0.00 z < 0.40
6 7 8 9 10 11 12log10(M * [M ])
3
2
1
0
1
2
log 1
0([M
yr1 ]
)
EARLY-TYPE : 25.12 %LATE-TYPE : 74.88 %-----------------------------------------------HOST-LESS : 17.81 %FAINT : 2.21 %
0
5
10
P[%
]
0 5 10P [%]
0.40 z < 1.00
6 7 8 9 10 11 12log10(M * [M ])
3
2
1
0
1
2
log 1
0([M
yr1 ]
)
EARLY-TYPE : 21.12 %LATE-TYPE : 78.88 %-----------------------------------------------HOST-LESS : 11.90 %FAINT : 3.56 %
0
5
10
P[%
]
0 5 10 15P [%]
1.00 z < 2.00
6 7 8 9 10 11 12log10(M * [M ])
3
2
1
0
1
2
log 1
0([M
yr1 ]
)
EARLY-TYPE : 23.46 %LATE-TYPE : 76.54 %-----------------------------------------------HOST-LESS : 14.83 %FAINT : 11.95 %
05
1015
P[%
]
0 5 10 15P [%]
2.00 z < 3.60
0.0 0.5 1.0 1.5 2.0 2.5 3.0 3.5 4.0log10( [Myr])
Resolved LimitFaint Galaxies [1 Region]Faint GalaxiesEjected BinariesHost GalaxiesSGRB HostsNGC 4993
merge > 1000 Myr 1000 merge > 100 Myr
merge 100 MyrHost-less
Figure B2. [COSMIC - eBHNS] Similar to Figure 6.
MNRAS 000, 1–?? (2021)
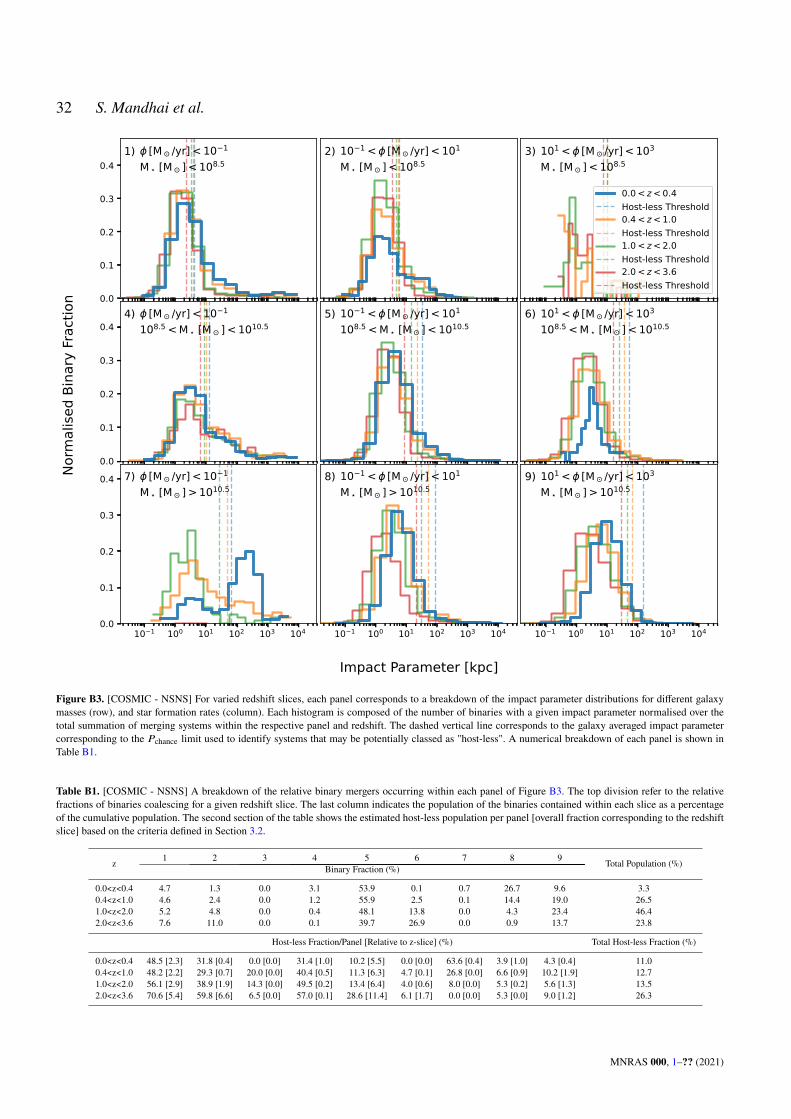
32 S. Mandhai et al.
10 1 100 101 102 103 1040.0
0.1
0.2
0.3
0.41) [M /yr] < 10 1
M [M ] < 108.5
10 1 100 101 102 103 104
2) 10 1 < [M /yr] < 101
M [M ] < 108.5
10 1 100 101 102 103 104
3) 101 < [M /yr] < 103
M [M ] < 108.5
0.0 < z < 0.4Host-less Threshold0.4 < z < 1.0Host-less Threshold1.0 < z < 2.0Host-less Threshold2.0 < z < 3.6Host-less Threshold
10 1 100 101 102 103 1040.0
0.1
0.2
0.3
0.44) [M /yr] < 10 1
108.5 < M [M ] < 1010.5
10 1 100 101 102 103 104
5) 10 1 < [M /yr] < 101
108.5 < M [M ] < 1010.5
10 1 100 101 102 103 104
6) 101 < [M /yr] < 103
108.5 < M [M ] < 1010.5
10 1 100 101 102 103 1040.0
0.1
0.2
0.3
0.4 7) [M /yr] < 10 1
M [M ] > 1010.5
10 1 100 101 102 103 104
8) 10 1 < [M /yr] < 101
M [M ] > 1010.5
10 1 100 101 102 103 104
9) 101 < [M /yr] < 103
M [M ] > 1010.5
Norm
alise
d Bi
nary
Frac
tion
Impact Parameter [kpc]
Figure B3. [COSMIC - NSNS] For varied redshift slices, each panel corresponds to a breakdown of the impact parameter distributions for different galaxymasses (row), and star formation rates (column). Each histogram is composed of the number of binaries with a given impact parameter normalised over thetotal summation of merging systems within the respective panel and redshift. The dashed vertical line corresponds to the galaxy averaged impact parametercorresponding to the 𝑃chance limit used to identify systems that may be potentially classed as "host-less". A numerical breakdown of each panel is shown inTable B1.
Table B1. [COSMIC - NSNS] A breakdown of the relative binary mergers occurring within each panel of Figure B3. The top division refer to the relativefractions of binaries coalescing for a given redshift slice. The last column indicates the population of the binaries contained within each slice as a percentageof the cumulative population. The second section of the table shows the estimated host-less population per panel [overall fraction corresponding to the redshiftslice] based on the criteria defined in Section 3.2.
z 1 2 3 4 5 6 7 8 9 Total Population (%)Binary Fraction (%)
0.0<z<0.4 4.7 1.3 0.0 3.1 53.9 0.1 0.7 26.7 9.6 3.30.4<z<1.0 4.6 2.4 0.0 1.2 55.9 2.5 0.1 14.4 19.0 26.51.0<z<2.0 5.2 4.8 0.0 0.4 48.1 13.8 0.0 4.3 23.4 46.42.0<z<3.6 7.6 11.0 0.0 0.1 39.7 26.9 0.0 0.9 13.7 23.8
Host-less Fraction/Panel [Relative to z-slice] (%) Total Host-less Fraction (%)
0.0<z<0.4 48.5 [2.3] 31.8 [0.4] 0.0 [0.0] 31.4 [1.0] 10.2 [5.5] 0.0 [0.0] 63.6 [0.4] 3.9 [1.0] 4.3 [0.4] 11.00.4<z<1.0 48.2 [2.2] 29.3 [0.7] 20.0 [0.0] 40.4 [0.5] 11.3 [6.3] 4.7 [0.1] 26.8 [0.0] 6.6 [0.9] 10.2 [1.9] 12.71.0<z<2.0 56.1 [2.9] 38.9 [1.9] 14.3 [0.0] 49.5 [0.2] 13.4 [6.4] 4.0 [0.6] 8.0 [0.0] 5.3 [0.2] 5.6 [1.3] 13.52.0<z<3.6 70.6 [5.4] 59.8 [6.6] 6.5 [0.0] 57.0 [0.1] 28.6 [11.4] 6.1 [1.7] 0.0 [0.0] 5.3 [0.0] 9.0 [1.2] 26.3
MNRAS 000, 1–?? (2021)
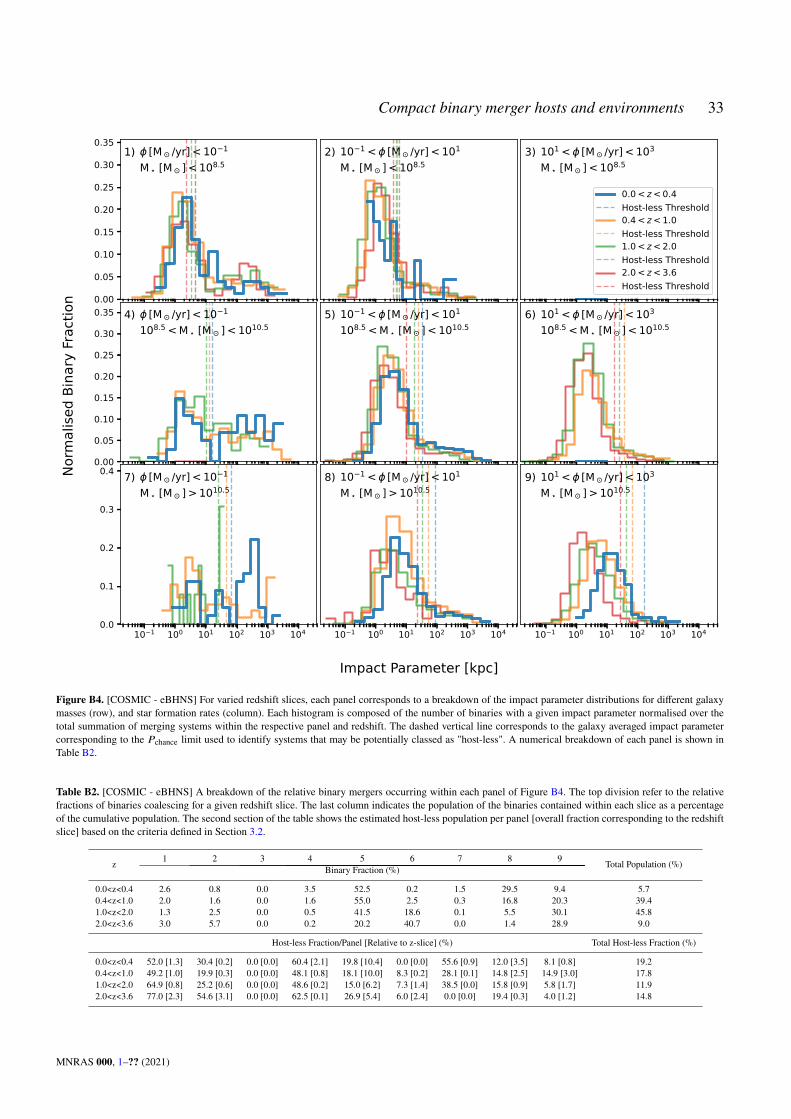
Compact binary merger hosts and environments 33
10 1 100 101 102 103 1040.00
0.05
0.10
0.15
0.20
0.25
0.30
0.351) [M /yr] < 10 1
M [M ] < 108.5
10 1 100 101 102 103 104
2) 10 1 < [M /yr] < 101
M [M ] < 108.5
10 1 100 101 102 103 104
3) 101 < [M /yr] < 103
M [M ] < 108.5
0.0 < z < 0.4Host-less Threshold0.4 < z < 1.0Host-less Threshold1.0 < z < 2.0Host-less Threshold2.0 < z < 3.6Host-less Threshold
10 1 100 101 102 103 1040.00
0.05
0.10
0.15
0.20
0.25
0.30
0.35 4) [M /yr] < 10 1
108.5 < M [M ] < 1010.5
10 1 100 101 102 103 104
5) 10 1 < [M /yr] < 101
108.5 < M [M ] < 1010.5
10 1 100 101 102 103 104
6) 101 < [M /yr] < 103
108.5 < M [M ] < 1010.5
10 1 100 101 102 103 1040.0
0.1
0.2
0.3
0.4 7) [M /yr] < 10 1
M [M ] > 1010.5
10 1 100 101 102 103 104
8) 10 1 < [M /yr] < 101
M [M ] > 1010.5
10 1 100 101 102 103 104
9) 101 < [M /yr] < 103
M [M ] > 1010.5
Norm
alise
d Bi
nary
Frac
tion
Impact Parameter [kpc]
Figure B4. [COSMIC - eBHNS] For varied redshift slices, each panel corresponds to a breakdown of the impact parameter distributions for different galaxymasses (row), and star formation rates (column). Each histogram is composed of the number of binaries with a given impact parameter normalised over thetotal summation of merging systems within the respective panel and redshift. The dashed vertical line corresponds to the galaxy averaged impact parametercorresponding to the 𝑃chance limit used to identify systems that may be potentially classed as "host-less". A numerical breakdown of each panel is shown inTable B2.
Table B2. [COSMIC - eBHNS] A breakdown of the relative binary mergers occurring within each panel of Figure B4. The top division refer to the relativefractions of binaries coalescing for a given redshift slice. The last column indicates the population of the binaries contained within each slice as a percentageof the cumulative population. The second section of the table shows the estimated host-less population per panel [overall fraction corresponding to the redshiftslice] based on the criteria defined in Section 3.2.
z 1 2 3 4 5 6 7 8 9 Total Population (%)Binary Fraction (%)
0.0<z<0.4 2.6 0.8 0.0 3.5 52.5 0.2 1.5 29.5 9.4 5.70.4<z<1.0 2.0 1.6 0.0 1.6 55.0 2.5 0.3 16.8 20.3 39.41.0<z<2.0 1.3 2.5 0.0 0.5 41.5 18.6 0.1 5.5 30.1 45.82.0<z<3.6 3.0 5.7 0.0 0.2 20.2 40.7 0.0 1.4 28.9 9.0
Host-less Fraction/Panel [Relative to z-slice] (%) Total Host-less Fraction (%)
0.0<z<0.4 52.0 [1.3] 30.4 [0.2] 0.0 [0.0] 60.4 [2.1] 19.8 [10.4] 0.0 [0.0] 55.6 [0.9] 12.0 [3.5] 8.1 [0.8] 19.20.4<z<1.0 49.2 [1.0] 19.9 [0.3] 0.0 [0.0] 48.1 [0.8] 18.1 [10.0] 8.3 [0.2] 28.1 [0.1] 14.8 [2.5] 14.9 [3.0] 17.81.0<z<2.0 64.9 [0.8] 25.2 [0.6] 0.0 [0.0] 48.6 [0.2] 15.0 [6.2] 7.3 [1.4] 38.5 [0.0] 15.8 [0.9] 5.8 [1.7] 11.92.0<z<3.6 77.0 [2.3] 54.6 [3.1] 0.0 [0.0] 62.5 [0.1] 26.9 [5.4] 6.0 [2.4] 0.0 [0.0] 19.4 [0.3] 4.0 [1.2] 14.8
MNRAS 000, 1–?? (2021)
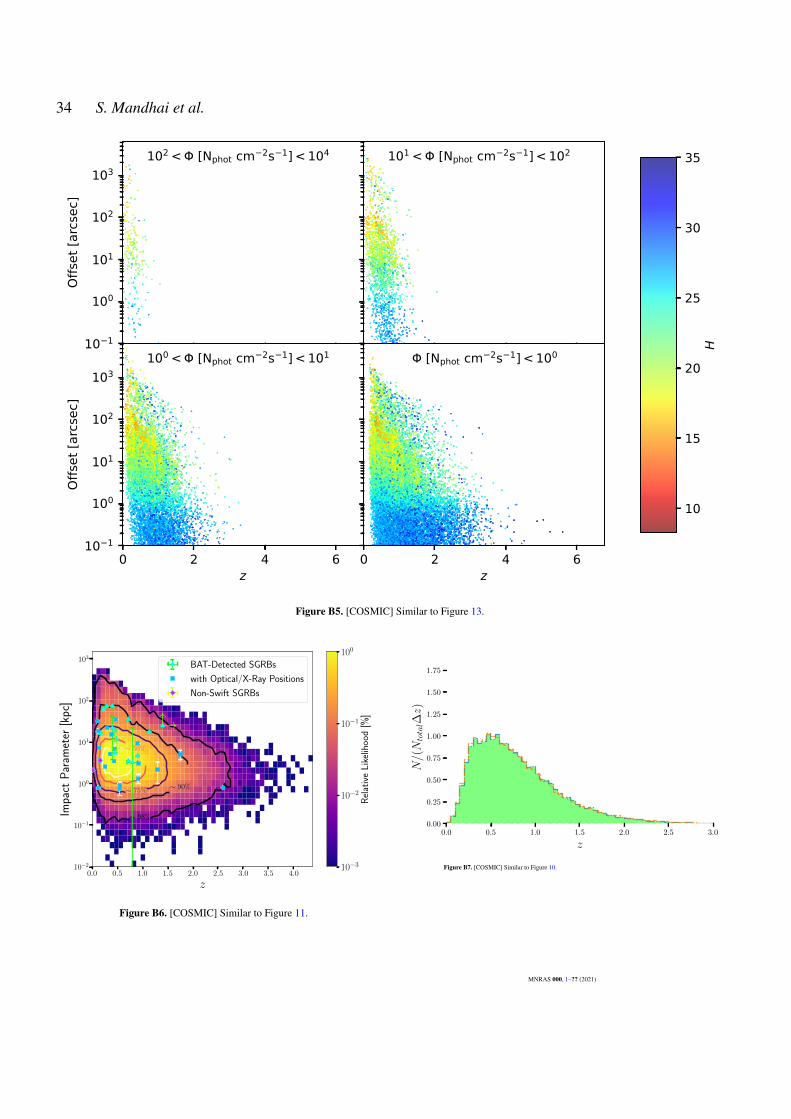
34 S. Mandhai et al.
10 1
100
101
102
103
Offs
et [a
rcse
c]
102 < [Nphot cm 2s 1] < 104 101 < [Nphot cm 2s 1] < 102
0 2 4 6z
10 1
100
101
102
103
Offs
et [a
rcse
c]
100 < [Nphot cm 2s 1] < 101
0 2 4 6z
[Nphot cm 2s 1] < 100
10
15
20
25
30
35
H
Figure B5. [COSMIC] Similar to Figure 13.
0.0 0.5 1.0 1.5 2.0 2.5 3.0 3.5 4.0
z
10−2
10−1
100
101
102
103
Impa
ctP
aram
eter
[kp
c]
∼ 98%
∼ 90%∼ 75%
∼ 50%∼ 25%
BAT-Detected SGRBs
with Optical/X-Ray Positions
Non-Swift SGRBs
→↑↓↓
10−3
10−2
10−1
100
Rel
ativ
eL
ikel
ihoo
d[%
]
Figure B6. [COSMIC] Similar to Figure 11.
0.0 0.5 1.0 1.5 2.0 2.5 3.0
z
0.00
0.25
0.50
0.75
1.00
1.25
1.50
1.75
N/(Ntotal∆z)
SGRB Sim. (Aft. Bright)
SGRB Sim.
Localised SGRBs
Figure B7. [COSMIC] Similar to Figure 10.
MNRAS 000, 1–?? (2021)
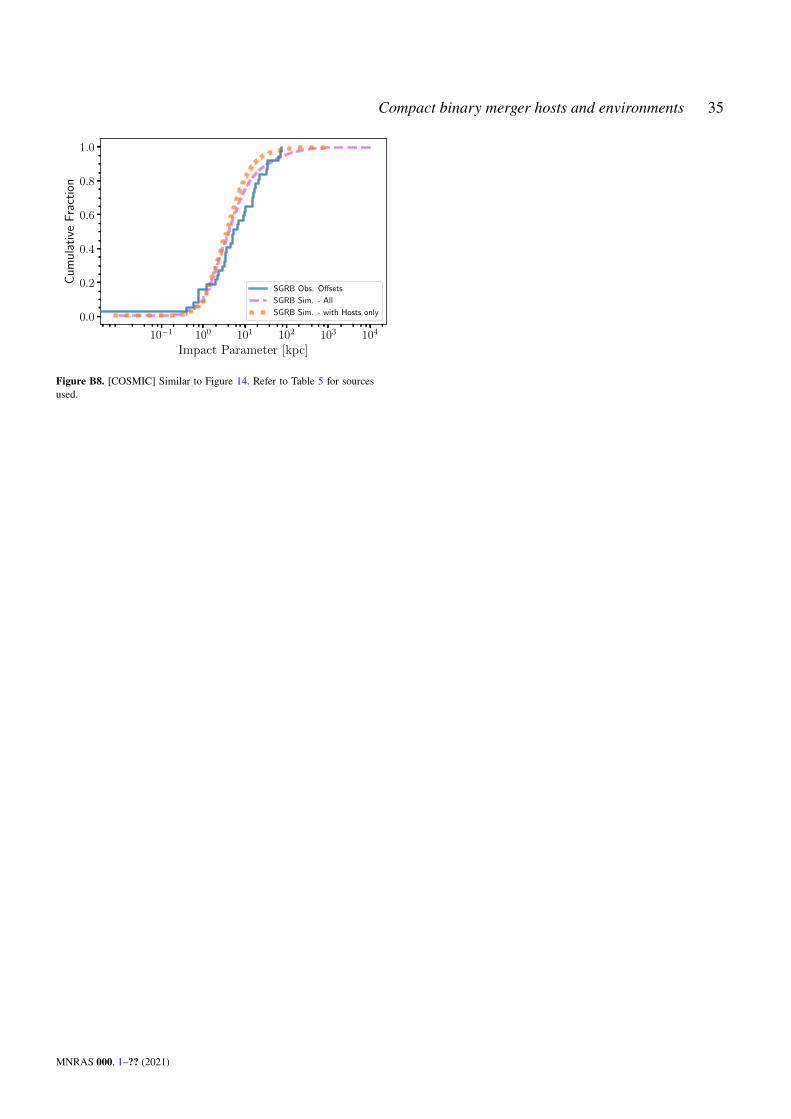
Compact binary merger hosts and environments 35
10−1 100 101 102 103 104
Impact Parameter [kpc]
0.0
0.2
0.4
0.6
0.8
1.0
Cum
ulat
ive
Fra
ctio
n
SGRB Obs. Offsets
SGRB Sim. - All
SGRB Sim. - with Hosts only
Figure B8. [COSMIC] Similar to Figure 14. Refer to Table 5 for sourcesused.
MNRAS 000, 1–?? (2021)