How Effective is European Merger Control
54
WISSENSCHAFTSZENTRUM BERLIN FÜR SOZIALFORSCHUNG SOCIAL SCIENCE RESEARCH CENTER BERLIN ISSN Nr. 0722 – 6748 Research Area Markets and Politics Schwerpunkt II Märkte und Politik Tomaso Duso * Klaus Gugler ** Burçin Yurtoglu ** How Effective is European Merger Control? * Humboldt University Berlin and WZB ** University of Vienna SP II 2006 – 12 July 2006 Research Unit Competitiveness and Industrial Change Abteilung Wettbewerbsfähigkeit und industrieller Wandel
Transcript of How Effective is European Merger Control

WISSENSCHAFTSZENTRUM BERLIN FÜR SOZIALFORSCHUNG SOCIAL SCIENCE RESEARCH CENTER BERLIN
ISSN Nr. 0722 – 6748
Research Area Markets and Politics
Schwerpunkt II Märkte und Politik
Tomaso Duso * Klaus Gugler **
Burçin Yurtoglu **
How Effective is European Merger Control?
* Humboldt University Berlin and WZB ** University of Vienna
SP II 2006 – 12
July 2006
Research Unit Competitiveness and Industrial Change
Abteilung Wettbewerbsfähigkeit und industrieller Wandel

Zitierweise/Citation: Tomaso Duso, Klaus Gugler, and Burçin Yurtoglu, How Effective is European Merger Control?, Discussion Paper SP II 2006 – 12, Wissenschaftszentrum Berlin, 2006. Wissenschaftszentrum Berlin für Sozialforschung gGmbH, Reichpietschufer 50, 10785 Berlin, Germany, Tel. (030) 2 54 91 – 0 Internet: www.wz-berlin.de
ii

ABSTRACT
How Effective is European Merger Control?*
by Tomaso Duso, Klaus Gugler, and Burçin Yurtoglu
This paper applies a novel methodology to a unique dataset of large concentrations during the period 1990-2002 to assess merger control’s effectiveness. By using data gathered from several sources and employing different evaluation techniques, we analyze the economic effects of the European Commission’s (EC) merger control decisions and distinguish between blockings, clearances with commitments (either behavioral or structural), and outright clearances. We run an event study on merging and rival firms’ stocks to quantify the profitability effects of mergers and merger control decisions. We back up our results and methodology by using alternative measures for the merger’s profitability effects based on balance-sheet data and obtain consistent results. Our findings suggest that outright blockings solve the competitive problems generated by the merger. Remedies are not always effective in solving the market power concerns, at least not on average. Nevertheless, both structural (divestitures) and behavioral remedies do help restore effective competition when correctly applied to anticompetitive mergers during the first investigation phase. Yet, they are on the whole ineffective or even detrimental when applied after the second investigation phase. Finally, remedies - especially behavioral ones - seem to constitute a rent transfer from merging firms to rivals when mistakenly applied to pro-competitive mergers.
Keywords: Mergers, Merger Control, Remedies, European Commission, Event
Studies, Ex-post Evaluation
JEL Classification: L4, K21, G34, C2, L2
* Acknowledgments: We would like to thank Joe Clougherty and Jo Seldeslachts for useful
comments and for providing us with some data and Dennis Mueller, Paul Heidhues, Lars-Hendrik Röller, Giancarlo Spagnolo, Konrad Stahl, and seminar participants at the WZB for helpful discussions. Cinzia Alcidi provided excellent research assistance. Tomaso Duso gratefully acknowledges financial support from the Deutsche Forschungsgemeinschaft through SFB/TR 15. Klaus Gugler and Burcin Yurtoglu gratefully acknowledge support by the OeNB Jubilaeumsfonds.
Corresponding author: Tomaso Duso, Wissenschaftszentrum Berlin für Sozialforschung (WZB), Reichpietschufer 50, D10785 Berlin, Germany. Tel: +49 30 25491 403, Fax: +49 30 25491 444, E-Mail: [email protected].
iii

ZUSAMMENFASSUNG
Wie wirksam ist die Europäische Fusionskontrolle?
In diesem Beitrag wenden wir eine neue Methodologie auf einen einzigartigen Datensatz von großen Unternehmenskonzentrationen während der Jahre 1990-2002 an, um die Wirksamkeit der Fusionskontrolle zu untersuchen. Wir benutzen Daten, welche von unterschiedlichen Quellen erfasst worden sind und setzen unterschiedliche Auswertungsmethoden ein, um die ökonomischen Effekte der Fusionskontrollentscheidungen der Europäischen Kommission zu analysieren. Wir unterscheiden zwischen Untersagungen, Genehmigung mit Auflagen (entweder Verhaltensauflagen oder strukturelle) und sofortige Genehmigung. Wir verwenden eine "event study" - Methodologie und untersuchen, wie die Aktienpreise sowohl der fusionierenden Unternehmen als auch der Wettbewerber auf die Ankündigung einer Fusion oder einer besonderen wettbewerbspolitischen Entscheidung reagieren, um die Rentabilitätseffekte von Fusionen und von Fusionskontrollentscheidungen quantitativ zu bestimmen. Wir stützen unsere Resultate und Methodologie, indem wir alternative Maße für die Rentabilitätseffekte der Fusion verwenden, die auf Bilanzdaten basieren und erreichen gleich bleibende Resultate. Unsere Analyse ergibt, dass sofortige Untersagungen das von der Fusion verursachte Wettbewerbsproblem lösen können. Dagegen sind Auflagen nicht immer wirkungsvoll – mindestens nicht im Durchschnitt - um die durch die Fusion erzeugte Markmacht zu begrenzen. Dennoch helfen strukturelle Auflagen wie Abstoßungen von Kapitalvermögen und Verhaltensauflagen, einen "effektiven" Wettbewerb wieder herzustellen, wenn sie richtig auf wettbewerbswidrige Fusionen während der ersten Untersuchungsphase des Fusionskontrollverfahren angewendet werden. Jedoch sind sie im Durchschnitt erfolglos – wenn nicht sogar schädlich - wenn sie nach der zweiten Untersuchungsphase angewendet werden. Schließlich scheinen Abhilfemaßnahmen - besonders Verhaltensauflagen -, ein Rententransfer von den fusionierenden Unternehmen auf ihre Rivalen zu sein, wenn sie irrtümlich Wettbewerb steigernden Fusionen auferlegt werden.
iv

1
1. Introduction
The evaluation of the economic effects of bureaucratic or legal institutions’ decisions is both
one of the most important but also one of the most difficult tasks in economics. When
analyzing merger control decisions, for example, there is uncertainty about the merger effects
per se, the impact of the antitrust authority’s decision, and the perennial problem of the proper
counterfactual: what would have happened had the two firms not merged, what would have
happened had the authority (not) blocked the merger or (not) ordered a particular remedy?
Merger control institutions are often criticized: they are protectionist (Aktas et al., 2006), are
relatively open to capture (Evans and Salinger, 2002), hinder "globalization" and hence
technological progress (GE/Honeywell), destroy synergistic efficiencies by unnecessarily
intervening in the market place (Aktas et al., 2004) or, on the contrary, let anticompetitive
mergers go through.
This paper applies a novel methodology to a unique dataset of large concentrations
scrutinized by the European Commission (EC) during the period 1990-2002. By using data
gathered from several sources and by employing different evaluation techniques, we avoid
many of the ambiguities of previous studies on the effects of institutional decisions. In
particular, we distinguish between blockings, clearances with commitments (i.e. behavioral or
structural remedies), and outright clearances. We run an event study on merging and rival
firms’ stocks to measure the profitability effects of mergers and merger control decisions. We
back up our results and methodology by using alternative measures for the merger’s
profitability effects based on balance sheet data and we obtain consistent results. Our findings
suggest that outright blockings solve the competitive problems generated by the merger. Yet,
remedies are not always effective in solving the market power concerns, at least not on
average. Nevertheless, both structural (divestitures) and behavioral remedies do help restore
effective competition when correctly applied to anticompetitive mergers during the first
investigation phase. Yet, they are on the whole ineffective or even detrimental when applied
in the second investigation phase. Furthermore, remedies - especially behavioral ones - seem
to constitute a rent transfer from merging to rival firms when mistakenly applied to pro-
competitive mergers.
We think that an evaluation of different policy instruments’ effectiveness in merger
control is particularly timely and necessary. While the European Commission cleared most of
the over 3,000 notified mergers since 1990 without commitments (around 95%) as they
presumably do not impose a threat to competition, few major mergers are completed without

2
some conditions and obligations being imposed such as divestitures, provision of access,
termination of agreements, or other behavioral requirements. More than half of phase 2
decisions (i.e. decisions after an in depth analysis: 75 out of 126 or 59%) are compatible only
with commitments, yet only 19 mergers have been blocked since 1990. Moreover, there are
significantly fewer proposed mergers blocked in recent years, following the overruling of
three of the Commission’s blocking decisions by the European Court of Justice in recent years
(Airtours/First Choice; Schneider/Legrand; and Tetra Laval/Sidel), which were under the
media spotlight and triggered major institutional changes.1 These events made it essentially
politically unfeasible for the Commission to block further mergers. Indeed, no merger was
blocked in 2002, 2003 and 2005, and only one was blocked in 2004.
The situation is partially comparable to the USA, where remedies have been heavily
used in merger control decisions. In its 1998 and 1999 fiscal years, the Federal Trade
Commission (FTC) challenged 63 mergers; of these 41 (65%) involved negotiated
restructurings, 18 (29%) were abandoned, and only four (6%) were litigated. Looking at the
overall activity of the two jurisdictions, however, one observes some notable differences.2
The European Commission was surely more “activist” between 1993 and 2002 than their
American counterparts, with an average ratio between actions and notifications of 6.4%,
while in the US in only 2.1 % of the notified mergers antitrust intervention was applied.3
Nevertheless, the American authorities appear to have been much tougher than the EC when
intervening in the last years (see figure 1). While the ratio between blocking decisions and
notifications is on average almost equal in the two jurisdictions over the entire sample, in the
last sample year it diverged significantly with much more blockings per notifications in the
US than in Europe.
[figure 1 about here]
Despite its economic importance, there is almost no systematic econometric evidence
on whether merger control achieves what it is supposed to achieve, namely to “protect and
restore effective competition.” This paper is the first study to accomplish this. We analyze the 1 See http://www.europa.eu.int/comm/competition/mergers/cases/stats.html for statistics on EU merger control. 2 We thank Joe Clougherty and Jo Seldeslachts for providing us with this data (see Seldeslachts, Clougherty, and Barros, 2006). While our approach looks at the effectiveness of particular policy decisions in restoring competition, they focus on possible deterrence effects that some of the antitrust decisions might have. They find that only outright blockings have a deterrence effect on future notifications. 3 Note, however, that this might also be due to the kinds of mergers under scrutiny by the EC. They are all big mergers, the smaller ones being under the jurisdiction of the national authorities. The DOJ and FTC, instead, are in charge of all mergers happening in the US. If one believes that big mergers are on average more likely to be anticompetitive than smaller ones, then one should observe more intervention by the EC than by the DOJ and FTC.

3
effects of merger control decisions using a sample of 167 mergers scrutinized by the
European Commission between 1990 and 2002. In a first step we use standard event study
methodology to compute the cumulative average abnormal returns (CAAR) around relevant
events for both merging firms as well as for rival firms, which have been identified by the
Commission itself and retrieved from its published files. According to our approach, the
CAAR around the merger’s announcement capture the merger competitive impact, while the
CAAR around the announcement of the Commission decision measures the merger control’s
effects.
The novelty of our approach lies in relating these stock market reactions using
regression analysis to measure the effectiveness of merger control. The general idea is that
anticompetitive rents generated by the merger either for merging firms or - and in particular -
for their rivals at the announcement of the merger should be dissipated by the final antitrust
authority decision, if this decision is effective in preserving competition. Consequently, in this
case, we expect a negative relationship between decision CAARs and announcement CAARs.
Moreover, the design of our tests gives us an absolute benchmark of the remedies’
effectiveness and, simultaneously, a robustness check for our method: we know whether
outright blockings are effective in restoring competition by whether they re-establish the pre-
merger situation. Thus, we expect a coefficient of minus one in this case: all rents that would
be generated by this anticompetitive merger are dissipated by the antitrust authority’s final
decision to block the merger.
Reassuringly, we get a significant negative coefficient in case of blocking decisions
and it is not significantly different from minus one. However, we do not always get negative
coefficients when other remedies have been applied, casting doubts on their general
effectiveness. Sometimes we even get significantly positive coefficients in the rivals’
regressions and, for the same cases, significantly negative coefficients for the merging firms.
This finding points to substantial rent transfers from merging firms to their rivals when
remedies are ordered without solving the anticompetitive problem.
A second novelty of our paper is to propose a way to account for the market
expectation about the antitrust inquiry’s outcome. In fact, some of our results could be
explained by the market updating its beliefs about a particular antitrust action, once the
uncertainty about the merger investigation is resolved. We use observable mergers’
characteristics to estimate the probability of a particular decision and correct our profitability
measures accordingly. Our main results about the effectiveness of blocking and the relative
ineffectiveness of remedies are not only confirmed but even reinforced.

4
Finally, to underline the robustness of our approach and results, we apply a second
methodology based on (balance sheet) profitability effects two years after the merger to
estimate the merger’s effects following Gugler et al. (2003), and show that the results are
consistent.
The paper proceeds as follows. In section 2 we present the institutional background of
the EU merger control. In section 3 we shortly describe the related literature on the
assessment of antitrust decisions. Section 4 discusses our main methodology and hypotheses
and highlights our approach to correct the profitability measures for the market expectation
about the antitrust investigation. In section 5, we introduce the data, present the results of the
event studies, and discuss some measurement issues. Section 6 highlights our main results and
presents a first set of robustness checks. In section 7 we discuss the methodology based on
balance sheet data and present a second set of robustness checks. Finally, section 8 sums up
and concludes with some remarks.
2. Institutional Details
Merger control in the EU began with the European Communities Merger Regulation
(ECMR), which came into force on September 21, 1990.4 Since then more than 4,000 mergers
were scrutinized by the European Commission. According to the ECMR, a merger has
community dimension, hence it is under jurisdiction of the Commission, if “it takes place
between firms with a combined worldwide turnover of at least 5 billion Euros and a turnover
within the European Economic Area of more than 250 million Euros for each of at least two
of the undertakings unless each undertaking achieves more than 2/3 of its aggregate
Community turnover within one and the same member state.” This definition also includes
mergers between firms that produce outside of Europe and sell into Europe. If necessary, a
merger can be referred back to the member states for review.
Art. 2(3) of the ECMR states that “A concentration, which creates or strengthens a
dominant position as a result of which effective competition would be significantly impeded
in the common market or in a substantial part of it, shall be declared incompatible with the
common market.” This is commonly referred to as the dominance test (DT). DT constitutes
an important difference to the SLC (Substantial lessening of competition) test, which is used
4 Council Regulation (EEC) No. 4064/89 was amended by Council Regulation (EC) No. 139/2004 on the control of concentrations between undertakings that entered into force on January 20, 2004. Commission Regulation (EC) No.802/2004 implements the Council Regulation (EC) No. 139/2004. See http://europa.eu.int/comm/competition/mergers/review/ for a description of the review process.

5
by US competition authorities. Some observers (e.g., Lyons, 2004) argue that the DT puts
unnecessary weight on the concept of dominance in cases where the more important issue
concerns the significant impediment of effective competition. The new merger regulation,
which is applicable from May 1, 2004, focuses on a merger’s impact on competition.
These regulations define the legal steps, which serve to control concentrations
between undertakings (see figure 2). Merging parties are obliged to notify their intentions to
merge to the Commission when the deal has a community dimension. After receiving
notification of the concentration, the Commission has 25 working days to assess whether the
concentration is compatible with the common market (the so called phase 1).
[figure 2 about here]
After this short period of time, the Commission can either clear the proposed
concentration unconditionally (Art 6.1.b), it can decide to let it go through after verifying that
the commitments and obligations proposed by the undertakings can effectively restore
competition (Art. 6.2.), or it can decide that the proposed concentrations raise serious doubts
as to their compatibility with the common market (Art. 6.1c) and, therefore, a more in depth
analysis is needed. Notice that the Commission cannot outright block a merger after the phase
1 investigation. In this case, the Commission opens the so-called phase 2, which consists of
90 working days, and during which an in depth investigation is carried out. Generally, the
Commission makes use of the entire available time, given the problematic nature of these
cases, after which it has to come to a final decision: either to block the merger (Art. 8.3) or to
let it through unconditionally or with commitments and obligations (Art. 8.2.).
Looking at figure 2, there are three events, which are important for our empirical
analysis. The first is the merger announcement, which we define as the first rumor appearing
in the press about the proposed merger, and which should help us identify the market
assessment of the merger’s competitive effects. The other two relevant events are the phase 1
and the phase 2 decision dates, which should help us identify the effect of remedial action, as
we will discuss in section 4.
3. Literature
Despite the large interest attracted by antitrust issues in the literature, the study of the
effectiveness of merger control decisions, which is the aim of our paper, has been very

6
limited.5 The most recent analyses of this question are two reports commissioned by the
world’s leading antitrust authorities: US and EU. The study commissioned by the FTC (1999)
reviews 35 divestiture orders from 1990 through 1994.6 Based on interviews, the authors
argue that most divestitures appear to have created viable competitors in the concerned market
(28 out of 37), whereas a higher percentage (19 out of 22) of divestitures were successful
when they involved the sale of an entire ongoing business. Similarly, at the end of 2005 the
Directorate General for Competition of the European Commission published an in-house
study on merger remedies (DG Comp, 2005). It reviews the design and implementation of 85
different remedies adopted in 40 decisions of the European Commission between 1996 and
2000. Also in this case, the analysis is done by means of interviews with the committing
parties or sellers, licensors and grantors, the purchasers or buyers, licensees and grantees and
the trustees. More than half (57% ) of the analyzed remedies were considered to have been
effective, 24% were only partially effective since they raised design or implementation issues
that were not resolved during implementation, only 7% were clearly “ineffective”, and 12%
have been categorized as “unclear” remedies. While certainly informative, the fact that these
divestiture studies only use qualitative information (interviews) for a small number of cases
limits their validity for a more comprehensive sample.
In this paper, we propose to use an event study methodology to directly assess merger
control’s effectiveness. Eckbo (1983), Stillman (1983), and Eckbo and Wier (1985) are the
first papers that use event studies to analyze antitrust decisions.7 Rather than looking at stock
reactions to a particular antitrust decision as a way of identifying its effectiveness, they use
this event to identify the competitive nature of the merger, i.e. whether market power or
efficiencies are the drivers of post-merger firms’ profitability. Eckbo and Wier (1985) look at
259 horizontal and vertical mergers in mining and manufacturing industries of which 76 were
challenged. Although they find significantly positive abnormal returns for rival firms, they
argue that this positive valuation effect may be due to positive information released by the
merger: the merger announcement is good news from the rival firms’ perspective, because it
5 See Duso, Gugler, and Yurtoglu (2006) for an in depth analysis of the literature. 6 Earlier studies tried to evaluate the ex post effectiveness of ordered remedies in the USA using a case-by-case approach. Elzinga (1969), Pfunder, Plaine and Whittemore (1972) and Rogowsky (1986) use a methodology that is based on classifying ordered remedies as successful, sufficient, deficient, or unsuccessful depending on whether they fulfill certain criteria. While Elzinga (1969) argues that only one out of ten cases can be classified as successful or sufficient, the success rate in Rogowsky’s (1986) sample increases to four out of ten. 7 Ellert (1976) is the first study that looks at valuation effects of anti-merger complaints. He does not, however, consider the impact on rival firms’ stock returns. There are also a number of studies that use event study methodology to evaluate the effects of mergers but do not analyze antitrust authority decisions, such as Banerjee and Eckard (1998), McGuckin et al. (1992), Mullin et al. (1995), Shahrur (2005), Simpson (2001), Singal (1996), Slovin et al. (1991), and Song and Walkling (2000).

7
makes them (or the market) aware of real profit opportunities that were so far unknown. To
separate the market power effect from the information effect, they also estimate abnormal
returns to rival firms around the time of an antitrust challenge, however, do not find
statistically significant abnormal decreases in the stock prices of rival firms. Thus, they claim
that the mergers in their sample do not raise market power on average. Several follow-up
studies tackle the same issue. Schumann (1993) conducts an event study analysis of 37
acquisitions that were challenged by the FTC over the period 1981-1987 and comes up with
the same pattern of abnormal returns as in Eckbo (1983) and Eckbo and Wier (1985). He
reports positive abnormal returns to rivals around the antitrust complaint, which are positive
and larger for smaller rivals.8
Fee and Shaw (2004) also find only little evidence consistent with collusion. They
look at the upstream and downstream product market effects of horizontal mergers and
identify the customers, suppliers, and rivals of the merging firms. In their sample of 554 US
mergers, the net effect of a merger on a particular supplier depends largely on the supplier’s
ability to retain its product market relationship with the merged entity. They report positive
abnormal returns to rivals of merging firms around announcements, which range from 0.67%
to 2.61%. The antitrust challenge of such mergers, however, does not lead to negative
abnormal returns for rivals. The evidence provided by Bittlingmayer and Hazlett (2000) on
the antitrust action against Microsoft also rejects the joint hypothesis that (a) Microsoft’s
conduct was anticompetitive and (b) antitrust policy enforcement produced net efficiency
gains.9
In contrast to this fairly long list of event studies on mergers in the US, there are only
a few very recent studies of mergers that were analyzed by the European Commission.10
Using the same sample of EU mergers utilized in this paper, Duso, Neven, and Röller (2006)
find evidence in favor of the market power hypothesis. Yet, they only look at whether the
Commission made errors and their determinants, without further exploring the issue of
whether the Commission’s decisions were on the whole effective. Aktas et al. (2004) look at
602 EU Commission’s decisions involving 1070 firms, and document significant abnormal
returns for the target firms and smaller and less significant bidder abnormal returns. Similarly
8 For a criticism of this methodology, see McAfee and Williams (1988). 9 Carstensen (1999) offers a less favorable conclusion on the Microsoft case. See also Comanor (2001), who discusses the problem of remedy in the specific Microsoft case. 10 Brady and Feinberg (2000) use event studies to evaluate the impact of the EU merger regulation’s introduction and the effects of particular news with respect to the development of EU procedures in specific cases (like the decision to open a phase 2 investigation). They focus on merging firms and do not consider the effect on competitors.

8
to our results, they also estimate the abnormal stock price reaction to phase 1 and phase 2
decisions and find that outright prohibitions are associated with negative abnormal returns and
approvals subject to conditions are relatively good news. In another paper, Aktas et al. (2006)
suggest that European merger control is protectionist. They reach this conclusion by showing
that the likelihood of an intervention by the EU Commission is higher, whenever the merger
is proposed by a bidder from outside the EU and has a negative effect on European rivals.
Summing up, the evidence on mergers and merger control decisions is rather mixed.
While most studies find positive effects of the merger for rivals, the interpretation differs.
Some authors interpret this as being consistent with the information revelation hypothesis
(e.g. Eckbo, 1983; and Eckbo and Wier, 1985), while other authors interpret it as consistent
with market power (e.g. Singal, 1996). There is no event study explicitly analyzing the
effectiveness of ordered remedies. Studies of remedies on a case-by-case approach point to
the superiority of structural over behavioral remedies, but leave doubt about their general
effectiveness. Theoretical arguments underline this.11 In what follows, we try to resolve these
ambiguities by (1) relating announcement and decision abnormal returns and (2) conducting
an ex post study of merger effects.
4. Hypotheses and Methods
When firms decide to merge, they potentially generate two externalities on rival firms: A
positive externality due to the merger’s market power effect and a negative externality due to
the potential efficiency gains generated by the merger. The first effect arises since, post-
merger, there is one less firm in the market and, ceteris paribus, pricing will be less aggressive
leading to higher prices and profits (“price umbrella”).12 Merging firms internalize their
former negative pricing externality on each other and set higher prices, ceteris paribus. In both
Cournot and Bertrand with differentiated products type of models, market output declines and
prices rise absent efficiency gains (see Salant et al., 1983; Farell and Shapiro, 1990; or Gugler
and Siebert, 2004). Particularly, rival firms gain since they need not bear the quantity
reduction of insiders and nevertheless benefit from the higher prices: the merger paradox. The 11 Motta et al. (2003) enumerate the most important pros and cons of the different kinds of remedies (i.e. structural and behavioral) used by the European Commission. While they in principle favor the use of structural remedies to clear problematic mergers, they also point to information asymmetries and incentive problems, as well as to the increased possibility of pro-collusive effects of divestitures. Farrell (2003) argues that the effectiveness of structural remedies may suffer from inadequate buyers, "over" (or miss-) fixing and the discounting of merger efficiencies. Cabral (2003) also qualifies for the superiority of structural remedies. 12 This is the sum of the anticompetitive effects of a merger that are called in the antitrust jargon “unilateral effects” – price increases due to imperfectly competitive markets – and “coordinated effects” – price increases due to the post-merger increased likelihood of collusive agreements.

9
second effect, higher efficiency, leads to lower prices and benefits only insiders. Rival firms
lose from fiercer competition.
An effective merger control policy should target only anticompetitive mergers: where
the market power problems are severe and strong enough to overcome any positive welfare
effects due to efficiency gains. Moreover, in such mergers, the antitrust authority should be
able to reduce the rents stemming from increased market power without destroying rents
stemming from increased efficiency. Therefore, to measure merger control effectiveness we
need three steps: (i) classify anticompetitive mergers, (ii) measure the rents generated by
mergers and antitrust decisions, and (iii) relate these measures by means of regression
analysis. We next discuss these three steps.
4.1 Merger Taxonomy: Anticompetitive Mergers
For a large class of static oligopoly models, a merger generates unilateral incentives to
increase prices for both merging firms and rivals at costs of consumers. Hence, there exists a
clear correspondence between increase in rivals’ profits and the decrease in consumers’
surplus after the merger if efficiency gains are absent (Farrell and Shapiro, 1990).13 This will
be one of our main identifying assumptions: a merger is anticompetitive (i.e. reduces
consumers’ surplus) if it increases competitors’ profits.14
In principle, a merger might have four possible effects on the merging and rival firms’
profits. Table 1 lists these four possibilities as well as the optimal incidence of an antitrust
action. If the merger generates positive profits for both the merging and the rival firms
( 0M∆Π > and 0R∆Π > ),15 the market power effect following from the merger outweighs
any efficiency gains. In this case, the authority should act by imposing the appropriate
remedies or by blocking the merger.
[table 1 about here]
If the merger generates positive profits for the merging firms but has a negative effect
on rival firms' profits ( 0M∆Π > and 0R∆Π < ), the efficiency effect of the merger outweighs
13 Duso, Neven, and Röller (2006) present a formal derivation of this result. They show that it holds for Cournot and Bertrand with differentiated goods. 14 Implicitly, we assume that the antitrust agency follows a consumer surplus standard, which indeed is the welfare standard adopted by the US and EU authorities. 15 i∆Π (i= M, R) represent changes in profits following the merger for merging firms (M) and rivals (R) respectively.
10
the market power effect, since only merging firms enjoy increased efficiency. There should be
no remedies in this case, at least none that (also) reduce the efficiency gains from the
merger.16
The fact that mergers, which reduce the efficiency and profits of merging firms,
happen cannot be well explained by standard industrial organization models.17 Nevertheless,
there is overwhelming evidence that many of such mergers do take place. For example,
Gugler et al. (2003) find several of these mergers taking place around the world and attribute
them to managerial motives, such as growth and size maximization. Within this category, two
cases can be distinguished: mergers that reduce the profits of the merging firms but increase
the profits of the rival firms and mergers that reduce profitability of both parties. In the first
case, if industry profits go up ( 0I∆Π > ), the merger may be considered as being
predominantly anticompetitive since rival firms react to the reduced efficiency of the merging
firms by increasing their prices. Here remedies may be considered, although the source of the
problem is not one of competition policy but one of inadequate corporate governance. If
industry profits go down, nothing can be said about the anticompetitive effects and necessary
remedies. The same holds true in the last case, where both merging and rival firms’ profits
decrease ( 0M∆Π < and 0R∆Π < ).
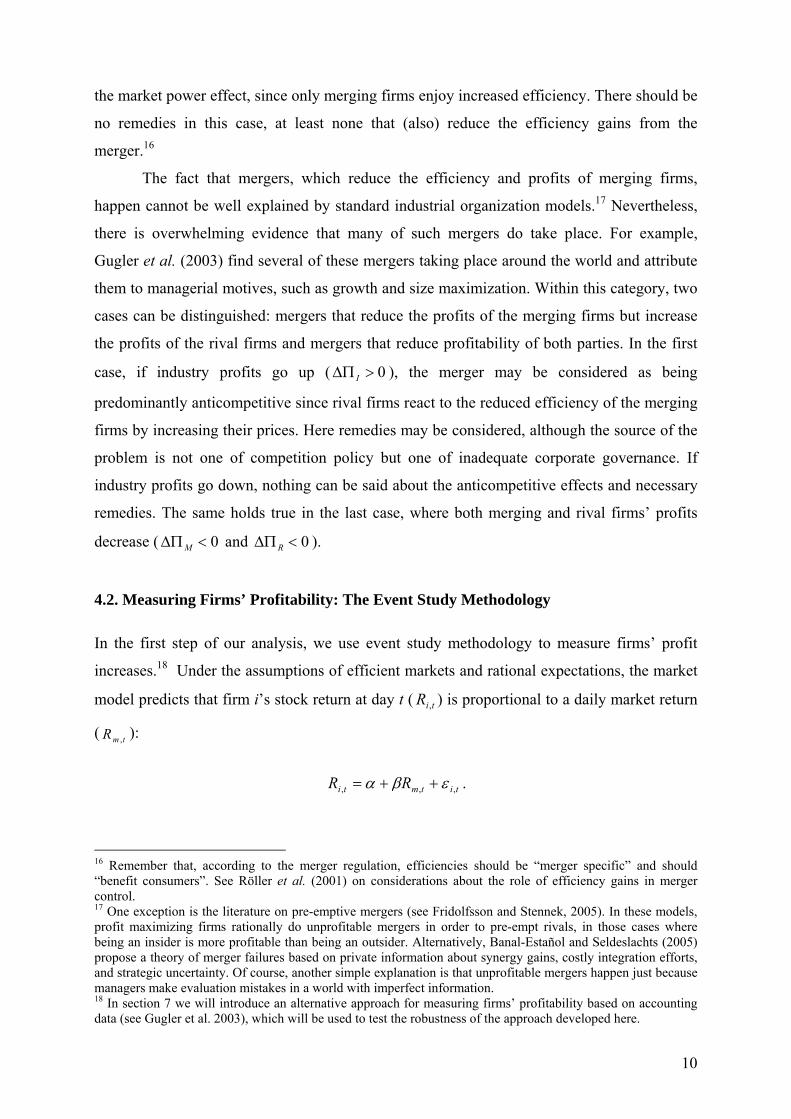
4.2. Measuring Firms’ Profitability: The Event Study Methodology
In the first step of our analysis, we use event study methodology to measure firms’ profit
increases.18 Under the assumptions of efficient markets and rational expectations, the market
model predicts that firm i’s stock return at day t ( tiR , ) is proportional to a daily market return
( tmR , ):
titmti RR ,,, εβα ++= .
16 Remember that, according to the merger regulation, efficiencies should be “merger specific” and should “benefit consumers”. See Röller et al. (2001) on considerations about the role of efficiency gains in merger control. 17 One exception is the literature on pre-emptive mergers (see Fridolfsson and Stennek, 2005). In these models, profit maximizing firms rationally do unprofitable mergers in order to pre-empt rivals, in those cases where being an insider is more profitable than being an outsider. Alternatively, Banal-Estañol and Seldeslachts (2005) propose a theory of merger failures based on private information about synergy gains, costly integration efforts, and strategic uncertainty. Of course, another simple explanation is that unprofitable mergers happen just because managers make evaluation mistakes in a world with imperfect information. 18 In section 7 we will introduce an alternative approach for measuring firms’ profitability based on accounting data (see Gugler et al. 2003), which will be used to test the robustness of the approach developed here.

11
To study the stock price reaction to the mergers’ announcement, we estimate the market
model over 240 trading days, starting 50 days prior to the announcement day and using the
Scholes–Williams (1977) method. We obtain estimated values for the model’s parameters α
and β, which we can use to predict what firm i’s stock price would have been, had the event
under consideration (merger or antitrust decision) not occurred. For firm i, we calculate then
the abnormal return around the mergers’ announcement day t (ARi,t) as:
tmtitititi R RRRAR ,,,,,ˆˆˆ βα −−=−= .
Under the null hypothesis of efficient markets, abnormal returns have zero mean and a
variance equal to:
⎥⎦
⎤⎢⎣
⎡ −++=
m
mmtti
RRL
ARVar tj 22
, 11)( , σσ ε ,
where L is the estimation period length and mR and m2σ are respectively the mean and
variance of the market portfolio.
For merging firms and all rivals, we then calculate a cumulative abnormal return over
an event window of x+y+1 days (x,y = 0, 1, 2, etc.):
∑+=
−=
=yt
xtjyxti ARCAR
τ
ττ,,,, .
In order to obtain the aggregate effects of merger j on merging firms (i=M) and on rivals
(i=R) around the events of interest ( aij∆Π , where a = A, D denotes the event: merger’s
announcement, A, and antitrust decision’s announcement, D), we take the weighted average of
the cumulative abnormal returns of all firms in each of the two groups (i=M,R), the weight
being firm j’s market value ( ajMV ):19
A, Da RMi Nf MV
MVCAR
ijN
f
af
N
f
af
af
aij ij
ij
====∆Π
∑
∑
=
= ,,,,...,1
1
1 .
19 With a slight abuse of notation, due to nature of our data where the unit of observation is not the firm but rather the merger, we drop the time index t and the window indexes x and y. We introduce instead the index a = A (announcement), D (decision). Moreover, from now on, the index i will not indicate a particular firm but rather a group of firms i=M (merging firms), R (rivals). Nij represents the maximum number of firms in each of the two groups for merger j.
12
These weighted average abnormal returns give us a measure of the merger and decision
profitability effects. We can now define merger j to be anticompetitive if 0>∆Π ARj .
4.3. Hypotheses Testing
We can now turn to the measurement of merger control’s effectiveness. After the merger,
insider firms’ profitability should rise due to both effects highlighted before: higher market
power and efficiency. Hence, their cumulative average abnormal returns (CAAR) around the
announcement of the merger should be positive (i.e. 0>∆Π AMj ). Rival firms’ profitability –
hence their CAARs around the merger announcement - should rise only if the merger
increases product market prices (i.e. the market power effect is larger than the efficiency
effect), and should diminish if the reverse is true.
The decisions of antitrust authorities can also have two major effects. Either the
antitrust action - i.e. clearance (no action), remedies, or blocking - is effective or not. A
clearance decision should not impact firms’ profitability, since it corresponds to the absence
of an antitrust action. Remedies, instead, should have different effects depending on the
merger’s competitive nature and their effectiveness. If, for instance, remedies are applied to
the right mergers - i.e. those that would otherwise increase product prices and are hence
anticompetitive - and they are effective, the decision-day abnormal returns of both, merging
( DMj∆Π ) and rival firms ( D
Rj∆Π ), should be negative. Yet, only the fraction of merging firms’
positive profitability increase due to the market power effect should be dissipated by effective
remedies, since the antitrust action should not destroy the merger induced efficiency gains. If
remedies are applied to the wrong (pro-competitive) mergers, the decision day abnormal
returns of merging firms should be negative ( 0<∆Π DMj ) and the CAARs of rival firms should
be positive ( 0>∆Π DRj ). If remedies are not effective, stock markets should not react. The
extreme action taken by the Commission, i.e. blockings, should of course be “effective” in the
sense that it should revert to the pre-merger situation.
This reasoning is true only if the market does not have expectations about the effect of
the antitrust action, otherwise many of the observed effects could simply be due to
information revelation and represent an update of the market’s priors about the Commission’s
decision. We will pick up on this point in the next section, where we develop an approach to
account for this problem.
13
According to the discussion above, we propose to measure the "degree of
effectiveness" of an antitrust action by running the following basic regression:
ijjAijjB
AijjD
AijjO
AijjC
Dij gXBbDbObCba η++∆Π⋅⋅+∆Π⋅⋅+∆Π⋅⋅+∆Π⋅⋅+=∆Π (1)
where subscript i denotes either merging or rival firms and subscript j denotes the merger,
which is our unit of observation. The dummy Cj takes on the value of one, if merger j is
cleared without commitments and zero otherwise. The dummy Oj takes on the value of one
and zero otherwise, if merger j is cleared with mainly behavioural commitments, such as
terminating existing exclusive agreements, granting access to a necessary infrastructure, or
licensing agreements, i.e. all those remedies that are not divestitures and which are mentioned
in the Commission Notice on remedies (2001) under “Other remedies”. The dummy Dj takes
on the value of one and zero otherwise, if merger j is only cleared under the commitment that
parts of the combined company are divested (structural remedies). The dummy Bj takes on the
value of one and zero otherwise, if merger j is blocked after an in depth analysis of the case.
The variables contained in X are exogenous controls.
It is important to notice that the direction of causality must run from announcement
day abnormal returns to decision period abnormal returns: the EU Commission should impose
stricter remedies in cases where potential market power concerns are more severe. That is,
announcement day abnormal returns determine the Commission’s action, which in turn
determines decision period abnormal returns.
The b-coefficients measure the degree of market power (profit) reversion due to the
final decision of the EU Commission. That is, if remedies are effective, then profits due to
market power at the announcement day should be (at least partially) dissipated by the final
decision and b should be negative. The higher these profits (or abnormal returns) are around
the announcement day, the larger should be the decline in profits (abnormal returns) due to
the decision. If remedies are perfectly effective in restoring competition, the hypothesis
1−=b should not be rejected for rivals: all anticompetitive rents generated by the merger are
reversed by the final decision. This is not necessarily true for the merging firms, as we noted
before, if part of the merger’s profitability effect is generated by efficiency gains.
It should be noted that bB , i.e. the coefficient for blockings, must have a coefficient of
minus one if our methodology is correct. We know that blocking is an effective remedy for an
anticompetitive concern. This provides an additional test not only for our methodology, but
more generally for using the event study methodology to assess anticompetitive effects of

14
mergers. Essentially, this complete profit reversion for both merging and rival firms is due to
the fact that blocking restores the pre-merger situation.20
If remedies are not effective, this should show up in zero or positive b−coefficients for
rival firms. Anticompetitive rents that the market foresaw at the merger announcement are
reinforced (or at least not reduced) by the Commission’s decision. This could happen since
the market expected tougher remedies and did not increase rivals’ share price adequately at
the announcement day and now simply updated. Otherwise, it could happen since a
behavioral remedy or a divestiture are considered as rent transfers from merging firms to
rivals without remedying the anticompetitive concern.21
If the Commission wrongly imposed remedies - i.e. it imposed remedies to mergers
that would increase efficiency - merging (rival) firms would lose (win) from such a decision,
since the efficiency gains are not longer attainable. Therefore, we expect negative (positive)
b's for merging (rival) firms.
4.4. Accounting for Market Expectations
Until now we have not considered that an efficient market should also account for the future
antitrust decision when reacting to a merger announcement. Yet this seems to be a too strong
assumption. We will now assume that the market can build expectation about the effect of the
Commission’s action a (a=clear, action) on firms i for merger j ( aDij∆Π ), given the public
information available in the market around the merger’s announcement day (IA). When
expectations are rational, the expected value of the Commission’s decision can be written as:
[ ] [ ] action clear,a Ia PrIEa
AjDijA
Dij
a =∆Π=∆Π ∑ , ,
where [ ]Aj Ia Pr is the probability of action a - i.e. clearance, remedies or blockings.
The observed abnormal return for firms i (i=M, R) around the announcement day
( Aij∆Π ) is then equal to the real effect of merger j for firms i ( *A
ij∆Π ) minus the expected
value of the effect of the Commission’s action, given the information available in the market
at that time about remedies (IA). Assuming that any effective action (remedies or blockings)
20 However, one can expect even a coefficient smaller than minus one for merging firms, if the opportunity costs of going through the antitrust investigation are judged to be very high. 21 See for example the merger between SIEMENS AG and VA TECH AG. In this case, the commission cleared the merger under the condition that Siemens divests one part of VA TECH, VA TECH Hydro, operating in the relevant market in Austria. Once the acquirer of this divested asset, Andriz AG - a direct competitor of Siemens in the Austrian market - was announced, its stock price jumped up by almost 10%.

15
destroys all anticompetitive profits accruing from the merger – i.e. *Aij
Dij
a ∆Π=∆Π – and a
clearance does not have any profitability effect– i.e. 0=∆Π cDij –, we can then write the
following:
[ ][ ] [ ]
[ ]( ) [ ]AjAijAj
Aij
AjDijAj
Dij
Aij
ADij
Aij
Aij
IclearIaction
IactionIclear
IE
aC
PrPr1
PrPr**
*
**
∆Π=−∆Π=
∆Π−∆Π−∆Π=
∆Π−∆Π=∆Π
Therefore, the real effect of merger j on firms i is:
[ ]AjAij
Aij IclearPr* ∆Π=∆Π , (2)
i.e. the measured announcement CAAR divided by the ex-ante probability that the merger
will be cleared.22 The market can build a prior of this probability by using past information,
which is exactly what the econometrician can do by running a logit regression to asses the
probability of clearance given the merger’s observables. Once one has such a measure, one
can build a proxy for the merger j’s real effect on firms i’s profitability ( *Aij∆Π ) according to
equation (2) and use this in regression (1) instead of Aij∆Π .
Similarly, at the time of the Commission’s decision some new information hits the
market, which updates its beliefs about the effects of a particular decision. The first important
date is the phase 1 decision. The phase 1 decision’s effect ( 1Pij∆Π ) is the difference between
the antitrust action’ real effect on firms i ( *Dij∆Π ) and the market expectation about this action
for merger j. Of course, if all information is public, then there should be no surprise for the
market and, hence, we should not observe any abnormal return around the decision day. Yet,
it seems reasonable to assume that some private information generated during the bargaining
process between the Commission and the merging parties is unknown to the market. If market
power concerns are substantial and the Commission decides to open a phase 2 investigation,
22 This is true for competitors but not necessarily for the merging firms, since a part of the merger’s profitability effect does not come from an increase in market power but rather from increased efficiency, which should not be dissipated by the antitrust decision. Hence, it must not necessarily hold that *A
MjDMj
a ∆Π=∆Π .

16
the market updates its beliefs about remedies.23 Therefore, the abnormal returns around phase
1 decision ( 1Pij∆Π ) for mergers that go into a phase 2 investigation should simply be the
update of the market expectation about remedies, given the newer information set available at
this point in time (IP1). 24
Summarizing, the phase 1 effect is the following:
[ ] [ ]( )
[ ] [ ]⎪⎪⎩
⎪⎪⎨
⎧
∆Π−∆Π
−∆Π=∆Π−∆Π
=∆Π
2 phaseifIEIE
phaseifIactionIE
ADijP
Dij
AjDijA
Dij
Dij
Pij
*1
*
***
1
1Pr1
.
Therefore, the real impact of the Commission’s decision for a case that does not go
into phase 2 is:
[ ]( )Aj
PijD
ij IactionPr1
1*
−
∆Π=∆Π . (3)
Again, the market can have a prior about the probability of an action in phase 2 at the
merger announcement. To control for that, we will use logit analysis to predict this probability
as a function of the merger’s observables.
Similarly, around the day of the phase 2 decision, the abnormal return ( 2Pij∆Π ) should
measure the difference between the real value of an action in phase 2 (remedies or
prohibitions) and the expectation that the market built given the information available on the
phase 1 decision [ ] [ ]ADij
Pij
DijP
Dij
Dij
Pij IE IE *1*
1**2 ∆Π−∆Π−∆Π=∆Π−∆Π=∆Π , i=M, R. Hence,
at the end of a phase 2 investigation the impact of the Commission’s decision is:
( ) [ ]( )AjPij
Pij
Dij IactionPr1/12* −∆Π+∆Π=∆Π . (4)
Again, we can compute the probability of an action by running a logit regression and
correcting our profitability measure to account for it. We then run regression (1) by using *A
ij∆Π and *Dij∆Π instead of A
ij∆Π and Dij∆Π .
23 Indeed, when a case goes into phase 2, the probability of an antitrust intervention increases sharply. According to the statistics produced by the European Commission, the incidence of remedies in phase 1 is 4%, while it increases to over 60% in phase 2. Moreover, a merger can be prohibited only after a phase 2 investigation. 24 Actually at the beginning of a phase 2 investigation, the market could also value the cost of such a procedure. Therefore, the abnormal return around the phase 1 decision for those mergers that went into a phase 2 investigation might also reflect the high costs these firms are expected to pay.

17
5. The Data and the Estimated Abnormal Returns
Our sample consists of 167 concentrations that have been analyzed by the European
Commission in the period 1990-2002. Our starting database was developed in Duso, Neven,
and Röller (2006). Our sample includes almost all phase 2 mergers scrutinized by the EC till
the end of 2001, and a randomly drawn sample of phase 1 cases, which run up to June 2002.
Because of difficulties in identifying competitors or their stock, we end up with 78 phase 2
cases and 89 phase 1 cases for which we have complete information. We identify 544
different firms involved in several mergers either as merging parties or as rivals.
Merging firms and competitors are identified from the publicly available Commission’s
decisions.25 This is a big advantage of our data set, since we can rely on the Commission’s
analysis concerning the market definition (the relevant competitors). Furthermore, the
Commission’s reports also provide in-depth information about the mergers’ and decisions’
characteristics, such as the kind of concentration (e.g. full versus partial merger), the nature of
the merger (horizontal vs. conglomerate/vertical), the involved product and geographical
markets, the kind of remedies imposed, the provenience of the involved firms, etc.
The mergers’ announcement date is collected from the financial press by using the Dow
Jones Interactive database. This is a customizable business news and research product that
integrates contents from newspapers, newswires, journals, research reports, and web sites. We
look at the first rumors about the merger, i.e. the first time a discussion of the merger appears
in the international press, and not necessarily the official merger’s announcement by the
involved parties. This has the advantage of reducing the noise in identifying the “right” event.
On the other hand, our measure of abnormal returns might be downward biased since there
might still be uncertainty on whether the merger will take place or not.
Finally, once firms have been identified, we collect information about their
characteristics form two sources. For the first part of the analysis, where we measure
profitability by means of event studies, we collect data on firms’ stock prices and market
value as well as market indexes by using Thomson Financial’s Datastream. This database
provides financial information and computation services to the securities industry worldwide.
For the second part of the analysis, we use the Standard & Poor’s Global Vantage and
Compustat databases to retrieve information about firms’ accounting profits and total assets
from their balance sheets.
25 The reports for each of the Commission’s decisions can be downloaded form the Commission’s webpage: http://europa.eu.int/comm/competition/mergers/cases/.

18
Table 2 presents a short description of the relevant variables. The market value of the
combined firm (rivals) is on average 45 (7.5) billion US dollars. On average, the Commission
reports 7.6 rival firms, and we could find stock market information for 62.5% of them. The
majority of the concentrations in our sample (57.1%) were full mergers, 24% joint ventures,
13.1% partial acquisitions, 11.3% tender offers, and only 6% consisted of asset acquisitions.
In 41.1% of the cases the geographical market definition is the European Economic Area, in
35.1% it was defined to be national, in 21% it was worldwide, and in a few cases it was left
open because the geographical definition was not relevant for the decision.
Remedies have been imposed in 35.1% of the mergers (6.6% in phase 1 and 28.7% in
phase 2), and 7.7% were blocked. Considering these prohibitions as an extreme type of
remedy, we have 43.1% of the cases in our sample where the Commission intervened to
modify the merger in order to restore effective competition.
[table 2 about here]
Remedies are categorized as structural or behavioral using the information contained
in the Commission’s decision. In 23.5% of the cases the Commission ordered a divestiture,
while in 10.8% it imposed other kinds of remedies. For the purpose of this study we will
consider these two categories - which happen to be those used in the merger remedies
guidelines - and blockings. The selling of shares was imposed in 10.3% of cases, licensing
agreements in 11.5%, the access to essential technologies or facilities in 9.7%, the dismissing
of exclusive agreements in 7.3%, and the dissolution of interlocking directorates only in 3.6%
of the mergers in our sample.
Table 3 reports statistics on cumulative average abnormal returns for merging firms and
competitors around various events and using different event windows. We consider a short
window from 5 days before to 5 days after the merger, and a long window that goes back 50
days before the event. For each event, we look at how abnormal returns differ according to the
future Commission’s decision.
[table 3 about here]
The mergers in our sample were on average “profitable” since the CAARs for the
merging firms around the announcement date are positive and statistically significant at the
5% level for all used windows. The size of the effects ranges from 1.05% in the short window

19
to 1.8% in the long window. This result seems to be in line with the literature.26 The
cumulative abnormal returns for the rivals around the announcement date are, instead, not
statistically significant different from zero and very small in size.27 On average, these mergers
seem to be welfare-neutral, in the sense that they neither increase nor decrease the average
rivals’ profitability. The breakdown across later decisions reveals significant effects for those
mergers that are either cleared with no remedies in phase 1 (efficiency-enhancing mergers?)
or that were cleared with remedies in phase 2 (market power mergers?).
Looking at phase 1 decisions, we observe negative CAARs for the merging firms as
well as for the rivals.28 These are, however, statistically significant only for the merging firms
using the short window. The negative effect stems mainly from those cases where a phase 2
investigation was started: The negative CAARs for the merging firms in that case are on
average -1.7% in the short window and -1.4% in the long window. Similarly, rivals lose from
the opening of a phase 2 investigation (in the long window up to -1.1%). Interestingly,
decisions that either clear mergers in phase 1 (with or without remedies) in the short window
and those decisions that lead to later blockings (long window) decrease rival firms' market
value by a rather large and significant 3.5%. If (presumably) efficiency enhancing mergers are
cleared without - or with ineffective - remedies, or if (presumably) market power enhancing
mergers are blocked, rival firms lose, which is exactly the pattern we predict and observe.
For phase 2 decisions, almost all measures of abnormal returns are statistically
insignificant. Nevertheless, looking at the long run CAARs, we observe strong negative,
though not significant, effects for the rivals in those mergers that were cleared with remedies
(-1.8%) or blocked (-5.5%). Moreover, merging firms have large and significant positive
long-run abnormal returns (+6.6%) in those mergers that were cleared without conditions. The
market expected some negative effects at the phase 1 decision day for merging firms, but was
surprised that the Commission did not impose remedies.
The next question is what is the “right” profitability measure to be used in the
regressions? If there is no information leakage, the right measure would be the abnormal 26 See for instance Andrade et al. (2002). In fact, the merging firms’ CAAR is the weighted sum of the acquiring and of the target firms’ abnormal returns. Depending on the event window, we estimate average abnormal returns for acquirers in the range between -0.54% and 0.12% (not statistically significantly different from zero) and for the targets in the range between 3.4% and 6.2% (statistically significantly greater than zero at the 1% level). These results are quite similar to those reported by Aktas et al. (2004) using a comparable sample of mergers. Note, however, that in their sample the phase 2 cases are more underrepresented than in ours. 27 The abnormal returns for rivals are measured with errors, since we lost part of them due to the fact that they are small - not quoted - firms. Because we have mostly the biggest competitors in our sample, we possibly have another bias towards “no significance”: big firms derive probably only a small fraction of their revenues from the market under consideration and are, therefore, only partially affected by the merger. 28 Note that we use a shorter window for the long term CAARs around the phase 1 decision, since the period of time between the notification and the phase 1 decision is only one month.

20
return at the event day. However, if we think that some relevant information was present in
the market already before this event, then a larger window should more carefully capture the
real effects. Looking at figure 3, which shows time plots of daily cumulative abnormal returns
averaged over merging firms and rivals, respectively, for the period from 50 days prior until 5
days after major events, we can get a feeling of how much of a surprise the event under
consideration was. For both types of firms, we see an upward drift of abnormal returns
beginning some 50 days before the announcement of the merger for merging firms and some
30 days for rivals. Hence, we decide to use the long-run window (-50, +5) to measure the
merger’s effect.
For the CAARs around the Commission’s decisions, we breakdown the figure
according to the kind of decision: clear, remedies, or opening of a phase 2 investigation for
the phase 1 decisions; and clear, remedies, block for the phase 2 decisions. Phase 1 decisions
– specifically, remedies in phase 1 - seem to come as a relative surprise. We therefore decide
to take the short-run window (-5, +5) to measure the rents generated by this event.29
Differently, for the phase 2 decisions, we observe quite a bit of movement in the long
run CAARs for all kinds of decisions suggesting that information leaks out to stock markets
in the course of the second investigation’s phase. This makes sense, since phase 2 is much
longer and attracts much more public attention than phase 1. Moreover, the Commission
might provide some information to the market by applying the so-called “market test”, where
it asks competitors and customers to evaluate the proposed conditions. Thus, we think that the
long-run window should better capture the market assessment of the Commission’s decision.
For mergers cleared in phase 1, the Commission’s decision effect is simply defined as
the abnormal return around the phase 1 decision date. For cases that go to phase 2, instead, we
define the decision’s effect as the sum of the phase 1 and phase 2 decision date abnormal
returns, since around the phase 1 decision the market updates its beliefs about the final
outcome. In fact, the probability that the merger will be blocked or cleared with remedies
sharply increases when a merger goes into a phase 2 investigation.
6. Results
In this section we present the main results and several robustness checks. We start by using
the CAARs not corrected for the probability of antitrust action as a benchmark case. We then
look at several sub-samples to qualify our findings. We finally show that the main results hold
29 We however run all tests also using the longer window. Our results remain mostly unchanged.
21
true also correcting for the market’s expectation about the Commission’s decision. Yet,
differences emerge, which helps to explain some of the previous findings.
6.1. Main Regressions
Table 4 presents our main regression results. Regressions are run separately for merging firms
and rivals. According to equation (1), the dependent variable is the decision CAAR of
merging firms or rivals, while the main independent variable is the corresponding
announcement CAAR of merging or rival firms respectively. In the different specifications,
we interact this independent variable with several sets of dummies for the Commission’s
decision, as well as for the merger competitive effect as discussed in section 4.3. Finally, in
all specifications we control for time as well as industry effects (manufacturing and
communications) and for those cases where conglomerate and/or foreclosure aspects play a
role (i.e. not purely horizontal mergers) by adding a dummy.30
Panel A presents the results for the entire sample. Neither for insiders nor for rivals is
there a significant relation between announcement and decision CAARs. There is also no
significant difference in effects for those mergers that were cleared with remedies or blocked
(ACTION) or cleared outright (CLEAR). As we will see, however, this masks important
differences across sub-samples.
[table 4 about here]
When we interact announcement CAARs not only with action/clearance dummies but
simultaneously with indicators for anticompetitive - rival announcement CAARs = ARj∆Π > 0 -
vs. pro-competitive - rival announcement CAARs = ARj∆Π < 0 - mergers, an interesting
difference arises for merging firms. Merging firms lose a part of the efficiency gains from a
merger, if remedies are wrongly applied in pro-competitive mergers: the coefficient’s point
estimate is equal to -0.29 and statistically significant different from zero.
When we breakup actions into outright blockings (BLOCK), divestitures
(DIVESTITURE), and other remedies (OTHERREM), it becomes evident that the blocking
decisions generate a rent reversion for rivals. We estimate a significant coefficient bΒ of -
0.69, significantly different form zero but not significantly different from minus one at
30 A merger has been defined to have conglomerate or vertical (foreclosure) effects if the Commission stated so in its report.

22
conventional significance levels. This is our first important finding: blocking is effective in
restoring the pre-merger situation.
The rents earned by rivals around the announcement of the merger are actually
exacerbated by the Commission’s decision to impose divestitures ( bD = 0.46, significant at
the 1% level). The coefficient for other remedies is also positive ( bO = 0.34) but not
significant. This could be the case if divestitures or other remedies were imposed in the wrong
mergers, i.e. efficiency enhancing mergers, and/or these remedies were not effective in
solving the anticompetitive problems identified by the Commission but rather resulted in a
rent transfer to rivals. For example, rival firms could buy the divested assets at below market
value prices. There are a number of reasons why this could be the case: deadlines for sale,
buyer approval by the Commission, etc.
The last regression in panel A of table 4 combines the interaction terms of the above
two panels. It is evident that the rent reversion of rival profits is due to the blocking of
anticompetitive mergers by the EU Commission. The coefficient rises to a significantly
negative 0.79, again not significantly different from minus one. Essentially all rents of the
rivals from an anticompetitive merger are dissipated by the blocking decision of the EU
Commission. In contrast, by the forced divestiture of assets in anticompetitive mergers, rivals’
rents are additionally increased, and effective competition is not restored. Interestingly, there
appears to exist a rent transfer from the merging firms to the rivals when pro-competitive
mergers are levied with other remedies: the coefficient for rivals is positive and significant
(bO = 1.41) while the estimated coefficient for merging firms is negative though not
significant (bO = -0.39).
Merging firms’ abnormal returns around the decision day do not correlate significantly
with their announcement day counterparts, with the startling exception of outright blockings.
In this case, merging firms lose either a significant share of their market power rents (bB = -
0.52) or their returns from investing in efficiency mergers (-0.80). Interestingly, it seems to be
worse for merging firms if a pro-competitive rather than an anticompetitive merger is
blocked.
Our results on the entire sample provide strong evidence that: (1) blockings restore
effective competition in mergers that the market has identified as anticompetitive. (2)
Remedies, be they behavioral or structural like divestitures, are on average not successful in
restoring effective competition. In some cases, especially if wrongly applied to pro-
competitive mergers, they merely result in rent transfers from merging firms to their rivals.
Yet, this does not preclude effective remedies in some mergers that are well designed, as it is

23
evidenced by the high standard errors around our estimated remedies’ coefficients in some
sub-samples. (3) Our results also indicate that the event study methodology can be applied in
antitrust analysis and in particular in the analysis of the effects of mergers. Here, we do not
stress the importance of looking at absolute CAARs at the announcement or decision dates,
but rather the need of analyzing the relation between announcement and decision CAARs,
which gives us a much more powerful test of the effects of the antitrust authority’s decision.
The fact that we get a coefficient not statistically different from minus one for the sub-sample
of blocking decisions is a robustness check in itself and a benchmark for the effectiveness of
other types of remedies.
We now go into further detail by analyzing phase 1 and phase 2 decisions (sub-
samples) separately in panel B and panel C of table 4 respectively. This analysis provides
very useful new insights. For the 81 final phase 1 decisions, rivals lose if anticompetitive
mergers are not cleared outright, which is consistent with the notion that the Commission’s
action is effective.31 Rivals win if pro-competitive mergers are levied with an action, and in
this case merging firms experience a profit loss. This is exactly what we expect by the design
of our regressions if remedies present a rent transfer between merging and rival firms.
Distinguishing between divestitures and other remedies, does not unearth significant
differences. Instead, splitting by the dichotomy anti- versus pro-competitive mergers yields
particularly interesting and reassuring results: if remedies are imposed on anticompetitive
mergers in phase 1, they are effective. The b-coefficients are between -0.5 (divestitures, not
significant) and -0.6 (other remedies, significant) and both coefficients are not statistically
significantly different from -1 at the 10% level. Again, wrongly imposing remedies in pro-
competitive mergers constitutes a rent transfer from merging firms to the rivals but only for
behavioral remedies. The only puzzling result in panel B of table 4 is the positive and
significant coefficient for rival firms in the sub-sample of pro-competitive mergers that were
cleared without remedies. Maybe these mergers and decisions signal good future prospects for
M&A activity in this industry without interference by antitrust authorities (i.e. the information
revelation hypothesis proposed by Eckbo and Wier, 1985).
Panel C in table 4 estimates all regressions for the sub-sample of mergers that were
decided upon in phase 2 (76). Here, as expected, the most striking feature is the negative and
significant coefficient on blockings. This is again not statistically different from minus one for
both merger’s insider and rival firms: both firms lose on average their rents due to this
31 Notice that the only action that the authority can take in phase 1 is to impose remedies. No blocking decisions can be made at this stage before an in depth (phase 2) investigation.

24
decision. Divestitures do not solve the anticompetitive problem. On the contrary, they
increase rivals’ profitability when imposed in anticompetitive mergers, hence constituting a
rent transfer from merging firms to competitors. Also behavioral (other) remedies show on
average this “perverse” effect significantly increasing rivals’ profitability, yet only when
applied to pro-competitive mergers.
To summarize, remedies seem to work in phase 1 when correctly applied, while they
seem to be ineffective in phase 2.32 Particularly, remedies in phase 2 represent on average a
rent transfer to the rivals. Finally, behavioral remedies that are wrongly applied, i.e. used in
pro-competitive mergers, constitute a rent transfer from insiders to competitors both in phase
1 and phase 2.
6.2. Robustness
6.2.1. Different Sub-samples
We have already mentioned that one "robustness test" for the validity of our methodology is
the coefficient of minus one on announcement CAARs for blocked mergers, which we
actually obtain. Panel A of Table 5 presents additional robustness checks by splitting the
sample into profitable (i.e. insider announcement CAARs are positive) versus unprofitable
(i.e. insider announcement CAARs are negative) mergers. We would expect that our tests are
most appropriate for profitable mergers, since motives behind unprofitable mergers may differ
(e.g. they may be undertaken for managerial discretion reasons, see Gugler et al., 2003). All
our results carry over. The coefficient on blocked anticompetitive mergers is negative and
significant in the rivals’ regression and not significantly different from minus one. Other
remedies still do not solve the anticompetitive problems on average.
[table 5 about here]
While no predictions are possible if merging firms' announcement CAARs are
negative using standard IO models assuming profit maximization, it is an empirical fact that
unprofitable mergers happen. If merging firms should not have merged from a corporate
32 This apparently anomalous result is however in line with the findings by the DG Comp (2005) study on remedies. Indeed, the Commission’s practice is to require that remedies proposed in phase 1 be clear-cut and straightforward. Hence, they tend to be more far-reaching and effective than remedies applied in phase 2. In fact, one of the main findings of the Commission’s study is that “more phase 1 remedies have been effective as opposed to phase 2 remedies[…] [and] more phase 2 remedies have been “partially effective” when compared to phase 1 remedies.”

25
governance perspective, a side effect of an antitrust action - in particular a blocking - by the
Commission may be to increase the merging firms’ abnormal returns for the benefit of
shareholders. This is what we observe for blocked unprofitable mergers: the market welcomes
these blocking decisions with a share price rally.
Panel B of table 5 splits the sample into mergers with conglomerate/vertical effects
and those with pure horizontal effects.33 Our tests should suit pure horizontal mergers best:
rents due to market power are best achieved by horizontal effects. Moreover, our sign
predictions change for e.g. vertical foreclosure mergers: the rents gained by merging firms
due to e.g. excluding rivals stem from the rival firms, thus while merging firms win rival
firms lose. Due to the small number of observations in the sub-sample conglomerate/vertical
mergers, we concentrate on pure horizontal mergers. For this sub-sample, all our results carry
over with comparable significance levels.
Some of our sub-samples suffer from a rather small number of observations, thus
Panel C estimates by robust regression techniques using STATA command rreg, which
essentially weights down extreme observations. Using robust regression techniques, however,
leaves our main results unaltered.
6.2.2. Correcting for Market Expectations
In this section we shall present the two steps of the regression where we correct for market
expectation about the authority’s action. In the first step we estimate the probability of a
particular action (clearance and remedies) and in the second stage we correct our measures for
the mergers’ and decisions’ profitability effects as highlighted in section 4.4.
In table 6 we report the results of the logit estimation for clearance and actions.
Clearances (dummy equal to 0 in the case of blocking and equal to 1 in the case of clearance)
and action (dummy equal to 0 in the case of outright clearance and equal to 1 in the case of
remedies or blocking decisions) are explained by the following observables proxying for the
likely (anti-) competitive effects of the mergers, lobbying and/or protectionist tendencies:
whether one or both of the merging firms stem from the USA (us), whether one or both of the
merging firms stem from a big EU country (bigeu; France, Germany, Italy, Spain, or UK),
whether conglomerate or vertical effects are also present (conglom), whether the merger is a
cross border deal (crossbord), whether the EU Commission defines the relevant geographic
market as worldwide (world), EU wide (eu) or national (reference group), whether the merger 33 It should be noted that all analyzed mergers have horizontal effects, but some have in addition conglomerate or vertical effects
26
is a full merger (full; as opposed to partial acquisitions), the size of merging and rival firms
measured by the logarithm of market values (lnvm and lnvr), industry indicators (d for
manufacturing as opposed to services; and i for communications) and time variables (time
trend and a dummy for the late years 1995-2002). Notice that all these variables are also
observable to the market when assessing the merger’s and decision’s effects.
[table 6 about here]
The probability of clearing a merger is significantly higher if one or both of the
merging firms stem from the USA, and it is lower if besides horizontal also conglomerate or
vertical concerns are identified by the Commission. All other variables are not significant,
although some of them have the expected sign, like the negative coefficients on cross border
deals or the wider than national market definitions. The probability of an action is
significantly lower if one or both of the merging firms stem from the USA34 or if markets are
defined as either world or EU-wide; this probability increases when also conglomerate or
vertical concerns are present, if rival firms are larger on average, and in the last years of the
sample.
From the reported estimation, we predict for each merger the probability of a
clearance and an action, which measure the ex-ante market’s expectation about these
Commission’s decisions [ ]Aj Ilearc Pr and [ ]Aj Iaction Pr respectively. We next correct the
estimated CAARs around the merger’s and decision’s announcement by the predicted
probabilities according to the discussion highlighted above. Finally, we run the same set of
regressions as in table 4 but using the probability corrected measures ( *Aij∆Π and *D
ij∆Π )
instead of the original ones ( Aij∆Π and D
ij∆Π respectively).
Panel A of table 7 presents the regression results using these corrected CAARs and the
entire sample. Results are qualitatively very similar and in most cases even stronger than
using the “uncorrected” values. Remedies, also including blockings, have significant effects:
they reduce rivals’ profitability in anticompetitive mergers while increasing it if wrongly
applied to pro-competitive mergers. In the latter case, insiders lose. Hence remedies can again
be seen as a rent transfer from merging firms to competitors. When we look more in detail at
the different decisions, it becomes evident that blockings are responsible for the profit-
34 Note that this result differs from what is found by Atkas et al. (2004), who claim that EU merger control is protectionist and favours European firms.

27
reversion effect, as we previously saw. Again, we cannot reject the hypothesis that the
coefficient bB is significantly different from minus one for rivals, whereas it is even
significantly smaller than minus one for merging firms. This means that a blocking decision
imposes some extra costs to the insiders in addition to the lost rents from market power or the
efficiency gains. While divestiture does not seem to have any significant effect on both
merging and rival firms independently of the merger’s competitive effect, behavioral
remedies continue to merely constitute a rent transfer from merging to rival firms if wrongly
applied to pro-competitive mergers.
[table 7 about here]
In panels B and C we again split the sample into phase 1 and 2 decisions. Most of the
previous results are qualitatively confirmed, some are even reinforced. Concerning phase 1
decisions, both divestitures and other remedies reduce rivals’ profitability when appropriately
applied to anticompetitive mergers. They instead have the opposite (OTHERREM) or no
(DIVESTITURE) effect when mistakenly adopted.
Looking at phase 2 decisions (panel C), results are again quite similar to those
presented in table 4. However, the coefficients are less precisely estimated and, therefore, they
lose significance. Nevertheless, the two main findings obtained before are confirmed: the
blockings of anticompetitive mergers completely dissipate rival firms’ rents (the coefficient is
not significantly different from minus one), while remedies increase it, even though not
significantly. Again, we notice that blocking decisions impose extra costs to merging firms by
reducing their rents well below the pre-merger situation (the bB coefficient is -2.3).
7. An Ex-Post Evaluation of Mergers
In this section, we present additional robustness checks on the results obtained so far using the
methodology of Gugler et al. (2003) to predict the profit effects of the merger. This method
compares actual post merger (e.g. two years as we do here) balance sheet profit levels with
predicted profit levels in the absence of the merger. Our counterfactual is the development of
profits and total assets in the same 3-digit industry as the merging firms or their rivals operate.
We used a number of other counterfactuals, such as similar size or geographical regions but
none changed our results significantly. We define ΠGt+n as the (balance sheet) profits of the
acquiring company in year t+n, ΠDt as the profits of the acquired company in the year t,

28
predictedMt n+Π as the predicted profits of the merged company in year t+n, ΠIGt+n as the profits of
the median firm in the same 3-digit industry of the acquiring company in year t+n, ΠIDt+n as
the profits of the median firm in the same 3-digit industry of the acquired company in year
t+n, KGt+n as the assets of the acquiring company in year t+n, KDt as the assets of the acquired
company in year t, KIGt+n as the assets of the median firm in the same 3-digit industry of the
acquiring company in year t+n, and KIDt+n as the assets of median firm in the same 3-digit
industry of the acquired company in year t+n.
We can now compute the projected change (∆IG t-1,t+n ) in the returns on the acquirer’s
assets from year t-1 to t+n using again the changes observed for the median (in terms of
profitability) company in its industry:
.1
1,1,
−
−
+
++−
Π−
Π=∆
IGt
IGt
nIGt
nIGtnttIG KK
If the median firm in the acquirer’s industry earned a 0.10 return on assets in t-1, and a
0.11 return in t+n, then we would predict that the acquiring firm’s returns on assets would
increase by 0.01 in the absence of the merger.
Defining ∆ID t,t+n for the acquired firm’s industry analogously to ∆IG t-1,t+n gives us the
following formula for predicting the profits of the combined company in the year t+n.
1 1 1, ,1
IG t n ID t npredictedGt G t IGt t n Dt D t IDt t nMt n
IG t ID t
K KK K
K K+ +
− − − + ++−
= + + +Π ∆ Π ∆Π . (5)
The profits of the merged company in year t+n are predicted to be the profits of the
acquirer in t-1, plus the predicted growth in its profits from t-1 to t+n, plus the profits of the
acquired firm in t, plus the predicted growth in its profits from t to t+n in the absence of the
merger. Analogously we can compute predicted profits for rival firms in the absence of the
merger.
Our measure to evaluate the effects of the merger is then the difference between actual
(observed) profits in year t+n and the predicted profits:
( )effect actual predicted
Mt n Mt n Mt n+ + +∆Π = Π − Π . (6)
Exactly the same logic can be applied for the rivals. In fact, antitrust markets are
different than industries based on SIC codes. The advantage of our database is that we have
information on the real rivals to the merging firms. These firms are not a good counterfactual

29
to the merging firms, since they are also influenced by the merger as the merging firms.
However, the rest of the industry should not be affected so strongly by the merger and this
makes the 3-digit SIC code a good counterfactual for the merger. We can hence get a measure
of the merger induced profit effect for rivals, which is something novel in the literature.
[table 8 about here]
Table 8 relates the ex post profit effects from (6) for n = 2 years (and divided by the
sum of the total assets of merging and rival firms, respectively, in year t-1 relative to the
merger) to the announcement CAARs and the total CAARs of the merger, which is the sum of
CAARs around announcement and decision. For both measures the relation is significantly
positive. This assures us that (1) stock markets - at least partially - foresee the eventual profit
effects of the merger and (2) both methodologies measure the true merger’s effects.
[table 9 about here]
Table 9 relates the profit effect for the rivals ( effectRt n+∆Π ) to the merging firms’ profit
effect ( effectMt n+∆Π ) and interacts the former with our dummies for outright clearance, other
remedies, divestitures, and blockings. If the merger induces both the profits of the merging
firms and the profits of their rivals to increase, then market power is at work, since the profits
stem from consumer surplus. While we do not find a significant relation between the two
profit effects for cleared mergers without commitments and blockings, there is a statistically
and economically significantly positive relation for those mergers that were cleared with
commitments. This is additional evidence for our earlier findings using an event study
methodology that remedies do not solve the anticompetitive problems on average.
8. Conclusions
This is the first paper to econometrically analyze the effects of merger control decisions of
one of the world’s most important antitrust agencies, the EU Commission. While this is a
formidable task and wrecked with several difficulties, we are very cautious in isolating the
true effects of the antitrust decisions: we do not only employ standard event study techniques
but also conduct an ex post analysis using balance sheet data on firms’ profits and assets. We
take great care in accounting for information leakage prior to major events, and we adjust for
possible priors the market already had priced in at the event day. We apply a novel

30
methodology relating abnormal returns at the two major event dates, the merger’s
announcement and antitrust decision, and obtain several testable hypotheses. By means of
regression analysis, we test these predictions. Moreover, our dataset is as “clean” as possible
in identifying major rivals of merging firms, since our source of information are the decisions
of the European Commission itself. Thus we believe that our results are robust.
We find that only the outright blockings of supposedly anticompetitive mergers
completely solve the anticompetitive concerns raised by the EU Commission. Only in this
case, do we statistically get the complete dissipation of anticompetitive rents that the market
believes will result from the merger between its announcement and the final antitrust decision.
Other remedies, such as behavioral remedies but also divestitures, do not achieve this, on
average. This is particularly true when remedies are applied after the Commission’s in-depth
investigation, while they seem to be effective when applied to the “right”, anticompetitive,
mergers during phase 1. Remedies, either because wrongly applied or wrongly designed,
often merely result in wealth transfers from merging firms to their rivals, without solving the
anticompetitive concerns. Our findings are thus consistent with potential problems of
remedies such as information asymmetry and incentive problems, and the increased
possibility of pro-collusive effects as pointed out in the theoretical literature.
In recent years the EU Commission - in contrast to the US antitrust authorities -
increasingly hesitates to block mergers after the European Court of Justice overruled several
blocking decisions. Our results imply that this may lead to the clearance of too many
anticompetitive mergers with ineffective remedies.

31
References
Aktas, N., E. de Bodt and R. Roll, 2004, “Market Response to European Regulation of
Business Combinations,” Journal of Financial and Quantitative Analysis, 39, 4, 731-
757.
Aktas, N., E. de Bodt and R. Roll, 2006, “European M&A Regulation is Protectionist,”
Economic Journal, forthcoming.
Andrade, G., M. Mitchell and E. Stafford, 2001, “New Evidence and Perspectives on
Mergers,” Journal of Economic Perspectives, 15, 103-120.
Baer, W. J. and R. C. Redcay, 2003, “Solving Competition Problems in Merger Control: The
Requirements for an Effective Divestiture Remedy,” in F. Leveque and H. Shelanski,
Merger Remedies in American and European Union Competition Law, Edward Elgar
Publishing, MA: Northampton.
Banerjee, A. and E. W. Eckard, 1998, “Are Mega-mergers Anticompetitive? Evidence from
the First Great Merger Wave,” The Rand Journal of Economics, 29, 4, 803-827.
Banal-Estañol and Jo Seldeslachts, 2005, “Merger Failures,” WZB Discussion paper, SP II
2005-09.
Bittlingmayer, G. and T. W. Hazlett, 2000, “DOS Kapital: Has Antitrust Action against
Microsoft Created Value in the Computer Industry?” Journal of Financial Economics,
55, 3, 329-359.
Brady, U. and R. Feinberg, 2000, “An examination of stock-price effects of EU merger
control policy,” International Journal of Industrial Organization, 18, 885-900.
Cabral, L. M. B., 2003, “Horizontal Mergers with Free-Entry: Why Cost Efficiencies May Be
a Weak Defense and Asset Sales a Poor Remedy,” International Journal of Industrial
Organization, 21, 607-623.
Carstensen, Peter C., 1999, “Remedying the Microsoft Monopoly: Monopoly Law, the Rights
of Buyers, and the Enclosure Movement in Intellectual Property,” The Antitrust
Bulletin, Fall, 44, 3, 577-617.
Comanor, William S., 2001, “The Problem of Remedy in Monopolization Cases: the
Microsoft Case as an Example,” The Antitrust Bulletin, Spring: 46, 1, 115-133.
DG Comp - European Commission, 2005, Merger Remedies Study.

32
Duso, T., D. Neven, and L.-H. Röller, 2006, “The Political Economy of European Merger
Control: Evidence Using Stock Market Data,” Journal of Law and Economics,
forthcoming.
Duso, T., K. Gugler, and B. Yurtoglu, 2006, “EU Merger Remedies: An Empirical
Assessment,” in J. Stennek and V. Ghosal Eds., The political Economy of Antitrust,
Contributions to Economic Analysis, North-Holland, 2006, forthcoming
Eckbo, B. E., 1983, “Horizontal Mergers, Collusion, and Stockholder Wealth,” Journal of
Financial Economics, 11, 241-273.
Eckbo, E. B., 1992, “Mergers and the Value of Antitrust Deterrence,” Journal of Finance, 47,
3, 1005-1029.
Eckbo, B. E. and P. Wier, 1985, “Antimerger Policy Under the Hart-Scott-Rodino Act: A Re-
examination of the Market Power Hypothesis,” The Journal of Law and Economics
28, 119-149.
Ellert, James, 1976, “Mergers, Antitrust Law Enforcement and Stockholder Returns,” Journal
of Finance, 31, 2, 715-732.
Elzinga, K., 1969, “The Antimerger Law: Pyrrhic Victories?,” Journal of Law and
Economics, 43, 52- .
Evans, D.S. and Michael Salinger, 2002, “Competition thinking at the European Commission:
lessons from the aborted GE/Honeywell merger”, 10 George Mason Law Review, 489-
532.
European Commission 2001, “Notice on remedies acceptable under Council Regulation
(EEC) No 4064/89 and under Commission Regulation (EC) No 447/98,” 2.3.2001.
Farell, J., 2003, “Negotiation and Merger Remedies: Some Problems,” in F. Leveque and H.
Shelanski, Merger Remedies in American and European Union Competition Law,
Edward Elgar Publishing, MA: Northampton.
Farrell, J. and C. Shapiro, 1990, “Horizontal Mergers: An Equilibrium Analysis,” American
Economic Review, March, 107-126.
Fee, E. C. and T. Shawn, 2004, “Sources of Gains in Horizontal Mergers: Evidence from
Customer, Supplier, and Rival Firms,” Journal of Financial Economics, 74, 423-460.

33
Fridolfsson, S. O. and J. Stennek, 2005, “Why Mergers Reduce Profits and Raise Share
Prices,” Journal of the European Economic Association, 3, 1083-1104.
Federal Trade Commission, 1999, A Study of the Commission's Divestiture Process, FTC.
Gugler, K., D.C. Mueller, B. B. Yurtoglu and C. Zulehner, 2003, “The Effects of Mergers: An
International Comparison,” International Journal of Industrial Organization, 21, 5,
625-653.
Gugler, K. and R. Siebert, 2004, “Market Power versus Efficiency Effects of Mergers and
Research Joint Ventures: Evidence from the Semiconductor Industry,” NBER Working
Paper 10323.
Kim E. H. and V. Singal, 1993, “Mergers and Market Power: Evidence from the Airline
Industry,” American Economic Review, 83, 3, 549-69.
Lyons, Bruce, 2004, “Reform of European Merger Policy,” Review of International
Economics, 12, 2, 246-261.
McAfee, R. P. and M. A. Williams, 1988, “Can Event Studies Detect Anticompetitive
Mergers?” Economics Letters, 28, 199-203.
McGuckin, R., F.R. Warren-Boulton, and P. Waldstein, 1992, “The Use of Stock Market
Returns in Antitrust Analysis of Mergers,” Review of Industrial Organization, 7, 1-11.
Motta, M., M. Polo, and H. Vasconcelos, 2003, “Merger Remedies in the European Union:
An Overview,” in F. Leveque and H. Shelanski, Merger Remedies in American and
European Union Competition Law, Edward Elgar Publishing, MA: Northampton.
Mullin, L., J. Mullin, and W. Mullin, 1995, “The competitive effects of mergers: stock market
evidence from the U.S. Steel dissolution suit,” Rand Journal of Economics, 26, 314-
330.
Neven, D. and L.-H. Röller, 2005, “Consumer Surplus vs. Welfare Standard in a Political
Economy Model of Merger Control,” International Journal of Industrial
Organization, 23, 9-10, 829-848.
Organisation for Economic Co-operation and Development, 2004, “Merger Remedies,”
DAF/COMP(2004)21.
Pfunder, M.R., D.J. Plaine and A. M. Whittemore, 1972, “Compliance with Divestiture
Orders under Section 7 of the Clayton Act,” Antitrust Bulletin, 17, 1, 19-180.

34
Röller, L.-H., Stennek, J., and Verboven, F. (2001), “Efficiency gains from mergers”,
European Economy, 5, 31-128.
Rogowsky, Robert A., 1986, “The Economic Effectiveness of Section 7 Relief,” Antitrust
Bulletin, Spring, 187-233.
Salant, S. W., S. Switzer and R. J. Reynolds, 1983, “Losses from Horizontal Merger: The
Effects of an Exogenous Change in Industry Structure on Cournot-Nash Equilibrium,”
Quarterly Journal of Economics, 98, 185-199.
Scholes, M., Williams, J., 1977, “Estimating Beta from Non-Synchronous Data,” Journal of
Financial Economics, 5, 309–327.
Schumann, L., 1993, “Patterns of Abnormal Returns and the Competitive Effects of
Horizontal Mergers,” Review of Industrial Organization, 8, 679-696.
Seldeslachts, J., J. Clougherty, and P.P. Barros, 2006 “Remedy for Now but Prevent for
Tomorrow: The Deterrence Effects of Merger Policy Tools,” mimeo.
Servaes, H. and A. Tamayo, 2005, “The Response of Industry Rivals to Control Threats,”
Working Paper: London Business School.
Shahrur, H., 2005, “Industry structure and horizontal takeovers: Analysis of wealth effect on
rivals, suppliers, and corporate customers,” Journal of Financial Economics, 76, 61-
98.
Simpson, H.D., 2001, “Did May Company’s Acquisition of Associated Dry Goods
Corporation Reduce Competition? An Event Study Analysis,” Review of Industrial
Organization, 18, 351-362.
Singal V., 1996, “Airline Mergers and Competition: An Integration of Stock and Product
Price Effects,” Journal of Business, 69, 2, 233-68.
Slovin, M. B., M.E. Sushka, and C. D. Hudson, 1991, “Deregulation, Contestability, and
Airline Acquisitions,” Journal of Financial Economics, 30, 2, 231-251.
Song, M. H. and R.A. Walkling, 2000, “Abnormal Returns to Rivals of Acquisition Targets:
A Test of the ‘Acquisitions Probability’ Hypothesis,” Journal of Financial Economics,
55, 2, 143-171.
Stillman, R., 1983, “Examining Antitrust Policy Towards Horizontal Mergers,” Journal of
Financial Economics, 11, 225-240.

35
Tables and Figures
Figure 1: Merger Control Interventions in Different Jurisdictions: USA and EU
USA EU
Note: rem_not = remedies divided by notifications; prev_not = preventions divided by notifications
Figure 2: The EU Merger Control Process

36
Figure 3. Cumulative Abnormal Returns Around Different Events
MERGING FIRMS RIVALS Announcement day
Announcement day
Phase 1 decision
Phase 1 decision
Phase 2 decision Phase 2 decision
-.02
0
.02
.04
.06
-60 -40 -20 0days
clear remedies phase 2
-.05
0
.05
.1
.15
-60 -40 -20 0days
clear remedies phase 2
-.02
0
.02
.04
.06
-60 -40 -20 0days
clear remediesblock
-.06
-.04
-.02
.02
.04
-60 -40 -20 0days
clear remediesblock
0
.005
.01
.015
.02
.025
-60 -40 -20 0days
-.005
0
.005
.01
-60 -40 -20 0days

37
Table 1: Possible Effects of Mergers on Merging (M) and Rival (R) Firms’ Profits and the Optimal Incidence of Remedies
0M∆Π > 0M∆Π <
0R∆Π > Market Power Increase;
Action
Efficiency Reduction;
Possibly Action (if 0I∆Π > )
0R∆Π < Efficiency Increase;
No Action
Efficiency Reduction;
No Action
Table 2. Preliminary Statistics
Description Obs Mean Min Max Market value merging firms in million US $ 159 44165 10.8 607975 Market value of rivals (average) in million US $ 156 7492 3.6 227604 Number of competitors listed in the Commission report 163 7.59 1 34 Percentange of Competitors listed 163 0.63 0 1 Full acquisition 168 0.57 0 1 Partial acquisition 168 0.13 0 1 Joint Venture 168 0.24 0 1 Asset acquisition 168 0.06 0 1 Tender offer 168 0.11 0 1 The merger was cleared in phase 1 168 0.53 0 1 The geographical market is national 168 0.35 0 1 The geographical market is the European Economic Area 168 0.41 0 1 The geographical market is worldwide 168 0.21 0 1 An action (remedies or blocking) have been taken 168 0.43 0 1 The merger was prohibited 168 0.08 0 1 The remedy consisted in a divestiture 166 0.23 0 1 Other kinds of remedies 166 0.11 0 1 The remedy consisted in selling shares 166 0.10 0 1 The remedy consisted in dissolving interlocking directorates 166 0.04 0 1 The remedy consisted in eliminating exclusive agreements 166 0.07 0 1 Merging firms must license some products / processes 166 0.11 0 1 Merging firms must guarantee access to an essential technology/ facility 166 0.10 0 1

38
Table 3: Abnormal Returns to Merging Firms and Their Rivals for Various Events, Windows and Decisions
Merging firms Rivals Short run Long run Short run Long run Nobs CAR5_5 S.E. CAR50_5 S.E. Nobs CAR5_5 St.Err. CAR50_5 St.Err.At announcement day of the merger: (Later) cleared in phase 1 74 0.010 0.009 0.021* 0.016 77 0.001 0.004 -0.001 0.011(Later) cleared with remedies in phase 1 10 -0.014 0.022 0.019 0.061 10 -0.010 0.015 -0.009 0.045(Later) going to phase 2 73 0.014** 0.007 0.013 0.014 78 -0.006* 0.004 0.010 0.012(Later) cleared in phase 2 16 0.010 0.010 0.014 0.021 17 -0.007 0.013 0.005 0.025(Later) cleared with remedies in phase 2 44 0.019 ** 0.009 0.023 0.019. 48 -0.005 0.004 0.004 0.014(Later) blocked 13 0.001 0.018 -0.019 0.033 13 -0.009 0.011 0.035 0.040 All 157 0.010** 0.005 0.018 ** 0.010 165 -0.003 0.003 0.004 0.008 At phase 1 decision day of the merger: Nobs CAR5_5 St.Err. CAR25_5 St.Err. Nobs CAR5_5 St.Err. CAR25_5 St.Err.Cleared in phase 1 74 -0.002 0.007 0.003 0.010 77 -0.002 0.005 0.008 0.009Cleared with remedies in phase 1 10 0.013 0.024 -0.007 0.033 10 -0.035* 0.020 0.032 0.066Going to phase 2 73 -0.017*** 0.006 -0.014** 0.008 78 -0.0001 0.005 -0.011 0.009(Later) cleared in phase 2 16 -0.023** 0.009 -0.017 0.020 17 0.003 0.010 -0.008 0.027(Later) cleared with remedies in phase 2 44 -0.011* 0.007 -0.013 0.010 48 -0.003 0.008 -0.006 0.011(Later) blocked 13 -0.029 0.027 -0.017 0.017 13 0.003 0.009 -0.035* 0.023 All 157 -0.008** 0.004 -0.005 0.006 165 -0.003 0.003 0.000 0.007 At phase 2 decision day of the merger: Nobs CAR5_5 St.Err. CAR50_5 St.Err. Nobs CAR5_5 St.Err. CAR50_5 St.Err.Cleared in phase 2 16 0.018 0.019 0.066** 0.037 17 0.0001 0.010 0.001 0.022Cleared with remedies in phase 2 44 0.003 0.012 -0.015 0.015 48 -0.004 0.008 -0.017 0.029Blocked 13 0.008 0.009 0.008 0.049 13 0.025 0.025 -0.055 0.045 All 73 0.007 0.008 0.005 0.015 78 0.001 0.007 -0.019 0.348
Note: *, **, *** ... significant at 10%, 5%, 1%.

39
Table 4. Regressions Results: Full Sample, Phase 1 and Phase 2
Dependent variable: Decision CAAR of Rivals Merging firms
Independent variable Rival/insider CAR at
announcement interacted with: Nobs R2 Coeff St.Err. Nobs R2 Coeff St.Err.
PANEL A – Full Sample One 157 0.095 0.110 0.095 149 0.134 -0.006 0.068 CLEAR 157 0.098 0.176 0.142 149 0.149 0.084 0.089 ACTION 0.051 0.135 -0.122 0.101 CLEAR *ANTICOMP 155 0.121 0.282 0.240 149 0.166 0.126 0.124 CLEAR *PROCOMP 0.091 0.230 0.032 0.134 ACTION*ANTICOMP -0.042 0.198 0.023 0.139 ACTION*PROCOMP 0.190 0.249 -0.285** 0.147 CLEAR 155 0.216 0.190 0.132 147 0.196 0.089 0.087 OTHERREM 0.339 0.298 -0.049 0.241 DIVESTITURE 0.456*** 0.174 -0.006 0.124 BLOCK -0.687*** 0.223 -0.639*** 0.246 CLEAR *ANTICOMP 155 0.274 0.303 0.218 147 0.217 0.122 0.122 CLEAR *PROCOMP 0.087 0.206 0.048 0.131 BLOCK*ANTICOMP -0.790*** 0.252 -0.523* 0.331 BLOCK*PROCOMP -0.228 0.509 -0.801** 0.376 DIVESTITURE*ANTICOMP 0.818*** 0.268 0.152 0.180 DIVESTITURE*PROCOMP 0.097 0.257 -0.160 0.169 OTHERREM*ANTICOMP -0.032 0.353 0.148 0.297 OTHERREM*PROCOMP 1.407** 0.592 -0.378 0.393
PANEL B - Phase1 CLEAR 81 0.183 0.219*** 0.075 78 0.152 0.058 0.060 ACTION 0.070 0.175 -0.025 0.141 CLEAR *ANTICOMP 81 0.310 0.062 0.122 78 0.200 0.081 0.080 CLEAR *PROCOMP 0.395*** 0.124 0.032 0.091 ACTION*ANTICOMP -0.455** 0.226 0.063 0.148 ACTION*PROCOMP 0.859*** 0.289 -0.626* 0.361 CLEAR 81 0.185 0.219*** 0.076 78 0.153 0.057 0.060 OTHERREM 0.109 0.200 0.022 0.274 DIVESTITURE -0.029 0.301 -0.043 0.169 CLEAR *ANTICOMP 81 0.392 0.033 0.116 78 0.202 0.079 0.081 CLEAR *PROCOMP 0.409*** 0.118 0.032 0.093 DIVESTITURE*ANTICOMP -0.522 0.360 0.027 0.177 DIVESTITURE*PROCOMP -0.014 0.417 -0.640 0.523 OTHERREM*ANTICOMP -0.604** 0.238 0.156 0.290 OTHERREM*PROCOMP 1.589*** 0.381 -0.582 0.530

40
PANEL C - Phase II
CLEAR 76 0.197 0.141 0.431 71 0.287 -0.293 0.439 ACTION 0.074 0.209 -0.200 0.158 CLEAR *ANTICOMP 74 0.222 0.546 0.824 71 0.291 0.038 0.829 CLEAR *PROCOMP -0.089 0.600 -0.424 0.535 ACTION*ANTICOMP 0.187 0.334 -0.140 0.246 ACTION*PROCOMP -0.089 0.428 -0.226 0.224 CLEAR 74 0.347 0.142 0.397 69 0.363 -0.309 0.427 OTHERREM 1.137 0.797 -0.177 0.441 DIVESTITURE 0.561** 0.258 -0.003 0.192 BLOCK -0.699** 0.322 -0.747** 0.329 CLEAR *ANTICOMP 74 0.409 0.268 0.766 69 0.371 0.021 0.829 CLEAR *PROCOMP 0.062 0.550 -0.436 0.529 BLOCK*ANTICOMP -0.647* 0.376 -0.747* 0.470 BLOCK*PROCOMP -0.780 0.898 -0.718 0.516 DIVESTITURE*ANTICOMP 1.112*** 0.416 0.151 0.324 DIVESTITURE*PROCOMP 0.022 0.406 -0.075 0.255 OTHERREM*ANTICOMP 0.366 1.048 -0.048 0.659 OTHERREM*PROCOMP 2.456* 1.421 -0.280 0.629
Note: We perform one-way-fixed effects regressions, where the absorbing categorical factor is the year of the decision. We also control for industry effects and for conglomerate/foreclosure aspects. Moreover we control for the proportion of rivals that we lost due to data limitation. The dependent variable is the decision abnormal returns for rivals and merging firms respectively. The decisions are defined as follows: CLEAR: the merger is cleared without remedies; ACTION: the merger is either cleared with remedies or blocked; OTHERREM: the merger is cleared with remedies other than divestitures (mainly behavioral remedies); DIVESTITURE: the merger is cleared with a divestiture; BLOCK the merger is blocked. The definition of anti-and pro-competitive merger is as follow: ANTICOMP is equal to one if rivals’ announcement CAARs > 0; PROCOMP is equal to one if rivals’ announcement CAARs< 0. The symbols *, **, *** represent significance at 10%, 5%, 1% respectively.

41
Table 5: Robustness Checks: Profitable vs. Unprofitable Mergers, Conglomerate vs. Non-conglomerate, and Robust regressions
Dependent variable: Decision CAAR of Rivals Merging firms
Independent variable Rival/insider CAR at announcement interacted with: Nobs R2 Coeff St.Err. Nobs R2 Coeff St.Err.
PANEL A Profitable CLEAR *ANTICOMP 82 0.4562 0.483** 0.229 82 0.3182 0.481 0.425 CLEAR *PROCOMP 0.164 0.313 0.154 0.176 BLOCK*ANTICOMP -0.766*** 0.222 -0.322 0.793 BLOCK*PROCOMP -0.262 0.573 -0.909** 0.416 DIVESTITURE*ANTICOMP 0.711* 0.372 0.240 0.256 DIVESTITURE*PROCOMP -0.294 0.357 -0.071 0.211 OTHERREM*ANTICOMP -0.040 0.295 0.302 0.429 OTHERREM*PROCOMP 1.036* 0.624 -0.805 0.744 Unprofitable CLEAR *ANTICOMP 73 0.4527 0.845 0.555 65 0.5166 -0.019 0.232 CLEAR *PROCOMP -0.323 0.325 0.258 0.346 BLOCK*ANTICOMP -1.063 0.727 -0.454 0.372 BLOCK*PROCOMP -0.386 0.918 3.079** 1.318 DIVESTITURE*ANTICOMP 0.996* 0.397 0.310 0.313 DIVESTITURE*PROCOMP -0.142 0.399 0.168 0.469 OTHERREM*ANTICOMP 0.575 2.071 0.570 0.482 OTHERREM*PROCOMP 1.817 1.203 0.221 0.488
PANEL B Conglomerate CLEAR *ANTICOMP 23 0.6631 21 0.9088 CLEAR *PROCOMP 0.323 0.316 0.9175 0.325 BLOCK*ANTICOMP -1.037 0.826 -0.452 0.587 BLOCK*PROCOMP -0.677 0.763 DIVESTITURE*ANTICOMP 0.715** 0.313 0.250 0.525 DIVESTITURE*PROCOMP 0.677 0.899 -1.597 1.216 OTHERREM*ANTICOMP -0.299 0.473 -0.201 0.530 OTHERREM*PROCOMP 5.374 6.530 0.443 0.517 Non Conglomerate CLEAR *ANTICOMP 132 0.2379 0.212 0.234 126 0.2192 0.100 0.130 CLEAR *PROCOMP 0.105 0.273 -0.038 0.170 BLOCK*ANTICOMP -0.797*** 0.271 -0.514 0.416 BLOCK*PROCOMP -0.119 0.619 -0.779** 0.391 DIVESTITURE*ANTICOMP 0.576 0.424 0.094 0.210 DIVESTITURE*PROCOMP 0.0967 0.275 -0.161 0.178 OTHERREM*ANTICOMP 0.066 0.578 0.041 0.497 OTHERREM*PROCOMP 1.463** 0.629 -0.343 0.413
PANEL C Robust regressions CLEAR *ANTICOMP 155 0.395*** 0.129 146 0.105 0.107 CLEAR *PROCOMP -0.046 0.121 0.069 0.116 BLOCK*ANTICOMP -0.980*** 0.149 -0.022 0.292 BLOCK*PROCOMP -0.412 0.301 2.016* 1.081 DIVESTITURE*ANTICOMP 1.380*** 0.158 0.129 0.158 DIVESTITURE*PROCOMP -0.322** 0.152 -0.616*** 0.149 OTHERREM*ANTICOMP 0.028 0.209 0.120 0.262 OTHERREM*PROCOMP 0.530 0.350 -0.339 0.346

42
Note: We perform one-way-fixed effects regressions by means of the areg command in STATA, where the absorbing categorical factor is the year of the decision. We also control for industry effects and for conglomerate/foreclosure aspects. Moreover we control for the proportion of rivals that we lost due to data limitation. The dependent variable is the decision abnormal returns for rivals and merging firms respectively. The decisions are defined as follows: CLEAR: the merger is cleared without remedies; ACTION: the merger is either cleared with remedies or blocked; OTHERREM: the merger is cleared with remedies other than divestitures (mainly behavioral remedies); DIVESTITURE: the merger is cleared with a divestiture; BLOCK the merger is blocked. The definition of anti-and pro-competitive merger is as follow: ANTICOMP is equal to one if rivals’ announcement CAARs > 0; PROCOMP is equal to one if rivals’ announcement CAARs< 0.. (Un)Profitable mergers are defined as mergers where the merging firms announcement CAAR > (<) 0; Conglomerate mergers are such when the Commission identified also conglomerate or vertical effects; in Non-conglomerate mergers the Commission identified only horizontal effects; Robust regressions uses STATA command rreg. The symbols *, **, *** represent significance at 10%, 5%, 1% respectively
Table 6: The Probability of Clearance and Remedies: Logit regressions
Dep. Var: CLEAR Dep. Var: ACTION Coef. Std. Err Coef. Std. Err
us 3.078* 1.609 -1.314** 0.540 Bigeu 0.486 1.009 -0.419 0.480 conglom -0.573** 0.883 0.955* 0.568 crossbord 1.921 0.743 -0.476 0.459 world -0.408 0.859 -0.418* 0.519 eu -0.158 0.887 -0.844* 0.482 full -0.136 0.790 0.781 0.421 lnvm -0.262 0.297 0.121 0.165 lnvr -0.055 0.254 0.183** 0.151 d -0.296 0.974 1.034 0.508 i -1.347 1.089 0.673 0.637 trend 0.870 1.122 -0.949 0.611 d95_02 -1.281 1.643 1.729* 0.921 constant 3.486 2.998 -2.452 1.688 Nobs 154 154 Pseudo R2 0.197 0.156 Log-likelihood -35.79 -88.80
Note: We perform probit regression given the categorical nature of the dependent variables. The Dependent variables are CLEAR equal to 1 if the merger was cleared with or without remedies and ACTION equal to 1 of the merger was cleared with remedies or blocked. The control variables are: us equal to 1 if one of the merging firms stems from the USA; bigeu equal to 1 if one of the merging firms stem from a big EU country (Germany, France, UK or Italy); conglom equal to 1 if conglomerate or vertical effects are also present; cross equal to 1 if the merger is a cross border deal; world equal to 1 if the EU Commission defines the relevant geographic market worldwide; eu equal to 1 if relevant market EU wide; full equal to 1 if the merger is a full merger; lnvm and lnvr are respectively the size of merging and rival firms measured by the logarithm of market values; d equal to 1 if manufacturing sector; i equal to 1 if communications sector; trend represents a time trend; d95_02 equal to 1 if the merger was scrutinized during 1995-2002. The symbols *, **, *** represent significance at 10%, 5%, 1% respectively

43
Table 7: Regression Results: Correcting for the Probability of Clearance and Remedies.
Dependent variable: Decision CAAR of Rivals Merging firms
Independent variable Rival/insider effective CAAR at announcement interacted with:
Nobs R2 Coeff St.Err. Nobs R2 Coeff St.Err.
PANEL A – Full Sample One 149 0.1029 0.034 0.176 149 0.1335 -0.229 0.153 CLEAR 149 0.1141 0.325 0.285 149 0.1791 0.1532 0.206 ACTION -0.155 0.229 -0.640*** 0.214 CLEAR*ANTICOMP 149 0.1855 -0.005 0.287 149 0.1851 0.164 0.301 CLEAR*PROCOMP -0.290 0.280 0.137 0.293 ACTION*ANTICOMP -0.918** 0.319 -0.428 0.306 ACTION*PROCOMP 0.859** 0.373 -0.849*** 0.302 CLEAR 149 0.2644 0.328 0.262 147 0.2792 0.1592 0.195 OTHERREM 1.233*** 0.454 -0.542 0.446 DIVESTITURE 0.449 0.359 -0.103 0.273 BLOCK -1.272*** 0.319 -2.225*** 0.455 CLEAR *ANTICOMP 149 0.3075 0.524 0.442 147 0.2917 0.138 0.287 CLEAR *PROCOMP 0.208 0.405 0.178 0.279 BLOCK*ANTICOMP -1.326*** 0.349 -2.003*** 0.647 BLOCK*PROCOMP -1.122 0.912 -2.494*** 0.661 DIVESTITURE*ANTICOMP 0.373 0.699 0.022 0.401 DIVESTITURE*PROCOMP 0.443 0.451 -0.244 0.369 OTHERREM*ANTICOMP -0.116 0.692 0.021 0.620 OTHERREM*PROCOMP 2.401*** 0.646 -1.086* 0.610
PANEL B – Phase1 CLEAR 78 0.4079 0.427*** 0.162 78 0.1614 0.036 0.128 ACTION 1.336*** 0.279 -0.324 0.277 CLEAR *ANTICOMP 78 0.5696 0.120 0.134 78 0.2848 0.032 0.170 CLEAR *PROCOMP 0.315** 0.137 0.045 0.174 ACTION*ANTICOMP -0.702* 0.490 0.218 0.312 ACTION*PROCOMP 2.414*** 0.324 -1.361*** 0.420 CLEAR 78 0.4203 0.421** 0.162 78 0.1710 0.038 0.128 OTHERREM 1.435*** 0.292 -0.587 0.423 DIVESTITURE 0.332 0.934 -0.111 0.379 CLEAR *ANTICOMP 78 0.6935 0.086 0.212 78 0.2909 0.027 0.173 CLEAR *PROCOMP 0.805*** 0.208 0.047 0.176 DIVESTITURE*ANTICOMP -1.640 1.586 0.083 0.383 DIVESTITURE*PROCOMP -0.053 0.800 -1.626 1.058 OTHERREM*ANTICOMP -1.202*** 0.432 0.532 0.575 OTHERREM*PROCOMP 2.940*** 0.305 -1.265* 0.476

44
PANEL C – Phase 2
CLEAR 71 0.2230 0.114 0.874 71 0.2832 -0.341 1.067 ACTION -0.316 0.351 -0.817** 0.347 CLEAR *ANTICOMP 71 0.2436 -0.144 1.963 71 -0.025 2.060 CLEAR *PROCOMP -0.009 1.246 -0.485 1.293 ACTION*ANTICOMP -0.756 0.510 -0.923* 0.526 ACTION*PROCOMP 0.356 0.663 -0.701 0.502 CLEAR 71 0.3395 0.1345 0.829 71 0.4134 -0.372 1.004 OTHERREM 1.374 1.552 -0.800 0.952 DIVESTITURE 0.655 0.520 -0.078 0.426 BLOCK -1.142** 0.465 -2.351*** 0.622 CLEAR *ANTICOMP 71 0.3497 0.470 1.698 71 0.4146 -0.011 1.994 CLEAR *PROCOMP 0.023 1.232 -0.520 1.241 BLOCK*ANTICOMP -1.015* 0.546 -2.344** 0.940 BLOCK*PROCOMP -2.067 1.744 -2.317** 0.937 DIVESTITURE*ANTICOMP 0.984 1.139 -0.147 0.714 DIVESTITURE*PROCOMP 0.501 0.724 -0.016 0.574 OTHERREM*ANTICOMP 0.846 2.176 -0.674 1.323 OTHERREM*PROCOMP 2.591 3.063 -0.973 1.458
Note: We perform one-way-fixed effects regressions by means of the areg command in STATA, where the absorbing categorical factor is the year of the decision. We also control for industry effects and for conglomerate/foreclosure aspects. Moreover we control for the proportion of rivals that we lost due to data limitation. The dependent variable is the decision abnormal returns for rivals and merging firms respectively divided by the probability of clearance. The announcement CAARs are divided by one minus the probability of remedies. This variable is interacted with the decisions that are defined as follows: CLEAR: the merger is cleared without remedies; ACTION: the merger is either cleared with remedies or blocked; OTHERREM: the merger is cleared with remedies other than divestitures (mainly behavioral remedies); DIVESTITURE: the merger is cleared with a divestiture; BLOCK the merger is blocked. The definition of anti-and pro-competitive merger is as follow: ANTICOMP is equal to one if rivals’ announcement CAARs > 0; PROCOMP is equal to one if rivals’ announcement CAARs< 0. The symbols *, **, *** represent significance at 10%, 5%, 1% respectively.

45
Table 8. Cumulative Average Abnormal Returns and Profit Effects
Rivals
Dependent Variable:
Total Effect Announcement CAAR+Decision CAAR
Announcement CAAR
Independent variables: Nobs R2 Coef. Std. Err. R2 Coef. Std. Err. Rivals' profit effect 2 years after the merger 105 0.1185 0.077*** 0.026 0.1485 0.067*** 0.018
Merging Firms
Dependent Variable:
Total Effect Announcement CAAR+Decision CAAR
Announcement CAAR
Independent variables: Nobs R2 Coef. Std. Err. R2 Coef. Std. Err. Merging firms' profit effect 2 years after the merger 94 0.1959 0.169 0.148 0.1960 0.218** 0.116
Note: We perform robust regressions by means of the rreg command in STATA to account for the role of outliers. The dependent variables are the announcement CAARs and the sum of the announcement and the decision CAARs for the rivals and merging firms respectively. The main explanatory variable is the profit effect two years after the merger measured by means of balance sheet data. We control for time and industry dummies in all regressions. The symbols *, **, *** represent significance at 10%, 5%, 1% respectively
Table 9. The Relationship between Merging Firms’ and Rivals’ Profit Effects
Dependent Variable: Merging firms' profit effect 2 years after the merger
Independent variables: Coef. Std. Err. Rivals' profit effect 2 years after the merger* CLEAR 0.089 0.108 Rivals' profit effect 2 years after the merger* OTHER REMEDIES 0.816*** 0.216 Rivals' profit effect 2 years after the merger* DIVESTITURE 1.849*** 0.089 Rivals' profit effect 2 years after the merger* BLOCK 0.347 0.893 Nobs 87 R2 0.1938
Note: We perform robust regressions by means of the rreg command in STATA to account for the role of outliers. The dependent variable is the profit effect two years after the merger measured by means of balance sheet data for the merging firm. The main explanatory variable is the same measure for the rivals that is interacted with the Commission’s decision defined as follows: CLEAR: the merger is cleared; OTHERREM: the merger is cleared with remedies other than divestiture (mainly behavioral remedies); DIVESTITURE: the merger is cleared with a divestiture; BLOCK the merger is blocked.. We control for time and industry dummies in all regressions. The symbols *, **, *** represent significance at 10%, 5%, 1% respectively

Bücher des Schwerpunkts Märkte und Politik Books of the Research Area Markets and Politics
Robert Nuscheler On Competition and Regulation in Health Care Systems 2005, Peter Lang Verlag, Berlin
Pablo Beramendi Decentralization and Income Inequality 2003, Madrid: Juan March Institute
Thomas Cusack A National Challenge at the Local Level: Citizens, Elites and Institutions in Reunified Germany 2003, Ashgate
Sebastian Kessing Essays on Employment Protection 2003, Freie Universität Berlin http://www.diss.fu-berlin.de/2003/202
Daniel Krähmer On Learning and Information in Markets and Organizations 2003, Shaker Verlag
Bob Hancké Large Firms and Institutional Change. Industrial Renewal and Economic Restructuring in France 2002, Oxford University Press
Andreas Stephan Essays on the Contribution of Public Infrastruc-ture to Private: Production and its Political Economy 2002, dissertation.de
Peter A. Hall, David Soskice (Eds.) Varieties of Capitalism 2001, Oxford University Press
Hans Mewis Essays on Herd Behavior and Strategic Delegation 2001, Shaker Verlag
Andreas Moerke Organisationslernen über Netzwerke – Die personellen Verflechtungen von Führungsgremien japanischer Aktiengesellschaften 2001, Deutscher Universitäts-Verlag
Silke Neubauer Multimarket Contact and Organizational Design 2001, Deutscher Universitäts-Verlag
Lars-Hendrik Röller, Christian Wey (Eds.) Die Soziale Marktwirtschaft in der neuen Weltwirtschaft, WZB Jahrbuch 2001 2001, edition sigma
Michael Tröge Competition in Credit Markets: A Theoretic Analysis 2001, Deutscher Universitäts-Verlag
Torben Iversen, Jonas Pontusson, David Soskice (Eds.) Unions, Employers, and Central Banks 2000, Cambridge University Press
Tobias Miarka Financial Intermediation and Deregulation: A Critical Analysis of Japanese Bank-Firm-Relationships 2000, Physica-Verlag
Rita Zobel Beschäftigungsveränderungen und organisationales Lernen in japanischen Industriengesellschaften 2000, Humboldt-Universität zu Berlin http://dochost.rz.hu-berlin.de/dissertationen/zobel-rita-2000-06-19
Jos Jansen Essays on Incentives in Regulation and Innovation 2000, Tilburg University
Ralph Siebert Innovation, Research Joint Ventures, and Multiproduct Competition 2000, Humboldt-Universität zu Berlin http://dochost.rz.hu-berlin.de/dissertationen/siebert-ralph-2000-03-23/
Damien J. Neven, Lars-Hendrik Röller (Eds.) The Political Economy of Industrial Policy in Europe and the Member States 2000, edition sigma
Jianping Yang Bankbeziehungen deutscher Unternehmen: Investitionsverhalten und Risikoanalyse 2000, Deutscher Universitäts-Verlag
Christoph Schenk Cooperation between Competitors – Subcontracting and the Influence of Information, Production and Capacity on Market Structure and Competition 1999, Humboldt-Universität zu Berlin http://dochost.rz.hu-berlin.de/dissertationen/schenk-christoph-1999-11-16
Horst Albach, Ulrike Görtzen, Rita Zobel (Eds.) Information Processing as a Competitive Advantage of Japanese Firms 1999, edition sigma
Dieter Köster Wettbewerb in Netzproduktmärkten 1999, Deutscher Universitäts-Verlag

DISCUSSION PAPERS 2005
Lutz Engelhardt Geschäftsmodelle und nationale Institutionen: Ein Vergleich britischer und deutscher Neuemissionen aus der IT-Service – und Softwareindustrie 1996 – 2002
SP II 2005 – 01
Philipp Rehm Citizen Support for the Welfare State: Determinants of Preferences for Income Redistribution
SP II 2005 – 02
Sigurt Vitols Lutz Engelhardt
National Institutions and High Tech Industries: A Varieties of Capitalism Perspective on the Failure of Germany’s “Neuer Markt”
SP II 2005 – 03
Sebastian G. Kessing Kai A. Konrad
Union Strategy and Optimal Income Taxation
SP II 2005 – 04
Kai A. Konrad Amedeo Spadaro
Education, Redistributive Taxation, and Confidence
SP II 2005 – 05
Joseph A. Clougherty The International Drivers of Domestic Airline Mergers in Twenty Nations: Integrating Industrial Organization and International Business
SP II 2005 – 06
Talat Mahmood Sara Geerdes
Klaus Schömann
Unmet Labour Demand In Europe – Chances for Immigrants?
SP II 2005 – 07
Johannes Münster Simultaneous Inter- and Intra-Group Conflicts SP II 2005 – 08
Albert Banal-Estañol Jo Seldeslachts
Merger Failures SP II 2005 – 09
Kai A. Konrad Silent Interests and All-Pay Auctions SP II 2005 – 10
Johannes Münster Lobbying Contests with Endogenous Policy Proposals
SP II 2005 – 11
Oz Shy Dynamic Models of Religious Conformity and Conversion: Theory and Calibration
SP II 2005 – 12
Kai A. Konrad Stergios Skaperdas
Succession Rules and Leadership Rents SP II 2005 – 13
Kai A. Konrad Dan Kovenock
Equilibrium and Efficiency in the Tug-of-War SP II 2005 – 14
Thomas Cusack Torben Iversen
Philipp Rehm
Risks at Work: The Demand and Supply Sides of Government Redistribution
SP II 2005 – 15
Tomaso Duso Klaus Gugler
Burcin Yurtoglu
EU Merger Remedies: A Preliminary Empirical Assessment
SP II 2005 – 16
Dan Kovenock Brian Roberson
Electoral Poaching and Party Identification SP II 2005 – 17
Sebastian G. Kessing Kai A. Konrad
Christos Kotsogiannis
Federal Tax Autonomy and the Limits of Cooperation
SP II 2005 – 18

Jonathan Beck Michał Grajek Christian Wey
Hypermarket Competition and the Diffusion of Retail Checkout Barcode Scanning
SP II 2005 – 19
Ela Glowicka Bailouts in a Common Market: A Strategic Approach
SP II 2005 – 20
Richard Deeg Complementarity and Institutional Change: How Useful a Concept?
SP II 2005 – 21

DISCUSSION PAPERS 2006
Klaus Gugler Dennis C. Müller
B. Burçin Yurtoglu
The Determinants of Merger Waves SP II 2006 – 01
Augusto R. Micola Albert Banal Estañol
Derek W. Bunn
Incentives and Cooperation in Vertically Related Energy Markets
SP II 2006 – 02
Benny Geys Looking across Borders: A Test of Spatial Policy Interdependence using Local Government Efficiency Ratings
SP II 2006 – 03
Thomas R. Cusack Sinking Budgets and Ballooning Prices: Recent Developments Connected to Military Spending
SP II 2006 – 04
Ela Glowicka Effectiveness of Bailouts in the EU SP II 2006 – 05
Benny Geys Government Weakness and Electoral Cycles in Local Public Debt: Evidence from Flemish Municipalities
SP II 2006 – 06
Benny Geys Bruno Heyndels
Disentangling the Effects of Political Fragmentation on Voter Turnout: The Flemish Municipal Elections
SP II 2006 – 07
Johannes Münster Selection Tournaments, Sabotage, and Participation
SP II 2006 – 08
Johannes Münster Contests with Investment SP II 2006 – 09
Kjell Erik Lommerud Steinar Vagstad
Mommy Tracks and Public Policy: On Self-Fulfilling Prophecies and Gender Gaps in Promotion
SP II 2006 – 10
Benny Geys Hilde Coffé
Towards an Empirical Characterization of Bridging and Bonding Social Capital
SP II 2006 – 11
Tomaso Duso Klaus Gugler
Burcin Yurtoglu
How Effective is European Merger Control? SP II 2006 – 12

Bei Ihren Bestellungen von WZB-Papers schicken Sie bitte unbedingt einen an Sie adressierten Auf-kleber mit sowie je paper eine Briefmarke im Wert von 0,51 Euro oder einen "Coupon Reponse Inter-national " (für Besteller aus dem Ausland)
Please send a self addressed label and postage stamps in the amount of 0.51 Euro or a "Coupon- Reponse International" (if you are ordering from outside Germany) for each WZB-paper requested
Bestellschein Order Form
Absender / Return Address:
Wissenschaftszentrum Berlin für Sozialforschung Presse- und Informationsreferat Reichpietschufer 50 D-10785 Berlin-Tiergarten
Hiermit bestelle ich folgende(s) Discussion paper(s):
Please send me the following Discussion paper(s):
Bestell-Nr. / Order no. Autor/in, Kurztitel /Author(s) / Title(s) in brief