GAM-NGS: genomic assemblies merger for next generation sequencing
18
RESEARCH Open Access GAM-NGS: genomic assemblies merger for next generation sequencing Riccardo Vicedomini 1,2* , Francesco Vezzi 3 , Simone Scalabrin 2 , Lars Arvestad 4,3 , Alberto Policriti 1,2 From Ninth Annual Meeting of the Italian Society of Bioinformatics (BITS) Catania, Sicily. 2-4 May 2012 Abstract Background: In recent years more than 20 assemblers have been proposed to tackle the hard task of assembling NGS data. A common heuristic when assembling a genome is to use several assemblers and then select the best assembly according to some criteria. However, recent results clearly show that some assemblers lead to better statistics than others on specific regions but are outperformed on other regions or on different evaluation measures. To limit these problems we developed GAM-NGS (Genomic Assemblies Merger for Next Generation Sequencing), whose primary goal is to merge two or more assemblies in order to enhance contiguity and correctness of both. GAM-NGS does not rely on global alignment: regions of the two assemblies representing the same genomic locus (called blocks) are identified through reads’ alignments and stored in a weighted graph. The merging phase is carried out with the help of this weighted graph that allows an optimal resolution of local problematic regions. Results: GAM-NGS has been tested on six different datasets and compared to other assembly reconciliation tools. The availability of a reference sequence for three of them allowed us to show how GAM-NGS is a tool able to output an improved reliable set of sequences. GAM-NGS is also a very efficient tool able to merge assemblies using substantially less computational resources than comparable tools. In order to achieve such goals, GAM-NGS avoids global alignment between contigs, making its strategy unique among other assembly reconciliation tools. Conclusions: The difficulty to obtain correct and reliable assemblies using a single assembler is forcing the introduction of new algorithms able to enhance de novo assemblies. GAM-NGS is a tool able to merge two or more assemblies in order to improve contiguity and correctness. It can be used on all NGS-based assembly projects and it shows its full potential with multi-library Illumina-based projects. With more than 20 available assemblers it is hard to select the best tool. In this context we propose a tool that improves assemblies (and, as a by-product, perhaps even assemblers) by merging them and selecting the generating that is most likely to be correct. Background The advent of Next Generation Sequencing (NGS) tech- nologies made possible to sequence virtually all the organisms of the biosphere [1]. NGS technologies are characterized by extremely high data production which makes it affordable to obtain high coverage of any organism. The ability to produce high sequence coverage for lots of genomes paved the way to a large number of de novo assembly projects [2,3]. Despite this, it is now commonly accepted that de novo assembly with short reads is more difficult than de novo assembly with long Sanger reads [4]. Short read length and reduced insert size made cor- rect assembling and positioning of repeats a very crucial and delicate issue. Even though some papers presented high quality assemblies based on NGS data (see [5,6]), de novo assembly, especially for large eukaryote gen- omes, is still a holy grail [7,8]. * Correspondence: [email protected] 1 Department of Mathematics and Computer Science, University of Udine, 33100 Udine, Italy Full list of author information is available at the end of the article Vicedomini et al. BMC Bioinformatics 2013, 14(Suppl 7):S6 http://www.biomedcentral.com/1471-2105/14/S7/S6 © 2013 Vicedomini et al.; licensee BioMed Central Ltd. This is an open access article distributed under the terms of the Creative Commons Attribution License (http://creativecommons.org/licenses/by/2.0), which permits unrestricted use, distribution, and reproduction in any medium, provided the original work is properly cited.
Transcript of GAM-NGS: genomic assemblies merger for next generation sequencing

RESEARCH Open Access
GAM-NGS: genomic assemblies merger for nextgeneration sequencingRiccardo Vicedomini1,2*, Francesco Vezzi3, Simone Scalabrin2, Lars Arvestad4,3, Alberto Policriti1,2
From Ninth Annual Meeting of the Italian Society of Bioinformatics (BITS)Catania, Sicily. 2-4 May 2012
Abstract
Background: In recent years more than 20 assemblers have been proposed to tackle the hard task of assemblingNGS data. A common heuristic when assembling a genome is to use several assemblers and then select the bestassembly according to some criteria. However, recent results clearly show that some assemblers lead to betterstatistics than others on specific regions but are outperformed on other regions or on different evaluationmeasures. To limit these problems we developed GAM-NGS (Genomic Assemblies Merger for Next GenerationSequencing), whose primary goal is to merge two or more assemblies in order to enhance contiguity andcorrectness of both. GAM-NGS does not rely on global alignment: regions of the two assemblies representing thesame genomic locus (called blocks) are identified through reads’ alignments and stored in a weighted graph.The merging phase is carried out with the help of this weighted graph that allows an optimal resolution of localproblematic regions.
Results: GAM-NGS has been tested on six different datasets and compared to other assembly reconciliation tools.The availability of a reference sequence for three of them allowed us to show how GAM-NGS is a tool able tooutput an improved reliable set of sequences. GAM-NGS is also a very efficient tool able to merge assembliesusing substantially less computational resources than comparable tools. In order to achieve such goals, GAM-NGSavoids global alignment between contigs, making its strategy unique among other assembly reconciliation tools.
Conclusions: The difficulty to obtain correct and reliable assemblies using a single assembler is forcing theintroduction of new algorithms able to enhance de novo assemblies. GAM-NGS is a tool able to merge two ormore assemblies in order to improve contiguity and correctness. It can be used on all NGS-based assemblyprojects and it shows its full potential with multi-library Illumina-based projects. With more than 20 availableassemblers it is hard to select the best tool. In this context we propose a tool that improves assemblies (and, as aby-product, perhaps even assemblers) by merging them and selecting the generating that is most likely to becorrect.
BackgroundThe advent of Next Generation Sequencing (NGS) tech-nologies made possible to sequence virtually all theorganisms of the biosphere [1]. NGS technologies arecharacterized by extremely high data production whichmakes it affordable to obtain high coverage of anyorganism.
The ability to produce high sequence coverage for lotsof genomes paved the way to a large number of de novoassembly projects [2,3]. Despite this, it is now commonlyaccepted that de novo assembly with short reads is moredifficult than de novo assembly with long Sanger reads[4]. Short read length and reduced insert size made cor-rect assembling and positioning of repeats a very crucialand delicate issue. Even though some papers presentedhigh quality assemblies based on NGS data (see [5,6]),de novo assembly, especially for large eukaryote gen-omes, is still a holy grail [7,8].
* Correspondence: [email protected] of Mathematics and Computer Science, University of Udine,33100 Udine, ItalyFull list of author information is available at the end of the article
Vicedomini et al. BMC Bioinformatics 2013, 14(Suppl 7):S6http://www.biomedcentral.com/1471-2105/14/S7/S6
© 2013 Vicedomini et al.; licensee BioMed Central Ltd. This is an open access article distributed under the terms of the CreativeCommons Attribution License (http://creativecommons.org/licenses/by/2.0), which permits unrestricted use, distribution, andreproduction in any medium, provided the original work is properly cited.
Recently, several evaluations have been presented, try-ing to rank assemblers’ performances on different data-sets: Assemblathon [9] and GAGE [10] are among themost important ones. As a byproduct, these “competi-tions” showed that it is extremely difficult to establishthe best assembler. Each dataset is characterized by dif-ferent peculiarities and the heuristics implemented by asingle assembler are usually only partially able to solvethe raised issues.An interesting strategy to improve de novo assemblies
has been proposed and goes under the name of assemblyreconciliation [11,12]. The goal of assembly reconciliationis to merge the assemblies produced by different toolswhile detecting possible mis-assemblies and isolating pro-blematic regions. Such a strategy has already been pro-posed for Sanger-based assemblies and one of the goals ofthis paper is to study its adaptation to NGS data.Zimin et al. in [11] presented Reconciliator, which is
based on an iteration of errors identification and correc-tion, and merging phases. Using the so called CE statistics[11] they identify regions likely to contain errors in theassemblies. After this, a global alignment between the twoassemblies is performed. In order to avoid problems withrepeats, alignment is performed using seeds unique inboth the reference and the query sequences. At this pointareas marked as problematic are solved using the assem-bler with better CE statistics and possible gaps in theassemblies are filled. The last step consists in the valida-tion of the merged assembly.Casagrande and colleagues in [12] proposed GAM
(GAM-NGS’s ancestor), a tool similar to Reconciliator,but able to avoid the global alignment step. In order toidentify similar sequences they searched for areasassembled by the same reads. Subsequently the notionof “block” is introduced to evaluate sensible local align-ments and a graph is built to describe global relation-ships between the two assemblies. When confrontedwith problematic regions (e.g., loops and bifurcations inthe graph), GAM uses one of the assemblies as guide.Both Reconciliator and GAM have advantages/disad-
vantages on one another (e.g., GAM does not need a glo-bal alignment while Reconciliator does, however GAMwas not able to detect and correct mis-assemblies).Nevertheless, both tools share the limitation that they aretailored for Sanger-based assemblers. As an example,they both need a layout file (usually an afg file) describingfor each read the (unique) position where it has beenused. In NGS assemblers, such a layout file is providedby a small minority of tools (e.g., Velvet, Ray andSUTTA). Moreover, another limit of both tools is thefact that the two input assemblies must have been pro-duced using the same set of reads.Recently, two new tools appeared, tackling the pro-
blem of assembly reconciliation using NGS-like datasets:
GAA [13] and ZORRO [14]. The former one performs aglobal alignment between two assemblies (using BLAT).The alignment is used to build the so called AccordanceGraph in order to merge the assemblies. In the mergingphase reads are used to solve possible inconsistent linksin order to output a correct assembly. The latter one,ZORRO [14], performs a first error correction phasedirectly on the original contigs and then a global align-ment using nucmer. The alignment is used to order con-tigs and deriving a consensus sequence. The maindrawback of both GAA and ZORRO is the mandatoryglobal alignment phase between the assemblies, which isnot only a computational expensive step, but, in pre-sence of ortholog and paralog sequences, it may producea large number of false links affecting merging perfor-mances. Morover, GAA focuses more on avoiding mis-assemblies’ introduction than correcting them, whileZORRO is explicitly designed for short genomes (as sizeincreases, merging is not feasible).Other tools that belong to the assembly reconciliation
family are MAIA [15], e-RGA [16], and the Velvet’sColumbus module. However, they focus more on enhan-cing de novo assembly results guided by a referencesequence belonging to closely related species, than onpure reconciling de novo assemblies.With this picture in mind we developed GAM-NGS
(Genomic Assemblies Merger for Next GenerationSequencing) whose primary goal is to merge two assem-blies in order to enhance contiguity and possibly correct-ness. GAM-NGS does not need global alignment betweencontigs, making it unique among assembly reconciliationtools. In this way not only a computationally expensiveand error prone alignment phase is avoided, but alsomuch more information is used (total read length isusually one or two order of magnitude higher than themere assembly’s length). Read alignments allow the identi-fication of regions reconstructed with the same reads, thusisolating natural candidates to represent the same genomiclocus. GAM-NGS merge-phase is guided by an AssembliesGraph (AG). AG is a weighted graph and this is anotherspecific feature of our tool. Weights indicate the likelihoodthat a link is part of a correct path. AG allows GAM-NGSto identify genomic regions in which assemblies contradicteach other (loops, bifurcations, etc.). In all these situationsweights are locally used to output the most reliablesequence, given the information in AG.GAM-NGS requires as input two assemblies and a
SAM-compatible alignment (e.g., obtained with BWA [17],ERNE [18]) for each input read library and each assembly.GAM-NGS can also work with assemblies obtained usingdifferent datasets, as long as the set of reads aligned on theassemblies is the same. It is important to note that, map-ping reads back to the assembly is practically a mandatoryphase for a large number of downstream analyses (e.g.,
Vicedomini et al. BMC Bioinformatics 2013, 14(Suppl 7):S6http://www.biomedcentral.com/1471-2105/14/S7/S6
Page 2 of 18
SNP calling, repeat analyses, etc.) and therefore representsno extra cost.We tested GAM-NGS on six datasets. We used three
GAGE datasets [10] in order to evaluate GAM-NGS andto compare it with other assembly reconciliators (i.e.,GAA and ZORRO). Moreover, in order to show GAM-NGS data and “biological” scalability, we tested it on threelarge plant datasets: a Prunus persica genome (227 Mbp,double haploid), a Populus nigra genome (423 Mbp, het-erozygous) and a Picea abies genome (20 Gbp, diploid andhighly repetitive). GAM-NGS turned out to be able to cor-rectly merge these assemblies, significantly improving theresults achievable using only one assembler. Statisticscomputed on GAM-NGS outputs show comparableresults with respect to other assembly reconciliation tools.Nevertheless, GAM-NGS is always the fastest and theleast computationally demanding tool, which makesGAM-NGS the best candidate for large datasets.
MethodsGAM-NGS’s main idea is to identify highly similar frag-ments between two assemblies, searching for regions shar-ing a large amount of mapped reads. The assumption isthat areas built using the same reads most likely representthe same genomic locus.The vast majority of NGS assemblers does not return a
layout file as output (i.e., a file, usually in afg format, listingalong the assembly the reads used and their positions). Inorder to overcome this limit, GAM-NGS approximatesthe layout file using reads aligned back to the assembly: ananalysis step almost mandatory in all de novo assemblyprojects. Such an approximation may turn out errorsprone: as an example, consider a genome containing(almost) perfectly duplicated regions. In such a case geno-mic read belonging to any two repeated sequences will berandomly assigned to one of the two copies. In order tokeep problems related with repeats, at least partially,under control, GAM-NGS uses only reads aligning to asingle position (a.k.a. uniquely aligned), discarding allreads that have two or more high scoring alignments (a.k.a. ambiguously aligned).As a matter of fact, since assemblers implement different
heuristics (if this was not the case, merging would be tri-vial), they may contradict each other by invertingsequences’ order or erroneously merging (e.g., scaffolding)sequences belonging to different genomic regions. Thus, itis compulsory to identify these situations and, possibly,solve them. To address this problem we used a graphstructure (dubbed Assemblies Graph or AG) recordingand weighting the most probable order relation amongregions, blocks, where the same reads are mapped.Once AG is built, GAM-NGS identifies “problematic”
regions, signalled by specific sub-graph structures. Suchlocal problems are solved by selecting the path in the
graph that maximizes a set of measurable and local fea-tures, suggesting the assembly’s correctness. Some ofthese features are borrowed from [19] and are computedusing pairing information coming from aligned paired-end and possibly mate-pair reads libraries. If there is notenough evidence to decide on assembly correctness (e.g.,weights are too close to each other), we chose to be asconservative as possible, electing one of the sequences asmaster, the other one, therefore, becoming the slave. Inthe following sections we will denote the master assemblyas M and the slave one as S.After this last phase, GAM-NGS visits the simplified
graph, merges contigs finding a consensus sequence andfinally outputs the improved assembly.
DefinitionsLet Σ be an alphabet and Σ* be the set of finite-lengthstrings from Σ. For every s Î Σ* we will denote by |s|the number of characters in s. In our context reads andcontigs are elements of Σ*, where Σ = {A, C, T, G, N}.With R = {r1, r2, ..., rn} we denote the set of readsaligned against both M and S, which are the master andslave assemblies, respectively. Usually R is the set, or asubset, of reads used to assemble both M and S and itselements may belong to different paired read and matepair libraries. However, alignments of reads belonging todifferent libraries should be provided into separate align-ment files, in order to exploit the information of differ-ent inserts’ sizes.Let r1, r2 be two reads aligned against the same contig
C (with C belonging to either M or S). For i Î {1, 2}, letbegin(ri) and end(ri) be the positions in C where the firstand last base of ri are aligned, respectively. Therefore,we can assume begin(ri) <end(ri), for i Î {1, 2}. We saythat r1 and r2 are adjacent if and only if begin(r2) ≤ end(r1)+1 and begin(r1) ≤ end(r2) + 1.Given a contig C belonging to assembly A, a frame over
A is defined as a sequence of reads r1, ..., rn mappedagainst A where ri, ri+1 are adjacent for i = 1, ..., n - 1.Thus, a frame F can be identified by the contig where itsreads are aligned and the interval [begin(F), end(F)],where begin(F) = min{begin(ri)|i = 1, ..., n} and end(F) =max{end(ri)|i = 1, ..., n}. Moreover, we define the lengthof a frame F as |F| = end(F) - begin(F) + 1.Given two different assemblies M and S, we define a
block B as a pair of frames (one over M and one over S)consisting of the same sequence of reads r1, ..., rn, andthe size of the block as the number of reads it is com-posed of. If the majority of the reads ri are aligned withopposite orientations on the two frames, we say that B isdiscordant. Otherwise, we say that B is concordant. Weare interested in finding blocks where the reads’ sequence(the frame) is as long as possible. Ideally, blocks shouldrepresent those fragments of the considered genome
Vicedomini et al. BMC Bioinformatics 2013, 14(Suppl 7):S6http://www.biomedcentral.com/1471-2105/14/S7/S6
Page 3 of 18

which have been built in accordance by both theassemblies.In the following we will first explain how blocks are built
from alignments and then we will show how blocks are fil-tered in order to avoid spurious blocks produced as conse-quence of the existence of similar genomic regions. Afterthis we will illustrate the Assembly Graph construction,the handling of the problematic regions identified on thegraph and, lastly, how the merging phase is carried out.
Blocks constructionThe first, and most computational demanding, step ofGAM-NGS’s outer algorithm is the identification and con-struction of blocks between assemblies M and S. The basicinput format are BAM files (i.e. file in the, by now, stan-dard alignment format). Alignments are assumed to beordered by their contig identifier and by the alignmentposition.The procedure starts by loading into a hash table H
all the reads uniquely mapped on M (memorizing onlythe strictly necessary data). Once H has been popu-lated, uniquely mapped reads on S are processed. Inparticular, for each read r, we perform the followingsteps:
• if r is not present in H , we will not use it forblocks construction;• if r is adjacent to a previously created block B (i.e.,adjacent to a read contained in both its frames),then B is extended using r;• otherwise, a new block, started by the single read r,is built.
Storing in main memory all the alignments of M andgoing through all the alignments of S may easily becomea major computational stumbling block. For this reasonwe carefully designed the data structures and the rela-tive manipulation algorithm. Each uniquely aligned readrequires only 21 bytes: 8 bytes for its identifier, 4 bytesfor contig’s identifier, starting and ending position, and1 byte for mapping orientation (reverse complementedor original strand). Moreover, we decided to store themin a memory efficient hash table such as Google’s Spar-seHash [20], which is characterized by a 2 bits overheadper entry.For each processed read r mapped on a contig C of an
assembly A, we define the scope of r as the set of blockswhose frame on C is adjacent to r. We exploit the fact thatinput alignments are ordered, during the blocks construc-tion phase: if a block B is “out of scope” for the currentprocessed read r then B will not be successively altered. Ifthe size of B is higher than a user predefined thresholdBmin then B is saved into secondary memory and mainmemory space is released. Otherwise, B is discarded. The
rationale behind the Bmin threshold is that blocks consist-ing of only few reads are likely to be a consequence ofalignment errors or chimeric sequences.
Blocks filteringA typical problem common to all assembly reconciliationtools, is that, especially with highly repetitive genomes, itmay happen to merge similar regions belonging to differ-ent genomic areas (such a problem is also commonamong de novo assemblers). In particular, GAM-NGS maybuild blocks between regions that attract the same readsonly because they are similar (note that perfect genomicrepeats are not a problem because in this case reads willbe ambiguously aligned). This situation not only compli-cates Assemblies Graph’s structure, but it also suggests thepresence of problematic regions (i.e., errors) in sequencesthat are, in fact, correct. To limit this problem, GAM-NGS runs two additional filtering steps before the graphconstruction: one based on depth-of-coverage analysis, andthe other one on block-length considerations.More specifically, considering a block B with frames
FM, FS, on M and S, respectively, GAM-NGS computesfor each frame two different types of coverages: a blockcoverage BC and a global coverage GC. For instance,considering the frame on the master assembly FM, letRFM be the set of all reads uniquely aligned on FM,while let be RBM the set of reads uniquely aligned on FMand used as part of block B. Clearly, RBM ⊆ RFM . More-over, we define the block coverage of FM as
BCFM =
∑r∈RBM
|r||FM| .
and the global coverage of FM as
GCFM =
∑r∈RFM
|r||FM| .
At this point, GAM-NGS keeps only blocks satisfyingthe following condition:
max{
BCFM
GCFM
,BCFS
GCFS
}≥ Tc,
where Tc is a user defined real number in the interval[0, 1]. The idea is to get rid of blocks built using a lowamount of reads compared to the number of mappedreads on both frame intervals (see Figure 1).We decided to use the maximum between the two
ratios in order to avoid the removal of blocks corre-sponding to heterozygous regions: it may happen thatone assembler returns both alleles while the otherreturns only one of them. In this case, the proportion ofreads used in the block should be close to 1 and 0.5,respectively.
Vicedomini et al. BMC Bioinformatics 2013, 14(Suppl 7):S6http://www.biomedcentral.com/1471-2105/14/S7/S6
Page 4 of 18

The second filtering step is based on the length ofblock’s frames. In particular, given a block B composedof frames FMi , FSj on contigs Mi Î M and Sj Î Srespectively, B is retained if
|FMi | ≥ min{0.3 · |Mi|, Tl} ∨ |FSj | ≥ min{0.3 · |Sj|, Tl},
where Tl is a user-defined threshold. Nevertheless,when this condition is not satisfied we still retain theblock if any of the following conditions is satisfied: thereare other blocks between Mi and Sj satisfying the condi-tion or this is the only block between the two contigs.The rationale is, again, to discard blocks that are likelyto be consequences of wrong alignments or chimericregions, while keeping small blocks that can still witnessinsertions or deletions by one of the two assemblies.
Assemblies graph constructionFor each assembly, we can define a block order relativeto an assembly exploiting frames’ order along its contigs.In particular, consider an assembly A and two blocks B1
and B2 with frames FA1 and FA
2 , respectively, both on A.We say that B1 comes before B2 with respect to A if andonly if both FA
1 and FA2 lie on the same contig CA and
FA1 comes before FA
2 (i.e., begin(FA1 ) <begin(F
A2 )) and
there is no frame FA3 lying over CA for which FA
1 comes
before FA3 and FA
3 comes before FA2 .
It is important to point out that this block orderstrictly depends on the considered assembly, since thesame genomic region may have been reconstructed onopposite strands in the input assemblies. Thus, theremay be cases where B1 comes before B2 with respect toM, but B2 comes before B1 with respect to S. In thisscenario, block orders of the two assemblies may contra-dict each other (leading to cycles in AG) even whenthere is no contradiction at all.Our goal is to determine a consistent order of blocks
among each contig of both the assemblies. To facilitatethat, we build a Contigs Graph (CG) which consists of a
vertex VMi for each contig Mi Î M and a vertex VSj foreach contig Sj Î S. Two vertices VU and VW are con-nected by an undirected edge if and only if U and Wbelong to different assemblies and have at least oneblock over them.For each edge e connecting two vertices VMi , VSj , we
assign the weight
we = max(
r+
r+ + r− ,r−
r+ + r−
),
where r+ and r- are the number of reads belonging toconcordant and discordant blocks between Mi and Sj,respectively. For each vertex V the weight wV is thencomputed, corresponding to the mean of its incidentedges’ weights (this mean is weighted on the overall sizeof all blocks connecting two contigs). The main idea isthat edges’ weights will have a value close to one whenthe majority of the reads composing the blocks aremapped either with the same orientation or with theopposite orientation. In the former case contigs willmost likely have the same orientation, while in the lattercase one of the two contigs must be complemented andreversed.In more detail, let Q be the set of processed vertices.
At first, for each connected component of CG, we insertinto Q a vertex V which maximizes wV and we set theoriginal blocks’ order for V’s contig. Then, we repeat thefollowing steps until all vertices of the graph belong toQ :
• Pick V ∈ Q with largest wV;• Let adj(V) be the set of the vertexes adjacent to V.For each vertex VU Î adj(V), we set the order ofblocks on U depending on whether the majority ofreads belongs to concordant or discordant blocksand according to blocks’ order of V’s contig;• adj(V)’s elements are added to Q and we removeV’s incident edges from the graph, updating vertices’weights.
Figure 1 Blocks construction and coverage filtering. Blocks are identified by regions belonging to M and S that share a relatively highamount of mapped reads. In this figure, blue reads identify clusters of adjacent reads that are uniquely mapped in the same contig of both theassemblies. Moreover, GAM-NGS discards blocks like B3 that contains a small amount of shared reads compared to the number of reads alignedin the same regions (e.g., in B3 these are less than 35% and this block may create a wrong link between contigs).
Vicedomini et al. BMC Bioinformatics 2013, 14(Suppl 7):S6http://www.biomedcentral.com/1471-2105/14/S7/S6
Page 5 of 18

The rationale behind this heuristic is that, at eachiteration, we set the order of the blocks over one of thecontigs for which we have the clearest evidence. How-ever, this is a simple (yet effective) procedure to com-pute a consistent blocks’ order among the assembliesand we plan to improve it in order to have a higherguarantee of avoiding the introduction of “false contra-dictions” (i.e., cycles) in AG.With the updated blocks order we are now able to
build the Assemblies Graph (AG): a node VB is addedfor each block B, while edges connect blocks that shareat least one frame on the same contig. In particular, if ablock B1 comes before a block B2 with respect to M orS we put a directed edge from VB1 to VB2 (see Figure2). Notice that, since we are considering the merging oftwo assemblies, each node cannot have an input or out-put degree strictly greater than two.Moreover, during AG construction, we add to each
edge a weight characterized by a series of features thatare evaluated within the region relative to the blocksrelated to the vertices connected by the edge.Let VB1 , VB2 be two nodes linked by an edge (i.e., B1
comes before B2 on a contig C of either one of M and S).Let F1 and F2 be, respectively, their frames on C. Then, wecompute the number of reads that have a correctly placedpair (or mate) that spans the gap between F1 and F2 andthe number of reads that are expected to have their pair(or mate) correctly placed and crossing over F1 and F2which is unmapped or mapped to a different sequence. Inparticular, a read r’, mapped on a contig C, has a correctlyplaced pair (or mate) r“ if begin(r“) is inside the region[begin(r’) + (m - 3 · sd), begin(r’) + (m + 3 · sd)] and |C| ≥begin(r’) + (m + 3 · sd), where m and sd are the mean andthe standard deviation of the insert size of the library,respectively. Furthermore, we also compute values such ascoverage and number of wrongly oriented pairs (or
mates). These weights are used to determine the likelihoodthat a link represents a correct path allowing us to takemotivated decisions in case of problematic regions wit-nessed by non-linear graphs (i.e., bubbles, bifurcations,etc.).Every path in AG corresponds to a sequence of blocks
such that every pair of consecutive blocks lies on the sameassembled sequence for at least one assembly. Thus, wecan exploit AG to integrate or extend contigs.Also, it is important to notice that if we consider AG
disregarding edges’ orientation, more than a single con-nected component can be present. We exploited this factimplementing GAM-NGS in a way that it can correct andmerge contigs handling single connected components inparallel.
Handling problematic regionsEven if we build AG using the previously describedmethod, block orders suggested by assemblies may con-tradict each other. For instance, suppose two blocks lieon a single contig in both the assemblies with oppositeorder with respect to M and S. This scenario will leadto a cycle in AG. Moreover, strongly connected compo-nents (SCC) containing at least two nodes denote asituation where M and S disagree on the order of someblocks. To find these kind of contradictions we usedTarjan’s algorithm [21] to determine SCC in linear timewhile visiting AG.Another possible problem is represented by divergent
paths that may indicate situations where assemblieslocally behaved differently: one assembler extended asequence in a different way with respect to the other. Inparticular, we can exploit edges’ weights to performchoices that are locally optimal (e.g., in the presence of abifurcation the path minimizing the evidence of mis-assemblies will be chosen) in order to output a correct
Figure 2 Assemblies Graph construction. A simple example of AG construction: B1 comes before B2 in both S1 and M1 so a directed edge
connects VB1 and VB2 . The same also applies for VB2 and VB3 , since B2 comes before B3 in S1. Moreover, an edge is added between VB3
and VB4 as B3 comes before B4 in M2.
Vicedomini et al. BMC Bioinformatics 2013, 14(Suppl 7):S6http://www.biomedcentral.com/1471-2105/14/S7/S6
Page 6 of 18

sequence. In situations where weights/features do notallow us to take a position (e.g. similar weights), wedecided to be as conservative as possible, trusting onlycontigs belonging to the master assembly.Among the various graph structures generated by dis-
cordant assemblies, bubbles and forks are the most com-mon ones (see Figures 3 and Figure 4). Bubbles consistof a path that first diverges and then converges back.Forks, instead, contain only divergent or convergentpaths. We can spot and distinguish these two structureswith a simple depth-first traversal of AG. Such struc-tures can nest in highly complex scenarios and, at thisstage, we decided to deal only with graphs for which wehave a good guarantee that they will be handled cor-rectly. In particular, we took care only of cycles invol-ving exactly two nodes and bifurcations not involvingany bubble.Handling cycles involving exactly two nodesCycles involving only two nodes may indicate inversionsalong the same contig in both M and S. To solve thisparticular kind of loop we can exploit mate-pair andpair-end reads’ orientation. In [19] it has been shownhow the use of mate-pair-happiness [22] is one of thebest methodologies to detect mis-assemblies.If the graph is indeed the result of two inverted blocks
in one of the two assemblies, contigs pairs will bemapped with the correct orientation in only one of thetwo (see Figure 3). Hence, if we are able to find a mini-mum number of reads that are aligned properly in onecontig and with the wrong orientation in the other one,we can include the correct sequence in the improvedassembly. Otherwise, we chose to directly output thesequence of the master assembly.
Handling bifurcationsGraphs containing bifurcations may signify biologicalrepeats or mis-assemblies. We will only show how we han-dle nodes with output degree equal to two, since nodeswith input degree equal to two can be treated symmetri-cally. Let B be a block such that VB has two outgoingedges to VBM and VBS . Let Mi Î M be the contig sharedbetween B and BM, and Sj Î S be the contig between Band BS. In order to solve this scenario we focus on wherereads placed on frames defined by B have their respectivepaired read (or mate): do they end up in BM or BS? SeeFigure 4 for an illustration of this case. Let nM and nScount the number of mates mapped to BM’s and BS’sframe, respectively. Given a read library with mean insertsize m and standard deviation s, we define uM (respectivelyuS) as the number of reads mapped on the frame definedby B such that their pair/mate, accordingly to libraryorientation, is not aligned within a region of length m + 3 ·s (i.e., insert size spanning) in BM’s frame on Mi (respec-tively, in BS’s frame on Sj). If Mi (or Sj) is so short that it isincluded within the insert size spanning of a read place-ment, then that read is not used to compute uM (or uS).For instance, if we find that
nM
uM≥ TU ∧ nS
uS≤ TL,
where TU >TL are two threshold values in [0, 1], wemay be able to spot a mis-assembly in Sj. Conversely, ifwe find that
nS
uS≥ TU ∧ nM
uM≤ TL,
Figure 3 Handling 2-node cycles in Assemblies Graph. A 2-node cycle in AG witness a putative inversion along a single contig in M and S. Ifthere actually is an inversion, then mate-pair reads are aligned with the wrong orientation in one of the two contigs. We can use thisinformation to provide in output a correct sequence (the blue one in the picture).
Vicedomini et al. BMC Bioinformatics 2013, 14(Suppl 7):S6http://www.biomedcentral.com/1471-2105/14/S7/S6
Page 7 of 18

we may be able to spot a mis-assembly in Mi, as inFigure 4(b). If we are not in any of the two previoussituations, it might mean that either blocks are too dis-tant to let us discover the mis-assembly or B has beenbuilt due to a repetitive sequence. In this case, to avoidthe introduction of errors in the improved assembly, wedo not risk resolving the bifurcation and instead simplyoutput the master’s contigs.
MergingAfter solving problematic regions in AG, we can visit max-imal disjoint paths in order to produce a draft alignmentof contigs belonging to different assemblies. Such align-ment is based on reads mapping and might be inaccurate(e.g., regions having low identity). Therefore, we perform asemi-global alignment algorithm [23] (a banded variant tosave memory) to make sure that contigs have a high simi-larity (i.e., at least an identity of 95%) and should bemerged.We decided not to return a consensus, since there is
no guarantee that it would be better than the two origi-nal sequences. Therefore, we decided to output thesequence belonging to the assembly that locally showsthe best CE statistics [11] for insert sizes.We also tried to avoid the introduction of duplicated
regions, closing a gap between two contigs of M linked bya contig of S if and only if semi-global alignments on bothends of the region do not drop below 95% identity (seeFigure 5).After this phase, we obtain a set of merged contigs
that we called paired contigs. To obtain the finalimproved assembly we simply output this set along withcontigs of M that were not involved in any merge.
Results and discussionValidation of GAM-NGS’s output has been performedon public data, for which results obtained by variousassemblers are public as well. In particular, we chosethree real datasets (i.e., Staphylococcus aureus,
Rhodobacter sphaeroides and human chromosome 14)downloaded from GAGE [10] website [24] (see Table 1)for which a reference genome is available. Moreover, wechose to test GAM-NGS on larger datasets such as Pru-nus persica, Populus nigra and Picea abies, in order toshow our tool’s scalability.It is also important to point out that datasets provided
by GAGE represent a useful instrument to evaluateGAM-NGS for a number of different reasons. First,GAGE provides state of the art datasets formed by sev-eral paired end and mate pairs libraries. Second, it pro-vides highly reliable reference assemblies suitable forbenchmarking. Third, a suite of reusable scripts is avail-able for computing assembly metrics.Reads available for each public dataset were error-cor-
rected using both Quake and the Allpaths-LG error cor-rector. We chose to use the Allpaths-LG error-correctedreads.Since GAM-NGS (as well as GAA) follows a master/
slave approach and many assemblies are available foreach GAGE datasets, we had to decide which assembliesshould be merged and which should be elected asmaster.Evaluating de novo assemblies in absence of a reference
sequence is as difficult as de novo assembly itself. As anexample, consider that Assemblathon 2 [25] requiredmore than a year to evaluate submitted assemblies.GAGE datasets gave us the possibility to choose the twobest assemblies accordingly to GAGE evaluation, how-ever we decided to be as realistic as possible and to avoidthe use of the available reference sequence. To the bestof our knowledge, the only methodology available toevaluate assemblies in absence either of a referencesequence or of external-validation-data (e.g., fosmid ends,physical maps, etc.) is based on Feature Response Curve-analysis (FRCurve-analysis) [19]. Recently, a novel tooldubbed FRCbam [26], designed for computing a FRCurvefrom NGS-datasets, has been presented. Results summar-ized in [26] show that FRCbam is able to effectively detect
Figure 4 Handling bifurcations in Assemblies Graph. Bifurcations in AG, may spot biological repeats or mis-assemblies. In panel (a), paired reads donot solve the bifurcation and we might face a biological repeat. In panel (b), paired reads on M1 might help us to spot a mis-join in the assembly.
Vicedomini et al. BMC Bioinformatics 2013, 14(Suppl 7):S6http://www.biomedcentral.com/1471-2105/14/S7/S6
Page 8 of 18

mis-assemblies. FRCbam enabled us to evaluate a de novoassembly using only an alignment file (given in SAM/BAM format) of a set of reads (usually the same readsused in the assembly), which is also the same inputrequired by GAM-NGS.For each GAGE dataset we plotted the FRCurve [19]
using FRCbam . Then we chose to merge the two assem-blies having the steepest curves (i.e., few negative featuresin the longest contigs) and whole length close to the gen-ome size. As expected by the results shown in [26], wewere always able to choose assemblies that, using GAGE’sevaluation scripts, were characterized by good statisticssuch as number of errors and corrected NG50 (i.e., NG50of the assemblies broken in correspondence of each mis-assembly). All experiments were performed using bothcombinations of master/slave assemblies. We also decidedto follow a common “bad practice” electing as best assem-blies those characterized by the longest NG50 (withoutany consideration on the number of errors) and runGAM, GAA and ZORRO to merge them.As far as the three larger datasets were concerned, we
merged assemblies obtained with CLC [27] and ABySS[28] for Prunus persica and Populus nigra, while we usedGAM-NGS with a whole genome shotgun assembly and aseries of fosmid-pools assemblies (all assembled with CLCassembler) for Picea abies that, to the best of our knowl-edge, represents the largest ever sequenced genome.GAM-NGS’s performance rely on the choice of several
parameters: the minimum number of reads per block
Bmin, the threshold Tc related to blocks’ coverage filter-ing, the minimum block’s length threshold Tl.Low values of Bmin increase the number of blocks
which leads to a larger memory requirement and to apotentially more complex Assemblies Graph. Moreover,high values of Tc or Tl allow us to filter more blocks,running the risk of discarding significant blocks, whilewith low values we might keep blocks due to repeatsthat will complicate AG’s structure. We decided to setBmin = 10, Tc = 0.75 and Tl = 200 bp for all experimentson bacteria. Instead, for human chr14, we set Bmin = 50,Tc = 0.75 and Tl = 500 bp.To evaluate correctness, we computed statistics using
the same analysis script used in [10] and available fordownloading at [24]. In particular, N50 sizes were com-puted based on the known size of the genome (NG50)and only contigs longer than 200 bp were used for thecomputations. As a consequence of the absence of areference sequence in the case of the three new plantsgenomes we simply returned statistics showing theimprovements in contiguity.All experiments were performed on a 16 CPU
machine with 128 GB of RAM, with the only exceptionof Picea abies where we used a machine equipped with32 CPUs and 2 TB of RAM. A brief description of thecommands we used to carry out the merging on all thedatasets can be found as supplementary material (seeAdditional file 1). GAM-NGS was always executed tak-ing advantage of all available CPUs. GAA and ZORRO
Table 1 Reference genomes and libraries for public datasets (Allpaths-LG corrected)
Organism Genome length (bp) Library Avg Read length (bp) Insert size (bp) Coverage
S. aureus 2,903,081 Fragment 101 180 29X
Short jump 96 3500 32X
R. sphaeroides 4,603,060 Fragment 101 180 31X
Short jump 101 3500 29X
Human chr14 88,289,540 Fragment 101 180 39X
Short jump 96 3000 12X
Long jump 96 35000 0.2X
Figure 5 GAM-NGS’s merging phase. During the merging phase, we fill the gaps between contigs in M and we extend a contig of M only ifthe corresponding sequence in S is longer and semi-global alignments at any end do not drop below 95% identity. Moreover, for regionsdefined by a block, we output the frame with better CE statistics.
Vicedomini et al. BMC Bioinformatics 2013, 14(Suppl 7):S6http://www.biomedcentral.com/1471-2105/14/S7/S6
Page 9 of 18
are designed as single-core programs. For this reason,we reported both CPU and wall clock times for eachexperiment. Moreover, GAA’s internal call to BLAT isspecified with the parameter -fastMap which requiresinput sequences to have contigs shorter than 5 Kbp.Thus, in each experiment, we had to manually runBLAT, providing its output to GAA’s call. As we willshow later, GAM-NGS was the fastest tool on the lar-gest GAGE dataset (human chromosome 14).Time of alignment was added to GAM-NGS’ time but
we would like to emphasize that read alignment is oftenrequired in downstream analyses and is also needed whenFRCbam [26] is used to evaluate assemblies’ correctness.
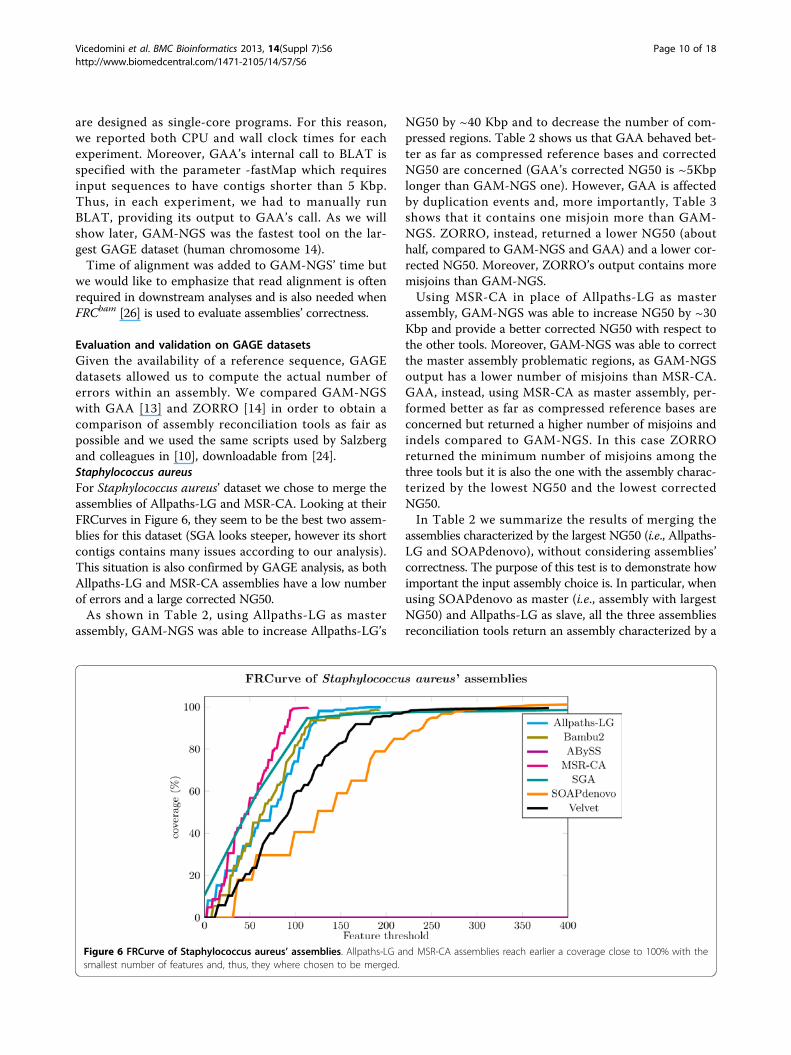
Evaluation and validation on GAGE datasetsGiven the availability of a reference sequence, GAGEdatasets allowed us to compute the actual number oferrors within an assembly. We compared GAM-NGSwith GAA [13] and ZORRO [14] in order to obtain acomparison of assembly reconciliation tools as fair aspossible and we used the same scripts used by Salzbergand colleagues in [10], downloadable from [24].Staphylococcus aureusFor Staphylococcus aureus’ dataset we chose to merge theassemblies of Allpaths-LG and MSR-CA. Looking at theirFRCurves in Figure 6, they seem to be the best two assem-blies for this dataset (SGA looks steeper, however its shortcontigs contains many issues according to our analysis).This situation is also confirmed by GAGE analysis, as bothAllpaths-LG and MSR-CA assemblies have a low numberof errors and a large corrected NG50.As shown in Table 2, using Allpaths-LG as master
assembly, GAM-NGS was able to increase Allpaths-LG’s
NG50 by ~40 Kbp and to decrease the number of com-pressed regions. Table 2 shows us that GAA behaved bet-ter as far as compressed reference bases and correctedNG50 are concerned (GAA’s corrected NG50 is ~5Kbplonger than GAM-NGS one). However, GAA is affectedby duplication events and, more importantly, Table 3shows that it contains one misjoin more than GAM-NGS. ZORRO, instead, returned a lower NG50 (abouthalf, compared to GAM-NGS and GAA) and a lower cor-rected NG50. Moreover, ZORRO’s output contains moremisjoins than GAM-NGS.Using MSR-CA in place of Allpaths-LG as master
assembly, GAM-NGS was able to increase NG50 by ~30Kbp and provide a better corrected NG50 with respect tothe other tools. Moreover, GAM-NGS was able to correctthe master assembly problematic regions, as GAM-NGSoutput has a lower number of misjoins than MSR-CA.GAA, instead, using MSR-CA as master assembly, per-formed better as far as compressed reference bases areconcerned but returned a higher number of misjoins andindels compared to GAM-NGS. In this case ZORROreturned the minimum number of misjoins among thethree tools but it is also the one with the assembly charac-terized by the lowest NG50 and the lowest correctedNG50.In Table 2 we summarize the results of merging the
assemblies characterized by the largest NG50 (i.e., Allpaths-LG and SOAPdenovo), without considering assemblies’correctness. The purpose of this test is to demonstrate howimportant the input assembly choice is. In particular, whenusing SOAPdenovo as master (i.e., assembly with largestNG50) and Allpaths-LG as slave, all the three assembliesreconciliation tools return an assembly characterized by a
Figure 6 FRCurve of Staphylococcus aureus’ assemblies. Allpaths-LG and MSR-CA assemblies reach earlier a coverage close to 100% with thesmallest number of features and, thus, they where chosen to be merged.
Vicedomini et al. BMC Bioinformatics 2013, 14(Suppl 7):S6http://www.biomedcentral.com/1471-2105/14/S7/S6
Page 10 of 18
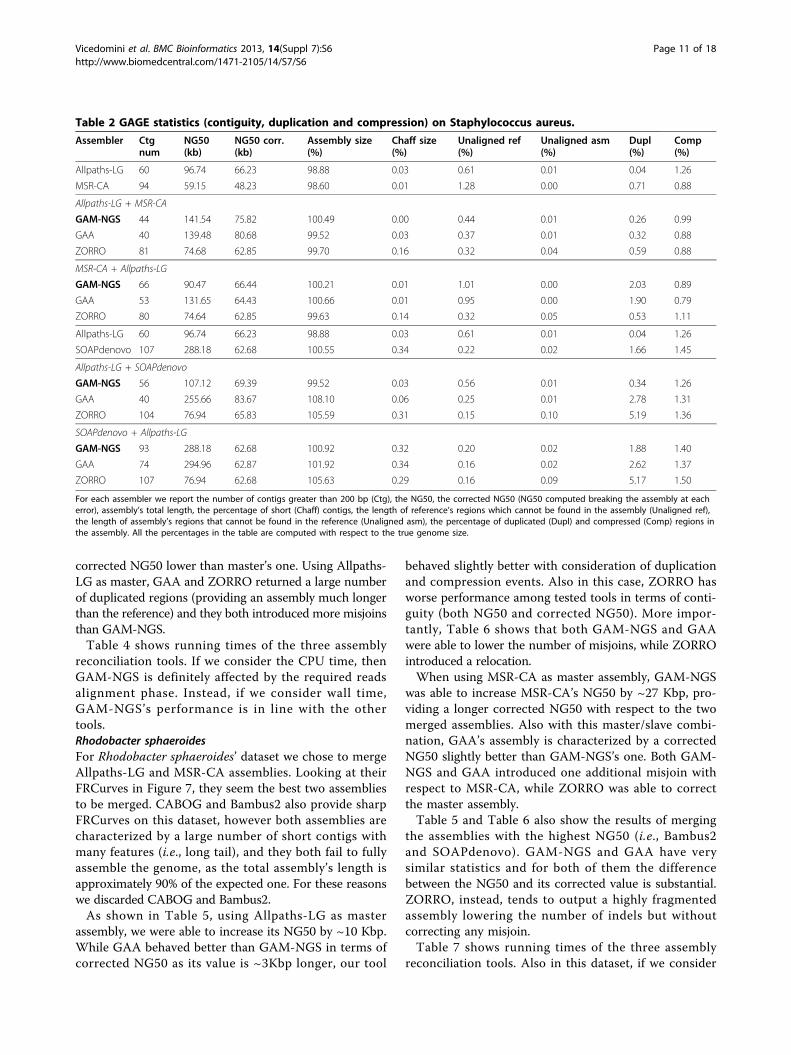
corrected NG50 lower than master’s one. Using Allpaths-LG as master, GAA and ZORRO returned a large numberof duplicated regions (providing an assembly much longerthan the reference) and they both introduced more misjoinsthan GAM-NGS.Table 4 shows running times of the three assembly
reconciliation tools. If we consider the CPU time, thenGAM-NGS is definitely affected by the required readsalignment phase. Instead, if we consider wall time,GAM-NGS ’s performance is in line with the othertools.Rhodobacter sphaeroidesFor Rhodobacter sphaeroides’ dataset we chose to mergeAllpaths-LG and MSR-CA assemblies. Looking at theirFRCurves in Figure 7, they seem the best two assembliesto be merged. CABOG and Bambus2 also provide sharpFRCurves on this dataset, however both assemblies arecharacterized by a large number of short contigs withmany features (i.e., long tail), and they both fail to fullyassemble the genome, as the total assembly’s length isapproximately 90% of the expected one. For these reasonswe discarded CABOG and Bambus2.As shown in Table 5, using Allpaths-LG as master
assembly, we were able to increase its NG50 by ~10 Kbp.While GAA behaved better than GAM-NGS in terms ofcorrected NG50 as its value is ~3Kbp longer, our tool
behaved slightly better with consideration of duplicationand compression events. Also in this case, ZORRO hasworse performance among tested tools in terms of conti-guity (both NG50 and corrected NG50). More impor-tantly, Table 6 shows that both GAM-NGS and GAAwere able to lower the number of misjoins, while ZORROintroduced a relocation.When using MSR-CA as master assembly, GAM-NGS
was able to increase MSR-CA’s NG50 by ~27 Kbp, pro-viding a longer corrected NG50 with respect to the twomerged assemblies. Also with this master/slave combi-nation, GAA’s assembly is characterized by a correctedNG50 slightly better than GAM-NGS’s one. Both GAM-NGS and GAA introduced one additional misjoin withrespect to MSR-CA, while ZORRO was able to correctthe master assembly.Table 5 and Table 6 also show the results of merging
the assemblies with the highest NG50 (i.e., Bambus2and SOAPdenovo). GAM-NGS and GAA have verysimilar statistics and for both of them the differencebetween the NG50 and its corrected value is substantial.ZORRO, instead, tends to output a highly fragmentedassembly lowering the number of indels but withoutcorrecting any misjoin.Table 7 shows running times of the three assembly
reconciliation tools. Also in this dataset, if we consider
Table 2 GAGE statistics (contiguity, duplication and compression) on Staphylococcus aureus.
Assembler Ctgnum
NG50(kb)
NG50 corr.(kb)
Assembly size(%)
Chaff size(%)
Unaligned ref(%)
Unaligned asm(%)
Dupl(%)
Comp(%)
Allpaths-LG 60 96.74 66.23 98.88 0.03 0.61 0.01 0.04 1.26
MSR-CA 94 59.15 48.23 98.60 0.01 1.28 0.00 0.71 0.88
Allpaths-LG + MSR-CA
GAM-NGS 44 141.54 75.82 100.49 0.00 0.44 0.01 0.26 0.99
GAA 40 139.48 80.68 99.52 0.03 0.37 0.01 0.32 0.88
ZORRO 81 74.68 62.85 99.70 0.16 0.32 0.04 0.59 0.88
MSR-CA + Allpaths-LG
GAM-NGS 66 90.47 66.44 100.21 0.01 1.01 0.00 2.03 0.89
GAA 53 131.65 64.43 100.66 0.01 0.95 0.00 1.90 0.79
ZORRO 80 74.64 62.85 99.63 0.14 0.32 0.05 0.53 1.11
Allpaths-LG 60 96.74 66.23 98.88 0.03 0.61 0.01 0.04 1.26
SOAPdenovo 107 288.18 62.68 100.55 0.34 0.22 0.02 1.66 1.45
Allpaths-LG + SOAPdenovo
GAM-NGS 56 107.12 69.39 99.52 0.03 0.56 0.01 0.34 1.26
GAA 40 255.66 83.67 108.10 0.06 0.25 0.01 2.78 1.31
ZORRO 104 76.94 65.83 105.59 0.31 0.15 0.10 5.19 1.36
SOAPdenovo + Allpaths-LG
GAM-NGS 93 288.18 62.68 100.92 0.32 0.20 0.02 1.88 1.40
GAA 74 294.96 62.87 101.92 0.34 0.16 0.02 2.62 1.37
ZORRO 107 76.94 62.68 105.63 0.29 0.16 0.09 5.17 1.50
For each assembler we report the number of contigs greater than 200 bp (Ctg), the NG50, the corrected NG50 (NG50 computed breaking the assembly at eacherror), assembly’s total length, the percentage of short (Chaff) contigs, the length of reference’s regions which cannot be found in the assembly (Unaligned ref),the length of assembly’s regions that cannot be found in the reference (Unaligned asm), the percentage of duplicated (Dupl) and compressed (Comp) regions inthe assembly. All the percentages in the table are computed with respect to the true genome size.
Vicedomini et al. BMC Bioinformatics 2013, 14(Suppl 7):S6http://www.biomedcentral.com/1471-2105/14/S7/S6
Page 11 of 18

the CPU time, then GAM-NGS is definitely affected bythe required reads alignment phase and requires muchmore time than GAA and ZORRO. If we consider walltime, instead, GAM-NGS runs in less than 8 minutes,comparable, if not better, than the other tools.Human chromosome 14These first two bacteria datasets are small and time mightnot be considered an issue (each assembly reconciliationtool was able to run in reasonable time). The third GAGEdataset on which we tested our tool was the human chro-mosome 14 (characterized by an ungapped 88 Mbp size).This dataset is not only ~20 times larger than the othertwo, but it is also more complex (e.g., containing repeats,afflicted by heterozygosity). Moreover, in this scenarioGAM-NGS starts to show its real potential: assemblinglarge datasets using a relatively low amount of resources,while preserving correctness.ZORRO output is not shown in Table 8 as, after two
weeks of computation, it was not able to provide an out-put. Thus, we limit our evaluation to only GAM-NGS andGAA.For this dataset we chose to merge Allpaths-LG and
CABOG assemblies. Looking at their FRCurves in Figure 8,they are clearly the best two assemblies to be merged.GAGE’s statistics also show that Allpaths-LG and CABOGassemblers produce the best two assemblies for this dataset(i.e., highest NG50 and low number of misjoins).Table 9 shows how, using Allpaths-LG as master assem-
bly, GAM-NGS was able to increase NG50 by ~ 32 Kbpand the corrected NG50 by ~ 6 Kbp. GAA returned betterNG50 values but it produced more duplicated regions andit was afflicted by a larger amount of misjoins and indelscompared to GAM-NGS.We also want to point out that the corrected NG50 is
certainly an important statistic to evaluate the improve-ment of a merge with respect to the master assemblybut it only indicates whether the longest contigs areaffected by errors and does not tell how the assemblerbehaves on short contigs (which are also important toassess assemblies’ quality, as FRCurve demonstrates).We finally plot the FRCurve to globally estimate thequality of the merged assemblies. Figure 9 shows thatGAM-NGS globally behaved better and, in particular,seems to introduce less features (especially in the short-est contigs of the assembly).Table 10 shows running times of the two assembly
reconciliation tools used with this dataset. GAM-NGSrequired about 1 hour to accomplish its task (reads’ align-ments included), while GAA required about 13 hours(manually running multiple BLAT alignments in parallel).This characteristic may not be very important for
short genomes but, as the size increases, it becomes ofcrucial importance. As we will show in the tests onsome large plant genomes, GAM-NGS is able to merge
Table 3 GAGE statistics (SNPs, indels and misjoins) onStaphylococcus aureus.
Assembler SNPs Indels < 5bp
Indels ≥ 5bp
Misjoins Inv Reloc
Allpaths-LG 79 4 12 4 0 4
MSR-CA 191 23 10 13 6 7
Allpaths-LG + MSR-CA
GAM-NGS 137 9 15 5 0 5
GAA 145 8 16 6 0 6
ZORRO 133 12 8 6 2 4
MSR-CA + Allpaths-LG
GAM-NGS 214 19 10 9 2 7
GAA 206 22 15 11 2 9
ZORRO 262 24 9 7 4 3
Allpaths-LG 79 4 12 4 0 4
SOAPdenovo 247 25 31 15 1 14
Allpaths-LG + SOAPdenovo
GAM-NGS 88 5 14 4 0 4
GAA 100 9 19 10 1 9
ZORRO 227 19 12 6 1 5
SOAPdenovo+ Allpaths-LG
GAM-NGS 304 27 29 15 1 14
GAA 314 32 30 12 1 11
ZORRO 299 28 11 13 2 11
For each assembly we show the number of SNPs, the number of indelsshorter than 5 bp and greater (or equal) than 5 bp. The number of misjoins iscomputed as the sum of inversions (parts of contigs reversed with respect tothe reference genome) and relocations (rearrangements moving a contigwithin/between chromosomes).
Table 4 Assembly reconciliation tools performances onStaphylococcus aureus.
Tool User (CPU) time Wall clock time
Allpaths-LG + MSR-CA
GAM-NGS 1h 10’ 19” + 51” 4’ 10” + 17”
GAA 1’ 20” 1’ 20”
ZORRO 3’ 04” 3’ 04”
MSR-CA + Allpaths-LG
GAM-NGS 1h 10’ 19” + 49” 4’ 10” + 17”
GAA 1’ 11” 1’ 11”
ZORRO 14’ 18” 14’ 18”
Allpaths-LG + SOAPdenovo
GAM-NGS 1h 10’ 53” + 33” 5’ 12” + 24”
GAA 5’ 04” 5’ 04”
ZORRO 7’ 08” 7’ 08”
SOAPdenovo + Allpaths-LG
GAM-NGS 1h 10’ 53” + 34” 5’ 12” + 25”
GAA 4’ 49” 4’ 49”
ZORRO 9’ 52” 9’ 52”
In GAM-NGS’s entries the first value indicates the time spent in alignmentphase, while the second one is GAM-NGS’s run time.
Vicedomini et al. BMC Bioinformatics 2013, 14(Suppl 7):S6http://www.biomedcentral.com/1471-2105/14/S7/S6
Page 12 of 18

even 20 Gbp assemblies using a relatively low amount ofmemory and time.
GAM-NGS’s performances on large datasetsOn small datasets, all the assembly reconciliation toolsprovide an output in reasonable time. However, when we
consider the human chromosome 14 we observe howGAA runs at least 10 times slower than GAM-NGS (if weconsider also the mandatory reads’ alignment step) whileZORRO, after two weeks, is not even able to provide us apartial output. This proves that the major bottleneck con-sists in the global alignment phase of these tools.
Figure 7 FRCurve of Rhodobacter sphaeroides’ assemblies. Allpaths-LG and MSR-CA assemblies reach earlier a coverage close to 100% withthe smallest number of features and, thus, they where chosen to be merged. CABOG’s assembly seems better but provides a low coverage ofthe genome and, for this reason, it was not taken into account.
Table 5 GAGE statistics (contiguity, duplication and compression) on Rhodobacter sphaeroides.
Assembler Ctgnum
NG50(kb)
NG50 corr.(kb)
Assembly size(%)
Chaff size(%)
Unaligned ref(%)
Unaligned asm(%)
Dupl(%)
Comp(%)
Allpaths-LG 204 42.45 34.42 99.68 0.01 0.45 0.01 0.38 0.31
MSR-CA 395 22.12 19.08 97.02 0.01 3.47 0.04 1.05 0.53
Allpaths-LG + MSR-CA
GAM-NGS 168 51.12 37.88 99.97 0.00 0.28 0.01 0.61 0.31
GAA 164 53.82 40.55 100.07 0.01 0.20 0.01 0.63 0.32
ZORRO 216 38.87 30.64 100.41 0.03 0.36 0.02 0.43 0.48
MSR-CA + Allpaths-LG
GAM-NGS 199 49.61 37.88 97.95 0.01 3.10 0.04 1.58 0.61
GAA 177 54.71 40.55 99.74 0.01 1.61 0.04 1.08 0.35
ZORRO 206 44.61 38.79 101.14 0.09 0.21 0.06 1.64 0.25
Bambus2 177 93.19 12.78 94.97 0.00 4.92 0.01 0.00 0.24
SOAPdenovo 202 131.68 14.34 100.29 0.44 0.76 0.01 1.30 0.46
Bambus2 + SOAPdenovo
GAM-NGS 83 149.75 14.16 98.32 0.00 3.02 0.00 1.59 0.63
GAA 100 194.16 14.74 98.35 0.13 2.28 0.01 0.63 0.58
ZORRO 711 16.56 13.18 100.48 0.89 0.66 0.25 1.05 0.59
SOAPdenovo + Bambus2
GAM-NGS 177 154.47 15.17 100.41 0.42 0.82 0.01 1.67 0.48
GAA 174 188.18 14.54 100.35 0.44 0.76 0.01 1.38 0.48
ZORRO 720 16.56 12.78 100.48 0.84 0.69 0.24 1.14 0.56
For each assembler we report the number of contigs greater than 200 bp (Ctg), the NG50, the corrected NG50 (NG50 computed breaking the assembly at eacherror), assembly’s total length, the percentage of short (Chaff) contigs, the length of reference’s regions which cannot be found in the assembly (Unaligned ref),the length of assembly’s regions that cannot be found in the reference (Unaligned asm), the percentage of duplicated (Dupl) and compressed (Comp) regions inthe assembly. All the percentages in the table are computed with respect to the true genome size.
Vicedomini et al. BMC Bioinformatics 2013, 14(Suppl 7):S6http://www.biomedcentral.com/1471-2105/14/S7/S6
Page 13 of 18

On the contrary, GAM-NGS’s approximation (usingread’s alignment back to the assemblies) coupled with theimplementation of a weighted graph, achieves similarresults in a reasonable amount of time. In order to showGAM-NGS’s scalability, we tested it on three large plantsgenomes whose sizes vary from 227 Mbp to 20 Gbp.The first of these datasets is Prunus persica, character-
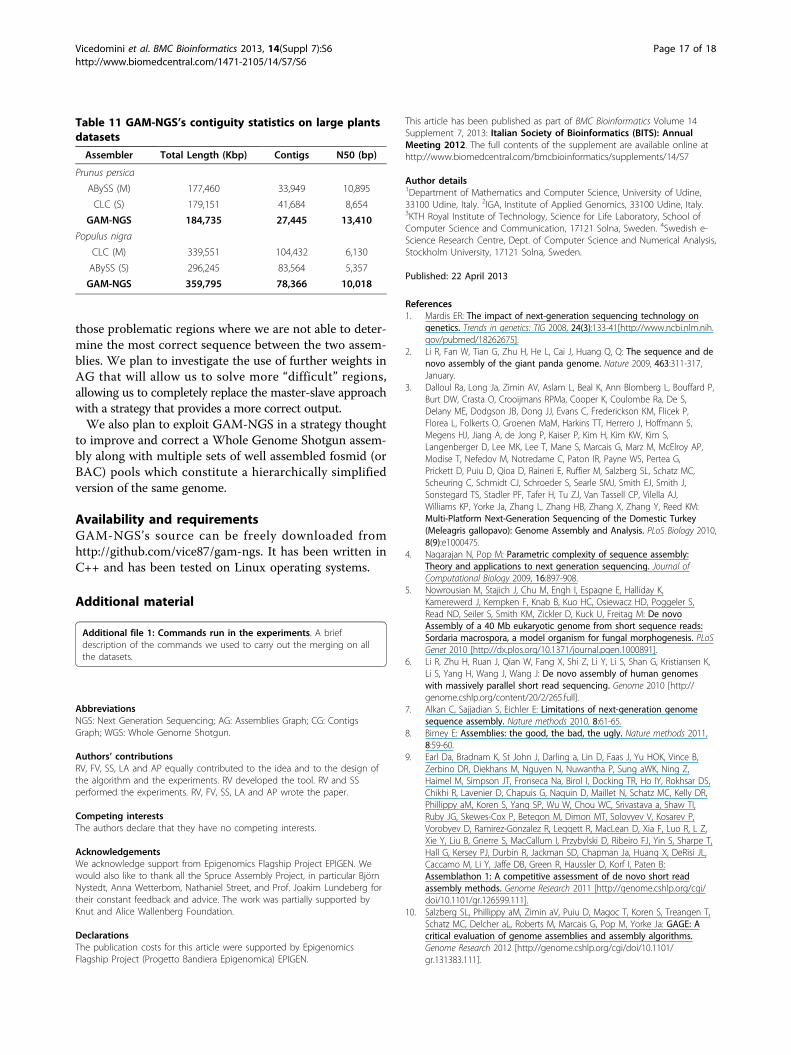
ized by a genome size of 227 Mbp. The best assemblies wewere able to compute were produced with CLC andABySS assemblers, which were similar in length and num-ber of contigs. We chose to use ABySS as master, since itwas more contiguous. As shown in Table 11, we were ableto increase NG50 (of ~3 Kbp with respect to the master)and provide a more contiguous assembly compared toboth CLC and ABySS. After mapping a 65× coverage ofIllumina paired-end reads (which required 4 hours and 37minutes), GAM-NGS took less than 2 hours using at most19.6 GB of RAM.The second large dataset we used is Populus nigra, char-
acterized by a genome size of ~423 Mbp. Also in this case,as for Prunus persica, the assemblies we had at our dispo-sal were made with CLC and ABySS. This time, CLC’sassembler looked better for its total length and NG50 and,thus, we decided to use it as master. As shown in Table11, even with this dataset, we were able to increase NG50(by ~4 Kbp with respect to the master) and to provide amore contiguous assembly. To perform the mandatoryalignment step we used a 80× coverage of Illumina paired-end reads, which required about 8 hours. Then, GAM-NGS took less than 4 hours using at most 34.5 GB ofRAM to perform the merge. In order to save memory wecould have decreased the reads coverage (at least 30× issuggested at the cost of a lower assembly improvement).As a demonstration of GAM-NGS’s flexibility, con-
sider that GAM-NGS has also been used to obtain anassembly of the 20 Gbp genome of Picea abies, whereperforming a global alignment is impracticable.In this scenario, the idea was to improve a Whole
Genome Shotgun (WGS) assembly AWGS with a set offosmid pools FP sampled from the same genome.Each fosmid pool was sequenced and assembled sepa-rately using a 80× coverage. Then, the 50× coverage ofIllumina reads used to assemble AWGS has beenmapped on both AWGS and FP for the blocks con-struction phase. GAM-NGS was able to run in less than3 days (6 days, taking into account also the mandatoryalignment phase) using at most 612 GB of RAM. Theseis certainly a low amount of resources, considering thedataset’s size (almost a Terabyte) and that building theWGS assembly took one week and required more than1 TB of RAM. Furthermore, GAM-NGS was able toincrease the assembly length by 1.4 Gbp of the esti-mated genome size with a NG50 that was 1.42 timesgreater than the one of the WGS assembly (data not yet
Table 6 GAGE statistics (SNPs, indels and misjoins) onRhodobacter sphaeroides.
Assembler SNPs Indels < 5bp
Indels ≥ 5bp
Misjoins Inv Reloc
Allpaths-LG 218 150 37 6 0 6
MSR-CA 807 179 32 9 1 8
Allpaths-LG + MSR-CA
GAM-NGS 250 157 44 5 0 5
GAA 345 162 48 5 0 5
ZORRO 263 153 35 7 0 7
MSR-CA + Allpaths-LG
GAM-NGS 842 198 46 10 1 9
GAA 802 187 49 10 1 9
ZORRO 928 215 29 7 0 7
Bambus2 189 149 363 5 0 5
SOAPdenovo 534 155 404 8 0 8
Bambus2 + SOAPdenovo
GAM-NGS 431 173 406 10 0 10
GAA 581 177 404 10 0 10
ZORRO 546 196 84 8 0 8
SOAPdenovo+ Bambus2
GAM-NGS 534 153 393 8 0 8
GAA 532 155 407 8 0 8
ZORRO 513 175 111 9 0 9
For each assembly we show the number of SNPs, the number of indelsshorter than 5 bp and greater (or equal) than 5 bp. The number of misjoins iscomputed as the sum of inversions (parts of contigs reversed with respect tothe reference genome) and relocations (rearrangements moving a contigwithin/between chromosomes).
Table 7 Assembly reconciliation tools performances onRhodobacter sphaeroides.
Tool User (CPU) time Wall clock time
Allpaths-LG + MSR-CA
GAM-NGS 1h 21’ 09” + 2’ 20” 5’ 03” + 43”
GAA 17” 17”
ZORRO 14’ 46” 14’ 46”
MSR-CA + Allpaths-LG
GAM-NGS 1h 21’ 09” + 2’ 19” 5’ 03” + 48”
GAA 19” 19”
ZORRO 16’ 15” 16’ 15”
Bambus2 + SOAPdenovo
GAM-NGS 1h 26’ 47” + 2’ 35” 5’ 53” + 1’ 13”
GAA 3’ 59” 3’ 59”
ZORRO 8’ 22” 8’ 22’
SOAPdenovo + Bambus2
GAM-NGS 1h 26’ 47” + 2’ 23” 5’ 53” + 1’ 09”
GAA 3’ 47” 3’ 47”
ZORRO 7’ 44” 7’ 44”
In GAM-NGS’s entries the first value indicates the time spent in alignmentphase, while the second one is GAM-NGS’s run time.
Vicedomini et al. BMC Bioinformatics 2013, 14(Suppl 7):S6http://www.biomedcentral.com/1471-2105/14/S7/S6
Page 14 of 18

published and not yet publicly available, we wereallowed to show only the increment of the statisticswith respect to the assembly we wanted to improve).
Conclusions and future workGAM-NGS is a de novo graph-based assembler which isable to merge assemblies using a (relatively) low amountof computational resources. Its strength relies on the factthat it does not need a global alignment to be performedand that makes our strategy unique among the otherassembly reconciliation tools. In fact, GAM-NGS findsregions belonging to the same DNA locus using readsaligned back to the assembly, which is an almost manda-tory analysis step in all de novo assembly projects. Theorder in which these regions have been assembled isexploited to build a locally weighted graph that GAM-NGS uses to fill gaps between sequences and to correct
putative mis-assemblies. Moreover, mapping reads to theassemblies (thus, without knowing how they have beenplaced by the assemblers) may lead to complex graphsub-structures (e.g., bubbles, bifurcations, cycles) due toalignment errors or chimeric assembly sequences. Resol-ving these types of sub-graphs is not a trivial task, as incertain regions there may be lack of any possible evi-dence. In these kind of situations (which, for instance,represented 40% of the problematic cases for the humanGAGE’s dataset) we decided to be as conservative as pos-sible, returning the sequences of one of the assemblies(elected as master by the user).In this paper we validated our tool using GAGE [10]
datasets, proving its effectiveness and reliability. Resultsshowed that, for each GAGE dataset, GAM-NGS wasalways able to improve master assembly’s NG50 and cor-rected NG50 (i.e., NG50 of the assembly broken in
Table 8 GAGE statistics (contiguity, duplication and compression) on human chromosome 14.
Assembler Ctgnum
NG50(kb)
NG50 corr.(kb)
Assembly size(%)
Chaff size(%)
Unaligned ref(%)
Unaligned asm(%)
Dupl(%)
Comp(%)
Allpaths-LG
4529 27.96 15.69 78.67 0.02 20.03 0.04 0.23 2.11
CABOG 3361 35.86 18.63 80.34 0.02 19.13 0.07 0.13 1.39
Allpaths-LG + CABOG
GAM-NGS 2235 61.64 21.91 80.94 0.02 19.08 0.10 0.88 1.43
GAA 1989 69.40 23.04 82.08 0.02 18.92 0.09 1.52 1.39
CABOG + Allpaths-LG
GAM-NGS 1979 66.29 23.63 81.00 0.02 19.00 0.06 0.74 1.37
GAA 1903 70.39 23.89 81.89 0.02 18.98 0.07 1.21 1.36
For each assembler we report the number of contigs greater than 200 bp (Ctg), the NG50, the corrected NG50 (NG50 computed breaking the assembly at eacherror), assembly’s total length, the percentage of short (Chaff) contigs, the length of reference’s regions which cannot be found in the assembly (Unaligned ref),the length of assembly’s regions that cannot be found in the reference (Unaligned asm), the percentage of duplicated (Dupl) and compressed (Comp) regions inthe assembly. All the statistics were computed using the same script with the gapped reference genome (107,349,540 bp).
Figure 8 FRCurve of Human chromosome 14 assemblies. FRCurve of human chromosome 14. Allpaths-LG and CABOG contain definitely thelowest numbers of features with respect to the other assemblers.
Vicedomini et al. BMC Bioinformatics 2013, 14(Suppl 7):S6http://www.biomedcentral.com/1471-2105/14/S7/S6
Page 15 of 18

correspondence of the errors), thus providing a globallymore correct output (even if some errors were carried bythe slave assembly). Although GAA provided better sta-tistics in some cases, GAM-NGS gives comparable resultsand offers excellent scalability. GAM-NGS yields animproved assembly in reasonable time on large datasets(especially if used on a multicore computer) for which
competing tools are impractical. In particular, we showedGAM-NGS’s scalability on large (plant) datasets (genomesize up to 20 Gbp), where our tool required a lowamount of computational resources compared to thedataset sizes and assembly requirements.The presented algorithm performs a merge of two
assemblies, returning the sequences of one of them in
Table 9 GAGE statistics (SNPs, indels and misjoins) on human chromosome 14.
Assembler SNPs Indels < 5 bp Indels ≥ 5 bp Misjoins Inv Reloc
Allpaths-LG 55319 27563 2558 101 44 57
CABOG 81151 28438 2884 149 46 103
Allpaths-LG + CABOG
GAM-NGS 61725 29936 2950 119 32 87
GAA 63835 30151 2990 123 29 94
CABOG + Allpaths
GAM-NGS 79478 29653 3021 154 43 111
GAA 81763 29812 3008 134 31 103
For each assembly we show the number of SNPs, the number of indels shorter than 5 bp and greater (or equal) than 5 bp. The number of misjoins is computedas the sum of inversions (parts of contigs reversed with respect to the reference genome) and relocations (rearrangements moving a contig within/betweenchromosomes). All the statistics were computed using the same script with the gapped reference genome (107,349,540 bp).
Figure 9 FRCurve of assembly reconciliation tools. FRCurve of assembly reconciliation tools on human chromosome 14, using (a) Allpaths-LGand (b) CABOG as master assembly. Despite the lower corrected NG50 (which means errors in the longest contigs), considering the wholeassembly, GAM-NGS seems to behave globally better than GAA and the input assemblies.
Table 10 Assembly reconciliation tools performances on human chromosome 14.
Tool User (CPU) time Wall clock time
Allpaths-LG + CABOG
GAM-NGS 4h 24’ 59” + 1h 14’ 41” 45’ 56” + 18’ 16”
GAA 452h 18’ 14h 16’ 4”
CABOG + Allpaths-LG
GAM-NGS 4h 24’ 59” + 1h 12’ 35” 45’ 56” + 19’ 21”
GAA 467h 40’ 13h 44’ 58’
In GAM-NGS’s entries the first value indicates the time spent in alignment phase, while the second one is GAM-NGS’s run time. Due to the size of the assemblies,we parallelized BLAT’s execution to get GAA’s output in a reasonable time. ZORRO results are not shown due to the fact that the tool cannot run in parallel and,after more than a week of computation, was still not able to provide an output.
Vicedomini et al. BMC Bioinformatics 2013, 14(Suppl 7):S6http://www.biomedcentral.com/1471-2105/14/S7/S6
Page 16 of 18
those problematic regions where we are not able to deter-mine the most correct sequence between the two assem-blies. We plan to investigate the use of further weights inAG that will allow us to solve more “difficult” regions,allowing us to completely replace the master-slave approachwith a strategy that provides a more correct output.We also plan to exploit GAM-NGS in a strategy thought
to improve and correct a Whole Genome Shotgun assem-bly along with multiple sets of well assembled fosmid (orBAC) pools which constitute a hierarchically simplifiedversion of the same genome.
Availability and requirementsGAM-NGS’s source can be freely downloaded fromhttp://github.com/vice87/gam-ngs. It has been written inC++ and has been tested on Linux operating systems.
Additional material
Additional file 1: Commands run in the experiments. A briefdescription of the commands we used to carry out the merging on allthe datasets.
AbbreviationsNGS: Next Generation Sequencing; AG: Assemblies Graph; CG: ContigsGraph; WGS: Whole Genome Shotgun.
Authors’ contributionsRV, FV, SS, LA and AP equally contributed to the idea and to the design ofthe algorithm and the experiments. RV developed the tool. RV and SSperformed the experiments. RV, FV, SS, LA and AP wrote the paper.
Competing interestsThe authors declare that they have no competing interests.
AcknowledgementsWe acknowledge support from Epigenomics Flagship Project EPIGEN. Wewould also like to thank all the Spruce Assembly Project, in particular BjörnNystedt, Anna Wetterbom, Nathaniel Street, and Prof. Joakim Lundeberg fortheir constant feedback and advice. The work was partially supported byKnut and Alice Wallenberg Foundation.
DeclarationsThe publication costs for this article were supported by EpigenomicsFlagship Project (Progetto Bandiera Epigenomica) EPIGEN.
This article has been published as part of BMC Bioinformatics Volume 14Supplement 7, 2013: Italian Society of Bioinformatics (BITS): AnnualMeeting 2012. The full contents of the supplement are available online athttp://www.biomedcentral.com/bmcbioinformatics/supplements/14/S7
Author details1Department of Mathematics and Computer Science, University of Udine,33100 Udine, Italy. 2IGA, Institute of Applied Genomics, 33100 Udine, Italy.3KTH Royal Institute of Technology, Science for Life Laboratory, School ofComputer Science and Communication, 17121 Solna, Sweden. 4Swedish e-Science Research Centre, Dept. of Computer Science and Numerical Analysis,Stockholm University, 17121 Solna, Sweden.
Published: 22 April 2013
References1. Mardis ER: The impact of next-generation sequencing technology on
genetics. Trends in genetics: TIG 2008, 24(3):133-41[http://www.ncbi.nlm.nih.gov/pubmed/18262675].
2. Li R, Fan W, Tian G, Zhu H, He L, Cai J, Huang Q, Q: The sequence and denovo assembly of the giant panda genome. Nature 2009, 463:311-317,January.
3. Dalloul Ra, Long Ja, Zimin AV, Aslam L, Beal K, Ann Blomberg L, Bouffard P,Burt DW, Crasta O, Crooijmans RPMa, Cooper K, Coulombe Ra, De S,Delany ME, Dodgson JB, Dong JJ, Evans C, Frederickson KM, Flicek P,Florea L, Folkerts O, Groenen MaM, Harkins TT, Herrero J, Hoffmann S,Megens HJ, Jiang A, de Jong P, Kaiser P, Kim H, Kim KW, Kim S,Langenberger D, Lee MK, Lee T, Mane S, Marcais G, Marz M, McElroy AP,Modise T, Nefedov M, Notredame C, Paton IR, Payne WS, Pertea G,Prickett D, Puiu D, Qioa D, Raineri E, Ruffier M, Salzberg SL, Schatz MC,Scheuring C, Schmidt CJ, Schroeder S, Searle SMJ, Smith EJ, Smith J,Sonstegard TS, Stadler PF, Tafer H, Tu ZJ, Van Tassell CP, Vilella AJ,Williams KP, Yorke Ja, Zhang L, Zhang HB, Zhang X, Zhang Y, Reed KM:Multi-Platform Next-Generation Sequencing of the Domestic Turkey(Meleagris gallopavo): Genome Assembly and Analysis. PLoS Biology 2010,8(9):e1000475.
4. Nagarajan N, Pop M: Parametric complexity of sequence assembly:Theory and applications to next generation sequencing. Journal ofComputational Biology 2009, 16:897-908.
5. Nowrousian M, Stajich J, Chu M, Engh I, Espagne E, Halliday K,Kamerewerd J, Kempken F, Knab B, Kuo HC, Osiewacz HD, Poggeler S,Read ND, Seiler S, Smith KM, Zickler D, Kuck U, Freitag M: De novoAssembly of a 40 Mb eukaryotic genome from short sequence reads:Sordaria macrospora, a model organism for fungal morphogenesis. PLoSGenet 2010 [http://dx.plos.org/10.1371/journal.pgen.1000891].
6. Li R, Zhu H, Ruan J, Qian W, Fang X, Shi Z, Li Y, Li S, Shan G, Kristiansen K,Li S, Yang H, Wang J, Wang J: De novo assembly of human genomeswith massively parallel short read sequencing. Genome 2010 [http://genome.cshlp.org/content/20/2/265.full].
7. Alkan C, Sajjadian S, Eichler E: Limitations of next-generation genomesequence assembly. Nature methods 2010, 8:61-65.
8. Birney E: Assemblies: the good, the bad, the ugly. Nature methods 2011,8:59-60.
9. Earl Da, Bradnam K, St John J, Darling a, Lin D, Faas J, Yu HOK, Vince B,Zerbino DR, Diekhans M, Nguyen N, Nuwantha P, Sung aWK, Ning Z,Haimel M, Simpson JT, Fronseca Na, Birol I, Docking TR, Ho IY, Rokhsar DS,Chikhi R, Lavenier D, Chapuis G, Naquin D, Maillet N, Schatz MC, Kelly DR,Phillippy aM, Koren S, Yang SP, Wu W, Chou WC, Srivastava a, Shaw TI,Ruby JG, Skewes-Cox P, Betegon M, Dimon MT, Solovyev V, Kosarev P,Vorobyev D, Ramirez-Gonzalez R, Leggett R, MacLean D, Xia F, Luo R, L Z,Xie Y, Liu B, Gnerre S, MacCallum I, Przybylski D, Ribeiro FJ, Yin S, Sharpe T,Hall G, Kersey PJ, Durbin R, Jackman SD, Chapman Ja, Huang X, DeRisi JL,Caccamo M, Li Y, Jaffe DB, Green R, Haussler D, Korf I, Paten B:Assemblathon 1: A competitive assessment of de novo short readassembly methods. Genome Research 2011 [http://genome.cshlp.org/cgi/doi/10.1101/gr.126599.111].
10. Salzberg SL, Phillippy aM, Zimin aV, Puiu D, Magoc T, Koren S, Treangen T,Schatz MC, Delcher aL, Roberts M, Marcais G, Pop M, Yorke Ja: GAGE: Acritical evaluation of genome assemblies and assembly algorithms.Genome Research 2012 [http://genome.cshlp.org/cgi/doi/10.1101/gr.131383.111].
Table 11 GAM-NGS’s contiguity statistics on large plantsdatasets
Assembler Total Length (Kbp) Contigs N50 (bp)
Prunus persica
ABySS (M) 177,460 33,949 10,895
CLC (S) 179,151 41,684 8,654
GAM-NGS 184,735 27,445 13,410
Populus nigra
CLC (M) 339,551 104,432 6,130
ABySS (S) 296,245 83,564 5,357
GAM-NGS 359,795 78,366 10,018
Vicedomini et al. BMC Bioinformatics 2013, 14(Suppl 7):S6http://www.biomedcentral.com/1471-2105/14/S7/S6
Page 17 of 18

11. Zimin AV, Smith DR, Sutton G, Yorke Ja: Assembly reconciliation.Bioinformatics (Oxford, England) 2008, 24:42-5.
12. Casagrande A, Del Fabbro C, Scalabrin S, Policriti A: GAM: GenomicAssemblies Merger: A Graph Based Method to Integrate DifferentAssemblies. 2009 IEEE International Conference on Bioinformatics andBiomedicine 2009, 321-326 [http://ieeexplore.ieee.org/lpdocs/epic03/wrapper.htm?arnumber=5341771].
13. Yao G, Ye L, Gao H, Minx P, Warren WC, Weinstock GM: Graph accordanceof next-generation sequence assemblies. Bioinformatics 2012 [http://bioinformatics.oxfordjournals.org/content/early/2011/10/23/bioinformatics.btr588.abstract].
14. ZORRO. [http://lge.ibi.unicamp.br/zorro/].15. Nijkamp J, Winterbach W, van den Broek M, Daran JM, Reinders M, de
Ridder D: Integrating genome assemblies with MAIA. Bioinformatics(Oxford, England) 2010, 26(18):i433-i439.
16. Cattonaro F, Policriti A, Vezzi F: Enhanced reference guided assembly IEEE;2010 [http://ieeexplore.ieee.org/xpl/freeabs\_all.jsp?arnumber=5706540].
17. Li H, Durbin R: Fast and accurate short read alignment with Burrows-Wheeler transform. Bioinformatics 2009, 25(14):1754-1760.
18. ERNE (Extended Randomized Numerical alignEr). [http://erne.sourceforge.net/].
19. Vezzi F, Narzisi G, Mishra B: Feature-by-Feature – Evaluating De NovoSequence Assembly. PLoS ONE 2012, 7(2):e31002.
20. Google’s SparseHash library. [http://code.google.com/p/sparsehash/].21. Tarjan R: Depth-First Search and Linear Graph Algorithms. SIAM Journal
on Computing 1972, 1(2):146-160 [http://epubs.siam.org/doi/abs/10.1137/0201010].
22. Phillippy AM, Schatz MC, Pop M: Genome assembly forensics: finding theelusive mis-assembly. Genome biology 2008, 9(3):R55.
23. Ukkonen E: Algorithms for approximate string matching. Information andControl 1985, 64(1-3):100-118, [International Conference on Foundations ofComputation Theory].
24. GAGE. [http://gage.cbcb.umd.edu].25. Assemblathon 2. [http://assemblathon.org/].26. Vezzi F, Narzisi G, Mishra B: Reevaluating Assembly Evaluations with
Feature Response Curves: GAGE and Assemblathons. PLoS ONE 2012,7(12):e52210.
27. CLC de novo assembler. [http://www.clcdenovo.com/].28. Simpson J, Wong K, Jackman S, Schein J: ABySS: A parallel assembler for
short read sequence data. Genome 2009, 1117-1123[http://genome.cshlp.org/content/19/6/1117.short].
doi:10.1186/1471-2105-14-S7-S6Cite this article as: Vicedomini et al.: GAM-NGS: genomic assembliesmerger for next generation sequencing. BMC Bioinformatics 201314(Suppl 7):S6.
Submit your next manuscript to BioMed Centraland take full advantage of:
• Convenient online submission
• Thorough peer review
• No space constraints or color figure charges
• Immediate publication on acceptance
• Inclusion in PubMed, CAS, Scopus and Google Scholar
• Research which is freely available for redistribution
Submit your manuscript at www.biomedcentral.com/submit
Vicedomini et al. BMC Bioinformatics 2013, 14(Suppl 7):S6http://www.biomedcentral.com/1471-2105/14/S7/S6
Page 18 of 18