
GAM Star Fund p.l.c. - cloudfront.net
405
GAM Star Fund p.l.c. Annual Report and Audited Financial Statements 30 June 2020 GAM Star Fund p.l.c. is an open-ended umbrella investment company incorporated with limited liability with variable capital under the laws of Ireland. It is an umbrella fund with segregated liability between Funds (registered number 280599).
-
Upload
khangminh22 -
Category
Documents
-
view
0 -
download
0
Transcript of GAM Star Fund p.l.c. - cloudfront.net

GAM Star Fund p.l.c.Annual Report and Audited Financial Statements
30 June 2020
GAM Star Fund p.l.c. is an open-ended umbrella investment company incorporated with limited liability with variable capital under the laws of Ireland. It is an umbrella fund with segregated liability between Funds (registered number 280599).

Directors of the CompanyAndrew Bates*David Dillon**Daniel O' Donovan** Deborah Reidy**Kaspar Boehni*/***
*Non-executive Director **Independent non-executive Director ***Appointed 5 July 2019
Manager, Registrar, Transfer Agent and Global DistributorGAM Fund Management LimitedGeorge’s Court54-62 Townsend StreetDublin 2, DO2 R156 Ireland
SecretaryAmy Carrollc/o GAM Fund Management Limited54-62 Townsend StreetDublin 2, DO2 R156 Ireland
Registered Address of the CompanyGeorge’s Court54-62 Townsend StreetDublin 2, DO2 R156 Ireland
Co-Investment ManagersGAM International Management Limited8 Finsbury Circus London, EC2M 7GB United Kingdom
GAM Hong Kong Limited Suite 2302, 23/F Lee Garden One 33 Hysan Avenue Causeway Bay Hong Kong
GAM USA Inc One Rockefeller Plaza 21st Floor New York NY 10020 USA
Delegate Investment Managers GAM Systematic LLPCity House126-130 Hill RoadCambridge CB2 1REUnited Kingdom
Wellington Management International LimitedCardinal Place, 80 Victoria StreetLondon SW1E 5JL United Kingdom
ATLANTICOMNIUM SA24 Route de MalagnouCase Postale 330CH-1211 Geneva 17 Switzerland
Fermat Capital Management LLC615 Riverside AvenueWestport CT 06880USA
GAM Investment Management (Switzerland) AG Hardstrasse 201 CH-8037 Zurich Switzerland
Depositary and Securities Lending AgentState Street Custodial Services (Ireland) Limited78 Sir John Rogerson's QuayDublin 2, DO2 HD32 Ireland
Delegate Administrator State Street Fund Services (Ireland) Limited78 Sir John Rogerson's QuayDublin 2, DO2 HD32 Ireland
Independent AuditorsPricewaterhouseCoopersChartered Accountants and Registered AuditorsOne Spencer DockNorth Wall QuayDublin 1, D01 X9R7 Ireland
Legal Advisers to the Company and the Manager as to Irish LawDillon Eustace33 Sir John Rogerson’s QuayDublin 2, D02 XK09 Ireland
Irish Listing SponsorDillon Eustace, 33 Sir John Rogerson's Quay, Dublin 2, D02 XK09 Ireland

1
Table of ContentsReport of the Directors 2
Investment Objectives (unaudited) 6
GAM Star Alpha Spectrum 11
GAM Star Alpha Technology 14
GAM Star Asian Equity 21
GAM Star Global Balanced 25
GAM Star Capital Appreciation US Equity 29
GAM Star Cat Bond 37
GAM Star Global Cautious 44
GAM Star China Equity 48
GAM Star Composite Global Equity 52
GAM Star Continental European Equity 55
GAM Star Credit Opportunities (EUR) 60
GAM Star Credit Opportunities (GBP) 69
GAM Star Credit Opportunities (USD) 76
GAM Star Global Defensive 85
GAM Star Global Dynamic Growth 89
GAM Star Emerging Equity 93
GAM Star Emerging Market Rates 100
GAM Star European Equity 106
GAM Star Flexible Global Portfolio 111
GAM Star Global Rates 115
GAM Star Global Growth 120
GAM Star Interest Trend 124
GAM Star Japan Leaders 130
GAM Star MBS Total Return 134
GAM Systematic Alternative Risk Premia 147
GAM Systematic Core Macro 153
GAM Star Tactical Opportunities 160
GAM Star Disruptive Growth 164
GAM Star US All Cap Equity 170
GAM Star Worldwide Equity 175
GAM Systematic Dynamic Credit 180
Balance Sheet 185
Profit and Loss Account 196
Statement of Changes in Net Assets Attributable to Redeemable Participating Shareholders 207
Notes to the Financial Statements 217
Statement of Depositary Responsibilities 382
Report of the Depositary to the Shareholders 383
Independent Auditors’ Report to the Shareholders 384
Additional Information and Regulatory Requirements (Unaudited) 388-401
Remuneration Disclosure 388
Additional Market Risk Notes 390
Transaction charges 393
Changes to the Prospectus 395
Securities Financing Transactions 396
Calendar Year Performance 398
General Information 400
Contact Information 401

2
GAM Star Fund p.l.c.
Report of the DirectorsThe Board of Directors (the Board" or the "Directors") submit their report together with the audited financial statements for the year ended 30 June 2020.
Principal ActivitiesGAM Star Fund p.l.c. (the “Company”) was incorporated and registered in Ireland under the Companies Act 2014 as an investment company with variable capital on 20 February 1998 and is authorised by the Central Bank of Ireland (“the Central Bank”) as an Undertaking for Collective Investment in Transferable Securities ("UCITS") under the European Communities (Undertakings for Collective Investment in Transferable Securities) Regulations, 2011 (as amended) (the "UCITS Regulations") and under the Central Bank (Supervision and Enforcement) Act, 2013 (Section 48(1) (Undertakings for Collective Investment in Transferable Securities) Regulations 2019).
It is an umbrella type company, in that shares may be issued in relation to different funds (the “Funds”) from time to time. A separate portfolio of assets will be maintained for each Fund and will be invested in accordance with the investment objective and policies applicable to such a Fund as set out in "Investments Objectives". Segregated liability exists between Funds.
Certain Funds are authorised for sale in Austria, Bahrain, Belgium, Bulgaria, Chile, Denmark, Finland, France, Germany, Gibraltar, Iceland, Ireland, Israel, Italy, Japan, Lebanon, Liechtenstein, Luxembourg, the Netherlands, Norway, Peru, Portugal, Singapore, Spain, Switzerland, Sweden, Taiwan, United Arab Emirates and the United Kingdom.
Risk Management ObjectivesDetails of risk management objectives are shown in Note 3.
Results and DistributionsThe results and distributions for the year are stated in the Profit and Loss Account.
Significant events during the yearOn 5 July 2019 Kaspar Boehni was appointed as Director of the Company.
GAM Star Absolute Return Macro on receipt of redemption requests of all remaining shares closed on 17 July 2019.
On 17 July 2019 GAM Star Dynamic Global Bond completed a full compulsory repurchase of shares.
On 23 July 2019, the following Funds completed a full compulsory redemption of shares.
– GAM Star Absolute Return Bond– GAM Star Absolute Return Bond Plus– GAM Star Absolute Return Bond Defender
These Funds have completed the disposal of all investments and subsequent payments to the shareholders of the Funds.
GAM Star Target Return Plus on receipt of redemption requests of all remaining shares closed on 21 August 2019.
Effective from 6 September 2019 the names of the following Funds changed:
– GAM Star Balanced to GAM Star Global Balanced– GAM Star Cautious to GAM Star Global Cautious– GAM Star Defensive to GAM Star Global Defensive– GAM Star Dynamic Growth to GAM Star Global Dynamic Growth– GAM Star Growth to GAM Star Global Growth
Effective from 1 November 2019 GAM Star Credit Opportunities Fund (USD) SI USD class was listed on the Global Exchange Market of Euronext Dublin.
On 2 January 2020 the Delegate Investment Manager, Cantab Capital Partners LLP changed its name to GAM Systematic LLP.
Effective from 20 January 2020 the name of the following Fund changed:
– GAM Star Technology to GAM Star Disruptive Growth.
With effect from 20 January 2020 and 31 January 2020 there has been addendum added to the Prospectus issued on 6 December 2019 as detailed in note 21.
On 22 January 2020 the followings Funds merged: GAM Star Asia-Pacific Equity into GAM Star Asian Equity and GAM Star Global Selector into GAM Star Worldwide Equity.
Review of the Business and Future DevelopmentsPlease refer to the Commentary of each Fund on the following pages for a review of each Fund’s activities during the year.
2020 to date has seen a sharp increase in the volatility of global financial markets due to the COVID-19 pandemic. The Investment Managers are actively monitoring the situation and will continue to manage the Fund’s assets within the investment and risk parameters that have been established. It should be noted that COVID-19 has, and may continue to have, an adverse effect on the global economy and the economies of certain nations, which may negatively impact the performance of the Funds.
Events Since Year EndPlease refer to Note 22 for further details.
DirectorsThe Directors of the Company during the year ended 30 June 2020 were:
Andrew BatesDavid DillonDaniel O'DonovanDeborah ReidyKaspar Boehni (Appointed 5 July 2019)
Directors’ fees for the year are stated in Note 10.
Directors’ and Secretary’s InterestsNone of the Directors or Secretary or their families held any beneficial interest in the share capital of the Company during the years ended 30 June 2020 and 30 June 2019.
Transactions Involving DirectorsThe Board are not aware of any contracts or arrangements of any significance in relation to the business of the Company in which the Directors had any interest as defined in the Companies Act 2014 at any time during the year from 1 July 2019 to 30 June 2020, other than those disclosed in Note 10.

3
Transactions with Connected Persons (for the purposes of Central Bank UCITS Regulation 41(1))
The Board are satisfied:(i) that there are arrangements (evidenced by written procedures)
in place to ensure that all transactions with connected persons (for the purposes of Central Bank of Ireland UCITS Regulation 41(1)) are conducted at arm’s length and in the best interest of shareholders and
(ii) that any transactions with connected persons entered into during the year complied with the obligation of (i) above as attested by GAM Fund Management Limited (the "Manager") through regular updates to the Board.
Statement of Directors’ ResponsibilitiesThe Directors are responsible for preparing the Directors’ Report and the financial statements in accordance with Irish law.
Irish law requires the Directors to prepare financial statements for each financial year. The Directors have prepared the financial statements in accordance with Financial Reporting Standard (“FRS”) 102 and the UCITS Regulations.
Under Irish law the Directors shall not approve the financial statements unless they are satisfied that they give a true and fair view of the Company’s assets, liabilities and financial position as at the end of the financial year and of the profit or loss of the Company for the financial year.
In preparing these financial statements, the Directors are required to:
• select suitable accounting policies and then apply them consistently;
• make judgements and estimates that are reasonable and prudent;
• state whether the financial statements have been prepared in accordance with FRS 102 and ensure that they contain the additional information required by the Companies Act 2014; and
• prepare the financial statements on the going concern basis unless it is inappropriate to presume that the Company will continue in business.
The Directors are responsible for keeping adequate accounting records that are sufficient to:
• correctly record and explain the transactions of the Company;
• enable, at any time, the assets, liabilities, financial position and profit or loss of the Company to be determined with reasonable accuracy; and
• enable the Directors to ensure that the financial statements comply with the Companies Act 2014 and enable those financial statements to be audited.
The Directors believe that they have complied with the requirement to maintain adequate accounting records by employing an experienced Administrator for the purpose of maintaining adequate accounting records.
The Directors are responsible for safeguarding the assets of the Company. In this regard they have entrusted the assets of the Company to the Depositary who has been appointed as Depositary to the Company pursuant to the terms of a Depositary Agreement. The Directors have a general responsibility for taking such steps as are reasonably open to them to prevent and detect fraud and other irregularities.
Corporate GovernanceThe Company is subject to and complies with Irish Statute comprising the Companies Act 2014, the UCITS Regulations. The Company does not apply additional requirements in addition to those required by the above. Each of the service providers engaged by the Company is subject to their own corporate governance requirements.
Financial Reporting Process – Description of Main FeaturesThe Board has delegated to the Manager, the responsibility for establishing and maintaining adequate internal control and risk management systems of the Company in relation to the financial reporting process whilst maintaining effective oversight of this process. Such systems are designed to manage rather than eliminate the risk of failure to achieve the Company’s financial reporting objectives and can only provide reasonable and not absolute assurance against material misstatement or loss. This includes appointing the Manager to maintain the accounting records of the Company independently of each of Co-Investment Managers, Delegate Investment Managers and State Street Custodial Services (Ireland). The Manager has delegated this responsibility to the Delegate Administrator.
The Manager was contractually obliged to maintain adequate accounting records as required by the Amendment and Restated Management Agreement dated 11 July 2017 as may be amended from time to time and in compliance with local laws. The Delegate Administrator is contractually obliged to maintain adequate accounting records as required by the Administration Agreement dated 6 March 2016 as may be amended from time to time and in compliance with local laws. To that end the Delegate Administrator performs regular reconciliations of its records to those of the Depositary. The Delegate Administrator is also contractually obliged to prepare for review and approval by the Board the annual report including financial statements intended to give a true and fair view.
The Board evaluates and discusses significant accounting and reporting issues as the need arises. The Board also assesses and evaluates the Delegate Administrator's financial accounting and reporting routines and further assesses and evaluates the external auditors’ performance, qualifications and independence. The Manager has operating responsibility for internal control in relation to the financial reporting process and the Manager’s report to the Board.
Risk AssessmentThe Board is responsible for assessing the risk of irregularities whether caused by fraud or error in financial reporting and ensuring the processes are in place for the timely identification of internal and external matters with a potential effect on financial reporting. The Board has also put in place processes to identify changes in accounting rules and to ensure that these changes are accurately reflected in the Company’s financial statements.
2020 to date has seen a sharp increase in the volatility of global financial markets due to the COVID-19 pandemic. The Investment Managers are actively monitoring the situation. It should be noted that COVID-19 has, and may continue to have, an adverse effect on the global economy and the economies of certain nations, which may negatively impact the performance of the Funds.
Following the entry into force of the European Union (Withdrawal Agreement) Act 2020, the United Kingdom formally left the European Union on 31 January 2020 and entered into a transition period. The United Kingdom will continue to apply the entire body of European Union law during the transition period, but it will be outside of the

4
GAM Star Fund p.l.c.
European Union's political institutions. The Company’s Manager, GAM Fund Management Limited has been preparing for a Hard Brexit on the assumption that regulatory cooperation agreement will be in place between EU27 and the FCA by Brexit date. GAM Fund Management Limited is not contracted with any UK entities which are relying on a European passport to continue to provide services and has been appointed as the Global Distributor to GAM’s Irish fund range and therefore it is expected that the impact to business as a result of Brexit will be minimal. All portfolio holdings have been analysed to determine if there would be a potential breach of UCITS investment restrictions/concentration limits as a result of a Hard Brexit and the portfolios will be adjusted accordingly and our investment restrictions coding system has been adjusted to reflect the UK as a non-EEA jurisdiction.
Control ActivitiesThe Manager/Delegate Administrator is contractually obliged to design and maintain control structures to manage the risks which the Board judges to be significant for internal control over financial reporting. These control structures include appropriate division of responsibilities and specific control activities aimed at detecting or preventing the risk of significant deficiencies in financial reporting for every significant account in the financial statements and the related notes in the Company’s annual report. Examples of control activities exercised by the Manager/Delegate Administrator include approval of transactions, analytical procedures, reconciliations and automatic controls in IT systems. In the event that prices are not available from external independent sources, the Board has approved the use of a pricing committee, comprised of certain Directors of the Manager, to review and make decisions on the value of any securities that the Pricing department of the Delegate Administrator cannot determine. Any decisions are notified to the Board.
Information and CommunicationThe Company’s policies and the Board’s instructions with relevance for financial reporting are updated and communicated via appropriate channels, such as e-mail correspondence and meetings to ensure that all financial reporting information requirements are met in a complete and accurate manner.
MonitoringThe Board receives regular presentations and review reports from the Depositary, each of the Co-Investment Managers and Delegate Investment Managers, the Manager and the Delegate Administrator as appropriate. The Board also has an annual process to ensure that appropriate measures are taken to consider and address the shortcomings identified and measures recommended by the independent auditors.
Given the contractual obligations on the Manager and the Delegate Administrator, the Board has concluded that there is currently no need for the Company to have a separate internal audit function or an audit committee in order for the Board to perform effective monitoring and oversight of the internal control and risk management systems of the Company in relation to the financial reporting process.
Shareholder MeetingsThe Annual General Meetings of the Company are held in Ireland. Twenty one days notice is given in respect of each general meeting. A proxy may attend on behalf of any shareholder. An ordinary resolution is a resolution passed by an absolute majority of votes cast and a special resolution is a resolution passed by a majority of 75% or more of the votes cast.
Each of the shares entitles the holder to attend and vote at meetings of the Company. Matters may be determined by a meeting of shareholders on a show of hands unless a poll is requested. Each shareholder has one vote on a show of hands. Each share gives the holder one vote in relation to any matters relating to the Company which are submitted to shareholders for a vote by poll.
No class of shares confers on the holder thereof any preferential or pre-emptive rights or any rights to participate in the profits and dividends of any other share class or any voting rights in relation to matters relating solely to any other share class.
Any resolution to alter the class rights of the shares requires the approval of three quarters of the holders of the shares represented or present and voting at a general meeting of the class. The quorum for any general meeting of the class convened to consider any alteration to the class rights of the shares shall be such number of shareholders being two or more persons whose holdings comprise one third of the shares.
Each of the shares other than subscriber shares entitles the shareholder to participate equally on a pro-rata basis in the dividends and net assets of the sub-fund in respect of which the shares have been issued, save in the case of dividends declared prior to becoming a shareholder.
Subscriber shares entitle the shareholders holding them to attend and vote at all general meetings of the company but do not entitle the holders to participate in the dividends or net assets of the Company.
Composition and Operation of Board and CommitteesThere are currently five directors, all of whom are non-executive. Mr Andrew Bates is a consultant with Dillon Eustace who are legal advisers to the Company. None of the Directors have entered into an employment or service contract with the Company. The Articles of Association do not provide for retirement of Directors by rotation. However, the Directors may be removed by the shareholders by ordinary resolution in accordance with the procedures established under the Irish Companies Act 2014. Currently the Board meets at least quarterly. There are no standing sub-committees of the Board however sub committees of 2 Directors can convene on an ad hoc basis if required to do so.
Accounting RecordsThe measures taken by the Board to secure compliance with the Company’s obligations to keep adequate accounting records are the use of appropriate systems and procedures and the employment of competent persons. The Board have appointed the Manager for the purpose of maintaining accounting records. The Manager have delegated these responsibilities effective from 7 March 2016 to State Street Fund Services (Ireland) Limited as Delegate Administrator. Accordingly, the books of account are kept at 78 Sir John Rogerson's Quay, Dublin 2, Ireland.
The integrity of these financial statements published on www.gam.com remain the responsibility of the Board.
Legislation in the Republic of Ireland governing the preparation and dissemination of financial statements may differ from legislation in other jurisdictions.

5
Relevant Audit InformationIn accordance with section 330 and 332 of the Companies Act 2014, we confirm that all audit information relating to the Company has been made available to PricewaterhouseCoopers.
In accordance with section 330 of the Companies Act 2014, the Board have taken all steps that ought to have been taken by the Board in order to make themselves aware of any relevant audit information and to establish that PricewaterhouseCoopers are aware of that information.
Directors Compliance StatementIn accordance with Section 225 of the Companies Act 2014, The Directors:
(a) acknowledge that they are responsible for securing the Company’s compliance with its relevant obligations, as defined by the Companies Act 2014; and
(b) confirm that
i) a compliance policy statement has been prepared setting out the Company’s policies (that, in the Directors’ opinion, are appropriate to the Company) for ensuring compliance by the Company with its relevant obligations;
ii) adequate structures are in place, that in the Directors’ opinion, are designed to secure material compliance with the Company’s relevant obligations; and
iii) an annual review procedure has been put in place to review the Company’s relevant obligations and ensure a structure is in place to comply with these obligations
Independent AuditorsThe independent auditors, PricewaterhouseCoopers, have indicated their willingness to remain in office in accordance with section 383(2) of the Companies Act 2014.
Approval of Financial StatementsThese financial statements were approved by the Board of Directors on 27 October 2020.
On behalf of the Board of Directors:
Daniel O’Donovan Andrew BatesDirector: Director:
27 October 2020

6
GAM Star Fund p.l.c.
Investment Objectives (unaudited)The investment objectives of each Fund are set out below.
GAM Star Absolute Return Bond(Fund terminated on 23 July 2019)The investment objective of the Fund was to invest at least 85% of its assets in GAM Multibond Absolute Return Bond Fund (the “Master Fund”), the investment objective of which was to achieve a long term positive (absolute) return in both rising and falling financial markets while observing the principle of risk diversification. The Master Fund is a sub-fund of GAM Multibond which is established as a societe d’investissement, a capital variable, and is authorised by the Commission de Surveillance du Secteur Financier in Luxembourg (“CSSF”) as a UCITS. The Master Fund is managed by GAM International Management Limited, which has also been appointed as Co-Investment Manager of the Fund.
GAM Star Absolute Return Bond Defender(Fund terminated on 23 July 2019)The investment objective of the Fund was to invest at least 85% of its assets in GAM Multibond Absolute Return Bond Fund Defender (the “Master Fund”), the investment objective of which was to achieve a long term positive (absolute) return in both rising and falling financial markets while observing the principle of risk diversification. The Master Fund is a sub-fund of GAM Multibond which is established as a societe d’investissement, a capital variable, and is authorised by the Commission de Surveillance du Secteur Financier in Luxembourg (“CSSF”) as a UCITS. The Master Fund is managed by GAM International Management Limited, which has also been appointed as Co-Investment Manager of the Fund.
GAM Star Absolute Return Bond Plus(Fund terminated on 23 July 2019)The investment objective of the Fund was to invest at least 85% of its assets in GAM Multibond Absolute Return Bond Fund Plus (the “Master Fund”), the investment objective of which was to achieve a long term positive (absolute) return in both rising and falling financial markets while observing the principle of risk diversification. The Master Fund is a sub-fund of GAM Multibond which is established as a societe d’investissement, a capital variable, and is authorised by the Commission de Surveillance du Secteur Financier in Luxembourg (“CSSF”) as a UCITS. The Master Fund is managed by GAM International Management Limited, which has also been appointed as Co-Investment Manager of the Fund.
GAM Star Absolute Return Macro(Fund terminated on 17 July 2019)The investment objective of the Fund was to seek to achieve consistent positive returns over the long term while observing the principle of risk diversification. The Fund aimed to achieve this by blending discretionary and model driven investment strategies which may generate exposure (either directly or indirectly through the use of financial derivative instruments) principally to fund income instruments and currencies.
GAM Star Alpha SpectrumThe investment objective of the Fund is to seek to achieve an attractive return on capital while simultaneously attempting to limit the risk of capital loss. The Fund aims to achieve this investment objective by gaining exposure to equity, fixed income and trading strategies. Such exposure may be achieved principally through investment in open-ended collective investment schemes deploying equity long only, equity hedge, fixed income and trading strategies.
GAM Star Alpha TechnologyThe investment objective of the Fund is to achieve long term capital appreciation. The Fund seeks to achieve this objective by taking long and short positions primarily in equities or equity related derivative contracts of technology related companies. Such companies will be listed on or dealt in Recognised Markets globally (including in Emerging Markets as described in the Prospectus) and up to 10% of its Net Asset Value (“NAV”) may be invested in unlisted equities of such companies.
GAM Star Asian EquityThe investment objective of the Fund is to achieve capital appreciation through investment primarily in quoted securities which are issued by public companies with principal offices or significant business activities in the Asian region, excluding Japan.
GAM Star Asia-Pacific Equity(Merged into GAM Star Asian Equity on 22 January 2020) The investment objective of the Fund is to achieve long-term capital appreciation through investing, primarily in quoted equity securities, in companies with principal offices in the Pacific Basin, including Australia, China, Hong Kong, India, Indonesia, Japan, Malaysia, New Zealand, Pakistan, the Philippines, Singapore, South Korea, Sri Lanka, Taiwan and Thailand.
GAM Star Global Balanced(Formerly known as GAM Star Balanced)The investment objective of the Fund is to seek to achieve an attractive return on capital while simultaneously attempting to limit the risk of capital loss. This investment objective may be achieved primarily through investment in open-ended collective investment schemes which gain exposure to equities, Fixed Income Securities, property, commodities and currencies as set out in the Prospectus. The Fund will not invest directly in property or commodities and such indirect exposure shall be generated as described in the Prospectus.
GAM Star Capital Appreciation US EquityThe investment objective of the Fund is to achieve long-term capital appreciation. It will be the policy of the Fund to invest primarily in equities and other equity related securities (including preferred shares, convertible bonds, American Depositary Receipts and exchange traded funds) which are issued by companies with principal offices in the United States of America, which exercise their primary economic activity in the United States of America, or which are listed on or dealt in a Recognised Market in the United States of America.
GAM Star Cat BondThe investment objective of the Fund is to seek to generate returns through selective investment in a global portfolio of catastrophe bonds (“Cat Bonds”). Cat Bonds are debt securities that transfer the risk of catastrophic events from insurance companies, reinsurance companies, corporations, governments, etc. to the capital markets.
GAM Star Global Cautious(Formerly known as GAM Star Cautious)The investment objective of the Fund is to seek to achieve long term capital growth with lower volatility than a fund which invests solely in equities. The Fund aims to achieve this investment objective primarily through investment in open-ended collective investment schemes which provide exposure to equities, Fixed Income Securities, property, commodities and currencies as set out in the Prospectus.

7
GAM Star China A Equity(Approved on 12 December 2014. Not yet launched)The investment objective of the Fund is to achieve capital appreciation. GAM International Management Limited and GAM Hong Kong Limited, which have been appointed as Co-Investment Managers to the Fund, intend to achieve this investment objective through investment primarily in China A shares listed on or dealt in the Shanghai Stock Exchange (“SSE”) or the Shenzhen Stock Exchange (“SZSE”) (“China A Shares”).
GAM Star China Bond(Approved on 27 September 2016. Not yet launched.)The investment objective of the Fund is to provide long-term capital growth and income. The Fund seeks to achieve this investment objective through investment primarily in Fixed Income Securities and Money Market Instruments denominated in Renminbi (“RMB”) issued by entities located in the People's Republic of China (the “PRC”) or by entities which carry out a predominant proportion of their business activities in the PRC. The Fund may also invest up to 100% of net assets in instruments issued by government, government agencies, supra-national agencies located in the PRC in accordance with the requirements set out in the Investment Restrictions section of the Prospectus.
GAM Star China EquityThe investment objective of the Fund is to achieve capital appreciation through investment primarily in quoted equity securities listed on or dealt in any Recognised Market and which are issued by companies with principal offices or significant business activities in the People’s Republic of China and Hong Kong.
GAM Star China Focus(Approved on 12 October 2015. Not yet launched)The investment objective of the Fund is to achieve capital appreciation through investment primarily in equity securities of small or medium sized companies listed on or dealt in any Recognised Market and which are issued by companies with principal offices or significant business activities in the People’s Republic of China and Hong Kong.
GAM Star Composite Global EquityThe investment objective of the Fund is to achieve long term capital appreciation with the aim of generating a capital return in excess of global equity markets over the medium to long term. The Fund intends to pursue its investment objective by gaining exposure principally to equity strategies. Such exposure may be achieved principally through investment in open ended collective investment schemes deploying equity long only and equity hedge strategies. The Fund may also invest in exchange traded funds which are listed or traded on Recognised Markets worldwide in order to gain exposure to such strategies. The Fund may also invest in unlisted collective investment schemes in accordance with the provisions of the UCITS Regulations.
GAM Star Continental European EquityThe investment objective of the Fund is to achieve long-term capital appreciation through investing primarily in quoted equity and equity related securities (including but not limited to warrants), listed on or dealt in Recognised Markets within the EU which are issued by companies with principal offices in Europe other than the United Kingdom.
GAM Star Credit Opportunities (EUR)The investment objective of the Fund is to achieve long-term capital gain in Euro. It will be the policy of the Fund to seek to achieve its investment objective through investment principally in income bearing or accruing securities with fixed principal amounts including government bonds, corporate bonds, junior debt securities, preferred shares, convertible securities and contingent capital notes.
GAM Star Credit Opportunities (GBP)The investment objective of the Fund is to achieve long-term capital gain in Sterling. It will be the policy of the Fund to seek to achieve its investment objective through investment principally in income bearing or accruing securities with fixed principal amounts including government bonds, corporate bonds, junior debt securities, preferred shares, convertible securities and contingent capital notes.
GAM Star Credit Opportunities (USD)The investment objective of the Fund is to achieve long-term capital gain in US dollars. It will be the policy of the Fund to seek to achieve its investment objective through investment principally in income bearing or accruing securities with fixed principal amounts including government bonds, corporate bonds, junior debt securities, preferred shares, convertible securities and contingent capital notes.
GAM Star Global Defensive(Formerly known as GAM Star Defensive)The investment objective of the Fund is to seek to achieve long term capital growth. The Fund aims to achieve this investment objective primarily through investment in open-ended collective investment schemes which provide exposure to equities, Fixed Income Securities, property, commodities and currencies as set out in the Prospectus.
GAM Star Discretionary FX(Terminated on 28 February 2019)The investment objective of the Fund was to achieve absolute returns over the medium term arising out of the Fund’s participation in the global currency and related markets.
GAM Star Dynamic Global Bond(Fund terminated on 19 July 2019)The investment objective of the Fund was to maximise total investment return generated from a combination of income, capital appreciation and currency gains. The Fund aimed to achieve this investment objective principally through investment either directly or through the use of associated financial derivative instruments in a broadly diversified portfolio of Fixed Income Securities and currencies.
GAM Star Global Dynamic Growth(Formerly known as GAM Star Dynamic Growth)The investment objective of the Fund is to seek to achieve long term capital growth. The Fund aims to achieve this investment objective primarily through investment in open-ended collective investment schemes which provide exposure to equities, Fixed Income Securities, property, commodities and currencies as set out in the terms of the Prospectus. The Fund will not invest directly in property or commodities and such indirect exposure shall be generated as described in the terms of the Prospectus.

8
GAM Star Fund p.l.c.
GAM Star Emerging EquityThe investment objective of the Fund is to achieve long term capital appreciation. The Fund seeks to achieve this objective through investing primarily in equity and equity related securities (such as warrants and rights issues) of companies listed on or dealt in Recognised Markets in Emerging Markets or which are listed on or dealt in Recognised Markets outside of the Emerging Markets but which generate the bulk of their earnings in Emerging Markets.
GAM Star Emerging Market RatesThe investment objective of the Fund is to achieve absolute return regardless of market conditions through investment in a portfolio of local and hard currency bonds and other fixed income securities from emerging markets worldwide.
GAM Star European EquityThe investment objective of the Fund is to achieve long-term capital appreciation through investing primarily in quoted equity securities issued by companies with principal offices in Europe, including Austria, Belgium, Denmark, Finland, France, Germany, Greece, Iceland, Ireland, Italy, Luxembourg, the Netherlands, Norway, Portugal, Russia, Spain, Sweden, Switzerland, Turkey and the United Kingdom. It will be the policy of the Fund to invest primarily in equities.
GAM Star Flexible Global Allocation EUR(Approved on 21 December 2018. Not yet launched)The investment objective of the Fund is to achieve capital preservation accompanied by stable returns via a dynamic asset allocation. The Fund aims to achieve this investment objective by gaining exposure, either directly or indirectly through the use of derivatives and through investment in securities, to the following range of asset classes as further described below: equities, Fixed Income Securities, currencies, commodities and property. The Fund will not invest directly in property or commodities.
GAM Star Flexible Global Allocation Plus EUR(Approved on 21 December 2018. Not yet launched)The investment objective of the Fund is to achieve capital preservation accompanied by stable returns via a dynamic asset allocation. The Fund aims to achieve this investment objective by gaining exposure, either directly or indirectly through the use of derivatives and through investment in securities, to the following range of asset classes as further described below: equities, Fixed Income Securities, currencies, commodities and property. The Fund will not invest directly in property or commodities.
GAM Star Flexible Global Allocation USD(Approved on 21 December 2018. Not yet launched)The investment objective of the Fund is to achieve capital preservation accompanied by stable returns via a dynamic asset allocation. The Fund aims to achieve this investment objective by gaining exposure, either directly or indirectly through the use of derivatives and through investment in securities, to the following range of asset classes as further described below: equities, Fixed Income Securities, currencies, commodities and property. The Fund will not invest directly in property or commodities.
GAM Star Flexible Global PortfolioThe investment objective of the Fund is to achieve capital appreciation by gaining exposure to one or more of the following asset classes: financial indices, open-ended collective investment schemes, exchange traded funds, exchange traded commodities, Fixed Income Securities, equities, equity related securities, derivative instruments, cash, cash equivalents, Money Market Instruments and closed-ended funds. Allocations will be made at the Co-Investment Manager’s discretion, both within each asset class and among the asset classes. The Fund need not be invested in any or all of the asset classes at any one time.
GAM Star GAMCO US Equity(Merged into GAM Star Capital Appreciation US Equity on 12 December 2018)The investment objective of the Fund was to achieve long-term capital appreciation. It was the policy of the Fund to invest primarily in a diversified portfolio of equities (i) issued by companies with principal offices in the United States of America and/or (ii) which are listed on Recognised Markets in the United States of America. Whilst the Fund will primarily invest in the equities described above, it may also invest in other equities listed on Recognised Markets worldwide.
GAM Star Global Income(Approved on 21 December 2018. Not yet launched)The investment objective of the Fund is to maximise investment return, consistent with prudent investment management, through interest income as well as capital appreciation. The investment objective will be achieved principally through selective investments in a portfolio of fixed-income securities of issuers globally, including developed and emerging markets.
GAM Star Global Quality(Merged into GAM Star Worldwide Equity on 12 December 2018)The investment objective of the Fund was to provide capital appreciation primarily through investment in quoted equity securities listed on or dealt in Recognised Markets on a worldwide basis. The Fund emphasised investment in companies in developed countries such as the United States, the countries of Western Europe and certain countries in the Pacific Basin, which include but were not limited to Australia, Hong Kong, Japan, New Zealand and Singapore.
GAM Star Global RatesThe investment objective of the Fund is to achieve absolute returns. The Fund employs a process of economic analysis to identify fundamental trends within both the fixed income and global currency markets. There are both medium term and short term based themes involved in the Fund’s strategy.
GAM Star Global Selector(Merged into GAM Star Worldwide Equity on 22 January 2020)The investment objective of the Fund is to achieve long term capital appreciation by investing primarily in a focused, concentrated portfolio of worldwide quoted equity and equity related securities (including, but not limited to warrants), listed on or dealt in Recognised Markets on a worldwide basis.
GAM Star Global Growth(Formerly known as GAM Star Growth)The investment objective of the Fund is to seek to achieve long term capital growth. The Fund aims to achieve this investment objective primarily through investment in open-ended collective investment schemes which provide exposure to equities, Fixed Income Securities, property, commodities and currencies as set out in the Prospectus. The Fund will not invest directly in property or commodities and such indirect exposure shall be generated as described in the terms of the Prospectus.

9
GAM Star India Equity(Terminated on 15 November 2018)The investment objective of the Fund was to achieve long-term capital appreciation. It was the policy of the Fund to invest primarily in a diversified portfolio of equity and equity related securities and/or other derivative instruments of companies listed or dealt on any Recognised Market with principal offices in India or significant business activities, assets or resources related to India.
GAM Star Interest TrendThe investment objective of the Fund is to achieve long-term capital appreciation in US dollars. The Fund aims to achieve its investment objective through investment principally in income bearing securities which are expected to generate fixed income payments and also selectively make capital gains from trends in interest rates. Such instruments include government bonds, corporate bonds, junior debt securities, preferred shares, convertible securities and contingent convertible notes.
GAM Star Japan Leaders(Formerly known as GAM Star Japan Equity)The investment objective of the Fund is to achieve long-term capital appreciation through investing primarily in quoted equity securities in Japan issued by companies with principal office in Japan. It will be the policy of the Fund to invest primarily in equities.
GAM Star Keynes Quantitative Strategies(Terminated on 15 November 2018)The investment objective of the Fund was to seek to achieve an attractive return on capital while simultaneously attempting to limit the risk of capital loss. The Fund aimed to achieve this investment objective through the use of systematic quantitative models.
GAM Star MBS Total ReturnThe Fund’s primary investment objective is to seek to generate returns through selective investment in a diversified portfolio of mortgage-backed debt securities (“MBS”). The Fund may also invest to a lesser extent in asset-backed debt securities (“ABS”) as well as debt securities (such as bonds and notes) issued by corporations and governments. Such debt securities may pay fixed, floating and inverse floating rates of interest and may include zero coupon obligations.
GAM Systematic Alternative Risk PremiaThe investment objective of the Fund is to provide consistent above-average, risk-adjusted returns on capital with a low long term correlation with traditional asset classes such as equities and bonds. The investment objective is achieved by the Co-Investment Manager by gaining exposure directly or indirectly using financial derivatives instruments to the following four asset classes i.e. equities (which will be listed or traded worldwide), fixed income (i.e. Fixed Income Securities), Currencies and Commodities.
GAM Systematic Alternative Risk Premia Ex-A(Approved on 11 July 2017. Not yet launched)The investment objective of the Fund is to provide consistent above-average, risk-adjusted returns on capital with a low long term correlation with traditional asset classes such as equities and bonds.
GAM Systematic Core MacroThe investment objective of the Fund is to achieve long term capital growth through the generation of absolute returns by the use of proprietary advanced modelling techniques which are used to identify appropriate investments for the Fund across all relevant asset classes.
GAM Systematic Global Equity Market Neutral(Terminated on 26 February 2020)The investment objective of the Fund is to provide investors with consistent absolute returns independent of global equity markets. The Fund aims to achieve this investment objective through the use of proprietary advanced modelling techniques which are used to identify appropriate investments for the Fund.
GAM Star Tactical OpportunitiesThe investment objective of the Fund is to seek to achieve capital appreciation via unconstrained tactical asset allocation. The Fund aims to achieve this investment objective by gaining exposure either directly or indirectly through the use of derivatives to a range of asset classes including equities, fixed income securities, currencies, commodities and property as described in the Prospectus. The Fund will not invest directly in property or commodities.
GAM Star Target Return(Fund terminated on 23 October 2019)The investment objective of the Fund is to seek to achieve long term growth and capital appreciation via a flexible asset allocation, using a conservative approach. The Fund aims to achieve this investment objective by gaining exposure, either directly or indirectly through the use of collective investment schemes and derivatives to a range of asset classes including equities, Fixed Income Securities, currencies, commodities and property as described in the Prospectus. The Fund will not invest directly in property or commodities.
GAM Star Target Return Plus(Fund terminated on 21 August 2019)The investment objective of the Fund is to seek to achieve long term growth and capital appreciation via a flexible asset allocation, using a moderate approach. The Fund aims to achieve this investment objective by gaining exposure, either directly or indirectly through the use of collective investment schemes and derivatives to a range of asset classes including equities, Fixed Income Securities, currencies, commodities and property as described in the Prospectus. The Fund will not invest directly in property or commodities.
GAM Star Disruptive Growth(Formerly known as GAM Star Technology)The investment objective of the Fund is to achieve long-term capital appreciation. It will be the policy of the Fund to invest primarily in a globally diversified portfolio of technology related companies. The Fund seeks to achieve this objective through investing primarily in equity and equity related securities (such as warrants and rights issues) of companies listed on or dealt in Recognised Markets worldwide, and up to 10% of its net assets in unlisted equities, in each case which demonstrate long term growth opportunities within the broader technology sector or whose business models are driven by new technologies. The Fund may also seek to gain exposure to such companies through the use of financial derivative instruments described in the Prospectus.
GAM Star UK Diversified(Approved on 12 October 2015. Not yet launched)The investment objective of the Fund is to provide capital appreciation. The Fund aims to achieve this investment objective primarily through investment in quoted equity and equity related securities (which shall comprise of preferred stock) which are (i) listed on or dealt in Recognised Markets in the UK, (ii) issued by companies with principal offices in the UK or (iii) issued by companies which exercise their primary economic activity in the UK.

10
GAM Star Fund p.l.c.
GAM Star UK Equity Income(Approved 21 December 2018. Not yet launched)The investment objective of the Fund is to invest at least 85% of its assets in GAM Funds – GAM UK Equity Income (" the Master Fund"), the investment objective of which is to provide income generation through investments primarily in UK equities. The Master Fund also seeks to achieve capital appreciation
GAM Star US All Cap EquityThe investment objective of the Fund is to achieve long-term capital appreciation through investing primarily in quoted securities in the United States of America issued by companies with principal offices in the United States of America. The Fund will invest in a broad spread of equities, and may invest in Fixed Income Securities and preferred stock listed on or dealt in a Recognised Market in the United States of America. It will be the policy of the Fund to invest primarily in equities.
GAM Star Worldwide EquityThe investment objective of the Fund is to provide capital appreciation primarily through investment in quoted securities on a worldwide basis. It will be the normal policy of the Fund to invest primarily in equities.
GAM Systematic Dynamic CreditThe investment objective of the Fund is to seek to achieve long-term capital growth through the generation of absolute returns from credit, interest rate and fixed income markets. The Fund aims to achieve this investment objective through the use of proprietary advanced modelling techniques which are used to identify appropriate investments for the Fund across all relevant asset classes.
GAM Systematic Dynamic Multi Asset(Approved on 27 August 2020. Not yet launched)The investment objective of the Fund is to achieve long-term capital growth by allocating across the following asset classes available across financial markets; equities, sovereign and corporate debt, commodities and currencies (predominantly G10, emerging market and other liquid currencies including Hungarian Forint, Singapore Dollar, Israeli Shekel and Turkish Lira), based upon a systematic, proprietary algorithm as further detailed below under “Investment Approach”. With the exception of permitted investments in unlisted securities, such equities and sovereign and corporate debt (such as Government bonds and Fixed Income Securities) will be listed or dealt on Recognised Markets worldwide.
General
In addition, please note the following in relation to the investment objectives and policies of the Funds:
(i) any Fund, the name of which contains a reference to a specific type of security, country or region will invest at least two thirds of its non-liquid assets in that specific type of security, country or region;
(ii) any Fund, the name of which contains a specific reference to a specific currency, will invest at least two thirds of its non-liquid assets in securities denominated in that specific currency;
(iii) where the investment policy of a Fund states that investments are made “primarily” in a specific type of security, country or region, that Fund will invest either directly or indirectly (through the use of financial derivative instruments) at least two thirds of its non-liquid assets in that specific type of security, country or region;
(iv) where the investment policy of a Fund refers to investments in companies of a specific country or region, this means (in the absence of any other definition) that these companies will have their registered office in the specific country or region stated, notwithstanding their being listed on any stock exchange mentioned in the investment policy of the Fund.

11
30 June 2020
GAM Star Alpha Spectrum Fund Manager: Julian Howard
Commentary (Unaudited)
The Fund (as measured by the EUR Accumulation share class) fell 1.4% over the year to 30 June 2020, underperforming its benchmark, the Average EUR 1 Month Deposit Rate which fell 0.4% in EUR terms.
In the third quarter of 2019 after a difficult summer for risk assets as the US-China trade dispute progressed alongside global growth concerns, investors returned in a bullish mood and drove equities higher in September as central banks remained supportive. Government bond yields declined markedly over the third quarter, helped by central bank easing and rising concerns about global growth. However, there was some retracement in early September as the US and China announced talks would resume in early October, which gave rise to a more optimistic outlook.
The geopolitical risks that dominated the markets for most of 2019 faded towards the end of the year, allowing global equities and corporate bonds to rally with developed market government bonds giving up some of their gains as yields rose. Trade uncertainty was reduced as a phase one deal between the US and China was announced; the US also did not impose tariffs on European Union auto exports and economic data picked up which collectively contributed to support equities. In commodities, crude prices were also driven higher by news of the US-China trade deal.
The start of the first quarter of 2020 saw global equities on a positive note following the signing of a phase one trade deal between the US and China but declined as the spread of coronavirus reduced investors’ appetite for risk and volatility picked up towards the end of January. Assets perceived as safe havens, such as government bonds, performed well with the turn in sentiment and yields fell significantly over the month as major central banks were set to remain accommodative. Concerns over the coronavirus outbreak and its potential impact on global growth replaced trade as the main focus for the markets over the month of February. Equity markets experienced a sharp sell off towards the end of the month after initially shrugging off concerns about the virus and government bond yields were markedly lower with US 10 and 30-year Treasury yields hitting all-time lows. March saw waterfall sell offs across all markets in the same league as the 1929 Wall Street crash, 1987 stock market crash, 2001 technology unwind and the 2008 Lehman Brothers failure, with the MSCI AC World down significantly to 31 March 2020. As the lockdowns and quarantines gathered pace, concerns about the duration of the crisis and its effect on the global economy mounted and investors and companies engaged in an asset fire sale in order to raise liquidity at literally any price. This meant that by mid-March those assets which normally provide more stability showed signs of strain, including even safe haven stalwarts such as government bonds and gold. Towards the end of the first quarter though, there were signs of market stability as governments around the world committed to supporting the economy with huge fiscal stimulus packages implicitly financed by central banks renewing their quantitative easing programmes.
The second quarter of 2020 saw global equities rebounding strongly as focus was on expectations that economies could gradually reopen and recover, in addition to governments and central banks introducing dramatic stimulus packages to reduce the damage caused by the lockdown. This helped to improve investor sentiment and drove the rebound in riskier assets. Government bond yields broadly declined over April as central banks committed to purchase more government and corporate bonds. As the focus in markets turned to lockdowns being lifted along with further support measures, equity markets rebounded further in the month of May. For many market commentators, it was hard to square the desperate fundamental picture of an economic crash and plunging corporate earnings outlooks with a buoyant equity market. Little wonder therefore that the move was described as the ‘hated rally’ in some quarters. A fast and comprehensive response from policymakers went some way to explaining the rebound. Underneath the headline moves investors were coolly assessing potential winners and losers in the months and years to come. Cyclical stocks rightly suffered amid this ‘great re-allocation’, while those areas deemed to have a promising future, notably technology, fared so well that they were able to drive the entire market upwards. June missing
The top three holdings contributing to performance were Natixis Loomis Sayles US Equity Leaders, UBS ETF (IE) S&P 500 ESG UCITS and Stonehage Fleming Global Best Ideas Equity Fund. The bottom three performers were Ashmore SICAV – Emerging Markets Short Duration Fund, Magallanes Value Investors UCITS, and Polar Capital Global Insurance Fund USD.
July 2020
Portfolio Statement
Analysis, by geographical area30 June2020 %
30 June2019 %
United States 50.00 17.26
Global 24.02 39.95
Japan 8.17 9.13
Europe 7.32 4.08
Emerging Markets Global 6.44 15.70
Asia-Pacific ex Japan – 3.82
Luxembourg – 1.97
Ireland – 6.69
Currency Forwards (0.12) 0.19
Net Current Assets 4.17 1.21
100.00 100.00
Analysis, by investment30 June2020 %
30 June2019 %
Equity Funds 40.78 59.55
Exchange Traded Funds 39.87 8.95
Bond Funds 15.30 23.30
Diversified Funds – 6.80
Currency Forwards (0.12) 0.19
Net Current Assets 4.17 1.21
100.00 100.00

12
30 June 2020
GAM Star Alpha Spectrum
Portfolio Statement
Holdings Description Fair Value€
Net Assets%
Bond Funds*
196,539 GAM Star Credit Opportunities (EUR) Inst Acc** 2,889,068 4.87
268,378 GAM Star MBS Total Return Institutional Hedged EUR Acc** 2,810,717 4.73
211,133 PIMCO GIS Mortgage Opportunities Fund Inst EUR Hedged Acc 2,153,555 3.63
91,606 GAM Star Cat Bond EUR Institutional Acc** 1,230,533 2.07
9,083,873 15.30
Equity Funds*
2,493,363 Natixis Loomis Sayles US Equity Leaders – Class Q Inst Acc USD 6,595,985 11.11
536,155 GAM Star Japan Leaders Z JPY Acc** 4,852,302 8.17
23,346 Stonehage Fleming Global Best Ideas Equity Fund USD B Acc 4,184,295 7.05
532,817 Polar Capital Global Insurance Fund USD I Acc 3,820,161 6.44
2,039 GAM Emerging Markets Equity EUR S*** 2,620,231 4.41
21,238 GAM Star (Lux) – Merger Arbitrage I EUR*** 2,135,966 3.60
24,208,940 40.78
Exchange Traded Funds*
535,529 UBS ETF (IE) S&P 500 ESG UCITS ETF USD A-acc 9,807,979 16.52
4,304 iShares Edge MSCI USA Quality Factor UCITS ETF 4,377,001 7.37
43,497 iShares EUR Ultrashort Bond UCITS ETF 4,347,090 7.32
17,931 Invesco EQQQ Nasdaq-100 UCITS ETF USD 3,936,151 6.63
276,600 iShares MSCI EM ESG Enhanced UCITS ETF 1,205,500 2.03
23,673,721 39.87
Purchase Currency
Contractual Amount
SaleCurrency
ContractualAmount
MaturityDate
Counterparty Unrealised Loss
€
Net Assets%
Open Forward Contracts
EUR 5,292,306 USD (6,026,010) 2020-07-10 UBS (72,088) (0.12)
Unrealised loss on Open Forward Contracts (72,088) (0.12)
Fair Value€
Net Assets%
Net Financial Assets and Liabilities at fair value 56,894,446 95.83
Net Current Assets (excluding Financial Assets and Financial Liabilities at fair value) 2,474,199 4.17
Net assets attributable to the shareholders of the Fund 59,368,645 100.00
Analysis of Total Assets %
UCITS collective investment schemes 95.72
Other Assets 4.28
100.00
* Typically each of the above collective investment schemes may charge management fees of up to 2% per annum of their NAV and performance fees of up to 20% of the increase of performance for a predetermined period of time subject to any applicable hurdle rates.** Investment in other GAM Star Funds.*** Investment in other GAM Funds.
In line with the requirements of the UCITS regulation S.I. No. 344/2017 the open Forward Contracts have been condensed in the Portfolio Statement based on the purchase and sale currency, maturity date, counterparty and unrealised gain or unrealised loss of the contract as at the year end.

13
30 June 2020
GAM Star Alpha Spectrum
Portfolio Changes (Unaudited)
Major Purchases Cost€
Natixis Loomis Sayles US Equity Leaders – Class Q Inst Acc USD 7,029,685
UBS ETF (IE) S&P 500 ESG UCITS ETF USD A-acc 5,086,307
iShares EUR Ultrashort Bond UCITS ETF 4,355,385
iShares Edge MSCI USA Quality Factor UCITS ETF 4,173,527
Invesco EQQQ Nasdaq-100 UCITS ETF USD 3,872,984
Polar Capital Global Insurance Fund USD I Acc 2,251,634
PIMCO GIS Mortgage Opportunities Fund Inst EUR Hedged Acc 2,162,000
GAM Star (Lux) – Merger Arbitrage I EUR 2,162,000
Magallanes Value Investors UCITS – European Equity 1,461,000
GAM Star Cat Bond EUR Institutional Acc 1,231,000
iShares MSCI EM ESG Enhanced UCITS ETF 1,209,095
Stewart Investors Asia Pacific Leaders Fund 81
Total for the financial year 34,994,698
There were no other purchases and sales during the year.
Major Sales Proceeds€
Fidelity Funds – America Fund 5,669,513
JPMorgan Investment Funds – Gbl Macro Opps C acc EUR 5,224,149
GAM Star Credit Opportunities (EUR) Inst Acc 5,203,996
Ashmore SICAV – Emerging Markets Short Duration Fund – Inst 5,135,002
Stewart Investors Asia Pacific Leaders Fund 4,658,925
Merian Global Equity Absolute Return Fund I EUR Acc 4,304,921
Stonehage Fleming Global Best Ideas Equity Fund USD B Acc 4,202,801
Magallanes Value Investors UCITS – European Equity 3,410,978
GAM Star Japan Leaders Z JPY Acc 2,244,196
Prusik Asian Equity Income Fund 2X 2,153,586
iShares Emerging Markets Local Government Bond UCITS ETF 2,116,440
Polar Capital Global Insurance Fund USD I Acc 1,939,417
Orbis SICAV – Global Equity Fund 1,845,659
Magallanes Value Investors UCITS – Iberian Equity 1,474,734
Natixis Loomis Sayles US Equity Leaders – Class Q Inst Acc USD 1,152,492
MAN Funds PLC – MAN GLG Japan CoreAlpha Equity 736,578
UBS ETF (IE) S&P 500 ESG UCITS ETF USD A-acc 555,881
Total for the financial year 52,029,268

14
30 June 2020
GAM Star Alpha TechnologyFund Manager: Mark Hawtin
Commentary (Unaudited)
The Fund (as measured by the USD Income class) rose 0.4% over the year to 30 June 2020, underperforming its benchmark, the Average USD 1 Month Deposit Rate which rose to 1.8% in USD terms.
At first glance the third quarter of 2019 looked like a non-eventful quarter with the S&P gaining +1.7% and the Nasdaq 100 +1.3%, however a closer look shows high levels of volatility with markets posting big losses in August and regaining ground in September. Much of the volatility has been due to commentary over US-China trade talks. The rhetoric during August was decidedly negative and during the month there were three days where the S&P was -2%. In contrast September news flow turned more positive with an agreement to meet in early October and tweets from Trump suggesting a deal would be done ahead of the 2020 election. The backdrop of uncertainty proved to be ideal for long/short investing with investors punishing companies that reported weak numbers rather than giving them the benefit of the doubt. The GAM Star Alpha Technology Fund outperformed all benchmark indices by a wide margin.
The fourth quarter of 2019 was the culmination of a strong year, with markets continuing to reach new highs. The S&P gained 8.5% during the quarter and was up 10 of the last 11 weeks of the year with very low volatility. This is a complete reversal of 2018, where all asset classes provided negative returns. For much of the year, the US-China trade war has dominated discussions and put pressure on the markets. News flow regarding these talks improved in October and November, climaxing with phase one of a trade deal being struck in mid December. On the same day, the Conservative Party won the UK general election, thus removing much of the uncertainty surrounding Brexit. The Federal Reserve (Fed) ended the year suggesting that rates would remain low for the foreseeable future. During the quarter the Fund, with a strong long book contribution setting off a strong bounce back from shorts.
At the start of quarter one of 2020 the focus was on the US and China signing a trade deal, Brexit negotiations, the start of the US election cycle and earnings growth. By the end of the quarter the focus had shifted entirely to the coronavirus and its horrific impact both physically and economically. As news-flow deteriorated during the quarter, policymakers scrambled to respond. By the end of the quarter there had been a global policy response of unprecedented proportion. In addition, by the end of the quarter over a third of the global population was in lockdown, including much of Europe, parts of the US and Canada, India, and parts of Asia. The S&P reached an all-time high in quarter one before selling off precipitously and posting 11 of the worst days for the market in a decade. GAM Star Alpha Technology was well set up for the market declines. We had reduced exposure in the latter part of 2019 and were quick to add to the short side as soon as the virus was clearly a global issue. While we never moved to an outright neutral or short position given our view on the prospects for disruption over time, we did manage to outperform the benchmark.
2020 started with a lot of promise. There were hopes of a trade deal between the US and China, the UK was finally moving forward with Brexit, an election cycle in the US began, and there was the promise of earnings' growth. By mid-February, all this promise had been forgotten and markets became singularly focused on the spread globally of the deadly coronavirus. By mid-March, the S&P had fallen significantly and had achieved its worst quarter since the peak of the global financial crisis (GFC). As we entered Q2, most of the world was in lockdown, bringing with it a slew of appalling economic data. Despite that backdrop, the S&P posted its best return since Q4 1998, only a few percent away from all-time highs, and the Nasdaq its best return since Q4 2001.
Two factors drove this outstanding market performance. Firstly, global fiscal and monetary stimulus, and secondly, the surge in retail investors. The global fiscal and monetary policy responses have been unprecedented in size – the ‘free’ money has brought with it a surge in retail investors through platforms like Robinhood. Many of these ‘investors’ approach trading in the same way they would sports gambling. By the end of the quarter, it felt like all news was good news and no valuation was too high. This backdrop was a difficult one for a long short strategy built on intrinsic valuation and fundamental research. While the long book bounced strongly, shorts moved up at a more rapid pace as the dash for trash gained momentum. Over the quarter the Fund fell, eclipsing the great work done in March, where capital was well preserved in the selloff. In short, while the Fund lost very little in the fall, it did not make anything in the rally either.
As we look forward, the focus shifts to Q2 earnings. In general, expectations are for disappointing results as most countries were in lockdown for much of the quarter. That being said, beneficiaries of ‘remote working’ and lockdown orders have high expectations and will be punished if they do not deliver. As with the Q1 reporting season, more emphasis will be placed on current snapshots and any future guidance versus backward looking results. Although many countries are now easing their way out of lockdowns and attempting to return to ‘life before Covid’, the fear of a second wave remains, as does the hope of a vaccine. It is becoming evident that life is not going to return to what it was in 2019, and that to succeed in this new reality, enterprises must adapt and digitalise. Having digital at your core is no longer ‘nice to have’, but rather a ‘must have’. The Fund is positioned to continue to take advantage of this trend, as it is clear we are still in the early innings. The short book was adjusted as the quarter progressed to reflect the ‘retail’ frenzy and the buy at any price mentality. There are a bucket of names that now look really interesting as possible high return shorts when economic activity normalises, but we await the catalyst for that before engaging in this list in any size. The result is a positioning that will better capture the long exposure of the Fund until a turning point is more evident.
The top three holdings contributing to performance were Amazon, Afterpay and Microsoft. The bottom three performers were Wayfair, Tesla and Etsy.
July 2020

15
30 June 2020
GAM Star Alpha Technology
Portfolio Statement
Analysis, by geographical area30 June2020 %
30 June2019 %
United States 65.75 79.45
China 7.64 3.35
United Kingdom 4.91 0.39
Israel 4.90 0.60
Japan 3.05 0.95
Germany 1.89 0.14
Australia 1.53 1.25
Norway 0.40 –
Netherlands – 2.08
Denmark – 1.85
France (0.05) –
India (0.09) –
Currency Forwards 1.54 0.66
Net Current Assets 8.53 9.28
100.00 100.00
Analysis, by industry sector30 June2020 %
30 June2019 %
Software & Services 27.76 32.83
Media & Entertainment 11.82 5.78
Retailing 10.35 5.88
Fixed Interest 9.02 14.35
Semiconductors & Semiconductor Equipment 6.05 9.27
Health Care Equipment & Services 5.61 3.62
Diversified Financials 4.39 (0.16)
Technology Hardware & Equipment 3.89 8.65
Telecommunication Services 3.54 –
Capital Goods 3.05 0.95
Consumer Services 2.29 –
Consumer Durables & Apparel 2.19 5.91
Food & Staples Retailing 1.52 3.01
Automobiles & Components (0.21) (0.02)
Commercial & Professional Services (0.26) –
Transportation (0.27) (0.10)
Real Estate (0.81) 0.09
Currency Forwards 1.54 0.66
Net Current Assets 8.53 9.28
100.00 100.00
Analysis, by investment30 June2020 %
30 June2019 %
Equities Quoted 86.10 71.95
Government Bonds 9.02 14.35
Equities Unquoted 1.50 4.07
Preference Shares 0.08 –
Contracts for Difference (6.77) (0.31)
Currency Forwards 1.54 0.66
Net Current Assets 8.53 9.28
100.00 100.00
Analysis of Credit Ratings (S&P)30 June
202030 June
2019
Government Bonds AA+ AA+

16
30 June 2020
GAM Star Alpha Technology
Portfolio Statement
Holdings Description Fair ValueUS$
Net Assets%
Equities Quoted
8,614 Microsoft 1,753,035 5.65
6,789 Alibaba Group Holding-Sp ADR 1,464,387 4.72
83,782 Plus500 1,361,820 4.39
472 Amazon.Com 1,302,163 4.20
5,349 Facebook 1,214,597 3.91
11,209 Akamai Technologies 1,200,372 3.87
782,284 BT Group 1,102,397 3.55
693 Alphabet Inc Com. A 982,709 3.17
5,300 Fanuc 946,174 3.05
18,251 Micron Technology 940,292 3.03
1,612 Intuitive Surgical 918,566 2.96
11,654 Omnicell 823,005 2.65
16,583 Seagate Technology 802,783 2.59
12,449 Jd.Com ADRs 749,181 2.41
1,524 Netflix 693,481 2.23
18,395 Marvell Technology Group 644,929 2.08
5,774 Guidewire Software 640,048 2.06
7,771 PTC 604,506 1.95
5,733 Siltronic 584,534 1.88
7,535 New Relic 519,162 1.67
27,703 Pure Storage 480,093 1.55
11,298 Afterpay 474,421 1.53
1,560 Costco Wholesale 473,008 1.52
19,724 SVMK 464,303 1.50
4,249 Pegasystems 429,871 1.39
2,027 Visa 391,556 1.26
912 ServiceNow 369,415 1.19
1,340 EPAM Systems 337,693 1.09
759 Adobe Inc 330,400 1.06
1,078 Mastercard 318,765 1.03
14,590 Dropbox 317,624 1.02
14,185 Pinterest 314,481 1.01
4,590 Chegg 308,723 0.99
30,577 Kainos Group 282,979 0.91
7,796 Cloudflare 280,266 0.90
2,441 Walt Disney Co 272,196 0.88
4,370 Peloton Interactive 252,455 0.81
2,061 Roku 240,168 0.77
3,006 Starbucks 221,212 0.71
35,255 SDL 217,806 0.70
687 Wix.com 176,023 0.57
4,386 2U† 166,493 0.54
2,321 Tal Education Group- Adr 158,710 0.51
36,949 Kahoot! 122,563 0.40
5,804 Zuora 74,001 0.24
26,723,366 86.10
† Partial amount of security on loan as at 30 June 2020. Refer to note 5 for further information on securities lending.

17
30 June 2020
GAM Star Alpha Technology
Portfolio Statement
Holdings Description Fair ValueUS$
Net Assets%
Equity Unquoted**
142,320 Afiniti International Class C Pref.*** 464,675 1.50
464,675 1.50
Preference Shares
1,288 Overstock.Com Inc 24,472 0.08
24,472 0.08
Government Bonds
1,300,000 United States Treasury Bill 0% 2020-10-29 (1,300,000 units held as collateral)* 1,299,354 4.19
1,000,000 United States Treasury Bill 0% 2020-12-17 (1,000,000 units held as collateral)* 999,341 3.22
500,000 United States Treasury Bill 0% 2020-11-12 (500,000 units held as collateral)* 499,724 1.61
2,798,419 9.02
Holdings Description Counterparty Fair ValueUS$
Net Assets%
Contracts for Difference
(48,795) Micro Focus International CFDs Goldman Sachs 76,249 0.25
(19,423) Slack Technologies CFDs Goldman Sachs 23,620 0.08
(4,584) DraftKings CFDs Goldman Sachs 21,470 0.07
(65,861) Rightmove CFDs Goldman Sachs 5,029 0.02
(12,778) Infineon Technologies CFDs Goldman Sachs 1,814 0.01
(2,462) Texas Instruments CFDs Goldman Sachs 1,531 0.00
(5,289) Zillow Group CFDs Goldman Sachs (2,394) (0.01)
(10,255) AT&T CFDs Goldman Sachs (4,120) (0.01)
(1,342) Monolithic Power Systems CFDs Goldman Sachs (12,607) (0.04)
(2,599) Digital Realty Trust CFDs Goldman Sachs (13,281) (0.04)
(2,738) Check Point Software Technologies CFDs Goldman Sachs (15,660) (0.05)
(2,759) Capgemini CFDs Goldman Sachs (15,824) (0.05)
(4,889) Arrow Electronics CFDs Goldman Sachs (18,173) (0.06)
(4,009) Fastly CFDs Goldman Sachs (23,390) (0.08)
(7,756) ASOS CFDs Goldman Sachs (26,028) (0.08)
(30,158) Teradata CFDs Goldman Sachs (26,456) (0.09)
(103,167) Wipro Ltd-Adr CFDs Goldman Sachs (27,583) (0.09)
(2,490) International Business Machines CFDs Goldman Sachs (30,131) (0.10)
(25,024) WANdisco CFDs Goldman Sachs (32,775) (0.11)
(139,141) GoPro CFDs Goldman Sachs (37,472) (0.12)
(27,301) Softcat CFDs Goldman Sachs (39,041) (0.13)
(3,421) salesforce.com CFDs Goldman Sachs (39,598) (0.13)
(14,421) NetApp CFDs Goldman Sachs (56,530) (0.18)
(6,366) Citrix Systems CFDs Goldman Sachs (61,872) (0.20)
(87,513) Sage Group CFDs Goldman Sachs (63,238) (0.20)
(176) Tesla Motors CFDs Goldman Sachs (66,715) (0.21)
(1,890) Zoom Video Communications CFD Goldman Sachs (72,002) (0.23)
(1,720) Wayfair CFDs Goldman Sachs (75,009) (0.24)
(40,945) Nielsen Holdings CFDs Goldman Sachs (80,295) (0.26)
* Held as collateral with Goldman Sachs for OTC positions.** Level 3 investments.*** Valued using Market Approach.

18
30 June 2020
GAM Star Alpha Technology
Portfolio Statement
Holdings Description Counterparty Fair ValueUS$
Net Assets%
Contracts for Difference, continued
(372) Booking Holdings CFDs Goldman Sachs (83,693) (0.27)
(18,500) Lyft CFDs Goldman Sachs (84,127) (0.27)
(1,035) Broadcom CFDs Goldman Sachs (136,613) (0.44)
(4,853) Etsy CFDs Goldman Sachs (142,012) (0.46)
(3,079) Skyworks Solutions CFDs Goldman Sachs (144,788) (0.47)
(2,239) RingCentral CFDs Goldman Sachs (166,818) (0.54)
(1,719) Spotify Technology CFDs Goldman Sachs (173,154) (0.56)
(30,815) Box CFDs Goldman Sachs (220,902) (0.71)
(16,574) Redfin CFDs Goldman Sachs (239,350) (0.77)
Unrealised gain on Contracts for Difference 129,713 0.43
Unrealised loss on Contracts for Difference (2,231,651) (7.20)
(2,101,938) (6.77)
Purchase Currency
Contractual Amount
SaleCurrency
ContractualAmount
MaturityDate
Counterparty Unrealised Gain/(Loss)
US$
Net Assets%
Open Forward Contracts
EUR 12,344,500 USD (13,485,809) 2020-07-08 Bank of America 380,610 1.22
GBP 5,552,800 USD (6,762,533) 2020-07-08 Bank of America 98,748 0.32
USD 13,640,768 EUR (12,076,700) 2020-07-08 Bank of America 75,166 0.24
USD 6,899,059 GBP (5,526,400) 2020-07-08 Bank of America 70,399 0.23
USD 200,065 EUR (177,800) 2020-08-10 Bank of America 202 0.00
USD 7,744 EUR (6,900) 2020-08-10 Bank of America (12) (0.00)
USD 150,524 GBP (122,200) 2020-07-08 Bank of America (473) (0.00)
USD 87,601 GBP (71,300) 2020-08-10 Bank of America (518) (0.00)
EUR 98,900 USD (111,699) 2020-07-08 Bank of America (607) (0.00)
GBP 95,800 USD (120,182) 2020-07-08 Bank of America (1,807) (0.01)
USD 406,859 EUR (366,700) 2020-07-08 Bank of America (5,051) (0.02)
GBP 5,150,700 USD (6,426,162) 2020-08-10 Bank of America (60,399) (0.19)
EUR 12,076,000 USD (13,651,260) 2020-08-10 Bank of America (76,597) (0.25)
Unrealised gain on Open Forward Contracts 625,125 2.01
Unrealised loss on Open Forward Contracts (145,464) (0.47)
479,661 1.54

19
30 June 2020
GAM Star Alpha Technology
Portfolio Statement
Fair ValueUS$
Net Assets%
Net Financial Assets and Liabilities at fair value 28,388,655 91.47
Net Current Assets (excluding Financial Assets and Financial Liabilities at fair value) 2,648,473 8.53
Net assets attributable to the shareholders of the Fund 31,037,128 100.00
Analysis of Total Assets %
Transferable securities admitted to official stock exchange listing 79.38
Other transferable securities of the type referred to in Regulation 68(1)(a), (b) and (c) 9.68
OTC financial derivative instruments 2.24
Other Assets 8.70
100.00
In line with the requirements of the UCITS regulation S.I. No. 344/2017 the open Forward Contracts have been condensed in the Portfolio Statement based on the purchase and sale currency, maturity date, counterparty and unrealised gain or unrealised loss of the contract as at the year end.

20
30 June 2020
GAM Star Alpha Technology
Portfolio Changes (Unaudited)
Major Purchases CostUS$
Micron Technology 3,075,867
Microsoft 2,537,785
Alphabet Inc Com. A 2,178,947
Facebook 2,031,023
Siltronic 1,830,740
Amazon.Com 1,803,646
Seagate Technology 1,715,947
Alibaba Group Holding-Sp ADR 1,683,707
Akamai Technologies 1,604,702
BT Group 1,496,047
Netflix 1,371,128
Nortonlifelock 1,343,266
United States Treasury Bill 0% 2020-10-29 1,299,314
United States Treasury Note/Bond 1.375% 2020-04-30 1,298,680
Plus500 1,265,649
Netcompany Group 1,242,162
ASML Holding 1,223,776
Mastercard 1,182,847
Intuitive Surgical 1,158,479
Infineon Technologies 1,141,425
United States Treasury Bill 0% 2020-12-17 999,193
United States Treasury Bill 0% 2020-06-25 992,478
Dada Nexus 990,460
Visa 958,880
Zalando SE 947,606
Fanuc 919,294
Hewlett Packard 907,693
Omnicell 901,567
Zillow Group 893,184
Walt Disney 881,443
Guidewire Software 838,612
Cisco Systems 817,353
Pure Storage 815,613
Blue Prism Group 809,018
New Relic 808,928
Pinterest 739,699
Jd.Com ADRs 731,953
Marvell Technology Group 658,624
Dixons Carphone 641,615
Tencent Holdings 629,210
Total for the financial year 49,367,560
Major Sales ProceedsUS$
Micron Technology 2,957,357
Seagate Technology 1,967,660
ASML Holding 1,812,812
Netcompany Group 1,749,450
Facebook 1,684,737
Visa 1,672,341
Mastercard 1,631,987
Amazon.Com 1,626,963
Alphabet Inc Com. A 1,552,032
Nortonlifelock 1,473,418
Walt Disney Co 1,283,185
Siltronic 1,275,479
Cisco Systems Inc 1,237,130
Docusign 1,184,306
Infineon Technologies 1,168,832
Dada Nexus 1,125,870
Zalando SE 1,031,760
Microsoft 1,023,021
Alibaba Group Holding-Sp ADR 965,432
Afterpay 956,986
Blue Prism Group 909,737
Netflix 832,551
Intuitive Surgical 824,543
Xilinx 818,710
Zillow Group 814,120
Pegasystems 803,825
Hewlett Packard 789,999
Costco Wholesale 747,323
PayPal Holdings 727,375
Meituan Dianping 677,961
Adobe Inc 621,956
Tencent Holdings 611,667
ServiceNow 609,856
Dropbox 606,372
Roku 604,665
Wix.com 588,698
Dixons Carphone 566,200
Pure Storage 531,063
Total for the financial year 42,067,379

21
30 June 2020
GAM Star Asian EquityFund Manager: Rob Mumford
Commentary (Unaudited)
The Fund (as measured by the USD Accumulation class) rose 10.9% over the year to 30 June 2020, outperforming its benchmark, the MSCI AC ex Japan Index which rose 2.8% in USD terms.
The third quarter of 2019 started on a positive note, however July finished the month sharply weaker and this weakness continued into August. September started on a better note with a more conciliatory tone from the US regarding US China trade talks and more visibility on central bank easing (China cut the reserve requirement rate and imminent easing was expected from European Central Bank (ECB) and the Federal Reserve (Fed)) triggering an early rally and strong rotation from growth to value stocks (the index was up over 5% by mid-month). However the positive shift proved short lived despite rate cuts from both the US and ECB (and regional economies) as weak global macro data continued to put pressure on markets leading to a marginal gain of 1.5% over the month (MXFEJ Index).
After a slow start to the fourth quarter of 2019 Asia Pacific equities finished strongly in line with global markets after the confirmation of a “Phase 1” China US trade deal, ongoing evidence of positive economic trends and additional policy support from around the region led to strong returns in the quarter.
After a strong start to quarter one of 2020 driven by ongoing positive global industrial momentum, a weaker USD and further policy support (particularly out of China), the Wuhan coronavirus outbreak led to sharp weakness towards the end of the month with the index finishing down 4.5%. February was another choppy month with early index gains due to lower infection rates in China (index up 5% by mid-month) sharply eroded as COVID-19 infection cases started to accelerate offshore leading to international capital market weakness and the index (MSCI Asia ex Japan) to finish in negative territory. March was a difficult month, with the accelerating spread of Covid-19 plus the collapse of the oil price due to the fallout within OPEC+ leading to market dysfunction and sharp falls in global markets, including the Asia-ex Japan Index. The Fund underperformed as the positive ASEAN and India underweight was offset by negative sector and stock positioning in financials and to a lesser degree consumer discretionary and technology. Year-to-date the Fund is behind the index after outperforming in 2019.
The start of quarter two of 2020 saw equity markets rebounded sharply driven by signs of Covid-19 infections peaking across key regions including the eurozone and select US states and policymakers globally adopting a “whatever it takes” approach to stimulus. Asia’s virus trends continued to improve particularly in China (also South Korea and Vietnam) while policy action remains highly supportive. Although in May, despite a broader improvement in risk appetite (developed markets up 4%), Asia remained under the shroud of a re-escalation in US China tension, which led the Hong Kong index down as much as 9% over May. The Asia X Japan Index fell by 1.1%, though outside of greater China, particularly towards the end of the month, we saw positive credit and commodity moves support markets such as Malaysia up 5%, Thailand up 4% and Indonesia up 3%.June saw a strong performance from Asian equity markets including significantly outpacing world markets. Over June the MSCI Asia ex-Japan Index rose by 8.4% (versus MSCI World up 2.7%) while GAM Star Asian Equities significantly outperformed the index driven by a strong performance from China and Taiwan exposure across IT, consumer discretionary and consumer services. Underweights across the underperforming South Asia (particularly Thailand and Malaysia up just 2.1% and 2.7% respectively) also made positive relative contributions. The Fund is significantly ahead of the index year-to-date.
The top three holdings contributing to performance were Sea Ltd, Taiwan Semi Conductor Manufacturing and Tencent. The bottom three performers were Axis Bank, State Bank of India and Bank Rakyat Indonesia.
July 2020
Portfolio Statement
Analysis, by geographical area30 June2020 %
30 June2019 %
China 41.64 46.21
Taiwan 15.60 12.72
Korea, Republic of 15.42 14.88
India 9.07 –
Hong Kong 5.00 11.93
Thailand 4.22 5.29
Philippines 2.88 0.98
Indonesia 2.15 3.26
Australia 0.92 –
Singapore 0.83 4.13
Currency Forwards – (0.00)
Net Current Assets 2.27 0.60
100.00 100.00
Analysis, by industry sector30 June2020 %
30 June2019 %
Technology Hardware & Equipment 14.39 12.09
Retailing 13.36 7.57
Media & Entertainment 12.26 12.76
Semiconductors & Semiconductor Equipment 11.15 12.57
Banks 8.29 12.11
Materials 5.08 3.14
Real Estate 5.06 9.27
Diversified Financials 4.41 2.65
Capital Goods 3.79 1.84
Insurance 3.75 6.18
Consumer Services 2.90 7.39
Energy 2.59 2.10
Pharmaceuticals & Biotechnology 2.43 3.93
Food Beverage & Tobacco 2.38 2.66
Consumer Durables & Apparel 2.35 1.63
Automobiles & Components 1.62 –
Transportation 0.96 –
Software & Services 0.96 –
Telecommunication Services – 1.51
Currency Forwards – (0.00)
Net Current Assets 2.27 0.60
100.00 100.00
Analysis, by investment30 June2020 %
30 June2019 %
Equities Quoted 97.68 99.31
Equity Warrants 0.05 0.09
Currency Forwards – (0.00)
Net Current Assets 2.27 0.60
100.00 100.00

22
30 June 2020
GAM Star Asian Equity
Portfolio Statement
Holdings Description Fair ValueUS$
Net Assets%
Equities Quoted
81,624 Alibaba Group Holding 2,207,520 7.45
49,686 Samsung Electronics 2,181,004 7.36
32,700 Tencent Holdings 2,103,757 7.10
147,000 Taiwan Semiconductor Manufacturing Company 1,559,457 5.27
9,139 Sea Ltd-Adr 994,049 3.36
7,000 Largan Precision 969,174 3.27
12,998 SK Hynix 919,591 3.10
42,000 MediaTek 824,213 2.78
33,150 Reliance Industries 744,631 2.51
18,549 Baozun Inc-Spn Adr 713,580 2.41
2,998,300 Bank Rakyat Indonesia Persero Tbk 635,971 2.15
112,000 Delta Electronics 635,835 2.15
14,365 Hong Kong Exchanges and Clearing 611,667 2.07
4,660 New Oriental Educatio-Sp Adr 611,299 2.06
176,000 China Overseas Land & Investment 532,538 1.80
8,305 Jd.Com ADRs 494,812 1.67
98,393 China Merchants Bank 452,605 1.53
35,957 Larsen & Toubro 444,630 1.50
41,037 Lexinfintech Holdings L-ADRs 436,223 1.47
225,600 CSPC Pharmaceutical Group 426,163 1.44
351,000 China Aoyuan Group 424,368 1.43
8,257 SKC 418,736 1.41
41,300 Ping An Insurance Group of China A (XSSC) 416,847 1.41
1,900 Kweichow Moutai A (XSSC) 392,908 1.33
962 LG Chem 392,286 1.32
24,500 Sunny Optical Technology Group Company 391,997 1.32
92,500 China Conch Venture Holdings 390,288 1.32
751,125 Welspun India 369,575 1.25
177,000 China Life Insurance 356,282 1.20
36,000 AIA Group 335,843 1.13
48,000 Merida Industry 327,001 1.10
82,000 China Mengniu Dairy 313,185 1.06
206,000 Asia Cement 304,415 1.03
2,493 Baidu ADR’s 302,376 1.02
435,700 Ayala Land 295,568 1.00
16,000 Wuxi Biologics Cayman 292,746 0.99
90,000 BOC Hong Kong Holdings 286,256 0.97
919,000 Wilcon Depot 285,522 0.96
62,767 Adani Ports & Special Economic Zone 285,472 0.96
38,624 HCL Technologies 285,010 0.96
37,557 Woori Financial Group 275,078 0.93
205,930 Lynas 272,636 0.92
365,000 Metropolitan Bank & Trust 271,049 0.92
114,035 State Bank of India 268,158 0.91
35,395 Hanon Systems 266,599 0.90
49,545 Axis Bank 265,364 0.90
137,000 CITIC Securities 259,149 0.87
242,000 Central Retail PCL F 256,426 0.87
63,200 Sands China 247,906 0.84

23
30 June 2020
GAM Star Asian Equity
Portfolio Statement
Holdings Description Fair ValueUS$
Net Assets%
Equities Quoted, continued
40,800 City Developments 245,848 0.83
13,176 Momo Inc ADRs 230,580 0.78
296,000 Guangzhou Automobile Group 213,501 0.72
128,000 Xinjiang Goldwind Science & Technology A (XSHE) 180,399 0.61
801 POSCO 115,870 0.39
124,200 Xinjiang Goldwind Science & Technology 106,411 0.36
53,680,000 China Trends Holdings 69,264 0.23
2,210 Reliance Industries 23,123 0.08
28,932,761 97.68
Equity Warrants
10,736,000 China Trends Holdings Wts March 2021 13,853 0.05
13,853 0.05
Fair ValueUS$
Net Assets%
Net Financial Assets and Liabilities at fair value 28,946,614 97.73
Net Current Assets (excluding Financial Assets and Financial Liabilities at fair value) 672,221 2.27
Net assets attributable to the shareholders of the Fund 29,618,835 100.00
Analysis of Total Assets %
Transferable securities admitted to official stock exchange listing 97.38
Other Assets 2.62
100.00

24
30 June 2020
GAM Star Asian Equity
Portfolio Changes (Unaudited)
Major Purchases CostUS$
Samsung Electronics 1,450,493
Ping An Insurance Group of China A (XSSC) 1,323,964
Alibaba Group Holding 1,259,430
Taiwan Semiconductor Manufacturing Company 1,109,597
Tencent Holdings 1,002,822
New Oriental Educatio-Sp Adr 826,891
Bank Rakyat Indonesia Persero Tbk 710,104
Reliance Industries 696,161
Largan Precision 637,775
China Overseas Land & Investment 636,503
China Life Insurance 622,649
SK Hynix 621,551
Baozun Inc-Spn Adr 614,465
Lexinfintech Holdings L-ADRs 612,994
AIA Group 578,539
Sea Ltd-Adr 575,795
Delta Electronics 537,705
State Bank of India 505,831
Axis Bank 498,066
Jd.Com ADRs 498,008
Momo Inc ADRs 494,270
Sunny Optical Technology Group Company 482,230
Alibaba Group Holding-Sp ADR 425,372
Coway 410,556
China Aoyuan Group 406,973
Metropolitan Bank & Trust 399,416
Kweichow Moutai A (XSSC) 389,397
Larsen & Toubro 383,791
Longfor Group Holdings 382,353
China Conch Venture Holdings 381,549
CITIC Securities 377,304
MediaTek 370,108
Sands China 360,639
CNOOC 358,565
Merida Industry 348,975
Adani Ports & Special Economic Zone 337,727
China CITIC Bank 337,214
Hanon Systems 335,273
Hong Kong Exchanges and Clearing 333,588
China Mengniu Dairy 330,942
Vipshop Holdings Ltd 318,929
Welspun India 306,697
HCL Technologies 305,864
Asia Cement 304,786
Woori Financial Group 301,163
CSPC Pharmaceutical Group 287,147
Total for the financial year 24,790,171
Major Sales ProceedsUS$
Sea Ltd-Adr 1,065,549
Taiwan Semiconductor Manufacturing Company 991,231
Longfor Group Holdings 908,598
Tencent Holdings 804,435
AIA Group 723,627
New Oriental Educatio-Sp Adr 680,651
Ping An Insurance Group of China A (XSSC) 670,497
Ping An Insurance Group of China 552,602
Wuxi Biologics Cayman 453,168
Huazhu Group Ltd NPV 448,380
Luzhou Laojiao A (XSEC) 426,412
Vipshop Holdings Ltd USD 0.0001 346,983
CNOOC 346,724
Bank Rakyat Indonesia Persero Tbk 329,292
Coway 316,928
China CITIC Bank 312,646
MediaTek 289,090
PetroChina 281,672
Baozun Inc-Spn Adr 247,426
Weichai Power 243,830
Kasikornbank 242,550
CSPC Pharmaceutical Group 238,297
Sands China 237,898
Samsung Electronics 235,069
CK Asset Holdings 226,387
Oversea-Chinese Banking 216,898
Hong Kong Exchanges and Clearing 211,684
China Mobile 209,042
LG Chem 208,271
Jd.Com ADRs 199,709
Pinduoduo Inc Adr 183,188
Woori Financial Group 180,471
DBS 174,708
AAC Technologies Holdings 172,695
ASE Technology Holding 172,303
Total for the financial year 13,548,911

25
30 June 2020
GAM Star Global BalancedFund Manager: Charles Hepworth/James McDaid
Commentary (Unaudited)
The Fund (as measured by the GBP II Accumulation class) rose to 3.0% over the year to 30 June 2020, compared to its benchmark, Lipper Global Mixed Asset GBP Balanced which fell 1.0% in GBP terms.
The third quarter of 2019 saw equity markets as defined by the MSCI AC World index in local currency terms gain just over 1%. While this may appear unremarkable, the headline number hid a significant drop towards the end of July, as the US-China trade war intensified and the outlook for global growth and inflation darkened accordingly. Markets swiftly regained their poise as central banks stepped in to reduce interest rates and, in some cases, resume extraordinary stimulus measures. Simultaneously, major government bond markets took off as yields plummeted. Equity allocations remained broadly constant during the review period, with a reasonable weighting to the more stable US market maintained amid our belief that the Federal Reserve would have to respond to any trade-related slowdown. This expectation was met as the US central bank acted pre-emptively even while the economy remained in fair shape. Given the uncertainty surrounding the trade war, it is unsurprising that the gold position held within the strategy performed well. On the flipside, equity positions with a bias towards the emerging markets and Asia Pacific regions suffered as the trade war continued. The Cadence Strategic Asia fund fell slightly by 0.14%.
The fourth quarter of the year saw global indices climb, with the US equity markets surging to record highs, amid increased optimism for global reflation. Cyclical equity sectors such as industrials and financials fared better than safer bets such as utilities or consumer staples, as investors took the view that the synchronised global slowdown which began in 2017 was taking a turn for the better. These positive effects were compounded by the pricing out of some of the uncertainty that has recently haunted markets. That the UK was going to leave the European Union began to look certain under new Prime Minister Boris Johnson and this was all but confirmed by his election victory in December. At the same time, the US and China appeared to reach ‘phase one’ of a comprehensive trade deal after months of negotiations. Within the portfolio, the Polar Capital UK Value Opportunities fund was the standout performer seeing a gain of 14.13%. The Fund has a focus on domestic UK mid-cap stocks which have been held back by the uncertainty that has been hanging over the UK economy since the 2016 referendum. As the political situation became clearer with the results of the general election, this cloud has lifted somewhat and provided relief for the sector. However, the year ahead will define the ‘shape’ of Brexit and will be key to determining the outlook for ‘UK Inc’.
The first quarter of 2020 began brightly enough amid optimism over a US-China trade deal; however, by mid-February global stock markets had started to lose their poise over the rapid spread of the Covid-19 virus around the world. Large sell-offs followed across all markets, with the MSCI AC World falling 15.87% in sterling terms over the quarter. As the lockdowns and quarantines gathered pace, concerns about the duration of the crisis and its effect on the global economy mounted, and investors and companies engaged in an asset fire sale in order to raise liquidity at literally any price. This meant that by mid-March, those assets which normally provide more stability showed signs of strain, including ‘safe haven’ stalwarts such as government bonds. Towards the end of the month however, there were signs of market stability as governments around the world committed to supporting the economy with huge fiscal stimulus packages, implicitly financed by central banks, renewing their quantitative easing programmes. Equity allocations could not escape the absolute market falls. Some funds, such as the Polar Capital UK Value Opportunities fund, saw declines in excess of 30%. Exposure to technology was a relatively strong contributor, with the GAM Star Disruptive Growth fund registering a decline as well. This was in part because of increased demand for both home working and home entertainment. Crucially, the overall equity allocation was not cut ahead of improving sentiment towards the end of March.
If the first quarter of 2020 was characterised by waterfall moves in markets, the second quarter saw an almost equally sharp rebound, with the MSCI AC World Index in local currency terms up nearly 18% from the end of March to 30 June. A fast and comprehensive response from policymakers went some way to explaining the rebound. Central banks across the world rushed to reduce interest rates to or towards zero, while fiscal rectitude was abandoned as governments sought to incubate workers until the economy could be opened up again. Highlights of this ‘new responsiveness’ by the authorities included the UK’s more than nine million workers on government furlough and the US
Federal Reserve’s stated willingness to buy corporate bonds outright to ensure a continued flow of financing into the private sector. Equity weightings within the strategy were marginally increased, facilitating meaningful participation in the market rebound as investors favoured thematic, secular growth over uncertain, near-term cyclicality. The emphasis on the US equity market and, stylistically, growth over value was especially helpful during the review period. While value investing had some good days, growth stocks dominated the overall narrative. This theme was combined in equity portfolios with other secular growth sources such as emerging markets and disruptive technology. In fixed income and credit, developed market corporate bond spreads tightened as fears of mass defaults receded and central banks offered direct intervention in credit markets. This was constructive for the allocation to European subordinated financial debt. An emerging market debt holding that had seen some stress in the first quarter was also quick to recover its poise in the second. Stateside, non-agency mortgage-backed securities (MBS) paper made steady progress from its March sell-off.
The top three holdings contributing to performance were Loomis Sayles US Equity Leaders Fund, Coupland Cardiff – CC Japan Alpha Fund and GAM Star Disruptive Growth. The bottom three performers were Alken Continental Fund, Polar Capital – UK Value Opportunity Fund and River and Mercantile – World Recovery Fund.
July 2020
Portfolio Statement
Analysis, by geographical area30 June2020 %
30 June2019 %
Global 31.09 26.22
United Kingdom 18.40 11.90
United States 17.39 22.43
Japan 10.30 9.42
Europe ex UK 6.15 10.54
Emerging Markets Global 5.42 9.06
Asia-Pacific ex Japan 5.24 5.14
Currency Forwards (0.33) 0.15
Net Current Assets 6.34 5.14
100.00 100.00
Analysis, by investment30 June2020 %
30 June2019 %
Equity Funds 36.84 50.89
Bond Funds 33.57 18.01
Exchange Traded Funds 15.33 7.20
Other Funds 8.25 12.61
Diversified Funds – 6.00
Currency Forwards (0.33) 0.15
Net Current Assets 6.34 5.14
100.00 100.00

26
30 June 2020
GAM Star Global Balanced
Portfolio Statement
Holdings Description Fair Value£
Net Assets%
Bond Funds*
2,472,736 GAM Star Credit Opportunities GBP Z II Acc** 26,104,421 7.61
1,835,770 GAM Star MBS Total Return Inst GBP Acc** 20,402,385 5.94
146,190 Active Global High Income Bond Fund Z2 15,395,268 4.49
154,864 Active Global High Income Bond Fund Z1 15,213,870 4.43
9,410,099 JPM Global Macro Opportunities Fund 14,773,856 4.30
1,165,011 GAM Star MBS Total Return W GBP Acc** 13,723,943 4.00
50,912 RWC Global Emerging Markets Fund B GBP Acc 9,592,835 2.80
115,206,578 33.57
Equity Funds*
904,864 Coupland Cardiff Funds plc – CC Japan Alpha Fund 18,424,836 5.37
7,299,708 JPMorgan Fund ICVC – Japan Fund 16,920,722 4.93
494,241 GAM Star Disruptive Growth Z GBP Acc** 15,278,966 4.45
1,398,066 Polar Capital Funds PLC – UK Value Opport Fund S GBP Acc 14,190,374 4.13
10,486,061 Ninety One Funds Series I – UK Alpha Fund 13,519,678 3.94
7,465,068 Hermes Europe ex-UK Equity Fund M GBP Acc 11,295,395 3.29
9,786,029 Premier Pan European Property C Acc 9,858,446 2.87
11,301 Veritas Asian C GBP 9,375,838 2.73
5,464 GAM Emerging Markets Equity S GBP*** 9,006,321 2.62
5,399 CompAM Fund – Cadence Strategic Asia GBP C Acc 8,622,149 2.51
126,492,725 36.84
Exchange Traded Funds*
958,235 Amundi Prime USA ETF 18,161,428 5.29
397,990 iShares Physical Gold ETC 11,183,519 3.26
2,414,499 Amundi Msci Emerging Markets ETF 8,769,460 2.55
401,646 Amundi Prime Eurozone ETF 7,450,935 2.17
1,449,892 iShares Edge MSCI USA Value Factor UCITS ETF 7,071,848 2.06
52,637,190 15.33
Other Funds*
5,062,159 Loomis Sayles U.S. Equity Leaders Fund**** 18,504,215 5.39
119,515 Alken Fund – Continental Europe SGB1 Cap GBP Acc 9,827,742 2.86
28,331,957 8.25
Purchase Currency
Contractual Amount
SaleCurrency
ContractualAmount
MaturityDate
Counterparty Unrealised Gain
£
Net Assets%
Open Forward Contracts
USD 162,786,000 GBP (130,476,336) 2020-08-10 Bank of America 1,237,924 0.36
EUR 56,321,190 GBP (50,476,929) 2020-07-08 Bank of America 723,010 0.21
EUR 53,937,790 GBP (48,829,885) 2020-08-10 Bank of America 228,684 0.07
USD 7,272,100 GBP (5,788,187) 2020-07-08 Bank of America 97,089 0.03
* Typically each of the above collective investment schemes may charge management fees of up to 2% per annum of their NAV and performance fees of up to 20% of the increase of performance for a predetermined period of time subject to any applicable hurdle rates.** Investment in other GAM Star Funds. *** Investment in other GAM Funds. **** Not admitted to an official stock exchange.

27
30 June 2020
GAM Star Global Balanced
Portfolio Statement
Purchase Currency
Contractual Amount
SaleCurrency
ContractualAmount
MaturityDate
Counterparty Unrealised Gain/(Loss)
£
Net Assets%
Open Forward Contracts, continued
AUD 1,171,500 GBP (627,885) 2020-07-08 Bank of America 24,908 0.01
CHF 2,374,400 GBP (2,006,393) 2020-07-08 Bank of America 21,893 0.01
CHF 2,328,600 GBP (1,980,346) 2020-08-10 Bank of America 10,348 0.00
SGD 2,090,100 GBP (1,205,259) 2020-08-11 Bank of America 7,093 0.00
SGD 2,113,000 GBP (1,218,812) 2020-07-08 Bank of America 6,993 0.00
GBP 572,151 USD (701,000) 2020-07-08 Bank of America 4,833 0.00
AUD 1,157,200 GBP (642,832) 2020-08-10 Bank of America 1,947 0.00
GBP 261,503 USD (321,300) 2020-08-10 Bank of America 1,531 0.00
JPY 681,700 GBP (4,913) 2020-07-08 Bank of America 201 0.00
GBP 12,873 EUR (14,100) 2020-08-10 Bank of America 47 0.00
JPY 13,658,200 GBP (102,443) 2020-08-11 Bank of America 42 0.00
EUR 2,800 GBP (2,548) 2020-08-10 Bank of America (1) 0.00
GBP 103,596 JPY (13,818,200) 2020-07-08 Bank of America (66) 0.00
GBP 127,430 EUR (140,800) 2020-08-10 Bank of America (635) 0.00
JPY 13,136,500 GBP (100,357) 2020-07-08 Bank of America (1,809) 0.00
GBP 650,705 AUD (1,171,500) 2020-07-08 Bank of America (2,088) 0.00
USD 498,900 GBP (406,582) 2020-08-10 Bank of America (2,909) 0.00
GBP 712,784 USD (885,900) 2020-08-10 Bank of America (4,021) 0.00
GBP 1,218,452 SGD (2,113,000) 2020-07-08 Bank of America (7,356) 0.00
GBP 2,016,826 CHF (2,374,400) 2020-07-08 Bank of America (11,461) 0.00
GBP 50,930,066 EUR (56,321,190) 2020-07-08 Bank of America (269,874) (0.08)
GBP 133,727,710 USD (166,849,400) 2020-07-08 Bank of America (1,302,657) (0.38)
USD 160,278,300 GBP (131,598,697) 2020-07-08 Bank of America (1,886,281) (0.56)
Unrealised gain on Open Forward Contracts 2,366,543 0.69
Unrealised loss on Open Forward Contracts (3,489,158) (1.02)
(1,122,615) (0.33)
Fair Value£
Net Assets%
Net Financial Assets and Liabilities at fair value 321,545,835 93.66
Net Current Assets (excluding Financial Assets and Financial Liabilities at fair value) 21,754,292 6.34
Net assets attributable to the shareholders of the Fund 343,300,127 100.00
Analysis of Total Assets %
UCITS collective investment schemes 92.34
OTC financial derivative instruments 0.67
Other Assets 6.99
100.00
In line with the requirements of the UCITS regulation S.I. No. 344/2017 the open Forward Contracts have been condensed in the Portfolio Statement based on the purchase and sale currency, maturity date, counterparty and unrealised gain or unrealised loss of the contract as at the year end.

28
30 June 2020
GAM Star Global Balanced
Portfolio Changes (Unaudited)
Major Purchases Cost£
Amundi Prime USA ETF 28,220,735
Amundi Msci Emerging Markets ETF 17,962,136
Amundi Prime Eurozone ETF 15,485,595
GAM Star Credit Opportunities GBP Z II Acc 10,816,161
Loomis Sayles U.S. Equity Leaders Fund 7,570,380
GAM Star MBS Total Return Inst GBP Acc 6,385,775
GAM Star Disruptive Growth Z GBP Acc 6,223,773
RWC Funds – RWC Global Emerging Markets Fund B GBP Acc 5,153,282
Active Global High Income Bond Fund Z1 4,048,842
Hermes Europe ex-UK Equity Fund M GBP Acc 3,601,540
Alken Fund – Continental Europe SGB1 Cap GBP Acc 3,506,036
GAM Star MBS Total Return W GBP Acc 3,185,723
Active Global High Income Bond Fund Z2 3,085,049
Polar Capital Funds PLC – UK Value Opport Fund S GBP Acc 2,715,401
iShares Edge MSCI USA Value Factor UCITS ETF 2,528,083
GAM Emerging Markets Equity S GBP 2,366,828
Ninety One Funds Series I – UK Alpha Fund 1,624,251
Premier Pan European Property C Acc 1,390,248
JPMorgan Fund ICVC – Japan Fund 961,413
JPM Global Macro Opportunities Fund 929,312
Total for the financial year 127,760,563
Major Sales Proceeds£
GAM North American Growth GBP Inst Inc 17,859,301
GAM Star Continental European Eq GBP Z II 14,179,462
iShares Edge MSCI USA Value Factor UCITS ETF 12,673,186
JPM Global Macro Opportunities Fund 12,617,852
Ashmore SICAV EM Frontier Equity Fund Z2 GBP Inc 12,536,946
Amundi Prime USA ETF 11,648,217
Loomis Sayles U.S. Equity Leaders Fund 11,245,639
GAM Star MBS Total Return W GBP Acc 11,017,696
Amundi Msci Emerging Markets ETF 10,001,537
Hermes Europe ex-UK Equity Fund M GBP Acc 9,065,085
RWC Funds – RWC Global Emerging Markets Fund B GBP Acc 8,296,514
Amundi Prime Eurozone ETF 7,949,373
JPMorgan Fund ICVC – Japan Fund 7,671,949
River and Mercantile World Recovery Fund 7,630,018
Ninety One Funds Series I – UK Alpha Fund 7,296,052
GAM Star Credit Opportunities GBP Z II Acc 7,108,018
GAM Star MBS Total Return Inst GBP Acc 6,981,229
Alken Fund – Continental Europe SGB1 Cap GBP Acc 6,769,275
GAM Emerging Markets Equity S GBP 6,599,925
iShares Physical Gold ETC 6,293,006
Coupland Cardiff Funds plc – CC Japan Alpha Fund 6,188,865
Polar Capital Funds PLC – UK Value Opport Fund S GBP Acc 6,179,515
Active Global High Income Bond Fund Z2 5,600,817
Active Global High Income Bond Fund Z1 5,424,181
Veritas Asian C GBP 4,193,692
Premier Pan European Property C Acc 3,706,492
GAM Star Disruptive Growth Z GBP Acc 3,562,828
CompAM Fund – Cadence Strategic Asia GBP C Acc 3,357,378
Total for the financial year 233,654,048

29
30 June 2020
GAM Star Capital Appreciation US EquityFund Manager: Wellington Management Company LLP
Commentary (Unaudited)
The Fund (as measured by the USD Accumulation class) fell 0.6% over the year to 30 June 2020, underperforming to its benchmark, the S&P 500 Index, which returned 7.5% in USD terms.
US equities rose in the third quarter of 2019, with the US economy remaining resilient despite elevated geopolitical uncertainties and slowing global growth. US-China trade relations were particularly volatile, as expectations for a protracted trade war has eroded consumer and business confidence and curtailed capital spending. The Federal Reserve (Fed) lowered its benchmark interest rate in July and September by a combined 50 bps, in an effort to sustain economic expansion and mitigate the risks of moderating growth and trade frictions. Political pressure on President Trump mounted as the US House of Representatives launched a formal impeachment enquiry. The Fund underperformed the S&P 500 Index during the third quarter. Security selection drove underperformance as weaker selection within information technology and communication services was only partially offset by stronger selection within industrials and consumer discretionary. At the issuer level, underweight exposure to Apple and not holding Alphabet detracted most; exposure to Insulet and Aramark contributed most. Sector allocation, a residual of our bottom-up stock selection process, was flat during the quarter.
The fourth quarter of 2019, saw US equities rise again, ending 2019 with a 31.5% gain. President Trump announced that the US and China will sign a phase one trade deal on 15 January. Although the contents of the deal were not publicly released, officials from both countries indicated that the agreement includes tariff reductions, greater purchases of US products, limits on China’s ability to weaken its currency and enhanced protections for US companies doing business in China. Optimism was tempered by myriad concerns, including skepticism about the likelihood of a comprehensive trade deal and worries about the impact on business investment from the longer-term decoupling of both countries’ economies. The US Federal Reserve (Fed) left its benchmark interest rate unchanged, signaling that its favorable outlook for economic growth and employment and modest inflation should allow rates to remain stable in 2020. A new trade deal with Mexico and Canada was passed by the US House of Representatives, putting the agreement on course for ratification by Congress in 2020. The House voted to impeach President Trump; however, markets were unaffected given that the Republican-led Senate is unlikely to support his impeachment. During the quarter, we increased our overweight exposure to financials and decreased our overweight exposure to consumer staples. We initiated a variety of new positions during the month, including Apple, Roku and Zoom Video Communications. We eliminated our position in Trade Desk.
In 2020, the portfolio has sought to be as balanced as possible across risk factors to avoid being whipsawed by shorter-term shocks on the daily news flow. Positioning has also been biased toward a more defensive (rather than cyclical) stance given the long-term risks seen for global markets and the economy. However, there is a smaller-cap bias relative to the benchmark, and this has represented a significant headwind for the portfolio. The smaller-cap bias relative to the benchmark was the primary driver of negative relative returns over the period, but this was partially offset by style. Positioning has also meant less exposure to the highest beta names and less exposure to the highest dividend yielding names – which contributed positively to relative performance. Security selection by the underlying managers detracted from relative performance. This may be attributed to weaker selection in the consumer discretionary and consumer staples sectors in particular. These losses were partially offset by stronger selection in the industrials and financials sectors.
US equities ended the second quarter higher after an extraordinary rally drove US stocks to their largest quarterly gain since the fourth quarter of 1998. The unprecedented scale of the fiscal and monetary stimulus implemented by Congress and the Federal Reserve (Fed), in response to the pandemic, was the most influential driver of the market’s rebound in the second quarter. There were also a host of other themes that supported equities, including corporate commentary that indicated some stabilisation in April, promising developments on a potential coronavirus vaccine, optimism about the US economic reopening, declining infections in several key hotspots, and aggressive risk positioning by hedge funds and retail investors
The top three holdings contributing to performance were Amazon, Microsoft and Apple. The bottom three performers were Aramark, Advance Auto Parts Inc. and Kohls.
July 2020

30
30 June 2020
GAM Star Capital Appreciation US Equity
Portfolio Statement
Analysis, by geographical area30 June2020 %
30 June2019 %
United States 94.58 95.83
United Kingdom 1.24 0.63
Belgium 0.37 –
Korea, Republic of 0.23 –
Spain 0.22 –
Ireland 0.15 –
Japan 0.14 –
France 0.08 –
Canada 0.08 –
Italy 0.07 –
Switzerland – 1.14
Futures – Equity Indices 0.01 0.02
Net Current Assets 2.83 2.38
100.00 100.00
Analysis, by industry sector30 June2020 %
30 June2019 %
Software & Services 17.02 11.66
Health Care Equipment & Services 9.11 9.55
Media & Entertainment 6.85 3.95
Retailing 6.78 6.20
Food Beverage & Tobacco 6.75 2.90
Technology Hardware & Equipment 6.41 5.00
Capital Goods 6.08 3.75
Semiconductors & Semiconductor Equipment 4.91 3.42
Pharmaceuticals & Biotechnology 4.64 5.96
Real Estate 4.24 4.35
Insurance 3.50 7.91
Diversified Financials 3.39 5.90
Consumer Services 2.30 2.87
Commercial & Professional Services 2.29 6.45
Food & Staples Retailing 2.04 0.79
Utilities 1.89 2.19
Household & Personal Products 1.83 1.66
Consumer Durables & Apparel 1.68 3.21
Materials 1.67 3.71
Banks 1.30 1.55
Telecommunication Services 0.75 1.05
Energy 0.67 0.94
Automobiles & Components 0.58 –
Transportation 0.48 2.48
Non-sector specific – 0.15
Futures 0.01 0.02
Net Current Assets 2.83 2.38
100.00 100.00
Analysis, by investment30 June2020 %
30 June2019 %
Equities Quoted 97.16 97.60
Futures – Equity Indices 0.01 0.02
Equity Warrants – 0.00
Net Current Assets 2.83 2.38
100.00 100.00

31
30 June 2020
GAM Star Capital Appreciation US Equity
Portfolio Statement
Holdings Description Fair ValueUS$
Net Assets%
Equities Quoted
9,487 Apple 3,460,858 3.94
1,033 Amazon.Com 2,849,861 3.25
8,809 Facebook 2,000,260 2.28
8,709 Microsoft 1,772,369 2.02
9,596 Danaher 1,696,861 1.93
11,747 Procter & Gamble Co 1,404,589 1.60
3,665 NVIDIA 1,392,370 1.59
17,252 Merck & Company 1,334,097 1.52
5,123 American Tower 1,324,500 1.51
9,779 Wal-Mart Stores 1,171,329 1.34
8,767 PepsiCo 1,159,523 1.32
6,184 McDonald’s 1,140,762 1.30
25,479 Coca-Cola Co 1,138,402 1.30
6,020 Workday 1,127,907 1.29
6,573 Global Payments 1,114,912 1.27
2,444 Netflix 1,112,118 1.27
7,784 Motorola Solutions 1,090,772 1.24
10,064 Square 1,056,116 1.20
19,082 Oracle 1,054,662 1.20
55,894 Medical Properties Trust 1,050,807 1.20
27,732 TD Ameritrade Holding 1,008,890 1.15
7,459 Fidelity National Information Services 1,000,177 1.14
5,726 PayPal Holdings 997,641 1.14
11,787 Progressive Corp 944,257 1.08
4,714 Splunk 936,672 1.07
16,192 Hologic 922,944 1.05
16,150 BWX Technologies 914,736 1.04
11,842 GoDaddy 868,374 0.99
14,631 Entegris 863,961 0.98
6,624 International Business Machines 799,980 0.91
18,931 Avangrid 794,723 0.91
10,699 Fortive 723,894 0.83
5,098 Lowe’s Companies 688,842 0.79
7,222 Waste Connections 677,351 0.77
1,670 DexCom 677,018 0.77
8,073 Copart 672,239 0.77
1,209 BlackRock 657,805 0.75
6,063 Match Group 649,044 0.74
3,685 Illinois Tool Works 644,322 0.73
6,569 Fiserv 641,266 0.73
11,887 Advanced Micro Devices 625,375 0.71
392 Booking Holdings 624,197 0.71
2,368 Spotify Technology 611,394 0.70
3,105 Insulet 603,177 0.69
1,548 Humana 600,237 0.68
3,411 Constellation Brands 596,754 0.68
3,768 3M Company 587,770 0.67
5,970 Arthur J Gallagher & 582,015 0.66
818 CoStar Group 581,328 0.66
2,410 Becton Dickinson 576,641 0.66

32
30 June 2020
GAM Star Capital Appreciation US Equity
Portfolio Statement
Holdings Description Fair ValueUS$
Net Assets%
Equities Quoted, continued
1,002 Intuitive Surgical 570,970 0.65
8,124 Monster Beverage 563,156 0.64
1,548 Thermo Fisher Scientific 560,902 0.64
10,911 Mondelez International 557,879 0.64
5,142 First Republic Bank 545,001 0.62
3,460 Automatic Data Processing 515,159 0.59
4,833 T-Mobile US 503,357 0.57
12,714 Comcast 495,592 0.56
6,268 Science Applications International 486,898 0.56
13,653 Marvell Technology Group 478,674 0.55
14,574 Pfizer 476,570 0.54
2,267 Martin Marietta Materials 468,294 0.53
7,201 CVS Health 467,849 0.53
9,078 TJX Cos Inc 458,984 0.52
20,891 Nomad Foods 448,112 0.51
4,009 Guidewire Software 444,398 0.51
5,953 Globe Life 441,891 0.50
5,029 Exact Sciences 437,221 0.50
1,779 ABIOMED 429,735 0.49
7,313 Peloton Interactive 422,472 0.48
6,718 Emerson Electric 416,718 0.48
5,863 Philip Morris International 410,762 0.47
7,682 Astrazeneca Plc-Spons ADRs 406,301 0.46
5,828 Ball 404,988 0.46
4,166 HCA Holdings 404,352 0.46
966 ServiceNow 391,288 0.45
4,541 Ross Stores 387,075 0.44
6,400 Intel 382,912 0.44
1,309 ANSYS 381,875 0.44
14,643 Snap 343,964 0.39
11,624 Performance Food Group Co Com. 338,723 0.39
5,212 Centene 331,223 0.38
11,336 Keurig Dr Pepper NPV 321,942 0.37
5,615 Blackstone Group Inc 318,146 0.36
4,620 Raymond James Financial 317,995 0.36
3,892 Carter’s 314,084 0.36
1,578 Galapagos 310,247 0.35
1,604 Dollar General 305,578 0.35
6,474 Cisco Systems 301,947 0.34
2,700 Walt Disney Co 301,077 0.34
1,645 Vail Resorts 299,637 0.34
8,227 Exelon 298,558 0.34
8,045 MetLife 293,803 0.33
3,281 Trane Technologies 291,943 0.33
3,143 Polaris Industries 290,885 0.33
5,175 Sysco 282,866 0.32
7,646 Americold Realty Trust 277,550 0.32
2,979 Dollar Tree 276,094 0.31
8,609 Uber Technologies 267,568 0.31
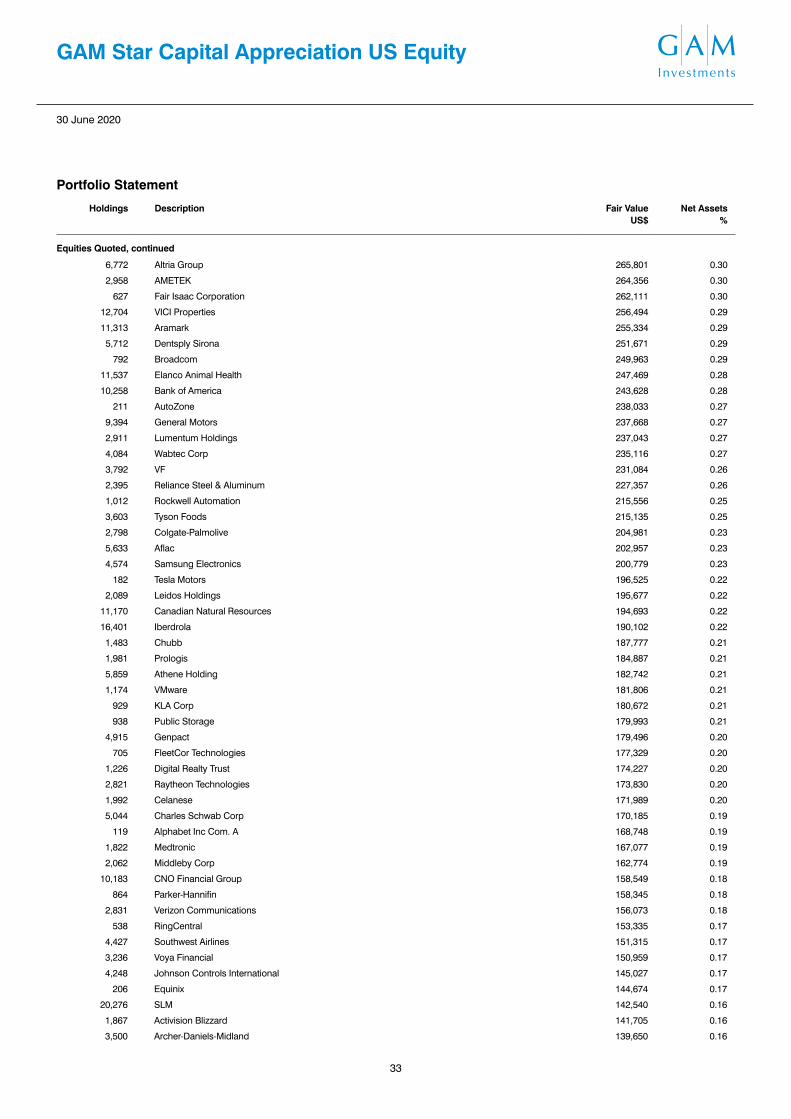
33
30 June 2020
GAM Star Capital Appreciation US Equity
Portfolio Statement
Holdings Description Fair ValueUS$
Net Assets%
Equities Quoted, continued
6,772 Altria Group 265,801 0.30
2,958 AMETEK 264,356 0.30
627 Fair Isaac Corporation 262,111 0.30
12,704 VICI Properties 256,494 0.29
11,313 Aramark 255,334 0.29
5,712 Dentsply Sirona 251,671 0.29
792 Broadcom 249,963 0.29
11,537 Elanco Animal Health 247,469 0.28
10,258 Bank of America 243,628 0.28
211 AutoZone 238,033 0.27
9,394 General Motors 237,668 0.27
2,911 Lumentum Holdings 237,043 0.27
4,084 Wabtec Corp 235,116 0.27
3,792 VF 231,084 0.26
2,395 Reliance Steel & Aluminum 227,357 0.26
1,012 Rockwell Automation 215,556 0.25
3,603 Tyson Foods 215,135 0.25
2,798 Colgate-Palmolive 204,981 0.23
5,633 Aflac 202,957 0.23
4,574 Samsung Electronics 200,779 0.23
182 Tesla Motors 196,525 0.22
2,089 Leidos Holdings 195,677 0.22
11,170 Canadian Natural Resources 194,693 0.22
16,401 Iberdrola 190,102 0.22
1,483 Chubb 187,777 0.21
1,981 Prologis 184,887 0.21
5,859 Athene Holding 182,742 0.21
1,174 VMware 181,806 0.21
929 KLA Corp 180,672 0.21
938 Public Storage 179,993 0.21
4,915 Genpact 179,496 0.20
705 FleetCor Technologies 177,329 0.20
1,226 Digital Realty Trust 174,227 0.20
2,821 Raytheon Technologies 173,830 0.20
1,992 Celanese 171,989 0.20
5,044 Charles Schwab Corp 170,185 0.19
119 Alphabet Inc Com. A 168,748 0.19
1,822 Medtronic 167,077 0.19
2,062 Middleby Corp 162,774 0.19
10,183 CNO Financial Group 158,549 0.18
864 Parker-Hannifin 158,345 0.18
2,831 Verizon Communications 156,073 0.18
538 RingCentral 153,335 0.17
4,427 Southwest Airlines 151,315 0.17
3,236 Voya Financial 150,959 0.17
4,248 Johnson Controls International 145,027 0.17
206 Equinix 144,674 0.17
20,276 SLM 142,540 0.16
1,867 Activision Blizzard 141,705 0.16
3,500 Archer-Daniels-Midland 139,650 0.16

34
30 June 2020
GAM Star Capital Appreciation US Equity
Portfolio Statement
Holdings Description Fair ValueUS$
Net Assets%
Equities Quoted, continued
4,095 Zions Bancorp NA 139,230 0.16
2,699 Concho Resources 138,999 0.16
2,254 Amdocs 137,224 0.16
1,717 Duke Energy 137,171 0.16
9,694 Compass Group 133,194 0.15
2,581 Micron Technology 132,973 0.15
1,004 Electronic Arts 132,578 0.15
3,777 CRH 128,339 0.15
1,765 Consolidated Edison 126,956 0.14
2,781 Las Vegas Sands 126,647 0.14
5,365 Bank OZK 125,917 0.14
14,100 Sanwa Holdings 125,728 0.14
950 Coherent 124,431 0.14
1,359 Camden Property Trust 123,968 0.14
1,451 Expedia Group 119,272 0.14
2,852 Diamondback Energy 119,271 0.14
1,212 Garmin 118,170 0.13
998 CDW Corp 115,948 0.13
2,450 AO Smith 115,444 0.13
429 Anthem 112,818 0.13
1,528 Pinnacle West Capital 111,987 0.13
5,564 Equitable Holdings 107,330 0.12
1,708 General Mills 105,298 0.12
956 London Stock Exchange Group 98,728 0.11
3,959 Steven Madden 97,748 0.11
850 Quest Diagnostics 96,866 0.11
1,637 Bristol-Myers Squibb 96,256 0.11
2,421 Pentair 91,974 0.10
2,021 Western Digital 89,227 0.10
3,685 Atlantic Union Bankshares Corp Com. USD 1.33 85,345 0.10
300 Align Technology 82,332 0.09
131 Regeneron Pharmaceuticals 81,698 0.09
495 Eli Lilly & Co 81,269 0.09
4,553 Unum Group 75,534 0.09
700 Thor Industries 74,571 0.09
3,158 Herman Miller 74,560 0.09
1,004 Airbus Group SE 71,628 0.08
5,373 Halliburton 69,742 0.08
2,086 Nutrien 66,807 0.08
5,121 Tenaris ADRs 66,215 0.08
750 Yum! Brands 65,183 0.07
1,323 Live Nation Entertainment 58,649 0.07
176 Paycom Software 54,512 0.06
176 Waters 31,750 0.04
44 Galapagos Nv-Spon Adr 8,681 0.01
12 Galapagos 2,359 0.00
85,255,078 97.16

35
30 June 2020
GAM Star Capital Appreciation US Equity
Portfolio Statement
Holdings Description Counterparty Fair ValueUS$
Net Assets%
Futures – Equity Indices
3 S&P 500 Emini Futures (XCME) 2020-09-18 JP Morgan 13,645 0.01
Unrealised gain on Futures – Equity Indices 13,645 0.01
13,645 0.01
Fair ValueUS$
Net Assets%
Net Financial Assets and Liabilities at fair value 85,268,723 97.17
Net Current Assets (excluding Financial Assets and Financial Liabilities at fair value) 2,481,549 2.83
Net assets attributable to the shareholders of the Fund 87,750,272 100.00
Analysis of Total Assets %
Transferable securities admitted to official stock exchange listing 96.70
Financial derivative instruments dealt in on a regulated market 0.02
Other Assets 3.28
100.00

36
30 June 2020
GAM Star Capital Appreciation US Equity
Portfolio Changes (Unaudited)
Major Purchases CostUS$
Apple 3,126,030
Facebook 1,971,797
Procter & Gamble 1,335,804
PepsiCo 1,217,129
Danaher 1,188,904
Coca-Cola 1,171,549
McDonald's 1,164,931
Medical Properties Trust 1,159,403
Wal-Mart Stores 1,140,013
Aramark 1,122,277
Fortive 1,057,894
NVIDIA 1,046,468
Oracle 1,014,333
Square 1,011,792
BlackRock 984,663
Netflix 965,275
Progressive 919,245
Lowe's Companies 883,038
Motorola Solutions 877,359
Berkshire Hathaway 850,206
Total for the financial year 24,208,110
Major Sales ProceedsUS$
Berkshire Hathaway 3,529,096
Willis Towers Watson 2,541,472
Motorola Solutions 2,062,404
Alleghany 1,877,872
Steris 1,868,977
Aramark 1,708,305
Microsoft 1,661,223
American Express 1,472,104
Morgan Stanley 1,371,303
Lowe's Companies 1,361,126
Advance Auto Parts 1,340,031
Amazon.Com 1,294,977
Wal-Mart Stores 1,280,850
Johnson & Johnson 1,269,681
Southern 1,203,870
Spotify Technology 1,167,757
AT&T 1,151,363
Lamb Weston Holdings 1,137,900
Spectrum Brands Holdings 1,111,282
Lockheed Martin 1,093,519
Total for the financial year 31,505,112

37
30 June 2020
GAM Star Cat BondFund Manager: Fermat Capital Management, LLC
Commentary (Unaudited)
The Fund’s NAV rose by 5.2% over the year to 30 June 2020 (as measured by the USD Accumulation Class) compared to a rise of 4.6% for its benchmark, the FTSE (WGBI) World Government Bond index in USD.
There were no new issuance insurance-linked securities (ILS) deals in the third quarter of 2019 against USD 300 million in maturities, and the size of the ILS market ended the quarter at USD 32.1 billion (or USD 1.1 billion of net shrinkage over the previous 12 months). The market took a breather after a busy first half of the year. With renewals completed, there was less selling pressure in the secondary catastrophe bond market and the June maturities provided ample capacity for what sellers there were. Overall, the secondary market was orderly and relatively uneventful during the quarter. Hurricane Dorian caused the most market commotion. After devastating the Bahamas (total property losses are estimated to be well over 50% of its GDP), Dorian seemed destined at one point to hit Florida as a major hurricane. However, it swerved and weakened and briefly made landfall in North Carolina as a Category 1. Insured loss estimates suggest that losses from Dorian to North Carolina will likely be much less than 10% of those from last year’s Hurricane Florence.
December saw a healthy USD 2.3 billion of new issuance catastrophe bonds. While capacity was aided by catastrophe bond maturities, investor demand was still stronger than dealers expected. Pricing however remained favourable compared to last year as many of the deals were upsized to meet the additional demand. Quarter four of 2019 was an active quarter with USD 3.2 billion of new issuances against USD 2.3 billion in maturities, and the size of the ILS market ended the quarter at USD 33.1 billion (modest growth of USD 400 million over the previous 12 months).The most significant catastrophe of the quarter was October’s Typhoon Hagibis which hit the Tokyo area as a category 2 equivalent just about a month after Typhoon Faxai also hit the region with a similar strength but a less severe path. So far, the loss impact of Hagibis has mainly been felt in the retro markets and to a lesser extent in the reinsurance markets. The catastrophe bond market has been largely unaffected by Hagibis. There were no North Atlantic Hurricanes that threatened in Q4; and while there was much press coverage on various California wildfires, none caused any significant insured losses. Loss creep due to 2017 and 2018 events (primarily Hurricane’s Irma and Michael) has still been present but in smaller amounts.
In the first quarter of 2020 several of the deals that got delayed because of Covid-19 have started to come back to the market. With talks of Covid-19 potentially causing massive insured losses across many insurance lines, and seemingly enough issuance interest at the current market rates, it appears that the hard market we are in may be sustained in the near term, and the spread tightening we were anticipating last month will likely be pushed back. There were no significant catastrophes outside of Covid-19, which many in the industry believe will cause significant business interruption losses for the insurance industry (particularly outside of the US). We currently do not expect any portfolio losses due to Covid-19 related business interruption.
There were no new significant catastrophes in the second quarter of 2020. Covid-19 remains a concern for the traditional markets (not much for the catastrophe bond market, however), but many of the insurance payouts will likely be spread out over a longer period of time compared to most catastrophe events. Covid-19 has trapped collateral on many retro, international, and lower layer collateralised reinsurance programs, and the catastrophe bond market is benefiting from the reduced capacity in the market with the wider spreads we are seeing.
July 2020
Portfolio Statement
Analysis, by geographical area30 June2020 %
30 June2019 %
Bermuda 72.91 72.04
Cayman Islands 11.95 12.51
United States 4.32 2.95
Global 4.08 3.55
United Kingdom 2.00 1.98
Singapore 1.39 0.44
Ireland 0.69 2.11
Denmark 0.05 0.06
Currency Forwards 1.98 1.13
Net Current Assets 0.63 3.23
100.00 100.00
Analysis, by industry sector30 June2020 %
30 June2019 %
Fixed Interest 97.39 95.64
Currency Forwards 1.98 1.13
Net Current Assets 0.63 3.23
100.00 100.00
Analysis, by investment30 June2020 %
30 June2019 %
Catastrophe Bonds 93.91 –
Government Bonds 2.85 –
Corporate Bonds 0.54 95.64
Equities Quoted 0.09 –
Currency Forwards 1.98 1.13
Net Current Assets 0.63 3.23
100.00 100.00
Analysis of Credit Ratings (S&P)30 June
202030 June
2019
Catastrophe Bonds, Corporate Bonds and Government Bonds
From AA+, to B- or may not be rated
From BB to B-, or may
not be rated

38
30 June 2020
GAM Star Cat Bond
Portfolio Statement
Holdings Description Fair ValueUS$
Net Assets%
Equity Quoted
1,546,912 Isesceles Re 2020* 1,550,934 0.09
1,550,934 0.09
Government Bond
50,000,000 United States Treasury Bill 0% 2020-07-14 49,998,000 2.85
49,998,000 2.85
Corporate Bonds
7,400,000 Security First Insurance Hldg 1% 2028-12-17* 7,400,000 0.42
700,000 Allied Trust Debt 12/25 1* 700,000 0.04
600,000 Allied Trust Debt 12/25 1* 600,000 0.03
863,075 Gefion Insurance A/S 1 2027-06-13* 484,681 0.03
550,000 Gefion Insurance A/S 10/29 1* 308,866 0.02
950,000 Gefion Insurance AS 06/27 VAR* – 0.00
550,000 Gefion Insurance AS RA29 GEFIO 10/29 VAR* – 0.00
863,075 Gefion A 30.06.20/0.000000/ R 0627 VAR* – 0.00
550,000 Gefion2 A 30.06.20/0.000000/ 10/29 VAR* – 0.00
950,000 Gefion Insurance AS RA19* – 0.00
550,000 Gefion RA/0.00/Gefion* – 0.00
9,493,547 0.54
Catastrophe Bonds
47,475,000 Long Point Re III FRN 2025-06-01 46,495,798 2.65
44,685,000 Sanders Re FRN 2022-04-07 41,824,364 2.38
37,550,000 Alamo Re FRN 2021-06-07 37,102,139 2.12
37,232,000 FloodSmart Re FRN 2021-08-06 36,020,260 2.05
34,235,000 Nakama Re FRN 2021-10-13 33,983,073 1.94
34,195,000 International Bank for Reconstruction & Devel FRN 2021-02-15 33,645,061 1.92
32,850,000 Cape Lookout Re FRN 2022-02-25 32,362,723 1.85
30,875,000 Kilimanjaro II Re FRN 2021-04-20 30,259,294 1.73
29,450,000 Ursa Re FRN 2022-12-10 28,901,147 1.65
29,275,000 Sanders RE II FRN 2023-04-07 27,302,554 1.56
27,950,000 Galileo Re FRN 2024-01-08 27,119,485 1.55
26,377,000 Sutter Re FRN 2022-06-06 26,490,594 1.51
26,057,000 Sutter Re FRN 2022-06-06 26,200,118 1.49
26,785,000 Sanders Re FRN 2021-12-06 25,641,526 1.46
26,200,000 Kilimanjaro III Re FRN 2024-12-19 25,348,597 1.45
24,550,000 Nakama Re FRN 2023-04-13 24,071,701 1.37
23,425,000 FloodSmart Re FRN 2022-03-07 22,609,972 1.29
22,675,000 Merna Re FRN 2021-04-08 22,536,502 1.29
22,370,000 Mona Lisa Re FRN 2023-01-09 22,201,238 1.27
22,350,000 Ursa Re FRN 2020-12-10 22,171,277 1.26
22,600,000 Kilimanjaro III Re FRN 2023-12-19 22,015,715 1.26
22,815,000 FloodSmart Re FRN 2023-02-27 21,774,125 1.24
21,325,000 Northshore Re II FRN 2020-07-06 21,325,244 1.22
21,575,000 Merna Reinsurance II FRN 2022-04-07 21,284,342 1.21
20,725,000 Residential Reinsurance 2016 FRN 2020-12-06 20,327,039 1.16
20,075,000 Merna Reinsurance II FRN 2023-04-07 20,103,406 1.15
20,000,000 Aozora Re FRN 2021-04-07 19,655,979 1.12* Level 3 investments.

39
30 June 2020
GAM Star Cat Bond
Portfolio Statement
Holdings Description Fair ValueUS$
Net Assets%
Catastrophe Bonds, continued
18,960,000 Kilimanjaro Re FRN 2023-05-05 18,303,279 1.04
19,380,000 Residential Reinsurance 2017 FRN 2021-06-06 17,671,391 1.01
18,100,000 Atlas Capital UK 2019 FRN 2023-06-07 17,577,326 1.00
17,000,000 First Coast Re 2017-1 FRN 2021-06-07 16,709,817 0.95
17,225,000 FloodSmart Re FRN 2021-08-06 16,546,076 0.94
16,120,000 Cranberry Re FRN 2020-07-13 16,115,101 0.92
16,100,000 Everglades Re II FRN 2021-05-04 15,801,531 0.90
15,995,000 Galilei Re Series 2017-1 D2 FRN 2021-01-08 15,719,382 0.90
15,825,000 Spectrum Capital FRN 2021-06-08 15,511,099 0.88
15,900,000 Bowline Re Series 2018-1 FRN 2022-05-23 15,465,010 0.88
15,125,000 Atlas Capital UK 2018 FRN 2022-06-07 14,806,055 0.84
14,875,000 Ursa Re FRN 2021-09-24 14,564,582 0.83
14,749,000 Nakama Re FRN 2025-01-14 14,465,961 0.83
14,500,000 Matterhorn Re 0% 2020-12-07 13,861,667 0.79
13,463,000 Kilimanjaro II Re FRN 2022-04-21 13,022,206 0.74
13,160,000 International Bank for Reconstruction & Devel FRN 2021-02-15 12,974,297 0.74
12,750,000 Sanders RE II FRN 2024-04-07 12,646,388 0.72
12,755,000 Kilimanjaro II Re FRN 2021-04-20 12,369,563 0.71
12,464,000 Kilimanjaro Re FRN 2022-05-06 12,107,987 0.69
12,500,000 Blue Halo Re FRN 2022-06-21 12,035,914 0.69
11,925,000 Herbie Re FRN 2024-07-08 11,952,327 0.68
11,825,000 Atlas Capital Reinsurance 2020 DAC FRN 2024-06-10 11,902,993 0.68
11,825,000 Alamo Re II FRN 2023-06-08 11,870,222 0.68
12,013,000 Riverfront Re FRN 2021-01-15 11,834,557 0.68
12,100,000 Kilimanjaro III Re FRN 2024-12-19 11,629,308 0.66
11,750,000 Matterhorn Re FRN 2021-12-07 11,565,700 0.66
11,620,000 Galilei Re Series 2017-1 C2 FRN 2021-01-08 11,411,408 0.65
11,850,000 Kilimanjaro III Re FRN 2023-12-19 11,396,704 0.65
12,668,000 Caelus Re V FRN 2021-06-07* 11,272,407 0.64
11,175,000 Ursa Re FRN 2020-12-10 11,085,452 0.63
10,915,000 Sanders RE II FRN 2023-06-07 10,951,469 0.62
19,865,000 Frontline Re FRN 2022-07-06* 10,178,431 0.58
10,565,000 Caelus Re VI FRN 2024-06-07 10,162,054 0.58
10,480,000 Caelus Re VI FRN 2023-06-07 10,156,635 0.58
8,620,000 Resilience Re 0% 2021-01-08* 9,361,320 0.53
9,500,000 Cape Lookout Re FRN 2022-05-09 9,299,383 0.53
9,590,000 Residential Reinsurance 2018 FRN 2022-06-06 9,268,115 0.53
9,250,000 Galilei Re Series 2017-1 E2 FRN 2021-01-08 9,129,477 0.52
9,250,000 3264 re FRN 2023-02-07 9,068,701 0.52
9,250,000 Galileo Re FRN 2024-01-08 9,026,124 0.51
9,000,000 Limestone Re 0% 2024-10-01 9,000,000 0.51
9,320,000 Residential Reinsurance 2017 FRN 2021-12-06 8,854,628 0.51
9,075,000 Residential Reinsurance 2016 0% 2020-12-06 8,832,760 0.50
8,850,000 Acorn Re FRN 2021-11-10 8,773,884 0.50
8,750,000 Northshore Re II FRN 2022-07-08 8,572,535 0.49
8,750,000 Galilei Re Series 2017-1 A2 FRN 2021-01-08 8,529,099 0.49
8,500,000 Alamo Re FRN 2022-06-08 8,406,368 0.48
8,470,000 Caelus Re V FRN 2021-06-07 8,184,205 0.47
8,250,000 Sanders RE II FRN 2024-04-07 8,132,200 0.46
* Level 3 investments.

40
30 June 2020
GAM Star Cat Bond
Portfolio Statement
Holdings Description Fair ValueUS$
Net Assets%
Catastrophe Bonds, continued
8,250,000 First Coast Re II FRN 2023-06-07 8,048,978 0.46
8,260,000 Tailwind Re 2017-1 FRN 2025-01-08 8,029,299 0.46
8,015,000 Kizuna Re II FRN 2023-04-07 7,904,407 0.45
8,125,000 Tailwind Re 2017-1 FRN 2025-01-08 7,889,305 0.45
8,300,000 SD Re FRN 2021-10-19 7,883,889 0.45
7,750,000 Sierra FRN 2022-12-28 7,711,009 0.44
7,500,000 Matterhorn Re FRN 2021-12-07 7,453,855 0.43
7,404,000 Blue Halo Re FRN 2023-06-28 7,428,667 0.42
7,500,000 Northshore Re II FRN 2023-07-07 7,420,916 0.42
8,000,000 Matterhorn Re 0% 2020-12-07 7,297,761 0.42
7,410,000 Mona Lisa Re FRN 2023-01-09 7,253,855 0.41
7,100,000 Integrity Re II FRN 2023-04-12 7,085,675 0.40
7,313,000 Tailwind Re 2017-1 FRN 2025-01-08 7,071,085 0.40
7,032,000 Residential Reinsurance 2020 FRN 2024-06-06 7,029,595 0.40
725,000,000 White Rock Insurance 3.0999% 23/07/2021* 6,720,119 0.38
6,842,000 Riverfront Re FRN 2021-01-15 6,716,063 0.38
7,000,000 Galileo Re FRN 2024-01-08 6,698,850 0.38
6,750,000 Fortius RE II FRN 2021-07-07 6,652,245 0.38
6,400,000 International Bank for Reconstruction & Devel FRN 2024-03-13 6,240,966 0.36
6,000,000 Matterhorn Re FRN 2021-12-07 5,859,486 0.33
6,149,000 Residential Reinsurance 2017 FRN 2021-12-06 5,834,629 0.33
5,800,000 Integrity Re FRN 2022-06-10 5,574,491 0.32
5,675,000 Residential Reinsurance 2019 FRN 2023-06-06 5,563,997 0.32
5,600,000 International Bank for Reconstruction & Devel FRN 2024-03-13 5,524,966 0.32
5,600,000 International Bank for Reconstruction & Devel FRN 2024-03-13 5,477,794 0.31
5,600,000 International Bank for Reconstruction & Devel FRN 2024-03-13 5,450,811 0.31
5,650,000 Residential Reinsurance 2018 FRN 2022-12-06 5,421,283 0.31
5,518,000 Residential Reinsurance 2019 FRN 2023-12-06 5,356,264 0.31
5,190,000 MetroCat Re FRN 2023-05-08 5,190,894 0.30
5,233,000 Residential Reinsurance 2017 FRN 2021-06-06 5,157,256 0.29
5,425,000 Kilimanjaro Re FRN 2022-05-06 5,143,427 0.29
5,470,000 Caelus Re V FRN 2021-06-07* 5,141,105 0.29
5,000,000 Matterhorn Re FRN 2021-12-07 4,892,134 0.28
4,900,000 Seaside 2020 51 (FAIRFAX) 2021-01-15* 4,667,250 0.27
4,053,457 Eclipse Re EC0024* 4,536,629 0.26
4,450,000 Caelus Re V FRN 2024-06-05 4,074,450 0.23
3,940,000 Kizuna Re II FRN 2023-04-07 3,888,098 0.22
4,830,000 Caelus Re V FRN 2021-06-07* 3,851,373 0.22
3,850,000 Galilei Re FRN 2021-01-08 3,782,211 0.22
3,750,000 Sierra FRN 2022-12-28 3,720,064 0.21
3,750,000 Matterhorn Re FRN 2024-01-08 3,669,704 0.21
3,760,000 Armor RE II FRN 2022-06-08 3,663,254 0.21
3,700,000 Galileo Re FRN 2020-11-06 3,594,523 0.21
3,475,000 Bowline Re Series 2019-1 FRN 2023-03-20 3,400,654 0.19
3,322,200 Eclipse Re EC0029* 3,322,200 0.19
3,400,000 FloodSmart Re FRN 2023-02-27 3,230,925 0.18
3,075,000 Galileo Re FRN 2020-11-06 2,967,747 0.17
2,775,000 Kilimanjaro II Re FRN 2021-04-20 (BYPGBY1) 2,728,591 0.16
2,175,000 Baltic PCC FRN 2022-03-07 2,675,069 0.15
* Level 3 investments.

41
30 June 2020
GAM Star Cat Bond
Portfolio Statement
Holdings Description Fair ValueUS$
Net Assets%
Catastrophe Bonds, continued
2,900,000 Seaside 2020 31 (HARTFORD) 2021-01-15* 2,672,350 0.15
2,650,000 Caelus Re VI FRN 2023-06-07 2,579,429 0.15
2,650,000 Kilimanjaro Re FRN 2023-05-05 2,484,789 0.14
2,500,000 Akibare Re FRN 2022-04-07 2,433,890 0.14
2,390,000 Caelus Re VI FRN 2023-06-07 2,337,009 0.13
2,350,000 International Bank for Reconstruction & Devel FRN 2022-12-02 2,327,329 0.13
2,475,000 Casablanca Re 0% 2021-06-07 2,277,621 0.13
2,475,000 Casablanca Re 0% 2021-06-07 2,177,237 0.12
1,999,920 Eclipse Re EC0025* 2,009,920 0.12
6,455,000 Loma Reinsurance Ltd/Bermuda FRN 2021-01-08* 2,001,050 0.11
1,950,000 Eclipse Re EC0027 (CEA)* 1,952,730 0.11
2,321,000 Residential Reinsurance 2019 0% 2020-12-06 1,875,876 0.11
195,000,000 White Rock Asagao 2021-05-05* 1,807,480 0.10
1,900,000 Kaith Re LTD AC/ZERO CP BD 2021-01-15* 1,719,880 0.10
1,750,000 FloodSmart Re FRN 2022-03-07 1,685,912 0.10
5,679,034 Citrus Re FRN 2021-02-25* 1,404,898 0.08
1,568,000 Residential Reinsurance 2015 FRN 2021-06-07 1,285,760 0.07
1,275,000 Integrity Re FRN 2023-06-12 1,237,513 0.07
1,240,000 Caelus Re VI FRN 2023-06-07 1,211,664 0.07
1,200,000 Seaside 2020 42 (AM FAM) 2021-01-15* 1,209,120 0.07
1,425,000 Espada Reinsurance FRN 2020-09-06* 1,122,188 0.06
900,000 Seaside 2020 21 (AIG) 2021-01-15* 827,820 0.05
783,801 Eclipse Re EC0026 (LIBERY)* 808,882 0.05
2,628,772 Citrus Re FRN 2023-03-18 781,994 0.04
700,000 Seaside 2020 41 (AM FAM) 2021-01-15* 706,160 0.04
5,710,658 Frontline Re FRN 2022-07-06* 656,276 0.04
650,000 Kaith Re LTD AC 0% BD 2021-01-15* 567,970 0.03
546,250 Seaside Re BD 2020-12 USD* 534,833 0.03
503,910 Cerulean Re SAC Ltd 0% 2021-06-01 B2* 518,221 0.03
450,000 Blue Halo Re FRN 2021-06-30 451,245 0.03
979,650 Blue Halo Re FRN 2022-06-21 429,821 0.02
444,691 Seaside 2019 41 (AMERICAN FAMI) 2020-01-15* 412,896 0.02
450,000 Seaside 2020 21 (AIG) 2021-01-15* 406,305 0.02
356,250 Seaside Re 0% BD 2020-11 USD* 345,883 0.02
5,110,000 Residential Reinsurance 2016 FRN 2023-06-06* 261,888 0.02
3,915,000 Caelus Re V FRN 2024-06-05 249,630 0.01
302,500 Atlas IX Capital DAC FRN 2021-01-07 236,328 0.01
211,201 Cerulean Re SAC Ltd 0% 2021-06-01 TWIA* 222,163 0.01
219,209 Cerulean Re SAC Ltd 0% 2021-06-01* 221,774 0.01
2,695,103 Caelus Re V FRN 2024-06-05 39,652 0.00
500,000 Cal Phoenix Re FRN 2021-08-13 18,906 0.00
1,647,266,481 93.91
* Level 3 investments.
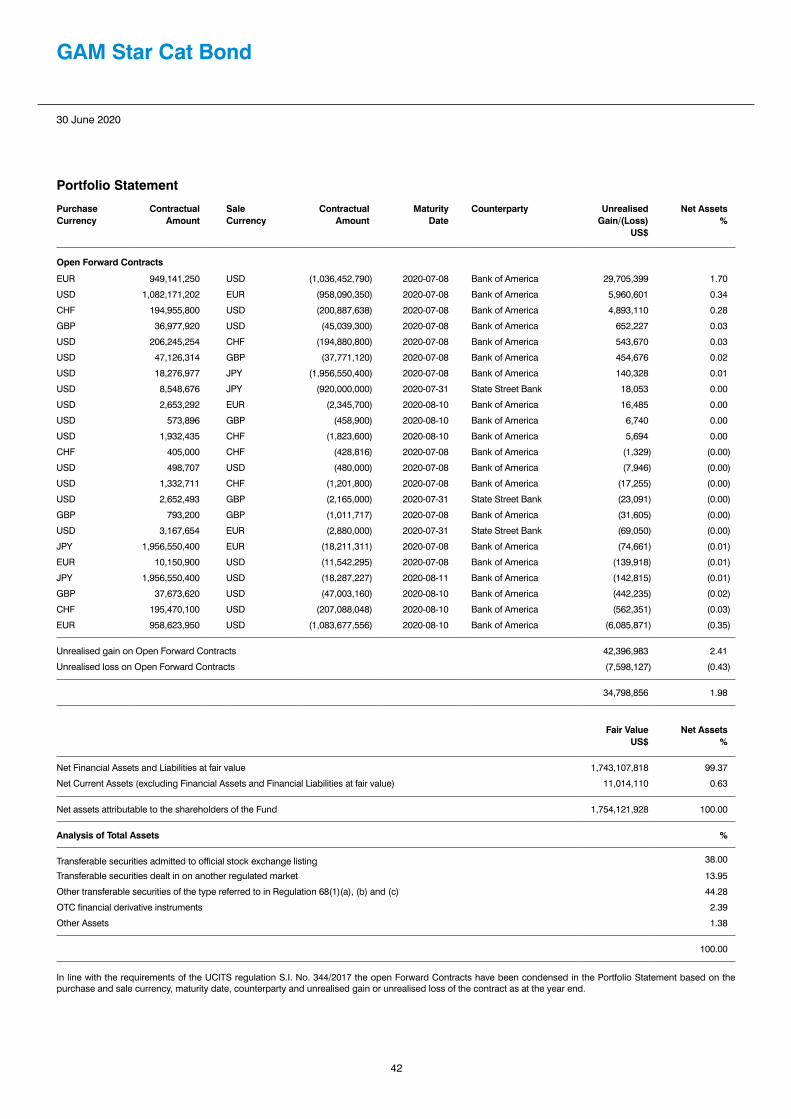
42
30 June 2020
GAM Star Cat Bond
Portfolio Statement
Purchase Currency
Contractual Amount
SaleCurrency
ContractualAmount
MaturityDate
Counterparty Unrealised Gain/(Loss)
US$
Net Assets%
Open Forward Contracts
EUR 949,141,250 USD (1,036,452,790) 2020-07-08 Bank of America 29,705,399 1.70
USD 1,082,171,202 EUR (958,090,350) 2020-07-08 Bank of America 5,960,601 0.34
CHF 194,955,800 USD (200,887,638) 2020-07-08 Bank of America 4,893,110 0.28
GBP 36,977,920 USD (45,039,300) 2020-07-08 Bank of America 652,227 0.03
USD 206,245,254 CHF (194,880,800) 2020-07-08 Bank of America 543,670 0.03
USD 47,126,314 GBP (37,771,120) 2020-07-08 Bank of America 454,676 0.02
USD 18,276,977 JPY (1,956,550,400) 2020-07-08 Bank of America 140,328 0.01
USD 8,548,676 JPY (920,000,000) 2020-07-31 State Street Bank 18,053 0.00
USD 2,653,292 EUR (2,345,700) 2020-08-10 Bank of America 16,485 0.00
USD 573,896 GBP (458,900) 2020-08-10 Bank of America 6,740 0.00
USD 1,932,435 CHF (1,823,600) 2020-08-10 Bank of America 5,694 0.00
CHF 405,000 CHF (428,816) 2020-07-08 Bank of America (1,329) (0.00)
USD 498,707 USD (480,000) 2020-07-08 Bank of America (7,946) (0.00)
USD 1,332,711 CHF (1,201,800) 2020-07-08 Bank of America (17,255) (0.00)
USD 2,652,493 GBP (2,165,000) 2020-07-31 State Street Bank (23,091) (0.00)
GBP 793,200 GBP (1,011,717) 2020-07-08 Bank of America (31,605) (0.00)
USD 3,167,654 EUR (2,880,000) 2020-07-31 State Street Bank (69,050) (0.00)
JPY 1,956,550,400 EUR (18,211,311) 2020-07-08 Bank of America (74,661) (0.01)
EUR 10,150,900 USD (11,542,295) 2020-07-08 Bank of America (139,918) (0.01)
JPY 1,956,550,400 USD (18,287,227) 2020-08-11 Bank of America (142,815) (0.01)
GBP 37,673,620 USD (47,003,160) 2020-08-10 Bank of America (442,235) (0.02)
CHF 195,470,100 USD (207,088,048) 2020-08-10 Bank of America (562,351) (0.03)
EUR 958,623,950 USD (1,083,677,556) 2020-08-10 Bank of America (6,085,871) (0.35)
Unrealised gain on Open Forward Contracts 42,396,983 2.41
Unrealised loss on Open Forward Contracts (7,598,127) (0.43)
34,798,856 1.98
Fair ValueUS$
Net Assets%
Net Financial Assets and Liabilities at fair value 1,743,107,818 99.37
Net Current Assets (excluding Financial Assets and Financial Liabilities at fair value) 11,014,110 0.63
Net assets attributable to the shareholders of the Fund 1,754,121,928 100.00
Analysis of Total Assets %
Transferable securities admitted to official stock exchange listing 38.00
Transferable securities dealt in on another regulated market 13.95
Other transferable securities of the type referred to in Regulation 68(1)(a), (b) and (c) 44.28
OTC financial derivative instruments 2.39
Other Assets 1.38
100.00
In line with the requirements of the UCITS regulation S.I. No. 344/2017 the open Forward Contracts have been condensed in the Portfolio Statement based on the purchase and sale currency, maturity date, counterparty and unrealised gain or unrealised loss of the contract as at the year end.

43
30 June 2020
GAM Star Cat Bond
Portfolio Changes (Unaudited)
Major Purchases CostUS$
United States Treasury Bill 0% 2020-02-11 119,859,907
United States Treasury Bill 0% 2020-02-18 109,967,874
United States Treasury Bill 0% 2020-02-25 89,973,190
United States Treasury Bill 0% 2020-01-14 69,916,918
United States Treasury Bill 0% 2020-03-17 64,942,442
United States Treasury Bill 0% 2020-07-14 49,995,012
United States Treasury Bill 0% 2019-08-01 49,974,969
United States Treasury Bill 0% 2019-07-23 49,961,090
United States Treasury Bill 0% 2019-09-10 44,953,710
United States Treasury Bill 0% 2019-12-17 42,448,863
United States Treasury Bill 0% 2020-03-03 39,950,603
United States Treasury Bill 0% 2019-11-19 39,447,158
United States Treasury Bill 0% 2019-09-12 34,996,320
Ursa Re FRN 2022-12-10 29,429,700
Galileo Re FRN 2024-01-08 27,699,350
Sutter Re FRN 2022-06-06 26,377,000
Sutter Re FRN 2022-06-06 26,057,000
Kilimanjaro III Re FRN 2024-12-19 26,012,110
United States Treasury Bill 0% 2019-08-20 24,970,316
United States Treasury Bill 0% 2019-08-15 23,981,823
Kilimanjaro III Re FRN 2023-12-19 22,579,900
FloodSmart Re FRN 2023-02-27 22,430,540
Mona Lisa Re FRN 2023-01-09 22,315,580
Kilimanjaro Re FRN 2019-12-06 21,314,338
Merna Reinsurance II FRN 2023-04-07 20,075,000
United States Treasury Bill 0% 2019-07-30 19,986,300
Nakama Re FRN 2021-10-13 18,663,700
Total for the financial year 1,138,280,713
Major Sales ProceedsUS$
Everglades Re II FRN 2021-05-04 19,930,000
Alamo Re FRN 2023-06-08 15,560,517
MetroCat Re FRN 2020-05-08 10,705,925
Sanders Re FRN 2020-06-05 9,730,382
International Bank for Reconstruction & Devel FRN 2021-02-15 7,769,840
Akibare Re FRN 2022-04-07 7,162,500
Integrity Re FRN 2020-06-10 6,793,200
Galilei Re Series 2017-1 D2 FRN 2021-01-08 6,250,000
Horse Capital I DAC FRN 2020-06-15 6,015,113
United States Treasury Bill 0% 2019-08-01 5,997,670
United States Treasury Bill 0% 2020-01-14 5,993,392
Baltic PCC FRN 2022-03-07 5,411,549
United States Treasury Bill 0% 2019-12-17 4,994,661
Alamo Re FRN 2022-06-08 4,990,350
United States Treasury Bill 0% 2019-10-29 3,999,046
Galilei Re Series 2017-1 E2 FRN 2021-01-08 2,970,000
Frontline Re FRN 2022-07-06 2,899,725
Spectrum Capital FRN 2021-06-08 2,441,250
Resilience Re 0% 2019-06-07 1,307,676
Ursa Re FRN 2020-12-10 985,000
Total for the financial year 131,907,796

44
30 June 2020
GAM Star Global CautiousFund Manager: Charles Hepworth/James McDaid
Commentary (Unaudited)
The Fund (as measured by the GBP Accumulation class) returned 2.3% over the year to 30 June 2020, compared to its benchmark, Lipper Global Mixed Asset GBP Conservative which returned 0.9% in GBP terms.
The third quarter of 2019 saw equity markets as defined by the MSCI AC World index in local currency terms gain just over 1%. While this may appear unremarkable, the headline number hid a significant drop towards the end of July, as the US-China trade war intensified and the outlook for global growth and inflation darkened accordingly. Markets swiftly regained their poise as central banks stepped in to reduce interest rates and, in some cases, resume extraordinary stimulus measures. Simultaneously, major government bond markets took off as yields plummeted. How could equity markets brush off a trade war while bond markets priced in a future of virtually no growth? In our view, the answer partly lies in the diverse impact the trade war is having around the world. The US economy is well placed to withstand an assault on globalisation for the simple reason that it is structured towards consumption rather than export manufacturing. The latter now accounts for a mere 11% of America’s total GDP. Equity allocations remained broadly constant during the quarter, with a reasonable weighting to the more stable US market maintained amid our belief that the Federal Reserve would have to respond to any trade-related slowdown. This expectation was met as the US central bank acted pre-emptively even while the economy remained in fair shape. Given the uncertainty surrounding the trade war, it is unsurprising that the gold position held within the strategy performed well. On the flipside, equity positions with a bias towards the emerging markets and Asia Pacific regions suffered as the trade war continued. The Cadence Strategic Asia fund fell slightly by 0.14%.
The fourth quarter of the year saw global indices climb, with the US equity markets surging to record highs, amid increased optimism for global reflation. Cyclical equity sectors such as industrials and financials fared better than safer bets such as utilities or consumer staples, as investors took the view that the synchronised global slowdown which began in 2017 was taking a turn for the better. These positive effects were compounded by the pricing out of some of the uncertainty that has recently haunted markets. That the UK was going to leave the European Union began to look certain under new Prime Minister Boris Johnson and this was all but confirmed by his election victory in December. At the same time, the US and China appeared to reach ‘phase one’ of a comprehensive trade deal after months of negotiations. Within the portfolio, the Polar Capital UK Value Opportunities fund was the standout performer seeing a gain of 14.13%. The Fund has a focus on domestic UK mid-cap stocks which have been held back by the uncertainty that has been hanging over the UK economy since the 2016 referendum.
The first quarter of 2020 began brightly enough amid optimism over a US-China trade deal; however, by mid-February global stock markets had started to lose their poise over the rapid spread of the Covid-19 virus around the world. Large sell-offs followed across all markets, with the MSCI AC World falling 15.87% in sterling terms over the quarter. As the lockdowns and quarantines gathered pace, concerns about the duration of the crisis and its effect on the global economy mounted, and investors and companies engaged in an asset fire sale in order to raise liquidity at literally any price. This meant that by mid-March, those assets which normally provide more stability showed signs of strain, including ‘safe haven’ stalwarts such as government bonds. Towards the end of the month however, there were signs of market stability as governments around the world committed to supporting the economy with huge fiscal stimulus packages, implicitly financed by central banks, renewing their quantitative easing programmes.
If the first quarter of 2020 was characterised by waterfall moves in markets, the second quarter saw an almost equally sharp rebound, with the MSCI AC World Index in local currency terms up nearly 18% from the end of March to 30 June. A fast and comprehensive response from policymakers went some way to explaining the rebound. Central banks across the world rushed to reduce interest rates to or towards zero, while fiscal rectitude was abandoned as governments sought to incubate workers until the economy could be opened up again. Highlights of this ‘new responsiveness’ by the authorities included the UK’s more than nine million workers on government furlough and the US Federal Reserve’s stated willingness to buy corporate bonds outright to ensure a continued flow of financing into the private sector. Equity weightings within the strategy were marginally increased, facilitating meaningful participation in the market rebound as investors favoured thematic, secular growth over uncertain, near-term cyclicality. The emphasis on the US equity market and,
stylistically, growth over value was especially helpful during the review period. While value investing had some good days, growth stocks dominated the overall narrative. This theme was combined in equity portfolios with other secular growth sources such as emerging markets and disruptive technology.
In fixed income and credit, developed market corporate bond spreads tightened as fears of mass defaults receded and central banks offered direct intervention in credit markets. This was constructive for the allocation to European subordinated financial debt. An emerging market debt holding that had seen some stress in the first quarter was also quick to recover its poise in the second. Stateside, non-agency mortgage-backed securities (MBS) paper made steady progress from its March sell-off.
The top three holdings contributing to performance were GAM Star Disruptive Growth, iShares Physical Gold ETC and Coupland Cardiff – CC Japan Alpha Fund. The bottom three performers were Alken Continental Fund, GAM Star MBS Total Return and Polar Capital – UK Value Opportunity Fund.
July 2020
Portfolio Statement
Analysis, by geographical area30 June2020 %
30 June2019 %
Global 39.20 36.67
United States 18.53 23.58
United Kingdom 14.75 9.99
Japan 8.02 7.41
Asia-Pacific ex Japan 4.31 4.16
Europe ex UK 4.19 8.52
Emerging Markets Global 1.72 2.06
Currency Forwards (0.29) 0.13
Net Current Assets 9.57 7.48
100.00 100.00
Analysis, by investment30 June2020 %
30 June2019 %
Bond Funds 44.00 28.34
Equity Funds 27.87 41.63
Exchange Traded Funds 13.14 6.26
Other Funds 5.71 10.09
Diversified Funds – 6.07
Currency Forwards (0.29) 0.13
Net Current Assets 9.57 7.48
100.00 100.00

45
30 June 2020
GAM Star Global Cautious
Portfolio Statement
Holdings Description Fair Value£
Net Assets%
Bond Funds*
2,102,292 GAM Star Credit Opportunities GBP Z II Acc*** 22,193,684 13.19
1,082,732 GAM Star MBS Total Return Inst GBP Acc*** 12,033,264 7.15
99,008 Active Global High Income Bond Fund Z2 10,426,581 6.19
105,950 Active Global High Income Bond Fund Z1 10,408,533 6.18
729,849 GAM Star MBS Total Return W GBP Acc*** 8,597,693 5.11
4,782,287 JPM Global Macro Opportunities Fund 7,508,191 4.46
15,339 RWC Funds – RWC Global Emerging Markets Fund B GBP Acc 2,890,152 1.72
74,058,098 44.00
Equity Funds*
237,121 GAM Star Disruptive Growth Z GBP Acc*** 7,330,363 4.35
345,452 Coupland Cardiff Funds plc – CC Japan Alpha Fund 7,034,099 4.18
2,790,501 JPMorgan Fund ICVC – Japan Fund 6,468,380 3.84
511,828 Polar Capital Funds PLC – UK Value Opport Fund S GBP Acc 5,195,059 3.09
3,901,499 Ninety One Funds Series I – UK Alpha Fund 5,030,203 2.99
4,834,203 Premier Pan European Property C Acc 4,869,976 2.89
4,517 Veritas Asian C GBP 3,747,440 2.23
2,466,421 Hermes Europe ex-UK Equity Fund M GBP Acc 3,731,941 2.22
2,191 CompAM Fund – Cadence Strategic Asia GBP C Acc 3,498,207 2.08
46,905,668 27.87
Exchange Traded Funds*
325,114 Amundi Prime USA ETF 6,161,886 3.66
197,669 iShares Physical Gold ETC 5,554,499 3.30
872,071 iShares Edge MSCI USA Value Factor UCITS ETF 4,253,526 2.53
192,786 Amundi Prime Eurozone ETF 3,576,373 2.13
705,962 Amundi Msci Emerging Markets ETF 2,564,054 1.52
22,110,338 13.14
Other Funds*
1,723,790 Loomis Sayles U.S. Equity Leaders Fund** 6,301,143 3.74
40,356 Alken Fund – Continental Europe SGB1 Cap GBP Acc 3,318,481 1.97
9,619,624 5.71
Purchase Currency
Contractual Amount
SaleCurrency
ContractualAmount
MaturityDate
Counterparty Unrealised Gain
£
Net Assets%
Open Forward Contracts
USD 66,645,500 GBP (53,417,682) 2020-08-10 Bank of America 506,873 0.30
EUR 25,225,375 GBP (22,609,096) 2020-07-08 Bank of America 322,553 0.19
EUR 23,376,055 GBP (21,162,341) 2020-08-10 Bank of America 99,111 0.06
USD 3,342,600 GBP (2,659,629) 2020-07-08 Bank of America 45,519 0.03
AUD 912,966 GBP (489,370) 2020-07-08 Bank of America 19,361 0.01
GBP 1,127,252 USD (1,381,100) 2020-07-08 Bank of America 9,536 0.01
* Typically each of the above collective investment schemes may charge management fees of up to 2% per annum of their NAV and performance fees of up to 20% of the increase of performance for a predetermined period of time subject to any applicable hurdle rates.** Not admitted to an official stock exchange.*** Investment in other GAM Star Funds.

46
30 June 2020
GAM Star Global Cautious
Portfolio Statement
Purchase Currency
Contractual Amount
SaleCurrency
ContractualAmount
MaturityDate
Counterparty Unrealised Gain/(Loss)
£
Net Assets%
Open Forward Contracts, continued
CHF 397,300 GBP (335,746) 2020-07-08 Bank of America 3,641 0.00
SGD 1,041,400 GBP (600,525) 2020-08-11 Bank of America 3,534 0.00
SGD 1,055,700 GBP (608,913) 2020-07-08 Bank of America 3,526 0.00
CHF 366,400 GBP (311,603) 2020-08-10 Bank of America 1,628 0.00
AUD 901,626 GBP (500,859) 2020-08-10 Bank of America 1,518 0.00
GBP 243,588 USD (300,100) 2020-08-10 Bank of America 770 0.00
GBP 184,528 EUR (202,840) 2020-08-10 Bank of America 37 0.00
EUR 600 GBP (546) 2020-08-10 Bank of America – 0.00
GBP 613 AUD (1,100) 2020-08-10 Bank of America – 0.00
GBP 4,275 CHF (5,000) 2020-08-10 Bank of America – 0.00
GBP 8,061 SGD (13,900) 2020-08-11 Bank of America (2) (0.00)
USD 600 GBP (489) 2020-08-10 Bank of America (3) (0.00)
GBP 174,041 EUR (192,400) 2020-08-10 Bank of America (954) (0.00)
GBP 507,096 AUD (912,966) 2020-07-08 Bank of America (1,634) (0.00)
GBP 336,859 CHF (397,300) 2020-07-08 Bank of America (2,527) (0.00)
GBP 1,125,796 USD (1,395,300) 2020-08-10 Bank of America (3,179) (0.00)
GBP 608,731 SGD (1,055,700) 2020-07-08 Bank of America (3,709) (0.00)
GBP 22,810,097 EUR (25,225,375) 2020-07-08 Bank of America (121,546) (0.07)
GBP 56,400,018 USD (70,385,500) 2020-07-08 Bank of America (562,611) (0.34)
USD 68,424,000 GBP (56,178,840) 2020-07-08 Bank of America (803,647) (0.48)
Unrealised gain on Open Forward Contracts 1,017,607 0.60
Unrealised loss on Open Forward Contracts (1,499,812) (0.89)
(482,205) (0.29)
Fair Value£
Net Assets%
Net Financial Assets and Liabilities at fair value 152,211,523 90.43
Net Current Assets (excluding Financial Assets and Financial Liabilities at fair value) 16,108,180 9.57
Net assets attributable to the shareholders of the Fund 168,319,703 100.00
Analysis of Total Assets %
UCITS collective investment schemes 89.23
OTC financial derivative instruments 0.59
Other Assets 10.18
100.00
In line with the requirements of the UCITS regulation S.I. No. 344/2017 the open Forward Contracts have been condensed in the Portfolio Statement based on the purchase and sale currency, maturity date, counterparty and unrealised gain or unrealised loss of the contract as at the year end.

47
30 June 2020
GAM Star Global Cautious
Portfolio Changes (Unaudited)
Major Purchases Cost£
Amundi Prime USA ETF 7,527,808
GAM Star Credit Opportunities GBP Z II Acc 5,225,743
Amundi Prime Eurozone ETF 4,690,845
Active Global High Income Bond Fund Z1 3,595,308
GAM Star Disruptive Growth Z GBP Acc 3,145,903
Amundi Msci Emerging Markets ETF 2,974,635
Active Global High Income Bond Fund Z2 2,851,478
GAM Star MBS Total Return Inst GBP Acc 2,193,178
iShares Edge MSCI USA Value Factor UCITS ETF 1,368,644
RWC Global Emerging Markets Fund B GBP Acc 1,200,987
Polar Capital Funds PLC – UK Value Opport Fund S GBP Acc 987,837
GAM Star MBS Total Return W GBP Acc 977,704
Loomis Sayles U.S. Equity Leaders Fund 812,125
Premier Pan European Property C Acc 743,029
Ninety One Funds Series I – UK Alpha Fund 712,260
JPM Global Macro Opportunities Fund 542,641
Coupland Cardiff Funds plc – CC Japan Alpha Fund 461,886
JPMorgan Fund ICVC – Japan Fund 417,479
iShares Physical Gold ETC 407,174
CompAM Fund – Cadence Strategic Asia GBP C Acc 368,721
Total for the financial year 41,205,385
Major Sales Proceeds£
GAM Star Credit Opportunities GBP Z II Acc 10,389,689
GAM Star MBS Total Return W GBP Acc 6,831,034
GAM North American Growth GBP Inst Inc 6,377,583
JPM Global Macro Opportunities Fund 5,651,546
GAM Star Continental European Eq GBP Z II 4,501,242
GAM Star MBS Total Return Inst GBP Acc 4,089,221
River and Mercantile World Recovery Fund 3,559,770
Hermes Europe ex-UK Equity Fund M GBP Acc 3,316,261
Active Global High Income Bond Fund Z2 3,115,716
Active Global High Income Bond Fund Z1 3,087,867
iShares Physical Gold ETC 2,929,627
iShares Edge MSCI USA Value Factor UCITS ETF 2,890,176
Ninety One Funds Series I – UK Alpha Fund 2,766,607
JPMorgan Fund ICVC – Japan Fund 2,713,818
Alken Fund – Continental Europe SGB1 Cap GBP Acc 2,459,456
Loomis Sayles U.S. Equity Leaders Fund 2,390,217
Polar Capital Funds PLC – UK Value Opport Fund S GBP Acc 2,259,078
Coupland Cardiff Funds plc – CC Japan Alpha Fund 2,208,700
GAM Emerging Markets Equity S GBP 2,054,189
GAM Star Disruptive Growth Z GBP Acc 1,829,098
Premier Pan European Property C Acc 1,597,021
Amundi Prime USA ETF 1,573,445
Veritas Asian C GBP 1,506,202
CompAM Fund – Cadence Strategic Asia GBP C Acc 1,157,301
Amundi Prime Eurozone ETF 851,929
Total for the financial year 82,106,793
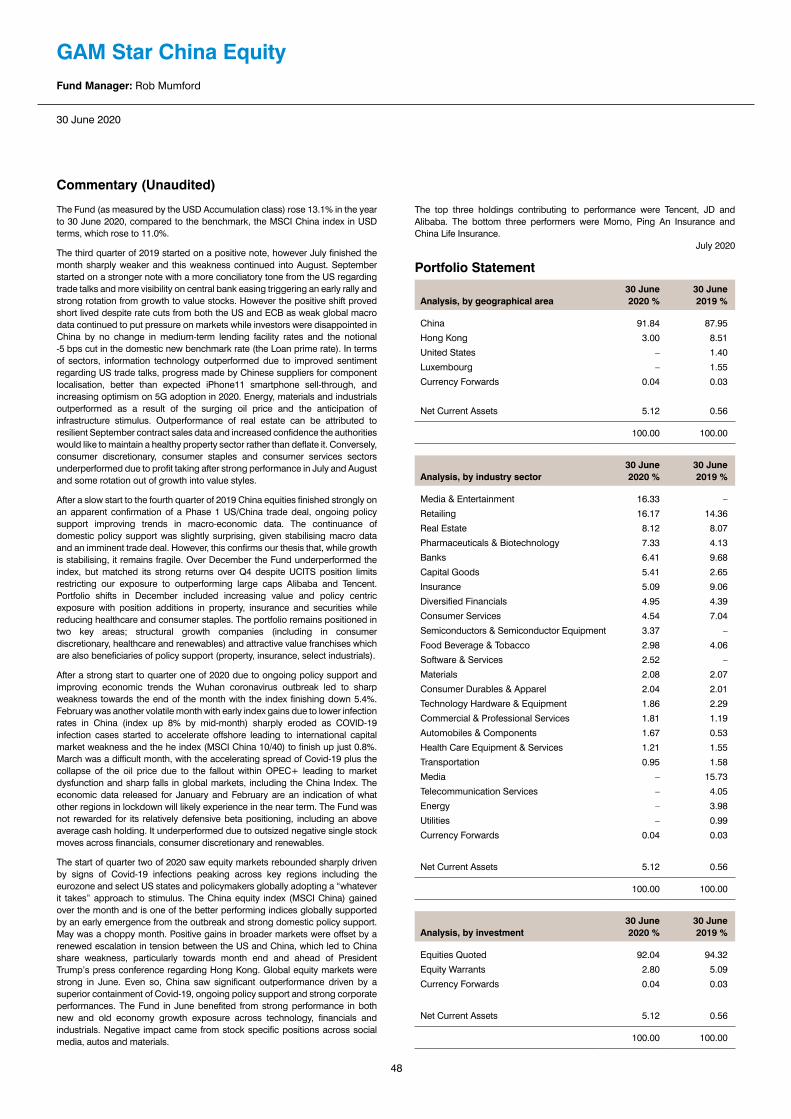
48
30 June 2020
GAM Star China EquityFund Manager: Rob Mumford
Commentary (Unaudited)
The Fund (as measured by the USD Accumulation class) rose 13.1% in the year to 30 June 2020, compared to the benchmark, the MSCI China index in USD terms, which rose to 11.0%.
The third quarter of 2019 started on a positive note, however July finished the month sharply weaker and this weakness continued into August. September started on a stronger note with a more conciliatory tone from the US regarding trade talks and more visibility on central bank easing triggering an early rally and strong rotation from growth to value stocks. However the positive shift proved short lived despite rate cuts from both the US and ECB as weak global macro data continued to put pressure on markets while investors were disappointed in China by no change in medium-term lending facility rates and the notional -5 bps cut in the domestic new benchmark rate (the Loan prime rate). In terms of sectors, information technology outperformed due to improved sentiment regarding US trade talks, progress made by Chinese suppliers for component localisation, better than expected iPhone11 smartphone sell-through, and increasing optimism on 5G adoption in 2020. Energy, materials and industrials outperformed as a result of the surging oil price and the anticipation of infrastructure stimulus. Outperformance of real estate can be attributed to resilient September contract sales data and increased confidence the authorities would like to maintain a healthy property sector rather than deflate it. Conversely, consumer discretionary, consumer staples and consumer services sectors underperformed due to profit taking after strong performance in July and August and some rotation out of growth into value styles.
After a slow start to the fourth quarter of 2019 China equities finished strongly on an apparent confirmation of a Phase 1 US/China trade deal, ongoing policy support improving trends in macro-economic data. The continuance of domestic policy support was slightly surprising, given stabilising macro data and an imminent trade deal. However, this confirms our thesis that, while growth is stabilising, it remains fragile. Over December the Fund underperformed the index, but matched its strong returns over Q4 despite UCITS position limits restricting our exposure to outperforming large caps Alibaba and Tencent. Portfolio shifts in December included increasing value and policy centric exposure with position additions in property, insurance and securities while reducing healthcare and consumer staples. The portfolio remains positioned in two key areas; structural growth companies (including in consumer discretionary, healthcare and renewables) and attractive value franchises which are also beneficiaries of policy support (property, insurance, select industrials).
After a strong start to quarter one of 2020 due to ongoing policy support and improving economic trends the Wuhan coronavirus outbreak led to sharp weakness towards the end of the month with the index finishing down 5.4%. February was another volatile month with early index gains due to lower infection rates in China (index up 8% by mid-month) sharply eroded as COVID-19 infection cases started to accelerate offshore leading to international capital market weakness and the he index (MSCI China 10/40) to finish up just 0.8%. March was a difficult month, with the accelerating spread of Covid-19 plus the collapse of the oil price due to the fallout within OPEC+ leading to market dysfunction and sharp falls in global markets, including the China Index. The economic data released for January and February are an indication of what other regions in lockdown will likely experience in the near term. The Fund was not rewarded for its relatively defensive beta positioning, including an above average cash holding. It underperformed due to outsized negative single stock moves across financials, consumer discretionary and renewables.
The start of quarter two of 2020 saw equity markets rebounded sharply driven by signs of Covid-19 infections peaking across key regions including the eurozone and select US states and policymakers globally adopting a “whatever it takes” approach to stimulus. The China equity index (MSCI China) gained over the month and is one of the better performing indices globally supported by an early emergence from the outbreak and strong domestic policy support. May was a choppy month. Positive gains in broader markets were offset by a renewed escalation in tension between the US and China, which led to China share weakness, particularly towards month end and ahead of President Trump’s press conference regarding Hong Kong. Global equity markets were strong in June. Even so, China saw significant outperformance driven by a superior containment of Covid-19, ongoing policy support and strong corporate performances. The Fund in June benefited from strong performance in both new and old economy growth exposure across technology, financials and industrials. Negative impact came from stock specific positions across social media, autos and materials.
The top three holdings contributing to performance were Tencent, JD and Alibaba. The bottom three performers were Momo, Ping An Insurance and China Life Insurance.
July 2020
Portfolio Statement
Analysis, by geographical area30 June2020 %
30 June2019 %
China 91.84 87.95
Hong Kong 3.00 8.51
United States – 1.40
Luxembourg – 1.55
Currency Forwards 0.04 0.03
Net Current Assets 5.12 0.56
100.00 100.00
Analysis, by industry sector30 June2020 %
30 June2019 %
Media & Entertainment 16.33 –
Retailing 16.17 14.36
Real Estate 8.12 8.07
Pharmaceuticals & Biotechnology 7.33 4.13
Banks 6.41 9.68
Capital Goods 5.41 2.65
Insurance 5.09 9.06
Diversified Financials 4.95 4.39
Consumer Services 4.54 7.04
Semiconductors & Semiconductor Equipment 3.37 –
Food Beverage & Tobacco 2.98 4.06
Software & Services 2.52 –
Materials 2.08 2.07
Consumer Durables & Apparel 2.04 2.01
Technology Hardware & Equipment 1.86 2.29
Commercial & Professional Services 1.81 1.19
Automobiles & Components 1.67 0.53
Health Care Equipment & Services 1.21 1.55
Transportation 0.95 1.58
Media – 15.73
Telecommunication Services – 4.05
Energy – 3.98
Utilities – 0.99
Currency Forwards 0.04 0.03
Net Current Assets 5.12 0.56
100.00 100.00
Analysis, by investment30 June2020 %
30 June2019 %
Equities Quoted 92.04 94.32
Equity Warrants 2.80 5.09
Currency Forwards 0.04 0.03
Net Current Assets 5.12 0.56
100.00 100.00

49
30 June 2020
GAM Star China Equity
Portfolio Statement
Holdings Description Fair ValueUS$
Net Assets%
Equities Quoted
378,500 Tencent Holdings 24,349,567 9.50
850,536 Alibaba Group Holding 23,001,548 8.97
204,924 Jd.Com ADRs 12,332,326 4.81
3,586,000 China Overseas Land & Investment 10,849,912 4.23
889,446 Ping An Insurance Group of China A (XSSC) 8,977,318 3.50
66,565 Baidu ADR’s 7,980,478 3.11
987,218 Yantai Eddie Precision Machinery A (XSSC) 7,312,623 2.85
52,786 New Oriental Educatio-Sp Adr 6,874,321 2.68
3,480,000 CSPC Pharmaceutical Group 6,573,451 2.56
81,199 Gds Holdings Ltd – Adr 6,468,312 2.52
159,034 Baozun Inc-Spn Adr 6,114,857 2.39
6,413,456 Xinyi Solar Holdings 6,073,811 2.37
8,568,000 China Jinmao Holdings Group 6,024,889 2.35
1,282,624 China Merchants Bank 5,899,728 2.30
1,460,136 Bank of Ningbo A (XSEC) 5,422,283 2.12
4,346,000 China Resources Cement Holdings 5,321,438 2.08
619,144 Midea Group A (XSEC) 5,232,979 2.04
6,326,000 China Construction Bank 5,117,641 2.00
463,263 Lexinfintech Holdings L-ADRs 4,929,118 1.92
280,807 Momo Inc ADRs 4,908,506 1.91
2,556,000 CITIC Securities 4,834,682 1.89
1,213,600 Sands China 4,760,167 1.86
1,418,381 Zhejiang Weiming Environment Protection A (XSSC) 4,651,679 1.81
10,776 Netease Inc-ADRs 4,626,999 1.81
5,924,000 Guangzhou Automobile Group 4,272,676 1.67
2,016,000 China Life Insurance 4,057,777 1.58
937,500 China Conch Venture Holdings 3,955,416 1.54
3,263,000 China Aoyuan Group 3,944,843 1.54
246,300 Sunny Optical Technology Group Company 3,940,571 1.54
18,800 Kweichow Moutai A (XSSC) 3,887,723 1.52
984,000 China Mengniu Dairy 3,758,027 1.47
68,823 Hong Kong Exchanges and Clearing 2,930,358 1.14
219,973 Jiangsu Hengrui Medicine A (XSSC) 2,870,119 1.12
151,500 Wuxi Biologics Cayman 2,771,800 1.08
2,228,000 China Medical System Holdings 2,624,575 1.02
739,000 Hua Hong Semiconductor 2,564,896 1.00
3,894,000 Beijing Capital International Airport 2,436,749 0.95
1,158,900 Xinjiang Goldwind Science & Technology A (XSHE) 1,633,315 0.64
1,122,200 Xinjiang Goldwind Science & Technology 961,416 0.38
528,880,000 China Trends Holdings 682,386 0.27
235,931,280 92.04
Equity Warrants
302,596 Jpm -Cw20 Jiangsu Hengr 3,948,878 1.54
503,465 Jpm -Cw21 Aier Eye Hosp 3,096,310 1.21
105,776,000 China Trends Holdings Wts March 2021 136,477 0.05
7,181,665 2.80

50
30 June 2020
GAM Star China Equity
Portfolio Statement
Purchase Currency
Contractual Amount
SaleCurrency
ContractualAmount
MaturityDate
Counterparty Unrealised Gain/(Loss)
US$
Net Assets%
Open Forward Contracts
EUR 3,364,180 USD (3,676,826) 2020-07-08 Bank of America 102,116 0.04
USD 3,838,296 EUR (3,398,580) 2020-07-08 Bank of America 20,715 0.01
EUR 39,300 USD (44,122) 2020-08-10 Bank of America 55 0.00
USD 5,219 EUR (4,600) 2020-08-10 Bank of America 48 0.00
USD 100,643 EUR (89,600) 2020-08-10 Bank of America (77) (0.00)
EUR 393,600 USD (444,256) 2020-07-08 Bank of America (2,131) (0.00)
USD 394,667 EUR (359,200) 2020-07-08 Bank of America (8,818) (0.00)
EUR 3,260,580 USD (3,685,861) 2020-08-10 Bank of America (20,634) (0.01)
Unrealised gain on Open Forward Contracts 122,934 0.05
Unrealised loss on Open Forward Contracts (31,660) (0.01)
91,274 0.04
Fair ValueUS$
Net Assets%
Net Financial Assets and Liabilities at fair value 243,204,219 94.88
Net Current Assets (excluding Financial Assets and Financial Liabilities at fair value) 13,132,294 5.12
Net assets attributable to the shareholders of the Fund 256,336,513 100.00
Analysis of Total Assets %
Transferable securities admitted to official stock exchange listing 93.94
OTC financial derivative instruments 0.05
Other Assets 6.01
100.00
In line with the requirements of the UCITS regulation S.I. No. 344/2017 the open Forward Contracts have been condensed in the Portfolio Statement based on the purchase and sale currency, maturity date, counterparty and unrealised gain or unrealised loss of the contract as at the year end.

51
30 June 2020
GAM Star China Equity
Portfolio Changes (Unaudited)
Major Purchases CostUS$
Ping An Insurance Group of China A (XSSC) 12,979,399
CSPC Pharmaceutical Group 7,157,949
China Mengniu Dairy 6,124,750
CITIC Securities 5,846,720
JPM-CW20 Jiangsu Hengr 5,192,922
Midea Group A (XSEC) 5,186,257
China Life Insurance 4,896,122
Baozun Inc-Spn Adr 4,823,956
Gds Holdings Ltd – Adr 4,814,710
China CITIC Bank 4,692,028
Guangzhou Automobile Group 4,238,727
Lexinfintech Holdings L-ADRs 4,141,399
Momo Inc ADRs 3,973,446
Sunny Optical Technology Group Company 3,854,837
Baidu ADR's 3,840,761
Trip.Com Group Ltd-Adr 3,824,340
China Aoyuan Group 3,773,747
Xinyi Solar Holdings 3,757,229
Zhejiang Weiming Environment Protection A (XSSC) 3,550,334
China Conch Venture Holdings 3,165,459
Yantai Eddie Precision Machinery A (XSSC) 3,156,480
JPM-CW20 Jiangsu Hengr 3,155,270
Hua Hong Semiconductor 3,083,699
Vipshop Holdings Ltd USD 0.0001 2,657,103
Tencent Holdings 2,603,634
Jiangsu Hengrui Medicine A (XSSC) 2,385,150
Sands China 2,285,253
China Construction Bank 1,882,170
China Resources Cement Holdings 1,863,770
Jd.Com ADRs 1,799,823
Bank of Ningbo A (XSEC) 1,775,993
Netease Inc-ADRs 1,714,221
Hong Kong Exchanges and Clearing 1,603,036
Xinjiang Goldwind Science & Technology A (XSHE) 1,597,084
China Jinmao Holdings Group 1,536,408
China Overseas Land & Investment 1,528,047
Beijing Capital International Airport 1,507,914
Longfor Group Holdings 1,444,719
Total for the financial year 137,414,866
Major Sales ProceedsUS$
Tencent Holdings 20,683,320
Ping An Insurance Group of China 19,952,296
China Construction Bank 14,523,262
CNOOC 13,224,964
Alibaba Group Holding-Sp ADR 11,481,534
China Mobile 10,008,879
Netease Inc-ADRs 10,007,337
Hong Kong Exchanges and Clearing 9,137,807
Longfor Group Holdings 8,667,162
JPM-CW20 Aier Eye Hosp 8,412,608
Midea Group-A CW JPM 8,193,605
Jd.Com ADRs 7,853,041
New Oriental Educatio-Sp Adr 7,585,719
JPM-CW19 Jiangsu Hengr 6,605,416
Alibaba Group Holding 6,449,951
Country Garden Holdings 6,390,566
Sunny Optical Technology Group Company 6,353,198
Luzhou Laojiao A (XSEC) 5,971,544
Wuxi Biologics Cayman 5,836,692
China Life Insurance 5,789,679
Huazhu Group Ltd NPV 5,372,660
Lexinfintech Holdings L-ADRs 5,341,607
Techtronic Industries 4,995,475
AIA Group 4,899,974
China Resources Cement Holdings 4,627,248
China CITIC Bank 4,561,389
Sands China 4,155,669
Baozun Inc-Spn Adr 3,919,407
Country Garden Services Holdings 3,865,024
Shanghai International Airport A (XSSC) 3,854,558
Industrial & Commercial Bank of China 3,793,716
Hangzhou Hikvision Digital Technology A (XSEC) 3,685,186
China Unicom Hong Kong 3,537,137
Vipshop Holdings Ltd USD 0.0001 3,426,921
Beijing Enterprises Holdings 3,242,065
Trip.Com Group Ltd-Adr 3,197,424
Kweichow Moutai A (XSSC) 3,179,813
AviChina Industry & Technology 3,099,548
Tingyi Cayman Islands Holding 2,948,317
Total for the financial year 268,831,718

52
30 June 2020
GAM Star Composite Global EquityFund Manager: Julian Howard/GAM's Multi Asset Solutions Team
Commentary (Unaudited)
The Fund (as measured by the USD Accumulation class) rose 4.6% in the year to 30 June 2020, versus the MSCI AC World index, which returned 2.7% in USD terms.
After a difficult summer for risk assets while the US-China trade dispute progressed moved alongside with global growth concerns, investors returned in a bullish mood and drove equities higher in September as central banks remained supportive. Government bond yields declined markedly over the third quarter, helped by central bank easing and rising concerns about global growth. However, there was some retracement in early September as the US and China announced talks would resume in early October, which gave rise to a more optimistic outlook.
The geopolitical risks that dominated the markets for most of the year faded towards the end of the year, allowing global equities and corporate bonds to rally with developed market government bonds giving up some of their gains as yields rose. Trade uncertainty was reduced as a phase one deal between the US and China was announced; the US also did not impose tariffs on European Union auto exports and economic data picked up which collectively contributed to support equities. In commodities, crude prices were also driven higher by news of the US-China trade deal.
Global equities started the new decade on a positive note following the signing of a phase one trade deal between the US and China but declined as the spread of coronavirus reduced investors’ appetite for risk and volatility picked up towards the end of the month. Assets perceived as safe havens, such as government bonds, performed well in January with the turn in sentiment and yields fell significantly over the month as major central banks were set to remain accommodative. Concerns over the coronavirus outbreak and its potential impact on global growth replaced trade as the main focus for the markets over the first quarter of 2020. March saw waterfall sell offs across all markets in the same league as the 1929 Wall Street crash, 1987 stock market crash, 2001 technology unwind and the 2008 Lehman Brothers failure, with the MSCI AC World down significantly to 31 March. As the lockdowns and quarantines gathered pace, concerns about the duration of the crisis and its effect on the global economy mounted and investors and companies engaged in an asset fire sale in order to raise liquidity at literally any price. This meant that by mid-March those assets which normally provide more stability showed signs of strain, including even safe haven stalwarts such as government bonds and gold. Towards the end of the month though, there were signs of market stability as governments around the world committed to supporting the economy with huge fiscal stimulus packages implicitly financed by central banks renewing their quantitative easing programmes.
The month of April saw global equities rebounding strongly as focus was on expectations that economies could gradually reopen and recover, in addition to governments and central banks introducing dramatic stimulus packages to reduce the damage caused by the lockdown. This helped to improve investor sentiment and drove the rebound in riskier assets. Government bond yields broadly declined over April as central banks committed to purchase more government and corporate bonds. As the focus in markets turned to lockdowns being lifted along with further support measures, equity markets rebounded further in the month of May. For many market commentators, it was hard to square the desperate fundamental picture of an economic crash and plunging corporate earnings outlooks with a buoyant equity market. Little wonder therefore that the move was described as the ‘hated rally’ in some quarters. A fast and comprehensive response from policymakers went some way to explaining the rebound. Underneath the headline moves investors were coolly assessing potential winners and losers in the months and years to come. Cyclical stocks rightly suffered amid this ‘great re-allocation’, while those areas deemed to have a promising future, notably technology, fared so well that they were able to drive the entire market upwards. The easing of Covid-19 lockdowns and early signs of economic recovery saw risk appetite return rapidly over the month of June, supporting equity and credit markets. Overall, the market rallied on the back of fiscal and monetary stimulus, combined with the reopening of economies, with central banks making clear that they stand willing to provide liquidity support and keep borrowing costs low. US equities contributed positively to performance as they gained ground amid optimism over the re-opening of the economy. EM equities also contributed to positive performance as they advanced amid global monetary and fiscal stimulus
The top three holdings contributing to performance were S&P500 EMINI FUT Jun20, Invesco and UBS EFT. The bottom three performers were S&P500 EMINI FUT Mar20, GAM Multistock- GAM Emerging Markets Equity and iShares Core FTSE100.
July 2020
Portfolio Statement
Analysis, by geographical area30 June2020 %
30 June2019 %
United States 44.39 39.97
Emerging Markets Global 17.48 17.44
Japan 5.87 8.77
Europe ex UK 5.69 8.15
Europe 5.59 3.97
United Kingdom 2.47 2.95
Futures – Equity Indices 0.37 0.31
Net Current Assets 18.14 18.44
100.00 100.00
Analysis, by industry sector30 June2020 %
30 June2019 %
External Funds (Other) 36.57 16.45
External Funds 33.36 47.88
GAM Funds 11.56 16.92
Futures 0.37 0.31
Net Current Assets 18.14 18.44
100.00 100.00
Analysis, by investment30 June2020 %
30 June2019 %
Exchange Traded Funds 62.66 53.71
Equity Funds 18.83 27.54
Futures – Equity Indices 0.37 0.31
Net Current Assets 18.14 18.44
100.00 100.00

53
30 June 2020
GAM Star Composite Global Equity
Portfolio Statement
Holdings Description Fair ValueUS$
Net Assets%
Bond Funds*
7,430 GAM Emerging Markets Equity S USD*** 9,649,884 7.27
766,628 GAM Star Japan Leaders Z JPY Acc** 7,792,549 5.87
348,688 GAM Star Continental European Equity Z EUR Acc** 7,550,683 5.69
24,993,116 18.83
Exchange Traded Funds*
1,010,084 UBS ETF (IE) S&P 500 ESG UCITS ETF USD A-acc 20,777,428 15.65
46,030 SPDR S&P 500 UCITS ETF 14,140,876 10.65
12,134 iShares Edge MSCI USA Quality Factor UCITS ETF 13,859,455 10.44
2,769,905 iShares MSCI EM ESG Enhanced UCITS ETF 13,558,685 10.22
41,153 Invesco EQQQ Nasdaq-100 UCITS ETF USD 10,146,272 7.64
120,144 Amundi Index MSCI Europe SRI UCITS ETF DR – EUR 7,421,820 5.59
438,589 iShares Core FTSE 100 UCITS ETF (Dist) 3,275,370 2.47
83,179,906 62.66
Holdings Description Counterparty Fair ValueUS$
Net Assets%
Futures – Equity Indices
149 S&P 500 Emini Futures (CME) 2020-09-18 UBS 494,680 0.37
Unrealised gain on Futures – Equity Indices 494,680 0.37
494,680 0.37
Fair ValueUS$
Net Assets%
Net Financial Assets and Liabilities at fair value 108,667,702 81.86
Net Current Assets (excluding Financial Assets and Financial Liabilities at fair value) 24,079,075 18.14
Net assets attributable to the shareholders of the Fund 132,746,777 100.00
Analysis of Total Assets %
UCITS collective investment schemes 81.42
Financial derivative instruments dealt in on a regulated market 0.37
Other Assets 18.21
100.00
* Typically each of the above collective investment schemes may charge management fees of up to 2% per annum of their NAV and performance fees of up to 20% of the increase of performance for a predetermined period of time subject to any applicable hurdle rates.** Investment in other GAM Star Funds.*** Investment in other GAM Funds.

54
30 June 2020
GAM Star Composite Global Equity
Portfolio Changes (Unaudited)
Major Purchases CostUS$
iShares MSCI EM ESG Enhanced UCITS ETF 13,748,392
Invesco EQQQ Nasdaq-100 UCITS ETF USD 9,621,332
Amundi Index MSCI Europe SRI UCITS ETF DR – EUR 9,011,325
UBS ETF (IE) S&P 500 ESG UCITS ETF USD A-acc 6,687,574
iShares Edge MSCI USA Quality Factor UCITS ETF 5,210,828
GAM Emerging Markets Equity S USD 3,964,000
SPDR S&P 500 UCITS ETF 3,791,561
Vanguard FTSE Emerging Markets UCITS USD ETF 3,597,441
iShares MSCI Europe Mid Cap UCITS ETF 1,255,227
iShares Core FTSE 100 UCITS ETF (Dist) 1,023,145
GAM Star Japan Leaders Z JPY Acc 1,023,066
Total for the financial year 58,933,891
There were no other purchases and sales during the financial year.
Major Sales ProceedsUS$
iShares Edge MSCI USA Quality Factor UCITS ETF 11,493,745
Vanguard FTSE Emerging Markets UCITS USD ETF 10,361,477
iShares MSCI Europe Mid Cap UCITS ETF 5,650,182
GAM Emerging Markets Equity S USD 4,545,000
GAM Star Japan Leaders Z JPY Acc 3,677,063
Amundi Index MSCI Europe SRI UCITS ETF DR – EUR 1,380,484
Invesco EQQQ Nasdaq-100 UCITS ETF USD 1,359,413
GAM Star Continental European Equity Z EUR Acc 1,121,562
Total for the financial year 39,588,926

55
30 June 2020
GAM Star Continental European EquityFund Manager: Niall Gallagher
Commentary (Unaudited)
The Fund (as measured by the EUR Accumulation class) rose 4.7% in the year to 30 June 2020, outperforming its benchmark, the MSCI Europe ex UK Net index in EUR terms, which fell 1.6%.
European equity markets resumed their upward trajectory in the third quarter of 2019. Following strong performance in a rising market in the first half of the year, the Fund gave some performance back during the quarter, underperforming the market in an environment characterised by higher volatility and rotational pressures.
All of the underperformance came in September, which is rather disappointing to us given the attention we pay towards portfolio construction – in particular, to containing ‘factor risks’. However, September was a somewhat strange month: in the first four trading days of October, almost all of September’s underperformance was reversed, highlighting the somewhat skittish nature of factor performance.
We expressed the view at the end of 2018 that too much pessimism was priced into the market in general and in particular to cyclical stocks. A balanced appraisal of the economic data did not justify the cries – shrill and inescapable at the time – that a recession was just around the corner. Specifically, a declining rate of consumption growth (ie a negative consumption impulse) which has always been associated with a late cycle peak was not present. Consumption growth in the US and Europe actually continued to accelerate in 2019, even if industrial data, about which news outlets like to obsess, remained weak for most of the period. Even here, however, the picture was mixed – with France consistently outperforming Germany for example. Positive economic news flow and the reduction of left hand tail risks from a ‘no-deal Brexit’ and a far-left UK government then propelled the market higher towards the end of the year.
GAM Star Continental European had a strong finish to the first quarter of 2020. Performance attribution for the quarter is a strong reflection of the economic shock caused by measures to control the spread of the virus. The Fund benefited in relative terms from very strong positive attribution in the financial sector with a very low weighting to traditional banks and big positions in exchanges offset by very weak attribution in healthcare, due to the Fund’s very low weighting in traditional large-cap pharmaceuticals.
The advent of the coronavirus, first in China / East Asia and then in Europe and North America, led to a dramatic change in market confidence, an element of panic and dramatic declines in sovereign bond yields and equities. However, we do not want to downplay the significance of what has happened and what may happen yet. It is reasonably obvious to state that the economic damage inflicted by the virus will be as a result of reactions such as containment and mitigation taken by consumers in their individual actions and governments in their general actions. An economic slowdown and recession in some countries is highly likely. This will lead to declines in earnings growth and for some companies absolute earnings declines. The cross-country data on Covid-19 is absolutely startling with enormous cross-country variations. It will take many years and voluminous amounts of data analysis / research to get behind these differences and what drove them but observationally we can see that almost all Asian countries have experienced a far lesser health impact than the US and especially Europe, which is the healthcare and economic epicentre of the virus. Even within Europe we see vastly different impacts between large countries with Germany versus the UK particularly notable. It is very hard to know what is behind the differential health impacts – superior healthcare systems, demographics, obesity rates, reaction times, lockdown / no lockdowns (Sweden has a lower mortality rate than the UK despite not imposing a general lockdown) but we are of the firm belief that differential health impact will ultimately exert a differential economic impact with Asia (and the US) likely to emerge relatively stronger than Europe and Northern Europe likely to emerge stronger than the UK & Mediterranean Europe. There was certainly strong evidence of differentiation in May but there was also evidence of V-shaped recoveries, or something akin to a V, in parts / regions of the key Chinese economy and this has increased the hope that as other countries begin to open up they will experience a somewhat similar path to China. There is some evidence for this in recent European survey data and this has encouraged equity (and credit) markets to view the current crisis as largely a 2020 earnings event; whether this will prove to be the case will depend on what happens next in the pace of openings of economies and whether there are any second spikes in the virus.
Finally, we remain relatively optimistic on the future direction of markets and economies based on our view that the current economic crisis reflects a one-off shock in reaction to a ‘healthcare crisis’ (alternatively and more critically a ‘panic’ by politicians amplified by the global media) that will extinguish itself relatively quickly but we do expect to see some economic scarring and a large fiscal hangover. We also note that markets and our Fund have largely bounced back from the extreme sell off in March.
The top three holdings contributing to performance were ASML, Flutter Entertainment and Adyen. The bottom three performers were Anheuser-Busch, Peugeot and Eiffage.
July 2020

56
30 June 2020
GAM Star Continental European Equity
Portfolio Statement
Analysis, by geographical area30 June2020 %
30 June2019 %
Germany 18.88 13.39
Switzerland 18.59 15.78
France 11.25 14.63
Ireland 7.83 9.18
Sweden 7.70 8.51
Italy 7.25 9.04
Netherlands 6.74 2.75
United Kingdom 5.44 7.06
Denmark 4.78 2.72
Spain 3.77 6.44
United States 2.56 6.12
China 2.02 –
Finland 1.54 –
Belgium 1.47 4.08
Currency Forwards (0.02) (0.01)
Net Current Assets 0.20 0.31
100.00 100.00
Analysis, by industry sector30 June2020 %
30 June2019 %
Capital Goods 19.57 17.13
Semiconductors & Semiconductor Equipment 8.35 3.77
Food Beverage & Tobacco 7.96 12.36
Retailing 7.00 5.07
Pharmaceuticals & Biotechnology 6.21 1.55
Automobiles & Components 6.02 6.12
Consumer Durables & Apparel 5.78 7.39
Software & Services 5.62 7.12
Health Care Equipment & Services 4.61 8.12
Utilities 4.35 2.72
Insurance 3.99 –
Banks 3.66 5.11
Diversified Financials 3.46 3.26
Commercial & Professional Services 2.97 3.62
Materials 2.70 5.35
Consumer Services 2.47 0.85
Transportation 2.01 2.34
Technology Hardware & Equipment 1.80 3.87
Real Estate 1.29 1.47
Energy – 2.48
Currency Forwards (0.02) (0.01)
Net Current Assets 0.20 0.31
100.00 100.00
Analysis, by investment30 June2020 %
30 June2019 %
Equities Quoted 97.35 99.70
Preference Shares 2.47 –
Currency Forwards (0.02) (0.01)
Net Current Assets 0.20 0.31
100.00 100.00

57
30 June 2020
GAM Star Continental European Equity
Portfolio Statement
Holdings Description Fair Value€
Net Assets%
Equities Quoted
63,817 ASML Holding 20,861,777 4.24
52,429 LVMH Moet Hennessy Louis Vuitton SE 20,473,524 4.16
968,166 Infineon Technologies 20,210,465 4.11
199,740 Nestle 19,657,926 3.99
62,489 Zurich Insurance Group 19,623,213 3.99
1,500,932 FinecoBank Banca Fineco 18,033,698 3.66
105,755 Deutsche Boerse 17,031,843 3.46
283,126 Kingspan Group 16,138,182 3.28
272,474 Novo Nordisk 15,698,069 3.19
1,384,875 Epiroc 15,365,448 3.12
240,164 Zalando SE 15,077,496 3.06
226,083 Bayer 14,874,001 3.02
181,554 Eiffage 14,778,496 3.00
286,927 Alcon 14,655,848 2.98
710,902 RELX 14,624,859 2.97
362,430 ATLAS COPCO A 13,667,329 2.78
436,623 RWE 13,583,342 2.76
77,532 Sika 13,284,550 2.70
69,668 Microsoft 12,623,545 2.57
1,722,552 Grafton Group 12,507,100 2.54
9,510 Adyen 12,320,205 2.50
87,966 Pernod Ricard 12,319,638 2.50
104,181 Flutter Entertainment 12,143,107 2.47
119,929 Prosus 9,922,925 2.02
927,263 Ryanair Holdings 9,879,987 2.01
63,723 Ferrari 9,676,338 1.97
400,829 Industria de Diseno Textil 9,447,540 1.92
170,693 Hexagon 8,873,952 1.80
240,218 Stadler Rail 8,802,991 1.79
10,486 Straumann Holding 8,020,369 1.63
234,805 Moncler 7,992,762 1.62
76,287 Orsted 7,834,262 1.59
223,626 Faurecia 7,775,476 1.58
123,928 Kone 7,586,872 1.54
35,571 Schindler Holding-Part Cert 7,453,513 1.51
164,616 Anheuser-Busch InBev SA/NV 7,220,881 1.47
394,298 Aedas Homes SAU 6,363,970 1.29
58,901 Amadeus IT Group 2,731,828 0.56
479,137,327 97.35
Preference Shares
90,055 Volkswagen 12,152,022 2.47
12,152,022 2.47

58
30 June 2020
GAM Star Continental European Equity
Portfolio Statement
Purchase Currency
Contractual Amount
SaleCurrency
ContractualAmount
MaturityDate
Counterparty Unrealised Gain/(Loss)
€
Net Assets%
Open Forward Contracts
USD 4,351,200 EUR (3,849,189) 2020-08-10 Bank of America 21,632 0.00
EUR 215,196 USD (239,800) 2020-07-08 Bank of America 1,715 0.00
USD 287,200 EUR (254,797) 2020-07-08 Bank of America 881 0.00
EUR 95,923 USD (107,700) 2020-08-10 Bank of America 113 0.00
EUR 3,967,116 USD (4,480,000) 2020-07-08 Bank of America (21,178) (0.00)
USD 4,432,600 EUR (4,055,655) 2020-07-08 Bank of America (109,558) (0.02)
Unrealised gain on Open Forward Contracts 24,341 0.00
Unrealised loss on Open Forward Contracts (130,736) (0.02)
(106,395) (0.02)
Fair Value€
Net Assets%
Net Financial Assets and Liabilities at fair value 491,182,954 99.80
Net Current Assets (excluding Financial Assets and Financial Liabilities at fair value) 964,197 0.20
Net assets attributable to the shareholders of the Fund 492,147,151 100.00
Analysis of Total Assets %
Transferable securities admitted to official stock exchange listing 96.82
OTC financial derivative instruments 0.01
Other Assets 3.17
100.00
In line with the requirements of the UCITS regulation S.I. No. 344/2017 the open Forward Contracts have been condensed in the Portfolio Statement based on the purchase and sale currency, maturity date, counterparty and unrealised gain or unrealised loss of the contract as at the year end.

59
30 June 2020
GAM Star Continental European Equity
Portfolio Changes (Unaudited)
Major Purchases Cost€
Flutter Entertainment 24,259,516
Zurich Insurance Group 24,201,332
Pernod Ricard 22,110,288
Eiffage 20,727,415
Infineon Technologies 19,333,678
Ryanair Holdings 19,086,627
Grafton Group 18,382,306
Volkswagen 17,952,137
RELX 17,383,681
Amadeus IT Group 14,500,297
Novo Nordisk 14,266,998
RWE 14,216,392
Adyen 13,778,664
Airbus Group SE 11,846,855
BNP Paribas 10,634,220
Bayer 10,138,370
Alcon 9,891,350
Prosus 9,836,841
CaixaBank 9,441,500
SES SA 8,725,918
Kone 8,323,863
Anheuser-Busch InBev SA/NV 7,949,452
Fresenius SE & KGaA 7,795,355
Moncler 7,610,347
Straumann Holding 7,360,472
Nestle 6,999,127
Peugeot 6,856,930
Kingspan Group 6,433,029
Orsted 6,217,784
Deutsche Boerse 5,302,266
LVMH Moet Hennessy Louis Vuitton SE 4,919,272
Industria de Diseno Textil 4,876,837
ASML Holding 4,745,319
Dassault Systemes 4,322,686
Faurecia 4,267,312
Total for the financial year 404,694,436
Major Sales Proceeds€
Nestle 46,341,952
RELX 32,266,959
Flutter Entertainment 29,677,960
LVMH Moet Hennessy Louis Vuitton SE 28,929,723
Visa 27,657,614
FinecoBank Banca Fineco 27,611,634
Orsted 27,361,262
Fresenius SE & KGaA 27,174,416
Kingspan Group 26,555,564
Ryanair Holdings 25,830,656
Eiffage 24,650,839
Industria de Diseno Textil 24,485,277
Hexagon 24,463,003
Anheuser-Busch InBev SA/NV 23,933,219
Fresenius Medical Care & KGaA 23,051,145
Deutsche Boerse 22,658,113
ASML Holding 21,489,865
Microsoft 21,469,944
Rio Tinto 21,429,407
Pernod Ricard 20,298,008
ATLAS COPCO A 18,845,357
Tenaris 18,434,913
Peugeot 15,821,009
Grafton Group 15,524,415
Infineon Technologies 14,684,124
Amadeus IT Group 14,414,479
Alcon 13,010,960
Faurecia 12,867,861
Sika 12,265,641
CaixaBank 12,236,607
Schindler Holding-Part Cert 11,923,612
Ferrari 11,130,582
Cairn Homes 10,633,676
Adyen 10,103,149
Epiroc 8,767,087
Bayer 8,606,775
Zalando SE 8,483,639
Stadler Rail 8,439,043
Kering 8,434,414
Total for the financial year 761,963,903

60
30 June 2020
GAM Star Credit Opportunities (EUR)Fund Manager: Anthony Smouha, Gregoire Mivelaz and Patrick Smouha, ATLANTICOMNIUM SA
Commentary (Unaudited)
The Fund (as measured by the EUR Accumulation class) fell 3.8% in the year to 30 June 2020, versus the Barclays Euro Aggregate Corporate Total Return index in EUR terms, which fell 0.4%.
During the third quarter of 2019, despite strong earnings, markets were somewhat mixed due to on-going political headlines and macro uncertainties. The tone turned better in late August and September, following cuts in interest rates by both the European Central Bank (ECB) and the Federal Reserve (Fed). The Fund mainly benefited from the income during the quarter, as well as from further price appreciation of securities held. The ECB also announced the re-opening of asset purchases, which despite being lower than expected at EUR 20 billion a month, is open-ended, which can be seen as a positive. Finally, the ECB has announced a new round of targeted longer-term refinancing operations (TLTRO) at very favourable terms and deposit tiering where part of the banks’ excess liquidity reserves will be exempt from negative rates. The 10-year bund finished the quarter lower at -0.573%. This makes the income aspect of our portfolio even more attractive on a relative basis, as we are capturing spreads well above 400 bps. At the end of September, within the legacy space, we saw a positive development, which was that Santander called one of their floating-rate notes at par at the end of the month. The bond was trading at 67% prior to the call at par. This had a positive impact on other legacy bonds that we own. However, we feel that there is significantly more upside. Instruments which have been issued under Basel II and Solvency I do not comply with the new regulatory framework (so-called legacy / grandfathered bonds). Over time, these bonds are becoming inefficient. Therefore, there is a lot of optionality in terms of having issuers tendering or calling these bonds over the coming quarters / years at a significant premium to current prices, as has been demonstrated by Santander.
The fourth quarter of 2019 was strong for the Fund following positive developments related to trade wars and the UK election. Spreads on subordinated debt of financials tightened during the quarter and the legacy bonds also performed strongly. Despite the continued dovishness of central banks, the 10-year bund rate went up during the quarter. Nevertheless, our Fund performed strongly demonstrating its low sensitivity to interest rates. In this low interest rate environment, we feel the Fund is well positioned by capturing spreads of more than 350 bps. The stress tests conducted during the fourth quarter by the Bank of England were positive as banks performed well overall with improved capital positions. Moreover, banks have de-risked their business models, leading to higher capacity to absorb losses and lower potential losses in a stress scenario. Furthermore, any impact from current geopolitical issues such as Brexit are highly manageable for our issuers, even in a tail risk scenario. We have strong visibility on the future path of capital accumulation over the coming decade – with Basel IV due to be implemented from 2022 to 2027, again setting the bar for capital requirements higher, a continuation of the strengthening of European financials’ fundamentals. Despite the strengthening of fundamentals, we continue to capture extremely large spreads and yields on high quality issuers in our Fund, with spreads of more than 350 bps in EUR.
Despite a strong start to the first quarter of 2020, the last week of February was marked by strong ‘risk-off’ sentiment due to negative headlines on the Covid-19 coronavirus. Markets were challenging during the month of March, driven by the economic ramifications of the Covid-19 outbreak. This has led to a sharp sell off during the first half of the month in subordinated debt markets and wider credit and equity markets more generically. Sentiment improved during the second part of the month as central banks, governments and regulators all took extraordinary measures to support the economy through this period of uncertainty.
During the second quarter of 2020, financial markets showed some positive momentum, due to the fact that economies have been starting to gradually open, as well as the EU coronavirus recovery plan. The European Banking Authority and the Bank of England both published reports on banks. In each case, they believe that banks started this crisis with extremely high levels of capital and should be able to withstand the shock through pre-provisioned income, as banks should likely generate enough income to cover future expected credit losses, in addition to the excess capital they have built up. This is in line with our view that the Covid-19 crisis remains an equity story for European financials, and not a balance sheet story. The end of the first quarter earnings went in a similar direction. The month of June started strongly as there was positive news on the macroeconomic front, combined with central bank easing and the continued reopening of economies. This led to a large amount of new issues within the fixed income universe, as well as within subordinated debt of financials. Most of the new issues came at attractive levels. However, the amount of new supply combined with less positive news on Covid-19 meant our securities ended the month mixed. Given the blackout period, in terms of new issues, prior to thr second quarter results, as well as attractive spreads, we believe this should be supportive for valuations. Supervisors still believe banks should be able to withstand the Covid-19 shock through pre-provisioned income, as banks should generate enough income to cover future expected credit losses, as well as the excess capital they have built up. This is in line with our view that the Covid-19 crisis remains an equity story for European financials, and not a balance sheet story.
We expect prices to continue to recover in the next six to nine months as the uncertainty raised by the Covid-19 outbreak slowly fades away. Despite the partial recovery, we feel current valuations remain extremely attractive as we are able to capture spreads of more than 550 bps. On top of that, a large number of the subordinated debt issues of financials are still trading to perpetuity – with a large upside for bondholders on a re-pricing to call. Moreover, the Fund is capturing high and predictable income.
July 2020

61
30 June 2020
GAM Star Credit Opportunities (EUR)
Portfolio Statement
Analysis, by geographical area30 June2020 %
30 June2019 %
United Kingdom 30.32 22.31
France 13.26 13.02
Netherlands 12.03 13.82
Spain 11.48 10.69
Germany 5.50 5.57
Belgium 5.21 5.67
Switzerland 3.56 1.69
Singapore 2.35 2.55
United States 2.06 1.87
Austria 1.91 2.22
Czech Republic 1.06 0.63
Ireland 0.50 0.57
Sweden 0.30 –
Canada 0.17 0.11
Denmark 0.14 0.08
Brazil 0.10 0.10
India – 0.29
Japan – 0.09
Italy – 0.06
Luxembourg – 0.47
Ukraine – 0.73
Kazakhstan – 0.93
Norway – 0.10
Currency Forwards 1.19 0.18
Net Current Assets 8.86 16.25
100.00 100.00
Analysis, by industry sector30 June2020 %
30 June2019 %
Banks 42.08 33.37
Fixed Interest 27.73 31.62
Insurance 14.75 12.16
Real Estate 2.35 1.27
Diversified Financials 1.29 2.37
Non-sector specific 0.82 0.57
Food & Staples Retailing 0.64 0.40
Utilities 0.13 0.90
Food Beverage & Tobacco 0.10 0.48
Transportation 0.06 0.04
Materials – 0.29
Pharmaceuticals & Biotechnology – 0.10
Currency Forwards 1.19 0.18
Net Current Assets 8.86 16.25
100.00 100.00
Analysis, by investment30 June2020 %
30 June2019 %
Corporate Bonds 83.02 76.98
Convertible Bonds to Equities 4.31 4.28
Preference Shares 2.45 1.98
Other Bonds 0.17 0.33
Equity Warrants 0.00 –
Convertible Bonds to Unquoted Equities – 0.00
Currency Forwards 1.19 0.18
Net Current Assets 8.86 16.25
100.00 100.00
Analysis of Credit Ratings (S&P)30 June
202030 June
2019
Convertible Bonds, Corporate Bonds, Government Bonds & Other Bonds
From A to CCC+, or
may not be rated
From AAA to CCC+, or
may not be rated

62
30 June 2020
GAM Star Credit Opportunities (EUR)
Portfolio Statement
Holdings Description Fair Value€
Net Assets%
Preference Shares
11,775,000 General Accident 8.875% Pfd Perp 18,265,029 0.86
7,516,661 Santander UK Plc 12,879,333 0.61
5,236,000 Aviva Plc 7,949,120 0.37
3,616,294 RSA Insurance Group 7.375% Pfd Perp 4,793,924 0.23
1,500,000 Lloyds Banking Group Plc 2,376,261 0.11
1,551,118 Lloyds Banking Group Plc 2,333,525 0.11
2,085,000 REA Holdings 9% Pfd. Perp 1,404,923 0.07
793,000 Bristol & West Invest 8.125% Pfd Perp 1,055,599 0.05
311,000 Standard Chartered 8.25% Pfd Perp 424,250 0.02
250,000 Standard Chartered Plc 311,334 0.01
11,620 Strats-Gs-2006-02 192,434 0.01
51,985,732 2.45
Equity Warrants
361,790 REA Holdings PLC Ord. GBP 25.00 – 0.00
– 0.00
Convertible Bonds to Equities
74,250,000 BNP Paribas Fortis FRN Cnv Perp 52,778,385 2.48
24,113,000 Standard Chartered Plc Stanln 6.409 2049-01-29 17,380,725 0.82
26,500,000 Ageasfinlux FRN Cnv Perp 16,336,190 0.77
2,850,000 APQ Global 3.5% Cnv 2024-09-30 2,868,840 0.13
221,950 JZ Capital Partners 6% Cnv 2021-07-30 2,258,589 0.11
91,622,729 4.31
Other Bond
4,435,000 KLM Royal Dutch Airlines 5.75% Perp 3,735,975 0.17
3,735,975 0.17
Corporate Bonds
77,915,000 HSBC Holdings FRN Perp 77,720,212 3.66
78,900,000 Banco Santander FRN Perp 75,758,360 3.57
68,234,450 Stichting AK Rabobank Certificaten 6.5% Perp 72,726,324 3.42
55,400,000 Barclays FRN Perp 60,417,061 2.84
53,200,000 Banco Bilbao Vizcaya Argentaria FRN Perp 51,870,798 2.44
36,000,000 Aegon FRN Perp 5.63% 2049-12-29 38,987,820 1.83
46,515,000 Trafigura Group FRN Perp 37,092,724 1.75
32,000,000 Erste Group Bank FRN Perp 31,280,160 1.47
30,485,000 ASR Nederland FRN Perp 30,646,875 1.44
31,135,000 Liberty Mutual Group FRN 2059-05-23 30,119,065 1.42
25,803,000 Phoenix Group Holdings 4.375% 2029-01-24 27,481,743 1.29
29,000,000 IKB Deutsche Industriebank FRN 2028-01-31 27,089,480 1.27
25,548,000 Barclays FRN Perp 26,538,841 1.25
25,645,000 Credit Suisse Group Funding Guernsey 1.25% 2022-04-14 26,099,045 1.23
25,600,000 Banco Bilbao Vizcaya Argentaria FRN Perp 25,056,512 1.18
27,200,000 Banco Santander FRN Perp 24,685,224 1.16
24,300,000 Societe Generale 1.25% 2024-02-15 24,640,807 1.16
19,656,000 Dresdner Fndg Trust I 8.151% 2031-06-30 24,250,829 1.14
25,600,000 Ageas FRN Perp 24,241,920 1.14

63
30 June 2020
GAM Star Credit Opportunities (EUR)
Portfolio Statement
Holdings Description Fair Value€
Net Assets%
Corporate Bonds, continued
24,500,000 La Mondiale SAM FRN Perp 24,037,072 1.13
23,000,000 CPI Property Group FRN Perp 22,585,655 1.06
21,738,000 Societe Generale FRN Perp 21,630,723 1.02
21,000,000 BNP Paribas 1.125% 2023-10-10 21,425,775 1.01
20,900,000 Standard Chartered FRN 2030-09-09 21,242,969 1.00
19,000,000 Aroundtown FRN Perp 20,876,375 0.98
21,000,000 ABN AMRO Bank FRN Perp 20,462,190 0.96
20,000,000 Standard Chartered FRN Perp 19,906,690 0.94
19,150,000 Phoenix Group Holdings FRN Perp 19,457,137 0.92
26,621,000 CNP Assurances FRN Perp 19,035,346 0.90
18,000,000 Banco Bilbao Vizcaya Argentaria .75% 2022-09-11 18,082,080 0.85
18,793,000 Trafigura Group FRN 7.5% Perp 17,956,242 0.85
15,700,000 Groupama FRN Perp 17,360,824 0.82
17,339,000 Virgin Money UK FRN Perp 16,738,879 0.79
16,000,000 Royal Bank of Scotland Group 2.5% 2023-03-22 16,676,320 0.78
15,000,000 Lloyds Banking Group FRN 2026-04-01 16,661,325 0.78
16,500,000 Credit Agricole SA/London .5% 2024-06-24 16,480,447 0.78
14,412,000 JRP Group 9% 2026-10-26 16,391,550 0.77
16,000,000 Lloyds Banking Group FRN Perp GBP 16,135,251 0.76
14,471,000 La Mondiale SAM FRN Perp 16,025,330 0.75
15,600,000 Deutsche Pfandbriefbank FRN 2027-06-28 14,969,838 0.70
12,764,000 AXA FRN Perp 14,636,579 0.69
14,467,000 Direct Line Insurance Group FRN Perp 14,590,326 0.69
13,500,000 Barclays FRN 2025-04-02 14,517,495 0.68
14,646,000 Barclays FRN 2028-02-07 14,384,422 0.68
14,600,000 Banco Santander FRN Perp Subordina Regs 12/99 Var 13,838,756 0.65
19,778,500 Aegon FRN Perp 13,481,817 0.63
13,000,000 Barclays 1.875% 2023-12-08 13,452,270 0.63
13,014,000 Credit Suisse Group FRN 2025-07-17 13,289,571 0.63
11,650,000 Pension Insurance FRN Perp 13,279,015 0.62
18,090,000 AXA FRN Perp 12,980,479 0.61
17,100,000 Puma International Financing 5% 2026-01-24 12,888,222 0.61
13,000,000 Banco Bilbao Vizcaya Argentaria FRN Perp 12,853,815 0.60
11,350,000 Just Group 8.125% 2029-10-26 12,753,578 0.60
40,989,000 Casino Guichard Perrachon FRN Perp 12,086,836 0.57
12,000,000 Banco Bilbao Vizcaya Argentaria 1.125% 2024-02-28 12,073,320 0.57
10,200,000 Royal Bank of Scotland Group FRN 2030-08-14 11,500,191 0.54
11,200,000 Standard Chartered FRN Perp 11,147,747 0.52
10,500,000 Credit Suisse FRN 2025-09-18 10,583,108 0.50
10,000,000 ING Groep 1.125% 2025-02-14 10,296,200 0.48
9,500,000 CYBG FRN Perp 10,151,251 0.48
9,528,000 Barclays FRN 2025-11-11 9,534,479 0.45
8,100,000 UNIQA Insurance Group FRN 2046-07-27 9,338,652 0.44
9,200,000 Lloyds Banking Group FRN 2024-01-15 9,151,286 0.43
8,850,000 UBS Group Funding Switzerland FRN 2025-04-17 9,085,720 0.43
9,600,000 La Banque Postale FRN Perp 9,023,328 0.42
9,000,000 ABN AMRO Bank FRN Perp 9,006,750 0.42
3,880,000 Cheltenham & Gloucester 11.75% Perp 8,408,883 0.40
3,945,000 Coventry Bldg Society 12.125% Perp 8,245,955 0.39
13,110,834 BNP Paribas FRN Perp 8,243,437 0.39

64
30 June 2020
GAM Star Credit Opportunities (EUR)
Portfolio Statement
Holdings Description Fair Value€
Net Assets%
Corporate Bonds, continued
8,600,000 Commerzbank FRN Perp 8,225,986 0.39
7,824,000 HSBC Holdings FRN Perp 8,164,579 0.38
9,200,000 Belfius Bank SA/NV FRN Perp 8,014,166 0.38
8,400,000 CNP Assurances FRN Perp* 7,980,000 0.38
11,000,000 AXA FRN Perp 7,912,300 0.37
8,264,000 Beazley Re 5.875% 2026-11-04 7,780,698 0.37
6,318,000 Lloyds Banking Group FRN Perp 7,118,975 0.33
7,000,000 Commerzbank FRN 2030-12-05 7,047,040 0.33
3,413,000 Bank of Ireland 13.375% Perp 7,030,698 0.33
5,000,000 HSBC Capital Funding Dollar 1 LP FRN Perp 6,940,680 0.33
6,970,000 HSBC Holdings FRN Perp 6,617,353 0.31
7,000,000 Akelius Residential Property FRN 2081-05-17 6,403,390 0.30
8,019,000 ING Groep FRN Perp 6,237,980 0.29
5,994,000 Commerzbank 4% 2027-03-30 6,233,460 0.29
5,763,000 Commerzbank 4% 2026-03-23 5,988,016 0.28
6,500,000 NIBC Bank FRN Perp 5,661,760 0.27
5,000,000 Nationwide Building Society FRN Perp 5,557,645 0.26
5,200,000 ASR Nederland FRN 2049-05-02 5,416,112 0.25
5,000,000 Belfius Bank SA/NV FRN Perp 5,359,325 0.25
5,000,000 BNP Paribas 1.5% 2025-11-17 5,221,675 0.25
5,000,000 Credit Agricole SA/London 1.375% 2025-03-13 5,186,525 0.24
5,000,000 UBS Group Funding Jersey 1.75% 2022-11-16 5,172,050 0.24
5,000,000 Societe Generale 1.125% 2025-01-23 5,044,825 0.24
5,450,000 La Mondiale SAM FRN Perp 5,033,484 0.24
5,800,000 SCOR SE FRN Perp 5,021,855 0.24
5,000,000 Credit Suisse Group FRN 2027-06-24 5,008,950 0.24
5,000,000 Banco Bilbao Vizcaya Argentaria .375% 2024-10-02 4,863,500 0.23
6,145,400 ING Groep FRN Perp 4,819,223 0.23
5,543,000 NIBC Bank FRN 2040-02-21 4,794,695 0.23
4,600,000 Banco Bilbao Vizcaya Argentaria 1.375% 2025-05-14 4,694,139 0.22
5,200,000 Phoenix Group Holdings FRN Perp 4,475,593 0.21
5,107,000 Jefferies Group / Jefferies Group Capital Fin FRN 2037-08-31 3,672,870 0.17
3,485,000 BNP Paribas 1.125% 2023-11-22 3,557,035 0.17
8,632,000 Gran Tierra Energy International Holdings 6.25% 2025-02-15 3,530,116 0.17
3,000,000 Credit Suisse Group FRN 2026-04-02 3,327,900 0.16
5,000,000 Jefferies Group / Jefferies Group Capital Fin FRN 2037-12-28 3,233,094 0.15
3,360,000 La Mondiale SAM FRN Perp 3,124,800 0.15
3,000,000 Credit Agricole FRN 2026-04-22 3,031,440 0.14
3,000,000 Electricite de France FRN Perp 2,872,695 0.14
3,927,000 AXA FRN Perp 2,810,456 0.13
4,300,000 NIBC Bank FRN Perp 2,682,276 0.13
2,557,000 UBS Group Funding Jersey 1.25% 2026-09-01 2,660,495 0.13
2,569,000 Barclays 1.5% 2022-04-01 2,605,197 0.12
2,439,000 Allied Irish Banks FRN 2025-11-26 2,452,171 0.12
2,783,000 REA Finance 8.75% 2025-08-31* 2,449,309 0.12
3,250,000 Jyske Bank FRN Perp 2,426,921 0.11
990,000 NIBC Bank 0% 2043-02-10 2,394,751 0.11
2,850,000 Credit Logement FRN Perp 2,331,044 0.11
3,030,000 REA Holdings 7.5% 2022-06-30* 2,239,149 0.11
4,350,000 Gol Finance 7% 2025-01-31 2,223,432 0.10
* Level 3 investments.

65
30 June 2020
GAM Star Credit Opportunities (EUR)
Portfolio Statement
Holdings Description Fair Value€
Net Assets%
Corporate Bonds, continued
2,000,000 Legal & General Group FRN 2049-11-26 2,164,311 0.10
1,831,000 Natwest Markets PLC RBS 5 5/8 2049-06-29 2,115,752 0.10
2,175,000 OneSavings Bank FRN Perp 2,054,785 0.10
2,000,000 ING Bank FRN 2026-02-25 2,033,140 0.10
2,000,000 BP Capital Markets FRN Perp 2,011,180 0.09
2,102,000 Phoenix Group Holdings 5.375% 2027-07-06 1,980,594 0.09
894,000 Skipton Building Society 12.875% Perp 1,917,840 0.09
1,600,000 CYBG FRN 2028-12-14 1,868,586 0.09
1,750,000 Investec Bank FRN 2028-07-24 1,857,174 0.09
1,100,000 HBOS Sterling Finance Jersey FRN Perp 1,849,083 0.09
1,800,000 KBC Group FRN Perp 1,824,957 0.09
2,000,000 HBOS Capital Funding LP 6.85% Perp 1,806,651 0.08
1,800,000 ATF Netherlands FRN Perp 1,790,451 0.08
1,585,000 Natwest Markets PLC/The FRN Perp 1,761,172 0.08
3,305,000 de Saint-Gobain FRN Perp* 1,569,875 0.07
1,700,000 Belfius Bank SA/NV FRN Perp* 1,538,500 0.07
3,000,000 Casino Guichard Perrachon FRN Perp 1,482,105 0.07
2,500,000 Jefferies Group / Jefferies Group Capital Fin FRN 2038-02-28 1,421,782 0.07
2,177,000 STRATS FRN 2034-02-15* 1,308,351 0.06
600,000 Bank Of Scotland 13.625% Perp* 1,303,643 0.06
3,895,000 Koninklijke Luchtvaart Maatschappij FRN Perp 1,294,208 0.06
1,000,000 HDL Debenture 10.375% 2023-07-31 1,276,740 0.06
580,000 Leeds Building Society 13.375% Perp 1,268,164 0.06
1,299,000 OneSavings Bank FRN Perp* 1,227,203 0.06
1,500,000 Jefferies Group FRN 2042-06-20 1,217,340 0.06
1,000,000 Direct Line Insurance Group 4% 2032-06-05 1,137,134 0.05
1,500,000 Jefferies Group / Jefferies Group Capital Fin FRN 2037-10-31* 1,135,200 0.05
1,000,000 Legal & General Group FRN Perp 1,089,307 0.05
1,056,000 National Westminster Bank FRN Perp 976,800 0.05
1,000,000 Credit Mutuel Arkea FRN Perp 694,785 0.03
1,000,000 Jefferies Group / Jefferies Group Capital Fin FRN 2038-01-31 657,079 0.03
900,000 Standard Chartered 6.409% Perp 648,723 0.03
489,000 Barclays Bank 9% Perp 644,533 0.03
1,000,000 BNP Paribas FRN Perp 626,849 0.03
750,000 Jyske Bank FRN Perp 583,136 0.03
1,049,000 NIBC Bank FRN Perp 579,946 0.03
500,000 P & V Assurances – P & V Verzekeringen SCRL 5.5% 2028-07-13 514,485 0.02
600,000 Royal Bank of Scotland Group FRN Perp 492,623 0.02
540,000 Deutsche Postbank Funding Trust I FRN Perp 433,107 0.02
375,000 Natwest Markets PLC/The FRN Perp 399,138 0.02
500,000 Jefferies Group / Jefferies Group Capital Fin FRN 2038-03-29 392,156 0.02
353,000 CNP Assurances FRN Perp 356,530 0.02
771,000 EFG International FRN Perp* 329,217 0.02
545,000 Lloyds Bank FRN 2034-04-25 312,654 0.01
394,009 HSBC France FRN Perp* 265,956 0.01
273,000 GS Finance FRN 2037-04-13 236,212 0.01
150,000 Co-operative Group Holdings 2011 7.5% Step 2026-07-08 190,566 0.01
200,000 Banco Santander FRN Perp 181,255 0.01
280,000 Lloyds Bank FRN 2033-10-25 174,628 0.01
296,000 Bank of Nova Scotia/The FRN 2034-05-29 163,492 0.01
* Level 3 investments.

66
30 June 2020
GAM Star Credit Opportunities (EUR)
Portfolio Statement
Holdings Description Fair Value€
Net Assets%
Corporate Bonds, continued
260,000 STRATS FRN 2034-02-15* 160,887 0.01
149,000 Nationwide Building Society FRN Perp 141,789 0.01
100,000 Bank Of Scotland 8.75% Perp* 119,088 0.01
55,000 Barclays Bank 9% Perp 73,316 0.00
40,000 Bank Of Scotland Perp* 43,785 0.00
20,000 Skipton Building Society 8.5% Perp 30,236 0.00
1,764,045,333 83.02
Purchase Currency
Contractual Amount
SaleCurrency
ContractualAmount
MaturityDate
Counterparty Unrealised Gain/(Loss)
€
Net Assets%
Open Forward Contracts
EUR 306,663,896 GBP (262,300,000) 2020-08-14 State Street Bank 18,296,022 0.86
EUR 96,834,004 GBP (83,000,000) 2020-07-16 JP Morgan 5,543,058 0.26
GBP 80,000,000 EUR (86,429,490) 2020-07-16 State Street Bank 1,561,783 0.07
EUR 100,234,151 USD (111,000,000) 2020-08-14 JP Morgan 1,497,391 0.07
EUR 14,154,565 GBP (12,000,000) 2020-08-14 JP Morgan 961,983 0.04
EUR 13,136,226 GBP (11,500,000) 2020-10-15 JP Morgan 507,191 0.03
EUR 45,960,394 GBP (41,500,000) 2020-12-15 State Street Bank 439,134 0.02
EUR 15,068,736 GBP (13,400,000) 2020-10-15 State Street Bank 353,164 0.02
CHF 129,717,640 EUR (121,667,726) 2020-08-10 Bank of America 255,615 0.01
EUR 9,979,152 USD (11,000,000) 2020-10-15 JP Morgan 208,622 0.01
EUR 4,588,103 USD (5,000,000) 2020-10-15 State Street Bank 146,953 0.01
EUR 5,475,092 USD (6,000,000) 2020-08-14 State Street Bank 137,970 0.01
EUR 12,590,268 USD (14,000,000) 2020-07-16 JP Morgan 129,027 0.01
CHF 7,466,700 EUR (6,942,086) 2020-07-08 Bank of America 74,188 0.00
EUR 9,861,888 USD (11,000,000) 2020-07-16 State Street Bank 70,913 0.00
USD 1,400,000 EUR (1,230,333) 2020-10-15 State Street Bank 13,189 0.00
EUR 643,484 CHF (681,500) 2020-07-08 Bank of America 3,094 0.00
EUR 25,019 CHF (26,600) 2020-08-10 Bank of America 17 0.00
CHF 438,500 EUR (412,259) 2020-08-10 Bank of America (107) (0.00)
EUR 223,459 CHF (238,600) 2020-08-10 Bank of America (806) (0.00)
GBP 3,000,000 EUR (3,342,782) 2020-07-16 JP Morgan (43,110) (0.00)
GBP 5,500,000 EUR (6,169,253) 2020-10-15 State Street Bank (129,279) (0.01)
GBP 4,900,000 EUR (5,521,482) 2020-08-14 JP Morgan (134,510) (0.01)
EUR 131,691,860 CHF (140,638,740) 2020-07-08 Bank of America (462,883) (0.02)
CHF 133,853,540 EUR (126,439,095) 2020-07-08 Bank of America (660,237) (0.03)
USD 49,000,000 EUR (45,111,398) 2020-08-14 State Street Bank (1,524,900) (0.07)
EUR 118,963,582 USD (136,000,000) 2020-09-16 State Street Bank (1,921,650) (0.09)
Unrealised gain on Open Forward Contracts 30,199,314 1.42
Unrealised loss on Open Forward Contracts (4,877,482) (0.23)
25,321,832 1.19
* Level 3 investments.

67
30 June 2020
GAM Star Credit Opportunities (EUR)
Portfolio Statement
Fair Value€
Net Assets%
Net Financial Assets and Liabilities at fair value 1,936,711,601 91.14
Net Current Assets (excluding Financial Assets and Financial Liabilities at fair value) 188,188,084 8.86
Net assets attributable to the shareholders of the Fund 2,124,899,685 100.00
Analysis of Total Assets %
Transferable securities admitted to official stock exchange listing 83.79
Transferable securities dealt in on another regulated market 3.12
Other transferable securities of the type referred to in Regulation 68(1)(a), (b) and (c) 0.58
OTC financial derivative instruments 1.38
Other Assets 11.13
100.00
In line with the requirements of the UCITS regulation S.I. No. 344/2017 the open Forward Contracts have been condensed in the Portfolio Statement based on the purchase and sale currency, maturity date, counterparty and unrealised gain or unrealised loss of the contract as at the year end.

68
30 June 2020
GAM Star Credit Opportunities (EUR)
Portfolio Changes (Unaudited)
Major Purchases Cost€
Stichting AK Rabobank Certificaten 6.5% Perp 89,916,198
Banco Santander FRN Perp 88,574,000
Barclays FRN Perp 71,374,689
Dresdner Fndg Trust I 8.151% 2031-06-30 61,344,347
Ageas FRN Perp 57,952,300
La Mondiale SAM FRN Perp 56,034,200
Barclays FRN 2028-02-07 50,094,761
Banco Bilbao Vizcaya Argentaria FRN 2030-01-16 44,754,200
Banco Santander FRN Perp 43,253,330
Barclays 1.875% 2023-12-08 39,831,000
Barclays FRN 2025-11-11 38,207,451
BNP Paribas FRN 2025-07-15 37,874,830
BNP Paribas 1.125% 2023-10-10 37,266,265
Credit Agricole SA/London .5% 2024-06-24 35,106,440
ING Groep FRN 2025-09-03 33,355,070
Royal Bank of Scotland Group 2.5% 2023-03-22 33,254,850
Credit Suisse Group FRN 2025-07-17 32,795,518
CNP Assurances FRN 2041-09-30 32,743,020
Royal Bank of Scotland Group FRN 2023-03-08 32,458,684
ING Groep FRN 2030-11-13 30,906,600
Electricite de France FRN Perp 30,653,130
Societe Generale 1.25% 2024-02-15 28,931,490
Aviva 6.875% 2058-05-20 28,340,395
Lloyds Banking Group FRN 2026-04-01 27,386,500
Lloyds Banking Group FRN 2024-01-15 25,952,550
JRP Group 9% 2026-10-26 25,536,729
UBS Group FRN Perp 25,457,785
Credit Suisse Group Funding Guernsey 1.25% 2022-04-14 25,188,200
Commerzbank 4% 2026-03-23 24,144,415
Reassure Group 5.867% Perp 22,445,180
Credit Suisse Group FRN 2026-04-02 22,401,100
Trafigura Group FRN 7.5% Perp 21,752,490
Total for the financial year 1,255,287,717
Major Sales Proceeds€
Stichting AK Rabobank Certificaten 6.5% Perp 133,055,465
Cooperatieve Rabobank UA FRN Perp 84,511,750
Barclays FRN 2028-02-07 54,092,178
Groupama FRN Perp 53,603,100
Barclays PLC 5.875% FRN Perp 52,755,291
HSBC Holdings FRN Perp 50,092,750
Credit Suisse Group FRN 2025-07-17 45,962,240
Aegon FRN Perp 45,666,700
Banco Bilbao Vizcaya Argentaria FRN 2030-01-16 42,469,500
KBC Group FRN Perp 41,204,750
Royal Bank of Scotland Group FRN 2023-03-08 40,578,452
Banco Santander FRN Perp 40,171,250
HT1 Funding GMBH FRN Perp 40,144,235
BNP Paribas FRN 2025-07-15 37,857,000
Dresdner Fndg Trust I 8.151% 2031-06-30 37,394,360
Banco Santander FRN Perp 37,223,000
Trafigura Funding 5% 2020-04-27 36,854,180
Lloyds Bank PLC FRN Perpetual 36,626,465
Banco Santander FRN Perp 36,411,250
UBS Group Funding Switzerland FRN 2025-04-17 34,060,955
Credit Agricole SA/London .5% 2024-06-24 33,356,080
ING Groep FRN 2025-09-03 33,152,414
CNP Assurances FRN 2041-09-30 32,019,250
Electricite de France FRN Perp 31,997,875
UBS Group FRN Perp 31,929,800
ING Groep FRN 2030-11-13 31,249,600
BNP Paribas 1.125% 2023-10-10 30,471,508
Societe Generale 1.25% 2024-02-15 30,196,224
BNP Paribas 1.5% 2025-11-17 29,835,370
La Mondiale SAM FRN Perp 29,450,000
Total for the financial year 1,294,392,992

69
30 June 2020
GAM Star Credit Opportunities (GBP)Fund Manager: Anthony Smouha, Gregoire Mivelaz and Patrick Smouha, ATLANTICOMNIUM SA
Commentary (Unaudited)
The Fund (as measured by the GBP Accumulation class) fell 0.5% in the year to 30 June 2020, versus the Barclays Sterling Aggregate Corporate Total Return index, which rose 7.1% in GBP terms.
During the third quarter of 2019, despite strong earnings, markets were somewhat mixed due to on-going political headlines and macro uncertainties. The tone turned better in late August and September, following cuts in interest rates by both the European Central Bank (ECB) and the Federal Reserve (Fed). The Fund mainly benefited from the income during the quarter, as well as from further price appreciation of securities held. The ECB also announced the re-opening of asset purchases, which despite being lower than expected at EUR 20 billion a month, is open-ended, which can be seen as a positive. Finally, the ECB has announced a new round of targeted longer-term refinancing operations (TLTRO) at very favourable terms and deposit tiering where part of the banks’ excess liquidity reserves will be exempt from negative rates. Following the dovishness of the central banks, the 10-year gilt finished the quarter lower at 0.48%. This makes the income aspect of our portfolio even more attractive on a relative basis, as we are capturing spreads well above 500 bps. At the end of September, within the legacy space, we saw a positive development, which was that Santander called one of their floating-rate notes at par at the end of the month. The bond was trading at 67% prior to the call at par. However, we feel that there is significantly more upside. Instruments which have been issued under Basel II and Solvency I do not comply with the new regulatory framework (so-called legacy/grandfathered bonds). Over time, these bonds are becoming inefficient. Therefore, there is a lot of optionality in terms of having issuers tendering or calling these bonds over the coming quarters / years at a significant premium to current prices, as has been demonstrated by Santander.
The fourth quarter of 2019 was strong for the Fund following positive developments related to trade wars and the UK election. Spreads on subordinated debt of financials tightened during the quarter and the legacy bonds also performed strongly. Despite the continued dovishness of central banks, the 10-year bund rate went up during the quarter. Nevertheless, our Fund performed strongly demonstrating its low sensitivity to interest rates. In this low interest rate environment, we feel the Fund is well positioned by capturing spreads of more than 400 bps. The stress tests conducted during the fourth quarter by the Bank of England were positive as banks performed well overall with improved capital positions. Moreover, banks have de-risked their business models, leading to higher capacity to absorb losses and lower potential losses in a stress scenario. Furthermore, any impact from current geopolitical issues such as Brexit are highly manageable for our issuers, even in a tail risk scenario. We have strong visibility on the future path of capital accumulation over the coming decade – with Basel IV due to be implemented from 2022 to 2027, again setting the bar for capital requirements higher, a continuation of the strengthening of European financials’ fundamentals. Despite the strengthening of fundamentals, we continue to capture extremely large spreads and yields on high quality issuers in our Fund, with spreads of more than 400 bps in GBP.
Despite a strong start to the first quarter of 2020, the last week of February was marked by strong ‘risk-off’ sentiment due to negative headlines on the Covid-19 coronavirus. Markets were challenging during the month of March, driven by the economic ramifications of the Covid-19 outbreak. This has led to a sharp sell off during the first half of the month in subordinated debt markets and wider credit and equity markets more generically. Sentiment improved during the second part of the month as central banks, governments and regulators all took extraordinary measures to support the economy through this period of uncertainty.
During the second quarter of 2020, financial markets showed some positive momentum, due to the fact that economies have been starting to gradually open, as well as the EU coronavirus recovery plan. The European Banking Authority and the Bank of England both published reports on banks. In each case, they believe that banks started this crisis with extremely high levels of capital and should be able to withstand the shock through pre-provisioned income, as banks should likely generate enough income to cover future expected credit losses, in addition to the excess capital they have built up. This is in line with our view that the Covid-19 crisis remains an equity story for European financials, and not a balance sheet story. The end of the first quarter earnings went in a similar direction. The month of June started strongly as there was positive news on the macroeconomic front, combined with central bank easing and the continued reopening of economies. This led to a large amount of new issues within the fixed income universe, as well as within subordinated debt of financials. Most of the new issues came at attractive levels. However, the amount of new supply combined with less positive news on Covid-19 meant our securities ended the month mixed. Given the blackout period, in terms of new issues, prior to the second quarter results, as well as attractive spreads, we believe this should be supportive for valuations. Supervisors still believe banks should be able to withstand the Covid-19 shock through pre-provisioned income, as banks should generate enough income to cover future expected credit losses, as well as the excess capital they have built up. This is in line with our view that the Covid-19 crisis remains an equity story for European financials, and not a balance sheet story. We expect prices to continue to recover in the next six to nine months as the uncertainty raised by the Covid-19 outbreak slowly fades away. Despite the partial recovery, we feel current valuations remain extremely attractive as we are able to capture spreads of more than 550 bps. On top of that, a large number of the subordinated debt issues of financials are still trading to perpetuity – with a large upside for bondholders on a re-pricing to call. Moreover, the Fund is capturing high and predictable income.
We expect prices to continue to recover in the next six to nine months as the uncertainty raised by the Covid-19 outbreak slowly fades away.
July 2020

70
30 June 2020
GAM Star Credit Opportunities (GBP)
Portfolio Statement
Analysis, by geographical area30 June2020 %
30 June2019 %
United Kingdom 61.51 67.06
France 9.51 6.07
Netherlands 7.78 7.19
Switzerland 3.04 1.55
Singapore 2.51 3.21
Ireland 2.30 1.95
Germany 1.81 1.59
Belgium 0.64 0.66
United States 0.53 1.38
Spain 0.38 0.46
Luxembourg 0.24 0.18
Hong Kong 0.23 0.15
South Africa – 0.41
Australia – 0.24
Currency Forwards (0.88) (0.61)
Net Current Assets 10.40 8.51
100.00 100.00
Analysis, by industry sector30 June2020 %
30 June2019 %
Fixed Interest 37.26 43.03
Banks 34.64 29.19
Insurance 12.15 11.82
Diversified Financials 3.54 5.74
Utilities 1.80 1.48
Real Estate 0.86 0.62
Food Beverage & Tobacco 0.23 0.17
Consumer Services – 0.05
Currency Forwards (0.88) (0.61)
Net Current Assets 10.40 8.51
100.00 100.00
Analysis, by investment30 June2020 %
30 June2019 %
Corporate Bonds 75.54 77.83
Preference Shares 12.51 11.58
Convertible Bonds to Equities 1.65 1.88
Other Bonds 0.78 0.81
Equity Warrants 0.00 –
Currency Forwards (0.88) (0.61)
Net Current Assets 10.40 8.51
100.00 100.00
Analysis of Credit Ratings (S&P)30 June
202030 June
2019
Convertible Bonds, Corporate Bonds & Other Bonds
From A to BBB, or may not be rated
From A to BBB, or may not be rated

71
30 June 2020
GAM Star Credit Opportunities (GBP)
Portfolio Statement
Holdings Description Fair Value£
Net Assets%
Preference Shares
11,617,367 General Accident 8.875% Pfd Perp 16,380,488 2.34
7,708,950 Lloyds Banking Group Plc 10,541,989 1.51
6,925,100 National Westminster Bank 9% Pfd Perp 9,909,818 1.42
6,269,579 Santander UK Plc 9,764,869 1.40
7,615,161 RSA Insurance Group 7.375% Pfd Perp 9,176,269 1.31
5,914,830 General Accident 7.875% Pfd Perp 7,363,963 1.05
5,872,250 Standard Chartered 8.25% Pfd Perp 7,281,590 1.04
4,655,227 Standard Chartered Plc 5,269,717 0.75
3,776,165 Aviva Plc 5,211,108 0.75
2,714,000 Bristol & West Invest 8.125% Pfd Perp 3,283,940 0.47
2,438,100 REA Holdings 9% Pfd. Perp 1,493,336 0.21
1,027,000 Lloyds Banking Group Plc 1,478,880 0.21
226,750 Santander UK Plc 294,775 0.04
25,894 Royal Bank Scotland Grp Plc* 35,604 0.01
16,724 Royal Bank Scotland Grp Plc* 15,052 0.00
87,501,398 12.51
Equity Warrants
358,540 REA Holdings PLC Ord. GBP 25.00 – 0.00
– 0.00
Convertible Bonds to Equities
391,026 JZ Capital Partners 6% Cnv 2021-07-30 3,616,990 0.52
2,970,000 APQ Global 3.5% Cnv 2024-09-30 2,717,550 0.39
1,546,000 Santander UK 10.0625% Perp 2,474,852 0.36
2,000,000 Ageasfinlux FRN Cnv Perp 1,120,713 0.16
1,175,000 Aberdeen Standard Asia Focus 2.25% Cv. 2025-05-31 1,113,313 0.16
264,000 National Westminster Bank 11.5% Perp 440,631 0.06
6,000 Santander UK 10.0625% Perp* 8,580 0.00
11,492,629 1.65
Other Bond
3,157,000 National Westminster Bank 11.5% Perp 5,424,610 0.78
5,424,610 0.78
Corporate Bonds
34,700,000 HSBC Holdings FRN Perp 34,137,686 4.88
24,558,000 Stichting AK Rabobank Certificaten 6.5% Perp 23,792,528 3.40
20,102,000 Credit Agricole FRN Perp 2049-04-29 21,920,628 3.13
18,804,000 Lloyds Banking Group FRN Perp 19,259,621 2.75
24,215,000 Trafigura Group FRN Perp 17,552,535 2.51
8,185,000 Lloyds Bank PLC FRN Perpetual 14,039,198 2.01
14,000,000 Barclays FRN Perp 13,878,340 1.98
15,256,000 HSBC Holdings FRN Perp 13,832,900 1.98
13,700,000 Barclays FRN Perp 13,653,146 1.95
13,500,000 Aegon FRN Perp 5.63% 2049-12-29 13,289,844 1.90
13,318,000 Brit Insurance Holdings FRN 2030-12-09 12,991,443 1.86
12,520,000 Direct Line Insurance Group FRN Perp 11,477,585 1.64
10,900,000 Electricite de France FRN Perp 11,333,929 1.62
* Level 3 investments.

72
30 June 2020
GAM Star Credit Opportunities (GBP)
Portfolio Statement
Holdings Description Fair Value£
Net Assets%
Corporate Bonds, continued
11,050,000 Coventry Building Society FRN Perp 11,180,003 1.60
10,312,000 Barclays FRN Perp 10,376,502 1.48
10,201,000 Phoenix Group Holdings FRN Perp 9,421,338 1.35
8,525,000 Royal Bank of Scotland Group FRN 2030-08-14 8,736,931 1.25
8,539,000 Barclays FRN Perp 8,062,908 1.15
12,100,000 Standard Chartered 6.409% 2049-01-29 7,927,964 1.13
4,119,000 Bank of Ireland 13.375% Perp 7,712,827 1.10
7,000,000 Credit Suisse Group FRN 2026-04-02 7,058,407 1.01
6,911,000 Phoenix Life FRN Perp 6,964,871 1.00
6,000,000 Aldermore Group FRN 2026-10-28 6,525,090 0.93
8,200,000 SCOR SE FRN Perp 6,453,714 0.92
3,365,000 Coventry Bldg Society 12.125% Perp 6,393,500 0.91
7,000,000 Virgin Money UK FRN Perp 6,142,710 0.88
6,076,000 Aviva VRN 2049-11-29 6,095,686 0.87
6,000,000 Aroundtown FRN Perp 5,992,560 0.86
5,046,000 HDL Debenture 10.375% 2023-07-31 5,856,110 0.84
5,500,000 CYBG FRN 2028-12-14 5,838,690 0.84
6,000,000 Societe Generale 1.25% 2024-02-15 5,530,439 0.79
5,000,000 BNP Paribas 5.75% 2022-01-24 5,357,450 0.77
2,470,000 Cheltenham & Gloucester 11.75% Perp 4,865,900 0.70
5,000,000 Investec Bank FRN 2028-07-24 4,823,300 0.69
5,000,000 BNP Paribas 1.125% 2023-11-22 4,638,900 0.66
5,250,000 Credit Suisse Group FRN Perp 4,396,023 0.63
4,000,000 Phoenix Group Holdings 5.625% 2031-04-28 4,303,540 0.62
2,087,000 Skipton Building Society 12.875% Perp 4,069,650 0.58
3,520,000 PGH Capital 6.625% 2025-12-18 4,058,159 0.58
5,000,000 HSBC Holdings FRN Perp 4,038,097 0.58
4,000,000 BNP Paribas 1.5% 2025-11-17 3,797,165 0.54
4,000,000 HSBC Holdings FRN Perp 3,794,238 0.54
3,831,000 Aggregated Micro Power Infrastructure 2 8% 2036-10-17* 3,773,535 0.54
3,610,000 Pension Insurance FRN Perp 3,740,303 0.53
4,000,000 Credit Suisse Group FRN 2025-07-17 3,712,956 0.53
4,000,000 BNP Paribas 1.125% 2023-10-10 3,709,684 0.53
4,000,000 Leucadia National 6.625% 2043-10-23 3,706,975 0.53
4,000,000 Lendinvest Secured Income 5.375% 2023-10-06 3,643,600 0.52
1,830,000 Leeds Building Society 13.375% Perp 3,637,125 0.52
3,013,000 Barclays Bank 9% Perp 3,609,899 0.52
3,356,000 Quilter FRN 2028-02-28 3,360,145 0.48
3,500,000 CNP Assurances FRN Perp 3,324,253 0.48
3,800,000 KBC Group FRN Perp 3,320,542 0.47
4,095,000 EFG International Guernsey FRN 2027-04-05 3,289,802 0.47
3,221,000 Nationwide Building Society FRN Perp 3,285,420 0.47
4,000,000 AT Securities FRN Perp 3,242,666 0.46
3,780,000 International Personal Finance 5.75% 2021-04-07 2,992,469 0.43
3,415,000 HSBC Holdings FRN Perp 2,947,148 0.42
2,912,000 Natwest Markets PLC/The FRN Perp 2,817,360 0.40
3,000,000 Credit Suisse Group Funding Guernsey 1.25% 2022-04-14 2,775,255 0.40
3,400,000 Royal Bank of Scotland Group FRN Perp 2,537,478 0.36
3,000,000 Banco Santander FRN Perp 2,471,388 0.35
2,700,000 Societe Generale FRN Perp 2,442,164 0.35
2,000,000 AXA FRN Perp 2,379,620 0.34
* Level 3 investments.

73
30 June 2020
GAM Star Credit Opportunities (GBP)
Portfolio Statement
Holdings Description Fair Value£
Net Assets%
Corporate Bonds, continued
1,900,000 Nationwide Building Society FRN Perp 2,311,014 0.33
1,150,000 Bank Of Scotland 13.625% Perp* 2,271,250 0.32
2,200,000 Nationwide Building Society FRN Perp 2,208,591 0.32
2,758,000 REA Finance 8.75% 2025-08-31* 2,206,400 0.32
2,000,000 JRP Group 9% 2026-10-26 2,067,690 0.30
2,000,000 Nationwide Building Society FRN Perp 2,020,740 0.29
1,374,000 Yorkshire Building Society 13.5% 2025-04-01 1,994,072 0.29
1,881,000 Natwest Markets PLC RBS 5 5/8 2049-06-29 1,975,718 0.28
2,200,000 OneSavings Bank FRN Perp 1,889,250 0.27
1,120,000 Ulster Bank Ireland DAC 11.75% Perp 1,857,094 0.27
2,025,000 Bruntwood Investments 6% 2025-02-25 1,848,339 0.26
1,800,000 Santander UK Group Holdings FRN Perp 1,845,225 0.26
2,000,000 Barclays 1.5% 2022-04-01 1,843,598 0.26
2,000,000 Societe Generale FRN Perp 1,703,568 0.24
2,400,000 REA Holdings 7.5% 2022-06-30* 1,612,171 0.23
1,582,000 Natwest Markets PLC/The FRN Perp 1,597,860 0.23
2,500,000 Hongkong & Shanghai Banking Ltd FRN Perp 1,585,120 0.23
1,500,000 CYBG FRN Perp 1,456,957 0.21
2,500,000 Rothschilds Continuation Finance FRN Perp* 1,392,036 0.20
1,400,000 Legal & General Group FRN Perp 1,386,238 0.20
1,200,000 Electricite de France FRN Perp 1,270,944 0.18
1,461,000 OneSavings Bank FRN Perp* 1,254,634 0.18
747,000 HBOS Sterling Finance Jersey FRN Perp 1,141,416 0.16
1,000,000 Direct Line Insurance Group 4% 2032-06-05 1,033,645 0.15
1,000,000 Just Group 8.125% 2029-10-26 1,021,400 0.15
1,000,000 BP Capital Markets FRN Perp 1,010,780 0.14
875,000 RSA Insurance Group FRN 2045-10-10 966,235 0.14
850,000 Bank Of Scotland 8.75% Perp* 920,125 0.13
1,000,000 Lloyds Banking Group FRN Perp GBP 916,675 0.13
827,000 Barclays Bank FRN Perp 900,285 0.13
1,056,000 National Westminster Bank FRN Perp 887,903 0.13
1,000,000 Nationwide Building Society FRN Perp 865,000 0.12
1,499,000 NIBC Bank FRN Perp 753,309 0.11
600,000 Co-operative Group Holdings 2011 7.5% Step 2025-12-18 692,892 0.10
438,000 Newcastle Building Society 10.75% Perp 690,945 0.10
528,031 Co-Operative Group 11% 2025-12-20 657,045 0.09
372,000 Bank Of Scotland 9.375% Perp 598,224 0.09
500,000 CNP Assurances 7.375% FRN 2041-09-30 533,426 0.08
421,000 National Westminster Bank FRN 7.125% Perp 472,305 0.07
700,000 AXA FRN Perp 455,380 0.07
350,000 Aviva FRN Perp 374,761 0.05
270,000 Skipton Building Society 8.5% Perp 371,033 0.05
203,000 Newcastle Building Society 12.625% Perp 352,300 0.05
187,000 Barclays Bank 9% Perp 226,588 0.03
154,000 Direct Line Insurance PL FRN 2042-04-27 174,588 0.03
200,000 HSBC Bank FRN Perp 126,282 0.02
150,000 Santander Financial Pref 7.005% Perpetual 110,250 0.02
100,000 BBVA Intl. Pref Unipersonal 7.093% Perp 67,288 0.01
40,000 Bank Of Scotland Perp* 39,800 0.01
20,000 Lloyds Bank FRN Perp* 19,600 0.00
528,269,831 75.54
* Level 3 investments.

74
30 June 2020
GAM Star Credit Opportunities (GBP)
Portfolio StatementPurchase Currency
Contractual Amount
SaleCurrency
ContractualAmount
MaturityDate
Counterparty Unrealised Gain/(Loss)
£
Net Assets%
Open Forward Contracts
EUR 5,900,000 GBP (5,241,778) 2020-09-15 JP Morgan 127,833 0.02
EUR 6,700,000 GBP (6,090,126) 2020-09-15 State Street Bank 7,569 0.00
EUR 1,500,000 GBP (1,356,195) 2020-07-14 State Street Bank 7,535 0.00
GBP 488,413 USD (600,000) 2020-11-09 JP Morgan 3,206 0.00
USD 4,000,000 GBP (3,239,698) 2020-09-15 State Street Bank (3,797) (0.00)
USD 5,000,000 GBP (4,051,257) 2020-11-09 State Street Bank (7,867) (0.00)
GBP 793,834 USD (1,000,000) 2020-11-09 State Street Bank (14,844) (0.00)
GBP 2,061,361 EUR (2,300,000) 2020-11-09 JP Morgan (34,018) (0.00)
GBP 840,336 USD (1,100,000) 2020-08-11 State Street Bank (49,697) (0.01)
GBP 1,150,188 USD (1,500,000) 2020-07-15 State Street Bank (63,698) (0.01)
GBP 1,748,300 EUR (2,000,000) 2020-10-14 JP Morgan (72,864) (0.01)
GBP 2,445,688 EUR (2,800,000) 2020-10-16 JP Morgan (104,040) (0.01)
GBP 4,668,306 USD (5,900,000) 2020-09-15 State Street Bank (104,648) (0.01)
GBP 3,155,496 EUR (3,600,000) 2020-10-14 State Street Bank (122,600) (0.02)
GBP 1,422,774 EUR (1,700,000) 2020-08-11 State Street Bank (123,470) (0.02)
GBP 9,014,906 EUR (10,100,000) 2020-09-15 JP Morgan (177,141) (0.03)
GBP 17,418,460 EUR (19,300,000) 2020-12-17 State Street Bank (177,279) (0.03)
GBP 6,117,461 EUR (7,000,000) 2020-10-16 State Street Bank (256,858) (0.04)
GBP 39,375,952 USD (49,080,000) 2020-10-14 State Street Bank (321,335) (0.05)
GBP 12,833,912 EUR (14,500,000) 2020-11-09 State Street Bank (376,088) (0.05)
GBP 7,689,429 EUR (9,000,000) 2020-07-14 JP Morgan (492,950) (0.07)
GBP 21,554,677 USD (28,000,000) 2020-08-11 JP Morgan (1,100,719) (0.16)
GBP 18,761,908 EUR (22,000,000) 2020-08-11 JP Morgan (1,248,310) (0.18)
GBP 34,976,400 EUR (40,000,000) 2020-09-15 State Street Bank (1,427,747) (0.20)
Unrealised gain on Open Forward Contracts 146,143 0.02
Unrealised loss on Open Forward Contracts (6,279,970) (0.90)
(6,133,827) (0.88)
Fair Value£
Net Assets%
Net Financial Assets and Liabilities at fair value 626,554,641 89.60
Net Current Assets (excluding Financial Assets and Financial Liabilities at fair value) 72,740,776 10.40
Net assets attributable to the shareholders of the Fund 699,295,417 100.00
Analysis of Total Assets %
Transferable securities admitted to official stock exchange listing 87.71
Other transferable securities of the type referred to in Regulation 68(1)(a), (b) and (c) 0.29
OTC financial derivative instruments 0.02
Other Assets 11.98
100.00
In line with the requirements of the UCITS regulation S.I. No. 344/2017 the open Forward Contracts have been condensed in the Portfolio Statement based on the purchase and sale currency, maturity date, counterparty and unrealised gain or unrealised loss of the contract as at the year end.

75
30 June 2020
GAM Star Credit Opportunities (GBP)
Portfolio Changes (Unaudited)
Major Purchases Cost£
Barclays FRN Perp 9,088,702
Royal Bank of Scotland Group FRN 2030-08-14 8,633,555
Credit Suisse Group FRN 2026-04-02 6,564,914
Aviva VRN 2050-01-31 6,097,228
Societe Generale 1.25% 2024-02-15 5,387,427
BNP Paribas 5.75% 2022-01-24 5,365,000
HSBC Holdings FRN Perp 4,587,291
BNP Paribas 1.125% 2023-11-22 4,531,901
Phoenix Group Holdings 5.625% 2031-04-28 3,953,760
Pension Insurance FRN Perp 3,898,550
BNP Paribas 1.125% 2023-10-10 3,697,598
BNP Paribas 1.5% 2025-11-17 3,516,084
Credit Suisse Group FRN 2025-07-17 3,391,823
HSBC Holdings FRN Perp 3,115,740
Credit Suisse Group Funding Guernsey 1.25% 2022-04-14 2,620,135
Nationwide Building Society FRN Perp 2,202,300
Bruntwood Investments 6% 2025-02-25 2,046,400
Nationwide Building Society FRN Perp 2,000,000
Barclays 1.5% 2022-04-01 1,735,651
Stichting AK Rabobank Certificaten 6.5% Perp 1,624,402
Legal & General Group FRN Perp 1,395,000
Reassure Group 5.867% 2029-06-13 1,014,830
BP Capital Markets FRN Perp 1,007,500
Just Group 8.125% 2029-10-26 1,000,000
Lloyds Banking Group FRN Perp GBP 1,000,000
Direct Line Insurance Group 4% 2032-06-05 996,040
Total for the financial year 90,471,831
Major Sales Proceeds£
Lloyds Bank PLC FRN Perpetual 22,273,718
PGH Capital 6.625% 2025-12-18 14,096,855
HSBC Holdings FRN Perp 13,144,200
Trafigura Group FRN Perp 12,394,733
HSBC Holdings FRN Perp 12,344,650
Burford Capital PLC 5.000% 2026-12-01 11,390,390
Barclays PLC 5.875% FRN Perpetual 11,350,576
Coventry Building Society FRN Perp 8,517,550
Direct Line Insurance Group FRN Perp 7,713,675
Paragon Group FRN 2026-09-09 6,087,010
Stichting AK Rabobank Certificaten 6.5% Perp 6,042,402
Hiscox FRN 2045-11-24 5,778,325
HSBC Holdings FRN Perp 5,757,048
TP ICAP 5.25% 2026-05-29 5,237,500
Burford Capital Finance LLC 6.125% 2025-08-12 4,833,346
Paragon Banking Group PLC 6.125% 2022-01-30 4,456,008
Virgin Money Holdings UK FRN Perp 4,347,292
Deutsche Bank AG 7.125% FRN Perp 4,109,250
Julius Baer Group Ltd 4.750% FRN Perp 4,087,180
Lendinvest Secured Income PLC 5.25% 2022-08-10 4,050,000
SCOR SE FRN Perp 3,813,424
Investec Bank FRN 2028-07-24 3,682,340
Burford Capital PLC 6.125% 2024-10-26 3,550,560
Louis Dreyfus Co BV 5.250% 2023-06-13 3,507,386
Barclays FRN Perp 3,285,000
Petra Diamonds US Treasury 7.25% 2022-05-01 3,280,319
Leucadia National 6.625% 2043-10-23 3,129,854
Legal & General Group FRN 2045-10-27 2,963,208
Santander UK 10.0625% Perp 2,925,000
National Westminster Bank PLC 1.725% FRN Perp 2,881,828
Prudential FRN 2051-10-20 2,773,400
Deutsche Bank AG FRN Perp 2,712,414
Santander UK 2,619,000
Total for the financial year 209,135,441

76
30 June 2020
GAM Star Credit Opportunities (USD)Fund Manager: Anthony Smouha, Gregoire Mivelaz and Patrick Smouha, ATLANTICOMNIUM SA
Commentary (Unaudited)
The Fund (as measured by the USD Accumulation class) rose 1.2% over the year to 30 June 2020, versus the Barclays US Aggregate Corporate Total Return index, which returned 9.5% in USD terms.
During the third quarter of 2019, despite strong earnings, markets were somewhat mixed due to on-going political headlines and macro uncertainties. The tone turned better in late August and September, following cuts in interest rates by both the European Central Bank (ECB) and the Federal Reserve (Fed). The Fund mainly benefited from the income during the quarter, as well as from further price appreciation of securities held. The ECB also announced the re-opening of asset purchases, which despite being lower than expected at EUR 20 billion a month, is open-ended, which can be seen as a positive. Finally, the ECB has announced a new round of targeted longer-term refinancing operations (TLTRO) at very favourable terms and deposit tiering where part of the banks’ excess liquidity reserves will be exempt from negative rates. Following the dovishness of the central banks, the 10-year US Treasury finished the quarter at 1.67%. This makes the income aspect of our portfolio even more attractive on a relative basis, as we are capturing spreads well above 350 bps. At the end of September, within the legacy space, we saw a positive development, which was that Santander called one of their floating-rate notes at par at the end of the month. The bond was trading at 67% prior to the call at par. However, we feel that there is significantly more upside. Instruments which have been issued under Basel II and Solvency I do not comply with the new regulatory framework (so-called legacy/grandfathered bonds). Over time, these bonds are becoming inefficient. Therefore, there is a lot of optionality in terms of having issuers tendering or calling these bonds over the coming quarters / years at a significant premium to current prices, as has been demonstrated by Santander.
The fourth quarter of 2019 was strong for the Fund following positive developments related to trade wars and the UK election. Spreads on subordinated debt of financials tightened during the quarter and the legacy bonds also performed strongly. Despite the continued dovishness of central banks, the 10-year bund rate went up during the quarter. Nevertheless, our Fund performed strongly demonstrating its low sensitivity to interest rates. In this low interest rate environment, we feel the Fund is well positioned by capturing spreads of more than 300 bps. The stress tests conducted during the fourth quarter by the Bank of England were positive as banks performed well overall with improved capital positions. Moreover, banks have de-risked their business models, leading to higher capacity to absorb losses and lower potential losses in a stress scenario. Furthermore, any impact from current geopolitical issues such as Brexit are highly manageable for our issuers, even in a tail risk scenario. We have strong visibility on the future path of capital accumulation over the coming decade – with Basel IV due to be implemented from 2022 to 2027, again setting the bar for capital requirements higher, a continuation of the strengthening of European financials’ fundamentals. Despite the strengthening of fundamentals, we continue to capture extremely large spreads and yields on high quality issuers in our Fund, with spreads of more than 300 bps in USD.
Despite a strong start to the first quarter of 2020, the last week of February was marked by strong ‘risk-off’ sentiment due to negative headlines on the Covid-19 coronavirus. Markets were challenging during the month of March, driven by the economic ramifications of the Covid-19 outbreak. This has led to a sharp sell off during the first half of the month in subordinated debt markets and wider credit and equity markets more generically. Sentiment improved during the second part of the month as central banks, governments and regulators all took extraordinary measures to support the economy through this period of uncertainty.
During the second quarter of 2020, financial markets showed some positive momentum, due to the fact that economies have been starting to gradually open, as well as the EU coronavirus recovery plan. The European Banking Authority and the Bank of England both published reports on banks. In each case, they believe that banks started this crisis with extremely high levels of capital and should be able to withstand the shock through pre-provisioned income, as banks should likely generate enough income to cover future expected credit losses, in addition to the excess capital they have built up. This is in line with our view that the Covid-19 crisis remains an equity story for European financials, and not a balance sheet story. The end of the first quarter earnings went in a similar direction. The month of June started strongly as there was positive news on the macroeconomic front, combined with central bank easing and the continued reopening of economies. This led to a large amount of new issues within the fixed income universe, as well as within subordinated debt of financials. Most of the new issues came at attractive levels. However, the amount of new supply combined with less positive news on Covid-19 meant our securities ended the month mixed. Given the blackout period, in terms of new issues, prior to the second quarter results, as well as attractive spreads, we believe this should be supportive for valuations. Supervisors still believe banks should be able to withstand the Covid-19 shock through pre-provisioned income, as banks should generate enough income to cover future expected credit losses, as well as the excess capital they have built up. This is in line with our view that the Covid-19 crisis remains an equity story for European financials, and not a balance sheet story. We expect prices to continue to recover in the next six to nine months as the uncertainty raised by the Covid-19 outbreak slowly fades away.
July 2020

77
30 June 2020
GAM Star Credit Opportunities (USD)
Portfolio Statement
Analysis, by geographical area30 June2020 %
30 June2019 %
United Kingdom 32.40 30.68
Switzerland 13.23 10.72
France 9.86 8.24
Netherlands 7.67 8.83
Spain 4.39 2.81
Belgium 3.78 4.53
Luxembourg 3.21 2.90
Singapore 2.95 3.55
United States 2.88 3.47
Australia 2.63 4.86
Germany 2.20 1.72
Norway 1.07 1.09
Canada 0.83 1.32
Ireland 0.55 1.11
Brazil 0.37 0.51
Hong Kong 0.33 0.33
Italy 0.16 0.11
Jersey 0.06 0.04
Guernsey 0.03 0.02
Bermuda 0.01 –
India 0.00 1.01
Japan – 0.13
Ukraine – 1.38
South Africa – 0.67
Kazakhstan – 0.89
Mexico – 0.10
Belarus – 0.33
Global – 0.02
Argentina – 0.01
Currency Forwards 0.49 0.34
Net Current Assets 10.90 8.28
100.00 100.00
Analysis, by industry sector30 June2020 %
30 June2019 %
Banks 40.06 32.28
Fixed Interest 30.94 37.84
Diversified Financials 9.50 9.74
Insurance 6.99 7.76
Non-sector specific 0.45 0.39
Consumer Durables & Apparel 0.25 0.17
Utilities 0.24 0.46
Food Beverage & Tobacco 0.13 1.48
Telecommunication Services 0.03 0.02
Transportation 0.02 0.03
Materials – 1.11
Capital Goods – 0.10
Currency Forwards 0.49 0.34
Net Current Assets 10.90 8.28
100.00 100.00
Analysis, by investment30 June2020 %
30 June2019 %
Corporate Bonds 81.86 83.38
Convertible Bonds to Equities 3.65 5.17
Preference Shares 2.50 1.88
Other Bonds 0.60 0.95
Convertible Bonds to Unquoted Equities 0.00 0.00
Equity Warrants 0.00 –
Equity Quoted – 0.00
Currency Forwards 0.49 0.34
Net Current Assets 10.90 8.28
100.00 100.00
Analysis of Credit Ratings (S&P)30 June
202030 June
2019
Convertible Bonds to Equities, Convertible Bonds to Unquoted Equities, Corporate Bonds, Government Bonds & Other Bonds
From A to CCC-, or
may not be rated
From AAA to CCC+, or
may not be rated

78
30 June 2020
GAM Star Credit Opportunities (USD)
Portfolio Statement
Holdings Description Fair ValueUS$
Net Assets%
Preference Shares
12,392,951 Santander UK Plc 23,849,589 1.15
4,113,000 National Westminster Bank 9% Pfd Perp 7,272,378 0.35
2,998,000 General Accident 8.875% Pfd Perp 5,223,106 0.25
2,576,475 General Accident 7.875% Pfd Perp 3,963,450 0.19
2,650,000 RSA Insurance Group 7.375% Pfd Perp 3,945,582 0.19
1,750,000 Lloyds Banking Group Plc 2,956,947 0.14
138,156 Strats-Gs-2006-02 2,569,702 0.12
1,589,444 REA Holdings 9% Pfd. Perp 1,202,900 0.06
445,000 Bristol & West Invest 8.125% Pfd Perp 665,309 0.03
14,577 Citigroup Pfd Perp 384,978 0.02
52,033,941 2.50
Equity Warrants
362,050 REA Holdings PLC Ord. GBP 25.00 – 0.00
– 0.00
Convertible Bonds to Unquoted Equities
300,000 REI Agro 5.5% Cnv 2014-11-13* 3,000 0.00
3,000 0.00
Convertible Bonds to Equities
64,000,000 BNP Paribas Fortis FRN Cnv Perp 51,094,880 2.45
11,500,000 Standard Chartered Plc Stanln 6.409 2049-01-29 9,310,055 0.45
12,500,000 Ageasfinlux FRN Cnv Perp 8,654,714 0.41
319,750 JZ Capital Partners 6% Cnv 2021-07-30 3,654,521 0.18
2,385,000 APQ Global 3.5% Cnv 2024-09-30 2,696,420 0.13
676,000 Shanta Gold 13.5% Cnv 2021-04-10* 662,480 0.03
76,073,070 3.65
Other Bonds
9,800,000 Bank of Nova Scotia FRN 2085-08-31 7,927,955 0.38
5,070,000 Den Norske Bank FRN Perp 3,623,478 0.17
1,200,000 HSBC Bank FRN Perp 941,088 0.05
12,492,521 0.60
Corporate Bonds
65,273,800 Stichting AK Rabobank Certificaten 6.5% Perp 78,138,417 3.75
69,324,000 HSBC Holdings FRN Perp 69,686,911 3.34
63,818,000 Credit Suisse Group FRN Perp 66,749,161 3.20
60,968,000 Societe Generale FRN Perp 64,166,686 3.08
59,800,000 Banco Santander FRN Perp 62,488,309 3.00
60,200,000 Royal Bank of Scotland Group FRN Perp 55,513,430 2.66
60,036,000 Trafigura Group FRN Perp 53,770,643 2.58
43,627,000 HSBC Holdings FRN Perp 43,608,022 2.09
34,650,000 Standard Chartered FRN Perp 38,735,581 1.86
34,333,000 Credit Agricole FRN Perp 35,634,564 1.71
31,697,000 UBS Group FRN Perp 33,385,341 1.60
30,750,000 La Mondiale SAM FRN 2048-01-18 30,952,489 1.48
27,300,000 Societe Generale FRN Perp 27,526,044 1.32* Level 3 investments.

79
30 June 2020
GAM Star Credit Opportunities (USD)
Portfolio Statement
Holdings Description Fair ValueUS$
Net Assets%
Corporate Bonds, continued
25,000,000 Barclays FRN Perp 26,092,750 1.25
23,692,000 Demeter Investments for Swiss Re FRN 2052-08-15 25,922,128 1.24
23,948,000 Barclays Bank 10.179% 2021-06-12 25,882,040 1.24
25,000,000 Royal Bank of Scotland Group FRN 2029-11-01 25,881,500 1.24
24,995,000 Credit Suisse Group FRN Perp 25,860,202 1.24
24,066,000 HBOS Capital Funding LP 6.85% Perp 24,416,642 1.17
22,035,000 Lloyds Banking Group FRN Perp 22,961,021 1.10
21,465,000 Phoenix Group Holdings 5.375% 2027-07-06 22,715,980 1.09
16,338,000 Dresdner Fndg Trust I 8.151% 2031-06-30 22,639,567 1.09
21,500,000 Barclays FRN Perp 21,914,842 1.05
20,235,000 UBS Group Funding Switzerland FRN 2023-08-15 20,977,928 1.01
19,470,000 Beazley Re 5.875% 2026-11-04 20,588,844 0.99
20,000,000 Barclays FRN Perp 20,374,100 0.98
21,000,000 Banco Bilbao Vizcaya Argentaria FRN Perp 20,317,395 0.97
18,000,000 Ageas FRN Perp 19,144,205 0.92
8,996,000 Lloyds Bank PLC FRN Perpetual 19,065,631 0.91
17,400,000 Credit Suisse Group FRN Perp 18,747,891 0.90
16,693,000 Lloyds Banking Group FRN 2023-11-07 17,356,463 0.83
15,684,000 QBE Insurance Group FRN 2044-12-02 17,334,663 0.83
15,980,000 Standard Chartered 3.95% 2023-01-11 16,584,204 0.80
15,899,000 ING Groep 3.15% 2022-03-29 16,544,340 0.79
23,310,000 BNP Paribas FRN Perp 16,411,289 0.79
11,218,000 Royal Bank Scotland Grp FRN Perp 16,256,004 0.78
14,116,000 Commerzbank 8.125% 2023-09-19 16,125,765 0.77
14,956,000 QBE Insurance Group FRN 2046-06-17 15,960,894 0.77
15,726,000 EFG International Guernsey FRN 2027-04-05 15,610,335 0.75
13,720,000 La Mondiale SAM FRN 2047-01-26 14,830,908 0.71
14,000,000 UBS Group Funding Switzerland 3.491% 2023-05-23 14,648,900 0.70
14,166,000 Barclays 3.2% 2021-08-10 14,595,867 0.70
20,173,000 AXA FRN Perp 14,201,792 0.68
5,700,000 Cheltenham & Gloucester 11.75% Perp 13,874,559 0.67
17,960,000 Australia & New Zealand Banking Group FRN Perp 12,391,771 0.59
16,940,000 Den Norske Creditbank FRN Perp 12,105,663 0.58
11,600,000 ING Groep FRN Perp 11,894,350 0.57
14,600,000 Standard Chartered 6.409% Perp 11,819,722 0.57
11,500,000 Credit Suisse Group FRN Perp 11,678,883 0.56
10,335,000 BNP Paribas FRN Perp 11,376,768 0.55
10,000,000 Societe Generale 4.25% 2023-09-14 10,789,050 0.52
10,000,000 Credit Agricole SA/London 3.75% 2023-04-24 10,708,250 0.51
9,526,000 UBS Group FRN Perp 10,518,990 0.50
9,250,000 Direct Line Insurance Group FRN Perp 10,477,702 0.50
10,000,000 UBS Group Funding Switzerland FRN Perp 10,447,100 0.50
10,600,000 SCOR SE FRN Perp 10,308,129 0.49
9,500,000 AT Securities FRN Perp 9,515,770 0.46
13,050,000 Rothschilds Continuation Finance FRN Perp* 8,978,400 0.43
8,000,000 Royal Bank of Scotland Group 6% 2023-12-19 8,970,200 0.43
9,600,000 Banco Bilbao Vizcaya Argentaria FRN Perp 8,795,664 0.42
8,500,000 Credit Suisse Group Funding Guernsey 3.125% 2020-12-10 8,597,368 0.41
8,500,000 Phoenix Group Holdings FRN Perp 8,216,823 0.39
11,165,600 Aegon FRN Perp 8,157,978 0.39
* Level 3 investments.

80
30 June 2020
GAM Star Credit Opportunities (USD)
Portfolio Statement
Holdings Description Fair ValueUS$
Net Assets%
Corporate Bonds, continued
7,671,000 ABN AMRO Bank 3.4% 2021-08-27 7,931,239 0.38
7,000,000 Royal Bank Scotland Group 6.125% 2022-12-15 7,645,925 0.37
7,000,000 Credit Suisse Group FRN 2023-12-14 7,291,830 0.35
8,745,000 Hongkong & Shanghai Banking Ltd FRN Perp 6,851,095 0.33
7,000,000 Commerzbank FRN Perp 6,763,715 0.32
9,130,000 DNB Bank ASA FRN Perp 6,531,237 0.31
11,180,000 Gol Finance 7% 2025-01-31 6,418,214 0.31
5,765,000 Cooperatieve Rabobank UA 3.875% 2023-09-26 6,338,156 0.30
5,500,000 Leucadia National 6.625% 2043-10-23 6,297,968 0.30
5,933,000 Standard Life Aberdeen FRN 2028-06-30 6,036,323 0.29
6,800,000 Puma International Financing 5% 2026-01-24 5,756,302 0.28
4,146,000 Dresdner Fndg Trust I 8.151% Pdf. 2031-06-30 5,745,112 0.28
5,000,000 Lloyds Banking Group FRN Perp 5,645,950 0.27
5,000,000 ING Groep 4.1% 2023-10-02 5,484,400 0.26
6,730,000 HSBC Bank FRN Perp 5,250,544 0.25
5,000,000 BNP Paribas FRN 2025-11-19 5,235,925 0.25
5,210,000 Brookfield Residential Properties 6.375% 2025-05-15 5,205,077 0.25
5,000,000 Standard Chartered FRN 2023-01-20 5,191,325 0.25
5,000,000 BNP Paribas FRN Perp 5,102,575 0.24
5,000,000 Phoenix Group Holdings FRN 2031-09-04 5,048,625 0.24
4,745,000 ING Groep FRN Perp 4,874,610 0.23
7,429,000 NIBC Bank FRN Perp 4,612,963 0.22
4,260,000 Standard Chartered FRNs Perp 4,460,753 0.21
1,761,000 Coventry Bldg Society 12.125% Perp 4,134,196 0.20
4,584,000 BAC Capital Trust XIV FRN Perp 4,097,454 0.20
8,820,000 Gran Tierra Energy International Holdings 6.25% 2025-02-15 4,051,202 0.19
5,000,000 Jefferies Group / Jefferies Group Capital Fin FRN 2037-08-31 4,038,755 0.19
5,700,000 Westpac Banking FRN Perp 3,990,998 0.19
3,700,000 HSBC Holdings FRN Perp 3,692,212 0.18
3,256,000 BPCE 5.7% 2023-10-22 3,633,859 0.17
5,000,000 Jefferies Group / Jefferies Group Capital Fin FRN 2037-12-28 3,631,250 0.17
3,400,000 ABN AMRO Bank FRN 2028-03-27 3,541,236 0.17
2,500,000 HVB Funding Trust III 9% 2031-10-22 3,362,500 0.16
2,955,000 BNP Paribas 3.5% 2023-03-01 3,130,557 0.15
3,000,000 Credit Suisse Group FRN Perp 3,105,240 0.15
3,000,000 Lloyds Banking Group 3.1% 2021-07-06 3,071,625 0.15
3,000,000 BP Capital Markets FRN Perp 3,051,285 0.15
2,785,000 REA Finance 8.75% 2025-08-31* 2,752,918 0.13
1,100,000 Bank Of Scotland 13.625% Perp* 2,684,342 0.13
2,400,000 RWE FRN 2075-07-30 2,663,880 0.13
3,150,000 REA Holdings 7.5% 2022-06-30* 2,614,500 0.13
2,307,000 Royal Bank of Scotland Group 6.1% 2023-06-10 2,553,549 0.12
2,410,000 Lloyds Banking Group FRN Perp 2,516,787 0.12
2,330,000 Electricite de France FRN Perp 2,413,426 0.12
2,250,000 UBS Group Funding Jersey 3% 2021-04-15 2,294,190 0.11
2,156,000 OneSavings Bank FRN Perp 2,287,671 0.11
1,839,000 Lloyds Banking Group Plc 6.657% Perp 2,076,580 0.10
2,000,000 QBE Insurance Group FRN Perp 2,075,080 0.10
2,331,000 Puma International Financing 5.125% 2024-10-06 1,985,930 0.10
2,000,000 QBE Insurance Group FRN Perp 1,969,240 0.09
* Level 3 investments.

81
30 June 2020
GAM Star Credit Opportunities (USD)
Portfolio Statement
Holdings Description Fair ValueUS$
Net Assets%
Corporate Bonds, continued
1,600,000 Legal & General Group FRN Perp 1,957,527 0.09
1,740,000 Barclays 3.684% 2023-01-10 1,805,128 0.09
2,439,000 STRATS FRN 2034-02-15* 1,646,325 0.08
2,500,000 Jefferies Group / Jefferies Group Capital Fin FRN 2038-02-28 1,596,875 0.08
1,494,000 Standard Chartered 5.7% 2022-01-25 1,579,024 0.08
2,114,000 AXA FRN Perp 1,566,876 0.08
1,811,000 AXA FRN Perp 1,463,074 0.07
1,000,000 HDL Debenture 10.375% 2023-07-31 1,433,970 0.07
1,000,000 Co-operative Group Holdings 2011 7.5% Step 2026-07-08 1,426,896 0.07
1,500,000 Jefferies Group / Jefferies Group Capital Fin FRN 2037-10-31* 1,275,000 0.06
1,100,000 QBE Insurance Group FRN 2043-11-24 1,207,014 0.06
1,566,000 Investor Solutions FRN 2035-01-22* 1,151,010 0.06
1,056,000 National Westminster Bank FRN Perp 1,097,093 0.05
1,000,000 JPMorgan Chase & FRN 2034-07-03 861,330 0.04
919,737 GP Investments 10% Perp 826,526 0.04
1,000,000 Jefferies Group / Jefferies Group Capital Fin FRN 2038-01-31 737,998 0.04
680,000 OneSavings Bank FRN Perp* 721,529 0.03
296,000 Bank of Ireland 13.375% Perp 684,844 0.03
670,000 Demeter Investments for Swiss Re FRN Perp 671,102 0.03
500,000 Alcatel-Lucent USA 6.5% 2028-01-15 537,960 0.03
1,000,000 Gol Finance 8.75% Perp 500,455 0.02
700,000 NIBC Bank FRN Perp 490,423 0.02
725,000 Lloyds Bank FRN 2033-01-31 466,701 0.02
500,000 Jefferies Group / Jefferies Group Capital Fin FRN 2038-03-29 440,450 0.02
620,000 STRATS FRN 2034-02-15* 430,900 0.02
500,000 HSBC Bank FRN Perp 391,400 0.02
600,000 Lloyds Bank FRN 2034-04-25 386,595 0.02
582,000 Lloyds Bank FRN 2033-11-27 374,997 0.02
300,000 Standard Chartered FRN Perp 335,373 0.02
350,000 JPMorgan Chase & FRN 2035-08-31 308,823 0.02
395,000 Deutsche Bank AG/London FRN 2034-06-30 281,834 0.01
240,000 Trafigura Group FRN 7.5% Perp 257,554 0.01
175,000 AXA 8.6% 2030-12-15 254,158 0.01
296,000 Bank of Nova Scotia/The FRN 2034-05-29 183,627 0.01
213,000 Natixis US Medium-Term Note Program FRN 2033-10-31 182,496 0.01
161,000 Citigroup FRN 2030-11-19* 130,893 0.01
187,500 Noble Group Holdings Limited/Hamilton 2.5% Perp 115,336 0.01
142,000 Lloyds Bank FRN 2033-10-25 99,467 0.01
150,000 TILES-JPM FRN 2034-02-15 96,226 0.00
63,000 Natwest Markets PLC RBS 5 5/8 2049-06-29 81,763 0.00
100,000 Lloyds Bank FRN 2033-07-29* 69,400 0.00
50,000 Bank Of Scotland 8.75% Perp* 66,877 0.00
200,000 Virgolino de Oliveira Finance 10.5% 2018-01-28 DFLT* 4,000 0.00
400 Aegon FRN Perp 306 0.00
1,707,280,308 81.86
* Level 3 investments.

82
30 June 2020
GAM Star Credit Opportunities (USD)
Portfolio Statement
Purchase Currency
Contractual Amount
SaleCurrency
ContractualAmount
MaturityDate
Counterparty Unrealised Gain/(Loss)
US$
Net Assets%
Open Forward Contracts
USD 73,317,898 GBP (56,400,000) 2020-09-17 State Street Bank 3,599,285 0.17
USD 63,645,757 GBP (49,000,000) 2020-08-13 State Street Bank 3,085,647 0.15
AUD 82,063,600 USD (53,469,927) 2020-07-08 Bank of America 3,033,668 0.14
SGD 129,877,000 USD (91,311,500) 2020-07-08 Bank of America 1,788,096 0.09
GBP 17,000,000 USD (19,958,000) 2020-09-17 State Street Bank 1,056,475 0.05
USD 6,563,985 GBP (5,000,000) 2020-07-13 State Street Bank 385,564 0.02
USD 58,218,127 AUD (84,060,400) 2020-07-08 Bank of America 339,666 0.02
USD 26,201,324 EUR (23,000,000) 2020-09-17 State Street Bank 324,946 0.02
EUR 13,800,000 USD (15,242,707) 2020-09-17 JP Morgan 283,119 0.01
USD 95,511,977 SGD (132,999,800) 2020-07-08 Bank of America 173,865 0.01
ILS 22,741,800 USD (6,453,376) 2020-07-08 Bank of America 118,359 0.01
EUR 29,000,000 USD (32,530,779) 2020-09-17 State Street Bank 95,958 0.00
USD 11,006,476 EUR (9,700,000) 2020-11-12 State Street Bank 77,865 0.00
USD 8,917,221 GBP (7,150,000) 2020-10-16 State Street Bank 77,146 0.00
USD 6,781,534 ILS (23,271,200) 2020-07-08 Bank of America 56,818 0.00
USD 2,154,257 GBP (1,700,000) 2020-11-12 State Street Bank 52,016 0.00
GBP 7,150,000 USD (8,820,597) 2020-10-16 JP Morgan 19,478 0.00
USD 1,249,699 GBP (1,000,000) 2020-12-16 State Street Bank 12,786 0.00
USD 489,228 AUD (709,200) 2020-08-10 Bank of America 852 0.00
USD 42,113 SGD (58,500) 2020-08-11 Bank of America 176 0.00
USD 23,740 ILS (81,500) 2020-08-10 Bank of America 168 0.00
USD 88,270 ILS (306,000) 2020-08-10 Bank of America (231) (0.00)
ILS 941,500 USD (273,040) 2020-07-08 Bank of America (973) (0.00)
USD 1,230,563 SGD (1,718,000) 2020-08-11 Bank of America (1,041) (0.00)
USD 728,734 AUD (1,060,000) 2020-08-10 Bank of America (1,212) (0.00)
USD 117,565 ILS (412,100) 2020-07-08 Bank of America (1,520) (0.00)
USD 308,633 AUD (455,400) 2020-07-08 Bank of America (4,925) (0.00)
USD 649,188 SGD (912,600) 2020-07-08 Bank of America (4,990) (0.00)
EUR 1,800,000 USD (2,030,706) 2020-07-13 JP Morgan (8,569) (0.00)
USD 6,730,584 EUR (6,000,000) 2020-07-13 State Street Bank (9,871) (0.00)
SGD 4,035,400 USD (2,904,107) 2020-07-08 Bank of America (11,416) (0.00)
AUD 2,452,200 USD (1,707,211) 2020-07-08 Bank of America (18,787) (0.00)
GBP 750,000 USD (956,816) 2020-10-16 JP Morgan (29,535) (0.00)
EUR 2,700,000 USD (3,075,098) 2020-11-12 JP Morgan (33,113) (0.00)
ILS 23,383,100 USD (6,820,545) 2020-08-10 Bank of America (57,747) (0.00)
USD 3,828,643 EUR (3,500,000) 2020-10-16 JP Morgan (111,878) (0.00)
USD 4,802,208 EUR (4,400,000) 2020-09-17 State Street Bank (148,055) (0.01)
SGD 132,978,700 USD (95,508,953) 2020-08-11 Bank of America (178,799) (0.01)
USD 12,966,268 EUR (11,700,000) 2020-09-17 JP Morgan (196,933) (0.01)
AUD 82,721,900 USD (57,295,918) 2020-08-10 Bank of America (331,285) (0.02)
USD 17,358,736 EUR (16,000,000) 2020-11-12 State Street Bank (667,838) (0.03)
USD 24,312,255 EUR (22,200,000) 2020-10-16 State Street Bank (681,907) (0.03)
USD 115,118,928 EUR (104,000,000) 2020-08-13 State Street Bank (1,795,437) (0.09)
Unrealised gain on Open Forward Contracts 14,581,953 0.69
Unrealised loss on Open Forward Contracts (4,296,062) (0.20)
10,285,891 0.49

83
30 June 2020
GAM Star Credit Opportunities (USD)
Portfolio Statement
Fair ValueUS$
Net Assets%
Net Financial Assets and Liabilities at fair value 1,858,168,731 89.10
Net Current Assets (excluding Financial Assets and Financial Liabilities at fair value) 227,396,415 10.90
Net assets attributable to the shareholders of the Fund 2,085,565,146 100.00
Analysis of Total Assets %
Transferable securities admitted to official stock exchange listing 84.56
Transferable securities dealt in on another regulated market 0.37
Other transferable securities of the type referred to in Regulation 68(1)(a), (b) and (c) 2.36
OTC financial derivative instruments 0.69
Other Assets 12.02
100.00
In line with the requirements of the UCITS regulation S.I. No. 344/2017 the open Forward Contracts have been condensed in the Portfolio Statement based on the purchase and sale currency, maturity date, counterparty and unrealised gain or unrealised loss of the contract as at the year end.

84
30 June 2020
GAM Star Credit Opportunities (USD)
Portfolio Changes (Unaudited)
Major Purchases CostUS$
Barclays Bank 10.179% 2021-06-12 26,387,771
Royal Bank of Scotland Group FRN 2029-11-01 25,252,800
Commerzbank 8.125% 2023-09-19 24,841,524
Banco Bilbao Vizcaya Argentaria FRN Perp 22,367,500
Ageas FRN Perp 22,167,002
Barclays FRN Perp 21,910,000
Barclays FRN Perp 19,795,000
UBS Group Funding Switzerland 3.491% 2023-05-23 19,553,600
Barclays 3.2% 2021-08-10 19,477,683
Royal Bank of Scotland Group 6% 2023-12-19 17,973,480
Lloyds Banking Group FRN 2023-11-07 16,901,557
Standard Chartered 3.95% 2023-01-11 16,391,310
UBS Group Funding Switzerland FRN 2023-08-15 16,352,500
Royal Bank Scotland Group 6.125% 2022-12-15 14,994,764
HBOS Capital Funding LP 6.85% Perp 12,585,000
Credit Suisse Group FRN Perp 11,547,250
Societe Generale 4.25% 2023-09-14 10,812,400
Credit Agricole SA/London 3.75% 2023-04-24 10,717,950
ING Groep 4.1% 2023-10-02 10,708,000
Phoenix Group Holdings FRN Perp 8,672,338
Credit Suisse Group Funding Guernsey 3.125% 2020-12-10 8,605,145
ABN AMRO Bank 3.4% 2021-08-27 7,941,434
Credit Suisse Group FRN Perp 7,525,000
Swiss Re Finance Luxembourg SA 4.25% FRN Perp 7,400,000
Standard Chartered FRN 2030-02-12 7,002,090
Commerzbank FRN Perp 7,000,000
Royal Bank of Scotland Group 5.125% 2024-05-28 6,594,000
ING Groep 3.15% 2022-03-29 6,036,475
Beazley Insurance DAC 5.5% 2029-09-10 5,500,000
La Mondiale SAM FRN 2048-01-18 5,266,250
BNP Paribas FRN 2025-11-19 5,262,000
Standard Chartered FRN 2023-01-20 5,142,000
Phoenix Group Holdings FRN 2031-09-04 5,000,000
Total for the financial year 433,683,823
Major Sales ProceedsUS$
HSBC Holdings FRN Perp 64,038,500
Stichting AK Rabobank Certificaten 6.5% Perp 61,508,682
QBE Insurance Group FRN 2046-06-17 39,102,850
UBS Group Funding Switzerland FRN Perp 36,834,625
HSBC Holdings FRN Perp 36,528,125
Barclays FRN Perp 34,190,000
QBE Insurance Group FRN 2044-12-02 34,049,750
Ageasfinlux FRN Cnv Perp 32,592,551
Phoenix Group Holdings 5.375% 2027-07-06 27,586,595
Royal Bank of Scotland Group FRN Perp 27,209,250
BNP Paribas SA 6.75% FRN Perp 26,878,250
Lloyds Bank PLC FRN Perpetual 26,365,533
Glencore Canada 6.2% 2035-06-15 25,291,070
BNP Paribas Fortis FRN Cnv Perp 24,931,914
Societe Generale FRN Perp 23,466,250
MHP 7.75% 2024-05-10 23,239,900
Standard Chartered FRN Perp 21,745,625
UBS Group Funding Switzerland FRN Perp 21,086,000
Standard Chartered 6.409% Perp 20,475,375
Groupama FRN Perp 19,578,593
Demeter Investments for Swiss Re FRN Perp 19,309,262
Vedanta Resources 6.125% 2024-08-09 18,510,388
Deutsche Bank FRN Perp 18,031,500
HSBC Holdings FRN Perp 17,580,750
Standard Chartered FRNs Perp 17,507,310
HSBC USA 7.2% 2097-07-15 17,469,300
Credit Suisse Group FRN Perp 17,320,000
Puma International Financing 5% 2026-01-24 16,499,000
Barclays FRN Perp 16,201,603
Banco Bilbao Vizcaya Argentaria FRN Perp 16,040,900
Trafigura Funding 5.25% 2023-03-19 15,944,500
Trafigura Group FRN Perp 15,869,750
Louis Dreyfus Co BV 5.250% 2023-06-13 14,509,874
Kernel Holding 8.75% 2022-01-31 14,039,950
Nostrum Oil & Gas Finance 8% 2022-07-25 13,801,025
Puma International Financing 5.125% 2024-10-06 13,770,135
Burford Capital Finance LLC 6.125% 2025-08-12 13,516,376
BNP Paribas FRN Perp 13,297,500
Total for the financial year 915,918,561

85
30 June 2020
GAM Star Global DefensiveFund Manager: Charles Hepworth/James McDaid
Commentary (Unaudited)
The Fund (as measured by the GBP Accumulation class) rose 0.9% over the year to 30 June 2020, matching its benchmark, the Lipper Global Mixed Asset GBP Conservative, which also rose 0.9% in GBP terms.
The third quarter of 2019 saw equity markets as defined by the MSCI AC World index in local currency terms gain just over 1%. While this may appear unremarkable, the headline number hid a significant drop towards the end of July, as the US-China trade war intensified and the outlook for global growth and inflation darkened accordingly. Markets swiftly regained their poise as central banks stepped in to reduce interest rates and, in some cases, resume extraordinary stimulus measures. Simultaneously, major government bond markets took off as yields plummeted. How could equity markets brush off a trade war while bond markets priced in a future of virtually no growth? In our view, the answer partly lies in the diverse impact the trade war is having around the world. The US economy is well placed to withstand an assault on globalisation for the simple reason that it is structured towards consumption rather than export manufacturing. The latter now accounts for a mere 11% of America’s total GDP. Equity allocations remained broadly constant during the review period, with a reasonable weighting to the more stable US market maintained amid our belief that the Federal Reserve would have to respond to any trade-related slowdown. This expectation was met as the US central bank acted pre-emptively even while the economy remained in fair shape. Given the uncertainty surrounding the trade war, it is unsurprising that the gold position held within the strategy performed well. On the flipside, equity positions with a bias towards Asia Pacific regions suffered as the trade war continued. The Cadence Strategic Asia fund fell slightly by 0.14%.
The fourth quarter of the year saw global indices climb, with the US equity markets surging to record highs, amid increased optimism for global reflation. Cyclical equity sectors such as industrials and financials fared better than safer bets such as utilities or consumer staples, as investors took the view that the synchronised global slowdown which began in 2017 was taking a turn for the better. These positive effects were compounded by the pricing out of some of the uncertainty that has recently haunted markets. That the UK was going to leave the European Union began to look certain under new Prime Minister Boris Johnson and this was all but confirmed by his election victory in December. At the same time, the US and China appeared to reach ‘phase one’ of a comprehensive trade deal after months of negotiations. Within the portfolio, the Polar Capital UK Value Opportunities fund was the standout performer seeing a gain of 14.13%. The Fund has a focus on domestic UK mid-cap stocks which have been held back by the uncertainty that has been hanging over the UK economy since the 2016 referendum. As the political situation became clearer with the results of the general election, this cloud has lifted somewhat and provided relief for the sector. However, the year ahead will define the ‘shape’ of Brexit and will be key to determining the outlook for ‘UK Inc’.
The first quarter of 2020 began brightly enough amid optimism over a US-China trade deal; however, by mid-February global stock markets had started to lose their poise over the rapid spread of the Covid-19 virus around the world. Large sell-offs followed across all markets, with the MSCI AC World falling 15.87% in sterling terms over the quarter. As the lockdowns and quarantines gathered pace, concerns about the duration of the crisis and its effect on the global economy mounted, and investors and companies engaged in an asset fire sale in order to raise liquidity at literally any price. This meant that by mid-March, those assets which normally provide more stability showed signs of strain, including ‘safe haven’ stalwarts such as government bonds. Towards the end of the month however, there were signs of market stability as governments around the world committed to supporting the economy with huge fiscal stimulus packages, implicitly financed by central banks, renewing their quantitative easing programmes.
If the first quarter of 2020 was characterised by waterfall moves in markets, the second quarter saw an almost equally sharp rebound, with the MSCI AC World Index in local currency terms up nearly 18% from the end of March to 30 June. A fast and comprehensive response from policymakers went some way to explaining the rebound. Central banks across the world rushed to reduce interest rates to or towards zero, while fiscal rectitude was abandoned as governments sought to incubate workers until the economy could be opened up again. Highlights of this ‘new responsiveness’ by the authorities included the UK’s more than nine million workers on government furlough and the US Federal Reserve’s stated willingness to buy corporate bonds outright to ensure a continued flow of financing into the private sector. For all the largesse,
though, the profound long-term economic damage was soon becoming apparent as consumption plunged and many already vulnerable businesses in the US, UK and Europe ceased operating. In late June, the International Monetary Fund (IMF) revised down its world economic growth outlook for 2020 to -4.9%, while Bloomberg consensus estimates for US GDP growth for 2020 plummeted to -5.6%, having begun the year forecasting nearly +2.0%. Cyclical stocks suffered, while those areas deemed to have a promising future, notably technology, fared so well that they were able to drive the entire market upwards. By the end of the quarter, the technology-heavy Nasdaq 100 Index in the US stood higher than at the start of the year. Equity weightings within the strategy were marginally increased, facilitating meaningful participation in the market rebound as investors favoured thematic, secular growth over uncertain, near-term cyclicality. The emphasis on the US equity market and, stylistically, growth over value was especially helpful during the review period. While value investing had some good days, growth stocks dominated the overall narrative. This theme was combined in equity portfolios with other secular growth sources such as emerging markets and disruptive technology. In fixed income and credit, developed market corporate bond spreads tightened as fears of mass defaults receded and central banks offered direct intervention in credit markets. This was constructive for the allocation to European subordinated financial debt. An emerging market debt holding that had seen some stress in the first quarter was also quick to recover its poise in the second. Stateside, non-agency mortgage-backed securities (MBS) paper made steady progress from its March sell-off.
The top three holdings contributing to performance were iShare Physical Gold, Coupland Cardiff – CC Alpha Japan Fund and JPMorgan Fund – Japan Fund. The bottom three performers were GAM Star MBS Total Return, Alken Continental Fund and Active Global High Income Bond Fund.
July 2020
Portfolio Statement
Analysis, by geographical area30 June2020 %
30 June2019 %
Global 39.74 40.47
United States 21.40 22.22
United Kingdom 10.37 5.99
Japan 5.85 5.28
Europe ex UK 3.20 5.32
Asia-Pacific ex Japan 2.19 2.08
Currency Forwards (0.03) 0.12
Net Current Assets 17.28 18.52
100.00 100.00
Analysis, by investment30 June2020 %
30 June2019 %
Bond Funds 53.97 32.24
Equity Funds 15.81 31.99
Exchange Traded Funds 8.74 4.18
Other Funds 4.23 6.88
Diversified Funds – 6.07
Currency Forwards (0.03) 0.12
Net Current Assets 17.28 18.52
100.00 100.00

86
30 June 2020
GAM Star Global Defensive
Portfolio Statement
Holdings Description Fair Value£
Net Assets%
Bond Funds*
263,873 GAM Star Credit Opportunities GBP Z II Acc*** 2,785,677 13.91
17,968 Active Global High Income Bond Fund Z2 1,892,252 9.45
19,227 Active Global High Income Bond Fund Z1 1,888,847 9.44
168,457 GAM Star MBS Total Return Inst GBP Acc*** 1,872,199 9.35
123,648 GAM Star MBS Total Return W GBP Acc*** 1,456,589 7.28
578,819 JPM Global Macro Opportunities Fund 908,746 4.54
10,804,310 53.97
Equity Funds*
30,029 Coupland Cardiff Funds plc – CC Japan Alpha Fund 611,456 3.05
241,167 JPMorgan Fund ICVC – Japan Fund 559,026 2.79
41,299 Polar Capital Funds PLC – UK Value Opport Fund S GBP Acc 419,184 2.09
314,809 Ninety One Funds Series I – UK Alpha Fund 405,883 2.03
390,238 Premier Pan European Property C Acc 393,126 1.96
223,813 Hermes Europe ex-UK Equity Fund M GBP Acc 338,651 1.69
274 Veritas Asian C GBP 227,159 1.14
133 CompAM Fund – Cadence Strategic Asia GBP C Acc 212,020 1.06
3,166,505 15.81
Exchange Traded Funds*
28,107 Amundi Prime USA ETF 532,712 2.66
17,089 iShares Physical Gold ETC 480,201 2.40
84,440 iShares Edge MSCI USA Value Factor UCITS ETF 411,856 2.06
17,500 Amundi Prime Eurozone ETF 324,643 1.62
1,749,412 8.74
Other Funds*
149,027 Loomis Sayles U.S. Equity Leaders Fund** 544,754 2.72
3,664 Alken Fund – Continental Europe SGB1 Cap GBP Acc 302,140 1.51
846,894 4.23
Purchase Currency
Contractual Amount
SaleCurrency
ContractualAmount
MaturityDate
Counterparty Unrealised Gain/(Loss)
£
Net Assets%
Open Forward Contracts
EUR 3,662,200 GBP (3,280,695) 2020-07-08 Bank of America 48,501 0.25
USD 5,024,000 GBP (4,026,835) 2020-08-10 Bank of America 38,211 0.19
EUR 3,461,000 GBP (3,133,242) 2020-08-10 Bank of America 14,674 0.07
AUD 400,000 GBP (214,186) 2020-07-08 Bank of America 8,705 0.04
USD 119,100 GBP (94,428) 2020-07-08 Bank of America 1,959 0.01
AUD 123,800 GBP (68,772) 2020-08-10 Bank of America 208 0.00
CHF 17,250 GBP (14,579) 2020-07-08 Bank of America 156 0.00
GBP 21,403 USD (26,300) 2020-07-08 Bank of America 119 0.00
CHF 17,020 GBP (14,475) 2020-08-10 Bank of America 76 0.00
GBP 14,647 EUR (16,100) 2020-08-10 Bank of America 3 0.00
* Typically each of the above collective investment schemes may charge management fees of up to 2% per annum of their NAV and performance fees of up to 20% of the increase of performance for a predetermined period of time subject to any applicable hurdle rates.** Not admitted to an official stock exchange.*** Investment in other GAM Star Funds.

87
30 June 2020
GAM Star Global Defensive
Portfolio Statement
Purchase Currency
Contractual Amount
SaleCurrency
ContractualAmount
MaturityDate
Counterparty Unrealised Loss
£
Net Assets%
Open Forward Contracts, continued
GBP 14,655 CHF (17,250) 2020-07-08 Bank of America (81) 0.00
GBP 218,051 AUD (400,000) 2020-07-08 Bank of America (4,840) (0.02)
GBP 3,312,178 EUR (3,662,200) 2020-07-08 Bank of America (17,020) (0.09)
GBP 4,052,593 USD (5,055,700) 2020-07-08 Bank of America (38,958) (0.19)
USD 4,962,900 GBP (4,074,334) 2020-07-08 Bank of America (57,883) (0.29)
Unrealised gain on Open Forward Contracts 112,612 0.56
Unrealised loss on Open Forward Contracts (118,782) (0.59)
(6,170) (0.03)
Fair Value£
Net Assets%
Net Financial Assets and Liabilities at fair value 16,560,951 82.72
Net Current Assets (excluding Financial Assets and Financial Liabilities at fair value) 3,459,091 17.28
Net assets attributable to the shareholders of the Fund 20,020,042 100.00
Analysis of Total Assets %
UCITS collective investment schemes 80.52
OTC financial derivative instruments 0.54
Other Assets 18.94
100.00
In line with the requirements of the UCITS regulation S.I. No. 344/2017 the open Forward Contracts have been condensed in the Portfolio Statement based on the purchase and sale currency, maturity date, counterparty and unrealised gain or unrealised loss of the contract as at the year end.

88
30 June 2020
GAM Star Global Defensive
Portfolio Changes (Unaudited)
Major Purchases Cost£
GAM Star Credit Opportunities GBP Z II Acc 912,443
Amundi Prime Eurozone ETF 591,532
Amundi Prime USA ETF 569,366
Active Global High Income Bond Fund Z1 539,698
GAM Star MBS Total Return Inst GBP Acc 499,608
Active Global High Income Bond Fund Z2 434,363
GAM Star MBS Total Return W GBP Acc 287,981
iShares Edge MSCI USA Value Factor UCITS ETF 218,978
JPM Global Macro Opportunities Fund 184,517
Polar Capital Funds PLC – UK Value Opport Fund S GBP Acc 165,491
Loomis Sayles U.S. Equity Leaders Fund 160,521
iShares Physical Gold ETC 119,702
Premier Pan European Property C Acc 116,165
Ninety One Funds Series I – UK Alpha Fund 105,808
Coupland Cardiff Funds plc – CC Japan Alpha Fund 103,055
JPMorgan Fund ICVC – Japan Fund 87,010
Hermes Europe ex-UK Equity Fund M GBP Acc 72,883
Alken Fund – Continental Europe SGB1 Cap GBP Acc 58,853
CompAM Fund – Cadence Strategic Asia GBP C Acc 46,923
Veritas Asian C GBP 38,595
Total for the financial year 5,313,492
Major Sales Proceeds£
GAM Star Credit Opportunities GBP Z II Acc 1,859,271
GAM Star MBS Total Return W GBP Acc 1,178,181
Active Global High Income Bond Fund Z2 963,716
Active Global High Income Bond Fund Z1 888,189
JPM Global Macro Opportunities Fund 880,244
GAM Star MBS Total Return Inst GBP Acc 878,105
iShares Physical Gold ETC 331,888
JPMorgan Fund ICVC – Japan Fund 323,899
Hermes Europe ex-UK Equity Fund M GBP Acc 306,642
iShares Edge MSCI USA Value Factor UCITS ETF 295,801
GAM Star Continental European Eq GBP Z II 294,769
Loomis Sayles U.S. Equity Leaders Fund 290,857
Coupland Cardiff Funds plc – CC Japan Alpha Fund 287,371
Polar Capital Funds PLC – UK Value Opport Fund S GBP Acc 211,199
Alken Fund – Continental Europe SGB1 Cap GBP Acc 210,278
Amundi Prime Eurozone ETF 210,053
Ninety One Funds Series I – UK Alpha Fund 209,396
Premier Pan European Property C Acc 207,298
Veritas Asian C GBP 130,748
Amundi Prime USA ETF 122,176
CompAM Fund – Cadence Strategic Asia GBP C Acc 105,282
Total for the financial year 10,185,363
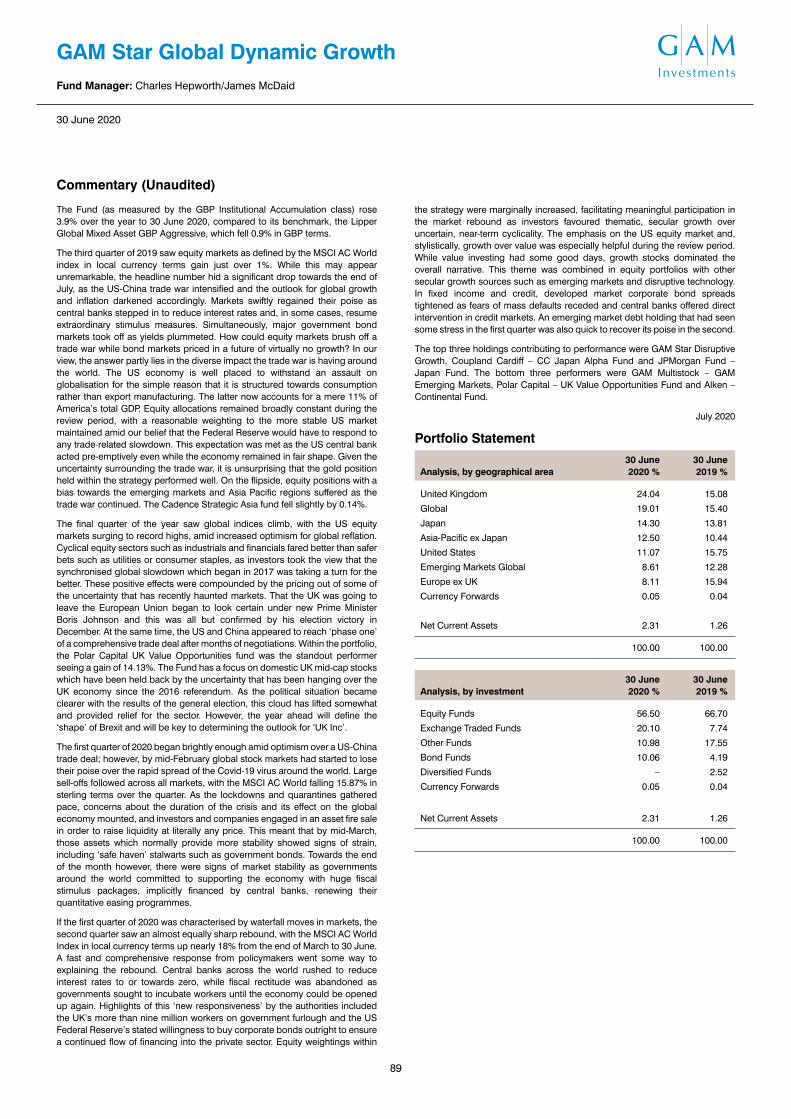
89
30 June 2020
GAM Star Global Dynamic GrowthFund Manager: Charles Hepworth/James McDaid
Commentary (Unaudited)
The Fund (as measured by the GBP Institutional Accumulation class) rose 3.9% over the year to 30 June 2020, compared to its benchmark, the Lipper Global Mixed Asset GBP Aggressive, which fell 0.9% in GBP terms.
The third quarter of 2019 saw equity markets as defined by the MSCI AC World index in local currency terms gain just over 1%. While this may appear unremarkable, the headline number hid a significant drop towards the end of July, as the US-China trade war intensified and the outlook for global growth and inflation darkened accordingly. Markets swiftly regained their poise as central banks stepped in to reduce interest rates and, in some cases, resume extraordinary stimulus measures. Simultaneously, major government bond markets took off as yields plummeted. How could equity markets brush off a trade war while bond markets priced in a future of virtually no growth? In our view, the answer partly lies in the diverse impact the trade war is having around the world. The US economy is well placed to withstand an assault on globalisation for the simple reason that it is structured towards consumption rather than export manufacturing. The latter now accounts for a mere 11% of America’s total GDP. Equity allocations remained broadly constant during the review period, with a reasonable weighting to the more stable US market maintained amid our belief that the Federal Reserve would have to respond to any trade-related slowdown. This expectation was met as the US central bank acted pre-emptively even while the economy remained in fair shape. Given the uncertainty surrounding the trade war, it is unsurprising that the gold position held within the strategy performed well. On the flipside, equity positions with a bias towards the emerging markets and Asia Pacific regions suffered as the trade war continued. The Cadence Strategic Asia fund fell slightly by 0.14%.
The final quarter of the year saw global indices climb, with the US equity markets surging to record highs, amid increased optimism for global reflation. Cyclical equity sectors such as industrials and financials fared better than safer bets such as utilities or consumer staples, as investors took the view that the synchronised global slowdown which began in 2017 was taking a turn for the better. These positive effects were compounded by the pricing out of some of the uncertainty that has recently haunted markets. That the UK was going to leave the European Union began to look certain under new Prime Minister Boris Johnson and this was all but confirmed by his election victory in December. At the same time, the US and China appeared to reach ‘phase one’ of a comprehensive trade deal after months of negotiations. Within the portfolio, the Polar Capital UK Value Opportunities fund was the standout performer seeing a gain of 14.13%. The Fund has a focus on domestic UK mid-cap stocks which have been held back by the uncertainty that has been hanging over the UK economy since the 2016 referendum. As the political situation became clearer with the results of the general election, this cloud has lifted somewhat and provided relief for the sector. However, the year ahead will define the ‘shape’ of Brexit and will be key to determining the outlook for ‘UK Inc’.
The first quarter of 2020 began brightly enough amid optimism over a US-China trade deal; however, by mid-February global stock markets had started to lose their poise over the rapid spread of the Covid-19 virus around the world. Large sell-offs followed across all markets, with the MSCI AC World falling 15.87% in sterling terms over the quarter. As the lockdowns and quarantines gathered pace, concerns about the duration of the crisis and its effect on the global economy mounted, and investors and companies engaged in an asset fire sale in order to raise liquidity at literally any price. This meant that by mid-March, those assets which normally provide more stability showed signs of strain, including ‘safe haven’ stalwarts such as government bonds. Towards the end of the month however, there were signs of market stability as governments around the world committed to supporting the economy with huge fiscal stimulus packages, implicitly financed by central banks, renewing their quantitative easing programmes.
If the first quarter of 2020 was characterised by waterfall moves in markets, the second quarter saw an almost equally sharp rebound, with the MSCI AC World Index in local currency terms up nearly 18% from the end of March to 30 June. A fast and comprehensive response from policymakers went some way to explaining the rebound. Central banks across the world rushed to reduce interest rates to or towards zero, while fiscal rectitude was abandoned as governments sought to incubate workers until the economy could be opened up again. Highlights of this ‘new responsiveness’ by the authorities included the UK’s more than nine million workers on government furlough and the US Federal Reserve’s stated willingness to buy corporate bonds outright to ensure a continued flow of financing into the private sector. Equity weightings within
the strategy were marginally increased, facilitating meaningful participation in the market rebound as investors favoured thematic, secular growth over uncertain, near-term cyclicality. The emphasis on the US equity market and, stylistically, growth over value was especially helpful during the review period. While value investing had some good days, growth stocks dominated the overall narrative. This theme was combined in equity portfolios with other secular growth sources such as emerging markets and disruptive technology. In fixed income and credit, developed market corporate bond spreads tightened as fears of mass defaults receded and central banks offered direct intervention in credit markets. An emerging market debt holding that had seen some stress in the first quarter was also quick to recover its poise in the second.
The top three holdings contributing to performance were GAM Star Disruptive Growth, Coupland Cardiff – CC Japan Alpha Fund and JPMorgan Fund – Japan Fund. The bottom three performers were GAM Multistock – GAM Emerging Markets, Polar Capital – UK Value Opportunities Fund and Alken – Continental Fund.
July 2020
Portfolio Statement
Analysis, by geographical area30 June2020 %
30 June2019 %
United Kingdom 24.04 15.08
Global 19.01 15.40
Japan 14.30 13.81
Asia-Pacific ex Japan 12.50 10.44
United States 11.07 15.75
Emerging Markets Global 8.61 12.28
Europe ex UK 8.11 15.94
Currency Forwards 0.05 0.04
Net Current Assets 2.31 1.26
100.00 100.00
Analysis, by investment30 June2020 %
30 June2019 %
Equity Funds 56.50 66.70
Exchange Traded Funds 20.10 7.74
Other Funds 10.98 17.55
Bond Funds 10.06 4.19
Diversified Funds – 2.52
Currency Forwards 0.05 0.04
Net Current Assets 2.31 1.26
100.00 100.00

90
30 June 2020
GAM Star Global Dynamic Growth
Portfolio Statement
Holdings Description Fair Value£
Net Assets%
Bond Funds*
1,345 RWC Funds – RWC Global Emerging Markets Fund B GBP Acc 253,401 4.47
1,629 Active Global High Income Bond Fund Z2 171,563 3.02
92,865 JPM Global Macro Opportunities Fund 145,798 2.57
570,762 10.06
Equity Funds*
20,744 Coupland Cardiff Funds plc – CC Japan Alpha Fund 422,384 7.45
167,653 JPMorgan Fund ICVC – Japan Fund 388,621 6.85
12,471 GAM Star Disruptive Growth Z GBP Acc*** 385,522 6.80
439 Veritas Asian C GBP 364,173 6.42
216 CompAM Fund – Cadence Strategic Asia GBP C Acc 344,998 6.08
33,107 Polar Capital Funds PLC – UK Value Opport Fund S GBP Acc 336,037 5.92
252,564 Ninety One Funds Series I – UK Alpha Fund 325,631 5.74
162,178 Hermes Europe ex-UK Equity Fund M GBP Acc 245,392 4.32
142 GAM Emerging Markets Equity S GBP 234,936 4.14
156,311 Premier Pan European Property C Acc 157,467 2.78
3,205,161 56.50
Exchange Traded Funds*
18,038 Amundi Prime USA ETF 341,874 6.03
60,929 Amundi Msci Emerging Markets ETF 221,294 3.90
45,159 iShares Edge MSCI USA Value Factor UCITS ETF 220,263 3.88
10,919 Amundi Prime Eurozone ETF 202,558 3.57
5,484 iShares Physical Gold ETC 154,101 2.72
1,140,090 20.10
Other Funds*
111,570 Loomis Sayles U.S. Equity Leaders Fund** 407,832 7.19
2,613 Alken Fund – Continental Europe SGB1 Cap GBP Acc 214,840 3.79
622,672 10.98
Purchase Currency
Contractual Amount
SaleCurrency
ContractualAmount
MaturityDate
Counterparty Unrealised Gain/(Loss)
£
Net Assets%
Open Forward Contracts
EUR 224,000 GBP (200,785) 2020-07-08 Bank of America 2,847 0.05
EUR 220,000 GBP (199,166) 2020-08-10 Bank of America 933 0.02
GBP 3,639 EUR (4,000) 2020-08-10 Bank of America 1 0.00
GBP 202,628 EUR (224,000) 2020-07-08 Bank of America (1,005) (0.02)
Unrealised gain on Open Forward Contracts 3,781 0.07
Unrealised loss on Open Forward Contracts (1,005) (0.02)
2,776 0.05
* Typically each of the above collective investment schemes may charge management fees of up to 2% per annum of their NAV and performance fees of up to 20% of the increase of performance for a predetermined period of time subject to any applicable hurdle rates.** Not admitted to an official stock exchange.*** Investment in other GAM Star Funds.

91
30 June 2020
GAM Star Global Dynamic Growth
Portfolio Statement
Fair Value£
Net Assets%
Net Financial Assets and Liabilities at fair value 5,541,461 97.69
Net Current Assets (excluding Financial Assets and Financial Liabilities at fair value) 131,167 2.31
Net assets attributable to the shareholders of the Fund 5,672,628 100.00
Analysis of Total Assets %
UCITS collective investment schemes 94.90
OTC financial derivative instruments 0.06
Other Assets 5.04
100.00
In line with the requirements of the UCITS regulation S.I. No. 344/2017 the open Forward Contracts have been condensed in the Portfolio Statement based on the purchase and sale currency, maturity date, counterparty and unrealised gain or unrealised loss of the contract as at the year end.

92
30 June 2020
GAM Star Global Dynamic Growth
Portfolio Changes (Unaudited)
Major Purchases Cost£
GAM Emerging Markets Equity S GBP 2,430,029
Amundi Prime USA ETF 570,610
Amundi Msci Emerging Markets ETF 381,558
Amundi Prime Eurozone ETF 376,545
CompAM Fund – Cadence Strategic Asia GBP C Acc 263,190
Polar Capital Funds PLC – UK Value Opport Fund S GBP Acc 251,154
Loomis Sayles U.S. Equity Leaders Fund 247,678
Veritas Asian C GBP 242,289
Coupland Cardiff Funds plc – CC Japan Alpha Fund 240,302
GAM Star Disruptive Growth Z GBP Acc 234,210
JPMorgan Fund ICVC – Japan Fund 232,736
Ninety One Funds Series I – UK Alpha Fund 214,743
iShares Edge MSCI USA Value Factor UCITS ETF 166,943
RWC Global Emerging Markets Fund B GBP Acc 158,375
Alken Fund – Continental Europe SGB1 Cap GBP Acc 155,124
Active Global High Income Bond Fund Z2 154,868
Hermes Europe ex-UK Equity Fund M GBP Acc 131,294
Premier Pan European Property C Acc 131,225
JPM Global Macro Opportunities Fund 98,209
River and Mercantile World Recovery Fund 95,310
iShares Physical Gold ETC 89,096
Total for the financial year 6,865,488
Major Sales Proceeds£
GAM Emerging Markets Equity S GBP 2,336,270
JPMorgan Fund ICVC – Japan Fund 376,990
GAM Star Continental European Eq GBP Z II 370,716
Coupland Cardiff Funds plc – CC Japan Alpha Fund 357,195
GAM North American Growth GBP Inst Inc 350,588
Ninety One Funds Series I – UK Alpha Fund 324,443
River and Mercantile World Recovery Fund 323,150
Polar Capital Funds PLC – UK Value Opport Fund S GBP Acc 316,673
Veritas Asian C GBP 303,277
CompAM Fund – Cadence Strategic Asia GBP C Acc 282,459
Loomis Sayles U.S. Equity Leaders Fund 281,486
iShares Edge MSCI USA Value Factor UCITS ETF 272,866
Hermes Europe ex-UK Equity Fund M GBP Acc 265,822
Ashmore SICAV EM Frontier Equity Fund Z2 GBP Inc 265,608
Alken Fund – Continental Europe SGB1 Cap GBP Acc 251,769
Amundi Prime USA ETF 242,825
GAM Star Disruptive Growth Z GBP Acc 226,096
RWC Global Emerging Markets Fund B GBP Acc 198,092
Amundi Msci Emerging Markets ETF 166,863
iShares Physical Gold ETC 156,833
Amundi Prime Eurozone ETF 156,594
Active Global High Income Bond Fund Z2 126,648
JPM Global Macro Opportunities Fund 125,553
Premier Pan European Property C Acc 101,142
Total for the financial year 8,179,958

93
30 June 2020
GAM Star Emerging EquityFund Manager: Tim Love
Commentary (Unaudited)
The Fund (as measured by the USD Accumulation Class) fell 8.3% over the year to 30 June 2020, compared to its benchmark, the MSCI Emerging Markets index which fell 3.1% in USD terms.
During the third quarter of 2019 another escalation of trade war tension negatively impacted emerging market (EM) equities. Global slowdown fears and impeachment noise did not stop the MSCI EM Index from closing up 1.9% in September. The markets were partially propelled by renewed expectations of engagement between US-China and G-3 monetary policy easing. Technology stocks led the MSCI EM Index, due to a recovery in memory semiconductors prices and iPhone and 5G related demand pick up. We added selectively to India post the tax cuts, especially into the most oversold quality names such as KEI Industries, HDFC Bank and Tata Consulting. We started to reduce the Saudi Arabian underweight by adding to Al Rajhi Bank, Samba Financial Group and Axa Cooperative Insurance. We also trimmed our Russian overweight and added modestly to non-bank Polish stocks and Brazilian high quality industrials.
Emerging market equities enjoyed a strong fourth quarter of 2019. After adding to Russia and Brazil in late summer, we took some money off the table in Brazil during December – from the temporarily overbought Brazilian banks – and allocated part of it to South Africa (Multichoice and Impala Platinum), where we saw better risk / return potential. South Africa had corrected materially and seemed to be supported by an improved economic and political outlook, with President Cyril Ramaphosa driving a reformist agenda on key sectors such as electricity and state-owned enterprises (SOEs).Throughout the quarter, we also added to Saudi Arabia (AXA Saudi) and Poland (Kruk and Grupa Lotos). We also added modestly to oversold names in Vietnam (KBC, Hoa Phat and Vietnam Dairy) since we viewed these market as laggard growth opportunities, with improving top-down fundamentals.
Following an initial strong January rally, the coronavirus outbreak dominated the performance of emerging market equities at month end, resulting in a negative MSCI EM Index performance. In February, the coronavirus outbreak went from being considered just a Chinese issue to being recognised as a potential global pandemic. Emerging market equities depreciated by 5.3%,outperforming developed market (DM) equities, which depreciated by 8.4%. The DM to EM equity gap narrowed as a global demand shock was further priced into all industrial/commodity/energy and travel/luxury equities. It has been a challenging period for the Fund, which declined over the month slightly more significantly than the benchmark. Our positioning prior to the coronavirus outbreak and not one, but two extreme events were the key drivers of this underperformance of the index year-to-date. However, we retain full confidence in our methodology, process and team and anticipate a quick resumption of the outperformance we have historically delivered over the long term. The event shock in March of the OPEC+ massive “stand off” was clearly a punishing blow for our Russia positioning. This was combined with a major growth shock fear triggered by the widening Covid-19 pandemic, which led to large-scale cross asset market dysfunction throughout the final month of the quarter. The impact of this was particularly punishing for carry trade currencies and commodity-linked markets, resulting in a very negative impact from our overweight Brazil position.
The markets during the second quarter of 2020 the best in over a decade. The concerns about the rebound of Covid infection rates were more than offset by the continuing liquidity stimulus (via fiscal, monetary and balance sheet) and faster than expected economic rebound. The portfolio benefitted from its pro-cyclical positioning in China, Brazil and India, especially in sectors like IT, energy, industrials and financials. On a relative basis, the Fund outperformed thanks to the strong stock selection in China, Brazil, India, Mexico and Colombia which was slightly offset by stock selection in South Korea, Russia and South Africa. Our allocation to VARPS also meaningfully contributed to the outperformance. The size of the US stimulus in historical context should continue to turn investors from a fear of deflation to a fear of inflation. Climbing the Wall of Worry should therefore continue through the second half of 2020 helping a virtuous cycle accompanied by declining volatility. With further evidence of a less negative rate of change – or even of positive absolute growth – markets will continue to act as discounting devices of a stronger EPS/GDP rate of change into 2021. Active managers will be able to exploit the increasingly wide differentiation between the ETF Index with poor ESG stocks and cheaper less crowded, higher quality non-index ESG laggards.
The top three holdings contributing to performance were Tencent, Alibaba and Taiwan Semiconductor. The bottom three performers were Banco do Brasil, Banco Bradesco and Mini MSCI Emerging Markets Future.
July 2020

94
30 June 2020
GAM Star Emerging Equity
Portfolio Statement
Analysis, by geographical area30 June2020 %
30 June2019 %
China 27.53 24.90
Taiwan 10.95 5.23
Korea, Republic of 10.91 10.22
Brazil 7.72 11.45
India 7.37 8.68
Hong Kong 6.23 5.79
South Africa 5.96 4.57
Russian Federation 5.25 7.09
Mexico 2.45 2.27
Indonesia 2.05 1.74
Thailand 1.75 0.90
Philippines 1.49 0.68
Canada 1.14 0.94
Hungary 1.07 0.54
United Kingdom 0.78 1.69
Qatar 0.67 0.43
Greece 0.64 0.19
Australia 0.50 0.18
U.A.E. 0.49 1.40
Portugal 0.47 –
Panama 0.45 –
Argentina 0.44 0.72
Turkey 0.42 1.29
Switzerland 0.39 0.41
Saudi Arabia 0.33 0.27
Malaysia 0.29 –
Peru 0.27 0.23
Romania 0.20 0.55
Chile 0.16 0.29
Poland 0.04 0.99
Bermuda 0.02 0.26
Cyprus – 0.12
United States – 0.65
Options – Stock 0.11 0.07
Currency Forwards (0.02) 0.00
Net Current Assets 1.48 5.26
100.00 100.00
Analysis, by industry sector30 June2020 %
30 June2019 %
Banks 18.55 20.36
Retailing 9.95 6.03
Semiconductors & Semiconductor Equipment 9.18 3.05
Technology Hardware & Equipment 7.47 6.91
Media & Entertainment 6.97 7.37
Energy 5.78 7.22
Software & Services 5.15 2.06
Materials 4.53 8.48
Capital Goods 4.08 3.74
Consumer Services 3.90 1.66
Insurance 3.44 4.59
Consumer Durables & Apparel 3.36 2.79
Diversified Financials 2.99 2.30
Utilities 2.47 3.13
Automobiles & Components 2.13 1.90
Real Estate 1.93 3.28
Food & Staples Retailing 1.64 0.50
Transportation 1.13 2.41
Commercial & Professional Services 1.06 –
Telecommunication Services 0.99 1.67
Household & Personal Products 0.76 –
Pharmaceuticals & Biotechnology 0.50 0.28
Fixed Interest 0.47 0.91
Food Beverage & Tobacco – 2.87
Non-sector specific – 0.72
Health Care Equipment & Services – 0.44
Options 0.11 0.07
Currency Forwards (0.02) 0.00
Net Current Assets 1.48 5.26
100.00 100.00
Analysis, by investment30 June2020 %
30 June2019 %
Equities Quoted 95.09 84.08
Preference Shares 2.54 6.86
Equity Participation Notes 0.33 2.91
Equity Warrants (Unquoted) 0.28 –
Corporate Bonds 0.19 0.82
Options – Stock 0.11 0.07
Currency Forwards (0.02) 0.00
Net Current Assets 1.48 5.26
100.00 100.00
Analysis of Credit Ratings (S&P)30 June
202030 June
2019
Corporate Bond Not rated Not rated

95
30 June 2020
GAM Star Emerging Equity
Portfolio Statement
Holdings Description Fair ValueUS$
Net Assets%
Equities Quoted
4,850 Alibaba Group Holding-Sp ADR 1,046,145 7.09
95,000 Taiwan Semiconductor Manufacturing Company 1,007,812 6.83
12,700 Tencent Holdings 817,013 5.54
16,260 Samsung Electronics 713,745 4.84
104,400 Sands China 409,494 2.77
1,590 Naspers 289,459 1.96
47,400 Banco do Brasil 277,539 1.88
5,900 Hong Kong Exchanges and Clearing 251,211 1.70
22,900 Ping An Insurance Group of China A (XSSC) 231,133 1.57
3,060 Lukoil Pjsc-Spon ADRs 227,236 1.54
296,000 Metropolitan Bank & Trust 219,809 1.49
7,640 Tata Consultancy Services 210,687 1.43
21,600 Infosys 210,539 1.43
39,000 Gazprom PJSC RUB 5.00 210,444 1.43
35,000 Delta Electronics 198,698 1.35
208,000 Xinyi Solar Holdings 196,985 1.33
5,960 KB Financial Group 168,219 1.14
14,000 Parex Resources 168,164 1.14
780,000 Bank Rakyat Indonesia Persero Tbk 165,446 1.12
6,840 Shinhan Financial Group 163,487 1.11
102,000 Inmobiliaria Vesta SAB de 150,526 1.02
13,800 Lexinfintech Holdings L-ADRs 146,832 0.99
1,740 Polyus PJSC RUB 1.00 146,421 0.99
51,000 Infraestructura Energetica Nova SAB de CV NPV 146,398 0.99
208,000 Old Mutual 144,134 0.98
14,500 Techtronic Industries 141,811 0.96
23,000 Standard Bank Group 138,331 0.94
31,400 Hangzhou Robam Appliances A (XSEC) 138,089 0.94
87,000 Geely Automobile Holdings 136,947 0.93
2,460 LG Electronics 129,253 0.88
17,400 Yantai Eddie Precision Machinery A (XSSC) 128,887 0.87
28,000 China Merchants Bank 128,793 0.87
9,100 HDFC Bank 128,460 0.87
168,000 Guangzhou Automobile Group 121,170 0.82
140,000 Xinjiang Goldwind Science & Technology 119,941 0.81
5,160 Housing Development Finance 119,914 0.81
2,060 Rio Tinto 115,787 0.78
380 Samsung SDI 114,836 0.78
35,600 EDP – Energias do Brasil 112,944 0.76
19,000 MOL Hungarian Oil & Gas 111,865 0.76
14,800 HCL Technologies 109,152 0.74
32,200 Ultrapar Participacoes 107,787 0.73
138,000 Growthpoint Properties 106,032 0.72
1,540,000 Inter RAO UES PJSC 105,340 0.71
5,000 MediaTek 98,121 0.66
10,000 OPAP 94,850 0.64
2,660 Pagseguro Digital 94,004 0.64
28,000 Zhejiang Weiming Environment Protection A (XSSC) 91,828 0.62
10,691 Midea Group A (XSEC) 90,360 0.61
111,000 China Construction Bank 89,797 0.61

96
30 June 2020
GAM Star Emerging Equity
Portfolio Statement
Holdings Description Fair ValueUS$
Net Assets%
Equities Quoted, continued
3,800 Asian Paints 84,927 0.58
254,000 Bank Negara Indonesia Persero Tbk 81,436 0.55
190 LG Chem 77,478 0.52
82,000 E.Sun Financial Holding Co Ltd TWD 10.00 77,263 0.52
530 POSCO 76,668 0.52
174 Netease Inc-ADRs 74,712 0.51
77,000 Ningbo Sanxing Medical Electric A (XSSC) 74,561 0.50
37,600 Airports Of Thailand Pc-Nvdr 73,600 0.50
55,000 Lynas 73,274 0.50
108,000 Minor International Pcl-Nvdr 70,934 0.48
14,800 Qatar National Bank QPSC 70,687 0.48
7,000 President Chain Store 70,345 0.48
5,900 Siam Cement Pcl-Nvdr 70,248 0.48
5,800 Clicks Group 70,221 0.48
4,000 Jeronimo Martins SGPS 70,017 0.47
9,600 Natura & Holding 69,760 0.47
6,100 Sberbank Pjsc -Sponsored Adr 69,418 0.47
11,800 Nedbank Group 68,966 0.47
3,100 Meituan Dianping 68,756 0.47
9,600 Shenzhen Desay Battery Technology A (XSHE) 66,510 0.45
1,300 Copa Holdings 65,728 0.45
66 MercadoLibre 65,061 0.44
18,800 Grupo Financiero Banorte SAB de 64,861 0.44
12,750 A-Living Services 64,240 0.43
3,500 Wuxi Biologics Cayman 64,035 0.43
26,000 Turkcell Iletisim Hizmetleri 62,357 0.42
17,400 Beijing SuperMap Software A (XSEC) 61,935 0.42
7,600 Bharti Airtel 56,353 0.38
10,000 Sitronix Technology 52,195 0.35
52,000 Man Wah Holdings 49,716 0.34
2,740 Kotak Mahindra Bank 49,370 0.33
19,000 Emirates NBD PJSC 45,830 0.31
1,300 OTP Bank 45,396 0.31
9,600 KEI Industries 44,349 0.30
19,000 Kingdee International Software Group Company 44,175 0.30
27,000 Primax Electronics 43,834 0.30
14,400 Kasikornbank Pcl-Nvdr 43,446 0.29
4,300 B3 43,143 0.29
38 LG Household & Health Care 42,522 0.29
11,000 Public Bank Bhd 42,357 0.29
190 NAVER 42,175 0.29
300 Credicorp 40,101 0.27
5,600 MultiChoice Group 34,251 0.23
44 NCSoft 32,593 0.22
500 Cie Financiere Richemont 31,893 0.22
13,000 Flytech Technology 31,239 0.21
2,400 Brasileira de Distribuicao 31,025 0.21
24,000 NIIT 30,038 0.20
1,400 Hankook Tire 28,690 0.19
5,600 NEPI ROCKCASTLE 28,608 0.19

97
30 June 2020
GAM Star Emerging Equity
Portfolio Statement
Holdings Description Fair ValueUS$
Net Assets%
Equities Quoted, continued
3,800 Localiza Rent a Car 28,312 0.19
13,000 WANDA FILM HLDG A 28,062 0.19
14,000 Bank Central Asia Tbk 27,907 0.19
82,000 Astra International Tbk 27,553 0.19
196,000 Idea Cellular 27,517 0.19
6,200 Qatar Fuel Company 27,433 0.19
50,000 Tabreed Common Stock AED 1.00 26,272 0.18
2,800 AIA Group 26,120 0.18
900 Quimica Y Minera Chil-Sp ADR’s 23,463 0.16
2,709 Midea Group A (XSHE) 22,896 0.15
16,000 Cathay Financial Holding 22,695 0.15
140 Samsung Fire & Marine Insurance 20,485 0.14
40,000 Banca Transilvania 19,772 0.13
35,000 Welspun India 17,198 0.12
2,800 PIK Group PJSC 16,744 0.11
9,000 Fubon Financial Holding 13,391 0.09
3,800 BRD-Groupe Societe Generale 10,194 0.07
5,200 CSPC Pharmaceutical Group 9,822 0.07
7,600 Bank Millennium 5,806 0.04
14,034,814 95.09
Equity Warrants (Unquoted)
5,000 BOCI Financial Products SHANDONG 2020-11-09 40,995 0.28
40,995 0.28
Preference Shares
59,000 Banco Bradesco 222,427 1.51
33,000 Itau Unibanco Holding 152,956 1.03
375,383 2.54
Equity Participation Note
6,200 AXA Cooperative Co Insurance (P-Note) X 49,297 0.33
49,297 0.33
Corporate Bonds
1,100 Credit Suisse AG/Nassau 0% 2021-09-07 WTS 25,821 0.17
1,200,000 Renaissance Financial Holdings 0% 2022-05-16* 1,440 0.01
924,000 Renaissance Financial Holdings 0% 2022-05-16* 1,109 0.01
28,370 0.19
* Level 3 investments.

98
30 June 2020
GAM Star Emerging Equity
Portfolio Statement
Holdings Description Counterparty Fair ValueUS$
Net Assets%
Options – Stock
800 Alibaba Group Holding 210 Call September 2020 JP Morgan 13,672 0.09
40,000 Petroleo Brasileiro (PBR) 18 Call September 2020 JP Morgan 800 0.01
8,000 Petroleo Brasileiro (PBR) 14 Call September 2020 JP Morgan 640 0.01
8,400 Petroleo Brasileiro (PBR) 16 Call September 2020 JP Morgan 588 0.00
Unrealised gain on Options – Stock 15,700 0.11
15,700 0.11
Purchase Currency
Contractual Amount
SaleCurrency
ContractualAmount
MaturityDate
Counterparty Unrealised Gain/(Loss)
US$
Net Assets%
Open Forward Contracts
USD 333,774 ZAR (5,750,148) 2020-07-02 State Street Bank 2,830 0.01
HKD 9,283,824 USD (1,197,761) 2020-07-02 State Street Bank 83 0.00
USD 1,508,297 HKD (11,690,781) 2020-07-02 State Street Bank (103) (0.00)
ZAR 9,910,404 USD (575,261) 2020-07-02 State Street Bank (4,879) (0.03)
Unrealised gain on Open Forward Contracts 2,913 0.01
Unrealised loss on Open Forward Contracts (4,982) (0.03)
(2,069) (0.02)
Fair ValueUS$
Net Assets%
Net Financial Assets and Liabilities at fair value 14,542,490 98.52
Net Current Assets (excluding Financial Assets and Financial Liabilities at fair value) 217,764 1.48
Net assets attributable to the shareholders of the Fund 14,760,254 100.00
Analysis of Total Assets %
Transferable securities admitted to official stock exchange listing 71.86
Other transferable securities of the type referred to in Regulation 68(1)(a), (b) and (c) 0.01
OTC financial derivative instruments 0.09
Other Assets 28.04
100.00
In line with the requirements of the UCITS regulation S.I. No. 344/2017 the open Forward Contracts have been condensed in the Portfolio Statement based on the purchase and sale currency, maturity date, counterparty and unrealised gain or unrealised loss of the contract as at the year end.

99
30 June 2020
GAM Star Emerging Equity
Portfolio Changes (Unaudited)
Major Purchases CostUS$
Taiwan Semiconductor Manufacturing Company 1,055,471
Alibaba Group Holding-Sp ADR 1,034,400
Samsung Electronics 922,073
Alibaba Group Holding 862,087
Banco do Brasil 528,020
Sands China 461,832
Petroleo Brasileiro-Spon Adr 459,021
Reliance Industries 445,467
Hong Kong Exchanges and Clearing 427,693
Lukoil Pjsc-Spon ADRs 416,626
Banco Bradesco 407,546
KB Financial Group 403,399
Xinyi Solar Holdings 383,657
Samsung Electronics 357,644
SK Hynix 331,053
Baozun Inc-Spn Adr 308,940
Ayala Land 293,729
Metropolitan Bank & Trust 291,396
Ping An Insurance Group of China A (XSSC) 277,170
Tata Consultancy Services 268,283
Total for the financial year 9,935,507
Major Sales ProceedsUS$
Alibaba Group Holding-Sp ADR 1,356,593
Samsung Electronics 1,333,247
Tencent Holdings 1,212,366
Alibaba Group Holding 881,206
Reliance Industries 780,359
Taiwan Semiconductor Manufacturing Company 692,732
Samsung Electronics 646,589
SK Hynix 601,644
Petroleo Brasileiro-Spon Adr 572,662
Ping An Insurance Group of China 518,286
Lukoil Pjsc-Spon ADRs 465,005
Banco do Brasil 413,635
Banco Bradesco 383,053
CNOOC 375,969
MMC Norilsk Nickel PJSC ADRs 345,108
China Mobile ADRs 343,926
Even Construtora e Incorporadora 338,727
HDFC Bank ADRs 332,337
Industrial & Commercial Bank of China 317,933
Galaxy Entertainment Group 304,796
Total for the financial year 12,216,173

100
30 June 2020
GAM Star Emerging Market RatesFund Manager: Paul McNamara/Denise Prime
Commentary (Unaudited)
The Fund (as measured by the USD Accumulation class) rose 9.6% over the year to 30 June 2020, outperforming its benchmark, the 3 Month Libor in USD, which returned 1.7%.
The third quarter of 2019 started well with positive returns, then JPMorgan GBI EM GD index sank by 2.6% in August. An escalation of the trade war between the US and China heightened risk aversion, driving down bond yields globally, pushing up the US dollar and hurting emerging market assets. Furthermore, an unexpected primary election result in Argentina sent the peso reeling, forcing the government to announce a debt restructuring and impose capital controls. Emerging markets (EM) bounced back in September, with JPMorgan’s GBI EM GD index up 1.0% despite broad US dollar strength in the wake of a dovish European Central Bank. High-yielding countries outperformed, led by a surge in Turkey. Mexico and Russia also fared well. Argentina, however, failed to recover from August’s rout due to uncertainty about the economic policies – and debt restructuring proposals – of presidential frontrunner Alberto Fernandez. Central European countries, hit by the euro’s weakness as well as by higher developed market bond yields, also lagged.
EM extended gains into the start of the fourth quarter with a fall by 1.8% in November, as the combination of a stronger US dollar and escalating political tensions across Latin America weighed on the asset class. JPMorgan’s GBI EM GD index rose by 4.1% in December, as investors applauded a ‘Phase 1’ trade deal between the US and China. Lower-yielding European and Asian markets lagged, though Turkey was the only major country to end the quarter in negative territory on concerns that a focus on boosting growth may again undermine central bank credibility (by encouraging too many rate cuts) and erode economic fundamentals (current account deterioration).
During the first quarter of 2020, Covid-19 spread globally, forcing severe population lockdowns and a sudden stop in large swathes of economic output, while oil prices plunged after Russia and Saudi Arabia failed to reach an agreement on output quotas. Adding to the uncertainty, trading conditions deteriorated significantly, with record outflows from the asset class coinciding with the adjustment to new working conditions as well as quarter-end. Bid-offer spreads widened dramatically, and some markets operated on an order-only basis. Unsurprisingly, those countries with weak fundamentals, such as South Africa and Colombia, were among the worst impacted; however, heavy positioning also took its toll on Russia and Mexico. Turkey proved unexpectedly resilient despite a sharp fall in foreign exchange reserves, reflecting very light foreign interest. The strategy had an exceptionally strong March, notching up a positive performance despite the very difficult environment for emerging markets. A net short EM FX exposure was beneficial. Short positions in the Indonesian rupiah, Brazilian real and Turkish lira all contributed, while FX hedges on South Africa bonds also helped to mitigate losses.
EM rebounded in the seconded quarter of 2020 with JPMorgan’s GBI-EM Global Diversified Index up despite persistent concerns about the economic impact of Covid-19 and unprecedented volatility in oil prices. EM local currency debt recorded a small gain June, with JPMorgan’s GBI EM Global Diversified Index rising 0.47%. This was largely due to carry, with marginally stronger FX and weaker bond returns effectively cancelling each other out. Notably, there was a wide dispersion in performance among index constituents. Geographically, Latin America generally underperformed: currencies came under pressure, though bonds were more resilient as central banks cut interest rates and rolled out bond-buying plans to help support fiscal initiatives and boost economic growth. Meanwhile, in Europe and Asia a weaker US dollar supported currency returns, but bonds were generally weaker.
We are encouraged by recent data showing a sharp recovery in economic activity, though we caution that Covid-related risks, such as a second wave of infections, have not fully dissipated (as illustrated by the resurgence of cases in some US states). Nevertheless, valuations in EM FX still look cheap, and should the expected economic rebound be sustained, the asset class could benefit. Furthermore, the mandate’s flexibility – its broad investment universe and the ability to take short as well as long positions – means we should be able to exploit relative value as well as outright directional opportunities, leaving us well placed, in our view, to continue to build on the strategy’s strong performance this year.
July 2020
Portfolio Statement
Analysis, by geographical area30 June2020 %
30 June2019 %
United States 43.80 66.19
Global 8.69 7.81
Indonesia 7.73 –
Jordan 3.33 –
Brazil 1.90 12.10
South Africa 0.91 2.42
Sri Lanka 0.79 –
Ireland – 2.07
Argentina – 2.82
Interest Rate Swaps 0.07 (0.58)
Futures – Interest Rates – (0.06)
Currency Forwards 0.72 0.35
Net Current Assets 32.06 6.88
100.00 100.00
Analysis, by industry sector30 June2020 %
30 June2019 %
Fixed Interest 67.15 93.41
Swaps 0.07 (0.58)
Futures – (0.06)
Currency Forwards 0.72 0.35
Net Current Assets 32.06 6.88
100.00 100.00
Analysis, by investment30 June2020 %
30 June2019 %
Government Bonds 56.56 85.60
Corporate Bonds 10.59 7.81
Interest Rate Swaps 0.07 (0.58)
Futures – Interest Rates – (0.06)
Currency Forwards 0.72 0.35
Net Current Assets 32.06 6.88
100.00 100.00
Analysis of Credit Ratings (S&P)30 June
202030 June
2019
Corporate Bonds & Government Bonds From AA+ to B-, or may
not be rated
From AAA to B, or may
not be rated

101
30 June 2020
GAM Star Emerging Market Rates
Portfolio Statement
Holdings Description Fair ValueUS$
Net Assets%
Government Bonds
31,600,000 United States Treasury Bill 0% 2020-09-10 31,592,302 43.80
51,870,000,000 Indonesia Treasury Bond 9% 2029-03-15 4,031,136 5.59
2,400,000 Jordan Government International Bond 5.85% 2030-07-07 2,400,000 3.33
21,980,000,000 Indonesia Treasury Bond 7% 2027-05-15 1,545,509 2.14
13,740,000 South Africa Government Bond 9% 2040-01-31 653,886 0.91
733,000 Sri Lanka Government International Bond 5.875% 2022-07-25 569,680 0.79
40,792,513 56.56
Corporate Bonds
92,990,000 European Investment Bank 0% 2032-10-18 2,239,948 3.11
140,700,000 International Finance 0% 2038-02-22 1,865,202 2.59
1,318,000 Petrobras Global Finance 5.299% 2025-01-27 1,373,409 1.90
105,200,000 African Development Bank 0% 2046-04-05 993,966 1.38
67,820,000 European Bank for Reconstruction & Developmen 30% 2021-01-25 829,692 1.15
48,000,000 International Finance C 0% 2047-11-21 335,514 0.46
7,637,731 10.59
Currency Notional Amount
Fund Pays Fund Receives
Termination Date
Counterparty Fair Value US$
Net Assets%
Interest Rate Swaps
MXN 30,830,000 MXN-TIIE-Banxico 6.42% 2030-04-17 JP Morgan 81,418 0.11
MXN 27,000,000 MXN-TIIE-Banxico 5.82% 2025-04-14 HSBC 52,017 0.07
MXN 10,714,000 MXN-TIIE-Banxico 6.87% 2029-11-07 Goldman Sachs 44,770 0.06
BRL 12,236,824 BRL-CDI 5.71% 2025-01-02 HSBC 18,708 0.03
ZAR 11,465,000 ZAR-JIBAR-SAFEX 7.32% 2030-06-11 Morgan Stanley 16,274 0.02
MXN 14,300,000 MXN-TIIE-Banxico 5.69% 2030-04-17 JP Morgan 2,437 0.01
BRL 11,192,406 BRL-CDI 5.49% 2025-01-02 HSBC 1,782 0.00
MXN 7,540,000 MXN-TIIE-Banxico 5.65% 2029-11-07 Goldman Sachs 1,541 0.00
MXN 13,250,000 MXN-TIIE-Banxico 4.85% 2025-04-14 HSBC 1,228 0.00
RUB 81,500,000 RUB-MOSPR 5.38% 2025-12-16 Goldman Sachs 1,147 0.00
CZK 24,000,000 0.49% CZK-PRIBO 2025-06-23 Morgan Stanley (587) (0.00)
ZAR 5,000,000 ZAR-JIBAR-SAFEX 6.96% 2030-06-11 Morgan Stanley (629) (0.00)
ZAR 10,800,000 ZAR-JIBAR-SAFEX 6.98% 2030-06-25 Morgan Stanley (940) (0.00)
CZK 50,000,000 0.49% CZK-PRIBO 2025-05-22 Morgan Stanley (1,830) (0.00)
CNY 7,500,000 CNY- CNRR 2.38% 2025-12-16 HSBC (5,431) (0.01)
RUB 158,860,000 RUB-MOSPR 5.29% 2025-12-16 Goldman Sachs (5,582) (0.01)
ZAR 23,393,000 ZAR-JIBAR-SAFEX 6.94% 2030-06-25 Morgan Stanley (6,135) (0.01)
CNY 13,570,000 CNY-CNRR 2.35% 2025-12-16 HSBC (12,508) (0.02)
CZK 47,500,000 0.64% CZK-PRIBO 2025-06-23 Morgan Stanley (16,347) (0.02)
BRL 48,729,428 3.02% BRL-CDI 2022-01-03 HSBC (18,816) (0.02)
PLN 4,060,000 1.08% PLN-WIBOR-WIBR 2030-06-10 Morgan Stanley (21,891) (0.03)
PLN 8,000,000 1.37% PLN-WIBOR-WIBR 2025-06-17 Morgan Stanley (82,967) (0.11)
Unrealised gain on Interest Rate Swaps 221,322 0.30
Unrealised loss on Interest Rate Swaps (173,663) (0.23)
47,659 0.07

102
30 June 2020
GAM Star Emerging Market Rates
Portfolio Statement
Purchase Currency
Contractual Amount
SaleCurrency
ContractualAmount
MaturityDate
Counterparty Unrealised Gain/(Loss)
US$
Net Assets%
Open Forward Contracts
EUR 30,383,900 USD (33,220,368) 2020-07-08 Bank of America 909,475 1.26
TRY 30,372,400 USD (4,000,000) 2020-08-27 HSBC 366,592 0.51
USD 34,957,816 EUR (30,950,000) 2020-07-08 Bank of America 192,080 0.26
IDR 31,560,000,000 USD (2,000,000) 2020-08-27 HSBC 152,797 0.21
TRY 14,936,200 USD (2,000,000) 2020-08-21 HSBC 151,177 0.21
TRY 14,910,000 USD (2,000,000) 2020-08-18 HSBC 149,316 0.21
MXN 48,553,233 USD (2,000,000) 2020-08-18 HSBC 88,183 0.12
ZAR 45,086,000 USD (2,500,000) 2020-08-27 HSBC 79,633 0.11
RUB 148,752,000 USD (2,000,000) 2020-08-18 HSBC 76,787 0.11
CNY 28,840,000 USD (4,000,000) 2020-08-27 HSBC 69,400 0.10
IDR 15,313,000,000 USD (1,000,000) 2020-08-18 HSBC 46,578 0.06
KRW 2,447,520,000 USD (2,000,000) 2020-08-18 HSBC 41,007 0.06
RUB 74,293,700 USD (1,000,000) 2020-08-21 HSBC 36,865 0.05
EUR 20,413,000 USD (22,909,939) 2020-08-10 Bank of America 36,368 0.05
USD 1,888,630 GBP (1,500,000) 2020-08-27 HSBC 34,624 0.05
USD 2,000,000 MXN (45,736,000) 2020-08-14 HSBC 31,968 0.04
USD 1,000,000 PEN (3,433,000) 2020-08-21 HSBC 29,774 0.04
CZK 54,024,420 EUR (2,000,000) 2020-08-18 HSBC 29,601 0.04
USD 1,000,000 BRL (5,342,000) 2020-08-21 HSBC 29,061 0.04
GBP 1,614,921 USD (1,966,826) 2020-07-08 Bank of America 28,640 0.04
USD 1,250,000 BRL (6,728,750) 2020-08-27 HSBC 27,273 0.04
MXN 23,893,950 USD (1,000,000) 2020-08-21 HSBC 27,238 0.04
KRW 1,230,900,000 USD (1,000,000) 2020-08-21 HSBC 26,514 0.04
BRL 2,887,000 USD (500,000) 2020-08-21 HSBC 24,729 0.03
BRL 2,879,500 USD (500,000) 2020-08-18 HSBC 23,422 0.03
RUB 145,080,000 USD (2,000,000) 2020-08-27 HSBC 23,300 0.03
IDR 7,619,475,000 USD (500,000) 2020-08-19 HSBC 20,646 0.03
USD 2,046,011 GBP (1,639,981) 2020-07-08 Bank of America 19,578 0.03
THB 31,490,000 USD (1,000,000) 2020-08-18 HSBC 18,739 0.03
CZK 12,257,500 USD (500,000) 2020-08-21 HSBC 16,910 0.02
USD 1,500,000 ZAR (25,918,170) 2020-08-18 HSBC 15,741 0.02
USD 1,000,000 IDR (14,438,000,000) 2020-08-18 HSBC 13,225 0.02
INR 76,723,900 USD (1,000,000) 2020-08-21 HSBC 10,935 0.02
ZAR 8,874,250 USD (500,000) 2020-08-18 HSBC 8,203 0.01
PLN 2,009,809 USD (500,000) 2020-08-21 HSBC 8,169 0.01
USD 500,000 ZAR (8,684,200) 2020-08-21 HSBC 2,829 0.00
USD 1,000,000 COP (3,751,000,000) 2020-08-21 HSBC 1,295 0.00
USD 896,205 EUR (796,200) 2020-08-10 Bank of America 1,194 0.00
COP 3,758,000,000 USD (1,000,000) 2020-08-21 HSBC 569 0.00
USD 27,679 GBP (22,370) 2020-08-10 Bank of America 31 0.00
USD 30,843 GBP (25,070) 2020-07-08 Bank of America (135) (0.00)
CLP 819,700,000 USD (1,000,000) 2020-08-18 HSBC (189) (0.00)
USD 1,500,000 AUD (2,178,662) 2020-08-21 HSBC (321) (0.00)
USD 1,000,000 TRY (6,932,000) 2020-08-14 HSBC (455) (0.00)
GBP 50,130 USD (62,778) 2020-07-08 Bank of America (837) (0.00)
COP 3,751,000,000 USD (1,000,000) 2020-08-18 HSBC (1,062) (0.00)
CLP 818,800,000 USD (1,000,000) 2020-08-21 HSBC (1,240) (0.00)
USD 207,283 EUR (186,700) 2020-07-08 Bank of America (2,434) (0.00)
PLN 3,942,278 USD (1,000,000) 2020-08-18 HSBC (3,227) (0.00)

103
30 June 2020
GAM Star Emerging Market Rates
Portfolio Statement
Purchase Currency
Contractual Amount
SaleCurrency
ContractualAmount
MaturityDate
Counterparty Unrealised Loss US$
Net Assets%
Open Forward Contracts, continued
INR 113,550,000 USD (1,500,000) 2020-08-27 HSBC (4,839) (0.01)
MYR 4,267,500 USD (1,000,000) 2020-08-21 Morgan Stanley (6,294) (0.01)
EUR 752,800 USD (852,448) 2020-07-08 Bank of America (6,837) (0.01)
ZAR 8,536,000 USD (500,000) 2020-08-21 HSBC (11,314) (0.02)
USD 500,000 PHP (25,515,000) 2020-08-20 HSBC (11,393) (0.02)
ZAR 25,954,723 USD (1,500,000) 2020-08-18 HSBC (13,648) (0.01)
USD 1,000,000 EGP (16,615,000) 2020-08-21 HSBC (18,267) (0.03)
GBP 1,614,881 USD (2,014,774) 2020-08-10 Bank of America (18,938) (0.03)
MXN 46,002,740 USD (2,000,000) 2020-08-14 HSBC (20,490) (0.03)
BRL 5,372,500 USD (1,000,000) 2020-08-21 HSBC (23,517) (0.04)
CLP 1,620,200,000 USD (2,000,000) 2020-08-14 HSBC (23,919) (0.03)
USD 2,000,000 CNH (14,352,000) 2020-08-18 HSBC (25,595) (0.04)
COP 20,567,500,000 USD (5,500,000) 2020-08-27 HSBC (26,442) (0.04)
USD 2,000,000 PHP (101,220,000) 2020-08-18 HSBC (28,965) (0.04)
RUB 69,480,000 USD (1,000,000) 2020-08-18 HSBC (29,962) (0.04)
JPY 99,550,750 CAD (1,300,000) 2020-08-18 HSBC (31,300) (0.04)
USD 3,000,000 COP (11,397,000,000) 2020-08-27 HSBC (33,044) (0.05)
USD 1,000,000 RON (4,479,469) 2020-08-21 HSBC (36,198) (0.05)
USD 1,000,000 KRW (1,243,800,000) 2020-08-21 HSBC (37,272) (0.05)
USD 1,000,000 THB (32,105,900) 2020-08-18 HSBC (38,665) (0.05)
BRL 5,244,500 USD (1,000,000) 2020-08-18 HSBC (46,680) (0.06)
USD 4,000,000 CNY (28,720,000) 2020-08-27 HSBC (52,468) (0.07)
USD 1,000,000 AUD (1,534,159) 2020-08-18 HSBC (56,482) (0.08)
USD 1,750,000 BRL (9,967,250) 2020-08-27 HSBC (61,216) (0.08)
USD 4,000,000 CNY (29,170,000) 2021-05-27 HSBC (61,535) (0.08)
USD 1,000,000 ZAR (18,577,500) 2020-08-21 HSBC (63,562) (0.09)
USD 1,000,000 ZAR (18,758,271) 2020-08-18 HSBC (74,232) (0.11)
USD 2,000,000 IDR (30,508,000,000) 2020-08-27 HSBC (81,037) (0.11)
USD 2,500,000 ZAR (45,130,000) 2020-08-27 HSBC (82,150) (0.11)
USD 2,000,000 AUD (3,038,401) 2020-08-27 HSBC (92,400) (0.13)
USD 1,500,000 BRL (8,787,500) 2020-08-18 HSBC (97,350) (0.13)
EUR 30,935,800 USD (34,971,206) 2020-08-10 Bank of America (196,192) (0.27)
USD 3,000,000 TRY (22,313,200) 2020-08-18 HSBC (216,507) (0.30)
USD 3,000,000 TRY (22,459,800) 2020-08-21 HSBC (234,758) (0.33)
USD 6,000,000 TRY (45,030,600) 2020-08-27 HSBC (473,979) (0.66)
Unrealised gain on Open Forward Contracts 2,870,466 3.97
Unrealised loss on Open Forward Contracts (2,347,347) (3.25)
523,119 0.72

104
30 June 2020
GAM Star Emerging Market Rates
Portfolio Statement
Fair ValueUS$
Net Assets%
Net Financial Assets and Liabilities at fair value 49,001,022 67.94
Net Current Assets (excluding Financial Assets and Financial Liabilities at fair value) 23,117,968 32.06
Net assets attributable to the shareholders of the Fund 72,118,990 100.00
Analysis of Total Assets %
Transferable securities admitted to official stock exchange listing 13.62
Transferable securities dealt in on another regulated market 44.97
OTC financial derivative instruments 3.74
Other Assets 37.67
100.00
In line with the requirements of the UCITS regulation S.I. No. 344/2017 the open Forward Contracts have been condensed in the Portfolio Statement based on the purchase and sale currency, maturity date, counterparty and unrealised gain or unrealised loss of the contract as at the year end.

105
30 June 2020
GAM Star Emerging Market Rates
Portfolio Changes (Unaudited)
Major Purchases CostUS$
United States Treasury Bill 0% 2020-03-05 62,980,945
United States Treasury Bill 0% 2020-09-10 46,250,085
United States Treasury Bill 0% 2019 -09-12 8,974,912
Indonesia Treasury Bond 9% 2029-03-15 3,818,013
South Africa Government Bond 8.875% 2035-02-28 2,941,199
Jordan Government International Bond 5.85% 2030-07-07 2,400,000
Indonesia Treasury Bond 7% 2027-05-15 1,499,208
Petrobras Global Finance 5.299% 2025-01-27 1,265,280
Ukreximbank Via Biz Finance FRN 2029-11-14 1,140,000
European Bank for Reconstruction & Developmen 30% 2021-01-25 976,442
Angolan Government International Bond 9.125% 2049-11-26 934,000
African Development Bank 0% 2046-04-05 871,581
South Africa Government Bond 9% 2040-01-31 787,382
European Investment Bank 0% 2032-10-18 730,398
Brazil Government Bond 3.875% 2030-06-12 638,402
International Finance 0% 2038-02-22 620,261
Sri Lanka Government International Bond 5.875% 2022-07-25 494,070
Total for the financial year 137,322,178
There were no other purchases and sales during the financial year.
Major Sales ProceedsUS$
United States Treasury Bill 0% 2020-03-05 24,912,465
United States Treasury Bill 0% 2020-09-10 14,785,406
Brazil Notas do Tesouro Nacional Serie B 6% I/L 2022-08-15 8,567,562
Republic Of South Africa 8.875% 2035-02-28 2,890,061
European Bank for Reconstruction & Developmen 24% 2021-09-10 2,436,818
Ukraine Government International Bond FRN 2040-05-31 1,780,000
Argentina POM Politica Monetaria FRN 2020-06-21 1,671,965
Biz Finance Plc 9.95% 2029-11-14 1,140,000
United States Treasury Bill 0% 2019-09-12 998,107
South Africa Government Bond 10.5% 2026-12-21 980,943
Republic Of Angola 9.125% 2049-11-26 956,182
Republic Of Brazil 3.875% 2030-06-12 620,812
South Africa Government Bond 9% 2040-01-31 607,958
Total for the financial year 62,348,279

106
30 June 2020
GAM Star European EquityFund Manager: Niall Gallagher
Commentary (Unaudited)
The Fund (as measured by the EUR Accumulation class) rose 5.4% over the year to 30 June 2020, outperforming its benchmark, the MSCI Europe Index Net in EUR ex-DEM, which fell 5.5% in EUR terms.
European equity markets resumed their upward trajectory in the third quarter of 2019. Following strong performance in a rising market in the first half of the year, the Fund gave some performance back during the quarter, underperforming the market in an environment characterised by higher volatility and rotational pressures.
All of the underperformance came in September, which is rather disappointing to us given the attention we pay towards portfolio construction – in particular, to containing ‘factor risks’. However, September was a somewhat strange month: in the first four trading days of October, almost all of September’s underperformance was reversed, highlighting the somewhat skittish nature of factor performance.
We expressed the view at the end of 2018 that too much pessimism was priced into the market in general and in particular to cyclical stocks. A balanced appraisal of the economic data did not justify the cries – shrill and inescapable at the time – that a recession was just around the corner. Specifically, a declining rate of consumption growth (ie a negative consumption impulse) which has always been associated with a late cycle peak was not present. Consumption growth in the US and Europe actually continued to accelerate in 2019, even if industrial data, about which news outlets like to obsess, remained weak for most of the period. Even here, however, the picture was mixed – with France consistently outperforming Germany for example. Positive economic news flow and the reduction of left hand tail risks from a ‘no-deal Brexit’ and a far left UK government propelled the market higher towards the end of the year. The Fund remains positioned for, among other things, rising business confidence across Europe, a significant pick-up in investment activity in the UK from depressed levels and our key long-term structural trends.
The advent of the coronavirus, first in China / East Asia and then in Europe and North America, led to a dramatic change in market confidence, an element of panic and dramatic declines in sovereign bond yields and equities. However, we do not want to downplay the significance of what has happened and what may happen yet. It is reasonably obvious to state that the economic damage inflicted by the virus will be as a result of reactions such as containment and mitigation taken by consumers in their individual actions and governments in their general actions. An economic slowdown and recession in some countries is highly likely. This will lead to declines in earnings growth and for some companies absolute earnings declines. The cross-country data on Covid-19 is absolutely startling with enormous cross-country variations. It will take many years and voluminous amounts of data analysis / research to get behind these differences and what drove them but observationally we can see that almost all Asian countries have experienced a far lesser health impact than the US and especially Europe, which is the healthcare and economic epicentre of the virus. Even within Europe we see vastly different impacts between large countries with Germany versus the UK particularly notable. It is very hard to know what is behind the differential health impacts – superior healthcare systems, demographics, obesity rates, reaction times, lockdown/no lockdowns (Sweden has a lower mortality rate than the UK despite not imposing a general lockdown) but we are of the firm belief that differential health impact will ultimately exert a differential economic impact with Asia (and the US) likely to emerge relatively stronger than Europe and Northern Europe likely to emerge stronger than the UK & Mediterranean Europe. There was certainly strong evidence of differentiation in May but there was also evidence of V-shaped recoveries, or something akin to a V, in parts / regions of the key Chinese economy and this has increased the hope that as other countries begin to open up they will experience a somewhat similar path to China. There is some evidence for this in recent European survey data and this has encouraged equity (and credit) markets to view the current crisis as largely a 2020 earnings event; whether this will prove to be the case will depend on what happens next in the pace of openings of economies and whether there are any second spikes in the virus.
Finally, we remain relatively optimistic on the future direction of markets and economies based on our view that the current economic crisis reflects a one-off shock in reaction to a ‘healthcare crisis’ (alternatively and more critically a ‘panic’ by politicians amplified by the global media) that will extinguish itself relatively quickly but we do expect to see some economic scarring and a large fiscal hangover. We also note that markets and our Fund have largely bounced back from the extreme sell off in March.
The top three holdings contributing to performance were LASML, Flutter entertainment and Zalando. The bottom three performers were Peugeot, Fresenius and Anheuser-Busch InBev.
July 2020

107
30 June 2020
GAM Star European Equity
Portfolio Statement
Analysis, by geographical area30 June2020 %
30 June2019 %
United Kingdom 23.41 19.36
Germany 17.04 12.27
Switzerland 13.03 14.52
France 7.85 14.66
Italy 7.52 7.92
Denmark 6.96 3.52
Ireland 6.96 8.98
Netherlands 6.56 2.64
Spain 3.49 5.47
United States 2.62 5.73
China 1.77 –
Finland 1.51 –
Sweden 1.06 3.55
Currency Forwards (0.00) –
Net Current Assets 0.22 1.38
100.00 100.00
Analysis, by industry sector30 June2020 %
30 June2019 %
Consumer Durables & Apparel 10.10 8.29
Capital Goods 9.85 9.85
Software & Services 8.18 8.01
Semiconductors & Semiconductor Equipment 8.11 3.65
Food Beverage & Tobacco 7.98 9.95
Retailing 6.66 4.57
Diversified Financials 6.25 5.69
Materials 6.20 6.76
Pharmaceuticals & Biotechnology 5.87 1.54
Automobiles & Components 5.24 6.28
Health Care Equipment & Services 4.40 7.24
Utilities 4.06 2.23
Banks 3.63 4.17
Commercial & Professional Services 2.95 3.27
Consumer Services 2.44 0.98
Transportation 1.90 2.31
Insurance 1.78 3.10
Food & Staples Retailing 1.10 –
Real Estate 1.10 1.35
Technology Hardware & Equipment 1.06 3.55
Telecommunication Services 0.92 –
Energy – 5.83
Currency Forwards (0.00) –
Net Current Assets 0.22 1.38
100.00 100.00
Analysis, by investment30 June2020 %
30 June2019 %
Equities Quoted 97.47 98.62
Preference Shares 2.31 –
Currency Forwards (0.00) –
Net Current Assets 0.22 1.38
100.00 100.00
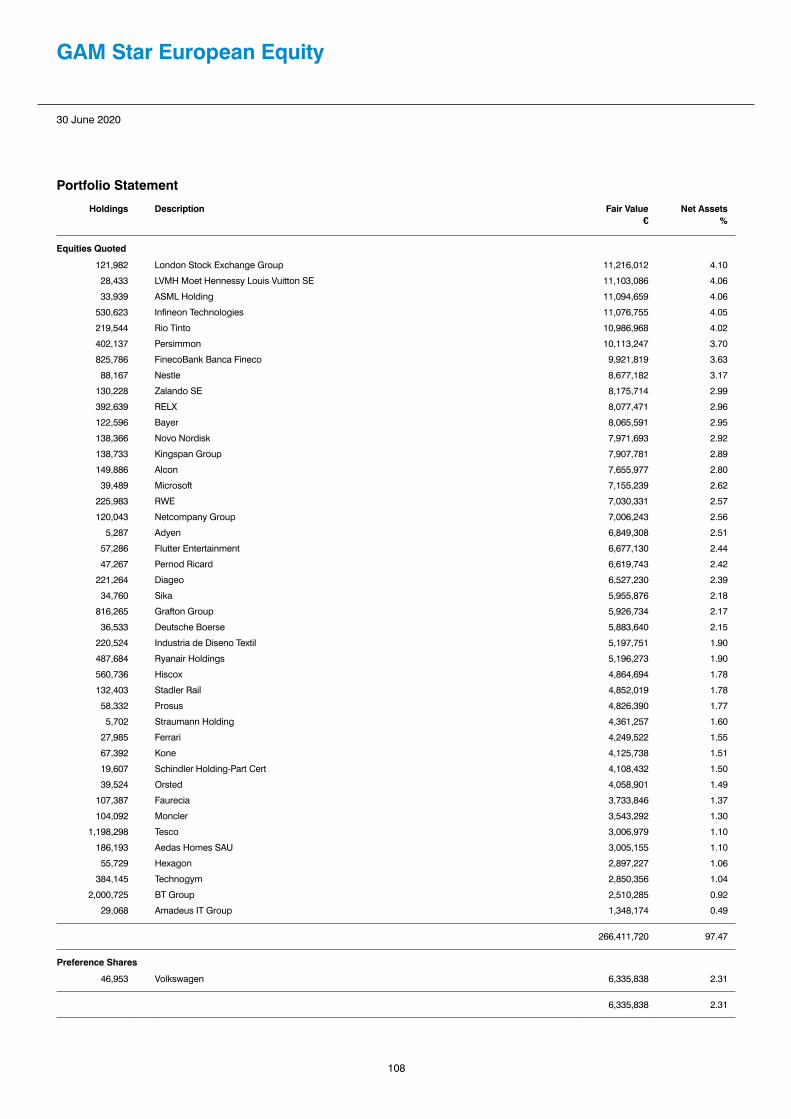
108
30 June 2020
GAM Star European Equity
Portfolio Statement
Holdings Description Fair Value€
Net Assets%
Equities Quoted
121,982 London Stock Exchange Group 11,216,012 4.10
28,433 LVMH Moet Hennessy Louis Vuitton SE 11,103,086 4.06
33,939 ASML Holding 11,094,659 4.06
530,623 Infineon Technologies 11,076,755 4.05
219,544 Rio Tinto 10,986,968 4.02
402,137 Persimmon 10,113,247 3.70
825,786 FinecoBank Banca Fineco 9,921,819 3.63
88,167 Nestle 8,677,182 3.17
130,228 Zalando SE 8,175,714 2.99
392,639 RELX 8,077,471 2.96
122,596 Bayer 8,065,591 2.95
138,366 Novo Nordisk 7,971,693 2.92
138,733 Kingspan Group 7,907,781 2.89
149,886 Alcon 7,655,977 2.80
39,489 Microsoft 7,155,239 2.62
225,983 RWE 7,030,331 2.57
120,043 Netcompany Group 7,006,243 2.56
5,287 Adyen 6,849,308 2.51
57,286 Flutter Entertainment 6,677,130 2.44
47,267 Pernod Ricard 6,619,743 2.42
221,264 Diageo 6,527,230 2.39
34,760 Sika 5,955,876 2.18
816,265 Grafton Group 5,926,734 2.17
36,533 Deutsche Boerse 5,883,640 2.15
220,524 Industria de Diseno Textil 5,197,751 1.90
487,684 Ryanair Holdings 5,196,273 1.90
560,736 Hiscox 4,864,694 1.78
132,403 Stadler Rail 4,852,019 1.78
58,332 Prosus 4,826,390 1.77
5,702 Straumann Holding 4,361,257 1.60
27,985 Ferrari 4,249,522 1.55
67,392 Kone 4,125,738 1.51
19,607 Schindler Holding-Part Cert 4,108,432 1.50
39,524 Orsted 4,058,901 1.49
107,387 Faurecia 3,733,846 1.37
104,092 Moncler 3,543,292 1.30
1,198,298 Tesco 3,006,979 1.10
186,193 Aedas Homes SAU 3,005,155 1.10
55,729 Hexagon 2,897,227 1.06
384,145 Technogym 2,850,356 1.04
2,000,725 BT Group 2,510,285 0.92
29,068 Amadeus IT Group 1,348,174 0.49
266,411,720 97.47
Preference Shares
46,953 Volkswagen 6,335,838 2.31
6,335,838 2.31

109
30 June 2020
GAM Star European Equity
Portfolio Statement
Purchase Currency
Contractual Amount
SaleCurrency
ContractualAmount
MaturityDate
Counterparty Unrealised Gain/(Loss)
€
Net Assets%
Open Forward Contracts
USD 293,566 EUR (259,696) 2020-08-10 Bank of America 1,461 0.00
USD 18,000 EUR (15,967) 2020-07-08 Bank of America 56 0.00
EUR 6,947 USD (7,800) 2020-08-10 Bank of America 8 0.00
EUR 267,531 USD (302,166) 2020-07-08 Bank of America (1,470) (0.00)
USD 284,166 EUR (260,140) 2020-07-08 Bank of America (7,163) (0.00)
Unrealised gain on Open Forward Contracts 1,525 0.00
Unrealised loss on Open Forward Contracts (8,633) (0.00)
(7,108) (0.00)
Fair Value€
Net Assets%
Net Financial Assets and Liabilities at fair value 272,740,450 99.78
Net Current Assets (excluding Financial Assets and Financial Liabilities at fair value) 588,785 0.22
Net assets attributable to the shareholders of the Fund 273,329,235 100.00
Analysis of Total Assets %
Transferable securities admitted to official stock exchange listing 99.18
OTC financial derivative instruments 0.00
Other Assets 0.82
100.00
In line with the requirements of the UCITS regulation S.I. No. 344/2017 the open Forward Contracts have been condensed in the Portfolio Statement based on the purchase and sale currency, maturity date, counterparty and unrealised gain or unrealised loss of the contract as at the year end.
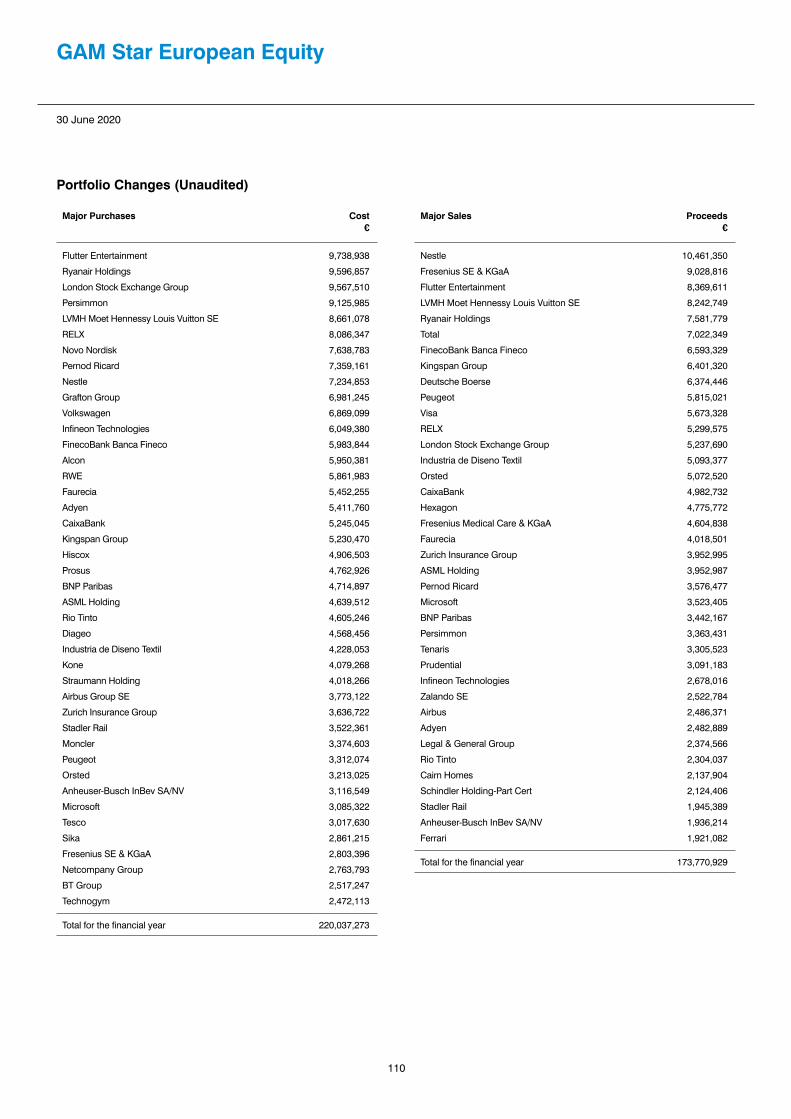
110
30 June 2020
GAM Star European Equity
Portfolio Changes (Unaudited)
Major Purchases Cost€
Flutter Entertainment 9,738,938
Ryanair Holdings 9,596,857
London Stock Exchange Group 9,567,510
Persimmon 9,125,985
LVMH Moet Hennessy Louis Vuitton SE 8,661,078
RELX 8,086,347
Novo Nordisk 7,638,783
Pernod Ricard 7,359,161
Nestle 7,234,853
Grafton Group 6,981,245
Volkswagen 6,869,099
Infineon Technologies 6,049,380
FinecoBank Banca Fineco 5,983,844
Alcon 5,950,381
RWE 5,861,983
Faurecia 5,452,255
Adyen 5,411,760
CaixaBank 5,245,045
Kingspan Group 5,230,470
Hiscox 4,906,503
Prosus 4,762,926
BNP Paribas 4,714,897
ASML Holding 4,639,512
Rio Tinto 4,605,246
Diageo 4,568,456
Industria de Diseno Textil 4,228,053
Kone 4,079,268
Straumann Holding 4,018,266
Airbus Group SE 3,773,122
Zurich Insurance Group 3,636,722
Stadler Rail 3,522,361
Moncler 3,374,603
Peugeot 3,312,074
Orsted 3,213,025
Anheuser-Busch InBev SA/NV 3,116,549
Microsoft 3,085,322
Tesco 3,017,630
Sika 2,861,215
Fresenius SE & KGaA 2,803,396
Netcompany Group 2,763,793
BT Group 2,517,247
Technogym 2,472,113
Total for the financial year 220,037,273
Major Sales Proceeds€
Nestle 10,461,350
Fresenius SE & KGaA 9,028,816
Flutter Entertainment 8,369,611
LVMH Moet Hennessy Louis Vuitton SE 8,242,749
Ryanair Holdings 7,581,779
Total 7,022,349
FinecoBank Banca Fineco 6,593,329
Kingspan Group 6,401,320
Deutsche Boerse 6,374,446
Peugeot 5,815,021
Visa 5,673,328
RELX 5,299,575
London Stock Exchange Group 5,237,690
Industria de Diseno Textil 5,093,377
Orsted 5,072,520
CaixaBank 4,982,732
Hexagon 4,775,772
Fresenius Medical Care & KGaA 4,604,838
Faurecia 4,018,501
Zurich Insurance Group 3,952,995
ASML Holding 3,952,987
Pernod Ricard 3,576,477
Microsoft 3,523,405
BNP Paribas 3,442,167
Persimmon 3,363,431
Tenaris 3,305,523
Prudential 3,091,183
Infineon Technologies 2,678,016
Zalando SE 2,522,784
Airbus 2,486,371
Adyen 2,482,889
Legal & General Group 2,374,566
Rio Tinto 2,304,037
Cairn Homes 2,137,904
Schindler Holding-Part Cert 2,124,406
Stadler Rail 1,945,389
Anheuser-Busch InBev SA/NV 1,936,214
Ferrari 1,921,082
Total for the financial year 173,770,929

111
30 June 2020
GAM Star Flexible Global PortfolioFund Manager: Julian Howard/GAM's Multi Asset Solutions Team
Commentary (Unaudited)
The Fund (as measured by the EUR Accumulation class) fell 0.1% over the year to 30 June 2020, compared to its benchmark, the Lipper Global Mixed Asset Flexible Index, which fell 1.6% in EUR terms.
After a difficult summer for risk assets while the US-China trade dispute moved along with global growth concerns, investors returned in a bullish mood and drove equities higher in September as central banks remained supportive. Government bond yields declined markedly over the third quarter, helped by central bank easing and rising concerns about global growth; however, there was some retracement in early September as the US and China announced talks would resume in early October, which gave rise to a more optimistic outlook. Global hedge funds, as measured by the HFRI/HFRX Global Hedge Fund Index, were up 0.4% in September and the Fund also ended the period in positive territory.
The geopolitical risks that dominated the markets for most of the year faded towards the end of 2019, allowing global equities and corporate bonds to rally with developed market government bonds giving up some of their gains as yields rose. Trade uncertainty was reduced as a phase one deal between the US and China was announced; the US also did not impose tariffs on European Union auto exports and economic data picked up which collectively contributed to support equities. In commodities, crude prices were also driven higher by news of the US-China trade deal.
Global equities started the new decade on a positive note following the signing of a phase one trade deal between the US and China but declined as the spread of coronavirus reduced investors’ appetite for risk and volatility picked up towards the end of the month. Concerns over the coronavirus outbreak and its potential impact on global growth replaced trade as the main focus for the markets over the month of February. March saw waterfall sell offs across all markets in the same league as the 1929 Wall Street crash, 1987 stock market crash, 2001 technology unwind and the 2008 Lehman Brothers failure, with the MSCI AC World Index down significantly to 31 March. As the lockdowns and quarantines gathered pace, concerns about the duration of the crisis and its effect on the global economy mounted and investors and companies engaged in an asset fire sale in order to raise liquidity at literally any price. This meant that by mid-March those assets which normally provide more stability showed signs of strain, including even safe haven stalwarts such as government bonds and gold. Towards the end of the month though, there were signs of market stability as governments around the world committed to supporting the economy with huge fiscal stimulus packages implicitly financed by central banks renewing their quantitative easing programmes.
The second quarter of 2020 saw global equities rebounding, as the focus in markets turned to lockdowns being lifted along with further support measures, equity markets rebounded further in the quarter. For many market commentators, it was hard to square the desperate fundamental picture of an economic crash and plunging corporate earnings outlooks with a buoyant equity market. Little wonder therefore that the move was described as the ‘hated rally’ in some quarters. A fast and comprehensive response from policymakers went some way to explaining the rebound. Underneath the headline moves investors were coolly assessing potential winners and losers in the months and years to come. Cyclical stocks rightly suffered amid this ‘great re-allocation’, while those areas deemed to have a promising future, notably technology, fared so well that they were able to drive the entire market upwards. The easing of Covid-19 lockdowns and early signs of economic recovery saw risk appetite return rapidly over the month of June, supporting equity and credit markets. Overall, the market rallied on the back of fiscal and monetary stimulus, combined with the reopening of economies, with central banks making clear that they stand willing to provide liquidity support and keep borrowing costs low.
July 2020
Portfolio Statement
Analysis, by geographical area30 June2020 %
30 June2019 %
Global 36.60 46.56
United States 34.88 30.38
Europe 12.39 2.14
Emerging Markets Global 6.36 5.69
Europe ex UK 2.12 3.24
Japan 2.00 2.55
United Kingdom 0.86 1.33
Currency Forwards (1.33) (0.50)
Net Current Assets 6.12 8.61
100.00 100.00
Analysis, by investment30 June2020 %
30 June2019 %
Exchange Traded Funds 36.47 23.87
Bond Funds 33.42 28.28
Equity Funds 15.33 18.08
Diversified Funds 9.99 21.66
Currency Forwards (1.33) (0.50)
Net Current Assets 6.12 8.61
100.00 100.00

112
30 June 2020
GAM Star Flexible Global Portfolio
Portfolio Statement
Holdings Description Fair Value€
Net Assets%
Bond Funds*
913,766 PIMCO GIS Mortgage Opportunities Fund Inst EUR Hedged Acc 9,320,410 7.22
693,576 GAM Star MBS Total Return Institutional Hedged EUR Acc** 7,263,822 5.63
58,263 Legg Mason Western Asset Global Core Plus Bond Fund EUR PR Acc Hedged 6,612,914 5.12
448,295 GAM Star Credit Opportunities (EUR) Inst Acc** 6,589,809 5.11
488,870 GAM Star Cat Bond EUR Institutional Acc** 6,566,938 5.09
39,516 GAM Total Return-EUR C*** 3,973,327 3.08
29,147 AB SICAV I – Short Duration High Yield Portfolio 2,794,048 2.17
43,121,268 33.42
Diversified Fund*
1,303 GAM Star Tactical Opportunities X EUR Acc** 12,896,200 9.99
12,896,200 9.99
Equity Funds*
77,505 GAM Star (Lux) – Merger Arbitrage I EUR** 7,795,035 6.04
31,305 GAM Star (Lux) – European Alpha I EUR** 3,365,698 2.61
2,573 GAM Emerging Markets Equity EUR S*** 3,305,256 2.56
141,737 GAM Star Continental European Equity Z EUR Acc** 2,732,708 2.12
284,894 GAM Star Japan Leaders Z JPY Acc** 2,578,345 2.00
19,777,042 15.33
Exchange Traded Funds*
37,498 iShares Core S&P 500 UCITS ETF 10,293,045 7.98
540,629 UBS ETF (IE) S&P 500 ESG UCITS ETF USD A-acc 9,901,383 7.68
93,642 iShares EUR Ultrashort Bond UCITS ETF 9,358,581 7.25
1,125,358 iShares MSCI EM ESG Enhanced UCITS ETF 4,904,623 3.80
18,822 Invesco EQQQ Nasdaq-100 UCITS ETF USD 4,131,740 3.20
4,022 iShares Edge MSCI USA Quality Factor UCITS ETF 4,090,218 3.17
59,347 Amundi Index MSCI Europe SRI UCITS ETF DR – EUR 3,264,144 2.53
167,151 iShares Core FTSE 100 UCITS ETF (Dist) 1,111,409 0.86
47,055,143 36.47
Purchase Currency
Contractual Amount
SaleCurrency
ContractualAmount
MaturityDate
Counterparty Unrealised Gain
€
Net Assets%
Open Forward Contracts
USD 52,313,695 EUR (46,276,876) 2020-08-10 Bank of America 261,305 0.20
EUR 25,846,164 GBP (23,376,470) 2020-07-08 Bank of America 131,472 0.10
CHF 10,128,446 EUR (9,499,930) 2020-08-10 Bank of America 19,931 0.02
USD 1,238,100 EUR (1,096,757) 2020-07-08 Bank of America 5,455 0.00
EUR 297,813 USD (329,500) 2020-07-08 Bank of America 4,478 0.00
CHF 347,300 EUR (322,824) 2020-07-08 Bank of America 3,526 0.00
EUR 541,036 CAD (826,427) 2020-07-08 Bank of America 842 0.00
SGD 290,078 EUR (184,393) 2020-08-11 Bank of America 597 0.00
EUR 667,460 USD (749,800) 2020-08-10 Bank of America 439 0.00
* Typically each of the above collective investment schemes may charge management fees of up to 2% per annum of their NAV and performance fees of up to 20% of the increase of performance for a predetermined period of time subject to any applicable hurdle rates.** Investment in other GAM Star Funds. *** Investment in other GAM Funds.

113
30 June 2020
GAM Star Flexible Global Portfolio
Portfolio Statement
Purchase Currency
Contractual Amount
SaleCurrency
ContractualAmount
MaturityDate
Counterparty Unrealised Gain/(Loss)
€
Net Assets%
Open Forward Contracts, continued
EUR 277,433 GBP (252,200) 2020-08-10 Bank of America 151 0.00
EUR 154,968 CHF (164,800) 2020-08-10 Bank of America 71 0.00
SGD 6,700 EUR (4,266) 2020-07-08 Bank of America 10 0.00
EUR 2,998 SGD (4,700) 2020-08-11 Bank of America 1 0.00
EUR 8,684 CAD (13,300) 2020-08-10 Bank of America (4) (0.00)
EUR 9,331 CAD (14,300) 2020-07-08 Bank of America (17) (0.00)
EUR 44,206 CHF (47,200) 2020-08-10 Bank of America (158) (0.00)
EUR 33,905 GBP (31,100) 2020-08-10 Bank of America (289) (0.00)
CAD 840,727 EUR (550,048) 2020-07-08 Bank of America (508) (0.00)
EUR 187,895 SGD (295,378) 2020-07-08 Bank of America (601) (0.00)
CAD 825,727 EUR (540,224) 2020-08-10 Bank of America (832) (0.00)
SGD 288,678 EUR (185,959) 2020-07-08 Bank of America (1,739) (0.00)
EUR 9,718,055 CHF (10,365,346) 2020-07-08 Bank of America (22,004) (0.02)
CHF 10,018,046 EUR (9,462,931) 2020-07-08 Bank of America (49,221) (0.04)
GBP 22,653,570 EUR (25,023,274) 2020-08-10 Bank of America (116,646) (0.09)
EUR 46,894,823 USD (52,965,395) 2020-07-08 Bank of America (257,318) (0.20)
GBP 23,376,470 EUR (26,084,556) 2020-07-08 Bank of America (369,866) (0.29)
USD 52,056,795 EUR (47,661,917) 2020-07-08 Bank of America (1,318,652) (1.01)
Unrealised gain on Open Forward Contracts 428,278 0.32
Unrealised loss on Open Forward Contracts (2,137,855) (1.65)
(1,709,577) (1.33)
Fair Value€
Net Assets%
Net Financial Assets and Liabilities at fair value 121,140,076 93.88
Net Current Assets (excluding Financial Assets and Financial Liabilities at fair value) 7,891,443 6.12
Net assets attributable to the shareholders of the Fund 129,031,519 100.00
Analysis of Total Assets %
UCITS collective investment schemes 93.56
OTC financial derivative instruments 0.32
Other Assets 6.12
100.00
In line with the requirements of the UCITS regulation S.I. No. 344/2017 the open Forward Contracts have been condensed in the Portfolio Statement based on the purchase and sale currency, maturity date, counterparty and unrealised gain or unrealised loss of the contract as at the year end.

114
30 June 2020
GAM Star Flexible Global Portfolio
Portfolio Changes (Unaudited)
Major Purchases Cost€
GAM Star MBS Total Return Inst Hedged EUR Acc 9,509,000
iShares EUR Ultrashort Bond UCITS ETF 6,373,194
iShares MSCI EM ESG Enhanced UCITS ETF 4,937,202
Legg Mason Western Asset Global Core Plus Bond Fund EUR PR Acc Hedged 4,239,000
Invesco EQQQ Nasdaq-100 UCITS ETF USD 3,851,454
UBS ETF (IE) S&P 500 ESG UCITS ETF USD A-acc 3,545,661
GAM Star Tactical Opportunities X EUR Acc 3,541,770
Amundi Index MSCI Europe SRI UCITS ETF DR – EUR 3,520,040
AB SICAV I – Short Duration High Yield Portfolio 3,353,000
GAM Star Credit Opportunities (EUR) Inst Acc 2,686,268
Vanguard FTSE Emerging Markets UCITS USD ETF 1,793,946
GAM Star Cat Bond EUR Institutional Acc 1,112,175
PIMCO GIS Mortgage Opportunities Fund Inst EUR Hedged Acc 1,048,000
Total for the financial year 49,510,710
There were no other purchases during the financial year.
Major Sales Proceeds€
GAM Star MBS Total Return USD Inst Acc 9,851,453
Vanguard FTSE Emerging Markets UCITS USD ETF 6,213,921
iShares Edge MSCI USA Quality Factor UCITS ETF 5,486,684
Merian Global Equity Absolute Return Fund I EUR Acc 5,025,915
GAM Star Target Return X EUR Acc 4,844,206
iShares Core S&P 500 UCITS ETF 3,965,632
GAM Star Tactical Opportunities EUR Inst Acc 3,638,700
iShares Fallen Angels High Yield Corp Bond UCITS ETF 3,473,328
AB Short Duration High Yield Portfolio Class S1 USD 3,364,236
GAM Star Tactical Opportunities X EUR Acc 3,145,000
GAM Star Continental European Equity Z EUR Acc 2,892,000
Legg Mason Western Asset Global Core Plus Bond Fund EUR PR Acc Hedged 2,600,120
GAM Star Cat Bond EUR Institutional Acc 1,943,513
GAM Star (Lux) – Merger Arbitrage I EUR 1,790,000
GAM Star MBS Total Return Inst Hedged EUR Acc 1,757,000
GAM Star Japan Leaders Z JPY Acc 1,698,375
GAM Emerging Markets Equity EUR S 1,574,900
PIMCO GIS Mortgage Opportunities Fund Inst EUR Hedged Acc 1,494,000
GAM Total Return-EUR C 1,402,100
GAM Star Credit Opportunities (EUR) Inst Acc 1,317,000
UBS ETF (IE) S&P 500 ESG UCITS ETF USD A-acc 1,017,327
iShares EUR Ultrashort Bond UCITS ETF 791,288
Total for the financial year 69,286,698

115
30 June 2020
GAM Star Global RatesFund Manager: Adrian Owens
Commentary (Unaudited)
The Fund (as measured by the USD Institutional Accumulation class) fell 0.8% over the year to 30 June 2020, compared to its benchmark, the 3 month Libor in USD, which fell 5.5%.
Most of the world’s central banks have been cutting interest rates this year (Norway and Sweden being two honourable exceptions), but this has not been enough to offset the headwinds from the ongoing political turmoil. Consequently, global economic data continues to deteriorate. During September, political tensions rose further in the US and the latest Purchasing Managers’ Indices (PMI) data was particularly disappointing. Although economic data is weakening, labour markets in general remain tight and wage growth on a rising trend. The net result is that corporate profitability is coming under increasing pressure. Despite soft economic data, fixed income markets, after a very strong August, gave back some of their recent gains in September.
There were a number of key events in December that resulted in the Fund recording its best month of 2019. In Sweden, the Riksbank hiked interest rates by 25 bps taking official rates back to zero. This decision was supported by November inflation remaining close to target and coming in firmer than the consensus expected. A more positive risk environment, higher oil prices and a positive technical backdrop also helped our positions in the Norwegian krone. The Global Rates strategy is invested in a number of themes that are idiosyncratic and can make money in “risk off” and “risk on” environments. Having held most of our risk in currency markets throughout much of 2019 we enter 2020 with risk fairly evenly split between interest rates and currency.
For the first quarter of 2020, fear of a global recession on the back of the spread of Covid-19, combined with the breakdown in OPEC talks, resulted in the strategy’s worst month since its inception in January 2004. While it is never easy to disentangle fully the impact from Covid-19 fears and the collapse in the oil price on the strategy’s themes, it was arguably the dramatic collapse in oil prices that did the most damage. Our long US breakeven inflation positions and our long Norwegian krone positions were hardest hit. Managing the immediate impact of the oil price fall was also complicated by the fact that the news of a price war broke over the weekend. Once US break-even inflation swaps opened on the Monday, they were immediately marked 40 bps lower. This gap lower was met with further ‘forced selling’. Currency and fixed income detracted from performance, with losses fairly evenly distributed between the two asset classes.
In the second quarter of 2020, despite a mixed few weeks for the global economy, with more economies reopening but occasional flare-ups in Covid-19 cases, risk markets continued to benefit from unprecedented liquidity. Commodities performed particularly strongly with Brent oil up over 16% on the month and copper up close to 12%. Equity markets also performed strongly and peripheral European bond markets did well with Greek 10-year bond yields down around 30 bps and Italian 10-year yields around 22 bps lower. One might have expected yields on the more developed fixed income markets to have drifted higher against such a backdrop but with liquidity so abundant and tail risks still very evident yields on US, German and UK 10-year bonds all ended the month around 1 bp lower. In June currency markets the New Zealand dollar, Australian dollar and Korean won were the top performers among the majors. They rallied respectively 2.6%, 1.8% and 1.6% versus the US dollar. Mexico (down 3.8% versus the USD), Brazil (down 1.7%) and sterling (down 0.7%) were the worst performing currencies. In the case of Brazil and Mexico, struggles with growing cases of Covid-19 were a worry and the UK has been weighed down by a perceived lacklustre handling of Covid-19, poor fiscal and current account dynamics and pessimism over a trade deal with the European Union (EU). June was a bad month for the US dollar with the dollar index falling by 1% – its third consecutive monthly decline.
July 2020
Portfolio Statement
Analysis, by geographical area30 June2020 %
30 June2019 %
United States 59.41 55.41
Mexico 10.59 15.45
Interest Rate Swaps (2.79) (2.09)
Options – Currency (Unquoted) (0.05) –
Futures – Interest Rates – (0.63)
Currency Forwards 7.25 8.96
Net Current Assets 25.59 22.90
100.00 100.00
Analysis, by industry sector30 June2020 %
30 June2019 %
Fixed Interest 70.00 70.86
Swaps (2.79) (2.09)
Futures – (0.63)
Options (0.05) –
Currency Forwards 7.25 8.96
Net Current Assets 25.59 22.90
100.00 100.00
Analysis, by investment30 June2020 %
30 June2019 %
Government Bonds 70.00 70.86
Futures – Interest Rates – (0.63)
Options – Currency (Unquoted) (0.05) –
Interest Rate Swaps (2.79) (2.09)
Currency Forwards 7.25 8.96
Net Current Assets 25.59 22.90
100.00 100.00
Analysis of Credit Ratings (S&P)30 June
202030 June
2019
Government Bonds From AA+ to BBB, or may not be rated
From AA+ to BBB+, or
may not be rated

116
30 June 2020
GAM Star Global Rates
Portfolio Statement
Holdings Description Fair ValueUS$
Net Assets%
Government Bonds
20,000,000 United States Treasury Bill 0% 2020-12-31 19,984,524 15.23
15,000,000 United States Treasury Bill 0% 2021-02-25 14,985,020 11.42
14,000,000 United States Treasury Bill 0% 2020-12-03 (5,637,000 units held as collateral)* 13,991,352 10.67
285,300,000 Mexican Bonos 8% 2047-11-07 13,893,790 10.59
12,000,000 United States Treasury Bill 0% 2021-04-22 11,985,353 9.14
10,000,000 United States Treasury Bill 0% 2021-03-25 9,988,502 7.61
4,000,000 United States Treasury Bill 0% 2020-11-05 3,997,886 3.05
3,000,000 United States Treasury Bill 0% 2020-09-10 2,999,269 2.29
91,825,696 70.00
Options – Currency (Unquoted)
25,000,000 EUR/USD (OTC) 1.16 Call European Vanilla September 2020 0.000% 2020-09-14 106,222 0.08
(25,000,000) EUR/USD (OTC) 1.108 Call European Vanilla September 2020 0.000% 2020-09-14 (177,767) (0.13)
Unrealised gain on Options – Currency (Unquoted) 106,222 0.08
Unrealised loss on Options – Currency (Unquoted) (177,767) (0.13)
(71,545) (0.05)
Currency Notional Amount
Fund Pays Fund Receives
Termination Date
Counterparty Fair Value US$
Net Assets%
Interest Rate Swaps
USD 43,862,200 USD-LIBOR-BBA 2.79% 2023-11-29 Morgan Stanley 3,816,194 2.91
USD 68,540,000 USD-LIBOR-BBA 1.79% 2022-11-14 Morgan Stanley 2,541,129 1.94
GBP 24,600,000 GBP-UKRPI 3.58% 2024-04-15 Morgan Stanley 1,389,320 1.06
MXN 397,400,000 MXN-TIIE-Banxico 7.46% 2027-08-26 HSBC 1,216,928 0.93
USD 12,347,000 USD-LIBOR-BBA 2.79% 2023-11-29 Morgan Stanley 1,074,240 0.82
GBP 19,900,000 GBP-UKRPI 3.43% 2024-03-15 Morgan Stanley 938,824 0.72
EUR 30,800,000 EUR-EURIBOR-Telerate 0.43% 2030-01-07 Morgan Stanley 854,891 0.65
GBP 14,900,000 GBP-UKRPI 3.41% 2024-02-15 Morgan Stanley 752,389 0.57
CAD 22,330,000 CAD-BA-CDOR 2.22% 2039-09-11 Morgan Stanley 680,494 0.52
EUR 15,500,000 EUR-EURIBOR-Telerate 0.20% 2029-09-13 Morgan Stanley 253,036 0.19
EUR 15,400,000 EUR-EURIBOR-Telerate 0.20% 2029-09-13 Morgan Stanley 251,403 0.19
MXN 488,200,000 MXN-TIIE-Banxico 6.95% 2030-01-24 Barclays Bank 225,279 0.17
USD 2,510,000 USD-LIBOR-BBA 2.79% 2023-11-29 Morgan Stanley 218,380 0.17
CAD 137,500,000 CAD-BA-CDOR 0.91% 2024-06-04 Morgan Stanley 134,659 0.10
EUR 1,400,000 EUR-EURIBOR-Telerate 1.45% 2028-12-06 Morgan Stanley 129,146 0.10
MXN 26,300,000 MXN-TIIE-Banxico 7.45% 2027-08-26 HSBC 80,537 0.06
GBP 1,410,000 GBP-UKRPI 3.39% 2024-02-15 Morgan Stanley 69,555 0.05
MXN 16,400,000 MXN-TIIE-Banxico 7.45% 2027-08-26 HSBC 50,220 0.04
MXN 16,400,000 MXN-TIIE-Banxico 7.45% 2027-08-26 HSBC 50,220 0.04
USD 3,500,000 1.71% USD-USCPI 2050-06-15 Morgan Stanley 14,117 0.01
MXN 3,800,000 MXN-TIIE-Banxico 7.45% 2027-08-26 HSBC 11,636 0.01
USD 3,500,000 1.74% USD-USCPI 2050-06-30 Morgan Stanley (895) (0.00)
USD 100,000 2.35% USD-LIBOR-BBA 2027-09-08 Morgan Stanley (8,775) (0.01)
USD 700,000 2.35% USD-LIBOR-BBA 2027-09-08 Morgan Stanley (61,427) (0.05)
USD 800,000 USD-LIBOR-BBA 2.35% 2027-09-08 Morgan Stanley (70,202) (0.05)
USD 800,000 2.35% USD-LIBOR-BBA 2027-09-08 Morgan Stanley (70,202) (0.05)
* Held as collateral with JP Morgan for OTC positions.
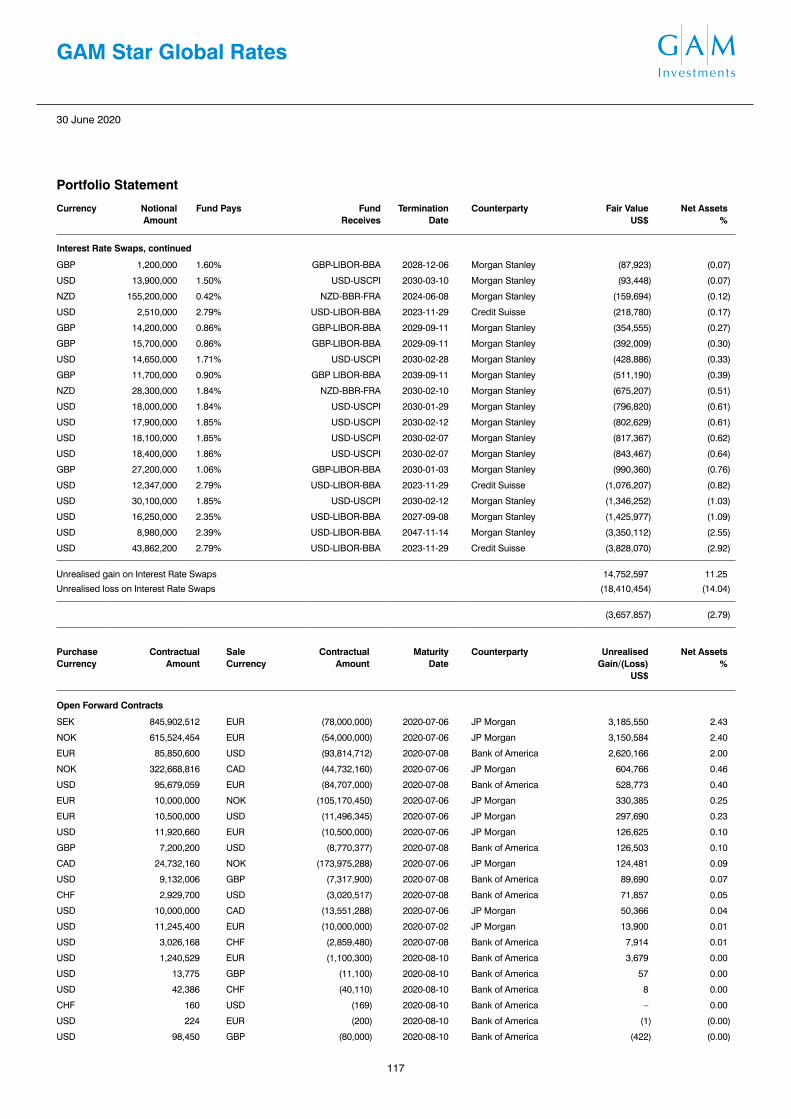
117
30 June 2020
GAM Star Global Rates
Portfolio Statement
Currency Notional Amount
Fund Pays Fund Receives
Termination Date
Counterparty Fair Value US$
Net Assets%
Interest Rate Swaps, continued
GBP 1,200,000 1.60% GBP-LIBOR-BBA 2028-12-06 Morgan Stanley (87,923) (0.07)
USD 13,900,000 1.50% USD-USCPI 2030-03-10 Morgan Stanley (93,448) (0.07)
NZD 155,200,000 0.42% NZD-BBR-FRA 2024-06-08 Morgan Stanley (159,694) (0.12)
USD 2,510,000 2.79% USD-LIBOR-BBA 2023-11-29 Credit Suisse (218,780) (0.17)
GBP 14,200,000 0.86% GBP-LIBOR-BBA 2029-09-11 Morgan Stanley (354,555) (0.27)
GBP 15,700,000 0.86% GBP-LIBOR-BBA 2029-09-11 Morgan Stanley (392,009) (0.30)
USD 14,650,000 1.71% USD-USCPI 2030-02-28 Morgan Stanley (428,886) (0.33)
GBP 11,700,000 0.90% GBP LIBOR-BBA 2039-09-11 Morgan Stanley (511,190) (0.39)
NZD 28,300,000 1.84% NZD-BBR-FRA 2030-02-10 Morgan Stanley (675,207) (0.51)
USD 18,000,000 1.84% USD-USCPI 2030-01-29 Morgan Stanley (796,820) (0.61)
USD 17,900,000 1.85% USD-USCPI 2030-02-12 Morgan Stanley (802,629) (0.61)
USD 18,100,000 1.85% USD-USCPI 2030-02-07 Morgan Stanley (817,367) (0.62)
USD 18,400,000 1.86% USD-USCPI 2030-02-07 Morgan Stanley (843,467) (0.64)
GBP 27,200,000 1.06% GBP-LIBOR-BBA 2030-01-03 Morgan Stanley (990,360) (0.76)
USD 12,347,000 2.79% USD-LIBOR-BBA 2023-11-29 Credit Suisse (1,076,207) (0.82)
USD 30,100,000 1.85% USD-USCPI 2030-02-12 Morgan Stanley (1,346,252) (1.03)
USD 16,250,000 2.35% USD-LIBOR-BBA 2027-09-08 Morgan Stanley (1,425,977) (1.09)
USD 8,980,000 2.39% USD-LIBOR-BBA 2047-11-14 Morgan Stanley (3,350,112) (2.55)
USD 43,862,200 2.79% USD-LIBOR-BBA 2023-11-29 Credit Suisse (3,828,070) (2.92)
Unrealised gain on Interest Rate Swaps 14,752,597 11.25
Unrealised loss on Interest Rate Swaps (18,410,454) (14.04)
(3,657,857) (2.79)
Purchase Currency
Contractual Amount
SaleCurrency
ContractualAmount
MaturityDate
Counterparty Unrealised Gain/(Loss)
US$
Net Assets%
Open Forward Contracts
SEK 845,902,512 EUR (78,000,000) 2020-07-06 JP Morgan 3,185,550 2.43
NOK 615,524,454 EUR (54,000,000) 2020-07-06 JP Morgan 3,150,584 2.40
EUR 85,850,600 USD (93,814,712) 2020-07-08 Bank of America 2,620,166 2.00
NOK 322,668,816 CAD (44,732,160) 2020-07-06 JP Morgan 604,766 0.46
USD 95,679,059 EUR (84,707,000) 2020-07-08 Bank of America 528,773 0.40
EUR 10,000,000 NOK (105,170,450) 2020-07-06 JP Morgan 330,385 0.25
EUR 10,500,000 USD (11,496,345) 2020-07-06 JP Morgan 297,690 0.23
USD 11,920,660 EUR (10,500,000) 2020-07-06 JP Morgan 126,625 0.10
GBP 7,200,200 USD (8,770,377) 2020-07-08 Bank of America 126,503 0.10
CAD 24,732,160 NOK (173,975,288) 2020-07-06 JP Morgan 124,481 0.09
USD 9,132,006 GBP (7,317,900) 2020-07-08 Bank of America 89,690 0.07
CHF 2,929,700 USD (3,020,517) 2020-07-08 Bank of America 71,857 0.05
USD 10,000,000 CAD (13,551,288) 2020-07-06 JP Morgan 50,366 0.04
USD 11,245,400 EUR (10,000,000) 2020-07-02 JP Morgan 13,900 0.01
USD 3,026,168 CHF (2,859,480) 2020-07-08 Bank of America 7,914 0.01
USD 1,240,529 EUR (1,100,300) 2020-08-10 Bank of America 3,679 0.00
USD 13,775 GBP (11,100) 2020-08-10 Bank of America 57 0.00
USD 42,386 CHF (40,110) 2020-08-10 Bank of America 8 0.00
CHF 160 USD (169) 2020-08-10 Bank of America – 0.00
USD 224 EUR (200) 2020-08-10 Bank of America (1) (0.00)
USD 98,450 GBP (80,000) 2020-08-10 Bank of America (422) (0.00)

118
30 June 2020
GAM Star Global Rates
Portfolio Statement
Purchase Currency
Contractual Amount
SaleCurrency
ContractualAmount
MaturityDate
Counterparty Unrealised LossUS$
Net Assets%
Open Forward Contracts, continued
USD 72,455 CHF (70,220) 2020-07-08 Bank of America (1,664) (0.00)
USD 257,327 GBP (210,300) 2020-07-08 Bank of America (2,528) (0.00)
CHF 2,829,310 USD (2,997,383) 2020-08-10 Bank of America (8,050) (0.01)
GBP 328,000 USD (413,838) 2020-07-08 Bank of America (8,547) (0.01)
EUR 1,510,000 USD (1,708,867) 2020-07-08 Bank of America (12,703) (0.01)
EUR 10,000,000 USD (11,246,316) 2020-07-06 JP Morgan (13,902) (0.01)
NZD 21,329,910 AUD (20,000,000) 2020-07-06 JP Morgan (38,960) (0.03)
USD 2,923,400 EUR (2,653,600) 2020-07-08 Bank of America (57,356) (0.04)
GBP 7,253,500 USD (9,049,108) 2020-08-10 Bank of America (84,490) (0.06)
CAD 20,000,000 NOK (143,030,566) 2020-07-06 JP Morgan (142,220) (0.11)
CAD 13,417,264 USD (10,000,000) 2020-07-06 JP Morgan (148,769) (0.11)
EUR 18,000,000 NOK (198,160,791) 2020-07-06 JP Morgan (323,117) (0.26)
USD 8,111,000 MXN (198,045,622) 2020-07-10 JP Morgan (451,145) (0.34)
EUR 83,318,100 USD (94,183,288) 2020-08-10 Bank of America (525,195) (0.40)
Unrealised gain on Open Forward Contracts 11,332,994 8.64
Unrealised loss on Open Forward Contracts (1,819,069) (1.39)
9,513,925 7.25
Fair ValueUS$
Net Assets%
Net Financial Assets and Liabilities at fair value 97,610,219 74.41
Net Current Assets (excluding Financial Assets and Financial Liabilities at fair value) 33,565,838 25.59
Net assets attributable to the shareholders of the Fund 131,176,057 100.00
Analysis of Total Assets %
Transferable securities admitted to official stock exchange listing 8.69
Transferable securities dealt in on another regulated market 14.38
Other transferable securities of the type referred to in Regulation 68(1)(a), (b) and (c) 34.37
OTC financial derivative instruments 16.39
Other Assets 26.17
100.00
In line with the requirements of the UCITS regulation S.I. No. 344/2017 the open Forward Contracts have been condensed in the Portfolio Statement based on the purchase and sale currency, maturity date, counterparty and unrealised gain or unrealised loss of the contract as at the year end.

119
30 June 2020
GAM Star Global Rates
Portfolio Changes (Unaudited)
Major Purchases CostUS$
United States Treasury Bill 0% 2020-05-21 25,578,728
United States Treasury Bill 0% 2020-06-18 24,698,809
United States Treasury Bill 0% 2020-12-31 19,729,581
United States Treasury Bill 0% 2020-09-10 16,804,401
United States Treasury Bill 0% 2021-02-25 14,985,929
United States Treasury Bill 0% 2020-11-05 13,825,754
United States Treasury Bill 0% 2020-12-03 13,796,615
United States Treasury Bill 0% 2021-04-22 11,982,900
United States Treasury Bill 0% 2021-03-25 9,985,541
Total for the financial year 151,388,258
There were no other purchases and sales during the financial year.
Major Sales ProceedsUS$
Mexican Bonos 8% 2047-11-07 26,817,232
United States Treasury Bill 0% 2020-06-18 24,934,782
United States Treasury Bill 0% 2020-05-21 22,935,504
United States Treasury Bill 0% 2020-01-02 21,895,667
United States Treasury Bill 0% 2020-03-26 16,869,254
United States Treasury Bill 0% 2020-04-23 14,893,998
United States Treasury Bill 0% 2020-09-10 13,998,005
United States Treasury Bill 0% 2020-11-05 9,996,094
United States Treasury Bill 0% 2019-12-05 4,966,196
Total for the financial year 157,306,732

120
30 June 2020
GAM Star Global GrowthFund Manager: Charles Hepworth/James McDaid
Commentary (Unaudited)
The Fund (as measured by the GBP Institutional Accumulation class) rose 4.0% over the year to 30 June 2020, compared to its benchmark, the Lipper Global Mixed Asset GBP Flexible, which was flat 0.0% in GBP terms.
The third quarter of 2019 saw equity markets as defined by the MSCI AC World index in local currency terms gain just over 1%. While this may appear unremarkable, the headline number hid a significant drop towards the end of July, as the US-China trade war intensified and the outlook for global growth and inflation darkened accordingly. Markets swiftly regained their poise as central banks stepped in to reduce interest rates and, in some cases, resume extraordinary stimulus measures. Simultaneously, major government bond markets took off as yields plummeted. How could equity markets brush off a trade war while bond markets priced in a future of virtually no growth? In our view, the answer partly lies in the diverse impact the trade war is having around the world. The US economy is well placed to withstand an assault on globalisation for the simple reason that it is structured towards consumption rather than export manufacturing. The latter now accounts for a mere 11% of America’s total GDP. Equity allocations remained broadly constant during the review period, with a reasonable weighting to the more stable US market maintained amid our belief that the Federal Reserve would have to respond to any trade-related slowdown. This expectation was met as the US central bank acted pre-emptively even while the economy remained in fair shape. Given the uncertainty surrounding the trade war, it is unsurprising that the gold position held within the strategy performed well. On the flipside, equity positions with a bias towards the emerging markets and Asia Pacific regions suffered as the trade war continued. The Cadence Strategic Asia fund fell slightly by 0.14%.
The final quarter of the year saw global indices climb, with the US equity markets surging to record highs, amid increased optimism for global reflation. Cyclical equity sectors such as industrials and financials fared better than safer bets such as utilities or consumer staples, as investors took the view that the synchronised global slowdown which began in 2017 was taking a turn for the better. These positive effects were compounded by the pricing out of some of the uncertainty that has recently haunted markets. That the UK was going to leave the European Union began to look certain under new Prime Minister Boris Johnson and this was all but confirmed by his election victory in December. At the same time, the US and China appeared to reach ‘phase one’ of a comprehensive trade deal after months of negotiations. Within the portfolio, the Polar Capital UK Value Opportunities fund was the standout performer seeing a gain of 14.13%. The Fund has a focus on domestic UK mid-cap stocks which have been held back by the uncertainty that has been hanging over the UK economy since the 2016 referendum. As the political situation became clearer with the results of the general election, this cloud has lifted somewhat and provided relief for the sector. However, the year ahead will define the ‘shape’ of Brexit and will be key to determining the outlook for ‘UK Inc’.
The first quarter of 2020 began brightly enough amid optimism over a US-China trade deal; however, by mid-February global stock markets had started to lose their poise over the rapid spread of the Covid-19 virus around the world. Large sell-offs followed across all markets, with the MSCI AC World falling 15.87% in sterling terms over the quarter. As the lockdowns and quarantines gathered pace, concerns about the duration of the crisis and its effect on the global economy mounted, and investors and companies engaged in an asset fire sale in order to raise liquidity at literally any price. This meant that by mid-March, those assets which normally provide more stability showed signs of strain, including ‘safe haven’ stalwarts such as government bonds. Towards the end of the month however, there were signs of market stability as governments around the world committed to supporting the economy with huge fiscal stimulus packages, implicitly financed by central banks, renewing their quantitative easing programmes. Equity allocations could not escape the absolute market falls. Some funds, such as the Polar Capital UK Value Opportunities fund, saw declines in excess of 30%. Exposure to technology was a relatively strong contributor, with the GAM Star Disruptive Growth fund registering a decline as well. This was in part because of increased demand for both home working and home entertainment. Crucially, the overall equity allocation was not cut ahead of improving sentiment towards the end of the month. The iShares Physical Gold ETC, which tracks the price of gold, was unsurprisingly the best performing holding within the portfolio. It saw a gain of 12.81% over the quarter.
If the first quarter of 2020 was characterised by waterfall moves in markets, the second quarter saw an almost equally sharp rebound, with the MSCI AC World Index in local currency terms up nearly 18% from the end of March to 30 June. A fast and comprehensive response from policymakers went some way to explaining the rebound. Central banks across the world rushed to reduce interest rates to or towards zero, while fiscal rectitude was abandoned as governments sought to incubate workers until the economy could be opened up again. Highlights of this ‘new responsiveness’ by the authorities included the UK’s more than nine million workers on government furlough and the US Federal Reserve’s stated willingness to buy corporate bonds outright to ensure a continued flow of financing into the private sector. Equity weightings within the strategy were marginally increased, facilitating meaningful participation in the market rebound as investors favoured thematic, secular growth over uncertain, near-term cyclicality. The emphasis on the US equity market and, stylistically, growth over value was especially helpful during the review period. While value investing had some good days, growth stocks dominated the overall narrative. This theme was combined in equity portfolios with other secular growth sources such as emerging markets and disruptive technology. In fixed income and credit, developed market corporate bond spreads tightened as fears of mass defaults receded and central banks offered direct intervention in credit markets. This was constructive for the allocation to European subordinated financial debt. An emerging market debt holding that had seen some stress in the first quarter was also quick to recover its poise in the second. Stateside, non-agency mortgage-backed securities (MBS) paper made steady progress from its March sell-off.
The top three holdings contributing to performance were Coupland Cardiff – CC Japan Alpha Fund, GAM Star Disruptive Growth and Loomis Sayles U.S. Leaders Fund. The bottom three performers were Polar Capital UK Value Opportunities Fund, River and Mercantile World Recovery Fund and Alken Continental Europe Fund.
July 2020
Portfolio Statement
Analysis, by geographical area30 June2020 %
30 June2019 %
Global 24.90 21.96
United Kingdom 21.50 12.73
United States 14.25 20.27
Japan 12.34 11.37
Asia-Pacific ex Japan 8.41 7.11
Emerging Markets Global 7.54 8.94
Europe ex UK 6.13 12.49
Currency Forwards (0.47) 0.09
Net Current Assets 5.40 5.04
100.00 100.00
Analysis, by investment30 June2020 %
30 June2019 %
Equity Funds 45.15 56.41
Bond Funds 22.79 11.85
Exchange Traded Funds 17.94 7.60
Other Funds 9.19 15.06
Diversified Funds – 3.95
Currency Forwards (0.47) 0.09
Net Current Assets 5.40 5.04
100.00 100.00

121
30 June 2020
GAM Star Global Growth
Portfolio Statement
Holdings Description Fair Value£
Net Assets%
Bond Funds*
42,033 RWC Funds – RWC Global Emerging Markets Fund B GBP Acc 7,919,943 4.45
644,376 GAM Star Credit Opportunities GBP Z II Acc*** 6,802,614 3.83
3,957,696 JPM Global Macro Opportunities Fund 6,213,583 3.49
50,878 Active Global High Income Bond Fund Z2 5,358,006 3.01
54,448 Active Global High Income Bond Fund Z1 5,348,930 3.01
479,331 GAM Star MBS Total Return Inst GBP Acc*** 5,327,184 3.00
301,453 GAM Star MBS Total Return W GBP Acc*** 3,551,150 2.00
40,521,410 22.79
Equity Funds*
561,216 Coupland Cardiff Funds plc – CC Japan Alpha Fund 11,427,472 6.43
4,534,919 JPMorgan Fund ICVC – Japan Fund 10,511,943 5.91
306,593 GAM Star Disruptive Growth Z GBP Acc*** 9,478,022 5.33
882,231 Polar Capital Funds PLC – UK Value Opport Fund S GBP Acc 8,954,644 5.04
6,725,006 Ninety One Funds Series I – UK Alpha Fund 8,670,550 4.88
9,345 Veritas Asian C GBP 7,752,990 4.36
4,502 CompAM Fund – Cadence Strategic Asia GBP C Acc 7,190,051 4.04
3,801,792 Hermes Europe ex-UK Equity Fund M GBP Acc 5,752,491 3.24
3,328 GAM Emerging Markets Equity S GBP**** 5,485,254 3.09
4,999,904 Premier Pan European Property C Acc 5,036,903 2.83
80,260,320 45.15
Exchange Traded Funds*
576,552 Amundi Prime USA ETF 10,927,390 6.15
204,484 iShares Physical Gold ETC 5,746,001 3.23
1,460,598 Amundi Msci Emerging Markets ETF 5,304,892 2.99
1,082,561 iShares Edge MSCI USA Value Factor UCITS ETF 5,280,191 2.97
249,289 Amundi Prime Eurozone ETF 4,624,560 2.60
31,883,034 17.94
Other Funds*
3,056,620 Loomis Sayles U.S. Equity Leaders Fund** 11,173,168 6.29
62,613 Alken Fund – Continental Europe SGB1 Cap GBP Acc 5,148,661 2.90
16,321,829 9.19
Purchase Currency
Contractual Amount
SaleCurrency
ContractualAmount
MaturityDate
Counterparty Unrealised Gain
£
Net Assets%
Open Forward Contracts
USD 104,816,640 GBP (84,012,640) 2020-08-10 Bank of America 797,149 0.45
EUR 26,019,965 GBP (23,320,823) 2020-07-08 Bank of America 333,165 0.19
EUR 25,775,165 GBP (23,334,244) 2020-08-10 Bank of America 109,294 0.06
USD 6,043,800 GBP (4,818,064) 2020-07-08 Bank of America 73,154 0.04
AUD 1,491,950 GBP (799,728) 2020-07-08 Bank of America 31,626 0.02
* Typically each of the above collective investment schemes may charge management fees of up to 2% per annum of their NAV and performance fees of up to 20% of the increase of performance for a predetermined period of time subject to any applicable hurdle rates.** Not admitted to an official stock exchange.*** Investment in other GAM Star Funds.**** Investment in other GAM Funds.

122
30 June 2020
GAM Star Global Growth
Portfolio Statement
Purchase Currency
Contractual Amount
SaleCurrency
ContractualAmount
MaturityDate
Counterparty Unrealised Gain/(Loss)
£
Net Assets%
Open Forward Contracts, continued
SGD 2,314,400 GBP (1,334,929) 2020-07-08 Bank of America 7,714 0.00
SGD 2,023,900 GBP (1,167,085) 2020-08-11 Bank of America 6,869 0.00
CHF 481,000 GBP (406,435) 2020-07-08 Bank of America 4,452 0.00
CHF 477,200 GBP (405,828) 2020-08-10 Bank of America 2,124 0.00
AUD 1,158,490 GBP (643,548) 2020-08-10 Bank of America 1,949 0.00
GBP 160,093 USD (195,800) 2020-07-08 Bank of America 1,633 0.00
GBP 60,336 USD (74,300) 2020-08-10 Bank of America 219 0.00
GBP 264,381 EUR (290,600) 2020-08-10 Bank of America 70 0.00
GBP 18,209 SGD (31,400) 2020-08-11 Bank of America (4) 0.00
USD 10,700 GBP (8,720) 2020-08-10 Bank of America (62) 0.00
EUR 166,900 GBP (153,094) 2020-08-10 Bank of America (1,292) 0.00
GBP 300,044 EUR (331,700) 2020-08-10 Bank of America (1,651) 0.00
GBP 408,628 CHF (481,000) 2020-07-08 Bank of America (2,256) 0.00
GBP 827,296 AUD (1,491,950) 2020-07-08 Bank of America (4,058) 0.00
GBP 2,127,681 USD (2,638,700) 2020-08-10 Bank of America (7,358) 0.00
GBP 1,335,237 SGD (2,314,400) 2020-07-08 Bank of America (7,407) 0.00
GBP 23,536,461 EUR (26,019,965) 2020-07-08 Bank of America (117,525) (0.07)
GBP 86,403,829 USD (107,817,640) 2020-07-08 Bank of America (852,443) (0.48)
USD 101,969,640 GBP (83,724,470) 2020-07-08 Bank of America (1,200,961) (0.68)
Unrealised gain on Open Forward Contracts 1,369,418 0.76
Unrealised loss on Open Forward Contracts (2,195,017) (1.23)
(825,599) (0.47)
Fair Value£
Net Assets%
Net Financial Assets and Liabilities at fair value 168,160,994 94.60
Net Current Assets (excluding Financial Assets and Financial Liabilities at fair value) 9,595,632 5.40
Net assets attributable to the shareholders of the Fund 177,756,626 100.00
Analysis of Total Assets %
UCITS collective investment schemes 93.23
OTC financial derivative instruments 0.76
Other Assets 6.01
100.00
In line with the requirements of the UCITS regulation S.I. No. 344/2017 the open Forward Contracts have been condensed in the Portfolio Statement based on the purchase and sale currency, maturity date, counterparty and unrealised gain or unrealised loss of the contract as at the year end.

123
30 June 2020
GAM Star Global Growth
Portfolio Changes (Unaudited)
Major Purchases Cost£
Amundi Prime USA ETF 12,187,898
Amundi Msci Emerging Markets ETF 6,365,149
Amundi Prime Eurozone ETF 6,268,070
RWC Global Emerging Markets Fund B GBP Acc 3,178,083
GAM Star Disruptive Growth Z GBP Acc 2,944,667
Polar Capital Funds PLC – UK Value Opport Fund S GBP Acc 2,204,631
GAM Star Credit Opportunities GBP Z II Acc 1,843,653
Ninety One Funds Series I – UK Alpha Fund 1,739,525
CompAM Fund – Cadence Strategic Asia GBP C Acc 1,579,624
Loomis Sayles U.S. Equity Leaders Fund 1,433,666
Alken Fund – Continental Europe SGB1 Cap GBP Acc 1,029,764
Veritas Asian C GBP 981,391
Active Global High Income Bond Fund Z1 802,324
GAM Star MBS Total Return Inst GBP Acc 770,000
GAM Emerging Markets Equity S GBP 757,918
Premier Pan European Property C Acc 666,805
Coupland Cardiff Funds plc – CC Japan Alpha Fund 597,034
JPMorgan Fund ICVC – Japan Fund 567,104
JPM Global Macro Opportunities Fund 552,066
Active Global High Income Bond Fund Z2 422,897
Total for the financial year 46,892,269
Major Sales Proceeds£
GAM North American Growth GBP Inst Inc 9,507,429
GAM Star Continental European Eq GBP Z II 8,944,195
Ashmore SICAV EM Frontier Equity Fund Z2 GBP Inc 5,928,192
River and Mercantile World Recovery Fund 5,217,794
iShares Edge MSCI USA Value Factor UCITS ETF 3,933,005
JPMorgan Fund ICVC – Japan Fund 3,817,225
Hermes Europe ex-UK Equity Fund M GBP Acc 3,747,413
Loomis Sayles U.S. Equity Leaders Fund 3,429,148
Alken Fund – Continental Europe SGB1 Cap GBP Acc 3,415,710
Ninety One Funds Series I – UK Alpha Fund 3,205,434
Coupland Cardiff Funds plc – CC Japan Alpha Fund 3,000,695
GAM Star MBS Total Return W GBP Acc 2,779,920
JPM Global Macro Opportunities Fund 2,734,344
iShares Physical Gold ETC 2,624,740
Polar Capital Funds PLC – UK Value Opport Fund S GBP Acc 2,529,400
Veritas Asian C GBP 2,160,584
GAM Star Disruptive Growth Z GBP Acc 2,139,117
CompAM Fund – Cadence Strategic Asia GBP C Acc 1,905,634
Amundi Prime USA ETF 1,871,031
RWC Global Emerging Markets Fund B GBP Acc 1,864,560
Active Global High Income Bond Fund Z2 1,465,718
GAM Emerging Markets Equity S GBP 1,436,439
Active Global High Income Bond Fund Z1 1,384,596
GAM Star Credit Opportunities GBP Z II Acc 1,372,849
Premier Pan European Property C Acc 1,366,037
GAM Star MBS Total Return Inst GBP Acc 1,345,710
Amundi Prime Eurozone ETF 1,149,449
Amundi Msci Emerging Markets ETF 1,129,229
Total for the financial year 85,405,597

124
30 June 2020
GAM Star Interest TrendFund Manager: Anthony Smouha, Gregoire Mivelaz and Patrick Smouha, ATLANTICOMNIUM SA
Commentary (Unaudited)
The Fund (as measured by the Non UK RFS USD Accumulation Class) rose 5.6% over the year to 30 June 2020, underperforming its benchmark Barclays US Aggregate Corporate Total Return Index in USD which rose 9.5%.
During the third quarter of 2019, despite strong earnings, markets were somewhat mixed due to on-going political headlines and macro uncertainties. The tone turned more positive in late August and September, following cuts in interest rates by both the European Central Bank (ECB) and the Federal Reserve (Fed). The ECB also announced the re-opening of asset purchases, which despite being lower than expected at EUR 20 billion a month, is open-ended, which can be seen as a positive. Finally, the ECB has announced a new round of targeted longer-term refinancing operations (TLTRO) at very favourable terms and deposit tiering where part of the banks’ excess liquidity reserves will be exempt from negative rates. There are two important sources of return for the Fund. The first, which is significant and always positive, is the income from underlying bonds. The second component of return for the Fund is realised / unrealised capital gains or losses. In general, as the Fund follows a fundamental buy-and-hold strategy, this component is largely the result of prices going up and down. During the period, price appreciation contributed positively.
The fourth quarter of 2019 was strong for the Fund following positive developments related to trade wars and the UK election. Spreads on subordinated debt of financials tightened during the month and legacy bonds also performed strongly. Despite the continued dovishness of central banks, the 10-year US treasury rate went up during the month. Nevertheless, our Fund performed strongly demonstrating its low sensitivity to interest rates. In this low interest rate environment, we feel the Fund is well positioned by capturing spreads of more than 300 bps. Within the legacy space, prices of the securities continued benefitting from the positive developments linked to a number of issuers redeeming their old-style bonds. We feel that there is significantly more upside within the legacy space. Over time, these bonds are becoming inefficient. Therefore, there is a lot of optionality in terms of having issuers tendering or calling these bonds over the coming quarters / years at a significant premium to current prices, as has been demonstrated by Santander, Commerzbank and Ageas. The stress tests conducted during the fourth quarter by the Bank of England were positive as banks performed well overall with improved capital positions. Moreover, banks have de-risked their business models, leading to higher capacity to absorb losses and lower potential losses in a stress scenario. Furthermore, any impact from current geopolitical issues such as Brexit are highly manageable for our issuers, even in a tail risk scenario. We have strong visibility on the future path of capital accumulation over the coming decade – with Basel IV due to be implemented from 2022 to 2027, again setting the bar for capital requirements higher, a continuation of the strengthening of European financials’ fundamentals. Despite the strengthening of fundamentals, we continue to capture extremely large spreads and yields on high quality issuers in our Fund, with spreads of more than 300 bps in USD.
January was another strong month for the Fund, despite markets ending the month weaker, following fears regarding developments of the coronavirus and its impact on global growth. Despite a strong start to the month, the last week of February was marked by strong ‘risk-off’ sentiment activity due to negative headlines on the Covid-19 coronavirus. The Fund was not immune as reflected by a negative performance in the month. Markets were challenging during the month of March, driven by the economic ramifications of the Covid-19 outbreak. This has led to a sharp sell off during the first half of the month in subordinated debt markets and wider credit and equity markets more generically. Sentiment improved during the second part of the month as central banks, governments and regulators all took extraordinary measures to support the economy through this period of uncertainty.
During the second quarter of 2020, financial markets showed some positive momentum, due to the fact that economies have been starting to gradually open, as well as the EU coronavirus recovery plan. This led to a large amount of new issues within the fixed income universe, as well as within subordinated debt of financials. Most of the new issues came at attractive levels. However, the amount of new supply combined with less positive news on Covid-19 meant our securities ended the month mixed. Given the blackout period, in terms of new issues, prior to the second quarter results, as well as attractive spreads, we believe this should be supportive for valuations. Supervisors still believe banks should be able to withstand the Covid-19 shock through pre-provisioned income, as banks should generate enough income to cover future expected credit losses, as well as the excess capital they have built up. This is in line with our view that the Covid-19 crisis remains an equity story for European financials, and not a balance sheet story. We expect prices to continue to recover in the next six to nine months as the uncertainty raised by the Covid-19 outbreak slowly fades away. Despite the partial recovery, we feel current valuations remain extremely attractive as we are able to capture spreads of more than 550 bps. On top of that, a large number of the subordinated debt issues of financials are still trading to perpetuity – with a large upside for bondholders on a re-pricing to call. Moreover, the Fund is capturing high and predictable income.
July 2020

125
30 June 2020
GAM Star Interest Trend
Portfolio Statement
Analysis, by geographical area30 June2020 %
30 June2019 %
United Kingdom 24.70 24.75
Netherlands 15.15 16.38
France 13.24 13.91
Switzerland 10.28 9.11
United States 8.39 12.19
Spain 4.20 0.81
Singapore 3.52 2.95
Australia 3.32 2.67
Luxembourg 2.02 1.69
Belgium 1.32 1.04
Germany 0.89 2.56
Denmark 0.48 0.39
Hong Kong 0.45 0.33
Japan – 2.80
Currency Forwards 0.08 0.19
Net Current Assets 11.96 8.23
100.00 100.00
Analysis, by industry sector30 June2020 %
30 June2019 %
Banks 38.89 35.30
Fixed Interest 27.26 32.45
Insurance 10.51 10.27
Diversified Financials 10.42 12.79
Food & Staples Retailing 0.88 0.77
Currency Forwards 0.08 0.19
Net Current Assets 11.96 8.23
100.00 100.00
Analysis, by investment30 June2020 %
30 June2019 %
Corporate Bonds 82.72 87.11
Preference Shares 3.92 3.43
Convertible Bonds to Equities 1.32 1.04
Equity Warrants 0.00 –
Currency Forwards 0.08 0.19
Net Current Assets 11.96 8.23
100.00 100.00
Analysis of Credit Ratings (S&P)30 June
202030 June
2019
Convertible Bonds, Corporate Bonds, Government Bonds & Other Bonds
From A to CCC, or may not be rated
From A to CCC+,
or may not be rated

126
30 June 2020
GAM Star Interest Trend
Portfolio Statement
Holdings Description Fair ValueUS$
Net Assets%
Preference Shares
750,000 General Accident 7.875% Pfd Perp 1,153,742 2.67
29,060 Strats-Gs-2006-02 540,516 1.25
1,694,258 3.92
Equity Warrants
18,200 REA Holdings PLC Ord. GBP 25.00 – 0.00
– 0.00
Convertible Bonds to Equities
500,000 BNP Paribas Fortis FRN Cnv Perp 399,179 0.92
250,000 Ageasfinlux FRN Cnv Perp 173,094 0.40
572,273 1.32
Corporate Bonds
3,269,000 AXA FRN Perp 2,301,376 5.32
2,200,000 HSBC Holdings FRN Perp 2,211,517 5.11
2,980,000 Rothschilds Continuation Finance FRN Perp* 2,050,240 4.74
2,013,000 HBOS Capital Funding LP 6.85% Perp 2,042,329 4.72
1,700,000 Trafigura Group FRN Perp 1,522,588 3.52
2,040,000 BNP Paribas FRN Perp 1,436,252 3.32
2,000,000 Westpac Banking FRN Perp 1,400,350 3.23
1,000,000 Stichting AK Rabobank Certificaten 6.5% Perp 1,197,087 2.76
1,100,000 UBS Group Funding Switzerland FRN Perp 1,149,181 2.65
1,430,000 Aegon FRN Perp 1,094,785 2.53
1,000,000 Credit Suisse Group FRN Perp 1,077,465 2.49
1,700,000 NIBC Bank FRN Perp 1,055,598 2.44
1,000,000 Credit Suisse Group FRN Perp 1,045,930 2.42
1,000,000 Banco Santander FRN Perp 1,044,955 2.41
1,000,000 Credit Agricole FRN Perp 1,037,910 2.40
1,000,000 Barclays FRN Perp 1,018,705 2.35
1,100,000 Citigroup FRN 2034-06-27 900,894 2.08
830,000 Societe Generale FRN Perp 873,546 2.02
800,000 HSBC Holdings FRN Perp 798,316 1.84
800,000 Banco Bilbao Vizcaya Argentaria FRN Perp 773,996 1.79
700,000 Lloyds Banking Group FRN Perp 729,417 1.68
700,000 Bank of America FRN 2026-09-15 667,212 1.54
500,000 Phoenix Group Holdings FRN Perp 570,582 1.32
550,000 Credit Suisse Group FRN Perp 566,742 1.31
500,000 Beazley Insurance DAC 5.5% 2029-09-10 524,265 1.21
765,000 STRATS FRN 2034-02-15* 516,375 1.19
500,000 ING Groep FRN Perp 513,657 1.19
700,000 Aegon FRN Perp 511,445 1.18
500,000 Credit Suisse Group FRN Perp 507,778 1.17
500,000 Societe Generale FRN Perp 504,140 1.16
600,000 HSBC Bank FRN Perp 469,680 1.08
500,000 Royal Bank of Scotland Group FRN Perp 461,075 1.06
500,000 Citigroup FRN 2034-01-29 413,790 0.96
400,000 Commerzbank FRN Perp 386,498 0.89
1,149,000 Casino Guichard Perrachon FRN Perp 380,542 0.88
* Level 3 investments.

127
30 June 2020
GAM Star Interest Trend
Portfolio Statement
Holdings Description Fair ValueUS$
Net Assets%
Corporate Bonds, continued
437,000 Jefferies Group Capital Fin FRN 2034-05-31 313,900 0.73
300,000 Standard Chartered 6.409% Perp 242,871 0.56
300,000 HSBC Bank FRN Perp 234,051 0.54
200,000 Barclays FRN Perp 208,742 0.48
237,000 Jyske Bank FRN Perp 206,964 0.48
250,000 Hongkong & Shanghai Banking Ltd FRN Perp 195,858 0.45
205,000 Citigroup FRN 2034-07-31 163,942 0.38
140,000 REA Finance 8.75% 2025-08-31* 138,387 0.32
164,000 STRATS FRN 2034-02-15* 113,980 0.26
215,000 EFG International FRN Perp* 103,111 0.24
100,000 AXA FRN Perp 74,119 0.17
50,000 Australia & New Zealand Banking Group FRN Perp 34,498 0.08
25,000 Lloyds Bank FRN 2033-10-25 17,512 0.04
11,000 Bank Of Scotland Perp* 13,524 0.03
35,817,677 82.72
Purchase Currency
Contractual Amount
SaleCurrency
ContractualAmount
MaturityDate
Counterparty Unrealised Gain/(Loss)
US$
Net Assets%
Open Forward Contracts
EUR 760,000 USD (829,843) 2020-09-11 State Street Bank 25,084 0.07
EUR 230,000 USD (248,217) 2020-07-16 JP Morgan 10,185 0.03
GBP 90,000 USD (104,301) 2020-09-11 State Street Bank 6,948 0.02
EUR 163,000 USD (177,134) 2020-07-16 State Street Bank 5,994 0.01
EUR 142,000 USD (154,274) 2020-10-13 State Street Bank 5,586 0.01
USD 1,387,226 EUR (1,230,000) 2020-09-11 State Street Bank 3,594 0.01
USD 39,420 GBP (30,000) 2020-07-16 JP Morgan 2,349 0.01
USD 39,145 GBP (30,000) 2020-07-16 State Street Bank 2,074 0.00
USD 131,730 GBP (105,000) 2020-10-13 JP Morgan 1,914 0.00
USD 50,778 GBP (40,000) 2020-11-13 JP Morgan 1,313 0.00
USD 130,442 EUR (115,000) 2020-10-13 JP Morgan 978 0.00
USD 229,315 GBP (185,000) 2020-09-11 JP Morgan 635 0.00
USD 87,097 GBP (70,000) 2020-10-13 State Street Bank 553 0.00
GBP 20,000 USD (24,642) 2020-07-16 JP Morgan 72 0.00
USD 78,992 EUR (70,000) 2020-12-18 State Street Bank 51 0.00
USD 37,053 GBP (30,000) 2020-11-13 State Street Bank (46) (0.00)
GBP 72,000 USD (89,079) 2020-10-13 State Street Bank (62) (0.00)
EUR 20,000 USD (22,565) 2020-07-16 JP Morgan (95) (0.00)
GBP 52,000 USD (64,658) 2020-10-13 JP Morgan (368) (0.00)
GBP 74,000 EUR (81,647) 2020-09-11 JP Morgan (374) (0.00)
GBP 30,000 USD (37,817) 2020-07-16 State Street Bank (746) (0.00)
USD 414,718 EUR (372,063) 2020-09-11 State Street Bank (3,817) (0.01)
USD 1,613,464 GBP (1,308,000) 2020-11-13 JP Morgan (4,037) (0.02)
USD 2,561,913 EUR (2,286,300) 2020-07-16 State Street Bank (6,707) (0.02)
USD 463,537 EUR (425,000) 2020-10-13 State Street Bank (14,917) (0.03)
Unrealised gain on Open Forward Contracts 67,330 0.16
Unrealised loss on Open Forward Contracts (31,169) (0.08)
36,161 0.08
* Level 3 investments.

128
30 June 2020
GAM Star Interest Trend
Portfolio Statement
Fair ValueUS$
Net Assets%
Net Financial Assets and Liabilities at fair value 38,120,369 88.04
Net Current Assets (excluding Financial Assets and Financial Liabilities at fair value) 5,179,041 11.96
Net assets attributable to the shareholders of the Fund 43,299,410 100.00
Analysis of Total Assets %
Transferable securities admitted to official stock exchange listing 81.35
Other transferable securities of the type referred to in Regulation 68(1)(a), (b) and (c) 5.66
OTC financial derivative instruments 0.15
Other Assets 12.84
100.00
In line with the requirements of the UCITS regulation S.I. No. 344/2017 the open Forward Contracts have been condensed in the Portfolio Statement based on the purchase and sale currency, maturity date, counterparty and unrealised gain or unrealised loss of the contract as at the year end.

129
30 June 2020
GAM Star Interest Trend
Portfolio Changes (Unaudited)
Major Purchases CostUS$
Stichting AK Rabobank Certificaten 6.5% Perp 1,376,238
Credit Agricole FRN Perp 1,060,850
Banco Bilbao Vizcaya Argentaria FRN Perp 820,500
Banco Santander FRN Perp 642,500
Phoenix Group Holdings FRN Perp 613,482
ING Groep FRN Perp 523,125
Credit Suisse Group FRN Perp 503,250
Beazley Insurance DAC 5.5% 2029-09-10 500,000
Royal Bank of Scotland Group FRN Perp 480,000
Commerzbank FRN Perp 410,700
Standard Chartered 6.409% Perp 249,000
Barclays FRN Perp 209,200
EFG International FRN Perp 107,547
Total for the financial year 7,496,392
There were no other purchases during the financial year.
Major Sales ProceedsUS$
Rothschilds Continuation Finance FRN Perp 2,888,250
KBC IFIMA FRN 2025-02-07 1,379,325
Glencore Canada 6.2% 2035-06-15 1,337,150
Nomura America Finance LLC 2034-07-29 1,189,300
UBS Group Funding Switzerland FRN Perp 990,625
NIBC Bank FRN Perp 967,500
AXA FRN Perp 961,000
HSBC Holdings FRN Perp 851,500
Citigroup Inc 2034-04-29 781,440
Aegon FRN Perp 769,626
BNP Paribas SA 557,875
Bank of America Corp 2031-07-14 520,260
BNP Paribas FRN Perp 496,875
Nomura America Finance LLC 2034-05-03 409,500
Citigroup FRN 2034-07-31 354,900
Bank of America Corp 2031-06-27 348,840
BNP Paribas SA 6.75% FRN Perp 318,750
Citadel LP 5.375% 2023-01-17 316,500
Societe Generale SA 2035-06-30 237,000
REA Finance 8.75% 2020-08-31 219,054
Barclays Bank PLC 2034-10-30 215,250
HSBC Holdings FRN Perp 211,750
Total for the financial year 16,322,270

130
30 June 2020
GAM Star Japan LeadersFund Manager: Ernst Glanzmann/Reiko Mito
Commentary (Unaudited)
The Fund (as measured by the JPY Accumulation Class) rose 14.2% over the year to 30 June 2020, outperforming its benchmark, the Tokyo Stock Exchange (TOPIX) 1st Section index which returned 3.1%.
The Japanese equity market saw a volatile third quarter in 2019. The market first declined towards the end of July amid slowing global economic data. Yet in September, the Topix index made a forceful comeback as it became clear trade talks between the US and China would continue in October and monetary policy was eased in North America and Europe. During the quarter the growth investment style outperformed the value style and large-cap stocks outperformed small-cap stocks. Over the quarter, the largest relative contribution to portfolio performance came from our holdings in healthcare, materials and energy. This was partly offset by declines for consumer discretionary, technology and real estate. M3 reported strong quarterly earnings in July and confirmed the recovery in its medical platform segment where operating profit jumped by double digits. The company also confirmed its outlook for the full year, which could turn out to be too conservative if operational momentum continues. In addition, the company was added to the Nikkei 225 stock index. Results at Shin-Etsu have been solid overall and beat market expectations with all segments posting double digit growth quarter-on-quarter. Suzuki had a volatile quarter as economic activity and car sales in India deteriorated quickly. The stock price recovered in September somewhat after the Indian government announced a 5% cut in the corporate tax rate. This gives Suzuki`s India operations more leeway to handle the current crisis in the auto industry. Makita suffered from slower economic growth in Europe and concerns about the impact from List 4 tariffs.
The final quarter turned out to be the best-performing quarter for Japanese equities of 2019 with the TOPIX gaining 8.6%. Stocks were supported by the more constructive US-China trade dialog which should conclude in the signing of a written partial trade agreement in January. This and other indicators turned investors more optimistic about an economic recovery. Some Japanese stocks also benefited from the government’s announcement of an economic stimulus package. In the fourth quarter small-cap stocks outperformed large-cap stocks and growth stocks outperformed value stocks. The Fund outperformed its benchmark over the quarter and the full year. Over the quarter, the largest relative contribution to portfolio performance came from our holdings in communication services, consumer staples and financials.
Topix declined 17% and fell into bear market territory quickly during the first quarter of 2020. Until 21 February, stocks traded in a narrow range, digesting mostly underwhelming corporate earnings reports which were negatively impacted by the tax hike in late 2019. Japan equities declined fast in March, although the decline was not as strong compared to other regions, before stabilising somewhat during the last week of March. Over the quarter, the largest relative contribution to portfolio performance came from our holdings in industrials, information technology and healthcare. On the negative side, our position in Suzuki Motor detracted the most from performance as investors become increasingly concerned about the spread of Covid-19 in Suzuki`s important sales region India, which would negatively impact its small car business in this region.
Over the second quarter, Japanese equities recovered strongly from the stock market crash in the first quarter caused by the Covid-19 pandemic. The recovery was based on better control of the health crisis after most governments declared emergency status and introduced lockdown measures. After Covid-19 case numbers peaked in most developed regions, most countries eased their respective lockdown restrictions, and economies were able to restart. The pickup of economic activity together with enormous global fiscal and monetary stimulus led to more optimism among investors about the prospects of an economic recovery in the second half of the year. The second quarter was the best relative result since inception of the strategy in 2008 as the market began to separate more clearly between strong business models which are likely to strive in a post pandemic world and those with weaker fundamentals. Our holdings in consumer discretionary, industrials and communication services contributed most to portfolio returns in relative terms, while financials, real estate and consumer staples ended up at the bottom of the table. Our healthcare holding M3 benefited strongly from elevated usage of its online platform as health professionals increasingly accessed information online. On the contrary, our holdings in East Japan Railway suffered from low passenger traffic as people maintain some level of social distancing to prevent contagion. As a result the company reported an operational loss for the March-end quarter. Towards the end of the second quarter the annual rebalancing of the strategy to an equal weighting positioning was executed.
The top three holdings contributing to performance were M3, Z Holdings and Obic. The bottom three performers were Suzuki, Daito Trust Construction and East Japan Railway.
July 2020
Portfolio Statement
Analysis, by geographical area30 June2020 %
30 June2019 %
Japan 98.91 99.57
Currency Forwards 0.51 0.04
Net Current Assets 0.58 0.39
100.00 100.00
Analysis, by industry sector30 June2020 %
30 June2019 %
Capital Goods 24.72 25.79
Health Care Equipment & Services 12.83 11.84
Automobiles & Components 11.40 12.25
Household & Personal Products 8.73 7.90
Media & Entertainment 4.97 4.24
Retailing 4.64 4.42
Software & Services 4.42 3.86
Consumer Durables & Apparel 4.39 3.98
Technology Hardware & Equipment 4.26 4.38
Materials 4.16 4.47
Banks 3.75 4.13
Transportation 3.57 4.03
Real Estate 3.54 4.05
Diversified Financials 3.53 4.23
Currency Forwards 0.51 0.04
Net Current Assets 0.58 0.39
100.00 100.00
Analysis, by investment30 June2020 %
30 June2019 %
Equities Quoted 98.91 99.57
Currency Forwards 0.51 0.04
Net Current Assets 0.58 0.39
100.00 100.00

131
30 June 2020
GAM Star Japan Leaders
Portfolio Statement
Holdings Description Fair Value¥
Net Assets%
Equities Quoted
5,507,100 Z Holdings 2,896,734,600 4.97
618,900 Unicharm 2,735,538,000 4.70
128,000 Nitori Holdings 2,704,000,000 4.64
136,500 Obic 2,575,755,000 4.42
123,300 Shimano Inc NPV 2,558,475,000 4.39
147,000 Daikin Industries 2,548,245,000 4.37
548,800 M3 2,516,248,000 4.32
348,000 Nidec 2,504,208,000 4.30
815,500 Asahi Intecc 2,499,507,500 4.29
55,100 Keyence 2,481,153,000 4.26
298,900 Sysmex 2,459,947,000 4.22
622,800 Makita Corp NPV 2,438,262,000 4.19
192,200 Shin-Etsu Chemical 2,420,759,000 4.16
43,300 SMC Corp/Japan NPV 2,389,294,000 4.10
275,000 Kao Corp NPV 2,348,500,000 4.03
118,100 Fanuc 2,274,606,000 3.90
653,900 Bridgestone 2,268,379,100 3.89
835,500 MISUMI Group 2,250,837,000 3.86
806,100 Honda Motor Company 2,221,208,550 3.81
723,090 Sumitomo Mitsui Trust Holdings 2,187,347,250 3.75
588,300 Suzuki Motor Corp NPV 2,151,413,100 3.69
278,300 East Japan Railway 2,080,014,200 3.57
208,400 Daito Trust Construction 2,065,035,600 3.55
1,546,100 ORIX 2,053,993,850 3.53
57,629,460,750 98.91
Purchase Currency
Contractual Amount
Sale Currency
ContractualAmount
Maturity Date
Counterparty Unrealised Gain/(Loss)
¥
Net Assets%
Open Forward Contracts
EUR 61,281,300 JPY (7,187,120,274) 2020-07-08 Bank of America 213,152,956 0.36
CHF 30,862,900 JPY (3,417,018,280) 2020-07-08 Bank of America 76,860,253 0.13
JPY 7,835,596,799 EUR (64,771,500) 2020-07-08 Bank of America 13,850,240 0.02
USD 15,818,151 JPY (1,692,383,952) 2020-08-11 Bank of America 11,820,439 0.02
USD 16,098,251 JPY (1,729,631,585) 2020-07-08 Bank of America 5,491,970 0.01
JPY 3,487,241,338 CHF (30,778,700) 2020-07-08 Bank of America 2,894,787 0.01
JPY 116,241,726 USD (1,072,400) 2020-07-08 Bank of America 654,851 0.00
JPY 130,795,907 EUR (1,080,100) 2020-08-11 Bank of America 324,670 0.00
JPY 87,978,223 CHF (775,200) 2020-08-11 Bank of America 171,697 0.00
CHF 26,400 JPY (2,982,811) 2020-08-11 Bank of America 7,503 0.00
JPY 3,571,238 EUR (29,700) 2020-08-11 Bank of America (16,389) (0.00)
JPY 45,879,882 CHF (405,700) 2020-08-11 Bank of America (73,559) (0.00)
CHF 1,276,000 JPY (144,637,255) 2020-07-08 Bank of America (185,859) (0.00)
JPY 59,079,935 EUR (493,800) 2020-07-08 Bank of America (550,898) (0.00)
JPY 153,311,798 CHF (1,360,200) 2020-07-08 Bank of America (671,578) (0.00)
USD 1,447,000 JPY (157,672,014) 2020-07-08 Bank of America (1,709,493) (0.00)
EUR 3,984,000 JPY (483,001,881) 2020-07-08 Bank of America (1,897,718) (0.00)
CHF 30,719,200 JPY (3,482,651,064) 2020-08-11 Bank of America (3,102,271) (0.00)

132
30 June 2020
GAM Star Japan Leaders
Portfolio Statement
Purchase Currency
Contractual Amount
Sale Currency
ContractualAmount
Maturity Date
Counterparty Unrealised Loss¥
Net Assets%
Open Forward Contracts, continued
EUR 56,828,800 JPY (6,873,731,797) 2020-08-11 Bank of America (9,067,590) (0.02)
JPY 1,763,633,982 USD (16,472,851) 2020-07-08 Bank of America (11,865,220) (0.02)
Unrealised gain on Open Forward Contracts 325,229,366 0.55
Unrealised loss on Open Forward Contracts (29,140,575) (0.04)
296,088,791 0.51
Fair Value¥
Net Assets%
Net Financial Assets and Liabilities at fair value 57,925,549,541 99.42
Net Current Assets (excluding Financial Assets and Financial Liabilities at fair value) 339,572,808 0.58
Net assets attributable to the shareholders of the Fund 58,265,122,349 100.00
Analysis of Total Assets %
Transferable securities admitted to official stock exchange listing 98.33
OTC financial derivative instruments 0.55
Other Assets 1.12
100.00
In line with the requirements of the UCITS regulation S.I. No. 344/2017 the open Forward Contracts have been condensed in the Portfolio Statement based on the purchase and sale currency, maturity date, counterparty and unrealised gain or unrealised loss of the contract as at the year end.

133
30 June 2020
GAM Star Japan Leaders
Portfolio Changes (Unaudited)
Major Purchases Cost¥
Daito Trust Construction 1,982,558,681
M3 1,975,368,005
Sumitomo Mitsui Trust Holdings 1,972,498,128
East Japan Railway 1,961,089,419
Suzuki Motor Corp NPV 1,944,489,217
Bridgestone 1,917,654,940
ORIX 1,768,696,675
Nidec 1,748,490,682
Shin-Etsu Chemical 1,738,042,622
SMC Corp/Japan NPV 1,712,786,806
Nitori Holdings 1,659,485,850
Kao Corp NPV 1,619,354,317
Z Holdings 1,591,307,155
Fanuc 1,590,684,696
Asahi Intecc 1,578,234,771
Honda Motor Company 1,569,962,420
Sysmex 1,561,425,541
Keyence 1,553,393,032
MISUMI Group 1,476,303,711
Unicharm 1,474,039,064
Makita Corp NPV 1,460,964,762
Obic 1,450,385,984
Daikin Industries 1,434,315,110
Shimano Inc NPV 1,369,857,544
Total for the financial year 40,111,389,132
Major Sales Proceeds¥
M3 3,267,186,327
SMC Corp/Japan NPV 1,656,747,593
Z Holdings Corp 1,581,430,253
Nitori Holdings 1,524,501,795
Keyence 1,447,802,138
Shin-Etsu Chemical 1,397,615,734
Obic 1,322,784,097
Daikin Industries 888,995,925
Asahi Intecc 879,691,334
Makita Corp NPV 850,955,985
Shimano Inc NPV 849,783,516
ORIX 840,815,913
Unicharm 836,913,592
Nidec 801,737,428
Kao Corp NPV 799,640,251
Honda Motor Company 797,633,904
MISUMI Group 795,439,889
Fanuc 782,821,415
Sysmex 771,259,529
Sumitomo Mitsui Trust Holdings 755,592,463
East Japan Railway 728,280,324
Bridgestone Corp 726,698,243
Daito Trust Construction 714,593,560
Suzuki Motor Corp 665,661,798
Total for the financial year 25,684,583,006

134
30 June 2020
GAM Star MBS Total ReturnFund Manager: Gary Singleterry/Tom Mansley
Commentary (Unaudited)
The Fund (as measured by the USD Ordinary share class) fell 2.0% over the year to 30 June 2020, underperforming its benchmark, the Bank of America Merrill Lynch US Mortgage Backed Securities index which rose 5.8%.
The third quarter of 2019 saw an increase in volatility in the financial markets as sovereign debt had its strongest rally in many years. The 10-year US Treasury touched a recent low yield of 1.46% in early September before finishing the quarter at 1.67%. The S&P 500 index returned 1.7% for the quarter. Most equity and fixed income markets showed positive results. The forward LIBOR market continued its inversion, and the Federal Reserve lowered its target rates twice by 25 bps during the quarter. The main contributor to the performance during the quarter was the interest income generated by the Fund. The Fund was negatively impacted by spread weakness in one sector of the CMBS Agency IO market related to multi-family apartment buildings. In that sector, the underlying credit remains strong as buildings are still appreciating in value, and underlying cash flows provide excellent debt service coverage driven by low vacancy rates and increasing rental rates. We are therefore confident in our allocation to that sector.
The fourth quarter provided strong results for risk assets. Through October, the Case-Shiller National Home Price Index was up 3.3% from the year before. Price changes have not been uniform across all markets. Valuations in some of the more expensive and heavily taxed states are not increasing as much, while many of the less expensive markets, particularly those in states with lower tax rates have experienced higher increases, according to CoreLogic. The US employment situation continues to be strong. The latest official estimate of the November unemployment rate in the US is 3.5%, a 50-year low. In the residential mortgage market, we continue to favour non-agency bonds over government guaranteed agency securities, and bonds with floating coupons. In the commercial sector, the securities in the Fund are concentrated in apartment complexes and small balance commercial loans.
The first quarter of 2020 was dominated by the shock of the Covid-19 pandemic, the economic impact of travel and work restrictions and supply line disruptions around the world. Virtually every risk asset plunged in price as projections for a major economic downturn combined with a lack of liquidity as cash was drained from the system. This prompted dramatic and unprecedented action from the Federal Reserve (Fed) and other central banks. Sovereign bond markets were the only safe haven. The 10-year US treasury rallied 125 bps in just three months. We have now seen unprecedented actions by both the Federal Reserve and by Congress in the US to backstop the financial markets and the economy as we work through the coronavirus pandemic. Despite all of these actions, spreads widened significantly over the course of the month. As a result of this major disruption to the financial markets, the Fund had a net decline for the quarter
After the devastating first quarter in which markets fell precipitously in March, the second quarter was characterised by rallies in virtually all risk markets. The main drivers of returns were the unprecedented levels of liquidity provided by governments and central banks around the world, a focus on the spread and impact of the Covid-19 virus, and the gradual re-opening of specific economies. The Federal Reserve’s (Fed) reinstated quantitative easing programme was enormous in size and resulted in it purchasing more treasuries and mortgages per week than it did per month following the 2008 crisis. As of 3 July, the Fed balance sheet had swollen to USD 7.0 trillion, a dramatic change from 2019, when the balance sheet was only USD 3.8 trillion at one point. This compares with the prior peak of the balance sheet after the 2008 financial crisis of USD 4.5 trillion. It is our view that the MBS market will weather this storm relatively well. Mortgages are a long-term financing of a long-term asset and the credit quality was very high as we entered into this recession. Our longstanding preference for senior bonds in the non-agency market was designed to prepare for an economic slowdown or recession, and now that the economy has entered that state, our preference for senior bonds is as strong as ever. As many of you know, we successfully navigated the 2008 markets and provided positive returns for our clients. We are still confident in the relative value of our portfolio, and are working to optimise the returns going forward.
July 2020
Portfolio Statement
Analysis, by geographical area30 June2020 %
30 June2019 %
United States 85.31 89.38
Ireland 3.30 0.23
Australia – 3.87
Futures – Interest Rates (0.04) (0.11)
Currency Forwards 0.68 0.57
Net Current Assets 10.75 6.06
100.00 100.00
Analysis, by industry sector30 June2020 %
30 June2019 %
Fixed Interest 87.83 92.40
Insurance 0.78 1.00
Non-sector specific – 0.08
Futures (0.04) (0.11)
Currency Forwards 0.68 0.57
Net Current Assets 10.75 6.06
100.00 100.00
Analysis, by investment30 June2020 %
30 June2019 %
Mortgage-Backed 63.68 65.75
Asset Backed Security 23.47 26.54
Corporate Bonds 1.42 1.16
Mortgage Pass Thru 0.04 0.03
Futures – Interest Rates (0.04) (0.11)
Currency Forwards 0.68 0.57
Net Current Assets 10.75 6.06
100.00 100.00
Analysis of Credit Ratings (S&P)30 June
202030 June
2019
Asset Backed Securities & Corporate Bonds & Mortgage-backed Bonds & Mortgage Pass Thru Bonds
From AAA to D, or may
not be rated
From AAA to D, or may
not be rated

135
30 June 2020
GAM Star MBS Total Return
Portfolio Statement
Holdings Description Fair ValueUS$
Net Assets%
Mortgage-Backed
15,980,000 PNMSR 2018-GT1 A FRN 2023-02-25 15,781,412 1.66
14,338,000 CHMSR 2018-GT1 A FRN 2023-05-25 13,848,752 1.46
89,794,000 FHMS K-1515 X1 FRN 2035-02-25 13,707,943 1.45
230,544,960 GNR 2017-143 IO FRN 2059-01-16 12,162,388 1.28
13,000,000 NWSTR 2015-1RA CR FRN 2027-01-20 12,100,465 1.28
11,766,300 HMBT 2005-4 M2 FRN 2035-10-25 10,953,517 1.15
11,100,000 CERB 2017-1A B FRN 2027-04-15 10,925,246 1.15
139,422,784 FMMHR 2015-R1 XA1 FRN 2055-11-25 10,247,310 1.08
11,522,646 INDX 2007-AR21 10A1 FRN 2037-09-25 10,039,753 1.06
170,602,795 GNR 2017-108 IO FRN 2059-08-16 9,471,270 1.00
186,722,420 GNR 2017-185 IO FRN 2059-04-16 9,371,813 0.99
137,495,630 FMMHR 2015-R1 XA3 FRN 2052-11-25 8,627,026 0.91
9,474,573 BCAP 2007-AA3 2A1A FRN 2047-05-25 8,616,337 0.91
9,124,263 GSMPS 2005-RP2 1AF FRN 2035-03-25 8,195,197 0.86
9,039,761 BAYC 2007-4A A1 FRN 2037-09-25 8,166,811 0.86
8,020,763 BAYC 2008-2 A4A FRN 2038-04-25 7,941,459 0.84
7,771,000 LBSBC 2007-2A M1 FRN 2037-06-25 7,332,887 0.77
7,188,818 WFALT 2007-PA3 3A1 6.25% 2037-07-25 7,042,690 0.74
132,739,196 GNR 2017-92 IO FRN 2058-08-16 6,968,449 0.73
7,000,000 LBSBC 2007-3A M1 FRN 2037-10-25 6,807,179 0.72
7,572,948 MHL 2007-1 2A11 FRN 2047-06-25 6,777,698 0.71
123,707,677 GNR 2017-169 IO FRN 2060-01-16 6,734,374 0.71
7,825,214 CSMC 2006-3 3A1 6% 2036-04-25 6,703,883 0.71
110,841,079 GNR 2017-90 IO FRN 2059-01-16 6,307,423 0.66
6,500,000 PNMSR 2018-GT2 A FRN 2025-08-25 6,220,102 0.66
10,629,935 IMSA 2006-3 A2 FRN 2036-11-25 6,024,315 0.64
44,142,000 FHMS K110 X1 FRN 2030-04-25 5,983,611 0.63
7,605,476 RALI 2006-QS2 1A17 FRN 2036-02-25 5,814,844 0.61
6,138,094 BAYC 2007-3 A1 FRN 2037-07-25 5,495,391 0.58
4,450,000 RYZE 2018-1 A1 FRN 2038-06-25 5,177,099 0.55
5,849,829 BAYC 2006-3A A1 FRN 2036-10-25 5,132,666 0.54
5,000,000 LBSBC 2007-3A AJ FRN 2037-10-25 5,073,307 0.53
5,095,700 BAYC 2008-1 A4 FRN 2038-01-25 4,821,684 0.51
4,362,429 VOLT 2019-NPL9 A1A 3.3269% Step 2049-11-26 4,376,552 0.46
4,528,938 TMST 2007-5 3A1 FRN 2047-09-25 4,175,385 0.44
4,505,532 CWALT 2005-76 3A1 FRN 2046-01-25 3,987,343 0.42
4,318,609 INDX 2005-AR23 4A1 FRN 2035-11-25 3,940,345 0.42
23,860,000 FHMS K110 XAM FRN 2030-04-25 3,780,613 0.40
3,682,715 BAFC 2007-4 2A10 FRN 2037-06-25 3,683,987 0.39
3,500,975 DBALT 2005-3 4A6 5.25% 2035-06-25 3,607,182 0.38
3,594,988 BOAMS 2004-F 2A7 FRN 2034-07-25 3,464,694 0.37
52,111,033 GNR 2016-94 IO FRN 2057-12-16 3,269,342 0.34
3,511,123 GEBL 2007-1A A FRN 2035-04-15 3,251,411 0.34
3,534,307 BAYC 2005-2A A1 FRN 2035-08-25 3,225,375 0.34
90,196,250 GNR 2012-83 AI FRN 2053-12-16 3,180,933 0.34
3,471,009 BAYC 2007-2A A1 FRN 2037-07-25 3,091,257 0.33
2,722,723 GSMPS 2005-RP1 1A3 8% 2035-01-25 3,065,934 0.32
3,284,607 BAFC 2005-F 2A1 FRN 2035-09-20 3,052,779 0.32
59,084,870 GNR 2017-28 IO FRN 2057-02-16 3,027,479 0.32

136
30 June 2020
GAM Star MBS Total Return
Portfolio Statement
Holdings Description Fair ValueUS$
Net Assets%
Mortgage-Backed, continued
3,197,243 BALTA 2004-12 1M1 FRN 2035-01-25 3,006,311 0.32
3,535,859 CMLTI 2006-AR9 2A FRN 2036-11-25 2,994,415 0.32
56,636,448 GNR 2016-169 IO FRN 2058-06-16 2,914,800 0.31
3,047,433 BALTA 2006-3 24A1 FRN 2036-05-25 2,904,112 0.31
2,563,574 DBALT 2005-5 1A4 FRN 2035-11-25 2,597,751 0.27
2,458,223 MALT 2004-12 6A3 5.5% 2034-12-25 2,521,851 0.27
2,689,986 BAYC 2006-SP2 A FRN 2037-01-25 2,512,663 0.26
2,964,550 BSARM 2005-12 11A1 FRN 2036-02-25 2,489,013 0.26
2,683,280 CMLTI 2005-8 1A1A FRN 2035-10-25 2,421,430 0.26
2,611,297 HMBT 2007-1 11A1 FRN 2047-04-25 2,405,898 0.25
44,333,986 GNR 2018-26 IO FRN 2060-03-16 2,366,954 0.25
316,074,078 OASI 2014-1A IO .21% 2028-02-27 2,265,840 0.24
2,313,972 MLCC 2005-3 1A FRN 2035-11-25 2,250,667 0.24
2,420,844 WFMBS 2006-AR14 2A1 FRN 2036-10-25 2,209,388 0.23
2,226,428 LBSBC 2006-2A M2 FRN 2036-09-25 2,193,798 0.23
21,276,000 FHMS K059 X3 FRN 2044-11-25 2,178,895 0.23
2,198,630 BCAP 2014-RR3 1A1 FRN 2036-11-26 2,153,009 0.23
2,202,298 CMLTI 2006-AR7 1A4A FRN 2036-11-25 2,089,577 0.22
2,082,210 MSM 2006-8AR 6A1 FRN 2036-06-25 2,072,130 0.22
20,223,693 FHMS K060 X3 FRN 2044-12-25 2,054,212 0.22
2,643,615 RFMSI 2005-SA4 1A21 FRN 2035-09-25 2,032,821 0.21
2,362,202 LXS 2005-7N 3A1 FRN 2035-12-25 2,021,155 0.21
2,300,286 RALI 2006-QA6 A2 FRN 2036-07-25 2,018,323 0.21
2,054,779 STALT 2005-1F 1A3 5.75% 2035-12-25 1,991,119 0.21
36,008,609 GNR 2018-4 IO FRN 2059-10-16 1,976,563 0.21
36,086,613 GNR 2017-35 IO FRN 2059-05-16 1,955,571 0.21
2,255,059 CWHL 2005-25 A12 5.5% 2035-11-25 1,944,147 0.20
2,123,770 CWHL 2006-HYB5 3A1A FRN 2036-09-20 1,900,127 0.20
1,925,328 NAA 2004-R1 A2 7.5% 2034-03-25 1,889,473 0.20
2,259,187 CWHL 2006-18 2A7 6% 2036-12-25 1,887,533 0.20
1,800,928 CWHL 2005-R2 2A1 7% 2035-06-25 1,868,617 0.20
2,078,659 IMSA 2007-2 2A FRN 2037-04-25 1,816,262 0.19
1,922,584 SAMI 2005-AR6 1A1 FRN 2045-09-25 1,805,908 0.19
1,956,088 CWHL 2005-27 1A3 5.5% 2035-12-25 1,799,820 0.19
2,005,831 WMALT 2005-9 5A1 5.5% 2035-11-25 1,774,899 0.19
1,760,325 RBSGC 2005-RP1 2A FRN 2034-03-25 1,749,002 0.18
1,866,517 CWHL 2005-7 2A1 FRN 2035-03-25 1,727,251 0.18
1,729,590 BOAMS 2005-J 3A1 FRN 2035-11-25 1,726,512 0.18
1,738,322 VCC 2018-1 M1 3.91% 2048-04-25 1,723,483 0.18
1,830,967 BAYC 2007-1 A1 FRN 2037-03-25 1,712,636 0.18
1,941,525 INDX 2005-AR13 2A1 FRN 2035-08-25 1,695,131 0.18
15,530,000 FHMS K057 X3 FRN 2044-08-25 1,687,494 0.18
3,338,368 RALI 2005-QA11 3A1 FRN 2035-10-25 1,684,241 0.18
1,699,388 MASTR 2006-3 1A8 6% 2036-10-25 1,682,462 0.18
2,969,005 INDX 2007-AR7 1A1 FRN 2037-06-25 1,655,329 0.17
1,436,476 GSMPS 2005-RP1 1A4 8.5% 2035-01-25 1,648,844 0.17
29,140,643 GNR 2017-138 IO FRN 2059-10-16 1,630,718 0.17
2,047,367 ARMT 2005-4 1A1 FRN 2035-08-25 1,626,401 0.17
1,992,947 CMLTI 2005-9 1A1 FRN 2035-11-25 1,594,513 0.17
2,255,812 MLMI 2005-A4 1A FRN 2035-07-25 1,593,721 0.17

137
30 June 2020
GAM Star MBS Total Return
Portfolio Statement
Holdings Description Fair ValueUS$
Net Assets%
Mortgage-Backed, continued
48,468,000 FHMS K067 XAM FRN 2027-08-25 1,566,500 0.17
1,676,102 GMACM 2005-AR2 4A FRN 2035-05-25 1,566,379 0.17
1,629,626 BSARM 2007-4 21A1 FRN 2047-06-25 1,549,813 0.16
1,527,000 MSRR 2015-R2 2A2 FRN 2046-12-27 1,527,000 0.16
1,417,570 GSMPS 2004-4 1A2 7.5% 2034-06-25 1,523,295 0.16
18,562,500 FHMS K055 X3 FRN 2044-04-25 1,517,999 0.16
1,500,362 DMSI 2004-4 2MR1 FRN 2034-06-25 1,507,805 0.16
1,500,000 BAYC 2006-SP1 M4 FRN 2036-04-25 1,493,968 0.16
1,515,381 LBSBC 2006-1A M3 FRN 2031-04-25 1,489,191 0.16
1,648,926 WAMU 2007-HY4 4A1 FRN 2036-09-25 1,474,821 0.16
1,542,573 BAFC 2007-5 1A1 5.5% 2037-07-25 1,472,544 0.16
1,558,452 INDX 2006-AR33 2A21 FRN 2037-01-25 1,471,329 0.16
1,640,000 CSMC 2011-4R 1A2 FRN 2037-09-27 1,456,636 0.15
1,628,597 HVMLT 2006-12 2A2A FRN 2038-01-19 1,443,712 0.15
1,970,935 FHAMS 2005-AA3 2A1 FRN 2035-05-25 1,437,283 0.15
1,404,442 CSFB 2005-5 7A1 6% 2035-07-25 1,429,026 0.15
1,597,866 FHAMS 2006-AA2 2A1 FRN 2036-05-25 1,427,402 0.15
1,513,183 NYMT 2005-2 A FRN 2035-08-25 1,419,393 0.15
1,440,942 CWHL 2005-HYB8 3A1 FRN 2035-12-20 1,404,709 0.15
1,440,126 VCC 2017-2 M2 FRN 2047-11-25 1,399,032 0.15
1,795,255 BCAP 2007-AA2 2A5 6% 2037-04-25 1,392,991 0.15
1,468,420 CMLTI 2010-7 2A2 FRN 2035-02-25 1,390,801 0.15
1,545,509 STARM 2007-4 3A1 FRN 2037-10-25 1,384,843 0.15
1,640,000 GSR 2004-9 5A8 FRN 2034-08-25 1,380,047 0.15
1,290,613 MALT 2004-6 9A1 5.75% 2034-07-25 1,362,491 0.14
1,556,252 BCAP 2006-AA1 A1 FRN 2036-10-25 1,351,745 0.14
1,417,897 MLMI 2005-A9 2A1E FRN 2035-12-25 1,330,308 0.14
1,304,767 SAMI 2005-AR3 2A1 FRN 2035-08-25 1,311,966 0.14
1,300,000 OPMAC 2005-1 M7 FRN 2035-02-25 1,310,475 0.14
1,621,141 CWHL 2005-29 A1 5.75% 2035-12-25 1,297,840 0.14
1,451,848 CWALT 2005-61 1A1 FRN 2035-12-25 1,296,652 0.14
1,427,677 BAFC 2015-R3 6A2 FRN 2036-05-27 1,293,371 0.14
1,194,275 BAFC 2004-1 1A1 6% 2034-02-25 1,285,077 0.14
1,316,037 BAFC 2006-F 1A1 FRN 2036-07-20 1,270,143 0.13
1,273,720 HVMLT 2004-8 3A1 FRN 2034-11-19 1,266,472 0.13
1,261,151 NWSB 2016-1A A FRN 2042-02-25 1,259,874 0.13
1,390,360 GEBL 2007-1A B FRN 2035-04-16 1,256,399 0.13
1,669,827 RALI 2006-QS17 A3 FRN 2036-12-25 1,255,482 0.13
1,293,174 STALT 2005-1F 1A7 5.75% 2035-12-25 1,253,109 0.13
1,382,589 ARMT 2005-10 1A21 FRN 2036-01-25 1,249,600 0.13
1,588,380 WMALT 2006-AR6 1A FRN 2046-07-25 1,228,587 0.13
1,244,986 BAFC 2006-6 3A4 6% 2036-08-25 1,213,892 0.13
1,221,022 CMLTI 2013-A B1 FRN 2042-05-25 1,205,117 0.13
1,367,910 CHASE 2007-A2 7A1 FRN 2037-07-25 1,192,568 0.13
1,618,072 CSMC 2006-3 2A9 5.75% 2036-04-25 1,179,677 0.12
17,419,384 FNR 2012-84 WI 4% 2027-08-25 1,178,043 0.12
1,732,087 GSR 2006-8F 4A2 FRN 2036-09-25 1,177,762 0.12
1,254,023 IMM 2005-8 2M1 FRN 2036-02-25 1,173,697 0.12
1,279,937 INDX 2004-AR15 1A1 FRN 2035-02-25 1,171,074 0.12

138
30 June 2020
GAM Star MBS Total Return
Portfolio Statement
Holdings Description Fair ValueUS$
Net Assets%
Mortgage-Backed, continued
1,214,645 IMM 2004-8 3A FRN 2034-08-25 1,166,458 0.12
1,209,468 BOAMS 2004-L 3A1 FRN 2035-01-25 1,166,302 0.12
1,265,319 INDA 2007-AR3 1A1 FRN 2037-07-25 1,131,932 0.12
1,251,732 SASC 2005-RF2 A FRN 2035-04-25 1,128,269 0.12
1,128,667 CHASE 2007-A1 7A1 FRN 2037-02-25 1,098,488 0.12
1,009,955 GSMPS 2006-RP1 1A4 8.5% 2036-01-25 1,087,894 0.11
1,159,397 CMLTI 2006-AR7 2A1A FRN 2036-11-25 1,083,273 0.11
24,766,646 GNR 2017-174 FRN 2043-01-20 1,080,534 0.11
1,170,110 SARM 2005-21 4A1 FRN 2035-11-25 1,077,234 0.11
927,855 BOAA 2005-5 1CB2 FRN 2035-06-25 1,056,693 0.11
44,752,789 GNR 2012-107 IO FRN 2053-12-16 1,045,844 0.11
1,181,646 BAYC 2006-1A A2 FRN 2036-04-25 1,043,350 0.11
1,231,099 RALI 2005-QA2 A1II FRN 2035-02-25 1,037,600 0.11
981,073 GSMPS 2006-RP1 1A3 8% 2036-01-25 1,031,880 0.11
1,068,661 CHASE 2007-A1 12M3 FRN 2037-03-25 1,013,149 0.11
1,061,580 MSM 2005-7 7A1 5.5% 2035-11-25 1,012,011 0.11
1,208,599 CWALT 2005-J3 2A1 FRN 2035-05-25 1,011,148 0.11
993,546 WMALT 2005-9 2A2 5.5% 2035-11-25 1,001,178 0.11
935,793 BOAA 2005-12 4A3 5.75% 2036-01-25 985,422 0.10
982,548 RAST 2003-A9 A2 4% 2033-08-25 985,101 0.10
1,165,303 RFMSI 2006-SA1 2A1 FRN 2036-02-25 981,288 0.10
11,617,591 GNR 2017-162 GI FRN 2044-02-20 971,692 0.10
1,029,436 LBSBC 2007-1A 1A FRN 2037-03-25 964,337 0.10
871,844 BAFC 2004-1 2A1 6% 2034-02-25 956,145 0.10
1,728,409 CWALT 2005-J11 1A8 FRN 2035-11-25 949,038 0.10
983,461 BAYC 2004-2 A FRN 2034-08-25 943,731 0.10
932,158 BOAA 2007-2 2A1 6% 2037-06-25 925,402 0.10
1,275,692 BSABS 2005-AC7 A1 FRN 2035-10-25 922,081 0.10
1,001,749 MLCC 2005-1 1A FRN 2035-04-25 920,468 0.10
972,699 BOAMS 2006-B 4A2 FRN 2046-11-20 919,999 0.10
985,496 BAFC 2004-C 3A1 FRN 2034-12-20 918,620 0.10
1,003,652 BOAMS 2006-A 4A1 FRN 2036-02-25 915,373 0.10
948,697 SARM 2004-20 1A1 FRN 2035-01-25 911,901 0.10
8,238,636 FHMS K056 X3 FRN 2044-06-25 895,116 0.09
41,864,175 GNR 2012-100 IO FRN 2052-08-16 886,558 0.09
922,314 SASC 2006-RF4 3A1 FRN 2036-10-25 878,788 0.09
883,343 BAYC 2004-3 M2 FRN 2035-01-25 877,174 0.09
955,984 SARM 2004-13 A4 FRN 2034-09-25 873,341 0.09
659,855 FNR 2006-44 SX FRN 2036-06-25 871,612 0.09
951,378 HVMLT 2006-6 4A1A FRN 2036-08-19 866,252 0.09
1,069,613 MASTR 2007-2 A3 6.25% 2038-01-25 852,773 0.09
32,036,698 GNR 2013-15 IO FRN 2051-08-16 840,848 0.09
810,208 BAFC 2006-5 3A2 5.75% 2036-09-25 830,476 0.09
846,650 CWHL 2005-10 A2 5.5% 2035-05-25 815,867 0.09
844,811 MLCC 2005-3 3A FRN 2035-11-25 813,980 0.09
1,000,940 GSR 2007-AR1 1A1 FRN 2037-03-25 806,293 0.08
773,200 GSMPS 2006-RP1 1A2 7.5% 2036-01-25 806,103 0.08
874,959 ARMT 2005-10 6A21 FRN 2036-01-25 802,816 0.08
853,080 RALI 2004-QA6 NB4 FRN 2034-12-26 787,454 0.08
821,155 MLCC 2005-A A1 FRN 2030-03-25 785,073 0.08

139
30 June 2020
GAM Star MBS Total Return
Portfolio Statement
Holdings Description Fair ValueUS$
Net Assets%
Mortgage-Backed, continued
733,417 BOAMS 2004-2 2A5 5.5% 2034-03-25 774,478 0.08
862,571 NAA 2005-AR3 1A1 FRN 2035-07-25 773,412 0.08
897,606 BAYC 2005-1X A2 FRN 2035-04-25 757,556 0.08
795,612 IMSA 2006-1 2M1 FRN 2036-05-25 731,272 0.08
685,545 MSSTR 2004-2 A1 FRN 2032-08-25 706,733 0.07
795,362 BAYC 2006-1A A1 FRN 2036-04-25 705,446 0.07
8,515,940 CMLTI 2005-9 1IOP FRN 2035-11-25 693,223 0.07
751,880 SEMT 2007-2 1A1 FRN 2036-06-20 686,901 0.07
615,357 DBALT 2005-5 1A3 FRN 2035-11-25 677,901 0.07
772,077 JPMMT 2007-A4 1A1 FRN 2037-06-25 676,371 0.07
876,970 NAA 2004-R1 0% 2034-03-25 673,434 0.07
686,424 DMSI 2004-3 2MR1 FRN 2034-05-25 671,218 0.07
835,525 JPALT 2006-S1 1A16 6% 2036-03-25 657,112 0.07
535,771 CSFB 2005-5 3A1 FRN 2035-07-25 655,555 0.07
655,319 BAYC 2007-5A A3 FRN 2037-10-25 652,545 0.07
651,816 BSARM 2005-11 2A1 FRN 2035-12-25 650,788 0.07
668,889 MLCC 2007-2 2A1 FRN 2037-06-25 649,277 0.07
679,122 BSARM 2004-8 11A2 FRN 2034-11-25 629,733 0.07
484,303 FNR 2003-45 SG FRN 2033-06-25 621,821 0.07
681,702 CWHL 2006-HYB2 3A1 FRN 2036-04-20 606,852 0.06
622,636 WAMU 2004-AR8 A1 FRN 2044-06-25 606,369 0.06
677,370 CWHL 2004-R2 1AF1 FRN 2034-11-25 605,927 0.06
610,000 IMSA 2006-2 2M1 FRN 2036-08-25 599,241 0.06
587,702 MALT 2004-4 11A1 6% 2034-03-25 598,188 0.06
592,668 CCMLT 2016-1A AFL FRN 2049-03-25 597,031 0.06
635,861 HVMLT 2004-8 2A1 FRN 2034-11-19 593,076 0.06
761,334 GSR 2005-AR4 2A1 FRN 2035-07-25 587,534 0.06
699,300 CWHL 2005-15 A7 5.5% 2035-08-25 583,985 0.06
611,700 RALI 2005-QA7 A22 FRN 2035-07-25 579,175 0.06
629,860 SARM 2005-11 3A FRN 2035-05-25 572,438 0.06
629,365 GMACM 2005-AR6 3A1 FRN 2035-11-19 570,331 0.06
563,098 CWHL 2004-HYB5 3A1 FRN 2035-04-20 558,441 0.06
595,646 INDX 2005-AR3 2A1 FRN 2035-04-25 557,231 0.06
566,647 TMST 2003-3 A2 FRN 2043-06-25 556,372 0.06
579,172 HVMLT 2006-6 5A1A FRN 2036-08-19 550,590 0.06
500,277 GSMPS 2005-RP1 1A2 7.5% 2035-01-25 548,924 0.06
6,188,959 FHR 4553 KI 3% 2031-02-15 544,441 0.06
564,284 RFMSI 2005-SA2 4A FRN 2035-06-25 544,365 0.06
573,969 BSARM 2004-10 22A1 FRN 2035-01-25 536,761 0.06
661,305 CWALT 2006-OC2 2A3 FRN 2036-02-25 533,479 0.06
545,782 RALI 2005-QS5 A5 5.75% 2035-04-25 520,802 0.05
545,441 HVMLT 2005-4 1A FRN 2035-07-19 519,100 0.05
521,533 BALTA 2005-4 23A1 FRN 2035-05-25 507,847 0.05
529,411 IMM 2005-8 2M3 FRN 2036-02-25 506,459 0.05
529,883 CMLTI 2004-UST1 A4 FRN 2034-08-25 502,174 0.05
518,034 CMLTI 2004-HYB4 AA FRN 2034-12-25 500,567 0.05
528,114 GSR 2004-12 1A1 FRN 2034-12-25 499,142 0.05
500,000 VCC 2016-2 M2 FRN 2046-10-25 493,953 0.05
2,711,862 GNR 2013-66 IO 4.5% 2041-05-16 493,111 0.05
525,873 SARM 2004-7 A3 FRN 2034-06-25 482,905 0.05

140
30 June 2020
GAM Star MBS Total Return
Portfolio Statement
Holdings Description Fair ValueUS$
Net Assets%
Mortgage-Backed, continued
494,228 INDX 2004-AR15 3A1 FRN 2035-02-25 479,561 0.05
504,105 WMALT 2005-11 A2 5.75% 2036-01-25 467,653 0.05
492,639 PRIME 2004-CL1 1A2 FRN 2034-02-25 467,102 0.05
462,786 BAYC 2004-3 A2 FRN 2035-01-25 459,565 0.05
473,025 WAMU 2005-AR13 A1B3 FRN 2045-10-25 454,911 0.05
669,600 FHASI 2007-AR2 1A1 FRN 2037-08-25 453,745 0.05
560,560 FHAMS 2005-AA2 1A1 FRN 2035-03-25 442,024 0.05
520,332 CWHL 2004-15 3A FRN 2034-10-20 440,358 0.05
256,249 GNR 2004-35 FRN 2034-03-20 439,636 0.05
456,649 RALI 2005-QA7 A21 FRN 2035-07-25 434,520 0.05
528,174 NAA 2006-AR1 3A FRN 2036-02-25 432,252 0.05
433,148 CMLTI 2005-11 A1A FRN 2035-05-25 427,166 0.05
284,684 FHR 2571 SY FRN 2032-12-15 426,946 0.04
468,623 SARM 2005-2 A2 FRN 2035-02-25 425,185 0.04
451,899 INDX 2005-AR3 4A1 FRN 2035-04-25 415,618 0.04
400,958 MALT 2003-7 2A1 5.5% 2033-10-25 412,848 0.04
449,304 CWHL 2005-R1 1AF1 FRN 2035-03-25 409,933 0.04
358,287 FHR 2835 AJ FRN 2034-07-15 408,872 0.04
408,457 MLCC 2007-2 1A FRN 2037-06-25 388,096 0.04
410,813 MARM 2005-1 3A1 FRN 2035-02-25 375,767 0.04
2,826,985 FNR 2013-31 AI 3.5% 2033-04-25 373,731 0.04
393,425 CWHL 2004-HYB4 2A1 FRN 2034-09-20 372,988 0.04
384,386 JPMMT 2005-A2 9A1 FRN 2035-04-25 372,480 0.04
372,014 WFMBS 2005-AR14 A6 FRN 2035-08-25 369,916 0.04
1,840,756 GNR 2005-28 FRN 2035-03-20 367,480 0.04
3,492,354 FNR 2015-36 WI 3.5% 2030-06-25 367,476 0.04
548,240 RALI 2005-QA6 NB23 FRN 2035-05-25 364,732 0.04
401,121 CNL 2003-1A A1 FRN 2031-05-15 363,234 0.04
367,077 MSDWC 2003-HYB1 A1 FRN 2033-03-25 349,498 0.04
1,737,221 GNR 2013-109 SM FRN 2043-07-16 347,059 0.04
1,591,059 FHR 3510 DI FRN 2035-12-15 339,493 0.04
8,208,250 GNR 2016-37 FRN 2043-11-20 329,770 0.03
312,640 BOAA 2004-6 3A3 6% 2034-07-25 323,055 0.03
322,456 ARMT 2005-1 2A1 FRN 2035-05-25 320,941 0.03
310,385 BOAMS 2004-E 3A1 FRN 2034-06-25 314,861 0.03
314,219 MARM 2004-15 7A1 FRN 2034-11-25 307,412 0.03
320,495 BAYC 2005-3A A2 FRN 2035-11-25 300,777 0.03
4,332,002 FNR 2013-59 DI 3% 2028-06-25 298,356 0.03
290,337 GSR 2005-AR2 3A1 FRN 2035-04-25 295,170 0.03
311,352 SARM 2004-18 1A2 FRN 2034-12-25 293,913 0.03
288,575 ARMT 2005-1 1A1 FRN 2035-05-25 290,784 0.03
315,954 MSM 2005-3AR 2A1 FRN 2035-07-25 279,602 0.03
285,844 GMACM 2005-AA1 2A1 FRN 2035-05-18 262,718 0.03
266,565 FHAMS 2004-AA2 2A1 FRN 2034-08-25 257,911 0.03
168,128 FNR 2005-66 SG FRN 2035-07-25 256,365 0.03
254,771 CWHL 2004-R1 3A 7.5% 2034-11-25 254,364 0.03
1,327,929 GNR 2009-94 KI 5.5% 2039-10-16 253,807 0.03
263,454 CWHL 2004-HYB1 2A FRN 2034-05-20 253,449 0.03
254,474 GMSI 2003-1 A1 FRN 2033-10-25 249,221 0.03
257,252 SASC 2003-24A 2A FRN 2033-07-25 247,785 0.03

141
30 June 2020
GAM Star MBS Total Return
Portfolio Statement
Holdings Description Fair ValueUS$
Net Assets%
Mortgage-Backed, continued
246,885 MARM 2004-15 9A1 FRN 2034-10-25 245,171 0.03
6,748,467 GNR 2016-117 FRN 2043-07-20 230,611 0.02
241,323 ARMT 2005-4 2A1 FRN 2035-08-25 229,935 0.02
1,279,911 GNR 2007-58 SC FRN 2037-10-20 228,971 0.02
182,540 FNR 2003-79 FRN 2033-08-25 228,650 0.02
2,960,209 GNR 2014-25 BI 4.5% 2026-09-16 220,984 0.02
234,712 SASC 2002-21A 1A1 FRN 2032-11-25 218,940 0.02
244,379 CWHL 2005-HYB8 2A1 FRN 2035-12-20 218,184 0.02
209,719 BOAA 2003-8 1CB1 5.5% 2033-10-25 211,282 0.02
2,609,783 GNR 2014-21 BI 4% 2026-03-20 209,663 0.02
2,322,780 FHR 4354 HI 3.5% 2041-07-15 207,757 0.02
218,270 IMM 2005-8 2M2 FRN 2036-02-25 203,662 0.02
208,725 RFMSI 2005-SA2 2A2 FRN 2035-06-25 201,790 0.02
209,846 BOAMS 2005-I 3A1 FRN 2035-10-25 194,540 0.02
221,561 BOAMS 2005-F 3A1 FRN 2035-07-25 188,797 0.02
194,881 GSR 2005-9F 1A1 5.5% 2035-12-25 187,324 0.02
190,041 MARM 2006-2 4A1 FRN 2036-02-25 187,311 0.02
1,139,852 FNR 2003-71 IL 5.5% 2033-08-25 181,904 0.02
627,960 GNR 2008-51 FRN 2038-06-20 172,953 0.02
164,891 BOAMS 2004-2 1A8 5.5% 2034-03-25 168,900 0.02
169,142 ARMT 2005-7 7A22 FRN 2035-10-25 167,667 0.02
1,029,572 GNR 2012-102 NI 4.5% 2039-11-20 158,600 0.02
87,285 FHR 2896 SM FRN 2034-06-15 156,038 0.02
2,636,927 FNR 2012-93 CI 3% 2027-09-25 155,371 0.02
913,348 FNR 2013-118 QI 5% 2043-09-25 152,391 0.02
157,770 MLCC 2007-3 1A1 FRN 2037-09-25 149,301 0.02
197,844 RFMSI 2005-SA5 1A FRN 2035-11-25 145,956 0.02
595,147 FNS 384 30 6.5% 2037-08-25 141,265 0.01
144,759 MARM 2005-1 9A1 FRN 2035-01-25 136,892 0.01
136,366 CMLTI 2004-UST1 A6 FRN 2034-08-25 126,949 0.01
683,984 GNR 2013-152 GI 5% 2043-09-16 125,160 0.01
586,452 FHR 3128 JI FRN 2036-03-15 125,137 0.01
135,242 BSARM 2004-3 1A1 FRN 2034-07-25 121,810 0.01
523,122 FNS 383 41 6% 2038-04-25 118,262 0.01
3,312,857 GNR 2015-20 IL 2.5% 2040-08-16 114,868 0.01
114,740 CWALT 2005-7CB 1A4 5.5% 2020-02-25 114,671 0.01
936,033 FHS 300 IO 4% 2043-01-15 114,628 0.01
548,671 FNS 343 19 6% 2033-10-25 109,057 0.01
106,064 BOAMS 2004-L 4A1 FRN 2035-01-25 100,147 0.01
1,039,601 GNR 2011-151 TE FRN 2041-04-20 94,223 0.01
561,940 FNR 2007-76 SE FRN 2037-08-25 93,396 0.01
69,999 FNR 2008-27 SK FRN 2038-04-25 92,173 0.01
93,664 GMACM 2004-AR2 4A FRN 2034-08-19 88,184 0.01
394,959 FNS 385 21 6.5% 2037-08-25 86,513 0.01
335,069 FHS 243 13 FRN 2032-02-15 84,533 0.01
352,764 FNS 385 20 6.5% 2037-08-25 83,294 0.01
479,842 GNR 2008-4 PY FRN 2038-01-20 72,147 0.01
386,140 FNS 381 5 5.5% 2035-12-25 71,096 0.01
56,025 FHR 1673 SD FRN 2024-02-15 67,022 0.01
1,097,057 GNR 2011-118 NI 4.5% 2040-11-16 66,789 0.01
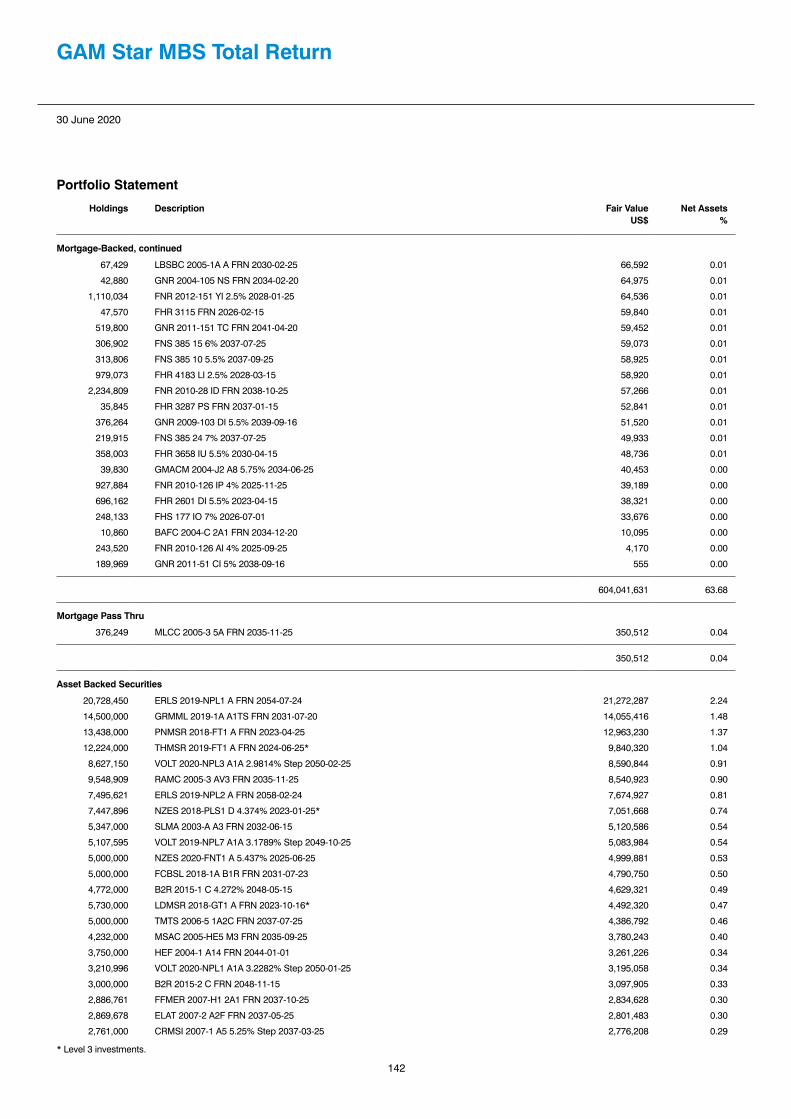
142
30 June 2020
GAM Star MBS Total Return
Portfolio Statement
Holdings Description Fair ValueUS$
Net Assets%
Mortgage-Backed, continued
67,429 LBSBC 2005-1A A FRN 2030-02-25 66,592 0.01
42,880 GNR 2004-105 NS FRN 2034-02-20 64,975 0.01
1,110,034 FNR 2012-151 YI 2.5% 2028-01-25 64,536 0.01
47,570 FHR 3115 FRN 2026-02-15 59,840 0.01
519,800 GNR 2011-151 TC FRN 2041-04-20 59,452 0.01
306,902 FNS 385 15 6% 2037-07-25 59,073 0.01
313,806 FNS 385 10 5.5% 2037-09-25 58,925 0.01
979,073 FHR 4183 LI 2.5% 2028-03-15 58,920 0.01
2,234,809 FNR 2010-28 ID FRN 2038-10-25 57,266 0.01
35,845 FHR 3287 PS FRN 2037-01-15 52,841 0.01
376,264 GNR 2009-103 DI 5.5% 2039-09-16 51,520 0.01
219,915 FNS 385 24 7% 2037-07-25 49,933 0.01
358,003 FHR 3658 IU 5.5% 2030-04-15 48,736 0.01
39,830 GMACM 2004-J2 A8 5.75% 2034-06-25 40,453 0.00
927,884 FNR 2010-126 IP 4% 2025-11-25 39,189 0.00
696,162 FHR 2601 DI 5.5% 2023-04-15 38,321 0.00
248,133 FHS 177 IO 7% 2026-07-01 33,676 0.00
10,860 BAFC 2004-C 2A1 FRN 2034-12-20 10,095 0.00
243,520 FNR 2010-126 AI 4% 2025-09-25 4,170 0.00
189,969 GNR 2011-51 CI 5% 2038-09-16 555 0.00
604,041,631 63.68
Mortgage Pass Thru
376,249 MLCC 2005-3 5A FRN 2035-11-25 350,512 0.04
350,512 0.04
Asset Backed Securities
20,728,450 ERLS 2019-NPL1 A FRN 2054-07-24 21,272,287 2.24
14,500,000 GRMML 2019-1A A1TS FRN 2031-07-20 14,055,416 1.48
13,438,000 PNMSR 2018-FT1 A FRN 2023-04-25 12,963,230 1.37
12,224,000 THMSR 2019-FT1 A FRN 2024-06-25* 9,840,320 1.04
8,627,150 VOLT 2020-NPL3 A1A 2.9814% Step 2050-02-25 8,590,844 0.91
9,548,909 RAMC 2005-3 AV3 FRN 2035-11-25 8,540,923 0.90
7,495,621 ERLS 2019-NPL2 A FRN 2058-02-24 7,674,927 0.81
7,447,896 NZES 2018-PLS1 D 4.374% 2023-01-25* 7,051,668 0.74
5,347,000 SLMA 2003-A A3 FRN 2032-06-15 5,120,586 0.54
5,107,595 VOLT 2019-NPL7 A1A 3.1789% Step 2049-10-25 5,083,984 0.54
5,000,000 NZES 2020-FNT1 A 5.437% 2025-06-25 4,999,881 0.53
5,000,000 FCBSL 2018-1A B1R FRN 2031-07-23 4,790,750 0.50
4,772,000 B2R 2015-1 C 4.272% 2048-05-15 4,629,321 0.49
5,730,000 LDMSR 2018-GT1 A FRN 2023-10-16* 4,492,320 0.47
5,000,000 TMTS 2006-5 1A2C FRN 2037-07-25 4,386,792 0.46
4,232,000 MSAC 2005-HE5 M3 FRN 2035-09-25 3,780,243 0.40
3,750,000 HEF 2004-1 A14 FRN 2044-01-01 3,261,226 0.34
3,210,996 VOLT 2020-NPL1 A1A 3.2282% Step 2050-01-25 3,195,058 0.34
3,000,000 B2R 2015-2 C FRN 2048-11-15 3,097,905 0.33
2,886,761 FFMER 2007-H1 2A1 FRN 2037-10-25 2,834,628 0.30
2,869,678 ELAT 2007-2 A2F FRN 2037-05-25 2,801,483 0.30
2,761,000 CRMSI 2007-1 A5 5.25% Step 2037-03-25 2,776,208 0.29
* Level 3 investments.

143
30 June 2020
GAM Star MBS Total Return
Portfolio Statement
Holdings Description Fair ValueUS$
Net Assets%
Asset Backed Securities, continued
2,818,761 BSABS 2004-FR3 M2 FRN 2034-09-25 2,765,182 0.29
2,703,590 NZES 2018-PLS2 D 4.593% 2023-02-25* 2,703,590 0.28
2,904,319 MASD 2006-3 A FRN 2046-06-25 2,561,507 0.27
2,653,450 RASC 2004-KS10 M3 FRN 2034-11-25 2,543,054 0.27
3,033,811 BLX 2007-AA A FRN 2040-10-20 2,468,987 0.26
2,550,000 SLMA 2003-A A4 FRN 2032-06-15 2,441,513 0.26
2,197,388 GCS 2 A FRN 2058-12-24 2,348,912 0.25
2,500,000 HEF 2004-1 A12 FRN 2044-01-01 2,274,490 0.24
2,307,243 FHLT 2004-3 M2 FRN 2034-11-25 2,251,388 0.24
2,450,000 HEF 2004-1 A10 FRN 2044-01-01 2,243,997 0.24
2,264,000 MABS 2004-HE1 M5 FRN 2034-09-25 2,219,287 0.23
2,200,000 B2R 2015-1 D FRN 2048-05-15 2,153,620 0.23
2,250,000 WFHET 2005-3 M7 FRN 2035-11-25 2,128,395 0.22
2,000,000 RASC 2005-KS7 M5 FRN 2035-08-25 1,977,775 0.21
1,824,264 NWSB 2018-1 A FRN 2044-02-25 1,780,463 0.19
1,787,172 SASC 2007-BC3 1A3 FRN 2047-05-25 1,690,956 0.18
1,550,000 CAFL 2017-2 M 5.6219% 2027-12-25 1,514,630 0.16
1,489,350 ACCR 2006-2 A4 FRN 2036-09-25 1,432,757 0.15
1,400,000 CAFL 2017-1 C 3.756% 2049-10-15 1,409,599 0.15
1,417,300 VCC 2017-1 M2 FRN 2047-05-25 1,408,173 0.15
1,356,158 BSABS 2007-SD2 1A2A 6% 2046-09-25 1,337,432 0.14
1,400,000 PCHLT 2005-4 1A3 FRN 2035-12-25 1,297,696 0.14
1,362,372 BSABS 2004-HE7 M1 FRN 2034-08-25 1,296,043 0.14
1,500,000 WFHET 2007-1 A3 FRN 2037-03-25 1,279,743 0.13
1,338,724 AABST 2004-6 M2 FRN 2035-03-25 1,278,930 0.13
1,119,395 PPSI 2005-WCW2 M2 FRN 2035-07-25 1,094,945 0.12
1,162,924 CBASS 2006-CB3 AV4 FRN 2036-03-25 1,078,406 0.11
1,179,224 AAA 2005-1A 1A3A FRN 2035-02-27 1,069,696 0.11
1,081,247 AMSI 2002-C M1 FRN 2032-11-25 1,060,524 0.11
1,087,955 ACE 2003-HE1 M1 FRN 2033-11-25 1,060,120 0.11
1,049,121 HEAT 2004-7 M1 FRN 2035-01-25 1,043,577 0.11
1,141,489 BSABS 2007-HE6 2A FRN 2037-08-25 1,009,098 0.11
1,052,889 SABR 2004-OP1 M1 FRN 2034-02-25 1,008,668 0.11
1,000,000 GSAMP 2007-HS1 M2 FRN 2047-02-25 1,001,154 0.11
1,000,000 NHEL 2005-1 M5 FRN 2035-06-25 973,760 0.10
1,017,033 FHLT 2004-D M1 FRN 2034-11-25 930,695 0.10
1,000,000 HEF 2004-1 A6 FRN 2044-01-01 919,517 0.10
937,359 CSFB 2005-AGE1 M6 FRN 2032-02-25 911,682 0.10
975,850 FNGT 2004-T5 AB2 FRN 2035-05-28 903,919 0.09
905,024 VOLT 2020-NPL2 A1A 2.9814% Step 2050-02-25 898,825 0.09
901,524 NHEL 2003-1 A1 FRN 2033-05-25 892,001 0.09
1,018,503 TMTS 2007-QHLW A1 FRN 2038-10-25 869,897 0.09
762,907 TMTS 2005-4HE M3 FRN 2035-03-25 750,812 0.08
753,847 ACE 2003-NC1 M1 FRN 2033-07-25 746,099 0.08
711,302 ARSI 2003-W3 M2 FRN 2033-09-25 700,495 0.07
756,348 FFML 2002-FF4 2A2 FRN 2033-02-25 686,938 0.07
642,691 SNMLT 2005-2A A3 FRN 2036-02-25 673,866 0.07
705,168 BAYV 2006-C 2A4 FRN 2036-11-28 647,684 0.07
615,713 CWL 2005-4 AF5B 5.147% Step 2035-10-25 633,866 0.07
611,634 SAIL 2004-7 M1 FRN 2034-08-25 607,994 0.06* Level 3 investments.

144
30 June 2020
GAM Star MBS Total Return
Portfolio Statement
Holdings Description Fair ValueUS$
Net Assets%
Asset Backed Securities, continued
500,000 CBASS 2007-SP1 M1 5.19% Step 2037-12-25 557,999 0.06
560,583 ACCR 2004-1 A2 FRN 2034-04-25 540,978 0.06
528,951 MSAC 2004-HE9 M2 FRN 2034-11-25 522,580 0.05
490,786 SURF 2005-BC2 M3 FRN 2035-12-25 484,435 0.05
427,908 ACCR 2003-3 A1 5.21% Step 2034-01-25 453,555 0.05
424,865 CSMC 2007-NC1 2A1 FRN 2037-09-25 413,152 0.04
400,477 HANA 2016-1A A FRN 2042-08-25 400,933 0.04
415,215 TMTS 2004-19HE A1 FRN 2034-10-25 398,597 0.04
384,541 TMTS 2004-13AL 1A2 FRN 2034-08-25 379,294 0.04
412,942 CFAB 2003-6 2A2 FRN 2034-11-25 375,445 0.04
378,092 ACE 2003-TC1 M2 FRN 2033-06-25 371,839 0.04
340,475 CRMSI 2006-2 A5 5.28% Step 2036-09-25 340,475 0.04
313,964 SAIL 2003-BC11 M1 FRN 2033-10-25 312,542 0.03
324,067 BLX 2005-1A A FRN 2033-06-27 297,110 0.03
270,700 MLMI 2002-AFC1 MF2 5.94% Step 2032-09-25 274,553 0.03
176,429 QUEST 2004-X2 M2 FRN 2034-06-25 176,779 0.02
116,965 CWL 2004-13 AF5B 5.103% Step 2035-05-25 118,450 0.01
222,641,073 23.47
Corporate Bonds
5,887,577 Finance of America Structured NT 20691125 SECD 14 6,035,294 0.64
4,038,251 Finance of America Structured Securities Trust JR2 2019-JR3 4,202,248 0.44
2,989,725 Finance of America Structured Securities Trust FASST 2019-JR2 3,201,831 0.34
13,439,373 1.42
Holdings Description Counterparty Fair ValueUS$
Net Assets%
Futures – Interest Rates
(476) US 5Yr Note Futures (CBT) 2020-09-30 Morgan Stanley (133,899) (0.01)
(523) US 10Yr Note Futures (CBT) 2020-09-21 Morgan Stanley (257,414) (0.03)
Unrealised loss on Futures – Interest Rates (391,313) (0.04)
(391,313) (0.04)
Purchase Currency
Contractual Amount
SaleCurrency
ContractualAmount
MaturityDate
Counterparty Unrealised GainUS$
Net Assets%
Open Forward Contracts
EUR 168,222,300 USD (184,026,871) 2020-07-08 Bank of America 4,935,078 0.52
GBP 67,220,000 USD (81,871,360) 2020-07-08 Bank of America 1,188,595 0.13
SEK 308,056,100 USD (31,894,979) 2020-07-08 Bank of America 1,172,144 0.12
USD 195,253,687 EUR (172,865,400) 2020-07-08 Bank of America 1,076,202 0.11
USD 88,342,611 GBP (70,809,400) 2020-07-08 Bank of America 847,436 0.10
CHF 2,213,710 USD (2,283,434) 2020-07-08 Bank of America 53,193 0.01
USD 30,668,330 SEK (285,276,300) 2020-07-08 Bank of America 46,419 0.00
USD 5,264,718 JPY (563,594,300) 2020-07-08 Bank of America 40,364 0.00
USD 2,356,630 CHF (2,226,780) 2020-07-08 Bank of America 6,208 0.00

145
30 June 2020
GAM Star MBS Total Return
Portfolio Statement
Purchase Currency
Contractual Amount
SaleCurrency
ContractualAmount
MaturityDate
Counterparty Unrealised Gain/(Loss)
US$
Net Assets%
Open Forward Contracts, continued
USD 1,660,233 EUR (1,472,100) 2020-08-10 Bank of America 5,441 0.00
USD 495,494 GBP (398,500) 2020-08-10 Bank of America 2,987 0.00
EUR 1,403,100 USD (1,574,762) 2020-08-10 Bank of America 2,468 0.00
JPY 14,005,000 USD (129,138) 2020-07-08 Bank of America 684 0.00
SEK 3,160,000 USD (339,238) 2020-08-10 Bank of America 100 0.00
GBP 6,900 USD (8,501) 2020-08-10 Bank of America 27 0.00
CHF 13,700 USD (14,455) 2020-08-10 Bank of America 19 0.00
USD 4,192 CHF (4,030) 2020-07-08 Bank of America (61) (0.00)
CHF 17,100 USD (18,220) 2020-07-08 Bank of America (170) (0.00)
USD 414,107 EUR (369,000) 2020-08-10 Bank of America (687) (0.00)
USD 112,521 GBP (91,700) 2020-08-10 Bank of America (811) (0.00)
USD 427,777 GBP (349,600) 2020-07-08 Bank of America (4,203) (0.00)
CHF 2,226,780 USD (2,359,127) 2020-08-10 Bank of America (6,403) (0.00)
JPY 549,589,300 USD (5,115,883) 2020-07-08 Bank of America (21,351) (0.00)
SEK 36,942,900 USD (3,994,161) 2020-07-08 Bank of America (28,664) (0.00)
JPY 562,737,300 USD (5,259,719) 2020-08-11 Bank of America (41,076) (0.00)
SEK 284,003,100 USD (30,543,650) 2020-08-10 Bank of America (45,811) (0.00)
GBP 3,939,000 USD (4,955,284) 2020-07-08 Bank of America (88,086) (0.01)
EUR 13,536,300 USD (15,324,329) 2020-07-08 Bank of America (119,178) (0.01)
USD 9,847,349 EUR (8,893,200) 2020-07-08 Bank of America (142,271) (0.01)
USD 6,206,288 SEK (59,722,700) 2020-07-08 Bank of America (204,419) (0.02)
USD 34,811,706 EUR (31,200,000) 2020-10-09 State Street Bank (308,779) (0.03)
GBP 70,622,400 USD (88,105,375) 2020-08-10 Bank of America (822,966) (0.10)
EUR 173,462,500 USD (196,085,341) 2020-08-10 Bank of America (1,095,691) (0.13)
Unrealised gain on Open Forward Contracts 9,377,365 0.99
Unrealised loss on Open Forward Contracts (2,930,627) (0.31)
6,446,738 0.68
Fair ValueUS$
Net Assets%
Net Financial Assets and Liabilities at fair value 846,528,014 89.25
Net Current Assets (excluding Financial Assets and Financial Liabilities at fair value) 101,953,624 10.75
Net assets attributable to the shareholders of the Fund 948,481,638 100.00
Analysis of Total Assets %
Transferable securities admitted to official stock exchange listing 4.08
Transferable securities dealt in on another regulated market 43.52
Other transferable securities of the type referred to in Regulation 68(1)(a), (b) and (c) 38.89
OTC financial derivative instruments 0.97
Other Assets 12.54
100.00
In line with the requirements of the UCITS regulation S.I. No. 344/2017 the open Forward Contracts have been condensed in the Portfolio Statement based on the purchase and sale currency, maturity date, counterparty and unrealised gain or unrealised loss of the contract as at the year end.
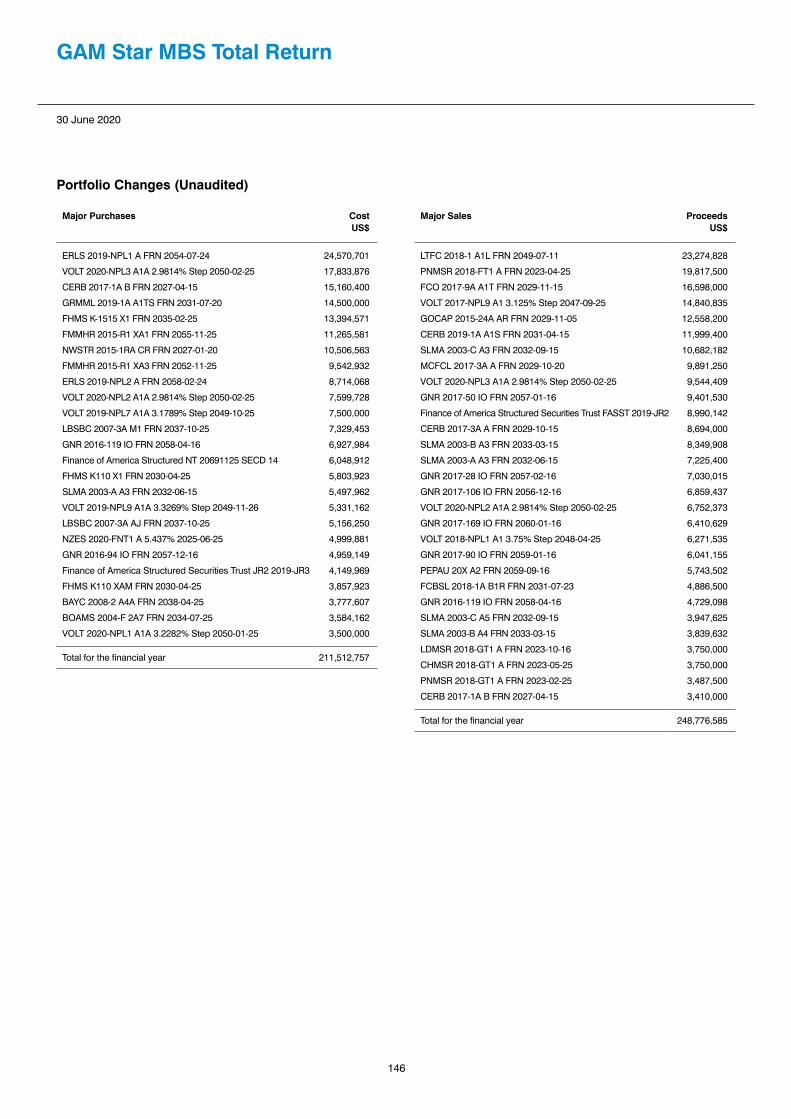
146
30 June 2020
GAM Star MBS Total Return
Portfolio Changes (Unaudited)
Major Purchases CostUS$
ERLS 2019-NPL1 A FRN 2054-07-24 24,570,701
VOLT 2020-NPL3 A1A 2.9814% Step 2050-02-25 17,833,876
CERB 2017-1A B FRN 2027-04-15 15,160,400
GRMML 2019-1A A1TS FRN 2031-07-20 14,500,000
FHMS K-1515 X1 FRN 2035-02-25 13,394,571
FMMHR 2015-R1 XA1 FRN 2055-11-25 11,265,581
NWSTR 2015-1RA CR FRN 2027-01-20 10,506,563
FMMHR 2015-R1 XA3 FRN 2052-11-25 9,542,932
ERLS 2019-NPL2 A FRN 2058-02-24 8,714,068
VOLT 2020-NPL2 A1A 2.9814% Step 2050-02-25 7,599,728
VOLT 2019-NPL7 A1A 3.1789% Step 2049-10-25 7,500,000
LBSBC 2007-3A M1 FRN 2037-10-25 7,329,453
GNR 2016-119 IO FRN 2058-04-16 6,927,984
Finance of America Structured NT 20691125 SECD 14 6,048,912
FHMS K110 X1 FRN 2030-04-25 5,803,923
SLMA 2003-A A3 FRN 2032-06-15 5,497,962
VOLT 2019-NPL9 A1A 3.3269% Step 2049-11-26 5,331,162
LBSBC 2007-3A AJ FRN 2037-10-25 5,156,250
NZES 2020-FNT1 A 5.437% 2025-06-25 4,999,881
GNR 2016-94 IO FRN 2057-12-16 4,959,149
Finance of America Structured Securities Trust JR2 2019-JR3 4,149,969
FHMS K110 XAM FRN 2030-04-25 3,857,923
BAYC 2008-2 A4A FRN 2038-04-25 3,777,607
BOAMS 2004-F 2A7 FRN 2034-07-25 3,584,162
VOLT 2020-NPL1 A1A 3.2282% Step 2050-01-25 3,500,000
Total for the financial year 211,512,757
Major Sales ProceedsUS$
LTFC 2018-1 A1L FRN 2049-07-11 23,274,828
PNMSR 2018-FT1 A FRN 2023-04-25 19,817,500
FCO 2017-9A A1T FRN 2029-11-15 16,598,000
VOLT 2017-NPL9 A1 3.125% Step 2047-09-25 14,840,835
GOCAP 2015-24A AR FRN 2029-11-05 12,558,200
CERB 2019-1A A1S FRN 2031-04-15 11,999,400
SLMA 2003-C A3 FRN 2032-09-15 10,682,182
MCFCL 2017-3A A FRN 2029-10-20 9,891,250
VOLT 2020-NPL3 A1A 2.9814% Step 2050-02-25 9,544,409
GNR 2017-50 IO FRN 2057-01-16 9,401,530
Finance of America Structured Securities Trust FASST 2019-JR2 8,990,142
CERB 2017-3A A FRN 2029-10-15 8,694,000
SLMA 2003-B A3 FRN 2033-03-15 8,349,908
SLMA 2003-A A3 FRN 2032-06-15 7,225,400
GNR 2017-28 IO FRN 2057-02-16 7,030,015
GNR 2017-106 IO FRN 2056-12-16 6,859,437
VOLT 2020-NPL2 A1A 2.9814% Step 2050-02-25 6,752,373
GNR 2017-169 IO FRN 2060-01-16 6,410,629
VOLT 2018-NPL1 A1 3.75% Step 2048-04-25 6,271,535
GNR 2017-90 IO FRN 2059-01-16 6,041,155
PEPAU 20X A2 FRN 2059-09-16 5,743,502
FCBSL 2018-1A B1R FRN 2031-07-23 4,886,500
GNR 2016-119 IO FRN 2058-04-16 4,729,098
SLMA 2003-C A5 FRN 2032-09-15 3,947,625
SLMA 2003-B A4 FRN 2033-03-15 3,839,632
LDMSR 2018-GT1 A FRN 2023-10-16 3,750,000
CHMSR 2018-GT1 A FRN 2023-05-25 3,750,000
PNMSR 2018-GT1 A FRN 2023-02-25 3,487,500
CERB 2017-1A B FRN 2027-04-15 3,410,000
Total for the financial year 248,776,585

147
30 June 2020
GAM Systematic Alternative Risk PremiaFund Manager: GAM ARP Investment Team
Commentary (Unaudited)
The Fund fell 2.6% over the year to 30 June 2020 (as measured by the USD Institutional class) compared to a rise of 1.7% for its benchmark, the 3 month Libor in USD.
The Fund performed positively for the months of July and August with the diversified alternative risk premia composite portfolio posted small losses in September. Two of the three styles contributed positively to performance; momentum was the strongest detractor, while value led gains, followed by the carry style. Leading gains was the global equity value allocation with traditional value stocks outperforming the broader market. The market neutral, variance minimisation approach to stock selection was flat on the month while positive contributions came from merger arbitrage on the back of company specific news. On the other side, the currency value allocation detracted driven mainly by losses from long exposures to the Japanese yen and euro as both currencies weakened relative to the US dollar.
The diversified alternative risk premia portfolio performed positively for most of the fourth quarter of 2019 but ended down December. Despite this, full year 2019 performance remains in strongly positive territory. The carry style led gains in the last month of the year, while the value and momentum styles detracted.
The diversified alternative risk premia composite started the year with a strong positive month with all styles contributing positively. Through the sustained risk-off moves into February month-end, the alternative risk premia strategy produced losses. From a style perspective for February, value was the main detractor, followed by carry, while momentum was a small positive contributor. The alternative risk premia portfolio was not completely immune to the broad, generalised and strong risk off moves witnessed across asset classes, and it ended the quarter down.
As traditional risk premia rallied and compressed throughout the start of the second quarter, so did the Fund’s diversified risk premia portfolio. From a style perspective for April, all styles contributed positively. While a correlated rally developed across traditional risk premia driving strong returns, the alternative risk premia portfolio was negative for the month of May as more conservative positioning and specific reversals across asset classes drove negative performance. The Fund’s Alternative Risk Premia portfolio was slightly up in June. From a style perspective for the end of quarter two, diversification was evident, though dispersion across styles was abnormally low in June. Value and momentum posted small losses, while carry contributed positively.
July 2020
Portfolio Statement
Analysis, by geographical area30 June2020 %
30 June2019 %
United States 30.82 11.39
Global 21.29 12.99
Finland 11.76 –
Germany 7.04 14.82
Canada 3.71 10.30
Sweden – 9.51
Norway – 3.80
Austria – 3.61
Futures – Interest Rates 0.20 0.61
Futures – Equity Indices 0.16 (0.30)
Equity Swaps 0.14 0.02
Total Return Swaps 0.10 (1.27)
Credit Default Swaps 0.02 1.00
Currency Forwards 1.90 1.05
Net Current Assets 22.86 32.47
100.00 100.00
Analysis, by industry sector30 June2020 %
30 June2019 %
Fixed Interest 74.62 66.42
Futures 0.36 0.31
Swaps 0.26 (0.25)
Currency Forwards 1.90 1.05
Net Current Assets 22.86 32.47
100.00 100.00
Analysis, by investment30 June2020 %
30 June2019 %
Government Bonds 46.29 38.42
Corporate Bonds 28.33 28.00
Futures – Interest Rates 0.20 0.61
Futures – Equity Indices 0.16 (0.30)
Equity Swaps 0.14 0.02
Total Return Swaps 0.10 (1.27)
Credit Default Swaps 0.02 1.00
Currency Forwards 1.90 1.05
Net Current Assets 22.86 32.47
100.00 100.00
Analysis of Credit Ratings (S&P)30 June
202030 June
2019
Corporate Bonds & Government Bonds From AAA to AA+, or may not be rated
From AAA to AA-, or may not be rated

148
30 June 2020
GAM Systematic Alternative Risk Premia
Portfolio Statement
Holdings Description Fair ValueUS$
Net Assets%
Government Bonds
6,955,000 Municipality Finance 1.875% 2020-09-18 6,977,291 11.76
5,400,000 United States Treasury Bill 0% 2020-10-15 5,397,751 9.09
5,000,000 United States Treasury Bill 0% 2020-10-01 4,998,274 8.42
4,000,000 United States Treasury Bill 0% 2020-12-03 3,997,529 6.74
3,900,000 United States Treasury Bill 0% 2020-12-10 3,897,449 6.57
2,185,000 Export Development Canada 2% 2020-11-30 2,200,448 3.71
27,468,742 46.29
Corporate Bonds
12,602,000 International Bank for Reconstruction & Devel 1.625% 2020-09-04 12,632,182 21.29
4,161,000 Kreditanstalt fuer Wiederaufbau 2.75% 2020-09-08 4,180,245 7.04
16,812,427 28.33
Holdings Description Counterparty Fair ValueUS$
Net Assets%
Futures – Interest Rate
41 Euro-Bund Futures (EUR) 2020-09-08 Morgan Stanley 84,270 0.14
50 US 10Yr Note Futures (XCBT) 2020-09-21 Morgan Stanley 19,055 0.03
65 Australian 10Yr Bond Futures (XSFE) 2020-09-15 Morgan Stanley 13,483 0.02
(8) JPN 10Yr Bond Futures (OSE) (XOSE) 2020-09-14 Morgan Stanley 13,348 0.02
39 US 5Yr Note Futures (CBT) (XCBT) 2020-09-30 Morgan Stanley 11,652 0.02
5 US Long Bond Futures (CBT) (XCBT) 2020-09-21 Morgan Stanley 2,031 0.01
30 US 2Yr Note Futures (CBT) (XCBT) 2020-09-30 Morgan Stanley 1,149 0.00
5 Canadian 10Yr Bond Futures (XMOD) 2020-09-21 Morgan Stanley 1,101 0.00
(1) Long Gilt Futures (IFLL) 2020-09-28 Morgan Stanley (840) (0.00)
(66) Euro-Schatz Futures (XEUR) 2020-09-08 Morgan Stanley (6,301) (0.01)
(23) Euro-Bobl Futures (XEUR) 2020-09-08 Morgan Stanley (16,533) (0.03)
Unrealised gain on Futures – Interest Rates 146,089 0.24
Unrealised loss on Futures – Interest Rates (23,674) (0.04)
122,415 0.20
Futures – Equity Indices
(16) Topix Index Futures (XOSE) 2020-09-10 Morgan Stanley 101,605 0.17
(27) FTSE 100 Index Futures (IFLL) 2020-09-18 Morgan Stanley 22,753 0.04
(95) Euro Stoxx 50 (XEUR) 2020-09-18 Morgan Stanley 14,364 0.02
1 Nasdaq 100 E-Mini Futures (XCME) 2020-09-18 Morgan Stanley 7,111 0.01
7 MSCI Taiwan Index Futures (XSIM) 2020-07-30 Morgan Stanley (1,185) (0.00)
4 Swiss Market Index Futures (XEUR) 2020-09-18 Morgan Stanley (5,555) (0.01)
(32) S&P500 Emini Futures (XCME) 2020-09-18 Morgan Stanley (44,917) (0.07)
Unrealised gain on Futures – Equity Indices 145,833 0.24
Unrealised loss on Futures – Equity Indices (51,657) (0.08)
94,176 0.16

149
30 June 2020
GAM Systematic Alternative Risk Premia
Portfolio Statement
Holdings Description Counterparty Fair ValueUS$
Net Assets%
Credit Default Swaps
480,000 CDS ITRX EUR XOVER S33 5Y ICEE JPM2025-06-20 AG80658
Morgan Stanley 28,180 0.05
1,620,000 CDS CDX NA HY S34 5Y V2 MS ICEE 500 BPS2025-06-20 AG80700
Morgan Stanley (16,335) (0.03)
Unrealised gain on Credit Default Swaps 28,180 0.05
Unrealised loss on Credit Default Swaps (16,335) (0.03)
11,845 0.02
Equity Swaps
4,900 S&P500 Index JP Morgan 42,032 0.07
6,200 S&P500 Index Citigroup 34,309 0.06
4,400 S&P500 Index Citigroup 9,239 0.01
Unrealised gain on Equity Swaps 85,580 0.14
85,580 0.14
Currency Notional Amount
Fund Pays Fund Receives
Termination Date
Counterparty Fair Value US$
Net Assets%
Total Return Swaps
USD 30,142 12 Month LIBOR Macquarie Investor Product
598E
2099-12-31 Macquarie Bank 208,893 0.35
EUR 37,023 12 Month LIBOR JP Morgan Basket
2099-12-31 JP Morgan 98,134 0.17
GBP 24,282 12 Month LIBOR JP Morgan Basket
2099-12-31 JP Morgan 75,907 0.13
USD 37,760 12 Month LIBOR Citi Custom Basket
2099-12-31 Citigroup 39,837 0.07
USD 35,148 12 Month LIBOR Macquarie Index Product 536E
2099-12-31 Macquarie Bank 26,403 0.04
EUR 8,112 12 Month LIBOR JP Morgan Basket
2099-12-31 JP Morgan 16,673 0.03
JPY 3,654,712 12 Month LIBOR Citi Custom Basket
2099-12-31 Citigroup 8,129 0.01
USD 58,651 12 Month LIBOR Citi Custom Basket
2099-12-31 Citigroup 5,279 0.01
JPY 495,006 12 Month LIBOR Citi Custom Basket
2099-12-31 Citigroup (345) 0.00
USD 29,467 12 Month LIBOR Citi Custom Basket
2099-12-31 Citigroup (38,443) (0.06)
USD 68,381 12 Month LIBOR JP Morgan Basket
2021-02-08 JP Morgan (383,185) (0.65)
Unrealised gain on Total Return Swap 479,255 0.81
Unrealised loss on Total Return Swaps (421,973) (0.71)
57,282 0.10

150
30 June 2020
GAM Systematic Alternative Risk Premia
Portfolio Statement
Purchase Currency
Contractual Amount
Sale Currency
ContractualAmount
Maturity Date
Counterparty Unrealised Gain/(Loss)
US$
Net Assets%
Open Forward Contracts
EUR 26,397,900 USD (28,822,688) 2020-07-08 Bank of America 829,734 1.40
USD 3,790,700 NOK (34,977,809) 2020-07-15 HSBC 164,758 0.28
USD 29,543,647 EUR (26,154,800) 2020-07-08 Bank of America 164,296 0.28
CHF 7,028,000 USD (7,255,535) 2020-07-08 Bank of America 162,697 0.28
USD 955,100 BRL (4,663,778) 2020-07-15 HSBC 106,176 0.18
USD 4,210,500 AUD (6,014,570) 2020-07-15 HSBC 69,118 0.11
USD 7,167,264 JPY (767,311,700) 2020-07-08 Bank of America 54,510 0.09
USD 852,500 MXN (18,713,283) 2020-07-15 HSBC 44,020 0.07
USD 852,500 ZAR (14,179,315) 2020-07-15 HSBC 37,622 0.06
USD 2,517,000 EUR (2,214,852) 2020-07-15 HSBC 28,706 0.04
USD 919,600 GBP (720,993) 2020-07-15 HSBC 28,668 0.05
USD 852,500 RUB (58,845,711) 2020-07-15 HSBC 27,724 0.05
USD 6,874,199 CHF (6,495,100) 2020-07-08 Bank of America 18,458 0.03
USD 1,102,500 CAD (1,476,973) 2020-07-15 HSBC 18,050 0.03
USD 852,500 NZD (1,301,976) 2020-07-15 HSBC 14,311 0.02
USD 806,700 SEK (7,394,828) 2020-07-15 HSBC 12,861 0.02
USD 2,100,200 JPY (225,279,004) 2020-07-15 HSBC 11,747 0.02
USD 5,591,900 CHF (5,288,064) 2020-07-15 HSBC 9,059 0.02
USD 205,200 HUF (62,070,230) 2020-07-15 HSBC 8,539 0.01
GBP 200,100 USD (243,694) 2020-07-08 Bank of America 3,559 0.01
USD 811,600 ILS (2,797,946) 2020-07-15 HSBC 2,933 0.01
USD 205,200 CZK (4,798,754) 2020-07-15 HSBC 2,890 0.01
EUR 731,869 USD (820,000) 2020-07-15 HSBC 2,225 0.00
INR 91,877,790 USD (1,212,700) 2020-07-15 HSBC 2,181 0.00
USD 161,936 GBP (129,800) 2020-07-08 Bank of America 1,549 0.00
USD 102,600 PLN (401,254) 2020-07-15 HSBC 1,157 0.00
USD 38,464 EUR (34,100) 2020-08-10 Bank of America 131 0.00
EUR 16,800 USD (18,841) 2020-08-10 Bank of America 45 0.00
CHF 200 USD (210) 2020-08-10 Bank of America 1 0.00
USD 317 CHF (300) 2020-08-10 Bank of America – 0.00
USD 12,234 CHF (11,600) 2020-08-10 Bank of America (22) (0.00)
USD 11,219 EUR (10,000) 2020-08-10 Bank of America (22) (0.00)
USD 85,890 GBP (70,300) 2020-07-08 Bank of America (976) (0.00)
EUR 120,800 USD (137,066) 2020-07-08 Bank of America (1,374) (0.00)
CHF 844,006 USD (892,500) 2020-07-15 HSBC (1,446) (0.00)
GBP 129,400 USD (161,443) 2020-08-10 Bank of America (1,517) (0.00)
USD 404,801 EUR (363,900) 2020-07-08 Bank of America (3,964) (0.01)
USD 558,089 CHF (532,900) 2020-07-08 Bank of America (4,400) (0.00)
NOK 1,161,713 USD (125,900) 2020-07-15 HSBC (5,472) (0.01)
MXN 6,758,733 USD (307,900) 2020-07-15 HSBC (15,899) (0.03)
CHF 6,419,300 USD (6,800,826) 2020-08-10 Bank of America (18,457) (0.03)
AUD 2,107,278 USD (1,475,200) 2020-07-15 HSBC (24,217) (0.04)
JPY 767,311,700 USD (7,142,035) 2020-07-08 Bank of America (29,280) (0.05)
SEK 19,357,453 USD (2,111,700) 2020-07-15 HSBC (33,666) (0.05)
CAD 2,811,542 USD (2,098,700) 2020-07-15 HSBC (34,360) (0.06)
NZD 3,219,432 USD (2,108,000) 2020-07-15 HSBC (35,386) (0.06)
ZAR 13,342,694 USD (802,200) 2020-07-15 HSBC (35,402) (0.06)
RUB 90,791,512 USD (1,315,300) 2020-07-15 HSBC (42,775) (0.07)
JPY 759,611,700 USD (7,099,838) 2020-08-11 Bank of America (55,446) (0.09)

151
30 June 2020
GAM Systematic Alternative Risk Premia
Portfolio Statement
Purchase Currency
Contractual Amount
Sale Currency
ContractualAmount
Maturity Date
Counterparty Unrealised LossUS$
Net Assets%
Open Forward Contracts, continued
EUR 5,172,357 USD (5,880,400) 2020-07-15 HSBC (69,470) (0.12)
GBP 3,253,079 USD (4,143,600) 2020-07-15 HSBC (123,768) (0.21)
EUR 25,899,700 USD (29,278,283) 2020-08-10 Bank of America (164,362) (0.28)
Unrealised gain on Open Forward Contracts 1,827,725 3.07
Unrealised loss on Open Forward Contracts (701,681) (1.17)
1,126,044 1.90
Fair ValueUS$
Net Assets%
Net Financial Assets and Liabilities at fair value 45,778,511 77.14
Net Current Assets (excluding Financial Assets and Financial Liabilities at fair value) 13,567,343 22.86
Net assets attributable to the shareholders of the Fund 59,345,854 100.00
Analysis of Total Assets %
Transferable securities admitted to official stock exchange listing 42.13
Other transferable securities of the type referred to in Regulation 68(1)(a), (b) and (c) 29.65
OTC financial derivative instruments 3.92
Financial derivative instruments dealt in on a regulated market 0.47
Other Assets 23.83
100.00
In line with the requirements of the UCITS regulation S.I. No. 344/2017 the open Forward Contracts have been condensed in the Portfolio Statement based on the purchase and sale currency, maturity date, counterparty and unrealised gain or unrealised loss of the contract as at the year end.

152
30 June 2020
GAM Systematic Alternative Risk Premia
Portfolio Changes (Unaudited)
Major Purchases CostUS$
European Stability Mechanism 3% 2020-10-23 43,207,980
Council Of Europe Development Bank 1.75% 2019-11-14 25,319,278
Council Of Europe Development Bank 1.875% 2020-01-27 23,310,758
International Bank for Reconstruction & Devel 1.625% 2020-09-04 21,977,120
Kreditanstalt fuer Wiederaufbau 2.75% 2020-09-08 20,173,260
Oesterreichische Kontrollbank 1.5% 2020-10-21 19,941,000
United States Treasury Bill 0% 2020-04-30 19,842,772
United States Treasury Bill 0% 2020-05-21 19,840,222
International Bank for Reconstruction & Devel 1.25% 2019-07-26 18,847,939
Municipality Finance 1.875% 2020-09-18 16,456,646
Kreditanst Fur Wie 1.25% 2019-09-30 14,964,600
Kommunalbanken 1.625% 2020-01-15 14,862,005
CDP Financial 4.4% 2019-11-25 13,589,737
Cse D'Amort Dette 1.75% 2019-09-24 12,483,250
CPPIB Capital 2.375% 2021-01-29 11,052,367
United States Treasury Bill 0% 2020-04-23 10,065,822
United States Treasury Notes 2.625% 2020-08-15 9,062,031
United States Treasury Bill 0% 2020-02-27 8,166,349
Export Development Canada 2% 2020-11-30 8,021,520
BNG Bank 2.5% 2020-02-28 6,951,104
United States Treasury Bill 0% 2020-10-15 5,395,086
United States Treasury Notes 1.625% 2020-06-30 5,000,977
United States Treasury Notes 1.5% 2020-05-31 4,998,438
United States Treasury Bill 0% 2020-10-01 4,995,927
United States Treasury Bill 0% 2020-12-03 3,996,581
United States Treasury Bill 0% 2020-12-10 3,896,988
Total for the financial year 366,419,757
There were no other sales during the financial year.
Major Sales ProceedsUS$
European Stability Mechanism 3% 2020-10-23 43,238,448
Oesterreichische Kontrollbank 1.5% 2020-10-21 20,070,053
United States Treasury Bill 0% 2020-05-21 19,982,895
United States Treasury Bill 0% 2020-04-30 19,946,003
Kreditanstalt fuer Wiederaufbau 2.75% 2020-09-08 15,970,971
CPPIB Capital 2.375% 2021-01-29 11,114,038
Municipality Finance 1.875% 2020-09-18 9,552,250
International Bank for Reconstruction & Devel 1.625% 2020-09-04 9,422,106
United States Treasury Notes 2.625% 2020-08-15 9,061,836
International Bank for Reconstruction & Devel 1.25% 2019-07-26 8,176,000
Export Development Canada 2% 2020-11-30 5,858,612
United States Treasury Bill 0% 2020-04-23 4,999,957
United States Treasury Notes 1.625% 2020-06-30 2,006,797
United States Treasury Notes 1.5% 2020-05-31 2,004,609
CDP Financial 4.4% 2019-11-25 1,135,289
Council of Europe Development Bank 1.75% 2019-11-14 637,575
Total for the financial year 183,177,439

153
30 June 2020
GAM Systematic Core MacroFund Manager: GAM Systematic LLP
Commentary (Unaudited)
The Fund (as measured by the Institutional USD Accumulation Class) fell 6.7% over the year to 30 June 2020, underperforming its benchmark, the 3 Month Libor in USD which rose 1.7%.
Global stocks rallied and bonds declined in the first half of September amid signs of reduced geopolitical risks. China and the US agreed to hold trade talks in October, and political tensions in Hong Kong and Italy eased. Economic data indicated that global growth was not as bad as some had expected. Mid-month, the European Central Bank (ECB) cut rates further into negative territory and announced plans for an open-ended period of quantitative easing (QE). The Federal Reserve similarly cut rates, which was in line with investor expectations but weighed slightly on bond yields nevertheless. The dollar strengthened through the second half of the month, putting downward pressure on precious metals. Oil jumped nearly 20% following a drone strike on Saudi Aramco’s oil facilities, but subsequently fell back to its previous level as production was restored. Agricultural contracts rallied, with cocoa leading the way amid concerns over reduced supply and warehouse stockpiles. Corn prices rose over 5% following concern that heavy rainfall would slow harvest activities.
The Fund had a very strong year in 2019. US equities climbed to new highs, finishing the year up over 30%, while treasuries ended the month relatively unchanged. The announcement of a preliminary US-China trade deal, which staved off a scheduled tariff hike, helped to boost markets. Commodities rallied, with the GSCI gaining more than 8% over December. Crude oil, in particular, gained in response to the OPEC+ meeting at the start of the month, in which it was announced that an even larger cut in production would take place than initially suggested. Other top performing commodities were agricultural products correlated to Chinese demand, such as lean hogs, soybean oil and soybeans. The portfolio has continued its rotation away from safe haven assets, with the majority of the risk rotated into equities.
The first half of January saw a continuation of the strong bull, run seen in the last quarter of 2019. This was followed by a strong earnings season in the US, as well as the signing of phase one of the US / China trade deal. The second half of the month was dominated by the novel coronavirus outbreak in China, which weighed on global equities. As a result, the Hang Seng finished the month almost 7% down. Markets in the quarter continued to be dominated by the spread of Covid-19 and its ever-widening impact as well as by the oil tensions between Russia and Saudi Arabia. The Dow Jones Industrial Average has declined more than 23% since January and experienced its worst quarter since 1987. Dispersion among stock performance was relatively wide. The best performance in the index was posted by Microsoft which was flat for the quarter. The worst performance was experienced by aviation stocks and oil companies. The US dollar held onto its safe haven mantle to a certain extent.
Following the crisis triggered by the spread of Covid-19 in February and March, global equities continued to recover throughout April. This was triggered by optimism that the growth rate of new cases is slowing in the US and Europe, combined with a glimmer of hope from various clinical trials. Despite weak earnings and weak economic data, market participants largely focused on lockdown easing and re-openings. News of countries reopening and reported progress on a potential Covid-19 vaccine fuelled positive market sentiment in May. The equities recovery continued, with some indices such as NASDAQ now up year-to-date. On the back of the rebound in equity markets as well as new bond supply, bunds sold off. Despite a positive start to the end of the quarter, driven by strong employment data, June marked the point where the recovery stumbled. Weak economic data from China, combined with increasing concerns about a second wave of Covid-19, acted to dampen market sentiment. Going into July, fixed income remains the largest risk contributor in the portfolio. We are long bond future contracts across the board, with UK and German government bonds contributing the most risk. This is closely followed by the allocation to equity index futures, which has increased relative to last month.
July 2020
Portfolio Statement
Analysis, by geographical area30 June2020 %
30 June2019 %
United States 32.04 67.48
Ireland 8.35 14.86
Futures – Interest Rates 0.39 1.39
Futures – Equity Indices 0.23 0.33
Futures – Currency – (0.00)
Currency Forwards (0.14) 0.86
Net Current Assets 59.13 15.08
100.00 100.00
Analysis, by industry sector30 June2020 %
30 June2019 %
Government Bonds 32.04 67.48
Private Placement 4.35 4.90
Exchange Traded Funds 4.00 9.96
Futures – Interest Rates 0.39 1.39
Futures – Equity Indices 0.23 0.33
Futures – Foreign Currency – (0.00)
Currency Forwards (0.14) 0.86
Net Current Assets 59.13 15.08
100.00 100.00
Analysis of Credit Ratings (S&P)30 June
202030 June
2019
Government Bonds AA+, or may not be rated
AA+, or may not be rated

154
30 June 2020
GAM Systematic Core Macro
Portfolio Statement
Holdings Description Fair ValueUS$
Net Assets%
Exchange Traded Fund
392,643 State Street USD Liquidity LVNAV Fund 392,643 4.00
392,643 4.00
Government Bonds
800,000 United States Treasury Bill 0% 2020-07-16 799,958 8.14
600,000 United States Treasury Bill 0% 2020-07-02 599,997 6.10
500,000 United States Treasury Bill 0% 2020-07-23 499,962 5.09
500,000 United States Treasury Bill 0% 2020-07-30 499,950 5.09
500,000 United States Treasury Bill 0% 2020-09-10 499,878 5.08
250,000 United States Treasury Bill 0% 2020-08-20 249,957 2.54
3,149,702 32.04
Private Placement
5,319,860 Star Compass 0% 2021-10-01 427,717 4.35
427,717 4.35
Holdings Description Counterparty Fair ValueUS$
Net Assets%
Futures – Interest Rates
24 Euro-Bund Futures (EUR) 2020-09-08 Goldman Sachs 9,962 0.10
6 Euro-BTP Futures (EUR) 2020-09-08 Goldman Sachs 9,008 0.09
31 US 10Yr Note Futures (CBT) 2020-09-21 Goldman Sachs 6,719 0.07
33 Long Gilt Futures (FLL) 2020-09-28 Goldman Sachs 4,411 0.05
6 Euro-OAT Futures (EUR) 2020-09-08 Goldman Sachs 3,830 0.04
29 US 5Yr Note Futures (CBT) (XCBT) 2020-09-30 Goldman Sachs 3,766 0.04
19 Euro-Bobl Futures (EUR) 2020-09-08 Goldman Sachs 1,999 0.02
33 90 Day Euro Futures (CME) 2022-06-13 Goldman Sachs 1,100 0.01
2 90 Day Euro Futures (CME) 2022-09-19 Goldman Sachs 1,100 0.01
1 90 Day Euro Futures (CME) 2022-12-19 Goldman Sachs 438 0.01
2 90 Day Sterling Futures (FLL) 2022-12-21 Goldman Sachs 417 0.01
1 90 Day Euro Futures (CME) 2023-03-13 Goldman Sachs 313 0.00
3 90 Day Sterling Futures (FLL) 2022-09-21 Goldman Sachs 270 0.00
3 Australian 10Yr Bond Futures (SFE) 2020-09-15 Goldman Sachs 249 0.00
10 Euro-Schatz Futures (EUR) 2020-09-08 Goldman Sachs 219 0.00
3 90 Day Sterling Futures (FLL) 2022-03-16 Goldman Sachs 216 0.00
2 90 Day Sterling Futures (FLL) 2021-12-15 Goldman Sachs 185 0.00
1 90 Day Euro Futures (CME) 2023-06-19 Goldman Sachs 163 0.00
2 90 Day Sterling Futures (FLL) 2021-09-15 Goldman Sachs 162 0.00
2 3Mo Euro Euribor Futures (FLL) 2021-12-13 Goldman Sachs 154 0.00
3 90 Day Sterling Futures (FLL) 2022-06-15 Goldman Sachs 147 0.00
1 90 Day Euro Futures (CME) 2022-03-14 Goldman Sachs 138 0.00
2 3Mo Euro Euribor Futures (FLL) 2022-06-13 Goldman Sachs 112 0.00
2 3Mo Euro Euribor Futures (FLL) 2022-09-19 Goldman Sachs 112 0.00
1 90 Day Sterling Futures (FLL) 2021-06-16 Goldman Sachs 100 0.00
1 3Mo Euro Euribor Futures (FLL) 2022-12-19 Goldman Sachs 98 0.00
2 3Mo Euro Euribor Futures (FLL) 2022-03-14 Goldman Sachs 84 0.00
1 90 Day Euro Futures (CME) 2020-09-14 Goldman Sachs 75 0.00
2 3Mo Euro Euribor Futures (FLL) 2021-09-13 Goldman Sachs 42 0.00

155
30 June 2020
GAM Systematic Core Macro
Portfolio Statement
Holdings Description Counterparty Fair ValueUS$
Net Assets%
Futures – Interest Rates, continued
2 3Mo Euro Euribor Futures (FLL) 2021-06-14 Goldman Sachs 28 0.00
1 90 Day Euro Futures (CME) 2021-09-13 Goldman Sachs 25 0.00
1 90 Day Bank Bill Futures (SFE) 2020-12-10 Goldman Sachs 17 0.00
1 3Mo Euro Euribor Futures (FLL) 2023-03-13 Goldman Sachs 14 0.00
1 90 Day Sterling Futures (FLL) 2021-03-17 Goldman Sachs 8 0.00
(1) 90 Day Sterling Futures (FLL) 2020-12-16 Goldman Sachs (8) (0.00)
1 Australian 3Yr Bond Futures (SFE) 2020-09-15 Goldman Sachs (11) (0.00)
1 90 Day Euro Futures (CME) 2021-06-14 Goldman Sachs (13) (0.00)
1 90 Day Bank Bill Futures (SFE) 2021-03-11 Goldman Sachs (17) (0.00)
(1) 90 Day Euro Futures (CME) 2020-12-14 Goldman Sachs (25) (0.00)
1 90 Day Euro Futures (CME) 2021-12-13 Goldman Sachs (25) (0.00)
(1) Euro CHF 3Mo Ice Futures (FLL) 2021-03-15 Goldman Sachs (26) (0.00)
1 90 Day Euro Futures (CME) 2023-09-18 Goldman Sachs (37) (0.00)
1 90 Day Euro Futures (CME) 2023-12-18 Goldman Sachs (50) (0.00)
8 CAN 10YR Bond Futures (MOD) 2020-09-21 Goldman Sachs (551) (0.00)
1 Euro Buxl 30Yr Bond Futures (EUR) 2020-09-08 Goldman Sachs (764) (0.01)
4 US Long Bond Futures (CBT) 2020-09-21 Goldman Sachs (1,156) (0.01)
1 US Ultra Bond Futures (CBT) 2020-09-21 Goldman Sachs (1,281) (0.01)
(31) US 2Yr Note Futures (CBT) 2020-09-30 Goldman Sachs (1,492) (0.01)
1 JPN 10Yr Bond Futures (OSE) 2020-09-14 Goldman Sachs (1,947) (0.02)
Unrealised gain on Futures – Interest Rates 45,681 0.45
Unrealised loss on Futures – Interest Rates (7,403) (0.06)
38,278 0.39
Futures – Equity Indices
3 Nasdaq 100 E-Mini Futures (CME) 2020-09-18 Goldman Sachs 16,135 0.16
2 S&P 500 Emini Futures (CME) 2020-09-18 Goldman Sachs 5,173 0.05
1 DAX Index Futures (EUR) 2020-09-18 Goldman Sachs 2,331 0.02
1 E-Mini Russell 2000 Futures (CME) 2020-09-18 Goldman Sachs 2,285 0.02
1 Djia Mini E-CBOT Futures (CBT) 2020-09-18 Goldman Sachs 1,660 0.02
1 S&P/TSX 60 IX Futures (MOD) 2020-09-17 Goldman Sachs 1,101 0.01
1 HSCEI Futures (HKF) 2020-07-30 Goldman Sachs 232 0.00
1 MSCI Taiwan Index Futures (SIM) 2020-07-30 Goldman Sachs (35) (0.00)
7 Euro Stoxx 50 (EUR) 2020-09-18 Goldman Sachs (81) (0.00)
2 OMXS30 Index Futures (STO) 2020-07-17 Goldman Sachs (204) (0.00)
1 Amsterdam Index Futures (EUE) 2020-07-17 Goldman Sachs (562) (0.00)
4 CAC40 10 Euro Futures (PAR) 2020-07-17 Goldman Sachs (1,050) (0.01)
11 Nikkei 225 Mini Futures (OSE) 2020-09-10 Goldman Sachs (1,933) (0.02)
3 FTSE 100 IDX Futures (FLL) 2020-09-18 Goldman Sachs (1,940) (0.02)
Unrealised gain on Futures – Equity Indices 28,917 0.28
Unrealised loss on Futures – Equity Indices (5,805) (0.05)
23,112 0.23
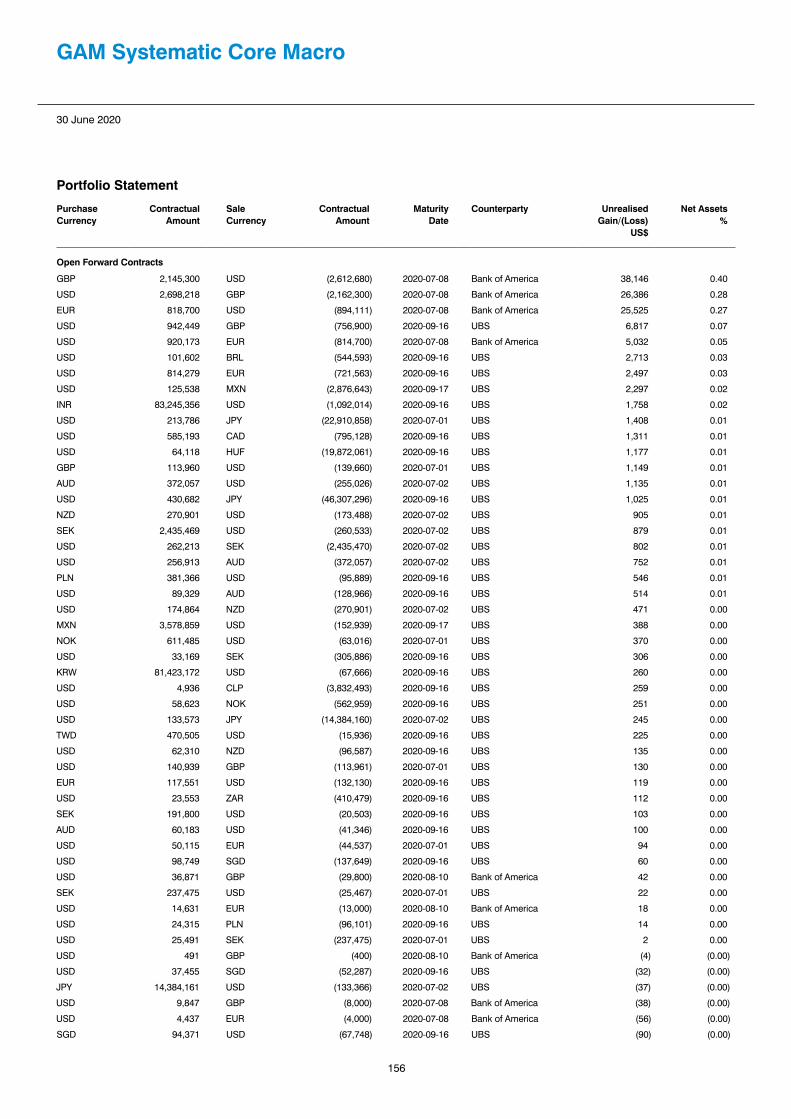
156
30 June 2020
GAM Systematic Core Macro
Portfolio Statement
Purchase Currency
Contractual Amount
SaleCurrency
ContractualAmount
MaturityDate
Counterparty Unrealised Gain/(Loss)
US$
Net Assets%
Open Forward Contracts
GBP 2,145,300 USD (2,612,680) 2020-07-08 Bank of America 38,146 0.40
USD 2,698,218 GBP (2,162,300) 2020-07-08 Bank of America 26,386 0.28
EUR 818,700 USD (894,111) 2020-07-08 Bank of America 25,525 0.27
USD 942,449 GBP (756,900) 2020-09-16 UBS 6,817 0.07
USD 920,173 EUR (814,700) 2020-07-08 Bank of America 5,032 0.05
USD 101,602 BRL (544,593) 2020-09-16 UBS 2,713 0.03
USD 814,279 EUR (721,563) 2020-09-16 UBS 2,497 0.03
USD 125,538 MXN (2,876,643) 2020-09-17 UBS 2,297 0.02
INR 83,245,356 USD (1,092,014) 2020-09-16 UBS 1,758 0.02
USD 213,786 JPY (22,910,858) 2020-07-01 UBS 1,408 0.01
USD 585,193 CAD (795,128) 2020-09-16 UBS 1,311 0.01
USD 64,118 HUF (19,872,061) 2020-09-16 UBS 1,177 0.01
GBP 113,960 USD (139,660) 2020-07-01 UBS 1,149 0.01
AUD 372,057 USD (255,026) 2020-07-02 UBS 1,135 0.01
USD 430,682 JPY (46,307,296) 2020-09-16 UBS 1,025 0.01
NZD 270,901 USD (173,488) 2020-07-02 UBS 905 0.01
SEK 2,435,469 USD (260,533) 2020-07-02 UBS 879 0.01
USD 262,213 SEK (2,435,470) 2020-07-02 UBS 802 0.01
USD 256,913 AUD (372,057) 2020-07-02 UBS 752 0.01
PLN 381,366 USD (95,889) 2020-09-16 UBS 546 0.01
USD 89,329 AUD (128,966) 2020-09-16 UBS 514 0.01
USD 174,864 NZD (270,901) 2020-07-02 UBS 471 0.00
MXN 3,578,859 USD (152,939) 2020-09-17 UBS 388 0.00
NOK 611,485 USD (63,016) 2020-07-01 UBS 370 0.00
USD 33,169 SEK (305,886) 2020-09-16 UBS 306 0.00
KRW 81,423,172 USD (67,666) 2020-09-16 UBS 260 0.00
USD 4,936 CLP (3,832,493) 2020-09-16 UBS 259 0.00
USD 58,623 NOK (562,959) 2020-09-16 UBS 251 0.00
USD 133,573 JPY (14,384,160) 2020-07-02 UBS 245 0.00
TWD 470,505 USD (15,936) 2020-09-16 UBS 225 0.00
USD 62,310 NZD (96,587) 2020-09-16 UBS 135 0.00
USD 140,939 GBP (113,961) 2020-07-01 UBS 130 0.00
EUR 117,551 USD (132,130) 2020-09-16 UBS 119 0.00
USD 23,553 ZAR (410,479) 2020-09-16 UBS 112 0.00
SEK 191,800 USD (20,503) 2020-09-16 UBS 103 0.00
AUD 60,183 USD (41,346) 2020-09-16 UBS 100 0.00
USD 50,115 EUR (44,537) 2020-07-01 UBS 94 0.00
USD 98,749 SGD (137,649) 2020-09-16 UBS 60 0.00
USD 36,871 GBP (29,800) 2020-08-10 Bank of America 42 0.00
SEK 237,475 USD (25,467) 2020-07-01 UBS 22 0.00
USD 14,631 EUR (13,000) 2020-08-10 Bank of America 18 0.00
USD 24,315 PLN (96,101) 2020-09-16 UBS 14 0.00
USD 25,491 SEK (237,475) 2020-07-01 UBS 2 0.00
USD 491 GBP (400) 2020-08-10 Bank of America (4) (0.00)
USD 37,455 SGD (52,287) 2020-09-16 UBS (32) (0.00)
JPY 14,384,161 USD (133,366) 2020-07-02 UBS (37) (0.00)
USD 9,847 GBP (8,000) 2020-07-08 Bank of America (38) (0.00)
USD 4,437 EUR (4,000) 2020-07-08 Bank of America (56) (0.00)
SGD 94,371 USD (67,748) 2020-09-16 UBS (90) (0.00)

157
30 June 2020
GAM Systematic Core Macro
Portfolio Statement
Purchase Currency
Contractual Amount
SaleCurrency
ContractualAmount
MaturityDate
Counterparty Unrealised LossUS$
Net Assets%
Open Forward Contracts, continued
USD 40,912 PLN (162,214) 2020-09-16 UBS (107) (0.00)
USD 60,594 EUR (54,056) 2020-07-02 UBS (115) (0.00)
EUR 44,535 USD (50,144) 2020-07-01 UBS (125) (0.00)
EUR 54,054 USD (60,837) 2020-07-02 UBS (126) (0.00)
CAD 215,255 USD (158,188) 2020-07-02 UBS (145) (0.00)
USD 54,960 NZD (85,683) 2020-09-16 UBS (195) (0.00)
USD 69,580 ZAR (1,222,044) 2020-09-16 UBS (206) (0.00)
KRW 28,713,087 USD (24,171) 2020-09-16 UBS (218) (0.00)
USD 100,939 EUR (89,931) 2020-09-16 UBS (237) (0.00)
USD 63,122 NOK (611,484) 2020-07-01 UBS (265) (0.00)
JPY 22,910,866 USD (212,675) 2020-07-01 UBS (311) (0.00)
USD 132,528 KRW (159,274,220) 2020-09-16 UBS (345) (0.00)
GBP 25,000 USD (31,339) 2020-07-08 Bank of America (447) (0.00)
USD 83,490 NOK (810,517) 2020-09-16 UBS (551) (0.01)
USD 100,535 SEK (941,497) 2020-09-16 UBS (613) (0.01)
USD 137,527 AUD (200,612) 2020-09-16 UBS (628) (0.01)
USD 154,988 INR (11,844,584) 2020-09-16 UBS (639) (0.01)
GBP 324,834 USD (402,008) 2020-07-02 UBS (643) (0.01)
USD 163,251 HUF (51,755,170) 2020-09-16 UBS (671) (0.01)
USD 157,286 CAD (215,255) 2020-07-02 UBS (754) (0.01)
PLN 687,992 USD (175,183) 2020-09-16 UBS (1,202) (0.01)
USD 249,923 GBP (203,319) 2020-09-16 UBS (1,409) (0.01)
USD 247,494 CAD (338,965) 2020-09-16 UBS (1,417) (0.01)
BRL 175,878 USD (34,069) 2020-09-16 UBS (2,133) (0.02)
USD 398,543 GBP (324,837) 2020-07-02 UBS (2,821) (0.03)
ZAR 5,955,984 USD (343,052) 2020-09-16 UBS (2,929) (0.03)
NZD 747,996 USD (485,567) 2020-09-16 UBS (4,066) (0.04)
NOK 1,278,665 USD (137,202) 2020-09-16 UBS (4,619) (0.05)
SEK 5,446,365 USD (590,090) 2020-09-16 UBS (4,962) (0.05)
EUR 805,700 USD (910,779) 2020-08-10 Bank of America (5,090) (0.05)
EUR 653,455 USD (742,030) 2020-09-16 UBS (6,884) (0.07)
HUF 56,687,071 USD (186,447) 2020-09-16 UBS (6,897) (0.07)
AUD 1,064,506 USD (741,306) 2020-09-16 UBS (8,229) (0.08)
USD 1,047,156 JPY (113,907,696) 2020-09-16 UBS (9,718) (0.10)
CAD 943,530 USD (702,687) 2020-09-16 UBS (9,831) (0.10)
GBP 408,683 USD (516,306) 2020-09-16 UBS (11,114) (0.11)
JPY 149,522,483 USD (1,398,689) 2020-09-16 UBS (11,357) (0.12)
MXN 6,022,497 USD (271,529) 2020-09-17 UBS (13,508) (0.15)
GBP 2,117,600 USD (2,641,996) 2020-08-10 Bank of America (24,849) (0.26)
Unrealised gain on Open Forward Contracts 126,500 1.29
Unrealised loss on Open Forward Contracts (140,633) (1.43)
(14,133) (0.14)

158
30 June 2020
GAM Systematic Core Macro
Portfolio Statement
Fair ValueUS$
Net Assets%
Net Financial Assets and Liabilities at fair value 4,017,319 40.87
Net Current Assets (excluding Financial Assets and Financial Liabilities at fair value) 5,811,845 59.13
Net assets attributable to the shareholders of the Fund 9,829,164 100.00
Analysis of Total Assets %
Transferable securities dealt in on another regulated market 28.02
Other transferable securities of the type referred to in Regulation 68(1)(a), (b) and (c) 11.32
Financial derivative instruments dealt in on a regulated market 0.74
OTC financial derivative instruments 1.25
Other Assets 58.67
100.00
In line with the requirements of the UCITS regulation S.I. No. 344/2017 the open Forward Contracts have been condensed in the Portfolio Statement based on the purchase and sale currency, maturity date, counterparty and unrealised gain or unrealised loss of the contract as at the year end.
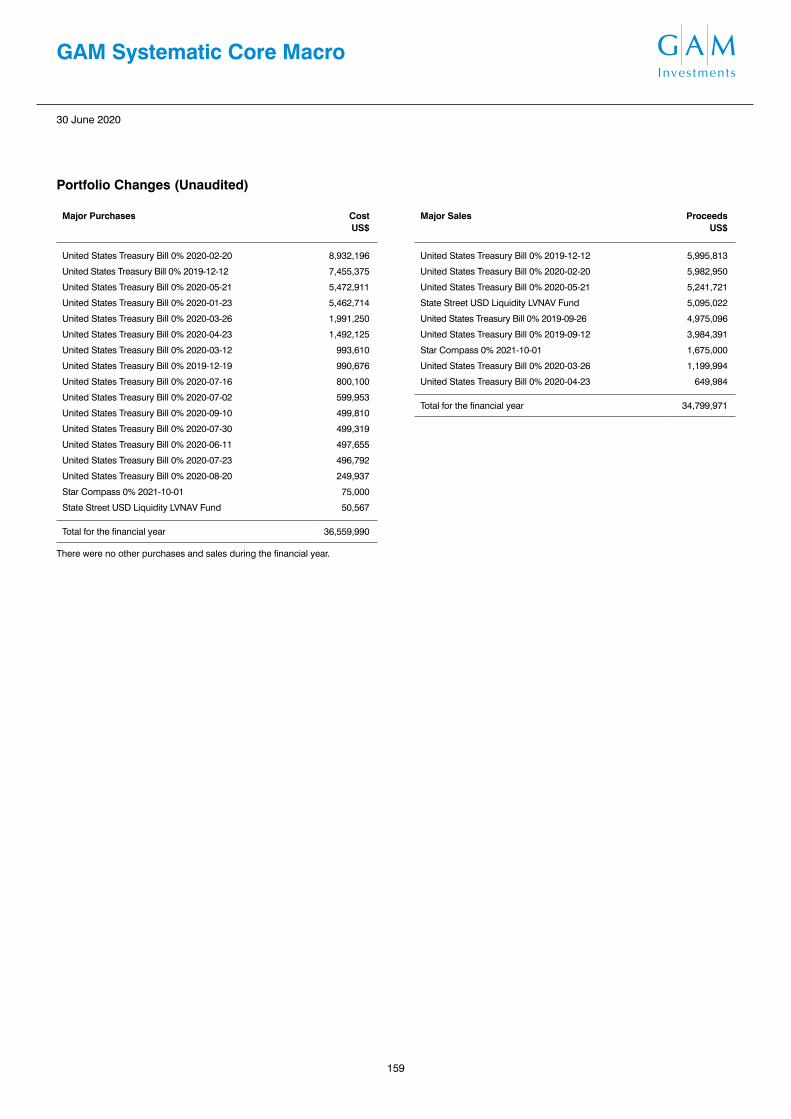
159
30 June 2020
GAM Systematic Core Macro
Portfolio Changes (Unaudited)
Major Purchases CostUS$
United States Treasury Bill 0% 2020-02-20 8,932,196
United States Treasury Bill 0% 2019-12-12 7,455,375
United States Treasury Bill 0% 2020-05-21 5,472,911
United States Treasury Bill 0% 2020-01-23 5,462,714
United States Treasury Bill 0% 2020-03-26 1,991,250
United States Treasury Bill 0% 2020-04-23 1,492,125
United States Treasury Bill 0% 2020-03-12 993,610
United States Treasury Bill 0% 2019-12-19 990,676
United States Treasury Bill 0% 2020-07-16 800,100
United States Treasury Bill 0% 2020-07-02 599,953
United States Treasury Bill 0% 2020-09-10 499,810
United States Treasury Bill 0% 2020-07-30 499,319
United States Treasury Bill 0% 2020-06-11 497,655
United States Treasury Bill 0% 2020-07-23 496,792
United States Treasury Bill 0% 2020-08-20 249,937
Star Compass 0% 2021-10-01 75,000
State Street USD Liquidity LVNAV Fund 50,567
Total for the financial year 36,559,990
There were no other purchases and sales during the financial year.
Major Sales ProceedsUS$
United States Treasury Bill 0% 2019-12-12 5,995,813
United States Treasury Bill 0% 2020-02-20 5,982,950
United States Treasury Bill 0% 2020-05-21 5,241,721
State Street USD Liquidity LVNAV Fund 5,095,022
United States Treasury Bill 0% 2019-09-26 4,975,096
United States Treasury Bill 0% 2019-09-12 3,984,391
Star Compass 0% 2021-10-01 1,675,000
United States Treasury Bill 0% 2020-03-26 1,199,994
United States Treasury Bill 0% 2020-04-23 649,984
Total for the financial year 34,799,971

160
30 June 2020
GAM Star Tactical OpportunitiesFund Manager: Julian Howard/GAM's Multi Asset Solutions Team
Commentary (Unaudited)
The Fund (as measured by the USD Institutional Accumulation Class) rose 0.8% over the year to 30 June 2020, compared to its benchmark, the 3 Month Libor in USD which rose 1.7%.
The Fund delivered a positive return in six of the twelve months under review, with positive performance coming mostly in Q2 2020 from engagement in US and quality factor-exposed equities, plus short-dated T-Bills. Losses were limited to an average of 0.36% in negative months.
July 2020
Portfolio Statement
Analysis, by geographical area30 June2020 %
30 June2019 %
United States 90.90 45.58
Germany – 22.40
Total Return Swaps 0.55 0.40
Futures – Equity Indices (0.05) (0.11)
Futures – Interest Rates – (0.08)
Currency Forwards 1.79 0.46
Net Current Assets 6.81 31.35
100.00 100.00
Analysis, by industry sector30 June2020 %
30 June2019 %
Fixed Interest 90.90 67.98
Swaps 0.55 0.40
Futures (0.05) (0.19)
Currency Forwards 1.79 0.46
Net Current Assets 6.81 31.35
100.00 100.00
Analysis, by investment30 June2020 %
30 June2019 %
Government Bonds 90.90 67.98
Total Return Swaps 0.55 0.40
Futures – Interest Rates – (0.08)
Futures – Equity Indices (0.05) (0.11)
Currency Forwards 1.79 0.46
Net Current Assets 6.81 31.35
100.00 100.00
Analysis of Credit Ratings (S&P)30 June
202030 June
2019
Government Bonds AA+ AA+

161
30 June 2020
GAM Star Tactical Opportunities
Portfolio Statement
Holdings Description Fair ValueUS$
Net Assets%
Government Bonds
12,000,000 United States Treasury Note/Bond 2% 2021-01-15 12,120,469 30.10
9,000,000 United States Treasury Note/Bond 2.125% 2020-08-31 9,030,410 22.42
7,900,000 United States Treasury Note/Bond 1.375% 2020-09-15 7,921,293 19.67
7,500,000 United States Treasury Note/Bond 2% 2020-09-30 7,535,742 18.71
36,607,914 90.90
Holdings Description Counterparty Fair ValueUS$
Net Assets%
Futures – Equity Indices
30 S&P 500 Emini Futures (XCME) 2020-09-18 UBS 99,600 0.25
(56) MSCI World Index (XEUR) 2020-09-18 UBS (119,840) (0.30)
Unrealised gain on Futures – Equity Indices 99,600 0.25
Unrealised loss on Futures – Equity Indices (119,840) (0.30)
(20,240) (0.05)
Currency Notional Amount
Fund Pays Fund Receives
Termination Date
Counterparty Fair Value US$
Net Assets%
Total Return Swap
USD 3,055 12 Month LIBOR TRS World SecNeutral QLT $
M1WONQ
2020-08-19 Goldman Sachs 222,625 0.55
Unrealised gain on Total Return Swap 222,625 0.55
222,625 0.55
Purchase Currency
Contractual Amount
SaleCurrency
ContractualAmount
MaturityDate
Counterparty Unrealised Gain/(Loss)
US$
Net Assets%
Open Forward Contracts
EUR 20,637,200 USD (22,532,087) 2020-07-08 Bank of America 649,415 1.61
USD 23,093,192 EUR (20,445,500) 2020-07-08 Bank of America 127,024 0.32
GBP 4,016,350 USD (4,891,352) 2020-07-08 Bank of America 71,424 0.17
USD 5,033,275 GBP (4,033,750) 2020-07-08 Bank of America 48,997 0.12
CHF 136,300 USD (140,433) 2020-07-08 Bank of America 3,435 0.01
USD 142,872 CHF (135,000) 2020-07-08 Bank of America 376 0.00
USD 16,188 GBP (13,000) 2020-08-10 Bank of America 121 0.00
USD 1,353 CHF (1,300) 2020-07-08 Bank of America (20) (0.00)
USD 46,354 GBP (37,700) 2020-07-08 Bank of America (229) (0.00)
CHF 135,000 USD (143,024) 2020-08-10 Bank of America (388) (0.00)
GBP 55,100 USD (69,348) 2020-07-08 Bank of America (1,263) (0.00)
USD 212,825 EUR (191,700) 2020-07-08 Bank of America (2,509) (0.00)
GBP 3,901,050 USD (4,867,067) 2020-08-10 Bank of America (45,749) (0.12)
EUR 20,445,500 USD (23,112,615) 2020-08-10 Bank of America (129,775) (0.32)

162
30 June 2020
GAM Star Tactical Opportunities
Portfolio Statement
Purchase Currency
Contractual Amount
SaleCurrency
ContractualAmount
MaturityDate
Counterparty Unrealised Gain/(Loss)
US$
Net Assets%
Unrealised gain on Open Forward Contracts 900,792 2.23
Unrealised loss on Open Forward Contracts (179,933) (0.44)
720,859 1.79
Fair ValueUS$
Net Assets%
Net Financial Assets and Liabilities at fair value 37,531,158 93.19
Net Current Assets (excluding Financial Assets and Financial Liabilities at fair value) 2,742,922 6.81
Net assets attributable to the shareholders of the Fund 40,274,080 100.00
Analysis of Total Assets %
Transferable securities admitted to official stock exchange listing 89.69
OTC financial derivative instruments 2.75
Financial derivative instruments dealt in on a regulated market 0.25
Other Assets 7.31
100.00
In line with the requirements of the UCITS regulation S.I. No. 344/2017 the open Forward Contracts have been condensed in the Portfolio Statement based on the purchase and sale currency, maturity date, counterparty and unrealised gain or unrealised loss of the contract as at the year end.

163
30 June 2020
GAM Star Tactical Opportunities
Portfolio Changes (Unaudited)
Major Purchases CostUS$
United States Treasury Note/Bond 2% 2021-01-15 12,139,219
United States Treasury Note/Bond 1.375% 2020-05-31 11,985,000
United States Treasury Note/Bond 1.125% 2020-04-30 10,753,172
United States Treasury Note/Bond 3.625% 2020-02-15 9,592,402
United States Treasury Note/Bond 2.125% 2020-08-31 9,027,422
United States Treasury Note/Bond 2.25% 2020-02-29 8,015,938
United States Treasury Note/Bond 1.375% 2020-09-15 7,941,660
United States Treasury Note/Bond 2% 2020-09-30 7,541,016
Total for the financial year 76,995,829
There were no other purchases and sales during the financial year.
Major Sales ProceedsUS$
United States Treasury Note/Bond 1.125% 2020-04-30 2,001,562
Total for the financial year 2,001,562

164
30 June 2020
GAM Star Disruptive GrowthFund Manager: Mark Hawtin
Commentary (Unaudited)
The Fund (as measured by the USD Accumulation Class) rose 25.7% over the year to 30 June 2020, outperforming its benchmark, the MSCI World Information Technology index which rose 17.9% in USD terms.
At first glance the third quarter of 2019 looked like an uneventful quarter with the S&P gaining 1.7% and the Nasdaq 100 up 1.3%, however a closer look shows high levels of volatility, with markets posting big losses in August and regaining ground in September. Much of the volatility has been due to commentary over US / Chinese trade talks. The rhetoric during August was decidedly negative and during the month there were three days where the S&P was down 2%; in contrast, September newsflow turned more positive with an agreement by the two parties to meet in early October and tweets from Trump suggesting a deal would be done ahead of the 2020 election (the conversation appears to have turned more negative again post the third quarter). US economic data was mixed during the quarter. Despite inflation reaching its highest level since September 2008, Federal Reserve rate cuts are still expected as fears over the US / China trade war affecting growth continue. Despite the US / China trade war being a constant overlay we still anticipate strong growth from the companies in the Fund. We were encouraged by the strong growth shown by portfolio companies during Q2 earnings and we expect the momentum to continue when Q3 earnings are reported and into the end of the year.
Markets performed well in October due to optimism around a Brexit agreement and a US-China trade deal. The Federal Reserve also gave markets a boost as it committed to a USD 60 billion per month treasury buying programme and then later in the month a third rate cut for the year. October also marked the start of the third quarter earnings which got off to a good start with most reporting a positive earnings surprise. That being said, clear differences did emerge between industrially/cyclically sensitive and disruptive secular growth stories. Following a strong October, markets continued to show strength into the quarter with November with the S&P gaining 3.6% achieving all-time highs, and the Nasdaq growing 4.1%. Although uncertainty surrounding US / China trade disputes continued and the overhang of the 2020 election and Brexit remained, investors were able to look through this and helped push markets higher. Earnings growth continued at the start of November and were on the whole good. Throughout the quarter economic data was strong, US PMI ticked up, US retail sales were solid and housing starts were slightly higher. Together this created a nice backdrop for equities.
January got off to a strong start, as phase one of the US / China trade deal was signed and Brexit finally seemed to be moving forward. Economic data overall appeared resilient, and the start of earnings appeared to be going well. However, as the Chinese New Year approached, news of the coronavirus and its severity began to dominate news flow. As the epicentre of the pandemic, Wuhan, was put on lockdown, markets reacted severely and gave back early 2020 gains. By the end of March, the focus had shifted entirely to coronavirus and its horrific impact both physically and economically. As newsflow deteriorated during the quarter, policy makers scrambled to respond. By the end of the quarter, there had been a global policy response to the crisis, with central banks announcing dramatic rate cuts and vast quantitative easing programmes, and governments commencing huge stimulus programmes. In addition, by the end of the quarter over a third of the global population was in ‘lockdown’, including much of Europe, parts of the US and Canada, India and parts of Asia. This crisis is accelerating trends that we had already been seeing; companies that are disruptive are taking share, and although may be hit in the short term, we believe they are likely to come out of this crisis on higher growth trajectories than before. The Fund is positioned to take advantage of this disruption and continues to look for opportunities to add to quality companies at cheap valuations.
April was a very unusual month. On one hand, we had some of the worst economic data seen for years; yet on the other hand, the S&P had its largest one month rally since January 1987. The market is being fuelled by accommodative fiscal and monetary stimulus from governments around the world, combined with an inflection in the growth of coronavirus and the start of earnings that have been better than feared. The S&P ended April only 14% below its all-time high (achieved in the middle of February), and 30% higher than March lows. That is despite US unemployment reaching its highest level since World War II. Following April’s market strength (despite appalling economic data), indices paused during the first half of May. Economic data released at the start of the month continued to decline, with US unemployment reaching record levels not seen since the great depression in 1932. Yet again, investors put the real economy to one side and focused instead on comments from the Federal Reserve (Fed) indicating that they are "not out of ammunition by a long shot". Unprecedented monetary policy, combined with fiscal policy and optimism about economies re-opening, sent the markets higher in the second half of the month. Investors continue to pile into the equity markets as returns have been squeezed out of risk free assets. In addition, there has been a surge in retail investing, with many people stuck at home, bored and in possession of a cheque from the government. Rather than spending on the real economy, these new ‘investors’ have started to trade stocks and spend little, if any, time looking at fundamentals. 2020 started with a lot of promise. There were hopes of a trade deal between the US and China, the UK was finally moving forward with Brexit, an election cycle began in the US and there was promise of earnings growth. By mid-February, all this promise had been forgotten and markets became singularly focused on the spread globally of the deadly coronavirus. By mid-March, the S&P had fallen 35% and had achieved its worst quarter since the peak of the Global Financial Crisis. As we entered quarter two most of the world was in lockdown bringing with it a slew of appalling economic data. Despite that backdrop, the S&P posted its best return since quarter four in 1998, only a few percent away from all-time highs, and the Nasdaq posted its best return since quarter four in 2001. As we look forward, the focus shifts to Q2 earnings. In general, expectations are for disappointing results, as most countries were in lockdown for much of the quarter. That being said, beneficiaries of ‘remote working’ and lockdown orders have high expectations and will be punished if they do not deliver. As with Q1 reporting season, more emphasis will be placed on current snapshots and any future guidance versus backward looking results. Although many countries are now easing their way out of lockdowns and attempting to return to ‘life before Covid’, the fear of a second wave remains, as does the hope of a vaccine. It is becoming evident that life is not going to return to what it was in 2019 and that to succeed in this new reality enterprises must adapt and digitalise. Having digital at your core is no longer ‘nice to have’, but rather a ‘must have’. The Fund is positioned to continue to take advantage of this trend, as it is clear we are still in the early innings.
The top three holdings contributing to performance were Microsoft, Plus500 and Amazon. The bottom three performers were Afiniti, GoPro and Dropbox.
July 2020

165
30 June 2020
GAM Star Disruptive Growth
Portfolio Statement
Analysis, by geographical area30 June2020 %
30 June2019 %
United States 63.18 78.40
China 7.49 3.77
United Kingdom 5.15 2.00
Israel 4.91 2.09
Japan 3.04 1.25
Germany 1.85 2.25
Australia 1.48 1.63
Norway 0.39 –
Netherlands – 2.15
Denmark – 2.11
Currency Forwards 0.01 0.00
Net Current Assets 12.50 4.35
100.00 100.00
Analysis, by industry sector30 June2020 %
30 June2019 %
Software & Services 30.49 45.54
Retailing 11.78 6.07
Media & Entertainment 9.82 6.24
Semiconductors & Semiconductor Equipment 6.94 11.95
Health Care Equipment & Services 5.64 3.79
Diversified Financials 4.33 1.26
Consumer Durables & Apparel 4.20 7.20
Technology Hardware & Equipment 4.07 9.26
Telecommunication Services 3.44 –
Capital Goods 3.04 1.25
Consumer Services 2.25 –
Food & Staples Retailing 1.49 3.09
Currency Forwards 0.01 0.00
Net Current Assets 12.50 4.35
100.00 100.00
Analysis, by investment30 June2020 %
30 June2019 %
Equities Quoted 83.52 90.74
Equities Unquoted 3.41 5.20
Contracts for Difference 0.56 (0.29)
Preference Shares 0.07 –
Currency Forwards 0.01 0.00
Net Current Assets 12.50 4.35
100.00 100.00

166
30 June 2020
GAM Star Disruptive Growth
Portfolio Statement
Holdings Description Fair ValueUS$
Net Assets%
Equities Quoted
79,391 Microsoft 16,156,862 5.59
4,956 Amazon.Com 13,672,712 4.73
61,972 Alibaba Group Holding-Sp ADR 13,367,360 4.62
769,984 Plus500 12,515,571 4.33
49,264 Facebook 11,186,376 3.87
103,164 Akamai Technologies 11,047,833 3.82
7,069,012 BT Group 9,961,669 3.44
171,348 Micron Technology 8,827,849 3.05
49,200 Fanuc 8,783,353 3.04
14,850 Intuitive Surgical 8,461,976 2.93
111,150 Omnicell 7,849,413 2.71
152,293 Seagate Technology 7,372,504 2.55
113,635 Jd.Com ADRs 6,838,554 2.36
13,948 Netflix 6,346,898 2.19
53,929 Guidewire Software 5,978,030 2.07
168,184 Marvell Technology Group 5,896,531 2.04
72,581 PTC 5,646,076 1.95
52,569 Siltronic 5,359,912 1.85
69,197 New Relic 4,767,673 1.65
193,974 SVMK 4,566,148 1.58
253,388 Pure Storage 4,391,214 1.52
14,228 Costco Wholesale 4,314,072 1.49
102,088 Afterpay 4,286,839 1.48
40,113 Pegasystems 4,058,232 1.40
19,816 Visa 3,827,857 1.32
8,906 ServiceNow 3,607,464 1.25
13,168 EPAM Systems 3,318,468 1.15
7,407 Adobe Inc 3,224,341 1.11
10,605 Mastercard 3,135,899 1.08
143,510 Dropbox 3,124,213 1.08
140,152 Pinterest 3,107,170 1.07
42,711 Chegg 2,872,742 0.99
299,676 Kainos Group 2,773,396 0.96
23,917 Walt Disney Co 2,666,985 0.92
70,443 Cloudflare 2,532,426 0.88
20,080 Roku 2,339,922 0.81
39,483 Peloton Interactive 2,280,933 0.79
29,488 Starbucks 2,170,022 0.75
350,396 SDL 2,164,748 0.75
6,579 Wix.com 1,685,671 0.58
40,815 2U† 1,549,337 0.54
21,594 Tal Education Group- Adr 1,476,598 0.51
342,573 Kahoot! 1,136,347 0.39
58,452 Zuora 745,263 0.26
241,393,459 83.45
Preference Shares
10,347 Overstock.Com Inc 196,593 0.07
196,593 0.07
† Partial amount of security on loan as at 30 June 2020 Refer to note 5 for further information on securities lending.

167
30 June 2020
GAM Star Disruptive Growth
Portfolio Statement
Holdings Description Fair ValueUS$
Net Assets%
Equities Unquoted*
1,618,760 Afiniti International Class C Pref.** 5,285,252 1.83
49,739 Afiniti International Class D Pref.** 4,574,993 1.58
9,860,245 3.41
Holdings Description Counterparty Fair ValueUS$
Net Assets%
Contract for Difference
6,370 Alphabet CFDs JP Morgan 1,625,178 0.56
Unrealised gain on Contracts for Difference 1,625,178 0.56
1,625,178 0.56
Purchase Currency
Contractual Amount
SaleCurrency
ContractualAmount
MaturityDate
Counterparty Unrealised Gain/(Loss)
US$
Net Assets%
Open Forward Contracts
GBP 427,600 USD (520,757) 2020-07-08 Bank of America 7,604 0.01
USD 573,409 GBP (459,600) 2020-07-08 Bank of America 5,507 0.00
EUR 33,000 USD (36,051) 2020-07-08 Bank of America 1,017 0.00
USD 39,300 EUR (34,800) 2020-07-08 Bank of America 210 0.00
USD 8,690 GBP (7,000) 2020-08-10 Bank of America 39 0.00
USD 563 EUR (500) 2020-08-10 Bank of America 1 0.00
USD 562 EUR (500) 2020-08-10 Bank of America – (0.00)
USD 333 EUR (300) 2020-07-08 Bank of America (4) (0.00)
EUR 2,100 USD (2,368) 2020-07-08 Bank of America (8) (0.00)
USD 4,923 GBP (4,000) 2020-07-08 Bank of America (20) (0.00)
USD 6,143 GBP (5,000) 2020-08-10 Bank of America (36) (0.00)
EUR 34,000 USD (38,437) 2020-08-10 Bank of America (218) (0.00)
GBP 36,000 USD (45,301) 2020-07-08 Bank of America (818) (0.00)
GBP 452,600 USD (564,719) 2020-08-10 Bank of America (5,350) (0.00)
Unrealised gain on Open Forward Contracts 14,378 0.01
Unrealised loss on Open Forward Contracts (6,454) (0.00)
7,924 0.01
* Level 3 investments. ** Valued using Market Approach.

168
30 June 2020
GAM Star Disruptive Growth
Portfolio Statement
Fair ValueUS$
Net Assets%
Net Financial Assets and Liabilities at fair value 253,083,399 87.50
Net Current Assets (excluding Financial Assets and Financial Liabilities at fair value) 36,157,786 12.50
Net assets attributable to the shareholders of the Fund 289,241,185 100.00
Analysis of Total Assets %
Transferable securities admitted to official stock exchange listing 82.45
Other transferable securities of the type referred to in Regulation 68(1)(a), (b) and (c) 3.37
OTC financial derivative instruments 0.56
Other Assets 13.62
100.00
In line with the requirements of the UCITS regulation S.I. No. 344/2017 the open Forward Contracts have been condensed in the Portfolio Statement based on the purchase and sale currency, maturity date, counterparty and unrealised gain or unrealised loss of the contract as at the year end.

169
30 June 2020
GAM Star Disruptive Growth
Portfolio Changes (Unaudited)
Major Purchases CostUS$
Micron Technology 21,080,732
BT Group 13,809,508
Akamai Technologies 12,838,997
Facebook 12,331,890
Netflix 11,400,554
Nortonlifelock 11,173,383
Amazon.Com 11,042,099
Infineon Technologies 10,054,650
Alibaba Group Holding-Sp ADR 9,552,745
Dada Nexus 9,402,563
Seagate Technology 9,181,349
Microsoft 8,602,850
Zillow Group 8,044,454
Cisco Systems 7,550,515
Zalando SE 7,546,209
Mastercard 6,967,696
Blue Prism Group 6,350,386
Omnicell 5,737,073
Guidewire Software 5,699,294
Jd.Com ADRs 5,642,232
PTC 5,576,353
Marvell Technology Group 5,516,403
Intuitive Surgical 5,409,438
Fanuc 5,392,016
Xilinx 5,031,503
New Relic 4,989,502
Tencent Holdings 4,861,622
Pinterest 4,699,983
Visa 4,542,061
Plus500 4,304,476
Walt Disney Co 4,234,693
Netcompany Group 4,080,621
Siltronic 4,033,256
ASML Holding 3,838,532
Total for the financial year 260,519,638
Major Sales ProceedsUS$
Micron Technology 22,582,479
Microsoft 21,892,722
Seagate Technology 15,364,336
Visa 14,317,023
Mastercard 13,382,268
Cisco Systems 13,139,322
Nortonlifelock 12,253,952
Facebook 10,909,241
Dada Nexus 10,702,166
Infineon Technologies 10,315,319
ASML Holding 10,253,554
Docusign 10,052,013
Xilinx 10,033,132
Netcompany Group 9,664,171
Walt Disney Co 9,578,831
Zalando SE 8,254,639
Amazon.Com 8,239,929
Zillow Group 7,332,364
Blue Prism Group 7,139,579
Afterpay 6,596,848
Netflix 6,057,612
Siltronic 5,944,513
PayPal Holdings 5,930,999
Meituan Dianping 5,207,769
Pegasystems 5,178,797
Accenture 4,990,212
Monolithic Power Systems 4,810,271
Tencent Holdings 4,647,584
Wix.com 4,449,343
Alibaba Group Holding-Sp ADR 4,381,227
Costco Wholesale 4,119,032
Intuitive Surgical 4,053,492
Dropbox 3,797,191
Adobe Inc 3,721,533
Proofpoint 3,656,413
Roku 3,519,366
Total for the financial year 306,469,242

170
30 June 2020
GAM Star US All Cap EquityFund Manager: Ali Miremadi and Kevin Kruczynski
Commentary (Unaudited)
The Fund (as measured by the USD Accumulation Class) rose 6.1% over the year to 30 June 2020, compared to its benchmark, the S&P 500 in USD which rose 7.5%.
July was a month which sparked much debate on the matter of the “cycle”. On the last day of the month the Federal Reserve cut overnight rates by 25 bps – the first cut since the financial crisis – and accompanied it with the comment that this is a “mid-cycle adjustment”. The meaning of this seemingly innocuous phrase has been discussed and interpreted by financial market commentators. August proved to be an eventful month for markets, with trade tensions once again being the focus of attention. Against a backdrop of mostly unhelpful rhetoric from both Washington and Beijing, the Chinese yuan fell against the US dollar, stoking fears that China was triggering a currency war by depreciating its currency to help offset the impact of US tariffs. September was a fascinating month for US equities, even by the standards of the absorbing period which has prevailed over the past few years. At a macro level, the world’s two most important central banks – the Federal Reserve (Fed) and European Central Bank (ECB) – took further steps back towards unconventional monetary policy. The ECB has been unable to raise rates at all, but last month but overnight rates further and announced recommencement of quantitative easing on a potentially unlimited basis. In the small print of the announcement, they also granted eurozone banks some small relief from the agony of negative deposit rates with a tiering system. The Fed also cut rates, despite the US economy being at full employment, perhaps in recognition of the manufacturing recession that has prevailed for the past year and the increasing signs of stress from the trade war with China.
Notwithstanding the reversion of the crude price itself, energy was the sector with the greatest positive relative return for the Fund in September.
The fourth quarter of 2019 was positive and December saw a strong end to the calendar year. On a relative basis our holdings in materials, energy and consumer staples were all positive contributors. During the month we sold out of BlackRock while adding a new position in Trip.com. Analysts estimate that there will be 12 million additional international travellers each year, which will lead to a doubling of international trips over the next five years. Trip.com is well placed to continue to gain market share as the vast majority of this incremental demand will flow through online travel agencies, which should also help fuel margin expansion. The share price has been subdued in recent quarters as the situation in Hong Kong has hindered growth, and there have been some concerns that we could see a step up in competitive intensity in the domestic hotel market. This has allowed us to buy shares at less than 20x forward earnings, which is well below its long-term average of above 30x.
A cocktail of events dominated the debate scene during January. There were political events, such as the US and China reaching the end of the beginning of their trade dispute; the UK similarly arriving at the beginning of the end of its membership of the European Union; military events such as the assassination of General Solemani of Iran by the US; and a health event with the beginning of the coronavirus in Wuhan and its growing spread around the world. There can be no doubt that February was a dramatic month for US equities. Markets began to respond to the potential financial implications of the coronavirus on 19 February, at which point the S&P500 Index was up around 4% for the year. March 2020 is a month that will live long in the memory. Readers will know all about the spread of coronavirus and associated Covid-19 cases around the world, and how the response in the US in particular was somewhat staggered, meaning that the country is perhaps at an earlier stage in dealing with the crisis than places further to the east. In this monthly report, therefore, we will focus instead on the impact on our portfolio companies, how they are responding to rapidly changing conditions and the changes that we have made as opportunities have presented themselves.
April was a strong month for US equities, as a series of historic market events continue to take effect. After equity markets fell into a fast bear market from the beginning of the Covid-19 impact in mid-February, we have now a similarly fast-paced correction. There has been much discussion among economists and market strategists about what shape we can expect recovery to take as the world struggles through the next stages of “lockdown”. If we use global equity prices as an indicator, however, the results are already in – a fall over a month between February and March of this year has been succeeded by a vertiginous rally from the low point. Last month, the S&P 500 index increased, with the Fund also rising, but underperforming the benchmark. US equities continued their recovery from the March lows in June, with the S&P 500 Index rising and the Fund fractionally ahead. The ongoing rally has two principal drivers behind it, in our view. One is the commitment from global central banks to provide liquidity to both the real economy and financial markets. The actions of the Federal Reserve (Fed) in particular have been interpreted by many fixed income investors as meaning that the Fed will act as a backstop. This view, which itself may be overly simplistic, clearly does not apply directly to equities, but it still provides a “risk on” backdrop. Secondly, there is an increased sense of optimism about an eventual economic recovery going forward. While the US seems in parts of the country to be struggling to contain further outbreaks of the coronavirus, economic statistics such as employment figures show early signs of being ahead of expectations. Regardless of short-term economic data over the long term, we believe it is growth in earnings of the companies in the portfolio that will determine returns, and this is where our focus is heavily concentrated. At the index level, valuations are now quite full for equities on more or less every measure, other than when compared to the very low level of long-term interest rates. Therefore, it behoves investors to be vigilant about avoiding either lower quality companies or indeed stocks on prohibitively high multiples. We continue to focus on businesses that we expect to grow throughout this difficult economic period.
The top three holdings contributing to performance were Microsoft, Amazon and Alibaba. The bottom three performers were CF Industries, Nutrien and Booking Holdings.
July 2020

171
30 June 2020
GAM Star US All Cap Equity
Portfolio Statement
Analysis, by geographical area30 June2020 %
30 June2019 %
United States 86.47 88.72
China 8.57 1.53
Canada – 3.50
Belgium – 2.83
Currency Forwards 0.01 0.00
Net Current Assets 4.95 3.42
100.00 100.00
Analysis, by industry sector30 June2020 %
30 June2019 %
Software & Services 27.59 16.85
Health Care Equipment & Services 15.92 9.98
Retailing 14.98 8.39
Media & Entertainment 10.10 5.13
Food Beverage & Tobacco 10.05 10.62
Pharmaceuticals & Biotechnology 5.77 5.30
Household & Personal Products 4.24 1.79
Consumer Durables & Apparel 3.63 5.05
Commercial & Professional Services 1.25 1.02
Transportation 1.25 4.50
Capital Goods 0.26 1.82
Materials – 13.74
Energy – 10.44
Diversified Financials – 1.95
Currency Forwards 0.01 0.00
Net Current Assets 4.95 3.42
100.00 100.00
Analysis, by investment30 June2020 %
30 June2019 %
Equities Quoted 95.04 96.58
Currency Forwards 0.01 0.00
Net Current Assets 4.95 3.42
100.00 100.00

172
30 June 2020
GAM Star US All Cap Equity
Portfolio Statement
Holdings Description Fair ValueUS$
Net Assets%
Equities Quoted
31,970 Microsoft 6,506,215 9.64
26,744 Visa 5,166,138 7.65
21,606 Alibaba Group Holding-Sp ADR 4,660,414 6.90
2,691 Alphabet Inc Com. A 3,815,973 5.65
14,721 Becton Dickinson 3,522,294 5.22
1,204 Amazon.Com 3,321,619 4.92
47,507 CVS Health 3,086,530 4.57
39,030 Colgate-Palmolive 2,859,338 4.24
49,282 Mondelez International 2,519,789 3.73
8,129 Mastercard 2,403,745 3.56
17,925 PepsiCo 2,370,760 3.51
10,183 Facebook 2,312,254 3.43
22,962 Fiserv 2,241,550 3.32
6,024 Thermo Fisher Scientific 2,182,736 3.23
23,275 Medtronic 2,134,318 3.16
42,391 Coca-Cola Co 1,894,030 2.81
12,202 Johnson & Johnson 1,715,967 2.54
5,186 Intuit 1,536,041 2.28
15,377 NIKE 1,507,715 2.23
37,764 Boston Scientific 1,325,894 1.96
18,672 Jd.Com ADRs 1,123,681 1.66
894 AutoZone 1,008,539 1.49
15,331 Lennar A 944,696 1.40
4,909 Equifax 843,759 1.25
7,588 United Parcel Service B 843,634 1.25
1,778 Adobe Inc 773,981 1.15
5,209 Electronic Arts 687,848 1.02
1,191 Intuitive Surgical 678,668 1.01
3,653 Cubic 175,454 0.26
64,163,580 95.04
Purchase Currency
Contractual Amount
SaleCurrency
ContractualAmount
MaturityDate
Counterparty Unrealised Gain/(Loss)
US$
Net Assets%
Open Forward Contracts
EUR 136,400 USD (149,006) 2020-07-08 Bank of America 4,211 0.01
USD 163,070 EUR (144,400) 2020-07-08 Bank of America 867 0.00
USD 2,251 EUR (2,000) 2020-08-10 Bank of America 3 0.00
USD 3,368 EUR (3,000) 2020-08-10 Bank of America (4) (0.00)
USD 1,114 EUR (1,000) 2020-07-08 Bank of America (10) (0.00)
EUR 9,000 USD (10,153) 2020-07-08 Bank of America (44) (0.00)
EUR 139,400 USD (157,582) 2020-08-10 Bank of America (882) (0.00)
Unrealised gain on Open Forward Contracts 5,081 0.01
Unrealised loss on Open Forward Contracts (940) (0.00)
4,141 0.01

173
30 June 2020
GAM Star US All Cap Equity
Portfolio Statement
Fair ValueUS$
Net Assets%
Net Financial Assets and Liabilities at fair value 64,167,721 95.05
Net Current Assets (excluding Financial Assets and Financial Liabilities at fair value) 3,342,668 4.95
Net assets attributable to the shareholders of the Fund 67,510,389 100.00
Analysis of Total Assets %
Transferable securities admitted to official stock exchange listing 93.77
OTC financial derivative instruments 0.01
Other Assets 6.22
100.00
In line with the requirements of the UCITS regulation S.I. No. 344/2017 the open Forward Contracts have been condensed in the Portfolio Statement based on the purchase and sale currency, maturity date, counterparty and unrealised gain or unrealised loss of the contract as at the year end.
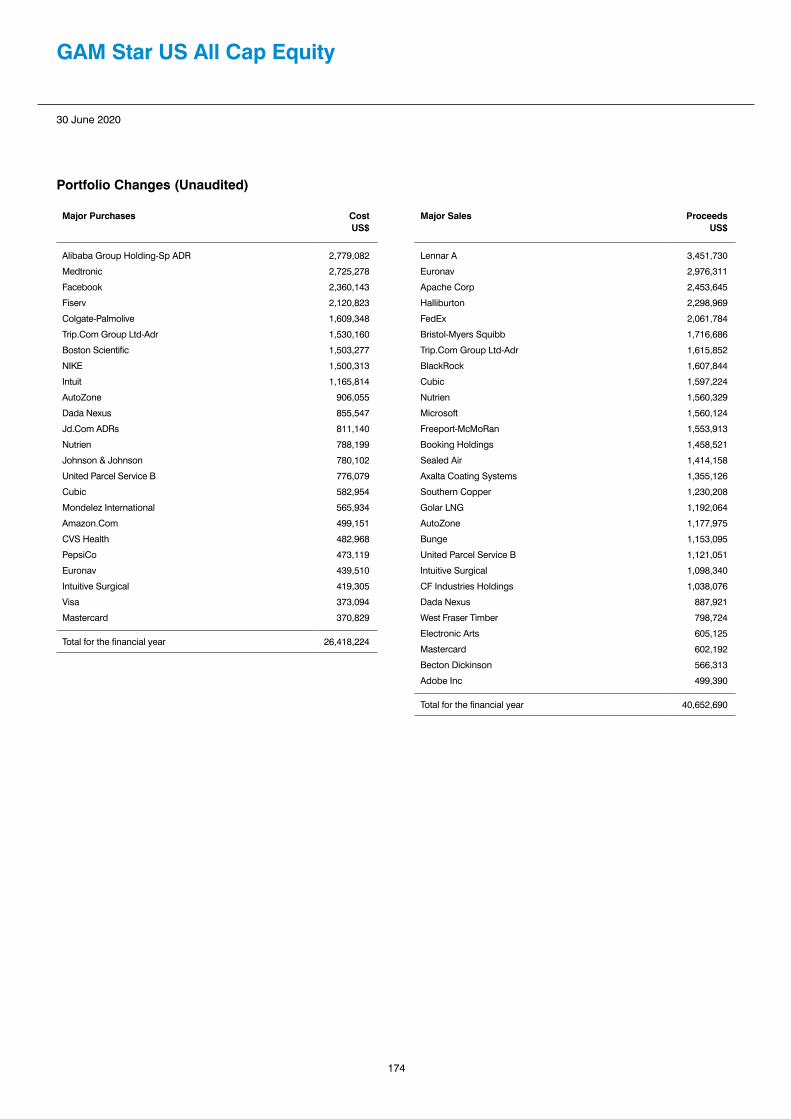
174
30 June 2020
GAM Star US All Cap Equity
Portfolio Changes (Unaudited)
Major Purchases CostUS$
Alibaba Group Holding-Sp ADR 2,779,082
Medtronic 2,725,278
Facebook 2,360,143
Fiserv 2,120,823
Colgate-Palmolive 1,609,348
Trip.Com Group Ltd-Adr 1,530,160
Boston Scientific 1,503,277
NIKE 1,500,313
Intuit 1,165,814
AutoZone 906,055
Dada Nexus 855,547
Jd.Com ADRs 811,140
Nutrien 788,199
Johnson & Johnson 780,102
United Parcel Service B 776,079
Cubic 582,954
Mondelez International 565,934
Amazon.Com 499,151
CVS Health 482,968
PepsiCo 473,119
Euronav 439,510
Intuitive Surgical 419,305
Visa 373,094
Mastercard 370,829
Total for the financial year 26,418,224
Major Sales ProceedsUS$
Lennar A 3,451,730
Euronav 2,976,311
Apache Corp 2,453,645
Halliburton 2,298,969
FedEx 2,061,784
Bristol-Myers Squibb 1,716,686
Trip.Com Group Ltd-Adr 1,615,852
BlackRock 1,607,844
Cubic 1,597,224
Nutrien 1,560,329
Microsoft 1,560,124
Freeport-McMoRan 1,553,913
Booking Holdings 1,458,521
Sealed Air 1,414,158
Axalta Coating Systems 1,355,126
Southern Copper 1,230,208
Golar LNG 1,192,064
AutoZone 1,177,975
Bunge 1,153,095
United Parcel Service B 1,121,051
Intuitive Surgical 1,098,340
CF Industries Holdings 1,038,076
Dada Nexus 887,921
West Fraser Timber 798,724
Electronic Arts 605,125
Mastercard 602,192
Becton Dickinson 566,313
Adobe Inc 499,390
Total for the financial year 40,652,690

175
30 June 2020
GAM Star Worldwide EquityFund Manager: Ali Miremadi and Kevin Kruczynski
Commentary (Unaudited)
The Fund (as measured by the USD Accumulation Class) rose 0.4% over the year to 30 June 2020, compared to its benchmark, the MSCI World index in USD which rose 3.4%.
July was a month which sparked much debate on the matter of the “cycle”. On the last day of the month the Federal Reserve cut overnight rates by 25 bps – the first cut since the financial crisis – and accompanied it with the comment that this is a “mid-cycle adjustment”. The meaning of this seemingly innocuous phrase has been discussed and interpreted by financial market commentators. August proved to be an eventful month for markets, with trade tensions once again being the focus of attention. Against a backdrop of mostly unhelpful rhetoric from both Washington and Beijing, the Chinese yuan fell against the US dollar, stoking fears that China was triggering a currency war by depreciating its currency to help offset the impact of US tariffs. September was a fascinating month for US equities, even by the standards of the absorbing period which has prevailed over the past few years. At a macro level, the world’s two most important central banks – the Federal Reserve (Fed) and European Central Bank (ECB) – took further steps back towards unconventional monetary policy. The ECB has been unable to raise rates at all, but last month but overnight rates further and announced recommencement of quantitative easing on a potentially unlimited basis. In the small print of the announcement, they also granted eurozone banks some small relief from the agony of negative deposit rates with a tiering system. The Fed also cut rates, despite the US economy being at full employment, perhaps in recognition of the manufacturing recession that has prevailed for the past year and the increasing signs of stress from the trade war with China.
The fourth quarter of 2019 was positive and December saw a strong end to the calendar year. Better mood music between the US and China helped this along, though perhaps the most striking feature was that December was a strong month to conclude a remarkably positive year for global equities On a relative basis our Chinese e-commerce holdings Alibaba and Tencent were positive contributors, as was the oil tanker owner Euronav, oil company Apache and new holding Trainline in the UK, the latter being perhaps a beneficiary of the defeat of the Labour Party in the UK general election during the month. The biggest drags on relative performance were Lennar, Unilever and UPS. We remain positive on all three holdings and indeed added to Lennar and Unilever during the month on weakness. During December we sold out of Heidelberg entirely, as well as reducing our holdings in CRH and Euronav after strong performance. We made three new investments, in Reliance Industries, Trip.com and Trainline.
A cocktail of events dominated the debate scene during January. There were political events, such as the US and China reaching the end of the beginning of their trade dispute; the UK similarly arriving at the beginning of the end of its membership of the European Union; military events such as the assassination of General Solemani of Iran by the US; and a health event with the beginning of the coronavirus in Wuhan and its growing spread around the world. There can be no doubt that February was a dramatic month for US equities. Markets began to respond to the potential financial implications of the coronavirus on 19 February, at which point the S&P500 Index was up around 4% for the year. March 2020 is a month that will live long in the memory. Readers will know all about the spread of coronavirus and associated Covid-19 cases around the world, and how the response in the US in particular was somewhat staggered, meaning that the country is perhaps at an earlier stage in dealing with the crisis than places further to the east. In this monthly report, therefore, we will focus instead on the impact on our portfolio companies, how they are responding to rapidly changing conditions and the changes that we have made as opportunities have presented themselves.
April was a strong month for US equities, as a series of historic market events continue to take effect. After equity markets fell into a fast bear market from the beginning of the Covid-19 impact in mid-February, we have now a similarly fast-paced correction. There has been much discussion among economists and market strategists about what shape we can expect recovery to take as the world struggles through the next stages of “lockdown”. If we use global equity prices as an indicator, however, the results are already in – a fall over a month between February and March of this year has been succeeded by a vertiginous rally from the low point. Last month, the S&P 500 index increased, with the Fund also rising, but underperforming the benchmark. Global equities continued to push higher in June. The ongoing rally has two principal drivers behind it, in our view. One is the commitment from global central banks to provide liquidity to both the real economy and financial markets. The actions of the Federal Reserve (Fed) in particular have been interpreted by many fixed income investors as meaning that the Fed will act as a backstop. This view, which itself may be overly simplistic, clearly does not apply directly to equities, but it still provides a “risk on” backdrop. Secondly, the indications from the reopening of economies around the world have been broadly more encouraging than many had expected. Over the long term, we believe it is growth in earnings of the companies in the portfolio that will determine returns, and this is where our focus is heavily concentrated. At the index level, valuations are now quite full for equities on more or less every measure, other than when compared to the very low level of long--term interest rates. Therefore, it behoves investors to be vigilant about avoiding either lower quality companies or indeed stocks on prohibitively high multiples. We continue to focus on businesses that we expect to grow throughout this difficult economic period.
The top three holdings contributing to performance were Microsoft, Afterpay and Alibaba. The bottom three performers were Nutrien, ING Groep and Dalata Hotel.
July 2020

176
30 June 2020
GAM Star Worldwide Equity
Portfolio Statement
Analysis, by geographical area30 June2020 %
30 June2019 %
United States 44.07 35.13
United Kingdom 18.04 4.56
China 12.97 5.41
India 6.07 1.47
Germany 5.15 9.20
Ireland 4.02 4.04
Switzerland 2.83 3.35
Australia 1.73 1.84
Japan – 2.18
France – 6.19
Canada – 6.65
Netherlands – 3.33
Italy – 4.01
Belgium – 5.03
Sweden – 1.84
Norway – 1.19
Currency Forwards 0.03 –
Net Current Assets 5.09 4.58
100.00 100.00
Analysis, by industry sector30 June2020 %
30 June2019 %
Software & Services 17.44 5.23
Household & Personal Products 14.61 4.86
Retailing 10.70 1.55
Health Care Equipment & Services 10.45 6.65
Media & Entertainment 9.63 7.26
Food Beverage & Tobacco 7.11 7.30
Capital Goods 4.30 2.43
Consumer Durables & Apparel 4.17 8.24
Energy 3.81 12.36
Real Estate 3.78 3.81
Banks 2.26 11.27
Materials 2.05 12.43
Consumer Services 1.97 –
Diversified Financials 1.37 1.42
Transportation 1.23 6.33
Telecommunication Services – 2.00
Insurance – 1.47
Semiconductors & Semiconductor Equipment – 0.81
Currency Forwards 0.03 –
Net Current Assets 5.09 4.58
100.00 100.00
Analysis, by investment30 June2020 %
30 June2019 %
Equities Quoted 94.88 95.42
Currency Forwards 0.03 –
Net Current Assets 5.09 4.58
100.00 100.00

177
30 June 2020
GAM Star Worldwide Equity
Portfolio Statement
Holdings Description Fair ValueUS$
Net Assets%
Equities Quoted
23,270 Microsoft 4,735,678 7.92
148,800 Alibaba Group Holding 4,024,086 6.73
35,927 Reckitt Benckiser Group 3,299,171 5.52
56,555 Unilever Plc 3,043,248 5.09
96,050 Bunzl 2,570,597 4.30
1,780 Alphabet Inc Com. A 2,524,129 4.22
37,823 CVS Health 2,457,360 4.11
32,627 Colgate-Palmolive 2,390,254 4.00
45,046 Mondelez International 2,303,202 3.85
49,277 Reliance Inds-Spons Gdr 144a 2,276,597 3.81
114,133 Deutsche Konsum REIT-AG 2,262,527 3.79
32,900 Tencent Holdings 2,116,514 3.54
8,558 Becton Dickinson 2,047,673 3.43
20,360 Fiserv 1,987,543 3.32
14,740 PepsiCo 1,949,512 3.26
19,000 Medtronic 1,742,300 2.91
26,487 Cie Financiere Richemont 1,689,488 2.83
95,830 HDFC Bank 1,352,786 2.26
6,937 Visa 1,340,020 2.24
4,477 Intuit 1,326,043 2.22
35,843 CRH 1,227,840 2.05
367,274 Dalata Hotel Group 1,175,636 1.97
171,514 Auto Trader Group 1,115,562 1.87
24,614 Afterpay 1,033,581 1.73
16,848 Jd.Com ADRs 1,013,913 1.70
14,133 Creditshelf 817,484 1.37
13,026 Lennar A 802,662 1.34
140,555 Trainline 754,422 1.26
6,629 United Parcel Service B 737,012 1.23
20,100 JD.com HKD 601,150 1.01
56,717,990 94.88
Purchase Currency
Contractual Amount
SaleCurrency
ContractualAmount
MaturityDate
Counterparty Unrealised Gain/(Loss)
US$
Net Assets%
Open Forward Contracts
EUR 622,200 USD (679,714) 2020-07-08 Bank of America 19,196 0.03
USD 740,757 EUR (656,100) 2020-07-08 Bank of America 3,768 0.00
GBP 78,500 USD (95,609) 2020-07-08 Bank of America 1,388 0.00
USD 105,805 GBP (84,800) 2020-07-08 Bank of America 1,023 0.00
USD 2,110 GBP (1,700) 2020-08-10 Bank of America 9 0.00
USD 1,233 GBP (1,000) 2020-08-10 Bank of America (3) (0.00)
USD 18,866 EUR (16,800) 2020-08-10 Bank of America (19) (0.00)
USD 1,463 GBP (1,200) 2020-07-08 Bank of America (19) (0.00)
GBP 7,500 USD (9,435) 2020-07-08 Bank of America (167) (0.00)
EUR 43,300 USD (48,814) 2020-07-08 Bank of America (176) (0.00)
USD 10,249 EUR (9,400) 2020-07-08 Bank of America (309) (0.00)

178
30 June 2020
GAM Star Worldwide Equity
Portfolio Statement
Purchase Currency
Contractual Amount
SaleCurrency
ContractualAmount
MaturityDate
Counterparty Unrealised LossUS$
Net Assets%
Open Forward Contracts, continued
GBP 82,900 USD (103,425) 2020-08-10 Bank of America (969) (0.00)
EUR 513,500 USD (580,471) 2020-08-10 Bank of America (3,245) (0.00)
Unrealised gain on Open Forward Contracts 25,384 0.03
Unrealised loss on Open Forward Contracts (4,907) (0.00)
20,477 0.03
Fair ValueUS$
Net Assets%
Net Financial Assets and Liabilities at fair value 56,738,467 94.91
Net Current Assets (excluding Financial Assets and Financial Liabilities at fair value) 3,040,074 5.09
Net assets attributable to the shareholders of the Fund 59,778,541 100.00
Analysis of Total Assets %
Transferable securities admitted to official stock exchange listing 94.23
OTC financial derivative instruments 0.04
Other Assets 5.73
100.00
In line with the requirements of the UCITS regulation S.I. No. 344/2017 the open Forward Contracts have been condensed in the Portfolio Statement based on the purchase and sale currency, maturity date, counterparty and unrealised gain or unrealised loss of the contract as at the year end.

179
30 June 2020
GAM Star Worldwide Equity
Portfolio Changes (Unaudited)
Major Purchases CostUS$
Alibaba Group Holding 4,141,807
Reckitt Benckiser Group 3,178,625
Bunzl 2,993,591
Alibaba Group Holding-Sp ADR 2,403,883
Alphabet Inc Com. A 2,328,494
Medtronic 2,271,942
Reliance Inds-Spons Gdr 144a 2,134,748
Dalata Hotel Group 2,031,529
Fiserv 1,837,234
Unilever Plc 1,419,426
Colgate-Palmolive 1,376,806
Trip.Com Group 1,359,418
Visa 1,256,615
HDFC Bank 1,166,403
BNP Paribas 1,021,532
Intuit 958,540
Microsoft 957,826
Trainline 882,647
CVS Health 766,020
Dada Nexus 760,610
Jd.Com ADRs 697,237
UniCredit 695,939
ING Groep 694,088
JD.com HKD 599,101
Total for the financial year 37,934,061
Major Sales ProceedsUS$
Alibaba Group Holding-Sp ADR 4,685,344
Lennar A 3,321,900
BNP Paribas 3,320,610
Euronav 3,295,662
Nutrien 2,513,350
CRH 2,226,552
ING Groep 2,210,199
Apache Corp 2,193,502
Halliburton 2,180,750
Tencent Holdings 1,842,252
Compagnie De Saint Gobain 1,831,516
Afterpay 1,816,122
UniCredit 1,754,870
Nordic Entertainment Group 1,717,308
United Parcel Service B 1,623,278
Telecom Italia 1,609,313
Sumitomo Mitsui Financial 1,523,783
Trip.Com Group 1,447,893
FedEx 1,315,303
Heidelbergcement 1,190,644
Golar LNG 1,133,177
Ion Beam Applications 1,101,383
Deutsche Post 1,086,564
ICICI Prudential Life Insurance 1,060,928
Dada Nexus 789,357
Flex 786,469
Bunge 770,551
Deutsche Konsum REIT-AG 720,452
Infineon Technologies 673,708
Microsoft 653,245
Bunzl 587,147
Total for the financial year 52,983,132

180
30 June 2020
GAM Systematic Dynamic CreditFund Manager: GAM Systematic LLP
Commentary (Unaudited)
The Fund (as measured by the EUR Accumulation Class) fell 4.2% over the year to 30 June 2020, compared to its benchmark, the 3 Month Libor in EUR which fell 0.6%.
July was a relatively quiet month while August was a choppy one for credit markets. In September, US, European and emerging market (EM) credit markets started showing significant regional dispersion. Nonetheless, September was a relatively rangebound month for credit markets. Both CDX high yield (HY) and iTraxx Europe Crossover spreads tightened initially, but the tightening was more muted in Europe than in the US. In the second half of the month, spreads rose again and regional differences increased. European spreads rose sharply to finish the month above, whereas US HY spreads finished the month lower than at the end of August.
The fourth quarter of 2019 marked the end of the first year of trading for GAM Systematic Dynamic Credit. It was a good quarter for credit markets, with corporate credit spreads tightening across ratings, and especially in the US. The portfolio finished the year with strong positive December performance, returning a total of 5.2% year-to-date in its first year since inception.
With the late January drawdown at the start of quarter one of 2020, in February credit markets began with a recovery. Corporate credit spreads gradually tightened in the first three weeks of the month, supported by better-than-expected US labour market data. March saw the emergence of strong bear-market sentiment in global credit markets. However, the accelerating number of reported Covid-19 cases in the US and Europe escalated fears of a global pandemic and triggered sharp credit sell-offs.
Developments around the Covid-19 global economic crisis continued to drive credit market sentiment in the second quarter of 2020. Credit market sentiment continued to improve during the quarter as the US and major European economies started to reopen from lockdown. Despite a positive start, driven by strong employment data, June marked the point where the recovery stumbled. Weak economic data from China, combined with increasing concerns about a second wave of Covid-19, acted to dampen market sentiment.
July 2020
Portfolio Statement
Analysis, by geographical area30 June2020 %
30 June2019 %
United States 61.83 62.29
Credit Default Swaps 0.52 4.76
Futures – Interest Rates 0.05 0.08
Currency Forwards 1.52 0.78
Net Current Assets 36.08 32.09
100.00 100.00
Analysis, by industry sector30 June2020 %
30 June2019 %
Government Bonds 61.83 62.29
Credit Default Swaps 0.52 4.76
Futures – Interest Rates 0.05 0.08
Currency Forwards 1.52 0.78
Net Current Assets 36.08 32.09
100.00 100.00
Analysis of Credit Ratings (S&P)30 June
202030 June
2019
Government Bonds AA+ AA+

181
30 June 2020
GAM Systematic Dynamic Credit
Portfolio Statement
Holdings Description Fair ValueUS$
Net Assets%
Government Bonds
2,000,000 United States Treasury Bill 0% 2020-07-30 1,999,799 18.46
1,400,000 United States Treasury Bill 0% 2020-07-23 1,399,894 12.92
1,400,000 United States Treasury Bill 0% 2020-09-24 1,399,574 12.92
1,300,000 United States Treasury Bill 0% 2020-07-16 1,299,932 12.00
500,000 United States Treasury Bill 0% 2020-08-20 499,914 4.61
100,000 United States Treasury Bill 0% 2020-07-02 100,000 0.92
6,699,113 61.83
Holdings Description Counterparty Fair ValueUS$
Net Assets%
Futures – Interest Rates
12 US 10Yr Note Futures (CBT) 2020-09-21 Morgan Stanley 3,578 0.03
2 Euro-Bund Futures (EUR) 2020-09-08 Morgan Stanley 1,629 0.02
Unrealised gain on Futures – Interest Rates 5,207 0.05
5,207 0.05
Credit Default Swaps
2,771,000 CDS Index ITRAXX Morgan Stanley 160,712 1.48
110,000 CDS Company Anglo American Plc Morgan Stanley 22,654 0.21
620,000 CDS Index ITRAXX Morgan Stanley 11,591 0.11
641,000 CDS Index CDX Morgan Stanley 7,602 0.07
56,000 CDS Company Thyssenkrupp AG Morgan Stanley 6,785 0.06
55,000 CDS Company Centurylink Inc. Morgan Stanley 6,446 0.06
53,000 CDS Company Freeport-Mcmoran Inc. Morgan Stanley 4,188 0.04
179,000 CDS Index ITRAXX Morgan Stanley 2,044 0.02
36,000 CDS Company Airbus SE Morgan Stanley 294 0.00
108,000 CDS Company British Telecommunications Plc Morgan Stanley 50 0.00
2,000 CDS Company Vodafone Group Plc Morgan Stanley 35 0.00
2,000 CDS Company AT&T Inc. Morgan Stanley 16 0.00
129,000 CDS Company Enbridge Inc. Morgan Stanley 12 0.00
13,000 CDS Company Daimler AG Morgan Stanley 10 0.00
1,000 CDS Company Imperial Brands Plc Morgan Stanley 7 0.00
2,000 CDS Company Canadian Natural Resources Limited Morgan Stanley 3 0.00
7,000 CDS Company Ryder Morgan Stanley (49) (0.00)
32,000 CDS Company Telefonica S.A. Morgan Stanley (201) (0.00)
98,000 CDS Company Repsol S.A. Morgan Stanley (232) (0.00)
44,000 CDS Company BP Plc Morgan Stanley (274) (0.00)
20,000 CDS Company Verizon Communications Inc. Morgan Stanley (289) (0.00)
12,000 CDS Company Arrow Electronics Inc. Morgan Stanley (290) (0.00)
24,000 CDS Company Anheuser-Busch Inbev Morgan Stanley (309) (0.00)
22,000 CDS Company Domtar Corporation Morgan Stanley (390) (0.00)
22,000 CDS Company Avnet Inc. Morgan Stanley (414) (0.00)
34,000 CDS Company Volkswagen AG Morgan Stanley (458) (0.00)
12,000 CDS Company Target Corporation Morgan Stanley (471) (0.00)
31,000 CDS Company Devon Energy Corporation Morgan Stanley (904) (0.01)
25,000 CDS Company Johnson & Johnson Morgan Stanley (945) (0.01)
69,000 CDS Company Royal Dutch Shell Plc Morgan Stanley (1,246) (0.01)

182
30 June 2020
GAM Systematic Dynamic Credit
Portfolio Statement
Holdings Description Counterparty Fair ValueUS$
Net Assets%
Credit Default Swaps, continued
133,000 CDS Company Tesco Plc Morgan Stanley (1,293) (0.01)
53,000 CDS Company General Electric Company Morgan Stanley (1,983) (0.02)
106,000 CDS Company Enel S.P.A. Morgan Stanley (2,107) (0.02)
13,000 CDS Company Teck Resources Limited Morgan Stanley (2,187) (0.02)
43,000 CDS Company Telecom Italia SpA Morgan Stanley (2,536) (0.02)
63,000 CDS Company Dell Inc. Morgan Stanley (3,041) (0.03)
98,000 CDS Company Deutsche Telekom AG Morgan Stanley (3,359) (0.03)
111,000 CDS Company Conagra Brands Inc. Morgan Stanley (3,416) (0.03)
31,000 CDS Company Kohl’s Corporation Morgan Stanley (3,607) (0.03)
98,000 CDS Company Firstenergy Corp. Morgan Stanley (3,774) (0.04)
98,000 CDS Company Exelon Corporation Morgan Stanley (3,864) (0.04)
31,000 CDS Company The Aes Corporation Morgan Stanley (3,902) (0.04)
173,000 CDS Company Electricite De France Morgan Stanley (3,943) (0.04)
33,000 CDS Company Arcelormittal Morgan Stanley (3,958) (0.04)
31,000 CDS Company Virgin Media Finance Plc Morgan Stanley (4,020) (0.04)
171,000 CDS Company Naturgy Energy Group SA Morgan Stanley (4,052) (0.04)
98,000 CDS Index CDX Morgan Stanley (4,369) (0.04)
31,000 CDS Company Nordstrom Inc. Morgan Stanley (5,346) (0.05)
54,000 CDS Company The Gap Inc. Morgan Stanley (6,112) (0.06)
60,000 CDS Company Deutsche Lufthansa AG Morgan Stanley (6,237) (0.06)
63,000 CDS Company Xerox Corporation Morgan Stanley (6,987) (0.07)
55,000 CDS Company General Motors Company Morgan Stanley (7,468) (0.07)
63,000 CDS Company Rolls-Royce Plc Morgan Stanley (9,929) (0.09)
62,000 CDS Company Glencore International AG Morgan Stanley (10,422) (0.10)
55,000 CDS Company Cnh Industrial N.V. Morgan Stanley (10,495) (0.10)
1,768,000 CDS Index CDX Morgan Stanley (12,152) (0.11)
136,000 CDS Company Heidelbergcement AG Morgan Stanley (28,527) (0.26)
Unrealised gain on Credit Default Swaps 222,449 2.05
Unrealised loss on Credit Default Swaps (165,558) (1.53)
56,891 0.52
Purchase Currency
Contractual Amount
SaleCurrency
ContractualAmount
MaturityDate
Counterparty Unrealised Gain/(Loss)
US$
Net Assets%
Open Forward Contracts
EUR 4,468,700 USD (4,880,391) 2020-07-08 Bank of America 139,243 1.29
GBP 1,605,400 USD (1,955,152) 2020-07-08 Bank of America 28,550 0.26
USD 4,955,333 EUR (4,387,500) 2020-07-08 Bank of America 26,912 0.25
USD 2,014,072 GBP (1,614,400) 2020-07-08 Bank of America 19,249 0.17
CHF 9,800 USD (10,102) 2020-07-08 Bank of America 243 0.00
USD 64,939 EUR (57,700) 2020-08-10 Bank of America 78 0.00
USD 9,980 CHF (9,430) 2020-07-08 Bank of America 26 0.00
USD 22,271 GBP (18,000) 2020-08-10 Bank of America 25 0.00
USD 106 CHF (100) 2020-08-10 Bank of America – 0.00
USD 137 CHF (130) 2020-08-10 Bank of America – 0.00
USD 386 CHF (370) 2020-07-08 Bank of America (5) (0.00)
USD 51,347 EUR (45,700) 2020-08-10 Bank of America (24) (0.00)
EUR 52,200 USD (58,660) 2020-07-08 Bank of America (25) (0.00)

183
30 June 2020
GAM Systematic Dynamic Credit
Portfolio Statement
Purchase Currency
Contractual Amount
SaleCurrency
ContractualAmount
MaturityDate
Counterparty Unrealised LossUS$
Net Assets%
Open Forward Contracts, continued
CHF 9,430 USD (9,990) 2020-08-10 Bank of America (27) (0.00)
USD 23,450 GBP (19,000) 2020-08-10 Bank of America (32) (0.00)
USD 35,695 GBP (29,000) 2020-07-08 Bank of America (139) (0.00)
GBP 38,000 USD (47,652) 2020-07-08 Bank of America (698) (0.00)
USD 147,095 EUR (133,400) 2020-07-08 Bank of America (2,752) (0.03)
GBP 1,586,400 USD (1,979,240) 2020-08-10 Bank of America (18,604) (0.17)
EUR 4,312,100 USD (4,874,613) 2020-08-10 Bank of America (27,371) (0.25)
Unrealised gain on Open Forward Contracts 214,326 1.97
Unrealised loss on Open Forward Contracts (49,677) (0.45)
164,649 1.52
Fair ValueUS$
Net Assets%
Net Financial Assets and Liabilities at fair value 6,925,860 63.92
Net Current Assets (excluding Financial Assets and Financial Liabilities at fair value) 3,909,779 36.08
Net assets attributable to the shareholders of the Fund 10,835,639 100.00
Analysis of Total Assets %
Transferable securities dealt in on another regulated market 37.93
Other transferable securities of the type referred to in Regulation 68(1)(a), (b) and (c) 22.57
OTC financial derivative instruments 3.94
Financial derivative instruments dealt in on a regulated market 0.05
Other Assets 35.51
100.00
In line with the requirements of the UCITS regulation S.I. No. 344/2017 the open Forward Contracts have been condensed in the Portfolio Statement based on the purchase and sale currency, maturity date, counterparty and unrealised gain or unrealised loss of the contract as at the year end.
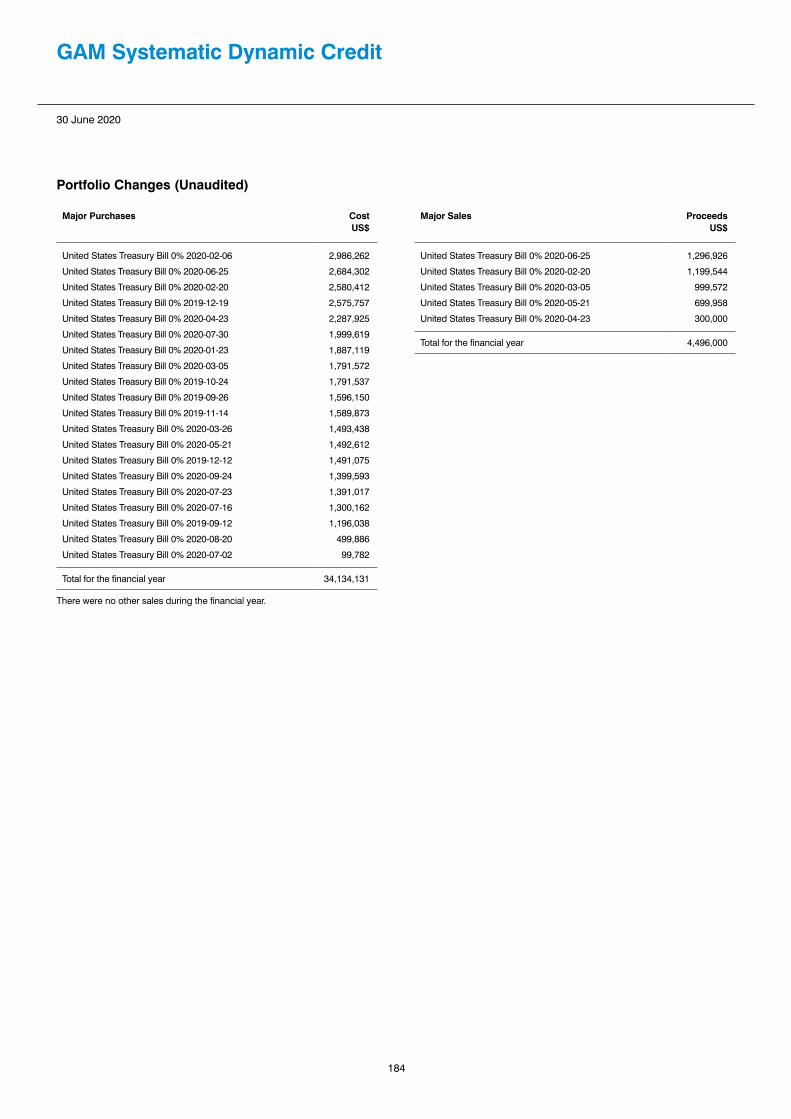
184
30 June 2020
GAM Systematic Dynamic Credit
Portfolio Changes (Unaudited)
Major Purchases CostUS$
United States Treasury Bill 0% 2020-02-06 2,986,262
United States Treasury Bill 0% 2020-06-25 2,684,302
United States Treasury Bill 0% 2020-02-20 2,580,412
United States Treasury Bill 0% 2019-12-19 2,575,757
United States Treasury Bill 0% 2020-04-23 2,287,925
United States Treasury Bill 0% 2020-07-30 1,999,619
United States Treasury Bill 0% 2020-01-23 1,887,119
United States Treasury Bill 0% 2020-03-05 1,791,572
United States Treasury Bill 0% 2019-10-24 1,791,537
United States Treasury Bill 0% 2019-09-26 1,596,150
United States Treasury Bill 0% 2019-11-14 1,589,873
United States Treasury Bill 0% 2020-03-26 1,493,438
United States Treasury Bill 0% 2020-05-21 1,492,612
United States Treasury Bill 0% 2019-12-12 1,491,075
United States Treasury Bill 0% 2020-09-24 1,399,593
United States Treasury Bill 0% 2020-07-23 1,391,017
United States Treasury Bill 0% 2020-07-16 1,300,162
United States Treasury Bill 0% 2019-09-12 1,196,038
United States Treasury Bill 0% 2020-08-20 499,886
United States Treasury Bill 0% 2020-07-02 99,782
Total for the financial year 34,134,131
There were no other sales during the financial year.
Major Sales ProceedsUS$
United States Treasury Bill 0% 2020-06-25 1,296,926
United States Treasury Bill 0% 2020-02-20 1,199,544
United States Treasury Bill 0% 2020-03-05 999,572
United States Treasury Bill 0% 2020-05-21 699,958
United States Treasury Bill 0% 2020-04-23 300,000
Total for the financial year 4,496,000

The accompanying notes form an integral part of these financial statements.
Balance Sheet As at 30 June 2020
Notes
GAM Star Fund p.l.c.
US$
GAM Star Absolute
Return Bond*
€
GAM Star Absolute
Return Bond
Defender*€
GAM Star Absolute
Return Bond Plus*
€
GAM Star Absolute
Return Macro*€
GAM Star Alpha
Spectrum€
GAM Star Alpha
TechnologyUS$
GAM Star Asian
EquityUS$
GAM Star Asia-Pacific
Equity*US$
Current assets
Cash and bank balances 14 296,760,974 – – – – 2,547,523 1,001,461 597,543 –
Margin cash 14 631,186,444 – – – – – 1,879,379 1,131 –
Amounts receivable for subscriptions 64,824,959 – – – – – – – –
Amounts receivable from brokers for sales of securities 26,677,808 – – – – – – 113,662 –
Bond interest receivable 69,308,143 – – – – – – – –
Dividend receivable 6,724,816 – – – – – 49,057 66,084 –
Other receivables 109,440 – – – – – – – –
Financial assets at fair value 4 10,776,309,236 – – – – 56,966,534 30,765,770 28,946,614 –
Total current assets 11,871,901,820 – – – – 59,514,057 33,695,667 29,725,034 –
Current liabilities
Amounts payable for redemptions (84,783,528) – – – – – (14,826) (5,031) –
Amounts payable to brokers for purchases of securities (28,852,451) – – – – – – – –
Accrued expenses (23,321,271) – – – – (73,323) (254,208) (101,157) –
Financial liabilities at fair value 4 (67,657,027) – – – – (72,088) (2,377,115) – –
Bank overdraft 14 (1,947,746) – – – – – (12) (11) –
Amounts due to broker 14 (30,102,489) – – – – (1) – – –
Distribution payable on income shares (31,397,569) – – – – – – – –
Interest payable (249,210) – – – – – (12,378) – –
Capital gains tax payable 2(k) (53,421) – – – – – – – –
Total liabilities (excluding net assets attributable to holders of redeemable participating shares) (268,364,712) – – – – (145,412) (2,658,539) (106,199) –
Net assets attributable to holders of redeemable participating shares 11,603,537,108 – – – – 59,368,645 31,037,128 29,618,835 –
Director: Daniel O’Donovan Director: Andrew Bates
27 October 2020
Cross holdings in other GAM Star Funds of (US$266,350,952) in financial assets at fair value have been eliminated from the Company total.
* Fund terminated during the year.
185

The accompanying notes form an integral part of these financial statements.
Balance SheetAs at 30 June 2020, continued
Notes
GAM Star Global
Balanced**£
GAM Star Capital
Appreciation US Equity
US$
GAM Star Cat
BondUS$
GAM Star Global
Cautious***£
GAM Star China Equity
US$
GAM Star Composite
Global EquityUS$
GAM Star Continental
European Equity
€
GAM Star Credit
Opportunities (EUR)
€
GAM Star Credit
Opportunities (GBP)
£
Current assets
Cash and bank balances 14 22,415,761 2,472,977 1,149,632 16,723,444 7,816,307 6,158,120 9,620,958 48,292,724 18,004,993
Margin cash 14 54 28,724 309,097 65,584 – 17,974,351 7,005 161,810,004 58,577,968
Amounts receivable for subscriptions 455,273 3,363 8,460,030 3,799 653,879 – 626,955 11,182,005 1,185,643
Amounts receivable from brokers for sales of securities 1,539,480 204,191 475,000 619,191 5,925,312 – 4,146,304 4,117,967 –
Bond interest receivable – – 14,068,365 – – – – 17,226,731 7,857,915
Dividend receivable – 75,363 – – 1,146,469 55,788 1,697,817 574,830 515,088
Other receivables – 109,440 – – – – – – –
Financial assets at fair value 4 325,034,993 85,268,723 1,750,705,945 153,711,335 243,235,879 108,667,702 491,313,690 1,941,589,083 632,834,611
Total current assets 349,445,561 88,162,781 1,775,168,069 171,123,353 258,777,846 132,855,961 507,412,729 2,184,793,344 718,976,218
Current liabilities
Amounts payable for redemptions (1,797,612) (79,605) (1,908,960) (906,169) (1,761,631) – (12,794,660) (28,440,626) (5,062,510)
Amounts payable to brokers for purchases of securities – (170,734) – – – – (1,280,960) – –
Accrued expenses (847,772) (161,964) (5,779,372) (373,319) (620,497) (109,184) (605,565) (3,639,022) (1,183,950)
Financial liabilities at fair value 4 (3,489,158) – (7,598,127) (1,499,812) (31,660) – (130,736) (4,877,482) (6,279,970)
Bank overdraft 14 (4,806) – (7,530) (1,587) (1,614) – (74) (86,385) –
Amounts due to broker 14 – – (19,619) – – – – (14,509,225) (1,371,000)
Distribution payable on income shares (6,086) (206) (5,732,533) (22,763) (25,931) – (453,583) (8,340,919) (5,783,371)
Interest payable – – – – – – – – –
Capital gains tax payable 2(k) – – – – – – – – –
Total liabilities (excluding net assets attributable to holders of redeemable participating shares) (6,145,434) (412,509) (21,046,141) (2,803,650) (2,441,333) (109,184) (15,265,578) (59,893,659) (19,680,801)
Net assets attributable to holders of redeemable participating shares 343,300,127 87,750,272 1,754,121,928 168,319,703 256,336,513 132,746,777 492,147,151 2,124,899,685 699,295,417
* Formely called GAM Star Technology.** Formely called GAM Star Balanced.*** Formely called GAM Star Cautious.
GAM Star Fund p.l.c.
186

The accompanying notes form an integral part of these financial statements.
Balance SheetAs at 30 June 2020, continued
Notes
GAM Star Credit
Opportunities (USD)
US$
GAM Star Global
Defensive**£
GAM StarDynamic
Global Bond*US$
GAM StarGlobal
DynamicGrowth***
£
GAM Star Emerging
EquityUS$
GAM Star Emerging
Market RatesUS$
GAM Star European
Equity€
GAM Star Flexible Global
Portfolio€
GAM Star Global Rates
US$
Current assets
Cash and bank balances 14 38,658,289 593,426 – 173,630 999,541 2,816,214 417,145 1,248,295 15,264,236
Margin cash 14 187,449,932 3,021,693 – – 5,055 4,355,247 106 6,762,813 26,187,789
Amounts receivable for subscriptions 6,392,271 220,566 – – – 23,019,048 19,051 – 93
Amounts receivable from brokers for sales of securities 500,000 60,422 – 120,260 4,634,347 643,876 1,387,890 – –
Bond interest receivable 21,267,395 – – – – 303,636 75,846 – 383,918
Dividend receivable 164,380 – – – 28,965 – 366,282 – –
Other receivables – – – – – – – – –
Financial assets at fair value 4 1,862,464,793 16,679,733 – 5,542,466 14,547,472 51,522,032 272,749,083 123,277,931 118,017,509
Total current assets 2,116,897,060 20,575,840 – 5,836,356 20,215,380 82,660,053 275,015,403 131,289,039 159,853,545
Current liabilities
Amounts payable for redemptions (11,529,280) (351,990) – (142,605) – (3,781) (359,901) (34,586) (65,545)
Amounts payable to brokers for purchases of securities (6,284,999) – – – (4,760,977) (6,648,601) (793,199) – (522,300)
Accrued expenses (2,934,973) (84,987) – (20,118) (67,730) (350,433) (523,099) (84,792) (281,142)
Financial liabilities at fair value 4 (4,296,062) (118,782) – (1,005) (4,982) (2,521,010) (8,633) (2,137,855) (20,407,290)
Bank overdraft 14 (960,293) (39) – – (621,437) (36) – (287) –
Amounts due to broker 14 – – – – – (975,615) – – (7,120,001)
Distribution payable on income shares (5,326,307) – – – – (6,670) (1,336) – (61,166)
Interest payable – – – – – (11,958) – – (220,044)
Capital gains tax payable 2(k) – – – – – (22,959) – – –
Total liabilities (excluding net assets attributable to holders of redeemable participating shares) (31,331,914) (555,798) – (163,728) (5,455,126) (10,541,063) (1,686,168) (2,257,520) (28,677,488)
Net assets attributable to holders of redeemable participating shares 2,085,565,146 20,020,042 – 5,672,628 14,760,254 72,118,990 273,329,235 129,031,519 131,176,057
* Fund terminated during the year. ** Formely called GAM Star Defensive.*** Formely called GAM Star Dynamic Growth.
187

The accompanying notes form an integral part of these financial statements.
Balance SheetAs at 30 June 2020, continued
Notes
GAM Star Global
Selector*US$
GAM StarGlobal
Growth**£
GAM Star Interest
TrendUS$
GAM Star Japan
Leaders¥
GAM Star MBS
Total ReturnUS$
GAM Systematic Alternative
Risk PremiaUS$
GAM Systematic
Core Macro
US$
GAM Systematic
Global Equity Market Neutral*
US$
GAM Star Tactical
OpportunitiesUS$
Current assets
Cash and bank balances 14 – 10,344,791 4,312,929 393,063,050 26,621,152 5,868,612 200,795 55,815 1,683,023
Margin cash 14 – 2 1,007,035 – 88,612,036 8,660,971 895,320 851 1,057,699
Amounts receivable for subscriptions – 205,697 – 177,631,358 3,447,091 27,179 4,896,735 – –
Amounts receivable from brokers for sales of securities – 344,029 – – – – 2,759 – –
Bond interest receivable – – 299,051 – 3,208,910 146,244 – – 244,276
Dividend receivable 235,147 – – 83,342,295 – – 78 – –
Other receivables – – – – – – – – –
Financial assets at fair value 4 – 170,356,011 38,151,538 57,954,690,116 849,849,954 46,993,831 4,171,160 – 37,830,931
Total current assets 235,147 181,250,530 43,770,553 58,608,726,819 971,739,143 61,696,837 10,166,847 56,666 40,815,929
Current liabilities
Amounts payable for redemptions – (807,914) (332,958) (229,899,402) (8,324,044) (40,316) (418) (2,197) (76)
Amounts payable to brokers for purchases of securities – – – – (7,392,478) – (75,000) – –
Accrued expenses (235,147) (489,624) (107,016) (78,741,825) (1,078,103) (115,293) (108,414) (54,469) (72,000)
Financial liabilities at fair value 4 – (2,195,017) (31,169) (29,140,575) (3,321,940) (1,215,320) (153,841) – (299,773)
Bank overdraft 14 – (1,349) – (350,487) (9,523) (54) (10) – –
Amounts due to broker 14 – – – – – (980,000) – – (170,000)
Distribution payable on income shares – – – (5,472,181) (3,131,417) – – – –
Interest payable – – – – – – – – –
Capital gains tax payable 2(k) – – – – – – – – –
Total liabilities (excluding net assets attributable to holders of redeemable participating shares) (235,147) (3,493,904) (471,143) (343,604,470) (23,257,505) (2,350,983) (337,683) (56,666) (541,849)
Net assets attributable to holders of redeemable participating shares – 177,756,626 43,299,410 58,265,122,349 948,481,638 59,345,854 9,829,164 – 40,274,080
* Fund terminated during the year.** Formely called GAM Star Growth.
GAM Star Fund p.l.c.
188

The accompanying notes form an integral part of these financial statements.
Balance SheetAs at 30 June 2020, continued
Notes
GAM Star Target Return*
US$
GAM Star Target Return
Plus*US$
GAM Star Disruptive
Growth*US$
GAM Star US All Cap
EquityUS$
GAM Star Worldwide
EquityUS$
GAM Systematic
Dynamic CreditUS$
Current assets
Cash and bank balances 14 – – 14,801,698 4,202,889 3,135,869 1,182,554
Margin cash 14 – 230,000 24,266,370 5,241 5,794 2,720,186
Amounts receivable for subscriptions – – 432,151 478 1,169 –
Amounts receivable from brokers for sales of securities – – – – – 22,248
Bond interest receivable – – – – 237,013 6,700
Dividend receivable – – 418,077 43,883 67,977 –
Other receivables – – – – – –
Financial assets at fair value 4 – – 253,089,853 64,168,661 56,743,374 7,141,095
Total current assets – 230,000 293,008,149 68,421,152 60,191,196 11,072,783
Current liabilities
Amounts payable for redemptions – – (564,380) (50,249) (5,490) –
Amounts payable to brokers for purchases of securities – – – (660,233) – (7,537)
Accrued expenses – – (573,874) (199,239) (369,852) (13,344)
Financial liabilities at fair value 4 – – (6,454) (940) (4,907) (215,235)
Bank overdraft 14 – – (1,245) (102) – –
Amounts due to broker 14 – (230,000) (2,617,208) – – –
Distribution payable on income shares – – – – (1,944) –
Interest payable – – (3,803) – – (1,028)
Capital gains tax payable 2(k) – – – – (30,462) –
Total liabilities (excluding net assets attributable to holders of redeemable participating shares) – (230,000) (3,766,964) (910,763) (412,655) (237,144)
Net assets attributable to holders of redeemable participating shares – – 289,241,185 67,510,389 59,778,541 10,835,639
* Fund terminated during the year.
189

The accompanying notes form an integral part of these financial statements.
Balance Sheet As at 30 June 2019
Notes
GAM Star Fund p.l.c.
US$
GAM Star Absolute
Return Bond
€
GAM Star Absolute
Return Bond Defender
€
GAM Star Absolute
Return Bond Plus
€
GAM Star Absolute
Return Macro€
GAM Star Alpha
Spectrum€
GAM Star Alpha
TechnologyUS$
GAM Star Asian
EquityUS$
GAM Star Asia-Pacific
EquityUS$
Current assets
Cash and bank balances 14 381,962,454 854,805 87,240 698,261 1,690,833 1,068,084 1,907,863 96,433 292,921
Margin cash 14 1,062,117,487 – – – 80,095 – 303,137 2,294 32
Amounts receivable for subscriptions 321,574,693 – – – – – 16,555 6,489 34
Amounts receivable from brokers for sales of securities 76,923,069 – – – – – – 997 –
Bond interest receivable 117,359,421 – – – 293,425 – 12,262 51 52
Dividend receivable 8,970,671 – – – – – 18,287 62,278 48,044
Other receivables 144,000 – – – – – – – –
Financial assets at fair value 4 14,550,372,693 62,081,131 2,305,461 106,509,895 9,343,871 75,519,608 18,021,424 15,566,896 18,553,896
Total current assets 16,519,424,488 62,935,936 2,392,701 107,208,156 11,408,224 76,587,692 20,279,528 15,735,438 18,894,979
Current liabilities
Amounts payable for redemptions (249,555,840) – – – – – (3,433) – (24,132)
Amounts payable to brokers for purchases of securities (111,801,196) – – – – – – – –
Accrued expenses (24,013,730) (236,078) (33,375) (230,808) (82,509) (141,499) (236,963) (73,637) (70,827)
Financial liabilities at fair value 4 (86,313,470) – – – (226,435) (9,911) (364,839) – –
Bank overdraft 14 (3,156,181) – (47) – (18,907) – (186,666) (39) (53)
Amounts due to broker 14 (49,006,247) – – – (64,929) – – – –
Distribution payable on income shares (52,340,137) – – – (29,453) – – (1,284) (55,674)
Interest payable (1,071,801) – – – – – (25,196) – –
Capital gains tax payable 2(k) (96,273) – – – – – – – –
Total liabilities (excluding net assets attributable to holders of redeemable participating shares) (577,354,875) (236,078) (33,422) (230,808) (422,233) (151,410) (817,097) (74,960) (150,686)
Net assets attributable to holders of redeemable participating shares 15,942,069,613 62,699,858 2,359,279 106,977,348 10,985,991 76,436,282 19,462,431 15,660,478 18,744,293
Cross holdings in other GAM Star Funds of (US$300,159,748) in financial assets at fair value have been eliminated from the Company total.
GAM Star Fund p.l.c.
190

The accompanying notes form an integral part of these financial statements.
Balance SheetAs at 30 June 2019, continued
Notes
GAM Star Global
Balanced£
GAM Star Capital
Appreciation US Equity
US$
GAM Star Cat
BondUS$
GAM Star Global
Cautious£
GAM Star China Equity
US$
GAM Star Composite
Global EquityUS$
GAM Star Continental
European Equity
€
GAM Star Credit
Opportunities (EUR)
€
GAM Star Credit
Opportunities (GBP)
£
Current assets
Cash and bank balances 14 27,111,722 1,348,020 20,774,266 18,876,548 6,979,006 4,393,438 2,779,823 63,249,297 28,818,973
Margin cash 14 120,179 11,010 241,680 65,362 – 14,319,694 168,995 444,837,665 50,251,883
Amounts receivable for subscriptions 405,655 – 32,043,461 123,287 498,901 – 313,078 237,604,427 2,261,781
Amounts receivable from brokers for sales of securities 2,652,039 61,628 – 1,104,674 3,795,358 – 14,481,758 2,051,722 7,463,999
Bond interest receivable – – 16,031,922 – – – 14 32,873,587 11,847,051
Dividend receivable – 38,809 – 5,938 1,215,607 102,662 2,857,316 740,718 734,626
Other receivables – 144,000 – – – – – – –
Financial assets at fair value 4 412,877,564 58,768,387 1,661,110,292 189,585,672 364,063,303 82,745,964 853,100,646 3,034,508,087 867,548,613
Total current assets 443,167,159 60,371,854 1,730,201,621 209,761,481 376,552,175 101,561,758 873,701,630 3,815,865,503 968,926,926
Current liabilities
Amounts payable for redemptions (6,998,295) (23,540) (4,576,404) (4,436,088) (2,179,348) – (7,468,323) (112,641,599) (6,907,442)
Amounts payable to brokers for purchases of securities – (2,057) – – (7,408,439) – (7,577,627) (60,977,348) (4,706,933)
Accrued expenses (970,828) (142,945) (1,832,134) (407,795) (714,310) (99,012) (1,085,211) (4,599,259) (1,078,702)
Financial liabilities at fair value 4 (1,181,542) – (9,431,197) (476,588) (54,015) – (197,071) (2,895,400) (5,898,314)
Bank overdraft 14 (133) – (60) (3) (302) – (3,946) (31,174) (19,365)
Amounts due to broker 14 – – (19,619) – – – – – –
Distribution payable on income shares (3,255) – (7,504,303) (38,308) (135,374) (7,196) (1,806,881) (14,901,253) (8,550,335)
Interest payable – – – – – – – – –
Capital gains tax payable 2(k) – – – – – – – – –
Total liabilities (excluding net assets attributable to holders of redeemable participating shares) (9,154,053) (168,542) (23,363,717) (5,358,782) (10,491,788) (106,208) (18,139,059) (196,046,033) (27,161,091)
Net assets attributable to holders of redeemable participating shares 434,013,106 60,203,312 1,706,837,904 204,402,699 366,060,387 101,455,550 855,562,571 3,619,819,470 941,765,835
191

The accompanying notes form an integral part of these financial statements.
Balance SheetAs at 30 June 2019, continued
Notes
GAM Star Credit
Opportunities (USD)
US$
GAM Star Global
Defensive£
GAM Star Discretionary
FX*US$
GAM Star Dynamic
Global BondUS$
GAM Star Global
Dynamic Growth
£
GAM Star Emerging
EquityUS$
GAM Star Emerging
Market RatesUS$
GAM Star European
Equity€
GAM Star Flexible Global
Portfolio€
Current assets
Cash and bank balances 14 17,962,082 1,813,832 14,346 3,293,734 326,610 1,502,618 8,631,112 4,282,890 1,809,287
Margin cash 14 241,356,897 3,011,470 25 662,700 – 4,879 3,648,054 9,033 1,331,598
Amounts receivable for subscriptions 6,298,965 9,748 – – 11,031 9,762 688,912 2,988 –
Amounts receivable from brokers for sales of securities 25,080,236 155,420 – – 147,328 247,104 – 624,629 –
Bond interest receivable 40,834,572 – – – – – 459,382 – –
Dividend receivable 264,682 – – – 484 115,597 – 597,316 7,836
Other receivables – – – – – – – – –
Financial assets at fair value 4 2,883,085,626 21,162,054 – 10,047,247 6,647,951 24,128,725 67,337,640 188,939,587 33,399,644
Total current assets 3,214,883,060 26,152,524 14,371 14,003,681 7,133,404 26,008,685 80,765,100 194,456,443 36,548,365
Current liabilities
Amounts payable for redemptions (43,852,950) (120,077) – – (399,147) (144,995) (6,859,951) (404,083) –
Amounts payable to brokers for purchases of securities (10,674,653) – – – – (150,351) (618,764) (2,306,096) –
Accrued expenses (4,038,617) (71,719) (14,371) (77,256) (1,711) (93,983) (175,752) (134,855) (35,493)
Financial liabilities at fair value 4 (2,693,142) (49,964) – (85,328) (518) (1) (2,754,122) – (358,009)
Bank overdraft 14 (992,299) (38) – – – (3) (3,245) (868) –
Amounts due to broker 14 – – – (260,000) – – (970,000) – –
Distribution payable on income shares (12,101,639) – – – – (54,219) (30,024) (31,216) –
Interest payable – – – – – – (1,317) – –
Capital gains tax payable 2(k) – – – – – (96,273) – – –
Total liabilities (excluding net assets attributable to holders of redeemable participating shares) (74,353,300) (241,798) (14,371) (422,584) (401,376) (539,825) (11,413,175) (2,877,118) (393,502)
Net assets attributable to holders of redeemable participating shares 3,140,529,760 25,910,726 – 13,581,097 6,732,028 25,468,860 69,351,925 191,579,325 36,154,863
* Fund terminated during the year.
GAM Star Fund p.l.c.
192

The accompanying notes form an integral part of these financial statements.
Balance SheetAs at 30 June 2019, continued
Notes
GAM Star GAMCO
US Equity*US$
GAM Star Global
Quality**US$
GAM Star Global Rates
US$
GAM Star Global
SelectorUS$
GAM Star Global
Growth£
GAM Star India
Equity**US$
GAM Star Interest
TrendUS$
GAM Star Japan
Leaders***¥
GAM Star Keynes
Quantitative Strategies**
US$
Current assets
Cash and bank balances 14 38,345 37,383 13,175,761 171,675 11,472,418 – 4,057,880 353,591,398 –
Margin cash 14 – – 90,393,214 732 2,554 – – – –
Amounts receivable for subscriptions – – – 13,189 142,808 – – 19,497,946 –
Amounts receivable from brokers for sales of securities – – 217,838 48,703 1,383,607 – – – –
Bond interest receivable – – 1,058,185 – – – 441,316 29 –
Dividend receivable – – – 242,725 – – – 63,130,337 –
Other receivables – – – – – – – – –
Financial assets at fair value 4 – – 236,640,568 4,814,138 198,209,268 – 48,570,658 36,502,604,828 –
Total current assets 38,345 37,383 341,485,566 5,291,162 211,210,655 – 53,069,854 36,938,824,538 –
Current liabilities
Amounts payable for redemptions – – (1,276,157) (16,980) (2,010,027) – – (227,675,197) –
Amounts payable to brokers for purchases of securities – – (217,648) – – – – – –
Accrued expenses (38,345) (37,383) (412,026) (37,372) (497,868) – (141,132) (49,000,986) –
Financial liabilities at fair value 4 – – (36,109,433) (18,074) (658,815) – (4,238) (68,861,465) –
Bank overdraft 14 – – (10,861) (120) (484) – – (108,355) –
Amounts due to broker 14 – – (42,415,007) – – – – – –
Distribution payable on income shares – – – – – – – (15,099,100) –
Interest payable – – (968,866) – – – – – –
Capital gains tax payable 2(k) – – – – – – – – –
Total liabilities (excluding net assets attributable to holders of redeemable participating shares) (38,345) (37,383) (81,409,998) (72,546) (3,167,194) – (145,370) (360,745,103) –
Net assets attributable to holders of redeemable participating shares – – 260,075,568 5,218,616 208,043,461 – 52,924,484 36,578,079,435 –
* Fund merged into GAM Star Capital Appreciation US Equity during the year.** Fund terminated during the year.*** Formerly called GAM Star Japan Equity
193

The accompanying notes form an integral part of these financial statements.
Balance SheetAs at 30 June 2019, continued
Notes
GAM Star MBS
Total ReturnUS$
GAM Systematic Alternative
Risk PremiaUS$
GAM Systematic
Core Macro
US$
GAM Systematic
Global Equity Market Neutral
US$
GAM Star Tactical
OpportunitiesUS$
GAM Star Target Return
US$
GAM Star Target Return
PlusUS$
GAM Star Disruptive
GrowthUS$
GAM Star US All Cap
EquityUS$
Current assets
Cash and bank balances 14 31,346,326 38,897,546 10,955,796 1,254,443 1,132,459 1,440,048 494,031 1,945,263 1,372,995
Margin cash 14 47,890,398 49,330,953 15,746,246 437,016 5,841,878 1,579,999 1,068,842 10,361,968 528,525
Amounts receivable for subscriptions 5,856,395 271,948 32,893 – – – – 950,867 660
Amounts receivable from brokers for sales of securities – – 44,707 – 8,000,000 – 700,000 – 1,003,210
Bond interest receivable 4,482,752 888,407 – – 154,960 109,400 22,476 – –
Dividend receivable – – 10,246 2,293 – – – 376,675 57,326
Other receivables – – – – – – – – –
Financial assets at fair value 4 1,171,724,714 187,043,433 48,369,516 19,138,319 32,733,379 28,698,517 6,925,020 233,507,639 77,245,623
Total current assets 1,261,300,585 276,432,287 75,159,404 20,832,071 47,862,676 31,827,964 9,210,369 247,142,412 80,208,339
Current liabilities
Amounts payable for redemptions (4,707,378) (138,620) (18,088,468) – (34,646) – – (1,480,336) (11,723)
Amounts payable to brokers for purchases of securities (5,048,665) – – – – – – – –
Accrued expenses (2,364,184) (237,280) (448,559) (58,025) (77,524) (53,396) (26,143) (337,697) (216,168)
Financial liabilities at fair value 4 (4,931,067) (9,584,803) (2,006,281) (956,334) (323,910) (325,263) (148,888) (721,506) (1,388)
Bank overdraft 14 (3,922) (9,343) (18,046) (1,831,741) (16) – – (1,589) –
Amounts due to broker 14 – (3,687,571) – – (220,109) (160,000) – (1,200,000) –
Distribution payable on income shares (2,195,383) – – – – – – – –
Interest payable – – – (37,149) – – – (36,486) –
Capital gains tax payable 2(k) – – – – – – – – –
Total liabilities (excluding net assets attributable to holders of redeemable participating shares) (19,250,599) (13,657,617) (20,561,354) (2,883,249) (656,205) (538,659) (175,031) (3,777,614) (229,279)
Net assets attributable to holders of redeemable participating shares 1,242,049,986 262,774,670 54,598,050 17,948,822 47,206,471 31,289,305 9,035,338 243,364,798 79,979,060
GAM Star Fund p.l.c.
194

The accompanying notes form an integral part of these financial statements.
Balance SheetAs at 30 June 2019, continued
Notes
GAM Star Worldwide
EquityUS$
GAM Systematic
Dynamic Credit**
US$
Current assets
Cash and bank balances 14 2,144,698 3,346,188
Margin cash 14 1,312 1,966,643
Amounts receivable for subscriptions 784 –
Amounts receivable from brokers for sales of securities 1,706,180 50,620
Bond interest receivable – 15,317
Dividend receivable 99,767 –
Other receivables – –
Financial assets at fair value 4 73,003,729 9,675,941
Total current assets 76,956,470 15,054,709
Current liabilities
Amounts payable for redemptions (219,567) –
Amounts payable to brokers for purchases of securities – (993,488)
Accrued expenses (143,723) (13,362)
Financial liabilities at fair value 4 – (442,127)
Bank overdraft 14 (3,993) (4,826)
Amounts due to broker 14 – –
Distribution payable on income shares (83,667) –
Interest payable – (2,787)
Capital gains tax payable 2(k) – –
Total liabilities (excluding net assets attributable to holders of redeemable participating shares) (450,950) (1,456,590)
Net assets attributable to holders of redeemable participating shares 76,505,520 13,598,119
** Fund launched during the year.
195

The accompanying notes form an integral part of these financial statements.
Profit and Loss Account
For the year ended 30 June 2020
Notes
GAM Star Fund p.l.c.*
US$
GAM Star Absolute
Return Bond**
€
GAM Star Absolute
Return Bond
Defender**€
GAM Star Absolute
Return Bond Plus**
€
GAM Star Absolute
Return Macro**
€
GAM Star Alpha
Spectrum€
GAM Star Alpha
TechnologyUS$
GAM Star Asian
EquityUS$
GAM Star Asia-Pacific
Equity**US$
Income
Dividend income 2(c) 56,333,977 – – – – 289,390 207,448 371,835 286,144
Bank interest 2(c) 1,586,738 82 – 99 – – – 13,743 3,739
Bond interest income 2(c) 533,067,574 – – – 4,906 – 90,180 – –
Sundry income 2(j) and 5 191,514 – – – – – 12,044 – 52
Net (losses)/gains on investments at fair value 12 (422,144,555) 806,482 21,981 1,494,748 76,084 (1,988,499) (377,114) 728,960 1,542,046
Total investment income 169,035,248 806,564 21,981 1,494,847 80,990 (1,699,109) (67,442) 1,114,538 1,831,981
Operating expenses 13 (183,475,018) 6,280 2,610 44,171 37,702 (604,667) (376,057) (395,390) (176,844)
Operating (loss)/profit (14,439,770) 812,844 24,591 1,539,018 118,692 (2,303,776) (443,499) 719,148 1,655,137
Finance costs
Bank interest 2(l) (4,894,714) (165) – – (102,558) (7,954) (223,220) (16) (37)
Distribution to redeemable participating shareholders 18 (418,354,084) – – – – – – (2,563) –
Total finance costs (423,248,798) (165) – – (102,558) (7,954) (223,220) (2,579) (37)
(Loss)/profit before tax (437,688,568) 812,679 24,591 1,539,018 16,134 (2,311,730) (666,719) 716,569 1,655,100
Withholding tax on dividend income 2(c) (5,298,654) – – – – – (16,884) (45,677) (25,126)
(Decrease)/increase in net assets from operations attributable to redeemable participating shareholders (442,987,222) 812,679 24,591 1,539,018 16,134 (2,311,730) (683,603) 670,892 1,629,974
*Net losses on investments of (US$13,040,232) due to cross holdings have been eliminated from the Company total.** Fund terminated during the year.All the amounts above arose from continuing operations with the exception of GAM Star Absolute Return Bond, GAM Star Absolute Return Bond Defender, GAM Star Absolute Return Bond Plus, GAM Star Absolute Return Macro, GAM Star Asia-Pacific Equity, GAM Star Dynamic Global Bond, GAM Star Global Selector, GAM Systematic Global Equity Market Neutral, GAM Star Target Return, GAM Star Target Return Plus, which terminated during the year. There were no gains or losses other than those shown in the Profit and Loss Account above.
GAM Star Fund p.l.c.
196

The accompanying notes form an integral part of these financial statements.
Profit and Loss Account
For the year ended 30 June 2020, continued
Notes
GAM Star Global
Balanced**£
GAM Star Capital
Appreciation US Equity
US$
GAM Star Cat
BondUS$
GAM Star Global
Cautious***£
GAM Star China Equity
US$
GAM Star Composite
Global EquityUS$
GAM Star Continental
European Equity
€
GAM Star Credit
Opportunities (EUR)
€
GAM Star Credit
Opportunities (GBP)
£
Income
Dividend income 2(c) 342,879 1,330,246 – 197,918 5,773,239 1,049,463 8,497,865 4,283,122 6,251,604
Bank interest 2(c) 209,880 83,608 107,567 87,594 28,383 13,068 – – 21,333
Bond interest income 2(c) – – 127,181,684 – – – – 138,251,237 37,647,937
Sundry income 2(j) and 5 – 3 – – 37 1 – 1 –
Net (losses)/gains on investments at fair value 12 19,549,640 (1,421,059) (49,595,624) 7,593,005 32,902,309 7,729,142 22,674,936 (271,833,305) (43,664,511)
Total investment income 20,102,399 (7,202) 77,693,627 7,878,517 38,703,968 8,791,674 31,172,801 (129,298,945) 256,363
Operating expenses 13 (6,077,202) (1,193,370) (23,440,238) (2,264,058) (4,697,722) (751,525) (6,718,207) (47,289,862) (8,627,682)
Operating (loss)/profit 14,025,197 (1,200,572) 54,253,389 5,614,459 34,006,246 8,040,149 24,454,594 (176,588,807) (8,371,319)
Finance costs
Bank interest 2(l) (2) – (42,222) (16) – (7,848) (86,491) (2,984,932) (10,085)
Distribution to redeemable participating shareholders 18 (377,403) (1,466) (103,659,642) (947,473) (818,874) (513,063) (782,814) (93,973,477) (35,200,494)
Total finance costs (377,405) (1,466) (103,701,864) (947,489) (818,874) (520,911) (869,305) (96,958,409) (35,210,579)
(Loss)/profit before tax 13,647,792 (1,202,038) (49,448,475) 4,666,970 33,187,372 7,519,238 23,585,289 (273,547,216) (43,581,898)
Withholding tax on dividend income 2(c) – (376,206) 1,969 – (313,134) – (1,277,247) (635,988) (43,877)
(Decrease)/increase in net assets from operations attributable to redeemable participating shareholders 13,647,792 (1,578,244) (49,446,506) 4,666,970 32,874,238 7,519,238 22,308,042 (274,183,204) (43,625,775)
** Formely called GAM Star Balanced.*** Formely called GAM Star Cautious.
197

The accompanying notes form an integral part of these financial statements.
Profit and Loss Account
For the year ended 30 June 2020, continued
Notes
GAM Star Credit
Opportunities (USD)
US$
GAM Star Global
Defensive***£
GAM StarDynamic
Global Bond*US$
GAM StarGlobal
DynamicGrowth**
£
GAM Star Emerging
EquityUS$
GAM Star Emerging
Market RatesUS$
GAM Star European
Equity€
GAM Star Flexible Global
Portfolio€
GAM Star Global Rates
US$
Income
Dividend income 2(c) 6,126,087 25,560 – 11,356 522,526 – 3,513,680 395,161 16
Bank interest 2(c) 15,638 7,642 2,161 3,533 1,144 24,449 53,449 – 29,193
Bond interest income 2(c) 130,754,737 – – – – 1,106,380 – – 2,623,288
Sundry income 2(j) and 5 – – – – 23 – – 3 –
Net (losses)/gains on investments at fair value 12 (94,565,479) 520,099 (79,676) 265,691 (1,545,885) 2,197,411 (99,766) 703,580 (14,865,498)
Total investment income 42,330,983 553,301 (77,515) 280,580 (1,022,192) 3,328,240 3,467,363 1,098,744 (12,213,001)
Operating expenses 13 (34,727,444) (248,613) 11,270 (55,777) (457,599) (1,106,907) (2,555,044) (670,523) (2,309,564)
Operating (loss)/profit 7,603,539 304,688 (66,245) 224,803 (1,479,791) 2,221,333 912,319 428,221 (14,522,565)
Finance costs
Bank interest 2(l) (33,716) (716) (208) – – (868) (8,922) (24,810) (39,552)
Distribution to redeemable participating shareholders 18 (102,002,333) (153,561) – – (3) (235,101) (127,137) (55,265) (213,660)
Total finance costs (102,036,049) (154,277) (208) – (3) (235,969) (136,059) (80,075) (253,212)
(Loss)/profit before tax (94,432,510) 150,411 (66,453) 224,803 (1,479,794) 1,985,364 776,260 348,146 (14,775,777)
Withholding tax on dividend income 2(c) 1,935 – – – (59,236) (21,608) (408,448) – –
(Decrease)/increase in net assets from operations attributable to redeemable participating shareholders (94,430,575) 150,411 (66,453) 224,803 (1,539,030) 1,963,756 367,812 348,146 (14,775,777)
* Fund terminated during the year. ** Formely called GAM Star Dynamic Growth. *** Formely called GAM Star Defensive.
GAM Star Fund p.l.c.
198

The accompanying notes form an integral part of these financial statements.
Profit and Loss Account
For the year ended 30 June 2020, continued
Notes
GAM Star Global
Selector*US$
GAM StarGlobal
Growth**£
GAM Star Interest
TrendUS$
GAM Star Japan
Leaders¥
GAM Star MBS
Total ReturnUS$
GAM Systematic Alternative
Risk PremiaUS$
GAM Systematic
Core Macro
US$
GAM Systematic
Global Equity Market Neutral*
US$
GAM Star Tactical
OpportunitiesUS$
Income
Dividend income 2(c) 36,193 296,413 98,741 820,543,206 557,090 143,508 81,706 316,635 30,433
Bank interest 2(c) 439 102,080 49,937 – 39,591 436,394 61,282 – 22,782
Bond interest income 2(c) 1,285 – 2,374,299 – 64,646,295 2,392,056 14,693 – 769,872
Sundry income 2(j) and 5 – 41 – 3 – – – 161 97
Net (losses)/gains on investments at fair value 12 76,430 12,253,055 1,147,854 6,971,840,651 (123,286,989) (19,068,422) (302,740) 375,688 (820,518)
Total investment income 114,347 12,651,589 3,670,831 7,792,383,860 (58,044,013) (16,096,464) (145,059) 692,484 2,666
Operating expenses 13 (50,115) (3,132,995) (652,387) (531,189,495) (11,131,025) (1,418,044) (280,484) (137,805) (441,960)
Operating (loss)/profit 64,232 9,518,594 3,018,444 7,261,194,365 (69,175,038) (17,514,508) (425,543) 554,679 (439,294)
Finance costs
Bank interest 2(l) (8) (2,550) (243) (2,306,663) (13,383) (137,082) (19,031) (409,853) (58,535)
Distribution to redeemable participating shareholders 18 – (71,499) – (178,700,931) (54,186,837) (2,778,730) (6,011) – (242,053)
Total finance costs (8) (74,049) (243) (181,007,594) (54,200,220) (2,915,812) (25,042) (409,853) (300,588)
(Loss)/profit before tax 64,224 9,444,545 3,018,201 7,080,186,771 (123,375,258) (20,430,320) (450,585) 144,826 (739,882)
Withholding tax on dividend income 2(c) (7,273) – 18,397 (123,081,483) 2,737 – – – –
(Decrease)/increase in net assets from operations attributable to redeemable participating shareholders 56,951 9,444,545 3,036,598 6,957,105,288 (123,372,521) (20,430,320) (450,585) 144,826 (739,882)
* Fund terminated during the year.** Formely called GAM Star Growth.
199

The accompanying notes form an integral part of these financial statements.
Profit and Loss Account
For the year ended 30 June 2020, continued
Notes
GAM Star Target Return*
US$
GAM Star Target Return
Plus*US$
GAM Star Disruptive Growth**
US$
GAM Star US All Cap
EquityUS$
GAM Star Worldwide
EquityUS$
GAM Systematic
Dynamic CreditUS$
Income
Dividend income 2(c) 10,877 3,475 1,989,369 957,900 1,001,009 17,916
Bank interest 2(c) 4,628 686 14,279 7,670 – 21,279
Bond interest income 2(c) 182,813 21,475 164 – – 38,760
Sundry income 2(j) and 5 29 – 178,929 – 82 –
Net (losses)/gains on investments at fair value 12 (577,372) (544,320) 63,384,495 3,946,649 (146,704) (864,211)
Total investment income (379,025) (518,684) 65,567,236 4,912,219 854,387 (786,256)
Operating expenses 13 (72,042) (35,283) (3,014,462) (621,540) (1,042,937) (227,933)
Operating (loss)/profit (451,067) (553,967) 62,552,774 4,290,679 (188,550) (1,014,189)
Finance costs
Bank interest 2(l) (40) (21) (273,154) (317) (14,801) (15,920)
Distribution to redeemable participating shareholders 18 – – (453) – (15,816) (327,236)
Total finance costs (40) (21) (273,607) (317) (30,617) (343,156)
(Loss)/profit before tax (451,107) (553,988) 62,279,167 4,290,362 (219,167) (1,357,345)
Withholding tax on dividend income 2(c) 158 (15) (252,419) (253,863) (183,174) –
(Decrease)/increase in net assets from operations attributable to redeemable participating shareholders (450,949) (554,003) 62,026,748 4,036,499 (402,341) (1,357,345)
* Fund terminated during the year.** Formely called GAM Star Technology.
GAM Star Fund p.l.c.
200

All the amounts above arose from continuing operations. There were no gains or losses other than those shown in the Profit and Loss Account above.
The accompanying notes form an integral part of these financial statements.
Profit and Loss Account
For the year ended 30 June 2019
Notes
GAM Star Fund p.l.c.*
US$
GAM Star Absolute
Return Bond
€
GAM Star Absolute
Return Bond Defender
€
GAM Star Absolute
Return Bond Plus
€
GAM Star Absolute
Return Macro€
GAM Star Alpha
Spectrum€
GAM Star Alpha
TechnologyUS$
GAM Star Asian
EquityUS$
GAM Star Asia-Pacific
EquityUS$
Income
Dividend income 2(c) 92,478,191 – – – – 178,721 143,774 666,999 699,212
Bank interest 2(c) 3,772,656 522 78 2,171 19,395 – 15,648 4,019 984
Bond interest income 2(c) 691,419,769 – – – 1,155,147 – 99,790 – –
Sundry income 2(j) and 5 5,251,246 – – – – – 11,510 81 119
Net (losses)/gains on investments at fair value 12 (666,007,213) (4,524,179) (192,891) (4,794,098) 525,488 1,305,071 1,138,135 (5,849,280) (1,498,475)
Total investment income 126,914,649 (4,523,657) (192,813) (4,791,927) 1,700,030 1,483,792 1,408,857 (5,178,181) (798,160)
Operating expenses 13 (234,631,041) (830,580) (32,203) (971,997) (681,816) (719,916) (423,590) (470,209) (409,273)
Operating (loss)/profit (107,716,392) (5,354,237) (225,016) (5,763,924) 1,018,214 763,876 985,267 (5,648,390) (1,207,433)
Finance costs
Bank interest 2(l) (4,794,302) (2,281) (286) (1,282) (45,772) (5,585) (207,428) (11) –
Distribution to redeemable participating shareholders 18 (569,593,534) – – – (77,458) – – (133,074) (239,073)
Total finance costs (574,387,836) (2,281) (286) (1,282) (123,230) (5,585) (207,428) (133,085) (239,073)
(Loss)/profit before tax (682,104,228) (5,356,518) (225,302) (5,765,206) 894,984 758,291 777,839 (5,781,475) (1,446,506)
Withholding tax on dividend income 2(c) (10,692,165) – – – – – (5,947) (87,951) (60,431)
Capital gains tax (1,625) – – – – – – – –
(Decrease)/increase in net assets from operations attributable to redeemable participating shareholders (692,798,018) (5,356,518) (225,302) (5,765,206) 894,984 758,291 771,892 (5,869,426) (1,506,937)
* Net losses on investments of (US$1,355,312) due to cross holdings have been eliminated from the Company total.
201

All the amounts above arose from continuing operations. There were no gains or losses other than those shown in the Profit and Loss Account above.
The accompanying notes form an integral part of these financial statements.
Profit and Loss Account
For the year ended 30 June 2019, continued
Notes
GAM Star Global
Balanced£
GAM Star Capital
Appreciation US Equity
US$
GAM Star Cat
BondUS$
GAM Star Global
Cautious£
GAM Star China Equity
US$
GAM Star Composite
Global EquityUS$
GAM Star Continental
European Equity
€
GAM Star Credit
Opportunities (EUR)
€
GAM Star Credit
Opportunities (GBP)
£
Income
Dividend income 2(c) 376,353 788,577 – 102,539 9,800,695 1,131,923 25,778,661 5,994,513 7,614,644
Bank interest 2(c) 19,068 22,952 12,385 14,387 36,922 21,635 33,700 – –
Bond interest income 2(c) – – 124,821,745 – – – – 182,279,200 51,110,227
Sundry income 2(j) and 5 – 39 – – 78 – 25 199,839 3,567,765
Net (losses)/gains on investments at fair value 12 14,451,108 8,223,451 (136,502,046) 7,090,238 (110,735,379) 1,872,543 (129,664,567) (155,894,981) (6,530,406)
Total investment income 14,846,529 9,035,019 (11,667,916) 7,207,164 (100,897,684) 3,026,101 (103,852,181) 32,578,571 55,762,230
Operating expenses 13 (7,692,569) (842,108) (19,936,107) (2,955,382) (7,949,996) (737,232) (13,511,945) (53,479,948) (11,394,216)
Operating (loss)/profit 7,153,960 8,192,911 (31,604,023) 4,251,782 (108,847,680) 2,288,869 (117,364,126) (20,901,377) 44,368,014
Finance costs
Bank interest 2(l) (26) – – (14) – (28) (75,366) (1,571,334) (49,686)
Distribution to redeemable participating shareholders 18 (321,486) – (104,995,230) (846,195) (1,534,107) (603,268) (10,579,344) (136,591,315) (47,415,400)
Total finance costs (321,512) – (104,995,230) (846,209) (1,534,107) (603,296) (10,654,710) (138,162,649) (47,465,086)
(Loss)/profit before tax 6,832,448 8,192,911 (136,599,253) 3,405,573 (110,381,787) 1,685,573 (128,018,836) (159,064,026) (3,097,072)
Withholding tax on dividend income 2(c) – (223,590) (2,467) – (559,579) – (1,782,266) (650,633) (148,477)
Capital gains tax – – – – – – – – –
(Decrease)/increase in net assets from operations attributable to redeemable participating shareholders 6,832,448 7,969,321 (136,601,720) 3,405,573 (110,941,366) 1,685,573 (129,801,102) (159,714,659) (3,245,549)
GAM Star Fund p.l.c.
202

All the amounts above arose from continuing operations. There were no gains or losses other than those shown in the Profit and Loss Account above.
The accompanying notes form an integral part of these financial statements.
Profit and Loss Account
For the year ended 30 June 2019, continued
Notes
GAM Star Credit
Opportunities (USD)
US$
GAM Star Global
Defensive£
GAM Star Discretionary
FX*US$
GAM Star Dynamic
Global BondUS$
GAM Star Global
Dynamic Growth
£
GAM Star Emerging
EquityUS$
GAM Star Emerging
Market RatesUS$
GAM Star European
Equity€
GAM Star Flexible Global
Portfolio€
Income
Dividend income 2(c) 5,908,979 16,496 39 – 12,689 873,801 – 5,787,910 130,358
Bank interest 2(c) 304,727 1,904 106,359 29,761 139 455 125,444 – –
Bond interest income 2(c) 204,713,589 – – 434,642 – – 3,137,297 – –
Sundry income 2(j) and 5 160,240 – – – – – – 43 9
Net (losses)/gains on investments at fair value 12 24,495,614 929,937 1,066,187 (3,150,901) (120,299) (502,930) (2,660,076) (14,554,328) 598,816
Total investment income 235,583,149 948,337 1,172,585 (2,686,498) (107,471) 371,326 602,665 (8,766,375) 729,183
Operating expenses 13 (48,606,271) (293,395) (72,717) (195,438) (67,065) (575,688) (1,277,254) (589,405) (308,989)
Operating (loss)/profit 186,976,878 654,942 1,099,868 (2,881,936) (174,536) (204,362) (674,589) (9,355,780) 420,194
Finance costs
Bank interest 2(l) (20) (8) (6) (10,881) – (2,138) (2,945) (27,189) (10,210)
Distribution to redeemable participating shareholders 18 (158,298,323) (98,324) – – – (203,039) (1,908,118) (4,790,784) (487,142)
Total finance costs (158,298,343) (98,332) (6) (10,881) – (205,177) (1,911,063) (4,817,973) (497,352)
(Loss)/profit before tax 28,678,535 556,610 1,099,862 (2,892,817) (174,536) (409,539) (2,585,652) (14,173,753) (77,158)
Withholding tax on dividend income 2(c) (3,701,919) – – – – (102,311) (39,225) (404,087) –
Capital gains tax – – – – – – – – –
(Decrease)/increase in net assets from operations attributable to redeemable participating shareholders 24,976,616 556,610 1,099,862 (2,892,817) (174,536) (511,850) (2,624,877) (14,577,840) (77,158)
* Fund terminated during the year.
203

All the amounts above arose from continuing operations. There were no gains or losses other than those shown in the Profit and Loss Account above.
The accompanying notes form an integral part of these financial statements.
Profit and Loss Account
For the year ended 30 June 2019, continued
Notes
GAM Star GAMCO
US Equity*US$
GAM Star Global
Quality*US$
GAM Star Global Rates
US$
GAM Star Global
SelectorUS$
GAM Star Global
Growth£
GAM Star India
Equity*US$
GAM Star Interest
TrendUS$
GAM Star Japan
Leaders¥
GAM Star Keynes
Quantitative Strategies*
US$
Income
Dividend income 2(c) 89,556 239,242 992 193,897 192,611 12,651 118,373 950,396,974 48,285
Bank interest 2(c) 6,141 264,737 784,353 – 5,046 1,454 74,366 – 9,546
Bond interest income 2(c) 10,522 – 4,911,576 – – – 2,514,448 – 46,224
Sundry income 2(j) and 5 11 63 – 48 16 – 41,250 3,140 2,678
Net (losses)/gains on investments at fair value 12 (2,573,183) (5,328,720) (10,540,031) (1,848,572) 6,236,781 (812,759) (2,508,304) (5,969,193,599) (541,688)
Total investment income (2,466,953) (4,824,678) (4,843,110) (1,654,627) 6,434,454 (798,654) 240,133 (5,018,793,485) (434,955)
Operating expenses 13 (225,221) (202,767) (5,437,227) (199,093) (3,567,480) (58,932) (854,017) (589,972,205) (177,606)
Operating (loss)/profit (2,692,174) (5,027,445) (10,280,337) (1,853,720) 2,866,974 (857,586) (613,884) (5,608,765,690) (612,561)
Finance costs
Bank interest 2(l) – – (323,589) (319) – – – (2,647,585) (9,550)
Distribution to redeemable participating shareholders 18 – – (6,711) (1,757) (24,345) – – (236,574,582) –
Total finance costs – – (330,300) (2,076) (24,345) – – (239,222,167) (9,550)
(Loss)/profit before tax (2,692,174) (5,027,445) (10,610,637) (1,855,796) 2,842,629 (857,586) (613,884) (5,847,987,857) (622,111)
Withholding tax on dividend income 2(c) (73,946) (42,214) – (31,255) – – (21,693) (142,559,548) –
Capital gains tax – – – – – – – – (1,625)
(Decrease)/increase in net assets from operations attributable to redeemable participating shareholders (2,766,120) (5,069,659) (10,610,637) (1,887,051) 2,842,629 (857,586) (635,577) (5,990,547,405) (623,736)
* Fund terminated during the year.
GAM Star Fund p.l.c.
204

All the amounts above arose from continuing operations. There were no gains or losses other than those shown in the Profit and Loss Account above.
The accompanying notes form an integral part of these financial statements.
Profit and Loss Account
For the year ended 30 June 2019, continued
Notes
GAM Star MBS
Total ReturnUS$
GAM Systematic Alternative
Risk PremiaUS$
GAM Systematic
Core MacroUS$
GAM Systematic
Global Equity Market Neutral
US$
GAM Star Tactical
OpportunitiesUS$
GAM Star Target Return
US$
GAM Star Target Return
PlusUS$
GAM Star Disruptive
GrowthUS$
GAM Star US All Cap
EquityUS$
Income
Dividend income 2(c) 963,247 381,385 391,715 1,024,701 183,712 19,576 10,073 2,662,396 1,594,409
Bank interest 2(c) 121,815 1,042,517 347,178 – 12,203 17,083 5,476 196,094 69,833
Bond interest income 2(c) 71,058,113 2,946,000 – 641 803,566 445,642 126,031 5,066 –
Sundry income 2(j) and 5 – – 19 44 – – – 190,123 –
Net (losses)/gains on investments at fair value 12 (40,007,088) (504,608) (1,779,128) 478,203 154,101 (513,170) (474,749) 6,299,968 3,468,069
Total investment income 32,136,087 3,865,294 (1,040,216) 1,503,589 1,153,582 (30,869) (333,169) 9,353,647 5,132,311
Operating expenses 13 (14,767,120) (1,979,234) (1,142,007) (201,458) (561,047) (211,541) (135,644) (3,401,619) (2,103,809)
Operating (loss)/profit 17,368,967 1,886,060 (2,182,223) 1,302,131 592,535 (242,410) (468,813) 5,952,028 3,028,502
Finance costs
Bank interest 2(l) (95) (309,732) (64,886) (1,217,881) (41,116) (2,541) (366) (508,385) (6)
Distribution to redeemable participating shareholders 18 (57,386,496) (4,179,608) (24,509) – (186,385) (280,713) (9,021) (789) –
Total finance costs (57,386,591) (4,489,340) (89,395) (1,217,881) (227,501) (283,254) (9,387) (509,174) (6)
(Loss)/profit before tax (40,017,624) (2,603,280) (2,271,618) 84,250 365,034 (525,664) (478,200) 5,442,854 3,028,496
Withholding tax on dividend income 2(c) (15,975) – – – – (211) (76) (314,655) (407,156)
Capital gains tax – – – – – – – – –
(Decrease)/increase in net assets from operations attributable to redeemable participating shareholders (40,033,599) (2,603,280) (2,271,618) 84,250 365,034 (525,875) (478,276) 5,128,199 2,621,340
205205
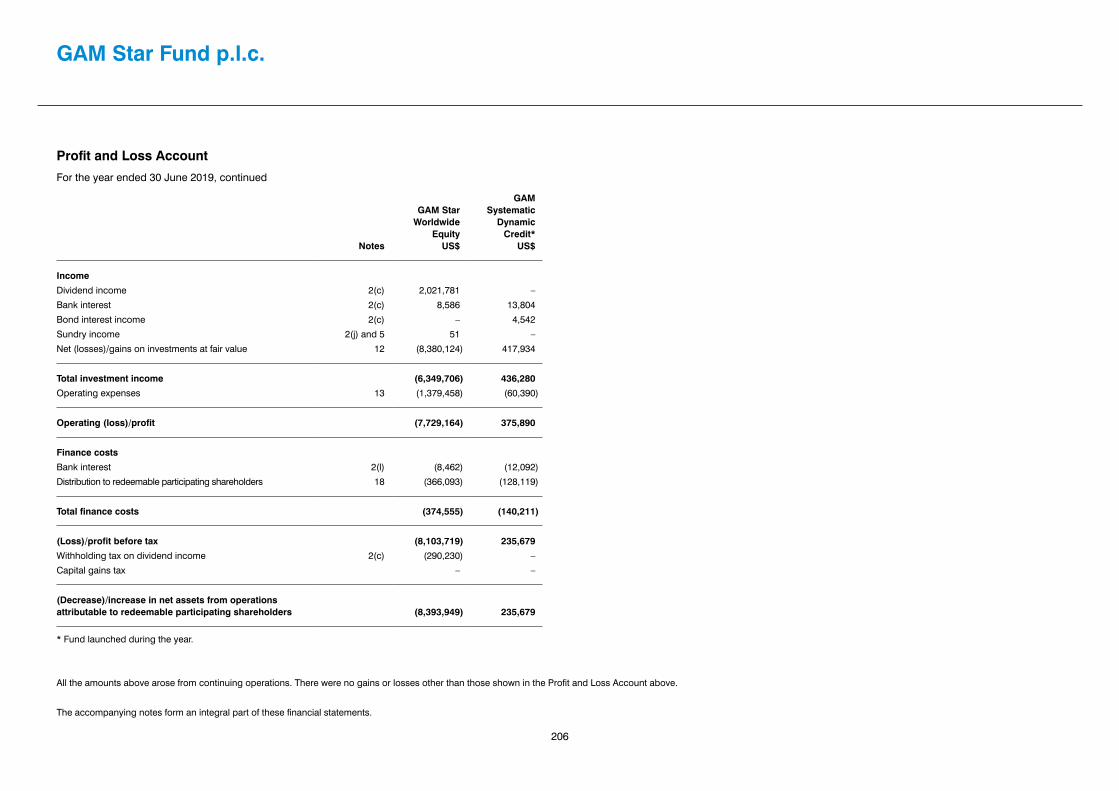
All the amounts above arose from continuing operations. There were no gains or losses other than those shown in the Profit and Loss Account above.
The accompanying notes form an integral part of these financial statements.
Profit and Loss Account
For the year ended 30 June 2019, continued
Notes
GAM Star Worldwide
EquityUS$
GAM Systematic
Dynamic Credit*
US$
Income
Dividend income 2(c) 2,021,781 –
Bank interest 2(c) 8,586 13,804
Bond interest income 2(c) – 4,542
Sundry income 2(j) and 5 51 –
Net (losses)/gains on investments at fair value 12 (8,380,124) 417,934
Total investment income (6,349,706) 436,280
Operating expenses 13 (1,379,458) (60,390)
Operating (loss)/profit (7,729,164) 375,890
Finance costs
Bank interest 2(l) (8,462) (12,092)
Distribution to redeemable participating shareholders 18 (366,093) (128,119)
Total finance costs (374,555) (140,211)
(Loss)/profit before tax (8,103,719) 235,679
Withholding tax on dividend income 2(c) (290,230) –
Capital gains tax – –
(Decrease)/increase in net assets from operations attributable to redeemable participating shareholders (8,393,949) 235,679
* Fund launched during the year.
GAM Star Fund p.l.c.
206

The accompanying notes form an integral part of these financial statements.
Statement of Changes in Net Assets Attributable to Redeemable Participating ShareholdersFor the year ended 30 June 2020
Notes
GAM Star Fund p.l.c.
US$
GAM Star Absolute
Return Bond*
€
GAM Star Absolute
Return Bond
Defender*€
GAM Star Absolute
Return Bond Plus*
€
GAM Star Absolute
Return Macro*€
GAM Star Alpha
Spectrum€
GAM Star Alpha
TechnologyUS$
GAM Star Asian
EquityUS$
GAM Star Asia-Pacific
Equity*US$
GAM Star Global
Balanced**£
Net assets attributable to redeemable participating shareholders at the start of the year 15,942,069,613 62,699,858 2,359,279 106,977,348 10,985,991 76,436,282 19,462,431 15,660,478 18,744,293 434,013,106
Foreign exchange movement arising on aggregation 2(d) (153,918,435) – – – – – – – – –
Movement due to issue and redemption of shares
Proceeds from redeemable participating shares issued 17 8,308,440,132 – – – 230 932,032 18,841,599 20,169,391 230,729 33,123,486
Cost of redeemable participating shares redeemed 17 (12,315,790,853) (63,512,537) (2,383,870) (108,516,366) (11,002,355) (15,687,939) (6,583,299) (6,884,133) (20,604,996) (137,736,992)
Net increase/(decrease) in share transactions (4,161,269,156) (63,512,537) (2,383,870) (108,516,366) (11,002,125) (14,755,907) 12,258,300 13,285,258 (20,374,267) (104,613,506)
Increase/(decrease) in net assets from operations attributable to redeemable participating shareholders (442,987,222) 812,679 24,591 1,539,018 16,134 (2,311,730) (683,603) 670,892 1,629,974 13,647,792
Retained distribution on accumulation shares 2(i) 265,723,873 – – – – – – 2,207 – 252,735
Net assets attributable to redeemable participating shareholders at the end of the year 11,603,537,108 – – – – 59,368,645 31,037,128 29,618,835 – 343,300,127
* Fund terminated during the year.** Formely called GAM Star Balanced.
207
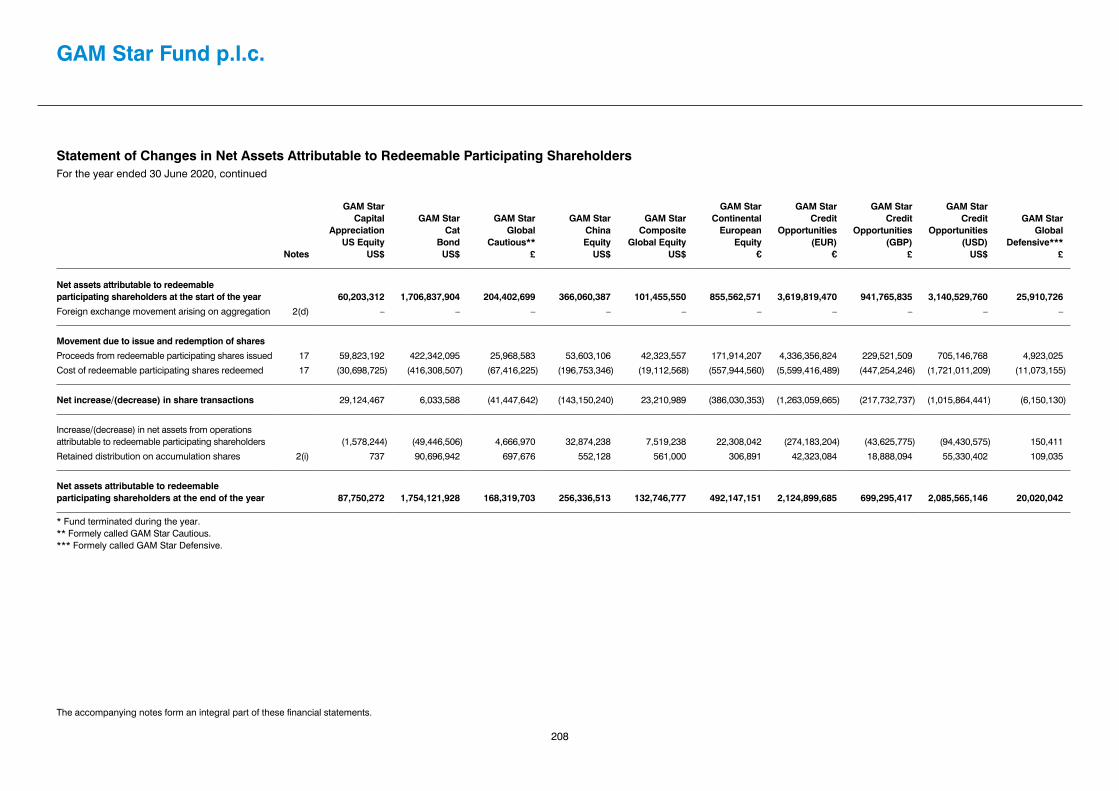
The accompanying notes form an integral part of these financial statements.
Statement of Changes in Net Assets Attributable to Redeemable Participating ShareholdersFor the year ended 30 June 2020, continued
Notes
GAM Star Capital
Appreciation US Equity
US$
GAM Star Cat
BondUS$
GAM Star Global
Cautious**£
GAM Star
China Equity
US$
GAM Star Composite
Global EquityUS$
GAM Star Continental
European Equity
€
GAM Star Credit
Opportunities (EUR)
€
GAM Star Credit
Opportunities (GBP)
£
GAM Star Credit
Opportunities (USD)
US$
GAM Star Global
Defensive***£
Net assets attributable to redeemable participating shareholders at the start of the year 60,203,312 1,706,837,904 204,402,699 366,060,387 101,455,550 855,562,571 3,619,819,470 941,765,835 3,140,529,760 25,910,726
Foreign exchange movement arising on aggregation 2(d) – – – – – – – – – –
Movement due to issue and redemption of shares
Proceeds from redeemable participating shares issued 17 59,823,192 422,342,095 25,968,583 53,603,106 42,323,557 171,914,207 4,336,356,824 229,521,509 705,146,768 4,923,025
Cost of redeemable participating shares redeemed 17 (30,698,725) (416,308,507) (67,416,225) (196,753,346) (19,112,568) (557,944,560) (5,599,416,489) (447,254,246) (1,721,011,209) (11,073,155)
Net increase/(decrease) in share transactions 29,124,467 6,033,588 (41,447,642) (143,150,240) 23,210,989 (386,030,353) (1,263,059,665) (217,732,737) (1,015,864,441) (6,150,130)
Increase/(decrease) in net assets from operations attributable to redeemable participating shareholders (1,578,244) (49,446,506) 4,666,970 32,874,238 7,519,238 22,308,042 (274,183,204) (43,625,775) (94,430,575) 150,411
Retained distribution on accumulation shares 2(i) 737 90,696,942 697,676 552,128 561,000 306,891 42,323,084 18,888,094 55,330,402 109,035
Net assets attributable to redeemable participating shareholders at the end of the year 87,750,272 1,754,121,928 168,319,703 256,336,513 132,746,777 492,147,151 2,124,899,685 699,295,417 2,085,565,146 20,020,042
* Fund terminated during the year. ** Formely called GAM Star Cautious.*** Formely called GAM Star Defensive.
GAM Star Fund p.l.c.
208

The accompanying notes form an integral part of these financial statements.
Statement of Changes in Net Assets Attributable to Redeemable Participating ShareholdersFor the year ended 30 June 2020, continued
Notes
GAM StarDynamic
GlobalBond*
US$
GAM StarGlobal
DynamicGrowth**
£
GAM Star Emerging
EquityUS$
GAM Star Emerging
Market RatesUS$
GAM Star European
Equity€
GAM Star Flexible Global
Portfolio€
GAM Star Global Rates
US$
GAM Star Global
Selector*US$
GAM StarGlobal
Growth***£
GAM Star Interest
TrendUS$
Net assets attributable to redeemable participating shareholders at the start of the year 13,581,097 6,732,028 25,468,860 69,351,925 191,579,325 36,154,863 260,075,568 5,218,616 208,043,461 52,924,484
Foreign exchange movement arising on aggregation 2(d) – – – – – – – – – –
Movement due to issue and redemption of shares
Proceeds from redeemable participating shares issued 17 – 1,216,519 1,724,480 51,050,007 296,164,258 128,256,342 5,906,937 41,838 24,806,557 3,600,000
Cost of redeemable participating shares redeemed 17 (13,514,644) (2,500,722) (10,894,056) (50,486,660) (214,897,794) (35,770,707) (120,139,013) (5,317,405) (64,596,891) (16,261,672)
Net increase/(decrease) in share transactions (13,514,644) (1,284,203) (9,169,576) 563,347 81,266,464 92,485,635 (114,232,076) (5,275,567) (39,790,334) (12,661,672)
Increase/(decrease) in net assets from operations attributable to redeemable participating shareholders (66,453) 224,803 (1,539,030) 1,963,756 367,812 348,146 (14,775,777) 56,951 9,444,545 3,036,598
Retained distribution on accumulation shares 2(i) – – – 239,962 115,634 42,875 108,342 – 58,954 –
Net assets attributable to redeemable participating shareholders at the end of the year – 5,672,628 14,760,254 72,118,990 273,329,235 129,031,519 131,176,057 – 177,756,626 43,299,410
* Fund terminated during the year.** Formely called GAM Star Dynamic Growth.*** Formely called GAM Star Growth.
209

The accompanying notes form an integral part of these financial statements.
Statement of Changes in Net Assets Attributable to Redeemable Participating ShareholdersFor the year ended 30 June 2020, continued
Notes
GAM Star Japan
Leaders¥
GAM Star MBS
Total ReturnUS$
GAM Systematic Alternative
Risk PremiaUS$
GAM Systematic
Core Macro
US$
GAM Systematic
Global Equity Market Neutral*
US$
GAM Star Tactical
OpportunitiesUS$
GAM Star Target Return*
US$
GAM Star Target Return
Plus*US$
GAM Star Disruptive Growth**
US$
GAM Star US All Cap
EquityUS$
Net assets attributable to redeemable participating shareholders at the start of the year 36,578,079,435 1,242,049,986 262,774,670 54,598,050 17,948,822 47,206,471 31,289,305 9,035,338 243,364,798 79,979,060
Foreign exchange movement arising on aggregation 2(d) – – – – – – – – – –
Movement due to issue and redemption of shares
Proceeds from redeemable participating shares issued 17 42,834,244,041 628,964,338 28,216,131 10,772,643 – 20,411,645 4,155,310 – 68,122,015 749,404
Cost of redeemable participating shares redeemed 17 (28,296,311,024) (841,612,231) (212,116,922) (55,096,955) (18,093,648) (26,794,445) (34,993,666) (8,481,335) (84,272,750) (17,254,574)
Net increase/(decrease) in share transactions 14,537,933,017 (212,647,893) (183,900,791) (44,324,312) (18,093,648) (6,382,800) (30,838,356) (8,481,335) (16,150,735) (16,505,170)
Increase/(decrease) in net assets from operations attributable to redeemable participating shareholders 6,957,105,288 (123,372,521) (20,430,320) (450,585) 144,826 (739,882) (450,949) (554,003) 62,026,748 4,036,499
Retained distribution on accumulation shares 2(i) 192,004,609 42,452,066 902,295 6,011 – 190,291 – – 374 –
Net assets attributable to redeemable participating shareholders at the end of the year 58,265,122,349 948,481,638 59,345,854 9,829,164 – 40,274,080 – – 289,241,185 67,510,389
* Fund terminated during the year.** Formely called GAM Star Technology.
GAM Star Fund p.l.c.
210

The accompanying notes form an integral part of these financial statements.
Statement of Changes in Net Assets Attributable to Redeemable Participating ShareholdersFor the year ended 30 June 2020, continued
Notes
GAM Star Worldwide
EquityUS$
GAM Systematic
Dynamic Credit US$
Net assets attributable to redeemable participating shareholders at the start of the year 76,505,520 13,598,119
Foreign exchange movement arising on aggregation 2(d) – –
Movement due to issue and redemption of shares
Proceeds from redeemable participating shares issued 17 3,369,605 10,404,027
Cost of redeemable participating shares redeemed 17 (19,702,167) (11,988,429)
Net increase/(decrease) in share transactions (16,332,562) (1,584,402)
Increase/(decrease) in net assets from operations attributable to redeemable participating shareholders (402,341) (1,357,345)
Retained distribution on accumulation shares 2(i) 7,924 179,267
Net assets attributable to redeemable participating shareholders at the end of the year 59,778,541 10,835,639
211

The accompanying notes form an integral part of these financial statements.
Statement of Changes in Net Assets Attributable to Redeemable Participating ShareholdersFor the year ended 30 June 2019
Notes
GAM Star Fund p.l.c.
US$
GAM Star Absolute
Return Bond
€
GAM Star Absolute
Return Bond Defender
€
GAM Star Absolute
Return Bond Plus
€
GAM Star Absolute
Return Macro€
GAM Star Alpha
Spectrum€
GAM Star Alpha
TechnologyUS$
GAM Star Asian
EquityUS$
GAM Star Asia-Pacific
EquityUS$
GAM Star Global
Balanced£
Net assets attributable to redeemable participating shareholders at the start of the year 25,996,445,451 691,666,624 19,368,928 969,604,927 167,623,393 78,433,899 16,268,937 49,386,837 26,740,342 559,909,187
Foreign exchange movement arising on aggregation 2(d) (348,799,424) – – – – – – – – –
Movement due to issue and redemption of shares
Proceeds from redeemable participating shares issued 17 7,969,134,244 91,302,340 27,324,560 890,912 140,875 831,937 4,771,467 3,400,913 281,107 85,763,560
Cost of redeemable participating shares redeemed 17 (17,360,947,195) (714,912,588) (44,108,907) (857,753,285) (157,720,536) (3,587,845) (2,349,865) (31,307,124) (6,923,585) (218,674,095)
Net (decrease)/increase in share transactions (9,740,612,375) (623,610,248) (16,784,347) (856,862,373) (157,579,661) (2,755,908) 2,421,602 (27,906,211) (6,642,478) (132,910,535)
(Decrease)/increase in net assets from operations attributable to redeemable participating shareholders (692,798,018) (5,356,518) (225,302) (5,765,206) 894,984 758,291 771,892 (5,869,426) (1,506,937) 6,832,448
Retained distribution on accumulation shares 2(i) 379,034,555 – – – 47,275 – – 49,278 153,366 182,006
Net assets attributable to redeemable participating shareholders at the end of the year 15,942,069,613 62,699,858 2,359,279 106,977,348 10,985,991 76,436,282 19,462,431 15,660,478 18,744,293 434,013,106
GAM Star Fund p.l.c.
212

The accompanying notes form an integral part of these financial statements.
Statement of Changes in Net Assets Attributable to Redeemable Participating ShareholdersFor the year ended 30 June 2019, continued
Notes
GAM Star Capital
Appreciation US Equity
US$
GAM Star Cat
BondUS$
GAM Star Global
Cautious£
GAM Star
China Equity
US$
GAM Star Composite
Global EquityUS$
GAM Star Continental
European Equity
€
GAM Star Credit
Opportunities (EUR)
€
GAM Star Credit
Opportunities (GBP)
£
GAM Star Credit
Opportunities (USD)
US$
GAM Star Global
Defensive£
Net assets attributable to redeemable participating shareholders at the start of the year 64,315,079 1,699,455,862 277,985,904 833,512,246 114,826,796 1,901,218,132 5,565,826,734 1,184,905,147 4,387,176,427 31,651,474
Foreign exchange movement arising on aggregation 2(d) – – – – – – – – – –
Movement due to issue and redemption of shares
Proceeds from redeemable participating shares issued 17 13,481,643 437,867,210 47,314,915 130,160,733 23,576,307 244,624,669 3,830,713,137 419,258,684 630,049,319 10,630,239
Cost of redeemable participating shares redeemed 17 (25,562,731) (384,042,100) (124,641,031) (487,391,406) (39,201,128) (1,167,914,686) (5,706,411,843) (683,147,065) (1,983,089,664) (17,011,646)
Net (decrease)/increase in share transactions (12,081,088) 53,825,110 (77,326,116) (357,230,673) (15,624,821) (923,290,017) (1,875,698,706) (263,888,381) (1,353,040,345) (6,381,407)
(Decrease)/increase in net assets from operations attributable to redeemable participating shareholders 7,969,321 (136,601,720) 3,405,573 (110,941,366) 1,685,573 (129,801,102) (159,714,659) (3,245,549) 24,976,616 556,610
Retained distribution on accumulation shares 2(i) – 90,158,652 337,338 720,180 568,002 7,435,558 89,406,101 23,994,618 81,417,062 84,049
Net assets attributable to redeemable participating shareholders at the end of the year 60,203,312 1,706,837,904 204,402,699 366,060,387 101,455,550 855,562,571 3,619,819,470 941,765,835 3,140,529,760 25,910,726
213

The accompanying notes form an integral part of these financial statements.
Statement of Changes in Net Assets Attributable to Redeemable Participating ShareholdersFor the year ended 30 June 2019, continued
Notes
GAM Star Discretionary
FX*US$
GAM Star Dynamic
Global BondUS$
GAM Star Global
Dynamic Growth
£
GAM Star Emerging
EquityUS$
GAM Star Emerging
Market RatesUS$
GAM Star European
Equity€
GAM Star Flexible Global
Portfolio€
GAM Star GAMCO
US Equity*US$
GAM Star Global
Quality*US$
GAM Star Global Rates
US$
Net assets attributable to redeemable participating shareholders at the start of the year 20,604,625 160,249,711 10,779,376 37,447,885 148,900,107 265,994,867 49,725,971 33,804,719 38,483,704 796,705,091
Foreign exchange movement arising on aggregation 2(d) – – – – – – – – – –
Movement due to issue and redemption of shares
Proceeds from redeemable participating shares issued 17 275,777 5,601 2,969,820 2,097,028 49,173,441 1,588,687 6,628,489 123,725 180,093 33,310,300
Cost of redeemable participating shares redeemed 17 (21,980,264) (143,781,398) (6,842,632) (13,689,445) (127,541,896) (65,862,328) (20,439,178) (31,162,324) (33,594,138) (559,336,738)
Net (decrease)/increase in share transactions (21,704,487) (143,775,797) (3,872,812) (11,592,417) (78,368,455) (64,273,641) (13,810,689) (31,038,599) (33,414,045) (526,026,438)
(Decrease)/increase in net assets from operations attributable to redeemable participating shareholders 1,099,862 (2,892,817) (174,536) (511,850) (2,624,877) (14,577,840) (77,158) (2,766,120) (5,069,659) (10,610,637)
Retained distribution on accumulation shares 2(i) – – – 125,242 1,445,150 4,435,939 316,739 – – 7,552
Net assets attributable to redeemable participating shareholders at the end of the year – 13,581,097 6,732,028 25,468,860 69,351,925 191,579,325 36,154,863 – – 260,075,568
* Fund terminated during the year.
GAM Star Fund p.l.c.
214

The accompanying notes form an integral part of these financial statements.
Statement of Changes in Net Assets Attributable to Redeemable Participating ShareholdersFor the year ended 30 June 2019, continued
Notes
GAM Star Global
SelectorUS$
GAM Star Global
Growth£
GAM Star India
Equity*US$
GAM Star Interest
TrendUS$
GAM Star Japan
Leaders¥
GAM Star Keynes
Quantitative Strategies*
US$
GAM Star MBS
Total ReturnUS$
GAM Systematic Alternative
Risk PremiaUS$
GAM Systematic
Core MacroUS$
GAM Systematic
Global Equity Market Neutral
US$
Net assets attributable to redeemable participating shareholders at the start of the year 15,350,309 244,670,411 8,238,382 76,995,766 69,120,573,338 16,923,592 1,676,269,026 313,695,616 173,051,720 20,432,389
Foreign exchange movement arising on aggregation 2(d) – – – – – – – – –
Movement due to issue and redemption of shares
Proceeds from redeemable participating shares issued 17 138,586 38,354,101 324,178 – 29,290,383,097 190,807 584,286,800 114,303,838 17,227,108 6,055,878
Cost of redeemable participating shares redeemed 17 (8,384,985) (77,837,495) (7,704,974) (23,435,705) (56,017,582,277) (16,490,663) (1,028,738,879) (166,475,927) (133,416,456) (8,623,695)
Net (decrease)/increase in share transactions (8,246,399) (39,483,394) (7,380,796) (23,435,705) (26,727,199,180) (16,299,856) (444,452,079) (52,172,089) (116,189,348) (2,567,817)
(Decrease)/increase in net assets from operations attributable to redeemable participating shareholders (1,887,051) 2,842,629 (857,586) (635,577) (5,990,547,405) (623,736) (40,033,599) (2,603,280) (2,271,618) 84,250
Retained distribution on accumulation shares 2(i) 1,757 13,815 – – 175,252,682 – 50,266,638 3,854,423 7,296 –
Net assets attributable to redeemable participating shareholders at the end of the year 5,218,616 208,043,461 – 52,924,484 36,578,079,435 – 1,242,049,986 262,774,670 54,598,050 17,948,822
* Fund terminated during the year.
215

The accompanying notes form an integral part of these financial statements.
Statement of Changes in Net Assets Attributable to Redeemable Participating ShareholdersFor the year ended 30 June 2019, continued
Notes
GAM Star Tactical
OpportunitiesUS$
GAM Star Target Return
US$
GAM Star Target Return
PlusUS$
GAM Star Disruptive
GrowthUS$
GAM Star US All Cap
EquityUS$
GAM Star Worldwide
EquityUS$
GAM Systematic
Dynamic Credit**
US$
Net assets attributable to redeemable participating shareholders at the start of the year 62,606,943 23,185,919 11,650,476 317,831,094 247,741,303 114,585,978 –
Foreign exchange movement arising on aggregation 2(d)
Movement due to issue and redemption of shares
Proceeds from redeemable participating shares issued 17 21,103,497 38,092,619 10,717 70,180,609 26,141,918 25,450,265 27,595,852
Cost of redeemable participating shares redeemed 17 (37,121,344) (29,713,447) (2,156,600) (149,775,707) (196,525,501) (55,401,829) (14,370,130)
Net (decrease)/increase in share transactions (16,017,847) 8,379,172 (2,145,883) (79,595,098) (170,383,583) (29,951,564) 13,225,722
(Decrease)/increase in net assets from operations attributable to redeemable participating shareholders 365,034 (525,875) (478,276) 5,128,199 2,621,340 (8,393,949) 235,679
Retained distribution on accumulation shares 2(i) 252,341 250,089 9,021 603 – 265,055 136,718
Net assets attributable to redeemable participating shareholders at the end of the year 47,206,471 31,289,305 9,035,338 243,364,798 79,979,060 76,505,520 13,598,119
** Fund launched during the year.
GAM Star Fund p.l.c.
216

217
Notes to the Financial Statements
1. List of Funds
The various funds comprising GAM Star Fund p.l.c as at 30 June 2020 are as follows:
Fund name Functional currencyGAM Star Absolute Return Bond Euro(Terminated 23 July 2019) GAM Star Absolute Return Bond Defender Euro(Terminated 23 July 2019) GAM Star Absolute Return Bond Plus Euro(Terminated 23 July 2019) GAM Star Absolute Return Macro Euro(Terminated 17 July 2019) GAM Star Alpha Spectrum EuroGAM Star Alpha Technology US dollarGAM Star Asian Equity US dollarGAM Star Asia-Pacific Equity US dollar(Merged into GAM Star Asian Equity on 22 January 2020) GAM Star Global Balanced Pound SterlingGAM Star Capital Appreciation US Equity US dollarGAM Star Cat Bond US dollarGAM Star Global Cautious Pound SterlingGAM Star China A Equity US dollar(Approved on 12 December 2014. Not yet launched) GAM Star China Equity US dollarGAM Star Composite Global Equity US dollarGAM Star Continental European Equity EuroGAM Star Credit Opportunities (EUR) EuroGAM Star Credit Opportunities (GBP) Pound SterlingGAM Star Credit Opportunities (USD) US dollarGAM Star Global Defensive Pound SterlingGAM Star Discretionary FX US dollar(Terminated on 28 February 2019 )GAM Star Dynamic Global Bond US dollar(Terminated on 19 July 2019) GAM Star Global Dynamic Growth Pound SterlingGAM Star Emerging Equity US dollarGAM Star Emerging Market Rates US dollarGAM Star European Equity EuroGAM Star Flexible Allocation EUR Euro(Approved on 21 December 2018. Not yet launched) GAM Star Flexible Allocation Plus EUR Euro(Approved on 21 December 2018. Not yet launched) GAM Star Flexible Allocation USD US dollar(Approved on 21 December 2018. Not yet launched) GAM Star Flexible Global Portfolio EuroGAM Star GAMCO US Equity US dollar(Merged into GAM Star Capital Appreciation US Equity on 12 December 2018)GAM Star Global Income US dollar(Approved on 21 December 2018. Not yet launched) GAM Star Global Quality US dollar(Merged into GAM Star Worldwide Equity on 12 December 2018)GAM Star Global Rates US dollarGAM Star Global Selector US dollar(Merged into GAM Star Worldwide Equity on 22 January 2020) GAM Star Global Growth Pound SterlingGAM Star Interest Trend US dollarGAM Star Japan Leaders Japanese YenGAM Star MBS Total Return US dollarGAM Systematic Alternative Risk Premia US dollarGAM Systematic Alternative Risk Premia Ex-A US dollar(Approved on 11 July 2017. Not yet launched) GAM Systematic Core Macro US dollarGAM Systematic Global Equity Market Neutral US dollar(Terminated on 26 February 2020) GAM Star Tactical Opportunities US dollarGAM Star Target Return (Terminated 23 October 2019) US dollar
Fund name Functional currencyGAM Star Target Return Plus (Terminated 21 August 2019) US dollarGAM Star Disruptive Growth US dollar(Formerly known as GAM Star Technology) GAM Star UK Equity Income Pound Sterling(Approved on 21 December 2018, Not yet launched) GAM Star US All Cap Equity US dollarGAM Star Worldwide Equity US dollarGAM Systematic Dynamic Credit US dollarGAM Systematic Dynamic Multi Asset US dollar(Approved on 27 August 2020, Not yet launched)
The Company is an umbrella fund with segregated liability between Funds. Accordingly any liability incurred on behalf of or attributable to any Fund of the Company shall be discharged solely out of the assets of that Fund, and neither the Company nor any director, receiver, examiner, liquidator, provisional liquidator or other person shall apply, nor be obliged to apply, the assets of any such Fund in satisfaction of any liability incurred on behalf of or attributable to any other Fund of the Company, irrespective of when such liability was incurred.
2. Accounting policies
The significant accounting policies and estimations techniques adopted by the Company are as follows:
(a) Basis of preparation of financial statementsThese financial statements have been prepared in accordance with FRS 102: the Financial Reporting Standard applicable in the Republic of Ireland, Irish Statute comprising the Companies Act 2014 and the European Communities (Undertakings for Collective Investment in Transferable Securities) Regulations, 2011 (as amended) (the “UCITS Regulations”) and under the Central Bank (Supervision and Enforcement) Act, 2013 (Section 48(1) (Undertakings for Collective Investment in Transferable Securities) Regulations 2019). Accounting standards generally accepted in Ireland in preparing financial statements giving a true and fair view are those published by the Institute of Chartered Accountants in Ireland and issued by the Financial Reporting Council (“FRC”).
The Companies Act 2014 prescribed formats for financial statements have been adapted to make them more applicable to investment funds. The Company has availed of the exemption available to open ended investment funds that hold a substantial proportion of highly liquid and fair valued investments under FRS 102 and is not presenting a cash flow statement. The information required by FRS 102 to be included in a statement of comprehensive income, is in the opinion of the Directors, contained in the Profit and Loss Account of each Fund.
On initial application of FRS 102, in accounting for its financial instruments, a reporting entity is required to apply either a) the full requirements of FRS 102 relating to Basic Financial Instruments and Other Financial Instruments Issues, b) the recognition and measurement provisions of IAS 39 Financial Instruments: Recognition and Measurement and only the disclosure requirements of FRS 102 relating to Basic Financial Instruments and Other Financial Instruments, or c) the recognition and measurement provisions of IFRS 9 Financial Instruments and only the disclosure requirements of FRS 102 relating to Basic Financial Instruments and Other Financial Instruments.
The Company has elected to apply the recognition and measurement provisions of IAS 39 and only the disclosure requirements of FRS 102.

218
GAM Star Fund p.l.c.
Notes to the Financial Statements
2. Accounting policies, continued
(a) Basis of preparation of financial statements, continuedIn arriving at the results for the year, all amounts in the Profit and Loss Account related to continuing activities for all open Funds and discontinuing activities for the terminating Funds. The open Funds noted within note 1 are prepared on a going concern basis whereas the terminating Funds are prepared on a non going concern basis.
In the opinion of the Directors, the financial statements disclose the information required by the Irish Companies Act 2014.
The financial statements have been prepared for all Funds under the historical cost convention, as modified by the revaluation of financial assets and financial liabilities (including derivative instruments) at fair value through profit or loss.
(b) Investments at fair valueClassificationThis category has two sub-categories: financial assets and liabilities held for trading, and those designated at fair value through profit or loss at inception. Financial assets or liabilities held for trading are acquired or incurred principally for the purpose of selling or repurchasing in the short term. Derivatives are also categorised as held for trading, as the Company does not designate any derivatives as hedges in a hedging relationship.
Recognition/DerecognitionPurchases and sales are recognised on trade date – the date on which the Company commits to purchase or sell the asset. Investments are derecognised when the rights to receive cash flows from the investments have expired or the Company has transferred substantially all risks and rewards of ownership.
MeasurementFinancial assets and liabilities are initially recognised at fair value, and transaction costs for all financial assets/liabilities carried at fair value through profit or loss are expensed as incurred. Subsequent to initial recognition, all financial assets and liabilities at fair value through profit or loss are measured at fair value.
The computation of realised gains and losses on sales of financial assets and liabilities at fair value through profit or loss is made on the basis of average cost and accounted for in the Profit and Loss Account.
Gains and losses arising from changes in the fair value of the ‘financial assets and financial liabilities at fair value through profit or loss’ category are included in the Profit and Loss Account in the period in which they arise.
Fair value estimationThe fair value of financial instruments traded in active markets (such as publicly traded derivatives and trading securities) is based on quoted market prices at the balance sheet date. The quoted market price used for financial assets and liabilities held by the Company is the last traded price.
In the case of any security not listed, quoted or dealt with on a regulated market or for which no quotation or value is readily available which would provide a fair valuation, or in respect of which the price is unrepresentative, the fair value of such security is determined by the Directors in conjunction with the pricing committee, or through broker quotations, or other competent person appointed by the Directors and approved for the purpose by the Depositary, using the market approach which consists of estimating the fair value of these securities using a comparable multiple of revenue for similar guideline public companies.
Shares or units in any collective investment scheme which provides for those shares or units to be redeemed at the option of their holder out of the assets of the undertaking shall be valued at the last published unaudited net asset value per share.
The Company may from time to time invest in financial instruments that are not traded in an active market (for example in over the counter derivatives). The fair value is determined by using valuation techniques. The Company uses a variety of methods and makes assumptions that are based on market conditions existing at each balance sheet date. Valuation techniques used include the use of comparable recent arm’s length transactions, discounted cash flow analysis, option pricing models and other valuation techniques commonly used by market participants. Any such securities are disclosed in the portfolio statements.
Critical accounting estimates and assumptionsManagement makes estimates and assumptions concerning the future. The resulting accounting estimates will, by definition seldom equal the actual related results. The estimates and assumptions that have a significant risk of causing a material adjustment to the carrying amounts of assets and liabilities within the financial year for Debt securities as noted below and Level 3 positions in note 4 fair value hierarchy.
Debt securitiesDebt securities are valued on the basis of dealer supplied quotations or by using a pricing service selected by the Manager. The fair value of the instrument is estimated using valuation techniques if a quoted market price is not available from a broker/dealer or a third party pricing service. Valuation methods include the use of recent unaffiliated market transactions, reference to the current fair value of another instrument that is substantially the same, discounted cash flow techniques or any other valuation technique that provides a reliable estimate of prices obtained in actual market transactions.
Financial derivativesFunds may hold derivatives for investment purposes and/or efficient portfolio management purposes as described in the relevant Supplement to the Prospectus.
(i) Forward foreign currency exchange contractWhen entering into a forward foreign currency exchange contract, the Funds agree to receive or deliver a fixed quantity of foreign currency for an agreed price upon an agreed future date. These contracts are valued daily at the forward rate and the Fund’s equity therein, representing unrealised gains or losses on the contracts, is included in the Balance Sheet. The unrealised gain/(loss) on open forward exchange contracts is calculated by reference to the difference between the contracted rate and the rate to close out the contract. Realised and changes in unrealised gains and losses are included in the Profit and Loss Account.

219
Notes to the Financial Statements
2. Accounting policies, continued
(b) Investments at fair value, continued(ii) Futures contract
A futures contract obligates one party to sell and the other party to purchase a specific instrument for an agreed price on an agreed future date. Initial margin deposits made with respect to futures contacts are recognised as assets due from the Fund’s broker agent in acquiring the futures position. Subsequent changes in the daily valuation of open contacts are recognised as changes in unrealised gains and losses in the Profit and Loss Account. Variation margin payments are made or received on traded futures as appreciation or depreciation occurs. Futures contracts are valued using quoted daily settlement prices established by the exchange on which they trade. Realised gains or losses are recorded when a contract is closed and are included in the Profit and Loss Account. Futures contracts are included in Financial assets at fair value when the fair value is positive, and in Financial liabilities when the fair value is negative in the Balance Sheet.
(iii) Options contractAn option contract gives the buyer the right, but not the obligation, to buy (call) or sell (put) a financial instrument. Options held by the Funds which are dealt on a recognised market are valued using a settlement price as determined by the recognised market in question. Where a settlement price is not available, the value is the probable realisation value estimated with care and good faith by the Manager. Exchange traded options are valued at the settlement price determined by the relevant exchange. These are valued daily and any realised and changes in unrealised gains and losses are included in the Profit and Loss Account. Options contracts are included in Financial assets at fair value when the fair value is positive, and in Financial liabilities when the fair value is negative in the Balance Sheet.
(iv) Credit default swapsIn a credit default swap contract, one party makes payments to another party in exchange for the right to receive a specified return (or to put a security) if a credit event (e.g., default or similar event) occurs with respect to a reference entity or entities. A seller of credit default protection receives periodic payments in return for its obligation to pay the principal amount of a debt security (or other agreed-upon value) to the other party upon the occurrence of a credit event. If no credit event occurs, the seller has no payment obligations so long as there is no early termination. Credit default swap agreements are fair valued on the valuation date using market vendors. The change in fair value, if any, is recorded as changes in unrealised gains and losses in the Profit and Loss Account. Realised gains and losses on maturity or termination are recorded in the Profit and Loss Account. Credit default swaps are included in Financial assets at fair value when the fair value is positive, and in Financial liabilities when the fair value is negative in the Balance Sheet.
(v) Contracts for differenceContracts for difference are OTC derivatives which take advantage of the economical benefits which are not afforded through investing directly in certain securities markets. Funds may purchase equity contracts for difference as a means of
gaining exposure to the economic performance and cash flows of an equity security without the need for taking or making physical delivery of the security. A contract for difference is a financial instrument linked to an underlying share price. Consequently, no rights are acquired or obligations incurred relating to the underlying share and the Fund may buy or sell depending on the fund manager’s view of a company’s share price. Contracts for difference are highly leveraged instruments and for a small deposit it is possible for Fund to hold a position much greater than would be possible with a traditional investment. These are valued daily based on quoted market prices at the balance sheet date. Contracts for difference are included in Financial assets at fair value when the fair value is positive, and in Financial liabilities when the fair value is negative in the Balance Sheet.
The fair value of contracts for differences is the difference between the opening price and the volume weighted average price of the financial instrument multiplied by the number of shares specified within the contract.
(vi) Interest rate swapsInterest rate swaps may be used as a substitute for a physical security or a less expensive or more liquid way of obtaining desired exposures. These are valued daily using market vendors and any realised and changes in unrealised gains and losses are included in the Profit and Loss Account. Interest rate swaps are included in Financial assets at fair value when the fair value is positive, and in Financial liabilities when the fair value is negative in the Balance Sheet.
Some of the interest rate swaps are centrally cleared positions. In a centrally cleared swap, immediately following execution of the swap agreement, the swap contract is novated to a clearing counterparty and the Funds faces the clearing counterparty through a broker. Upon entering into a centrally cleared swap the Funds are required to deposit initial margin with the broker in the form of cash in an amount that varies depending on the size and risk profile of the swap.
(vii) Total return swapsTotal Return swaps may be used as a substitute for investing in standardised exchange traded funds, futures or options contracts. Total return swaps involve the exchange of the right to receive the total return, dividends or coupons plus capital gains or losses, of a specified reference asset, index or basket of assets against the right to make fixed or floating payments. Any assets to be received by the Funds will be consistent with the investment policies of the Funds. Where the Funds enter into a total return swap on a net basis, the two payment streams are netted out, with the Funds receiving or paying, as the case may be, only the net amount of the two payments. These are valued daily using market vendors, except GAM Systematic Alternative Risk Premia which uses counterparties valuation, and any realised and changes in unrealised gains and losses are included in the Profit and Loss Account. Total return swaps are included in Financial assets at fair value when the fair value is positive, and in Financial liabilities when the fair value is negative in the Balance Sheet.

220
GAM Star Fund p.l.c.
Notes to the Financial Statements
2. Accounting policies, continued
(c) Income from InvestmentsDividend income is recognised on the ex-dividend date. All dividends on investments quoted ex dividend up to the Balance Sheet date are included in the Profit and Loss Account.
Bank and other interest receivable is accrued up to this date. Income is shown gross of any non-recoverable withholding taxes, which is disclosed separately in the Profit and Loss Account, and net of attributable tax credits.
Bond interest income on investments on debt securities is recognised when earned using the effective interest method and is shown in the Profit and Loss Account. The effective interest rate is the rate that exactly discounts estimated future cash payments or receipts through the expected life of the financial instrument to the net carrying amount of the financial asset or liability.
Cash inflows relating to interest payments on swaps are treated as swap income and are shown in the Net gains/(losses) on investments at fair value in the Profit and Loss Account.
(d) Foreign Currency Translation – Functional currency and Presentation currency
The financial statements of the individual Funds are prepared in the functional currency of the respective Fund which is also the presentation currency. The functional currency of each Fund is listed in note 1. The functional currency of the Company is US dollar as this reflects the global exposure of the Funds, their shareholders and the markets in which the Funds are available. The aggregated financial statements of the Company are prepared in the presentation currency of the Company, the US dollar. Amounts of the individual Funds in overseas currencies are translated for the purpose of the aggregation as follows:
(i) Using average exchange rates (as an approximation of actual) for the year for the Profit and Loss Account.
(ii) Using average exchange rates (as an approximation of actual) for the year for the proceeds and cost of issue and redemption of shares for the Statement of Changes in Net Assets Attributable to Redeemable Participating Shareholders.
(iii) Using year end exchange rates for the Balance Sheet.
For the purposes of producing the aggregated financial statements, the notional currency gain or loss on the re-translation of the opening net assets attributable to redeemable participating shareholders into US dollar, the presentation currency of the Company, is included in the Statement of Changes in Net Assets Attributable to Redeemable Participating Shareholders. This figure also includes the notional gain or loss from use of average rates as noted above compared to the year end exchange rates for the Balance Sheet.
Transactions and balancesForeign currency transactions are translated into the functional currency of the individual Funds using the average exchange rates (as an approximation of actual). Foreign exchange gains and losses resulting from the settlement of such transactions and from the translation at year end rates of monetary assets and liabilities denominated in foreign currencies are recognised in the Profit and Loss Account. Translation differences on non-monetary assets and liabilities are recognised in the Profit and Loss Account within net gains/(losses) on investments at fair value line.
(e) Fees and expensesFees and expenses are accounted for on an accruals basis and are charged against income and used in determining the distribution.
(f) Allocation of incomeAll the income of the Funds after deduction of expenses, will be allocated between holders of Accumulation Shares and holders of Income Shares in accordance with their respective interests.
(g) EqualisationAn equalisation account is maintained by each Fund so that the amount distributed is the same for all shares of the same type notwithstanding different dates of issue. A sum equal to that part of the price of a share which reflects the net income at the date of issue or redemption is booked to the equalisation account and added or deducted to/from the first dividend or accumulation in the same accounting period as that in which the shares are issued or redeemed.
(h) Redeemable participating sharesThe issued redeemable participating share capital is at all times equal to the Net Asset Value (“NAV”) of the Company. Redeemable participating shares are redeemable at the shareholders option and are classified as financial liabilities. Redeemable shares can be put back to the Company at any time for cash equal to a proportionate share of the Company’s NAV. The redeemable share is carried at the redemption amount that is payable at the balance sheet date if the holder exercises the right to put the share back to the Company. The movement in the number of participating shares is set out in note 17. Each Fund’s NAV per share is calculated by dividing the NAV of each Fund being the value of its assets less its liabilities by the numbers of shares of each Fund then in issue.
(i) DistributionsDividend distributions to redeemable participating shareholders are classified as finance costs in the Profit and Loss Account in the year in which they are declared. Where both Income Shares and Accumulation Shares in a Fund are in issue, all income of a Fund after deduction of expenses will be allocated between holders of Accumulation Shares and holders of Income Shares in accordance with their respective interests.
(j) Sundry incomeSundry income includes amounts received by the Company in respect of litigation payments, fee rebates received and in respect of securities lending income. These amounts are recorded on an accruals basis.
(k) TaxesLiabilities relating to uncertain tax positions are accrued only when such liabilities are probable and can be estimated with reasonable accuracy. These figures are recognised in the Balance Sheet within capital gains tax payable line.
(l) Bank interest expenseBank interest expenses relate to a bank overdraft which is repayable on demand. These figures are recognised in the Profit and Loss Accounts within bank interest.

221
Notes to the Financial Statements
3. Financial risk management
The investment objectives of the Funds may expose the Company to a variety of financial risks: market risk (including currency risk, interest rate risk and price risk), credit risk and liquidity risk (including cash flow risk) both directly through its own assets and liabilities and indirectly through the assets and liabilities of the investee funds.
As outlined in the Prospectus, the Funds are subject to certain investment restrictions and may also use certain derivative financial instruments for both investment purposes and also in an attempt to moderate certain risk exposures. Further, the Board of Directors of the Company have the power to borrow on a temporary basis. Such borrowing will not exceed 10 per cent of a respective Fund’s net assets.
Financial risk management of the Company has been delegated by the Board of Directors (which however remains ultimately responsible) through the Manager to GAM UK Limited. The Board of Directors review the performance of the Company on a quarterly basis and can confirm that there have been no significant changes to risk management procedures since the prior year.
(a) Market price riskThe Funds’ investments are susceptible to market price risk arising from uncertainties about future prices. It represents the potential loss the Company might suffer through holding market positions in the face of price movements caused by factors specific to the individual investment or factors affecting all instruments traded in the market.
For those Funds which do not use the Value at Risk (“VaR”) approach, the Co-Investment and Delegate Investment Managers use the analysis of the Funds investment by Strategy, Sector and Asset Type which show the concentrations of risk and are disclosed in the relevant Portfolio Statement of each Fund.
The Co-Investment Manager and Delegate Investment Managers manage market risk on an ongoing basis by implementing a set of procedures and controls, for those Funds which use the VaR approach, the purpose of which is to manage risk within defined parameters. The Co-Investment Manager regularly reviews and evaluates each Fund’s VaR to assess exposure to market risk. Risk can be calculated using either the commitment approach or VaR method. VaR analysis for each Fund is shown on pages 389 to 390.

222
GAM Star Fund p.l.c.
Notes to the Financial Statements
3. Financial risk management, continued
(a) Market price risk, continued
i) Sensitivity analysis for funds which do not calculate risk using VaR
At 30 June 2020 and 30 June 2019 if the fair value of investments had changed by 5% with all other variables held constant, this would have resulted in a change of net assets attributable to holders of redeemable shares and would amount to the following:
30 June2020
30 June2019
GAM Star Absolute Return Bond* – €3,104,057GAM Star Absolute Return Bond Defender* – €115,273GAM Star Absolute Return Bond Plus* – €5,325,495GAM Star Absolute Return Macro* – €455,872GAM Star Alpha Spectrum €2,844,722 €3,775,485GAM Star Alpha Technology US$1,419,433 US$882,829GAM Star Asian Equity US$1,447,331 US$778,345GAM Star Asia-Pacific Equity* – US$927,695GAM Star Global Balanced £16,077,292 £20,584,801GAM Star Capital Appreciation US Equity US$4,263,436 US$2,938,419GAM Star Cat Bond US$87,155,771 US$82,583,955GAM Star Global Cautious £7,610,576 £9,455,454GAM Star China Equity US$12,160,211 US$18,200,464GAM Star Composite Global Equity US$5,433,385 US$4,137,298GAM Star Continental European Equity €24,559,148 €42,645,179GAM Star Credit Opportunities (EUR) €96,835,580 €151,580,634GAM Star Credit Opportunities (GBP) £31,327,732 £43,082,515GAM Star Credit Opportunities (USD) US$92,908,437 US$144,019,624GAM Star Global Defensive £828,048 £1,055,605GAM Star Dynamic Global Bond* – US$498,096GAM Star Global Dynamic Growth £277,073 £332,372GAM Star Emerging Equity US$727,125 US$1,206,436GAM Star Emerging Market Rates US$2,450,051 US$3,229,176GAM Star European Equity €13,637,023 €9,446,979GAM Star Flexible Global Portfolio €6,057,004 €1,652,082GAM Star Global Rates US$4,880,511 US$10,026,557GAM Star Global Selector* – US$239,803GAM Star Global Growth £8,408,050 £9,877,523GAM Star Interest Trend US$1,906,018 US$2,428,321GAM Star Japan Leaders ¥2,896,277,477 ¥1,821,687,168GAM Star MBS Total Return US$42,326,401 US$58,339,682GAM Systematic Alternative Risk Premia US$2,288,925 US$8,872,932GAM Systematic Core Macro US$200,866 US$2,318,162GAM Systematic Global Equity Market Neutral* – US$909,099GAM Star Tactical Opportunities US$1,876,558 US$1,620,473GAM Star Target Return* – US$1,418,663GAM Star Target Return Plus* – US$338,807GAM Star Disruptive Growth US$12,654,170 US$11,639,307GAM Star US All Cap Equity US$3,208,386 US$3,862,212GAM Star Worldwide Equity US$2,836,923 US$3,650,186GAM Systematic Dynamic Credit US$346,293 US$461,691
* Fund terminated during the year.

223
Notes to the Financial Statements
3. Financial risk management, continued
(b) Currency risksThe Funds may hold assets and liabilities denominated in currencies other than their respective functional currency. Therefore they may be exposed to currency risk, as the value of the assets and liabilities denominated in other currencies may fluctuate due to changes in exchange rates.
The Co-Investment Managers and Delegate Investment Managers monitor the currency exposure each dealing day whether used for hedging or investment purposes in accordance with the Prospectus. Currency exposure used for hedging techniques is normally done in order to remove or reduce currency risks within the relevant Fund where appropriate.
Currency risk sensitivity analysisAt 30 June 2020 and 30 June 2019, had the exchange rate between the functional currency and the non functional currencies arising from changes in the value of monetary assets/(liabilities) and hedging positions of the Funds changed by 5%, with all other variables held constant, the impact on net assets attributable to holders of redeemable shares would be as per the below table. Other Funds may not be listed below as they did not hold monetary assets/(liabilities) in non functional currencies at 30 June 2020 and 30 June 2019.
30 June2020
30 June2019
GAM Star Absolute Return Bond* – € 35,544GAM Star Absolute Return Bond Defender* – € 2,849GAM Star Absolute Return Bond Plus* – € 33,186GAM Star Absolute Return Macro* – € 37,355GAM Star Alpha Spectrum € 1,986 € 30GAM Star Alpha Technology US$(3,314) US$4GAM Star Asian Equity US$3,323 US$3,412GAM Star Asia-Pacific Equity* – US$3,790GAM Star Global Balanced £12,524 –GAM Star Capital Appreciation US Equity US$235 US$124GAM Star Cat Bond US$701,326 US$1,596,200GAM Star Global Cautious £8,286 –GAM Star China Equity US$57,498 US$344,874GAM Star Composite Global Equity US$2,875 US$2,156GAM Star Continental European Equity € 13,974 € 44,763GAM Star Credit Opportunities (EUR) € 26,738,363 € 37,152,093GAM Star Credit Opportunities (GBP) £8,630,261 £11,483,542GAM Star Credit Opportunities (USD) US$12,059,457 US$24,341,148GAM Star Global Defensive £719 (£2)GAM Star Dynamic Global Bond* – US$483,786GAM Star Global Dynamic Growth £484 –GAM Star Emerging Equity US$43,595 US$8,508GAM Star Emerging Market Rates US$553,375 US$914,995GAM Star European Equity € 6,375 € 19,352GAM Star Flexible Global Portfolio € 341,001 € 68,594GAM Star Global Rates US$926,862 US$1,973,152GAM Star Global Selector – US$11,986GAM Star Global Growth £12,244 –GAM Star Interest Trend US$215,682 US$179,336GAM Star Japan Leaders ¥28,097 ¥28,464GAM Star MBS Total Return US$1,621,402 US$2,694,472GAM Systematic Alternative Risk Premia US$(32,012) US$149,448GAM Systematic Core Macro US$1,435 US$2,975GAM Star Tactical Opportunities US$(3,822) US$41,923GAM Star Target Return* – US$475,930GAM Star Target Return Plus* – US$145,776GAM Star Disruptive Growth US$8,090 US$51,149GAM Star US All Cap Equity – US$144GAM Star Worldwide Equity US$127,316 US$153,925GAM Systematic Dynamic Credit US$(9,446) US$8,453
* Fund terminated during the year.

224
GAM Star Fund p.l.c.
Notes to the Financial Statements
3. Financial risk management, continued
(c) Net currency hedgingThe tables below sets out the Funds’ exposure to foreign currency risk, the notional value of the forward foreign currency exchange contracts designed to hedge this exposure and the resulting net unhedged amounts invested in assets denominated in foreign currency.
In addition to currency risk on a Funds’ assets, a class of shares of a Fund may be designated in a currency other than the functional currency of the Fund. Changes in the exchange rate between the functional currency and such designated currency may lead to a depreciation of the value of such shares as expressed in the designated currency. Depreciation of that nature may also occur as a result of changes in the exchange rate between the designated currency of a particular class and the currency of denomination of the assets of the Fund attributable to that class. The Fund’s Investment Manager may or may not try to mitigate these risks by using financial instruments such as forward foreign currency exchange contracts. Although hedging strategies may not necessarily be used in relation to each class of share within a Fund, the financial instruments used to implement such strategies shall be assets/liabilities of the Fund as a whole. However the gains/losses on and the costs of the relevant financial instruments will accrue solely to the relevant class of shares of the Fund.
For those Funds not shown below, all assets/liabilities are in the functional currency of the Fund and are therefore not subject to foreign currency risk.
As at 30 June 2020Non-monetary
assets/(liabilities)Monetary
assets/(liabilities)Forward foreign
exchange Net exposure
GAM Star Alpha Spectrum € € € €Japanese yen 4,852,302 – – 4,852,302US Dollar 33,927,072 39,716 (5,364,394) 28,602,394
38,779,374 39,716 (5,364,394) 33,454,696
GAM Star Alpha Technology US$ US$ US$ US$Australian dollar 474,421 – – 474,421Euro 584,534 13,012 – 597,546Japanese yen 946,174 – – 946,174Norwegian krone 122,563 – – 122,563Pound sterling 2,965,002 (79,288) – 2,885,714
5,092,694 (66,276) – 5,026,418
GAM Star Asian Equity US$ US$ US$ US$Australian dollar 272,636 – – 272,636Chinese yuan renminbi 990,154 2,528 – 992,682Hong Kong dollar 10,035,299 54,032 – 10,089,331Indian rupee 2,685,963 – – 2,685,963Indonesian rupiah 635,971 – – 635,971Philippine peso 852,139 – – 852,139Pound sterling – 4 – 4Singapore dollar 245,848 30 – 245,878South Korean won 4,569,164 – – 4,569,164Swiss franc – 20 – 20Taiwan dollar 4,620,095 9,841 – 4,629,936Thai baht 256,426 – – 256,426
25,163,695 66,455 – 25,230,150
GAM Star Global Balanced £ £ £ £Euro – 163,434 – 163,434US Dollar – 87,045 – 87,045
– 250,479 – 250,479
GAM Star Capital Appreciation US Equity US$ US$ US$ US$Canadian dollar 66,807 2,669 – 69,476Euro 574,336 – – 574,336Japanese yen 125,728 – – 125,728Pound sterling 360,261 2,027 – 362,288South Korean won 200,779 – – 200,779
1,327,911 4,696 – 1,332,607

225
Notes to the Financial Statements
3. Financial risk management, continued
(c) Net currency hedging, continued
As at 30 June 2020Non-monetary
assets/(liabilities)Monetary
assets/(liabilities)Forward foreign
exchange Net exposure
GAM Star Cat Bond US$ US$ US$ US$Danish krone – 277 – 277Euro – 2,760,636 (3,236,704) (476,068)Japanese yen – 8,580,258 (8,530,624) 49,634Pound sterling – 2,685,292 (2,675,584) 9,708Swiss franc – 49 – 49
– 14,026,512 (14,442,912) (416,400)
GAM Star Global Cautious £ £ £ £Euro – 106,276 – 106,276US Dollar – 59,449 – 59,449
– 165,725 – 165,725
GAM Star China Equity US$ US$ US$ US$Chinese yuan renminbi 39,988,039 22,844 – 40,010,883Hong Kong dollar 141,844,801 1,127,121 – 142,971,922
181,832,840 1,149,965 – 182,982,805
GAM Star Composite Global Equity US$ US$ US$ US$
Euro 14,972,503 – – 14,972,503Japanese yen 7,792,549 – – 7,792,549Pound sterling 3,275,370 57,498 – 3,332,868
26,040,422 57,498 – 26,097,920
GAM Star Continental European Equity € € € €Danish krone 23,532,331 279,367 – 23,811,698Pound sterling 39,275,066 2 – 39,275,068Swedish krona 37,906,729 – – 37,906,729Swiss franc 91,498,410 – – 91,498,410US Dollar 12,623,545 119 – 12,623,664
204,836,081 279,488 – 205,115,569
GAM Star Credit Opportunities (EUR) € € € €Canadian dollar – 264,114 – 264,114Pound sterling 51,793,298 312,954,844 (362,999,380) 1,748,762Swiss franc – 5,306,656 – 5,306,656US Dollar 192,434 216,241,636 (216,592,990) (158,920)
51,985,732 534,767,250 (579,592,370) 7,160,612
GAM Star Credit Opportunities (GBP) £ £ £ £Euro – 109,322,448 (109,428,423) (105,975)US Dollar – 63,282,762 (63,244,150) 38,612
– 172,605,210 (172,672,573) (67,363)
GAM Star Credit Opportunities (USD) US$ US$ US$ US$Australian dollar – (169,863) – (169,863)Canadian dollar – 381,925 – 381,925Euro – 172,351,987 (172,317,847) 34,140New Israeli shekel – 5 – 5Pound sterling 49,079,261 68,928,508 (117,854,542) 153,227Singapore dollar – (303,421) – (303,421)
49,079,261 241,189,141 (290,172,389) 96,013
GAM Star Global Defensive £ £ £ £Euro – 14,414 – 14,414US Dollar – (39) – (39)
– 14,375 – 14,375
The tables below sets out the Funds’ exposure to foreign currency risk, the notional value of the forward foreign currency exchange contracts designed to hedge this exposure and the resulting net unhedged amounts invested in assets denominated in foreign currency.
In addition to currency risk on a Funds’ assets, a class of shares of a Fund may be designated in a currency other than the functional currency of the Fund. Changes in the exchange rate between the functional currency and such designated currency may lead to a depreciation of the value of such shares as expressed in the designated currency. Depreciation of that nature may also occur as a result of changes in the exchange rate between the designated currency of a particular class and the currency of denomination of the assets of the Fund attributable to that class. The Fund’s Investment Manager may or may not try to mitigate these risks by using financial instruments such as forward foreign currency exchange contracts. Although hedging strategies may not necessarily be used in relation to each class of share within a Fund, the financial instruments used to implement such strategies shall be assets/liabilities of the Fund as a whole. However the gains/losses on and the costs of the relevant financial instruments will accrue solely to the relevant class of shares of the Fund.
For those Funds not shown below, all assets/liabilities are in the functional currency of the Fund and are therefore not subject to foreign currency risk.
As at 30 June 2020Non-monetary
assets/(liabilities)Monetary
assets/(liabilities)Forward foreign
exchange Net exposure
GAM Star Alpha Spectrum € € € €Japanese yen 4,852,302 – – 4,852,302US Dollar 33,927,072 39,716 (5,364,394) 28,602,394
38,779,374 39,716 (5,364,394) 33,454,696
GAM Star Alpha Technology US$ US$ US$ US$Australian dollar 474,421 – – 474,421Euro 584,534 13,012 – 597,546Japanese yen 946,174 – – 946,174Norwegian krone 122,563 – – 122,563Pound sterling 2,965,002 (79,288) – 2,885,714
5,092,694 (66,276) – 5,026,418
GAM Star Asian Equity US$ US$ US$ US$Australian dollar 272,636 – – 272,636Chinese yuan renminbi 990,154 2,528 – 992,682Hong Kong dollar 10,035,299 54,032 – 10,089,331Indian rupee 2,685,963 – – 2,685,963Indonesian rupiah 635,971 – – 635,971Philippine peso 852,139 – – 852,139Pound sterling – 4 – 4Singapore dollar 245,848 30 – 245,878South Korean won 4,569,164 – – 4,569,164Swiss franc – 20 – 20Taiwan dollar 4,620,095 9,841 – 4,629,936Thai baht 256,426 – – 256,426
25,163,695 66,455 – 25,230,150
GAM Star Global Balanced £ £ £ £Euro – 163,434 – 163,434US Dollar – 87,045 – 87,045
– 250,479 – 250,479
GAM Star Capital Appreciation US Equity US$ US$ US$ US$Canadian dollar 66,807 2,669 – 69,476Euro 574,336 – – 574,336Japanese yen 125,728 – – 125,728Pound sterling 360,261 2,027 – 362,288South Korean won 200,779 – – 200,779
1,327,911 4,696 – 1,332,607

226
GAM Star Fund p.l.c.
Notes to the Financial Statements
3. Financial risk management, continued
(c) Net currency hedging, continued
As at 30 June 2020Non-monetary
assets/(liabilities)Monetary
assets/(liabilities)Forward foreign
exchange Net exposure
GAM Star Global Dynamic Growth £ £ £ £Euro – 6,547 – 6,547US Dollar – 3,127 – 3,127
– 9,674 – 9,674
GAM Star Emerging Equity US$ US$ US$ US$Australian dollar 73,274 – – 73,274Brazilian real 1,045,893 2,777 – 1,048,670Canadian dollar 168,164 (4) – 168,160Chilean peso – 26,230 – 26,230Chinese yuan renminbi 934,261 – – 934,261Euro 164,867 5 – 164,872Hong Kong dollar 2,740,026 313,654 (310,557) 2,743,123Hungarian forint 157,261 – – 157,261Indian rupee 1,088,504 391,838 – 1,480,342Indonesian rupiah 302,342 – – 302,342Malaysian ringgit 42,357 – – 42,357Mexican peso 361,785 – – 361,785New Turkish lira 62,357 – – 62,357Pakistani rupee – 16 – 16Philippine peso 219,809 – – 219,809Polish zloty 5,806 1,836 – 7,642Pound sterling 115,787 16 – 115,803Qatari Riyal 98,120 – – 98,120Romanian new leu 29,966 – – 29,966Russian ruble 122,084 – – 122,084South African rand 880,002 (239,439) 239,438 880,001South Korean won 1,610,151 – – 1,610,151Swiss franc 31,893 – – 31,893Taiwan dollar 1,615,593 374,965 – 1,990,558Thai baht 258,228 – – 258,228United Arab Emirates dirham 72,102 – – 72,102
12,200,632 871,894 (71,119) 13,001,407
GAM Star Emerging Market Rates US$ US$ US$ US$Argentine peso – 954,360 – 954,360Australian dollar – – (4,649,203) (4,649,203)Brazilian real – 1,675 (2,624,278) (2,622,603)Canadian dollar – – (954,580) (954,580)Chilean peso – – 3,974,651 3,974,651Chinese yuan renminbi – (17,939) (4,044,602) (4,062,541)Chinese yuan renminbi (offshore) – – (2,025,595) (2,025,595)Colombian peso – – 3,441,315 3,441,315Czech koruna – (19,195) 2,795,111 2,775,916Egyptian Pound – – (1,018,267) (1,018,267)Euro – 50,411 (2,248,600) (2,198,189)Hungarian forint – 4,697 – 4,697Indian rupee – – 2,506,096 2,506,096Indonesian rupiah – 3,852,207 652,208 4,504,415Japanese yen – – 923,280 923,280Malaysian ringgit – – 993,706 993,706Mexican peso – 2,386,097 3,126,898 5,512,995New Turkish lira – – (5,258,614) (5,258,614)New Zealand dollar – 8,994 – 8,994Peruvian Nouveau Sol – – (970,226) (970,226)Philippine peso – – (2,540,358) (2,540,358)Polish zloty – (78,465) 1,504,943 1,426,478Pound sterling – 400 (1,854,007) (1,853,607)Romanian new leu – – (1,036,198) (1,036,198)Russian ruble – (4,435) 6,106,990 6,102,555

227
Notes to the Financial Statements
3. Financial risk management, continued
(c) Net currency hedging, continued
As at 30 June 2020Non-monetary
assets/(liabilities)Monetary
assets/(liabilities)Forward foreign
exchange Net exposure
GAM Star Emerging Market Rates, continued US$ US$ US$ US$South African rand – 3,928,689 (1,638,500) 2,290,189South Korean won – – 2,030,249 2,030,249Thai baht – – (19,925) (19,925)
– 11,067,496 (2,827,506) 8,239,990
GAM Star European Equity € € € €Danish krone 19,036,837 41,820 – 19,078,657Pound sterling 69,906,750 85,688 – 69,992,438Swedish krona 2,897,227 – – 2,897,227Swiss franc 35,610,743 – – 35,610,743US Dollar 7,155,239 – – 7,155,239
134,606,796 127,508 – 134,734,304
GAM Star Flexible Global Portfolio € € € €Japanese yen 2,578,345 – – 2,578,345Pound sterling 1,111,409 19,509 – 1,130,918US Dollar 33,321,009 6,800,517 – 40,121,526
37,010,763 6,820,026 – 43,830,789
GAM Star Global Rates US$ US$ US$ US$Australian dollar – 4,314 (13,770,455) (13,766,141)Brazilian real – 1 – 1Canadian dollar – 1,520,907 (98,403) 1,422,504Euro – 1,393,605 (116,816,198) (115,422,593)Hungarian forint – 75,654 – 75,654Mexican peso – 16,085,594 (8,562,145) 7,523,449New Zealand dollar – (834,628) 13,731,496 12,896,868Norwegian krone – 16,546 32,949,156 32,965,702Pound sterling – 215,021 – 215,021Swedish krona – 60,225 90,798,383 90,858,608
– 18,537,239 (1,768,166) 16,769,073
GAM Star Global Growth £ £ £ £Euro – 159,777 – 159,777US Dollar – 85,096 – 85,096
– 244,873 – 244,873
GAM Star Interest Trend US$ US$ US$ US$Euro – 3,575,163 (3,670,706) (95,543)Pound sterling 1,153,742 738,477 (1,805,433) 86,786
1,153,742 4,313,640 (5,476,139) (8,757)
GAM Star Japan Leaders ¥ ¥ ¥ ¥Euro – 494,087 – 494,087Pound sterling – 60 – 60Swiss franc – 1 – 1US Dollar – 67,794 – 67,794
– 561,942 – 561,942
GAM Star MBS Total Return US$ US$ US$ US$Euro – 32,507,195 (35,120,485) (2,613,290)Japanese yen – 210 – 210Pound sterling – (79,366) – (79,366)
– 32,428,039 (35,120,485) (2,692,446)
Notes to the Financial Statements
3. Financial risk management, continued
(c) Net currency hedging, continued
As at 30 June 2020Non-monetary
assets/(liabilities)Monetary
assets/(liabilities)Forward foreign
exchange Net exposure
GAM Star Global Dynamic Growth £ £ £ £Euro – 6,547 – 6,547US Dollar – 3,127 – 3,127
– 9,674 – 9,674
GAM Star Emerging Equity US$ US$ US$ US$Australian dollar 73,274 – – 73,274Brazilian real 1,045,893 2,777 – 1,048,670Canadian dollar 168,164 (4) – 168,160Chilean peso – 26,230 – 26,230Chinese yuan renminbi 934,261 – – 934,261Euro 164,867 5 – 164,872Hong Kong dollar 2,740,026 313,654 (310,557) 2,743,123Hungarian forint 157,261 – – 157,261Indian rupee 1,088,504 391,838 – 1,480,342Indonesian rupiah 302,342 – – 302,342Malaysian ringgit 42,357 – – 42,357Mexican peso 361,785 – – 361,785New Turkish lira 62,357 – – 62,357Pakistani rupee – 16 – 16Philippine peso 219,809 – – 219,809Polish zloty 5,806 1,836 – 7,642Pound sterling 115,787 16 – 115,803Qatari Riyal 98,120 – – 98,120Romanian new leu 29,966 – – 29,966Russian ruble 122,084 – – 122,084South African rand 880,002 (239,439) 239,438 880,001South Korean won 1,610,151 – – 1,610,151Swiss franc 31,893 – – 31,893Taiwan dollar 1,615,593 374,965 – 1,990,558Thai baht 258,228 – – 258,228United Arab Emirates dirham 72,102 – – 72,102
12,200,632 871,894 (71,119) 13,001,407
GAM Star Emerging Market Rates US$ US$ US$ US$Argentine peso – 954,360 – 954,360Australian dollar – – (4,649,203) (4,649,203)Brazilian real – 1,675 (2,624,278) (2,622,603)Canadian dollar – – (954,580) (954,580)Chilean peso – – 3,974,651 3,974,651Chinese yuan renminbi – (17,939) (4,044,602) (4,062,541)Chinese yuan renminbi (offshore) – – (2,025,595) (2,025,595)Colombian peso – – 3,441,315 3,441,315Czech koruna – (19,195) 2,795,111 2,775,916Egyptian Pound – – (1,018,267) (1,018,267)Euro – 50,411 (2,248,600) (2,198,189)Hungarian forint – 4,697 – 4,697Indian rupee – – 2,506,096 2,506,096Indonesian rupiah – 3,852,207 652,208 4,504,415Japanese yen – – 923,280 923,280Malaysian ringgit – – 993,706 993,706Mexican peso – 2,386,097 3,126,898 5,512,995New Turkish lira – – (5,258,614) (5,258,614)New Zealand dollar – 8,994 – 8,994Peruvian Nouveau Sol – – (970,226) (970,226)Philippine peso – – (2,540,358) (2,540,358)Polish zloty – (78,465) 1,504,943 1,426,478Pound sterling – 400 (1,854,007) (1,853,607)Romanian new leu – – (1,036,198) (1,036,198)Russian ruble – (4,435) 6,106,990 6,102,555

228
GAM Star Fund p.l.c.
Notes to the Financial Statements
3. Financial risk management, continued
(c) Net currency hedging, continued
As at 30 June 2020Non-monetary
assets/(liabilities)Monetary
assets/(liabilities)Forward foreign
exchange Net exposure
GAM Systematic Alternative Risk Premia US$ US$ US$ US$Australian dollar – (82,112) (2,690,398) (2,772,510)Brazilian real – – (848,924) (848,924)Canadian dollar – 1,101 979,890 980,991Czech koruna – – (202,310) (202,310)Euro – (535,139) 4,144,860 3,609,721Hungarian forint – – (196,661) (196,661)Indian rupee – – 1,214,881 1,214,881Japanese yen – 182,126 (2,088,453) (1,906,327)Mexican peso – – (516,479) (516,479)New Israeli shekel – – (808,667) (808,667)New Zealand dollar – – 1,234,424 1,234,424Norwegian krone – – (3,505,514) (3,505,514)Polish zloty – – (101,443) (101,443)Pound sterling – (210,760) 3,128,899 2,918,139Russian ruble – – 447,749 447,749South African rand – – (48,080) (48,080)Swedish krona – – 1,284,195 1,284,195Swiss franc – 4,545 (4,691,786) (4,687,241)
– (640,239) (3,263,817) (3,904,056)
GAM Systematic Core Macro US$ US$ US$ US$Australian dollar – (2,758) 547,562 544,804Brazilian real – – (66,953) (66,953)Canadian dollar – 8,384 (139,933) (131,549)Chilean peso – – (4,677) (4,677)Euro – 11,265 (45,554) (34,289)Hong Kong dollar – 2,854 – 2,854Hungarian forint – – (47,321) (47,321)Indian rupee – – 938,145 938,145Japanese yen – (8,368) (99,209) (107,577)Mexican peso – – 288,103 288,103New Zealand dollar – – 364,174 364,174Norwegian krone – – (9,831) (9,831)Polish zloty – – 205,084 205,084Pound sterling – 25,563 (681,774) (656,211)Singapore dollar – – (68,517) (68,517)South African rand – – 246,897 246,897South Korean won – – (40,993) (40,993)Swedish krona – (3,902) 471,717 467,815Swiss franc – (4,331) – (4,331)Taiwan dollar – – 16,161 16,161
– 28,707 1,873,081 1,901,788
GAM Star Tactical Opportunities US$ US$ US$ US$Euro – (76,432) – (76,432)
– (76,432) – (76,432)
GAM Star Disruptive Growth US$ US$ US$ US$Australian dollar 4,286,839 – – 4,286,839Euro 5,359,912 151,181 – 5,511,093Japanese yen 8,783,353 – – 8,783,353Norwegian krone 1,136,347 – – 1,136,347Pound sterling 27,415,384 10,614 – 27,425,998
46,981,835 161,795 – 47,143,630

229
Notes to the Financial Statements
3. Financial risk management, continued
(c) Net currency hedging, continued
As at 30 June 2020Non-monetary
assets/(liabilities)Monetary
assets/(liabilities)Forward foreign
exchange Net exposure
GAM Star Worldwide Equity US$ US$ US$ US$Australian dollar 1,033,581 – – 1,033,581Euro 5,483,487 2,576,712 – 8,060,199Hong Kong dollar 6,741,750 – – 6,741,750Indian rupee 1,352,786 (30,462) – 1,322,324Pound sterling 10,783,000 78 – 10,783,078Swiss franc 1,689,488 – – 1,689,488
27,084,092 2,546,328 – 29,630,420
GAM Systematic Dynamic Credit US$ US$ US$ US$Euro – (188,919) – (188,919)
– (188,919) – (188,919)
Notes to the Financial Statements
3. Financial risk management, continued
(c) Net currency hedging, continued
As at 30 June 2020Non-monetary
assets/(liabilities)Monetary
assets/(liabilities)Forward foreign
exchange Net exposure
GAM Systematic Alternative Risk Premia US$ US$ US$ US$Australian dollar – (82,112) (2,690,398) (2,772,510)Brazilian real – – (848,924) (848,924)Canadian dollar – 1,101 979,890 980,991Czech koruna – – (202,310) (202,310)Euro – (535,139) 4,144,860 3,609,721Hungarian forint – – (196,661) (196,661)Indian rupee – – 1,214,881 1,214,881Japanese yen – 182,126 (2,088,453) (1,906,327)Mexican peso – – (516,479) (516,479)New Israeli shekel – – (808,667) (808,667)New Zealand dollar – – 1,234,424 1,234,424Norwegian krone – – (3,505,514) (3,505,514)Polish zloty – – (101,443) (101,443)Pound sterling – (210,760) 3,128,899 2,918,139Russian ruble – – 447,749 447,749South African rand – – (48,080) (48,080)Swedish krona – – 1,284,195 1,284,195Swiss franc – 4,545 (4,691,786) (4,687,241)
– (640,239) (3,263,817) (3,904,056)
GAM Systematic Core Macro US$ US$ US$ US$Australian dollar – (2,758) 547,562 544,804Brazilian real – – (66,953) (66,953)Canadian dollar – 8,384 (139,933) (131,549)Chilean peso – – (4,677) (4,677)Euro – 11,265 (45,554) (34,289)Hong Kong dollar – 2,854 – 2,854Hungarian forint – – (47,321) (47,321)Indian rupee – – 938,145 938,145Japanese yen – (8,368) (99,209) (107,577)Mexican peso – – 288,103 288,103New Zealand dollar – – 364,174 364,174Norwegian krone – – (9,831) (9,831)Polish zloty – – 205,084 205,084Pound sterling – 25,563 (681,774) (656,211)Singapore dollar – – (68,517) (68,517)South African rand – – 246,897 246,897South Korean won – – (40,993) (40,993)Swedish krona – (3,902) 471,717 467,815Swiss franc – (4,331) – (4,331)Taiwan dollar – – 16,161 16,161
– 28,707 1,873,081 1,901,788
GAM Star Tactical Opportunities US$ US$ US$ US$Euro – (76,432) – (76,432)
– (76,432) – (76,432)
GAM Star Disruptive Growth US$ US$ US$ US$Australian dollar 4,286,839 – – 4,286,839Euro 5,359,912 151,181 – 5,511,093Japanese yen 8,783,353 – – 8,783,353Norwegian krone 1,136,347 – – 1,136,347Pound sterling 27,415,384 10,614 – 27,425,998
46,981,835 161,795 – 47,143,630

230
GAM Star Fund p.l.c.
Notes to the Financial Statements
3. Financial risk management, continued
(c) Net currency hedging, continued
As at 30 June 2019Non-monetary
assets/(liabilities)Monetary
assets/(liabilities)Forward foreign
exchange Net exposure
GAM Star Absolute Return Bond € € € €Pound sterling 54,518,073 710,884 – 55,228,957Swedish krona 9,201 – – 9,201
54,527,274 710,884 – 55,238,158
GAM Star Absolute Return Bond Defender € € € €Pound sterling 1,458,882 57,027 – 1,515,909US dollar 108,393 (47) – 108,346
1,567,275 56,980 – 1,624,255
GAM Star Absolute Return Bond Plus € € € €Pound sterling 100,990,601 618,311 – 101,608,912Swedish Krona 2,025,518 11,031 – 2,036,549US dollar 326,462 34,379 – 360,841
103,342,581 663,721 – 104,006,302
GAM Star Absolute Return Macro € € € €Chinese yuan renminbi – (18,906) – (18,906)Chinese yuan renminbi (offshore) – 18,893 – 18,893Pound sterling – 747,112 (719,979) 27,133South Korean won – (1) – (1)
– 747,098 (719,979) 27,119
GAM Star Alpha Spectrum € € € €Japanese yen 6,974,864 (52) (8,081,440) (1,106,628)Pound sterling – 408 (726,809) (726,401)US dollar 21,134,834 238 (8,264,505) 12,870,567
28,109,698 594 (17,072,754) 11,037,538
GAM Star Alpha Technology US$ US$ US$ US$Australian dollar 242,571 – – 242,571Danish krone 359,687 – – 359,687Euro 404,467 27,854 – 432,321Hong Kong dollar 203,418 – – 203,418Japanese yen 184,982 – – 184,982Pound sterling 34,198 (27,776) – 6,422
1,429,323 78 – 1,429,401
GAM Star Asian Equity US$ US$ US$ US$Chinese yuan renminbi 603,628 – – 603,628Hong Kong dollar 6,436,720 38,265 (997) 6,473,988Indonesian rupiah 510,115 – – 510,115New Taiwan dollar 1,992,320 29,913 – 2,022,233Philippine peso 153,392 – – 153,392Pound Sterling – 4 – 4Singapore dollar 646,841 31 – 646,872South Korean won 2,330,534 – – 2,330,534Swiss Franc – 18 – 18Thai baht 322,578 – – 322,578
12,996,128 68,231 (997) 13,063,362

231
Notes to the Financial Statements
3. Financial risk management, continued
(c) Net currency hedging, continued
As at 30 June 2019Non-monetary
assets/(liabilities)Monetary
assets/(liabilities)Forward foreign
exchange Net exposure
GAM Star Asia-Pacific Equity US$ US$ US$ US$
Australian dollar 2,836,923 31,250 – 2,868,173Euro – 12 – 12Hong Kong dollar 3,899,254 12,090 – 3,911,344Japanese yen 11,397,208 32,439 – 11,429,647Singapore dollar 420,511 – – 420,511
18,553,896 75,791 – 18,629,687
GAM Star Capital Appreciation US Equity US$ US$ US$ US$Pound sterling – 2,470 – 2,470
– 2,470 – 2,470
GAM Star Cat Bond US$ US$ US$ US$Euro – 10,011,036 (9,999,745) 11,291Japanese yen – 13,707,459 (13,721,154) (13,695)Pound sterling – 8,205,452 (8,157,142) 48,310Swiss franc – 48 – 48
– 31,923,995 (31,878,041) 45,954
GAM Star Global Cautious £ £ £ £Euro – 4 – 4US dollar – 1 – 1
– 5 – 5
GAM Star China Equity US$ US$ US$ US$Chinese yuan renminbi 25,674,964 72,967 – 25,747,931Euro – 5,605,448 – 5,605,448Hong Kong dollar 220,787,697 1,219,071 (3,795,358) 218,211,410Pound sterling – (1) – (1)
246,462,661 6,897,485 (3,795,358) 249,564,788
GAM Star Composite Global Equity US$ US$ US$ US$Euro 12,293,354 (12) – 12,293,342Japanese yen 8,901,128 – – 8,901,128Pound sterling 2,996,209 43,141 – 3,039,350
24,190,691 43,129 – 24,233,820
GAM Star Continental European Equity € € € €Danish krone 23,303,113 383,128 – 23,686,241Pound sterling 72,777,027 58,639 – 72,835,666Swedish krona 72,820,592 – – 72,820,592Swiss franc 135,000,754 21 – 135,000,775US dollar 52,331,794 453,471 – 52,785,265
356,233,280 895,259 – 357,128,539
GAM Star Credit Opportunities (EUR) € € € €Canadian dollar – 271,134 – 271,134Pound sterling 71,289,547 360,499,940 (426,536,738) 5,252,749Swiss franc – 6,934,344 – 6,934,344US dollar 207,187 375,336,432 (370,756,142) 4,787,477
71,496,734 743,041,850 (797,292,880) 17,245,704
GAM Star Credit Opportunities (GBP) £ £ £ £Euro – 113,640,644 (113,345,268) 295,376US dollar – 116,030,192 (114,172,529) 1,857,663
– 229,670,836 (227,517,797) 2,153,039
Notes to the Financial Statements
3. Financial risk management, continued
(c) Net currency hedging, continued
As at 30 June 2019Non-monetary
assets/(liabilities)Monetary
assets/(liabilities)Forward foreign
exchange Net exposure
GAM Star Absolute Return Bond € € € €Pound sterling 54,518,073 710,884 – 55,228,957Swedish krona 9,201 – – 9,201
54,527,274 710,884 – 55,238,158
GAM Star Absolute Return Bond Defender € € € €Pound sterling 1,458,882 57,027 – 1,515,909US dollar 108,393 (47) – 108,346
1,567,275 56,980 – 1,624,255
GAM Star Absolute Return Bond Plus € € € €Pound sterling 100,990,601 618,311 – 101,608,912Swedish Krona 2,025,518 11,031 – 2,036,549US dollar 326,462 34,379 – 360,841
103,342,581 663,721 – 104,006,302
GAM Star Absolute Return Macro € € € €Chinese yuan renminbi – (18,906) – (18,906)Chinese yuan renminbi (offshore) – 18,893 – 18,893Pound sterling – 747,112 (719,979) 27,133South Korean won – (1) – (1)
– 747,098 (719,979) 27,119
GAM Star Alpha Spectrum € € € €Japanese yen 6,974,864 (52) (8,081,440) (1,106,628)Pound sterling – 408 (726,809) (726,401)US dollar 21,134,834 238 (8,264,505) 12,870,567
28,109,698 594 (17,072,754) 11,037,538
GAM Star Alpha Technology US$ US$ US$ US$Australian dollar 242,571 – – 242,571Danish krone 359,687 – – 359,687Euro 404,467 27,854 – 432,321Hong Kong dollar 203,418 – – 203,418Japanese yen 184,982 – – 184,982Pound sterling 34,198 (27,776) – 6,422
1,429,323 78 – 1,429,401
GAM Star Asian Equity US$ US$ US$ US$Chinese yuan renminbi 603,628 – – 603,628Hong Kong dollar 6,436,720 38,265 (997) 6,473,988Indonesian rupiah 510,115 – – 510,115New Taiwan dollar 1,992,320 29,913 – 2,022,233Philippine peso 153,392 – – 153,392Pound Sterling – 4 – 4Singapore dollar 646,841 31 – 646,872South Korean won 2,330,534 – – 2,330,534Swiss Franc – 18 – 18Thai baht 322,578 – – 322,578
12,996,128 68,231 (997) 13,063,362
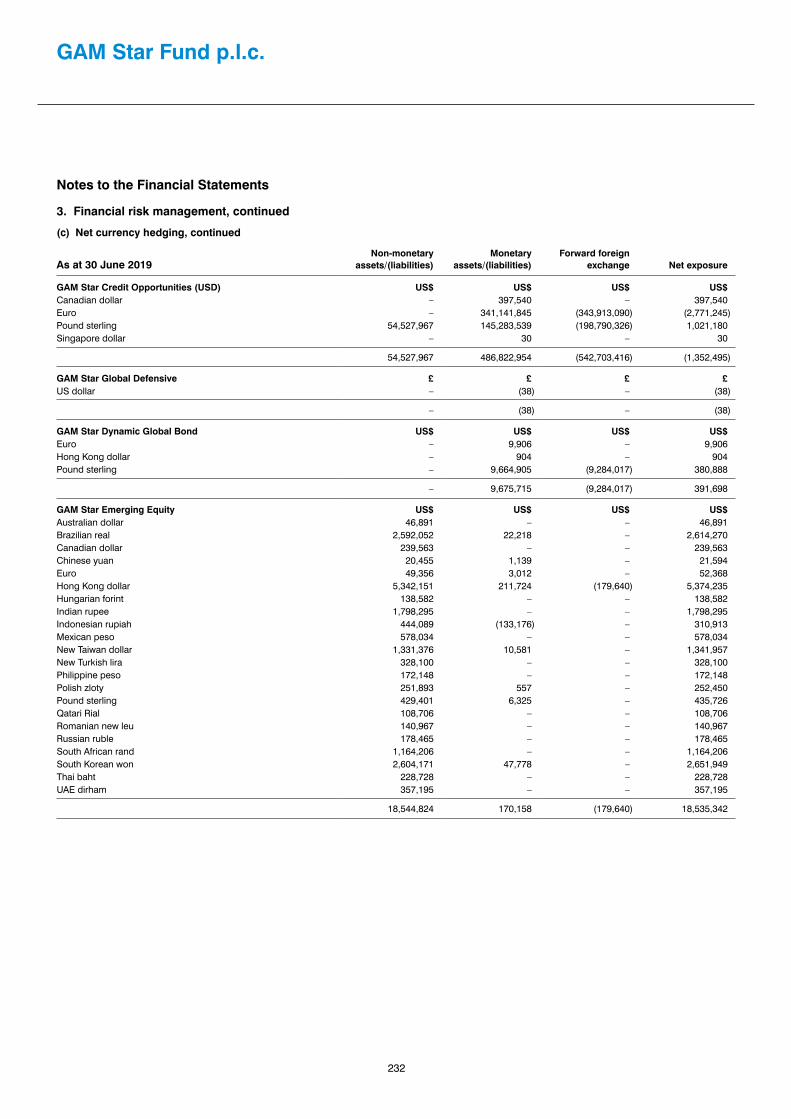
232
GAM Star Fund p.l.c.
Notes to the Financial Statements
3. Financial risk management, continued
(c) Net currency hedging, continued
As at 30 June 2019Non-monetary
assets/(liabilities)Monetary
assets/(liabilities)Forward foreign
exchange Net exposure
GAM Star Credit Opportunities (USD) US$ US$ US$ US$Canadian dollar – 397,540 – 397,540Euro – 341,141,845 (343,913,090) (2,771,245)Pound sterling 54,527,967 145,283,539 (198,790,326) 1,021,180Singapore dollar – 30 – 30
54,527,967 486,822,954 (542,703,416) (1,352,495)
GAM Star Global Defensive £ £ £ £US dollar – (38) – (38)
– (38) – (38)
GAM Star Dynamic Global Bond US$ US$ US$ US$Euro – 9,906 – 9,906Hong Kong dollar – 904 – 904Pound sterling – 9,664,905 (9,284,017) 380,888
– 9,675,715 (9,284,017) 391,698
GAM Star Emerging Equity US$ US$ US$ US$Australian dollar 46,891 – – 46,891Brazilian real 2,592,052 22,218 – 2,614,270Canadian dollar 239,563 – – 239,563Chinese yuan 20,455 1,139 – 21,594Euro 49,356 3,012 – 52,368Hong Kong dollar 5,342,151 211,724 (179,640) 5,374,235Hungarian forint 138,582 – – 138,582Indian rupee 1,798,295 – – 1,798,295Indonesian rupiah 444,089 (133,176) – 310,913Mexican peso 578,034 – – 578,034New Taiwan dollar 1,331,376 10,581 – 1,341,957New Turkish lira 328,100 – – 328,100Philippine peso 172,148 – – 172,148Polish zloty 251,893 557 – 252,450Pound sterling 429,401 6,325 – 435,726Qatari Rial 108,706 – – 108,706Romanian new leu 140,967 – – 140,967Russian ruble 178,465 – – 178,465South African rand 1,164,206 – – 1,164,206South Korean won 2,604,171 47,778 – 2,651,949Thai baht 228,728 – – 228,728UAE dirham 357,195 – – 357,195
18,544,824 170,158 (179,640) 18,535,342

233
Notes to the Financial Statements
3. Financial risk management, continued
(c) Net currency hedging, continued
As at 30 June 2019Non-monetary
assets/(liabilities)Monetary
assets/(liabilities)Forward foreign
exchange Net exposure
GAM Star Emerging Market Rates US$ US$ US$ US$Argentine peso – 2,298,251 – 2,298,251Australian dollar – 168,847 (8,107,404) (7,938,557)Brazilian real – 7,992,247 (4,449,875) 3,542,372Canadian dollar – 485 (4,142,939) (4,142,454)Chilean peso – – 983,209 983,209Chinese yuan renminbi – – (5,040,373) (5,040,373)Colombian peso – – 984,693 984,693Czech koruna – – (13,681) (13,681)Euro – 142,993 (2,038,551) (1,895,558)Hungarian forint – (150,748) – (150,748)Indian rupee – 4,064 – 4,064Mexican peso – 1,622,569 (121,900) 1,500,669New Turkish lira – 2,965,995 7,395,251 10,361,246New Zealand Dollar – 9,383 – 9,383Polish zloty – (292,473) – (292,473)Pound sterling – 412 – 412Russian ruble – (8,462) 2,067,768 2,059,306Thai baht – 17,382 – 17,382South African rand – 2,910,191 (8,094) 2,902,097
– 17,681,136 (12,491,896) 5,189,240
GAM Star European Equity € € € €Danish krone 6,736,844 47,799 – 6,784,643Pound sterling 39,636,068 257,741 – 39,893,809Swedish krona 6,807,655 – – 6,807,655Swiss franc 27,821,508 44 – 27,821,552US dollar 10,977,555 81,454 – 11,059,009
91,979,630 387,038 – 92,366,668
GAM Star Flexible Global Portfolio € € € €Japanese yen 922,728 – – 922,728Pound sterling 481,207 6,928 (499,332) (11,197)Swiss franc – – (468,388) (468,388)US dollar 11,197,902 1,364,958 (9,046,330) 3,516,530
12,601,837 1,371,886 (10,014,050) 3,959,673
GAM Star Global Rates US$ US$ US$ US$Australian dollar – (6,531,748) (17,879,220) (24,410,968)Brazilian real – 2 – 2Canadian dollar – 323,047 40,852,702 41,175,749Chilean peso – – 33,574,845 33,574,845Chinese yuan renminbi (offshore) – – (281,941) (281,941)Czech koruna – (14,662) – (14,662)Euro – 1,169,229 (484,292,568) (483,123,339)Mexican peso – 42,183,996 19,967,824 62,151,820New Taiwan dollar – – (4,802,826) (4,802,826)New Zealand dollar – 258,507 (16,981,692) (16,723,185)Norwegian krone – – 152,378,748 152,378,748Pound sterling – (2,907,409) – (2,907,409)Russian ruble – – 156,263 156,263Saudi Arabian Riyal – – 16,592 16,592South Korean won – 2,741,665 749,890 3,491,555Swedish krona – 1,539,308 318,619,511 320,158,819Swiss franc – 701,099 – 701,099
– 39,463,034 42,078,128 81,541,162
Notes to the Financial Statements
3. Financial risk management, continued
(c) Net currency hedging, continued
As at 30 June 2019Non-monetary
assets/(liabilities)Monetary
assets/(liabilities)Forward foreign
exchange Net exposure
GAM Star Credit Opportunities (USD) US$ US$ US$ US$Canadian dollar – 397,540 – 397,540Euro – 341,141,845 (343,913,090) (2,771,245)Pound sterling 54,527,967 145,283,539 (198,790,326) 1,021,180Singapore dollar – 30 – 30
54,527,967 486,822,954 (542,703,416) (1,352,495)
GAM Star Global Defensive £ £ £ £US dollar – (38) – (38)
– (38) – (38)
GAM Star Dynamic Global Bond US$ US$ US$ US$Euro – 9,906 – 9,906Hong Kong dollar – 904 – 904Pound sterling – 9,664,905 (9,284,017) 380,888
– 9,675,715 (9,284,017) 391,698
GAM Star Emerging Equity US$ US$ US$ US$Australian dollar 46,891 – – 46,891Brazilian real 2,592,052 22,218 – 2,614,270Canadian dollar 239,563 – – 239,563Chinese yuan 20,455 1,139 – 21,594Euro 49,356 3,012 – 52,368Hong Kong dollar 5,342,151 211,724 (179,640) 5,374,235Hungarian forint 138,582 – – 138,582Indian rupee 1,798,295 – – 1,798,295Indonesian rupiah 444,089 (133,176) – 310,913Mexican peso 578,034 – – 578,034New Taiwan dollar 1,331,376 10,581 – 1,341,957New Turkish lira 328,100 – – 328,100Philippine peso 172,148 – – 172,148Polish zloty 251,893 557 – 252,450Pound sterling 429,401 6,325 – 435,726Qatari Rial 108,706 – – 108,706Romanian new leu 140,967 – – 140,967Russian ruble 178,465 – – 178,465South African rand 1,164,206 – – 1,164,206South Korean won 2,604,171 47,778 – 2,651,949Thai baht 228,728 – – 228,728UAE dirham 357,195 – – 357,195
18,544,824 170,158 (179,640) 18,535,342

234
GAM Star Fund p.l.c.
Notes to the Financial Statements
3. Financial risk management, continued
(c) Net currency hedging, continued
As at 30 June 2019Non-monetary
assets/(liabilities)Monetary
assets/(liabilities)Forward foreign
exchange Net exposure
GAM Star Global Selector US$ US$ US$ US$Canadian dollar 354,912 146 – 355,058Euro 1,374,483 239,575 – 1,614,058Japanese yen 134,238 – – 134,238Norwegian krone 70,571 – – 70,571Pound sterling 433,512 – – 433,512Singapore dollar 194,071 – – 194,071Swedish krona 91,423 – – 91,423Swiss franc 173,412 – – 173,412
2,826,622 239,721 – 3,066,343
GAM Star Interest Trend US$ US$ US$ US$Euro – 2,888,192 (2,883,038) 5,154Pound sterling 1,226,565 698,528 (1,939,277) (14,184)
1,226,565 3,586,720 (4,822,315) (9,030)
GAM Star Japan Leaders ¥ ¥ ¥ ¥Euro – 501,555 – 501,555Pound sterling – 93 – 93US dollar – 67,638 – 67,638
– 569,286 – 569,286
GAM Star MBS Total Return US$ US$ US$ US$Australian dollar – 51,028,027 (50,916,648) 111,379Euro – 3,103,657 (3,092,358) 11,299Japanese yen – 58 – 58Pound sterling – (242,311) – (242,311)Swedish krona – 1 – 1Swiss franc – – – –
– 53,889,432 (54,009,006) (119,574)
GAM Systematic Alternative Risk Premia US$ US$ US$ US$Australian dollar – 2,123,249 (22,426,516) (20,303,267)Brazilian real – – (4,576,343) (4,576,343)Canadian dollar – (39,425) 16,093,994 16,054,569Czech koruna – – (570,140) (570,140)Euro – 837,395 5,335,958 6,173,353Hong Kong dollar – 71,546 – 71,546Hungarian forint – – (5,405,517) (5,405,517)Indian rupee – – (280,213) (280,213)Japanese yen – (268,512) 17,844,439 17,575,927Mexican peso – – 3,789,830 3,789,830New Israeli shekel – 22 (5,417,888) (5,417,866)New Zealand dollar – – (8,455,165) (8,455,165)Norwegian krone – – (23,457,270) (23,457,270)Polish zloty – – (5,176,283) (5,176,283)Pound sterling – (57,014) 21,263,045 21,206,031Russian ruble – – 3,528,224 3,528,224Singapore dollar – 132,920 – 132,920South African rand – – (4,633,383) (4,633,383)Swedish krona – 38,863 262,405 301,268Swiss franc – 149,913 (46,476,677) (46,326,764)
– 2,988,957 (58,757,500) (55,768,543)

235
Notes to the Financial Statements
3. Financial risk management, continued
(c) Net currency hedging, continued
As at 30 June 2019Non-monetary
assets/(liabilities)Monetary
assets/(liabilities)Forward foreign
exchange Net exposure
GAM Systematic Core Macro US$ US$ US$ US$Australian dollar – 191,345 (3,554,284) (3,362,939)Brazilian real – – 2,113,488 2,113,488Canadian dollar – (66,756) 3,029,769 2,963,013Chilean peso – – (209,656) (209,656)Euro – 16,757 (16,069,266) (16,052,509)Hong Kong dollar – (119,564) – (119,564)Hungarian forint – – 535,655 535,655Indian rupee – – 6,226,787 6,226,787Japanese yen – 338,900 3,265,546 3,604,446Mexican peso – – 4,767,438 4,767,438New Taiwan dollar – – (47,385) (47,385)New Zealand dollar – – (1,751,239) (1,751,239)Norwegian krone – – 3,651,802 3,651,802Polish zloty – – 5,811,465 5,811,465Pound sterling – (109,164) (6,810,439) (6,919,603)Singapore dollar – – (1,746,724) (1,746,724)South African rand – – 1,956,767 1,956,767South Korean won – – (2,466,528) (2,466,528)Swedish krona – (189,464) 59,137 (130,327)Swiss franc – (2,558) – (2,558)
– 59,496 (1,237,667) (1,178,171)
GAM Systematic Global Equity Market Neutral US$ US$ US$ US$Australian dollar (9,259) – – (9,259)Canadian dollar (1,476) – – (1,476)Danish krone 3,362 – – 3,362Euro 74,788 – – 74,788Hong Kong dollar (9,121) – – (9,121)Japanese yen (33,674) – – (33,674)Norwegian krone (4,992) – – (4,992)Pound sterling (2,156) – – (2,156)Singapore dollar 2,423 – – 2,423South African rand (6,403) – – (6,403)Swedish krona (9,601) – – (9,601)Swiss franc (21,500) – – (21,500)
(17,609) – – (17,609)
GAM Star Tactical Opportunities US$ US$ US$ US$Euro – 870,774 – 870,774Hong Kong dollar – 65,312 – 65,312Japanese yen – (26,269) – (26,269)Pound sterling – (50,338) – (50,338)Swedish krona – (21,027) – (21,027)
– 838,452 – 838,452
GAM Star Target Return US$ US$ US$ US$Australian dollar – 56,325 – 56,325Euro – (293,222) 3,169,436 2,876,214Japanese yen – 5,100,302 (5,128,631) (28,329)New Zealand dollar – 4,859,622 (4,691,881) 167,741Pound sterling – (184,697) – (184,697)Swedish krona – (19,732) – (19,732)
– 9,518,598 (6,651,076) 2,867,522
Notes to the Financial Statements
3. Financial risk management, continued
(c) Net currency hedging, continued
As at 30 June 2019Non-monetary
assets/(liabilities)Monetary
assets/(liabilities)Forward foreign
exchange Net exposure
GAM Star Global Selector US$ US$ US$ US$Canadian dollar 354,912 146 – 355,058Euro 1,374,483 239,575 – 1,614,058Japanese yen 134,238 – – 134,238Norwegian krone 70,571 – – 70,571Pound sterling 433,512 – – 433,512Singapore dollar 194,071 – – 194,071Swedish krona 91,423 – – 91,423Swiss franc 173,412 – – 173,412
2,826,622 239,721 – 3,066,343
GAM Star Interest Trend US$ US$ US$ US$Euro – 2,888,192 (2,883,038) 5,154Pound sterling 1,226,565 698,528 (1,939,277) (14,184)
1,226,565 3,586,720 (4,822,315) (9,030)
GAM Star Japan Leaders ¥ ¥ ¥ ¥Euro – 501,555 – 501,555Pound sterling – 93 – 93US dollar – 67,638 – 67,638
– 569,286 – 569,286
GAM Star MBS Total Return US$ US$ US$ US$Australian dollar – 51,028,027 (50,916,648) 111,379Euro – 3,103,657 (3,092,358) 11,299Japanese yen – 58 – 58Pound sterling – (242,311) – (242,311)Swedish krona – 1 – 1Swiss franc – – – –
– 53,889,432 (54,009,006) (119,574)
GAM Systematic Alternative Risk Premia US$ US$ US$ US$Australian dollar – 2,123,249 (22,426,516) (20,303,267)Brazilian real – – (4,576,343) (4,576,343)Canadian dollar – (39,425) 16,093,994 16,054,569Czech koruna – – (570,140) (570,140)Euro – 837,395 5,335,958 6,173,353Hong Kong dollar – 71,546 – 71,546Hungarian forint – – (5,405,517) (5,405,517)Indian rupee – – (280,213) (280,213)Japanese yen – (268,512) 17,844,439 17,575,927Mexican peso – – 3,789,830 3,789,830New Israeli shekel – 22 (5,417,888) (5,417,866)New Zealand dollar – – (8,455,165) (8,455,165)Norwegian krone – – (23,457,270) (23,457,270)Polish zloty – – (5,176,283) (5,176,283)Pound sterling – (57,014) 21,263,045 21,206,031Russian ruble – – 3,528,224 3,528,224Singapore dollar – 132,920 – 132,920South African rand – – (4,633,383) (4,633,383)Swedish krona – 38,863 262,405 301,268Swiss franc – 149,913 (46,476,677) (46,326,764)
– 2,988,957 (58,757,500) (55,768,543)

236
GAM Star Fund p.l.c.
Notes to the Financial Statements
3. Financial risk management, continued
(c) Net currency hedging, continued
As at 30 June 2019Non-monetary
assets/(liabilities)Monetary
assets/(liabilities)Forward foreign
exchange Net exposure
GAM Star Target Return Plus US$ US$ US$ US$Australian dollar – 24,578 – 24,578Euro – (28,125) 913,711 885,586Pound sterling – (44,776) – (44,776)Hong Kong dollar – (26) – (26)Japanese yen – 2,243,902 (2,304,263) (60,361)New Zealand Dollar – 722,517 (665,088) 57,429Swedish krona – (2,545) – (2,545)
– 2,915,525 (2,055,640) 859,885
GAM Star Disruptive Growth US$ US$ US$ US$Australian dollar 3,960,419 – – 3,960,419Danish krone 5,134,217 – – 5,134,217Euro 10,691,636 795,004 – 11,486,640Hong Kong dollar 3,515,968 – – 3,515,968Japanese yen 3,033,711 52,343 – 3,086,054Pound sterling 7,953,357 175,641 – 8,128,998
34,289,308 1,022,988 – 35,312,296
GAM Star US All Cap Equity US$ US$ US$ US$Canadian dollar 1,012,627 2,544 – 1,015,171Euro – 328 – 328
1,012,627 2,872 – 1,015,499
GAM Star Worldwide Equity US$ US$ US$ US$Australian dollar 1,405,600 – (959,107) 446,493Canadian dollar 5,084,731 1,783 – 5,086,514Euro 24,332,318 3,074,714 956,508 28,363,540Hong Kong dollar 2,956,198 – – 2,956,198Indian rupee 1,123,922 – – 1,123,922Japanese yen 1,667,377 – – 1,667,377Norwegian krone 907,672 – – 907,672Pound sterling 3,487,653 2,004 – 3,489,657Swedish krona 1,407,853 – – 1,407,853Swiss franc 2,563,367 – – 2,563,367
44,936,691 3,078,501 (2,599) 48,012,593
GAM Systematic Dynamic Credit** US$ US$ US$ US$ Euro – 169,061 – 169,061
– 169,061 – 169,061
** Fund launched during the year.

237
Notes to the Financial Statements
3. Financial risk management, continued
(d) Interest rate riskAt 30 June 2020 and 30 June 2019, had the interest rates changed, with all other variables held constant, the impact on net asset attributable to holders of redeemable shares would be +/- 0.25% of the total interest rate sensitivity gap figures presented in the tables below. The tables below show the expected maturity of Assets and Liabilities held as at 30 June 2020.
As at 30 June 2020Less than
1 month Up to 1 year 1 – 5 yearsGreater than
5 yearsNon-interest
bearing Total
GAM Star Alpha Technology US$ US$ US$ US$ US$ US$Current assetsCash and bank balances 1,001,461 – – – – 1,001,461Margin cash 1,879,379 – – – – 1,879,379Debtors – – – – 49,057 49,057Financial assets at fair value – 2,798,419 – – 27,967,351 30,765,770
Total current assets 2,880,840 2,798,419 – – 28,016,408 33,695,667
Current liabilitiesBank overdraft (12) – – – – (12)Creditors – amounts falling due within one year – – – – (281,412) (281,412)Financial liabilities at fair value – – – – (2,377,115) (2,377,115)Net assets attributable to redeemable participating shareholders – – – – (31,037,128) (31,037,128)
Total current liabilities (12) – – – (33,695,655) (33,695,667)
Total interest rate sensitivity gap 2,880,828 2,798,419 – –
Less than 1 month Up to 1 year 1 – 5 years
Greater than 5 years
Non-interest bearing Total
GAM Star Cat Bond US$ US$ US$ US$ US$ US$Current assetsCash and bank balances 1,149,632 – – – – 1,149,632Margin cash 309,097 – – – – 309,097Debtors – – – – 23,003,395 23,003,395Financial assets at fair value 92,387,870 474,546,497 1,130,330,114 9,493,547 43,947,917 1,750,705,945
Total current assets 93,846,599 474,546,497 1,130,330,114 9,493,547 66,951,312 1,775,168,069
Current liabilitiesBank overdraft (7,530) – – – – (7,530)Amounts due to broker (19,619) – – – – (19,619)Creditors – amounts falling due within one year – – – – (13,420,865) (13,420,865)Financial liabilities at fair value – – – – (7,598,127) (7,598,127)Net assets attributable to redeemable participating shareholders – – – – (1,754,121,928) (1,754,121,928)
Total current liabilities (27,149) – – – (1,775,140,920) (1,775,168,069)
Total interest rate sensitivity gap 93,819,450 474,546,497 1,130,330,114 9,493,547
Notes to the Financial Statements
3. Financial risk management, continued
(c) Net currency hedging, continued
As at 30 June 2019Non-monetary
assets/(liabilities)Monetary
assets/(liabilities)Forward foreign
exchange Net exposure
GAM Star Target Return Plus US$ US$ US$ US$Australian dollar – 24,578 – 24,578Euro – (28,125) 913,711 885,586Pound sterling – (44,776) – (44,776)Hong Kong dollar – (26) – (26)Japanese yen – 2,243,902 (2,304,263) (60,361)New Zealand Dollar – 722,517 (665,088) 57,429Swedish krona – (2,545) – (2,545)
– 2,915,525 (2,055,640) 859,885
GAM Star Disruptive Growth US$ US$ US$ US$Australian dollar 3,960,419 – – 3,960,419Danish krone 5,134,217 – – 5,134,217Euro 10,691,636 795,004 – 11,486,640Hong Kong dollar 3,515,968 – – 3,515,968Japanese yen 3,033,711 52,343 – 3,086,054Pound sterling 7,953,357 175,641 – 8,128,998
34,289,308 1,022,988 – 35,312,296
GAM Star US All Cap Equity US$ US$ US$ US$Canadian dollar 1,012,627 2,544 – 1,015,171Euro – 328 – 328
1,012,627 2,872 – 1,015,499
GAM Star Worldwide Equity US$ US$ US$ US$Australian dollar 1,405,600 – (959,107) 446,493Canadian dollar 5,084,731 1,783 – 5,086,514Euro 24,332,318 3,074,714 956,508 28,363,540Hong Kong dollar 2,956,198 – – 2,956,198Indian rupee 1,123,922 – – 1,123,922Japanese yen 1,667,377 – – 1,667,377Norwegian krone 907,672 – – 907,672Pound sterling 3,487,653 2,004 – 3,489,657Swedish krona 1,407,853 – – 1,407,853Swiss franc 2,563,367 – – 2,563,367
44,936,691 3,078,501 (2,599) 48,012,593
GAM Systematic Dynamic Credit** US$ US$ US$ US$ Euro – 169,061 – 169,061
– 169,061 – 169,061
** Fund launched during the year.

238
GAM Star Fund p.l.c.
Notes to the Financial Statements
3. Financial risk management, continued(d) Interest rate risk, continued
As at 30 June 2020Less than
1 month Up to 1 year 1 – 5 yearsGreater than
5 yearsNon-interest
bearing Total
GAM Star Credit Opportunities (EUR) € € € € € €Current assetsCash and bank balances 48,292,724 – – – – 48,292,724Margin cash 161,810,004 – – – – 161,810,004Debtors – – – – 33,101,533 33,101,533Financial assets at fair value – – 237,500,902 1,621,903,135 82,185,046 1,941,589,083
Total current assets 210,102,728 – 237,500,902 1,621,903,135 115,286,579 2,184,793,344
Current liabilitiesBank overdraft (86,385) – – – – (86,385)Amounts due to broker (14,509,225) – – – – (14,509,225)Creditors – amounts falling due within one year – – – – (40,420,567) (40,420,567)Financial liabilities at fair value – – – – (4,877,482) (4,877,482)Net assets attributable to redeemable participating shareholders – – – – (2,124,899,685) (2,124,899,685)
Total current liabilities (14,595,610) – – – (2,170,197,734) (2,184,793,344)
Total interest rate sensitivity gap 195,507,118 – 237,500,902 1,621,903,135
Less than 1 month Up to 1 year 1 – 5 years
Greater than 5 years
Non-interest bearing Total
GAM Star Credit Opportunities (GBP) £ £ £ £ £ £Current assetsCash and bank balances 18,004,993 – – – – 18,004,993Margin cash 58,577,968 – – – – 58,577,968Debtors – – – – 9,558,646 9,558,646Financial assets at fair value – 2,992,470 46,257,470 495,937,130 87,647,541 632,834,611
Total current assets 76,582,961 2,992,470 46,257,470 495,937,130 97,206,187 718,976,218
Current liabilitiesAmounts due to broker (1,371,000) – – – – (1,371,000)Creditors – amounts falling due within one year – – – – (12,029,831) (12,029,831)Financial liabilities at fair value – – – – (6,279,970) (6,279,970)Net assets attributable to redeemable participating shareholders – – – – (699,295,417) (699,295,417)
Total current liabilities (1,371,000) – – – (717,605,218) (718,976,218)
Total interest rate sensitivity gap 75,211,961 2,992,470 46,257,470 495,937,130
Less than 1 month Up to 1 year 1 – 5 years
Greater than 5 years
Non-interest bearing Total
GAM Star Credit Opportunities (USD) US$ US$ US$ US$ US$ US$Current assetsCash and bank balances 38,658,289 – – – – 38,658,289Margin cash 187,449,932 – – – – 187,449,932Debtors – – – – 28,324,046 28,324,046Financial assets at fair value 7,000 37,436,078 231,017,420 1,527,388,401 66,615,894 1,862,464,793
Total current assets 226,115,221 37,436,078 231,017,420 1,527,388,401 94,939,940 2,116,897,060
Current liabilitiesBank overdraft (960,293) – – – – (960,293)Creditors – amounts falling due within one year – – – – (26,075,559) (26,075,559)Financial liabilities at fair value – – – – (4,296,062) (4,296,062)Net assets attributable to redeemable participating shareholders – – – – (2,085,565,146) (2,085,565,146)
Total current liabilities (960,293) – – – (2,115,936,767) (2,116,897,060)
Total interest rate sensitivity gap 225,154,928 37,436,078 231,017,420 1,527,388,401

239
Notes to the Financial Statements
3. Financial risk management, continued(d) Interest rate risk, continued
As at 30 June 2020Less than
1 month Up to 1 year 1 – 5 yearsGreater than
5 yearsNon-interest
bearing Total
GAM Star Emerging Equity US$ US$ US$ US$ US$ US$Current assetsCash and bank balances 999,541 – – – – 999,541Margin cash 5,055 – – – – 5,055Debtors – – – – 4,663,312 4,663,312Financial assets at fair value – – 2,549 – 14,544,923 14,547,472
Total current assets 1,004,596 – 2,549 – 19,208,235 20,215,380
Current liabilitiesBank overdraft (621,437) – – – – (621,437)Creditors – amounts falling due within one year – – – – (4,828,707) (4,828,707)Financial liabilities at fair value – – – – (4,982) (4,982)Net assets attributable to redeemable participating shareholders – – – – (14,760,254) (14,760,254)
Total current liabilities (621,437) – – – (19,593,943) (20,215,380)
Total interest rate sensitivity gap 383,159 – 2,549 –
Less than 1 month Up to 1 year 1 – 5 years
Greater than 5 years
Non-interest bearing Total
GAM Star Emerging Market Rates US$ US$ US$ US$ US$ US$Current assetsCash and bank balances 2,816,214 – – – – 2,816,214Margin cash 4,355,247 – – – – 4,355,247Debtors – – – – 23,966,560 23,966,560Financial assets at fair value – 32,421,994 2,016,824 14,212,748 2,870,466 51,522,032
Total current assets 7,171,461 32,421,994 2,016,824 14,212,748 26,837,026 82,660,053
Current liabilitiesBank overdraft (36) – – – – (36)Amounts due to broker (975,615) – – – – (975,615)Creditors – amounts falling due within one year – – – – (7,044,402) (7,044,402)Financial liabilities at fair value – – (120,547) (53,116) (2,347,347) (2,521,010)Net assets attributable to redeemable participating shareholders – – – – (72,118,990) (72,118,990)
Total current liabilities (975,651) – (120,547) (53,116) (81,510,739) (82,660,053)
Total interest rate sensitivity gap 6,195,810 32,421,994 1,896,277 14,159,632
Less than 1 month Up to 1 year 1 – 5 years
Greater than 5 years
Non-interest bearing Total
GAM Star Global Rates US$ US$ US$ US$ US$ US$Current assetsCash and bank balances 15,264,236 – – – – 15,264,236Margin cash 26,187,789 – – – – 26,187,789Debtors – – – – 384,011 384,011Financial assets at fair value – 77,931,906 10,934,690 17,711,697 11,439,216 118,017,509
Total current assets 41,452,025 77,931,906 10,934,690 17,711,697 11,823,227 159,853,545
Current liabilitiesAmounts due to broker (7,120,001) – – – – (7,120,001)Creditors – amounts falling due within one year – – – – (1,150,197) (1,150,197)Financial liabilities at fair value – – (5,282,751) (13,127,703) (1,996,836) (20,407,290)Net assets attributable to redeemable participating shareholders – – – – (131,176,057) (131,176,057)
Total current liabilities (7,120,001) – (5,282,751) (13,127,703) (134,323,090) (159,853,545)
Total interest rate sensitivity gap 34,332,024 77,931,906 5,651,939 4,583,994
Notes to the Financial Statements
3. Financial risk management, continued(d) Interest rate risk, continued
As at 30 June 2020Less than
1 month Up to 1 year 1 – 5 yearsGreater than
5 yearsNon-interest
bearing Total
GAM Star Credit Opportunities (EUR) € € € € € €Current assetsCash and bank balances 48,292,724 – – – – 48,292,724Margin cash 161,810,004 – – – – 161,810,004Debtors – – – – 33,101,533 33,101,533Financial assets at fair value – – 237,500,902 1,621,903,135 82,185,046 1,941,589,083
Total current assets 210,102,728 – 237,500,902 1,621,903,135 115,286,579 2,184,793,344
Current liabilitiesBank overdraft (86,385) – – – – (86,385)Amounts due to broker (14,509,225) – – – – (14,509,225)Creditors – amounts falling due within one year – – – – (40,420,567) (40,420,567)Financial liabilities at fair value – – – – (4,877,482) (4,877,482)Net assets attributable to redeemable participating shareholders – – – – (2,124,899,685) (2,124,899,685)
Total current liabilities (14,595,610) – – – (2,170,197,734) (2,184,793,344)
Total interest rate sensitivity gap 195,507,118 – 237,500,902 1,621,903,135
Less than 1 month Up to 1 year 1 – 5 years
Greater than 5 years
Non-interest bearing Total
GAM Star Credit Opportunities (GBP) £ £ £ £ £ £Current assetsCash and bank balances 18,004,993 – – – – 18,004,993Margin cash 58,577,968 – – – – 58,577,968Debtors – – – – 9,558,646 9,558,646Financial assets at fair value – 2,992,470 46,257,470 495,937,130 87,647,541 632,834,611
Total current assets 76,582,961 2,992,470 46,257,470 495,937,130 97,206,187 718,976,218
Current liabilitiesAmounts due to broker (1,371,000) – – – – (1,371,000)Creditors – amounts falling due within one year – – – – (12,029,831) (12,029,831)Financial liabilities at fair value – – – – (6,279,970) (6,279,970)Net assets attributable to redeemable participating shareholders – – – – (699,295,417) (699,295,417)
Total current liabilities (1,371,000) – – – (717,605,218) (718,976,218)
Total interest rate sensitivity gap 75,211,961 2,992,470 46,257,470 495,937,130
Less than 1 month Up to 1 year 1 – 5 years
Greater than 5 years
Non-interest bearing Total
GAM Star Credit Opportunities (USD) US$ US$ US$ US$ US$ US$Current assetsCash and bank balances 38,658,289 – – – – 38,658,289Margin cash 187,449,932 – – – – 187,449,932Debtors – – – – 28,324,046 28,324,046Financial assets at fair value 7,000 37,436,078 231,017,420 1,527,388,401 66,615,894 1,862,464,793
Total current assets 226,115,221 37,436,078 231,017,420 1,527,388,401 94,939,940 2,116,897,060
Current liabilitiesBank overdraft (960,293) – – – – (960,293)Creditors – amounts falling due within one year – – – – (26,075,559) (26,075,559)Financial liabilities at fair value – – – – (4,296,062) (4,296,062)Net assets attributable to redeemable participating shareholders – – – – (2,085,565,146) (2,085,565,146)
Total current liabilities (960,293) – – – (2,115,936,767) (2,116,897,060)
Total interest rate sensitivity gap 225,154,928 37,436,078 231,017,420 1,527,388,401
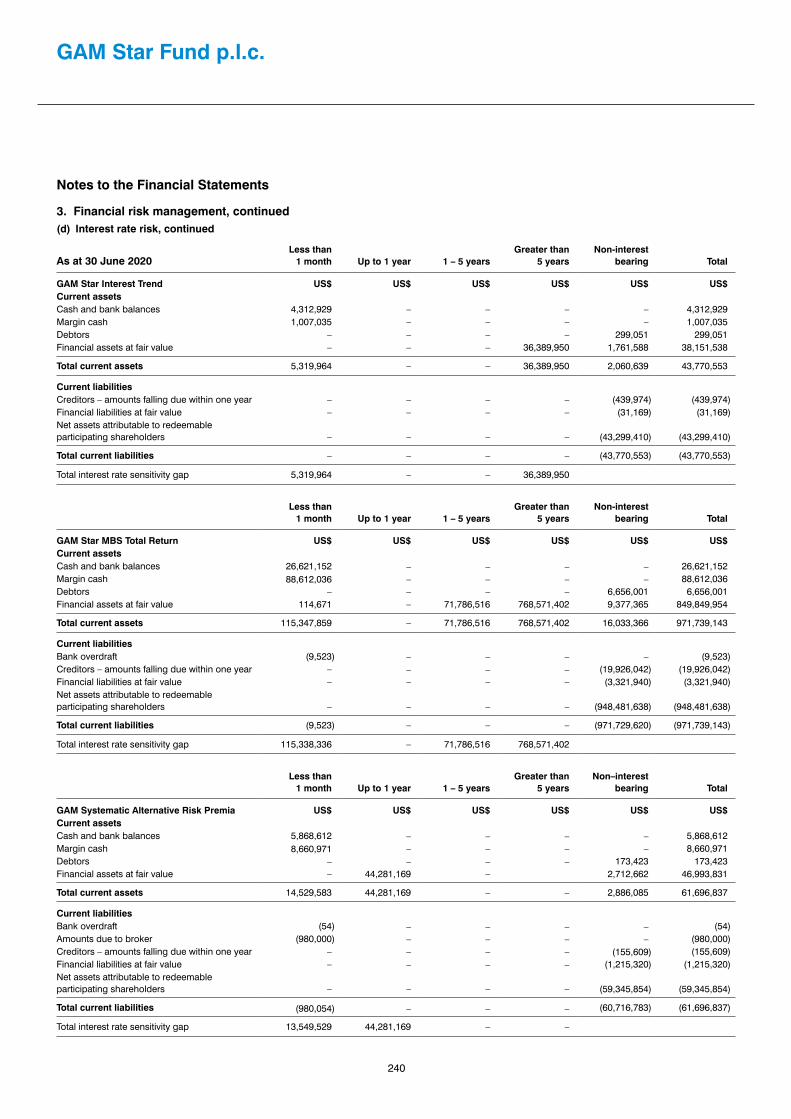
240
GAM Star Fund p.l.c.
Notes to the Financial Statements
3. Financial risk management, continued(d) Interest rate risk, continued
As at 30 June 2020Less than
1 month Up to 1 year 1 – 5 yearsGreater than
5 yearsNon-interest
bearing Total
GAM Star Interest Trend US$ US$ US$ US$ US$ US$Current assetsCash and bank balances 4,312,929 – – – – 4,312,929Margin cash 1,007,035 – – – – 1,007,035Debtors – – – – 299,051 299,051Financial assets at fair value – – – 36,389,950 1,761,588 38,151,538
Total current assets 5,319,964 – – 36,389,950 2,060,639 43,770,553
Current liabilitiesCreditors – amounts falling due within one year – – – – (439,974) (439,974)Financial liabilities at fair value – – – – (31,169) (31,169)Net assets attributable to redeemable participating shareholders – – – – (43,299,410) (43,299,410)
Total current liabilities – – – – (43,770,553) (43,770,553)
Total interest rate sensitivity gap 5,319,964 – – 36,389,950
Less than 1 month Up to 1 year 1 – 5 years
Greater than 5 years
Non-interest bearing Total
GAM Star MBS Total Return US$ US$ US$ US$ US$ US$Current assetsCash and bank balances 26,621,152 – – – – 26,621,152Margin cash 88,612,036 – – – – 88,612,036Debtors – – – – 6,656,001 6,656,001Financial assets at fair value 114,671 – 71,786,516 768,571,402 9,377,365 849,849,954
Total current assets 115,347,859 – 71,786,516 768,571,402 16,033,366 971,739,143
Current liabilitiesBank overdraft (9,523) – – – – (9,523)Creditors – amounts falling due within one year – – – – (19,926,042) (19,926,042)Financial liabilities at fair value – – – – (3,321,940) (3,321,940)Net assets attributable to redeemable participating shareholders – – – – (948,481,638) (948,481,638)
Total current liabilities (9,523) – – – (971,729,620) (971,739,143)
Total interest rate sensitivity gap 115,338,336 – 71,786,516 768,571,402
Less than 1 month Up to 1 year 1 – 5 years
Greater than 5 years
Non–interest bearing Total
GAM Systematic Alternative Risk Premia US$ US$ US$ US$ US$ US$Current assetsCash and bank balances 5,868,612 – – – – 5,868,612Margin cash 8,660,971 – – – – 8,660,971Debtors – – – – 173,423 173,423Financial assets at fair value – 44,281,169 – 2,712,662 46,993,831
Total current assets 14,529,583 44,281,169 – – 2,886,085 61,696,837
Current liabilitiesBank overdraft (54) – – – – (54)Amounts due to broker (980,000) – – – – (980,000)Creditors – amounts falling due within one year – – – – (155,609) (155,609)Financial liabilities at fair value – – – – (1,215,320) (1,215,320)Net assets attributable to redeemable participating shareholders – – – – (59,345,854) (59,345,854)
Total current liabilities (980,054) – – – (60,716,783) (61,696,837)
Total interest rate sensitivity gap 13,549,529 44,281,169 – –

241
Notes to the Financial Statements
3. Financial risk management, continued(d) Interest rate risk, continued
As at 30 June 2020Less than
1 month Up to 1 year 1 – 5 yearsGreater than
5 yearsNon-interest
bearing Total
GAM Systematic Core Macro US$ US$ US$ US$ US$ US$Current assetsCash and bank balances 200,795 – – – – 200,795Margin cash 895,320 – – – – 895,320Debtors – – – – 4,899,572 4,899,572Financial assets at fair value 2,399,867 749,835 – – 1,021,458 4,171,160
Total current assets 3,495,982 749,835 – – 5,921,030 10,166,847
Current liabilitiesBank overdraft (10) – – – – (10)Creditors – amounts falling due within one year – – – – (183,832) (183,832)Financial liabilities at fair value – – – – (153,841) (153,841)Net assets attributable to redeemable participating shareholders – – – – (9,829,164) (9,829,164)
Total current liabilities (10) – – – (10,166,837) (10,166,847)
Total interest rate sensitivity gap 3,495,972 749,835 – –
Less than 1 month Up to 1 year 1 – 5 years
Greater than 5 years
Non-interest bearing Total
GAM Star Tactical Opportunities US$ US$ US$ US$ US$ US$Current assetsCash and bank balances 1,683,023 – – – – 1,683,023Margin cash 1,057,699 – – – – 1,057,699Debtors – – – – 244,276 244,276Financial assets at fair value – 36,607,914 – – 1,223,017 37,830,931
Total current assets 2,740,722 36,607,914 – – 1,467,293 40,815,929
Current liabilitiesAmounts due to broker (170,000) – – – – (170,000)Creditors – amounts falling due within one year – – – – (72,076) (72,076)Financial liabilities at fair value – – – – (299,773) (299,773)Net assets attributable to redeemable participating shareholders – – – – (40,274,080) (40,274,080)
Total current liabilities (170,000) – – – (40,645,929) (40,815,929)
Total interest rate sensitivity gap 2,570,722 36,607,914 – –
Less than 1 month Up to 1 year 1 – 5 years
Greater than 5 years
Non-interest bearing Total
GAM Systematic Dynamic Credit US$ US$ US$ US$ US$ US$Current assetsCash and bank balances 1,182,554 – – – – 1,182,554Margin cash 2,720,186 – – – – 2,720,186Debtors – – – – 28,948 28,948Financial assets at fair value 4,799,625 1,899,488 – – 441,982 7,141,095
Total current assets 8,702,365 1,899,488 – – 470,930 11,072,783
Current liabilitiesCreditors – amounts falling due within one year – – – – (21,909) (21,909)Financial liabilities at fair value – – – – (215,235) (215,235)Net assets attributable to redeemable participating shareholders – – – – (10,835,639) (10,835,639)
Total current liabilities – – – – (11,072,783) (11,072,783)
Total interest rate sensitivity gap 8,702,365 1,899,488 – –
Notes to the Financial Statements
3. Financial risk management, continued(d) Interest rate risk, continued
As at 30 June 2020Less than
1 month Up to 1 year 1 – 5 yearsGreater than
5 yearsNon-interest
bearing Total
GAM Star Interest Trend US$ US$ US$ US$ US$ US$Current assetsCash and bank balances 4,312,929 – – – – 4,312,929Margin cash 1,007,035 – – – – 1,007,035Debtors – – – – 299,051 299,051Financial assets at fair value – – – 36,389,950 1,761,588 38,151,538
Total current assets 5,319,964 – – 36,389,950 2,060,639 43,770,553
Current liabilitiesCreditors – amounts falling due within one year – – – – (439,974) (439,974)Financial liabilities at fair value – – – – (31,169) (31,169)Net assets attributable to redeemable participating shareholders – – – – (43,299,410) (43,299,410)
Total current liabilities – – – – (43,770,553) (43,770,553)
Total interest rate sensitivity gap 5,319,964 – – 36,389,950
Less than 1 month Up to 1 year 1 – 5 years
Greater than 5 years
Non-interest bearing Total
GAM Star MBS Total Return US$ US$ US$ US$ US$ US$Current assetsCash and bank balances 26,621,152 – – – – 26,621,152Margin cash 88,612,036 – – – – 88,612,036Debtors – – – – 6,656,001 6,656,001Financial assets at fair value 114,671 – 71,786,516 768,571,402 9,377,365 849,849,954
Total current assets 115,347,859 – 71,786,516 768,571,402 16,033,366 971,739,143
Current liabilitiesBank overdraft (9,523) – – – – (9,523)Creditors – amounts falling due within one year – – – – (19,926,042) (19,926,042)Financial liabilities at fair value – – – – (3,321,940) (3,321,940)Net assets attributable to redeemable participating shareholders – – – – (948,481,638) (948,481,638)
Total current liabilities (9,523) – – – (971,729,620) (971,739,143)
Total interest rate sensitivity gap 115,338,336 – 71,786,516 768,571,402
Less than 1 month Up to 1 year 1 – 5 years
Greater than 5 years
Non–interest bearing Total
GAM Systematic Alternative Risk Premia US$ US$ US$ US$ US$ US$Current assetsCash and bank balances 5,868,612 – – – – 5,868,612Margin cash 8,660,971 – – – – 8,660,971Debtors – – – – 173,423 173,423Financial assets at fair value – 44,281,169 – 2,712,662 46,993,831
Total current assets 14,529,583 44,281,169 – – 2,886,085 61,696,837
Current liabilitiesBank overdraft (54) – – – – (54)Amounts due to broker (980,000) – – – – (980,000)Creditors – amounts falling due within one year – – – – (155,609) (155,609)Financial liabilities at fair value – – – – (1,215,320) (1,215,320)Net assets attributable to redeemable participating shareholders – – – – (59,345,854) (59,345,854)
Total current liabilities (980,054) – – – (60,716,783) (61,696,837)
Total interest rate sensitivity gap 13,549,529 44,281,169 – –

242
GAM Star Fund p.l.c.
Notes to the Financial Statements
3. Financial risk management, continued(d) Interest rate risk, continuedThe tables below show the expected maturity of Assets and Liabilities held as at 30 June 2019.
As at 30 June 2019Less than
1 month Up to 1 year 1 – 5 yearsGreater than
5 yearsNon-interest
bearing Total
GAM Star Absolute Return Macro € € € € € €Current assetsCash and bank balances 1,690,833 – – – – 1,690,833Margin cash 80,095 – – – – 80,095Debtors – – – – 293,425 293,425Financial assets at fair value 8,502,338 – – 753,437 88,096 9,343,871
Total current assets 10,273,266 – – 753,437 381,521 11,408,224
Current liabilitiesBank overdraft (18,907) – – – – (18,907)Amounts due to broker (64,929) – – – – (64,929)Creditors – amounts falling due within one year – – – – (111,962) (111,962)Financial liabilities at fair value – – – – (226,435) (226,435)Net assets attributable to redeemable participating shareholders – – – – (10,985,991) (10,985,991)
Total current liabilities (83,836) – – – (11,324,388) (11,408,224)
Total interest rate sensitivity gap 10,189,430 – – 753,437
Less than 1 month Up to 1 year 1 – 5 years
Greater than 5 years
Non-interest bearing Total
GAM Star Alpha Technology US$ US$ US$ US$ US$ US$Current assetsCash and bank balances 1,907,863 – – – – 1,907,863Margin cash 303,137 – – – – 303,137Debtors – – – – 47,104 47,104Financial assets at fair value – 2,793,254 – – 15,228,170 18,021,424
Total current assets 2,211,000 2,793,254 – – 15,275,274 20,279,528
Current liabilitiesBank overdraft (186,666) – – – – (186,666)Creditors – amounts falling due within one year – – – – (265,592) (265,592)Financial liabilities at fair value – – – – (364,839) (364,839)Net assets attributable to redeemable participating shareholders – – – – (19,462,431) (19,462,431)
Total current liabilities (186,666) – – – (20,092,862) (20,279,528)
Total interest rate sensitivity gap 2,024,334 2,793,254 – –
Less than 1 month Up to 1 year 1 – 5 years
Greater than 5 years
Non-interest bearing Total
GAM Star Cat Bond US$ US$ US$ US$ US$ US$Current assetsCash and bank balances 20,774,266 – – – – 20,774,266Margin cash 241,680 – – – – 241,680Debtors – – – – 48,075,383 48,075,383Financial assets at fair value 41,518,052 434,609,889 1,114,780,933 41,513,283 28,688,135 1,661,110,292
Total current assets 62,533,998 434,609,889 1,114,780,933 41,513,283 76,763,518 1,730,201,621
Current liabilitiesBank overdraft (60) – – – – (60)Amounts due to broker (19,619) – – – – (19,619)Creditors – amounts falling due within one year – – – – (13,912,841) (13,912,841)Financial liabilities at fair value – – – – (9,431,197) (9,431,197)Net assets attributable to redeemable participating shareholders – – – – (1,706,837,904) (1,706,837,904)
Total current liabilities (19,679) – – – (1,730,181,942) (1,730,201,621)
Total interest rate sensitivity gap 62,514,319 434,609,889 1,114,780,933 41,513,283

243
Notes to the Financial Statements
3. Financial risk management, continued(d) Interest rate risk, continued
As at 30 June 2019Less than
1 month Up to 1 year 1 – 5 yearsGreater than
5 yearsNon-interest
bearing Total
GAM Star Credit Opportunities (EUR) € € € € € €Current assetsCash and bank balances 63,249,297 – – – – 63,249,297Margin cash 444,837,665 – – – – 444,837,665Debtors – – – – 273,270,454 273,270,454Financial assets at fair value – 36,203,692 147,830,925 2,769,354,823 81,118,647 3,034,508,087
Total current assets 508,086,962 36,203,692 147,830,925 2,769,354,823 354,389,101 3,815,865,503
Current liabilitiesBank overdraft (31,174) – – – – (31,174)Creditors – amounts falling due within one year – – – – (193,119,459) (193,119,459)Financial liabilities at fair value – – – – (2,895,400) (2,895,400)Net assets attributable to redeemable participating shareholders – – – – (3,619,819,470) (3,619,819,470)
Total current liabilities (31,174) – – – (3,815,834,329) (3,815,865,503)
Total interest rate sensitivity gap 508,055,788 36,203,692 147,830,925 2,769,354,823
Less than 1 month Up to 1 year 1 – 5 years
Greater than 5 years
Non-interest bearing Total
GAM Star Credit Opportunities (GBP) £ £ £ £ £ £Current assetsCash and bank balances 28,818,973 – – – – 28,818,973Margin cash 50,251,883 – – – – 50,251,883Debtors – – – – 22,307,457 22,307,457Financial assets at fair value – 650,878 42,712,979 714,996,411 109,188,345 867,548,613
Total current assets 79,070,856 650,878 42,712,979 714,996,411 131,495,802 968,926,926
Current liabilitiesBank overdraft (19,365) – – – – (19,365)Creditors – amounts falling due within one year – – – – (21,243,412) (21,243,412)Financial liabilities at fair value – – – – (5,898,314) (5,898,314)Net assets attributable to redeemable participating shareholders – – – – (941,765,835) (941,765,835)
Total current liabilities (19,365) – – – (968,907,561) (968,926,926)
Total interest rate sensitivity gap 79,051,491 650,878 42,712,979 714,996,411
Less than 1 month Up to 1 year 1 – 5 years
Greater than 5 years
Non-interest bearing Total
GAM Star Credit Opportunities (USD) US$ US$ US$ US$ US$ US$Current assetsCash and bank balances 17,962,082 – – – – 17,962,082Margin cash 241,356,897 – – – – 241,356,897Debtors – – – – 72,478,455 72,478,455Financial assets at fair value – 662,480 200,641,202 2,609,247,063 72,534,881 2,883,085,626
Total current assets 259,318,979 662,480 200,641,202 2,609,247,063 145,013,336 3,214,883,060
Current liabilitiesBank overdraft (992,299) – – – – (992,299)Creditors – amounts falling due within one year – – – – (70,667,859) (70,667,859)Financial liabilities at fair value – – – – (2,693,142) (2,693,142)Net assets attributable to redeemable participating shareholders – – – – (3,140,529,760) (3,140,529,760)
Total current liabilities (992,299) – – – (3,213,890,761) (3,214,883,060)
Total interest rate sensitivity gap 258,326,680 662,480 200,641,202 2,609,247,063
Notes to the Financial Statements
3. Financial risk management, continued(d) Interest rate risk, continuedThe tables below show the expected maturity of Assets and Liabilities held as at 30 June 2019.
As at 30 June 2019Less than
1 month Up to 1 year 1 – 5 yearsGreater than
5 yearsNon-interest
bearing Total
GAM Star Absolute Return Macro € € € € € €Current assetsCash and bank balances 1,690,833 – – – – 1,690,833Margin cash 80,095 – – – – 80,095Debtors – – – – 293,425 293,425Financial assets at fair value 8,502,338 – – 753,437 88,096 9,343,871
Total current assets 10,273,266 – – 753,437 381,521 11,408,224
Current liabilitiesBank overdraft (18,907) – – – – (18,907)Amounts due to broker (64,929) – – – – (64,929)Creditors – amounts falling due within one year – – – – (111,962) (111,962)Financial liabilities at fair value – – – – (226,435) (226,435)Net assets attributable to redeemable participating shareholders – – – – (10,985,991) (10,985,991)
Total current liabilities (83,836) – – – (11,324,388) (11,408,224)
Total interest rate sensitivity gap 10,189,430 – – 753,437
Less than 1 month Up to 1 year 1 – 5 years
Greater than 5 years
Non-interest bearing Total
GAM Star Alpha Technology US$ US$ US$ US$ US$ US$Current assetsCash and bank balances 1,907,863 – – – – 1,907,863Margin cash 303,137 – – – – 303,137Debtors – – – – 47,104 47,104Financial assets at fair value – 2,793,254 – – 15,228,170 18,021,424
Total current assets 2,211,000 2,793,254 – – 15,275,274 20,279,528
Current liabilitiesBank overdraft (186,666) – – – – (186,666)Creditors – amounts falling due within one year – – – – (265,592) (265,592)Financial liabilities at fair value – – – – (364,839) (364,839)Net assets attributable to redeemable participating shareholders – – – – (19,462,431) (19,462,431)
Total current liabilities (186,666) – – – (20,092,862) (20,279,528)
Total interest rate sensitivity gap 2,024,334 2,793,254 – –
Less than 1 month Up to 1 year 1 – 5 years
Greater than 5 years
Non-interest bearing Total
GAM Star Cat Bond US$ US$ US$ US$ US$ US$Current assetsCash and bank balances 20,774,266 – – – – 20,774,266Margin cash 241,680 – – – – 241,680Debtors – – – – 48,075,383 48,075,383Financial assets at fair value 41,518,052 434,609,889 1,114,780,933 41,513,283 28,688,135 1,661,110,292
Total current assets 62,533,998 434,609,889 1,114,780,933 41,513,283 76,763,518 1,730,201,621
Current liabilitiesBank overdraft (60) – – – – (60)Amounts due to broker (19,619) – – – – (19,619)Creditors – amounts falling due within one year – – – – (13,912,841) (13,912,841)Financial liabilities at fair value – – – – (9,431,197) (9,431,197)Net assets attributable to redeemable participating shareholders – – – – (1,706,837,904) (1,706,837,904)
Total current liabilities (19,679) – – – (1,730,181,942) (1,730,201,621)
Total interest rate sensitivity gap 62,514,319 434,609,889 1,114,780,933 41,513,283

244
GAM Star Fund p.l.c.
Notes to the Financial Statements
3. Financial risk management, continued(d) Interest rate risk, continued
As at 30 June 2019Less than
1 month Up to 1 year 1 – 5 yearsGreater than
5 yearsNon-interest
bearing Total
GAM Star Dynamic Global Bond US$ US$ US$ US$ US$ US$Current assetsCash and bank balances 3,293,734 – – – – 3,293,734Margin cash 662,700 – – – – 662,700Financial assets at fair value – – – 9,750,232 297,015 10,047,247
Total current assets 3,956,434 – – 9,750,232 297,015 14,003,681
Current liabilitiesAmounts due to broker (260,000) – – – – (260,000)Creditors – amounts falling due within one year – – – – (77,256) (77,256)Financial liabilities at fair value – – – – (85,328) (85,328)Net assets attributable to redeemable participating shareholders – – – – (13,581,097) (13,581,097)
Total current liabilities (260,000) – – – (13,743,681) (14,003,681)
Total interest rate sensitivity gap 3,696,434 – – 9,750,232
Less than 1 month Up to 1 year 1 – 5 years
Greater than 5 years
Non-interest bearing Total
GAM Star Emerging Equity US$ US$ US$ US$ US$ US$Current assetsCash and bank balances 1,502,618 – – – – 1,502,618Margin cash 4,879 – – – – 4,879Debtors – – – – 372,463 372,463Financial assets at fair value – 11,144 198,845 – 23,918,736 24,128,725
Total current assets 1,507,497 11,144 198,845 – 24,291,199 26,008,685
Current liabilitiesBank overdraft (3) – – – – (3)Creditors – amounts falling due within one year – – – – (539,821) (539,821)Financial liabilities at fair value – – – – (1) (1)Net assets attributable to redeemable participating shareholders – – – – (25,468,860) (25,468,860)
Total current liabilities (3) – – – (26,008,682) (26,008,685)
Total interest rate sensitivity gap 1,507,494 11,144 198,845 –
Less than 1 month Up to 1 year 1 – 5 years
Greater than 5 years
Non-interest bearing Total
GAM Star Emerging Market Rates US$ US$ US$ US$ US$ US$Current assetsCash and bank balances 8,631,112 – – – – 8,631,112Margin cash 3,648,054 – – – – 3,648,054Debtors – – – – 1,148,294 1,148,294Financial assets at fair value – 47,865,936 10,742,676 6,177,610 2,551,418 67,337,640
Total current assets 12,279,166 47,865,936 10,742,676 6,177,610 3,699,712 80,765,100
Current liabilitiesBank overdraft (3,245) – – – – (3,245)Amounts due to broker (970,000) – – – – (970,000)Creditors – amounts falling due within one year – – – – (7,685,808) (7,685,808)Financial liabilities at fair value – – – (404,364) (2,349,758) (2,754,122)Net assets attributable to redeemable participating shareholders – – – – (69,351,925) (69,351,925)
Total current liabilities (973,245) – – (404,364) (79,387,491) (80,765,100)
Total interest rate sensitivity gap 11,305,921 47,865,936 10,742,676 5,773,246

245
Notes to the Financial Statements
3. Financial risk management, continued(d) Interest rate risk, continued
As at 30 June 2019Less than
1 month Up to 1 year 1 – 5 yearsGreater than
5 yearsNon-interest
bearing Total
GAM Star Global Rates US$ US$ US$ US$ US$ US$Current assetsCash and bank balances 13,175,761 – – – – 13,175,761Margin cash 90,393,214 – – – – 90,393,214Debtors – – – – 1,276,023 1,276,023Financial assets at fair value 23,673,470 120,773,597 3,231,144 52,170,750 36,791,607 236,640,568
Total current assets 127,242,445 120,773,597 3,231,144 52,170,750 38,067,630 341,485,566
Current liabilitiesBank overdraft (10,861) – – – – (10,861)Amounts due to brokers (42,415,007) – – – – (42,415,007)Creditors – amounts falling due within one year – – – – (2,874,697) (2,874,697)Financial liabilities at fair value – (255,246) (2,642,907) (18,099,267) (15,112,013) (36,109,433)Net assets attributable to redeemable participating shareholders – – – – (260,075,568) (260,075,568)
Total current liabilities (42,425,868) (255,246) (2,642,907) (18,099,267) (278,062,278) (341,485,566)
Total interest rate sensitivity gap 84,816,577 120,518,351 588,237 34,071,483
Less than 1 month Up to 1 year 1 – 5 years
Greater than 5 years
Non–interest bearing Total
GAM Star Global Selector US$ US$ US$ US$ US$ US$Current assetsCash and bank balances 171,675 – – – – 171,675Margin cash 732 – – – – 732Debtors – – – – 304,617 304,617Financial assets at fair value – – – – 4,814,138 4,814,138
Total current assets 172,407 – – – 5,118,755 5,291,162
Current liabilitiesBank overdraft (120) – – – – (120)Creditors – amounts falling due within one year – – – – (54,352) (54,352)Financial liabilities at fair value – – – – (18,074) (18,074)Net assets attributable to redeemable participating shareholders – – – – (5,218,616) (5,218,616)
Total current liabilities (120) – – – (5,291,042) (5,291,162)
Total interest rate sensitivity gap 172,287 – – –
Less than 1 month Up to 1 year 1 – 5 years
Greater than 5 years
Non-interest bearing Total
GAM Star Interest Trend US$ US$ US$ US$ US$ US$Current assetsCash and bank balances 4,057,880 – – – – 4,057,880Debtors – – – – 441,316 441,316Financial assets at fair value – – 705,133 45,941,861 1,923,664 48,570,658
Total current assets 4,057,880 – 705,133 45,941,861 2,364,980 53,069,854
Current liabilitiesCreditors – amounts falling due within one year – – – – (141,132) (141,132)Financial liabilities at fair value – – – – (4,238) (4,238)Net assets attributable to redeemable participating shareholders – – – – (52,924,484) (52,924,484)
Total current liabilities – – – – (53,069,854) (53,069,854)
Total interest rate sensitivity gap 4,057,880 – 705,133 45,941,861
Notes to the Financial Statements
3. Financial risk management, continued(d) Interest rate risk, continued
As at 30 June 2019Less than
1 month Up to 1 year 1 – 5 yearsGreater than
5 yearsNon-interest
bearing Total
GAM Star Dynamic Global Bond US$ US$ US$ US$ US$ US$Current assetsCash and bank balances 3,293,734 – – – – 3,293,734Margin cash 662,700 – – – – 662,700Financial assets at fair value – – – 9,750,232 297,015 10,047,247
Total current assets 3,956,434 – – 9,750,232 297,015 14,003,681
Current liabilitiesAmounts due to broker (260,000) – – – – (260,000)Creditors – amounts falling due within one year – – – – (77,256) (77,256)Financial liabilities at fair value – – – – (85,328) (85,328)Net assets attributable to redeemable participating shareholders – – – – (13,581,097) (13,581,097)
Total current liabilities (260,000) – – – (13,743,681) (14,003,681)
Total interest rate sensitivity gap 3,696,434 – – 9,750,232
Less than 1 month Up to 1 year 1 – 5 years
Greater than 5 years
Non-interest bearing Total
GAM Star Emerging Equity US$ US$ US$ US$ US$ US$Current assetsCash and bank balances 1,502,618 – – – – 1,502,618Margin cash 4,879 – – – – 4,879Debtors – – – – 372,463 372,463Financial assets at fair value – 11,144 198,845 – 23,918,736 24,128,725
Total current assets 1,507,497 11,144 198,845 – 24,291,199 26,008,685
Current liabilitiesBank overdraft (3) – – – – (3)Creditors – amounts falling due within one year – – – – (539,821) (539,821)Financial liabilities at fair value – – – – (1) (1)Net assets attributable to redeemable participating shareholders – – – – (25,468,860) (25,468,860)
Total current liabilities (3) – – – (26,008,682) (26,008,685)
Total interest rate sensitivity gap 1,507,494 11,144 198,845 –
Less than 1 month Up to 1 year 1 – 5 years
Greater than 5 years
Non-interest bearing Total
GAM Star Emerging Market Rates US$ US$ US$ US$ US$ US$Current assetsCash and bank balances 8,631,112 – – – – 8,631,112Margin cash 3,648,054 – – – – 3,648,054Debtors – – – – 1,148,294 1,148,294Financial assets at fair value – 47,865,936 10,742,676 6,177,610 2,551,418 67,337,640
Total current assets 12,279,166 47,865,936 10,742,676 6,177,610 3,699,712 80,765,100
Current liabilitiesBank overdraft (3,245) – – – – (3,245)Amounts due to broker (970,000) – – – – (970,000)Creditors – amounts falling due within one year – – – – (7,685,808) (7,685,808)Financial liabilities at fair value – – – (404,364) (2,349,758) (2,754,122)Net assets attributable to redeemable participating shareholders – – – – (69,351,925) (69,351,925)
Total current liabilities (973,245) – – (404,364) (79,387,491) (80,765,100)
Total interest rate sensitivity gap 11,305,921 47,865,936 10,742,676 5,773,246

246
GAM Star Fund p.l.c.
Notes to the Financial Statements
3. Financial risk management, continued(d) Interest rate risk, continued
As at 30 June 2019Less than
1 month Up to 1 year 1 – 5 yearsGreater than
5 yearsNon-interest
bearing Total
GAM Star MBS Total Return US$ US$ US$ US$ US$ US$Current assetsCash and bank balances 31,346,326 – – – – 31,346,326Margin cash 47,890,398 – – – – 47,890,398Debtors – – – – 10,339,147 10,339,147Financial assets at fair value – 140,142 100,802,851 1,060,256,582 10,525,139 1,171,724,714
Total current assets 79,236,724 140,142 100,802,851 1,060,256,582 20,864,286 1,261,300,585
Current liabilitiesBank overdraft (3,922) – – – – (3,922)Creditors – amounts falling due within one year – – – – (14,315,610) (14,315,610)Financial liabilities at fair value – – – – (4,931,067) (4,931,067)Net assets attributable to redeemable participating shareholders – – – – (1,242,049,986) (1,242,049,986)
Total current liabilities (3,922) – – – (1,261,296,663) (1,261,300,585)
Total interest rate sensitivity gap 79,232,802 140,142 100,802,851 1,060,256,582
Less than 1 month Up to 1 year 1 – 5 years
Greater than 5 years
Non-interest bearing Total
GAM Systematic Alternative Risk Premia US$ US$ US$ US$ US$ US$Current assetsCash and bank balances 38,897,546 – – – – 38,897,546Margin cash 49,330,953 – – – – 49,330,953Debtors – – – – 1,160,355 1,160,355Financial assets at fair value 48,151,057 126,372,260 – – 12,520,116 187,043,433
Total current assets 136,379,556 126,372,260 – – 13,680,471 276,432,287
Current liabilitiesBank overdraft (9,343) – – – – (9,343)Amounts due to broker (3,687,571) – – – – (3,687,571)Creditors – amounts falling due within one year – – – – (375,900) (375,900)Financial liabilities at fair value – – – – (9,584,803) (9,584,803)Net assets attributable to redeemable participating shareholders – – – – (262,774,670) (262,774,670)
Total current liabilities (3,696,914) – – – (272,735,373) (276,432,287)
Total interest rate sensitivity gap 132,682,642 126,372,260 – –
Less than 1 month Up to 1 year 1 – 5 years
Greater than 5 years
Non-interest bearing Total
GAM Systematic Core Macro US$ US$ US$ US$ US$ US$Current assetsCash and bank balances 10,955,796 – – – – 10,955,796Margin cash 15,746,246 – – – – 15,746,246Debtors – – – – 87,846 87,846Financial assets at fair value 999,634 35,844,218 – – 11,525,664 48,369,516
Total current assets 27,701,676 35,844,218 – – 11,613,510 75,159,404
Current liabilitiesBank overdraft (18,046) – – – – (18,046)Creditors – amounts falling due within one year – – – – (18,537,027) (18,537,027)Financial liabilities at fair value – – – – (2,006,281) (2,006,281)Net assets attributable to redeemable participating shareholders – – – – (54,598,050) (54,598,050)
Total current liabilities (18,046) – – – (75,141,358) (75,159,404)
Total interest rate sensitivity gap 27,683,630 35,844,218 – –

247
Notes to the Financial Statements
3. Financial risk management, continued(d) Interest rate risk, continued
As at 30 June 2019Less than
1 month Up to 1 year 1 – 5 yearsGreater than
5 yearsNon-interest
bearing Total
GAM Systematic Global Equity Market Neutral US$ US$ US$ US$ US$ US$Current assetsCash and bank balances 1,254,443 – – – – 1,254,443Margin cash 437,016 – – – – 437,016Debtors – – – – 2,293 2,293Financial assets at fair value 2,998,903 15,422,723 – – 716,693 19,138,319
Total current assets 4,690,362 15,422,723 – – 718,986 20,832,071
Current liabilitiesBank overdraft (1,831,741) – – – – (1,831,741)Creditors – amounts falling due within one year – – – – (95,174) (95,174)Financial liabilities at fair value – – – – (956,334) (956,334)Net assets attributable to redeemable participating shareholders – – – – (17,948,822) (17,948,822)
Total current liabilities (1,831,741) – – – (19,000,330) (20,832,071)
Total interest rate sensitivity gap 2,858,621 15,422,723 – –
Less than 1 month Up to 1 year 1 – 5 years
Greater than 5 years
Non-interest bearing Total
GAM Star Tactical Opportunities US$ US$ US$ US$ US$ US$Current assetsCash and bank balances 1,132,459 – – – – 1,132,459Margin cash 5,841,878 – – – – 5,841,878Debtors – – – – 8,154,960 8,154,960Financial assets at fair value – 32,097,840 – – 635,539 32,733,379
Total current assets 6,974,337 32,097,840 – – 8,790,499 47,862,676
Current liabilitiesBank overdraft (16) – – – – (16)Amounts due to broker (220,109) – – – – (220,109)Creditors – amounts falling due within one year – – – – (112,170) (112,170)Financial liabilities at fair value – – – – (323,910) (323,910)Net assets attributable to redeemable participating shareholders – – – – (47,206,471) (47,206,471)
Total current liabilities (220,125) – – – (47,642,551) (47,862,676)
Total interest rate sensitivity gap 6,754,212 32,097,840 – –
Less than 1 month Up to 1 year 1 – 5 years
Greater than 5 years
Non-interest bearing Total
GAM Star Target Return US$ US$ US$ US$ US$ US$Current assetsCash and bank balances 1,440,048 – – – – 1,440,048Margin cash 1,579,999 – – – – 1,579,999Debtors – – – – 109,400 109,400Financial assets at fair value – 10,037,643 3,850,784 14,425,667 384,423 28,698,517
Total current assets 3,020,047 10,037,643 3,850,784 14,425,667 493,823 31,827,964
Current liabilitiesAmounts due to broker (160,000) – – – – (160,000)Creditors – amounts falling due within one year – – – – (53,396) (53,396)Financial liabilities at fair value – – (93,385) – (231,878) (325,263)Net assets attributable to redeemable participating shareholders – – – – (31,289,305) (31,289,305)
Total current liabilities (160,000) – (93,385) – (31,574,579) (31,827,964)
Total interest rate sensitivity gap 2,860,047 10,037,643 3,757,399 14,425,667
Notes to the Financial Statements
3. Financial risk management, continued(d) Interest rate risk, continued
As at 30 June 2019Less than
1 month Up to 1 year 1 – 5 yearsGreater than
5 yearsNon-interest
bearing Total
GAM Star MBS Total Return US$ US$ US$ US$ US$ US$Current assetsCash and bank balances 31,346,326 – – – – 31,346,326Margin cash 47,890,398 – – – – 47,890,398Debtors – – – – 10,339,147 10,339,147Financial assets at fair value – 140,142 100,802,851 1,060,256,582 10,525,139 1,171,724,714
Total current assets 79,236,724 140,142 100,802,851 1,060,256,582 20,864,286 1,261,300,585
Current liabilitiesBank overdraft (3,922) – – – – (3,922)Creditors – amounts falling due within one year – – – – (14,315,610) (14,315,610)Financial liabilities at fair value – – – – (4,931,067) (4,931,067)Net assets attributable to redeemable participating shareholders – – – – (1,242,049,986) (1,242,049,986)
Total current liabilities (3,922) – – – (1,261,296,663) (1,261,300,585)
Total interest rate sensitivity gap 79,232,802 140,142 100,802,851 1,060,256,582
Less than 1 month Up to 1 year 1 – 5 years
Greater than 5 years
Non-interest bearing Total
GAM Systematic Alternative Risk Premia US$ US$ US$ US$ US$ US$Current assetsCash and bank balances 38,897,546 – – – – 38,897,546Margin cash 49,330,953 – – – – 49,330,953Debtors – – – – 1,160,355 1,160,355Financial assets at fair value 48,151,057 126,372,260 – – 12,520,116 187,043,433
Total current assets 136,379,556 126,372,260 – – 13,680,471 276,432,287
Current liabilitiesBank overdraft (9,343) – – – – (9,343)Amounts due to broker (3,687,571) – – – – (3,687,571)Creditors – amounts falling due within one year – – – – (375,900) (375,900)Financial liabilities at fair value – – – – (9,584,803) (9,584,803)Net assets attributable to redeemable participating shareholders – – – – (262,774,670) (262,774,670)
Total current liabilities (3,696,914) – – – (272,735,373) (276,432,287)
Total interest rate sensitivity gap 132,682,642 126,372,260 – –
Less than 1 month Up to 1 year 1 – 5 years
Greater than 5 years
Non-interest bearing Total
GAM Systematic Core Macro US$ US$ US$ US$ US$ US$Current assetsCash and bank balances 10,955,796 – – – – 10,955,796Margin cash 15,746,246 – – – – 15,746,246Debtors – – – – 87,846 87,846Financial assets at fair value 999,634 35,844,218 – – 11,525,664 48,369,516
Total current assets 27,701,676 35,844,218 – – 11,613,510 75,159,404
Current liabilitiesBank overdraft (18,046) – – – – (18,046)Creditors – amounts falling due within one year – – – – (18,537,027) (18,537,027)Financial liabilities at fair value – – – – (2,006,281) (2,006,281)Net assets attributable to redeemable participating shareholders – – – – (54,598,050) (54,598,050)
Total current liabilities (18,046) – – – (75,141,358) (75,159,404)
Total interest rate sensitivity gap 27,683,630 35,844,218 – –

248
GAM Star Fund p.l.c.
Notes to the Financial Statements
3. Financial risk management, continued(d) Interest rate risk, continued
As at 30 June 2019Less than
1 month Up to 1 year 1 – 5 yearsGreater than
5 yearsNon-interest
bearing Total
GAM Star Target Return Plus US$ US$ US$ US$ US$ US$Current assetsCash and bank balances 494,031 – – – – 494,031Margin cash 1,068,842 – – – – 1,068,842Debtors – – – – 722,476 722,476Financial assets at fair value – 2,612,446 528,324 3,570,232 214,018 6,925,020
Total current assets 1,562,873 2,612,446 528,324 3,570,232 936,494 9,210,369
Current liabilitiesCreditors – amounts falling due within one year – – – – (26,143) (26,143)Financial liabilities at fair value – (58,366) – – (90,522) (148,888)Net assets attributable to redeemable participating shareholders – – – – (9,035,338) (9,035,338)
Total current liabilities – (58,366) – – (9,152,003) (9,210,369)
Total interest rate sensitivity gap 1,562,873 2,554,080 528,324 3,570,232
Less than 1 month Up to 1 year 1 – 5 years
Greater than 5 years
Non-interest bearing Total
GAM Star Disruptive Growth US$ US$ US$ US$ US$ US$Current assetsCash and bank balances 1,945,263 – – – – 1,945,263Margin cash 10,361,968 – – – – 10,361,968Debtors – – – – 1,327,542 1,327,542Financial assets at fair value – – – – 233,507,639 233,507,639
Total current assets 12,307,231 – – – 234,835,181 247,142,412
Current liabilitiesBank overdraft (1,589) – – – – (1,589)Amounts due to broker (1,200,000) – – – – (1,200,000)Creditors – amounts falling due within one year – – – – (1,854,519) (1,854,519)Financial liabilities at fair value – – – – (721,506) (721,506)Net assets attributable to redeemable participating shareholders – – – – (243,364,798) (243,364,798)
Total current liabilities (1,201,589) – – – (245,940,823) (247,142,412)
Total interest rate sensitivity gap 11,105,642 – – –
Less than 1 month Up to 1 year 1 – 5 years
Greater than 5 years
Non-interest bearing Total
GAM Systematic Dynamic Credit** US$ US$ US$ US$ US$ US$ Current assetsCash and bank balances 3,346,188 – – – – 3,346,188Margin cash 1,966,643 – – – – 1,966,643Debtors – – – – 65,937 65,937Financial assets at fair value 3,198,378 5,272,477 – – 1,205,086 9,675,941
Total current assets 8,511,209 5,272,477 – – 1,271,023 15,054,709
Current liabilitiesBank overdraft (4,826) – – – – (4,826)Creditors – amounts falling due within one year – – – – (1,009,637) (1,009,637)Financial liabilities at fair value – – – – (442,127) (442,127)Net assets attributable to redeemable participating shareholders – – – – (13,598,119) (13,598,119)
Total current liabilities (4,826) – – – (15,049,883) (15,054,709)
Total interest rate sensitivity gap 8,506,383 5,272,477 – –
** Fund launched during the year.

249
Notes to the Financial Statements
3. Financial risk management, continued(d) Interest rate risk, continued
As at 30 June 2019Less than
1 month Up to 1 year 1 – 5 yearsGreater than
5 yearsNon-interest
bearing Total
GAM Star Target Return Plus US$ US$ US$ US$ US$ US$Current assetsCash and bank balances 494,031 – – – – 494,031Margin cash 1,068,842 – – – – 1,068,842Debtors – – – – 722,476 722,476Financial assets at fair value – 2,612,446 528,324 3,570,232 214,018 6,925,020
Total current assets 1,562,873 2,612,446 528,324 3,570,232 936,494 9,210,369
Current liabilitiesCreditors – amounts falling due within one year – – – – (26,143) (26,143)Financial liabilities at fair value – (58,366) – – (90,522) (148,888)Net assets attributable to redeemable participating shareholders – – – – (9,035,338) (9,035,338)
Total current liabilities – (58,366) – – (9,152,003) (9,210,369)
Total interest rate sensitivity gap 1,562,873 2,554,080 528,324 3,570,232
Less than 1 month Up to 1 year 1 – 5 years
Greater than 5 years
Non-interest bearing Total
GAM Star Disruptive Growth US$ US$ US$ US$ US$ US$Current assetsCash and bank balances 1,945,263 – – – – 1,945,263Margin cash 10,361,968 – – – – 10,361,968Debtors – – – – 1,327,542 1,327,542Financial assets at fair value – – – – 233,507,639 233,507,639
Total current assets 12,307,231 – – – 234,835,181 247,142,412
Current liabilitiesBank overdraft (1,589) – – – – (1,589)Amounts due to broker (1,200,000) – – – – (1,200,000)Creditors – amounts falling due within one year – – – – (1,854,519) (1,854,519)Financial liabilities at fair value – – – – (721,506) (721,506)Net assets attributable to redeemable participating shareholders – – – – (243,364,798) (243,364,798)
Total current liabilities (1,201,589) – – – (245,940,823) (247,142,412)
Total interest rate sensitivity gap 11,105,642 – – –
Less than 1 month Up to 1 year 1 – 5 years
Greater than 5 years
Non-interest bearing Total
GAM Systematic Dynamic Credit** US$ US$ US$ US$ US$ US$ Current assetsCash and bank balances 3,346,188 – – – – 3,346,188Margin cash 1,966,643 – – – – 1,966,643Debtors – – – – 65,937 65,937Financial assets at fair value 3,198,378 5,272,477 – – 1,205,086 9,675,941
Total current assets 8,511,209 5,272,477 – – 1,271,023 15,054,709
Current liabilitiesBank overdraft (4,826) – – – – (4,826)Creditors – amounts falling due within one year – – – – (1,009,637) (1,009,637)Financial liabilities at fair value – – – – (442,127) (442,127)Net assets attributable to redeemable participating shareholders – – – – (13,598,119) (13,598,119)
Total current liabilities (4,826) – – – (15,049,883) (15,054,709)
Total interest rate sensitivity gap 8,506,383 5,272,477 – –
** Fund launched during the year.
Notes to the Financial Statements
3. Financial risk management, continued(d) Interest rate risk, continuedThe majority of the assets of the other Funds are equity shares and other investments which neither pay interest nor have a maturity date. As a result, these Funds are not subject to significant amounts of risk due to fluctuations in the prevailing levels of market interest rates.
The majority of the cash positions of the Company were held with State Street Bank and Trust, earning interest rates which are based on current LIBOR rates less a spread as determined by the Depositary. This interest rate risk is not actively managed.
(e) Credit riskThe Company may be exposed to credit risk, which is the risk that a counterparty to a financial transaction with the Company will be unable to pay amounts in full when due.
For Funds which hold equities, transactions are in exchange traded securities and are settled/paid for upon delivery (DVP Trades) and the risk of default is considered minimal, as security delivery and payment are simultaneous. The trade will fail if either party fails to meet its obligation.
The Company, through the investment in investee funds, may also be exposed to any credit risk which these investee funds have at any point in time. The maximum credit risk which the Company may have in relation to these investments is the value of its investment in the Funds.
Investments in bonds and debt income securities are subject to risk (generally lower where securities are rated above investment grade) that payments may not be made by issuers on due dates or at all.
The Co-Investment Managers and Delegate Investment Managers manage credit risk for cash and derivatives by only using approved counterparties that belong to an internationally recognised financial services firm or alternatively command a high market share in a given market segment. The Company’s intention would be to net its liabilities due to any counterparty against any asset due from the same counterparty. Details of investments and cash held with various brokers are disclosed in the relevant Portfolio Statement of each Fund and in note 14.
The Company participated in securities lending as disclosed in note 5. The Company ensures that collateral received in respects of securities lent must equal or exceed, in value, at all times, the value of the securities loaned.
The majority of the investments and cash held by each Fund are with the Depositary. Cash and bank balances and margin cash balances are unsecured balances held with the Depositary and counterparties as set out in note 14. Bankruptcy or insolvency of the Depositary or brokers it uses may cause the Company’s rights with respect
to its cash and investments held by the Depositary or brokers to be delayed or limited. Please refer to note 5 for amounts held as collateral for stock lending as 30 June 2020 and 30 June 2019.
The Company’s investments held with the Depositary are held within segregated accounts. Any profit (net of margin held by the Company) on over the counter derivatives due from counterparties is unsecured. At 30 June 2020 and 30 June 2019 the credit rating of the Depositary was equal to A according to Standard & Poor’s.
(f) Liquidity riskThe majority of Funds are exposed to daily cash redemptions of redeemable shares and therefore may be exposed to liquidity risk and cash flow risk which is the risk that they will encounter difficulty in liquidating assets to fund redemptions. However, as the Funds invest the majority of their assets in investments that are traded in active markets and can be readily disposed of, liquidity risk and cash flow risk is considered low. The Co-Investment Managers manage this liquidity risk and cash flow risk through the diversification of investments and investment strategies and through their overall investment approach.
The Directors are entitled to limit the number of Shares of a Fund redeemed on any Dealing Day to 10% of the total number of Shares of that Fund in issue or equal to 10% or more of the Net Asset Value of a particular Fund. In this event, the limitation will apply pro rata so that all Shareholders wishing to have their Shares of that Fund redeemed on that Dealing Day will realise the same proportion of such Shares for which a redemption request has been accepted by the Manager and any Shares not redeemed, but which would otherwise have been redeemed, will be carried forward to be redeemed on the next Dealing Day. If requests for the redemption of Shares are so carried forward, the Directors will inform the Shareholders affected.
The Articles contain special provisions where redemption requests received from any one Shareholder would result in more than 5% of the Net Asset Value of Shares of the relevant Fund being redeemed by the Shareholders of the Company on any Dealing Day. In such a case, the Company may, without the consent of the Shareholder, satisfy the redemption request by a distribution of investments in specie and may, elect by notice in writing to the Shareholder to appropriate and transfer to him such assets in satisfaction or part satisfaction of the redemption price or any part of the said redemption price, provided that any such distribution will cause no material prejudice to the interests of remaining Shareholders. Where a notice of election is served on a Shareholder the Shareholder may, by a further notice served on the Company, require the Company instead of transferring the assets in question to arrange for a sale of the assets on behalf of the Applicant after the repurchase has been effected in a method and at a price to be chosen at the Company’s sole discretion and for payment to the Shareholder of the net proceeds of sale.

250
GAM Star Fund p.l.c.
Notes to the Financial Statements
3. Financial risk management, continued(f) Liquidity risk, continuedTermination of a Fund or Share Class The Manager may close or terminate a Fund or a Share class of a Fund or a Series of Shares and realise all Shares, at its absolute discretion if, at any time, after the date of first issue of Shares in the Fund, Share class or Series, the Net Asset Value of the Fund or Share Class or Series is less than USD 50,000,000 (or its foreign currency equivalent).
Suspension of Determination of NAV and or issue, redemption and switchingThe Directors may at any time declare a temporary suspension of the calculation of the Net Asset Value of any Fund and the issue/redemption of Shares of any Fund and the switching of Shares in one Fund for those of another or between classes or Series in the one Fund.
Any such suspension of the determination of the NAV of any Fund and/or issue, redemption and/or switching of the Shares shall be notified immediately (without delay( to the Central Bank and to the competent authorities in the Member States in which the relevant class of Shares or Series is marketed. It shall also be notified if applicable to Euronext Dublin and to Shareholders requesting the issue or redemption of Shares of the relevant class or Series by the Directors at the time of application or the making of the irrevocable request to redeem. Any such redemption request which is not withdrawn shall be dealt with on the first Dealing Day after the suspension is lifted at the relevant redemption price prevailing on that day.
Any such suspension of switching of Shares shall be notified to the Shareholders requesting such a switch and, where the relevant switch notice is not withdrawn, any such switch shall be dealt with on the first Dealing Day after such suspension is lifted.
Where the Directors declare a temporary suspension of the determination of the NAV of the Fund, no Shares will be issued (except where an application for Shares was previously received), redeemed or switched on any Dealing Day during the period of suspension. Where the Directors only declare a temporary suspension of the issue., redemption and/or switching of Shares, the determination of the NAV of the relevant Fund, class of Shares and Series and the NAV per Share shall continue to be calculated.
The Company may from time to time invest in derivative contracts traded over the counter and certain other investments, which are not traded in an organised market and may be illiquid. As a result, the Company may not be able to liquidate quickly its investments in these instruments at an amount close to their fair value to meet its liquidity requirements or to respond to specific events such as deterioration in the credit worthiness of any particular issuer. Details of open derivative contracts are disclosed in the relevant Portfolio Statement of each Fund.
The tables overleaf analyses the Company’s financial liabilities into relevant maturity groupings based on the remaining period at the balance sheet date to contractual maturity date. The amounts in the tables are the contractual undiscounted cash flows.
All liabilities of the Funds including the net assets attributable to redeemable participating shareholders are due within one month with the exception of the following Funds:

251
Notes to the Financial Statements
3. Financial risk management, continued(f) Liquidity risk, continued
As at 30 June 2020Less than
1 month1 – 6
months6 – 12
monthsGreater than
1 yearNo stated
maturity
GAM Star Alpha Technology US$ US$ US$ US$ US$Financial liabilities at fair value (7,938) (137,526) – – (2,231,651)Bank overdraft (12) – – – –Amounts payable for redemptions (14,826) – – – –Accrued expenses (254,208) – – – –Interest payable (12,378) – – – –Net assets attributable to shareholders (31,037,128) – – – –
Total financial liabilities (31,326,490) (137,526) – – (2,231,651)
GAM Star Global Balanced £ £ £ £ £ Financial liabilities at fair value (3,481,592) (7,566) – – –Bank overdraft (4,806) – – – –Amounts payable for redemptions (1,797,612) – – – –Accrued expenses (847,772) – – – –Distribution payable on income shares – (6,086) – – –Net assets attributable to shareholders (343,300,127) – – – –
Total financial liabilities (349,431,909) (13,652) – – –
GAM Star Capital Appreciation US Equity US$ US$ US$ US$ US$Amounts payable for redemptions (79,605) – – – –Amounts payable to brokers for purchases of securities (170,734) – – – –Accrued expenses (161,964) – – – –Distribution payable on income shares – (206) – – –Net assets attributable to shareholders (87,750,272) – – – –
Total financial liabilities (88,162,575) (206) – – –
GAM Star Cat Bond US$ US$ US$ US$ US$Financial liabilities at fair value (272,714) (7,325,413) – – –Bank overdraft (7,530) – – – –Amounts payable for redemptions (1,908,960) – – – –Accrued expenses (5,779,372) – – – –Amounts due to broker (19,619) – – – –Distribution payable on income shares – (5,732,533) – – –Net assets attributable to shareholders (1,754,121,928) – – – –
Total financial liabilities (1,762,110,123) (13,057,946) – – –
GAM Star Global Cautious £ £ £ £ £Financial liabilities at fair value (1,495,674) (4,138) – – –Bank overdraft (1,587) – – – –Amounts payable for redemptions (906,169) – – – –Accrued expenses (373,319) – – – –Distribution payable on income shares – (22,763) – – –Net assets attributable to shareholders (168,319,703) – – – –
Total financial liabilities (171,096,452) (26,901) – – –
GAM Star China Equity US$ US$ US$ US$ US$Financial liabilities at fair value (10,949) (20,711) – – –Bank overdraft (1,614) – – – –Amounts payable for redemptions (1,761,631) – – – –Accrued expenses (620,497) – – – –Distribution payable on income shares – (25,931) – – –Net assets attributable to shareholders (256,336,513) – – – –
Total financial liabilities (258,731,204) (46,642) – – –

252
GAM Star Fund p.l.c.
Notes to the Financial Statements
3. Financial risk management, continued(f) Liquidity risk, continued
As at 30 June 2020 Less than
1 month1 – 6
months6 – 12
monthsGreater than
1 yearNo stated
maturity
GAM Star Continental European Equity € € € € €Financial liabilities at fair value (130,736) – – – –Bank overdraft (74) – – – –Amounts payable for redemptions (12,794,660) – – – –Amounts payable to brokers for purchases of securities (1,280,960) – – – –Accrued expenses (605,565) – – – –Distribution payable on income shares – (453,583) – – –Net assets attributable to shareholders (492,147,151) – – – –
Total financial liabilities (506,959,146) (453,583) – – –
GAM Star Credit Opportunities (EUR) € € € € €Financial liabilities at fair value (1,166,230) (3,711,252) – – –Bank overdraft (86,385) – – – –Amounts payable for redemptions (28,440,626) – – – –Accrued expenses (3,639,022) – – – –Amounts due to broker (14,509,225) – – – –Distribution payable on income shares – (8,340,919) – – –Net assets attributable to shareholders (2,124,899,685) – – – –
Total financial liabilities (2,172,741,173) (12,052,171) – – –
GAM Star Credit Opportunities (GBP) £ £ £ £ £Financial liabilities at fair value (556,648) (5,723,322) – – –Amounts payable for redemptions (5,062,510) – – – –Accrued expenses (1,183,950) – – – –Amounts due to broker (1,371,000) – – – –Distribution payable on income shares – (5,783,371) – – –Net assets attributable to shareholders (699,295,417) – – – –
Total financial liabilities (707,469,525) (11,506,693) – – –
GAM Star Credit Opportunities (USD) US$ US$ US$ US$ US$Financial liabilities at fair value (61,051) (4,235,011) – – –Bank overdraft (960,293) – – – –Amounts payable for redemptions (11,529,280) – – – –Amounts payable to brokers for purchases of securities (6,284,999) – – – –Accrued expenses (2,934,973) – – – –Distribution payable on income shares – (5,326,307) – – –Net assets attributable to shareholders (2,085,565,146) – – – –
Total financial liabilities (2,107,335,742) (9,561,318) – – –
GAM Star Emerging Market Rates US$ US$ US$ US$ US$Financial liabilities at fair value (10,243) (2,275,569) (61,535) (173,663) –Bank overdraft (36) – – – –Amounts payable for redemptions (3,781) – – – –Amounts payable to brokers for purchases of securities (6,648,601) – – – –Accrued expenses (350,433) – – – –Amounts due to broker (975,615) – – – –Interest payable (11,958) – – – –Capital gains tax payable (22,959) – – – –Distribution payable on income shares – (6,670) – – –Net assets attributable to shareholders (72,118,990) – – – –
Total financial liabilities (80,142,616) (2,282,239) (61,535) (173,663) –
GAM Star European Equity € € € € €Financial liabilities at fair value (8,633) – – – –Amounts payable for redemptions (359,901) – – – –Amounts payable to brokers for purchases of securities (793,199) – – – –Accrued expenses (523,099) – – – –Distribution payable on income shares – (1,336) – – –Net assets attributable to shareholders (273,329,235) – – – –
Total financial liabilities (275,014,067) (1,336) – – –

253
Notes to the Financial Statements
3. Financial risk management, continued(f) Liquidity risk, continued
As at 30 June 2020 Less than
1 month1 – 6
months6 – 12
monthsGreater than
1 yearNo stated
maturity
GAM Star Continental European Equity € € € € €Financial liabilities at fair value (130,736) – – – –Bank overdraft (74) – – – –Amounts payable for redemptions (12,794,660) – – – –Amounts payable to brokers for purchases of securities (1,280,960) – – – –Accrued expenses (605,565) – – – –Distribution payable on income shares – (453,583) – – –Net assets attributable to shareholders (492,147,151) – – – –
Total financial liabilities (506,959,146) (453,583) – – –
GAM Star Credit Opportunities (EUR) € € € € €Financial liabilities at fair value (1,166,230) (3,711,252) – – –Bank overdraft (86,385) – – – –Amounts payable for redemptions (28,440,626) – – – –Accrued expenses (3,639,022) – – – –Amounts due to broker (14,509,225) – – – –Distribution payable on income shares – (8,340,919) – – –Net assets attributable to shareholders (2,124,899,685) – – – –
Total financial liabilities (2,172,741,173) (12,052,171) – – –
GAM Star Credit Opportunities (GBP) £ £ £ £ £Financial liabilities at fair value (556,648) (5,723,322) – – –Amounts payable for redemptions (5,062,510) – – – –Accrued expenses (1,183,950) – – – –Amounts due to broker (1,371,000) – – – –Distribution payable on income shares – (5,783,371) – – –Net assets attributable to shareholders (699,295,417) – – – –
Total financial liabilities (707,469,525) (11,506,693) – – –
GAM Star Credit Opportunities (USD) US$ US$ US$ US$ US$Financial liabilities at fair value (61,051) (4,235,011) – – –Bank overdraft (960,293) – – – –Amounts payable for redemptions (11,529,280) – – – –Amounts payable to brokers for purchases of securities (6,284,999) – – – –Accrued expenses (2,934,973) – – – –Distribution payable on income shares – (5,326,307) – – –Net assets attributable to shareholders (2,085,565,146) – – – –
Total financial liabilities (2,107,335,742) (9,561,318) – – –
GAM Star Emerging Market Rates US$ US$ US$ US$ US$Financial liabilities at fair value (10,243) (2,275,569) (61,535) (173,663) –Bank overdraft (36) – – – –Amounts payable for redemptions (3,781) – – – –Amounts payable to brokers for purchases of securities (6,648,601) – – – –Accrued expenses (350,433) – – – –Amounts due to broker (975,615) – – – –Interest payable (11,958) – – – –Capital gains tax payable (22,959) – – – –Distribution payable on income shares – (6,670) – – –Net assets attributable to shareholders (72,118,990) – – – –
Total financial liabilities (80,142,616) (2,282,239) (61,535) (173,663) –
GAM Star European Equity € € € € €Financial liabilities at fair value (8,633) – – – –Amounts payable for redemptions (359,901) – – – –Amounts payable to brokers for purchases of securities (793,199) – – – –Accrued expenses (523,099) – – – –Distribution payable on income shares – (1,336) – – –Net assets attributable to shareholders (273,329,235) – – – –
Total financial liabilities (275,014,067) (1,336) – – –
Notes to the Financial Statements
3. Financial risk management, continued(f) Liquidity risk, continued
As at 30 June 2020 Less than
1 month1 – 6
months6 – 12
monthsGreater than
1 yearNo stated
maturity
GAM Star Flexible Global Portfolio € € € € €Financial liabilities at fair value (2,019,926) (117,929) – – –Bank overdraft (287) – – – –Amounts payable for redemptions (34,586) – – – –Accrued expenses (84,792) – – – –Net assets attributable to shareholders (129,031,519) – – – –
Total financial liabilities (131,171,110) (117,929) – – –
GAM Star Global Rates US$ US$ US$ US$ US$ Financial liabilities at fair value (1,200,911) (795,925) – (18,410,454) –Amounts payable for redemptions (65,545) – – – –Amounts payable to brokers for purchases of securities (522,300) – – – –Accrued expenses (281,142) – – – –Amounts due to broker (7,120,001) – – – –Interest payable (220,044) – – – –Distribution payable on income shares – (61,166) – – –Net assets attributable to shareholders (131,176,057) – – – –
Total financial liabilities (140,586,000) (857,091) – (18,410,454) –
GAM Star Global Growth £ £ £ £ £Financial liabilities at fair value (2,184,650) (10,367) – – –Bank overdraft (1,349) – – – –Amounts payable for redemptions (807,914) – – – –Accrued expenses (489,624) – – – –Net assets attributable to shareholders (177,756,626) – – – –
Total financial liabilities (181,240,163) (10,367) – – –
GAM Star Interest Trend US$ US$ US$ US$ US$Financial liabilities at fair value (7,548) (23,621) – – –Amounts payable for redemptions (332,958) – – – –Accrued expenses (107,016) – – – –Net assets attributable to shareholders (43,299,410) – – – –
Total financial liabilities (43,746,932) (23,621) – – –
GAM Star Japan Leaders ¥ ¥ ¥ ¥ ¥Financial liabilities at fair value (16,880,766) (12,259,809) – – –Bank overdraft (350,487) – – – –Amounts payable for redemptions (229,899,402) – – – –Accrued expenses (78,741,825) – – – –Distribution payable on income shares – (5,472,181) – – –Net assets attributable to shareholders (58,265,122,349) – – – –
Total financial liabilities (58,590,994,829) (17,731,990) – – –
GAM Star MBS Total Return US$ US$ US$ US$ US$Financial liabilities at fair value (608,403) (2,713,537) – – –Bank overdraft (9,523) – – – –Amounts payable for redemptions (8,324,044) – – – –Amounts payable to brokers for purchases of securities (7,392,478) – – – –Accrued expenses (1,078,103) – – – –Distribution payable on income shares – (3,131,417) – – –Net assets attributable to shareholders (948,481,638) – – – –
Total financial liabilities (965,894,189) (5,844,954) – – –

254
GAM Star Fund p.l.c.
Notes to the Financial Statements
3. Financial risk management, continued(f) Liquidity risk, continued
As at 30 June 2020 Less than
1 month1 – 6
months6 – 12
monthsGreater than
1 yearNo stated
maturity
GAM Systematic Alternative Risk Premia US$ US$ US$ US$ US$Financial liabilities at fair value (461,855) (315,157) (383,185) (55,123) –Bank overdraft (54) – – – –Amounts payable for redemptions (40,316) – – – –Accrued expenses (115,293) – – – –Amounts due to broker (980,000) – – – –Net assets attributable to shareholders (59,345,854) – – – –
Total financial liabilities (60,943,372) (315,157) (383,185) (55,123) –
GAM Systematic Core Macro US$ US$ US$ US$ US$Financial liabilities at fair value (7,699) (145,974) (56) (112) –Bank overdraft (10) – – – –Amounts payable for redemptions (418) – – – –Amounts payable to brokers for purchases of securities (75,000) – – – –Accrued expenses (108,414) – – – –Net assets attributable to shareholders (9,829,164) – – – –
Total financial liabilities (10,020,705) (145,974) (56) (112) –
GAM Star Tactical Opportunities US$ US$ US$ US$ US$Financial liabilities at fair value (4,021) (295,752) – – –Amounts payable for redemptions (76) – – – –Accrued expenses (72,000) – – – –Amounts due to broker (170,000) – – – –Net assets attributable to shareholders (40,274,080) – – – –
Total financial liabilities (40,520,177) (295,752) – – –
GAM Star Disruptive Growth US$ US$ US$ US$ US$Financial liabilities at fair value (850) (5,604) – – –Bank overdraft (1,245) – – – –Amounts payable for redemptions (564,380) – – – –Accrued expenses (573,874) – – – –Amounts due to broker (2,617,208) – – – –Interest payable (3,803) – – – –Net assets attributable to shareholders (289,241,185) – – – –
Total financial liabilities (293,002,545) (5,604) – – –
GAM Star US All Cap Equity US$ US$ US$ US$ US$Financial liabilities at fair value (54) (886) – – –Bank overdraft (102) – – – –Amounts payable for redemptions (50,249) – – – –Amounts payable to brokers for purchases of securities (660,233) – – – –Accrued expenses (199,239) – – – –Net assets attributable to shareholders (67,510,389) – – – –
Total financial liabilities (68,420,266) (886) – – –
GAM Star Worldwide Equity US$ US$ US$ US$ US$Financial liabilities at fair value (671) (4,236) – – –Amounts payable for redemptions (5,490) – – – –Accrued expenses (369,852) – – – –Capital gains tax payable (30,462) – – – –Distribution payable on income shares – (1,944) – – –Net assets attributable to shareholders (59,778,541) – – – –
Total financial liabilities (60,185,016) (6,180) – – –
GAM Systematic Dynamic Credit US$ US$ US$ US$ US$Financial liabilities at fair value (3,619) (46,058) – (165,558) –Amounts payable to brokers for purchases of securities (7,537) – – – –Accrued expenses (13,344) – – – –Interest payable (1,028) – – – –Net assets attributable to shareholders (10,835,639) – – – –
Total financial liabilities (10,861,167) (46,058) – (165,558) –

255
Notes to the Financial Statements
3. Financial risk management, continued(f) Liquidity risk, continued
As at 30 June 2020 Less than
1 month1 – 6
months6 – 12
monthsGreater than
1 yearNo stated
maturity
GAM Systematic Alternative Risk Premia US$ US$ US$ US$ US$Financial liabilities at fair value (461,855) (315,157) (383,185) (55,123) –Bank overdraft (54) – – – –Amounts payable for redemptions (40,316) – – – –Accrued expenses (115,293) – – – –Amounts due to broker (980,000) – – – –Net assets attributable to shareholders (59,345,854) – – – –
Total financial liabilities (60,943,372) (315,157) (383,185) (55,123) –
GAM Systematic Core Macro US$ US$ US$ US$ US$Financial liabilities at fair value (7,699) (145,974) (56) (112) –Bank overdraft (10) – – – –Amounts payable for redemptions (418) – – – –Amounts payable to brokers for purchases of securities (75,000) – – – –Accrued expenses (108,414) – – – –Net assets attributable to shareholders (9,829,164) – – – –
Total financial liabilities (10,020,705) (145,974) (56) (112) –
GAM Star Tactical Opportunities US$ US$ US$ US$ US$Financial liabilities at fair value (4,021) (295,752) – – –Amounts payable for redemptions (76) – – – –Accrued expenses (72,000) – – – –Amounts due to broker (170,000) – – – –Net assets attributable to shareholders (40,274,080) – – – –
Total financial liabilities (40,520,177) (295,752) – – –
GAM Star Disruptive Growth US$ US$ US$ US$ US$Financial liabilities at fair value (850) (5,604) – – –Bank overdraft (1,245) – – – –Amounts payable for redemptions (564,380) – – – –Accrued expenses (573,874) – – – –Amounts due to broker (2,617,208) – – – –Interest payable (3,803) – – – –Net assets attributable to shareholders (289,241,185) – – – –
Total financial liabilities (293,002,545) (5,604) – – –
GAM Star US All Cap Equity US$ US$ US$ US$ US$Financial liabilities at fair value (54) (886) – – –Bank overdraft (102) – – – –Amounts payable for redemptions (50,249) – – – –Amounts payable to brokers for purchases of securities (660,233) – – – –Accrued expenses (199,239) – – – –Net assets attributable to shareholders (67,510,389) – – – –
Total financial liabilities (68,420,266) (886) – – –
GAM Star Worldwide Equity US$ US$ US$ US$ US$Financial liabilities at fair value (671) (4,236) – – –Amounts payable for redemptions (5,490) – – – –Accrued expenses (369,852) – – – –Capital gains tax payable (30,462) – – – –Distribution payable on income shares – (1,944) – – –Net assets attributable to shareholders (59,778,541) – – – –
Total financial liabilities (60,185,016) (6,180) – – –
GAM Systematic Dynamic Credit US$ US$ US$ US$ US$Financial liabilities at fair value (3,619) (46,058) – (165,558) –Amounts payable to brokers for purchases of securities (7,537) – – – –Accrued expenses (13,344) – – – –Interest payable (1,028) – – – –Net assets attributable to shareholders (10,835,639) – – – –
Total financial liabilities (10,861,167) (46,058) – (165,558) –
Notes to the Financial Statements
3. Financial risk management, continued(f) Liquidity risk, continued
As at 30 June 2019Less than
1 month1 – 6
months6 – 12
monthsGreater than
1 yearNo stated
maturity
GAM Star Alpha Technology US$ US$ US$ US$ US$Financial liabilities at fair value (90,936) (344) – – (273,559)Bank overdraft (186,666) – – – –Amounts payable for redemptions (3,433) – – – –Accrued expenses (236,963) – – – –Interest payable (25,196) – – – –Net assets attributable to shareholders (19,462,431) – – – –
Total financial liabilities (20,005,625) (344) – – (273,559)
GAM Star Asian Equity US$ US$ US$ US$ US$Bank overdraft (39) – – – –Accrued expenses (73,637) – – – –Distribution payable on income shares – (1,284) – – –Net assets attributable to shareholders (15,660,478) – – – –
Total financial liabilities (15,734,154) (1,284) – – –
GAM Star Asia-Pacific Equity US$ US$ US$ US$ US$Bank overdraft (53) – – – –Amounts payable for redemptions (24,132) – – – –Accrued expenses (70,827) – – – –Distribution payable on income shares – (55,674) – – –Net assets attributable to shareholders (18,744,293) – – – –
Total financial liabilities (18,839,305) (55,674) – – –
GAM Star Global Balanced £ £ £ £ £Financial liabilities at fair value (435,353) (746,189) – – –Bank overdraft (133) – – – –Amounts payable for redemptions (6,998,295) – – – –Accrued expenses (970,828) – – – –Distribution payable on income shares – (3,255) – – –Net assets attributable to shareholders (434,013,106) – – – –
Total financial liabilities (442,417,715) (749,444) – – –
GAM Star Cat Bond US$ US$ US$ US$ US$Financial liabilities at fair value (9,320,893) (110,304) – – –Bank overdraft (60) – – – –Amounts payable for redemptions (4,576,404) – – – –Accrued expenses (1,832,134) – – – –Amounts due to broker (19,619) – – – –Distribution payable on income shares – (7,504,303) – – –Net assets attributable to shareholders (1,706,837,904) – – – –
Total financial liabilities (1,722,587,014) (7,614,607) – – –
GAM Star Global Cautious £ £ £ £ £Financial liabilities at fair value (185,015) (291,573) – – –Bank overdraft (3) – – – –Amounts payable for redemptions (4,436,088) – – – –Accrued expenses (407,795) – – – –Distribution payable on income shares – (38,308) – – –Net assets attributable to shareholders (204,402,699) – – – –
Total financial liabilities (209,431,600) (329,881) – – –

256
GAM Star Fund p.l.c.
Notes to the Financial Statements
3. Financial risk management, continued(f) Liquidity risk, continued
As at 30 June 2019 Less than
1 month1 – 6
months6 – 12
monthsGreater than
1 yearNo stated
maturity
GAM Star China Equity US$ US$ US$ US$ US$Financial liabilities at fair value (53,876) (139) – – –Bank overdraft (302) – – – –Amounts payable for redemptions (2,179,348) – – – –Amounts payable to brokers for purchases of securities (7,408,439) – – – –Accrued expenses (714,310) – – – –Distribution payable on income shares – (135,374) – – –Net assets attributable to shareholders (366,060,387) – – – –
Total financial liabilities (376,416,662) (135,513) – – –
GAM Star Composite Global Equity US$ US$ US$ US$ US$Accrued expenses (99,012) – – – –Distribution payable on income shares – (7,196) – – –Net assets attributable to shareholders (101,455,550) – – – –
Total financial liabilities (101,554,562) (7,196) – – –
GAM Star Continental European Equity € € € € €Financial liabilities at fair value (141,191) (55,880) – – –Bank overdraft (3,946) – – – –Amounts payable for redemptions (7,468,323) – – – –Amounts payable to brokers for purchases of securities (7,577,627) – – – –Accrued expenses (1,085,211) – – – –Distribution payable on income shares – (1,806,881) – – –Net assets attributable to shareholders (855,562,571) – – – –
Total financial liabilities (871,838,869) (1,862,761) – – –
GAM Star Credit Opportunities (EUR) € € € € €Financial liabilities at fair value (731,278) (2,164,122) – – –Bank overdraft (31,174) – – – –Amounts payable for redemptions (112,641,599) – – – –Amounts payable to brokers for purchases of securities (60,977,348) – – – –Accrued expenses (4,599,259) – – – –Distribution payable on income shares – (14,901,253) – – –Net assets attributable to shareholders (3,619,819,470) – – – –
Total financial liabilities (3,798,800,128) (17,065,375) – – –
GAM Star Credit Opportunities (GBP) £ £ £ £ £Financial liabilities at fair value (254,559) (5,643,755) – – –Bank overdraft (19,365) – – – –Amounts payable for redemptions (6,907,442) – – – –Amounts payable to brokers for purchases of securities (4,706,933) – – – –Accrued expenses (1,078,702) – – – –Distribution payable on income shares – (8,550,335) – – –Net assets attributable to shareholders (941,765,835) – – – –
Total financial liabilities (954,732,836) (14,194,090) – – –
GAM Star Credit Opportunities (USD) US$ US$ US$ US$ US$Financial liabilities at fair value (2,172,587) (520,555) – – –Bank overdraft (992,299) – – – –Amounts payable for redemptions (43,852,950) – – – –Amounts payable to brokers for purchases of securities (10,674,653) – – – –Accrued expenses (4,038,617) – – – –Distribution payable on income shares – (12,101,639) – – –Net assets attributable to shareholders (3,140,529,760) – – – –
Total financial liabilities (3,202,260,866) (12,622,194) – – –

257
Notes to the Financial Statements
3. Financial risk management, continued(f) Liquidity risk, continued
As at 30 June 2019 Less than
1 month1 – 6
months6 – 12
monthsGreater than
1 yearNo stated
maturity
GAM Star China Equity US$ US$ US$ US$ US$Financial liabilities at fair value (53,876) (139) – – –Bank overdraft (302) – – – –Amounts payable for redemptions (2,179,348) – – – –Amounts payable to brokers for purchases of securities (7,408,439) – – – –Accrued expenses (714,310) – – – –Distribution payable on income shares – (135,374) – – –Net assets attributable to shareholders (366,060,387) – – – –
Total financial liabilities (376,416,662) (135,513) – – –
GAM Star Composite Global Equity US$ US$ US$ US$ US$Accrued expenses (99,012) – – – –Distribution payable on income shares – (7,196) – – –Net assets attributable to shareholders (101,455,550) – – – –
Total financial liabilities (101,554,562) (7,196) – – –
GAM Star Continental European Equity € € € € €Financial liabilities at fair value (141,191) (55,880) – – –Bank overdraft (3,946) – – – –Amounts payable for redemptions (7,468,323) – – – –Amounts payable to brokers for purchases of securities (7,577,627) – – – –Accrued expenses (1,085,211) – – – –Distribution payable on income shares – (1,806,881) – – –Net assets attributable to shareholders (855,562,571) – – – –
Total financial liabilities (871,838,869) (1,862,761) – – –
GAM Star Credit Opportunities (EUR) € € € € €Financial liabilities at fair value (731,278) (2,164,122) – – –Bank overdraft (31,174) – – – –Amounts payable for redemptions (112,641,599) – – – –Amounts payable to brokers for purchases of securities (60,977,348) – – – –Accrued expenses (4,599,259) – – – –Distribution payable on income shares – (14,901,253) – – –Net assets attributable to shareholders (3,619,819,470) – – – –
Total financial liabilities (3,798,800,128) (17,065,375) – – –
GAM Star Credit Opportunities (GBP) £ £ £ £ £Financial liabilities at fair value (254,559) (5,643,755) – – –Bank overdraft (19,365) – – – –Amounts payable for redemptions (6,907,442) – – – –Amounts payable to brokers for purchases of securities (4,706,933) – – – –Accrued expenses (1,078,702) – – – –Distribution payable on income shares – (8,550,335) – – –Net assets attributable to shareholders (941,765,835) – – – –
Total financial liabilities (954,732,836) (14,194,090) – – –
GAM Star Credit Opportunities (USD) US$ US$ US$ US$ US$Financial liabilities at fair value (2,172,587) (520,555) – – –Bank overdraft (992,299) – – – –Amounts payable for redemptions (43,852,950) – – – –Amounts payable to brokers for purchases of securities (10,674,653) – – – –Accrued expenses (4,038,617) – – – –Distribution payable on income shares – (12,101,639) – – –Net assets attributable to shareholders (3,140,529,760) – – – –
Total financial liabilities (3,202,260,866) (12,622,194) – – –
Notes to the Financial Statements
3. Financial risk management, continued(f) Liquidity risk, continued
As at 30 June 2019 Less than
1 month1 – 6
months6 – 12
monthsGreater than
1 yearNo stated
maturity
GAM Star Global Defensive £ £ £ £ £Financial liabilities at fair value (21,352) (28,612) – – –Bank overdraft (38) – – – –Amounts payable for redemptions (120,077) – – – –Accrued expenses (71,719) – – – –Net assets attributable to shareholders (25,910,726) – – – –
Total financial liabilities (26,123,912) (28,612) – – –
GAM Star Emerging Equity US$ US$ US$ US$ US$Financial liabilities at fair value (1) – – – –Bank overdraft (3) – – – –Amounts payable for redemptions (144,995) – – – –Amounts payable to brokers for purchases of securities (150,351) – – – –Accrued expenses (93,983) – – – –Capital gains tax payable (96,273) – – – –Distribution payable on income shares – (54,219) – – –Net assets attributable to shareholders (25,468,860) – – – –
Total financial liabilities (25,954,466) (54,219) – – –
GAM Star Emerging Market Rates US$ US$ US$ US$ US$Financial liabilities at fair value (454,374) (1,895,384) – (404,364) –Bank overdraft (3,245) – – – –Amounts payable for redemptions (6,859,951) – – – –Amounts payable to brokers for purchases of securities (618,764) – – – –Accrued expenses (175,752) – – – –Amounts due to broker (970,000) – – – –Interest payable (1,317) – – – –Distribution payable on income shares – (30,024) – – –Net assets attributable to shareholders (69,351,925) – – – –
Total financial liabilities (78,435,328) (1,925,408) – (404,364) –
GAM Star European Equity € € € € €Bank overdraft (868) – – – –Amounts payable for redemptions (404,083) – – – –Amounts payable to brokers for purchases of securities (2,306,096) – – – –Accrued expenses (134,855) – – – –Distribution payable on income shares – (31,216) – – –Net assets attributable to shareholders (191,579,325) – – – –
Total financial liabilities (194,425,227) (31,216) – – –
GAM Star Flexible Global Portfolio € € € € €Financial liabilities at fair value (278,016) (79,993) – – –Accrued expenses (35,493) – – – –Net assets attributable to shareholders (36,154,863) – – – –
Total financial liabilities (36,468,372) (79,993) – – –
GAM Star Global Rates US$ US$ US$ US$ US$Financial liabilities at fair value (4,142,979) (750,134) (1,159,274) (30,057,046) –Bank overdraft (10,861) – – – –Amounts payable for redemptions (1,276,157) – – – –Amounts payable to brokers for purchases of securities (217,648) – – – –Accrued expenses (412,026) – – – –Amounts due to broker (42,415,007) – – – –Interest payable (968,866) – – – –Net assets attributable to shareholders (260,075,568) – – – –
Total financial liabilities (309,519,112) (750,134) (1,159,274) (30,057,046) –

258
GAM Star Fund p.l.c.
Notes to the Financial Statements
3. Financial risk management, continued(f) Liquidity risk, continued
As at 30 June 2019 Less than
1 month1 – 6
months6 – 12
monthsGreater than
1 yearNo stated
maturity
GAM Star Global Selector US$ US$ US$ US$ US$Financial liabilities at fair value (18,050) (24) – – –Bank overdraft (120) – – – –Amounts payable for redemptions (16,980) – – – –Accrued expenses (37,372) – – – –Net assets attributable to shareholders (5,218,616) – – – –
Total financial liabilities (5,291,138) (24) – – –
GAM Star Global Growth £ £ £ £ £Financial liabilities at fair value (648,737) (10,078) – – –Bank overdraft (484) – – – –Amounts payable for redemptions (2,010,027) – – – –Accrued expenses (497,868) – – – –Net assets attributable to shareholders (208,043,461) – – – –
Total financial liabilities (211,200,577) (10,078) – – –
GAM Star Interest Trend US$ US$ US$ US$ US$Financial liabilities at fair value (927) (3,311) – – –Accrued expenses (141,132) – – – –Net assets attributable to shareholders (52,924,484) – – – –
Total financial liabilities (53,066,543) (3,311) – – –
GAM Star Japan Leaders ¥ ¥ ¥ ¥ ¥Financial liabilities at fair value (68,817,059) (44,406) – – –Bank overdraft (108,355) – – – –Amounts payable for redemptions (227,675,197) – – – –Accrued expenses (49,000,986) – – – –Distribution payable on income shares – (15,099,100) – – –Net assets attributable to shareholders (36,578,079,435) – – – –
Total financial liabilities (36,923,681,032) (15,143,506) – – –
GAM Star MBS Total Return US$ US$ US$ US$ US$Financial liabilities at fair value (3,456,032) (1,475,035) – – –Bank overdraft (3,922) – – – –Amounts payable for redemptions (4,707,378) – – – –Amounts payable to brokers for purchases of securities (5,048,665) – – – –Accrued expenses (2,364,184) – – – –Distribution payable on income shares – (2,195,383) – – –Net assets attributable to shareholders (1,242,049,986) – – – –
Total financial liabilities (1,257,630,167) (3,670,418) – – –
GAM Systematic Alternative Risk Premia US$ US$ US$ US$ US$Financial liabilities at fair value (6,559,812) (2,651,283) (373,708) – –Bank overdraft (9,343) – – – –Amounts payable for redemptions (138,620) – – – –Accrued expenses (237,280) – – – –Amounts due to broker (3,687,571) – – – –Net assets attributable to shareholders (262,774,670) – – – –
Total financial liabilities (273,407,296) (2,651,283) (373,708) – –
GAM Systematic Core Macro US$ US$ US$ US$ US$Financial liabilities at fair value (498,364) (1,470,284) – (37,633) –Bank overdraft (18,046) – – – –Amounts payable for redemptions (18,088,468) – – – –Accrued expenses (448,559) – – – –Net assets attributable to shareholders (54,598,050) – – – –
Total financial liabilities (73,651,487) (1,470,284) – (37,633) –

259
Notes to the Financial Statements
3. Financial risk management, continued(f) Liquidity risk, continued
As at 30 June 2019 Less than
1 month1 – 6
months6 – 12
monthsGreater than
1 yearNo stated
maturity
GAM Star Global Selector US$ US$ US$ US$ US$Financial liabilities at fair value (18,050) (24) – – –Bank overdraft (120) – – – –Amounts payable for redemptions (16,980) – – – –Accrued expenses (37,372) – – – –Net assets attributable to shareholders (5,218,616) – – – –
Total financial liabilities (5,291,138) (24) – – –
GAM Star Global Growth £ £ £ £ £Financial liabilities at fair value (648,737) (10,078) – – –Bank overdraft (484) – – – –Amounts payable for redemptions (2,010,027) – – – –Accrued expenses (497,868) – – – –Net assets attributable to shareholders (208,043,461) – – – –
Total financial liabilities (211,200,577) (10,078) – – –
GAM Star Interest Trend US$ US$ US$ US$ US$Financial liabilities at fair value (927) (3,311) – – –Accrued expenses (141,132) – – – –Net assets attributable to shareholders (52,924,484) – – – –
Total financial liabilities (53,066,543) (3,311) – – –
GAM Star Japan Leaders ¥ ¥ ¥ ¥ ¥Financial liabilities at fair value (68,817,059) (44,406) – – –Bank overdraft (108,355) – – – –Amounts payable for redemptions (227,675,197) – – – –Accrued expenses (49,000,986) – – – –Distribution payable on income shares – (15,099,100) – – –Net assets attributable to shareholders (36,578,079,435) – – – –
Total financial liabilities (36,923,681,032) (15,143,506) – – –
GAM Star MBS Total Return US$ US$ US$ US$ US$Financial liabilities at fair value (3,456,032) (1,475,035) – – –Bank overdraft (3,922) – – – –Amounts payable for redemptions (4,707,378) – – – –Amounts payable to brokers for purchases of securities (5,048,665) – – – –Accrued expenses (2,364,184) – – – –Distribution payable on income shares – (2,195,383) – – –Net assets attributable to shareholders (1,242,049,986) – – – –
Total financial liabilities (1,257,630,167) (3,670,418) – – –
GAM Systematic Alternative Risk Premia US$ US$ US$ US$ US$Financial liabilities at fair value (6,559,812) (2,651,283) (373,708) – –Bank overdraft (9,343) – – – –Amounts payable for redemptions (138,620) – – – –Accrued expenses (237,280) – – – –Amounts due to broker (3,687,571) – – – –Net assets attributable to shareholders (262,774,670) – – – –
Total financial liabilities (273,407,296) (2,651,283) (373,708) – –
GAM Systematic Core Macro US$ US$ US$ US$ US$Financial liabilities at fair value (498,364) (1,470,284) – (37,633) –Bank overdraft (18,046) – – – –Amounts payable for redemptions (18,088,468) – – – –Accrued expenses (448,559) – – – –Net assets attributable to shareholders (54,598,050) – – – –
Total financial liabilities (73,651,487) (1,470,284) – (37,633) –
Notes to the Financial Statements
3. Financial risk management, continued(f) Liquidity risk, continued
As at 30 June 2019 Less than
1 month1 – 6
months6 – 12
monthsGreater than
1 yearNo stated
maturity
GAM Systematic Global Equity Market Neutral US$ US$ US$ US$ US$Financial liabilities at fair value (64,393) (601) – – (891,340)Bank overdraft (1,831,741) – – – –Accrued expenses (58,025) – – – –Interest payable (37,149) – – – –Net assets attributable to shareholders (17,948,822) – – – –
Total financial liabilities (19,940,130) (601) – – (891,340)
GAM Star Tactical Opportunities US$ US$ US$ US$ US$Financial liabilities at fair value (130,549) (152,578) – (40,783) –Bank overdraft (16) – – – –Amounts payable for redemptions (34,646) – – – –Accrued expenses (77,524) – – – –Amounts due to broker (220,109) – – – –Net assets attributable to shareholders (47,206,471) – – – –
Total financial liabilities (47,669,315) (152,578) – (40,783) –
GAM Star Target Return US$ US$ US$ US$ US$Financial liabilities at fair value (117,201) (60,583) – (147,479) –Accrued expenses (53,396) – – – –Amounts due to broker (160,000) – – – –Net assets attributable to shareholders (31,289,305) – – – –
Total financial liabilities (31,619,902) (60,583) – (147,479) –
GAM Star Target Return Plus US$ US$ US$ US$ US$Financial liabilities at fair value (54,455) (94,433) – – –Amounts payable for redemptions – – – – –Accrued expenses (26,143) – – – –Net assets attributable to shareholders (9,035,338) – – – –
Total financial liabilities (9,115,936) (94,433) – – –
GAM Star Disruptive Growth US$ US$ US$ US$ US$Financial liabilities at fair value (3,888) (22) – – (717,596)Bank overdraft (1,589) – – – –Amounts payable for redemptions (1,480,336) – – – –Accrued expenses (337,697) – – – –Amounts due to broker (1,200,000) – – – –Interest payable (36,486) – – – –Net assets attributable to shareholders (243,364,798) – – – –
Total financial liabilities (246,424,794) (22) – – (717,596)
GAM Star US All Cap Equity US$ US$ US$ US$ US$Financial liabilities at fair value (1,386) (2) – – –Amounts payable for redemptions (11,723) – – – –Accrued expenses (216,168) – – – –Net assets attributable to shareholders (79,979,060) – – – –
Total financial liabilities (80,208,337) (2) – – –
GAM Star Worldwide Equity US$ US$ US$ US$ US$Bank overdraft (3,993) – – – –Amounts payable for redemptions (219,567) – – – –Amounts payable to brokers for purchases of securities – – – – –Accrued expenses (143,723) – – – –Distribution payable on income shares – (83,667) – – –Net assets attributable to shareholders (76,505,520) – – – –
Total financial liabilities (76,872,803) (83,667) – – –

260
GAM Star Fund p.l.c.
Notes to the Financial Statements
3. Financial risk management, continued(f) Liquidity risk, continued
As at 30 June 2019 Less than
1 month1 – 6
months6 – 12
monthsGreater than
1 yearNo stated
maturity
GAM Systematic Dynamic Credit** US$ US$ US$ US$ US$ Financial liabilities at fair value (66,203) (311) – (375,613) –Bank overdraft (4,826) – – – –Amounts payable to brokers for purchases of securities (993,488) – – – –Accrued expenses (13,362) – – – –Interest payable (2,787) – – – –Net assets attributable to shareholders (13,598,119) – – – –
Total financial liabilities (14,678,785) (311) – (375,613) –
** Fund launched during the year.

261
Notes to the Financial Statements
3. Financial risk management, continued
(g) Gains and losses on financial assets and financial liabilitiesIn the event of liquidity issues, the Company may borrow to meet redemptions. The Directors are also entitled to limit the number of shares of a Fund redeemed on any dealing day to 10% of the total number of shares of that Fund in issue.
The net gains and losses from trading in financial assets and financial liabilities shown in the Profit and Loss Account are analysed in note 12.
4. Fair value hierarchy
The Company is required to classify fair value measurements using a fair value hierarchy that reflects the significance of the inputs used in making the measurements. The guidance establishes three levels of the fair value hierarchy as follows:
Level 1: Inputs that reflect unadjusted quoted prices in active markets for identical assets or liabilities that the Company has the ability to access at the measurement date;
Level 2: Inputs other than quoted prices from active markets that are observable for the asset or liability either directly or indirectly, including inputs from markets that are not considered to be active;
Level 3: Inputs that are unobservable and are significant to the valuation.
The Company uses the “market approach” valuation technique to value its investments. A financial instrument’s level within the fair value hierarchy is based on the lowest level of any input that is
significant to the fair value measurement. However, the determination of what constitutes “observable” may require significant judgement but can generally be considered as that market data which is readily available, regularly distributed or updated, reliable and verifiable, not proprietary, and provided by independent sources that are actively involved in the relevant market. The categorisation of a financial instrument within the hierarchy is based upon the pricing transparency of the instrument and does not necessarily correspond to the risk of that instrument.
Investments typically classified within level 1 include active listed equities, exchange traded derivatives and certain government bonds. Investments typically classified within level 2 include investments in corporate bonds, certain government bonds, certain listed equities and over the counter derivatives. Investment funds are also considered level 2 investments if there is evidence that redemptions occurred during the year and there were no restrictions preventing redemptions at the year end. As level 2 investments include positions that are not traded in active markets and/or are subject to transfer restrictions, valuations may be adjusted to reflect illiquidity and/or non–transferability. Such adjustments are generally based on available market information. Investments typically classified within level 3 include certain corporate bonds, private equities and investment funds that have suspended redemptions, created side pocket classes or imposed gates. Within level 3, the use of the market approach generally consists of using comparable market transactions.
As at 30 June 2020
GAM Star Alpha SpectrumLevel 1 Level 2 Level 3 Total
€ € € €
AssetsFinancial assets designated at fair value through profit or loss at inception– Investment funds 23,673,721 33,292,813 – 56,966,534
Total assets 23,673,721 33,292,813 – 56,966,534
LiabilitiesFinancial liabilities held for trading– Derivatives – (72,088) – (72,088)
Total liabilities – (72,088) – (72,088)

262
GAM Star Fund p.l.c.
Notes to the Financial Statements
4. Fair value hierarchy, continued
As at 30 June 2020
GAM Star Alpha TechnologyLevel 1 Level 2 Level 3 Total
US$ US$ US$ US$
AssetsFinancial assets designated at fair value through profit or loss at inception– Debt securities 2,798,419 – – 2,798,419– Equity securities 26,723,366 24,472 464,675 27,212,513– Derivatives – 754,838 – 754,838
Total assets 29,521,785 779,310 464,675 30,765,770
LiabilitiesFinancial liabilities held for trading– Derivatives – (2,377,115) – (2,377,115)
Total liabilities – (2,377,115) – (2,377,115)
GAM Star Asian EquityLevel 1 Level 2 Level 3 Total
US$ US$ US$ US$
AssetsFinancial assets designated at fair value through profit or loss at inception– Equity securities 28,932,761 13,853 – 28,946,614
Total assets 28,932,761 13,853 – 28,946,614
GAM Star Global BalancedLevel 1 Level 2 Level 3 Total
£ £ £ £
AssetsFinancial assets designated at fair value through profit or loss at inception– Investment funds 52,637,190 270,031,260 – 322,668,450– Derivatives – 2,366,543 – 2,366,543
Total assets 52,637,190 272,397,803 – 325,034,993
LiabilitiesFinancial liabilities held for trading– Derivatives – (3,489,158) – (3,489,158)
Total liabilities – (3,489,158) – (3,489,158)
GAM Star Capital Appreciation US EquityLevel 1 Level 2 Level 3 Total
US$ US$ US$ US$
AssetsFinancial assets designated at fair value through profit or loss at inception– Equity securities 85,255,078 – – 85,255,078– Derivatives 13,645 – – 13,645
Total assets 85,268,723 – – 85,268,723

263
Notes to the Financial Statements
4. Fair value hierarchy, continued
As at 30 June 2020
GAM Star Cat BondLevel 1 Level 2 Level 3 Total
US$ US$ US$ US$
AssetsFinancial assets designated at fair value through profit or loss at inception– Debt securities 49,998,000 1,565,824,960 90,935,068 1,706,758,028– Equity securities – – 1,550,934 1,550,934– Derivatives – 42,396,983 – 42,396,983
Total assets 49,998,000 1,608,221,943 92,486,002 1,750,705,945
LiabilitiesFinancial liabilities held for trading– Derivatives – (7,598,127) – (7,598,127)
Total liabilities – (7,598,127) – (7,598,127)
GAM Star Global CautiousLevel 1 Level 2 Level 3 Total
£ £ £ £
AssetsFinancial assets designated at fair value through profit or loss at inception– Investment funds 22,110,338 130,583,390 – 152,693,728– Derivatives – 1,017,607 – 1,017,607
Total assets 22,110,338 131,600,997 – 153,711,335
LiabilitiesFinancial liabilities held for trading– Derivatives – (1,499,812) – (1,499,812)
Total liabilities – (1,499,812) – (1,499,812)
GAM Star China EquityLevel 1 Level 2 Level 3 Total
US$ US$ US$ US$
AssetsFinancial assets designated at fair value through profit or loss at inception– Equity securities 235,931,280 7,181,665 – 243,112,945– Derivatives – 122,934 – 122,934
Total assets 235,931,280 7,304,599 – 243,235,879
LiabilitiesFinancial liabilities held for trading– Derivatives – (31,660) – (31,660)
Total liabilities – (31,660) – (31,660)
GAM Star Composite Global EquityLevel 1 Level 2 Level 3 Total
US$ US$ US$ US$
AssetsFinancial assets designated at fair value through profit or loss at inception– Investment funds 83,179,906 24,993,116 – 108,173,022– Derivatives 494,680 – – 494,680
Total assets 83,674,586 24,993,116 – 108,667,702

264
GAM Star Fund p.l.c.
Notes to the Financial Statements
4. Fair value hierarchy, continued
As at 30 June 2020
GAM Star Continental European EquityLevel 1 Level 2 Level 3 Total
€ € € €
AssetsFinancial assets designated at fair value through profit or loss at inception– Equity securities 479,137,327 12,152,022 – 491,289,349– Derivatives – 24,341 – 24,341
Total assets 479,137,327 12,176,363 – 491,313,690
LiabilitiesFinancial liabilities held for trading– Derivatives – (130,736) – (130,736)
Total liabilities – (130,736) – (130,736)
GAM Star Credit Opportunities (EUR)Level 1 Level 2 Level 3 Total
€ € € €
AssetsFinancial assets designated at fair value through profit or loss at inception– Debt securities – 1,837,733,874 21,670,163 1,859,404,037– Equity securities – 51,985,732 – 51,985,732– Derivatives – 30,199,314 – 30,199,314
Total assets – 1,919,918,920 21,670,163 1,941,589,083
LiabilitiesFinancial liabilities held for trading– Derivatives – (4,877,482) – (4,877,482)
Total liabilities – (4,877,482) – (4,877,482)
GAM Star Credit Opportunities (GBP)Level 1 Level 2 Level 3 Total
£ £ £ £
AssetsFinancial assets designated at fair value through profit or loss at inception– Debt securities – 531,688,939 13,498,131 545,187,070– Equity securities – 87,450,742 50,656 87,501,398– Derivatives – 146,143 – 146,143
Total assets – 619,285,824 13,548,787 632,834,611
LiabilitiesFinancial liabilities held for trading– Derivatives – (6,279,970) – (6,279,970)
Total liabilities – (6,279,970) – (6,279,970)

265
Notes to the Financial Statements
4. Fair value hierarchy, continued
As at 30 June 2020
GAM Star Credit Opportunities (USD)Level 1 Level 2 Level 3 Total
US$ US$ US$ US$
AssetsFinancial assets designated at fair value through profit or loss at inception– Debt securities – 1,772,657,325 23,191,574 1,795,848,899– Equity securities – 52,033,941 – 52,033,941– Derivatives – 14,581,953 – 14,581,953
Total assets – 1,839,273,219 23,191,574 1,862,464,793
LiabilitiesFinancial liabilities held for trading– Derivatives – (4,296,062) – (4,296,062)
Total liabilities – (4,296,062) – (4,296,062)
GAM Star Global DefensiveLevel 1 Level 2 Level 3 Total
£ £ £ £
AssetsFinancial assets designated at fair value through profit or loss at inception– Investment funds 1,749,412 14,817,709 – 16,567,121– Derivatives – 112,612 – 112,612
Total assets 1,749,412 14,930,321 – 16,679,733
LiabilitiesFinancial liabilities held for trading– Derivatives – (118,782) – (118,782)
Total liabilities – (118,782) – (118,782)
GAM Star Global Dynamic GrowthLevel 1 Level 2 Level 3 Total
£ £ £ £
AssetsFinancial assets designated at fair value through profit or loss at inception– Investment funds 1,140,090 4,398,595 – 5,538,685– Derivatives – 3,781 – 3,781
Total assets 1,140,090 4,402,376 – 5,542,466
LiabilitiesFinancial liabilities held for trading– Derivatives – (1,005) – (1,005)
Total liabilities – (1,005) – (1,005)
GAM Star Emerging EquityLevel 1 Level 2 Level 3 Total
US$ US$ US$ US$
AssetsFinancial assets designated at fair value through profit or loss at inception– Debt securities – 25,821 2,549 28,370– Equity securities 14,034,814 465,675 – 14,500,489– Derivatives – 18,613 – 18,613
Total assets 14,034,814 510,109 2,549 14,547,472
LiabilitiesFinancial liabilities held for trading– Derivatives – (4,982) – (4,982)
Total liabilities – (4,982) – (4,982)

266
GAM Star Fund p.l.c.
Notes to the Financial Statements
4. Fair value hierarchy, continued
As at 30 June 2020
GAM Star Emerging Market RatesLevel 1 Level 2 Level 3 Total
US$ US$ US$ US$
AssetsFinancial assets designated at fair value through profit or loss at inception– Debt securities 31,592,302 16,837,942 – 48,430,244– Derivatives – 3,091,788 – 3,091,788
Total assets 31,592,302 19,929,730 – 51,522,032
LiabilitiesFinancial liabilities held for trading– Derivatives – (2,521,010) – (2,521,010)
Total liabilities – (2,521,010) – (2,521,010)
GAM Star European EquityLevel 1 Level 2 Level 3 Total
€ € € €
AssetsFinancial assets designated at fair value through profit or loss at inception– Equity securities 266,411,720 6,335,838 – 272,747,558– Derivatives – 1,525 – 1,525
Total assets 266,411,720 6,337,363 – 272,749,083
LiabilitiesFinancial liabilities held for trading– Derivatives – (8,633) – (8,633)
Total liabilities – (8,633) – (8,633)
GAM Star Flexible Global PortfolioLevel 1 Level 2 Level 3 Total
€ € € €
AssetsFinancial assets designated at fair value through profit or loss at inception– Investment funds 47,055,143 75,794,510 – 122,849,653– Derivatives – 428,278 – 428,278
Total assets 47,055,143 76,222,788 – 123,277,931
LiabilitiesFinancial liabilities held for trading– Derivatives – (2,137,855) – (2,137,855)
Total liabilities – (2,137,855) – (2,137,855)
GAM Star Global RatesLevel 1 Level 2 Level 3 Total
US$ US$ US$ US$
AssetsFinancial assets designated at fair value through profit or loss at inception– Debt securities 77,931,906 13,893,790 – 91,825,696– Derivatives – 26,191,813 – 26,191,813
Total assets 77,931,906 40,085,603 – 118,017,509
LiabilitiesFinancial liabilities held for trading– Derivatives – (20,407,290) – (20,407,290)
Total liabilities – (20,407,290) – (20,407,290)

267
Notes to the Financial Statements
4. Fair value hierarchy, continued
As at 30 June 2020
GAM Star Global GrowthLevel 1 Level 2 Level 3 Total
£ £ £ £
AssetsFinancial assets designated at fair value through profit or loss at inception– Investment funds 31,883,034 137,103,559 – 168,986,593– Derivatives – 1,369,418 – 1,369,418
Total assets 31,883,034 138,472,977 – 170,356,011
LiabilitiesFinancial liabilities held for trading– Derivatives – (2,195,017) – (2,195,017)
Total liabilities – (2,195,017) – (2,195,017)
GAM Star Interest TrendLevel 1 Level 2 Level 3 Total
US$ US$ US$ US$
AssetsFinancial assets designated at fair value through profit or loss at inception– Debt securities – 33,454,333 2,935,617 36,389,950– Equity securities – 1,694,258 – 1,694,258– Derivatives – 67,330 – 67,330
Total assets – 35,215,921 2,935,617 38,151,538
LiabilitiesFinancial liabilities held for trading– Derivatives – (31,169) – (31,169)
Total liabilities – (31,169) – (31,169)
GAM Star Japan LeadersLevel 1 Level 2 Level 3 Total
¥ ¥ ¥ ¥
AssetsFinancial assets designated at fair value through profit or loss at inception– Equity securities 57,629,460,750 – – 57,629,460,750– Derivatives – 325,229,366 – 325,229,366
Total assets 57,629,460,750 325,229,366 – 57,954,690,116
LiabilitiesFinancial liabilities held for trading– Derivatives – (29,140,575) – (29,140,575)
Total liabilities – (29,140,575) – (29,140,575)
GAM Star MBS Total ReturnLevel 1 Level 2 Level 3 Total
US$ US$ US$ US$
AssetsFinancial assets designated at fair value through profit or loss at inception– Debt securities – 816,384,691 24,087,898 840,472,589– Derivatives – 9,377,365 – 9,377,365
Total assets – 825,762,056 24,087,898 849,849,954
LiabilitiesFinancial liabilities held for trading– Derivatives (391,313) (2,930,627) – (3,321,940)
Total liabilities (391,313) (2,930,627) – (3,321,940)

268
GAM Star Fund p.l.c.
Notes to the Financial Statements
4. Fair value hierarchy, continued
As at 30 June 2020
GAM Systematic Alternative Risk PremiaLevel 1 Level 2 Level 3 Total
US$ US$ US$ US$
AssetsFinancial assets designated at fair value through profit or loss at inception– Debt securities 18,291,003 25,990,166 – 44,281,169– Derivatives 291,922 2,420,740 – 2,712,662
Total assets 18,582,925 28,410,906 – 46,993,831
LiabilitiesFinancial liabilities held for trading– Derivatives (75,331) (1,139,989) – (1,215,320)
Total liabilities (75,331) (1,139,989) – (1,215,320)
GAM Systematic Core MacroLevel 1 Level 2 Level 3 Total
US$ US$ US$ US$
AssetsFinancial assets designated at fair value through profit or loss at inception– Debt securities 3,149,702 427,717 – 3,577,419– Investment funds 392,643 – – 392,643– Derivatives 74,598 126,500 – 201,098
Total assets 3,616,943 554,217 – 4,171,160
LiabilitiesFinancial liabilities held for trading– Derivatives (13,208) (140,633) – (153,841)
Total liabilities (13,208) (140,633) – (153,841)
GAM Star Tactical OpportunitiesLevel 1 Level 2 Level 3 Total
US$ US$ US$ US$
AssetsFinancial assets designated at fair value through profit or loss at inception– Debt securities 36,607,914 – – 36,607,914– Derivatives 99,600 1,123,417 – 1,223,017
Total assets 36,707,514 1,123,417 – 37,830,931
LiabilitiesFinancial liabilities held for trading– Derivatives (119,840) (179,933) – (299,773)
Total liabilities (119,840) (179,933) – (299,773)
GAM Star Disruptive GrowthLevel 1 Level 2 Level 3 Total
US$ US$ US$ US$
AssetsFinancial assets designated at fair value through profit or loss at inception– Equity securities 241,393,459 196,593 9,860,245 251,450,297– Derivatives – 1,639,556 – 1,639,556
Total assets 241,393,459 1,836,149 9,860,245 253,089,853
LiabilitiesFinancial liabilities held for trading– Derivatives – (6,454) – (6,454)
Total liabilities – (6,454) – (6,454)

269
Notes to the Financial Statements
4. Fair value hierarchy, continued
As at 30 June 2020
GAM Star US All Cap EquityLevel 1 Level 2 Level 3 Total
US$ US$ US$ US$
AssetsFinancial assets designated at fair value through profit or loss at inception– Equity securities 64,163,580 – – 64,163,580– Derivatives – 5,081 – 5,081
Total assets 64,163,580 5,081 – 64,168,661
LiabilitiesFinancial liabilities held for trading– Derivatives – (940) – (940)
Total liabilities – (940) – (940)
GAM Star Worldwide EquityLevel 1 Level 2 Level 3 Total
US$ US$ US$ US$
AssetsFinancial assets designated at fair value through profit or loss at inception– Equity securities 56,717,990 – – 56,717,990– Derivatives – 25,384 – 25,384
Total assets 56,717,990 25,384 – 56,743,374
LiabilitiesFinancial liabilities held for trading– Derivatives – (4,907) – (4,907)
Total liabilities – (4,907) – (4,907)
GAM Systematic Dynamic Credit Level 1 Level 2 Level 3 Total
US$ US$ US$ US$
AssetsFinancial assets designated at fair value through profit or loss at inception– Debt securities 6,699,113 – – 6,699,113– Derivatives 5,207 436,775 – 441,982
Total assets 6,704,320 436,775 – 7,141,095
LiabilitiesFinancial liabilities held for trading– Derivatives – (215,235) – (215,235)
Total liabilities – (215,235) – (215,235)

270
GAM Star Fund p.l.c.
Notes to the Financial Statements
4. Fair value hierarchy, continued
As at 30 June 2019
GAM Star Absolute Return BondLevel 1 Level 2 Level 3 Total
€ € € €
AssetsFinancial assets designated at fair value through profit or loss at inception– Investment funds – – 62,081,131 62,081,131
Total assets – – 62,081,131 62,081,131
GAM Star Absolute Return Bond DefenderLevel 1 Level 2 Level 3 Total
€ € € €
AssetsFinancial assets designated at fair value through profit or loss at inception– Investment funds – – 2,305,461 2,305,461
Total assets – – 2,305,461 2,305,461
GAM Star Absolute Return Bond PlusLevel 1 Level 2 Level 3 Total
€ € € €
AssetsFinancial assets designated at fair value through profit or loss at inception– Investment funds – – 106,509,895 106,509,895
Total assets – – 106,509,895 106,509,895
GAM Star Absolute Return MacroLevel 1 Level 2 Level 3 Total
€ € € €
AssetsFinancial assets designated at fair value through profit or loss at inception– Debt securities 8,502,338 – 753,437 9,255,775– Derivatives – 88,096 – 88,096
Total assets 8,502,338 88,096 753,437 9,343,871
LiabilitiesFinancial liabilities held for trading– Derivatives (6,326) (220,109) – (226,435)
Total liabilities (6,326) (220,109) – (226,435)
GAM Star Alpha SpectrumLevel 1 Level 2 Level 3 Total
€ € € €
AssetsFinancial assets designated at fair value through profit or loss at inception– Investment funds 6,841,387 68,528,740 – 75,370,127– Derivatives – 149,481 – 149,481
Total assets 6,841,387 68,678,221 – 75,519,608
LiabilitiesFinancial liabilities held for trading– Derivatives – (9,911) – (9,911)
Total liabilities – (9,911) – (9,911)

271
Notes to the Financial Statements
4. Fair value hierarchy, continued
As at 30 June 2019
GAM Star Alpha TechnologyLevel 1 Level 2 Level 3 Total
US$ US$ US$ US$
AssetsFinancial assets designated at fair value through profit or loss at inception– Debt securities 2,793,254 – – 2,793,254– Equity securities 14,003,174 – 791,299 14,794,473– Derivatives – 433,697 – 433,697
Total assets 16,796,428 433,697 791,299 18,021,424
LiabilitiesFinancial liabilities held for trading– Derivatives – (364,839) – (364,839)
Total liabilities – (364,839) – (364,839)
GAM Star Asian EquityLevel 1 Level 2 Level 3 Total
US$ US$ US$ US$
AssetsFinancial assets designated at fair value through profit or loss at inception– Equity securities 15,553,147 13,749 – 15,566,896
Total assets 15,553,147 13,749 – 15,566,896
GAM Star Asia-Pacific EquityLevel 1 Level 2 Level 3 Total
US$ US$ US$ US$
AssetsFinancial assets designated at fair value through profit or loss at inception– Equity securities 18,553,896 – – 18,553,896
Total assets 18,553,896 – – 18,553,896
GAM Star Global BalancedLevel 1 Level 2 Level 3 Total
£ £ £ £
AssetsFinancial assets designated at fair value through profit or loss at inception– Investment funds 31,256,132 379,788,217 – 411,044,349– Derivatives – 1,833,215 – 1,833,215
Total assets 31,256,132 381,621,432 – 412,877,564
LiabilitiesFinancial liabilities held for trading– Derivatives – (1,181,542) – (1,181,542)
Total liabilities – (1,181,542) – (1,181,542)
GAM Star Capital Appreciation US EquityLevel 1 Level 2 Level 3 Total
US$ US$ US$ US$
AssetsFinancial assets designated at fair value through profit or loss at inception– Equity securities 58,692,179 2,352 62,006 58,756,537– Derivatives 11,850 – – 11,850
Total assets 58,704,029 2,352 62,006 58,768,387

272
GAM Star Fund p.l.c.
Notes to the Financial Statements
4. Fair value hierarchy, continued
As at 30 June 2019
GAM Star Cat BondLevel 1 Level 2 Level 3 Total
US$ US$ US$ US$
AssetsFinancial assets designated at fair value through profit or loss at inception– Debt securities – 1,586,684,448 45,737,709 1,632,422,157– Derivatives – 28,688,135 – 28,688,135
Total assets – 1,615,372,583 45,737,709 1,661,110,292
LiabilitiesFinancial liabilities held for trading– Derivatives – (9,431,197) – (9,431,197)
Total liabilities – (9,431,197) – (9,431,197)
GAM Star Global CautiousLevel 1 Level 2 Level 3 Total
£ £ £ £
AssetsFinancial assets designated at fair value through profit or loss at inception– Investment funds 12,790,087 176,068,469 – 188,858,556– Derivatives – 727,116 – 727,116
Total assets 12,790,087 176,795,585 – 189,585,672
LiabilitiesFinancial liabilities held for trading– Derivatives – (476,588) – (476,588)
Total liabilities – (476,588) – (476,588)
GAM Star China EquityLevel 1 Level 2 Level 3 Total
US$ US$ US$ US$
AssetsFinancial assets designated at fair value through profit or loss at inception– Equity securities 345,261,905 18,667,288 – 363,929,193– Derivatives – 134,110 – 134,110
Total assets 345,261,905 18,801,398 – 364,063,303
LiabilitiesFinancial liabilities held for trading– Derivatives – (54,015) – (54,015)
Total liabilities – (54,015) – (54,015)
GAM Star Composite Global EquityLevel 1 Level 2 Level 3 Total
US$ US$ US$ US$
AssetsFinancial assets designated at fair value through profit or loss at inception– Investment funds 54,490,531 27,943,583 – 82,434,114– Derivatives 311,850 – – 311,850
Total assets 54,802,381 27,943,583 – 82,745,964

273
Notes to the Financial Statements
4. Fair value hierarchy, continued
As at 30 June 2019
GAM Star Continental European EquityLevel 1 Level 2 Level 3 Total
€ € € €
AssetsFinancial assets designated at fair value through profit or loss at inception– Equity securities 853,030,544 – – 853,030,544– Derivatives – 70,102 – 70,102
Total assets 853,030,544 70,102 – 853,100,646
LiabilitiesFinancial liabilities held for trading– Derivatives – (197,071) – (197,071)
Total liabilities – (197,071) – (197,071)
GAM Star Credit Opportunities (EUR)Level 1 Level 2 Level 3 Total
€ € € €
AssetsFinancial assets designated at fair value through profit or loss at inception– Debt securities – 2,945,903,862 7,587,317 2,953,491,179– Equity securities – 71,496,734 – 71,496,734– Derivatives – 9,520,174 – 9,520,174
Total assets – 3,026,920,770 7,587,317 3,034,508,087
LiabilitiesFinancial liabilities held for trading– Derivatives – (2,895,400) – (2,895,400)
Total liabilities – (2,895,400) – (2,895,400)
GAM Star Credit Opportunities (GBP)Level 1 Level 2 Level 3 Total
£ £ £ £
AssetsFinancial assets designated at fair value through profit or loss at inception– Debt securities 3,892,060 749,204,433 5,263,775 758,360,268– Equity securities – 108,982,281 51,910 109,034,191– Derivatives – 154,154 – 154,154
Total assets 3,892,060 858,340,868 5,315,685 867,548,613
LiabilitiesFinancial liabilities held for trading– Derivatives – (5,898,314) – (5,898,314)
Total liabilities – (5,898,314) – (5,898,314)
GAM Star Credit Opportunities (USD)Level 1 Level 2 Level 3 Total
US$ US$ US$ US$
AssetsFinancial assets designated at fair value through profit or loss at inception– Debt securities 20,972,801 2,785,914,363 3,788,401 2,810,675,565– Equity securities 7,997 58,925,847 – 58,933,844– Derivatives – 13,476,217 – 13,476,217
Total assets 20,980,798 2,858,316,427 3,788,401 2,883,085,626
LiabilitiesFinancial liabilities held for trading– Derivatives – (2,693,142) – (2,693,142)
Total liabilities – (2,693,142) – (2,693,142)

274
GAM Star Fund p.l.c.
Notes to the Financial Statements
4. Fair value hierarchy, continued
As at 30 June 2019
GAM Star Global DefensiveLevel 1 Level 2 Level 3 Total
£ £ £ £
AssetsFinancial assets designated at fair value through profit or loss at inception– Investment funds 1,082,013 19,998,624 – 21,080,637– Derivatives – 81,417 – 81,417
Total assets 1,082,013 20,080,041 – 21,162,054
LiabilitiesFinancial liabilities held for trading– Derivatives – (49,964) – (49,964)
Total liabilities – (49,964) – (49,964)
GAM Star Dynamic Global BondLevel 1 Level 2 Level 3 Total
US$ US$ US$ US$
AssetsFinancial assets designated at fair value through profit or loss at inception– Debt securities – – 9,750,232 9,750,232– Derivatives – 297,015 – 297,015
Total assets – 297,015 9,750,232 10,047,247
LiabilitiesFinancial liabilities held for trading– Derivatives (85,328) – – (85,328)
Total liabilities (85,328) – – (85,328)
GAM Star Global Dynamic GrowthLevel 1 Level 2 Level 3 Total
£ £ £ £
AssetsFinancial assets designated at fair value through profit or loss at inception– Investment funds 520,916 6,123,938 – 6,644,854– Derivatives – 3,097 – 3,097
Total assets 520,916 6,127,035 – 6,647,951
LiabilitiesFinancial liabilities held for trading– Derivatives – (518) – (518)
Total liabilities – (518) – (518)
GAM Star Emerging EquityLevel 1 Level 2 Level 3 Total
US$ US$ US$ US$
AssetsFinancial assets designated at fair value through profit or loss at inception– Debt securities – 209,989 – 209,989– Equity securities 21,937,952 1,964,060 – 23,902,012– Derivatives 16,650 74 – 16,724
Total assets 21,954,602 2,174,123 – 24,128,725
LiabilitiesFinancial liabilities held for trading– Derivatives – (1) – (1)
Total liabilities – (1) – (1)

275
Notes to the Financial Statements
4. Fair value hierarchy, continued
As at 30 June 2019
GAM Star Emerging Market RatesLevel 1 Level 2 Level 3 Total
US$ US$ US$ US$
AssetsFinancial assets designated at fair value through profit or loss at inception– Debt securities 45,907,665 18,878,557 – 64,786,222– Derivatives – 2,551,418 – 2,551,418
Total assets 45,907,665 21,429,975 – 67,337,640
LiabilitiesFinancial liabilities held for trading– Derivatives (43,273) (2,710,849) – (2,754,122)
Total liabilities (43,273) (2,710,849) – (2,754,122)
GAM Star European EquityLevel 1 Level 2 Level 3 Total
€ € € €
AssetsFinancial assets designated at fair value through profit or loss at inception– Equity securities 188,939,587 – – 188,939,587
Total assets 188,939,587 – – 188,939,587
GAM Star Flexible Global PortfolioLevel 1 Level 2 Level 3 Total
€ € € €
AssetsFinancial assets designated at fair value through profit or loss at inception– Investment funds 8,629,018 24,592,183 – 33,221,201– Derivatives – 178,443 – 178,443
Total assets 8,629,018 24,770,626 – 33,399,644
LiabilitiesFinancial liabilities held for trading– Derivatives – (358,009) – (358,009)
Total liabilities – (358,009) – (358,009)
GAM Star Global RatesLevel 1 Level 2 Level 3 Total
US$ US$ US$ US$
AssetsFinancial assets designated at fair value through profit or loss at inception– Debt securities 144,133,489 40,154,737 – 184,288,226– Derivatives 348,500 52,003,842 – 52,352,342
Total assets 144,481,989 92,158,579 – 236,640,568
LiabilitiesFinancial liabilities held for trading– Derivatives (1,967,745) (34,141,688) – (36,109,433)
Total liabilities (1,967,745) (34,141,688) – (36,109,433)

276
GAM Star Fund p.l.c.
Notes to the Financial Statements
4. Fair value hierarchy, continued
As at 30 June 2019
GAM Star Global SelectorLevel 1 Level 2 Level 3 Total
US$ US$ US$ US$
AssetsFinancial assets designated at fair value through profit or loss at inception– Debt securities – – 6 6– Equity securities 4,767,433 – – 4,767,433– Derivatives – 46,699 – 46,699
Total assets 4,767,433 46,699 6 4,814,138
LiabilitiesFinancial liabilities held for trading– Derivatives – (18,074) – (18,074)
Total liabilities – (18,074) – (18,074)
GAM Star Global GrowthLevel 1 Level 2 Level 3 Total
£ £ £ £
AssetsFinancial assets designated at fair value through profit or loss at inception– Investment funds 15,820,220 181,527,746 – 197,347,966– Derivatives – 861,302 – 861,302
Total assets 15,820,220 182,389,048 – 198,209,268
LiabilitiesFinancial liabilities held for trading– Derivatives – (658,815) – (658,815)
Total liabilities – (658,815) – (658,815)
GAM Star Interest TrendLevel 1 Level 2 Level 3 Total
US$ US$ US$ US$
AssetsFinancial assets designated at fair value through profit or loss at inception– Debt securities – 46,598,873 48,121 46,646,994– Equity securities – 1,816,628 – 1,816,628– Derivatives – 107,036 – 107,036
Total assets – 48,522,537 48,121 48,570,658
LiabilitiesFinancial liabilities held for trading– Derivatives – (4,238) – (4,238)
Total liabilities – (4,238) – (4,238)
GAM Star Japan LeadersLevel 1 Level 2 Level 3 Total
¥ ¥ ¥ ¥
AssetsFinancial assets designated at fair value through profit or loss at inception– Equity securities 36,419,110,940 – – 36,419,110,940– Derivatives – 83,493,888 – 83,493,888
Total assets 36,419,110,940 83,493,888 – 36,502,604,828
LiabilitiesFinancial liabilities held for trading– Derivatives – (68,861,465) – (68,861,465)
Total liabilities – (68,861,465) – (68,861,465)

277
Notes to the Financial Statements
4. Fair value hierarchy, continued
As at 30 June 2019
GAM Star MBS Total ReturnLevel 1 Level 2 Level 3 Total
US$ US$ US$ US$
AssetsFinancial assets designated at fair value through profit or loss at inception– Debt securities – 1,161,199,574 – 1,161,199,574– Derivatives – 10,525,140 – 10,525,140
Total assets – 1,171,724,714 – 1,171,724,714
LiabilitiesFinancial liabilities held for trading– Derivatives (1,419,426) (3,511,641) – (4,931,067)
Total liabilities (1,419,426) (3,511,641) – (4,931,067)
GAM Systematic Alternative Risk PremiaLevel 1 Level 2 Level 3 Total
US$ US$ US$ US$
AssetsFinancial assets designated at fair value through profit or loss at inception– Debt securities 41,890,758 132,632,559 – 174,523,317– Derivatives 2,105,814 10,414,302 – 12,520,116
Total assets 43,996,572 143,046,861 – 187,043,433
LiabilitiesFinancial liabilities held for trading– Derivatives (1,271,030) (8,313,773) – (9,584,803)
Total liabilities (1,271,030) (8,313,773) – (9,584,803)
GAM Systematic Core MacroLevel 1 Level 2 Level 3 Total
US$ US$ US$ US$
AssetsFinancial assets designated at fair value through profit or loss at inception– Debt securities 36,843,852 2,675,202 – 39,519,054– Investment funds 5,437,098 – – 5,437,098– Derivatives 974,811 2,438,553 – 3,413,364
Total assets 43,255,761 5,113,755 – 48,369,516
LiabilitiesFinancial liabilities held for trading– Derivatives (37,633) (1,968,648) – (2,006,281)
Total liabilities (37,633) (1,968,648) – (2,006,281)
GAM Systematic Global Equity Market NeutralLevel 1 Level 2 Level 3 Total
US$ US$ US$ US$
AssetsFinancial assets designated at fair value through profit or loss at inception– Debt securities 18,421,626 – – 18,421,626– Derivatives – 716,693 – 716,693
Total assets 18,421,626 716,693 – 19,138,319
LiabilitiesFinancial liabilities held for trading– Derivatives – (956,334) – (956,334)
Total liabilities – (956,334) – (956,334)

278
GAM Star Fund p.l.c.
Notes to the Financial Statements
4. Fair value hierarchy, continued
As at 30 June 2019
GAM Star Tactical OpportunitiesLevel 1 Level 2 Level 3 Total
US$ US$ US$ US$
AssetsFinancial assets designated at fair value through profit or loss at inception– Debt securities 32,097,840 – – 32,097,840– Derivatives 37,125 598,414 – 635,539
Total assets 32,134,965 598,414 – 32,733,379
LiabilitiesFinancial liabilities held for trading– Derivatives (130,289) (193,621) – (323,910)
Total liabilities (130,289) (193,621) – (323,910)
GAM Star Target ReturnLevel 1 Level 2 Level 3 Total
US$ US$ US$ US$
AssetsFinancial assets designated at fair value through profit or loss at inception– Debt securities 14,861,153 13,424,417 – 28,285,570– Derivatives – 412,947 – 412,947
Total assets 14,861,153 13,837,364 – 28,698,517
LiabilitiesFinancial liabilities held for trading– Derivatives (60,503) (264,760) – (325,263)
Total liabilities (60,503) (264,760) – (325,263)
GAM Star Target Return PlusLevel 1 Level 2 Level 3 Total
US$ US$ US$ US$
AssetsFinancial assets designated at fair value through profit or loss at inception– Debt securities 4,814,666 1,878,508 – 6,693,174– Equity securities 76,808 – – 76,808– Derivatives – 155,038 – 155,038
Total assets 4,891,474 2,033,546 – 6,925,020
LiabilitiesFinancial liabilities held for trading– Derivatives (24,075) (124,813) – (148,888)
Total liabilities (24,075) (124,813) – (148,888)
GAM Star Disruptive GrowthLevel 1 Level 2 Level 3 Total
US$ US$ US$ US$
AssetsFinancial assets designated at fair value through profit or loss at inception– Equity securities 220,841,731 – 12,658,112 233,499,843– Derivatives – 7,796 – 7,796
Total assets 220,841,731 7,796 12,658,112 233,507,639
LiabilitiesFinancial liabilities held for trading– Derivatives – (721,506) – (721,506)
Total liabilities – (721,506) – (721,506)

279
Notes to the Financial Statements
4. Fair value hierarchy, continued
As at 30 June 2019
GAM Star US All Cap EquityLevel 1 Level 2 Level 3 Total
US$ US$ US$ US$
AssetsFinancial assets designated at fair value through profit or loss at inception– Equity securities 77,241,769 – – 77,241,769– Derivatives – 3,854 – 3,854
Total assets 77,241,769 3,854 – 77,245,623
LiabilitiesFinancial liabilities held for trading– Derivatives – (1,388) – (1,388)
Total liabilities – (1,388) – (1,388)
GAM Star Worldwide EquityLevel 1 Level 2 Level 3 Total
US$ US$ US$ US$
AssetsFinancial assets designated at fair value through profit or loss at inception– Equity securities 73,003,729 – – 73,003,729
Total assets 73,003,729 – – 73,003,729
GAM Systematic Dynamic Credit* Level 1 Level 2 Level 3 Total
US$ US$ US$ US$
AssetsFinancial assets designated at fair value through profit or loss at inception– Debt securities 8,470,855 – – 8,470,855– Derivatives 11,024 1,194,062 – 1,205,086
Total assets 8,481,879 1,194,062 – 9,675,941
LiabilitiesFinancial liabilities held for trading– Derivatives – (442,127) – (442,127)
Total liabilities – (442,127) – (442,127)
* Fund launched during the year.

280
GAM Star Fund p.l.c.
Notes to the Financial Statements
5. Securities lending
During the year ended 30 June 2020 and 30 June 2019, the Company participated in securities lending with State Street Custodial Services (Ireland) Limited (the “Securities Lending Agent”). The Company and the Securities Lending Agent receive 80 per cent and 20 per cent respectively of the securities lending income.
The Company earned securities lending income of:
CCY 30 June 2020 30 June 2019
GAM Star Alpha Technology US$ 11,846 10,752GAM Star Disruptive Growth US$ 176,810 174,532
State Street Custodial Services (Ireland) Limited also received securities lending income of:
CCY 30 June 2020 30 June 2019
GAM Star Alpha Technology US$ 2,961 2,688GAM Star Disruptive Growth US$ 44,202 43,634
The value of securities lent and collateral received was:
CCY 30 June 2020 30 June 2020 30 June 2019 30 June 2019
Securities lent Collateral received Securities lent Collateral received
GAM Star Alpha Technology US$ 166,493 202,790 1,131,129 1,196,113GAM Star Disruptive Growth US$ 562,339 684,937 7,596,596 7,880,002
The collateral noted above, consisted of sovereign bonds issued by the governments of the following countries: Belgium, Canada, France, Germany, Sweden, Switzerland, the Netherlands, the United Kingdom and the United States of America.
6. Taxation
Under current Irish law and practice, the Company qualifies as an investment undertaking as defined in Section 739B of the Taxes Consolidation Act, 1997 (as amended). It is not chargeable to Irish tax on its income and gains. However, tax can arise on the happening of a “Chargeable Event” in the Company. A Chargeable Event includes any distribution payments to shareholders or any encashment, cancellation, redemption or transfer of shares.
No Irish tax will arise on the Company in respect of Chargeable Events in respect of a shareholder who is not an Irish Resident and not Ordinarily Resident for tax purposes in Ireland at the time of the Chargeable Event provided that the appropriate valid declarations in accordance with the provisions of the Taxes Consolidation Act 1997, (as amended), are held by the Company; and certain exempted Irish resident investors who have provided the Company with the necessary signed statutory declarations. Following changes introduced by Finance Act 2010, investment undertakings will no longer be required to obtain relevant declarations from shareholders who are neither Irish Resident nor Ordinarily Resident in Ireland where the investment undertaking is not actively marketed to Irish investors and the Irish Revenue have given the investment undertaking the appropriate approval. With effect from 3 April 2010 a chargeable event will not arise if at the time of the chargeable event appropriate equivalent measures have been put in place by the Company to ensure that shareholders in the Company are neither Irish Resident nor Ordinarily Resident in Ireland and the Company has received approval from the Irish Revenue Commissioners to this effect and the approval has not been withdrawn.
Dividends, interest and capital gains (if any) which the Company receives with respect to its investments may be subject to taxes, including withholding taxes, in the countries in which the issuers of the investments are located and such taxes may not be recoverable by the Company or its shareholders.
7. Feeder funds
As at 23 July 2019 GAM Star Absolute Return Bond, GAM Star Absolute Return Bond Plus and GAM Star Absolute Return Bond Defender were terminated. As at 30 June 2019, the aggregate charges of GAM Star Absolute Return Bond and the master fund GAM Multibond Absolute Return Bond Fund were €957,001; the aggregate charges of GAM Star Absolute Return Bond Defender and the master fund GAM Multibond Absolute Return Bond Fund Defender were €68,661, the aggregate charges of GAM Star Absolute Return Bond Plus and the master fund GAM Multibond Absolute Return Bond Fund Plus were €1,142,331.
8. Exchange rates
The average exchange rates used to convert the Statement of Comprehensive Income and Statement of Changes in Net Assets Attributable to Holders of Redeemable Share into US dollars were:
30 June2020
30 June2019
Euro 0.9017 0.8754Pound sterling 0.7919 0.7718Japanese yen 108.0569 110.8423

Notes to the Financial Statements
8. Exchange rates, continued
The rates of exchange used to translate assets and liabilities to US dollars at the year end were:
30 June 2020 30 June 2019
Argentine peso 70.4532 42.3830Australian dollar 1.4524 1.4250Brazilian real 5.4908 3.8327Bulgarian lev – 1.7176Canadian dollar 1.3620 1.3068Chilean peso 820.6000 678.9500Chinese yuan renminbi 7.0741 6.8683Chinese yuan renminbi offshore 7.0678 6.8730Colombian peso 3,739.2800 3,207.0000Czech koruna 23.7213 22.3429Danish krone 6.6360 6.5540Egyptian Pound 16.1400 –Euro 0.8904 0.8781Hong Kong dollar 7.7505 7.8125Hungarian forint 315.5768 283.4344Indian rupee 75.5038 69.0275Indonesian rupiah 14,285.0000 14,127.5000Japanese yen 107.8850 107.7400Malaysian ringgit 4.2850 –Mexican peso 23.1070 19.2117New Israeli shekel 3.4610 3.5666New Taiwan dollar 29.5045 31.0595New Turkish Lira 6.8548 5.7840New Zealand dollar 1.5534 1.4889Norwegian krone 9.6470 8.5261Pakistani rupee 167.9000 –Peruvian nuevo sol 3.5355 –Philippine peso 49.8250 51.2350Polish zloty – 3.7292Pound sterling 0.8093 0.7857Qatari Rial 3.6410 3.6413Romanian new leu 4.3091 4.1538Russian ruble 71.2544 63.0750Saudi Arabian Riyal 3.7510 3.7503Singapore dollar 1.3951 1.3530South African rand 17.3750 14.1013South Korean won 1,202.8500 1,154.6500Swedish krona 9.3167 9.2782Swiss franc 0.9476 0.9750Thai baht 30.9075 30.6675UAE dirham 3.6732 3.6732
9. Use of derivatives for Efficient Portfolio Management
Subject to the conditions and within the limits from time to time laid down by the Central Bank of Ireland, and except as otherwise stated in the investment objective and policies of a Fund, the Investment Managers and/or Co-Investment Manager(s) may employ, for certain Funds, investment techniques and instruments such as futures, options, forward foreign currency exchange contracts and other derivatives for investment purposes or efficient portfolio management. Furthermore, new techniques and instruments may be developed which may be suitable for use by a Fund in the future, and a Fund may employ such techniques and instruments subject to the prior approval of, and any restrictions imposed by, the Central Bank of Ireland.
For UCITS which have engaged in efficient portfolio management techniques, disclosures are required under the Central Bank UCITS Regulations. The Investment Managers of the Funds have identified that all financial derivative instruments are transactions designed to deliver additional returns through efficient portfolio management.
Details of all open transactions at the year end are disclosed in the Portfolio of Investments.
Securities lending transactionsCertain Funds may also utilise stock lending agreements for efficient portfolio management purposes as described above. In such transactions the Fund may temporarily transfer its securities to a borrower, with agreement by the borrower to return equivalent securities to the Fund at a pre-agreed time. Refer to note 5 for further information on securities lending.
10. Significant agreements and transactions with related parties
The Company and the DirectorsAt year end Andrew Bates was a partner with Dillon Eustace, legal advisers to the Company, and may have an interest in the following transactions and balances with Dillon Eustace:
– The Company paid US$205,204 (2019: US$236,314) to Dillon Eustace for legal fees during the year ended 30 June 2020.
– Up to 30 September 2019 Dillon Eustace received a fee at the annual rate of €20,000 (2019: €20,000). From 1 October 2019 Dillon Eustace received a fee at the annual rate of €30,000 gross subject to income tax deductions for the provision of a Director to the Company for the year ended 30 June 2020.
Up to 30 September 2019 David Dillon, Daniel O’Donovan and Deborah Reidy each received a fee at the annual rate of €20,000 (2019: €20,000). From 1 October 2019 David Dillon, Daniel O’Donovan and Deborah Reidy each received a fee at the annual rate of €30,000 gross subject to income tax deductions for their services as Directors to the Company for the year ended 30 June 2020.
The Company and the Manager, the Sponsor and theInvestment ManagersAt the year end, accrued expenses included amounts owing to the Manager, the Sponsor and the Investment Managers of US$7,296,571 (2019: US$8,570,728).
Any such transactions have been entered into the ordinary course of business and on normal commercial terms.
The Directors are not aware of any other related party transactions except for those disclosed in these financial statements.
The Company invests in other funds that are also managed by the investment managers of the Company. These trades have been carried out at arm’s length in the ordinary course of business. The terms and returns received by the Company in making these investments were no more favourable than those received by other investors investing into the same share classes. There are no management fees charged on these investments at the Company level.
11. Performance feeThe Co–Investment Manager may be entitled to receive an annual performance fee on certain classes of some Funds. Any performance fee is accrued on each valuation day and paid annually in arrears at the end of June each year and is based on net realised and net unrealised gains and losses of the relevant classes subject to a high water mark and a benchmark where relevant. Therefore the amount outstanding for the performance fee at the end of each year is the same as the amount expensed for that year.
Please refer to note 13 for details of the performance fee expensed by Fund.
281
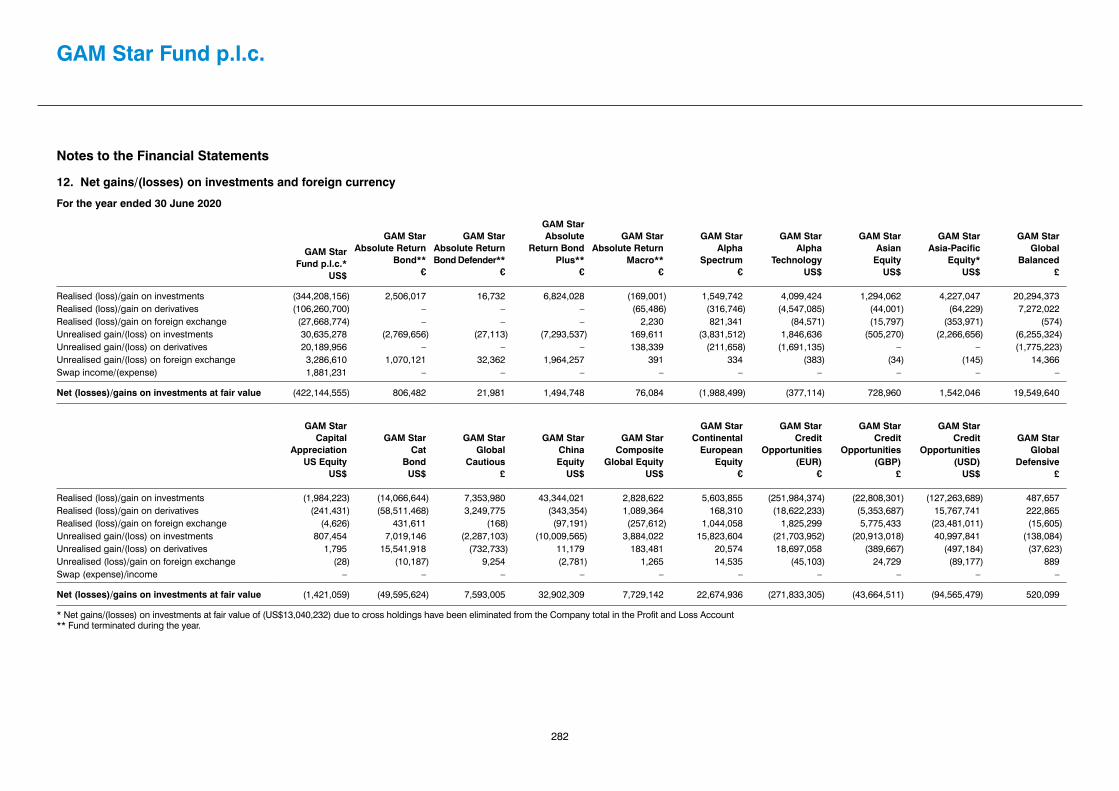
GAM Star Fund p.l.c.
282
Notes to the Financial Statements
12. Net gains/(losses) on investments and foreign currency
For the year ended 30 June 2020
GAM Star Fund p.l.c.*
US$
GAM Star Absolute Return
Bond**€
GAM Star Absolute Return Bond Defender**
€
GAM Star Absolute
Return Bond Plus**
€
GAM Star Absolute Return
Macro**€
GAM Star Alpha
Spectrum€
GAM Star Alpha
TechnologyUS$
GAM Star Asian
EquityUS$
GAM Star Asia-Pacific
Equity*US$
GAM Star Global
Balanced£
Realised (loss)/gain on investments (344,208,156) 2,506,017 16,732 6,824,028 (169,001) 1,549,742 4,099,424 1,294,062 4,227,047 20,294,373Realised (loss)/gain on derivatives (106,260,700) – – – (65,486) (316,746) (4,547,085) (44,001) (64,229) 7,272,022Realised (loss)/gain on foreign exchange (27,668,774) – – – 2,230 821,341 (84,571) (15,797) (353,971) (574)Unrealised gain/(loss) on investments 30,635,278 (2,769,656) (27,113) (7,293,537) 169,611 (3,831,512) 1,846,636 (505,270) (2,266,656) (6,255,324)Unrealised gain/(loss) on derivatives 20,189,956 – – – 138,339 (211,658) (1,691,135) – – (1,775,223)Unrealised gain/(loss) on foreign exchange 3,286,610 1,070,121 32,362 1,964,257 391 334 (383) (34) (145) 14,366Swap income/(expense) 1,881,231 – – – – – – – – –
Net (losses)/gains on investments at fair value (422,144,555) 806,482 21,981 1,494,748 76,084 (1,988,499) (377,114) 728,960 1,542,046 19,549,640
GAM Star Capital
Appreciation US Equity
US$
GAM Star Cat
BondUS$
GAM Star Global
Cautious£
GAM Star
China Equity
US$
GAM Star Composite
Global EquityUS$
GAM Star Continental
European Equity
€
GAM Star Credit
Opportunities (EUR)
€
GAM Star Credit
Opportunities (GBP)
£
GAM Star Credit
Opportunities (USD)
US$
GAM Star Global
Defensive£
Realised (loss)/gain on investments (1,984,223) (14,066,644) 7,353,980 43,344,021 2,828,622 5,603,855 (251,984,374) (22,808,301) (127,263,689) 487,657Realised (loss)/gain on derivatives (241,431) (58,511,468) 3,249,775 (343,354) 1,089,364 168,310 (18,622,233) (5,353,687) 15,767,741 222,865Realised (loss)/gain on foreign exchange (4,626) 431,611 (168) (97,191) (257,612) 1,044,058 1,825,299 5,775,433 (23,481,011) (15,605)Unrealised gain/(loss) on investments 807,454 7,019,146 (2,287,103) (10,009,565) 3,884,022 15,823,604 (21,703,952) (20,913,018) 40,997,841 (138,084)Unrealised gain/(loss) on derivatives 1,795 15,541,918 (732,733) 11,179 183,481 20,574 18,697,058 (389,667) (497,184) (37,623)Unrealised (loss)/gain on foreign exchange (28) (10,187) 9,254 (2,781) 1,265 14,535 (45,103) 24,729 (89,177) 889Swap (expense)/income – – – – – – – – – –
Net (losses)/gains on investments at fair value (1,421,059) (49,595,624) 7,593,005 32,902,309 7,729,142 22,674,936 (271,833,305) (43,664,511) (94,565,479) 520,099
* Net gains/(losses) on investments at fair value of (US$13,040,232) due to cross holdings have been eliminated from the Company total in the Profit and Loss Account ** Fund terminated during the year.

Notes to the Financial Statements
12. Net gains/(losses) on investments and foreign currency, continued
For the year ended 30 June 2020
GAM StarDynamic
Global BondUS$
GAM StarGlobal
DynamicGrowth
£
GAM Star Emerging
EquityUS$
GAM Star Emerging
Market RatesUS$
GAM Star European
Equity€
GAM Star Flexible Global
Portfolio€
GAM Star Global Rates
US$
GAM Star Global
Selector*US$
GAM StarGlobal
Growth£
GAM Star Interest
TrendUS$
Realised gain/(loss) on investments 753,962 414,575 5,454 2,357,590 (6,849,229) 1,118,245 5,213,227 (769,919) 9,339,450 275,231Realised gain/(loss) on derivatives 344,932 611 (122,334) 876,960 100,575 1,440,318 (6,621,162) (47,101) 4,501,848 323,089Realised (loss)/gain on foreign exchange (278,753) (21) (947,341) (1,337,922) (574,579) 254,218 (18,859) (152,994) (560) 48,878Unrealised (loss)/gain on investments (688,130) (150,228) (417,946) (478,897) 7,226,943 (579,591) (2,838,929) 1,080,121 (573,629) 566,742Unrealised (loss)/gain on derivatives (211,687) 197 (62,976) 773,482 (7,108) (1,530,011) (10,458,385) (28,552) (1,028,086) (66,637)Unrealised (loss)/gain on foreign exchange – 557 (742) (1,831) 3,632 401 3,648 (5,125) 14,032 551Swap (expense)/income – – – 8,029 – – (145,038) – – –
Net (losses)/gains on investments at fair value (79,676) 265,691 (1,545,885) 2,197,411 (99,766) 703,580 (14,865,498) 76,430 12,253,055 1,147,854
GAM Star Japan
Leaders¥
GAM Star MBS
Total ReturnUS$
GAM Systematic Alternative
Risk PremiaUS$
GAM Systematic
Core Macro
US$
GAM Systematic
Global Equity Market Neutral*
US$
GAM Star Tactical
OpportunitiesUS$
GAM Star Target Return*
US$
GAM Star Target Return
Plus*US$
GAM Star Disruptive
GrowthUS$
GAM Star US All Cap
EquityUS$
Realised gain/(loss) on investments 1,833,326,660 (49,190,644) 2,138,776 (6,850,305) 250,805 64,030 416,043 48,985 43,910,340 (4,591,604)Realised (loss)/gain on derivatives (101,436,697) (26,265,306) (22,974,049) 1,413,014 (36,525) (1,354,826) (448,991) (530,810) 5,240,166 (7,941)Realised (loss)/gain on foreign exchange (48,379) (9,325,465) 403,194 3,497 (13,339) (12,846) (93,195) 50,404 (809,529) (6,496)Unrealised gain/(loss) on investments 4,958,864,762 (38,909,676) 1,258,473 6,489,521 (61,460) (127,841) (283,765) (62,871) 12,704,097 8,551,034Unrealised gain/(loss) on derivatives 281,456,368 461,352 (1,463,645) (1,359,826) 239,641 611,615 (152,545) (46,733) 2,346,812 1,675Unrealised (loss)/gain on foreign exchange (322,063) (57,250) (24,297) 1,359 (3,434) 9,889 (941) (206) (7,391) (19)Swap (expense)/income – – 1,593,126 – – (10,539) (13,978) (3,089) – –
Net gains/(losses) on investments at fair value 6,971,840,651 (123,286,989) (19,068,422) (302,740) 375,688 (820,518) (577,372) (544,320) 63,384,495 3,946,649
* Fund terminated during the year.
283
Notes to the Financial Statements
12. Net gains/(losses) on investments and foreign currency
For the year ended 30 June 2020
GAM Star Fund p.l.c.*
US$
GAM Star Absolute Return
Bond**€
GAM Star Absolute Return Bond Defender**
€
GAM Star Absolute
Return Bond Plus**
€
GAM Star Absolute Return
Macro**€
GAM Star Alpha
Spectrum€
GAM Star Alpha
TechnologyUS$
GAM Star Asian
EquityUS$
GAM Star Asia-Pacific
Equity*US$
GAM Star Global
Balanced£
Realised (loss)/gain on investments (344,208,156) 2,506,017 16,732 6,824,028 (169,001) 1,549,742 4,099,424 1,294,062 4,227,047 20,294,373Realised (loss)/gain on derivatives (106,260,700) – – – (65,486) (316,746) (4,547,085) (44,001) (64,229) 7,272,022Realised (loss)/gain on foreign exchange (27,668,774) – – – 2,230 821,341 (84,571) (15,797) (353,971) (574)Unrealised gain/(loss) on investments 30,635,278 (2,769,656) (27,113) (7,293,537) 169,611 (3,831,512) 1,846,636 (505,270) (2,266,656) (6,255,324)Unrealised gain/(loss) on derivatives 20,189,956 – – – 138,339 (211,658) (1,691,135) – – (1,775,223)Unrealised gain/(loss) on foreign exchange 3,286,610 1,070,121 32,362 1,964,257 391 334 (383) (34) (145) 14,366Swap income/(expense) 1,881,231 – – – – – – – – –
Net (losses)/gains on investments at fair value (422,144,555) 806,482 21,981 1,494,748 76,084 (1,988,499) (377,114) 728,960 1,542,046 19,549,640
GAM Star Capital
Appreciation US Equity
US$
GAM Star Cat
BondUS$
GAM Star Global
Cautious£
GAM Star
China Equity
US$
GAM Star Composite
Global EquityUS$
GAM Star Continental
European Equity
€
GAM Star Credit
Opportunities (EUR)
€
GAM Star Credit
Opportunities (GBP)
£
GAM Star Credit
Opportunities (USD)
US$
GAM Star Global
Defensive£
Realised (loss)/gain on investments (1,984,223) (14,066,644) 7,353,980 43,344,021 2,828,622 5,603,855 (251,984,374) (22,808,301) (127,263,689) 487,657Realised (loss)/gain on derivatives (241,431) (58,511,468) 3,249,775 (343,354) 1,089,364 168,310 (18,622,233) (5,353,687) 15,767,741 222,865Realised (loss)/gain on foreign exchange (4,626) 431,611 (168) (97,191) (257,612) 1,044,058 1,825,299 5,775,433 (23,481,011) (15,605)Unrealised gain/(loss) on investments 807,454 7,019,146 (2,287,103) (10,009,565) 3,884,022 15,823,604 (21,703,952) (20,913,018) 40,997,841 (138,084)Unrealised gain/(loss) on derivatives 1,795 15,541,918 (732,733) 11,179 183,481 20,574 18,697,058 (389,667) (497,184) (37,623)Unrealised (loss)/gain on foreign exchange (28) (10,187) 9,254 (2,781) 1,265 14,535 (45,103) 24,729 (89,177) 889Swap (expense)/income – – – – – – – – – –
Net (losses)/gains on investments at fair value (1,421,059) (49,595,624) 7,593,005 32,902,309 7,729,142 22,674,936 (271,833,305) (43,664,511) (94,565,479) 520,099
* Net gains/(losses) on investments at fair value of (US$13,040,232) due to cross holdings have been eliminated from the Company total in the Profit and Loss Account ** Fund terminated during the year.

Notes to the Financial Statements
12. Net gains/(losses) on investments and foreign currency, continued
For the year ended 30 June 2020
GAM Star Worldwide
EquityUS$
GAM Systematic
Dynamic CreditUS$
Realised (loss)/gain on investments (5,444,225) 196,833Realised (loss)/gain on derivatives (155,287) (1,373,891)Realised (loss)/gain on foreign exchange (1,973,635) (4,151)Unrealised gain/(loss) on investments 7,383,283 399,590Unrealised gain/(loss) on derivatives 20,251 (536,212)Unrealised (loss)/gain on foreign exchange 22,909 900Swap (expense)/income – 452,720
Net gains/(losses) on investments at fair value (146,704) (864,211)
GAM Star Fund p.l.c.
284
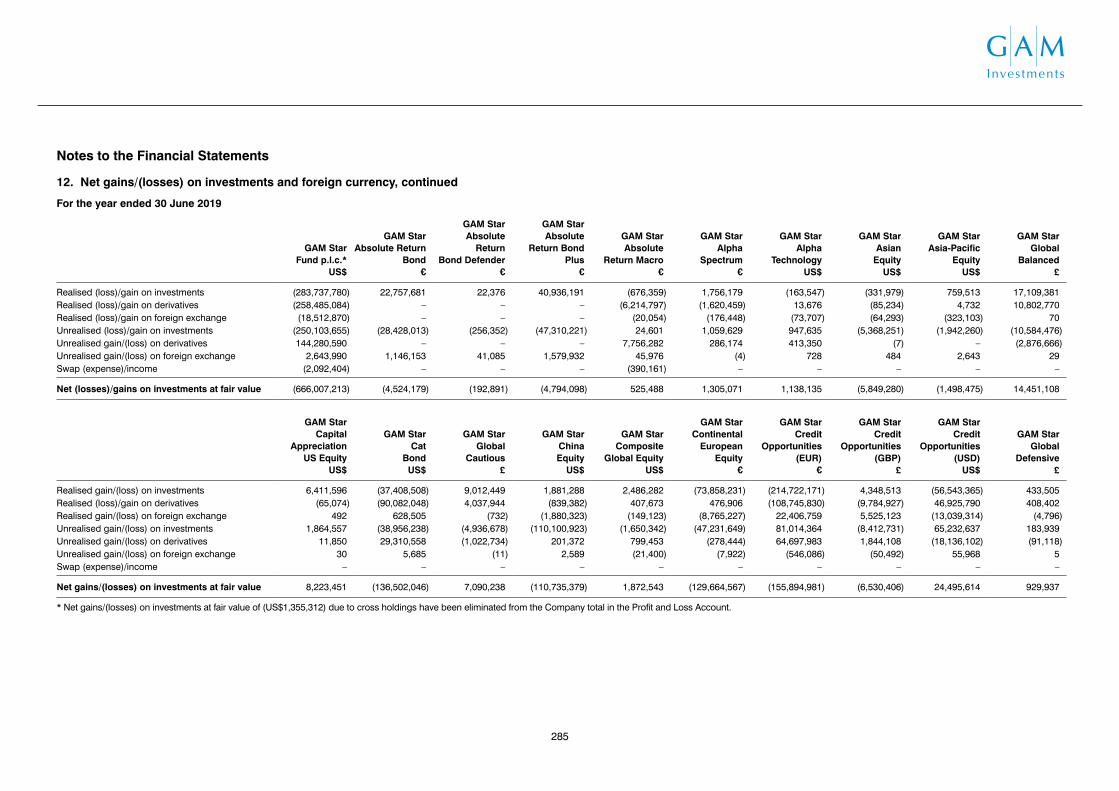
Notes to the Financial Statements
12. Net gains/(losses) on investments and foreign currency, continued
For the year ended 30 June 2020
GAM Star Worldwide
EquityUS$
GAM Systematic
Dynamic CreditUS$
Realised (loss)/gain on investments (5,444,225) 196,833Realised (loss)/gain on derivatives (155,287) (1,373,891)Realised (loss)/gain on foreign exchange (1,973,635) (4,151)Unrealised gain/(loss) on investments 7,383,283 399,590Unrealised gain/(loss) on derivatives 20,251 (536,212)Unrealised (loss)/gain on foreign exchange 22,909 900Swap (expense)/income – 452,720
Net gains/(losses) on investments at fair value (146,704) (864,211)
Notes to the Financial Statements
12. Net gains/(losses) on investments and foreign currency, continued
For the year ended 30 June 2019
GAM Star Fund p.l.c.*
US$
GAM Star Absolute Return
Bond€
GAM Star Absolute
Return Bond Defender
€
GAM Star Absolute
Return Bond Plus
€
GAM Star Absolute
Return Macro€
GAM Star Alpha
Spectrum€
GAM Star Alpha
TechnologyUS$
GAM Star Asian
EquityUS$
GAM Star Asia-Pacific
EquityUS$
GAM Star Global
Balanced£
Realised (loss)/gain on investments (283,737,780) 22,757,681 22,376 40,936,191 (676,359) 1,756,179 (163,547) (331,979) 759,513 17,109,381Realised (loss)/gain on derivatives (258,485,084) – – – (6,214,797) (1,620,459) 13,676 (85,234) 4,732 10,802,770Realised (loss)/gain on foreign exchange (18,512,870) – – – (20,054) (176,448) (73,707) (64,293) (323,103) 70Unrealised (loss)/gain on investments (250,103,655) (28,428,013) (256,352) (47,310,221) 24,601 1,059,629 947,635 (5,368,251) (1,942,260) (10,584,476)Unrealised gain/(loss) on derivatives 144,280,590 – – – 7,756,282 286,174 413,350 (7) – (2,876,666)Unrealised gain/(loss) on foreign exchange 2,643,990 1,146,153 41,085 1,579,932 45,976 (4) 728 484 2,643 29Swap (expense)/income (2,092,404) – – – (390,161) – – – – –
Net (losses)/gains on investments at fair value (666,007,213) (4,524,179) (192,891) (4,794,098) 525,488 1,305,071 1,138,135 (5,849,280) (1,498,475) 14,451,108
GAM Star Capital
Appreciation US Equity
US$
GAM Star Cat
BondUS$
GAM Star Global
Cautious£
GAM Star
China Equity
US$
GAM Star Composite
Global EquityUS$
GAM Star Continental
European Equity
€
GAM Star Credit
Opportunities (EUR)
€
GAM Star Credit
Opportunities (GBP)
£
GAM Star Credit
Opportunities (USD)
US$
GAM Star Global
Defensive£
Realised gain/(loss) on investments 6,411,596 (37,408,508) 9,012,449 1,881,288 2,486,282 (73,858,231) (214,722,171) 4,348,513 (56,543,365) 433,505Realised (loss)/gain on derivatives (65,074) (90,082,048) 4,037,944 (839,382) 407,673 476,906 (108,745,830) (9,784,927) 46,925,790 408,402Realised gain/(loss) on foreign exchange 492 628,505 (732) (1,880,323) (149,123) (8,765,227) 22,406,759 5,525,123 (13,039,314) (4,796)Unrealised gain/(loss) on investments 1,864,557 (38,956,238) (4,936,678) (110,100,923) (1,650,342) (47,231,649) 81,014,364 (8,412,731) 65,232,637 183,939Unrealised gain/(loss) on derivatives 11,850 29,310,558 (1,022,734) 201,372 799,453 (278,444) 64,697,983 1,844,108 (18,136,102) (91,118)Unrealised gain/(loss) on foreign exchange 30 5,685 (11) 2,589 (21,400) (7,922) (546,086) (50,492) 55,968 5Swap (expense)/income – – – – – – – – – –
Net gains/(losses) on investments at fair value 8,223,451 (136,502,046) 7,090,238 (110,735,379) 1,872,543 (129,664,567) (155,894,981) (6,530,406) 24,495,614 929,937
* Net gains/(losses) on investments at fair value of (US$1,355,312) due to cross holdings have been eliminated from the Company total in the Profit and Loss Account.
285

Notes to the Financial Statements
12. Net gains/(losses) on investments and foreign currency, continued
For the year ended 30 June 2019
GAM Star Discretionary
FX*US$
GAM Star Dynamic
Global BondUS$
GAM Star Global Dynamic
Growth£
GAM Star Emerging
EquityUS$
GAM Star Emerging
Market RatesUS$
GAM Star European
Equity€
GAM Star Flexible Global
Portfolio€
GAM Star GAMCO
US Equity*US$
GAM Star Global
Quality*US$
GAM Star Global Rates
US$
Realised gain/(loss) on investments 123,652 1,569,436 353,781 (1,369,995) (2,381,644) (9,481,143) 1,392,503 3,521,040 (4,963,765) 10,084,653Realised gain/(loss) on derivatives 8,792,775 (2,239,757) (3,653) (68,962) (3,704,057) (76,488) (331,970) (799) (38,397) (62,407,971)Realised (loss)/gain on foreign exchange (277) (2,752,423) – (1,118,146) (3,998,092) (385,197) 62,025 (83,366) (1,513,077) (6,648,016)Unrealised (loss)/gain on investments (77,462) 354,994 (473,006) 1,987,880 7,265,124 (4,608,449) (645,049) (6,010,091) 1,186,765 (2,225,210)Unrealised (loss)/gain on derivatives (7,772,329) 248,129 2,579 64,147 297,306 – 121,289 – – 54,178,494Unrealised (loss)/gain on foreign exchange (172) 12,076 – 2,146 (79,120) (3,051) 18 33 (246) 48,988Swap (expense)/income – (343,356) – – (59,593) – – – – (3,570,969)
Net gains/(losses) on investments at fair value 1,066,187 (3,150,901) (120,299) (502,930) (2,660,076) (14,554,328) 598,816 (2,573,183) (5,328,720) (10,540,031)
GAM Star Global
SelectorUS$
GAM Star Global
Growth£
GAM Star India
Equity*US$
GAM Star Interest
TrendUS$
GAM Star Japan
Leaders¥
GAM Star Keynes
Quantitative Strategies*
US$
GAM Star MBS
Total ReturnUS$
GAM Systematic
Alternative Risk Premia
US$
GAM Systematic
Core MacroUS$
GAM Systematic
Global Equity Market Neutral
US$
Realised (loss)/gain on investments (1,189,906) 8,486,837 851,939 (606,457) (608,894,961) 283,885 (5,891,961) 1,175,362 421,444 420,489Realised (loss)/gain on derivatives (339,978) 6,214,708 – 1,253,710 (145,048,010) (527,661) (31,616,351) (4,871,388) 1,314,896 189,481Realised (loss)/gain on foreign exchange (258,548) – (776,513) 417,350 (17,263) 3,523 (6,065,350) 5,737 167,245 (42,699)Unrealised (loss)/gain on investments (144,408) (6,876,666) (909,595) (2,976,409) (5,156,986,411) (286,027) (5,338,090) 3,153,609 (6,416,391) (14,601)Unrealised gain/(loss) on derivatives 90,075 (1,588,078) 20,157 (603,697) (58,195,724) (15,210) 8,854,008 (2,171,732) 2,725,488 (103,052)Unrealised (loss)/gain on foreign exchange (5,807) (20) 1,253 7,199 (51,230) (180) 50,656 25,121 8,190 28,585Swap (expense)/income – – – – – (18) – 2,178,683 – –
Net (losses)/gains on investments at fair value (1,848,572) 6,236,781 (812,759) (2,508,304) (5,969,193,599) (541,688) (40,007,088) (504,608) (1,779,128) 478,203
* Fund terminated during the year.
GAM Star Fund p.l.c.
286

Notes to the Financial Statements
12. Net gains/(losses) on investments and foreign currency, continued
For the year ended 30 June 2019
GAM Star Tactical
OpportunitiesUS$
GAM Star Target Return
US$
GAM Star Target Return
PlusUS$
GAM Star Disruptive
GrowthUS$
GAM Star US All Cap
EquityUS$
GAM Star Worldwide
EquityUS$
GAM Systematic
Dynamic Credit**
US$
Realised gain/(loss) on investments (578,429) 63,517 (50,378) 8,904,896 24,807,875 (808,306) 43,924Realised gain/(loss) on derivatives (957,121) (764,904) (492,273) 731,577 (74,426) 166,764 (33,330)Realised (loss)/gain on foreign exchange 29,224 45,237 (97,902) (753,817) (6,030) (2,273,160) (529)Unrealised (loss)/gain on investments 1,118,027 (40,857) 12,797 687,804 (21,269,106) (5,483,062) (537,650)Unrealised (loss)/gain on derivatives 597,409 194,601 156,829 (3,279,021) 9,753 – 762,959Unrealised gain/(loss) on foreign exchange (37,584) 2,971 (636) 8,529 3 17,640 398Swap (expense)/income (17,425) (13,735) (3,186) – – – 182,162
Net gains/(losses) on investments at fair value 154,101 (513,170) (474,749) 6,299,968 3,468,069 (8,380,124) 417,934
** Fund launched during the year.
287
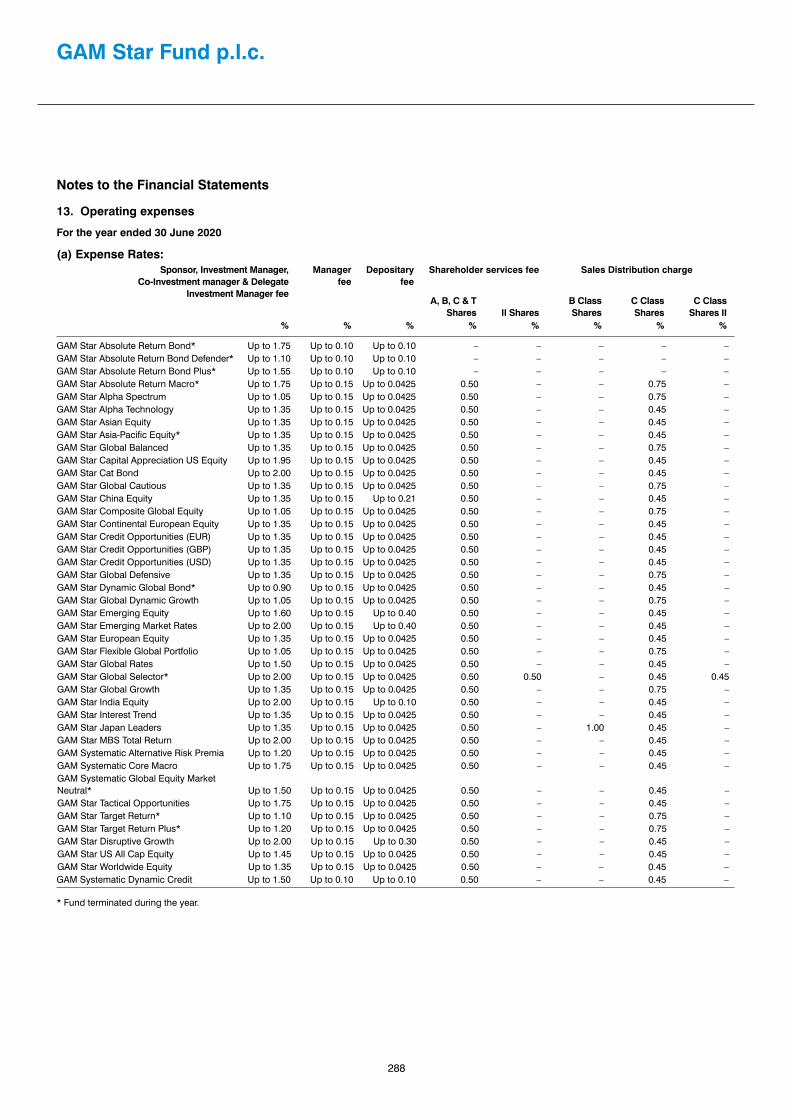
288
GAM Star Fund p.l.c.
Notes to the Financial Statements
13. Operating expenses
For the year ended 30 June 2020
(a) Expense Rates:Sponsor, Investment Manager,
Co-Investment manager & Delegate Investment Manager fee
Manager fee
Depositary fee
Shareholder services fee Sales Distribution charge
A, B, C & T Shares II Shares
B Class Shares
C Class Shares
C Class Shares II
% % % % % % % %
GAM Star Absolute Return Bond* Up to 1.75 Up to 0.10 Up to 0.10 – – – – –GAM Star Absolute Return Bond Defender* Up to 1.10 Up to 0.10 Up to 0.10 – – – – –GAM Star Absolute Return Bond Plus* Up to 1.55 Up to 0.10 Up to 0.10 – – – – –GAM Star Absolute Return Macro* Up to 1.75 Up to 0.15 Up to 0.0425 0.50 – – 0.75 –GAM Star Alpha Spectrum Up to 1.05 Up to 0.15 Up to 0.0425 0.50 – – 0.75 –GAM Star Alpha Technology Up to 1.35 Up to 0.15 Up to 0.0425 0.50 – – 0.45 –GAM Star Asian Equity Up to 1.35 Up to 0.15 Up to 0.0425 0.50 – – 0.45 –GAM Star Asia-Pacific Equity* Up to 1.35 Up to 0.15 Up to 0.0425 0.50 – – 0.45 –GAM Star Global Balanced Up to 1.35 Up to 0.15 Up to 0.0425 0.50 – – 0.75 –GAM Star Capital Appreciation US Equity Up to 1.95 Up to 0.15 Up to 0.0425 0.50 – – 0.45 –GAM Star Cat Bond Up to 2.00 Up to 0.15 Up to 0.0425 0.50 – – 0.45 –GAM Star Global Cautious Up to 1.35 Up to 0.15 Up to 0.0425 0.50 – – 0.75 –GAM Star China Equity Up to 1.35 Up to 0.15 Up to 0.21 0.50 – – 0.45 –GAM Star Composite Global Equity Up to 1.05 Up to 0.15 Up to 0.0425 0.50 – – 0.75 –GAM Star Continental European Equity Up to 1.35 Up to 0.15 Up to 0.0425 0.50 – – 0.45 –GAM Star Credit Opportunities (EUR) Up to 1.35 Up to 0.15 Up to 0.0425 0.50 – – 0.45 –GAM Star Credit Opportunities (GBP) Up to 1.35 Up to 0.15 Up to 0.0425 0.50 – – 0.45 –GAM Star Credit Opportunities (USD) Up to 1.35 Up to 0.15 Up to 0.0425 0.50 – – 0.45 –GAM Star Global Defensive Up to 1.35 Up to 0.15 Up to 0.0425 0.50 – – 0.75 –GAM Star Dynamic Global Bond* Up to 0.90 Up to 0.15 Up to 0.0425 0.50 – – 0.45 –GAM Star Global Dynamic Growth Up to 1.05 Up to 0.15 Up to 0.0425 0.50 – – 0.75 –GAM Star Emerging Equity Up to 1.60 Up to 0.15 Up to 0.40 0.50 – – 0.45 –GAM Star Emerging Market Rates Up to 2.00 Up to 0.15 Up to 0.40 0.50 – – 0.45 –GAM Star European Equity Up to 1.35 Up to 0.15 Up to 0.0425 0.50 – – 0.45 –GAM Star Flexible Global Portfolio Up to 1.05 Up to 0.15 Up to 0.0425 0.50 – – 0.75 –GAM Star Global Rates Up to 1.50 Up to 0.15 Up to 0.0425 0.50 – – 0.45 –GAM Star Global Selector* Up to 2.00 Up to 0.15 Up to 0.0425 0.50 0.50 – 0.45 0.45GAM Star Global Growth Up to 1.35 Up to 0.15 Up to 0.0425 0.50 – – 0.75 –GAM Star India Equity Up to 2.00 Up to 0.15 Up to 0.10 0.50 – – 0.45 –GAM Star Interest Trend Up to 1.35 Up to 0.15 Up to 0.0425 0.50 – – 0.45 –GAM Star Japan Leaders Up to 1.35 Up to 0.15 Up to 0.0425 0.50 – 1.00 0.45 –GAM Star MBS Total Return Up to 2.00 Up to 0.15 Up to 0.0425 0.50 – – 0.45 –GAM Systematic Alternative Risk Premia Up to 1.20 Up to 0.15 Up to 0.0425 0.50 – – 0.45 –GAM Systematic Core Macro Up to 1.75 Up to 0.15 Up to 0.0425 0.50 – – 0.45 –GAM Systematic Global Equity Market Neutral* Up to 1.50 Up to 0.15 Up to 0.0425 0.50 – – 0.45 –GAM Star Tactical Opportunities Up to 1.75 Up to 0.15 Up to 0.0425 0.50 – – 0.45 –GAM Star Target Return* Up to 1.10 Up to 0.15 Up to 0.0425 0.50 – – 0.75 –GAM Star Target Return Plus* Up to 1.20 Up to 0.15 Up to 0.0425 0.50 – – 0.75 –GAM Star Disruptive Growth Up to 2.00 Up to 0.15 Up to 0.30 0.50 – – 0.45 –GAM Star US All Cap Equity Up to 1.45 Up to 0.15 Up to 0.0425 0.50 – – 0.45 –GAM Star Worldwide Equity Up to 1.35 Up to 0.15 Up to 0.0425 0.50 – – 0.45 –GAM Systematic Dynamic Credit Up to 1.50 Up to 0.10 Up to 0.10 0.50 – – 0.45 –
* Fund terminated during the year.

Notes to the Financial Statements
13. Operating expenses, continued
For the year ended 30 June 2020
(b) Breakdown of expenses:
GAM Star Fund p.l.c.
US$
GAM Star Absolute
Return Bond*
€
GAM Star Absolute
Return Bond
Defender*€
GAM Star Absolute
Return Bond Plus*
€
GAM Star Absolute
Return Macro*€
GAM Star Alpha
Spectrum€
GAM Star Alpha
TechnologyUS$
GAM Star Asian
EquityUS$
GAM Star Asia-Pacific
Equity*US$
GAM Star Global
Balanced£
Manager's fee (20,627,097) (4,387) (164) (7,343) 291 (56,988) (41,333) (31,487) (15,662) (463,710)Sponsor and Investment Manager's fee (103,304,896) 22,260 879 14,002 (2,391) (512,889) (267,073) (261,765) (108,273) (2,403,430)Investment Advisor fee (39,715,627) – – – 129 – – (12,216) (30,973) –Performance fee (4,074,813) – – – – – – – – –
Payable to the Depositary, associates of the Depositary and their agentsDepositary's fee (144,754) 1,206 950 1,918 9,191 (1,660) (5,063) (10,646) (1,632) 12,008
Other expensesAudit fee (643,963) – – – – (17,835) (16,322) (12,922) (9,045) (21,582)Legal fees (238,612) (368) (14) (628) (76) (1,730) (484) (9,955) (2,584) (4,595)Directors fees (98,770) (537) (234) (165) (147) (2,563)Printing and publication expenses (366,297) (338) (365) (402) (1,219) (1,667) (4,189) (6,731) (7,319) (16,863)Shareholder Services fee (specific to A, B and C class only) (6,206,186) – – – – – (184) (407) (655) (1,309,041)Sales distribution charge (specific to B and C class only) (4,429,651) – – – – – (166) (367) (590) (1,689,358)Sundry expenses (3,624,352) (12,093) 1,324 36,624 31,777 (11,361) (41,009) (48,729) 36 (178,068)
Total expenses (183,475,018) 6,280 2,610 44,171 37,702 (604,667) (376,057) (395,390) (176,844) (6,077,202)
* Fund terminated during the year.289

Notes to the Financial Statements
13. Operating expenses, continued
For the year ended 30 June 2020
(b) Breakdown of expenses, continued:
GAM Star Capital
Appreciation US Equity
US$
GAM Star Cat
BondUS$
GAM Star Global
Cautious£
GAM Star
China Equity
US$
GAM Star Composite
Global EquityUS$
GAM Star Continental
European Equity
€
GAM Star Credit
Opportunities (EUR)
€
GAM Star Credit
Opportunities (GBP)
£
GAM Star Credit
Opportunities (USD)
US$
GAM Star Global
Defensive£
Manager's fee (127,221) (1,819,259) (205,866) (446,123) (165,831) (989,383) (5,337,763) (1,196,526) (3,983,094) (26,088)Sponsor and Investment Manager's fee (574,601) (15,476,838) (1,019,585) (3,523,963) (529,790) (2,979,029) (24,453,190) (3,963,170) (19,115,934) (121,738)Investment Advisor fee (457,996) (2,127,441) – (165,419) – (2,639,911) (14,234,034) (3,168,939) (10,621,584) –Performance fee – (3,702,262) – – – – – – – –
Payable to the Depositary, associates of the Depositary and their agentsDepositary's fee (10,625) (45,519) 10,823 (2,890) (1,891) 45,643 (90,851) 43,585 96,199 (3,442)
Other expensesAudit fee (12,922) (27,203) (21,582) (14,282) (13,602) (14,145) (15,990) (14,028) (17,682) (14,298)Legal fees (2,542) (21,029) (3,198) (18,318) (1,571) (8,420) (44,614) (9,891) (38,122) (298)Directors fees (657) (13,787) (1,290) (2,020) (963) (4,534) (21,398) (5,422) (17,429) (174)Printing and publication expenses (7,329) (20,509) (16,090) (11,070) (6,066) (14,158) (22,030) (8,291) (23,062) (8,619)Shareholder Services fee (specific to A, B and C class only) (2,312) (21,179) (422,814) (278,554) – (29,298) (1,768,348) – (523,739) (27,011)Sales distribution charge (specific to B and C class only) (2,080) – (451,590) (26,809) – (26,368) (441,477) – (29,970) (5,229)Sundry expenses 4,915 (165,212) (132,866) (208,274) (31,811) (58,604) (860,167) (305,000) (453,027) (41,716)
Total expenses (1,193,370) (23,440,238) (2,264,058) (4,697,722) (751,525) (6,718,207) (47,289,862) (8,627,682) (34,727,444) (248,613)
* Fund terminated during the year.
GAM Star Fund p.l.c.
290

Notes to the Financial Statements
13. Operating expenses, continued
For the year ended 30 June 2020
(b) Breakdown of expenses, continued:
GAM Star Capital
Appreciation US Equity
US$
GAM Star Cat
BondUS$
GAM Star Global
Cautious£
GAM Star
China Equity
US$
GAM Star Composite
Global EquityUS$
GAM Star Continental
European Equity
€
GAM Star Credit
Opportunities (EUR)
€
GAM Star Credit
Opportunities (GBP)
£
GAM Star Credit
Opportunities (USD)
US$
GAM Star Global
Defensive£
Manager's fee (127,221) (1,819,259) (205,866) (446,123) (165,831) (989,383) (5,337,763) (1,196,526) (3,983,094) (26,088)Sponsor and Investment Manager's fee (574,601) (15,476,838) (1,019,585) (3,523,963) (529,790) (2,979,029) (24,453,190) (3,963,170) (19,115,934) (121,738)Investment Advisor fee (457,996) (2,127,441) – (165,419) – (2,639,911) (14,234,034) (3,168,939) (10,621,584) –Performance fee – (3,702,262) – – – – – – – –
Payable to the Depositary, associates of the Depositary and their agentsDepositary's fee (10,625) (45,519) 10,823 (2,890) (1,891) 45,643 (90,851) 43,585 96,199 (3,442)
Other expensesAudit fee (12,922) (27,203) (21,582) (14,282) (13,602) (14,145) (15,990) (14,028) (17,682) (14,298)Legal fees (2,542) (21,029) (3,198) (18,318) (1,571) (8,420) (44,614) (9,891) (38,122) (298)Directors fees (657) (13,787) (1,290) (2,020) (963) (4,534) (21,398) (5,422) (17,429) (174)Printing and publication expenses (7,329) (20,509) (16,090) (11,070) (6,066) (14,158) (22,030) (8,291) (23,062) (8,619)Shareholder Services fee (specific to A, B and C class only) (2,312) (21,179) (422,814) (278,554) – (29,298) (1,768,348) – (523,739) (27,011)Sales distribution charge (specific to B and C class only) (2,080) – (451,590) (26,809) – (26,368) (441,477) – (29,970) (5,229)Sundry expenses 4,915 (165,212) (132,866) (208,274) (31,811) (58,604) (860,167) (305,000) (453,027) (41,716)
Total expenses (1,193,370) (23,440,238) (2,264,058) (4,697,722) (751,525) (6,718,207) (47,289,862) (8,627,682) (34,727,444) (248,613)
* Fund terminated during the year.
Notes to the Financial Statements
13. Operating expenses, continued
For the year ended 30 June 2020
(b) Breakdown of expenses, continued:
GAM StarDynamic
Global Bond*
US$
GAM Star Global
Dynamic Growth
£
GAM Star Emerging
EquityUS$
GAM Star Emerging
Market RatesUS$
GAM Star European
Equity€
GAM Star Flexible Global
Portfolio€
GAM Star Global Rates
US$
GAM Star Global
Selector*US$
GAM StarGlobal
Growth£
GAM Star Interest
TrendUS$
Manager's fee (1,018) (8,486) (31,129) (84,544) (254,498) (104,765) (277,199) (3,155) (245,965) (74,681)Sponsor and Investment Manager's fee 2,736 (27,618) (139,294) (550,674) (1,163,579) (486,167) (1,834,841) (25,018) (1,277,086) (360,960)Investment Advisor fee 113 – (114,365) – (945,278) – – (3,140) – (199,150)Performance fee – – – (221,197) – – – – – –
Payable to the Depositary, associates of the Depositary and their agentsDepositary's fee 2,838 (7,385) (119,447) 5,400 (5,829) (4,713) (2,649) (3,649) (6,800) (2,009)
Other expensesAudit fee (11,425) (14,028) (14,962) (19,722) (15,990) (15,990) (19,722) (9,045) (19,424) (17,682)Legal fees (92) (69) (597) (839) (4,450) (1,866) (2,502) (41) (2,232) (602)Directors fees – (40) (143) (354) (1,663) (1,062) (1,091) (19) (1,271) (344)Printing and publication expenses (1,111) (3,905) (4,417) (8,480) (16,077) (5,533) (6,750) (6,677) (11,704) (1,693)Shareholder Services fee (specific to A, B and C class only) (5) (506) – (6,991) (46,416) (2,818) (68,768) (2,176) (652,294) –Sales distribution charge (specific to B and C class only) (4) (759) – (4,256) (17,314) (4,227) – (1,959) (818,862) –Sundry expenses 19,238 7,019 (33,245) (215,250) (83,950) (43,382) (96,042) 4,764 (97,357) 4,734
Total expenses 11,270 (55,777) (457,599) (1,106,907) (2,555,044) (670,523) (2,309,564) (50,115) (3,132,995) (652,387)
* Fund terminated during the year.
291

Notes to the Financial Statements
13. Operating expenses, continued
For the year ended 30 June 2020
(b) Breakdown of expenses, continued:
GAM Star Japan
Leaders¥
GAM Star MBS
Total ReturnUS$
GAM Systematic Alternative
Risk PremiaUS$
GAM Systematic
Core Macro
US$
GAM Systematic
Global Equity Market Neutral*
US$
GAM Star Tactical
OpportunitiesUS$
GAM Star Target Return*
US$
GAM Star Target Return
Plus*US$
GAM Star Disruptive
GrowthUS$
GAM Star US All Cap
EquityUS$
Manager's fee (74,092,838) (1,684,528) (202,195) (38,293) (16,734) (64,386) (14,208) (1,935) (378,062) (111,629)Sponsor and Investment Manager's fee (223,399,893) (9,166,156) (1,056,799) (64,836) (29,611) (321,928) (3,602) (9,028) (2,252,603) (666,287)Investment Advisor fee (197,866,110) – – (65,925) (23,631) – – – – (299,415)Performance fee – 83,490 – (80,794) (3,187) – – – (150,818) –
Payable to the Depositary, associates of the Depositary and their agentsDepositary's fee (2,960,939) (151) (30,236) – 25 (1,067) 2,156 7,259 (7,745) 7,058
Other expensesAudit fee (1,911,981) (27,203) (17,682) (27,203) (19,042) (12,922) (12,377) (12,377) (16,662) (12,922)Legal fees (814,519) (14,132) (2,732) (422) (202) (3,923) (1,355) (63) (2,942) (3,239)Directors fees (387,972) (7,457) (1,065) (141) (130) (316) (77) – (1,704) (525)Printing and publication expenses (2,357,918) (18,609) (5,406) (5,237) (3,867) (5,004) (5,448) (549) (12,788) (9,502)Shareholder Services fee (specific to A, B and C class only) (4,392,102) (49,781) (3,593) (964) (4,644) – – – (26,991) (77,775)Sales distribution charge (specific to B and C class only) (885,862) (32,526) (3,233) (868) (4,179) – – – (8,592) (16,051)Sundry expenses (22,119,361) (213,972) (95,103) 4,199 (32,603) (32,414) (37,131) (18,590) (155,555) 568,747
Total expenses (531,189,495) (11,131,025) (1,418,044) (280,484) (137,805) (441,960) (72,042) (35,283) (3,014,462) (621,540)
* Fund terminated during the year.
GAM Star Fund p.l.c.
292

Notes to the Financial Statements
13. Operating expenses, continued
For the year ended 30 June 2020
(b) Breakdown of expenses, continued:
GAM Star Japan
Leaders¥
GAM Star MBS
Total ReturnUS$
GAM Systematic Alternative
Risk PremiaUS$
GAM Systematic
Core Macro
US$
GAM Systematic
Global Equity Market Neutral*
US$
GAM Star Tactical
OpportunitiesUS$
GAM Star Target Return*
US$
GAM Star Target Return
Plus*US$
GAM Star Disruptive
GrowthUS$
GAM Star US All Cap
EquityUS$
Manager's fee (74,092,838) (1,684,528) (202,195) (38,293) (16,734) (64,386) (14,208) (1,935) (378,062) (111,629)Sponsor and Investment Manager's fee (223,399,893) (9,166,156) (1,056,799) (64,836) (29,611) (321,928) (3,602) (9,028) (2,252,603) (666,287)Investment Advisor fee (197,866,110) – – (65,925) (23,631) – – – – (299,415)Performance fee – 83,490 – (80,794) (3,187) – – – (150,818) –
Payable to the Depositary, associates of the Depositary and their agentsDepositary's fee (2,960,939) (151) (30,236) – 25 (1,067) 2,156 7,259 (7,745) 7,058
Other expensesAudit fee (1,911,981) (27,203) (17,682) (27,203) (19,042) (12,922) (12,377) (12,377) (16,662) (12,922)Legal fees (814,519) (14,132) (2,732) (422) (202) (3,923) (1,355) (63) (2,942) (3,239)Directors fees (387,972) (7,457) (1,065) (141) (130) (316) (77) – (1,704) (525)Printing and publication expenses (2,357,918) (18,609) (5,406) (5,237) (3,867) (5,004) (5,448) (549) (12,788) (9,502)Shareholder Services fee (specific to A, B and C class only) (4,392,102) (49,781) (3,593) (964) (4,644) – – – (26,991) (77,775)Sales distribution charge (specific to B and C class only) (885,862) (32,526) (3,233) (868) (4,179) – – – (8,592) (16,051)Sundry expenses (22,119,361) (213,972) (95,103) 4,199 (32,603) (32,414) (37,131) (18,590) (155,555) 568,747
Total expenses (531,189,495) (11,131,025) (1,418,044) (280,484) (137,805) (441,960) (72,042) (35,283) (3,014,462) (621,540)
* Fund terminated during the year.
Notes to the Financial Statements
13. Operating expenses, continued
For the year ended 30 June 2020
(b) Breakdown of expenses, continued:
GAM Star Worldwide
EquityUS$
GAM Systematic
Dynamic CreditUS$
Manager's fee (98,993) (26,562)Sponsor and Investment Manager's fee (838,812) (142,816)Investment Advisor fee – –Performance fee – (45)
Payable to the Depositary, associates of the Depositary and their agentsDepositary's fee 1,734 (7,455)
Other expensesAudit fee (12,922) (17,750)Legal fees (4,789) (3,692)Directors fees (449) (121)Printing and publication expenses (7,880) (3,948)
Shareholder Services fee (specific to A, B and C class only) (3,184) –Sales distribution charge (specific to B and C class only) (1,899) –Sundry expenses (75,743) (25,544)
Total expenses (1,042,937) (227,933)
293

Notes to the Financial Statements
13. Operating expenses, continued
For the year ended 30 June 2019
(b) Breakdown of expenses, continued:
GAM Star Fund p.l.c.
US$
GAM Star Absolute
Return Bond
€
GAM Star Absolute
Return Bond Defender
€
GAM Star Absolute
Return Bond Plus
€
GAM Star Absolute
Return Macro€
GAM Star Alpha
Spectrum€
GAM Star Alpha
TechnologyUS$
GAM Star Asian
EquityUS$
GAM Star Asia-Pacific
EquityUS$
GAM Star Global
Balanced£
Manager's fee (26,737,799) (217,074) (10,611) (280,919) (80,610) (61,614) (24,760) (46,352) (32,067) (598,947)Sponsor and Investment Manager's fee (132,355,579) (552,366) (16,817) (640,210) (533,117) (554,522) (162,266) (318,399) (222,295) (2,976,761)Investment Advisor fee (50,166,577) – – – – – – (15,198) (63,579) –Performance fee (1,786,637) – – – – (61,610) (179,872) – – –
Payable to the Depositary, associates of the Depositary and their agentsDepositary's fee (1,760,524) 1,683 (670) 5,287 (18,054) (3,365) (7,889) (25,008) (6,414) (30,418)
Other expensesAudit fee (801,172) (11,685) (11,685) (11,685) (14,760) (13,530) (16,861) (16,861) (13,348) (21,680)Legal fees (325,982) (3,383) (445) (4,507) (797) (1,226) (7,628) (3,294) (3,215) (7,256)Directors fees (87,444) (506) (23) (632) (49) (359) (74) (114) (92) (2,356)Printing and publication expenses (732,768) (2,550) (2,956) (3,450) (3,921) (1,672) (6,368) (13,674) (20,513) (41,254)Shareholder service fee (specific to A, B and C class only) (8,451,084) – – – – – – – (1,409) (1,725,249)Sales distribution charge (specific to B and C class only) (5,882,119) – – – – – – – (1,268) (2,202,199)Sundry expenses (5,543,356) (44,699) 11,004 (35,881) (30,508) (22,018) (17,872) (31,309) (45,073) (86,449)
Total expenses (234,631,041) (830,580) (32,203) (971,997) (681,816) (719,916) (423,590) (470,209) (409,273) (7,692,569)
GAM Star Fund p.l.c.
294

Notes to the Financial Statements
13. Operating expenses, continued
For the year ended 30 June 2019
(b) Breakdown of expenses, continued:
GAM Star Fund p.l.c.
US$
GAM Star Absolute
Return Bond
€
GAM Star Absolute
Return Bond Defender
€
GAM Star Absolute
Return Bond Plus
€
GAM Star Absolute
Return Macro€
GAM Star Alpha
Spectrum€
GAM Star Alpha
TechnologyUS$
GAM Star Asian
EquityUS$
GAM Star Asia-Pacific
EquityUS$
GAM Star Global
Balanced£
Manager's fee (26,737,799) (217,074) (10,611) (280,919) (80,610) (61,614) (24,760) (46,352) (32,067) (598,947)Sponsor and Investment Manager's fee (132,355,579) (552,366) (16,817) (640,210) (533,117) (554,522) (162,266) (318,399) (222,295) (2,976,761)Investment Advisor fee (50,166,577) – – – – – – (15,198) (63,579) –Performance fee (1,786,637) – – – – (61,610) (179,872) – – –
Payable to the Depositary, associates of the Depositary and their agentsDepositary's fee (1,760,524) 1,683 (670) 5,287 (18,054) (3,365) (7,889) (25,008) (6,414) (30,418)
Other expensesAudit fee (801,172) (11,685) (11,685) (11,685) (14,760) (13,530) (16,861) (16,861) (13,348) (21,680)Legal fees (325,982) (3,383) (445) (4,507) (797) (1,226) (7,628) (3,294) (3,215) (7,256)Directors fees (87,444) (506) (23) (632) (49) (359) (74) (114) (92) (2,356)Printing and publication expenses (732,768) (2,550) (2,956) (3,450) (3,921) (1,672) (6,368) (13,674) (20,513) (41,254)Shareholder service fee (specific to A, B and C class only) (8,451,084) – – – – – – – (1,409) (1,725,249)Sales distribution charge (specific to B and C class only) (5,882,119) – – – – – – – (1,268) (2,202,199)Sundry expenses (5,543,356) (44,699) 11,004 (35,881) (30,508) (22,018) (17,872) (31,309) (45,073) (86,449)
Total expenses (234,631,041) (830,580) (32,203) (971,997) (681,816) (719,916) (423,590) (470,209) (409,273) (7,692,569)
Notes to the Financial Statements
13. Operating expenses, continued
For the year ended 30 June 2019
(b) Breakdown of expenses, continued:
GAM Star Capital
Appreciation US Equity
US$
GAM Star Cat
BondUS$
GAM Star Global
Cautious£
GAM Star
China Equity
US$
GAM Star Composite
Global EquityUS$
GAM Star Continental
European Equity
€
GAM Star Credit
Opportunities (EUR)
€
GAM Star Credit
Opportunities (GBP)
£
GAM Star Credit
Opportunities (USD)
US$
GAM Star Global
Defensive£
Manager's fee (87,453) (1,781,422) (248,738) (783,852) (127,187) (1,888,039) (5,955,057) (1,520,253) (5,425,260) (28,367)Sponsor and Investment Manager's fee (355,972) (15,392,063) (1,240,098) (6,108,418) (546,775) (5,912,868) (27,551,941) (5,172,599) (26,741,495) (134,995)Investment Advisor fee (314,812) (2,162,611) – (287,176) – (5,197,237) (15,880,153) (4,026,335) (14,467,360) –Performance fee – – – – – – – – – –
Payable to the Depositary, associates of the Depositary and their agentsDepositary's fee (35,130) (138,528) (24,593) (104,505) (8,259) (75,499) (162,004) (104,117) (361,684) (15,111)
Other expensesAudit fee (13,348) (28,101) (21,680) (14,753) (13,699) (12,300) (15,990) (14,092) (21,427) (14,363)Legal fees (1,102) (20,039) (3,930) (10,652) (1,580) (18,895) (51,160) (12,384) (53,372) (1,430)Directors fees (253) (8,171) (1,141) (2,233) (463) (5,383) (16,571) (4,708) (16,138) (134)Printing and publication expenses (6,665) (21,843) (44,371) (26,231) (7,711) (24,077) (26,434) (7,960) (28,382) (24,638)Shareholder service fee (specific to A, B and C class only) – (34,596) (607,373) (342,841) – (57,833) (2,380,915) – (746,194) (38,857)Sales distribution charge (specific to B and C class only) – – (675,573) (43,497) – (52,049) (533,430) – (45,850) (13,224)Sundry expenses (27,373) (348,733) (87,885) (225,838) (31,558) (267,765) (906,293) (531,768) (699,109) (22,276)
Total expenses (842,108) (19,936,107) (2,955,382) (7,949,996) (737,232) (13,511,945) (53,479,948) (11,394,216) (48,606,271) (293,395)
295

Notes to the Financial Statements
13. Operating expenses, continued
For the year ended 30 June 2019
(b) Breakdown of expenses, continued:
GAM Star Discretionary
FX*US$
GAM Star Dynamic
Global BondUS$
GAM Star Global
Dynamic Growth
£
GAM Star Emerging
EquityUS$
GAM Star Emerging
Market RatesUS$
GAM Star European
Equity€
GAM Star Flexible Global
Portfolio€
GAM Star GAMCO
US Equity*US$
GAM Star Global
Quality*US$
GAM Star Global Rates
US$
Manager's fee (3,494) (57,906) (14,038) (43,213) (143,458) (48,997) (37,151) (18,051) (22,800) (638,305)Sponsor and Investment Manager's fee (22,375) (87,691) (35,551) (192,649) (986,773) (221,511) (222,092) (110,630) (109,438) (4,258,723)Investment Advisor fee – (1,429) – (157,241) – (180,338) – (52,958) (44,404) –Performance fee – – – – (12,624) – – – – –
Payable to the Depositary, associates of the Depositary and their agentsDepositary's fee (11,653) (19,157) (8,729) (100,495) (19,128) (30,960) (3,403) (6,922) (1,130) (61,633)
Other expensesAudit fee (10,960) (16,861) (14,092) (15,456) (21,779) (12,300) (15,990) (8,009) (8,009) (28,101)Legal fees (1,167) (1,021) (210) (795) (1,978) (5,054) (831) (610) (664) (6,212)Directors fees (7) (62) (55) (126) (415) (894) (193) (54) (120) (1,706)Printing and publication expenses (8,882) (7,061) (6,457) (9,317) (22,835) (17,947) (8,562) (8,724) (7,808) (14,708)Shareholder service fee (specific to A, B and C class only) – (275) (652) – (18,545) (32,560) (3,495) – – (126,836)Sales distribution charge (specific to B and C class only) – (248) (979) – (14,317) (4,886) (5,243) – – –Sundry expenses (14,179) (3,727) 13,698 (56,396) (35,402) (33,958) (12,029) (19,263) (8,394) (301,003)
Total expenses (72,717) (195,438) (67,065) (575,688) (1,277,254) (589,405) (308,989) (225,221) (202,767) (5,437,227)
* Fund terminated during the year.
GAM Star Fund p.l.c.
296

Notes to the Financial Statements
13. Operating expenses, continued
For the year ended 30 June 2019
(b) Breakdown of expenses, continued:
GAM Star Discretionary
FX*US$
GAM Star Dynamic
Global BondUS$
GAM Star Global
Dynamic Growth
£
GAM Star Emerging
EquityUS$
GAM Star Emerging
Market RatesUS$
GAM Star European
Equity€
GAM Star Flexible Global
Portfolio€
GAM Star GAMCO
US Equity*US$
GAM Star Global
Quality*US$
GAM Star Global Rates
US$
Manager's fee (3,494) (57,906) (14,038) (43,213) (143,458) (48,997) (37,151) (18,051) (22,800) (638,305)Sponsor and Investment Manager's fee (22,375) (87,691) (35,551) (192,649) (986,773) (221,511) (222,092) (110,630) (109,438) (4,258,723)Investment Advisor fee – (1,429) – (157,241) – (180,338) – (52,958) (44,404) –Performance fee – – – – (12,624) – – – – –
Payable to the Depositary, associates of the Depositary and their agentsDepositary's fee (11,653) (19,157) (8,729) (100,495) (19,128) (30,960) (3,403) (6,922) (1,130) (61,633)
Other expensesAudit fee (10,960) (16,861) (14,092) (15,456) (21,779) (12,300) (15,990) (8,009) (8,009) (28,101)Legal fees (1,167) (1,021) (210) (795) (1,978) (5,054) (831) (610) (664) (6,212)Directors fees (7) (62) (55) (126) (415) (894) (193) (54) (120) (1,706)Printing and publication expenses (8,882) (7,061) (6,457) (9,317) (22,835) (17,947) (8,562) (8,724) (7,808) (14,708)Shareholder service fee (specific to A, B and C class only) – (275) (652) – (18,545) (32,560) (3,495) – – (126,836)Sales distribution charge (specific to B and C class only) – (248) (979) – (14,317) (4,886) (5,243) – – –Sundry expenses (14,179) (3,727) 13,698 (56,396) (35,402) (33,958) (12,029) (19,263) (8,394) (301,003)
Total expenses (72,717) (195,438) (67,065) (575,688) (1,277,254) (589,405) (308,989) (225,221) (202,767) (5,437,227)
* Fund terminated during the year.
Notes to the Financial Statements
13. Operating expenses, continued
For the year ended 30 June 2019
(b) Breakdown of expenses, continued:
GAM Star Global
SelectorUS$
GAM Star Global
Growth£
GAM Star India
Equity*US$
GAM Star Interest
TrendUS$
GAM Star Japan
Leaders¥
GAM Star Keynes
Quantitative Strategies*
US$
GAM Star MBS
Total ReturnUS$
GAM Systematic Alternative
Risk PremiaUS$
GAM Systematic
Core MacroUS$
GAM Systematic
Global Equity Market Neutral
US$
Manager's fee (13,344) (275,779) (4,230) (96,289) (80,316,314) (11,921) (2,036,828) (280,323) (167,822) (29,693) Sponsor and Investment Manager's fee (101,014) (1,388,420) (20,404) (465,397) (247,519,380) (43,815) (10,973,427) (1,461,356) (269,173) (45,747)Investment Advisor fee (12,706) – (14,101) (256,771) (218,286,737) (59,410) – – (274,521) (36,501)Performance fee – – – – – – (1,150,877) – (364,203) (7,061)
Payable to the Depositary, associates of the Depositary and their agentsDepositary's fee (4,361) (22,382) (9,252) (6,419) (8,030,204) (27) (72,255) (42,454) – –
Other expensesAudit fee (13,348) (17,073) (9,273) (18,266) (2,258,739) (16,861) (23,184) (18,266) (28,101) (28,101)Legal fees (4,282) (3,698) (540) (745) (930,425) (475) (23,619) (3,970) (1,681) (620)Directors fees (35) (1,032) (11) (295) (239,894) (26) (6,039) (1,248) (440) (92)Printing and publication expenses (16,858) (32,481) (10,842) (2,180) (5,483,821) (15,962) (29,631) (5,851) (8,279) (299)Shareholder service fee (specific to A, B and C class only) (9,968) (769,492) – – (7,487,774) (3,791) (42,267) (5,087) (1,503) (7,436)Sales distribution charge (specific to B and C class only) (8,971) (963,485) – – (1,754,715) – (26,532) (4,579) (1,352) (6,692)Sundry expenses (14,206) (93,638) 9,721 (7,655) (17,664,202) (25,318) (382,461) (156,100) (24,932) (39,216)
Total expenses (199,093) (3,567,480) (58,932) (854,017) (589,972,205) (177,606) (14,767,120) (1,979,234) (1,142,007) (201,458)
* Fund terminated during the year.
297

Notes to the Financial Statements
13. Operating expenses, continued
For the year ended 30 June 2019
(b) Breakdown of expenses, continued:
GAM Star Tactical
OpportunitiesUS$
GAM Star Target Return
US$
GAM Star Target Return
PlusUS$
GAM Star Disruptive
GrowthUS$
GAM Star US All Cap
EquityUS$
GAM Star Worldwide
EquityUS$
GAM Systematic
Dynamic Credit**
US$
Manager's fee (81,717) (41,767) (14,059) (408,184) (188,524) (134,418) (8,601)Sponsor and Investment Manager's fee (420,977) (79,233) (65,609) (2,771,386) (1,204,499) (1,083,445) (46,328)Investment Advisor fee – – – – (451,429) (74,709) –Performance fee – – – – – – (1,736)
Payable to the Depositary, associates of the Depositary and their agentsDepositary's fee (2,144) (5,694) (5,811) (9,725) (12,568) (16,547) (393)
Other expensesAudit fee (13,348) (18,266) (18,266) (16,861) (13,348) (13,348) (13,910)Legal fees (1,179) (720) (125) (21,688) (4,407) (4,096) (72)Directors fees (248) (129) (4,305) (1,218) (413) (400) (28)Printing and publication expenses (9,089) (13,169) (199) (19,257) (20,050) (12,679) (44)
Shareholder service fee (specific to A, B and C class only) – – – (32,685) (119,026) (3,362) –Sales distribution charge (specific to B and C class only) – – – (11,742) (30,971) (1,891) –Sundry expenses (32,345) (52,563) (27,270) (108,873) (58,574) (34,563) 10,722
Total expenses (561,047) (211,541) (135,644) (3,401,619) (2,103,809) (1,379,458) (60,390)
** Fund terminated during the year.
GAM Star Fund p.l.c.
298

Notes to the Financial Statements
14. Cash and bank balances
As at 30 June 2020As at 30 June 2020 all cash and bank balances were held with State Street Custodial Services (Ireland) Limited, with the exception of the amounts in the following tables. These balances include mark to market on spots which is included in the Cash and bank balances in the Balance Sheet.
GAM Star Fund p.l.c.US$
GAM Star Alpha
TechnologyUS$
GAM Star Asian Equity
US$
GAM Star Global
Balanced£
GAM Star Capital
Appreciation US Equity
US$
GAM Star Global
Cautious£
GAM Star China Equity
US$
GAM Star Continental
European Equity
€
GAM Star Credit
Opportunities (EUR)
€
GAM Star Emerging
Market RatesUS$
Bank of America (34,624) 13 4 3,302 (1) 856 1,184 (227) 565 (37,728)
(34,624) 13 4 3,302 (1) 856 1,184 (227) 565 (37,728)
GAM Star European
Equity€
GAM Star Flexible Global
Portfolio€
GAM Star Global Rates
US$
GAM Star Global
Growth£
GAM Star Japan Leaders
¥
GAM Star MBS Total Return
US$
GAM Systematic Alternative
Risk PremiaUS$
GAM Systematic
Core MacroUS$
GAM Star Disruptive
GrowthUS$
GAM Star US All Cap Equity
US$
Bank of America (9) 287 (54) 1,086 (230,287) (2,627) (2) 9 (560) 104
(9) 287 (54) 1,086 (230,287) (2,627) (2) 9 (560) 104
299

Notes to the Financial Statements
14. Cash and bank balances, continued
As at 30 June 2020Margin cash may not be withdrawn on demand due to restrictions imposed by brokers with whom the cash is deposited. The margin cash and amounts due to broker as at 30 June 2020 was held with the following brokers.
GAM Star Fund p.l.c.US$
GAM Star Alpha
Spectrum€
GAM Star Alpha
TechnologyUS$
GAM Star Asian Equity
US$
GAM Star Global
Balanced£
GAM Star Capital
Appreciation US Equity
US$
GAM Star Cat Bond
US$
GAM Star Global
Cautious£
GAM Star Composite
Global EquityUS$
GAM Star Continental
European Equity
€
ABN Amro 548,796,847 – 2,499 1,131 54 – – 65,584 16,185,606 7,005Bank of New York Mellon 289,478 – – – – – 289,478 – – –Citi 1,042,370 – – – – – – – – –Credit Suisse 5,250,000 – – – – – – – – –Goldman Sachs 2,306,870 – 1,871,828 – – – – – – –HSBC 3,470,000 – – – – – – – – –JP Morgan 13,194,799 – 5,052 – – 28,724 – – – –MacQuarie Bank 4,110,001 – – – – – – – – –Morgan Stanley 19,533,161 – – – – – – – – –UBS 3,090,429 (1) – – – – – – 1,788,745 –
601,083,955 (1) 1,879,379 1,131 54 28,724 289,478 65,584 17,974,351 7,005
GAM Star Fund p.l.c.
300

Notes to the Financial Statements
14. Cash and bank balances, continued
As at 30 June 2020Margin cash may not be withdrawn on demand due to restrictions imposed by brokers with whom the cash is deposited. The margin cash and amounts due to broker as at 30 June 2020 was held with the following brokers.
GAM Star Credit
Opportunities (EUR)
€
GAM Star Credit
Opportunities (GBP)
£
GAM Star Credit
Opportunities (USD)
US$
GAM Star Global
Defensive£
GAM Star Emerging
EquityUS$
GAM Star Emerging
Market RatesUS$
GAM Star European
Equity€
GAM Star Flexible Global
Portfolio€
GAM Star Global Rates
US$
GAM Star Global
Growth£
ABN Amro 142,539,779 52,427,962 187,109,932 3,021,693 51 4,220 106 6,762,810 175 2Bank of New York Mellon – – – – – – – – – –Citi – – – – – – – – – –Credit Suisse – – – – – – – – 5,250,000 –Goldman Sachs – – – – – – – – – –HSBC – – – – – 2,920,000 – – – –JP Morgan 4,761,000 4,779,006 340,000 – 5,004 125,027 – – 3,705 –MacQuarie Bank – – – – – – – – – –Morgan Stanley – – – – – 330,385 – – 13,813,908 –UBS – – – – – – – 3 – –
147,300,779 57,206,968 187,449,932 3,021,693 5,055 3,379,632 106 6,762,813 19,067,788 2
301

Notes to the Financial Statements
14. Cash and bank balances, continued
As at 30 June 2020Margin cash may not be withdrawn on demand due to restrictions imposed by brokers with whom the cash is deposited. The margin cash and amounts due to broker as at 30 June 2020 was held with the following brokers.
GAM Star Interest Trend
US$
GAM Star MBS Total Return
US$
GAM Systematic Alternative
Risk PremiaUS$
GAM Systematic
Core MacroUS$
GAM Systematic
Global Equity Market Neutral
US$
GAM Star Tactical
OpportunitiesUS$
GAM Star Disruptive
GrowthUS$
GAM Star US All Cap Equity
US$
GAM Star Worldwide
EquityUS$
GAM Systematic
Dynamic CreditUS$
ABN Amro 1,007,035 86,779,599 14,728 4 – 47,142 20,524,135 5,241 5,794 817,627Bank of New York Mellon – – – – – – – – – –Citi – – 1,042,370 – – – – – – –Credit Suisse – – – – – – – – – –Goldman Sachs – – – 434,191 851 – – – – –HSBC – – 550,000 – – – – – – –JP Morgan – – 310,000 – – – 1,125,027 – – –MacQuarie Bank – – 4,110,001 – – – – – – –Morgan Stanley – 1,832,437 1,653,872 – – – – – – 1,902,559UBS – – – 461,125 – 840,557 – – – –
1,007,035 88,612,036 7,680,971 895,320 851 887,699 21,649,162 5,241 5,794 2,720,186
GAM Star Fund p.l.c.
302

Notes to the Financial Statements
14. Cash and bank balances, continued
As at 30 June 2019As at 30 June 2019, all cash and bank balances were held with State Street Custodial Services (Ireland) Limited, with the exception of the amounts in the following tables. These balances include mark to market on spots which is included in the Cash and bank balances in the Balance Sheet.
GAM Star Fund p.l.c.
US$
GAM Star Asian Equity
US$
GAM Star Asia-Pacific Equity
US$
GAM Star Global
Balanced£
GAM Star Global
Cautious£
GAM Star China Equity
US$
GAM Star Continental
European Equity
€
GAM Star Credit
Opportunities (EUR)
€
GAM Star Credit
Opportunities (USD)
US$
GAM Star Global
Defensive£
Bank of America 25,419 21 12 (1,051) (334) 252 309 (451) 446 (2)HSBC 3,371 – – – – – – – – –
28,790 21 12 (1,051) (334) 252 309 (451) 446 (2)
GAM Star Emerging
EquityUS$
GAM Star Emerging
Market RatesUS$
GAM Star Global Rates
US$
GAM Star Global
SelectorUS$
GAM Star Global Growth
£
GAM Star Japan Leaders
¥
GAM Star MBS Total Return
US$
GAM Systematic Alternative
Risk PremiaUS$
GAM Systematic
Core MacroUS$
GAM Star Tactical
OpportunitiesUS$
Bank of America (14) 4,113 1,230 (4) 343 14,902 1,730 (20) 18,804 16HSBC – 3,371 – – – – – – – –
(14) 7,484 1,230 (4) 343 14,902 1,730 (20) 18,804 16
GAM Star Disruptive
GrowthUS$
GAM Star Worldwide
EquityUS$
Bank of America (163) 348HSBC – –
(163) 348
.
303

Notes to the Financial Statements
14. Cash and bank balances, continued
As at 30 June 2019Margin cash may not be withdrawn on demand due to restrictions imposed by brokers with whom the cash is deposited. The margin cash and amounts due to broker as at 30 June 2019 was held with the following brokers.
GAM Star Fund p.l.c.
US$
GAM Star Absolute
Return Macro€
GAM Star Alpha
TechnologyUS$
GAM Star Asian Equity
US$
GAM Star Asia-Pacific Equity
US$
GAM Star Global
Balanced£
GAM Star Capital
Appreciation US Equity
US$
GAM Star Cat Bond
US$
GAM Star Global
Cautious£
GAM Star Composite
Global EquityUS$
ABN Amro 892,097,025 – 344 2,294 32 120,179 – – 65,362 13,674,574Bank of New York Mellon 222,061 – – – – – – 222,061 – –Barclays Bank 160,000 – – – – – – – – –Citi 2,860,183 – – – – – – – – –Credit Suisse 2,750,000 – – – – – – – – –Goldman Sachs 12,121,855 – 17,793 – – – – – – –HSBC 14,259,187 – – – – – – – – –JP Morgan 30,866,608 – 285,000 – – – 11,010 – – –MacQuarie Bank 30,680,000 – – – – – – – – –Morgan Stanley 21,615,755 15,166 – – – – – – – –UBS 5,478,566 – – – – – – – – 645,120
1,013,111,240 15,166 303,137 2,294 32 120,179 11,010 222,061 65,362 14,319,694
GAM Star Fund p.l.c.
304

Notes to the Financial Statements
14. Cash and bank balances, continued
As at 30 June 2019Margin cash may not be withdrawn on demand due to restrictions imposed by brokers with whom the cash is deposited. The margin cash and amounts due to broker as at 30 June 2019 was held with the following brokers.
GAM Star Continental
European Equity
€
GAM Star Credit
Opportunities (EUR)
€
GAM Star Credit
Opportunities (GBP)
£
GAM Star Credit
Opportunities (USD)
US$
GAM Star Global
Defensive£
GAM Star Discretionary
FX*US$
GAM Star Dynamic
Global BondUS$
GAM Star Emerging
EquityUS$
GAM Star Emerging
Market RatesUS$
GAM Star European
Equity€
ABN Amro 168,995 444,837,665 50,251,883 241,356,897 3,011,470 25 – 51 4,166 9,033Bank of New York Mellon – – – – – – – – – –Barclays Bank – – – – – – – – – –Citi – – – – – – – – – –Credit Suisse – – – – – – – – – –Goldman Sachs – – – – – – – – 250,000 –HSBC – – – – – – – – 2,173,314 –JP Morgan – – – – – – – 4,828 243,380 –MacQuarie Bank – – – – – – – – – –Morgan Stanley – – – – – – 402,700 – 7,194 –UBS – – – – – – – – – –
168,995 444,837,665 50,251,883 241,356,897 3,011,470 25 402,700 4,879 2,678,054 9,033
* Fund terminated during the year.305

Notes to the Financial Statements
14. Cash and bank balances, continued
As at 30 June 2019Margin cash may not be withdrawn on demand due to restrictions imposed by brokers with whom the cash is deposited. The margin cash and amounts due to broker as at 30 June 2019 was held with the following brokers.
GAM Star Flexible Global
Portfolio€
GAM Star Global Rates
US$
GAM Star Global
SelectorUS$
GAM Star Global
Growth£
GAM Star MBS Total Return
US$
GAM Systematic Alternative
Risk PremiaUS$
GAM Systematic
Core MacroUS$
GAM Systematic
Global Equity Market Neutral
US$
GAM Star Tactical
OpportunitiesUS$
GAM Star Target Return
US$
ABN Amro 1,331,598 173 732 2,554 45,735,926 14,540 – – 5,117,523 1,206,270 Bank of New York Mellon – – – – – – – – – –Barclays Bank – 160,000 – – – – – – – –Citi – – – – – 2,860,183 – – – –Credit Suisse – 2,750,000 – – – – – – – –Goldman Sachs – – – – – – 11,417,046 437,016 – –HSBC – 5,965,873 – – – 6,120,000 – – – –JP Morgan – 26,577,390 – – – 1,710,000 – – – –MacQuarie Bank – – – – – 30,680,000 – – – –Morgan Stanley – 12,524,771 – – 2,154,472 4,258,659 – – – 213,729UBS – – – – – – 4,329,200 – 504,246 –
1,331,598 47,978,207 732 2,554 47,890,398 45,643,382 15,746,246 437,016 5,621,769 1,419,999
GAM Star Fund p.l.c.
306

Notes to the Financial Statements
14. Cash and bank balances, continued
As at 30 June 2019Margin cash may not be withdrawn on demand due to restrictions imposed by brokers with whom the cash is deposited. The margin cash and amounts due to broker as at 30 June 2019 was held with the following brokers.
GAM Star Target Return
PlusUS$
GAM Star Disruptive
GrowthUS$
GAM Star US All Cap Equity
US$
GAM Star Worldwide
EquityUS$
GAM Systematic
Dynamic Credit**
US$
ABN Amro 998,526 7,126,968 528,525 1,312 – Bank of New York Mellon – – – – –Barclays Bank – – – – –Citi – – – – –Credit Suisse – – – – –Goldman Sachs – – – – –HSBC – – – – –JP Morgan – 2,035,000 – – –MacQuarie Bank – – – – –Morgan Stanley 70,316 – – – 1,966,643UBS – – – – –
1,068,842 9,161,968 528,525 1,312 1,966,643
** Fund launched during the year.
Notes to the Financial Statements
14. Cash and bank balances, continued
As at 30 June 2019Margin cash may not be withdrawn on demand due to restrictions imposed by brokers with whom the cash is deposited. The margin cash and amounts due to broker as at 30 June 2019 was held with the following brokers.
GAM Star Flexible Global
Portfolio€
GAM Star Global Rates
US$
GAM Star Global
SelectorUS$
GAM Star Global
Growth£
GAM Star MBS Total Return
US$
GAM Systematic Alternative
Risk PremiaUS$
GAM Systematic
Core MacroUS$
GAM Systematic
Global Equity Market Neutral
US$
GAM Star Tactical
OpportunitiesUS$
GAM Star Target Return
US$
ABN Amro 1,331,598 173 732 2,554 45,735,926 14,540 – – 5,117,523 1,206,270 Bank of New York Mellon – – – – – – – – – –Barclays Bank – 160,000 – – – – – – – –Citi – – – – – 2,860,183 – – – –Credit Suisse – 2,750,000 – – – – – – – –Goldman Sachs – – – – – – 11,417,046 437,016 – –HSBC – 5,965,873 – – – 6,120,000 – – – –JP Morgan – 26,577,390 – – – 1,710,000 – – – –MacQuarie Bank – – – – – 30,680,000 – – – –Morgan Stanley – 12,524,771 – – 2,154,472 4,258,659 – – – 213,729UBS – – – – – – 4,329,200 – 504,246 –
1,331,598 47,978,207 732 2,554 47,890,398 45,643,382 15,746,246 437,016 5,621,769 1,419,999
307

308
GAM Star Fund p.l.c.
Notes to the Financial Statements
15. Holdings in other GAM Star Funds
As at 30 June 2020At 30 June 2020, the following Funds held investments in other GAM Star Funds:
Investing Fund Fund
GAM Star Alpha Spectrum GAM Star Cat Bond GAM Star Credit Opportunities (EUR) GAM Star Japan Leaders GAM Star MBS Total Return
GAM Star Global Balanced GAM Star Credit Opportunities GBP Z II Acc GAM Star MBS Total Return GAM Star Disruptive Growth GAM Star Global Cautious GAM Star Credit Opportunities GBP Z II Acc GAM Star MBS Total Return GAM Star Disruptive Growth GAM Star Composite Global Equity GAM Star Continental European Equity GAM Star Japan Leaders
Investing Fund Fund
GAM Star Global Defensive GAM Star Credit Opportunities GBP Z II Acc GAM Star MBS Total Return GAM Star Global Dynamic Growth GAM Star Disruptive Growth GAM Star Flexible Global Portfolio GAM Star Cat Bond GAM Star Continental European Equity GAM Star Credit Opportunities (EUR) GAM Star Japan Leaders GAM Star MBS Total Return GAM Star Tactical Opportunities GAM Star Global Growth GAM Star Credit Opportunities GBP Z II Acc GAM Star Disruptive Growth GAM Star MBS Total Return
Shares issued and redeemed, and the related realised and unrealised gains and losses during the year were:
Currency Opening CostProceeds from shares issued
Proceeds from shares
redeemed
Realised gain/(loss) on
investments at fair value Closing Cost Market value
Net change in unrealised
gains/(losses) on investments
at fair value
GAM Star Alpha Spectrum € 14,541,632 1,231,000 (7,448,193) 1,980,354 10,304,793 11,782,620 (1,128,239)GAM Star Global Balanced £ 77,943,666 26,611,433 (42,849,233) 4,384,672 66,090,538 75,509,715 (570,682)GAM Star Global Cautious £ 59,280,795 11,542,528 (27,640,284) 2,013,361 45,196,400 50,155,004 (354,090)GAM Star Composite Global Equity US$ 18,010,613 1,023,066 (4,798,625) 353,493 14,588,547 15,343,232 1,595,700GAM Star Global Defensive £ 8,194,707 1,708,812 (4,210,326) 140,800 5,833,993 6,114,465 (157,844)GAM Star Global Dynamic Growth £ 547,341 236,211 (596,811) 88,990 275,731 385,522 10,036GAM Star Flexible Global Portfolio € 12,707,669 56,565,686 (31,087,247) 231,092 38,417,200 38,627,822 (33,925)GAM Star Global Growth £ 28,913,642 5,808,030 (16,581,792) 2,365,387 20,505,267 25,158,970 (38,299)

309
Notes to the Financial Statements
15. Holdings in other GAM Star Funds, continued
As at 30 June 2019At 30 June 2019, the following Funds held investments in other GAM Star Funds:
Investing Fund Fund
GAM Star Alpha Spectrum GAM Star Credit Opportunities (EUR) GAM Star Japan Leaders GAM Star MBS Total Return
GAM Star Global Balanced GAM Star Continental European Equity GAM Star Credit Opportunities GBP Z II Acc GAM Star MBS Total Return GAM Star Disruptive Growth GAM Star Global Cautious GAM Star Continental European Equity GAM Star Credit Opportunities GBP Z II Acc GAM Star MBS Total Return GAM Star Disruptive Growth
GAM Star Composite Global Equity GAM Star Continental European Equity GAM Star Japan Leaders
Investing Fund Fund
GAM Star Global Defensive GAM Star Continental European Equity GAM Star Credit Opportunities GBP Z II Acc GAM Star MBS Total Return
GAM Star Global Dynamic Growth GAM Star Continental European Equity GAM Star Disruptive Growth
GAM Star Flexible Global Portfolio GAM Star Cat Bond GAM Star Continental European Equity GAM Star Credit Opportunities (EUR) GAM Star Japan Leaders GAM Star MBS Total Return GAM Star Tactical Opportunities GAM Star Target Return X EUR Acc
GAM Star Global Growth GAM Star Continental European Equity GAM Star Credit Opportunities GBP Z II Acc GAM Star MBS Total Return GAM Star Disruptive Growth
Shares issued and redeemed, and the related realised and unrealised gains and losses during the year were:
Currency Opening CostProceeds from shares issued
Proceeds from shares
redeemed
Realised gain/(loss) on
investments at fair value Closing Cost Market value
Net change in unrealised
gains/(losses) on investments
at fair value
GAM Star Alpha Spectrum € 11,312,035 3,918,482 (1,011,000) 322,115 14,541,632 17,147,699 (146,594)GAM Star Global Balanced £ 139,739,891 35,837,061 (103,565,158) 5,931,872 77,943,666 87,933,524 (4,740,529)GAM Star Global Cautious £ 111,221,844 36,892,962 (93,332,642) 4,498,631 59,280,795 64,593,490 (3,312,422)GAM Star Composite Global Equity US$ 22,448,903 2,003,661 (5,602,060) (839,891) 18,010,613 17,169,599 (694,513)GAM Star Global Defensive £ 16,482,883 7,886,054 (16,376,056) 201,826 8,194,707 8,633,021 (51,980)GAM Star Global Dynamic Growth £ 1,401,968 386,552 (1,291,488) 50,309 547,341 647,096 (137,137)GAM Star Flexible Global Portfolio € 21,658,846 2,023,781 (11,447,940) 472,982 12,707,669 12,952,215 (340,330)GAM Star Global Growth £ 45,037,322 13,350,218 (31,677,146) 2,203,248 28,913,642 33,605,644 (2,685,367)
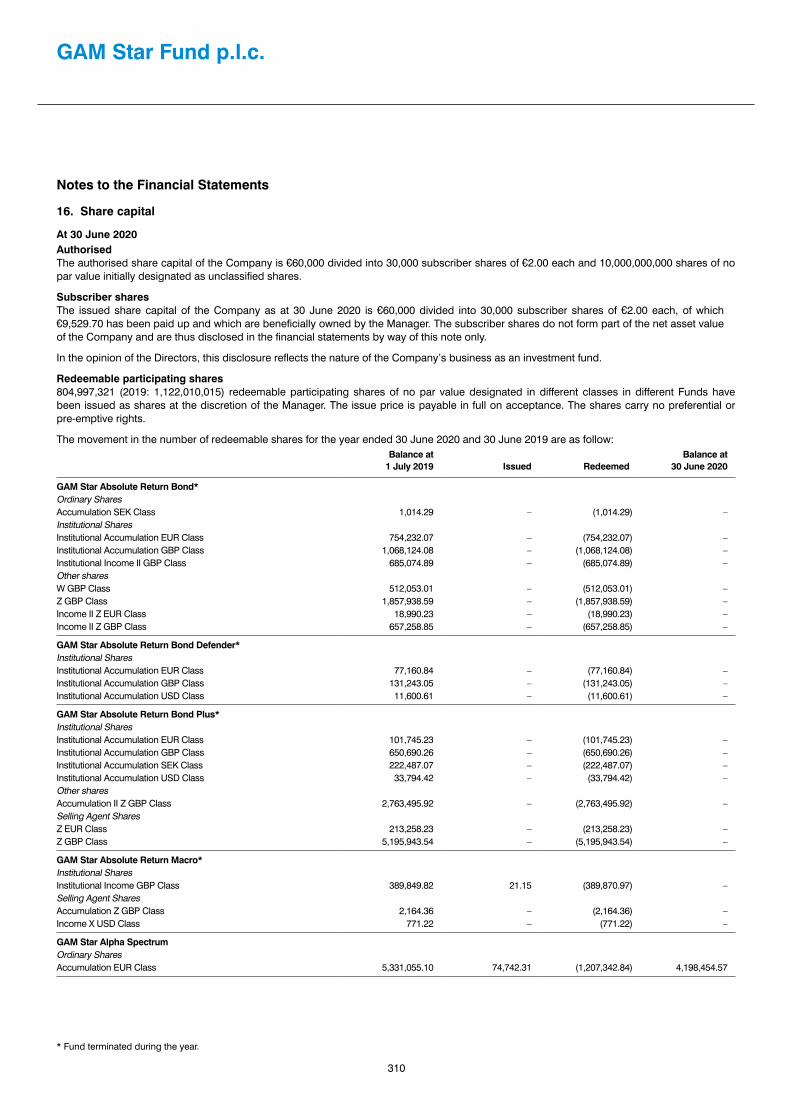
310
GAM Star Fund p.l.c.
Notes to the Financial Statements
16. Share capital
At 30 June 2020AuthorisedThe authorised share capital of the Company is €60,000 divided into 30,000 subscriber shares of €2.00 each and 10,000,000,000 shares of no par value initially designated as unclassified shares.
Subscriber sharesThe issued share capital of the Company as at 30 June 2020 is €60,000 divided into 30,000 subscriber shares of €2.00 each, of which €9,529.70 has been paid up and which are beneficially owned by the Manager. The subscriber shares do not form part of the net asset value of the Company and are thus disclosed in the financial statements by way of this note only.
In the opinion of the Directors, this disclosure reflects the nature of the Company’s business as an investment fund.
Redeemable participating shares804,997,321 (2019: 1,122,010,015) redeemable participating shares of no par value designated in different classes in different Funds have been issued as shares at the discretion of the Manager. The issue price is payable in full on acceptance. The shares carry no preferential or pre-emptive rights.
The movement in the number of redeemable shares for the year ended 30 June 2020 and 30 June 2019 are as follow:Balance at
1 July 2019 Issued RedeemedBalance at
30 June 2020
GAM Star Absolute Return Bond* Ordinary SharesAccumulation SEK Class 1,014.29 – (1,014.29) –Institutional SharesInstitutional Accumulation EUR Class 754,232.07 – (754,232.07) –Institutional Accumulation GBP Class 1,068,124.08 – (1,068,124.08) –Institutional Income II GBP Class 685,074.89 – (685,074.89) –Other sharesW GBP Class 512,053.01 – (512,053.01) –Z GBP Class 1,857,938.59 – (1,857,938.59) –Income II Z EUR Class 18,990.23 – (18,990.23) –Income II Z GBP Class 657,258.85 – (657,258.85) –
GAM Star Absolute Return Bond Defender*Institutional SharesInstitutional Accumulation EUR Class 77,160.84 – (77,160.84) –Institutional Accumulation GBP Class 131,243.05 – (131,243.05) –Institutional Accumulation USD Class 11,600.61 – (11,600.61) –
GAM Star Absolute Return Bond Plus*Institutional SharesInstitutional Accumulation EUR Class 101,745.23 – (101,745.23) –Institutional Accumulation GBP Class 650,690.26 – (650,690.26) –Institutional Accumulation SEK Class 222,487.07 – (222,487.07) –Institutional Accumulation USD Class 33,794.42 – (33,794.42) –Other sharesAccumulation II Z GBP Class 2,763,495.92 – (2,763,495.92) –Selling Agent SharesZ EUR Class 213,258.23 – (213,258.23) –Z GBP Class 5,195,943.54 – (5,195,943.54) –
GAM Star Absolute Return Macro*Institutional SharesInstitutional Income GBP Class 389,849.82 21.15 (389,870.97) –Selling Agent SharesAccumulation Z GBP Class 2,164.36 – (2,164.36) –Income X USD Class 771.22 – (771.22) –
GAM Star Alpha SpectrumOrdinary SharesAccumulation EUR Class 5,331,055.10 74,742.31 (1,207,342.84) 4,198,454.57
* Fund terminated during the year.
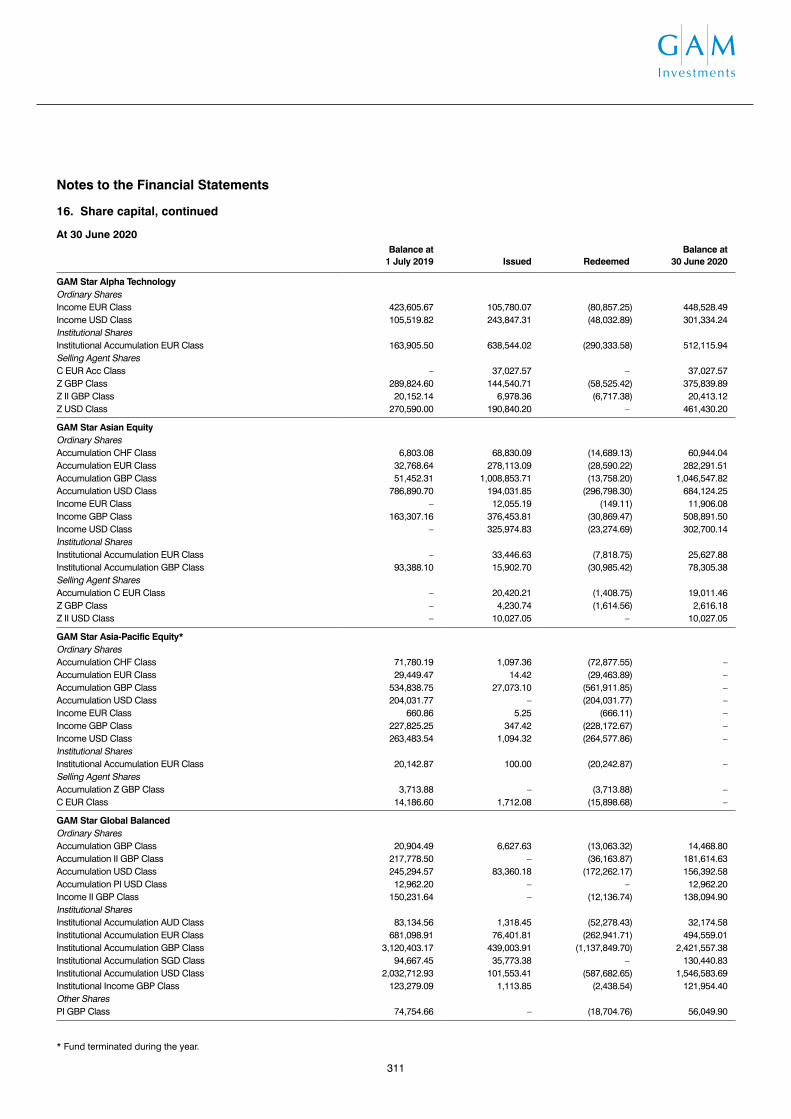
311
Notes to the Financial Statements
16. Share capital
At 30 June 2020AuthorisedThe authorised share capital of the Company is €60,000 divided into 30,000 subscriber shares of €2.00 each and 10,000,000,000 shares of no par value initially designated as unclassified shares.
Subscriber sharesThe issued share capital of the Company as at 30 June 2020 is €60,000 divided into 30,000 subscriber shares of €2.00 each, of which €9,529.70 has been paid up and which are beneficially owned by the Manager. The subscriber shares do not form part of the net asset value of the Company and are thus disclosed in the financial statements by way of this note only.
In the opinion of the Directors, this disclosure reflects the nature of the Company’s business as an investment fund.
Redeemable participating shares804,997,321 (2019: 1,122,010,015) redeemable participating shares of no par value designated in different classes in different Funds have been issued as shares at the discretion of the Manager. The issue price is payable in full on acceptance. The shares carry no preferential or pre-emptive rights.
The movement in the number of redeemable shares for the year ended 30 June 2020 and 30 June 2019 are as follow:Balance at
1 July 2019 Issued RedeemedBalance at
30 June 2020
GAM Star Absolute Return Bond* Ordinary SharesAccumulation SEK Class 1,014.29 – (1,014.29) –Institutional SharesInstitutional Accumulation EUR Class 754,232.07 – (754,232.07) –Institutional Accumulation GBP Class 1,068,124.08 – (1,068,124.08) –Institutional Income II GBP Class 685,074.89 – (685,074.89) –Other sharesW GBP Class 512,053.01 – (512,053.01) –Z GBP Class 1,857,938.59 – (1,857,938.59) –Income II Z EUR Class 18,990.23 – (18,990.23) –Income II Z GBP Class 657,258.85 – (657,258.85) –
GAM Star Absolute Return Bond Defender*Institutional SharesInstitutional Accumulation EUR Class 77,160.84 – (77,160.84) –Institutional Accumulation GBP Class 131,243.05 – (131,243.05) –Institutional Accumulation USD Class 11,600.61 – (11,600.61) –
GAM Star Absolute Return Bond Plus*Institutional SharesInstitutional Accumulation EUR Class 101,745.23 – (101,745.23) –Institutional Accumulation GBP Class 650,690.26 – (650,690.26) –Institutional Accumulation SEK Class 222,487.07 – (222,487.07) –Institutional Accumulation USD Class 33,794.42 – (33,794.42) –Other sharesAccumulation II Z GBP Class 2,763,495.92 – (2,763,495.92) –Selling Agent SharesZ EUR Class 213,258.23 – (213,258.23) –Z GBP Class 5,195,943.54 – (5,195,943.54) –
GAM Star Absolute Return Macro*Institutional SharesInstitutional Income GBP Class 389,849.82 21.15 (389,870.97) –Selling Agent SharesAccumulation Z GBP Class 2,164.36 – (2,164.36) –Income X USD Class 771.22 – (771.22) –
GAM Star Alpha SpectrumOrdinary SharesAccumulation EUR Class 5,331,055.10 74,742.31 (1,207,342.84) 4,198,454.57
* Fund terminated during the year.
Notes to the Financial Statements
16. Share capital, continued
At 30 June 2020Balance at
1 July 2019 Issued RedeemedBalance at
30 June 2020
GAM Star Alpha TechnologyOrdinary SharesIncome EUR Class 423,605.67 105,780.07 (80,857.25) 448,528.49Income USD Class 105,519.82 243,847.31 (48,032.89) 301,334.24Institutional SharesInstitutional Accumulation EUR Class 163,905.50 638,544.02 (290,333.58) 512,115.94Selling Agent SharesC EUR Acc Class – 37,027.57 – 37,027.57Z GBP Class 289,824.60 144,540.71 (58,525.42) 375,839.89Z II GBP Class 20,152.14 6,978.36 (6,717.38) 20,413.12Z USD Class 270,590.00 190,840.20 – 461,430.20
GAM Star Asian EquityOrdinary SharesAccumulation CHF Class 6,803.08 68,830.09 (14,689.13) 60,944.04Accumulation EUR Class 32,768.64 278,113.09 (28,590.22) 282,291.51Accumulation GBP Class 51,452.31 1,008,853.71 (13,758.20) 1,046,547.82Accumulation USD Class 786,890.70 194,031.85 (296,798.30) 684,124.25Income EUR Class – 12,055.19 (149.11) 11,906.08Income GBP Class 163,307.16 376,453.81 (30,869.47) 508,891.50Income USD Class – 325,974.83 (23,274.69) 302,700.14Institutional SharesInstitutional Accumulation EUR Class – 33,446.63 (7,818.75) 25,627.88Institutional Accumulation GBP Class 93,388.10 15,902.70 (30,985.42) 78,305.38Selling Agent SharesAccumulation C EUR Class – 20,420.21 (1,408.75) 19,011.46Z GBP Class – 4,230.74 (1,614.56) 2,616.18Z II USD Class – 10,027.05 – 10,027.05
GAM Star Asia-Pacific Equity* Ordinary SharesAccumulation CHF Class 71,780.19 1,097.36 (72,877.55) –Accumulation EUR Class 29,449.47 14.42 (29,463.89) –Accumulation GBP Class 534,838.75 27,073.10 (561,911.85) –Accumulation USD Class 204,031.77 – (204,031.77) –Income EUR Class 660.86 5.25 (666.11) –Income GBP Class 227,825.25 347.42 (228,172.67) –Income USD Class 263,483.54 1,094.32 (264,577.86) –Institutional SharesInstitutional Accumulation EUR Class 20,142.87 100.00 (20,242.87) –Selling Agent SharesAccumulation Z GBP Class 3,713.88 – (3,713.88) –C EUR Class 14,186.60 1,712.08 (15,898.68) –
GAM Star Global BalancedOrdinary SharesAccumulation GBP Class 20,904.49 6,627.63 (13,063.32) 14,468.80Accumulation II GBP Class 217,778.50 – (36,163.87) 181,614.63Accumulation USD Class 245,294.57 83,360.18 (172,262.17) 156,392.58Accumulation PI USD Class 12,962.20 – – 12,962.20Income II GBP Class 150,231.64 – (12,136.74) 138,094.90Institutional SharesInstitutional Accumulation AUD Class 83,134.56 1,318.45 (52,278.43) 32,174.58Institutional Accumulation EUR Class 681,098.91 76,401.81 (262,941.71) 494,559.01Institutional Accumulation GBP Class 3,120,403.17 439,003.91 (1,137,849.70) 2,421,557.38Institutional Accumulation SGD Class 94,667.45 35,773.38 – 130,440.83Institutional Accumulation USD Class 2,032,712.93 101,553.41 (587,682.65) 1,546,583.69Institutional Income GBP Class 123,279.09 1,113.85 (2,438.54) 121,954.40Other SharesPI GBP Class 74,754.66 – (18,704.76) 56,049.90
* Fund terminated during the year.

312
GAM Star Fund p.l.c.
Notes to the Financial Statements
16. Share capital, continued
At 30 June 2020Balance at
1 July 2019 Issued RedeemedBalance at
30 June 2020
GAM Star Global Balanced, continuedSelling Agent SharesAccumulation Open II Acc EUR 47,122.87 – – 47,122.87C AUD Class 82,153.00 3,159.01 (51,617.97) 33,694.04T AUD Class 33,149.86 4,679.17 (32,110.65) 5,718.38U AUD Class 31,368.18 – (7,305.66) 24,062.52A CHF Class 74,245.70 1,758.47 (41,086.48) 34,917.69C CHF Class 123,023.60 1,349.56 (18,596.39) 105,776.77F CHF Class 78,766.48 – (9,600.00) 69,166.48A EUR Class 327,397.31 22,331.65 (141,681.85) 208,047.11C EUR Class 3,402,489.06 237,044.29 (708,338.94) 2,931,194.41F EUR Class 73,279.24 27.60 (23,836.39) 49,470.45G EUR Class 144,455.83 – (70,154.25) 74,301.58T EUR Class 52,908.94 – (37,414.94) 15,494.00U EUR Class 207,768.06 – (38,154.81) 169,613.25Z EUR Class 288,181.46 83,378.95 (125,102.46) 246,457.95A GBP Class 1,400,297.00 218,710.13 (1,104,365.35) 514,641.78C GBP Class 6,514,747.38 171,650.86 (2,400,614.88) 4,285,783.36F GBP Class 1,363,975.73 21,134.78 (644,989.43) 740,121.08G GBP Class 1,186,518.54 13,898.58 (563,136.31) 637,280.81T GBP Class 493,304.51 – (268,192.60) 225,111.91U GBP Class 1,562,947.35 20,189.33 (191,197.82) 1,391,938.86Z GBP Class 763,803.54 159,533.54 (348,497.52) 574,839.56C JPY Class 12,485.01 1,559.32 (2,447.06) 11,597.27A SGD Class 18,607.05 55,621.46 (27,808.12) 46,420.39A USD Class 1,103,789.22 285,719.75 (415,138.16) 974,370.81C USD Class 8,219,939.12 554,279.32 (1,170,697.43) 7,603,521.01F USD Class 253,437.91 707.49 (117,504.53) 136,640.87G USD Class 139,516.85 727.11 (79,012.33) 61,231.63T USD Class 335,290.56 – (268,819.34) 66,471.22U USD Class 297,642.92 – (70,935.69) 226,707.23Z USD Accumulation Class – 217,112.73 – 217,112.73Non UK RFSAccumulation GBP Class 87,660.52 – (1,782.67) 85,877.85Accumulation USD Class 213,285.33 – (13,003.35) 200,281.98
GAM Star Capital Appreciation US EquityOrdinary SharesAccumulation GBP Class 4,611.46 – – 4,611.46Accumulation USD Class 64,595.70 1,438,233.05 (256,113.76) 1,246,714.99Income GBP Class 15,157.07 – (10,248.25) 4,908.82Income USD Class 233,097.28 937,654.33 (438,737.39) 732,014.22Institutional SharesInstitutional Accumulation GBP Class 468,744.42 22,292.63 (138,234.97) 352,802.08Institutional Accumulation USD Class 1,305,866.21 82,336.78 (386,171.14) 1,002,031.85Institutional Income GBP Class 199,412.74 46,576.27 (98,697.46) 147,291.55Selling Agent SharesC USD Acc – 80,561.07 (27,497.70) 53,063.37Non UK RFSAccumulation USD Class 785,138.07 – (69,955.15) 715,182.92
GAM Star Cat BondOrdinary SharesAccumulation CHF Class 1,188,057.27 231,740.11 (418,488.78) 1,001,308.60Accumulation EUR Class 2,811,245.16 219,315.07 (565,204.05) 2,465,356.18Accumulation GBP Class 109,620.65 84,023.29 (77,807.22) 115,836.72Accumulation USD Class 4,007,329.00 743,053.11 (1,049,267.41) 3,701,114.70Accumulation A EUR Class 298,060.93 280,038.92 (93,517.41) 484,582.44Accumulation M EUR Class 4,949,993.73 – – 4,949,993.73Hedged Ordinary Accumulation JPY 385,411.24 – (286,659.88) 98,751.36Income EUR Class 130,113.09 7,577.69 (50,202.00) 87,488.78Income USD Class 179,623.97 25,326.72 (230.69) 204,720.00

313
Notes to the Financial Statements
16. Share capital, continued
At 30 June 2020Balance at
1 July 2019 Issued RedeemedBalance at
30 June 2020
GAM Star Global Balanced, continuedSelling Agent SharesAccumulation Open II Acc EUR 47,122.87 – – 47,122.87C AUD Class 82,153.00 3,159.01 (51,617.97) 33,694.04T AUD Class 33,149.86 4,679.17 (32,110.65) 5,718.38U AUD Class 31,368.18 – (7,305.66) 24,062.52A CHF Class 74,245.70 1,758.47 (41,086.48) 34,917.69C CHF Class 123,023.60 1,349.56 (18,596.39) 105,776.77F CHF Class 78,766.48 – (9,600.00) 69,166.48A EUR Class 327,397.31 22,331.65 (141,681.85) 208,047.11C EUR Class 3,402,489.06 237,044.29 (708,338.94) 2,931,194.41F EUR Class 73,279.24 27.60 (23,836.39) 49,470.45G EUR Class 144,455.83 – (70,154.25) 74,301.58T EUR Class 52,908.94 – (37,414.94) 15,494.00U EUR Class 207,768.06 – (38,154.81) 169,613.25Z EUR Class 288,181.46 83,378.95 (125,102.46) 246,457.95A GBP Class 1,400,297.00 218,710.13 (1,104,365.35) 514,641.78C GBP Class 6,514,747.38 171,650.86 (2,400,614.88) 4,285,783.36F GBP Class 1,363,975.73 21,134.78 (644,989.43) 740,121.08G GBP Class 1,186,518.54 13,898.58 (563,136.31) 637,280.81T GBP Class 493,304.51 – (268,192.60) 225,111.91U GBP Class 1,562,947.35 20,189.33 (191,197.82) 1,391,938.86Z GBP Class 763,803.54 159,533.54 (348,497.52) 574,839.56C JPY Class 12,485.01 1,559.32 (2,447.06) 11,597.27A SGD Class 18,607.05 55,621.46 (27,808.12) 46,420.39A USD Class 1,103,789.22 285,719.75 (415,138.16) 974,370.81C USD Class 8,219,939.12 554,279.32 (1,170,697.43) 7,603,521.01F USD Class 253,437.91 707.49 (117,504.53) 136,640.87G USD Class 139,516.85 727.11 (79,012.33) 61,231.63T USD Class 335,290.56 – (268,819.34) 66,471.22U USD Class 297,642.92 – (70,935.69) 226,707.23Z USD Accumulation Class – 217,112.73 – 217,112.73Non UK RFSAccumulation GBP Class 87,660.52 – (1,782.67) 85,877.85Accumulation USD Class 213,285.33 – (13,003.35) 200,281.98
GAM Star Capital Appreciation US EquityOrdinary SharesAccumulation GBP Class 4,611.46 – – 4,611.46Accumulation USD Class 64,595.70 1,438,233.05 (256,113.76) 1,246,714.99Income GBP Class 15,157.07 – (10,248.25) 4,908.82Income USD Class 233,097.28 937,654.33 (438,737.39) 732,014.22Institutional SharesInstitutional Accumulation GBP Class 468,744.42 22,292.63 (138,234.97) 352,802.08Institutional Accumulation USD Class 1,305,866.21 82,336.78 (386,171.14) 1,002,031.85Institutional Income GBP Class 199,412.74 46,576.27 (98,697.46) 147,291.55Selling Agent SharesC USD Acc – 80,561.07 (27,497.70) 53,063.37Non UK RFSAccumulation USD Class 785,138.07 – (69,955.15) 715,182.92
GAM Star Cat BondOrdinary SharesAccumulation CHF Class 1,188,057.27 231,740.11 (418,488.78) 1,001,308.60Accumulation EUR Class 2,811,245.16 219,315.07 (565,204.05) 2,465,356.18Accumulation GBP Class 109,620.65 84,023.29 (77,807.22) 115,836.72Accumulation USD Class 4,007,329.00 743,053.11 (1,049,267.41) 3,701,114.70Accumulation A EUR Class 298,060.93 280,038.92 (93,517.41) 484,582.44Accumulation M EUR Class 4,949,993.73 – – 4,949,993.73Hedged Ordinary Accumulation JPY 385,411.24 – (286,659.88) 98,751.36Income EUR Class 130,113.09 7,577.69 (50,202.00) 87,488.78Income USD Class 179,623.97 25,326.72 (230.69) 204,720.00
Notes to the Financial Statements
16. Share capital, continued
At 30 June 2020Balance at
1 July 2019 Issued RedeemedBalance at
30 June 2020
GAM Star Cat Bond, continuedInstitutional SharesInstitutional Accumulation CHF Class 15,848,799.42 3,733,422.86 (2,233,628.36) 17,348,593.92Institutional Accumulation EUR Class 51,646,770.63 13,873,173.17 (11,411,713.00) 54,108,230.80Institutional Accumulation GBP Class 3,074,045.98 360,837.67 (1,739,357.93) 1,695,525.72Institutional Accumulation USD Class 21,496,456.16 6,553,035.89 (6,605,736.36) 21,443,755.69Institutional Hedged Income JPY Class 2,032,241.33 – (2,032,241.33) –Institutional Income EUR Class 15,210,583.96 2,326,653.92 (1,954,551.14) 15,582,686.74Institutional Income GBP Class 1,270,060.91 136,621.48 (160,075.47) 1,246,606.92Institutional Income USD Class 1,816,656.15 1,027,937.95 (1,433,634.58) 1,410,959.52Institutional Hedge SharesInstitutional Accumulation Hedge JPY Class – 1,870,708.68 – 1,870,708.68Distribution SharesDistribution Quarterly Ordinary USD Class 2,399,083.19 166,335.00 (1,578,838.52) 986,579.67R SharesAccumulation R EUR Class – 181,080.16 (774.17) 180,305.99Accumulation R USD Class – 40,000.00 – 40,000.00
GAM Star Global CautiousOrdinary SharesAccumulation EUR Class 4,044.54 – (3,191.54) 853.00Accumulation U EUR Class 229,920.25 9,090.76 (20,569.91) 218,441.10Accumulation GBP Class 51,123.20 9,202.00 (20,579.20) 39,746.00Accumulation U GBP Class 1,639,452.60 15,450.04 (249,352.28) 1,405,550.36Accumulation USD Class 255,870.77 10,074.20 (147,138.97) 118,806.00Income GBP Class 30,745.94 – (30,745.94) –Institutional SharesInstitutional Accumulation AUD Class 73,608.69 – (50,557.26) 23,051.43Institutional Accumulation EUR Class 419,883.61 41,316.86 (49,341.69) 411,858.78Institutional Accumulation GBP Class 2,875,549.15 325,144.30 (917,236.76) 2,283,456.69Institutional Accumulation USD Class 374,671.65 276,379.99 (45,089.05) 605,962.59Institutional Accumulation Hedged USD Class 92,859.88 3,202.90 (17,000.00) 79,062.78Distribution SharesQuarterly Institutional Income GBP Class 25,281.48 1,972.00 (8,331.68) 18,921.80Other sharesPI GBP Class 49,024.38 – (32,070.17) 16,954.21Selling Agent SharesA AUD Class 6,600.00 – – 6,600.00T AUD Class 133,063.32 – (96,735.10) 36,328.22U AUD Class 37,014.97 – (27,321.31) 9,693.66U CHF Class 42,555.89 – (8,801.50) 33,754.39A EUR Class 132,774.36 9,717.88 (63,987.46) 78,504.78C EUR Class 946,474.99 254,786.19 (398,424.18) 802,837.00CQ EUR Class Income II 8,217.89 – (7,865.27) 352.62F EUR Class 5,290.58 – – 5,290.58G EUR Class 53,805.87 9,408.74 (14,608.82) 48,605.79T EUR Class 13,177.74 – (975.04) 12,202.70TQ EUR Class Income II 6,037.26 – (5,651.27) 385.99Z EUR Accumulation Class 328,707.67 79,061.68 (19,566.10) 388,203.25A GBP Class 833,225.23 122,639.31 (346,457.40) 609,407.14AQ GBP Class Income II 30,735.27 – (20,735.27) 10,000.00C GBP Class 1,934,638.40 70,439.56 (909,829.94) 1,095,248.02CQ GBP Class Income II 205,284.63 1.03 (67,853.51) 137,432.15F GBP Class 308,256.07 2,195.68 (164,025.86) 146,425.89G GBP Accumulation Class 464,021.42 1,050.62 (170,305.34) 294,766.70G GBP Income Class 99,526.71 – (45,472.88) 54,053.83T GBP Accumulation Class 184,545.96 – (57,726.63) 126,819.33Z GBP Class 701,755.12 195,996.01 (301,333.10) 596,418.03TQ GBP Income II Class 52,282.68 4,383.90 (40,414.40) 16,252.18A SGD Class 79,069.19 – – 79,069.19

314
GAM Star Fund p.l.c.
Notes to the Financial Statements
16. Share capital, continued
At 30 June 2020Balance at
1 July 2019 Issued RedeemedBalance at
30 June 2020
GAM Star Global Cautious, continuedA USD Class 873,961.41 104,683.28 (325,383.30) 653,261.39C USD Class 2,040,453.93 397,043.75 (644,136.48) 1,793,361.20CQ USD Class Income II 70,026.63 45,480.77 (36,992.17) 78,515.23F USD Class 61,463.25 – (41,627.03) 19,836.22T USD Class 237,450.97 – (217,708.58) 19,742.39U USD Class 459,882.15 – (129,412.90) 330,469.25Z USD Class 1,116,238.08 411,729.72 – 1,527,967.80G Quarterly Income II EUR Class 17,496.98 – (17,496.98) –
GAM Star China EquityOrdinary SharesAccumulation EUR Class 994,004.91 465,263.96 (620,723.29) 838,545.58Accumulation GBP Class 1,326,360.04 546,323.23 (463,405.79) 1,409,277.48Accumulation USD Class 8,304,665.50 668,489.15 (4,040,392.65) 4,932,762.00Income USD Class 407,696.42 15,446.51 (142,060.32) 281,082.61Institutional SharesInstitutional Accumulation EUR Class 117,821.21 427,391.79 (66,938.91) 478,274.09Institutional Accumulation GBP Class 525,336.92 163,335.20 (371,460.76) 317,211.36Institutional Accumulation USD Class 1,441,532.78 79,347.24 (753,240.72) 767,639.30Institutional Income EUR Class 243,489.80 27,512.67 (262,941.78) 8,060.69Institutional Income GBP Class 435,278.07 7,568.05 (423,774.47) 19,071.65Institutional Income USD Class 181,420.86 5,804.00 (151,260.72) 35,964.14Selling Agent SharesC EUR Class 456,265.60 88,338.65 (269,024.55) 275,579.70A USD Class 2,924,094.63 718,554.89 (1,465,285.13) 2,177,364.39C USD Class 145,979.00 9,312.08 (61,451.87) 93,839.21Z USD Class 17,707.88 6,429.17 (11,554.06) 12,582.99
GAM Star Composite Global EquityOrdinary SharesAccumulation CHF Class 541.14 10,000.00 (6,000.00) 4,541.14Accumulation EUR Class 99,038.40 150.89 (5,352.12) 93,837.17Accumulation GBP Class 800,714.07 3,657.08 (194,109.46) 610,261.69Accumulation USD Class 300,110.05 8,654.48 (62,960.22) 245,804.31Income GBP Class 103,742.67 – (16,491.66) 87,251.01Institutional SharesInstitutional Accumulation EUR Class 432,938.85 4,759.92 (171,456.78) 266,241.99Institutional Accumulation GBP Class 1,526,533.52 189,734.94 (261,161.38) 1,455,107.08Institutional Accumulation USD Class 360,689.27 292,714.93 (117,352.40) 536,051.80Selling Agent SharesAccumulation Z GBP Class 2,135,409.21 1,330,004.52 (239,428.93) 3,225,984.80Z USD Acc – 1,763,300.00 – 1,763,300.00Non UK RFSAccumulation GBP Class 215,498.78 – (3,731.53) 211,767.25Accumulation USD Class 359,606.42 – (134,346.24) 225,260.18
GAM Star Continental European EquityOrdinary SharesAccumulation CHF Class 286,353.67 10,000.00 (56,050.79) 240,302.88Accumulation EUR Class 3,984,615.66 734,858.44 (1,561,713.14) 3,157,760.96Accumulation R EUR Class 99,717.18 394,785.43 (440,023.93) 54,478.68Accumulation Z EUR Class 6,430,302.28 68,458.00 (1,064,347.16) 5,434,413.12Accumulation GBP Class 775,605.66 89,420.30 (385,486.36) 479,539.60Accumulation Z II GBP Class 2,557,805.90 81,496.41 (2,631,948.75) 7,353.56Accumulation USD Class 244,664.45 82,516.93 (80,206.81) 246,974.57Income Z EUR Class 4,446,178.80 851,403.88 (2,198,716.87) 3,098,865.81Income GBP Class 18,013.89 – (6,188.84) 11,825.05Institutional SharesInstitutional Accumulation EUR Class 20,243,033.58 6,028,650.28 (18,818,445.77) 7,453,238.09Institutional Accumulation GBP Class 934,453.97 35,651.13 (288,274.48) 681,830.62Institutional Accumulation USD Class 1,123,559.13 5,265.06 (617,518.61) 511,305.58

315
Notes to the Financial Statements
16. Share capital, continued
At 30 June 2020Balance at
1 July 2019 Issued RedeemedBalance at
30 June 2020
GAM Star Global Cautious, continuedA USD Class 873,961.41 104,683.28 (325,383.30) 653,261.39C USD Class 2,040,453.93 397,043.75 (644,136.48) 1,793,361.20CQ USD Class Income II 70,026.63 45,480.77 (36,992.17) 78,515.23F USD Class 61,463.25 – (41,627.03) 19,836.22T USD Class 237,450.97 – (217,708.58) 19,742.39U USD Class 459,882.15 – (129,412.90) 330,469.25Z USD Class 1,116,238.08 411,729.72 – 1,527,967.80G Quarterly Income II EUR Class 17,496.98 – (17,496.98) –
GAM Star China EquityOrdinary SharesAccumulation EUR Class 994,004.91 465,263.96 (620,723.29) 838,545.58Accumulation GBP Class 1,326,360.04 546,323.23 (463,405.79) 1,409,277.48Accumulation USD Class 8,304,665.50 668,489.15 (4,040,392.65) 4,932,762.00Income USD Class 407,696.42 15,446.51 (142,060.32) 281,082.61Institutional SharesInstitutional Accumulation EUR Class 117,821.21 427,391.79 (66,938.91) 478,274.09Institutional Accumulation GBP Class 525,336.92 163,335.20 (371,460.76) 317,211.36Institutional Accumulation USD Class 1,441,532.78 79,347.24 (753,240.72) 767,639.30Institutional Income EUR Class 243,489.80 27,512.67 (262,941.78) 8,060.69Institutional Income GBP Class 435,278.07 7,568.05 (423,774.47) 19,071.65Institutional Income USD Class 181,420.86 5,804.00 (151,260.72) 35,964.14Selling Agent SharesC EUR Class 456,265.60 88,338.65 (269,024.55) 275,579.70A USD Class 2,924,094.63 718,554.89 (1,465,285.13) 2,177,364.39C USD Class 145,979.00 9,312.08 (61,451.87) 93,839.21Z USD Class 17,707.88 6,429.17 (11,554.06) 12,582.99
GAM Star Composite Global EquityOrdinary SharesAccumulation CHF Class 541.14 10,000.00 (6,000.00) 4,541.14Accumulation EUR Class 99,038.40 150.89 (5,352.12) 93,837.17Accumulation GBP Class 800,714.07 3,657.08 (194,109.46) 610,261.69Accumulation USD Class 300,110.05 8,654.48 (62,960.22) 245,804.31Income GBP Class 103,742.67 – (16,491.66) 87,251.01Institutional SharesInstitutional Accumulation EUR Class 432,938.85 4,759.92 (171,456.78) 266,241.99Institutional Accumulation GBP Class 1,526,533.52 189,734.94 (261,161.38) 1,455,107.08Institutional Accumulation USD Class 360,689.27 292,714.93 (117,352.40) 536,051.80Selling Agent SharesAccumulation Z GBP Class 2,135,409.21 1,330,004.52 (239,428.93) 3,225,984.80Z USD Acc – 1,763,300.00 – 1,763,300.00Non UK RFSAccumulation GBP Class 215,498.78 – (3,731.53) 211,767.25Accumulation USD Class 359,606.42 – (134,346.24) 225,260.18
GAM Star Continental European EquityOrdinary SharesAccumulation CHF Class 286,353.67 10,000.00 (56,050.79) 240,302.88Accumulation EUR Class 3,984,615.66 734,858.44 (1,561,713.14) 3,157,760.96Accumulation R EUR Class 99,717.18 394,785.43 (440,023.93) 54,478.68Accumulation Z EUR Class 6,430,302.28 68,458.00 (1,064,347.16) 5,434,413.12Accumulation GBP Class 775,605.66 89,420.30 (385,486.36) 479,539.60Accumulation Z II GBP Class 2,557,805.90 81,496.41 (2,631,948.75) 7,353.56Accumulation USD Class 244,664.45 82,516.93 (80,206.81) 246,974.57Income Z EUR Class 4,446,178.80 851,403.88 (2,198,716.87) 3,098,865.81Income GBP Class 18,013.89 – (6,188.84) 11,825.05Institutional SharesInstitutional Accumulation EUR Class 20,243,033.58 6,028,650.28 (18,818,445.77) 7,453,238.09Institutional Accumulation GBP Class 934,453.97 35,651.13 (288,274.48) 681,830.62Institutional Accumulation USD Class 1,123,559.13 5,265.06 (617,518.61) 511,305.58
Notes to the Financial Statements
16. Share capital, continued
At 30 June 2020Balance at
1 July 2019 Issued RedeemedBalance at
30 June 2020
GAM Star Continental European Equity, continuedInstitutional Accumulation Hedge USD Class 24,934.36 16,929.74 (17,509.13) 24,354.97Institutional Income EUR Class 20,175.76 54.62 (646.32) 19,584.06Institutional Income GBP Class 1,117,762.71 42,519.93 (429,028.32) 731,254.32Institutional Income GBP Z Class 2,439,222.43 727,586.94 (614,116.78) 2,552,692.59Selling Agent SharesC EUR Class 27,272.11 39,365.09 (15,193.97) 51,443.23C USD Class 611,946.97 21,815.60 (362,140.38) 271,622.19
GAM Star Credit Opportunities (EUR)Ordinary SharesAccumulation CHF Class 1,797,076.76 224,661.30 (473,567.29) 1,548,170.77Accumulation EUR Class 43,944,816.88 77,077,748.41 (96,853,274.32) 24,169,290.97Accumulation R EUR Class 987,448.92 6,881,838.45 (6,507,973.81) 1,361,313.56Income CHF Class 859,025.22 173,563.99 (225,090.46) 807,498.75Income CHF R Class 695.00 – – 695.00Income EUR Class 2,534,021.18 252,570.18 (792,535.71) 1,994,055.65Income EUR II Class 23,412,792.34 2,483,507.81 (13,564,624.88) 12,331,675.27Institutional SharesInstitutional Accumulation CHF Class 6,069,476.47 2,058,073.05 (2,499,269.83) 5,628,279.69Institutional Accumulation EUR Class 100,210,087.41 176,339,224.07 (219,544,415.49) 57,004,895.99Institutional Income CHF Class 1,081,597.42 101,590.39 (207,655.99) 975,531.82Institutional Income EUR Class 18,402,395.39 6,354,660.49 (12,964,110.65) 11,792,945.23Distribution SharesM EUR Class 4,314,326.28 287,500.28 (3,512,665.16) 1,089,161.40Quarterly Z Income EUR Class 1,980,555.97 107,218.15 (288,066.33) 1,799,707.79SI EUR Class 11,400,769.64 2,145,399.35 (3,769,947.05) 9,776,221.94SO EUR Class 4,217,044.05 199,870.01 (1,618,599.95) 2,798,314.11Other SharesR EUR Class 32,171.71 136,468.59 (15,632.00) 153,008.30Selling Agent SharesAccumulation Z EUR Class 1,110,948.57 – (1,110,948.57) –A EUR Class 16,187,526.21 1,086,656.11 (6,008,730.90) 11,265,451.42AQ EUR Class 7,023,221.98 400,205.56 (1,985,722.50) 5,437,705.04C EUR Class 9,383,161.24 1,554,897.09 (2,755,049.69) 8,183,008.64Non UK RFSAccumulation CHF Class 1,642,123.87 18,000.00 (248,641.50) 1,411,482.37Accumulation EUR Class 1,174,317.52 – (554,973.86) 619,343.66
GAM Star Credit Opportunities (GBP)Ordinary SharesAccumulation GBP Class 1,352,646.71 221,633.15 (590,528.60) 983,751.26Income GBP Class 951,156.44 310,687.13 (459,373.38) 802,470.19Institutional SharesInstitutional Accumulation GBP Class 24,710,957.21 5,326,842.73 (13,038,318.50) 16,999,481.44Institutional Income GBP Class 9,353,098.23 1,930,982.15 (4,419,521.86) 6,864,558.52Distribution SharesMonthly Z Income GBP Class 6,166,488.30 1,380,715.48 (3,275,093.25) 4,272,110.53Quarterly Institutional GBP Class 1,443,300.65 807,640.44 (725,249.66) 1,525,691.43Quarterly Z Income GBP Class 16,285,824.69 1,514,278.53 (8,143,022.75) 9,657,080.47SI GBP Class 2,170,967.89 704,832.18 (527,806.19) 2,347,993.88Selling Agent SharesQZ GBP Class 14,826.57 – (14,826.57) –Z GBP Class 2,471,285.00 3,196,440.58 (1,902,237.28) 3,765,488.30ZII GBP Class 8,199,836.90 3,192,700.26 (2,786,547.88) 8,605,989.28
GAM Star Credit Opportunities (USD)Ordinary SharesAccumulation USD Class 26,540,240.12 4,916,872.16 (12,013,021.22) 19,444,091.06Accumulation R USD Class 126,527.62 48,997.61 (8,970.04) 166,555.19Income USD Class 6,315,708.52 496,037.63 (3,611,507.19) 3,200,238.96

316
GAM Star Fund p.l.c.
Notes to the Financial Statements
16. Share capital, continued
At 30 June 2020Balance at
1 July 2019 Issued RedeemedBalance at
30 June 2020
GAM Star Credit Opportunities (USD), continuedInstitutional SharesInstitutional Accumulation Hedged ILS Class 608,477.72 84,412.85 (100,316.58) 592,573.99Institutional Accumulation USD Class 90,539,976.71 31,944,193.97 (56,036,440.27) 66,447,730.41Institutional Income USD Class 2,452,565.42 194,137.54 (117,558.77) 2,529,144.19Distribution SharesMCO II AUD Class 13,209,112.41 1,122,251.61 (5,061,846.14) 9,269,517.88MO II SGD Class 19,474,250.46 1,285,914.69 (9,219,982.26) 11,540,182.89SI USD Class 20,228,976.45 1,305,898.94 (15,039,044.10) 6,495,831.29SO USD Class 1,169,513.54 19,270.00 (331,403.33) 857,380.21MO USD Class 50,916,231.79 5,007,285.93 (29,508,319.10) 26,415,198.62Income II PMCO USD Class 522,538.19 38,743.34 (91,393.39) 469,888.14Monthly Institutional SGD Class 794,734.32 1,683,696.09 (1,024,131.60) 1,454,298.81Monthly Institutional USD Class 1,232,748.58 990,300.10 (1,560,223.61) 662,825.07Quarterly Accumulation USD Class 6,624.76 – – 6,624.76Quarterly Income USD Class 238,135.94 – (213,872.96) 24,262.98Selling Agent SharesA USD Class 5,673,370.60 657,369.79 (2,391,297.40) 3,939,442.99C USD Class 607,265.96 98,204.58 (252,659.28) 452,811.26Income II AQ USD Class 3,791,055.97 896,597.71 (1,089,927.07) 3,597,726.61Z Distribution SharesMCZ SGD Class 1,006,389.43 106,434.38 (131,667.48) 981,156.33Non UK RFSAccumulation USD Class 7,335,025.80 382,911.11 (1,608,936.17) 6,109,000.74
GAM Star Global DefensiveOrdinary SharesAccumulation GBP Class 2,213.27 – – 2,213.27Institutional SharesInstitutional Accumulation AUD Class 7,007.29 – (7,007.29) –Institutional Accumulation EUR Class 49,465.48 47,436.47 (25,632.74) 71,269.21Institutional Accumulation GBP Class 512,567.26 155,014.61 (340,879.35) 326,702.52Institutional Accumulation USD Class 473,649.16 40,259.03 (181,291.46) 332,616.73Selling Agent SharesAccumulation F GBP Class 8,682.87 – (8,682.87) –Accumulation A USD Class 1,800.00 – (1,800.00) –U AUD Class 32,382.92 – (22,424.52) 9,958.40A CHF Class 10,756.52 – (9,004.00) 1,752.52A EUR Class 76,497.63 16,139.19 (25,944.77) 66,692.05U EUR Class 89,244.52 – (29,517.04) 59,727.48Z EUR Class 49,161.54 88,943.27 (19,058.91) 119,045.90A GBP Class 376,101.09 13,456.47 (80,179.74) 309,377.82C GBP Class 45,695.55 – (15,146.70) 30,548.85G GBP Class 57,703.48 1,009.01 (42,704.73) 16,007.76T GBP Class 11,398.50 – – 11,398.50U GBP Class 257,075.69 – (76,453.75) 180,621.94Z GBP Class 194,020.40 77,999.25 (102,579.95) 169,439.70F USD Class 15,916.14 – (9,142.86) 6,773.28T USD Class 8,399.17 1,228.02 (6,905.26) 2,721.93U USD Class 65,464.35 – (2,608.77) 62,855.58
GAM Star Dynamic Global Bond* Ordinary SharesAccumulation EUR Class 30,054.15 – (30,054.15) –Accumulation GBP Class 1,045.24 – (1,045.24) –Accumulation USD Class 16,177.78 – (16,177.78) –Institutional SharesInstitutional Accumulation USD Class 1,246.92 – (1,246.92) –Selling Agent SharesC EUR Class 1,816.83 – (1,816.83) –
* Fund terminated during the year.

317
Notes to the Financial Statements
16. Share capital, continued
At 30 June 2020Balance at
1 July 2019 Issued RedeemedBalance at
30 June 2020
GAM Star Credit Opportunities (USD), continuedInstitutional SharesInstitutional Accumulation Hedged ILS Class 608,477.72 84,412.85 (100,316.58) 592,573.99Institutional Accumulation USD Class 90,539,976.71 31,944,193.97 (56,036,440.27) 66,447,730.41Institutional Income USD Class 2,452,565.42 194,137.54 (117,558.77) 2,529,144.19Distribution SharesMCO II AUD Class 13,209,112.41 1,122,251.61 (5,061,846.14) 9,269,517.88MO II SGD Class 19,474,250.46 1,285,914.69 (9,219,982.26) 11,540,182.89SI USD Class 20,228,976.45 1,305,898.94 (15,039,044.10) 6,495,831.29SO USD Class 1,169,513.54 19,270.00 (331,403.33) 857,380.21MO USD Class 50,916,231.79 5,007,285.93 (29,508,319.10) 26,415,198.62Income II PMCO USD Class 522,538.19 38,743.34 (91,393.39) 469,888.14Monthly Institutional SGD Class 794,734.32 1,683,696.09 (1,024,131.60) 1,454,298.81Monthly Institutional USD Class 1,232,748.58 990,300.10 (1,560,223.61) 662,825.07Quarterly Accumulation USD Class 6,624.76 – – 6,624.76Quarterly Income USD Class 238,135.94 – (213,872.96) 24,262.98Selling Agent SharesA USD Class 5,673,370.60 657,369.79 (2,391,297.40) 3,939,442.99C USD Class 607,265.96 98,204.58 (252,659.28) 452,811.26Income II AQ USD Class 3,791,055.97 896,597.71 (1,089,927.07) 3,597,726.61Z Distribution SharesMCZ SGD Class 1,006,389.43 106,434.38 (131,667.48) 981,156.33Non UK RFSAccumulation USD Class 7,335,025.80 382,911.11 (1,608,936.17) 6,109,000.74
GAM Star Global DefensiveOrdinary SharesAccumulation GBP Class 2,213.27 – – 2,213.27Institutional SharesInstitutional Accumulation AUD Class 7,007.29 – (7,007.29) –Institutional Accumulation EUR Class 49,465.48 47,436.47 (25,632.74) 71,269.21Institutional Accumulation GBP Class 512,567.26 155,014.61 (340,879.35) 326,702.52Institutional Accumulation USD Class 473,649.16 40,259.03 (181,291.46) 332,616.73Selling Agent SharesAccumulation F GBP Class 8,682.87 – (8,682.87) –Accumulation A USD Class 1,800.00 – (1,800.00) –U AUD Class 32,382.92 – (22,424.52) 9,958.40A CHF Class 10,756.52 – (9,004.00) 1,752.52A EUR Class 76,497.63 16,139.19 (25,944.77) 66,692.05U EUR Class 89,244.52 – (29,517.04) 59,727.48Z EUR Class 49,161.54 88,943.27 (19,058.91) 119,045.90A GBP Class 376,101.09 13,456.47 (80,179.74) 309,377.82C GBP Class 45,695.55 – (15,146.70) 30,548.85G GBP Class 57,703.48 1,009.01 (42,704.73) 16,007.76T GBP Class 11,398.50 – – 11,398.50U GBP Class 257,075.69 – (76,453.75) 180,621.94Z GBP Class 194,020.40 77,999.25 (102,579.95) 169,439.70F USD Class 15,916.14 – (9,142.86) 6,773.28T USD Class 8,399.17 1,228.02 (6,905.26) 2,721.93U USD Class 65,464.35 – (2,608.77) 62,855.58
GAM Star Dynamic Global Bond* Ordinary SharesAccumulation EUR Class 30,054.15 – (30,054.15) –Accumulation GBP Class 1,045.24 – (1,045.24) –Accumulation USD Class 16,177.78 – (16,177.78) –Institutional SharesInstitutional Accumulation USD Class 1,246.92 – (1,246.92) –Selling Agent SharesC EUR Class 1,816.83 – (1,816.83) –
* Fund terminated during the year.
Notes to the Financial Statements
16. Share capital, continued
At 30 June 2020Balance at
1 July 2019 Issued RedeemedBalance at
30 June 2020
GAM Star Global Dynamic GrowthInstitutional SharesInstitutional Accumulation GBP Class 94,496.65 5,215.81 (24,389.80) 75,322.66Other SharesPI GBP Class 24,565.61 3,078.74 (27,644.35) –Selling Agent SharesU EUR Class 21,905.33 – – 21,905.33Accumulation U GBP Class 89,234.31 – (7,950.50) 81,283.81C GBP Class 12,404.87 – (7,769.43) 4,635.44Z GBP Class 237,172.71 70,530.22 (102,565.25) 205,137.68
GAM Star Emerging EquityOrdinary SharesAccumulation EUR Class 112,179.94 – (2,309.87) 109,870.07Accumulation GBP Class 12,676.28 – (6,091.36) 6,584.92Accumulation USD Class 263,385.40 1,504.01 (212,501.79) 52,387.62Institutional SharesInstitutional Accumulation GBP Class 20,970.17 38,218.50 (39,412.88) 19,775.79Institutional Accumulation USD Class 922,810.91 41,744.08 (384,767.61) 579,787.38Institutional Income GBP Class 292,193.93 13,853.01 (86,666.02) 219,380.92
GAM Star Emerging Market RatesOrdinary SharesAccumulation EUR Class 1,421,901.22 64,637.48 (988,860.95) 497,677.75Accumulation GBP Class 115,276.92 30.00 (7.52) 115,299.40Accumulation USD Class 70,032.01 9,953.49 (56,432.28) 23,553.22Institutional SharesInstitutional Accumulation EUR Class 2,227,053.85 774,010.37 (1,185,646.55) 1,815,417.67Institutional Accumulation USD Class 468,918.78 540,915.00 (977,724.91) 32,108.87Institutional Income GBP Class 100,513.13 321.18 (5,966.48) 94,867.83Selling Agent SharesA EUR Class 41,205.10 12,643.67 (19,905.10) 33,943.67C EUR Class 92,971.87 22,797.36 (32,851.09) 82,918.14W EUR Acc Class – 41,300.00 – 41,300.00W Income EUR Class – 2,000,000.00 – 2,000,000.00Z GBP Class 734.63 – (3.55) 731.08W USD Acc Class – 229,473.00 – 229,473.00X USD Acc Class – 400.00 – 400.00Z USD Class 503,273.46 3,573.90 (504,847.36) 2,000.00Z II GBP Class 57,080.73 – (24,203.37) 32,877.36Z II USD Class 388,075.14 236,626.03 (129,358.37) 495,342.80
GAM Star European EquityOrdinary SharesAccumulation CHF Class 87,995.06 3,544.44 (1,268.36) 90,271.14Accumulation EUR Class 22,796.71 586,329.85 (57,062.11) 552,064.45Accumulation GBP Class 565,256.09 25,719.49 (40,760.04) 550,215.54Accumulation USD Class 31,713.89 13,995.41 (17,124.33) 28,584.97Income EUR Class 4,440.50 120,275.57 (47,834.83) 76,881.24Income GBP Class 65,073.36 3,314.57 (388.15) 67,999.78Income USD Class 56,424.74 6.89 – 56,431.63Ordinary Hedge SharesAccumulation Hedge USD Class – 14,042.27 (137.87) 13,904.40Income Hedge USD Class – 16,926.92 (121.40) 16,805.52Institutional SharesInstitutional Accumulation EUR Class 135,566.41 246,353.66 (86,516.32) 295,403.75Institutional Accumulation GBP Class – 36,253.02 (98.20) 36,154.82Institutional Accumulation USD Class 59,609.14 20,042.22 (7,492.63) 72,158.73Institutional Income EUR Class – 178,344.72 (170,572.88) 7,771.84Institutional Income GBP Class – 2,774.09 (97.42) 2,676.67Institutional Accumulation Hedge USD Class – 20,711.52 (20,711.52) –

318
GAM Star Fund p.l.c.
Notes to the Financial Statements
16. Share capital, continued
At 30 June 2020Balance at
1 July 2019 Issued RedeemedBalance at
30 June 2020
GAM Star European Equity, continuedSelling Agent SharesA EUR Class 324,030.50 20,540.12 (28,535.36) 316,035.26C EUR Class 35,436.69 224,205.94 (63,891.12) 195,751.51Z EUR Class 12,526,783.06 1,208.36 (12,527,991.42) –ZII GBP Acc Class – 29,942.43 – 29,942.43R SharesAccumulation R EUR Class – 9,386.99 (103.50) 9,283.49Accumulation R GBP Class – 11,923.53 (1,012.39) 10,911.14Income R GBP Class – 24,127.71 (11,851.69) 12,276.02
GAM Star Flexible Global PortfolioOrdinary SharesAccumulation CHF Class 13,070.44 – (500.00) 12,570.44Accumulation EUR Class 624,262.85 – (30,988.53) 593,274.32Accumulation GBP Class 251,996.65 1,589.10 (29,559.32) 224,026.43Accumulation USD Class 409,595.98 10,402.00 (30,467.79) 389,530.19Institutional SharesInstitutional Accumulation EUR Class 884,926.08 – (884,926.08) –Institutional Accumulation GBP Class 615,594.41 54,957.72 (202,767.26) 467,784.87Institutional USD Class 235,375.89 25,414.08 (32,450.00) 228,339.97Selling Agent SharesC EUR Class 56,284.77 8,768.73 (12,073.69) 52,979.81Non UK RFS ClassNon UK RFS EUR Acc Class – 2,411,211.76 (351,822.84) 2,059,388.92Non UK RFS GBP Acc Class – 1,244,234.94 (246,239.25) 997,995.69Non UK RFS Z SharesNon UK RFS Z CAD Class – 82,209.20 (560.96) 81,648.24Non UK RFSZ CHF Class – 1,329,192.52 (333,045.36) 996,147.16Non UK RFS Z EUR Class – 2,632,308.38 (748,130.63) 1,884,177.75Non UK RFS Z GBP Class – 448,486.94 (200.05) 448,286.89Non UK RFSZ SGD Class – 28,858.66 (196.93) 28,661.73Non UK RFS Z USD Class – 4,947,113.39 (600,327.46) 4,346,785.93
GAM Star Global RatesInstitutional SharesAccumulation CHF Class 391,381.08 16,075.00 (118,684.98) 288,771.10Accumulation EUR Class 11,613,154.06 234,917.31 (7,455,143.76) 4,392,927.61Accumulation GBP Class 9,324,090.07 123,176.45 (5,972,876.55) 3,474,389.97Accumulation USD Class 906,575.07 195,379.38 (637,635.29) 464,319.16Income EUR Class 2,749,308.20 – (43,863.35) 2,705,444.85Income GBP Class 3,968,762.41 16,425.43 (1,895,412.96) 2,089,774.88Income USD Class 193,623.44 – – 193,623.44Selling Agent SharesAccumulation Z GBP Class 109,283.31 16,430.81 (42,357.50) 83,356.62A CHF Class 1,100.00 – – 1,100.00A EUR Class 856,169.86 6,408.13 (204,949.16) 657,628.83A JPY Class 11,111.71 – (11,111.71) –A USD Class 809,369.49 1,029.16 (545,719.62) 264,679.03Non UK RFSAccumulation USD Class 1,810,088.35 – (297,517.53) 1,512,570.82
GAM Star Global Selector* Ordinary SharesAccumulation EUR Class 12,852.89 – (12,852.89) –Accumulation II EUR Class 63,956.89 – (63,956.89) –Accumulation GBP Class 42,000.00 – (42,000.00) –Accumulation II GBP Class 7,340.73 1,482.36 (8,823.09) –Accumulation USD Class 104,945.69 – (104,945.69) –Accumulation II USD Class 134,986.04 569.83 (135,555.87) –Institutional SharesInstitutional Accumulation II USD Class 52,300.00 – (52,300.00) –
* Fund terminated during the year.

319
Notes to the Financial Statements
16. Share capital, continued
At 30 June 2020Balance at
1 July 2019 Issued RedeemedBalance at
30 June 2020
GAM Star European Equity, continuedSelling Agent SharesA EUR Class 324,030.50 20,540.12 (28,535.36) 316,035.26C EUR Class 35,436.69 224,205.94 (63,891.12) 195,751.51Z EUR Class 12,526,783.06 1,208.36 (12,527,991.42) –ZII GBP Acc Class – 29,942.43 – 29,942.43R SharesAccumulation R EUR Class – 9,386.99 (103.50) 9,283.49Accumulation R GBP Class – 11,923.53 (1,012.39) 10,911.14Income R GBP Class – 24,127.71 (11,851.69) 12,276.02
GAM Star Flexible Global PortfolioOrdinary SharesAccumulation CHF Class 13,070.44 – (500.00) 12,570.44Accumulation EUR Class 624,262.85 – (30,988.53) 593,274.32Accumulation GBP Class 251,996.65 1,589.10 (29,559.32) 224,026.43Accumulation USD Class 409,595.98 10,402.00 (30,467.79) 389,530.19Institutional SharesInstitutional Accumulation EUR Class 884,926.08 – (884,926.08) –Institutional Accumulation GBP Class 615,594.41 54,957.72 (202,767.26) 467,784.87Institutional USD Class 235,375.89 25,414.08 (32,450.00) 228,339.97Selling Agent SharesC EUR Class 56,284.77 8,768.73 (12,073.69) 52,979.81Non UK RFS ClassNon UK RFS EUR Acc Class – 2,411,211.76 (351,822.84) 2,059,388.92Non UK RFS GBP Acc Class – 1,244,234.94 (246,239.25) 997,995.69Non UK RFS Z SharesNon UK RFS Z CAD Class – 82,209.20 (560.96) 81,648.24Non UK RFSZ CHF Class – 1,329,192.52 (333,045.36) 996,147.16Non UK RFS Z EUR Class – 2,632,308.38 (748,130.63) 1,884,177.75Non UK RFS Z GBP Class – 448,486.94 (200.05) 448,286.89Non UK RFSZ SGD Class – 28,858.66 (196.93) 28,661.73Non UK RFS Z USD Class – 4,947,113.39 (600,327.46) 4,346,785.93
GAM Star Global RatesInstitutional SharesAccumulation CHF Class 391,381.08 16,075.00 (118,684.98) 288,771.10Accumulation EUR Class 11,613,154.06 234,917.31 (7,455,143.76) 4,392,927.61Accumulation GBP Class 9,324,090.07 123,176.45 (5,972,876.55) 3,474,389.97Accumulation USD Class 906,575.07 195,379.38 (637,635.29) 464,319.16Income EUR Class 2,749,308.20 – (43,863.35) 2,705,444.85Income GBP Class 3,968,762.41 16,425.43 (1,895,412.96) 2,089,774.88Income USD Class 193,623.44 – – 193,623.44Selling Agent SharesAccumulation Z GBP Class 109,283.31 16,430.81 (42,357.50) 83,356.62A CHF Class 1,100.00 – – 1,100.00A EUR Class 856,169.86 6,408.13 (204,949.16) 657,628.83A JPY Class 11,111.71 – (11,111.71) –A USD Class 809,369.49 1,029.16 (545,719.62) 264,679.03Non UK RFSAccumulation USD Class 1,810,088.35 – (297,517.53) 1,512,570.82
GAM Star Global Selector* Ordinary SharesAccumulation EUR Class 12,852.89 – (12,852.89) –Accumulation II EUR Class 63,956.89 – (63,956.89) –Accumulation GBP Class 42,000.00 – (42,000.00) –Accumulation II GBP Class 7,340.73 1,482.36 (8,823.09) –Accumulation USD Class 104,945.69 – (104,945.69) –Accumulation II USD Class 134,986.04 569.83 (135,555.87) –Institutional SharesInstitutional Accumulation II USD Class 52,300.00 – (52,300.00) –
* Fund terminated during the year.
Notes to the Financial Statements
16. Share capital, continued
At 30 June 2020Balance at
1 July 2019 Issued RedeemedBalance at
30 June 2020
GAM Star Global Selector*, continued Selling Agent SharesSA C II EUR Class 123,468.12 1,742.53 (125,210.65) –
GAM Star Global GrowthOrdinary SharesAccumulation EUR Class 8,966.80 – – 8,966.80Other SharesPI GBP Class 18,205.12 180.01 (8,640.90) 9,744.23Institutional SharesInstitutional Accumulation CHF Class 10,300.00 3,576.92 – 13,876.92Institutional Accumulation EUR Class 430,649.35 55,036.36 (40,315.66) 445,370.05Institutional Accumulation U EUR Class 105,305.60 – (15,257.12) 90,048.48Institutional Accumulation GBP Class 814,458.90 169,569.28 (392,706.64) 591,321.54Institutional Accumulation USD Class 684,865.63 154,628.83 (193,604.05) 645,890.41Selling Agent SharesC AUD Class 18,188.84 900.00 (18,188.84) 900.00U AUD Class 106,113.48 – (23,563.98) 82,549.50A CHF Class 23,677.33 8,572.94 (6,480.25) 25,770.02A EUR Class 62,954.22 24,083.96 (33,559.29) 53,478.89C EUR Class 1,234,905.81 159,947.00 (353,527.28) 1,041,325.53F EUR Class 16,046.95 – – 16,046.95G EUR Class 46,074.45 4,470.66 (17,237.69) 33,307.42Z EUR Class 60,061.15 261,017.62 (7,741.25) 313,337.52A GBP Class 754,573.47 149,111.22 (609,118.42) 294,566.27C GBP Class 2,229,755.63 122,895.40 (877,022.96) 1,475,628.07F GBP Class 320,977.09 4,849.01 (175,204.56) 150,621.54G GBP Class 364,742.24 6,001.22 (201,624.58) 169,118.88T GBP Class 124,005.04 – (38,298.86) 85,706.18U GBP Class 1,025,730.40 5,537.73 (192,293.88) 838,974.25Z GBP Class 1,169,514.72 160,008.46 (294,904.91) 1,034,618.27A SGD Class 282,857.14 23,595.05 (153,691.06) 152,761.13A USD Class 855,586.72 178,889.49 (392,142.98) 642,333.23C USD Class 5,080,860.28 484,441.15 (635,048.24) 4,930,253.19F USD Class 114,272.47 4,906.30 (53,123.96) 66,054.81G USD Class 86,660.13 2,287.90 (54,399.17) 34,548.86T USD Class 158,521.92 21.14 (127,571.62) 30,971.44U USD Class 69,584.07 – (18,075.13) 51,508.94Non UK RFSAccumulation GBP Class 67,788.74 – (62,637.08) 5,151.66Accumulation USD Class 150,023.60 – (30,882.06) 119,141.54
GAM Star Interest TrendNon UK RFSAccumulation USD Class 5,031,667.65 333,721.37 (1,467,486.69) 3,897,902.33
GAM Star Japan LeadersOrdinary SharesAccumulation EUR Class 76,017.58 111,012.01 (28,857.13) 158,172.46Accumulation GBP Class 2,519.97 770.29 (1,622.85) 1,667.41Accumulation JPY Class 913,941.04 26,682.49 (193,579.07) 747,044.46Accumulation USD Class 238,680.61 605,494.01 (202,145.82) 642,028.80Income EUR Class 6,749.98 849.03 (908.03) 6,690.98Income GBP Class 1,126.70 446.65 (94.66) 1,478.69Income USD Class 14,266.85 – (621.71) 13,645.14Institutional SharesInstitutional Accumulation CHF Class 1,690,640.28 327,327.23 (248,152.88) 1,769,814.63Institutional Accumulation EUR Class 3,399,142.23 8,685,001.64 (1,102,604.06) 10,981,539.81Institutional Accumulation GBP Class 459,320.79 176,449.41 (315,864.79) 319,905.41Institutional Accumulation JPY Class 1,731,780.61 139,048.42 (445,618.78) 1,425,210.25Institutional Accumulation USD Class 1,854,843.36 7,840,271.50 (7,168,122.07) 2,526,992.79
* Fund terminated during the year.

320
GAM Star Fund p.l.c.
Notes to the Financial Statements
16. Share capital, continued
At 30 June 2020Balance at
1 July 2019 Issued RedeemedBalance at
30 June 2020
GAM Star Japan Leaders, continuedInstitutional Hedged Accumulation EUR Class 453,155.22 214,973.86 (463,578.92) 204,550.16Institutional Hedged Accumulation USD Class 297,537.86 670,497.45 (127,255.38) 840,779.93Institutional Hedged Income EUR Class 1,809,508.00 5,595,994.05 (3,234,382.73) 4,171,119.32Institutional Income GBP Class 99,281.02 5,441.13 (18,972.83) 85,749.32Selling Agent SharesA EUR Class 26,338.79 3,580.59 (12,945.30) 16,974.08B EUR Class 2,317.00 – – 2,317.00C EUR Class 89,282.63 2,569.47 (43,675.67) 48,176.43Z GBP Acc – 825,784.84 (56,776.15) 769,008.69A JPY Class 83,992.62 10,420.65 (18,715.86) 75,697.41Z JPY Class 11,712,197.35 454,094.38 (3,382,595.05) 8,783,696.68A USD Class 82,969.38 1,799.37 (17,296.23) 67,472.52Z USD Class 157,824.62 – (123,341.36) 34,483.26Z CHF Class 27,133.14 17,761.95 (9,044.38) 35,850.71Non UK RFSAccumulation JPY Class 213,259.21 – (151,000.66) 62,258.55Accumulation USD Class 681,893.91 12,258.19 (121,445.75) 572,706.35
GAM Star MBS Total ReturnOrdinary SharesAccumulation Hedged CHF Class 8,468.00 – (6,620.00) 1,848.00Accumulation Hedged EUR Class 941,974.17 748,624.39 (611,529.24) 1,079,069.32Accumulation Hedged SEK Class 743.72 – (743.72) –Accumulation USD Class 16,141,113.91 5,247,707.67 (7,738,212.96) 13,650,608.62Income USD Class 2,472,163.98 1,149,228.55 (1,041,914.05) 2,579,478.48Institutional SharesInstitutional Accumulation GBP Class 5,898,879.94 2,194,208.04 (1,879,205.92) 6,213,882.06Institutional Accumulation USD Class 24,083,569.78 10,263,837.81 (18,343,251.04) 16,004,156.55Institutional Hedged Accumulation CHF Class 76,389.58 355,096.00 (207,860.39) 223,625.19Institutional Hedged Accumulation EUR Class 22,403,908.26 8,558,245.67 (20,372,895.82) 10,589,258.11Institutional Hedged Accumulation JPY Class 613,845.89 21,662.69 (46,372.59) 589,135.99Institutional Hedged Accumulation SEK Class 2,705,314.77 2,126,342.33 (1,924,326.96) 2,907,330.14Institutional Hedged Income EUR Class 1,159,053.39 1,957,407.61 (507,979.05) 2,608,481.95Institutional Income GBP Class 192,755.03 17,334.59 (68,646.38) 141,443.24Institutional Income USD Class 1,007,661.75 314,161.84 (308,550.65) 1,013,272.94Selling Agent SharesA EUR Class 105,036.57 75,178.46 (134,449.65) 45,765.38C EUR Class 316,687.54 9,204.00 (148,299.53) 177,592.01U EUR Class 298,087.34 – – 298,087.34W GBP Class 4,424,853.90 944,348.44 (2,277,415.72) 3,091,786.62A USD Class 29,442.81 339,097.48 (69,540.37) 298,999.92Income II CQ USD Class 302,700.38 529,753.85 (46,262.12) 786,192.11Z USD Class 18,865,112.93 20,012,704.25 (21,475,466.68) 17,402,350.50Z II USD Class 89,529.99 68,672.47 (29,843.32) 128,359.14R SharesAccumulation R USD Class 15,500.00 491,848.03 (352,716.48) 154,631.55Accumulation Hedge R EUR Class 1,356,521.32 2,620,386.32 (1,508,289.02) 2,468,618.62
GAM Systematic Alternative Risk PremiaInstitutional SharesInstitutional Accumulation EUR Class 4,840,513.39 1,147,282.82 (3,605,098.29) 2,382,697.92Institutional Accumulation GBP Class 17,589.40 3,844.61 (9,922.50) 11,511.51Institutional Accumulation JPY Class 949,106.72 – (237,338.35) 711,768.37Institutional Accumulation SEK Class 76.39 – (76.39) –Institutional Accumulation USD Class 292,922.36 67,243.42 (17,676.29) 342,489.49Institutional Hedge Accumulation CHF Class 2,296,398.66 337,164.48 (1,948,094.90) 685,468.24Selling Agent SharesZ CHF Class 7,531,761.54 859,851.55 (8,389,507.08) 2,106.01C EUR Class 74,193.53 – (9,767.96) 64,425.57Z EUR Class 2,198,707.00 101,572.00 (2,300,279.00) –X USD Class 6,135.92 – (4,918.90) 1,217.02

321
Notes to the Financial Statements
16. Share capital, continued
At 30 June 2020Balance at
1 July 2019 Issued RedeemedBalance at
30 June 2020
GAM Star Japan Leaders, continuedInstitutional Hedged Accumulation EUR Class 453,155.22 214,973.86 (463,578.92) 204,550.16Institutional Hedged Accumulation USD Class 297,537.86 670,497.45 (127,255.38) 840,779.93Institutional Hedged Income EUR Class 1,809,508.00 5,595,994.05 (3,234,382.73) 4,171,119.32Institutional Income GBP Class 99,281.02 5,441.13 (18,972.83) 85,749.32Selling Agent SharesA EUR Class 26,338.79 3,580.59 (12,945.30) 16,974.08B EUR Class 2,317.00 – – 2,317.00C EUR Class 89,282.63 2,569.47 (43,675.67) 48,176.43Z GBP Acc – 825,784.84 (56,776.15) 769,008.69A JPY Class 83,992.62 10,420.65 (18,715.86) 75,697.41Z JPY Class 11,712,197.35 454,094.38 (3,382,595.05) 8,783,696.68A USD Class 82,969.38 1,799.37 (17,296.23) 67,472.52Z USD Class 157,824.62 – (123,341.36) 34,483.26Z CHF Class 27,133.14 17,761.95 (9,044.38) 35,850.71Non UK RFSAccumulation JPY Class 213,259.21 – (151,000.66) 62,258.55Accumulation USD Class 681,893.91 12,258.19 (121,445.75) 572,706.35
GAM Star MBS Total ReturnOrdinary SharesAccumulation Hedged CHF Class 8,468.00 – (6,620.00) 1,848.00Accumulation Hedged EUR Class 941,974.17 748,624.39 (611,529.24) 1,079,069.32Accumulation Hedged SEK Class 743.72 – (743.72) –Accumulation USD Class 16,141,113.91 5,247,707.67 (7,738,212.96) 13,650,608.62Income USD Class 2,472,163.98 1,149,228.55 (1,041,914.05) 2,579,478.48Institutional SharesInstitutional Accumulation GBP Class 5,898,879.94 2,194,208.04 (1,879,205.92) 6,213,882.06Institutional Accumulation USD Class 24,083,569.78 10,263,837.81 (18,343,251.04) 16,004,156.55Institutional Hedged Accumulation CHF Class 76,389.58 355,096.00 (207,860.39) 223,625.19Institutional Hedged Accumulation EUR Class 22,403,908.26 8,558,245.67 (20,372,895.82) 10,589,258.11Institutional Hedged Accumulation JPY Class 613,845.89 21,662.69 (46,372.59) 589,135.99Institutional Hedged Accumulation SEK Class 2,705,314.77 2,126,342.33 (1,924,326.96) 2,907,330.14Institutional Hedged Income EUR Class 1,159,053.39 1,957,407.61 (507,979.05) 2,608,481.95Institutional Income GBP Class 192,755.03 17,334.59 (68,646.38) 141,443.24Institutional Income USD Class 1,007,661.75 314,161.84 (308,550.65) 1,013,272.94Selling Agent SharesA EUR Class 105,036.57 75,178.46 (134,449.65) 45,765.38C EUR Class 316,687.54 9,204.00 (148,299.53) 177,592.01U EUR Class 298,087.34 – – 298,087.34W GBP Class 4,424,853.90 944,348.44 (2,277,415.72) 3,091,786.62A USD Class 29,442.81 339,097.48 (69,540.37) 298,999.92Income II CQ USD Class 302,700.38 529,753.85 (46,262.12) 786,192.11Z USD Class 18,865,112.93 20,012,704.25 (21,475,466.68) 17,402,350.50Z II USD Class 89,529.99 68,672.47 (29,843.32) 128,359.14R SharesAccumulation R USD Class 15,500.00 491,848.03 (352,716.48) 154,631.55Accumulation Hedge R EUR Class 1,356,521.32 2,620,386.32 (1,508,289.02) 2,468,618.62
GAM Systematic Alternative Risk PremiaInstitutional SharesInstitutional Accumulation EUR Class 4,840,513.39 1,147,282.82 (3,605,098.29) 2,382,697.92Institutional Accumulation GBP Class 17,589.40 3,844.61 (9,922.50) 11,511.51Institutional Accumulation JPY Class 949,106.72 – (237,338.35) 711,768.37Institutional Accumulation SEK Class 76.39 – (76.39) –Institutional Accumulation USD Class 292,922.36 67,243.42 (17,676.29) 342,489.49Institutional Hedge Accumulation CHF Class 2,296,398.66 337,164.48 (1,948,094.90) 685,468.24Selling Agent SharesZ CHF Class 7,531,761.54 859,851.55 (8,389,507.08) 2,106.01C EUR Class 74,193.53 – (9,767.96) 64,425.57Z EUR Class 2,198,707.00 101,572.00 (2,300,279.00) –X USD Class 6,135.92 – (4,918.90) 1,217.02
Notes to the Financial Statements
16. Share capital, continued
At 30 June 2020Balance at
1 July 2019 Issued RedeemedBalance at
30 June 2020
GAM Systematic Core MacroOrdinary SharesAccumulation EUR Class 10,000.00 – (10,000.00) –Accumulation GBP Class 20,306.61 4,308.92 (8,994.92) 15,620.61Institutional SharesInstitutional Accumulation EUR Class 172,886.62 33,716.19 (126,011.66) 80,591.15Institutional Accumulation USD Class 150,815.07 101,697.50 (122,902.51) 129,610.06Selling Agent SharesC EUR Class 20,360.88 – (20,360.88) –W EUR Class 1,041,777.54 314,703.42 (1,356,480.96) –X EUR Class 256.58 – (256.58) –W GBP Class 1,861,353.08 39,572.68 (1,839,904.06) 61,021.70Z GBP Class 122,850.24 – – 122,850.24W USD Class 672,285.05 372.00 (668,499.09) 4,157.96Z USD Class 9,658.81 489,535.18 (9,658.81) 489,535.18
GAM Systematic Global Equity Market Neutral* Ordinary SharesAccumulation GBP Class 116,625.16 – (116,625.16) –Institutional SharesInstitutional Accumulation EUR Class 138,265.45 – (138,265.45) –Institutional Accumulation USD Class 140,235.91 – (140,235.91) –Selling Agent SharesC EUR Class 138,108.83 – (138,108.83) –Z GBP Class 320,475.70 – (320,475.70) –W USD Class 10,000.00 – (10,000.00) –Z USD Class 743,394.81 – (743,394.81) –
GAM Star Tactical OpportunitiesInstitutional SharesInstitutional Accumulation CHF Class 14,958.57 – – 14,958.57Institutional Accumulation EUR Class 1,292,898.07 19,500.00 (426,997.87) 885,400.20Institutional Accumulation GBP Class 324,669.01 148,081.68 (110,273.10) 362,477.59Institutional Accumulation USD Class 1,897,470.40 56,191.47 (1,702,803.09) 250,858.78Selling Agent SharesX EUR Acc – 1,621.43 (318.45) 1,302.98Non UK RFSAccumulation GBP Class 114,854.98 – (57,689.43) 57,165.55Accumulation USD Class 984,481.10 – (52,702.46) 931,778.64
GAM Star Target Return*Institutional SharesInstitutional Accumulation CHF Class 200.00 – (200.00) –Institutional Accumulation EUR Class 182,175.56 – (182,175.56) –Institutional Accumulation GBP Class 23,105.48 – (23,105.48) –Institutional Accumulation USD Class 23,563.70 – (23,563.70) –Selling Agent SharesZII CHF Class 6,527.03 – (6,527.03) –X EUR Class 116.81 388.13 (504.94) –ZII EUR Class 251,488.90 – (251,488.90) –ZII GBP Class 176,123.80 520.51 (176,644.31) –ZII USD Class 2,200,997.07 – (2,200,997.07) –
GAM Star Target Return Plus*Institutional SharesInstitutional Accumulation GBP Class 716,000.00 – (716,000.00) –
GAM Star Disruptive GrowthOrdinary SharesAccumulation EUR Class 134,602.00 114,444.89 (70,273.38) 178,773.51Accumulation GBP Class 67,117.64 8,975.01 (9,861.92) 66,230.73Accumulation USD Class 1,355,060.24 94,812.59 (530,427.76) 919,445.07Income USD Class 1,157.60 330.96 (250.00) 1,238.56
* Fund terminated during the year.

322
GAM Star Fund p.l.c.
Notes to the Financial Statements
16. Share capital, continued
At 30 June 2020Balance at
1 July 2019 Issued RedeemedBalance at
30 June 2020
GAM Star Disruptive Growth, continuedInstitutional SharesInstitutional Accumulation EUR Class 61,681.38 134,571.78 (90,206.47) 106,046.69Institutional Accumulation GBP Class 1,430,393.86 345,332.84 (282,338.63) 1,493,388.07Institutional Accumulation USD Class 1,391,168.10 132,817.43 (387,231.44) 1,136,754.09Institutional Hedged Accumulation GBP Class 31,868.33 2,211.12 (1,065.24) 33,014.21Institutional Income GBP Class 468,304.43 55,145.07 (251,435.39) 272,014.11Selling Agent SharesAccumulation Z GBP II Class 6,554.07 1,811.28 (3,277.03) 5,088.32Z GBP Class 1,546,721.38 836,631.78 (597,398.27) 1,785,954.89A USD Class 160,011.62 44,565.82 (63,312.00) 141,265.44C USD Class 100,821.42 5,376.19 (42,533.17) 63,664.44Z USD Class 928,648.99 192,725.08 (120,169.93) 1,001,204.14R Hedged SharesAccumulation Hedged R EUR Class 15,955.67 – (13,113.85) 2,841.82
GAM Star US All Cap EquityOrdinary SharesAccumulation EUR Class 97,327.71 5,640.46 (36,860.33) 66,107.84Accumulation GBP Class 27,028.96 579.32 (12,993.75) 14,614.53Accumulation USD Class 2,106,093.15 4,435.44 (281,589.08) 1,828,939.51Income USD Class 81,389.05 – (43,993.69) 37,395.36Institutional SharesInstitutional Accumulation EUR Class 985.35 6.90 (27.89) 964.36Institutional Accumulation GBP Class 101,851.24 5,892.85 (32,652.54) 75,091.55Institutional Accumulation USD Class 471,546.83 3,060.50 (100,373.39) 374,233.94Institutional Income GBP Class 8,964.92 – (8,964.92) –Institutional Income USD Class 84,068.68 – (55,051.89) 29,016.79Selling Agent SharesC EUR Class 5,361.27 – (592.33) 4,768.94A USD Class 420,976.78 6,253.97 (94,296.05) 332,934.70C USD Class 142,039.36 – (39,699.56) 102,339.80
GAM Star Worldwide EquityOrdinary SharesAccumulation EUR Class 209,731.34 200.00 (82,939.58) 126,991.76Accumulation GBP Class 1,721,906.34 – (638,347.97) 1,083,558.37Accumulation USD Class 8,134.86 431.82 (1,030.01) 7,536.67Income GBP Class 11,978.71 316.48 (5,250.17) 7,045.02Income USD Class 7,644.67 9.95 (1,000.11) 6,654.51Ordinary Hedge SharesAccumulation Hedge C EUR Class – 30,780.04 (8,217.24) 22,562.80Accumulation Hedge EUR Class – 59,905.20 (27,394.55) 32,510.65Accumulation Hedge GBP Class – 14,047.04 (5,097.96) 8,949.08Institutional SharesInstitutional Accumulation USD Class 984,321.92 – (690,329.96) 293,991.96Institutional Income GBP Class 254,060.04 4,203.65 (92,676.99) 165,586.70Institutional Income USD Class 38,986.22 13,005.80 (42,486.22) 9,505.80Selling Agent SharesC EUR Class 22,247.18 1,912.08 (6,313.32) 17,845.94ZII GBP Class 29,381.87 17,428.50 (9,793.96) 37,016.41A USD Class 22,107.42 4,419.74 (10,683.22) 15,843.94
GAM Systematic Dynamic CreditInstitutional SharesInstitutional Accumulation EUR Class 177,561.99 – – 177,561.99Institutional Accumulation USD Class 203,918.00 – – 203,918.00Selling Agent SharesZ CHF Acc Class – 537,070.00 (536,070.00) 1,000.00Z EUR Accumulation 454,269.19 431,853.86 (614,499.00) 271,624.05Z GBP Accumulation 160,620.83 – – 160,620.83Z USD Accumulation 203,698.20 8,505.55 – 212,203.75

323
Notes to the Financial Statements
16. Share capital, continued
At 30 June 2020Balance at
1 July 2019 Issued RedeemedBalance at
30 June 2020
GAM Star Disruptive Growth, continuedInstitutional SharesInstitutional Accumulation EUR Class 61,681.38 134,571.78 (90,206.47) 106,046.69Institutional Accumulation GBP Class 1,430,393.86 345,332.84 (282,338.63) 1,493,388.07Institutional Accumulation USD Class 1,391,168.10 132,817.43 (387,231.44) 1,136,754.09Institutional Hedged Accumulation GBP Class 31,868.33 2,211.12 (1,065.24) 33,014.21Institutional Income GBP Class 468,304.43 55,145.07 (251,435.39) 272,014.11Selling Agent SharesAccumulation Z GBP II Class 6,554.07 1,811.28 (3,277.03) 5,088.32Z GBP Class 1,546,721.38 836,631.78 (597,398.27) 1,785,954.89A USD Class 160,011.62 44,565.82 (63,312.00) 141,265.44C USD Class 100,821.42 5,376.19 (42,533.17) 63,664.44Z USD Class 928,648.99 192,725.08 (120,169.93) 1,001,204.14R Hedged SharesAccumulation Hedged R EUR Class 15,955.67 – (13,113.85) 2,841.82
GAM Star US All Cap EquityOrdinary SharesAccumulation EUR Class 97,327.71 5,640.46 (36,860.33) 66,107.84Accumulation GBP Class 27,028.96 579.32 (12,993.75) 14,614.53Accumulation USD Class 2,106,093.15 4,435.44 (281,589.08) 1,828,939.51Income USD Class 81,389.05 – (43,993.69) 37,395.36Institutional SharesInstitutional Accumulation EUR Class 985.35 6.90 (27.89) 964.36Institutional Accumulation GBP Class 101,851.24 5,892.85 (32,652.54) 75,091.55Institutional Accumulation USD Class 471,546.83 3,060.50 (100,373.39) 374,233.94Institutional Income GBP Class 8,964.92 – (8,964.92) –Institutional Income USD Class 84,068.68 – (55,051.89) 29,016.79Selling Agent SharesC EUR Class 5,361.27 – (592.33) 4,768.94A USD Class 420,976.78 6,253.97 (94,296.05) 332,934.70C USD Class 142,039.36 – (39,699.56) 102,339.80
GAM Star Worldwide EquityOrdinary SharesAccumulation EUR Class 209,731.34 200.00 (82,939.58) 126,991.76Accumulation GBP Class 1,721,906.34 – (638,347.97) 1,083,558.37Accumulation USD Class 8,134.86 431.82 (1,030.01) 7,536.67Income GBP Class 11,978.71 316.48 (5,250.17) 7,045.02Income USD Class 7,644.67 9.95 (1,000.11) 6,654.51Ordinary Hedge SharesAccumulation Hedge C EUR Class – 30,780.04 (8,217.24) 22,562.80Accumulation Hedge EUR Class – 59,905.20 (27,394.55) 32,510.65Accumulation Hedge GBP Class – 14,047.04 (5,097.96) 8,949.08Institutional SharesInstitutional Accumulation USD Class 984,321.92 – (690,329.96) 293,991.96Institutional Income GBP Class 254,060.04 4,203.65 (92,676.99) 165,586.70Institutional Income USD Class 38,986.22 13,005.80 (42,486.22) 9,505.80Selling Agent SharesC EUR Class 22,247.18 1,912.08 (6,313.32) 17,845.94ZII GBP Class 29,381.87 17,428.50 (9,793.96) 37,016.41A USD Class 22,107.42 4,419.74 (10,683.22) 15,843.94
GAM Systematic Dynamic CreditInstitutional SharesInstitutional Accumulation EUR Class 177,561.99 – – 177,561.99Institutional Accumulation USD Class 203,918.00 – – 203,918.00Selling Agent SharesZ CHF Acc Class – 537,070.00 (536,070.00) 1,000.00Z EUR Accumulation 454,269.19 431,853.86 (614,499.00) 271,624.05Z GBP Accumulation 160,620.83 – – 160,620.83Z USD Accumulation 203,698.20 8,505.55 – 212,203.75
Notes to the Financial Statements
16. Share capital, continued
At 30 June 2019Balance at
1 July 2018 Issued RedeemedBalance at
30 June 2019
GAM Star Absolute Return BondOrdinary SharesAccumulation SEK Class 12,528.15 – (11,513.86) 1,014.29Institutional SharesInstitutional Accumulation EUR Class 9,003,432.02 314,473.35 (8,563,673.30) 754,232.07Institutional Accumulation GBP Class 13,176,344.04 18,701.73 (12,126,921.69) 1,068,124.08Institutional Income II GBP Class 8,308,102.34 234,112.89 (7,857,140.34) 685,074.89Other sharesW GBP Class 6,647,819.18 10,153.11 (6,145,919.28) 512,053.01Z GBP Class 15,852,048.49 7,099,600.58 (21,093,710.48) 1,857,938.59Income II Z EUR Class 234,612.00 – (215,621.77) 18,990.23Income II Z GBP Class 8,115,214.87 4,570.64 (7,462,526.66) 657,258.85
GAM Star Absolute Return Bond DefenderInstitutional SharesInstitutional Accumulation EUR Class 1,515,826.42 1,141.99 (1,439,807.57) 77,160.84Institutional Accumulation GBP Class 189,286.68 2,393,830.36 (2,451,873.99) 131,243.05Institutional Accumulation USD Class 265,367.83 7,202.02 (260,969.24) 11,600.61
GAM Star Absolute Return Bond PlusInstitutional SharesInstitutional Accumulation EUR Class 894,477.10 26,910.07 (819,641.94) 101,745.23Institutional Accumulation GBP Class 5,984,889.75 9,569.52 (5,343,769.01) 650,690.26Institutional Accumulation SEK Class 2,014,588.27 – (1,792,101.20) 222,487.07Institutional Accumulation USD Class 344,852.60 – (311,058.18) 33,794.42Other sharesAccumulation II Z GBP Class 25,024,102.82 1,886.19 (22,262,493.09) 2,763,495.92Selling Agent SharesZ EUR Class 1,938,132.26 445.02 (1,725,319.05) 213,258.23Z GBP Class 47,011,107.07 41,355.01 (41,856,518.54) 5,195,943.54
GAM Star Absolute Return MacroInstitutional SharesInstitutional Income GBP Class 8,935,065.07 12,405.13 (8,557,620.38) 389,849.82Selling Agent SharesAccumulation Z GBP Class 21,643.60 – (19,479.24) 2,164.36Income X USD Class 7,712.24 – (6,941.02) 771.22
GAM Star Alpha SpectrumOrdinary SharesAccumulation EUR Class 5,528,942.59 60,518.41 (258,405.90) 5,331,055.10
GAM Star Alpha TechnologyOrdinary SharesIncome EUR Class 421,031.70 93,575.00 (91,001.03) 423,605.67Income USD Class 87,343.41 30,016.41 (11,840.00) 105,519.82Institutional SharesInstitutional Accumulation EUR Class – 164,691.38 (785.88) 163,905.50Selling Agent SharesZ GBP Class 290,121.31 39,248.12 (39,544.83) 289,824.60Z II GBP Class – 20,152.14 – 20,152.14Z USD Class 274,590.00 – (4,000.00) 270,590.00
GAM Star Asian EquityOrdinary SharesAccumulation CHF Class 15,304.72 3,513.94 (12,015.58) 6,803.08Accumulation EUR Class 38,182.95 3,001.75 (8,416.06) 32,768.64Accumulation GBP Class 63,728.53 1,053.16 (13,329.38) 51,452.31Accumulation USD Class 1,043,999.92 27,571.83 (284,681.05) 786,890.70Income GBP Class 172,227.47 2,326.77 (11,247.08) 163,307.16Institutional SharesInstitutional Accumulation GBP Class 1,466,670.43 156,091.34 (1,529,373.67) 93,388.10

324
GAM Star Fund p.l.c.
Notes to the Financial Statements
16. Share capital, continued
At 30 June 2019Balance at
1 July 2018 Issued RedeemedBalance at
30 June 2019
GAM Star Asia-Pacific EquityOrdinary SharesAccumulation CHF Class 127,651.31 3,645.17 (59,516.29) 71,780.19Accumulation EUR Class 35,161.56 113.54 (5,825.63) 29,449.47Accumulation GBP Class 523,002.63 20,512.73 (8,676.61) 534,838.75Accumulation USD Class 367,331.77 – (163,300.00) 204,031.77Income EUR Class 656.62 9.58 (5.34) 660.86Income GBP Class 529,426.21 2,284.50 (303,885.46) 227,825.25Income USD Class 354,778.59 592.65 (91,887.70) 263,483.54Institutional SharesInstitutional Accumulation EUR Class 20,120.03 22.84 – 20,142.87Selling Agent SharesAccumulation Z GBP Class 1,614.20 2,637.75 (538.07) 3,713.88C EUR Class 18,598.81 2,607.95 (7,020.16) 14,186.60
GAM Star Global BalancedOrdinary SharesAccumulation GBP Class 31,864.77 4,161.60 (15,121.88) 20,904.49Accumulation II GBP Class 228,158.69 553.71 (10,933.90) 217,778.50Accumulation USD Class 261,115.95 13,800.87 (29,622.25) 245,294.57Accumulation PI USD Class 12,962.20 – – 12,962.20Income II GBP Class 172,529.17 11.33 (22,308.86) 150,231.64Institutional SharesInstitutional Accumulation AUD Class 129,762.87 40,676.96 (87,305.27) 83,134.56Institutional Accumulation EUR Class 649,368.79 495,388.38 (463,658.26) 681,098.91Institutional Accumulation GBP Class 3,898,289.52 1,267,733.83 (2,045,620.18) 3,120,403.17Institutional Accumulation SGD Class 148,351.39 – (53,683.94) 94,667.45Institutional Accumulation USD Class 3,463,513.22 502,846.31 (1,933,646.60) 2,032,712.93Institutional Income GBP Class 446,635.90 3,366.24 (326,723.05) 123,279.09Other SharesPI GBP Class 85,419.68 4,553.78 (15,218.80) 74,754.66Selling Agent SharesAccumulation Open II Acc EUR 51,418.76 – (4,295.89) 47,122.87C AUD Class 178,964.09 – (96,811.09) 82,153.00T AUD Class 176,143.69 – (142,993.83) 33,149.86U AUD Class 18,862.90 12,871.20 (365.92) 31,368.18A CHF Class 48,984.02 42,446.34 (17,184.66) 74,245.70C CHF Class 168,903.39 1,981.42 (47,861.21) 123,023.60F CHF Class 69,854.76 14,405.24 (5,493.52) 78,766.48A EUR Class 259,475.72 149,931.32 (82,009.73) 327,397.31C EUR Class 3,946,862.00 271,032.02 (815,404.96) 3,402,489.06F EUR Class 104,049.80 65,283.59 (96,054.15) 73,279.24G EUR Class 193,500.46 117,141.46 (166,186.09) 144,455.83T EUR Class 70,000.01 – (17,091.07) 52,908.94U EUR Class 232,102.95 31,278.34 (55,613.23) 207,768.06Z EUR Class 250,849.73 82,348.67 (45,016.94) 288,181.46A GBP Class 1,684,052.60 391,051.41 (674,807.01) 1,400,297.00C GBP Class 10,457,152.80 287,440.95 (4,229,846.37) 6,514,747.38F GBP Class 1,804,728.91 640,728.40 (1,081,481.58) 1,363,975.73G GBP Class 1,399,039.23 596,098.44 (808,619.13) 1,186,518.54T GBP Class 775,445.43 8,612.82 (290,753.74) 493,304.51U GBP Class 1,338,767.13 428,362.16 (204,181.94) 1,562,947.35Z GBP Class 1,667,933.59 379,866.64 (1,283,996.69) 763,803.54C JPY Class 33,997.32 1,351.24 (22,863.55) 12,485.01A SGD Class 48,007.82 – (29,400.77) 18,607.05A USD Class 1,561,523.39 458,592.28 (916,326.45) 1,103,789.22C USD Class 8,482,707.59 997,868.76 (1,260,637.23) 8,219,939.12F USD Class 433,525.44 104,111.27 (284,198.80) 253,437.91G USD Class 269,437.97 45,785.69 (175,706.81) 139,516.85T USD Class 909,416.66 – (574,126.10) 335,290.56U USD Class 291,187.23 34,774.21 (28,318.52) 297,642.92

325
Notes to the Financial Statements
16. Share capital, continued
At 30 June 2019Balance at
1 July 2018 Issued RedeemedBalance at
30 June 2019
GAM Star Asia-Pacific EquityOrdinary SharesAccumulation CHF Class 127,651.31 3,645.17 (59,516.29) 71,780.19Accumulation EUR Class 35,161.56 113.54 (5,825.63) 29,449.47Accumulation GBP Class 523,002.63 20,512.73 (8,676.61) 534,838.75Accumulation USD Class 367,331.77 – (163,300.00) 204,031.77Income EUR Class 656.62 9.58 (5.34) 660.86Income GBP Class 529,426.21 2,284.50 (303,885.46) 227,825.25Income USD Class 354,778.59 592.65 (91,887.70) 263,483.54Institutional SharesInstitutional Accumulation EUR Class 20,120.03 22.84 – 20,142.87Selling Agent SharesAccumulation Z GBP Class 1,614.20 2,637.75 (538.07) 3,713.88C EUR Class 18,598.81 2,607.95 (7,020.16) 14,186.60
GAM Star Global BalancedOrdinary SharesAccumulation GBP Class 31,864.77 4,161.60 (15,121.88) 20,904.49Accumulation II GBP Class 228,158.69 553.71 (10,933.90) 217,778.50Accumulation USD Class 261,115.95 13,800.87 (29,622.25) 245,294.57Accumulation PI USD Class 12,962.20 – – 12,962.20Income II GBP Class 172,529.17 11.33 (22,308.86) 150,231.64Institutional SharesInstitutional Accumulation AUD Class 129,762.87 40,676.96 (87,305.27) 83,134.56Institutional Accumulation EUR Class 649,368.79 495,388.38 (463,658.26) 681,098.91Institutional Accumulation GBP Class 3,898,289.52 1,267,733.83 (2,045,620.18) 3,120,403.17Institutional Accumulation SGD Class 148,351.39 – (53,683.94) 94,667.45Institutional Accumulation USD Class 3,463,513.22 502,846.31 (1,933,646.60) 2,032,712.93Institutional Income GBP Class 446,635.90 3,366.24 (326,723.05) 123,279.09Other SharesPI GBP Class 85,419.68 4,553.78 (15,218.80) 74,754.66Selling Agent SharesAccumulation Open II Acc EUR 51,418.76 – (4,295.89) 47,122.87C AUD Class 178,964.09 – (96,811.09) 82,153.00T AUD Class 176,143.69 – (142,993.83) 33,149.86U AUD Class 18,862.90 12,871.20 (365.92) 31,368.18A CHF Class 48,984.02 42,446.34 (17,184.66) 74,245.70C CHF Class 168,903.39 1,981.42 (47,861.21) 123,023.60F CHF Class 69,854.76 14,405.24 (5,493.52) 78,766.48A EUR Class 259,475.72 149,931.32 (82,009.73) 327,397.31C EUR Class 3,946,862.00 271,032.02 (815,404.96) 3,402,489.06F EUR Class 104,049.80 65,283.59 (96,054.15) 73,279.24G EUR Class 193,500.46 117,141.46 (166,186.09) 144,455.83T EUR Class 70,000.01 – (17,091.07) 52,908.94U EUR Class 232,102.95 31,278.34 (55,613.23) 207,768.06Z EUR Class 250,849.73 82,348.67 (45,016.94) 288,181.46A GBP Class 1,684,052.60 391,051.41 (674,807.01) 1,400,297.00C GBP Class 10,457,152.80 287,440.95 (4,229,846.37) 6,514,747.38F GBP Class 1,804,728.91 640,728.40 (1,081,481.58) 1,363,975.73G GBP Class 1,399,039.23 596,098.44 (808,619.13) 1,186,518.54T GBP Class 775,445.43 8,612.82 (290,753.74) 493,304.51U GBP Class 1,338,767.13 428,362.16 (204,181.94) 1,562,947.35Z GBP Class 1,667,933.59 379,866.64 (1,283,996.69) 763,803.54C JPY Class 33,997.32 1,351.24 (22,863.55) 12,485.01A SGD Class 48,007.82 – (29,400.77) 18,607.05A USD Class 1,561,523.39 458,592.28 (916,326.45) 1,103,789.22C USD Class 8,482,707.59 997,868.76 (1,260,637.23) 8,219,939.12F USD Class 433,525.44 104,111.27 (284,198.80) 253,437.91G USD Class 269,437.97 45,785.69 (175,706.81) 139,516.85T USD Class 909,416.66 – (574,126.10) 335,290.56U USD Class 291,187.23 34,774.21 (28,318.52) 297,642.92
Notes to the Financial Statements
16. Share capital, continued
At 30 June 2019Balance at
1 July 2018 Issued RedeemedBalance at
30 June 2019
GAM Star Global Balanced, continuedNon UK RFSAccumulation GBP Class 93,301.71 – (5,641.19) 87,660.52Accumulation USD Class 244,979.67 – (31,694.34) 213,285.33
GAM Star Capital Appreciation US EquityOrdinary SharesAccumulation GBP Class – 4,611.46 – 4,611.46Accumulation USD Class 120,786.04 5,907.69 (62,098.03) 64,595.70Income GBP Class 18,587.07 11.31 (3,441.31) 15,157.07Income USD Class 698,104.21 – (465,006.93) 233,097.28Institutional SharesInstitutional Accumulation GBP Class 370,993.22 180,985.87 (83,234.67) 468,744.42Institutional Accumulation USD Class 1,832,216.69 55,302.73 (581,653.21) 1,305,866.21Institutional Income GBP Class 252,770.81 21,396.43 (74,754.50) 199,412.74Selling Agent SharesZ USD Class – 9,072.57 (9,072.57) –Non UK RFSAccumulation USD Class – 832,848.92 (47,710.85) 785,138.07
GAM Star Cat BondOrdinary SharesAccumulation CHF Class 1,515,431.05 12,298.66 (339,672.44) 1,188,057.27Accumulation EUR Class 4,108,601.94 229,351.58 (1,526,708.36) 2,811,245.16Accumulation GBP Class 225,330.90 324.90 (116,035.15) 109,620.65Accumulation USD Class 4,967,638.27 647,514.01 (1,607,823.28) 4,007,329.00Accumulation A EUR Class 866,720.29 7,723.67 (576,383.03) 298,060.93Accumulation M EUR Class 4,949,993.73 – – 4,949,993.73Hedged Ordinary Accumulation JPY 385,411.25 – (0.01) 385,411.24Income EUR Class 165,825.98 6,843.34 (42,556.23) 130,113.09Income USD Class 182,112.96 6,774.42 (9,263.41) 179,623.97Institutional SharesInstitutional Accumulation CHF Class 17,317,330.61 2,910,281.87 (4,378,813.06) 15,848,799.42Institutional Accumulation EUR Class 43,731,847.76 17,064,946.09 (9,150,023.22) 51,646,770.63Institutional Accumulation GBP Class 2,471,581.37 823,424.37 (220,959.76) 3,074,045.98Institutional Accumulation USD Class 23,386,220.76 4,277,940.67 (6,167,705.27) 21,496,456.16Institutional Hedged Income JPY Class 2,032,246.90 – (5.57) 2,032,241.33Institutional Income EUR Class 11,300,128.81 5,140,666.68 (1,230,211.53) 15,210,583.96Institutional Income GBP Class 1,545,719.19 298,909.67 (574,567.95) 1,270,060.91Institutional Income USD Class 1,534,381.31 814,950.80 (532,675.96) 1,816,656.15Distribution SharesDistribution Quarterly Ordinary USD Class 5,641,913.57 6,824.64 (3,249,655.02) 2,399,083.19
GAM Star Global CautiousOrdinary SharesAccumulation EUR Class 70,420.06 – (66,375.52) 4,044.54Accumulation U EUR Class 229,702.22 75,190.78 (74,972.75) 229,920.25Accumulation GBP Class 58,844.92 8,953.41 (16,675.13) 51,123.20Accumulation U GBP Class 1,778,200.32 205,351.22 (344,098.94) 1,639,452.60Accumulation USD Class 317,381.79 24,645.23 (86,156.25) 255,870.77Income GBP Class 30,745.94 – – 30,745.94Institutional SharesInstitutional Accumulation AUD Class 99,892.48 17,376.15 (43,659.94) 73,608.69Institutional Accumulation EUR Class 425,856.14 147,093.24 (153,065.77) 419,883.61Institutional Accumulation GBP Class 4,694,679.14 725,387.86 (2,544,517.85) 2,875,549.15Institutional Accumulation USD Class 1,364,794.57 136,094.70 (1,126,217.62) 374,671.65Institutional Accumulation Hedged USD Class 184,754.36 1,555.06 (93,449.54) 92,859.88Distribution SharesQuarterly Institutional Income GBP Class 13,687.76 16,650.48 (5,056.76) 25,281.48

326
GAM Star Fund p.l.c.
Notes to the Financial Statements
16. Share capital, continued
At 30 June 2019Balance at
1 July 2018 Issued RedeemedBalance at
30 June 2019
GAM Star Global Cautious, continuedOther sharesPI GBP Class 50,539.19 – (1,514.81) 49,024.38PI USD Class 16,622.50 477.12 (17,099.62) –Selling Agent SharesA AUD Class 15,614.08 – (9,014.08) 6,600.00C AUD Class 78,472.71 – (78,472.71) –T AUD Class 406,052.66 – (272,989.34) 133,063.32U AUD Class 47,100.62 – (10,085.65) 37,014.97U CHF Class 49,608.35 20,525.88 (27,578.34) 42,555.89A EUR Class 129,869.74 59,262.53 (56,357.91) 132,774.36C EUR Class 1,278,411.50 76,800.12 (408,736.63) 946,474.99CQ EUR Class Income II 54,828.91 – (46,611.02) 8,217.89F EUR Class 18,010.58 3,341.22 (16,061.22) 5,290.58G EUR Class 53,557.14 18,361.08 (18,112.35) 53,805.87T EUR Class 29,114.73 – (15,936.99) 13,177.74TQ EUR Class Income II 16,391.22 – (10,353.96) 6,037.26Z EUR Accumulation Class 288,072.28 47,403.12 (6,767.73) 328,707.67A GBP Class 862,942.26 224,732.45 (254,449.48) 833,225.23AQ GBP Class Income II 30,735.27 – – 30,735.27C GBP Class 3,615,011.80 76,625.96 (1,756,999.36) 1,934,638.40CQ GBP Class Income II 406,648.58 10,002.39 (211,366.34) 205,284.63F GBP Class 476,413.96 156,232.71 (324,390.60) 308,256.07G GBP Accumulation Class 550,110.72 289,558.06 (375,647.36) 464,021.42G GBP Income Class 122,607.36 – (23,080.65) 99,526.71T GBP Accumulation Class 284,902.90 – (100,356.94) 184,545.96Z GBP Class 1,063,570.77 226,422.73 (588,238.38) 701,755.12TQ GBP Income II Class 141,581.24 – (89,298.56) 52,282.68A SGD Class 79,069.19 – – 79,069.19A USD Class 987,268.00 140,606.33 (253,912.92) 873,961.41C USD Class 2,589,718.57 582,611.68 (1,131,876.32) 2,040,453.93CQ USD Class Income II 196,691.83 – (126,665.20) 70,026.63F USD Class 108,326.84 26,269.12 (73,132.71) 61,463.25T USD Class 286,147.10 – (48,696.13) 237,450.97U USD Class 414,683.18 103,585.58 (58,386.61) 459,882.15Z USD Class – 1,116,238.08 – 1,116,238.08G Quarterly Income II EUR Class 13,723.70 4,310.34 (537.06) 17,496.98
GAM Star China EquityOrdinary SharesAccumulation EUR Class 1,191,054.38 825,034.05 (1,022,083.52) 994,004.91Accumulation GBP Class 2,381,317.75 805,569.13 (1,860,526.84) 1,326,360.04Accumulation USD Class 17,799,452.50 1,722,449.86 (11,217,236.86) 8,304,665.50Income USD Class 616,214.38 24,934.34 (233,452.30) 407,696.42Institutional SharesInstitutional Accumulation EUR Class 118,159.68 369,615.76 (369,954.23) 117,821.21Institutional Accumulation GBP Class 821,105.68 276,523.07 (572,291.83) 525,336.92Institutional Accumulation USD Class 6,865,293.30 876,090.96 (6,299,851.48) 1,441,532.78Institutional Hedged Accumulation GBP Class 10,000.00 10,000.00 (20,000.00) –Institutional Income EUR Class 208,642.74 126,322.06 (91,475.00) 243,489.80Institutional Income GBP Class 663,476.86 145,672.25 (373,871.04) 435,278.07Institutional Income USD Class 1,149,470.53 566,815.50 (1,534,865.17) 181,420.86Selling Agent SharesC EUR Class 813,594.16 473,451.55 (830,780.11) 456,265.60A USD Class 3,251,572.72 1,545,884.53 (1,873,362.62) 2,924,094.63C USD Class 157,576.89 79,584.86 (91,182.75) 145,979.00Z USD Class 14,555.76 8,004.04 (4,851.92) 17,707.88

327
Notes to the Financial Statements
16. Share capital, continued
At 30 June 2019Balance at
1 July 2018 Issued RedeemedBalance at
30 June 2019
GAM Star Global Cautious, continuedOther sharesPI GBP Class 50,539.19 – (1,514.81) 49,024.38PI USD Class 16,622.50 477.12 (17,099.62) –Selling Agent SharesA AUD Class 15,614.08 – (9,014.08) 6,600.00C AUD Class 78,472.71 – (78,472.71) –T AUD Class 406,052.66 – (272,989.34) 133,063.32U AUD Class 47,100.62 – (10,085.65) 37,014.97U CHF Class 49,608.35 20,525.88 (27,578.34) 42,555.89A EUR Class 129,869.74 59,262.53 (56,357.91) 132,774.36C EUR Class 1,278,411.50 76,800.12 (408,736.63) 946,474.99CQ EUR Class Income II 54,828.91 – (46,611.02) 8,217.89F EUR Class 18,010.58 3,341.22 (16,061.22) 5,290.58G EUR Class 53,557.14 18,361.08 (18,112.35) 53,805.87T EUR Class 29,114.73 – (15,936.99) 13,177.74TQ EUR Class Income II 16,391.22 – (10,353.96) 6,037.26Z EUR Accumulation Class 288,072.28 47,403.12 (6,767.73) 328,707.67A GBP Class 862,942.26 224,732.45 (254,449.48) 833,225.23AQ GBP Class Income II 30,735.27 – – 30,735.27C GBP Class 3,615,011.80 76,625.96 (1,756,999.36) 1,934,638.40CQ GBP Class Income II 406,648.58 10,002.39 (211,366.34) 205,284.63F GBP Class 476,413.96 156,232.71 (324,390.60) 308,256.07G GBP Accumulation Class 550,110.72 289,558.06 (375,647.36) 464,021.42G GBP Income Class 122,607.36 – (23,080.65) 99,526.71T GBP Accumulation Class 284,902.90 – (100,356.94) 184,545.96Z GBP Class 1,063,570.77 226,422.73 (588,238.38) 701,755.12TQ GBP Income II Class 141,581.24 – (89,298.56) 52,282.68A SGD Class 79,069.19 – – 79,069.19A USD Class 987,268.00 140,606.33 (253,912.92) 873,961.41C USD Class 2,589,718.57 582,611.68 (1,131,876.32) 2,040,453.93CQ USD Class Income II 196,691.83 – (126,665.20) 70,026.63F USD Class 108,326.84 26,269.12 (73,132.71) 61,463.25T USD Class 286,147.10 – (48,696.13) 237,450.97U USD Class 414,683.18 103,585.58 (58,386.61) 459,882.15Z USD Class – 1,116,238.08 – 1,116,238.08G Quarterly Income II EUR Class 13,723.70 4,310.34 (537.06) 17,496.98
GAM Star China EquityOrdinary SharesAccumulation EUR Class 1,191,054.38 825,034.05 (1,022,083.52) 994,004.91Accumulation GBP Class 2,381,317.75 805,569.13 (1,860,526.84) 1,326,360.04Accumulation USD Class 17,799,452.50 1,722,449.86 (11,217,236.86) 8,304,665.50Income USD Class 616,214.38 24,934.34 (233,452.30) 407,696.42Institutional SharesInstitutional Accumulation EUR Class 118,159.68 369,615.76 (369,954.23) 117,821.21Institutional Accumulation GBP Class 821,105.68 276,523.07 (572,291.83) 525,336.92Institutional Accumulation USD Class 6,865,293.30 876,090.96 (6,299,851.48) 1,441,532.78Institutional Hedged Accumulation GBP Class 10,000.00 10,000.00 (20,000.00) –Institutional Income EUR Class 208,642.74 126,322.06 (91,475.00) 243,489.80Institutional Income GBP Class 663,476.86 145,672.25 (373,871.04) 435,278.07Institutional Income USD Class 1,149,470.53 566,815.50 (1,534,865.17) 181,420.86Selling Agent SharesC EUR Class 813,594.16 473,451.55 (830,780.11) 456,265.60A USD Class 3,251,572.72 1,545,884.53 (1,873,362.62) 2,924,094.63C USD Class 157,576.89 79,584.86 (91,182.75) 145,979.00Z USD Class 14,555.76 8,004.04 (4,851.92) 17,707.88
Notes to the Financial Statements
16. Share capital, continued
At 30 June 2019Balance at
1 July 2018 Issued RedeemedBalance at
30 June 2019
GAM Star Composite Global EquityOrdinary SharesAccumulation CHF Class 1,227.16 1,800.47 (2,486.49) 541.14Accumulation EUR Class 129,908.13 1,748.13 (32,617.86) 99,038.40Accumulation GBP Class 1,526,529.84 17,653.60 (743,469.37) 800,714.07Accumulation USD Class 504,707.83 29,007.96 (233,605.74) 300,110.05Income GBP Class 313,756.13 3,392.64 (213,406.10) 103,742.67Institutional SharesInstitutional Accumulation EUR Class 631,248.65 74,249.83 (272,559.63) 432,938.85Institutional Accumulation GBP Class 176,612.57 1,357,966.66 (8,045.71) 1,526,533.52Insitutional Accumulation USD Class – 361,031.93 (342.66) 360,689.27Selling Agent SharesAccumulation Z GBP Class 2,500,000.00 – (364,590.79) 2,135,409.21Non UK RFSAccumulation GBP Class 234,048.53 – (18,549.75) 215,498.78Accumulation USD Class 515,408.27 – (155,801.85) 359,606.42
GAM Star Continental European EquityOrdinary SharesAccumulation CHF Class 88,561.57 220,235.11 (22,443.01) 286,353.67Accumulation EUR Class 7,247,381.54 1,680,336.63 (4,943,102.51) 3,984,615.66Accumulation R EUR Class 53,484.03 316,673.83 (270,440.68) 99,717.18Accumulation Z EUR Class 11,376,970.09 470,618.30 (5,417,286.11) 6,430,302.28Accumulation GBP Class 1,194,441.06 81,407.50 (500,242.90) 775,605.66Accumulation Z GBP Class 10,000.00 10,000.00 (20,000.00) –Accumulation Z II GBP Class 3,687,616.99 408,907.29 (1,538,718.38) 2,557,805.90Accumulation USD Class 447,492.05 52,289.09 (255,116.69) 244,664.45Income Z EUR Class 5,370,454.28 539,380.07 (1,463,655.55) 4,446,178.80Income GBP Class 275,103.31 1,471.21 (258,560.63) 18,013.89Institutional SharesInstitutional Accumulation EUR Class 55,874,506.52 7,419,146.45 (43,050,619.39) 20,243,033.58Institutional Accumulation GBP Class 1,582,289.37 49,201.16 (697,036.56) 934,453.97Institutional Accumulation USD Class 2,197,556.40 346,570.95 (1,420,568.22) 1,123,559.13Institutional Accumulation Hedge USD Class 330,263.82 323,710.00 (629,039.46) 24,934.36Institutional Income EUR Class 64,634.67 596.52 (45,055.43) 20,175.76Institutional Income GBP Class 1,741,898.23 69,377.12 (693,512.64) 1,117,762.71Institutional Income GBP Z Class 897,562.97 1,781,819.00 (240,159.54) 2,439,222.43Institutional Income USD Class 2,479.45 – (2,479.45) –Selling Agent SharesC EUR Class 121,282.41 665.25 (94,675.55) 27,272.11C USD Class 1,320,736.47 98,392.48 (807,181.98) 611,946.97
GAM Star Credit Opportunities (EUR)Ordinary SharesAccumulation CHF Class 3,769,900.61 267,837.91 (2,240,661.76) 1,797,076.76Accumulation EUR Class 57,091,465.92 64,912,246.90 (78,058,895.94) 43,944,816.88Accumulation R EUR Class 916,086.79 2,370,607.85 (2,299,245.72) 987,448.92Income CHF Class 1,069,018.69 155,047.93 (365,041.40) 859,025.22Income CHF R Class 173,880.00 6,185.00 (179,370.00) 695.00Income EUR Class 7,617,268.63 621,382.39 (5,704,629.84) 2,534,021.18Income EUR II Class 21,653,459.09 8,424,851.24 (6,665,517.99) 23,412,792.34Institutional SharesInstitutional Accumulation CHF Class 9,946,323.78 2,072,836.94 (5,949,684.25) 6,069,476.47Institutional Accumulation EUR Class 190,390,466.13 152,108,044.70 (242,288,423.42) 100,210,087.41Institutional Income CHF Class 1,599,108.06 32,747.51 (550,258.15) 1,081,597.42Institutional Income EUR Class 14,364,113.52 15,191,885.28 (11,153,603.41) 18,402,395.39Distribution SharesM EUR Class 4,743,338.76 652,924.81 (1,081,937.29) 4,314,326.28Quarterly Z Income EUR Class 230,615.71 1,956,348.29 (206,408.03) 1,980,555.97SI EUR Class 12,165,583.00 2,827,228.18 (3,592,041.54) 11,400,769.64SO EUR Class 7,869,691.79 622,096.50 (4,274,744.24) 4,217,044.05

328
GAM Star Fund p.l.c.
Notes to the Financial Statements
16. Share capital, continued
At 30 June 2019Balance at
1 July 2018 Issued RedeemedBalance at
30 June 2019
GAM Star Credit Opportunities (EUR), continuedOther SharesR EUR Class 2,832,728.99 129,214.00 (2,929,771.28) 32,171.71Selling Agent SharesAccumulation Z EUR Class 1,110,948.57 – – 1,110,948.57A EUR Class 23,999,047.63 2,581,454.24 (10,392,975.66) 16,187,526.21AQ EUR Class 12,102,113.18 1,149,415.18 (6,228,306.38) 7,023,221.98C EUR Class 11,975,471.16 962,271.42 (3,554,581.34) 9,383,161.24Z Distribution SharesMZ EUR Class 8,548.54 – (8,548.54) –Non UK RFSAccumulation CHF Class 2,155,989.76 6,880.80 (520,746.69) 1,642,123.87Accumulation EUR Class 1,332,744.58 6,530.00 (164,957.06) 1,174,317.52
GAM Star Credit Opportunities (GBP)Ordinary SharesAccumulation GBP Class 2,019,746.11 206,524.40 (873,623.80) 1,352,646.71Income GBP Class 1,402,753.03 372,416.87 (824,013.46) 951,156.44Institutional SharesInstitutional Accumulation GBP Class 39,076,871.83 8,479,528.72 (22,845,443.34) 24,710,957.21Institutional Income GBP Class 11,833,140.30 3,173,134.56 (5,653,176.63) 9,353,098.23Distribution SharesMonthly Z Income GBP Class 5,636,748.59 1,255,599.77 (725,860.06) 6,166,488.30Quarterly Institutional GBP Class 1,816,465.70 356,604.47 (729,769.52) 1,443,300.65Quarterly Z Income GBP Class 16,609,620.80 5,971,851.86 (6,295,647.97) 16,285,824.69SI GBP Class 6,562,408.25 737,390.46 (5,128,830.82) 2,170,967.89Selling Agent SharesQZ GBP Class – 14,826.57 – 14,826.57Z GBP Class 3,159,713.93 7,648,407.06 (8,336,835.99) 2,471,285.00ZII GBP Class 1,548,684.37 8,089,820.62 (1,438,668.09) 8,199,836.90
GAM Star Credit Opportunities (USD)Ordinary SharesAccumulation USD Class 44,511,507.64 3,884,358.38 (21,855,625.90) 26,540,240.12Accumulation R USD Class 121,527.62 5,000.00 – 126,527.62Income USD Class 10,602,011.52 949,178.12 (5,235,481.12) 6,315,708.52Institutional SharesInstitutional Accumulation Hedged ILS Class 724,502.64 164,926.55 (280,951.47) 608,477.72Institutional Accumulation USD Class 129,352,904.08 22,372,876.10 (61,185,803.47) 90,539,976.71Institutional Income AUD Class 32,000.00 – (32,000.00) –Institutional Income USD Class 2,276,582.55 374,810.21 (198,827.34) 2,452,565.42Distribution SharesMCO II AUD Class 15,236,813.00 1,700,892.41 (3,728,593.00) 13,209,112.41MO II SGD Class 27,002,389.72 1,086,683.10 (8,614,822.36) 19,474,250.46SI USD Class 17,560,860.34 11,195,522.10 (8,527,405.99) 20,228,976.45SO USD Class 1,819,516.54 33,205.91 (683,208.91) 1,169,513.54MO USD Class 83,270,165.25 6,045,155.63 (38,399,089.09) 50,916,231.79Income II PMCO USD Class 1,051,443.93 – (528,905.74) 522,538.19Monthly Institututional SGD Class 492,086.58 561,176.64 (258,528.90) 794,734.32Monthly Institutional USD Class – 1,723,546.59 (490,798.01) 1,232,748.58Quarterly Accumulation USD Class – 61,819.84 (55,195.08) 6,624.76Quarterly Income USD Class 465,028.84 286,933.00 (513,825.90) 238,135.94Selling Agent SharesA USD Class 9,613,755.01 829,121.07 (4,769,505.48) 5,673,370.60C USD Class 960,579.63 104,632.94 (457,946.61) 607,265.96Income II AQ USD Class 8,026,487.66 453,820.29 (4,689,251.98) 3,791,055.97Income QZ AUD Class – 29,064.48 (29,064.48) –Z Distribution SharesMCZ SGD Class 968,162.57 38,226.86 – 1,006,389.43Non UK RFSAccumulation USD Class 8,651,953.61 32,825.05 (1,349,752.86) 7,335,025.80

329
Notes to the Financial Statements
16. Share capital, continued
At 30 June 2019Balance at
1 July 2018 Issued RedeemedBalance at
30 June 2019
GAM Star Credit Opportunities (EUR), continuedOther SharesR EUR Class 2,832,728.99 129,214.00 (2,929,771.28) 32,171.71Selling Agent SharesAccumulation Z EUR Class 1,110,948.57 – – 1,110,948.57A EUR Class 23,999,047.63 2,581,454.24 (10,392,975.66) 16,187,526.21AQ EUR Class 12,102,113.18 1,149,415.18 (6,228,306.38) 7,023,221.98C EUR Class 11,975,471.16 962,271.42 (3,554,581.34) 9,383,161.24Z Distribution SharesMZ EUR Class 8,548.54 – (8,548.54) –Non UK RFSAccumulation CHF Class 2,155,989.76 6,880.80 (520,746.69) 1,642,123.87Accumulation EUR Class 1,332,744.58 6,530.00 (164,957.06) 1,174,317.52
GAM Star Credit Opportunities (GBP)Ordinary SharesAccumulation GBP Class 2,019,746.11 206,524.40 (873,623.80) 1,352,646.71Income GBP Class 1,402,753.03 372,416.87 (824,013.46) 951,156.44Institutional SharesInstitutional Accumulation GBP Class 39,076,871.83 8,479,528.72 (22,845,443.34) 24,710,957.21Institutional Income GBP Class 11,833,140.30 3,173,134.56 (5,653,176.63) 9,353,098.23Distribution SharesMonthly Z Income GBP Class 5,636,748.59 1,255,599.77 (725,860.06) 6,166,488.30Quarterly Institutional GBP Class 1,816,465.70 356,604.47 (729,769.52) 1,443,300.65Quarterly Z Income GBP Class 16,609,620.80 5,971,851.86 (6,295,647.97) 16,285,824.69SI GBP Class 6,562,408.25 737,390.46 (5,128,830.82) 2,170,967.89Selling Agent SharesQZ GBP Class – 14,826.57 – 14,826.57Z GBP Class 3,159,713.93 7,648,407.06 (8,336,835.99) 2,471,285.00ZII GBP Class 1,548,684.37 8,089,820.62 (1,438,668.09) 8,199,836.90
GAM Star Credit Opportunities (USD)Ordinary SharesAccumulation USD Class 44,511,507.64 3,884,358.38 (21,855,625.90) 26,540,240.12Accumulation R USD Class 121,527.62 5,000.00 – 126,527.62Income USD Class 10,602,011.52 949,178.12 (5,235,481.12) 6,315,708.52Institutional SharesInstitutional Accumulation Hedged ILS Class 724,502.64 164,926.55 (280,951.47) 608,477.72Institutional Accumulation USD Class 129,352,904.08 22,372,876.10 (61,185,803.47) 90,539,976.71Institutional Income AUD Class 32,000.00 – (32,000.00) –Institutional Income USD Class 2,276,582.55 374,810.21 (198,827.34) 2,452,565.42Distribution SharesMCO II AUD Class 15,236,813.00 1,700,892.41 (3,728,593.00) 13,209,112.41MO II SGD Class 27,002,389.72 1,086,683.10 (8,614,822.36) 19,474,250.46SI USD Class 17,560,860.34 11,195,522.10 (8,527,405.99) 20,228,976.45SO USD Class 1,819,516.54 33,205.91 (683,208.91) 1,169,513.54MO USD Class 83,270,165.25 6,045,155.63 (38,399,089.09) 50,916,231.79Income II PMCO USD Class 1,051,443.93 – (528,905.74) 522,538.19Monthly Institututional SGD Class 492,086.58 561,176.64 (258,528.90) 794,734.32Monthly Institutional USD Class – 1,723,546.59 (490,798.01) 1,232,748.58Quarterly Accumulation USD Class – 61,819.84 (55,195.08) 6,624.76Quarterly Income USD Class 465,028.84 286,933.00 (513,825.90) 238,135.94Selling Agent SharesA USD Class 9,613,755.01 829,121.07 (4,769,505.48) 5,673,370.60C USD Class 960,579.63 104,632.94 (457,946.61) 607,265.96Income II AQ USD Class 8,026,487.66 453,820.29 (4,689,251.98) 3,791,055.97Income QZ AUD Class – 29,064.48 (29,064.48) –Z Distribution SharesMCZ SGD Class 968,162.57 38,226.86 – 1,006,389.43Non UK RFSAccumulation USD Class 8,651,953.61 32,825.05 (1,349,752.86) 7,335,025.80
Notes to the Financial Statements
16. Share capital, continued
At 30 June 2019Balance at
1 July 2018 Issued RedeemedBalance at
30 June 2019
GAM Star Global DefensiveOrdinary SharesAccumulation GBP Class 1,000.00 2,213.27 (1,000.00) 2,213.27Institutional SharesInstitutional Accumulation AUD Class 37,287.30 7,007.29 (37,287.30) 7,007.29Institutional Accumulation EUR Class 24,500.00 26,339.88 (1,374.40) 49,465.48Institutional Accumulation GBP Class 631,159.58 245,184.25 (363,776.57) 512,567.26Institutional Accumulation USD Class 394,008.32 256,543.70 (176,902.86) 473,649.16Other SharesPI GBP Class 32,861.65 – (32,861.65) –Selling Agent SharesAccumulation F GBP Class 8,640.00 9,671.85 (9,628.98) 8,682.87Accumulation A USD Class 34,646.88 – (32,846.88) 1,800.00U AUD Class 32,382.92 – – 32,382.92A CHF Class 9,004.00 1,752.52 – 10,756.52A EUR Class 38,345.63 48,484.03 (10,332.03) 76,497.63C EUR Class 3,772.84 – (3,772.84) –U EUR Class 107,798.68 – (18,554.16) 89,244.52Z EUR Class 1,000.00 49,161.54 (1,000.00) 49,161.54A GBP Class 399,972.65 199,402.09 (223,273.65) 376,101.09C GBP Class 195,997.24 – (150,301.69) 45,695.55G GBP Class 52,646.33 5,057.15 – 57,703.48T GBP Class 14,008.29 – (2,609.79) 11,398.50U GBP Class 354,225.98 34,002.82 (131,153.11) 257,075.69Z GBP Class 259,456.34 107,395.69 (172,831.63) 194,020.40C USD Class 31,119.36 – (31,119.36) –F USD Class 25,765.35 14,021.42 (23,870.63) 15,916.14T USD Class 184,002.73 – (175,603.56) 8,399.17U USD Class 80,094.23 – (14,629.88) 65,464.35
GAM Star Discretionary FX* Institutional SharesAccumulation CHF Class 76,210.00 – (76,210.00) –Accumulation EUR Class 1,194,551.84 15,464.62 (1,210,016.46) –Accumulation EUR U Class 500,514.25 – (500,514.25) –Accumulation GBP Class 81,158.33 50,541.52 (131,699.85) –Accumulation USD Class 138,057.73 1,090.26 (139,147.99) –
GAM Star Dynamic Global BondOrdinary SharesAccumulation EUR Class 333,935.00 – (303,880.85) 30,054.15Accumulation GBP Class 12,860.87 – (11,815.63) 1,045.24Accumulation USD Class 179,247.01 506.13 (163,575.36) 16,177.78Institutional SharesInstitutional Accumulation USD Class 14,641.18 – (13,394.26) 1,246.92Other SharesPI GBP Class 19,637.17 4,928.44 – 24,565.61Selling Agent SharesC EUR Class 20,187.09 – (18,370.26) 1,816.83
GAM Star Global Dynamic GrowthInstitutional SharesInstitutional Accumulation GBP Class 100,358.11 10,325.24 (16,186.70) 94,496.65Selling Agent SharesU EUR Class – 21,905.33 – 21,905.33Accumulation U GBP Class 19,695.79 82,090.82 (12,552.30) 89,234.31C GBP Class 14,222.79 – (1,817.92) 12,404.87Z GBP Class 556,776.48 119,614.01 (439,217.78) 237,172.71
* Fund terminated during the year.

330
GAM Star Fund p.l.c.
Notes to the Financial Statements
16. Share capital, continued
At 30 June 2019Balance at
1 July 2018 Issued RedeemedBalance at
30 June 2019
GAM Star Emerging EquityOrdinary SharesAccumulation EUR Class 132,279.38 1,446.06 (21,545.50) 112,179.94Accumulation GBP Class 13,959.59 1,513.01 (2,796.32) 12,676.28Accumulation USD Class 299,304.27 6,833.12 (42,751.99) 263,385.40Institutional SharesInstitutional Accumulation EUR Class 213,051.80 119.05 (213,170.85) –Institutional Accumulation GBP Class 33,694.81 5,240.84 (17,965.48) 20,970.17Institutional Accumulation USD Class 1,413,517.95 78,659.89 (569,366.93) 922,810.91Institutional Income GBP Class 351,645.33 39,656.32 (99,107.72) 292,193.93
GAM Star Emerging Market RatesOrdinary SharesAccumulation CHF Class 148,783.88 – (148,783.88) –Accumulation EUR Class 2,941,586.30 1,242,740.97 (2,762,426.05) 1,421,901.22Accumulation GBP Class 320,709.38 1.00 (205,433.46) 115,276.92Accumulation USD Class 75,275.59 688.17 (5,931.75) 70,032.01Institutional SharesInstitutional Accumulation EUR Class 3,237,070.37 834,290.54 (1,844,307.06) 2,227,053.85Institutional Accumulation USD Class 414,321.58 285,201.00 (230,603.80) 468,918.78Institutional Income GBP Class 231,841.82 473.56 (131,802.25) 100,513.13Selling Agent SharesA EUR Class 40,466.90 22,671.54 (21,933.34) 41,205.10C EUR Class 578,495.64 670,145.71 (1,155,669.48) 92,971.87A GBP Class 4,900.00 – (4,900.00) –Z GBP Class 738.29 – (3.66) 734.63C USD Class 17,020.65 – (17,020.65) –Z USD Class 4,520,676.44 504,108.52 (4,521,511.50) 503,273.46Z II GBP Class 59,599.20 17,347.92 (19,866.39) 57,080.73Z II USD Class – 388,075.14 – 388,075.14
GAM Star European EquityOrdinary SharesAccumulation CHF Class 377,491.64 3,378.39 (292,874.97) 87,995.06Accumulation EUR Class 40,847.63 85.14 (18,136.06) 22,796.71Accumulation GBP Class 596,399.80 7,053.46 (38,197.17) 565,256.09Accumulation USD Class 786,426.04 890.68 (755,602.83) 31,713.89Income EUR Class 5,129.32 22.24 (711.06) 4,440.50Income GBP Class 98,696.73 7,478.07 (41,101.44) 65,073.36Income USD Class 59,119.69 5.05 (2,700.00) 56,424.74Institutional SharesInstitutional Accumulation EUR Class 177,492.89 13,131.54 (55,058.02) 135,566.41Institutional Accumulation USD Class 96,382.94 – (36,773.80) 59,609.14Selling Agent SharesA EUR Class 356,136.57 37,239.03 (69,345.10) 324,030.50C EUR Class 47,625.50 939.73 (13,128.54) 35,436.69Z EUR Class 15,412,854.09 38,738.13 (2,924,809.16) 12,526,783.06
GAM Star Flexible Global PortfolioOrdinary SharesAccumulation CHF Class 172,716.71 – (159,646.27) 13,070.44Accumulation EUR Class 1,248,468.97 – (624,206.12) 624,262.85Accumulation GBP Class 604,927.59 1,611.63 (354,542.57) 251,996.65Accumulation USD Class 598,365.69 62,067.07 (250,836.78) 409,595.98Institutional SharesInstitutional Accumulation EUR Class 884,926.08 – – 884,926.08Institutional Accumulation GBP Class 523,787.09 315,411.55 (223,604.23) 615,594.41Institutional USD Class – 235,895.89 (520.00) 235,375.89Selling Agent SharesC EUR Class 68,288.53 – (12,003.76) 56,284.77

331
Notes to the Financial Statements
16. Share capital, continued
At 30 June 2019Balance at
1 July 2018 Issued RedeemedBalance at
30 June 2019
GAM Star Emerging EquityOrdinary SharesAccumulation EUR Class 132,279.38 1,446.06 (21,545.50) 112,179.94Accumulation GBP Class 13,959.59 1,513.01 (2,796.32) 12,676.28Accumulation USD Class 299,304.27 6,833.12 (42,751.99) 263,385.40Institutional SharesInstitutional Accumulation EUR Class 213,051.80 119.05 (213,170.85) –Institutional Accumulation GBP Class 33,694.81 5,240.84 (17,965.48) 20,970.17Institutional Accumulation USD Class 1,413,517.95 78,659.89 (569,366.93) 922,810.91Institutional Income GBP Class 351,645.33 39,656.32 (99,107.72) 292,193.93
GAM Star Emerging Market RatesOrdinary SharesAccumulation CHF Class 148,783.88 – (148,783.88) –Accumulation EUR Class 2,941,586.30 1,242,740.97 (2,762,426.05) 1,421,901.22Accumulation GBP Class 320,709.38 1.00 (205,433.46) 115,276.92Accumulation USD Class 75,275.59 688.17 (5,931.75) 70,032.01Institutional SharesInstitutional Accumulation EUR Class 3,237,070.37 834,290.54 (1,844,307.06) 2,227,053.85Institutional Accumulation USD Class 414,321.58 285,201.00 (230,603.80) 468,918.78Institutional Income GBP Class 231,841.82 473.56 (131,802.25) 100,513.13Selling Agent SharesA EUR Class 40,466.90 22,671.54 (21,933.34) 41,205.10C EUR Class 578,495.64 670,145.71 (1,155,669.48) 92,971.87A GBP Class 4,900.00 – (4,900.00) –Z GBP Class 738.29 – (3.66) 734.63C USD Class 17,020.65 – (17,020.65) –Z USD Class 4,520,676.44 504,108.52 (4,521,511.50) 503,273.46Z II GBP Class 59,599.20 17,347.92 (19,866.39) 57,080.73Z II USD Class – 388,075.14 – 388,075.14
GAM Star European EquityOrdinary SharesAccumulation CHF Class 377,491.64 3,378.39 (292,874.97) 87,995.06Accumulation EUR Class 40,847.63 85.14 (18,136.06) 22,796.71Accumulation GBP Class 596,399.80 7,053.46 (38,197.17) 565,256.09Accumulation USD Class 786,426.04 890.68 (755,602.83) 31,713.89Income EUR Class 5,129.32 22.24 (711.06) 4,440.50Income GBP Class 98,696.73 7,478.07 (41,101.44) 65,073.36Income USD Class 59,119.69 5.05 (2,700.00) 56,424.74Institutional SharesInstitutional Accumulation EUR Class 177,492.89 13,131.54 (55,058.02) 135,566.41Institutional Accumulation USD Class 96,382.94 – (36,773.80) 59,609.14Selling Agent SharesA EUR Class 356,136.57 37,239.03 (69,345.10) 324,030.50C EUR Class 47,625.50 939.73 (13,128.54) 35,436.69Z EUR Class 15,412,854.09 38,738.13 (2,924,809.16) 12,526,783.06
GAM Star Flexible Global PortfolioOrdinary SharesAccumulation CHF Class 172,716.71 – (159,646.27) 13,070.44Accumulation EUR Class 1,248,468.97 – (624,206.12) 624,262.85Accumulation GBP Class 604,927.59 1,611.63 (354,542.57) 251,996.65Accumulation USD Class 598,365.69 62,067.07 (250,836.78) 409,595.98Institutional SharesInstitutional Accumulation EUR Class 884,926.08 – – 884,926.08Institutional Accumulation GBP Class 523,787.09 315,411.55 (223,604.23) 615,594.41Institutional USD Class – 235,895.89 (520.00) 235,375.89Selling Agent SharesC EUR Class 68,288.53 – (12,003.76) 56,284.77
Notes to the Financial Statements
16. Share capital, continued
At 30 June 2019Balance at
1 July 2018 Issued RedeemedBalance at
30 June 2019
GAM Star GAMCO US Equity* Ordinary SharesAccumulation GBP Class 2,844.42 – (2,844.42) –Accumulation USD Class 11,271.60 – (11,271.60) –Institutional SharesInstitutional Accumulation GBP Class 130,905.77 937.16 (131,842.93) –Institutional Income GBP Class 15,489.35 91.37 (15,580.72) –Selling Agent SharesZ USD Class 128,000.57 – (128,000.57) –Non UK RFSAccumulation USD Class 2,091,220.22 8,006.03 (2,099,226.25) –
GAM Star Global Quality*Ordinary SharesAccumulation GBP Class 29,257.34 – (29,257.34) –Accumulation USD Class 244,299.38 – (244,299.38) –Institutional SharesInstitutional Accumulation EUR Class 71,498.83 – (71,498.83) –Institutional Accumulation USD Class 1,257,567.37 – (1,257,567.37) –Institutional Income GBP Class 350,870.65 7,253.88 (358,124.53) –Institutional Income USD Class 30,883.03 – (30,883.03) –
GAM Star Global RatesInstitutional SharesAccumulation CHF Class 873,723.85 50,998.13 (533,340.90) 391,381.08Accumulation EUR Class 36,016,228.96 2,067,833.71 (26,470,908.61) 11,613,154.06Accumulation GBP Class 52,423,366.55 602,881.04 (43,702,157.52) 9,324,090.07Accumulation USD Class 8,331,777.61 335,190.80 (7,760,393.34) 906,575.07Income CHF Class 216,458.47 – (216,458.47) –Income EUR Class 3,583,568.95 – (834,260.75) 2,749,308.20Income GBP Class 24,876,350.32 531,955.17 (21,439,543.08) 3,968,762.41Income USD Class 1,769,470.65 9,024.00 (1,584,871.21) 193,623.44Selling Agent SharesAccumulation Z GBP Class 49,132.30 81,854.17 (21,703.16) 109,283.31A CHF Class 10,991.67 – (9,891.67) 1,100.00A EUR Class 1,497,676.93 43,465.22 (684,972.29) 856,169.86A JPY Class 11,111.71 – – 11,111.71A USD Class 1,460,268.06 – (650,898.57) 809,369.49Non UK RFSAccumulation USD Class 2,418,981.73 – (608,893.38) 1,810,088.35
GAM Star Global SelectorOrdinary SharesAccumulation CHF Class 3,867.74 – (3,867.74) –Accumulation EUR Class 22,537.34 – (9,684.45) 12,852.89Accumulation II EUR Class 187,008.22 – (123,051.33) 63,956.89Accumulation GBP Class 42,000.00 – – 42,000.00Accumulation II GBP Class 10,962.52 – (3,621.79) 7,340.73Accumulation USD Class 128,122.00 – (23,176.31) 104,945.69Accumulation II USD Class 573,007.54 93.29 (438,114.79) 134,986.04Institutional SharesInstitutional Accumulation II USD Class 67,102.89 – (14,802.89) 52,300.00Institutional Income II GBP Class 3,200.02 – (3,200.02) –Selling Agent SharesC EUR Class 3,874.87 – (3,874.87) –SA C II EUR Class 296,725.70 14,313.32 (187,570.90) 123,468.12
* Fund terminated during the year.

332
GAM Star Fund p.l.c.
Notes to the Financial Statements
16. Share capital, continued
At 30 June 2019Balance at
1 July 2018 Issued RedeemedBalance at
30 June 2019
GAM Star Global GrowthOrdinary SharesAccumulation EUR Class 18,223.90 – (9,257.10) 8,966.80Other SharesPI GBP Class 18,366.03 198.19 (359.10) 18,205.12Institutional SharesInstitutional Accumulation CHF Class – 10,300.00 – 10,300.00Institutional Accumulation EUR Class 137,176.73 346,116.48 (52,643.86) 430,649.35Institutional Accumulation U EUR Class 78,185.55 28,676.93 (1,556.88) 105,305.60Institutional Accumulation GBP Class 1,048,824.46 115,056.51 (349,422.07) 814,458.90Institutional Accumulation USD Class 839,027.28 296,458.36 (450,620.01) 684,865.63Selling Agent SharesC AUD Class 28,361.09 – (10,172.25) 18,188.84U AUD Class 104,984.89 1,207.23 (78.64) 106,113.48A CHF Class 19,823.94 15,852.18 (11,998.79) 23,677.33A EUR Class 61,206.61 36,941.32 (35,193.71) 62,954.22C EUR Class 1,380,815.27 210,754.45 (356,663.91) 1,234,905.81F EUR Class 9,600.00 6,446.95 – 16,046.95G EUR Class 54,878.83 15,274.39 (24,078.77) 46,074.45U EUR Class 78,185.55 28,676.93 (1,556.88) 105,305.60Z EUR Class 11,972.56 50,290.61 (2,202.02) 60,061.15A GBP Class 679,070.88 345,939.21 (270,436.62) 754,573.47C GBP Class 3,501,153.29 101,113.19 (1,372,510.85) 2,229,755.63F GBP Class 407,314.51 133,788.95 (220,126.37) 320,977.09G GBP Class 341,472.96 174,731.15 (151,461.87) 364,742.24T GBP Class 167,417.67 – (43,412.63) 124,005.04U GBP Class 910,950.01 195,772.23 (80,991.84) 1,025,730.40Z GBP Class 1,834,463.85 295,964.52 (960,913.65) 1,169,514.72A SGD Class 295,504.69 – (12,647.55) 282,857.14A USD Class 1,103,414.79 299,156.22 (546,984.29) 855,586.72C USD Class 5,470,564.86 536,106.29 (925,810.87) 5,080,860.28F USD Class 134,444.79 37,805.16 (57,977.48) 114,272.47G USD Class 135,329.38 22,296.94 (70,966.19) 86,660.13T USD Class 214,354.05 1,203.13 (57,035.26) 158,521.92U USD Class 84,898.69 22,411.85 (37,726.47) 69,584.07Non UK RFSAccumulation GBP Class 72,879.77 – (5,091.03) 67,788.74Accumulation USD Class 234,394.99 – (84,371.39) 150,023.60
GAM Star India Equity* Ordinary SharesAccumulation EUR Class 130,172.76 1,029.00 (131,201.76) –Accumulation USD Class 165,596.80 9,171.26 (174,768.06) –Institutional SharesInstitutional Hedged Accumulation EUR Class 192,244.97 – (192,244.97) –Institutional Accumulation GBP Class 24,439.59 10,039.31 (34,478.90) –Institutional Accumulation USD Class 120,923.61 – (120,923.61) –
GAM Star Interest TrendNon UK RFSAccumulation USD Class 7,313,324.49 – (2,281,656.84) 5,031,667.65
* Fund terminated during the year.

333
Notes to the Financial Statements
16. Share capital, continued
At 30 June 2019Balance at
1 July 2018 Issued RedeemedBalance at
30 June 2019
GAM Star Global GrowthOrdinary SharesAccumulation EUR Class 18,223.90 – (9,257.10) 8,966.80Other SharesPI GBP Class 18,366.03 198.19 (359.10) 18,205.12Institutional SharesInstitutional Accumulation CHF Class – 10,300.00 – 10,300.00Institutional Accumulation EUR Class 137,176.73 346,116.48 (52,643.86) 430,649.35Institutional Accumulation U EUR Class 78,185.55 28,676.93 (1,556.88) 105,305.60Institutional Accumulation GBP Class 1,048,824.46 115,056.51 (349,422.07) 814,458.90Institutional Accumulation USD Class 839,027.28 296,458.36 (450,620.01) 684,865.63Selling Agent SharesC AUD Class 28,361.09 – (10,172.25) 18,188.84U AUD Class 104,984.89 1,207.23 (78.64) 106,113.48A CHF Class 19,823.94 15,852.18 (11,998.79) 23,677.33A EUR Class 61,206.61 36,941.32 (35,193.71) 62,954.22C EUR Class 1,380,815.27 210,754.45 (356,663.91) 1,234,905.81F EUR Class 9,600.00 6,446.95 – 16,046.95G EUR Class 54,878.83 15,274.39 (24,078.77) 46,074.45U EUR Class 78,185.55 28,676.93 (1,556.88) 105,305.60Z EUR Class 11,972.56 50,290.61 (2,202.02) 60,061.15A GBP Class 679,070.88 345,939.21 (270,436.62) 754,573.47C GBP Class 3,501,153.29 101,113.19 (1,372,510.85) 2,229,755.63F GBP Class 407,314.51 133,788.95 (220,126.37) 320,977.09G GBP Class 341,472.96 174,731.15 (151,461.87) 364,742.24T GBP Class 167,417.67 – (43,412.63) 124,005.04U GBP Class 910,950.01 195,772.23 (80,991.84) 1,025,730.40Z GBP Class 1,834,463.85 295,964.52 (960,913.65) 1,169,514.72A SGD Class 295,504.69 – (12,647.55) 282,857.14A USD Class 1,103,414.79 299,156.22 (546,984.29) 855,586.72C USD Class 5,470,564.86 536,106.29 (925,810.87) 5,080,860.28F USD Class 134,444.79 37,805.16 (57,977.48) 114,272.47G USD Class 135,329.38 22,296.94 (70,966.19) 86,660.13T USD Class 214,354.05 1,203.13 (57,035.26) 158,521.92U USD Class 84,898.69 22,411.85 (37,726.47) 69,584.07Non UK RFSAccumulation GBP Class 72,879.77 – (5,091.03) 67,788.74Accumulation USD Class 234,394.99 – (84,371.39) 150,023.60
GAM Star India Equity* Ordinary SharesAccumulation EUR Class 130,172.76 1,029.00 (131,201.76) –Accumulation USD Class 165,596.80 9,171.26 (174,768.06) –Institutional SharesInstitutional Hedged Accumulation EUR Class 192,244.97 – (192,244.97) –Institutional Accumulation GBP Class 24,439.59 10,039.31 (34,478.90) –Institutional Accumulation USD Class 120,923.61 – (120,923.61) –
GAM Star Interest TrendNon UK RFSAccumulation USD Class 7,313,324.49 – (2,281,656.84) 5,031,667.65
* Fund terminated during the year.
Notes to the Financial Statements
16. Share capital, continued
At 30 June 2019Balance at
1 July 2018 Issued RedeemedBalance at
30 June 2019
GAM Star Japan LeadersOrdinary SharesAccumulation EUR Class 93,718.91 12,733.55 (30,434.88) 76,017.58Accumulation GBP Class 3,606.60 987.06 (2,073.69) 2,519.97Accumulation JPY Class 1,566,035.91 343,267.43 (995,362.30) 913,941.04Accumulation USD Class 401,364.14 19,489.73 (182,173.26) 238,680.61Income EUR Class 7,352.03 746.73 (1,348.78) 6,749.98Income GBP Class 651.49 475.21 – 1,126.70Income USD Class 16,949.68 13.00 (2,695.83) 14,266.85Institutional SharesInstitutional Accumulation CHF Class 1,688,016.93 448,779.13 (446,155.78) 1,690,640.28Institutional Accumulation EUR Class 14,076,984.12 3,749,877.39 (14,427,719.28) 3,399,142.23Institutional Accumulation GBP Class 232,023.71 401,361.90 (174,064.82) 459,320.79Institutional Accumulation JPY Class 1,821,552.85 130,635.00 (220,407.24) 1,731,780.61Institutional Accumulation USD Class 6,226,332.07 8,423,670.60 (12,795,159.31) 1,854,843.36Institutional Hedged Accumulation EUR Class 259,577.13 762,245.97 (568,667.88) 453,155.22Institutional Hedged Accumulation GBP Class 10,000.00 10,000.00 (20,000.00) –Institutional Hedged Accumulation USD Class 1,575,228.53 92,357.65 (1,370,048.32) 297,537.86Institutional Hedged Income EUR Class 2,871,515.00 903,325.00 (1,965,332.00) 1,809,508.00Institutional Income GBP Class 130,470.18 16,686.39 (47,875.55) 99,281.02Selling Agent SharesA EUR Class 26,905.12 9,979.36 (10,545.69) 26,338.79B EUR Class 2,317.00 – – 2,317.00C EUR Class 269,112.41 6,347.22 (186,177.00) 89,282.63A JPY Class 97,549.22 5,064.13 (18,620.73) 83,992.62Z JPY Class 9,425,020.60 3,037,271.46 (750,094.71) 11,712,197.35A USD Class 278,681.18 6,082.36 (201,794.16) 82,969.38B USD Class 1,240.69 – (1,240.69) –Z USD Class 316,801.81 3,915.93 (162,893.12) 157,824.62Z CHF Class – 27,133.14 – 27,133.14Non UK RFSAccumulation JPY Class 233,127.14 – (19,867.93) 213,259.21Accumulation USD Class 1,255,206.45 5,702.41 (579,014.95) 681,893.91
GAM Star Keynes Quantitative Strategies* Ordinary SharesAccumulation EUR Class 68,446.09 5,602.08 (74,048.17) –Accumulation GBP Class 35,610.78 – (35,610.78) –Accumulation USD Class 1,007,976.77 7,012.96 (1,014,989.73) –Income GBP Class 3,902.50 – (3,902.50) –Institutional SharesInstitutional Accumulation EUR Class 39,285.96 24.04 (39,310.00) –Institutional Accumulation GBP Class 3,481.22 985.66 (4,466.88) –Institutional Accumulation USD Class 80,669.22 – (80,669.22) –Selling Agent SharesA EUR Class 20,024.03 9.34 (20,033.37) –W GBP Class 909.12 – (909.12) –A SEK Class 140,014.68 2,159.14 (142,173.82) –A USD Class 23,900.02 – (23,900.02) –W USD Class 9,630.26 – (9,630.26) –
GAM Star MBS Total ReturnOrdinary SharesAccumulation Hedged CHF Class 27,093.10 4,644.00 (23,269.10) 8,468.00Accumulation Hedged EUR Class 2,408,975.80 716,637.77 (2,183,639.40) 941,974.17Accumulation Hedged SEK Class 3,489.97 – (2,746.25) 743.72Accumulation USD Class 14,233,401.15 8,616,558.13 (6,708,845.37) 16,141,113.91Income USD Class 2,558,177.16 554,407.03 (640,420.21) 2,472,163.98Institutional SharesInstitutional Accumulation GBP Class 6,332,622.47 2,616,426.78 (3,050,169.31) 5,898,879.94
* Fund terminated during the year.

334
GAM Star Fund p.l.c.
Notes to the Financial Statements
16. Share capital, continued
At 30 June 2019Balance at
1 July 2018 Issued RedeemedBalance at
30 June 2019
GAM Star MBS Total Return, continuedInstitutional Accumulation USD Class 29,921,100.44 9,556,909.06 (15,394,439.72) 24,083,569.78Institutional Hedged Accumulation CHF Class 275,039.29 46,531.63 (245,181.34) 76,389.58Institutional Hedged Accumulation EUR Class 32,150,853.02 11,843,156.74 (21,590,101.50) 22,403,908.26Institutional Hedged Accumulation JPY Class 96,868.68 518,674.63 (1,697.42) 613,845.89Institutional Hedged Accumulation SEK Class 2,702,982.78 857,668.84 (855,336.85) 2,705,314.77Institutional Hedged Income EUR Class 2,277,218.60 258,758.01 (1,376,923.22) 1,159,053.39Institutional Income GBP Class 106,775.42 118,255.25 (32,275.64) 192,755.03Institutional Income USD Class 1,700,842.13 258,416.48 (951,596.86) 1,007,661.75Selling Agent SharesA EUR Class 540,152.08 30,130.49 (465,246.00) 105,036.57C EUR Class 573,067.72 13,677.21 (270,057.39) 316,687.54U EUR Class 301,769.34 – (3,682.00) 298,087.34W GBP Class 5,242,535.71 877,655.74 (1,695,337.55) 4,424,853.90A USD Class 30,018.81 – (576.00) 29,442.81Income II CQ USD Class 17,483.86 288,380.35 (3,163.83) 302,700.38U USD Class 437,983.62 52,503.08 (490,486.70) –Z USD Class 37,176,638.56 12,685,809.15 (30,997,334.78) 18,865,112.93Z II USD Class – 89,529.99 – 89,529.99R SharesAccumulation R USD Class – 15,500.00 – 15,500.00Accumulation Hedge R EUR Class 2,461,741.50 837,631.65 (1,942,851.83) 1,356,521.32
GAM Systematic Alternative Risk PremiaInstitutional SharesInstitutional Accumulation EUR Class 6,307,140.66 932,555.33 (2,399,182.60) 4,840,513.39Institutional Accumulation GBP Class 35,219.26 4,309.19 (21,939.05) 17,589.40Institutional Accumulation JPY Class 1,077,094.75 – (127,988.03) 949,106.72Institutional Accumulation SEK Class 76.39 – – 76.39Institutional Accumulation USD Class 580,619.03 128.00 (287,824.67) 292,922.36Institutional Hedge Accumulation CHF Class 4,428,242.31 582,431.88 (2,714,275.53) 2,296,398.66Selling Agent SharesZ CHF Class 7,190,434.16 2,066,818.97 (1,725,491.59) 7,531,761.54C EUR Class 110,882.62 – (36,689.09) 74,193.53Z EUR Class 2,404,824.00 149,409.00 (355,526.00) 2,198,707.00X USD Class – 7,482.65 (1,346.73) 6,135.92Z USD Class 6,851,725.65 – (6,851,725.65) –
GAM Systematic Core MacroOrdinary SharesAccumulation EUR Class – 10,000.00 – 10,000.00Accumulation GBP Class 82,065.81 3,729.49 (65,488.69) 20,306.61Institutional SharesInstitutional Accumulation EUR Class 517,110.29 90,572.20 (434,795.87) 172,886.62Institutional Accumulation USD Class 609,968.19 – (459,153.12) 150,815.07Selling Agent SharesC EUR Class 81,684.90 – (61,324.02) 20,360.88W EUR Class 2,832,787.37 396,548.04 (2,187,557.87) 1,041,777.54X EUR Class 3,273.94 218.12 (3,235.48) 256.58W GBP Class 4,817,388.30 309,628.81 (3,265,664.03) 1,861,353.08Z GBP Class 880,570.15 – (757,719.91) 122,850.24W USD Class 1,080,292.91 5,796.00 (413,803.86) 672,285.05Z USD Class 9,658.81 490,789.88 (490,789.88) 9,658.81
GAM Systematic Global Equity Market NeutralOrdinary SharesAccumulation GBP Class 116,625.16 116,625.16 (116,625.16) 116,625.16Institutional SharesInstitutional Accumulation EUR Class 138,108.83 138,265.45 (138,108.83) 138,265.45Institutional Accumulation USD Class 140,235.91 140,235.91 (140,235.91) 140,235.91

335
Notes to the Financial Statements
16. Share capital, continued
At 30 June 2019Balance at
1 July 2018 Issued RedeemedBalance at
30 June 2019
GAM Star MBS Total Return, continuedInstitutional Accumulation USD Class 29,921,100.44 9,556,909.06 (15,394,439.72) 24,083,569.78Institutional Hedged Accumulation CHF Class 275,039.29 46,531.63 (245,181.34) 76,389.58Institutional Hedged Accumulation EUR Class 32,150,853.02 11,843,156.74 (21,590,101.50) 22,403,908.26Institutional Hedged Accumulation JPY Class 96,868.68 518,674.63 (1,697.42) 613,845.89Institutional Hedged Accumulation SEK Class 2,702,982.78 857,668.84 (855,336.85) 2,705,314.77Institutional Hedged Income EUR Class 2,277,218.60 258,758.01 (1,376,923.22) 1,159,053.39Institutional Income GBP Class 106,775.42 118,255.25 (32,275.64) 192,755.03Institutional Income USD Class 1,700,842.13 258,416.48 (951,596.86) 1,007,661.75Selling Agent SharesA EUR Class 540,152.08 30,130.49 (465,246.00) 105,036.57C EUR Class 573,067.72 13,677.21 (270,057.39) 316,687.54U EUR Class 301,769.34 – (3,682.00) 298,087.34W GBP Class 5,242,535.71 877,655.74 (1,695,337.55) 4,424,853.90A USD Class 30,018.81 – (576.00) 29,442.81Income II CQ USD Class 17,483.86 288,380.35 (3,163.83) 302,700.38U USD Class 437,983.62 52,503.08 (490,486.70) –Z USD Class 37,176,638.56 12,685,809.15 (30,997,334.78) 18,865,112.93Z II USD Class – 89,529.99 – 89,529.99R SharesAccumulation R USD Class – 15,500.00 – 15,500.00Accumulation Hedge R EUR Class 2,461,741.50 837,631.65 (1,942,851.83) 1,356,521.32
GAM Systematic Alternative Risk PremiaInstitutional SharesInstitutional Accumulation EUR Class 6,307,140.66 932,555.33 (2,399,182.60) 4,840,513.39Institutional Accumulation GBP Class 35,219.26 4,309.19 (21,939.05) 17,589.40Institutional Accumulation JPY Class 1,077,094.75 – (127,988.03) 949,106.72Institutional Accumulation SEK Class 76.39 – – 76.39Institutional Accumulation USD Class 580,619.03 128.00 (287,824.67) 292,922.36Institutional Hedge Accumulation CHF Class 4,428,242.31 582,431.88 (2,714,275.53) 2,296,398.66Selling Agent SharesZ CHF Class 7,190,434.16 2,066,818.97 (1,725,491.59) 7,531,761.54C EUR Class 110,882.62 – (36,689.09) 74,193.53Z EUR Class 2,404,824.00 149,409.00 (355,526.00) 2,198,707.00X USD Class – 7,482.65 (1,346.73) 6,135.92Z USD Class 6,851,725.65 – (6,851,725.65) –
GAM Systematic Core MacroOrdinary SharesAccumulation EUR Class – 10,000.00 – 10,000.00Accumulation GBP Class 82,065.81 3,729.49 (65,488.69) 20,306.61Institutional SharesInstitutional Accumulation EUR Class 517,110.29 90,572.20 (434,795.87) 172,886.62Institutional Accumulation USD Class 609,968.19 – (459,153.12) 150,815.07Selling Agent SharesC EUR Class 81,684.90 – (61,324.02) 20,360.88W EUR Class 2,832,787.37 396,548.04 (2,187,557.87) 1,041,777.54X EUR Class 3,273.94 218.12 (3,235.48) 256.58W GBP Class 4,817,388.30 309,628.81 (3,265,664.03) 1,861,353.08Z GBP Class 880,570.15 – (757,719.91) 122,850.24W USD Class 1,080,292.91 5,796.00 (413,803.86) 672,285.05Z USD Class 9,658.81 490,789.88 (490,789.88) 9,658.81
GAM Systematic Global Equity Market NeutralOrdinary SharesAccumulation GBP Class 116,625.16 116,625.16 (116,625.16) 116,625.16Institutional SharesInstitutional Accumulation EUR Class 138,108.83 138,265.45 (138,108.83) 138,265.45Institutional Accumulation USD Class 140,235.91 140,235.91 (140,235.91) 140,235.91
Notes to the Financial Statements
16. Share capital, continued
At 30 June 2019Balance at
1 July 2018 Issued RedeemedBalance at
30 June 2019
GAM Systematic Global Equity Market Neutral, continuedSelling Agent SharesC EUR Class 139,101.88 138,108.83 (139,101.88) 138,108.83Z GBP Class 516,108.96 – (195,633.26) 320,475.70W USD Class 10,000.00 10,000.00 (10,000.00) 10,000.00Z USD Class 743,394.81 – – 743,394.81
GAM Star Tactical OpportunitiesInstitutional SharesInstitutional Accumulation CHF Class 127,370.45 – (112,411.88) 14,958.57Institutional Accumulation EUR Class 1,541,043.15 792.22 (248,937.30) 1,292,898.07Institutional Accumulation GBP Class 318,861.00 126,617.76 (120,809.75) 324,669.01Institutional Accumulation USD Class 393,987.90 2,042,626.46 (539,143.96) 1,897,470.40Selling Agent SharesM USD Class 2,431,532.85 – (2,431,532.85) –Non UK RFSAccumulation GBP Class 211,416.28 – (96,561.30) 114,854.98Accumulation USD Class 1,215,209.10 – (230,728.00) 984,481.10
GAM Star Target ReturnInstitutional SharesInstitutional Accumulation CHF Class 46,535.70 200.00 (46,535.70) 200.00Institutional Accumulation EUR Class 495,544.40 7,958.43 (321,327.27) 182,175.56Institutional Accumulation GBP Class 179,169.77 57,578.46 (213,642.75) 23,105.48Institutional Accumulation USD Class 1,423,594.81 549,698.86 (1,949,729.97) 23,563.70Selling Agent SharesZII CHF Class – 6,527.03 – 6,527.03X EUR Class – 176.20 (59.39) 116.81ZII EUR Class – 251,488.90 – 251,488.90ZII GBP Class – 233,246.76 (57,122.96) 176,123.80ZII USD Class – 2,367,624.18 (166,627.11) 2,200,997.07
GAM Star Target Return PlusInstitutional SharesInstitutional Accumulation GBP Class 716,000.00 – – 716,000.00Institutional Accumulation USD Class – 500.00 (500.00) –Selling Agent SharesX EUR Class 187.66 0.50 (188.16) –
GAM Star Disruptive GrowthOrdinary SharesAccumulation EUR Class 203,473.56 210,782.20 (279,653.76) 134,602.00Accumulation GBP Class 81,354.20 13,324.32 (27,560.88) 67,117.64Accumulation USD Class 2,170,856.70 151,056.39 (966,852.85) 1,355,060.24Income USD Class 23,407.60 – (22,250.00) 1,157.60Institutional SharesInstitutional Accumulation EUR Class 26,164.88 49,771.70 (14,255.20) 61,681.38Institutional Accumulation GBP Class 2,012,569.05 277,053.25 (859,228.44) 1,430,393.86Institutional Accumulation USD Class 2,638,605.26 139,723.75 (1,387,160.91) 1,391,168.10Institutional Hedged Accumulation GBP Class 275,814.38 42,656.70 (286,602.75) 31,868.33Institutional Income GBP Class 676,064.63 174,195.98 (381,956.18) 468,304.43Selling Agent SharesAccumulation Z GBP II Class 9,831.10 – (3,277.03) 6,554.07Z GBP Class 1,371,775.73 911,117.60 (736,171.95) 1,546,721.38A USD Class 206,994.86 132,633.47 (179,616.71) 160,011.62C USD Class 162,787.66 69,920.21 (131,886.45) 100,821.42Z USD Class 726,842.99 312,976.05 (111,170.05) 928,648.99R Hedged SharesAccumulation Hedged R EUR Class – 38,071.86 (22,116.19) 15,955.67

336
GAM Star Fund p.l.c.
Notes to the Financial Statements
16. Share capital, continued
At 30 June 2019Balance at
1 July 2018 Issued RedeemedBalance at
30 June 2019
GAM Star US All Cap EquityOrdinary SharesAccumulation EUR Class 1,587,991.09 433,475.08 (1,924,138.46) 97,327.71Accumulation GBP Class 37,524.85 6,642.03 (17,137.92) 27,028.96Accumulation USD Class 4,091,733.31 130,634.35 (2,116,274.51) 2,106,093.15Income USD Class 130,975.43 – (49,586.38) 81,389.05Institutional SharesInstitutional Accumulation EUR Class 13,089.00 210.00 (12,313.65) 985.35Institutional Accumulation GBP Class 115,919.17 30,601.18 (44,669.11) 101,851.24Institutional Accumulation USD Class 2,285,869.01 17,628.01 (1,831,950.19) 471,546.83Institutional Income GBP Class 26,964.92 – (18,000.00) 8,964.92Institutional Income USD Class 27,048.00 58,370.68 (1,350.00) 84,068.68Selling Agent SharesC EUR Class 27,745.47 923.92 (23,308.12) 5,361.27A USD Class 775,362.06 10,395.80 (364,781.08) 420,976.78C USD Class 353,278.77 1,737.75 (212,977.16) 142,039.36
GAM Star Worldwide EquityOrdinary SharesAccumulation EUR Class 463,477.55 7,948.76 (261,694.97) 209,731.34Accumulation GBP Class 1,743,222.77 243,927.93 (265,244.36) 1,721,906.34Accumulation USD Class 7,833.54 868.77 (567.45) 8,134.86Income GBP Class 12,199.57 1,073.37 (1,294.23) 11,978.71Income USD Class 21,613.85 181.07 (14,150.25) 7,644.67Institutional SharesInstitutional Accumulation USD Class – 1,361,688.67 (377,366.75) 984,321.92Institutional Income GBP Class – 512,590.09 (258,530.05) 254,060.04Institutional Income USD Class – 41,812.51 (2,826.29) 38,986.22Institutional Income EUR Class – 22,035.56 (22,035.56) –Selling Agent SharesC EUR Class 34,137.72 – (11,890.54) 22,247.18ZII GBP Class – 29,381.87 – 29,381.87A USD Class 18,103.61 10,435.26 (6,431.45) 22,107.42
GAM Systematic Dynamic Credit Fund** Institutional SharesInstitutional Accumulation EUR Class – 355,123.98 (177,561.99) 177,561.99Institutional Accumulation USD Class – 407,836.00 (203,918.00) 203,918.00Selling Agent SharesZ EUR Accumulation – 716,667.51 (262,398.32) 454,269.19Z GBP Accumulation – 396,136.61 (235,515.78) 160,620.83Z USD Accumulation – 603,698.20 (400,000.00) 203,698.20
** Fund launched during the year.

Notes to the Financial Statements
17. NAV per redeemable participating shares in issue
The following tables detail the NAV of each share class in each Fund as at 30 June 2020, 30 June 2019 and 30 June 2018:
NAV 30 June 2020
Shares in issue
30 June 2020
NAV per Share
30 June 2020NAV
30 June 2019
Shares in issue
30 June 2019
NAV per Share
30 June 2019NAV
30 June 2018
Shares in issue
30 June 2018
NAV per Share
30 June 2018
GAM Star Absolute Return Bond*Ordinary SharesAccumulation SEK Class – – – SEK98,558 1,014.29 SEK97.1693 SEK1,222,582 12,528.15 SEK97.5868Institutional SharesInstitutional Accumulation EUR Class – – – €7,474,510 754,232.07 €9.9100 €89,658,116 9,003,432.02 €9.9582Institutional Accumulation GBP Class – – – £11,210,226 1,068,124.08 £10.4952 £137,304,182 13,176,344.04 £10.4205Institutional Income II GBP Class – – – £6,624,543 685,074.89 £9.6698 £81,403,618 8,308,102.34 £9.7981Other sharesW GBP Class – – – £5,129,682 512,053.01 £10.0178 £66,136,070 6,647,819.18 £9.9485Z GBP Class – – – £19,835,728 1,857,938.59 £10.6762 £168,055,018 15,852,048.49 £10.6014Income II Z EUR Class – – – €175,801 18,990.23 €9.2574 €2,227,251 234,612.00 €9.4933Income II Z GBP Class – – – £6,449,303 657,258.85 £9.8124 £80,679,379 8,115,214.87 £9.9417
GAM Star Absolute Return Bond Defender*Institutional SharesInstitutional Accumulation EUR Class – – – €755,481 77,160.84 €9.7909 €14,821,028 1,515,826.42 €9.7775Institutional Accumulation GBP Class – – – £1,335,848 131,243.05 £10.1784 £1,901,359 189,286.68 £10.0448Institutional Accumulation USD Class – – – US$126,272 11,600.61 US$10.8849 US$2,799,631 265,367.83 US$10.5500
GAM Star Absolute Return Bond Plus*Institutional SharesInstitutional Accumulation EUR Class – – – €1,029,906 101,745.23 €10.1224 €9,058,829 894,477.10 €10.1275Institutional Accumulation GBP Class – – – £6,977,886 650,690.26 £10.7238 £63,448,591 5,984,889.75 £10.6014Institutional Accumulation SEK Class – – – SEK21,473,412 222,487.07 SEK96.5153 SEK194,512,183 2,014,588.27 SEK96.5518Institutional Accumulation USD Class – – – US$372,917 33,794.42 US$11.0348 US$3,695,254 344,852.60 US$10.7154Other sharesAccumulation II Z GBP Class – – – £30,373,450 2,763,495.92 £10.9909 £271,750,414 25,024,102.82 £10.8595Selling Agent SharesZ EUR Class – – – €2,154,160 213,258.23 €10.1011 €19,584,385 1,938,132.26 €10.1047Z GBP Class – – – £53,410,433 5,195,943.54 £10.2792 £477,661,055 47,011,107.07 £10.1606
GAM Star Absolute Return Macro*
Institutional SharesInstitutional Income GBP Class – – – £3,828,916 389,849.82 £9.8215 £89,782,890 8,935,065.07 £10.0483Selling Agent SharesAccumulation Z GBP Class – – – £20,854 2,164.36 £9.6351 £211,297 21,643.60 £9.7625Income X USD Class – – – US$7,644,789 771.22 US$9,912.5923 US$76,893,903 7,712.24 US$9,970.3722
*Fund terminated during the year. 337

Notes to the Financial Statements
17. NAV per redeemable participating shares in issue, continued
NAV 30 June 2020
Shares in issue
30 June 2020
NAV per Share
30 June 2020NAV
30 June 2019
Shares in issue
30 June 2019
NAV per Share
30 June 2019NAV
30 June 2018
Shares in issue
30 June 2018
NAV per Share
30 June 2018
GAM Star Alpha SpectrumOrdinary SharesAccumulation EUR Class €59,368,645 4,198,454.57 €14.1405 €76,436,282 5,331,055.10 €14.3379 €78,433,899 5,528,942.59 €14.1860
GAM Star Alpha TechnologyOrdinary SharesIncome EUR Class €6,504,524 448,528.49 €14.5019 €6,233,860 423,605.67 €14.7161 €5,903,791 421,031.70 €14.0221Income USD Class US$4,762,723 301,334.24 US$15.8054 US$1,660,429 105,519.82 US$15.7357 US$1,276,577 87,343.41 US$14.6156Institutional SharesInstitutional Accumulation EUR Class €5,158,098 512,115.94 €10.0721 €1,674,639 163,905.50 €10.2171 – – –Selling Agent SharesC EUR Acc Class €368,558 37,027.57 €9.9536 – – – – – –Z GBP Class £4,926,631 375,839.89 £13.1083 £3,793,841 289,824.60 £13.0901 £3,531,058 290,121.31 £12.1709Z II GBP Class £212,403 20,413.12 £10.4052 £208,003 20,152.14 £10.3216 – – –Z USD Class US$6,411,791 461,430.20 US$13.8954 US$3,702,637 270,590.00 US$13.6835 US$3,437,505 274,590.00 US$12.5186
GAM Star Asian EquityOrdinary SharesAccumulation CHF Class SFr798,291 60,944.04 SFr13.0987 SFr82,226 6,803.08 SFr12.0866 SFr202,239 15,304.72 SFr13.2141Accumulation EUR Class €5,644,909 282,291.51 €19.9967 €581,366 32,768.64 €17.7415 €710,588 38,182.95 €18.6100Accumulation GBP Class £2,820,028 1,046,547.82 £2.6946 £120,995 51,452.31 £2.3516 £155,133 63,728.53 £2.4342Accumulation USD Class US$12,073,544 684,124.25 US$17.6481 US$12,522,634 786,890.70 US$15.9140 US$17,841,394 1,043,999.92 US$17.0894Income EUR Class €113,232 11,906.08 €9.5104 – – – – – –Income GBP Class £1,324,199 508,891.50 £2.6021 £371,839 163,307.16 £2.2769 £405,939 172,227.47 £2.3569Income USD Class $2,908,169 302,700.14 $9.6074 – – – – – –Institutional SharesInstitutional Accumulation EUR Class €244,192 25,627.88 €9.5283 – – – – – –Institutional Accumulation GBP Class £1,346,186 78,305.38 £17.1914 £1,394,674 93,388.10 £14.9341 £22,643,349 1,466,670.43 £15.4386Selling Agent SharesAccumulation C EUR Class €180,404 19,011.46 €9.4892 – – – – – –Z GBP Class £26,896 2,616.18 £10.2807 – – – – – –Z II USD Class $104,148 10,027.05 $10.3867 – – – – – –
GAM Star Asia-Pacific Equity* Ordinary SharesAccumulation CHF Class – – – SFr902,727 71,780.19 SFr12.5762 SFr1,678,889 127,651.31 SFr13.1521Accumulation EUR Class – – – €5,353,673 29,449.47 €181.7918 €6,431,239 35,161.56 €182.9054Accumulation GBP Class – – – £2,389,828 534,838.75 £4.4683 £2,316,776 523,002.63 £4.4297Accumulation USD Class – – – US$3,078,782 204,031.77 US$15.0897 US$5,706,499 367,331.77 US$15.5350Income EUR Class – – – €107,736 660.86 €163.0235 €108,319 656.62 €164.9648
*Fund terminated during the year.
GAM Star Fund p.l.c.
338

Notes to the Financial Statements
17. NAV per redeemable participating shares in issue, continued
NAV 30 June 2020
Shares in issue
30 June 2020
NAV per Share
30 June 2020NAV
30 June 2019
Shares in issue
30 June 2019
NAV per Share
30 June 2019NAV
30 June 2018
Shares in issue
30 June 2018
NAV per Share
30 June 2018
GAM Star Asia-Pacific Equity*, continued Income GBP Class – – – £914,406 227,825.25 £4.0136 £2,118,817 529,426.21 £4.0021Income USD Class – – – US$3,745,824 263,483.54 US$14.2165 US$5,222,567 354,778.59 US$14.7206Institutional SharesInstitutional Accumulation EUR Class – – – €296,024 20,142.87 €14.6962 €296,012 20,120.03 €14.7122Selling Agent SharesAccumulation Z GBP Class – – – £39,605 3,713.88 £10.6640 £16,859 1,614.20 £10.4441C EUR Class – – – €224,237 14,186.60 €15.8000 €298,195 18,598.81 €16.0300
GAM Star Global BalancedOrdinary SharesAccumulation GBP Class £188,694 14,468.80 £13.0414 £264,714 20,904.49 £12.6630 £398,316 31,864.77 £12.5002Accumulation II GBP Class £2,421,837 181,614.63 £13.3350 £2,818,665 217,778.50 £12.9428 £2,914,021 228,158.69 £12.7719Accumulation USD Class US$2,145,471 156,392.58 US$13.7184 US$3,212,045 245,294.57 US$13.0946 US$3,319,125 261,115.95 US$12.7113Accumulation PI USD Class US$141,649 12,962.20 US$10.9278 US$134,911 12,962.20 US$10.4080 US$130,632 12,962.20 US$10.0779Income II GBP Class £1,841,203 138,094.90 £13.3328 £1,944,105 150,231.64 £12.9407 £2,203,170 172,529.17 £12.7698Institutional SharesInstitutional Accumulation AUD Class AUD357,867 32,174.58 AUD11.1226 AUD895,572 83,134.56 AUD10.7725 AUD1,358,055 129,762.87 AUD10.4656Institutional Accumulation EUR Class €5,106,074 494,559.01 €10.3245 €6,853,459 681,098.91 €10.0623 €6,510,115 649,368.79 €10.0252Institutional Accumulation GBP Class £38,575,409 2,421,557.38 £15.9300 £48,050,152 3,120,403.17 £15.3987 £59,003,341 3,898,289.52 £15.1357Institutional Accumulation SGD Class SGD1,502,476 130,440.83 SGD11.5184 SGD1,043,657 94,667.45 SGD11.0244 SGD1,592,714 148,351.39 SGD10.7360Institutional Accumulation USD Class US$25,010,286 1,546,583.69 US$16.1713 US$31,244,221 2,032,712.93 US$15.3707 US$51,460,138 3,463,513.22 US$14.8577Institutional Income GBP Class £1,913,763 121,954.40 £15.6924 £1,873,263 123,279.09 £15.1953 £6,698,601 446,635.90 £14.9979Other SharesPI GBP Class £667,689 56,049.90 £11.9124 £862,198 74,754.66 £11.5337 £969,821 85,419.68 £11.3535Selling Agent SharesAccumulation Open II Acc EUR €563,730 47,122.87 €11.9629 €551,739 47,122.87 €11.7085 €602,432 51,418.76 €11.7161C AUD Class AUD401,918 33,694.04 AUD11.9284 AUD963,159 82,153.00 AUD11.7200 AUD2,068,751 178,964.09 AUD11.5500T AUD Class AUD74,634 5,718.38 AUD13.0515 AUD422,149 33,149.86 AUD12.7300 AUD2,194,401 176,143.69 AUD12.4500U AUD Class AUD329,853 24,062.52 AUD13.7081 AUD419,168 31,368.18 AUD13.3628 AUD246,523 18,862.90 AUD13.0691A CHF Class SFr389,117 34,917.69 SFr11.1438 SFr814,216 74,245.70 SFr10.9600 SFr541,350 48,984.02 SFr11.0500C CHF Class SFr1,264,995 105,776.77 SFr11.9590 SFr1,459,101 123,023.60 SFr11.8600 SFr2,032,879 168,903.39 SFr12.0300F CHF Class SFr684,335 69,166.48 SFr9.8940 SFr770,199 78,766.48 SFr9.7700 SFr691,242 69,854.76 SFr9.8900A EUR Class €2,562,426 208,047.11 €12.3165 €3,958,233 327,397.31 €12.0900 €3,152,630 259,475.72 €12.1500C EUR Class €38,961,729 2,931,194.41 €13.2921 €44,763,186 3,402,489.06 €13.1500 €52,532,733 3,946,862.00 €13.3100F EUR Class €494,320 49,470.45 €9.9922 €722,308 73,279.24 €9.8500 €1,034,325 104,049.80 €9.9400G EUR Class €792,590 74,301.58 €10.6672 €1,520,076 144,455.83 €10.5200 €2,053,731 193,500.46 €10.6100T EUR Class €175,555 15,494.00 €11.3304 €588,845 52,908.94 €11.1200 €782,410 70,000.01 €11.1700U EUR Class €2,135,866 169,613.25 €12.5925 €2,567,670 207,768.06 €12.3583 €2,877,494 232,102.95 €12.3974
*Fund terminated during the year.
Notes to the Financial Statements
17. NAV per redeemable participating shares in issue, continued
NAV 30 June 2020
Shares in issue
30 June 2020
NAV per Share
30 June 2020NAV
30 June 2019
Shares in issue
30 June 2019
NAV per Share
30 June 2019NAV
30 June 2018
Shares in issue
30 June 2018
NAV per Share
30 June 2018
GAM Star Alpha SpectrumOrdinary SharesAccumulation EUR Class €59,368,645 4,198,454.57 €14.1405 €76,436,282 5,331,055.10 €14.3379 €78,433,899 5,528,942.59 €14.1860
GAM Star Alpha TechnologyOrdinary SharesIncome EUR Class €6,504,524 448,528.49 €14.5019 €6,233,860 423,605.67 €14.7161 €5,903,791 421,031.70 €14.0221Income USD Class US$4,762,723 301,334.24 US$15.8054 US$1,660,429 105,519.82 US$15.7357 US$1,276,577 87,343.41 US$14.6156Institutional SharesInstitutional Accumulation EUR Class €5,158,098 512,115.94 €10.0721 €1,674,639 163,905.50 €10.2171 – – –Selling Agent SharesC EUR Acc Class €368,558 37,027.57 €9.9536 – – – – – –Z GBP Class £4,926,631 375,839.89 £13.1083 £3,793,841 289,824.60 £13.0901 £3,531,058 290,121.31 £12.1709Z II GBP Class £212,403 20,413.12 £10.4052 £208,003 20,152.14 £10.3216 – – –Z USD Class US$6,411,791 461,430.20 US$13.8954 US$3,702,637 270,590.00 US$13.6835 US$3,437,505 274,590.00 US$12.5186
GAM Star Asian EquityOrdinary SharesAccumulation CHF Class SFr798,291 60,944.04 SFr13.0987 SFr82,226 6,803.08 SFr12.0866 SFr202,239 15,304.72 SFr13.2141Accumulation EUR Class €5,644,909 282,291.51 €19.9967 €581,366 32,768.64 €17.7415 €710,588 38,182.95 €18.6100Accumulation GBP Class £2,820,028 1,046,547.82 £2.6946 £120,995 51,452.31 £2.3516 £155,133 63,728.53 £2.4342Accumulation USD Class US$12,073,544 684,124.25 US$17.6481 US$12,522,634 786,890.70 US$15.9140 US$17,841,394 1,043,999.92 US$17.0894Income EUR Class €113,232 11,906.08 €9.5104 – – – – – –Income GBP Class £1,324,199 508,891.50 £2.6021 £371,839 163,307.16 £2.2769 £405,939 172,227.47 £2.3569Income USD Class $2,908,169 302,700.14 $9.6074 – – – – – –Institutional SharesInstitutional Accumulation EUR Class €244,192 25,627.88 €9.5283 – – – – – –Institutional Accumulation GBP Class £1,346,186 78,305.38 £17.1914 £1,394,674 93,388.10 £14.9341 £22,643,349 1,466,670.43 £15.4386Selling Agent SharesAccumulation C EUR Class €180,404 19,011.46 €9.4892 – – – – – –Z GBP Class £26,896 2,616.18 £10.2807 – – – – – –Z II USD Class $104,148 10,027.05 $10.3867 – – – – – –
GAM Star Asia-Pacific Equity* Ordinary SharesAccumulation CHF Class – – – SFr902,727 71,780.19 SFr12.5762 SFr1,678,889 127,651.31 SFr13.1521Accumulation EUR Class – – – €5,353,673 29,449.47 €181.7918 €6,431,239 35,161.56 €182.9054Accumulation GBP Class – – – £2,389,828 534,838.75 £4.4683 £2,316,776 523,002.63 £4.4297Accumulation USD Class – – – US$3,078,782 204,031.77 US$15.0897 US$5,706,499 367,331.77 US$15.5350Income EUR Class – – – €107,736 660.86 €163.0235 €108,319 656.62 €164.9648
*Fund terminated during the year. 339

Notes to the Financial Statements
17. NAV per redeemable participating shares in issue, continued
NAV 30 June 2020
Shares in issue
30 June 2020
NAV per Share
30 June 2020NAV
30 June 2019
Shares in issue
30 June 2019
NAV per Share
30 June 2019NAV
30 June 2018
Shares in issue
30 June 2018
NAV per Share
30 June 2018
GAM Star Global Balanced, continuedZ EUR Class €3,082,727 246,457.95 €12.5081 €3,510,310 288,181.46 €12.1809 €3,042,556 250,849.73 €12.1290A GBP Class £6,508,211 514,641.78 £12.6461 £17,253,001 1,400,297.00 £12.3209 £20,553,020 1,684,052.60 £12.2045C GBP Class £60,346,830 4,285,783.36 £14.0807 £90,050,096 6,514,747.38 £13.8225 £144,253,286 10,457,152.80 £13.7947F GBP Class £8,162,176 740,121.08 £11.0281 £14,718,316 1,363,975.73 £10.7907 £19,370,697 1,804,728.91 £10.7333G GBP Class £7,297,117 637,280.81 £11.4503 £13,293,616 1,186,518.54 £11.2038 £15,593,272 1,399,039.23 £11.1457T GBP Class £2,848,511 225,111.91 £12.6537 £6,081,655 493,304.51 £12.3284 £9,469,972 775,445.43 £12.2123U GBP Class £18,531,750 1,391,938.86 £13.3136 £20,253,922 1,562,947.35 £12.9588 £17,167,201 1,338,767.13 £12.8231Z GBP Class £8,171,517 574,839.56 £14.2153 £10,475,947 763,803.54 £13.7155 £22,444,715 1,667,933.59 £13.4566C JPY Class ¥13,727,742 11,597.27 ¥1,183.7000 ¥14,558,684 12,485.01 ¥1,166.0900 ¥39,971,402 33,997.32 ¥1,175.7200A SGD Class SGD599,727 46,420.39 SGD12.9194 SGD231,658 18,607.05 SGD12.4500 SGD586,732 48,007.82 SGD12.2200A USD Class US$13,115,226 974,370.81 US$13.4602 US$14,227,843 1,103,789.22 US$12.8900 US$19,612,734 1,561,523.39 US$12.5600C USD Class US$111,269,166 7,603,521.01 US$14.6339 US$116,065,540 8,219,939.12 US$14.1200 US$117,570,327 8,482,707.59 US$13.8600F USD Class US$1,606,370 136,640.87 US$11.7561 US$2,865,663 253,437.91 US$11.3000 US$4,790,456 433,525.44 US$11.0500G USD Class US$694,329 61,231.63 US$11.3393 US$1,520,734 139,516.85 US$10.9000 US$2,872,209 269,437.97 US$10.6600T USD Class US$1,039,287 66,471.22 US$15.6351 US$5,019,300 335,290.56 US$14.9700 US$13,259,295 909,416.66 US$14.5800U USD Class US$2,989,118 226,707.23 US$13.1849 US$3,755,246 297,642.92 US$12.6166 US$3,574,609 291,187.23 US$12.2759Z USD Accumulation Class US$2,229,695 217,112.73 US$10.2697 – – – – – –Non UK RFSAccumulation GBP Class £1,071,833 85,877.85 £12.4809 £1,062,334 87,660.52 £12.1187 £1,116,209 93,301.71 £11.9634Accumulation USD Class US$2,634,729 200,281.98 US$13.1550 US$2,678,416 213,285.33 US$12.5579 US$2,986,641 244,979.67 US$12.1913
GAM Star Capital Appreciation US EquityOrdinary SharesAccumulation GBP Class £55,689 4,611.46 £12.0761 £54,375 4,611.46 £11.7911 – – –Accumulation USD Class US$28,710,350 1,246,714.99 US$23.0288 US$1,495,714 64,595.70 US$23.1550 US$2,456,562 120,786.04 US$20.3381Income GBP Class £150,760 4,908.82 £30.7119 £454,515 15,157.07 £29.9870 £471,953 18,587.07 £25.3914Income USD Class US$16,857,429 732,014.22 US$23.0288 US$5,397,333 233,097.28 US$23.1548 US$14,198,026 698,104.21 US$20.3379Institutional SharesInstitutional Accumulation GBP Class £6,280,218 352,802.08 £17.8009 £8,104,732 468,744.42 £17.2903 £5,393,474 370,993.22 £14.5379Institutional Accumulation USD Class US$21,977,297 1,002,031.85 US$21.9327 US$28,653,456 1,305,866.21 US$21.9421 US$35,065,049 1,832,216.69 US$19.1380Institutional Income GBP Class £2,621,927 147,291.55 £17.8009 £3,447,909 199,412.74 £17.2903 £3,674,764 252,770.81 £14.5379Selling Agent SharesC USD Acc US$519,958 53,063.37 US$9.7988 – – – – – –Non UK RFSAccumulation USD Class US$8,430,783 715,182.92 US$11.7882 US$9,306,048 785,138.07 US$11.8527 – – –
GAM Star Fund p.l.c.
340

Notes to the Financial Statements
17. NAV per redeemable participating shares in issue, continued
NAV 30 June 2020
Shares in issue
30 June 2020
NAV per Share
30 June 2020NAV
30 June 2019
Shares in issue
30 June 2019
NAV per Share
30 June 2019NAV
30 June 2018
Shares in issue
30 June 2018
NAV per Share
30 June 2018
GAM Star Cat BondOrdinary SharesAccumulation CHF Class SFr12,515,356 1,001,308.60 SFr12.4990 SFr14,458,137 1,188,057.27 SFr12.1695 SFr18,844,957 1,515,431.05 SFr12.4353Accumulation EUR Class €32,028,428 2,465,356.18 €12.9914 €35,434,340 2,811,245.16 €12.6045 €52,690,766 4,108,601.94 €12.8245Accumulation GBP Class £1,611,374 115,836.72 £13.9107 £1,463,228 109,620.65 £13.3481 £3,016,704 225,330.90 £13.3878Accumulation USD Class US$53,848,628 3,701,114.70 US$14.5493 US$55,412,544 4,007,329.00 US$13.8278 US$67,790,876 4,967,638.27 US$13.6465
Accumulation A EUR Class €5,053,907 484,582.44 €10.4294 €3,022,611 298,060.93 €10.1400 €8,964,901 866,720.29 €10.3400Accumulation M EUR Class €50,411,232 4,949,993.73 €10.1841 €48,790,730 4,949,993.73 €9.8567 €49,543,309 4,949,993.73 €10.0087Hedged Ordinary Accumulation JPY ¥104,272,302 98,751.36 ¥1,055.9000 ¥394,178,328 385,411.24 ¥1,022.7400 ¥400,704,368 385,411.25 ¥1039.6800Income EUR Class €868,366 87,488.78 €9.9254 €1,330,098 130,113.09 €10.2226 €1,807,420 165,825.98 €10.8994Income USD Class US$2,479,488 204,720.00 US$12.1116 US$2,187,292 179,623.97 US$12.1770 US$2,290,072 182,112.96 US$12.5750Institutional SharesInstitutional Accumulation CHF Class SFr182,758,763 17,348,593.92 SFr10.5345 SFr161,833,676 15,848,799.42 SFr10.2111 SFr179,769,477 17,317,330.61 SFr10.3809Institutional Accumulation EUR Class €730,488,170 54,108,230.80 €13.5005 €674,238,261 51,646,770.63 €13.0548 €578,012,578 43,731,847.76 €13.2172Institutional Accumulation GBP Class £24,305,531 1,695,525.72 £14.3351 £42,109,819 3,074,045.98 £13.6985 £33,800,111 2,471,581.37 £13.6755Institutional Accumulation USD Class US$321,411,877 21,443,755.69 US$14.9886 US$304,847,694 21,496,456.16 US$14.1813 US$325,606,352 23,386,220.76 US$13.9230Institutional Hedged Income JPY Class – – – ¥1,816,511,344 2,032,241.33 ¥893.8400 ¥1,932,803,227 2,032,246.90 ¥951.0600Institutional Income EUR Class €145,763,568 15,582,686.74 €9.3542 €146,661,972 15,210,583.96 €9.6421 €116,216,175 11,300,128.81 €10.2845Institutional Income GBP Class £12,086,602 1,246,606.92 £9.6956 £12,514,037 1,270,060.91 £9.8531 £16,006,182 1,545,719.19 £10.3551Institutional Income USD Class US$15,224,701 1,410,959.52 US$10.7903 US$19,713,584 1,816,656.15 US$10.8515 US$17,187,833 1,534,381.31 US$11.2018Institutional Hedge SharesInstitutional Accumulation Hedge JPY Class JPY1,869,703,124 1,870,708.68 JPY999.4600 – – – – – –Distribution SharesDistribution Quarterly Ordinary USD Class US$9,715,487 986,579.67 US$9.8476 US$23,745,166 2,399,083.19 US$9.8976 US$57,818,324 5,641,913.57 US$10.2479R SharesAccumulation R EUR Class €1,802,789 180,305.99 €9.9985 – – – – – –Accumulation R USD Class $400,000 40,000.00 $10.0000 – – – – – –
GAM Star Global CautiousOrdinary SharesAccumulation EUR Class €10,128 853.00 €11.8739 €47,374 4,044.54 €11.7130 €821,712 70,420.06 €11.6687Accumulation U EUR Class €2,658,042 218,441.10 €12.1682 €2,767,041 229,920.25 €12.0347 €2,758,570 229,702.22 €12.0093Accumulation GBP Class £502,063 39,746.00 £12.6317 £631,582 51,123.20 £12.3541 £713,957 58,844.92 £12.1328Accumulation U GBP Class £18,094,497 1,405,550.36 £12.8736 £20,687,433 1,639,452.60 £12.6185 £22,081,509 1,778,200.32 £12.4178Accumulation USD Class US$1,567,016 118,806.00 US$13.1897 US$3,248,707 255,870.77 US$12.6966 US$3,893,550 317,381.79 US$12.2677Income GBP Class – – – £376,674 30,745.94 £12.2511 £371,248 30,745.94 £12.0746Institutional SharesInstitutional Accumulation AUD Class AUD253,332 23,051.43 AUD10.9898 AUD788,268 73,608.69 AUD10.7089 AUD1,034,683 99,892.48 AUD10.3579Institutional Accumulation EUR Class €4,828,879 411,858.78 €11.7246 €4,835,716 419,883.61 €11.5168 €4,865,429 425,856.14 €11.4250
Notes to the Financial Statements
17. NAV per redeemable participating shares in issue, continued
NAV 30 June 2020
Shares in issue
30 June 2020
NAV per Share
30 June 2020NAV
30 June 2019
Shares in issue
30 June 2019
NAV per Share
30 June 2019NAV
30 June 2018
Shares in issue
30 June 2018
NAV per Share
30 June 2018
GAM Star Global Balanced, continuedZ EUR Class €3,082,727 246,457.95 €12.5081 €3,510,310 288,181.46 €12.1809 €3,042,556 250,849.73 €12.1290A GBP Class £6,508,211 514,641.78 £12.6461 £17,253,001 1,400,297.00 £12.3209 £20,553,020 1,684,052.60 £12.2045C GBP Class £60,346,830 4,285,783.36 £14.0807 £90,050,096 6,514,747.38 £13.8225 £144,253,286 10,457,152.80 £13.7947F GBP Class £8,162,176 740,121.08 £11.0281 £14,718,316 1,363,975.73 £10.7907 £19,370,697 1,804,728.91 £10.7333G GBP Class £7,297,117 637,280.81 £11.4503 £13,293,616 1,186,518.54 £11.2038 £15,593,272 1,399,039.23 £11.1457T GBP Class £2,848,511 225,111.91 £12.6537 £6,081,655 493,304.51 £12.3284 £9,469,972 775,445.43 £12.2123U GBP Class £18,531,750 1,391,938.86 £13.3136 £20,253,922 1,562,947.35 £12.9588 £17,167,201 1,338,767.13 £12.8231Z GBP Class £8,171,517 574,839.56 £14.2153 £10,475,947 763,803.54 £13.7155 £22,444,715 1,667,933.59 £13.4566C JPY Class ¥13,727,742 11,597.27 ¥1,183.7000 ¥14,558,684 12,485.01 ¥1,166.0900 ¥39,971,402 33,997.32 ¥1,175.7200A SGD Class SGD599,727 46,420.39 SGD12.9194 SGD231,658 18,607.05 SGD12.4500 SGD586,732 48,007.82 SGD12.2200A USD Class US$13,115,226 974,370.81 US$13.4602 US$14,227,843 1,103,789.22 US$12.8900 US$19,612,734 1,561,523.39 US$12.5600C USD Class US$111,269,166 7,603,521.01 US$14.6339 US$116,065,540 8,219,939.12 US$14.1200 US$117,570,327 8,482,707.59 US$13.8600F USD Class US$1,606,370 136,640.87 US$11.7561 US$2,865,663 253,437.91 US$11.3000 US$4,790,456 433,525.44 US$11.0500G USD Class US$694,329 61,231.63 US$11.3393 US$1,520,734 139,516.85 US$10.9000 US$2,872,209 269,437.97 US$10.6600T USD Class US$1,039,287 66,471.22 US$15.6351 US$5,019,300 335,290.56 US$14.9700 US$13,259,295 909,416.66 US$14.5800U USD Class US$2,989,118 226,707.23 US$13.1849 US$3,755,246 297,642.92 US$12.6166 US$3,574,609 291,187.23 US$12.2759Z USD Accumulation Class US$2,229,695 217,112.73 US$10.2697 – – – – – –Non UK RFSAccumulation GBP Class £1,071,833 85,877.85 £12.4809 £1,062,334 87,660.52 £12.1187 £1,116,209 93,301.71 £11.9634Accumulation USD Class US$2,634,729 200,281.98 US$13.1550 US$2,678,416 213,285.33 US$12.5579 US$2,986,641 244,979.67 US$12.1913
GAM Star Capital Appreciation US EquityOrdinary SharesAccumulation GBP Class £55,689 4,611.46 £12.0761 £54,375 4,611.46 £11.7911 – – –Accumulation USD Class US$28,710,350 1,246,714.99 US$23.0288 US$1,495,714 64,595.70 US$23.1550 US$2,456,562 120,786.04 US$20.3381Income GBP Class £150,760 4,908.82 £30.7119 £454,515 15,157.07 £29.9870 £471,953 18,587.07 £25.3914Income USD Class US$16,857,429 732,014.22 US$23.0288 US$5,397,333 233,097.28 US$23.1548 US$14,198,026 698,104.21 US$20.3379Institutional SharesInstitutional Accumulation GBP Class £6,280,218 352,802.08 £17.8009 £8,104,732 468,744.42 £17.2903 £5,393,474 370,993.22 £14.5379Institutional Accumulation USD Class US$21,977,297 1,002,031.85 US$21.9327 US$28,653,456 1,305,866.21 US$21.9421 US$35,065,049 1,832,216.69 US$19.1380Institutional Income GBP Class £2,621,927 147,291.55 £17.8009 £3,447,909 199,412.74 £17.2903 £3,674,764 252,770.81 £14.5379Selling Agent SharesC USD Acc US$519,958 53,063.37 US$9.7988 – – – – – –Non UK RFSAccumulation USD Class US$8,430,783 715,182.92 US$11.7882 US$9,306,048 785,138.07 US$11.8527 – – –
341

Notes to the Financial Statements
17. NAV per redeemable participating shares in issue, continued
NAV 30 June 2020
Shares in issue
30 June 2020
NAV per Share
30 June 2020NAV
30 June 2019
Shares in issue
30 June 2019
NAV per Share
30 June 2019NAV
30 June 2018
Shares in issue
30 June 2018
NAV per Share
30 June 2018
GAM Star Global Cautious, continuedInstitutional Accumulation GBP Class £34,254,134 2,283,456.69 £15.0010 £42,016,949 2,875,549.15 £14.6118 £67,114,664 4,694,679.14 £14.2959Institutional Accumulation USD Class US$7,537,382 605,962.59 US$12.4386 US$4,464,025 374,671.65 US$11.9145 US$15,651,767 1,364,794.57 US$11.4682Institutional Accumulation Hedged USD Class US$1,048,362 79,062.78 US$13.2598 US$1,178,937 92,859.88 US$12.6958 US$2,258,191 184,754.36 US$12.2226Distribution SharesQuarterly Institutional Income GBP Class £195,123 18,921.80 £10.3120 £256,899 25,281.48 £10.1615 £137,251 13,687.76 £10.0200Other sharesPI GBP Class £197,654 16,954.21 £11.6581 £557,524 49,024.38 £11.3723 £563,098 50,539.19 £11.1418PI USD Class – – – – – – US$179,643 16,622.50 US$10.8072Selling Agent SharesA AUD Class AUD77,102 6,600.00 AUD11.6821 AUD75,700 6,600.00 AUD11.4600 AUD174,261 15,614.08 AUD11.1600C AUD Class – – – – – – AUD899,192 78,472.71 AUD11.4500T AUD Class AUD449,486 36,328.22 AUD12.3729 AUD1,615,223 133,063.32 AUD12.1300 AUD4,799,382 406,052.66 AUD11.8100U AUD Class AUD125,004 9,693.66 AUD12.8954 AUD468,474 37,014.97 AUD12.6563 AUD580,021 47,100.62 AUD12.3145U CHF Class SFr365,762 33,754.39 SFr10.8359 SFr457,020 42,555.89 SFr10.7392 SFr533,330 49,608.35 SFr10.7508A EUR Class €878,582 78,504.78 €11.1914 €1,469,812 132,774.36 €11.0700 €1,437,658 129,869.74 €11.0700C EUR Class €9,448,921 802,837.00 €11.7694 €11,110,848 946,474.99 €11.7300 €15,107,872 1,278,411.50 €11.8100CQ EUR Class Income II €3,358 352.62 €9.5226 €81,021 8,217.89 €9.8500 €565,808 54,828.91 €10.3100F EUR Class €52,693 5,290.58 €9.9598 €52,423 5,290.58 €9.9000 €179,081 18,010.58 €9.9400G EUR Class €508,534 48,605.79 €10.4624 €559,990 53,805.87 €10.4000 €559,697 53,557.14 €10.4500T EUR Class €163,840 12,202.70 €13.4265 €175,111 13,177.74 €13.2800 €386,483 29,114.73 €13.2700TQ EUR Class Income II €3,597 385.99 €9.3194 €57,908 6,037.26 €9.5900 €163,487 16,391.22 €9.9700Z EUR Accumulation Class €4,638,314 388,203.25 €11.9481 €3,855,971 328,707.67 €11.7307 €3,349,935 288,072.28 €11.6288A GBP Class £7,510,967 609,407.14 £12.3250 £10,079,526 833,225.23 £12.0970 £10,289,136 862,942.26 £11.9233AQ GBP Class Income II £93,293 10,000.00 £9.3292 £293,083 30,735.27 £9.5357 £300,766 30,735.27 £9.7857C GBP Class £14,625,934 1,095,248.02 £13.3539 £25,549,028 1,934,638.40 £13.2061 £47,406,180 3,615,011.80 £13.1137CQ GBP Class Income II £1,360,109 137,432.15 £9.8965 £2,092,307 205,284.63 £10.1922 £4,283,670 406,648.58 £10.5300F GBP Class £1,648,104 146,425.89 £11.2555 £3,421,066 308,256.07 £11.0981 £5,235,924 476,413.96 £10.9902G GBP Accumulation Class £3,282,857 294,766.70 £11.1371 £5,095,593 464,021.42 £10.9813 £5,982,470 550,110.72 £10.8750G GBP Income Class £566,168 54,053.83 £10.4741 £1,027,877 99,526.71 £10.3276 £1,253,857 122,607.36 £10.2200T GBP Accumulation Class £1,796,780 126,819.33 £14.1680 £2,566,278 184,545.96 £13.9058 £3,905,109 284,902.90 £13.7068Z GBP Class £8,399,057 596,418.03 £14.0825 £9,609,764 701,755.12 £13.6939 £14,227,067 1,063,570.77 £13.3767TQ GBP Income II Class £168,710 16,252.18 £10.3807 £554,746 52,282.68 £10.6105 £1,541,389 141,581.24 £10.8869A SGD Class SGD1,039,921 79,069.19 SGD13.1520 SGD1,010,491 79,069.19 SGD12.7700 SGD987,073 79,069.19 SGD12.4800A USD Class US$8,440,464 653,261.39 US$12.9205 US$10,898,619 873,961.41 US$12.4700 US$11,939,249 987,268.00 US$12.0900C USD Class US$24,791,605 1,793,361.20 US$13.8241 US$27,439,255 2,040,453.93 US$13.4400 US$34,003,005 2,589,718.57 US$13.1300CQ USD Class Income II US$816,746 78,515.23 US$10.4023 US$737,804 70,026.63 US$10.5300 US$2,105,296 196,691.83 US$10.7000F USD Class US$234,046 19,836.22 US$11.7989 US$702,764 61,463.25 US$11.4300 US$1,206,237 108,326.84 US$11.1300T USD Class US$290,516 19,742.39 US$14.7153 US$3,366,302 237,450.97 US$14.1700 US$3,933,258 286,147.10 US$13.7400U USD Class US$4,221,969 330,469.25 US$12.7756 US$5,662,854 459,882.15 US$12.3137 US$4,944,022 414,683.18 US$11.9224Z USD Class US$16,715,474 1,527,967.80 US$10.9396 US$11,679,148 1,116,238.08 US$10.4629 – – –G Quarterly Income EUR Class – – – €166,287 17,496.98 €9.5000 €135,092 13,723.70 €9.8400
GAM Star Fund p.l.c.
342
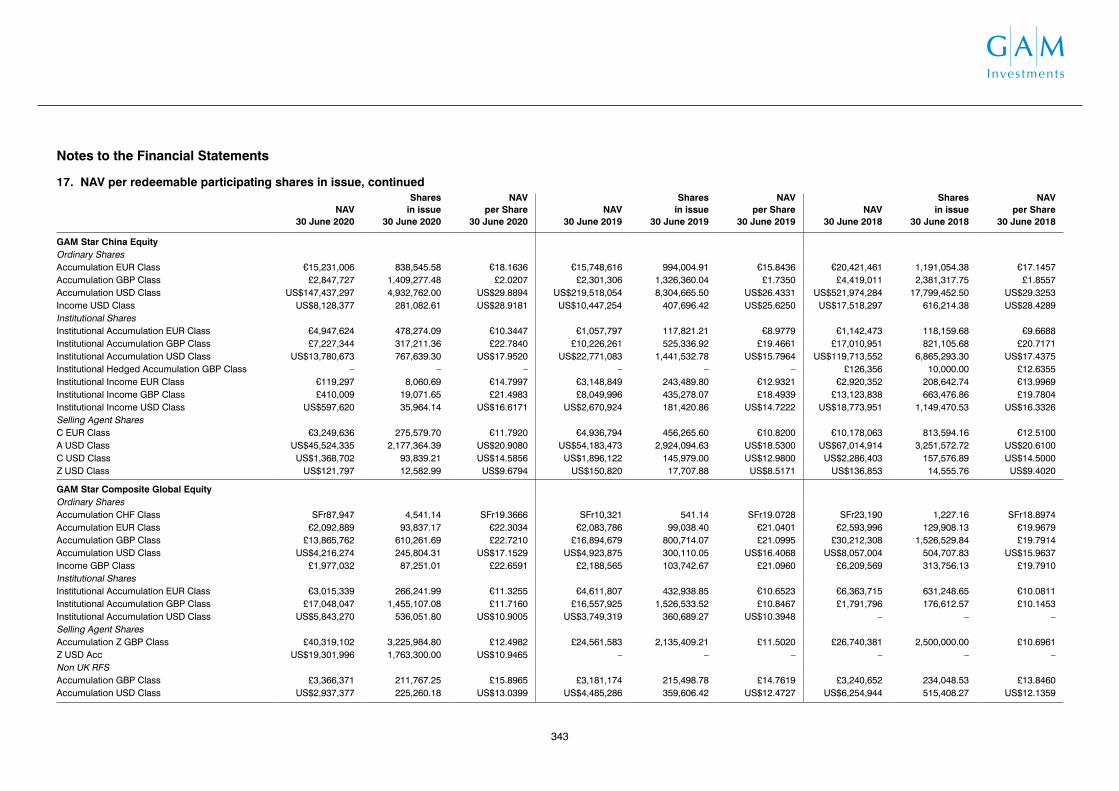
Notes to the Financial Statements
17. NAV per redeemable participating shares in issue, continued
NAV 30 June 2020
Shares in issue
30 June 2020
NAV per Share
30 June 2020NAV
30 June 2019
Shares in issue
30 June 2019
NAV per Share
30 June 2019NAV
30 June 2018
Shares in issue
30 June 2018
NAV per Share
30 June 2018
GAM Star China EquityOrdinary SharesAccumulation EUR Class €15,231,006 838,545.58 €18.1636 €15,748,616 994,004.91 €15.8436 €20,421,461 1,191,054.38 €17.1457Accumulation GBP Class £2,847,727 1,409,277.48 £2.0207 £2,301,306 1,326,360.04 £1.7350 £4,419,011 2,381,317.75 £1.8557Accumulation USD Class US$147,437,297 4,932,762.00 US$29.8894 US$219,518,054 8,304,665.50 US$26.4331 US$521,974,284 17,799,452.50 US$29.3253Income USD Class US$8,128,377 281,082.61 US$28.9181 US$10,447,254 407,696.42 US$25.6250 US$17,518,297 616,214.38 US$28.4289Institutional SharesInstitutional Accumulation EUR Class €4,947,624 478,274.09 €10.3447 €1,057,797 117,821.21 €8.9779 €1,142,473 118,159.68 €9.6688Institutional Accumulation GBP Class £7,227,344 317,211.36 £22.7840 £10,226,261 525,336.92 £19.4661 £17,010,951 821,105.68 £20.7171Institutional Accumulation USD Class US$13,780,673 767,639.30 US$17.9520 US$22,771,083 1,441,532.78 US$15.7964 US$119,713,552 6,865,293.30 US$17.4375Institutional Hedged Accumulation GBP Class – – – – – – £126,356 10,000.00 £12.6355Institutional Income EUR Class €119,297 8,060.69 €14.7997 €3,148,849 243,489.80 €12.9321 €2,920,352 208,642.74 €13.9969Institutional Income GBP Class £410,009 19,071.65 £21.4983 £8,049,996 435,278.07 £18.4939 £13,123,838 663,476.86 £19.7804Institutional Income USD Class US$597,620 35,964.14 US$16.6171 US$2,670,924 181,420.86 US$14.7222 US$18,773,951 1,149,470.53 US$16.3326Selling Agent SharesC EUR Class €3,249,636 275,579.70 €11.7920 €4,936,794 456,265.60 €10.8200 €10,178,063 813,594.16 €12.5100A USD Class US$45,524,335 2,177,364.39 US$20.9080 US$54,183,473 2,924,094.63 US$18.5300 US$67,014,914 3,251,572.72 US$20.6100C USD Class US$1,368,702 93,839.21 US$14.5856 US$1,896,122 145,979.00 US$12.9800 US$2,286,403 157,576.89 US$14.5000Z USD Class US$121,797 12,582.99 US$9.6794 US$150,820 17,707.88 US$8.5171 US$136,853 14,555.76 US$9.4020
GAM Star Composite Global EquityOrdinary SharesAccumulation CHF Class SFr87,947 4,541.14 SFr19.3666 SFr10,321 541.14 SFr19.0728 SFr23,190 1,227.16 SFr18.8974Accumulation EUR Class €2,092,889 93,837.17 €22.3034 €2,083,786 99,038.40 €21.0401 €2,593,996 129,908.13 €19.9679Accumulation GBP Class £13,865,762 610,261.69 £22.7210 £16,894,679 800,714.07 £21.0995 £30,212,308 1,526,529.84 £19.7914Accumulation USD Class US$4,216,274 245,804.31 US$17.1529 US$4,923,875 300,110.05 US$16.4068 US$8,057,004 504,707.83 US$15.9637Income GBP Class £1,977,032 87,251.01 £22.6591 £2,188,565 103,742.67 £21.0960 £6,209,569 313,756.13 £19.7910Institutional SharesInstitutional Accumulation EUR Class €3,015,339 266,241.99 €11.3255 €4,611,807 432,938.85 €10.6523 €6,363,715 631,248.65 €10.0811Institutional Accumulation GBP Class £17,048,047 1,455,107.08 £11.7160 £16,557,925 1,526,533.52 £10.8467 £1,791,796 176,612.57 £10.1453Institutional Accumulation USD Class US$5,843,270 536,051.80 US$10.9005 US$3,749,319 360,689.27 US$10.3948 – – –Selling Agent SharesAccumulation Z GBP Class £40,319,102 3,225,984.80 £12.4982 £24,561,583 2,135,409.21 £11.5020 £26,740,381 2,500,000.00 £10.6961Z USD Acc US$19,301,996 1,763,300.00 US$10.9465 – – – – – –Non UK RFSAccumulation GBP Class £3,366,371 211,767.25 £15.8965 £3,181,174 215,498.78 £14.7619 £3,240,652 234,048.53 £13.8460Accumulation USD Class US$2,937,377 225,260.18 US$13.0399 US$4,485,286 359,606.42 US$12.4727 US$6,254,944 515,408.27 US$12.1359
Notes to the Financial Statements
17. NAV per redeemable participating shares in issue, continued
NAV 30 June 2020
Shares in issue
30 June 2020
NAV per Share
30 June 2020NAV
30 June 2019
Shares in issue
30 June 2019
NAV per Share
30 June 2019NAV
30 June 2018
Shares in issue
30 June 2018
NAV per Share
30 June 2018
GAM Star Global Cautious, continuedInstitutional Accumulation GBP Class £34,254,134 2,283,456.69 £15.0010 £42,016,949 2,875,549.15 £14.6118 £67,114,664 4,694,679.14 £14.2959Institutional Accumulation USD Class US$7,537,382 605,962.59 US$12.4386 US$4,464,025 374,671.65 US$11.9145 US$15,651,767 1,364,794.57 US$11.4682Institutional Accumulation Hedged USD Class US$1,048,362 79,062.78 US$13.2598 US$1,178,937 92,859.88 US$12.6958 US$2,258,191 184,754.36 US$12.2226Distribution SharesQuarterly Institutional Income GBP Class £195,123 18,921.80 £10.3120 £256,899 25,281.48 £10.1615 £137,251 13,687.76 £10.0200Other sharesPI GBP Class £197,654 16,954.21 £11.6581 £557,524 49,024.38 £11.3723 £563,098 50,539.19 £11.1418PI USD Class – – – – – – US$179,643 16,622.50 US$10.8072Selling Agent SharesA AUD Class AUD77,102 6,600.00 AUD11.6821 AUD75,700 6,600.00 AUD11.4600 AUD174,261 15,614.08 AUD11.1600C AUD Class – – – – – – AUD899,192 78,472.71 AUD11.4500T AUD Class AUD449,486 36,328.22 AUD12.3729 AUD1,615,223 133,063.32 AUD12.1300 AUD4,799,382 406,052.66 AUD11.8100U AUD Class AUD125,004 9,693.66 AUD12.8954 AUD468,474 37,014.97 AUD12.6563 AUD580,021 47,100.62 AUD12.3145U CHF Class SFr365,762 33,754.39 SFr10.8359 SFr457,020 42,555.89 SFr10.7392 SFr533,330 49,608.35 SFr10.7508A EUR Class €878,582 78,504.78 €11.1914 €1,469,812 132,774.36 €11.0700 €1,437,658 129,869.74 €11.0700C EUR Class €9,448,921 802,837.00 €11.7694 €11,110,848 946,474.99 €11.7300 €15,107,872 1,278,411.50 €11.8100CQ EUR Class Income II €3,358 352.62 €9.5226 €81,021 8,217.89 €9.8500 €565,808 54,828.91 €10.3100F EUR Class €52,693 5,290.58 €9.9598 €52,423 5,290.58 €9.9000 €179,081 18,010.58 €9.9400G EUR Class €508,534 48,605.79 €10.4624 €559,990 53,805.87 €10.4000 €559,697 53,557.14 €10.4500T EUR Class €163,840 12,202.70 €13.4265 €175,111 13,177.74 €13.2800 €386,483 29,114.73 €13.2700TQ EUR Class Income II €3,597 385.99 €9.3194 €57,908 6,037.26 €9.5900 €163,487 16,391.22 €9.9700Z EUR Accumulation Class €4,638,314 388,203.25 €11.9481 €3,855,971 328,707.67 €11.7307 €3,349,935 288,072.28 €11.6288A GBP Class £7,510,967 609,407.14 £12.3250 £10,079,526 833,225.23 £12.0970 £10,289,136 862,942.26 £11.9233AQ GBP Class Income II £93,293 10,000.00 £9.3292 £293,083 30,735.27 £9.5357 £300,766 30,735.27 £9.7857C GBP Class £14,625,934 1,095,248.02 £13.3539 £25,549,028 1,934,638.40 £13.2061 £47,406,180 3,615,011.80 £13.1137CQ GBP Class Income II £1,360,109 137,432.15 £9.8965 £2,092,307 205,284.63 £10.1922 £4,283,670 406,648.58 £10.5300F GBP Class £1,648,104 146,425.89 £11.2555 £3,421,066 308,256.07 £11.0981 £5,235,924 476,413.96 £10.9902G GBP Accumulation Class £3,282,857 294,766.70 £11.1371 £5,095,593 464,021.42 £10.9813 £5,982,470 550,110.72 £10.8750G GBP Income Class £566,168 54,053.83 £10.4741 £1,027,877 99,526.71 £10.3276 £1,253,857 122,607.36 £10.2200T GBP Accumulation Class £1,796,780 126,819.33 £14.1680 £2,566,278 184,545.96 £13.9058 £3,905,109 284,902.90 £13.7068Z GBP Class £8,399,057 596,418.03 £14.0825 £9,609,764 701,755.12 £13.6939 £14,227,067 1,063,570.77 £13.3767TQ GBP Income II Class £168,710 16,252.18 £10.3807 £554,746 52,282.68 £10.6105 £1,541,389 141,581.24 £10.8869A SGD Class SGD1,039,921 79,069.19 SGD13.1520 SGD1,010,491 79,069.19 SGD12.7700 SGD987,073 79,069.19 SGD12.4800A USD Class US$8,440,464 653,261.39 US$12.9205 US$10,898,619 873,961.41 US$12.4700 US$11,939,249 987,268.00 US$12.0900C USD Class US$24,791,605 1,793,361.20 US$13.8241 US$27,439,255 2,040,453.93 US$13.4400 US$34,003,005 2,589,718.57 US$13.1300CQ USD Class Income II US$816,746 78,515.23 US$10.4023 US$737,804 70,026.63 US$10.5300 US$2,105,296 196,691.83 US$10.7000F USD Class US$234,046 19,836.22 US$11.7989 US$702,764 61,463.25 US$11.4300 US$1,206,237 108,326.84 US$11.1300T USD Class US$290,516 19,742.39 US$14.7153 US$3,366,302 237,450.97 US$14.1700 US$3,933,258 286,147.10 US$13.7400U USD Class US$4,221,969 330,469.25 US$12.7756 US$5,662,854 459,882.15 US$12.3137 US$4,944,022 414,683.18 US$11.9224Z USD Class US$16,715,474 1,527,967.80 US$10.9396 US$11,679,148 1,116,238.08 US$10.4629 – – –G Quarterly Income EUR Class – – – €166,287 17,496.98 €9.5000 €135,092 13,723.70 €9.8400
343

Notes to the Financial Statements
17. NAV per redeemable participating shares in issue, continued
NAV 30 June 2020
Shares in issue
30 June 2020
NAV per Share
30 June 2020NAV
30 June 2019
Shares in issue
30 June 2019
NAV per Share
30 June 2019NAV
30 June 2018
Shares in issue
30 June 2018
NAV per Share
30 June 2018
GAM Star Continental European EquityOrdinary SharesAccumulation CHF Class SFr4,530,902 240,302.88 SFr18.8549 SFr5,378,180 286,353.67 SFr18.7815 SFr1,809,827 88,561.57 SFr20.4358Accumulation EUR Class €81,115,300 3,157,760.96 €25.6876 €97,724,293 3,984,615.66 €24.5254 €185,198,863 7,247,381.54 €25.5539Accumulation R EUR Class €563,331 54,478.68 €10.3403 €979,518 99,717.18 €9.8229 €544,686 53,484.03 €10.1840Accumulation Z EUR Class €104,776,479 5,434,413.12 €19.2801 €117,656,320 6,430,302.28 €18.2971 €215,603,822 11,376,970.09 €18.9509Accumulation GBP Class £2,442,492 479,539.60 £5.0934 £3,713,290 775,605.66 £4.7876 £5,889,037 1,194,441.06 £4.9303Accumulation Z GBP Class – – – – – – £120,592 10,000.00 £12.0591Accumulation Z II GBP Class £96,856 7,353.56 £13.1713 £31,468,942 2,557,805.90 £12.3031 £46,447,011 3,687,616.99 £12.5954Accumulation USD Class US$4,535,006 246,974.57 US$18.3622 US$4,349,178 244,664.45 US$17.7760 US$8,498,134 447,492.05 US$18.9905Income Z EUR Class €56,515,814 3,098,865.81 €18.2375 €77,898,831 4,446,178.80 €17.5204 €98,615,504 5,370,454.28 €18.3626Income GBP Class £58,384 11,825.05 £4.9373 £83,601 18,013.89 £4.6409 £1,322,498 275,103.31 £4.8072Institutional SharesInstitutional Accumulation EUR Class €160,386,976 7,453,238.09 €21.5191 €413,816,190 20,243,033.58 €20.4424 €1,184,204,291 55,874,506.52 €21.1940Institutional Accumulation GBP Class £16,276,251 681,830.62 £23.8714 £20,864,021 934,453.97 £22.3275 £36,203,255 1,582,289.37 £22.8803Institutional Accumulation USD Class US$8,582,980 511,305.58 US$16.7864 US$18,166,491 1,123,559.13 US$16.1687 US$37,771,346 2,197,556.40 US$17.1878Institutional Accumulation Hedge USD Class US$305,736 24,354.97 US$12.5533 US$288,660 24,934.36 US$11.5768 US$3,835,147 330,263.82 US$11.6123Institutional Income EUR Class €401,550 19,584.06 €20.5039 €397,414 20,175.76 €19.6976 €1,334,346 64,634.67 €20.6444Institutional Income GBP Class £16,380,628 731,254.32 £22.4007 £23,680,362 1,117,762.71 £21.1855 £38,228,570 1,741,898.23 £21.9465Institutional Income GBP Z Class £26,808,378 2,552,692.59 £10.5020 £24,224,894 2,439,222.43 £9.9314 £9,233,589 897,562.97 £10.2874Institutional Income USD Class – – – – – – US$41,917 2,479.45 US$16.9057Selling Agent SharesC EUR Class €812,554 51,443.23 €15.7951 €414,157 27,272.11 €15.1800 €1,931,174 121,282.41 €15.9200C USD Class US$3,978,281 271,622.19 US$14.6463 US$8,363,333 611,946.97 US$13.6600 US$18,318,615 1,320,736.47 US$13.8700
GAM Star Credit Opportunities (EUR)Ordinary SharesAccumulation CHF Class SFr24,812,533 1,548,170.77 SFr16.0270 SFr30,118,288 1,797,076.76 SFr16.7596 SFr63,083,632 3,769,900.61 SFr16.7335Accumulation EUR Class €414,360,741 24,169,290.97 €17.1441 €783,448,195 43,944,816.88 €17.8280 €1,011,306,809 57,091,465.92 €17.7138Accumulation R EUR Class €12,585,050 1,361,313.56 €9.2447 €9,454,725 987,448.92 €9.5749 €8,680,564 916,086.79 €9.4757Income CHF Class SFr9,474,964 807,498.75 SFr11.7337 SFr10,866,660 859,025.22 SFr12.6499 SFr13,910,246 1,069,018.69 SFr13.0121Income CHF R Class SFr6,032 695.00 SFr8.6794 SFr6,499 695.00 SFr9.3507 SFr1,644,155 173,880.00 SFr9.4556Income EUR Class €29,610,460 1,994,055.65 €14.8493 €40,361,750 2,534,021.18 €15.9279 €124,196,518 7,617,268.63 €16.3046Income EUR II Class €106,162,159 12,331,675.27 €8.6089 €217,958,207 23,412,792.34 €9.3093 €209,897,201 21,653,459.09 €9.6934Institutional SharesInstitutional Accumulation CHF Class SFr73,133,626 5,628,279.69 SFr12.9939 SFr82,151,578 6,069,476.47 SFr13.5352 SFr133,876,523 9,946,323.78 SFr13.4599Institutional Accumulation EUR Class €837,949,169 57,004,895.99 €14.6996 €1,525,658,497 100,210,087.41 €15.2246 €2,868,575,075 190,390,466.13 €15.0668Institutional Income CHF Class SFr9,290,423 975,531.82 SFr9.5234 SFr11,105,148 1,081,597.42 SFr10.2673 SFr16,891,974 1,599,108.06 SFr10.5633Institutional Income EUR Class €150,933,615 11,792,945.23 €12.7986 €252,615,202 18,402,395.39 €13.7273 €201,889,052 14,364,113.52 €14.0551
GAM Star Fund p.l.c.
344

Notes to the Financial Statements
17. NAV per redeemable participating shares in issue, continued
NAV 30 June 2020
Shares in issue
30 June 2020
NAV per Share
30 June 2020NAV
30 June 2019
Shares in issue
30 June 2019
NAV per Share
30 June 2019NAV
30 June 2018
Shares in issue
30 June 2018
NAV per Share
30 June 2018
GAM Star Credit Opportunities (EUR), continuedDistribution SharesM EUR Class €10,340,403 1,089,161.40 €9.4939 €43,628,193 4,314,326.28 €10.1124 €49,201,704 4,743,338.76 €10.3728Quarterly Z Income EUR Class €15,459,058 1,799,707.79 €8.5897 €18,146,250 1,980,555.97 €9.1622 €2,170,650 230,615.71 €9.4124SI EUR Class €100,812,401 9,776,221.94 €10.3120 €125,430,128 11,400,769.64 €11.0019 €137,637,756 12,165,583.00 €11.3137SO EUR Class €32,376,138 2,798,314.11 €11.5698 €52,061,318 4,217,044.05 €12.3454 €99,878,980 7,869,691.79 €12.6916Other SharesR EUR Class €1,350,915 153,008.30 €8.8290 €304,654 32,171.71 €9.4696 €27,040,118 2,832,728.99 €9.5456Selling Agent SharesAccumulation Z EUR Class – – – €10,548,260 1,110,948.57 €9.4948 €10,418,165 1,110,948.57 €9.3777A EUR Class €154,571,006 11,265,451.42 €13.7208 €231,664,544 16,187,526.21 €14.3113 €342,226,419 23,999,047.63 €14.2600AQ EUR Class €49,278,114 5,437,705.04 €9.0623 €69,116,932 7,023,221.98 €9.8412 €124,530,745 12,102,113.18 €10.2900C EUR Class €89,785,607 8,183,008.64 €10.9722 €107,873,513 9,383,161.24 €11.4965 €137,717,918 11,975,471.16 €11.5000Z Distribution SharesMZ EUR Class – – – – – – €81,223 8,548.54 €9.5014Non UK RFSAccumulation CHF Class SFr12,991,707 1,411,482.37 SFr9.2043 SFr15,742,706 1,642,123.87 SFr9.5867 SFr20,553,217 2,155,989.76 SFr9.5330Accumulation EUR Class €5,779,000 619,343.66 €9.3308 €11,348,740 1,174,317.52 €9.6641 €12,746,332 1,332,744.58 €9.5639
GAM Star Credit Opportunities (GBP)Ordinary SharesAccumulation GBP Class £19,023,290 983,751.26 £19.3375 £26,289,906 1,352,646.71 £19.4359 £37,580,608 2,019,746.11 £18.6066Income GBP Class £10,498,267 802,470.19 £13.0824 £13,015,295 951,156.44 £13.6836 £19,091,122 1,402,753.03 £13.6097Institutional SharesInstitutional Accumulation GBP Class £282,878,171 16,999,481.44 £16.6404 £411,632,654 24,710,957.21 £16.6579 £620,685,309 39,076,871.83 £15.8837Institutional Income GBP Class £86,643,085 6,864,558.52 £12.6218 £123,463,703 9,353,098.23 £13.2003 £155,383,332 11,833,140.30 £13.1312Distribution SharesMonthly Z Income GBP Class £39,936,116 4,272,110.53 £9.3481 £60,203,425 6,166,488.30 £9.7630 £54,873,748 5,636,748.59 £9.7350Quarterly Institutional GBP Class £15,935,847 1,525,691.43 £10.4450 £15,772,534 1,443,300.65 £10.9281 £19,792,392 1,816,465.70 £10.8961Quarterly Z Income GBP Class £90,996,738 9,657,080.47 £9.4228 £160,565,203 16,285,824.69 £9.8592 £163,282,538 16,609,620.80 £9.8306SI GBP Class £26,347,779 2,347,993.88 £11.2214 £25,457,421 2,170,967.89 £11.7263 £76,741,458 6,562,408.25 £11.6941Selling Agent SharesQZ GBP Class – – – £155,783 14,826.57 £10.5070 – – –Z GBP Class £41,963,731 3,765,488.30 £11.1443 £27,274,584 2,471,285.00 £11.0366 £32,898,310 3,159,713.93 £10.4118ZII GBP Class £90,851,708 8,605,989.28 £10.5568 £86,481,220 8,199,836.90 £10.5467 £15,543,492 1,548,684.37 £10.0365
Notes to the Financial Statements
17. NAV per redeemable participating shares in issue, continued
NAV 30 June 2020
Shares in issue
30 June 2020
NAV per Share
30 June 2020NAV
30 June 2019
Shares in issue
30 June 2019
NAV per Share
30 June 2019NAV
30 June 2018
Shares in issue
30 June 2018
NAV per Share
30 June 2018
GAM Star Continental European EquityOrdinary SharesAccumulation CHF Class SFr4,530,902 240,302.88 SFr18.8549 SFr5,378,180 286,353.67 SFr18.7815 SFr1,809,827 88,561.57 SFr20.4358Accumulation EUR Class €81,115,300 3,157,760.96 €25.6876 €97,724,293 3,984,615.66 €24.5254 €185,198,863 7,247,381.54 €25.5539Accumulation R EUR Class €563,331 54,478.68 €10.3403 €979,518 99,717.18 €9.8229 €544,686 53,484.03 €10.1840Accumulation Z EUR Class €104,776,479 5,434,413.12 €19.2801 €117,656,320 6,430,302.28 €18.2971 €215,603,822 11,376,970.09 €18.9509Accumulation GBP Class £2,442,492 479,539.60 £5.0934 £3,713,290 775,605.66 £4.7876 £5,889,037 1,194,441.06 £4.9303Accumulation Z GBP Class – – – – – – £120,592 10,000.00 £12.0591Accumulation Z II GBP Class £96,856 7,353.56 £13.1713 £31,468,942 2,557,805.90 £12.3031 £46,447,011 3,687,616.99 £12.5954Accumulation USD Class US$4,535,006 246,974.57 US$18.3622 US$4,349,178 244,664.45 US$17.7760 US$8,498,134 447,492.05 US$18.9905Income Z EUR Class €56,515,814 3,098,865.81 €18.2375 €77,898,831 4,446,178.80 €17.5204 €98,615,504 5,370,454.28 €18.3626Income GBP Class £58,384 11,825.05 £4.9373 £83,601 18,013.89 £4.6409 £1,322,498 275,103.31 £4.8072Institutional SharesInstitutional Accumulation EUR Class €160,386,976 7,453,238.09 €21.5191 €413,816,190 20,243,033.58 €20.4424 €1,184,204,291 55,874,506.52 €21.1940Institutional Accumulation GBP Class £16,276,251 681,830.62 £23.8714 £20,864,021 934,453.97 £22.3275 £36,203,255 1,582,289.37 £22.8803Institutional Accumulation USD Class US$8,582,980 511,305.58 US$16.7864 US$18,166,491 1,123,559.13 US$16.1687 US$37,771,346 2,197,556.40 US$17.1878Institutional Accumulation Hedge USD Class US$305,736 24,354.97 US$12.5533 US$288,660 24,934.36 US$11.5768 US$3,835,147 330,263.82 US$11.6123Institutional Income EUR Class €401,550 19,584.06 €20.5039 €397,414 20,175.76 €19.6976 €1,334,346 64,634.67 €20.6444Institutional Income GBP Class £16,380,628 731,254.32 £22.4007 £23,680,362 1,117,762.71 £21.1855 £38,228,570 1,741,898.23 £21.9465Institutional Income GBP Z Class £26,808,378 2,552,692.59 £10.5020 £24,224,894 2,439,222.43 £9.9314 £9,233,589 897,562.97 £10.2874Institutional Income USD Class – – – – – – US$41,917 2,479.45 US$16.9057Selling Agent SharesC EUR Class €812,554 51,443.23 €15.7951 €414,157 27,272.11 €15.1800 €1,931,174 121,282.41 €15.9200C USD Class US$3,978,281 271,622.19 US$14.6463 US$8,363,333 611,946.97 US$13.6600 US$18,318,615 1,320,736.47 US$13.8700
GAM Star Credit Opportunities (EUR)Ordinary SharesAccumulation CHF Class SFr24,812,533 1,548,170.77 SFr16.0270 SFr30,118,288 1,797,076.76 SFr16.7596 SFr63,083,632 3,769,900.61 SFr16.7335Accumulation EUR Class €414,360,741 24,169,290.97 €17.1441 €783,448,195 43,944,816.88 €17.8280 €1,011,306,809 57,091,465.92 €17.7138Accumulation R EUR Class €12,585,050 1,361,313.56 €9.2447 €9,454,725 987,448.92 €9.5749 €8,680,564 916,086.79 €9.4757Income CHF Class SFr9,474,964 807,498.75 SFr11.7337 SFr10,866,660 859,025.22 SFr12.6499 SFr13,910,246 1,069,018.69 SFr13.0121Income CHF R Class SFr6,032 695.00 SFr8.6794 SFr6,499 695.00 SFr9.3507 SFr1,644,155 173,880.00 SFr9.4556Income EUR Class €29,610,460 1,994,055.65 €14.8493 €40,361,750 2,534,021.18 €15.9279 €124,196,518 7,617,268.63 €16.3046Income EUR II Class €106,162,159 12,331,675.27 €8.6089 €217,958,207 23,412,792.34 €9.3093 €209,897,201 21,653,459.09 €9.6934Institutional SharesInstitutional Accumulation CHF Class SFr73,133,626 5,628,279.69 SFr12.9939 SFr82,151,578 6,069,476.47 SFr13.5352 SFr133,876,523 9,946,323.78 SFr13.4599Institutional Accumulation EUR Class €837,949,169 57,004,895.99 €14.6996 €1,525,658,497 100,210,087.41 €15.2246 €2,868,575,075 190,390,466.13 €15.0668Institutional Income CHF Class SFr9,290,423 975,531.82 SFr9.5234 SFr11,105,148 1,081,597.42 SFr10.2673 SFr16,891,974 1,599,108.06 SFr10.5633Institutional Income EUR Class €150,933,615 11,792,945.23 €12.7986 €252,615,202 18,402,395.39 €13.7273 €201,889,052 14,364,113.52 €14.0551
345

Notes to the Financial Statements
17. NAV per redeemable participating shares in issue, continued
NAV 30 June 2020
Shares in issue
30 June 2020
NAV per Share
30 June 2020NAV
30 June 2019
Shares in issue
30 June 2019
NAV per Share
30 June 2019NAV
30 June 2018
Shares in issue
30 June 2018
NAV per Share
30 June 2018
GAM Star Credit Opportunities (USD)Ordinary SharesAccumulation USD Class US$332,985,893 19,444,091.06 US$17.1253 US$449,167,024 26,540,240.12 US$16.9240 US$711,547,608 44,511,507.64 US$15.9857Accumulation R USD Class US$1,699,073 166,555.19 US$10.2012 US$1,270,455 126,527.62 US$10.0409 US$1,148,006 121,527.62 US$9.4464Income USD Class US$38,180,413 3,200,238.96 US$11.9304 US$77,561,953 6,315,708.52 US$12.2808 US$128,298,288 10,602,011.52 US$12.1013Institutional SharesInstitutional Accumulation Hedged ILS Class ILS23,253,013 592,573.99 ILS39.2406 ILS24,010,147 608,477.72 ILS39.4593 ILS27,651,239 724,502.64 ILS38.1658Institutional Accumulation USD Class US$1,024,537,621 66,447,730.41 US$15.4187 US$1,374,061,849 90,539,976.71 US$15.1763 US$1,846,861,959 129,352,904.08 US$14.2777Institutional Income AUD Class – – – – – – AUD303,103 32,000.00 AUD9.4719Institutional Income USD Class US$24,148,271 2,529,144.19 US$9.5480 US$24,101,193 2,452,565.42 US$9.8269 US$21,637,181 2,276,582.55 US$9.5042Distribution SharesMCO II AUD Class AUD81,875,617 9,269,517.88 AUD8.8327 AUD123,789,197 13,209,112.41 AUD9.3715 AUD142,667,045 15,236,813.00 AUD9.3633MO II SGD Class SGD111,231,551 11,540,182.89 SGD9.6386 SGD197,301,421 19,474,250.46 SGD10.1314 SGD273,966,246 27,002,389.72 SGD10.1460SI USD Class US$67,343,164 6,495,831.29 US$10.3671 US$215,472,988 20,228,976.45 US$10.6517 US$184,690,834 17,560,860.34 US$10.5171SO USD Class US$9,908,680 857,380.21 US$11.5569 US$13,889,198 1,169,513.54 US$11.8760 US$21,330,548 1,819,516.54 US$11.7231MO USD Class US$270,919,560 26,415,198.62 US$10.2562 US$535,312,895 50,916,231.79 US$10.5136 US$862,687,239 83,270,165.25 US$10.3601Income II PMCO USD Class US$4,354,431 469,888.14 US$9.2669 US$5,039,306 522,538.19 US$9.6438 US$10,143,783 1,051,443.93 US$9.6474Monthly Institutional SGD Class SGD12,878,355 1,454,298.81 SGD8.8553 SGD7,362,431 794,734.32 SGD9.2640 SGD4,547,246 492,086.58 SGD9.2407Monthly Institutional USD Class US$6,521,827 662,825.07 US$9.8394 US$12,433,502 1,232,748.58 US$10.0860 – – –Quarterly Accumulation USD Class US$71,757 6,624.76 US$10.8315 US$70,488 6,624.76 US$10.6400 – – –Quarterly Income USD Class US$226,923 24,262.98 US$9.3526 US$2,289,107 238,135.94 US$9.6126 US$4,408,484 465,028.84 US$9.4800Selling Agent SharesA USD Class US$50,973,635 3,939,442.99 US$12.9393 US$72,732,611 5,673,370.60 US$12.8200 US$116,710,986 9,613,755.01 US$12.1400C USD Class US$5,702,110 452,811.26 US$12.5926 US$7,609,042 607,265.96 US$12.5300 US$11,450,109 960,579.63 US$11.9200Income II AQ USD Class US$32,420,136 3,597,726.61 US$9.0112 US$35,754,276 3,791,055.97 US$9.4300 US$75,930,573 8,026,487.66 US$9.4600Z Distribution SharesMCZ SGD Class SGD8,562,670 981,156.33 SGD8.7271 SGD9,260,397 1,006,389.43 SGD9.2016 SGD8,948,621 968,162.57 SGD9.2428Non UK RFSAccumulation USD Class US$62,700,340 6,109,000.74 US$10.2636 US$74,101,013 7,335,025.80 US$10.1023 US$82,230,233 8,651,953.61 US$9.5042
GAM Star Global DefensiveOrdinary SharesAccumulation GBP Class £27,560 2,213.27 £12.4523 £27,313 2,213.27 £12.3406 £12,166 1,000.00 £12.1662Institutional SharesInstitutional Accumulation AUD Class – – – AUD72,296 7,007.29 AUD10.3172 AUD373,436 37,287.30 AUD10.0151Institutional Accumulation EUR Class €721,472 71,269.21 €10.1231 €498,790 49,465.48 €10.0836 €246,047 24,500.00 €10.0427Institutional Accumulation GBP Class £4,275,310 326,702.52 £13.0862 £6,621,142 512,567.26 £12.9176 £8,008,191 631,159.58 £12.6880Institutional Accumulation USD Class US$4,190,850 332,616.73 US$12.5996 US$5,800,497 473,649.16 US$12.2464 US$4,661,891 394,008.32 US$11.8319Other SharesPI GBP Class – – – – – – £345,761 32,861.65 £10.5217
GAM Star Fund p.l.c.
346

Notes to the Financial Statements
17. NAV per redeemable participating shares in issue, continued
NAV 30 June 2020
Shares in issue
30 June 2020
NAV per Share
30 June 2020NAV
30 June 2019
Shares in issue
30 June 2019
NAV per Share
30 June 2019NAV
30 June 2018
Shares in issue
30 June 2018
NAV per Share
30 June 2018
GAM Star Global Defensive, continuedSelling Agent SharesAccumulation F GBP Class – – – £86,981 8,682.87 £10.0175 £86,045 8,640.00 £9.9588Accumulation A USD Class – – – US$18,385 1,800.00 US$10.2100 US$343,569 34,646.88 US$9.9100U AUD Class AUD124,725 9,958.40 AUD12.5245 AUD402,167 32,382.92 AUD12.4191 AUD392,603 32,382.92 AUD12.1237A CHF Class SFr17,092 1,752.52 SFr9.7527 SFr105,192 10,756.52 SFr9.7700 SFr88,643 9,004.00 SFr9.8400A EUR Class €718,299 66,692.05 €10.7703 €826,782 76,497.63 €10.8000 €415,917 38,345.63 €10.8400C EUR Class – – – – – – €38,775 3,772.84 €10.2700U EUR Class €675,032 59,727.48 €11.3018 €1,010,737 89,244.52 €11.3254 €1,222,803 107,798.68 €11.3433Z EUR Class €1,354,531 119,045.90 €11.3782 €556,485 49,161.54 €11.3195 €11,251 1,000.00 €11.2506A GBP Class £3,530,767 309,377.82 £11.4124 £4,268,971 376,101.09 £11.3505 £4,492,194 399,972.65 £11.2312C GBP Class £326,250 30,548.85 £10.6796 £489,039 45,695.55 £10.7021 £2,091,081 195,997.24 £10.6689G GBP Class £158,922 16,007.76 £9.9278 £572,424 57,703.48 £9.9200 £519,253 52,646.33 £9.8630T GBP Class £123,488 11,398.50 £10.8337 £122,818 11,398.50 £10.7749 £149,351 14,008.29 £10.6616U GBP Class £2,117,153 180,621.94 £11.7214 £2,992,610 257,075.69 £11.6409 £4,073,459 354,225.98 £11.4996Z GBP Class £2,128,739 169,439.70 £12.5634 £2,402,225 194,020.40 £12.3813 £3,150,572 259,456.34 £12.1429C USD Class – – – – – – US$350,113 31,119.36 US$11.2500F USD Class US$74,568 6,773.28 US$11.0090 US$172,245 15,916.14 US$10.8200 US$272,572 25,765.35 US$10.5700T USD Class US$32,040 2,721.93 US$11.7711 US$96,770 8,399.17 US$11.5200 US$2,053,406 184,002.73 US$11.1500U USD Class US$761,286 62,855.58 US$12.1116 US$774,971 65,464.35 US$11.8380 US$921,294 80,094.23 US$11.5026
GAM Star Discretionary FXInstitutional SharesAccumulation CHF Class – – – – – – SFr714,923 76,210.00 SFr9.3809Accumulation EUR Class – – – – – – €11,693,229 1,194,551.84 €9.7888Accumulation EUR U Class – – – – – – €4,015,326 500,514.25 €8.0224Accumulation GBP Class – – – – – – £81,952 81,158.33 £1.0097Accumulation USD Class – – – – – – US$1,435,705 138,057.73 US$10.3993
GAM Star Dynamic Global Bond*
Ordinary SharesAccumulation EUR Class – – – €276,293 30,054.15 €9.1931 €3,180,475 333,935.00 €9.5242Accumulation GBP Class – – – £10,227 1,045.24 £9.7844 £128,703 12,860.87 £10.0073Accumulation USD Class – – – US$177,594 16,177.78 US$10.9776 US$1,979,114 179,247.01 US$11.0412Institutional SharesInstitutional Accumulation USD Class – – – US$13,057,750 1,246.92 US$10,472.0028 US$154,171,759 14,641.18 US$10,530.0091Selling Agent SharesC EUR Class – – – €15,890 1,816.83 €8.7400 €184,619 20,187.09 €9.1400
*Fund terminated during the year.
Notes to the Financial Statements
17. NAV per redeemable participating shares in issue, continued
NAV 30 June 2020
Shares in issue
30 June 2020
NAV per Share
30 June 2020NAV
30 June 2019
Shares in issue
30 June 2019
NAV per Share
30 June 2019NAV
30 June 2018
Shares in issue
30 June 2018
NAV per Share
30 June 2018
GAM Star Credit Opportunities (USD)Ordinary SharesAccumulation USD Class US$332,985,893 19,444,091.06 US$17.1253 US$449,167,024 26,540,240.12 US$16.9240 US$711,547,608 44,511,507.64 US$15.9857Accumulation R USD Class US$1,699,073 166,555.19 US$10.2012 US$1,270,455 126,527.62 US$10.0409 US$1,148,006 121,527.62 US$9.4464Income USD Class US$38,180,413 3,200,238.96 US$11.9304 US$77,561,953 6,315,708.52 US$12.2808 US$128,298,288 10,602,011.52 US$12.1013Institutional SharesInstitutional Accumulation Hedged ILS Class ILS23,253,013 592,573.99 ILS39.2406 ILS24,010,147 608,477.72 ILS39.4593 ILS27,651,239 724,502.64 ILS38.1658Institutional Accumulation USD Class US$1,024,537,621 66,447,730.41 US$15.4187 US$1,374,061,849 90,539,976.71 US$15.1763 US$1,846,861,959 129,352,904.08 US$14.2777Institutional Income AUD Class – – – – – – AUD303,103 32,000.00 AUD9.4719Institutional Income USD Class US$24,148,271 2,529,144.19 US$9.5480 US$24,101,193 2,452,565.42 US$9.8269 US$21,637,181 2,276,582.55 US$9.5042Distribution SharesMCO II AUD Class AUD81,875,617 9,269,517.88 AUD8.8327 AUD123,789,197 13,209,112.41 AUD9.3715 AUD142,667,045 15,236,813.00 AUD9.3633MO II SGD Class SGD111,231,551 11,540,182.89 SGD9.6386 SGD197,301,421 19,474,250.46 SGD10.1314 SGD273,966,246 27,002,389.72 SGD10.1460SI USD Class US$67,343,164 6,495,831.29 US$10.3671 US$215,472,988 20,228,976.45 US$10.6517 US$184,690,834 17,560,860.34 US$10.5171SO USD Class US$9,908,680 857,380.21 US$11.5569 US$13,889,198 1,169,513.54 US$11.8760 US$21,330,548 1,819,516.54 US$11.7231MO USD Class US$270,919,560 26,415,198.62 US$10.2562 US$535,312,895 50,916,231.79 US$10.5136 US$862,687,239 83,270,165.25 US$10.3601Income II PMCO USD Class US$4,354,431 469,888.14 US$9.2669 US$5,039,306 522,538.19 US$9.6438 US$10,143,783 1,051,443.93 US$9.6474Monthly Institutional SGD Class SGD12,878,355 1,454,298.81 SGD8.8553 SGD7,362,431 794,734.32 SGD9.2640 SGD4,547,246 492,086.58 SGD9.2407Monthly Institutional USD Class US$6,521,827 662,825.07 US$9.8394 US$12,433,502 1,232,748.58 US$10.0860 – – –Quarterly Accumulation USD Class US$71,757 6,624.76 US$10.8315 US$70,488 6,624.76 US$10.6400 – – –Quarterly Income USD Class US$226,923 24,262.98 US$9.3526 US$2,289,107 238,135.94 US$9.6126 US$4,408,484 465,028.84 US$9.4800Selling Agent SharesA USD Class US$50,973,635 3,939,442.99 US$12.9393 US$72,732,611 5,673,370.60 US$12.8200 US$116,710,986 9,613,755.01 US$12.1400C USD Class US$5,702,110 452,811.26 US$12.5926 US$7,609,042 607,265.96 US$12.5300 US$11,450,109 960,579.63 US$11.9200Income II AQ USD Class US$32,420,136 3,597,726.61 US$9.0112 US$35,754,276 3,791,055.97 US$9.4300 US$75,930,573 8,026,487.66 US$9.4600Z Distribution SharesMCZ SGD Class SGD8,562,670 981,156.33 SGD8.7271 SGD9,260,397 1,006,389.43 SGD9.2016 SGD8,948,621 968,162.57 SGD9.2428Non UK RFSAccumulation USD Class US$62,700,340 6,109,000.74 US$10.2636 US$74,101,013 7,335,025.80 US$10.1023 US$82,230,233 8,651,953.61 US$9.5042
GAM Star Global DefensiveOrdinary SharesAccumulation GBP Class £27,560 2,213.27 £12.4523 £27,313 2,213.27 £12.3406 £12,166 1,000.00 £12.1662Institutional SharesInstitutional Accumulation AUD Class – – – AUD72,296 7,007.29 AUD10.3172 AUD373,436 37,287.30 AUD10.0151Institutional Accumulation EUR Class €721,472 71,269.21 €10.1231 €498,790 49,465.48 €10.0836 €246,047 24,500.00 €10.0427Institutional Accumulation GBP Class £4,275,310 326,702.52 £13.0862 £6,621,142 512,567.26 £12.9176 £8,008,191 631,159.58 £12.6880Institutional Accumulation USD Class US$4,190,850 332,616.73 US$12.5996 US$5,800,497 473,649.16 US$12.2464 US$4,661,891 394,008.32 US$11.8319Other SharesPI GBP Class – – – – – – £345,761 32,861.65 £10.5217
347

Notes to the Financial Statements
17. NAV per redeemable participating shares in issue, continued
NAV 30 June 2020
Shares in issue
30 June 2020
NAV per Share
30 June 2020NAV
30 June 2019
Shares in issue
30 June 2019
NAV per Share
30 June 2019NAV
30 June 2018
Shares in issue
30 June 2018
NAV per Share
30 June 2018
GAM Star Global Dynamic GrowthInstitutional SharesInstitutional Accumulation GBP Class £1,344,602 75,322.66 £17.8512 £1,623,896 94,496.65 £17.1846 £1,723,822 100,358.11 £17.1767Other SharesPI GBP Class – – – £295,536 24,565.61 £12.0304 £236,155 19,637.17 £12.0259Selling Agent SharesU EUR Class €219,544 21,905.33 €10.0223 €214,529 21,905.33 €9.7934 – – –Accumulation U GBP Class £811,188 81,283.81 £9.9796 £863,916 89,234.31 £9.6814 £192,081 19,695.79 £9.7523C GBP Class £51,146 4,635.44 £11.0337 £134,203 12,404.87 £10.8186 £156,652 14,222.79 £11.0100Z GBP Class £3,266,120 205,137.68 £15.9216 £3,622,505 237,172.71 £15.2737 £8,470,630 556,776.48 £15.2137
GAM Star Emerging EquityOrdinary SharesAccumulation EUR Class €1,795,685 109,870.07 €16.3437 €1,971,911 112,179.94 €17.5781 €2,277,197 132,279.38 €17.2150Accumulation GBP Class £128,402 6,584.92 £19.4994 £261,652 12,676.28 £20.6410 £279,007 13,959.59 £19.9867Accumulation USD Class US$712,761 52,387.62 US$13.6055 US$3,907,586 263,385.40 US$14.8360 US$4,458,590 299,304.27 US$14.8965Institutional SharesInstitutional Accumulation EUR Class – – – – – – €2,518,823 213,051.80 €11.8225Institutional Accumulation GBP Class £351,135 19,775.79 £17.7558 £392,243 20,970.17 £18.7048 £607,001 33,694.81 £18.0146Institutional Accumulation USD Class US$6,940,103 579,787.38 US$11.9700 US$11,983,211 922,810.91 US$12.9855 US$18,338,488 1,413,517.95 US$12.9736Institutional Income GBP Class £3,640,374 219,380.92 £16.5938 £5,150,006 292,193.93 £17.6253 £6,022,386 351,645.33 £17.1263
GAM Star Emerging Market RatesOrdinary SharesAccumulation CHF Class – – – – – – SFr1,647,359 148,783.88 SFr11.0721Accumulation EUR Class €6,274,636 497,677.75 €12.6078 €16,723,708 1,421,901.22 €11.7615 €34,035,574 2,941,586.30 €11.5704Accumulation GBP Class £152,865 115,299.40 £1.3258 £140,926 115,276.92 £1.2225 £380,260 320,709.38 £1.1856Accumulation USD Class US$326,139 23,553.22 US$13.8469 US$884,825 70,032.01 US$12.6345 US$907,733 75,275.59 US$12.0588Institutional SharesInstitutional Accumulation EUR Class €23,189,419 1,815,417.67 €12.7736 €26,451,387 2,227,053.85 €11.8773 €37,639,618 3,237,070.37 €11.6276Institutional Accumulation USD Class US$466,236 32,108.87 US$14.5204 US$6,184,918 468,918.78 US$13.1897 US$5,191,295 414,321.58 US$12.5296Institutional Income GBP Class £1,083,532 94,867.83 £11.4214 £1,077,829 100,513.13 £10.7232 £2,408,151 231,841.82 £10.3870Selling Agent SharesA EUR Class €395,607 33,943.67 €11.6547 €449,831 41,205.10 €10.9100 €436,780 40,466.90 €10.7900C EUR Class €920,699 82,918.14 €11.1037 €968,767 92,971.87 €10.4200 €5,946,935 578,495.64 €10.2800W EUR Acc Class €410,339 41,300.00 €9.9355 – – – – – –W Income EUR Class €19,871,159 2,000,000.00 €9.9355 – – – – – –A GBP Class – – – – – – £52,572 4,900.00 £10.7290Z GBP Class £8,386 731.08 £11.4702 £7,589 734.63 £10.3301 £7,281 738.29 £9.8617Z II GBP Class £364,558 32,877.36 £11.0884 £570,677 57,080.73 £9.9977 £569,025 59,599.20 £9.5475
GAM Star Fund p.l.c.
348

Notes to the Financial Statements
17. NAV per redeemable participating shares in issue, continued
NAV 30 June 2020
Shares in issue
30 June 2020
NAV per Share
30 June 2020NAV
30 June 2019
Shares in issue
30 June 2019
NAV per Share
30 June 2019NAV
30 June 2018
Shares in issue
30 June 2018
NAV per Share
30 June 2018
GAM Star Emerging Market Rates, continuedC USD Class – – – – – – US$168,655 17,020.65 US$9.9088W USD Acc Class $2,281,580 229,473.00 $9.9426 – – – – – –X USD Acc Class $4,167,336 400.00 $10,418.3397 – – – – – –Z USD Class US$20,243 2,000.00 US$10.1213 US$5,379,868 503,273.46 US$10.6897 US$45,332,377 4,520,676.44 US$10.0277Z II USD Class US$5,525,349 495,342.80 US$11.1545 US$3,861,103 388,075.14 US$9.9493 – – –
GAM Star European EquityOrdinary SharesAccumulation CHF Class SFr1,172,644 90,271.14 SFr12.9902 SFr1,131,361 87,995.06 SFr12.8571 SFr5,241,678 377,491.64 SFr13.8855Accumulation EUR Class €219,603,288 552,064.45 €397.7856 €8,602,775 22,796.71 €377.3691 €15,945,113 40,847.63 €390.3559Accumulation GBP Class £2,144,926 550,215.54 £3.8983 £2,057,811 565,256.09 £3.6404 £2,219,707 596,399.80 £3.7218Accumulation USD Class US$778,101 28,584.97 US$27.2206 US$830,387 31,713.89 US$26.1837 US$21,854,998 786,426.04 US$27.7902Income EUR Class €26,324,373 76,881.24 €342.3993 €1,458,501 4,440.50 €328.4542 €1,758,271 5,129.32 €342.7882Income GBP Class £225,477 67,999.78 £3.3158 £203,708 65,073.36 £3.1304 £318,690 98,696.73 £3.2289Income USD Class US$1,310,963 56,431.63 US$23.2309 US$1,274,969 56,424.74 US$22.5959 US$1,429,822 59,119.69 US$24.1852Ordinary Hedge SharesAccumulation Hedge USD Class $130,417 13,904.40 $9.3795 – – – – – –Income Hedge USD Class $157,628 16,805.52 $9.3795 – – – – – –Institutional SharesInstitutional Accumulation EUR Class €8,213,612 295,403.75 €27.8046 €3,557,979 135,566.41 €26.2452 €4,794,671 177,492.89 €27.0133Institutional Accumulation GBP Class £358,408 36,154.82 £9.9131 – – – – – –Institutional Accumulation USD Class US$887,356 72,158.73 US$12.2972 US$701,587 59,609.14 US$11.7697 US$1,197,093 96,382.94 US$12.4201Institutional Income EUR Class €71,965 7,771.84 €9.2597 – – – – – –Institutional Income GBP Class £26,535 2,676.67 £9.9133 – – – – – –Selling Agent SharesA EUR Class €5,518,797 316,035.26 €17.4626 €5,378,906 324,030.50 €16.6000 €6,132,672 356,136.57 €17.2200C EUR Class €5,854,655 195,751.51 €29.9086 €1,012,665 35,436.69 €28.5700 €1,417,568 47,625.50 €29.7600Z EUR Class – – – €165,585,282 12,526,783.06 €13.2185 €207,612,686 15,412,854.09 €13.4701ZII GBP Acc Class £322,913 29,942.43 £10.7844 – – – – – –R SharesAccumulation R EUR Class €96,417 9,283.49 €10.3859 – – – – – –Accumulation R GBP Class £108,164 10,911.14 £9.9131 – – – – – –Income R GBP Class £121,685 12,276.02 £9.9124 – – – – – –
Notes to the Financial Statements
17. NAV per redeemable participating shares in issue, continued
NAV 30 June 2020
Shares in issue
30 June 2020
NAV per Share
30 June 2020NAV
30 June 2019
Shares in issue
30 June 2019
NAV per Share
30 June 2019NAV
30 June 2018
Shares in issue
30 June 2018
NAV per Share
30 June 2018
GAM Star Global Dynamic GrowthInstitutional SharesInstitutional Accumulation GBP Class £1,344,602 75,322.66 £17.8512 £1,623,896 94,496.65 £17.1846 £1,723,822 100,358.11 £17.1767Other SharesPI GBP Class – – – £295,536 24,565.61 £12.0304 £236,155 19,637.17 £12.0259Selling Agent SharesU EUR Class €219,544 21,905.33 €10.0223 €214,529 21,905.33 €9.7934 – – –Accumulation U GBP Class £811,188 81,283.81 £9.9796 £863,916 89,234.31 £9.6814 £192,081 19,695.79 £9.7523C GBP Class £51,146 4,635.44 £11.0337 £134,203 12,404.87 £10.8186 £156,652 14,222.79 £11.0100Z GBP Class £3,266,120 205,137.68 £15.9216 £3,622,505 237,172.71 £15.2737 £8,470,630 556,776.48 £15.2137
GAM Star Emerging EquityOrdinary SharesAccumulation EUR Class €1,795,685 109,870.07 €16.3437 €1,971,911 112,179.94 €17.5781 €2,277,197 132,279.38 €17.2150Accumulation GBP Class £128,402 6,584.92 £19.4994 £261,652 12,676.28 £20.6410 £279,007 13,959.59 £19.9867Accumulation USD Class US$712,761 52,387.62 US$13.6055 US$3,907,586 263,385.40 US$14.8360 US$4,458,590 299,304.27 US$14.8965Institutional SharesInstitutional Accumulation EUR Class – – – – – – €2,518,823 213,051.80 €11.8225Institutional Accumulation GBP Class £351,135 19,775.79 £17.7558 £392,243 20,970.17 £18.7048 £607,001 33,694.81 £18.0146Institutional Accumulation USD Class US$6,940,103 579,787.38 US$11.9700 US$11,983,211 922,810.91 US$12.9855 US$18,338,488 1,413,517.95 US$12.9736Institutional Income GBP Class £3,640,374 219,380.92 £16.5938 £5,150,006 292,193.93 £17.6253 £6,022,386 351,645.33 £17.1263
GAM Star Emerging Market RatesOrdinary SharesAccumulation CHF Class – – – – – – SFr1,647,359 148,783.88 SFr11.0721Accumulation EUR Class €6,274,636 497,677.75 €12.6078 €16,723,708 1,421,901.22 €11.7615 €34,035,574 2,941,586.30 €11.5704Accumulation GBP Class £152,865 115,299.40 £1.3258 £140,926 115,276.92 £1.2225 £380,260 320,709.38 £1.1856Accumulation USD Class US$326,139 23,553.22 US$13.8469 US$884,825 70,032.01 US$12.6345 US$907,733 75,275.59 US$12.0588Institutional SharesInstitutional Accumulation EUR Class €23,189,419 1,815,417.67 €12.7736 €26,451,387 2,227,053.85 €11.8773 €37,639,618 3,237,070.37 €11.6276Institutional Accumulation USD Class US$466,236 32,108.87 US$14.5204 US$6,184,918 468,918.78 US$13.1897 US$5,191,295 414,321.58 US$12.5296Institutional Income GBP Class £1,083,532 94,867.83 £11.4214 £1,077,829 100,513.13 £10.7232 £2,408,151 231,841.82 £10.3870Selling Agent SharesA EUR Class €395,607 33,943.67 €11.6547 €449,831 41,205.10 €10.9100 €436,780 40,466.90 €10.7900C EUR Class €920,699 82,918.14 €11.1037 €968,767 92,971.87 €10.4200 €5,946,935 578,495.64 €10.2800W EUR Acc Class €410,339 41,300.00 €9.9355 – – – – – –W Income EUR Class €19,871,159 2,000,000.00 €9.9355 – – – – – –A GBP Class – – – – – – £52,572 4,900.00 £10.7290Z GBP Class £8,386 731.08 £11.4702 £7,589 734.63 £10.3301 £7,281 738.29 £9.8617Z II GBP Class £364,558 32,877.36 £11.0884 £570,677 57,080.73 £9.9977 £569,025 59,599.20 £9.5475
349

Notes to the Financial Statements
17. NAV per redeemable participating shares in issue, continued
NAV 30 June 2020
Shares in issue
30 June 2020
NAV per Share
30 June 2020NAV
30 June 2019
Shares in issue
30 June 2019
NAV per Share
30 June 2019NAV
30 June 2018
Shares in issue
30 June 2018
NAV per Share
30 June 2018
GAM Star Flexible Global PortfolioOrdinary SharesAccumulation CHF Class SFr152,506 12,570.44 SFr12.1321 SFr159,541 13,070.44 SFr12.2062 SFr2,115,616 172,716.71 SFr12.2490Accumulation EUR Class €7,628,047 593,274.32 €12.8575 €8,033,853 624,262.85 €12.8693 €16,044,239 1,248,468.97 €12.8511Accumulation GBP Class £2,967,462 224,026.43 £13.2460 £3,315,013 251,996.65 £13.1549 £7,846,111 604,927.59 £12.9703Accumulation USD Class US$5,613,690 389,530.19 US$14.4114 US$5,759,052 409,595.98 US$14.0603 US$8,148,961 598,365.69 US$13.6186Institutional SharesInstitutional Accumulation EUR Class – – – €8,831,865 884,926.08 €9.9803 €8,801,419 884,926.08 €9.9459Institutional Accumulation GBP Class £5,208,990 467,784.87 £11.1354 £6,795,294 615,594.41 £11.0385 £5,689,101 523,787.09 £10.8614Institutional USD Class US$2,451,859 228,339.97 US$10.7377 US$2,460,254 235,375.89 US$10.4524 – – –Selling Agent SharesC EUR Class €584,850 52,979.81 €11.0391 €628,872 56,284.77 €11.1700 €770,463 68,288.53 €11.2800Non UK RFS ClassNon UK RFS EUR Acc Class €20,440,138 2,059,388.92 €9.9253 – – – – – –Non UK RFS GBP Acc Class £9,951,115 997,995.69 £9.9711 – – – – – –Non UK RFS Z SharesNon UK RFS Z CAD Class Can$824,128 81,648.24 Can$10.0936 – – – – – –Non UK RFS Z CHF Class SFr9,907,208 996,147.16 SFr9.9455 – – – – – –Non UK RFS Z EUR Class €18,737,406 1,884,177.75 €9.9446 – – – – – –Non UK RFS Z GBP Class £4,478,750 448,286.89 £9.9908 – – – – – –Non UK RFS Z SGD Class SGD289,508 28,661.73 SGD10.1008 – – – – – –Non UK RFS Z USD Class US$44,268,075 4,346,785.93 US$10.1840 – – – – – –
GAM Star GAMCO US Equity** Ordinary SharesAccumulation GBP Class – – – – – – £48,701 2,844.42 £17.1215Accumulation USD Class – – – – – – US$200,428 11,271.60 US$17.7817Institutional SharesInstitutional Accumulation GBP Class – – – – – – £2,287,657 130,905.77 £17.4756Institutional Income GBP Class – – – – – – £270,722 15,489.35 £17.4779Selling Agent SharesZ USD Class – – – – – – US$1,921,536 128,000.57 US$15.0119Non UK RFSAccumulation USD Class – – – – – – US$28,240,748 2,091,220.22 US$13.5044
** Fund terminated 12 December 2018.
GAM Star Fund p.l.c.
350

Notes to the Financial Statements
17. NAV per redeemable participating shares in issue, continued
NAV 30 June 2020
Shares in issue
30 June 2020
NAV per Share
30 June 2020NAV
30 June 2019
Shares in issue
30 June 2019
NAV per Share
30 June 2019NAV
30 June 2018
Shares in issue
30 June 2018
NAV per Share
30 June 2018
GAM Star Global Quality** Ordinary SharesAccumulation GBP Class – – – – – – £648,677 29,257.34 £22.1714Accumulation USD Class – – – – – – US$4,152,316 244,299.38 US$16.9968Institutional SharesInstitutional Accumulation EUR Class – – – – – – €1,564,970 71,498.83 €21.8880Institutional Accumulation USD Class – – – – – – US$22,032,957 1,257,567.37 US$17.5202
Institutional Income GBP Class – – – – – – £6,947,568 350,870.65 £19.8009Institutional Income USD Class – – – – – – US$531,497 30,883.03 US$17.2100
GAM Star Global RatesInstitutional SharesAccumulation CHF Class SFr2,804,742 288,771.10 SFr9.7126 SFr3,961,271 391,381.08 SFr10.1212 SFr8,548,252 873,723.85 SFr9.7837Accumulation EUR Class €47,198,267 4,392,927.61 €10.7441 €129,939,837 11,613,154.06 €11.1890 €388,384,607 36,016,228.96 €10.7836Accumulation GBP Class £3,947,602 3,474,389.97 £1.1362 £10,995,743 9,324,090.07 £1.1792 £58,771,836 52,423,366.55 £1.1211Accumulation USD Class US$5,667,560 464,319.16 US$12.2061 US$11,152,958 906,575.07 US$12.3023 US$95,518,847 8,331,777.61 US$11.4644Income CHF Class – – – – – – SFr2,118,175 216,458.47 SFr9.7855Income EUR Class €29,067,831 2,705,444.85 €10.7441 €30,762,570 2,749,308.20 €11.1892 €38,638,147 3,583,568.95 €10.7820Income GBP Class £2,374,120 2,089,774.88 £1.1360 £4,679,726 3,968,762.41 £1.1791 £27,886,701 24,876,350.32 £1.1210Income USD Class US$2,362,489 193,623.44 US$12.2014 US$2,381,876 193,623.44 US$12.3015 US$20,284,594 1,769,470.65 US$11.4636Selling Agent SharesAccumulation Z GBP Class £851,671 83,356.62 £10.2171 £1,147,458 109,283.31 £10.4998 £485,511 49,132.30 £9.8816A CHF Class SFr8,926 1,100.00 SFr8.1144 SFr9,346 1,100.00 SFr8.4900 SFr90,652 10,991.67 SFr8.2400A EUR Class €6,541,894 657,628.83 €9.9477 €8,912,728 856,169.86 €10.4100 €15,095,975 1,497,676.93 €10.0700A JPY Class – – – ¥11,251,404 11,111.71 ¥1,012.5700 ¥10,853,397 11,111.71 ¥976.7500A USD Class US$2,981,336 264,679.03 US$11.2639 US$9,234,412 809,369.49 US$11.4000 US$15,599,734 1,460,268.06 US$10.6800Non UK RFSAccumulation USD Class US$15,387,087 1,512,570.82 US$10.1728 US$18,560,846 1,810,088.35 US$10.2541 US$23,115,306 2,418,981.73 US$9.5558
GAM Star Global Selector* Ordinary SharesAccumulation CHF Class – – – – – – SFr45,489 3,867.74 SFr11.7610Accumulation EUR Class – – – €135,038 12,852.89 €10.5064 €275,454 22,537.34 €12.2221Accumulation II EUR Class – – – €569,549 63,956.89 €8.9052 €1,931,039 187,008.22 €10.3259Accumulation GBP Class – – – £48,652 42,000.00 £1.1583 £55,803 42,000.00 £1.3286Accumulation II GBP Class – – – £70,927 7,340.73 £9.6620 £121,209 10,962.52 £11.0566
** Fund terminated 12 December 2018.* Fund terminated during the year.
Notes to the Financial Statements
17. NAV per redeemable participating shares in issue, continued
NAV 30 June 2020
Shares in issue
30 June 2020
NAV per Share
30 June 2020NAV
30 June 2019
Shares in issue
30 June 2019
NAV per Share
30 June 2019NAV
30 June 2018
Shares in issue
30 June 2018
NAV per Share
30 June 2018
GAM Star Flexible Global PortfolioOrdinary SharesAccumulation CHF Class SFr152,506 12,570.44 SFr12.1321 SFr159,541 13,070.44 SFr12.2062 SFr2,115,616 172,716.71 SFr12.2490Accumulation EUR Class €7,628,047 593,274.32 €12.8575 €8,033,853 624,262.85 €12.8693 €16,044,239 1,248,468.97 €12.8511Accumulation GBP Class £2,967,462 224,026.43 £13.2460 £3,315,013 251,996.65 £13.1549 £7,846,111 604,927.59 £12.9703Accumulation USD Class US$5,613,690 389,530.19 US$14.4114 US$5,759,052 409,595.98 US$14.0603 US$8,148,961 598,365.69 US$13.6186Institutional SharesInstitutional Accumulation EUR Class – – – €8,831,865 884,926.08 €9.9803 €8,801,419 884,926.08 €9.9459Institutional Accumulation GBP Class £5,208,990 467,784.87 £11.1354 £6,795,294 615,594.41 £11.0385 £5,689,101 523,787.09 £10.8614Institutional USD Class US$2,451,859 228,339.97 US$10.7377 US$2,460,254 235,375.89 US$10.4524 – – –Selling Agent SharesC EUR Class €584,850 52,979.81 €11.0391 €628,872 56,284.77 €11.1700 €770,463 68,288.53 €11.2800Non UK RFS ClassNon UK RFS EUR Acc Class €20,440,138 2,059,388.92 €9.9253 – – – – – –Non UK RFS GBP Acc Class £9,951,115 997,995.69 £9.9711 – – – – – –Non UK RFS Z SharesNon UK RFS Z CAD Class Can$824,128 81,648.24 Can$10.0936 – – – – – –Non UK RFS Z CHF Class SFr9,907,208 996,147.16 SFr9.9455 – – – – – –Non UK RFS Z EUR Class €18,737,406 1,884,177.75 €9.9446 – – – – – –Non UK RFS Z GBP Class £4,478,750 448,286.89 £9.9908 – – – – – –Non UK RFS Z SGD Class SGD289,508 28,661.73 SGD10.1008 – – – – – –Non UK RFS Z USD Class US$44,268,075 4,346,785.93 US$10.1840 – – – – – –
GAM Star GAMCO US Equity** Ordinary SharesAccumulation GBP Class – – – – – – £48,701 2,844.42 £17.1215Accumulation USD Class – – – – – – US$200,428 11,271.60 US$17.7817Institutional SharesInstitutional Accumulation GBP Class – – – – – – £2,287,657 130,905.77 £17.4756Institutional Income GBP Class – – – – – – £270,722 15,489.35 £17.4779Selling Agent SharesZ USD Class – – – – – – US$1,921,536 128,000.57 US$15.0119Non UK RFSAccumulation USD Class – – – – – – US$28,240,748 2,091,220.22 US$13.5044
** Fund terminated 12 December 2018.
351

Notes to the Financial Statements
17. NAV per redeemable participating shares in issue, continued
NAV 30 June 2020
Shares in issue
30 June 2020
NAV per Share
30 June 2020NAV
30 June 2019
Shares in issue
30 June 2019
NAV per Share
30 June 2019NAV
30 June 2018
Shares in issue
30 June 2018
NAV per Share
30 June 2018
GAM Star Global Selector*, continued Accumulation USD Class – – – US$1,174,963 104,945.69 US$11.1959 US$1,610,435 128,122.00 US$12.5695Accumulation II USD Class – – – US$1,390,545 134,986.04 US$10.3014 US$6,611,745 573,007.54 US$11.5386Institutional SharesInstitutional Accumulation II USD Class – – – US$492,804 52,300.00 US$9.4226 US$706,330 67,102.89 US$10.5260Institutional Income II GBP Class – – – – – – £30,461 3,200.02 £9.5189Selling Agent SharesC EUR Class – – – – – – €40,440 3,874.87 €10.4300SA C II EUR Class – – – €1,058,772 123,468.12 €8.5700 €2,979,126 296,725.70 €10.0400
GAM Star Global GrowthOrdinary SharesAccumulation EUR Class €111,429 8,966.80 €12.4268 €108,500 8,966.80 €12.1001 €222,907 18,223.90 €12.2315Institutional SharesInstitutional Accumulation CHF Class SFr144,496 13,876.92 SFr10.4126 – – – – – –Institutional Accumulation EUR Class €5,374,761 445,370.05 €12.0680 €5,036,295 430,649.35 €11.6946 €1,613,746 137,176.73 €11.7639Institutional Accumulation GBP Class £10,240,069 591,321.54 £17.3172 £13,555,610 814,458.90 £16.6437 £17,314,204 1,048,824.46 £16.5082Institutional Accumulation USD Class US$11,311,269 645,890.41 US$17.5126 US$11,330,325 684,865.63 US$16.5438 US$13,545,173 839,027.28 US$16.1439Other SharesPI GBP Class £105,921 9,744.23 £10.8701 £190,530 18,205.12 £10.4657 £190,959 18,366.03 £10.3974Selling Agent SharesC AUD Class AUD11,058 900.00 AUD12.2864 AUD218,304 18,188.84 AUD12.0000 AUD339,261 28,361.09 AUD11.9600U AUD Class AUD1,154,822 82,549.50 AUD13.9894 AUD1,441,862 106,113.48 AUD13.5879 AUD1,409,970 104,984.89 AUD13.4302A CHF Class SFr335,570 25,770.02 SFr13.0217 SFr301,702 23,677.33 SFr12.7400 SFr256,820 19,823.94 SFr12.9500A EUR Class €603,504 53,478.89 €11.2849 €693,997 62,954.22 €11.0200 €684,164 61,206.61 €11.1700C EUR Class €13,712,487 1,041,325.53 €13.1683 €16,004,379 1,234,905.81 €12.9600 €18,281,994 1,380,815.27 €13.2400F EUR Class €159,623 16,046.95 €9.9472 €156,572 16,046.95 €9.7500 €95,406 9,600.00 €9.9300G EUR Class €346,904 33,307.42 €10.4152 €470,706 46,074.45 €10.2100 €570,597 54,878.83 €10.3900U EUR Class €1,041,452 90,048.48 €11.5654 €1,189,072 105,305.60 €11.2916 €894,366 78,185.55 €11.4390Z EUR Class €4,087,826 313,337.52 €13.0460 €758,477 60,061.15 €12.6284 €151,858 11,972.56 €12.6838A GBP Class £3,990,313 294,566.27 £13.5464 £9,904,079 754,573.47 £13.1254 £8,910,157 679,070.88 £13.1211C GBP Class £22,776,910 1,475,628.07 £15.4354 £33,599,965 2,229,755.63 £15.0689 £53,137,704 3,501,153.29 £15.1772F GBP Class £1,784,113 150,621.54 £11.8450 £3,698,713 320,977.09 £11.5232 £4,711,806 407,314.51 £11.5679G GBP Class £1,914,345 169,118.88 £11.3195 £4,016,244 364,742.24 £11.0111 £3,774,610 341,472.96 £11.0539T GBP Class £1,393,855 85,706.18 £16.2631 £1,954,044 124,005.04 £15.7577 £2,637,267 167,417.67 £15.7526U GBP Class £10,918,315 838,974.25 £13.0138 £12,925,600 1,025,730.40 £12.6013 £11,465,308 910,950.01 £12.5861Z GBP Class £15,463,301 1,034,618.27 £14.9459 £16,765,812 1,169,514.72 £14.3357 £26,035,445 1,834,463.85 £14.1924
*Fund terminated during the year.
GAM Star Fund p.l.c.
352

Notes to the Financial Statements
17. NAV per redeemable participating shares in issue, continued
NAV 30 June 2020
Shares in issue
30 June 2020
NAV per Share
30 June 2020NAV
30 June 2019
Shares in issue
30 June 2019
NAV per Share
30 June 2019NAV
30 June 2018
Shares in issue
30 June 2018
NAV per Share
30 June 2018
GAM Star Global Growth, continuedA SGD Class SGD2,017,195 152,761.13 SGD13.2048 SGD3,582,588 282,857.14 SGD12.6600 SGD3,709,248 295,504.69 SGD12.5500A USD Class US$8,996,840 642,333.23 US$14.0065 US$11,414,228 855,586.72 US$13.3400 US$14,465,768 1,103,414.79 US$13.1100C USD Class US$79,088,164 4,930,253.19 US$16.0414 US$78,194,440 5,080,860.28 US$15.3900 US$83,426,114 5,470,564.86 US$15.2500F USD Class US$811,261 66,054.81 US$12.2816 US$1,342,244 114,272.47 US$11.7400 US$1,559,726 134,444.79 US$11.6000G USD Class US$424,169 34,548.86 US$12.2773 US$1,017,400 86,660.13 US$11.7400 US$1,570,262 135,329.38 US$11.6000T USD Class US$518,824 30,971.44 US$16.7516 US$2,525,466 158,521.92 US$15.9300 US$3,358,535 214,354.05 US$15.6600U USD Class US$699,710 51,508.94 US$13.5842 US$899,867 69,584.07 US$12.9320 US$1,079,015 84,898.69 US$12.7094Non UK RFSAccumulation GBP Class £66,941 5,151.66 £12.9941 £850,664 67,788.74 £12.5487 £911,199 72,879.77 £12.5027Accumulation USD Class US$1,630,172 119,141.54 US$13.6826 US$1,949,082 150,023.60 US$12.9918 US$2,985,420 234,394.99 US$12.7367
GAM Star India Equity** Ordinary SharesAccumulation EUR Class – – – – – – €1,437,849 130,172.76 €11.0457Accumulation USD Class – – – – – – US$2,030,571 165,596.80 US$12.2621Institutional SharesInstitutional Hedged Accumulation EUR Class – – – – – – €2,164,403 192,244.97 €11.2585Institutional Accumulation GBP Class – – – – – – £354,466 24,439.59 £14.5037Institutional Accumulation USD Class – – – – – – US$1,534,003 120,923.61 US$12.6857
GAM Star Interest TrendNon UK RFSAccumulation USD Class US$43,299,410 3,897,902.33 US$11.1083 US$52,924,484 5,031,667.65 US$10.5182 US$76,995,412 7,313,324.49 US$10.5281
GAM Star Japan LeadersOrdinary SharesAccumulation EUR Class €34,353,492 158,172.46 €217.1901 €14,245,991 76,017.58 €187.4039 €18,099,000 93,718.91 €193.1200Accumulation GBP Class £342,618 1,667.41 £205.4790 £439,132 2,519.97 £174.2609 £639,050 3,606.60 £177.1890Accumulation JPY Class ¥1,743,499,720 747,044.46 ¥2,333.8600 ¥1,867,415,708 913,941.04 ¥2,043.2500 ¥3,465,436,200 1,566,035.91 ¥2,212.8700Accumulation USD Class US$13,527,483 642,028.80 US$21.0699 US$4,408,597 238,680.61 US$18.4706 US$7,819,176 401,364.14 US$19.4815Income EUR Class €1,423,001 6,690.98 €212.6744 €1,238,623 6,749.98 €183.5076 €1,390,301 7,352.03 €189.1044Income GBP Class £297,777 1,478.69 £201.3786 £192,652 1,126.70 £170.9875 £113,269 651.49 £173.8622Income USD Class US$281,358 13,645.14 US$20.6196 US$257,886 14,266.85 US$18.0758 US$323,147 16,949.68 US$19.0650Institutional SharesInstitutional Accumulation CHF Class SFr29,856,242 1,769,814.63 SFr16.8697 SFr25,136,102 1,690,640.28 SFr14.8678 SFr27,259,279 1,688,016.93 SFr16.1487Institutional Accumulation EUR Class €144,244,722 10,981,539.81 €13.1352 €38,311,828 3,399,142.23 €11.2710 €162,576,497 14,076,984.12 €11.5491Institutional Accumulation GBP Class £7,935,030 319,905.41 £24.8043 £9,617,810 459,320.79 £20.9392 £4,909,496 232,023.71 £21.1594Institutional Accumulation JPY Class ¥2,214,932,678 1,425,210.25 ¥1,554.1000 ¥2,344,438,212 1,731,780.61 ¥1,353.7700 ¥2,657,386,001 1,821,552.85 ¥1,458.8500
** Fund terminated 15 November 2018.
Notes to the Financial Statements
17. NAV per redeemable participating shares in issue, continued
NAV 30 June 2020
Shares in issue
30 June 2020
NAV per Share
30 June 2020NAV
30 June 2019
Shares in issue
30 June 2019
NAV per Share
30 June 2019NAV
30 June 2018
Shares in issue
30 June 2018
NAV per Share
30 June 2018
GAM Star Global Selector*, continued Accumulation USD Class – – – US$1,174,963 104,945.69 US$11.1959 US$1,610,435 128,122.00 US$12.5695Accumulation II USD Class – – – US$1,390,545 134,986.04 US$10.3014 US$6,611,745 573,007.54 US$11.5386Institutional SharesInstitutional Accumulation II USD Class – – – US$492,804 52,300.00 US$9.4226 US$706,330 67,102.89 US$10.5260Institutional Income II GBP Class – – – – – – £30,461 3,200.02 £9.5189Selling Agent SharesC EUR Class – – – – – – €40,440 3,874.87 €10.4300SA C II EUR Class – – – €1,058,772 123,468.12 €8.5700 €2,979,126 296,725.70 €10.0400
GAM Star Global GrowthOrdinary SharesAccumulation EUR Class €111,429 8,966.80 €12.4268 €108,500 8,966.80 €12.1001 €222,907 18,223.90 €12.2315Institutional SharesInstitutional Accumulation CHF Class SFr144,496 13,876.92 SFr10.4126 – – – – – –Institutional Accumulation EUR Class €5,374,761 445,370.05 €12.0680 €5,036,295 430,649.35 €11.6946 €1,613,746 137,176.73 €11.7639Institutional Accumulation GBP Class £10,240,069 591,321.54 £17.3172 £13,555,610 814,458.90 £16.6437 £17,314,204 1,048,824.46 £16.5082Institutional Accumulation USD Class US$11,311,269 645,890.41 US$17.5126 US$11,330,325 684,865.63 US$16.5438 US$13,545,173 839,027.28 US$16.1439Other SharesPI GBP Class £105,921 9,744.23 £10.8701 £190,530 18,205.12 £10.4657 £190,959 18,366.03 £10.3974Selling Agent SharesC AUD Class AUD11,058 900.00 AUD12.2864 AUD218,304 18,188.84 AUD12.0000 AUD339,261 28,361.09 AUD11.9600U AUD Class AUD1,154,822 82,549.50 AUD13.9894 AUD1,441,862 106,113.48 AUD13.5879 AUD1,409,970 104,984.89 AUD13.4302A CHF Class SFr335,570 25,770.02 SFr13.0217 SFr301,702 23,677.33 SFr12.7400 SFr256,820 19,823.94 SFr12.9500A EUR Class €603,504 53,478.89 €11.2849 €693,997 62,954.22 €11.0200 €684,164 61,206.61 €11.1700C EUR Class €13,712,487 1,041,325.53 €13.1683 €16,004,379 1,234,905.81 €12.9600 €18,281,994 1,380,815.27 €13.2400F EUR Class €159,623 16,046.95 €9.9472 €156,572 16,046.95 €9.7500 €95,406 9,600.00 €9.9300G EUR Class €346,904 33,307.42 €10.4152 €470,706 46,074.45 €10.2100 €570,597 54,878.83 €10.3900U EUR Class €1,041,452 90,048.48 €11.5654 €1,189,072 105,305.60 €11.2916 €894,366 78,185.55 €11.4390Z EUR Class €4,087,826 313,337.52 €13.0460 €758,477 60,061.15 €12.6284 €151,858 11,972.56 €12.6838A GBP Class £3,990,313 294,566.27 £13.5464 £9,904,079 754,573.47 £13.1254 £8,910,157 679,070.88 £13.1211C GBP Class £22,776,910 1,475,628.07 £15.4354 £33,599,965 2,229,755.63 £15.0689 £53,137,704 3,501,153.29 £15.1772F GBP Class £1,784,113 150,621.54 £11.8450 £3,698,713 320,977.09 £11.5232 £4,711,806 407,314.51 £11.5679G GBP Class £1,914,345 169,118.88 £11.3195 £4,016,244 364,742.24 £11.0111 £3,774,610 341,472.96 £11.0539T GBP Class £1,393,855 85,706.18 £16.2631 £1,954,044 124,005.04 £15.7577 £2,637,267 167,417.67 £15.7526U GBP Class £10,918,315 838,974.25 £13.0138 £12,925,600 1,025,730.40 £12.6013 £11,465,308 910,950.01 £12.5861Z GBP Class £15,463,301 1,034,618.27 £14.9459 £16,765,812 1,169,514.72 £14.3357 £26,035,445 1,834,463.85 £14.1924
*Fund terminated during the year. 353
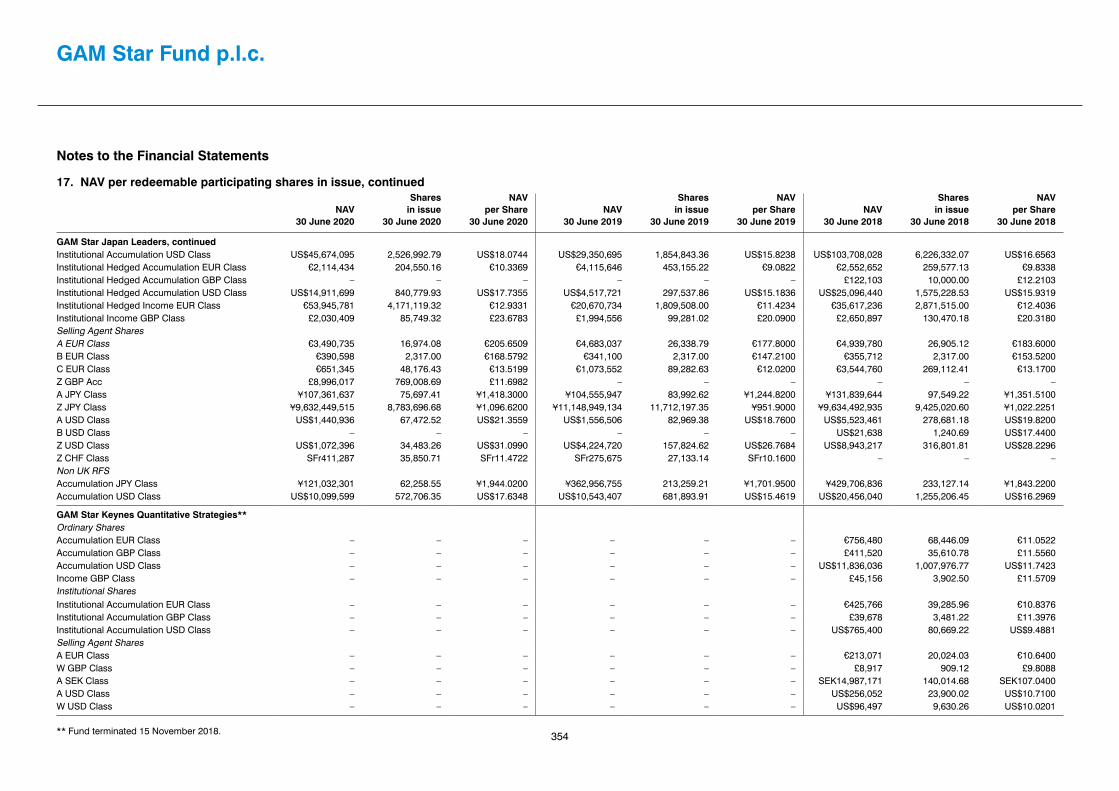
Notes to the Financial Statements
17. NAV per redeemable participating shares in issue, continued
NAV 30 June 2020
Shares in issue
30 June 2020
NAV per Share
30 June 2020NAV
30 June 2019
Shares in issue
30 June 2019
NAV per Share
30 June 2019NAV
30 June 2018
Shares in issue
30 June 2018
NAV per Share
30 June 2018
GAM Star Japan Leaders, continuedInstitutional Accumulation USD Class US$45,674,095 2,526,992.79 US$18.0744 US$29,350,695 1,854,843.36 US$15.8238 US$103,708,028 6,226,332.07 US$16.6563Institutional Hedged Accumulation EUR Class €2,114,434 204,550.16 €10.3369 €4,115,646 453,155.22 €9.0822 €2,552,652 259,577.13 €9.8338Institutional Hedged Accumulation GBP Class – – – – – – £122,103 10,000.00 £12.2103Institutional Hedged Accumulation USD Class US$14,911,699 840,779.93 US$17.7355 US$4,517,721 297,537.86 US$15.1836 US$25,096,440 1,575,228.53 US$15.9319Institutional Hedged Income EUR Class €53,945,781 4,171,119.32 €12.9331 €20,670,734 1,809,508.00 €11.4234 €35,617,236 2,871,515.00 €12.4036Institutional Income GBP Class £2,030,409 85,749.32 £23.6783 £1,994,556 99,281.02 £20.0900 £2,650,897 130,470.18 £20.3180Selling Agent SharesA EUR Class €3,490,735 16,974.08 €205.6509 €4,683,037 26,338.79 €177.8000 €4,939,780 26,905.12 €183.6000B EUR Class €390,598 2,317.00 €168.5792 €341,100 2,317.00 €147.2100 €355,712 2,317.00 €153.5200C EUR Class €651,345 48,176.43 €13.5199 €1,073,552 89,282.63 €12.0200 €3,544,760 269,112.41 €13.1700Z GBP Acc £8,996,017 769,008.69 £11.6982 – – – – – –A JPY Class ¥107,361,637 75,697.41 ¥1,418.3000 ¥104,555,947 83,992.62 ¥1,244.8200 ¥131,839,644 97,549.22 ¥1,351.5100Z JPY Class ¥9,632,449,515 8,783,696.68 ¥1,096.6200 ¥11,148,949,134 11,712,197.35 ¥951.9000 ¥9,634,492,935 9,425,020.60 ¥1,022.2251A USD Class US$1,440,936 67,472.52 US$21.3559 US$1,556,506 82,969.38 US$18.7600 US$5,523,461 278,681.18 US$19.8200B USD Class – – – – – – US$21,638 1,240.69 US$17.4400Z USD Class US$1,072,396 34,483.26 US$31.0990 US$4,224,720 157,824.62 US$26.7684 US$8,943,217 316,801.81 US$28.2296Z CHF Class SFr411,287 35,850.71 SFr11.4722 SFr275,675 27,133.14 SFr10.1600 – – –Non UK RFSAccumulation JPY Class ¥121,032,301 62,258.55 ¥1,944.0200 ¥362,956,755 213,259.21 ¥1,701.9500 ¥429,706,836 233,127.14 ¥1,843.2200Accumulation USD Class US$10,099,599 572,706.35 US$17.6348 US$10,543,407 681,893.91 US$15.4619 US$20,456,040 1,255,206.45 US$16.2969
GAM Star Keynes Quantitative Strategies** Ordinary SharesAccumulation EUR Class – – – – – – €756,480 68,446.09 €11.0522Accumulation GBP Class – – – – – – £411,520 35,610.78 £11.5560Accumulation USD Class – – – – – – US$11,836,036 1,007,976.77 US$11.7423Income GBP Class – – – – – – £45,156 3,902.50 £11.5709Institutional SharesInstitutional Accumulation EUR Class – – – – – – €425,766 39,285.96 €10.8376Institutional Accumulation GBP Class – – – – – – £39,678 3,481.22 £11.3976Institutional Accumulation USD Class – – – – – – US$765,400 80,669.22 US$9.4881Selling Agent SharesA EUR Class – – – – – – €213,071 20,024.03 €10.6400W GBP Class – – – – – – £8,917 909.12 £9.8088A SEK Class – – – – – – SEK14,987,171 140,014.68 SEK107.0400A USD Class – – – – – – US$256,052 23,900.02 US$10.7100W USD Class – – – – – – US$96,497 9,630.26 US$10.0201
** Fund terminated 15 November 2018.
GAM Star Fund p.l.c.
354

Notes to the Financial Statements
17. NAV per redeemable participating shares in issue, continued
NAV 30 June 2020
Shares in issue
30 June 2020
NAV per Share
30 June 2020NAV
30 June 2019
Shares in issue
30 June 2019
NAV per Share
30 June 2019NAV
30 June 2018
Shares in issue
30 June 2018
NAV per Share
30 June 2018
GAM Star MBS Total ReturnOrdinary SharesAccumulation Hedged CHF Class SFr18,348 1,848.00 SFr9.9283 SFr88,491 8,468.00 SFr10.4500 SFr284,919 27,093.10 SFr10.5162Accumulation Hedged EUR Class €10,890,183 1,079,069.32 €10.0922 €9,961,714 941,974.17 €10.5753 €25,545,502 2,408,975.80 €10.6043Accumulation Hedged SEK Class – – – SEK75,843 743.72 SEK101.9783 SEK356,475 3,489.97 SEK102.1428Accumulation USD Class US$154,172,704 13,650,608.62 US$11.2942 US$186,019,881 16,141,113.91 US$11.5246 US$159,446,830 14,233,401.15 US$11.2023Income USD Class US$24,939,688 2,579,478.48 US$9.6685 US$25,344,625 2,472,163.98 US$10.2520 US$25,850,636 2,558,177.16 US$10.1051Institutional SharesInstitutional Accumulation GBP Class £69,061,187 6,213,882.06 £11.1140 £67,405,321 5,898,879.94 £11.4268 £71,118,517 6,332,622.47 £11.2305Institutional Accumulation USD Class US$188,226,486 16,004,156.55 US$11.7611 US$286,994,268 24,083,569.78 US$11.9166 US$344,418,795 29,921,100.44 US$11.5109Institutional Hedged Accumulation CHF Class SFr2,242,680 223,625.19 SFr10.0287 SFr800,264 76,389.58 SFr10.4760 SFr2,880,101 275,039.29 SFr10.4715Institutional Hedged Accumulation EUR Class €110,905,536 10,589,258.11 €10.4734 €244,180,196 22,403,908.26 €10.8990 €349,010,370 32,150,853.02 €10.8554Institutional Hedged Accumulation JPY Class ¥567,926,847 589,135.99 ¥963.9900 ¥617,244,964 613,845.89 ¥1,005.5300 ¥96,863,459 96,868.68 ¥999.9400Institutional Hedged Accumulation SEK Class SEK288,219,627 2,907,330.14 SEK99.1355 SEK277,420,291 2,705,314.77 SEK102.5464 SEK275,806,557 2,702,982.78 SEK102.0378Institutional Hedged Income EUR Class €23,905,433 2,608,481.95 €9.1645 €11,572,005 1,159,053.39 €9.9840 €23,495,658 2,277,218.60 €10.3177Institutional Income GBP Class £1,350,502 141,443.24 £9.5480 £1,983,458 192,755.03 £10.2900 £1,118,459 106,775.42 £10.4748Institutional Income USD Class US$10,490,363 1,013,272.94 US$10.3529 US$11,062,690 1,007,661.75 US$10.9785 US$18,647,117 1,700,842.13 US$10.9634Selling Agent SharesA EUR Class €440,089 45,765.38 €9.6162 €1,061,643 105,036.57 €10.1073 €5,485,621 540,152.08 €10.1500C EUR Class €1,668,658 177,592.01 €9.3960 €3,141,255 316,687.54 €9.9191 €5,741,867 573,067.72 €10.0100U EUR Class €3,108,895 298,087.34 €10.4294 €3,241,334 298,087.34 €10.8737 €3,274,466 301,769.34 €10.8508W GBP Class £36,162,813 3,091,786.62 £11.6964 £50,862,811 4,424,853.90 £11.4948 £56,414,612 5,242,535.71 £10.7609A USD Class US$3,094,752 298,999.92 US$10.3503 US$311,901 29,442.81 US$10.5934 US$309,960 30,018.81 US$10.3200Income II CQ USD Class US$6,929,890 786,192.11 US$8.8145 US$2,913,698 302,700.38 US$9.6256 US$172,952 17,483.86 US$9.8920U USD Class – – – – – – US$5,002,244 437,983.62 US$11.4210Z USD Class US$194,358,967 17,402,350.50 US$11.1685 US$214,347,488 18,865,112.93 US$11.3621 US$409,225,033 37,176,638.56 US$11.0075Z II USD Class US$1,298,750 128,359.14 US$10.1180 US$912,356 89,529.99 US$10.1905 – – –R SharesAccumulation Hedge R EUR Class €23,816,986 2,468,618.62 €9.6479 €13,618,712 1,356,521.32 €10.0394 €24,625,210 2,461,741.50 €10.0031Accumulation R USD Class US$1,574,382 154,631.55 US$10.1815 US$160,014 15,500.00 US$10.3234 – – –
GAM Systematic Alternative Risk PremiaInstitutional SharesInstitutional Accumulation EUR Class €25,470,326 2,382,697.92 €10.6897 €54,462,068 4,840,513.39 €11.2513 €70,756,027 6,307,140.66 €11.2184Institutional Accumulation GBP Class £130,526 11,511.51 £11.3387 £207,771 17,589.40 £11.8122 £408,980 35,219.26 £11.6123Institutional Accumulation JPY Class ¥765,367,938 711,768.37 ¥1,075.3000 ¥1,072,350,235 949,106.72 ¥1,129.8500 ¥1,211,757,885 1,077,094.75 ¥1,125.0200Institutional Accumulation SEK Class – – – SEK8,762 76.39 SEK114.6979 SEK8,718 76.39 SEK114.1197Institutional Accumulation USD Class US$3,985,579 342,489.49 US$11.6370 US$3,500,856 292,922.36 US$11.9514 US$6,712,020 580,619.03 US$11.5601Institutional Hedge Accumulation CHF Class SFr6,439,403 685,468.24 SFr9.3941 SFr22,790,149 2,296,398.66 SFr9.9243 SFr44,010,972 4,428,242.31 SFr9.9387
Notes to the Financial Statements
17. NAV per redeemable participating shares in issue, continued
NAV 30 June 2020
Shares in issue
30 June 2020
NAV per Share
30 June 2020NAV
30 June 2019
Shares in issue
30 June 2019
NAV per Share
30 June 2019NAV
30 June 2018
Shares in issue
30 June 2018
NAV per Share
30 June 2018
GAM Star Japan Leaders, continuedInstitutional Accumulation USD Class US$45,674,095 2,526,992.79 US$18.0744 US$29,350,695 1,854,843.36 US$15.8238 US$103,708,028 6,226,332.07 US$16.6563Institutional Hedged Accumulation EUR Class €2,114,434 204,550.16 €10.3369 €4,115,646 453,155.22 €9.0822 €2,552,652 259,577.13 €9.8338Institutional Hedged Accumulation GBP Class – – – – – – £122,103 10,000.00 £12.2103Institutional Hedged Accumulation USD Class US$14,911,699 840,779.93 US$17.7355 US$4,517,721 297,537.86 US$15.1836 US$25,096,440 1,575,228.53 US$15.9319Institutional Hedged Income EUR Class €53,945,781 4,171,119.32 €12.9331 €20,670,734 1,809,508.00 €11.4234 €35,617,236 2,871,515.00 €12.4036Institutional Income GBP Class £2,030,409 85,749.32 £23.6783 £1,994,556 99,281.02 £20.0900 £2,650,897 130,470.18 £20.3180Selling Agent SharesA EUR Class €3,490,735 16,974.08 €205.6509 €4,683,037 26,338.79 €177.8000 €4,939,780 26,905.12 €183.6000B EUR Class €390,598 2,317.00 €168.5792 €341,100 2,317.00 €147.2100 €355,712 2,317.00 €153.5200C EUR Class €651,345 48,176.43 €13.5199 €1,073,552 89,282.63 €12.0200 €3,544,760 269,112.41 €13.1700Z GBP Acc £8,996,017 769,008.69 £11.6982 – – – – – –A JPY Class ¥107,361,637 75,697.41 ¥1,418.3000 ¥104,555,947 83,992.62 ¥1,244.8200 ¥131,839,644 97,549.22 ¥1,351.5100Z JPY Class ¥9,632,449,515 8,783,696.68 ¥1,096.6200 ¥11,148,949,134 11,712,197.35 ¥951.9000 ¥9,634,492,935 9,425,020.60 ¥1,022.2251A USD Class US$1,440,936 67,472.52 US$21.3559 US$1,556,506 82,969.38 US$18.7600 US$5,523,461 278,681.18 US$19.8200B USD Class – – – – – – US$21,638 1,240.69 US$17.4400Z USD Class US$1,072,396 34,483.26 US$31.0990 US$4,224,720 157,824.62 US$26.7684 US$8,943,217 316,801.81 US$28.2296Z CHF Class SFr411,287 35,850.71 SFr11.4722 SFr275,675 27,133.14 SFr10.1600 – – –Non UK RFSAccumulation JPY Class ¥121,032,301 62,258.55 ¥1,944.0200 ¥362,956,755 213,259.21 ¥1,701.9500 ¥429,706,836 233,127.14 ¥1,843.2200Accumulation USD Class US$10,099,599 572,706.35 US$17.6348 US$10,543,407 681,893.91 US$15.4619 US$20,456,040 1,255,206.45 US$16.2969
GAM Star Keynes Quantitative Strategies** Ordinary SharesAccumulation EUR Class – – – – – – €756,480 68,446.09 €11.0522Accumulation GBP Class – – – – – – £411,520 35,610.78 £11.5560Accumulation USD Class – – – – – – US$11,836,036 1,007,976.77 US$11.7423Income GBP Class – – – – – – £45,156 3,902.50 £11.5709Institutional SharesInstitutional Accumulation EUR Class – – – – – – €425,766 39,285.96 €10.8376Institutional Accumulation GBP Class – – – – – – £39,678 3,481.22 £11.3976Institutional Accumulation USD Class – – – – – – US$765,400 80,669.22 US$9.4881Selling Agent SharesA EUR Class – – – – – – €213,071 20,024.03 €10.6400W GBP Class – – – – – – £8,917 909.12 £9.8088A SEK Class – – – – – – SEK14,987,171 140,014.68 SEK107.0400A USD Class – – – – – – US$256,052 23,900.02 US$10.7100W USD Class – – – – – – US$96,497 9,630.26 US$10.0201
** Fund terminated 15 November 2018. 355

Notes to the Financial Statements
17. NAV per redeemable participating shares in issue, continued
NAV 30 June 2020
Shares in issue
30 June 2020
NAV per Share
30 June 2020NAV
30 June 2019
Shares in issue
30 June 2019
NAV per Share
30 June 2019NAV
30 June 2018
Shares in issue
30 June 2018
NAV per Share
30 June 2018
GAM Systematic Alternative Risk Premia, continuedSelling Agent SharesZ CHF Class SFr19,576 2,106.01 SFr9.2951 SFr73,914,448 7,531,761.54 SFr9.8137 SFr70,618,692 7,190,434.16 SFr9.8212C EUR Class €584,066 64,425.57 €9.0657 €717,743 74,193.53 €9.6700 €1,084,350 110,882.62 €9.7700Z EUR Class – – – €21,774,675 2,198,707.00 €9.9034 €23,737,056 2,404,824.00 €9.8706X USD Class US$12,025,112 1,217.02 US$9,880.7842 US$62,234,236 6,135.92 US$10,142.6087 – – –Z USD Class – – – – – – US$68,466,824 6,851,725.65 US$9.9926
GAM Systematic Core MacroOrdinary SharesAccumulation EUR Class – – – €113,557 10,000.00 €11.3556 – – –Accumulation GBP Class £160,164 15,620.61 £10.2534 £226,195 20,306.61 £11.1390 £862,323 82,065.81 £10.5077Institutional SharesInstitutional Accumulation EUR Class €800,903 80,591.15 €9.9378 €1,881,235 172,886.62 €10.8813 €5,359,840 517,110.29 €10.3649Institutional Accumulation USD Class US$1,387,809 129,610.06 US$10.7075 US$1,730,172 150,815.07 US$11.4721 US$6,491,970 609,968.19 US$10.6431Selling Agent SharesC EUR Class – – – €215,454 20,360.88 €10.5800 €833,693 81,684.90 €10.2000W EUR Class – – – €10,749,342 1,041,777.54 €10.3182 €27,732,705 2,832,787.37 €9.7899X EUR Class – – – €2,681,499 256.58 €10,450.9265 €32,544,426 3,273.94 €9,940.4466W GBP Class £610,571 61,021.70 £10.0057 £20,067,620 1,861,353.08 £10.7812 £48,695,124 4,817,388.30 £10.1082Z GBP Class £1,337,674 122,850.24 £10.8886 £1,435,075 122,850.24 £11.6814 £9,529,575 880,570.15 £10.8220W USD Class US$42,249 4,157.96 US$10.1610 US$7,284,268 672,285.05 US$10.8350 US$10,834,927 1,080,292.91 US$10.0296Z USD Class US$4,894,419 489,535.18 US$9.9980 US$116,970 9,658.81 US$12.1102 US$106,819 9,658.81 US$11.0591
GAM Systematic Global Equity Market Neutral* Ordinary SharesAccumulation GBP Class – – – £1,169,363 116,625.16 £10.0266 £1,161,252 116,625.16 £9.9571Institutional SharesInstitutional Accumulation EUR Class – – – €1,318,610 138,265.45 €9.5367 €1,323,964 138,108.83 €9.5863Institutional Accumulation USD Class – – – US$1,421,994 140,235.91 US$10.1400 US$1,394,340 140,235.91 US$9.9428Selling Agent SharesC EUR Class – – – €1,275,150 138,108.83 €9.2300 €1,307,133 139,101.88 €9.3900Z GBP Class – – – £3,262,545 320,475.70 £10.1803 £5,140,481 516,108.96 £9.9600W USD Class – – – US$99,905 10,000.00 US$9.9904 US$97,244 10,000.00 US$9.7243Z USD Class – – – US$7,832,657 743,394.81 US$10.5363 US$7,548,999 743,394.81 US$10.1547
*Fund terminated during the year.
GAM Star Fund p.l.c.
356

Notes to the Financial Statements
17. NAV per redeemable participating shares in issue, continued
NAV 30 June 2020
Shares in issue
30 June 2020
NAV per Share
30 June 2020NAV
30 June 2019
Shares in issue
30 June 2019
NAV per Share
30 June 2019NAV
30 June 2018
Shares in issue
30 June 2018
NAV per Share
30 June 2018
GAM Star Tactical OpportunitiesInstitutional SharesInstitutional Accumulation CHF Class SFr136,407 14,958.57 SFr9.1189 SFr139,323 14,958.57 SFr9.3139 SFr1,190,808 127,370.45 SFr9.3491Institutional Accumulation EUR Class €7,767,279 885,400.20 €8.7726 €11,534,357 1,292,898.07 €8.9213 €13,733,021 1,541,043.15 €8.9115Institutional Accumulation GBP Class £3,388,417 362,477.59 £9.3479 £3,056,707 324,669.01 £9.4148 £2,957,308 318,861.00 £9.2746Institutional Accumulation USD Class US$2,473,390 250,858.78 US$9.8596 US$18,567,968 1,897,470.40 US$9.7856 US$3,735,155 393,987.90 US$9.4803Selling Agent SharesX EUR Acc €12,896,200 1,302.98 €9,897.4656 – – – – – –M USD Class – – – – – – US$23,039,096 2,431,532.85 US$9.4751Non UK RFSAccumulation GBP Class £554,491 57,165.55 £9.6997 £1,121,824 114,854.98 £9.7673 £2,034,385 211,416.28 £9.6226Accumulation USD Class US$9,576,686 931,778.64 US$10.2778 US$10,042,261 984,481.10 US$10.2005 US$12,009,146 1,215,209.10 US$9.8823
GAM Star Target Return*Institutional SharesInstitutional Accumulation CHF Class – – – SFr1,901 200.00 SFr9.5029 SFr453,764 46,535.70 SFr9.7508Institutional Accumulation EUR Class – – – €1,755,778 182,175.56 €9.6378 €4,888,147 495,544.40 €9.8641Institutional Accumulation GBP Class – – – £229,818 23,105.48 £9.9464 £1,798,017 179,169.77 £10.0352Institutional Accumulation USD Class – – – US$244,512 23,563.70 US$10.3766 US$14,647,942 1,423,594.81 US$10.2894Selling Agent SharesZII CHF Class – – – SFr64,630 6,527.03 SFr9.9018 – – –X EUR Class – – – €1,141,990 116.81 €9,776.4756 – – –ZII EUR Class – – – €2,496,005 251,488.90 €9.9249 – – –ZII GBP Class – – – £1,764,321 176,123.80 £10.0175 – – –ZII USD Class – – – US$22,296,185 2,200,997.07 US$10.1300 – – –
GAM Star Target Return Plus*
Institutional SharesInstitutional Accumulation GBP Class – – – £7,099,345 716,000.00 £9.9152 £7,209,568 716,000.00 £10.0692Selling Agent SharesX EUR Class – – – – – – €1,826,079 187.66 €9,730.7834
GAM Star Disruptive GrowthOrdinary SharesAccumulation EUR Class €5,282,202 178,773.51 €29.5468 €3,120,788 134,602.00 €23.1853 €4,414,135 203,473.56 €21.6939Accumulation GBP Class £2,847,385 66,230.73 £42.9919 £2,228,896 67,117.64 £33.2087 £2,497,849 81,354.20 £30.7033Accumulation USD Class US$30,544,333 919,445.07 US$33.2204 US$35,814,920 1,355,060.24 US$26.4305 US$55,019,929 2,170,856.70 US$25.3448Income USD Class US$41,110 1,238.56 US$33.1916 US$30,571 1,157.60 US$26.4088 US$592,852 23,407.60 US$25.3273Institutional SharesInstitutional Accumulation EUR Class €3,730,670 106,046.69 €35.1795 €1,691,663 61,681.38 €27.4258 €667,986 26,164.88 €25.5298
* Fund terminated during the year.
Notes to the Financial Statements
17. NAV per redeemable participating shares in issue, continued
NAV 30 June 2020
Shares in issue
30 June 2020
NAV per Share
30 June 2020NAV
30 June 2019
Shares in issue
30 June 2019
NAV per Share
30 June 2019NAV
30 June 2018
Shares in issue
30 June 2018
NAV per Share
30 June 2018
GAM Systematic Alternative Risk Premia, continuedSelling Agent SharesZ CHF Class SFr19,576 2,106.01 SFr9.2951 SFr73,914,448 7,531,761.54 SFr9.8137 SFr70,618,692 7,190,434.16 SFr9.8212C EUR Class €584,066 64,425.57 €9.0657 €717,743 74,193.53 €9.6700 €1,084,350 110,882.62 €9.7700Z EUR Class – – – €21,774,675 2,198,707.00 €9.9034 €23,737,056 2,404,824.00 €9.8706X USD Class US$12,025,112 1,217.02 US$9,880.7842 US$62,234,236 6,135.92 US$10,142.6087 – – –Z USD Class – – – – – – US$68,466,824 6,851,725.65 US$9.9926
GAM Systematic Core MacroOrdinary SharesAccumulation EUR Class – – – €113,557 10,000.00 €11.3556 – – –Accumulation GBP Class £160,164 15,620.61 £10.2534 £226,195 20,306.61 £11.1390 £862,323 82,065.81 £10.5077Institutional SharesInstitutional Accumulation EUR Class €800,903 80,591.15 €9.9378 €1,881,235 172,886.62 €10.8813 €5,359,840 517,110.29 €10.3649Institutional Accumulation USD Class US$1,387,809 129,610.06 US$10.7075 US$1,730,172 150,815.07 US$11.4721 US$6,491,970 609,968.19 US$10.6431Selling Agent SharesC EUR Class – – – €215,454 20,360.88 €10.5800 €833,693 81,684.90 €10.2000W EUR Class – – – €10,749,342 1,041,777.54 €10.3182 €27,732,705 2,832,787.37 €9.7899X EUR Class – – – €2,681,499 256.58 €10,450.9265 €32,544,426 3,273.94 €9,940.4466W GBP Class £610,571 61,021.70 £10.0057 £20,067,620 1,861,353.08 £10.7812 £48,695,124 4,817,388.30 £10.1082Z GBP Class £1,337,674 122,850.24 £10.8886 £1,435,075 122,850.24 £11.6814 £9,529,575 880,570.15 £10.8220W USD Class US$42,249 4,157.96 US$10.1610 US$7,284,268 672,285.05 US$10.8350 US$10,834,927 1,080,292.91 US$10.0296Z USD Class US$4,894,419 489,535.18 US$9.9980 US$116,970 9,658.81 US$12.1102 US$106,819 9,658.81 US$11.0591
GAM Systematic Global Equity Market Neutral* Ordinary SharesAccumulation GBP Class – – – £1,169,363 116,625.16 £10.0266 £1,161,252 116,625.16 £9.9571Institutional SharesInstitutional Accumulation EUR Class – – – €1,318,610 138,265.45 €9.5367 €1,323,964 138,108.83 €9.5863Institutional Accumulation USD Class – – – US$1,421,994 140,235.91 US$10.1400 US$1,394,340 140,235.91 US$9.9428Selling Agent SharesC EUR Class – – – €1,275,150 138,108.83 €9.2300 €1,307,133 139,101.88 €9.3900Z GBP Class – – – £3,262,545 320,475.70 £10.1803 £5,140,481 516,108.96 £9.9600W USD Class – – – US$99,905 10,000.00 US$9.9904 US$97,244 10,000.00 US$9.7243Z USD Class – – – US$7,832,657 743,394.81 US$10.5363 US$7,548,999 743,394.81 US$10.1547
*Fund terminated during the year. 357

Notes to the Financial Statements
17. NAV per redeemable participating shares in issue, continued
NAV 30 June 2020
Shares in issue
30 June 2020
NAV per Share
30 June 2020NAV
30 June 2019
Shares in issue
30 June 2019
NAV per Share
30 June 2019NAV
30 June 2018
Shares in issue
30 June 2018
NAV per Share
30 June 2018
GAM Star Disruptive Growth, continuedInstitutional Accumulation GBP Class £68,999,905 1,493,388.07 £46.2036 £50,744,223 1,430,393.86 £35.4757 £65,681,197 2,012,569.05 £32.6355Institutional Accumulation USD Class US$39,740,696 1,136,754.09 US$34.9598 US$38,441,992 1,391,168.10 US$27.6328 US$69,578,965 2,638,605.26 US$26.3696Institutional Hedged Accumulation GBP Class £450,266 33,014.21 £13.6385 £354,463 31,868.33 £11.1227 £2,984,096 275,814.38 £10.8192Institutional Income GBP Class £12,574,396 272,014.11 £46.2270 £16,612,819 468,304.43 £35.4744 £22,062,558 676,064.63 £32.6338Selling Agent SharesAccumulation Z GBP II Class £81,697 5,088.32 £16.0558 £80,070 6,554.07 £12.2168 £109,395 9,831.10 £11.1273Z GBP Class £55,211,009 1,785,954.89 £30.9140 £36,676,631 1,546,721.38 £23.7125 £29,821,993 1,371,775.73 £21.7397A USD Class US$3,946,660 141,265.44 US$27.9379 US$3,560,259 160,011.62 US$22.2500 US$4,421,410 206,994.86 US$21.3600C USD Class US$1,721,910 63,664.44 US$27.0466 US$2,181,328 100,821.42 US$21.6300 US$3,396,015 162,787.66 US$20.8600Z USD Class US$29,897,684 1,001,204.14 US$29.8617 US$21,884,363 928,648.99 US$23.5658 US$16,288,802 726,842.99 US$22.4103R Hedged SharesAccumulation Hedged R EUR Class €33,904 2,841.82 €11.9302 €155,547 15,955.67 €9.7486 – – –
GAM Star US All Cap EquityOrdinary SharesAccumulation EUR Class €2,942,325 66,107.84 €44.5079 €4,027,753 97,327.71 €41.3834 €63,271,917 1,587,991.09 €39.8440Accumulation GBP Class £436,420 14,614.53 £29.8620 £738,772 27,028.96 £27.3325 £975,214 37,524.85 £25.9884Accumulation USD Class US$36,519,172 1,828,939.51 US$19.9674 US$39,644,694 2,106,093.15 US$18.8238 US$75,967,121 4,091,733.31 US$18.5660Income USD Class US$746,673 37,395.36 US$19.9669 US$1,532,084 81,389.05 US$18.8242 US$2,431,749 130,975.43 US$18.5664Institutional SharesInstitutional Accumulation EUR Class €35,577 964.36 €36.8916 €33,630 985.35 €34.1299 €428,124 13,089.00 €32.7086Institutional Accumulation GBP Class £1,460,812 75,091.55 £19.4537 £1,804,414 101,851.24 £17.7161 £1,942,883 115,919.17 £16.7606Institutional Accumulation USD Class US$9,957,841 374,233.94 US$26.6085 US$11,769,287 471,546.83 US$24.9588 US$55,991,607 2,285,869.01 US$24.4946Institutional Income GBP Class – – – £158,829 8,964.92 £17.7167 £451,966 26,964.92 £16.7612Institutional Income USD Class US$772,103 29,016.79 US$26.6088 US$2,098,270 84,068.68 US$24.9590 US$662,539 27,048.00 US$24.4949Selling Agent SharesC EUR Class €138,074 4,768.94 €28.9527 €152,010 5,361.27 €28.3500 €807,745 27,745.47 €29.1100A USD Class US$10,726,399 332,934.70 US$32.2177 US$12,818,168 420,976.78 US$30.4400 US$23,341,159 775,362.06 US$30.1000C USD Class US$2,944,272 102,339.80 US$28.7695 US$3,879,487 142,039.36 US$27.3100 US$9,581,592 353,278.77 US$27.1200
GAM Star Worldwide EquityOrdinary SharesAccumulation EUR Class €2,352,882 126,991.76 €18.5278 €3,818,248 209,731.34 €18.2054 €8,760,890 463,477.55 €18.9025Accumulation GBP Class £2,319,854 1,083,558.37 £2.1409 £3,565,961 1,721,906.34 £2.0709 £3,704,000 1,743,222.77 £2.1248Accumulation USD Class US$26,944,552 7,536.67 US$3,575.1269 US$28,974,449 8,134.86 US$3,561.7636 US$29,696,727 7,833.54 US$3,790.9715Income GBP Class £13,680 7,045.02 £1.9417 £22,600 11,978.71 £1.8866 £23,708 12,199.57 £1.9433Income USD Class US$19,940,704 6,654.51 US$2,996.5698 US$22,871,311 7,644.67 US$2,991.7983 US$68,911,131 21,613.85 US$3,188.2858Ordinary Hedge SharesAccumulation Hedge EUR Class €299,123 32,510.65 €9.2007 – – – – – –
GAM Star Fund p.l.c.
358

Notes to the Financial Statements
17. NAV per redeemable participating shares in issue, continued
NAV 30 June 2020
Shares in issue
30 June 2020
NAV per Share
30 June 2020NAV
30 June 2019
Shares in issue
30 June 2019
NAV per Share
30 June 2019NAV
30 June 2018
Shares in issue
30 June 2018
NAV per Share
30 June 2018
GAM Star Worldwide Equity, continuedAccumulation Hedge C EUR Class €206,947 22,562.80 €9.1720 – – – – – –Accumulation Hedge GBP Class £81,750 8,949.08 £9.1349 – – – – – –Institutional SharesInstitutional Accumulation USD Class US$3,246,157 293,991.96 US$11.0416 US$10,771,981 984,321.92 US$10.9435 – – –Institutional Income GBP Class £1,856,897 165,586.70 £11.2140 £2,765,903 254,060.04 £10.8868 – – –Institutional Income USD Class US$104,053 9,505.80 US$10.9462 US$426,647 38,986.22 US$10.9435 – – –Selling Agent SharesC EUR Class €273,467 17,845.94 €15.3237 €337,290 22,247.18 €15.1600 €540,935 34,137.72 €15.8400ZII GBP Class £418,722 37,016.41 £11.3117 £317,132 29,381.87 £10.7934 – – –A USD Class US$230,757 15,843.94 US$14.5644 US$321,529 22,107.42 US$14.5400 US$280,962 18,103.61 US$15.5100
GAM Systematic Dynamic CreditInstitutional SharesInstitutional Accumulation EUR Class €1,662,880 177,561.99 €9.3650 €1,778,279 177,561.99 €10.0149 – – –Institutional Accumulation USD Class US$1,976,138 203,918.00 US$9.6908 US$2,063,328 203,918.00 US$10.1184 – – –Selling Agent SharesZ CHF Acc Class SFr9,332 1,000.00 SFr9.3321 – – – – – –Z EUR Accumulation €2,603,072 271,624.05 €9.5833 €4,643,761 454,269.19 €10.2224 – – –Z GBP Accumulation £1,570,869 160,620.83 £9.7799 £1,653,566 160,620.83 £10.2948 – – –Z USD Accumulation US$2,117,381 212,203.75 US$9.9780 US$2,116,874 203,698.20 US$10.3922 – – –
Notes to the Financial Statements
17. NAV per redeemable participating shares in issue, continued
NAV 30 June 2020
Shares in issue
30 June 2020
NAV per Share
30 June 2020NAV
30 June 2019
Shares in issue
30 June 2019
NAV per Share
30 June 2019NAV
30 June 2018
Shares in issue
30 June 2018
NAV per Share
30 June 2018
GAM Star Disruptive Growth, continuedInstitutional Accumulation GBP Class £68,999,905 1,493,388.07 £46.2036 £50,744,223 1,430,393.86 £35.4757 £65,681,197 2,012,569.05 £32.6355Institutional Accumulation USD Class US$39,740,696 1,136,754.09 US$34.9598 US$38,441,992 1,391,168.10 US$27.6328 US$69,578,965 2,638,605.26 US$26.3696Institutional Hedged Accumulation GBP Class £450,266 33,014.21 £13.6385 £354,463 31,868.33 £11.1227 £2,984,096 275,814.38 £10.8192Institutional Income GBP Class £12,574,396 272,014.11 £46.2270 £16,612,819 468,304.43 £35.4744 £22,062,558 676,064.63 £32.6338Selling Agent SharesAccumulation Z GBP II Class £81,697 5,088.32 £16.0558 £80,070 6,554.07 £12.2168 £109,395 9,831.10 £11.1273Z GBP Class £55,211,009 1,785,954.89 £30.9140 £36,676,631 1,546,721.38 £23.7125 £29,821,993 1,371,775.73 £21.7397A USD Class US$3,946,660 141,265.44 US$27.9379 US$3,560,259 160,011.62 US$22.2500 US$4,421,410 206,994.86 US$21.3600C USD Class US$1,721,910 63,664.44 US$27.0466 US$2,181,328 100,821.42 US$21.6300 US$3,396,015 162,787.66 US$20.8600Z USD Class US$29,897,684 1,001,204.14 US$29.8617 US$21,884,363 928,648.99 US$23.5658 US$16,288,802 726,842.99 US$22.4103R Hedged SharesAccumulation Hedged R EUR Class €33,904 2,841.82 €11.9302 €155,547 15,955.67 €9.7486 – – –
GAM Star US All Cap EquityOrdinary SharesAccumulation EUR Class €2,942,325 66,107.84 €44.5079 €4,027,753 97,327.71 €41.3834 €63,271,917 1,587,991.09 €39.8440Accumulation GBP Class £436,420 14,614.53 £29.8620 £738,772 27,028.96 £27.3325 £975,214 37,524.85 £25.9884Accumulation USD Class US$36,519,172 1,828,939.51 US$19.9674 US$39,644,694 2,106,093.15 US$18.8238 US$75,967,121 4,091,733.31 US$18.5660Income USD Class US$746,673 37,395.36 US$19.9669 US$1,532,084 81,389.05 US$18.8242 US$2,431,749 130,975.43 US$18.5664Institutional SharesInstitutional Accumulation EUR Class €35,577 964.36 €36.8916 €33,630 985.35 €34.1299 €428,124 13,089.00 €32.7086Institutional Accumulation GBP Class £1,460,812 75,091.55 £19.4537 £1,804,414 101,851.24 £17.7161 £1,942,883 115,919.17 £16.7606Institutional Accumulation USD Class US$9,957,841 374,233.94 US$26.6085 US$11,769,287 471,546.83 US$24.9588 US$55,991,607 2,285,869.01 US$24.4946Institutional Income GBP Class – – – £158,829 8,964.92 £17.7167 £451,966 26,964.92 £16.7612Institutional Income USD Class US$772,103 29,016.79 US$26.6088 US$2,098,270 84,068.68 US$24.9590 US$662,539 27,048.00 US$24.4949Selling Agent SharesC EUR Class €138,074 4,768.94 €28.9527 €152,010 5,361.27 €28.3500 €807,745 27,745.47 €29.1100A USD Class US$10,726,399 332,934.70 US$32.2177 US$12,818,168 420,976.78 US$30.4400 US$23,341,159 775,362.06 US$30.1000C USD Class US$2,944,272 102,339.80 US$28.7695 US$3,879,487 142,039.36 US$27.3100 US$9,581,592 353,278.77 US$27.1200
GAM Star Worldwide EquityOrdinary SharesAccumulation EUR Class €2,352,882 126,991.76 €18.5278 €3,818,248 209,731.34 €18.2054 €8,760,890 463,477.55 €18.9025Accumulation GBP Class £2,319,854 1,083,558.37 £2.1409 £3,565,961 1,721,906.34 £2.0709 £3,704,000 1,743,222.77 £2.1248Accumulation USD Class US$26,944,552 7,536.67 US$3,575.1269 US$28,974,449 8,134.86 US$3,561.7636 US$29,696,727 7,833.54 US$3,790.9715Income GBP Class £13,680 7,045.02 £1.9417 £22,600 11,978.71 £1.8866 £23,708 12,199.57 £1.9433Income USD Class US$19,940,704 6,654.51 US$2,996.5698 US$22,871,311 7,644.67 US$2,991.7983 US$68,911,131 21,613.85 US$3,188.2858Ordinary Hedge SharesAccumulation Hedge EUR Class €299,123 32,510.65 €9.2007 – – – – – –
359

360
GAM Star Fund p.l.c.
Notes to the Financial Statements
18. Dividend distribution
The tables below include Dividend distribution detail of each share class in each Fund as at 30 June 2020 and 30 June 2019. The declared dividend distributions with a record date of 30 June 2020 are accounted for within the Annual Report. The columns “Gross Amount”, “Income received”, “Income deducted” and “Net Distribution” presented in the below tables disclose these amounts in each Fund’s base currency.
At 30 June 2020
CCY
First Valuation date
Ex-DividendGross
AmountIncome
receivedIncome
deductedNet
DistributionDividend
per share
GAM Star Asian EquityInstitutional SharesInstitutional Accumulation GBP Class £ 01/07/2020 (1,347) 126 (412) (1,633) £0.0140Institutional Accumulation EUR Class € 01/07/2020 (377) – (36) (413) €0.0131Z GBP Class £ 01/07/2020 (158) – (34) (192) £0.0493Z II USD Class US$ 01/07/2020 (325) – – (325) US$0.0324
GAM Star Global BalancedOrdinary SharesAccumulation PI USD Class US$ 01/07/2020 (165) – – (165) US$0.0157Institutional SharesInstitutional Accumulation AUD Class AUD 01/07/2020 (643) 43 (1,535) (2,135) AUD0.0359Institutional Accumulation EUR Class € 01/07/2020 (14,787) 3,564 (11,220) (22,443) €0.0329Institutional Accumulation GBP Class £ 01/07/2020 (122,289) 33,332 (91,726) (180,683) £0.0505Institutional Accumulation SGD Class SGD 01/07/2020 (2,752) 1,248 – (1,504) SGD0.0363Institutional Accumulation USD Class US$ 01/07/2020 (59,389) 6,166 (39,424) (92,647) US$0.0475Institutional Income GBP Class £ 01/07/2020 (6,086) 104 (173) (6,155) £0.0499Selling Agent SharesZ EUR Class € 01/07/2020 (10,992) 5,133 (7,741) (13,600) €0.0491PI GBP Class £ 01/07/2020 (1,076) – (1,171) (2,247) £0.0192Z GBP Class £ 01/07/2020 (40,641) 13,816 (28,999) (55,824) £0.0707
GAM Star Capital Appreciation US EquityInstitutional SharesInstitutional Accumulation GBP Class £ 01/07/2020 (35) 38 (52) (49) £0.0001Institutional Accumulation USD Class US$ 01/07/2020 (701) 7 (224) (918) US$0.0007Institutional Income GBP Class £ 01/07/2020 (206) 3 (296) (499) £0.0011
GAM Star Cat BondOrdinary SharesAccumulation CHF Class SFr 13/01/2020 (396,371) – – (396,371) SFr0.3582
SFr 13/07/2020 (349,457) 48,708 (71,074) (371,823) SFr0.3307Accumulation EUR Class € 13/01/2020 (1,092,816) – – (1,092,816) €0.3750
€ 13/07/2020 (939,301) 53,010 (89,394) (975,685) €0.3392Accumulation GBP Class £ 13/01/2020 (50,463) (50,463) £0.3424
£ 13/07/2020 (53,378) 9,748 (24,182) (67,812) £0.3729Accumulation USD Class US$ 13/01/2020 (1,318,992) (1,318,992) US$0.3746
US$ 13/07/2020 (1,415,676) 126,529 (171,649) (1,460,796) US$0.3825Accumulation A EUR Class € 13/01/2020 (82,469) – – (82,469) €0.2885
€ 13/07/2020 (143,291) 14,480 (15,846) (144,657) €0.2633Accumulation M EUR Class € 13/01/2020 (1,686,357) (1,686,357) €0.3035
€ 13/07/2020 (1,551,823) – – (1,551,823) €0.2791Hedged Ordinary Acculucation JPY Class ¥ 13/01/2020 (51,973) – – (51,973) ¥30.4041
¥ 13/07/2020 (26,297) – (34,053) (60,350) ¥28.7289Income EUR Class € 13/01/2020 (33,959) – – (33,959) €0.2959
€ 13/07/2020 (25,800) 2,001 (8,373) (32,172) €0.2626Income USD Class US$ 13/01/2020 (64,120) – – (64,120) US$0.3209
US$ 13/07/2020 (65,306) 4,246 (36) (61,096) US$0.3190Institutional SharesInstitutional Accumulation CHF Class SFr 13/01/2020 (5,867,903) – – (5,867,903) SFr0.3247
SFr 13/07/2020 (5,480,421) 497,839 (280,932) (5,263,514) SFr0.2993Institutional Accumulation EUR Class € 13/01/2020 (26,949,228) – – (26,949,228) €0.4056
€ 13/07/2020 (23,196,199) 3,216,438 (2,480,017) (22,459,778) €0.3817Institutional Accumulation GBP Class £ 13/01/2020 (915,530) – – (915,530) £0.3817
£ 13/07/2020 (877,435) 106,208 (314,848) (1,086,075) £0.4188Institutional Accumulation USD Class US$ 13/01/2020 (8,735,008) – – (8,735,008) US$0.4175
US$ 13/07/2020 (9,152,195) 989,511 (1,225,651) (9,388,335) US$0.4268

361
Notes to the Financial Statements
18. Dividend distribution
The tables below include Dividend distribution detail of each share class in each Fund as at 30 June 2020 and 30 June 2019. The declared dividend distributions with a record date of 30 June 2020 are accounted for within the Annual Report. The columns “Gross Amount”, “Income received”, “Income deducted” and “Net Distribution” presented in the below tables disclose these amounts in each Fund’s base currency.
At 30 June 2020
CCY
First Valuation date
Ex-DividendGross
AmountIncome
receivedIncome
deductedNet
DistributionDividend
per share
GAM Star Asian EquityInstitutional SharesInstitutional Accumulation GBP Class £ 01/07/2020 (1,347) 126 (412) (1,633) £0.0140Institutional Accumulation EUR Class € 01/07/2020 (377) – (36) (413) €0.0131Z GBP Class £ 01/07/2020 (158) – (34) (192) £0.0493Z II USD Class US$ 01/07/2020 (325) – – (325) US$0.0324
GAM Star Global BalancedOrdinary SharesAccumulation PI USD Class US$ 01/07/2020 (165) – – (165) US$0.0157Institutional SharesInstitutional Accumulation AUD Class AUD 01/07/2020 (643) 43 (1,535) (2,135) AUD0.0359Institutional Accumulation EUR Class € 01/07/2020 (14,787) 3,564 (11,220) (22,443) €0.0329Institutional Accumulation GBP Class £ 01/07/2020 (122,289) 33,332 (91,726) (180,683) £0.0505Institutional Accumulation SGD Class SGD 01/07/2020 (2,752) 1,248 – (1,504) SGD0.0363Institutional Accumulation USD Class US$ 01/07/2020 (59,389) 6,166 (39,424) (92,647) US$0.0475Institutional Income GBP Class £ 01/07/2020 (6,086) 104 (173) (6,155) £0.0499Selling Agent SharesZ EUR Class € 01/07/2020 (10,992) 5,133 (7,741) (13,600) €0.0491PI GBP Class £ 01/07/2020 (1,076) – (1,171) (2,247) £0.0192Z GBP Class £ 01/07/2020 (40,641) 13,816 (28,999) (55,824) £0.0707
GAM Star Capital Appreciation US EquityInstitutional SharesInstitutional Accumulation GBP Class £ 01/07/2020 (35) 38 (52) (49) £0.0001Institutional Accumulation USD Class US$ 01/07/2020 (701) 7 (224) (918) US$0.0007Institutional Income GBP Class £ 01/07/2020 (206) 3 (296) (499) £0.0011
GAM Star Cat BondOrdinary SharesAccumulation CHF Class SFr 13/01/2020 (396,371) – – (396,371) SFr0.3582
SFr 13/07/2020 (349,457) 48,708 (71,074) (371,823) SFr0.3307Accumulation EUR Class € 13/01/2020 (1,092,816) – – (1,092,816) €0.3750
€ 13/07/2020 (939,301) 53,010 (89,394) (975,685) €0.3392Accumulation GBP Class £ 13/01/2020 (50,463) (50,463) £0.3424
£ 13/07/2020 (53,378) 9,748 (24,182) (67,812) £0.3729Accumulation USD Class US$ 13/01/2020 (1,318,992) (1,318,992) US$0.3746
US$ 13/07/2020 (1,415,676) 126,529 (171,649) (1,460,796) US$0.3825Accumulation A EUR Class € 13/01/2020 (82,469) – – (82,469) €0.2885
€ 13/07/2020 (143,291) 14,480 (15,846) (144,657) €0.2633Accumulation M EUR Class € 13/01/2020 (1,686,357) (1,686,357) €0.3035
€ 13/07/2020 (1,551,823) – – (1,551,823) €0.2791Hedged Ordinary Acculucation JPY Class ¥ 13/01/2020 (51,973) – – (51,973) ¥30.4041
¥ 13/07/2020 (26,297) – (34,053) (60,350) ¥28.7289Income EUR Class € 13/01/2020 (33,959) – – (33,959) €0.2959
€ 13/07/2020 (25,800) 2,001 (8,373) (32,172) €0.2626Income USD Class US$ 13/01/2020 (64,120) – – (64,120) US$0.3209
US$ 13/07/2020 (65,306) 4,246 (36) (61,096) US$0.3190Institutional SharesInstitutional Accumulation CHF Class SFr 13/01/2020 (5,867,903) – – (5,867,903) SFr0.3247
SFr 13/07/2020 (5,480,421) 497,839 (280,932) (5,263,514) SFr0.2993Institutional Accumulation EUR Class € 13/01/2020 (26,949,228) – – (26,949,228) €0.4056
€ 13/07/2020 (23,196,199) 3,216,438 (2,480,017) (22,459,778) €0.3817Institutional Accumulation GBP Class £ 13/01/2020 (915,530) – – (915,530) £0.3817
£ 13/07/2020 (877,435) 106,208 (314,848) (1,086,075) £0.4188Institutional Accumulation USD Class US$ 13/01/2020 (8,735,008) – – (8,735,008) US$0.4175
US$ 13/07/2020 (9,152,195) 989,511 (1,225,651) (9,388,335) US$0.4268
Notes to the Financial Statements
18. Dividend distribution, continued
At 30 June 2020
CCY
First Valuation date
Ex-DividendGross
AmountIncome
receivedIncome
deductedNet
DistributionDividend
per share
GAM Star Cat Bond, continuedInstitutional Hedged Income JPY Class ¥ 13/01/2020 (505,748) – – (505,748) ¥27.0451Institutional Income EUR Class € 13/01/2020 (5,251,364) – – (5,251,364) €0.2927
€ 13/07/2020 (4,645,199) 387,117 (336,430) (4,594,512) €0.2654Institutional Income GBP Class £ 13/01/2020 (457,069) – – (457,069) £0.2672
£ 13/07/2020 (437,933) 17,783 (28,450) (448,600) £0.2843Institutional Income USD Class US$ 13/01/2020 (591,734) – – (591,734) US$0.3097
US$ 13/07/2020 (434,576) 101,853 (178,730) (511,453) US$0.3080Distribution SharesDistribution Quarterly Ordinary USD Class US$ 07/10/2019 (191,662) – – (191,662) US$0.1277
US$ 13/01/2020 (183,495) – – (183,495) US$0.1351US$ 13/04/2020 (150,724) – – (150,724) US$0.1359US$ 13/07/2020 (123,717) 6,667 (147,490) (264,540) US$0.1254
Institutional Hedge SharesInstitutional Accumulation Hedge JPY Class ¥ 13/07/2020 (327,000) – – (327,000) ¥18.8580R SharesAccumulation R EUR Class € 13/07/2020 (37,359) 24,813 (90) (12,636) €0.1845
GAM Star Global CautiousOrdinary SharesAccumulation EUR Class € 01/07/2020 (41) – (306) (347) €0.0526Accumulation U EUR Class € 01/07/2020 (5,701) 1,164 (2,052) (6,589) €0.0287Accumulation GBP Class £ 01/07/2020 (2,174) 933 (1,796) (3,037) £0.0547Accumulation U GBP Class £ 01/07/2020 (39,496) 1,752 (24,082) (61,826) £0.0281Accumulation USD Class US$ 01/07/2020 (5,049) 806 (9,249) (13,492) US$0.0525Institutional SharesInstitutional Accumulation AUD Class AUD 01/07/2020 (1,162) – (3,262) (4,424) AUD0.0904Institutional Accumulation EUR Class € 01/07/2020 (36,120) 4,454 (5,215) (36,881) €0.0965Institutional Accumulation GBP Class £ 01/07/2020 (282,692) 48,996 (139,241) (372,937) £0.1238Institutional Accumulation USD Class US$ 01/07/2020 (6,618) 370 (1,684) (7,932) US$0.1034Institutional Non Hedged Accumulation USD Class US$ 01/07/2020 (47,568) 28,704 (4,662) (23,526) US$0.0970Selling Agent SharesA AUD Class AUD 01/07/2020 (52) – – (52) AUD0.0141T AUD Class AUD 01/07/2020 (294) – (4,669) (4,963) AUD0.0145U AUD Class AUD 01/07/2020 (168) – (1,484) (1,652) AUD0.0311U CHF Class SFr 01/07/2020 (635) – (527) (1,162) SFr0.0220A EUR Class € 01/07/2020 (879) 632 (3,162) (3,409) €0.0123CQ EUR Class Income II € 01/10/2019 (469) (469) €0.1012
€ 02/01/2020 (330) – – (330) €0.0990€ 01/04/2020 (26) – – (26) €0.0845€ 01/07/2020 (30) – – (30) €0.0947
T EUR Class € 01/07/2020 (165) – (63) (228) €0.0148TQ EUR Class Income II € 01/10/2019 (175) – – (175) €0.0987
€ 02/01/2020 (121) – – (121) €0.0969€ 01/04/2020 (69) – – (69) €0.0826€ 01/07/2020 (33) – – (33) €0.0927
Z EUR Accumulation Class € 01/07/2020 (37,617) 8,955 (2,207) (30,869) €0.1066A GBP Class £ 01/07/2020 (6,582) 11,884 (21,638) (16,336) £0.0108AQ GBP Class Income II £ 01/10/2019 (3,024) – – (3,024) £0.0984
£ 02/01/2020 (2,978) – – (2,978) £0.0969£ 01/04/2020 (2,536) – – (2,536) £0.0825£ 01/07/2020 (928) – – (928) £0.0928
C GBP Class Income II £ 01/10/2019 (19,867) – – (19,867) £0.1049£ 02/01/2020 (17,274) – – (17,274) £0.1032£ 01/04/2020 (13,585) – – (13,585) £0.0877£ 01/07/2020 (13,523) – – (13,523) £0.0984
PI GBP Class £ 01/07/2020 (1,350) – (2,948) (4,298) £0.0796T GBP Accumulation Class £ 01/07/2020 (1,585) – (5,946) (7,531) £0.0125

362
GAM Star Fund p.l.c.
Notes to the Financial Statements
18. Dividend distribution, continued
At 30 June 2020
CCY
First Valuation date
Ex-DividendGross
AmountIncome
receivedIncome
deductedNet
DistributionDividend
per share
GAM Star Global Cautious, continuedTQ GBP Income II Class £ 01/10/2019 (3,292) – – (3,292) £0.1095
£ 02/01/2020 (2,396) – – (2,396) £0.1025£ 01/04/2020 (1,492) – – (1,492) £0.0918£ 01/07/2020 (1,677) – – (1,677) £0.1032
Z GBP Class £ 01/07/2020 (83,081) 31,128 (46,659) (98,612) £0.1393A SGD Class SGD 01/07/2020 (561) – – (561) SGD0.0122A USD Class US$ 01/07/2020 (4,312) 7,133 (16,922) (14,101) US$0.0082CQ USD Class Income II US$ 01/10/2019 (10,001) – – (10,001) US$0.1088
US$ 02/01/2020 (6,538) – – (6,538) US$0.1073US$ 01/04/2020 (5,819) – – (5,819) US$0.0919US$ 01/07/2020 (6,572) – – (6,572) US$0.1035
T USD Class US$ 01/07/2020 (138) – (12,061) (12,199) US$0.0086U USD Class US$ 01/07/2020 (6,510) – (7,630) (14,140) US$0.0243Z USD Class US$ 01/07/2020 (127,127) 37,701 – (89,426) US$0.1028Distribution Share – Quarterly InstitutionalG Quarterly Income II EUR Class € 01/10/2019 (1,511) – – (1,511) €0.0976
€ 02/01/2020 (1,417) – – (1,417) €0.0956€ 01/04/2020 (1,260) – – (1,260) €0.0814
GAM Star China EquityOrdinary SharesAccumulation EUR Class € 01/07/2020 (42,011) 8,688 (17,281) (50,604) €0.0446Accumulation GBP Class £ 01/07/2020 (7,328) 1,805 (720) (6,243) £0.0042Accumulation USD Class US$ 01/07/2020 (309,777) 26,104 (164,419) (448,092) US$0.0628Income USD Class US$ 01/07/2020 (17,511) 261 (5,443) (22,693) US$0.0623Institutional SharesInstitutional Accumulation EUR Class € 01/07/2020 (37,784) 10,367 (1,809) (29,226) €0.0703Institutional Accumulation GBP Class £ 01/07/2020 (60,746) 13,972 (27,925) (74,699) £0.1550Institutional Accumulation USD Class US$ 01/07/2020 (93,652) 4,553 (49,985) (139,084) US$0.1220Institutional Income EUR Class € 01/07/2020 (911) 958 (8,578) (8,531) €0.1006Institutional Income GBP Class £ 01/07/2020 (3,444) 563 (25,069) (27,950) £0.1462Institutional Income USD Class US$ 01/07/2020 (4,064) 302 (7,039) (10,801) US$0.1130Selling Agent SharesZ USD Class US$ 01/07/2020 (829) 256 (378) (951) US$0.0659
GAM Star Composite Global EquityInstitutional SharesInstitutional Accumulation EUR Class € 01/07/2020 (6,576) 85 (4,020) (10,511) €0.0220Institutional Accumulation GBP Class £ 01/07/2020 (41,034) 4,194 (5,358) (42,198) £0.0228Insitutional Accumulation USD Class US$ 01/07/2020 (11,364) 3,975 (2,479) (9,868) US$0.0212Selling Agent SharesAccumulation Z GBP Class £ 01/07/2020 (387,763) 51,556 (10,813) (347,020) £0.0973Z USD Acc US$ 01/07/2020 (114,262) 10,796 – (103,466) US$0.0648
GAM Star Continental European EquityOrdinary SharesAccumulation EUR Class € 01/07/2020 – – 70 70 €0.0000Accumulation R EUR Class € 01/07/2020 (1,084) – (4,892) (5,976) €0.0199Accumulation Z EUR Class € 01/07/2020 (250,526) 8 (1,845) (252,363) €0.0461Accumulation GBP Class £ 01/07/2020 – 1 – 1 £0.0000Accumulation Z II GBP Class £ 01/07/2020 – (454) 41 (413) £0.0000Income Z EUR Class € 01/07/2020 (124,884) 15,512 (10,378) (119,750) €0.0403Institutional SharesInstitutional Accumulation EUR Class € 01/07/2020 (35,030) 131 (22,355) (57,254) €0.0047Institutional Accumulation GBP Class £ 01/07/2020 (20,250) 534 (958) (20,674) £0.0270Institutional Accumulation USD Class US$ 01/07/2020 – – 2,109 2,109 US$0.0000Institutional Accumulation Hedge USD Class US$ 01/07/2020 – – 133 133 US$0.0000Institutional Income EUR Class € 01/07/2020 (631) – – (631) €0.0322Institutional Income GBP Class £ 01/07/2020 (17,916) 254 (756) (18,418) £0.0223Institutional Income GBP Z Class £ 01/07/2020 (310,152) 26,704 (26,200) (309,648) £0.1104

363
Notes to the Financial Statements
18. Dividend distribution, continued
At 30 June 2020
CCY
First Valuation date
Ex-DividendGross
AmountIncome
receivedIncome
deductedNet
DistributionDividend
per share
GAM Star Global Cautious, continuedTQ GBP Income II Class £ 01/10/2019 (3,292) – – (3,292) £0.1095
£ 02/01/2020 (2,396) – – (2,396) £0.1025£ 01/04/2020 (1,492) – – (1,492) £0.0918£ 01/07/2020 (1,677) – – (1,677) £0.1032
Z GBP Class £ 01/07/2020 (83,081) 31,128 (46,659) (98,612) £0.1393A SGD Class SGD 01/07/2020 (561) – – (561) SGD0.0122A USD Class US$ 01/07/2020 (4,312) 7,133 (16,922) (14,101) US$0.0082CQ USD Class Income II US$ 01/10/2019 (10,001) – – (10,001) US$0.1088
US$ 02/01/2020 (6,538) – – (6,538) US$0.1073US$ 01/04/2020 (5,819) – – (5,819) US$0.0919US$ 01/07/2020 (6,572) – – (6,572) US$0.1035
T USD Class US$ 01/07/2020 (138) – (12,061) (12,199) US$0.0086U USD Class US$ 01/07/2020 (6,510) – (7,630) (14,140) US$0.0243Z USD Class US$ 01/07/2020 (127,127) 37,701 – (89,426) US$0.1028Distribution Share – Quarterly InstitutionalG Quarterly Income II EUR Class € 01/10/2019 (1,511) – – (1,511) €0.0976
€ 02/01/2020 (1,417) – – (1,417) €0.0956€ 01/04/2020 (1,260) – – (1,260) €0.0814
GAM Star China EquityOrdinary SharesAccumulation EUR Class € 01/07/2020 (42,011) 8,688 (17,281) (50,604) €0.0446Accumulation GBP Class £ 01/07/2020 (7,328) 1,805 (720) (6,243) £0.0042Accumulation USD Class US$ 01/07/2020 (309,777) 26,104 (164,419) (448,092) US$0.0628Income USD Class US$ 01/07/2020 (17,511) 261 (5,443) (22,693) US$0.0623Institutional SharesInstitutional Accumulation EUR Class € 01/07/2020 (37,784) 10,367 (1,809) (29,226) €0.0703Institutional Accumulation GBP Class £ 01/07/2020 (60,746) 13,972 (27,925) (74,699) £0.1550Institutional Accumulation USD Class US$ 01/07/2020 (93,652) 4,553 (49,985) (139,084) US$0.1220Institutional Income EUR Class € 01/07/2020 (911) 958 (8,578) (8,531) €0.1006Institutional Income GBP Class £ 01/07/2020 (3,444) 563 (25,069) (27,950) £0.1462Institutional Income USD Class US$ 01/07/2020 (4,064) 302 (7,039) (10,801) US$0.1130Selling Agent SharesZ USD Class US$ 01/07/2020 (829) 256 (378) (951) US$0.0659
GAM Star Composite Global EquityInstitutional SharesInstitutional Accumulation EUR Class € 01/07/2020 (6,576) 85 (4,020) (10,511) €0.0220Institutional Accumulation GBP Class £ 01/07/2020 (41,034) 4,194 (5,358) (42,198) £0.0228Insitutional Accumulation USD Class US$ 01/07/2020 (11,364) 3,975 (2,479) (9,868) US$0.0212Selling Agent SharesAccumulation Z GBP Class £ 01/07/2020 (387,763) 51,556 (10,813) (347,020) £0.0973Z USD Acc US$ 01/07/2020 (114,262) 10,796 – (103,466) US$0.0648
GAM Star Continental European EquityOrdinary SharesAccumulation EUR Class € 01/07/2020 – – 70 70 €0.0000Accumulation R EUR Class € 01/07/2020 (1,084) – (4,892) (5,976) €0.0199Accumulation Z EUR Class € 01/07/2020 (250,526) 8 (1,845) (252,363) €0.0461Accumulation GBP Class £ 01/07/2020 – 1 – 1 £0.0000Accumulation Z II GBP Class £ 01/07/2020 – (454) 41 (413) £0.0000Income Z EUR Class € 01/07/2020 (124,884) 15,512 (10,378) (119,750) €0.0403Institutional SharesInstitutional Accumulation EUR Class € 01/07/2020 (35,030) 131 (22,355) (57,254) €0.0047Institutional Accumulation GBP Class £ 01/07/2020 (20,250) 534 (958) (20,674) £0.0270Institutional Accumulation USD Class US$ 01/07/2020 – – 2,109 2,109 US$0.0000Institutional Accumulation Hedge USD Class US$ 01/07/2020 – – 133 133 US$0.0000Institutional Income EUR Class € 01/07/2020 (631) – – (631) €0.0322Institutional Income GBP Class £ 01/07/2020 (17,916) 254 (756) (18,418) £0.0223Institutional Income GBP Z Class £ 01/07/2020 (310,152) 26,704 (26,200) (309,648) £0.1104
Notes to the Financial Statements
18. Dividend distribution, continued
At 30 June 2020
CCY
First Valuation date
Ex-DividendGross
AmountIncome
receivedIncome
deductedNet
DistributionDividend
per share
GAM Star Credit Opportunities (EUR)Ordinary SharesAccumulation CHF Class SFr 01/07/2020 (571,430) 51,864 (92,243) (611,809) SFr0.3928Accumulation EUR Class € 01/07/2020 (10,286,450) 16,529,154 (24,677,779) (18,435,075) €0.4256Accumulation R EUR Class € 01/07/2020 (364,288) 1,259,079 (1,312,272) (417,481) €0.2676Income CHF Class SFr 01/07/2020 (218,105) 17,451 (39,217) (239,871) SFr0.2875Income CHF R Class SFr 01/07/2020 (163) – – (163) SFr0.2501Income EUR Class € 01/07/2020 (734,810) 49,085 (165,914) (851,639) €0.3685Income EUR II Class € 01/07/2020 (363,784) 24,954 (146,050) (484,880) €0.0295
€ 01/08/2019 (658,944) – – (658,944) €0.0308€ 02/09/2019 (654,383) – – (654,383) €0.0312€ 01/10/2019 (643,621) – – (643,621) €0.0328€ 01/11/2019 (642,156) – – (642,156) €0.0325€ 02/12/2019 (530,020) – – (530,020) €0.0271€ 02/01/2020 (674,531) – – (674,531) €0.0347€ 03/02/2020 (516,113) – – (516,113) €0.0283€ 02/03/2020 (452,337) – – (452,337) €0.0263€ 01/04/2020 (355,089) – – (355,089) €0.0286€ 01/05/2020 (343,694) – – (343,694) €0.2830€ 02/06/2020 (315,116) – – (315,116) €0.0256
Institutional SharesInstitutional Accumulation CHF Class SFr 01/07/2020 (1,963,707) 448,607 (472,525) (1,987,625) SFr0.3713Institutional Accumulation EUR Class € 01/07/2020 (24,249,883) 37,707,395 (56,401,419) (42,943,907) €0.4254Institutional Income CHF Class SFr 01/07/2020 (249,541) 15,007 (41,339) (275,873) SFr0.2722Institutional Income EUR Class € 01/07/2020 (4,368,107) 72,701 (4,197,351) (8,492,757) €0.3704Selling Agent SharesA EUR Class € 01/07/2020 (3,357,105) 163,877 (873,933) (4,067,161) €0.2980AQ EUR Class € 01/10/2019 (655,496) – – (655,496) €0.0996
€ 02/01/2020 (637,299) – – (637,299) €0.0998€ 01/04/2020 (443,498) – – (443,498) €0.0813€ 01/07/2020 (480,149) 10,258 (56,041) (525,932) €0.0883
C EUR Class € 01/07/2020 (1,530,223) 192,104 (258,884) (1,597,003) €0.1870M EUR Class € 01/08/2019 (99,865) – – (99,865) €0.0234
€ 02/09/2019 (105,715) – – (105,715) €0.0248€ 01/10/2019 (113,645) – – (113,645) €0.0262€ 01/11/2019 (111,784) – – (111,784) €0.0258€ 02/12/2019 (88,858) – – (88,858) €0.0205€ 02/01/2020 (117,187) – – (117,187) €0.0278€ 03/02/2020 (87,619) – – (87,619) €0.0210€ 02/03/2020 (82,445) – – (82,445) €0.0197€ 01/04/2020 (31,745) – – (31,745) €0.0230€ 01/05/2020 (27,057) – – (27,057) €0.0227€ 02/06/2020 (21,978) – – (21,978) €0.0200€ 01/07/2020 (25,486) 2,935 (64,449) (87,000) €0.0234
R EUR Class € 01/07/2020 (39,094) 22,448 (2,848) (19,494) €0.2555SI EUR Class € 02/01/2020 (1,580,185) – – (1,580,185) €0.1604
€ 01/07/2020 (1,371,604) 191,394 (230,569) (1,410,779) €0.1403SO EUR Class € 02/01/2020 (567,831) – – (567,831) €0.1549
€ 01/07/2020 (375,254) 13,482 (92,737) (454,509) €0.1341Distribution SharesQuarterly Ordinary EUR Class € 01/10/2019 (138,107) – – (138,107) €0.0719
€ 02/01/2020 (136,968) – – (136,968) €0.0716€ 01/04/2020 (114,935) – – (114,935) €0.0622€ 01/07/2020 (114,821) 3,276 (10,753) (122,298) €0.0638

364
GAM Star Fund p.l.c.
Notes to the Financial Statements
18. Dividend distribution, continued
At 30 June 2020
CCY
First Valuation date
Ex-DividendGross
AmountIncome
receivedIncome
deductedNet
DistributionDividend
per share
GAM Star Credit Opportunities (GBP)Ordinary SharesAccumulation GBP Class £ 01/07/2020 (726,894) 67,717 (203,337) (862,514) £0.7389Income GBP Class £ 01/07/2020 (401,155) 66,633 (131,286) (465,808) £0.4999Institutional SharesInstitutional Accumulation GBP Class £ 01/07/2020 (11,933,636) 2,041,807 (4,447,764) (14,339,593) £0.7020Institutional Income GBP Class £ 01/07/2020 (3,655,377) 521,564 (1,316,826) (4,450,639) £0.5325Selling Agent SharesQZ GBP Class £ 01/10/2019 (1,899) – – (1,899) £0.1281SI GBP Class £ 01/10/2019 (283,088) – – (283,088) £0.1336
£ 02/01/2020 (557,591) – – (557,591) £0.2546£ 01/07/2020 (526,655) 94,123 (57,622) (490,154) £0.2243
Z GBP Class £ 01/07/2020 (2,213,731) 1,586,897 (787,951) (1,414,785) £0.5879ZII GBP Class £ 01/07/2020 (4,013,833) 960,073 (668,007) (3,721,767) £0.4664Distribution SharesMonthly Ordinary GBP Class £ 01/08/2019 (203,238) – – (203,238) £0.0331
£ 02/09/2019 (218,677) – – (218,677) £0.0369£ 01/10/2019 (284,279) – – (284,279) £0.0482£ 01/11/2019 (222,973) – – (222,973) £0.0378£ 02/12/2019 (169,969) – – (169,969) £0.2890£ 02/01/2020 (223,069) – – (223,069) £0.0389£ 03/02/2020 (144,076) – – (144,076) £0.0294£ 02/03/2020 (131,269) – – (131,269) £0.0268£ 01/04/2020 (167,235) – – (167,235) £0.0478£ 01/05/2020 (154,202) – – (154,202) £0.0359£ 02/06/2020 (111,085) – – (111,085) £0.0258£ 01/07/2020 (137,562) 12,101 (101,078) (226,539) £0.0322
Quarterly Institutional GBP Class £ 01/10/2019 (167,086) – – (167,086) £0.1262£ 02/01/2020 (156,749) – – (156,749) £0.1122£ 01/04/2020 (148,540) – – (148,540) £0.1105£ 01/07/2020 (151,959) 45,002 (51,034) (157,991) £0.0996
Quarterly Ordinary GBP Class £ 01/10/2019 (1,743,506) – – (1,743,506) £0.1189£ 02/01/2020 (1,521,528) – – (1,521,528) £0.1062£ 01/04/2020 (1,051,833) – – (1,051,833) £0.1046£ 01/07/2020 (910,663) 74,148 (572,297) (1,408,812) £0.0943
GAM Star Credit Opportunities (USD)Ordinary SharesAccumulation USD Class US$ 01/07/2020 (12,039,781) 1,912,252 (4,259,902) (14,387,431) US$0.6192Accumulation R USD Class US$ 01/07/2020 (68,171) 13,497 (2,777) (57,451) US$0.4093Income USD Class US$ 01/07/2020 (1,380,583) 122,073 (783,993) (2,042,503) US$0.4314Institutional SharesInstitutional Accumulation Hedged ILS Class ILS 01/07/2020 (269,147) 22,208 (22,257) (269,196) ILS1.5719Institutional Accumulation USD Class US$ 01/07/2020 (41,097,921) 12,836,701 (19,589,572) (47,850,792) US$0.6185Institutional Income USD Class US$ 01/07/2020 (968,915) 49,616 (24,429) (943,728) US$0.3831Selling Agent SharesMCO II AUD Class AUD 01/08/2019 (300,637) – – (300,637) AUD0.0341
AUD 02/09/2019 (300,514) – – (300,514) AUD0.0350AUD 01/10/2019 (312,362) – – (312,362) AUD0.0370AUD 01/11/2019 (276,080) – – (276,080) AUD0.0326AUD 02/12/2019 (255,537) – – (255,537) AUD0.0315AUD 02/01/2020 (310,825) – – (310,825) AUD0.0376AUD 03/02/2020 (240,238) – – (240,238) AUD0.0357AUD 02/03/2020 (219,421) – – (219,421) AUD0.0310AUD 01/04/2020 (222,742) – – (222,742) AUD0.0380AUD 01/05/2020 (222,316) – – (222,316) AUD0.0357AUD 02/06/2020 (163,530) – – (163,530) AUD0.0259AUD 01/07/2020 (201,149) 15,861 (58,056) (243,344) AUD0.0315
A USD Class US$ 01/07/2020 (1,691,203) 136,248 (552,495) (2,107,450) US$0.4293C USD Class US$ 01/07/2020 (163,555) 21,504 (48,458) (190,509) US$0.3612

Notes to the Financial Statements
18. Dividend distribution, continued
At 30 June 2020
CCY
First Valuation date
Ex-DividendGross
AmountIncome
receivedIncome
deductedNet
DistributionDividend
per share
GAM Star Credit Opportunities (USD), continuedMO USD Class US$ 01/08/2019 (1,748,902) – – (1,748,902) US$0.0354
US$ 02/09/2019 (1,729,059) – – (1,729,059) US$0.0370US$ 01/10/2019 (1,648,919) – – (1,648,919) US$0.0368US$ 01/11/2019 (1,401,115) – – (1,401,115) US$0.0326US$ 02/12/2019 (1,304,707) – – (1,304,707) US$0.0308US$ 02/01/2020 (1,617,763) – – (1,617,763) US$0.0370US$ 03/02/2020 (1,189,542) – – (1,189,542) US$0.0311US$ 02/03/2020 (1,070,646) – – (1,070,646) US$0.0397US$ 01/04/2020 (835,488) – – (835,488) US$0.0305US$ 01/05/2020 (845,680) – – (845,680) US$0.0313US$ 02/06/2020 (511,545) – – (511,545) US$0.0192US$ 01/07/2020 (639,248) 97,330 (585,799) (1,127,717) US$0.0242
SI USD Class US$ 02/01/2020 (4,408,978) – – (4,408,978) US$0.2339US$ 01/07/2020 (1,214,071) 109,567 (1,416,747) (2,521,251) US$0.1869
SO USD Class US$ 02/01/2020 (238,463) – – (238,463) US$0.2368US$ 01/07/2020 (159,216) 3,006 (38,917) (195,127) US$0.1857
MCZ SGD Class SGD 01/08/2019 (30,444) – – (30,444) SGD0.0414SGD 02/09/2019 (30,253) – – (30,253) SGD0.0417SGD 01/10/2019 (30,711) – – (30,711) SGD0.0422SGD 01/11/2019 (29,061) – – (29,061) SGD0.0393SGD 02/12/2019 (28,731) – – (28,731) SGD0.0371SGD 02/01/2020 (35,204) – – (35,204) SGD0.0368SGD 03/02/2020 (30,337) – – (30,337) SGD0.0391SGD 02/03/2020 (29,060) – – (29,060) SGD0.0375SGD 01/04/2020 (22,013) – – (22,013) SGD0.0338
SGD 01/05/2020 (25,691) – – (25,691) SGD0.0390SGD 02/06/2020 (19,507) – – (19,507) SGD0.0281SGD 01/07/2019 (23,940) 1,265 (1,935) (24,610) SGD0.0340
MO II SGD Class SGD 01/08/2019 (642,015) – – (642,015) SGD0.0456SGD 02/09/2019 (599,046) – – (599,046) SGD0.0459SGD 01/10/2019 (577,670) – – (577,670) SGD0.0465SGD 01/11/2019 (528,452) – – (528,452) SGD0.0433SGD 02/12/2019 (483,263) – – (483,263) SGD0.0409SGD 02/01/2020 (585,874) – – (585,874) SGD0.0493SGD 03/02/2020 (493,993) – – (493,993) SGD0.0432SGD 02/03/2020 (462,428) – – (462,428) SGD0.0424SGD 01/04/2020 (307,969) – – (307,969) SGD0.0374SGD 01/05/2020 (348,057) – – (348,057) SGD0.0429SGD 02/06/2020 (252,426) – – (252,426) SGD0.0310SGD 01/07/2019 (310,431) 17,576 (123,484) (416,339) SGD0.0375
Distribution SharesIncome II AQ USD Class US$ 01/10/2019 (494,569) – – (494,569) US$0.1338
US$ 02/01/2020 (490,959) – – (490,959) US$0.1276US$ 01/04/2020 (369,024) – – (369,024) US$0.1106US$ 01/07/2019 (357,254) 29,202 (60,939) (388,991) US$0.0993
Income II PMCO USD Class US$ 01/08/2019 (23,549) – – (23,549) US$0.0456US$ 02/09/2019 (23,211) – – (23,211) US$0.0457US$ 01/10/2019 (23,077) – – (23,077) US$0.0460US$ 01/11/2019 (20,645) – – (20,645) US$0.0426US$ 02/12/2019 (19,337) – – (19,337) US$0.0399US$ 02/01/2020 (21,911) – – (21,911) US$0.0485US$ 03/02/2020 (18,259) – – (18,259) US$0.0412US$ 02/03/2020 (17,062) – – (17,062) US$0.0385US$ 01/04/2020 (18,232) – – (18,232) US$0.0388US$ 01/05/2020 (18,514) – – (18,514) US$0.0394US$ 02/06/2020 (13,590) – – (13,590) US$0.0282US$ 01/07/2020 (15,976) 1,067 (1,382) (16,291) US$0.0340
365
Notes to the Financial Statements
18. Dividend distribution, continued
At 30 June 2020
CCY
First Valuation date
Ex-DividendGross
AmountIncome
receivedIncome
deductedNet
DistributionDividend
per share
GAM Star Credit Opportunities (GBP)Ordinary SharesAccumulation GBP Class £ 01/07/2020 (726,894) 67,717 (203,337) (862,514) £0.7389Income GBP Class £ 01/07/2020 (401,155) 66,633 (131,286) (465,808) £0.4999Institutional SharesInstitutional Accumulation GBP Class £ 01/07/2020 (11,933,636) 2,041,807 (4,447,764) (14,339,593) £0.7020Institutional Income GBP Class £ 01/07/2020 (3,655,377) 521,564 (1,316,826) (4,450,639) £0.5325Selling Agent SharesQZ GBP Class £ 01/10/2019 (1,899) – – (1,899) £0.1281SI GBP Class £ 01/10/2019 (283,088) – – (283,088) £0.1336
£ 02/01/2020 (557,591) – – (557,591) £0.2546£ 01/07/2020 (526,655) 94,123 (57,622) (490,154) £0.2243
Z GBP Class £ 01/07/2020 (2,213,731) 1,586,897 (787,951) (1,414,785) £0.5879ZII GBP Class £ 01/07/2020 (4,013,833) 960,073 (668,007) (3,721,767) £0.4664Distribution SharesMonthly Ordinary GBP Class £ 01/08/2019 (203,238) – – (203,238) £0.0331
£ 02/09/2019 (218,677) – – (218,677) £0.0369£ 01/10/2019 (284,279) – – (284,279) £0.0482£ 01/11/2019 (222,973) – – (222,973) £0.0378£ 02/12/2019 (169,969) – – (169,969) £0.2890£ 02/01/2020 (223,069) – – (223,069) £0.0389£ 03/02/2020 (144,076) – – (144,076) £0.0294£ 02/03/2020 (131,269) – – (131,269) £0.0268£ 01/04/2020 (167,235) – – (167,235) £0.0478£ 01/05/2020 (154,202) – – (154,202) £0.0359£ 02/06/2020 (111,085) – – (111,085) £0.0258£ 01/07/2020 (137,562) 12,101 (101,078) (226,539) £0.0322
Quarterly Institutional GBP Class £ 01/10/2019 (167,086) – – (167,086) £0.1262£ 02/01/2020 (156,749) – – (156,749) £0.1122£ 01/04/2020 (148,540) – – (148,540) £0.1105£ 01/07/2020 (151,959) 45,002 (51,034) (157,991) £0.0996
Quarterly Ordinary GBP Class £ 01/10/2019 (1,743,506) – – (1,743,506) £0.1189£ 02/01/2020 (1,521,528) – – (1,521,528) £0.1062£ 01/04/2020 (1,051,833) – – (1,051,833) £0.1046£ 01/07/2020 (910,663) 74,148 (572,297) (1,408,812) £0.0943
GAM Star Credit Opportunities (USD)Ordinary SharesAccumulation USD Class US$ 01/07/2020 (12,039,781) 1,912,252 (4,259,902) (14,387,431) US$0.6192Accumulation R USD Class US$ 01/07/2020 (68,171) 13,497 (2,777) (57,451) US$0.4093Income USD Class US$ 01/07/2020 (1,380,583) 122,073 (783,993) (2,042,503) US$0.4314Institutional SharesInstitutional Accumulation Hedged ILS Class ILS 01/07/2020 (269,147) 22,208 (22,257) (269,196) ILS1.5719Institutional Accumulation USD Class US$ 01/07/2020 (41,097,921) 12,836,701 (19,589,572) (47,850,792) US$0.6185Institutional Income USD Class US$ 01/07/2020 (968,915) 49,616 (24,429) (943,728) US$0.3831Selling Agent SharesMCO II AUD Class AUD 01/08/2019 (300,637) – – (300,637) AUD0.0341
AUD 02/09/2019 (300,514) – – (300,514) AUD0.0350AUD 01/10/2019 (312,362) – – (312,362) AUD0.0370AUD 01/11/2019 (276,080) – – (276,080) AUD0.0326AUD 02/12/2019 (255,537) – – (255,537) AUD0.0315AUD 02/01/2020 (310,825) – – (310,825) AUD0.0376AUD 03/02/2020 (240,238) – – (240,238) AUD0.0357AUD 02/03/2020 (219,421) – – (219,421) AUD0.0310AUD 01/04/2020 (222,742) – – (222,742) AUD0.0380AUD 01/05/2020 (222,316) – – (222,316) AUD0.0357AUD 02/06/2020 (163,530) – – (163,530) AUD0.0259AUD 01/07/2020 (201,149) 15,861 (58,056) (243,344) AUD0.0315
A USD Class US$ 01/07/2020 (1,691,203) 136,248 (552,495) (2,107,450) US$0.4293C USD Class US$ 01/07/2020 (163,555) 21,504 (48,458) (190,509) US$0.3612

366
GAM Star Fund p.l.c.
Notes to the Financial Statements
18. Dividend distribution, continued
At 30 June 2020
CCY
First Valuation date
Ex-DividendGross
AmountIncome
receivedIncome
deductedNet
DistributionDividend
per share
GAM Star Credit Opportunities (USD), continuedMonthly Institutional SGD Class SGD 01/08/2020 (24,216) – – (24,216) SGD0.0417
SGD 02/09/2019 (19,795) – – (19,795) SGD0.0420SGD 01/10/2019 (19,228) – – (19,228) SGD0.0426SGD 01/11/2019 (10,882) – – (10,882) SGD0.0395SGD 02/12/2019 (10,861) – – (10,861) SGD0.0374SGD 02/01/2020 (13,290) – – (13,290) SGD0.0450SGD 03/02/2020 (10,157) – – (10,157) SGD0.0396SGD 02/03/2020 (10,648) – – (10,648) SGD0.0389SGD 01/04/2020 (28,383) – – (28,383) SGD0.0342SGD 01/05/2020 (35,955) – – (35,955) SGD0.0393SGD 02/06/2020 (27,037) – – (27,037) SGD0.0284SGD 01/07/2020 (35,921) 36,480 (9,549) (8,990) SGD0.0344
Monthly Institutional USD Class US$ 01/08/2019 (45,485) – – (45,485) US$0.0376US$ 02/09/2019 (46,482) – – (46,482) US$0.0388US$ 01/10/2019 (46,623) – – (46,623) US$0.0369US$ 01/11/2019 (40,785) – – (40,785) US$0.0379US$ 02/12/2019 (38,904) – – (38,904) US$0.0329US$ 02/01/2020 (45,092) – – (45,092) US$0.0409US$ 03/02/2020 (34,501) – – (34,501) US$0.0334US$ 02/03/2020 (49,666) – – (49,666) US$0.0317US$ 01/04/2020 (16,602) – – (16,602) US$0.0327US$ 01/05/2020 (16,998) – – (16,998) US$0.0330US$ 02/06/2020 (11,286) – – (11,286) US$0.0215US$ 01/07/2020 (17,631) 17,688 (32,634) (32,577) US$0.0266
Quarterly Accumulation USD Class US$ 01/10/2019 (847) – – (847) US$0.1278US$ 02/01/2020 (809) – – (809) US$0.1221US$ 01/04/2020 (741) – – (741) US$0.1119US$ 01/07/2020 (623) – – (623) US$0.0941
Quarterly Income USD Class US$ 01/10/2019 (7,521) – – (7,521) US$0.1141US$ 02/01/2020 (5,985) – – (5,985) US$0.1080US$ 01/04/2020 (4,027) – – (4,027) US$0.0977US$ 01/07/2020 (1,973) – (13,481) (15,454) US$0.0813
GAM Star Global DefensiveOrdinary SharesAccumulation GBP Class £ 01/07/2020 (118) – – (118) £0.0531Institutional SharesInstitutional Accumulation EUR Class € 01/07/2020 (5,345) 5,700 (2,755) (2,400) €0.0825Institutional Accumulation GBP Class £ 01/07/2020 (34,630) 22,826 (44,440) (56,244) £0.1060Institutional Accumulation USD Class US$ 01/07/2020 (25,878) 4,983 (18,423) (39,318) US$0.0961Selling Agent SharesU AUD Class AUD 01/07/2020 (171) – (662) (833) AUD0.0308A CHF Class SFr 01/07/2020 (10) – (760) (770) SFr0.0068A EUR Class € 01/07/2020 (674) 765 (2,189) (2,098) €0.0111Z EUR Class € 01/07/2020 (11,619) 10,712 (1,944) (2,851) €0.1074U EUR Class € 01/07/2020 (1,469) – (2,531) (4,000) €0.0271A GBP Class £ 01/07/2020 (2,661) 1,473 (7,082) (8,270) £0.0086T GBP Class £ 01/07/2020 (95) – – (95) £0.0083U GBP Class £ 01/07/2020 (4,606) – (5,098) (9,704) £0.0255Z GBP Class £ 01/07/2020 (20,604) 11,217 (15,626) (25,013) £0.1216T USD Class US$ 01/07/2020 (12) 95 (599) (516) US$0.0053U USD Class US$ 01/07/2020 (1,144) – (187) (1,331) US$0.0225
GAM Star Emerging EquityInstitutional SharesInstitutional Accumulation GBP Class £ 01/07/2020 – (8) 5 (3) £0.0000

367
Notes to the Financial Statements
18. Dividend distribution, continued
At 30 June 2020
CCY
First Valuation date
Ex-DividendGross
AmountIncome
receivedIncome
deductedNet
DistributionDividend
per share
GAM Star Credit Opportunities (USD), continuedMonthly Institutional SGD Class SGD 01/08/2020 (24,216) – – (24,216) SGD0.0417
SGD 02/09/2019 (19,795) – – (19,795) SGD0.0420SGD 01/10/2019 (19,228) – – (19,228) SGD0.0426SGD 01/11/2019 (10,882) – – (10,882) SGD0.0395SGD 02/12/2019 (10,861) – – (10,861) SGD0.0374SGD 02/01/2020 (13,290) – – (13,290) SGD0.0450SGD 03/02/2020 (10,157) – – (10,157) SGD0.0396SGD 02/03/2020 (10,648) – – (10,648) SGD0.0389SGD 01/04/2020 (28,383) – – (28,383) SGD0.0342SGD 01/05/2020 (35,955) – – (35,955) SGD0.0393SGD 02/06/2020 (27,037) – – (27,037) SGD0.0284SGD 01/07/2020 (35,921) 36,480 (9,549) (8,990) SGD0.0344
Monthly Institutional USD Class US$ 01/08/2019 (45,485) – – (45,485) US$0.0376US$ 02/09/2019 (46,482) – – (46,482) US$0.0388US$ 01/10/2019 (46,623) – – (46,623) US$0.0369US$ 01/11/2019 (40,785) – – (40,785) US$0.0379US$ 02/12/2019 (38,904) – – (38,904) US$0.0329US$ 02/01/2020 (45,092) – – (45,092) US$0.0409US$ 03/02/2020 (34,501) – – (34,501) US$0.0334US$ 02/03/2020 (49,666) – – (49,666) US$0.0317US$ 01/04/2020 (16,602) – – (16,602) US$0.0327US$ 01/05/2020 (16,998) – – (16,998) US$0.0330US$ 02/06/2020 (11,286) – – (11,286) US$0.0215US$ 01/07/2020 (17,631) 17,688 (32,634) (32,577) US$0.0266
Quarterly Accumulation USD Class US$ 01/10/2019 (847) – – (847) US$0.1278US$ 02/01/2020 (809) – – (809) US$0.1221US$ 01/04/2020 (741) – – (741) US$0.1119US$ 01/07/2020 (623) – – (623) US$0.0941
Quarterly Income USD Class US$ 01/10/2019 (7,521) – – (7,521) US$0.1141US$ 02/01/2020 (5,985) – – (5,985) US$0.1080US$ 01/04/2020 (4,027) – – (4,027) US$0.0977US$ 01/07/2020 (1,973) – (13,481) (15,454) US$0.0813
GAM Star Global DefensiveOrdinary SharesAccumulation GBP Class £ 01/07/2020 (118) – – (118) £0.0531Institutional SharesInstitutional Accumulation EUR Class € 01/07/2020 (5,345) 5,700 (2,755) (2,400) €0.0825Institutional Accumulation GBP Class £ 01/07/2020 (34,630) 22,826 (44,440) (56,244) £0.1060Institutional Accumulation USD Class US$ 01/07/2020 (25,878) 4,983 (18,423) (39,318) US$0.0961Selling Agent SharesU AUD Class AUD 01/07/2020 (171) – (662) (833) AUD0.0308A CHF Class SFr 01/07/2020 (10) – (760) (770) SFr0.0068A EUR Class € 01/07/2020 (674) 765 (2,189) (2,098) €0.0111Z EUR Class € 01/07/2020 (11,619) 10,712 (1,944) (2,851) €0.1074U EUR Class € 01/07/2020 (1,469) – (2,531) (4,000) €0.0271A GBP Class £ 01/07/2020 (2,661) 1,473 (7,082) (8,270) £0.0086T GBP Class £ 01/07/2020 (95) – – (95) £0.0083U GBP Class £ 01/07/2020 (4,606) – (5,098) (9,704) £0.0255Z GBP Class £ 01/07/2020 (20,604) 11,217 (15,626) (25,013) £0.1216T USD Class US$ 01/07/2020 (12) 95 (599) (516) US$0.0053U USD Class US$ 01/07/2020 (1,144) – (187) (1,331) US$0.0225
GAM Star Emerging EquityInstitutional SharesInstitutional Accumulation GBP Class £ 01/07/2020 – (8) 5 (3) £0.0000
Notes to the Financial Statements
18. Dividend distribution, continued
At 30 June 2020
CCY
First Valuation date
Ex-DividendGross
AmountIncome
receivedIncome
deductedNet
DistributionDividend
per share
GAM Star Emerging Market RatesInstitutional SharesInstitutional Accumulation EUR Class € 01/07/2020 (82,783) 25,321 (284) (57,746) €0.0406Institutional Income GBP Class £ 01/07/2020 (4,070) – – (4,070) £0.0347Selling Agent SharesZ GBP Class £ 01/07/2020 (215) – – (215) £0.2385Z II GBP Class £ 01/07/2020 (9,347) – (1,535) (10,882) £0.2301Z USD Class US$ 01/07/2020 (44) 100 (25,954) (25,898) US$0.0218Z II USD Class US$ 01/07/2020 (113,483) 14,332 (7,879) (107,030) US$0.2291W EUR Acc Class € 01/07/2020 (54) – – (54) €0.0012W USD Acc Class US$ 01/07/2020 (184) 86 – (98) US$0.0008W Income EUR Class € 01/07/2020 (2,600) – – (2,600) €0.0012X USD Acc Class US$ 01/07/2020 (33,809) 7,301 – (26,508) US$84.5236
GAM Star European EquityOrdinary SharesAccumulation EUR Class € 01/07/2020 (78,835) 1,167 (8,587) (86,255) €0.1428Ordinary Hedge SharesAccumulation Hedge USD Class US$ 01/07/2020 (277) – – (277) US$0.0224Income Hedge USD Class US$ 01/07/2020 (336) – – (336) US$0.0225Institutional SharesInstitutional Accumulation EUR Class € 01/07/2020 (29,540) 421 (3,743) (32,862) €0.1000Institutional Accumulation USD Class US$ 01/07/2020 (2,186) 69 (4) (2,121) US$0.0340Institutional Accumulation GBP Class £ 01/07/2020 (1,685) 1,185 – (500) £0.0424Institutional Income EUR Class € 01/07/2020 (303) – (197) (500) €0.0390Institutional Income GBP Class £ 01/07/2020 (125) – – (125) £0.0424Selling Agent SharesZII GBP Acc Class £ 01/07/2020 (2,297) – – (2,297) £0.0697R SharesAccumulation R EUR Class € 01/07/2020 (305) – – (305) €0.0329Accumulation R GBP Class £ 01/07/2020 (508) – (42) (550) £0.0424Income R GBP Class £ 01/07/2020 (572) 134 (571) (1,009) £0.0424
GAM Star Flexible Global PortfolioOrdinary SharesAccumulation CHF Class SFr 01/07/2020 (129) – (28) (157) SFr0.0110Accumulation EUR Class € 01/07/2020 (8,187) – (1,012) (9,199) €0.0138Accumulation GBP Class £ 01/07/2020 (3,405) 53 (1,475) (4,827) £0.0138Accumulation USD Class US$ 01/07/2020 (4,051) 96 (1,540) (5,495) US$0.0117Institutional SharesInstitutional Accumulation GBP Class £ 01/07/2020 (20,115) 2,781 (10,491) (27,825) £0.0391Institutional Accumulation USD Class US$ 01/07/2020 (6,987) 874 (1,649) (7,762) US$0.0344
GAM Star Global RatesSelling Agent SharesAccumulation Z GBP Class £ 01/07/2020 (12,495) 1,314 (3,364) (14,545) £0.1213Institutional SharesAccumulation CHF Class SFr 01/07/2020 (3,292) 24 (89) (3,357) SFr0.0108Accumulation EUR Class € 01/07/2020 (77,316) 157 (40,640) (117,799) €0.0157Accumulation GBP Class £ 01/07/2020 (5,906) 10 (1,992) (7,888) £0.0014Accumulation USD Class US$ 01/07/2020 (9,333) 1,024 (433) (8,742) US$0.0201Income EUR Class € 01/07/2020 (54,379) – – (54,379) €0.0179Income GBP Class £ 01/07/2020 (2,508) – (163) (2,671) £0.0010Income USD Class US$ 01/07/2020 (4,279) – – (4,279) US$0.0221

368
GAM Star Fund p.l.c.
Notes to the Financial Statements
18. Dividend distribution, continued
At 30 June 2020
CCY
First Valuation date
Ex-DividendGross
AmountIncome
receivedIncome
deductedNet
DistributionDividend
per share
GAM Star Global GrowthInstitutional SharesInstitutional Accumulation CHF Class SFr 01/07/2020 (65) 90 – 25 SFr0.0055Institutional Accumulation EUR Class € 01/07/2020 (3,162) 1,458 (1,152) (2,856) €0.0078Institutional Accumulation GBP Class £ 01/07/2020 (6,209) 7,498 (18,318) (17,029) £0.0105Institutional Accumulation USD Class US$ 01/07/2020 (4,521) 5,318 (6,571) (5,774) US$0.0087Selling Agent SharesZ GBP Class £ 01/07/2020 (39,419) 7,760 (15,837) (47,496) £0.0381Z EUR Class € 01/07/2020 (5,577) 7,457 (249) 1,631 €0.0196
GAM Star Japan LeadersInstitutional SharesInstitutional Accumulation CHF Class SFr 01/07/2020 (11,459,196) 515,471 (810,051) (11,753,776) SFr0.0572Institutional Accumulation EUR Class € 01/07/2020 (72,401,292) 20,570,694 (2,900,639) (54,731,237) €0.0546Institutional Accumulation GBP Class £ 01/07/2020 (3,371,451) 810,326 (879,003) (3,440,128) £0.0797Institutional Accumulation JPY Class ¥ 01/07/2020 (7,331,567) 120,017 (440,822) (7,652,372) ¥5.1442Institutional Accumulation USD Class US$ 01/07/2020 (17,677,831) 14,671,841 (12,083,883) (15,089,873) US$0.0649Institutional Hedged Accumulation EUR Class € 01/07/2020 (4,583,226) 310 (58,670) (4,641,586) €0.0091Institutional Hedged Accumulation USD Class US$ 01/07/2020 (6,588,604) 2,283,871 (170,655) (4,475,388) US$0.0727Institutional Hedged Income EUR Class € 01/07/2020 (810,162) 275,323 (391,873) (926,712) €0.0328Institutional Income GBP Class £ 01/07/2020 (888,955) 22,834 (64,869) (930,990) £0.0784Selling Agent SharesZ JPY Class ¥ 01/07/2020 (63,139,847) 139,340 (6,972,110) (69,972,617) ¥7.1883Z CHF Class SFr 01/07/2020 (520,251) 102,909 (52,340) (469,682) SFr0.1282Non UK RFSAccumulation Z GBP Class £ 01/07/2020 (8,704,409) 4,410,612 (322,773) (4,616,570) £0.0856
GAM Star MBS Total ReturnOrdinary SharesAccumulation Hedged CHF Class SFr 01/07/2020 (828) – (1,129) (1,957) SFr0.4247Accumulation Hedged EUR Class € 01/07/2020 (529,068) 291,255 (197,998) (435,811) €0.4365Accumulation Hedge R EUR Class € 01/07/2020 (1,339,226) 1,153,274 (677,601) (863,553) €0.4830Accumulation USD Class US$ 01/07/2020 (6,695,624) 1,428,642 (1,939,808) (7,206,790) US$0.4905Income USD Class US$ 01/07/2020 (1,082,865) 271,912 (219,356) (1,030,309) US$0.4198Institutional SharesInstitutional Accumulation GBP Class £ 01/07/2020 (4,503,822) 792,912 (664,452) (4,375,362) £0.5866Institutional Accumulation USD Class US$ 01/07/2020 (9,463,258) 3,393,626 (4,541,170) (10,610,802) US$0.5913Institutional Hedged Accumulation CHF Class SFr 01/07/2020 (116,978) 139,966 (80,342) (57,354) SFr0.4957Institutional Hedged Accumulation EUR Class € 01/07/2020 (6,238,132) 3,302,873 (8,695,797) (11,631,056) €0.5245Institutional Hedged Accumulation JPY Class ¥ 01/07/2020 (267,821) 901 (8,637) (275,557) ¥49.0485Institutional Hedged Income EUR Class € 01/07/2020 (1,344,672) 846,168 (145,434) (643,938) €0.4590Institutional Hedged Income SEK Class SEK 01/07/2020 (1,514,719) 721,525 (613,425) (1,406,619) SEK4.8536Institutional Income GBP Class £ 01/07/2020 (86,295) 7,394 (16,856) (95,757) £0.4938Institutional Income USD Class US$ 01/07/2020 (527,409) 96,156 (55,082) (486,335) US$0.5205Z II USD Class US$ 01/07/2020 (72,844) 26,570 (11,839) (58,113) US$0.5675Selling Agent SharesA EUR Class € 01/07/2020 (19,922) 10,210 (37,735) (47,447) €0.3876C EUR Class € 01/07/2020 (67,254) 2,378 (19,944) (84,820) €0.3372U EUR Class € 01/07/2020 (168,002) – – (168,002) €0.5018W GBP Class £ 01/07/2020 (2,240,309) 269,418 (1,031,267) (3,002,158) £0.5864A USD Class US$ 01/07/2020 (125,281) 89,005 (27,734) (64,010) US$0.4190Z USD Class US$ 01/07/2020 (9,010,937) 5,548,107 (7,837,744) (11,300,574) US$0.5178Income II CQ USD Class US$ 01/04/2020 (91,227) – – (91,227) US$0.1330
US$ 02/01/2020 (83,790) – – (83,790) US$0.1410US$ 01/10/2019 (52,371) – – (52,371) US$0.1319US$ 01/07/2020 (90,176) 28,031 (3,107) (65,252) US$0.1147
R SharesAccumulation R USD Class US$ 01/07/2020 (78,043) 167,132 (136,962) (47,873) US$0.5047

369
Notes to the Financial Statements
18. Dividend distribution, continued
At 30 June 2020
CCY
First Valuation date
Ex-DividendGross
AmountIncome
receivedIncome
deductedNet
DistributionDividend
per share
GAM Star Global GrowthInstitutional SharesInstitutional Accumulation CHF Class SFr 01/07/2020 (65) 90 – 25 SFr0.0055Institutional Accumulation EUR Class € 01/07/2020 (3,162) 1,458 (1,152) (2,856) €0.0078Institutional Accumulation GBP Class £ 01/07/2020 (6,209) 7,498 (18,318) (17,029) £0.0105Institutional Accumulation USD Class US$ 01/07/2020 (4,521) 5,318 (6,571) (5,774) US$0.0087Selling Agent SharesZ GBP Class £ 01/07/2020 (39,419) 7,760 (15,837) (47,496) £0.0381Z EUR Class € 01/07/2020 (5,577) 7,457 (249) 1,631 €0.0196
GAM Star Japan LeadersInstitutional SharesInstitutional Accumulation CHF Class SFr 01/07/2020 (11,459,196) 515,471 (810,051) (11,753,776) SFr0.0572Institutional Accumulation EUR Class € 01/07/2020 (72,401,292) 20,570,694 (2,900,639) (54,731,237) €0.0546Institutional Accumulation GBP Class £ 01/07/2020 (3,371,451) 810,326 (879,003) (3,440,128) £0.0797Institutional Accumulation JPY Class ¥ 01/07/2020 (7,331,567) 120,017 (440,822) (7,652,372) ¥5.1442Institutional Accumulation USD Class US$ 01/07/2020 (17,677,831) 14,671,841 (12,083,883) (15,089,873) US$0.0649Institutional Hedged Accumulation EUR Class € 01/07/2020 (4,583,226) 310 (58,670) (4,641,586) €0.0091Institutional Hedged Accumulation USD Class US$ 01/07/2020 (6,588,604) 2,283,871 (170,655) (4,475,388) US$0.0727Institutional Hedged Income EUR Class € 01/07/2020 (810,162) 275,323 (391,873) (926,712) €0.0328Institutional Income GBP Class £ 01/07/2020 (888,955) 22,834 (64,869) (930,990) £0.0784Selling Agent SharesZ JPY Class ¥ 01/07/2020 (63,139,847) 139,340 (6,972,110) (69,972,617) ¥7.1883Z CHF Class SFr 01/07/2020 (520,251) 102,909 (52,340) (469,682) SFr0.1282Non UK RFSAccumulation Z GBP Class £ 01/07/2020 (8,704,409) 4,410,612 (322,773) (4,616,570) £0.0856
GAM Star MBS Total ReturnOrdinary SharesAccumulation Hedged CHF Class SFr 01/07/2020 (828) – (1,129) (1,957) SFr0.4247Accumulation Hedged EUR Class € 01/07/2020 (529,068) 291,255 (197,998) (435,811) €0.4365Accumulation Hedge R EUR Class € 01/07/2020 (1,339,226) 1,153,274 (677,601) (863,553) €0.4830Accumulation USD Class US$ 01/07/2020 (6,695,624) 1,428,642 (1,939,808) (7,206,790) US$0.4905Income USD Class US$ 01/07/2020 (1,082,865) 271,912 (219,356) (1,030,309) US$0.4198Institutional SharesInstitutional Accumulation GBP Class £ 01/07/2020 (4,503,822) 792,912 (664,452) (4,375,362) £0.5866Institutional Accumulation USD Class US$ 01/07/2020 (9,463,258) 3,393,626 (4,541,170) (10,610,802) US$0.5913Institutional Hedged Accumulation CHF Class SFr 01/07/2020 (116,978) 139,966 (80,342) (57,354) SFr0.4957Institutional Hedged Accumulation EUR Class € 01/07/2020 (6,238,132) 3,302,873 (8,695,797) (11,631,056) €0.5245Institutional Hedged Accumulation JPY Class ¥ 01/07/2020 (267,821) 901 (8,637) (275,557) ¥49.0485Institutional Hedged Income EUR Class € 01/07/2020 (1,344,672) 846,168 (145,434) (643,938) €0.4590Institutional Hedged Income SEK Class SEK 01/07/2020 (1,514,719) 721,525 (613,425) (1,406,619) SEK4.8536Institutional Income GBP Class £ 01/07/2020 (86,295) 7,394 (16,856) (95,757) £0.4938Institutional Income USD Class US$ 01/07/2020 (527,409) 96,156 (55,082) (486,335) US$0.5205Z II USD Class US$ 01/07/2020 (72,844) 26,570 (11,839) (58,113) US$0.5675Selling Agent SharesA EUR Class € 01/07/2020 (19,922) 10,210 (37,735) (47,447) €0.3876C EUR Class € 01/07/2020 (67,254) 2,378 (19,944) (84,820) €0.3372U EUR Class € 01/07/2020 (168,002) – – (168,002) €0.5018W GBP Class £ 01/07/2020 (2,240,309) 269,418 (1,031,267) (3,002,158) £0.5864A USD Class US$ 01/07/2020 (125,281) 89,005 (27,734) (64,010) US$0.4190Z USD Class US$ 01/07/2020 (9,010,937) 5,548,107 (7,837,744) (11,300,574) US$0.5178Income II CQ USD Class US$ 01/04/2020 (91,227) – – (91,227) US$0.1330
US$ 02/01/2020 (83,790) – – (83,790) US$0.1410US$ 01/10/2019 (52,371) – – (52,371) US$0.1319US$ 01/07/2020 (90,176) 28,031 (3,107) (65,252) US$0.1147
R SharesAccumulation R USD Class US$ 01/07/2020 (78,043) 167,132 (136,962) (47,873) US$0.5047
Notes to the Financial Statements
18. Dividend distribution, continued
At 30 June 2020
CCY
First Valuation date
Ex-DividendGross
AmountIncome
receivedIncome
deductedNet
DistributionDividend
per share
GAM Systematic Alternative Risk PremiaInstitutional SharesInstitutional Accumulation EUR Class € 01/07/2020 (439,370) 105,489 (426,023) (759,904) €0.1642Institutional Accumulation GBP Class £ 01/07/2020 (2,640) 206 (2,174) (4,608) £0.1856Institutional Accumulation JPY Class ¥ 01/07/2020 (111,748) – (15,706) (127,454) ¥16.9388Institutional Accumulation USD Class US$ 01/07/2020 (60,278) 6,717 (487) (54,048) US$0.1760Hedged Institutional Accumulation CHF Class SFr 01/07/2020 (99,530) 20,263 (171,178) (250,445) SFr0.1376Selling Agent SharesZ CHF Class SFr 01/07/2020 (316) 62,231 (1,076,341) (1,014,426) SFr0.1421C EUR Class € 01/07/2020 (354) – (45) (399) €0.0049X USD Class US$ 01/07/2020 (188,060) – (379,386) (567,446) US$154.5248
GAM Systematic Core Macro Selling Agent SharesZ GBP Class £ 01/07/2020 (6,011) – – (6,011) £0.0396
GAM Star Tactical OpportunitiesInstitutional SharesInstitutional Accumulation CHF Class SFr 01/07/2020 (1,032) – – (1,032) SFr0.0654Institutional Accumulation EUR Class € 01/07/2020 (63,749) 1,104 (9,178) (71,823) €0.0641Institutional Accumulation GBP Class £ 01/07/2020 (31,608) 8,790 (4,895) (27,713) £0.0706Institutional Accumulation USD Class US$ 01/07/2020 (18,087) 2,033 (36,365) (52,419) US$0.0721Selling Agent SharesX EUR Acc € 01/07/2020 (75,815) 701 (13,952) (89,066) €51.8058
GAM Star Disruptive GrowthSelling Agent SharesAccumulation Z GBP II Class £ 01/07/2020 (374) 97 (176) (453) £0.0595
GAM Star Worldwide EquityInstitutional SharesInstitutional Accumulation USD Class US$ 01/07/2020 (3,205) – (5,506) (8,711) US$0.0109Institutional Income GBP Class £ 01/07/2020 (1,838) 29 (940) (2,749) £0.0090Institutional Income USD Class US$ 01/07/2020 (106) 191 (388) (303) US$0.0111Selling Agent SharesZII GBP Class £ 01/07/2020 (4,720) 1,524 (857) (4,053) £0.1032
GAM Systematic Dynamic CreditInstitutional SharesInstitutional Accumulation USD Class US$ 01/07/2020 (29,079) – – (29,079) US$0.1426Selling Agent SharesZ CHF Acc Class SFr 01/07/2020 (158) 3,408 (66,352) (63,102) SFr0.1494Z EUR Accumulation € 01/07/2020 (50,549) 4,039 (89,609) (136,119) €0.1657Z GBP Accumulation £ 01/07/2020 (35,401) – – (35,401) £0.1784Z USD Accumulation US$ 01/07/2020 (36,648) 546 – (36,102) US$0.1727Non UK RFSAccumulation USD Class US$ 01/07/2020 (27,433) – – (27,433) US$0.1376

370
GAM Star Fund p.l.c.
Notes to the Financial Statements
18. Dividend distribution, continued
At 30 June 2019
CCY
First Valuation date
Ex-DividendGross
AmountIncome
receivedIncome
deductedNet
DistributionDividend
per share
GAM Star Absolute Return MacroInstitutional SharesInstitutional Income GBP Class £ 01/07/2019 (29,453) 99 (98) (29,452) £0.0676Selling Agent SharesAccumulation Z GBP Class £ 01/07/2019 (485) – (731) (1,216) £0.2004Income X USD Class US$ 01/07/2019 (46,790) – – (46,790) US$69.0916
GAM Star Asian EquityOrdinary SharesAccumulation CHF Class SFr 02/07/2019 (170) 36 (190) (324) SFr0.0244Accumulation EUR Class € 02/07/2019 (1,858) 5 (70) (1,923) €0.0498Accumulation GBP Class £ 02/07/2019 (417) – (71) (488) £0.0064Accumulation USD Class US$ 02/07/2019 (33,679) 183 (7,374) (40,870) US$0.0428Income GBP Class £ 02/07/2019 (1,284) – (37) (1,321) £0.0062Institutional SharesInstitutional Accumulation GBP Class £ 02/07/2019 (13,153) 7,557 (82,552) (88,148) £0.1111
GAM Star Asia-Pacific EquityOrdinary SharesAccumulation CHF Class SFr 01/07/2019 (10,284) 324 (2,740) (12,700) SFr0.1397Accumulation EUR Class € 01/07/2019 (67,676) 177 (5,325) (72,824) €2.0184Accumulation GBP Class £ 01/07/2019 (33,699) 969 (380) (33,110) £0.0497Accumulation USD Class US$ 01/07/2019 (34,216) – (8,804) (43,020) US$0.1677Income EUR Class € 01/07/2019 (1,364) 6 (3) (1,361) €1.8134Income GBP Class £ 01/07/2019 (12,679) 5 (6,439) (19,113) £0.0439Income USD Class US$ 01/07/2019 (41,630) – (8,196) (49,826) US$0.1580Institutional SharesInstitutional Accumulation EUR Class € 01/07/2019 (5,364) 2 – (5,362) €0.2339Selling Agent SharesAccumulation Z GBP Class £ 01/07/2019 (1,206) 416 (85) (875) £0.2562C EUR Class € 01/07/2019 (921) 39 – (882) £0.0570
GAM Star Global BalancedOrdinary SharesAccumulation PI USD Class US$ 01/07/2019 (19) – – (19) US$0.0019Institutional SharesInstitutional Accumulation AUD Class AUD 01/07/2019 (908) 991 (1,559) (1,476) AUD0.0198Institutional Accumulation EUR Class € 01/07/2019 (12,433) 19,422 (12,278) (5,289) €0.0204Institutional Accumulation GBP Class £ 01/07/2019 (83,939) 79,858 (96,430) (100,511) £0.0269Institutional Accumulation SGD Class SGD 01/07/2019 (1,006) – (602) (1,608) SGD0.0183Institutional Accumulation USD Class US$ 01/07/2019 (38,811) 23,631 (83,507) (98,687) US$0.0243Institutional Income GBP Class £ 01/07/2019 (3,255) 218 (20,984) (24,021) £0.0264Selling Agent SharesZ EUR Class € 01/07/2019 (8,097) 3,353 (1,996) (6,740) €0.0314PI GBP Class £ 01/07/2019 (284) 86 (387) (585) £0.0038Z GBP Class £ 01/07/2019 (36,510) 23,817 (69,857) (82,550) £0.0478
GAM Star Cat BondOrdinary SharesAccumulation CHF Class SFr 14/01/2019 (469,401) – – (469,401) SFr0.3288
SFr 08/07/2019 (430,991) 1,687 (61,018) (490,322) SFr0.3537Accumulation EUR Class € 14/01/2019 (1,331,738) – – (1,331,738) €0.3429
€ 08/07/2019 (1,189,977) 34,152 (367,704) (1,523,529) €0.3717Accumulation GBP Class £ 14/01/2019 (73,016) (73,016) £0.3627
£ 08/07/2019 (56,168) 27 (22,178) (78,319) £0.4026Accumulation USD Class US$ 14/01/2019 (1,674,037) (1,674,037) US$0.3630
US$ 08/07/2019 (1,629,781) 181,705 (356,748) (1,804,824) US$0.4067Accumulation A EUR Class € 14/01/2019 (198,387) – – (198,387) €0.2636
€ 08/07/2019 (97,451) 1,205 (69,470) (165,716) €0.2871

371
Notes to the Financial Statements
18. Dividend distribution, continued
At 30 June 2019
CCY
First Valuation date
Ex-DividendGross
AmountIncome
receivedIncome
deductedNet
DistributionDividend
per share
GAM Star Absolute Return MacroInstitutional SharesInstitutional Income GBP Class £ 01/07/2019 (29,453) 99 (98) (29,452) £0.0676Selling Agent SharesAccumulation Z GBP Class £ 01/07/2019 (485) – (731) (1,216) £0.2004Income X USD Class US$ 01/07/2019 (46,790) – – (46,790) US$69.0916
GAM Star Asian EquityOrdinary SharesAccumulation CHF Class SFr 02/07/2019 (170) 36 (190) (324) SFr0.0244Accumulation EUR Class € 02/07/2019 (1,858) 5 (70) (1,923) €0.0498Accumulation GBP Class £ 02/07/2019 (417) – (71) (488) £0.0064Accumulation USD Class US$ 02/07/2019 (33,679) 183 (7,374) (40,870) US$0.0428Income GBP Class £ 02/07/2019 (1,284) – (37) (1,321) £0.0062Institutional SharesInstitutional Accumulation GBP Class £ 02/07/2019 (13,153) 7,557 (82,552) (88,148) £0.1111
GAM Star Asia-Pacific EquityOrdinary SharesAccumulation CHF Class SFr 01/07/2019 (10,284) 324 (2,740) (12,700) SFr0.1397Accumulation EUR Class € 01/07/2019 (67,676) 177 (5,325) (72,824) €2.0184Accumulation GBP Class £ 01/07/2019 (33,699) 969 (380) (33,110) £0.0497Accumulation USD Class US$ 01/07/2019 (34,216) – (8,804) (43,020) US$0.1677Income EUR Class € 01/07/2019 (1,364) 6 (3) (1,361) €1.8134Income GBP Class £ 01/07/2019 (12,679) 5 (6,439) (19,113) £0.0439Income USD Class US$ 01/07/2019 (41,630) – (8,196) (49,826) US$0.1580Institutional SharesInstitutional Accumulation EUR Class € 01/07/2019 (5,364) 2 – (5,362) €0.2339Selling Agent SharesAccumulation Z GBP Class £ 01/07/2019 (1,206) 416 (85) (875) £0.2562C EUR Class € 01/07/2019 (921) 39 – (882) £0.0570
GAM Star Global BalancedOrdinary SharesAccumulation PI USD Class US$ 01/07/2019 (19) – – (19) US$0.0019Institutional SharesInstitutional Accumulation AUD Class AUD 01/07/2019 (908) 991 (1,559) (1,476) AUD0.0198Institutional Accumulation EUR Class € 01/07/2019 (12,433) 19,422 (12,278) (5,289) €0.0204Institutional Accumulation GBP Class £ 01/07/2019 (83,939) 79,858 (96,430) (100,511) £0.0269Institutional Accumulation SGD Class SGD 01/07/2019 (1,006) – (602) (1,608) SGD0.0183Institutional Accumulation USD Class US$ 01/07/2019 (38,811) 23,631 (83,507) (98,687) US$0.0243Institutional Income GBP Class £ 01/07/2019 (3,255) 218 (20,984) (24,021) £0.0264Selling Agent SharesZ EUR Class € 01/07/2019 (8,097) 3,353 (1,996) (6,740) €0.0314PI GBP Class £ 01/07/2019 (284) 86 (387) (585) £0.0038Z GBP Class £ 01/07/2019 (36,510) 23,817 (69,857) (82,550) £0.0478
GAM Star Cat BondOrdinary SharesAccumulation CHF Class SFr 14/01/2019 (469,401) – – (469,401) SFr0.3288
SFr 08/07/2019 (430,991) 1,687 (61,018) (490,322) SFr0.3537Accumulation EUR Class € 14/01/2019 (1,331,738) – – (1,331,738) €0.3429
€ 08/07/2019 (1,189,977) 34,152 (367,704) (1,523,529) €0.3717Accumulation GBP Class £ 14/01/2019 (73,016) (73,016) £0.3627
£ 08/07/2019 (56,168) 27 (22,178) (78,319) £0.4026Accumulation USD Class US$ 14/01/2019 (1,674,037) (1,674,037) US$0.3630
US$ 08/07/2019 (1,629,781) 181,705 (356,748) (1,804,824) US$0.4067Accumulation A EUR Class € 14/01/2019 (198,387) – – (198,387) €0.2636
€ 08/07/2019 (97,451) 1,205 (69,470) (165,716) €0.2871
Notes to the Financial Statements
18. Dividend distribution, continued
At 30 June 2019
CCY
First Valuation date
Ex-DividendGross
AmountIncome
receivedIncome
deductedNet
DistributionDividend
per share
GAM Star Cat Bond, continuedAccumulation M EUR Class € 14/01/2019 (1,578,745) (1,578,745) €0.2790
€ 08/07/2019 (1,693,371) – – (1,693,371) €0.3004Hedged Ordinary Acculucation JPY Class ¥ 14/01/2019 (94,415) – – (94,415) ¥26.8756
¥ 08/07/2019 (106,594) – – (106,594) ¥29.7967Income EUR Class € 14/01/2019 (44,238) – – (44,238) €0.2868
€ 08/07/2019 (44,689) 1,495 (2,739) (45,933) €0.3016Income USD Class US$ 14/01/2019 (59,744) – – (59,744) US$0.3296
US$ 08/07/2019 (64,449) 701 (408) (64,156) US$0.3588Institutional SharesInstitutional Accumulation CHF Class SFr 14/01/2019 (4,514,512) – – (4,514,512) SFr0.3012
SFr 08/07/2019 (5,188,653) 456,499 (1,093,695) (5,825,849) SFr0.3192Institutional Accumulation EUR Class € 14/01/2019 (23,120,660) – – (23,120,660) €0.3903
€ 08/07/2019 (24,502,472) 4,650,390 (2,237,052) (22,089,134) €0.4166Institutional Accumulation GBP Class £ 14/01/2019 (1,538,381) – – (1,538,381) £0.4080
£ 08/07/2019 (1,751,945) 175,262 (55,810) (1,632,493) £0.4478Institutional Accumulation USD Class US$ 14/01/2019 (9,274,925) – – (9,274,925) US$0.4079
US$ 08/07/2019 (9,727,146) 936,030 (1,641,826) (10,432,942) US$0.4525Institutional Hedged Income JPY Class ¥ 14/01/2019 (491,138) – – (491,138) ¥26.5137
¥ 08/07/2019 (530,999) – (1) (531,000) ¥28.1499Institutional Income EUR Class € 14/01/2019 (4,982,865) – – (4,982,865) €0.2967
€ 08/07/2019 (5,345,511) 1,054,459 (218,058) (4,509,110) €0.3086Institutional Income GBP Class £ 14/01/2019 (592,556) – – (592,556) £0.3011
£ 08/07/2019 (518,705) 44,176 (97,120) (571,649) £0.3209Institutional Income USD Class US$ 14/01/2019 (528,045) – – (528,045) US$0.3211
US$ 08/07/2019 (629,290) 211,943 (73,540) (490,887) US$0.3464Distribution SharesDistribution Quarterly Ordinary USD Class US$ 08/10/2018 (660,043) – – (660,043) US$0.1353
US$ 14/01/2019 (652,144) – – (652,144) US$0.1344US$ 08/04/2019 (455,104) – – (455,104) US$0.0335US$ 08/07/2019 (370,658) 443 (235,093) (605,308) US$0.1545
GAM Star Global CautiousOrdinary SharesAccumulation EUR Class € 01/07/2019 (59) – (3,279) (3,338) €0.0163Accumulation GBP Class £ 01/07/2019 (818) 696 (761) (883) £0.0160Accumulation USD Class US$ 01/07/2019 (2,734) 1,177 (5,395) (6,952) US$0.0136Income GBP Class £ 01/07/2019 (498) – – (498) £0.0162Institutional SharesInstitutional Accumulation AUD Class AUD 15/07/2019 (2,151) 789 (1,418) (2,780) AUD0.0530Institutional Accumulation EUR Class € 01/07/2019 (21,491) 11,406 (10,229) (20,314) €0.0572Institutional Accumulation GBP Class £ 01/07/2019 (206,752) 76,275 (247,909) (378,386) £0.0719Institutional Accumulation USD Class US$ 01/07/2019 (16,015) 8,209 (60,636) (68,442) US$0.0544Institutional Accumulation Hedged USD Class US$ 01/07/2019 (4,246) 117 (6,144) (10,273) US$0.0582Selling Agent SharesA EUR Class € 01/07/2019 – (3) – (3) €0.0000CQ EUR Class Income II € 01/10/2018 (4,766) – – (4,766) €0.1009
€ 02/01/2019 (4,575) – – (4,575) €0.0961€ 01/04/2019 (1,526) – – (1,526) €0.0932€ 01/07/2019 (722) – (108) (830) €0.0982
TQ EUR Class Income II € 01/10/2018 (1,123) – – (1,123) €0.0977€ 02/01/2019 (596) – – (596) €0.0932€ 01/04/2019 (513) – – (513) €0.0906€ 01/07/2019 (516) – (36) (552) €0.0956
Z EUR Accumulation Class € 01/07/2019 (19,383) 3,192 (516) (16,707) €0.0659AQ GBP Class Income II £ 01/10/2018 (2,957) – – (2,957) £0.0962
£ 02/01/2019 (2,831) – – (2,831) £0.0921£ 01/04/2019 (2,760) – – (2,760) £0.0898£ 01/07/2019 (2,923) – – (2,923) £0.0951

372
GAM Star Fund p.l.c.
Notes to the Financial Statements
18. Dividend distribution, continued
At 30 June 2019
CCY
First Valuation date
Ex-DividendGross
AmountIncome
receivedIncome
deductedNet
DistributionDividend
per share
GAM Star Global Cautious, continuedCQ GBP Class Income II £ 01/10/2018 (37,456) – – (37,456) £0.1033
£ 02/01/2019 (33,529) – – (33,529) £0.0988£ 01/04/2019 (27,229) – – (27,229) £0.0962£ 01/07/2019 (20,857) 2 (2,484) (23,339) £0.1016
PI GBP Class £ 01/07/2019 (2,005) – (101) (2,106) £0.0409TQ GBP Income II Class £ 01/10/2018 (13,763) – – (13,763) £0.1070
£ 02/01/2019 (11,492) – – (11,492) £0.1025£ 01/04/2019 (10,919) – – (10,919) £0.0999£ 01/07/2019 (5,532) – (1,029) (6,561) £0.1058
Z GBP Class £ 01/07/2019 (61,684) 24,323 (57,869) (95,230) £0.0879CQ USD Class Income II US$ 01/10/2018 (15,883) – – (15,883) US$0.1053
US$ 02/01/2019 (15,232) – – (15,232) US$0.1012US$ 01/04/2019 (6,158) – – (6,158) US$0.0988US$ 01/07/2019 (5,777) – – (5,777) US$0.1050
Distribution Share – Quarterly InstitutionalQuarterly Institutional Income GBP Class £ 01/10/2018 (1,873) – – (1,873) £0.0702G Quarterly Income II EUR Class € 01/10/2018 (1,187) – – (1,187) €0.0971
€ 02/01/2019 (1,096) – – (1,096) €0.0926€ 01/04/2019 (1,354) – – (1,354) €0.0898€ 01/07/2019 (1,483) – – (1,483) €0.0947
GAM Star China EquityOrdinary SharesAccumulation EUR Class € 01/07/2019 (37,355) 13,586 (17,911) (41,680) €0.0330Accumulation GBP Class £ 01/07/2019 (4,558) 2,839 (3,855) (5,574) £0.0027Accumulation USD Class US$ 01/07/2019 (421,047) 65,562 (385,788) (741,273) US$0.0507Income USD Class US$ 01/07/2019 (21,078) 1,117 (6,562) (26,523) US$0.0517Institutional SharesInstitutional Accumulation EUR Class € 01/07/2019 (8,346) 13,529 (9,431) (4,248) €0.0622Institutional Accumulation GBP Class £ 01/07/2019 (90,127) 21,219 (41,475) (110,383) £0.1348Institutional Accumulation USD Class US$ 01/07/2019 (157,704) 43,597 (323,540) (437,647) US$0.1094Institutional Income EUR Class € 01/07/2019 (24,845) 5,206 (3,537) (23,176) €0.0896Institutional Income GBP Class £ 01/07/2019 (70,965) 11,159 (28,418) (88,224) £0.1281Institutional Income USD Class US$ 01/07/2019 (18,487) 32,909 (68,831) (54,409) US$0.1019Selling Agent SharesZ USD Class US$ 01/07/2019 (1,045) 186 (111) (970) US$0.0590
GAM Star Composite Global EquityOrdinary SharesAccumulation CHF Class SFr 01/07/2019 (27) 57 (61) (31) SFr0.0492Accumulation EUR Class € 01/07/2019 (6,124) 54 (1,186) (7,256) €0.0543Accumulation GBP Class £ 01/07/2019 (55,437) 523 (23,405) (78,319) £0.0544Accumulation USD Class US$ 01/07/2019 (12,725) 542 (2,353) (14,536) US$0.0424Income GBP Class £ 01/07/2019 (7,196) 92 (9,579) (16,683) £0.0545Institutional SharesInstitutional Accumulation EUR Class € 01/07/2019 (27,906) 2,781 (8,093) (33,218) €0.0566Institutional Accumulation GBP Class £ 01/07/2019 (111,906) 46,941 (339) (65,304) £0.0576Insitutional Accumulation USD Class US$ 01/07/2019 (17,421) 1,943 (10) (15,488) US$0.0483Selling Agent SharesAccumulation Z GBP Class £ 01/07/2019 (336,456) – (35,977) (372,433) £0.1238
GAM Star Continental European EquityOrdinary SharesAccumulation CHF Class SFr 01/07/2019 (34,197) – – (34,197) SFr0.1326Accumulation EUR Class € 01/07/2019 (515,609) 8,458 (33,934) (541,085) €0.1294Accumulation R EUR Class € 01/07/2019 (10,630) 582 (3,814) (13,862) €0.1066Accumulation Z EUR Class € 01/07/2019 (1,441,031) 1,221 (129,796) (1,569,606) €0.2241Accumulation GBP Class £ 01/07/2019 (22,884) 214 (1,451) (24,121) £0.0264Accumulation Z II GBP Class £ 01/07/2019 (430,212) 22,213 (47,742) (455,741) £0.1505Accumulation USD Class US$ 01/07/2019 (19,916) 447 (429) (19,898) US$0.0927

373
Notes to the Financial Statements
18. Dividend distribution, continued
At 30 June 2019
CCY
First Valuation date
Ex-DividendGross
AmountIncome
receivedIncome
deductedNet
DistributionDividend
per share
GAM Star Global Cautious, continuedCQ GBP Class Income II £ 01/10/2018 (37,456) – – (37,456) £0.1033
£ 02/01/2019 (33,529) – – (33,529) £0.0988£ 01/04/2019 (27,229) – – (27,229) £0.0962£ 01/07/2019 (20,857) 2 (2,484) (23,339) £0.1016
PI GBP Class £ 01/07/2019 (2,005) – (101) (2,106) £0.0409TQ GBP Income II Class £ 01/10/2018 (13,763) – – (13,763) £0.1070
£ 02/01/2019 (11,492) – – (11,492) £0.1025£ 01/04/2019 (10,919) – – (10,919) £0.0999£ 01/07/2019 (5,532) – (1,029) (6,561) £0.1058
Z GBP Class £ 01/07/2019 (61,684) 24,323 (57,869) (95,230) £0.0879CQ USD Class Income II US$ 01/10/2018 (15,883) – – (15,883) US$0.1053
US$ 02/01/2019 (15,232) – – (15,232) US$0.1012US$ 01/04/2019 (6,158) – – (6,158) US$0.0988US$ 01/07/2019 (5,777) – – (5,777) US$0.1050
Distribution Share – Quarterly InstitutionalQuarterly Institutional Income GBP Class £ 01/10/2018 (1,873) – – (1,873) £0.0702G Quarterly Income II EUR Class € 01/10/2018 (1,187) – – (1,187) €0.0971
€ 02/01/2019 (1,096) – – (1,096) €0.0926€ 01/04/2019 (1,354) – – (1,354) €0.0898€ 01/07/2019 (1,483) – – (1,483) €0.0947
GAM Star China EquityOrdinary SharesAccumulation EUR Class € 01/07/2019 (37,355) 13,586 (17,911) (41,680) €0.0330Accumulation GBP Class £ 01/07/2019 (4,558) 2,839 (3,855) (5,574) £0.0027Accumulation USD Class US$ 01/07/2019 (421,047) 65,562 (385,788) (741,273) US$0.0507Income USD Class US$ 01/07/2019 (21,078) 1,117 (6,562) (26,523) US$0.0517Institutional SharesInstitutional Accumulation EUR Class € 01/07/2019 (8,346) 13,529 (9,431) (4,248) €0.0622Institutional Accumulation GBP Class £ 01/07/2019 (90,127) 21,219 (41,475) (110,383) £0.1348Institutional Accumulation USD Class US$ 01/07/2019 (157,704) 43,597 (323,540) (437,647) US$0.1094Institutional Income EUR Class € 01/07/2019 (24,845) 5,206 (3,537) (23,176) €0.0896Institutional Income GBP Class £ 01/07/2019 (70,965) 11,159 (28,418) (88,224) £0.1281Institutional Income USD Class US$ 01/07/2019 (18,487) 32,909 (68,831) (54,409) US$0.1019Selling Agent SharesZ USD Class US$ 01/07/2019 (1,045) 186 (111) (970) US$0.0590
GAM Star Composite Global EquityOrdinary SharesAccumulation CHF Class SFr 01/07/2019 (27) 57 (61) (31) SFr0.0492Accumulation EUR Class € 01/07/2019 (6,124) 54 (1,186) (7,256) €0.0543Accumulation GBP Class £ 01/07/2019 (55,437) 523 (23,405) (78,319) £0.0544Accumulation USD Class US$ 01/07/2019 (12,725) 542 (2,353) (14,536) US$0.0424Income GBP Class £ 01/07/2019 (7,196) 92 (9,579) (16,683) £0.0545Institutional SharesInstitutional Accumulation EUR Class € 01/07/2019 (27,906) 2,781 (8,093) (33,218) €0.0566Institutional Accumulation GBP Class £ 01/07/2019 (111,906) 46,941 (339) (65,304) £0.0576Insitutional Accumulation USD Class US$ 01/07/2019 (17,421) 1,943 (10) (15,488) US$0.0483Selling Agent SharesAccumulation Z GBP Class £ 01/07/2019 (336,456) – (35,977) (372,433) £0.1238
GAM Star Continental European EquityOrdinary SharesAccumulation CHF Class SFr 01/07/2019 (34,197) – – (34,197) SFr0.1326Accumulation EUR Class € 01/07/2019 (515,609) 8,458 (33,934) (541,085) €0.1294Accumulation R EUR Class € 01/07/2019 (10,630) 582 (3,814) (13,862) €0.1066Accumulation Z EUR Class € 01/07/2019 (1,441,031) 1,221 (129,796) (1,569,606) €0.2241Accumulation GBP Class £ 01/07/2019 (22,884) 214 (1,451) (24,121) £0.0264Accumulation Z II GBP Class £ 01/07/2019 (430,212) 22,213 (47,742) (455,741) £0.1505Accumulation USD Class US$ 01/07/2019 (19,916) 447 (429) (19,898) US$0.0927
Notes to the Financial Statements
18. Dividend distribution, continued
At 30 June 2019
CCY
First Valuation date
Ex-DividendGross
AmountIncome
receivedIncome
deductedNet
DistributionDividend
per share
GAM Star Continental European Equity, continuedIncome Z EUR Class € 01/07/2019 (954,595) 10,524 (89,400) (1,033,471) €0.2147Institutional SharesInstitutional Accumulation EUR Class € 01/07/2019 (4,522,294) 105,619 (1,208,213) (5,624,888) €0.2234Institutional Accumulation GBP Class £ 01/07/2019 (258,889) 1,825 (25,099) (282,163) £0.2479Institutional Accumulation USD Class US$ 01/07/2019 (177,295) 1,882 (41,811) (217,224) US$0.1797Institutional Accumulation Hedge USD Class US$ 01/07/2019 (2,601) 24 (3,876) (6,453) US$0.1188Institutional Income EUR Class € 01/07/2019 (4,469) – (26) (4,495) €0.2215Institutional Income GBP Class £ 01/07/2019 (294,434) 2,513 (11,875) (303,796) £0.2357Institutional Income GBP Z Class £ 01/07/2019 (553,383) 125,584 (20,545) (448,344) £0.2030
GAM Star Credit Opportunities (EUR)Ordinary SharesAccumulation CHF Class SFr 01/07/2019 (813,138) 29,267 (478,178) (1,262,049) SFr0.5024Accumulation EUR Class € 01/07/2019 (23,954,320) 19,033,419 (20,466,144) (25,387,045) €0.5451Accumulation R EUR Class € 01/07/2019 (325,364) 159,410 (313,783) (479,737) €0.3295Income CHF Class SFr 01/07/2019 (293,529) 19,067 (58,049) (332,511) SFr0.3794Income CHF R Class SFr 01/07/2019 (198) 477 (22,244) (21,965) SFr0.3161Income EUR Class € 01/07/2019 (1,234,575) 141,868 (768,727) (1,861,434) €0.4872Income EUR II Class € 01/07/2019 (714,090) 111,081 (93,395) (696,404) €0.0305
€ 01/08/2018 (1,002,433) – – (1,002,433) €0.0401€ 03/09/2018 (955,878) – – (955,878) €0.0387€ 01/10/2018 (916,268) – – (916,268) €0.0377€ 01/11/2018 (938,475) – – (938,475) €0.0415€ 03/12/2018 (886,111) – – (886,111) €0.0402€ 02/01/2019 (821,034) – – (821,034) €0.0369€ 01/02/2019 (755,504) – – (755,504) €0.0343€ 01/03/2019 (663,188) – – (663,188) €0.0303€ 01/04/2019 (781,710) – – (781,710) €0.0344€ 02/05/2019 (786,560) – – (786,560) €0.0334€ 04/06/2019 (754,748) – – (754,748) €0.0323
Institutional SharesInstitutional Accumulation CHF Class SFr 01/07/2019 (2,496,492) 383,077 (1,407,634) (3,521,049) SFr0.4567Institutional Accumulation EUR Class € 01/07/2019 (52,500,065) 37,698,249 (49,866,370) (64,668,186) €0.5239Institutional Income CHF Class SFr 01/07/2019 (337,533) 5,926 (36,208) (367,815) SFr0.3465Institutional Income EUR Class € 01/07/2019 (8,696,972) 6,268,413 (2,328,220) (4,756,779) €0.4726Selling Agent SharesAccumulation Z EUR Class € 01/07/2019 (383,166) – – (383,166) €0.3449A EUR Class € 01/07/2019 (6,415,117) 443,078 (1,888,483) (7,860,522) €0.3963AQ EUR Class € 01/10/2018 (1,132,612) – – (1,132,612) €0.1229
€ 02/01/2019 (874,030) – – (874,030) €0.1245€ 01/04/2019 (740,839) – – (740,839) €0.1048€ 01/07/2019 (716,369) 42,110 (293,976) (968,235) €0.1020
C EUR Class € 01/07/2019 (2,518,440) 108,950 (433,221) (2,842,711) €0.2684M EUR Class € 01/08/2018 (153,596) – – (153,596) €0.0329
€ 03/09/2018 (147,184) – – (147,184) €0.0318€ 01/10/2018 (142,311) – – (142,311) €0.0318€ 01/11/2018 (138,426) – – (138,426) €0.0346€ 03/12/2018 (138,553) – – (138,553) €0.0346€ 02/01/2019 (123,481) – – (123,481) €0.0309€ 01/02/2019 (110,421) – – (110,421) €0.0279€ 01/03/2019 (97,462) – – (97,462) €0.0243€ 01/04/2019 (115,295) – – (115,295) €0.0285€ 02/05/2019 (114,251) – – (114,251) €0.0263€ 04/06/2019 (111,983) – – (111,983) €0.0258€ 01/07/2019 (106,132) 5,899 (22,122) (122,355) €0.0246
R EUR Class € 01/07/2019 (10,485) 16,192 (549,022) (543,315) €0.3259SI EUR Class € 02/01/2019 (2,209,837) – – (2,209,837) €0.2130
€ 01/07/2019 (1,939,271) 291,481 (371,701) (2,019,491) €0.1701

374
GAM Star Fund p.l.c.
Notes to the Financial Statements
18. Dividend distribution, continued
At 30 June 2019
CCY
First Valuation date
Ex-DividendGross
AmountIncome
receivedIncome
deductedNet
DistributionDividend
per share
GAM Star Credit Opportunities (EUR), continuedSO EUR Class € 02/01/2019 (1,248,990) – – (1,248,990) €0.2142
€ 01/07/2019 (705,933) 37,861 (429,927) (1,097,999) €0.1674Distribution SharesQuarterly Ordinary EUR Class € 01/10/2018 (173,859) – – (173,859) €0.0919
€ 02/01/2019 (181,192) – – (181,192) €0.0952€ 01/04/2019 (156,815) – – (156,815) €0.0772€ 01/07/2019 (146,165) 131,263 (10,599) (25,501) €0.0738
GAM Star Credit Opportunities (GBP)Ordinary SharesAccumulation GBP Class £ 01/07/2019 (1,029,094) 56,102 (255,271) (1,228,263) £0.7608Income GBP Class £ 01/07/2019 (509,535) 50,252 (208,552) (667,835) £0.5357Institutional SharesInstitutional Accumulation GBP Class £ 01/07/2019 (17,653,508) 2,528,810 (7,195,440) (22,320,138) £0.7144Institutional Income GBP Class £ 01/07/2019 (5,296,660) 872,930 (1,219,484) (5,643,214) £0.5663Selling Agent SharesQZ GBP Class £ 01/07/2019 (1,754) – – (1,754) £0.1183SI GBP Class £ 02/01/2019 (959,059) – – (959,059) £0.2570
£ 01/07/2019 (546,867) 91,591 (495,040) (950,316) £0.2519Z GBP Class £ 01/07/2019 (1,440,759) 2,447,955 (2,900,570) (1,893,374) £0.5830ZII GBP Class £ 01/07/2019 (3,869,503) 2,465,875 (537,232) (1,940,860) £0.4719Distribution SharesMonthly Ordinary GBP Class £ 01/08/2018 (194,591) – – (194,591) £0.0335
£ 03/09/2018 (216,635) – – (216,635) £0.0362£ 01/10/2018 (256,843) – – (256,843) £0.0425£ 01/11/2018 (228,176) – – (228,176) £0.0376£ 03/12/2018 (263,862) – – (263,862) £0.0433£ 02/01/2019 (197,473) – – (197,473) £0.0324£ 01/02/2019 (193,100) – – (193,100) £0.0320£ 01/03/2019 (183,439) – – (183,439) £0.0305£ 01/04/2019 (287,963) – – (287,963) £0.0482£ 02/05/2019 (220,838) – – (220,838) £0.0365£ 04/06/2019 (236,086) – – (236,086) £0.0383£ 01/07/2019 (219,527) 25,583 (16,411) (210,355) £0.0356
Quarterly Institutional GBP Class £ 01/10/2018 (216,028) – – (216,028) £0.1197£ 02/01/2019 (207,877) – – (207,877) £0.1210£ 01/04/2019 (184,850) – – (184,850) £0.1183£ 01/07/2019 (170,021) 16,963 (41,927) (194,985) £0.1178
Quarterly Ordinary GBP Class £ 01/10/2018 (2,126,155) – – (2,126,155) £0.1129£ 02/01/2019 (2,212,423) – – (2,212,423) £0.1139£ 01/04/2019 (2,041,780) – – (2,041,780) £0.1114£ 01/07/2019 (1,807,727) 276,044 (405,445) (1,937,128) £0.1110
GAM Star Credit Opportunities (USD)Ordinary SharesAccumulation USD Class US$ 01/07/2019 (17,981,013) 1,454,735 (6,614,693) (23,140,971) US$0.6775Accumulation R USD Class US$ 01/07/2019 (55,596) 42 – (55,554) US$0.4394Income USD Class US$ 01/07/2019 (3,105,434) 157,603 (1,303,605) (4,251,436) US$0.4917Institutional SharesInstitutional Accumulation Hedged ILS Class ILS 01/07/2019 (292,267) 29,318 (49,876) (312,825) ILS1.7131Institutional Accumulation USD Class US$ 01/07/2019 (60,127,599) 7,351,113 (17,654,350) (70,430,836) US$0.6641Institutional Income USD Class US$ 01/07/2019 (1,054,603) 46,559 (28,165) (1,036,209) US$0.4300Selling Agent SharesMCO II AUD Class AUD 01/08/2018 (488,775) – – (488,775) AUD0.0431
AUD 03/09/2018 (442,702) – – (442,702) AUD0.0405AUD 01/10/2018 (395,633) – – (395,633) AUD0.0369AUD 01/11/2018 (398,485) – – (398,485) AUD0.0386AUD 03/12/2018 (419,390) – – (419,390) AUD0.0400AUD 02/01/2019 (377,618) – – (377,618) AUD0.0376

375
Notes to the Financial Statements
18. Dividend distribution, continued
At 30 June 2019
CCY
First Valuation date
Ex-DividendGross
AmountIncome
receivedIncome
deductedNet
DistributionDividend
per share
GAM Star Credit Opportunities (EUR), continuedSO EUR Class € 02/01/2019 (1,248,990) – – (1,248,990) €0.2142
€ 01/07/2019 (705,933) 37,861 (429,927) (1,097,999) €0.1674Distribution SharesQuarterly Ordinary EUR Class € 01/10/2018 (173,859) – – (173,859) €0.0919
€ 02/01/2019 (181,192) – – (181,192) €0.0952€ 01/04/2019 (156,815) – – (156,815) €0.0772€ 01/07/2019 (146,165) 131,263 (10,599) (25,501) €0.0738
GAM Star Credit Opportunities (GBP)Ordinary SharesAccumulation GBP Class £ 01/07/2019 (1,029,094) 56,102 (255,271) (1,228,263) £0.7608Income GBP Class £ 01/07/2019 (509,535) 50,252 (208,552) (667,835) £0.5357Institutional SharesInstitutional Accumulation GBP Class £ 01/07/2019 (17,653,508) 2,528,810 (7,195,440) (22,320,138) £0.7144Institutional Income GBP Class £ 01/07/2019 (5,296,660) 872,930 (1,219,484) (5,643,214) £0.5663Selling Agent SharesQZ GBP Class £ 01/07/2019 (1,754) – – (1,754) £0.1183SI GBP Class £ 02/01/2019 (959,059) – – (959,059) £0.2570
£ 01/07/2019 (546,867) 91,591 (495,040) (950,316) £0.2519Z GBP Class £ 01/07/2019 (1,440,759) 2,447,955 (2,900,570) (1,893,374) £0.5830ZII GBP Class £ 01/07/2019 (3,869,503) 2,465,875 (537,232) (1,940,860) £0.4719Distribution SharesMonthly Ordinary GBP Class £ 01/08/2018 (194,591) – – (194,591) £0.0335
£ 03/09/2018 (216,635) – – (216,635) £0.0362£ 01/10/2018 (256,843) – – (256,843) £0.0425£ 01/11/2018 (228,176) – – (228,176) £0.0376£ 03/12/2018 (263,862) – – (263,862) £0.0433£ 02/01/2019 (197,473) – – (197,473) £0.0324£ 01/02/2019 (193,100) – – (193,100) £0.0320£ 01/03/2019 (183,439) – – (183,439) £0.0305£ 01/04/2019 (287,963) – – (287,963) £0.0482£ 02/05/2019 (220,838) – – (220,838) £0.0365£ 04/06/2019 (236,086) – – (236,086) £0.0383£ 01/07/2019 (219,527) 25,583 (16,411) (210,355) £0.0356
Quarterly Institutional GBP Class £ 01/10/2018 (216,028) – – (216,028) £0.1197£ 02/01/2019 (207,877) – – (207,877) £0.1210£ 01/04/2019 (184,850) – – (184,850) £0.1183£ 01/07/2019 (170,021) 16,963 (41,927) (194,985) £0.1178
Quarterly Ordinary GBP Class £ 01/10/2018 (2,126,155) – – (2,126,155) £0.1129£ 02/01/2019 (2,212,423) – – (2,212,423) £0.1139£ 01/04/2019 (2,041,780) – – (2,041,780) £0.1114£ 01/07/2019 (1,807,727) 276,044 (405,445) (1,937,128) £0.1110
GAM Star Credit Opportunities (USD)Ordinary SharesAccumulation USD Class US$ 01/07/2019 (17,981,013) 1,454,735 (6,614,693) (23,140,971) US$0.6775Accumulation R USD Class US$ 01/07/2019 (55,596) 42 – (55,554) US$0.4394Income USD Class US$ 01/07/2019 (3,105,434) 157,603 (1,303,605) (4,251,436) US$0.4917Institutional SharesInstitutional Accumulation Hedged ILS Class ILS 01/07/2019 (292,267) 29,318 (49,876) (312,825) ILS1.7131Institutional Accumulation USD Class US$ 01/07/2019 (60,127,599) 7,351,113 (17,654,350) (70,430,836) US$0.6641Institutional Income USD Class US$ 01/07/2019 (1,054,603) 46,559 (28,165) (1,036,209) US$0.4300Selling Agent SharesMCO II AUD Class AUD 01/08/2018 (488,775) – – (488,775) AUD0.0431
AUD 03/09/2018 (442,702) – – (442,702) AUD0.0405AUD 01/10/2018 (395,633) – – (395,633) AUD0.0369AUD 01/11/2018 (398,485) – – (398,485) AUD0.0386AUD 03/12/2018 (419,390) – – (419,390) AUD0.0400AUD 02/01/2019 (377,618) – – (377,618) AUD0.0376
Notes to the Financial Statements
18. Dividend distribution, continued
At 30 June 2019
CCY
First Valuation date
Ex-DividendGross
AmountIncome
receivedIncome
deductedNet
DistributionDividend
per share
GAM Star Credit Opportunities (USD), continuedAUD 01/02/2019 (359,080) – – (359,080) AUD0.0357AUD 01/03/2019 (348,221) – – (348,221) AUD0.0359AUD 01/04/2019 (329,796) – – (329,796) AUD0.0356AUD 02/05/2019 (323,508) – – (323,508) AUD0.0350AUD 04/06/2019 (318,487) – – (318,487) AUD0.0351AUD 01/07/2019 (272,523) 21,845 (39,192) (289,870) AUD0.0294
A USD Class US$ 01/07/2019 (2,708,467) 183,594 (979,384) (3,504,257) US$0.4774C USD Class US$ 01/07/2019 (251,347) 20,814 (122,622) (353,155) US$0.4139MO USD Class US$ 01/08/2018 (3,150,063) – – (3,150,063) US$0.0387
US$ 03/09/2018 (2,764,205) – – (2,764,205) US$0.0358US$ 01/10/2018 (2,595,809) – – (2,595,809) US$0.0349US$ 01/11/2018 (2,569,887) – – (2,569,887) US$0.0358US$ 03/12/2018 (2,693,478) – – (2,693,478) US$0.0387US$ 02/01/2019 (2,516,076) – – (2,516,076) US$0.0370US$ 01/02/2019 (2,355,144) – – (2,355,144) US$0.0363US$ 01/03/2019 (2,312,705) – – (2,312,705) US$0.0359US$ 01/04/2019 (2,234,991) – – (2,234,991) US$0.0359US$ 02/05/2019 (2,015,133) – – (2,015,133) US$0.0342US$ 04/06/2019 (1,890,598) – – (1,890,598) US$0.0349US$ 01/07/2019 (1,588,586) 114,645 (741,514) (2,215,455) US$0.0312
SI USD Class US$ 02/01/2019 (3,341,553) – – (3,341,553) US$0.2429US$ 01/07/2019 (4,638,504) 1,189,838 (1,100,480) (4,549,146) US$0.2293
SO USD Class US$ 02/01/2019 (314,571) – – (314,571) US$0.2477US$ 01/07/2019 (272,848) 2,095 (80,727) (351,480) US$0.2333
MCZ SGD Class SGD 01/08/2018 (29,088) – – (29,088) SGD0.0409SGD 03/09/2018 (26,995) – – (26,995) SGD0.0382SGD 01/10/2018 (26,080) – – (26,080) SGD0.0362SGD 01/11/2018 (26,088) – – (26,088) SGD0.0367SGD 03/12/2018 (27,264) – – (27,264) SGD0.0380SGD 02/01/2019 (26,577) – – (26,577) SGD0.0368SGD 01/02/2019 (26,940) – – (26,940) SGD0.0368SGD 01/03/2019 (27,319) – – (27,319) SGD0.0375SGD 01/04/2019 (27,398) – – (27,398) SGD0.0377
SGD 02/05/2019 (27,503) – – (27,503) SGD0.0372SGD 04/06/2019 (28,151) – – (28,151) SGD0.0385SGD 01/07/2019 (26,407) 470 – (25,937) SGD0.0355
MO II SGD Class SGD 01/08/2018 (875,039) – – (875,039) SGD0.0449SGD 03/09/2018 (780,573) – – (780,573) SGD0.0423SGD 01/10/2018 (719,160) – – (719,160) SGD0.0397SGD 01/11/2018 (713,707) – – (713,707) SGD0.0403SGD 03/12/2018 (710,360) – – (710,360) SGD0.0418SGD 02/01/2019 (678,014) – – (678,014) SGD0.0405SGD 01/02/2019 (644,429) – – (644,429) SGD0.0404SGD 01/03/2019 (644,834) – – (644,834) SGD0.0412SGD 01/04/2019 (629,863) – – (629,863) SGD0.0414SGD 02/05/2019 (610,816) – – (610,816) SGD0.0409SGD 04/06/2019 (607,444) – – (607,444) SGD0.0424SGD 01/07/2019 (561,363) 14,315 (102,927) (649,975) SGD0.0390
Distribution SharesIncome II AQ USD Class US$ 01/10/2018 (900,078) – – (900,078) US$0.1345
US$ 02/01/2019 (604,821) – – (604,821) US$0.1355US$ 01/04/2019 (557,977) – – (557,977) US$0.1308US$ 01/07/2019 (473,882) 21,062 (223,797) (676,617) US$0.1250
Income II PMCO USD Class US$ 01/08/2018 (51,416) – – (51,416) US$0.0489US$ 03/09/2018 (47,615) – – (47,615) US$0.0456US$ 01/10/2018 (43,020) – – (43,020) US$0.0434US$ 01/11/2018 (44,191) – – (44,191) US$0.0460

376
GAM Star Fund p.l.c.
Notes to the Financial Statements
18. Dividend distribution, continued
At 30 June 2019
CCY
First Valuation date
Ex-DividendGross
AmountIncome
receivedIncome
deductedNet
DistributionDividend
per share
GAM Star Credit Opportunities (USD), continuedUS$ 03/12/2018 (41,419) – – (41,419) US$0.0472US$ 02/01/2019 (36,061) – – (36,061) US$0.0459US$ 01/02/2019 (35,747) – – (35,747) US$0.0455US$ 01/03/2019 (34,568) – – (34,568) US$0.0440US$ 01/04/2019 (34,208) – – (34,208) US$0.0443US$ 02/05/2019 (31,478) – – (31,478) US$0.0441US$ 04/06/2019 (24,512) – – (24,512) US$0.0441US$ 01/07/2019 (20,797) – (9,967) (30,764) US$0.0398
Monthly Institutional SGD Class SGD 01/08/2018 (14,785) – – (14,785) SGD0.0409SGD 03/09/2018 (13,756) – – (13,756) SGD0.0383SGD 01/10/2018 (7,739) – – (7,739) SGD0.0362SGD 01/11/2018 (7,762) – – (7,762) SGD0.0368SGD 03/12/2018 (23,456) – – (23,456) SGD0.0382SGD 02/01/2019 (22,808) – – (22,808) SGD0.0369SGD 01/02/2019 (21,454) – – (21,454) SGD0.0368SGD 01/03/2019 (21,814) – – (21,814) SGD0.0376SGD 01/04/2019 (21,877) – – (21,877) SGD0.0378SGD 02/05/2019 (21,481) – – (21,481) SGD0.0373SGD 04/06/2019 (22,099) – – (22,099) SGD0.0388SGD 01/07/2019 (20,912) 9,897 (2,543) (13,558) SGD0.0356
Monthly Institutional USD Class US$ 03/09/2018 (60,736) – – (60,736) US$0.0363US$ 01/10/2018 (61,805) – – (61,805) US$0.0365US$ 01/11/2018 (65,322) – – (65,322) US$0.0379US$ 03/12/2018 (63,223) – – (63,223) US$0.0403US$ 02/01/2019 (54,963) – – (54,963) US$0.0387US$ 01/02/2019 (50,305) – – (50,305) US$0.0381US$ 01/03/2019 (49,513) – – (49,513) US$0.0375US$ 01/04/2019 (48,763) – – (48,763) US$0.0375US$ 02/05/2019 (46,477) – – (46,477) US$0.0363US$ 04/06/2019 (47,117) – – (47,117) US$0.0368US$ 01/07/2019 (40,681) 5,599 (10,863) (45,945) US$0.0330
Quarterly Z Class Inc AUD Class AUD 01/10/2018 (2,415) – – (2,415) AUD0.1135AUD 02/01/2019 (2,589) – – (2,589) AUD0.1259AUD 01/04/2019 (2,476) – – (2,476) AUD0.0775
Quarterly Accumulation USD Class US$ 01/07/2019 (773) – (3,704) (4,477) US$0.1167Quarterly Income USD Class US$ 01/10/2018 (82,923) – – (82,923) US$0.1139
US$ 02/01/2019 (84,015) – – (84,015) US$0.1158US$ 01/04/2019 (40,096) – – (40,096) US$0.1118US$ 01/07/2019 (25,100) 918 (17,244) (41,426) US$0.1054
GAM Star Global DefensiveOrdinary SharesAccumulation GBP Class £ 01/07/2019 (57) 195 (51) 87 £0.0256Institutional SharesInstitutional Accumulation AUD Class AUD 01/07/2019 (159) – (1,181) (1,340) AUD0.0412Institutional Accumulation EUR Class € 01/07/2019 (2,514) 2,468 (114) (160) €0.0568Institutional Accumulation GBP Class £ 01/07/2019 (36,905) 26,414 (41,297) (51,788) £0.0720Institutional Accumulation USD Class US$ 01/07/2019 (23,334) 22,574 (14,681) (15,441) US$0.0627Selling Agent SharesU AUD Class AUD 01/07/2019 (34) – – (34) AUD0.0019Z EUR Class € 01/07/2019 (3,634) 4,003 (64) 305 €0.0826U EUR Class € 01/07/2019 (192) – (1,065) (1,257) €0.0024U GBP Class £ 01/07/2019 (283) 3,288 (9,288) (6,283) £0.0011Z GBP Class £ 01/07/2019 (16,938) 13,096 (18,571) (22,413) £0.0873

377
Notes to the Financial Statements
18. Dividend distribution, continued
At 30 June 2019
CCY
First Valuation date
Ex-DividendGross
AmountIncome
receivedIncome
deductedNet
DistributionDividend
per share
GAM Star Credit Opportunities (USD), continuedUS$ 03/12/2018 (41,419) – – (41,419) US$0.0472US$ 02/01/2019 (36,061) – – (36,061) US$0.0459US$ 01/02/2019 (35,747) – – (35,747) US$0.0455US$ 01/03/2019 (34,568) – – (34,568) US$0.0440US$ 01/04/2019 (34,208) – – (34,208) US$0.0443US$ 02/05/2019 (31,478) – – (31,478) US$0.0441US$ 04/06/2019 (24,512) – – (24,512) US$0.0441US$ 01/07/2019 (20,797) – (9,967) (30,764) US$0.0398
Monthly Institutional SGD Class SGD 01/08/2018 (14,785) – – (14,785) SGD0.0409SGD 03/09/2018 (13,756) – – (13,756) SGD0.0383SGD 01/10/2018 (7,739) – – (7,739) SGD0.0362SGD 01/11/2018 (7,762) – – (7,762) SGD0.0368SGD 03/12/2018 (23,456) – – (23,456) SGD0.0382SGD 02/01/2019 (22,808) – – (22,808) SGD0.0369SGD 01/02/2019 (21,454) – – (21,454) SGD0.0368SGD 01/03/2019 (21,814) – – (21,814) SGD0.0376SGD 01/04/2019 (21,877) – – (21,877) SGD0.0378SGD 02/05/2019 (21,481) – – (21,481) SGD0.0373SGD 04/06/2019 (22,099) – – (22,099) SGD0.0388SGD 01/07/2019 (20,912) 9,897 (2,543) (13,558) SGD0.0356
Monthly Institutional USD Class US$ 03/09/2018 (60,736) – – (60,736) US$0.0363US$ 01/10/2018 (61,805) – – (61,805) US$0.0365US$ 01/11/2018 (65,322) – – (65,322) US$0.0379US$ 03/12/2018 (63,223) – – (63,223) US$0.0403US$ 02/01/2019 (54,963) – – (54,963) US$0.0387US$ 01/02/2019 (50,305) – – (50,305) US$0.0381US$ 01/03/2019 (49,513) – – (49,513) US$0.0375US$ 01/04/2019 (48,763) – – (48,763) US$0.0375US$ 02/05/2019 (46,477) – – (46,477) US$0.0363US$ 04/06/2019 (47,117) – – (47,117) US$0.0368US$ 01/07/2019 (40,681) 5,599 (10,863) (45,945) US$0.0330
Quarterly Z Class Inc AUD Class AUD 01/10/2018 (2,415) – – (2,415) AUD0.1135AUD 02/01/2019 (2,589) – – (2,589) AUD0.1259AUD 01/04/2019 (2,476) – – (2,476) AUD0.0775
Quarterly Accumulation USD Class US$ 01/07/2019 (773) – (3,704) (4,477) US$0.1167Quarterly Income USD Class US$ 01/10/2018 (82,923) – – (82,923) US$0.1139
US$ 02/01/2019 (84,015) – – (84,015) US$0.1158US$ 01/04/2019 (40,096) – – (40,096) US$0.1118US$ 01/07/2019 (25,100) 918 (17,244) (41,426) US$0.1054
GAM Star Global DefensiveOrdinary SharesAccumulation GBP Class £ 01/07/2019 (57) 195 (51) 87 £0.0256Institutional SharesInstitutional Accumulation AUD Class AUD 01/07/2019 (159) – (1,181) (1,340) AUD0.0412Institutional Accumulation EUR Class € 01/07/2019 (2,514) 2,468 (114) (160) €0.0568Institutional Accumulation GBP Class £ 01/07/2019 (36,905) 26,414 (41,297) (51,788) £0.0720Institutional Accumulation USD Class US$ 01/07/2019 (23,334) 22,574 (14,681) (15,441) US$0.0627Selling Agent SharesU AUD Class AUD 01/07/2019 (34) – – (34) AUD0.0019Z EUR Class € 01/07/2019 (3,634) 4,003 (64) 305 €0.0826U EUR Class € 01/07/2019 (192) – (1,065) (1,257) €0.0024U GBP Class £ 01/07/2019 (283) 3,288 (9,288) (6,283) £0.0011Z GBP Class £ 01/07/2019 (16,938) 13,096 (18,571) (22,413) £0.0873
Notes to the Financial Statements
18. Dividend distribution, continued
At 30 June 2019
CCY
First Valuation date
Ex-DividendGross
AmountIncome
receivedIncome
deductedNet
DistributionDividend
per share
GAM Star Emerging EquityOrdinary SharesAccumulation EUR Class € 01/07/2019 (7,473) 41 (488) (7,920) €0.0585Accumulation GBP Class £ 01/07/2019 (1,068) – (16) (1,084) £0.0662Accumulation USD Class US$ 01/07/2019 (13,459) 124 (907) (14,242) US$0.0511Institutional SharesInstitutional Accumulation GBP Class £ 01/07/2019 (4,131) 607 (1,499) (5,023) £0.1548Institutional Accumulation USD Class US$ 01/07/2019 (99,110) 2,006 (19,103) (116,207) US$0.1074Institutional Income GBP Class £ 01/07/2019 (54,219) 2,141 (6,485) (58,563) £0.1458
GAM Star Emerging Market RatesOrdinary SharesAccumulation EUR Class € 01/07/2019 (351,865) 6,913 (91,119) (436,071) €0.2173Accumulation GBP Class £ 01/07/2019 (3,242) – (4,114) (7,356) £0.0221Accumulation USD Class US$ 01/07/2019 (14,139) 25 (124) (14,238) US$0.2019Institutional SharesInstitutional Accumulation EUR Class € 01/07/2019 (697,700) 118,436 (363,134) (942,398) €0.2751Institutional Accumulation USD Class US$ 01/07/2019 (120,793) 33,356 (3,912) (91,349) US$0.2576Institutional Income GBP Class £ 01/07/2019 (30,024) 8 (1,821) (31,837) £0.2347Selling Agent SharesA EUR Class € 01/07/2019 (6,903) 1,388 (1,270) (6,785) €0.1471Z GBP Class £ 01/07/2019 (323) – (1) (324) £0.3450Z II GBP Class £ 01/07/2019 (24,308) 744 (5,174) (28,738) £0.3346Z USD Class US$ 01/07/2019 (176,397) 18,723 (141,868) (299,542) US$0.3505Z II USD Class US$ 01/07/2019 (49,480) – – (49,480) US$0.1275
GAM Star European EquityOrdinary SharesAccumulation CHF Class SFr 01/07/2019 (10,009) 149 (524) (10,384) SFr0.1263Accumulation EUR Class € 01/07/2019 (92,541) 26 (2,742) (95,257) €4.0594Accumulation GBP Class £ 01/07/2019 (25,648) 136 (59) (25,571) £0.0406Accumulation USD Class US$ 01/07/2019 (7,906) – (4,120) (12,026) US$0.2839Income EUR Class € 01/07/2019 (16,242) 8 (1,046) (17,280) €3.6578Income GBP Class £ 01/07/2019 (2,487) 3 (33) (2,517) £0.0342Income USD Class US$ 01/07/2019 (12,486) – – (12,486) US$0.2520Institutional SharesInstitutional Accumulation EUR Class € 01/07/2019 (56,491) 2,366 (7,504) (61,629) €0.4167Institutional Accumulation USD Class US$ 01/07/2019 (9,788) – (469) (10,257) US$0.1870Selling Agent SharesA EUR Class € 01/07/2019 (46,855) 555 (2,151) (48,451) €0.1446C EUR Class € 01/07/2019 (4,008) – – (4,008) €0.1131Z EUR Class € 01/07/2019 (4,182,693) 2,610 (310,835) (4,490,918) €0.3339
GAM Star Flexible Global PortfolioOrdinary SharesAccumulation CHF Class SFr 01/07/2019 (1,189) – (19,736) (20,925) SFr0.1010Accumulation EUR Class € 01/07/2019 (69,293) – (85,366) (154,659) €0.1110Accumulation GBP Class £ 01/07/2019 (31,627) 217 (58,235) (89,645) £0.1123Accumulation USD Class US$ 01/07/2019 (40,679) 8,031 (32,926) (65,574) US$0.1131Institutional SharesInstitutional Accumulation EUR Class € 01/07/2019 (93,802) – – (93,802) €0.1060Institutional Accumulation GBP Class £ 01/07/2019 (80,149) 48,047 (30,435) (62,537) £0.1165
GAM Star Global RatesSelling Agent SharesAccumulation Z GBP Class £ 01/07/2019 (7,552) 1,314 (473) (6,711) £0.0543
GAM Star Global SelectorOrdinary SharesAccumulation II GBP Class £ 01/07/2019 (41) – – (41) £0.0044Institutional SharesInstitutional Accumulation II USD Class US$ 01/07/2019 (1,716) – – (1,716) US$0.0328

378
GAM Star Fund p.l.c.
Notes to the Financial Statements
18. Dividend distribution, continued
At 30 June 2019
CCY
First Valuation date
Ex-DividendGross
AmountIncome
receivedIncome
deductedNet
DistributionDividend
per share
GAM Star Global GrowthSelling Agent SharesZ GBP Class £ 01/07/2019 (13,449) 9,553 (20,728) (24,624) £0.0115Z EUR Class € 01/07/2019 (365) 693 (49) 279 €0.0068
GAM Star Japan LeadersOrdinary SharesIncome GBP Class £ 01/07/2019 (32,174) – – (32,174) £0.2092Institutional SharesInstitutional Accumulation CHF Class SFr 01/07/2019 (14,897,029) 1,386,689 (814,681) (14,325,021) SFr0.0798Institutional Accumulation EUR Class € 01/07/2019 (21,459,690) 6,417,775 (12,977,605) (28,019,520) €0.0515Institutional Accumulation GBP Class £ 01/07/2019 (7,410,746) 1,507,577 (761,191) (6,664,360) £0.1182Institutional Accumulation JPY Class ¥ 01/07/2019 (11,626,309) 223,889 (47,174) (11,449,594) ¥6.7135Institutional Accumulation USD Class US$ 01/07/2019 (18,433,324) 12,450,648 (54,756,708) (60,739,384) US$0.0923Institutional Hedged Accumulation EUR Class € 01/07/2019 (13,664,323) 2,216,648 (3,006,698) (14,454,373) €0.0616Institutional Hedged Accumulation USD Class US$ 01/07/2019 (2,377,064) 135,535 (2,096,000) (4,337,529) US$0.0742Institutional Hedged Income EUR Class € 01/07/2019 (2,555,358) 456,969 (945,001) (3,043,390) €0.0460Institutional Income GBP Class £ 01/07/2019 (1,402,604) 54,063 (161,102) (1,509,643) £0.1035Selling Agent SharesZ JPY Class ¥ 01/07/2019 (96,253,180) 6,691,758 (2,198,190) (91,759,612) ¥8.2182Z CHF Class SFr 01/07/2019 (239,982) – – (239,982) SFr0.0801
GAM Star MBS Total ReturnOrdinary SharesAccumulation Hedged CHF Class SFr 01/07/2019 (3,438) 206 (4,628) (7,860) SFr0.3958Accumulation Hedged EUR Class € 01/07/2019 (437,992) 95,846 (248,931) (591,077) €0.4083Accumulation Hedged SEK Class SEK 01/07/2019 (320) – (575) (895) SEK3.9973Accumulation USD Class US$ 01/07/2019 (7,006,858) 1,655,383 (1,351,432) (6,702,907) US$0.4341Income USD Class US$ 01/07/2019 (954,997) 99,402 (113,172) (968,767) US$0.3863Institutional SharesInstitutional Accumulation GBP Class £ 01/07/2019 (3,774,773) 856,986 (1,050,305) (3,968,092) £0.5028Institutional Accumulation USD Class US$ 01/07/2019 (12,542,723) 2,339,888 (3,524,819) (13,727,654) US$0.5208Institutional Hedged Accumulation CHF Class SFr 01/07/2019 (36,643) 5,945 (45,477) (76,175) SFr0.4677Institutional Hedged Accumulation EUR Class € 01/07/2019 (12,550,125) 4,994,805 (4,093,238) (11,648,558) €0.4919Institutional Hedged Accumulation JPY Class ¥ 01/07/2019 (247,932) 168,173 (415) (80,174) ¥43.5142Institutional Hedged Accumulation SEK Class SEK 01/07/2019 (1,359,136) 261,548 (84,739) (1,182,327) SEK4.6613Institutional Hedged Income EUR Class € 01/07/2019 (594,232) 61,946 (295,395) (827,681) €0.4502Institutional Income GBP Class £ 01/07/2019 (113,117) 14,035 (11,085) (110,167) £0.4611Institutional Income USD Class US$ 01/07/2019 (492,444) 32,924 (109,188) (568,708) US$0.4887Z II USD Class US$ 01/07/2019 (15,399) – – (15,399) US$0.1720Selling Agent SharesA EUR Class € 01/07/2019 (43,062) 9,833 (42,255) (75,484) €0.3600C EUR Class € 01/07/2019 (111,764) 1,736 (41,088) (151,116) €0.3099U EUR Class € 01/07/2019 (159,785) – (977) (160,762) €0.4707W GBP Class £ 01/07/2019 (2,498,702) 332,069 (584,955) (2,751,588) £0.4437A USD Class US$ 01/07/2019 (10,917) – (42) (10,959) US$0.3708Z USD Class US$ 01/07/2019 (8,760,958) 2,444,493 (6,634,458) (12,950,923) US$0.4644Income II CQ USD Class US$ 01/04/2019 (28,318) – – (28,318) US$0.1315
US$ 02/01/2019 (2,995) – – (2,995) US$0.1293US$ 01/10/2018 (2,091) – – (2,091) US$0.1196US$ 01/07/2019 (40,592) 12,920 (91) (27,763) US$0.1341
R SharesAccumulation Hedge R EUR Class € 01/07/2019 (699,797) 157,267 (199,213) (741,743) €0.4530Accumulation R USD Class US$ 01/07/2019 (6,313) – – (6,313) US$0.4073
GAM Systematic Alternative Risk PremiaInstitutional SharesInstitutional Accumulation EUR Class € 01/07/2019 (937,655) 106,573 (191,945) (1,023,027) €0.1701Institutional Accumulation GBP Class £ 01/07/2019 (4,027) 316 (4,400) (8,111) £0.1799Institutional Accumulation JPY Class ¥ 01/07/2019 (145,488) – (11,202) (156,690) ¥16.5147Institutional Accumulation SEK Class SEK 01/07/2019 (15) – – (15) SEK1.7964

379
Notes to the Financial Statements
18. Dividend distribution, continued
At 30 June 2019
CCY
First Valuation date
Ex-DividendGross
AmountIncome
receivedIncome
deductedNet
DistributionDividend
per share
GAM Star Global GrowthSelling Agent SharesZ GBP Class £ 01/07/2019 (13,449) 9,553 (20,728) (24,624) £0.0115Z EUR Class € 01/07/2019 (365) 693 (49) 279 €0.0068
GAM Star Japan LeadersOrdinary SharesIncome GBP Class £ 01/07/2019 (32,174) – – (32,174) £0.2092Institutional SharesInstitutional Accumulation CHF Class SFr 01/07/2019 (14,897,029) 1,386,689 (814,681) (14,325,021) SFr0.0798Institutional Accumulation EUR Class € 01/07/2019 (21,459,690) 6,417,775 (12,977,605) (28,019,520) €0.0515Institutional Accumulation GBP Class £ 01/07/2019 (7,410,746) 1,507,577 (761,191) (6,664,360) £0.1182Institutional Accumulation JPY Class ¥ 01/07/2019 (11,626,309) 223,889 (47,174) (11,449,594) ¥6.7135Institutional Accumulation USD Class US$ 01/07/2019 (18,433,324) 12,450,648 (54,756,708) (60,739,384) US$0.0923Institutional Hedged Accumulation EUR Class € 01/07/2019 (13,664,323) 2,216,648 (3,006,698) (14,454,373) €0.0616Institutional Hedged Accumulation USD Class US$ 01/07/2019 (2,377,064) 135,535 (2,096,000) (4,337,529) US$0.0742Institutional Hedged Income EUR Class € 01/07/2019 (2,555,358) 456,969 (945,001) (3,043,390) €0.0460Institutional Income GBP Class £ 01/07/2019 (1,402,604) 54,063 (161,102) (1,509,643) £0.1035Selling Agent SharesZ JPY Class ¥ 01/07/2019 (96,253,180) 6,691,758 (2,198,190) (91,759,612) ¥8.2182Z CHF Class SFr 01/07/2019 (239,982) – – (239,982) SFr0.0801
GAM Star MBS Total ReturnOrdinary SharesAccumulation Hedged CHF Class SFr 01/07/2019 (3,438) 206 (4,628) (7,860) SFr0.3958Accumulation Hedged EUR Class € 01/07/2019 (437,992) 95,846 (248,931) (591,077) €0.4083Accumulation Hedged SEK Class SEK 01/07/2019 (320) – (575) (895) SEK3.9973Accumulation USD Class US$ 01/07/2019 (7,006,858) 1,655,383 (1,351,432) (6,702,907) US$0.4341Income USD Class US$ 01/07/2019 (954,997) 99,402 (113,172) (968,767) US$0.3863Institutional SharesInstitutional Accumulation GBP Class £ 01/07/2019 (3,774,773) 856,986 (1,050,305) (3,968,092) £0.5028Institutional Accumulation USD Class US$ 01/07/2019 (12,542,723) 2,339,888 (3,524,819) (13,727,654) US$0.5208Institutional Hedged Accumulation CHF Class SFr 01/07/2019 (36,643) 5,945 (45,477) (76,175) SFr0.4677Institutional Hedged Accumulation EUR Class € 01/07/2019 (12,550,125) 4,994,805 (4,093,238) (11,648,558) €0.4919Institutional Hedged Accumulation JPY Class ¥ 01/07/2019 (247,932) 168,173 (415) (80,174) ¥43.5142Institutional Hedged Accumulation SEK Class SEK 01/07/2019 (1,359,136) 261,548 (84,739) (1,182,327) SEK4.6613Institutional Hedged Income EUR Class € 01/07/2019 (594,232) 61,946 (295,395) (827,681) €0.4502Institutional Income GBP Class £ 01/07/2019 (113,117) 14,035 (11,085) (110,167) £0.4611Institutional Income USD Class US$ 01/07/2019 (492,444) 32,924 (109,188) (568,708) US$0.4887Z II USD Class US$ 01/07/2019 (15,399) – – (15,399) US$0.1720Selling Agent SharesA EUR Class € 01/07/2019 (43,062) 9,833 (42,255) (75,484) €0.3600C EUR Class € 01/07/2019 (111,764) 1,736 (41,088) (151,116) €0.3099U EUR Class € 01/07/2019 (159,785) – (977) (160,762) €0.4707W GBP Class £ 01/07/2019 (2,498,702) 332,069 (584,955) (2,751,588) £0.4437A USD Class US$ 01/07/2019 (10,917) – (42) (10,959) US$0.3708Z USD Class US$ 01/07/2019 (8,760,958) 2,444,493 (6,634,458) (12,950,923) US$0.4644Income II CQ USD Class US$ 01/04/2019 (28,318) – – (28,318) US$0.1315
US$ 02/01/2019 (2,995) – – (2,995) US$0.1293US$ 01/10/2018 (2,091) – – (2,091) US$0.1196US$ 01/07/2019 (40,592) 12,920 (91) (27,763) US$0.1341
R SharesAccumulation Hedge R EUR Class € 01/07/2019 (699,797) 157,267 (199,213) (741,743) €0.4530Accumulation R USD Class US$ 01/07/2019 (6,313) – – (6,313) US$0.4073
GAM Systematic Alternative Risk PremiaInstitutional SharesInstitutional Accumulation EUR Class € 01/07/2019 (937,655) 106,573 (191,945) (1,023,027) €0.1701Institutional Accumulation GBP Class £ 01/07/2019 (4,027) 316 (4,400) (8,111) £0.1799Institutional Accumulation JPY Class ¥ 01/07/2019 (145,488) – (11,202) (156,690) ¥16.5147Institutional Accumulation SEK Class SEK 01/07/2019 (15) – – (15) SEK1.7964
Notes to the Financial Statements
18. Dividend distribution, continued
At 30 June 2019
CCY
First Valuation date
Ex-DividendGross
AmountIncome
receivedIncome
deductedNet
DistributionDividend
per share
GAM Systematic Alternative Risk Premia, continuedInstitutional Accumulation USD Class US$ 01/07/2019 (51,964) 1 (9,298) (61,261) US$0.1774Hedged Institutional Accumulation CHF Class SFr 01/07/2019 (346,697) 35,124 (148,363) (459,936) SFr0.1472Selling Agent SharesZ CHF Class SFr 01/07/2019 (1,161,050) 141,895 (142,346) (1,161,501) SFr0.1503C EUR Class € 01/07/2019 (963) – (273) (1,236) €0.0114Z EUR Class € 01/07/2019 (387,101) 10,300 (33,618) (410,419) €0.1546X USD Class US$ 01/07/2019 (819,462) 8,538 (86,488) (897,412) US$133.5516
GAM Systematic Core MacroSelling Agent SharesZ GBP Class £ 01/07/2019 (6,848) – (15,044) (21,892) £0.0438Z USD Class US$ 01/07/2019 (448) 4,486 (6,655) (2,617) US$0.0464
GAM Star Tactical OpportunitiesInstitutional SharesInstitutional Accumulation CHF Class SFr 01/07/2019 (999) – (4,922) (5,921) SFr0.0651Institutional Accumulation EUR Class € 01/07/2019 (93,936) 38 (10,514) (104,412) €0.0638Institutional Accumulation GBP Class £ 01/07/2019 (27,809) 4,247 (6,494) (30,056) £0.0673Institutional Accumulation USD Class US$ 01/07/2019 (129,597) 109,616 (26,015) (45,996) US$0.0683
GAM Star Target ReturnInstitutional SharesInstitutional Accumulation CHF Class SFr 01/07/2019 (13) 4 (1,337) (1,346) SFr0.0649Institutional Accumulation EUR Class € 01/07/2019 (13,796) 103 (9,463) (23,156) €0.0665Institutional Accumulation GBP Class £ 01/07/2019 (2,026) 570 (5,801) (7,257) £0.0689Institutional Accumulation USD Class US$ 01/07/2019 (1,659) 12,487 (52,538) (41,710) US$0.0704Selling Agent SharesZII CHF Class SFr 01/07/2019 (546) – – (546) SFr0.0816X EUR Class € 01/07/2019 (11,197) – (2,067) (13,264) €84.1714ZII EUR Class € 01/07/2019 (23,742) 224 – (23,518) €0.0829ZII GBP Class £ 01/07/2019 (18,829) 2,006 (3,738) (20,561) £0.0840ZII USD Class US$ 01/07/2019 (178,281) 34,304 (5,378) (149,355) US$0.0810
GAM Star Target Return PlusInstitutional SharesInstitutional Accumulation GBP Class £ 01/07/2019 (9,021) – – (9,021) £0.0099
GAM Star Disruptive GrowthSelling Agent SharesAccumulation Z GBP II Class £ 01/07/2019 (603) – (186) (789) £0.0723
GAM Star Worldwide EquityOrdinary SharesAccumulation EUR Class € 01/07/2019 (12,085) – (773) (12,858) €0.0506Accumulation GBP Class £ 01/07/2019 (20,600) – (107) (20,707) £0.0094Accumulation USD Class US$ 01/07/2019 (132,819) 237 (1) (132,583) US$16.3272Income GBP Class £ 01/07/2019 (128) – – (128) £0.0084Income USD Class US$ 01/07/2019 (49,196) – (608) (49,804) US$6.4353Institutional SharesInstitutional Accumulation USD Class US$ 01/07/2019 (93,806) – (7,325) (101,131) US$0.0953Institutional Income GBP Class £ 01/07/2019 (30,621) – (8,704) (39,325) £0.0947Institutional Income USD Class US$ 01/07/2019 (3,723) – (83) (3,806) US$0.0955Selling Agent SharesZII GBP Class £ 01/07/2019 (4,723) – – (4,723) £0.1263A USD Class US$ 01/07/2019 (1,021) 7 (14) (1,028) US$0.0462

380
GAM Star Fund p.l.c.
Notes to the Financial Statements
18. Dividend distribution, continued
At 30 June 2019
CCY
First Valuation date
Ex-DividendGross
AmountIncome
receivedIncome
deductedNet
DistributionDividend
per share
GAM Systematic Dynamic Credit** Institutional SharesInstitutional Accumulation USD Class US$ 01/07/2019 (13,234) 4,070 (4,070) (13,234) US$0.0649Selling Agent SharesZ EUR Accumulation € 01/07/2019 (60,475) 35,120 (15,846) (41,201) €0.1169Z GBP Accumulation £ 01/07/2019 (24,796) 12,973 (16,550) (28,373) £0.1213Z USD Accumulation US$ 01/07/2019 (24,220) 12,663 (19,761) (31,318) US$0.1189Non UK RFSAccumulation USD Class US$ 01/07/2019 (13,993) 4,368 (4,368) (13,993) US$0.0692
19. Contingent liabilities
The Directors are not aware of any contingent liabilities.
20. Auditors remuneration
The fees charged by the auditors for the year ended 30 June 2020 and the year ended 30 June 2019 are as follows:
Auditor’s remuneration*
30 June 2020US$
30 June 2019US$
Statutory audit 588,230 651,359Other assurance services – –Tax advisory services 198,299 189,614Other non audit services 23,600 –
810,129 840,973
* Figures are shown before Value Added Tax.
21. Significant events during the year
On 5 July 2019 Kaspar Boehni was appointed as Director of the Company.
GAM Star Absolute Return Macro on receipt of redemption requests of all remaining shares closed on 17 July 2019.
On 17 July 2019, GAM Star Dynamic Global Bond completed a full compulsory repurchase of shares.
On 23 July 2019, the following Funds completed a full compulsory redemption of shares.
– GAM Star Absolute Return Bond– GAM Star Absolute Return Bond Plus– GAM Star Absolute Return Bond Defender
These Funds have completed the disposal of all investments and subsequent payments to the shareholders of the Funds.
GAM Star Target Return Plus on receipt of redemption requests of all remaining shares closed on 21 August 2019.
Effective from 6 September 2019 the names of the following Funds changed:
– GAM Star Balanced to GAM Star Global Balanced– GAM Star Cautious to GAM Star Global Cautious– GAM Star Defensive to GAM Star Global Defensive– GAM Star Dynamic Growth to GAM Star Global Dynamic Growth– GAM Star Growth to GAM Star Global Growth
Effective from 1 November 2019 GAM Star Credit Opportunities Fund (USD) SI USD class was listed on the Global Exchange Market of Euronext Dublin.
On 2 January 2020 the Delegate Investment Manager, Cantab Capital Partners LLP changed its name to GAM Systematic LLP.
Effective from 20 January 2020 the name of the following Fund changed:
– GAM Star Technology to GAM Star Disruptive Growth.
With effect from 20 January 2020 and 31 January 2020 there has been addendum added to the Prospectus issued on 6 December 2019.
On 22 January 2020 the followings Funds merged: GAM Star Asia-Pacific Equity into GAM Star Asian Equity and GAM Star Global Selector into GAM Star Worldwide Equity.
** Fund launched during the year.

381
Notes to the Financial Statements
18. Dividend distribution, continued
At 30 June 2019
CCY
First Valuation date
Ex-DividendGross
AmountIncome
receivedIncome
deductedNet
DistributionDividend
per share
GAM Systematic Dynamic Credit** Institutional SharesInstitutional Accumulation USD Class US$ 01/07/2019 (13,234) 4,070 (4,070) (13,234) US$0.0649Selling Agent SharesZ EUR Accumulation € 01/07/2019 (60,475) 35,120 (15,846) (41,201) €0.1169Z GBP Accumulation £ 01/07/2019 (24,796) 12,973 (16,550) (28,373) £0.1213Z USD Accumulation US$ 01/07/2019 (24,220) 12,663 (19,761) (31,318) US$0.1189Non UK RFSAccumulation USD Class US$ 01/07/2019 (13,993) 4,368 (4,368) (13,993) US$0.0692
19. Contingent liabilities
The Directors are not aware of any contingent liabilities.
20. Auditors remuneration
The fees charged by the auditors for the year ended 30 June 2020 and the year ended 30 June 2019 are as follows:
Auditor’s remuneration*
30 June 2020US$
30 June 2019US$
Statutory audit 588,230 651,359Other assurance services – –Tax advisory services 198,299 189,614Other non audit services 23,600 –
810,129 840,973
** Fund launched during the year.
Notes to the Financial Statements
21. Significant events during the year, continued
2020 to date has seen a sharp increase in the volatility of global financial markets due to the COVID-19 pandemic. The Investment Managers are actively monitoring the situation. It should be noted that COVID-19 has, and may continue to have, an adverse effect on the global economy and the economies of certain nations, which may negatively impact the performance of the Funds.
Following the entry into force of the European Union (Withdrawal Agreement) Act 2020, the United Kingdom formally left the European Union on 31 January 2020 and entered into a transition period. The United Kingdom will continue to apply the entire body of European Union law during the transition period, but it will be outside of the European Union’s political institutions. The Company’s Manager, GAM Fund Management Limited has been preparing for a Hard Brexit on the assumption that regulatory cooperation agreement will be in place between EU27 and the FCA by Brexit date. GAM Fund Management Limited is not contracted with any UK entities which are relying on a European passport to continue to provide services and has been appointed as the Global Distributor to GAM’s Irish fund range and therefore it is expected that the impact to business as a result of Brexit will be minimal. All portfolio holdings have been analysed to determine if there would be a potential breach of UCITS investment restrictions/concentration limits as a result of a Hard Brexit and the portfolios will be adjusted accordingly and our investment restrictions coding system has been adjusted to reflect the UK as a non-EEA jurisdiction.
22. Events since year end
On 31 July 2020 Andrew Bates retired as Partner with Dillon Eustace and commenced as a Consultant with Dillon Eustace.
There has been no other events since year ended 30 June 2020.

382
GAM Star Fund p.l.c.
Statement of Depositary Responsibilities
The Depositary is required under the European Communities (Undertakings for Collective Investment in Transferable Securities) Regulations 2011 (as amended), and under the Central Bank (Supervision and Enforcement) Act, 2013 (Section 48(1) (Undertakings for Collective Investment in Transferable Securities) Regulations 2019) (together “UCITS Regulations and Central Bank UCITS Regulations”) to:
1. ensure that the sale, issue, repurchase, redemption and cancellation of shares effected by or on behalf of the Company are carried out in accordance with the UCITS Regulations and Central Bank UCITS Regulations and in accordance with the Memorandum and Articles of Association.
2. ensure that the value of shares is calculated in accordance with the UCITS Regulations and Central Bank UCITS Regulations and the Memorandum and Articles of Association.
3. carry out the instructions of the Company unless they conflict with the UCITS Regulations and Central Bank UCITS Regulations or the Memorandum and Articles of Association.
4. ensure that in transactions involving the Company’s assets, any consideration is remitted to it within time limits which are acceptable market practice in the context of a particular transaction.
5. ensure that the Company’s income is applied in accordance with the UCITS Regulations and Central Bank UCITS Regulations and the Memorandum and Articles of Association.
6. enquire into the conduct of the Company in each annual accounting period and report thereon to the shareholders. The Depositary’s report shall be delivered to the Company in good time to enable the Company to include a copy of the report in its Annual Report. The Depositary’s Report shall state whether in the Depositary’s opinion the Company has been managed in that period:
(i) in accordance with the limitations imposed on the investment and borrowing powers of the Company by the Memorandum and Articles of Association and the UCITS Regulations and Central Bank UCITS Regulations; and
(ii) otherwise in accordance with the provisions of the Memorandum and Articles of Association and the UCITS Regulations and Central Bank UCITS Regulations.
If the Company does not comply with (i) or (ii) above, the Depositary must state why this is the case and outline the steps which the Depositary has taken to rectify the situation.
7. notify the Central Bank promptly of any material breach of the UCITS Regulations and Central Bank UCITS Regulations, conditions imposed by the Central Bank or provisions of the Prospectus with regard to the Company.
The duties provided for above may not be delegated by the Depositary to a third party. These duties must be carried out in the State.
The Depositary also takes into its custody or under its control all the assets of the Company and holds them in safekeeping for the shareholders.

383
Report of the Depositary to the Shareholders for the year ended 30 June 2020.
We have enquired into the conduct of GAM Star Fund p.l.c. (‘the Company’) for the year ended 30 June 2020, in our capacity as Depositary to the Company.
This report including the opinion has been prepared for and solely for the shareholders in the Company as a body, in accordance with Regulation 34, (1), (3) and (4) in Part 5 of the European Communities (Undertakings for Collective Investment in Transferable Securities) Regulations 2011, as amended, (‘the UCITS Regulations’), and for no other purpose. We do not, in giving this opinion, accept or assume responsibility for any other purpose or to any other person to whom this report is shown.
Responsibilities of the Depositary
Our duties and responsibilities are outlined in Regulation 34, (1), (3) and (4) in Part 5 of the UCITS Regulations. One of those duties is to enquire into the conduct of the Company in each annual accounting period and report thereon to the shareholders.
Our report shall state whether, in our opinion, the Company has been managed in that period in accordance with the provisions of the Company’s Memorandum and Articles of Association and the UCITS Regulations. It is the overall responsibility of the Company to comply with these provisions. If the Company has not so complied, we as Depositary must state why this is the case and outline the steps which we have taken to rectify the situation.
Basis of Depositary Opinion
The Depositary conducts such reviews as it, in its reasonable opinion, considers necessary in order to comply with its duties as outlined in Regulation 34, (1), (3) and (4) in Part 5 of the UCITS Regulations and to ensure that, in all material respects, the Company has been managed (i) in accordance with the limitations imposed on its investment and borrowing powers by the provisions of the Company’s Memorandum and Articles of Association and the UCITS Regulations and (ii) otherwise in accordance with the Company’s constitutional documentation and the appropriate regulations.
Opinion
In our opinion, the Company has been managed during the year, in all material respects:
(i) in accordance with the limitations imposed on the investment and borrowing powers of the Company by the Memorandum & Articles of Association, the UCITS Regulations and the Central Bank (Supervision and Enforcement) Act 2013 (Section 48(1)) (Undertakings for Collective Investment in Transferable Securities) Regulations 2019 (‘the Central Bank UCITS Regulations’); and
(ii) otherwise in accordance with the provisions of the Memorandum and Articles of Association, the UCITS Regulations and the Central Bank UCITS Regulations.
State Street Custodial Services (Ireland) Limited 78 Sir John Rogerson’s Quay Dublin 2 Ireland
Date: 27 October 2020

384
GAM Star Fund p.l.c.
Independent auditors’ report to the members of GAM Star Fund p.l.c.
Report on the audit of the financial statements
Opinion
In our opinion, GAM Star Fund p.l.c.’s financial statements:
– give a true and fair view of the Company’s and Funds’ assets, liabilities and financial position as at 30 June 2020 and of their results for the year then ended;
– have been properly prepared in accordance with Generally Accepted Accounting Practice in Ireland (accounting standards issued by the Financial Reporting Council of the UK, including Financial Reporting Standard 102 “The Financial Reporting Standard applicable in the UK and Republic of Ireland” and Irish law); and
– have been properly prepared in accordance with the requirements of the Companies Act 2014 and the European Communities (Undertakings for Collective Investment in Transferable Securities) Regulations 2011 (as amended).
We have audited the financial statements, included within the Annual Report and Audited Financial Statements, which comprise:
– the Balance Sheet as at 30 June 2020;
– the Profit and Loss Account for the year then ended;
– the Statement of Changes in Net Assets Attributable to Redeemable Participating Shareholders for the year then ended;
– the Portfolio Statement for each of the Funds as at 30 June 2020; and
– the notes to the financial statements for the Company and for each of its Funds, which include a description of the significant accounting policies.
Basis for opinion
We conducted our audit in accordance with International Standards on Auditing (Ireland) (“ISAs (Ireland)”) and applicable law.
Our responsibilities under ISAs (Ireland) are further described in the Auditors’ responsibilities for the audit of the financial statements section of our report. We believe that the audit evidence we have obtained is sufficient and appropriate to provide a basis for our opinion.
IndependenceWe remained independent of the Company in accordance with the ethical requirements that are relevant to our audit of the financial statements in Ireland, which includes IAASA’s Ethical Standard as applicable to listed entities, and we have fulfilled our other ethical responsibilities in accordance with these requirements.
Our audit approach
Overview
Materiality
Overall materiality: 50 basis points (2019: 50 basis points) of Net Assets Value (“NAV”) at 30 June 2020 for each of the Company’s Funds, 50 basis points (2019: 50 basis points) of average NAV for the Company’s Funds that ceased trading in the current year.
Audit scope
The Company is an open-ended investment Company with variable capital and engages GAM Fund Management Limited (the “Manager”) to manage certain duties and responsibilities with regards to the day-to-day management of the Company. We tailored the scope of our audit taking into account the types of investments within the Funds, the involvement of the third parties referred to overleaf, the accounting processes and controls, and the industry in which the Company operates. We look at each of the Funds at an individual level.
Key audit matters– Valuation of financial assets at fair value and financial liabilities at fair value.
– Existence of financial assets at fair value and financial liabilities at fair value.
The scope of our auditAs part of designing our audit, we determined materiality and assessed the risks of material misstatement in the financial statements. In particular, we looked at where the directors made subjective judgements, for example the selection of pricing sources to value the investment portfolio. As in all of our audits, we also addressed the risk of management override of internal controls, including evaluating whether there was evidence of bias by the directors that represented a risk of material misstatement due to fraud.

385
Independent auditors’ report to the members of GAM Star Fund p.l.c., continued
Key audit mattersKey audit matters are those matters that, in the auditors’ professional judgement, were of most significance in the audit of the financial statements of the current period and include the most significant assessed risks of material misstatement (whether or not due to fraud) identified by the auditors, including those which had the greatest effect on: the overall audit strategy; the allocation of resources in the audit; and directing the efforts of the engagement team. These matters, and any comments we make on the results of our procedures thereon, were addressed in the context of our audit of the financial statements as a whole, and in forming our opinion thereon, and we do not provide a separate opinion on these matters. This is not a complete list of all risks identified by our audit.
KEY AUDIT MATTER HOW OUR AUDIT ADDRESSED THE KEY AUDIT MATTER
Valuation of financial assets at fair value and financial liabilities at fair value
Refer to the Portfolio Statement for each of the Funds, the significant accounting policies set out in note 2 and the Fair Value hierarchy set out in note 4.
The financial assets at fair value and financial liabilities at fair value included in the Balance Sheet of the Funds at 30 June 2020 are valued at fair value in line with Generally Accepted Accounting Practice in Ireland.
We considered the valuation of financial assets at fair value and financial liabilities to be a key audit matter as it represents the principal element of the financial statements.
We tested the valuation of the financial assets at fair value and financial liabilities at fair value at 30 June 2020 to third party vendor sources where available.
In the absence of third party vendor sources being available, we tested the valuation by obtaining broker quotes as at the year end date. For level 3 positions, we tested the valuation by obtaining a broker quote, through the use of our internal valuation expert or through review of pricing committee valuation minutes.
For Funds with investments in other investment funds, we compared the net asset value per share used by the Fund to the independently obtained audit confirmation from the underlying funds’ transfer agents. Furthermore, we obtained the latest available audited financial statements for these underlying funds and read the underlying independent auditors’ report within the audited financial statements. No modifications to these auditors’ reports were noted.
We tested the valuation of financial derivative instruments by using our internal valuation expert or obtaining independent counterparty confirmations.
No material misstatements were noted from the performance of these procedures.
Existence of financial assets at fair value and financial liabilities at fair value
Refer to the Portfolio Statement for each of the Funds, the significant accounting policies set out in note 2 and the Fair Value hierarchy set out in note 4.
The financial assets at fair value and financial liabilities at fair value in the Balance Sheet of each Fund are held in each Fund’s name at 30 June 2020.
We considered the existence of financial assets at fair value and financial liabilities to be a key audit matter as it represents the principal element of the financial statements.
We obtained independent confirmations of the existence of the investments from the Depositary, the underlying funds’ transfer agents or the counterparties of the investments held at 30 June 2020, agreeing the amounts confirmed to the accounting records and resolving any material reconciling items noted.
No material misstatements were noted from the performance of these procedures.
How we tailored the audit scopeWe tailored the scope of our audit to ensure that we performed enough work to be able to give an opinion on the financial statements as a whole, taking into account the structure of the Company, the accounting processes and controls, and the industry in which it operates.
As at 30 June 2020 there are 31 Funds operating. The Company’s Balance Sheet, Profit and Loss Account and Statement of Changes in Net Assets attributable to Redeemable Participating Shareholders are an aggregation of the positions and results of the Funds.
The directors control the affairs of the Company and are responsible for the overall investment policy which is determined by them. The Company engages the Manager to manage certain duties and responsibilities with regards to the day to day management of the Company. The Manager has delegated certain responsibilities to the Co-Investment Managers and Delegate Investment Managers (the ‘Investment Manager’) and to State Street Fund Services (Ireland) Limited (the ‘Delegate Administrator’). The financial statements, which remain the responsibility of the directors, are prepared on their behalf by the Delegate Administrator. The Company has appointed State Street Custodial Services (Ireland) Limited (the “Depositary”) to act as Depositary of the Company’s assets. In establishing the overall approach to our audit, we assessed the risk of material misstatement at a Fund level, taking into account the nature, likelihood and potential magnitude of any misstatement. As part of our risk assessment, we considered the Company’s interaction with the Delegate Administrator, and we assessed the control environment in place at the Delegate Administrator.
MaterialityThe scope of our audit was influenced by our application of materiality. We set certain quantitative thresholds for materiality. These, together with qualitative considerations, helped us to determine the scope of our audit and the nature, timing and extent of our audit procedures on the individual financial statement line items and disclosures and in evaluating the effect of misstatements, both individually and in aggregate on the financial statements as a whole.
386
GAM Star Fund p.l.c.
Independent auditors’ report to the members of GAM Star Fund p.l.c., continued
Based on our professional judgement, we determined materiality for the financial statements of each of the Company’s Funds as follows:
Overall materiality and how we determined it
50 basis points (2019: 50 basis points) of Net Assets Value (“NAV”) at 30 June 2020 for each of the Company’s Funds, 50 basis points (2019: 50 basis points) of average NAV for the Company’s Funds that ceased trading in the current year.
Rationale for benchmark appliedWe have applied this benchmark because the main objective of the Company is to provide investors with a total return at a Fund level, taking account of the capital and income returns.
We agreed with the Board of Directors that we would report to them misstatements identified during our audit above 10% of overall materiality, for NAV per share impacting differences (2019: 5% of overall materiality, for NAV per share impacting differences) as well as misstatements below that amount that, in our view, warranted reporting for qualitative reasons.
Conclusions relating to going concern
We have nothing to report in respect of the following matters in relation to which ISAs (Ireland) require us to report to you where:
– the directors’ use of the going concern basis of accounting in the preparation of the financial statements is not appropriate; or
– the directors have not disclosed in the financial statements any identified material uncertainties that may cast significant doubt about the Company’s and Funds’ ability to continue to adopt the going concern basis of accounting for a period of at least twelve months from the date when the financial statements are authorised for issue
However, because not all future events or conditions can be predicted, this statement is not a guarantee as to the Company’s and Funds’ ability to continue as going concerns.
Reporting on other information
The other information comprises all of the information in the Annual Report and Audited Financial Statements other than the financial statements and our auditors’ report thereon. The directors are responsible for the other information. Our opinion on the financial statements does not cover the other information and, accordingly, we do not express an audit opinion or, except to the extent otherwise explicitly stated in this report, any form of assurance thereon. In connection with our audit of the financial statements, our responsibility is to read the other information and, in doing so, consider whether the other information is materially inconsistent with the financial statements or our knowledge obtained in the audit, or otherwise appears to be materially misstated. If we identify an apparent material inconsistency or material misstatement, we are required to perform procedures to conclude whether there is a material misstatement of the financial statements or a material misstatement of the other information. If, based on the work we have performed, we conclude that there is a material misstatement of this other information, we are required to report that fact. We have nothing to report based on these responsibilities.
With respect to the Report of the Directors, we also considered whether the disclosures required by the Companies Act 2014 have been included.
Based on the responsibilities described above and our work undertaken in the course of the audit, ISAs (Ireland) and the Companies Act 2014 require us to also report certain opinions and matters as described below:
– In our opinion, based on the work undertaken in the course of the audit, the information given in the Report of the Directors for the year ended 30 June 2020 is consistent with the financial statements and has been prepared in accordance with applicable legal requirements.
– Based on our knowledge and understanding of the Company and its environment obtained in the course of the audit, we have not identified any material misstatements in the Report of the Directors.
Responsibilities for the financial statements and the audit
Responsibilities of the directors for the financial statementsAs explained more fully in the Statement of Directors’ Responsibilities set out on page 3, the directors are responsible for the preparation of the financial statements in accordance with the applicable framework and for being satisfied that they give a true and fair view.
The directors are also responsible for such internal control as they determine is necessary to enable the preparation of financial statements that are free from material misstatement, whether due to fraud or error.
In preparing the financial statements, the directors are responsible for assessing the Company’s and Funds’ ability to continue as going concerns, disclosing as applicable, matters related to going concern and using the going concern basis of accounting unless the directors either intend to liquidate the Company or to cease operations, or have no realistic alternative but to do so.

387
Independent auditors’ report to the members of GAM Star Fund p.l.c., continued
Auditors’ responsibilities for the audit of the financial statementsOur objectives are to obtain reasonable assurance about whether the financial statements as a whole are free from material misstatement, whether due to fraud or error, and to issue an auditors’ report that includes our opinion. Reasonable assurance is a high level of assurance, but is not a guarantee that an audit conducted in accordance with ISAs (Ireland) will always detect a material misstatement when it exists. Misstatements can arise from fraud or error and are considered material if, individually or in the aggregate, they could reasonably be expected to influence the economic decisions of users taken on the basis of these financial statements.
A further description of our responsibilities for the audit of the financial statements is located on the IAASA website at:
https://www.iaasa.ie/getmedia/b2389013-1cf6-458b-9b8f-a98202dc9c3a/Description_of_auditors_responsibilities_for_audit.pdf.
This description forms part of our auditors’ report.
Use of this reportThis report, including the opinions, has been prepared for and only for the Company’s members as a body in accordance with section 391 of the Companies Act 2014 and for no other purpose. We do not, in giving these opinions, accept or assume responsibility for any other purpose or to any other person to whom this report is shown or into whose hands it may come save where expressly agreed by our prior consent in writing.
Other required reporting
Companies Act 2014 opinions on other matters
– We have obtained all the information and explanations which we consider necessary for the purposes of our audit.
– In our opinion the accounting records of the Company were sufficient to permit the financial statements to be readily and properly audited.
– The financial statements are in agreement with the accounting records.
Companies Act 2014 exception reporting
Directors’ remuneration and transactionsUnder the Companies Act 2014 we are required to report to you if, in our opinion, the disclosures of directors’ remuneration and transactions specified by sections 305 to 312 of that Act have not been made. We have no exceptions to report arising from this responsibility.
Jonathan O’Connellfor and on behalf of PricewaterhouseCoopersChartered Accountants and Statutory Audit FirmDublin
27 October 2020

388
GAM Star Fund p.l.c.
Additional Information and Regulatory Requirements (Unaudited)
Remuneration Disclosure
Qualitative disclosuresDecision-making process to determine remuneration policiesUnder the GAM Group’s framework ultimate responsibility in compensation matters is held by the Board of Directors (“the Board”). The Board is supported in compensation-related issues by the Compensation Committee (“CompC”).
– The Board is responsible for establishing the Group Compensation Policy, and with support of the CompC regularly reviewing the Group Compensation Policy in order to meet any important regulatory developments and the objectives of the Group.
– The CompC is delegated with the role of supporting the Board in setting compensation guidelines, establishing share-based compensation plans and approving the aggregate variable compensation expenditure of the Group as well as determining and proposing to the Board the individual total compensation payable to the members of the Board (other than its Chairman) for approval. The CompC regularly reports to the Board on the status of its activities, the development of the compensation architecture within the Group as well as on the operational implementation of this Policy. The CompC consists of at least three members of the Board all of whom are Non-Executive Directors.
– The Compensation Management Committee (‘CMC’, ‘the Committee’) has delegated authority from the CompC to provide support and advice to the CompC to ensure that the compensation policy and practices across GAM Holding AG Group operate in line with EU regulations that apply to its regulated entities and delegates. The CMC comprises of four members including three senior members from Risk, Legal and Compliance and Human Resources functions of the Group.
GAM Group’s compensation philosophy is aligned with the Group’s overall long-term objective of sustainable growth and profitability as well as its tolerance for risk. The Group’s approach provides for compensation that attracts and retains employees in a given local market and motivates them to contribute to the development and growth of our business. The policy promotes sound and effective risk management and does not encourage inappropriate risk taking.
Link between pay and performanceAs described above, GAM Group operates a Group-wide remuneration policy, which applies to all employees across the Group including the above entities. The compensation structure is simple and straight-forward. It is first and foremost designed to safeguard the long-term success and prosperity of the shareholders. A robust performance management system forms part of the compensation process and enables us to reward success and minimise the possibility of payment for failure.
The composition of the elements within an individual’s overall compensation is the result of the function and performance of the individual, including alignment with the Group’s risk tolerances, market competitiveness and overall profitability. The Group’s total compensation approach comprises fixed and variable compensation.
Fixed compensation includes base salary, which reflects seniority, experience, skills and market conditions, together with fixed allowances for certain employees in Switzerland consistent with customary local practice.
Variable compensation is awarded annually and is dependent on Group, business area and individual performance. Cash bonuses that are driven by activities that leave meaningful amounts of future risk with the Group, either via direct balance sheet exposure or through the potential for other negative income events are prohibited.
For members of the Group Management Board, a portion of variable compensation is paid in the form of deferred, share-based awards, reflecting their accountability for the operating results achieved and the impact of their decisions on the Group’s future development.
In addition to members of the Group Management Board, other senior employees of the Group may have a portion of their variable compensation deferred to provide alignment with long term interest of clients and shareholders.
Discretionary compensation decisions are based on individual’s achievement of pre-set targets and contributions to the Group’s development. This fosters a work ethic that is driven by high performance and tangible results.
Identified StaffThe categories of staff for inclusion as Identified staff for GAM Fund Management Limited include:
– Executive and non-executive members of the Board
– Other members of senior management
– Staff responsible for control functions
Executive Directors of this regulated entity do not receive any kind of remuneration linked to their role. Should any remuneration be granted directors in the future, such remuneration will be fixed and not linked to the short-term results of the entity.

389
Additional Information and Regulatory Requirements (Unaudited), continued
Remuneration Disclosure, continued
The Identified Staff are identified and reviewed on an annual basis by the CMC in line with the criteria set out under EU regulations, namely:
If, in the performance of their professional activities certain staff of a delegate portfolio manager can have a material impact on the risk profiles of the funds they manage, these employees are considered as “Identified Staff”. For this purpose the Group considers the respective delegate portfolio manager as subject to equally effective regulation if they are required by law and regulations or in accordance to internal standards to put in place a remuneration policy, which in accordance to the ESMA Remuneration Guidelines 2013/232 and 2016/575 is considered equivalent in its objectives. The Group’s regulated entities will only delegate its portfolio management to firms, whose remuneration policy complies with the ‘equivalence standard’ as described.
Quantitative disclosures
The remuneration data provided below reflects amounts paid in respect of the performance year 2019 in relation to the funds managed by GAM Fund Management Limited.
GAM Fund Management Limited manages funds, with a combined AUM of €16,560m at 31 December 2019.
Total annual remuneration paid to all Management Company employees €7.26M
Of which fixed: €6.45M
Of which variable: €0.81M
Number of Management Company employees 110
Total Remuneration paid to Identified Staff in the Management Company €2.51M
Of which paid to Senior Management: €1.17M
Of which paid to other identified staff: €1.34M
Total annual remuneration paid to employees in delegate(s): €12.14M
Of which fixed: €3.02M
Of which variable: €9.12M
NotesIn the figures above, fixed remuneration relates to salary and pension benefits and variable remuneration includes the annual bonus including any long term incentive awards.
Where relevant, the remuneration information provided in the table above relates to a proportion of the amount of total fixed and variable remuneration paid to employees in the Management Company and its delegate(s) that relates to their funds activities.

390
GAM Star Fund p.l.c.
Additional Information and Regulatory Requirements (Unaudited), continued
Additional Market Risk Notes
Market price riski) Funds which calculate risk using VaRThe VaR model is an estimate of the maximum loss each Fund may experience over any 20 day period, with a probability of 99%. The VaR is calculated by an external service provider using the historical simulation method using three years of weekly historical price data for the underlying securities. The VaR of the portfolio is stress tested on a fortnightly basis by running the VaR using current holdings against historical events. The VaR cannot take into account the fact that future market price movements may bear no relation to historical patterns as future market conditions could vary significantly from those experienced in the past.
VaR is an estimate of the maximum loss a Fund may suffer over a defined period and calculated with a specified confidence level. It is calculated for the investment pool of each Fund.
As at 30 June 2020Value at Risk (over 20 day period
with 99% confidence level) Utilisation of VaR Limit
30 June 2020
%
Minimum during period
%
Maximum during period
%
Average during period
%
Minimum during period
%
Maximum during period
%
Average during period
%
GAM Star Absolute Return Bond * N/A N/A N/A N/A N/A N/A N/AGAM Star Absolute Return Bond Defender * N/A N/A N/A N/A N/A N/A N/AGAM Star Absolute Return Bond Plus * N/A N/A N/A N/A N/A N/A N/AGAM Star Absolute Return Macro* N/A N/A N/A N/A N/A N/A N/AGAM Star Alpha Technolgy 6.99 4.07 14.92 6.67 35.00 20.40 74.60GAM Star Dynamic Global Bond* N/A N/A N/A N/A N/A N/A N/AGAM Star Emerging Market Rates 3.93 0.93 7.93 2.67 19.70 4.70 39.70GAM Star Global Rates 10.30 5.14 20.89 9.46 52.90 25.70 104.50GAM Star MBS Total Return 0.37 0.19 2.93 0.46 1.90 1.00 14.70GAM Systematic Alternative Risk Premia 2.76 1.74 14.16 3.79 13.80 8.70 70.80GAM Systematic Core Macro 8.96 2.49 15.34 8.19 12.45 76.70 40.95GAM Systematic Global Equity Market Neutral* N/A N/A N/A N/A N/A N/A N/AGAM Star Tactical Opportunities 2.86 0.21 6.09 1.63 14.30 1.10 30.50GAM Star Target Return* N/A N/A N/A N/A N/A N/A N/AGAM Star Target Return Plus* N/A N/A N/A N/A N/A N/A N/AGAM Star Disruptive Growth 15.36 6.83 30.18 12.98 23.00 67.00 47.00GAM Systematic Dynamic Credit 2.41 1.79 4.92 3.05 8.95 24.60 15.25
* Fund terminated during the year.

391
Additional Information and Regulatory Requirements (Unaudited), continued
Additional Market Risk Notes, continued
Market price risk, continuedi) Funds which calculate risk using VaR, continuedAs at 30 June 2019
Value at Risk (over 20 day period with 99% confidence level) Utilisation of VaR Limit
30 June 2019
%
Minimum during period
%
Maximum during period
%
Average during period
%
Minimum during period
%
Maximum during period
%
Average during period
%
GAM Star Absolute Return Bond ** N/A N/A N/A N/A N/A N/A N/AGAM Star Absolute Return Bond Defender ** N/A N/A N/A N/A N/A N/A N/AGAM Star Absolute Return Bond Plus ** N/A N/A N/A N/A N/A N/A N/AGAM Star Absolute Return Macro 0.10 0.00 2.90 0.50 0.00 14.50 2.50GAM Star Alpha Technolgy 5.89 4.39 10.97 7.02 21.96 54.83 35.08GAM Star Dynamic Global Bond N/A N/A N/A N/A N/A N/A N/AGAM Star Emerging Market Rates 2.20 1.60 8.90 3.80 8.00 44.50 19.00GAM Star Global Rates 7.50 6.40 11.00 8.40 32.00 55.00 42.00GAM Star MBS Total Return 0.30 0.20 0.50 0.30 1.00 2.50 1.50GAM Systematic Alternative Risk Premia 2.70 1.73 5.48 2.54 8.65 27.39 12.68GAM Systematic Core Macro 7.68 6.26 17.63 10.87 31.28 88.14 54.35GAM Systematic Global Equity Market Neutral 3.34 2.10 4.02 2.97 10.50 20.12 14.85GAM Systematic Dynamic Credit 2.91 1.56 6.08 3.54 7.80 30.38 17.70GAM Star Tactical Opportunities 0.69 0.47 1.73 1.13 2.37 8.63 5.67GAM Star Target Return 0.76 0.40 1.22 0.65 2.01 6.10 3.27GAM Star Target Return Plus 0.97 0.60 1.58 1.11 3.00 7.89 5.53GAM Star Disruptive Growth 9.61 6.20 17.90 11.20 30.90 89.40 56.10
* Fund terminated during the year.** Fund is in liquidation so no VaR calculated.
The level of leverage may be calculated in a number of ways:
Sum of the notionalsThis calculation has been disclosed in accordance with Central Bank requirements but it does not take into account any netting and hedging arrangements that a Fund has in place. It is a “simple and easy to compute” formula of adding notional amounts without taking account of whether each derivative is used for risk reduction or otherwise, the disclosed sum of the notional amounts represents, in many cases, an inflated figure that fails to indicate the risk levels in a Fund. For example, positions that economically offset risk, such as currency hedges, are required to be included in the gross notional calculation even though such transactions would reduce risk in a portfolio, thereby increasing the gross notional amount but actually creating a less risky product for the investor.
10 year equivalentsThis is more relevant for fixed income funds and has been provided as a more appropriate leverage calculation for those type of funds. It measures the marginal impact on position value of a small change in interest rates such as a 1 basis point (“bp”) move, and then to express that impact in terms of the quantity of the current 10–year note that would have the same sensitivity to rate moves.
Leverage calculated at 30 June 2020 using
Leverage calculated at 30 June 2019 using
Sum of the notionals
%
10 Year Equivalent unless otherwise
indicated%
Sum of the notionals
%
10 Year Equivalent unless otherwise
indicated%
GAM Star Absolute Return Macro N/A N/A 16GAM Star Alpha Technology 55 N/A 61 N/AGAM Star Dynamic Global Bond N/A N/A N/A N/AGAM Star Emerging Market Rates 220 0 177 8GAM Star Global Rates 1,155 0 4,769 17GAM Star MBS Total Return – 0 11 9GAM Systematic Alternative Risk Premia 258 N/A 335 N/AGAM Systematic Core Macro 1,346 N/A 925 N/AGAM Systematic Global Equity Market Neutral N/A N/A 358 N/AGAM Systematic Dynamic Credit 110 N/A 191 N/AGAM Star Tactical Opportunities 32 N/A 56 N/AGAM Star Target Return N/A N/A 120 N/AGAM Star Target Return Plus N/A N/A 160 N/AGAM Star Disruptive Growth 3 N/A 3 N/A

392
GAM Star Fund p.l.c.
Additional Information and Regulatory Requirements (Unaudited), continued
Additional Market Risk Notes, continued
Market price risk, continuedii) Funds which calculate risk using the commitment approachThe commitment approach calculates exposure as a result of the use of derivatives by converting the derivatives into the equivalent positions of the underlying assets.
Leverage at 30 June
2020
Leverage at 30 June
2019
GAM Star Absolute Return Macro* – 0.00%GAM Star Alpha Spectrum 0.00% 2.40%GAM Star Asian Equity 0.05% 0.05%GAM Star Asia-Pacific Equity* – 0.00%GAM Star Global Balanced 0.00% 0.00%GAM Star Capital Appreciation US Equity 0.53% 1.00%GAM Star Cat Bond 0.04% 0.00%GAM Star Global Cautious 0.00% 0.00%GAM Star China Equity 2.77% 16.83%GAM Star Composite Global Equity 17.49% 18.27%GAM Star Continental European Equity 0.00% 0.00%GAM Star Credit Opportunities (EUR) 0.04% 0.03%GAM Star Credit Opportunities (GBP) 0.05% 0.01%GAM Star Credit Opportunities (USD) 0.04% 0.12%GAM Star Global Defensive 0.00% 0.00%GAM Star Global Dynamic Growth 0.00% 0.00%GAM Star Emerging Equity 2.50% 0.45%GAM Star European Equity 0.00% 0.00%GAM Star Flexible Global Portfolio 0.00% 1.33%GAM Star GAMCO US Equity * – 0.00%GAM Star Global Selector* – 0.00%GAM Star Global Growth 0.00% 0.00%GAM Star India Equity* – 0.00%GAM Star Interest Trend 0.23% 0.03% GAM Star Japan Leaders 0.00% 0.00%GAM Star US All Cap Equity 0.00% 0.00%GAM Star Worldwide 0.00% 0.00%
* Fund terminated during the year.
Additional Information and Regulatory Requirements (Unaudited), continued
Transaction charges
The following table details the transaction charges for the year ended 30 June 2020. Trade charges and Depositary trade fees are recognised in the Balance Sheet within accrued expenses line.
For the period ended 30 June 2020 CurrencyCommission
chargesTrade
chargesDepositary trade fees
Total transaction charges
GAM Star Absolute Return Bond* € – – – –GAM Star Absolute Return Bond Defender* € – – – –GAM Star Absolute Return Bond Plus* € – – – –GAM Star Absolute Return Macro* € 10 – 27 37GAM Star Alpha Spectrum € 6,576 2,332 1,350 10,258GAM Star Alpha Technology US$ 30,993 6,652 50 37,695GAM Star Asian Equity US$ 19,369 17,713 – 37,082GAM Star Asia-Pacific Equity* US$ 4,549 2,511 – 7,060GAM Star Global Balanced £ 53,394 5,374 10,931 69,699GAM Star Capital Appreciation US Equity US$ 30,401 34,436 360 65,197GAM Star Cat Bond US$ – 54,943 – 54,943GAM Star Global Cautious £ 10,887 3,085 9,702 23,674GAM Star China Equity US$ 248,612 39,483 – 288,095GAM Star Composite Global Equity US$ 27,866 5,108 205 33,179GAM Star Continental European Equity € 454,476 52,251 – 506,727GAM Star Credit Opportunities (EUR) € – 154,888 19,446 174,334GAM Star Credit Opportunities (GBP) £ 2,339 35,190 4,767 42,296GAM Star Credit Opportunities (USD) US$ – 113,912 11,958 125,870GAM Star Global Defensive £ 1,173 1,375 8,084 10,632GAM Star Dynamic Global Bond* US$ 152 – 40 192GAM Star Global Dynamic Growth £ 895 1,658 7,478 10,031GAM Star Emerging Equity US$ 41,456 125,455 – 166,911GAM Star Emerging Market Rates US$ 1,091 2,766 7,550 11,407GAM Star European Equity € 146,436 19,404 – 165,840GAM Star Flexible Global Portfolio € 16,587 3,574 1,313 21,474GAM Star Global Rates US$ 12,174 5,923 5,320 23,417GAM Star Global Selector* US$ 1,838 3,427 – 5,265GAM Star Global Growth £ 14,419 3,542 8,474 26,435GAM Star Interest Trend US$ – 2,228 1,314 3,542GAM Star Japan Leaders ¥ 13,932,140 6,050,886 – 19,983,026
GAM Star MBS Total Return US$ 10,184 33,444 – 43,628GAM Systematic Alternative Risk Premia US$ 54,573 5,863 30,780 91,216GAM Systematic Core Macro US$ – – 22,878 22,878GAM Systematic Global Equity Market Neutral* US$ – – 9,973 9,973GAM Star Tactical Opportunities US$ 697 1,274 50 2,021GAM Star Target Return* US$ 3,055 503 230 3,788GAM Star Target Return Plus* US$ 157 232 140 529GAM Star Disruptive Growth US$ 203,190 10,987 – 214,177GAM Star US All Cap Equity US$ 23,467 3,256 – 26,723GAM Star Worldwide Equity US$ 37,785 8,137 50 45,972GAM Systematic Dynamic Credit US$ – 347 – 347
* Fund terminated during the year.

393
ii) Funds which calculate risk using the commitment approachThe commitment approach calculates exposure as a result of the use of derivatives by converting the derivatives into the equivalent positions of the underlying assets.
Leverage at 30 June
2020
Leverage at 30 June
2019
GAM Star Absolute Return Macro* – 0.00%GAM Star Alpha Spectrum 0.00% 2.40%GAM Star Asian Equity 0.05% 0.05%GAM Star Asia-Pacific Equity* – 0.00%GAM Star Global Balanced 0.00% 0.00%GAM Star Capital Appreciation US Equity 0.53% 1.00%GAM Star Cat Bond 0.04% 0.00%GAM Star Global Cautious 0.00% 0.00%GAM Star China Equity 2.77% 16.83%GAM Star Composite Global Equity 17.49% 18.27%GAM Star Continental European Equity 0.00% 0.00%GAM Star Credit Opportunities (EUR) 0.04% 0.03%GAM Star Credit Opportunities (GBP) 0.05% 0.01%GAM Star Credit Opportunities (USD) 0.04% 0.12%GAM Star Global Defensive 0.00% 0.00%GAM Star Global Dynamic Growth 0.00% 0.00%GAM Star Emerging Equity 2.50% 0.45%GAM Star European Equity 0.00% 0.00%GAM Star Flexible Global Portfolio 0.00% 1.33%GAM Star GAMCO US Equity * – 0.00%GAM Star Global Selector* – 0.00%GAM Star Global Growth 0.00% 0.00%GAM Star India Equity* – 0.00%GAM Star Interest Trend 0.23% 0.03% GAM Star Japan Leaders 0.00% 0.00%GAM Star US All Cap Equity 0.00% 0.00%GAM Star Worldwide 0.00% 0.00%
* Fund terminated during the year.
Additional Information and Regulatory Requirements (Unaudited), continued
Transaction charges
The following table details the transaction charges for the year ended 30 June 2020. Trade charges and Depositary trade fees are recognised in the Balance Sheet within accrued expenses line.
For the period ended 30 June 2020 CurrencyCommission
chargesTrade
chargesDepositary trade fees
Total transaction charges
GAM Star Absolute Return Bond* € – – – –GAM Star Absolute Return Bond Defender* € – – – –GAM Star Absolute Return Bond Plus* € – – – –GAM Star Absolute Return Macro* € 10 – 27 37GAM Star Alpha Spectrum € 6,576 2,332 1,350 10,258GAM Star Alpha Technology US$ 30,993 6,652 50 37,695GAM Star Asian Equity US$ 19,369 17,713 – 37,082GAM Star Asia-Pacific Equity* US$ 4,549 2,511 – 7,060GAM Star Global Balanced £ 53,394 5,374 10,931 69,699GAM Star Capital Appreciation US Equity US$ 30,401 34,436 360 65,197GAM Star Cat Bond US$ – 54,943 – 54,943GAM Star Global Cautious £ 10,887 3,085 9,702 23,674GAM Star China Equity US$ 248,612 39,483 – 288,095GAM Star Composite Global Equity US$ 27,866 5,108 205 33,179GAM Star Continental European Equity € 454,476 52,251 – 506,727GAM Star Credit Opportunities (EUR) € – 154,888 19,446 174,334GAM Star Credit Opportunities (GBP) £ 2,339 35,190 4,767 42,296GAM Star Credit Opportunities (USD) US$ – 113,912 11,958 125,870GAM Star Global Defensive £ 1,173 1,375 8,084 10,632GAM Star Dynamic Global Bond* US$ 152 – 40 192GAM Star Global Dynamic Growth £ 895 1,658 7,478 10,031GAM Star Emerging Equity US$ 41,456 125,455 – 166,911GAM Star Emerging Market Rates US$ 1,091 2,766 7,550 11,407GAM Star European Equity € 146,436 19,404 – 165,840GAM Star Flexible Global Portfolio € 16,587 3,574 1,313 21,474GAM Star Global Rates US$ 12,174 5,923 5,320 23,417GAM Star Global Selector* US$ 1,838 3,427 – 5,265GAM Star Global Growth £ 14,419 3,542 8,474 26,435GAM Star Interest Trend US$ – 2,228 1,314 3,542GAM Star Japan Leaders ¥ 13,932,140 6,050,886 – 19,983,026
GAM Star MBS Total Return US$ 10,184 33,444 – 43,628GAM Systematic Alternative Risk Premia US$ 54,573 5,863 30,780 91,216GAM Systematic Core Macro US$ – – 22,878 22,878GAM Systematic Global Equity Market Neutral* US$ – – 9,973 9,973GAM Star Tactical Opportunities US$ 697 1,274 50 2,021GAM Star Target Return* US$ 3,055 503 230 3,788GAM Star Target Return Plus* US$ 157 232 140 529GAM Star Disruptive Growth US$ 203,190 10,987 – 214,177GAM Star US All Cap Equity US$ 23,467 3,256 – 26,723GAM Star Worldwide Equity US$ 37,785 8,137 50 45,972GAM Systematic Dynamic Credit US$ – 347 – 347
* Fund terminated during the year.

394
GAM Star Fund p.l.c.
Additional Information and Regulatory Requirements (Unaudited), continued
Transaction charges, continued
The following table details the transaction charges for the year ended 30 June 2019. Trade charges and Depositary trade fees are recognised in the Balance Sheet within accrued expenses line.
For the period ended 30 June 2019 CurrencyCommission
chargesTrade
chargesDepositary trade fees
Total transaction charges
GAM Star Absolute Return Bond € – – 269 269GAM Star Absolute Return Bond Defender € – – 130 130GAM Star Absolute Return Bond Plus € – – 2,209 2,209GAM Star Absolute Return Macro € 11,377 3,206 8,489 23,072GAM Star Alpha Spectrum € 5,475 1,620 1,265 8,360GAM Star Alpha Technology US$ 21,030 3,384 – 24,414GAM Star Asian Equity US$ 25,439 17,672 – 43,111GAM Star Asia-Pacific Equity US$ 6,073 4,971 – 11,044GAM Star Global Balanced £ 10,963 4,383 9,580 24,926GAM Star Capital Appreciation US Equity US$ 18,698 25,312 60 44,070GAM Star Cat Bond US$ – 41,421 – 41,421GAM Star Global Cautious £ 4,454 1,776 9,739 15,969GAM Star China Equity US$ 648,669 69,258 – 717,927GAM Star Composite Global Equity US$ 13,987 3,407 288 17,682GAM Star Continental European Equity € 997,508 94,551 – 1,092,059GAM Star Credit Opportunities (EUR) € 144 179,959 15,229 195,332GAM Star Credit Opportunities (GBP) £ 11,927 45,330 4,061 61,318GAM Star Credit Opportunities (USD) US$ – 163,617 9,327 172,944GAM Star Global Defensive £ 615 650 8,877 10,142GAM Star Discretionary FX* US$ – 323 9,600 9,923GAM Star Dynamic Global Bond US$ 1,146 2,079 8,960 12,185GAM Star Global Dynamic Growth £ 461 833 8,363 9,657GAM Star Emerging Equity US$ 45,587 80,519 – 126,106GAM Star Emerging Market Rates US$ 1,033 13,101 4,910 19,044GAM Star European Equity € 117,421 18,660 – 136,081GAM Star Flexible Global Portfolio € 2,823 974 1,710 5,507GAM Star GAMCO US Equity* US$ 62,010 5,789 – 67,799 GAM Star Global Quality* US$ 7,205 3,287 – 10,492GAM Star Global Rates US$ 11,028 16,114 14,350 41,492GAM Star Global Selector US$ 4,829 5,071 – 9,900
GAM Star Global Growth £ 4,905 2,460 8,327 15,692GAM Star India Equity* US$ 7,628 8,054 – 15,682GAM Star Interest Trend US$ – 2,918 213 3,131GAM Star Japan Leaders ¥ 19,110,886 6,042,888 – 25,153,774GAM Star Keynes Quantitative Strategies* US$ – 173 – 173GAM Star MBS Total Return US$ 4,105 41,641 – 45,746GAM Systematic Alternative Risk Premia US$ 85,889 7,890 21,810 115,589GAM Systematic Core Macro US$ 13,242 – 100,619 113,861GAM Systematic Global Equity Market Neutral US$ – – 17,857 17,857GAM Star Tactical Opportunities US$ 5,279 2,316 510 8,105GAM Star Target Return US$ 6,155 1,805 1,226 9,186GAM Star Target Return Plus US$ 2,300 880 1,113 4,293GAM Star Disruptive Growth US$ 396,240 11,807 – 408,047GAM Star US All Cap Equity US$ 94,737 6,655 – 101,392GAM Star Worldwide Equity US$ 41,870 10,584 – 52,454GAM Systematic Dynamic Credit** US$ 113 356 – 469
* Fund terminated during the year.** Fund launched during the year.

395
Additional Information and Regulatory Requirements (Unaudited), continued
Transaction charges, continued
The following table details the transaction charges for the year ended 30 June 2019. Trade charges and Depositary trade fees are recognised in the Balance Sheet within accrued expenses line.
For the period ended 30 June 2019 CurrencyCommission
chargesTrade
chargesDepositary trade fees
Total transaction charges
GAM Star Absolute Return Bond € – – 269 269GAM Star Absolute Return Bond Defender € – – 130 130GAM Star Absolute Return Bond Plus € – – 2,209 2,209GAM Star Absolute Return Macro € 11,377 3,206 8,489 23,072GAM Star Alpha Spectrum € 5,475 1,620 1,265 8,360GAM Star Alpha Technology US$ 21,030 3,384 – 24,414GAM Star Asian Equity US$ 25,439 17,672 – 43,111GAM Star Asia-Pacific Equity US$ 6,073 4,971 – 11,044GAM Star Global Balanced £ 10,963 4,383 9,580 24,926GAM Star Capital Appreciation US Equity US$ 18,698 25,312 60 44,070GAM Star Cat Bond US$ – 41,421 – 41,421GAM Star Global Cautious £ 4,454 1,776 9,739 15,969GAM Star China Equity US$ 648,669 69,258 – 717,927GAM Star Composite Global Equity US$ 13,987 3,407 288 17,682GAM Star Continental European Equity € 997,508 94,551 – 1,092,059GAM Star Credit Opportunities (EUR) € 144 179,959 15,229 195,332GAM Star Credit Opportunities (GBP) £ 11,927 45,330 4,061 61,318GAM Star Credit Opportunities (USD) US$ – 163,617 9,327 172,944GAM Star Global Defensive £ 615 650 8,877 10,142GAM Star Discretionary FX* US$ – 323 9,600 9,923GAM Star Dynamic Global Bond US$ 1,146 2,079 8,960 12,185GAM Star Global Dynamic Growth £ 461 833 8,363 9,657GAM Star Emerging Equity US$ 45,587 80,519 – 126,106GAM Star Emerging Market Rates US$ 1,033 13,101 4,910 19,044GAM Star European Equity € 117,421 18,660 – 136,081GAM Star Flexible Global Portfolio € 2,823 974 1,710 5,507GAM Star GAMCO US Equity* US$ 62,010 5,789 – 67,799 GAM Star Global Quality* US$ 7,205 3,287 – 10,492GAM Star Global Rates US$ 11,028 16,114 14,350 41,492GAM Star Global Selector US$ 4,829 5,071 – 9,900
GAM Star Global Growth £ 4,905 2,460 8,327 15,692GAM Star India Equity* US$ 7,628 8,054 – 15,682GAM Star Interest Trend US$ – 2,918 213 3,131GAM Star Japan Leaders ¥ 19,110,886 6,042,888 – 25,153,774GAM Star Keynes Quantitative Strategies* US$ – 173 – 173GAM Star MBS Total Return US$ 4,105 41,641 – 45,746GAM Systematic Alternative Risk Premia US$ 85,889 7,890 21,810 115,589GAM Systematic Core Macro US$ 13,242 – 100,619 113,861GAM Systematic Global Equity Market Neutral US$ – – 17,857 17,857GAM Star Tactical Opportunities US$ 5,279 2,316 510 8,105GAM Star Target Return US$ 6,155 1,805 1,226 9,186GAM Star Target Return Plus US$ 2,300 880 1,113 4,293GAM Star Disruptive Growth US$ 396,240 11,807 – 408,047GAM Star US All Cap Equity US$ 94,737 6,655 – 101,392GAM Star Worldwide Equity US$ 41,870 10,584 – 52,454GAM Systematic Dynamic Credit** US$ 113 356 – 469
* Fund terminated during the year.** Fund launched during the year.
Additional Information and Regulatory Requirements (Unaudited), continued
Changes to the Prospectus
A new Prospectus for GAM Star Fund p.l.c. was issued on 6 December 2019 and addendum added on 20 January 2020 and 31 January 2020 to include:
Summary of principal amendments to the Prospectus– Updating the definition of the “CBI UCITS Regulations” in light of the newly issued 2019 regulations;– Making a clarification regarding the definition of “Ordinary Shares” and “Z Shares”;– Deletion of details of former directors of the Manager;– Deleting reference to the requirement to clear indices in advance with the Central Bank;– Updates to the Minimum Initial Subscription for each class of Institutional Shares and X Shares and for W Shares of GAM Systematic Core
Macro and GAM Systematic Global Equity Market Neutral;– Updates to the Company’s Anti Money Laundering and Counter Terrorist Financing Measures to bring in line with the fourth AML directive;– Including references throughout to Mexican Peso as new share classes denominated in Mexican Peso are being established in the following
Sub-Funds of the Company:-– GAM Star Alpha Technology– GAM Star Cat Bond– GAM Star Continental European Equity– GAM Star Credit Opportunities (EUR)– GAM Star Credit Opportunities (USD)– GAM Star Emerging Market Rates– GAM Star Japan Leaders– GAM Star MBS Total Return– GAM Systematic Alternative Risk Premia – GAM Systematic Dynamic Credit
– Updating the issued share capital of the Company as at 31 August 2019;– Updates to reflect the revised Central Bank section 2 form (regarding investment restrictions).
First Addendum : 20 January 2020– Prospectus heading “Determination of Net Asset Value” the first paragraph is deleted and updated with new wording.– GAM Star Technology to be renamed GAM Star Disruptive Growth.
– Wording under the heading Investment Objectives and Policies updated within the Fund Supplement– Wording in relation to performance fee updated within the Fund Supplement.
– GAM Star Cat Bond - wording in relation to annual distributions under the heading Dividends updated within Fund Supplement.– Change of name of a Delegate Investment Manager of Funds with GAM Star Fund p.l.c.
– Cantab Capital Partners LLP changed to GAM Systematic LLP.
Second Addendum : 31 January 2020– With effect from 31 January 2020, the United Kingdom is no longer part of the European Union.
– Supplements updated for GAM Star Alpha Spectrum, GAM Star Composite Global Equity, GAM Star Flexible Global Portfolio and GAM Star Tactical Opportunities.
– Prospectus heading Risk Factors and wording within sub-heading Brexit has been updated.– Prospectus heading Introduction and wording within sub-heading Investment Restrictions has been updated.

396
GAM Star Fund p.l.c.
Additional Information and Regulatory Requirements (Unaudited), continued
Securities Financing Transactions
Article 13 of Regulation (EU) 2015/2365 on transparency of securities financing transactions (“SFTs”) and of reuse and amending Regulation (EU) No 648/2012, requires UCITS investment companies to provide the following information on the use made of SFTs and total return swaps (“TRSs”).
Securities lending
The below table details the value of securities on loan as a proportion of the Funds’ total lendable assets and NAV as at 30 June 2020 and the income/returns earned for the year ended 30 June 2020. Total lendable assets are those assets held within the portfolio of the sub-funds that utilise security lending.
Securities on loan
Fund Currency% of lendable
assets % of NAV
GAM Star Alpha Technology US$ 0.62 0.54GAM Star Disruptive Growth US$ 0.23 0.19
Please refer to Note 5 for details on how the total income earned on securities lending transactions is split between the Company and the Securities Lending Agent and how much income was earned by each party during the year ended 30 June 2020.
The following tables detail the value of securities on loan and associated collateral received, analysed by borrowing counterparty as at 30 June 2020:
GAM Star Alpha Technology
CounterpartyCountry of
establishmentSecurities on loan
US$Non-cash Collateral
received US$
UBS AG United Kingdom 166,493 202,790
166,493 202,790
GAM Star Disruptive Growth
CounterpartyCountry of
establishmentSecurities on loan
US$Non-cash Collateral
received US$
UBS AG United States 562,339 684,937
562,339 684,937
There was only one counterparty in use for securities lending purposes as at 30 June 2020. All securities lending contracts are settled on a bi-lateral basis. Non-cash collateral received in relation to securities lending transactions cannot be sold, re-invested or pledged.
The following table provides an analysis of the type, quality and maturity tenor of non-cash collateral received and posted by the Funds in respect of securities lending transactions as at 30 June 2020.
Maturity Tenor
Fund Collateral type CurrencyLess than one
yearOne to five
yearsGreater than
five years Total
GAM Star Alpha Technology Sovereign debt US$ – 21,555 181,235 202,790GAM Star Disruptive Growth Sovereign debt US$ – 72,803 612,134 684,937
The maturity tenor analysis for Sovereign Debt securities received as collateral is based on the contractual maturity date. All non-cash collateral received by the Funds is held by the Depositary (or through its delegates) as at 30 June 2020.
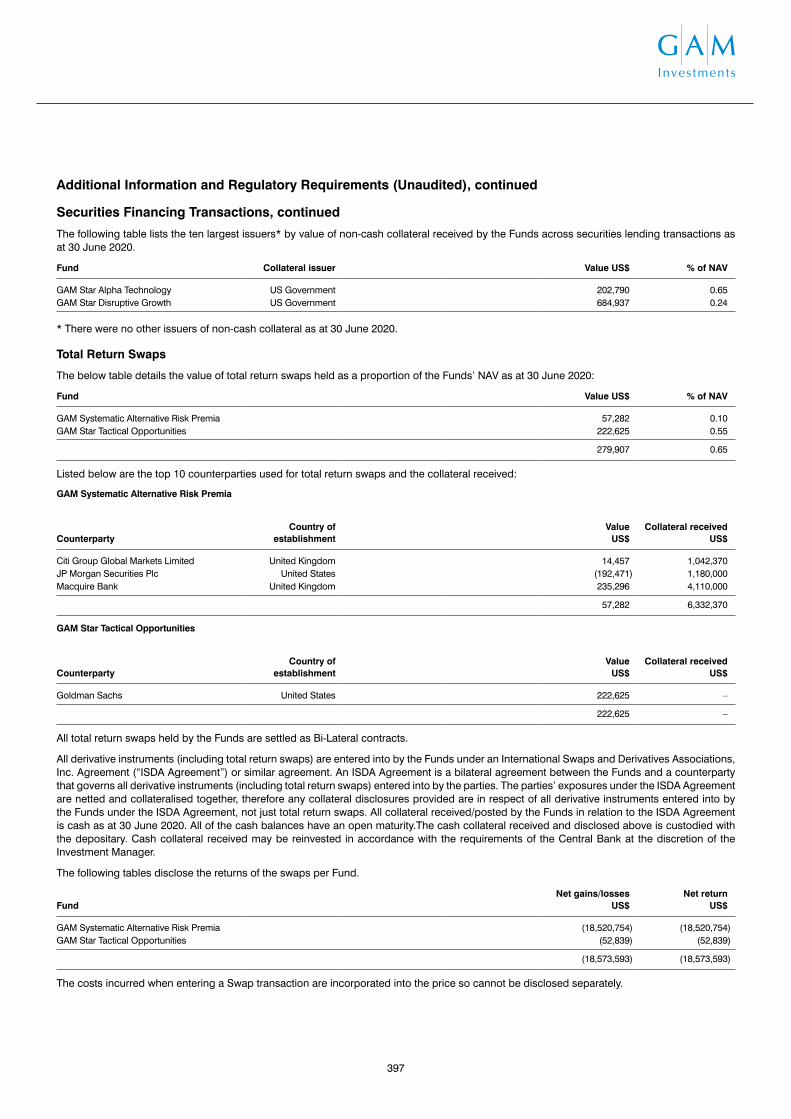
397
Additional Information and Regulatory Requirements (Unaudited), continued
Securities Financing Transactions, continued
The following table lists the ten largest issuers* by value of non-cash collateral received by the Funds across securities lending transactions as at 30 June 2020.
Fund Collateral issuer Value US$ % of NAV
GAM Star Alpha Technology US Government 202,790 0.65GAM Star Disruptive Growth US Government 684,937 0.24
* There were no other issuers of non-cash collateral as at 30 June 2020.
Total Return Swaps
The below table details the value of total return swaps held as a proportion of the Funds’ NAV as at 30 June 2020:
Fund Value US$ % of NAV
GAM Systematic Alternative Risk Premia 57,282 0.10GAM Star Tactical Opportunities 222,625 0.55
279,907 0.65
Listed below are the top 10 counterparties used for total return swaps and the collateral received:
GAM Systematic Alternative Risk Premia
CounterpartyCountry of
establishmentValue
US$Collateral received
US$
Citi Group Global Markets Limited United Kingdom 14,457 1,042,370JP Morgan Securities Plc United States (192,471) 1,180,000Macquire Bank United Kingdom 235,296 4,110,000
57,282 6,332,370
GAM Star Tactical Opportunities
CounterpartyCountry of
establishmentValue
US$Collateral received
US$
Goldman Sachs United States 222,625 –
222,625 –
All total return swaps held by the Funds are settled as Bi-Lateral contracts.
All derivative instruments (including total return swaps) are entered into by the Funds under an International Swaps and Derivatives Associations, Inc. Agreement (“ISDA Agreement”) or similar agreement. An ISDA Agreement is a bilateral agreement between the Funds and a counterparty that governs all derivative instruments (including total return swaps) entered into by the parties. The parties’ exposures under the ISDA Agreement are netted and collateralised together, therefore any collateral disclosures provided are in respect of all derivative instruments entered into by the Funds under the ISDA Agreement, not just total return swaps. All collateral received/posted by the Funds in relation to the ISDA Agreement is cash as at 30 June 2020. All of the cash balances have an open maturity.The cash collateral received and disclosed above is custodied with the depositary. Cash collateral received may be reinvested in accordance with the requirements of the Central Bank at the discretion of the Investment Manager.
The following tables disclose the returns of the swaps per Fund.
FundNet gains/losses
US$Net return
US$
GAM Systematic Alternative Risk Premia (18,520,754) (18,520,754)GAM Star Tactical Opportunities (52,839) (52,839)
(18,573,593) (18,573,593)
The costs incurred when entering a Swap transaction are incorporated into the price so cannot be disclosed separately.

398
GAM Star Fund p.l.c.
Additional Information and Regulatory Requirements (Unaudited), continued
Calendar Year Performance*
The following performance figures relate to ordinary share classes unless otherwise indicated.
1 January 2019 to
31 December 2019
%
1 January 2018 to
31 December 2018
%
1 January 2017 to
31 December 2017
%
1 January 2016 to
31 December 2016
%
1 January 2015 to
31 December 2015
%
1 January 2014 to
31 December 2014
%
GAM Star Absolute Return BondEUR class – Institutional – (3.9) 1.6 2.5 (1.1) (2.4)
GAM Star Absolute Return Bond DefenderGBP class – Institutional – (2.4) 1.8 2.3 (0.5) –USD class – Institutional – – – – – (2.2)
GAM Star Absolute Return Bond PlusEUR class – Institutional – (3.6) 1.6 5.1 (1.3) (2.8)
GAM Star Absolute Return MacroGBP class – Institutional – (5.0) 3.8 11.8 1.6 (5.7)
GAM Star Alpha SpectrumEUR class – Accumulation 11.1 (8.6) 8.4 (1.0) 1.6 6.3
GAM Star Alpha TechnologyUSD class – Income 16.7 11.2 6.9 3.1 6.0 (9.9)
GAM Star Asian EquityUSD class – Accumulation 33.5 (24.3) 35.8 (1.4) (5.9) (5.9)
GAM Star Asia-Pacific EquityUSD class – Accumulation 21.0 (15.5) 30.5 2.1 1.6 (6.1)
GAM Star Global BalancedGBP class – Institutional 15.2 (8.6) 11.9 8.3 3.7 2.6
GAM Star Capital Appreciation US EquityUSD class – Accumulation 32.1 (4.8) 17.5 (2.5) (1.9) 2.4
GAM Star Cat BondUSD class – Accumulation 5.2 1.8 1.1 4.5 2.5 4.4
GAM Star Global CautiousGBP class – Institutional 12.7 (6.4) 9.5 7.1 3.2 2.7
GAM Star China EquityUSD class – Accumulation 37.5 (28.7) 46.1 (11.1) 3.6 (5.4)
GAM Star Composite Global EquityUSD class – Accumulation 27.0 (12.9) 21.9 2.7 (3.5) 1.4
GAM Star Continental European EquityEUR class – Accumulation 31.5 (19.6) 10.4 (0.7) 23.6 4.1
GAM Star Credit Opportunities (EUR)EUR class – Accumulation 13.4 (11.0) 13.8 7.2 3.7 10.7
GAM Star Credit Opportunities (GBP)GBP class – Accumulation 13.3 (6.9) 13.9 9.9 4.5 11.9
GAM Star Credit Opportunities (USD)USD class – Accumulation 16.2 (8.2) 12.6 8.5 2.0 8.0
GAM Star Global DefensiveGBP class – Accumulation 7.8 (5.4) 6.9 5.9 1.6 2.3
GAM Star Discretionary FXUSD class – Accumulation – 3.9 (4.6) (8.7) 6.4 22.6
GAM Star Dynamic Global BondUSD class – Accumulation – (5.4) 9.6 7.9 (8.5) (3.1)
GAM Star Global Dynamic GrowthUSD class – Accumulation 21.9 (12.0) 17.3 11.8 5.0 1.2
5.20
* Performance is calculated for the share class of each Fund cum dividend, on a price by price basis.** Performance data is not published for funds under one year old.*** Past performance is not a guide to future performance.**** The performance data does not take account of the commissions and cost incurred on the issue and redemption of units.

399
Additional Information and Regulatory Requirements (Unaudited), continued
Calendar Year Performance*, continued
The following performance figures relate to ordinary share classes unless otherwise indicated.
1 January 2019 to
31 December 2019
%
1 January 2018 to
31 December 2018
%
1 January 2017 to
31 December 2017
%
1 January 2016 to
31 December 2016
%
1 January 2015 to
31 December 2015
%
1 January 2014 to
31 December 2014
%
GAM Star Emerging EquityUSD class – Accumulation 18.4 (19.3) 17.3 21.3 (17.2) (6.6)
GAM Star Emerging Market RatesUSD class – Accumulation 5.2 (0.6) 2.7 6.0 (0.8) 2.2
GAM Star European EquityEUR class – Accumulation 32.4 (18.6) 12.2 (3.8) 21.9 4.1
GAM Star Flexible Global PortfolioEUR class – Accumulation 8.0 (6.2) 6.4 (3.7) 0.4 3.2
GAM Star Global RatesUSD class – Accumulation 11.6 2.5 (1.8) (5.4) 1.2 5.8
GAM Star Global SelectorUSD class – Accumulation 18.7 (22.9) 6.3 (4.6) (14.5) 3.1
GAM Star Global GrowthGBP class – Institutional 18.2 (10.5) 14.8 9.7 3.6 2.0
GAM Star Interest TrendNon UK RFS – Accumulation 14.6 (9.5) – – – –
GAM Star Japan LeadersJPY class – Accumulation 23.6 (18.3) 28.0 5.8 14.4 4.9
GAM Star MBS Total ReturnUSD class – Institutional 3.3 2.8 4.9 4.2 3.5 –
GAM Star Systematic Alternative Risk PremiaUSD class – Institutional 6.5 (2.4) 3.9 4.8 0.5 3.3
GAM Systematic Core MacroUSD class – Institutional 16.3 (12.0) 7.2 – – –
GAM Systematic Global Equity Market NeutralUSD class – Institutional (2.2) (1.6) 6.0 – – –
GAM Star Tactical OpportunitiesUSD class – Institutional 2.9 (0.1) 6.0 (8.7) (2.6) –
GAM Star Target ReturnUSD class – Institutional – (0.2) 5.2 – – –
GAM Star Target Return PlusEUR class – X Accumulation – (5.3) 4.7 – – –
GAM Star Disruptive GrowthUSD class – Accumulation 37.7 1.6 33.9 2.6 (2.3) (0.3)
GAM Star US All Cap EquityUSD class – Accumulation 25.3 (8.2) 26.6 6.1 (5.5) 8.2
GAM Star Worldwide EquityUSD class – Accumulation 23.4 (21.2) 23.3 2.9 (5.3) (6.6)
GAM Systematic Dynamic CreditUSD class – Z Accumulation 5.2 – – – – –
5.20
* Performance is calculated for the share class of each Fund cum dividend, on a price by price basis.

400
GAM Star Fund p.l.c.
Additional Information and Regulatory Requirements (Unaudited), continued
General Information
The Company
GAM Star Fund p.l.c. (the “Company”), an investment company with variable capital and segregated liability between Funds, is authorised by the Central Bank of Ireland (“the Central Bank”) as an undertaking for collective investment in transferable securities (“UCITS”) under the European Communities (Undertakings for Collective Investment in Transferable Securities) Regulations, 2011 (S.I. No. 211 of 2011) as amended and under the Central Bank (Supervision and Enforcement) Act, 2013 (Section 48(1) (Undertakings for Collective Investment in Transferable Securities) Regulations 2019).
The Manager
The Manager of the Company is GAM Fund Management Limited.
Dealing days
Shares may be purchased or sold on any day which is a business day in Dublin or alternatively such business day as stated in the Prospectus. In the case of all Funds, dealing will be at least twice a month. The NAV per share of each Fund will be determined on each Dealing Day at 23:00 hrs (UK time) or such other time as the Manager may determine in the base currency of the relevant Fund.
Application for shares
All applications should be made directly to the Manager or via the German information and distribution agent, the Austrian paying agent, or via the Swiss representative of the Company. Shares will be purchased on the relevant Dealing Day and a contract note will be sent to the purchaser. Prospective shareholders should note that the price of shares may go down as well as up.
Redemption of shares
Requests for redemption of shares and requests for the switch of shares can be submitted via the German paying agent, the Austrian paying agent, the Swiss representative of the Company or directly to the Manager. This should be done in writing by post, by facsimile, by email or by telephone.
Income distributions
Income distributions are normally made within two months of period end.
Availability of Prices
Prices are available from GAM Fund Management Limited, on www.gam.com.
Reports
Annual and semi–annual reports are issued.
Purchases and Sales
Please contact the Manager, the Swiss representative or other local GAM Contacts to obtain a complete list of all purchases and sales for any Fund free of charge.
Prospectus
Further details concerning the Funds are contained in the Prospectus and Prospectus Addendum, the Key Investor Information Documents of the Company and the Articles of Incorporation. Copies of these, as well as copies of the annual and semi–annual reports, are available on application to the Manager, to the UK facilities agent, the German and Austrian information agent as well as to the Swiss representative free of charge.
Place of performance and forum in Switzerland
In the case of shares which are distributed in Switzerland or from Switzerland, the place of performance and the forum are at the domicile of the Swiss representative of the Fund in Zürich.
Reporting Fund Status (relevant to UK Shareholders only)
It is the policy of the Company to apply to HM Revenue and Customs (“HMRC”) for certification of all share classes (with the exception of GAM Star Alpha Spectrum and the non UK RFS Classes of the relevant Funds) as reporting funds as defined in the Offshore Funds (Tax) Regulations 2009.

401
Additional Information and Regulatory Requirements (Unaudited), continued
Contact Information
EnquiriesClient ServicesGAM Fund Management LimitedGeorge’s Court54–62 Townsend StreetDublin 2, DO2 R156 Ireland
Freephone: 0800 919 927 (UK only)T +353 (0) 1 6093927F +353 (0) 1 6117941 E [email protected]
DealingDealing DepartmentGAM Fund Management LimitedGeorge’s Court54–62 Townsend StreetDublin 2, DO2 R156 Ireland
Freephone: 0800 919 928 (UK only)T +353 (0) 1 6093974F +353 (0) 1 8290778E [email protected]
Information agent and sales office in GermanyGAM (Deutschland) GmbHBockenheimer Landstr. 51-5360325 Frankfurt am MainGermanyT +49 (0) 69 50 50 500
Swiss RepresentativeGAM Investment Management (Switzerland) AGHardstrasse 201CH–8037 ZurichSwitzerlandT +41 (0) 58 426 30 30
Paying and distribution agent in the Republic of AustriaErste Bank der Oesterreichischen Sparkassen AGAm Belvedere 11100 ViennaAustria
Paying agent in the Federal Republic of GermanyDekaBank Deutsche GirozentraleMainzer Landstrasse 1660325 Frankfurt am MainGermany
Paying agent in SwitzerlandState Street Bank International GmbH, Munich, Zurich BranchBeethovenstrasse 19CH-8002 ZurichSwitzerland
Details of all other paying agents are contained in the Prospectus
Other GAM Contact Details
LondonGAM London Limited(Regulated by the FCA)8 Finsbury CircusLondon, EC2M 7GB, United KingdomT +44 (0) 20 7493 9990F +44 (0) 20 7493 0715/7491 2644
New YorkGAM USA Inc.One Rockefeller Plaza, 21st FloorNew York NY 10020, USAT +1 212 407 4600F +1 212 407 4684
TokyoGAM Japan Limited2F Kokusai Building1–1 Marunouchi 3–chomeChiyoda–ku, Tokyo 100–0005, JapanT +81 (0) 3 5219 8800F +81 (0) 3 5219 8808

GAM Star Fund p.l.c. is authorised as a UCITS pursuant to the European Communities (Undertakings for Collective Investment in Transferable Securities) Regulations 1989 and is subject to the European Communities (Undertakings for Collective Investment in Transferable Securities) Regulations, 2011 (as amended) and under the Central Bank (Supervision and Enforcement) Act, 2013 (Section 48(1) (Undertakings for Collective Investment in Transferable Securities) Regulations 2019) and is a recognised scheme under the Financial Services and Markets Act 2000.
These financial statements are issued by the Company and made available to the shareholders by the Manager, which is regulated by the Central Bank in respect of its fund administration and management activities. The Manager does not conduct investment business in the UK nor does it intend doing so. As the Manager is not an authorised person for the purposes of the Financial Conduct Authority, the contents of this report have been approved for issue in the UK by GAM London Limited, 8 Finsbury Circus, London EC2M 7GB (authorised and regulated by the Financial Conduct Authority) for the provision of investment services.
This report is not an invitation to subscribe for shares in any Funds described herein and is by way of information only. Subscriptions will only be received and shares issued on the basis of the current Prospectus for the Company. Shares in the Company are not available for sale in any jurisdiction in which such a sale would be prohibited. This document is not available for distribution in any jurisdiction where such distribution would be prohibited. Without limiting the generality of the preceding statement, in particular, shares in the Company are not available to US residents generally.
Investment involves risk. Please refer to the Prospectus for details of the risk factors, including those associated with investments in emerging markets and financial derivative instruments. Past performance is not a guide to future performance. The price of shares can go down as well as up and may be affected by changes in the rates of exchange. An investor may not get back the amount invested. No recommendation is made positive or otherwise regarding the individual securities mentioned in this document.
This document is intended solely for the use of the person to whom it is sent and may not be reproduced for any other person.

www.gam.com
JNA200603-01