WellLivingHouse - cloudfront.net
82
SENIOR POVERTY & INEQUITY August 2020 The Toronto Experience Well Living House
-
Upload
khangminh22 -
Category
Documents
-
view
2 -
download
0
Transcript of WellLivingHouse - cloudfront.net

SENIOR POVERTY & INEQUITY
August 2020
The Toronto Experience
Well Living House

SENIOR POVERTY & INEQUITY: THE TORONTO EXPERIENCE
ISBN: 978-1-894199-60-5
Published in TorontoAugust 2020by Social Planning Toronto2 Carlton St., Suite 1001Toronto, ON M5B 1J3
ABOUT SOCIAL PLANNING TORONTOSocial Planning Toronto is a non-profit, charitable community organization that works to improve equity, social justice, and quality of life in Toronto through community capacity building, community education and advocacy, policy research and analysis, and social reporting.
Social Planning Toronto is committed to building a “Civic Society,” one in which diversity, equity, social and economic justice, interdependence, and active civic participation are central to all aspects of our lives — in our families, neighbourhoods, voluntary and recreational activities, and in our politics.
To download this report and learn more about Social Planning Toronto, visit socialplanningtoronto.org.
ABOUT WELL LIVING HOUSEThe Well Living House is an action research centre that is focused on Indigenous infant, child and family health and well-being. At its heart is an aspiration to be a place where Indigenous people can come together to gather, understand, link and share best knowledge about happy and healthy child, family and community living.
The Well Living House is working to:
• Be a place of refuge and renewal for Indigenous infants, children and families.• Build on similarities and synergies between Indigenous and western science.• Put Indigenous knowledge at the foundation of health services and programs for Indigenous
peoples.
The long-term vision of the Well Living House is that every Indigenous infant will be born into a context that promotes health and well-being — at the individual, family and community levels. We plan to achieve this vision by improving health policies, services and programs through knowledge work: conducting research, building knowledge networks and providing training.
The centre is built from a foundation of almost two decades of collaborative work between Indigenous health researchers, front line health practitioners and Indigenous community grandparents. In all that we do, the Well Living House is committed to using and protecting our Indigenous knowledge, languages and ways of working.
The Well Living House is housed at the Centre for Urban Health Solutions (C-UHS), part of St. Michael’s Hospital in Toronto. A committee of Elders, the Counsel of Grandparents, has been struck to guide the establishment and operation of the Well Living House.
For more information, visit welllivinghouse.com.

REPORT AUTHORS
Sharma Queiser, Social Planning Toronto
Raglan Maddox, Well Living House, Centre for Urban Health Solutions (C-UHS); Li Ka Shing Knowledge Institute, St. Michael’s Hospital; National Centre for Epidemiology and Public Health, Research School of Population Health, The Australian National University
Beth Wilson, Social Planning Toronto
Angelica de Jesus-Bretschneider, Social Planning Toronto
CONTRIBUTORS
Janet SmylieCheryllee BourgeoisKristen O’BrienRiju SamuelAyan JamaRyan TilleyRichard LauDevika Shah
Many thanks to Scott Leon (Wellesley Institute), John Stapleton, Vanessa Campisi, Meena Bhardwaj, Andrea Austen, Peter Hicks, and Thrmiga Sathiyamoorthy (Wellesley Institute) for their thoughtful comments and advice on the draft report.
We would like to extend our appreciation to the City of Toronto as the lead agency of the Toronto Consortium of the Community Data Program (CDP) and its staff who support community access to data. Data accessed through the CDP were essential to this project.
LAYOUT & DESIGN
Lisa Ferguson, Social Planning Toronto
FUNDING SUPPORT
Our thanks to our key funders, the City of Toronto and United Way Greater Toronto.


SENIOR POVERTY & INEQUITY: THE TORONTO EXPERIENCE
List of Figures
Executive Summary
Section 1: Introduction
Section 2: Methods
Section 3: Data Findings
3.1 Toronto Seniors: Population Trends & Geography
3.2 Low-Income Seniors
3.3 Senior Income Levels & Income Sources
3.4 Senior Tenants
3.5 Indigenous Seniors
Conclusion & Policy Directions
Appendix 1: Relevant Government Strategies & Reports
Appendix 2: Three Pillars of Canada’s Retirement Income System
Appendix 3: Countries That Have an International Social Security Agreement with Canada
Appendix 4: Profile of Seniors, Aged 65 & Over
Appendix 5: Breakdown of Seniors in Collective Dwellings
References
Photo Credits
CONTENTS
i
1
5
8
11
11
14
27
34
42
50
58
59
61
62
64
65
73


SOCIAL PLANNING TORONTO & WELL LIVING HOUSE | i
LIST OF FIGURES
Figure 1: Toronto’s Senior Population by Age Group: 1996–2016 ��������������������������������������������������������������������������������������������������������������������������������� 11
Figure 2: Population Projections for Toronto Seniors, 2018–2041 �������������������������������������������������������������������������������������������������������������������������������� 12
Figure 3: Percentage of Population Aged 65 & Over by Neighbourhood, Toronto, 2016 ����������������������������������������������������������������������������� 13
Figure 4: Senior Poverty Rate in Canada & Ontario, 1976–2018, Based on the LIM-AT ��������������������������������������������������������������������������������� 14
Figure 5: Senior Poverty Rates (LIM-AT) in Canada, Ontario, & Select Urban Centres, 2015 ���������������������������������������������������������������������� 16
Figure 6: Senior Poverty Rates (LIM-AT) by Neighbourhood, Toronto, 2015 ��������������������������������������������������������������������������������������������������������� 17
Figure 7: Senior Poverty Rates (LIM-AT) by Immigrant Status & Period of Immigration, Toronto, 2015 ������������������������������������������� 19
Figure 8: Toronto Seniors by Place of Birth & Status of Social Security Agreements with Canada, 2016 ���������������������������������������� 21
Figure 9: Senior Poverty Rates (LIM-AT) by Racialized Status & Racialized Groups, Toronto, 2015 ������������������������������������������������������ 22
Figure 10: Senior Poverty Rates (LIM-AT) by Gender, Toronto, 2015 ��������������������������������������������������������������������������������������������������������������������������� 24
Figure 11: Senior Poverty Rates (LIM-AT) by Age Group, Toronto, 2015 �������������������������������������������������������������������������������������������������������������������� 25
Figure 12: Poverty Rates (LIM-AT) for all Seniors & Seniors Living Alone, Toronto, 2015 ������������������������������������������������������������������������������ 26
Figure 13: Percentage of Seniors by After-Tax Individual Income Brackets, Toronto, 2015 ���������������������������������������������������������������������� 27
Figure 14: Ontario Maximum Guaranteed Annual Income, 2015 �������������������������������������������������������������������������������������������������������������������������������� 28
Figure 15: Composition of Total Income for Seniors, Toronto, 2015 ��������������������������������������������������������������������������������������������������������������������������� 29
Figure 16: Percentage of Seniors with Income from Various Sources by Age Categories, Toronto, 2015 ���������������������������������������� 31
Figure 17: Work Activity of Seniors, Aged 65 & Older, as a Percent of Total Senior Population, Toronto, 2005 & 2015 ������������ 32
Figure 18: Senior Households by Housing Affordability & Tenure, Toronto, 2016 �������������������������������������������������������������������������������������������� 34
Figure 19: Proportion of Senior Tenant Households Spending 30% or More of Income on Rent & Utilities by Neighbourhood, Toronto, 2016 ����������������������������������������������������������������������������������������������������������������������������������������������������������������������������������������������������������� 36
Figure 20: Proportion of Senior Tenant Households Spending 50% or More of Income on Rent & Utilities by Neighbourhood, Toronto, 2016 ���������������������������������������������������������������������������������������������������������������������������������������������������������������������������������������������������� 37
Figure 21: Proportion of Senior Tenant Households Spending 30% or More & 50% or More of Income on Rent & Utilities in Select Urban Centres, 2016 �������������������������������������������������������������������������������������������������������������������������������������������������������������������������� 38
Figure 22: Core Housing Need for Senior Households by Housing Tenure, Toronto, 2016 ������������������������������������������������������������������������ 39
Figure 23: Percentage of Senior Households who Rent & Live in Core Housing Need in Canada, Ontario, & Select Urban Centres, 2016 �������������������������������������������������������������������������������������������������������������������������������������������������������������������������������������������������������������� 40
Figure 24: Percentage of Indigenous Seniors Above & Below the Low Income Cut-Off (LICO) by Age Group & Sex, Toronto, 2016 ��������������������������������������������������������������������������������������������������������������������������������������������������������������������������������������������������������������������������������������������������� 43
Figure 25: Percentage of Indigenous Seniors by Employment Status, Age Group, & Sex, Toronto, 2016 ������������������������������������� 44
Figure 26: Percentage of Indigenous Seniors by Household Composition & Age Group, Toronto, 2016 ��������������������������������������� 46
Figure 27: Dwelling in Need of Any Major Repairs by Age Group, Toronto, 2016 �������������������������������������������������������������������������������������������� 46
Figure 28: Overall Health & Well-Being Has Been Affected by Financial Hardship in the Past 12 Months, by Age Group, Toronto, 2016 ����������������������������������������������������������������������������������������������������������������������������������������������������������������������������������������������������������������� 47
Figure 29: The Ability to Engage in Preventative Health Activities Has Been Affected by Financial Hardship in the Past 12 Months, by Age Group, Toronto, 2016 ����������������������������������������������������������������������������������������������������������������������������������������������������������� 48
Figure 30: Language Spoken Most Often at Home, by Age Group, Toronto, 2016 ���������������������������������������������������������������������������������������� 48
SENIOR POVERTY & INEQUITY: THE TORONTO EXPERIENCE


SOCIAL PLANNING TORONTO & WELL LIVING HOUSE | 1
Many Toronto seniors — especially Indigenous, racialized, and immigrant seniors, women and older seniors, and seniors living alone — are struggling with poverty. In the pandemic response and economic recovery process, all three levels of government must take action to address senior poverty and the long-standing inequities that are so prevalent in our city.

2 | SENIOR POVERTY & INEQUITY: THE TORONTO EXPERIENCE
EXECUTIVE SUMMARY
Seniors living in poverty experience many challenges and hardships, from food insecurity, risk of eviction, and homelessness to compromised physical and mental health and social isolation.1,2,3 As a key social determinant of health, poverty impacts the health and well-being of Toronto’s large and diverse senior population. Yet senior poverty is not always top of mind for policy-makers — perhaps owing to the relative success of national income security programs established decades ago to address high rates of senior poverty in Canada, particularly among senior women.
However, data from the most recent census and related research paint a disturbing picture of senior poverty in the city of Toronto, particularly among Indigenous, racialized, and immigrant seniors. In this time of pandemic, public attention has focused on the vulnerability
of seniors in long-term care homes, particularly those living in for-profit, privatized facilities where the spread of COVID-19, health consequences, and deaths have been most severe. It is important to extend our focus to include seniors living in poverty in the broader community and to consider the ways in which Indigenous identity, race, immigration status, and gender intersect.
Social Planning Toronto and Well Living House worked together to produce Senior Poverty & Inequity: The Toronto Experience. Using data from the 2016 Census and the Indigenous-led Our Health Counts Toronto research study, this report examines senior poverty and the housing challenges of senior tenants in the city of Toronto. Through an equity lens, the research team documents inequities in the circumstances of Toronto’s diverse senior population. We suggest policy directions for addressing senior poverty in response to the pandemic and in planning for a just recovery.
KEY FINDINGS
1. Toronto has one of the highest rates of senior poverty among large urban centres in Canada.
• Across the city, 17.4% of seniors live in low-income households, compared to 12% of seniors in Ontario and 14.5% of seniors in Canada.
• Toronto has the third-highest rate of senior poverty among large urban centres in Canada, with Montreal and Vancouver topping the list.
• The spatial pattern of senior poverty follows a familiar U-shaped distribution, with higher rates through parts of the inner suburbs into the downtown core. This spatial pattern of concentrated poverty among seniors resembles the areas of concentrated poverty among children and families and the overall population.

SOCIAL PLANNING TORONTO & WELL LIVING HOUSE | 3
2. Indigenous seniors, racialized seniors, immigrants, women, older seniors, and seniors living alone have the highest rates of poverty.
• Overall, the Indigenous population is much younger than the non-Indigenous population. But shamefully, more than 90% of Indigenous seniors in Toronto aged 55 and older and 65 and older live in poverty.
• Racialized seniors are twice as likely to live in poverty compared to non-racialized seniors (25.5% versus 12.9%). Most racialized senior groups have higher rates of poverty than non-racialized seniors, with the exception of Japanese and Filipino seniors. Staggering rates of poverty are experienced among Korean (45.7%), West Asian (45.2%), and Arab (37.7%) seniors.
• Immigrant seniors are twice as likely to live in poverty compared to non-immigrant seniors (20.0% versus 10.4%). Immigrant seniors who came to Canada between 1991 and 2010 have the highest rates of poverty, ranging from 35.7% to 36.9%.
• 19.2% of seniors aged 85 and older live in poverty compared to 18.1% of those aged 75 to 84 and 16.5% of those 65 to 74.
• 18.9% of senior women live in poverty compared to 15.5% of senior men.• One in three seniors who live alone experience poverty.
3. A lack of affordable housing is a troubling and common issue among senior tenant households.
• Senior tenant households are almost three times as likely to live in unaffordable housing compared to senior homeowners.
• One in five senior tenant households spend 50% or more of their income on housing, placing them at heightened risk of becoming homeless.
• In every single ward in the city, more than half of senior tenant households spend 30% or more of their income on housing costs.
POLICY DIRECTIONS
The coronavirus pandemic has brought much-needed attention to the health and well-being of seniors living in our city. Seniors make up a vibrant and valuable segment of our population and should enjoy the opportunities and resources needed to age comfortably and with dignity. The data presented in this report clearly demonstrate that this is not the case. We are calling on each level of government to work together to identify and implement specific, concrete, and tangible solutions that support seniors through the pandemic and in the economic recovery process. These solutions should be guided by the following policy directions.

4 | SENIOR POVERTY & INEQUITY: THE TORONTO EXPERIENCE
IMMEDIATE ACTIONS TO SUPPORT SENIORS THROUGH THE COVID-19 PANDEMIC
1. Ensure every person who is homeless has a safe place to stay with an expedited plan to end homelessness, once and for all.
2. Protect tenants by reinstating the eviction ban until an eviction prevention plan is established.a
3. Continue to provide temporary additional income to low-income seniors to pay for new and rising expenses resulting from the pandemic, such as food and transportation.
ACTIONS TO TAKE TO ENSURE A FAIR RECOVERY FROM THE PANDEMIC
4. Build post–COVID-19 recovery plans on investment in essential programs and services, with the goal of reducing social and economic inequality.
5. Deliver on election promise to increase Old Age Security benefits by 10% once a person turns 75 and boost the Canada Pension Plan survivor benefit by 25%.
6. Increase income supports for seniors in poverty, including OAS and GIS, both now and sustainably in the future.
7. Review income security programs to examine gaps and address disparities among certain groups of seniors.
8. Invest in non-profit and municipally run community-based senior services and long-term care that reflects the growing senior population.
9. Significantly increase the supply of affordable non-profit and supportive housing to meet the needs of seniors and the broader population.
10. Support and invest in Indigenous-led organizations to develop Indigenous-specific seniors’ strategies that address poverty across generations.
11. Implement the Calls to Action from the Final Report of the Truth and Reconciliation Commission of Canada, specifically Calls to Action 7 and 14 pertaining to equity in education and employment and support for Indigenous language and culture.
12. Strengthen Indigenous cultural identity by promoting traditional practices, teachings, and languages.
13. Remove barriers that systemically prevent Indigenous peoples from accessing health and wellness programming and services.
14. Increase access to healthy nutrition and food security programming for Indigenous peoples.
15. Ensure Poverty Reduction Strategies developed by each level of government deliver for diverse seniors.
16. Remove barriers to employment for low-income seniors who want to work, including steep clawbacks on OAS, GIS, and GAINS.
a. At the time of publication of this report, the ban on evictions had just been lifted in Ontario. The provincial government also passed Bill 184, which increases powers of landlords to more easily evict tenants once the ban is lifted. See https://www.acto.ca/ontario-eviction-bill/

SOCIAL PLANNING TORONTO & WELL LIVING HOUSE | 5
SECTION 1: INTRODUCTION
Like many cities around the globe, Toronto is seeing its population age. Seniors make up a large and increasing part of our city. Those aged 65 and over are the fastest growing age cohort, representing more than 1 in 7 residents.
Toronto seniors are a very diverse group and come from different cultural, racial, and ethnic backgrounds. One-third of seniors are racialized, almost three-quarters were born outside of Canada, and collectively seniors in Toronto speak over 150 different languages.4 Seniors may also identify as members of the LGBTQ2S community, have varying abilities, and reside in different living situations. These and other factors affect how each person experiences the aging process.b
The well-being of seniors is something that touches us all. Ensuring that the supports are available to allow every senior to live and age with dignity is essential to building an equitable city. Investments in making Toronto an age-friendly place to live can enable the vast contributions of older people — within their families, to their local communities, and to building a better city — for generations to come.
b. A profile of Toronto seniors is included in Appendix 4.c. See Appendix 2 for more information on Canada’s retirement income system including government benefits, pensions, and retirement savings vehicles for seniors.
Yet senior poverty and economic insecurity has not always been a primary focus of policy-makers. Thirty years ago, seniors were among the poorest residents in the country. Since then, the federal government introduced a suite of new public programs to combat senior poverty and made considerable progress in doing so. This included the Canada Pension Plan, Old Age Security, and the Guaranteed Income Supplement.c
Now, amid the COVID-19 crisis, there is a spotlight on seniors, including those who are homeless and in long-term care homes, and their well-being. The impact of COVID-19 has not been evenly distributed, and seniors have been the most severely impacted. Given these unprecedented circumstances, there is an urgency to better understand the diversity and inequities among the senior population to inform our policy and recovery responses.
Making our city, our province, and our country income and housing secure for seniors is important for everyone — those who are seniors today and those who will be seniors tomorrow. The pandemic has made clear that there are many gaps within our social safety net that require attention.

6 | SENIOR POVERTY & INEQUITY: THE TORONTO EXPERIENCE
Seniors and the COVID-19
Pandemic
6 | SENIOR POVERTY & INEQUITY: THE TORONTO EXPERIENCE
THE DISPROPORTIONATE IMPACT OF COVID-19 ON SENIORS
On March 11, 2020, the World Health Organization declared the spread of a novel coronavirus (COVID-19) a pandemic. Soon thereafter, a state of emergency was enacted by all three levels of governments in an attempt to flatten the curve. The alarming spread and severity of the virus has impacted persons of all walks of life, however, its toll on seniors has been especially tragic.
Older adults, who are at heightened risk of severe illness from COVID-19, have been the hardest hit by the virus. As of July 12, 2020, seniors aged 70 and older represented about 24% of all COVID-19 cases in Toronto and about 87% of all deaths.5 While the impact of COVID-19 on seniors has been more severe than with other cohorts, having the virus does not constitute a death sentence. There have been many stories of older adults successfully beating the virus, and those should be celebrated.6,7,8
INDIVIDUAL & COMMUNITY CONSEQUENCES OF SOCIALLY ISOLATED SENIORS
Across the city, seniors over the age of 70, regardless of their health status or living situation, have been urged to take extra precautions to safeguard their health. At the beginning of the pandemic, older seniors were
asked to stay home as much as possible. More recently, with the introduction of “social circles” allowing people more close contact with a limited number of individuals, public health officials have encouraged older adults to take a careful approach. Public health measures are important for reducing the risk of contracting the virus, but limited contact with family and community can have unfortunate effects on the mental health and well-being of seniors.
Research has documented the many negative consequences of social isolation on seniors, both individually and at the community level. Socially isolated seniors are at risk of negative health behaviours including drinking, smoking, having a sedentary lifestyle, and not eating well; have a higher likelihood of falls; and have greater risk of hospitalization.9 Isolation may also have psychological and cognitive impacts such as depression and suicide.10 At the same time, socially isolated seniors are unable to share their wealth of knowledge and experience with their friends, families, and local communities.
Most seniors in Toronto live in private households and benefit significantly from social support systems. Though social distancing guidelines have changed how social interactions occur, these systems still play a key role in the lives of seniors. For example, seniors may rely on friends, family, and neighbours to deliver essential items like groceries and medications to their homes.11 Visits through windows and from vehicles have become common practices for checking in on older residents.

SOCIAL PLANNING TORONTO & WELL LIVING HOUSE | 7
For seniors living in poverty, these connections may not be as present. Statistics Canada analysis found that, while overall seniors in Canada have a high level of social support, lower-income seniors were less likely to report a high level of social support than high-income seniors.12 The report also found that seniors who live alone, seniors who reside in urban areas, senior men, and immigrant seniors were somewhat less likely to have high levels of social support than their counterparts.
FINANCIAL IMPACT ON SENIORS
The impact of COVID-19 on seniors has also been financial. Even before the crisis, Toronto seniors had financial challenges in everyday life. Almost 70,000 seniors (17.4%) live in poverty.13 The number of seniors who use food banks has also grown in recent years, the majority of whom are single-person house-holds and report relying on government pensions, including the Canada Pension Plan (CPP) / Quebec Pension Plan (QPP), Old Age Security (OAS), and Guaranteed Income Supplement (GIS).14
With the COVID-19 pandemic, seniors have endured additional expenses from higher food prices, delivery and transportation costs, and added dispensing fees for prescription medications. On top of that, some have reported seeing their retirement savings shrink because of a drop in the stock market.15 The federal government has responded with limited financial support including a one-time payment up to $500 for low-income seniors. In addition, the minimum withdrawal from Registered Retirement Income Funds was lowered by 25%, and GIS and Allowance payments were temporarily extended if a person’s 2019 income was not yet assessed.16 In Ontario, Guaranteed Annual Income System (GAINS) payments have also been doubled for the six-month period from April to September 2020.17
There are about 78,000 working seniors in Toronto, some of whom may have lost work, experienced reduced hours, or stopped working because of exposure risks. Working seniors who have lost income as a result of
d. For an excellent review of the long-term care system and the consequences of privatization and failure to properly regulate the system, see https://rabble.ca/blogs/bloggers/views-expressed/2020/05/private-long-term-care-facilities-have-been-understaffed-and
COVID-19 may be eligible for the Canada Emergency Response Benefit (CERB). The CERB, which offers $2,000/month, is a taxable benefit, and eligibility is not affected by pension income.18 In June, the federal government extended the CERB to a maximum of 24 weeks between March 15 and October 3, 2020.19
EXPOSURE OF YEARS OF NEGLECT IN OUR LONG-TERM CARE FACILITIES
Long-term care homes make up a vital component of our health system, providing medical and personal care to individuals experiencing serious health problems. They provide support to some of the most frail and vulnerable seniors who are no longer able to live independently. In Ontario, long-term care homes are regulated by the Ministry of Health and Long-Term Care.
For decades, advocates, families, front-line workers, and unions have called for comprehensive change to the long-term care system to ensure proper oversight, appropriate staffing levels, and needed upgrades to facilities.d These calls have been largely ignored as governments paved the way for greater privatization and failed to properly regulate long-term care facilities to ensure high-quality service and support.
The consequences of neglect have been tragic and predictable. As of May 25, 2020, residents and staff of long-term care homes represented the vast majority of COVID-19 deaths in Canada.20 Of Ontario’s 626 long-term care homes, 58% are privately owned, 24% are non-profit/charitable, and 16% are municipal.21 Recent research on Ontario long-term care homes found the worst outcomes in private, for-profit homes, with the highest death rates from COVID-19.22 Residents in non-profit and publicly operated long-term care homes, which tend to have higher staffing levels, have fared much better. The rapid spread of the coronavirus through so many of our long-term care homes has made it impossible to ignore the unacceptable and unsafe conditions any longer.
SOCIAL PLANNING TORONTO & WELL LIVING HOUSE | 7

8 | SENIOR POVERTY & INEQUITY: THE TORONTO EXPERIENCE
SECTION 2: METHODS
Senior Poverty & Inequity: The Toronto Experience is part of Social Planning Toronto’s census research series, which examines sociodemographic trends and the implications for building a more liveable, equitable city for all. This report presents a picture of senior poverty and the housing challenges of senior tenants in Toronto. We consider the implications for programs, services, and policies delivered by each level of government. Using an equity lens, this report highlights the poverty and housing challenges of Toronto’s diverse senior population. The research team identifies action needed to support the senior population, including those most marginalized, through the pandemic and as we plan for recovery from the pandemic.
Social Planning Toronto and Well Living House worked in partnership on this project to bring together a more comprehensive picture of senior poverty and housing challenges among senior tenants in Toronto, including an important analysis of the experience of Indigenous seniors.
Data sources
Drawing extensively on 2016 Census data, this report looks at population
e. The census short-form questionnaire is used with residents living in collective dwellings. A small number of data tables are publicly available on residents living in collective dwellings.
trends, low-income rates, income levels and sources, and housing affordability. Using disaggregated data, we analyze how poverty affects seniors differently based on various sociodemographic factors including gender, age, race, immigration status, and living arrangements. We also explored population trends among the Indigenous population. Further analysis is needed to explore how poverty impacts groups based on intersectional identities.
The census collects information about people in Canada who live in two broad categories of dwellings: private and collective. Private dwellings such as a house or apartment offer a separate set of living quarters with a private entrance. Collective dwellings, on the other hand, are institutional, communal, or commercial in nature. These include long-term care facilities, retirement homes, and hospitals. The census collects only basic information about residents living in collective dwellings, such as type of collective dwelling, population counts, age, and sex.e Most detailed information from the census is based on individuals living in private dwellings. Since almost 25,000 seniors in Toronto live in collective dwellings, this distinction is helpful to remember.
Due to limitations in the Canadian census that undermines the accuracy of the

SOCIAL PLANNING TORONTO & WELL LIVING HOUSE | 9
Indigenousf population estimates, this report draws on data from Our Health Counts Toronto (OHC).23,24 Gaps in Indigenous data are commonly magnified among seniors who may be isolated and hard to reach. While OHC used an inclusive, community-driven survey for Indigenous peoples in Toronto, aligned with the United Nations Declaration on the Rights of Indigenous Peoples, and included a large sample of a hard-to-reach population using a probability-based method, it is likely that OHC under-sampled Indigenous seniors. Participants were recruited using Respondent-Driven Sampling (RDS), a statistical method that uses social networks, relationships, and kinship lines in the community to recruit Indigenous peoples living and accessing services in the city of Toronto. While OHC is a robust, Indigenous community–driven study, care must be taken in the interpretation and generalization of the findings.
Defining “senior”
There is no universally agreed age at which someone is considered a senior. Different programs and services provided by different institutions and organizations use various definitions. This report relies heavily on 2016 Census data and therefore uses Statistics Canada’s definition of senior: 65 years and older. A senior is commonly defined as a person 65 years of
f. First Nations (Status and non-Status), Inuit, and Métis.
age and older, with retirement generally recognized as commencing at age 65.25
However, it is important to acknowledge that people go through various senior-related experiences at different points — both prior to and after age 65. For example, many people retire or receive full pension well before reaching this age.26 Aging is a widely heterogenous process that is shaped by one’s individual experiences as well as the society within which they live.
Measuring poverty
In 2018, the federal government’s new Poverty Reduction Strategy named the Market Basket Measure (MBM) as Canada’s Official Poverty Line. MBM uses a specific “basket” of goods and services representing a modest, basic standard of living to define the threshold for low income. A person or family is considered low income when their disposable income is less than the cost of the basket.
Statistics Canada is currently undertaking a comprehensive review to update the MBM in order to use it to track the effectiveness of federal poverty reduction programs. While current MBM thresholds are still valid, this report uses the Low-Income Measure, After Tax (LIM-AT) to measure poverty. LIM-AT is a threshold calculated at 50 percent of the national household

10 | SENIOR POVERTY & INEQUITY: THE TORONTO EXPERIENCE
median income and is adjusted for household size.g
The use of the LIM-AT is consistent with our previous reports, which used the LIM-AT because it is widely considered the best available measure of low income and is a relative measure of poverty, capturing both household low income and income inequality.h The LIM-AT also allows us to
g. For more information on the different poverty measurement tools see https://maytree.com/wp-content/uploads/How_do_we_measure_poverty_May2017.pdfh. For a review of the advantages and disadvantages of Canada’s three main measurements of poverty see https://campaign2000.ca/wp-content/uploads/2017/07/May9-Campaign-2000-Measurement-Brief-Canadian-Poverty-Reduction-Strategy-Teleconference-.pdf
track poverty rates over longer periods of time.
Throughout this report the terms “low-income” and “poverty” are used interchangeably in reference to household income that falls below the LIM-AT threshold.

SOCIAL PLANNING TORONTO & WELL LIVING HOUSE | 11
FIGURE 1: TORONTO’S SENIOR POPULATION BY AGE GROUP: 1996–2016
Source: Statistics Canada. 2017. Toronto, CDR [Census division], Ontario and Ontario [Province] (table). Census Profile. 2016 Census. Statistics Canada Catalogue no. 98-316-X2016001. Ottawa. Released 29 November 2017. https://www12.statcan.gc.ca/census-recensement/2016/dp-pd/prof/index.cfm?Lang=E (Accessed April 6, 2019). Statistics Canada, 2011 Census of Population, Statistics Canada Catalogue no. 98-311-XCB2011006. Statistics Canada, 2006 Census of Population, Statistics Canada Catalogue no. 94-575-XCB2006001. Statistics Canada, 2001 Census of Population, Statistics Canada Catalogue no. 95F0300XCB2001001. Statistics Canada, 1996 Census of Population, Statistics Canada Catalogue no. 95F0181XDB96001.
319,850337,825
353,460377,445
426,945
13.4 13.614.1 14.4
15.6
0.0
2.0
4.0
6.0
8.0
10.0
12.0
14.0
16.0
0
50,000
100,000
150,000
200,000
250,000
300,000
350,000
400,000
450,000
1996 2001 2006 2011 2016
% o
f Tot
al P
opu
lati
on
Pop
ula
tion
Ag
ed 6
5 an
d O
ver
65-74 75-84 85+ % of total population
SECTION 3: DATA FINDINGS
3.1 TORONTO SENIORS: POPULATION TRENDS & GEOGRAPHY
Seniors are the fastest-growing age cohort.
Toronto is home to 426,945 residents aged 65 and over. The city’s senior population has increased by 33% over the past two decades, making up 15.6% of the population in 2016, up from 13.4% in 1996 (Figure 1).
The senior population is expected to make up more than one in five Toronto residents by 2041.
With the aging of the baby boom generation, seniors have become the fastest growing population group in Canada.27 In addition, improvements in life expectancy are contributing to a growing cohort of older seniors. In Toronto, the life expectancy in 2016 was 84.7, with women expected to live longer than men (87.0 years verses 82.1).28

12 | SENIOR POVERTY & INEQUITY: THE TORONTO EXPERIENCE
The number of residents over the age of 65 is growing and has recently surpassed the number of children under 15. At the same time, the percent of the population aged 25–64 is expected to decrease.29 The number of seniors in Toronto is projected to increase by nearly 80%, from 464,198 in 2018 to 828,064 in 2041 — reaching 21% of the city’s total population (Figure 2).30
Seniors make up a substantial proportion of the population in many Toronto neighbourhoods.
While seniors live in every neighbourhood in the city, they are not distributed equally. Some neighbourhoods have fewer than 1,000 seniors, while other areas have more than 8,000 seniors. Fifty-eight neighbourhoods have a greater proportion of seniors than the city-wide figure of 15.6% (Figure 3).
Notably, in four Toronto neighbourhoods seniors make up one-quarter of the
Source: Ontario Ministry of Finance, 2018
FIGURE 2: POPULATION PROJECTIONS FOR TORONTO SENIORS, 2018–2041
0%
5%
10%
15%
20%
25%
0
100,000
200,000
300,000
400,000
500,000
600,000
700,000
800,000
900,000
2018
2019
2020 20
2120
2220
2320
2420
2520
2620
2720
2820
2920
30 2031
2032
2033
2034
2035
2036
2037
2038
2039
2040
2041
TOTAL AGE 65+ % total popTotal age 65+ % Total population

SOCIAL PLANNING TORONTO & WELL LIVING HOUSE | 13
population: Markland Wood in central Etobicoke, along the western border of the city; Hillcrest Village and Bayview Woods-Steeles in the northeast corner of North York; and Guildwood in Scarborough, along the waterfront. In nine neighbourhoods, fewer than one in 10 residents are aged 65 and over: Niagara, Regent Park, Waterfront Communities-The Island, North St. James Town, Moss Park, Bay Street Corridor, and Church-Yonge Corridor, all located downtown; Little Portugal, on the west side
of the former city of Toronto; and Henry Farm, on the east side of North York.
Among the city’s 25 wards, Ward 22 – Scarborough-Agincourt and Ward 2 – Etobicoke Centre have the highest percentage of seniors at 21.4% and 21.2%, respectively. Ward 10 – Spadina-Fort York and Ward 13 – Toronto Centre have the lowest prevalence of seniors at 7.2% and 10.4%, respectively.
FIGURE 3: PERCENTAGE OF POPULATION AGED 65 & OVER BY NEIGHBOURHOOD, TORONTO, 2016
Source: Statistics Canada, 2016 Census of Population, Statistics Canada Catalogue no. EO2937_Toronto SCP Part 1. Accessed through the Community Data Program.

14 | SENIOR POVERTY & INEQUITY: THE TORONTO EXPERIENCE
3.2 LOW-INCOMESENIORS
A. SENIOR POVERTY RATES
After a dramatic decline, senior poverty rates have been on the rise over the past two decades, with a growing gap between seniors and non-seniors, loss of workplace pensions, and inadequate income security programs.
Statistics Canada survey data allowed us to examine trends in senior poverty from the mid-1970s to present for Canada and Ontario.i After a striking decline from
i. Senior poverty rates are shown for Canada and Ontario only. The data quality is not sufficient for the city of Toronto.j. Based on available Statistics Canada survey data from 1976–2018.k. Senior poverty rates shown in Figure 4 are based on Statistics Canada surveys; in contrast, rates shown in subsequent charts and maps are based on the 2016 Census. There are small differences in senior poverty rates depending on the data source.
the mid-1970s to the mid-1990s, the percentage of seniors living in poverty has been on the rise again in Canada and in Ontario (Figure 4). In Canada, senior poverty was at a high of 33.1% in 1977 and declined dramatically to a low of 3.9% in 1995.j However, in 2018, 14.3% of Canada’s senior population lived in low-income households. Ontario figures show a similar trend, with a high of 33% poverty among Ontario seniors in 1978, falling to a remarkable 1.9% in 1995. Poverty now affects 11.3% of Ontario seniors.k
FIGURE 4: SENIOR POVERTY RATE IN CANADA & ONTARIO, 1976–2018, BASED ON THE LIM-AT
0
5
10
15
20
25
30
35
1976
1977
1978
1979
1980 19
811982
1983
1984 19
851986 19
871988
1989
1990 19
911992
1993
1994 19
951996
1997
1998 19
992000 20
0120022003200420052006200720082009
2010 20
112012201320142015201620172018
Per
cen
tag
e of
sen
iors
wh
o ar
e lo
w-in
com
e
Canada Ontario
Source: Statistics Canada, Table 11-10-0135-01 Low income statistics by age, sex and economic family type. Note: Senior poverty rate for Ontario in 1998 not shown due to poor data quality.

SOCIAL PLANNING TORONTO & WELL LIVING HOUSE | 15
This upward trend in senior poverty may be, in part, due to the use of the LIM poverty measurement tool. LIM defines poverty in terms of distance from the median income of the population as a whole and is an indicator of social exclusion and inequality.
An analysis by Statistics Canada found that the income of seniors steadily rose from 1976 to 2014. However, the income of younger families declined from 1976 to 1995 and rose from 1996 to 2014.31 These trends mean that “the gap in income between senior and younger families narrowed from 1976 to 1995, but widened from 1995 onward” (p. 3).32 The Experts Panel on Income Security of The Council on Aging of Ottawa came to similar conclusions, noting that the U-shaped trend “is driven mainly by what is happening to incomes of the working-age population and has less to do with any changes in the income of seniors” (p. 21).33
The upward trend in senior poverty as measured by the LIM-AT is still cause for concern. It signifies an inequality within our society in that seniors do not have the income to afford the same quality of life as other segments of the population. Left unaddressed, the gap will continue to widen, and seniors may find themselves without the means to participate fully in our society.
The significant decline in seniors’ poverty from the mid-1970s to mid-1990s has been attributed to investments in public programs, namely at the federal level, that sought to provide income in old age.34 Old Age Security and the Guaranteed Income Supplement, two main tools for alleviating senior poverty, are indexed based on the Consumer Price Index (CPI), which has not kept pace with average earnings. Therefore, given the high reliance of seniors on these two programs, senior poverty is likely to continue to climb unless this gap is remedied.35
In addition to the inequalities between seniors and non-seniors, there are inequalities among seniors that deserve policy attention. Those with, and without, good private pensions is an example. Over the past several decades, there has been an overall decline in access to workplace pensions. In 1977, nearly half (46%) of paid employees in Canada belonged to an employer pension plan. However, by 2014, that number had decreased to 33%.36
Generally, most public sector employers have access to strong workplace pensions; however, that has not been the case in the private sector.37 The rise in precarious work, including part-time, temporary, and low-wage positions, has made it more difficult for workers to adequately prepare for retirement.

16 | SENIOR POVERTY & INEQUITY: THE TORONTO EXPERIENCE
Not only are workplace pensions becoming less common, but also the employers who do offer pension plans are moving from defined benefit pension plans toward defined contribution.38 Unlike defined benefit pension plans, defined contribution plans do not guarantee the amount of income that a worker will receive in retirement, leaving retirees insecure.l
l. Defined benefit pension plans provide a set amount of income to the pensioner, offering a measure of security to retired workers. In a defined contribution pension plan, the amount of income provided by the pension is not guaranteed. Contributions to the pension plan are invested, and the amount of the benefit provided is based on the performance of the investment. Defined contribution pension plans leave pensioners at risk if investments do not earn adequate returns or lose value, including during economic downturns.
Toronto has the third-highest senior poverty rate among large urban centres in Canada.
According to the 2016 Census, the city of Toronto has the third-highest poverty rate for seniors (17.4%) among large urban centres in Canada (Figure 5). Montreal ranks first and Vancouver ranks second with poverty rates for seniors of 22.9% and 21.0%, respectively. Toronto has a higher senior poverty rate than Ontario and Canada.
Montreal, Toronto, and Vancouver are Canada’s three most populated cities and
FIGURE 5: SENIOR POVERTY RATES (LIM-AT) IN CANADA, ONTARIO, & SELECT URBAN CENTRES, 2015
12.0%14.5%
7.3%8.2%8.4%8.6%9.4%10.3%
11.5%11.6%12.1%
15.3%17.4%
21.0%22.9%
0.0% 5.0% 10.0% 15.0% 20.0% 25.0%
OntarioCanada
HaltonDurhamCalgary
EdmontonOttawa
PeelYork
HamiltonWinnipeg
Quebec CityToronto
VancouverMontreal
Source: Statistics Canada, 2016 Census of Population, Statistics Canada Catalogue no. 98-401-X2016055.
SOCIAL PLANNING TORONTO & WELL LIVING HOUSE | 17
are also the top three for working-age poverty with rates of 22.3%, 19.2%, and 18.1%, respectively. Large urban centres tend to have higher rates of poverty because they offer low-income people a range of services and opportunities that can’t be accessed as easily in smaller cities or rural areas. Urban centres also tend to attract more immigrants because of the existing cultural, linguistic, and racial diversity and breadth of settlement services, but systemic issues
of discrimination and racism coupled with barriers such as not being able to speak an official language or lack of personal networks make them more susceptible to poverty.
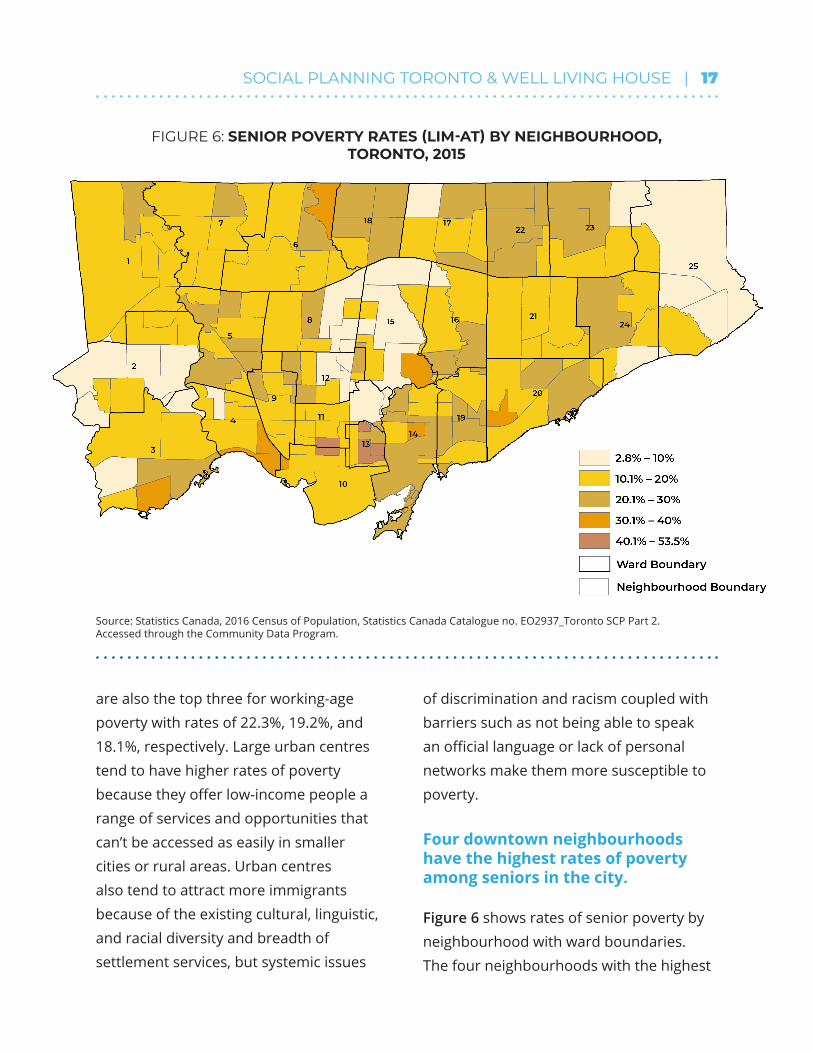
Four downtown neighbourhoods have the highest rates of poverty among seniors in the city.
Figure 6 shows rates of senior poverty by neighbourhood with ward boundaries. The four neighbourhoods with the highest
FIGURE 6: SENIOR POVERTY RATES (LIM-AT) BY NEIGHBOURHOOD, TORONTO, 2015
Source: Statistics Canada, 2016 Census of Population, Statistics Canada Catalogue no. EO2937_Toronto SCP Part 2. Accessed through the Community Data Program.

18 | SENIOR POVERTY & INEQUITY: THE TORONTO EXPERIENCE
rates of senior poverty, all above 40%, are located in the downtown core. Regent Park has the highest rate of senior poverty with just over half (53.5%) of the residents aged 65 and above living in poverty. Nearby Moss Park has the second-highest senior poverty rate of 43.0%. Kensington-Chinatown and North St. James Town have senior poverty rates of 42.0% and 41.5%, respectively. In part, these high rates of senior poverty are likely driven by access to rent-geared-to-income social housing for low-income households.39 Several neighbourhoods, located mostly along subway lines, have senior poverty rates below 10%.
Accordingly, Ward 13 – Toronto Centre and Ward 10 – Spadina-Fort York have the highest senior poverty rates of 31.2% and 24.5%, respectively. Ward 2 – Etobicoke Centre and Ward 25 – Scarborough-Rouge River have the lowest rates of senior poverty in the city at 8.4% and 9.4%, respectively.
B. GROUPS OF SENIORS AT HIGHER RISK OF POVERTY
Data from the 2016 Census reveal higher rates of poverty for several groups of Toronto seniors, including older seniors, women, immigrants, racialized groups, and seniors living alone. The census does
m. The census collects information on a related concept, activity limitations, which “refers to difficulties a person may have doing certain activities as a result of physical, mental, or other health-related conditions or problems.” This information is used to develop the Canadian Survey on Disability.
not include information on disabilitym or LGBTQ2S identity. We draw on related research to explore the issue of poverty among seniors with disabilities and LGBTQ2S seniors.
Immigrant seniors
Of all Toronto seniors, 71.6% are immigrants (not born in Canada), 28% are non-immigrants (born in Canada), and 0.4% are non-permanent residents. Almost two-thirds (64%) of immigrant seniors in Toronto gained permanent residency status before 1981: just over one in 10 (12.8%) between 1981 and 1990, 13.3% between 1991 and 2000, fewer than one in 10 (6.9%) between 2001 and 2010, and only 3% are newcomers, becoming permanent residents between 2011 and 2016. Immigration patterns shifted over time, moving from a greater proportion of immigrants from European countries (before 1981) to, more recently (2011–2016), a greater proportion of immigrants from Asian countries.40
In Toronto, the poverty rate for immigrant seniors (20.0%) is almost double the rate for non-immigrant seniors (10.4%), with the highest rates among seniors who immigrated to Canada after 1990 (Figure 7). While seniors who immigrated before 1991 are less likely to live in a low-income

SOCIAL PLANNING TORONTO & WELL LIVING HOUSE | 19
household than other immigrant seniors, this group is still more likely to live in poverty than seniors born in Canada.
Overall, immigrants have not seen income gains during the last 35 years; they typically earn lower incomes than their Canadian-born counterparts.41 Immigrants face discrimination and barriers within the labour market during their working life, which disadvantages them during retirement.
Recent immigrants to Canada tend to have higher rates of poverty than immigrants who have lived in Canada longer. However, this is not the case for Toronto seniors. While having a high rate of poverty at nearly 30%, recent immigrant seniors
(i.e., those who gained their permanent residency status between 2011 and 2016) were less likely to live in a low-income household than seniors who immigrated between 1991 and 2010.
This difference is likely related to categories of admission to Canada. For Toronto seniors who are recent immigrants, more than 80% were sponsored by family members, and only 3.5% entered through the economic immigrant class.42 In comparison, Toronto seniors aged 65 and over in 2016 who came to Canada in earlier periods were more likely to enter through the economic immigrant class and less likely to be sponsored by family members.
FIGURE 7: SENIOR POVERTY RATES (LIM-AT) BY IMMIGRANT STATUS & PERIOD OF IMMIGRATION, TORONTO, 2015
Source: Statistics Canada, 2016 Census of Population, Statistics Canada Catalogue no. E02767-CPP-01 (CDCSDDA-ON). Accessed through the Community Data Program.
10.4%
20.0%15.4%
36.0% 35.7% 36.4% 36.9%
29.4%33.8%
0%5%10%15%20%25%30%35%40%
Non-im
mig
rants
Imm
igrants
Befo
re 19
91
19
91 to
1995
19
96 to
2000
20
01 to 2005
20
06 to 2
010
20
11 to
2016
Non-p
erm
anent r
esiden
ts

20 | SENIOR POVERTY & INEQUITY: THE TORONTO EXPERIENCE
Individuals who sponsor family members are required to meet income criteria and agree in writing to provide financial support for the family member that they are sponsoring for up to 20n years.43 Recent immigrant seniors may be more likely to live with sponsoring family members, individuals who have sufficient income — a household income above the poverty line — to meet sponsorship requirements.
The data appear to bear this out. According to 2016 Census data for the Toronto Census Metropolitan Area (CMA), over 70% of recent immigrant seniors sponsored by family members live in multi-generational households.44 No other group of immigrant seniors in the Toronto CMA has as high a rate of living in multi-generational households.
While the length of the sponsorship depends on the age of the person coming to Canada and their relationship to the sponsor, generally those sponsoring a parent or grandparent are required to pledge the full 20-year undertaking.45 During this time the new immigrant cannot access any social assistance programs.
The situation seems to be quite different for those who came prior to 1991. Almost half (48.3%) of Toronto seniors aged 65 and over in 2016 who came to Canada
n. It is important to note that the 20-year undertaking is a relatively recent development: the undertaking increased from 10 years to 20 years in 2014. While the effects of this increase are not reflected in the 2016 Census data used in this report, it will likely have an impact on senior poverty in future years.
between 1980 and 1990 entered as economic immigrants.46 According to Colomba and Pino (2017), immigrants coming to Canada before 1991 through the economic class “came as landed or permanent residents, a legal status which provided them juridical rights and protections in their new host country. Their work experiences and educational credentials from their countries of origin were largely recognized by Canadian employers and professional accrediting associations, which facilitated their entry and advancement in the labour market” (p. 86).47 Research has also found that immigrants who came to Canada under the economic class have a lower persistent low-income rate than those who came via family or refugee classifications.48
At the same time, other factors affect the risk of poverty for seniors who immigrated to Canada. For example, recent immigrant seniors have fewer years to prepare for retirement by accumulating assets and savings in Canada.49 As well, the amount that recent immigrants receive from the Canada Pension Plan will be low due to the limited amount of time they have had to work in Canada and contribute to the CPP. Only those who have worked in Canada for 40 years are eligible to receive the full CPP entitlement.

SOCIAL PLANNING TORONTO & WELL LIVING HOUSE | 21
However, some relief is provided to immigrants who arrived from a country that has a social security agreement (SSA) with Canada. Canada has SSAs with 58 countries (Appendix 3) to help seniors who have lived or worked elsewhere to qualify for pension benefits. The agreement allows periods of contribution to the other country’s social security system or the periods of residence abroad to be added to periods of contribution to the CPP in order to meet qualifying conditions in Canada.50
A recent study by Statistics Canada found that senior immigrants who were from a country that has an SSA with Canada were
less likely to have a low income than those who were from a country without such an agreement.51 About 103,000 seniors aged 65 and older in 2016 were born in countries without an SSA (Figure 8).
Most recently, Canada formed new agreements with China and India. These countries have been large sources of senior immigrants in recent years; however, the financial benefits of these agreements are not reflected in the 2016 Census.52 These agreements will likely help to reduce senior poverty amongst immigrants coming from China and India in future years.
FIGURE 8: TORONTO SENIORS BY PLACE OF BIRTH & STATUS OF SOCIAL SECURITY AGREEMENTS WITH CANADA, 2016
Source: Statistics Canada, 2016 Census, Statistics Canada Catalogue no. EO3258-Table 1C-CDCSD (Quebec-Ontario). Accessed through the Community Data Program. Note: After the 2016 Census, an SSA between Canada and India came into effect in January 2017.
Born in Canada, 111,910
Born in a Country
without SSA, 103,075
Born in a Country with SSA, 187,075

22 | SENIOR POVERTY & INEQUITY: THE TORONTO EXPERIENCE
Racialized seniors
In Toronto, over one-third (36.4%) of seniors are from racializedo groups; almost two-thirds (63.6%) are non-racialized. Among Toronto seniors, the four largest racialized groups are Chinese (11.1% of all Toronto seniors, 44,520 residents), South Asian (8.1%, 32,585), Black (5.9%, 23,540), and Filipino (3.2%, 12,985) seniors.
The poverty rate amongst racialized seniors (25.2%) is nearly double the rate for non-racialized seniors (12.9%) in Toronto (Figure 9). Among racialized seniors in Toronto, Korean, West Asian,
o. We use the term “racialized” in reference to the official category of “visible minority” used by Statistics Canada. Statistics Canada defines visible minority as “whether a person belongs to a visible minority group as defined by the Employment Equity Act and, if so, the visible minority group to which the person belongs. The Employment Equity Act defines visible minorities as ‘persons, other than Aboriginal peoples, who are non-Caucasian in race or non-white in colour.’ ” Racialized is preferred because it acknowledges the social process of racialization and the barriers that result from the historical and racial prejudice in our society.
and Arab seniors experienced the highest rates of poverty. Most racialized senior groups had higher rates of poverty than non-racialized seniors, with the exception of Japanese and Filipino seniors.
Overall, racialized workers are more likely to face employment discrimination that reduces their employment earnings and subsequent retirement income.53 Some studies also suggest that variations in health status across and within ethnocultural groups in Canada may affect the decision to retire and the financial security enjoyed at retirement.54
FIGURE 9: SENIOR POVERTY RATES (LIM-AT) BY RACIALIZED STATUS & RACIALIZED GROUPS, TORONTO, 2015
25.2%
12.9%
45.7% 45.2%
37.7%
29.3% 28.3% 27.0%24.3%
22.1% 21.7%
9.9% 9.4%
0%
10%
20%
30%
40%
50%
Racialized
Non-racializ
ed
Korean
Wes
t Asian Ara
b
Chinese
Latin
Am
erican
South
east Asia
n
Other r
acialized
Black
South A
sian
Filipin
o
Japanese
Source: Statistics Canada, 2016 Census of Population, Statistics Canada Catalogue no. E02767-CPP-01 (CDCSDDA-ON). Accessed through the Community Data Program.

SOCIAL PLANNING TORONTO & WELL LIVING HOUSE | 23
While racialized and immigrant status should not be conflated, the majority of racialized seniors immigrated to Canada, with the exception of Japanese seniors.p As such, immigration status, period of immigration, category of admission, and presence of an SSA may also affect one’s experience of poverty in retirement.
For example, Korean seniors have a notably high rate of poverty, with 45.7% living below the LIM-AT threshold in Toronto. Data for the city of Toronto show that almost all (98.7%) Korean seniors are immigrantsq, the majority of whom have been in Canada for more than 25 years.55 Two factors likely contribute to the substantially high poverty rate.
First, the Korea/Canada SSA does not apply to those who left Korea before January 1, 1988. Nor does it help those who left Korea after that date but did not contribute to Korea’s national pension plan.56 This accounts for a substantial portion of Toronto Korean seniors: 49.5% immigrated before 1981 and 22.6% immigrated between 1981 and 1990.57
Second, Koreans tend to have high levels of self-employment in small family
p. In Toronto, 65.3% of Japanese seniors aged 65 and older in 2016 were non-immigrants (born in Canada), compared to 2.2% of all racialized seniors (Statistics Canada, 2016 Census, Statistics Canada Catalogue no. E02825_Table1-pt6_ON1. Accessed through the Community Data Program.).q. Korean, as a racialized group, includes immigrants from North and South Korea; however, the SSA only applies to those from South Korea, which accounts for the majority of Koreans. Based on 2016 Census data, 195 seniors in Toronto were born in North Korea, and 4,950 seniors were born in South Korea (Statistics Canada, 2016 Census, Statistics Canada Catalogue no. EO3258-Table 1C-CDCSD [Quebec-Ontario]. Accessed through the Community Data Program.).
businesses in trade and service sectors.58,59 These employment trajectories provide less opportunity to accumulate retirement and pension savings, including CPP/QPP, and as a result Koreans rely heavily on OAS/GIS in retirement.
Senior women
As women have a longer life expectancy than men, women make up the majority (56.8%) of Toronto seniors. The gender split widens for older groups. For example, women make up 54.2% of seniors aged 65–74, 57.3% of seniors aged 75–84, and 64.8% of those 85 years of age and older.
The overall senior poverty rate for women is 18.9%, compared to 15.5% for men (Figure 10).
Among immigrants and non-immigrants, senior women have higher rates of poverty than senior men, with a larger gender difference among immigrants. Among immigrants, 21.7% of senior women and 17.8% of senior men in Toronto have low incomes; among non-immigrants, 11.0% of senior women and 9.6% of senior men in Toronto have low incomes.60

24 | SENIOR POVERTY & INEQUITY: THE TORONTO EXPERIENCE
Rates of poverty also vary by gender among Toronto seniors based on period of immigration. Senior women aged 65 and over in 2016 who immigrated prior to 2001 have higher rates of poverty than senior men from comparable immigration periods.61 For example, among Toronto residents aged 65 and over in 2016 who immigrated to Canada between 1996 and 2000, 38.1% of women and 32.4% of men have low incomes.
In contrast, rates of poverty are the same for senior men and senior women in Toronto who immigrated between 2001 and 2005, at 36.4% for both groups. For Toronto seniors who immigrated more recently, men have a higher rate of poverty than women. For example, among Toronto seniors who are recent immigrants, gaining permanent residency status between 2011 and 2016, 31.6% of men and 27.6% of women have low incomes. In Toronto, senior men who are non-permanent
residents (38.1%) have a higher rate of poverty than senior women (31.3%).
In most instances, poverty rates are higher for senior women than senior men by racialized status and racialized group. For example, among racialized seniors in Toronto, 26.2% of women and 23.8% of men live in poverty; among non-racialized seniors in Toronto, 14.5% of women and 10.9% of men have low incomes.62 Most racialized groups show similar gender differences with a few exceptions. Among Toronto seniors with Southeast Asian, West Asian, and Japanese backgrounds, rates of poverty did not vary by gender.
Economic insecurity for senior women is shaped by gendered life courses, including labour market experiences.63 Women tend to have interrupted employment histories and/or low lifetime earnings and therefore receive limited Canada Pension Plan (CPP) /Quebec Pension Plan (QPP) payments and private pensions that are earnings based.64
FIGURE 10: SENIOR POVERTY RATES (LIM-AT) BY GENDER, TORONTO, 2015
15.5%
18.9%
0%
5%
10%
15%
20%
Male Female
Source: Statistics Canada, 2016 Census, Statistics Canada Catalogue no. 98-401-x2016043.

SOCIAL PLANNING TORONTO & WELL LIVING HOUSE | 25
16.5%
18.1%19.2%
0%
5%
10%
15%
20%
65 to 74 75 to 84 85 and over
FIGURE 11: SENIOR POVERTY RATES (LIM-AT) BY AGE GROUP, TORONTO, 2015
Source: Statistics Canada, 2016 Census of Population, Statistics Canada Catalogue no. E02767-CPP-01 (CDCSDDA-ON). Accessed through the Community Data Program.
Women are more likely to take time out of the paid labour force to care for children and other family members. This is further compounded by women’s participation in female-dominated occupations that are often low-wage, part-time, and precarious. These conditions systematically reduce women’s ability to achieve economic security through the current retirement income programs.
The CPP child-rearing provisions, introduced in 1983, provide some help to women (and men) who stay home or only work part-time to care for young children. These allow applicants to exclude the years of low or no earnings due to raising a young child from their CPP calculations, increasing the amount of their CPP retirement pension and other CPP benefits such as disability or survivor benefits.65,66
Older seniors
Just over half (52.5%) of Toronto seniors are aged 65–74, about one-third (32%) are aged 75–84, and 15.5% are aged 85 and over. The oldest group includes 770 centenarians. The aged 85 and over group is the fastest growing age cohort in the city.67 It is important to recognize this group as a vulnerable population in Toronto, as older seniors experience higher rates of poverty than younger seniors (Figure 11).
Seniors living alone
In Toronto, 107,215 seniors, just over one-quarter (26.7%) of all seniors, live alone. Senior women are almost twice as likely to live alone than men: one-third of senior women live alone, compared to 18.2%

26 | SENIOR POVERTY & INEQUITY: THE TORONTO EXPERIENCE
of senior men.68 Among seniors who live alone, 70.1% are women.
The proportion of seniors in Toronto who live alone increases with age: 23% of seniors aged 65–74 live alone, 28.1% of seniors aged 75–84 live alone, as do 38.7% who are aged 85 and over. Note that seniors living in nursing homes, long-term care homes, and other collective dwellings are not included in these figures.r
Many studies have indicated that seniors who live alone are more likely to experience poverty.69,70 According to the 2016 Census, just over one-third of Toronto seniors who live alone live in
r. According to the 2016 Census, 24,875 seniors aged 65 and older live in collective dwellings in Toronto. A breakdown by collective dwelling type is included in Appendix 5.
poverty, about double the poverty rate for seniors overall (Figure 12).71
Widowhood is a reality for many seniors who live alone, especially women. With historically lower workforce participation, these women often have limited CPP benefits of their own and rely on survivor benefits, which amount to only 60% of the deceased spouse’s entitlement.72 A Statistics Canada study found that five years after the death of a spouse, the low-income rates had risen at a faster pace for widows than it did for widowers, though both groups had a similar low-income rate prior to widowhood.73
17.4%
33.0%
0%
5%
10%
15%
20%
25%
30%
35%
All Seniors Seniors Living Alone
Source: Statistics Canada 2016 Census, Statistics Canada Catalogue no E03184 Tb8_CDCSD. Accessed through the Community Data Program.
FIGURE 12: POVERTY RATES (LIM-AT) FOR ALL SENIORS & SENIORS LIVING ALONE, TORONTO, 2015

SOCIAL PLANNING TORONTO & WELL LIVING HOUSE | 27
7.2%
30.3%
21.5%
12.7%
8.6%6.1%
3.8% 2.5% 1.6% 1.1%4.5%
0%
5%
10%
15%
20%
25%
30%
35%
Under $10
,000 (inc l
oss)
$10,000 to
$19,99
9
$20,000 to
$29,999
$30,000 to
$39,999
$40,000 to $49,9
99
$50,000 to
$59,999
$60,000 to
$69,999
$70,000 to
$79,99
9
$80,000 to
$89,99
9
$90,000 to
$99,999
$100,000 and ove
r
FIGURE 13: PERCENTAGE OF SENIORS BY AFTER-TAX INDIVIDUAL INCOME BRACKETS, TORONTO, 2015
Source: Statistics Canada 2016 Census, Statistics Canada Catalogue no. EO2766 Table 2 – TGP_65+ Part 2. Accessed through the Community Data Program.
Seniors with disabilities
According to the Canadian Survey on Disability, almost half (47.0%) of Toronto seniors live with disabilities. Senior women experience slightly higher rates of disabilities than senior men (48.1% compared to 45.3%).74 While local data are limited, national survey data show that seniors with more severe disabilities have a higher rate of poverty than seniors without disabilities or with milder disabilities.75
LGBTQ2S seniors
Little research exists on the income of lesbian, gay, bisexual, transgender, queer, and two-spirit (LGBTQ2S) seniors in Toronto or Canada. Although progress has been made to advance the rights and
protections of LGBTQ2S people in Canada, specifically with regard to employment and housing rights, discrimination towards this group still persists.76,77 Further research is needed to understand the economic security of LGBTQ2S individuals in Toronto, including seniors.
3.3 SENIOR INCOME LEVELS & INCOME SOURCES
Most seniors have modest incomes.
2016 Census data show modest after-tax individual income levels for most Toronto seniors. In total, 37.5% of seniors have after-tax individual incomes below $20,000 (Figure 13). Almost one-third of senior men (31.2%) have after-tax individual incomes below $20,000. For senior women, the

28 | SENIOR POVERTY & INEQUITY: THE TORONTO EXPERIENCE
situation is worse, with more than two out of five (42.4%) below $20,000.
In comparison, the maximum guaranteed annual income provided to eligible seniors aged 65 and older in Ontario is about $17,000 for a single person and $14,000 for a person in a married or common-law relationship (Figure 14s).
As part of its Thriving in the City report, the Wellesley Institute calculated that “the cost of thriving in retirement will be between $32,947 and $33,509 annually (after tax) for an adult 65–74 years who does not have significant limitations
s. 2015 figures are shown to allow comparison with 2015 income data presented in this report. Since 2015, the federal government has improved these programs. As of 2020, the maximum annual amount of OAS per person (regardless of marital status) is $7,362.36; the annual maximum of GIS for a single person is $10,996.56 and $6,619.56 per person in a married or common-law relationship (Government of Canada. [2020]. Old Age Security payment amounts. https://www.canada.ca/en/services/benefits/publicpensions/cpp/old-age-security/payments.html). Provincial GAINS payments have remained the same (Government of Ontario. [2020]. Ontario Guaranteed Annual Income System payments for seniors. https://www.ontario.ca/page/guaranteed-annual-income-system-payments-seniors).
to activities of daily living and lives in a single household in the GTA” (p. 10).78 The maximum guaranteed income for seniors falls significantly below this threshold. Consequently, over half of Toronto seniors have individual incomes less than $30,000, suggesting that far too many older adults are going without the things they need to ensure good health and well-being in retirement.
Government transfers play an important role in senior incomes, especially for women.
We examined senior income from various
INCOME SECURITY PROGRAM
MAXIMUM AMOUNTS FOR A SINGLE PERSON
MAXIMUM AMOUNTS FOR
MARRIED OR COMMON-LAW
PARTNERS (PER PERSON)
Old Age Security pension (OAS) $9,191.16 $6,778.44
Guaranteed Income Supplement (GIS) $6,778.44 $6,094.44
Guaranteed Annual Income Supplement (GAINS) $996.00 $1,992.00
TOTAL $16,965.60 $14,864.88
FIGURE 14: ONTARIO MAXIMUM GUARANTEED ANNUAL INCOME, 2015
Source: Calculations based on: York Region. (2015). Program Instructions: Government Income Sources Available to Seniors. 2015 Third Quarter Update. https://www.york.ca/wps/wcm/connect/yorkpublic/7d96e49a-4ecb-4cfc-863d-dc5252558263/2015-11+%28HSA%29+Government+Income+Sources+Available+to+Seniors+Q3.pdf?MOD=AJPERES11+%28HSA%29+Government+Income+Sources+Available+to+Seniors+Q3.pdf?MOD=AJPERES

SOCIAL PLANNING TORONTO & WELL LIVING HOUSE | 29
Source: Statistics Canada 2016 Census, Statistics Canada Catalogue no. EO2766 Table 2 – TGP_65+ Part 2. Accessed through the Community Data Program
FIGURE 15: COMPOSITION OF TOTAL INCOME FOR SENIORS, TORONTO, 2015
Market income
71%
Government transfers
29%
sources. Market incomet and income from government transfersu are the two broad income sources used in the census. Market income includes all income sources that are not government transfers. Examples include income from employmentv, investments, and retirement savings. Income from government transfers excludes all market income sources. Examples include CPP, OAS, and GIS.
t. Statistics Canada defines market income as “the sum of employment income (wages, salaries and commissions, net self-employment income from farm or non-farm unincorporated business and/or professional practice), investment income, private retirement income (retirement pensions, superannuation and annuities, including those from registered retirement savings plans [RRSPs] and registered retirement income funds [RRIFs]) and other money income from market sources during the reference period. It is equivalent to total income minus government transfers. It is also referred to as income before transfers and taxes. For the 2016 Census, the reference period is the calendar year 2015 for all income variables.”u. Statistics Canada defines government transfers as “all cash benefits received from federal, provincial, territorial or municipal governments during the reference period. It includes: Old Age Security pension, Guaranteed Income Supplement, Allowance or Allowance for the Survivor; retirement, disability and survivor benefits from Canada Pension Plan and Québec Pension Plan; benefits from Employment Insurance and Québec parental insurance plan; child benefits from federal and provincial programs; social assistance benefits; workers’ compensation benefits; working income tax benefit; goods and services tax credit and harmonized sales tax credit; other income from government sources.”v. Statistics Canada defines employment income as “all income received as wages, salaries and commissions from paid employment and net self-employment income from farm or non-farm unincorporated business and/or professional practice during the reference period.”
Aggregating all income from Toronto seniors, we find market income makes up 71% of total senior income in Toronto. Employment income, which is part of market income, makes up 24% of total senior income. Income from government transfers makes up 29% of total senior income (Figure 15).

30 | SENIOR POVERTY & INEQUITY: THE TORONTO EXPERIENCE
Composition of total senior income varies by gender. For Toronto seniors, market income makes up 77% of total income for men but only 64% for women. Similarly, employment income makes up 30% of total senior income for men and only 17% for women. In contrast, for senior women, a higher percentage of total income comes from government transfers (36%) compared to total income for senior men (23%).
The proportionally higher reliance of senior women on government transfers is noteworthy as government transfers are typically much lower for women than men.79 Women, in general, have faced and continue to experience employment and income inequities when compared to men.80 Such factors, coupled with interrupted career patterns, result in low private and public pension contributions and lower personal savings for retirement.81,82 Old Age Security and the Guaranteed Income Supplement, which ensure a minimum income for seniors, have been credited for having a significant impact on reducing senior poverty among women.83 Still, poverty rates have risen to unacceptable levels over the past two decades, impacting senior women to a greater degree.
w. Categories are not mutually exclusive; for people with reported income.x. Includes Old Age Security pension (OAS) and Guaranteed Income Supplement (GIS), Canada Pension Plan (CPP) and Quebec Pension Plan (QPP) benefits, Employment Insurance (EI) benefits, and Other income from government sources.
Older seniors are more likely to have private retirement income, while younger seniors are more likely to have employment income.
Among Toronto seniors, median individual incomes from various sources are modest. The median total income is $25,841, median after-tax income is $24,713, median market income is $19,040, median employment income is $11,977, and median income from government transfers is $15,436.84
For all of these income sources, senior women have lower median incomes compared to senior men. In particular, senior men have much higher median market and employment incomes ($23,304 and $13,168, respectively) than senior women ($15,951 and $10,568, respectively). In contrast, median income from government transfers is similar for senior men ($15,660) and senior women ($15,190).
Figure 16w shows that just over one-quarter of seniors have some employment income; almost all have income from government transfersx, and more than half have private retirement income. Younger seniors aged 65–74 are more likely to report some employment income compared to older

SOCIAL PLANNING TORONTO & WELL LIVING HOUSE | 31
age groups. Seniors aged 75–84 and 85 and over are more likely to have some private retirement income compared to younger seniors aged 65–74.
The percentage of seniors receiving employment income and government transfers is comparable to provincial figures. However, Toronto seniors are less likely to have private retirement income compared to Ontario seniors.y
Among Toronto seniors aged 75–84 and 85 and over with employment income, median income from employment is marginal ($390 and $184, respectively)
y. Employment income: 31% of Ontario seniors have some employment income compared to 28% of Toronto seniors. Government transfers: 98% of Ontario seniors compared to 97% of Toronto seniors. Private retirement income: 63% of Ontario seniors compared to 54% of Toronto seniors.z. Statistics Canada defines employment rate as “the number of persons employed in the week of Sunday, May 1 to Saturday, May 7, 2016, expressed as a percentage of the total population aged 15 years and over. The employment rate for a particular group (age, sex, marital status, province, etc.) is the number employed in that group expressed as a percentage of the population for that group.”
compared to younger seniors aged 65–74 ($10,122). While older seniors are more likely to have private retirement incomes, the median private retirement income is higher for younger seniors aged 65–74 ($17,697) compared to older seniors aged 75–84 and 85 and over ($13,872 and $11,591, respectively).
More people are working past 65.
Sixty-five is the common retirement age in Canada, but more and more people are working into their senior years. In 2016, the employment ratez for Toronto seniors age
28%
39%
16%10%
97% 95% 99% 100%
54%47%
63% 61%
0%
20%
40%
60%
80%
100%
65+ 65-74 75-84 85+
Employment Income Government Transfers Private Retirement Income
FIGURE 16: PERCENTAGE OF SENIORS WITH INCOME FROM VARIOUS SOURCES BY AGE CATEGORIES, TORONTO, 2015
Source: Statistics Canada 2016 Census, Custom Table: EO2767 Tb 4 -CPP-5B -CDCSD. Accessed through the Community Data Program.

32 | SENIOR POVERTY & INEQUITY: THE TORONTO EXPERIENCE
65 and over was 14.9%, with rates higher for men (19.9%) than women (10.9%).85
In the last decade the number of seniors who workedaa in Toronto increased by 73.7%, from 45,300 in 2005 to 78,670 in 2015.86,87
In 2015, 7.0% of seniors aged 65 and older worked full-time for the full year, compared to 4.8% in 2005; 12.6% worked part-time or for part of the year in 2015, compared to 8.8% in 2005; and 80.4% did not work in 2015, compared to 86.4% in 2005 (Figure 17).
aa. Includes people who worked full- or part-time for any portion of the year.
At a national level, Statistics Canada reported that in 2015, seniors’ work activity was the highest on record.88 This trend is likely to continue well into the future, with older workers making up a growing proportion of the Canadian labour force.89
There are reasons why people decide to continue working in their senior years, sometimes by choice and other times by necessity. Increased educational attainment, improved life expectancy, better health, and changes to seniors’ financial status and obligations are among the factors that affect this decision.90,91
FIGURE 17: WORK ACTIVITY OF SENIORS, AGED 65 & OLDER, AS A PERCENT OF TOTAL SENIOR POPULATION, TORONTO, 2005 & 2015
Source: Statistics Canada 2006 Census, Statistics Canada Catalogue no. UPP06_Table-06B_CSD. Accessed through the Community Data Program. Statistics Canada, 2016 Census, Custom Table: EO3002 Table 1A - Part 4 Ontario. Accessed through the Community Data Program.
4.8%7.0%
8.8%
12.6%
0%
5%
10%
15%
20%
25%
2005 2015
Worked full year full time Worked part year or part time

SOCIAL PLANNING TORONTO & WELL LIVING HOUSE | 33
Across Canada, each province has enacted law to eliminate mandatory retirement. In Ontario, this law came into effect on December 12, 2006.92 Despite this reform, other public policies have not kept up and many low-income seniors face disincentives to work.
Effective July 2020, GIS recipients can earn up to $5,000 from employment or self-employment before facing clawbacks.93 In addition, 50% of the next $10,000 of employment or self-employment income will be exempt.
This is a modest improvement from the previous policy, which allowed only $3,500 in employment income before clawback. However, the steep clawback rates discourage seniors’ participation in the labour force.
No senior should be compelled to work due to inadequate income. Systems need to work to ensure that every senior can live in dignity with proper income security. For seniors who wish to work, our income programs should not penalize their participation in the labour force.

34 | SENIOR POVERTY & INEQUITY: THE TORONTO EXPERIENCE
3.4 SENIOR TENANTS
Most senior households that rent spend 30% or more of their income on housing. For more than one in five senior tenant households, housing costs take up half of their income or more.
In Toronto, approximately one-third of senior households rent their home. While most own their homes, Toronto’s senior households are more likely to rent than senior households in Ontario and Canada.94
ab. Statistics Canada defines primary household maintainer as the “First person in the household identified as someone who pays the rent or the mortgage, or the taxes, or the electricity bill, and so on, for the dwelling. In the case of a household where two or more people are listed as household maintainers, the first person listed is chosen as the primary household maintainer. The order of the persons in a household is determined by the order in which the respondent lists the persons on the questionnaire. Generally, an adult is listed first followed, if applicable, by that person’s spouse or common-law partner and by their children. The order does not necessarily correspond to the proportion of household payments made by the person.”
The lack of affordable housing in Toronto is undeniable, and for seniors who rent, housing affordability is a considerable challenge. Almost three times as many senior tenant households live in unaffordable housing compared to senior homeowners: 60% of senior tenant households spend more than 30% of their income on shelter compared to 22% of senior homeowners (Figure 18ab). More than one in five senior tenant households pay 50% or more of their income on
FIGURE 18: SENIOR HOUSEHOLDS BY HOUSING AFFORDABILITY & TENURE, TORONTO, 2016
Source: Statistics Canada, 2016 Census of Population, Statistics Canada Catalogue no. CR00163850_CT.8 (ON/CSDs). Note: Senior household was defined using primary household maintainer. All households with a primary household maintainer aged 65 and over were selected.
60.1%
21.9%21.6%
8.3%
0%
10%
20%
30%
40%
50%
60%
70%
Spending 30% or more of income onshelter costs
Spending 50% or more of income onshelter costs
Rent Owned

SOCIAL PLANNING TORONTO & WELL LIVING HOUSE | 35
shelter costs, compared to less than one in 10 senior homeowners.
It should be noted that among senior homeowners, those with a mortgage (22.8%) fare quite differently from those without a mortgage (77.2%). While most senior homeowners in Toronto are mortgage-free, those who carry a mortgage are more likely to experience affordability issues: 49% of senior owner households with a mortgage spend 30% or more on shelter costs, compared to 13% of owners with no mortgage.95
Overall, senior households who own their homes tend to be in a better financial position than those who rent. In Toronto, the median household income of seniors who own their home is $67,887 compared to $29,751 for seniors who rent.96
In every single ward in the city, more than half of senior tenant households pay 30% or more of their income on housing costs.
Spending 30% or more of household income on rent and utilities is commonly used as an indicator that a tenant household lacks affordable housing.
In nine neighbourhoods, 70% or more of senior tenant households pay 30% or more of income on housing costs: Greenwood Coxwell (75.3%) and Danforth-East York (72.5%), located east of the downtown; Oakridge (70.1%), in the southwest corner
of Scarborough; and Newtonbrook West (73.2%), Newtonbrook East (73.2%), Clanton Park (73.2%), West Minster-Branson (71.5%), Hillcrest Village (70.5%), and Bathurst Manor (70.4%) in North York, particularly along the north boundary of the city (Figure 19).
Rates remain high even in the four neighbourhoods with the lowest concentrations of senior tenant households spending 30% or more of their income on housing: Upper Rouge (30%) in the northeast corner of the city; Trinity Bellwoods (34.4%) and Little Portugal (36.4%), located west of the downtown; and Mount Dennis (39.1%), in the former City of York.
At the ward level, census data show that more than half of senior tenant households in all 25 wards in the city pay 30% or more of their income on housing costs. Ward 14 – Toronto-Danforth (66.6%), Ward 6 – York Centre (65.5%), Ward 18 – Willowdale (65.4%), Ward 17 – Don Valley North (65.3%), and Ward 22 – Scarborough-Agincourt (64.5%) have the highest percentages of senior tenant households spending 30% or more of their income on housing costs. Even in the wards with the lowest percentages, more than half of senior tenant households are affected: Ward 25 – Scarborough-Rouge Park (51.1%) and Ward 23 – Scarborough North (52.7%).

36 | SENIOR POVERTY & INEQUITY: THE TORONTO EXPERIENCE
Senior tenant households paying 50% or more of their income on housing costs is far too common in many areas of the city.
Tenant households spending 50% or more of their household income on rent and utilities are severely cost burdened and often considered at risk of homelessness.97 It is troublingly common among Toronto’s senior tenant households, affecting more than one in five.
Among Toronto neighbourhoods, Avondale (50%) and Empress (43.9%) in North York have the highest percentage of senior tenant households paying 50% or more of income on housing costs. Regent Park in the downtown has the lowest (7.1%).
At the city ward level, there are five in which at least one-quarter of senior tenant households pay 50% or more of their income on housing costs: Ward 18 –
FIGURE 19: PROPORTION OF SENIOR TENANT HOUSEHOLDS SPENDING 30% OR MORE OF INCOME ON RENT & UTILITIES
BY NEIGHBOURHOOD, TORONTO, 2016
Source: Statistics Canada, 2016 Census of Population. Data table provided by City of Toronto. Note: This map uses the City of Toronto’s new 158-neighbourhood classification.

SOCIAL PLANNING TORONTO & WELL LIVING HOUSE | 37
FIGURE 20: PROPORTION OF SENIOR TENANT HOUSEHOLDS SPENDING 50% OR MORE OF INCOME ON RENT & UTILITIES
BY NEIGHBOURHOOD, TORONTO, 2016
Source: Statistics Canada, 2016 Census of Population. Data table provided by City of Toronto. Note: This map uses the City of Toronto’s new 158-neighbourhood classification.
Willowdale (30.5%), Ward 17 – Don Valley North (27.9%), Ward 8 – Eglinton-Lawrence (26.6%), Ward 6 – York Centre (25.5%), and Ward 16 – Don Valley East (25.1%) (Figure 20). Ward 5 – York South—Weston (15.2%) and Ward 13 – Toronto Centre (16%) have the lowest percentages of senior tenant households paying 50% or more of their income on rent and utilities.
Spending such a large portion of income on rent is particularly concerning for senior households, who often live on fixed incomes. Except for cost-of-living increases to their pension benefits, seniors have little promise of their income rising. This means that many seniors struggle with rent increases, placing undue strain on their finances and ability to make ends meet.

38 | SENIOR POVERTY & INEQUITY: THE TORONTO EXPERIENCE
A lack of affordable rental housing is a common occurrence for senior households in many urban centres.
In urban centres across Canada, senior tenants struggle to access affordable rental housing. Among 13 urban centres, including regional municipalities of the GTA, Toronto has the fourth-highest percentage of senior tenant households paying 30% or more of their income on housing costs (60%), following York Region (63%), Durham Region (62%), and Halton Region (61%), and tied with Edmonton (60%) and Montreal (60%) (Figure 21).
Toronto has the third-highest percentage of senior tenant households paying 50% or more of their income on housing costs (22%), following York Region (27%) and
Halton Region (24%), and tied with Durham Region (22%) and Vancouver (22%). Based on both measures of affordability, Toronto has a greater affordable housing problem with respect to senior tenants compared to Ontario overall.
More than half of senior households that rent are in core housing need.
Core housing need is another indicator used to identify households experiencing housing problems. This measure examines three dimensions of housing need: affordability (spending less than 30% of household income on housing costs), suitability (housing that has a sufficient number of bedrooms to meet the household’s needs, based on the National
58%63% 62% 61% 60% 60% 60%
57% 56% 54% 54%
47% 47% 45%
19%
27%22% 24% 22%
7% 7%
18% 16%22%
18%14%
9%14%
0%
10%
20%
30%
40%
50%
60%
70%
Ontario
York
Durham
Halton
Toro
nto
Edmon
ton
Mon
treal
Calgar
y
Hamilt
on
Vancouve
r
Ottawa
Win
nipeg
Peel
Quebec C
ity
spending 30% or more spending 50% or more
FIGURE 21: PROPORTION OF SENIOR TENANT HOUSEHOLDS SPENDING 30% OR MORE & 50% OR MORE OF INCOME ON RENT & UTILITIES
IN SELECT URBAN CENTRES, 2016
Source: Statistics Canada, 2016 Census of Population. Data provided by Canadian Rental Housing Index.

SOCIAL PLANNING TORONTO & WELL LIVING HOUSE | 39
53.3%
14.8%
0%
10%
20%
30%
40%
50%
60%
Renters Homeowners
FIGURE 22: CORE HOUSING NEED FOR SENIOR HOUSEHOLDS BY HOUSING TENURE, TORONTO, 2016
Source: Statistics Canada, EO2767 Table12B. Accessed through the Community Data Program.
Occupancy Standard), and adequacy (housing that does not require major repairs). According to Statistics Canada, a household is in core housing need if one or more of the three standards is not met and if paying the median rent for alternative local housing that would meet all three standards would take up 30% or more of its before-tax income.
In Toronto, approximately 67,000 (27%) senior households are in core housing need. Senior tenant households are more likely to be in core housing need, with
ac. Among senior tenant households in core housing need, 82.8% have housing that does not meet the affordability criterion only, 11.8% have housing that does not meet the affordability criterion and one or both of the other housing standards (suitability, adequacy), and 5.3% have housing that does not meet the suitability and/or adequacy standard but is affordable. Among senior homeowners in core housing need, 86.1% have housing that does not meet the affordability criterion only, 7.7% have housing that does not meet the affordability criterion and also does not meet the suitability and/or adequacy criteria, and 6.1% have housing that does not meet the suitability and/or adequacy standard but is affordable.
more than half (53.3%) affected compared to 14.8% of senior homeowners (Figure 22). Among Toronto renters, senior households are much more likely to be in core housing need (53.3%) compared to working-age households (33.2%).
Among senior households in core housing need in Toronto, a lack of affordable housing is the most common problem. It affects more than 90% of senior renters and a similar percentage of senior homeowners in core housing need.ac

40 | SENIOR POVERTY & INEQUITY: THE TORONTO EXPERIENCE
32.8%
43.1%
21.0%
28.4%
29.6%
35.0%
40.0%
43.1%
46.1%
46.2%
49.2%
49.3%
50.0%
51.7%
53.3%
0.0% 10.0% 20.0% 30.0% 40.0% 50.0% 60.0%
CanadaOntario
Quebec CityMontreal
WinnipegHalton
OttawaHamiltonDurham
VancouverYork
EdmontonCalgary
PeelToronto
FIGURE 23: PERCENTAGE OF SENIOR HOUSEHOLDS WHO RENT & LIVE IN CORE HOUSING NEED IN CANADA, ONTARIO, & SELECT URBAN CENTRES, 2016
Source: Statistics Canada, Census of Population, Statistics Canada Catalogue no. EO2767 Table12B CD CSD DA. Accessed through the Community Data Program.
Toronto is the “core housing need” capital of Canada for senior households that rent.
A greater percentage (53.3%) of senior tenant households live in core housing need in Toronto than in any other urban centre in Canada (Figure 23). This is also well above the provincial (43.1%) and national (32.8%) statistics.
Toronto has social housing, including seniors-designated buildings, but it’s not nearly enough.
The City of Toronto has 20,000 units in the social housing portfolio (including Toronto Community Housing) in buildings with mandates to serve seniors. As of the end of 2019, the entire social housing portfolio had at least 25,900 senior households, including those in buildings without seniors mandates.98
Demand for social housing remains high among seniors. As of December 31, 2019, about one-third (27,511) of households on the City’s social housing waitlist were seniors.99

SOCIAL PLANNING TORONTO & WELL LIVING HOUSE | 41
Seniors who are homeless: the consequence of inaction.
The city’s affordable housing crisis has clear consequences for seniors, including the increased risk of eviction and homelessness. Toronto’s most recent Street Needs Assessment found over 8,700 individuals were experiencing homelessness on the evening of April 26, 2018.100 According to this point-in-time survey, 10% of the homeless population were aged 60 and over. Related research
conducted by the Centre for Equality Rights in Accommodation focused on senior tenants in the Greater Toronto Area and the risk of eviction.101 Researchers found factors such as lack of appropriate and accessible supports, low and fixed incomes coupled with rising rents, and social isolation contributed to the risk of eviction for older adults. Report findings underscored the impact of eviction and homelessness on the physical, mental, and emotional well-being of seniors.

42 | SENIOR POVERTY & INEQUITY: THE TORONTO EXPERIENCE
3.5 INDIGENOUS SENIORS
Senior Poverty & Inequity: The Toronto Experience draws on Our Health Counts Toronto data due to significant limitations in the Canadian census that undermine the accuracy of the Indigenousad population estimate in Canada.102,103 Our Health Counts Toronto is an inclusive, community-driven survey for Indigenous peoples in Toronto and is consistent with the United Nations Declaration on the Rights of Indigenous Peoples. Our Health Counts Toronto recruited participants using Respondent-Driven Sampling (RDS), a statistical method that uses social networks and kinship lines in the community to recruit Indigenous peoples living and accessing services in Toronto.
Indigenous peoples are diverse, and represent a diversity of cultures, languages, perspectives, experiences, and circumstances, and that brings vibrancy to Toronto. The Our Health Counts Toronto findings indicated that there were 54,000–87,000 Indigenous peoples living in Toronto in 2016,104 approximately two to four times larger than the population estimated by Statistics Canada.105,106 This undercounting in the census is due to a number of limitations, including misclassification errors and non-response
ad. First Nations (Status and non-Status), Inuit and Métis.ae. CI refers to confidence interval. Confidence intervals are used to indicate the reliability of an estimate based on a sample. Throughout this section, a 95% CI is used to indicate a range of values that you can be 95% certain contains the true mean of the population.
bias, that systematically underestimate the Indigenous population and inequities between Indigenous and non-Indigenous peoples in Canada.107
Overall, the Indigenous population in Toronto is much younger than the non-Indigenous population. However, within the Indigenous population in Toronto, 10.6% (95%CI 7.2, 14.0)ae were aged 55–65 and 3.4% (95%CI 1.8, 5.0) were aged 65 years and older.
In Toronto, 41.7% (95%CI 28.8, 54.6) of Indigenous adults aged 55 and older were female, and 58.2% (95%CI 45.3, 71.0) were male. However, of those aged 65 and older, 57.1% (95%CI 33.5, 80.7) were female, and 42.9% (95%CI 19.3, 66.5) were male.
Low socioeconomic status is common among the Indigenous population as a direct and indirect result of colonization.
The mechanics of colonization have eroded power, social structures, and Indigenous community resources including access and connection to land over generations and have resulted in low socioeconomic status (SES) being common among the Indigenous population.108,109,110 As detailed in the Final Report of the Truth and Reconciliation Commission of Canada (2015), colonization and the processes of

SOCIAL PLANNING TORONTO & WELL LIVING HOUSE | 43
FIGURE 24: PERCENTAGE OF INDIGENOUS SENIORS ABOVE & BELOW THE LOW INCOME CUT-OFF (LICO) BY AGE GROUP & SEX, TORONTO, 2016
Source: Our Health Counts Toronto, 2016.
0102030405060708090
100
55 years andolder
65 years andolder
55 years andolder
65 years andolder
Female Male
Below LICO Above LICO
assimilation have eroded social structures and intergenerational connectedness, directly and indirectly impacting SES.111
As a result, only 7.2% (95%CI 3.3, 11.0) of Indigenous adults in Toronto aged 55 and over were living above the before-tax Low Income Cut-Off (LICO) in 2016, and just 1.3% (95%CI 0.0, 4.4) of those aged 65 and over were living above the LICO. As shown in Figure 24, 8.1% (95%CI 2.2, 14.0) of Indigenous females and 6.5% (95%CI 1.4, 11.6) of Indigenous males aged 55 and older lived above the LICO. However, the percentage of Indigenous females aged 65 and older living above the LICO was lower, at just 3.1% (95%CI 0.0, 4.4).
The median income of Indigenous seniors is less than $20,000.
The historical and ongoing implications of colonization have led to poverty, chronic unemployment, under-employment, and poor health outcomes.112 For Indigenous peoples aged 55 years and older and 65 and older the median total household income from all sources was less than $20,000. Specifically, 86.8% (95%CI 80.6, 93.0) of Indigenous peoples aged 55 years and older and 84.1% (95%CI 66.5, 100.0) of Indigenous peoples aged 65 and older reported that total household income from all sources was less than $20,000. We recognise that the Low-Income Measure, After Tax (LIM-AT) threshold for a one-person household in Toronto in 2016 was

44 | SENIOR POVERTY & INEQUITY: THE TORONTO EXPERIENCE
$22,133, indicating that there is substantial potential for change.113
Indigenous seniors in Toronto face various shortfalls in workplace pensions, benefits, and local programming, planning, and service delivery. Further, senior-based programs, policies, and services have supported seniors according to various demographic factors, such as sex, gender, sexual orientation, age, immigration, and race. Therefore, inequities are commonly perpetuated or entrenched among specific population groups such as Indigenous seniors in Toronto. The economic challenges of Indigenous seniors highlight the substantial limitations of federal, provincial, and municipal policies, programs, and services in supporting the complexities of the Indigenous population.
af. Employed includes part-/full-time work, seasonal work, self-employment, homemaking, or any informal paid work (e.g., babysitting, housekeeping). Not in labour force includes student or retired.
Many Indigenous seniors leave the labour force by age 65.
Overall, the Indigenous population experiences much higher levels of unemployment than the non-Indigenous population. The processes of colonization as detailed by the Truth and Reconciliation Commission of Canada (2015) have directly and indirectly impacted educational achievement and led to chronic unemployment and under-employment.114 In 2016, 63% (95%CI 55.7, 70.5) of Indigenous adults in Toronto were unemployed compared to 7% of adults (15 years and older) in Ontario.115
Figure 25af illustrates that 17.5% (95%CI 5.9, 29.1) of Indigenous women aged 55 years and over were employed, 49.7%
FIGURE 25: PERCENTAGE OF INDIGENOUS SENIORS BY EMPLOYMENT STATUS, AGE GROUP, & SEX, TORONTO, 2016
Source: Our Health Counts Toronto, 2016.
0
20
40
60
80
100
120
Female Male Female Male
55 years and older 65 years and older
Employed Unemployed Not in labour force

SOCIAL PLANNING TORONTO & WELL LIVING HOUSE | 45
(95%CI 30.1, 69.3) were unemployed, and 32.8% (95%CI 15.6, 50.0) were not in the labour force. Similarly, 16.6% (95%CI 2.0, 31.2) of Indigenous men 55 and over were employed, 63.5% (95%CI 46.3, 80.8) were unemployed, and 19.8% (95%CI 7.5, 32.2) were not in the labour force.
Among Indigenous seniors aged 65 and older, 7.9% (95%CI 0.0, 20.7) of women were employed, 21.3% (95%CI 0.0, 46.5) were unemployed, and 70.8% (95%CI 43.5, 98.0) were not in the labour force. Similarly, 7.3% (95%CI 0.0, 20.7) of men were unemployed and 92.7% (95%CI 79.3, 100.0) were not in the labour force.
Most Indigenous seniors live alone.
Housing is a key determinant of health and well-being.116,117 Unstable housing has been associated with poorer overall health,118 unmet health care needs, and higher emergency department use.119 High levels of mobility often coincide with unstable or crowded housing and can impact health, well-being, and labour force participation.
Indigenous populations living in urban areas experience higher levels of mobility and precarious housing conditions than non-Indigenous people.120 The TRC highlights the connection between loss of traditional territories, unemployment, and attendance at residential schools and the high levels of unstable housing among Indigenous peoples in Canada.
In Toronto, most Indigenous peoples aged 55 years and older and 65 and older lived in one-person households. Specifically, 69.5% (95%CI 57.6, 81.5) of the Indigenous population aged 55 and over and 81.9% (95%CI 60.3, 100.0) of those 65 and over lived in one-person households (Figure 26). Among Indigenous peoples aged 55 and over, 8.8% (95%CI 1.0, 16.6) resided in couple-family households without children, in comparison to 11.6% (95%CI 0.0, 32.9) of those aged 65 and over.
Almost one-third of Indigenous adults 55 and older and 65 and older live in housing that needs major repairs.
In Toronto, 31.1% (95%CI 16.9, 45.2) of Indigenous adults aged 55 years and over and 31.2% (95%CI 6.0, 56.3) of those 65 and over resided in a dwelling that needed major repairs (Figure 27). In comparison, among the general population in Toronto, only 7.1% lived in private dwellings that needed major repairs.121
Indigenous seniors’ health and access to health services is impacted by financial hardship.
The Indigenous population in Toronto commonly experiences barriers to health and social services, including transportation challenges, lack of trust in health care providers, and significant socioeconomic barriers.122,123 Our Health Counts Toronto found that the overall

46 | SENIOR POVERTY & INEQUITY: THE TORONTO EXPERIENCE
FIGURE 26: PERCENTAGE OF INDIGENOUS SENIORS BY HOUSEHOLD COMPOSITION & AGE GROUP, TORONTO, 2016
Source: Our Health Counts Toronto, 2016.
0
10
20
30
40
50
60
70
80
90
100
One-personhousehold
Lone parenthousehold
Couple-familyhouseholds with
children
Couple-familyhouseholds
without children
Multiple familyhouseholds
Other
55 Years and older 65 Years and older
FIGURE 27: DWELLING IN NEED OF ANY MAJOR REPAIRS BY AGE GROUP, TORONTO, 2016
Source: Our Health Counts Toronto, 2016.
0%10%20%30%40%50%60%70%80%90%
100%
55 years and older 65 years and older
Yes No

SOCIAL PLANNING TORONTO & WELL LIVING HOUSE | 47
health/well-being of 57.2% (95%CI 43.8, 70.5) of Indigenous adults aged 55 years and older and 43.5% (95%CI 20.3, 66.7) of those 65 years and older had been affected by financial hardship in the past 12 months (Figure 28). Furthermore, 50.2% (95%CI 36.9, 63.5) of Indigenous adults aged 55 years and older and 40.1% (95% CI 16.1,64.1%) of those 65 and older reported that their ability to engage in preventative health activities — such as regular exercise, visiting a doctor or nurse for health screening tests, and accessing preventative dental care — was affected by financial hardship in the past 12 months (Figure 29).
Poverty is a major barrier to accessing health care and a central cause of ill health. While this relationship is financial,
the relationship is perpetuated by other factors including the mechanics of colonization as outlined above and detailed by the TRC.124,125,126 At this time of reconciliation, there are significant opportunities to improve the health and well-being of Indigenous peoples, including supporting appropriate health-promoting practices and addressing poverty.
Indigenous seniors play a significant role in preserving languages and cultures.
Cultural practices, traditions, and language are key elements to Indigenous health and well-being. As detailed in the TRC report, the Indian Act, residential school system, Sixties Scoop, and other mechanisms of cultural genocide and oppression
FIGURE 28: OVERALL HEALTH & WELL-BEING HAS BEEN AFFECTED BY FINANCIAL HARDSHIP IN THE PAST 12 MONTHS, BY AGE GROUP, TORONTO, 2016
Source: Our Health Counts Toronto, 2016.
0%10%20%30%40%50%60%70%80%90%
100%
55 years and older 65 years and older
Yes No

48 | SENIOR POVERTY & INEQUITY: THE TORONTO EXPERIENCE
FIGURE 30: LANGUAGE SPOKEN MOST OFTEN AT HOME, BY AGE GROUP, TORONTO, 2016
Source: Our Health Counts Toronto, 2016.
0102030405060708090
100
55 years and older 65 years and older
English First Nations language(s)
FIGURE 29: THE ABILITY TO ENGAGE IN PREVENTATIVE HEALTH ACTIVITIES HAS BEEN AFFECTED BY FINANCIAL HARDSHIP IN THE PAST 12 MONTHS,
BY AGE GROUP, TORONTO, 2016
Source: Our Health Counts Toronto, 2016.
0%10%20%30%40%50%60%70%80%90%
100%
55 years and older 65 years and older
No Yes

SOCIAL PLANNING TORONTO & WELL LIVING HOUSE | 49
have attempted to destroy Indigenous languages.127 Despite the suppression of Indigenous languages and the ongoing impact of colonization, Indigenous peoples have maintained many languages. According to Our Health Counts Toronto, while 93% (95% CI 86.3, 99.7) of Indigenous seniors aged 55 years and older spoke English most often at home, 5.3% (95% CI 0.0, 11.2) spoke a First Nations language(s) such as Cree, Anishinaabemowin, Mohawk, or Dene most often at home (Figure 30). Among Indigenous seniors aged 65 and older, the percentage of those speaking a First Nations language(s) at home increased to 12.3% (95% CI 0.0, 33.6); 87.7% (95% CI 66.4, 100.0) spoke English most often at home.
Indigenous seniors continue to play important roles in protecting and passing on their cultural identities and languages to their families and communities.128 Language plays a pivotal role in preserving and revitalizing cultural and traditional teachings while enhancing pride and identity. In addition, culture and language are protective factors against health crises and social isolation.129 At this time of reconciliation and given the importance of language, there are exciting opportunities to improve access to Indigenous languages in Toronto. The role of Elders is critical in this work.

50 | SENIOR POVERTY & INEQUITY: THE TORONTO EXPERIENCE
Seniors make up a significant, growing, and valuable part of our city. They bring a breadth of knowledge and lived experience to our communities, contributing to our collective well-being. In Toronto, our senior population is growing, in size and in age. To create an inclusive and liveable city, we must ensure that each and every senior has the ability to live and age with dignity.
While it is common to think of seniors as a homogeneous group who, in general, are relatively financially secure, this report’s findings tell a different story. Many Toronto seniors struggle with low incomes. Higher rates of poverty among senior women, as well as seniors who are racialized, immigrants, and Indigenous reflect the systemic and structural inequalities that are embedded throughout our society. Seniors living alone also have a high rate of poverty — a group of particular concern given the increase in social isolation among seniors due to the pandemic. In addition, senior tenants have a particularly tough time coping with housing costs that take up a significant portion of their incomes. The well-being of these seniors and tenants in general is on the minds of many at this precarious time.
With the onset of the COVID-19 pandemic, the needs of seniors, particularly those who are marginalized and most vulnerable, have been front and centre in our collective consciousness. Seniors have a heightened risk of the severe health outcomes of COVID-19 and have been impacted in various social, financial, and physical ways. The rapid spread of the virus through many long-term care homes and seniors residences has demonstrated the inadequate, and often unsafe, living conditions that so many seniors experience.
This is clearly a moment in history to take action to improve the conditions in which our population ages, especially those most marginalized. Each order of government has already established or is in the process of developing important strategies to address poverty, seniors issues, Indigenous issues, and housing (Appendix 1). These strategies are clearly interrelated and should be in alignment with the overarching policy directions that follow.
CONCLUSION AND POLICY DIRECTIONS

SOCIAL PLANNING TORONTO & WELL LIVING HOUSE | 51
IMMEDIATE ACTIONS TO SUPPORT SENIORS THROUGH THE PANDEMIC
1. Ensure every person who is homeless has a safe place to stay with an expedited plan to end homelessness, once and for all.
To get through the pandemic, it is critical that every Torontonian is safe, with a roof over their head and the space to practice social distancing. While steps are being taken in the right direction, like the fast-tracking of the City’s Modular Housing Initiative, full shelters and homeless encampments continue to prevail across our city. Colder months are just around the corner. While we are still in the midst of the first wave of the pandemic, public health officials are thinking ahead for the potential of a second wave in the Fall.
In the weeks ahead, the City must ensure access to housing or hotel rooms for every person experiencing homelessness and make clear its plan to end homelessness, with targets and timelines. The provincial and federal governments have a responsibility to act in tandem with the City. Seniors, who make up approximately 10% of the homeless population, should receive priority for accessing affordable housing, along with other groups who are more vulnerable to severe illness from COVID-19.
2. Protect tenants by reinstating the eviction ban until an eviction prevention plan is established.ag
The government of Ontario has helped many renters weather the storm by banning evictions during the pandemic. However, this ban was recently lifted. To make matters worse, the provincial government also passed Bill 184, Protecting Tenants and Strengthening Communities Housing Act. Despite its title, this bill increased the powers of landlords to fast-track the eviction process.
The importance of having a home has never been clearer. The eviction ban needs to be reinstated until an eviction prevention plan is developed. No one should lose their home during this global health crisis. Senior tenants, who often spend a sizeable portion of their fixed income on rent, could be in danger of eviction if measures are not taken to protect them. A recent analysis by the Maytree Foundation and the Canadian Centre for Policy Alternatives suggested that an eviction prevention plan needs to
ag. At the time of publication of this report, an eviction ban was in place in Ontario. However, the provincial government also passed Bill 184, which increases powers of landlords to more easily evict tenants once the ban is lifted. See https://www.acto.ca/ontario-eviction-bill/
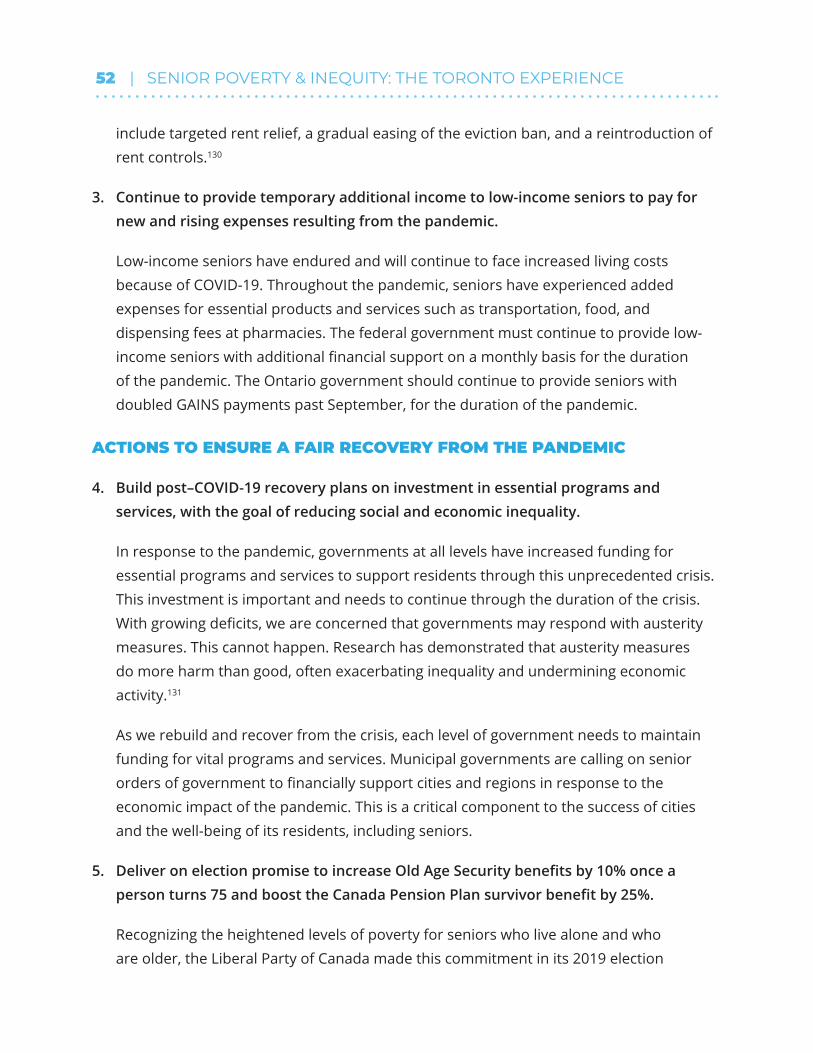
52 | SENIOR POVERTY & INEQUITY: THE TORONTO EXPERIENCE
include targeted rent relief, a gradual easing of the eviction ban, and a reintroduction of rent controls.130
3. Continue to provide temporary additional income to low-income seniors to pay for new and rising expenses resulting from the pandemic.
Low-income seniors have endured and will continue to face increased living costs because of COVID-19. Throughout the pandemic, seniors have experienced added expenses for essential products and services such as transportation, food, and dispensing fees at pharmacies. The federal government must continue to provide low-income seniors with additional financial support on a monthly basis for the duration of the pandemic. The Ontario government should continue to provide seniors with doubled GAINS payments past September, for the duration of the pandemic.
ACTIONS TO ENSURE A FAIR RECOVERY FROM THE PANDEMIC
4. Build post–COVID-19 recovery plans on investment in essential programs and services, with the goal of reducing social and economic inequality.
In response to the pandemic, governments at all levels have increased funding for essential programs and services to support residents through this unprecedented crisis. This investment is important and needs to continue through the duration of the crisis. With growing deficits, we are concerned that governments may respond with austerity measures. This cannot happen. Research has demonstrated that austerity measures do more harm than good, often exacerbating inequality and undermining economic activity.131
As we rebuild and recover from the crisis, each level of government needs to maintain funding for vital programs and services. Municipal governments are calling on senior orders of government to financially support cities and regions in response to the economic impact of the pandemic. This is a critical component to the success of cities and the well-being of its residents, including seniors.
5. Deliver on election promise to increase Old Age Security benefits by 10% once a person turns 75 and boost the Canada Pension Plan survivor benefit by 25%.
Recognizing the heightened levels of poverty for seniors who live alone and who are older, the Liberal Party of Canada made this commitment in its 2019 election

SOCIAL PLANNING TORONTO & WELL LIVING HOUSE | 53
platform. Following the election, the federal government committed to making these enhancements by July 2020 but have not done so.
6. Increase income supports for seniors in poverty, including OAS and GIS, both now and sustainably in the future.
To help low-income seniors today, the federal government should increase GIS payments for low-income single seniors and senior couples. The federal government should index OAS and GIS to the average industrial wage and salary (rather than the Consumer Price Index) to ensure these retirement benefits keep up with earned incomes. These measures would help address senior poverty and the growing income gap between the working age population and seniors.
7. Review income security programs to examine gaps and address disparities among certain groups of seniors.
Indigenous seniors, racialized seniors, immigrants, women, older seniors, and seniors living alone have much higher rates of poverty than seniors overall. It is time for the federal government and the Ontario government to review their income security programs for seniors, including CPP, OAS, GIS, and GAINS, through an equity lens to identify gaps and address disparities in access and outcomes. In combination, these income security programs should ensure that every senior has sufficient financial support in retirement.
8. Invest in non-profit and municipally run, community-based senior services and long-term care that reflects the growing senior population.
With Toronto’s older senior population set to dramatically increase, senior services must be properly resourced, with an expanded capacity to meet the needs of our aging and diverse population. Emphasis should be placed on community-based services that would allow people to stay in their homes for longer periods of time. The recent COVID-19 outbreaks in so many long-term care facilities demonstrate years of neglect and the need for proper oversight. Long-term care homes should be municipally or non-profit owned and operated. Toronto’s frail and vulnerable seniors have a right to live in dignity in a safe and supportive environment.

54 | SENIOR POVERTY & INEQUITY: THE TORONTO EXPERIENCE
9. Significantly increase the supply of affordable non-profit and supportive housing to meet the needs of seniors and the broader population.
Housing insecurity is a growing concern for residents of all ages, including seniors, and calls for coordinated efforts by each level of government. Now is the time to invest in public, non-profit, and co-operative housing that is affordable and accessible. Innovative solutions like community land trusts, a model for community stewardship of land and community assets, should be scaled up to dramatically increase the supply of affordable housing.
10. Support and invest in Indigenous-led organizations to develop Indigenous-specific seniors’ strategies that address poverty across generations.
The mechanics of colonization have actively eroded power, social structures, and Indigenous community resources including access and connection to land over generations and have resulted in low socioeconomic status (SES) being common among the Indigenous population. Consistent with the United Nations Declaration on the Rights of Indigenous Peoples, Indigenous-led organizations such as Toronto Aboriginal Support Services Council (TASSC) and Anishnawbe Health Toronto (AHT) should be adequately funded and supported in developing relevant self-determined, Indigenous-specific seniors’ strategies that address poverty across generations.
11. Implement the Calls to Action from the Final Report of the Truth and Reconciliation Commission of Canada, specifically Calls to Action 7 and 14 pertaining to equity in education and employment and support for Indigenous language and culture.
a) Call to Action 7: We call upon the federal government to develop with Aboriginal groups a joint strategy to eliminate educational and employment gaps between Aboriginal and non-Aboriginal Canadians. b) Call to Action 14: We call upon the federal government to enact an Aboriginal Languages Act that incorporates the following principles:
• Aboriginal languages are a fundamental and valued element of Canadian culture and society, and there is an urgency to preserve them.
• Aboriginal language rights are reinforced by the Treaties. • The federal government has a responsibility to provide sufficient funds for
Aboriginal-language revitalization and preservation. • The preservation, revitalization, and strengthening of Aboriginal languages and
cultures are best managed by Aboriginal people and communities.

SOCIAL PLANNING TORONTO & WELL LIVING HOUSE | 55
• Funding for Aboriginal language initiatives must reflect the diversity of Aboriginal languages.
12. Strengthen Indigenous cultural identity by promoting traditional practices, teachings, and languages.
Having a connection to your linguistic and cultural history contributes to one’s sense of identity, belonging, and overall well-being. Indigenous seniors and Elders play a key role in this work, which can be supported by:
• Developing and implementing programs and services to improve access to Indigenous ceremonies and traditional medicines.
• Funding an expansion of Indigenous language education programming for children and adults.
• Expanding the number and accessibility of dedicated safe spaces for the practice of ceremony and traditions.
• Developing, funding, and implementing an Indigenous language and cultural teacher/knowledge keeper human resource strategy.
• Unpacking and addressing barriers for Indigenous peoples in the access of Indigenous language and cultural programming, services, and supports.
13. Remove barriers that systemically prevent Indigenous peoples from accessing health and wellness programming and services.
Provide adequate funding and support to:
• Develop and coordinate screening schedules and tracking systems across Canada to address mobility and other barriers for Indigenous peoples in accessing timely health screening.
• Ensure education and health promotion materials for Indigenous communities are culturally safe, including translation into Indigenous languages when appropriate.
• Provide adequate funding and support to provincial and regional public health programs to explore alternative and innovative ways to educate and deliver culturally safe screening programs for Indigenous people, including utilizing existing programs already serving Indigenous communities.
• Create dedicated spaces in hospitals and clinics for traditional cultural practices and ceremonies.
• Provide anti-racism and cultural safety training across the healthcare system, expanding availability and continuing education.

56 | SENIOR POVERTY & INEQUITY: THE TORONTO EXPERIENCE
14. Increase access to healthy nutrition and food security programming for Indigenous peoples.
Food insecurity continues to impact how Indigenous peoples experience the aging process. Appropriate interventions should be grounded in the realities of Indigenous peoples’ culture, beliefs, and political systems. Systems and programs that support traditional Indigenous food gathering practices should be promoted.
15. Ensure Poverty Reduction Strategies developed by each level of government deliver for diverse seniors.
Toronto has one of the highest rates of senior poverty among urban centres in Canada, with higher rates for senior women, as well as seniors who are racialized, immigrants, and Indigenous, reflecting deep inequities within the city. The City of Toronto and the federal government have each made a commitment to poverty reduction through their respective strategies, and the provincial government has begun the process of developing its newest strategy (Appendix 1). An approach that addresses poverty across the general population of seniors should be combined with targeted interventions for specific groups of seniors who are more adversely affected by poverty. Clear and measurable targets and timelines are essential, along with a plan for community-led oversight and accountability.
16. Remove barriers to employment for low-income seniors who want to work, including steep clawbacks on OAS, GIS, and GAINS.
A strong income security system is essential to ensure that no senior be compelled to work as a result of poverty. Participation in paid employment should be a choice available to seniors who are interested and able to do so. Improved life expectancies and better health for the general population have allowed many older adults an opportunity to continue to work past the customary age of retirement. For low-income seniors, clawbacks on OAS, GIS, and GAINS should be reduced to allow individuals to keep more of their earnings and not penalize seniors who work.

SOCIAL PLANNING TORONTO & WELL LIVING HOUSE | 57
Seniors make up a vibrant and valuable segment of our population and should enjoy
the opportunities and resources needed to age comfortably and with dignity.

58 | SENIOR POVERTY & INEQUITY: THE TORONTO EXPERIENCE
APPENDIX 1: RELEVANT GOVERNMENT STRATEGIES & REPORTS
SENIORS
• Municipal: Toronto Seniors Strategy 2.0 (2019)
• Provincial: From June 7 to July 19, 2019, the government of Ontario consulted on a new Seniors Strategy
POVERTY REDUCTION
• Municipal: TO Prosperity: Toronto Poverty Reduction Strategy (2015)
• Provincial: From December 16, 2019, to April 30, 2020, the government of Ontario consulted on a new Poverty Reduction Strategy
• Federal: Opportunity for All – Canada’s First Poverty Reduction Strategy (2018)
HOUSING
• Municipal: HousingTO 2020–2030 Action Plan (2019)
• Provincial: More Homes, More Choice: Ontario’s Housing Supply Action Plan (May 2019)
• Federal: A Place to Call Home: Canada’s National Housing Strategy (2018)
INDIGENOUS PEOPLES
• Municipal: Toronto Indigenous Health Strategy (2016–2021)
• Provincial: Urban Indigenous Action Plan (2019)
• Federal: Honouring the Truth, Reconciling for the Future: Summary of the Final Report of the Truth and Reconciliation Commission of Canada (2015)
• Federal: Truth and Reconciliation Commission of Canada: Calls to Action (2015)

SOCIAL PLANNING TORONTO & WELL LIVING HOUSE | 59
APPENDIX 2: THREE PILLARS OF CANADA’S RETIREMENT INCOME SYSTEM
Canada’s retirement system is made up of three components, briefly described below: universal government benefits, the Canada Pension Plan, and private pensions and individual retirement savings. The main goals of Canada’s retirement income system are to maintain pre-retirement living standards and alleviate poverty.132
1. UNIVERSAL GOVERNMENT BENEFITS
The first pillar is aimed at alleviating poverty and is financed through federal and provincial general tax revenues.
Old Age Security (OAS) pension is available to seniors who are 65 and older and citizens or legal residents of Canada. To qualify for OAS, an individual must have resided in Canada for at least 10 years between the ages of 18 and 65; however, one must have lived in Canada for at least 40 years to receive the full amounts.
Guaranteed Income Supplement (GIS) is a monthly, non-taxable benefit to OAS pension recipients who have a low income and are living in Canada. The Allowance is available for people aged 60 to 64 who have low income and whose spouse or common-law partner receive OAS and are eligible for GIS.
In addition, most provinces and territories offer top-ups to OAS and GIS. Guaranteed Annual Income System (GAINS) provides a monthly payment to OAS and GIS recipients who have lived in Ontario for the past 12 months or for a total of 20 years since turning age 18.
2. CANADA PENSION PLAN
The second pillar is a compulsory, earnings-related plan aimed at providing basic retirement income.
Canada Pension Plan (CPP) provides a monthly, taxable benefit that replaces part of your income when you retire. Canadians contribute to this federally administered pension plan based on their earnings. Workers in Quebec are covered by the Quebec Pension Plan (QPP).
Canada also has 58 social security agreements (SSAs) to help seniors who have lived or worked outside of Canada qualify for pension benefits. An SSA allows periods of

60 | SENIOR POVERTY & INEQUITY: THE TORONTO EXPERIENCE
contribution to the other country’s social security system or the periods of residence abroad be added to periods of contribution to the CPP. Appendix 3 lists the 58 countries that are covered by an SSA.
3. WORKPLACE PENSIONS AND INDIVIDUAL RETIREMENT SAVINGS
The third pillar is extremely diverse and includes voluntary programs aimed at providing adequate retirement income, as well as personal savings and assets. Three main vehicles within this pillar are described here; they are privately administered but receive government support in the form of special tax measures and regulatory oversight.133
Employer-sponsored pension plan is a registered plan that you and your employer (or just your employer) regularly contribute to. There are two main types:
• Defined benefit: with this type of plan, the income you get when you retire is usually calculated based on your salary and the number of years you contributed to the plan
• Defined contribution: with this type of plan, you know how much you will contribute to the plan, usually a set amount each year, but not how much you will receive upon retirement
Registered retirement savings plan (RRSP) is a registered savings account that a person and their spouse or common-law partner can contribute to. Any money contributed to an RRSP is exempt from taxes until it is withdrawn.
Tax-free savings account (TFSA) is a registered savings account that allows for tax-free gains. The amount of money that can be contributed to a TFSA is limited each year.

SOCIAL PLANNING TORONTO & WELL LIVING HOUSE | 61
APPENDIX 3: COUNTRIES THAT HAVE AN INTERNATIONAL SOCIAL SECURITY AGREEMENT WITH CANADA:134
1. Antigua and Barbuda
2. Austria
3. Barbados
4. Belgium
5. Brazil
6. Bulgaria
7. Chile
8. China
9. Croatia
10. Cyprus
11. Czech Republic
12. Denmark
13. Dominica
14. Estonia
15. Finland
16. France
17. Germany
18. Greece
19. Grenada
20. Guernsey
21. Hungary
22. Iceland
23. India
24. Ireland
25. Israel
26. Italy
27. Jamaica
28. Japan
29. Jersey
30. Korea (South)
31. Latvia
32. Lithuania
33. Luxembourg
34. Macedonia
35. Malta
36. Mexico
37. Morocco
38. Netherlands
39. Norway
40. Peru
41. Philippines
42. Poland
43. Portugal
44. Romania
45. St. Kitts and Nevis
46. Saint Lucia
47. Saint Vincent and the Grenadines
48. Serbia
49. Slovakia
50. Slovenia
51. Spain
52. Sweden
53. Switzerland
54. Trinidad and Tobago
55. Turkey
56. United Kingdom
57. United States
58. Uruguay

62 | SENIOR POVERTY & INEQUITY: THE TORONTO EXPERIENCE
APPENDIX 4: PROFILE OF SENIORS, AGED 65 & OVER, CITY OF TORONTO, 2016135
POPULATION n %
All seniors 426,945 15.6
GENDER
Male 184,325 43.2
Female 242,615 56.8
AGE
65–74 224,150 52.5
75–84 136,795 32.0
85 and over 66,000 15.5
RACIALIZED STATUS
Racialized (visible minority) 146,510 36.4
Non-racialized (not visible minority) 255,530 63.6
Chinese 44,525 11.1
South Asian 32,580 8.1
Black 23,540 5.9
Filipino 12,985 3.2
Latin American 6,770 1.7
Korean 5,225 1.3
West Asian 4,335 1.1
Southeast Asian 3,370 0.8
Arab 2,900 0.7
Japanese 2,505 0.6
Multiple racialized groups 3,410 0.8
Other racialized group 4,360 1.1
IMMIGRANT STATUS & PERIOD OF IMMIGRATION
Immigrant 287,835 71.6
Non-immigrant 112,515 28.0
Before 1981 184,120 45.8
1991–1990 36,765 9.1
1991–2000 38,355 9.5
2001–2005 11,235 2.8
2006–2010 8,675 2.2
2011–2016 8,690 2.2
Non-permanent residents 1,700 0.4
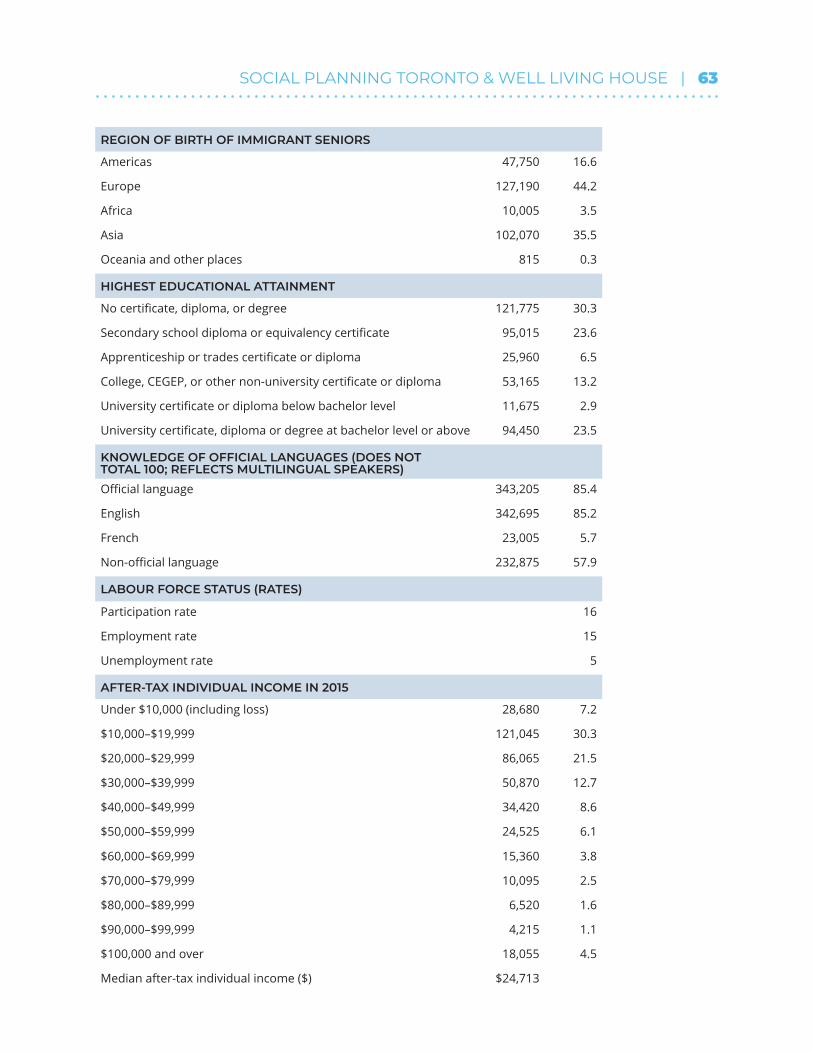
SOCIAL PLANNING TORONTO & WELL LIVING HOUSE | 63
REGION OF BIRTH OF IMMIGRANT SENIORS
Americas 47,750 16.6
Europe 127,190 44.2
Africa 10,005 3.5
Asia 102,070 35.5
Oceania and other places 815 0.3
HIGHEST EDUCATIONAL ATTAINMENT
No certificate, diploma, or degree 121,775 30.3
Secondary school diploma or equivalency certificate 95,015 23.6
Apprenticeship or trades certificate or diploma 25,960 6.5
College, CEGEP, or other non-university certificate or diploma 53,165 13.2
University certificate or diploma below bachelor level 11,675 2.9
University certificate, diploma or degree at bachelor level or above 94,450 23.5
KNOWLEDGE OF OFFICIAL LANGUAGES (DOES NOT TOTAL 100; REFLECTS MULTILINGUAL SPEAKERS)
Official language 343,205 85.4
English 342,695 85.2
French 23,005 5.7
Non-official language 232,875 57.9
LABOUR FORCE STATUS (RATES)
Participation rate 16
Employment rate 15
Unemployment rate 5
AFTER-TAX INDIVIDUAL INCOME IN 2015
Under $10,000 (including loss) 28,680 7.2
$10,000–$19,999 121,045 30.3
$20,000–$29,999 86,065 21.5
$30,000–$39,999 50,870 12.7
$40,000–$49,999 34,420 8.6
$50,000–$59,999 24,525 6.1
$60,000–$69,999 15,360 3.8
$70,000–$79,999 10,095 2.5
$80,000–$89,999 6,520 1.6
$90,000–$99,999 4,215 1.1
$100,000 and over 18,055 4.5
Median after-tax individual income ($) $24,713

64 | SENIOR POVERTY & INEQUITY: THE TORONTO EXPERIENCE
APPENDIX 5: BREAKDOWN OF SENIORS IN COLLECTIVE DWELLINGS, CITY OF TORONTO, 2016
n %
TOTAL IN COLLECTIVE DWELLINGS 24,875 5.8
HEALTH CARE AND RELATED FACILITIES 23,805 95.7
Hospitals 755 3.0
Nursing homes 10,335 41.5
Residences for senior citizens 6,710 27.0
Facilities that are a mix of both a nursing home & a residence for senior citizens 5,485 22.1
Residential care facilities such as group homes for persons with disabilities & addictions 510 2.1
CORRECTIONAL AND CUSTODIAL FACILITIES 15 0.1
SHELTERS 280 1.1
SERVICE COLLECTIVE DWELLINGS 450 1.8
Lodging and rooming houses 345 1.4
Hotels, motels, & other establishments with temporary accommodation services 80 0.3
Other service collective dwellings 20 0.1
RELIGIOUS ESTABLISHMENTS 270 1.1
HUTTERITE COLONIES 0 0.0
OTHER COLLECTIVE DWELLINGS 55 0.2
Source: Statistics Canada, 2016 Census of Population, Statistics Canada catalogue no. EO3258 - Table 2 - CD-CSD. Accessed through the Community Data Program.

SOCIAL PLANNING TORONTO & WELL LIVING HOUSE | 65
REFERENCES1. Ivanova, I. (2017). Poverty and inequality among British Columbia’s seniors. Canadian Centre for Policy Alternatives BC Office. https://www.policyalternatives.ca/sites/default/files/uploads/publica-tions/BC%20Office/2017/04/ccpa-bc_seniors-inequality.pdf
2. The National Seniors Council. (2017). Who’s at risk and what can be done about It? A review of the literature on the social isolation of different groups of seniors. Employment and Social Development Canada Catalogue No. SSD-183-02-17E. https://www.canada.ca/en/national-seniors-council/pro-grams/publications-reports/2017/review-social-isolation-seniors.html#h2.6-h3.4
3. Leroux, J., Morrison, K., & Rosenberg, M. (2018). Prevalence and predictors of food insecu-rity among older people in Canada. International journal of environmental research and public health, 15(11), 2511. https://doi.org/10.3390/ijerph15112511
4. Statistics Canada, 2016 Census of Population, Statistics Canada Catalogue no. EO2766 Table 2-TGP_65+ Part 1 (CD-CSD-DA)
5. City of Toronto. (2020, July 12). CityofToronto_COVID-19_Data. Proportion of all cases. [data file]. https://drive.google.com/file/d/1euhrML0rkV_hHF1thiA0G5vSSeZCqxHY/view
6. Katawazi, M. (2020, April 20). This 101-year-old Ontario man with failing lungs beat COVID-19. CTV News. https://toronto.ctvnews.ca/this-101-year-old-ontario-man-with-failing-lungs-beat-covid-19-1.4904530
7. King, A. (2020, May 5). ‘I feel wonderful’: 100-year-old long-term care resident survives COVID-19. CBC News. https://www.cbc.ca/news/canada/toronto/100-year-old-long-term-care-resident-survives-covid-19-1.5555457
8. Macdonnell, B. (2020, May 1). ‘I beat it’: Big celebration for 82-year-old Ontario man who recovered from COVID-19. CTV News. https://toronto.ctvnews.ca/i-beat-it-big-celebration-for-82-year-old-ontar-io-man-who-recovered-from-covid-19-1.4921668
9. National Seniors Council. (2014). Report on the social isolation of seniors 2013–14. Employment and Social Development Canada. Catalogue no. SSD-138-12-14. https://www.canada.ca/content/dam/nsc-cna/documents/pdf/policy-and-program-development/publications-reports/2014/Report_on_the_Social_Isolation_of_Seniors.pdf
10. National Seniors Council. (2014). Report on the social isolation of seniors 2013–14. Employment and Social Development Canada. Catalogue no. SSD-138-12-14. https://www.canada.ca/content/dam/nsc-cna/documents/pdf/policy-and-program-development/publications-reports/2014/Report_on_the_Social_Isolation_of_Seniors.pdf
11. Frank, K. (2020). COVID-19 and social support for seniors: Do seniors have people they can de-pend on during difficult times? Statistics Canada. Catalogue no. 45280001. https://www150.statcan.gc.ca/n1/en/pub/45-28-0001/2020001/article/00007-eng.pdf?st=3FJE29hb
12. Frank, K. (2020). COVID-19 and social support for seniors: Do seniors have people they can de-pend on during difficult times? Statistics Canada. Catalogue no. 45280001. https://www150.statcan.gc.ca/n1/en/pub/45-28-0001/2020001/article/00007-eng.pdf?st=3FJE29hb
13. Statistics Canada, 2016 Census of Population, Statistics Canada Catalogue no. 98-316-X2016001
14. North York Harvest Food Bank and Daily Bread Food Bank. (2018). Who’s hungry: A profile of hunger in Toronto 2018. https://www.dailybread.ca/wp-content/uploads/2018/10/Whos-Hungry-2018-full-3.pdf
15. Harris, K. (2020, May 12). Seniors to receive up to $500 in a one-time payment to off-set added costs due to COVID-19. CBC News. https://www.cbc.ca/news/politics/seniors-sup-ports-covid19-1.5565743
16. Government of Canada. (2020). Canada’s COVID-19 economic response plan. https://www.cana-da.ca/en/department-finance/economic-response-plan.html
66 | SENIOR POVERTY & INEQUITY: THE TORONTO EXPERIENCE
17. Government of Ontario. (2020). Ontario guaranteed annual income system payments for seniors. https://www.ontario.ca/page/guaranteed-annual-income-system-payments-seniors#:~:text=Pay-ment%20amounts,benefit%20of%20%2483%20a%20month.&text=The%20Province%20guaran-tees%20that%20eligible,this%20minimum%20level%20of%20income.
18. Golombek, J. (2020, May 22). Here’s all the financial relief the government is offering seniors and what might be on tap. Financial Post. https://business.financialpost.com/personal-finance/taxes/what-the-government-is-offering-seniors-what-might-be-on-tap
19. Government of Canada (2020). Questions and answers on the Canada Emergency Response Ben-efit. https://www.canada.ca/en/services/benefits/ei/cerb-application/questions.html
20. Canadian Institute for Health Information (2020). Pandemic experience in the long-term care sector: How does Canada compare with other countries? https://www.cihi.ca/sites/default/files/doc-ument/covid-19-rapid-response-long-term-care-snapshot-en.pdf
21. Ontario Long Term Care Association (2019). About long-term care in Ontario: Facts and figures. https://www.oltca.com/oltca/OLTCA/Public/LongTermCare/FactsFigures.aspx#Ontario’s%20long-term%20care%20homes%20(June%202017)
22. Ontario Health Coalition (2020). COVID-19 death rates in Ontario long-term care homes signifi-cantly higher and increasing in for-profit homes vs. non-profit and publicly-owned homes: New data analysis. https://www.ontariohealthcoalition.ca/index.php/death-rates-in-long-term-care-by-owner-ship-release/
23. Rotondi, M. A., O’Campo, P., O’Brien, K., Firestone, M., Wolfe, S. H., Bourgeois, C., & Smylie, J. K. (2017). Our health counts Toronto: Using respondent-driven sampling to unmask census un-dercounts of an urban indigenous population in Toronto, Canada. BMJ Open, 7(12), e018936. doi:10.1136/bmjopen-2017-018936
24. Smylie, J., & Firestone, M. (2015). Back to the basics: Identifying and addressing underlying chal-lenges in achieving high quality and relevant health statistics for Indigenous populations in Canada. Statistical Journal of the IAOS, 31(1), 67-87. doi:10.3233/SJI-150864
25. Turcotte, M., & Schellenberg, G. (1999). A portrait of seniors in Canada: Introduction. Statistics Canada. Catalogue no. 89-519-X. https://www150.statcan.gc.ca/n1/pub/89-519-x/89-519-x2006001-eng.htm
26. In 2016, the average retirement age for all workers was 63.6. See Statistics Canada. (2019, Sep-tember 9). Table 14-10-0060-01 Retirement age by class of worker, annual. https://www150.statcan.gc.ca/t1/tbl1/en/tv.action?pid=1410006001
27. Employment and Social Development Canada. (2018, August 8). Newly appointed Minister of Se-niors reaffirms government commitment to support older persons. Government of Canada. https://www.canada.ca/en/employment-social-development/news/2018/08/newly-appointed-minister-of-se-niors-reaffirms-government-commitment-to-support-older-persons.html
28. Based on three-year average from 2014–2016. See Statistics Canada (2020). Table 13-10-0063-01 Life expectancy, at birth and at age 65, by sex, three-year average, Canada, provinces, territories, health regions and peer groups, inactive. https://www150.statcan.gc.ca/t1/tbl1/en/ Canadian Centre of Economic Analysis & the Canadian Urban Institute. (2019). Toronto housing market analysis: From insight to action. PH2.5 Appendix 1. Prepared for the Affordable Housing Office of the City of Toron-to. https://www.toronto.ca/legdocs/mmis/2019/ph/bgrd/backgroundfile-124480.pdf
29. Canadian Centre of Economic Analysis & the Canadian Urban Institute. (2019). Toronto housing market analysis: From insight to action. PH2.5 Appendix 1. Prepared for the Affordable Housing Office of the City of Toronto. https://www.toronto.ca/legdocs/mmis/2019/ph/bgrd/background-file-124480.pdf
30. Ontario Ministry of Finance. (2018, June 1) Population projections: Annual population projections, from 2018 to 2041. Government of Ontario. https://www.ontario.ca/data/population-projections
31. Gustajtis, B., & Heisz, A. (2016). Seniors’ income from 1976 to 2014: Four decades, two

SOCIAL PLANNING TORONTO & WELL LIVING HOUSE | 67
stories. Statistics Canada Catalogue no. 11-630-X. https://www150.statcan.gc.ca/n1/en/cata-logue/11-630-X2016008
32. Gustajtis, B., & Heisz, A. (2016). Seniors’ income from 1976 to 2014: Four decades, two stories. Statistics Canada Catalogue no. 11-630-X. https://www150.statcan.gc.ca/n1/en/cata-logue/11-630-X2016008
33. Experts Panel on Income Security of the Council of Aging of Ottawa. (n.d.). Comments on Bill C-87, an Act respecting the reduction of poverty. https://coaottawa.ca/wp-content/uploads/docu-ments/Submission-on-Bill-C-87-PH-final-11DEC18.pdf
34. Ivanova, I. (2017). Poverty and inequality among British Columbia’s seniors. Canadian Centre for Policy Alternatives BC Office. https://www.policyalternatives.ca/sites/default/files/uploads/publica-tions/BC%20Office/2017/04/ccpa-bc_seniors-inequality.pdf
35. Shillington, R. (2016). An analysis of the economic circumstances of Canadian seniors. Broad-bent Institute. https://d3n8a8pro7vhmx.cloudfront.net/broadbent/pages/4904/attachments/original/1455216659/ An_Analysis_of_the_Economic_Circumstances_of_Canadian_Seniors.pdf?1455216659
36. Healthcare of Ontario Pension Plan (HOOP). (2017). Seniors and poverty – Canada’s next crisis? https://hoopp.com/docs/default-source/newsroom-library/research/hoopp-research-article---senior-poverty---canada-next-crises.pdf
37. Mackenzie, H. (2014). Risky Business: Canada’s retirement income system. Canadian Centre for Policy Alternatives. https://www.policyalternatives.ca/sites/default/files/uploads/publications/Nation-al%20Office/2014/03/Risky_Business.pdf
38. Healthcare of Ontario Pension Plan (HOOP). (2017). Seniors and poverty – Canada’s next crisis? https://hoopp.com/docs/default-source/newsroom-library/research/hoopp-research-article---senior-poverty---canada-next-crises.pdf
39. City of Toronto (2014). Open data – Social housing unit density by neighbourhoods. https://open.toronto.ca/dataset/social-housing-unit-density-by-neighbourhoods/
40. Statistics Canada, 2016 Census of Population, Statistics Canada Catalogue no. 98-400-X2016185.
41. Dinca-Panaitescu, M., McDonough, L., Simone, D., Johnson, B., Procyk, S., Laflèche, M., & Walks, A. (2019). Rebalancing the opportunity equation. United Way Greater Toronto. https://www.unitedway-gt.org/file/2019_OE_fullreport_FINAL.pdf
42. Statistics Canada, 2016 Census of Population, Statistics Canada Catalogue no. EO3139-T22_CD-CSD-DA. Accessed through the Community Data Program.
43. Government of Canada. (2019). Sponsor your relatives: Who can sponsor. Retrieved from https://www.canada.ca/en/immigration-refugees-citizenship/services/immigrate-canada/family-sponsor-ship/other-relatives/eligibility.html
44. Statistics Canada, 2016 Census of Population, Statistics Canada Catalogue no. 98-400-X2016203.
45. Government of Canada. (2020). Guide 5772 – Application to sponsor parents and grandpar-ents. https://www.canada.ca/en/immigration-refugees-citizenship/services/application/applica-tion-forms-guides/guide-5772-application-sponsor-parents-grandparents.html
46. Statistics Canada, 2016 Census of Population, Statistics Canada Catalogue no. EO3139-T22_CD-CSD-DA. Accessed through the Community Data Program.
47. Coloma, R. S., & Pino, F. L. (2016). “There’s hardly anything left”: Poverty and the economic insecu-rity of elderly Filipinos in Toronto. Canadian Ethnic Studies, 48(2), 71-97.
48. Picot, G., & Lu, Y. (2017). Chronic low-income among immigrants in Canada and its commu-nities. Statistics Canada. Catalogue no. 11F0019M — No. 397. https://www150.statcan.gc.ca/n1/pub/11f0019m/11f0019m2017397-eng.pdf
49. National Seniors Council. (2009). Report of the National Seniors Council on low income among

68 | SENIOR POVERTY & INEQUITY: THE TORONTO EXPERIENCE
seniors. Government of Canada. https://www.canada.ca/en/national-seniors-council/programs/pub-lications-reports/2009/low-income-seniors.html
50. Government of Canada. (2017). What is the purpose of international social security agreements? https://www.canada.ca/en/revenue-agency/services/tax/canada-pension-plan-cpp-employment-in-surance-ei-rulings/international-social-security-agreements-canada-pension-plan/what-purpose-in-ternational-social-security-agreements.html
51. Kei, W., Seidel, M. L., Ma, D., & Houshmand, M. (2019, December 3). Results from the 2016 Census: Examining the effect of public pension benefits on the low income of senior immigrants. Statistics Canada Catalogue no. 75-006-X. https://www150.statcan.gc.ca/n1/pub/75-006-x/2019001/article/00017-eng.htm
52. The Canadian Press. (2019, December 3). Older immigrants far less likely to face poverty with old-age benefits: Study. CTV News. Retrieved from https://www.ctvnews.ca/canada/older-immigrants-far-less-likely-to-face-poverty-with-old-age-benefits-study-1.4713142
53. Pendakur & Pendakur, 2002; Ray and Preston, 2009 as cited in Preston, V., Kim, A. H., Hudyma, S., Mandell, N., Luxton, M., & Hemphill, J. (2013). Gender, race, and immigration: Aging and economic security in Canada. Canadian Review of Social Policy, 68/69, 90-106.
54. Preston, V., Kim, A. H., Hudyma, S., Mandell, N., Luxton, M., & Hemphill, J. (2013). Gender, race, and immigration: Aging and economic security in Canada. Canadian Review of Social Policy, 68/69, 90-106.
55. Statistics Canada, 2016 Census of Population, Statistics Canada Catalogue no. E02825_Ta-ble1-pt6_ON1. Accessed through the Community Data Program.
56. Government of Canada. (2019). Korea – Pension and benefits. Retrieved from https://www.cana-da.ca/en/services/benefits/publicpensions/cpp/cpp-international/korea.html
57. Statistics Canada, 2016 Census, Statistics Canada Catalogue no. E02825_Table1-pt6_ON1. Ac-cessed through the Community Data Program.
58. Kim, 2010 as cited in Preston, V., Kim, A. H., Hudyma, S., Mandell, N., Luxton, M., & Hemphill, J. (2013). Gender, race, and immigration: Aging and economic security in Canada. Canadian Review of Social Policy, 68/69, 90-106.
59. Lindsay, C. (2007). Profiles of ethnic communities in Canada: The Korean community in Canada (2001). Social and Aboriginal Statistics Division. Catalogue no. 89-621-XIE, no. 14. https://www150.statcan.gc.ca/n1/en/pub/89-621-x/89-621-x2007014-eng.pdf?st=dZQuYOqf
60. Statistics Canada, 2016 Census of Population, Statistics Canada Catalogue no. E02767-CPP-01 (CDCSDDA-ON). Accessed through the Community Data Program.
61. Statistics Canada, 2016 Census of Population, Statistics Canada Catalogue no. E02767-CPP-01 (CDCSDDA-ON). Accessed through the Community Data Program
62. Statistics Canada, 2016 Census of Population, Statistics Canada Catalogue no. E02767-CPP-01 (CDCSDDA-ON). Accessed through the Community Data Program.
63. Preston, V., Kim, A. H., Hudyma, S., Mandell, N., Luxton, M., & Hemphill, J. (2013). Gender, race, and immigration: Aging and economic security in Canada. Canadian Review of Social Policy, 68/69, 90-106.
64. Preston, V., Kim, A. H., Hudyma, S., Mandell, N., Luxton, M., & Hemphill, J. (2013). Gender, race, and immigration: Aging and economic security in Canada. Canadian Review of Social Policy, 68/69, 90-106.
65. Government of Canada. (2020). Child-rearing provisions. https://www.canada.ca/en/services/ben-efits/publicpensions/cpp/child-rearing.html
66. Runchey, D. (2020, Jan 6). CPP child rearing dropout – The good. Retire Happy. https://retirehap-py.ca/child-rearing-dropout/

SOCIAL PLANNING TORONTO & WELL LIVING HOUSE | 69
67. City of Toronto. (2018). Toronto seniors strategy 2.0. https://www.toronto.ca/wp-content/up-loads/2019/02/93cd-CoT-seniors-strategy2.pdf
68. Statistics Canada, 2016 Census of Population, Statistics Canada Catalogue no. 98-400-X2016029.b0.
69. National Seniors Council. (2009). Report of the National Seniors Council on low income among seniors. Government of Canada. https://www.canada.ca/en/national-seniors-council/programs/pub-lications-reports/2009/low-income-seniors.html
70. Ivanova, I. (2017). Poverty and inequality among British Columbia’s seniors. Canadian Centre for Policy Alternatives BC Office. https://www.policyalternatives.ca/sites/default/files/uploads/publica-tions/BC%20Office/2017/04/ccpa-bc_seniors-inequality.pdf
71. Statistics Canada, 2016 Census of Population, Table E03184 Tb8_CDCSD. Accessed through the Community Data Program.
72. Bazel, P., & Mintz, J. M. (2014). Income adequacy among Canadian seniors: Helping singles most. The School of Public Policy Publications (SPPP), 7 doi:http://dx.doi.org.ezproxy.lib.ryerson.ca/10.11575/sppp.v7i0.42456
73. Bernard, A., & Li, C. (2006). Death of a spouse: The Impact on income for senior men and women. Statistics Canada Catalogue no. 11-621-MIE-No. 046. https://www150.statcan.gc.ca/n1/en/pub/11-621-m/11-621-m2006046-eng.pdf?st=AxoXgN8S
74. Statistics Canada. (2017). 2017 Canadian Survey on Disability. Table 1 PCD. Accessed through the Community Data Program.
75. Using the Market Basket Measure, the Canadian Survey on Disability indicates overall higher rates of poverty for seniors with disabilities in Canada. See Morris, S., Fawcett, G., Brisebos, L., & Hughes, J. (2018). Canadian Survey on Disability – A demographic, employment and income profile of Canadians with disabilities aged 15 years and over, 2017. Statistics Canada Catalogue no. 89-654-X2018002. https://www150.statcan.gc.ca/n1/en/pub/89-654-x/89-654-x2018002-eng.pdf?st=sSWx-A4aG
76. Waite, S., Ecker, J., & Ross, L. E. (2019). A systematic review and thematic synthesis of Cana-da’s LGBTQ2S+ employment, labour market and earnings literature. PloS One, 14(10), e0223372. doi:10.1371/journal.pone.0223372
77. The National Seniors Council. (2017). Who’s at risk and what can be done about it? A review of the literature on the social isolation of different groups of seniors. Employment and Social Develop-ment Canada Catalogue No. SSD-183-02-17E. https://www.canada.ca/en/national-seniors-council/programs/publications-reports/2017/review-social-isolation-seniors.html#h2.6-h3.4
78. Laher, N., Kumar, N., Um, S., & McKenzie, K. (2018). Thriving in the city: What does it cost to have a healthy retirement? Wellesley Institute. https://www.wellesleyinstitute.com/wp-content/up-loads/2018/05/Thriving-Retirement-Costs-Wellesley-Institute-May-2018.pdf
79. Ivanova, I. (2017). Poverty and inequality among British Columbia’s seniors. Canadian Centre for Policy Alternatives BC Office. https://www.policyalternatives.ca/sites/default/files/uploads/publica-tions/BC%20Office/2017/04/ccpa-bc_seniors-inequality.pdf
80. Berger, E. D., & Denton, M. A. (2004). The interplay between women’s life course work patterns and financial planning for later life. Canadian Journal on Aging, 23 Suppl 1(5), S99-S95. doi:10.1353/cja.2005.0029
81. Ivanova, I. (2017). Poverty and inequality among British Columbia’s seniors. Canadian Centre for Policy Alternatives BC Office. https://www.policyalternatives.ca/sites/default/files/uploads/publica-tions/BC%20Office/2017/04/ccpa-bc_seniors-inequality.pdf
82. Marier, P., & Skinner, S. (2008). The impact of gender and immigration on pension outcomes in Canada. Canadian Public Policy / Analyse De Politiques, 34(4), 59-78. doi:10.3138/cpp.34.4.S59
83. Mackenzie, H. (2014). Risky business: Canada’s retirement income system. Canadian Centre for

70 | SENIOR POVERTY & INEQUITY: THE TORONTO EXPERIENCE
Policy Alternatives National Office. https://www.policyalternatives.ca/sites/default/files/uploads/pub-lications/National%20Office/2014/03/Risky_Business.pdf
84. Statistics Canada, 2016 Census of Population, Statistics Canada Catalogue no. EO2766 Table 2 – TGP_65+ Part 2. Accessed through the Community Data Program.
85. Statistics Canada, 2016 Census of Population, Statistics Canada Catalogue no. 98-400-X2016283.
86. Statistics Canada, 2006 Census of Population, Statistics Canada Catalogue no. UPP06_Table-06B_CSD. Accessed through the Community Data Program.
87. Statistics Canada, 2016 Census of Population, Statistics Canada Catalogue no. EO 3002 Table 1A - Part 4 Ontario. Accessed through the Community Data Program.
88. Statistics Canada. (2017). Census in brief: Working seniors in Canada. Statistics Canada Cata-logue no. 98-200-X2016027. https://www12.statcan.gc.ca/census-recensement/2016/as-sa/98-200-x/2016027/98-200-x2016027-eng.pdf
89. The Experts Panel on Income Security of the Council of Aging of Ottawa. (2017). The grey tsunami threat: A failure of evidence to drive policy. The Council of Aging of Ottawa. https://coaottawa.ca/wp-content/uploads/2017/11/2017-10-income-security-Tsunami-paper.pdf
90. Statistics Canada. (2017). Census in brief: Working seniors in Canada. Statistics Canada Cata-logue no. 98-200-X2016027. https://www12.statcan.gc.ca/census-recensement/2016/as-sa/98-200-x/2016027/98-200-x2016027-eng.pdf
91. Park, 2010 as cited in Hicks, P. (2019). Retirement income policies: Reform pressures over the coming decade. A discussion paper. The Council on Aging of Ottawa. https://coaottawa.ca/wp-con-tent/uploads/documents/Hicks-et-al-Retirement-Income-Policies-Reform-Pressures-24JUNE2019.pdf
92. CBC News. (2009, Aug 20). Mandatory retirement fades in Canada. https://www.cbc.ca/news/business/mandatory-retirement-fades-in-canada-1.799697
93. Government of Canada. (2020). Guaranteed income supplement – How much could you receive. https://www.canada.ca/en/services/benefits/publicpensions/cpp/old-age-security/guaranteed-in-come-supplement/benefit-amount.html
94. Statistics Canada, 2016 Census of Population, Statistics Canada Catalogue no. E02767 – Table 12B (CDCSDDA).
95. Statistics Canada, 2016 Census of Population, Statistics Canada Catalogue no. 98-400-X2016231
96. Statistics Canada, 2016 Census of Population. Data table provided by the City of Toronto.
97. Paradis, E., Wilson, R. M., & Logan, J., (2014). Nowhere else to go: Inadequate housing & risk of homelessness among families in Toronto’s aging rental buildings. Cities Centre, University of Toron-to. http://neighbourhoodchange.ca/documents/2014/04/paradis-et-al-2014-nowhere-else-to-go-in-adequate-housing-risk-of-homelessness-among-families-in-torontos-aging-rental-buildings-rp231.pdf
98. Data provided by the City of Toronto.
99. Data provided by the City of Toronto.
100. City of Toronto (2018). 2018 Street needs assessment. https://www.toronto.ca/wp-content/up-loads/2018/11/99be-2018-SNA-Results-Report.pdf
101. Centre for Equality Rights in Accommodation (2017). Preventing evictions of senior tenants in the GTA: A call to action to curtail an emerging crisis. https://static1.squarespace.com/static/5e-3aed3ea511ae64f3150214/t/5e7bdfc69d40fd65fff88d73/1585176522238/Preventing%2BEvic-tions%2Bof%2BSenior%2BTenants%2Bin%2Bthe%2BGTA.pdf
102. Rotondi, M. A., O’Campo, P., O’Brien, K., Firestone, M., Wolfe, S. H., Bourgeois, C., & Smylie, J. K. (2017). Our health counts Toronto: Using respondent-driven sampling to unmask census undercounts of an urban indigenous population in Toronto, Canada. BMJ Open, 7(12), e018936. doi:10.1136/bmjopen-2017-018936

SOCIAL PLANNING TORONTO & WELL LIVING HOUSE | 71
103. Smylie, J., & Firestone, M. (2015). Back to the basics: Identifying and addressing underlying chal-lenges in achieving high quality and relevant health statistics for Indigenous populations in Cana-da. Statistical Journal of the IAOS, 31(1), 67-87. doi:10.3233/SJI-150864
104. Smylie, J., O’Brien, K., Bourgeois, C., Wolfe, S., Maddox, R., & Rotondi, M. (2019). 2016 Indigenous population estimates for the city of Toronto 2019. http://www.welllivinghouse.com/wp-content/up-loads/2019/08/2016-OHC-Toronto-Pop-Estimate-August-2019.pdf
105. Rotondi, M. A., O’Campo, P., O’Brien, K., Firestone, M., Wolfe, S. H., Bourgeois, C., & Smylie, J. K. (2017). Our health counts Toronto: Using respondent-driven sampling to unmask census undercounts of an urban indigenous population in Toronto, Canada. BMJ Open, 7(12), e018936. doi:10.1136/bmjopen-2017-018936
106. Statistics Canada, 2016 Census of Population, Statistics Canada Catalogue no. 98-316-X2016001.
107. Smylie, J., & Firestone, M. (2015). Back to the basics: Identifying and addressing underlying chal-lenges in achieving high quality and relevant health statistics for Indigenous populations in Cana-da. Statistical Journal of the IAOS, 31(1), 67-87. doi:10.3233/SJI-150864
108. Ministry of Health & University of Otago. (2006). Decades of disparity III: Ethnic and socioeco-nomic inequalities in mortality, New Zealand 1981–1999. http://www.rangahau.co.nz/assets/de-cades_disparity/disparities_report3.pdf
109. Williams, D. R. (1999). Race, socioeconomic status, and health: The added effects of racism and discrimination. Annals of the New York Academy of Sciences, 896(1), 173-188. doi:10.1111/j.1749-6632.1999.tb08114.x
110. Truth and Reconciliation Commission of Canada. (2015). Honouring the truth, reconciling for the future: Summary of the final report of the Truth and Reconciliation Commission of Canada. http://www.trc.ca/assets/pdf/
111. Truth and Reconciliation Commission of Canada. (2015). Honouring the truth, reconciling for the future: Summary of the final report of the Truth and Reconciliation Commission of Canada. http://www.trc.ca/assets/pdf/
112. Truth and Reconciliation Commission of Canada. (2015). Honouring the truth, reconciling for the future: Summary of the final report of the Truth and Reconciliation Commission of Canada. http://www.trc.ca/assets/pdf/Honouring_the_Truth_Reconciling_for_the_Future_July_23_2015.pdf
113. Statistics Canada, 2016 Census of Population. Table 4.2 Low-income measures thresholds (LIM-AT and LIM-BT) for private households of Canada, 2015.
114. Truth and Reconciliation Commission of Canada. (2015). Honouring the truth, reconciling for the future: Summary of the final report of the Truth and Reconciliation Commission of Canada. http://www.trc.ca/assets/pdf/Honouring_the_Truth_Reconciling_for_the_Future_July_23_2015.pdf
115. Firestone, M., Xavier, C., O’Brien, K., Maddox, R., Wolfe, S., & Smylie, J. (2018). Our health counts: Demographics. http://www.welllivinghouse.com/wp-content/uploads/2019/10/OHC-TO-Adult-Demo-graphics-.pdf
116. Webster, P. C. (2015). Housing triggers health problems for Canada’s First Nations. The Lancet, 385(9967), 495-496. doi:10.1016/S0140-6736(15)60187-8
117. King, M., Prof, Smith, A., MD, & Gracey, M., Prof. (2009). Indigenous health part 2: The underlying causes of the health gap. The Lancet, 374(9683), 76-85. doi:10.1016/S0140-6736(09)60827-8
118. Webster, P. C. (2015). Housing triggers health problems for Canada’s First Nations. The Lancet, 385(9967), 495-496. doi:10.1016/S0140-6736(15)60187-
119. Jaworsky, D., Gadermann, A., Duhoux, A., Naismith, T. E., Norena, M., To, M. J., et al. (2016). Residential stability reduces unmet health care needs and emergency department utilization among a cohort of homeless and vulnerably housed persons in Canada. Journal of Urban Health, 93(4), 666-681. doi:10.1007/s11524-016-0065-6

72 | SENIOR POVERTY & INEQUITY: THE TORONTO EXPERIENCE
120. Smylie, J., Firestone, M., Cochran, L., Prince, C., Maracle, S., Morley, M., et al. (2011). Our health counts urban Aboriginal health database research project: Community report — First Nations adults and children, Hamilton, Ontario, Canada. http://www.ourhealthcounts.ca/images/PDF/our-health-counts-brief.pdf
121. Statistics Canada, 2016 Census of Population. Statistics Canada Catalogue no. 98-316-X2016001
122. Allan, B. & Smylie, J. (2015). First Peoples, second class treatment: The role of racism in the health and well-being of Indigenous peoples in Canada. Wellesley Institute. https://www.wellesleyin-stitute.com/wp-content/uploads/2015/02/Full-Report-FPSCT-Updated.pdf
123. Kitching, G. T., Firestone, M., Schei, B., Wolfe, S., Bourgeois, C., O’Campo, P., et al. (2020). Unmet health needs and discrimination by healthcare providers among an Indigenous population in To-ronto, Canada. Canadian Journal of Public Health = Revue Canadienne De Sante Publique, 111(1), 40-49. doi:10.17269/s41997-019-00242-z
124. Ministry of Health & University of Otago. (2006). Decades of disparity III: Ethnic and socioeco-nomic inequalities in mortality, New Zealand 1981–1999. Ministry of Health: Wellington, New Zea-land. http://www.rangahau.co.nz/assets/decades_disparity/disparities_report3.pdf
125. Williams, D. R. (1999). Race, socioeconomic status, and health: The added effects of racism and discrimination. Annals of the New York Academy of Sciences, 896(1), 173-188. doi:10.1111/j.1749-6632.1999.tb08114.x
126. Truth and Reconciliation Commission of Canada. (2015). Honouring the truth, reconciling for the future: Summary of the final report of the Truth and Reconciliation Commission of Canada. http://www.trc.ca/assets/pdf/Honouring_the_Truth_Reconciling_for_the_Future_July_23_2015.pdf
127. Truth and Reconciliation Commission of Canada. (2015). Honouring the truth, reconciling for the future: Summary of the final report of the Truth and Reconciliation Commission of Canada. http://www.trc.ca/assets/pdf/Honouring_the_Truth_Reconciling_for_the_Future_July_23_2015.pdf
128. Government of Canada. (2018). Social isolation of seniors — A focus on Indigenous seniors in Canada. Employment and Social Development Canada. Catalogue no. Em12-51/2018E-PDF. https://www.canada.ca/en/employment-social-development/corporate/seniors/forum/social-isolation-indig-enous.html
129. Government of Canada. (2018). Social Isolation of seniors — A focus on Indigenous seniors in Canada. Employment and Social Development Canada. Catalogue no. Em12-51/2018E-PDF. https://www.canada.ca/en/employment-social-development/corporate/seniors/forum/social-isolation-indig-enous.html
130. Tranjan, R., Talwar Kapoor, G., & Aldridge, H. (2020, May 28). Locked down, not locked out: An eviction prevention plan for Ontario. Maytree Foundation & Canadian Centre for Policy Alternatives. http://behindthenumbers.ca/2020/05/28/locked-down-not-locked-out-an-eviction-prevention-plan-for-ontario/
131. Ostry, J. D., Loungani, P., & Furceri, D. (2016). Neoliberalism: Oversold? International Monetary Fund, Finance and Development, 53(2). https://www.imf.org/external/pubs/ft/fandd/2016/06/pdf/os-try.pdf
132. Hicks, P. (2019). Retirement income policies: Reform pressures over the coming decade. A discussion paper. The Council on Aging of Ottawa. https://coaottawa.ca/wp-content/uploads/docu-ments/Hicks-et-al-Retirement-Income-Policies-Reform-Pressures-24JUNE2019.pdf
133. Bladwin, B. (2009). Research study on the Canadian retirement income system. Prepared for the Ministry of Finance, Government of Ontario. https://www.fin.gov.on.ca/en/consultations/pension/dec09report.pdf
134. Government of Canada. (2017). What is the purpose of international social security agree-ments? https://www.canada.ca/en/revenue-agency/services/tax/canada-pension-plan-cpp-employ-ment-insurance-ei-rulings/international-social-security-agreements-canada-pension-plan/what-pur-pose-international-social-security-agreements.html

SOCIAL PLANNING TORONTO & WELL LIVING HOUSE | 73
135. Data source for population, gender, and age: Statistics Canada, 2016 Census of Population, Sta-tistics Canada Catalogue no. 98-316-X2016001. Data source for racialized status, immigrant status, & period of immigration, region of birth of immigrant seniors, highest educational attainment, knowl-edge of official languages, and labour force status: Statistics Canada, 2016 Census of Population, Statistics Canada Catalogue no. EO2766 Table 2 – TGP_65+ Part 1. Accessed through the Community Data Program. Data source for after-tax individual income in 2015: Statistics Canada, 2016 Census of Population, Statistics Canada Catalogue no. EO2766 Table 2 – TGP_65+ Part 2. Accessed through the Community Data Program.
Front and back cover: Photo by Kamille Sampaio from Pexels
Page 1: Photo by Chevanon Photography from Pexels
Page 6: Photo by Yaraslau Saulevich from iStock
Page 10: “Yksinainen vanhuus /Sylvi, 91 / Old Age Loneliness” by Milla Talassalo. Licensed under CC BU-NC 4.0
Page 33: Photo by Vladimir Soares on Unsplash
Page 41: Photo by Cristian Newman on Unsplash
Page 49: Photo by Taylor Ruecker on Unsplash
Page 57: “Yksinainen vanhuus /Sylvi, 91 / Old Age Loneliness” by Milla Talassalo. Licensed under CC BU-NC 4.0
PHOTO CREDITS

Well Living House