analisis reaksi pasar atas pengumuman merger - Universitas ...
Upload
independentCategory
view
1download
0
Coordinated Effects in the
2010 Horizontal Merger Guidelines∗
Wayne-Roy Gayle,†Robert C. Marshall,‡Leslie M. Marx,§
and Jean-Francois Richard¶
December 30, 2010
Abstract
Recent research has highlighted the quantitative contribution to merger analysis
from extending unilateral effects models to understand the payoffs to future potential
coordinated effects. Some of the emphasis of this research appears to have made its
way into the 2010 Horizontal Merger Guidelines. In this paper, we demonstrate the
quantification of coordinated effects in an oligopoly and procurement model, and we
show that screens based on upward pricing pressure are not adequate in mergers where
coordinated effects are a potential concern.
∗Marshall and Marx thank the Human Capital Foundation (http://www.hcfoundation.ru/en/), and es-pecially Andrey Vavilov, for financial support. We are grateful to FTC Commissioner William Kovacic forhelpful discussions as well as John Dougherty and Pradeep Kumar for research assistance.†[email protected], Department of Economics, University of Virginia‡[email protected], Department of Economics, Penn State University§[email protected], Fuqua School of Business, Duke University¶[email protected], Department of Economics, University of Pittsburgh

“The Agencies examine whether a merger is likely to change the manner
in which market participants interact, inducing substantially more coordinated
interaction.”1
1 Introduction
Incentives matter, and the incentive for firms in an industry to engage in coordinated in-
teraction is an increasing function of their payoffs from doing so. Instead of focusing on these
payoffs to coordinated interaction, the 1997 Guidelines exclusively addressed the probability
of coordinated interaction, which is not directly amenable to quantification. In contrast, the
2010 Guidelines recognize that the payoffs from coordinated interaction are relevant: “The
Agencies regard coordinated interaction as more likely, the more the participants stand to
gain from successful coordination.”2 Furthermore, the payoffs from coordinated interaction
can be quantified, with large payoffs to such conduct implying that the conduct is likely.
In recent work, two of us, with coauthors, have proposed a straightforward way of quanti-
fying the payoffto coordinated interaction (see Kovacic et al., 2006, 2009). The quantification
of the payoff to coordinated interaction starts with a unilateral effects model, which could
be a model of differentiated product price competition, a procurement or auction model, or
whatever is appropriate for the product/industry/market under consideration. Taking as
given that such a model has been created for the analysis of post-merger unilateral effects,
the recent aforementioned research has advocated that the unilateral effects modeling tool
be extended to look at coordinated effects. Specifically, it recommends the use of the uni-
lateral effects model to quantify the impact on firm profits as a consequence of incremental
mergers beyond the proposed merger, using the profits from these incremental mergers as a
measure of the possible profits available from coordination. The higher are the profits from
coordination, the greater will be the firms’incentives to overcome whatever impediments to
coordination they face. This quantification of the possible payoff from coordination does not
replace anything that the FTC or DoJ has previously done to analyze coordinated effects,
but is rather an augmentation.
The 2010 Guidelines adopt upward pricing pressure (UPP) as one method for analyzing
potential unilateral effects from horizontal mergers involving differentiated products. The
1Horizontal Merger Guidlines, Federal Trade Commission and Department of Justice, Issued August 19,2010. page 25, http://www.ftc.gov/os/2010/08/100819hmg.pdf, accessed December 21, 2010.
2Horizontal Merger Guidlines, Federal Trade Commission and Department of Justice, Issued August 19,2010. page 26, http://www.ftc.gov/os/2010/08/100819hmg.pdf, accessed December 21, 2010.
1

current chief economist of the FTC, Professor Joe Farrell, and the current chief economist
of the DoJ, Professor Carl Shapiro, have coauthored work that advocates the use of upward
pricing pressure for unilateral effects analysis. Upward pricing pressure is a simple concept
that captures some essential features of bilateral firm interaction in a market with differ-
entiated products. A merger may result in production effi ciencies that will naturally put
downward pressure on price. However, a merged entity will also evaluate the internalized ef-
fect on profits for one product from changing the price of another product. If a price increase
for one product substantially increases profits for a second, and even net of effi ciency gains
the merged entity finds it worthwhile to increase prices above pre-merger levels, then Farrell
and Shapiro advocate that the merger should be scrutinized. As described in Langenfeld
and Wrobel (2010, p.22), “UPP is an all-or-nothing test: It does not attempt to predict the
level of price increase that the merged firm would actually be able to sustain.”Proponents
of UPP have offered it primarily as a screening tool to identify mergers that warrant closer
scrutiny.3
In this paper, we show that UPP is not suffi cient as a screen when coordinated effects
are a potential concern associated with a proposed merger. We provide a theoretical model
and real-world application in which there is no upward pricing pressure associated with a
merger, even without countervailing effi ciency effects, but in which the merger creates strong
incentives for coordinated interaction among firms.
In its discussion of coordinated effects analysis, the 2010 Guidelines state, “Buyer char-
acteristics and the nature of the procurement process can affect coordination.”(2010 Guide-
lines, p.27) Thus, we continue our discussion by illustrating how one can use a procurement
model to quantify the extent to which a merger increases incentives for coordination, using
the recent merger of BASF and Ciba as a foundation for this analysis. Recent innovations in
numerical methods and software for analyzing procurement models allows us to examine the
profits to bidding firms associated with mergers and various coordinated interaction. As we
show, in addition to basic coordinated effects, the methods also allow the consideration of
post-merger effi ciencies, the role of fringe firms and mavericks, and the effects of divestiture.
In Section 2, we review proposed measures of UPP and examine the application of UPP
measures to a standard oligopoly model and to an application based on the vitamins in-
dustry. In Section 3, we provide techniques that can be used to analyze coordinated effects
when buyers use ‘competitive’procurements for price discovery and illustrate their use with
an application based on the recent BASF-Ciba merger. In Section 4, we offer concluding
remarks.3See Farrell and Shapiro (2010a).
2
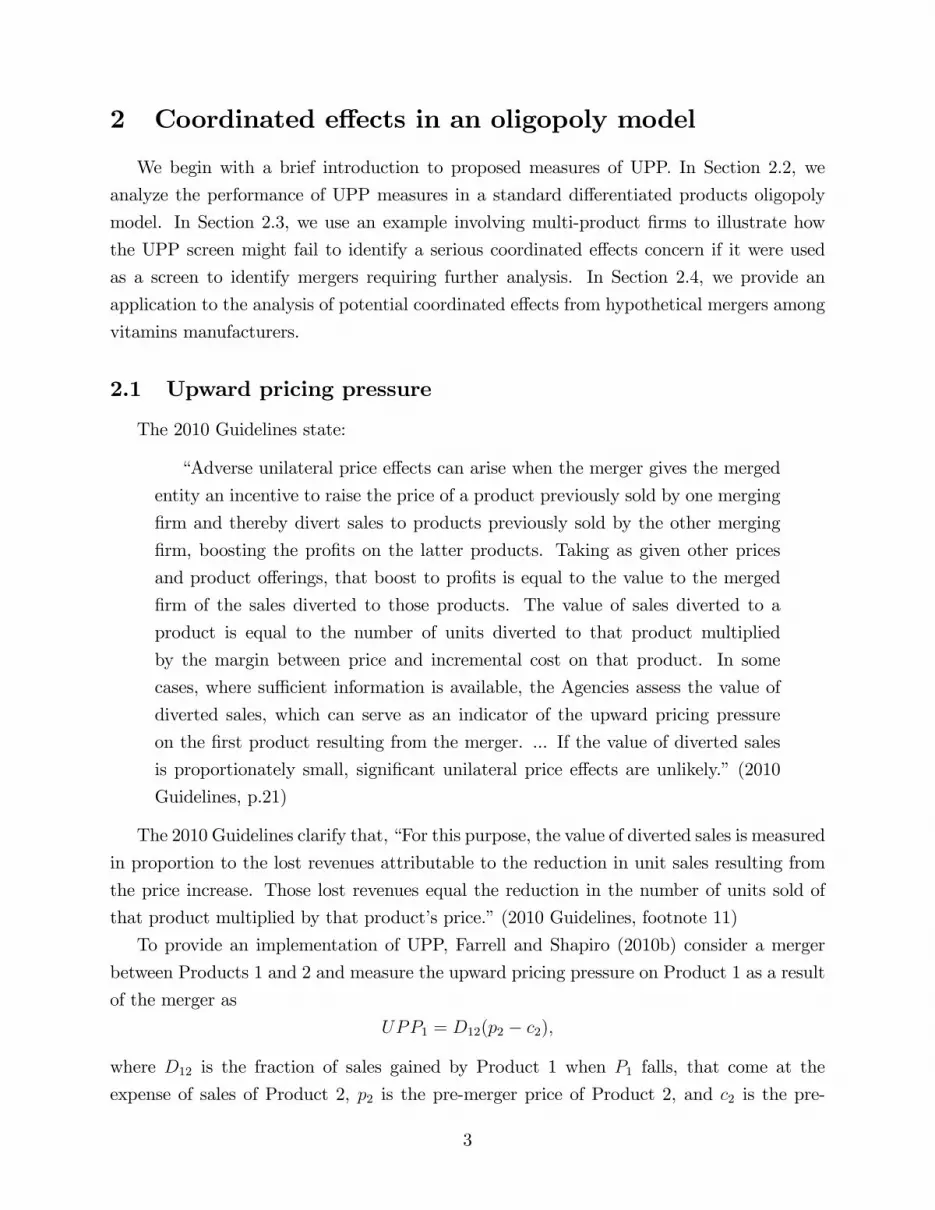
2 Coordinated effects in an oligopoly model
We begin with a brief introduction to proposed measures of UPP. In Section 2.2, we
analyze the performance of UPP measures in a standard differentiated products oligopoly
model. In Section 2.3, we use an example involving multi-product firms to illustrate how
the UPP screen might fail to identify a serious coordinated effects concern if it were used
as a screen to identify mergers requiring further analysis. In Section 2.4, we provide an
application to the analysis of potential coordinated effects from hypothetical mergers among
vitamins manufacturers.
2.1 Upward pricing pressure
The 2010 Guidelines state:
“Adverse unilateral price effects can arise when the merger gives the merged
entity an incentive to raise the price of a product previously sold by one merging
firm and thereby divert sales to products previously sold by the other merging
firm, boosting the profits on the latter products. Taking as given other prices
and product offerings, that boost to profits is equal to the value to the merged
firm of the sales diverted to those products. The value of sales diverted to a
product is equal to the number of units diverted to that product multiplied
by the margin between price and incremental cost on that product. In some
cases, where suffi cient information is available, the Agencies assess the value of
diverted sales, which can serve as an indicator of the upward pricing pressure
on the first product resulting from the merger. ... If the value of diverted sales
is proportionately small, significant unilateral price effects are unlikely.” (2010
Guidelines, p.21)
The 2010 Guidelines clarify that, “For this purpose, the value of diverted sales is measured
in proportion to the lost revenues attributable to the reduction in unit sales resulting from
the price increase. Those lost revenues equal the reduction in the number of units sold of
that product multiplied by that product’s price.”(2010 Guidelines, footnote 11)
To provide an implementation of UPP, Farrell and Shapiro (2010b) consider a merger
between Products 1 and 2 and measure the upward pricing pressure on Product 1 as a result
of the merger as
UPP1 = D12(p2 − c2),
where D12 is the fraction of sales gained by Product 1 when P1 falls, that come at the
expense of sales of Product 2, p2 is the pre-merger price of Product 2, and c2 is the pre-
3

merger marginal cost of Product 2. Taking into account the effect of merger effi ciencies, the
net upward pricing pressure is
NUPP1 = D12(p2 − c2)− e1c1,
where e1 is an “effi ciency credit”applied to Product 1, meaning that the merger is assumed
to reduce the marginal cost of Product 1 by e1c1.
2.2 UPP in a differentiated products oligopoly
To further explore the UPP measure defined above, we place it in the context of a
standard model of a differentiated products oligopoly.
Consider a model in which n ≥ 2 firms compete in a differentiated products oligopoly.Assume firms engage in price competition, with each firm choosing a price for its product.
We adopt a symmetric version of the model presented in Singh and Vives (1984), although
we extend the model to allow more than two firms. We work with inverse demand functions
pi = a− bqi − sb∑j 6=i
qj,
where s ∈ (0, 1). As one can see from these demand functions, the market price for firm
i’s product is decreasing in its own quantity. This is a standard downward sloping demand
curve. The market price for firm i’s product is also decreasing in the quantities produced
by firm i’s rivals; however, because s is less than one, the impact on firm i’s price of an
increase in the rivals’total quantity is less than the impact of an equal increase in firm i’s
own quantity.
We assume firm i has constant marginal cost ci < a and zero fixed costs. Thus, firm i’s
payoff is equal to its price minus its marginal cost, times the quantity it produces: (pi−ci)qi.We can write the demand functions as
qi =a(1− s)− pi − s(n− 2)pi + s
∑j 6=i pj
b(1− s)(1 + (n− 1)s) .
The diversion ratio from product 1 to product 2 is
D12 ≡ −∂q2∂p1∂q1∂p1
=s
1 + s(n− 2) . (1)
If the products are independent, then s = 0 and the diversion ratio is zero. In the case of
4

independent products, a change in product 1’s price does not allow it to captures any sales
from product 2.
If the products are perfect substitutes, then s = 1 and the diversion ratio is 1n−1 , which
is decreasing in the number of firms. The effect on the diversion ratio of the number of firms
can be interpreted as saying that when there are more (symmetric) firms in the industry,
the diversion ratio will be smaller because a smaller share of the incremental sales captured
through a decrease in price is diverted from any particular rival firm.
Using (1), we see that with only two firms (n = 2), the diversion ratio is simply s, the
substitutability parameter.
As a simple example, if n = 3 then D12 =s1+s
, which says that if the products are perfect
substitutes (s = 1), then the diversion ratio is one-half. In other words, when firm 1 reduces
the price of product 1, it captures all sales from firms 2 and 3, and so one-half of the diverted
sales are from firm 2.
To evaluate the value of the diverted sales, the upward pricing pressure model uses pre-
merger prices and marginal costs. If we assume competitive behavior prior to the merger,
our model of price competition implies that pi would be given by:
p∗i =a(1− s)(2 + (2n− 3)s) + (1 + (n− 2)s)((2 + s(n− 2)) ci + s
∑j 6=i cj)
(2 + (n− 3)s)(2 + (2n− 3)s) .
Using the definition of upward pricing pressure above,
UPP1 = D12(P2 − c2) =s
1 + s(n− 2)(p∗2 − c2).
If we assume three firms (n = 3), simplify to the case of common marginal cost c, and fix
the parameter a = 1, then
p∗i − c =1
2(1− s)(1− c)
and
UPP1 =s(1− s)2(1 + s)
(1− c).
Given these parameters, it follows that for s = 1 and for s = 0, UPP1 = 0, but for s ∈ (0, 1),UPP1 is positive.
Thus, for independent firms, upward pricing pressure would indicate no concern associ-
ated with the merger, and for perfect substitutes, upward pricing pressure would indicate
no concern associated with the merger, but for different reasons. With independent prod-
ucts, pricing decisions are not affects by the merger, so there is no concern. With perfect
substitutes, competition between the merged entity and the remaining independent third
5

firm is assumed to be suffi cient to keep prices at the level of marginal cost, so again there
is no concern. For a given level of substitutability, upward pricing pressure is greater when
marginal costs are lower.
2.3 Industry with multi-product firms
In this section, we develop and example to illustrate both a UPP calculation and also
the quantification of coordinated effects using a differentiated products oligopoly model.
We consider a scenario with four firms. Firms 1 and 2 both produce two products. Firm
1 produces A1 and B1, and firm 2 produces A2 and B2. Firm 3 produces only product
A3, and firm 4 produces only product B4. Assume that products A1, A2, and A3 are close
substitutes and that products B1, B2, and B4 are close substitutes, but that the A products
and B products are not close substitutes. Thus, firm 3’s product competes closely with one
of firm 1’s products and one of firm 2’s products. Firm 4’s product also competes closely
with one of firm 1’s products and one of firm 2’s products. But, the products of firms 3 and
4 do not compete closely with one another.
Consider a merger between firms 3 and 4. Because products A3 and B4 are not close
substitutes for one another, there would be little upward pricing pressure as a result of the
merger. Thus, upward pricing pressure would indicate little competitive concern associated
with the merger.
To make the example concrete, assume that for distinct i, j, k ∈ {1, 2, 3},
pAi = 1− qAi − sqAj − sqAk − σqB1 − σqB2 − σqB4
and for distinct i, j, k ∈ {1, 2, 4},
pBi = 1− qBi − sqBj − sqBk − σqA1 − σqA2 − σqA3 ,
where s, σ ∈ (0, 1), with s close to 1 and σ close to zero.In this case,
D34 ≡ −∂qB4∂pA3
∂qA3∂pA3
=(1− s)σ
1 + 3s+ 2s2 − 6σ2 ,
which approaches zero as s approaches 1 or σ approaches zero. Thus, a merger of firms 3 and
4 generates little upward pricing pressure and so that criteria would indicate little concern
associated with the merger.
However, when we compare the pre-merger and post-merger environments in light of
possible coordinated effects, we see the potential for concern.
6

In order to present a numerical example, let s = 0.9 and σ = 0.1. Assume firms 1 and 2
have constant marginal costs equal to zero, and assume firms 3 and 4 have constant marginal
costs equal to 0.045.4 Assume that a merger between firms 3 and 4 results in effi ciencies that
reduces their marginal costs to zero (the same as the incumbent multi-product firms).
With these parameters, we can calculate the pre-merger profits of the four firms under a
variety of scenarios regarding coordination among the firms. Table 1 considers three scenarios
for coordination. In the pre-merger environment with coordination by firms 1 and 2, firms
1 and 2 coordinate their pricing decisions to maximize their joint profit, while firms 3 and
4 choose the price of their individual products to maximize their individual profits. In the
pre-merger environment with coordination by firms 1, 2, and 3, firms 1—3 coordinate their
pricing decisions to maximize their joint profit, and similarly for the pre-merger environment
with coordination by firms 1, 2, and 4. As shown in Table 1, firms 1 and 2 increase their
profits through coordination, but firms 3 and 4 would prefer to remain outside the cartel
of firms 1 and 2 rather than join them. The two smaller firms prefer to remain outside the
cartel where their prices are not constrained by the joint profit maximization problem of the
larger firms.
Table 1: Pre-merger profits
Profit 1 Profit 2 Profit 3 Profit 4premerger 0.039 0.039 0.005 0.005premerger: coordination by 1 and 2 0.051 0.051 0.012 0.012premerger: coordination by 1, 2, and 3 0.134 0.134 0.004 0.014premerger: coordination by 1, 2, and 4 0.134 0.134 0.014 0.004
Table 1 suggests that although there is an incentive in the pre-merger market for coordi-
nation between firms 1 and 2, in the absence of significant compensating transfer payments,
there is no incentive for firm 3 or firm 4 to join the cartel.
That characterization changes for the post-merger market. As shown in Table 2, in the
post-merger industry, the merged entity 3-4 does have the incentive to join firms 1 and 2 in
the coordination of prices.
Table 2: Post-merger profits
Profit 1 Profit 2 Profit 34postmerger: coordination by 1 and 2 0.037 0.037 0.046postmerger: coordination by all 0.161 0.161 0.161
4This marginal cost is suffi ciently small that an all-inclusive cartel prefers to continue to allow firms 3and 4 to produce positive output.
7

The comparison of the pre-merger and post-merger profits shows that the merger increases
the incentive for the merging firms to participate in coordinated pricing in the industry.
Thus, even though upward pricing pressure does not signal a competitive concern asso-
ciated with the merger, there are potentially significant coordinated effects concerns.
2.4 Application to vitamins
This analysis above can be applied to the firms involved in the Vitamins Cartel.5
Consider a merger of vitamins manufacturers Rhone-Poulenc and Takeda. During the
period of the vitamins conspiracy, Rhone-Poulenc manufactured vitamins A, E, and D3,
while Takeda manufactured vitamins B1, B2, B6, C, and Folic acid.6
Because of the lack of direct overlap, an analysis of upward pricing pressure would not
signal any potential concern associated with the merger. However, the merger would create
a firm capable of producing eight of the 12 vitamin products considered in the EC Decision
in Vitamins, making the merged entity a key competitor to the two largest players in the
cartel, Roche and BASF.
Table 3: Vitamin Products for Key Vitamins Cartel Participants
A E B1 B2 B5 B6FolidAcid C D3 H
Betacarotene
Caro tinoids
Roche X X X X X X X X X X X XBASF X X X X X X X X X XRhônePoulenc X X XTakeda X X X X XMerged RPTakeda X X X X X X X X
Source: EC Decision in Vitamins at paragraph 2
As in the model discussed above, one might expect the merger of Rhone-Poulenc and
Takeda to result in significant coordinated effects concerns.
In contrast, the merger of Rhone-Poulenc with a firm such as Solvay, which produces
only Vitamin D3, or with a firm such as Eisai, which produces only Vitamin E, would result
in upward pricing pressure and so potentially receive attention based on the merger screen of
upward pricing pressure. As another example, a merger of minor players, such as Kongo and
Sumika, both of which produce only Folic Acid might be identified as a cause for concern
based on upward pricing pressure.
5See the EC Decision inVitamins, available at http://eur-lex.europa.eu/LexUriServ/site/en/oj/2003/l_006/l_00620030110en00010089.pdf (accessed December 10, 2010).
6EC Decision in Vitamins at paragraph 2.
8

As this suggests, in some cases UPP does not provide a useful screen to identify mergers of
antitrust concern because it allows mergers to go through that involve significant coordinated
effects.
3 Coordinated effects in a procurement model
In this section, we approach the analysis of coordinated effect by modeling the interaction
among competing suppliers at competitive procurements. Such a model is appropriate in
cases where buyers conduct competitive procurements to acquire the products of the merging
firms. In Section 3.1, we introduce our application involving the recent BASF-Ciba merger.
In Section 3.2, we show a quantification of the basic incentives for coordinated effects in the
merger. In Section 3.3, we analyze the effects of cost effi ciencies, showing how they enhance
the incentives for coordinated effects in this application. In Section 3.4, we show how certain
behavior might be interpreted as that of a maverick firm. In Section 3.5, we analyze the
effects of divestiture on incentives for coordinated effects, showing how certain divestitures
can reduce those incentives. In Section 3.6, we briefly summarize.
Unfortunately, sealed-bid procurements (auctions) are not trivial to analyze.7 The dif-
ferential equations and boundary conditions that define the unique Nash equilibrium are
almost always analytically intractable. Numerical methods are required to solve them. But,
under somewhat mild conditions, the solution is unique. This is a positive attribute when
considering the use of the framework for policy analysis because we avoid the ambiguities
created by multiple equilibria as we move from one industry configuration to another. A
recent breakthrough in the economics literature by Gayle and Richard (2008) permits the
type of analysis required to quantify the effects of bidder collusion at procurements and so
to study coordinated effects.8
In addition to affecting the behavior of colluding bidders, collusion at a sealed-bid pro-
curement affects the bidding behavior and expected payoff of non-colluding bidders.9 The
7By a sealed-bid procurement (auction), we mean that bidders simultaneously submit sealed bids —thelow (high) bidder wins and receives (pays) the amount of their bid. For more complicated procurementswhere bids are multi-dimensional, each bid is "scored" (i.e. mapped into a real number), ranked, and thewinner is the firm with the best score. The winning bidder delivers per their bid and receives payment fromthe procurer per their bid.
8Gayle and Richard (2008) provide numerical methods, together with an analytical result for evaluatingTaylor Series expansions of inverse functions, that allow the use of any underlying distribution for valuesor costs, even empirical ones. Prior to this work, one was constrained to work with power functions andextreme value distributions, neither of which may have adequate flexibility to account for the richness of agiven merger environment.
9This is not the case for descending-bid procurements. See, e.g., Robinson (1985) and Marshall and Marx(2006).
9

benefits from the suppression of competition between the merged entities typically cannot
be captured exclusively by the merging firms. Some of the suppression of rivalry benefits
non-merging firms as well.10
A single object auction/procurement analysis does not capture a reduction in quantity
as a consequence of coordinated effects. Additionally, our analysis quantifies payoffs to fully
explicit collusion as opposed to some lesser forms of coordination. These two aspects of the
proposed analysis should be kept in mind when it is used to quantify coordinated effects.
3.1 Application to BASF-Ciba
We discuss procurement-based techniques for quantifying coordinated effects within the
context of an example based on the 2009 merger of chemical manufacturers, BASF and Ciba
Holding Inc. Under the terms of a consent order allowing the transaction to proceed, the
FTC required BASF to sell all assets related to the two pigments, bismuth vanadate and
indanthrone blue, but both BASF and Ciba produce a variety of other chemicals in com-
mon.11 We focus on one in particular, the chemical Dimethylaminoethyl acrylate (DMA3)
that is an intermediate in the production of chemicals used in the water treatment and paper
industries, or as a specialty monomer.12
We view the manufacturers of DMA3 as competing with one another through their bid-
ding at competitive procurements used by buyers to purchase DMA3. We model the market
as involving manufacturers BASF, Ciba, and Arkema, plus two fringe firms. We standardize
firms’costs on the zero to one interval and model them as draws from individually calibrated
Beta distributions.13 Computations are done using the numerical algorithm of Gayle and
Richard (2008).14
10Duso, Gugler, and Yurtoglu (2007) examine the abnormal returns of non-merging firms around theannouncement of a merger and other events related to antitrust enforcement for evidence of anti-competitiveeffects.11FTC Press Release, April 2, 2009, “FTC Intervenes in BASF’s Proposed $5.1 Billion Acquisition of Ciba
Holding Inc.,”available at http://www.ftc.gov/opa/2009/04/basf.shtm, accessed December 18, 2010.12Case No COMP/M.5355 - BASF/ CIBA, Notification of 22 January 2009 pur-
suant to Article 4 of Council Regulation No 139/20041, pp.2—3, available athttp://ec.europa.eu/competition/mergers/cases/decisions/m5355_20090312_20212_en.pdf accessedDecember 17, 2010.13In the baseline model, Ciba and the two fringe firms are modeled as having costs drawn from the
Beta distribution with parameters (5.0, 1, 0). BASF is modeled using a Beta distribution with parameters(2.8, 2.0), and Arkema is modeled using a Beta distribution with parameters (1.0, 2.5).14We modify the algorithm of Gayle and Richard (2008) to allow the exponents used to construct coalitions
to be real numbers.
10

3.2 Incremental incentives for coordination
Given the market shares for DMA3, we can calibrate a procurement model to replicate
the market shares of the firms. We use the market share ranges for DMA3 given on p.4 of
the EC Decision in the merger of BASF/Ciba as a guide in calibrating the cost distributions
for the DMA3 producers.15 We view potential collusion between the dominant firm in the
market, Arkema, and BASF as something of possible concern given the history of collusion
between those two firms. For example, both Arkema and BASF were involved in cartels
in tin stabilizers and in ESBO/esters. These cartels were supported by a consultancy firm
based in Switzerland, AC Treuhand, which organized and monitored various aspects of the
collusive agreements.16
The target market shares are those shown in Table 4 in the panel for pre-merger non-
cooperative. Given cost distributions generating these pre-merger non-cooperative market
shares, we can then calculate the shares associated with three other scenarios. In the pre-
merger cooperative scenario, we model collusion between BASF and Arkema by assuming
BASF and Arkema act as one bidder with a cost equal to the minimum of the cost draws
for the two firms.17 In the post-merger non-cooperative scenario, we model the merger of
Ciba and BASF by assuming Ciba and BASF act as one bidder with a cost equal to the
minimum of the cost draws for the two firms. In the post-merger cooperative scenario, we
model collusion between the merged firm Ciba-BASF and Arkema by assuming Ciba, BASF,
and Arkema act as one bidder with a cost equal to the minimum of the cost draws for the
three firms.15Case No COMP/M.5355 - BASF/ CIBA, Notification of 22 January 2009
pursuant to Article 4 of Council Regulation No 139/20041, p.4, available athttp://ec.europa.eu/competition/mergers/cases/decisions/m5355_20090312_20212_en.pdf, accessedDecember 17, 2010.16Patricie Eliasova, Josefine Henderstrom, Willibrord Janssen, and Eline Post, “The
heat stabilisers cartel,” Competition Policy Newsletter 1, 51—52, 2010, available athttp://ec.europa.eu/competition/publications/cpn/2010_1_16.pdf, accessed December 17, 2010.17Formally, if firms A and B draw their costs from distributions FA and FB , then we model the cartel of
A and B and the merged firm A-B both as drawing its cost from the distribution 1− (1− FA)(1− FB).
11

Table 4: Market shares in the baseline model
Fringe 1 0.025 Fringe 1 0.066
Fringe 2 0.025 Fringe 2 0.066
Ciba 0.025 Ciba 0.066
BASF 0.265 BASFArkema 0.807
Arkema 0.666
Fringe 1 0.026 Fringe 1 0.090
Fringe 2 0.026 Fringe 2 0.090
CibaBASF 0.285 CibaBASFArkema 0.826
Arkema 0.669
premerger noncooperative
postmerger cooperativepostmerger noncooperative
premerger cooperative
Using the cost distributions calibrated to pre-merger non-cooperative market shares, we
can calculate the expected surplus to the bidding firms in the various scenarios. As shown by
a comparison of the pre-merger non-cooperative panel and the pre-merger cooperative panel
in Table 5, prior to the merger, BASF and Arkema can increase their joint profit by 30%
(from 0.255 to 0.331) through cooperative behavior. Comparing the two post-merger panels,
Table 5 shows that after the merger, Ciba-BASF and Arkema can increase their joint profit
by 40% (from 0.261 to 0.366) through cooperative behavior. Thus, the merger increases the
gains to BASF and Arkema from cooperative behavior, although the extent of this effect
was not suffi cient for there to be a required divestiture in DMA3 as a condition of merger
approval by the U.S. Federal Trade Commission.18
Table 5: Expected surplus in the baseline model
Fringe 1 0.002 Fringe 1 0.007
Fringe 2 0.002 Fringe 2 0.007
Ciba 0.002 Ciba 0.007
BASF 0.042 BASFArkema 0.331
Arkema 0.213
Fringe 1 0.002 Fringe 1 0.010
Fringe 2 0.002 Fringe 2 0.010
CibaBASF 0.045 CibaBASFArkema 0.366
Arkema 0.216
premerger noncooperative
postmerger noncooperative postmerger cooperative
premerger cooperative
18Decision and Order In the Matter of BASF SE, a Corporation, Docket No. C-4253, available athttp://www.ftc.gov/os/caselist/0810265/090526basfdo.pdf, accessed December 17, 2010.
12

As a hypothetical example, and to provide contrast, consider a modification to the base-
line model where we increase the share for Ciba and lower the share for Arkema. By in-
creasing Ciba’s share, we make the merger between BASF and Ciba a more significant
undertaking.
In this case, we adjust the cost distributions so that the pre-merger non-cooperative
shares are as shown in Table 6.
Table 6: Market shares in the adjusted model
Fringe 1 0.026
Fringe 2 0.026
Ciba 0.215
BASF 0.265
Arkema 0.473
premerger noncooperative
With these cost distributions, expected surpluses are as shown in Table 7.
Table 7: Expected surplus in the adjusted model
Fringe 1 0.003 Fringe 1 0.004
Fringe 2 0.003 Fringe 2 0.004
Ciba 0.032 Ciba 0.046
BASF 0.043 BASFArkema 0.170
Arkema 0.104
Fringe 1 0.003 Fringe 1 0.012
Fringe 2 0.003 Fringe 2 0.012
CibaBASF 0.081 CibaBASFArkema 0.292
Arkema 0.116
premerger noncooperative premerger cooperative
postmerger noncooperative postmerger cooperative
As shown in Table 7, prior to the merger, BASF and Arkema can increase their joint
profit by 16% (from 0.147 to 0.170) through cooperative behavior. After the merger, Ciba-
BASF and Arkema can increase their joint profit by 48% (from 0.197 to 0.292) through
cooperative behavior. Thus, in this case the merger has a more substantial effect on the
incremental incentives for cooperative behavior.
As illustrated by this example, when the merger combines two relatively equal firms to
produce a new firm that is close to equal to the largest firm in the market, the gains for
post-merger cooperative behavior can be substantially larger than the gains from pre-merger
cooperative behavior.
13

3.3 Cost effi ciencies
Returning to the baseline model, we now consider the potential for cost effi ciencies as
a result of the merger. Effi ciency gains from the merger are modeled by adjusting the
parameters governing the cost distributions of Ciba and BASF so that their respective mean
costs are scaled down, with little change to their variances.19
We start by assuming 10% cost effi ciencies. The associated expected surpluses are shown
in Table 8.
Table 8: Expected surplus with 10% cost effi ciencies
Fringe 1 0.002 Fringe 1 0.009
Fringe 2 0.002 Fringe 2 0.009
CibaBASF 0.055 CibaBASFArkema 0.372
Arkema 0.188
postmerger noncooperative postmerger cooperative
Recall that prior to the merger, BASF and Arkema can increase their joint profit by 30%
(from 0.255 to 0.331) through cooperative behavior. After the merger, if we consider 10%
cost effi ciencies, Ciba-BASF and Arkema can increase their joint profit by 53% (from 0.243
to 0.372) through cooperative behavior. Thus, the presence of cost effi ciencies increases the
incremental gain from cooperative behavior.
The next table, Table 9, considers even greater cost effi ciencies of 25%.
Table 9: Expected surplus with 25% cost effi ciencies
Fringe 1 0.001 Fringe 1 0.009
Fringe 2 0.001 Fringe 2 0.009
CibaBASF 0.071 CibaBASFArkema 0.386
Arkema 0.150
postmerger noncooperative postmerger cooperative
After the merger, if we consider 25% cost effi ciencies, Ciba-BASF and Arkema can in-
crease their joint profit by 75% (from 0.221 to 0.386) through cooperative behavior.
These example illustrate that while cost effi ciencies may relieve concerns regarding uni-
lateral effects, they can exacerbate concerns regarding coordinated effects be making the
merged entity a more valuable partner in a collusive arrangement for existing firms.
19In particular, let α0 and β0 be the baseline parameters for Ciba. Then, to model δ% effi ciency gains, weuse α1 = δ
100α0 and α1 + β1 = α0 + β0. Using this rule to obtain 10% effi ciency gains, the new parametersfor Ciba are (4.5, 1.5) and for BASF are (2.52, 2.28). To obtain 25% effi ciency gains, the new parameters forCiba are (3.75, 2.25) and for BASF are (2.1, 2.7).
14

3.4 Maverick behavior
In this example, we reduce the pre-merger non-cooperative shares of Fringe 1, Fringe 2,
and Ciba to 0.01, and correspondingly increase the shares of BASF and Arkema, as shown in
Table 10. We refer to this model as the maverick model because it will allow us to interpret
certain behavior as that of a maverick.
Table 10: Market shares in the maverick model
Fringe 1 0.010
Fringe 2 0.010
Ciba 0.010
BASF 0.284
Arkema 0.690
premerger noncooperative
In this model, the expected surpluses are as shown in Table 11.
Table 11: Expected surplus in the maverick model
Fringe 1 0.001 Fringe 1 0.004
Fringe 2 0.001 Fringe 2 0.004
Ciba 0.001 Ciba 0.004
BASF 0.046 BASFArkema 0.392
Arkema 0.229
Fringe 1 0.009 Fringe 1 0.006
Fringe 2 0.009 Fringe 2 0.006
CibaBASF 0.047 CibaBASFArkema 0.423
Arkema 0.231
premerger noncooperative premerger cooperative
postmerger noncooperative postmerger cooperative
As shown in Table 11, if BASF and Arkema collude and Ciba remains outside the cartel,
Ciba’s payoff is 0.004. If Ciba joints the cartel of BASF and Arkema, the joint payoff of the
three firms is 0.423. If this is divided according to the firms’relative non-cooperative market
shares, Ciba’s payoff would be 0.004. Thus, prior to the merger, Ciba has little incentive to
join a cartel of BASF and Arkema. One might interpret an unwillingness by Ciba to behave
cooperatively with BASF and Arkema as Ciba being a maverick.
Following the merger, once Ciba is joined with BASF, there is no impediment to coopera-
tive behavior by Ciba-BASF and Arkema. There is a sense in which the merger’s elimination
of a maverick opens the door for cooperation among three firms, when only two might have
coordinated prior to the merger.
15

3.5 Divestiture
Sometimes the FTC will approve a merger subject to the merging firms divesting cer-
tain assets or divisions. Our techniques can allow one to assess the extent to which such
divestitures diminish unilateral and/or coordinated effects.
Consider the case in which Fringe 2 is initially part of Ciba so that the pre-merger non-
cooperative market shares are as shown in Table 12.
Table 12: Market shares in divestiture model
Fringe 1 0.025
Ciba 0.052
BASF 0.265
Arkema 0.662
premerger noncooperative
In this case, as shown in Table 13, prior to the merger, BASF and Arkema can increase
their joint profit by 34% (from 0.255 to 0.341) through cooperative behavior. After the
merger, Ciba-BASF and Arkema can increase their joint profit by 60% (from 0.269 to 0.431)
through cooperative behavior.
Table 13: Expected surplus in divestiture model
Fringe 1 0.002 Fringe 1 0.008
Ciba 0.006 Ciba 0.016
BASF 0.042 BASFArkema 0.341
Arkema 0.213
Fringe 1 0.003 Fringe 1 0.018
CibaBASF 0.050 CibaBASFArkema 0.431
Arkema 0.219
premerger noncooperative premerger cooperative
postmerger noncooperative postmerger cooperative
Suppose competition authorities requiring Ciba to divest the assets of Fringe 2. In this
case, the post-merger incentive for cooperative behavior falls to 40% as shown in Table 5
above, which is not dramatically more than the pre-merger incentive for cooperative behavior.
In this sense, divestiture can address incentives for coordinated behavior.
As an alternative way to think about possible divestiture, suppose that Ciba consists
of two groups of assets and that competition authorities only allow the merger of BASF
with one of the groups of Ciba assets. Specifically, suppose that the pre and post-merger
non-cooperative market shares are as shown in Table 14.
16

Table 14: Market shares in alternative divestiture model
Fringe 1 0.025
Fringe 2 0.025
Ciba 0.025
BASF 0.265
Arkema 0.666
Fringe 1 0.025
Fringe 2 0.025
CibaA 0.012
CibaBBASF 0.275
Arkema 0.667
premerger noncooperative
postmerger noncooperative
In this alternative divestiture model, expected surpluses are as shown in Table 15.
Table 15: Expected surpluses in the alternative divestiture model
Fringe 1 0.002 Fringe 1 0.008
Fringe 2 0.002 Fringe 2 0.008
CibaA 0.001 CibaA 0.004
CibaBBASF 0.043 CibaBBASFArkema 0.347
Arkema 0.214
postmerger noncooperative postmerger cooperative
As shown in Table 15, in the alternative divestiture model, the post-merger incentive
for cooperative behavior falls to 35% (from 0.257 to 0.347), which is even closer to the pre-
merger incentive for cooperative behavior. Thus, allowing a merger to incorporate only a
subset of the target firm’s assets can reduce incentives for post-merger coordinated effects.
3.6 Summary
In this section, we show that procurement processes can be modeled to allow quantifica-
tion of the incremental payoffs for coordinated effects as the result of a merger. We show
that cost effi ciencies, while potentially reducing unilateral effects, can significantly increase
the payoffs associated with coordinated effects. The behavior of a maverick firm can poten-
tially be understood within the context of our model as arising from a superior payoff to
non-participation; however, a merger can change this payoff, eliminating the incentive for
maverick behavior. Finally, we show that our approach can be used to analyze the effi cacy
of various proposed divestitures in reducing incentives for coordinated effects.
17
4 Conclusion
We show that the incremental incentives for coordination created by a merger can be
quantified using a standard model of oligopoly or a standard procurement model. We also
show that, in some cases, UPP does not provide a useful screen to identify mergers of antitrust
concern because it fails to flag mergers with significant coordinated effects. In addition, we
show in our procurement model that cost effi ciencies suffi cient to allow the merger to pass an
antitrust screen based on UPP, can exacerbate the incentives for coordinated effects. Thus,
even the presence of significant cost effi ciencies associated with a merger cannot be used
by antitrust authorities as a reason to allow the merger without further coordinated effects
scrutiny.
18

References
Duso, Tomaso, Klaus Gugler, and Burcin Yurtoglu (2007), “EU Merger Remedies: An
Empirical Assessment,” in J. Stennek and V. Ghosal Eds., The Political Economy of
Antitrust, Contributions to Economic Analysis, North-Holland, 302—348.
Farrell, Joseph and Carl Shapiro (2010a), “Antitrust Evaluation of Horizontal Mergers: An
Economic Alternative to Market Definition,”B. E. Journal of Theoretical Economics
10(1), Article 9.
Farrell, Joseph and Carl Shapiro (2010b), “Upward Pricing Pressure and Critical Loss
Analysis: Response,”The CPI Antitrust Journal, February 2010, 1—17.
Gayle, Wayne-Roy and Jean-Francois Richard (2008), “Numerical Solutions of Asymmet-
ric First Price Independent Private Values Auctions”, Journal of Computational Eco-
nomics, 32(3), 245—278.
Kovacic, William E., Robert C. Marshall, Leslie M. Marx, and Steven P. Schulenberg (2006),
“Coordinated Effects in Merger Review: Quantifying the Payoffs from Collusion,”
International Antitrust Law & Policy: Fordham Corporate Law 2006, ed. B. Hawk.
(Juris Publishing), Chapter 13.
Kovacic, William E., Robert C. Marshall, Leslie M. Marx, and Steven P. Schulenberg (2009),
“Quantitative Analysis of Coordinated Effects,”Antitrust Law Journal 76(2), 397—430.
Langenfeld, James and Gregory G. Wrobel (2010), “Upward Pricing Pressure Analysis
Under the 2010 Horizontal Merger Guidelines,”Antitrust 25(1), 21—27.
Marshall, Robert C. and Leslie M. Marx (2007), “Bidder Collusion,”Journal of Economic
Theory 133, 374—402.
Robinson, Marc S. (1985), “Collusion and the Choice of Auction,”RAND Journal of Eco-
nomics 16, 141—145.
Singh, Nirvikar and Xavier Vives (1984) “Price and Quantity Competition in a Differenti-
ated Duopoly”RAND Journal of Economics 15, 546—554.
19
Copyright © 2022 FDOKUMEN