Coordinated Plan Cover - FINAL - SANDAG
506
2010-2014 Coordinated Plan The The Regional Short-Range Transit Plan & Coordinated Public Transit-Human Services Transportation Plan One Region - One Network - One Plan Technical Appendix Final – October 2010
-
Upload
khangminh22 -
Category
Documents
-
view
0 -
download
0
Transcript of Coordinated Plan Cover - FINAL - SANDAG
2010-2014
CoordinatedPlan
The
The Regional Short-Range Transit Plan & CoordinatedPublic Transit-Human Services Transportation Plan
One Region - One Network - One Plan
Technical Appendix
Final – October 2010


The Coordinated Plan (2010 – 2014) – DRAFT vii
Technical Appendices (bound under separate cover)
A Public Involvement
B FY09 Transit Services and Programs
C FY09 RSRTP Route Statistics and Historical Data
D Social Service Transportation Inventory
E Program Management Plan (September 2010)
F Service Implementation Plans
G Sample Roadway Capacities
H Annual Title VI Consistency Evaluation
I Transit-Deficit Smart Growth Areas
J TDA Performance Indicators
K Agency Mission Statements
L RSRTP Performance Statistics
M Regional Population Maps
N Social Service Transportation Maps
O Regional Transit and Social Service Transportation Gaps
P Issues and Strategies
Q Rural Transportation Survey Results


appendix A
Public Involvement


The Coordinated Plan (2010 – 2014) A-1 Appendix A—Public Outreach
Dear Community Stakeholder, SANDAG has created an online version of the Rural Transportation Survey! Please forward the text between the red words “start” and “stop” throughout your respective rural communities. We appreciate your continued assistance in our efforts to understand your needs. (Start) Overview of the Rural Transportation Survey The San Diego Association of Governments (SANDAG) is conducting an important survey of the transportation needs of residents in the rural areas of San Diego County, called the Rural Transportation Survey. This survey will allow SANDAG to include an in-depth analysis of transportation issues in the update of the regional Coordinated Plan. The Coordinated Plan identifies mobility needs in the County from a passenger perspective and focuses on transportation for seniors, persons with disabilities, reverse-commute trips, and employment-related transportation for persons with limited means. The Coordinated Plan currently is being revised to more fully represent rural areas in the Coordinated Planning process by thoroughly evaluating the mobility and access needs of rural residents. Your input will help to ensure that transportation projects sponsored by groups in rural San Diego County are eligible for federal, state, and local grant programs. (English) https://www.surveymonkey.com/s/2010RuralSurvey (Español) https://www.surveymonkey.com/s/2010EncuestaSobreTransporteRural Thank you for your participation! (Stop) We look forward to receiving your responses and hope to stay in contact with you in the coming months. We welcome your participation in all aspects of the process and ask that you contact Dillon Miner with any questions at (619) 699-1954 or by e-mail at [email protected].

The Coordinated Plan (2010 – 2014) A-2 Appendix A—Public Outreach
January 25, 2010 File Number 3320200
«Business_Name» «firstname» «lastname» «address» «city», «st» «zip» Dear Community Leader,
Thank you for participating in the San Diego Association of Governments (SANDAG) Coordinated Plan rural outreach effort! Your answers to the initial phone survey will be very helpful to determine the categories of transportation needs in your area. As requested, enclosed are the Rural Transportation Surveys, which will help us clarify the specific transportation needs of your community members.
We will use the responses from the Rural Transportation Survey to update our next Coordinated Plan. This plan provides the mechanism to fund transit and social service transportation, with an emphasis on transportation geared toward seniors, disabled individuals, and persons with limited incomes. The plan includes an assessment of transportation needs and strategies to meet those needs in both the rural and urban areas of San Diego County. Additionally, several million dollars are available through the Coordinated Plan annually (with separate funding pools for the rural and urban areas).
This survey effort will help clarify the rural transportation needs to help facilitate the development of transportation services in your area, so we appreciate your help in gathering this data.
We have included a paid-postage envelope for the return of the surveys. Please return them by February 26, 2010. We look forward to receiving your responses and hope to stay in contact with you in the coming months. We welcome your participation in all aspects of the process and ask that you contact Dillon Miner with any questions at (619) 699-1954 or by e-mail at [email protected].
If you wish to view the most recent Coordinated Plan, please visit www.sandag.org/CoordinatedPlan or contact me at (619) 699-6942 or [email protected] to make arrangements to receive a printed copy.
Sincerely,
DAN LEVY Senior Transit Planner DLE/dmin/gkr Enclosure

The Coordinated Plan (2010 – 2014) A-3 Appendix A—Public Outreach
Key Stakeholder Survey
Name of Organization Name
Address
Phone Number
Number of Members Type of Organization How long has your organization been in existence? Years: Transportation Services and Coordination in San Diego County Thank you for agreeing to be surveyed. The San Diego Association of Governments (SANDAG) is updating its Coordinated Plan to specifically expand the information included about the rural areas of the County. The plan enables the continued funding of transit and social service transportation projects in San Diego County. We are talking to key stakeholders in rural areas of San Diego County about the state of transportation available to help people meet their mobility needs. Please be as open, honest, and frank as you would like to be. Your answers will be held in strict confidence. You will not be identified as the source.
1. To begin, please tell us a little about your agency (or community). What is your mission? What types of services do you provide? Who do you provide your services to? Since our plan includes specific funding for low-income, seniors and disabled individuals, please explain if your membership includes individuals who would fall under any of these categories.
2. If you or your organization’s members provide transportation associated with your events or meetings, please describe the methods used, (i.e. informal ridersharing, organized volunteer driver program, van, etc.) and whether the organization owns the vehicles and/or pays drivers.
3. In what ways are transportation services important to your agency’s (or community’s) mission? And to the services that you offer? And to the people you serve?
4. If there are MTS/NCTD services in your community, what are your perceptions of those services in helping (YOUR) community residents meet their travel needs? What are the strengths? What are the weaknesses?
5. What are your perceptions of other agency and private transportation services that are available in (YOUR) city? What are the strengths? What are the weaknesses?
6. What are your members’ greatest unmet transportation needs? Are there certain areas and/or people in the community who need service?
7. Is your organization capable of partnering or operating transportation if there was corresponding funding available?

The Coordinated Plan (2010 – 2014) A-4 Appendix A—Public Outreach
8. Are you aware of transportation resources in areas you serve that are under-utilized (e.g. parked mini-bus, mini-van, etc.) that could be put into service if funding was available?
9. Would you be willing to distribute a survey to your organization’s members? Their responses will help us create a comprehensive understanding of (YOUR) community’s needs. a. If so, how many paper copies (both English and Spanish available) would you like?
10. Who else should I speak to?
The Coordinated Plan (2010 – 2014) A-5 Appendix A—Public Outreach
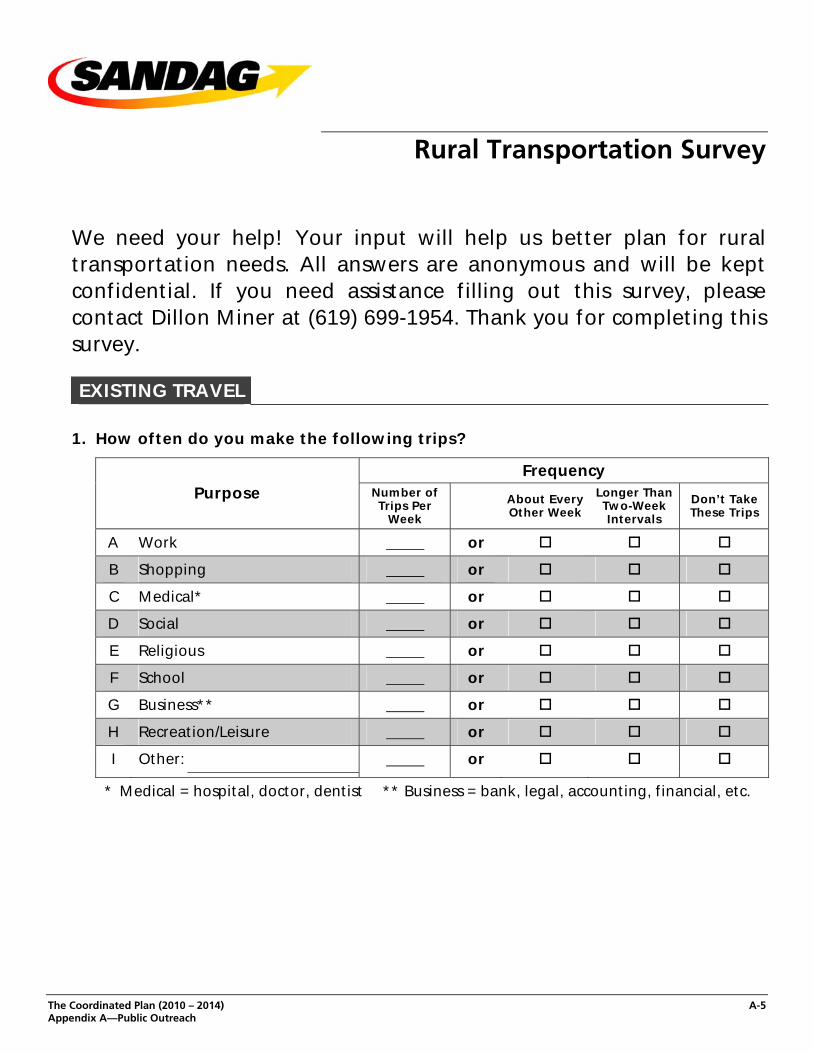
Rural Transportation Survey
We need your help! Your input will help us better plan for rural transportation needs. All answers are anonymous and will be kept confidential. If you need assistance filling out this survey, please contact Dillon Miner at (619) 699-1954. Thank you for completing this survey.
EXISTING TRAVEL
1. How often do you make the following trips?
Frequency Purpose Number of
Trips Per Week
About Every Other Week
Longer Than Two-Week Intervals
Don’t Take These Trips
A Work or
B Shopping or
C Medical* or
D Social or
E Religious or
F School or
G Business** or
H Recreation/Leisure or
I Other: or
* Medical = hospital, doctor, dentist ** Business = bank, legal, accounting, financial, etc.

The Coordinated Plan (2010 – 2014) A-6 Appendix A—Public Outreach
EXISTING TRAVEL (continued)
2. Which mode do you use most often when making these trips? (choose one mode per purpose)
Mode of Transportation
Purpose Walk/Cycle
Drive Myself
Ride From
Family/ Friends
ADA Para-
transitBus
Taxi Service
Volun-teer
Driver Other*
Don’t Take These Trips
A Work
B Shopping
C Medical**
D Social
E Religious
F School
G Business***
H Recreation/Leisure
I Other:
* Please list other mode: ** Medical = hospital, doctor, dentist *** Business = bank, legal, accounting, financial, etc.
3. Where do you typically make the following trips?
Purpose Within My Community
Outside My Community
Don’t Take These Trips
A Work
B Shopping
C Medical*
D Social
E Religious
F School
G Business**
H Recreation/Leisure
I Other:
* Medical = hospital, doctor, dentist ** Business = bank, legal, accounting, financial, etc.
4. Do you usually need physical assistance to make these trips from your house to your destination?
1) Yes 2) No

The Coordinated Plan (2010 – 2014) A-7 Appendix A—Public Outreach
5. How many times during the week are you unable to make a trip because you can’t get transportation?
Frequency Purpose Number of
Trips Per Week
About Every Other Week
Longer Than Two-Week Intervals
Don’t Take These Trips
A Work or
B Shopping or
C Medical* or
D Social or
E Religious or
F School or
G Business** or
H Recreation/Leisure or
I Other: or
* Medical = hospital, doctor, dentist ** Business = bank, legal, accounting, financial, etc.
6. Do you have a current driver’s license? 1) Yes 2) No
7. Do you own a motor vehicle? 1) Yes 2) No
ABOUT YOUR CONCERNS
8. When using any form of transportation where you don’t drive (e.g., taxi, church vehicle), how concerned are you with each of the following areas?
Factor
Ve
ry
Co
nce
rned
Co
nce
rned
No
t V
ery
C
on
cern
ed
No
t C
on
cern
ed
No
t
Ap
pli
cab
le
A Transportation cost
B Vehicle safety
C Personal security
D Reliability (vehicle on time at pick-up/drop-off)
E Travel time is long
F Vehicle crowding
G Driver courtesy
H Comfort
I Having to cross streets upon arrival at my destination

The Coordinated Plan (2010 – 2014) A-8 Appendix A—Public Outreach
The San Diego Association of Governments (SANDAG) 401 B Street Suite 800 San Diego, CA 92101 Phone: (619) 699-1900 Website: www.sandag.org (Rev 022510)
ABOUT YOUR CONCERNS (continued)
9. If you have other concerns not referenced in question 8, please let us know.
ABOUT YOURSELF
10. Cross streets closest to your residence?
11. What is the name of your community?
12. ZIP Code of your residence?
13. Gender? 1) Male 2) Female 14. In what year were you born? 19
15. Including yourself, how many people live in your home?
16. What is the combined annual income for your household?
1) Under $15,000 5) $30,000 – $34,999 2) $15,000 – $19,999 6) $35,000 – $39,999 3) $20,000 – $24,999 7) $40,000 – $44,999 4) $25,000 – $29,999 8) $50,000 or more
17. What do you consider yourself?
1) Hispanic 2) White (non-Hispanic) 3) Asian (non-Hispanic) 4) African-American (non-Hispanic) 5) American Indian 6) Other:
18. Do you have a disability? 1) Yes 2) No
18a. If YES, are you certified to ride ADA paratransit (includes ACCESS and LIFT)?
1) Yes 2) No
The Coordinated Plan (2010 – 2014) A-9 Appendix A—Public Outreach
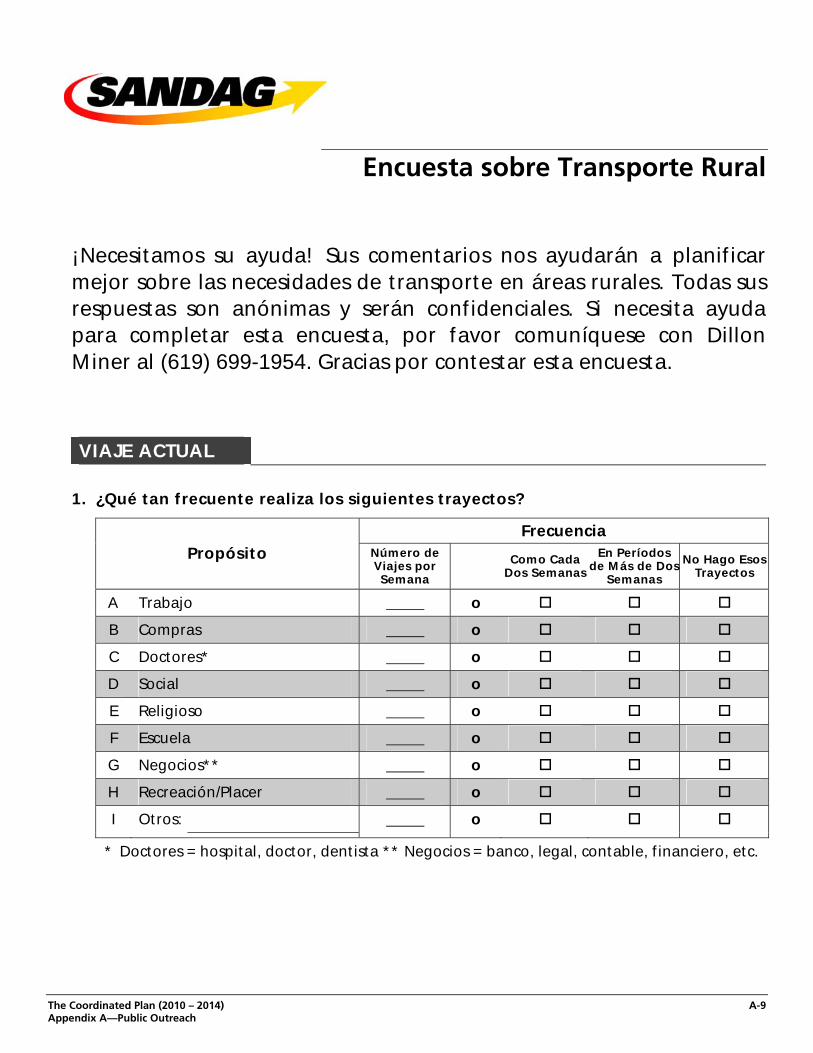
Encuesta sobre Transporte Rural
¡Necesitamos su ayuda! Sus comentarios nos ayudarán a planificar mejor sobre las necesidades de transporte en áreas rurales. Todas sus respuestas son anónimas y serán confidenciales. Si necesita ayuda para completar esta encuesta, por favor comuníquese con Dillon Miner al (619) 699-1954. Gracias por contestar esta encuesta.
VIAJE ACTUAL
1. ¿Qué tan frecuente realiza los siguientes trayectos?
Frecuencia Propósito Número de
Viajes por Semana
Como Cada Dos Semanas
En Períodos de Más de Dos
Semanas
No Hago Esos Trayectos
A Trabajo o
B Compras o
C Doctores* o
D Social o
E Religioso o
F Escuela o
G Negocios** o
H Recreación/Placer o
I Otros: o
* Doctores = hospital, doctor, dentista ** Negocios = banco, legal, contable, financiero, etc.

The Coordinated Plan (2010 – 2014) A-10 Appendix A—Public Outreach
VIAJE ACTUAL (continua)
2. ¿Cuál modo usa más frecuente para recorrer esos trayectos? (Elija un modo para cada propósito)
Modo de Transporte
Propósito Caminar/
Bicicleta
Manejo yo
mismo
Viajo con Familiares
o Amigos
ADA Para-
transit
Auto-bús
Taxi
Conduc-tor
Volun-tario
Otro* No Hago
Esos Trayectos
A Trabajo
B Compras
C Doctores**
D Social
E Religioso
F Escuela
G Negocios***
H Recreación/Placer
I Otro:
* Por favor describa el otro modo ** Doctores = hospital, doctor, dentista *** Negocios = banco, legal, contable, financiero,
etc.
3. ¿En dónde hace usualmente los siguientes trayectos?
Propósito Dentro de Mi Comunidad
Afuera de Mi Comunidad
No hago esos Trayectos
A Trabajo
B Compras
C Doctores*
D Social
E Religioso
F Escuela
G Negocios**
H Recreación/Placer
I Otro:
* Doctores = hospital, doctor, dentista ** Negocios = banco, legal, contable, financiero, etc.
4. ¿Usualmente requiere asistencia física para hacer esos trayectos desde su casa hasta su lugar de destino?
1) Sí 2) No

The Coordinated Plan (2010 – 2014) A-11 Appendix A—Public Outreach
5. ¿Cuántas veces a la semana le sucede que no puede hacer su trayecto porque no puede conseguir transportación?
Frecuencia Propósito Número de
Viajes Por Semana
Como Cada Dos Semanas
En Períodos de Más de Dos
Semanas
No Hago Esos Trayectos
A Trabajo o
B Compras o
C Doctores* o
D Social o
E Religioso o
F Escuela o
G Negocios** o
H Recreación/Placer o
I Otro: o
* Doctores = hospital, doctor, dentista ** Negocios= banco, legal, contable, financiero, etc.
6. ¿Tiene una licencia de conducer vigente? 1) Sí 2) No
7. ¿Posee un vehículo de motor? 1) Sí 2) No
ACERCA DE SUS PREOCUPACIONES
8. Cuando usa un medio de transporte en donde usted no maneja (ej., taxi, vehículo de la iglesia), ¿Qué tanto le preocupa cada una de las siguientes áreas?
Factor
Mu
y
Pre
ocu
pad
o
Pre
ocu
pad
o
No
mu
y
Pre
ocu
pad
o
No
Pre
ocu
pad
o
No
A
pli
ca
A Costo del transporte
B Seguridad del vehículo
C Seguridad personal
D Confiabilidad (puntualidad para abordar o para llegar)
E El tiempo del trayecto es muy largo
F Vehículo muy lleno
G Cortesía del conductor
H Confort
I Tener que cruzar calles para llegar al destino

The Coordinated Plan (2010 – 2014) A-12 Appendix A—Public Outreach
The San Diego Association of Governments (SANDAG) 401 B Street Suite 800 San Diego, CA 92101 Phone: (619) 699-1900 Website: www.sandag.org (Rev 022510)
ACERCA DE SUS PREOCUPACIONES (continua)
9. Déjenos saber si usted tuviera alguna otra preocupación que no esté incluida en la pregunta 8.
ACERCA DE USTED
10. Cuál es la intersección de la calle más cercana a su casa?
11. ¿Cuál es el nombre de su comunidad?
12. ¿Cuál es el Código Postal de su hogar?
13. Género 1) Masculino 2) Femenino 14. ¿En qué año nació usted? 19
15. Incluyéndose a sí mismo ¿cuántas personas más viven en su casa?
16. ¿Cuál es el ingreso anual combinado en su casa?
1) Abajo de $15,000 5) $30,000 – $34,999 2) $15,000 – $19,999 6) $35,000 – $39,999 3) $20,000 – $24,999 7) $40,000 – $44,999 4) $25,000 – $29,999 8) $50,000 o más
17. ¿Qué se considera usted mismo?
1) Hispano 2) Blanco (no-Hispano) 3) Asiático (no-Hispano) 4) Africano americano (no-Hispano) 5) Tribu Nativa de América 6) Otro:
18. ¿Tiene usted alguna discapacidad? 1) Sí 2) No
18a. Si es SÏ, ¿Está certificado para los servicios ADA paratransit (incluyendo ACCESS y LIFT)?
1) Sí 2) No

The Coordinated Plan (2010 – 2014) A-13 Appendix A—Public Outreach
NEWS Date: March 22, 2010
For Release: Immediately Contact: Colleen Windsor, (619) 699-1960, or e-mail: [email protected]
SURVEY SEEKS DATA ON THE TRANSPORTATION NEEDS OF THE REGION’S RURAL RESIDENTS
Rural residents can help shape the future of transportation services in their communities by participating in a survey currently being conducted by SANDAG.
“We need to hear from the people in our rural communities,” SANDAG Executive Director Gary Gallegos said. “This information will help us quantify the needs and identify them in our plans. So, when funding does become available, projects and services that meet these needs will be eligible for the money.”
Data gathered by the Rural Transportation Survey will be analyzed and incorporated into the SANDAG Coordinated Plan, which identifies mobility needs in the county from a passenger perspective and focuses on transportation for seniors, persons with disabilities, reverse-commute trips, and employment-related transportation for persons with limited means.
SANDAG currently is revising the Coordinated Plan to more fully represent rural areas by thoroughly evaluating the mobility and access needs of rural residents. The input of rural residents will help to ensure that transportation projects sponsored by groups in rural San Diego County are eligible for federal, state, and local grant programs.
The survey – which is anonymous – asks 19 simple questions about transportation needs and concerns. It’s available online in English at this link: https://www.surveymonkey.com/s/2010RuralSurvey. And in Spanish at this link:
https://www.surveymonkey.com/s/2010EncuestaSobreTransporteRural. Also see the attached PDF, or visit the SANDAG Web site at: http://www.sandag.org/coordinatedplan.
SANDAG is actively circulating the survey among rural residents through various means, including service organizations, community liaisons, and public outreach meetings. Responses will be gathered through the end of April. Draft results will be made public in May during a series of public outreach meeting.

The Coordinated Plan (2010 – 2014) A-14 Appendix A—Public Outreach
Final results will be included in the updated Coordinated Plan which is expected to be ready for public review this fall. About SANDAG The San Diego Association of Governments (SANDAG) is the San Diego region’s primary public planning, transportation, and research agency, providing the public forum for regional policy decisions about growth, transportation planning and construction, environmental management, housing, open space, energy, public safety, and binational topics. SANDAG is governed by a Board of Directors composed of mayors, council members, and supervisors from each of the region’s 18 cities and the county government.

The Coordinated Plan (2010 – 2014) A-15 Appendix A—Public Outreach
HHSA E-mail Announcement From: Trom, Philip Sent: Monday, June 07, 2010 11:21 AM To: Trom, Philip Subject: Social Service Transportation Outreach and Grant Opportunities Dear Interested Citizens and Social Service Organizations, SANDAG wants to hear from you! The San Diego Association of Governments (SANDAG) is pleased to announce a series of outreach meetings on the update of the Coordinated Public Transit – Human Services Transportation Plan (Coordinated Plan). SANDAG also will be discussing current grant opportunities available for interested social service organizations. Over $8 million will be available for social service transportation grants in the coming year! Background The Coordinated Plan is being updated with a focus on the rural areas of the San Diego County and will include an update on the strategies to improve public transit and social service transportation in the County as a whole. The update of the plan will also assist SANDAG and the State of California with the distribution of future federal and local grants for social service transportation. Persons attending the meetings are encouraged to provide input into the new plan, share thoughts on social service transportation needs, or raise other issues pertinent to social service transportation. The previous plan (2009-2013 Coordinated Plan) can be viewed at www.sandag.org/coordinatedplan. SANDAG staff will also share results of the spring 2010 Rural Transportation Survey as a basis for the discussion in the rural areas. Public Outreach Meetings: June 28, 2010 3 – 4:30 pm Lower Level NCTD Offices 810 Mission Avenue Oceanside June 29, 2010 3 – 4:30 pm City Hall City of Chula Vista 276 Fourth Avenue Chula Vista June 30, 2010 5:30 – 7 pm Ronald Reagan Community Center 195 East Douglas Avenue El Cajon July 1, 2010 3 – 4:30 pm Ramona Senior Center 434 Aqua Lane Ramona July 6, 2010 3 – 4:30 pm Rincon Tribal Hall 1 West Tribal Road Valley Center July 7, 2010 5:30 – 7 pm Mountain Empire Community Center 976 Sheridan Road Campo

The Coordinated Plan (2010 – 2014) A-16 Appendix A—Public Outreach
July 8, 2010 2 – 3:30 pm Borrego Senior Center 580 Circle J Drive Borrego Springs July 9, 2010 3 – 4:30 pm Gallegos Room Caltrans District 11 Offices 4050 Taylor Street Old Town, San Diego Grant Opportunity Information Sessions (Intended for Private, Government and Non-Profit Transportation Operators): June 28, 2010 1 – 2:30 pm Lower Level NCTD Offices 810 Mission Avenue Oceanside June 29, 2010 1 – 2:30 pm City Hall City of Chula Vista 276 Fourth Avenue Chula Vista June 30, 2010 3:30 – 5 pm Ronald Reagan Community Center 195 East Douglas Avenue El Cajon July 1, 2010 1 – 2:30 pm Ramona Senior Center 434 Aqua Lane Ramona July 6, 2010 1 – 2:30 pm Rincon Tribal Hall 1 West Tribal Road Valley Center July 7, 2010 3:30 – 5 pm Mountain Empire Community Center 976 Sheridan Road Campo July 8, 2010 12 – 1:30 pm Borrego Senior Center 580 Circle J Drive Borrego Springs
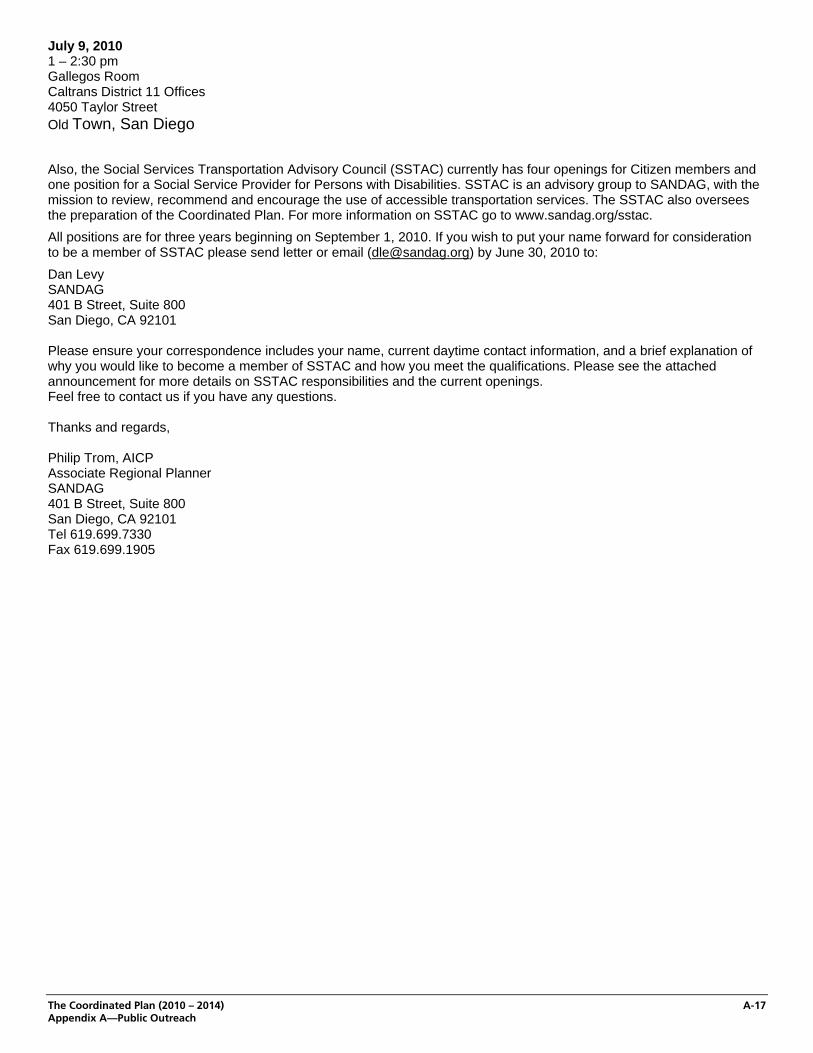
The Coordinated Plan (2010 – 2014) A-17 Appendix A—Public Outreach
July 9, 2010 1 – 2:30 pm Gallegos Room Caltrans District 11 Offices 4050 Taylor Street Old Town, San Diego Also, the Social Services Transportation Advisory Council (SSTAC) currently has four openings for Citizen members and one position for a Social Service Provider for Persons with Disabilities. SSTAC is an advisory group to SANDAG, with the mission to review, recommend and encourage the use of accessible transportation services. The SSTAC also oversees the preparation of the Coordinated Plan. For more information on SSTAC go to www.sandag.org/sstac. All positions are for three years beginning on September 1, 2010. If you wish to put your name forward for consideration to be a member of SSTAC please send letter or email ([email protected]) by June 30, 2010 to: Dan Levy SANDAG 401 B Street, Suite 800 San Diego, CA 92101 Please ensure your correspondence includes your name, current daytime contact information, and a brief explanation of why you would like to become a member of SSTAC and how you meet the qualifications. Please see the attached announcement for more details on SSTAC responsibilities and the current openings. Feel free to contact us if you have any questions. Thanks and regards, Philip Trom, AICP Associate Regional Planner SANDAG 401 B Street, Suite 800 San Diego, CA 92101 Tel 619.699.7330 Fax 619.699.1905

The Coordinated Plan (2010 – 2014) A-18 Appendix A—Public Outreach
061510 E-mail Announcement Dear Community Liaisons, The San Diego Association of Governments pleased to announce a series of outreach meetings on the update of the Coordinated Public Transit – Humans Services Transportation Plan (Coordinated Plan). We appreciate your help in distributing our Rural Transportation Survey, and would like to hear your feedback concerning the results. We are hosting meetings for both transportation providers and the public. Please review the attached flier detailing the outreach purpose and schedule, and then post the flier in your communities. If you have questions, feel free to contact me. Sincerely, Dillon Miner Transit Planning Intern SANDAG 401 B Street San Diego, CA 92101 (619) 699-1954 (w) (626) 298-3838 (c)

The Coordinated Plan (2010 – 2014) A-19 Appendix A—Public Outreach
June 15, 2010

The Coordinated Plan (2010 – 2014) A-20 Appendix A—Public Outreach
June 21, 2010

The Coordinated Plan (2010 – 2014) A-21 Appendix A—Public Outreach
June 24, 2010

The Coordinated Plan (2010 – 2014) A-22 Appendix A—Public Outreach
062410 Voice and Viewpoint

The Coordinated Plan (2010 – 2014) A-23 Appendix A—Public Outreach

The Coordinated Plan (2010 – 2014) A-24 Appendix A—Public Outreach
June 25, 2010

The Coordinated Plan (2010 – 2014) A-25 Appendix A—Public Outreach
NEWS Date: June 28, 2010
For Release: Immediately Contact: Colleen Windsor, (619) 699-1960, or e-mail: [email protected] David Hicks, (619) 699-6939, e-mail: [email protected]
SURVEY GIVES INSIGHT INTO RURAL TRANSPORTATION NEEDS GRANT MONEY AVAILABLE TO HELP FILL THE GAPS
SANDAG will conduct a series of public meetings in June and July to share the results of a recent survey about social services transportation needs in the region’s rural areas, and to discuss how providers can apply for grants to help meet those needs. “Our survey results show that low-income, disabled, and elderly people are skipping trips to the doctor’s office, missing work, or forgoing church visits because they don’t have access to transportation,” SANDAG Executive Director Gary Gallegos said. “However, grant funds are currently available for organizations interested in providing these types of transportation services in rural and urban areas.” SANDAG conducted the survey earlier this year, asking mostly rural residents 19 questions about their transportation needs and concerns. Approximately 400 people responded. Much of the survey focused on the number of trips people were forced to forego because no transportation was available to them. Results showed that 30 percent of persons with disabilities could not take trips they wanted to take in a given week. Approximately a quarter of limited-income rural residents (those at 150 percent of the federal poverty line) missed trips they wanted to take, and 10 percent of seniors could not find transportation. Other results included: persons with disabilities and individuals with limited-incomes each miss 35 percent of their medical trips; 21 percent of work trips were missed by respondents with limited-incomes; religious trips were given up most frequently among seniors and persons with disabilities; 40 percent of disabled individuals said they regularly had to forego school-related trips.

The Coordinated Plan (2010 – 2014) A-26 Appendix A—Public Outreach
SANDAG is still gathering data to complete the picture. Planners will hold a series of eight public meetings around the county in June and July to discuss the survey results and gather additional feedback. The information will be incorporated into the SANDAG Coordinated Plan, which identifies mobility needs in the county from a passenger perspective and focuses on transportation for seniors, persons with disabilities, reverse-commute trips, and employment-related transportation for persons with limited means. SANDAG is currently revising the Coordinated Plan. The input of rural residents will help ensure that transportation projects sponsored by groups in rural San Diego County are eligible for federal, state, and local grant programs. Simultaneously, SANDAG is soliciting requests for available grants from organizations interested in filling the identified needs. SANDAG expects to award many relatively small grants to numerous organizations. The grants include $2.1 million from the TransNet Senior Mini Grant program, which are available to applicants in rural and urban areas. In addition, federal Jobs Access Reverse Commute and New Freedom grants are available for programs in the urban areas of the region, which includes some communities such as Ramona that are usually considered rural. In addition, the state of California has a pool of grant money to distribute statewide to fund similar programs. The public meetings will provide opportunities for residents to learn about the survey and give feedback. They also will include sessions on the grants and how to apply. The meetings will be held on the following dates:
• June 28: 1 – 2:30 p.m. grants session; 3 – 4:30 p.m. public meeting. Lower Level NCTD Offices, 810 Mission Ave., Oceanside
• June 29: 1 – 2:30 p.m. grants session; 3 – 4:30 p.m. public meeting. Chula Vista City Hall, 276 Fourth Ave., Chula Vista
• June 30: 3:30 – 5 p.m. grants session; 5:30 – 7 p.m. public meeting. Ronald Reagan Community Center, 195 East Douglas Ave., El Cajon
• July 1: 1 – 2:30 p.m. grants session; 3 – 4:30 p.m. public meeting. Ramona Senior Center, 434 Aqua Lane, Ramona
• July 6: 1 – 2:30 p.m. grants session; 3 – 4:30 p.m. public meeting. Rincon Tribal Hall, 1 West Tribal Road, Valley Center
• July 7: 3:30 – 5 p.m. grants session; 5:30 – 7 p.m. public Meeting. Mountain Empire Community Center, 976 Sheridan Road, Campo
• July 7: 3:30 – 5 p.m. grants session; 5:30 – 7 p.m. public meeting. Mountain Empire Community Center, 976 Sheridan Road, Campo
• July 8: 12 – 1:30 p.m. grants session; 2 – 3:30 p.m. public meeting. Borrego Senior Center, 580 Circle J Drive, Borrego Springs
• July 9: 1 – 2:30 p.m. grants session; 3 – 4:30 p.m. public meeting. Gallegos Room, Caltrans District 11 Offices, 4050 Taylor St., San Diego
About SANDAG The San Diego Association of Governments (SANDAG) is the San Diego region’s primary public planning, transportation, and research agency, providing the public forum for regional policy decisions about growth, transportation planning and construction, environmental management, housing, open space, energy, public safety, and binational topics. SANDAG is governed by a Board of Directors composed of mayors, council members, and supervisors from each of the region’s 18 cities and the county government.
###

The Coordinated Plan (2010 – 2014) A-27 Appendix A—Public Outreach
July 2010

The Coordinated Plan (2010 – 2014) A-28 Appendix A—Public Outreach
July 2, 2010

The Coordinated Plan (2010 – 2014) A-29 Appendix A—Public Outreach
July 1, 2010

The Coordinated Plan (2010 – 2014) A-30 Appendix A—Public Outreach
092010 SSTAC Agenda Placeholder

The Coordinated Plan (2010 – 2014) A-31 Appendix A—Public Outreach
NEWS Date: August 13, 2010
For Release: Immediately Contact: Colleen Windsor, (619) 699-1960, or e-mail: [email protected] David Hicks, (619) 699-6939, or e-mail: [email protected]
SANDAG TO ALLOCATE $4.5M FOR SENIOR, DISABLED, LOW-INCOME, AND REVERSE-COMMUTER TRANSPORTATION
SANDAG is soliciting applications for $4.5 million in funds available through three separate grant programs that will support various transportation initiatives serving seniors, the disabled, low-income individuals, and reverse commuters. The three grant programs include two funded by the federal government and administered by SANDAG – Job Access and Reverse Commute (JARC) and New Freedom. The third program – Senior Transportation Mini Grant -- is funded by the local TransNet half-cent sales tax. (All three programs require various levels of matching funds.) “Most of these funds will be aimed toward new or expanding programs,” SANDAG Executive Director Gary Gallegos said. “Our intentions are to distribute a large number of relatively small grants to encourage a variety of services to help fill the gaps in our transportation system.” Grants will be awarded to programs that meet the priorities outlined in the SANDAG Coordinated Plan, which identifies mobility needs in the county from a passenger perspective and focuses on transportation for seniors, persons with disabilities, reverse-commute trips, and employment-related transportation for persons with limited means. Applications are due no later than Nov. 12, 2010. SANDAG will host an application workshop in September – the exact date and location will be posted on the SANDAG Web site, along with the Coordinated Plan, grant application forms, and related materials at http://www.sandag.org/CoordinatedPlan. The $2 million in Senior Transportation Mini Grant funds will go to innovative and flexible programs that support the transportation needs of people aged 60 and older. Examples of eligible projects include:
• Senior shuttle services

The Coordinated Plan (2010 – 2014) A-32 Appendix A—Public Outreach
• Volunteer driver programs • Brokerage of multi-jurisdictional transportation services • Mobility/travel training • Support of accessible taxis • Rideshare and vanpool programs
The $1.6 million in JARC grants will fund employment-related transportation projects serving low-income individuals and reverse commuters. Examples of projects that may be funded through JARC include:
• Late-night and weekend fixed-route service • Employment shuttles • Guaranteed ride home service • Vanpools, ridesharing, and carpooling activities • Regional mobility management • Bicycling programs and car sharing • Intelligent transportation, information, and dispatch systems
The $940,000 in New Freedom grants will be awarded to applicants who can provide new or expanded transportation services for individuals with disabilities that go beyond the requirements of the Americans with Disabilities Act (ADA). Examples of eligible projects include:
• Purchasing accessible vehicles • Administering voucher programs • Administering volunteer driver programs • Regional mobility management • Travel training for individual users • Expansion of paratransit service beyond ADA required boundary • Providing door-to-door or door-through-door shuttle service
About SANDAG The San Diego Association of Governments (SANDAG) is the San Diego region’s primary public planning, transportation, and research agency, providing the public forum for regional policy decisions about growth, transportation planning and construction, environmental management, housing, open space, energy, public safety, and binational topics. SANDAG is governed by a Board of Directors composed of mayors, council members, and supervisors from each of the region’s 18 cities and the county government.
###

appendix B
FY09 Transit Services and Programs


The Coordinated Plan (2010 – 2014) B-1 Appendix B—FY09 Transit Services and Programs
This appendix provides a detailed description of the existing transit system (fixed-route and paratransit), along with a general overview of maintenance and passenger facilities, transit infrastructure incorporating Intelligent Transportation Systems (ITS), public information and marketing, fare policy and SANDAG sponsored short-range transit projects.
SERVICE PROVISION Public transit service is provided throughout the region by two transit agencies, Metropolitan Transit System (MTS) and North County Transit District (NCTD), which covers 9 public transit operators, including three fixed-route bus operators (Chula Vista Transit, San Diego Transit Corporation, and MTS Contract Services consolidated under MTS Bus), COASTER commuter rail operations, San Diego Trolley Incorporated, SPRINTER light rail operations, Coronado Ferry Service, Sorrento Valley COASTER Connection, and two Americans with Disabilities Act (ADA) complementary paratransit operators. These operators provide service in SANDAG’s area of jurisdiction covering 4,261 square miles and encompassing 18 incorporated cities and the County of San Diego. Table B.1 identifies each transit operator including route numbers.
Table B.1: FY 2009 San Diego Regional Transit Operators
SERVICES ROUTE NUMBERS
MTS Bus 1-210, 700-999
NCTD 300-496
San Diego Trolley Incorportated Blue (510), Orange (520), and Green (530)
Coronado-San Diego Bay Ferry Commuter Service — MTS ACCESS — NCTD COASTER 398
NCTD SPRINTER 399
NCTD LIFT -
Sorrento Valley COASTER Connection 971-978 Transit services in the region are provided directly by the operating agency, or indirectly through contracts with public or private operators. During FY 2009, transit services were provided through a private operator selected as a result of a competitive bid process, except for NCTD BREEZE Service, MTS Bus, and San Diego Trolley Incorporated (SDTI) fixed-route services, which were provided directly by these transit operators. Table B.2 identifies the operating contract information for each of the transit operators (split between “Contract” and “Noncontract” services), while Table B.3 contains a vehicle inventory for each service.

The Coordinated Plan (2010 – 2014) B-2 Appendix B—FY09 Transit Services and Programs
Table B.2: Contract and Noncontract Base Operating Statistics (FY 2009)
NUMBER OF REVENUE TOTAL COST/ OPERATOR ROUTES MILES PASSENGERS REVENUE HOUR
CONTRACT SERVICES
FIXED-ROUTE SERVICES
Chula Vista Transit (700 series) 6 1,241,841 3,602,160 $60.52
MTS Contract Services 60 8,810,847 21,315,889 $60.10
City of Coronado 1 N/A N/A
RAIL SERVICES
NCTD COASTER 1 1,349,238 1,501,619 $493.79
NCTD SPRINTER 1 618,004 2,195,373 $536.56
GENERAL PUBLIC DEMAND RESPONSIVE SYSTEMS
MTS Sorrento Valley COASTER Connection 9 123,582 130,780 $60.08
MTS DART N/A N/A N/A N/A
NCTD FAST 4 21,921 8,205 $50.87
ADA COMPLEMENTARY PARATRANSIT SERVICE
MTS ADA Paratransit Services (Central and Suburban)** 2 3,244,550 372,373 $59.98
NCTD LIFT N/A 1,138,108 115,496 $66.81
Subtotal 84 16,548,091 29,241,895
Percent of Total: 53% 42% 28%
NONCONTRACT SERVICES
NCTD BREEZE 46 5,745,711 8,747,458 $97.02
MTS Bus Operations 26 9,231,454 29,771,695 $96.10
MTS Rail Operations*** 3 7,894,529 36,928,284 $142.82
Subtotal 75 22,871,694 75,447,437
Percent of Total: 47% 58% 72%
TOTAL 159 39,419,785 104,689,332
Notes: MTS = Metropolitan Transit System; NCTD = North County Transit District Demand-Responsive Systems are shown as single routes for each distinct area;
*
** MTS ADA Paratransit comprises MTS Access and MTS ADA Suburban; under consolidated budget*** Car miles
MTS Contract Services fixed-route include all contracted fixed routes, premium express routes, and rural routes, in accordance withNTD reporting

The Coordinated Plan (2010 – 2014) B-3 Appendix B—FY09 Transit Services and Programs
Table B.3: FY 2009 SANDAG Jurisdictional Transit Operator Vehicles
OperatorNumber of
Fleet Vehicles
Number of Peak
VehiclesType of Vehicle
Owned by Operator
or Contrator
Wheelchair Lifts
Chula Vista Transit 40 30 40 Coaches MTS 40
MTS Multimodal Operations 266 201 240 Coaches / 26 Cutaway MTS 266
North County Transit District (NCTD) 156 120 Coaches NCTD 156
MTS Bus Operations 241 193 202 Coaches/39 Articulated MTS 241
SUBTOTAL 703 544 703
MTS Rail Operations 134 99 Light Rail Vehicle MTS 134 NCTD COASTER (Heavy Rail)* 35 24 Heavy Rail NCTD 28
NCTD SPRINTER (Light Rail) 12 6 Light Rail NCTD 12
SUBTOTAL 169 123 162
MTS DART N/A N/A N/A N/A N/A
MTS Sorrento Valley COASTER Connection 6 6 6 Minibus Contractor 3
MTS Sorrento Valley COASTER Connection - Caltrans 2 2 2 Minibus MTS 2
NCTD FAST N/A N/A N/A N/A N/A
SUBTOTAL 8 8 5
MTS Access/MTS Paratransit Suburban 120 117 120 Cutaway MTS 120
NCTD LIFT 34 31 23 Coaches NCTD 34
SUBTOTAL 154 148 120
REGIONAL SUBTOTAL 1034 823 1024
Coronado - San Diego Bay Ferry 4 1 Monohull ferry Contractor 0
CORONADO FERRY SERVICES
* includes 7 locomotives and 28 cars - peak = 4 locomotive and 20 cars
FIXED-ROUTE SERVICES
REGIONAL RAIL SERVICES
ADA COMPLEMENTARY PARATRANSIT SERVICE
GENERAL PUBLIC DEMAND RESPONSIVE SERVICES
Transit Service Categories Providing transit service to San Diego’s diverse topography, development pattern, and population is a challenge. Therefore, a family of services that are tailored to fit the different travel markets and operating environments must be provided. The Trolley, SPRINTER, COASTER, and express bus routes provide fast interregional service along major travel corridors, while local bus service provides convenient access to homes, businesses, and other local destinations, while ADA paratransit service provides basic mobility for persons with disabilities. Since various services are designed to meet different needs, they must be developed and evaluated according to their primary function. SANDAG and the region’s transit agencies have developed transit service categories to help identify the differences between services and to allow for a more equitable comparison of service performance. Each transit route has been designated into one of the following service categories.
Regional Service
Corridor Service
Local Bus Service
Community Bus Service

The Coordinated Plan (2010 – 2014) B-4 Appendix B—FY09 Transit Services and Programs
Regional Service
Regional services provide the fastest type of service and are designed to serve longer distance trip making. The COASTER commuter rail system provides Regional Service, connecting the urban and suburban areas of the county from Oceanside to Downtown San Diego. Commuter Express bus routes also provide regional service, providing point-to-point service for major employment centers. Currently all regional service routes are tailored primarily for commuters and not for all-day service.
Commuter Rail Service
Commuter rail service is usually provided along well-defined, established regional travel corridors, and tends to be highly productive and cost-effective due to greater capacity on the vehicles, and significant ridership demand along the major travel corridor.
Commuter Express Bus Routes
The purpose of Commuter Express routes is to provide point-to-point regional service to major employment centers. As such, they operate primarily in the peak hour, on freeways and major arterials, with limited, if any, stops between the route origin and destination. Due to the low passenger turnover compared to the service miles and hours provided, the productivity and cost-effectiveness of these services are below that of Urban and Corridor routes.
Corridor Service Corridor services provide high-frequency rapid transit services along major travel corridors, usually in urban areas. The San Diego Trolley provides corridor service along its network while the NCTD SPRINTER provides corridor service in North County. Urban corridor routes generally serve medium-to-high land use densities with good transit and pedestrian orientation. Mixed-use development can be generally found along the route, and boardings are typically consistent along the route and throughout the day. Due to the number of people and destinations served, along with streamlined routing, urban corridor routes are generally the most productive and cost-effective within the system. Corridor service also can serve in suburban areas with greater spacing between stops. Local Bus Service
Local service can serve urban, suburban, and some rural areas. Usually made by bus, the local service network serves shorter-distance trips, with routes making frequent stops. These types of services can include line haul routes or cross-town routes.
Urban Routes Urban routes generally serve medium-to-high land use densities and often provide the core routes of the transit system, with feeder services to suburban and outlying areas. Service is typically productive with higher frequencies and longer service spans than suburban and rural routes.
Suburban Routes Suburban routes generally serve low-to-medium land use densities and often provide intercommunity service and feeder service to major regional routes. Stop spacing may be less consistent than urban routes due to the changing land uses and densities along the route. Suburban routes are not expected to perform as well as urban routes due to the lower travel demand, particularly during off-peak time periods.
Rural Routes Access routes provide a lifeline level of service to rural and low-density areas. These services have low frequencies and a constrained span of service. Therefore, productivity and cost-effectiveness are low due to the limited ridership and service levels.

The Coordinated Plan (2010 – 2014) B-5 Appendix B—FY09 Transit Services and Programs
Community Bus Service
Community Service are local shuttles that provide neighborhood service and generally have shorter routings compared to other services, and often provide intracommunity circulation, including feeder service to major regional routes. These services generally have short routings that provide access within neighborhood or business communities. Productivity and cost-effectiveness are reflective of the localized travel market. Community Services also can serve specialized routes tailored for specific niche travel markets, such as school trips. Since limited service is provided only at the optimal time to capture the majority of the travel market, specialized services tend to achieve high levels of productivity, but low cost-effectiveness due to low passenger turnover and high non-revenue to revenue service ratios, particularly during peak hour periods.
General Public Demand Response General public demand response service is provided to areas with no defined travel patterns, discontinuous and circuitous street patterns, and low travel demand. The Sorrento Valley COASTER Connection (SVCC) service is classified by MTS as demand response because the service accommodates some on-call demand response needs into its routes and schedules.
Accessible Transit Service The federal Americans with Disabilities Act (ADA) of 1990 provides a series of regulations that ensure the provision of accessible public transit services. This law governs both fixed-route and paratransit services. Accessible transit service, which eliminates impediments to persons with physical or mental disabilities, is provided by all public operators in the SANDAG service area. For example, all of the region's bus routes, all light rail vehicles (LRVs) (including low-floor vehicles), and COASTER Coaches are equipped with wheelchair lifts or wheelchair accessible boarding ramps. Table B.3 identifies wheelchair lift information in the existing fleet. Other ADA requirements for accessibility are met by providing "kneeling" buses, courtesy seating on buses and light rail vehicles, Braille route identification at Regional Transit Centers, public address systems to announce stops, audio-accessible light rail transit (LRT) ticket vending machines, tactile boarding area mats at LRT stations, and accessible station and bus stop designs. These amenities are routinely included in the design of new transit centers and transfer facilities or in the procurement of new vehicles. Community input on accessible facilities and operational issues continues to be solicited through public hearings and advisory committees. SANDAG considers the transportation needs of seniors, persons with disabilities, and persons of limited means, including conducting an annual unmet needs hearing for these communities, through the Social Services Transportation Advisory Council (SSTAC). The SSTAC also reviews station and vehicle plans and specifications, as well as operating procedures for ADA compliance. The Metropolitan Transit System (MTS) has its own committee that meets throughout the year, the Accessible Services Advisory Committee (ASAC), which addresses the appropriate issues for operations of all public transit modes. NCTD’s Americans with Disability Act Compliance Committee (ADACC) is an internal staff committee that meets bi-monthly to discuss accessibility to NCTD services and at each of the district’s transit facilities. NCTD’s ADA Review Group is comprised of passengers and community members and meets quarterly to discuss accessibility issues. The major compliance requirement for fixed-route service is onboard announcements of COASTER stations, light rail stations, and primary bus stops. Compliance with this onboard announcement policy is being evaluated through increased monitoring. In addition, all operators within SANDAG’s jurisdiction participate in an annual program to upgrade existing bus stops to comply with ADA requirements. This program is ongoing and continually increases the number of bus stops in compliance with ADA guidelines.

The Coordinated Plan (2010 – 2014) B-6 Appendix B—FY09 Transit Services and Programs
For fixed-route operators, the fare for persons with disabilities (as well as for seniors) is one-half or less than the region’s prevailing urban base fare. There are no restrictions for trip purpose or hours of travel, and the only requirement for a discounted fare is the ability to present an eligibility identification card at the time of boarding. Either a disabled rider transit photo identification card, California Department of Motor Vehicles disabled placard identification card, or a Medicare card may be used. The region’s two ADA complementary paratransit services, MTS Access and NCTD LIFT, continue to operate in full compliance with the guidelines of ADA. These services complement the fixed-route operations by providing curb-to-curb service to persons with disabilities who are unable to use fixed-route service and live within ¾ jile of a fixed transit route (rail or bus). SANDAG updated the ADA Paratransit Service Area map for the NCTD service area given the significant service changes that have affected the service areas in FY 2009 and FY 2010. This map is available at www.511sd.com with a link also included on ADAride.com for those seeking eligibility in the NCTD service area. In San Diego County, ADA Paratransit service is divided into five zones. MTS operates MTS Access in Zone 1, which primarily covers the City of San Diego, MTS operates MTS ADA Suburban in Zone 2 (Poway, Rancho Bernardo, Carmel Mountain), Zone 3 (East County), and Zone 4 (South Bay). NCTD operates NCTD LIFT in Zone 5 (NCTD service area). Because of the zone structure, transfers are required when traveling between zones. There is some overlap in paratransit service areas, where fixed-routes intersect along the MTS/NCTD service boundary. Specifically, NCTD LIFT operates in the coverage area created by the presence of Route 101 extending to UTC (in Zone 1), and MTS Suburban operates in the coverage area created by the presence of Route 20, extending to North County Fair (in Zone 5).
TRANSIT OPERATIONS FACILITIES AND PROGRAMS In addition to vehicles, operating a public transportation system requires various supporting facilities and programs. Maintenance and fueling facilities ensure that vehicles are able to operate safely and reliably. Operations facilities, such as priority measures, allow transit vehicles to bypass congestion and maintain their schedules. Accessible, safe, and clean bus stops, shelters, and transit centers provide comfort and convenience to passengers. A variety of discounted multi-ride tickets and monthly passes provide incentives for people to ride transit, and public information programs increase convenience and keep customers informed of service and fare changes.
Maintenance and Fueling Facilities San Diego Transit Corporation (SDTC) Imperial Avenue Division
This facility, owned by MTS, is the central bus maintenance, operations, and administrative facility for SDTC and has the capacity to park and maintain 170 buses. The facility provides full maintenance capabilities and now accommodates Compressed Natural Gas (CNG) buses and expanded administrative space. Roughly 60 percent of the SDTC fleet operates out of this division. The Imperial Avenue Division is a 100 percent Natural Gas Division and more than 130 CNG buses can be fueled at this location. Its repair area has 14 bays and there are three service lanes/islands, which have the capability to service 25 buses per hour. SDTC Kearny Mesa Division
This maintenance facility, also owned by MTS, opened in 1989 and has a capacity to service and maintain 145 buses including many CNG buses. Roughly 40 percent of the SDTC bus fleet operates from this division. An expansion of the existing CNG fuel station was completed in 2006, which increases the CNG fueling capacity from 70 buses to 150 buses.

The Coordinated Plan (2010 – 2014) B-7 Appendix B—FY09 Transit Services and Programs
MTS South Bay Contract Services Maintenance Facility
Approximately 50 percent of the fixed route bus transit service provided by MTS is done under contract with Veolia Transportation, Inc. This facility is owned by MTS and can accommodate up to 160 buses. MTS is currently in the process of purchasing land to expand the parking and maintenance facilities. It is estimated that with the expansion, this maintenance facility will be able to store and service approximately 190 buses. The facility currently serves 156 buses, which are operated by MTS’ Contract Services operators. An expanded CNG fuel station was completed in 2003, which can now fuel up to 160 buses. SDTI LRT Yard and Maintenance Facility Improvements
The light rail maintenance facility and yard storage tracks are owned by MTS and used by SDTI to provide storage and maintenance for the 134 LRVs. There is storage capacity for 160 LRVs, and maintenance capacity for up to 215 LRVs. A yard control tower and LRV painting facility were added in 2000. SDTI Light Rail Tracks and Wayside Facilities
These capital improvements are owned by MTS and are used by SDTI to provide light rail service on the Blue and Orange Lines. SPRINTER Operations Facility
The SPRINTER Operations Facility (SOF) was dedicated in August 2007 and represents the home of the 12 SPRINTER Light rail vehicles and their maintenance workforce, plus the location of the SPRINTER system dispatching and security control center. The facility was an integral part of the SPRINTER construction project and resides on approximately 14 acres of NCTD-owned land, which was once the Santa Fe Railway Escondido freight yard. The SOF houses approximately 45 contract workers from Veolia Transportation/Bombardier, who use the building as their office base (many workers are on shift coverage), along with NCTD Facilities Maintenance and Security Control Technicians staff, who also work shifts. The SOF contains several conference and training rooms where meetings and classes can be held. The Storeroom contains inventories for both NCTD and Bombardier, with most NCTD parts considered capital project spares while Bombardier’s are considered consumables, such as fluids and filters. The Yard contains five storage tracks, two of which extend through the shop on pits. One exterior yard track also contains the vehicle washer and two fuel dispensing stations, all of which are used to service each vehicle upon inbound arrival, after which the units move to the shop and/or storage track locations for additional servicing.
The SOF also contains ancillary areas such as restrooms, locker rooms, overhead cranes, exhaust systems, pits, and appropriate environmental facilities and protections for fluids, lubricants, hazardous materials, storm water runoff, and other elements supportive of a full maintenance shop. NCTD West Division Facility
This West Division Facility is located on Via Del Norte in the City of Oceanside. The Transportation Building, which is a portion of the facility, houses portions of the Bus Services’ West Division Operations. The maintenance building houses the district’s main garage facility, the fleet maintenance department, facility maintenance department, and portions of the security department.
The West Division’s current site configuration was developed in 1990. Approximately 111 vehicles, including CNG buses, are located at this site. The site has separate operations and maintenance facilities. The operations’ building includes space for a driver’s break room, training room, and offices for supervisor staff.

The Coordinated Plan (2010 – 2014) B-8 Appendix B—FY09 Transit Services and Programs
The maintenance building has 14 bus bays and is equipped to handle all light-duty and heavy-duty maintenance needs. The site includes parking for up to 120 revenue vehicles and is equipped with both diesel and CNG fueling equipment. NCTD East Division Facility
This East Division Facility is located on Norlak Avenue in the City of Escondido and houses the East Division Operations and Maintenance staff. The East Division site supports the Escondido Transit Center and all Escondido and San Marcos-area bus services. This facility is significantly smaller than the western site and underwent a parking expansion project in 2000 along with a new service island. A CNG fueling facility was also completed in 2002.
The East Division maintenance facilities are located primarily in one building with four service bays. Due to the service bay limitations, this division is limited to 56 transit vehicles. A larger facility is currently being constructed to accommodate additional vehicles stationed in the East Division. East Division Operations are currently located adjacent to the maintenance facilities building where operations staff was relocated from their offices at the Escondido Transit Center. The 2008 facility expansion included the following completed improvements:
Shop facility erected and the interior liner installed
Painting the interior of the new shop
In-ground lifts cavities set
The interior lighting and wet & dry mechanical completed
Outside finishes and trim on the building
The structural steel in the new breezeway erected and painted
Exterior drainage work NCTD Stuart Mesa Maintenance Facility
This Stuart Mesa Maintenance facility is located approximately three miles north of Oceanside, along the San Diego Northern Railway (SDNR) main line tracks, within Camp Pendleton. Stuart Mesa Maintenance Facility has a freight yard consisting of four tracks for use by the Burlington Northern Santa Fe Railroad (BNSF) and a passenger storage yard consisting of storage tracks to be used by COASTER commuter trains, as well as Metrolink trains. The maintenance facilities include a train washer, fueling station, outdoor inspection pit, and shop building. The shop building includes service pits, workshops, a storage facility, and administrative areas. A number of activities are housed as well, including administrative personnel, transportation management, train crew reporting, maintenance-of-equipment forces, Metrolink local management, and train crews.
Operations Facilities The existing transit system includes a variety of facilities to support and enhance the operation of transit service. Many of these facilities are grouped into the category of transit priority treatments. The Regional Transit Vision envisions having transit priority treatments installed throughout the region to help promote faster and more reliable transit services. HOV Lanes, Freeway Ramps, and Freeway Shoulders Open to Transit Vehicles
As freeway congestion increases, high occupancy vehicle (HOV) lanes will become more important for transit services to allow buses to avoid congested main lanes and reduce travel times. These lanes restrict uses to carpools and buses. MTS operated four bus routes in FY 2009 on the Interstate 15 (I-15) HOV lane (between SR [State Route] 163 and SR 56) from the Escondido, Rancho Bernardo, Rancho Peñasquitos, and Poway areas to San Diego and the Centre City of
The Coordinated Plan (2010 – 2014) B-9 Appendix B—FY09 Transit Services and Programs
San Diego. Additionally, MTS added Route 880 in FY 2009 which operates Premium Express service between 4S Ranch (north of Rancho Peñasquitos and south of Rancho Bernardo) and Sorrento Valley/ UTC.
HOV lanes exist at many freeway on-ramps in the MTS area, including the southbound on-ramp from Washington Street to SR 163 and along many sections of Interstate 8 (I-8) and SR 94. Exclusive Bus Lanes
This concept extends beyond HOV lanes by creating lanes exclusively for bus use. An example of an exclusive bus lane is located at the north end of Downtown San Diego where 11th Avenue flows onto northbound SR 163. This bus-only lane allows bus service to bypass the congestion prior to the merge of SR 163 and Interstate 5 (I-5). These lanes also help buses maintain on-time performance, and provide convenience for passengers using transit.
For bus stops demonstrating high activity in areas of major congestion, if street widths are adequate, an exclusive lane for the bus stop has been demonstrated to work well for all traffic movement. Also, some freeway access points may require an exclusive bus lane designation, rather than one for HOVs, to create an operational benefit for transit. Exclusive bus-only through lanes are currently striped at the University Avenue and El Cajon Boulevard I-15 off ramps. Signal Prioritization
Signal prioritization for transit shortens or lengthens a traffic signal cycle to allow the uninterrupted flow of an approaching bus or LRV. Signal prioritization is presently employed on C Street, Twelfth Avenue, and Commercial Street in San Diego to facilitate trolley movements. Queue Jumpers
Priority treatments also include queue jumpers that allow buses priority access through congested intersections. Queue jumpers exist at westbound Friars Road at Frazee Road, southbound 4th Avenue at E Street, eastbound on Broadway at 3rd Avenue, westbound H Street at I-805 in Chula Vista, and eastbound Taylor Street at Pacific Highway to enter the Old Town Transit Center. These queue jumpers allow buses to depart from the bus stop and cross traffic lanes prior to the flow of traffic. Queue jump testing was also performed on NCTD’s Route 350 in FY 2010 and will be fully deployed as that project reaches completion. Bus Pads
Concrete pads create a strong foundation, which helps to reduce roadway wear and tear at bus stops caused by transit vehicles. They also help to reduce street repair costs, as well as help make transit stops more accessible for buses. It is an objective of MTS to install concrete pads at all bus stops served by four or more buses per hour. Several hundred pads exist in the region. MTS is currently developing a more formal process for determining the location and funding for bus pad installations. Turnouts
Turnouts are areas where buses can pull out of the flow of traffic to make a stop to pick up or discharge passengers. They are generally not promoted due to the difficulty of the buses to re-enter the traffic stream. However, there are instances, particularly where buses lay over, where a turnout can increase safety by removing the bus from the path of free-flow traffic.

The Coordinated Plan (2010 – 2014) B-10 Appendix B—FY09 Transit Services and Programs
Preferential Traffic Restrictions
Preferential restrictions consist of traffic control measures that are waived for transit vehicles to improve their operations, or to help them avoid traffic congestion. The simplest example is the use of red curbs at bus stops. Another approach that has worked well is exempting buses from traffic restrictions, such as right- or left-turn prohibitions.
Passenger Facilities NCTD currently serves over 2,700 bus stops throughout the North County. Stops range in complexity; while some stops are marked with only a pole and bus stop sign, others contain passenger facilities such as benches and shelters. Although some stops have existed since service began, the process of adding and deleting stops from the system is continuous. A route change may cause the discontinuation of a stop, while a new development may trigger the need for a new stop. At the current time, transit supervisors are responsible for coordinating the addition/discontinuation of new stops with the facilities maintenance department, although the NCTD Service Development Department does assist with logistics. As mentioned, new development often triggers the need for new stops. District staff reviews every relevant development application that is submitted in the service area. Staff analyzes the type, location, size and complexity of each project in order to determine the number and type of bus stop improvements the project developer should be required to complete. Conditions such as these are placed in the Planning Commission Resolutions as conditions of approval. When bus stop facilities have been requested, NCTD requires the developer to purchase, install and maintain the facility. The district is responsible for the purchase, installation, and maintenance of the bus stop pole and sign. NCTD is currently improving bus stops with ADA compliant boarding pads, and installing benches, shelters and on-demand solar lighting and replacing these as needed. Trashcans also are provided by NCTD when an agreement is reached with a city or the local waste hauler, such as EDCO in the Bonsall and Fallbrook communities, to empty them on a regular basis. In return, each city must be willing to provide an ongoing level of maintenance and cleaning of the bus stop facilities. Although bus stop facilities installed with a new development are required to be maintained by the developer or other private organization, the district does not currently have a maintenance policy that governs how the remaining bus stops are maintained. Some bus stop facilities are owned and maintained by NCTD, while others are owned and maintained by individual cities. Some facilities have been installed by developers and maintained by homeowner associations or other private groups. In the rural and unincorporated areas NCTD serves, bus stop improvement program funds have been used to pour ADA compliant bus pads, build retaining walls, pave road shoulders, and install benches, shelters, and on-demand solar lighting at up to 200 bus stop locations. NCTD is also hoping to expand its existing agreement with EDCO to provide trash pickup at all of these locations once the physical bus stop improvements have been completed. MTS Bus Shelters
The MTS Transit Shelter Program currently has approximately 500 shelters throughout the City of San Diego and nearly 900 throughout the entire system. These shelters are placed at 838 different stops (348 of those stops are within the City of San Diego). However, redevelopment projects often require temporary removal or relocation of these shelters.

The Coordinated Plan (2010 – 2014) B-11 Appendix B—FY09 Transit Services and Programs
Shelters provide transit route information, lighting, and protection from wind, sun, and rain. The entire program is funded through the sale of advertising space provided within the transit shelters, and is provided at no cost to the public, MTS, or the participating cities. Transit shelters with advertising have been permitted in commercial, industrial, and multi-family housing areas. However, in sensitive areas where advertising is not compatible with adjacent property use, transit shelters without advertising have been installed. The shelter company provides routine service maintenance twice a week on each shelter and responds to repairs, damage, and graffiti removal requests within 24 hours. Trolley Stations
San Diego Trolley maintains a total of 53 stations, most of which consist of two platforms, a large shelter, supplementary smaller shelters, and information signage and ticket vending machines. Most of the stations include facilities for connecting bus routes, with the largest of these designated as transit centers (discussed below). Twenty-three stations have free park-and-ride lots adjacent to them, while the 12th and Imperial Transfer Station has an adjacent, paid-parking facility. COASTER Stations
COASTER service, operated by NCTD, provides service to eight stations, located in Oceanside, Carlsbad (two stations), Encinitas, Solana Beach, Sorrento Valley, Old Town Transit Center and Downtown San Diego. Free parking lots are provided at each of the COASTER stations, except Santa Fe Depot in Downtown San Diego. Passengers can connect to Metrolink and Greyhound at the Oceanside Transit Center and can connect to Amtrak at the Oceanside Transit Center, Solana Beach Station, and Santa Fe Depot. All COASTER stations also include facilities for connecting bus routes. SPRINTER Stations
The SPRINTER service, provided by NCTD, is a new light rail service along the Highway 78 corridor in North County which began operating in February 2008. The line connects Oceanside and Escondido along a 22 mile stretch between the two transit centers with a total of 15 stations. Transit Centers
Major off-street passenger stations are situated at high-volume boarding and transfer locations. The regions existing bus transit centers are listed below. Bus Only College Grove Center North County Fair Plaza Bonita Carlsbad Village Parkway Plaza – El Cajon Plaza Camino Real Southwestern College Kearny Mesa (on street) University Towne Centre I-15 BRT Stations at Rancho Bernardo, Sabre Springs, and Del Lago

The Coordinated Plan (2010 – 2014) B-12 Appendix B—FY09 Transit Services and Programs
Bus and Rail Chula Vista Bayfront/E Street Grossmont Center Chula Vista H Street 12th and Imperial Transfer Station Chula Vista Palomar Street Old Town Transit Center El Cajon Transit Center Santee Town Center Iris Avenue Encinitas COASTER Station National City 24th Street San Ysidro/Tijuana Solana Beach COASTER Station VA Hospital/UCSD Oceanside Transit Center San Diego State University Grantville LRT Station Escondido Transit Center Sorrento Valley 70th Street LRT Station America Plaza Palomar College Euclid Avenue Vista Transit Center Fashion Valley Transit Center
Additional transit centers are under construction or planned as listed below.
Mira Mesa
Kearny Mesa (off street facility)
Spring Valley
Carmel Valley
San Luis Rey Park-and-Ride Lots
Park-and-ride lots are designed to provide convenient automobile access to the regional fixed-route transit system. These parking lots offer an important transit access for those areas not served by transit. Park-and-ride lots are most effective to transit when situated along regional transit routes such as the COASTER, SPRINTER, Trolley, and express bus service. Bicycle Access
All of the region’s bus operators, the Coronado-San Diego Ferry, SPRINTER and the Trolley operate bicycle-accessible service. All buses are equipped with front-mounted or side compartment racks, and all SPRINTER and Trolley cars and stops can accommodate bicycles. All COASTER train cars have stalls for securing bicycles (many of which utilize electronic bike lockers) and SPRINTER vehicles have a designated striped bicycle area. Permits are not required to take a bike on the bus, trolley, COASTER or SPRINTER.
San Diego Region Transit Management System SANDAG has been working to develop two innovative public transportation projects that will provide much needed advancements for public transit in San Diego County. These projects would involve all six fixed-route operators in the San Diego region. Specifically, these projects include a Smart Card Fare Technology project and a Transit Management (Radio) System project. The projects have been developed using multi-operator teams that are multi-functional as well. Both projects will be important to the future efficiencies of regional public transportation operations. Additionally, the CTSA has received funding to begin the development of a regional mobility management center, which will serve as a consolidated source for the scheduling of social service transportation for the County.

The Coordinated Plan (2010 – 2014) B-13 Appendix B—FY09 Transit Services and Programs
Smart Card Fare Technology Project
SANDAG completed the deployment of the regional automated fare collection system called the “Compass Card” In FY 2010. Smart Card technology has replaced currently outdated fare-collection equipment used by the fixed-route bus and rail transit operators in the County. Operator-specific fare collection systems in San Diego have been upgraded to a single, regional, integrated and uniform fare-collection system using new electronic-based smart card technology (Compass Card).
This automated fare collection (AFC) system involves the use of technology to enhance the ability to manage fares and implement fare policy in a customer-oriented fashion. It will create the first impression for the transit user, and provide the necessary support systems for all operators. The project has created seamless travel throughout the region since one card and one system allow patrons to go anywhere, and customer and operator interaction is improved, confusion is eliminated, and transit is made more accessible. The system also provides more accurate transit data, which will improve service planning and monitoring. Recent experience with similar automated fare collection systems throughout the country has shown significant increases in revenue with a more accurate collection process and the reduction of potential fraud. Transit Management (Radio) System Project
MTS and NCTD also have partnered in deploying core elements of an Intelligent Transportation System (ITS). The project, referred to as the Regional Transit Management System, includes implementation of a state-of-the-art communication system capable of supporting AVL for all of the region’s fixed-route operators. A new regional Computer Aided Dispatch (CAD) system has been integrated with AVL to provide more efficient operations and improve service, reliability, and safety. A key component of the system is the scheduling system, which will be used by all operators in the region to develop schedules and headways. This system will be interfaced with the existing regional telephone information system and the region’s Internet-based trip planner to provide seamless updates for timely and accurate customer information.
The implementation of AVL and the scheduling system also furthers the development of the state’s showcase projects by allowing information flows to the Caltrans District 11 (San Diego) Transportation Management Center. AVL data would provide congestion management information on a regional basis and consolidation of route, bus stop, and schedule data can be fed to the planned Southern California Trip Planner. This information flow is dependent on completion of the Caltrans I-5 fiber optics project to Coronado and agreement with MTS for operational parameters.
TRANSIT-SUPPORTIVE PROGRAMS SANDAG, MTS, and NCTD have developed a variety of transit-supportive programs and activities, which range from providing regional transit marketing strategies to presenting transit information at local community events. These programs and activities have been established to help improve upon and maintain the integrity of the existing transit system.
Regional Program for Transit Priority for the Existing System A SANDAG capital budget (CIP# 1128800) exists to implement selected cost-effective transit priority measures along existing transit service routes. The Transit Priority Measures capital improvement project provides for low cost transit priority treatments, such as signal priority, queue jumps lanes, and transit use of freeway shoulder lanes that will serve to improve bus transit operating speed and lower operating costs.

The Coordinated Plan (2010 – 2014) B-14 Appendix B—FY09 Transit Services and Programs
Public Information and Marketing SANDAG, MTS, and NCTD have developed a variety of transit-supportive programs and activities, which range from providing and improving transit security systems, to providing regional transit marketing strategies and presenting transit information at local community events. These programs and activities have been established to help improve upon and maintain the integrity of the existing transit system.
NCTD’s Communications, Outreach and Customer Service Department is responsible for the facilitation of a high-level of awareness of NCTD services and projects with our customers and the general public. Communications and marketing is responsible for internal and external communications, public relations, advertising, media relations, community relations, and customer service. Other functions within the department are management of the ADA certification process, pass outlets and sale, distribution of schedules and timetable, delivery and management of Reduced Fare Identification Program. Printed Materials
A comprehensive set of printed materials has been prepared to explain and promote MTS services. The Regional Transit Map and route timetables are two principal components of this information system. SDTC replenishes these materials at over 250 locations throughout the MTS service area. A variety of user guides also are published to assist passengers. Several publications, including the Take One notices, are distributed aboard transit vehicles, and highlight upcoming service changes, detours related to special events and construction, or public hearings on service additions or changes. Rider Guides/COASTER Timetables
A comprehensive set of printed materials are routinely published to explain NCTD’s services, and provide important information to passengers. A route finder, individual route maps, and timetables are printed in the District’s Rider Guides. The printing of new Rider Guides coincides with service changes that take place three times a year. Rider Guides can be found on the buses, at each of the transit centers, at schools and libraries, and at the district’s headquarters, located at 810 Mission Avenue in Oceanside. A separate COASTER brochure also is printed and can be obtained on the COASTER, at all transit centers, and at the district’s headquarters. Rider Alerts/Take Ones
Rider Alerts are used to notify passengers of upcoming route, schedule or fare changes and any other events that may be of interest. The marketing, service development, planning and transportation operations departments of SANDAG, MTS and NCTD all play a role in the production of these paper flyers. Route and schedule changes are handled by MTS and NCTD while fare change notices are the responsibility of SANDAG. While some Rider Alerts are used as district-wide announcements, others are produced and made available to a smaller segment of the ridership. For example, a Take One may be produced to publicize an upcoming public hearing for a service change, but also may be produced to announce a small schedule change. Juror Transit Ticket Program
More than 40,000 jurors in San Diego County now use public transportation each year to get to and from jury duty. San Diego is the first region in the country to create this unique partnership between the courts and the public transportation system. Thanks to an award winning program, almost half of San Diego jurors take transit to the courthouse. The free transit tickets are made possible through a partnership between the San Diego Superior Court, the Metropolitan Transit System, North County Transit District, and the Air Pollution Control District.

The Coordinated Plan (2010 – 2014) B-15 Appendix B—FY09 Transit Services and Programs
Web Sites
SANDAG has now fully deployed its 511 service across San Diego County. The 511 service (and www.511sd.com) is a free phone and Web service that consolidates the San Diego region’s transportation information into a one-stop resource. The service provides schedule, route and fare information for public transportation services and also provides up-to-the minute information on traffic conditions, incidents and driving times. The service is available 24 hours a day, 7 days a week. The service is managed by a partnership of public agencies led by SANDAG, the California Highway Patrol, the California Department of Transportation, MTS, NCTD, and San Diego SAFE.
MTS and NCTD also both maintain informative Web sites at www.sdmts.com and www.gonctd.com. Those sites provide fares, schedules, rider alerts, etc. for the host of MTS and NCTD services. They also provide administrative information on the two Board of Directors, meetings, agendas, and employment opportunities. Regional Transit Information Service
SDTC provides telephone transit information for all fixed-route transit operators in San Diego County. Two telephone services are available to customers: personal operator-assisted calls and automated information.
The operator-assisted service is available Monday through Friday from 9 a.m. to 5 p.m. The operator-assisted system provides full transit information (route, schedule, fare, and travel itinerary) to callers. Personalized travel information is also provided via U.S. mail and fax, with printed trip plans. In addition, special arrangements have been made with government and service organizations to provide bulk faxing of itineraries to clients. Information is available in English and Spanish. A state-of-the-art automated trip information system (ATIS) assists thoroughly trained operators in providing transit customers with the best travel plan possible. The Transit Store
The Transit Store, an MTS project, is located in the heart of Downtown San Diego and assists over 300,000 customers annually. The facility is open Monday through Friday from 9 a.m. to 5 p.m. and closed weekends and holidays. Staff at The Transit Store provide visitor information, sell all forms of fare media, provide transit information, issue Senior, Disabled, and Youth Identification Cards, distribute informational materials, and handle lost-and-found articles. Similar materials and information are available at the Oceanside, Escondido, and Solana Beach Transit Centers. Community Promotions and Partnerships
MTS Marketing and Community Relations has developed and implemented a diverse range of marketing initiatives and community-based partnerships and programs. Marketing initiatives have been designed to tap new, as well as solidly existing markets, including youths, professionals, sports fans, families, multilingual markets and other niche segments. Depending on status and objective, MTS has sought to initiate, strengthen and establish mutually beneficial partnerships and collaborate with learning institutions, business associations, nonprofit organizations, and civic groups. MTS also introduced new developments and promoted services in community festival and high-volume special event settings. Specialized Marketing Programs
Specialized, seasonal and niche marketing programs and campaigns have included, among others, employer, jury, college, youth and holiday. Marketing strategies and resources were utilized and leveraged around sporting events, including new and “custom-designed” offerings centered on San Diego Padres and San Diego Chargers games and events. Building on previous success, MTS positioned and communicated positive and identifiable messages, images, logos, and slogans by way of radio and print advertising.

The Coordinated Plan (2010 – 2014) B-16 Appendix B—FY09 Transit Services and Programs
NCTD markets its services through such targeted promotions as the COASTER service to Petco Park. It also has collaborated with 101 Highway merchants to offer discounts to users of the BREEZE Day Pass.
FARE POLICY AND STRUCTURE With the approval of Senate Bill 1703, SANDAG is now responsible for developing a Regional Fare Policy, including setting fares for transit services in the region. SANDAG and transit agency staffs are currently completed a new regional fare system in FY 2009 to corresponde to the full deployment of the Compass Card. A uniform fare structure is not only a convenience for the public that rides services provided by multiple operators, it also is an important tool for coordinating the regional public transportation system. Average fare levels have increased over the years to reflect annual increases in area-wide operating cost indicators, and to keep up with inflation. A unified Regional Fare Ordinance was adopted in 2006 consolidating all regional fares into a single document approved by the SANDAG Board. This ordinance has since been amended in 2007, 2008 and 2009. Table B.10 illustrates the fare structure corresponding to the most recent ordinance update (May 8, 2009). MTS and NCTD currently have an adopted transfer agreement. In addition, NCTD has transfer agreements with Orange County Transportation Authority (OCTA) and Metrolink. These agreements not only help to create seamless travel throughout the system within SANDAG’s jurisdiction, but also help link our system to bordering communities and cities. Fares have been established for complementary paratransit services as called for by the ADA of 1990. According to the ADA regulations and regional plans, fares for complementary paratransit services are set at no more than twice the fare of the corresponding fixed-route service.
SANDAG SHORT-RANGE TRANSIT PROJECTS SANDAG is currently developing several key transit projects which will be implemented over the next five years. These projects are discussed and included in the Regional Service Implementation Plan (RSIP) included in Chapter 10 of the Coordinated Plan. These transit projects and services are included in the Program of Projects Expenditure Plan in the TransNet sales tax extension approved by the San Diego County voters in November 2004. As these projects are implemented, existing duplicative services should be restructured to provide complimentary feeder and collector service, or to address other unmet needs included in the Coordinated Plan. These projects include the Mid-City Rapid Bus, I-15 Express Lanes/BRT Project, SuperLoop, Escondido Rapid, South Bay BRT Project, and the Mid-Coast Corridor Transit Project. The budget worksheets for these projects (as included in the SANDAG FY 2011 Program Budget) follow this section as Tables B.4 through B.8.

The Coordinated Plan (2010 – 2014) B-17 Appendix B—FY09 Transit Services and Programs
Table B.4: SANDAG Program Budget – FY 2011 – Mid-City Rapid

The Coordinated Plan (2010 – 2014) B-18 Appendix B—FY09 Transit Services and Programs
Table B.5: SANDAG Program Budget – FY 2011 – Interstate 15 BRT

The Coordinated Plan (2010 – 2014) B-19 Appendix B—FY09 Transit Services and Programs
Table B.6: SANDAG Program Budget – FY 2011 – SuperLoop

The Coordinated Plan (2010 – 2014) B-20 Appendix B—FY09 Transit Services and Programs
Table B.7: SANDAG Program Budget – FY 2011 – South Bay BRT

The Coordinated Plan (2010 – 2014) B-21 Appendix B—FY09 Transit Services and Programs
Table B.8: SANDAG Program Budget – FY 2011 – Mid-Coast Corridor Transit Project

The Coordinated Plan (2010 – 2014) B-22 Appendix B—FY09 Transit Services and Programs
Table B.9: SANDAG Program Budget – FY 2011 – Escondido Rapid Bus

The Coordinated Plan (2010 – 2014) B-23 Appendix B—FY09 Transit Services and Programs
Table B.10: Regional Fare Structure Summary (As of May 8, 2009)
Shuttle $1.00 Local Circulator/Feeder $2.00 Line Haul Bus (Urban) $2.25 Express Bus $2.50 Commuter Express Bus $5.00 Trolley $2.50 Senior/Disabled/Medicare - Bus and Light Rail 50% of Single-Ride Fare Transfers No Transfers Coronado-San Diego Bay Ferry Commuter Service Free Rural Routes $5.00 to $10.00 Sports Express Bus $6.00 OW to $12.00 RT
Regular - BREEZE $2.00 Regular - COASTER $5.00 to $6.50 Senior/Disabled - BREEZE $1.00 Senior/Disabled - COASTER $2.50 to $3.25 LIFT Services $4.00
Regional Day Pass $5.00RegionPlus Day Pass $14.00Region 2-Day Pass (Bus and Light Rail) $9.00Region 3-Day Pass (Bus and Light Rail) $12.00Region 4-Day Pass (Bus and Light Rail) $15.00NCTD Only (Senior/Disabled/Medicare) $2.25
Region Regular $72.00Regional Senior/Disabled/Medicare $18.00Regional Youth (ages 6-18) $36.00Regional Premium $100.00Regional Premium Senior/Disabled/Medicare $25.00Regional Premium Youth (ages 6-18) $50.00MTS College Monthly Pass $57.60
Regular - BREEZE $59.00Regular - COASTER $144.00 to $182.00 Senior/Disabled - COASTER $45.00Youth COASTER Pass $91.00NCTD College Monthly Pass $44.00 to $49.00
Universal Tokens (MTS & NCTD)20-Pack Bus & Trolley Fares up to $2.25 $45.0040-Pack Bus & Trolley Fares up to $2.25 $90.00
Monthly Passes (MTS & NCTD)
Monthly Passes (NCTD Only)
Other Passes
MTS & NCTD
NCTD Only
Day Passes (MTS & NCTD)
Single-Ride Fares
Multi-Ride Fare Media

The Coordinated Plan (2010 – 2014) B-24 Appendix B—FY09 Transit Services and Programs
Table B.11: Regional Transportation Improvement Program San Diego Region (in $000s)

appendix C
FY09 RSRTP Route Statistics and Historical Data


The Coordinated Plan (2010 – 2014) C-1 Appendix C—FY09 RSRTP Route Statistics and Historical Data
Operations Data
Route Type of Days of Operating Hours
Route Operation (Weekday) Peak Base Night Base Peak1 Urban Frequent Monday - Sunday 5:05A - 12:36A 15 15 30 8 10 12.72 Urban Frequent Monday - Sunday 4:29A - 1:10A 11 12 30 9 12 6.33 Urban Frequent Monday - Sunday 4:52A - 12:12A 15 15 30 10 11 9.44 Urban Standard Monday - Sunday 4:43A - 11:51P 30 30 30 4 5 10.95 Urban Frequent Monday - Sunday 4:58A - 11:33P 15 15 30 3 4 4.46 Urban Frequent Monday - Sunday 5:23A - 11:29P 15 15 30 4 4 8.37 Urban Frequent Monday - Sunday 4:30A - 2:08A 6 12/24 30 13 19 11.38 Urban Frequent Monday - Sunday 5:15A - 12:23A 15 15 30 4 6 12.59 Urban Frequent Monday - Sunday 5:03A - 8:56P 15 15 30 5 5 12.210 Urban Frequent Monday - Sunday 4:48A - 12:21A 15 15 30 7 8 9.011 Urban Frequent Monday - Sunday 4:36A - 11:46P 7.5 15 30 18 20 19.713 Urban Frequent Monday - Sunday 4:58A - 12:14A 15 15 30 9 10 12.714 Urban Standard Monday - Sunday 5:55A - 8:38P 30 30 60 2 2 11.415 Urban Frequent Monday - Sunday 4:30A - 12:52A 10 15 30 7 9 9.618 Circulator Monday - Friday 6:40A - 6:00P 30 30 ---- 1 1 7.520 Express Monday - Sunday 4:41A - 11:46P 15/30 15/30 60 12 14 33.125 Urban Standard Monday - Sunday 6:25A - 7:15P 60 60 60 2 2 13.827 Urban Standard Monday - Sunday 5:30A - 10:04P 30 30 60 3 3 8.728 Urban Standard Monday - Sunday 5:22A - 11:02P 15 30 30 2 3 3.330 Urban Frequent Monday - Sunday 4:55A - 1:21A 15 15 30 18 20 23.831 Urban Standard Monday - Friday 5:37A - 7:08P 30 30 --- 3 3 8.935 Urban Standard Monday - Sunday 5:11A - 11:10P 30 30 30 3 3 4.641 Urban Frequent Monday - Sunday 5:25A - 11:48P 15 15 30 7 9 11.944 Urban Frequent Monday - Sunday 4:37A - 11:38P 15 15 30 7 7 11.0
48/49 Urban Standard Monday - Sunday 5:31A - 7:07P 15 30 ---- 4 4 5.750 Express Monday - Friday 4:58A - 7:14P 15/30 60 ---- 3 3 14.473 Seasonal Chargers Game Days varies ---- ---- ---- ----83 Circulator Monday - Saturday 6:04A - 6:53P 60 60 ---- 1 1 7.184 Circulator Monday - Sunday 6:13A - 6:11P 60 60 ---- 1 1 5.086 Circulator Monday - Sunday 6:15A - 7:03P 30 30 ---- 1 1 3.788 Circulator Monday - Sunday 6:01A - 9:30P 30 30 60 1 1 2.8
105 Urban Standard Monday - Sunday 5:08A - 10:43P 30 30 30 4 6 11.2115 Urban Standard Monday - Sunday 5:55A - 10:38P 30 30 60 5 6 11.8120 Urban Frequent Monday - Sunday 4:58A - 11:59P 15/30 15/30 30 6 7 13.1150 Express Monday - Friday 5:56A - 7:20P 15/30 60 ---- 2 6 17.0210 Express Monday - Friday 6:01A - 6:39P 15 ---- ---- 5 21.6701 Urban Frequent Monday - Sunday 5:35A - 11:05P 15 15 45 7 7 8.5704 Urban Standard Monday - Sunday 5:22A - 9:54P 30 30 60 5 5 13.6705 Urban Standard Monday - Sunday 6:05A - 10:45P 30 30 60 3 3 9.2707 Urban Standard Monday - Friday 8:44A - 7:44P 60 60 ---- 1 1 6.6709 Urban Frequent Monday - Sunday 4:58A - 11:00P 15 15 30 6 7 13.2712 Urban Frequent Monday - Sunday 5:07A - 9:29P 15 15 30 7 7 7.5810 Premium Express Monday - Friday 5:00A - 7:00P 20 ---- ---- 6 32.3815 Urban Standard Monday - Sunday 5:26A - 9:35P 30 30 30 2 2 4.1816 Urban Standard Monday - Friday 4:49A - 7:35P 30 30 ---- 3 3 7.5820 Premium Express Monday - Friday 6:07A - 6:49P 30 ---- ---- 4 25.7832 Urban Standard Monday - Sunday 6:16A - 7:01P 30 30 ---- 1 1 7.0833 Urban Standard Monday - Sunday 5:55A - 6:23P 30 30 60 5.9833 Urban Standard Monday - Sunday 5:48A - 6:26P 30/60 30/60 ---- 2 2 7.4834 Circulator Monday - Friday 6:38A - 3:30P 60 ---- ---- 1 1 14.4844 Urban Standard Monday - Friday 5:24A - 5:23P 30 ---- ---- 3 19.8845 Urban Standard Monday - Sunday 5:40A - 7:39P 30 30 ---- 3 3 12.7848 Urban Standard Monday - Sunday 4:23A - 10:15P 30 30 60 3 3 7.8850 Premium Express Monday - Friday 6:00A - 6:24P 30 ---- ---- 4 23.7
MTS FIXED-ROUTE BUS SERVICE - FY 09 TRANSIT SERVICE DATA
APPENDIX C
One-Way
Length
(Miles)
Frequency (Minutes) Vehicles

The Coordinated Plan (2010 – 2014) C-2 Appendix C—FY09 RSRTP Route Statistics and Historical Data
Operations Data
Route Type of Days of Operating HoursRoute Operation (Weekday) Peak Base Night Base Peak
851 Circulator Monday - Friday 5:14A - 6:58P 45 60 60 1 2 7.1854 Urban Standard Monday - Sunday 5:36A - 10:25P 30 30 60 2 2 5.9855 Urban Standard Monday - Sunday 5:14A - 10:55P 30 30 60 2 2 4.7856 Urban Standard Monday - Sunday 4:41A - 11:15P 30 30 60 5 5 16.5860 Premium Express Monday - Friday 5:49A - 6:23P 30 ---- ---- 3 28.5864 Urban Standard Monday - Sunday 4:58A - 11:23P 30/60 30/60 60 6 6 22.8870 Premium Express Monday - Friday 6:00A - 6:02P 30 ---- ---- 1 18.1
871/872 Urban Standard Monday - Sunday 5:22A - 10:10P 30 60 60 2 2 5.9874/875 Urban Standard Monday - Sunday 5:24A - 10:04P 30 30 60 4 4 11.2
901 Urban Frequent Monday - Sunday 4:34A - 2:30A 15 30 30 10 11 19.5904 Urban Standard Monday - Sunday 10:03A - 6:42P ---- 60 ---- 1 1 2.3905 Urban Standard Monday - Sunday 4:39A - 6:42P 15 30 30 2 5 9.3
916/917 Urban Standard Monday - Sunday 4:56A - 10:35P 30/60 30/60 60 3 3 11.5921 Urban Standard Monday - Sunday 5:43A - 7:57P 30 30 30 4 4 11.1923 Urban Standard Monday - Sunday 5:19A - 7:30P 30 30 ---- 4 4 8.3928 Urban Standard Monday - Sunday 4:50A - 10:03P 30 30 30 4 4 9.6929 Urban Frequent Monday - Sunday 4:20A - 2:56P 15 15 30 18 19 19.3932 Urban Frequent Monday - Sunday 4:06A - 12:51A 15 15 30 11 13 13.6
933/934 Urban Frequent Monday - Sunday 4:40A - 1:17A 12 15 30 12 14 15.6936 Urban Standard Monday - Sunday 5:05A - 10:17P 30 30 60 3 3 8.4955 Urban Frequent Monday - Sunday 4:49A - 11:45P 15 15 30 9 9 10.6960 Express Monday - Friday 5:09A - 6:50P 15/30 ---- ---- 4 5 20.8
961/962/963 Urban Frequent Monday - Sunday 5:15A - 10:56P 15/30/30 15/30/30 60 10 10 9.5/8.5/5.8964 Circulator Monday - Friday 5:55A - 8:14P 30/60 30/60 30/60 2 2 5.3965 Circulator Monday - Sunday 5:00A - 8:52P 30 30 30 1 2 5.9967 Urban Standard Monday - Sunday 5:36A - 9:32P 60 60 60 1 1 8.8968 Urban Standard Monday - Sunday 5:10A - 9:09P 60 60 60 1 1 10.1992 Urban Frequent Monday - Sunday 4:59A - 12:25A 15 15 15 3 4 7.3
(Miles)
APPENDIX C
MTS FIXED-ROUTE BUS SERVICE - FY 09 TRANSIT SERVICE DATA
One-WayFrequency (Minutes) Vehicles Length

The Coordinated Plan (2010 – 2014) C-3 Appendix C—FY09 RSRTP Route Statistics and Historical Data
APPENDIX C
MTS FIXED-ROUTE BUS SERVICE - FY 09 TRANSIT SERVICE DATA
Base Statistics and Performance IndicatorsOper- Oper- Total Passen-ating ating Revenue Passen- Sub- ger Average
Total Total Revenue Farebox Cost/ Cost/ Miles/ gers/ Subsidy Mile Trip Passen-Operating Fare Subsidy Passen- Passen- Total Revenue Revenue Recovery Revenue Revenue Revenue Revenue Per Per Seat Length ger
Route Cost Revenue Amount gers gers Miles Miles Hours Rate Mile Hour Hours Mile Boarding Mile (Miles) Miles1 $4,465,205 $1,439,273 $3,025,932 1,497,287 1,455,313 543,689 519,775 48,639 32.23% $8.59 $91.80 10.69 2.88 $2.022 $4,120,616 $1,676,001 $2,444,615 1,745,244 1,703,273 445,758 426,261 44,902 40.67% $9.67 $91.77 9.49 4.09 $1.40 0.26 1.8 10,3453 $4,189,419 $1,901,404 $2,288,015 1,990,091 1,930,470 420,156 398,804 46,838 45.39% $10.50 $89.44 8.51 4.99 $1.15 0.24 2.3 12,5264 $2,087,581 $834,743 $1,252,838 900,290 863,542 315,263 301,319 22,722 39.99% $6.93 $91.87 13.26 2.99 $1.39 0.28 2.8 7,8545 $1,804,492 $784,859 $1,019,633 849,772 819,231 197,229 188,703 19,668 43.49% $9.56 $91.75 9.59 4.50 $1.20 0.27 1.8 5,8116 $1,692,611 $571,423 $1,121,188 623,030 610,554 174,704 167,130 18,448 33.76% $10.13 $91.75 9.06 3.73 $1.80 0.24 2.2 4,5297 $7,537,912 $3,500,630 $4,037,282 3,793,588 3,673,292 863,794 825,272 82,084 46.44% $9.13 $91.83 10.05 4.60 $1.06 0.33 2.4 25,5318 $2,148,840 $579,755 $1,569,085 703,681 689,010 299,769 287,131 23,439 26.98% $7.48 $91.68 12.25 2.45 $2.23 0.24 3.5 6,8229 $2,129,550 $584,635 $1,544,915 695,390 682,122 288,301 276,053 23,222 27.45% $7.71 $91.70 11.89 2.52 $2.22 0.24 3.6 6,749
10 $3,846,991 $1,484,559 $2,362,432 1,546,119 1,522,804 479,723 459,063 41,931 38.59% $8.38 $91.75 10.95 3.37 $1.53 0.32 2.9 14,36711 $7,580,419 $2,738,167 $4,842,252 2,847,068 2,768,964 1,114,569 1,066,863 10 36.12% $7.11 $758,041.90 106,686.30 2.67 $1.70 0.27 2.9 27,69413 $4,181,786 $1,724,010 $2,457,776 1,875,882 1,810,530 530,916 507,715 45,552 41.23% $8.24 $91.80 11.15 3.69 $1.31 0.32 2.6 17,92014 $1,447,916 $247,267 $1,200,649 262,747 259,635 221,973 212,524 15,788 17.08% $6.81 $91.71 13.46 1.24 $4.57 0.13 2.9 2,67415 $4,042,929 $1,608,541 $2,434,388 1,702,120 1,667,112 541,517 518,125 44,058 39.79% $7.80 $91.76 11.76 3.29 $1.43 0.42 3.8 21,06318 $144,845 $36,473 $108,372 36,607 36,272 48,661 42,283 2,886 25.18% $3.43 $50.19 14.65 0.87 $2.96 0.14 3.3 63720 $4,338,459 $1,192,244 $3,146,215 1,371,512 1,356,255 979,990 938,459 47,292 27.48% $4.62 $91.74 19.84 1.46 $2.29 0.39 9.5 34,853
25 (New) $336,911 $117,302 $219,609 113,363 111,416 99,657 88,016 6,707 34.82% $3.83 $50.23 13.12 1.29 $1.94 0.22 3.8 1,90827 $830,559 $295,385 $535,174 294,420 289,604 199,146 151,546 16,499 35.56% $5.48 $50.34 9.19 1.94 $1.82 0.18 2.7 3,82628 $508,701 $434,349 $74,352 442,794 436,286 141,544 93,363 13,415 85.38% $5.45 $37.92 6.96 4.74 $0.17 0.27 2.1 2,98730 $7,153,893 $2,203,530 $4,950,363 2,314,528 2,289,098 1,117,218 1,069,549 77,984 30.80% $6.69 $91.74 13.71 2.16 $2.14 0.36 5.8 42,89231 $443,959 $99,347 $344,612 106,174 105,167 84,102 80,527 4,840 22.38% $5.51 $91.73 16.64 1.32 $3.25 0.14 3.9 1,34135 $621,603 $510,311 $111,292 510,892 502,996 157,263 113,345 17,484 82.10% $5.48 $35.55 6.48 4.51 $0.22 0.33 2.3 4,47241 $3,164,655 $1,259,505 $1,905,150 1,301,811 1,282,972 503,917 482,150 34,476 39.80% $6.56 $91.79 13.98 2.70 $1.46 0.34 4.3 18,47144 $3,156,588 $1,141,563 $2,015,025 1,212,944 1,185,346 458,528 438,753 34,395 36.16% $7.19 $91.77 12.76 2.76 $1.66 0.30 3.7 14,311
48/49 $130,626 $108,460 $22,166 122,046 121,428 32,527 23,776 2,741 83.03% $5.49 $47.66 8.68 5.13 $0.18 n/a n/a n/a50 $1,219,582 $331,262 $888,320 348,900 344,490 227,423 217,618 13,284 27.16% $5.60 $91.81 16.38 1.60 $2.55 0.27 7.1 7,90983 $168,329 $52,971 $115,358 51,905 51,211 39,965 32,464 3,344 31.47% $5.19 $50.34 9.71 1.60 $2.22 0.12 1.7 40584 $214,726 $59,269 $155,457 56,713 56,331 76,690 64,040 4,286 27.60% $3.35 $50.10 14.94 0.89 $2.74 0.13 2.8 59086 $185,438 $28,786 $156,652 28,037 27,865 31,377 26,169 3,664 15.52% $7.09 $50.61 7.14 1.07 $5.59 0.14 1.6 20688 $23,278 $3,826 $19,452 5,054 4,921 3,412 3,269 254 16.44% $7.12 $91.67 12.87 1.55 $3.85 n/a n/a n/a105 $1,708,507 $413,007 $1,295,500 444,491 435,974 274,039 262,399 18,629 24.17% $6.51 $91.71 14.09 1.69 $2.91 0.23 4.0 6,413115 $1,114,462 $435,250 $679,212 432,754 423,834 213,266 203,943 15,549 39.05% $5.46 $71.67 13.12 2.12 $1.57 0.30 4.1 6,911120 $3,211,124 $971,504 $2,239,620 1,050,511 1,034,139 410,423 392,856 35,005 30.25% $8.17 $91.73 11.22 2.67 $2.13 0.28 3.4 12,193150 $1,360,454 $493,640 $866,814 531,282 523,070 260,802 249,696 14,830 36.28% $5.45 $91.74 16.84 2.13 $1.63 0.49 8.5 17,682201 $83,031 $5,596 $77,435 5,476 5,382 10,880 10,397 904 6.74% $7.99 $91.85 11.50 0.53 $14.14 n/a n/a n/a202 $82,573 $5,386 $77,187 5,368 5,267 10,856 10,361 899 6.52% $7.97 $91.87 11.53 0.52 $14.38 n/a n/a n/a210 $268,380 $85,864 $182,516 87,758 86,539 80,645 77,203 2,924 31.99% $3.48 $91.77 26.40 1.14 $2.08 0.46 11.4 3,721701 $1,534,667 $700,413 $834,254 701,592 677,696 288,444 266,433 26,580 45.64% $5.76 $57.74 10.02 2.63 $1.19 0.18 2.2 5,567704 $1,397,895 $533,508 $864,387 517,274 500,659 256,804 242,710 21,743 38.17% $5.76 $64.29 11.16 2.13 $1.67 0.22 3.4 6,151705 $602,326 $316,688 $285,638 309,602 301,986 117,042 104,555 11,853 52.58% $5.76 $50.82 8.82 2.96 $0.92 0.32 3.3 3,465707 $164,693 $58,978 $105,715 54,140 53,633 32,251 28,593 2,408 35.81% $5.76 $68.39 11.87 1.89 $1.95 0.20 2.9 593709 $1,934,317 $1,120,458 $813,859 1,089,816 1,069,947 365,926 338,161 29,350 57.93% $5.72 $65.90 11.52 3.22 $0.75 0.44 4.6 18,010712 $1,505,761 $949,715 $556,046 929,079 911,655 302,483 261,391 25,886 63.07% $5.76 $58.17 10.10 3.55 $0.60 0.48 4.0 15,474810 $861,486 $361,035 $500,451 114,387 111,856 321,196 130,417 5,213 41.91% $6.61 $165.26 25.02 0.88 $4.38 0.55 28.5 15,117

The Coordinated Plan (2010 – 2014) C-4 Appendix C—FY09 RSRTP Route Statistics and Historical Data
APPENDIX C
MTS FIXED-ROUTE BUS SERVICE - FY 09 TRANSIT SERVICE DATA
Base Statistics and Performance IndicatorsOper- Oper- Total Passen-ating ating Revenue Passen- Sub- ger Average
Total Total Revenue Farebox Cost/ Cost/ Miles/ gers/ Subsidy Mile Trip Passen-Operating Fare Subsidy Passen- Passen- Total Revenue Revenue Recovery Revenue Revenue Revenue Revenue Per Per Seat Length ger
Route Cost Revenue Amount gers gers Miles Miles Hours Rate Mile Hour Hours Mile Boarding Mile (Miles) Miles815 $479,730 $348,285 $131,445 347,474 333,123 92,435 87,557 11,400 72.60% $5.48 $42.08 7.68 3.97 $0.38 0.25 1.8 2,238816 $585,935 $322,264 $263,671 314,392 304,325 117,980 108,612 10,653 55.00% $5.39 $55.00 10.20 2.89 $0.84 0.27 2.9 4,006820 $341,523 $158,094 $183,429 51,200 49,449 133,450 51,737 1,901 46.29% $6.60 $179.69 27.22 0.99 $3.58 0.39 21.8 4,224832 $269,382 $74,639 $194,743 73,263 71,579 50,664 47,879 4,209 27.71% $5.63 $64.00 11.38 1.53 $2.66 0.15 3.0 903833 $381,897 $138,630 $243,267 133,191 130,219 100,141 70,085 7,629 36.30% $5.45 $50.06 9.19 1.90 $1.83 0.24 2.5 1,296834 $91,502 $26,447 $65,055 24,238 23,721 20,676 16,703 1,173 28.90% $5.48 $78.02 14.24 1.45 $2.68 0.24 4.5 595
844/845 $759,868 $229,527 $530,341 208,901 191,071 259,411 214,540 14,970 30.21% $3.54 $50.76 14.33 0.97 $2.54 0.20 4.3 3,785848 $854,379 $412,995 $441,384 381,082 366,541 168,675 155,977 14,440 48.34% $5.48 $59.17 10.80 2.44 $1.16 0.32 3.8 5,682850 $329,505 $194,902 $134,603 62,866 60,743 127,282 49,932 1,800 59.15% $6.60 $183.01 27.73 1.26 $2.14 0.47 21.2 4,699851 $234,805 $110,682 $124,123 101,140 107,636 84,231 58,663 4,661 47.14% $4.00 $50.38 12.59 1.72 $1.23 0.29 3.2 1,752854 $583,841 $164,328 $419,513 166,817 163,079 111,219 106,597 8,900 28.15% $5.48 $65.60 11.98 1.56 $2.51 0.23 4.0 2,797855 $514,137 $287,704 $226,433 286,618 276,846 107,546 93,749 9,673 55.96% $5.48 $53.15 9.69 3.06 $0.79 0.25 2.4 2,678856 $1,719,165 $960,308 $758,857 965,219 870,986 343,892 313,368 25,483 55.86% $5.49 $67.46 12.30 3.08 $0.79 0.27 3.6 9,823860 $380,124 $189,801 $190,323 61,844 59,628 145,645 57,590 2,270 49.93% $6.60 $167.43 25.37 1.07 $3.08 0.34 20.1 4,153864 $2,252,458 $526,283 $1,726,175 485,099 467,803 456,941 410,961 26,891 23.36% $5.48 $83.76 15.28 1.18 $3.56 0.22 6.8 9,816870 $117,819 $35,236 $82,583 11,023 11,030 30,010 18,646 857 29.91% $6.32 $137.48 21.76 0.59 $7.49 0.12 13.5 446
871/872 $632,284 $244,383 $387,901 228,923 219,290 119,838 115,539 13,268 38.65% $5.47 $47.65 8.71 1.98 $1.69 0.17 2.1 1,837874/875 (new) $1,227,351 $506,182 $721,169 492,208 470,327 230,111 223,852 19,831 41.24% $5.48 $61.89 11.29 2.20 $1.47 0.19 2.7 4,215
880 $9,503 $6,956 $2,547 2,229 2,142 26,322 8,031 346 73.20% $1.18 $27.47 23.21 0.28 $1.14 0.03 10.0 191901 $3,731,254 $1,139,478 $2,591,776 1,137,624 1,113,189 736,036 682,248 48,196 30.54% $5.47 $77.42 14.16 1.67 $2.28 0.30 6.1 25,856904 $87,916 $50,505 $37,411 42,659 41,898 24,661 16,040 3,157 57.45% $5.48 $27.85 5.08 2.66 $0.88 0.12 1.2 132905 $1,366,511 $524,253 $842,258 415,079 408,690 294,034 263,408 16,401 38.36% $5.19 $83.32 16.06 1.58 $2.03 0.33 7.0 12,530
916/917 $921,824 $267,333 $654,491 281,231 267,481 47,635 176,235 15,244 29.00% $5.23 $60.47 11.56 1.60 $2.33 0.11 2.4 2,464921 $898,457 $402,173 $496,284 405,188 399,388 225,157 170,979 15,708 44.76% $5.25 $57.20 10.88 2.37 $1.22 0.31 4.2 7,270923 $764,572 $310,727 $453,845 301,091 296,764 171,001 139,405 16,197 40.64% $5.48 $47.20 8.61 2.16 $1.51 0.30 4.6 5,818928 $1,031,004 $353,173 $677,831 358,662 352,808 228,586 187,990 15,956 34.26% $5.48 $64.62 11.78 1.91 $1.89 0.21 4.7 5,288929 $4,600,364 $3,030,677 $1,569,687 3,063,486 2,987,102 929,158 839,721 90,655 65.88% $5.48 $50.75 9.26 3.65 $0.51 0.39 3.3 36,343932 $3,526,918 $2,245,693 $1,281,225 2,267,395 2,216,089 693,230 643,905 63,556 63.67% $5.48 $55.49 10.13 3.52 $0.57 0.34 2.8 22,961
933/934 $4,433,637 $2,081,490 $2,352,147 2,133,446 2,077,831 838,553 808,720 65,172 46.95% $5.48 $68.03 12.41 2.64 $1.10 0.21 2.5 18,818936 $1,029,465 $314,749 $714,716 327,693 372,644 216,733 190,432 19,959 30.57% $5.41 $51.58 9.54 1.72 $2.18 0.24 2.4 4,464955 $2,192,448 $1,552,073 $640,375 1,613,319 1,560,796 450,082 399,647 42,604 70.79% $5.49 $51.46 9.38 4.04 $0.40 0.29 2.5 15,349960 $394,055 $122,594 $271,461 100,445 99,542 139,139 66,958 3,463 31.11% $5.89 $113.80 19.34 1.50 $2.70 0.51 11.1 5,484
961/962/963 $2,501,981 $1,331,847 $1,170,134 1,357,533 1,323,065 508,336 455,752 43,273 53.23% $5.49 $57.82 10.53 2.98 $0.86 0.24 2.6 13,626963 (old)/964 $364,435 $145,833 $218,602 136,794 134,011 72,135 67,148 7,257 40.02% $5.43 $50.22 9.25 2.04 $1.60 0.16 1.9 1,112
965 $371,782 $76,871 $294,911 77,943 74,253 100,441 78,924 7,593 20.68% $4.71 $48.96 10.39 0.99 $3.78 0.30 2.1 738967 $266,663 $71,179 $195,484 73,577 70,542 54,635 48,617 5,374 26.69% $5.49 $49.62 9.05 1.51 $2.66 0.10 2.2 609968 $308,091 $81,681 $226,410 84,185 80,893 62,174 56,165 5,391 26.51% $5.49 $57.15 10.42 1.50 $2.69 0.10 2.5 685992 $1,108,978 $447,439 $661,539 417,967 410,384 239,721 202,906 24,025 40.35% $5.47 $46.16 8.45 2.06 $1.58 0.21 2.7 2,984
Total = 82 $131,413,658 $53,488,306 $77,925,352 54,616,583 53,266,055 22,341,755 20,304,394 1,662,162 40.70% $6.47 $79.06 12.22 2.69 $1.43

The Coordinated Plan (2010 – 2014) C-5 Appendix C—FY09 RSRTP Route Statistics and Historical Data
Operations DataOne-Way
LengthPeak Base Night Base Peak (Miles)
SVCC DART Monday - Friday 6:37 am - 8:41 am & 3:30 pm - 6:30 pm 4 4 N/R
Total = 4 4 4 N/R
APPENDIX C
MTS CONTRACT SERVICES DART AND DARFY 08 TRANSIT SERVICE DATA
RouteType ofRoute
Days ofOperation
Operating Hours(Weekday)
Frequency (Minutes) Vehicles
Base Statistics and Performance Indicators
Opera- Opera- Total Passen-ting ting Revenue Passen- ger Average
Total Farebox Cost/ Cost/ Miles/ gers Subsidy Mile TripOperating Fare Subsidy Total Revenue Total Revenue Revenue Recovery Revenue Revenue Revenue Revenue Per Per Length
Route Cost Revenue Amount Passengers Passengers Miles Miles Hours Rate Mile Hour Hours Mile Boarding Seat Mile (Miles)*
SVCC $767,421 $217,036 $550,385 $130,780 0 175,743 123,582 12,773 28.28% $6.21 $60.08 9.68 1.06 $4.21 N/A
Total = 4 $767,421 $217,036 $550,385 $130,780 0 175,743 123,582 12,773 28.28% $6.21 $60.08 9.68 1.06 $4.21

The Coordinated Plan (2010 – 2014) C-6 Appendix C—FY09 RSRTP Route Statistics and Historical Data
Base Statistics and Performance IndicatorsOne-WayLength
Peak Base Night Base Peak (Miles)
MTS ACCESS ADA/DAR 5:00 am - 12:00 am* ---- ---- ---- 32 51 N/A
MTS ACCESS ADA/DAR Saturday/Sunday/Holiday 7:00 am - 9:00 pm* ---- ---- ---- 25 25 N/A
APPENDIX C
MTS CONTRACT SERVICES ADA PARATRANSITFY 08 TRANSIT SERVICE DATA
RouteType ofRoute
Days ofOperation
Operating Hours(Weekday)
Frequency (Minutes) Vehicles
*Peak and Base are both based on demand. While peak is fairly predictable due to subscription commuters, base is a general estimate as demand changes dramatically day-to-day/trip-to-trip.
Monday - Friday
Base Statistics and Performance Indicators
Opera- Opera- Total Passen- ting ting Revenue Passen- ger Average
Total Farebox Cost/ Cost/ Miles/ gers Subsidy Mile Trip Operating Fare Subsidy Total Revenue Total Revenue Revenue Recovery Revenue Revenue Revenue Revenue Per Per Length
Route Cost Revenue Amount Passengers Passengers Miles Miles Hours Rate Mile Hour Hours Mile Boarding Seat Mile (Miles)*
MTS ACCESS $11,292,690 $1,640,857 $9,651,833 372,373 333,318 4,407,478 3,244,550 185,080 14.53% $3.48 $61.02 17.53 0.11 $25.92
ADA TOTAL $11,292,690 $1,640,857 $9,651,833 372,373 333,318 4,407,478 3,244,550 185,080 14.53% $3.48 $61.02 17.53 0.11 $25.92

The Coordinated Plan (2010 – 2014) C-7 Appendix C—FY09 RSRTP Route Statistics and Historical Data
Base Statistics and Performance IndicatorsOne-WayLength
Peak Base Night Base Peak (Miles)
888 Rural 9:40 am - 6:38 pm 1 1 86.2
891 Rural Friday only 7:45 am - 4:51 pm 1 1 97.3
892 Rural Thursday Only 7:50 am - 5:06 pm 1 1 95.4
894 Rural Monday thu Friday 6:12 am - 7:03 pm 1 2 65.3
4 5 N/R
Three roundtrips per day
One roundtrip on Friday
Monday & Friday only
RouteType ofRoute
Days ofOperation
Operating Hours(Weekday)
Frequency (Minutes) Vehicles
APPENDIX C
MTS CONTRACT SERVICES RURALFY 08 TRANSIT SERVICE DATA
One roundtrip Monday and Friday
One roundtrip on Thursday
Base Statistics and Performance Indicators
Opera- Opera- Total Passen- ting ting Revenue Passen- ger Average
Total Farebox Cost/ Cost/ Miles/ gers Subsidy Mile Trip Operating Fare Subsidy Total Revenue Total Revenue Revenue Recovery Revenue Revenue Revenue Revenue Per Per Length
Route Cost Revenue Amount Passengers Passengers Miles Miles Hours Rate Mile Hour Hours Mile Boarding Seat Mile (Miles)*
888 $91,046 $2,472 $88,574 1,809 1,566 18,542 16,768 570 2.72% $5.43 $159.73 29.42 0.11 $48.96
891 $48,891 $2,551 $46,340 1,254 1,253 9,726 9,438 335 5.22% $5.18 $145.94 28.17 0.13 $36.95
892 $45,001 $2,911 $42,090 1,091 1,091 9,567 9,237 323 6.47% $4.87 $139.32 28.60 0.12 $38.58
894 $461,307 $64,321 $396,986 20,281 19,303 91,751 83,649 3,104 13.94% $5.51 $148.62 26.95 0.24 $19.57
Total = 4 $646,245 $72,255 $573,990 24,435 23,213 129,586 119,092 4,332 11.18% $5.43 $149.18 27.49 0.21 $23.49
Southeast Rural Services were changed significantly December 1, 2003Northeast Rural Services were changed significantly February 1, 2004. Routes 878 and 879 discontinued February 1, 2004.

The Coordinated Plan (2010 – 2014) C-8 Appendix C—FY09 RSRTP Route Statistics and Historical Data
Base Statistics and Performance IndicatorsOne-WayLength
Peak Base Night Base Peak (Miles)
---- Ferry 5:45 am - 9:00 am 45 ---- ---- ---- 1 3.8
2:00 pm - 7:00 pm 60 1
Monday - Friday
APPENDIX C
CITY OF CORONADO - CORONADO FERRYFY 09 TRANSIT SERVICE DATA
RouteType ofRoute
Days ofOperation
Operating Hours(Weekday)
Frequency (Minutes) Vehicles
Base Statistics and Performance Indicators
Opera- Opera- Total Passen- ting ting Revenue Passen- ger Average
Total Farebox Cost/ Cost/ Miles/ gers Subsidy Mile Trip Operating Fare Subsidy Total Revenue Total Revenue Revenue Recovery Revenue Revenue Revenue Revenue Per Per Length
Route Cost Revenue Amount Passengers Passengers Miles Miles Hours Rate Mile Hour Hours Mile Boarding Seat Mile (Miles)*
#REF! $147,584 N/A $147,584 N/A 7,500 N/A N/A N/A N/A N/A N/A N/A N/A N/A N/A
Note: No fares are collected on the ferry service.

The Coordinated Plan (2010 – 2014) C-9 Appendix C—FY09 RSRTP Route Statistics and Historical Data
Base Statistics and Performance IndicatorsOne-WayLength
Peak Base Night Base Peak (Miles)
Blue Light Rail 4:10 am - 1:55 am 7.5 15 15/30 27 1 24.5
Orange Light Rail 4:07 am - 1:55 am 15 15 15/30 18 28 20.7
Green Light Rail 4:15 am - 12:55 am 15 15 15/30 14 14 19.3
Total = 3 59 43 64.5
Days ofOperation
Operating Hours(Weekday)
Frequency (Minutes) Vehicles
Monday - Sunday
Monday - Sunday
Monday - Sunday
APPENDIX C
SAN DIEGO TROLLEYFY 08 TRANSIT SERVICE DATA
LineType ofRoute
Base Statistics and Performance Indicators
Opera- Opera- Total Passen- ting ting Revenue Passen- Sub- ger Average
Total Total Revenue Farebox Cost/ Cost/ Miles/ gers sidy Mile Trip Passen-Operating Fare Subsidy Passen- Passen- Total Revenue Revenue Recovery Revenue Revenue Revenue Revenue Per Per Seat Length ger
Line Cost Revenue Amount gers gers Miles Miles Hours Rate Mile Hour Hours Mile Boarding Mile (Miles)* Miles
Blue $28,991,795 $18,491,843 $10,499,952 20,412,493 18,412,069 1,266,139 1,260,737 203,000 63.78% $23.00 $142.82 6.21 16.19 $0.51 718,457.00 6.40 436,713
Orange $17,129,580 $7,570,167 $9,559,413 8,356,440 7,537,509 1,016,826 1,013,082 119,941 44.19% $16.91 $142.82 8.45 8.25 $1.14 441,536.00 5.40 167,698
Green $12,364,215 $7,391,622 $4,972,593 8,159,351 7,359,735 982,355 948,257 86,574 59.78% $13.04 $142.82 10.95 8.60 $0.61 340,992.00 5.80 140,524
Total = 3 $58,485,590 $33,453,632 $25,031,958 36,928,284 33,309,312 3,265,320 3,222,076 409,515 57.20% $18.15 $142.82 7.87 11.46 $0.68

The Coordinated Plan (2010 – 2014) C-10 Appendix C—FY09 RSRTP Route Statistics and Historical Data
Base Statistics and Performance Indicators
Tota
l O
per
atin
gC
ost
Fare
Rev
enu
e
Sub
sid
yA
mo
un
t
Tota
lPa
ssen
ger
s
Rev
enu
ePa
ssen
ger
s
Tota
lM
iles
Rev
enu
eM
iles
Rev
enu
eH
ou
rs
Fare
bo
xR
eco
very
Rat
e
Op
erat
ing
Co
st/R
even
ue
Mile
Op
erat
ing
Co
st/R
even
ue
Ho
ur
Rev
enu
e M
iles/
Rev
enu
e H
ou
rsTo
tal
Pass
eng
ers/
Rev
enu
e M
ile
Sub
sid
yPe
r B
oar
din
g
Pass
eng
er M
ilePe
r Se
at M
ile
Ave
rag
e Tr
ipLe
ng
th (
mile
s)
300 $537,443 $16,431 $521,012 14,887 14,235 25,164 22,889 5,032 3.06% $23.48 $106.81 4.55 0.62 $35.00 N/A N/A
301 $3,838,876 $1,057,186 $2,781,690 957,842 915,889 641,051 580,817 35,940 27.54% $6.61 $106.81 16.16 1.58 $2.90 0.20 8.1
302 $3,342,080 $958,937 $2,383,143 868,826 830,771 473,711 398,847 31,289 28.69% $8.38 $106.81 12.75 2.08 $2.74 0.23 10.7
303 $4,651,814 $1,541,937 $3,109,877 1,397,041 1,335,851 632,873 572,233 43,551 33.15% $8.13 $106.81 13.14 2.44 $2.23 0.37 12.0
304 $998,108 $163,156 $834,952 147,824 141,349 156,016 133,903 9,344 16.35% $7.45 $106.81 14.33 1.10 $5.65 0.17 5.4
305 $2,063,960 $564,570 $1,499,391 511,517 489,113 273,658 256,933 19,323 27.35% $8.03 $106.81 13.30 1.99 $2.93 0.28 9.8
306 $1,232,957 $275,276 $957,681 249,408 238,484 208,861 175,676 11,543 22.33% $7.02 $106.81 15.22 1.42 $3.84 0.19 7.0
308 $1,445,224 $213,097 $1,232,127 193,072 184,615 248,494 246,633 13,530 14.74% $5.86 $106.81 18.23 0.78 $6.38 0.11 3.8
309 $4,100,823 $723,026 $3,377,797 655,083 626,390 628,469 584,250 38,392 17.63% $7.02 $106.81 15.22 1.12 $5.16 0.18 5.5
311 $135,490 $1,148 $134,342 1,040 994 11,953 12,017 1,268 0.85% $11.27 $106.81 9.47 0.09 $129.17 0.04 0.4
312 $144,522 $31,655 $112,868 28,680 27,424 13,211 13,161 1,353 21.90% $10.98 $106.81 9.73 2.18 $3.94 0.13 10.7
313 $1,043,271 $211,114 $832,157 191,276 182,898 143,434 129,897 9,767 20.24% $8.03 $106.81 13.30 1.47 $4.35 0.19 7.2
315 $1,269,087 $137,752 $1,131,336 124,807 119,340 184,955 171,670 11,881 10.85% $7.39 $106.81 14.45 0.73 $9.06 0.18 3.6
317 $591,639 $65,102 $526,537 58,984 56,401 78,008 74,963 5,539 11.00% $7.89 $106.81 13.53 0.79 $8.93 0.08 3.9
318 $569,057 $94,551 $474,506 85,666 81,914 64,168 61,229 5,328 16.62% $9.29 $106.81 11.49 1.40 $5.54 0.19 6.9
319 $1,111,016 $50,246 $1,060,770 45,524 43,530 93,107 86,407 10,401 4.52% $12.86 $106.81 8.31 0.53 $23.30 0.03 2.6
321 $1,192,310 $108,482 $1,083,828 98,288 93,983 174,260 144,203 11,163 9.10% $8.27 $106.81 12.92 0.68 $11.03 0.12 3.3
324 $284,528 $24,357 $260,172 22,068 21,101 32,084 30,328 2,664 8.56% $9.38 $106.81 11.39 0.73 $11.79 0.16 3.6
325 $1,494,903 $183,580 $1,311,323 166,329 159,044 177,406 170,526 13,995 12.28% $8.77 $106.81 12.18 0.98 $7.88 0.20 4.8
332 $695,514 $189,441 $506,073 171,639 164,121 114,496 99,569 6,511 27.24% $6.99 $106.81 15.29 1.72 $2.95 0.29 8.4
333 $989,075 $153,728 $835,347 139,282 133,181 105,059 97,280 9,260 15.54% $10.17 $106.81 10.51 1.43 $6.00 0.32 7.0
334/335 $1,029,722 $169,158 $860,564 153,262 146,549 111,980 99,569 9,640 16.43% $10.34 $106.81 10.33 1.54 $5.61 0.31 7.5
338 $130,973 $3,221 $127,753 2,918 2,790 15,098 13,161 1,226 2.46% $9.95 $106.81 10.73 0.22 $43.78 0.12 1.1
339 $140,006 $31,628 $108,378 28,656 27,401 17,615 14,306 1,311 22.59% $9.79 $106.81 10.91 2.00 $3.78 0.37 9.8
341 $406,469 $40,906 $365,563 37,062 35,439 48,441 41,201 3,805 10.06% $9.87 $106.81 10.83 0.90 $9.86 0.12 4.4
347 $1,025,206 $106,825 $918,380 96,787 92,548 128,965 121,886 9,598 10.42% $8.41 $106.81 12.70 0.79 $9.49 0.11 3.9
348 $140,006 $15,041 $124,965 13,628 13,031 14,469 13,161 1,311 10.74% $10.64 $106.81 10.04 1.04 $9.17 0.14 5.1
349 $130,973 $8,017 $122,956 7,264 6,946 11,953 12,017 1,226 6.12% $10.90 $106.81 9.80 0.60 $16.93 0.08 3.0
350/450 $2,208,483 $706,704 $1,501,779 640,295 612,250 247,236 240,910 20,676 32.00% $9.17 $106.81 11.65 2.66 $2.35 0.36 13.0
351 $1,025,206 $293,222 $731,984 265,668 254,032 89,332 87,552 9,598 28.60% $11.71 $106.81 9.12 3.03 $2.76 0.41 14.9
352 $1,016,173 $307,527 $708,646 278,629 266,425 89,961 89,841 9,514 30.26% $11.31 $106.81 9.44 3.10 $2.54 0.42 15.2
354 $1,074,885 $293,685 $781,201 266,087 254,432 120,787 120,741 10,063 27.32% $8.90 $106.81 12.00 2.20 $2.94 0.30 10.8
356 $546,475 $180,407 $366,068 163,454 156,295 47,811 48,068 5,116 33.01% $11.37 $106.81 9.40 3.40 $2.24 0.46 16.7
358 $257,430 $48,565 $208,866 44,001 42,074 27,051 26,323 2,410 18.87% $9.78 $106.81 10.92 1.67 $4.75 0.22 8.2
359 $252,914 $20,467 $232,447 18,544 17,732 26,422 26,323 2,368 8.09% $9.61 $106.81 11.12 0.70 $12.53 0.09 3.5
365 $284,528 $19,523 $265,006 17,688 16,913 35,859 30,901 2,664 6.86% $9.21 $106.81 11.60 0.57 $14.98 0.08 2.8
386 $686,419 $65,129 $621,289 59,009 56,424 125,820 126,464 6,427 9.49% $5.43 $106.80 19.68 0.47 $10.53 0.06 2.3
388 $532,926 $129,992 $402,934 117,777 112,618 120,787 121,313 4,989 24.39% $4.39 $106.81 24.31 0.97 $3.42 0.13 4.8
389 $225,816 $39,382 $186,435 35,681 34,118 57,877 58,368 2,114 17.44% $3.87 $106.81 27.61 0.61 $5.23 0.08 3.0
395 $862,618 $168,461 $694,157 152,631 145,946 193,133 186,548 8,076 19.53% $4.62 $106.81 23.10 0.82 $4.55 0.11 4.0
397 $347,757 $29,955 $317,802 27,140 25,951 70,459 66,379 3,256 8.61% $5.24 $106.81 20.39 0.41 $11.71 0.06 2.0
400 $67,745 $5,114 $62,631 4,633 4,430 3,145 2,861 634 7.55% $23.68 $106.81 4.51 1.62 $13.52 0.22 7.9
401 $34,031 $8,501 $25,530 7,702 7,365 3,251 2,843 319 24.98% $11.97 $106.81 8.92 2.71 $3.31 0.36 13.3
403 $18,065 $2,019 $16,047 1,829 1,749 5,662 3,433 169 11.17% $5.26 $106.81 20.30 0.53 $8.77 0.07 2.6
404 $451,632 $85,611 $366,022 77,566 74,169 87,445 68,096 4,228 18.96% $6.63 $106.81 16.11 1.14 $4.72 0.15 5.6
408 $87,619 $7,436 $80,183 6,737 6,442 7,928 6,968 820 8.49% $12.57 $106.81 8.49 0.97 $11.90 0.13 4.7
410 $45,163 $1,870 $43,294 1,694 1,620 1,258 0 423 4.14% NA $106.81 - NA $25.56 1.13 NA
413 $45,163 $632 $44,531 573 548 1,258 572 423 1.40% $78.92 $106.81 1.35 1.00 $77.72 0.13 4.9
415 $45,163 $501 $44,662 454 434 629 572 423 1.11% $78.92 $106.81 1.35 0.79 $98.37 0.11 3.9
430 $67,745 $6,226 $61,519 5,641 5,394 5,033 4,006 634 9.19% $16.91 $106.81 6.32 1.41 $10.91 0.19 6.9
432 $67,745 $30,537 $37,208 27,667 26,455 32,713 7,439 634 45.08% $9.11 $106.81 11.73 3.72 $1.34 0.50 18.2
442 $27,098 $4,158 $22,940 3,767 3,602 5,033 2,861 254 15.34% $9.47 $106.81 11.28 1.32 $6.09 0.18 6.5
444 $99,359 $15,646 $83,713 14,176 13,555 39,004 13,161 930 15.75% $7.55 $106.81 14.15 1.08 $5.91 0.14 5.3
445 $85,810 $34,249 $51,561 31,031 29,672 28,309 10,872 803 39.91% $7.89 $106.81 13.53 2.85 $1.66 0.38 14.0
447 $45,163 $273 $44,891 247 236 629 572 423 0.60% $78.92 $106.81 1.35 0.43 $181.74 0.06 2.1
472 $26,810 $577 $26,233 523 500 2,478 2,212 251 2.15% $12.12 $106.81 8.81 0.24 $50.16 0.03 N/A
475 $60,350 $5,114 $55,236 4,633 4,430 5,574 5,083 565 8.47% $11.87 $106.81 9.00 0.91 $11.92 0.12 N/A
476 $60,350 $2,616 $57,734 2,370 2,266 5,565 5,084 565 4.33% $11.87 $106.81 9.00 0.47 $24.36 0.06 N/A
496 $7,157 $768 $6,388 696 666 643 615 67 N/A $11.64 N/A N/A N/A $9.18 0 N/A
* $24 $281 ($257) 255 244 0 - - N/A N/A N/A N/A N/A N/A N/A N/A
Total $45,398,876 $9,654,712 $35,744,164 $8,747,458 $8,364,319 $6,317,053 $5,745,711 $425,029 21.27% $7.90 $106.81 13.52 1.52 $4.09
*Unassigned
APPENDIX C
NORTH COUNTY TRANSIT DISTRICT BREEZEFY 09 TRANSIT SERVICE DATA

The Coordinated Plan (2010 – 2014) C-11 Appendix C—FY09 RSRTP Route Statistics and Historical Data
Operations Data
Peak Base Night Base Peak
SPRINTER Light Rail 4:03 am - 9:26 pm 30 30 30 4 4 22.0
4:33 am - 9:26 pm 30 60 60 4 4 22.0
Trains
Monday - Friday
Saturday-Sunday
APPENDIX C
NORTH COUNTY TRANSIT DISTRICT - SPRINTERFY 09 TRANSIT SERVICE DATA
RouteType of Route
Days ofOperation
Operating Hours(weekdays)
One-WayLength(miles)
Frequency (Minutes)
Base Statistics and Performance Indicators
Fare- Opera- Opera- Total Passen-Reve- box ting ting Revenue Passen- ger Average
Total Total nue Reve- Reve- Recov- Cost/ Cost/ Miles/ gers Subsidy Mile TripOperating Fare Subsidy Passen- Passen- Total nue nue ery Revenue Revenue Revenue Revenue Per Per Seat Length
Route Cost Revenue Amount gers gers Miles Miles Hours Rate Mile Hour Hours Mile Boarding Mile (miles)
SPRINTER $15,050,977 $2,272,203 $12,778,774 2,195,373 2,195,373 629,928 618,004 28,051 15.10% $24.35 $536.56 22.03 3.55 $5.82 0.297 8.92

The Coordinated Plan (2010 – 2014) C-12 Appendix C—FY09 RSRTP Route Statistics and Historical Data
Operations Data
Peak Base Night Base Peak
COASTER Commuter 5:18 am - 7:45 pm 30 120 - 4 4 41.1
Friday Night Service (Apr-Sep) 8:26 pm -12:45 am - - - 1 1 41.1
Monday - Friday
APPENDIX C
NORTH COUNTY TRANSIT DISTRICT - COASTERFY 09 TRANSIT SERVICE DATA
RouteType of Route
Days ofOperation
Operating Hours(weekdays)
One-WayLength(miles)
Frequency (Minutes) Trains
Base Statistics and Performance Indicators
Fare- Opera- Opera- Total Passen-Reve- box ting ting Revenue Passen- ger Average
Total Total nue Reve- Reve- Recov- Cost/ Cost/ Miles/ gers Subsidy Mile TripOperating Fare Subsidy Passen- Passen- Total nue nue ery Revenue Revenue Revenue Revenue Per Per Seat Length
Route Cost Revenue Amount gers gers Miles Miles Hours Rate Mile Hour Hours Mile Boarding Mile (miles)
COASTER $16,466,352 $6,975,640 $9,490,712 1,501,619 1,501,619 1,421,080 1,349,238 33,347 42.36% $12.20 $493.79 40.46 1.11 $6.32 0.225 28.01

The Coordinated Plan (2010 – 2014) C-13 Appendix C—FY09 RSRTP Route Statistics and Historical Data
Operations Data
Peak Base Night Base Peak
Encinitas FAST DAR 5:00 am - 8:00 pm -- -- -- 3 2 NA
Fallbrook FAST DAR 5:00 am - 8:30 pm -- -- -- 3 2 NA
Ramona FAST DAR 5:00 am -8:00 pm -- -- -- 3 1 NA
San Marcos FAST DAR N/A -- -- -- 0 0 NA
Vista FAST DAR 5:30 am - 8:00 pm -- -- -- 3 2 NA
Total = 4 12 7
RouteType of Route
Days ofOperation
Operating Hours(weekdays)
One-WayLength(miles)
Frequency (Minutes) Vehicles*
APPENDIX C
NORTH COUNTY TRANSIT FASTFY 09 TRANSIT SERVICE DATA
SERVICE DISCONTINUED 8/10/08
Monday - Saturday
Monday - Saturday
Monday - Saturday
Monday - Saturday
Monday - Saturday
Base Statistics and Performance Indicators
Fare- Opera- Opera- Total Passen-Reve- box ting ting Revenue Passen- ger Average
Total Total nue Reve- Reve- Recov- Cost/ Cost/ Miles/ gers Subsidy Mile TripOperating Fare Subsidy Passen- Passen- Total nue nue ery Revenue Revenue Revenue Revenue Per Per Seat Length
Route Cost Revenue Amount gers gers Miles Miles Hours Rate Mile Hour Hours Mile Boarding Mile (miles)
Encinitas FAST $29,824 $3,083 $26,741 1,989 1,989 7,312 6,868 587 10% $4.34 $50.81 11.70 0.29 $13.44 N/A N/A
Fallbrook FAST $25,169 $2,165 $23,004 2,623 2,623 5,370 5,146 491 9% $4.89 $51.26 10.48 0.51 $8.77 N/A N/A
Ramona FAST $23,417 $1,115 $22,302 1,586 1,586 4,903 4,651 474 5% $5.03 $49.40 9.81 0.34 $14.06 N/A N/A
San Marcos FAST* $0 $0 $0 0 0 0 0 0 N/A N/A N/A N/A N/A N/A N/A N/A
Vista FAST $23,955 $1,566 $22,389 2,007 2,007 6,869 5,256 460 7% $4.56 $52.08 11.43 0.38 $11.16 N/A N/A
Total = 4 $102,365 $7,929 $94,436 8,205 8,205 24,454 21,921 2,012 7.75% $4.67 $50.88 10.90 0.37 $11.51 N/A N/A

The Coordinated Plan (2010 – 2014) C-14 Appendix C—FY09 RSRTP Route Statistics and Historical Data
Operations Data
Peak Base Night Base Peak
-- ADA 4:30 am - 12:11 am -- -- -- 26 26 --
7:00 am - 9:00 pm -- -- -- 5 + Taxis 5 + Taxis --
Frequency (Minutes) Vehicles*
Monday - Friday
Saturday/Sunday/Holiday
APPENDIX C
NORTH COUNTY TRANSIT LIFTFY 09 TRANSIT SERVICE DATA
RouteType of Route
Days ofOperation
Operating Hours(weekdays)
One-WayLength(miles)
Base Statistics and Performance IndicatorsFare- Opera- Opera- Total Passen-
Reve- box ting ting Revenue Passen- ger AverageTotal Total nue Reve- Reve- Recov- Cost/ Cost/ Miles/ gers Subsidy Mile Trip
Operating Fare Subsidy Passen- Passen- Total nue nue ery Revenue Revenue Revenue Revenue Per Per Seat LengthRoute Cost Revenue Amount gers gers Miles Miles Hours Rate Mile Hour Hours Mile Boarding Mile (miles)
ADA $3,750,653 $484,516 $3,266,137 115,496 115,496 1,352,620 1,138,108 56,139 12.92% $3.30 $66.81 20.27 0.10 $28.28 13.2 13.2
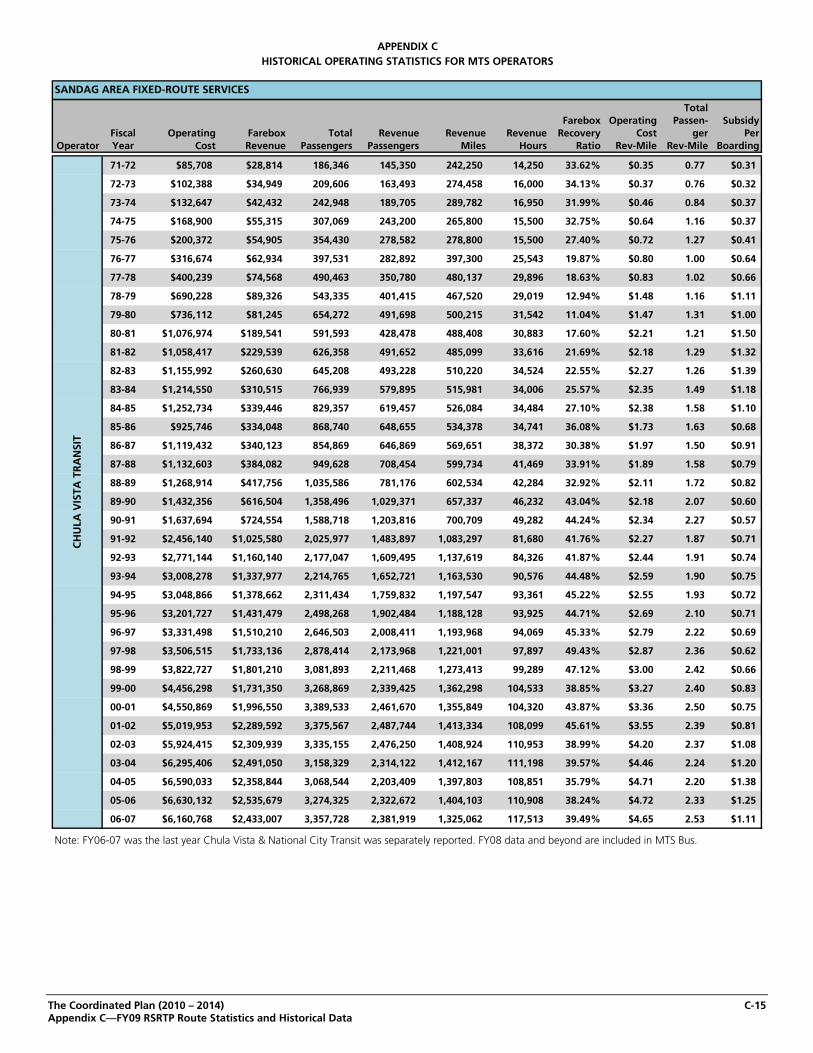
The Coordinated Plan (2010 – 2014) C-15 Appendix C—FY09 RSRTP Route Statistics and Historical Data
TotalFarebox Operating Passen- Subsidy
Fiscal Operating Farebox Total Revenue Revenue Revenue Recovery Cost ger PerOperator Year Cost Revenue Passengers Passengers Miles Hours Ratio Rev-Mile Rev-Mile Boarding
71-72 $85,708 $28,814 186,346 145,350 242,250 14,250 33.62% $0.35 0.77 $0.31
72-73 $102,388 $34,949 209,606 163,493 274,458 16,000 34.13% $0.37 0.76 $0.32
73-74 $132,647 $42,432 242,948 189,705 289,782 16,950 31.99% $0.46 0.84 $0.37
74-75 $168,900 $55,315 307,069 243,200 265,800 15,500 32.75% $0.64 1.16 $0.37
75-76 $200,372 $54,905 354,430 278,582 278,800 15,500 27.40% $0.72 1.27 $0.41
76-77 $316,674 $62,934 397,531 282,892 397,300 25,543 19.87% $0.80 1.00 $0.64
77-78 $400,239 $74,568 490,463 350,780 480,137 29,896 18.63% $0.83 1.02 $0.66
78-79 $690,228 $89,326 543,335 401,415 467,520 29,019 12.94% $1.48 1.16 $1.11
79-80 $736,112 $81,245 654,272 491,698 500,215 31,542 11.04% $1.47 1.31 $1.00
80-81 $1,076,974 $189,541 591,593 428,478 488,408 30,883 17.60% $2.21 1.21 $1.50
81-82 $1,058,417 $229,539 626,358 491,652 485,099 33,616 21.69% $2.18 1.29 $1.32
82-83 $1,155,992 $260,630 645,208 493,228 510,220 34,524 22.55% $2.27 1.26 $1.39
83-84 $1,214,550 $310,515 766,939 579,895 515,981 34,006 25.57% $2.35 1.49 $1.18
84-85 $1,252,734 $339,446 829,357 619,457 526,084 34,484 27.10% $2.38 1.58 $1.10
85-86 $925,746 $334,048 868,740 648,655 534,378 34,741 36.08% $1.73 1.63 $0.68
86-87 $1,119,432 $340,123 854,869 646,869 569,651 38,372 30.38% $1.97 1.50 $0.91
87-88 $1,132,603 $384,082 949,628 708,454 599,734 41,469 33.91% $1.89 1.58 $0.79
88-89 $1,268,914 $417,756 1,035,586 781,176 602,534 42,284 32.92% $2.11 1.72 $0.82
89-90 $1,432,356 $616,504 1,358,496 1,029,371 657,337 46,232 43.04% $2.18 2.07 $0.60
90-91 $1,637,694 $724,554 1,588,718 1,203,816 700,709 49,282 44.24% $2.34 2.27 $0.57
91-92 $2,456,140 $1,025,580 2,025,977 1,483,897 1,083,297 81,680 41.76% $2.27 1.87 $0.71
92-93 $2,771,144 $1,160,140 2,177,047 1,609,495 1,137,619 84,326 41.87% $2.44 1.91 $0.74
93-94 $3,008,278 $1,337,977 2,214,765 1,652,721 1,163,530 90,576 44.48% $2.59 1.90 $0.75
94-95 $3,048,866 $1,378,662 2,311,434 1,759,832 1,197,547 93,361 45.22% $2.55 1.93 $0.72
95-96 $3,201,727 $1,431,479 2,498,268 1,902,484 1,188,128 93,925 44.71% $2.69 2.10 $0.71
96-97 $3,331,498 $1,510,210 2,646,503 2,008,411 1,193,968 94,069 45.33% $2.79 2.22 $0.69
97-98 $3,506,515 $1,733,136 2,878,414 2,173,968 1,221,001 97,897 49.43% $2.87 2.36 $0.62
98-99 $3,822,727 $1,801,210 3,081,893 2,211,468 1,273,413 99,289 47.12% $3.00 2.42 $0.66
99-00 $4,456,298 $1,731,350 3,268,869 2,339,425 1,362,298 104,533 38.85% $3.27 2.40 $0.83
00-01 $4,550,869 $1,996,550 3,389,533 2,461,670 1,355,849 104,320 43.87% $3.36 2.50 $0.75
01-02 $5,019,953 $2,289,592 3,375,567 2,487,744 1,413,334 108,099 45.61% $3.55 2.39 $0.81
02-03 $5,924,415 $2,309,939 3,335,155 2,476,250 1,408,924 110,953 38.99% $4.20 2.37 $1.08
03-04 $6,295,406 $2,491,050 3,158,329 2,314,122 1,412,167 111,198 39.57% $4.46 2.24 $1.20
04-05 $6,590,033 $2,358,844 3,068,544 2,203,409 1,397,803 108,851 35.79% $4.71 2.20 $1.38
05-06 $6,630,132 $2,535,679 3,274,325 2,322,672 1,404,103 110,908 38.24% $4.72 2.33 $1.25
06-07 $6,160,768 $2,433,007 3,357,728 2,381,919 1,325,062 117,513 39.49% $4.65 2.53 $1.11
Note: FY06-07 was the last year Chula Vista & National City Transit was separately reported. FY08 data and beyond are included in MTS Bus.
SANDAG AREA FIXED-ROUTE SERVICES C
HU
LA V
ISTA
TR
AN
SIT
HISTORICAL OPERATING STATISTICS FOR MTS OPERATORSAPPENDIX C

The Coordinated Plan (2010 – 2014) C-16 Appendix C—FY09 RSRTP Route Statistics and Historical Data
TotalFarebox Operating Passen- Subsidy
Fiscal Operating Farebox Total Revenue Revenue Revenue Recovery Cost ger PerOperator Year Cost Revenue Passengers Passengers Miles Hours Ratio Rev-Mile Rev-Mile Boarding
78-79 $118,000 $23,000 90,000 90,000 92,000 N/A 19.49% $1.28 0.98 $1.06
79-80 $990,035 $103,970 393,678 229,485 558,601 29,755 10.50% $1.77 0.70 $2.25
80-81 $1,525,323 $160,514 540,596 387,433 782,985 41,643 10.52% $1.95 0.69 $2.52
81-82 $1,565,869 $219,311 589,101 465,936 825,490 41,618 14.01% $1.90 0.71 $2.29
82-83 $1,653,299 $256,569 591,669 465,047 812,498 40,186 15.52% $2.03 0.73 $2.36
83-84 $1,582,292 $277,094 631,571 499,700 810,981 40,094 17.51% $1.95 0.78 $2.07
84-85 $1,246,429 $232,132 502,391 414,304 597,715 30,600 18.62% $2.09 0.84 $2.02
85-86 $993,909 $236,186 538,461 448,427 580,531 30,688 23.76% $1.71 0.93 $1.41
86-87 $1,017,902 $247,550 525,406 439,310 585,225 31,056 24.32% $1.74 0.90 $1.47
87-88 $1,167,233 $280,494 577,786 486,605 646,904 35,077 24.03% $1.80 0.89 $1.53
88-89 $1,231,116 $325,774 645,078 547,396 739,222 39,388 26.46% $1.67 0.87 $1.40
89-90 $2,247,871 $671,779 1,278,345 1,012,410 1,351,002 93,592 29.89% $1.66 0.95 $1.23
90-91 $2,612,340 $879,263 1,759,808 1,393,713 1,396,168 96,720 33.66% $1.87 1.26 $0.98
91-92 $3,192,244 $1,095,294 2,093,628 1,690,256 1,721,322 117,915 34.31% $1.85 1.22 $1.00
92-93 $3,559,782 $1,385,488 2,397,030 1,978,645 1,782,668 128,667 38.92% $2.00 1.34 $0.91
93-94 $3,708,325 $1,676,587 2,578,321 2,171,771 1,803,424 131,906 45.21% $2.06 1.43 $0.79
94-95 $4,129,388 $1,761,928 2,876,843 2,414,768 1,945,810 143,805 42.67% $2.12 1.48 $0.82
95-96 $4,664,823 $1,849,871 3,160,993 2,618,175 2,126,374 181,305 39.66% $2.19 1.49 $0.89
96-97 $4,846,618 $2,043,284 3,425,473 2,895,086 2,212,224 176,832 42.16% $2.19 1.55 $0.82
97-98 $5,315,990 $2,150,329 3,785,654 2,910,043 2,269,485 184,640 40.45% $2.34 1.67 $0.84
98-99 $5,840,703 $2,164,070 3,693,373 3,136,706 2,338,995 185,705 37.05% $2.50 1.58 $1.00
99-00 $6,434,418 $2,104,518 3,563,731 2,890,218 2,335,354 184,246 32.71% $2.76 1.53 $1.21
00-01 $6,514,841 $2,072,800 3,389,852 2,744,889 2,274,157 170,748 31.82% $2.86 1.49 $1.31
01-02 $9,989,225 $2,498,192 3,357,126 2,929,773 2,373,258 175,881 25.01% $4.21 1.41 $2.23
02-03 $10,344,201 $2,895,778 3,904,054 3,168,399 2,494,667 208,063 27.99% $4.15 1.56 $1.91
03-04 $10,533,242 $3,095,900 3,728,010 3,038,995 2,504,479 211,125 29.39% $4.21 1.49 $1.99
04-05 $10,611,486 $3,007,293 3,718,614 3,036,938 2,448,077 206,999 28.34% $4.33 1.52 $2.04
05-06 N/A N/A N/A N/A N/A N/A — — — —
06-07 N/A N/A N/A N/A N/A N/A — — — —
MTS
EA
ST C
OU
NTY
SU
BU
RB
AN

The Coordinated Plan (2010 – 2014) C-17 Appendix C—FY09 RSRTP Route Statistics and Historical Data
TotalFarebox Operating Passen- Subsidy
Fiscal Operating Farebox Total Revenue Revenue Revenue Recovery Cost ger PerOperator Year Cost Revenue Passengers Passengers Miles Hours Ratio Rev-Mile Rev-Mile Boarding
81-82 $207,813 $61,406 37,922 37,857 65,550 1,926 29.55% $3.17 0.58 $3.86
82-83 $313,250 $111,041 68,202 68,202 91,257 2,807 35.45% $3.43 0.75 $2.96
83-84 $340,014 $121,594 72,809 72,809 110,040 3,168 35.76% $3.09 0.66 $3.00
84-85 $317,210 $132,573 80,255 79,480 117,880 4,021 41.79% $2.69 0.68 $2.30
85-86 $377,106 $160,253 98,850 97,932 127,915 3,957 42.50% $2.95 0.77 $2.19
86-87 $544,813 $191,628 109,232 107,857 145,225 4,584 35.17% $3.75 0.75 $3.23
87-88 $654,313 $248,319 133,966 132,352 189,274 5,949 37.95% $3.46 0.71 $3.03
88-89 $722,238 $281,850 153,482 152,252 247,836 8,040 39.02% $2.91 0.62 $2.87
89-90 $906,311 $354,753 202,241 200,306 267,749 8,421 39.14% $3.38 0.76 $2.73
90-91 $1,204,801 $440,639 284,447 281,725 349,892 11,004 36.57% $3.44 0.81 $2.69
91-92 $1,524,422 $585,082 300,818 295,615 427,635 14,002 38.38% $3.56 0.70 $3.12
92-93 $1,600,766 $560,989 287,658 281,059 424,990 17,902 35.05% $3.77 0.68 $3.61
93-94 $1,611,027 $521,858 264,031 260,582 426,750 14,181 32.39% $3.78 0.62 $4.13
94-95 $1,448,650 $457,123 254,998 250,674 382,233 13,239 31.56% $3.79 0.67 $3.89
95-96 $1,224,841 $460,328 240,821 236,239 324,407 11,738 37.58% $3.78 0.74 $3.17
96-97 $1,164,318 $521,889 269,506 265,240 320,001 11,740 44.82% $3.64 0.84 $2.38
97-98 $1,161,612 $485,538 264,320 263,652 328,748 11,727 41.80% $3.53 0.80 $2.56
98-99 $1,272,872 $543,235 273,566 268,779 330,899 11,590 42.68% $3.85 0.83 $2.67
99-00 $1,322,155 $545,228 279,339 273,747 332,302 13,548 41.24% $3.98 0.84 $2.78
00-01 $1,388,052 $523,699 258,392 255,425 320,840 11,444 37.73% $4.33 0.81 $3.35
01-02 $2,007,665 $580,921 258,977 257,659 328,376 11,806 28.94% $6.11 0.79 $5.51
02-03 $1,994,705 $607,812 263,902 261,552 330,398 11,880 30.47% $6.04 0.80 $5.26
03-04 $2,089,787 $655,212 245,991 239,956 333,465 13,609 31.35% $6.27 0.74 $5.83
04-05 $2,178,434 $677,753 262,658 252,808 364,988 14,871 31.11% $5.97 0.72 $5.71
05-06 N/A N/A N/A N/A N/A N/A — — — —
06-07 N/A N/A N/A N/A N/A N/A — — — —
Note: In FY05-06, all MTS fixed route bus service consolidated under MTS Bus reporting.
MTS
EX
PRES
S B
US

The Coordinated Plan (2010 – 2014) C-18 Appendix C—FY09 RSRTP Route Statistics and Historical Data
TotalFarebox Operating Passen- Subsidy
Fiscal Operating Farebox Total Revenue Revenue Revenue Recovery Cost ger PerOperator Year Cost Revenue Passengers Passengers Miles Hours Ratio Rev-Mile Rev-Mile Boarding
84-85 $293,932 $46,258 115,981 85,634 191,461 10,816 15.74% $1.54 0.61 $2.14
85-86 $345,737 $64,321 152,115 122,794 255,171 11,709 18.60% $1.35 0.60 $1.85
86-87 $374,575 $78,043 175,495 148,281 289,735 13,114 20.84% $1.29 0.61 $1.69
87-88 $456,590 $86,811 196,360 168,734 313,425 14,517 19.01% $1.46 0.63 $1.88
88-89 $515,788 $112,712 228,584 197,344 409,206 20,284 21.85% $1.26 0.56 $1.76
89-90 $632,972 $143,660 264,851 227,548 390,881 19,631 22.70% $1.62 0.68 $1.85
90-91 $667,481 $128,348 251,656 216,211 387,739 19,473 19.23% $1.72 0.65 $2.14
91-92 $720,934 $138,834 246,995 206,405 393,918 20,028 19.26% $1.83 0.63 $2.36
92-93 $714,424 $138,810 222,352 189,310 293,722 14,665 19.43% $2.43 0.76 $2.59
93-94 $692,725 $157,713 224,108 192,600 289,040 16,461 22.77% $2.40 0.78 $2.39
94-95 $725,706 $167,518 240,606 208,011 317,245 13,236 23.08% $2.29 0.76 $2.32
95-96 $749,036 $181,517 265,494 231,709 316,110 17,962 24.23% $2.37 0.84 $2.14
96-97 $829,408 $181,633 274,939 236,632 326,938 18,749 21.90% $2.54 0.84 $2.36
97-98 $831,366 $183,283 266,488 220,403 331,544 19,062 22.05% $2.51 0.80 $2.43
98-99 $890,558 $187,415 262,292 226,489 337,048 18,890 21.04% $2.64 0.78 $2.68
99-00 $1,040,449 $190,504 272,326 224,738 344,889 18,830 18.31% $3.02 0.79 $3.12
00-01 $1,090,540 $216,632 283,509 249,183 339,143 19,115 19.86% $3.22 0.84 $3.08
01-02 $1,047,414 $244,723 287,568 259,397 332,873 19,614 23.36% $3.15 0.86 $2.79
02-03 $958,529 $260,266 286,746 253,690 326,639 19,757 27.15% $2.93 0.88 $2.44
03-04 $962,970 $275,132 266,016 235,920 315,584 19,301 28.57% $3.05 0.84 $2.59
04-05 $937,874 $263,866 251,611 228,308 305,157 19,180 28.13% $3.07 0.82 $2.68
04-05 $937,874 $263,866 251,611 228,308 305,157 19,180 28.13% $3.07 0.82 $2.68
05-06 N/A N/A N/A N/A N/A N/A — — — —
06-07 N/A N/A N/A N/A N/A N/A — — — —
MTS
PO
WA
Y S
UB
UR
BA
N

The Coordinated Plan (2010 – 2014) C-19 Appendix C—FY09 RSRTP Route Statistics and Historical Data
TotalFarebox Operating Passen- Subsidy
Fiscal Operating Farebox Total Revenue Revenue Revenue Recovery Cost ger PerOperator Year Cost Revenue Passengers Passengers Miles Hours Ratio Rev-Mile Rev-Mile Boarding
79-80 $87,089 $10,196 18,243 17,189 21,890 1,068 11.71% $3.98 0.83 $4.21
80-81 $208,504 $67,132 120,075 110,204 132,420 6,036 32.20% $1.57 0.91 $1.18
81-82 $374,906 $133,366 216,029 196,943 169,836 8,224 35.57% $2.21 1.27 $1.12
82-83 $1,030,912 $495,489 833,435 608,187 416,418 26,288 48.06% $2.48 2.00 $0.64
83-84 $1,133,014 $542,856 859,284 778,674 415,946 30,836 47.91% $2.72 2.07 $0.69
84-85 $1,168,895 $464,402 920,287 726,645 422,543 27,696 39.73% $2.77 2.18 $0.77
85-86 $1,184,647 $511,748 924,752 648,147 408,655 28,564 43.20% $2.90 2.26 $0.73
86-87 $1,303,734 $533,680 830,595 655,689 399,846 26,637 40.93% $3.26 2.08 $0.93
87-88 $1,893,137 $1,184,641 1,709,742 1,386,372 754,957 55,196 62.58% $2.51 2.26 $0.41
88-89 $2,161,239 $1,470,698 2,190,252 1,726,155 826,151 61,132 68.05% $2.62 2.65 $0.32
89-90 $2,551,089 $1,750,887 2,684,711 2,115,842 1,042,887 78,631 68.63% $2.45 2.57 $0.30
90-91 $3,056,749 $2,121,891 3,309,694 2,608,039 1,334,699 100,633 69.42% $2.29 2.48 $0.28
91-92 $3,367,427 $2,518,588 3,502,851 2,775,758 1,474,151 106,190 74.79% $2.28 2.38 $0.24
92-93 $3,972,460 $2,540,794 3,526,825 2,838,687 1,549,279 115,737 63.96% $2.56 2.28 $0.41
93-94 $4,389,314 $2,882,031 3,590,654 2,941,423 1,687,262 121,423 65.66% $2.60 2.13 $0.42
94-95 $4,999,125 $2,903,880 3,835,227 3,194,024 1,794,949 127,460 58.09% $2.79 2.14 $0.55
95-96 $5,960,164 $3,376,316 4,593,992 3,844,224 2,014,616 147,096 56.65% $2.96 2.28 $0.56
96-97 $8,022,702 $5,170,728 7,277,223 6,139,987 2,702,639 215,816 64.45% $2.97 2.69 $0.39
97-98 $10,766,446 $5,995,890 8,742,613 6,801,547 3,254,665 258,628 55.69% $3.31 2.69 $0.55
98-99 $12,515,475 $6,665,261 9,888,292 7,495,849 3,719,185 295,907 53.26% $3.37 2.66 $0.59
99-00 $13,340,134 $6,829,487 10,577,214 8,147,416 3,906,975 313,401 51.20% $3.41 2.71 $0.62
00-01 $15,650,016 $7,705,953 11,145,805 8,318,731 4,149,821 332,888 49.24% $3.77 2.69 $0.71
01-02 $16,653,600 $9,138,844 11,615,074 8,943,607 4,573,694 367,041 54.88% $3.64 2.54 $0.65
02-03 $20,486,140 $9,266,943 11,928,713 9,457,318 4,878,594 396,760 45.24% $4.20 2.45 $0.94
03-04 $23,742,781 $10,727,179 12,911,070 10,232,692 5,398,320 448,114 45.18% $4.40 2.39 $1.01
04-05 $25,116,503 $10,483,712 12,896,353 10,155,341 5,434,064 455,878 41.74% $4.62 2.37 $1.13
MTS
CO
NTR
AC
T SE
RV
ICES
- S
OU
TH C
ENTR
AL
(900
SER
IES)
TotalFarebox Operating Passen- Subsidy
Fiscal Operating Farebox Total Revenue Revenue Revenue Recovery Cost ger PerOperator Year Cost Revenue Passengers Passengers Miles Hours Ratio Rev-Mile Rev-Mile Boarding
03-04 $1,913,826 $576,543 684,061 563,274 541,266 51,941 30.13% $3.54 1.26 $1.95
04-05 $1,957,490 $568,485 694,820 563,003 525,091 50,075 29.04% $3.73 1.32 $2.00MTS
800,
900
M
INIB
US
Note: Includes 800- and 900- Series Minibus Fixed routes. In FY 03-04, these routes were demand response. In FY 04-05, they became fixed routeservices. For previous years, these numbers were included in the DART service data. In FY05-06, MTS fixed route bus service consolidated under MTS Bus.

The Coordinated Plan (2010 – 2014) C-20 Appendix C—FY09 RSRTP Route Statistics and Historical Data
TotalFarebox Operating Passen- Subsidy
Fiscal Operating Farebox Total Revenue Revenue Revenue Recovery Cost ger PerOperator Year Cost Revenue Passengers Passengers Miles Hours Ratio Rev-Mile Rev-Mile Boarding
79-80 $589,521 $61,706 323,281 185,889 277,393 23,655 10.47% $2.13 1.17 $1.63
80-81 $482,807 $90,259 416,035 259,142 234,822 18,796 18.69% $2.06 1.77 $0.94
81-82 $542,010 $135,930 416,955 280,683 248,023 21,761 25.08% $2.19 1.68 $0.97
82-83 $657,955 $165,163 458,027 307,545 263,612 24,940 25.10% $2.50 1.74 $1.08
83-84 $650,457 $192,520 542,446 371,192 271,249 22,077 29.60% $2.40 2.00 $0.84
84-85 $715,947 $235,339 620,403 441,554 270,763 22,089 32.87% $2.64 2.29 $0.77
85-86 $768,510 $248,247 670,190 473,292 274,198 22,848 32.30% $2.80 2.44 $0.78
86-87 $756,993 $262,867 668,955 475,000 270,781 22,751 34.73% $2.80 2.47 $0.74
87-88 $788,772 $283,389 728,956 445,567 276,303 22,973 35.93% $2.85 2.64 $0.69
88-89 $687,212 $342,928 821,036 591,722 274,290 23,038 49.90% $2.51 2.99 $0.42
89-90 $887,109 $463,706 1,048,356 747,874 289,536 24,431 52.27% $3.06 3.62 $0.40
90-91 $1,061,165 $512,346 1,171,537 797,568 299,668 25,286 48.28% $3.54 3.91 $0.47
91-92 $1,178,162 $670,146 1,339,506 870,890 405,254 35,828 56.88% $2.91 3.31 $0.38
92-93 $1,253,392 $734,230 1,376,341 1,036,531 404,161 35,739 58.58% $3.10 3.41 $0.38
93-94 $1,468,051 $796,881 1,379,330 1,081,501 404,872 35,886 54.28% $3.63 3.41 $0.49
94-95 $1,427,390 $827,339 1,466,162 1,171,660 403,175 36,648 57.96% $3.54 3.64 $0.41
95-96 $1,529,906 $868,326 1,558,739 1,249,326 401,988 37,180 56.76% $3.81 3.88 $0.42
96-97 $1,583,821 $909,303 1,624,360 1,310,458 401,717 36,693 57.41% $3.94 4.04 $0.42
97-98 $1,857,692 $1,005,884 1,750,844 1,313,134 423,381 36,838 54.15% $4.39 4.14 $0.49
98-99 $1,603,654 $1,033,454 1,982,133 1,562,571 447,415 41,567 64.44% $3.58 4.43 $0.29
99-00 $1,961,000 $1,074,000 2,050,045 1,448,658 450,940 41,747 54.77% $4.35 4.55 $0.43
00-01 $2,241,000 $1,032,000 1,986,276 1,831,942 432,477 41,542 46.05% $5.18 4.59 $0.61
01-02 $2,143,567 $1,205,296 1,891,509 1,782,009 448,298 41,588 56.23% $4.78 4.22 $0.50
02-03 $2,454,155 $1,184,416 1,841,966 1,841,966 455,367 41,478 48.26% $5.39 4.05 $0.69
03-04 $2,679,365 $1,318,695 1,727,169 1,637,895 455,497 42,347 49.22% $5.88 3.79 $0.79
04-05 $2,728,967 $1,213,757 1,633,113 1,233,419 475,364 41,781 44.48% $5.74 3.44 $0.93
05-06 $2,898,014 $1,081,871 1,691,913 1,283,045 474,965 41,284 37.33% $6.10 3.56 $1.07
06-07 $1,401,991 $680,402 859,444 N/A 227,593 20,542 48.53% $6.16 3.78 $0.84
Note: Beginning with Quarter 4, FY 2007 National City Transit data was consolidated with MTS Bus
NA
TIO
NA
L C
ITY
TR
AN
SIT
TotalFarebox Operating Passen- Subsidy
Fiscal Operating Farebox Total Revenue Revenue Revenue Recovery Cost ger PerOperator Year Cost Revenue Passengers Passengers Miles Hours Ratio Rev-Mile Rev-Mile Boarding
96-97 $28,093,133 $7,785,795 11,043,967 8,915,190 8,501,735 478,939 27.71% $3.30 1.30 $1.84
97-98 $28,265,848 $8,452,623 11,246,332 9,162,314 8,510,252 481,210 29.90% $3.32 1.32 $1.76
98-99 $28,761,060 $8,448,589 11,123,629 8,813,141 8,189,269 471,730 29.38% $3.51 1.36 $1.83
99-00 $30,828,650 $8,434,395 11,197,183 9,256,262 8,159,269 477,197 27.36% $3.78 1.37 $2.00
00-01 $35,153,704 $8,256,259 10,905,917 9,056,074 8,194,433 477,548 23.49% $4.29 1.33 $2.47
01-02 $36,754,780 $8,455,657 10,456,545 8,694,417 7,921,430 486,318 23.01% $4.64 1.32 $2.71
02-03 $40,896,704 $8,228,640 10,177,834 8,506,750 7,391,751 488,659 20.12% $5.53 1.38 $3.21
03-04 $39,660,424 $8,753,422 10,330,762 10,330,762 6,954,651 493,838 22.07% $5.70 1.49 $2.99
04-05 $40,956,942 $9,037,231 10,104,823 9,671,619 6,826,695 488,533 22.07% $6.00 1.48 $3.16
05-06 $43,723,296 $9,374,184 10,161,233 9,725,032 6,915,721 495,834 21.44% $6.32 1.47 $3.38
06-07 $45,398,876 $9,654,711 10,160,477 9,733,737 7,062,209 497,389 21.27% $6.43 1.44 $3.52
07-08 $45,398,876 $9,654,712 9,744,558 9,317,746 6,650,337 475,848 21.27% $6.83 1.47 $3.67
08-09 $0 $0 8,747,458 8,364,319 5,745,711 425,029 0.00% $0.00 1.52 $4.09
NC
TD B
REE
ZE

The Coordinated Plan (2010 – 2014) C-21 Appendix C—FY09 RSRTP Route Statistics and Historical Data
TotalFarebox Operating Passen- Subsidy
Fiscal Operating Farebox Total Revenue Revenue Revenue Recovery Cost ger PerOperator Year Cost Revenue Passengers Passengers Miles Hours Ratio Rev-Mile Rev-Mile Boarding
07-08 $6,217,603 $668,047 718,481 718,481 140,347 6,217 10.74% $44.30 5.12 $7.72
08-09 $15,050,977 $2,272,203 2,195,373 2,195,373 618,004 28,051 15.10% $24.35 3.55 $5.82NC
TDSP
RIN
TER
TotalFarebox Operating Passen- Subsidy
Fiscal Operating Farebox Total Revenue Revenue Revenue Recovery Cost ger PerOperator Year Cost Revenue Passengers Passengers Miles Hours Ratio Rev-Mile Rev-Mile Boarding
96-97 $9,106,568 $2,195,956 909,974 — 210,421 4,986 24.11% $43.28 4.32 $7.59
97-98 $8,580,048 $2,612,672 1,031,268 — 215,518 5,125 30.45% $39.81 4.79 $5.79
98-99 $7,711,957 $3,022,646 1,240,225 — 208,854 4,952 39.19% $36.93 5.94 $3.78
99-00 $10,936,233 $2,890,853 1,187,749 — 207,908 4,825 26.43% $52.60 5.71 $6.77
00-01 $10,331,888 $3,415,325 1,206,839 — 207,527 4,902 33.06% $49.79 5.82 $5.73
01-02 $10,152,892 $4,148,329 1,281,124 — 236,604 5,607 40.86% $42.91 5.41 $4.69
02-03 $10,826,109 $4,748,984 1,345,333 1,345,333 1,271,798 6,057 43.87% $8.51 1.06 $4.52
03-04 $13,985,454 $5,239,389 1,428,819 1,428,819 1,137,319 6,194 37.46% $12.30 1.26 $6.12
04-05 $15,474,873 $5,774,132 1,432,468 1,432,468 1,229,625 6,103 37.31% $12.59 1.16 $6.77
05-06 $16,174,476 $6,086,694 1,554,450 1,554,450 1,298,922 30,788 37.63% $12.45 1.20 $6.49
06-07 $17,809,005 $6,368,047 1,560,729 1,560,729 1,267,523 30,258 35.76% $14.05 1.23 $7.33
07-08 $17,851,115 $6,997,396 1,686,015 1,686,015 1,284,363 31,313 39.20% $13.90 1.31 $6.44
08-09 $16,466,352 $6,975,640 1,501,619 1,501,619 1,349,238 33,347 42.36% $12.20 1.11 $6.32
Note: For FY 97 to FY 02, Revenue Miles are measured in train miles. For FY04-Current Reported Year, Revenue Miles are measured in car miles.
For FY 96 to FY 05, Revenue Hours in train hours but for FY 05, Revenue Hours in car hours.
NC
TD C
OA
STER

The Coordinated Plan (2010 – 2014) C-22 Appendix C—FY09 RSRTP Route Statistics and Historical Data
TotalFarebox Operating Passen- Subsidy
Fiscal Operating Farebox Total Revenue Revenue Revenue Recovery Cost ger PerOperator Year Cost Revenue Passengers Passengers Miles Hours Ratio Rev-Mile Rev-Mile Boarding
67-68 $4,930,985 $4,834,937 19,610,000 15,997,968 6,130,000 440,000 98.05% $0.80 3.20 $0.00
68-69 $5,852,529 $5,283,796 21,566,000 17,781,911 6,980,000 500,000 90.28% $0.84 3.09 $0.03
69-70 $5,898,675 $4,706,687 18,913,000 15,515,751 6,290,000 450,000 79.79% $0.94 3.01 $0.06
70-71 $8,005,800 $5,301,324 16,295,592 13,601,050 6,840,000 490,000 66.22% $1.17 2.38 $0.17
71-72 $8,299,628 $4,937,983 15,382,606 13,015,770 6,390,000 460,000 59.50% $1.30 2.41 $0.22
72-73 $11,199,107 $4,642,071 22,689,656 18,519,042 8,640,000 620,000 41.45% $1.30 2.63 $0.29
73-74 $13,600,652 $5,728,459 29,511,549 24,567,011 8,910,100 640,000 42.12% $1.53 3.31 $0.27
74-75 $18,552,121 $6,370,606 33,475,895 27,629,963 10,720,000 771,000 34.34% $1.73 3.12 $0.36
75-76 $23,173,785 $7,793,339 35,964,036 29,316,157 12,990,000 935,000 33.63% $1.78 2.77 $0.43
76-77 $25,632,894 $7,941,986 36,942,743 30,067,931 13,402,375 1,043,471 30.98% $1.91 2.76 $0.48
77-78 $27,030,538 $8,443,753 36,666,768 29,920,024 13,082,989 1,003,191 31.24% $2.07 2.80 $0.51
78-79 $28,262,505 $9,157,016 33,581,655 27,282,980 11,085,172 700,429 32.40% $2.55 3.03 $0.57
79-80 $30,335,825 $12,190,300 34,619,632 27,913,111 11,550,395 892,888 40.18% $2.63 3.00 $0.52
80-81 $33,913,545 $13,991,103 33,141,011 26,306,208 11,568,481 885,135 41.26% $2.93 2.86 $0.60
81-82 $32,429,860 $13,645,922 25,412,056 21,118,678 9,678,495 775,042 42.08% $3.35 2.63 $0.74
82-83 $32,556,104 $12,429,875 22,699,831 18,525,895 9,566,069 748,929 38.18% $3.40 2.37 $0.89
83-84 $33,218,582 $12,813,029 23,538,734 19,188,394 9,612,275 758,159 38.57% $3.46 2.45 $0.87
84-85 $34,470,383 $13,417,760 24,141,287 19,649,835 9,497,756 756,760 38.93% $3.63 2.54 $0.87
85-86 $37,038,091 $13,965,802 24,943,358 20,228,754 9,710,703 766,939 37.71% $3.81 2.57 $0.92
86-87 $37,190,262 $14,538,504 24,834,207 20,750,689 10,074,338 788,755 39.09% $3.69 2.47 $0.91
87-88 $40,307,840 $16,183,029 25,898,552 20,121,180 10,782,693 840,843 40.15% $3.74 2.40 $0.93
88-89 $41,181,434 $17,527,970 27,908,880 22,817,198 10,862,764 867,026 42.56% $3.79 2.57 $0.85
89-90 $45,496,406 $19,168,856 30,833,877 25,011,134 10,946,559 894,437 42.13% $4.16 2.82 $0.85
90-91 $51,008,649 $20,352,242 32,813,590 27,098,104 11,417,566 932,923 39.90% $4.47 2.87 $0.93
91-92 $55,412,234 $24,031,292 34,021,076 28,152,608 13,088,481 1,003,820 43.37% $4.23 2.60 $0.92
92-93 $55,965,573 $24,441,827 33,911,607 28,290,897 12,275,744 1,063,160 43.67% $4.56 2.76 $0.93
93-94 $54,735,950 $25,296,731 32,626,464 27,559,463 11,514,167 964,012 46.22% $4.75 2.83 $0.90
94-95 $54,458,716 $24,890,870 32,290,301 27,217,166 11,116,676 973,416 45.71% $4.90 2.90 $0.92
95-96 $52,844,641 $24,665,544 32,991,673 27,899,925 10,699,631 889,979 46.68% $4.94 3.08 $0.85
96-97 $53,729,910 $23,716,433 32,288,816 25,967,672 10,105,048 877,196 44.14% $5.32 3.20 $0.93
97-98 $55,471,259 $24,355,780 33,511,770 26,380,190 10,297,247 909,839 43.91% $5.39 3.25 $0.93
98-99 $57,972,520 $24,485,192 34,469,298 28,252,834 10,869,345 935,273 42.24% $5.33 3.17 $0.97
99-00 $60,925,000 $24,100,000 34,884,263 26,569,249 11,146,854 961,674 39.56% $5.47 3.13 $1.06
00-01 $67,257,730 $24,572,000 33,677,068 26,267,395 11,130,210 963,217 36.53% $6.04 3.03 $1.27
01-02 $71,944,000 $25,914,000 31,923,576 25,349,612 11,285,546 958,032 36.02% $6.37 2.83 $1.44
02-03 $71,209,003 $23,758,460 28,966,424 23,028,411 10,867,305 913,322 33.36% $6.55 2.67 $1.64
03-04 $75,526,059 $22,500,657 25,545,374 20,385,481 10,348,010 851,415 29.79% $7.30 2.47 $2.08
04-05 $78,216,331 $21,383,099 24,425,117 20,057,566 10,087,350 829,743 27.34% $7.75 2.42 $2.33
05-06 $125,906,217 $41,457,861 48,134,101 38,928,793 20,245,177 1,728,020 32.93% $6.22 2.38 $1.75
06-07 $124,679,338 $41,862,215 49,070,997 39,515,214 19,776,866 1,756,170 33.58% $6.30 2.48 $1.69
07-08 $135,300,449 $45,956,569 52,386,315 50,706,986 21,001,543 1,805,932 33.97% $6.44 2.49 $1.71
08-09 $131,413,658 $53,488,306 54,616,583 53,266,055 20,304,394 1,744,790 40.70% $6.47 2.69 $1.43
SAN
DIE
GO
TR
AN
SIT
CO
RPO
RA
TIO
N F
Y 6
7-05
(MTS
BU
S FY
05-
08)
Note: FY 05-08 includes Contract Services, Chula Vista Transit & National City Transit. Future fixed route services will also be consolidated under MTS Bus.

The Coordinated Plan (2010 – 2014) C-23 Appendix C—FY09 RSRTP Route Statistics and Historical Data
TotalFarebox Operating Passen- Subsidy
Fiscal Operating Farebox Total Revenue Revenue Revenue Recovery Cost ger PerOperator Year Cost Revenue Passengers Passengers Miles Hours Ratio Rev-Mile Rev-Mile Boarding
81-82 $3,453,804 $2,787,175 3,893,073 3,659,185 1,004,861 27,776 80.70% $3.44 3.87 $0.17
82-83 $4,101,325 $3,037,204 4,177,010 4,044,989 1,266,319 30,376 74.05% $3.24 3.30 $0.25
83-84 $4,950,481 $3,976,264 5,401,091 4,801,126 1,612,697 34,038 80.32% $3.07 3.35 $0.18
84-85 $5,516,600 $4,753,300 5,973,965 5,392,345 1,600,228 34,438 86.16% $3.45 3.73 $0.13
85-86 $6,116,199 $5,560,148 6,995,674 6,294,555 1,795,735 41,371 90.91% $3.41 3.90 $0.08
86-87 $7,379,527 $6,336,741 7,776,166 6,805,374 2,044,831 53,495 85.87% $3.61 3.80 $0.13
87-88 $8,280,085 $7,362,028 9,280,616 8,506,381 2,129,521 53,631 88.91% $3.89 4.36 $0.10
88-89 $9,003,936 $8,480,826 10,716,454 9,849,208 2,237,206 57,404 94.19% $4.02 4.79 $0.05
89-90 $13,320,475 $12,411,220 16,005,726 15,370,145 4,014,744 82,033 93.17% $3.32 3.99 $0.06
90-91 $16,833,128 $13,453,473 18,029,989 17,092,017 4,454,978 91,028 79.92% $3.78 4.05 $0.19
91-92 $18,843,438 $13,972,888 17,162,550 16,430,786 4,507,494 99,648 74.15% $4.18 3.81 $0.28
92-93 $19,878,005 $12,999,123 16,961,838 15,772,460 4,410,636 99,769 65.39% $4.51 3.85 $0.41
93-94 $19,396,557 $12,839,279 14,887,952 12,450,989 4,175,656 99,315 66.19% $4.65 3.57 $0.44
94-95 $19,927,498 $12,896,511 15,624,411 12,292,790 4,098,876 97,650 64.72% $4.86 3.81 $0.45
95-96 $20,842,211 $14,119,409 16,770,356 13,387,730 4,215,284 100,761 67.74% $4.94 3.98 $0.40
96-97 $23,150,851 $15,641,407 18,286,616 14,955,548 5,059,054 95,308 67.56% $4.58 3.61 $0.41
97-98 $26,480,208 $18,589,024 22,969,209 18,751,507 6,186,987 108,685 70.20% $4.28 3.71 $0.34
98-99 $29,340,950 $20,132,617 24,567,479 20,477,711 6,990,998 126,960 68.62% $4.20 3.51 $0.37
99-00 $32,154,689 $20,940,891 28,743,326 22,972,488 7,090,499 124,861 65.13% $4.53 4.05 $0.39
00-01 $37,282,268 $22,244,487 28,885,554 22,697,993 7,070,019 126,740 59.67% $5.27 4.09 $0.52
01-02 $37,358,997 $22,157,906 25,432,952 20,676,990 7,046,660 138,821 59.31% $5.30 3.61 $0.60
02-03 $38,985,869 $22,071,207 25,174,788 23,256,229 6,921,657 137,298 56.61% $5.63 3.64 $0.67
03-04 $41,830,450 $24,196,943 26,538,239 24,543,606 6,983,370 137,383 57.85% $5.99 3.80 $0.66
04-05 $47,661,707 $25,855,241 29,333,350 24,579,512 7,060,503 137,932 54.25% $6.75 4.15 $0.74
05-06 $55,014,600 $27,933,766 33,829,833 27,646,268 8,317,250 468,830 50.78% $6.61 4.07 $0.80
06-07 $55,951,561 $27,401,733 35,114,185 29,394,096 7,932,153 438,168 48.97% $7.05 4.43 $0.81
07-08 $56,133,210 $31,120,170 37,858,533 33,981,819 7,932,153 439,377 55.44% $7.08 4.77 $0.66
08-09 $58,485,590 $33,453,632 36,928,284 33,309,312 7,932,153 409,515 57.20% $7.37 4.66 $0.68
Note: Figure for San Diego Trolley, Inc. is in car miles and train hours (except FY 05-06 which begins the reporting of car hours).
SAN
DIE
GO
TR
OLL
EYIN
CO
RPO
RA
TED
TotalFarebox Operating Passen- Subsidy
Fiscal Operating Farebox Total Revenue Revenue Revenue Recovery Cost ger PerOperator Year Cost Revenue Passengers Passengers Miles Hours Ratio Rev-Mile Rev-Mile Boarding
99-00 $120,000 N/A 45,810 N/A 6,985 1,778 N/A $17.18 6.56 N/A
00-01 $120,000 N/A 48,420 N/A 7,440 1,984 N/A $16.13 6.51 N/A
01-02 $120,000 N/A 73,590 N/A 7,470 1,992 N/A $16.06 9.85 N/A
02-03 $123,600 N/A 83,680 N/A 7,500 1,992 N/A $16.48 11.16 N/A
03-04 $127,308 N/A 88,862 N/A 7,500 N/A N/A $16.97 11.85 N/A
04-05 $131,124 N/A 88,750 N/A 7,560 N/A N/A $17.34 11.74 N/A
05-06 $135,060 N/A 72,238 N/A 7,470 N/A N/A $18.08 9.67 N/A
06-07 $139,116 N/A 77,536 N/A 7,440 N/A N/A $18.70 10.42 N/A
07-08 $143,285 N/A 74,386 N/A 7,500 N/A N/A $19.10 9.92 N/A
08-09 $147,584 N/A N/A N/A 7,500 N/A N/A $19.68 N/A N/A
Note: Figures for Ferry not included in fixed-route totals. No fare is collected on the ferry.
CO
RO
NA
DO
FER
RY

The Coordinated Plan (2010 – 2014) C-24 Appendix C—FY09 RSRTP Route Statistics and Historical Data
TotalFarebox Operating Passen- Subsidy
Fiscal Operating Farebox Total Revenue Revenue Revenue Recovery Cost ger PerOperator Year Cost Revenue Passengers Passengers Miles Hours Ratio Rev-Mile Rev-Mile Boarding
67-68 $4,930,985 $4,834,937 19,610,000 15,997,968 6,130,000 440,000 98.05% $0.80 3.20 $0.00
68-69 $5,852,529 $5,283,796 21,566,000 17,781,911 6,980,000 500,000 90.28% $0.84 3.09 $0.03
69-70 $5,898,675 $4,706,687 18,913,000 15,515,751 6,290,000 450,000 79.79% $0.94 3.01 $0.06
70-71 $8,005,800 $5,301,324 16,295,592 13,601,050 6,840,000 490,000 66.22% $1.17 2.38 $0.17
71-72 $8,385,336 $4,966,797 15,568,952 13,161,120 6,632,250 474,250 59.23% $1.26 2.35 $0.22
72-73 $11,301,495 $4,677,020 22,899,262 18,682,535 8,914,458 636,000 41.38% $1.27 2.57 $0.29
73-74 $13,733,299 $5,770,891 29,754,497 24,756,716 9,199,882 656,950 42.02% $1.49 3.23 $0.27
74-75 $18,721,021 $6,425,921 33,782,964 27,873,163 10,985,800 786,500 34.32% $1.70 3.08 $0.36
75-76 $23,374,157 $7,848,244 36,318,466 29,594,739 13,268,800 950,500 33.58% $1.76 2.74 $0.43
76-77 $25,949,568 $8,004,920 37,340,274 30,350,823 13,799,675 1,069,014 30.85% $1.88 2.71 $0.48
77-78 $27,430,777 $8,518,321 37,157,231 30,270,804 13,563,126 1,033,087 31.05% $2.02 2.74 $0.51
78-79 $29,070,733 $9,269,342 34,214,990 27,774,395 11,644,692 729,448 31.89% $2.50 2.94 $0.58
79-80 $32,738,582 $12,447,417 36,009,106 28,837,372 12,908,494 978,908 38.02% $2.54 2.79 $0.56
80-81 $37,207,153 $14,498,549 34,809,310 27,491,465 13,207,116 982,493 38.97% $2.82 2.64 $0.65
81-82 $39,632,679 $17,212,649 31,191,494 26,250,934 12,477,354 909,963 43.43% $3.18 2.50 $0.72
82-83 $41,468,837 $16,755,971 29,473,382 24,513,093 12,926,393 908,050 40.41% $3.21 2.28 $0.84
83-84 $43,089,390 $18,233,872 31,812,874 26,291,790 13,349,169 922,378 42.32% $3.23 2.38 $0.78
84-85 $44,982,130 $19,621,210 33,183,926 27,409,254 13,224,430 920,904 43.62% $3.40 2.51 $0.76
85-86 $47,749,945 $21,080,753 35,192,140 28,962,556 13,687,286 940,817 44.15% $3.49 2.57 $0.76
86-87 $49,687,238 $22,529,136 35,774,925 30,029,069 14,379,632 978,764 45.34% $3.46 2.49 $0.76
87-88 $54,680,573 $26,012,793 39,475,606 31,955,645 15,692,811 1,069,655 47.57% $3.48 2.52 $0.73
88-89 $56,771,877 $28,960,514 43,699,352 36,662,451 16,199,209 1,118,596 51.01% $3.50 2.70 $0.64
89-90 $67,474,589 $35,581,365 53,676,603 45,714,630 18,960,695 1,247,408 52.73% $3.56 2.83 $0.59
90-91 $78,082,007 $38,612,756 59,209,439 50,691,193 20,341,419 1,326,349 49.45% $3.84 2.91 $0.67
91-92 $86,695,001 $44,037,704 60,693,401 51,906,215 23,101,552 1,479,111 50.80% $3.75 2.63 $0.70
92-93 $89,715,546 $43,961,401 60,860,698 51,997,084 22,278,819 1,559,965 49.00% $4.03 2.73 $0.75
93-94 $89,010,227 $45,509,057 57,765,625 48,311,050 21,464,701 1,473,760 51.13% $4.15 2.69 $0.75
94-95 $90,165,339 $45,283,831 58,899,982 48,508,925 21,256,511 1,498,815 50.22% $4.24 2.77 $0.76
95-96 $91,017,349 $46,952,790 62,080,336 51,369,812 21,286,538 1,479,946 51.59% $4.28 2.92 $0.71
96-97 $133,858,827 $59,676,638 78,047,377 62,694,224 31,033,745 2,010,328 44.58% $4.31 2.51 $0.95
97-98 $142,236,984 $65,564,159 86,446,912 67,976,758 33,038,828 2,113,651 46.10% $4.31 2.62 $0.89
98-99 $149,732,476 $68,483,689 90,582,180 72,445,548 34,705,421 2,191,863 45.74% $4.31 2.61 $0.90
99-00 $163,399,026 $68,841,226 96,024,045 74,122,201 35,337,288 2,244,862 42.13% $4.62 2.72 $0.98
00-01 $181,460,908 $72,035,705 95,128,745 73,883,302 35,474,476 2,252,464 39.70% $5.12 2.68 $1.15
01-02 $193,072,092 $76,633,461 89,880,018 71,381,208 35,960,073 2,312,806 39.69% $5.37 2.50 $1.30
02-03 $204,079,831 $75,332,444 87,224,915 73,595,898 36,347,099 2,334,226 36.91% $5.61 2.40 $1.48
03-04 $219,219,764 $79,830,122 86,563,840 74,951,522 36,384,128 2,386,465 36.42% $6.03 2.38 $1.61
04-05 $233,368,513 $80,887,277 88,073,082 73,642,699 36,459,874 2,379,126 34.66% $6.40 2.42 $1.73
05-06 $240,818,589 $84,852,505 93,679,617 77,854,543 36,777,070 2,723,472 35.24% $6.55 2.55 $1.66
06-07 $243,838,780 $85,286,706 95,906,388 80,203,776 36,038,751 2,721,985 34.98% $6.77 2.66 $1.65
07-08 $260,901,253 $94,396,894 $102,393,902 $96,411,047 $37,008,743 $2,758,687 36.18% $7.05 2.77 $1.63
08-09 $221,416,577 $96,189,781 $103,989,317 $98,636,679 $35,949,501 $2,640,732 43.44% $6.16 2.89 $1.20
Note: Figures for North County not included prior to FY97.
FIX
ED R
OU
TE O
PER
ATO
R T
OTA
L(E
XC
LUD
ING
CO
RO
NA
DO
FER
RY
)

The Coordinated Plan (2010 – 2014) C-25 Appendix C—FY09 RSRTP Route Statistics and Historical Data
SANDAG AREA GENERAL PUBLIC DEMAND RESPONSIVE SERVICES
TotalFarebox Operating Passen- Subsidy
Fiscal Operating Farebox Total Revenue Revenue Revenue Recovery Cost ger PerOperator Year Cost Revenue Passengers Passengers Miles Hours Ratio Rev-Mile Rev-Mile Boarding
96-97 $1,032,845 $233,773 205,411 178,682 672,322 49,761 22.63% $1.54 0.31 $3.89
97-98 $1,180,466 $213,005 186,887 163,132 654,407 48,089 18.04% $1.80 0.29 $5.18
98-99 $1,179,436 $206,498 178,870 153,574 636,752 46,239 17.51% $1.85 0.28 $5.44
99-00 $1,110,721 $183,204 157,719 134,332 607,119 45,454 16.49% $1.83 0.26 $5.88
00-01 $1,370,442 $225,653 292,435 239,968 424,945 40,987 16.47% $3.22 0.69 $3.91
01-02 $1,364,772 $315,764 387,975 322,019 423,432 41,705 23.14% $3.22 0.92 $2.70
02-03 $1,345,644 $364,844 453,808 375,406 414,353 38,605 27.11% $3.25 1.10 $2.16
03-04 $2,892,462 $683,984 917,277 N/A 748,638 71,240 23.65% $3.86 1.23 $2.41
04-05 $1,080,101 $113,130 239,404 N/A 217,612 20,776 10.47% $4.96 1.10 $4.04
05-06 $1,212,481 $145,264 253,170 N/A 237,819 22,370 11.98% $5.10 1.06 $4.22
06-07 $1,165,212 $123,644 258,926 N/A 222,076 20,650 10.61% $5.25 1.17 $4.02
07-08 $1,162,948 $160,662 253,152 N/A 202,338 19,819 13.82% $5.75 1.25 $3.96
08-09 $767,421 $217,036 130,780 N/A 123,582 12,773 28.28% $6.21 1.06 $4.21
Years after and including FY 05-06 include SVCC service. MTS DART discontinued at end of FY 07-08 but statistics include SVCC service.
Note: Service was previously included in San Diego Transit Fixed Route data. Years prior to and including FY03-04 include DART and Flex services.
MTS
DA
RT
TotalFarebox Operating Passen- Subsidy
Fiscal Operating Farebox Total Revenue Revenue Revenue Recovery Cost ger PerOperator Year Cost Revenue Passengers Passengers Miles Hours Ratio Rev-Mile Rev-Mile Boarding
03-04 $1,913,826 $576,543 684,061 563,274 541,266 51,941 30.13% $3.54 1.26 $1.95
Note: Includes 800 and 900 Series Flex routes. For FY 04-05, these routes became fixed route services.
See MTS 800, 900 Minibus in the Fixed Routes Services Section.
MTS
FLEX
TotalFarebox Operating Passen- Subsidy
Fiscal Operating Farebox Total Revenue Revenue Revenue Recovery Cost ger PerOperator Year Cost Revenue Passengers Passengers Miles Hours Ratio Rev-Mile Rev-Mile Boarding
94-95 $731,474 $0 131,334 0 154,488 17,634 0.00% $4.73 0.85 $5.57
95-96 $648,107 $0 147,257 0 159,383 17,777 0.00% $4.07 0.92 $4.40
96-97 $549,062 $0 166,045 0 135,072 15,058 0.00% $4.06 1.23 $3.31
97-98 $563,403 $54,752 168,710 0 139,677 15,390 9.72% $4.03 1.21 $3.01
98-99 $559,610 $71,610 185,850 0 142,864 14,398 12.80% $3.92 1.30 $2.63
99-00 $535,398 $68,033 160,619 0 135,898 15,073 12.71% $3.94 1.18 $2.91
00-01 $516,880 $68,982 194,493 0 138,256 14,844 13.35% $3.74 1.41 $2.30
01-02 $517,538 $74,751 192,631 0 139,838 14,874 14.44% $3.70 1.38 $2.30
02-03 $634,565 $86,752 190,664 0 130,840 14,679 13.67% $4.85 1.46 $2.87
03-04 $771,602 $87,953 218,152 0 138,035 14,155 11.40% $5.59 1.58 $3.13
04-05 $908,464 $96,314 227,245 0 167,727 16,839 10.60% $5.42 1.35 $3.57
Note: No fare charged on SVCC until FY 07-08. FY 05-06 through FY 07-08 included in MTS DART services.
MTS
SO
RR
ENTO
VA
LLEY
C
OA
STER
CO
NN
ECTI
ON

The Coordinated Plan (2010 – 2014) C-26 Appendix C—FY09 RSRTP Route Statistics and Historical Data
TotalFarebox Operating Passen- Subsidy
Fiscal Operating Farebox Total Revenue Revenue Revenue Recovery Cost ger PerOperator Year Cost Revenue Passengers Passengers Miles Hours Ratio Rev-Mile Rev-Mile Boarding
01-02 $662,884 $83,702 41,151 36,891 210,825 6,472 12.63% $3.14 0.20 $14.07
02-03 $678,303 $89,237 42,883 42,883 188,146 6,281 13.16% $3.61 0.23 $13.74
03-04 $1,156,402 $100,698 52,239 42,665 418,454 16,733 8.71% $2.76 0.12 $20.21
04-05 $1,520,977 $121,771 59,754 52,935 601,232 21,328 8.01% $2.53 0.10 $23.42
05-06 $999,891 $107,448 41,908 37,177 358,728 12,687 10.75% $2.79 0.12 $21.30
06-07 $624,245 $103,531 24,323 22,015 126,854 4,246 16.58% $4.92 0.19 $21.41
07-08 $709,040 $86,587 25,822 24,260 126,673 4,645 12.21% $5.60 0.20 $24.11
08-09 $646,245 $72,255 24,435 23,213 119,092 4,332 11.18% $5.43 0.21 $23.49
MTS
CO
NTR
AC
TSE
RV
ICE
RU
RA
L
TotalFarebox Operating Passen- Subsidy
Fiscal Operating Farebox Total Revenue Revenue Revenue Recovery Cost ger PerOperator Year Cost Revenue Passengers Passengers Miles Hours Ratio Rev-Mile Rev-Mile Boarding
96-97 $493,052 $59,104 108,416 84,144 185,055 13,969 11.99% $2.66 0.59 $4.00
97-98 $510,159 $53,939 103,245 77,403 180,162 13,944 10.57% $2.83 0.57 $4.42
98-99 $525,309 $53,428 101,071 77,228 184,666 13,945 10.17% $2.84 0.55 $4.67
99-00 $531,590 $49,007 100,034 74,894 161,319 13,949 9.22% $3.30 0.62 $4.82
00-01 $605,633 $43,596 84,306 65,065 158,714 13,849 7.20% $3.82 0.53 $6.67
01-02 $566,085 $55,808 77,535 60,737 152,792 13,645 9.86% $3.70 0.51 $6.58
02-03 $847,387 $30,307 109,178 89,241 216,274 19,081 3.58% $3.92 0.50 $7.48
03-04 $1,125,209 $89,060 140,122 140,122 288,290 24,848 7.91% $3.90 0.49 $7.39
04-05 $932,009 $76,636 115,747 115,747 239,716 21,497 8.22% $3.89 0.48 $7.39
05-06 $925,238 $85,109 105,739 105,739 226,838 20,316 9.20% $4.08 0.47 $7.95
06-07 $1,011,950 $84,089 95,239 95,239 230,053 20,948 8.31% $4.40 0.41 $9.74
07-08 $998,297 $80,331 87,818 87,818 224,674 20,724 8.05% $4.44 0.39 $10.45
08-09 $102,365 $7,929 8,205 8,205 21,921 2,012 7.75% $4.67 0.37 $11.51
Note: NCTD FAST service discontinued in first quarter of FY 08-09 (8/10/2008)
NC
TD F
AST

The Coordinated Plan (2010 – 2014) C-27 Appendix C—FY09 RSRTP Route Statistics and Historical Data
TotalFarebox Operating Passen- Subsidy
Fiscal Operating Farebox Total Revenue Revenue Revenue Recovery Cost ger PerOperator Year Cost Revenue Passengers Passengers Miles Hours Ratio Rev-Mile Rev-Mile Boarding
73-74 $79,973 $24,436 66,124 66,124 103,169 — 30.56% $0.78 0.64 $0.84
74-75 $371,728 $96,785 265,687 265,687 515,799 — 26.04% $0.72 0.52 $1.03
75-76 $432,349 $116,082 319,457 319,457 591,042 — 26.85% $0.73 0.54 $0.99
76-77 $426,110 $100,535 272,368 272,368 532,473 — 23.59% $0.80 0.51 $1.20
77-78 $549,568 $148,416 283,619 283,619 635,696 — 27.01% $0.86 0.45 $1.41
78-79 $538,303 $152,361 281,594 281,594 627,666 18,381 28.30% $0.86 0.45 $1.37
79-80 $747,980 $191,753 350,290 343,127 643,480 40,525 25.64% $1.16 0.54 $1.59
80-81 $950,194 $270,295 399,143 385,703 774,563 46,954 28.45% $1.23 0.52 $1.70
81-82 $906,925 $282,065 350,628 338,240 692,548 42,547 31.10% $1.31 0.51 $1.78
82-83 $945,423 $296,336 369,989 351,599 698,218 45,926 31.34% $1.35 0.53 $1.75
83-84 $904,382 $280,831 348,294 326,393 617,928 40,537 31.05% $1.46 0.56 $1.79
84-85 $963,986 $290,300 340,592 322,271 624,267 43,039 30.11% $1.54 0.55 $1.98
85-86 $1,116,006 $301,018 356,918 342,379 764,394 49,967 26.97% $1.46 0.47 $2.28
86-87 $1,211,894 $354,033 371,119 353,551 789,213 49,676 29.21% $1.54 0.47 $2.31
87-88 $1,272,417 $363,170 370,899 352,411 822,587 58,075 28.54% $1.55 0.45 $2.45
88-89 $1,356,083 $368,297 362,767 355,620 828,045 63,920 27.16% $1.64 0.44 $2.72
89-90 $1,369,019 $390,690 321,569 311,845 754,363 52,525 28.54% $1.81 0.43 $3.04
90-91 $1,597,741 $444,299 326,778 317,302 840,585 59,160 27.81% $1.90 0.39 $3.53
91-92 $1,542,237 $424,122 289,525 291,669 824,389 53,177 27.50% $1.87 0.35 $3.86
92-93 $1,293,725 $361,035 146,565 139,618 552,536 48,478 27.91% $2.34 0.27 $6.36
93-94 $1,271,206 $273,292 132,572 125,656 533,365 40,673 21.50% $2.38 0.25 $7.53
94-95 $1,820,905 $256,743 241,608 104,682 657,873 54,199 14.10% $2.77 0.37 $6.47
95-96 $1,741,450 $289,089 247,762 102,787 729,918 52,905 16.60% $2.39 0.34 $5.86
96-97 $2,074,959 $292,877 479,872 262,826 992,449 78,788 14.11% $2.09 0.48 $3.71
97-98 $2,254,028 $321,696 458,842 240,535 974,246 77,423 14.27% $2.31 0.47 $4.21
98-99 $2,264,355 $331,536 465,791 230,802 964,282 74,582 14.64% $2.35 0.48 $4.15
99-00 $2,177,709 $300,244 418,372 209,226 904,336 74,476 13.79% $2.41 0.46 $4.49
00-01 $2,492,955 $338,231 571,234 305,033 721,915 69,680 13.57% $3.45 0.79 $3.77
01-02 $3,111,279 $530,025 699,292 419,647 926,887 76,696 17.04% $3.36 0.75 $3.69
02-03 $3,505,899 $571,140 796,533 507,530 949,613 78,646 16.29% $3.69 0.84 $3.68
03-04 $7,859,501 $1,538,238 2,011,851 746,061 2,134,683 178,917 19.57% $3.68 0.94 $3.14
04-05 $4,441,551 $407,851 642,150 168,682 1,226,287 80,441 9.18% $3.62 0.52 $6.28
05-06 $3,137,610 $337,821 400,817 N/A 823,385 55,373 10.77% $3.81 0.49 $6.99
06-07 $2,801,407 $311,264 378,488 N/A 578,983 45,844 11.11% $4.84 0.65 $6.58
07-08 $2,870,285 $327,580 366,792 N/A 553,685 45,188 11.41% $5.18 0.66 $6.93
08-09 $1,516,031 $297,220 163,420 N/A 264,595 19,117 19.61% $5.73 0.62 $7.46
Notes: Figures for North County not included prior to FY97.
GEN
ERA
L PU
BLI
CD
EMA
ND
RES
PON
SIV
E TO
TAL

The Coordinated Plan (2010 – 2014) C-28 Appendix C—FY09 RSRTP Route Statistics and Historical Data
SANDAG AREA ADA COMPLEMENTARY PARATRANSIT SERVICES
TotalFarebox Operating Passen- Subsidy
Fiscal Operating Farebox Total Revenue Revenue Revenue Recovery Cost ger PerOperator Year Cost Revenue Passengers Passengers Miles Hours Ratio Rev-Mile Rev-Mile Boarding
95-96 $1,256,685 $146,785 56,443 55,416 555,325 33,684 11.68% $2.26 0.10 $19.66
96-97 $1,655,357 $336,413 106,479 103,618 953,257 59,061 20.32% $1.74 0.11 $12.39
97-98 $2,279,790 $417,247 130,483 125,007 1,126,692 80,841 18.30% $2.02 0.12 $14.27
98-99 $2,274,675 $472,690 139,034 129,463 1,283,892 75,889 20.78% $1.77 0.11 $12.96
99-00 $2,629,497 $510,342 149,175 137,011 1,613,818 82,279 19.41% $1.63 0.09 $14.21
00-01 $4,415,169 $703,907 192,847 172,443 1,957,277 118,084 15.94% $2.26 0.10 $19.24
01-02 $4,448,575 $816,510 218,094 203,255 2,017,476 123,868 18.35% $2.21 0.11 $16.65
02-03 $5,597,299 $867,193 220,840 212,006 2,177,621 128,264 15.49% $2.57 0.10 $21.42
03-04 $5,389,153 $1,025,386 207,708 190,382 1,929,552 106,519 19.03% $2.79 0.11 $21.01
04-05 $4,963,453 $884,325 186,253 169,648 1,811,809 95,185 17.82% $2.74 0.10 $21.90
05-06 $8,630,214 $1,557,544 339,257 307,567 2,926,242 158,976 18.05% $2.95 0.12 $20.85
06-07 $9,712,026 $1,576,577 362,779 329,523 2,997,919 166,851 16.23% $3.24 0.12 $22.43
07-08 $10,915,383 $1,617,490 366,727 330,810 3,120,661 166,852 14.82% $3.50 0.12 $25.35
08-09 $11,292,690 $1,640,857 372,373 333,318 3,244,550 185,080 14.53% $3.48 0.11 $25.92
MTS
AC
CES
S -
CEN
TRA
L
TotalFarebox Operating Passen- Subsidy
Fiscal Operating Farebox Total Revenue Revenue Revenue Recovery Cost ger PerOperator Year Cost Revenue Passengers Passengers Miles Hours Ratio Rev-Mile Rev-Mile Boarding
79-80 $121,422 $4,702 5,956 5,956 73,080 3,581 3.87% $1.66 0.08 $19.60
80-81 $188,619 $23,494 21,399 21,399 171,694 8,823 12.46% $1.10 0.12 $7.72
81-82 $251,881 $33,869 29,576 29,576 217,070 11,490 13.45% $1.16 0.14 $7.37
82-83 $265,998 $36,942 29,622 28,932 210,926 13,937 13.89% $1.26 0.14 $7.73
83-84 $355,405 $46,692 38,481 38,036 239,868 16,673 13.14% $1.48 0.16 $8.02
84-85 $334,735 $46,342 39,198 39,198 250,554 16,219 13.84% $1.34 0.16 $7.36
85-86 $333,402 $44,712 37,901 37,558 249,275 16,258 13.41% $1.34 0.15 $7.62
86-87 $365,337 $52,534 36,579 36,579 234,318 16,362 14.38% $1.56 0.16 $8.55
87-88 $422,793 $51,858 35,944 35,944 219,960 16,530 12.27% $1.92 0.16 $10.32
88-89 $349,981 $63,811 43,582 41,790 278,660 20,514 18.23% $1.26 0.16 $6.57
89-90 $381,539 $60,651 41,184 41,184 275,561 20,105 15.90% $1.38 0.15 $7.79
90-91 $451,503 $68,315 46,760 46,760 314,980 22,981 15.13% $1.43 0.15 $8.19
91-92 $612,065 $92,134 57,033 57,033 348,937 22,549 15.05% $1.75 0.16 $9.12
92-93 $827,579 $112,596 63,844 61,984 398,516 27,836 13.61% $2.08 0.16 $11.20
93-94 $992,707 $150,600 75,010 73,549 453,617 31,904 15.17% $2.19 0.17 $11.23
94-95 $950,029 $143,015 67,333 66,936 426,442 28,390 15.05% $2.23 0.16 $11.99
95-96 $1,032,036 $141,021 67,774 66,740 443,984 30,113 13.66% $2.32 0.15 $13.15
96-97 $1,336,617 $154,531 106,905 104,301 517,256 34,338 11.56% $2.58 0.21 $11.06
97-98 $2,333,137 $287,512 120,675 116,035 767,621 49,860 12.32% $3.04 0.16 $16.95
98-99 $2,246,761 $280,077 127,795 117,833 838,155 56,457 12.47% $2.68 0.15 $15.39
99-00 $2,639,422 $311,422 139,274 134,306 1,142,517 63,855 11.80% $2.31 0.12 $16.72
00-01 $3,051,049 $285,926 130,765 117,834 984,634 66,797 9.37% $3.10 0.13 $21.15
01-02 $2,838,077 $385,346 127,387 115,094 973,673 64,369 13.58% $2.91 0.13 $19.25
02-03 $2,909,626 $423,336 139,730 126,213 1,076,706 72,240 14.55% $2.70 0.13 $17.79
03-04 $2,952,814 $600,720 141,356 127,496 1,048,214 67,581 20.34% $2.82 0.13 $16.64
04-05 $3,067,391 $442,956 139,277 125,366 993,331 62,022 14.44% $3.09 0.14 $18.84
Note: FY05-08 data included in Access Central
MTS
AD
A P
AR
ATR
AN
SIT
- SU
BU
RB
AN
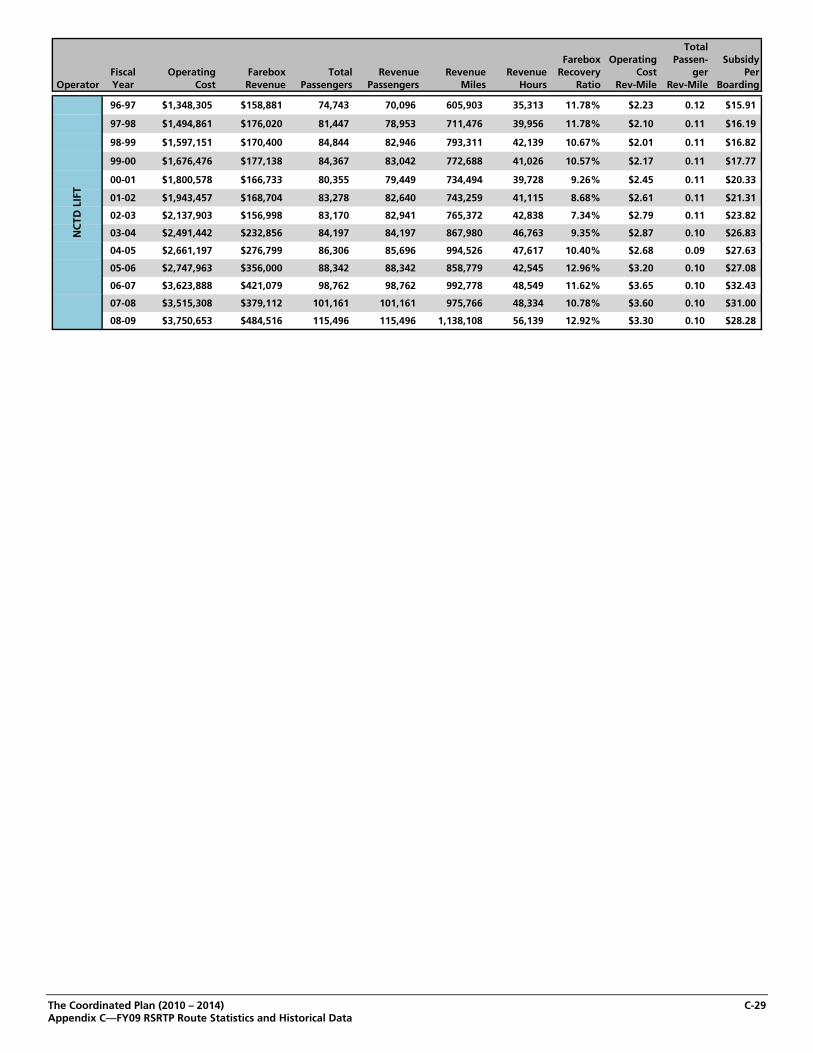
The Coordinated Plan (2010 – 2014) C-29 Appendix C—FY09 RSRTP Route Statistics and Historical Data
TotalFarebox Operating Passen- Subsidy
Fiscal Operating Farebox Total Revenue Revenue Revenue Recovery Cost ger PerOperator Year Cost Revenue Passengers Passengers Miles Hours Ratio Rev-Mile Rev-Mile Boarding
96-97 $1,348,305 $158,881 74,743 70,096 605,903 35,313 11.78% $2.23 0.12 $15.91
97-98 $1,494,861 $176,020 81,447 78,953 711,476 39,956 11.78% $2.10 0.11 $16.19
98-99 $1,597,151 $170,400 84,844 82,946 793,311 42,139 10.67% $2.01 0.11 $16.82
99-00 $1,676,476 $177,138 84,367 83,042 772,688 41,026 10.57% $2.17 0.11 $17.77
00-01 $1,800,578 $166,733 80,355 79,449 734,494 39,728 9.26% $2.45 0.11 $20.33
01-02 $1,943,457 $168,704 83,278 82,640 743,259 41,115 8.68% $2.61 0.11 $21.31
02-03 $2,137,903 $156,998 83,170 82,941 765,372 42,838 7.34% $2.79 0.11 $23.82
03-04 $2,491,442 $232,856 84,197 84,197 867,980 46,763 9.35% $2.87 0.10 $26.83
04-05 $2,661,197 $276,799 86,306 85,696 994,526 47,617 10.40% $2.68 0.09 $27.63
05-06 $2,747,963 $356,000 88,342 88,342 858,779 42,545 12.96% $3.20 0.10 $27.08
06-07 $3,623,888 $421,079 98,762 98,762 992,778 48,549 11.62% $3.65 0.10 $32.43
07-08 $3,515,308 $379,112 101,161 101,161 975,766 48,334 10.78% $3.60 0.10 $31.00
08-09 $3,750,653 $484,516 115,496 115,496 1,138,108 56,139 12.92% $3.30 0.10 $28.28
NC
TD L
IFT

The Coordinated Plan (2010 – 2014) C-30 Appendix C—FY09 RSRTP Route Statistics and Historical Data
TotalFarebox Operating Passen- Subsidy
Fiscal Operating Farebox Total Revenue Revenue Revenue Recovery Cost ger PerOperator Year Cost Revenue Passengers Passengers Miles Hours Ratio Rev-Mile Rev-Mile Boarding
75-76 $537,000 $27,300 124,000 124,000 610,000 NA 5.08% $0.88 0.20 $4.11
76-77 $534,000 $31,200 142,000 142,000 628,000 NA 5.84% $0.85 0.23 $3.54
77-78 $567,000 $31,900 145,000 145,000 563,000 NA 5.63% $1.01 0.26 $3.69
78-79 $474,496 $28,493 137,508 137,508 404,432 NA 6.00% $1.17 0.34 $3.24
79-80 $918,276 $55,581 160,294 149,169 507,673 44,244 6.05% $1.81 0.32 $5.38
80-81 $1,139,880 $103,246 197,633 174,273 672,999 54,578 9.06% $1.69 0.29 $5.25
81-82 $1,182,208 $142,372 182,527 159,728 638,469 50,605 12.04% $1.85 0.29 $5.70
82-83 $1,195,919 $235,066 184,927 165,918 773,590 46,949 19.66% $1.55 0.24 $5.20
83-84 $1,799,745 $302,747 276,254 245,700 1,040,507 68,717 16.82% $1.73 0.27 $5.42
84-85 $1,734,537 $317,197 289,741 286,997 985,661 66,724 18.29% $1.76 0.29 $4.89
85-86 $1,937,449 $450,302 325,424 320,226 1,164,256 75,237 23.24% $1.66 0.28 $4.57
86-87 $2,512,188 $762,076 388,591 385,673 1,392,989 83,966 30.34% $1.80 0.28 $4.50
87-88 $2,897,091 $975,285 423,945 420,714 1,573,623 93,844 33.66% $1.84 0.27 $4.53
88-89 $2,799,607 $949,310 399,311 374,336 1,654,433 98,802 33.91% $1.69 0.24 $4.63
89-90 $3,109,349 $1,024,041 418,775 415,669 1,696,887 101,335 32.93% $1.83 0.25 $4.98
90-91 $3,542,932 $1,239,624 479,868 476,291 1,943,388 116,553 34.99% $1.82 0.25 $4.80
91-92 $3,803,777 $1,216,590 495,170 491,791 1,992,084 118,500 31.98% $1.91 0.25 $5.22
92-93 $3,269,676 $576,705 360,432 355,982 1,480,988 92,666 17.64% $2.21 0.24 $7.47
93-94 $2,539,472 $567,513 289,950 287,242 1,189,148 77,858 22.35% $2.14 0.24 $6.80
94-95 $2,327,591 $472,463 246,764 221,486 1,098,566 65,448 20.30% $2.12 0.22 $7.52
95-96 $1,315,019 $221,177 108,875 107,752 565,182 41,086 16.82% $2.33 0.19 $10.05
96-97 $4,340,279 $649,825 288,127 278,015 2,076,416 128,712 14.97% $2.09 0.14 $12.81
97-98 $6,107,788 $880,779 332,605 319,995 2,605,789 170,657 14.42% $2.34 0.13 $15.72
98-99 $6,118,587 $923,167 351,673 330,242 2,915,358 174,485 15.09% $2.10 0.12 $14.77
99-00 $6,945,395 $998,902 372,816 354,359 3,529,023 187,160 14.38% $1.97 0.11 $15.95
00-01 $9,266,796 $1,156,566 403,967 369,726 3,676,405 224,609 12.48% $2.52 0.11 $20.08
01-02 $9,230,109 $1,370,560 428,759 400,989 3,734,408 229,352 14.85% $2.47 0.11 $18.33
02-03 $10,644,828 $1,447,527 443,740 421,160 4,019,699 243,342 13.60% $2.65 0.11 $20.73
03-04 $10,833,409 $1,858,962 433,261 402,075 3,845,746 220,863 17.16% $2.82 0.11 $20.71
04-05 $10,692,042 $1,604,080 411,836 380,710 3,799,666 204,824 15.00% $2.81 0.11 $22.07
05-06 $11,378,177 $1,913,544 427,599 395,909 3,785,021 201,521 16.82% $3.01 0.11 $22.13
06-07 $13,335,914 $1,997,656 461,541 428,285 3,990,697 215,400 14.98% $3.34 0.12 $24.57
07-08 $14,430,691 $1,996,602 467,888 431,971 4,096,427 215,186 13.84% $3.52 0.11 $26.57
08-09 $15,043,343 $2,125,373 487,869 448,814 4,382,658 241,219 14.13% $3.43 0.11 $26.48
Note: Figures for North County not included prior to FY97.
AD
A C
OM
PLEM
ENTA
RY
PA
RA
TRA
NSI
T TO
TAL

The Coordinated Plan (2010 – 2014) C-31 Appendix C—FY09 RSRTP Route Statistics and Historical Data
TotalFarebox Operating Passen- Subsidy
Fiscal Operating Farebox Total Revenue Revenue Revenue Recovery Cost ger PerOperator Year Cost Revenue Passengers Passengers Miles Hours Ratio Rev-Mile Rev-Mile Boarding
67-68 $4,930,985 $4,834,937 19,610,000 15,997,968 6,130,000 440,000 98.05% $0.80 3.20 $0.00
68-69 $5,852,529 $5,283,796 21,566,000 17,781,911 6,980,000 500,000 90.28% $0.84 3.09 $0.03
69-70 $5,898,675 $4,706,687 18,913,000 15,515,751 6,290,000 450,000 79.79% $0.94 3.01 $0.06
70-71 $8,005,800 $5,301,324 16,295,592 13,601,050 6,840,000 490,000 66.22% $1.17 2.38 $0.17
71-72 $8,385,336 $4,966,797 15,568,952 13,161,120 6,632,250 474,250 59.23% $1.26 2.35 $0.22
72-73 $11,301,495 $4,677,020 22,899,262 18,682,535 8,914,458 636,000 41.38% $1.27 2.57 $0.29
73-74 $13,813,272 $5,795,327 29,820,621 24,822,840 9,303,051 656,950 41.95% $1.48 3.21 $0.27
74-75 $19,092,749 $6,522,706 34,048,651 28,138,850 11,501,599 786,500 34.16% $1.66 2.96 $0.37
75-76 $24,343,506 $7,991,626 36,761,923 30,038,196 14,469,842 950,500 32.83% $1.68 2.54 $0.44
76-77 $26,909,678 $8,136,655 37,754,642 30,765,191 14,960,148 1,069,014 30.24% $1.80 2.52 $0.50
77-78 $28,547,345 $8,698,637 37,585,850 30,699,423 14,761,822 1,033,087 30.47% $1.93 2.55 $0.53
78-79 $30,083,532 $9,450,196 34,634,092 28,193,497 12,676,790 747,829 31.41% $2.37 2.73 $0.60
79-80 $34,404,838 $12,694,751 36,519,690 29,329,668 14,059,647 1,063,677 36.90% $2.45 2.60 $0.59
80-81 $39,297,227 $14,872,090 35,406,086 28,051,441 14,654,678 1,084,025 37.85% $2.68 2.42 $0.69
81-82 $41,721,812 $17,637,086 31,724,649 26,748,902 13,808,371 1,003,115 42.27% $3.02 2.30 $0.76
82-83 $43,610,179 $17,287,373 30,028,298 25,030,610 14,398,201 1,000,925 39.64% $3.03 2.09 $0.88
83-84 $45,793,517 $18,817,450 32,437,422 26,863,883 15,007,604 1,031,632 41.09% $3.05 2.16 $0.83
84-85 $47,680,653 $20,228,707 33,814,259 28,018,522 14,834,358 1,030,667 42.43% $3.21 2.28 $0.81
85-86 $50,803,400 $21,832,073 35,874,482 29,625,161 15,615,936 1,066,021 42.97% $3.25 2.30 $0.81
86-87 $53,411,320 $23,645,245 36,534,635 30,768,293 16,561,834 1,112,406 44.27% $3.22 2.21 $0.81
87-88 $58,850,081 $27,351,248 40,270,450 32,728,770 18,089,021 1,221,574 46.48% $3.25 2.23 $0.78
88-89 $60,927,567 $30,278,121 44,461,430 37,392,407 18,681,687 1,281,318 49.70% $3.26 2.38 $0.69
89-90 $71,952,957 $36,996,096 54,416,947 46,442,144 21,411,945 1,401,268 51.42% $3.36 2.54 $0.64
90-91 $83,222,680 $40,296,679 60,016,085 51,484,786 23,125,392 1,502,062 48.42% $3.60 2.60 $0.72
91-92 $92,041,015 $45,678,416 61,478,096 52,689,675 25,918,025 1,650,788 49.63% $3.55 2.37 $0.75
92-93 $94,278,947 $44,899,141 61,367,695 52,492,684 24,312,343 1,701,109 47.62% $3.88 2.52 $0.80
93-94 $92,820,905 $46,349,862 58,188,147 48,723,948 23,187,214 1,592,291 49.93% $4.00 2.51 $0.80
94-95 $94,313,835 $46,013,037 59,388,354 48,835,093 23,012,950 1,618,462 48.79% $4.10 2.58 $0.81
95-96 $94,073,818 $47,463,056 62,436,973 51,580,351 22,581,638 1,573,937 50.45% $4.17 2.76 $0.75
96-97 $140,274,065 $60,619,340 78,815,376 63,235,065 34,102,610 2,217,828 43.21% $4.11 2.31 $1.01
97-98 $150,598,800 $66,766,634 87,238,359 68,537,288 36,618,863 2,361,731 44.33% $4.11 2.38 $0.96
98-99 $158,115,418 $69,738,392 91,399,644 73,006,592 38,585,061 2,440,930 44.11% $4.10 2.37 $0.97
99-00 $172,642,130 $70,140,372 96,861,043 74,685,786 39,777,632 2,508,276 40.63% $4.34 2.44 $1.06
00-01 $193,340,659 $73,530,502 96,152,366 74,558,061 39,880,236 2,548,737 38.03% $4.85 2.41 $1.25
01-02 $205,533,480 $78,534,046 91,081,659 72,201,844 40,628,838 2,620,846 38.21% $5.06 2.24 $1.39
02-03 $218,354,158 $77,351,111 88,548,868 74,524,589 41,323,911 2,658,206 35.42% $5.28 2.14 $1.59
03-04 $238,039,982 $83,227,322 89,097,814 76,099,658 42,372,057 2,786,245 34.96% $5.62 2.10 $1.74
04-05 $248,633,230 $82,899,209 89,215,818 74,192,091 41,493,387 2,664,390 33.34% $5.99 2.15 $1.86
05-06 $255,469,436 $87,103,870 94,580,271 N/A 41,392,946 2,980,366 34.10% $6.17 2.28 $1.78
06-07 $260,115,217 $87,595,625 96,823,953 N/A 40,615,871 2,983,229 33.68% $6.40 2.38 $1.78
07-08 $278,345,514 $96,721,076 103,302,968 N/A 41,666,355 3,019,061 34.75% $6.68 2.48 $1.76
08-09 $237,975,951 $98,612,374 $104,640,606 N/A 40,596,754 2,901,068 41.44% $5.86 2.58 $1.33
Note: Figures for North County not included prior to FY97. No Ferry data included beginning FY 08-09.
SAN
DA
G O
PER
ATO
RS
TOTA
L(F
IXED
RO
UTE
, DEM
AN
D R
ESPO
NSI
VE,
AD
A P
AR
ATR
AN
SIT,
AN
D F
ERR
Y)

The Coordinated Plan (2010 – 2014) C-32 Appendix C—FY09 RSRTP Route Statistics and Historical Data
Farebox Operating Passen- SubsidyFiscal Operating Farebox Total Revenue Revenue Revenue Recovery Cost ger Per
Operator Year Cost Revenue Passengers Passengers Miles Hours Ratio Rev-Mile Rev-Mile Boarding
67-68 $4,930,985 $4,834,937 19,610,000 15,997,968 6,130,000 440,000 98.05% $0.80 3.20 $0.00
68-69 $5,852,529 $5,283,796 21,566,000 17,781,911 6,980,000 500,000 90.28% $0.84 3.09 $0.03
69-70 $5,898,675 $4,706,687 18,913,000 15,515,751 6,290,000 450,000 79.79% $0.94 3.01 $0.06
70-71 $8,005,800 $5,301,324 16,295,592 13,601,050 6,840,000 490,000 66.22% $1.17 2.38 $0.17
71-72 $8,385,336 $4,966,797 15,568,952 13,161,120 6,632,250 474,250 59.23% $1.26 2.35 $0.22
72-73 $11,301,495 $4,677,020 22,899,262 18,682,535 8,914,458 636,000 41.38% $1.27 2.57 $0.29
73-74 $13,813,272 $5,795,327 29,820,621 24,822,840 9,303,051 656,950 41.95% $1.48 3.21 $0.27
74-75 $19,092,749 $6,522,706 34,048,651 28,138,850 11,501,599 786,500 34.16% $1.66 2.96 $0.37
75-76 $24,343,506 $7,991,626 36,761,923 30,038,196 14,469,842 950,500 32.83% $1.68 2.54 $0.44
76-77 $26,909,678 $8,136,655 37,754,642 30,765,191 14,960,148 1,069,014 30.24% $1.80 2.52 $0.50
77-78 $28,547,345 $8,698,637 37,585,850 30,699,423 14,761,822 1,033,087 30.47% $1.93 2.55 $0.53
78-79 $30,083,532 $9,450,196 34,634,092 28,193,497 12,676,790 747,829 31.41% $2.37 2.73 $0.60
79-80 $34,404,838 $12,694,751 36,519,690 29,329,668 14,059,647 1,063,677 36.90% $2.45 2.60 $0.59
80-81 $39,297,227 $14,872,090 35,406,086 28,051,441 14,654,678 1,084,025 37.85% $2.68 2.42 $0.69
81-82 $41,721,812 $17,637,086 31,724,649 26,748,902 13,808,371 1,003,115 42.27% $3.02 2.30 $0.76
82-83 $43,610,179 $17,287,373 30,028,298 25,030,610 14,398,201 1,000,925 39.64% $3.03 2.09 $0.88
83-84 $45,793,517 $18,817,450 32,437,422 26,863,883 15,007,604 1,031,632 41.09% $3.05 2.16 $0.83
84-85 $47,680,653 $20,228,707 33,814,259 28,018,522 14,834,358 1,030,667 42.43% $3.21 2.28 $0.81
85-86 $50,803,400 $21,832,073 35,874,482 29,625,161 15,615,936 1,066,021 42.97% $3.25 2.30 $0.81
86-87 $53,411,320 $23,645,245 36,534,635 30,768,293 16,561,834 1,112,406 44.27% $3.22 2.21 $0.81
87-88 $58,850,081 $27,351,248 40,270,450 32,728,770 18,089,021 1,221,574 46.48% $3.25 2.23 $0.78
88-89 $60,927,567 $30,278,121 44,461,430 37,392,407 18,681,687 1,281,318 49.70% $3.26 2.38 $0.69
89-90 $71,952,957 $36,996,096 54,416,947 46,442,144 21,411,945 1,401,268 51.42% $3.36 2.54 $0.64
90-91 $83,222,680 $40,296,679 60,016,085 51,484,786 23,125,392 1,502,062 48.42% $3.60 2.60 $0.72
91-92 $92,041,015 $45,678,416 61,478,096 52,689,675 25,918,025 1,650,788 49.63% $3.55 2.37 $0.75
92-93 $94,278,947 $44,899,141 61,367,695 52,492,684 24,312,343 1,701,109 47.62% $3.88 2.52 $0.80
93-94 $92,820,905 $46,349,862 58,188,147 48,723,948 23,187,214 1,592,291 49.93% $4.00 2.51 $0.80
94-95 $94,313,835 $46,013,037 59,388,354 48,835,093 23,012,950 1,618,462 48.79% $4.10 2.58 $0.81
95-96 $94,073,818 $47,463,056 62,436,973 51,580,351 22,581,638 1,573,937 50.45% $4.17 2.76 $0.75
96-97 $101,233,007 $50,419,604 66,678,276 54,165,635 24,599,496 1,684,621 49.81% $4.12 2.71 $0.76
97-98 $111,747,884 $55,471,380 74,776,067 59,218,618 27,001,455 1,821,496 49.64% $4.14 2.77 $0.75
98-99 $119,519,941 $58,043,329 78,849,875 64,033,277 29,208,961 1,908,164 48.56% $4.09 2.70 $0.78
99-00 $128,549,181 $58,588,979 84,245,900 65,271,588 30,469,463 1,969,501 45.58% $4.22 2.76 $0.83
00-01 $145,328,856 $61,648,589 83,826,529 65,357,473 30,577,628 2,010,726 42.42% $4.75 2.74 $1.00
01-02 $155,996,266 $65,705,548 79,109,587 63,364,050 31,567,283 2,072,169 42.12% $4.94 2.51 $1.14
02-03 $163,522,454 $64,186,182 76,749,673 64,500,324 31,671,216 2,099,579 39.25% $5.16 2.42 $1.29
03-04 $180,650,145 $68,912,595 77,025,052 64,115,758 33,116,317 2,214,602 38.15% $5.46 2.33 $1.45
04-05 $188,477,085 $67,734,411 77,387,724 62,886,561 32,195,265 2,100,640 35.94% $5.85 2.40 $1.56
05-06 $191,763,403 $71,201,883 82,598,269 N/A 32,085,216 2,390,883 37.13% $5.98 2.57 $1.46
06-07 $192,132,382 $71,067,699 84,831,210 N/A 31,055,868 2,386,085 36.99% $6.19 2.73 $1.43
07-08 $204,221,030 $78,941,478 90,890,549 N/A 32,383,368 2,436,625 38.65% $6.31 2.81 $1.38
08-09 $202,605,604 $88,872,086 92,072,455 N/A 31,723,771 2,356,490 43.86% $6.39 2.90 $1.24
MTS
OPE
RA
TIO
NS
TOTA
L(F
IXED
RO
UTE
, DEM
AN
D R
ESPO
NSI
VE,
AD
A P
AR
ATR
AN
SIT)

The Coordinated Plan (2010 – 2014) C-33 Appendix C—FY09 RSRTP Route Statistics and Historical Data
TotalFarebox Operating Passen- Subsidy
Fiscal Operating Farebox Total Revenue Revenue Revenue Recovery Cost ger PerOperator Year Cost Revenue Passengers Passengers Miles Hours Ratio Rev-Mile Rev-Mile Boarding
96-97 $39,041,058 $10,199,736 12,137,100 9,069,430 9,503,114 533,207 26.13% $4.11 1.28 $2.38
97-98 $38,850,916 $11,295,254 12,462,292 9,318,670 9,617,408 540,235 29.07% $4.04 1.30 $2.21
98-99 $38,595,477 $11,695,063 12,549,769 8,973,315 9,376,100 532,766 30.30% $4.12 1.34 $2.14
99-00 $43,972,949 $11,551,393 12,569,333 9,414,198 9,301,184 536,997 26.27% $4.73 1.35 $2.58
00-01 $47,891,803 $11,881,913 12,277,417 9,200,588 9,295,168 536,027 24.81% $5.15 1.32 $2.93
01-02 $49,417,214 $12,828,498 11,898,482 8,837,794 9,054,085 546,685 25.96% $5.46 1.31 $3.08
02-03 $54,708,104 $13,164,929 11,715,515 10,024,265 9,645,195 556,635 24.06% $5.67 1.21 $3.55
03-04 $57,262,529 $14,314,727 11,983,900 11,983,900 9,248,240 571,643 25.00% $6.19 1.30 $3.58
04-05 $60,025,021 $15,164,798 11,739,344 11,305,530 9,290,562 563,750 25.26% $6.46 1.26 $3.82
05-06 $63,570,973 $15,901,987 11,909,764 11,473,563 9,300,260 589,483 25.01% $6.84 1.28 $4.00
06-07 $67,843,719 $16,527,926 11,915,207 11,488,467 9,552,563 597,144 24.36% $7.10 1.25 $4.31
07-08 $73,981,199 $17,779,598 $12,338,033 $11,911,221 $9,275,487 $582,436 24.03% $7.98 1.33 $4.56
08-09 $35,370,347 $9,740,288 $12,568,151 $12,185,012 $8,872,982 $544,578 27.54% $3.99 1.42 $2.04
NC
TD T
OTA
L (F
IXED
RO
UTE
, DEM
AN
D R
ESPO
NSI
VE,
A
DA
PA
RA
TRA
NSI
T)
DISCONTINUED SERVICES
MTS AREA GENERAL PUBLIC DEMAND RESPONSIVE SERVICES
TotalFarebox Operating Passen- Subsidy
Fiscal Operating Farebox Total Revenue Revenue Revenue Recovery Cost ger PerOperator Year Cost Revenue Passengers Passengers Miles Hours Ratio Rev-Mile Rev-Mile Boarding
79-80 $15,946 $7,248 10,079 10,079 13,595 922 45.45% $1.17 0.74 $0.86
80-81 $17,894 $7,267 12,683 12,683 16,250 1,257 40.61% $1.10 0.78 $0.84
81-82 $35,815 $12,258 15,179 15,179 17,404 1,760 34.23% $2.06 0.87 $1.55
82-83 $25,527 $9,500 12,788 12,788 14,916 3,120 37.22% $1.71 0.86 $1.25
Note: Service discontinued in FY83.
CO
RO
NA
DO
DIA
L-A
-RID
E

The Coordinated Plan (2010 – 2014) C-34 Appendix C—FY09 RSRTP Route Statistics and Historical Data
TotalFarebox Operating Passen- Subsidy
Fiscal Operating Farebox Total Revenue Revenue Revenue Recovery Cost ger PerOperator Year Cost Revenue Passengers Passengers Miles Hours Ratio Rev-Mile Rev-Mile Boarding
74-75 $145,000 $31,100 88,869 88,869 232,400 NA 21.45% $0.62 0.38 $1.28
75-76 $159,390 $38,600 108,558 108,558 259,144 NA 24.22% $0.62 0.42 $1.11
76-77 $157,846 $32,386 84,945 84,945 227,578 NA 20.52% $0.69 0.37 $1.48
77-78 $230,089 $52,951 90,699 90,699 287,742 NA 23.01% $0.80 0.32 $1.95
78-79 $220,514 $55,220 97,548 97,548 290,899 18,123 25.04% $0.76 0.34 $1.69
79-80 $303,436 $76,764 132,738 125,575 251,707 15,684 25.30% $1.21 0.53 $1.71
80-81 $404,758 $105,655 160,214 146,774 327,743 19,803 26.10% $1.23 0.49 $1.87
81-82 $356,075 $112,786 130,563 118,175 274,431 16,983 31.67% $1.30 0.48 $1.86
82-83 $393,739 $123,719 144,564 126,174 293,425 18,814 31.42% $1.34 0.49 $1.87
83-84 $390,218 $125,350 149,900 129,261 266,807 16,958 32.12% $1.46 0.56 $1.77
84-85 $384,724 $124,704 143,364 126,720 261,236 17,272 32.41% $1.47 0.55 $1.81
85-86 $441,221 $121,552 149,752 137,065 288,463 18,540 27.55% $1.53 0.52 $2.13
86-87 $444,630 $123,375 142,692 128,952 272,614 17,673 27.75% $1.63 0.52 $2.25
87-88 $410,172 $114,412 131,245 117,407 251,248 16,837 27.89% $1.63 0.52 $2.25
88-89 $419,369 $105,839 120,530 116,176 229,879 16,082 25.24% $1.82 0.52 $2.60
89-90 $385,987 $89,927 100,455 95,841 198,104 13,235 23.30% $1.95 0.51 $2.95
90-91 $400,791 $85,937 95,599 91,208 185,459 12,390 21.44% $2.16 0.52 $3.29
91-92 $395,975 $81,735 91,328 87,480 177,452 12,263 20.64% $2.23 0.51 $3.44
92-93 $435,587 $70,551 55,638 53,817 106,455 7,688 16.20% $4.09 0.52 $6.56
93-94 $449,317 $81,198 58,138 56,388 168,454 16,374 18.07% $2.67 0.35 $6.33
94-95 $452,346 $81,186 59,490 57,555 179,769 17,768 17.95% $2.52 0.33 $6.24
95-96 $495,180 $80,464 60,198 58,538 177,209 17,130 16.25% $2.79 0.34 $6.89
96-97 $427,897 $70,099 42,477 41,518 126,666 12,648 16.38% $3.38 0.34 $8.42
97-98 $404,223 $48,161 29,768 29,768 98,697 10,758 11.91% $4.10 0.30 $11.96
98-99 $356,365 $44,359 31,698 24,342 103,251 10,125 12.45% $3.45 0.31 $9.84
99-00 $423,050 $51,800 31,902 31,902 107,918 11,616 12.24% $3.92 0.30 $11.64
00-01 $463,400 $44,300 26,836 26,836 94,144 10,577 9.56% $4.92 0.29 $15.62
01-02 $461,904 $41,431 24,361 24,361 92,186 10,797 8.97% $5.01 0.26 $17.26
02-03 $436,819 $22,946 15,646 15,646 63,865 8,012 5.25% $6.84 0.24 $26.45
Note: This service was discontinued June FY03.
LA M
ESA
DIA
L-A
-RID
E

The Coordinated Plan (2010 – 2014) C-35 Appendix C—FY09 RSRTP Route Statistics and Historical Data
TotalFarebox Operating Passen- Subsidy
Fiscal Operating Farebox Total Revenue Revenue Revenue Recovery Cost ger PerOperator Year Cost Revenue Passengers Passengers Miles Hours Ratio Rev-Mile Rev-Mile Boarding
87-88 $95,145 $26,937 31,032 28,616 73,097 10,472 28.31% $1.30 0.42 $2.20
88-89 $113,681 $31,001 35,195 31,842 86,470 10,884 27.27% $1.31 0.41 $2.35
89-90 $126,104 $31,304 35,665 33,114 88,591 11,010 24.82% $1.42 0.40 $2.66
90-91 $190,306 $24,251 27,663 25,684 119,339 14,831 12.74% $1.59 0.23 $6.00
91-92 $211,901 $19,865 20,481 18,408 116,291 7,794 9.37% $1.82 0.18 $9.38
92-93 $211,510 $23,995 20,966 18,414 103,568 7,128 11.34% $2.04 0.20 $8.94
93-94 $218,414 $25,038 25,222 21,852 104,500 7,433 11.46% $2.09 0.24 $7.67
94-95 $194,977 $24,250 18,965 16,489 64,057 6,459 12.44% $3.04 0.30 $9.00
95-96 $156,671 $13,792 11,007 9,710 55,067 4,327 8.80% $2.85 0.20 $12.98
96-97 $261,180 $22,080 26,957 23,075 85,302 6,455 8.45% $3.06 0.32 $8.87
97-98 $325,924 $51,619 84,037 71,185 144,433 9,572 15.84% $2.26 0.58 $3.26
98-99 $388,737 $77,601 126,483 108,446 168,916 11,370 19.96% $2.30 0.75 $2.46
99-00 $423,721 $81,801 132,414 114,479 152,746 10,212 19.31% $2.77 0.87 $2.58
00-01 $408,078 $92,910 138,435 109,748 146,019 11,105 22.77% $2.79 0.95 $2.28
01-02 $456,284 $103,223 118,052 115,897 120,696 10,074 22.62% $3.78 0.98 $2.99
02-03 $433,148 $73,342 129,867 101,980 139,366 11,554 16.93% $3.11 0.93 $2.77
03-04 $43,198 $2,530 1,543 1,543 10,669 1,150 5.86% $4.05 0.14 $26.36
Note: This service was discontinued in October FY04. Data for Flex Routes 851 and 853 data are included with MTS Flex data.
MTS
EA
ST C
OU
NTY
DIA
L-A
-RID
E

The Coordinated Plan (2010 – 2014) C-36 Appendix C—FY09 RSRTP Route Statistics and Historical Data
TotalFarebox Operating Passen- Subsidy
Fiscal Operating Farebox Total Revenue Revenue Revenue Recovery Cost ger PerOperator Year Cost Revenue Passengers Passengers Miles Hours Ratio Rev-Mile Rev-Mile Boarding
73-74 $79,973 $24,436 66,124 66,124 103,169 NA 30.56% $0.78 0.64 $0.84
74-75 $226,728 $65,685 176,818 176,818 283,399 NA 28.97% $0.80 0.62 $0.91
75-76 $272,959 $77,482 210,899 210,899 331,898 NA 28.39% $0.82 0.64 $0.93
76-77 $268,264 $68,149 187,423 187,423 304,895 NA 25.40% $0.88 0.61 $1.07
77-78 $319,479 $95,465 192,920 192,920 347,954 NA 29.88% $0.92 0.55 $1.16
78-79 $314,119 $95,465 180,694 180,694 332,949 NA 30.39% $0.94 0.54 $1.21
79-80 $407,926 $100,448 192,888 192,888 359,298 22,627 24.62% $1.14 0.54 $1.59
80-81 $470,314 $140,353 194,751 194,751 382,974 22,766 29.84% $1.23 0.51 $1.69
81-82 $460,743 $135,545 176,166 176,166 357,785 21,321 29.42% $1.29 0.49 $1.85
82-83 $458,428 $138,247 178,949 178,949 340,687 21,236 30.16% $1.35 0.53 $1.79
83-84 $414,725 $129,605 162,428 162,468 300,194 19,580 31.25% $1.38 0.54 $1.76
84-85 $408,809 $115,782 154,486 154,156 294,539 19,823 28.32% $1.39 0.52 $1.90
85-86 $452,588 $117,752 157,056 156,823 318,176 21,864 26.02% $1.42 0.49 $2.13
86-87 $491,126 $138,199 169,279 169,100 335,980 22,662 28.14% $1.46 0.50 $2.08
87-88 $464,504 $118,410 152,987 152,896 308,331 20,899 25.49% $1.51 0.50 $2.26
88-89 $511,676 $118,670 153,063 150,874 321,930 26,558 23.19% $1.59 0.48 $2.57
89-90 $467,949 $125,852 125,975 125,296 280,718 18,041 26.89% $1.67 0.45 $2.72
90-91 $513,485 $131,382 131,250 130,538 281,513 18,092 25.59% $1.82 0.47 $2.91
91-92 $430,544 $108,026 107,904 120,320 234,188 16,940 25.09% $1.84 0.46 $2.99
92-93 $269,732 $45,749 21,294 20,618 89,976 7,421 16.96% $3.00 0.24 $10.52
93-94 $288,712 $45,909 23,154 22,485 90,639 7,614 15.90% $3.19 0.26 $10.49
94-95 $290,473 $48,229 21,495 20,384 87,184 7,403 16.60% $3.33 0.25 $11.27
95-96 $231,261 $28,353 14,233 13,625 67,207 6,159 12.26% $3.44 0.21 $14.26
96-97 $225,200 $22,315 10,889 10,550 56,089 5,935 9.91% $4.02 0.19 $18.63
97-98 $230,527 $20,473 11,379 9,362 59,879 6,608 8.88% $3.85 0.19 $18.46
98-99 $374,898 $30,687 40,775 33,937 101,568 10,744 8.19% $3.69 0.40 $8.44
99-00 $446,285 $54,799 70,305 64,193 121,655 12,246 12.28% $3.67 0.58 $5.57
00-01 $386,168 $52,973 66,321 56,665 128,315 12,963 13.72% $3.01 0.52 $5.02
01-02 $436,035 $47,657 71,281 64,674 126,501 13,379 10.93% $3.45 0.56 $5.45
02-03 $469,584 $70,961 67,377 56,934 107,350 12,526 15.11% $4.37 0.63 $5.92
Note: This service was discontinued in April FY03. Data includes Flex Route 874 data that is still in service.
MTS
EL
CA
JON
DIA
L-A
-RID
E

The Coordinated Plan (2010 – 2014) C-37 Appendix C—FY09 RSRTP Route Statistics and Historical Data
TotalFarebox Operating Passen- Subsidy
Fiscal Operating Farebox Total Revenue Revenue Revenue Recovery Cost ger PerOperator Year Cost Revenue Passengers Passengers Miles Hours Ratio Rev-Mile Rev-Mile Boarding
84-85 $57,192 $20,940 4,134 4,134 NA NA 36.61% NA NA $8.77
85-86 $68,450 $27,006 4,363 4,363 67,475 2,699 39.45% $1.01 0.06 $9.50
86-87 $118,767 $56,205 7,340 7,340 88,425 3,537 47.32% $1.34 0.08 $8.52
87-88 $147,284 $67,985 9,107 9,107 103,925 4,157 46.16% $1.42 0.09 $8.71
88-89 $163,389 $76,910 10,351 11,548 109,550 4,704 47.07% $1.49 0.09 $8.35
89-90 $214,344 $96,067 12,453 12,453 98,100 3,929 44.82% $2.18 0.13 $9.50
90-91 $271,769 $147,793 16,201 16,210 138,525 5,548 54.38% $1.96 0.12 $7.65
91-92 $272,789 $162,786 16,886 16,886 185,925 7,356 59.67% $1.47 0.09 $6.51
92-93 $256,677 $179,655 17,117 17,117 190,725 7,629 69.99% $1.35 0.09 $4.50
93-94 $152,066 $101,479 8,733 8,733 121,981 3,524 66.73% $1.25 0.07 $5.79
94-95 $135,209 $101,653 9,179 9,179 168,792 4,449 75.18% $0.80 0.05 $3.66
95-96 $210,231 $166,480 15,067 20,914 271,052 7,512 79.19% $0.78 0.06 $2.90
96-97 $313,167 $257,486 23,020 23,020 435,338 11,720 82.22% $0.72 0.05 $2.42
97-98 $334,552 $280,980 23,481 23,481 457,548 12,575 83.99% $0.73 0.05 $2.28
98-99 $401,381 $322,076 23,921 23,921 284,544 7,963 80.24% $1.41 0.08 $3.32
99-00 $426,575 $337,284 24,609 24,609 465,035 12,838 79.07% $0.92 0.05 $3.63
00-01 $417,654 $296,890 22,387 22,387 421,189 11,881 71.09% $0.99 0.05 $5.39
01-02 $288,167 $255,572 20,085 20,085 362,514 10,198 88.69% $0.79 0.06 $1.62
02-03 $137,500 $114,869 9,419 9,419 161,071 4,486 83.54% $0.85 0.06 $2.40
Note: The transit subsidy for this service was discontinued in December FY03. This service is no longer be part of the MTS.
MTS
PO
WA
Y A
IRPO
RTE
R
TotalFarebox Operating Passen- Subsidy
Fiscal Operating Farebox Total Revenue Revenue Revenue Recovery Cost ger PerOperator Year Cost Revenue Passengers Passengers Miles Hours Ratio Rev-Mile Rev-Mile Boarding
78-79 $3,670 $1,676 3,352 3,352 3,818 258 45.67% $0.96 0.88 $0.59
79-80 $20,672 $7,293 14,585 14,585 18,880 1,292 35.28% $1.09 0.77 $0.92
80-81 $57,228 $17,020 31,495 31,495 47,596 3,128 29.74% $1.20 0.66 $1.28
81-82 $54,292 $21,476 28,720 28,720 42,928 2,483 39.56% $1.26 0.67 $1.14
82-83 $67,729 $24,870 33,688 33,688 49,190 2,756 36.72% $1.38 0.68 $1.27
83-84 $70,386 $25,498 35,562 34,306 49,462 3,009 36.23% $1.42 0.72 $1.26
84-85 $73,972 $25,359 34,747 33,409 51,782 3,355 34.28% $1.43 0.67 $1.40
85-86 $100,619 $29,240 39,992 38,532 70,092 4,338 29.06% $1.44 0.57 $1.78
86-87 $100,793 $29,348 44,874 41,451 70,327 4,301 29.12% $1.43 0.64 $1.59
87-88 $95,250 $28,469 39,368 37,458 62,956 4,065 29.89% $1.51 0.63 $1.70
88-89 $93,334 $27,261 36,186 37,822 58,461 3,966 29.21% $1.60 0.62 $1.83
89-90 $110,762 $39,670 40,660 38,678 68,222 4,653 35.82% $1.62 0.60 $1.75
90-91 $147,755 $48,930 50,965 48,480 82,345 5,616 33.12% $1.79 0.62 $1.94
91-92 $145,344 $45,810 48,028 43,689 79,152 5,966 31.52% $1.84 0.61 $2.07
92-93 $109,124 $40,105 30,890 29,000 58,424 4,532 36.75% $1.87 0.53 $2.23
93-94 $162,697 $19,668 17,325 16,198 47,792 5,728 12.09% $3.40 0.36 $8.26
94-95 $16,426 $1,425 1,145 1,075 3,583 486 8.68% $4.58 0.32 $13.10
Note: Service discontinued in FY95.
SAN
DIE
GO
CO
UN
TY T
RA
NSI
T SE
RV
ICES
(L
EMO
N G
RO
VE
DIA
L-A
-RID
E)

The Coordinated Plan (2010 – 2014) C-38 Appendix C—FY09 RSRTP Route Statistics and Historical Data
TotalFarebox Operating Passen- Subsidy
Fiscal Operating Farebox Total Revenue Revenue Revenue Recovery Cost ger PerOperator Year Cost Revenue Passengers Passengers Miles Hours Ratio Rev-Mile Rev-Mile Boarding
83-84 $29,053 $378 404 358 1,465 990 1.30% $19.83 0.28 $70.98
84-85 $39,289 $3,515 3,861 3,852 16,710 2,589 8.95% $2.35 0.23 $9.27
85-86 $53,128 $5,468 5,755 5,596 20,188 2,526 10.29% $2.63 0.29 $8.28
86-87 $56,578 $6,906 6,934 6,708 21,867 1,503 12.21% $2.59 0.32 $7.16
87-88 $60,062 $6,957 7,160 6,927 23,030 1,645 11.58% $2.61 0.31 $7.42
88-89 $54,634 $8,616 7,442 7,358 21,755 1,726 15.77% $2.51 0.34 $6.18
89-90 $63,873 $7,870 6,361 6,463 20,628 1,657 12.32% $3.10 0.31 $8.80
90-91 $73,635 $6,006 5,100 5,182 33,404 2,683 8.16% $2.20 0.15 $13.26
91-92 $85,684 $5,900 4,898 4,886 31,381 2,858 6.89% $2.73 0.16 $16.29
92-93 $11,095 $980 660 652 3,388 14,080 8.83% $3.27 0.19 $15.33
Note: Service discontinued in FY93.
SAN
DIE
GO
CO
UN
TYTR
AN
SIT
SER
VIC
ES(P
OW
AY
DIA
L-A
-RID
E)
ADA COMPLEMENTARY PARATRANSIT SERVICES
TotalFarebox Operating Passen- Subsidy
Fiscal Operating Farebox Total Revenue Revenue Revenue Recovery Cost ger PerOperator Year Cost Revenue Passengers Passengers Miles Hours Ratio Rev-Mile Rev-Mile Boarding
79-80 $107,692 $7,832 12,378 11,265 43,507 3,279 7.27% $2.48 0.28 $8.07
80-81 $169,803 $18,652 28,015 25,828 84,769 5,435 10.98% $2.00 0.33 $5.40
81-82 $212,680 $26,956 33,864 31,655 95,943 6,801 12.67% $2.22 0.35 $5.48
82-83 $254,360 $59,496 43,940 41,466 116,353 8,023 23.39% $2.19 0.38 $4.43
83-84 $248,911 $70,865 49,193 46,650 125,516 8,108 28.47% $1.98 0.39 $3.62
84-85 $253,877 $79,881 53,394 53,284 114,308 7,985 31.46% $2.22 0.47 $3.26
85-86 $283,166 $98,538 48,346 47,630 121,438 8,006 34.80% $2.33 0.40 $3.82
86-87 $324,461 $139,698 50,735 50,362 130,705 7,407 43.06% $2.48 0.39 $3.64
87-88 $342,595 $133,536 50,648 50,276 128,807 7,081 38.98% $2.66 0.39 $4.13
88-89 $227,958 $30,786 29,815 29,166 89,154 7,280 13.51% $2.56 0.33 $6.61
89-90 $236,313 $33,380 30,696 30,380 97,240 7,325 14.13% $2.43 0.32 $6.61
90-91 $242,368 $32,502 29,158 28,858 98,755 7,439 13.41% $2.45 0.30 $7.20
91-92 $281,349 $40,265 33,775 33,524 104,778 8,202 14.31% $2.69 0.32 $7.14
92-93 $283,908 $62,409 34,648 34,077 105,586 8,344 21.98% $2.69 0.33 $6.39
93-94 $233,725 $76,099 35,503 35,167 106,158 8,833 32.56% $2.20 0.33 $4.44
94-95 $233,558 $71,510 37,856 37,712 106,588 8,924 30.62% $2.19 0.36 $4.28
95-96 $226,396 $69,553 35,753 35,670 97,483 8,433 30.72% $2.32 0.37 $4.39
96-97 $306,318 $71,251 33,705 33,297 110,432 10,308 23.26% $2.77 0.31 $6.97
Note: Service reported as part of CTS-ADA Paratransit.
CH
ULA
VIS
TA H
AN
DY
-TR
AN
S

The Coordinated Plan (2010 – 2014) C-39 Appendix C—FY09 RSRTP Route Statistics and Historical Data
TotalFarebox Operating Passen- Subsidy
Fiscal Operating Farebox Total Revenue Revenue Revenue Recovery Cost ger PerOperator Year Cost Revenue Passengers Passengers Miles Hours Ratio Rev-Mile Rev-Mile Boarding
81-82 $16,947 $1,585 1,520 1,438 7,397 783 9.35% $2.29 0.21 $10.11
82-83 $27,015 $2,546 2,525 2,485 12,923 1,890 9.42% $2.09 0.20 $9.69
83-84 $36,494 $4,316 4,316 4,316 15,203 2,221 11.83% $2.40 0.28 $7.46
84-85 $39,138 $5,506 5,506 5,506 17,921 2,171 14.07% $2.18 0.31 $6.11
85-86 $39,296 $7,121 7,121 7,121 20,799 2,200 18.12% $1.89 0.34 $4.52
86-87 $41,696 $4,986 4,893 4,893 17,983 2,024 11.96% $2.32 0.27 $7.50
87-88 $43,797 $8,825 6,649 6,643 15,159 2,040 20.15% $2.89 0.44 $5.26
88-89 $55,480 $9,120 6,751 7,378 15,349 2,332 16.44% $3.61 0.44 $6.87
89-90 $51,404 $8,868 6,615 6,615 18,992 2,043 17.25% $2.71 0.35 $6.43
90-91 $56,985 $9,354 7,274 7,274 23,957 2,577 16.41% $2.38 0.30 $6.55
91-92 $55,581 $9,249 7,445 7,445 23,836 2,481 16.64% $2.33 0.31 $6.22
92-93 $56,495 $8,707 5,137 4,928 19,199 2,540 15.41% $2.94 0.27 $9.30
93-94 $55,824 $10,820 5,639 5,434 20,592 2,540 19.38% $2.71 0.27 $7.98
94-95 $54,654 $10,638 5,469 5,343 23,444 2,570 19.46% $2.33 0.23 $8.05
95-96 $56,587 $10,603 5,348 5,342 23,715 2,540 18.74% $2.39 0.23 $8.60
Note: Service reported as part of CTS-ADA Paratransit.
NA
TIO
NA
L C
ITY
DIA
L-A
-RID
E
TotalFarebox Operating Passen- Subsidy
Fiscal Operating Farebox Total Revenue Revenue Revenue Recovery Cost ger PerOperator Year Cost Revenue Passengers Passengers Miles Hours Ratio Rev-Mile Rev-Mile Boarding
82-83 $63,837 $3,837 3,273 3,103 12,623 2,210 6.01% $5.06 0.26 $18.33
83-84 $117,476 $10,717 9,670 8,662 37,897 5,183 9.12% $3.10 0.26 $11.04
84-85 $106,229 $9,100 8,448 8,447 37,326 4,237 8.57% $2.85 0.23 $11.50
85-86 $111,159 $11,138 9,193 9,193 42,770 4,155 10.02% $2.60 0.21 $10.88
86-87 $134,763 $14,595 11,487 11,487 51,114 4,873 10.83% $2.64 0.22 $10.46
87-88 $141,139 $14,526 11,312 11,312 60,156 5,007 10.29% $2.35 0.19 $11.19
88-89 $163,917 $16,701 13,143 12,814 63,302 6,198 10.19% $2.59 0.21 $11.20
89-90 $152,868 $14,697 12,195 12,195 60,517 6,297 9.61% $2.53 0.20 $11.33
90-91 $169,959 $17,123 11,277 11,277 82,445 8,578 10.07% $2.06 0.14 $13.55
91-92 $180,300 $18,552 10,685 10,685 77,476 8,267 10.29% $2.33 0.14 $15.14
92-93 $168,670 $21,267 11,170 11,170 83,962 6,760 12.61% $2.01 0.13 $13.20
Note: Service discontinued in FY93.
SAN
DIE
GO
CO
UN
TYTR
AN
SIT
SER
VIC
ES(P
OW
AY
CA
LL-A
-RID
E)

The Coordinated Plan (2010 – 2014) C-40 Appendix C—FY09 RSRTP Route Statistics and Historical Data
TotalFarebox Operating Passen- Subsidy
Fiscal Operating Farebox Total Revenue Revenue Revenue Recovery Cost ger PerOperator Year Cost Revenue Passengers Passengers Miles Hours Ratio Rev-Mile Rev-Mile Boarding
75-76 $537,000 $27,300 124,000 124,000 610,000 N/A 5.08% $0.88 0.20 $4.11
76-77 $534,000 $31,200 142,000 142,000 628,000 N/A 5.84% $0.85 0.23 $3.54
77-78 $567,000 $31,900 145,000 145,000 563,000 N/A 5.63% $1.01 0.26 $3.69
78-79 $474,496 $28,493 137,508 137,508 404,432 N/A 6.00% $1.17 0.34 $3.24
79-80 $689,162 $43,047 141,960 131,948 391,086 37,384 6.25% $1.76 0.36 $4.55
80-81 $781,458 $61,100 148,219 127,046 416,536 40,320 7.82% $1.88 0.36 $4.86
81-82 $700,700 $79,962 117,567 97,059 318,059 31,531 11.41% $2.20 0.37 $5.28
82-83 $584,709 $132,245 105,567 89,932 420,765 20,889 22.62% $1.39 0.25 $4.29
83-84 $1,041,459 $170,157 174,594 148,036 622,023 36,532 16.34% $1.67 0.28 $4.99
84-85 $1,000,558 $176,368 183,195 180,562 565,552 36,112 17.63% $1.77 0.32 $4.50
85-86 $1,170,426 $288,793 222,863 218,724 729,974 44,618 24.67% $1.60 0.31 $3.96
86-87 $1,645,931 $550,263 284,897 282,352 958,869 53,300 33.43% $1.72 0.30 $3.85
87-88 $1,946,767 $766,540 319,392 316,539 1,149,541 63,186 39.38% $1.69 0.28 $3.70
88-89 $2,002,271 $828,892 306,020 283,188 1,207,968 62,478 41.40% $1.66 0.25 $3.83
89-90 $2,287,225 $906,445 328,085 325,295 1,244,577 65,565 39.63% $1.84 0.26 $4.21
90-91 $2,622,117 $1,112,330 385,399 382,122 1,423,251 74,978 42.42% $1.84 0.27 $3.92
91-92 $2,674,482 $1,056,390 386,232 383,104 1,437,057 77,001 39.50% $1.86 0.27 $4.19
92-93 $1,933,024 $371,726 245,633 243,823 873,725 47,186 19.23% $2.21 0.28 $6.36
93-94 $1,257,216 $329,994 173,798 173,092 608,781 34,581 26.25% $2.07 0.29 $5.34
94-95 $1,089,350 $247,300 136,106 111,495 542,092 25,564 22.70% $2.01 0.25 $6.19
Note: Service discontinued in FY95.
SAN
DIE
GO
DIA
L-A
-RID
E

appendix D
Social Service Transportation Inventory


[THIS PAGE INTENTIONALLY LEFT BLANK]

Compiled List of Agencies Contacted for 2008 Coordinated Plan & STRIDE Website Update - HHSA Providers
The Coordinated Plan (2010 – 2014) D-2 Appendix D—Social Service Transportation Inventory
Ag
en
cy N
am
e
Pro
gra
m
Na
me
Ag
en
cy
Str
ee
t
Ag
en
cy
Cit
y
Ag
en
cy S
tate
Org
an
iza
tio
nTy
pe
Ch
arg
e F
are
? A
mo
un
t p
er
on
e
wa
y t
rip
, pe
r m
ile
, o
the
r.
En
roll
me
nt
or
Pro
gra
m
Re
qu
ire
-m
en
ts
Se
rvic
e A
rea
Bo
un
da
rie
s -
Cit
ies
&/o
r U
rba
n, R
ura
l, Z
IP
CO
DE
S
Se
rvic
e A
rea
s D
iffe
ren
t D
ep
en
d-i
ng
on
Po
pu
lati
on
Ability Center4797 Ruffner St
San Diego CA private for profit
24hr period $110, week $100day, month $2600
noneall county and outside area too
no
Able-Disabled Advocacy (A-DA)
A-DA Techworks2850 6th Ave, Ste #311
San Diego CA private nonprofit
no qualify w/income n/a no
Accessible San Diego
The Access Information Services for Transit Riders with Disabilities
P.O. Box 124526 San Diego CA
Adult Protective Services, Inc
Geriatric Case Management
2840 Adams Ave San Diego CA private nonprofit
NO medical need to attend adult day care center - med referral
within an hour of Santee vista and Chula Vsta
all
Age Concerns Age Concerns Client Transportation Program
2250 Fourth Ave, Ste 300
San Diego CA private no part of care giving need yes county
All Congregations Together (ACT)
ACT Comlink4970 Market Street
San Diego CA nonprofit
Alpha Project for the Homeless
Alpha Project Transportation Program
1620 5th Ave, Ste #100
San Diego CA nonprofit no no
all over san Diego county primary SE and central
no
Alpine Special Treatment Center
2120 Alpine Blvd Alpine CA
American Cancer Society
American Cancer Society Transportation Program
2655 Camino del Rio N, Ste 100
San Diego CA non profit
nocancer patient active treatment
all of county
AmeriCare AmeriCare Transportation Program
340 Ranchero Dr, Ste 196
San Marcos
CA non profit
no yesmostly north county
Amputees in Motion Int'l, Inc
PO Box 19236 San Diego CA
American Red Cross of San Diego
ARC3030 Market St, Ste B
San Diego CA
At Your Home Family Care
At Your Home Family Care Transportation
6540 Lusk Blvd,Ste C-266
San Diego CA private2 hr min 19.95 per hour 3.00per visit stipend
no all county no
Bayside Community Center
2202 Comstock St
San Diego CA
Blind Community Center
Blind Community Center Transportation Program
1805 Upas St San Diego CA nonprofit nopriority first membership fee $25
San Diego County
no
Boys & Girls Club of Carlsbad
North County Student Transportation
3115 Roosevelt St
Carlsbad CA nonprofitmonthly fee to join program $68 per month w/bus after school pick up
agency member Carlsbad only no
Boys & Girls Club of Chula Vista
Boys & Girls Club - Chula Vista Transportation. Program
1301 Oleander Ave
Chula Vista CA nonprofitmonthly fee to join program $68 per month w/bus after school pick up
agency member Chula Vista only

The Coordinated Plan (2010 – 2014) D-3 Appendix D—Social Service Transportation Inventory
Ho
urs
/Da
ys
of
pe
rati
on
s
Ve
hic
le
Typ
e
No
. V
eh
icle
s
Wh
ee
lch
air
A
cce
ssib
le?
Typ
es
of
Trip
s P
rov
ide
d
How is transportation scheduled for this program? Upon request/same day service, in advance # of days? D
o y
ou
acc
ep
t in
sura
nce
? If
so
, wh
ich
?
What is primary funding source for transporta-tion? Grants, State-Federal-local Funds, fares, fundraising?
Is there a time of day when your vehicles are not being used?
Is your organization willing to coordinate services if the appropriate funding or manage-ment mechanisms were established?
M-F 8-5Sat 10-3
vans dodge mini vans
4 all n/asame day call a few weeks in advance
nogrants, state funds, fares
n/a no
M-F some start 8:30-5
n/a n/a n/a no trips providedrequests for allowances are processed in advance
no
Dept of Labor, State Employ-ment Depart-ment
n/a yes
M-F 8-5Passenger vans
15 nofrom home to program, program to home
upon enrollment, MTS LIFT passengers
depends on long-term
medi-callunch service 11-1
Yes, under the right circumstances
M-F 8-5 on call 24 hours
o nomedical grocery entertainment
one week in advance no donationsvolunteer cars
no
senior mini grants,
yes
M-F 8-5 2 vans 6 1 yes medical, grocerysame day, primarily residents or on streets
NC State grants SD subcontract with family health center
no undecided
M-F 8-5volunteer use own vehicles
33 nocancer related med appointments
scheduled through ACS in advance
no all donation n/a yes
6:30-5 vans 8-9
2 vans 1 bus 18 pass con-tractors
busfrom house to center scheduled trips to come here
office 8-5 pick up weekends Well
workers vehicle
70 yes, some med, errands, shopping
schedules w/24hrs notice try to do same day
no for-profitprivate vehicles
open to coordination, San Diego regional center
dependent on drivers M-F 8-5 weekend on Sun
2 vans 2 busses lacking sufficient volunteer drivers
yes both buses 9 passengers, 16 pass
no medical, recreational and social education trips
24 hrs in advance nofundraising, state funds
yes yes
M-F 2:30-6 vans
3 also contract bus service with North County student transit
no
after school transportation to club, also operated for field trips and special events
fixed route, after school runs
no grants, fares yes, morning
no
after school transportation to club, also operated for field trips and special events
grants, fares

Compiled List of Agencies Contacted for 2008 Coordinated Plan & STRIDE Website Update - HHSA Providers
The Coordinated Plan (2010 – 2014) D-4 Appendix D—Social Service Transportation Inventory
Ag
en
cy N
am
e
Pro
gra
m
Na
me
Ag
en
cy
Str
ee
t
Ag
en
cy
Cit
y
Ag
en
cy S
tate
Org
an
iza
tio
nTy
pe
Ch
arg
e F
are
? A
mo
un
t p
er
on
e
wa
y t
rip
, pe
r m
ile
, o
the
r.
En
roll
me
nt
or
Pro
gra
m
Re
qu
ire
-m
en
ts
Se
rvic
e A
rea
Bo
un
da
rie
s -
Cit
ies
&/o
r U
rba
n, R
ura
l, Z
IP
CO
DE
S
Se
rvic
e A
rea
s D
iffe
ren
t D
ep
en
d-i
ng
on
Po
pu
lati
on
Boys & Girls Club of Greater San Diego -Encanto Branch
6785 Imperial Ave
San Diego CA nonprofitmonthly fee to join program $68 per month w/bus after school pick up
agency member
Boys & Girls Club of San Dieguito
3800-A Mykonos Lane
San Diego CA nonprofitmonthly fee to join program $68 per month w/bus after school pick up
agency member
Boys & Girls Club of San Marcos
Day-care Off Track 1 Positive Pl San Marcos
CA nonprofitmonthly fee to join program $68 per month w/bus after school pick up
agency member
Braille Institute Braille Institute Transportation Program
4555 Executive Dr
San Diego CA nonprofit no, do take donationsask David or joy, visually impaired
entire county, rural areas as well
no
Broad Horizons - R.T.C
1236 H St Ramona CA
Cal-Diego Paralyzed Veterans Association
3350 La Jolla Village Dr,#1A-118
San Diego CA nonprofit no honorable dischargedSan Diego, rural areas
no
California Mother Infant, Inc
Project S.T.A.R.4991 Imperial Ave
San Diego CA
Camp Pendleton Armed Services YMCA
Y-ShuttleA Street, Building 16144
Oceanside (Camp Pendleton)
CA nonprofit no
Casa de AmparoSupervised Family Visitation
3355 Mission Ave, Ste 238
Oceanside CA
Casa Familiar119 West Hall Ave
San Ysidro CA
Catholic Charities Diocese of San Diego
Refugee Resettlement Program Wilson/Fish CRC Project
4575-A Mission Gorge Pl
San Diego CA nonprofit norefugees asylum seekers victims of trafficking
all county-only offer services for first 8 months
Center for Employment Training
CET3295 Market St
San Diego CA nonprofit nomust be enrolled job training program
san Ysidro south bay, east county, all san Diego
no
Charles Cheneweth Foundation
715 E. V. Ave
National City
CA nonprofitreimbursed by san Diego regional center weekday, no fare weekends
no
m-f south of 8 freeway south county week-ends all with San Diego county
no
Chula Vista Transit
Keep on Stride Website, but not HHSA
1800 Maxwell Rd
Chula Vista CA public $2, $1 seniors/disabled none
Six local routes most within Chula Vista city limits, with some service in unincorporated areas of the County (Bonita)
no

The Coordinated Plan (2010 – 2014) D-5 Appendix D—Social Service Transportation Inventory
Ho
urs
/Da
ys
of
pe
rati
on
s
Ve
hic
le
Typ
e
No
. V
eh
icle
s
Wh
ee
lch
air
A
cce
ssib
le?
Typ
es
of
Trip
s P
rov
ide
d
How is transportation scheduled for this program? Upon request/same day service, in advance # of days? D
o y
ou
acc
ep
t in
sura
nce
? If
so
, wh
ich
?
What is primary funding source for transporta-tion? Grants, State-Federal-local Funds, fares, fundraising?
Is there a time of day when your vehicles are not being used?
Is your organization willing to coordinate services if the appropriate funding or manage-ment mechanisms were established?
after school transportation to club, also operated for field trips and special events
grants, fares
after school transportation to club, also operated for field trips and special events
grants, fares
after school transportation to club, also operated for field trips and special events
grants, fares
M-F 8:30-5 classes 10-2:30Friday classes are special events
ask Davidto bring them here for classes or field trip
in advance usually 48hrs nofundraising, donations
no yes
M-F 8:30-4:30 transports 6 am occa-sional weekends
1 bus 1 van4 drivers 8-10 vehicles per day
yesmed appoints other activities
drivers schedule some regular basis riders, in advance of 24hrs no 911
no
5310, grants, private donors members donations
no
yes, as long as health of passengers came 1st
M-F 8:30-3:307 Chevy gastro vans
2
groceries (commissary), med appointments, wic appointments
call in advance do take same day,24-hr notice, 1st come
fundraising1 back up vehicle
no
M-F 8-5 weekends Sat by appt
Honda passenger van pick up van
2 no
pick up from airport, doctor appointment, shopping, job-related activities
24 hr advance - case manager
no federal varies yes
M-F 8-6 office training
bus 25 passengers (farm workers)
1 noonly to and from job training center
in advance n/agrants, donations
in evening no
M-F 7-10am 2-5pm weekends 9-9
type II buses 6 wheelchairs
10 yes
adult day program, medical, shopping, weekends recreational
fixed route M-F weekends reserve in advance from monthly calendar
no
M-F reimbursed through regional center -profits from that are used to fund weekend outings
M-F 4 vehicles rotated in for main-tenance not being used on daily basis
yes
M-F 5-10 Weekend 7-8
37 buses allfixed, handled thru access

Compiled List of Agencies Contacted for 2008 Coordinated Plan & STRIDE Website Update - HHSA Providers
The Coordinated Plan (2010 – 2014) D-6 Appendix D—Social Service Transportation Inventory
Ag
en
cy N
am
e
Pro
gra
m
Na
me
Ag
en
cy
Str
ee
t
Ag
en
cy
Cit
y
Ag
en
cy S
tate
Org
an
iza
tio
nTy
pe
Ch
arg
e F
are
? A
mo
un
t p
er
on
e
wa
y t
rip
, pe
r m
ile
, o
the
r.
En
roll
me
nt
or
Pro
gra
m
Re
qu
ire
-m
en
ts
Se
rvic
e A
rea
Bo
un
da
rie
s -
Cit
ies
&/o
r U
rba
n, R
ura
l, Z
IP
CO
DE
S
Se
rvic
e A
rea
s D
iffe
ren
t D
ep
en
d-i
ng
on
Po
pu
lati
on
City Link Foundation
6610 Federal Blvd
Lemon Grove
CA
Clairemont Friendship Center, Inc - renamed Live Well San Diego
Claremont Friendship Center Transportation Program
4425 Bannock Ave
San Diego CA nonprofitdonations suggested, get reimbursed $5 per ride
enrolled in lunch program
Linda vista, Serra Mesa, Kearny Mesa, Clairemont, University City
no
Community Catalysts of California
6050 Santo Rd, Ste 145
San Diego CA
Community Christian Service Agency
Community Christian Service Agency Program
4167 Rappa-hannock Ave
San Diego CA
Community Connection Resource Center
Jobsplus 4080 Centre St San Diego CA
Community Development Commission
National City Senior Nutrition
1415 D. AveNational City
CA
Community Mobile
7825 La Mesa Blvd
La Mesa Ca nonprofitno fare, was asking for a $2 per trip donation
sign up and must live in la mesa and lemon grove area
La Mesa and Lemon Grove
no
Community Options
8555 Aero Dr San Diego CA NP regional center reimbursefunded thru regional center case manager
Mira Mesa, Scripps Ranch
Consolidated Trans-portation Service Agency (CTSA)
Full Access & Coordinated Transportation, (FACT)
810 Mission Ave Oceanside CA
Crash, Options for Recovery
5605 El Cajon Blvd
San Diego CA
Crossroads Foundation
3594 4th Ave San Diego CA
Del Mar Community Connections (DMCC)
DMCC Volunteer Drivers & Del Mar Dial a Ride
P. O. Box 2947 Del Mar CA nonprofit no, accept donationssign up 60 older del mar resident
all del mar residents, go outside city limits for doctors and other outing bus goes to Encinitas
Del Mar Community Connections (DMCC)
DMCC Grocery & Pharmacy Shuttle Service
P. O. Box 2947 Del Mar CA
Disabled American Veterans
3350 La Jolla Village Dr, Rm 1459
San Diego CA nonprofit no veterans
all county w/ boundaries, El Centro (E), Oceanside (N), Escondido (NE), South Bay (S)
no
Don Allen Parentcare
Parentcare Family Recovery Center
4990 Williams Ave
La Mesa CA nonprofit no agency clientsel Cajon, spring valley lemon grove, east conty
no
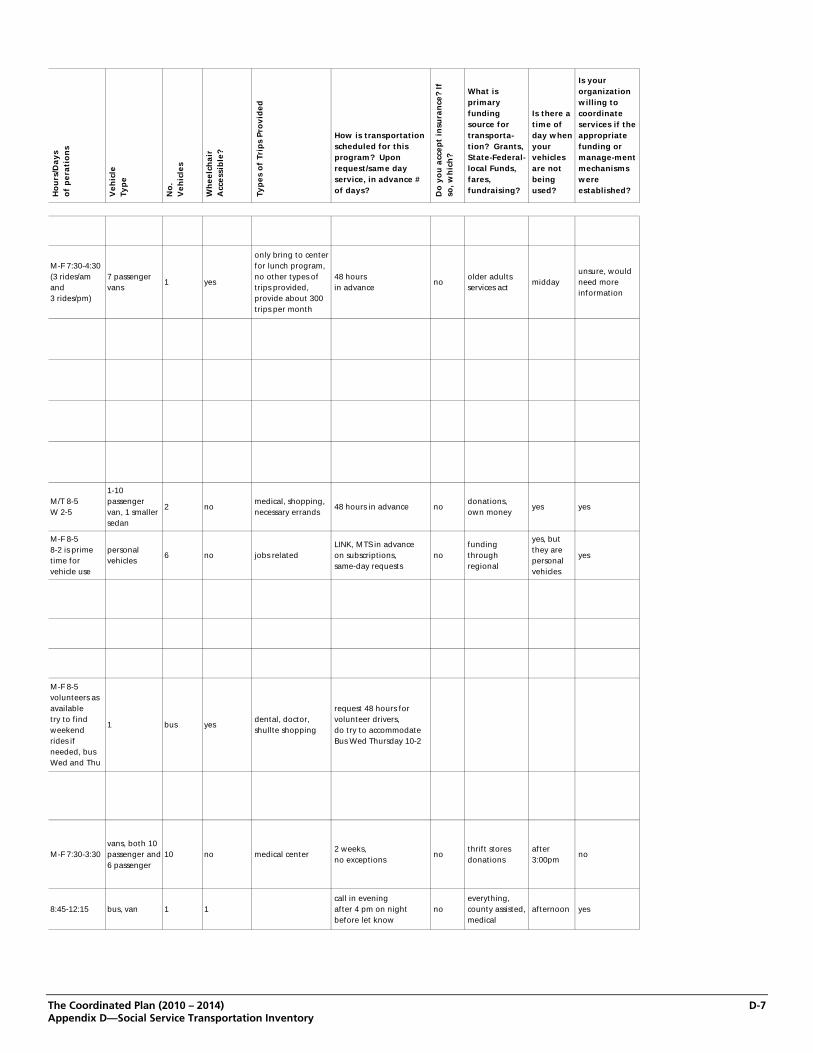
The Coordinated Plan (2010 – 2014) D-7 Appendix D—Social Service Transportation Inventory
Ho
urs
/Da
ys
of
pe
rati
on
s
Ve
hic
le
Typ
e
No
. V
eh
icle
s
Wh
ee
lch
air
A
cce
ssib
le?
Typ
es
of
Trip
s P
rov
ide
d
How is transportation scheduled for this program? Upon request/same day service, in advance # of days? D
o y
ou
acc
ep
t in
sura
nce
? If
so
, wh
ich
?
What is primary funding source for transporta-tion? Grants, State-Federal-local Funds, fares, fundraising?
Is there a time of day when your vehicles are not being used?
Is your organization willing to coordinate services if the appropriate funding or manage-ment mechanisms were established?
M-F 7:30-4:30 (3 rides/am and 3 rides/pm)
7 passenger vans
1 yes
only bring to center for lunch program, no other types of trips provided, provide about 300 trips per month
48 hours in advance
noolder adults services act
middayunsure, would need more information
M/T 8-5 W 2-5
1-10 passenger van, 1 smaller sedan
2 nomedical, shopping, necessary errands
48 hours in advance nodonations, own money
yes yes
M-F 8-5 8-2 is prime time for vehicle use
personal vehicles
6 no jobs relatedLINK, MTS in advance on subscriptions, same-day requests
nofunding through regional
yes, but they are personal vehicles
yes
M-F 8-5 volunteers as available try to find weekend rides if needed, bus Wed and Thu
1 bus yesdental, doctor, shullte shopping
request 48 hours for volunteer drivers, do try to accommodate Bus Wed Thursday 10-2
M-F 7:30-3:30vans, both 10 passenger and 6 passenger
10 no medical center 2 weeks, no exceptions
nothrift stores donations
after 3:00pm
no
8:45-12:15 bus, van 1 1call in evening after 4 pm on night before let know
noeverything, county assisted, medical
afternoon yes

Compiled List of Agencies Contacted for 2008 Coordinated Plan & STRIDE Website Update - HHSA Providers
The Coordinated Plan (2010 – 2014) D-8 Appendix D—Social Service Transportation Inventory
Ag
en
cy N
am
e
Pro
gra
m
Na
me
Ag
en
cy
Str
ee
t
Ag
en
cy
Cit
y
Ag
en
cy S
tate
Org
an
iza
tio
nTy
pe
Ch
arg
e F
are
? A
mo
un
t p
er
on
e
wa
y t
rip
, pe
r m
ile
, o
the
r.
En
roll
me
nt
or
Pro
gra
m
Re
qu
ire
-m
en
ts
Se
rvic
e A
rea
Bo
un
da
rie
s -
Cit
ies
&/o
r U
rba
n, R
ura
l, Z
IP
CO
DE
S
Se
rvic
e A
rea
s D
iffe
ren
t D
ep
en
d-i
ng
on
Po
pu
lati
on
Elder Help of San Diego
Care Management 4069 30th St San Diego CA private, nonprofit
no agency client
92101, 92102, 92103, 92104, 92105, 92111, 92115, 92116, 92117, 92108, 92106, 92107, 92109, 92110, 92123, 92019, 92020, 92021, 92119, 92120, 91941, 92942, 92943, 92944, 92945, 92977,
Elizabeth Hospice Elizabeth Hospice 150 W Crest St
Escondido CA
Employment Services, Mental Health Systems, Inc
Mental Health Systems Bus Pass Program
1202 Morena Blvd
San Diego CA
Encinitas (City of) Out & About Encinitas
1140 Oakcrest Park
Encinitas CA
Escondido Joslyn Senior Center
Nutrition Transportation Program
210 Park Ave Escondido CA
Escondido Roslyn Senior Center
Out & About 210 Park Ave Escondido CA
Escondido Joslyn Senior Center
Daily Ranch 210 Park Ave Escondido CA
Fallbrook Healthcare Foundation
Care VanP.O. Box 2155 Fallbrook
Fallbrook CA nonprofit noagency clients and seniors (55 and over) people w/disabilities
Fallbrook, Bonsall, Rainbow, De Luz
no
Fish Service Volunteers, Inc
5940 Kelton Ave
La Mesa CA
Fourth District Seniors Resource Center
George L. Stevens Community Senior Center
570 South 65th St
San Diego CA
Fraternity House, Inc
20702 Elfin Forest Rd
Escondido CA
Fresh Start Surgical Gifts, Inc
Fresh Start Surgical Gifts Transportation Program
351 Santa Fe Dr, Ste 210
Encinitas CA nonprofit no agency client, patientall county if needed
no
Friends of Adult Day Health Care Centers
Poway Adult Day Health Care
13180 Poway Road
Poway CA
George G. Glenner Alzheimer's Family Centers Inc
George G. Glenner Alzheimer's Family Center Prog.
3702 Fourth Ave San Diego CA private nonprofit
yes, dependent on the patient (varies)
agency clientNorth County only
no
Golden State Paratransit
Pineapple Express Transportation
4350 Palm Ave #1
La Mesa CA private for profit
wheelchair $90 round trip $3.50 per mile, ambulatory $70rt $2.50
no
All County Oceanside, Fallbrook East Blvd East County Alpine, Border
no

The Coordinated Plan (2010 – 2014) D-9 Appendix D—Social Service Transportation Inventory
Ho
urs
/Da
ys
of
pe
rati
on
s
Ve
hic
le
Typ
e
No
. V
eh
icle
s
Wh
ee
lch
air
A
cce
ssib
le?
Typ
es
of
Trip
s P
rov
ide
d
How is transportation scheduled for this program? Upon request/same day service, in advance # of days? D
o y
ou
acc
ep
t in
sura
nce
? If
so
, wh
ich
?
What is primary funding source for transporta-tion? Grants, State-Federal-local Funds, fares, fundraising?
Is there a time of day when your vehicles are not being used?
Is your organization willing to coordinate services if the appropriate funding or manage-ment mechanisms were established?
M-T 8-4 F 8-12 I&R M-T 8-12
volunteers personal cars
15-30 rides per months
nomedical appointments
one week in advance for rides
no
grants fundraisers personal donations
personal vehicles
yes
M-F 8-5 mini vans 7 2 nomedical, grocery, necessary errands, recreation
24 hrs advance can take same day
no
donations sponsorships annual money ad on van
no no
M-F 8:30-5 surgery week-ends vary throughout the year
contract out 1 van
1 nomedical, on surgery day only
in advance nogrants donations
no no
M-F 8:45-5:15 1 van yesto center and back home only
in advance nogrants, donations
yes no
7 days 24 hours
towncars, vans
8all wheelchair accessible
anysame day, advance
yesinsurance, workman's comp., fares
no yes

Compiled List of Agencies Contacted for 2008 Coordinated Plan & STRIDE Website Update - HHSA Providers
The Coordinated Plan (2010 – 2014) D-10 Appendix D—Social Service Transportation Inventory
Ag
en
cy N
am
e
Pro
gra
m
Na
me
Ag
en
cy
Str
ee
t
Ag
en
cy
Cit
y
Ag
en
cy S
tate
Org
an
iza
tio
nTy
pe
Ch
arg
e F
are
? A
mo
un
t p
er
on
e
wa
y t
rip
, pe
r m
ile
, o
the
r.
En
roll
me
nt
or
Pro
gra
m
Re
qu
ire
-m
en
ts
Se
rvic
e A
rea
Bo
un
da
rie
s -
Cit
ies
&/o
r U
rba
n, R
ura
l, Z
IP
CO
DE
S
Se
rvic
e A
rea
s D
iffe
ren
t D
ep
en
d-i
ng
on
Po
pu
lati
on
Green Oak RanchGreen Oak Ranch Ministries
1237 Green Oak Rd
Vista CA
Hanbleceya Hanbleceya Transportation Program & Referral
5520 Wellesley, Ste 107
La Mesa CA
Heartland Human Relations and Fair Housing
Zip Trip Program 1068 BroadwaySte 201
El Cajon CA
Indian Health Council
50100 Golsh RdValley Center
CA
Interfaith Community Services
Project CARE Taxi Voucher Program
111 Richmar Rd San Marcos
CA
Interim Healthcare1875 Centre City Pkwy
Escondido CA
International Rescue Committee
5348 University Ave, Ste 205
San Diego CA nonprofit norefugees, low income immigrants
all county, more in city than outlying areas but not opposed to it
no
ITNSanDiegoTemporarily located @ Center for the Blind in SD
Center for Blind 15922 El Cajon Blvd
nonprofit
yes, fare and membership based amounts decided later, 50 year discounted for advance scheduled discounted shared rides available 24-7 no limitation purpose of trip volunteer drivers supplemented w/ part time paid drivers
city of San Diego all council district 6 southern 5 triangular shape to connect council 1 Mira Mesa Mission Valley, expanding, hope
Jewish Family Service
College Ave. Senior Ctr. Nutrition Transportation
4855 College Ave
San Diego CA donation based with zones as well
no92115, 92119, 92120, 91941
no
Jewish Family Service
Rides and Smiles 13094 Civic Center Dr
Poway CA nonprofitRides and smiles donation based zone suggested donation
rides smiles 20 enrollment fee lots of enrolls
92127, 92128, 92064, 92129, 92131 * Pick up from these areas only, but will take anywhere in San Diego County
no
Joan's Journeys
Joan's Journeys Senior Transportation Program
3355 Moraga Pl San Diego CA private profit
$25 up to 1/2 $5 every 15minutes after flat rate, regular
no
central San Diego beach areas pb as far as Del not South Bay East County
no
La Maestra Family Clinic, Inc
4185 Fairmount Ave
San Diego CA nonprofit no agency patient
mostly w/in city of San Diego limits and also El Cajon
no
La Mesa (City of) rides 4 neighbors 8130 Allison Ave La Mesa CA public nomust be older adults or persons of disability
only in city limits of La Mesa
no

The Coordinated Plan (2010 – 2014) D-11 Appendix D—Social Service Transportation Inventory
Ho
urs
/Da
ys
of
pe
rati
on
s
Ve
hic
le
Typ
e
No
. V
eh
icle
s
Wh
ee
lch
air
A
cce
ssib
le?
Typ
es
of
Trip
s P
rov
ide
d
How is transportation scheduled for this program? Upon request/same day service, in advance # of days? D
o y
ou
acc
ep
t in
sura
nce
? If
so
, wh
ich
?
What is primary funding source for transporta-tion? Grants, State-Federal-local Funds, fares, fundraising?
Is there a time of day when your vehicles are not being used?
Is your organization willing to coordinate services if the appropriate funding or manage-ment mechanisms were established?
M-F 8:30-5 van 1 nojob related medical related
scheduled in advance thru case manager
nofed grants not specific to transportation
no maybe
6 0 advance no
first year city and county applying for grants in the private sector part of a national non-profit within five years be sustainable
volunteers yes
M-F only 9:30-3
E350 van, Euro Van
2 noanything but to the airport
24hr in advance
M-F 8:30-5 office, rides dependent on volunteer availability
volunteer own vehicles (102 enrolled, about 45 active )
north inland wheelchair, Euro van hold trips college
nomedical, varied everything but trips to the airport
max of 1 calendar month, min of 1week R&S (there is a waiting list of 100 people for the program)
nonf grants, donations, fundraising
volunteers, AIS vehicles used between 9-3
consider it
M-F 6-6 sedans 2
walkers but no wheel-chairs typically
no restrictions 24 hours no fares no no
M-T 8:30-8 F 8:30-5 S 10-2 trans-portation not provided in evenings or on weekends
1998 Plymouth 7 passenger van, 1996 ford commercial van
2
no, physically lift passen- gers into vehicles (collapsible chairs only)
medical appointments, and medical related needs
advance 48 hours
no
clinic operations funds, comes out of budget
yes in evening and on weekends
yes
dependent on volunteer availability
11 volunteer drivers, use own cars
11 volunteer drivers, use own cars
no, but if an individual needs, will subcontract out for service
medical, essential shopping, personal care, social activities
call one week in advance no
new freedom funds, donations, fundraising
volunteer vehicles, not available for other trans. Purposes
would be interested in working with other agencies but not sharing vehicles. Agency has no intention of purchasing vehicles

Compiled List of Agencies Contacted for 2008 Coordinated Plan & STRIDE Website Update - HHSA Providers
The Coordinated Plan (2010 – 2014) D-12 Appendix D—Social Service Transportation Inventory
Ag
en
cy N
am
e
Pro
gra
m
Na
me
Ag
en
cy
Str
ee
t
Ag
en
cy
Cit
y
Ag
en
cy S
tate
Org
an
iza
tio
nTy
pe
Ch
arg
e F
are
? A
mo
un
t p
er
on
e
wa
y t
rip
, pe
r m
ile
, o
the
r.
En
roll
me
nt
or
Pro
gra
m
Re
qu
ire
-m
en
ts
Se
rvic
e A
rea
Bo
un
da
rie
s -
Cit
ies
&/o
r U
rba
n, R
ura
l, Z
IP
CO
DE
S
Se
rvic
e A
rea
s D
iffe
ren
t D
ep
en
d-i
ng
on
Po
pu
lati
on
Lenora's Assisted Living Services, Inc
Caring Neighbors Program
7148 BroadwayLemon Grove
CA
Lutheran Social Services
Caring Neighbors Program
270 F St Chula Vista CA
MAAC Project Head Start
Head Start800 Los Vallecitos Blvd Suite J
San Marcos
CA
Mesa Valley Grove Senior Program
4975 Memorial Dr
La Mesa CA
Metropolitan Transit System
DART 1255 Imperial Ave, #1000
San Diego CA Public
Adults, $3.00 Seniors, disabled, children under 5 years, $1.50 If you're paying by Monthly Pass, transfer, Senior/Disabled pass or Youth pass, please add 50 cents.
noneRancho Bernardo, Scripps Ranch
no
Metropolitan Transit System
MTS Access 1255 Imperial Ave, #1000
San Diego CA Public$4.50 one way (urban), $45.00 for packet of 10
ada certified
City of SD, uptown, downtown, North Park, east San Diego, College area, Mission Valley, Ocean Beach, Pacific Beach, Imperial Beach, Tierrasanta, Mira Mesa, Carmel Valley, Scripps Ranch, and La Jolla
no
Metropolitan Transit System
MTS Para transit 1255 Imperial Ave, #1000
San Diego CA Public$3.50 (suburban), $40 for packet of 10
ada certified
Zone II : Poway Rancho Bernardo Rancho Penasquitos Sabre Springs Escondido (connect with NCTD at North County Fair Mall); Zone III El Cajon Santee Lakeside La Mesa Lemon Grove Spring Valley Casa De Oro Rancho San Diego Alpine; Zone IV Bonita
no
MHS - Cal Works Multi-Service Center South
MHS - Cal Works Counseling Program
1105 Broadway, #207
Chula Vista CA
Mountain Health & Community Services
Mountain Health Transportation Program
31115 Hwy 94 Campo CA
Mountain Shadows Support Group
2067 West El Norte Pkwy
Escondido CA nonprofit nomountain shadows residents only
mainly north county, exceptions to that
no

The Coordinated Plan (2010 – 2014) D-13 Appendix D—Social Service Transportation Inventory
Ho
urs
/Da
ys
of
pe
rati
on
s
Ve
hic
le
Typ
e
No
. V
eh
icle
s
Wh
ee
lch
air
A
cce
ssib
le?
Typ
es
of
Trip
s P
rov
ide
d
How is transportation scheduled for this program? Upon request/same day service, in advance # of days? D
o y
ou
acc
ep
t in
sura
nce
? If
so
, wh
ich
?
What is primary funding source for transporta-tion? Grants, State-Federal-local Funds, fares, fundraising?
Is there a time of day when your vehicles are not being used?
Is your organization willing to coordinate services if the appropriate funding or manage-ment mechanisms were established?
all2 days in advance and up to 5pm the day before travel
all3 days in advance and up to 5pm the day before travel
7 days24 hours
buses & vans5 buses, 8 vans
alljob, shopping anything
scheduled in advance from 48 hours, can do same day if needed, also have fixed route
noregional center 5310
middle of the night
unsure

Compiled List of Agencies Contacted for 2008 Coordinated Plan & STRIDE Website Update - HHSA Providers
The Coordinated Plan (2010 – 2014) D-14 Appendix D—Social Service Transportation Inventory
Ag
en
cy N
am
e
Pro
gra
m
Na
me
Ag
en
cy
Str
ee
t
Ag
en
cy
Cit
y
Ag
en
cy S
tate
Org
an
iza
tio
nTy
pe
Ch
arg
e F
are
? A
mo
un
t p
er
on
e
wa
y t
rip
, pe
r m
ile
, o
the
r.
En
roll
me
nt
or
Pro
gra
m
Re
qu
ire
-m
en
ts
Se
rvic
e A
rea
Bo
un
da
rie
s -
Cit
ies
&/o
r U
rba
n, R
ura
l, Z
IP
CO
DE
S
Se
rvic
e A
rea
s D
iffe
ren
t D
ep
en
d-i
ng
on
Po
pu
lati
on
National City (City of)
National City Senior Program
140 East 12th St, Suite A
National City
CA public no register aat center only residents on
National Multiple Sclerosis Society, San Diego
National Multiple Sclerosis Society Transportation. Prog.
8840 Complex Dr, Ste 130
San Diego CA
Neighborhood Care Center
6122 El Cajon Blvd
San Diego CA nonprofit no case management
some areas of north county mostly city of San Diego
no
Neighborhood House
Neighborhood House Transportation Program
4425 Federal Blvd, Ste B-024
San Diego CA no agency clients
hiv county wide head start county seniors w/in city of San Diego and South Bay Metro San Diego Spring Valley El Cajon 30-mile limit for senior program
no
Neighborhood House
Ryan White CARE Act
4425 Federal Blvd, Ste B-024
San Diego CA nonprofit
New Alternatives, Inc Foster FamilyAgency
NAI-FFA7867 Convoy Ct, Ste 410
San Diego CA nonprofit
New Entra Casa3575 Pershing Ave
San Diego CA nonprofit
Noah Homes, Inc 12526 Campo RdSpring Valley
CA nonprofitno, vendorized w/ san Diego regional center
must be a resident all county no
No Vacancy Agency, Inc
No Vacancy Transportation Program
1557 Grand Ave, Suite 103
San Marcos
CA private for profit
Trip rates depend on location and mileage. Accept medical/medicare and that changes mileage rates. Gave an example of $1.30 per mile w/medi-cal, but would not give a flat rate. Must call
no78 corridor, North County only
no
North County Child Study Center
Mariposa Project6949 El Camino Real, #201
Carlsbad CA
North County Community Services
Child Dev. Preschool1557 Grand Ave, Suite C
San Marcos
CA
North County Lifeline, Inc
LIFT Transportation, ADA Para transit Service
200 Michigan Ave
Vista CA nonprofit
North County Solutions for Change
722 West Calif Ave
Vista CA
North County Transit District
LIFT810 Mission Ave
Oceanside CA
Del Mar Solana Beach Encinitas Carlsbad Oceanside Vista San Marcos Escondido (connect with MTS at North County Fair Mall) Camp Pendleton Ramona Fallbrook
North County Transit District
NCTD Travel Training Services
810 Mission Ave
Oceanside CA

The Coordinated Plan (2010 – 2014) D-15 Appendix D—Social Service Transportation Inventory
Ho
urs
/Da
ys
of
pe
rati
on
s
Ve
hic
le
Typ
e
No
. V
eh
icle
s
Wh
ee
lch
air
A
cce
ssib
le?
Typ
es
of
Trip
s P
rov
ide
d
How is transportation scheduled for this program? Upon request/same day service, in advance # of days? D
o y
ou
acc
ep
t in
sura
nce
? If
so
, wh
ich
?
What is primary funding source for transporta-tion? Grants, State-Federal-local Funds, fares, fundraising?
Is there a time of day when your vehicles are not being used?
Is your organization willing to coordinate services if the appropriate funding or manage-ment mechanisms were established?
M-5 8-5bus 18 passenger
1 no lift center back, through same day no city no
M-F 9-5volunteer vehicles
15 no
medical mostly SSI appointments medical VA rehab or mental health program
same day in advance no private no yes
M-F 7-5 seniors HIV special occasions weekends
bus
9 Para transit 44 school buses
6 school buses wheelchair accessible
m-f medical dental appointments case management 90%
emergencies same day, hiv taxi service senior program fixed routes 48 hours
no grants 5310 no yes
trans-portation must be available 24 7
vans 12&15 passenger vans
14 3medical, recreational, any need
same day and in advance
medi-cal, medi-care
reimbursed by regional center and grants
yes, but they must be available 24 7
unsure
6-6 7 days/week
buses, sedans, vans
8 bus, 8 vans, 8 sedans
all buses and vans handle wheelchairs
all48 hourscan do same day if approved
yes fares no no
yes

Compiled List of Agencies Contacted for 2008 Coordinated Plan & STRIDE Website Update - HHSA Providers
The Coordinated Plan (2010 – 2014) D-16 Appendix D—Social Service Transportation Inventory
Ag
en
cy N
am
e
Pro
gra
m
Na
me
Ag
en
cy
Str
ee
t
Ag
en
cy
Cit
y
Ag
en
cy S
tate
Org
an
iza
tio
nTy
pe
Ch
arg
e F
are
? A
mo
un
t p
er
on
e
wa
y t
rip
, pe
r m
ile
, o
the
r.
En
roll
me
nt
or
Pro
gra
m
Re
qu
ire
-m
en
ts
Se
rvic
e A
rea
Bo
un
da
rie
s -
Cit
ies
&/o
r U
rba
n, R
ura
l, Z
IP
CO
DE
S
Se
rvic
e A
rea
s D
iffe
ren
t D
ep
en
d-i
ng
on
Po
pu
lati
on
North Inland Community Prevention Program
12344 Oak Knoll Rd
Poway Ca nonprofit no agency clientsservice north inland
Oceanside (City of) Oceanside Ca
Pacific Educational Facilities, Inc
Meals on Wheels PO Box 657 Ramona CA
Parkinson Disease Association of San Diego
Parkinson Disease Assoc. Transportation Program
8555 Aero Dr,Ste 205
San Diego CA
Partners MentorshipProgram
Partners Mentorship Transportation Program
3295 Meade Ave San Diego CA
Partnership with Industry
Partnership with Industry Transportation Program
7540 Metropolitan Dr, Ste 105
San Diego CA
Peninsula Shepherd Senior Center
Out & About Peninsula
3740 Sports Arena Blvd, #2
San Diego CA non profit
4 donation for van service $ for gas volunteer
sign up w/ emergency contact
92106, 92107, 92110 peninsula Sports Arena area
no
PERT, IncPsychiatric Emergency Response Team
1094 Cudahy Pl, #314
San Diego CA
Poway Senior Center
13094 Bowran Rd
Poway CA nonprofit donation within zip codes
Poway, Rancho Bernardo, Sabre Springs, PQ, Carmel Mountain
no
Poway ( City of) senior center P.O. Box 789 Poway CA
Presbyterian Crisis Center
Urban Ministries 2459 Market St San Diego CA nonprofitdo not charge to hand out tokens and passes
recipients of passes must present letter from employer on letterhead w/information requested by the center
resource center located in downtown, will help clients with trans needs countywide
no
Promising Futures12960 Ha Hana Rd
Lakeside CA nonprofityes funded thru regional center 12,000
vendorized thru regional center
East County, South Bay, La Mesa, Ramona
no
Providence PlaceMental Health Systems
446 26th St, 4th Floor
San Diego CA
Rancho Bernardo Community Presbyterian Church
17010 Pomerado Rd
San Diego CA nonprofit no anyone
Sunday more 17 passenger busses senior shuttle on Sunday limited to North County, Rancho Bernardo PQ, different retirement

The Coordinated Plan (2010 – 2014) D-17 Appendix D—Social Service Transportation Inventory
Ho
urs
/Da
ys
of
pe
rati
on
s
Ve
hic
le
Typ
e
No
. V
eh
icle
s
Wh
ee
lch
air
A
cce
ssib
le?
Typ
es
of
Trip
s P
rov
ide
d
How is transportation scheduled for this program? Upon request/same day service, in advance # of days? D
o y
ou
acc
ep
t in
sura
nce
? If
so
, wh
ich
?
What is primary funding source for transporta-tion? Grants, State-Federal-local Funds, fares, fundraising?
Is there a time of day when your vehicles are not being used?
Is your organization willing to coordinate services if the appropriate funding or manage-ment mechanisms were established?
M-F 9-5 some evening programs
van 12 passenger
1no ramp, can hold
to coalition meetings city hall town hall meetings information session community training sessions
in advance 48 hours
no county funded no
Ralphs Tues pmTarget Fri amVons Wed pmWal-Mart 1 pm-close
astro van pick up at own home
1 no
medical appointments, van 99% grocery shopping
2 days in advance preferred
nodonations, fundraising
yes yes
M-F 8-2 van, bus1 bus, 1 van
no 24 nogrant from AIS
2pm on yes
M-F 9-11M-T 1-2 closed first Friday of the month
n/a n/a n/abus passes for job-related activities
n/a nofunded thru Presbyterian churches
n/a no
M-F 7-3 vans3 vans one non-abul
1
transport jobs, medical, social day program primary funding to and from day programs
advance no5310 grants, funding thru regional center
after 3pm yes
Sun only
17 passenger bus 28 passenger bus use for trip for youth
1 noadvance one week, decons schedule
no
set aside church budget donations
yes

Compiled List of Agencies Contacted for 2008 Coordinated Plan & STRIDE Website Update - HHSA Providers
The Coordinated Plan (2010 – 2014) D-18 Appendix D—Social Service Transportation Inventory
Ag
en
cy N
am
e
Pro
gra
m
Na
me
Ag
en
cy
Str
ee
t
Ag
en
cy
Cit
y
Ag
en
cy S
tate
Org
an
iza
tio
nTy
pe
Ch
arg
e F
are
? A
mo
un
t p
er
on
e
wa
y t
rip
, pe
r m
ile
, o
the
r.
En
roll
me
nt
or
Pro
gra
m
Re
qu
ire
-m
en
ts
Se
rvic
e A
rea
Bo
un
da
rie
s -
Cit
ies
&/o
r U
rba
n, R
ura
l, Z
IP
CO
DE
S
Se
rvic
e A
rea
s D
iffe
ren
t D
ep
en
d-i
ng
on
Po
pu
lati
on
Reachout to Families Resource Center
Reachout to Families Social Service Program
1237 Elder AveImperial Beach
CA
Redwood Senior Homes & Services
Adult Day Health Care
1151 S Redwood St
Escondido CA nonprofitpaid for through enrollment in eldercare
agency client
all north county, will pick up from home and bring to center
no
Redwood Senior Homes & Services
Out & About Escondido
1151 S Redwood St
Escondido CA nonprofit nomust live in city of Escondido, and enroll in esco out & about
Escondido only no
Reliable Transportation
Reliable Transportation
P.O. Box 1339 Lemon Grove
CA private, for profit
Rate for ambulatory - $25 RT, plus $1/mile.
no eligibility requirements
Downtown San Diego and outlying areas, including Spring Valley, La Mesa, El Cajon, Santee, Clairemont, and Chula Vista
no
S.D.Y.C.S. Storefront Teen Shelter
Homeless Outreach 3427 4th Ave San Diego CA nonprofit no agency client
all county, thru country will provide transportation for an individual out of state
no
San Diego American Indian Health Center
Outreach Department
2630 1st Ave San Diego CA
San Diego Center For The Blind and Vision Impaired
San Diego Center For The Blind-Transportation
5922 El Cajon Blvd
San Diego CA
San Diego Center For The Blind and Vision Impaired
San Diego Center For The Blind-Transportation
1385 Bonair Rd Vista Ca
San Diego County Juvenile Court Schools
San Diego County Juvenile Court Schools Program
6401 Linda Vista Rd
San Diego CA public
San Diego County Probation Department
Work Project Program
5555 Overland Ave #2011
San Diego CA public no parolees/ court ordered
San Diego Regional Center
San Diego Regional Center Private Para transit
4355 Ruffin Rd San Diego CA nonprofit no
regional center clients, must go thru application process and be developmentally disabled
all county
San Diego County Special Olympics
10977 San Diego MSN Rd
San Diego CA nonprofit no agency clients all county no
San Diego Parkinson Corporation
8555 Areo Dr, Ste 205
San Diego CA nonprofit no Parkinson's n/a no
S.E.A.R. Center324 North 47th St
San Diego CA nonprofit nocase managed from Ryan white center
n/a no

The Coordinated Plan (2010 – 2014) D-19 Appendix D—Social Service Transportation Inventory
Ho
urs
/Da
ys
of
pe
rati
on
s
Ve
hic
le
Typ
e
No
. V
eh
icle
s
Wh
ee
lch
air
A
cce
ssib
le?
Typ
es
of
Trip
s P
rov
ide
d
How is transportation scheduled for this program? Upon request/same day service, in advance # of days? D
o y
ou
acc
ep
t in
sura
nce
? If
so
, wh
ich
?
What is primary funding source for transporta-tion? Grants, State-Federal-local Funds, fares, fundraising?
Is there a time of day when your vehicles are not being used?
Is your organization willing to coordinate services if the appropriate funding or manage-ment mechanisms were established?
M-F 8-4 yes
for day program don't go valley center or beyond sm
set up during time of enrollment, fixed schedule for adult day care program
medi-cal, medi-care
allnot on weekends
no
M-F 9:30-12:30 (medical) M-F vary times (all-day shopping)
bus, vans, cars ?? yesshopping medical in Escondido only
make appoint 24 to 48 hours
grant from city of esco
afternoons M-T
no
24 hours7 days
yes
same-day service is considered, but 1-day notice is preferred
24 hours7 days
van 2 no
appointments, medical, errands, outings, education, employment
ILS worker usually schedule in advance
nofed, state, county, fundraising
no no
7 days week 7:45am-3:30pm
vans 27 nocourt ordered community service
in advance no county no no
Mon-Sun 8-5 n/a n/a n/a n/a 48 hours n/a state funded n/a yes
M-F 9-5, occasional weekend events
van 6 1 sport events advance no donations
yes, but varies dependent on activities
possibly
M-F 9-5 n/a n/a n/a advance yes state grants n/a yes
M-F 8-5 n/a n/a n/a n/a advance no
county funded program/also accepts donations
n/a no
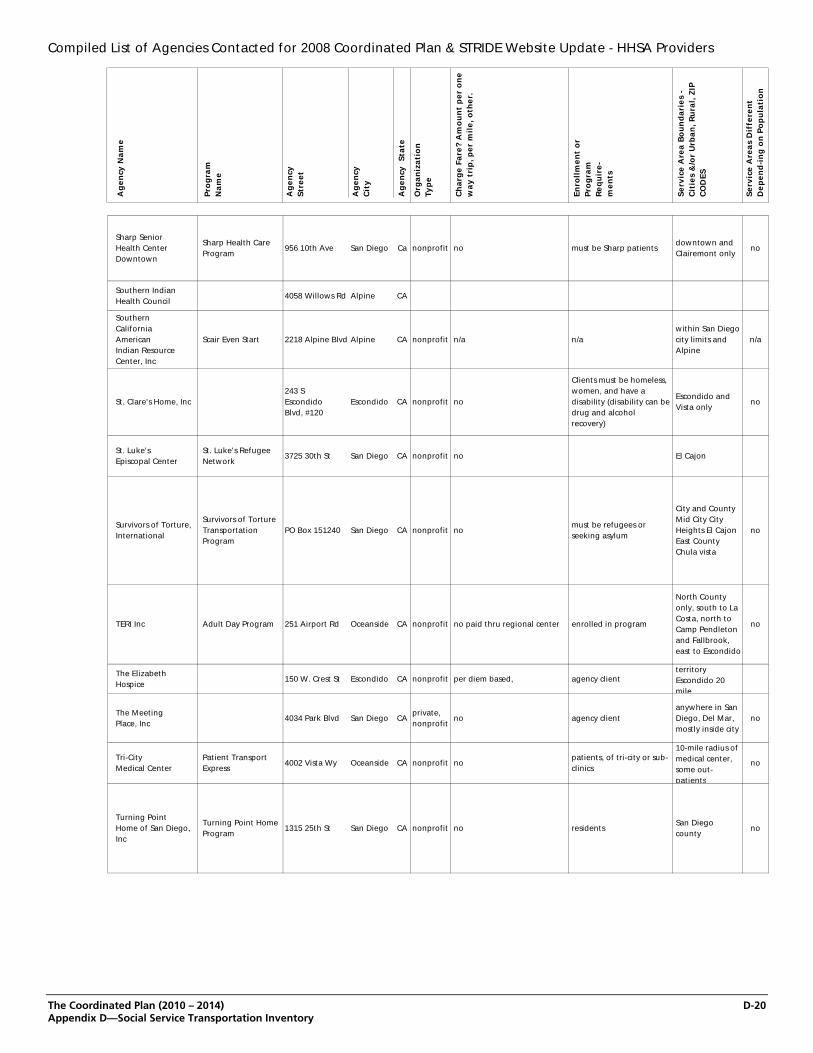
Compiled List of Agencies Contacted for 2008 Coordinated Plan & STRIDE Website Update - HHSA Providers
The Coordinated Plan (2010 – 2014) D-20 Appendix D—Social Service Transportation Inventory
Ag
en
cy N
am
e
Pro
gra
m
Na
me
Ag
en
cy
Str
ee
t
Ag
en
cy
Cit
y
Ag
en
cy S
tate
Org
an
iza
tio
nTy
pe
Ch
arg
e F
are
? A
mo
un
t p
er
on
e
wa
y t
rip
, pe
r m
ile
, o
the
r.
En
roll
me
nt
or
Pro
gra
m
Re
qu
ire
-m
en
ts
Se
rvic
e A
rea
Bo
un
da
rie
s -
Cit
ies
&/o
r U
rba
n, R
ura
l, Z
IP
CO
DE
S
Se
rvic
e A
rea
s D
iffe
ren
t D
ep
en
d-i
ng
on
Po
pu
lati
on
Sharp Senior Health Center Downtown
Sharp Health Care Program
956 10th Ave San Diego Ca nonprofit no must be Sharp patientsdowntown and Clairemont only
no
Southern Indian Health Council
4058 Willows Rd Alpine CA
Southern California American Indian Resource Center, Inc
Scair Even Start 2218 Alpine Blvd Alpine CA nonprofit n/a n/awithin San Diego city limits and Alpine
n/a
St. Clare's Home, Inc243 S Escondido Blvd, #120
Escondido CA nonprofit no
Clients must be homeless, women, and have a disability (disability can be drug and alcohol recovery)
Escondido and Vista only
no
St. Luke's Episcopal Center
St. Luke's Refugee Network
3725 30th St San Diego CA nonprofit no El Cajon
Survivors of Torture, International
Survivors of Torture Transportation Program
PO Box 151240 San Diego CA nonprofit nomust be refugees or seeking asylum
City and County Mid City City Heights El Cajon East County Chula vista
no
TERI Inc Adult Day Program 251 Airport Rd Oceanside CA nonprofit no paid thru regional center enrolled in program
North County only, south to La Costa, north to Camp Pendleton and Fallbrook, east to Escondido
no
The Elizabeth Hospice
150 W. Crest St Escondido CA nonprofit per diem based, agency clientterritory Escondido 20 mile
The Meeting Place, Inc
4034 Park Blvd San Diego CA private, nonprofit
no agency clientanywhere in San Diego, Del Mar, mostly inside city
no
Tri-City Medical Center
Patient Transport Express
4002 Vista Wy Oceanside CA nonprofit nopatients, of tri-city or sub-clinics
10-mile radius of medical center, some out-patients
no
Turning Point Home of San Diego, Inc
Turning Point Home Program
1315 25th St San Diego CA nonprofit no residentsSan Diego county
no
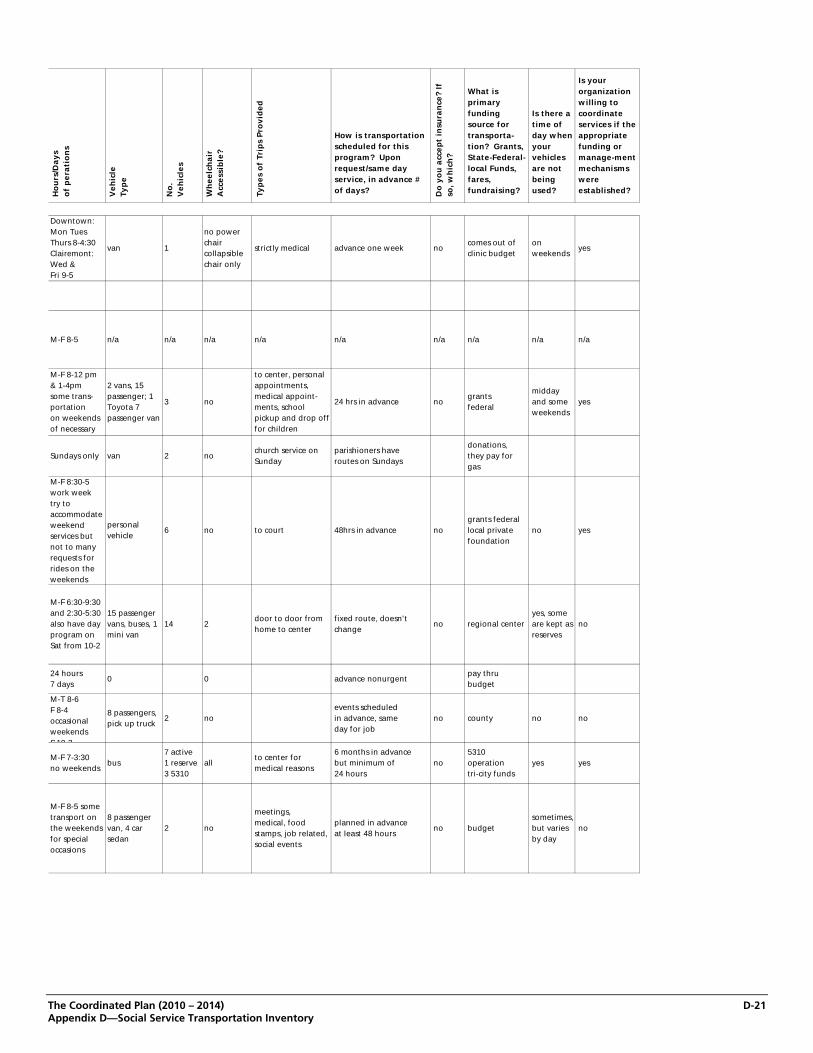
The Coordinated Plan (2010 – 2014) D-21 Appendix D—Social Service Transportation Inventory
Ho
urs
/Da
ys
of
pe
rati
on
s
Ve
hic
le
Typ
e
No
. V
eh
icle
s
Wh
ee
lch
air
A
cce
ssib
le?
Typ
es
of
Trip
s P
rov
ide
d
How is transportation scheduled for this program? Upon request/same day service, in advance # of days? D
o y
ou
acc
ep
t in
sura
nce
? If
so
, wh
ich
?
What is primary funding source for transporta-tion? Grants, State-Federal-local Funds, fares, fundraising?
Is there a time of day when your vehicles are not being used?
Is your organization willing to coordinate services if the appropriate funding or manage-ment mechanisms were established?
Downtown: Mon Tues Thurs 8-4:30 Clairemont: Wed & Fri 9-5
van 1
no power chair collapsible chair only
strictly medical advance one week nocomes out of clinic budget
on weekends
yes
M-F 8-5 n/a n/a n/a n/a n/a n/a n/a n/a n/a
M-F 8-12 pm & 1-4pm some trans-portation on weekends of necessary
2 vans, 15 passenger; 1 Toyota 7 passenger van
3 no
to center, personal appointments, medical appoint-ments, school pickup and drop off for children
24 hrs in advance nogrants federal
midday and some weekends
yes
Sundays only van 2 nochurch service on Sunday
parishioners have routes on Sundays
donations, they pay for gas
M-F 8:30-5 work weektry to accommodate weekend services but not to many requests for rides on the weekends
personal vehicle
6 no to court 48hrs in advance nogrants federal local private foundation
no yes
M-F 6:30-9:30 and 2:30-5:30also have day program on Sat from 10-2
15 passenger vans, buses, 1 mini van
14 2door to door from home to center
fixed route, doesn't change
no regional centeryes, some are kept as reserves
no
24 hours7 days
0 0 advance nonurgentpay thru budget
M-T 8-6 F 8-4 occasional weekends S 10 2
8 passengers, pick up truck
2 noevents scheduled in advance, same day for job
no county no no
M-F 7-3:30 no weekends
bus7 active 1 reserve 3 5310
allto center for medical reasons
6 months in advance but minimum of 24 hours
no5310 operation tri-city funds
yes yes
M-F 8-5 some transport on the weekends for special occasions
8 passenger van, 4 car sedan
2 no
meetings, medical, food stamps, job related, social events
planned in advance at least 48 hours
no budgetsometimes, but varies by day
no

Compiled List of Agencies Contacted for 2008 Coordinated Plan & STRIDE Website Update - HHSA Providers
The Coordinated Plan (2010 – 2014) D-22 Appendix D—Social Service Transportation Inventory
Ag
en
cy N
am
e
Pro
gra
m
Na
me
Ag
en
cy
Str
ee
t
Ag
en
cy
Cit
y
Ag
en
cy S
tate
Org
an
iza
tio
nTy
pe
Ch
arg
e F
are
? A
mo
un
t p
er
on
e
wa
y t
rip
, pe
r m
ile
, o
the
r.
En
roll
me
nt
or
Pro
gra
m
Re
qu
ire
-m
en
ts
Se
rvic
e A
rea
Bo
un
da
rie
s -
Cit
ies
&/o
r U
rba
n, R
ura
l, Z
IP
CO
DE
S
Se
rvic
e A
rea
s D
iffe
ren
t D
ep
en
d-i
ng
on
Po
pu
lati
on
Uplift Seniors Partner Plus Uplift Program
PO Box 620819 San Diego CA nonprofit yes, donation $5 minimum rt none
usually within City of San Diego limits but have made exceptions; also rely heavily on public transit
no
Volunteers of America
Hawley Center For Supportive Living
9980 Hawley Rd El Cajon CA non profit
no agency clients
depends on circumstance, do not operate on vehicle on regular basis. Mostly clients come to center, but if patients are transported to the hospital, then as far north as UCSD
no
Yellow Cab Yellow Cab, also concluded on Private Provider wkst
639 Thirteenth St
San Diego CA private for profit
$2.40 in cab $2.60 miles, 20 hr waiting time
none
entire County of San Diego except Coronado, no pick ups on
no
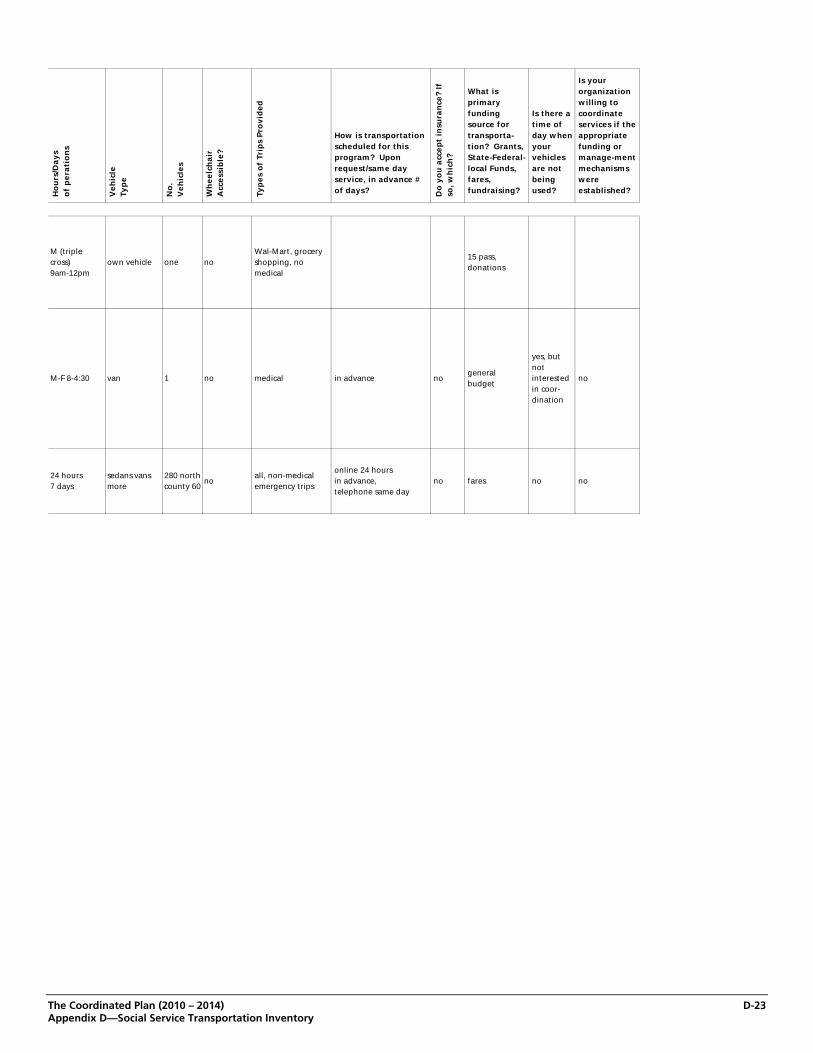
The Coordinated Plan (2010 – 2014) D-23 Appendix D—Social Service Transportation Inventory
Ho
urs
/Da
ys
of
pe
rati
on
s
Ve
hic
le
Typ
e
No
. V
eh
icle
s
Wh
ee
lch
air
A
cce
ssib
le?
Typ
es
of
Trip
s P
rov
ide
d
How is transportation scheduled for this program? Upon request/same day service, in advance # of days? D
o y
ou
acc
ep
t in
sura
nce
? If
so
, wh
ich
?
What is primary funding source for transporta-tion? Grants, State-Federal-local Funds, fares, fundraising?
Is there a time of day when your vehicles are not being used?
Is your organization willing to coordinate services if the appropriate funding or manage-ment mechanisms were established?
M (triple cross) 9am-12pm
own vehicle one noWal-Mart, grocery shopping, no medical
15 pass, donations
M-F 8-4:30 van 1 no medical in advance nogeneral budget
yes, but not interested in coor-dination
no
24 hours7 days
sedans vans more
280 north county 60
noall, non-medical emergency trips
online 24 hours in advance, telephone same day
no fares no no


appendix E
Program Management Plan September 2010


The Coordinated Plan (2010 – 2014) E-1 Appendix E—Program Management Plan
Program Management Plan September 2010
—an appendix to the Coordinated Transit-Human Services Transportation Plan


The Coordinated Plan (2010 – 2014) E-3 Appendix E—Program Management Plan
GOALS AND OBJECTIVES The goal of this Program Management Plan is to guide the San Diego Association of Governments (SANDAG) management of the Job Access and Reverse Commute (JARC), New Freedom (NF), and Senior Mini-Grant programs. This plan is designed to ensure that all SANDAG policies and federal and local statutes and regulations applicable to these programs are fulfilled. The intent of this plan is to ensure that the maximum possible benefit is enjoyed by the community through a fair and equitable distribution of available funds and the effective administration of these grant programs. JARC and NF are federal programs authorized under the Safe, Accountable, Flexible, Efficient Transportation Equity Act: A Legacy for Users, (SAFETEA-LU), enacted on August 10, 2005. Subsequently, the Federal Transit Administration (FTA) released guidance for each program on May 1, 2007. As set out in the FTA Circular 9045.1 “New Freedom Program Guidance and Application Instructions,” the goal of the New Freedom program is to provide additional tools to overcome existing barriers facing Americans with disabilities seeking integration into the work force and full participation in society. The New Freedom formula grant program seeks to expand the transportation mobility options available to people with disabilities beyond the minimum requirements of the American’s with Disabilities Act (ADA) of 1990. The goal of the JARC program, as stated in FTA Circular 9050.1 “The Job Access and Reverse Commute (JARC) Program Guidance and Application Instructions” is to improve access to transportation services to employment and employment related activities for welfare recipients and eligible low-income individuals and to transport residents of urbanized area and nonurbanized areas to suburban employment opportunities. To assist in meeting this goal, the FTA provides financial assistance for transportation services planned, designed, and carried out to meet the transportation needs of low-income individuals, and of reverse commuters regardless of income. Both programs require coordination of federally-assisted programs and services in order to make the most efficient use of federal resources. Under the Government Performance Results Act (GPRA), the FTA is required by law to “establish performance goals to define the level of performance” and to also “establish performance indicators to be used in measuring relevant outputs, service levels, and outcomes” for each of its programs. The three measures established for the New Freedom Program are:
1) Increase or enhancements related to geographic coverage, service quality and/or service times that impact availability of transportation services for individuals with disabilities as a result of the New Freedom projects implemented in the current reporting year.
2) Additions or changes to environmental infrastructure (e.g., transportation facilities, side walks, etc), technology, and vehicles that impact availability of transportation services as a result of the New Freedom projects implemented in the current reporting year.
3) Actual or estimated number of rides (as measured by one-way trips) provided for individuals with disabilities as a result of the New Freedom projects implemented in the current reporting year.

The Coordinated Plan (2010 – 2014) E-4 Appendix E—Program Management Plan
The two measures established for the JARC Program are:
1) Actual or estimated number of jobs that can be accessed as a result of geographic or temporal coverage of JARC projects implemented in the current reporting year.
2) Actual or estimated number of rides (as measured by one-way trips) provided as a result of the JARC projects implemented in the current reporting year.
The TransNet Extension Ordinance includes the provision for a competitive grant program for senior transportation programs, referred to as the TransNet Senior Mini-Grant program. The TransNet ordinance states that the funds shall be used for innovative and cost-effective specialized transportation services for older adults including, but not limited to, shared group services, special shuttle services using volunteers, and brokerage of multi-jurisdictional transportation services. The program and evaluation criteria were developed with stakeholder input and through this process three performance indicators were established to measure the performance of projects funded under these programs. The three measures established for operational projects funded by the Senior Mini-Grant program are:
1) Cost Efficiency, measured in Operating Cost in Dollars per Vehicle Service Hour
2) Cost Effectiveness, measured by Operating Cost in Dollars per Passenger
3) Service Effectiveness, measured in Passenger Utilization measured as a percentage of available seats. Alternative indicators may be developed for operational, capital or mobility management projects that to not fit the typical profile of operational projects. SANDAG seeks to administer the JARC, New Freedom and Senior Mini-Grant programs in a manner that will work towards attaining the goals for each program and maximizing the established performance indicators. SANDAG’s goal is to distribute these funds in a manner that will ultimately provide the best, most efficient and cost-effective transportation services to the senior, disabled, and low-income residents of the San Diego region. To this end, SANDAG’s objectives include:
Providing a fair and unbiased review of all proposals submitted for funding;
Selecting projects determined to be a high priority for funding and implementation through the Coordinated Public Transit-Human Services Transportation Plan (Coordinated Plan);
Facilitating an expedient and equitable mechanism for distributing and managing these grant funds;
Providing proper oversight of grantees; and
Ensuring that all grantees comply with federal and local requirements. SANDAG will provide continuing oversight for these programs by monitoring individual projects in addition to the overall programs. The results of the performance monitoring program shall be provided in annual updates to the Coordinated Plan. The performance measures will provide the major means of assessing the overall health of the transportation system and pinpointing the successes of JARC, New Freedom, and Senior Mini-Grant projects.

The Coordinated Plan (2010 – 2014) E-5 Appendix E—Program Management Plan
ROLES AND RESPONSIBILITIES The FTA, has the responsibility for national implementation of Title 49 U.S.C. §5316 and §5317, and has provided program guidance in circulars C 9045.1, NF Program Guidance and Application Instructions, and C 9050.1, The Job Access and Reverse Commute (JARC) Program Guidance and Application Instructions. The guidance elaborates upon the intent of these programs, interprets some provisions, and provides additional instructions and requirements. In a letter dated August 21, 2006, the Governor of the State of California appointed SANDAG as the designated recipient for JARC and New Freedom funds for the urbanized portion of San Diego County. SANDAG, as the designated recipient, assumes the responsibility for the development of the Coordinated Plan for the entire county, and complete administration of the JARC and New Freedom programs for the San Diego urbanized area, including the preparation of this Program Management Plan. The specific tasks required by the FTA for this designation are:
Conducting an areawide competitive selection process
Certifying fair and equitable distribution of funds resulting from the competitive selection process
Certifying that each project selected for funding was derived from the Coordinated Public Transit-Human Services Transportation Plan
Certifying that the Coordinated Public Transit-Human Services Transportation Plan was developed through a process that included representatives of public, private, and nonprofit transportation and human service providers, as well as participation by the public
As the Transportation Authority collecting TransNet revenues, SANDAG is also responsible for the selection of grantees for the Senior Mini-Grant program. As the lead agency for conducting all aspects the competitive selection process for all programs, SANDAG is responsible for the following tasks:
Notifying eligible applicants of the availability of funds
Developing selection criteria
Determining applicant eligibility
Selecting the projects for funding
Including selected projects in the Regional Transportation Plan (RTP), as well as the Regional Transportation Improvement Program (RTIP)
Working with key stakeholders, SANDAG has developed a methodology for the selection of projects to receive JARC, New Freedom, and Senior Mini-Grant funds. Please see the Project Selection Criteria and Methodology section of this document for a full description of activities related to this responsibility.

The Coordinated Plan (2010 – 2014) E-6 Appendix E—Program Management Plan
Advisory Committees and Stakeholder Input SANDAG draws upon the Social Services Transportation Advisory Council (SSTAC) in order to ensure constant participation by stakeholders and members of the public to assist in the development of a variety of materials, including the Coordinated Plan and the project evaluation criteria for JARC, New Freedom, and Senior Mini-Grant programs.
Social Services Transportation Advisory Council (SSTAC) Roles and Responsibilities
Promote coordinationof accessible transportation
serving seniors, personswith disabilities, and
persons of limited means
Serve as the local reviewcommittee and appeals
board for 5310
Provide input andproposals to SANDAG on
legislation and regulations
Advise and overseeunmet transit needs as
required by TDA and PUC
Comment on regionalissues brought forth to
the committee
Provide input on accessibletransportation issues and keyactivities for relevant SANDAG
plans and programs
Provide input on theprogress of the region’s
transit operators and CTSA
Provide input for keyactivities required for the
development of the CP
Advise staff on transitfacilities with ADA
requirements and Title 24
Advise staff on accessibilityand usability of transitfacilities beyond strict
interpretations of regulations
SANDAGCapital Assets
UsingSANDAG
Dollars
SANDAGBuilt
SANDAGDesign

The Coordinated Plan (2010 – 2014) E-7 Appendix E—Program Management Plan
The minimum membership of the SSTAC is defined by California Public Utilities Code Section 99238.5, of the State of California. SANDAG has added additional key stakeholders to improve the input for developing and updating these plans and programs. The current composition of this group includes:
Eight at-large citizen members representing transit users who are senior, disabled, and/or low-income
Two representatives of local social service providers for seniors, including one representative of a social service transportation provider
Two representatives of local social service providers for persons with disabilities, including one representative of a social service transportation provider
Two representatives of local social service providers for persons of limited means, including one representative of a social service transportation provider
Two representatives from the local Consolidated Transportation Service Agency (CTSA). One CTSA member representing the North County Transit District (NCTD) service area and the other representing the Metropolitan Transit System (MTS) service area
One representative from NCTD representing fixed-route service
One representative from NCTD representing ADA paratransit service
One representative from MTS representing fixed-route service
One representative from MTS representing ADA paratransit service In addition to the SSTAC, other local agencies, stakeholders, members of the public, and public and private transportation partners are involved in the development of the Coordinated Plan and the development of scoring criteria for the JARC, New Freedom, and Senior Mini-Grant competitive processes. SANDAG employs multiple community outreach and public involvement techniques for the development of the Coordinated Plan. The community outreach program for this plan usually includes outreach meetings throughout San Diego County and the participation of the SSTAC. Invitations are sent out to stakeholders to participate in these outreach meetings, and transportation providers and consumers are surveyed. Tribal participation is also emphasized seeking input through the Tribal Transportation Working Group. Finally a comment period is held before the adoption of the final plan, where the public is invited to submit written comments or speak at the public hearing. A complete description of all outreach and public involvement activities is available in the Coordinated Plan. For the competitive grant process, SANDAG also completes extensive outreach. The same list of public and private transportation providers, school districts, tribes, and businesses that are contacted for the Coordinated Plan are also informed of the availability of funds through a postcard. This postcard also details the logistics of information sessions that SANDAG sponsors in each of the four subregions of San Diego County. These information sessions inform interested applicants about the background of the programs, federal requirements, and gives instructions for effectively filling out the application form. Additionally, key stakeholders are critical to the development of the evaluation criteria used to determine which projects will be funded through these grant programs. Stakeholder groups are formed each time it is necessary to reassess the evaluation criteria being used. The SSTAC have the opportunity to comment on newly developed evaluation criteria for all three programs. The evaluation criteria for the Senior Mini-Grant

The Coordinated Plan (2010 – 2014) E-8 Appendix E—Program Management Plan
program is also reviewed by the Independent Taxpayer Oversight Committee (ITOC) before being brought to the SANDAG Transportation Committee for approval. Throughout the development of both the Coordinated Plan and the competitive process, as with all other SANDAG plans, programs, and processes, participation is continuously encouraged by all interested stakeholders, including the private sector. Policy Committees Unlike other metropolitan planning organizations that operate under a Joint Powers Agreement, SANDAG is now a statutory agency. With the passage of State Senate Bill 1703 (SB 1703), the San Diego Regional Transportation Consolidation Act, SANDAG became the consolidated regional agency on January 1, 2003. Transit planning, programming, project development, and construction for the region, are now consolidated under SANDAG. SANDAG is governed by a Board of Directors composed of mayors, council members, and county supervisors from each of the region's 19 local governments. Supplementing these voting members are advisory representatives from Imperial County, the U.S. Department of Defense, Caltrans, San Diego Unified Port District, Metropolitan Transit System, North County Transit District, San Diego County Water Authority, the Southern California Tribal Chairman’s Association, and Mexico. The Board of Directors is assisted by a professional staff of planners, engineers, and research specialists. SANDAG's monthly Board meetings provide the public forum and decision point for significant regional issues such as growth, transportation, environmental management, housing, open space, air quality, energy, fiscal management, economic development, and criminal justice. Association Directors establish policies, adopt plans, allocate transportation funds, and develop programs for regional issues which are used by local governments as well as other public and private organizations. Citizens as well as representatives from community, civic, environmental, education, business, and other special interest groups, and other agencies are involved in the planning and approval process by participating in SANDAG's committees, as well as by attending workshops and public hearings. In addition to the Board of Directors, SANDAG has five standing committees known as policy advisory committees, with the membership set forth in SB 1703. The five standing committees are the Executive Committee, Regional Planning Committee, Transportation Committee, Borders Committee, and the Public Safety Committee. The Transportation Committee advises the SANDAG Board of Directors on major policy-level matters related to transportation. The Committee assists in the preparation of the RTP and other regional transportation planning and programming efforts. It provides oversight for the major highway, transit, regional arterial, and regional bikeway projects funded under the RTIP, including the TransNet program of projects. Areas of interest include project schedules, costs, and scope. The Transportation Committee generally meets twice each month. The project selection process for JARC, New Freedom, and Senior Mini-Grant consists of a first-level review committee comprised of staff from non-applicant planning partners such as state agencies, municipalities, and social services agencies that review, score, and rank the project applications with assistance from

The Coordinated Plan (2010 – 2014) E-9 Appendix E—Program Management Plan
SANDAG. SANDAG staff reviews the recommended list and then the ranked list of selected projects for the Senior Mini-Grant program is brought to the ITOC for recommendation before submitting the ranked lists for all three programs to the SANDAG Transportation Committee. The Transportation Committee approves the recommendation, and forwards it for final approval by the full Board of Directors. Once the Board approves the list of projects, SANDAG’s RTIP is be amended to include the projects for funding. Once the SANDAG Board of Directors approves the amendment of the RTIP, including the new JARC and New Freedom projects, the applications are then forwarded to FTA for final approval and funding. The list of projects also is forwarded for inclusion in the RTP. COORDINATION The coordination of public transit and human services transportation is the central theme of the Coordinated Plan. This plan is used to encourage coordination by all transportation providers and consumers in the county. SANDAG also coordinates with a variety of other agencies and organizations to implement the Coordinated Plan and when awarding JARC, New Freedom, and Senior Mini-Grant funding. State-Level Coordination Statewide coordination efforts involve SANDAG’S participation in FTA’s Transportation for Elderly Persons and Persons with Disabilities (5310) program. While this program is administered by the California State Department of Transportation (Caltrans), all selected Section 5310 projects in San Diego County must be included in SANDAG’s Coordinated Plan. Therefore, the coordination between SANDAG and Caltrans is critical in ensuring that all 5310 applicant projects from the San Diego region are derived from SANDAG’s Coordinated Plan. Coordination between SANDAG and Caltrans also is critical to the success of the JARC and New Freedom programs. JARC and New Freedom projects in the rural areas of the county are awarded by Caltrans through a state-wide competition, yet must be derived from SANDAG’s Coordinated Plan. SANDAG also encourages agencies in the rural parts of the county to apply to the rural JARC and New freedom competitive process held by Caltrans and provides outreach and assistance to these agencies through all stages of the application process. There is constant coordination between Caltrans and SANDAG staff. Staff from the Caltrans district office participate in the development of the Coordinated Plan by attending the SSTAC meetings, and also participate in the JARC, New Freedom, and Senior Mini-Grant scoring process by serving on the evaluation committee. Applicants for JARC and New Freedom projects that cross the urban/rural boundaries are encouraged to work jointly with SANDAG and Caltrans staff to determine the most appropriate funding opportunity. Finally there is a consistent sharing of ideas and best practices between SANDAG staff and Caltrans headquarters staff in the development of our respective JARC and New Freedom application process, application form, and scoring criteria. Additional coordination between the state and SANDAG includes the participation of SANDAG in the State-wide Transportation Improvement Program (STIP), State of California Transportation Development Act (TDA), and Traffic Congestion Relief Program (TCRP).

The Coordinated Plan (2010 – 2014) E-10 Appendix E—Program Management Plan
Regional Coordination It is the goal of SANDAG to meld the visions and missions of MTS, NCTD, the Consolidated Transportation Services Agency (CTSA) into a coordinated transportation approach for San Diego County. The CTSA is a special purpose agency required by state legislation and designated by SANDAG to improve, consolidate, and coordinate health and human services transportation in the region. Full Access & Coordinated Transportation (FACT), a 501 C3 nonprofit agency, has been designated by SANDAG to serve as the CTSA for San Diego County. SANDAG also works with the Port of San Diego and the San Diego Regional Airport Authority to provide a coordinated approach to road and rail transportation. SANDAG also encourages coordination among other local agencies, and private and public transportation providers through the Coordinated Plan. The coordination of public transit and human service transportation is a central theme of the Coordinated Plan, and also can be considered a strategy to eliminate gaps in service, remove real or perceived barriers to transportation, and reduce inefficiencies in existing and future service. Coordination has been touted as a way to improve transportation service delivery for almost 50 years with interest in coordination coming from multiple levels of government and from various transportation providers and agencies. Simply put, coordination is a path towards the effective management of limited resources requiring organizations to work together. In practice, coordination means doing more with less and becoming more efficient in the process. It also means allocating resources to maximize passenger benefits and has been called “the best way to stretch scarce resources and improve mobility for everyone” (Ohio Department of Transportation, 1997). While coordination should not be seen as the solution to solve all human service and public transit needs, it is a necessary and important tool to help deliver an efficient and comprehensive regional transportation system. Table 8.1 illustrates some of the potential benefits of having a coordinated transportation system including the associated level of expected improvement or change.

The Coordinated Plan (2010 – 2014) E-11 Appendix E—Program Management Plan
Figure 2: Potential Benefits of Coordinated Transportation System
System Characteristics Desired or Expected Change from Coordination
Number of Transportation Providers Lower Number of Agencies Purchasing Transportation Higher Number of Vehicles Lower Number of Drivers Lower Part-time/full-time Driver Ratio Lower Average Hourly Driver Pay Higher Total Driver Wages Lower Level and Quality of Driver Training Higher Hours When Service is Provided Each Day Expanded Days When Service is Provided Each Week Expanded Vehicle Hours of Service Maybe Lower Vehicle Miles of Service Maybe Lower Total Service Area Expanded Number of Persons Who Can Get Services Expanded Joint Purchasing More Frequent Joint Dispatching of Agency Owned Vehicles More Frequent Centralized Oversight and Management More Frequent Level of Route Duplication Lower Number of Funding Sources Higher Total Transportation Funding Higher One Central Community Information Source More Frequent Segregated Client Types Less Frequent Limited Trip Purposes Less Frequent Community-wide Transportation Perspective More Frequent Time Spent in Meetings Higher Level of Planning Process Higher
SOURCE: Adaptation from “TCRP Report 91 – Economic Benefits of Coordinating Human Service Transportation and Transit
Service,” Transit Cooperative Research Program, 2003.
The Coordinated Plan includes strategies to fill in identified gaps in service. These strategies are further prioritized for funding and implementation. The Coordinated Plan includes four levels of priorities: Very High, High, Medium and Low. The FTA requires that projects funded through Section 5310, JARC, and New Freedom must be derived from strategies in the Coordinated Plan. SANDAG has also adopted an identical policy for the Senior Mini-Grant program. To ensure that the limited funding available for these programs is utilized effectively, a new more stringent policy was developed that requires projects in the San Diego region be derived from either the Very High or High priority lists in the Coordinated Plan to be eligible for funding through the JARC, New Freedom and Senior Mini-Grant programs.

The Coordinated Plan (2010 – 2014) E-12 Appendix E—Program Management Plan
ELIGIBLE RECIPIENTS The following entities are eligible to apply for the JARC , New Freedom and Senior Mini-Grant programs:
Local Government Agencies
Private and Public Transportation Operators
Tribal Governments
Nonprofit Organizations
Social Service Agencies
Consolidated Transportation Services Agency (CTSA) In addition to being classified as one of the listed types of agencies, pursuant to §5317(c)(2), only sponsors whose projects serve the area for which the funds were apportioned are eligible to apply. For JARC and New Freedom, this means is the project must serve residents of the San Diego Urbanized Area (see Figure 1). For projects that serve individuals outside of the urbanized area, applicants may submit an application to Caltrans for the state-wide competition for rural JARC and New Freedom funds. The previous listed types of agencies can apply for Senior Mini-Grant funds as long as their project exists within San Diego County. For the JARC and New Freedom programs, grantees may either enter into a subrecipient relationship with SANDAG or may be a direct recipient to the FTA depending on the type of agency awarded funds. The competitive selection process may result in JARC or New Freedom funds being awarded to a transit agency in the San Diego urbanized area. The two transit agencies in the urbanized area, MTS and NCTD, are currently FTA grantees, so it is possible for them to become a direct recipient of JARC and New Freedom funds rather than enter into a subrecipient relationship with SANDAG. This arrangement allows the MTS and NCTD to access and administer their grant directly. All other agencies awarded funds will become a subrecipient to SANDAG. LOCAL SHARE AND LOCAL FUNDING REQUIREMENTS New Freedom funds may be used for planning, capital, or operating costs of services and facilities that improve mobility for persons with disabilities, but not limited to persons who are ADA certified. JARC funds may be used for planning, capital or operating costs of providing access to jobs for persons of limited means, or reverse commute service to all potential passengers. Both New Freedom and JARC funds have the same matching requirements with the grant supporting up to 80 percent (80/20 match) of capital and mobility management projects, and not more than 50 percent (50/50 match) of projects for operating assistance. The Senior Mini-Grant program may be used for operating or capital dollars for innovative transportation projects specifically designed to meet the special needs of seniors. The Senior Mini-Grant money can be used to fund up to 80 percent (80/20 match) of operating projects, and 20% (20/80 match) of capital projects. Fare revenue or user fees generated by the service to be supported may not be used as matching funds for operating projects for any of these grant programs. Grant money may NOT be used to pay for transit fares including monthly passes or multi-trip tickets. Non-DOT federal funds and local and private funds can be used as a match to the JARC and New Freedom program. Possible match sources include the following:
State or local appropriations
Other non-DOT federal funds that are eligible to be expended for transportation
TransNet Senior Mini-Grant Program

The Coordinated Plan (2010 – 2014) E-13 Appendix E—Program Management Plan
Private donations
Revenues from human service contracts
Net income generated from advertising and concessions
Donations, volunteered services, or other in-kind contributions
Income from contracts to provide human service transportation Any source of funding other than TransNet revenues may be used to match the Senior Mini-Grant program.

The Coordinated Plan (2010 – 2014) E-14 Appendix E—Program Management Plan
Figure 1: Urbanized Area Map

The Coordinated Plan (2010 – 2014) E-15 Appendix E—Program Management Plan
PROJECT SELECTION CRITERIA AND METHOD OF DISTRIBUTING FUNDS Project Selection Methodology Application Cycle Pursuant to the § 5316 and § 5317 programs and the TransNet Extension Ordinance, SANDAG shall conduct a competitive selection process for projects seeking grant funds through these programs. Application forms are developed to correspond to the evaluation criteria, and are available on SANDAG’s website during each competitive selection cycle. Grant applications for projects within the rural areas of San Diego County must be obtained from Caltrans. Project Selection Criteria and Scoring Process The evaluation criteria vary slightly between the Senior Mini-Grant program and the JARC and New Freedom programs. Each set of evaluation criteria were developed by a subcommittee composed of potential applicants, transportation consumers, and other stakeholders.

The Coordinated Plan (2010 – 2014) E-16 Appendix E—Program Management Plan
JARC and New Freedom Evaluation Criteria
Goals and Objectives .............................................................................................................. 15 points
1. Will the project serve the appropriate population? Does the proposal provide pertinent demographic data and/or maps?
2. Will the proposed program increase or enhance the availability of transportation for low-income individuals (JARC) or individuals with disabilities (New Freedom)?
3. To what extent is the proposed project consistent with the goals and objectives of the JARC or New Freedom program?
Implementation Plan .............................................................................................................. 15 points
1. How thorough is the implementation plan? Does the proposal include project tasks, timelines, benchmarks, key milestones, key personnel, deliverables, and routes and schedules as applicable? Does the implementation plan and timeline seem feasible?
2. Does the applicant demonstrate the technical ability to manage the project? Has the applicant effectively implemented project using federal or state funds in the recent past; has the applicant managed similar projects has the applicant had sufficient experience in providing services for seniors? Does the agency have adequate staff resources to handle the project? If applicable, are drivers properly trained? If applicable, does the agency display the ability to maintain vehicles?
3. Does the project relate to other services or facilities provided by the agency or firm? Does the implementation plan correspond with the project goals/objectives?
Coordination and Program Outreach.................................................................................... 15 points
1. Does the proposal describe how key stakeholders will remain involved and informed throughout the process? Does the applicant attach three letters of support from stakeholders to the grant application?
2. How thorough are the applicant’s proposed strategies for marketing the project and
promoting public awareness?
3. To what extent does the project demonstrate coordination among various entities? (5 points maximum - 1 point per type of coordination)
Shared use of vehicles;
Dispatching or scheduling;
Maintenance; Backup transportation;
Staff training programs;
Joint procurement of services and supplies;
Active participation in local social service transportation planning process;
Coordination of client trips with other transportation agencies.

The Coordinated Plan (2010 – 2014) E-17 Appendix E—Program Management Plan
Program Effectiveness and Performance Indicators ............................................................ 20 points
1. Does the project make use of JARC/New Freedom funds in an efficient and cost effective manner?
2. Does the proposal describe efforts to ensure the project’s cost effectiveness (and other measurable units of service)? Will the project experience increasing efficiencies over time? If applying for a capital project, does the applicant demonstrate that the purchase is the most cost-effective produce for the service being provided?
3. Does the proposal provide measurable performance indicators to measure and evaluate the effectiveness of the proposed project in meeting the identified goals? For capital-related projects, does the applicant establish milestones and methods for reporting the status of project delivery?
4. Does the applicant describe methodologies and procedures for ongoing monitoring and evaluation of the project or service, and steps to be taken if original goals are not achieved?
Sustainability........................................................................................................................... 10 points
1. Does the applicant demonstrate a long-term commitment to the project to continue the effort beyond the availability of the requested grant resources? Is this applicant financially capable of sustaining operations after the initial grant funding is expended?
2. Does the applicant provide sufficient justification as to why JARC/New Freedom funding is need for this project?
Innovation ............................................................................................................................... 10 points
1. Is the proposed project an innovative solution to addressing the need, and could the innovations be applied to other services in the region?
2. Are there elements of the project that are environmentally sustainable (including the use of alternative fuels and clean air vehicles)?
Project Budget ........................................................................................................................ 15 points
1. Was a clearly defined budget submitted for the proposed project?
2. Does the project appear to be feasible as described?
3. Is the source of matching funds stable?

The Coordinated Plan (2010 – 2014) E-18 Appendix E—Program Management Plan
TransNet Senior Mini-Grant Evaluation Criteria The following evaluation and scoring criteria were reviewed by the Independent Taxpayer Oversight Committee on March 25, 2010 and approved by the SANDAG Transportation Committee on April 2, 2010. These criterion are used to score and rate project applications for the Senior Mini-Grant Program. Minimum Eligibility Requirement: Projects must address a very high or high priority in the adopted Coordinated Plan in order to be eligible for Senior Mini-Grant Funding.
A. Goals and Objectives .............................................................................................................. 15 points
1. Will the project serve the appropriate population? Does the proposal provide pertinent demographic data and/or maps?
2. Will the proposed program increase or enhance the availability of transportation for seniors?
3. To what extent is the proposed project consistent with the goals and objectives of the Senior Mini-Grant program?
B. Implementation Plan .............................................................................................................. 15 points
1. How thorough is the implementation plan? Does the proposal include project tasks, timelines, benchmarks, key milestones, key personnel, deliverables, and routes and schedules as applicable? Do the implementation plan and timeline seem feasible?
2. Does the applicant demonstrate the technical ability to manage the project? Has the applicant effectively implemented a project using federal or state funds in the recent past; has the applicant managed similar projects; has the applicant had sufficient experience in providing services for seniors? Does the agency have adequate staff resources to handle the project? If applicable, are drivers properly trained? If applicable, does the agency display the ability to maintain vehicles?
Does the project relate to other services or facilities provided by the agency or firm? Does the implementation plan correspond with the project goals/objectives?
C. Coordination and Program Outreach.................................................................................... 15 points
1. Does the proposal describe how key stakeholders will remain involved and informed throughout the process? Does the proposal include three letters of support from stakeholders for the grant application?
2. How thorough are the applicant’s proposed strategies for marketing the project and promoting public awareness?
3. To what extent does the project demonstrate coordination among various entities? (5 points maximum - 1 point per type of coordination) Shared use of vehicles; Dispatching or scheduling; Maintenance; Backup transportation; Staff training programs; Joint procurement of services and supplies; Active participation in local social service transportation planning process; Coordination of client trips with other transportation agencies.

The Coordinated Plan (2010 – 2014) E-19 Appendix E—Program Management Plan
D. Performance Indicators........................................................................................................... 15 points
There will be three different performance indicators that will be evaluated to measure the effectiveness of the project in meeting the identified goals. They are as follows: Cost Efficiency, measured by the operating cost per vehicle service hour; Cost Effectiveness, measured by the operating costs per passenger; and Service Effectiveness, measured by passengers utilization expressed as a percentage of available seats. These three performance indicators will be worth a maximum of 5 points each and will be based on the matrices below:
Cost Efficiency Operating Cost in Dollars per Vehicle Service Hour
Number of Years in Service
Points Proposed/1st Year 2nd Year 3rd Year 4th+ Year
0 > 70 > 65 > 60 > 55
1 65<x≤70 60<x≤65 55<x≤60 50<x≤55
3 60<x≤65 55<x≤60 50<x≤55 45<x≤50
5 ≤ 60 ≤ 55 ≤ 50 ≤ 45
Cost Effectiveness
Operating Cost in Dollars per Passenger
Number of Years in Service
Points Proposed/1st Year 2nd Year 3rd Year 4th+ Year
0 > 32 > 29 > 26 > 23
1 29<x≤32 26<x≤29 23<x≤26 20<x≤23
3 26<x≤29 23<x≤26 20<x≤23 17<x≤20
5 ≤ 26 ≤ 23 ≤ 20 ≤ 17
Service Effectiveness
Passenger Utilization in Percentages
Number of Years in Service
Points Proposed/1st Year 2nd Year 3rd Year 4th+ Year
0 < 15 < 20 < 25 < 30
1 15≤x<25 20≤x<30 25≤x<35 30≤x<40
3 25≤x<35 30≤x<40 35≤x<45 40≤x<50
5 ≥ 35 ≥ 40 ≥ 45 ≥ 50

The Coordinated Plan (2010 – 2014) E-20 Appendix E—Program Management Plan
E. Program Effectiveness ............................................................................................................ 10 points
1. Does the applicant describe methodologies and procedures for ongoing monitoring and evaluation of the project or service, and steps to be taken if original goals are not achieved?
2. Is the grant request amount appropriate given the priority being addressed by the project?
F. Operational Sustainability ....................................................................................................... 5 points
1. Does the applicant demonstrate a long-term commitment to the project to continue the effort beyond the availability of the requested grant resources? Is this applicant financially capable of sustaining operations after the initial grant funding is expended?
G. Innovation ............................................................................................................................... 10 points
1. Is the proposed project an innovative solution to addressing the need, and could the innovations be applied to other services in the region?
2. Are there elements of the project that are environmentally sustainable (including the use of alternative fuels and clean air vehicles)?
H. Project Budget ........................................................................................................................ 15 points
1. Was a clearly defined budget submitted for the proposed project?
2. Does the project appear to be feasible as described?
3. Is the source of matching funds stable?
Method of Distributing Funds The competitive process held by SANDAG will include a public notice of funding availability, regional public pre-proposal meetings, and an evaluation process. The first-level scoring committee for the evaluation process will be comprised of staff from SANDAG’s planning partners, such as state agencies, municipalities, and social services agencies. This committee will review, score, and rank the project applications. The ranked list of projects will be submitted to the Independent Taxpayer Oversight Committee (Senior Mini-Grant program only), the SANDAG Transportation Committee and to the SANDAG Board of Directors for final approval. The opportunity to comment publicly will be provided at the Transportation Committee meeting, as well as the Board of Directors meeting. Once approved, this list of projects will be published and the Regional Transportation Improvement Program will be amended to include these projects. Then the grant applications will be forwarded to the FTA for funding. Competitive grant cycles will be held as funding becomes available.

The Coordinated Plan (2010 – 2014) E-21 Appendix E—Program Management Plan
As an example of this process, a sample schedule for the competitive process and grant award for JARC and NF funding is included below: Figure 3: FY 2007 JARC AND NF TIMETABLE
Actions Week – Month
Public Advertisement 1st Week – Sep
Outreach Workshops 3rd Week – Sep
Applications Due (2 p.m.) 3rd Week – Oct
Scoring Committee Meets 4th Week – Oct
Transportation Committee Approves Project List 3rd Week – Nov
Board Of Directors Approves Project List December
Transportation Committee adopts TIP Amendment 3rd Week – Feb
Title VI Assurances SANDAG will ensure the equitable distribution of benefits among eligible groups by requiring a Title VI policy self-assessment from the applicant at the time of project submission. SANDAG will monitor projects to ensure compliance with Title VI requirements throughout the project. Project Selection from Coordinated Plan The Coordinated Plan specifically identifies strategies to address the transportation needs and gaps in transit service in the San Diego region. The strategies are further prioritized for funding an implementation. In order to be eligible to receive JARC, New Freedom or Senior Mini-Grant funds, the project must be derived from either the Very High or High priority lists included in the Coordinated Plan. Applicants are required to identify the specific priority their project is derived from in the application form. ADMINISTRATION, PLANNING, AND TECHNICAL ASSISTANCE SANDAG uses JARC and New Freedom funds within the 10 percent limitation for administration, planning, and technical assistance. SANDAG also uses a portion of the Senior Mini-Grant funds for administration of the program. In Fiscal Year 2010, SANDAG used 3.5% of available funds for this function. These funds are used to fund staff’s time and materials required for such projects as:
Development and updates to the Coordinated Plan;
Development and updates to the Program Management Plan;
Development of the scoring criteria for the JARC and NF competitive process;
Management of the competitive process;
Development and processing of the Fund Transfer Agreements
Outreach for the Coordinated Plan and competitive process including subregional meetings;
Grant management, ongoing administration, and monitoring of direct recipients and subrecipients.
Coordination with human social service transportation providers, public agencies with available piggyback agreement options, and vehicle manufacturers/distributors as applicable to the grant recipients

The Coordinated Plan (2010 – 2014) E-22 Appendix E—Program Management Plan
SANDAG staff also is available for technical assistance to the subrecipients in any aspect of their project to the best of staff’s capabilities. TRANSFER OF FUNDS SANDAG does not allow the transfer of JARC and New Freedom funds to Section 5311 or 5307 programs. For the JARC and New Freedom programs, SANDAG will require subrecipients to sign a Fund Transfer Agreement to ensure subrecipients follow federal requirements. An example of the Fund Transfer Agreement is included in Appendix A. As the designated recipient, SANDAG is responsible for the review of subrecipients for compliance. To ensure continuing oversight of capital projects, SANDAG maintains ownership of any capital equipment or facilities procured through these programs. An example of a Leaseback agreement for the purchase of a vehicle is included in Appendix B.
DESIGNATED RECIPIENT PROGRAM MANAGEMENT The following section applies only to grants that SANDAG will administer on behalf of subrecipients in the San Diego urbanized area for the JARC and New Freedom programs. When transit agencies become direct recipients of JARC and NF funds, they will sign a supplemental agreement found in TEAM, and SANDAG is released from any liability pertaining to the direct recipient grant. The direct recipient is then responsibility for adhering to FTA requirements through their agreements and grants with FTA directly. Civil Rights SANDAG requires that all JARC and New Freedom subrecipients submit all appropriate FTA certifications and assurances to SANDAG prior to contract execution and annually thereafter. SANDAG will not execute any contracts prior to having received these items from the selected subrecipients. SANDAG, within its administration, planning, and technical assistance capacity, also will comply with all appropriate certifications and assurances for FTA assistance programs and will submit this information to the FTA as required. The certifications and assurances pertaining to civil rights include:
1. Nondiscrimination Assurances in Accordance with the Civil Rights Act
2. Documentation Pertaining to Civil Rights Lawsuits and Complaints Nondiscrimination assurances included above involve the prohibition of discrimination on the basis of race, color, creed, national origin, sex, or age, and prohibit discrimination in employment or business opportunity, as specified by 49 U.S.C. 5332 (otherwise known as Title VI of the Civil Rights Act of 1964, as amended (42 U.S.C. 2000d et seq.) and U.S. DOT regulations, Nondiscrimination in Federally-Assisted Programs of the Department of Transportation-Effectuation of Title VI of the Civil Rights Act, 49 C.F.R. Part 2. By complying with the Civil Rights Act, no person, on the basis of race, color, national origin, creed, sex, or age, will be excluded from participation in, be denied the benefits of any program for which the subrecipient receives federal funding via SANDAG.

The Coordinated Plan (2010 – 2014) E-23 Appendix E—Program Management Plan
Title VI of the 1964 Civil Rights Act The subrecipient will be required to gather, maintain, and submit Title VI information to SANDAG as required by FTA through the DOT Title VI regulations (49 C.F.R. Part 21), the U.S. DOT’s Order to Address Environmental Justice in Minority Populations (62 FR 18377, April 15, 1997), and U.S. DOT Policy Guidance Concerning Recipient’s Responsibilities to Limited English Proficient (LEP) Persons (70 FR 74087, December 14, 2005). This information will be included in the triennial Title VI report submitted by SANDAG for SANDAG related activities. In addition, SANDAG requires that all subrecipients comply with the Title VI requirement to record Title VI investigations, complaints, and lawsuits (49 C.F.R. Section 21.9(b)). Prior to contract execution, and annually thereafter, subrecipients will be required to prepare and submit a list of any active investigations, lawsuits or complaints alleging the subrecipient discriminated on the basis of race, color or national origin. This list shall include the date, summary of allegations, current status, and actions taken by the subrecipient in response to the investigation, lawsuit, or complaint. Disadvantaged Business Enterprise Program (DBE) and Equal Opportunity Employment (EEO) The Equal Opportunity Employment (EEO) provision requires all recipients of FTA funds provide equal employment to all people, without regard to race, color, religion, sex, or national origin. SANDAG requires that subrecipients certify their compliance with the EEO federal requirements of Title VII of the Civil Rights Act of 1964, as amended, (42 U.S.C. 2000e and 49 U.S.C. 5332) and any implementing requirements FTA may issue. This will be required prior to contract execution and annually thereafter. SANDAG will assure that it will not discriminate on the basis of race, color, sex, national origin, or disability in the award and performance of any third-party contract executed under the JARC or NF programs and will comply with the requirement of 49 C.F.R. Part 26. Furthermore, SANDAG agrees to take all necessary and reasonable steps set forth in 49 C.F.R. Part 26 to ensure nondiscrimination in the award and administration of third-party contracts. To ensure that SANDAG has the most complete information to provide these assurances, SANDAG requires all subrecipients to annually file a Disadvantaged Business Enterprise (DBE) statement including a determination of their status as a DBE. SANDAG will then calculate the dollar value of all contracts to designated DBE firms under JARC and NF as a percentage of all contracts under JARC and NF. Section 504 and ADA Reporting SANDAG requires subrecipients to enter into the Fund Transfer Agreement prior to receiving funding for the JARC or NF programs. The Fund Transfer Agreement includes provisions regarding discrimination, including a section where the subrecipient agrees to comply with the applicable provisions of the Americans with Disabilities Act (ADA) of 1990, which prohibits discrimination on the basis of disability, as well as all applicable regulations and guidelines issued pursuant to the ADA (42 U.S.C. 12101 et seq.). Additionally, pursuant to the Fund Transfer Agreement, subrecipients are required to agree to a nondiscrimination clause, in which the subrecipient shall not unlawfully discriminate, harass, or allow harassment, against any employee or applicant for employment. Additionally, SANDAG’s adopted Board Policy #9, included as Appendix C, outlines discrimination complaint procedures. It is SANDAG policy to comply with state and federal discrimination laws. SANDAG prohibits discrimination by its employees, contractors, and consultants. The responsibility for the implementation of the

The Coordinated Plan (2010 – 2014) E-24 Appendix E—Program Management Plan
discrimination complaint procedure is assigned to the Office of General Counsel. Persons who believe they have been subjected to discrimination or have been denied access to services or accommodations required by law, have the right to use this grievance procedure, as outlined in Board Policy #9 available on SANDAG’s Web site. Financial Management SANDAG maintains financial management systems for financial reporting, accounting records, internal controls, and budget controls subject to standards specified in state laws enforced by the State Auditor and the State Controller’s Office. All systems and procedures for financial management are in compliance with 49 C.F.R. 18.20. Subrecipients will bill SANDAG no more frequently than monthly and no less frequently than quarterly by forwarding their itemized signed invoices with backup documentation to the SANDAG project manager. Invoices shall reference the Fund Transfer Agreement Contract Number. The project manager then forwards the request for payment form for the invoice to SANDAG’s accounts payable department. In signing the Fund Transfer Agreement, subrecipients must agree to comply with the Office of Management and Budget Circular A-87, Cost Principles for State and Local Government, and 49 C.F.R., Part 18, Uniform Administrative Requirements for Grants and Cooperative Agreements to State and Local Governments. They also must agree to establishing and maintaining an accounting system and records that properly accumulate and segregate incurred project costs and matching funds by line item for the project. This accounting system must conform to Generally Accepted Accounting Principles (GAAP), enable the determination of incurred costs at interim points of completion, and provide support for reimbursement payment vouchers or invoices. All accounting records and other supporting papers should be maintained for a minimum of three years from the date of the final payment, and should be held open to inspection, copying, and audit by representatives of SANDAG and auditors representing the federal government. Subrecipients are required to procure any property in compliance with all federal requirements for competitive procurement. For purchases of any nonbudgeted purchase orders or subagreement exceeding $500 for supplies, equipment, or consulting services, subrecipients are required to obtain prior authorization in writing from SANDAG. For the purchase of any item, service, or consulting work not covered in the Attachment to the Fund Transfer Agreement and exceeding $500, three competitive bids must be submitted with the request, or the absence of bidding must be adequately justified, and prior authorization must be obtained from SANDAG. The subrecipient must agree to maintain each property, procured as a result of these funding programs, in good operating order for the purposes in which they were attended. During the life of this property the subrecipient is responsible for all normal maintenance, upkeep, taxes, and registration fees related to the property. The recipient also must make all maintenance records available to SANDAG. At the conclusion of the useful life of the property, or once the Fund Transfer Agreement is terminated, the subrecipient may either keep the property and credit SANDAG in an amount equal to its fair market value, or sell such property at the best price obtainable at a public or private sale in accordance with established SANDAG procedures and credit SANDAG in an amount equal to the sale price. Any vehicles, or other property, purchased by the subrecipient through the JARC or NF programs must be used in a manner that is consistent with the application submitted. The misuse of a vehicle will result in an

The Coordinated Plan (2010 – 2014) E-25 Appendix E—Program Management Plan
early termination of the Fund Transfer Agreement. The subrecipient must maintain adequate written records of vehicle use such as a log book. The Fund Transfer Agreement will contain an expiration date, which will refer to the last date that the subrecipient can incur valid project costs or credit. The subrecipient has until sixty (60) days after the expiration date to make final allowable payments to project contractors or vendors, prepare the project closeout report, and submit the final invoice to SANDAG for reimbursement for allowable costs. Any unexpended project funds not invoiced by the sixtieth day will be reverted and will no longer be accessible to reimburse late project invoices. More detailed information on the program management performed by SANDAG, and the subrecipients requirements are included in the Fund Transfer Agreement available in Appendix B. Environmental Protection SANDAG does not foresee that any projects funded through the JARC and NF programs will require additional environmental review beyond a Categorical Exclusion (CE) under the National Environmental Protection Act (NEPA) or a Categorical Exemption (CE) under the California Environmental Quality Act. In the event that additional documentation is required, SANDAG will ensure that the appropriate steps are taken so that the selected subrecipient will meet environmental protection requirements. Designated subrecipients also will be required to submit compliance to the Clean Air Act conformity provisions; protection of public parkland, wetland, and waterfowl refuges, and historic sites (49 U.S.C. 303); Section 106 of the National Historic Preservation Act (protection of historic and archaeological resources); and Section 404 of the Clean Water Act (Corp of Engineers’ permit requirements for dredge and fill activities in “waters of the United States”). Vehicle Procurement and Pre-Award/Post Delivery Reviews SANDAG will take the lead on equipment and vehicle purchases by subrecipients as part of the pre-award and post-delivery grant review process. Under this process, subrecipients shall comply with federal transit laws regarding procurement restrictions as codified in the common rule (49 C.F.R. 18.36). Each subrecipient shall certify to FTA that its procurements and procurement system will observe all applicable third-party procurement provisions of federal laws, regulations, and directives, except to the extent FTA has expressly approved otherwise in writing. The subrecipient shall also verify that the vehicle will be manufactured by a Transit Vehicle Manufacturer (TVM) eligible to bid on federally funded transit agency contracts within the federal fiscal year the vehicle purchase order is issued. The FTA also requires grant recipients purchasing 11 or more vehicles (in urbanized areas greater than 200,000 population) to undertake reviews of the rolling stock both before the award of the contract and following delivery of the vehicles. The intention of these rules is to improve compliance with “Buy America” requirements. The procurement of unmodified vans, in any quantity, is not subject to the review requirement. Should a grant application meet the above criteria, SANDAG will take the lead on the procurement process and conduct the pre-award and post delivery reviews. Any grant applicants seeking funding for capital vehicle procurement/s should review vehicle specs, plans, and cost estimates when preparing a capital grant proposal. With the current economic conditions, the State may not always contract obligations available for vehicle procurement. When a State vehicle contract is not available to procure a vehicle directly with the State, an approved alternative is to procure a vehicle through a
The Coordinated Plan (2010 – 2014) E-26 Appendix E—Program Management Plan
public agency with State authorized “piggyback” agreement options. All of the above mentioned information can be found at the California Department of Transportation’s Procurement Grants Management webpage at: http://www.dot.ca.gov/hq/MassTrans/Procurement-Grants-Management.html. Restrictions on Lobbying SANDAG requires that any subrecipient awarded FTA assistance exceeding $100,000 must sign a certification stating that federal financial assistance may not be used to influence any Member of Congress, directly or indirectly, or an officer or employee of any agency in connection with the making of any federal contract, grant, or cooperative agreement. Prohibition on Exclusive School Transportation SANDAG requires that all subrecipients comply with 49 U.S.C. 5323 and FTA “School Bus Operations” (49 C.F.R. 605.14) by agreeing that they will:
1. Only engage in school transportation operations in competition with private school transportation to the extent permitted by 49 U.S.C. 5323 and federal regulations; and
2. Comply with the requirements of 49 C.F.R. Part 605 before providing school transportation using equipment or facilities acquired with federal assistance authorized by 49 U.S.C. Chapter 53 or Title 23 U.S.C. for transportation projects.
Any subrecipients exclusively providing transportation for students with disabilities are exempted from the above requirements. Drug and Alcohol Testing SANDAG requires that any recipients of JARC or NF funds comply with the Federal Motor Carrier Safe Administration (FMCSA) rule for employees who hold Commercial Driver’s Licenses (49 C.F.R. Part 382). Other than compliance with FMCSA rules, subrecipients that receive only JARC (5316), NF (5317), or Elderly Individuals and Individuals with Disabilities (5310) Program assistance are not subject to FTA Drug and Alcohol testing rules. However, JARC and NF subrecipients from SANDAG that also receive funding under one of the other FTA programs requiring compliance with the drug and alcohol testing rules, should include any JARC and or NF related employees in their testing program. SENIOR MINI-GRANT PROGRAM MANAGEMENT The preceding Designated Recipient Program Management. section pertains only to JARC and New Freedom grants. This section provides the requirements that apply to the Senor Mini-Grant program. Additional detail is available in the Grant Agreement template included in Appendix C. Ethics The Grantee must maintain a written code of conduct or standards of conduct that shall govern the actions of its officers, employees, board members, or agents engaged in the award or administration of subagreements, leases, or third-party contracts supported with TransNet Ordinance assistance. This written code of conduct should specify that its officers, Employees, board members, or agents cannot solicit or

The Coordinated Plan (2010 – 2014) E-27 Appendix E—Program Management Plan
accept gratuities, favors or anything of monetary value from any present or potential subgrantee, lessee, or third-party contractor at any tier or agent thereof. The code of conduct shall also include penalties, sanctions, or other disciplinary actions for violation by its officers, employees, board members, or their agents, or its third-party contractors or sugrantees or their agents. Accounting Records In compliance with applicable laws, regulations and policies, a grantee must establish and maintain for the Project either a separate set of accounts or separate accounts within the framework of an established accounting system that can be identified within the Project. The Grantee must also maintain all checks, payrolls, invoices, contracts, vouchers, orders, or other accounting documents related to the project so that they may be clearly identified, readily accessible, and available to SANDAG upon request. Record Retention During the course of the project and for three years after the date of transmission of the final expenditure report, the Grantee must maintain, intact and readily accessible, all data, documents, reports, records, contracts, and supporting materials relating to the project as SANDAG may require. Audit of Grantees The Grantee must agree to have performed financial and compliance audits that SANDAG may require. If performed, these audits must comply with the provisions of OMB Circular A-133, Revised, “Audits of States, Local Governments, and Non-Profit Organizations. The Grantee must also agree to obtain any other audit required by SANDAG. Civil Rights Grantees must comply with all applicable civil rights law, regulations and policies, including but not limited to:
Nondiscrimination (Title VI of the Civil Rights Act) – The grantee must comply and assure the compliance of each subgrantee, lessee, or third-party contractor at any tier of the Project, with all provision prohibiting discrimination on the basis of race, color, or national origin of Title VI of the Civil Rights Act of 1964, as amended, 42 U.S.C. §§2000d et seq.
Equal Employment Opportunity – The grantee must agree to take affirmative action to ensure that applicants are employed and that employees are treated during employment without regard to their race, color, religion, sex, disability, age, or national origin. Such action shall include, but not be limited to, employment upgrading, demotions or transfers, recruitment or recruitment advertising, layoffs or terminations, rates of pay or other forms of compensation, and selection for training, including apprenticeship.

The Coordinated Plan (2010 – 2014) E-28 Appendix E—Program Management Plan
MONITORING AND REPORTING SANDAG has developed a monitoring and reporting program that is applicable to all three grant programs. For the JARC, New Freedom, and Senior Mini-Grant program, grantees may invoice no more frequently than monthly. To be reimbursed for project expenses, the grantee must submit an invoice (a sample invoice form is included in Appendix E), documentation of all expenses accrued during the invoice period, and a Progress Report. In addition to the progress report, Grantees are required to submit a Quarterly Project Report Form each quarter. If the project includes indirect expenses, SANDAG must have an Indirect Cost Allocation Plan on file for the agency for these expenses to be eligible. Additional instructions for invoicing are included in the JARC/New Freedom/Senior Mini-Grant Program Administration Overview included in Appendix D. Grant Progress Reports Grantees must include a written progress report with each set of invoices. The progress report will follow a format prescribed by SANDAG and attached as Appendix F. The purpose of the progress report is to provide additional information so SANDAG can ensure that grant funds are being spent effectively and grantees are demonstrating adequate progression of the project compared to the amount of funds expended. The progress report will permit SANDAG to determine if the grantees are:
performing to expectations
on schedule
on budget and within funding limitations
able to meet local match requirements from eligible funds
encountering nonfunding challenges or difficulties
meeting performance goals and
taking corrective action Quarterly Project Report The purpose of the Quarterly Report form is to collect information for reporting on individual projects and the grant programs as a whole to the FTA, the SSTAC, the ITOC, and for inclusion in the Coordinated Plan. Each grantee must fill out a quarterly report for each type of service provided by either JARC, New Freedom, or Senior Mini-Grant. The services being provided do not necessarily correlate with individual grant awards since one grant can fund many individual projects, and an individual project may have more than one source of grant funding. Please reference the list of service types listed on the following page:

The Coordinated Plan (2010 – 2014) E-29 Appendix E—Program Management Plan
Operating Projects Trip-Based Projects Capital Projects Mobility
Management Projects
Fixed route User-side subsidies/ vouchers
Vehicle for individual Mobility manager
Flexible routing Vanpool (service only) Vehicle for transit agency One-stop center/referral
Shuttle/feeder services Aide/escort assistance Vehicle for other agency Trip/itinerary planning
Demand response Vanpool vehicles purchased One-on-one travel training
Expanded ADA paratransit service
Car-sharing Group transportation resource training
Same-day ADA paratransit service
ITS-related hardware/software
Internet-based information
Door-to-door or door-through-door
Accessible taxis Information materials/ marketing
Volunteer driver program
Elevators*
Large-capacity wheelchair lifts added to vehicles*
Wheelchair securement areas added to vehicles*
Other infrastructure improvements
Other capital projects
*beyond ADA
The Quarterly Report consists of two components. The first component includes a section for a narrative which will include a description of the project, including highlighting milestones, project evaluation, lessons learned, and resolutions to problems. The second component includes a section for the grantee to provide data. This data will be used to analyze the performance measures discussed in the first section of the Program management Plan. SANDAG will compile this information from each of the subrecipients and track these measures. This information will be presented to the SSTAC twice a year, included in updates to the Coordinated Plan, and reported to the FTA annually.

The Coordinated Plan (2010 – 2014) E-30 Appendix E—Program Management Plan
Site Visits A final element of monitoring for these grant programs is site visits. SANDAG staff will conduct a minimum of at least one site visit each year for each active grant currently executed. Below is a table showing the current schedule of site visits at the time this Program Management Plan was updated.
Grantee No. of Grants J F M A M J J A S O N D
Accessible San Diego 1
All Congregations Together 2
Alpha Project 2
City of La Mesa 2
City of Oceanside 3
City of Vista 1
ElderHelp 1
Full Access & Coordinated Transportation 3
The International Rescue Committee 1
ITN San Diego 1
Jewish Family Services 2
North County Transit District 1
Peninsula Shepherd Senior Center 1
Redwood Elderlink 1
Southwestern Community College District 1
St. Madeleine Sophie’s Center 1
Traveler's Aid Society 1

appendix F
Service Implementation Plans

The Coordinated Plan (2010 – 2014) F-1 Appendix F—Service Implementation Plans
MTS
Service Implementation Plan
FY 2010
Revised: August 26, 2010

The Coordinated Plan (2010 – 2014) F-2 Appendix F—Service Implementation Plans
Table of Contents
I. Background………………………………………………………….……..…Page 3
II. Planned FY 2010 Service Changes
A. Approach……...………………………………………………………….Page 3
B. Service Changes and Impacts………………………………………….Page 4
III. Midyear Service Reduction………………………………………………….Page 6 IV. Outlook……………………………………………………………….….......Page 12

The Coordinated Plan (2010 – 2014) F-3 Appendix F—Service Implementation Plans
I. Background
MTS service planning for fiscal year (FY) 2010 was constrained by the overarching reality of significant revenue reductions. The elimination of all funding of transit for five years by the State of California in spring 2009 and lower sales tax revenue caused by the ongoing national recession created a projected budget deficit of $11 million for FY 2010. During the budget development process, the MTS Budget Development Committee, Executive Committee, and Board of Directors provided guidance in resolving this shortfall and the Board approved a strategy for bridging the budget gap. The elements of the strategy included:
• Non-fare revenue adjustments • Non-service cost adjustments • Personnel adjustments • Fare adjustments • Service reductions
Although some service reductions were ultimately needed to bridge the budgetary gap, minimizing impacts on service was a key objective. The Board approved a strategy that included $4.7 million in subsidy savings from service adjustments, a $4 increase in the adult monthly pass (from $68 to $72), elimination of the Downtown Trolley fare, and an increase of one-way cash fares on Routes 851, 871/872, and 904 from $1 to $2.25. Commensurate increases were made to the Youth and Senior/Disabled/Medicare passes and/or cash fares. The actions precipitated by the reduced operating revenue followed similar adjustments in FY 2009 when a $6.5 million shortfall in revenue was addressed in part by adjusting service to achieve a $1.7 million subsidy savings and adjusting fares to realize a $1.6 million increase in passenger revenue.
II. Planned FY 2010 Service Changes A. Approach In order to achieve the $4.7 million in subsidy savings from service adjustments, staff employed the performance concepts contained in MTS Policy 42, Transit Service Evaluation and Adjustment. This policy established by the Board of Directors was last amended in 2007 to incorporate the vision for MTS services developed in the Comprehensive Operational Analysis the previous year. The vision called for the development of services that are customer-focused, competitive with other travel options, integrated and sustainable. Further, it transformed the system from one based on area coverage to one focused on productivity. Policy 42 establishes a hierarchy of service evaluation that includes system, operator, route category and route criteria. In order to achieve the required subsidy savings, staff screened services based primarily on the route productivity measures of passengers per revenue hour (customer-focused and competitive criteria), farebox recovery ratio and subsidy per passenger (sustainability criteria).

The Coordinated Plan (2010 – 2014) F-4 Appendix F—Service Implementation Plans
Another significant measure used was minimizing the impacts on the most passengers (customer-focused and competitive criteria). Particular attention was placed on the savings achieved per passenger affected, in addition to the savings per passenger lost. On low performing routes with greater service adjustments, the net number of passengers affected was found to be lower but a larger portion of them was lost, whereas on high performing routes with fewer service reductions the net number of passengers affected was higher but a smaller portion lost. Each of the measures was weighed carefully prior to determining the final set of adjustments, and customer input was gathered through a variety of public outreach events, public hearings, surveys, and other venues and media for collection of comments. Proposals for route-level savings were developed that used the following techniques:
• Frequency reductions • Span reductions • Shortlines • Route discontinuation • Bus type/size adjustments • Operator changes (which contractor, or contract versus directly-operated)
B. Service Changes and Impacts The methodology employed for achieving the Board-recommended subsidy savings resulted in the following route adjustments:
• $3.12 million from minor service adjustments—primarily span and frequency reductions on weekend services.
• $850,000 from service adjustments requiring a public hearing under Policy 42. • $720,000 from adjustments to the Sorrento Valley Coaster Connection services previously
approved by the MTS Board. The adjustments by route, the impacts on ridership and the subsidy savings are detailed in Table 1. As a result of the budgetary realities, the only prospect for expansion of service in FY 2010 was provided by special TransNet Early Action project funding for the interim version of the new SuperLoop route in University City, which was implemented in June 2009.

The Coordinated Plan (2010 – 2014) F-5 Appendix F—Service Implementation Plans
Table 1: Adjustments to Achieve $4.7 Million Subsidy Savings
Route Recommended Change Ridership Lost
Ridership Affected
Subsidy Savings
MINOR ADJUSTMENTS (less than 25% of service)
2 Move downtown terminal to America Plaza on weekends, and reduce Sunday frequency to 20 minutes. 15,205 171,821 $62,041 7 Reduce Sunday frequency to 15 minutes. 13,541 261,078 $53,176
10 Reduce Sunday frequency to 20 minutes. 6,962 107,386 $40,252 11 Reduce Sunday frequency to 30 minutes. 23,667 205,343 $106,257 15 Reduce Sunday frequency to 20 minutes. 8,658 133,549 $57,241 20 Reduce frequency to 60 minutes north of Mira Mesa on Saturdays and north of Kearny Mesa on Sundays. 29,319 159,311 $168,945
105 Reduce frequency to 60 minutes after 7pm. 3,557 23,712 $71,761 115 Operate with minibus on weekends. - - $46,563 701 Reduce Saturday frequency to 60 minutes. 7,966 39,831 $56,290 709 Reduce weekday frequency between Southwestern College and Otay Ranch Town Center to 30 minutes. 45,903 273,123 $190,179 712 Reduce frequency to 60 minutes after 7pm on weekdays and all day on Saturday. 15,718 78,591 $91,569 810 Cut one AM and one PM trip. 6,095 121,890 $72,744 815 Reduce weekday frequency to 60 minutes after 7pm. 3,845 19,223 $30,708 848 Reduce weekday frequency to 60 minutes after 7pm. 3,024 15,120 $51,372 854 Operate with minibus on weekends. - - $21,383 855 Reduce weekday frequency to 60 minutes after 7pm. 6,391 31,953 $14,468
856 Reduce frequency to 60 minutes after 7pm on weekdays, and discontinue service to Rancho San Diego Village on weekends. 10,478 36,182 $96,361
864 Reduce weekday frequency east of East County Square to 60 minutes. 34,926 174,631 $377,573 870 Operate with minibus and adjust schedules. - - $10,000 901 Reduce frequency to 60 minutes after 7pm on all days, and before 7am on weekends. 36,430 182,151 $385,600 905 Reduce frequency to 60 minutes during the midday and all day on weekends. 31,988 479,204 $124,486 923 Move downtown terminal to airport on weekends. 6,543 40,894 $53,022 928 Reduce weekend frequency to 60 minutes and operate with minibuses. 5,081 35,853 $124,130 932 Reduce frequency to 60 minutes after 8pm, and on weekends end every other trip at E St. Trolley. 36,890 151,811 $95,929
933/934 Reduce frequency to 20 minutes on Saturdays, 30 minutes on Sundays, and 60 minutes after 830pm on all days. 67,200 486,057 $404,039 967 Reduce Sunday frequency to 120 minutes. 1,496 7,478 $16,129 968 Reduce Sunday frequency to 120 minutes. 1,437 7,183 $19,157 992 Reduce frequency to 30 minutes after 630pm on all days. 9,301 46,503 $123,686
Prem Exp Service No service Friday after Thanksgiving or 12/24/09 through 1/2/10. 1,200 2,400 $45,740 Blue Line Reduce consist sizes when possible on all days, and discontinue Saturday night 'Owl' service. 15,708 15,708 $107,050
SUBTOTAL 448,526 3,307,985 $3,117,853

The Coordinated Plan (2010 – 2014) F-6 Appendix F—Service Implementation Plans
Route Recommended Change RidershipLost
Ridership Affected
Subsidy Savings
MAJOR ADJUSTMENTS (25% or more of service) Ridershi
pAffected
SubsidySavings
14 Operate only between La Mesa and Grantville Monday – Friday only, and operate a separate Hotel Circle shuttle seven days/week
104,104,745 109,236 $75,494
84 Discontinue Saturday and Sunday service in September. 7,563 7,563 $60,575
86 Discontinue Route 86. 31,238 31,238 $155,093
820 Cut one AM and one PM trip. 5,228 52,275 $56,533
832 Reduce frequency to 60 minutes on weekdays. 14,382 71,910 $83,078
871/872 Reduce frequency to 60 minutes on weekdays, and discontinue weekend service to northern portion of route (continue Route 872 on southern portion).
21,541 109,913 $324,047
965 Cut weekday 965B loop. 10,865 11,307 $96,111
SUBTOTAL 195,562 393,442 $850,931
ADJUSTMENTS ALREADY APPROVED
SVCC Reduce scope of services. 22,950 69,020 $723,180
SUBTOTAL 22,950 69,020 $723,180
GRAND TOTALS 667,038 3,770,448 $4,691,964

The Coordinated Plan (2010 – 2014) F-7 Appendix F—Service Implementation Plans
III. Midyear Service Reduction
The service adjustments described in the previous section were implemented in the system schedule changes effective on June 14, 2009 and September 6, 2009. However, the elimination of state transit funding and the lower sales tax revenues and lower-than-projected fare revenues in fall 2009 led to a projected budget deficit of $15 million for FY 2011. During the budget development process, the MTS Budget Development Committee and the Board of Directors provided guidance in resolving a portion of this significant shortfall through service adjustments that would generate a subsidy savings of $7 million. In November 2009 the Board adopted a strategy of focusing on Sunday services in order to maintain weekday levels of service and minimize the impacts for the greatest number of riders.
The strategy to focus on Sunday service was adopted for several reasons.
• Focusing on one day of the week achieves a budget savings without completely eliminating any route. All routes that operate on weekdays and Saturdays would continue to operate six days of the week.
• Sunday was selected because it is the lowest ridership day of the week. On weekdays the average number of boardings on MTS services is 274,000 but on Sundays the rate is almost halved (an average of 145,000 boardings). Sunday ridership is concentrated in the midday with far fewer trips in the morning and late evening. Consequently, reductions in the span of service on Sunday would affect significantly fewer passengers than on other days of the week.
• Focusing service reductions on Sunday would make it easier to rebuild the system as the economy improves and revenues gradually return to pre-crisis levels.
• Surveys have shown that a greater percentage of trips on Sundays are discretionary than on
any other day. These include trips that, while essential, could be made at a different time or on a different day, such as shopping, social purposes, and recreation. Work, medical and school trips occur at a much higher incidence on weekdays and Saturdays, and are typically less flexible. Greater reductions on weekdays would have a greater impact on overall fare revenue since regular weekday commuters would be more likely to switch to alternative transportation modes and drop their monthly pass if they could no longer use the pass to access work.
• Sundays have a lower average farebox recovery ratio due primarily to higher discount pass
use. Since there is less revenue per hour and mile of service provided, and thus a higher subsidy, it requires fewer reductions to achieve the desired subsidy savings.
A proposed Sunday network was developed using ridership data, surveys, and information collected during a weekend service analysis project undertaken by MTS in FY 2009. A base service of 60-minute frequency was overlaid on the densest corridors, determined by ridership data, adjacent land uses, transit connections, and Sunday trip purpose and patterns. The base span of the proposed Sunday service network was set at approximately 7 a.m. to 7 p.m. covering the period of time when most of current Sunday ridership occurs. To maximize coverage using the minimum amount of resources possible, most overlapping or nearby services were consolidated. Segments that connect areas served in the new Sunday network but do not significantly enhance coverage were not included. These corridors were constructed into routes that mirror existing routes as much as possible to minimize passenger confusion. Some routes would have minor modifications from their existing path in order to cover the identified network. Additional frequency and span were added on corridors where warranted by demand and up to the level

The Coordinated Plan (2010 – 2014) F-8 Appendix F—Service Implementation Plans
possible to still achieve the $7 million in subsidy savings. Approximately 2/3 of remaining Sunday routes would operate at 30-minute or better frequency, and about 1/3 would offer later service up to or beyond 10 p.m.
In addition to the proposed revision of the Sunday service network, there are some proposals for major and minor reductions to weekday and Saturday services.
The service reductions and Sunday restructurings, which are shown in Table 2, were adopted by the Board in January 2010 and implemented on February 28, 2010. The service changes reduced weekday service by approximately 3% and Saturdays by 11%, while preserving about half of the Sunday service.
Table 2: Adjustments to Achieve $7 Million Subsidy Savings
WEEKDAY PROPOSED CHANGES: Mostly minor reductions with low passenger impacts.
Route Change summary Annual Subsidy Savings
2 Reduce to 15‐min. midday frequency; move Dwtn terminal to America Plaza. $326,7776 Selected evening minor trip reductions. $29,61211 Selected minor peak hour trip reductions. $112,09413 Trips shifted for improved morning northbound service. ($19,292)
20 Middays only: reduce to 30‐min. freq. between Dwtn/Mira Mesa; 60‐min. north of Mira Mesa. $371,996
30 Discontinue service between Dwtn and Old Town after 7pm. $263,94950 Reduce several trips at the periphery of the rush hours. $183,918150 Minor scheduling efficiencies due to Route 50 reductions. $16,908210 Move downtown terminal to America Plaza. $31,511
854 Every other trip runs directly between Amaya Trolley & Grossmont College, via SR‐125. $47,292
860 Discontinue the last northbound trip. $29,979874/875 No service to Granite Hills after 6pm. $12,269
880 Reroute to Dwtn instead of Sorrento Valley, UTC; operate 2 instead of 3 round trips. $0
906/907 New loop route (Iris Trolley‐San Ysidro) replaces southern end of Routes 929, 932. ($1,259,445)916/917 Discontinue half hour north side overlay except in peak. $103,480928 Reduce frequency to hourly after 630pm. $38,674
929 Service south of Iris replaced by new Rt. 906/907. Move Dwtn terminal to City College. $737,996
932 Service south of Iris replaced by new Rt. 906/907. $612,549992 Discontinue two last round trips at night. $19,666Blue Reduce span of peak to end earlier in the AM and start later in the PM. Blue End last four trips at America Plaza instead of Old Town.
$321,785
TOTAL WEEKDAY $1,981,717

The Coordinated Plan (2010 – 2014) F-9 Appendix F—Service Implementation Plans
SATURDAY PROPOSED CHANGES: Frequencies reduced on many core routes; routes shortened where possible.
Route Change summary Annual Subsidy Savings
2 Reduce to 20‐min. frequency. $64,686
3 Discontinue first southbound half‐trip. $1,585
7 Reduce to 15‐min. frequency. $79,879
8/9 Reduce to 30‐min. frequency during the non‐summer months. $50,053
10 Reduce to 20‐min. frequency and move eastern terminal to the City Hts. Transit Plaza. $101,103
11 Reduce to 30‐min. frequency. $144,748
15 Reduce to 20‐min. frequency. $102,147
20 Reduce to 60‐min. frequency north of Fashion Valley. $76,739
27 Reduce to 90‐min. frequency and move Kearny Mesa terminal to Balboa/Convoy. $21,894
30 Operate between Old Town and the VA Hospital only (extend to UTC after 10pm). $152,152
41 Move northern terminal to UTC instead of UCSD. $53,665
88 Reduce to 60‐min. frequency. $32,397
105 Reduce to 60‐min. frequency and move northern terminal to Clairemont Square. $108,634
874/875 Reduce to 60‐min. frequency, and discontinue service to Granite Hills. $63,760
901 Reduce to 60‐min. frequency between 6pm and 7pm. $10,856
906/907 New loop route (Iris Trolley‐San Ysidro) replaces southern end of Routes 929, 932. ($187,926)
929 Service south of Iris Trolley is replaced by new Route 906/907. $92,129
932 Service south of Iris Trolley is replaced by new Route 906/907. $92,039
955 Discontinue two early morning half‐trips. $2,189
967/968 Reduce to 120‐min. frequency. $29,710
992 Reduce to 30‐min. frequency and discontinue two last round trips at night. $46,177
Blue End last four trips at America Plaza instead of Old Town. $9,224
TOTAL SATURDAY $1,147,840

The Coordinated Plan (2010 – 2014) F-10 Appendix F—Service Implementation Plans
SUNDAY PROPOSED SERVICE NETWORK: Most service is hourly, some critical corridors more frequent; some routes slightly restructured for better coverage or connections; span is generally 6am‐7pm, select corridors operate later.
Route Current Freq.
Proposed Freq.
Current Span
Proposed Span
Routing change summary
1 30 30 530am‐12mid 7am‐8pm Move eastern terminal to Dwtn La Mesa (no Grossmont or Amaya).
2 20 30 430am‐1am 6am‐10pm Extend east on Adams Ave. through Normal Heights.
3 30 60 530am‐1130pm 6am‐8pm Move western terminal to City College (no Bankers Hill or Hillcrest).
4 30 60 6am‐1130pm 7am‐7pm No routing changes proposed.
5 30 30 5am‐930pm 6am‐8pm No routing changes proposed.
6 30 60 630am‐1030pm 8am‐7pm No routing changes proposed.
7 15 20 5am‐2am 6am‐12mid Move Dwtn terminal to City College.
8/9 20 30 530am‐1230am 6am‐8pm Operate between Old Town, Sea World, and Mission Blvd only.
10 20 30 5am‐1230am 6am‐8pm Move eastern terminal to the City Hts. Transit Plaza.
11 30 30 5am‐12am 6am‐8pm Operate between Euclid Trolley & Dwtn (5th/C St.) only.
13 30 60 530am‐10pm 6am‐8pm No routing changes proposed.
15 20 30 5am‐1am 6am‐12mid Move Dwtn terminal to City College.
20B 30/60 60 530am‐10pm 6am‐8pm Add service to Kearny Villa Rd. between Balboa and Clairemont Mesa.
27 60 ‐‐‐‐ 6am‐830pm ‐‐‐‐ Route would not operate on Sundays.
28 30 60 6am‐11pm 6am‐8pm No routing changes proposed.
30 30 30 5am‐130am 6am‐11pm Operate between Old Town and VA Medical Center only (no Dwtn or UTC).
35 30 30 630am‐11pm 7am‐8pm Move Ocean Beach terminal to Newport Ave. (no Point Loma Ave.).
41 30 30 6am‐11pm 630am‐830pm Operate via Linda Vista and move north terminal to UTC (no UCSD).
44 30 60 6am‐12mid 630am‐1030pm Via Health Center Dr., Meadowlark.
88 60 ‐‐‐‐ 630am‐9pm ‐‐‐‐ Route would not operate on Sundays.
105 60 60 630am‐9pm 6am‐7pm Move north terminal to Clairemont Sq. (no UTC); route change in Bay Park.
115 60 ‐‐‐‐ 630am‐9pm ‐‐‐‐ Route would not operate on Sundays.
120 30 30 530am‐1030pm 6am‐10pm Operate between Dwtn (Broadway) and Fashion Valley only.
201/202 15 15 6am‐1030pm 6am‐1030pm No changes proposed.
701 60 ‐‐‐‐ 630am‐930pm ‐‐‐‐ Route would not operate on Sundays.
704 60 ‐‐‐‐ 7am‐930pm ‐‐‐‐ Route would not operate on Sundays.
705 60 ‐‐‐‐ 730am‐730pm ‐‐‐‐ Route would not operate on Sundays.
709 30 60 630am‐930pm 630am‐7pm Major route changes to serve Hilltop, Sharp Hosp., E. Palomar (no East H St.).
712 60 ‐‐‐‐ 630am‐9pm ‐‐‐‐ Route would not operate on Sundays.
815 30 60 530am‐830pm 7am‐6pm No routing changes proposed.
Route Current Freq.
Proposed Freq.
Current Span
Proposed Span
Routing change summary
832 60 ‐‐‐‐ 9am‐530pm ‐‐‐‐ Route would not operate on Sundays.

The Coordinated Plan (2010 – 2014) F-11 Appendix F—Service Implementation Plans
SUNDAY PROPOSED SERVICE NETWORK: Most service is hourly, some critical corridors more frequent; some routes slightly restructured for better coverage or connections; span is generally 6am‐7pm, select corridors operate later.
Route Current Freq.
Proposed Freq.
Current Span
Proposed Span
Routing change summary
833 60 ‐‐‐‐ 9am‐530pm ‐‐‐‐ Route would not operate on Sundays.
845 60 ‐‐‐‐ 730am‐630pm ‐‐‐‐ Route would not operate on Sundays.
848 60 60 7am‐10pm 630am‐630pm No routing changes proposed.
854 60 ‐‐‐‐ 8am‐930pm ‐‐‐‐ Route would not operate on Sundays.
855 60 60 6am‐930pm 730am‐530pm No routing changes proposed.
856 60 ‐‐‐‐ 530am‐10pm ‐‐‐‐ Route would not operate on Sundays.
864 30 60 5am‐11pm 7am‐6pm Move east terminal to East Main & Broadway (no Alpine).
872A 60 ‐‐‐‐ 8am‐530pm ‐‐‐‐ Route would not operate on Sundays.
874/875 30 60 630am‐10pm 7am‐6pm Operate on Washington to/from 3rd/Lexington only.
901 30 60 5am‐230pm 6am‐8pm Operate between 12th/Imperial & Coronado; some trips ext. to I.B. or Iris.
904 60 ‐‐‐‐ 10am‐630pm ‐‐‐‐ Route would not operate on Sundays.
905 60 ‐‐‐‐ 530am‐7pm ‐‐‐‐ Route would not operate on Sundays.
906/907 ‐‐‐ 30 ‐‐‐‐ 6am‐8pm New loop route replaces southern end of Routes 929, 932.
916/917 60 ‐‐‐‐ 6am‐930pm ‐‐‐‐ Route would not operate on Sundays.
921 60 ‐‐‐‐ 7am‐8pm ‐‐‐‐ Route would not operate on Sundays.
923 60 ‐‐‐‐ 6am‐7pm ‐‐‐‐ Route would not operate on Sundays.
928 60 60 630am‐930pm 830am‐630pm No routing changes proposed.
929 20 20 5am‐3am 6am‐11pm Operate only between Iris Ave. and 8th St. Trolley (National City).
932 20 30 430am‐1am 6am‐8pm Operate only between Iris Ave. and E St. Trolley (Chula Vista).
933/934 30 30 530am‐130am 6am‐8pm Discontinue Satellite/Iris loop south of Coronado Ave.
936 30 30 530am‐11pm 6am‐8pm No routing changes proposed.
955 30 30 5am‐12mid 6am‐8pm No routing changes proposed.
961 60 60 7am‐8pm 6am‐8pm Operate only between 24th St. Trolley and Plaza Bonita.
962 60 60 7am‐730pm 7am‐530pm No routing changes proposed.
965 45 ‐‐‐‐ 7am‐730pm ‐‐‐‐ Route would not operate on Sundays.
967 120 ‐‐‐‐ 7am‐730pm ‐‐‐‐ Route would not operate on Sundays.
968 120 ‐‐‐‐ 8am‐7pm ‐‐‐‐ Route would not operate on Sundays.
992 15 30 5am‐1230am 6am‐11pm No routing changes proposed.
Blue 15 15 430am‐2am 430am‐2am End last four trips at America Plaza instead of Old Town.
Orange 15 30 530am‐1230am 530am‐1230am No routing changes proposed.
Green 15 30 430am‐1am 430am‐1am No routing changes proposed.
TOTAL SUNDAY SUBSIDY SAVINGS
$4,020,786

The Coordinated Plan (2010 – 2014) F-12 Appendix F—Service Implementation Plans
IV. Outlook The receipt of unbudgeted transit assistance funds from the State of California in June 2010 provided some flexibility to apply resources to the existing MTS system. This will enable MTS to implement improvements in September 2010, including modifying service to improve the network, address capacity deficiencies and respond to customer complaints received since the February 2010 weekend service.
The Coordinated Plan (2010 – 2014) F-13 Appendix F—Service Implementation Plans
FY 2010 Service Implementation Plan Submittal to the San Diego Association of Governments (SANDAG) March 2009 North County Transit District (NCTD) 810 Mission Avenue Oceanside, CA 92054
ATTACHMENT 4A

The Coordinated Plan (2010 – 2014) F-14 Appendix F—Service Implementation Plans
Table of Contents Executive Summary......................................................................................................15 Part 1 - Review of FY 2009 Service Changes..............................................................16
1.1 Implementation of the SPRINTER...................................................................16 1.2 FY2009 Service Plan Implementation .............................................................16 1.3 Overall System-wide Ridership Trends ...........................................................21
Part 2 – Service Area/Transit Network Design ...........................................................22 2.1 NCTD Service Area.........................................................................................22 2.2 NCTD Services................................................................................................22
Part 3 – Service Evaluation ..........................................................................................25 3.1 About Performance Monitoring........................................................................25 3.2 Fast Forward Strategic Plan – Productivity and Coverage..............................25 3.3 Applying the Service Standards ......................................................................26 3.4 BREEZE Performance Assessment................................................................29 3.5 COASTER Performance .................................................................................30 3.6 SPRINTER Performance.................................................................................30 3.7 LIFT Performance ...........................................................................................31
Part 4 - Major NCTD Service Issues ............................................................................32 4.1 Unserved/Underserved Areas .........................................................................32 4.2 Operational Routing Issues Requiring Consideration .....................................35
Part 5 - Service Improvements and Comprehensive Operational Analysis for FY 2010.....................................................................................................36
5.1 FY2010 Service Improvements .......................................................................36 5.2 Comprehensive Operational Analysis .............................................................36
Part 6 - Other Service and Planning Opportunities ...................................................37 6.1 Capacity-Oriented Planning and Implementation............................................37 6.2 Schedule Reliability-Oriented Planning and Implementation ..........................38 6.3 FY 2010 Marketing and Communications Initiatives .......................................38
Appendix A – Service Priorities Criteria .....................................................................40 Appendix B – Route Categories ..................................................................................43 Appendix C– Service Changes -- FY 2006 through FY2009 ......................................44

The Coordinated Plan (2010 – 2014) F-15 Appendix F—Service Implementation Plans
Executive Summary The FY2010 Service Implementation Plan provides a review of transit service changes that NCTD has implemented in the past year, evaluates the performance of current service, identifies major service needs and challenges in the North County area, and proposes to conduct a Comprehensive Operational Analysis (COA) to increase ridership, increase efficiency, improve community access, and support regional transportation goals. NCTD’s FY 2010 SIP is an input into SANDAG’s Regional Short-Range Transit Plan. SANDAG will use NCTD’s and the Metropolitan Transit System (MTS) SIP as the basis for evaluating regional service priorities. Since 2003, when regional consolidation of transit planning functions occurred, NCTD has used the SIP process as an opportunity to reallocate resources from under-utilized services to enhance higher-performing services or to implement new service. More recently, services have been significantly modified to support implementation of the SPRINTER light rail service, a major regional transit service, and to address significant funding shortfalls. Given constrained regional funding, NCTD must continue to find efficiencies and new funding sources if new service is to be introduced. Service Evaluation and Major Service Issues Based on Board-adopted criteria for evaluating NCTD’s services, a performance review was performed on all fixed routes in operation as of the January 2009 Service Change. Nearly all routes are meeting or exceeding their established performance standards. Areas of service need and operational issues requiring study are also addressed in these sections of the SIP. Service Improvements and Comprehensive Operations Analysis (COA) Typically, NCTD uses the SIP to recommend and prioritize service improvements for high-performing routes and new service areas. However, this year, NCTD’s ability to implement new or improved service is constrained by funding limitations. Given current declines in sales tax revenues and the pending elimination of state transit assistance, NCTD’s primary objective for the next year will be to minimize changes to the system and allow the current service to stabilize. In addition, during the upcoming year, NCTD will complete a Comprehensive Operations Analysis in order to identify the types of service and service delivery methods that will support improved ridership and operational efficiency. The recommendations adopted as a result of completing the COA will provide significant information that will be required to develop the FY2011 SIP.
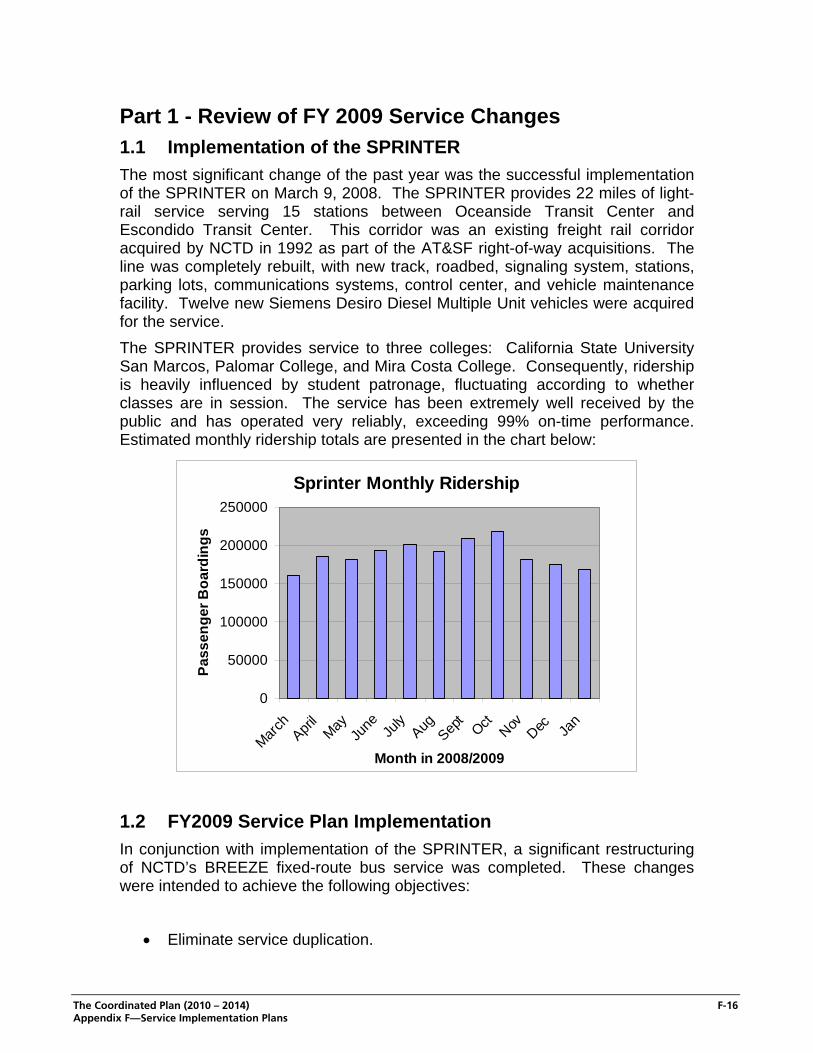
The Coordinated Plan (2010 – 2014) F-16 Appendix F—Service Implementation Plans
Part 1 - Review of FY 2009 Service Changes 1.1 Implementation of the SPRINTER The most significant change of the past year was the successful implementation of the SPRINTER on March 9, 2008. The SPRINTER provides 22 miles of light-rail service serving 15 stations between Oceanside Transit Center and Escondido Transit Center. This corridor was an existing freight rail corridor acquired by NCTD in 1992 as part of the AT&SF right-of-way acquisitions. The line was completely rebuilt, with new track, roadbed, signaling system, stations, parking lots, communications systems, control center, and vehicle maintenance facility. Twelve new Siemens Desiro Diesel Multiple Unit vehicles were acquired for the service. The SPRINTER provides service to three colleges: California State University San Marcos, Palomar College, and Mira Costa College. Consequently, ridership is heavily influenced by student patronage, fluctuating according to whether classes are in session. The service has been extremely well received by the public and has operated very reliably, exceeding 99% on-time performance. Estimated monthly ridership totals are presented in the chart below:
Sprinter Monthly Ridership
0
50000
100000
150000
200000
250000
March
April
MayJu
ne July
AugSep
tOct Nov Dec Ja
n
Month in 2008/2009
Pass
enge
r Boa
rdin
gs
1.2 FY2009 Service Plan Implementation In conjunction with implementation of the SPRINTER, a significant restructuring of NCTD’s BREEZE fixed-route bus service was completed. These changes were intended to achieve the following objectives:
• Eliminate service duplication.
The Coordinated Plan (2010 – 2014) F-17 Appendix F—Service Implementation Plans
• Provide connecting bus routes at as many SPRINTER stations as possible, with improved schedule connections to SPRINTER and COASTER.
• Provide a direct feeder connection to Mira Costa College from the Rancho Del Oro SPRINTER station.
• Provide fixed-route service to a new area – the Sycamore shopping area in east Vista, north of Highway 78.
Figure 1 provides a schematic overview of the entire North County Transit Network which was implemented on March 9, 2008, in conjunction with inauguration of service on the SPRINTER. As implemented, the North County Transit Network enhanced train to bus connections throughout the system. Major connection points with the SPRINTER were established at Oceanside Transit Center, Vista Transit Center, and Escondido Transit Center, which are long-standing timed-transfer locations in the system. A feeder route was implemented for Mira Costa College. SPRINTER-COASTER connections were also optimized to the extent train schedules would allow. Unfortunately, NCTD was not able to sustain operation of the North County Transit Network for very long due to declining sales tax and state transit assistance revenues. In February 2008, SANDAG revised downward NCTD’s estimates for Transportation Development Act (TDA) and TransNet sales tax revenues for FY08 as well as FY09, and the State put all transit agencies on notice to expect less from STA in FY09. At the same time, the price of diesel fuel was rising at a precipitous rate, with no end in sight at the time of development of the FY09 operating budget. With this “perfect storm” of cost increases and declining revenues, NCTD determined that dramatic action was called for to avoid multi-million dollar operating deficits in FY09. Accordingly, staff developed a proposed list of major service reductions for FY09, to be phased in over the August, 2008, and January, 2009 service changes. The changes were identified based on a performance evaluation of existing services using passengers per revenue hour as the primary evaluation factor. A Public Hearing was conducted for the proposed changes on May 12, 2008. A list of changes, with proposed date for implementation, follows:

The Coordinated Plan (2010 – 2014) F-18 Appendix F—Service Implementation Plans
Placeholder for Figure 1 – March 2008 North County Transit Network

The Coordinated Plan (2010 – 2014) F-19 Appendix F—Service Implementation Plans

The Coordinated Plan (2010 – 2014) F-20 Appendix F—Service Implementation Plans
Over 100 people spoke at the public hearing, and the NCTD Board was faced with the extremely difficult decision of reducing service on many of NCTD’s “coverage” routes or face the prospect of large operating deficits. Ultimately, the Board approved all of the proposals as identified above, with two exceptions:
• Limited Route 386 “commuter” service to Ramona was retained, with two morning, and two evening round trips on weekdays only.
• Limited Route 347 service was retained on weekdays only in San Marcos, with a slight routing revision to allow the route to cycle within 60 minutes and serve the SPRINTER station at CSUSM.
In addition, the January changes were postponed to January 25, 2009. Also, the Board voted to eliminate a $125,000 per year program with Amtrak for Rail-2-Rail which had previously allowed COASTER Monthly Pass Holders to ride Amtrak service in the corridor without additional fare payment. Finally, in late 2008, NCTD was successful in working with the Reservation Transportation Authority to obtain special grant funding for enhanced service on Route 388, which travels between Escondido Transit Center and the Pala Indian

The Coordinated Plan (2010 – 2014) F-21 Appendix F—Service Implementation Plans
Reservation and Casino. NCTD was able to implement this improvement with the other changes in January 2009, which more than doubled Route 388 service, with approximately 80% of the cost increase covered by the grant, and the remaining cost covered by projected fare revenues.
1.3 Overall System-wide Ridership Trends Despite the service reductions which became effective in August 2008, and fare increases implemented in July 2008, NCTD’s system-wide ridership (all modes) increased overall by 17.3% in the first six months of FY09, primarily due to implementation of the SPRINTER. The following chart illustrates this trend:
RIDERSHIP FOR ALL MODES FY08 VS. FY09
0100,000200,000300,000400,000500,000600,000700,000800,000900,000
1,000,0001,100,0001,200,0001,300,000
Jul FY08
Jul FY09
Aug FY08
Aug FY09
Sep FY08
Sep FY09
Oct FY08
Oct FY09
Nov FY08
Nov FY09
Dec FY08
Dec FY09
FASTADA/LiftCoasterSprinterBreeze
System-wide: FY09 YTD up 17.3% over FY08

The Coordinated Plan (2010 – 2014) F-22 Appendix F—Service Implementation Plans
Part 2 – Service Area/Transit Network Design 2.1 NCTD Service Area Each transit system operating environment is unique and determines the resulting system design, target riders markets, and ridership. NCTD serves the following eight cities in north San Diego County, the City of San Diego (with COASTER commuter rail service and special service for Chargers football games) and portions of the unincorporated San Diego County:
• Carlsbad • Del Mar • Encinitas • Escondido • Oceanside • San Marcos • Solana Beach
The service area covers a total of 1,020 square miles.
2.2 NCTD Services 2.2.1 BREEZE Fixed-Route Bus Service NCTD operates a network of 30 fixed bus routes, 18 of which have 7-day service. See Table 2.1 for existing days and hours of service and service frequencies. These routes can be categorized as corridor, local, or commuter depending upon the type of streets served, route length and number of communities served. BREEZE routes are also categorized as “productivity” or “coverage” depending on the frequency of service or the type/density of the area served. These categories determine the target productivity level for annual service evaluation. With the inauguration of SPRINTER light rail service, the BREEZE network was significantly restructured to maximize connections with SPRINTER. Of the 30 current BREEZE routes, only route 315 and the COASTER Connection routes 444 and 445 do not connect with SPRINTER. The BREEZE network also relies on route connections at five major Transit Centers (Oceanside, Plaza Camino Real, Vista, Palomar College, and Escondido), of which only Plaza Camino Real is not located on the SPRINTER line. Table 2.1 Existing BREEZE Service Days, Spans, and Frequencies

The Coordinated Plan (2010 – 2014) F-23 Appendix F—Service Implementation Plans
NCTD SERVICE LEVELS - JANUARY 25, 2009
Weekday Saturday Sunday/HolidayService Span Frequency (Minutes) Service Span Frequency (Minutes) Service Span Frequency (Minutes)
Start End Peak Midday Evening Start End Midday Evening Start End Midday EveningBREEZE
301 5:03 AM 10:59 PM 30 30 30-60 5:03 AM 10:34 PM 30 60 5:03 AM 10:34 PM 30 60302 4:26 AM 11:32 PM 30 30 30-60 5:08 AM 10:54 PM 30 30-60 5:08 AM 10:54 PM 30 30-60303 4:03 AM 12:14 AM 15 15 30-60 4:33 AM 12:02 AM 30 30-60 4:33 AM 12:02 AM 30 30-60304 5:15 AM 9:08 PM 60 60 60 -- -- -- -- -- -- -- --305 4:33 AM 11:59 PM 30 30 30-60 5:03 AM 11:25 PM 30 30 5:03 AM 11:25 PM 30 30306 5:10 AM 9:53 PM 30-60 60 60 6:05 AM 9:45 PM 60 60 6:05 AM 9:45 PM 60 60308 5:30 AM 8:49 PM 30 60 60 6:33 AM 7:27 PM 60 60 6:33 AM 7:27 PM 60 60309 4:25 AM 10:59 PM 30 30 60 6:20 AM 10:49 PM 60 60 6:20 AM 10:49 PM 60 60313 4:49 AM 8:51 PM 60 60 60 -- -- -- -- -- -- -- --315 5:10 AM 10:52 PM 60 60 60 5:10 AM 11:52 PM 60 60 5:10 AM 11:52 PM 60 60317 4:49 AM 10:12 PM 60 60 60 5:49 AM 10:11 PM 60 60 5:49 AM 10:11 PM 60 60318 4:44 AM 9:39 PM 60 60 60 5:44 AM 9:39 PM 60 60 5:44 AM 9:39 PM 60 60319 5:19 AM 10:07 PM 30 30 30 5:19 AM 10:07 PM 30 30 5:19 AM 10:07 PM 30 30321 5:00 AM 9:45 PM 60 60 60 -- -- -- -- -- -- -- --325 5:20 AM 9:10 PM 60 60 60 -- -- -- -- -- -- -- --332 4:33 AM 6:24 PM 30 60 -- -- -- -- -- -- -- -- --333 12:00 AM 7:49 PM 60 60 -- 7:05 AM 7:49 PM 60 -- 7:05 AM 7:49 PM 60 --
334/335 4:33 AM 8:16 PM 60 60 60 -- -- -- -- -- -- -- --347 6:03 AM 7:51 PM 60 60 -- -- -- -- -- -- -- -- --350 4:23 AM 10:23 PM 15 15 30 7:03 AM 10:21 PM 30 60 7:03 AM 10:21 PM 30 60
351/352 3:55 AM 11:51 PM 30 30 60 5:16 AM 9:21 PM 60 60 5:16 AM 9:21 PM 60 60354 5:03 AM 8:19 PM 30 30 30 8:33 AM 6:21 PM 60 -- 8:33 AM 6:21 PM 60 --356 5:03 AM 9:23 PM 30 30 30 8:03 AM 5:53 PM 30 -- 8:03 AM 5:53 PM 30 --
358/359 5:03 AM 8:47 PM 60 60 60 -- -- -- -- -- -- -- --386 4:40 AM 8:23 PM 60 60 60 -- -- -- -- -- -- -- --
388/389 5:03 AM 9:51 PM 60 60 60 5:03 AM 9:51 PM 60 60 5:03 AM 9:51 PM 60 60395 4:03 AM 12:00 AM 30-180 180 30-90 6:03 AM 2:09 AM 60 30-60 6:03 AM 2:09 AM 60 30-60
6:31 AM 9:09 AM 3 trips -- -- -- -- -- -- -- -- -- --4:32 PM 5:49 PM 2 trips -- -- -- -- -- -- -- -- -- --7:17 AM 9:12 AM 2 trips -- -- -- -- -- -- -- -- -- --4:27 PM 5:49 PM 2 trips -- -- -- -- -- -- -- -- -- --
SPRINTER 4:03 AM 9:26 PM 30 30 30 4:33 AM 9:26 PM 30 60 4:33 AM 9:26 PM 30 60
COASTER 5:18 AM 8:01 PM 35 130-160 4 trips (F) 6:35 AM 11:35 PM 150-180 2 trips I round trip for Padres home games
444
445
2.2.2 SPRINTER Light Rail Service SPRINTER light rail service currently operates seven days a week. On weekdays service operates from 4:03 a.m. until 9:26 p.m. On Saturdays and Sundays, service operates between 4:33 a.m. and 9:26 p.m. Weekday service operates every 30 minutes until approximately 6:30 p.m., after which it is hourly. Currently, the midday schedule is the same seven days a week between 9:33 a.m. and 7:26 p.m. On Saturday and Sunday, service operates every 60 minutes before 9:33 a.m. and after 6:33 p.m. Currently the SPRINTER service span is limited to 9:26 p.m. because the SPRINTER vehicles cannot operate at the same time that freight trains are on the tracks, based on Federal Railroad Administration regulations. Improving service frequencies to support trains operating every 15 minutes rather than every 30 minutes is dependent on double-tracking more of the alignment. SANDAG’s Mid-Range Transit Plan development is currently evaluating the potential costs, benefits, and timing of these improvements.

The Coordinated Plan (2010 – 2014) F-24 Appendix F—Service Implementation Plans
2.2.3 COASTER Commuter Rail Service NCTD currently operates 22 weekday and 8 Saturday COASTER trains between Oceanside Transit Center and Santa Fe Depot in downtown San Diego. Currently there is no regularly scheduled Sunday service; however, service is operated on Sundays for padres home games at Petco Park. Service is predominantly peak oriented, with most service southbound in the morning and northbound in the afternoon/evening. Each COASTER train has at least 5 passenger cars, with the capacity to carry more than 1,000 passengers per train. As with SPRINTER light rail, SANDAG is investigating the costs, benefits, and potential timing of improving peak and midday service on COASTER as part of the Mid-range Transit Plan development. 2.2.4 LIFT ADA Paratransit Service NCTD provides LIFT ADA Paratransit service to ADA-certified passengers who live within ¾ miles of existing fixed route service during the days and hours when fixed route service operates.

The Coordinated Plan (2010 – 2014) F-25 Appendix F—Service Implementation Plans
Part 3 – Service Evaluation 3.1 About Performance Monitoring Most transit systems develop performance standards for their services. An agency’s performance standards can provide guidance that supports the efficient allocation of limited resources. Performance standards also define how a specific type of bus service should perform and present a performance target: a level of performance to strive for. It is in setting these standards, to reflect both existing performance as well as developing a performance target, that the biggest challenge is created.
3.2 Fast Forward Strategic Plan – Productivity and Coverage As part of the Fast Forward Strategic planning process, NCTD’s Board adopted conceptual measures for evaluating BREEZE service and indicators for how different types of service should perform. In subsequent years, the Board refined the Performance Standards, categorizing them into “productivity” or “coverage” and by service type. Table 3-1 reviews the currently-adopted standards. Table 3.1 - NCTD Performance Standards Productivity-Oriented Routes: Route Type
Description Weekday Frequency
Peak
Weekday Frequency Non-Peak
Perf. Standard (Pass/Hr.)
Corridor Uses major arterials, higher average speed, inter-community
30 min or better
30 minutes 25
Local Generally serve one or two local communities, circulation-oriented
30 min 60 minutes 20
Commuter Commute hours only to major employment or education centers
Variable 20 AND at least 15 pass./ trip
Local Peak Capacity
Local backup capacity trippers/routes to alleviate over-crowding
Variable 30 AND at least 20 pass./ trip
Coverage-Oriented Routes:

The Coordinated Plan (2010 – 2014) F-26 Appendix F—Service Implementation Plans
Route Type
Description Weekday Frequency
Peak
Weekday Frequency Non-Peak
Perf. Standard (Pass/Hr.)
Corridor Uses major arterials, higher average speed, inter-community
60 minutes to 120 minutes
60 minutes to 120 minutes
15
Local Generally serve one or two local communities, circulation-oriented
60 minutes or better
60 minutes 12
COASTER Connection
Specialized “last mile” connectors to/from stations to work sites
60 minutes or better
60 minutes 10
Special Event and Supplemental Services Route Type
Description Weekday Frequency
Peak
Weekday Frequency Non-Peak
Perf. Standard (Pass/Hr.)
Special Event Service
Special Services to community and sporting events
Variable Variable -
COASTER/ SPRINTER Contingency
“Bus bridge” service in event of rail service interruption
Variable Variable -
Routes that are circulators (Route 351/352) with two numbers to denote directions are counted as one route. For FY 2010, there are 30 regular BREEZE bus routes. Table 3-1 shows recommended weekday service frequencies for each route category. NCTD typically operates less frequent service on weekends except in Camp Pendleton where weekend demand is higher than during weekdays. The term “variable” means that the service is designed to operate as needed to meet passenger demand or carry peak passenger loads.
3.3 Applying the Service Standards 3.3.1 Routes Will Be Monitored Annually Existing routes will be reviewed on an annual basis to determine how well they are performing based on performance in their category. This information will be included in the annual update of the Service Implementation Plan and the Budget as Decision Packages.

The Coordinated Plan (2010 – 2014) F-27 Appendix F—Service Implementation Plans
3.3.2 Categorizing Existing Route Performance Table 3-2 provides a decision tree for how the Board can identify both poor and good performers in a given category. 3.3.3 When a Route Does Not Meet Standard When a bus route fails to achieve a minimum of 75% of the Proposed Performance Standard in term of its total performance (which includes weekday and weekend), a specific set of recommendations aimed at improving the route's productivity would be presented. These types of recommendations could include a targeted marketing campaign, schedule changes to optimize more or different connections, and/or eliminating trips or segments that are underutilized. After 6 additional months, if a route does not show signs of productivity improvement, further recommendations would be presented, up to and including route elimination, and/or absorbing parts of a poorly performing route into other routes. The Board has the discretion to eliminate, replace , reduce or change service on an existing route as needed to meet its financial objectives or because a different type of service could meet existing demand. 3.3.4 When a Route is identified as Exceeding Standard Where possible and financially feasible, the District should reinforce success. A route that is already successful should be considered for improvements including additional trips, frequency enhancements or additional service coverage if its performance exceeds 125% of the Proposed Performance Standard. In some cases routes, that are performing better than average, may not be recommended for additional improvements because adding service will not appreciably improve ridership in the corridor that it serves. 3.3.5 When a Route is Meeting its Standard Generally no action would be proposed. However, if specific trips or a specific time period (lower weekend ridership for example) are identified that are above or fall below the category Performance Standard, a specific set of recommendations would be presented, aimed at improving the route's productivity.

The Coordinated Plan (2010 – 2014) F-28 Appendix F—Service Implementation Plans
Table 3-2 - Actions for using the Proposed Standards
Recommended Action Route Average (boardings per revenue hour)
Prioritize for Service Improvements 125% or more of Average of Category Service Standard
No action 75% to 124% of Average Category Service Standard
Monitor for Changes (up to and including elimination)
Less than 75% of Category Service Standard
3.4.6 Trial or Demonstration Route Service Evaluation All new routes or services once implemented should exceed 75% of its category standard within one year to be considered by the Board to be made permanent. If a trial service does not meet its ridership goal within a year, the Board may continue the service or choose to discontinue the route. All new or trial services will be identified in the affected route’s timetable in the NCTD Rider’s Guide. Should a route meet its category target before the one-year period, it may be proposed that the Board approve the project permanently. Conversely if the route’s performance is well below the 75% threshold, early discontinuation may be proposed at the following service change.

The Coordinated Plan (2010 – 2014) F-29 Appendix F—Service Implementation Plans
3.4 BREEZE Performance Assessment 3.4.1 FY2008-09 Route Productivity For the purpose of this year’s service evaluation, the NCTD Board-adopted standards were applied to those BREEZE routes which remained in operation following the January, 2009 service change. The evaluation utilizes Ridership data for April through November 2008 (the period following implementation of the SPRINTER and the associated bus network changes), with the following results:
3.4.2 Underutilized Routes/Suggested Actions As can be seen, nearly all of the currently-operating BREEZE services are strong performers (125% or more of service category performance) or are meeting

The Coordinated Plan (2010 – 2014) F-30 Appendix F—Service Implementation Plans
standards (75% to 124% of category standards). Only three routes are performing below their category standard, as follows:
• Route 309 Town Center North (Oceanside) to Encinitas Saturday service on this route was just reduced to hourly service in August, from the previous 30-minute service. In the evaluation chart, Saturday service was the weakest performing service of the three schedule types. More time will be needed to determine the effect of the August change.
• Route 319 Rancho Del Oro SPRINTER Station to Quarry Creek Shopping Ctr. This service was implemented as part of the SPRINTER feeder services to connect the Rancho Del Oro Station with Mira Costa College. The route continues by way of Tri-City Medical Center to Quarry Creek Shopping Center in Oceanside. Service is poorly utilized on all three day types, but is extremely low on Saturdays and Sundays. This route will be examined for possible segment reduction, and for operation on weekdays only.
• Route 386 Escondido – Wild Animal Park – Ramona As discussed earlier, this route was significantly altered in August, 2008, with the Ramona service reduced to just commuter hours. More time will be needed to evaluate the performance of this route following this change.
3.5 COASTER Performance The FAST FORWARD program did not establish a specific goal in terms of passengers per revenue hour for the COASTER. However, NCTD’s FY09 Operating Budget document established an average overall goal for the COASTER of 272 passengers per revenue hour. Due to the commute-oriented nature of COASTER service, some trips will fall below this standard while others will be well above it, based on peak hour, peak direction travel. Through December, this indicator stood at 267 passengers per revenue hour, reflecting a slight dip with the downturn in the economy, imposition of fare increases, and imposition of a special fare on the Sorrento Valley Coaster Connection.
3.6 SPRINTER Performance The FAST FORWARD program did not establish a specific goal in terms of passengers per revenue hour for the SPRINTER. The SANDAG ridership projections for the system established a forecast that the SPRINTER would carry 11,600 passengers per day by the end of the first year, but did not establish passenger per hour standards for the period during the first year of service. However, NCTD’s FY09 Operating Budget document established an average overall goal for the SPRINTER of 140 passengers per revenue hour, based on very little historical information when the budget was written. Through December, this indicator stood at an average of 108 passengers per revenue

The Coordinated Plan (2010 – 2014) F-31 Appendix F—Service Implementation Plans
hour, but has reached as high as 134 passengers per revenue hour when all the schools are in session.
3.7 LIFT Performance The FAST FORWARD program did not establish a specific goal in terms of passengers per revenue hour for LIFT service, and no specific goal was set in the FY09 Operating Budget. Historically, this service has hovered around 2.0 passengers per revenue hour, and stood at 2.1 passengers per revenue hour based on data through December. Productivity on this service is affected by NCTD’s huge service area and federal regulatory requirements to provide the service within a 3/4ths mile band around all fixed-route service areas. The BREEZE service reductions implemented in August and January may slightly reduce coverage demands (and therefore costs), but the simultaneous elimination of FAST service in four areas of the District in August has increased LIFT demand in those same areas, if a fixed-route still remains.

The Coordinated Plan (2010 – 2014) F-32 Appendix F—Service Implementation Plans
Part 4 - Major NCTD Service Issues 4.1 Unserved/Underserved Areas NCTD’s Fast Forward Strategic Business Plan, adopted by NCTD’s Board in 2001, presented an unconstrained service scenario. The Board’s vision at that time was for NCTD to provide service every 15 minutes on all corridor bus routes, service every 30 minutes on other routes, COASTER service every 20 minutes peak and hourly off-peak, and service every 15 minutes on the SPRINTER. Since the Fast Forward Plan was adopted, new regional issues in North County have emerged predominantly because of new development and due to the State of California’s on-going budget difficulties. Because NCTD’s funding has not kept pace with regional population growth, there continue to be areas where there is limited or no service. These are: 4.1.1 San Elijo Hills in San Marcos This planned community of 3,000 homes located in the City of San Marcos currently is not served. The main road connection is Twin Oaks Valley Road, which was completed in 2008. A service proposal was previously identified as an FY2007 service priority, but ranked low because it was expensive to introduce and would have required new resources. Nonetheless, should new resources for such a service be identified, NCTD would most likely operate a route connecting the San Elijo Hills town center with the CSUSM campus and SPRINTER station. The emphasis would be on providing a link to the service network at minimal operating cost. 4.1.2 South Carlsbad This area of South Carlsbad bounded by Palomar Airport Road to the north and College Boulevard to the east includes several new large planned communities including Bressi Ranch and major employment areas. Serving this is challenging for traditional public transportation due to moderate housing densities, its topography and suburban street network. NCTD has modified two routes (e.g., 309 and 321) in an effort to better serve the new development. 4.1.3 Fallbrook (Meadowood Development) A large planned development with a possible future branch campus of the Palomar College is being proposed east of the existing I-15 and SR 76 interchange, south of Riverside County’s county line. With the recent service augmentation funded by the Reservation Transportation Authority, Routes 388 and 389 now traverse this area en-route between Escondido and Pale. NCTD has requested SANDAG assistance in working with the County of San Diego to provide a park and ride lot. 4.1.4 Camp Pendleton Existing bus service continues to struggle on Camp Pendleton as a result of overseas deployments. NCTD is in a unique position in that it provides service on a major military installation. There may be opportunities to work with the Base to lobby for funding support to improve services.

The Coordinated Plan (2010 – 2014) F-33 Appendix F—Service Implementation Plans
4.1.5 Weekend Service Network Gaps NCTD has some significant service gaps in Saturday and Sunday service which constrains the ability of people to use public transportation for all their travel needs. On Sundays, COASTER does not operate providing express service between Oceanside and San Diego. Multiple weekend service reductions and/or eliminations were made on many routes as a result of the funding-driven service cuts discussed earlier. 4.1.6 Cross-Service Areas NCTD has been concerned with the lack of service within the Carmel Valley and Del Mar Heights area. Two of the long-standing service priorities are based on the Fast Forward Strategic Business Plan’s proposed extension of service from NCTD’s service area into the MTS service area which includes Carmel Valley and Del Mar Heights. 4.1.7 Schools NCTD’s last passenger survey completed by SANDAG in 2002 showed that 23% of its riders were between the ages of 12 and 18 and 18% of all trips taken on the BREEZE were home to school, the second largest category after home to work trips (41%). These numbers have likely grown since that survey, particularly with implementation of the SPRINTER. With more population growth in North County, new schools are needed. Due to the need to have sufficient land, schools are being built in suburban and formerly rural areas where there is no transit service. Table 4.1 presents a list of new schools that are open or scheduled to open in the next few years. Table 4.1 – New Schools or Schools Scheduled to Open Soon School District School Service
Vista Unified Rancho Minerva Middle School (East Vista, 0.9 mile from Route 334/335)
No planned service
Vista Unified (Under construction)
Magnet High Schools (Jefferies Ranch Area adjacent to SR 76)
No planned service
4.1.8 Other Major Public Facilities Other major public facilities range from government offices to hospitals where it is likely that significant passenger demand will be generated. NCTD has identified the following key sites which will likely need transit service, listed in Table 4.2:

The Coordinated Plan (2010 – 2014) F-34 Appendix F—Service Implementation Plans
Table 4.2 Key Developments/Facilities Requiring Transit Service City Site Service Plan
Oceanside New “El Corazon” Senior Center off Rancho Del Oro (under construction), opens Summer 2009
Approximately 0. 5 miles from Routes 317 and 318. Would require re-route to directly serve.
Escondido Palomar Pomerado Hospital – new replacement hospital at 2195 Citracado Pkwy under construction, opens December 2011
No service at this time. Would require modification of Route 347 and additional resources.
Oceanside Ocean Ranch Business Park between Rancho Del Oro and College
Portions currently served by Route 317.
Encinitas Scripps Memorial Expansion With elimination of Encinitas FAST service and Route 365, this hospital has weekday peak-hours-only service on Route 404.
San Marcos San Marcos Creek and University Business Park Specific Plans
With the recent elimination of Routes 341 and 442, there is minimal fixed-route service close to these potential developments – Peak service on route 321 and Route 347 (weekdays only).
County of San Diego Palomar Community College District North Education Center District Master Plan; University Park Residential Development
Currently Routes 388/389 connect Escondido Transit Center to the tribal casinos. This service has only recently been improved to hourly service by means of a Tribal Transportation Grant.
There are no current funding mechanisms that capture the cost of new development that impact the need to provide more transit service. NCTD works with local jurisdictions through the Development Review Program to provide physical improvements such as turnouts, bus shelters and bus stop pads. Unlike road improvements, there are no specific accepted methodologies to encourage or require new development to subsidize new public transportation services. As a result, new facilities may not be served with bus service for a number of years until new funding is found by NCTD or SANDAG.

The Coordinated Plan (2010 – 2014) F-35 Appendix F—Service Implementation Plans
4.2 Operational Routing Issues Requiring Consideration In addition to identified areas and facilities needing transit service, there are several BREEZE operational issues which NCTD will be reviewing over the next year. Because of the magnitude of recent BREEZE service changes, it is NCTD’s goal to limit changes to those which are operationally necessary or called for based on service evaluation results. Where proposed, our objective will be to address these changes through resource allocation to the extent possible. Table 4.3 Operational Issues Requiring Review
Route Issue Route 101 (Oceanside to UTC) Continuing capacity problems between UTC and UCSD in
mornings northbound. NCTD to investigate schedule coordination with MTS.
Routes 302/305 (Oceanside to South Vista/ South Vista to Escondido)
These routes were formerly one continuous route between Oceanside and Escondido. Route was split at Robelini/Sycamore to serve University Avenue shopping and education complexes in Vista. Turn-around at Kaplan College could not support bus traffic, so a circuitous detour is now in place. Alternatives for the current detour need to be explored.
Camp Pendleton Routes 315 and 395
When troops start returning from overseas, the limited services on these routes may not be adequate. Possible augmentation on weekends may be needed.
Route 350 (Escondido Transit Center to North County Fair)
Capacity problems during school peak periods. Backup buses are already used, but schedule is difficult to maintain. “Bus Rapid” priority treatments may assist. Also, this route is to be extended to the new Del Lago Transit Station just west of the mall when opened in Spring.
Route 320X As troops start returning from overseas, capacity problems are anticipated on weekends between OTC and Plaza Camino Real, where service is less frequent now with elimination of Route 320 and reduction of Route 302 to 30 minute frequency after start of SPRINTER. Re-establishment of “Route 320X Express” between OTC and PCR will be studied.

The Coordinated Plan (2010 – 2014) F-36 Appendix F—Service Implementation Plans
Part 5 - Service Improvements and Comprehensive Operational Analysis for FY 2010
5.1 FY2010 Service Improvements Given current declines in sales tax revenues and significant reduction of state transit assistance, NCTD’s primary objective for FY2010 will be to minimize changes to the system and allow the current service to stabilize. Only changes which are operationally necessary will be pursued this year, as discussed earlier.
5.2 Comprehensive Operational Analysis We have now completed the first full year of SPRINTER/North County Transit Network operation. It is an appropriate time to begin a process of reviewing all of NCTD’s services with a focus of increasing ridership and improving efficiency. This type of study is commonly referred to as a Comprehensive Operational analysis, or COA. The purpose of the COA is to determine the most cost-effective and cost-efficient approach to improving and expanding transit services in North San Diego County. The recent economic downturn, while significant, is one of many factors that demonstrate a need to review the agency’s operations. Changes in demographics, development and employment patterns, fuel prices, and other factors make it incumbent upon NCTD to review current operations and develop plans to meet future needs. NCTD plans to contract with a consultant to conduct this COA over the next year. The recommendations adopted as a result of completing the COA will provide significant information that will be required to develop the FY2011 SIP.

The Coordinated Plan (2010 – 2014) F-37 Appendix F—Service Implementation Plans
Part 6 - Other Service and Planning Opportunities NCTD’s focus in the next year will be to achieve service stability while evaluation continues for a long-term sustainable system. There are also several studies or projects that, once implemented, would enable the District to make capacity improvements to bus or train services or to continue to operate these services reliably. Some of these are proposed studies that will generally require funding from other partners to complete.
6.1 Capacity-Oriented Planning and Implementation 6.1.1 SPRINTER Traffic Signal Optimization Study This study was funded with a Caltrans planning grant and is just now wrapping up. Working with local jurisdictions along the SPRINTER line, the study sought to optimize traffic signal responses to SPRINTER grade crossing signal preemptions at 22 major intersections along the SPRINTER line, to improve overall street traffic operations. 6.1.2 San Luis Rey Transit Center A new twelve bay transit center is planned for north-east Oceanside to replace an existing on-street transfer location at Town Center North Shopping Center. The new transit center is part of a mixed-use transit –oriented development called North River Village. The transit center would serve five BREEZE routes (303, 309, 313, 315, and 325). These routes would either be realigned or extended to serve the new transit center from the Town Center North location. To date, NCTD has only been able to fund property acquisition, public (street/utility) improvements, and rough grading. Another $3 million is estimated to be needed to complete the project. 6.1.3 Carlsbad Area Public Transportation Study A specific area study is needed of the rapidly suburbanizing south Carlsbad area including North County’s major employment corridor, Palomar Airport Road. There is currently no funding for a study but NCTD requests that SANDAG consider funding this project as part of its Overall Work Program. 6.1.4 COASTER Smart Parking Research Study NCTD and SANDAG are conducting a Caltrans-funded study to identify innovative parking management strategies that can improve short-term parking availability at COASTER stations. This study will test the use of “Smart Parking” technologies to better manage limited COASTER parking resources and provide a preferential parking program for carpools and vanpools. The study will examine a tie-in with the COMPASS Card, revenue collection, enforcement, staffing and potential impacts to train ridership. 6.1.5 Coastal Railroad Corridor Capacity Expansion Studies NCTD is participating with SANDAG, regional stakeholders, and corridor users on a study to prioritize coastal rail corridor capacity enhancements. The goal is a rail facility expansion plan that improves rail transit travel times and capacity

The Coordinated Plan (2010 – 2014) F-38 Appendix F—Service Implementation Plans
and reduces rail traffic congestion. The study is using rail modeling software to prioritize near-term and long-term projects for rail facility improvements in the corridor. 6.1.6 SANDAG I-15 Operations Plan SANDAG is updating its 2007 operations plan for regional commuter (Bus Rapid Transit) service on I-15. Service funded by SANDAG’s TransNet Sales tax is scheduled to start in 2012, to be operated by MTS. NCTD is participating in this coordinated planning. Significant issues such as parking supply and pricing, route alignments, stop patterns, service frequencies, vehicle types and detailed funding arrangements are being worked out.
6.2 Schedule Reliability-Oriented Planning and Implementation 6.2.1 Escondido (Route 350) Rapid Bus Project In June 2005, in cooperation with the City of Escondido and North County Transit District, SANDAG initiated the Escondido Rapid Bus project. The purpose of this project was to identify and implement improvements that to facilitate a “rapid bus” connection between the Escondido Transit Center, downtown and south Escondido, and North County Fair. This Rapid Bus service will also connect to the SPRINTER light rail line and I-15 Bus Rapid Transit services. Transit priority measures include bus stop improvements, queue jumpers, and transit signal priority that will improve the travel time and reliability of Route 350, without adversely impacting the local transportation system. Route 350 is a six-mile route that suffers from congestion in key locations during the morning and evening commute periods. Transit priority measures include signal priority for the bus or dedicated “queue jumper” lanes at congested intersections. Preliminary engineering and design was completed in 2008, and final design for a bus only/right turn only lane along Valley Parkway between Centre City Parkway and Quince Street, transit signal priority, and new shelters and stop improvements will be completed in early 2009. Implementation is scheduled for the second half of 2009.
6.3 FY 2010 Marketing and Communications Initiatives 6.3.1 FY 2009 Accomplishments
• Introduced the SPRINTER rail line and celebrated the one year anniversary on March 9, 2009.
• Created and implemented a tactical marketing program targeting students at MiraCosta College, Palomar College and CSUSM
• Implemented a marketing campaign to increase ridership on COASTER Padres trains.
• Continued to support related activities for the Transit Alliance for a Better North County
• Conduct major employer and municipal employer outreach program for Sprinter corridor

The Coordinated Plan (2010 – 2014) F-39 Appendix F—Service Implementation Plans
• Promote the expanded Route 388/389 in combination with special partner Reservation Transportation Authority
• Promote the rollout and implementation of the regional Compass card with partners MTS and SANDAG.
• Promote Google transit feature allowing people using Google for driving directions to also get public transportation options
Of these campaigns, the most significant was the continuing effort of the SPRINTER outreach effort to integrate the redesigned Breeze bus system linking the buses with the new light rail train. 6.3.2 Planned FY2010 Marketing & Communication Department Initiatives
• Segment marketing program for seniors along with the Bus Buddy program.
• Continuing to target college and school students with creative new media and advertising strategies.
• Continuing with a marketing and communication program for the SPRINTER, especially during the summer months.
• Increasing ridership with commuters and promoting special event service (Padres) on the COASTER.
• Garnering positive publicity utilizing our green message and brand/communicate the environmental benefits of public transit.
• Promoting the new Escondido Breeze Rapid Route 350 with SANDAG
• Promoting increased allotments for employee pre-tax transit benefits
• Working with partners Legoland, Coke and MTS on summer fun ridership package
• Working with partners MTS, Coke and Balboa Park on Fall destination package for San Diego residents
• Providing service for special events.
• Conducting major employer and municipal employer outreach program for Coaster corridor
• Promote the expanded Breeze Route 388/389 to Tribal Employment areas

The Coordinated Plan (2010 – 2014) F-40 Appendix F—Service Implementation Plans
Appendix A – Service Priorities Criteria

The Coordinated Plan (2010 – 2014) F-41 Appendix F—Service Implementation Plans
Background: In years when NCTD has been able to obtain funding or reallocate resources, the following criteria have been used to evaluate and rank service proposals:
Criteria Indicator Points to be awarded
Affordability Actual Estimated Cost One to six points after dividing all proposed improvements into 16.5% bands with 6 points awarded to the lowest cost improvement and 1 point to the highest cost improvement
Cost Effectiveness Subsidy per Passenger Boarding
One to six points after dividing all proposed improvements into 16.5% bands with 6 points awarded to the lowest subsidy per passenger boarding and 1 point to the highest subsidy per passenger boarding
Other Funding Support
Other revenue identified from grant or private funding
0 point – 0% 1 point – Less than 10% 2 points – 11 to 19% 3 points – 20% or over
Productivity
Expected Boardings Per Revenue Hour. (Use last six months of operating experience if available from route category. If weekday improvement use weekday service or weekend use Saturday, Sunday or weekend average.)
BREEZE Services
2 points 7 or less boardings per hour
4 points 8 to 11 boardings per hour
6 points 12 to 14 boardings per hour
8 points 15 to 17 boardings per hour
10 points 18 to 20 boardings per hour
12 points 21 or more boardings per hour
COASTER
Points awarded by dividing expected boardings by average FY 03 weekday productivity and then multiplying this percent by 12 points with total rounded.
Example: Service is projected to be 100 boardings per hour. Therefore, 100 boardings/225 average weekday boardings = 44.4% x 12 = 5 (rounded down in this case)
Coverage Gaps/Missing Links
Purpose of service in meeting a perceived schedule gap or area
1 point – provides additional service at a time when no existing service operates currently (example: early morning or later evening service) 2 points – provides new service on a day when no existing service operates currently (example: Sunday service) 3 points – provides new service to an area or new connection or link

The Coordinated Plan (2010 – 2014) F-42 Appendix F—Service Implementation Plans
Criteria Indicator Points to be awarded
Service Quality and Integration
A. Fix existing problem such as overcrowding, poor on-time performance
B. Improve service quality by reducing passenger travel times. Examples: frequency improvements or coordinated schedules
C. New multi-modal connection between transit operators or different modes.
2 point – somewhat meets criteria
4 points – meets criteria
6 points – strongly meets criteria
Transit-Supportive Street Design & Pedestrian Accessibility
Evaluates the operational feasibility for providing efficient transit service and adequate pedestrian access
1 point – somewhat meets criteria
2 points – meets criteria
3 points – strongly meets criteria
Regional Goals Proposed improvements support regional goals by:
A. Services one or more congested corridors/area identities by SANDAG’s Congestion Management Plan
B. Route/line operates on current or future red or yellow car service
C. Meets other regional transportation goals such as improving commuter services, connecting major activity centers or supporting existing major transportation capital investments
1 point – somewhat meets criteria
2 points – meets criteria
3 points – strongly meets criteria

The Coordinated Plan (2010 – 2014) F-43 Appendix F—Service Implementation Plans
Appendix B – Route Categories NCTD System Routes and Classification, Effective January 25, 2009 Routes Corridor Productivity 7 101,302,303,305,306,309,350 Corridor Coverage 7 304,308,321,386,388/389,395,404 Local Productivity 4 319,351/352,354,356 Local Coverage 9 313,315,317,318,325,333,334/335,347,358/359 Commuter Productivity 1 332 COASTER Connections
2 444,445
Total Regular Routes 30 Special Event Services
12 401,408,412,417,421,423,461,471,472,475,476,491
Supplemental Services
5 402,413,416,432,450
Bus Contingency 1 300 COASTER Contingency
2 495,496

The Coordinated Plan (2010 – 2014) F-44 Appendix F—Service Implementation Plans
Appendix C– Service Changes -- FY 2006 through FY2009

The Coordinated Plan (2010 – 2014) F-45 Appendix F—Service Implementation Plans
August 14, 2005 Service Change BREEZE Bus Route Main Changes
101 Weekdays: Discontinued the 8:30 PM & 9:30 PM southbound trips. Discontinued the 7:30 PM & 10:00 PM southbound trips south of Encinitas Station. Discontinued the 9:05 PM northbound trip. Discontinued the 10:05 PM northbound trip south of Encinitas Station. Added a northbound trip leaving UTC at 10:35 PM.
Sunday & Holidays: Discontinued the 9:00 PM southbound trip. Discontinued the 5:55 AM & 9:35 PM northbound trips. Discontinued the partial 6:15 AM & 6:45 AM northbound trips from Carlsbad Village. Discontinued the 6:20 AM northbound trip south of Encinitas Station.
302 Sunday & Holidays: Discontinued the 5:00 AM eastbound trip west of Vista Transit Center.
303 All Days: Adjusted schedule to improve reliability. Weekdays: Added a partial eastbound trip leaving Town Center North at 2:24 PM.
304 Saturday: Last northbound trip revised to leave Encinitas Station at 8:20 PM.
306 All Days: Change the departure times for all northbound trips to 5 or 35 minutes past the hour. Weekdays: Change the departure time for the 9:12 PM southbound trip to 9:17 PM. Sunday & Holidays: Discontinued the 5:10 AM southbound trip & the 5:00 AM northbound trip.
308 Sunday & Holidays: Discontinued the 5:20 AM & 6:20 PM westbound trips & the 6:15 AM & 7:15 PM eastbound trips.
309 Weekdays: Adjusted the departure of the partial northbound trip from Plaza Camino Real from 5:50 AM to 5:56 AM to improve reliability. Sunday & Holidays: Discontinued the 10:20 PM northbound trip & the 9:01 PM & 10:01 PM southbound trips.
310 Weekdays: Change the departure time for the 6:00 AM southbound trip to 6:05 AM to improve connections at Plaza Camino Real and Encinitas Station.
315 All Days: Adjusted the departure time for all westbound trips at Town Center North from 40 to 38 minutes past the hour to improve reliability. Sunday & Holidays: Discontinued the 5:30 AM eastbound trip & the 8:50 PM westbound trip.
324 Weekdays: New morning deviation added to Carlsbad High School on the 6:31 AM westbound trip.
332 Weekdays: Change the departure times for all afternoon trips to either 5 or 35 minutes past the hour. Adjusted schedule to improve reliability.
333 Weekdays & Saturdays: Change the departure times for all trips to 5 minutes past the hour. Adjusted schedule to improve reliability.
338 Weekdays & Saturdays: All trips will now operate along College Blvd., Lake Blvd., and Thunder Drive to Hacienda Drive instead of along Plaza Drive. Change the departure times for all trips to 5 minutes past the hour.
344 Weekdays: Discontinued the 8:45 PM eastbound trip & the 8:45 PM westbound trip.
352 Weekdays: The 6:45 AM trip will now deviate to Orange Glen High School instead of the 7:30 AM trip.
355 Saturday: Change the departures times for all trips to 15 minutes past the hour.
386 Weekdays: Change the departure time for the 6:45 AM eastbound trip to 6:20 AM. Change the departure time for the 7:45 AM westbound trip to 7:15 AM.
391/392 Weekdays & Saturday: Route discontinued. Alternative service available on Routes 394, 395, and 397.
394 All Days: All trips will now operate along Pacific Street and Harbor Drive South instead of Coast Highway. Sunday & Holidays: Discontinued the 7:00 AM & 8:00 AM trips. Added new trips at 7:30 AM, 9:30 AM, 11:30 AM & 12:30 PM.
395 Saturday: Discontinued the 4:00 AM northbound trip & the 5:15 AM southbound trip. Sunday & Holidays: Discontinued the 4:00 AM, 9:00 AM, 10:30 AM, 11:30 AM, 12:30 PM, 1:30 PM, 2:30 PM & 3:30 PM northbound trips. Discontinued the 5:15 AM, 10:30 AM, 12:00 PM, 1:00 PM, 2:00 PM, 3:00 PM, 4:00 PM & 5:00 PM southbound trips.
422 Weekdays: Route discontinued. Alternative service available on Routes 322 and 324.
441 Weekdays: Discontinued 3:33 PM trip along Rancho Santa Fe Road. Alternative service available on Routes 304/404 and 341.
444 Weekdays: Discontinued the 3:18 PM & 3:51 PM trips.
445 Weekdays: Change the departure time for the 4:08 PM trip from Carlsbad Poinsettia Station to 4:00 PM.

The Coordinated Plan (2010 – 2014) F-46 Appendix F—Service Implementation Plans
January 15, 2006 Service Changes BREEZE Bus Route
Main Changes
304/404 All Days: Adjusted schedule and some departure times to improve reliability. Moved the timepoint on all trips from La Costa Avenue & Rancho Santa Fe Road to Camino de los Coches at La Costa Canyon High School.
315 Weekdays: Adjusted the departure time for the first two westbound trips at Town Center North from 38 to 33 minutes past the hour to improve reliability.
333 All Days: Adjusted the departure time for all southbound trips from the timepoint at California Avenue & Avenida de Benito Juarez from 41 to 39 minutes past the hour to improve reliability.
348 Weekdays: Change the departure time for the 6:45 AM trip to 6:40 AM to improve reliability.
350 All Days: Adjusted northbound routing to use Grand Avenue and Quince Street instead of Valley Parkway to improve reliability. Weekdays: Adjusted schedule to improve reliability.
352 All Days: Adjusted westbound routing to stay on Grand Avenue to Quince Street and on to Escondido Transit Center instead of using Broadway and Valley Parkway.
395 All Days: Adjusted schedule on select early morning and late night trips that are experiencing delay due to the closure of the Cristianitos Gate.
444 Weekdays: Adjusted schedule on the second morning trip to account for a revision to the northbound COASTER schedule.
445 Weekdays: Adjusted schedule on the second morning trip to account for a revision to the northbound COASTER schedule.
447 Weekdays: Adjusted the routing and schedule to serve the new Rex Industries building on Rancheros Drive near Mission Road.
Carlsbad Village COASTER Connection
Weekdays: Adjusted schedule on the last three morning trips to improve reliability.
COASTER Weekdays: Adjusted schedule on the second northbound trip to improve reliability.

The Coordinated Plan (2010 – 2014) F-47 Appendix F—Service Implementation Plans
May 21, 2006 Service changes BREEZE Bus Route
Main Changes
315 Weekdays: Adjusted the departure time for the first two westbound trips at El Camino Real & Mission Avenue and at Mission Avenue & Airport Road to improve reliability.
350 Weekdays: Adjusted schedule on selected northbound trips to improve reliability. Added a southbound trip leaving Escondido Transit Center at 2:40 PM.
354 Weekdays: Adjusted schedule on the first eastbound and westbound trips to improve reliability.

The Coordinated Plan (2010 – 2014) F-48 Appendix F—Service Implementation Plans
August 13, 2006 Service Changes Route Proposed Change
COASTER and BREEZE Fares
Most fares will have increased on July 1, 2006. Please consult the fare section on pages 10-14 for more information. (IN THE SPANISH TRANSLATION THIS IS pages 17-21)
Route 101
All Days: Adjusted the routing through UCSD via Revelle College Drive and Scholars Drive to Gilman Drive. One bus stop on Torrey Pines Road and another on La Jolla Village Drive will be discontinued.
Route 302
Weekdays: Added westbound trips departing Escondido Transit Center at 5:00 AM and 5:30 AM to Palomar College Transit Center.
Route 303
Weekdays: Service improved from every 30 minutes to every 15 minutes from 8:00 AM to 2:00 PM. Added 8:30 PM, 9:30 PM, 10:30 PM, 11:30 PM and 12 Midnight trips from Oceanside Transit Center to Mission Avenue and Airport Road. Saturdays: Added 7:30 PM, 8:30 PM, 9:30 PM, 10:30 PM & 11:30 PM trips from Oceanside Transit Center to Mission Avenue & Airport Road. Sunday & Holidays: Added 7:30 PM, 8:30 PM, 9:30 PM, 10:30 PM, 11:00 PM & 11:30 PM trips from Oceanside Transit Center to Mission Avenue & Airport Road.
Route 304
Weekdays: Moved 6:25 AM departure from Encinitas Station to 6:30 AM. Provides better connection from the southbound COASTER arriving at 6:22 AM.
Route 309
Weekdays: Service added to Carlsbad Business Parks all day (Rutherford Road and Priestly Drive area) from 5:30 AM to 6:30 PM.
Route 316
Weekdays: Reduced frequency from seven trips a day to four trips per day. Remaining trips will depart Oceanside Transit Center at 6:30 AM, 11:00 AM, 3:30 PM and 6:00 PM. Saturdays: Reduced frequency from seven trips a day to four trips per day. Remaining trips will depart Oceanside Transit Center at 7:00 AM, 11:00 AM, 3:30 PM and 6:00 PM.
Route 318
Weekdays: Modified running times on selected afternoon trips to improve on-time performance.
Route 325
Weekdays: Discontinue service into the Costa Serena neighborhood (North Way & Gail Drive) on the first two eastbound and westbound trips.
Route 332
Weekdays: Add 4 mid-day trips departing Vista Transit Center at 9:30 AM, 10:30 AM, 11:30 AM and 12:35 PM.
Route 344
Weekdays: Departure time for the first eastbound trip from Carlsbad Village Station changed from 5:45 AM to 5:20 AM. Discontinued last two westbound trips departing Palomar College at 6:45 PM and 7:45 PM and last two eastbound trips departing Carlsbad Village Station at 6:45 PM and 7:45 PM. Weekdays & Saturdays: Eastbound routing revised to serve Loker Avenue West instead of El Fuerte Street.
Route 349 A/B
Weekdays & Saturdays: Route 349 renumbered Route 349 B (clockwise direction). New route 349 A will run in a counter-clockwise direction. Each route will run in each direction every 2 hours.
Route 350
Weekdays: Service improved to every 10 minutes from 6:00 AM to 4:00 PM between Escondido Transit Center and North County Fair.

The Coordinated Plan (2010 – 2014) F-49 Appendix F—Service Implementation Plans
Route 354
All Days: Adjusted the eastbound routing to use Grand Avenue instead of 2nd Avenue. Weekdays: Discontinued last eastbound trip departing Escondido Transit Center at 8:15 PM and the last westbound trip departing Orange Glen at 8:40 PM.
Route 394
All Days: Route is discontinued and replaced by Route 395 which will serve Camp Del Mar on all trips.
Route 395
All Days: Route will now serve Camp Del Mar on all trips. Monday-Thursday: Trips will run every 3 hours (instead of 2 hours) during the day, but increase to every 90 minutes after 4:00 PM. Friday: Service will run every 3 hours until 1:00 PM, then every approximately every hour from 3:00 PM until the end of service. The last trip will depart from Oceanside Transit Center at 12:20 PM. Weekends and Holidays: Added a northbound trip at 9:00 AM. Last trip will depart from Oceanside Transit Center at 10:15 PM.
Route 419
Weekdays: Discontinue service to Loker Business Park. Transfer from Route 309 to Route 344 at El Camino Real and Faraday Avenue at 5:45 AM for service to Loker Business Park for 6:00 AM work starts.
Route 444
Weekdays: Route is extended to Carlsbad Business Parks (Rutherford Road and Priestly Drive area) via Faraday Road. Route ends at Fermi Court. Service is discontinued on Avenida Encinas, north of Palomar Airport Road, and on Paseo Del Norte.
Route 445
Weekdays: Route is redesigned to improve reliability and serve new areas. Route no longer serves Rutherford Road and Priestly Drive area. Instead route serves Palomar Airport Road and Loker Business Park via Camino Vida Roble, McClellan Palomar Airport, El Camino Real (ViaSat) and northern Bressi Ranch. Route ends at Loker Avenue East. Trip arriving for 3:46 PM COASTER is discontinued due to low ridership.
Carlsbad Village COASTER Connection
Weekdays: Adjusted the routing to serve Pine Avenue and Harding Street, instead of Roosevelt Street and Chestnut Avenue in the vicinity of Brierly Field.
Del Mar Race Shuttles All Days: Discontinue shuttles due to low ridership. Take BREEZE Routes 101 or 308, or the COASTER to Solana Beach Train Station and catch Del Mar Thoroughbred Club sponsored shuttles.

The Coordinated Plan (2010 – 2014) F-50 Appendix F—Service Implementation Plans
January 14, 2007 Service Changes Route Proposed Change
Route 303
Weekdays: Added eastbound trips departing Oceanside Transit Center at 5:15 PM and 5:45 PM. Added a westbound trip departing Vista Transit Center at 5:45 PM.
Route 309
Weekdays: Modified the northbound running time on the 5:45 AM trip departing Encinitas Station to improve on-time performance.
Route 318
Weekdays: Modified eastbound running times on selected afternoon trips to improve on-time performance.
Route 322
Weekdays: Adjusted departure time from Chestnut Avenue & Monroe Street on the 2:15 PM eastbound trip to improve connections at Carlsbad High School.
Route 344
Weekdays: Modified the running and/or departure times on the last two evening trips in both directions to improve on-time performance.
Route 350 Weekdays: Adjusted schedule to improve reliability.
Route 354
Weekdays: Adjusted the running times on the 6:45 AM, 7:00 AM & 7:15 AM eastbound tips to improve on-time performance. Modified the running and/or departure times on the 7:10 AM, 7:25 AM & 7:40 AM westbound trips to improve on-time performance.
Carlsbad Village COASTER Connection
Weekdays: Adjusted routing back to Roosevelt Street and Chestnut Avenue now that road construction in the vicinity of Brierly Field is completed.

The Coordinated Plan (2010 – 2014) F-51 Appendix F—Service Implementation Plans
May 20, 2007 Service Changes Route Proposed Change
COASTER Several minor schedule changes were implemented on April 2, 2007. Please consult the actual schedule on page 140 for more details.
Route 101
Weekdays and Saturdays: Moved 10:35 PM departure from UTC to 10:45 PM. Provides better connection from the MTS Route 41 arriving at 10:48 PM at the VA Hospital.
Route 304
Weekdays: Moved 7:15 AM departure from Encinitas Station to 7:18 AM. Provides better connection from the northbound COASTER arriving at 7:13 AM.
Route 308
Weekdays: Modified running times on the westbound trips departing Escondido Transit Center at 6:20 AM, 6:50 AM, 7:45 AM, 8:15 AM, 1:45 PM, 2:15 PM, 2:45 PM, 3:20 PM, 4:15 PM, 4:45 PM, and 5:15 PM to improve on-time performance.
Route 321
Weekdays and Saturdays: Modified running times on all trips to improve on-time performance.
Route 332
Weekdays: Moved 8:40 AM departure from Vista Transit Center to 8:35 AM. Provides better connection to buses leaving Vista Transit Center around 9:30 AM.
Route 338
Weekdays: Modified running times on all seven morning eastbound trips to improve on-time performance.
Route 350
Saturdays: Moved 9:51 PM departure from North County Fair to 9:55 PM. Provides better connection from the northbound MTS Route 20 arriving at 9:51 PM.
Route 352
Saturdays: Changed the departure time of the first trip leaving Midway Dr. & E. Valley Pkwy. from 4:55 AM to 5:00 AM and revised this trip’s running time. Sunday & Holidays: Revised the running time of the first three trips leaving Midway Dr. & E. Valley Pkwy. at 5:00 AM, 6:00 AM and 7:00 AM.
Route 356 Weekdays & Saturdays: Modified running times on all trips to improve on-time performance. Route 365
Weekdays: Moved 7:15 AM departure from Encinitas Station to 7:18 AM. Provides better connection from the northbound COASTER arriving at 7:13 AM.
Route 395
Monday-Thursday: Moved 10:00 PM departure from Oceanside Transit Center to 10:15 PM. Provides better connection from the westbound Route 315 arriving at 10:11 PM.
Route 444
Weekdays: The departure times for the second morning and second afternoon trips have been adjusted to reflect the modified COASTER schedule that went into effect on April 2, 2007.
Route 445
Weekdays: The departure times for the second morning and second afternoon trips have been adjusted to reflect the modified COASTER schedule that went into effect on April 2, 2007.
Carlsbad Village COASTER Connection
Weekdays: The departure times for most trips have been adjusted to reflect the modified COASTER schedule that went into effect on April 2, 2007.
Encinitas COASTER Connection
Weekdays: The departure times for all trips have been adjusted to reflect the modified COASTER schedule that went into effect on April 2, 2007.

The Coordinated Plan (2010 – 2014) F-52 Appendix F—Service Implementation Plans
August 12, 2007 Service Changes Route Proposed Change Route 310
Weekdays: Route is discontinued due to low ridership.
Route 316
Weekdays & Saturdays: Route is discontinued due to low ridership.
Route 350
Weekdays: All-day frequency of service reduced from every 10 minutes to every 15 minutes.
Route 351/352
Weekdays: Peak morning & afternoon frequency of service reduced from every 15 minutes to every 30 minutes.
Route 353/355
Weekdays & Saturdays: Route is discontinued due to low ridership.
Route 403
Weekdays: The schedule for all El Camino High School trips has been modified due to updated bell times. All trips serving Martin Luther King Jr. Middle School are discontinued due the OUSD resuming middle school transportation service.

The Coordinated Plan (2010 – 2014) F-53 Appendix F—Service Implementation Plans
March 2008 Service Changes – SPINTER start-up

The Coordinated Plan (2010 – 2014) F-54 Appendix F—Service Implementation Plans
What’s New Section – Effective June 15, 2008
Route Proposed Change SPRINTER/BREEZE/FAST Fares
Day Passes: The price of the Regular Day Pass is proposed to increase $0.50 to $4.50 beginning August 1, 2008. The Senior/Disabled/Medicare Day Pass is proposed to increase $0.25 to $2.25 beginning August 1, 2008. Monthly Passes: The price for all SPRINTER/BREEZE Monthly Passes is proposed to increase $5.00 for August 2008. This includes the Regular and College Monthly Passes.
COASTER Fares One-Way Ticket: The price of each one-way ticket is proposed to increase by $0.50 beginning August 1, 2008. The Senior/Disabled/Medicare one-way ticket is proposed to increase $0.25 beginning August 1, 2008. Monthly Passes: The price for all Regular COASTER Monthly Passes is proposed to increase $14.00 for August 2008. The price for the Student COASTER Monthly Pass is proposed to increase $7.00 for August 2008. The price for the Senior/Disabled/Medicare COASTER Monthly Pass is proposed to increase $3.50 for August 2008.
SPRINTER Saturday & Sunday/Holidays: Improved frequency to every 30-minutes between 10:00 AM and 6:00 PM.
Route 302
Weekdays: Adjusted departure times for the last five westbound trips from Maric College to improve connections with the Route 305.
Route 306
Saturday & Sunday/Holidays: Adjusted the departure times from Vista for all northbound trips to :05 minutes past the hour.
Route 308
Weekdays: Modified the eastbound running time on the first four trips departing Solana Beach to improve on-time performance.

The Coordinated Plan (2010 – 2014) F-55 Appendix F—Service Implementation Plans
What’s New Section – Effective August 10, 2008 Route Proposed Change Fares Price increases for many Day Passes, Monthly Passes, and One-Way
Tickets were instituted on July 1st. Please see pages 6-7 for details. SPRINTER Saturday & Sunday/Holidays: Improved frequency to every 30 minutes
between 10:00 AM and 6:00 PM (EFFECTIVE July 12th). Encinitas COASTER Connection, Routes 403, 415, 447
Weekdays: Discontinue service.
FAST Weekdays & Saturdays: Discontinue all services in Encinitas, Fallbrook, Ramona and Vista.
Routes 101, 308, 309, 350, 354, 356
Saturdays: Reduce schedule to match Sunday/Holiday levels.
Routes 304/404, 311/312, 321, 324, 334/335, 338/339, 341, 347, 348, 349A/B, 365, 386
Saturday: Discontinue service.
Route 313 Weekdays: Route will operate past El Camino High School every trip via Rancho Del Oro, Mesa Drive & Old Grove Road.
Routes 313, 325, 358/359
Saturday & Sunday/Holidays: Discontinue service.
Route 351/352
Saturday & Sunday/Holidays: Reduce frequency of each route to every 60 minutes.
Route 352 Weekdays: Adjusted first trip earlier to ensure connection with other services leaving Escondido Transit Center at 4:33 AM.
Route 386
Weekdays: Operate commuter hour-only service to Ramona with 2 AM trips and 2 PM trips. Service between Escondido and the Wild Animal Park will be operated every 60-minutes.
Route 395 Sunday/Holidays: Expand schedule to match Saturday levels.

The Coordinated Plan (2010 – 2014) F-56 Appendix F—Service Implementation Plans
What’s New Section – Effective January 25, 2009 Route Proposed Change Fares Price increases for many Day Passes, Monthly Passes, and One-Way
Tickets were instituted on January 1st. Please see pages 6-7 for details. COASTER Weekdays & Saturday: A new schedule was implemented on October 27,
2008. Routes 101, 302, 303, 305, 313, 350, 354, 395, 444 & 445
Weekdays: Modified the running times or departure times on selected trips to improve on-time performance or connections.
Routes 101, 302 & 303 Saturday & Sunday/Holidays: Modified the running times or departure times on selected trips to improve on-time performance or connections.
Routes 302 & 305 All Days: Terminal location changed from Kaplan College to Thibodo Road via Sycamore Avenue and Watson Way.
Route 306 All Days: Route extended north into Fallbrook via Main Avenue, Fallbrook Street, and Mission Road.
Routes 311/312, 324, 338/339, 341/442, 348, 349A/B, 365 & 397
Weekdays: Discontinue service.
Route 347 Weekdays: Route alignment changed to serve Cal State SPRINTER Station, Barham Drive, Woodland Parkway & West Valley Parkway. Service will no longer be operated along Twin Oaks Valley Road, Rancheros Drive, Howard Drive, Harmony Grove Road & West 11th Avenue.
Route 388
All Days: Route expanded into a bi-directional loop using I-15 and SR-76 with a departure from Escondido every hour. Route 389 added.

December 9, 2009Business Plan
Full Access & Coordinated Transportation (FACT)
This proposal was printed on 100% recycled paper.


Business Plan
Phil Monroe,
FACT BOARD OF DIRECTORS
Dave Roberts, Chairman
Teresa Barth, Secretary Vice Chairman
Susan Hafner, Treasurer Bob Campbell
LaVonna Connelly
Laurie Edwards-Tate
Max Calder
FACT EXECUTIVE DIRECTOR
Brent Boyd, Senior Transportation Planner, MTS FACT TECHNICAL ADVISORY COMMITTEE
Alane Haynes, Accessible Services Administrator, NCTD Dan Levy, Senior Transit Planner, SANDAG
Mac McGee, Director, All Congregations Together (ACT) Floyd Willis, Program Specialist and Executive Assistant, Aging & Independence Services (AIS)
The Business Plan was prepared by a team from Nelson\Nygaard Consulting Associates working in coordination with FACT staff and Board members. The Nelson\Nygaard team was
led by Joey Goldman and Richard Weiner.


B u s i n e s s P l a n
F U L L A C C E S S & C O O R D I N A T E D T R A N S P O R T A T I O N ( F A C T )
Table of Contents Page
Page i
Executive Summary ............................................................................................................ ES-1
Chapter 1. Introduction ...................................................................................................... 1-1
Chapter 2. Mission and Vision ........................................................................................... 2-1 Mission, Vision, Goals and Objectives ................................................................................. 2-1
Chapter 3. Background and Structure of FACT ................................................................ 3-1 Background ......................................................................................................................... 3-1 Physical Location ................................................................................................................. 3-2 Organizational Structure ...................................................................................................... 3-2
Chapter 4. Market Analysis ................................................................................................ 4-1 Target Markets for FACT Programs ..................................................................................... 4-1 Summary of Needs to be Addressed by FACT .................................................................... 4-5 Need for FACT..................................................................................................................... 4-9
Chapter 5. Competitive Analysis ....................................................................................... 5-1 Other Potential “Competitors” and Partners ......................................................................... 5-2 Key Competition Issues ....................................................................................................... 5-6 Peer Review Findings and Opportunities ............................................................................. 5-7
Chapter 6. Summary of Services ....................................................................................... 6-1 Long-Term Vision ................................................................................................................ 6-1 Short- and Medium-Term Projects for Implementation ........................................................ 6-2 Integration with FACT’s Core Responsibilities ..................................................................... 6-8 Keeping Track of Other Initiatives ........................................................................................ 6-8
Chapter 7. Implementation ................................................................................................. 7-1 Staffing ................................................................................................................................ 7-4 Software and Information Technology .................................................................................. 7-8 Service Contracts .............................................................................................................. 7-13 Risk Management and Insurance ...................................................................................... 7-14 Outreach Strategies ........................................................................................................... 7-17 Implementation Timeline .................................................................................................... 7-19
Chapter 8. Costs and Funding ........................................................................................... 8-1 Integrating New Strategies and Existing Responsibilities .................................................... 8-1 Cost Projections for New Strategies ..................................................................................... 8-1 Short-Term (FY 2009/10) Cost Projections .......................................................................... 8-7 Medium-Range Cost Projections ......................................................................................... 8-9 Revenue Projections .......................................................................................................... 8-12 Approach to Allocating Costs ............................................................................................. 8-17
Chapter 9. Evaluation ......................................................................................................... 9-1 Evaluating Program Administration ...................................................................................... 9-1 Evaluating Efficiency and Capacity ...................................................................................... 9-3 Evaluating Program Impact .................................................................................................. 9-5 Evaluating Program Compliance .......................................................................................... 9-6
Appendix A. Peer Review Findings and Opportunities Appendix B. Sample Contract from Ride Connection

B u s i n e s s P l a n
F U L L A C C E S S & C O O R D I N A T E D T R A N S P O R T A T I O N ( F A C T )
Table of Figures Page
Page ii
Figure 3-1 FACT Organization Chart ................................................................................. 3-4 Figure 4-1 North San Diego County ................................................................................... 4-1 Figure 4-2 North San Diego County Disability Population by Jurisdictions, 2000 ............... 4-2 Figure 4-3 North San Diego County Senior Population ...................................................... 4-3 Figure 4-4 North San Diego County Senior Population by Jurisdictions
and Age Group, 2000-2006 .............................................................................. 4-4 Figure 4-5 North San Diego County Senior Population by Jurisdictions
and Age Group, 2030 SANDAG Estimates ....................................................... 4-5 Figure 4-6 North San Diego County Senior Population (Detail) Population,
2006 US Census Estimates .............................................................................. 4-8 Figure 5-1 Summary of Nonprofit Organizations that Provide Transportation
in North San Diego County ............................................................................... 5-1 Figure 5-2 Competition Challenges and Opportunities for FACT ....................................... 5-7 Figure 7-1 Preferred Short-Term Nine-Member Board Composition .................................. 7-3 Figure 7-2 Short-Term (Year 1) Staffing Requirements ...................................................... 7-6 Figure 7-3 Medium- and Longer-Term (Years 2-5) Staffing Projections
(Assuming all Priority Initiatives are Implemented) ............................................ 7-6 Figure 7-4 Communication, Training & Organizational Support Strategies ......................... 7-8 Figure 7-5 Communication, Training and Organizational Support Strategies ................... 7-11 Figure 7-6 Roles for FACT in Implementation of Program Strategies ............................... 7-14 Figure 7-7 Short- and Medium-Term Implementation Schedule ....................................... 7-21 Figure 8-1 FACT Current Roles and Responsibilities Based on
Primary Public Funding Grants ......................................................................... 8-3 Figure 8-2 FY 2009/10 Costs and Revenues ..................................................................... 8-8 Figure 8-3 Projected Costs and Revenues ...................................................................... 8-10 Figure 8-4 Summary of Funding Opportunities ................................................................ 8-15 Figure 8-5 Cost Categories and Allocation Factors .......................................................... 8-17

B u s i n e s s P l a n
F U L L A C C E S S & C O O R D I N A T E D T R A N S P O R T A T I O N ( F A C T )
Page ES-1
Executive Summary Full Access & Coordinated Transportation’s (FACT) Business Plan provides a roadmap for FACT’s operation. FACT seeks to expand its services while keeping its commitments as the designated Consolidated Transportation Services Agency (CTSA) for San Diego County.1
Refining an Organizational Vision for FACT
FACT was incorporated in 2006 as a nonprofit corporation, organized under Section 501(c)(3) of the Internal Revenue Code. FACT’s goal was to create a mobility management center in San Diego County. The organization is currently focused on developing a pilot project in North County, along with some additional small-scale pilot transportation programs elsewhere in San Diego County.
Existing Organization The primary components of FACT’s organization include its Board, Technical Advisory Committee and staff.
Board: FACT is governed by a nine-member Board of Directors. The current FACT Board has two vacancies. According to its bylaws, FACT may have between five and 31 Board members, one of whom must be a sitting member of the SANDAG Transportation Committee and one-third of whom must be elected officials.
Technical Advisory Committee: The five-member Technical Advisory Committee participates in all Board meetings and conducts separate meetings with FACT’s administrative staff to advise on day-to-day management issues, funding opportunities, partnerships and programs.
Staff: FACT is staffed by three employees, including an Executive Director who is responsible for all aspects of managing FACT’s programs, and two part-time administrative specialists.
Mission and Vision FACT’s stated mission is to create a transportation system that will provide access and mobility for all people in San Diego County by coordinating existing resources, creating partnerships that eliminate barriers, accessing additional sources of funding, augmenting existing resources, and developing alternative models of transportation.
The vision for FACT is that all people living in San Diego County will have full mobility within their community by an accessible transportation system that meets their individual needs.
Based on the overall vision and strategies identified by staff, peers and Board members, the initial focus of FACT for this Business Plan will be:
To serve as the primary resource for human service and nonprofit coordination of transportation services, marketing, maintenance, purchasing, outreach and funding in the region.
1 Consolidated Transportation Service Agencies (CTSAs) were established by the State legislature in 1979 to foster coordination between social service transportation agencies.

B u s i n e s s P l a n
F U L L A C C E S S & C O O R D I N A T E D T R A N S P O R T A T I O N ( F A C T )
Page ES-2
To provide information and referral, travel navigation services, and other consumer-oriented services to match San Diego County residents with transportation services.
To become the regional specialized transportation broker in San Diego County, scheduling and coordinating transportation services to fill in spatial gaps where fixed route and ADA paratransit services are not available.
Identifying Market Opportunities for FACT The market analysis indicates that there are small clusters of seniors throughout North San Diego County, and that the senior population will remain at a fairly steady 12% of total population between 2000 and 2030. Del Mar and Solana Beach have the highest median ages in the region. At least 12% of the population in every North County city is comprised of people with a disability. Some cities have disabled populations that exceed 20%, including Escondido, Oceanside, and Vista.
There are a number of reasons FACT should provide services in San Diego County (with an initial focus on North County in order to begin coordination efforts on a manageable scale):
Shrinking funding for public transit. With reduced funding due to the current economic downturn, transit agencies and private organizations have struggled to operate all of their programs and services. FACT can serve a niche market by coordinating service and offloading some of the services that are otherwise provided by these organizations.
Reduction in services. FACT’s role as a coordinator of services can help to fill in some of the gaps that have been left. Working with a set of dedicated agencies and organizations, FACT can help them find solutions together rather than each trying to address its own needs.
Information sharing. No formal mechanism is in place for transit agencies and human service providers to share schedule updates or to offer information about connecting transportation services to their customers.
Human service agencies’ multiple priorities. Many of the agencies that FACT can benefit the most are those which have limited resources and staff, but are responsible for a wide array of programming. FACT can help these organizations focus on their core mission, while FACT focuses on its core transportation mission.
Limited transportation options. FACT can play a role in serving areas that are not viable for transit operators to serve because of topography and remote destinations.
Serving specific markets. Based on the review of needs and FACT’s stated priorities, three groups represent the key markets for FACT’s programs:
– Persons with Low Incomes. Outreach to persons with low incomes will focus on people residing outside transit service areas, such as in Ramona, as well as residents of areas with transit service who need to make trips beyond the transit service area (to clinics, workshops, or services not served by transit).
– Seniors. FACT will primarily focus on low-income seniors with limited transportation options. Likewise, in predominately suburban and rural areas with limited transit, FACT will continue to help seniors drive safely as long as possible.
– Persons with Disabilities. Although many ADA-eligible persons use existing paratransit service, FACT’s programs will address people who may not be ADA-eligible or when people could be served more cost-efficiently.

B u s i n e s s P l a n
F U L L A C C E S S & C O O R D I N A T E D T R A N S P O R T A T I O N ( F A C T )
Page ES-3
Opportunities and Challenges: FACT’s Partners and Competitors FACT is charged with coordinating transportation information and piloting new services in North County, but many other organizations are already focused on providing services for their own clients and using their own vehicles. For example, Jewish Family Services operates Rides and Smiles, providing transportation services to low-income seniors, for meal programs, to people with HIV, and immigrants. Del Mar Community Connections provides a volunteer driver program for low-income seniors and residents with disabilities. In fact, dozens of organizations exist that provide specialized transportation programs for many of the populations FACT strives to serve. These organizations use volunteer drivers, privately contracted services, or operate their own vans and sedans.
As part of the strategic planning process that FACT has undertaken, and in the agency’s role as the CTSA, a number of organizations have emerged as potential partners – and in some cases, potential competitors – including the following:
North County Transit District
Metropolitan Transit System
SANDAG
Alliance for Regional Solutions
All Congregations Together
County of San Diego HHSA
Ramona Transportation Action Committee
City Link.
San Diego County
Union of Pacific Asian Communities
Volunteer Driver Coalition
Heritage Clinic
Encinitas Out and About
Office of Emergency Services
Poway/Pomerado Health Community Action Council of San Marcos
San Diego Center for the Blind
Access to Independence
Accessible San Diego
San Diego Regional Center
Vista Out and About
Oceanside Volunteer Driver Program
In addition to the agency partners, FACT is encouraged to consider using private for-profit providers for some types of trips if other providers are not available, including taxicab operators, non-emergency medical transportation providers, and charter bus operators.
FACT Can Learn from Its Peers A review of peer agencies and organizations that operate mobility management brokerages in other parts of California and elsewhere in the US was conducted for FACT (see Appendix A, Peer Analysis). The peer review looks at Ride Connection in Portland, Oregon; Ride-On in San Luis Obispo; Special Transit in Boulder, Colorado; Outreach in San Jose; and Paratransit, Inc. in Sacramento. The peers provided information about how they started their programs, the services they offer, their various partnerships, their technology, board composition and staffing and funding. Some of the findings include the following:
In addition to operating mobility management brokerages, FACT’s peers provide a wide array of services, including one-stop call centers (information and referral and trip scheduling), travel training programs, volunteer driver programs, low-cost coordinated maintenance, local shuttles, transit passes, and ADA paratransit eligibility screening.

B u s i n e s s P l a n
F U L L A C C E S S & C O O R D I N A T E D T R A N S P O R T A T I O N ( F A C T )
Page ES-4
Other programs have been in place for a long time. Some of the peers began their services as early as 1978 and 1979.
FACT’s peers are generally larger organizations, ranging from 27 on staff to nearly 230, for those organizations that operate paratransit.
FACT’s peers serve between 125,000 trips and 1,000,000 trips per year.
Peer boards average 14 representatives.
Setting the Stage for 2030: What FACT Strives to be in the Future A model for FACT reflects the preferences expressed by the FACT Board and staff, as well as the input of other stakeholders and the lessons learned by peer organizations. Based on this input, FACT will serve as the mobility manager for the transportation-disadvantaged population and CTSA for all of San Diego County. Key services to be provided by FACT include the following:
• One-stop call center, providing a central location for all transportation services for seniors, people with disabilities and low-income residents. The call center will provide information and referral and travel navigation services.
• FACT will partner with multiple nonprofit agencies and serve as a broker of transportation services, ensuring that trip requests are directed to the most appropriate transportation provider.
• FACT will serve as a coordinator of shuttle and other transportation services when a transportation need has been identified that would be too costly for NCTD or MTS to provide.
• FACT will serve as a resource for all human service providers in the county who need technical assistance such as grant writing or training.
• FACT will serve as a coordinated maintenance facilitator.
• FACT will be responsible for all transit travel training in San Diego County.
• FACT will contract with local cab companies to provide “first mile-last mile” services to transit centers for transit-dependent individuals who do not live in areas served by ADA paratransit.
• FACT may also have an opportunity to position itself as an ADA paratransit provider.
FACT’s Priorities: Short- and Medium-Term Projects for Implementation FACT plans to grow as an organization by initiating a few small scale programs and executing them well. By promoting its successes, FACT can solicit additional partners and expand its scope of services. FACT will pursue the following short-term program strategies:
Ramona Senior Transportation Pilot Project: Identify a service delivery model for the provision of senior transportation in the Ramona area. The service will be designed with

B u s i n e s s P l a n
F U L L A C C E S S & C O O R D I N A T E D T R A N S P O R T A T I O N ( F A C T )
Page ES-5
the expectation that, if proven successful, service will be expanded to populations beyond the initial senior market.
Mobility Management Pilot Program: Implemented in two stages, the first step will be travel navigation. Existing administrative staff at FACT will be trained to provide assistance to callers in planning and booking trips. The expansion of this first step will be to develop a one-stop call center whereby FACT will broker trips in North County and then throughout San Diego County. FACT’s role will be cost management, centralized scheduling and dispatching for transportation providers.
Maintenance Coordination: FACT will provide referrals to City Link and facilitate the linkage between small and medium size human service transportation providers with a coordinated maintenance program. FACT will also explore the potential for expanding the geographic reach of the maintenance contracts to include North County, South County and coastal area providers.
Volunteer Driver Program Resource Allocation: FACT will provide financial support to volunteer driver programs to assist in recruitment efforts. Related functions include recruitment and training of volunteer drivers.
Older Driver Wellness Program: FACT will administer and contract for older driver wellness trainings in San Diego County. The program is designed to keep seniors driving safely and help them build awareness of their own capabilities and knowing when to “give up the keys.”
DMV Guaranteed Ride Home Program: FACT will establish an immediate-need service for those who are stranded at the DMV and need a ride home.
Medium- and longer-term strategies include the addition of the following:
Senior Group Travel Training: FACT may take over travel training responsibilities from NCTD and MTS. This strategy will need to be carefully coordinated with both transit agencies.
Homeless Transportation Program: FACT will evaluate the Winter Sheltering Program overseen by the Alliance for Regional Solutions to see whether a viable transportation program can be identified.
Trapeze Loan Program: FACT will explore the feasibility of “loaning” out licenses to area nonprofits that may have an interest in using Trapeze software but do not have the financial capability or need to purchase the Trapeze infrastructure. If productivity improvements are realized as a result of the use of Trapeze, this could provide greater incentives for agencies to coordinate with others in the FACT network.
Implementation Activities: FACT Actions to Carry Programs Forward A number of tools are required to carry forward the programs noted above. Specific organizational implementation actions are listed in the sections below.
Oversight and Governance FACT’s organizational structure must allow the organization to perform responsibly and effectively. In the short-term, FACT’s Board will remain at nine positions, with a view to expansion after the implementation of short-term projects in the next one to three years. Rather than expand the size of the Board now, FACT will focus on filling the current vacant positions in

B u s i n e s s P l a n
F U L L A C C E S S & C O O R D I N A T E D T R A N S P O R T A T I O N ( F A C T )
Page ES-6
the immediate term. Longer term, a larger Board could provide good representation of the jurisdictions and programs in the region, and Board subcommittees could be tasked with fulfilling the Board’s many responsibilities.
FACT will consider expanding TAC as new partners join with FACT to manage, operate services, or pay for providing services for their clients. A medium-term consideration for FACT would be to establish a standing community advisory committee comprised of partner agency representatives – consumers, clients, volunteers and riders.
Staffing The plan assumes that FACT has existing staff capacity – and appropriate skills – to undertake new responsibilities in the short-term. Current staff, especially administrative staff, have significant capacity for additional work responsibilities, so most of the new programs can be implemented without increasing FACT’s staff size in the first year. Medium-term and long-term staffing requirements assume the implementation of additional programs, which would require up to two additional staff members for taking phone calls and scheduling trips, integrating Trapeze systems with partner agencies, enhanced grant writing support, and travel training.
Software and Information Technology The most significant issues associated with implementing new technology for FACT will be purchasing the appropriate technology tools that can be expanded and shared as FACT’s programs grow and training staff – both within the organization and outside FACT – to operate and manage the technology and integrate new systems with older technologies.
FACT requires, and in some cases already uses, basic office software (Microsoft Excel, Microsoft Word, Microsoft PowerPoint), database software, web software (STRIDE web framework provided by SANDAG), document production/page layout software (Microsoft Publisher), and accounting/business management software (QuickBooks) .
In addition to software requirements, FACT requires telephones, printer(s), fax, computers that can operate software programs noted above, and a computer network.
Service Contracts For organizations and agencies that use FACT to provide services and/or broker trips for their clients, FACT will establish Memoranda of Understanding (MOU) or of Agreement (MOA) that specify the following:
Type of Service
Eligibility
Scheduling Trips
Service Levels
Funding Commitments
Billing and Cost-Sharing
Other Roles and Responsibilities of Each Party

B u s i n e s s P l a n
F U L L A C C E S S & C O O R D I N A T E D T R A N S P O R T A T I O N ( F A C T )
Page ES-7
FACT will also develop appropriate contracts with its providers to protect the organization and define operating and service expectations. Each contract will include clauses identifying the following:
Scope of services
Liability
Indemnification
Workers' compensation
Termination/suspension
Compliance with laws and regulations
Insurance
Subcontracting
Severability
Waiver
Authority
Federal or state requirements
Risk Management and Insurance Any role or program that FACT might assume brings with it some level of risk and potential for financial loss. FACT will consider hiring a Risk Management Advisor (RMA) to provide the agency with a complete assessment of potential risks and suitable insurance coverage.
At a minimum, insurance policies will be as follows:
Commercial General Liability (Minimum $1 million Combined Single Limit)
Commercial Business Auto (Minimum $1 million Combined Single Limit)
Directors’ and Officers’ Liability
Workers’ Compensation
Professional Liability
Umbrella
Outreach Strategies Outreach objectives for FACT are as follows:
Build support for FACT in San Diego County
Ensure FACT’s programs are understandable and recognizable
Inform and educate the public about transportation options in San Diego County
Provide comprehensive information about becoming a partner of FACT
To address these objectives, tools for FACT will include:
Attractive, updated printed information that defines the organization’s mission and ways other organizations can work with FACT
A redesigned website integrated with the STRIDE website
An outreach campaign with print advertisements, ongoing presentations and outreach meetings, to elected officials, community organizations and transportation and human service providers.

B u s i n e s s P l a n
F U L L A C C E S S & C O O R D I N A T E D T R A N S P O R T A T I O N ( F A C T )
Page ES-8
In addition, staff and members of the Board and TAC will continue the excellent, proactive approach to sharing experiences and gaining recognition for the organization through relationships with existing and new partner organizations.
FACT’s Financial Commitments and Funding Opportunities FACT, like many CTSAs in California relies on only one committed major funding source to support its day-to-day operation. As the CTSA in San Diego County, FACT is eligible to claim TDA Article 4.5 funds. In FY 2009/10 FACT is expecting to receive an allocation of approximately $95,000. These funds can be used for paratransit operating assistance and capital projects, and they provide financial stability for FACT.
FACT has been quite successful in seeking discretionary funding sources. In FY 2008/09 FACT was awarded a grant in the amount of $125,280 from the Senior Transportation Mini-Grant Program (STMGP) established with the reauthorization of TransNet. FACT also was awarded a $65,000 grant through Supervisor Bill Horn as part of the County Board of Supervisors’ Discretionary Fund Program. The largest and most significant grants awarded to FACT are from the FTA Section 5317 New Freedom Program which includes grants for FYs 2006/07, 2007/08 and 2008/09 totaling $859,000. As with all Federal funds, there are matching requirements — 50% for operating costs and 80% for capital purchases — posing a challenge for FACT to fully utilize the maximum amount of funds available to them.
Although FACT has received one-time grants and donations, it is an ongoing challenge to seek new funding opportunities to provide the required match to Federal grants and secure funding commitments from local and regional sources to enhance services. Nevertheless, several new funding opportunities may be available to FACT. These include discretionary traditional transportation federal grants and other federal and state funds that typically fund social service transportation and services for seniors and people with disabilities. FACT is also well positioned to secure funding commitments from transit agencies (NCTD and MTS) by providing travel training services and from social service agencies through its mobility management functions. Given FACT’s innovative and unique services and the scarcity of committed funds for CTSAs, it will require an ongoing commitment to cobble together a funding plan consisting of a variety of public, private and non-traditional funding sources.
FACT’s Service and Program Evaluation of Effectiveness Specific standards will be developed and adopted for each of FACT’s program elements. Evaluation elements of FACT’s programs will include the following:
Evaluating Efficiency and Capacity: A set of performance measures and standards will be established for each of the programs overseen by FACT. These could include such measures as the number of rides provided or coordinated, or the cost per ride. This information will be useful to determine whether FACT is meeting its internal cost controls, and for comparative analyses. FACT will conduct efficiency reviews to determine if it is able to manage the programs it sponsors more cost-efficiently than other organizations. This will allow those organizations to determine the extent to which they want to partner with FACT and will also help organizations determine which programs should be handed over to FACT — a key element of building FACT’s portfolio of programs.
B u s i n e s s P l a n
F U L L A C C E S S & C O O R D I N A T E D T R A N S P O R T A T I O N ( F A C T )
Page ES-9
Evaluating Program Administration: The administrative aspect of the evaluation focuses on the overall administrative function and the performance of FACT and its partners. It will consider the organization’s perspective on how well the operational aspects of all of the programs identified in the Business Plan are working. Day-to-day procedures and number of staff hours devoted to administering the programs will be evaluated. The evaluation will be carried out through interviews with FACT staff and partner agency staff.
Evaluating Program Impact: Program impacts will be evaluated through a combination of quantitative data collection, as well as focus groups, surveys and feedback from partner organizations. After the first year, FACT will consider conducting a series of surveys to evaluate the benefits of FACT’s programs. For transportation services, surveys will be administered on-board vehicles or via telephone. For information and referral (I&R) or travel navigation services, callers will be asked to answer questions upon completion of a call. Likewise, for trainings participants will complete a survey at the end of the training.
Evaluating Program Compliance: FACT is responsible for meeting all federal, state and local regulations in providing its services. SANDAG will provide FACT with most of the reporting mechanisms that are required in the short-term. FACT must undergo a TDA Performance Audit every three years based on procedures outlined by the California Department of Transportation to determine compliance with the TDA. In addition, FACT, as a recipient of New Freedom funds, is required to support SANDAG maintain compliance with Federal Title VI civil rights programs and guidelines.


B u s i n e s s P l a n
F U L L A C C E S S & C O O R D I N A T E D T R A N S P O R T A T I O N ( F A C T )
Page 1-1
Chapter 1. Introduction This is Full Access & Coordinated Transportation’s (FACT) Business Plan. The purpose of the plan is to define a roadmap for FACT to expand its scope of services, and meet its commitments as the designated Consolidated Transportation Services Agency (CTSA) for San Diego County. As the CTSA, FACT currently provides transportation coordination information and referral, and also facilitates information sharing to a large number of audiences — primarily organizations that serve seniors and people with disabilities. FACT’s plan goes beyond building alliances among organizations that address mobility needs, because FACT intends to implement transportation services. By brokering trips for consumers, FACT will help fill the transportation gaps that exist in San Diego County. While FACT cannot solve each transportation problem faced by seniors and people with disabilities, it can play an important role as a facilitator of organizations and agencies that collectively can go a long way to addressing these problems.
To address FACT’s priorities, the Business Plan identifies specific tasks, organizational elements and tools for FACT to undertake in the immediate term, as well as the mid-term (within five years) and longer-term (within 10 years) to help the organization reach its vision.
This plan was developed by Nelson\Nygaard Consulting Associates, working in close coordination with FACT Board members, the Plan Technical Guidance Committee (TGC), FACT staff, and other community stakeholders.
The remainder of this document is organized as follows:
Chapter 2 confirms the Mission and Vision statements for FACT, setting the framework for the development and implementation of new programs. The stated mission and vision of the organization also help to guide its growth, both in terms of services provided and staffing, as needed. The chapter includes a set of proposed milestones to help fact reach its longer-term vision.
Information about the background and existing structure of FACT is included in Chapter 3. Although it is not the intention of the Business Plan to detail the organization’s history, it is worthwhile to define the organizational structure and efforts that FACT has undertaken in the past several years that may impact its efficiency and effectiveness at launching new programs.
Chapter 4 presents the results of a Market Analysis that summarizes data from other reports and from the US Census. It provides a brief overview of transportation demands and needs, as well as an assessment of target markets for FACT’s programs.
The Competitive Analysis is presented in Chapter 5, and includes a summary of other organizations providing transportation services in San Diego County, potential “competitors” and partners, and risks and opportunities of FACT’s planned programs. A peer review of organizations similar to FACT in five other communities is noted and included in Appendix A.
Based on the information presented in Chapters 2 through 5, Chapter 6 provides a summary of FACT’s recommended programs for the short-term, with an additional discussion of opportunities for mid- and long-term implementation.

B u s i n e s s P l a n
F U L L A C C E S S & C O O R D I N A T E D T R A N S P O R T A T I O N ( F A C T )
Page 1-2
Chapter 7 provides organizational direction and guidance for program implementation, including oversight and governance, staffing, contracting, etc. A timeline for program implementation is also included as part of this chapter. Appendix B provides a sample contract that FACT can use to model its own contracts with providers.
Chapter 8, Costs and Funding, inventories capital needs and investments and provides cost projections for the recommended programs. This chapter includes information on funding, fund development and financial projections, as well as cost allocation and invoice policies and procedures. A short-term assessment of FACT’s programmatic obligations based on existing funding streams, including its CTSA responsibilities, is included, along with information about how these programs are incorporated into FACT’s overall set of programs defined in this Business Plan.
Finally, for FACT to monitor its success at moving toward reaching its vision and the effective implementation of its programs, it will be critical for the organization to evaluate its efforts. Chapter 9 defines a monitoring and evaluation strategy and references requirements to ensure programs are compliant with relevant state and federal funding regulations.

B u s i n e s s P l a n
F U L L A C C E S S & C O O R D I N A T E D T R A N S P O R T A T I O N ( F A C T )
Page 2-1
Chapter 2. Mission and Vision In 2005, California State Transportation Task Team (TTT) prepared a strategic plan that recommended that mobility management centers be attached to CTSAs. Although there are some examples of existing mobility management brokerages that are operated by CTSAs in California, there is still relatively limited experience in the state. FACT’s plan to operate a mobility management brokerage is directly in-line with the recommendations of the TTT, and also makes the organization somewhat of a trailblazer, with only a handful of peers that include organizations in San Luis Obispo County, San Jose, Sacramento, and San Mateo County that are ahead of FACT in planning or managing services.
TCRP Report 97, Emerging New Paradigms: A Guide to Fundamental Change in Local Public Transportation Organizations provides a summary of how transportation organizations have changed and are adapting to address contemporary gaps and needs. Much of the focus of the report is on improving the experience of the passenger, something that has been at the crux of mobility management, as well as balancing the bottom line. The report’s authors describe “six dimensions of fundamental change” for remaking a transportation organization. These are highlighted in this memo because they are especially relevant to the sequencing of this Business Plan. These are as follows:
Mission Shift. An organization focuses on managing mobility. This is most relevant for organizations that are currently providing service, but it suggests the need to define an organization’s vision and broaden its mission, something which FACT is in the process of doing.
“Obsession” for the Customer. Or becoming customer-centric, focusing on the overall experience of an individual rather than standard quantitative productivity measures.
Collaboration. The report’s authors argue for collaboration across modes, organizations, and jurisdictions. This is already a key focus of FACT’s mission.
Integration. The next step, sequentially, is to define assets, services, and business functions.
Information Technology. In order to make mobility management work, information technology is necessary, including unified scheduling and dispatching systems. FACT’s peers have emphasized the value of technology, and FACT’s pursuance of Trapeze to schedule and dispatch trips is an example of this component.
Organizational Structure Change. Finally, in order to address the elements identified above, it is necessary to determine the proper organizational structure for governing and managing the organization, given its new responsibilities.
Mission, Vision, Goals and Objectives Mission FACT’s stated mission is to create a transportation system that will provide access and mobility for all people in San Diego County by
Coordinating existing resources
Creating partnerships that eliminate barriers
Accessing additional sources of funding

B u s i n e s s P l a n
F U L L A C C E S S & C O O R D I N A T E D T R A N S P O R T A T I O N ( F A C T )
Page 2-2
Augmenting existing resources
Developing alternative models of transportation
It should be noted that FACT’s mission to serve all people in San Diego County effectively means that everyone should have mobility, and that FACT’s specific role is to serve the transportation needs of people who are transportation-disadvantaged so they can get access and mobility. In the future, FACT may consider incorporating its role as broker into its mission statement.
Vision Over the last two years, FACT has, in fact, clarified its mission and developed a vision that could best represent the organization’s goals:
The Vision for FACT is that all people living in San Diego County will have full mobility within their community by an accessible transportation system that meets their individual needs.
Based on the overall vision and strategies identified by staff, peers and Board members, an organizational description for FACT is as follows:
To serve as the primary resource for human service and nonprofit coordination of transportation services, marketing, maintenance, purchasing, outreach and funding in the region.
To become the regional specialized transportation broker in San Diego County, scheduling and coordinating transportation services to fill in spatial gaps where fixed route and ADA paratransit services are not available.
To achieve this organizational description, FACT will build upon and expand existing CTSA functions as well as contract brokering of transportation services and the provision of transportation to other providers. Longer term, like some of its peers, FACT will operate a brokerage in-house, and potentially directly operate transportation services. A plan for achieving FACT’s vision is presented in Chapter 6.
Goals and Objectives FACT has already defined a set of strategic goals as part of its most recent strategic planning process undertaken in March 2009. FACT’s primary strategic goals were identified as follows. Each includes objectives which are elements of the organization’s work plan.
The fulfillment of the current CTSA Tasks and Activities as defined in the contract with SANDAG, including the development of a Strategic Business Plan updated annually. Objectives:
Maintain meeting and training schedule for Council on Access and Mobility (CAM).
Maintain STRIDE Website (www.stridesd.org).Provide comprehensive information and referral services to the general public.
Participate in the development of the Public Transit and Human Services Coordinated Plan.
Distribute quarterly newsletter.

B u s i n e s s P l a n
F U L L A C C E S S & C O O R D I N A T E D T R A N S P O R T A T I O N ( F A C T )
Page 2-3
Maintain on the Board a minimum of three (3) local elected officials, including one (1) SANDAG Transportation Committee representative.
Annually update Business Plan.
Complete all required reports according to established guidelines.
The design of a mobility management center incorporating a coordinated system of transportation for seniors, people with disabilities and other transportation- disadvantaged people living in or visiting San Diego County. Objectives:
Create a mobility management center that is accessible and centralized.
Develop FACT as the “Broker” of rides within the mobility management center.
Facilitate the development of service provider partnerships and collaborations.
Identify customers of the coordinated system.
Secure funding from various sources that meet the needs of FACT and service providers.
Consolidate, combine and coordinate the purchasing of fuel, insurance, equipment and supplies for all partner agencies.
Determine best practices by provider type for economy of scale development (e.g., nonprofit consolidation vs. contract for provision of services with a transit agency).
Identify economies of scale in relation to both provider consolidation and cross-functional task performance (i.e., cost reduction per unit purchased)
Establish centralized administration of payment for rides provided.
Develop Cost Allocation models and test in simulated service environment.
Begin providing services coordinated through FACT in Pilot or Modular Start-up Phase (e.g., December 2009 or January 2010 following Plan Development with “coalition of the willing” formed over the summer in concert with work being performed).
The modular development of FACT as an operational transportation entity that effectively maximizes and implements its programmatic resources. Objectives:
Human resource and consultant development/acquisition by function.
Personnel administration policy development and departmental structure design.
Fund development and maximization of existing funding sources.
Develop, update and implement Strategic Five Year Business Plan.


B u s i n e s s P l a n
F U L L A C C E S S & C O O R D I N A T E D T R A N S P O R T A T I O N ( F A C T )
Page 3-1
Chapter 3. Background and Structure of FACT
Background FACT has enjoyed coordination successes along with organizational challenges. Incorporated in 2006 as a nonprofit corporation, organized under Section 501(c)(3) of the Internal Revenue Code, FACT’s original goal was to create a mobility management center in San Diego County. Trying to grow the organization, FACT encountered a number of obstacles. According to organizational stakeholders and observations by the consulting team, FACT’s greatest challenges have been as follows:
Difficulty forging new partnerships with potential organizations to create a regional brokerage
A limited pot of funds for a large number of organizations vying for transportation dollars
An internal (board and staff) and external (organizations outside of FACT) perception that FACT has accomplished less than has been expected of the organization
A lack of direction and the sense that FACT’s ambitions were beyond the capability of the staff and resources available in the first years
Limited recognition and a relatively low profile in San Diego County
Although these have resulted in setbacks for FACT, the organization has a number of strengths, including the following:
Board members and technical advisors who are experienced, congenial, and passionate about the organization and its potential for success
Support from key public agencies, including SANDAG, transit operators, San Diego County, and several jurisdictions within San Diego County
FACT’s successes at providing outreach to numerous organizations and bringing a diversity of groups to the table to define needs and search for mutually beneficial opportunities
Existing staff with the personality and skills — as well as availability — to grow the organization, and strong support from current board members
FACT’s office space and capacity for expansion
Several recent accomplishments include defining a transportation scenario in Ramona, soliciting interest from human service agencies for a winter shelter shuttle service, and FACT’s MOA/Funding Agreement with the Union of Pan Asian Communities (UPAC) and that organization’s recent funding from the San Diego County
FACT has already determined that a pilot project in North County, along with some additional small-scale pilot transportation programs elsewhere in San Diego County, would be an appropriate mechanism for expanding its services. The area designated for the pilot project is the North County Transit District (NCTD) service area, 1,020 square miles covering eight cities and several unincorporated areas.
for mental health services in North County.

B u s i n e s s P l a n
F U L L A C C E S S & C O O R D I N A T E D T R A N S P O R T A T I O N ( F A C T )
Page 3-2
Physical Location
Organizational Structure
FACT rents an office suite at 410 S. Melrose Drive in Vista. Although this is a North County location, FACT has CTSA responsibilities for all of San Diego County. Nevertheless, its presence in North County and close relationships with North County providers is part of the reason FACT has decided to pilot the various new programs described in this Business Plan within North County before expansion countywide.
Board FACT is governed by a nine-member Board of Directors. The current FACT Board has two vacancies. According to its bylaws, FACT may have between five and 31 Board members, one of whom must be a sitting member of the SANDAG Transportation Committee, and one third of whom must be elected officials.
Although nine positions on the Board are available, only seven are currently filled. Board membership is as follows:
Phil Monroe,
Dave Roberts,
Chairman of the Board, former MTS and SANDAG Board member and Coronado Councilmember
Vice Chair,
Teresa Barth, Secretary, Councilmember, City of Encinitas
Councilmember, City of Solana Beach
Susan Hafner, Treasurer, Principal, Multimodal Solutions
Bob Campbell
, Councilmember, City of Vista
Laurie Edwards-Tate, President and Founder,
At Your Home Familycare
FACT has been soliciting additional participants.
LaVonna Connelly, Founder, Ramona Transportation Action Committee (RTAC)
Technical Advisory Committee In addition to FACT’s Board, the TAC participates in all Board meetings and conducts separate meetings with FACT’s administrative staff to advise on day-to-day management issues, funding opportunities, partnerships and programs. The TAC was established to eliminate potential conflicts of interest — if TAC members were instead Board members — as perceived by some organizations whose staff sit on the TAC. Current TAC membership includes the following individuals and organizations:
Alane Haynes, Accessible Services Administrator, NCTD
Dan Levy, Senior Transit Planner, SANDAG
Floyd Willis, Program Specialist and Executive Assistant, Aging & Independence Services (AIS)

B u s i n e s s P l a n
F U L L A C C E S S & C O O R D I N A T E D T R A N S P O R T A T I O N ( F A C T )
Page 3-3
Brent Boyd, Senior Transportation Planner, MTS
Mac McGee, Director, All Congregations Together (ACT)
Staff FACT is staffed in-house with two full-time equivalents (FTE), including an Executive Director who is responsible for all aspects of managing FACT’s programs, developing partnerships with other agencies, overseeing staffing, participating in meetings of the FACT Board and other regional organizations, and assembling organization reports. The Executive Director is supported by 1 FTE administrative staff, in a position shared by two people, responsible for answering phones, doing mailings, maintaining the database and websites, bookkeeping, and providing information and referral assistance.
Key organizational functions of FACT’s in-house staff include the following:
Planning
Management
Outreach
Communication
Marketing
Grant writing
Customer service
Bookkeeping
Organizational development
Data collection and analysis
In addition to its regular staff, FACT contracts for accounting services and IT services. Key functions of FACT’s outside staff include the following:
Finance
Accounting
Technology
FACT’s administrative support staff has capacity for additional responsibilities, such as travel navigation and trip scheduling, recommended opportunities which are discussed in Chapter 6.

B u s i n e s s P l a n
F U L L A C C E S S & C O O R D I N A T E D T R A N S P O R T A T I O N ( F A C T )
Page 3-4
Transitions of Staff, Board, and TAC While this chapter has described the roles and responsibilities of the three main components of the FACT organizational structure (staff, board, and TAC), it should be recognized that the individuals currently occupying those roles may not be there for the duration of the organization. Much of the early stage of building FACT’s credibility and potential benefit to the community is based on relationship-building. It is therefore critical that the Business Plan set in place mechanisms to ensure that these efforts are recognized as important elements of the job descriptions of staff, board and TAC members, and that these efforts will endure beyond the inevitable turnover of the individuals occupying these roles.
Figure 3-1 FACT Organization Chart
Resources/Equipment FACT has basic office equipment including computers, telephones, FAX and a printer. The organization also has Internet access and office software for writing reports, preparing spreadsheets, maintaining the database, doing page layout designs and presentations. The organization is not networked to any outside agencies or organizations at this time and its existing programs do not warrant the expansion/integration of its hardware or software. Nevertheless, FACT is pursuing the purchase of some components of Trapeze software which could be used on its own computers and on those of call centers that could be based at outside agencies, such as 211 or 511. With an expansion of FACT’s programs, additional technology resources will be required.
F A C T B o a r d o f D i r e c t o r s
E x e c u t i v e D i r e c t o r
T e c h n i c a l A d v i s o r y C o m m i t t e e
A d m i n . S t a f f 1
I T
A c c o u n t i n g
A d m i n . S t a f f 2

B u s i n e s s P l a n
F U L L A C C E S S & C O O R D I N A T E D T R A N S P O R T A T I O N ( F A C T )
Page 4-1
Chapter 4. Market Analysis This chapter presents a demographic analysis of the key populations targeted in the Business Plan. Existing and projected concentrations of seniors and people with disabilities will help shape the design of recommended programs, as different models operate more efficiently depending on the density patterns of the target populations groups.
Target Markets for FACT Programs This Business Plan focuses on FACT as an organization that is primarily intended to serve the transportation needs of people with disabilities and older adults in San Diego County, with an emphasis on North County in the short-term. While a number of the proposed programs will serve a larger market, particularly low-income individuals who are transit dependent for reasons other than disability or age, the services are specifically designed with these two target populations in mind. The demographic review is followed by a discussion of key transportation needs of the target population groups, as identified in previous research efforts.
Demographic Analysis of Target Markets Census data has been gathered to determine the scope of the senior and disability population in North County. For the purposes of this research we have roughly defined the study area as being comparable to that of the NCTD service area, encompassing 1,020 square miles of north San Diego County extending from Del Mar in the South, northeasterly to Escondido, north to the Riverside County line and west to the Orange County line. Cities in the area include Solana Beach, Encinitas, Carlsbad, Oceanside, Vista and San Marcos. The area also includes the unincorporated communities of Fallbrook and Ramona. The total population of the NCTD service area is more than 800,000.
Figure 4-1 North San Diego County

B u s i n e s s P l a n
F U L L A C C E S S & C O O R D I N A T E D T R A N S P O R T A T I O N ( F A C T )
Page 4-2
Density Patterns of People with Disabilities In the year 2000 (US Census), at least 12% of the population in every North County city’s population was made up of people with a disability. Cities with 20% of its population disabled included Escondido, Oceanside, and Vista. However, it should be noted that this definition may include people who have a disability that does not necessarily impact their mobility.
Figure 4-2 North San Diego County Disability Population by Jurisdictions, 2000
Total Pop.
% Total Pop with disability
2000 Carlsbad 7,8247 14%
Del Mar 4,389 12% Encinitas 58,014 14% Escondido 133,559 20% Fallbrook 43,952 19% Oceanside 161,029 20% Poway 48,044 12% Ramona 32,573 16% San Marcos 54,977 17% Solana Beach 12,979 12% Vista 89,857 20%
Concentrations of Seniors in North County SANDAG reports that the Cities of Del Mar and Solana Beach have the highest median ages in the region (43.6 and 41.6 respectively) and are the only two cities with a median age older than 40.1 Along with La Mesa in the south, Solana Beach also has a very high proportion of residents age 65 or older – nearly 19%, based on 2006 estimates, compared to a national average of less than 13%. The overall senior population in North County appears to remain at a fairly steady 12% of total population from the year 2000 to 2030, based on forecasts from SANDAG.2
1 http://www.sandag.org/uploads/publicationid/publicationid_1100_3411.pdf 2 http://profilewarehouse.sandag.org/

B u s i n e s s P l a n
F U L L A C C E S S & C O O R D I N A T E D T R A N S P O R T A T I O N ( F A C T )
Page 4-3
Figure 4-3 North San Diego County Senior Population
2000 2006 2030
Total Pop. Over 65
% Total Pop. Over 65-
Total Pop. Over 65
% Total Pop. Over
65 Total Pop.
Over 65
%Total Pop Over
65 North County- East 47,558 13% 51,843 12% 48,951 12% North County-West 43,696 12% 49,707 12% 43,302 12%
The 2000 Census reported that in addition to Solana Beach’s high proportion of residents over age 65 (17% in 2000), Fallbrook also had a sizeable proportion of senior residents, at 16%. Del Mar, Oceanside and Carlsbad each had 14%. Within six years, however, senior populations had shifted. According to more current (2006) estimates by SANDAG, Del Mar, with 20% of its population over age 65, has replaced Solana Beach as the city with the highest senior population. This data suggests that Del Mar has experienced a 6% increase in its senior population since the year 2000. Following Del Mar and Solana Beach are Fallbrook (15%), and Carlsbad (14%). Oceanside remains the city with the greatest total number of senior residents (21,602), although the proportion of seniors decreased 2% since 2000. Carlsbad and Escondido also have significant numbers of senior residents at 14,651 and 14,064, respectively. It should be noted that even though Del Mar and Solana Beach have high concentrations of seniors, the overall population of seniors is small in comparison to Oceanside, Carlsbad or Escondido. Del Mar has 893 seniors and Solana Beach has 2,548.

B u s i n e s s P l a n
F U L L A C C E S S & C O O R D I N A T E D T R A N S P O R T A T I O N ( F A C T )
Page 4-4
Figure 4-4 North San Diego County Senior Population by Jurisdictions and Age Group, 2000-2006
Total Pop. 65-69 70-74 75-79 80-85
over 85
Total Over 65
% Total Pop Over 65
% Change since 2000
2000 Carlsbad 78,247 2,753 2,801 2,609 1,684 1,129 10,976 14%
Del Mar 4,389 174 188 124 83 51 620 14% Encinitas 5,8014 1,453 1,397 1,311 936 957 6,054 10% Escondido 133,559 3,336 3,225 3,212 2,536 2,413 14,722 11% Fallbrook 43,952 1,953 1,710 1,508 1,023 805 6,999 16% Oceanside 161,029 5,260 5,527 5,407 3,484 2,179 21,857 14% Poway 48,044 1,186 993 893 585 517 4,174 9% Ramona 32,573 930 836 619 377 251 3,013 9% San Marcos 54,977 1,466 1,527 1,522 1,086 935 6,536 12% Solana
Beach 12,979 579 528 518 346 265 2,236 17% Vista 89,857 2,155 2,197 2,064 1,341 1,261 9,018 10% 2006
Carlsbad 103,811 3,746 2,999 2,814 2,427 2,665 14,651 14% 0% Del Mar 4,580 304 199 168 126 96 893 20% 6%+ Encinitas 63,864 2,083 1,440 1,359 1,007 1,441 7,330 12% 2%+ Escondido 143,389 3,821 2,970 2,485 2,068 2,720 14,064 10% 1%- Fallbrook 48,530 1,644 1,644 1,611 1,197 1,355 7,451 15% 1%- Oceanside 178,806 4,642 4,338 4,437 4,084 4,101 21,602 12% 2%- Poway 51,103 1,875 1,265 859 633 626 5,258 10% 1%+ Ramona 35,640 1,131 873 768 544 516 3,832 11% 2%+ San Marcos 82,743 2,307 1,904 1,905 1,823 2,360 10,299 12% 0 Solana Beach 13,500 744 532 422 403 447 2,548 19% 2%+ Vista 95,770 2,181 1,836 1,752 1,489 1,700 8,958 9% 1%-

B u s i n e s s P l a n
F U L L A C C E S S & C O O R D I N A T E D T R A N S P O R T A T I O N ( F A C T )
Page 4-5
Estimated 2030 Senior Population SANDAG forecasts that by the year 2030, senior populations will range from a low of 9% (Poway) to a high of 17% (Solana Beach). The greatest number of people over age 65 will be in Oceanside (22,024), Carlsbad (16,531), and Escondido (14,267). Carlsbad will see the steepest increase in senior population beyond 2006 (4%), while the increasing proportion of younger people in Del Mar will mean the senior population will actually decrease by about 4%.
Figure 4-5 North San Diego County Senior Population by Jurisdictions and Age Group, 2030 SANDAG Estimates
Total Pop. 65-69 70-74 75-79 80-85
over 85
Total Over 65
% Total Pop Over 65
% Change since 2006
Carlsbad 106,351 3,651 3,844 3,072 3,420 2,544 16,531 16% 3%+ Del Mar 4,543 214 174 167 89 71 715 16% 4%- Encinitas 62,463 1,596 1,369 1,289 1,064 1,181 6,499 10% 2%- Escondido 140,328 3,512 2,990 2,717 2,421 2,627 14,267 10% 0 Fallbrook 47,403 1,821 1857 1,454 1,104 1,177 7,413 16% 1%+ Oceanside 172,866 4,734 5,062 4,978 4,200 3,050 22,024 13% 1%+ Poway 50,534 1,497 1,049 853 685 598 4,682 9% 1%- Ramona 34,907 957 874 719 498 413 3,461 10% 1%- San Marcos 66,850 1,721 1,782 1,883 1,783 1,509 8,678 13% 1%+ Solana Beach 13,396 600 482 483 359 296 2,220 17% 2%-
Summary of Needs to be Addressed by FACT The needs identified below are derived from two key sources: The “Coordinated Public Transit – Human Services Transportation Plan” and the “Transportation Concerns and Needs of Mental Health Client Populations in North San Diego County” study conducted by AMMA in 2009.
The issues identified as part of the Coordination Plan effort are fairly similar to those facing seniors and people with disabilities throughout California. While FACT cannot be expected to address all of these needs, the summary below provides a comprehensive list of the needs that FACT will address through the implementation of activities defined in this Business Plan. The list illustrates comments made directly by stakeholders:
ADA Paratransit Performance and Solutions Shorter windows for pick up times
Provide travel training at local churches, hospitals and community centers to encourage more individuals riding paratransit to use fixed-route buses
Provide training and safety lifts on regular transit buses so seniors can utilize that service as well

B u s i n e s s P l a n
F U L L A C C E S S & C O O R D I N A T E D T R A N S P O R T A T I O N ( F A C T )
Page 4-6
Health and Human Services transportation Encourage coalitions of similar programs to provide services and education on how to
access additional funding
Provide door-to-door services for trips such as non-emergency
Foster new technology-based systems such as a scheduling web interface or call center for a volunteer driver program
Increase transportation service and volunteer program in areas with denser senior populations
Order more paratransit vehicles and standard buses with ramps/lifts
Accessibility Retrofit existing bus stops to ensure accessibility and ADA compliance
Enhance sensitivity training for vehicle operators and those assisting disabled patrons
Coordination Increase efforts to combine vehicles, riders, funds for rides, vehicle maintenance,
drivers, training, insurance coverage, general ride subsidies, dispatching equipment, software and vehicles for volunteers
Require projects to coordinate with other transportation providers to be eligible for funding
In the AMMA study, seniors and people with disabilities participated in four focus groups. Following are the key issues identified in these groups:
General Options even more limited on weekends
Difficult to travel to destinations outside North County
Bus stops located too far from residence
Some streets lack sidewalks; difficult to navigate in wheelchair/scooter
Vista used to have “quick bus,” which added options
Even consumers who drive cars are still limited – only travel short distances, and not at night
Unsure about how to start using transit, where to begin. Difficult to use 511 as it is easy to get lost in the menu choices, pushing buttons on the phone.
Don’t have a legal residence so it is hard to get registered for services.
Those transported by family members don’t make many other trips;
Those driving themselves sometimes don’t have access to the car; very difficult when gasoline cost was so high.

B u s i n e s s P l a n
F U L L A C C E S S & C O O R D I N A T E D T R A N S P O R T A T I O N ( F A C T )
Page 4-7
Breeze Buses San Marcos is most underserved area. No Sunday service.
Drivers can be impatient/insensitive to needs of physically disabled
Safety concerns; could be alleviated by riding with a buddy
Cuts have removed service used by participants. Makes it longer and a less-certain trip.
Don’t know how to read the schedule; difficult to read.
No service on Saturdays (#325) which is inconvenient; have to plan all trips ahead.
Service hours are a concern – need earlier a.m. bus service; need more mid-day bus service.
Uncertain about bus services from Fallbrook into Oceanside; don’t know where to start looking but apprehensive about traveling alone.
Taxi Too expensive unless vouchers are available through senior center
Sometimes the only option on weekends
Rides (friends/family/clinicians) Walkers that are large/cumbersome can make getting rides difficult, if they don’t fit into
mid-sized cars
The map in Figure 4-6 shows the population densities of North County residents 65 and older who live more than ¼ mile beyond the transit service area.

B u s i n e s s P l a n
F U L L A C C E S S & C O O R D I N A T E D T R A N S P O R T A T I O N ( F A C T )
Page 4-8
Figure 4-6 North San Diego County Senior Population (Detail) Population, 2006 US Census Estimates

B u s i n e s s P l a n
F U L L A C C E S S & C O O R D I N A T E D T R A N S P O R T A T I O N ( F A C T )
Page 4-9
Need for FACT Based on this review and the feedback from stakeholders, there are a number of reasons FACT should provide services in San Diego County. Some of these are as follows:
Shrinking funding for public transit. With reduced funding budgets due to the current economic downturn, transit agencies and private organizations have struggled to operate all of their programs and services. FACT can serve a niche market by coordinating service and offloading some of the services that are otherwise provided by these organizations. With a different set of dedicated funding resources and the potential to leverage public funding sources, FACT may be able to provide some services more efficiently or cost-effectively than other organizations. These organizations can pay FACT to provide these services.
Reduction in services. Stakeholders indicated that over the years, many services have been reduced for seniors, people with disabilities and low incomes. FACT’s role as a coordinator of services can help to fill in some of the gaps that have been left. Working with a set of dedicated agencies and organizations, FACT can help them find solutions together rather than each trying to address its own needs.
Information sharing. No formal mechanism is in place for transit agencies and human service providers to share schedule updates or to offer information about connecting transportation services to their customers. Currently, individuals are directed to call any number of agencies about getting rides and navigating services. FACT can serve as a one-stop information and referral service to allow for consistent information to be shared and to ensure information is relevant and up-to-date.
Human service agencies’ multiple priorities. Many of the agencies that FACT can benefit the most are those which have limited resources and staff, but are responsible for a wide array of programming. Transportation may not be one of the core programs for these organizations, but due to the need to transport clients, the agency has incorporated transportation in to their docket of services. FACT can help these organizations focus on their core mission, while FACT focuses on its core transportation mission.
Limited transportation options. People without a car must rely not only on public transportation, but also on private transportation. Taxis and private vehicles can be costly to use. FACT can help people find other solutions and also work with private transportation providers to offer affordable alternatives to San Diego County residents. FACT can play a role in serving areas that are not viable for transit operators to serve because of topography and remote destinations.
Serving specific markets. Based on the review of needs and FACT’s stated priorities, three groups represent the key markets for FACT’s programs:
– Persons with Low Incomes. Outreach to persons with low incomes should focus on people residing outside transit service areas, such as in Ramona, as well as residents of areas with transit service who need to make trips beyond the transit service area (to clinics, workshops, or services not served by transit). This group also includes people with very low/no income(s), such as homeless individuals in North County.
– Seniors. FACT should primarily focus on low-income seniors with limited transportation options who live outside the NCTD or MTS service area. Within the existing transit service areas, FACT’s programs should reach out to the oldest seniors, since many 60 and 65 year-olds are very active and able to access fixed route transit.

B u s i n e s s P l a n
F U L L A C C E S S & C O O R D I N A T E D T R A N S P O R T A T I O N ( F A C T )
Page 4-10
Likewise, in predominately suburban and rural areas with limited transit, FACT can continue to help seniors drive safely as long as possible.
– Persons with Disabilities. Although many ADA-eligible persons use existing paratransit service, FACT’s programs can address people who may not be ADA-eligible. Although it is in the interest of FACT to help offer services for non ADA-eligible persons when other services do not address their needs, persons who could be served by regular NCTD and MTS fixed routes should be trained to use those routes.

B u s i n e s s P l a n
F U L L A C C E S S & C O O R D I N A T E D T R A N S P O R T A T I O N ( F A C T )
Page 5-1
Chapter 5. Competitive Analysis While Chapter 4 described a broad array of senior and disabled transportation needs that are not being met, in fact there are many nonprofit agencies in North County that specifically serve this population. They serve a variety of consumers and have a range of eligibility requirements, but due to funding and other constraints, are not able to meet all the transportation needs. Figure 5-1 illustrates the array of nonprofit organizations that provide transportation in North San Diego County. All of these organizations are potential partners (or, in some cases, competitors) and can offer transportation services to FACT under contract or can be contacted by FACT as the organization’s staff works to schedule trips for North County residents. Although some of the programs have specific requirements about who they can serve, FACT can gather information from potential consumers to help them schedule trips on services for which they may be eligible.
The matrix illustrates that although FACT is charged with coordinating transportation information and services in North County, many other organizations are already focused on providing services for their own clients and using their own vehicles.
Figure 5-1 Summary of Nonprofit Organizations that Provide Transportation in North San Diego County
Agency Name Service Recipients Provide Transportation? Charge Fare?
Enrollment or Program Requirements
AmeriCare
Disabled, seniors, and low income medical only Own vehicle lift No Yes
Del Mar Community Connections (DMCC)
Low-income seniors and residents w/disabilities
Volunteer driver program No; accept donations
Sign up 60 or older Del Mar residents
Fallbrook Health Care Foundation Seniors and disabled Yes No
Agency clients and seniors (55 and over) people with disabilities
Fresh Star Surgical Gifts, Inc.
Children w/deformities
Yes, but only for patients from different countries, if low income pay for airline tickets, send charter buses, also subcontract services No Agency client, patient
Jewish Family Services
Low income seniors, nutrition site, people with HIV, refugees, children Yes
Rides and Smiles donation based zone suggested donation
Rides and Smiles enrollment fee
Mountain Shadows Support Group
Developmental disabilities, patients are mainly seniors w/ developmental disabilities Yes No
Mountain Shadows residents only

B u s i n e s s P l a n
F U L L A C C E S S & C O O R D I N A T E D T R A N S P O R T A T I O N ( F A C T )
Page 5-2
Agency Name Service Recipients Provide Transportation? Charge Fare?
Enrollment or Program Requirements
No Vacancy Agency, Inc No restrictions Yes
Trip rates depend on location and mileage. Accepted Medical/Medicare and that changes mileage rates. No
North Inland Community Prevention Program
Community, primarily youth Yes No North Inland area
Poway Senior Center Low-income seniors
Yes, to and from center from homes activities Donation Within zip codes
Redwood Senior Homes & Services
Seniors and disabled adults Yes
Paid for through enrollment in eldercare Agency client
Redwood Senior Homes & Services/ Out and About Escondido
Seniors and disabled adults in the city of Escondido Yes No
Must live in the city of Escondido, and enroll in Esco Out and About
St. Clare's Home, Inc.
Low income homeless women and children Yes No
Clients must be homeless, women and have a disability (drug or alcohol dependency is valid)
TERI Inc. Developmental and learning disabilities Yes
No paid through Regional Center Enrolled in program
The Elizabeth Hospice
Hospice for terminally ill 6 months or less No contract Per diem based Agency client
Tri-City Medical Center
Anyone to and from tri-city, 80% behaviorally challenged and seniors Yes No
Patients of tri-city or sub-clinics
Other Potential “Competitors” and Partners In contrast to a profit-driven business plan in which potential competitors need to be identified in order to ensure dominance of the business or company, the FACT Business Plan is intended to complement the services provided by partners in the community. Existing resources are valued for their contribution to the community’s transportation choices, and to the extent that they can be coordinated or expanded upon, they represent ideal candidates for partnership in this Plan. As part of the strategic planning process that FACT has undertaken, and in the agency’s role as the CTSA, a number of organizations have emerged as potential partners, some of which are not included in the table on the previous page.

B u s i n e s s P l a n
F U L L A C C E S S & C O O R D I N A T E D T R A N S P O R T A T I O N ( F A C T )
Page 5-3
FACT’s first tier short-term potential partners are listed below:
North County Transit District (NCTD). Numerous opportunities to coordinate with NCTD include service coordination (first-mile/ last-mile service provided by FACT, offering transfers to/from NCTD service), evening and weekend ADA paratransit service, travel training programs, shared vehicles and scheduling, and outreach. Another opportunity includes the FACT-coordinated transfer of 12 retired NCTD-operated revenue vehicles to nonprofit agencies (FACT currently holds the title for these vehicles, which are scheduled for retirement in the first quarter of 2010). NCTD is a current competitor in that it receives travel training grants and operates service in North County, and may be unwilling to coordinate or transition some of its programs to FACT.
Metropolitan Transit System (MTS). For a North County pilot program, opportunities to coordinate with MTS are more limited but include service coordination (links to MTS service provided by FACT) and outreach. Longer term, arrangements can be made with MTS to coordinate on travel training programs, scheduling of services, and the possible provision of paratransit service. Similar to the potential arrangement with NCTD, evening and weekend ADA paratransit service may be a viable option for coordination of services.
SANDAG. As a primary funder and as a participant on FACT’s TAC, SANDAG is a critical organizational partner. One opportunity is for SANDAG, as the decision maker for Senior Minigrants, JARC and New Freedom programs to require coordination as part of its funding authorizations for the various grants it funds, and emphasize that FACT is the leading agency for coordination. This would be a substantial boost to FACT’s programming initiatives and would help crystallize FACT’s role as the regional coordination entity.
Accessible San Diego. Accessible San Diego is a specialized information and referral service for travelers with disabilities in South County. With both FACT and Accessible San Diego managing referral services for people with disabilities, there could be opportunities to coordinate in the creation of a comprehensive referral system and/or share office space where each could have a North and South County Division.
Alliance for Regional Solutions (ARS). ARS has valuable partner potential, given the group’s willingness to engage in discussions with FACT and encourage its member agencies and organizations to share operations and vehicle capacity information. The challenge for FACT in working with ARS is that the organization’s priorities are on serving the needs of homeless individuals in North County. Other than homeless youth transportation, provided using school buses to take children to school, few communities have developed programs specifically to transport homeless adults to shelters. Several ARS members indicated that their needs are currently served by public transit. ARS members have suggested that they may have some funding available specifically to address homeless transport to shelters. Interfaith Services, a member of ARS, may prove to be a valuable partner given their existing fleet of vehicles and interest in providing additional transportation services for their clients.
All Congregations Together (ACT). ACT’s Community Link transportation program is a potential competitor in that it already offers some of the services FACT has prioritized, although primarily in south San Diego County. Its 15 passenger vans provide trips primarily for the San Diego Workforce Partnership, CalWORKs, the Metro United Methodist Urban Ministry and Metro San Diego Youth at Work, among other organizations. ACT may be a critical partner once FACT expands its proposed services beyond North County. Once FACT begins to broker services in North County, it may be appropriate to establish a strong alliance with ACT, which could broker new services in

B u s i n e s s P l a n
F U L L A C C E S S & C O O R D I N A T E D T R A N S P O R T A T I O N ( F A C T )
Page 5-4
other portions of San Diego County. For example, FACT could contract with ACT to provide transportation for FACT or encourage coordination between the two organizations to use a single trip scheduling platform in Trapeze.
County of San Diego HHSA. Although a comprehensive partnership with HHSA is a medium-term project, in the short-term there is research and data analysis that may help define key next steps for FACT. For FACT it will be critical to provide assistance and continue planning dialogues with HHSA, illustrating that FACT is well on its way to providing service and implementing new programs.
Ramona Transportation Action Committee (RTAC). Implementing a local transportation service in Ramona means FACT has a de facto and important partnership with the RTAC, which can support FACT’s efforts in the community.
City Link. With City Link expressing interest in cultivating and expanding its coordinated maintenance program, the organization sees FACT as a marketing and information partner that can direct prospective maintenance clients to City Link. FACT stands to benefit by further building its coordination qualifications and as a potential recipient of incentive funding for bringing new partners to City Link. With the potential for additional City Link maintenance locations elsewhere in San Diego County, including North County, this relationship represents an important partnership for the progression of the coordinated maintenance program.
San Diego County
Union of Pacific Asian Communities (UPAC). UPAC has committed to partnering with FACT. UPAC’s recent award of funding by the County of San Diego allows FACT to move forward with the North County Pilot program with one key supporter. FACT and UPAC have agreed to brokering of transportation for seniors enrolled in the UPAC EMASS program. A recently signed Memorandum of Understanding between FACT and UPAC allows for the possibility of supplemental operations to be provided by UPAC using TDA reserve funds.
Volunteer Driver Coalition. The strength of existing volunteer driver programs offers some competition for FACT because these programs have been effective in addressing many transportation needs, particularly in North County. Although at one time FACT envisioned overseeing the array of volunteer driver programs, the Coalition is already strong and effective and would not necessarily benefit from FACT’s management. FACT’s participation, however, is critical because the array of volunteer driver programs offers a set of potential transportation providers. If FACT can work to supplement incentives for drivers and recruit for the program, the organization can expand the potential pool of drivers that can be used for FACT’s programs.
High-Tech High School (HTH). FACT could assist the group of HTH parents who are currently exploring the potential for provision of a shuttle service from the closest Sprinter station to HTH. While this is not a “disadvantaged market,” this service could become a revenue stream for FACT and a service model that could be replicated elsewhere.
Cal State San Marcos. FACT may be in a position to provide a customized weekday service to students to replace the current shuttle service provided by the university. Details of this potential opportunity are currently in the preliminary stages.
Other nonprofit and agency partners include the following potential participants in a brokered transportation program as operators and users of transportation services. This is not a complete list of potential partners, but represents some organizations that FACT can pursue:
Heritage Clinic

B u s i n e s s P l a n
F U L L A C C E S S & C O O R D I N A T E D T R A N S P O R T A T I O N ( F A C T )
Page 5-5
Encinitas Out and About
ITN San Diego
Office of Emergency Services
Palomar Pomerado Health Community Action Councils
San Diego Center for the Blind
Access to Independence
San Diego Regional Center
Vista Out and About
Oceanside Volunteer Driver Program
In addition to the agency partners described in the preceding sections, other potential contractors, outside of nonprofit organizations, can be used to provide transportation. Several of FACT’s peers (see page 5-7), and some other agencies in San Diego, indicated they contract with for-profit providers for all or some of their trips. One of the advantages of contracting with for-profit providers is that they may already meet the insurance requirements to transport passengers to any destination. They also may not have the restrictions regarding the types of passengers they may carry, in contrast to some nonprofits that are restricted by their funding sources. FACT will consider using private for-profit providers for some types of trips if other providers are not available:
Taxi operators: Although few taxicab companies in North County offer accessible vehicles, taxis such as Yellow Cab and Coach Cab can provide service under contract to FACT. One of FACT’s suggested short-term programs is to provide a guaranteed ride home service for seniors who are unable to renew their drivers’ licenses at the Department of Motor Vehicles (DMV). A taxi provider under contract to FACT would be an efficient way to address this transportation need. For other programs, FACT should consider the use of taxis initially only as a way to fill any gaps when partner agencies are unable to provide the transportation services FACT requires. It should be noted that taxi operators are potential competitors, but due to trip costs, are unlikely to always target the same markets as FACT. Likewise, taxi operators could see FACT as a potential threat, subsidizing volunteer trips or offering lower-cost services than they can offer themselves. Some of the taxi operators that should be considered in this competitive analysis include Yellow Cab, Carlsbad West Taxi and Fallbrook Taxi.
Non-emergency medical transportation (NEMT) providers: Most NEMT providers offer specialized services at contracted prices that are much higher than taxicabs or nonprofit transportation providers. In the short-term, it is unlikely that FACT will require the services of any NEMT providers for its day-to-day programs (often ambulances or other vehicles that provide a high level of medical-focused service), but relationships with NEMT providers may benefit FACT for emergency situations in the short-term.
Charter bus operators: Like taxicabs, charter bus providers are for-profit businesses that can carry large groups of people between a very limited number of pick-up and drop-off locations. Charter bus operators could benefit FACT if there is significant demand for long-distance medical trips (e.g., Ramona to Poway) or special group outings, such as shopping trips, but should be used on a very limited basis in the short-term. Most charter bus operators are not going to be direct competitors of FACT.

B u s i n e s s P l a n
F U L L A C C E S S & C O O R D I N A T E D T R A N S P O R T A T I O N ( F A C T )
Page 5-6
Other private providers: A number of private for-profit providers serve people with disabilities and seniors in San Diego County. Some examples of these organizations include the following:
– Access Care/Front Door Transportation. Front Door Transportation is a service
provided by In-Home Quality Care Services. Provides non-emergency, door through door, weekday, wheelchair transportation throughout most of North and Central San Diego County.
– At Your Home Familycare. At Your Home Familycare provides regional customized, door through door, personal care for seniors and transportation from school to home for children. Program services include transportation for medical appointments and child care access. The founder and President of At Your Home Familycare is a FACT Board Member and the organization was an original FACT partner.
– Care-A-Van. Care-A-Van provides non-emergency disabled transportation throughout North County. They transport nursing home patients to/from medical appointments.
– No Vacancy. No Vacancy provides transportation for disabled persons throughout San Diego County.
– Pineapple Express. Pineapple Express provides transportation for ambulatory and non ambulatory individuals throughout San Diego County.
– Reliable Transportation. Transports ambulatory and disabled residents of local care facilities throughout Central and East Suburban San Diego County for medical appointments only.
– Sol Transportation. Provides non-emergency ambulatory and wheelchair transportation services throughout San Diego County. Specialized services include ADA compliant wheelchair accessible transport vehicles; specialized transportation services for students; State, County, and civic special service transportation programs; municipal, civic, and private contract service programs for seniors; wheelchair accessible and non-emergency ambulatory medical transport; and other services.
– Tender Nursing & Home Care. Provides transportation for seniors located in North County to medical appointments, necessary errands or other destinations. Tender Nursing & Home Care also provides in-home, personal care services for seniors.
These providers represent only a sample of potential partners or competitors. A more complete list of operators and programs available to the general public can be found at www.stridesd.org.
Key Competition Issues Several issues may impact FACT’s success in a competitive transportation environment. Figure 5-2 presents a summary of some of the key issues raised by stakeholders and through meetings with potential partner organizations. FACT must be mindful of these issues and sensitivities for the elements outlined in the remainder of this Business Plan to be successful.

B u s i n e s s P l a n
F U L L A C C E S S & C O O R D I N A T E D T R A N S P O R T A T I O N ( F A C T )
Page 5-7
Figure 5-2 Competition Challenges and Opportunities for FACT
Issue Challenges for FACT Opportunities for FACT
Many other transportation providers in North County
Having multiple providers all doing similar things puts FACT at a disadvantage because each organization already has existing clients, funding and experience operating transportation services.
FACT is charged with coordinating services. By offering strategies that help other agencies save money and reallocate resources while continuing to serve their clients and also expanding mobility in North County, FACT can demonstrate its credibility.
Strength and success of existing volunteer driver programs
Although volunteer drivers have been used as a key component of mobility management programs in other communities, San Diego County already has a set of very strong independent programs and good oversight/governance for volunteer programs.
FACT can create partnerships with existing volunteer driver programs to improve reimbursement and expand pool of drivers for FACT's benefit (especially for providing service in communities that are difficult to serve).
Limited Funding With limited funding, multiple agencies are sometimes competing for the same sources of funding.
FACT has some dedicated funding for its role as the CTSA, but requires additional funding to support its planned program initiatives. FACT can tap into multiple funding sources by working with potential partner agencies that may be eligible for a wide array of human service or economic development funding streams.
Many opportunities for partnerships and new programs
Building alliances with strategic partners is a time- and resource-consuming effort. FACT has been exploring many different opportunities, some of which are potential partnerships and others which will be dead-end opportunities.
FACT must limit its efforts to a few key partnership initiatives in the short-term. It will be essential for FACT to present itself as a viable and effective organization, based on a couple of short-term projects, in order to build credibility and focus on opportunities central to the organization’s mission.
FACT's mission is to serve all of San Diego County
As the CTSA for San Diego County, FACT must focus resources and efforts in serving the needs of the entire County. As a result, the organization can get sidetracked from its immediate priority: to implement a North County pilot program.
FACT can assure SANDAG and potential partners throughout San Diego County that it intends to lead mobility management efforts and programs countywide. FACT must work closely with like-minded agencies throughout the County and keep them well-informed of progress in North County. FACT can assure stakeholders that the goal is to work out any "kinks" in North County before expanding new initiatives countywide.
Peer Review Findings and Opportunities Although not really part of the local competitive analysis, understanding how other peer agencies lead mobility management brokerages in other parts of California and the US provides useful information and examples for FACT, illustrating what has been successful elsewhere and what might be applied in San Diego County.
The five peers for FACT are as follows:
B u s i n e s s P l a n
F U L L A C C E S S & C O O R D I N A T E D T R A N S P O R T A T I O N ( F A C T )
Page 5-8
• Ride Connection, Portland, Oregon • Ride-On, San Luis Obispo, California • Special Transit, Boulder, Colorado • Outreach, San Jose, California • Paratransit, Inc., Sacramento, California
All of the peers expressed their interest in the success of FACT as San Diego County’s mobility management brokerage. All of them also provided information about how they started their programs, the services they offer, their various partnerships, their technology, board composition and staffing and funding. Many also offered advice for FACT.
Some of the findings are as follows:
In addition to operating mobility management brokerages, FACT’s peers provide a wide array of services, including one-stop call centers (information and referral and trip scheduling), travel training programs, volunteer driver programs, low-cost coordinated maintenance, local shuttles, transit passes, and ADA paratransit eligibility screening.
Other programs have been in place for a long time. Some of the peers begin their services as early as 1978 and 1979.
FACT’s peers are generally larger organizations, ranging from 27 on staff to nearly 230, for those organizations that operate paratransit.
FACT’s peers serve between 125,000 trips and 1,000,000 trips per year.
Peer boards average 14 representatives. Only one peer, Paratransit Inc. has a board comprised of nine members.
Results from the Peer Review and key lessons learned are included in the Appendix.

B u s i n e s s P l a n
F U L L A C C E S S & C O O R D I N A T E D T R A N S P O R T A T I O N ( F A C T )
Page 6-1
Chapter 6. Summary of Services FACT’s Vision Statement creates a framework for selecting and prioritizing potential services that could be offered by the organization in the short-, medium- and long-term. The Appendix of this report describes peer organizations that share a vision similar to that agreed upon by the FACT Board. The experiences of those organizations provide important insights into the types of services that may be offered by FACT and that are consistent with the organization’s mission. In this chapter we present a long-term vision for FACT, painting a picture of how the organization will be “when it grows up.” This is followed by a detailed discussion of the kinds of projects that will be considered in the short- and medium term in order to achieve this long-term vision.
Long-Term Vision Many of the elements of the best practices from the peers (Chapter 5) are directly applicable to San Diego County. Those elements that are not applicable are due to geographic differences, the availability of different kinds of alternative transportation choices, or the different ways in which the ADA paratransit services are structured in those regions. The following model reflects the preferences expressed by FACT board and staff, as well as the input of other stakeholders and the lessons learned by peer organizations. This vision is based on what FACT could look like in 2030, on the assumption that FACT’s service area will expand from North County in the early years of service implementation to encompass the whole county by 2030.
FACT 2030 FACT will serve as the Mobility Manager for the transportation-disadvantaged population and CTSA for all of San Diego County. In this role, FACT will provide services that complement existing ADA paratransit services, and hold contracts with at least two large entities that generate sufficient revenue to subsidize non-revenue generating services. Potential revenue generators could include FACT’s role as Maintenance Coordinator for all nonprofit transportation providers in the county, and provider of shuttle services that serve riders who would otherwise be dependent on NCTD’s and MST’s ADA paratransit programs.
Services Provided • One-Stop Call Center: By 2030 FACT will function as the centralized location for all
transportation services targeting seniors, people with disabilities and low-income residents. This would include all modes of transportation other than fixed-route and paratransit services provided by NCTD and MST. The call center will either be staffed internally, or this function will be contracted out to an existing call center. When an individual from one of these target groups calls the FACT call center, staff will be able to either schedule a trip for the individual on one of the services provided by a FACT partner, or arrange a trip with another provider, or provide information on how the trip can be made on fixed-route or paratransit services.
• Transportation Provider: FACT will partner with multiple nonprofit agencies in the region that provide transportation services through a variety of service models. FACT will primarily serve as a broker rather than a direct provider of transportation services. An exception to this rule would be if no viable nonprofit partner is available to serve a specific geographic area. If circumstances change with regard to the current arrangement for ADA paratransit services, FACT may choose to provide part of the ADA paratransit services, either as a direct contractor to the transit agencies (as in Boulder, Sacramento

B u s i n e s s P l a n
F U L L A C C E S S & C O O R D I N A T E D T R A N S P O R T A T I O N ( F A C T )
Page 6-2
and Los Angeles), or as a provider of services to individuals who would otherwise be riding ADA paratransit. In order to become an ADA paratransit provider, FACT would need to submit a proposal during the RFP cycle of these programs, or if either district chose to contract out a portion of their service, this could be well-suited to FACT’s capacity for service provision. Both of these options would generate significant revenues for the organization.
• Coordinator of Shuttle and Other Transportation Services: As mentioned earlier, FACT for the most part will not directly provide transportation service. However, where a transportation need has been identified that would be too costly for NCTD or MST to provide, FACT will work with local agencies to establish a range of hybrid services, such as shuttle services, circulators that connect to fixed-route services, or volunteer driver programs to fill those gaps.
• Technical Assistance: FACT will serve as a resource for all human service providers in the county who need technical assistance such as grant writing, driver training, or provision of marketing material templates. FACT will also provide assistance to organizations that wish to establish new transportation services, such as those described above.
• Maintenance Coordinator: FACT will serve as a link between the majority of nonprofit transportation providers in San Diego County and the entity that provides maintenance facilities. FACT will serve primarily in a coordination/administrative and referral role, while the maintenance facility (or facilities) will be overseen by City Link or another organization to conduct all maintenance activities.
• Travel Training: FACT will be responsible for all travel training under contract to NCTD and MTS. This contract will serve as a revenue generator for FACT programs.
• Connector to Fixed-Route Transit: Besides the partnerships with nonprofits that have already been mentioned, FACT will contract with local cab companies to provide “1st mile/last mile” services to transit stations for transit-dependent individuals who do not live in areas served by ADA paratransit.
One additional potential role for FACT — debated and discussed by stakeholders and Board members — is to become the ADA paratransit provider for San Diego County’s transit operators. Obviously, this can only be implemented if MTS and NCTD wish to divest of their paratransit operations. This remains a potential future role for FACT.
Short- and Medium-Term Projects for Implementation In order to achieve the long-term vision just described, FACT will need to
1. Build credibility in the community,
2. Provide services consistent with the requirements of various funding sources, and
3. Develop internal capacity to implement the envisioned range of strategies.

B u s i n e s s P l a n
F U L L A C C E S S & C O O R D I N A T E D T R A N S P O R T A T I O N ( F A C T )
Page 6-3
These objectives can be accomplished through the implementation of a small number of short-term strategies described below. They are listed roughly in order of those that have a greater likelihood of implementation in the short-term (i.e., within twelve months of completion of this Business Plan), and those that are either more medium-range efforts or those that may be less feasible but still worthy of documentation in the event circumstances change that would increase their feasibility.
FACT will grow as an organization by initiating a small number of strategically critical programs, mostly on a small scale, and executing them well. By promoting its successes, FACT can solicit additional partners and expand its scope of services.
This Business Plan identifies eleven potential strategies that FACT may implement in the short- and medium-term period. We anticipate that only about half a dozen of these will proceed to the next stage of this process, in which a more detailed implementation plan will be developed. Nevertheless, FACT’s success may be measured by the well executed implementation of just a couple of the strategies that show the most promise in the short-term.
Short-Term Strategies Ramona Senior Transportation Pilot Project Identify a service delivery model for the provision of senior transportation in the Ramona area. The likely candidate for the first year of service would be a demand-response model in which registered seniors call the FACT office to request a trip (at least the day before). The service will either be provided on a door-to-door basis in a defined geographic area surrounding Ramona, or to a transit center or bus stop where riders can transfer to a fixed-route service. Service should be concentrated on two days of the week in order to ensure that vehicles are used in an efficient manner. Surveys have already been conducted in Ramona by the Regional Transportation Action Committee (RTAC) in order to identify concentrations of senior origins and destinations. By the second year, FACT should be in a position to identify trip patterns and will have more funding available, and may wish to consider a point deviation service model in which riders can catch the bus (for a discounted fare) at designated locations if they are able to reach them independently, or continue to receive door to door service. Survey results from RTAC should be helpful in the design of this service. A couple of potential candidate service providers include the San Diego Center for the Blind and E&E Shuttle, which have drivers and vehicles available on specific days of the week. The service will be designed with the expectation that, if proven successful, service will be expanded to populations beyond the initial senior market. FACT staff have indicated another element of this service for Ramona could include group trips to Poway for medical services one day each week.
Feasibility First Year Costs Staffing Requirements Funding High
Potential operators and local agency
representatives have expressed interest
$27,000 0.3 FTE (could change if scheduling dispatching
occurs at provider)
TransNet

B u s i n e s s P l a n
F U L L A C C E S S & C O O R D I N A T E D T R A N S P O R T A T I O N ( F A C T )
Page 6-4
Mobility Management Pilot Program This program can be developed in two stages, the first of which can be implemented as an immediate-term strategy.
A. Travel Navigation Existing administrative staff at the FACT office will be trained to perform this function, in which callers are not simply referred to other agencies, but actually receive assistance in planning/booking their trip. This function will serve as an initial step towards developing a one-stop call center, which is identified as the next element of a mobility management program. FACT will need to identify potential partners for service provision, some of which have been included in this Plan, and develop memoranda of understanding regarding the roles and responsibilities of each party. These agencies could then serve either as potential referrals or providers of trips, based on an agreed-upon reimbursement mechanism. One agency that shows initial promise as a potential partner is the Union of Pan-Asian Communities (or “UPAC”), which is currently negotiating formulation of a grant from the county’s Health and Human Services Agency.
B. One-Stop Call Center (Medium-Term) As a next step in the development of the mobility management function, the role of brokering trips will be transferred to one of several currently operating call centers (211, operator of 511, American Logistics, County of San Diego Aging and Independent Services or Accessible San Diego) that could serve under contract to FACT. As a longer-term alternative, FACT will begin to build in-house capacity and expand outreach opportunities by taking on the role of centralized scheduling and dispatching for existing transportation providers. Potential opportunities may exist with entities such as Grossmont and Sharp Hospitals and All Congregations Together, all of which are already providing transportation but may be interested in contracting with FACT to provide the scheduling/dispatching function.
Feasibility First Year Costs Staffing Requirements Funding A.
Medium to High Requires training of existing FACT staff,
conducting outreach to agencies, some of whom have already expressed
interest
B. Medium
Will require contracting with call center and developing relationships with critical
mass of agencies interested in centralizing their dispatching services
$49,900 for Trapeze purchase. No additional
staffing costs
0.4 FTE of existing staff capacity
Supervisor Horn Discretionary Grant
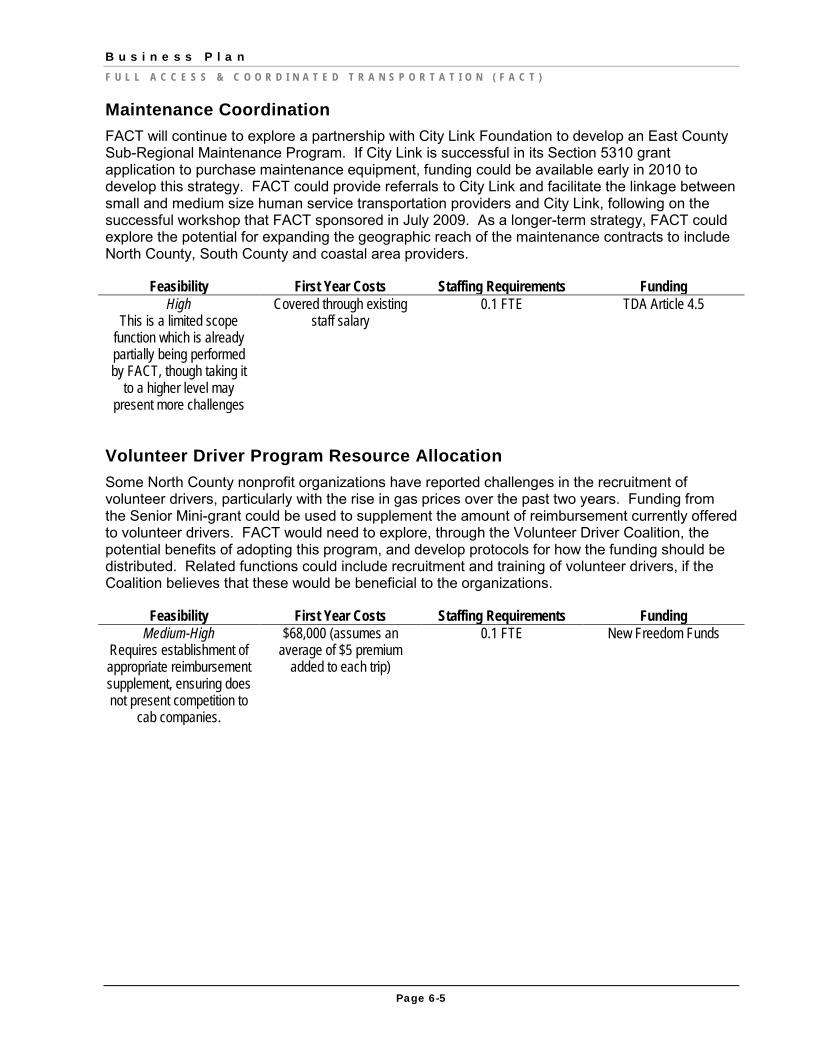
B u s i n e s s P l a n
F U L L A C C E S S & C O O R D I N A T E D T R A N S P O R T A T I O N ( F A C T )
Page 6-5
Maintenance Coordination FACT will continue to explore a partnership with City Link Foundation to develop an East County Sub-Regional Maintenance Program. If City Link is successful in its Section 5310 grant application to purchase maintenance equipment, funding could be available early in 2010 to develop this strategy. FACT could provide referrals to City Link and facilitate the linkage between small and medium size human service transportation providers and City Link, following on the successful workshop that FACT sponsored in July 2009. As a longer-term strategy, FACT could explore the potential for expanding the geographic reach of the maintenance contracts to include North County, South County and coastal area providers.
Feasibility First Year Costs Staffing Requirements Funding High
This is a limited scope function which is already partially being performed by FACT, though taking it
to a higher level may present more challenges
Covered through existing staff salary
0.1 FTE TDA Article 4.5
Volunteer Driver Program Resource Allocation Some North County nonprofit organizations have reported challenges in the recruitment of volunteer drivers, particularly with the rise in gas prices over the past two years. Funding from the Senior Mini-grant could be used to supplement the amount of reimbursement currently offered to volunteer drivers. FACT would need to explore, through the Volunteer Driver Coalition, the potential benefits of adopting this program, and develop protocols for how the funding should be distributed. Related functions could include recruitment and training of volunteer drivers, if the Coalition believes that these would be beneficial to the organizations.
Feasibility First Year Costs Staffing Requirements Funding Medium-High
Requires establishment of appropriate reimbursement supplement, ensuring does not present competition to
cab companies.
$68,000 (assumes an average of $5 premium
added to each trip)
0.1 FTE New Freedom Funds

B u s i n e s s P l a n
F U L L A C C E S S & C O O R D I N A T E D T R A N S P O R T A T I O N ( F A C T )
Page 6-6
Older Driver Wellness Program The Older Driver (or “DriveWell”) program was developed by the American Society on Aging and the National Highway Transportation Safety Administration (NHTSA), and takes a holistic approach to driving “retirement” (i.e., incorporating improved nutrition, exercise into extended healthy driving, knowing when to “give up the keys”). Over three thousand individuals throughout the U.S. have been trained to provide this program. As part of its CTSA role, FACT can ensure that other agencies such as Aging and Independent Services are aware of this program, and possibly facilitate marketing and recruitment of senior participants in the program.
Feasibility First Year Costs Staffing Requirements Funding Medium
While agency staff can download the curriculum
and conduct these classes, the most effective
approach would involved a trained trainer, of which there are at least two in
Northern California
$10,400 (assumes four trainings provided by professional Driver Wellness trainer)
0.1 FTE New Freedom Funds
DMV Guaranteed Ride Home Program Some senior car drivers do not make alternative travel arrangements in the event that they are unable to renew their license at the DMV office. This program would set up an immediate-need service for those who are stranded at the office, and need a ride home. FACT will need to negotiate a per-trip rate with a local partner, as well as develop protocols for how these requests will be handled, advertising of the program at the DMVs, and education of DMV staff about this option. In addition, this program could be linked with a travel training program in order to provide practical skills to those new to transit, and FACT could partner with a social service agency to supplement this training with counseling services. Finally, arrangements would need to be made for the senior’s vehicle to also be transported to their home.
Feasibility First Year Costs Staffing Requirements Funding Medium – depends on willingness of DMVs to
cooperate with the program, educate their
staff, disseminate materials etc
$4,200 (based on five occurrences monthly)
0.1 FTE New Freedom Funds

B u s i n e s s P l a n
F U L L A C C E S S & C O O R D I N A T E D T R A N S P O R T A T I O N ( F A C T )
Page 6-7
Medium and Long-Term Strategies Senior Group Travel Training Explore the possibility of taking over from NCTD, and possibly MTS, and expanding this function. Since group training requires less specific expertise than individualized training with people with disabilities, this function could be performed either by in-house staff or by sub-contractors to FACT. This strategy would need to be carefully coordinated with the transit agencies. NCTD already has an additional two years of funding to provide travel training, and the proposed strategy would need to benefit both FACT and the transit agency.
Feasibility First Year Costs Staffing Requirements Funding Medium
Depends on the development of an arrangement that is mutually beneficial
between NCTD and FACT
$65,000 (includes travel trainer and administrative
staff time/materials)
1.0 FTE NCTD and/or MTS
Homeless Transportation Program FACT will work with the Alliance for Regional Solutions (ARS) to develop a program that would enable homeless individuals and families to access the shelters in North County. ARS has already polled some of its members to determine the potential need for transportation, and a variety of service delivery models will need to be considered and tailored to address this unique transportation-dependent population. FACT and ARS have also agreed to conduct a more in-depth examination of the transportation needs with case managers at the shelters during the winter of 2009-2010.
Feasibility First Year Costs Staffing Requirements Funding Low–Medium
Requires development of a complex operating model
given the target population
$42,000 (based on three hours daily service on all
weekdays)
0.3 FTE Alliance for Regional Solutions and/or other churches and human
service agencies
Trapeze FACT will explore the feasibility of “loaning” out licenses to area nonprofits that may have an interest in using Trapeze software but do not have the financial capability or need to purchase the infrastructure. This program meets the FACT mission of coordination of services for those programs that may not choose to have their actual services coordinated, but can still benefit from the use of Trapeze scheduling software. If productivity improvements are realized as a result of the use of Trapeze, this could provide greater incentives for agencies to coordinate with others in the FACT network.
Feasibility First Year Costs Staffing Requirements Funding Low-Medium
Depends on designing a program that is acceptable to Trapeze and beneficial
to partners, need to identify partners and develop
MOU’s
Revenue generator Depends on type of license loan arrangement adopted
Partner agencies

B u s i n e s s P l a n
F U L L A C C E S S & C O O R D I N A T E D T R A N S P O R T A T I O N ( F A C T )
Page 6-8
Integration with FACT’s Core Responsibilities In addition to the strategies noted above, FACT has a significant array of responsibilities as the CTSA for San Diego County and as an organization that has pursued and received funding from various sources, including the TransNet Senior Mini-Grant, California Transportation Development Act (TDA) Article 4.5
Keeping Track of Other Initiatives
funds, and New Freedom Funds. All of FACT’s current commitments will be addressed through FACT’s general administrative responsibilities and the strategies listed above, some of which are enhancements to the services already being carried out by FACT. Some of the programs identified in specific grants (i.e., New Freedom) include elements that FACT will need to modify and categorize based on the new initiatives discussed in this chapter. Chapter 8 includes a refinement of FACT’s commitments based on grant funding and how those commitments are integrated into proposed new programs defined in this plan, based on their funding sources.
FACT staff have actively sought new partnerships and have worked hard to participate in formal community forums and informal discussions with transportation providers, human service agencies, public agencies, the San Diego Chamber of Commerce, and community action agencies. The pursuit of so many different efforts was necessitated by FACT’s lack of comprehensive programming, but has resulted in improving relationships and new opportunities for program development.
Although FACT has solicited interest from many partners, working with all of them would not be feasible in the short-term or medium-term. Nevertheless, these contacts, discussions and partnering opportunities may lead to the development of new strategies in future years. Thus, it is recommended that FACT maintain a running list of contacts and opportunities that should be re-reviewed each year as FACT’s new programs mature and as the organization is able to undertake more projects that support its mission. Two other programs, which have been added to this list for further consideration, are described below.
Connector to Fixed-Route Program FACT will explore the variety of service delivery models that could be used to assist seniors who are unable to get to and from bus stops and train stations. These could include various “connector” services (such as shuttles or route deviation) or a subsidized taxi program. FACT could then enter into agreements with local cab companies in a designated area, or could develop new services to fulfill this role (though the latter would more likely be a medium-term strategy.)
New Group Trip Transportation Services Where mobility management programs have demonstrated cost savings and the introduction of additional funding sources, they have flourished. One strategy to “put service on the street” – a key objective of FACT – is to begin operation of special group shopping and/or medical trips. Ideally targeted to seniors or others who may be ADA-eligible, FACT will quickly demonstrate the value of its services by reducing the demand on NCTD’s or MTS’ paratransit services. Individual paratransit trips can be costly to provide ($23.89 per trip on NCTD and $14.22 on MTS, according to 2007 National Transit Database (NTD) data), so service that can reduce demand on these paratransit program may be welcomed.

B u s i n e s s P l a n
F U L L A C C E S S & C O O R D I N A T E D T R A N S P O R T A T I O N ( F A C T )
Page 7-1
Chapter 7. Implementation This chapter focuses on key organizational considerations and tools needed to carry forward the recommended programs described in Chapter 6. It addresses oversight and governance, software and information technology, service contracts, risk management and insurance, and outreach strategies for FACT.
Oversight and Governance The goal of this element of the Business Plan is to ensure that FACT’s organizational structure allows the agency to perform responsibly and effectively. Board composition is a critical factor in meeting this goal, both in terms of number of members and the interests that they represent.
Board Composition and Representation As noted earlier, FACT is governed by a nine-member Board of Directors, although the Board currently has only seven members.
Considerations for Board Representation Most nonprofit mobility management peers include a mix of elected officials, representatives from human service agencies, and representatives from transit agencies and the business community. It is advantageous for FACT to have representation from a broad spectrum of organizations on its Board for several reasons:
• Elected officials. SANDAG’s contract with FACT requires that at least three of the FACT Board members are elected officials (municipal or county positions in San Diego County), and that one member must be a sitting member of the SANDAG Transportation Committee. Four of the five Board members are current or former elected officials from jurisdictions within San Diego County. Elected officials on the Board benefit FACT by bringing individuals with policy experience and the potential for jurisdictional support.
• Business community. Current Board members have business experience and at least two members have very strong ties to the regional business community. For an organization like FACT, it is critical to emphasize its 501(c)(3) status and build ties with potential corporate partners and donors who may be able to help raise private funds for the organization.
• Nonprofit/human service. Although FACT’s board members are involved with nonprofit organizations and service clubs, none of them are directly responsible for managing or overseeing human service organizations. Human service representatives bring the experience of managing nonprofit organizations and the funding streams available to these organizations to the Board table. All Congregations Together (ACT) and Aging & Independence Services (AIS) are represented on FACT’s TAC, a non-voting committee of advisors to the Board and the Executive Director.
• Public agencies. MTS, SANDAG, and NCTD staff are represented on the TAC, but not on the Board. Current or former board members of SANDAG and NCTD are FACT Board members, providing some links between decision-makers of the various agencies.
Other key considerations for Board representation include (1) geographic diversity, to ensure that cities or communities with a strong interest in FACT services (or that receive FACT services in the future) have representation on the Board; (2) unique skills or expertise, to capture individuals with direct experience in overseeing or managing a brokerage or related experience in other facets of

B u s i n e s s P l a n
F U L L A C C E S S & C O O R D I N A T E D T R A N S P O R T A T I O N ( F A C T )
Page 7-2
nonprofit transportation management, fundraising or marketing; and (3) diversity in terms of ethnicity, race, disability, age and gender, to ensure the Board represents the various demographic groups of San Diego County, including those groups of individuals who are targeted by FACT for services.
Plans Short Term (Year 1): Nine positions is a relatively small size for a board of directors, based on comparisons with peer CTSA’s and mobility management organizations. However, those reviewed in this Plan are all mature organizations that were comparable to FACT when they got started 20 to 30 years ago. Board size will remain at nine positions, with a view to expansion after the implementation of short-term projects in the next one to three years. Rather than expand the size of the board, FACT will focus on filling the current vacant positions in the immediate term.
Medium- to Long-Term (Years 2+): For nonprofit boards that are involved in fundraising, a larger board is usually advantageous because the organization has more individuals leading the fundraising effort. Although this is not a current function of the FACT Board (nor is it for most CTSAs), fundraising could become more important as FACT increases its scope of services. Likewise, for organizations that offer multiple services or serve a large region, as FACT intends to do in the coming years, a large Board could provide good representation of the jurisdictions and programs in the region, and Board subcommittees could be tasked with fulfilling the Board’s many responsibilities. For example, comparable agencies have found that creating a government relations sub-committee can be an important element in a board’s success. This committee can stay abreast of turnover among elected officials whose political and financial support can be instrumental in ensuring the funding viability of the organization.
Proposed Board Composition Peer agencies have varied compositions of board members. However, none has as large a representation of elected officials as the FACT Board. As long as the FACT Board remains at nine positions, we recommend that members be added to reflect the following board composition:
• Three elected officials, including one SANDAG Transportation Committee member (required)
• One transportation official/professional
• Two representatives of the disability and/or aging communities
• One representative of the business community
• Two individuals who are influential in the private and public sectors (e.g. university, hospital, Chamber of Commerce)
While some individuals can fit into more than one category in this list, each board member will primarily serve as a representative of one of these portfolios. To the extent possible, Board members will reflect the geographic diversity of FACT’s area of responsibility. Thus, additional representatives from South County will be added when FACT moves into the second stage of program implementation.

B u s i n e s s P l a n
F U L L A C C E S S & C O O R D I N A T E D T R A N S P O R T A T I O N ( F A C T )
Page 7-3
Figure 7-1 Preferred Short-Term Nine-Member Board Composition
Technical Advisory Committee The TAC is currently composed of five representatives. It is recommended that the TAC be expanded as new partners join with FACT to manage, operate services or pay FACT for providing services for their clients. As an example, if San Diego HHSA were to provide funding to FACT to provide transportation for a group of the organization’s consumers, it would be appropriate for the FACT TAC to include an HHSA representative. On the other hand, if an organization is being paid by FACT to operate a service (e.g., Agency X provides service in Ramona), it would not necessarily be appropriate for that agency (Agency X) to participate on FACT’s TAC. Some exceptions could be made, however, for very large nonprofit transportation operators who provide the bulk of service for FACT (if this happens) or for any organization that is contracted to serve as an I&R provider or to lead the scheduling and dispatch function for multiple providers. Likewise, any agency or organization that both offers services and purchases services from FACT will be invited to participate on the TAC.
Although not foreseen in the short-term, over time the TAC could become very large. Ultimately, it is recommended that the TAC include no more than 12 to 20 members (and FACT may, in fact, determine that 20 members is too large) to allow for effective management of meetings and to address the array of concerns than can arise. Partners could be rotated in and out every couple of years, if needed. Officers will be selected who can attend FACT Board meetings, as the current TAC does.
Elected officials, including one SANDAG
Transportation Committee member
(required)3
Transportation officials/
professionals1
Representatives of the disability and/or aging
communities2
Representatives of the business community
1
Individuals influential in private and public sectors
2

B u s i n e s s P l a n
F U L L A C C E S S & C O O R D I N A T E D T R A N S P O R T A T I O N ( F A C T )
Page 7-4
Subcommittees can be established that focus on different critical issues to allow a smaller number of TAC representatives to address key topics. Some of these can be permanent, but others may be temporary depending on the issue at hand. Examples of subcommittees could include service quality and evaluation; funding and partnerships; outreach and information; and policy, among others. Subcommittees could also be established to focus on specific subregions of San Diego County.
Community Advisory Committee A longer-term consideration is that FACT could rely on CAM as its community advisory group or establish a standing community advisory committee (CAC) comprised of partner agency representatives – consumers, clients, volunteers and riders – and other members from the general public. If CAM is not used, the CAC could meet on a quarterly basis to address consumer concerns, outreach opportunities, and service evaluations. Not only would the CAC offer recommendations to the TAC and Board for the oversight and management of FACT, but it would also be an opportunity for enhanced information sharing among partner agencies’ clients.
The composition of a CAC will depend somewhat on the number of partner agencies and comprehensiveness of FACT’s programs.
Staffing Considerations for Staffing Currently, FACT staff resources are limited to 2 full time employee equivalents (FTEs) - one full-time employee and two part-time administrative staff. While this staffing level may be adequate during the short-term, there are increasing roles and responsibilities that require additional staff resources as FACT’s programs expand and mature. Key responsibilities required to carry out recommended short-term programs are as follows:
• Manage organization. - Oversee all elements of management, staff supervision, budgeting, accounting,
purchasing, marketing, and payroll for FACT. • Perform existing and expanded CTSA responsibilities.
- Coordinate with partner agencies, SANDAG, NCTD and other agencies. This includes ongoing communication and coordination with agencies that interface with FACT, as well as facilitating an expanded advisory committee for information sharing and program evaluation.
- Maintain and update STRIDE website.
- Prepare newsletters and other outreach materials.
- Implement specialized programs and offer technical expertise. FACT staff would be responsible for training and will serve as a resource for all human service providers in the county who need technical assistance for grant writing, driver training, Trapeze, and outreach.
- Market and distribute public information. FACT will maintain its current outreach efforts and expand its contact with existing and potential partner agencies, as well as expand its contact with members of the public.

B u s i n e s s P l a n
F U L L A C C E S S & C O O R D I N A T E D T R A N S P O R T A T I O N ( F A C T )
Page 7-5
• Undertake expanded functions for implementation of the Mobility Management Pilot Program (travel navigation and small-scale reservations and scheduling), Ramona transportation program, coordinated maintenance program, the expanded mileage reimbursement program, and the older driver wellness program.
- Manage and monitor the transportation provider contracts. This involves oversight of transportation provider contracts including procurement of new providers, quality assurance checks, processing payment, and other day-to-day tasks to ensure contract compliance. In the short-term, the focus of this effort is the Ramona transportation program and any other small-scale transportation brokerage programs implemented by FACT.
- Maintain and update Trapeze rider database. A new database of riders will need to be developed and input into Trapeze. The task of maintaining the database will be a key function for FACT staff.
- Perform trip navigation and scheduling tasks. In the short-term, performing ongoing I&R and trip scheduling functions will be a key element of the work responsibilities for FACT’s administrative staff. Longer term, additional staff will be needed or the function will need to be contracted to another provider.
- Compile operating and financial statistics and prepare performance reports. This function involves gathering all operating and financial data and developing a standard performance report including tables, charts and graphs. The report will be distributed to the Board, TAC, all partner agencies and interested stakeholders.
- Apply for and coordinate funding. There are a number of opportunities for securing public and private funding sources to help finance FACT’s programs, as discussed in Chapter 8. Applying for funds; coordinating with other partner agencies and businesses; following through with funding requests; and securing funding agreements are major responsibilities. This also involves cost-sharing among partner organizations and utilizing funding appropriate for the specific services being offered by FACT and for specific rider groups.
- Plan, implement and evaluate new types of services. These responsibilities involve detailed planning and implementing of new types of service such as community circulators, new connections to public transit services, and pre-arranged shuttle services to maximize ridership and productivity in select communities.
Plans Short Term (Year 1): Based on the primary staff responsibilities described above, Figure 7-2 indicates the anticipated staffing levels for the short-term (Year 1). The plan assumes that FACT has existing staff capacity – and appropriate skills – to undertake new responsibilities. Current staff, especially administrative staff, have significant capacity for additional work responsibilities, so most of the new program recommendations can be implemented without increasing FACT’s staff size in the first year. It should be noted that start-up of some of these efforts is anticipated to require additional staff time, but these efforts could be accomplished by existing staff working overtime, or with temporary staffing (such as a program specialist or consultant).

B u s i n e s s P l a n
F U L L A C C E S S & C O O R D I N A T E D T R A N S P O R T A T I O N ( F A C T )
Page 7-6
Figure 7-2 Short-Term (Year 1) Staffing Requirements
Staffing Assumptions by Organizational and Programmatic
Responsibility
Existing Dedicated Staff (% FTE) Short-Term Needs
Staffing
Additional capacity of
existing FTE? FTE Required Organization Management * 0.5 FTE Yes 0.3 FTE Existing CTSA Responsibilities 1.5 FTE Yes 0.7 FTE Ramona Transportation Program 0.3 FTE Mobility Management Pilot Program: Travel Navigation
0.4 FTE
Maintenance Coordination 0.1 FTE Volunteer Driver Program Resource Allocation
0.1 FTE
DMV Guaranteed Ride Home Program 0.1 FTE Older Driver Wellness Program 0.1 FTE Total 2.0 FTE 2.1 FTE *In-house staff only; Excludes contracted staff for IT and accounting functions.
Medium- to Long-Term (Years 2+): Medium-term and long-term staffing requirements assume the implementation of additional programs, including senior group travel training, implementation of a homeless transportation program, significant expansion of the mobility management brokerage to include several providers operating throughout North County in Years 2 and 3 and additional providers during Years 4 and 5, regional implementation of Trapeze for multiple providers and other strategies. Although the specific staffing requirements cannot fully be assessed for medium- and long-term strategies, Figure 7-3 illustrates anticipated staffing needs if additional programs are implemented and existing programs are expanded in future years.
Figure 7-3 Medium- and Longer-Term (Years 2-5) Staffing Projections (Assuming all Priority Initiatives are Implemented)
Staffing Assumptions by Organizational and Programmatic Responsibility
Year 1 Years 2-3 Years 4-5 FTE Required
Organization Management * 0.3 FTE 0.5 FTE 0.5 FTE CTSA Responsibilities 0.7 FTE 0.7 FTE 0.7 FTE Ramona Transportation Program 0.3 FTE 0.3 FTE 0.3 FTE Mobility Management Pilot Program: Travel Navigation, Scheduling and Dispatch (Includes Trapeze implementation)
0.4 FTE 0.6 FTE 1.0 FTE
Maintenance Coordination 0.1 FTE 0.1 FTE 0.1 FTE Volunteer Driver Program Resource Allocation 0.1 FTE 0.1 FTE 0.1 FTE DMV Guaranteed Ride Home Program 0.1 FTE 0.1 FTE 0.1 FTE Older Driver Wellness Program 0.1 FTE 0.1 FTE 0.1 FTE Travel Training 1.0 FTE 1.0 FTE Homeless Transportation Program 0.3 FTE 0.3 FTE Other initiatives TBD TBD Total 2.1 FTE 3.8 FTE 4.2 FTE *In-house staff only; Excludes contracted staff for IT and accounting functions.

B u s i n e s s P l a n
F U L L A C C E S S & C O O R D I N A T E D T R A N S P O R T A T I O N ( F A C T )
Page 7-7
Additional Staffing Needs Beginning Year 2 Assuming successful start-up and implementation of the programs described above, primary skills for additional staff will likely include the following:
• Customer service skills: For taking phone calls and scheduling trips.
• Trapeze software skills: For integrating Trapeze systems with partner agencies and contracted providers
• Grant writing: Additional grant writing support will be required to support the expanded programs and to solicit new funding for an array or multidisciplinary initiatives.
• Travel trainers: If travel training is handled in-house, up to one full-time travel trainer, or one FTE, will be needed. Depending on the funding source for travel training and whether partnerships are established with NCTD and MTS, the travel training staff could also have additional training, customer service and outreach responsibilities within the FACT organization.
Planning for Transition
FACT recognizes that Board members, TAC members and staff may depart FACT at any time. When an i ndividual l eaves t he or ganization, from an y s taff l evel or B oard pos ition, FA CT w ill ens ure continuity within the organization by undertaking the following:
For Board Members: If Board members leave, FACT will endeavor to replace them with individuals who bring appropriate skills, understanding, and political responsibilities, as required by FACT’s Board composition requirements. The organization acknowledges that it may take several months to replace a Board member, but staff will work closely with the Board to identify and vet a potential new Board member. Any new Board member will commit to FACT’s mission, while broadening FACT’s breadth of experience and bringing a complementary perspective to the organization. For TAC Members: TAC participation includes individuals from key partner agencies and other organizations. When a TAC member departs from their job at one of the public agencies or organizations represented on the Committee, FACT will work with the agency or organization to find a replacement from that agency to serve on TAC. For staff Members: It is critical for the organization to have a smooth transition whenever feasible, particularly at the Executive Director level. Given the current small staff size, FACT does not have individuals who could serve in a temporary or acting Executive Director capacity on staff, but will make use of the skills of one or more TAC members (if they have capacity to manage the organization) or a consultant with mobility management/nonprofit experience in the interim before a new Executive Director is hired. In a small organization, the Executive Director has a key role in setting the tone of the organization and defining many of the day-to-day partnering activities. FACT staff does a good job of documenting the organization’s efforts so these can be carried forward even with a change of staff. TAC members have a solid understanding of the organization’s history and would provide briefings and assistance to any interim or new Executive Director. The Board will make every effort to fill a vacant Executive Director position within 60 days, but it is more important to identify “the right person for the job” than to

B u s i n e s s P l a n
F U L L A C C E S S & C O O R D I N A T E D T R A N S P O R T A T I O N ( F A C T )
Page 7-8
fill the position with someone without the appropriate set of skills and experience.
Likewise, any vacant administrative/support staff position at FACT will be filled with (an) individual(s) with appropriate experience in transportation, customer service and administration. If FACT needs additional administrative support due to a vacancy or a temporary increase in workload, FACT may hire temporary staff (either directly or through a temporary agency) to perform required duties.
Software and Information Technology For coordinating multiple services and brokering trips, technology revolves around software that provides assistance for making trip reservations, scheduling and dispatch of services, billing agencies for the trips or services provided, cost sharing (pulling funds from multiple accounts and funding sources, as appropriate, to cover the cost of a trip), and reporting.
Technology strategies include technological tools that support and enhance public transit and human service transportation operations and planning. Our list of relevant strategies includes a series of technological tools, including tools that support or improve data integrity, fare collection, cost sharing/allocation, billing/reporting and transfers, as well as live dispatch and productivity needs.
The most significant issues associated with implementing new technology for FACT will be (1) purchasing the appropriate technology tools that can be expanded and shared as FACT’s programs grow and (2) training staff – both within the organization and outside FACT – to operate and manage the technology and integrate new systems with older technologies. As with the other recommendations for FACT, technological projects are best achieved by demonstrating success on a smaller scale, and learning from and building on success before implementing new tools on a large-scale basis. It is worth noting that the FTA New Freedom (Section 5317) program allows for capital funding (requiring a 20% local match) for hardware and software that support coordination strategies.
Figure 7-4 illustrates the three primary functional areas for mobility managers. Live dispatch refers to automated dispatching systems that permits same-day scheduling and trip making. Live dispatch necessitates a software system that incorporates reservations and scheduling capabilities with current or predicted vehicle location information. Information may be transmitted to the system via MDT/AVL equipment to facilitate dynamic “live” dispatching of unscheduled trips to vehicles.
Figure 7-4 Communication, Training & Organizational Support Strategies
Functions Key Elements Benefits Evaluate, Develop and Purchase Tools that Support Data Management
Install tools that improve data integrity, fare collection, cost sharing/allocation, billing, reporting and transfers
Improves service operations, design and management; may create cost savings
Evaluate and Purchase Tools that Support Live Dispatch
Buy software that incorporates reservation and scheduling capabilities; uses vehicle location information to dispatch of unscheduled trips
Removes obstacles to providing same day, shared ride service; potential to reduce costs and increase productivity
Evaluate and Purchase Tools that Improve Productivity
Use Non-Dedicated Vehicle software to matches operational information with ridership data to maximize service design and enhance productivity
Increase services productivity and frees resources for service expansion

B u s i n e s s P l a n
F U L L A C C E S S & C O O R D I N A T E D T R A N S P O R T A T I O N ( F A C T )
Page 7-9
Recommendations Short Term (Year 1): Figure 7-5 illustrates the various functions for which technologies are required and identifies the software and hardware tools that are recommended to carry forward each element. It is worth noting that Trapeze, a software solution already identified by FACT for purchase and implementation because of its wide use in San Diego County and the flexibility of its modules, would address many of the software requirements for FACT. In addition, FACT requires, and in some cases already uses, the following:
• Basic office software (Microsoft Excel, Microsoft Word, Microsoft PowerPoint)
• Database software
• Web design software (STRIDE web framework provided by SANDAG)
• Document production/page layout software (Microsoft Publisher)
• Accounting/business management software (QuickBooks)
In addition to software requirements, FACT requires computers and communication devices. These include the following:
• Telephones
• Printer
• Fax
• Computers that can operate software programs listed above
• Computer network
Medium- to Long-Term (Years 2+): Figure 7-5 also illustrates software and hardware requirements for medium and long-term strategies. Additional Trapeze modules are assumed to be appropriate longer term. In addition to the software and hardware recommendations listed above, advanced equipment options include the following:
• For dispatch communications, two-way radio or cell phone connection
• AVL system for vehicles scheduled/dispatched by FACT

B u s i n e s s P l a n
F U L L A C C E S S & C O O R D I N A T E D T R A N S P O R T A T I O N ( F A C T )
Page 7-10
This page intentionally left blank.

B u s i n e s s P l a n
F U L L A C C E S S & C O O R D I N A T E D T R A N S P O R T A T I O N ( F A C T )
Page 7-11
Figure 7-5 Communication, Training and Organizational Support Strategies
Key Functional Areas for Short-Term Strategies - Software Needs
Hardware Tools that Improve Productivity Tools that Support Live Dispatch Tools that Support Data Management
Information and Referral Registration and Reservations Scheduling and Dispatch Operations and Data Analysis Cost-Sharing and Funding
General Management/CTSA Responsibilities
Microsoft Word, Excel; Access database; page layout software; accounting
software; web design N/A N/A N/A Microsoft Excel; Access database;
accounting software
Telephones; printer; fax; computers; computer network; internet
connection Short-Term Strategies
Ramona Senior Transportation Pilot Project
Basic: Microsoft Excel or Access database
Advanced: I&R software (e.g., Resource House); Trapeze
Basic: Microsoft Excel Advanced: Trapeze;
Basic: Microsoft Excel Advanced: Trapeze
Basic: Two-way radio or cell phone
Advanced: AVL (in combination with Trapeze); in-vehicle
diagnostics systems
Basic: Microsoft Excel Advanced: Trapeze (mobility
manager), accounting software
Basic: Telephones; fax; computers; internet connection
Advanced: Two-way radio or cell phone connection; AVL system
Mobility Management Pilot Program (Phase 1) Travel Navigation
Basic: Microsoft Excel or Access database
Advanced: I&R software; Trapeze; web design software
Microsoft Excel or Access database;
telephone N/A
Telephone N/A
Basic: Telephones; fax; computers; internet connection
Advanced: Two-way radio or cell phone connection
Maintenance Coordination Microsoft Excel; Access database Microsoft Excel; Access database N/A N/A Microsoft Excel; Trapeze (mobility
manager); accounting software Telephones; fax; printer; computers;
internet connection
Volunteer Driver Program Resource Allocation N/A N/A N/A
Access database; accounting software
Access database; accounting software
Telephones; fax; printer; computers;
internet connection
Older Driver Wellness Program Access database; I&R software Microsoft Excel N/A Survey software (e.g., Excel,
SPSS, on-line survey website)
Access database; accounting software
Telephones; fax; printer; computers;
internet connection
DMV Guaranteed Ride Home Program Access database; I&R software Basic: Microsoft Excel
Advanced: Trapeze Basic: Telephone
Advanced: Trapeze Access database
Access database; accounting software
Telephones; fax; printer; computers;
internet connection Medium and Long-Term Strategies
Mobility Management Pilot Program (Phase 2) One-Stop Call Center
Access database; I&R software; Trapeze;
web design software Trapeze
Trapeze
AVL (in combination with Trapeze); In-vehicle diagnostics
systems Trapeze (mobility manager),
accounting software
Basic: Telephones; fax; computers; internet connection; two-way radio or
cell phone connection Advanced: AVL system
Senior Group Travel Training Access database; I&R software Microsoft Excel N/A Survey software (e.g., Excel,
SPSS, on-line survey website)
Access database; accounting software
Telephones; fax; printer; computers;
internet connection
Homeless Transportation Program
Basic: Microsoft Excel or Access database
Advanced: I&R software; Trapeze
Basic: Microsoft Excel
Advanced: Trapeze Basic: Microsoft Excel
Advanced: Trapeze
Basic: Two-way radio or cell phone
Advanced: AVL (in combination with Trapeze); in-vehicle
diagnostics systems
Basic: Microsoft Excel Advanced: Trapeze (mobility
manager), accounting software
Telephones; fax; computers; internet connection; two-way radio or cell
phone connection
Trapeze N/A N/A N/A N/A N/A
Basic: Telephones; computers; internet connection
Advanced: Two-way radio or cell phone connection; AVL system


B u s i n e s s P l a n
F U L L A C C E S S & C O O R D I N A T E D T R A N S P O R T A T I O N ( F A C T )
Page 7-13
Service Contracts Plans Applicable for Short Term (Year 1) and Medium- to Long-Term (Years 2+)
MOAs and MOUs For organizations and agencies that use FACT to provide services and/or broker trips for their clients, FACT will establish Memoranda of Understanding (MOU) or of Agreement (MOA).1
1. Type of Service: Define the specific types of services and programs that FACT will offer to each partner agency/organization.
At a minimum, the MOU will identify specific responsibilities for each of the following:
2. Eligibility: Define who is responsible for determining eligibility for using the service.
3. Scheduling Trips: Define procedures for scheduling trips and coordinating services for clients.
4. Service Levels: Project the level of service needed by FACT for the upcoming year. This could be expressed as number of clients to be served, number of trips, frequency of service, etc.
5. Funding Commitments: Project an agency’s annual funding contributions to FACT to guarantee a level of service and allow for agency to budget for their financial obligations to FACT.
6. Billing and Cost-Sharing: Define how agencies are billed for FACT’s services any specific funding requirements or shared costs.
7. Other Roles and Responsibilities of Each Party: List any other roles and responsibilities of either FACT or the partner agency or organization.
One of the most valuable outcomes of a written MOU/MOA will be to establish the level of service for each agency or organization. This will enable FACT to project service levels and develop an operating budget based on local match funds available to the organization. MOUs or MOAs will become increasingly important as FACT expands and attracts new partners. Clear guidelines for partners and FACT will allow for a clear reporting and communication structure and for accountability in each partner relationship.
Contracts with Third-Party Providers It is essential that FACT develop appropriate contracts with its providers to protect the organization (See Risk Management and Insurance on Page 7-14) and define operating and service expectations. Sample text for the important Indemnification clause, with a “Duty to Defend” statement is shown on page 7-15, but at the very least, several clauses will be included in each contract identifying the following:
• Scope of services
• Liability
• Indemnification
• Workers' compensation 1 Individual agencies may also seek to have FACT sign their own contract to provide services to them.

B u s i n e s s P l a n
F U L L A C C E S S & C O O R D I N A T E D T R A N S P O R T A T I O N ( F A C T )
Page 7-14
• Termination/suspension
• Compliance with laws and regulations
• Insurance
• Subcontracting
• Severability
• Waiver
• Authority
• Federal or state requirements
A sample contract from one of FACT’s peers, Ride Connection, is included in the Appendix and can be used and modified by FACT for its own service provider contracts. It is recommended that FACT have an attorney review all contracts before they are signed.
Risk Management and Insurance Figure 7-6 presents the proposed short, medium- and long- term service recommendations and FACT’s proposed role(s). Understanding FACT’s key responsibilities helps to assess organizational vulnerabilities and proposed insurance requirements.
Figure 7-6 Roles for FACT in Implementation of Program Strategies
Program/Service FACT’s Role Special Insurance Implications Short Term Ramona Senior Transportation Pilot Project
FACT will administer the program. Services will be provided by a contract operator.
Ensure contracted providers carry full insurance coverage.
Mobility Management Pilot Program Travel Navigation
FACT will advise and provide travel planning services over the telephone and assist with scheduling trips.
Ensure contracted providers carry full insurance coverage.
Maintenance Coordination FACT will serve as a facilitator for organizing the maintenance program at a third party’s maintenance facility.
Volunteer Driver Program Resource Allocation
FACT will be providing financial reimbursement to organizations and/or directly to volunteer drivers.
Older Driver’s Wellness Program FACT will organize programs and contract with a provider to instruct the programs in the short-term. Longer term, FACT may teach/lead these programs.
Advisory/training role suggests need for professional liability insurance.
DMV Guaranteed Ride Home Program
FACT will arrange and pay for a ride home from the DMV if a driver’s license is revoked.
Ensure contracted providers carry full insurance coverage.
Medium-Long Term Strategies Mobility Management Pilot Program One-Stop Call Center
FACT will either provide brokerage services in-house or contract with a call center; FACT will contract with transportation providers to serve trips.
Ensure contracted providers carry full insurance coverage.

B u s i n e s s P l a n
F U L L A C C E S S & C O O R D I N A T E D T R A N S P O R T A T I O N ( F A C T )
Page 7-15
Program/Service FACT’s Role Special Insurance Implications Senior Group Travel Training FACT will lead travel training programs. Advisory/training role suggests need
for professional liability insurance. Homeless Transportation Program
FACT will administer this program and will use a contract operator to provide the service
Ensure contracted providers carry full insurance coverage.
Trapeze Software and Training
FACT will provide some licensing support for Trapeze scheduling/dispatching software as well as training.
Advisory/training role suggests need for professional liability insurance.
Plans Applicable for Short Term (Year 1) and Medium- to Long-Term (Years 2+)
Risk Management Advisor Any role or program that FACT might assume brings with it some level of risk and potential for financial loss. Based on the services listed in Figure 7-6 and identified in this Business Plan, most of the potential risk is likely minimal. Nevertheless, FACT will consider hiring a Risk Management Advisor (RMA) to provide the agency with a complete assessment of potential risks and suitable insurance coverage. Typically this service is called a Risk Management Audit. Standard Risk management services include:
• Risk Elimination: A RMA will demonstrate how to completely eliminate some potential risks via operational, physical or programmatic changes.
• Risk Transfer: In some cases, it is impossible to completely eliminate risks. In these cases, an RMA will provide guidance in how to legitimately transfer risk to another party. For example, for the Ramona transportation program, the contract with the third party operator should include language that transfers the primary risk associated with transporting passengers from FACT to the contractor. The contractor’s insurance policies should list FACT as an additional insured.
• Standards: An RMA can help create performance standards for each program as a way to monitor operations and manage risk.
• Hiring Practices and Employee Training: RMAs can provide guidance on hiring practices and training procedures as a way to manage employee risk.
These and other risk management practices provide effective, proven and low cost methods of reducing risk. Recommendations for RMA service providers can be obtained from a variety of sources including:
• CalACT (California Association for Coordinated Transportation (www.calact.org)
• CalTIP (California Transit Insurance Pool)(www.caltip.org)
• CTAA (Community Transportation Association of America) (www.ctaa.org)
Contracts and Indemnification As noted in the previous section, another way to manage risk is via the inclusion of Indemnification and Duty to Defend clauses inserted in all contracts between FACT and third parties. A sample is shown below:

B u s i n e s s P l a n
F U L L A C C E S S & C O O R D I N A T E D T R A N S P O R T A T I O N ( F A C T )
Page 7-16
******* shall defend, indemnify and hold harmless FACT and its directors, officers, agents and employees from all claims, demands, suits, loss, damages, injury and liability, direct or indirect (including reasonable attorney’s fees, and any and all costs and expenses in connection therewith), incurred by reason of any negligent act, or failure to act, of ******, its officers, agents, employees or any of them, under or in connection with this Agreement; and ****** agrees at its own cost, expense and risk to defend any and all claims, actions, suits, or other legal proceedings brought or instituted against FACT or its directors, officers, agents and employees, or any of them, arising out of ******’s services, and to pay and satisfy any resulting judgments.
Such indemnification includes without limitation any violation of proprietary rights, copyrights and rights of privacy, arising out of the publication, translation, reproduction, delivery, use or disposition of any data furnished under this Agreement.
An RMA can assist FACT with specific contract language.
Insurance Coverage There is a multitude of insurance coverage that FACT will consider obtaining. A RMA can provide guidance on the most applicable and relevant policies. At a minimum Nelson\Nygaard recommends that FACT consider obtaining:
• Commercial General Liability (Minimum $1 million Combined Single Limit): Under a commercial general liability insurance policy, the insurer pays the costs of a commercial enterprise in a liability claim or lawsuit, including property damage, personal injury, bodily injury, slander or false advertising. Compensatory and general damages are also covered.
• Commercial Business Auto (Minimum $1 million Combined Single Limit): If FACT owns and operates vehicles, commercial business auto insurance will protect any organizational vehicle.
• Directors’ and Officers’ Liability: This liability insurance provides coverage when a director or officer of an organization commits an omission or negligent act, or provides a misleading statement, and a libel suit is brought against the organization. The policy provides coverage for directors' and officers' liability exposure if they are sued and for the costs of legal fees.
• Workers’ Compensation: Workers' compensation insurance is mandatory in California and is insurance paid by the organization to provide benefits to employees who become ill or injured on the job. With workers’ compensation, employees receive benefits and medical care, and employers have the assurance that they will not be sued by the employee.
• Professional Liability: Professional liability insurance provides coverage for FACT as an organization that specializes and advises on various issues. General liability policies do not protect against situations arising out of business expertise or advisory pursuits.
• Umbrella: FACT should consider an umbrella liability insurance policy that protects the assets and future income of the organization above and beyond the standard limits set in FACT’s primary policies. Typically, an umbrella policy is simply liability coverage above the coverage afforded by the regular policy and covers liability claims from all policies underneath it.
CalTIP is probably the best place to start the search for insurance coverage. They can assist with the basic CGL and Auto policies, and recommend other parties to provide the remaining policies.

B u s i n e s s P l a n
F U L L A C C E S S & C O O R D I N A T E D T R A N S P O R T A T I O N ( F A C T )
Page 7-17
Outreach Strategies A key challenge facing FACT is the desire for service expansion to better address transportation needs in San Diego County, while ensuring program growth is sustainable and can be managed given available resources. FACT does not currently have a formal outreach program, so this strategy is focused on building relationships. Outreach means dedicating staff to activities that may seem less important than keeping programs operational from day-to-day. But in reality outreach is one of the most critical functions that can be undertaken to ensure the success and sustainability of FACT and its programs. Successful outreach efforts will result in a well-informed public, supportive public officials, potential for additional public and private funding, and loyal riders.
FACT outreach objectives are as follows:
• Build support for FACT in San Diego County. Outreach activities must inform and educate the public about the availability of transit service. FACT must also provide outreach to political leaders, human service agencies, and business interests in San Diego County. FACT staff must recognize potential questions and present accurate answers. This goal is particularly important for building the organization’s programs, securing sustainable funding, and for soliciting private participation in support of FACT. In coordinating services, FACT must emphasize the positive elements of public transportation and its value to San Diego County residents, social service agencies and employers.
• Ensure FACT’s programs are understandable and recognizable. The focus of this goal is on FACT’s identity – ensuring that people understand what FACT is and how the organization’s programs might serve them. Lack of visibility makes FACT’s programs less likely to achieve popular support and private funding.
• Inform and educate the public about transportation options in San Diego County. FACT’s own planned programs will represent only a small proportion of the transportation options available in San Diego County. County residents, agency representatives and political leaders are far more familiar with the high-profile services of MTS, NCTD, and the array of human service agencies operating transportation. In order for FACT to achieve public support, broaden knowledge of the role of public transportation in the county, and reach out to eligible participants to inform them of their transportation alternatives, a critical element of the program is education. To this end, FACT plans to provide regular positive press outreach about the program’s purpose and accomplishments; continue to coordinate with SANDAG, NCTD and MTS, perhaps to jointly develop informational materials about transportation services in San Diego County; emphasize the role public transportation plays in mobility for county residents; and emphasize the value of investing in public transportation for seniors, low-income residents and people with disabilities.
• Provide comprehensive information about becoming a partner of FACT. FACT must provide easy-to-understand outreach information and host meetings with prospective partners to ensure they understand the organization’s objectives and capabilities.
New Printed Informational Tools and Products Attractive, updated printed information will be prepared about FACT: brochures that define the organization’s mission and ways other organizations can work with FACT.
Implementation of the Ramona transportation programs will necessitate a comprehensive information brochure that outlines the program’s purpose, policies, and requirements. Information should include how to register for the program (eligibility requirements, if any) and how to use the program (rider

B u s i n e s s P l a n
F U L L A C C E S S & C O O R D I N A T E D T R A N S P O R T A T I O N ( F A C T )
Page 7-18
rules, scheduling a trip, fare information, service hours and service policies. It should include information on contacting FACT with questions or complaints and contact numbers. Following adoption of recommended program policies and prior to implementation, the brochure should be developed. Once developed, it will be reviewed and updated annually.
FACT Website FACT will explore redesigning the website to better illustrate the organizations’ mission and directly connect visitors with the information on the STRIDE website. Obviously once FACT begins scheduling and planning trips, direct links to each of FACT’s services will be added to the program website so individuals can find the programs they seek. The website will include links to other transportation programs, service changes or new information, special events information, links to partner agencies, etc. The site will be fast loading and incorporate accessible content, ideally including “Quick Keys” or text tags behind graphics for easier navigation for people with visual impairments.
Outreach Campaign The primary objective for an information and outreach campaign should be to provide good public information, particularly for agencies, elected officials and business representatives, but also for potential users. Many agency representatives are unfamiliar with FACT and many will certainly be unfamiliar with FACT’s new programs once they are carried forward.
Several strategies will be included as part of a comprehensive outreach campaign:
• Print Advertisements. The most critical advertising opportunities for FACT include
- Any public meetings or community events that would be hosted prior to the implementation of new services.
- The rollout of new services.
• Ongoing Public Relations. Some of the best advertising FACT can generate is by word of mouth and by making use of free access to the public and the press.
- Having FACT staff available to speak at major events or to disability, work training or senior groups on transportation offerings in San Diego County is an excellent way for inexpensive sharing of public information. In addition to public speaking, the San Diego Union-Tribune, radio stations and television stations (including local cable access stations), regularly seek informative news items and are glad to make available news in the public interest. Because transportation is viewed as a community service, published press releases can amount to regular media exposure. These can also preempt any negative press by continuing to keep positive accomplishments in the media spotlight.
- Information will also regularly be updated and sent to NCTD, MTS, SANDAG, 211, city and County offices, chambers of commerce, medical centers, and human service agencies across San Diego County.
• Agency and Elected Official Outreach. Although much of this effort is currently underway, FACT intends to develop a ready-to-present discussion of the organization, its initiatives, funding and partnership opportunities.
• Participation in Existing Committees. Many existing and potential partner agency members work with FACT, the Volunteer Driver Program Coalition, CAM and other

B u s i n e s s P l a n
F U L L A C C E S S & C O O R D I N A T E D T R A N S P O R T A T I O N ( F A C T )
Page 7-19
organizations with which FACT has existing relationships. Nevertheless, there are other organizations that FACT can join or participate in, as the organization has done recently with the Chamber of Commerce and ARS.
• Special Outreach for Providers. Several informational resources would provide good outreach for the providers of service. Some of these include better information about the other providers in the county, a dispatcher-to-dispatcher “back door” phone number directory to shift trips to other providers, volunteers on the buses to provide assistance, or FACT bulletin boards at senior centers to provide information about the program and provider contact information.
Plans Short-Term (Year 1): Efforts to implement this outreach program will commence immediately. Print advertisements will be placed at key milestones as described above. Ongoing public relations will include a minimum of two to three press releases per year when important data is released or a new partner joins the program. Agency and elected official outreach will be ongoing, and a list of individuals and agencies to target for outreach will be developed by program staff, along with goals and objectives for the outcome of these meetings. Special outreach for providers will be scheduled as needed. Staff will continue the excellent, proactive approach to sharing experiences and gaining recognition for the organization through relationships with existing and new partner organizations.
Medium- to Long-Term (Years 2+): Expansion of outreach efforts and continued implementation of the recommended programs is will proceed in future years. Although most of these functions will be carried out by FACT staff, accomplishing all these activities with a limited staff will results in the need to evaluate organizational growth. Board members and TAC members have some of the expertise to build relationships between organizations and could be more involved in doing so on behalf of FACT.
Implementation Timeline This chapter identifies major implementation considerations for the Business Plan recommendations. While FACT would lead most of the activities, there are several tasks that require close coordination and consultation with other agencies including SANDAG, NCTD, MTS, RTAC and others.
A timeline of activities is presented in Figure 7-7. For the first year, the timeline shows a breakdown by month to suggest a sequence of when tasks are planned to occur. Beyond Year 1, for medium- and potentially longer-term programs, tasks are presented by quarter. Even though the tasks are fairly specific, FACT may need to identify additional steps or activities depending on how they actually get implemented. Thus, this table is a guideline for more detailed implementation activities.
To allow for a modular approach, as desired by FACT, each element of the Business Plan can be carried out individually or as part of a set of programs overseen by FACT.

B u s i n e s s P l a n
F U L L A C C E S S & C O O R D I N A T E D T R A N S P O R T A T I O N ( F A C T )
Page 7-20
This page intentionally left blank.

B u s i n e s s P l a n
F U L L A C C E S S & C O O R D I N A T E D T R A N S P O R T A T I O N ( F A C T )
Page 7-21
Figure 7-7 Short- and Medium-Term Implementation Schedule
Year 1 Year 2 Year 3 Year 4 Year 5
1 2 3 4 5 6 7 8 9 10 11 12 Q1 Q2 Q3 Q4 Q1 Q2 Q3 Q4 Q1 Q2 Q3 Q4 Q1 Q2 Q3 Q4
General Management/CTSA Responsibilities Implement Board, TAC organizational restructuring/expansion Assess staff hours and availability/shift work schedules as needed Purchase license and install Trapeze Train staff Develop contracts/MOU(s)/MOA(s) and review with attorney Prioritize short-term programs Continue ongoing implementation of committed CTSA tasks Implement programs (as defined in this implementation schedule) Conduct ongoing meetings to explore potential partnerships Track program/partner opportunities for future implementation Identify new funding sources and other revenue sources Review and update Business Plan Short-Term Strategies
Ramona Senior Transportation Pilot Project Finalize data collection for service planning Develop and test service plan Confirm stop locations & dwell locations with City of Ramona Conduct public meeting(s) Review service plan with proposed contractors Conduct Risk Management Audit Solicit bids to operate service Install Trapeze or other reservations/scheduling system Select provider(s)
Define fare collection and billing procedures
Prepare and sign contract(s) and MOU(s)/MOA(s)
Complete training on Trapeze for FACT staff
Install radios/phones and equipment
Prepare informational materials (printed, web, other) Begin reservations and scheduling of trips Provide information and referral, resolve problems Conduct outreach meetings Monitor service progress Collect and report data Identify additional funding opportunities Conduct service evaluation and modify service as needed
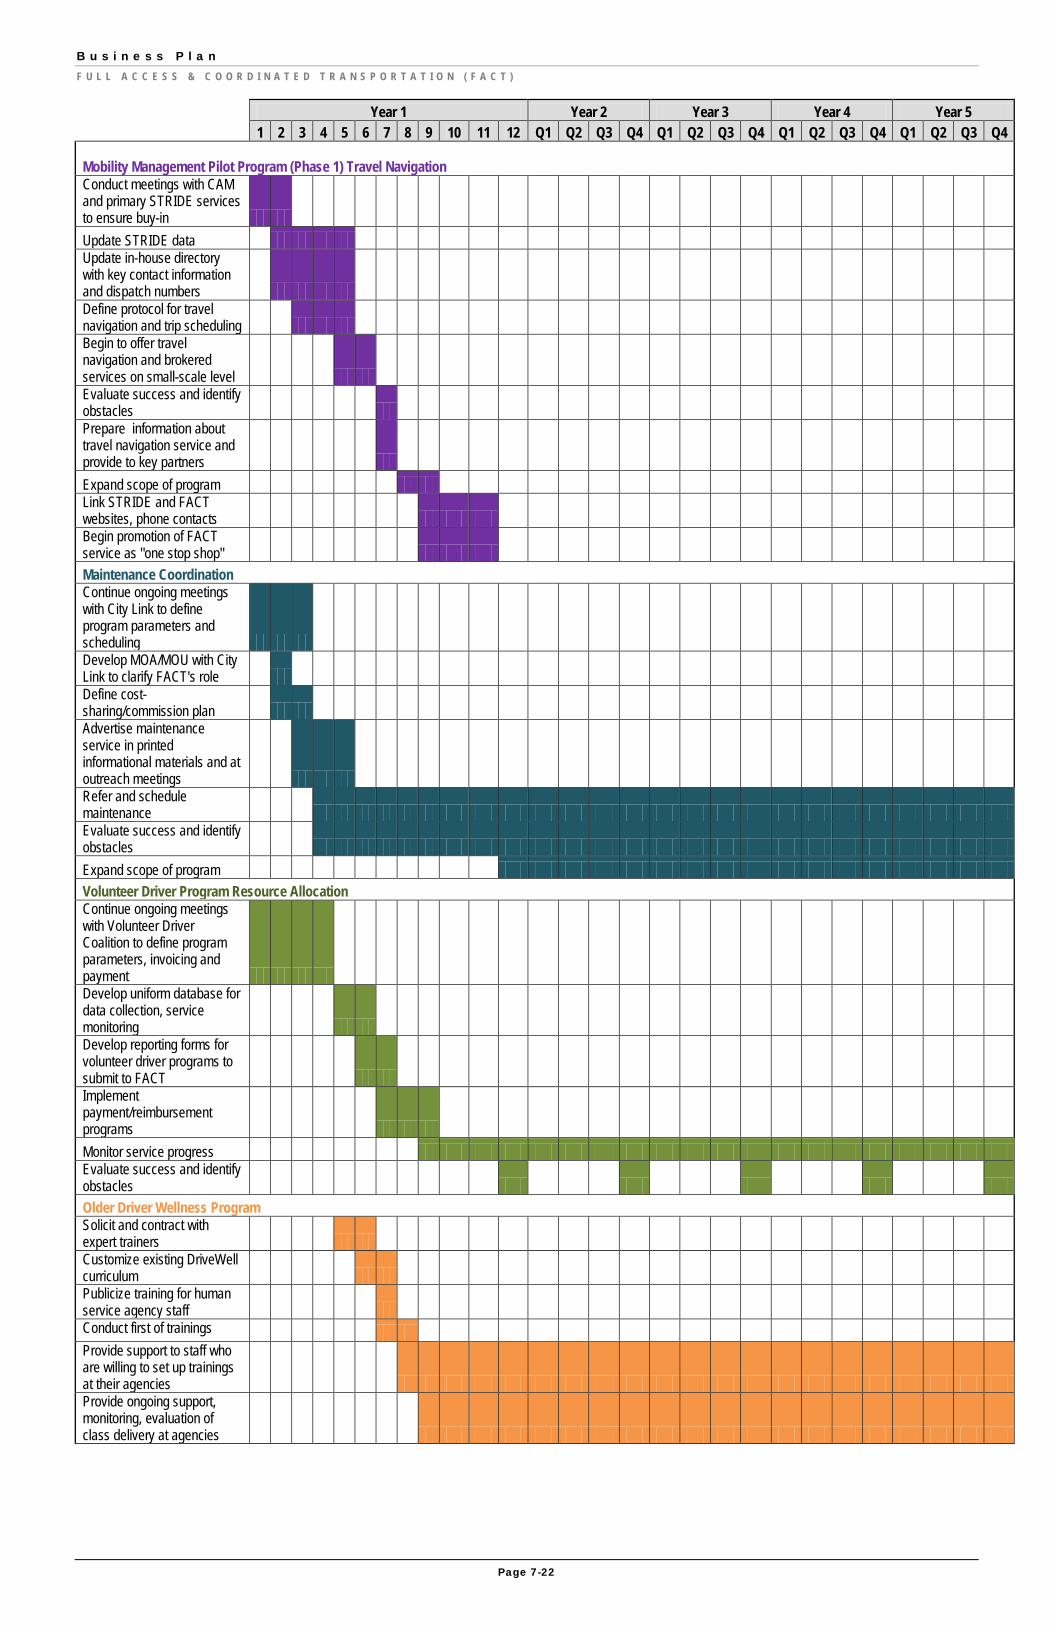
B u s i n e s s P l a n
F U L L A C C E S S & C O O R D I N A T E D T R A N S P O R T A T I O N ( F A C T )
Page 7-22
Year 1 Year 2 Year 3 Year 4 Year 5
1 2 3 4 5 6 7 8 9 10 11 12 Q1 Q2 Q3 Q4 Q1 Q2 Q3 Q4 Q1 Q2 Q3 Q4 Q1 Q2 Q3 Q4
Mobility Management Pilot Program (Phase 1) Travel Navigation Conduct meetings with CAM and primary STRIDE services to ensure buy-in Update STRIDE data Update in-house directory with key contact information and dispatch numbers Define protocol for travel navigation and trip scheduling Begin to offer travel navigation and brokered services on small-scale level Evaluate success and identify obstacles Prepare information about travel navigation service and provide to key partners Expand scope of program Link STRIDE and FACT websites, phone contacts Begin promotion of FACT service as "one stop shop" Maintenance Coordination Continue ongoing meetings with City Link to define program parameters and scheduling Develop MOA/MOU with City Link to clarify FACT's role Define cost-sharing/commission plan Advertise maintenance service in printed informational materials and at outreach meetings Refer and schedule maintenance Evaluate success and identify obstacles Expand scope of program Volunteer Driver Program Resource Allocation Continue ongoing meetings with Volunteer Driver Coalition to define program parameters, invoicing and payment Develop uniform database for data collection, service monitoring Develop reporting forms for volunteer driver programs to submit to FACT Implement payment/reimbursement programs Monitor service progress Evaluate success and identify obstacles Older Driver Wellness Program Solicit and contract with expert trainers Customize existing DriveWell curriculum Publicize training for human service agency staff Conduct first of trainings Provide support to staff who are willing to set up trainings at their agencies Provide ongoing support, monitoring, evaluation of class delivery at agencies
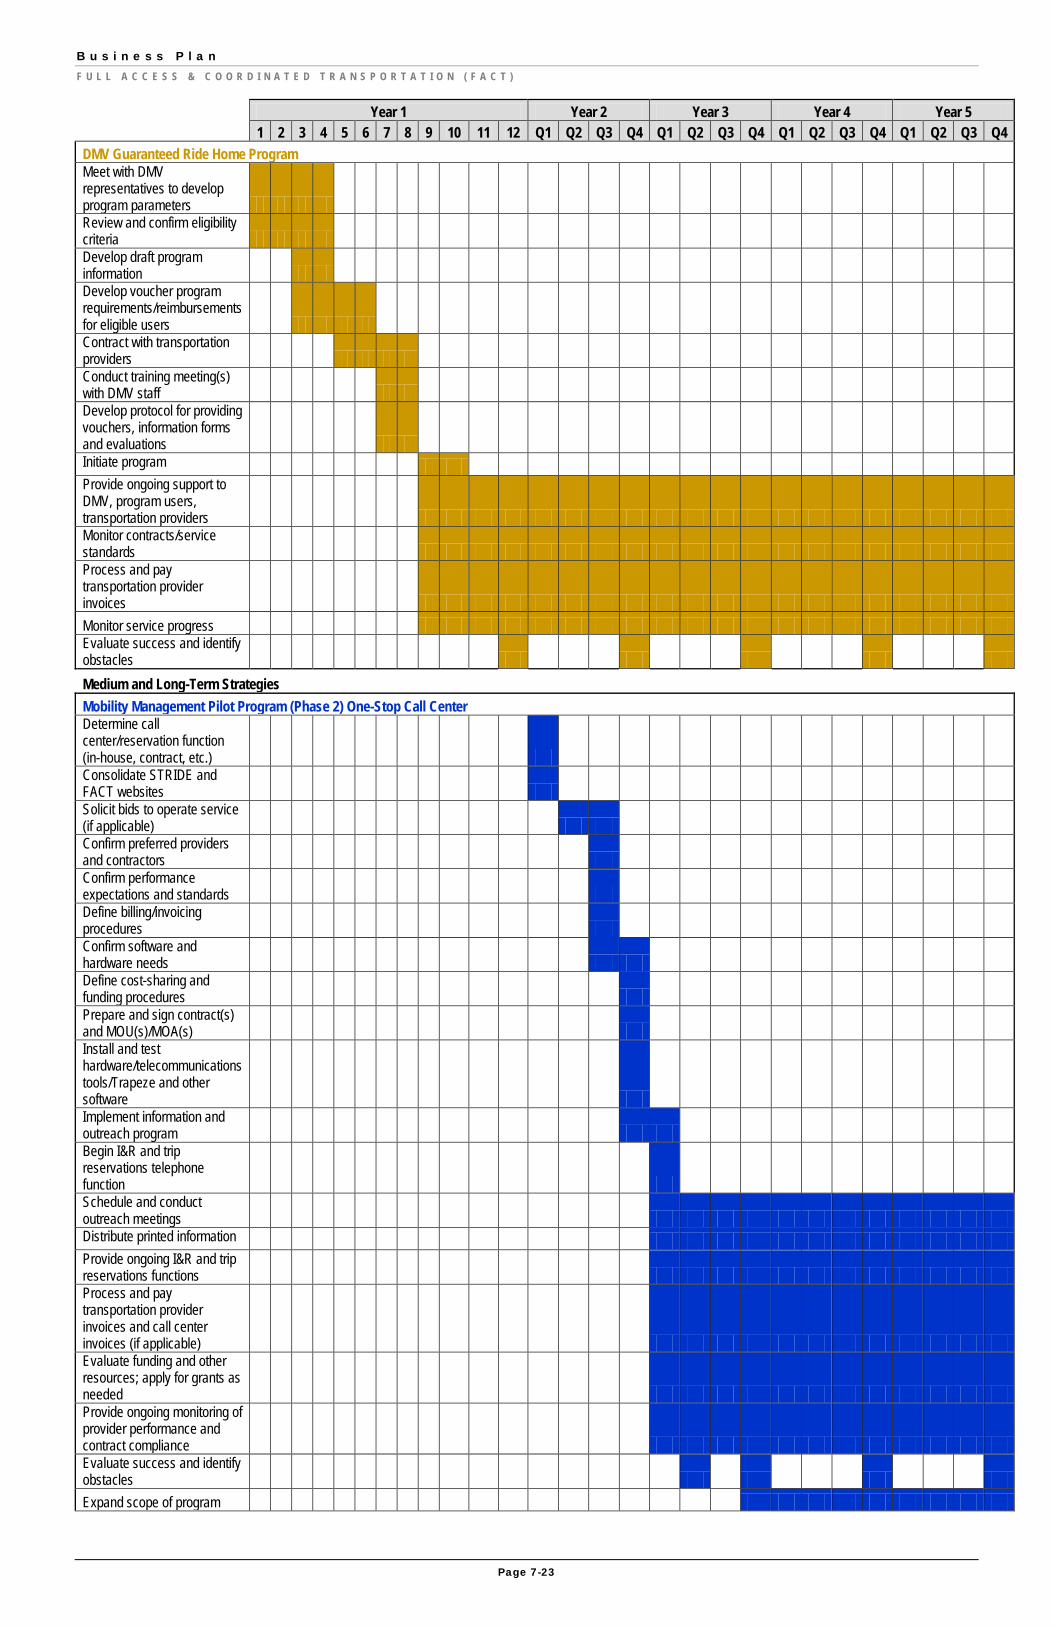
B u s i n e s s P l a n
F U L L A C C E S S & C O O R D I N A T E D T R A N S P O R T A T I O N ( F A C T )
Page 7-23
Year 1 Year 2 Year 3 Year 4 Year 5
1 2 3 4 5 6 7 8 9 10 11 12 Q1 Q2 Q3 Q4 Q1 Q2 Q3 Q4 Q1 Q2 Q3 Q4 Q1 Q2 Q3 Q4
DMV Guaranteed Ride Home Program Meet with DMV representatives to develop program parameters Review and confirm eligibility criteria Develop draft program information Develop voucher program requirements/reimbursements for eligible users Contract with transportation providers Conduct training meeting(s) with DMV staff Develop protocol for providing vouchers, information forms and evaluations Initiate program Provide ongoing support to DMV, program users, transportation providers Monitor contracts/service standards Process and pay transportation provider invoices Monitor service progress Evaluate success and identify obstacles Medium and Long-Term Strategies Mobility Management Pilot Program (Phase 2) One-Stop Call Center Determine call center/reservation function (in-house, contract, etc.) Consolidate STRIDE and FACT websites Solicit bids to operate service (if applicable) Confirm preferred providers and contractors Confirm performance expectations and standards Define billing/invoicing procedures Confirm software and hardware needs Define cost-sharing and funding procedures Prepare and sign contract(s) and MOU(s)/MOA(s) Install and test hardware/telecommunications tools/Trapeze and other software Implement information and outreach program Begin I&R and trip reservations telephone function Schedule and conduct outreach meetings Distribute printed information Provide ongoing I&R and trip reservations functions Process and pay transportation provider invoices and call center invoices (if applicable) Evaluate funding and other resources; apply for grants as needed Provide ongoing monitoring of provider performance and contract compliance Evaluate success and identify obstacles Expand scope of program

B u s i n e s s P l a n
F U L L A C C E S S & C O O R D I N A T E D T R A N S P O R T A T I O N ( F A C T )
Page 7-24
Year 1 Year 2 Year 3 Year 4 Year 5
1 2 3 4 5 6 7 8 9 10 11 12 Q1 Q2 Q3 Q4 Q1 Q2 Q3 Q4 Q1 Q2 Q3 Q4 Q1 Q2 Q3 Q4
Senior Group Travel Training Solicit and contract with a travel training expert Ensure that materials are appropriate for the target audience Coordinate with transit agencies in locations where trainings will be given to inform them and solicit help as needed Oversee implementation of training sessions at local level, including securing facility, publicizing the training, conducting trainings, monitoring and evaluation Conduct post-training evaluations to determine the effectiveness in changing seniors’ travel behavior Homeless Transportation Program Confirm partnerships and funding sources Develop and test service plan Confirm pick-up locations and schedules Prepare and sign contract(s) and MOU(s)/MOA(s) Define fare collection, reimbursement and billing procedures Install radios/phones and equipment Prepare print informational materials Conduct outreach meetings Begin scheduling of trips Provide information and referral, resolve problems Monitor service progress Collect and report data Identify additional funding opportunities Conduct service evaluation and modify service as needed Trapeze Secure additional licenses as needed Review legal commitments with attorney Develop MOAs/MOUs with partners to define organization roles Install hardware/software/networks needed for implementation Loan/sublicense Trapeze to partner organizations Collect payment/fees from organizations Evaluate success and identify obstacles Consolidate services, when feasible

B u s i n e s s P l a n
F U L L A C C E S S & C O O R D I N A T E D T R A N S P O R T A T I O N ( F A C T )
Page 8-1
Chapter 8. Costs and Funding Integrating New Strategies and Existing Responsibilities FACT has a significant array of responsibilities as the CTSA for San Diego County and as an organization that has pursued and received funding from various sources, including the TransNet Senior Mini-Grant, California Transportation Development Act (TDA) Article 4.5 funds, and New Freedom Funds. FACT had originally planned to implement the North County mobility management pilot program using funds from New Freedom 2007 and 2008 funding plans.
Cost Projections for New Strategies
The organization’s largest funding sources, New Freedom and TDA CTSA funding, identify specific responsibilities for FACT that are outlined in Figure 8-1. The figure illustrates that most of the required elements of the New Freedom 2006 allocation have been expended through work on the STRIDE website and information and referral responsibilities for FACT. Most of the 2007 and 2008 grant scope of work is easily addressed in the recommended strategies and FACT’s responsibilities under these grants can be assigned to carrying out the new strategies. Only two of FACT’s scoped tasks — to hire five staff members and eight contractors — are not appropriate for FACT in the immediate term because the organization can initiate new programs with existing staff capacity and then increase staffing in coming years to address additional needs.
This section presents cost and revenue projections for two time periods:
• Short- term (FY 2009/10)
• Medium- Range (FY 2010/11 through 2013/14)
Capital and operating costs are projected for each of the recommended strategies. Since many of the strategies represent new programs or services, the costs are based on several assumptions about service levels, ridership, program participation and anticipated growth. The major cost assumptions for short-term and medium-range strategies are presented in the following sections, and include a discussion about revenue assumptions.

B u s i n e s s P l a n
F U L L A C C E S S & C O O R D I N A T E D T R A N S P O R T A T I O N ( F A C T )
Page 8-2
This page intentionally left blank.

B u s i n e s s P l a n
F U L L A C C E S S & C O O R D I N A T E D T R A N S P O R T A T I O N ( F A C T )
Page 8-3
Figure 8-1 FACT Current Roles and Responsibilities Based on Primary Public Funding Grants
ORIGINAL WORK PROGRAM REVISED WORK PROGRAM Organizational Tasks Identified in Business Plan
Task Status Identified in Which Grant Application? Short-Term Programs
Mid- and Long-Term Programs
Com
plet
ed
Ongo
ing
Not S
tarte
d
2006
New
Fr
eedo
m G
rant
Al
loca
tion
2007
New
Fr
eedo
m G
rant
Al
loca
tion
2008
New
Fr
eedo
m G
rant
Al
loca
tion
CTSA
(TDA
) Fu
ndin
g
Ongo
ing
CTSA
Ma
nage
men
t
Ram
ona S
enio
r Tr
ansp
orta
tion
Pilo
t Pro
ject
Mobi
lity
Mana
gem
ent
Pilo
t Pro
gram
(P
hase
1) T
rave
l Na
vigat
ion
Main
tena
nce
Coor
dina
tion
Volu
ntee
r Driv
er
Prog
ram
Re
sour
ce
Allo
catio
n
Olde
r Driv
er
Well
ness
Pr
ogra
m
DMV
Guar
ante
ed
Ride
Hom
e Pr
ogra
m
Mobi
lity
Mana
gem
ent
Pilo
t Pro
gram
(P
hase
2) O
ne-
Stop
Call
Cen
ter
Seni
or G
roup
Tr
avel
Train
ing
Hom
eless
Tr
ansp
orta
tion
Prog
ram
Trap
eze
Organizational Tasks Identified in FACT Primary Funding Grants
Information and Referral Providing referral assistance and information X X X X X X X X Maintain STRIDE Website X X X Validate existing entries in the STRIDE web site database to ensure accuracy. X X X Implement an educational campaign to inform the community about the STRIDE web site. X X X Provide newsletters, brochures and other informational materials X X X X X X X X X Planning Strategic Planning Develop and document a 5 year business plan for FACT covering the following areas: governance, integration of current CTSA work activities, technical assistance and coordination planning, information and marketing initiatives, service contracting and operations programs, policy development and advocacy, trip demand estimation and utilization projections, funding and financial projections; annually update the strategic business plan X X X X Data Collection and Analysis Add data to the FACT Inventory Database (FID) of North County stakeholders that is an outcome of the CTAA Planning Grant X X X Complete a comprehensive on site inventory w/in the NCPP area & enter info into the FID X X X Call Center Planning and Implementation Advance data collection & planning required for implementation of a call center based, centrally located dispatched transportation brokerage for people with disabilities & other transportation disadvantaged persons X X X Complete a call center and software assessment and evaluation X X X X X Investigate local options/potential partnerships available for location of a FACT call center X X X X X Investigate potential software packages for use in the FACT call center for implementation through the North County Pilot Project (NCPP) & expansion to other areas of County. X X X X Implement a regional mobility management call center for transportation information and ride scheduling X X X X Transportation Planning Work with SANDAG on the locally developed Regional Coordinated X X X

B u s i n e s s P l a n
F U L L A C C E S S & C O O R D I N A T E D T R A N S P O R T A T I O N ( F A C T )
Page 8-4
ORIGINAL WORK PROGRAM REVISED WORK PROGRAM Organizational Tasks Identified in Business Plan
Task Status Identified in Which Grant Application? Short-Term Programs
Mid- and Long-Term Programs
Com
plet
ed
Ongo
ing
Not S
tarte
d
2006
New
Fr
eedo
m G
rant
Al
loca
tion
2007
New
Fr
eedo
m G
rant
Al
loca
tion
2008
New
Fr
eedo
m G
rant
Al
loca
tion
CTSA
(TDA
) Fu
ndin
g
Ongo
ing
CTSA
Ma
nage
men
t
Ram
ona S
enio
r Tr
ansp
orta
tion
Pilo
t Pro
ject
Mobi
lity
Mana
gem
ent
Pilo
t Pro
gram
(P
hase
1) T
rave
l Na
vigat
ion
Main
tena
nce
Coor
dina
tion
Volu
ntee
r Driv
er
Prog
ram
Re
sour
ce
Allo
catio
n
Olde
r Driv
er
Well
ness
Pr
ogra
m
DMV
Guar
ante
ed
Ride
Hom
e Pr
ogra
m
Mobi
lity
Mana
gem
ent
Pilo
t Pro
gram
(P
hase
2) O
ne-
Stop
Call
Cen
ter
Seni
or G
roup
Tr
avel
Train
ing
Hom
eless
Tr
ansp
orta
tion
Prog
ram
Trap
eze
Organizational Tasks Identified in FACT Primary Funding Grants
Transportation Plan Participate in regional disaster preparedness planning for coordinated emergency evacuation X X X Assist with federal capital grant process X X X X X X X X X X X X X Outreach and Partnerships Build a base of cooperation and coordination and serve as a liaison between public transportation providers and human service agencies X X X X X X X X X X X X X Provide all contacts w/in all activities of this project with educational material relating to FACT, CTSA, & STRIDE web site, & the development of the NCPP as a stepping stone to a county-wide coordinated system X X X X X X X X X X X X X Dedicate a page on Web site to this New Freedom Mobility Management Project, including narrative summary & report which will be posted monthly for the life of this New Freedom grant. X X X Increase number of signed Community Partnership Agreements that include an operating component X X X Market Regional Mobility Management Center through press releases, pamphlets, brochures, email newsletters, special informational pieces, newspaper articles, special events, workshops, and community training sessions X X X X X X X X X X X X Report actions and activities of the CTSA X X X Evaluate prospective partnerships between public and private services X X X X X X Ensure that local elected officials are involved in developing local actions necessary for the success of the CTSA X X X Training Provide technical assistance, information and education programs to transportation providers X X X X X X X X X X X X X Organize policy-oriented community training seminars X X X X X X X Develop a regional training program for human service agencies and clients and consumers in partnership with public transit operators X X X X Conduct quarterly workshops and safety roundtables X X X Maintain supplemental transportation library X X X Program Implementation Develop a coordinated system of transportation service options for the disabled community X X X X X X X Create a program to reimburse transportation providers with excess capacity for providing rides for FACT’s clients X X X X Create a pre-qualified pool of private operators that can be used to provide X X X X X X

B u s i n e s s P l a n
F U L L A C C E S S & C O O R D I N A T E D T R A N S P O R T A T I O N ( F A C T )
Page 8-5
ORIGINAL WORK PROGRAM REVISED WORK PROGRAM Organizational Tasks Identified in Business Plan
Task Status Identified in Which Grant Application? Short-Term Programs
Mid- and Long-Term Programs
Com
plet
ed
Ongo
ing
Not S
tarte
d
2006
New
Fr
eedo
m G
rant
Al
loca
tion
2007
New
Fr
eedo
m G
rant
Al
loca
tion
2008
New
Fr
eedo
m G
rant
Al
loca
tion
CTSA
(TDA
) Fu
ndin
g
Ongo
ing
CTSA
Ma
nage
men
t
Ram
ona S
enio
r Tr
ansp
orta
tion
Pilo
t Pro
ject
Mobi
lity
Mana
gem
ent
Pilo
t Pro
gram
(P
hase
1) T
rave
l Na
vigat
ion
Main
tena
nce
Coor
dina
tion
Volu
ntee
r Driv
er
Prog
ram
Re
sour
ce
Allo
catio
n
Olde
r Driv
er
Well
ness
Pr
ogra
m
DMV
Guar
ante
ed
Ride
Hom
e Pr
ogra
m
Mobi
lity
Mana
gem
ent
Pilo
t Pro
gram
(P
hase
2) O
ne-
Stop
Call
Cen
ter
Seni
or G
roup
Tr
avel
Train
ing
Hom
eless
Tr
ansp
orta
tion
Prog
ram
Trap
eze
Organizational Tasks Identified in FACT Primary Funding Grants
specialized trips Begin to coordinate trips within North County X X X X X X Schedule rides X X X X X X X Increase level of service as additional vehicle resources are identified and contracts with partner agencies X X X X X Expand trip coordination outside North County X X X Organization and Staffing Expand FACT’s staff capacity to support coordination transportation programs X X X X X X X Recruit, hire and train five
new positions: administrative/financial support, technical/planning support, marketing information and intergovernmental support, IT support and service operations support.* X X X X X X X Hire eight
contractors to conduct business plan development, operations/contract support, IT support, financial consultant, grant writing services, marketing, governmental liaison, and ride scheduling.* X X X X X X X Form a Community Implementation Work Group and/or other advisory groups, consisting of representatives from community organizations that either provide transportation and/or subsidize transportation, and transportation consumers X X X X Maintain an active Council for Access and Mobility (CAM), which currently meets quarterly X X X Maintain a CTSA mailing list X X X Ensure the FACT Board of Directors is comprised of at least three officials elected to municipal or county positions in San Diego County, including one member who is a sitting member of the SANDAG Transportation Committee X X X
*Note: Staffing/consulting numbers listed in original grant application are no longer applicable. Recommendation is for staffing and consulting hires as needed.

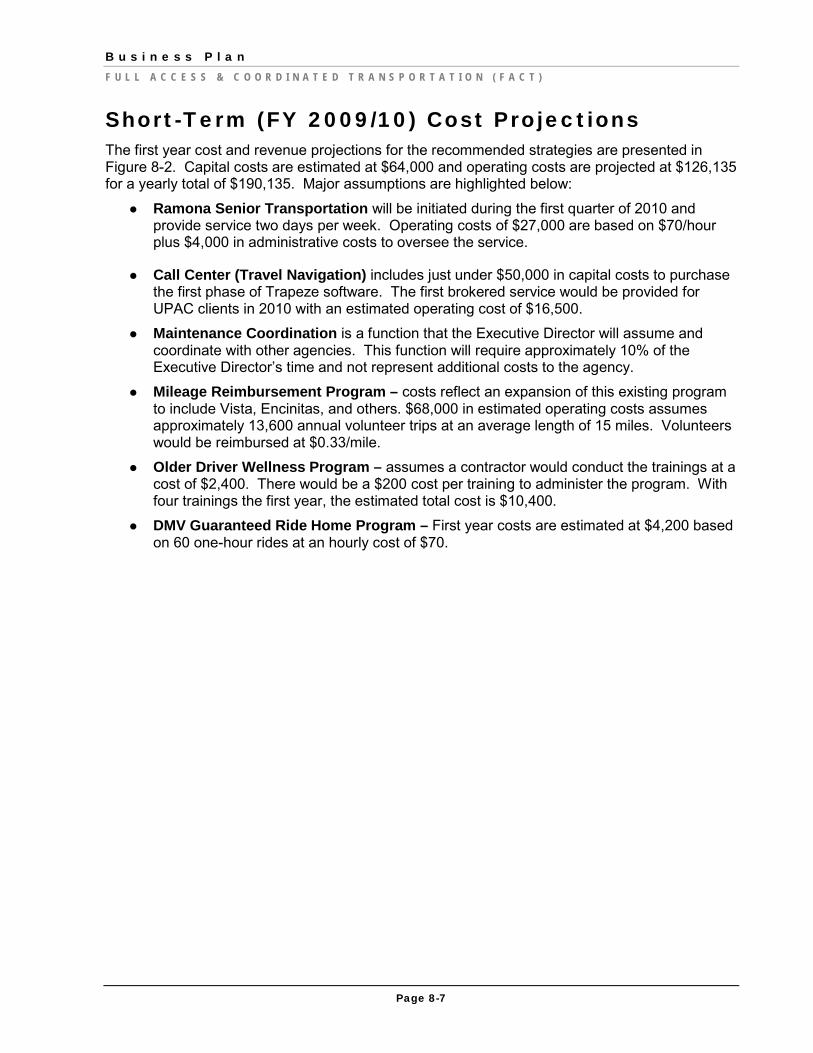
B u s i n e s s P l a n
F U L L A C C E S S & C O O R D I N A T E D T R A N S P O R T A T I O N ( F A C T )
Page 8-7
Short-Term (FY 2009/10) Cost Projections The first year cost and revenue projections for the recommended strategies are presented in Figure 8-2. Capital costs are estimated at $64,000 and operating costs are projected at $126,135 for a yearly total of $190,135. Major assumptions are highlighted below:
Ramona Senior Transportation will be initiated during the first quarter of 2010 and provide service two days per week. Operating costs of $27,000 are based on $70/hour plus $4,000 in administrative costs to oversee the service.
Call Center (Travel Navigation) includes just under $50,000 in capital costs to purchase the first phase of Trapeze software. The first brokered service would be provided for UPAC clients in 2010 with an estimated operating cost of $16,500.
Maintenance Coordination is a function that the Executive Director will assume and coordinate with other agencies. This function will require approximately 10% of the Executive Director’s time and not represent additional costs to the agency.
Mileage Reimbursement Program – costs reflect an expansion of this existing program to include Vista, Encinitas, and others. $68,000 in estimated operating costs assumes approximately 13,600 annual volunteer trips at an average length of 15 miles. Volunteers would be reimbursed at $0.33/mile.
Older Driver Wellness Program – assumes a contractor would conduct the trainings at a cost of $2,400. There would be a $200 cost per training to administer the program. With four trainings the first year, the estimated total cost is $10,400.
DMV Guaranteed Ride Home Program – First year costs are estimated at $4,200 based on 60 one-hour rides at an hourly cost of $70.

B u s i n e s s P l a n
F U L L A C C E S S & C O O R D I N A T E D T R A N S P O R T A T I O N ( F A C T )
Page 8-8
Figure 8-2 FY 2009/10 Costs and Revenues
Strategy Estimated Cost Comments
Capital Costs
Operating Costs Total Costs
Ramona Senior Transportation $0 $27,000 $27,000
Day-to-Day operating costs for two days per week of service at$70/hr plus administrative costs of $3,700. Assumes start-up service in 1st
Call Center (Travel Navigation)
Quarter 2010.
$49,900 $16,500 $66,400
First phase cost for capital purchase for Trapeze software and assumes 2010 start-up of UPAC service
Maintenance Coordination (1) $0 $0 $0
Assumes 10% of Executive Director's time based on fully loaded annual salary. Costs are absorbed through existing FACT CTSA 4.5 Funding
Expand Mileage Reimbursement Program $0 $68,035 $68,035
Assumes average of 15 miles/volunteer at $.033/mile; and13,608 trips and average supplement/trip = $5.00
Older Driver Wellness Program $0 $10,400 $10,400
Assumes $2600 per training and total of 4 trainings
DMV Guaranteed Ride Home Program $0 $4,200 $4,200
Assumes $70/hour and 60 rides at one hour length per ride.
Miscellaneous (2) $14,100
$14,100 Total Costs $64,000 $126,135 $190,135 Committed Funds Federal Funds New Freedom Grant
$82,635 $82,635 Overmatching the NF grant
Regional/Local Funds
TransNet
$27,000 $27,000 Senior mini grant to pay for Ramona senior transportation services.
Grant: Supervisor Bill Horn $64,000
$64,000
Total grant amount is $64,000. Must be expended by January 31, 2010 and used for capital purchases.
UPAC
$16,500 $16,500 Assumes service start up in Jan. 2010. Total Committed Funds $64,000 $126,135 $190,135
Notes: (1) Maintenance coordination cost of approximately $9,100 is funded through existing CTSA 4.5 funding. Assume 10% of Executive Director's time.
(2) Includes computer equipment, office furniture and mobility management assistance

B u s i n e s s P l a n
F U L L A C C E S S & C O O R D I N A T E D T R A N S P O R T A T I O N ( F A C T )
Page 8-9
Medium-Range Cost Projections Medium-range costs are projected for FYs 2010/11 through FY 2013/14. As shown in Figure 8-3, costs increase from nearly $248,000 to $561,500 over this four-year period. The programs that were initiated in the first year are expected to grow and at least two new programs would be initiated. Capital costs are projected to be minimal; only $60,000 over the four year time frame.
• Ramona Senior Transportation – In the next three years, the plan assumes one additional day of weekday service. Costs are projected from $66,000 in FY 2009/10 to nearly $105,000 in FY 2013/14.
• Mobility Management Brokerage – As FACT increases its mobility management functions, it will increase the number of partner agencies and number of brokered trips it provides each year. Financial contributions from these agencies provide local matching funds to NF grants and are an excellent opportunity to leverage and maximize these federal funds. This plan assumes two new partner agencies per year with costs gradually increasing from $40,000 in FY 2010/11 to $160,000 after four years.
• Mileage Reimbursement Program –is anticipated to grow and provide approximately 10% more volunteer trips each year. This means that in FY 2010/11, nearly 15,000 trips would be provided and by FY 2013/14, volunteers would provide over 19,000 trips. Costs would gradually increase from about $75,000 per year to nearly $100,000 in four years.
• Older Driver Wellness Program –is assumed to remain constant in the next four years at $10,400.
• DMV Guaranteed Ride Home Program – is expected to grow incrementally each year with the number of guaranteed rides home increasing from 60 to 73 in the four- year time frame. Costs for the four years total $20,500.
• Senior Group Travel Training – assumes service start-up in FY 2011/12 at an annual cost of $65,000. These costs assume one full-time employee equivalent (FTE) plus $5,000 in administrative expenses and materials. After a modest increase in the subsequent year, this program is assumed to double in size in FY 2013/14. Costs for travel training are assumed to be borne by NCTD and MTS (see funding section below).
• Homeless Transportation – this program would provide door-to-door transportation to homeless individuals. During the first year, it is assumed that service would be operated three hours a day; 200 days per year. Service could be provided on weekends or weekdays based on need. At $72/hour plus a 3% annual inflation factor, costs would range from $42,000 to $45,000 per year. Funds to pay for this service could come from the Alliance for Regional Solutions or other consortium of churches.
• Marketing – to promote the new services, $10,000 is recommended for marketing and public information to cover design and printing of new brochure and flyers.
• Capital Costs – are limited to additional Trapeze licenses estimated to cost $30,000 and new communications/technology purchases and upgrades to existing communications equipment for an additional $30,000.

B u s i n e s s P l a n
F U L L A C C E S S & C O O R D I N A T E D T R A N S P O R T A T I O N ( F A C T )
Page 8-10
Figure 8-3 Projected Costs and Revenues
Strategy Estimated Costs
Four Year Total Costs Comments
Operating Costs FY 10/11 FY 11/12 FY 12/13 FY 13/14
Ramona Senior Transportation $66,000 $84,263 $101,789 $104,843 $356,895
Day-to-Day operating costs for two days per week of service at$70/hr plus administrative costs of $10,000. Hourly costs increase 3%/year.
Mobility Management Brokerage $40,000 $80,000 $120,000 $160,000 $400,000
Assumes UPAC-paid brokered trips start in FY 10/11 with two new partner agencies per year.
Maintenance Coordination (1) $0 $0 $0 $0 $0
Assumes 10% of Executive Director's time based on fully loaded annual salary. Costs are absorbed through existing FACT CTSA 4.5 Funding
Expand Mileage Reimbursement Program $74,839 $82,322 $90,555 $99,610 $347,325
Assumes average of 15 miles/volunteer at $.033/mile; trips increase by 10% each year; average supplement/trip = $5.00
Older Driver Wellness Program $10,400 $10,400 $10,400 $10,400 $41,600
Assumes $2600 per training and total of 4 trainings in each year.
DMV Guaranteed Ride Home Program $4,542 $4,912 $5,313 $5,746 $20,514
Assumes $72/hour, rides increase by 5% per year at one hour length per ride. Hourly costs increase 3%/year.
Senior Group Travel Training $0 $65,000 $66,950 $134,000 $265,950
Assumes service start-up in FY 11/12, increase 3% following year, then doubles. Costs are covered through grant funds (e.g. NCTD current funding source)
Homeless Transportation $42,000 $43,260 $44,558 $45,895 $175,712
Assumes 3 hours daily @$72/hour for 200 weekdays/year. Hourly costs increase 3%/year.
Marketing /Public Information $10,000 $10,000
Marketing and public outreach materials
Subtotal Operating Costs $247,781 $370,158 $439,564 $560,493 $1,617,996

B u s i n e s s P l a n
F U L L A C C E S S & C O O R D I N A T E D T R A N S P O R T A T I O N ( F A C T )
Page 8-11
Strategy Estimated Costs
Four Year Total Costs Comments
Capital Costs FY 10/11 FY 11/12 FY 12/13 FY 13/14
Additional Trapeze Licenses $30,000
Assumes new Trapeze licensing for three years until core North County providers are integrated into FACT brokerage.
New Phone System, new computer hardware and mobile communication devices $15,000 $5,000 $5,000 $5,000 $30,000
Assumes new communications/technology purchases and upgrades to existing communications equipment.
Total Capital and Operating Costs $272,781 $385,158 $454,564 $565,493 $1,677,996
Required Funding Sources Federal Funds
New Freedom Grant $124,781 $164,898 $223,057 $205,599 $718,334
Total NF Grant amount is $859,000; full allocation of grants not required.
Regional/Local Funds
TransNet $66,000 $32,000 $98,000
$125,000 Senior mini grant fully expended by FY 2011/12 to pay for Ramona senior transportation services.
NCTD and/or MTS $0 $65,000 $66,950 $134,000 $265,950
Assumes NCTD and/or MTS will fund Senior Group Travel Training.
UPAC $20,000 $20,000 $20,000 $20,000 $80,000
Assumes UPAC will pay for their brokered trips at same level each year.
New Partners $20,000 $60,000 $100,000 $160,000 $340,000
Assumes new partners pay for their brokered trips and FACT uses some of these funds to leverage New Freedom funding.
Alliance for Regional Solutions $42,000 $43,260 $44,558 $45,895 $175,712
Assumes Alliance or consortium of churches will pay for homeless transportation services.
Total Funds $272,781 $385,158 $454,564 $565,493 $1,677,996

B u s i n e s s P l a n
F U L L A C C E S S & C O O R D I N A T E D T R A N S P O R T A T I O N ( F A C T )
Page 8-12
Revenue Projections Transportation funding in California is complex. Federal and state formula and discretionary programs provide funds for transit, paratransit services and social service transportation. Sales tax revenues are also used for public and paratransit services. Transportation funding programs are subject to rules and regulations that dictate how they can be used and applied for (or claimed) through federal, state and regional levels of government. Additionally, some funds for social service transportation come from a variety of non-traditional transportation funding programs including both public and private sector sources.
Another complexity with federal funding programs is the local match requirements. Each federal program requires that a share of total program costs be derived from local sources, and may not be matched with other federal Department of Transportation (DOT) funds. Examples of local match which may be used for the local share include: state or local appropriations; non-DOT federal funds; dedicated tax revenues; private donations; revenue from human service contracts; private donations; revenue from advertising and concessions. Non-cash funds such as donations, volunteer services, or in-kind contributions are eligible to be counted toward the local match as long as the value of each is documented and supported.
Because transportation funding is complicated and there is uncertainty with funding programs and funding levels, the Business Plan makes several assumptions about revenue projections. A review of the existing funds available to FACT is summarized below. At the end of this section is a figure outlining potential new funding opportunities.
Existing Revenues FTA Section 5316 New Freedom Program This Federal Funding Program seeks to reduce barriers to transportation services and expand the transportation mobility options available to people with disabilities beyond the requirements of the ADA. New Freedom funds are awarded following a competitive process, and are available for capital and operating expenses that support new public transportation services and alternatives, beyond those required by the ADA, that are designed to assist individuals with disabilities with accessing transportation services, including transportation to and from jobs and employment support services.
FACT has been awarded funds from the FTA Section 5316 New Freedom (NF) Program in FYs 2006/07, 2007/08 and 2008/09 for a total of $859,000. As with all Federal funds, there are matching requirements which poses a challenge for FACT to fully utilize the maximum amount of funds available to them.
Given the regional and local funds available to FACT, only $82,600 in NF funds is needed to support the recommended strategies in FY 2009/10. In the next four years, the amount of NF funds required that can be matched with local and regional funds ranges from a low of approximately $125,000 in FY 2010/11 to a high of $205,600 in FY 2012/13. The estimated total NF required in the next five years is $801,000 (including first year and medium-range costs) leaving a balance of $58,000. Should FACT expand its services beyond the levels conservatively projected in this plan and secure additional local and regional funds, then it is possible to fully maximize the NF allocation.

B u s i n e s s P l a n
F U L L A C C E S S & C O O R D I N A T E D T R A N S P O R T A T I O N ( F A C T )
Page 8-13
TransNet In November 2004, the voters of San Diego County approved an extension of the half-cent sales through 2048. The sales tax measure is known as TransNet. The TransNet Extension Ordinance contains provisions for a Senior Transportation Mini-Grant Program (STMGP). FACT applied for and was awarded a grant in the amount of $125,280, which can be applied to the planned Senior Transportation Program in Ramona. Funding disbursements were intended for a three-year period beginning FY 2008/09 and extending through FY 2101/11. These funds have not yet been disbursed so this plan recommends drawing down funds beginning with a first increment in the amount of $27,000 to initiate the senior service in FY 2009/10. A larger increment of $66,000 is recommended in Year 2, to pay for increased service levels. The third and final increment of $32,000 is estimated for FY 20011/12. The actual amounts will vary depending on the demand for service and performance standards. FACT will monitor and evaluate the program on an ongoing basis and adjust service levels, costs and revenues to match demand and comply with SANDAG performance standards established for this program.
Transportation Development Act (TDA) Article 4.5 The Local Transportation Fund revenues are derived from a one-quarter cent sales tax, which is collected by the Board of Equalization, and administered locally through SANDAG. As the CTSA in San Diego County, FACT is eligible to claim TDA Article 4.5 funds, which it does. These funds currently support the bulk of FACT’s administrative costs and programming expenses, but can also be used for paratransit operating assistance and capital projects. Since the revenues are tied to sales tax revenues, they fluctuate with the economy and have taken a downturn in the last year. The original estimate of $106,500 for FY 2009/10 has been revised downward to approximately $95,400. TDA Article 4.5 funds are used to pay for the day-to-day operation of FACT including leased space, salaries, and other essential expenses. These revenues are not available to help fund the recommended strategies that fall outside of FACT’s day-to-day operations.
Supervisor Horn Discretionary Grant The San Diego Board of Supervisors has a program that gives each supervisor $2 million per year for grants to community groups. FACT was awarded a grant from Supervisor Bill Horn’s 5th
North County Transit District and Metropolitan Transportation System
District in the amount of $64,000 for capital purchases. FACT is in the process of securing Trapeze software and plans to use these funds for this purpose. The grant requires that these funds must be fully expended by November 30, 2009 and used for capital purchases. As shown in Figure 8-2, $64,000 is proposed for FY 2009/10 to purchase Trapeze software.
NCTD and MTS each provide a family of transit and paratransit services in San Diego County. Each agency provides some travel training to assist riders who are unfamiliar with their services and require specialized assistance to be able to independently ride the services. Since this is a small element of their services, it would be cost effective for these agencies to contract out this function rather than continue to perform travel training with their own staff. This plan assumes that FACT will provide senior group travel training for both NCTD and MTS in the medium-term. No commitments have been made by either transit agency, but NCTD has expressed interest in shifting this function to FACT after its current two years of remaining funding is expended. This function could be phased out at these agencies, freeing up their staff to perform other functions. In FYs 2012 and 2013, approximately $65,000 is recommended for this function and it is

B u s i n e s s P l a n
F U L L A C C E S S & C O O R D I N A T E D T R A N S P O R T A T I O N ( F A C T )
Page 8-14
projected to double in the final year as FACT is able to significantly increase the number of trainings per year and take on training for MTS consumers.
The Union of Pan Asian Communities UPAC is a nationally recognized nonprofit organization, offering multicultural, multilingual, comprehensive health and human services to Asian, Pacific Islander and other ethnic communities. FACT is negotiating with UPAC to provide routine and special event transportation services for their clientele. In FY 2009/10, approximately $16,000 in UPAC funds is recommended to pay for start-up service in January 2010, which would represent the first formal initialization of FACT as a broker of trips. In the following four years, $20,000 is recommended each year to help pay for brokerage services.
Future Partners As FACT expands its mobility management functions, agencies will partner with FACT to provide brokered trips for their clientele. While it is difficult to predict the number of agencies, the level of transportation to be provided and how much funding they would contribute for transportation services, this plan assumes that agencies would fully fund their brokered trips, but these funds could also be used to leverage federal funding, including New Freedom funds.
The plan assumes that in FY 2010/11, agreements would be reached with two new partners and FACT would collect $20,000 for providing brokering their clients’ trips. This amount is assumed to significantly increase each year
Potential Funding Sources Other potential funding sources could be available to FACT to enable the organization to further expand its services and enhance its funding opportunities. A summary of each source is presented in Figure 8-4 highlighting the funding purpose, use of funds, and any special considerations.

B u s i n e s s P l a n
F U L L A C C E S S & C O O R D I N A T E D T R A N S P O R T A T I O N ( F A C T )
Page 8-15
Figure 8-4 Summary of Funding Opportunities
Funding Source Funding Purpose Use of Funds Special Considerations Lead Time Comments Federal Sources FTA Section 5317 New Freedom Program
Supports new services and alternatives, beyond ADA that are designed to assist individuals with disabilities access transportation services, including transportation to and from jobs and employment support services.
Capital projects and operations
FACT has received New Freedom funds in three Fiscal years
1 year Matching requirements: 50% for operating costs, 80% for capital costs. Can match with other federal funds
FTA Section 5311 Enhance access for those living in non-urbanized areas and improve public transportation systems in rural and small urban areas.
Capital projects and operations Funds are distributed on a formula basis to rural counties throughout the country.
Eligible recipients are public agencies, local governments, tribal governments, nonprofit agencies. Matching requirements: 50% for operating costs, 80% for capital costs
Job Access and Reverse Commute Program (JARC)
Special Program for Welfare to Work and commute to job rich suburban areas
Capital or Operations Funds to be used for two purposes: 1) To transport low-income individuals to and from jobs, and 2) To connect residents of urban areas to suburban employment centers.
1 year Unlike other federal funds, JARC funds can be matched with other federal funds (such as CDBG funds)
Federal Transit Administration (FTA) Section 5310 (1)
To provide transportation for elderly and persons with disabilities
Capital or Operations Public agencies and non-profits are eligible to apply for these funds.
1 year Funds distributed by Caltrans.
Medicaid To support non-emergency medical services
Operations or brokerage Public and private providers are contracted to transport Medicaid clients to non-emergency medical appointments; will require collaboration with existing providers.
2 years Complex process to become Medicaid provider.
Older Americans Act Title III B - Grants for Supportive Services & Senior Centers (Administration on Aging)
Funds are awarded by formula to State units on aging for providing supportive services to older persons, including operation of senior centers. May be used to purchase and/or operate vehicles and funding for mobility management services.
Capital projects and operations.
Eligible recipients are states and territories, recognized Native American tribes and Hawaiian Americans as well as nonprofit organizations.
Community Development Block Grant (CDBG) through the U.S. Department of Housing and Urban Development to Entitlement Jurisdictions (1)
To provide transportation to low- and moderate-income residents
Direct payments HUD limits public services, including transportation, to only 15% of total CDBG award, however, transportation is a high priority.
9 months

B u s i n e s s P l a n
F U L L A C C E S S & C O O R D I N A T E D T R A N S P O R T A T I O N ( F A C T )
Page 8-16
Funding Source Funding Purpose Use of Funds Special Considerations Lead Time Comments State Sources Title III Grants for State and Community Programs on Aging
To provide services for people 60 years and older
Transportation to senior centers for congregate meals
Nonprofits, including participating agencies, providing congregate meals can apply for and receive Title III funds.
1 year Funds distributed through State Agencies on Aging
Agricultural Worker Transportation Program (AWTP)
Provide safe, efficient, reliable and affordable transportation services, utilizing vans and buses, to agricultural workers commuting to/from worksites in rural areas statewide.
Capital projects and operations
No mandatory matching requirements Eligible recipients: all public agencies Administered by the Caltrans. Scheduled to sunset on June 30, 2010.
State Council on Developmental Disabilities
Provide funding for serving Californians with Developmental Disabilities that are part of an overall strategy for systemic change.
Primarily operations Each year the Council selects objectives from the Council’s State Plan and seeks proposals that are new and innovative in providing services to individuals with Developmental Disabilities and their families.
1 year Strong potential for FACT to secure funds from this source.
Partner Agencies To help provide ongoing operating support of FACTG Brokerage services
Operations or Capital To cover a percentage of brokered trips, agencies could contribute funds by making one-time or annual contributions, formula payments based on passenger trips, passenger miles or other relevant factors.
Ongoing An agreement is needed to spell out the responsibilities of each agency including payment schedule.
United Way Provide funds to help administration and operations
Operations, administration One possible source of funding for administration costs
1 year United Way does not usually fund governmental entities but with proper education on need for subsidized transportation may make an exception.
Private Employers Major employers could subsidize fares or could make direct contributions to FACT
No limitations Would require negotiations with interested employers
Ongoing Excellent opportunity for generating private revenues with large employers directly served by FACT. Represents a potential funding partnership opportunity with MOVE San Diego.
(1) This funding option is identified as a direct source for the FACT and is also listed as a potential source for partner agencies.

B u s i n e s s P l a n
F U L L A C C E S S & C O O R D I N A T E D T R A N S P O R T A T I O N ( F A C T )
Page 8-17
Approach to Allocating Costs When FACT implements its mobility management functions and provides brokered trips for UPAC and other partner agencies, a cost allocation model will be developed to determine how to charge agencies for services and how to make decisions about funding the various components. A cost allocation model will enable FACT to determine the full cost of each type of service it provides. This information will be valuable for negotiating payment with the participating agencies, seeking funding to pay for services, and planning.
A cost allocation plan typically includes both fixed and variable costs (fluctuating costs) and consists of vehicle hours and miles, as well as administrative staff time, expenses, volunteer time, maintenance time and cost, dispatch time, and other factors. The distinction between fixed and variable costs is important because there may be situations when a participating agency need only pay the variable cost of its service when fixed costs would be incurred anyway, even without the services provided to that agency.
The cost categories and allocation factors to develop a tailored model for FACT are presented in Figure 8-4 below.
Figure 8-5 Cost Categories and Allocation Factors
Programs Allocation Factors (Cost Drivers) Variable Labor Cost Drivers and Mechanics Directly operated driver hoursDispatch and Scheduling
a Office time
Volunteer Reimbursement Processing b
Number of volunteer rides Older Driver Wellness Program Number of trainings Information and Referral Office timeb
Fixed Labor Cost
Local Contractor Management Office timeTravel Training
b Proportional to non-administrative costs
General Administration Proportional to non-administrative costs Variable Expenses Vehicle Operations Directly operated vehicle milesVolunteer Reimbursement
a Volunteer miles
Brokered Transportation Brokered trips Fixed Expenses Insurance Directly operated vehicle milesLocal Office Materials & Supplies
a Office time
Contractor Materials & Supplies b
Proportional to non-administrative costs a Directly operated driver hours and vehicle miles are determined based on driver logs for agencies that have services with dedicated blocks of vehicle time. Remaining hours and miles, when clients of various agencies share rides, are allocated using ridership. b
For example, for a vehicle operating service for three different agencies, FACT would assign a percent allocation for the variable labor costs. For driver hours, costs would be allocated based on the proportion of riders carried for each agency. For dispatch and scheduling, the costs would be based on the amount of time devoted to scheduling each agency’s trips. While these cost
Office staff (management, schedulers, and dispatchers) estimate the time they spend on each program.

B u s i n e s s P l a n
F U L L A C C E S S & C O O R D I N A T E D T R A N S P O R T A T I O N ( F A C T )
Page 8-18
allocations may seem complex, Trapeze software can keep track of the breakdown of hours and miles between programs and service types.
Next Steps
FACT will develop a tailored model based on the cost categories and the allocation factors identified in the above figures. This means that for each partner agency, FACT will need to determine the characteristics that affect variable costs. For example, one partner agency may have a very productive service with subscription service that requires minimal scheduling effort whereas another participating agency has low productivity and requires significant scheduling and dispatch effort. FACT will determine the percentage allocation for labor and fixed expenses and then assign costs based on these percentages for each partner agency. After assigning the allocated portions for each partner agency, then all cost categories are added to arrive at the total allocated cost for each program. A major challenge for FACT is that without actual experience, this exercise will be very difficult to estimate. This will require FACT to make some initial estimates and then refine the model based on actual experience.

B u s i n e s s P l a n
F U L L A C C E S S & C O O R D I N A T E D T R A N S P O R T A T I O N ( F A C T )
Page 9-1
Chapter 9. Evaluation This chapter presents a methodology for evaluating FACT’s services and program implementation in the short-term. Specific standards will be developed and adopted for each of FACT’s programs elements. Medium- and long-term programs will also require a set of evaluation standards which can be developed later when those programs are planned and implemented.
Evaluating Program Administration The administrative aspect of the evaluation will focus on the overall administrative function and the performance of FACT and its partners. It should consider the organization’s perspective on how well the operational aspects of all of the programs identified in the Business Plan are working, day-to-day procedures and number of staff hours devoted to administering the programs.
Interviews with FACT staff and partner agency staff will be carried out to find answers to the following types of questions:
General Program Administration/Universal Evaluation:
Were the roles and responsibilities between the program administrator (multiple agencies, contractor(s), etc.) and partners clear, and were they followed? What types of problems did you encounter and how did you address them?
Did the process and procedures for program enrollment work well? For I&R? Travel navigation? The driver wellness program?
Were procedures clearly outlined in MOAs/MOUs? Were they easy to understand and administer?
If a specific program imposed limits on usage, were these reasonable and were they consistently followed?
Who were the program users or participants? Should eligibility requirements be established/modified?
What strategies did you employ for publicizing the program(s)?
What were the most effective strategies for getting the word out about the program?
Did you (or how did you) monitor service quality?
Transportation Programs (Ramona Senior Transportation Pilot Project, Mobility Management Pilot Program, DMV Guaranteed Ride Home Program):
What level of assistance did you provide program participants in scheduling a ride?
Were progress reports on usage submitted on a regular basis? How frequently? Did they provide the “right” level of information?
Was there regular communication between FACT and its partners?
Did you impose limits on the number of trips per person? If yes, what were they and how did this work?

B u s i n e s s P l a n
F U L L A C C E S S & C O O R D I N A T E D T R A N S P O R T A T I O N ( F A C T )
Page 9-2
How many and who were the service providers? Was it difficult to contract with them? If yes, what were the hurdles?
What can be done to improve the cost-sharing process? Are new accounting procedures required?
Did vendors submit their invoices promptly? Is the process for vendor payment working well?
Was the program coordinated with existing I&R programs?
Are there clear delineations between the roles and responsibilities between the telephone information function and the outreach function?
How many transportation services and other services are included in the database? How is this information gathered?
What steps were taken to ensure the database is updated and current?
How often are updates to the database made?
What types of informational materials were prepared?
Do the STRIDE and FACT websites reflect the various program elements?
Is information presented using accessibility guidelines?
Older Driver Wellness Program:
Did you have challenges in scheduling driver wellness trainings in the first year? If yes, what were the difficulties?
Were the trainers available when you needed them?
Was your staff appropriately trained to deliver the training?
Do you anticipate problems in arranging trainings next year?
Do you have the appropriate staff, marketing and other resources within your organization to hold successful driver wellness trainings? If not, what resources do you need?
Maintenance Coordination:
How many referrals did FACT make to the program?
What type of feedback did FACT receive about the Maintenance Coordination program?
Was your staff knowledge about the program?
How easy was it to schedule maintenance for partner organizations and agencies?
What could FACT do to improve the success of the program?
Volunteer Driver Program Resource Allocation:
What is FACT’s role in the volunteer reimbursement procedures? Is there anything FACT could do to enhance that role or improve the design of the program?
What type of feedback did FACT receive about allocating resources to volunteers?
Is the current allocation rate appropriate? Is it easy to administer or is it cumbersome?

B u s i n e s s P l a n
F U L L A C C E S S & C O O R D I N A T E D T R A N S P O R T A T I O N ( F A C T )
Page 9-3
Is data reported accurately? Do partners follow the expectations outlined in the MOU/MOA?
What could FACT do to improve the success of the program?
Evaluating Efficiency and Capacity A set of performance measures and standards will be established for each of the programs overseen by FACT. Unlike the administrative evaluation described above, this will allow FACT to conduct a quantitative evaluation of service efficiency and staff capacity. This information will be useful to determine whether FACT is meeting its internal cost controls, and for comparative analyses: FACT will be able to conduct efficiency reviews to determine if it is able to manage the programs it sponsors more cost-efficiently than other organizations. This will allow those organizations to determine the extent to which they want to partner with FACT and will also help organizations determine which programs should be handed over to FACT — a key element of building FACT’s portfolio of programs.
As part of the efficiency analysis, specific cost data will be reviewed. Start-up or initial capital costs should be documented as well as ongoing operating costs including labor (staff time), direct expenses (marketing, printing, etc) and in-kind services. By analyzing the data for each program, FACT can determine whether the following are true:
Were the start-up costs “in line” with initial estimates and benchmarks from other successful programs?
Is the trend showing increasing usage or participation over time?
What are the operating costs per program participant?
Is the cost per participant showing an improving trend over time?
If performance standards were recommended, were they met? If not, are they expected to be met in the next six to 12 months?
Transportation Programs Ramona Senior Transportation Pilot Project, Mobility Management Pilot Program (Phase 1) Travel Navigation, and DMV Guaranteed Ride Home Program
For transportation service programs, the efficiency evaluation should be based on specific standards to be determined as part of the program design process. Examples of the types of standards set by other CTSAs and transportation providers include the following:
Complaint Ratio: The number of complaints involving each contract provider should not exceed 5 complaints per every 100 trips provided.
Complaint Response: The contractor should respond to each complaint as specified according to the MOU/MOA/contract (this should be established).
On-Time Performance: The contractor should achieve an on-time performance target of 95% (i.e., 95% of the pick-up location arrivals shall be no later than 15 minutes after the pick-up time for advance-request trips; if taxis are used for future FACT services, an option could be “no later than 60 minutes after a taxi service request is placed.”).

B u s i n e s s P l a n
F U L L A C C E S S & C O O R D I N A T E D T R A N S P O R T A T I O N ( F A C T )
Page 9-4
Trip Denials: The contractor should accommodate all eligible trip requests for service as defined in the contract. (FACT will find that in some cases, it may be appropriate for contractors to negotiate ride times and this can be included in the contract).
Excessive Ride Time: The contractor should accommodate 99% of trips within maximum ride time standards. Suggested ride time standards can be included in the contract, such as a specific number of minutes for trip lengths less than a certain number of miles.
Missed Trips: FACT should evaluate the number of missed trips. A generous standard might be no more than one (1) missed trip per month.
In its contract, FACT can include the following and also monitor the data provided by the contractor:
– Safety: Maintain a safety standard of no more than 1.50 preventable accidents per 100,000 miles.
– Lift Operation: Ensure that wheelchair lifts are operating properly on all lift-equipped vehicles.
– Climate Control: Ensure every vehicle in revenue service shall have a functioning HVAC system, sufficient to keep the vehicle at a comfortable temperature, and a functioning radio for communication with the dispatch center and/or FACT staff.
– Clean Vehicles: Provide a clean vehicle (both interior and exterior) for this contract service.
FACT will ensure that the operations reports provided by the contractors provide sufficient information to indicate any capacity constraints that might be occurring in the service provided. Dispatch logs could be required for submission to verify on-time performance and no-shows.
Other tools FACT can use to monitor the quality of its brokered or managed transportation programs are to
Conduct random telephone calls at different times of the day to determine wait times when making reservations or calling for information (if third-party call centers are used).
If practical, listen in to conversations that take place with the reservations agents at the various providers to determine if customers are receiving trips in accordance with program policies.
Establish a “secret rider” program to document the ride experience. While the limited number of riders on a shared-ride or taxi vehicle can make this more difficult to implement, such programs have been successful in many communities.
Review complaint logs and the steps that were taken to resolve the complaints.
Develop a customer feedback form that can be included with vouchers.
Require reports from contractors’ drug/alcohol testing program.
Conduct observations of passenger boarding procedures, driver behavior on the vehicles, driver sensitivity, and passenger assistance.

B u s i n e s s P l a n
F U L L A C C E S S & C O O R D I N A T E D T R A N S P O R T A T I O N ( F A C T )
Page 9-5
Other Programs Other programs, such as the Older Driver Wellness Training, Maintenance Coordination, and Volunteer Driver Program Resource Allocation will require their own set of measures and associated standards. The cost and benefit evaluation of each service should be performed.
After one full year of operation, quantifiable standards will be established to further assess performance. For each measure, a standard or target will be established based on experiences at other organizations. Annual reports should state whether targets have been met and a year-end trend analysis should be prepared and accompanied by a brief explanation for the trends.
Evaluating Program Impact Program impacts will be evaluated through a combination of quantitative data collection, as well as focus groups, surveys and feedback from partner organizations.
After the first year, a series of surveys will be conducted to evaluate the benefits of FACT’s programs. For transportation services, surveys can be administered on-board vehicles or via telephone. For I&R or travel navigation services, callers can be asked to answer questions upon completion of a call. Likewise, for trainings participants can complete a survey at the end of the training.
Some example survey questions designed for the users of specific programs are listed below.
For trips taken: Did you understand how to schedule a ride? If you were unclear, what specifically was
confusing to you?
Has the program reduced your isolation at home or enabled you to get out of the house more?
What things are you doing now in your life that you could not do prior to the FACT-administered program?
Did the service you used (on your last trip) arrive within 15 minutes of the scheduled time? If not, how many minutes after the scheduled arrival time, did time did the vehicle show up?
Was the driver courteous and friendly?
Please rate your overall experience with the program (Extremely satisfied, Somewhat satisfied, Not satisfied)
How could the program be improved?
For travel navigation/I&R:
Did you obtain the information you were seeking? If yes, do you plan to follow up and contact the agency or service?
Did you learn about a transportation service that you were not aware of? If yes, what is it? Did you use it? Do you plan to use it?
Do you feel you are more familiar with transportation services that can get you where you need to go?

B u s i n e s s P l a n
F U L L A C C E S S & C O O R D I N A T E D T R A N S P O R T A T I O N ( F A C T )
Page 9-6
Are you now better informed about regional transportation programs than you were before you called FACT?
For DriveWell training:1
Please rank you feel this training has increased your confidence in driving on your own?
Having completed this training, do you plan to continue to drive? If yes, please rank how you feel this will training will provide you with a sense of independence?
Are you now better informed about the transportation options if and when you do stop driving?
What were the top three things you learned at this training session?
How would you rate the trainer?
For coordinated maintenance:
How would you evaluate the quality of the service provided?
Did you find this program saved you maintenance costs? If so, how much?
Will this service allow your organization to provide more trips than you were able to provide prior to the coordinated maintenance program?
What additional maintenance services would you like to see offered?
For the DMV Guaranteed Ride Home Program:
Did you anticipate that you might not be able to renew your license today?
How would you have gotten home if this service were not available?
When you called FACT to get a ride home, was the staff courteous? Were they helpful?
Are you familiar with FACT’s driver training program? Transportation programs?
The volunteer driver program resource allocation program can be evaluated through discussions with the administrators of those programs to determine whether they have sufficient numbers of volunteers, if volunteers remain drivers for longer periods of time than they did before the enhanced reimbursement allocation, if the program is easy to administer, and what changes can be made to facilitate expansion of the program.
Evaluating Program Compliance FACT is responsible for meeting all federal, state and local regulations in providing its services. SANDAG will provide FACT with most of the reporting mechanisms that are required in the short-term. Two areas of concern were raised by FACT and are discussed below.
1 Part of DriveWell’s training program includes a self-evaluation that can be used by participants to evaluate their own success with the program. These evaluations are integrated into the coursework, but can be used to more fully assess the participants’ accomplishments.

B u s i n e s s P l a n
F U L L A C C E S S & C O O R D I N A T E D T R A N S P O R T A T I O N ( F A C T )
Page 9-7
TDA Compliance As a CTSA, and recipient of TDA funds, FACT must undergo a TDA Performance Audit every three years based on procedures outlined by the California Department of Transportation (Caltrans) to determine compliance with the TDA. A CTSA audit consists of two components: (1) a compliance audit and 2) a functional audit. The compliance audit reviews and analyzes the five measures required by the TDA:
Operating Cost Per Passenger
Operating Cost Per Vehicle Service Hour
Passengers Per Vehicle Service Mile
Passengers Per Vehicle Service Hour
Vehicle Service Hours Per Employee
The functional audit evaluates performance based on the CTSA’s own internal set of goals, objectives and standards. This allows FACT to monitor whether it has successfully met its adopted performance standards and to identify areas for improvement.
The audit would serve as an independent, objective evaluation of FACT services, administration and procedures that would provide constructive recommendations for improvements.
Federal Title VI Compliance Recipients of New Freedom funds are required to maintain compliance with Federal Title VI civil rights programs and guidelines. Both Caltrans and SANDAG are responsible for documenting and ensuring they distribute New Freedom funds without regard to race, color, and national origin and must provide documentation to the Federal Department of Transportation. FACT may also be required to submit documentation of its own efforts to comply with Federal civil rights laws.2
Because New Freedom funding requests must reference a “locally developed coordinated plan” which must be developed in accordance with Federal Civil Rights Act regulations assuring equity of distribution of benefits among eligible groups, FACT has a basis for its programming that presumes the organization’s efforts target all populations equally. In fact, much of FACT’s programs will focus on underserved populations, including low income, disabled and minority populations as part of the organization’s interest in environmental justice.
Thus, as a recipient of federal funds, FACT must respond to requests from SANDAG and Caltrans to document its programs and efforts to serve minority and low-income communities, include minorities on staff, contract with minority providers, and provide service without regard to race, color or national origin.
Although there are no specific requirements for FACT directly to develop Title VI compliance reports, FACT is encouraged to document efforts to reach minority communities, provide outreach in languages other than English, partner with organizations that serve minority populations, and contract with minority or disadvantaged business enterprises (DBEs) to provide transportation or other services. FACT should summarize its efforts in its Annual Report. In the future, if FACT were to operate a public ADA paratransit service (i.e., for NCTD or MTS), the operation would be required to report its full compliance with Federal Title VI regulations.
2 Title VI requirements are outline in FTA Circular 4702.1.


B u s i n e s s P l a n
F U L L A C C E S S & C O O R D I N A T E D T R A N S P O R T A T I O N ( F A C T )
Appendix: Page 1
Appendix A. Peer Review Findings and Opportunities
Peer Review Findings and Opportunities The consulting team worked with the TGC to review and approve a set of four peer organizations for FACT on July 24. Nelson\Nygaard contacted each of the four peers, as well as one additional peer, and scheduled telephone interviews with the director of each organization.
The five peers for FACT are as follows:
• Ride Connection, Portland, Oregon • Ride-On, San Luis Obispo, California • Special Transit, Boulder, Colorado • Outreach, San Jose, California • Paratransit, Inc., Sacramento, California
We have summarized the findings from the peer reviews in a series of bullets and have included a summary table at the end of this discussion.
Ride Connection Ride Connection is a nonprofit organization based in Portland, Oregon, that links people with disabilities and seniors to transportation options throughout the tri-county Portland metro area. Ride Connection has served this coordinating function since 1988. Following are highlights from an interview with Julie Wilcke, Ride Connection’s Mobility Manager:
• Provides 371,000 annual trips, primarily partnering with 30 agencies for the provision of trips (96% of total), and providing some service directly that can be done more efficiently than through a contractor
• Staffing: Ride Connection has 37 employees, of whom 7 are part-time
• Besides brokering trips, Ride Connection provides the following three direct services:
a. One-stop call center, which provides both information and referral and schedules trips on partner agency vehicles
b. Travel training program
c. Operation of a small demand-response and shuttle service (three drivers, $175,000 annual budget, 15,000 annual trips)
• The organization started with six partner agencies, and provided 11,000 trips in its first year, almost exclusively through volunteer drivers. In 2000 Ride Connection still only had 6 employees, but has grown considerably since then.

B u s i n e s s P l a n
F U L L A C C E S S & C O O R D I N A T E D T R A N S P O R T A T I O N ( F A C T )
Appendix: Page 2
• The Board currently consists of 13 members, who do not get involved in day-to-day operations, but are well-informed and review service data monthly. They include private business people, an elected official, and a number of individuals who have retired from various positions at government or human service agencies.
• Ride Connection holds three different kinds of contracts with its partner agencies:
a. Rural - in areas where nonprofits are not able to provide transportation but there is a local taxi company willing to participate.
b. Operational - forms the bulk of service provision.
c. Vehicle only contracts - Ride Connections acquires Section 5310 vehicles, and requires that agencies provide a specific volume of monthly trips on those vehicle.
• Funding sources: Tri-Met (transit agency for tri-county region), State Department of Transportation, donations/fundraisers, and foundations.
• The cost/trip ($13.32, including administration), is much lower than the ADA paratransit service, which partly explains Tri-Met’s significant financial contribution to the agency.
• While Ride Connection receives most trip requests for partner agencies, it does not impose this as a requirement on partners, who may have specific reasons for preferring to take requests (e.g., some prefer clients to call their own agency as they may also have non-transportation questions).
• Ride Connection has also worked with partner agencies to set up half a dozen community based shuttle programs, and provides various forms of assistance to sustain these services.
Ride-On Ride-On is a nonprofit operated by United Cerebral Palsy (UCP) of San Luis Obispo. UCP was designated as the CTSA for the county in 1987. In contrast to Ride Connection, Ride-On is primarily a direct service provider and serves as a one-stop point of connection for most elderly and disabled transportation services outside of the ADA paratransit program.
• History: From 1987-92, United Cerebral Palsy was the CTSA, providing very limited service to its own client population in the evenings and on weekends (20 trips per month). The COG said they should be doing more to bring together social service transportation, which provided the impetus for the establishment of Ride-On.
• Staff initially documented the amount of funding being spent on transportation by all social service agencies in the county, and calculated potential savings if functions such as insurance, maintenance, and administration could be pooled.
• Ride-On started as a cooperative in 1993, when UCP joined with two other social service agency transportation providers, using their vehicles to replace their leased fleet, and one employee from each agency joined Ride-On. Ride-On paid agencies $0.25/mile to

B u s i n e s s P l a n
F U L L A C C E S S & C O O R D I N A T E D T R A N S P O R T A T I O N ( F A C T )
Appendix: Page 3
provide the drivers, while the CTSA provided maintenance, administrative services, the facility, and scheduled trips.
• In order to develop the mobility manager function as part of their CTSA role, Ride-On explored with other agencies how Ride-On could support their services. Ride-On acts as an ambassador (seen as a neutral entity), and holds regular meetings with the staff persons providing transportation at various social service agencies. If Ride-On discovers that rides are being denied at a specific agency, staff will explore the problem with the agency and determine if there are other agencies that have available capacity. If the ADA paratransit program cannot serve an individual because they are not eligible, they call Ride-On to see if they can help.
• In the first year there were just 6 or 7 partner agencies, mostly calling in for rides. Since UCP had merged with the providers that already had fleets, they were able to provide trips for these agencies, primarily to medical destinations.
• Ride-On now provides social service transportation (through the CTSA umbrella) in addition to general public transportation (through the public-private operation of a Transportation Management Association [TMA]), which includes airport shuttles, “lunchtime express” service, guaranteed ride home, visitor shuttles, agricultural and other vanpools.
• Ride-On uses TMA funding to subsidize CTSA programs. CTSA covers the cost of drivers, fuel, insurance, and charges the TMA $40/hour. The TMA in turn charges $68/hour to agencies/groups/vanpools that use their services.
• In addition to the TMA programs, the Executive Director suggests that it is helpful to have two anchor programs to complement CTSA funding. Ride-On’s two large contracts are the Regional Center (for people with developmental disabilities) and Medi-Cal transportation. This additional funding helps build staff that can also work on CTSA activities.
• Of the $5M budget, only $0.5M is derived from the CTSA. The Regional Center contracts bring in about $2M, in addition to Medi-Cal, TDA, and private pay funding sources (see TMA discussion above)
• Ride-On is currently hiring a person officially called a Social Mobility Manager, whose goal is to inform all stakeholders about transportation resources in the county, particularly focusing on educating dispatchers at social service agencies. She will also be creating a Resource Notebook (electronic and hard copies) and a DVD, which will be updated quarterly. This will be made available to all dispatchers throughout the county’s human services network.
• This position will be housed at the Regional Rideshare program, which operates the 511 line. All calls besides traffic and transit questions will be referred to the Social Mobility Manager. Over time the plan is for social service agencies to also direct their calls to this number rather than to Ride-On.

B u s i n e s s P l a n
F U L L A C C E S S & C O O R D I N A T E D T R A N S P O R T A T I O N ( F A C T )
Appendix: Page 4
• Currently, besides ride requests (on four phone lines), Ride-On gets about 20 calls daily for information. Rather than just giving the phone number of other services, Ride-On either arranges the trip and calls back the person, or transfers them directly to other services
• Staffing consists of the Executive Director, Operations Manager, Transportation Coordinator, three dispatchers, two business department staff, and 55 drivers
• Of the 310,000 annual trips provided, about 60% are for the CTSA functions and 40% for the TMA.
• The board consists of 14 members, but the agency is looking to add a couple more. Current board composition includes several transportation staff, people with disabilities, and people who are well-connected with the business and campus community. However, Ride-On consciously avoids having elected officials on the board because they may need to ask them for funding, and this could represent a conflict of interest.
• Lesson learned: If you build a service and show that it works, the money will follow. Always look to diversify, if you see a need that can be filled without losing money, pursue it.
• Challenge: Competing with other transportation agencies for funding. The CTSA is perceived as the “stepchild” because it is not supported by a jurisdiction. In order to address this perception, the Executive Director frequently presents to councils, showing them how Ride-On specifically benefits their community.
Special Transit Special Transit is a private, nonprofit organization that provides trips to a broad range of customers in Boulder, all of whom self-declare as either having a disability, are seniors, low-income, or have a life circumstance that prevents them from traveling to their destination. The program serves this population with paratransit services (125,000 annual trips), a travel training program, and also brokers with a couple of agencies to provide volunteer driver programs.
• In order to financially sustain these programs, Special Transit has a number of revenue- generating (“earned income”) contracts, including providing 20% of access-a-Ride’s (the ADA paratransit provider) trips, and the hybrid demand-response call-n-Ride program under contract to the Regional Transit District (RTD). Special Transit also has a contract with the City of Boulder to provide downtown shuttle service, known as the HOP.
• Special Transit serves as a one-stop location for all trip requests
• The largest funding sources are the County, RTD, and donations, in addition to almost 20% of the budget which is covered by earned income contracts
• Special Transit has approximately 230 employees.
• Early successes: Collaborated with American Red Cross, which now represents one of three brokered programs:

B u s i n e s s P l a n
F U L L A C C E S S & C O O R D I N A T E D T R A N S P O R T A T I O N ( F A C T )
Appendix: Page 5
a. American Red Cross recruits volunteers, provides vehicles, insurance, maintenance. Special Transit takes trip requests, develops schedules, and trains volunteer drivers. This service currently provides 5,000 annual trips.
b. Family and Friends Mileage Reimbursement Program – for hours/areas not covered by the paratransit program: the rider finds the driver/volunteer, gets reimbursed and passes this on to driver. This avoids the liability issue for the agency. Approximately 1,200 annual trips are provided through this program.
c. RSVP provides volunteers and insurance, and Special Transit refers approximately 2,500 passengers annually.
• Initiated a new program in 2008 funded through New Freedom Fund. A Mobility Specialist contacts all new ADA paratransit registrants and helps them develop individual travel plans that go beyond paratransit, if the registrant is able to use those services (she developed travel plans for over 400 registrants last year). In follow-up interviews, 35-40% report having used non-paratransit options
• The board is primarily a policy-setting body, but is responsible for fundraising, unlike the other peer boards. It consists of 17 members (four elected officials, members who are well-connected to the private industry such as a former bank manager, hospital administrator, attorney, and retired individuals from Federal agencies, RTD, and the public library.)
• Governmental Affairs is a very important sub-committee of the board, as they keep current with the constantly changing allies on city councils and other elected officials.
Outreach Outreach, a nonprofit organization, is 30 years old. The organization was founded during the War on Poverty movement and started as a social service program. The organization has provided transportation since 1979. Their vision is to solve community transit across all populations, and they indicated that although they have stuck with their vision, the external environment has changed, and they have built dynamic relationships among stakeholders to maintain their relevance. Outreach serves all of Santa Clara County, California, including the largest city in the county, San Jose.
• Their programs include a number of social service and transportation programs. Among social service programs, for example, they offer Senior Outreach, which provides benefits counseling (social security and other entitlement programs such as Medi-Cal or Medicaid), advocacy and other services (housing and food) to low-income older persons needing assistance getting through bureaucratic red-tape. Their transportation programs include the Senior Transportation Program offering paratransit rider fare subsidies, public transit passes, subsidized taxi services; operation of the ADA paratransit brokerage for Santa Clara Valley Transportation Authority (VTA), and a set of after-school and JARC transportation programs.
• The organization is small: the total administrative staff is 7 people (three people who
answer phones, 1 account manager; 2 funding and operations staff; 1 executive director)

B u s i n e s s P l a n
F U L L A C C E S S & C O O R D I N A T E D T R A N S P O R T A T I O N ( F A C T )
Appendix: Page 6
Outreach brokers rides on its 270 vehicles, in addition to taxi and other private providers’ vehicles.
• The Outreach board has up to 15 people. According to the Executive Director, board size and composition should be based on the community needs and local factors. Elected officials are not mandated on their board. They set up a board based on strategic sectors: they wanted to set up a board with people who come to the table with unique skills. The board includes Silicon Valley officials, a large university, financial experts, and business people. They are not used as a fundraising board.
• Outreach does grant writing in-house.
• The executive director advises that an agency does not need to own all of the capital itself. They did not want to carry the liability, so they make sure the contractors have more than adequate insurance. They advise to get a good insurance lawyer or consult the lawyers at your local transit agency. They have found it is good to get as many small companies working with you as possible, but that it is critical that they all have good indemnification.
• All of Outreach’s direct delivery is by contractors/partners, Outreach owns the vehicles.
They secure the vehicles for their partners by using their grants and then rent vehicles to providers ($1 a year) or they lend them to them.
• All of their contracts combined produce 1 million trips annually. Their costs for ADA paratransit trips average $24 per person; for senior and other trips, they average $19 per person. Their average trip distance is nine miles, but some people travel as far as 30 miles one-way.
• As part of their brokerage function, they manage their contract’s direct services and do
vehicle sharing and cost sharing. Outreach is responsible for trip assignments, trip volumes and trip allocation. They have found that the more they control directly, the more cost effective their business model is.
• They have a one-stop call center. They do eligibility evaluation and register people.
• Outreach recommends that FACT find out what the costs for the existing providers are
and deconstruct the NCTD data and figure out what the cost is for these types of services would be if FACT operated them. “If the transit authority is paying $30 per trip, then FACT can judge whether it can do it more cost-effectively.” They also suggest that FACT look at capacity: FACT needs to weigh whether it is an appropriate investment to do a mobility management brokerage. Will FACT be adding value and cutting costs by charging agencies $5 for their services?
• ADA paratransit is funded with local public transit money. Other funding sources include
JARC, TANF, New Freedom, Council on Aging, County Nutrition, Healthy Neighborhood, and public health funds. They take all of their funding sources and match the dollars for each trip to the appropriate sources.

B u s i n e s s P l a n
F U L L A C C E S S & C O O R D I N A T E D T R A N S P O R T A T I O N ( F A C T )
Appendix: Page 7
• Their greatest challenge is finding operating dollars for all of the demand that their programs have.
• Their success came about from their early start as an anti-poverty agency. They worked with a lot of people to begin with, so they had partnerships that had already been established. They also built their own information technology business system. Their entire system has been paid for and they have been able to divide up its costs based on the various funding sources. They use Trapeze for dispatch and scheduling, but tracking and routing are done using their own tools.
Paratransit, Inc. Paratransit, Inc. is the CTSA for the transit district portion of Sacramento County. A second CTSA covers the portions of Sacramento County outside of the transit district, and is overseen by the County Public Works Department. The organization is a nonprofit, founded 1978. When the organization was started, the goal was to create a transportation entity that would do the things that ultimately would become the CTSA’s responsibilities. They started with a consolidated maintenance function and operating limited transportation services themselves. They claim to be the most active, if not the most successful, CTSA in the state.
• Paratransit, Inc. has 230 employees. In addition to their call center, they have 25
employees in maintenance, 180 drivers and 15 people who administer their programs. They are not only the CTSA, which they consider that to be half of their business, but they are also the ADA operator for Sacramento Regional Transit (RT).
• Their board has evolved. In 1978, the original board included social service leaders in
the area to help design the organization. Between 1978 and 1981, they operated their service, and RT had its own paratransit service. Their first partner was the Community College, so they negotiated an agreement with them whereby the Community College District owned two buses and gave them to Paratransit, Inc. which in return carried their students as the number one priority for their service. In 1981, Paratransit, Inc. took over all complementary paratransit operations and RT went out of the paratransit business. They restructured their Board of Directors based on a four-party agreement between the City of Sacramento, SACOG (the MPO), RT, and Sacramento County. This agreement specifies the makeup of the board: nine members with specific appointment responsibilities for each jurisdiction. The City and County must ensure at least one of their appointments is a user. Two board members from the City Council are the only elected officials. One-half of their board is comprised of people with disabilities, and the board includes several social service agency representatives.
• On ADA side, they use Trapeze. They also have Trapeze links at two taxi companies.
They try to use as much state-of-the-art technology as possible. On the CTSA side, they primarily have partnership agreements with social service agencies for cost sharing depending on the services offered to their clientele. United Cerebral Palsy (UCP) is their largest partner and Paratransit, Inc. houses UCP’s transportation function in their building. 15 different agencies are under contract to them to provide service for them.

B u s i n e s s P l a n
F U L L A C C E S S & C O O R D I N A T E D T R A N S P O R T A T I O N ( F A C T )
Appendix: Page 8
• They have agreements with 50 organizations to do maintenance for their vehicles. The maintenance function is open weekdays, evenings and weekends, and they also have loaner vehicles. The maintenance function is a money-making operation.
• Since 1983, travel training has been a sizeable component of what they do. They have
trained thousands of people over the years and do training for Spokane, SJRTD, VTA and Honolulu.
• Sacramento RT handles the eligibility process and from then on, Paratransit, Inc. is in
charge.
• If someone has a potential affiliation with an agency, Paratransit, Inc. will direct them to that agency, which gets people off the paratransit service and on to the CTSA services they broker and operate. On their ADA side, passengers per hour is 1.61; for the CTSA, it is 4.76.
• They have two major funding sources on the CTSA side: TDA Section 4.5 and local
sales tax. In the local sales tax ordinance it says that, “the CTSA is a direct recipient of the sales tax funds.” They also get lots of grants: JARC, 5310 (every year they get 8 or 10 buses out of 5310), New Freedom, etc. They have almost no private funding, except the building they operate out of was donated to them.
• Largely, what they are marketing at this moment is directed to partners. They also have
a grant to establish a mobility management center in-house. They are in the process of setting up a one-stop shop – that will put them directly in the situation of dealing directly with consumers. They will be more actively marketing that particular component of what they do.
• Their greatest challenge is institutional jealousy: from time to time they have had battles
about their success. They have had conflict over their role because they are not a public organization and therefore can be involved in advocacy, pushing low-cost alternatives, etc.

B u s i n e s s P l a n
F U L L A C C E S S & C O O R D I N A T E D T R A N S P O R T A T I O N ( F A C T )
Appendix: Page 9
Summary of Peer Findings
Organization/ Agency
Location Services Provided Year Started
Budget Staffing Annual Trip Volume
Board Size/ Composition
Funding Sources Model Features/Lessons Learned
Ride Connection
Portland, OR • One-stop call center (information and referral and trip scheduling)
• Travel training • Small demand-response and shuttle
service (direct) • Partner/broker with 30 non-profit human
service transportation providers (shuttles, volunteer drivers, door-to-door)
1986 $5.6M 37 (of which 7 part-time)
371,000 13 – retired professionals, one elected official, attorney, business people
Tri-Met (transit agency), FTA Section 5311, State cigarette tax, foundations
• Travel Navigators provide individualized trip planning; Building credibility takes time, but can lead to extensive network of services; providing services in lieu of transit agency can be major revenue generator
Ride-On San Luis Obispo County, CA
• Mobility management • Direct service provider • Volunteer driver program • Contract with taxi companies • Maintenance • Vanpools (including agricultural)
1987 CTSA, became Ride-On 1992
$5M Over 60, including E.D., Ops Mgr, Coordinator, 3 dispatchers, 2 business department, 55 drivers
310,000 14 – transportation professionals, disability advocates, CalPoly
Regional Center, CTSA, profitable services
• Cross-subsidize revenue generators (tour groups, airport shuttle, weddings) with social service transportation; need anchor contracts e.g. Regional Center, Medi-Cal
Special Transit Boulder, CO • Mobility management • Direct service provider (including ADA
paratransit) • Call-n-Ride (circulators connecting to
transit centers) • Downtown shuttle • Mileage reimbursement program • Broker two small volunteer driver
programs • Travel training
1997 $3.2M 230 125,000, plus 980,000 on Hop (downtown Boulder circulator)
17 – 4 elected officials, people influential in private and public sectors, retirees from government agencies
Donations, FTA 5311, City and County, Regional Transit District (transit agency)
• Develop list of individuals who could influence organizations – designate as potential board members, donors, volunteers
• Providing services in lieu of transit agency can be major revenue generator
Outreach and Escort
Santa Clara County/ San Jose, CA
• One-stop call center • ADA paratransit provider (no direct
delivery) and eligibility screening • Paratransit rider fare subsidy program • Transit passes • Subsidized taxi • After-school transportation for
CalWORKs children
1979 27, including 20 in call center
1,000,000 15 – members connected to private industry, university
VTA (transit agency), JARC, TANF, New Freedom, public health funds
• Cashless pre-paid fare system • Emphasis on high-tech and partnerships • Stakeholders tend to underestimate fully loaded
transportation costs
Paratransit Inc. Sacramento, CA
• CTSA and ADA paratransit provider (contract with 15 agencies)
• Travel training • Maintenance
1978 $18M 230, including 180 drivers, 25 maintenance
700,000 9 – community members, including 4 disabled, 2 city council members
TDA 4.5, local sales tax, JARC, 5310
• Revenue generators include maintenance and travel training contracts, plus paratransit provision in lieu of transit agency
• Contracts with partners do not have penalties, more collaborative approach
• Highly computerized


B u s i n e s s P l a n
F U L L A C C E S S & C O O R D I N A T E D T R A N S P O R T A T I O N ( F A C T )
Appendix: Page 11
Appendix B. Sample Contract from Ride Connection
RIDE CONNECTION, INC.
PROFESSIONAL SERVICES CONTRACT Contract No: 04-0384XXX
This contract is by and between Ride Connection, Inc., an Oregon nonprofit corporation (hereinafter "RIDE CONNECTION") and XXXXX, (hereinafter "Contractor"). 1)
TERM
The term of this contract will be from XXXXXX through XXXXXX, unless terminated sooner under the provisions of this contract. 2)
FEDERAL REQUIREMENTS
a) This contract is funded in part under a financial assistance agreement between TriMet and the U.S. Department of Transportation, Federal Transit Administration ("FTA"). This contract is subject to all provisions prescribed for third party contracts by the financial assistance agreement, including, but not necessarily limited to, the provisions in Exhibit “A1” (FEDERAL REQUIREMENTS), which is attached hereto, and made a part of this contract.
b) This Contract is funded in part under financial assistance agreement between the Oregon Department of Transportation (ODOT) and RIDE CONNECTION, Inc. This contract is subject to all provisions prescribed for third party contracts by the financial assistance agreement, including, but not necessarily limited to, the provisions in Exhibit “A2” (UNITED STATES OF AMERICA DEPARTMENT OF TRANSPORTATION FEDERAL TRANSIT ADMINISTRATION MASTER AGREEMENT), which is attached hereto, and made part of this contract.
3)
SPECIAL CONDITIONS
a) The Contractor will provide the services as specified in Exhibit “B” (SCOPE OF SERVICES) "Services", which is attached hereto, and made part of this contract.
b) This Contract is funded under an agreement between TriMet and RIDE CONNECTION, Inc. Service provided under this contract is subject to all Program Requirements described in Exhibit F, which is attached hereto, and made part of this contract.
c) The Contractor response to TriMet RFP RC040384BW is attached hereto as Exhibit G and made part of this contract.
d) Contractor will provide “Special Services” as detailed in Exhibit “P”, which is attached hereto, and made part of this contract.
4)
RIDE CONNECTION agrees to pay Contractor a maximum of _______ for performance of the Services. All Contractor invoices must be sent directly to RIDE CONNECTION and must contain a reference to the contract number and date services were provided. After
COMPENSATION

B u s i n e s s P l a n
F U L L A C C E S S & C O O R D I N A T E D T R A N S P O R T A T I O N ( F A C T )
Appendix: Page 12
RIDE CONNECTION’S receipt of an approved invoice, RIDE CONNECTION will pay Contractor no later than 10 days from the receipt of payment from TriMet.
5)
VEHICLE PROVISIONS
RIDE CONNECTION operates a program in the State of Oregon, funded by TriMet and ODOT for the management and operation of RIDE CONNECTION owned and Contractor owned vehicles. Contractor owned vehicles are listed in Exhibit "D2", which is attached hereto, and made part of this contract.
a) Contractor owned vehicles listed in Exhibit "D2" are subject to the provisions stated herein during the service hours funded by this contract.
b) Contractor will utilize the vehicle(s) for the purpose of enhancing transportation services for people with disabilities and/or persons older than 60 years of age living in the Tri-county area.
c) Contractor will obey all laws in using the vehicle(s) and equipment and will only allow licensed, insured, and RIDE CONNECTION approved drivers to operate the vehicle(s).
d) All drivers of the vehicle(s) under this agreement must participate in training sessions sponsored or approved for by RIDE CONNECTION to ensure the safety of operations.
e) RIDE CONNECTION, ODOT and TriMet reserve the right to inspect the vehicle(s) at any time.
6)
CONTRACTOR IS AN INDEPENDENT CONTRACTOR
Contractor is an independent Contractor for all purposes and is entitled to no compensation from RIDE CONNECTION or TriMet other than that provided by this contract. Contractor will inform RIDE CONNECTION of Contractor's Federal Internal Revenue Service Employer Identification Number, or, if Contractor is an individual with no employer identification number, Contractor's Social Security Number. The Contractor and its officers, employees, and agents are not officers, employees or agents of TriMet and/or RIDE CONNECTION as those terms are used in ORS 30.265. The Contractor, its employees or officers will not hold themselves out either explicitly or implicitly as officers, employees or agents of RIDE CONNECTION or TriMet for any purpose whatsoever, nor are they authorized to do so. 7)
LABOR AND MATERIAL
Contractor will provide and pay for all labor, materials, equipment, utilities, and other goods or services necessary for full contract performance unless this contract specifically provides otherwise. Contractor will supervise and direct contract performance using its best skill, and will be responsible for selecting the means of contract performance. If, during or after the term of this contract, Contractor learns of any actual or potential defect in the services provided under this contract, of any problem associated with the results of contract performance, or of any nonconformance with a provision of this contract or of Federal, state, or local law, Contractor will inform RIDE CONNECTION immediately in writing with a full description of the defect, problem, or nonconformance. 8)
LIABILITY
Notwithstanding any other agreements, Contractor agrees to defend, hold harmless, and indemnify RIDE CONNECTION, TriMet, and ODOT against any legal liability with respect to bodily injury, death, and property damage arising from the negligence of Contractor during its

B u s i n e s s P l a n
F U L L A C C E S S & C O O R D I N A T E D T R A N S P O R T A T I O N ( F A C T )
Appendix: Page 13
use of the property owned or registered to RIDE CONNECTION or in performance of the Services. 9)
INDEMNIFICATION
a) To the fullest extent permitted by law, Contractor agrees to fully indemnify, hold harmless and defend RIDE CONNECTION, TriMet, and ODOT; their directors, officers, and employees from and against all claims, damages, losses, attorney fees and expenses incidental to the investigation and defense thereof, based upon or arising out of or incidental to damages or injuries to persons or property, caused by the fault or negligence in whole or in part of contractor, its agents, contractors, sub-contractors, or employees from the performance of the work.
b) This indemnity will survive the termination of this Contract or final payment hereunder. This indemnity is in addition to any other rights or remedies which RIDE CONNECTION and the other parties to be indemnified may have under the law or under this Contract. In the event of any claim or demand made against any party which is entitled to be indemnified hereunder, RIDE CONNECTION may in its sole discretion reserve, retain or apply any monies due to the Contractor under the contract for the purpose of resolving such claims; provided, however, that RIDE CONNECTION may release such funds if the Contractor provides RIDE CONNECTION and the other parties with adequate assurance of the protection of their interests. RIDE CONNECTION will be the sole judge of whether such assurances are adequate.
10)
HOURS OF EMPLOYMENT
No person will be employed to perform work under this Contract for more than 10 hours in any one day or 40 hours in any one week except in cases of necessity, emergency or where public policy absolutely requires it. In the case of contracts for personal services as defined in ORS 279.051, employees must be paid at least time and a half for all overtime worked in excess of 40 hours in any one week and for work performed on the legal holidays specified in ORS 279.334(1)(a)(C)(ii) to (vii), except for individuals who are excluded under ORS 653.010 to 653.261 or under 29 U.S.C. sections 201 to 209 from receiving overtime.
11)
WORKERS' COMPENSATION
a) The Contractor, its subcontractors, if any, and all employees working under this contract are subject employees under the Oregon Workers' Compensation Law and will comply with ORS 656.017, which requires them to provide workers' compensation coverage for all subject workers.
b) Contractor warrants that all persons engaged in contract work and subject to the Oregon Workers' Compensation Law are covered by a workers' compensation plan or insurance policy that fully complies with Oregon law. Contractor must indemnify RIDE CONNECTION for any liability incurred by RIDE CONNECTION as a result of Contractor's breach of the warranty under this Paragraph.
12)
WARRANTIES
Contractor warrants that all Services will meet or exceed standards and requirements set forth in this contract. If RIDE CONNECTION discovers a breach of that warranty within one (1) year after final payment under this contract and gives Contractor written notice of that breach

B u s i n e s s P l a n
F U L L A C C E S S & C O O R D I N A T E D T R A N S P O R T A T I O N ( F A C T )
Appendix: Page 14
within a reasonable time after discovery, Contractor must remedy the breach promptly and at no cost to RIDE CONNECTION. 13)
ASSIGNMENT AND SUBCONTRACTING
Contractor will not assign any of its rights or subcontract any of its responsibilities under this contract without the prior written consent of RIDE CONNECTION. Contractor must include in each subcontract any provisions necessary to make all of the provisions of this contract fully effective. Contractor will provide all necessary plans, specifications, and instructions to its suppliers and subcontractors to enable them to properly perform their work. 14)
FUNDING LIMITATION
Contractor understands that funds to pay for Contractor's performance under this contract are anticipated to be made available to RIDE CONNECTION from TriMet. All funds must be approved and administered by TriMet. RIDE CONNECTION's obligation hereunder is payable from funds that are appropriated and allocated by TriMet for the performance of this contract. If funds are not allocated, or ultimately are disapproved by TriMet, RIDE CONNECTION may terminate or suspend Contractor's Services without penalty. RIDE CONNECTION must notify Contractor promptly in writing of the non-allocation, delay, or disapproval of funding. RIDE CONNECTION will not be liable for damages in connection with this contract on account of delay in payments to Contractor due to RIDE CONNECTION's lack of available funds from TriMet. 15)
TERMINATION FOR CONVENIENCE
RIDE CONNECTION may terminate this contract, in whole or in part, at any time by written notice to the Contractor when it is in RIDE CONNECTION and/or TriMet’s best interest. The Contractor will be paid its costs, including contract closeout costs, on work performed up to the time of termination. RIDE CONNECTION will not be responsible for payment for any work performed after the time of termination. After termination, the Contractor must promptly submit to RIDE CONNECTION its termination claim for payment. If the Contractor has any property in its possession belonging to RIDE CONNECTION, the Contractor will account for the same, and return it to RIDE CONNECTION in the manner that RIDE CONNECTION directs. 16)
TERMINATION FOR DEFAULT
a) RIDE CONNECTION may, by written notice of default to the Contractor, terminate this contract in whole or in part if the Contractor fails to (i) Deliver the supplies or to perform the services within the time specified in this contract or any extension; (ii) Make progress, so as to endanger performance of this contract; or (iii) Perform any of the other provisions of this contract.
b) RIDE CONNECTION’s right to terminate this contract under subdivisions a)(ii) and (iii) of this clause may only be exercised if the Contractor does not cure such failure within 10 days (or more if authorized in writing by the Compliance Specialist) after receipt of the notice from the Compliance Specialist specifying the failure.
c) If Contractor fails to strictly perform in the manner called for in this contract (including without limitation failure of Contractor to follow procedures set forth in RIDE CONNECTION OPERATION MANUAL FOR TRANSPORTATION MANAGERS) or if Contractor fails to comply with any other provisions of the contract, RIDE CONNECTION

B u s i n e s s P l a n
F U L L A C C E S S & C O O R D I N A T E D T R A N S P O R T A T I O N ( F A C T )
Appendix: Page 15
may terminate this contract for default. If the default produces serious safety issues, as determined in the sole discretion of RIDE CONNECTION, then RIDE CONNECTION may immediately and without notice obtain possession and control of any RIDE CONNECTION vehicle used by Contractor to provide the Service.
d) Contractor will be paid the contract price only for completed supplies or services delivered and accepted. If it is later determined by RIDE CONNECTION that Contractor had an excusable reason for not performing, such as a strike, fire, flood, or other event that is not the fault of, or is beyond the control of, Contractor, RIDE CONNECTION may allow Contractor to continue work, or may treat the termination as a termination for convenience.
e) The rights and remedies of RIDE CONNECTION in this Paragraph are in addition to any other rights and remedies provided by law or under this Contract.
17)
NON-DISCRIMINATION
During the term of this contract, Contractor will not discriminate against any employee or applicant for employment because of race, creed, sex, religion, sexual orientation, color, age, national origin, political affiliation, marital status, or mental or physical disability. 18)
JURISDICTION
This contract will be governed by Oregon law without resort to any jurisdiction's conflicts of law principles, rules or doctrines. Any suit or action arising from this contract will be commenced and prosecuted in the courts of Multnomah County, Oregon or the U.S. District Court for the District of Oregon, in Portland, Oregon, as applicable. The parties agree to submit to the jurisdiction and venue of these courts. 19)
COMPLIANCE WITH LAWS AND REGULATIONS
Contractor must adhere to all applicable federal, state, and local laws, regulations, executive orders and ordinances applicable to the work under this contract. The Contractor must comply with the clauses required in every public contract entered into in the State of Oregon as set forth in ORS 279.312, 279.314, 279.316, 279.320 and 279.445, which are hereby incorporated by reference. Contractor must adhere to all safety standards and regulations established by TriMet and RIDE CONNECTION for Services performed on its premises or under its auspices. 20)
INTEGRATION, MODIFICATION, AND ADMINISTRATIVE CHANGES
This contract includes the entire agreement of the parties and supersedes any prior discussions or agreements regarding the same subject. This contract may be modified in writing by a modification that has been signed by individuals authorized to bind each of the parties contractually. RIDE CONNECTION reserves the right to make administrative changes to the contract unilaterally. An administrative change means a written contract change that does not affect the substantive rights of the parties.
21)
NOTICES AND COMMUNICATIONS
a) All notices and other communications concerning this contract will be written in English and must bear the number assigned to this contract by RIDE CONNECTION. Notices

B u s i n e s s P l a n
F U L L A C C E S S & C O O R D I N A T E D T R A N S P O R T A T I O N ( F A C T )
Appendix: Page 16
and other communications may be delivered personally, by telegram, by facsimile, or by regular, certified, or registered mail.
b) A notice to RIDE CONNECTION will be effective only if it is delivered to RIDE CONNECTION's Executive Director, 3220 N Williams, Portland, Oregon 97227, or to another individual specifically designated by this contract or by RIDE CONNECTION in a subsequent written notice to Contractor. A notice to Contractor will be effective if it is delivered to the individual who signed this contract on behalf of the Contractor at the address shown with that signature, or to another individual designated by Contractor in this contract or in a written notice to RIDE CONNECTION.
c) Communications other than notices will be effective if delivered to a person designated under this paragraph for receipt of notices or to the project manager for the party receiving the communication if that project manager has been designated by this contract or by written notice to the other party.
22)
INSURANCE
a) During the term of this contract, Contractor must purchase and maintain any insurance required by this contract. Policies must be purchased only from companies that are authorized to do business in Oregon, unless Contractor is adequately self-insured. Contractor must furnish acceptable certificates of insurance to RIDE CONNECTION with ten (10) days after award of this contract, and prior to commencement of any Services. Contractor will indemnify RIDE CONNECTION for any liability or damages that RIDE CONNECTION may incur due to Contractor's failure to purchase or maintain any required insurance. Contractor agrees to be responsible for the risk of loss, damage or destruction of RIDE CONNECTION vehicle(s) during the term of this Agreement and until the vehicle(s) is/are returned to RIDE CONNECTION.
b) Contractor will pay all premiums and deductibles required to provide the following: i) Commercial General Liability Insurance Contractor must maintain commercial general liability (CGL) with a limit of not less than $1,000,000 each occurrence. If Contractor is self-insured, Contractor must provide documentation to satisfy this requirement. ii) Business Auto Liability Insurance Contractor must maintain business auto liability insurance with a limit of not less than $1,000,000 each accident. Such insurance must cover liability arising out of the use of any auto (including owned, hired, and non-owned autos). iii) Worker’s Compensation Insurance Contractor must maintain worker’s compensation and employer’s liability insurance as required by ORS Chapter 656. The employer’s liability limit will not be less than $500,000 each accident for bodily injury by an accident and $500,000 each employee for bodily injury by disease. The worker’s compensation limit must be equivalent to or better than the Oregon Statutory limits. iv) Contractor will pay all deductibles for vehicles.

B u s i n e s s P l a n
F U L L A C C E S S & C O O R D I N A T E D T R A N S P O R T A T I O N ( F A C T )
Appendix: Page 17
c) Contractor will furnish RIDE CONNECTION and TriMet with certificate (s) of insurance, executed by a duly authorized representative of each insurer showing compliance with the insurance requirements set forth above. If contractor is self insured, contractor will furnish RIDE CONNECTION and TriMet with a letter stating the basis for the exemption.
d) Failure of RIDE CONNECTION or TriMet to demand such certificate or evidence of full compliance with these insurance requirements or failure of RIDE CONNECTION or TriMet to identify a deficiency from evidence that is provided will not be construed as a waiver of Contractors obligation to maintain such insurance.
e) The insurance required under this Paragraph must: i) Include RIDE CONNECTION, TriMet, and their directors, officers, representatives,
agents, and employees as additional insureds with respect to work or operations connected with the contract.
ii) Require the insurer to give RIDE CONNECTION not less than ten (10) days notice prior to termination or cancellation of coverage; and
iii) Include an endorsement providing that the insurance is primary insurance and that no insurance that may be provided by RIDE CONNECTION may be called in to contribute to payment for a loss.
23)
PROMPT PAYMENT
Contractor will make payment promptly, as due, to all persons supplying to Contractor labor or material for the prosecution of the Services provided for in this contract. 24)
INCOME TAX WITHHOLDING
Contractor must pay to the Oregon Department of Revenue all sums withheld from employees pursuant to ORS 316.167. 25)
SAFETY
In addition to Contractor's own safety procedures, Contractor must implement and enforce all safety requirements that are determined to be applicable to performance of this contract by RIDE CONNECTION's Safety/Training Department (including without limitation the current RIDE CONNECTION OPERATION MANUAL FOR TRANSPORTATION MANAGERS) and all requirements that are standard in the industry and/or required by TriMet’s Safety Department.
26)
SUBCONTRACT PROVISIONS
Contractor may not assign any of its rights or subcontract any of its responsibilities under this contract without the prior written consent of RIDE CONNECTION. Contractor must include in each subcontract any provisions necessary to make all of the provisions of this contract fully effective. Contractor must provide all necessary plans, specifications, and instructions to its suppliers and subcontractors to enable them to properly perform their work. 27)
PROHIBITED INTERESTS
a) No RIDE CONNECTION or TriMet Board member, officer, employee or agent may have any direct or indirect interest in this contract or its proceeds during that person’s tenure with RIDE CONNECTION or TriMet, except to the extent such interest is permitted and

B u s i n e s s P l a n
F U L L A C C E S S & C O O R D I N A T E D T R A N S P O R T A T I O N ( F A C T )
Appendix: Page 18
disclosed as may be required under applicable law and RIDE CONNECTION or TriMet policy.
b) Except for unsolicited gifts of nominal value given for advertising purposes, no RIDE CONNECTION or TriMet board member, officer, employee, or agent will solicit or accept, and Contractor will not offer or give to any RIDE CONNECTION or TriMet board member, officer, employee, or agent, any gratuities, favors, or anything of monetary value in connection with this contract, except to the extent permitted by applicable law and RIDE CONNECTON or TriMet policy.
c) No member of, or delegate to, the Congress of the United States will be admitted to a share or part of this contract or to any benefit arising therefrom.
28)
COMPUTATION OF TIME
Time periods measured in days will be computed by excluding the day upon which the period begins to run and including the last day of the period unless the last day is Saturday, Sunday, or a legal holiday as defined in ORS 187.010 or ORS 187.020. If the last day of the period is a Saturday, Sunday, or legal holiday, the period will run until, and will include, the next day that is not a Saturday, Sunday, or legal holiday. All time periods measured in days will be based upon calendar days. 29)
AUDIT AND RECORDS -- NEGOTIATION
a) As used in this clause, "records" includes books, documents, accounting procedures and practices, and other data, regardless of type and regardless of whether such items are in written form, in the form of computer data, or in any other form.
b) Examination of costs The Contractor must maintain and RIDE CONNECTION and/or TriMet, or an authorized representative of RIDE CONNECTION and/or TriMet, must have the right to examine and audit all records and other evidence sufficient to reflect properly all costs claimed to have been incurred or anticipated to be incurred directly or indirectly in performance of this contract. This right of examination must include inspection at all reasonable times and places engaged in performing the contract.
c) Cost or pricing data. If the Contractor has been required to submit cost or pricing data in connection with any pricing action relating to this contract, TriMet and/or RIDE CONNECTION, or an authorized representative of TriMet and/or RIDE CONNECTION, in order to evaluate the accuracy, completeness, and currency of the cost or pricing data, will have the right to examine and audit all of the Contractor's records, including computations and projections, related to – i) The proposal for the contract, subcontract, or modification; ii) The discussions conducted on the proposal(s), including those related to negotiating; iii) Pricing of the contract, subcontracts, or modification; or iv) Performance of the contract subcontract or modification.
d) Availability. The Contractor will make available at its office at all reasonable times the records, materials, and other evidence described in paragraphs (a), (b), and (c), of this clause, for examination, audit, or reproduction, until 3 years after final payment under this contract or for any shorter period specified in Subpart 4.7, Contractor Records Retention, of the Federal Acquisition Regulation (FAR), or for any longer period required by statute or by other clauses of this contract. In addition – i) If this contract is completely or partially terminated, the records relating to the work
terminated must be made available for three (3) years after any resulting final termination settlement; and

B u s i n e s s P l a n
F U L L A C C E S S & C O O R D I N A T E D T R A N S P O R T A T I O N ( F A C T )
Appendix: Page 19
ii) Records relating to disputes, litigation or the settlement of claims arising under or relating to this contract must be made available until such disputes, litigation, or claims are finally resolved.
30)
SEVERABILITY
If any of the provisions contained in this Agreement are held by a court of law or arbitrator to be illegal, invalid or unenforceable, the enforceability of the remaining provisions will not be impaired, and the parties will negotiate an equitable adjustment of this contract so that the purposes of this contract are affected. All provisions concerning indemnity survive the termination or expiration of this contract for any cause. 31)
WAIVER AND NONWAIVER
a) A waiver by one party of a right to a remedy for breach of this contract by the other party will not be deemed to waive the right to a remedy for a subsequent breach by the other party. RIDE CONNECTION's acceptance of goods or services, or payment under this contract, will not preclude RIDE CONNECTION from recovering against Contractor or Contractor's surety for damages due to Contractor's failure to comply with this contract.
b) Both parties having had the opportunity to consult an attorney regarding the provisions of
this contract, the parties agree to waive the principle of contract interpretation that an ambiguity will be construed against the party that drafted the ambiguous provision.
32)
For all contracts and subcontracts in excess of $100,000.00, Contractor agrees to comply with all applicable standards, orders, or requirements issued under Section 306 of the Clean Air Act (42 USC 1857(h)), Section 508 of the Clean Water Act (33 USC 1368), Executive order 11378, and Environmental Protection Agency regulations (40 CFR, Part 15), which prohibit the use under nonexempt Federal contracts, grants, or loans, of facilities included on the EPA List for Violating Facilities. Contractor must report violations to FTA and to the USEPA Assistant Administrator for Enforcement (EN0329)
ENVIRONMENTAL VIOLATIONS
33)
LIENS PROHIBITED
Contractor w ill not per mit any l ien or c laim t o be f iled or pr osecuted ag ainst R IDE CONNECTION and/or TriMet, their properties or right-of-way on account of any labor or material furnished or any other reason for work arising out of this Contract. If any l ien is f iled, Contractor must s atisfy and di scharge or c ause s uch l ien t o be s atisfied and di scharged i mmediately at Contractor’s sole expense
34)
MEDIATION
Should any dispute arise between the parties concerning this agreement which is not resolved by mutual agreement, it is agreed that it will be submitted to mediated negotiation prior to any party commencing litigation. In such an event, the parties to this agreement agree to participate in good faith in a non-binding mediation process. The mediator will be selected by mutual agreement of the parties, but in the absence of such agreement each party will select a temporary mediator and those mediators will jointly select the permanent mediator. All costs of mediation will be borne equally by the parties.

B u s i n e s s P l a n
F U L L A C C E S S & C O O R D I N A T E D T R A N S P O R T A T I O N ( F A C T )
Appendix: Page 20
35)
PARAGRAPH HEADINGS AND OTHER TITLES
The parties agree that paragraph headings and other titles used in this contract are for convenience only, and are not to be used to interpret this contract. 36)
ATTORNEY FEE PROVISION
If suit or action is instituted to enforce any of the terms or provisions of this contract, the prevailing party will be entitled to its reasonable attorney fees, costs and disbursements. 37)
AUTHORITY
The representative signing on behalf of the parties certify that they are duly authorized by the party for which they sign to make this contract. 38)
CERTIFICATE OF OREGON TAX LAW COMPLIANCE
By execution of this contract, Contractor certifies under penalty of perjury as provided in ORS 305.385(6), that it is, to the best of its knowledge, not in violation of any Oregon tax law. For purposes of this certification, "Oregon Tax Laws" are ORS Chapters 118, 119, 314, 316, 317, 318, 320, 321 and 323 and sections 10 to 20, chapter 533, Oregon Laws 1981, as amended by chapter 16, Oregon Laws 1982 (first special session); the Homeowners' and Renters' Property Tax Relief Program under ORS 310.630 to 310.690; and any local taxes administered by the Oregon Department of Revenue under ORS 305.620. Date:____________________________ Date:____________________________
By:______________________________ By:_____________________________ Robert Ueland, President Ride Connection, Inc. 3030 SW Moody Ave, Suite 230 Portland, Oregon 97201 Contractor’s Federal Tax Identification Number: ___________ Agency's designated contact is: ___________

appendix G
Sample Roadway Capacities


The Coordinated Plan (2010 – 2014) G-1 Appendix G—Sample Roadway Capacities


appendix H
Annual Title VI Consistency Evaluation


The Coordinated Plan (2010 – 2014) H-1 Appendix H—Annual Title VI Consistency Evaluation
Annual Title VI Consistency Evaluation Twenty low-income and/or minority (LIM) and 20 non-LIM census tracts were randomly selected from each transit district (Metropolitan Transit System (MTS) and North County Transit District (NCTD)) to determine the quality of service. The three most frequently traveled destinations were identified separately for MTS and NCTD using the most recent onboard passenger survey. For each of these most frequently traveled destinations, the following service quality variables were evaluated,1 as recommended by the Federal Transit Administration (FTA), for each transit district:
Average peak-hour travel time to destinations
Average nonpeak-hour travel time to destinations
Number of transfers required to reach the destination
Total cost of trip to the destination
Cost per mile of trip to the destination for people beginning the trip in the selected census tracts (added with the updated FTA Title VI Circular [FTA C 4702.1A dated May 13, 2007]).
The analysis of the above categories is included in the following tables (Tables H.4 through H.23). Table order is based on the original table formatting from the June 2009 Title VI Program Update submitted to the FTA.
Tables H.4 and H.5 present the average peak-period travel time (in minutes) from the select MTS LIM and non-LIM census tracts to each of the top three MTS transit trip destinations. Included in the average peak-period travel time is the travel time spent waiting for both initial vehicle boarding and any transfers required. The overall average for MTS LIM census tracts (56.4 minutes) is lower than that for non-LIM census tracts (78.9 minutes).
1 An analysis of other travel characteristics such as car availability, method of fare payment and frequency of transit use
were not evaluated in this Program Update since the onboard passenger survey used to determine the results was not updated since the last Title VI Program Update from February 2007. Data from the 2009-2010 onboard survey will be included in the next Coordinated Plan.

The Coordinated Plan (2010 – 2014) H-2 Appendix H—Annual Title VI Consistency Evaluation
TABLE H.4 MTS LIM CENSUS TRACT TO MAJOR DESTINATIONS
PEAK-HOUR TRAVEL TIME (MINUTES)
Census Tract Downtown San Diego
Mission Valley
San Ysidro
10013 48.6 77.5 17.5
10112 47.3 76.2 23.3
11601 33.3 62.2 35.6
11700 42.7 71.6 54.9
3208 NA NA NA
3109 51.6 82.8 67.7
3113 69.8 93.7 72.0
3902 26.8 72.1 47.7
3114 51.7 97.0 72.7
3302 43.7 64.3 49.2
4900 21.6 55.6 51.7
4000 34.8 70.1 58.1
3111 52.4 73.3 75.7
3404 33.7 52.6 53.9
2710 42.6 41.2 65.5
2402 34.7 33.3 71.5
2202 NA NA NA
2707 37.6 34.3 74.4
15802 63.5 55.0 89.3
8358 57.3 69.1 91.3
Average: 44.1 65.7 59.5
Overall Average: 56.4

The Coordinated Plan (2010 – 2014) H-3 Appendix H—Annual Title VI Consistency Evaluation
TABLE H.5
MTS NON-LIM CENSUS TRACT TO MAJOR DESTINATIONS PEAK-HOUR TRAVEL TIME (MINUTES)
Census Tract Downtown San Diego
Mission Valley
San Ysidro
14900 66.3 57.8 92.1
7100 36.9 44.5 76.8
13606 76.4 96.9 102.2
100 71.9 69.8 108.2
2001 53.1 33.1 92.6
9104 47.8 52.1 86.3
7700 44.5 52.4 84.6
7901 33.8 31.7 74.3
9801 74.5 58.8 102.4
9301 64.3 46.3 104.6
8102 80.9 94.6 122.8
16809 NA NA NA
9506 82.1 85.4 115.1
8505 41.1 40.3 83.0
16702 89.6 81.1 115.4
16608 102.3 86.3 143.6
8342 64.9 60.2 106.8
17041 65.4 103.4 100.0
17007 77.2 115.2 111.8
17014 72.4 110.3 107.0
Average: 65.5 69.5 101.6
Overall Average: 78.9

The Coordinated Plan (2010 – 2014) H-4 Appendix H—Annual Title VI Consistency Evaluation
Tables H.6 and H.7 show the average peak-hour travel time between 20 LIM and 20 non-LIM census tracts (in the NCTD service area) to the top three NCTD trip destinations. The overall average for LIM census tracts (88.9 minutes) is lower than that for non-LIM census tracts (93.9 minutes).
TABLE H.6 NCTD LIM CENSUS TRACT TO MAJOR DESTINATIONS
PEAK-HOUR TRAVEL TIME (MINUTES)
Census Tract Downtown
San Diego
Oceanside Palomar
College
18610 119.9 31.6 81.0
18609 115.6 27.2 85.4
18700 166.9 78.5 149.3
18607 126.9 38.5 84.4
18513 167.7 74.2 92.6
18603 103.8 15.5 86.2
19502 130.9 51.6 60.9
19501 120.6 48.5 45.5
18509 123.9 35.6 106.3
18400 150.4 62.0 132.8
18519 NA NA NA
20021 111.5 77.5 16.0
20206 102.9 101.8 59.8
20302 102.5 101.4 59.5
20009 139.5 97.4 35.9
20108 98.6 97.5 55.5
20202 100.4 99.3 57.4
20207 103.4 102.3 60.3
20212 49.5 166.9 NA
20500 NA NA NA
Average: 118.6 72.6 74.6
Overall Average: 88.9

The Coordinated Plan (2010 – 2014) H-5 Appendix H—Annual Title VI Consistency Evaluation
TABLE H.7 NCTD NON-LIM CENSUS TRACT TO MAJOR DESTINATIONS
PEAK-HOUR TRAVEL TIME (MINUTES)
Census Tract Downtown San Diego
Oceanside Palomar College
18802 162.6 95.7 92.5
19302 166.8 55.1 91.7
19807 146.6 79.8 64.3
19804 133.9 49.1 93.0
19806 148.0 81.2 62.6
20010 135.7 99.9 40.0
17805 109.1 52.0 108.4
17811 127.6 71.5 75.8
20405 84.9 102.3 60.3
20706 118.4 117.3 75.3
17808 110.3 72.6 76.7
20016 119.2 100.0 38.4
17108 101.5 81.0 74.5
17104 117.4 114.6 65.1
17403 97.4 85.1 67.3
17106 114.6 113.4 71.5
17303 89.1 78.7 92.1
17305 86.8 99.7 88.6
17306 122.6 109.0 79.5
17200 80.0 87.4 100.8
Average: 118.6 87.3 75.9
Overall Average: 93.9

The Coordinated Plan (2010 – 2014) H-6 Appendix H—Annual Title VI Consistency Evaluation
Tables H.8 and H.9 show the average nonpeak-hour travel time (in minutes) from the select MTS LIM and non-LIM census tracts to each of the top three MTS transit trip destinations. Included in the average nonpeak-hour travel time is the travel time spent waiting for both initial vehicle boarding and any transfers required. The overall average for MTS LIM census tracts (61.0 minutes) is lower than that for non-LIM census tracts (89.8 minutes).
TABLE H.8 MTS LIM CENSUS TRACT TO MAJOR DESTINATIONS
NONPEAK-HOUR TRAVEL TIME (MINUTES)
Census Tract Downtown San Diego
Mission Valley
San Ysidro
10013 53.6 82.8 21.2
10112 49.6 78.8 25.6
11601 37.1 82.3 39.3
11700 58.2 77.9 58.1
3208 NA NA NA
3109 51.5 110.2 71.3
3113 73.3 93.2 75.6
3902 30.5 71.5 53.9
3114 54.7 95.7 78.0
3302 53.7 64.1 52.8
4900 21.6 56.0 55.4
4000 45.0 70.3 61.7
3111 62.1 72.8 78.8
3404 33.4 52.3 57.5
2710 42.8 41.0 69.1
2402 35.0 33.1 75.5
2202 NA NA NA
2707 35.3 34.2 75.8
15802 63.5 55.0 93.0
8358 75.7 88.9 112.4
Average: 48.7 70.0 64.2
Overall Average: 61.0

The Coordinated Plan (2010 – 2014) H-7 Appendix H—Annual Title VI Consistency Evaluation
TABLE H.9 MTS NON-LIM CENSUS TRACT TO MAJOR DESTINATIONS
NONPEAK-HOUR TRAVEL TIME (MINUTES)
Census Tract Downtown San Diego
Mission Valley
San Ysidro
14900 66.3 57.8 95.8
7100 42.3 49.6 84.3
13606 74.6 95.2 104.1
100 72.0 69.8 112.1
2001 52.7 33.0 95.9
9104 47.3 52.0 88.5
7700 44.2 52.3 87.0
7901 33.8 31.6 78.1
9801 72.0 74.7 105.9
9301 60.7 43.2 103.9
8102 95.9 93.9 141.6
16809 NA NA NA
9506 77.1 85.3 113.8
8505 62.1 40.0 107.7
16702 89.6 81.1 119.1
16608 109.8 93.8 153.6
8342 78.1 59.7 123.8
17041 139.8 157.8 176.5
17007 124.2 142.1 160.8
17014 119.2 137.2 155.9
Average: 76.9 76.3 116.2
Overall Average: 89.8

The Coordinated Plan (2010 – 2014) H-8 Appendix H—Annual Title VI Consistency Evaluation
Tables 10 and 11 show the average nonpeak-hour travel time (in minutes) between 20 LIM and 20 non-LIM census tracts (in the NCTD service area) to the top three NCTD trip destinations. The overall average for LIM census tracts (111.6 minutes) is lower than that for non-LIM census tracts (116.1 minutes).
TABLE H.10 NCTD LIM CENSUS TRACT TO MAJOR DESTINATIONS
NON PEAK-HOUR TRAVEL TIME (MINUTES)
Census Tract Downtown San Diego
Oceanside Palomar College
18610 161.7 31.4 80.7
18609 157.4 27.0 85.0
18700 209.1 78.7 149.3
18607 196.4 38.1 99.7
18513 204.5 74.1 92.4
18603 145.8 15.4 97.0
19502 181.8 51.4 60.5
19501 166.7 48.6 45.3
18509 165.9 35.6 106.1
18400 192.6 62.2 132.8
18519 NA NA NA
20021 197.2 95.2 16.0
20206 200.2 101.8 59.8
20302 199.9 101.5 59.5
20009 217.2 97.5 35.9
20108 195.9 97.5 55.5
20202 197.8 99.4 57.4
20207 200.7 102.3 60.3
20212 53.3 220.9 NA
20500 NA NA NA
Average: 180.2 76.6 76.1
Overall Average: 111.6

The Coordinated Plan (2010 – 2014) H-9 Appendix H—Annual Title VI Consistency Evaluation
TABLE H.11 NCTD NON-LIM CENSUS TRACT TO MAJOR DESTINATIONS
NONPEAK-HOUR TRAVEL TIME (MINUTES)
Census Tract Downtown San Diego
Oceanside Palomar College
18802 223.4 110.3 106.9
19302 240.1 55.0 106.6
19807 239.7 94.7 63.7
19804 172.6 48.9 102.8
19806 241.2 96.1 62.0
20010 221.3 99.9 40.0
17805 145.8 52.0 116.1
17811 182.7 71.5 153.0
20405 106.0 102.5 60.4
20706 223.2 124.9 82.8
17808 149.1 72.3 79.3
20016 157.8 114.6 53.5
17108 140.5 80.9 74.6
17104 NA NA NA
17403 136.4 85.0 78.7
17106 152.9 132.5 86.4
17303 104.0 78.9 92.4
17305 135.3 114.8 103.7
17306 144.4 124.0 94.4
17200 95.0 87.6 101.1
Average: 169.0 91.9 87.3
Overall Average: 116.1

The Coordinated Plan (2010 – 2014) H-10 Appendix H—Annual Title VI Consistency Evaluation
Tables H.12 and H.13 show the number of transfers required for travel to the top three trip destinations within the MTS service area. The overall average for MTS LIM census tracts (1.2 transfers) is lower than that for non-LIM census tracts (1.4 transfers).
TABLE H.12 MTS LIM CENSUS TRACT TO MAJOR DESTINATIONS
NUMBER OF TRANSFERS
Census Tract Downtown San Diego
Mission Valley
San Ysidro
10013 1 3 1
10112 1 3 1
11601 1 3 1
11700 1 3 1
3208
3109 1 3 1
3113 1 3 1
3902 0 1 1
3114 0 1 1
3302 1 2 1
4900 0 2 1
4000 1 2 1
3111 1 3 1
3404 0 2 1
2710 0 1 1
2402 0 1 1
2202
2707 0 1 1
15802 1 2 2
8358 0 2 1
Average: 0.6 2.1 1.1
Overall Average: 1.2

The Coordinated Plan (2010 – 2014) H-11 Appendix H—Annual Title VI Consistency Evaluation
TABLE H.13 MTS NON-LIM CENSUS TRACT TO MAJOR DESTINATIONS
NUMBER OF TRANSFERS
Census Tract Downtown San Diego
Mission Valley
San Ysidro
14900 1 2 2
7100 1 2 1
13606 1 2 2
100 0 2 1
2001 0 1 1
9104 1 2 1
7700 1 2 1
7901 1 1 2
9801 1 2 2
9301 1 1 2
8102 1 2 2
16809
9506 1 1 2
8505 0 1 1
16702 1 2 2
16608 2 2 2
8342 1 2 2
17041 0 2 1
17007 1 3 2
17014 1 3 2
Average: 0.8 1.8 1.6
Overall Average: 1.4

The Coordinated Plan (2010 – 2014) H-12 Appendix H—Annual Title VI Consistency Evaluation
Tables H.14 and H.15 show the number of transfers required for travel to the top three trip destinations within the NCTD service area. The overall average for NCTD LIM census tracts (1.2 transfers) is slightly more than the average number of transfers for the non-LIM census tracts (1.1 transfers).
TABLE H.14 NCTD LIM CENSUS TRACT TO MAJOR DESTINATIONS
NUMBER OF TRANSFERS
Census Tract Downtown San Diego
Oceanside Palomar College
18610 1 0 2
18609 1 0 2
18700 1 0 2
18607 2 1 2
18513 2 1 2
18603 1 0 2
19502 2 0 2
19501 1 1 1
18509 1 0 2
18400 1 0 2
18519 NA NA NA
20021 1 2 0
20206 1 2 1
20302 1 2 1
20009 1 2 0
20108 1 2 1
20202 1 2 1
20207 1 2 1
20212 1 3
20500 NA NA NA
Average: 1.2 1.1 1.4
Overall Average: 1.2

The Coordinated Plan (2010 – 2014) H-13 Appendix H—Annual Title VI Consistency Evaluation
TABLE H.15 NCTD NON-LIM CENSUS TRACT TO MAJOR DESTINATIONS
NUMBER OF TRANSFERS
Census Tract Downtown San Diego
Oceanside Palomar College
18802 2 1 2
19302 2 1 2
19807 2 1 1
19804 1 1 1
19806 2 1 1
20010 1 2 0
17805 1 0 1
17811 1 1 0
20405 1 2 1
20706 1 2 1
17808 1 1 1
20016 1 2 0
17108 1 1 1
17104 1 1 0
17403 1 1 0
17106 1 2 1
17303 1 0 1
17305 1 1 1
17306 1 1 1
17200 1 0 1
Average: 1.2 1.1 0.9
Overall Average: 1.1

The Coordinated Plan (2010 – 2014) H-14 Appendix H—Annual Title VI Consistency Evaluation
Tables H.16 and H.17 present the total transit costs required for travel from the selected MTS LIM and non-LIM census tracts to the top three MTS destinations. The fare costs take into account round trips since an analysis of fares suggests that 24 percent of riders in the MTS service area use day passes versus 9 percent, which only travel one way with a one-way cash fare. The overall average fares for LIM census tracts ($2.39) is lower than that for non-LIM census tracts ($2.82).
TABLE H.16 MTS LIM CENSUS TRACT TO MAJOR DESTINATIONS
TOTAL COST OF TRIP ($) BASED ON A ROUND TRIP
Census Tract Downtown San Diego
Mission Valley
San Ysidro
10013 $ 2.50 $ 2.50 $ 2.25
10112 $ 2.50 $ 2.50 $ 2.50
11601 $ 2.50 $ 2.50 $ 2.50
11700 $ 2.25 $ 2.25 $ 2.50
3208 NA NA NA
3109 $ 2.50 $ 2.50 $ 2.50
3113 $ 2.50 $ 2.25 $ 2.50
3902 $ 2.25 $ 2.25 $ 2.50
3114 $ 2.25 $ 2.25 $ 2.50
3302 $ 2.25 $ 2.25 $ 2.50
4900 $ 2.25 $ 2.25 $ 2.50
4000 $ 2.25 $ 2.25 $ 2.50
3111 $ 2.25 $ 2.25 $ 2.50
3404 $ 2.25 $ 2.25 $ 2.50
2710 $ 2.25 $ 2.25 $ 2.50
2402 $ 2.25 $ 2.25 $ 2.50
2202 NA NA NA
2707 $ 2.25 $ 2.25 $ 2.50
15802 $ 2.50 $ 2.50 $ 2.50
8358 $ 2.50 $ 2.50 $ 2.50
Average: $ 2.35 $ 2.33 $ 2.49
Overall Average: $2.39

The Coordinated Plan (2010 – 2014) H-15 Appendix H—Annual Title VI Consistency Evaluation
TABLE H.17 MTS NON-LIM CENSUS TRACT TO MAJOR DESTINATIONS
TOTAL COST OF TRIP ($) BASED ON A ROUND TRIP
Census Tract Downtown San Diego
Mission Valley
San Ysidro
14900 $ 2.50 $ 2.50 $ 2.50
7100 $ 2.25 $ 2.50 $ 2.50
13606 $ 2.50 $ 2.25 $ 2.50
100 $ 2.25 $ 2.25 $ 2.50
2001 $ 2.25 $ 2.25 $ 2.50
9104 $ 2.50 $ 2.25 $ 2.50
7700 $ 2.25 $ 2.50 $ 2.50
7901 $ 2.25 $ 2.25 $ 2.50
9801 $ 2.25 $ 2.50 $ 2.50
9301 $ 2.25 $ 2.25 $ 2.50
8102 $ 2.50 $ 2.25 $ 2.50
16809 NA NA NA
9506 $ 2.50 $ 2.25 $ 2.50
8505 $ 2.50 $ 2.25 $ 2.50
16702 $ 2.50 $ 2.50 $ 2.50
16608 $ 2.50 $ 2.50 $ 2.50
8342 $ 2.50 $ 2.25 $ 2.50
17041 $ 5.00 $ 5.00 $ 5.00
17007 $ 5.00 $ 5.00 $ 5.00
17014 $ 5.00 $ 5.00 $ 5.00
Average: $ 2.80 $ 2.76 $ 2.89
Overall Average: $2.82

The Coordinated Plan (2010 – 2014) H-16 Appendix H—Annual Title VI Consistency Evaluation
Tables H.18 and H.19 show the total transit costs required for travel from the selected NCTD LIM and non-LIM census tracts to the top three NCTD destinations. Round-trip costs were evaluated based on the fare analysis, which revealed that 23 percent of riders utilized day passes versus 14 percent who pay for one-way fares. The overall average for LIM census tracts ($5.47) is lower than that for non-LIM census tracts ($5.51).
TABLE H.18 NCTD LIM CENSUS TRACT TO MAJOR DESTINATIONS
TOTAL COST OF TRIP ($) BASED ON A ROUND TRIP
Census Tract Downtown San Diego
Oceanside Palomar College
18610 $ 7.88 $ 2.00 $ 5.00
18609 $ 7.88 $ 2.00 $ 5.00
18700 $ 7.88 $ 2.00 $ 5.00
18607 $ 7.88 $ 5.00 $ 5.00
18513 $ 7.88 $ 5.00 $ 5.00
18603 $ 7.88 $ 2.00 $ 5.00
19502 $ 7.88 $ 2.00 $ 5.00
19501 $ 7.88 $ 5.00 $ 5.00
18509 $ 7.88 $ 2.00 $ 5.00
18400 $ 7.88 $ 2.00 $ 5.00
18519 NA NA NA
20021 $ 7.88 $ 5.00 $ 2.00
20206 $ 7.88 $ 5.00 $ 5.00
20302 $ 7.88 $ 5.00 $ 5.00
20009 $ 7.88 $ 5.00 $ 2.00
20108 $ 7.88 $ 5.00 $ 5.00
20202 $ 7.88 $ 5.00 $ 5.00
20207 $ 7.88 $ 5.00 $ 5.00
20212 $ 5.00 $ 7.88 NA
20500 NA NA NA
Average: $ 7.72 $ 3.99 $ 4.65
Overall Average: $5.47

The Coordinated Plan (2010 – 2014) H-17 Appendix H—Annual Title VI Consistency Evaluation
TABLE H.19 NCTD NON-LIM CENSUS TRACT TO MAJOR DESTINATIONS
TOTAL COST OF TRIP ($) BASED ON A ROUND TRIP
Census Tract Downtown San Diego
Oceanside Palomar College
18802 $ 7.88 $ 5.00 $ 5.00
19302 $ 7.88 $ 5.00 $ 5.00
19807 $ 7.88 $ 5.00 $ 5.00
19804 $ 7.88 $ 5.00 $ 5.00
19806 $ 7.88 $ 5.00 $ 5.00
20010 $ 7.88 $ 5.00 $ 2.00
17805 $ 7.88 $ 2.00 $ 5.00
17811 $ 7.88 $ 5.00 $ 2.00
20405 $ 7.88 $ 5.00 $ 5.00
20706 $ 7.88 $ 5.00 $ 5.00
17808 $ 7.88 $ 5.00 $ 5.00
20016 $ 7.88 $ 5.00 $ 2.00
17108 $ 7.88 $ 5.00 $ 5.00
17104 $ 7.88 $ 5.00 $ 2.00
17403 $ 7.88 $ 5.00 $ 2.00
17106 $ 7.88 $ 5.00 $ 5.00
17303 $ 7.88 $ 2.00 $ 5.00
17305 $ 7.88 $ 5.00 $ 5.00
17306 $ 7.88 $ 5.00 $ 5.00
17200 $ 5.00 $ 2.00 $ 5.00
Average: $ 7.74 $ 4.55 $ 4.25
Overall Average: $5.51

The Coordinated Plan (2010 – 2014) H-18 Appendix H—Annual Title VI Consistency Evaluation
Tables H.20 and H.21 present the average cost per mile from the selected MTS LIM and non-LIM census tracts to the top three MTS destinations. The overall average for MTS LIM census tracts ($0.30 per mile) is higher than that for non-LIM census tracts ($0.21). This is due to the locations of LIM census tracts versus non-LIM census tracts. In general, LIM tracts are closer to the top three evaluated destinations, yielding better overall travel times and lower fares as presented in previous tables. However, closer proximity to major destinations also includes higher costs on a per-mile basis.
TABLE H.20 MTS LIM CENSUS TRACT TO MAJOR DESTINATIONS
COST PER MILE OF TRIP ($) BASED ON A ROUND TRIP
Census Tract Downtown San Diego
Mission Valley
San Ysidro
10013 $ 0.17 $ 0.13 $ 1.24
10112 $ 0.18 $ 0.13 $ 0.61
11601 $ 0.40 $ 0.22 $ 0.23
11700 $ 0.37 $ 0.21 $ 0.16
3208 NA NA NA
3109 $ 0.28 $ 0.14 $ 0.14
3113 $ 0.26 $ 0.22 $ 0.18
3902 $ 0.74 $ 0.24 $ 0.16
3114 $ 0.27 $ 0.15 $ 0.12
3302 $ 0.46 $ 0.23 $ 0.18
4900 $ 1.10 $ 0.30 $ 0.16
4000 $ 0.77 $ 0.29 $ 0.16
3111 $ 0.33 $ 0.26 $ 0.13
3404 $ 0.53 $ 0.31 $ 0.16
2710 $ 0.33 $ 0.39 $ 0.14
2402 $ 0.43 $ 0.53 $ 0.13
2202 NA NA NA
2707 $ 0.34 $ 0.50 $ 0.12
15802 $ 0.14 $ 0.19 $ 0.08
8358 $ 0.14 $ 0.16 $ 0.08
Average: $ 0.40 $ 0.26 $ 0.23
Overall Average: $0.30

The Coordinated Plan (2010 – 2014) H-19 Appendix H—Annual Title VI Consistency Evaluation
TABLE H.21 MTS NON-LIM CENSUS TRACT TO MAJOR DESTINATIONS
COST PER MILE OF TRIP ($) BASED ON A ROUND TRIP
Census Tract Downtown San Diego
Mission Valley
San Ysidro
14900 $ 0.17 $ 0.24 $ 0.09
7100 $ 0.41 $ 0.47 $ 0.12
13606 $ 0.14 $ 0.13 $ 0.08
100 $ 0.37 $ 0.36 $ 0.12
2001 $ 0.32 $ 0.65 $ 0.11
9104 $ 0.28 $ 0.43 $ 0.11
7700 $ 0.22 $ 0.29 $ 0.10
7901 $ 0.75 $ 0.48 $ 0.14
9801 $ 0.18 $ 0.26 $ 0.10
9301 $ 0.24 $ 0.38 $ 0.09
8102 $ 0.13 $ 0.12 $ 0.07
16809 NA NA NA
9506 $ 0.20 $ 0.18 $ 0.09
8505 $ 0.23 $ 0.29 $ 0.10
16702 $ 0.11 $ 0.13 $ 0.07
16608 $ 0.10 $ 0.13 $ 0.06
8342 $ 0.17 $ 0.20 $ 0.08
17041 $ 0.21 $ 0.17 $ 0.13
17007 $ 0.18 $ 0.15 $ 0.12
17014 $ 0.19 $ 0.15 $ 0.12
Average: $ 0.24 $ 0.27 $ 0.10
Overall Average: $0.21

The Coordinated Plan (2010 – 2014) H-20 Appendix H—Annual Title VI Consistency Evaluation
Tables H.22 and H.23 present the average cost per mile from the selected NCTD LIM and non-LIM census tracts to the top three NCTD destinations. The overall average for LIM census tracts ($0.52 per mile) is higher than that for non-LIM census tracts ($0.29). Similar to the analysis of the MTS service area, this is due to the locations of LIM census tracts versus non-LIM census tracts. In general, LIM tracts are closer to the top three evaluated destinations, yielding better overall travel times and lower fares as presented in previous tables. However, closer proximity to major destinations also generates higher costs on a per-mile basis.
TABLE H.22 NCTD LIM CENSUS TRACT TO MAJOR DESTINATIONS
COST PER MILE OF TRIP ($) BASED ON A ROUND TRIP
Census Tract Downtown San Diego
Oceanside Palomar College
18610 $ 0.16 $ 0.29 $ 0.39
18609 $ 0.17 $ 0.37 $ 0.35
18700 $ 0.17 $ 0.35 $ 0.23
18607 $ 0.17 $ 1.23 $ 0.34
18513 $ 0.16 $ 0.45 $ 0.42
18603 $ 0.18 $ 1.12 $ 0.29
19502 $ 0.18 $ 0.15 $ 0.74
19501 $ 0.18 $ 0.48 $ 0.85
18509 $ 0.18 $ 1.48 $ 0.29
18400 $ 0.19 $ 4.17 $ 0.31
18519 NA NA NA
20021 $ 0.21 $ 0.30 $ 4.17
20206 $ 0.23 $ 0.20 $ 0.54
20302 $ 0.23 $ 0.20 $ 0.53
20009 $ 0.19 $ 0.28 $ 1.16
20108 $ 0.24 $ 0.21 $ 0.60
20202 $ 0.24 $ 0.20 $ 0.58
20207 $ 0.24 $ 0.20 $ 0.55
20212 $ 0.33 $ 0.14 NA
20500 NA NA NA
Average: $ 0.20 $ 0.66 $ 0.73
Overall Average: $0.52

The Coordinated Plan (2010 – 2014) H-21 Appendix H—Annual Title VI Consistency Evaluation
TABLE H.23 NCTD NON-LIM CENSUS TRACT TO MAJOR DESTINATIONS
COST PER MILE OF TRIP ($) BASED ON A ROUND TRIP
Census Tract Downtown San Diego
Oceanside Palomar College
18802 $ 0.15 $ 0.24 $ 0.36
19302 $ 0.16 $ 0.51 $ 0.46
19807 $ 0.17 $ 0.31 $ 0.45
19804 $ 0.18 $ 0.88 $ 0.32
19806 $ 0.17 $ 0.30 $ 0.47
20010 $ 0.20 $ 0.25 $ 0.62
17805 $ 0.22 $ 0.31 $ 0.33
17811 $ 0.18 $ 0.67 $ 0.14
20405 $ 0.24 $ 0.18 $ 0.40
20706 $ 0.22 $ 0.18 $ 0.42
17808 $ 0.22 $ 0.36 $ 0.51
20016 $ 0.22 $ 0.20 $ 0.24
17108 $ 0.24 $ 0.29 $ 0.48
17104 $ 0.23 $ 0.30 $ 0.16
17403 $ 0.24 $ 0.28 $ 0.16
17106 $ 0.19 $ 0.15 $ 0.28
17303 $ 0.33 $ 0.13 $ 0.31
17305 $ 0.29 $ 0.28 $ 0.20
17306 $ 0.17 $ 0.24 $ 0.23
17200 $ 0.25 $ 0.10 $ 0.26
Average: $ 0.21 $ 0.31 $ 0.34
Overall Average: $0.29

The Coordinated Plan (2010 – 2014) H-22 Appendix H—Annual Title VI Consistency Evaluation
Conclusion Overall, the LIM census tracts (MTS and NCTD) were shown to have faster service, lower fares, and similar transfers to the top three major destinations in each service area. However, the LIM census tracts were generally shown to have a higher cost per mile based on the close proximity of these tracts to the major destinations.

appendix I
Transit-Deficit Smart Growth Areas


The Coordinated Plan (2010 – 2014) I-1 Appendix I—Transit-Deficit Smart Growth Areas

The Coordinated Plan (2010 – 2014) I-2 Appendix I—Transit-Deficit Smart Growth Areas

The Coordinated Plan (2010 – 2014) I-3 Appendix I—Transit-Deficit Smart Growth Areas


The Coordinated Plan (2010 – 2014) Appendix J—TDA Performance Indicators
appendix J
TDA Performance Indicators

The Coordinated Plan (2010 – 2014) Appendix J—TDA Performance Indicators
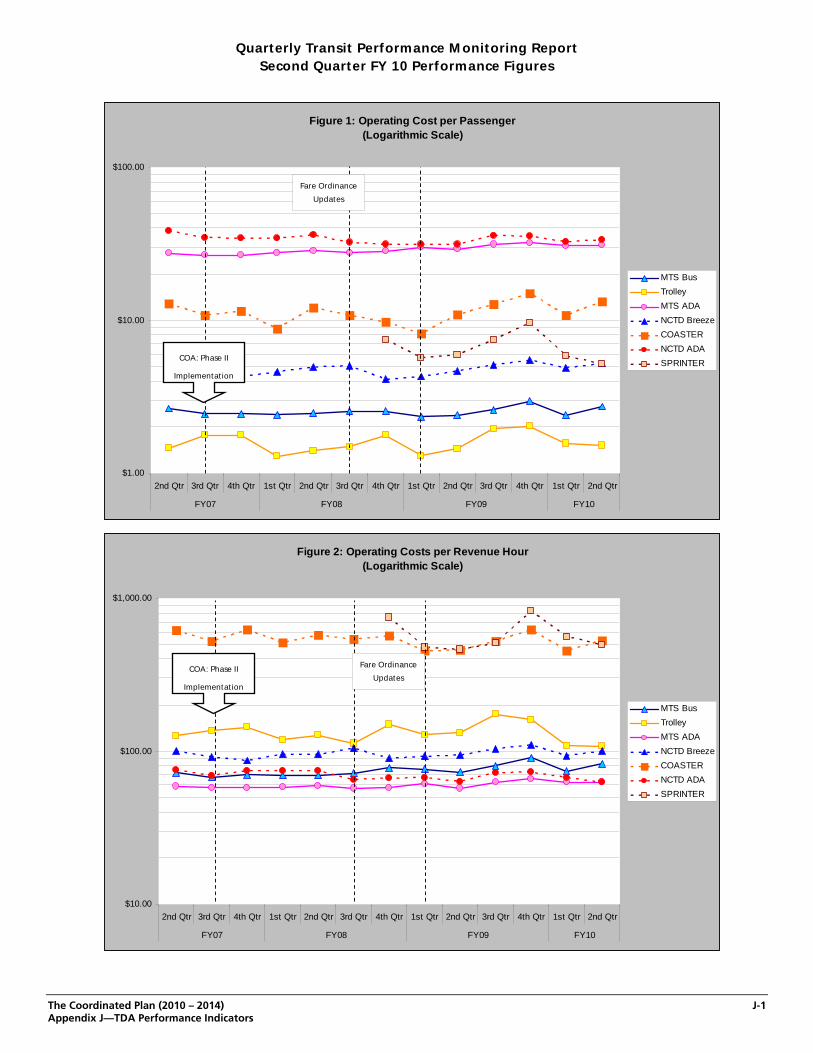
The Coordinated Plan (2010 – 2014) J-1 Appendix J—TDA Performance Indicators
Figure 1: Operating Cost per Passenger(Logarithmic Scale)
$1.00
$10.00
$100.00
2nd Qtr 3rd Qtr 4th Qtr 1st Qtr 2nd Qtr 3rd Qtr 4th Qtr 1st Qtr 2nd Qtr 3rd Qtr 4th Qtr 1st Qtr 2nd Qtr
FY07 FY08 FY09 FY10
MTS BusTrolleyMTS ADANCTD BreezeCOASTERNCTD ADASPRINTER
Figure 2: Operating Costs per Revenue Hour(Logarithmic Scale)
$10.00
$100.00
$1,000.00
2nd Qtr 3rd Qtr 4th Qtr 1st Qtr 2nd Qtr 3rd Qtr 4th Qtr 1st Qtr 2nd Qtr 3rd Qtr 4th Qtr 1st Qtr 2nd Qtr
FY07 FY08 FY09 FY10
MTS BusTrolleyMTS ADANCTD BreezeCOASTERNCTD ADASPRINTER
Quarterly Transit Performance Monitoring Report Second Quarter FY 10 Performance Figures
COA: Phase II
Implementation
Fare Ordinance
Updates
COA: Phase II
Implementation
Fare Ordinance
Updates

The Coordinated Plan (2010 – 2014) J-2 Appendix J—TDA Performance Indicators
Figure 3: Passengers per Revenue Hour
-
20.00
40.00
60.00
80.00
100.00
120.00
140.00
2nd Qtr 3rd Qtr 4th Qtr 1st Qtr 2nd Qtr 3rd Qtr 4th Qtr 1st Qtr 2nd Qtr 3rd Qtr 4th Qtr 1st Qtr 2nd Qtr
FY07 FY08 FY09 FY10
MTS BusTrolleyMTS ADANCTD BreezeCOASTERNCTD ADASPRINTER
Figure 4: Passengers per Revenue Mile
-
3.00
6.00
2nd Qtr 3rd Qtr 4th Qtr 1st Qtr 2nd Qtr 3rd Qtr 4th Qtr 1st Qtr 2nd Qtr 3rd Qtr 4th Qtr 1st Qtr 2nd Qtr
FY07 FY08 FY09 FY10
MTS BusTrolleyMTS ADANCTD BreezeCOASTERNCTD ADASPRINTER
COA: Phase II
Implementation
Fare Ordinance
Updates
COA: Phase II
Implementation
Fare Ordinance
Updates

The Coordinated Plan (2010 – 2014) J-3 Appendix J—TDA Performance Indicators
Figure 5: Revenue Hours per Employee(Logarithmic Scale)
10.00
100.00
1000.00
2nd Qtr 3rd Qtr 4th Qtr 1st Qtr 2nd Qtr 3rd Qtr 4th Qtr 1st Qtr 2nd Qtr 3rd Qtr 4th Qtr 1st Qtr 2nd Qtr
FY07 FY08 FY09 FY10
MTS BusTrolleyMTS ADANCTD BreezeCOASTERNCTD ADASPRINTER
Figure 6: Farebox Recovery Rate
0%
10%
20%
30%
40%
50%
60%
70%
2nd Qtr 3rd Qtr 4th Qtr 1st Qtr 2nd Qtr 3rd Qtr 4th Qtr 1st Qtr 2nd Qtr 3rd Qtr 4th Qtr 1st Qtr 2nd Qtr
FY07 FY08 FY09 FY10
Perc
ent
MTS
MTS ADA
NCTD
NCTD ADA
MTSComm.Exp.
NCTDThreshold
ADAThreshold
MTSThreshold
MTSComm.Exp.Threshold
COA: Phase II
Implementation
Fare Ordinance
Updates
COA: Phase II
Implementation
Fare Ordinance
Updates

The Coordinated Plan (2010 – 2014) J-4 Appendix J—TDA Performance Indicators
Figure 7: Fixed Route TDA Performance Composite Index
70
80
90
100
110
120
130
140
2nd Qtr 3rd Qtr 4th Qtr 1st Qtr 2nd Qtr 3rd Qtr 4th Qtr 1st Qtr 2nd Qtr 3rd Qtr 4th Qtr 1st Qtr 2nd Qtr
FY07 FY08 FY09 FY10
MTS Bus
Trolley
NCTD Breeze
COASTER
SPRINTER
Figure 8: ADA TDA Performance Composite Index
70
80
90
100
110
120
130
140
2nd Qtr 3rd Qtr 4th Qtr 1st Qtr 2nd Qtr 3rd Qtr 4th Qtr 1st Qtr 2nd Qtr 3rd Qtr 4th Qtr 1st Qtr 2nd Qtr
FY07 FY08 FY09 FY10
MTS ADA
NCTD ADA
COA: Phase II
Implementation
Fare Ordinance
Updates
COA: Phase II
Implementation
Fare Ordinance
Updates

appendix K
Agency Mission Statements


The Coordinated Plan (2010 – 2014) K-1 Appendix K—Agency Mission Statements
Agency Missions/Visions
The Mission of the North County Transit District is: To deliver safe, convenient, reliable, and user-friendly public transportation services. Our vision is to build an integrated transit system that enables our customers to travel easily and efficiently throughout our growing region.
NCTD will achieve this by:
• Placing service to our customers first,
• Ensuring the safety and security of our employees and customers,
• Delivering high quality transit services,
• Developing and maintaining facilities that sustain and promote current and future transportation services,
• Securing adequate revenue, protecting our assets, and getting the maximum return on the public investment,
• Working in partnership with our communities and other stakeholders, and
• Encouraging innovation, creativity, and leadership.
The Vision for MTS services is to:
• Develop a customer-focused system: provide services that reflect the travel needs and priorities of our customers,
• Develop a competitive system: provide services that are competitive with other travel options by meeting market segment expectations,
• Develop an integrated system: develop transit services as part of an integrated network rather than a collection of individual routes, and
• Develop a sustainable system: provide appropriate types and levels of service that are consistent with market demands and are maintainable under current financial conditions.

The Coordinated Plan (2010 – 2014) K-2 Appendix K—Agency Mission Statements
The Vision for FACT is: That all people living in San Diego County will have full mobility within their community through an accessible transportation system that meets their individual needs. The
Mission of FACT, functioning as the Consolidated Transportation Services Agency (CTSA), is to create a transportation system that will provide access and mobility for all people in San Diego County by:
• Coordinating existing resources,
• Creating partnerships that eliminate barriers,
• Accessing additional sources of funding,
• Augmenting existing resources, and
• Developing alternative models of transportation.
The SANDAG Mission Statement is: To serve as the forum for regional decision-making. SANDAG builds
consensus, makes strategic plans, obtains and allocates resources, plans, engineers, and builds public transit, and provides information on a broad range of topics pertinent to the region's quality of life. SANDAG is governed by a Board of Directors composed of mayors, councilmembers, and county supervisors from each of the region's 19 local governments. Supplementing these voting members are advisory representatives from Imperial County, the U.S. Department of Defense, Caltrans, San Diego Unified Port District, Metropolitan Transit System, North County Transit District, San Diego County Water Authority, Southern California Tribal Chairmen's Association, and Mexico. The Board of Directors is assisted by a professional staff of planners, engineers, and research specialists.

appendix L
RSRTP Performance Statistics


The Coordinated Plan (2010 – 2014) L-3 Appendix L—RSRTP Performance Statistics
Coordinated Plan Performance Statistics
The following is the list of detailed performance statistics as they relate to the transit service objectives presented and discussed in Chapter 4. Results highlighted in red denote indicators that do not meet the performance target or guideline. Greenhouse Gas Reduction Objective
Objective: Reduce regional Greenhouse Gas emissions
Indicator and Performance Results:
Service Category
Guideline Results
MTS No Regional Services Added
NCTD
Reduced carbon emissions from the expansion or addition of regional transit services No Regional Services Added
Growth Objective Objective: The ridership for each transit agency shall grow faster than the rate of growth in population, jobs, and
private vehicle registrations within their service area
Indicator and Performance Results:
Service Category Performance Guideline FY 2009 Performance Results
MTS
Transit ridership increased by 1.69%
Population increased by 1.03%
Jobs increased by -2.16%
Vehicle registrations increased by 0.90%
NCTD
Growth rate to be greater than the growth rate of population and of employment by transit service area; and growth rate of vehicle registrations for the County
Transit ridership increased by 1.87%
Population increased by 0.47%
Jobs increased by -2.71%
Vehicle registrations increased by 0.34%

The Coordinated Plan (2010 – 2014) L-4 Appendix L—RSRTP Performance Statistics
Financial Objective Objective: For each transit agency to meet or exceed the minimum TDA target for farebox cost recovery
Indicator and Performance Results:
Service Category TDA Target
SANDAG Guideline
FY 2007 Results
FY 2008 Results
FY 2009 Results
TDA Target Met?
SANDAG Guideline
Met?
MTS Fixed Route 31.9% Upward Trend 37.1% 39.7% 44.7% Yes Yes
MTS Commuter Express 20% Upward Trend 32.0% 45.2% 50.7% Yes Yes
NCTD Fixed Route 18.8% Upward Trend 24.4% 23.6% 24.4% Yes Yes
MTS ADA 10.0% Upward Trend 16.2% 15.1% 14.8% Yes No
NCTD ADA 10.0% Upward Trend 11.6% 10.8% 12.9% Yes Yes
Productivity Objective Objective: To operate transit services that are productive, convenient, and appropriate for the markets being
served
Indicator and Performance Results 1: Average percentage of seats occupied (load factor)
NCTD NCTD NCTD NCTD NCTD NCTD NCTD
MTS
Peak 25% 41% 39% 53% Urban Weekday 20% 41% 43% 50%
Peak 25% 41% 46% 42%
Regional Suburban
Weekday 20% 41% 43% 41%
Peak 45% Not Available 50% 54% Urban Weekday 40% 43% 44% 49%
Peak 20% Not Available 48% 52%
Corridor Suburban
Weekday 20% 36% 37% 42%
Peak 25% Not Available 31% 32% Urban Weekday 20% 25% 28% 29%
Peak 15% Not Available 32% 33% Suburban Weekday 15% 26% 29% 31%
Local Bus
Rural All Day 15% 21% 22% 21%
Peak 25% Not Available 26% 21% Urban Weekday 20% 19% 26% 19%
Peak 15% Not Available 28% 19% Suburban Weekday 15% 24% 25% 19%
Community Bus
Rural All Day 15% No Service No Service No Service

The Coordinated Plan (2010 – 2014) L-5 Appendix L—RSRTP Performance Statistics
Service Type Zone Period Guideline FY 2007 Results FY 2008 Results FY 2009 Results
NCTD
Peak 25% Not Available 24% 18% Urban Weekday 20% 24% 16% 13%
Peak 25% Not Available No Service No Service
Regional Suburban
Weekday 20% 24% No Service No Service
Peak 45% Not Available 43% 38% Urban Weekday 40% 36% 32% 31%
Peak 20% Not Available No Service No Service
Corridor Suburban
Weekday 20% 36% No Service No Service
Peak 25% Not Available 29% 25% Urban Weekday 20% 22% 27% 28%
Peak 15% Not Available 33% 25% Suburban Weekday 15% 22% 28% 22%
Local Bus
Rural All Day 15% 21% 21% 14%
Peak 25% No Service No Service No Service Urban Weekday 20% No Service No Service No Service
Peak 15% Not Available No Service No Service Suburban Weekday 15% 22% No Service No Service
Community Bus
Rural All Day 15% No Service No Service No Service
Indicator and Performance Results 2: Average annual revenue passengers per revenue service hour by operator
Service Category
Performance Guideline
FY 2007 Performance Results
FY 2008 Performance Results
FY 2009 Performance Results
MTS 35 revenue passenger boardings/service hour
36 revenue passenger boardings/service hour
37 revenue passenger boardings/service hour
39 revenue passenger boardings/service hour
NCTD 20 revenue passenger boardings/service hour
20 revenue passenger boardings/service hour
21 revenue passenger boardings/service hour
23 revenue passenger boardings/service hour

The Coordinated Plan (2010 – 2014) L-6 Appendix L—RSRTP Performance Statistics
Access Objectives Objective: In urban areas, transit and land use development should ensure a comfortable walking distance to
transit for residents and jobs
Indicator and Performance Results: Distance of residents or jobs from a bus stop or rail station in urban areas
Service Area
Performance Guideline
FY 2007 Performance
Results
FY 2008 Performance
Results
FY 2009 Performance
Results
MTS
Urban 60% Residents within one-quarter mile 78% 61% 58%
Urban 60% Jobs within one-quarter mile 81% 69% 54%
NCTD
Urban 60% Residents within one-quarter mile 76% 56% 44%
Urban 60% Jobs within one-quarter mile 88% 69% 62%
Objective: Transit and land use development should ensure that in suburban areas residents should be within a
reasonable distance of a park and ride facility with access to the transit network and transit services should be provided to existing or planned smart growth areas
Indicator and Performance Results 1: Percent of suburban residences within a specific distance of a park and ride facility with regional or corridor services
Service Area Performance Guideline
FY 2007 Performance
Results
FY 2008 Performance
Results
FY 2009 Performance
Results
MTS
Suburban 80% Residents within five miles of a park and ride lot served by regional and corridor services 91% 98% 100%
NCTD
Suburban 80% Residents within five miles of a park and ride lot served by regional and corridor services 86% 69% 78%
Indicator and Performance Results 2: Distance of residents or jobs from a bus stop or rail station in suburban areas
Service Area Performance Target
FY 2007 Performance
Results
FY 2008 Performance
Results
FY 2009 Performance
Results
MTS
Suburban 70% Residents within one mile 82% 69% 70%
Suburban 75% Jobs within one mile 91% 71% 78%
NCTD
Suburban 70% Residents within one mile 77% 67% 74%
Suburban 75% Jobs within one mile 92% 99% 99%

The Coordinated Plan (2010 – 2014) L-7 Appendix L—RSRTP Performance Statistics
Service Area Performance Target
FY 2007 Performance
Results
FY 2008 Performance
Results
FY 2009 Performance
Results
MTS
All 100% of “Potential” smart growth areas that meet minimum land use targets served by transit meeting
minimum smart growth transit service targets
5 areas with deficient high frequency local
service
5 areas with deficient high frequency local
service
5 areas with deficient high frequency local
service
NCTD
All 100% of “Potential” smart growth areas that meet minimum land use targets served by transit meeting
minimum smart growth transit service targets
0 areas with deficient high frequency local
service
1 area with deficient high frequency local
service
1 area with deficient high frequency local
service
Indicator and Performance Results 3: Transit service should be designed to support the smart growth areas located on the SANDAG Smart Growth Concept Map
Objective: Transit to maintain existing services to existing rural village smart growth areas
Indicator and Performance Results: Number of days per week with at least one return trip to destinations from rural villages identified on the Smart Growth Concept Map
Service Area Performance Target
FY 2007 Performance
Results
FY 2008 Performance
Results
FY 2009 Performance
Results
MTS
Rural Smart Growth One return trip provided at least two days per week 100% of rural
villages served 100% of rural villages served
100% of rural villages served
NCTD
Rural Smart Growth One return trip provided at least two days per week 100% of rural
village served 100% of rural village served
100% of rural village served
Objective: To provide fully accessible bus stops and transit stations
Indicator and Performance Results: Percentage of bus stops and transit stations that are fully accessible
Service Area Performance Target
FY 2007 Performance
Results
FY 2008 Performance
Results
FY 2009 Performance
Results
MTS
100 percent of bus stops and transit stations meeting ADA accessibility requirements
94% of available stops meet criteria
94% of available stops meet criteria
87% of available stops meet criteria
NCTD
100 percent of bus stops and transit stations meeting ADA accessibility requirements
No inventory of stops available
77% of available stops meet criteria
77% of available stops meet criteria

The Coordinated Plan (2010 – 2014) L-8 Appendix L—RSRTP Performance Statistics
Convenience Objectives Objective: To provide an appropriate span of service to bus stops based on the zone designation
Indicator and Performance Results: Percentage of stops provided with service within specified timeframes for each zone designation
Urban Suburban FY 07
Weekday Saturday Sunday Weekday Saturday Sunday Rural
Guideline 60% of stops; 6:00 – 23:00
50% of stops; 7:00 – 23:00
50% of stops; 8:00 - 21:00
60% of stops; 6:00 – 21:00
50% of stops; 7:00 – 21:00
40% of stops; 8:00 - 19:00
1 round trip per day, 2 days per week
allowing minimum 4-hour stay in city
MTS Results 46% 41% 75% 30% 20% 64% 100%
NCTD Results 9% 11% 39% 28% 43% 72% 100%
Urban Suburban
FY 08 Weekday Saturday Sunday Weekday Saturday Sunday
Rural
Guideline 50% of stops; 6:00 – 23:00
50% of stops; 7:00 – 23:00
50% of stops; 8:00 - 21:00
50% of stops; 6:00 – 21:00
50% of stops; 7:00 – 21:00
50% of stops; 8:00 - 19:00
1 round trip per day, 2 days per week
allowing minimum 4-hour stay in city
MTS Results 43% 43% 69% 32% 28% 62% 100%
NCTD Results 11% 32% 63% 32% 40% 82% 100%
Urban Suburban
FY 09 Weekday Saturday Sunday Weekday Saturday Sunday
Rural
Guideline 50% of stops; 6:00 – 23:00
50% of stops; 7:00 – 23:00
50% of stops; 8:00 - 21:00
50% of stops; 6:00 – 21:00
50% of stops; 7:00 – 21:00
50% of stops; 8:00 - 19:00
1 round trip per day, 2 days per week
allowing minimum 4-hour stay in city
MTS Results 46% 43% 37% 23% 27% 6% 100%
NCTD Results Not Available Not Available Not Available Not Available Not Available Not Available Not Available

The Coordinated Plan (2010 – 2014) L-9 Appendix L—RSRTP Performance Statistics
Objective: To provide frequency appropriate for spontaneous travel on major corridors and convenient travel to all parts of the urban core
Indicator and Performance Results: Minimum headways expressed in minutes
Urban Suburban FY 07 Zone
Services Peak Off-Peak Peak Off-Peak Rural
All Times
Guideline 30 120 30 120
MTS Results No Service No Service No Service No Service
NCTD Results
Regional Rail
36 120 36 120
Guideline 20 30 20 30
MTS Results 27 No Service 27 No Service
NCTD Results
Regional Bus
No Service No Service No Service No Service
Guideline 20 20 20 150
MTS Results 18 33 23 23
NCTD Results
Corridor
30 30 30 30
Guideline 30 60 60 60
MTS Results 29 30 37 37
NCTD Results
Local Bus
76 76 75 79
Guideline 60 60 60 120
MTS Results 38 42 36 60
NCTD Results
Community Bus
No Service No Service No Service No Service
Rural
Rural Guideline 1 round trip per day, 2 days per week allowing minimum 4-hour stay in urban zone
MTS Results 2 of 9 do not meet minimum
NCTD Results
All Services
3 of 3 meet minimum
1 round trip per day, 2 days per week allowing
minimum 4-hour stay in urban zone

The Coordinated Plan (2010 – 2014) L-10 Appendix L—RSRTP Performance Statistics
Urban Suburban Rural FY 08
Zone Services Peak Off-Peak Peak Off-Peak All Times
Guideline 30 120 30 120
MTS Results No Service No Service No Service No Service
NCTD Results
Regional Rail
36 120 36 120
Guideline 20 30 20 30
MTS Results 17 No Service 24 No Service
NCTD Results
Regional Bus
No Service No Service No Service No Service
Guideline 20 20 20 150
MTS Results 13 21 16 15
NCTD Results
Corridor
30 30 No Service No Service
Guideline 30 60 60 60
MTS Results 19 20 22 23
NCTD Results
Local Bus
43 48 40 48
Guideline 60 60 60 120
MTS Results 34 38 28 33
NCTD Results
Community Bus
No Service No Service No Service No Service
Rural
Rural Guideline 1 round trip per day, 2 days per week allowing minimum 4-hour stay in urban zone
MTS Results 2 of 9 do not meet minimum
NCTD Results
All Services
3 of 3 meet minimum
1 round trip per day, 2 days per week allowing
minimum 4-hour stay in urban zone

The Coordinated Plan (2010 – 2014) L-11 Appendix L—RSRTP Performance Statistics
Urban Suburban FY 09 Zone
Services Peak Off-Peak Peak Off-Peak Rural
All Times
Guideline 30 120 30 120
MTS Results No Service No Service No Service No Service
NCTD Results
Regional Rail
36 120 No Service No Service
Guideline 20 30 20 30
MTS Results 17 No Service 35 No Service
NCTD Results
Regional Bus
No Service No Service No Service No Service
Guideline 20 20 20 150
MTS Results 13 20 23 23
NCTD Results
Corridor
30 30 No Service No Service
Guideline 30 60 60 60
MTS Results 21 25 24 26
NCTD Results
Local Bus
46 48 45 48
Guideline 60 60 60 120
MTS Results 60 60 60 60
NCTD Results
Community Bus
No Service No Service No Service No Service
Rural
Rural Guideline 1 round trip per day, 2 days per week allowing minimum 4-hour stay in urban zone
MTS Results 2 of 6 do not meet minimum
NCTD Results
All Services
3 of 3 meet minimum
1 round trip per day, 2 days per week allowing
minimum 4-hour stay in urban zone
Reliability and Speed Objectives Objective: To operate transit services that are reliable, offer competitive travel times, and adhere to published
timetables or service intervals
Indicator and Performance Results 1: FY 2009 - Percentage of trips on time at departure, arrivals and enroute timing points
Urban Suburban Rural
Guidelines 80% within 5 minutes, none early
MTS
Regional 87% 83% No Service Corridor 76% 75% No Service Local Bus 73% 78% 80%
Community Bus 82% 77% No Service
NCTD
Regional 78% No Service No Service Corridor 92% No Service No Service Local Bus 80% 81% 79%
Community Bus No Service No Service No Service

The Coordinated Plan (2010 – 2014) L-12 Appendix L—RSRTP Performance Statistics
Indicator and Performance Results 2: Percentage of completed trips
Rail Fixed-Route Bus Demand Response ADA
Guideline 97.5% 97.5% 97.5% 97.5%
FY 07
MTS Results 100.0% 99.9% 100.0% 99.9%
NCTD Results 99.8% 99.9% 100.0% 100.0%
FY 08
MTS Results 100.0% 99.8% No Service 100.0%
NCTD Results 99.8% 99.9% 100.0% 100.0%
FY 09
MTS Results 100.0% 99.8% No Service 100.0%
NCTD Results 99.9% 100.0% 100.0% 100.0%
Indicator and Performance Results 3: Percentage of ADA trips with pickup within schedule window
Service Performance Guideline FY 2007
Performance Results
FY 2008 Performance
Results
FY 2009 Performance
Results
MTS – ADA 94% of pickups within schedule window 96.5% 95.0% 92.6
NCTD – ADA 94% of pickups within schedule window 94.1% 94.0% 94.0%
Objective: To maintain or improve existing average speeds on existing transit services within the geographical
zones
Indicator: To maintain or improve the average fleet speed for the transit services in each geographic zone
MTS Average Fleet Speed
NCTD Average Fleet Speed Indicator – Area
FY 07 FY 08 FY 09 FY 07 FY 08 FY 09
Urban: Maintain or improve the average fleet speed for transit services 13 mph 14 mph 14 mph 18 mph 18 mph 18 mph
Suburban: Maintain or improve the average fleet speed for transit services 15 mph 16 mph 16 mph 19 mph 18 mph 19 mph
Rural: Maintain or improve the average fleet speed for transit services 19 mph 19 mph 19 mph 28 mph 28 mph 26 mph

The Coordinated Plan (2010 – 2014) L-13 Appendix L—RSRTP Performance Statistics
Comfort Objective Objective: Occupancy on board vehicles in urban areas should be appropriate for the distance, speed, fare, and
type of service being operated
Indicator: Density of standees per square foot of available standing area (regular service)
Service Type Standee Density Guideline MTS FY 08 NCTD FY 08 MTS FY 09 NCTD FY 09
Regional and Community No Standees
Standees Identified on Route 851
No Standees No Standees No Standees
All Others No more than 20% of revenue hours exceeding one standee per 4 square foot on local street operation
FY 08 Not Available
FY 08 Not Available
FY 09 Not Available
FY 09 Not Available
Note: These guidelines do not apply to boarding procedures during major events when crush loading may be required.

The Coordinated Plan (2010 – 2014) L-14 Appendix L—RSRTP Performance Statistics
[THIS PAGE INTENTIONALLY LEFT BLANK]

The Coordinated Plan (2010 – 2014) L-15 Appendix L—RSRTP Performance Statistics
Social Service Transportation Evaluation OPERATIONS
FY08 FY09 FY08 FY09 FY08 FY09 FY08 FY09 FY08 FY09
NCTD SPRINTER Weekend Service JARC07 $156,375.00 307,911 $0.51 22 mi
MTS Route 30 (Weekends) JARC07-08 $370,008.00 $379,316.00 420,862 486,948 $0.88 $0.78 22.7 mi 22.7 mi 200,000 200,000
MTS Route 905 JARC07-08 $453,258.00 $452,329.00 418,817 415,079 $1.08 $1.09 10.3 mi 10.3 mi 16,608 16,608
MTS Route 960 JARC07-08 $101,023.00 $101,401.00 100,470 109,650 $1.01 $0.92 20.8 mi 20.8 mi 155,000 155,000
City of Oceanside Volunteer Driver Service Program NF06 $6,933.09 211 $32.86 Oceanside
City of Oceanside Shuttle Service NF07 $23,177.45 2,523 $9.19 Oceanside
City of La Mesa Rides4Neighbors NF06-07/SMG $28,554.55 $63,285.36 873 3,729 $32.71 $16.97 La Mesa 91941, 91942, 91945, 91977, 91978, 92019, 92020, 92021
Jewish Family Serivces UC Rides & Smiles NF07 $28,499.77 972 $29.32 92037, 92117, 92121, 92122
Jewish Family Serivces Rides & Smiles Extension SMG $32,590.00 2,531 $12.88 92126, 92127, 92128, 92129, 92131, 92064
All Congregations Together ComLink Transportation SMG $16,533.62 0 N/A
Alpha Project Senior Transportation Program SMG $11,814.18 556 $21.25 Escondido and Downtown SD
ElderHelp Volunteer Driver Program SMG $45,489.50 471 $96.58 92101, 92102, 92113, 92136, 92105, 92104, 92103, 92123, 92111, 92108, 92116, 92115, 92134, 92182
ITN Volunteer Driver Program SMG $24,586.63 467 $52.65 UC, Scripps Rnch, Mira Mesa, De Anza Cove, Linda Vista, Mission/Sorrento Valley, Serra Mesa, Kearny Mesa, Clmnt, PB (polygon)
Peninsula Shepherd Senior Center Volunteer Driver & Weekly Shuttle Services SMG $2,776.46 227 $12.23 Zip Codes: 92106, 92107, 92110 West of I-8
Redwood Elderlink Out & About SMG $9,278.84 353 $26.29 Escondido Sphere of Influence
Traveler's Aid Society SenioRide SMG $6,582.42 0 N/A
Total $952,843.55 $1,360,968.32 941,022 1,331,628 $1.01 $1.02 371,608 371,608
MOBILITY MANAGEMENT
FY08 FY09 FY08 FY09 FY08 FY09 FY08 FY09 FY08 FY09
FACT Planning toward implementing a call center NF06 $48,246.82 $9,046.72 12,875 14,394 $3.75 $0.63 Whole CounSan Diego County
FACT Regional mobility mgmt call center project NF07 $82,874.98 304 $272.62 NCTD Service Area
NCTD Mobility/travel training program NF07/SMG $44,242.00 $126,003.44 1,284 720 $34.46 $175.00 NCTD ServicNCTD Service Area
Total $92,488.82 $217,925.14 14,159 15,418 N/A N/A N/A N/A
*Service units include Web Hits (FACT Planning Activities), referrals (FACT Regional Mobility Management), and people trained (NCTD)
CAPITAL
FY08 FY09 FY08 FY09 FY08 FY09 FY08 FY09 FY08 FY09
NCTD SPRINTER Bus Stop Improvements JARC06 $482,492.00 120 $4,020.77 13,200
*Units added includes solar lights, bus benches, ADA landing pads, bus stop solar lights, trash cans, bus turnouts, and wayfinding signage
# of Targeted Jobs (JARC Only)
Agency Name Project Name Grant Sources
# of Targeted Jobs (JARC Only)
Grant SourcesProject NameAgency NameOperating Cost from Grant # One-Way Passenger Trips Operating Cost Per Trip Geographical Coverage
Operating Cost from Grant # One-Way Passenger Trips Operating Cost Per Trip Geographical Coverage
Operating Cost from Grant # of Units Added*Operating Cost Per Units Added
Geographical Coverage
# of Targeted Jobs (JARC Only)
Agency Name Project Name Grant Sources


appendix M
Regional Population Maps


The Coordinated Plan (2010 – 2014) M-1 Appendix M—Regional Population Maps

The Coordinated Plan (2010 – 2014) M-2 Appendix M—Regional Population Maps

The Coordinated Plan (2010 – 2014) M-3 Appendix M—Regional Population Maps

The Coordinated Plan (2010 – 2014) M-4 Appendix M—Regional Population Maps

The Coordinated Plan (2010 – 2014) M-5 Appendix M—Regional Population Maps

The Coordinated Plan (2010 – 2014) M-6 Appendix M—Regional Population Maps

The Coordinated Plan (2010 – 2014) M-7 Appendix M—Regional Population Maps

The Coordinated Plan (2010 – 2014) M-8 Appendix M—Regional Population Maps

The Coordinated Plan (2010 – 2014) M-9 Appendix M—Regional Population Maps

The Coordinated Plan (2010 – 2014) M-10 Appendix M—Regional Population Maps

The Coordinated Plan (2010 – 2014) M-11 Appendix M—Regional Population Maps


appendix N
Social Service Transportation Maps


The Coordinated Plan (2010 – 2014) N-1 Appendix N—Social Service Transportation Maps

The Coordinated Plan (2010 – 2014) N-2 Appendix N—Social Service Transportation Maps

The Coordinated Plan (2010 – 2014) N-3 Appendix N—Social Service Transportation Maps

The Coordinated Plan (2010 – 2014) N-4 Appendix N—Social Service Transportation Maps

The Coordinated Plan (2010 – 2014) N-5 Appendix N—Social Service Transportation Maps

The Coordinated Plan (2010 – 2014) N-6 Appendix N—Social Service Transportation Maps

The Coordinated Plan (2010 – 2014) N-7 Appendix N—Social Service Transportation Maps

The Coordinated Plan (2010 – 2014) N-8 Appendix N—Social Service Transportation Maps

The Coordinated Plan (2010 – 2014) N-9 Appendix N—Social Service Transportation Maps

The Coordinated Plan (2010 – 2014) N-10 Appendix N—Social Service Transportation Maps

The Coordinated Plan (2010 – 2014) N-11 Appendix N—Social Service Transportation Maps

The Coordinated Plan (2010 – 2014) N-12 Appendix N—Social Service Transportation Maps

The Coordinated Plan (2010 – 2014) N-13 Appendix N—Social Service Transportation Maps

The Coordinated Plan (2010 – 2014) N-14 Appendix N—Social Service Transportation Maps
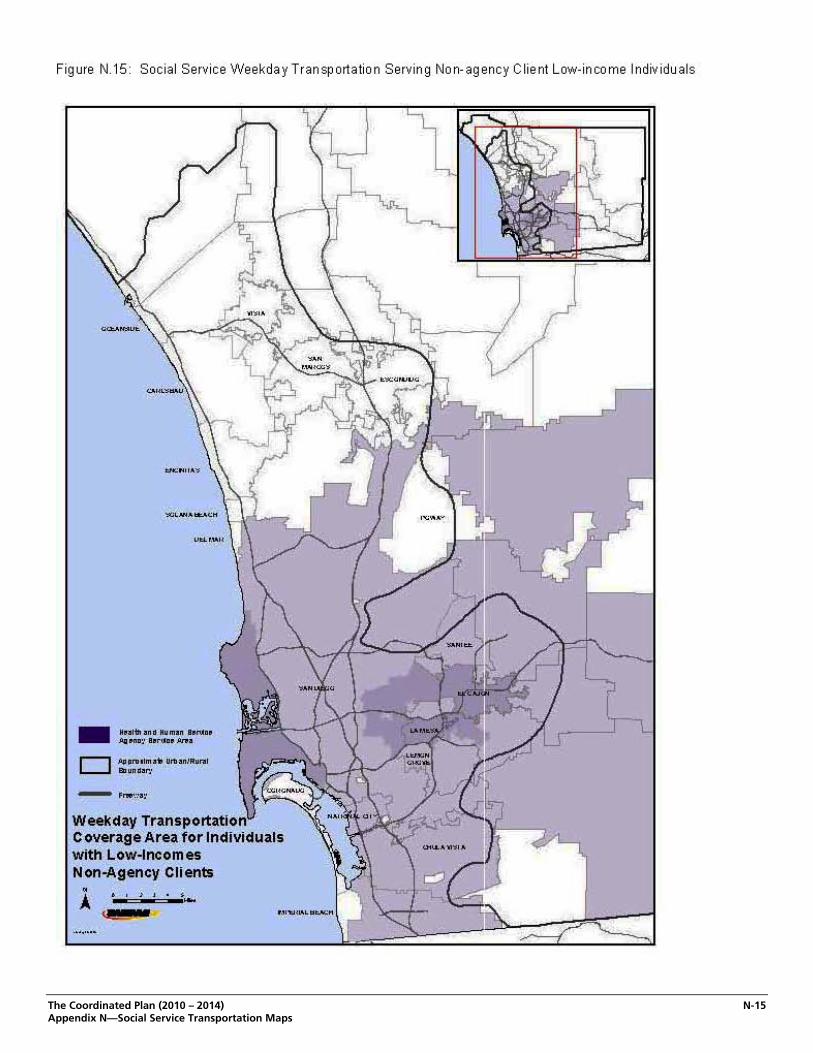
The Coordinated Plan (2010 – 2014) N-15 Appendix N—Social Service Transportation Maps

The Coordinated Plan (2010 – 2014) N-16 Appendix N—Social Service Transportation Maps

The Coordinated Plan (2010 – 2014) N-17 Appendix N—Social Service Transportation Maps
Figure N.16: Social Service Transportation Providers in the San Diego Region Funded Through the Coordinated Plan – New Freedom and Senior Mini-Grant Programs

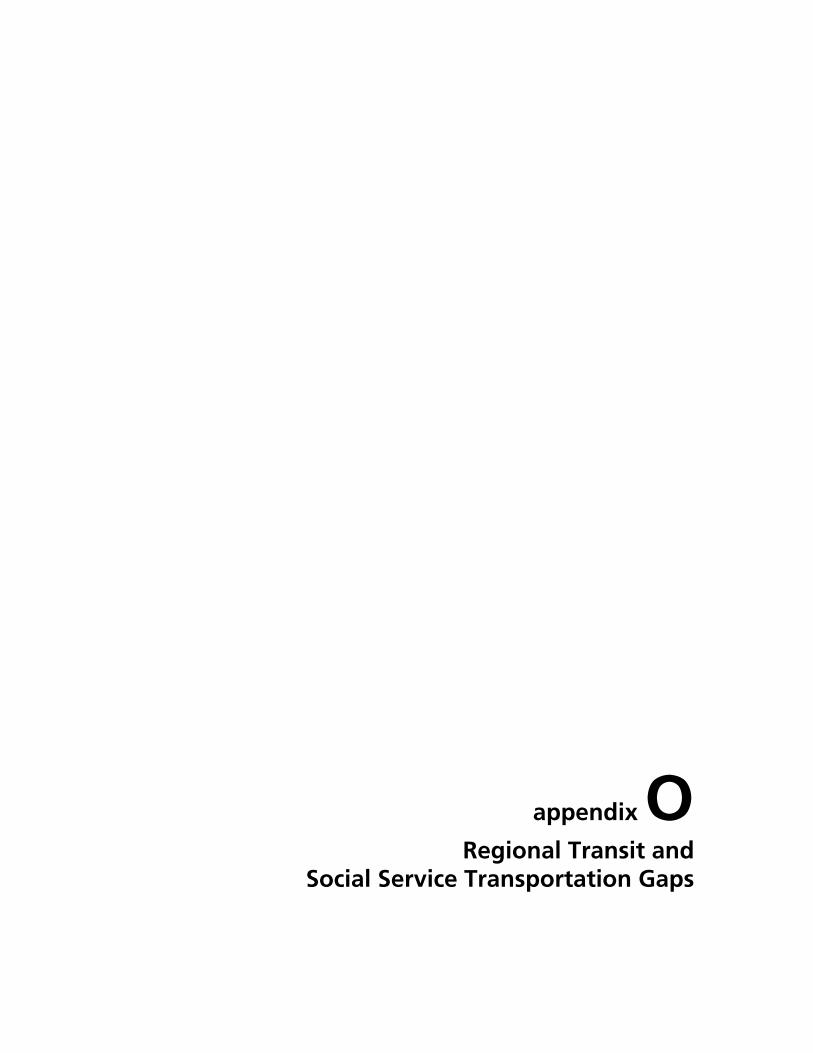
appendix O
Regional Transit and Social Service Transportation Gaps


The Coordinated Plan (2010 – 2014) O-1 Appendix O—Regional Transit and Social Service Transportation Gap
General Population Assessment An evaluation of the general population includes an assessment of residential locations and job locations to determine where transit deficiencies exist. Identified transit gaps involve both commuter needs for transit as well as for general trips relating to shopping, errands, medical appointments, etc. The analysis of the general population revealed several areas of the County with higher population densities that are not well served by public transit (see Figures O.1 and O.2). These residential areas (categorized by the urban, suburban, and rural subregions) are: Urban Area – Residential Transit Gaps
City Heights East Chula Vista La Mesa Lemon Grove Linda Vista Mira Mesa North El Cajon Northeast Oceanside Oceanside Peninsula San Marcos San Ysidro Skyline/Paradise Hills Spring Valley University Vista
Suburban Area – Residential Transit Gaps
56 Corridor(Carmel Valley, Pacific Highlands Ranch, Del Mar Mesa, Torrey Highlands, Rancho Peñasquitos, Black Mountain Ranch, and Carmel Mountain Ranch)
Encinitas Fallbrook Lakeside Santee Valle de Oro
Rural Area – Residential Transit Gaps
Alpine Barona Boulevard Campo Central Mountain Cuyamaca Descanso Desert Jacumba Jamul Julian Mountain Empire North Mountain

The Coordinated Plan (2010 – 2014) O-2 Appendix O—Regional Transit and Social Service Transportation Gap
Rural Area – Residential Transit Gaps (cont’d) Otay Pala-Pauma Palomar Mountain Pine Valley Potrero Rainbow Ramona Tecate Tribal area gaps as identified in the “Tribal Transit Feasibility Study” Valley Center
The analysis of the general population also revealed that there are several areas of the County that have higher workplace densities that are also underserved by public transit (see Figures O.3 and O.4). These employment areas (categorized by the urban, suburban, and rural subregions) are: Urban Area – Workplace Transit Gaps
Kearny Mesa La Mesa Mira Mesa Mission Valley National City North El Cajon Otay Mesa San Marcos University
Suburban Area – Transit Gaps
Camp Pendleton Carlsbad Coronado (NASNI) Fallbrook Rancho Bernardo Sorrento Valley
Rural Area – Transit Gaps
Alpine Barona Boulevard Campo Central Mountain Cuyamaca Descanso Desert Jacumba Jamul Julian Mountain Empire North Mountain

The Coordinated Plan (2010 – 2014) O-3 Appendix O—Regional Transit and Social Service Transportation Gap
Rural Area – Transit Gaps (cont’d) Otay Pala-Pauma Palomar Mountain Pine Valley Potrero Rainbow Ramona Tecate Tribal area gaps as identified in the “Tribal Transit Feasibility Study” Valley Center

The Coordinated Plan (2010 – 2014) O-4 Appendix O—Regional Transit and Social Service Transportation Gap
Figure O.1: Population Density (Place of Residence) Beyond Transit Service Area-Southern Area

The Coordinated Plan (2010 – 2014) O-5 Appendix O—Regional Transit and Social Service Transportation Gap
Figure O.2: Population Density (Place of Residence) Beyond Transit Service Area-Northern Area

The Coordinated Plan (2010 – 2014) O-6 Appendix O—Regional Transit and Social Service Transportation Gap
Figure O.3: Population Density (Place of Work) Beyond Transit Service Area-Southern Area

The Coordinated Plan (2010 – 2014) O-7 Appendix O—Regional Transit and Social Service Transportation Gap
Figure O.4: Population Density (Place of Work) Beyond Transit Service Area-Northern Area

The Coordinated Plan (2010 – 2014) O-8 Appendix O—Regional Transit and Social Service Transportation Gap
People with Limited Means An evaluation of individuals in poverty included both an assessment of residential locations and job locations to determine where potential transit deficiencies exist for this population group. Particular attention has been focused on the journey-to-work trip for those individuals who need to commute to and from their place of employment and may be eligible for funding under the federal Jobs Access and Reverse Commute (JARC) (Section 5316) program. The analysis of this population group showed that there are areas of the County that have higher population densities of individuals in poverty that are not well served by public transit (see Figures O.5 and O.6). An evaluation of zero car households was also included due to the high correlation between households without automobiles and poverty. The residential areas with workers in poverty and areas with higher concentrations of zero car households are: Urban Area – Residential Transit Gaps
City Heights Linda Vista San Ysidro University
Urban Area – Residential Social Service Transportation Gaps
Chula Vista City of San Diego Escondido Imperial Beach National City Oceanside Vista
Suburban Area – Residential Transit Gaps
Fallbrook Santee
Suburban Area – Residential Social Service Transportation Gaps
El Cajon Fallbrook
Rural Area – Residential Transit Gaps
Alpine Barona Boulevard Campo Central Mountain Cuyamaca Descanso Desert Jacumba Jamul

The Coordinated Plan (2010 – 2014) O-9 Appendix O—Regional Transit and Social Service Transportation Gap
Rural Area – Residential Transit Gaps (cont’d) Julian Mountain Empire North Mountain Otay Pala-Pauma Palomar Moutain Pine Valley Potrero Rainbow Ramona Tecate Tribal areas as identified in the “Tribal Transit Feasibility Study” Valley Center
Rural Area – Residential Social Service Transportation Gaps
Alpine Barona Boulevard Campo Central Mountain Cuyamaca Descanso Desert Jacumba Jamul Julian Mountain Empire North Mountain Otay Pala-Pauma Palomar Mountain Pine Valley Potrero Rainbow Ramona Tecate Tribal areas as identified in the “Tribal Transit Feasibility Study” Valley Center
Zero Car Households City Heights (Urban), North Park (Urban), and Fallbrook (Suburban)
Workplace transit service gaps also were determined as a result of the need to evaluate both trip ends of the commuter work trip. The employment areas with deficiencies or gaps in transit service for workers in poverty are (see Figures O.7 and O.8):

The Coordinated Plan (2010 – 2014) O-10 Appendix O—Regional Transit and Social Service Transportation Gap
Urban Area – Workplace Transit Gaps College Area Kearny Mesa La Mesa Mission Valley National City Otay Mesa
Suburban Area – Workplace Transit Gaps
Camp Pendleton Carlsbad – Palomar Airport Road Corridor Fallbrook Santee Vista – Business Parks
Rural Area – Workplace Transit Gaps
Alpine Barona Boulevard Campo Central Mountain Cuyamaca Descanso Desert Jacumba Jamul Julian Mountain Empire North Mountain Otay Pala-Pauma Palomar Mountain Pine Valley Potrero Rainbow Ramona Tecate Tribal areas as identified in the “Tribal Transit Feasibility Study” Valley Center

The Coordinated Plan (2010 – 2014) O-11 Appendix O—Regional Transit and Social Service Transportation Gap
Figure O.5: Working Population Below Poverty (Place of Residence) Beyond Transit Service Area-Southern Area

The Coordinated Plan (2010 – 2014) O-12 Appendix O—Regional Transit and Social Service Transportation Gap
Figure O.6: Working Population Below Poverty (Place of Residence) Beyond Transit Service Area-Northern Area

The Coordinated Plan (2010 – 2014) O-13 Appendix O—Regional Transit and Social Service Transportation Gap
Figure O.7: Working Population Below Poverty (Place of Work) Beyond Transit Service Area-Southern Area

The Coordinated Plan (2010 – 2014) O-14 Appendix O—Regional Transit and Social Service Transportation Gap
Figure O.8: Working Population Below Poverty (Place of Work) Beyond Transit Service Area-Northern Area

The Coordinated Plan (2010 – 2014) O-15 Appendix O—Regional Transit and Social Service Transportation Gap
Individuals with Disabilities Gaps and deficiencies in service for individuals with disabilities also were evaluated to help assess transit needs for this population subgroup. The assessment of the transportation needs of persons with disabilities includes work and non-work trips. Based on the assessment of the variety of residential based trip needs (for work trips and other trips) gaps in transit service were found in the following higher density residential locations (see Figures O.9, O.10, O.11, and O.12): Urban Area – Residential Transit Gaps
Chula Vista City Heights Mira Mesa North Park Northeast Oceanside San Ysidro Skyline/Paradise Hills Spring Valley
Urban Area – Residential Social Service Transportation Gaps
City of San Diego Coronado Escondido Imperial Beach National City Oceanside Vista
Suburban Area – Residential Transit Gaps
Fallbrook Lakeside Santee
Suburban Area – Residential Social Service Transportation Gaps
Carlsbad El Cajon Encinitas Fallbrook Lakeside Lemon Grove Poway
Rural Area – Residential Transit Gaps
Alpine Barona Boulevard Campo Central Mountain Cuyamaca Descanso Desert Jacumba Jamul

The Coordinated Plan (2010 – 2014) O-16 Appendix O—Regional Transit and Social Service Transportation Gap
Rural Area – Residential Transit Gaps (cont’d) Julian Mountain Empire North Mountain Otay Pala-Pauma Palomar Moutain Pine Valley Potrero Rainbow Ramona Tecate Tribal areas as identified in the “Tribal Transit Feasibility Study” Valley Center
Rural Area – Residential Social Service Transportation Gaps
Alpine Barona Boulevard Campo Central Mountain Cuyamaca Descanso Desert Jacumba Jamul Julian Mountain Empire North Mountain Otay Pala-Pauma Palomar Mountain Pine Valley Potrero Rainbow Ramona Tecate Tribal areas as identified in the “Tribal Transit Feasibility Study” Valley Center
Transit service gaps at the place of employment for individuals with disabilities also were identified in the San Diego region. The employment areas where transit service gaps were found include (see Figures O.13 and O.14): Urban Area – Workplace Transit Gaps
College Area Kearny Mesa Mission Valley National City

The Coordinated Plan (2010 – 2014) O-17 Appendix O—Regional Transit and Social Service Transportation Gap
Suburban Area – Workplace Transit Gaps Fallbrook
Rural Area – Workplace Transit Gaps
Alpine Barona Boulevard Campo Central Mountain Cuyamaca Descanso Desert Jacumba Jamul Julian Mountain Empire North Mountain Otay Pala-Pauma Palomar Mountain Pine Valley Potrero Rainbow Ramona Tecate Tribal areas as identified in the “Tribal Transit Feasibility Study” Valley Center

The Coordinated Plan (2010 – 2014) O-18 Appendix O—Regional Transit and Social Service Transportation Gap
Figure O.9: Population Density of People with Disabilities (Place of Residence) Beyond Transit Service Area-Southern Area

The Coordinated Plan (2010 – 2014) O-19 Appendix O—Regional Transit and Social Service Transportation Gap
Figure O.10: Population Density of People with Disabilities (Place of Residence) Beyond Transit Service Area-Northern Area

The Coordinated Plan (2010 – 2014) O-20 Appendix O—Regional Transit and Social Service Transportation Gap
Figure O.11: Population Density of Disabled Workers (Place of Residence) Beyond Transit Service Area-Southern Area

The Coordinated Plan (2010 – 2014) O-21 Appendix O—Regional Transit and Social Service Transportation Gap
Figure O.12: Population Density of Disabled Workers (Place of Residence) Beyond Transit Service area-Northern Area

The Coordinated Plan (2010 – 2014) O-22 Appendix O—Regional Transit and Social Service Transportation Gap
Figure O.13: Population Density of Disabled Workers (Place of Work) Beyond Transit Service Area-Southern Area

The Coordinated Plan (2010 – 2014) O-23 Appendix O—Regional Transit and Social Service Transportation Gap
Figure O.14: Population Density of Disabled Workers (Place of Work) Beyond Transit Service Area-Northern Area

The Coordinated Plan (2010 – 2014) O-24 Appendix O—Regional Transit and Social Service Transportation Gap
Seniors The assessment of senior transportation needs is an important and growing challenge given the expected increase in this population group over the next 25 years. Both 65+ and 85+ age ranges were included in the demographic analysis of older adults to determine as many gaps and deficiencies in existing transit service as possible. The following list includes the identified communities with both concentrations of older adults and deficient transit services (see Figures O.15, O.16 (Age 65+), O.17, and O.18 (Age 85+): Urban Area – Transit Gaps
Chula Vista City Heights College Area Coronado El Cajon La Mesa Linda Vista Mira Mesa Navajo North Park Northeast Oceanside Oceanside Pacific Beach San Marcos San Ysidro Skyline/Paradise Hills Spring Valley University West Escondido
Urban Area – Social Service Transportation Gaps
City of San Diego Escondido Imperial Beach Mira Mesa Oceanside San Marcos Vista
Suburban Area – Transit Gaps
Carmel Mountain Ranch Carmel Valley Fallbrook Lake San Marcos (Retirement) Lakeside Ocean Hills (Oceanside) Rancho Bernardo Santee South Carlsbad Tierrasanta

The Coordinated Plan (2010 – 2014) O-25 Appendix O—Regional Transit and Social Service Transportation Gap
Suburban Area – Social Service Transportation Gaps Carmel Valley El Cajon Fallbrook Rancho Bernardo Scripps Ranch Tierrasanta
Rural Area – Transit Gaps
Alpine Barona Boulevard Campo Central Mountain Cuyamaca Descanso Desert Jacumba Jamul Julian Mountain Empire North Mountain Otay Pala-Pauma Palomar Mountain Pine Valley Potrero Rainbow Ramona Tecate Tribal areas as identified in the “Tribal Transit Feasibility Study” Valley Center
Rural Area – Social Service Transportation Gaps
Alpine Barona Boulevard Campo Central Mountain Cuyamaca Descanso Desert Jacumba Jamul Julian Mountain Empire North Mountain Otay Pala-Pauma Palomar Mountain Pine Valley

The Coordinated Plan (2010 – 2014) O-26 Appendix O—Regional Transit and Social Service Transportation Gap
Rural Area – Social Service Transportation Gaps (cont’d) Potrero Rainbow Ramona Tecate Tribal areas as identified in the “Tribal Transit Feasibility Study” Valley Center

The Coordinated Plan (2010 – 2014) O-27 Appendix O—Regional Transit and Social Service Transportation Gap
Figure O.15: Population Density of Persons Age 65+ (Place of Residence) Beyond Transit Service Area-Southern Area

The Coordinated Plan (2010 – 2014) O-28 Appendix O—Regional Transit and Social Service Transportation Gap
Figure O.16: Population Density of Persons Age 65+ (Place of Residence) Beyond Transit Service Area-Northern Area

The Coordinated Plan (2010 – 2014) O-29 Appendix O—Regional Transit and Social Service Transportation Gap
Figure O.17: Population Density of Persons Age 85+ (Place of Residence) Beyond Transit Service Area-Southern Area

The Coordinated Plan (2010 – 2014) O-30 Appendix O—Regional Transit and Social Service Transportation Gap
Figure O.18: Population Density of Persons Age 85+ (Place of Residence) Beyond Transit Service Area-Northern Area

appendix P
Issues and Strategies


The Coordinated Plan (2010 – 2014) P-1 Appendix P—Issues and Strategies
ISSUES AND STRATEGIES The following represent the list of general issues and strategies to address those issues. 1. Issue: Gaps in transportation options for the general public
Possible Strategies – Urban/Suburban Area
Increase transportation options for the following urban residential areas: City Heights East Chula Vista Escondido Kearny Mesa La Mesa Lemon Grove Linda Vista Mira Mesa North El Cajon Northeast Oceanside
Oceanside Peninsula San Marcos San Ysidro Skyline/Paradise Hills Sorrento Valley Spring Valley University Vista - North County Square
Increase transportation options for the following suburban residential areas: Valle de Oro 56 Corridor (Carmel Valley, Pacific Highlands Ranch, Del Mar Mesa, Torrey Highlands, Rancho Peñasquitos, Black Mountain Ranch, and Carmel Mountain Ranch)
Encinitas Fallbrook Lakeside Santee
Increase transportation options for the following rural residential areas: Alpine Barona Boulevard Campo Central Mountain Cuyamaca Descanso Desert Jacumba Jamul Julian Mountain Empire North Mountain
Otay Pala-Pauma Palomar Mountain Pine Valley Potrero Rainbow Ramona San Elijo Hills Tecate Tribal areas as identified in the “Tribal Transit Feasibility Study”
Unincorporated sections of San Diego County Valley Center/Pala/Pauma
Increase employment-oriented transportation options to the following urban areas: Kearny Mesa La Mesa Mira Mesa Mission Valley National City North El Cajon
Otay Mesa San Marcos Sorrento Valley University Vista Business Park

The Coordinated Plan (2010 – 2014) P-2 Appendix P—Issues and Strategies
Increase employment-oriented transportation options to the following suburban areas: Camp Pendleton Carlsbad Coronado (NASNI)
Fallbrook Rancho Bernardo
Increase employment-oriented transportation options to the following rural areas: Alpine Barona Boulevard Campo Central Mountain Cuyamaca Descanso Desert Jacumba Jamul Julian Mountain Empire North Mountain
Otay Pala-Pauma Palomar Mountain Pine Valley Potrero Rainbow Ramona San Elijo Hills Tecate Tribal areas as identified in the “Tribal Transit Feasibility Study”
Unincorporated sections of San Diego County Valley Center/Pala/Pauma
Increase weekend hours for fixed-route services
Increase level of express service available
Additional feeder services to the Trolley and SPRINTER
Increased COASTER service, including regular weekend service
Increased SPRINTER service, including weekend and late evening service
Fixed-route connection from COASTER to Kearny Mesa
Improve services serving rural areas including Fallbrook, Temecula, Escondido, Rancho Bernardo, and Kearny Mesa
Commuter service from southern Riverside county
Increased transportation services in the rural areas of the county
Demand response transportation for areas not serviced by fixed-route
Create feeder to fixed-route services in rural areas:

The Coordinated Plan (2010 – 2014) P-3 Appendix P—Issues and Strategies
Increase employment-oriented transportation options to the following suburban areas and rural areas, including:
Alpine Barona Barona Boulevard Campo Campo Cuyamaca Descanso Desert Jacumba Jamul Julian Mountain Empire North Mountain Otay
Pala Pala-Pauma Palomar Moutain Pauma & Yuima Pine Valley Potrero Rainbow Ramona Rincon San Pasqual Sycuan Tecate Valley Center Viejas
Affected Population—General public
2. Issue: Gaps in transportation services serving individuals with limited means
Possible Strategies:
Increase employment-oriented transportation options from the following urban areas: Chula Vista City Heights City of San Diego Escondido Imperial Beach Linda Vista
National City Oceanside San Ysidro University Vista
Increase employment-oriented transportation options from the Fallbrook and El Cajon suburban areas
Increase employment-oriented transportation options from the unincorporated rural areas of the county including:
Alpine Barona Boulevard Campo Central Mountain Cuyamaca Descanso Desert Jacumba Jamul Julian Mountain Empire North Mountain
Otay Pala-Pauma Palomar Mountain Pine Valley Potrero Rainbow Ramona San Elijo Hills Tecate Tribal areas as identified in the “Tribal Transit Feasibility Study”
Unincorporated sections of San Diego County Valley Center/Pala/Pauma

The Coordinated Plan (2010 – 2014) P-4 Appendix P—Issues and Strategies
Increase employment-oriented transportation options to the following urban areas: College Area (SDSU) Kearny Mesa La Mesa
Mission Valley National City
Increase employment-oriented transportation options to the following suburban areas: Fallbrook Kearny Mesa
Increase employment-oriented transportation options to the following rural areas: Alpine Barona Boulevard Campo Central Mountain Cuyamaca Descanso Desert Jacumba Jamul Julian Mountain Empire North Mountain
Otay Pala-Pauma Palomar Mountain Pine Valley Potrero Rainbow Ramona San Elijo Hills Tecate Tribal areas as identified in the “Tribal Transit Feasibility Study”
Unincorporated sections of San Diego County Valley Center/Pala/Pauma
(tribal employment centers including): Barona Campo Pala Pauma & Yuima
Rincon San Pasqual Sycuan Viejas
Increase employment-oriented transportation options to the following areas noted in the assessment of the general public:
Camp Pendleton Carlsbad Coronado (NASNI) Fallbrook Kearny Mesa La Mesa Mira Mesa Mission Valley
National City North El Cajon Otay Mesa Rancho Bernardo San Marcos Sorrento Valley University Vista Business Park
Extend hours of operation and increase early morning, late night and weekend services
Affected Population—Individuals with limited means

The Coordinated Plan (2010 – 2014) P-5 Appendix P—Issues and Strategies
3. Issue: Gaps in mobility options for serving individuals with disabilities
Possible Strategies:
Improve mobility options for the following urban areas: Chula Vista City Heights City of San Diego Coronado Escondido Imperial Beach Mira Mesa National City North Park
Northeast Oceanside Oceanside Peacock Hills Senior Community – Oceanside (from public comment)
San Ysidro Skyline/Paradise hills Spring Valley Vista
Increase mobility options for the following suburban areas: Carlsbad El Cajon Encinitas Fallbrook
Lakeside Lemon Grove Poway Santee
Increase mobility options to the unincorporated and rural areas of the county including: Alpine Barona Boulevard Campo Central Mountain Cuyamaca Descanso Desert Jacumba Jamul Julian Mountain Empire North Mountain
Otay Pala-Pauma Palomar Mountain Pine Valley Potrero Rainbow Ramona San Elijo Hills Tecate Tribal areas as identified in the “Tribal Transit Feasibility Study”
Unincorporated sections of San Diego County Valley Center/Pala/Pauma
Increase employment-oriented mobility options to the following urban areas: College Area Kearny Mesa
Mission Valley National City
Increase employment-oriented mobility options to the following suburban areas: Fallbrook

The Coordinated Plan (2010 – 2014) P-6 Appendix P—Issues and Strategies
Increase employment-oriented mobility options to the unincorporated and rural areas of the county including:
Alpine Barona Boulevard Campo Central Mountain Cuyamaca Descanso Desert Jacumba Jamul Julian Mountain Empire North Mountain
Otay Pala-Pauma Palomar Mountain Pine Valley Potrero Rainbow Ramona San Elijo Hills Tecate Tribal areas as identified in the “Tribal Transit Feasibility Study”
Unincorporated sections of San Diego County Valley Center/Pala/Pauma
Affected Population—Individuals with disabilities
4. Issue: Gaps in transportation options serving seniors
Possible Strategies:
Increase transportation options for the following urban areas: Chula Vista City Heights City of San Diego College Area Coronado El Cajon Imperial Beach La Mesa Linda Vista Mira Mesa Navajo
North Park Northeast Oceanside Oceanside Pacific Beach San Marcos San Ysidro Skyline/Paradise Hills Spring Valley University Vista West Escondido
Increase local transportation options for the following suburban areas: Carmel Mountain Ranch Carmel Valley El Cajon Fallbrook Lake San Marcos Lakeside
Ocean Hills (Oceanside) Rancho Bernardo Santee Scripps Ranch South Carlsbad Tierrasanta

The Coordinated Plan (2010 – 2014) P-7 Appendix P—Issues and Strategies
Increase transportation options for the unincorporated and rural areas of the county including: Alpine Barona Boulevard Campo Central Mountain Cuyamaca Descanso Desert Jacumba Jamul Julian Mountain Empire North Mountain
Otay Pala-Pauma Palomar Mountain Pine Valley Potrero Rainbow Ramona San Elijo Hills Tecate Tribal areas as identified in the “Tribal Transit Feasibility Study”
Unincorporated sections of San Diego County Valley Center/Pala/Pauma
Provide more accessible public transit facilities near senior centers and high-density residential areas
Affected Population—Seniors
5. Issue: Limited amenities at existing transit stations
Possible Strategies:
Install and maintain additional amenities including shelters, seating, trash cans, and lighting
Affected Population—General public
6. Issue: Decreased independence for disabled riders restricted to using ADA paratransit services
Possible Strategies:
Increase paratransit service hours
Shorter windows for pickup times
Increased timeliness and reliability of pickup
Increased efficiency and flexibility
Decreased trip duration of paratransit rides
Same day reservations
Expanded paratransit eligibility beyond the three-quarter mile boundary
Community transportation options
Affected Population—Individuals with disabilities
7. Issue: Costliness of using ADA paratransit services
Possible Strategies:
Travel training to enable/encourage more individuals with disabilities to ride regular transit
Study impact of further reducing fares for ADA certified on regular transit

The Coordinated Plan (2010 – 2014) P-8 Appendix P—Issues and Strategies
Coordination of paratransit with social service transportation
Free trips for ADA certified passengers on fixed-routes
Affected Population—Individuals with disabilities
8. Issue: Supplemental Transportation Program’s vehicle fleets are inadequate to meet the existing demand
Possible Strategies:
Upgrade vehicles
Buy additional vehicles
Buy additional wheelchair accessible vehicles
Create or enhance a program to donate used ADA vehicles to community groups or social service agencies
Affected Population—Seniors, individuals with limited means, and individuals with disabilities
9. Issue: Lack of resources to provide enough services to meet Supplemental Transportation Program’s clientele demand
Possible Strategies:
Hire additional drivers
Hire additional administrative staff to coordinate services
Increase service area
Increase operating hours of accessible vehicles
Improve efficiency of existing programs through the use of technologies such as web-based scheduling and/or the development of a call center for volunteer driver programs
Support coalitions of similar programs such as the development of a volunteer driver program coalition
Affected Population—Seniors and individuals with disabilities
10. Issue: Decreased independence and isolation issues with transportation disadvantaged clients
Possible Strategies:
Distribute transportation vouchers
Provide door-to-door services for trips such as low-cost nonemergency medical transportation and grocery shopping in areas without paratransit
Provide taxi vouchers
Provide door-through-door transportation when necessary
More volunteer (privately owned vehicle and agency owned vehicle) driver programs or voucher programs
Expand shuttle services
Affected Population—Seniors, individuals with limited means, and individuals with disabilities

The Coordinated Plan (2010 – 2014) P-9 Appendix P—Issues and Strategies
11. Issue: Difficulties for CalWORKS clients to obtain and retain employment due to transportation issues
Possible Strategies:
Provide transportation programs for CalWORKS clients to access county buildings for program orientation and training
Provide Transportation services for CalWORKS clients to drop off their children at daycare prior to commuting to work
Affected Population—Individuals with limited means
PUBLIC INFORMATION Public information provides a crucial link in the public transit and human services transportation system by providing ride information to passengers. The identified issues involving the existing public information system along with sample strategies and the corresponding affected population group(s) are:
1. Issue: Lack of public knowledge about existing transportation services
Possible Strategies:
Multilingual community outreach and marketing of services
Transportation system guides
Transportation options marketing
Make improvements to 511sd.com Web site
Improved information on routes and schedules for buses and trolley system
Improved dissemination of service change information
Improvement and maintenance of the STRIDE Web site
Development of a coordinated “one-call” center for human and social service transportation
Development of a mobility management center for all transportation services
Affected Population—All
2. Issue: Lack of public knowledge about the benefits of coordinating services
Possible Strategies:
Marketing, education, and outreach regarding coordinating transportation services and the obligation to fulfill the spirit of coordination from the federal guidance for the purpose of being eligible for and obtaining funding.
Affected Population—Human and Social Service Agencies, seniors, individuals with limited means, and individuals with disabilities

The Coordinated Plan (2010 – 2014) P-10 Appendix P—Issues and Strategies
3. Issue: Difficulty with riders navigating the ADA certification process efficiently
Possible Strategies:
Provide an assistance program for individuals trying to become ADA certified
Affected Population—Individuals with disabilities
4. Issue: Inefficiency and decreased independence of riders using paratransit who could potentially be using fixed-route services
Possible Strategies:
Mobility/Travel Training
Affected Population—Individuals with disabilities ALTERNATIVE TRANSPORTATION PROGRAMS Alternative transportation programs involve those programs that facilitate the changing of transportation modes in order to improve cost efficiency or travel time efficiency. The identified issues which involve alternative transportation programs, with issues crossing the spectrum of transportation needs are identified below along with sample alternative transportation strategies including the targeted population group(s).
1. Issue: Lack of available public transportation services
Possible Strategies:
Development of car loan programs for low-income eligible individuals in all areas including areas with existing low-car ownership such as Fallbrook, City Heights, and North Park
Development or expansion of car sharing programs
Development of station car programs providing vehicles to and from transit nodes to employment centers
Development of nonmotorized transportation programs (such as bicycles) for low-income eligible individuals
Expansion of public information regarding alternative transportation programs
Expansion or support of existing vanpool programs
Development of new vanpool programs including vehicle procurement
Creation of voucher programs
Affected Population—Individuals with limited means

The Coordinated Plan (2010 – 2014) P-11 Appendix P—Issues and Strategies
SAFETY The identified issues involving safety along with sample remediation strategies and the corresponding affected population group(s) are:
1. Issue: Safe pedestrian mobility at COASTER stations
Possible Strategies:
Installation of pedestrian grade separations at COASTER stations
Affected Population—General public
2. Issue: Improved security at park-and-ride lots and transit stations
Possible Strategies:
Installation of Closed Circuit Television (CCTV) devices and security personnel to monitor CCTV feeds
Increase officer patrol in areas with known criminal activity
Affected Population—General public
3. Issue: Improve security on transit
Possible Strategies:
Installation of in-vehicle CCTV devices and operator monitoring equipment
Installation of signage notifying transit patrons of police monitoring activities via decals, posters, or other marketing material
Affected Population—General public
ACCESSIBILITY Accessibility is an issue that predominantly affects individuals with disabilities or who are permanently or temporarily mobility impaired. The identified issues involving accessibility along with sample strategies to improve accessibility and the corresponding affected population group(s) are:
1. Issue: Accessible taxicabs
Possible Strategies:
Upgrade existing cabs to either enhance or provide accessibility
Increase cab fleet with additional accessible vehicles
Affected Population—Individuals with disabilities

The Coordinated Plan (2010 – 2014) P-12 Appendix P—Issues and Strategies
2. Issue: Accessible bus stops and transit stations
Possible Strategies:
Retrofit existing bus stops to ensure accessibility and ADA compliance
Upgrade bus stops to include weather protection
Affected Population—Individuals with disabilities
3. Issue: Accessible paths of travel to public transit stops
Possible Strategies:
Improvement of accessible travel paths to transit stops and stations
Affected Population—Individuals with disabilities
4. Issue: External announcements on the buses
Possible Strategies:
Improve bus public address (PA) systems
Enhance driver training program to improve passenger information
Affected Population—Individuals with disabilities
5. Issue: More transportation services that can accommodate larger wheelchairs
Possible Strategies:
Include vehicles that can accommodate larger chairs in fleet
Improve dispatch communication system to ensure that passengers will be transported in the most appropriate vehicle
Community transportation options
Affected Population—Individuals with disabilities
6. Issue: Improve vehicles to enhance accessibility
Possible Strategies:
Replace older high-floor buses with newer low-floor models
Prioritize accessibility upgrades for existing vehicles
Increase the space and designated number of seats for disabled riders to accommodate more wheelchairs
Affected Population—Individuals with disabilities

The Coordinated Plan (2010 – 2014) P-13 Appendix P—Issues and Strategies
TRIP NEEDS The topic of trip purpose and trip needs was a reoccurring theme among the aging and rural populations of San Diego County. As such, the identified issues involving trip needs and sample strategies to address those needs (including the corresponding affected population groups) are:
1. Issue: Most common trip needs are for medical and shopping purposes
Possible Strategies:
Enhance transportation choices for discretionary and nonemergency medical trips
Affected Population—All Seniors, and rural persons with disabilities, individuals with limited means
2. Issue: Trips for church, school, shopping, social visits, and entertainment needed weekly
Possible Strategies:
Increase trip availability for discretionary trips throughout the week and on weekends
Affected Population—All Seniors, and rural persons with disabilities, individuals with limited means
3. Issue: Trips during off-peak hours, particularly midday weekday trips
Possible Strategies:
Increase service span to include off-peak hours and ensure midday trip coverage
Affected Population—All Seniors, and rural persons with disabilities, individuals with limited means COORDINATION While coordinating public transit and human service transportation is critical, existing examples are few and far between. The following represents the existing issues and subsequent opportunities involving coordination and collaboration along with the affected population groups:
1. Issue: Existing resources can be used more efficiently
Possible Strategies:
Increase coordination efforts in the forms of combining resources such as vehicles, riders, funds for rides, vehicle maintenance, drivers, driver training, insurance coverage, general ride subsidies, etc.
Require projects to coordinate with other transportation or resources in order to be eligible for Job Access and Reverse Commute (JARC), New Freedom (NF), Senior Mini-Grant, and Section 5310 funding
Encourage group purchasing of transportation equipment maximizing cost savings for equipment, vehicle maintenance, gas cards for volunteers, dispatching equipment, insurance, and software
Affected Population—General public

The Coordinated Plan (2010 – 2014) P-14 Appendix P—Issues and Strategies
2. Issue: Coordination efforts should result in a user-friendly system that is available and accessible to all populations
Possible Strategies:
Development of a centralized ride scheduling, dispatching, and mobility center
Affected Population—General public
3. Issue: Limited connections between health and human service transportation and public transit
Possible Strategies:
Increase information exchange between transit operators and health and human service transportation providers
Affected Population—General public
4. Issue: Transportation system could take advantage of new technologies
Possible Strategies:
Purchase technology to promote cohesive use between public and private transportation providers
Affected Population—General public
5. Issue: School districts may face additional coordination hurdles because of different vehicle standards and state requirements precluding other vehicles to access school sites
Possible Strategies:
Encourage coordination among school districts
Encourage collaboration with State of California and the California Highway Patrol to modify requirements for vehicles accessing school sites
Affected Population—General public
6. Issue: Some agencies may not be able to share their vehicles because their vehicles are at 100 percent capacity all day
Possible Strategies:
Develop the coordination of other activities such as driver training, insurance, maintenance programs, etc.
Affected Population—General public

The Coordinated Plan (2010 – 2014) P-15 Appendix P—Issues and Strategies
OTHER There are other miscellaneous issues that surfaced during the public involvement process which involve operators of transportation and passengers. The following issues and strategies are presented to include those issues, as well as the affected population groups:
1. Issue: Driver training
Possible Strategies:
Enhance sensitivity training for drivers particularly for those assisting passengers with developmental disabilities
Affected Population—General public including individuals with disabilities
2. Issue: Identified need for transit dependent individuals to get home for emergencies
Possible Strategies:
Enhance existing guaranteed ride home programs1
Affected Population—Individuals with limited means
3. Issue: Trips are needed during off-peak hours, particularly during midday weekday time periods
Possible Strategies:
Increase social service transportation in areas with denser senior populations
Affected Population—Seniors
1 The existing guaranteed ride home program provides an unscheduled ride home to commuters who carpool, vanpool, bike, use the COASTER,
or premium bus service to get to work at least three times per week.


Appendix Q
Rural Transportation Survey Results


The Coordinated Plan (2010 – 2014) Q-1 Appendix Q—Rural Transportation Survey Results

The Coordinated Plan (2010 – 2014) Q-2 Appendix Q—Rural Transportation Survey Results
“1. How often do you make the following trip?”
AND
“5. How many times during the week are you unable to make a trip because you can’t get transportation?”
TABLE 1 Trip Data (Rural San Diego)
Population of Interest Value Work Shopping Medical Social Religious School Business
Recreation/Leisure Other Totals
Limited-Income Taken 139 139 43 150 63 92 102 98 29 853
70 Surveys Missed 43 48 31 49 20 30 31 56 16 322
Demand 181 187 74 198 83 122 133 154 45 1175
% Missed 24% 26% 42% 25% 24% 25% 23% 36% 35% 27%
Senior Taken 111 184 63 156 65 33 111 145 38 905
90 Surveys Missed 12 23 5 13 13 7 10 15 1 100
Demand 123 207 68 169 78 40 121 160 39 1005
% Missed 10% 11% 8% 8% 16% 18% 9% 10% 1% 10%
Person with Disability Taken 103 117 50 104 34 51 75 100 34 667
59 Surveys Missed 20 37 25 40 20 24 17 49 15 249
Demand 123 154 76 145 54 75 92 149 49 916
% Missed 17% 24% 34% 28% 37% 32% 19% 33% 31% 27%
Non-Disadvantaged Taken 718 423 72 422 122 272 243 385 57 2713
187 Surveys Missed 5 7 1 6 2 2 6 6 0 36
Demand 723 430 73 428 124 274 248 391 57 2749
% Missed 1% 2% 2% 1% 1% 1% 2% 2% 0% 1%

The Coordinated Plan (2010 – 2014) Q-3 Appendix Q—Rural Transportation Survey Results
Questions 1 and 5 specific to Borrego Springs outreach area
TABLE 2 Borrego Springs Outreach1
Population of Interest Value Work Shopping Medical Social Religious School Business Recreation/
Leisure Other Totals
Limited-Income Taken 0 3 2 1 1 1 2 0 0 9
3 Surveys Missed 5 1 1 0 1 2 1 0 0 11
Demand 5 4 3 1 2 2 3 0 0 20
% Missed 98% 30% 38% 0% 50% 75% 32% #DIV/0! 0% 54%
Senior Taken 0 10 2 9 7 0 6 3 2 38
5 Surveys Missed 0 1 1 0 1 1 1 0 0 5
Demand 0 11 3 9 8 1 7 3 2 43
% Missed #DIV/0! 10% 31% 0% 13% 100% 15% 0% 0% 12%
Person with Disability Taken 0 1 1 0 0 1 0 0 0 2
2 Surveys Missed 5 0 0 0 0 1 0 0 0 6
Demand 5 1 1 0 0 1 0 0 0 8
% Missed 98% 14% 0% #DIV/0! #DIV/0! 50% 0% #DIV/0! 0% 74%
Non-Disadvantaged Taken 3 4 2 0 1 0 0 0 0 10.1
1 Survey Missed 0 0 1 0 1 0 0 0 0 1.7
Demand 3 4 3 0 2 0 0 0 0 11.8
% Missed 0% 0% 33% 0% 33% 100% 100% #DIV/0! #DIV/0! 14%
1 Includes: Borrego Springs

The Coordinated Plan (2010 – 2014) Q-4 Appendix Q—Rural Transportation Survey Results
Questions 1 and 5 specific to Ramona outreach area
TABLE 3 Ramona Outreach2
Population of Interest Value Work Shopping Medical Social Religious School Business Recreation/
Leisure Other Totals
Limited-Income Taken 84 67 19 52 30 55 47 42 12 407
27 Surveys Missed 21 26 20 26 9 16 16 33 15 183
Demand 105 93 39 78 39 71 63 75 27 591
% Missed 20% 28% 51% 34% 24% 23% 26% 44% 56% 31%
Senior Taken 34 45 17 39 13 18 31 31 19 246
22 Surveys Missed 0 6 1 6 1 0 1 4 1 20
Demand 34 51 18 45 14 18 32 35 20 266
% Missed 0% 12% 7% 14% 4% 1% 3% 12% 3% 8%
Person with Disability Taken 75 49 23 39 22 40 39 40 19 346
23 Surveys Missed 11 20 18 20 13 22 12 26 15 157
Demand 86 69 40 59 35 62 51 66 34 503
% Missed 13% 28% 44% 35% 38% 36% 23% 40% 44% 31%
Non-Disadvantaged Taken 448 236 37 232 70 195 134 217 40 1609
98 Surveys Missed 2 1 0 4 1 2 3 1 0 15
Demand 450 237 37 236 71 197 137 218 40 1623
% Missed 0% 0% 0% 2% 2% 1% 2% 1% 0% 1%
2 Includes: North Mountain, Julian, Cuyamaca, Central Mountain, Barona, Ramona

The Coordinated Plan (2010 – 2014) Q-5 Appendix Q—Rural Transportation Survey Results
Questions 1 and 5 specific to Valley Center outreach area
TABLE 4 Valley Center Outreach3
Population of Interest Value Work Shopping Medical Social Religious School Business Recreation/
Leisure Other Totals
Limited-Income Taken 11 28 5 45 14 6 20 28 4 160
12 Surveys Missed 5 8 0 7 5 5 5 5 0 40
Demand 16 36 5 52 19 11 25 33 4 200
% Missed 31% 22% 2% 13% 27% 45% 20% 15% 0% 20%
Senior Taken 41 96 29 85 36 9 47 79 7 429
37 Surveys Missed 9 14 1 7 9 5 7 9 0 61
Demand 50 110 30 92 45 14 54 88 7 490
% Missed 18% 13% 2% 8% 20% 35% 13% 10% 0% 12%
Person with Disability Taken 13 38 16 42 8 1 19 42 9 188
14 Surveys Missed 0 7 1 2 0 0 0 5 0 15
Demand 13 45 17 44 8 1 20 47 9 203
% Missed 0% 16% 3% 5% 0% 0% 1% 11% 0% 7%
Non-Disadvantaged Taken 109 108 18 122 36 37 64 104 13 611
42 Surveys Missed 0 6 0 2 0 0 0 5 0 14
Demand 109 115 18 124 36 37 64 109 13 625
% Missed 0% 5% 1% 2% 0% 0% 0% 5% 0% 2%
3 Includes: Palomar Mountain, Pala-Pauma, Rainbow, Fallbrook, Bonsall, Hidden Meadows

The Coordinated Plan (2010 – 2014) Q-6 Appendix Q—Rural Transportation Survey Results
Questions 1 and 5 specific to Campo outreach area
TABLE 5 Campo Outreach4
Population of Interest Value Work Shopping Medical Social Religious School Business Recreation/
Leisure Other Totals
Limited-Income Taken 43 42 17 52 18 30 33 29 13 277
28 Surveys Missed 12 13 10 15 5 8 8 17 1 88
Demand 55 55 27 67 23 38 41 47 14 365
% Missed 21% 23% 37% 23% 20% 20% 21% 37% 4% 24%
Senior Taken 37 34 14 23 9 6 27 32 11 192
26 Surveys Missed 3 2 2 0 2 1 1 2 0 14
Demand 40 36 17 23 11 7 28 34 11 206
% Missed 8% 6% 13% 0% 18% 14% 4% 6% 0% 7%
Person with Disability Taken 14 30 11 24 4 9 16 18 6 131
20 Surveys Missed 4 10 7 18 7 1 5 18 0 71
Demand 19 40 18 41 11 10 21 36 6 202
% Missed 22% 26% 40% 43% 63% 11% 25% 50% 0% 35%
Non-Disadvantaged Taken 158 75 15 68 16 40 45 63 4 483
46 Surveys Missed 3 0 0 0 0 0 2 0 0 6
Demand 161 75 15 68 16 40 48 63 4 489
% Missed 2% 0% 1% 0% 0% 0% 5% 0% 0% 1%
4 Includes: Alpine, Crest-Dehesa, Jamul, Otay, Potrero, Campo Boulevard, Mountain Empire, Pine Valley, Jacumba

The Coordinated Plan (2010 – 2014) Q-7 Appendix Q—Rural Transportation Survey Results
“2. Which mode do you use most often when making these trips?”
TABLE 6 Trip Data (Rural San Diego)
Population of Interest Work Shopping Medical Social Religious School Business Recreation/
Leisure Other Totals
Walk/Cycle 8 5 6 5 7 1 5 14 3 54
3% 1% 2% 1% 3% 1% 2% 4% 4% 2%
Drive Myself 248 327 316 293 181 137 283 266 57 2108
86% 86% 86% 81% 80% 87% 87% 74% 76% 83%
Ride from Family/Friends 14 31 30 47 30 9 23 63 6 253
5% 8% 8% 13% 13% 6% 7% 17% 8% 10%
ADA Paratransit 0 1 1 3 0 0 1 0 1 7
0% 0% 0% 1% 0% 0% 0% 0% 1% 0%
Bus 15 13 9 9 6 10 9 11 6 88
5% 3% 2% 2% 3% 6% 3% 3% 8% 3%
Taxi Service 0 0 2 1 0 0 2 2 0 7
0% 0% 1% 0% 0% 0% 1% 1% 0% 0%
Volunteer Driver 2 5 5 5 2 1 3 5 2 30
1% 1% 1% 1% 1% 1% 1% 1% 3% 1%
Total 287 382 369 363 226 158 326 361 75 2547

The Coordinated Plan (2010 – 2014) Q-8 Appendix Q—Rural Transportation Survey Results
“3. Where do you typically make the following trips?”
TABLE 7 Trip Data (Rural San Diego)
Work Shopping Medical Social Religious School Business Recreation/
Leisure Other Total
Inside Community 140 110 87 124 145 89 127 74 14 910
38% 28% 23% 33% 40% 25% 34% 20% 13% 38%
Both 23 138 72 140 18 10 88 144 28 661
6% 36% 19% 37% 5% 3% 24% 39% 25% 6%
Outside Community 109 132 206 90 48 39 113 130 21 888
29% 34% 54% 24% 13% 11% 30% 36% 19% 29%
Don't Take These Trips 101 7 16 22 152 214 43 17 47 619
27% 2% 4% 6% 42% 61% 12% 5% 43% 27%
Total 373 387 381 376 363 352 371 365 110 3078
“4. Do you usually need physical assistance to make these trips from your house to your destination?”
TABLE 8
Yes 15
No 278
6. Do you have a current driver’s license?
TABLE 9
Yes 346
No 30
7. Do you own a motor vehicle?
TABLE 10
Yes 331
No 45

The Coordinated Plan (2010 – 2014) Q-9 Appendix Q—Rural Transportation Survey Results
“8. When using any form of transportation where you don’t drive (e.g., taxi, church vehicle), how concerned are you with each of the following areas?”
TABLE 11 Rider Priorities
Transport- ation Cost
Vehicle Safety
Personal Security Reliability*
Travel Time Is Long
Vehicle Crowding
Driver Courtesy Comfort
Having To Cross Streets Upon Arrival At My Destination
Total
Very Concerned 113 110 114 118 106 86 71 70 53 841
30% 32% 31% 33% 30% 25% 20% 20% 14%
Concerned 92 85 80 75 69 78 86 99 47 711
25% 23% 22% 21% 20% 22% 25% 28% 13%
Not Very Concerned 32 31 32 26 50 47 63 46 76 403
8% 8% 8% 7% 13% 13% 16% 13% 22%
Not Concerned 24 24 28 21 22 27 25 26 60 257
7% 6% 8% 5% 5% 7% 7% 6% 17%
Not Applicable 103 104 102 113 109 113 107 110 114 975
30% 31% 31% 34% 32% 34% 32% 33% 34%
TOTAL 364 354 356 353 356 351 352 351 350 3187
*vehicle on time at pick-up/drop-off
“9. If you have other concerns not referenced in question 8, please let us know.”
Multiple responses
“10. Cross streets closest to your residence?”
Confidential
“11. What is the name of your community?”
Multiple responses

The Coordinated Plan (2010 – 2014) Q-10 Appendix Q—Rural Transportation Survey Results
“12. ZIP Code of your residence?”
TABLE 12
Respondent's Zip Codes
91901 91980 92065
91902 92003 92069
91905 92004 92070
91906 92021 92071
91916 92025 92078
91917 92026 92082
91931 92027 92084
91934 92028 92086
91935 92036 92127
91962 92040 92128
91963 92056 92154
91977 92057
91978 92061
“13. Gender?”
TABLE 13
Gender Female Male
# of Respondents 237 126
“14. In what year were you born?”
TABLE 14
Age (Years) 0-25 26-50 51-64 65-84 85+
# of Respondents 10 117 124 88 3
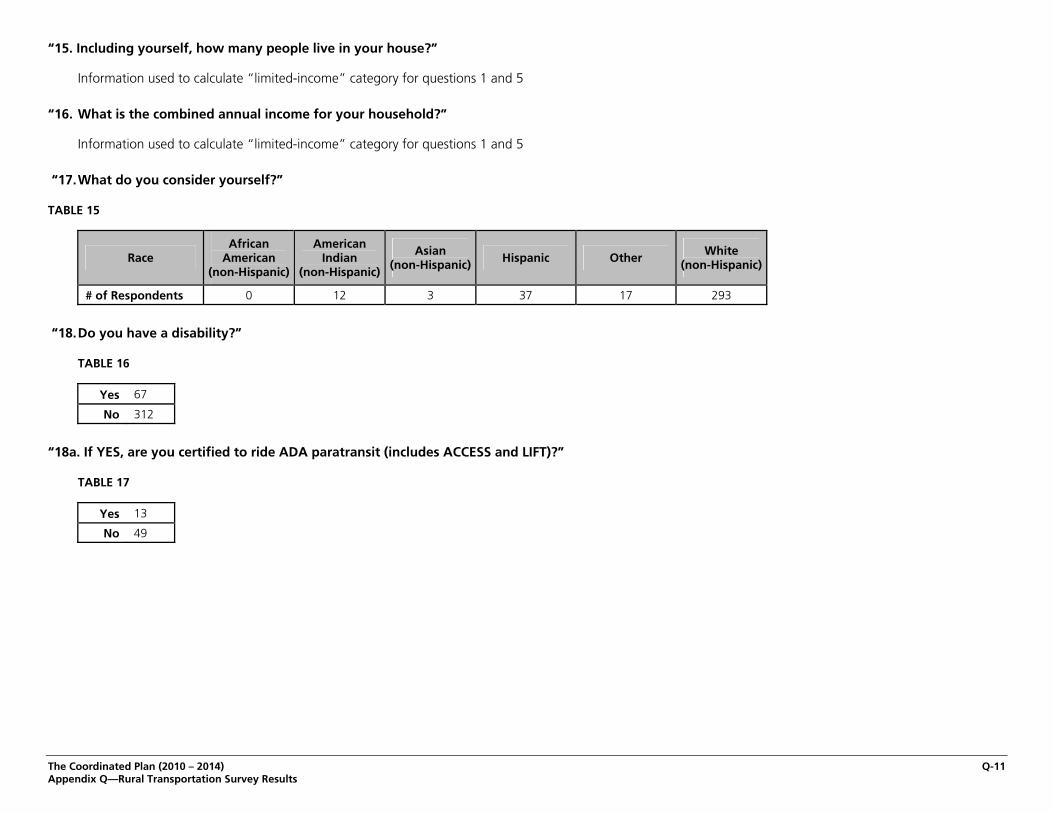
The Coordinated Plan (2010 – 2014) Q-11 Appendix Q—Rural Transportation Survey Results
“15. Including yourself, how many people live in your house?”
Information used to calculate “limited-income” category for questions 1 and 5
“16. What is the combined annual income for your household?”
Information used to calculate “limited-income” category for questions 1 and 5
“17. What do you consider yourself?”
TABLE 15
Race African
American (non-Hispanic)
American Indian
(non-Hispanic)
Asian (non-Hispanic) Hispanic Other
White (non-Hispanic)
# of Respondents 0 12 3 37 17 293
“18. Do you have a disability?”
TABLE 16
Yes 67
No 312
“18a. If YES, are you certified to ride ADA paratransit (includes ACCESS and LIFT)?”
TABLE 17
Yes 13
No 49
The Coordinated Plan (2010 – 2014) Q-12 Appendix Q—Rural Transportation Survey Results
The following maps illustrate the results of the liaison/stakeholder survey that were obtained through phone interviews with the liaisons in advance of the general public Rural Transportation survey.

The Coordinated Plan (2010 – 2014) Q-13 Appendix Q—Rural Transportation Survey Results
End Providers

The Coordinated Plan (2010 – 2014) Q-14 Appendix Q—Rural Transportation Survey Results
Potential Providers

The Coordinated Plan (2010 – 2014) Q-15 Appendix Q—Rural Transportation Survey Results
Partners

The Coordinated Plan (2010 – 2014) Q-16 Appendix Q—Rural Transportation Survey Results
Bus Route Proximity