¥ 00 Cover art final - UNCCD
83
United Nations Environment Programme GLOBAL ENVIRONMENT OUTLOOK YEAR BOOK 2003
-
Upload
khangminh22 -
Category
Documents
-
view
1 -
download
0
Transcript of ¥ 00 Cover art final - UNCCD

“It is our duty individually and collectively to takestock of the issues and developments of 2003 andof the measures taken during the year to achieve a
more sustainable future for the environment.”From the Preface by Klaus Töpfer, Executive Director, United Nations Environment Programme
The GEO Year Book 2003 is the first in an annual series associated with the UnitedNations Environment Programme (UNEP) flagship report, Global Environment
Outlook (GEO). Based upon a collaborative/comprehensive tracking and stocktakingprocess established with partners, the GEO Year Book 2003 includes:
• An Overview of major global and regional environmental issues and developments that shaped policy decisions and actions during the course of the year
• A Feature Focus on Water and its critical role in realizing variousinternationally-agreed development goals and targets,
including those contained in the UN MillenniumDeclaration and in the Plan of Implementation agreed at
the World Summit on Sustainable Development
• Emerging Challenges – New Findings presentingscientific progress made in 2003 that may assistsociety in recognizing and better understanding
emerging environmental issues and help decisionmakers in designing adequate responses
• GEO Indicators highlighting some of the keyglobal and regional environmental issues and trends
that have been identified in GEO reports. Theselected set of trend indicators will provide a
consistent and harmonized oversight of majorenvironmental changes
on an annual basis
Keeping abreast of environmental issues as they unfold,UNEP has encapsulated the most significant of these recent
developments in this readable and reliable volume – to inform, guideand stimulate further action for the health of our environment
United Nations Environment ProgrammeG
LOBA
L ENV
IRO
NM
ENT O
UTLO
OK
YEA
R B
OO
K 2003
www.unep.orgUNEP Division of Early Warning
and AssessmentP O Box 30552, Nairobi 00100 Kenya
Tel: +254 20 623562Fax: +254 20 623944e-mail: [email protected]
www.unep.org/geo/yearbook
UNEP ISBN paperback: 92-807-2415-0
hardcover: 92-807-2421-5

Copyright © 2004, United Nations Environment Programme
ISBN: 92-807-2415-0 (paperback)
92-807-2421-5 (hardback)
UNEP/GCSS.VIII/INF/2
UNEP Job No. DEW-05001-NA
DisclaimersThe contents and views expressed in this publication do not necessarily reflect the views or policies of the contributoryorganizations or the United Nations Environment Programme (UNEP).
The opinions, figures and estimates set forth in this publication should not necessarily be considered as reflecting the viewor carrying the endorsement of UNEP.
The designations employed and the presentation of material in this publication do not imply the expression of any opinionwhatsoever on the part of UNEP concerning the legal status of any country, territory or city or its authorities, or concerningthe delimitation of its frontiers and boundaries.
Mention of a commercial company or product in this publication does not imply the endorsement of UNEP.
© Maps, photos and illustrations as specified
ReproductionThis publication may be reproduced in whole or in part and in any form for educational or non-profit purposes withoutspecial permission from the copyright holder, provided acknowledgement of the source is made. UNEP would appreciatereceiving a copy of any publication that uses this publication as a source.
No use of this publication may be made for resale or any other commercial purpose whatsoever without prior permission inwriting from UNEP. Applications for such permission, with a statement of purpose and extent of the reproduction, shouldbe addressed to the Director, DCPI, UNEP, P.O. Box 30552, Nairobi 00100, Kenya.
The use of information from this publication concerning proprietary products for publicity or advertising is not permitted.
Produced by the GEO SectionDivision of Early Warning and Assessment (DEWA)United Nations Environment ProgrammeP.O. Box 30552Nairobi 00100Kenya
Tel: +254 20 623562Fax: +254 20 623944Email: [email protected] web site: http://www.unep.orgGEO Year Book web site: http://www.unep.org/geo/yearbookInternet references cited in this report are available on the GEO Year Book web site.
Editor and report design: Sylvia HoweGraphics and layout: Bounford.comCoordination of production: United Nations Office for Project Services (UNOPS)Printing: Interprint Ltd. MaltaDistribution: SMI (Distribution Services) Ltd. UK
This publication is available from Earthprint.com http://www.earthprint.com
This book is printed on 100 per cent recycled, chlorine free paper.

Contents
GEO YEAR BOOK !""#ii
Preface iii
2003 Overview 1
Global 2
Africa 9
Asia and the Pacific 12
Europe 15
Latin America and the Caribbean 18
North America 21
West Asia 24
Polar 27
Small Island Developing States 30
Feature Focus: Freshwater 34
Emerging Challenges – New Findings 55
GEO Indicators 65
Acronyms and abbreviations 75
Acknowledgements 76

iii
Preface
UNEP began 2003 with the 22nd session ofthe Governing Council/Global MinisterialEnvironment Forum (GC/GMEF). By the end ofthat important week, a total of 24 decisionshad been adopted. One of them is GC/22/1/IBwhich requests the preparation of an annualGlobal Environment Outlook (GEO) statementto highlight significant environmental eventsand achievements during the year and raiseawareness of emerging issues from scientificresearch and other sources.
The GEO Year Book is UNEP’s response tothis GC/GMEF decision. It is based oncomprehensive tracking – at global andregional level – of issues and developments asthey unfolded during the year, andcollaboration between UNEP and manypartners at both levels. The Year Book alsobecomes the latest addition to the set ofproducts developed within UNEP’s GEOprocess for integrated environmentalassessment. Like them, it aims to bridge thegap between science and policy, and makeenvironmental information easily accessible topolicy-makers and other readers.
Designing a new product is like being facedwith a blank canvas. The options for filling itare numerous, but space is limited andchoices have to be made. Decisions on thefocus of the Year Book, and what it should orshould not include, were a major part of theprocess which shaped this first report in theannual GEO series. We have used our best
judgment to reach a formula that will provide atimely overview of environmental change,highlight progress, contribute to theknowledge base for decision-making, stimulatedebate, and be visually informative andattractive all at the same time.
One of the overall objectives of the GEOYear Book, which will be published annuallybetween major GEO reports, is to present, ina clear and timely manner, an analyticaloverview of issues and developments which,for better or worse, have most influenced theenvironment during the year and may continueto be major factors in the years ahead. Whilesome of the issues and developments madeheadline news during the course of the year,and galvanized action, others hardlyregistered on the radar. But that does notmean that they were, or are, less important.All the issues – no matter how local, regionalor global – have a bearing on how theenvironment can either enhance humansecurity or increase human vulnerability.
The issues and developments of the yearare presented at both global and regionallevels in the Overview section. Some of theissues, such as climate change impacts, lossof biodiversity, and environment and security,are manifested both globally and regionally,demanding action at many levels. The shortanalyses are reinforced with boxeshighlighting specific examples of policydevelopments and instruments.
An example of one of the major policydevelopments at regional level is the increasingattention being given by African governmentsto phasing out leaded vehicle fuel. Progress in2003 is encouraging.
Also in the Overview section is a shortanalysis of key issues of critical importance toSmall Island Developing States (SIDS) –countries of special significance for theinternational meeting in Mauritius in August2004 to review the Barbados+10 Plan ofAction. The SIDS section focuses on the majorchallenges which these countries face ratherthan specifically on developments in 2003.
The GEO Year Book 2003 includes aFeature Focus on Water that highlights theimportant role that water plays in realizingvarious internationally-agreed developmentgoals, including those contained in theMillennium Declaration which arose out of theUN Millennium Summit of Heads of State andGovernment convened in 2000. Water is acrucial component of ecosystems. Its quantityand quality have a fundamental role in definingthe range of organisms that can live in a givenecosystem and the ability of water-relatedgoods and services to sustain human life andwell-being. It is clearly recognized that, withoutconcerted action, about a third of the world’spopulation is likely to suffer from chronic watershortages within a few decades. We must,therefore, work to ensure that different waterstakeholders understand and appreciate that

GEO YEAR BOOK !""#iv
freshwater resources are precious, sensitiveand finite. Water is not only critical in terms ofthe environment and human security but alsoprovides key sustainable developmentopportunities. With 2003 designated as theInternational Year of Freshwater, and waterissues receiving attention throughout the yearthrough activities such as the Third WorldWater Forum, it is only fitting that the GEO YearBook 2003 reinforces the need to keep waterhigh on the international agenda. This vitalresource is also on the agenda of theforthcoming 12th session of the Commissionon Sustainable Development (CSD 12). TheYear Book is designed to provide an input tothe CSD 12 and other deliberations at differentlevels, including UNEP’s own governing bodies.
The section on Emerging Challenges –New Findings describes some of the latestavailable knowledge that may assist society inrecognizing and better understanding ongoingand emerging environmental compexities andhelp decision-makers in designing appropriateresponses. Our ability to identify and respondto environmental challenges is closely related toour scientific understanding of the phenomena.The GEO Year Book 2003 focuses on scienceresearch findings related to the nitrogen cycleand marine fisheries. The science behind theseissues is broadening and has significantimplications on how we mange them.Nevertheless, their extent, magnitude andimpacts vary significantly, for example, while
problems related to nitrogen occur all over theworld there is too much in some places, andtoo little to meet human needs in others. Localand regional perspectives are, therefore,important to advancing our understanding ofthe nature of these issues and their impact invarious places, and appropriate interventionswhich can be put in place.
The Year Book uses GEO Indicators tohighlight trends in some of the major globaland regional environmental issues which havebeen addressed in previous GEO reports.While the availability of reliable, up-to-dateglobal data sets still limits the choice ofindicators, the core set selected for this reportaims to give a consistent and harmonizedoverview of major environmental changes onan annual basis and thereby facilitate trackingof major environmental issues over the years.
It is our duty individually and collectively totake stock of the issues and developments of2003 and of the measures taken during theyear to achieve a more sustainable future forthe environment. Ultimately we rely on you, asthe reader, to assess whether your needs arebeing met. It is our intention that the GEO YearBook 2003 and subsequent issues in thisannual series will be a constant reminder thatgood long-term planning for a sustainablefuture begins with what is happening aroundus today and every year. Your feedback on thisYear Book, and suggestions for future editions,are most welcome.
Klaus TöpferUnited Nations Under-Secretary General
and Executive Director, United Nations Environment Programme

GLOBAL ● AFRICA ● ASIA AND THE PACIFIC ● EUROPELATIN AMERICA AND THE CARIBBEAN ● NORTH AMERICA
WEST ASIA ● POLAR ● SMALL ISLAND DEVELOPING STATES
Overview
Sour
ce:R
EUTE
RS/A
lexe
i Kal
myk
ov
Sour
ce:R
EUTE
RS/R
ick
Willk
ing
Sour
ce:R
EUTE
RS/E
ric G
ailla
rd

GlobalWhile armed conflict, anti-war demonstrations and the bombing of the United Nations building in Iraqprovided some of the lasting images of 2003, a number of environmental milestones also made theirmark. At the global level, climate change, international environmental governance and the debate ongenetically modified organisms continued to dominate much of the environmental discourse
GEO YEAR BOOK
The Cartagena Protocol on Biosafety cameinto force on 11 September – exactly a yearafter the World Summit on SustainableDevelopment (WSSD) adopted the Plan ofImplementation. This was a toast to thesuccess of international cooperation in a worldtoo often badly affected by discord. Multilateralnegotiations and meetings in 2003strengthened the framework for internationalenvironmental governance at global andregional levels.
There were achievements, but therewere also challenges, many of which weresimilar across different regions of the world.Some of the common issues at the regionallevel included; extreme weather events,including drought and floods; waterresources management; protected area andbiodiversity management; and environmentalimpacts of armed conflict. The environmentalissues and challenges highlighted in thefollowing global and regional sections areonly a significant representative sample ofmany faced in 2003 at different spatial levels.They are not mutually exclusive, but keystrands in the complex web of life. Setbacksand controversy joined progress as regularitems on the agenda of internationalcooperation.
EXTREME WEATHER EVENTS Regional overviews show that a variety ofextreme weather events across the globe,supported by new research, added furtherweight to the concerns expressed by theIntergovernmental Panel on Climate Change(IPCC) and many others that climate change isalready having an impact on the environment.
According to the United States NationalOceanic and Atmospheric Administration(NOM), 2003 was the third warmest year onrecord. Average temperatures for the yearwere above average by as much as 1.7° C forlarge parts of Asia, Europe, and the western
United States. Warmer-than-averagetemperatures were also recorded in much ofSouth America, Australia, Canada and parts ofAfrica. However, widespread areas of cooler-than-average temperatures were experiencedin the eastern United States, western Asia,and coastal areas of Australia (NOM 2003).
In September, scientists from the UnitedStates and Canada announced that the largestice-shelf in the Arctic had broken up. TheWard Hunt Ice-shelf (see also Polar section),to the north of Canada’s Ellesmere Island, splitinto two main parts, with other large blocks ofice also pulling away from the main sections
2003
INTERNATIONAL YEAR OF
FRESHWATER
JanuaryUN global population projections for 2050have dropped by 400 million people fromthe 9.3 billion that was estimated two yearsago. The new figure of 8.9 billion reflects theimpact of the HIV/AIDS epidemic andreduction in the number of projected births
FebruaryA panel of Eminent Persons on UnitedNations-Civil Society Relations holds its firstmeeting to look into the modes ofparticipation in UN processes of non-governmental organizations, as well as ofother non-governmental actors such as theprivate sector and parliamentarians
The 22nd Session of the UNEP GoverningCouncil/Global Ministerial EnvironmentForum (GC/GMEF) held in Nairobi, Kenya
Preparations start in Paris for the UNIntergovernmental Panel on ClimateChange’s (IPCC) Fourth Assessment Reporton global warming
World Trade Organization (WTO) grantsthe Secretariats of six multilateralenvironmental agreements (MEAs)provisional observer status at meetingsof the WTO Committee on Trade andEnvironment. This decision extends to UNEP,as well as the Basel Convention, Conventionon International Trade in EndangeredSpecies of Flora and Fauna (CITES),Convention on Biological Diversity (CBD),the Montreal Protocol, International TropicalTimber Organization (ITTO), and UnitedNations Framework Convention on ClimateChange (UNFCCC)
NGOs in Chile ask the government topresent a proposal to UNESCO to declarepart of Chilean Patagonia a Heritage ofHumanity, to prevent polluting industriesfrom being built in the region
The Abu Dhabi Declaration on Environmentand Energy ratified by the Arab Ministers forEnergy and Environmental Affairs
Figure 1: Dramatic changes in Arctic sea ice since 1979. The loss of Arctic sea ice may be caused bywarming Arctic temperatures that result from greenhouse gas build-up in the atmosphere.
Source: NASA/Goddard Space Flight Center Scientific Visualization Studio
1979 2003

OVERVIEW: GLOBAL
(Mueller and others 2003). The news onlyadded to the growing number of reports inrecent years of melting in the Polar Regions.For example, trends of perennial sea ice in theArctic declining at a rate of nine per cent perdecade, which were found from studiesconducted in 2002, persisted in 2003.Researchers suspect that the loss of Arcticsea ice may be caused by changingatmospheric pressure patterns over the Arcticthat move sea ice around, and by warmingArctic temperatures that result fromgreenhouse gas buildup in the atmosphere.The two images (Figure 1) show a comparisonof Arctic sea ice extent in 1979 and 2003.
There were also reports of glaciers shrinkingat a rapid rate in Nepal as well as in Bolivia,while the Patagonian glaciers in Chile andArgentina were found in October 2003 tobe melting so fast that they were actuallycontributing to sea level rise (Combs andothers 2003). And in the Antarctic, it wasdiscovered that the Pine Island Glacier, oneof the continent’s biggest, had lost 31 km3
of ice since 1992, and could be lost to theocean in a few hundred years if present ratesof thinning continue (BAS 2003).
While not all cases of extreme weatherevents can be attributed to climate change,there was certainly an abundance of suchphenomena in 2003. A record summerheatwave affected Europe. The all-timemaximum temperature record in the UnitedKingdom was broken on 10 August, when themercury reached 38.1° C at Gravesend inKent. France had its warmest summer onrecord, with a heatwave that the NationalInstitute of Health and Medical Research
blamed for 14 802 deaths in the country(Boyer and others 2003). Temperatures alsosoared across southern
Asia in late May and June. During a 20-dayheatwave, maximum temperatures climbedto 45–50° C, and more than 1 500 deathsoccurred in India (NOAA 2003).
In China, widespread flooding left fourmillion people homeless after torrential rainshit the country’s eastern provinces in July.And there was no let up in reports of extremeweather as 2003 drew to an end, with majorfloods reported in southeastern France andsouthern Brazil, while a freak thunderstormstruck Melbourne, Australia, all within thespace of a few days.
Costs of disastersIn December, Munich Re, a major re-insurance firm, reported that naturaldisasters were set to cause a recordUS$60 billion of damage in 2003, withmost of the losses coming from weather-related catastrophes (Munich Re 2003).The biggest insured losses were reported inthe United States, where the tornadoes thathit the Midwest in April and May costinsurers more than US$3 billion. A companyrepresentative warned that, “as extremeweather becomes more or less the norm bythe middle of the century, the extensivelosses suffered in the past year provided“a glimpse into the future”. The companypredicted that the global economic lossdue to extreme weather events wouldreach US$300 billion annually by 2050(Munich Re 2003).
BIOSAFETY AND TRADEAt the centre of a highly emotional scientific,social and political debate about the prosand cons of modern biotechnology in 2003,the Cartagena Protocol on Biosafety (Box 1),negotiated under the auspices of theConvention on Biological Diversity andadopted by its Conference of the Parties on29 January 2000, entered into force on11 September 2003.
MarchOver 24 000 people from around the world attend the 3rdWorld Water Forum, held in Kyoto, Osaka and Shiga, Japan
The UN Economic Commission for Europe (UNECE) launchesa new compliance mechanism aimed at underpinning publicparticipation in environmental decision-making under theAarhus Convention
US Senate rejects provision to allow for oil and gas drillingin the Arctic National Wildlife Refuge in Alaska
Water Sciences and Technology Association (NGO) holds theSixth Gulf Water Conference in Riyadh, Saudi Arabia, underthe theme “water in the Gulf Cooperation Council. TowardsSustainable Development”. The conference emphasizesIntegrated Water Resources Management (IWRM)
War in Iraq begins
AprilArctic Council releases report documenting unacceptable levelsof human-made environmental toxins in the Inuit population ofGreenland
The Fourth Ministerial Conference on the Protection of Forestsin Europe meets in Vienna, Austria and adopts the ViennaLiving Forest Summit Declaration “European Forests-CommonBenefits, Shared Responsibilities”
The World Bank approves implementation of a project financedwith a US$5 million grant from the Global Environment Facility(GEF) to help islands and coastal nations in the Caribbeanadapt to climate change
Tornado damage in Oklahoma City, May 9, 2003. A recordseason of tornadoes hit North America, with an unprecedented300 ‘twisters’ striking the US in a single week in May.
Source: REUTERS/John Sommers

GEO YEAR BOOK
Trade debate heats upAlthough it is the only international instrumentthat deals exclusively with LMOs (alsocommonly known as genetically modifiedorganisms (GMOs)), the Cartagena Protocolruns in parallel with a number of internationalinstruments and standard-setting processesthat address different aspects of biosafety.These include the International PlantProtection Convention, the Codex AlimentariusCommission and several World TradeOrganization (WTO) agreements, such as theSanitary and Phytosanitary Measures andTechnical Barriers to Trade Agreements.All these various international agreementsare intended to guide implementation at thenational or regional level and also be mutuallycomplementary. However, improvingcoordination and avoiding potential conflictsremains a challenge (Box 2).
Differing domestic agendasThe European legislative framework nowincludes rules regarding the deliberate releaseof GMOs into the environment (Directive2001/18). Two regulations entered into force inNovember 2003, one on genetically-modifiedfood and feed (Regulation 1829/2003) and oneon traceability and labeling (Regulation1830/2003). A number of applications forproduct authorizations are currently in thepipeline, and it is unclear whether completionof the legislative framework will affect thevoting attitude of the European Union memberswhich have supported the moratorium. By theend of December 2003, the EU had failed toagree on lifting its five-year-old moratorium onnew genetically modified foods.
In contrast to the EU, the US hasnot developed separate biotechnologyregulations, but rather has opted forregulating GMOs through existing productlegislation. There are no mandatory riskassessment requirements for GMOs,although the proposed Premarket NoticeConcerning Bioengineered Foods will requirecompanies to submit information on safetyconsiderations before marketing genetically-modified foods (Cochran 2003). The USFood and Drug Administration has alsoissued voluntary draft guidelines for thelabeling of genetically modified foods.
These contrasting regulatory policies stemfrom, and indicate, the divergent riskmanagement approaches as well as social
MayParties to the UNECE Aarhus Convention adopta protocol on Pollutant Release and TransferRegisters, the first such legally bindinginternational instrument on the issue
War in Iraq declared over
Environment Ministers and senior officials from51 countries in the UNECE region meet in Kyiv,Ukraine for the Fifth Pan-European MinisterialConference “Environment for Europe (EfE)”
22 European countries sign new Protocolon Civil Liability and Damage Caused byTransboundary Effects of Industrial Accidentson Transboundary Waters to the Conventionson Transboundary Effects of Industrial Accidentsand on Protection and Use of TransboundaryWaters and International Lakes
35 European countries and the EU sign newProtocol on Strategic Environmental Assessmentto the Espoo Convention
The Framework Convention on the Protectionand Sustainable Development of theCarpathians adopted and signed by ministersfrom Central and Eastern Europe
A programme is inaugurated to administer andconserve the Guarani Aquifer, South America’slargest underground freshwater reservoir, whichcovers 1.2 million km2 across Argentina, Brazil,Paraguay and Uruguay
The Third Session of the UN Forum on Forests(UNFF-3) meets in Geneva, Switzerland. Delegatesaddress progress in the implementation of theIntergovernmental Panel on Forests/Intergovernmental Forum on Forests proposals foraction related to: economic aspects of forests;forest health and productivity; and maintainingforest cover to meet present and future needs
Box 1: The Cartagena Protocol
The Protocol aims to protect biological diversity from thepotential risks of living modified organisms (LMOs), withspecific focus on transboundary movements, and takingalso into account risks to human health. It makesreference to the precautionary approach contained inPrinciple 15 of the Rio Declaration, and establishes anadvance informed agreement procedure for ensuringthat countries are provided with prior written notificationand information necessary to make informed decisionsbefore agreeing to the first import of LMOs that are to beintentionally introduced into the environment. It alsoestablishes a Biosafety Clearing-House to facilitate theexchange of information and experiences on LMOs, andto assist countries in implementation.
Source: CBD 2003
Box 2: GMOs generate international controversy
The request by the US, Canada and Argentina for a WTO panel against the EU concerning Measures
Affecting the Approval and Marketing of Biotech Products (WT/DS291/23, 19 August 2003) can be
regarded as an illustration of the potential conflict between these diverse approaches to biosafety.
In this case, the three states allege that the EU de facto moratorium on the approval of LMOs or
GMOs poses an unjustifiable trade barrier in violation of the WTO Agreements. The EU moratorium
has been in place since June 1999, when the Danish, Greek, French, Italian and Luxembourg
delegations, later joined by Austria, submitted a declaration urging the need for rules on labelling and
traceability of GMOs and GMO-derived products stating that, until the adoption of such rules, in
accordance with the preventive and precautionary approaches, they would take steps to have any
new authorizations suspended. The European Commission described the request for the WTO panel
as “legally unwarranted, economically unfounded and politically unhelpful,” arguing that the EU
measures are justified under international law, citing the recently adopted Codex Alimentarius
principles for risk analysis of genetically-modified foods and the precautionary approach provided for
in the Cartagena Protocol. Civil society groups also attacked the decision to commence a trade
dispute, accusing the countries concerned of trying to force genetically-modified foods onto
European consumers.
Source: ICTSD 2003

OVERVIEW: GLOBAL
contexts in different parts of the world.In Europe negative public opinion, particularlyregarding inclusion of genetically modifiedproducts in food, a number of activeenvironmental and consumer groups, a seriesof food crises with long-term effects turningfood safety into a key policy objective in theEU, and the introduction of the precautionaryapproach in legal texts are at the heart of amajor societal and policy debate, and thereforemark European regulatory developments. Inthe US, the largest producer of geneticallymodified products in food in the world, astrictly scientific risk assessment process,the consideration of biotechnology as a keycontribution to economic growth, thesuccessful influence of regulatorydevelopments by the biotechnologycompanies, and a more tolerant or, up-to-now,largely unconcerned public have induced aframework that is more flexible. It consistsmainly of voluntary requirements, allowing themarket approval of various genetically modifiedfood products.
Unresolved issues While the international regulatory frameworkis still under development and many issuesremain unresolved, including the relationshipof the Cartagena Protocol to the WTOAgreements, the scientific basis of the policydebate is also far from clear. This is illustratedby the results published in 2003 of the firstlong-term farm-scale evaluation of threeherbicide-tolerant crops – maize, sugar beetand spring oilseed rape – carried out in theUK, and the subsequent unease of theAgriculture and Environment Biotechnology
Commission, the UK’s chief policy advisor ongenetically modified food and crops (The RoyalSociety 2003). The evaluation showed thatconventional varieties of the above crops arecontaminated with genetically-modified traits ata much faster rate than previously expected.It also showed that genetically modified beetand oilseed rape fields had fewer weed seeds,birds and butterflies than conventional ones,while genetically modified maize was anexception and brought more weed seeds,birds and butterflies.
INTERNATIONALENVIRONMENTAL AGENDAIn the post-WSSD world, the sustainabledevelopment agenda has successfullyintegrated the WSSD targets and theinternationally agreed development goals,including those contained in the MillenniumDeclaration of 2000, into the substantive workof all the relevant multilateral environmentalagreements that held meetings in 2003. Thelink between poverty reduction and environmenthas also been increasingly recognized, asevidenced by the constant calls forenvironmental issues to be framed in a human-centred development context and integratedwith national poverty reduction strategies.
On the heels of the Millennium Declarationand the WSSD, the 2003 International Year ofFreshwater helped keep water on the globalagenda (see Feature Focus) and led toincreased cooperation on related issues,including at the Third World Water Forum inJapan in March, and the G-8 Summit inEvian, France in June. The GlobalEnvironment Facility’s announcement that it
plans to increase funding for water projectsover the next four years further reflects animportant commitment to sustaining theplanet’s water resources and ecosystems.The Commission on SustainableDevelopment (CSD), at its 11th session in2003, agreed that freshwater, sanitation andhuman settlements would be its majorthemes of focus in 2004–05. This ensuresthat water will remain in the forefront of thesustainable development agenda for thenext two years.
Forest issues, particularly illegal logging,also received a good deal of internationalattention during the year (see Box 3). Onthe broader issue of the status of the planet’sterrestrial ecosystems, scientific findingsweighed in with the release of a studyindicating the apparent greening of thebiosphere (Box 4). Moving to the atmosphere,issues related to the implementation of theMontreal Protocol on Substances that Depletethe Ozone Layer were again on the agenda,with the phase-out of methyl bromide provingto be a challenge to resolve (Box 5).
Regarding climate change, moregovernments than ever seem convinced ofthe importance of multilaterally-agreedsolutions to this global problem. By the endof 2003, 188 countries had ratified the UnitedNations Framework Convention on ClimateChange (UNFCCC), while 120 had ratified theKyoto Protocol (UNFCCC 2003).
However, as 2003 drew to a close, theKyoto Protocol had still not gathered sufficientsupport to enter into force as a legally bindinginternational treaty. To do so, it must beratified by industrialized countries and former
JuneThe G8 Summit in Evian, France, gives priority toissues aimed at promoting global economicgrowth, enhancing sustainable development andimproving security
The African Ministerial Conference on theEnvironment (AMCEN) adopts the New Partnershipfor Africa’s Development (NEPAD) EnvironmentAction Plan in Maputo. Civil society organizationsalso adopt the plan
New figures for deforestation in Amazonia are thehighest in six years
Serious floods in Mexico, including tropical storms.Death and damage in Venezuela because of theheavy rains, floods and landslides following a longperiod of drought, lack of water and brush fires
Russian and French Presidents issue declarationon cooperation in Arctic research, and expressimportance of indigenous peoples’ roles insustainable development and environmentalprotection
Wild forest fires spread from southern Turkey intothe Syrian pine forests, causing heavy damage
The tenth International Coral Reef Symposiumin Okinawa, Japan, focuses on stability anddegradation of coral reef ecosystems
The United Nations Foundation and theInternational Coral Reef Action Network (ICRAN)launch the Coral Reef Fund, aimed at protectingand managing more than 284 000 km2 ofdamaged or threatened coral reefs worldwide

GEO YEAR BOOK
Eastern bloc nations (known under theConvention as Annex I countries) responsiblefor at least 55 per cent of total anthropogeniccarbon dioxide emissions for the year 1990.With many of the major developed countrieshaving already ratified, and the US having
rejected the treaty in 2001, the focus is nowon what the Russian Federation will do. Itsratification would be sufficient to trigger theProtocol’s entry into force. However, at year’send, the Russian Government had yet tomake a final decision.
The ninth Conference of the Parties to theUNFCCC, in Milan in December, concludedwith experts applauding a deal on the use ofcarbon sinks in the Kyoto Protocol’s CleanDevelopment Mechanism (CDM). This initiativeis designed to help industrialized countriesmeet their emissions targets in a cost-effectiveway while helping developing countries tomeet sustainable development targets. Withthis issue resolved, most of the details of howthe Kyoto Protocol could function in practicehave now been agreed.
New agreements in force The year heralded the entry into force ofseveral be Multilateral EnvironmentalAgreements (MEAs), including key regionalenvironmental agreements. The FrameworkConvention for the Protection of the MarineEnvironment of the Caspian Sea, and theAgreement on Transboundary Haze Pollutionof the Association of Southeast AsianNations, are both designed to address priorityissues in the respective regions. The 50thinstrument of ratification required for theConvention on the Prior Informed ConsentProcedure for Certain Hazardous Chemicalsand Pesticides in International Trade(Rotterdam Convention) to enter into forcewas also deposited at the end of 2003. Otherexamples are given in the timeline below.
There was also progress in the area of softlaw in 2003. The Vth World Parks Congress,held in Durban, South Africa, in September,demonstrated increased commitment amongcountries to the establishment of parks andprotected areas. A report released by UNEP-World Conservation Monitoring Centre and
Box 3: Forest policy developments
The issue of illegal logging dominated debate on international forest policy in 2003, highlighting much widerissues such as appropriate forest governance, effective law enforcement, sustainable trade, and ethicalinvestment.
In May 2003, the European Union published its Action Plan on Forest Law Enforcement, Governance andTrade. This outlines proposals for voluntary licensing to ensure that only legally verified timber could beimported into the EU, procurement policies that discriminate against illegal timber, encouragement ofresponsible financing and support for private sector-led trade initiatives. However, NGOs have criticized theaction plan as lacking the necessary legislation to make it effective, but deliberations are ongoing.
Regional Forest Law Enforcement and Governance (FLEG) processes have been running in tandem with theEU initiative. In the Asia Pacific region, for example, the East Asia FLEG, which was launched in 2001, met inJanuary 2003 in Bali, Indonesia, delivering tough messages but less in the way of concrete action plans. Manyof the governments involved have additionally signed up to other regional initiatives. Indonesia, home to themost extensive tropical forest cover in Asia, is the key member, with Japan, of the new Asia Forest Partnership(AFP). Indonesia also entered in 2003 into bilateral agreements on illegal logging and timber trade with China,South Korea and Laos.
In Africa, the first ministerial meeting of the FLEG process was held in Yaoundé, Cameroon, at which aministerial declaration was endorsed by 27 African governments to promote good governance and strengthenforest law enforcement capacity through a number of joint actions. Momentum is also coming from the CongoBasin Forest Partnership, which was launched in January 2003. It will support multi-purpose community-basedforest management, combat poaching and illegal logging, and improve management of protected areas. It hasa starting budget of US$53 million from the US government. A number of countries in Western and SouthernAfrica have also started up a Forest Governance Learning Group aimed at sharing learning on key challengesfor equitable and practicable forest policy.
The FLEG processes around the world have also opened space for action and calls for accountability by civilsociety. In Latin America, for example, where an official FLEG process is in the pipeline, a consortium of over500 NGOs agreed in October 2003 to urge the Brazilian government to drop infrastructural plans in Amazoniawhich could worsen deforestation.
Source: CIFOR 2003
AugustThe Sub-Commission on the Promotion and Protection ofHuman Rights, the main subsidiary body of the UN Commissionon Human Rights, adopts a resolution containing guidelines toensure compliance by international companies with existinghuman rights, labour and environmental standards
Heatwaves in large parts of Europe. Many excess heat-relateddeaths reported
Excess forest fires in Europe and western Canada
Canada announces designation of Ukkusiksalik National Park inNunavut, the culmination of many years of work by Inuitcommunities and Parks Canada
Sixth Conference of the Parties to the Convention to CombatDesertification (CCD) held in Havana, Cuba
JulyDelegates from over 30 countries and22 multilateral organizations attend theEarth Observation Summit hosted by theUnited States State Department inWashington, D.C., US
The Revised African Convention on theConservation of Nature and NaturalResources is endorsed by the Assembly ofthe African Union (AU)
AU leaders adopt the NEPAD EnvironmentAction Plan
The Brazilian Institute of Environment andRenewable Natural Resources (IBAMA)identifies more than 50 companies thathave illegally deforested more than10 000 ha of tropical forest in theAmazon region
Norway announces consultation process onthe proposed opening of the Barents Seafor oil and gas exploration
Biggest West Asia recycling plant opens inJeddah. The plant is designed to managethe city’s mounting waste disposal problems
The Ministry of Agriculture and Fisheries inthe United Arab Emirates announces theestablishment of the largest desertbotanical garden in the Arab world. Theproject aims at preserving environmentalresources, fauna and flora

OVERVIEW: GLOBAL
the World Conservation Union (IUCN) foundthat more than 12 per cent of the earth’ssurface is now protected (Chape and others2003). According to the report, there arecurrently more than 100 000 protected areas
covering 18.8 million km2 , an area equivalentto the size of China and Canada combined.However, recognizing that marine ecosystemsare largely unprotected, the Durban ActionPlan, one of the outputs of the World Parks
Congress, appeals for at least 20–30 percent of the marine areas of the planet tobe protected by 2012 (IUCN 2003).
Synergies and cooperation inenvironmental governance In spite of these achievements, environmentalgovernance at the international level is stillsometimes fragmented, diffused andoverlapping, due in part to the proliferation of
Box 5: Methyl bromide a sticking point
The Fifteenth Meeting of the Parties to the MontrealProtocol on Substances that Deplete the Ozone Layer(MOP-15), which was held in November 2003 in Nairobi,adopted numerous decisions, including one on trade inhydrochlorofluorocarbons. It also addressed goodhousekeeping of, and destruction technologies for,ozone-depleting substances (ODS), and adopted a planof action to modify regulatory requirements thatmandate the use of halons on new aircraft.
However, the parties failed to agree on key issuesrelated to ozone-destroying methyl bromide, includingthe critical-use exemptions for this broad-spectrumpesticide, conditions for granting and reporting on themand further interim reductions of methyl bromideconsumption for the period beyond 2005, applicable todeveloping country parties. An extraordinary meeting ofthe parties was, therefore, proposed for March 2004 tofollow up on issues related to this chemical.
Many experts believe that the amounts of methylbromide nominated for critical use exemptions byseveral industrialized countries were excessive andcould hamper progress in implementing the protocol.The methyl bromide issue is currently one of the keychallenges faced under the Montreal Protocol.
Source: UNEP 2003
Box 4: Greening of the biosphere
A globally comprehensiveanalysis of satellite andclimate data between1982–1999 was publishedin 2003. The results indicatean apparent greening of thebiosphere. These changescould not have beenidentified without the up-to-date, consistent, andcomprehensive picture ofthe planet that wasprovided by the long-termsatellite data sets that arenow available.
The results of this studydemonstrate that netprimary production (NPP),the amount of energy produced by plants through photosynthesis minus what they use in respiration,increased globally by about six per cent during the last two decades of the 20th century. Increasingtemperatures, precipitation, carbon dioxide levels, and nitrogen deposition, changes in cloud coverand land use have all been implicated in the global greening, even though their relative roles remainunclear. In addition, advances in agriculture and successful implementation of a number ofconservation programmes around the world may have contributed to the greening trend.
The study revealed that ecosystems in tropical zones and in the high latitudes of the NorthernHemisphere accounted for 80 per cent of the increase in global net primary production. Tropicalrainforests in the Amazon contributed nearly 40 per cent of the global increase, attributed to a declinein cloud cover and the resulting increase in the sun’s energy that reached the surface. Changes inmonsoon dynamics resulted in more rainfall in the 1990s that led to increased vegetation over theIndian sub-continent and the African Sahel.
Source: Nemani and others 2003
OctoberThe 1998 Aarhus Protocol on PersistentOrganic Pollutants to the Convention onLong-Range Transboundary Air Pollutionenters into force
The National Space Research Institute (INPE)of Brazil launches a second satellite, jointlydeveloped with China, to monitor the state offorests in tropical Amazonia
Third Ibero-American Forum of Ministers ofthe Environment held in Oaxaca, Mexico
Reports show that Andean glaciers in thesouthern part of Argentina and Chile recededtwice as quickly in the five years from1995–2000 as in the previous 25 years
A new species of bird, the Semillero deCarrizal (Amaurospiza carrizalensis) isdiscovered in Venezuela. It is a chaffinchnative to Carrizal Island, in the eastern partof Venezuela, whose habitat has already veryseriously deteriorated
The Water Middle East InternationalConference held in Bahrain emphasizesdemand management and technologicalsolutions to the water problem in the region
Big forest fires in California, US
SeptemberThe Xllth World Forestry Congress held in Quebec City,Canada
Trade and environment ministers gather for the first timeat a High Level Roundtable on Trade and Environment inCozumel, Mexico, ahead of the WTO MinisterialConference to discuss key trade and environment issuesin negotiations on the Doha Development Agenda
The Cartagena Protocol on safety and trade in geneticallymodified organisms and their derivatives enters into force.The protocol is part of the Convention on BiologicalDiversity
Planet’s list of protected areas tops 100 000 mark
The World Meteorological Organization (WMO) reports thatthe annual ozone hole over the Antarctic has matched thesize record set three years ago of 28 million km2
The Vth World Parks Congress sets the conservationagenda for the next decade through the Durban Accord,Action Plan and Recommendations.
World Climate Change Conference takes place in Moscow,Russia
Sustained drought in Argentina, the worst in more than75 years. The drought extends to adjacent zones inBolivia, Paraguay and Uruguay. It is particularly serious insome regions of Paraguay
Scientists report the break-up of the Arctic’s largest ice-shelf – the Ward Hunt
Eighth meeting of the GCC ministers responsible for theenvironment held in Kuwait
Change in NPP (Per cent/Year)
-1.5 1.50

GEO YEAR BOOK
MEAs. This stretches the capacity ofgovernments, especially in developingcountries, to participate fully in the internationalenvironmental decision-making process.
Responding to calls for greatercoordination between MEAs, the UNFCCCorganized workshops in 2003 to exploresynergies and cooperation with otherconventions, while the Convention onMigratory Species and the Convention toCombat Desertification signed an agreementto cooperate in the development of specifictargeted actions to address issues relating tomigratory species in areas affected by droughtand desertification. Efforts to cluster MEAswere also made during negotiations on aStrategic Approach to International ChemicalsManagement (SAICM), where countries, whilecalling for an ambitious scope and goal, also
expressed keen interest in building uponexisting initiatives and clarifying the role andimplementation process of the SAICM (seeNovember entry of timeline).
Traditional North-South relationshipsconcerning capacity building and technologytransfer remain important. However, 2003also saw enhanced South-South cooperation.Whether organized by region, as seenthrough the New Partnership for Africa’sDevelopment (NEPAD – see Africa section),or areas with shared concerns such as thethree SIDS regions (see SIDS section), or bystage of development, such as in the recentsigning of an agreement between Brazil,India, and South Africa to collaborate inscience and technology transfer, this trendcan only bring positive energy to thesustainable development agenda.
LOOKING TO THE FUTUREThere are many challenges facing countriesand their people in 2004 and beyond. Whilesome governments continue to focus onpeace and security issues, many of thepoorest people will continue to hope for food,housing, healthcare, freshwater and a cleanenvironment. The debates over climatechange, GMOs, free trade, and other issuesrelated to sustainable development are unlikelyto abate in the coming year. Internationalcooperation and multilateralism on these andother issues are imperative if the three pillars ofsustainable development – environmentalprotection, economic development and socialdevelopment – are to remain firmly in place.
DecemberCOP-9 of the United Nations Framework Convention on ClimateChange (UNFCCC) held in Milan, Italy
The Pan-African Implementation and Partnership Conference onWater held in the Ethiopian capital, Addis Ababa
EU fisheries ministers agree on catch quotas and limited numbersof days trawlers may go to sea and adopt a long-term recoveryplan for endangered fish stocks
International Meteorological Organization brings forward thedeadline for phasing out single-hull oil tankers from 2007 toApril 2005
The 15th Session of the Council of Arab Ministers Responsible forthe Environment held in Cairo, Egypt
Catastrophic earthquake strikes the city of Bam in southeast Iran
BAS (2003). Pine Island Glacier is retreating and thinning. Cambridge,British Antarctic Survey Natural Environment Research Councilhttp://www.antarctica.ac.uk/BAS_Science/Highlights/2000/pine_island.html
Boyer, L., Robitail, S., and Auquier, P. (2003). Heat Wave in France:how did the media treat the crisis? British Medical Journal, 327, 876http://bmj.bmjjournals.com/cgi/content/full/327/7419/876
CBD (2003). Cartagena Protocol on Biosafety Home. Montreal,Convention on Biological Diversityhttp://www.biodiv.org/biosafety/default.aspx
Chape, S., Blyth, S., Fish, L., Fox, P., and Spalding, M. (2003). 2003United Nations List of Protected Areas. Gland, World ConservationUnion and Cambridge, United Nations Environment Programme WorldConservation Monitoring Centre http://www.unep.org/PDF/Un-list-protected-areas.pdf
CIFOR (2003). Forest Law Enforcement, Governance, and Trade atCIFOR. Indonesia, Centre for International Forestry Researchhttp://www.cifor.cgiar.org/docs/_ref/research/flegt/index.htm
Cochran, C. (2003). Premarket Notice Concerning BioengineeredFoods: A Proposed Regulation Satisfying Some of the Players, Someof the Time. Journal of Law and Policy, 12http://law.wustl.edu/Journal/12/p173%20Cochran.pdf
Combs, S., Prentice, M.L., Hansen, L., and Rosentrater, L. (2003).Going, Going, Gone! Climate Change and Global Glacial Decline.Berlin, World Wide Fund for Naturehttp://www.worldwildlife.org/climate/glaciers_report_03.pdf
ICTSD (2003). WTO to Arbitrate the EU’s GMO Approval Regime.Bridges, 7. Geneva, International Centre for Trade and SustainableDevelopment http://www.ictsd.org/monthly/bridges/BRIDGES7-7.pdf
IUCN (2003). Recommendations of the Vth IUCN World ParksCongress. Gland, World Conservation Unionhttp://www.iucn.org/themes/wcpa/wpc2003/pdfs/outputs/wpc/recommendations.pdf
Mueller, D.R., Vincent, W.F., and Jeffries, M.O. (2003). Break-up of thelargest Arctic ice shelf and associated loss of an epishelf lake.Geophysical Research Letters, 30, 20http://www.agu.org/pubs/crossref/2003/2003GL017931.shtml
Munich Re (2003). Munich Re’s analysis of natural catastrophes in2003. Munich, Munich Re http://www.munichre.com
Nemani, R.R., Keeling, C.D., Hashimoto, H., Jolly, W.M., Piper, S.C.,Tucker, C.J., Myneni, R.B. and Running, S.W. (2003). Climate drivenincreases in global terrestrial net primary production from 1982 to1999. Science, 300, 1650
NOAA (2003). NOAA Reports 2003 was Marked by ContrastingConditions Across the U.S. while Global Temperatures Remain High.Washington DC, National Oceanic and Atmospheric Administrationhttp://www.publicaffairs.noaa.gov/releases2003/dec03/noaa03-156.html
The Royal Society (2003). Farm scale evaluations published today.Press release. London, The Royal Societyhttp://www.pubs.royalsoc.ac.uk/phil_trans_bio_content/news/fse_press.html
UNEP (2003). Synthesis of the 2002 Reports of the ScientificAssessment Panel (SAP), Environmental Effects Assessment Panel(EEAP), and Technology and Economic Assessment Panel (TEAP) ofthe Montreal Protocol. Nairobi, United Nations EnvironmentProgramme http://www.unep.org/ozone
UNFCCC (2003). Status of Ratification. Bonn, United NationsFramework Convention on Climate Changehttp://unfccc.int/resource/conv/ratlist.pdf
References
NovemberMinisters from Azerbaijan, Iran, Kazakhstan,Russia, and Turkmenistan adopt and signthe Framework Convention for theProtection of the Marine Environment of theCaspian Sea
The fourth session of the IntergovernmentalForum on Chemical Safety (IFCS) held inBangkok. The theme of Forum IV is“chemical safety in a vulnerable world”
The working group of the StrategicApproach to International ChemicalsManagement (SAICM), launched by theUNEP Governing Council in February 2003,meets in Bangkok
The Southern African DevelopmentCommunity (SADC) ratifies its Protocol onShared Watercourse Systems
The UN launches $25 million appeal to savegorillas, chimpanzees, bonobos andorangutans from extinction and to securetheir natural habitat
The 14th Meeting of the Forum of Ministersof the Environment in Latin America and theCaribbean held in Panama City, Panama
The golden lion tamarin has moved fromcritically endangered to endangered on theIUCN Red List of Threatened Species. Thespecies, which is endemic to Brazil, was theonly primate that shifted into a lower threatcategory on the list
The Association of South East Asian Nations(ASEAN) Agreement on Transboundary HazePollution enters into force

OVERVIEW: AFRICA
AfricaAfrica recorded a number of political and environmental policy milestones in 2003, with immediateand long-term impacts on environmental management in the region
Armed conflict in some parts of the regiondominated the headlines, but the less frequentlymentioned regional environmental policydevelopments were no less significant.Environmental issues which dominated includedfreshwater, famine, and environment and security.
FRESHWATER FOR ALL – WORKINGTOWARDS REALISTIC TARGETSWater issues were a priority in 2003 in Africa,which experiences large spatial variations inrainfall and in 1990 saw at least 13 countriessuffer water stress or scarcity (UNEP 2002).Governments in the region, and their partners,participated in various water-related events,including the Pan-African Implementation andPartnership Conference on Water, convened inDecember in Addis Ababa. One of itsobjectives was to explore ways of reaching theinternationally agreed water and sanitationtargets. A pre-conference report (UNEP2003a) noted that for the region to meet thewater targets:
● an additional 405 million people must haveimproved access to safe drinking water by2015, from January 2004, an average ofmore than 36 million each year, 690 000each week; and
● an additional 247 million people mustget improved sanitation by 2015, with anaverage of more than 22 million everyyear, 425 000 people every week, fromJanuary 2004.
These targets are demanding. Africa lacksadequate human and financial resources, andthe necessary investment has not been made.In addition, few African countries haveadequate technical capacity for necessaryinfrastructure, engineering and installation.It has been suggested that the targets mightbe realistically approached in an incrementalway (UNEP 2003a). Figure 1 shows how thiscould be achieved by 2015.
FAMINE AND DROUGHT Once again famine was a major issue in theregion, affecting millions of people andincreasing their vulnerability to disease andother hardships. At the beginning of the year,25 million people were being affected, andthis figure had jumped to 40 million by April(Harsch 2003a). In Southern Africa, much ofthe famine was attributed to the severedrought that hit the sub-region during the2002–2003 rainy season. In the Horn ofAfrica (Sudan, Eritrea and Ethiopia), faminewas mainly a result of drought, although inEthiopia and Eritrea, war was also acontributory factor (Harsch 2003b). A totalof 13.6 million people in the two countriesfaced immediate food shortages in early2003 (UN 2003).
ENVIRONMENT AND SECURITYThe overexploitation of resources over the yearsdue to conflict has contributed to environmentaldegradation and human insecurity, directly andindirectly. For example, both the DemocraticRepublic of Congo (DRC) and Liberia haveattracted international attention as areas where
greed for diamonds not only fuelled armedconflict but also environmental degradation.Environmental management institutions in Africa
Key Facts
● Africa has the highest rate of urbanization in the world.The urban population is projected to reach 42.7 per cent by2010. Despite this, the majority of the people in Africa stilllive in rural areas – about 498.4 million in 2000 comparedto 295.2 million in urban areas.
● The number of people living in absolute poverty in sub-Saharan Africa is projected to rise from 315 million to404 million over the next 15 years, making the continentthe world’s poorest region.
● Africa is the source of about a third of the world’s biodiversity.In 2003, Africa had more than 1 200 national parks, wildlifereserves, and other protected areas, representing an area ofmore than two million km2, nine per cent of the region’s totalland area or more than 21 times the size of Malawi.
● The HIV/AIDS pandemic in Africa is seriously affectingconservation success in the region. For example, it isreducing staff in protected areas.
● About 180 million people in Africa – pastoralists, farmers andother land users – live on fragile drylands where growingnumbers compete for water and land.
● In Africa, more than 20 per cent of the population’s proteincomes from freshwater fisheries.
Sources: UN-Habitat 2003, IUCN 2003a, IUCN 2003b, World Bank 2003a
additional people with access to safe water each year additional people with access to improved sanitation each year
2004
0
400
Source: UNWWAP 2003Note: The baseline year for the proportion referred to in the targets is 1990 and highlighted in WWDR. These targets represent an annual increase of around 20 per centin service delivery during 2004–14. If the service delivery achieved in 2014 is then maintained or increased, the target of water for all in Africa could be met by around2020, five years before the global deadline of 2025.
millions
2005
2006
2007
2008
2009
2010
2011
2012
2013
2014
350
300
250
200
150
100
50
2004
2005
2006
2007
2008
2009
2010
2011
2012
2013
2014
Figure 1: Africa regional targets: annual increased access to safe water and improved sanitationrequired to reach those who need to be served before 2015

GEO YEAR BOOK
have generally been weakened as a result ofarmed conflict, and so were enforcementregimes; forests and other resources suffered(UNEP 2002). The issue of post-conflictassessment in Africa has recently attractedattention with UNEP initially focusing on Liberia.More post-conflict assessments areexpected in other African countries in whichconflict was a major issue.
Conflicts have increased the numbers ofrefugees and internally-displaced people.In 2003, the overall number of displacedpeople in Africa was 15 million (Wilkinson2003), 3 343 700 of them refugees living incountries other than their own (UNHCR 2003)(Figure 2). The UN High Commission forRefugees (UNHCR) acknowledges that theunexpected arrival of large numbers ofrefugees, as well as lengthy stays in asylumcountries, can have a significantenvironmental impact, including exploitation ofprotected areas.
UNHCR launched activities to generateawareness among displaced people of thevalue of water in 2003, the International Yearof Freshwater. These were linked to planting
trees, cleaning up camps and raisingawareness among refugees in Africa about theneed to protect and improve the physicalenvironment (UN 2003). The Refugee andReturnee Environmental EducationProgramme, which was started in 1995 inrefugee camps in Kenya, has since beenexpanded to Ethiopia, Djibouti, the Sudan,Tanzania and Zambia.
REGIONAL POLICIESThere has been progress on the policy front asthe region took steps to consolidate theAfrican Renaissance. Various structures andpolicy measures of the new African Union (AU)were strengthened, the most significant ofwhich was the adoption by heads of state andgovernments of a new environmental actionplan. The second session of the Assembly ofthe AU Heads of State and Governmentendorsed the Action Plan for the EnvironmentInitiative of the New Partnership for Africa’sDevelopment (NEPAD) in July 2003. (Box 1).
The other significant policy developmentwas the adoption by the AU Assembly of therevised African Convention on the Conservation
of Nature and Natural Resources (Box 2). Thisupdates and strengthens the 1968 Conventionand boosts the commitment by Africangovernments to a collective approach tobiodiversity conservation in the region. Africa’scommitment to biodiversity conservation wasfurther reinforced by the Africa Forest LawEnforcement and Governance MinisterialDeclaration of October 2003, which recognizesthat the biodiversity of Africa’s forestecosystems is essential for the livelihoods ofthe African people (IISD 2003). The declarationhighlights problems of illegal logging, a movethat should pave the way for strong legislationsupportive of sustainable forest management,fair profit-sharing and poverty alleviation.
Box 1: the NEPAD EnvironmentAction Plan
The Action Plan of the Environment Initiative ofthe New Partnership for Africa’s Development(NEPAD) was prepared to promote Africa’ssustainable development and assist the regionto confront its short-term economic growthchallenges without losing sight of the long-termenvironmental, poverty eradication and socialdevelopment imperatives.
The action plan is organized in clusters ofprogrammatic and project activities to beimplemented over an initial period of 10 years.Programme areas cover the following prioritysectors and crosscutting issues:
● combatting land degradation, drought anddesertification;
● wetlands;
● invasive species;
● marine and coastal resources;
● cross-border conservation of naturalresources; and
● climate change.
The plan also addresses the related problemsof pollution, forests and plant geneticresources, freshwater, capacity building andtechnology transfer. The implementation of theplan is a challenge which will require thesupport and/or active participation by Africancountries and development partners.
Source: AU 2003a
Refugees – people who have crossed an international border seeking
sanctuary from persecution and being hosted in a second country.
Internally displaced people – flee their homes for the same reasons as
refugees but remain within their own country.
* Democratic Republic of Congo
** Central African Republic
Source: Adapted from UNHCR 2003
6 Burundi 41 000 500 000
1 Sudan 328 000 4 000 000
2 Angola 3 500 000
3 DRC* 330 000 2 500 000
3 500 0004 Somalia
10 Eritrea 58 000
8 Liberia 65 000 180 000
13 Sierra Leone 64 000 10 000
7 Côte d’Ivoire 45 000 200 000
15 Chad 44 000
12 Ethiopia 133 000 13 000
16 CAR** 51 000
9 Congo 109 000 75 000
11 Nigeria 30 000
14 Senegal 6 000
5 Uganda 217 000 650 000
17 Tanzania 690 000
18 Zambia 247 000
19 Kenya 234 000
20 Guinea 182 000
21 Algeria 169 000
22 Cameroon 58 000
Internally displacedpeoples
Refugees beinghosted
Figure 2: Africa’s uprooted people: The toll of conflict
6
1
3
4
10
813
7
15
1216
9
11
14
5
17
18
19
20
21
22
2
Countries with refugees only
Countries with internallydisplaced people only
Countries with both

OVERVIEW: AFRICA
The Vth World Parks Congress, about twomonths after the AU second Assembly,reinforced Africa’s commitment to biodiversityconservation, with several countries in theregion announcing the establishment of newprotected areas.
Africa made significant progress in 2003 tophase out leaded vehicle fuel, whose emissionsare both an environmental and human healthrisk. A UNEP survey found that most Africancountries will be using lead-free petrol, orshould be close to phasing out lead fromvehicle fuel, by the end of 2005. Countriessuch as Cape Verde, Egypt, Ghana, Libya,
Mauritius and Mauritania are already fully lead-free. Other countries that have drawn up actionplans to phase out lead by 2005 includeEritrea, Kenya, Nigeria, South Africa, Togo andUganda. (UNEP 2003b, World Bank 2003b).
CHALLENGES FOR THE FUTUREExtreme poverty continues to affect millionsof people in Africa. However, the focus onstrategies to meet the MDG targets of waterand sanitation, establishment of strongstructures of the African Union and adoptionof strategic environmental policies showedthe region’s commitment towards effectively
managing its environment. The implementationof these policies remains the challenge for theregion, so that it may achieve peace andsecurity, improve governance, and alleviateextreme poverty.
African Union (2003a). Draft Decision on the Action Plan of theEnvironment Initiative of NEPAD. Assembly of the African UnionSecond Ordinary Session, 10–12 July 2003, Maputo, Mozambique
African Union (2003b). Report of the Interim Chairperson on theRevision of the 1968 African Convention on the Conservation ofNature and Natural Resources. Executive Council Third OrdinarySession 4–8 July 2003 Maputo, Mozambique
Harsch E. (2003a) Africa Beyond Famine: New Strategies Needed toCombat Hunger, Disease and Rural Poverty. Africa Recovery, 17, 1http://www.un.org/ecosocdev/geninfo/afrec/vol17no1/171food1.htm
Harsch, E. (2003b). Famine Spreads Across Africa. Africa Recovery, 16, 4http://www.un.org/ecosocdev/geninfo/afrec/vol16no4/164food1.htm
IISD (2003). Africa Forest Law Enforcement and Governance (AFLEG)Process, Yaoundé, Cameroon. Winnipeg, International Institute forSustainable Development http://www.iisd.ca/sd/sdyao/curtain.html
IUCN (2003a). Recommendation: 5th World Parks Congress, Durban,South Africa, 5–17 September 2003: Support for Protected Areas inAfrica. Gland, World Conservation Unionhttp://www.iucn.org/themes/wcpa/wpc2003/pdfs/outputs/africa/recommendation.pdf
IUCN (2003b). Africa Day: HIV/AIDS Pandemic and Conservation. 5th WorldParks Congress Emerging Issues. Gland, World Conservation Unionhttp://www.iucn.org/themes//wcpa/wpc2003/english/outputs/durban/eissues.htm#11
UN (2003). A/58/353: Assistance to refugees, returnees and displacedpersons in Africa. Report of the Secretary-General. New York, UnitedNations
UNEP (2002). Global Environment Outlook 3. Earthscan, London
UNEP (2003a). Water Policy Challenges and Priorities in Africa.Background Paper. Pan-African Implementation and PartnershipConference on Water. Nairobi, United Nations EnvironmentProgramme
UNEP (2003b). Launch of UNEP’s Work to Phase Out Leaded Petrolin Sub-Saharan Africa, 17 October 2003. Nairobi, United NationsEnvironment Programmehttp://www.unep.org/pcfv/Events/LaunchPhaseII.htm
UN-Habitat (2003). The Challenge of Slums: Global Report on HumanSettlements 2003. London, Earthscan
UNHCR (2003). Africa at a Crossroads. Refugees, 131http://www.unhcr.ch/cgi-bin/texis/vtx/home/opendoc.pdf?tbl=MEDIA&id=3ee99ef52&page=publ
UNWWAP (2003). World Water Development Report: Water for People,Water for Life. World Water Assessment Programme. United NationsEducation, Scientific and Cultural Organization and Berghahn Books.
Wilkinson, R. (2003). Africa on the edge: The human toll has beenappalling, but is the light at the end of the tunnel a little big brighter?Africa at a Crossroads. Refugees, 131 http://www.unhcr.ch/cgi-bin/texis/vtx/home/opendoc.pdf?tbl=MEDIA&id=3ee99ef52&page=pbl
World Bank (2003a). Land Policies for Growth and Poverty Reduction.Washington DC, World Bankhttp://econ.worldbank.org/prr/land_policy/text-27809/
World Bank (2003b). Clean Air Initiative in Sub-Saharan Africa:Progress Report January 1 2003 – October 31, 2003. WashingtonDC, World Bankhttp://www.worldbank.org/cleanair/caiafrica/africaenglish/about/pdf/progress_03.pdf
References
Box 2: African nature convention adopted
The 1968 African Convention on the Conservation ofNature and Natural Resources was revised in 2003 withsupport from UNEP and the World Conservation Union(IUCN).
The new text makes the African Convention acomprehensive and modern regional treaty onenvironment and natural resources conservation, the firstto deal with a wide spectrum of sustainabledevelopment issues, including land and soil, water, andbiological diversity conservation and sustainable use. Italso addresses processes and activities which affect theenvironment and natural resources, as well as theirrelationship with sustainable development.
The convention provides for procedural rights (toinformation, participation and access to justice), echoingPrinciple 10 of the Rio Declaration. It encouragescooperation among parties to implement the convention,and whenever transboundary effects are likely to occur,and provides mechanisms including an independentsecretariat.
The revised convention will enter into force once it hasbeen ratified by 15 African states.
Source: AU 2003b
Several African countries announced new protected areas showing commitment to biodiversity conservation.
Source: Still Pictures

Asia and the PacificIn 2003, Asia and the Pacific was marked by extreme natural events such as droughts, floods, typhoons,mudslides, earthquakes, heat and cold waves. There were also positive environmental policy developments
GEO YEAR BOOK
These natural anomalies took place amid otherevolving environmental problems including landdegradation, air pollution and loss ofbiodiversity. The region has however alsowitnessed significant policy developments inthe abatement of transboundary air pollution,the protection of biodiversity and the fightagainst desertification.
DISASTROUS EVENTS The El Niño that still persisted at the beginningof the year sharply changed rainfall patterns,influenced temperature and wind patterns insome areas, and probably contributed todroughts in India, China and Australia (IRICP2003). The floods of the summer monsoonrains from April to August resulted in more than180 deaths and around 400 000 homelesspeople in eastern India, Nepal and Bangladesh(Reuters 2003). In May, a tropical storm acrossthe Bay of Bengal, which was accompanied bytorrential rainfall, caused around 300 deaths
and the displacement of 200 000 people.The flooding, which severely damaged theinfrastructure, economy and livelihoods in thesouthwestern part of Sri Lanka, wasconsidered the worst in over 50 years(UNOCHA 2003, NOAA 2003). Heavy rains inJuly also hit eight Chinese provinces.Numerous floods were blamed for hundreds oflives. One hundred million people were affectedand the economic loss was estimated atUS$5 000 million (CMA 2003a, IRICP 2003).
In eastern China, 640 000 ha of farmlandwere hit by drought and total crop failure wasreported for over 24 000 ha (Tong 2003). Morethan seven million people suffered from ashortage of drinking water and economiclosses were estimated at US$109 million(CMA 2003b). In May, 1 438 people in Indiaand 40 in Bangladesh died from a heatwavein South Asia. The southern Indian state ofAndhra Pradesh was the worst affected,with 1 317 reported deaths, as temperaturesrose to between 45 and 49° C (IRICP 2003).At the other extreme, in January a cold snapgripped South Asia and took the lives ofaround 1 000 people in Bangladesh, Indiaand Nepal (Disaster Relief 2003).
The devastating mudslides in thePhilippines in December, triggered by a weekof pounding rains in provinces near the PacificOcean, caused over 200 deaths (NOAA 2003).
Asia and the Pacific is well-known for itsvulnerability to earthquakes. The earthquakewhich devastated Bam City in Iran in Decemberwas one of the worst events of the year (Box 1).
GLACIAL CHANGES In Asia, more than 200 million people live inmountain and upland areas. The Himalayascontain the world’s third largest ice mass afterAntarctica and Greenland. A 2003 study ofglaciers and glacial lakes in Nepal and Bhutanby the International Centre for IntegratedMountain Development (ICIMOD) and UNEP
Key Facts
● Thirty-six per cent of Asia’s 3 500 million population lived inurban areas in 2001 and more than 42 per cent of thecontinent’s 1 300 million urban residents lived in slums. It isnow estimated that one in two urban slum dwellers in theworld are in Asia. About 900 million people or two-thirds ofthe world’s poor live in this region. Nearly one in three Asiansis poor.
● Asia is home to 60 per cent of the world’s population, but hasonly 36 per cent of the world’s freshwater resources. About80 per cent of the global population without access toimproved sanitation live in this region.
● The majority of the world’s population most severely affectedby desertification and drought live in Asia. Out of a total landarea of 4.3 million km2 , Asia contains some 1.7 million km2 ofdry sub-humid, semi-arid, and arid land.
● The Gobi Desert in China expanded by 52 400 km2 from 1994to 1999, creeping closer to Beijing. Over a quarter of China’sland is officially classified as desert. Up to 400 million peopleare under threat from the fast-advancing deserts.
● Most Himalayan glaciers have been thinning and retreatingover the past 30 years, with losses accelerating to alarminglevels in the past decade.
Sources: UN-Habitat 2003, UNHCR 2003, UNEP 2002, Larsen 2004,Greenpeace 2003, ICIMOD 2003, UNESCO 2003
Box 1: Bam earthquake
On 26 December 2003, an earthquakeof magnitude 6.5 struck Bam City insouth-eastern Iran, and killed at least42 000 people, injured 30 000, andleft 75 000 homeless. The earthquakedestroyed 80 per cent of wells and87 per cent of the buildings in the cityof Bam, as well as the 2 000 year oldmedieval fortress, the largest earthernstructure in the world, which sits on acliff near the city and attractsthousands of tourists each year.A total of 18 000 buildings in Bam andsurrounding villages were destroyedincluding 131 school buildings, threehospitals, 95 health centres and 14rural health clinics.
Sources: IRIN 2004a, IRIN 2004b, UNOCHA 2004
The earthquake killed at least 42 000 people, injured 30 000,and left 75 000 homeless.
Source: REUTERS/Caren Firouz

OVERVIEW: ASIA AND THE PACIFIC
identified 20 glacial lakes in Nepal and 24glacial lakes in Bhutan as potentially dangerousin the event of a ‘glacial lake outburst flood’(ICIMOD 2003). The formation of many glaciallakes on the glacier terminus is very likely theresult of the remarkable retreat since themiddle of the 20th century of glaciers in theHindu Kush-Himalayan region, which may berelated to climate change (UNEP RRC.AP2003a) (see also GEO Indicators section). Nineglacial lakes in the Astor River basin in Pakistanand 24 in the Pumqu Basin of China Himalayawere also classified as potentially dangerous.Though no outburst has been recorded in thepast decade, it is important to monitor theglacier lakes regularly in order to identify anddesign appropriate early warning and mitigationand response measures (ICIMOD 2003).
LAND DEGRADATIONMany Asian countries, including India, China,Afghanistan, and Mongolia, are facing thechallenges of desertification. This process,caused by overgrazing, overploughing andvegetation removal, is intensifying as humanand livestock numbers continue to increase. In China, approximately 2 674 000 km2 –which represents 27.9 per cent of the totalland area – is affected by desertification. It isestimated that one-third of China’s populationis threatened by desertification, mainly innorthwestern, northern and northeastern partsof the country, and that the annual directeconomic loss this causes is approximatelyUS$6 500 million (UNCCD 2003a).
In June 2003, environment ministers from30 countries in Asia and the Pacific signed anaccord on implementing the UN Convention toCombat Desertification (UNCCD) to addressthis issue and called for a global effort to fightthe problem. The Abu Dhabi Declaration forthe Implementation of the UNCCD urgesinnovative approaches in fightingdesertification and developing long-termstrategies to promote sustainable landmanagement. Specific measures includeinvestigating the causes of desertification,establishing a network for information sharing,implementing control measures, andstrengthening agricultural productivity through
sustainable land management. Countries arealso urged to pass relevant national actionprogrammes (UNWire 2003, UNCCD 2003b).
BIODIVERSITYIn March, the government of Fiji declaredthat the nation’s marine Exclusive EconomicZone (EEZ) is to become a whale sanctuary.The sanctuary covers 1.26 million km2 ofwater used by migrating humpback whalesfor breeding and calving. The governmentsof Australia, the Cook Islands, FrenchPolynesia, New Zealand, Niue, Papua NewGuinea, Tonga, Vanuatu, Samoa, as well asthe World Wildlife Fund for Nature (WWF)have applauded Fiji’s efforts and emphasizedthe need for conserving whales in otherPacific island states. Besides implementingits main function – protecting marinebiodiversity – the sanctuary is predicted tobecome a major tourist attraction, as has beenthe case in Tonga, New Zealand and Australia(ENS 2003).
The first regional marine plan underAustralia’s Oceans Policy was launched in July.More than two million km2 of Australia’s oceanterritory around Victoria, Tasmania, easternSouth Australia and southern New SouthWales, as well as the sub-Antarctic MacquarieIsland falls under the jurisdiction of this policy(National Oceans Office 2003). Thedevelopment of the ocean management planinvolved all relevant stakeholders, includingcommercial and recreational fishers,indigenous Australians, the conservationsector, industries and officials from differentgovernmental bodies. The National OceansMinisterial Board, established as acoordinating body, will provide for acomprehensive governmental framework fordecision-making in the field of oceanprotection. This is a big step toward protectionof key ecosystems as well as the promotion ofsustainable development of marine industriescurrently valued at more than US$19 400million a year (National Oceans Office 2003).
Asia also has a great diversity of birds. Its 2 700 species represent over 27 per centof all bird species described. However, one ineight (12.5 per cent) of all bird species in the
Asia region is globally threatened. The twoprimary threats are habitat destruction andhuman overexploitation. A total of 323 birdspecies are at risk of extinction over the next100 years (Birdlife International 2003). Of thisnumber, 41 are listed as “critical” and a further65 are “endangered,” meaning that thesespecies face a high risk of extinction over thenext 10 years. The declining populations ofbirds such as the hornbill in Nepal (Box 2)reflect the general deterioration of biodiversityand the environment in the region (BirdLifeInternational 2003).
AIR POLLUTION Air quality, especially the concentrations ofparticulate matter in major Asian cities, is ofserious concern. More than 500 000 peopledie every year from diseases related to airpollution (WHO 2003). In the next few years,
Box 2: Endangered hornbill in Nepal
According to the IUCN’s 2003 Red List of EndangeredSpecies, the hornbill is among Nepal’s most criticallyendangered birds. Habitat loss is the main threat to thehornbill, as deforestation in the region destroys nestingtrees and feeding sites. The hornbill is also hunted bypoachers who sell its beak and fat (which they call‘hornbill oil’) for medicinal purposes. The direcircumstances of Nepal’s four species of hornbill areindicative of the survival challenges of many Asian birds,which are faced with habitat destruction andoverexploitation.
Sources: Poudel 2003; Birdlife International 2003
Air pollution is a major environmental issue, particularly inAsian cities, and related diseases kill more than half a millionpeople each year.
Source: Still pictures

GEO YEAR BOOK
governments in the majority of countries in theregion intend to address air pollution as theirtop priority. Measures have been intensified atall levels and include tougher new emissionstandards aimed at reducing suspendedparticulate matter, regulations to control airpollution at construction sites, and theintroduction of alternative motor vehicle fuel,such as low sulphur diesel, ethanol blendedpetrol and compressed natural gas (CNG)(Enhesa 2003, CSE 2003). Although measuresvary from country to country, most have aclear focus on the motor vehicle sector.
Transboundary air pollution is a concern inAsia, affecting many countries in the region.Successful initiatives undertaken in 2003 totackle transboundary air pollution included:
● the ASEAN Agreement on TransboundaryHaze Pollution in Southeast Asia (Box 3);
● a regional programme on establishing a dustand sand storm monitoring and earlywarning system in Northeast Asia initiated bythe Asian Development Bank, the Economicand Social Commission for Asia and thePacific, the Asia office of the UNCCD andUNEP, together with governments of China,Japan, the Republic of Korea and Mongolia;and
● a capacity-building programme, undertakenunder Phase II of the Male Declaration,which aims to build national capacities toaddress issues of transboundary airpollution in South Asia. In-country trainingprogrammes, with monitoring equipment,have been provided to six participatingcountries, namely Nepal, Bhutan, Sri Lanka,Maldives, Iran and Bangladesh (UNEPRRC.AP 2003b).
ASEAN (2003). ASEAN Haze agreement to enter into force on 25November. Jakarta, Association of Southeast Asian Nations Secretariat http://www.haze-online.or.id/news.php?ID=20030926155515
BirdLife International (2003). Bird Life Asia Programme. Cambridge,BirdLife Internationalhttp://www.birdlife.net/worldwide/regional/asia/index.html
CMA (2003a). Heavy rain, floods expected to continue. Beijing, ChinaMeteorological Administrationhttp://www.cma.gov.cn/ywwz/englishread.php?recid=22669
CMA (2003b). Drought spreads in East China province. Beijing, ChinaMeteorological Administrationhttp://www.cma.gov.cn/ywwz/englishread.php?recid=23579
CSE (2003). Air Pollution: Smog Digest. New Delhi, Centre for Science andEnvironment http://www.cseindia.org/campaign/apc/sept-oct2003. htm
Disaster Relief (2003). Deadly cold grips South Asia. New York, ReliefWebhttp://www.reliefweb.int/w/rwb.nsf/0/307c66911c69075c85256cb1006c0f35?OpenDocument
Enhesa (2003). Air Quality. 2004 Global Forecast. Brussels, Enhesahttp://www.ehstrends.com/2004Forecast/Air.pdf
Environment News Service (2003). Whales Now Safe Within 200 Milesof Fiji. SoundNet. Byron Bay, Oceania Projecthttp://www.oceania.org.au/soundnet/mch03/safe.html
Greenpeace (2003). Livelihoods Blown Away: desertification in InnerMongolia destroys everything in its path. Greenpeace Internationalhttp://www.greenpeace.org/features/details?item_id=307689
ICIMOD (2003). Inventory of Glaciers, Glacial Lakes and theidentification of potential Glacial Lake Outburst Floods (GLOFs) affectedby Global Warming in the Mountains of Himalayan Region. February.Kathmandu, International Centre for Integrated Mountain Development
IRICP (2003). Climate Update for Asia: A look at climate, its impactsand outlook in Asia. Palisades, NY, International Research Institute forClimate Predictionhttp://iri.columbia.edu/asia/project/DigestAsia/Jul2003.html
IRIN (2004a). Iran: Death toll from Bam quake nears 45 000http://www.irinnews.org/report.asp?ReportID=39005&SelectRegion=Central_Asia
IRIN (2004b). Iran: Focus on Bam survivors four weeks after quakehttp://www.irinnews.org/report.asp?ReportID=39154&SelectRegion=Central_Asia&SelectCountry=IRAN
Larsen, J. (2004). Glaciers and Sea Ice Endangered by RisingTemperatures. Washington DC, Earth Policy Institutehttp://www.earth-policy.org/Updates/Update32.htm
National Oceans Office (2003). Release of draft Southeast RegionalMarine Plan. Hobart, Tasmania, Australia National Oceans Officehttp://www.oceans.gov.au/mr_180703.jsp
NOAA (2003). Hazards/ Climate Extremes. National EnvironmentalSatellite, Data, and Information Services. Asheville, NC, NationalOceanic and Atmospheric Associationhttp://www.ncdc.noaa.gov/oa/climate/research/2003/dec/hazards.html
Poudel, K. (2003). Nepal’s Hornbills on Danger List. New Delhi,OneWorld Network South Asia,http://www.oneworld.net/article/view/75008/1/
Reuters (2003). Monsoons hit South Asia, 180 dead, 400,000homeless. New York, ReliefWebhttp://www.reliefweb.int/w/rwb.nsf/0/100ca6e413e01ff649256d60001bcf11?OpenDocument
Tong, Z. (2003). China Hit by Unprecedented Heat Waves. New York,Association for Asian Researchhttp://www.asianresearch.org/articles/1544.html
UNCCD (2003a), Desertification: A Growing Threat in China. Down toEarth, 19. Bonn, United Nations Convention to Combat Desertificationhttp://www.unccd.int/publicinfo/newsletter/no19/news19eng.pdf
UNCCD (2003b). Second Asian Ministerial Conference on UNCCDImplementation in Preparation for the Sixth Session of the Conferenceof the Parties to UNCCD. Bonn, United Nations Convention toCombat Desertificationhttp://www.eci.ox.ac.uk/unccd/english/events.htm
UNEP (2002). Global Environment Outlook 3. London, Earthscan
UNEP RRC.AP (2003a). Glacial Lake Outburst Flooding Monitoringand Early Warning System. KluongLuang, Thailand, UNEP RegionalResource Centre for Asia and the Pacifichttp://www.rrcap.unep.org/issues/glof/
UNEP RRC.AP (2003b). Malé Declaration. KluongLuang, Thailand,UNEP Regional Resource Centre for Asia and the Pacifichttp://www.rrcap.unep.org/issues/air/maledec/
UNESCO (2003). Water Library – Asia and the Pacific. Paris, UnitedNations Educational Social and Cultural Organizationhttp://www.wateryear2003.org/en/ev.php@URL_ID=4924&URL_DO=DO_TOPIC&URL_SECTION=201.html
UN-Habitat (2003). Slums of the World: The Face of Urban Poverty inthe New Millennium Nairobi, United Nations Programme for HumanSettlements http://www.unhabitat.org/publication/slumreport.pdf
UNHCR (2003). Refugees by Numbers 2003. New York, UnitedNations High Commissioner for Refugeeshttp://www.unhcr.org.uk/info/briefings/statistics/documents/numb2003.pdf
UNOCHA (2003). Sri Lanka-Floods OCHA Situation Report No. 3.United Nations Office for the Coordination of Humanitarian Affairs.New York, ReliefWebhttp://wwww.reliefweb.int/w/rwb.nsf/0/2327a6272ca23c5a85256d2f00689e22?OpenDocument
UNOCHA (2004). United Nations Disaster Assessment Coordinationfollowing the Bam Earthquake of 26 December 2003. United NationsOffice for the Coordination of Humanitarian Affairs. New York, ReliefWebhttp://www.reliefweb.int/w/rwb.nsf/0/e5758d6a8a5f7d3dc1256e31005df669?OpenDocument
UNWire (2003). Environment Ministers Sign Desertification Accords.Washington DC, UNWirehttp://www.unwire.org/UNWire/20030612/449_5001.asp
WHO (2003). Asia’s cities face disease crisis, WHO warns. Manila,World Health Organization Western Pacific Regionhttp://www.wpro.who.int/public/press_release/press_view/asp?id=298
References
Box 3: Agreement on transboundaryhaze pollution entered into force
The 2002 Agreement on Transboundary Haze Pollutionof the Association of Southeast Asian Nations (ASEAN)entered into force in November 2003. The agreement,signed by the 10 member countries of ASEAN, is thefirst such regional arrangement in the world that binds agroup of contiguous states to tackle transboundary hazepollution resulting from land and forest fires. It containsprovisions on monitoring, assessment and prevention oftransboundary haze pollution, technical cooperation andscientific research, mechanisms for coordination andcommunication, and simplified customs and immigrationprocedures for disaster relief. It also provides for theestablishment of an ASEAN Coordinating Centre forTransboundary Haze Pollution Control. The agreementmay serve as a model for dealing with othertransboundary issues.
Source: ASEAN 2003

The expansion of the European Union (EU) was a major political development during the year while environmentalissues, including extreme weather events, overfishing and unsustainable transport patterns were also important
OVERVIEW: EUROPE
Europe
Only a few issues can be covered in detail butthis does not make other topics, such asbiodiversity loss or waste disposal andmanagement, less important.
EXTREME WEATHER EVENTS Exceptionally high temperatures occurred inWestern Europe in 2003, causing variousheat and drought-related impacts, both onhuman health and environment. Heatwavesare often accompanied by power failures,high levels of local air pollution, failures in thewater supply, excess forest fires and excessheat-related mortality. At the end of the hot2003 summer, authorities reported high
mortality figures (EEA 2003a, UNECE 2003a,and WHO 2003).
There is no doubt that hot and dry weatherconditions can make fires much more severe.Direct pressures that cause fires vary widelyand are both social and ecological in nature.Prevention and control strategies addresspublic awareness, repression of crime,silvicultural cleaning measures to reduce thefuel load, and economic incentives forappropriate management measures, as well aseffective fire suppression.
As with the heavy rainfall and floods inCentral Europe in 2002, the 2003 extremeweather-related events in Europe cannot beattributed to climate change and its pressuresalone, but they show what may happen ifclimate change continues. Europe hasexperienced an unprecedented rate ofwarming in recent decades, with an overalltemperature rise of as much as 2 ºC overlarge areas of the Arctic since the early 1950s(Bernes 2002, Klein Tank and others 2002).Average temperatures are expected to furtherincrease, droughts are likely to become morefrequent in various parts of Europe, andheatwaves, although rare at present, couldbecome more frequent, intense and longer(Houghton and others 2001).
The cost of climate change mitigation inWestern Europe can be reduced significantlythrough the use of mechanisms under theKyoto Protocol (EEA 2003b). In EasternEurope, greenhouse gas mitigation costs areexpected to be lower than in Western Europebut investments are needed in the energysector (EEA 2003b). The Russian Federation,which is likely to have a significant surplus ofemission allowances, could play a central rolein the ratification process of the protocol aswell as in the future market for GHGallowances (EEA 2003b). By the end of 2003,however, the Kyoto Protocol, had not yetentered into force.
UNSUSTAINABLE TRANSPORTPATTERNS The transport sector has clear links to climatechange. In Western Europe, it has becomethe second largest consumer of energy(30 per cent of total energy use) and animportant source of GHG emissions. In Centraland Eastern Europe and Central Asia (EE &CA, the transport sector is a relatively less
Key Facts
● With the Treaty of Accession between the EU and the10 accession countries, signed in April, Europe has entereda new era with numerous implications for the region’senvironment.
● The May 2003 Environment for Europe Ministerial Conferencein Kyiv, Ukraine, adopted among others, three pan-Europeanprotocols – the Protocol on Strategic EnvironmentalAssessment to the Convention on Environmental ImpactAssessment in a Transboundary Context; the Protocol on CivilLiability and Damage Caused by the Transboundary Effects ofIndustrial Accidents on Transboundary Waters to theConventions on the Transboundary Effects of IndustrialAccidents and on the Protection and Use of TransboundaryWaters and International Lakes; and the Protocol on PollutantRelease and Transfer Registers to the Aarhus Convention.
● A Convention on the Protection and Sustainable Developmentof the Carpathians was adopted and signed by the sevencountries of the Carpathians in May 2003 in the margins ofthe Kyiv Conference. A Framework Convention for theProtection of the Marine Environment of the Caspian Sea wassigned in November 2003 by the five riparian countries.
● As of 31 December 2003, a total of 27 countries had ratified,approved, accepted or acceded to the Aarhus Convention(Access to Information, Public Participation in Decision-making, and Access to Justice in Environmental Matters), fiveof which did so in 2003.
● In 2003, the issue of environment and security was furtherpursued through a UNEP, UNDP and the Organization forSecurity and Cooperation in Europe (OSCE) project whichestablished a mechanism to examine and address linkagesbetween environmental problems and ‘hot spots’ and securityissues affecting nations and people.
● The latest greenhouse gas emission projections show thatneither existing, nor additionally-planned domestic policiesand measures by member states to reduce emissions will besufficient to allow the EU to reach its Kyoto target.
Sources: EEA 2003b and 2003c, UNECE 2003b, 2003c, 2003d, 2003eand 2003f
Two firemen dwarfed by giant flames during forestfires in Southern France.
Source: REUTERS/Pascal Deschamps

GEO YEAR BOOK
important energy consumer but still accountsfor around 22 and 17 per cent respectively oftotal energy use (EEA 2002).
In Eastern Europe, rail transport remainsstrong with no signs of decline (EEA 2002).Central Europe, where transport patterns arecurrently more favourable to the environmentthan in Western Europe, risks ending up withthe present unsustainable, mainly road-dominated, transport patterns of WesternEurope unless preventive action is taken. Forinstance, the number of cars per 1 000inhabitants in Central Europe is currently halfof that in Western Europe, but the rising trendin 1990–99 of a 61 per cent increase in car-ownership in Central Europe continues.
Economic growth and related changinglifestyle patterns create increasingly strongpressures on the transport sector all overEurope. Western European experiences,including voluntary agreements and fuel taxes,show that environmental regulation on vehiclesand fuels has helped to reduce certainimpacts, such as air pollution. But these gainsin eco-efficiency have not been sufficient tomitigate the impact of the rapid growth oftransport and infrastructure on GHGemissions, noise and habitat fragmentation.Better-integrated transport and environmentalstrategies are needed to restrain traffic growthand promote the use of more environmentallyfriendly modes – two of the key objectives ofthe EU Sustainable Development Strategy.
Box 1 lists some findings of a recent
study on transport patterns and policy inCentral Europe in relation to EU enlargement(EEA 2002).
An overall assessment of the transportsector, and of the economic, social andenvironmental impacts and benefits of thetrans-European transport network and itseastern extension has not yet been made.
OVERFISHINGFishing fleets are modern and efficient, andthe market for protein from the sea is strong.Since 1990, total European landings of marinecatch have increased by 25 per cent despitea reduced fleet capacity. Overfishing hasresulted in a reduction of many marine fishstocks to levels below those that can sustaintheir populations (Table 1). (See EmergingChallenges and GEO Indicators sections.)
In October 2003, the International Councilfor the Exploration of the Sea (ICES) advisedzero catches of cod and several other fishstocks, until stocks recovered to certainspecific levels (ICES 2003). The EuropeanCommission adopted a proposal on theestablishment of a revised fishing effort regimein the western waters, which aims to protectfish stocks (European Council 2003).
Commercial inland fisheries have fallen by32 per cent since 1990 (EEA 2003b). The FAOnotes that environmental degradation, ratherthan overexploitation, is the biggest threat toinland fish stocks. However, illegal landings,for example of sturgeon from the Caspian Sea,
Box 1: Transport and environmentintegration: trends in Central Europe
1. Pricing system to internalize external costs:
● few internalization instruments (eg a CO2 tax on motor
fuels) are in force in the accession; and countries
● trends in fuel prices are not encouraging the use of
more fuel-efficient transport modes.
2. Introduction of cleaner technologies:
● the accession countries vehicle fleet is on average
four to five years older than the EU fleet; and
● the number of end-of-life vehicles and used tyres are
expected to grow significantly.
3. Use of environmental management and monitoring
tools:
● integrated transport and environment strategies are
lacking in accession countries; and
● accession countries are not monitoring the
environmental integration in their transport policies.
Source: EEA 2002
Table 1: Recommended and estimated 2003 stocks of cod, plaice, whiting, hake and capelin
Area Minimum recommended stock size (tonnes) Estimated stock size in 2003 (tonnes)
Cod – North Sea and Skagerrak, 150 000 52 000
Eastern Channel
Cod – Irish Sea 10 000 Just above 6 000
Cod – west of Scotland 22 000 2 500
Plaice – North Sea 300 000 152 000
Whiting – Irish Sea 7 000 1 700
Hake – Ireland down to Portugal Northern stock: 140 000 Northern stock: 114 100
Southern stock: 35 000 Southern stock: 16 000
Capelin – Barents Sea 200 000 280 000
Source: ICES 2003
Rail is one of the main modes of transport in Europe,particularly in Eastern Europe where it predominates.
Source: Still Pictures

OVERVIEW: EUROPE
are often many times greater than legallandings and constitute a major pressure onthe resource.
OTHER POLICY DEVELOPMENTS Improvements in the state of the ozone layer,air and water quality, have mainly beenbrought about through policy measures thathave regulated products such as lead in petrol,sulphur in liquid fuels or catalytic converters oncars and controlled release of emissions frompower plants, industry and waste incinerators.In Central and Eastern Europe, economicrestructuring was a major force behind thereductions in emissions that have beenrecorded. The loss of biodiversity and habitatshas been reduced by protecting importantnature sites.
Much of the environmental progress by 2003is unlikely to be sustained with continuing orrenewed economic growth, while many of thenegative impacts are likely to be exacerbated.This trend is already apparent in the transportfield. Clearly, the implementation of moreintegrated approaches to policy making needsto be accelerated if Europe is to ensure properprotection of its environment and meet itsaspirations on sectoral integration andsustainable development throughout the region(EEA 2003c). One aspect of such integration isthe need to further streamline environmentaldata and reporting across Europe (Box 2).
CHALLENGES FOR THE FUTUREEven though some environmental progresscan be witnessed, there is still much to bedone to make the environment moresustainable. Issues such as transport,biodiversity and waste need to be kept high onthe policy agenda in order to improve the stateof the environment and reach set targets.Acceleration toward more integrated
approaches and the implementation andenforcement of environmental policies –together with adaptation to technical progressand new insights – remain core tasksthroughout the region (EEA 2003c).
Box 2: Integration and sustainable development in Europe: monitoring andreporting
The search for more integrated approaches to policy-making directly relates to the need to improve reportingon the environment and sustainable development. Assessment and reporting is hindered by the continuinglack of comparable data and indicators across the whole European region. This applies for both environmentaland socio-economic data. Recent efforts have been made to streamline monitoring at EU, pan-European andsectoral levels.
On sectoral integration, the most advanced examples are related to activities to streamline reporting ontransport, environment and health:
● The European Environment Agency (EEA) (in cooperation with the European Commission) has developed anindicator-based reporting system, the Transport and Environment Reporting Mechanism (TERM), to monitorintegration of environmental concerns into EU transport policies. Since 2002, the 10 EU accession countrieshave also been included in the assessment. Eurostat and UNECE are the major providers of the statistics onwhich the reports build.
● The World Health Organization (WHO) European Centre for Environment and Health is implementing anenvironmental health indicator system, to facilitate the assessment of health effects related to environmentalconditions. The system will be recommended for endorsement to the 4th Ministerial Conference onEnvironment and Health, in Budapest, in 2004. The indicators have been developed in collaboration withEEA to maximize the possibility of data exchange between the two organizations and member states.
Source: UNECE 2003g
Bernes, C. (2002). A Warmer World – The Greenhouse Effect andClimate Change. Stockholm, Swedish Environmental ProtectionAgency and the Swedish Regional Climate Modeling Programme
European Council (2003). Outcome of Agriculture/Fisheries Council ofOctober 2003. Press Release. Brussels, European Commission Fisherieshttp://europa.eu.int/comm/fisheries/news_corner/press/inf03_44_en.htm
EEA (2002). Paving the way for EU enlargement: indicators fortransport and environment integration – TERM 2002. Environmentalissue report, 32. Copenhagen, European Environment Agency
EEA (2003a). Air pollution by ozone in Europe in Summer 2003:Overview of exceedances of EC ozone threshold values during thesummer season April – August 2003 and comparisons with previousyears. Summary report of a draft report to the Commission by theEEA Topic Centre on Air and Climate Change. Copenhagen, EuropeanEnvironment Agency
EEA (2003b). Greenhouse gas emission trends and projections in Europe2000: Summary: Tracking progress by the EU and candidate countriestowards achieving their Kyoto Protocol Targets. Environmental issuereport, 36. Copenhagen, European Environment Agency
EEA (2003c). Europe’s environment: the third assessment. Environmentalassessment report, 10. Copenhagen, European Environment Agency
Houghton, J.T., Ding, Y., Griggs, D.J., Noguer, M., van der Linden,P.J., Dai, X., Maskell, K., Johnson, C.A. (2001). Climate Change 2001:The Scientific Basis. Contribution of Working Group I to the ThirdAssessment Report of the Intergovernmental Panel on ClimateChange. Cambridge, Cambridge University Press
ICES (2003). ICES advises zero catches of cod and other fish stocks.Press Release. Denmark, International Council for Exploration of the Seas http://www.ices.dk/aboutus/pressrelease/ACFMautumn2003.pdf
Klein Tank, A., Wijngaard, J., van Engelen, A. (2002). Climate ofEurope: assessment of observed daily temperature extremes andprecipitation events. De Bilt, The Netherlands, KNMI
UNECE (2003a). Forest fires: a complex issue necessitatinginternational cooperation. Press Release. Geneva, United NationsEconomic Commission for Europehttp://www.unece.org/press/pr2003/03tim_n01e.htm
UNECE (2003b). Information on the Protocol on StrategicEnvironmental Assessment. Geneva, United Nations EconomicCommission for Europehttp://www.unece.org/env/eia/sea_protocol.htm
UNECE (2003c). Status of ratification of the Aarhus Convention.Geneva, United Nations Economic Commission for Europehttp://www.unece.org/env/pp/ctreaty.htm
UNECE (2003d). Information on the Protocol on Civil Liability andDamage Caused by the Transboundary Effects of Industrial Accidentson Transboundary Waters. Geneva, United Nations EconomicCommission for Europe http://www.unece.org/env/teia/welcome.html
UNECE (2003e). Information on the Protocol on Pollutant Release andTransfer Registers (PRTRs). Geneva, United Nations EconomicCommission for Europe http://www.unece.org/env/pp/prtr.htm
UNECE (2003f). Information on the Environment for Europe MinisterialConference held in Kiev in May 2003. Geneva, United NationsEconomic Commission for Europe http://www.unece.org/env/europe
UNECE (2003g). Information on monitoring and reporting activities inpan-Europe. Geneva, United Nations Economic Commission forEurope http://www.unece.org/env/europe/monitoring/index.html
WHO (2003). Heatwaves: impacts and responses. Meeting documentfor the European Environment and Health Committee held in Prague,9-10 October 2003 (EEHC9/Info.5). Prague, World HealthOrganization
References

Latin America and the CaribbeanA number of key regional events helped to further the in the region. However, an ongoing challenge is stillto address the growing levels of poverty and inequality, while at the same time integrating environmentaland social concerns into development policy
GEO YEAR BOOK
Despite the continued economic and socialcrisis in many countries, the legal andinstitutional frameworks were maintainedduring the year. In November 2003, the Forumof Ministers of Environment of Latin Americaand the Caribbean identified concrete actionsfor the implementation of the Latin Americanand Caribbean Initiative for SustainableDevelopment (Box 1). Other progress in2003 included the development of plans forbiological corridors in the Andean region and
the Amazon basin, the designation of newprotected areas in numerous countries, aswell as national legislation to enhance therole of the private sector in protected areamanagement (Box 2).
While more state regulations have beenintroduced, enforcement emerges as a majorproblem. This is either due to an imbalancebetween economic and environmental goalsor to the lack of adequate human andfinancial resources.
THE VANISHING FORESTS Satellite data from the Brazilian Institute forSpace Research (INPE, Instituto Nacional dePesquisas Espaciais) showed that an
estimated 25 476 km2 of forest vanishedbetween August 2001 and August 2002,the highest total in any of the past sixyears, and the second largest since record-keeping began in 1978 (INPE 2003).Agricultural and livestock expansioncontinue to be the main factors reducingforested areas in South America’s tropicalregions, as seen in the Cerrado and theAmazon in Brazil (UNEP 2003a) (Figure 1).Slash-and-burn activities continue to beimportant, but the expansion of soybeancultivation is exacerbating the situation.
Brazil is becoming a major soybean producer.In 1990, the area sown was more than11.4 million ha. By 2002–03, it had reached
Box 1: Forum of Ministers of Latin America and the Caribbean
The 14th Meeting of the Forum of Ministers of Environment of Latin America and the Caribbean washeld in Panama in November 2003. The Forum, created in 1982, helps coordinate environmentalactivities and ensure that regional and international cooperation is efficient and coherent, targetingthe priorities of the region.
At an extraordinary meeting of the Forum held within the framework of the World Summit onSustainable Development, the Latin America and Caribbean Initiative for Sustainable Development(ILAC) was approved and included in the WSSD Plan of Implementation.
The ILAC objectives include:
● increasing the use of renewable energy sources until 10 per cent of the regional energyrequirements are met;
● increasing natural protected areas and forests;
● improving the management of watersheds and marine and coastal zones;
● adopting regulatory frameworks for access to genetic resources; and
● implementing plans and policies to reduce urban environmental vulnerability to disasters.
ILAC has become one of the most important policy tools for promoting sustainable development inLatin America and the Caribbean. The 14th Meeting of the Forum of Ministers reaffirmed theimportance of the initiative and adopted concrete activities to further its goals, focusing on issuessuch as: access to genetic resources and fair and equitable sharing of benefits arising from their use,water resources, human settlements, vulnerability and land use planning and laws, renewableenergies, trade and the environment, economic instruments and fiscal policy, climate change, andenvironmental indicators.
Source: UNEP 2003b
Key Facts● In 2003, the number of people living in poverty was
225 million, nearly 44 per cent of the total population.
● LAC has the world’s largest area of arable land, 576 millionha, 30 per cent of the total region. During the 1990s, profitsfrom the region’s agricultural exports increased at an averageannual rate of 6.4 per cent.
● LAC lost almost 47 million ha of forests in the period 1990–2000, the second largest loss after Africa.
● The 178 eco-regions identified in LAC contain more than40 per cent of the world’s flora and fauna species. Brazil,Colombia, Ecuador, Mexico, Peru and Venezuela are allconsidered mega-diverse countries.
● LAC possesses more than 30 per cent of the globalrenewable water resources. Agriculture is the principalconsumer of water in the region, accounting for 73.5 per centof total withdrawals.
● 60 per cent of the population live within 100 km of the coast,and coastal and marine ecosystems continue to be threatenedby pollution and degradation caused mainly by growingdemographic pressure and associated increase in coastalresource use. Over 60 per cent of sewage from public drainagein LAC is discharged into water bodies without treatment.
● More than 80 million people in LAC are permanently affectedby low air quality.
● LAC is the most urbanized region in the developing world: thelevel of urbanization was 75.3 per cent in 2000 and isexpected to reach 80.4 per cent by 2020.
● The period 1995–2003 was the most active for Atlantichurricanes on record, with a high social economic andenvironmental impact on the region, especially the highly-vulnerable Small Island Developing States (SIDS) of theCaribbean. Between 1970–2001 natural disasters killed246 569 people, affected another 144.9 million and causedeconomic losses of US$68 600 million.
Sources: UNEP 2003a, FAO 2003

OVERVIEW: LATIN AMERICA AND THE CARIBBEAN
17.9 million ha (Conab 2003). As the area underthis crop increases, traditional agriculture andlivestock activities shift to marginal wildernessareas. A similar process is taking place in centralArgentina, where soybean is the dominant crop,so other crops and cattle are taking overmarginal areas, with increased impacts on water,soil and biodiversity.
The expansion of agriculture and livestockis, more than anything else, due to exportopportunities and technological changes. InSeptember 2003, the Brazilian governmentissued a provisional regulation (MP 131)permitting transgenetic soybean cultivation(WWF 2003a). This measure is a major issue initself, and also allows further expansion of thearea cultivated for soybean production.
FLOODS, DROUGHTS ANDHURRICANESThe vulnerability of people and ecosystems inLatin America and the Caribbean to extremeweather events was again in the spotlight in
2003. There were record-breaking floods anddroughts, as well as another abnormally heavyhurricane season. Argentina, Brazil, Colombia,Dominican Republic, Ecuador, Haiti andVenezuela all suffered extreme (and aboveaverage) floods and/or drought (IRICP 2003a,NOAA 2003, Pittaluga 2003).
Above-average rainfall in March and Aprilbrought floods to large areas of theArgentinian province of Santa Fe, resulting inmore than 30 deaths, and leaving 150 peopleinjured. There were outbreaks of infectiousdiseases, serious problems for agriculture andlivestock, and disruption of industrialproduction in some urban areas. More than28 000 dwellings were damaged, witheconomic losses estimated at almostUS$1 000 million (Pittaluga 2003, ECLACand UN 2003).
Heavy seasonal rains in October led tofloods and landslides in Colombia, affectingsome 72 000 people, mostly those displacedby conflict and living in marginal areas(Pittaluga 2003, WFP 2003).
The Dominican Republic suffered severefloods in November, which affected over65 000 people. There were also sizeablelivestock and crop losses (estimated at onemonth’s supply of rice for the country)(IRICP 2003b).
In October, the most serious drought inrecent decades reached its peak in central andnorthern Argentina, adjacent areas in Paraguayand Bolivia and to a lesser degree in westernUruguay. In some Argentine zones, the rainfallwas below the historic minimum recorded in1929 (ECLAC and UN 2003). This causedsignificant agricultural losses (especially ofwheat, with two million tonnes ruined) andlivestock, the total costs of which have beenestimated at more than US$300 million(Pittaluga 2003). In Paraguay’s Chaco region,the drought caused a shortage of food supplies(Pittaluga 2003, ECLAC and UN 2003).
There were more Atlantic hurricanesrecorded between 1995–2003 than ever beforefor a similar period. There were 14 tropicalstorms, of which seven became hurricanes andthree became major hurricanes (NOAA 2003).Mexico was hit by a series of these between
Box 2: Regulation for privateprotected areas in Chile
New Chilean legislation introduced in 2003provides a solid legal framework for thecreation and maintenance of private parks.It promotes private investment in theprotection of natural resources and biodiversityand is complementary to the existing systemof public parks.
With 14 million ha, the Chilean NationalProtected Areas System (Sistema Nacional deAreas Silvestres Protegidas del Estado,SNASPE) covers almost 20 per cent of Chile.However, 19 of the 85 eco-regions remainunprotected and others are insufficientlyprotected. Private protected areas, currentlycovering more than 500 000 ha, could make aconsiderable contribution to biodiversityprotection in the country. With the newregulation, the government aims at significantlyexpanding the current four per cent of privateprotected areas and providing for morecontinuity and coordination in the protection ofpriority areas.
Sources: Corcuera and others 2002, University of Chile 2003,Villarroel and others (in press)
Figure 1: Satellite images of deforestation 2000–2003.
Source: MODIS Land Rapid Response Team at NASA GSFC
This image shows the extent of deforestation in thestate of Rondonia, Brazil. Tropical rainforest appearsbright red, while pale red and brown areas representcleared land. Black and gray areas have probablybeen recently burned. The Jiparaná River appearsblue. Most of the clearing is done for agriculture –grazing cattle, and planting crops. Large cattlepastures often replace rainforest to grow beef for theworld market. Commercial logging is anothercommon form of deforestation, cutting trees for saleas timber or pulp.
Sources: NASA/ GSFC/ METI/ ERSDAC/ JAROS, and US/ Japan ASTERScience Team
24 Aug 2000
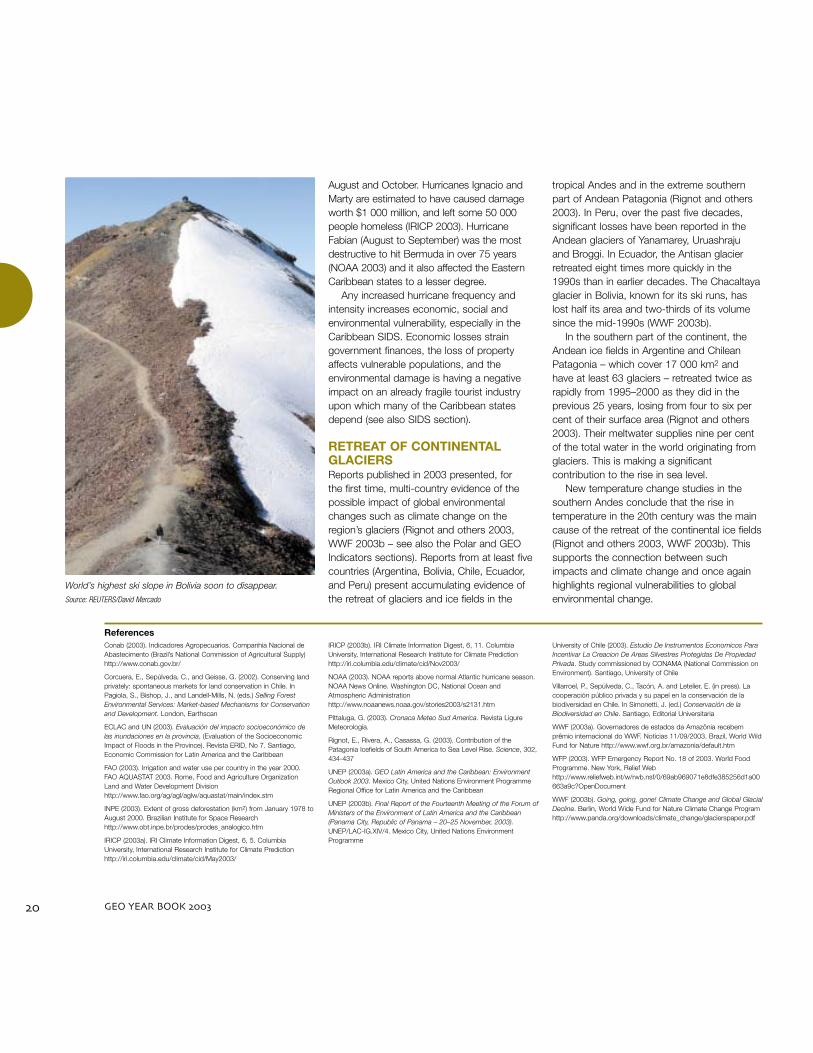
GEO YEAR BOOK
August and October. Hurricanes Ignacio andMarty are estimated to have caused damageworth $1 000 million, and left some 50 000people homeless (IRICP 2003). HurricaneFabian (August to September) was the mostdestructive to hit Bermuda in over 75 years(NOAA 2003) and it also affected the EasternCaribbean states to a lesser degree.
Any increased hurricane frequency andintensity increases economic, social andenvironmental vulnerability, especially in theCaribbean SIDS. Economic losses straingovernment finances, the loss of propertyaffects vulnerable populations, and theenvironmental damage is having a negativeimpact on an already fragile tourist industryupon which many of the Caribbean statesdepend (see also SIDS section).
RETREAT OF CONTINENTALGLACIERSReports published in 2003 presented, forthe first time, multi-country evidence of thepossible impact of global environmentalchanges such as climate change on theregion’s glaciers (Rignot and others 2003,WWF 2003b – see also the Polar and GEOIndicators sections). Reports from at least fivecountries (Argentina, Bolivia, Chile, Ecuador,and Peru) present accumulating evidence ofthe retreat of glaciers and ice fields in the
tropical Andes and in the extreme southernpart of Andean Patagonia (Rignot and others2003). In Peru, over the past five decades,significant losses have been reported in theAndean glaciers of Yanamarey, Uruashrajuand Broggi. In Ecuador, the Antisan glacierretreated eight times more quickly in the1990s than in earlier decades. The Chacaltayaglacier in Bolivia, known for its ski runs, haslost half its area and two-thirds of its volumesince the mid-1990s (WWF 2003b).
In the southern part of the continent, theAndean ice fields in Argentine and ChileanPatagonia – which cover 17 000 km2 andhave at least 63 glaciers – retreated twice asrapidly from 1995–2000 as they did in theprevious 25 years, losing from four to six percent of their surface area (Rignot and others2003). Their meltwater supplies nine per centof the total water in the world originating fromglaciers. This is making a significantcontribution to the rise in sea level.
New temperature change studies in thesouthern Andes conclude that the rise intemperature in the 20th century was the maincause of the retreat of the continental ice fields(Rignot and others 2003, WWF 2003b). Thissupports the connection between suchimpacts and climate change and once againhighlights regional vulnerabilities to globalenvironmental change.
Conab (2003). Indicadores Agropecuarios. Companhia Nacional deAbastecimento (Brazil’s National Commission of Agricultural Supply)http://www.conab.gov.br/
Corcuera, E., Sepúlveda, C., and Geisse, G. (2002). Conserving landprivately: spontaneous markets for land conservation in Chile. InPagiola, S., Bishop, J., and Landell-Mills, N. (eds.) Selling ForestEnvironmental Services: Market-based Mechanisms for Conservationand Development. London, Earthscan
ECLAC and UN (2003). Evaluación del impacto socioeconómico delas inundaciones en la provincia, (Evaluation of the SocioeconomicImpact of Floods in the Province). Revista ERID, No 7. Santiago,Economic Commission for Latin America and the Caribbean
FAO (2003). Irrigation and water use per country in the year 2000.FAO AQUASTAT 2003. Rome, Food and Agriculture OrganizationLand and Water Development Divisionhttp://www.fao.org/ag/agl/aglw/aquastat/main/index.stm
INPE (2003). Extent of gross deforestation (km2) from January 1978 toAugust 2000. Brazilian Institute for Space Researchhttp://www.obt.inpe.br/prodes/prodes_analogico.htm
IRICP (2003a). IRI Climate Information Digest, 6, 5. ColumbiaUniversity, International Research Institute for Climate Predictionhttp://iri.columbia.edu/climate/cid/May2003/
IRICP (2003b). IRI Climate Information Digest, 6, 11. ColumbiaUniversity, International Research Institute for Climate Predictionhttp://iri.columbia.edu/climate/cid/Nov2003/
NOAA (2003). NOAA reports above normal Atlantic hurricane season.NOAA News Online. Washington DC, National Ocean andAtmospheric Administrationhttp://www.noaanews.noaa.gov/stories2003/s2131.htm
Pittaluga, G. (2003). Cronaca Meteo Sud America. Revista LigureMeteorología.
Rignot, E., Rivera, A., Casassa, G. (2003). Contribution of thePatagonia Icefields of South America to Sea Level Rise. Science, 302,434-437
UNEP (2003a). GEO Latin America and the Caribbean: EnvironmentOutlook 2003. Mexico City, United Nations Environment ProgrammeRegional Office for Latin America and the Caribbean
UNEP (2003b). Final Report of the Fourteenth Meeting of the Forum ofMinisters of the Environment of Latin America and the Caribbean(Panama City, Republic of Panama – 20–25 November, 2003).UNEP/LAC-IG.XIV/4. Mexico City, United Nations EnvironmentProgramme
University of Chile (2003). Estudio De Instrumentos Economicos ParaIncentivar La Creacion De Areas Silvestres Protegidas De PropiedadPrivada. Study commissioned by CONAMA (National Commission onEnvironment). Santiago, University of Chile
Villarroel, P., Sepúlveda, C., Tacón, A. and Letelier, E. (in press). Lacooperación público privada y su papel en la conservación de labiodiversidad en Chile. In Simonetti, J. (ed.) Conservación de laBiodiversidad en Chile. Santiago, Editorial Universitaria
WWF (2003a). Governadores de estados da Amazônia recebemprêmio internacional do WWF. Notícias 11/09/2003. Brazil, World WildFund for Nature http://www.wwf.org.br/amazonia/default.htm
WFP (2003). WFP Emergency Report No. 18 of 2003. World FoodProgramme. New York, Relief Web http://www.reliefweb.int/w/rwb.nsf/0/69ab969071e8dfe385256d1a00663a9c?OpenDocument
WWF (2003b). Going, going, gone! Climate Change and Global GlacialDecline. Berlin, World Wide Fund for Nature Climate Change Programhttp://www.panda.org/downloads/climate_change/glacierspaper.pdf
References
World’s highest ski slope in Bolivia soon to disappear.
Source: REUTERS/David Mercado
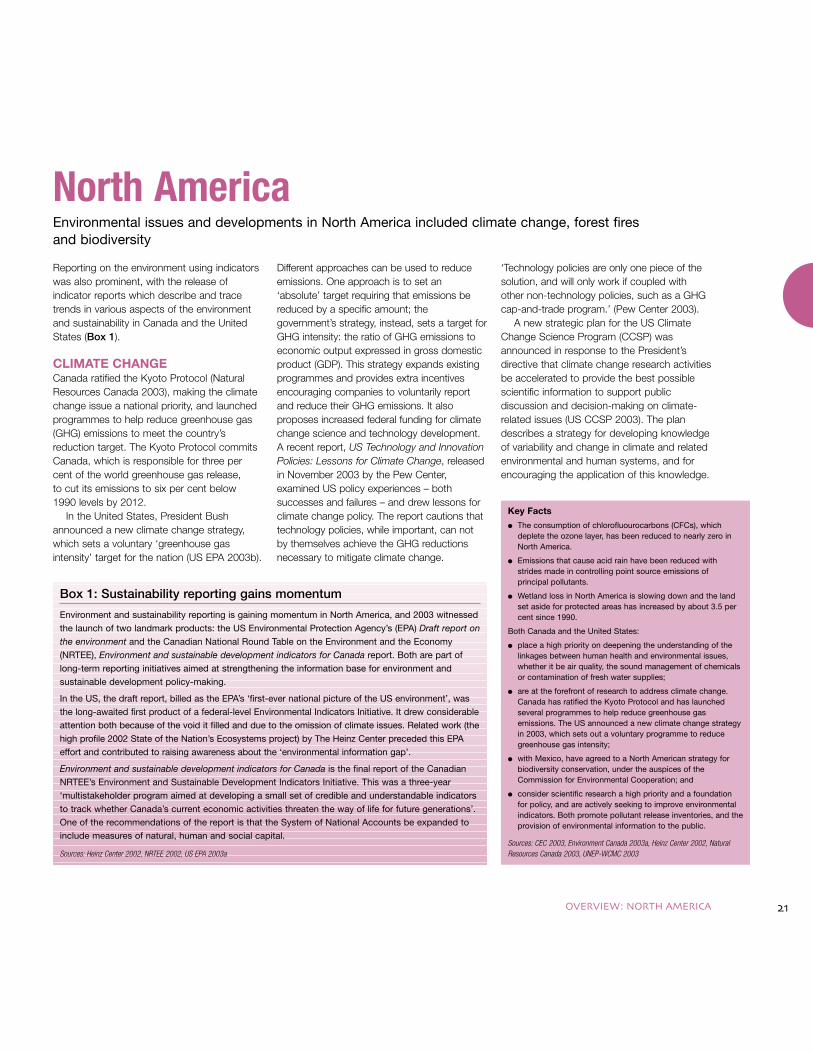
OVERVIEW: NORTH AMERICA
North AmericaEnvironmental issues and developments in North America included climate change, forest fires and biodiversity
Reporting on the environment using indicatorswas also prominent, with the release ofindicator reports which describe and tracetrends in various aspects of the environmentand sustainability in Canada and the UnitedStates (Box 1).
CLIMATE CHANGE Canada ratified the Kyoto Protocol (NaturalResources Canada 2003), making the climatechange issue a national priority, and launchedprogrammes to help reduce greenhouse gas(GHG) emissions to meet the country’sreduction target. The Kyoto Protocol commitsCanada, which is responsible for three percent of the world greenhouse gas release,to cut its emissions to six per cent below1990 levels by 2012.
In the United States, President Bushannounced a new climate change strategy,which sets a voluntary ‘greenhouse gasintensity’ target for the nation (US EPA 2003b).
Different approaches can be used to reduceemissions. One approach is to set an‘absolute’ target requiring that emissions bereduced by a specific amount; thegovernment’s strategy, instead, sets a target forGHG intensity: the ratio of GHG emissions toeconomic output expressed in gross domesticproduct (GDP). This strategy expands existingprogrammes and provides extra incentivesencouraging companies to voluntarily reportand reduce their GHG emissions. It alsoproposes increased federal funding for climatechange science and technology development.A recent report, US Technology and InnovationPolicies: Lessons for Climate Change, releasedin November 2003 by the Pew Center,examined US policy experiences – bothsuccesses and failures – and drew lessons forclimate change policy. The report cautions thattechnology policies, while important, can notby themselves achieve the GHG reductionsnecessary to mitigate climate change.
‘Technology policies are only one piece of thesolution, and will only work if coupled withother non-technology policies, such as a GHGcap-and-trade program.’ (Pew Center 2003).
A new strategic plan for the US ClimateChange Science Program (CCSP) wasannounced in response to the President’sdirective that climate change research activitiesbe accelerated to provide the best possiblescientific information to support publicdiscussion and decision-making on climate-related issues (US CCSP 2003). The plandescribes a strategy for developing knowledgeof variability and change in climate and relatedenvironmental and human systems, and forencouraging the application of this knowledge.
Box 1: Sustainability reporting gains momentum
Environment and sustainability reporting is gaining momentum in North America, and 2003 witnessedthe launch of two landmark products: the US Environmental Protection Agency’s (EPA) Draft report onthe environment and the Canadian National Round Table on the Environment and the Economy(NRTEE), Environment and sustainable development indicators for Canada report. Both are part oflong-term reporting initiatives aimed at strengthening the information base for environment andsustainable development policy-making.
In the US, the draft report, billed as the EPA’s ‘first-ever national picture of the US environment’, wasthe long-awaited first product of a federal-level Environmental Indicators Initiative. It drew considerableattention both because of the void it filled and due to the omission of climate issues. Related work (thehigh profile 2002 State of the Nation’s Ecosystems project) by The Heinz Center preceded this EPAeffort and contributed to raising awareness about the ‘environmental information gap’.
Environment and sustainable development indicators for Canada is the final report of the CanadianNRTEE’s Environment and Sustainable Development Indicators Initiative. This was a three-year‘multistakeholder program aimed at developing a small set of credible and understandable indicatorsto track whether Canada’s current economic activities threaten the way of life for future generations’.One of the recommendations of the report is that the System of National Accounts be expanded toinclude measures of natural, human and social capital.
Sources: Heinz Center 2002, NRTEE 2002, US EPA 2003a
Key Facts
● The consumption of chlorofluourocarbons (CFCs), whichdeplete the ozone layer, has been reduced to nearly zero inNorth America.
● Emissions that cause acid rain have been reduced withstrides made in controlling point source emissions of principal pollutants.
● Wetland loss in North America is slowing down and the landset aside for protected areas has increased by about 3.5 percent since 1990.
Both Canada and the United States:
● place a high priority on deepening the understanding of thelinkages between human health and environmental issues,whether it be air quality, the sound management of chemicalsor contamination of fresh water supplies;
● are at the forefront of research to address climate change.Canada has ratified the Kyoto Protocol and has launchedseveral programmes to help reduce greenhouse gasemissions. The US announced a new climate change strategyin 2003, which sets out a voluntary programme to reducegreenhouse gas intensity;
● with Mexico, have agreed to a North American strategy forbiodiversity conservation, under the auspices of theCommission for Environmental Cooperation; and
● consider scientific research a high priority and a foundationfor policy, and are actively seeking to improve environmentalindicators. Both promote pollutant release inventories, and theprovision of environmental information to the public.
Sources: CEC 2003, Environment Canada 2003a, Heinz Center 2002, NaturalResources Canada 2003, UNEP-WCMC 2003

GEO YEAR BOOK
Both countries also separately announcedinitiatives to develop and test hydrogen fuel-cell technologies and the systems needed toput them into widespread use. For example,the US government announced a hydrogenfuel initiative to reverse America’s growingdependence on foreign oil (White House2003a). The initiative is complemented by theInternational Partnership for the HydrogenEconomy, a partnership of 15 countries andthe European Union to promote thedevelopment and application of hydrogentechnology (US Department of Energy 2003).
In relation to air pollution, both countriesannounced in June a new Border Air QualityStrategy that will involve joint pilot projects toimprove air quality (Environment Canada2003b). One of the projects, the GeorgiaBasin/Puget Sound International AirshedStrategy, will identify measures to reduceemissions to the atmosphere and addresstransboundary pollution in northwesternWashington State and southwestern BritishColumbia (US EPA 2003b). Both governmentsalso agreed to build on the transboundary airquality improvements of the last decades bybeginning to develop new cooperativeprojects. Driven by domestic and internationalchallenges, both countries are taking a lead inthe development of new technologies to findsolutions to environmental problems.
In Canada, a prominent element of thegovernment’s strategy was to impose, throughits On-Road Vehicle and Engine EmissionRegulations, strict new emissions standardsfor on-road vehicles and engines (EnvironmentCanada 2003c). The regulations, which will beeffective for the 2004 model year, will alignCanadian emission standards for on-roadvehicles and engines with those of the USEPA. The US measures are recognized as themost stringent national standards in the world.
FOREST FIRES Both Canada and the US suffered a severe fireseason. In Canada, the 2003 fire season wasespecially harsh in the Province of BritishColumbia. For example, in August 2003, theprovincial government issued its mostrestrictive travel advisory ever after a wildfirenear the city of Kelowna grew fivefold in a day.The wildfire at Okanagan Mountain ProvincialPark, which started at a relatively manageablesize, grew over several weeks, eventuallycovering more than 250 km2 . Gusting winds,bone-dry forests and a lack of rain wereblamed for the fire’s growth. Two-kilometre-wide fire fronts burned through timber at ratesof up to 50 metres per minute. The Province ofBritish Columbia estimates that it spent morethan US$400 million fighting forest fires in2003 (Makarenko 2003).
In the US, in October 2003, fires ragingfrom just north of Los Angeles to the Mexicanborder became one of the worst naturaldisasters to strike California State in years,darkening the skies, and raining ash overmuch of the surrounding area (Figure 1).In all, the southern California fires killed20 people, burned almost 300 000 ha anddestroyed about 3 400 homes. They areconsidered the worst in the state’s modernhistory (Keating and Whitcomb 2003).
One of the major policy developments inthe US is a new forestry bill, approved by theUS Senate in 2003 (White House 2003b). Itwill give managers of the nation’s 155 nationalforests more leeway to approve logging andother commercial projects with less formalenvironmental review. The plan overhauls the1976 National Forest Management Act, easing
environmental rules and allowing more treethinning. California’s lawmakers, who considerthat thinning underbrush and small trees iscrucial to prevent devastating wildfires, havepraised the bill (Daly 2003).
BIODIVERSITYCanada and the US together with Mexicoadopted both national and regional measuresto strengthen conservation. In Canada, forexample, a new federal act to protectendangered species, the Species at Risk Act,became effective in 2003 following severalyears of intensive consultations. In addition,more than 450 km2 of the Canadian ForcesBase Suffield in Alberta was officiallydesignated in June 2003 as Canada’s 51stNational Wildlife Area. This designationrepresents a significant contribution to theGovernment of Canada’s goal of establishingprotected areas to preserve critical wildlifehabitats and protect species at risk.(Environment Canada 2003d).
In the US, The H. Heinz III Center forScience, Economics and the Environment,produced the first Annual Update 2003,a Web-only revision to the groundbreakingreport The State of the Nation’s Ecosystems,originally published in 2002 (Heinz Center2002). The report lays out a blueprint forperiodic reporting on the condition and use ofecosystems in the United States. Developedby experts from business, environmentalorganizations, universities, and federal, state,and local government agencies, it is designedto provide policymakers and the general publicwith a succinct and comprehensive – yetscientifically-sound and non-partisan – view ofprogress. The State of the Nation’sEcosystems identifies what should bemeasured, counted, and reported so thatdecision-makers and the public canunderstand the changes occurring in theAmerican landscape. The new data containedin Annual Update 2003 demonstrate acontinuation of existing trends; no majordeviations were reported (Heinz Center, 2004).
In keeping with a negotiated agreement toexpedite the protection of 29 species underthe Endangered Species Act, the US Fish and
A partnership of 15 countries and the European Union areworking together to promote the development and applicationof hydrogen fuel cell technologies and the systems needed toput them into widespread use.
Source: Still pictures

OVERVIEW: NORTH AMERICA
Wildlife Service (US FWS) acted in 2003 toprotect seven species in five states (WhiteHouse 2003c).
At the regional level, Canada, the US andMexico adopted in June 2003 a long-termstrategy for the conservation of critical speciesand habitats in North America (CEC 2003).The biodiversity strategy has been describedas a ‘landmark of cooperation’ that creates anopportunity for North America to serve as a‘global leader’ (CEC 2003) through thedevelopment of cooperative approaches toaddress biodiversity issues over which there isshared concern. The main goals of thestrategic plan are to:
● promote the conservation of regions ofecological significance, migratory birds andtransboundary species;
● facilitate data and information sharing onmonitoring and assessment, as well as bestpractices and priorities;
● promote collaborative responses to thethreats faced by ecosystems, habitats andspecies; and
● identify and evaluate trade and biodiversitylinkages.
Figure 1: In the top image taken on 26 October, 2003,vegetation is green, burned area is reddish, smoke isblue, and the blazing fire front is hot pink. In thebottom image taken on 18 November after fires hadsubsided, the burned areas are in darker red areasnorth of the urban development.
Source: Image courtesy NASA/GSFC/LaRC/JPL, MISR Team
CEC (2003). Top environment officials commit to biodiversity strategy.Commission for Environmental Cooperationhttp://www.cec.org/trio/stories/index.cfm?ed=11&ID=135&varlan=english
Daly, M. (2003). Bush plan to streamline forest rules nears completion.Environmental News Network http://www.enn.com/news/2003-09-10/s_8273.asp
Environment Canada (2003a). International Relations: Protocol to theVienna Convention on Substances that Deplete the Ozone Layer(Montreal Protocol). Ottawa, Environment Canadahttp://www.ec.gc.ca/international/multilat/ozone1_e.htm
Environment Canada (2003b). Canada and the United States LaunchAir Quality Projects Under the Border Air Quality Strategy. Green Lane.Ottawa, Environment Canadahttp://www.ec.gc.ca/press/2003/030623_n_e.htm
Environment Canada (2003c). Environment Minister AnnouncesTougher Emissions Standards for The New Generation of On-RoadVehicles and Engines. Ottawa, Environment Canadahttp://www.ec.gc.ca/Press/2003/030102_n_e.htm
Environment Canada (2003d). Acts Concerning Species at Risk.Ottawa, Environment Canadahttp://www.speciesatrisk.gc.ca/legislation/default_e.cfm
Heinz Center (2002). The State of the Nation’s Ecosystems. WashingtonDC, H. John Heinz III Center for Science, Economics, and the Environmenthttp://www.heinzctr.org/ecoystems
Heinz Center (2004). The State of the Nation’s Ecosystems: AnnualUpdate 2003. Washington DC, H. John Heinz III Center for Science,Economics, and the Environmenthttp://www.heinzctr.org/ecosystems/intro/updates.shtml
Keating, G. and Whitcomb, D. (2003). Winds subside in deadlySouthern California fires. Environmental News Networkhttp://www.enn.com/news/2003-10-28/s_9819.asp
Makarenko, J. (2003). British Columbia Forest Fires. Mapleleaf Webhttp://www.mapleleafweb.com/education/spotlight/issue_40/
Natural Resources Canada (2003). Backgrounder: Climate Changeand the Kyoto Protocol. Ottawa, Natural Resources Canadahttp://www.nrcan-rncan.gc.ca/media/newsreleases/1998/199898b_e. htm
NRTEE (2002). Environment and sustainable development indicatorsfor Canada. Ottawa, National Round Table on the Environment andthe Economy
Pew Center (2003). US Technology and Innovation Policies: Lessonsfor Climate Change. Pew Center on Global Climate Changehttp://www.pewclimate.org/global-warming-in depth/all_reports/technology_policy/index.cfm
UNEP-WCMC (2003). World Database on Protected Areas. Cambridge,United Nations Environment Programme World Conservation MonitoringCentre http://sea.unep-wcmc.org/wdbpa/
USCCSP (2003). Strategic Plan for the U.S. Climate Change ScienceProgram. Washington DC, United States Climate Change Science Programhttp://www.climatescience.gov/Library/stratplan2003/default.htm
US Department of Energy (2003). Fact Sheet: International Partnershipfor the Hydrogen Economy (IPHE). Washington DC, United StatesDepartment of Statehttp://www.state.gov/g/oes/rls/fs/2003/25983.htm
US EPA (2003a). Draft report on the environment. Washington DC,United States Environmental Protection Agencyhttp://www.epa.gov/indicators/roe
US EPA (2003b). Climate Change Strategic Plan Issued by FederalScience Panel. Washington DC, United States EnvironmentalProtection Agencyhttp://www.epa.gov/newsroom/headline_072403.htm
US EPA (2003c). Canada-US Border Air Quality Strategy BorderProjects. Clean Air Markets – Programs and Regulations. WashingtonDC, United States Environmental Protection Agencyhttp://www.epa.gov/airmarkets.usca.pilotproject.html
White House (2003a). Fact Sheet: Hydrogen Fuel: A Clean and SecureEnergy Future. Washington DC, The White Househttp://www.whitehouse.gov/news/releases/2003/20030206-2.html
White House (2003b). Healthy Forests Initiative. Washington DC, TheWhite House http://www.whitehouse.gov/ceq/healthy-forest.html
White House (2003c). Department of the Interior: The President’sProposal. Washington DC, The White Househttp://www.whitehouse.gov/news/usbudget/budget-fy2004/interior.html
References

West AsiaIn 2003, the war in Iraq and increased tension in the Israeli-Arab conflict were the major developments ofconcern in West Asia. Although the governments of the region, the public and the international communitywere concerned over the environmental consequences of armed conflict, policymakers gave politicaldevelopments and security issues highest priority
GEO YEAR BOOK
One of the main highlights related to freshwaterresources in 2003 were signs evident fromsatellite imagery of a reversal of recentdegradation trends in the Mesopotamianmarshlands in Iraq (Box 1). There were alsosome positive policy developments in the areaof air pollution (Box 2), institutional reforms,and public participation.
THE IMPACT OF WARThe most significant event in 2003 in thepolitical and environmental arena was the warin Iraq. Chronic problems, which accumulatedover the past two decades under the former
Iraqi government and the economic impact ofsanctions, were exacerbated by the war. Whilethe long-term environmental impacts of thewar are as yet unclear, the short-termproblems included water pollution (Box 3)and land degradation.
The destruction of military and industrialinfrastructure released heavy metals and otherhazardous substances into the air, soil andwater (UNEP 2003a). Fires at Rumeila oil wellsin southern Iraq and in oil trenches in andaround Baghdad, generated large quantities of
dense black smoke, containing toxicsubstances, with potential environmental andhuman health risks for local people (Figure 1).The oil trenches also cause soil pollution andpotentially threaten contamination of aquifersand drinking water supplies (UNEP 2003a).Fire at the Al-Mishraq sulphur plant, 30 kmsouth of Mosul in Northern Iraq, which lastedfor about a month between June–July 2003(UNEP 2003a), also contributed to air pollution.
A recent UNEP desk study on theenvironment in the Occupied Palestinian
Box 1: Mesopotamian marshlands 2003
The Mesopotamian marshlands, the largest wetlandecosystem in West Asia, now cover only seven percent of their original area due to mismanagementover the past three decades.
The marshlands, which are reputed to be the site ofthe Garden of Eden, are an important sanctuary formigratory birds, sustain freshwater fisheries and arean essential nutrient source for fisheries in the SeaArea of the Regional Organization for the Protectionof the Marine Environment (ROPME).
In the early 1970s, the marshlands covered morethan 20 000 km2 but by 2000, over 90 per cent haddried out, largely transformed into a vast and barrenlandscape of desert and salt flats. A third of theremaining 1 084 km2 of marshland, thetransboundary Al-Hawizeh/Al-Azim marsh, whichstraddles the Iran-Iraq border, dried out between2000 and early 2003.
However, signs of an environmental turnaround inthe marshlands started to emerge almostimmediately after the end of the war in May 2003, as the arid land was re-flooded for the first time ina decade. Satellite images taken in May 2003 show these changes. Formerly dry areas have beeninundated as floodgates were opened, embankments and dykes breached, and dams emptiedupstream, assisted by the heavy rainfall.
Sustained and coordinated efforts will be needed if the marshes are to recover.
Sources: UNEP 2003c, UNEP/GRID-Geneva 2003
Key Facts
● The total population of West Asia has increased from about 34.8 million in 1970 to 106.4 million people in 2002, and isprojected to increase to about 130 million in 2010.
● Rapid population growth has induced growth and expansionof urban centres. For example, in the Gulf CooperationCouncil (GCC) countries, the average percentage of the urbanpopulation increased from 66 per cent in 1980 to 87 per centin 2000, and is projected to be 89 per cent by 2005.
● About 60 per cent of surface water resources in West Asiaoriginate from outside the region, which causes tensionregarding their use.
● Six GCC countries – Bahrain, Kuwait, Qatar, Oman, SaudiArabia and United Arab Emirates – produce about half theworld’s desalinated water.
● Agriculture remains the largest water user in West Asia (91 percent of the total water used) compared to 6 per cent and 3 percent for domestic and industrial uses respectively.
● Forest wildfires are a recurring phenomenon in the EasternMediterranean forest vegetation, with 90 per cent caused byhuman activity. In 2003, they occurred in Lebanon, Syria andSaudi Arabia.
● Since 1991, Iraq’s rank on the United Nations HumanDevelopment Index has fallen from 96 to 127. No othercountry has fallen so far, so fast. Over 60 per cent of thepopulation – 16 million people – depended for survival on acomprehensive government food rationing system.
Sources: Alyaum 2003, CESR 2003, FAO 2003, Roufail 2003, UNEP 2003a,UNEP 2003b, UNPD 2002
This image shows the main areas that were re-flooded following the spring snowmelt andremoval of drainage and hydraulic structures bylocal communities in May 2003. Flood swollenrivers, canals, and re-inundated enclavesappear as dark blue patches.
Source: UNEP/GRID-Geneva 2003

OVERVIEW: WEST ASIA
Territories identifies serious environmentalproblems, including sewage pollution, waste ofwater resources and problems with solid wastehandling as a result of the escalating Israeli-Arab conflict (UNEP 2003d). The study furtherstates that the relative scarcity of water in theTerritories is a major constraint to economicdevelopment. The quality of water is rapidlydeteriorating, mainly from agricultural practices,localized industrial activities, and inadequate orimproper disposal of wastewater and solidwaste. Over-pumping has resulted in seawaterintrusion of groundwater, especially in Gaza. Italso reports that the separation wall would notonly separate people from their agricultural landand water wells, but would have environmentalimpacts, for example, fragmenting ecosystemsand disconnecting natural ecological corridors.
SANDSTORMS, FLOODS,HEATWAVES, FOREST FIRE:SIGNS OF ENVIRONMENTALCHANGE?The increased incidence in 2003 of immensedust and sandstorms, as well as floods,heatwaves and forest fires in West Asia mayindicate long-term environmental change.Countries are, however, taking measures toimprove coping capacity in terms of naturaldisasters.
Seven years of severe droughts in WestAsia came to an end in 2002–2003 withrecord rainfall. Heavy rain flooded rivers, wadisand agricultural areas in Jordan, Lebanon,Oman, Syria and Saudi Arabia. There wereother extreme weather related events:
● The heaviest snowstorm since 1950 sweptacross the Eastern Mediterranean on25 February, cutting power and closinghighways and schools in Lebanon, Jordanand Syria (NOAA 2003a, BBC Weather 2003);
● In Oman, thunderstorms on 14 Aprilproduced torrential rains and flash floodingin the northern part of the country, leaving14 dead, and causing extensive damage toproperty (Gulf News 2003);
● In Nizwa, southwest of the capital city ofMuscat, 66 mm of rain fell in one day,
which is more than double the normalrainfall received in the entire month of April(NOAA 2003b);
● In the Makka area in western Saudi Arabia,flooding from the heaviest rain in 25 yearscaused 12 fatalities and 50 injuries (Al-watan 2003); and
● Similar intense floods occurred across thekingdom during December, disruptingpower supplies and telephone services;
Box 2: Energy and transport –the development of a regionalstrategy
Per capita energy consumption in some WestAsian countries is among the highest in theworld, generating high emissions ofgreenhouse gases and traditional air pollutants.Countries are now developing a regionalstrategy to improve energy efficiency.
The strategy is being developed within theframework of the Water, Energy, Health,Agriculture, and Biodiversity (WEHAB) initiative,which advocates energy efficiency andalternative fuels, as well as cleaner fuels andtechnologies. These were reflected in the AbuDhabi Declaration on Environment and Energy,issued jointly by the Arab Ministers of Energy,Oil and Environment during the Environmentand Energy 2003 Conference and Exhibitionconvened in Abu Dhabi, United Arab Emiratesin February.
Policy approaches in the region have focusedmainly on switching to less polluting fuel types,such as unleaded motor vehicle fuel and naturalgas. All the GCC countries and some other ArabStates phased out leaded petrol in 2003. Amongother initiatives, Lebanon, for example, hasbanned all old diesel vehicles from enteringmajor urban areas, and legislated theirreplacement with newer petrol-powered engines.Efforts are also being made to introduce moresustainable fuels for power generation.
Sources: ERWDA 2003, UNDP 2003, UNEP 2003a
Box 3: Impact of conflict on freshwatersystems
Physical damage to Iraq’s water and sanitationinfrastructure has led to higher levels of pollution andhealth risks, worsening an already critical wastemanagement situation, particularly in urban areas. Therewere reports of water logging and salinization as a resultof regular power blackouts, which seriously affected thepumping out of saline water from irrigated lands in thesouthern floodplains.
In addition, the collapse of sewage treatment systemsdue to frequent power cuts has resulted in largeamounts of sewage, mixed with industrial waste,entering directly into water bodies such as the TigrisRiver, Baghdad’s only water source.
The indirect impacts on water quality and quantity occuras a result of conflict-related institutional challenges.Chronic uncoordinated and fragmented management ofwater resources and infrastructure has contributed towater quality and quantity degradation.
Source: UNEP 2003a
Figure 1: Satellite images of smoke from oil trench fires over Baghdad during the Iraq War, 2 April, 2003.
Source: USGS EROS Data Center/UNEP/GRID-Sioux Falls
Streets of Alriyadh city, central Saudi Arabia, after flash floodson December 3, 2003.
Source: Alriyadh Daily Newspaper

GEO YEAR BOOK
destroying farms, greenhouses, andbuildings; and killing a large number ofdomestic animals (Civil Defense 2003).
Overall, the rains in West Asia were far moresevere than had been anticipated, and theregion was ill-prepared to deal with theimpacts. Human lives were lost, and fishfarms, large areas of agricultural land, andirrigation networks were destroyed.
Severe dust and sandstorms were frequentin 2003, affecting large areas (Figure 2) andincreasing the risk of respiratory, eye and skindiseases.
West Asia was no exception to theheatwave which affected many other parts ofthe world during the year, the third hottest yearin more than 150 years (WMO 2003). Althoughhigh temperatures are common, heatwaves ofup to five degrees Celsius higher than normalswept across the region (NOAA 2003b). Eventhe GCC countries, usually well-prepared forthe heat, had problems with power systems,and cases of heat-related illnesses and deathswere reported around the region.
Forest fires were also associated withweather patterns in West Asia. Lightningignited forest fires in Saudi Arabia, along theSyrian-Turkish borders, and also in Syria(NASA 2003). In August, fires broke out inmany parts of Lebanon, during a heatwave,destroying pine forests in the Shweifat area
near the capital, and pines and other trees inthe north (Alyaum 2003).
COASTAL DEGRADATIONDredging and land reclamation in coastal andmarine areas in West Asia intensified duringthe year, particularly in GCC countries. Theseactivities were due to development ofrecreational facilities to meet growing tourism,urbanization and population increasecharacterized by migration to coastal areas.An emerging trend of large-scale landreclamation to boost economic growth is nowevident in some parts of the region. This rapidrate of development in coastal areas,especially in the Gulf region, was the moststriking development in West Asia other than
war. However, concerns have been expressedthat some of these developments may putpressure on the environment as well asexisting infrastructure. Major environmentaleffects of dredging and in-filling include directloss of often highly productive shallow-waterhabitat; and sedimentation, leading todegradation particularly of coral reefs,seagrass, and macroalgal beds.
CHALLENGES FOR THE FUTUREEnvironmental issues linked with conflict andsecurity were of major concern. Short-termimpacts such as water and air pollution andland degradation are obvious and requireimmediate action.
Figure 2: Satellite images of sandstorms in West Asia in 2003. Images were taken over Iraq (April 16)and Saudi Arabia (March 27).
Source: MODIS Rapid Response Project at NASA/GSFC
Al-watan (2003). 12 dead in Flash Flood in Mekka. Al-watanhttp://www.al-watan.com/data/20031111/index.asp?content= current#8
Alyaum (2003). Wild Fires Devastated Pine Forests in NorthernLebanon. Alyaumhttp://www.alyaum.com/home/search.php?Status=Confirm
BBC Weather (2003). Weather News 25/02/2003. London, BritishBroadcasting Corporationhttp://www.bbc.co.uk/weather/uk/news/25022003news.shtml
CESR (2003). The Human Costs of War in Iraq. Center for Economic& Social Rights. New York, Center for Economic and Social Rightshttp://wwww.reliefweb.int/w/rwb.nsf/s/3A534DE395513486C1256CE20036BA7E
Civil Defense (2003). Saudi Arabia. http://www.998.gov.sa/home.asp
ERWDA (2003). Proceedings of Environment and Energy Exhibitionand Conference: A framework for sustainable development, 2–5February 2003. Abu Dhabi, Environmental Research and WildlifeDevelopment Agency
FAO (2003). Irrigation and water use per country in the year 2000.FAO AQUASTAT 2003. Rome, Food and Agriculture OrganizationLand and Water Development Divisionhttp://www.fao.org/ag/agl/aglw/aquastat/main/index.stm
Gulf News (2003). 14 dead in Oman rains. Gulf News, Dubaihttp://www.gulfnews.com/Articles/news.asp?ArticleID=84441
NASA (2003). Fires in Turkey’s Adana Region. National Aeronauticsand Space Administration Earth Observatoryhttp://earthobservatory.nasa.gov/NaturalHazards/natural_hazards_v2.php3?img_id=10724
NOAA (2003a). Global Hazards and Significant Events, February 2003.Hazards/Climate Extremes. National Environmental Satellite, Data andInformation Service, National Oceanic and Atmospheric Administrationhttp://www.ncdc.noaa.gov/oa/climate/research/2003/feb/hazards.html
NOAA (2003b). Global Hazards and Significant Events, April 2003.Hazards/ Climate Extremes. National Environmental Satellite, Data andInformation Service, National Oceanic and Atmospheric Administrationhttp://lwf.ncdc.noaa.gov/oa/climate/research/2003/apr/hazards.html#Flooding
Roufail, N. (2003). Report on Progress on Water. Commission onSustainable Development, CSD12. New York, United Nations Divisionfor Sustainable Development
UNDP (2003). Arab Human Development Report 2003: Building aKnowledge Society. New York, Regional Bureau for Arab States(RBAS), United Nations Development Programmehttp://www.un.org/Pubs/whatsnew/e02175.htm
UNEP (2003a). Desk Study on the Environment in Iraq. Geneva, UnitedNations Environment Programme Post-Conflict Assessment Unit
UNEP (2003b). State of the Environment in the Arab World: AProgress Report. 15th Session of the Council of Arab MinistersResponsible for the Environment Cairo, Egypt, 7–8 December 2003.United Nations Environment Programme
UNEP (2003c). Environment in Iraq: UNEP Progress Report. Geneva,United Nations Environment Programme Post-Conflict Assessment Unit
UNEP (2003d). Desk Study on the Environment in the OccupiedPalestinian Territories. Geneva, United Nations EnvironmentProgramme Post-Conflict Assessment Unit
UNEP/GRID Geneva (2003). Water Returns to the DesiccatedMesopotamian Marshlands. Geneva, United Nations EnvironmentProgramme GRID Genevahttp://www.grid.unep.ch/activities/sustainable/tigris/marshlands/index.php
UNPD (2002). World Population Prospects. New York, United Nationshttp://www.un.org/esa/population/publications/wpp2002/wpp2002annextables.pdf
WMO (2003). WMO Statement on the Status of the Global Climate in2003: Global Temperature in 2003 Third Warmest. Geneva, WorldMeteorological Organizationhttp://www.wmo.ch/web/Press/Press702_en.doc
References
16 April 2003
300 km
27 March 2003
300 km

OVERVIEW: POLAR
PolarAtmospheric emissions, environmental pollution, and the impacts of activities associated with the exploitationof natural resources had negative impacts on the Polar Regions
Evidence continued to emerge in 2003 thataverage temperatures in the Arctic were risingeven more rapidly than the global average.Satellite data indicated that the rate of thesurface temperature increase over the last20 years was eight times the global averageover the last 100 years (Comiso 2003).
POLAR SEA ICE EXTENT Studies reported that the Arctic sea ice extenthad shrunk by 7.4 per cent over the past25 years, with record-low coverage inSeptember 2002 (Johannessen and others2003). An analysis of 30 years of satellite datasuggests that the loss of Arctic sea ice is alsoaccelerating (Cavalieri and others 2003).
There are projections that much of the seaice, until now thought to be permanent, willmelt during the summer by the end of thiscentury if the current trend in global warming
continues. This will have major direct impactson indigenous people and Arctic marinewildlife such as polar bears and seals, and willalso open the region to increaseddevelopment pressure as access by sea tovaluable natural resources becomes easier(Figure 1). The global impacts may also besignificant as absorption of solar radiationincreases, and could lead to changes in theworld ocean circulation (UCL 2003, NASA2003, Laxon and others 2003).
In the Antarctic, satellite data indicate that theoverall extent of sea ice has gradually increasedsince 1977, following a significant decrease inthe early part of the 1970s (Cavalieri and others2003). This reversal demonstrates a greatervariability in the trend for Antarctic sea ice extentin comparison to a more consistent trend ofdecline in the Arctic. However, on the Antarcticpeninsula, and in the Amundsen Sea sector ofwest Antarctica, several ice shelves that werethousands of years old have disintegrated withinthe last few decades – a sign of rapid change inthe region (Shepard and others 2003).
Argentine scientists have documented surgesin tributary glaciers following these break-ups(de Angelia and Skvarca 2003). Their study –with new results from theoretical models –suggests that ice shelves may play an importantrole in the stability of some inland ice streams,and their loss could result in the acceleratedcollapse of glaciers. Particular attention is beingpaid to the behaviour of critical ice flows in theWest Antarctic ice sheet, which could raiseglobal sea level by five metres, were it tocollapse completely (Casassa 2003).
Key Facts
● Inuit populations in Greenland and Canada were found tohave one of the highest environmental exposures in the worldto some persistent organic pollutants and mercury.
● An analysis of satellite data indicated that Arctic sea ice hasretreated by 900 000 km2 – an area the size of Nigeria – overthe last 30 years.
● The stratospheric ozone hole over Antarctica peaked in sizeat 28 million km2 in mid-September 2003, the second largestvalue on record.
Sources: AMAP 2003a, BAS 2003a and 2003b, Cavalieri and others 2003
Box 1: Ward Hunt Ice-shelf
The Arctic’s largest ice-shelf is breaking up. TheWard Hunt Ice-shelf is a remnant of the compactedsnow and ancient sea ice that extended along thenorthern shores of Ellesmere Island in NorthernCanada until the early 20th century. Risingtemperatures have reduced the original shelf into anumber of smaller shelves, the largest of which wasthe Ward Hunt Ice-shelf on the northwest fringe ofthe island. Between 2000–2002, the Ward Hunt Ice-shelf began to crack and eventually broke in two.This Standard Beam Mode RADARSAT-1 image,which was acquired September 27, 2003, clearlyshows a large crack dividing the ice-shelf in half.The crack runs from the Arctic Sea to the right ofWard Hunt Island and the bright white ice groundedthere and back to the rougher, mountainous region.
Source: Earth Observatory 2003
Ward Hunt IslandWard Hunt ice-shelf grounded ice
fracture
Break-up of the Ward Hunt Ice-shelf.
Source: NASA and Earth Observatory
Median ice extentat end of summer
1972–1990
Projected extentin 2030
North-west passage
Northernsea route
Russia
Canada
Alaska
Greenland
Source: New Scientist 2002
Figure 1: Projection of Arctic sea ice extentby 2030 and possible ice-free transpolarshipping routes

GEO YEAR BOOK
The break-up of the Ward Hunt sea ice-shelf in northern Canada (Box 1), the Arctic’slargest, was also reported in 2003 (Muellerand others 2003). The Ward Hunt has existedfor some 3 000 years. When it was mappedby explorers in the 1870s it was 1 000 kmlong and 60 km wide. By the late 1990s, itsdimensions had decreased to some 70 kmby 20 km, and now it’s disintegration isalmost complete.
This sequence may be attributed tonatural climate variability. However, just asthe recent collapse of ice shelves in westAntarctica has been interpreted as evidenceof accelerated climate change in that region,the break-up of the Ward Hunt may suggestthe same in the high Arctic (Mueller andothers 2003).
ENVIRONMENTAL POLLUTION The Polar Regions are particularly exposed tothe effects of pollutants emitted in other partsof the globe (Box 2). Though most sources ofpollutants are located far from the PolarRegions, some human-made chemicals canbe transported over long distances byprevalent winds, ocean currents and othermechanisms such as grasshopping ofPersistent Organic Pollutants (POPs) (Waniaand Mackay 1996) and have an impact on
the polar environment through a variety ofbiological and chemical mechanisms.
The resident population of the Arctic bearsthe effects of environmental pollution.Indigenous people are particularly exposed toheavy metal and persistent organiccontaminants through their traditional dietsbased on marine mammals. In some areas ofEast Greenland, up to 100 per cent of thepopulation was found to have levels of bloodcontamination higher than a ‘level of concern’,and 30 per cent were over the level of action
at which people were advised to reduce theirintake of traditional food (Figure 2) (AMAP2003a). Indigenous peoples’ organizations areundertaking a number of monitoringprogrammes to assess the risks and benefitsassociated with traditional diets and to designcommunity-level strategies to cope with thesituation (Crump 2003).
Implementation of the 1979 GenevaConvention on Long Range Transboundary Air
>5.8 ug/L based on USEPA 1999 re-evaluation of mercury; BMDL-derived >20 µg/L based on Health Canada Guideline
0
100
Source: AMAP 2003a
%
Figure 2: Percentage of blood samples taken from indigenous and non-indigenous women of reproductiveage that had mercury levels exceeding US EPA and Health Canada guidelines
70
60
20
10
Alaska
30
40
50
80
90
Canada Greenland Faroe
Is.
Finlan
d
Siberian Russia
Bethel
Yup’i
k
Barrow
2001
Iñupia
t
NWT Cauca
sian
NWT Dene/M
étis
NWT Other
Baffin
Inuit
Kitikm
eot In
uit
Kivall
iqInu
it
Nunav
ikInu
it
Ilullis
sat In
uit
Nuuk Inu
it
Ittoqq
ortoo
rmiit
Pregn
ant In
uit w
omen
Ittoqq
ortoo
rmiit
Non-pr
egna
nt Inu
it wom
enLa
pland
Norilsk
Non-in
digen
ous
Salek
hard
Non-in
digen
ous
Dudink
a Non-in
digen
ous
Taym
ir Indige
nous
Yamal
Indige
nous
Inuuv
ikInu
it
Figure 3: The 2003 ozone hole over Antarcticadark blue denoting high levels of ozone depletionwas very large, close to the all-time record.
Source: NASA 2003
Sep 24 2003
Box 2: International conventions addressing Arctic contaminants
Most of the critical contaminants impacting the Arctic environment and the health of its inhabitantscome from distant sources. The solution to these problems, therefore, lies in regional and global effortsto reduce worldwide emissions of persistent organic pollutants (POPs) and heavy metal pollutants.
2003 marked the entry into force of two important regional protocols under the Convention on LongRange Transboundary Air Pollution (LRTAP) set up under the United Nations Economic Commissionfor Europe (UNECE).
The Protocol on Persistent Organic Pollutants (POPs), entered into force on 23 October 2003. It bansor severely restricts the use of 16 substances, including 11 pesticides, two industrial chemicals andthree industrial by-products/contaminants.
The LRTAP protocol on heavy metals entered into force on 29 December 2003, and targets cadmium,lead and mercury. Parties are required, by 2012, to reduce their emissions for these three metals belowtheir level in 1990 (or an alternative year between 1985–1995). It will target industrial sources (metalsindustry), combustion processes (power generated and road transport) and waste incineration.
Sources: AMAP 2003b, UNECE 2003

OVERVIEW: POLAR
Pollution (Box 2) and the StockholmConvention on Persistent Organic Pollutantsis important for reducing the burden ofcontamination on the Arctic and its inhabitants.
STRATOSPHERIC OZONEDEPLETION IN ANTARCTICA Over the past few years, the ozone hole overAntarctica has varied considerably in size andseverity. In 2002, both its size and the time itstayed in position were less than usual (Angelland others 2002). In 2003, however, the ozonehole developed comparatively early and inSeptember was one of the biggest on record.The resulting depletion covered the entireAntarctic area by mid-September (BAS 2003a)(Figure 3). Some scientists believe that it willtake a decade or more before it will be clearwhether the ozone layer is recovering –assuming that the global phase-out of ozone-depleting chemicals continues successfully(BAS 2003b).
EXPLOITATION OF NATURALRESOURCESExploitation of mineral resources is animportant driver of change in many areas ofthe Arctic, including northern Canada, Alaska,Norway and Russia. There has been
increasing interest in exploiting hydrocarbonresources in the Arctic, motivated by higheroil prices, and a geopolitical trend towardsdiversification in sources of oil supply.Development pressure is also increasing, withthe building of new roads, oil and gasinfrastructure, holiday cabins, and new militarytraining grounds, all contributing to thefragmentation of wilderness areas (Nellemannand Vistnes 2002, Nellemann and others2002). Environmental impacts can be directand obvious in the event of oil spills, orindirect, such as pipelines, roads and powertransmission lines, which, with spreadinghuman settlements, fragment natural habitats.
In the latest release of the United NationsList of Protected Areas a significant increase inthe protected areas of key Arctic biomes wasreported (Chape and others 2003). Inparticular, the proportion of tundra listed asprotected has increased from 8.4 per cent in1997 to 11.8 per cent in 2003. Significant newprotected areas were also declared inSvalbard and northern Canada during the year.
However, the protected areas aredistributed unevenly across Arctic countriesand biogeographic zones, and levels andeffectiveness of protection vary. The size ofsome areas is not enough to sustain
biodiversity or the traditional lifestyles ofindigenous peoples.
In the Antarctic the management regime hasevolved quite differently, and implicitly builds oninternational coordination through the AntarcticTreaty System. The main, and substantial,challenges presented from exploitation ofnatural resources come from the fishing fleetoperating in the Southern Ocean, and the threatto the marine ecosystems from illegal,unregulated and unreported activities.
CHALLENGES FOR THE FUTUREThe events and information brought forward in2003 suggest:
● significant and accelerating climate changeimpact on the polar environment;
● significant and concerning impacts ofpollutants from distant sources on humanhealth and polar fauna; and
● a potential for long-term damage to thepolar environment through unsustainabledevelopment.
However, there was also evidence of anincreasing international political will to addressenvironment and sustainable developmentissues in the polar areas.
AMAP (2003a). AMAP Assessment 2002: Human Health in the Arctic.Oslo, Arctic Monitoring and Assessment Programme
AMAP (2003b). Arctic Pollution 2002. Oslo. Arctic Monitoring andAssessment Programme
Angell, J.K., Flynn, L.E., Gelman, M.E., Hofmann, D., Long, C.S.,Miller, A.J., Nagatani, R.M., Oltmans, S., and Zhou, S. (2002).Southern Hemisphere Winter Summary. Maryland, National Oceanicand Atmospheric Administration, National Weather Service ClimatePrediction Centerhttp://www.cpc.noaa.gov.products/stratosphere/winter_bulletins/sh_02/index.html
BAS (2003a). British Antarctic Survey Ozone: Halley, Rothera, andVernadsky/ Faraday. Ozone Bulletin 2003. Cambridge, BritishAntarctic Survey www.antarctica.ac.uk/met/jds/ozone
BAS (2003b). BA Festival of Science: The Ozone Hole. Press Release.Cambridge, British Antarctic Surveyhttp://www.antarctica.ac.uk/News_and_Information/Press_Releases/story.php?id=79
Casassa, G. (2003). New Concerns on the stability of the WestAntarctic Ice Sheet. Polar Environment Times, 3. Arendal, UnitedNations Environment Programme GRID-Arendal
Cavalieri, D.J., Parkinson, C.L. and Vinnikov, K.Y. (2003). 30-Yearsatellite record reveals contrasting Arctic and Antarctic decadal seaice variability. Geophysical Research Letters, 30, 10
Chape, S., Blyth, S., Fish, L., Fox, P., and Spalding, M. (compilers)(2003). 2003 United Nations List of Protected Areas. Gland,Switzerland, World Conservation Union and Cambridge, UK, UnitedNations Environment Programme World Conservation Monitoring Centre
Comiso, J.C. (2003). Warming Trends in the Arctic from Clear SkySatellite Observations. Journal of Climate, 16, 21, 3498–3510
Crump, J. (2003). Why the Arctic Matters. Polar Environment Times,3. Arendal, United Nations Environment Programme GRID-Arendal
de Angelis, H., and Skvarca, P. (2003). Glacier surge after ice-shelfcollapse. Science, 299, 1560–1562
Earth Observatory (2003). Natural Hazards – Ward Hunt Ice Shelf.National Aeronautics and Space Administration Earth Observatoryhtttp://earthobservatory.nasa.gov/NaturalHazards/natural_hazards_v2.php3?img_id=11793
Johannessen, O.M., Bengtsson, L., Miles, M., Kuzmina, S.I., Semenov, V.,Alekseev, G.V., Nagurny, A.P., Zakharov, V.F., Bobylev, L.P., Pettersson,L.H., Hasselmann, K., and Cattle, H.P. (2003). Arctic Climate Change –Observed and Modelled Temperature and Sea Ice. Technical ReportNo.218. Bergen, Nansen Environmental and Remote Sensing Centre http://www.nersc.no/AICSEX/rep218.pdf
Laxon, S., Peacock, N., and Smith, D. (2003). High interannualvariability of sea ice thickness in the Arctic region. Nature, 425, 947–950
Mueller, D.R., Vincent, W.F., and Jeffries, M.O. (2003). Break-up of thelargest Arctic ice shelf and associated loss of an epishelf lake.Geophysical Research Letters, 30, 20, 2031
NASA (2003). Dwindling Arctic Ice. National Aeronautics and SpaceAdministration Earth Observatoryhttp://earthobservatory.nasa.gov/Study/ArcticIce/arctic_ice4.html
Nellemann, C. and Vistnes, I. (2002). Hálkavárre – Porsangmoenbombing and firing range. NINA Technical Report Series, 750, 1-32
Nellemann, C., Vistnes, I., Ahlenius, H., Kullerud, L, Lieng, E., Olsen, T.and Johansen, B. (2002). Snøhvit and Saami reindeer husbandry outlook,impacts and mitigation. NINA Technical Report Series, 765, 1-28
New Scientist (2002). Arctic melting will open up new sea passages. http://www.newscientist.com/news/news.jsp?id=ns99991978
Shepard, A., Wingham, D., Payne, T., and Skvarca, P. (2003). LarsenIce Shelf has progressively thinned. Science, 302, 856-859
UCL (2003). Polar bears’ habitat threatened by thinning of Arctic seaice. Press Release. London, University College Londonhttp://www.ucl.ac.uk/media/archive/archive-release/?arctic
UNECE (2003). Convention on Long-range Transboundary Air Pollution.Protocols to the Convention. Geneva, United Nations EconomicCommission for Europe Environment and Human Settlements Divisionhttp://www.unece.org/env/lrtap/status/lrtap_s.htm
Wania, F. and Mackay, D. (1996). Tracking the distribution of persistentorganic pollutants. Environmental Science and Technology, 390A-6A
References

Small Island Developing StatesSmall Island Developing States (SIDS) face economic, social and environmental vulnerability due to factorssuch as their size, geography, fragile ecosystems and dependence on imports of essential commodities
GEO YEAR BOOK
Some well known challenges are certainto dominate debate during the 10-yearreview of the Barbados Programme of Actionfor the Sustainable Development of SmallIsland Developing States (BPoA + 10)scheduled for Mauritius from 30 August–3 September, 2004.
SIDS are heavily dependent on a naturalenvironment exposed to impacts from internaland external forces, including fluctuatingcommodity prices and trade regulations, andclimate change. This situation is exacerbated bythe relatively low Human Development Index ofmany of these countries (UNDP 2003) (Table 1).
GROWING VULNERABILITY OFCOUNTRIESThe SIDS have been facing problems suchas narrow resource bases, vulnerability tonatural hazards, high external debt, difficultiesin conforming to sanitary and phytosanitaryregulations, overexploitation of forest andmarine resources, high population growthand mobility, relative poverty, skilled humanresource scarcity and weak institutionalcapacities (SIDSNet 2003a). The Food andAgriculture Organization (FAO 2003a) reportedthat the SIDS are increasingly dependent onfood imports while the rates of nutrition-relatedhealth problems are growing.
Climate change, including sea level riseand vulnerability to natural disasters such ashurricanes, is a major concern (Box 1). It hasbeen projected that sea levels will increaseby half a metre by 2100, severely threateningislands and low-lying coastal states and thevery existence of some SIDS. If the sea levelrises in the Maldives, for example, a largeproportion of the landmass could disappearover the next 30 years, and be completelysubmerged by 2100 (IPCC 2001). Climatechange and sea level rise are also expectedto have adverse impacts on other naturalresources of SIDS, such as land, freshwater,forests, and coastal and marine areas(IPCC 2001).
Global warming is also likely to lead to anincrease in maximum tropical cyclone windspeeds and lower central pressures, leadingto more damaging storm surges.
The Pacific, Caribbean, and the AIMS (theAtlantic, Indian Ocean, Mediterranean and
the South China Seas) regions of SIDSreported in 2003 on their growingvulnerability. Meeting in August 2003, thePacific SIDS noted that the vulnerability ofSIDS has not only increased over the lastdecade but their resilience has notimproved (SIDSNet 2003c).
SIDS have been trying to respond tothese challenges by implementing variousmeasures. Governments in the AIMS regionreported in 2003 that they have beendeveloping climate change action plansand identifying their most vulnerable sites,with some countries implementing adaptationmeasures. All countries in the region havesubmitted their initial nationalcommunications to the UNFCCC (SIDSNet2003d). A meeting of the AIMS countries inCape Verde in September 2003 noted theincreasing risk of the adverse effects ofclimate change, highlighting the urgency forthe international community to ratify and fully
Box 1: Forum highlights climate change concerns
At the 34th Pacific Islands Forum meeting in Auckland in August 2003, the SIDS countries adopted a
communique, which highlighted among several concerns, those of climate change, climate variability
and sea level rise.
The communique stressed the need for:
● urgent action to reduce greenhouse gas (GHG) emissions and for further commitments in the future
by all major emitters;
● all countries to commit to a global effort to reduce GHG emissions and the adverse impacts of
climate change, taking into account the special circumstances of SIDS;
● Forum members to advocate internationally for immediate reductions and limits to GHG emissions
at levels that will prevent dangerous interference and for the Council of Regional Organizations in
the Pacific to continue to provide support at the UN Framework Convention on Climate Change
(UNFCCC) related meetings;
● a range of adoption options, particularly for extreme weather and climate events, that are
maintained and well funded, including through the Global Environment Facility; and
● being proactive and developing appropriate, affordable, and cost-effective adaptation response
measures immediately with support from relevant regional and national institutions.
Source: SIDSNet 2003b
Table 1: Human Development Index rank for selected SIDS
High ranking Medium ranking Low ranking
Bahamas, Bahrain, Antigua and Barbuda, Haiti,Barbados, Cuba, Cape Verde, Comoros MadagascarSeychelles, St. Kitts Dominica, Dominican Republicand Nevis, Trinidad Fiji, Grenada, Jamaica, Maldives,and Tobago Mauritius, Papua New Guinea,
São Tomé and Principe, SolomonIslands, St. Lucia, St. Vincentand the Grenadines, Vanuatu,Western Samoa
Source: UNDP 2003

OVERVIEW: SMALL ISLAND DEVELOPING STATES
implement the Kyoto Protocol. They alsorecognized the need to identify and developpolicies that build SIDS’ resilience, redressingvulnerability comprehensively. This includesthe need to diversify economies and addresssecurity concerns. (SIDSNet 2003d).
Some AIMS countries have establishednational early warning systems and disastermitigation plans, including national andregional oil spill contingency plans. However,national capacity is unlikely to cope with thegrowing frequency of extreme weather events,and the costs associated with rehabilitation.The meeting, therefore, called for furtherinternational assistance to develop capacity fornational disaster mitigation preparedness andcreate appropriate insurance and re-insuranceschemes for SIDS (SIDSNet 2003d).
The Caribbean SIDS consider that, to buildresilience, there is a need:
● for assistance from the internationalcommunity to develop climate changemodels at scales appropriate to SIDS tobetter plan for adaptation to climatechange;
● to mainstream adaptation to climate changeinto various sectors, particularly agriculture,fisheries, health and water resourcesmanagement;
● to incorporate climate change adaptationconcerns in national sustainabledevelopment plans; and
● to improve public education and awarenessof climate change issues in the region(UNDESA 2003).
Concern over the vulnerability of theenvironment in SIDS has also led to thedevelopment of the Environment VulnerabilityIndex (EVI), which reflects a country’senvironmental vulnerability to damage anddegradation. Development of the EVI is beingundertaken by the South Pacific AppliedGeoscience Commission (SOPAC), andpreliminary results were released in 2003 (Kalyand others 2003). The results confirmed thatSIDS are among the most vulnerable countriesin the world.
BIODIVERSITYMany small islands are characterized by ahigh level of endemism. For example,Madagascar has the highest number ofendemic species of any country in Africa, andranks sixth in the world. Up to 8 000 of the 9500 species of higher plants and over 50 percent of all vertebrate species found on theisland are known or thought to be endemic.In Mauritius, around 50 per cent of all higherplants, mammals, birds, reptiles andamphibians are endemic, and the Seychelleshas the highest level of amphibian endemismof any island country in the world (UNEP2002). Over 1 200 species of reef fish, 250species of haematitic corals and 285 speciesof algae have been identified in the Maldives.In addition, five sub-species of seabirds havebeen identified as endemic to the Maldives(UNEP RRC-AP 2003). Despite such richnessin biodiversity, many species in SIDS alreadyface extinction (Table 2). Virtually all the SIDShave species threatened with extinction andthese total about 1 680 (UNSD 2003),excluding Madagascar but also includingmore developed countries such as Singaporeand Malta. Biodiversity is threatened byhabitat degradation/loss, alien species,overexploitation of living resources, climatechange, and other factors.
The Pacific Islands contain the world’shighest proportion of endemic species per unitof land area or human inhabitants. There arealready far too many examples of illegalaccess, overexploitation, and extinction ofPacific Island biological resources, and theloss of associated traditional knowledge(SIDSNet 2003c).
Coral reefs, among the most biologicallydiverse ecosystems, have experiencedwidespread degradation in all three SIDSregions due to global warming, pollution,destructive fishing practices and otherpressures (Burke and others 1998, Wilkinson2000). Many poor people are economicallydependent on coral reefs and theirdegradation has significant implications forpoverty in SIDS (Wittingham and others 2003).Likewise, reefs underpin the lucrative touristactivities of many SIDS and their economies.
A recent study shows that up to 80 percent of shallow-water reefs in some areas ofthe Caribbean have been destroyed (Gardnerand others 2003). However, reefs in deeperwaters of the Caribbean appear to be in bettercondition (Kramer 2003).
Many SIDS have established both marineand terrestrial protected areas. Since 1961,over 50 marine reserves have beenestablished in the Caribbean, with the rate ofestablishment increasing since the mid-1980s(Appeldoorn and Lindeman 2003).
FISHERIESData published in 2003 show trends in marinefish catches for the period 1991–2001 forselected SIDS for the Atlantic and WesternIndian Ocean, Caribbean, and Pacific (Figures1–3). Although the catches of a few countriesshowed significant increases, most have beenstable or have declined. Considering thegeneral increase in fishing pressure, this mayindicate that the fish stocks of these countriesare already being exploited at or above theirmaximum sustainable levels, with little or nopotential for further increases under currentmanagement regimes (FAO 2002). Levelling offor declining fish catches are significant in viewof the projected increases in human population
Table 2: Number of endemic, threatened and extinctspecies by SIDS regions (2003)
Indian Pacific
Ocean Caribbean Ocean
Plants
Endemic 406 2 010 222
Threatened 380 2 595 273
Extinct 47 23 0
Total number of species 1 171 7 328 3 492
Animals
Endemic 303 698 824
Threatened 196 571 427
Extinct 44 51 24
Total number of species 4 273 13 891 11 270
Number of protected areas 124 823 219
Source: UNEP-WCMC 2003

GEO YEAR BOOK
in SIDS, and the dependence of nationaleconomies and subsistence livelihoods onSIDS fisheries resources (see also section onEmerging Challenges).
Increased catches can also be a source ofconcern. For example, a record tuna catch inthe Indian Ocean in 2003, which is about100 000 tonnes greater than the sustainablelimit, has prompted the Indian Ocean TunaCommission to express concerns aboutdepletion of tuna stocks in this region(Seychelles Nation 2003). According to FAO(2002), most tuna stocks are fully exploited inall oceans, including the Western Indian Ocean,and some are overfished or severely depleted.
FRESHWATER Availability of freshwater is a serious issue inmany small islands. Rainfall is oftenunpredictable and variable, and run-off high.Related issues include increasing domestic,agricultural and industrial consumption, lackof storage capacity, and pollution from a varietyof sources. There are, therefore, problems withboth the quality and quantity of water. Asclimate change has an impact on rainfallpatterns, many SIDS will experience increasedperiods of drought (IPCC 2001). This hasalready become a problem in Cape Verde andMadagascar which are now suffering drought-related food emergencies (FAO/GIEWS 2003).
In the Pacific, there are particular problemswith maintaining water supply and quality inlow and raised atolls, with the threat of pooreffluent disposal, fertilizers and pesticidesentering water supplies, leaching from wastedumps, activities close to boreholes which canpollute groundwater, and possible salt waterintrusion during storms or rising sea level.
NATURAL DISASTERS In December 2003, for the first time indecades, the Caribbean experienced ahurricane after the official hurricane seasonhad ended. In 2003, several SIDS experiencednatural disasters and though the impacts werenot as severe as in the late 1990s, many liveswere lost and thousands affected (Table 3).The most severe impacts were seen in thoseSIDS that are among the poorest in theirrespective regions (Figure 4).
MANAGEMENT STRATEGIES Some of the environmental vulnerabilities ofSIDS are intrinsic and cannot be influenced byhuman actions. Others could be managed, atleast in part, by the governments and peopleof SIDS, and to this end, the BPoA and otherprogrammes and initiatives have beenadopted. In 2003, SIDS, the UN, and otherregional and international organizations havebeen preparing for the 10-year review in 2004of progress in implementing the BPoA.
Regional meetings in 2003 to prepare forthe 10-year review have been crucial inhighlighting some progress and critical issues
Cape Verde
Comoros
MauritiusSao Tome& PrincipeSeychelles
MadagascarMaldives
1993
1994
1995
1996
1997
1998
1999
2001
2000
Source: FAO 2003b
Figure 1: Marine fish-catches for the period1991–2001 for selected SIDS in the Atlantic andWestern Indian Oceans
0
150
30
90
120
000 tonnes
60
1993
1994
1995
1996
1997
1998
1999
2001
2000
Source: FAO 2003b
Figure 2: Marine fish-catches for the period1991–2001 for selected SIDS in the Caribbean
0
50
10
30
40
Antigua &BarbudaBahamas
GrenadaJamaica
Puerto Rico
000 tonnes
Barbados
Dominica
20
Martinique
St. Kitts &NevisSt. LuciaSt. Vincent &the GrenadinesTrinidad &Tobago
1993
1994
1995
1996
1997
1998
1999
2001
2000
Source: FAO 2003b
Figure 3: Marine fish-catches for the period1991–2001 for selected SIDS in the Pacific
0
140
60
100
120
FijiKiribati
SamoaSolomon Islands
Tuvalu
000 tonnes
Nauru
Papua NewGuinea
80Tonga
Vanuatu40
20
Table 3: Natural disasters in SIDS in the firstnine months of 2003
Total No.Country Event No. Killed Affected
Dominican Floods 1 460Republic Earthquake 3 2 015
Fiji Storm 17 132 823
Haiti Floods 36 4 070
Madagascar Floods 16 25 585Cyclones 89 162 586Drought 0 527 000
Papua New Landslides 13 621Guinea
Puerto Rico Floods 2 2 405
Solomon Is. Cyclones 0 425
Total 177 857 990
Source: OFDA/CRED 2003
Bleached Anemones caused by ocean warming.
Source: Still Pictures

OVERVIEW: SMALL ISLAND DEVELOPING STATES
for attention. Most Caribbean SIDS, forexample, now have draft disaster managementpolicies and programmes. Some havedeveloped hazard mitigation policies and havesought to include these measures into theirnational development plans. There has been animprovement in the early warning system of theregion. In addition, a more coordinated regionalapproach to disaster management andrecovery has been developed (UNDESA 2003).
Countries and territories in the Pacific haverecommended the full implementation of theAction Strategy for Nature Conservation in thePacific Islands (2003–2007) to effectively dealwith biodiversity conservation. They have alsocalled on governments to complete andimplement national biodiversity strategic actionplans as well as ratify and implement theCartagena Protocol. The Pacific region hasalso called for the development of rules tolegally protect traditional knowledge ofindigenous and local communities, particularlyin the context of the Convention on BiologicalDiversity (CBD). They have also advocated for
regulatory frameworks or instruments toensure fair and equitable benefit sharing toindigenous and local communities whileproviding a fair system of access of investors(SIDSNet 2003c).
CHALLENGES FOR THE FUTURE While progress has been made since theadoption of the BPoA for the SIDS, muchmore still needs to be done to achievesustainable development in these countries.For example, many SIDS lack sound waterinfrastructure and adequate watermanagement and distribution systems.Affordable access to water for all andprotecting water quality remain importantchallenges (UNDESA 2003). The CaribbeanSIDS have, for example, called for theestablishment of national authorities foradministration and management of watershedand land to address such issues as landdegradation, soil erosion and desertification.
The BPoA + 10 scheduled for Mauritiusin August–September 2004 provides an
opportunity for policymakers to redefine prioritiesand put a revitalized programme into action.All stakeholders have a critical role to play.
Appeldoorn, R.S. and Lindeman, K.C. (2003). A Caribbean-widesurvey of marine reserves: spatial coverage and attributes ofeffectiveness. Gulf and Caribbean Research, 14, 2, 139-154
Burke, L., Bryant, D., McManus, J., Spalding, M.D. (1998). Reefs atRisk: a map-based indicator of threats to the world’s coral reefs.Washington DC, World Resources Institutehttp://www.wri.org/wri/reefsatrisk/reefrisk.html
FAO (2002). The State of the World Fisheries and Aquaculture 2002.Rome, Food and Agriculture Organization
FAO (2003a). FAO and SIDS: Challenges and emerging issues inagriculture, forestry and fisheries. Paper prepared by FAO on the occasionof the inter-regional conference of Small Island Developing States,Bahamas, January 26-30 2004. Rome, Food and Agriculture Organization
FAO (2003b). FAOSTAT Fisheries Data. Rome, Food and AgricultureOrganizationhttp://apps.fao.org/default.htm.
FAO/GIEWS (2003). Food supply situation and crop prospects in Sub-Saharan Africa. Africa Report No.2. Rome, Food and AgricultureOrganization Global Information and Early Warning Systemhttp://www.fao.org/docrep/005/y9976e/y9976e00.htm
Gardner, T.A., Côté, I.M., Gill, J.A., Grant, A., Watkinson, A.R. (2003).Long-term region-wide declines in Caribbean corals. Science, 301,958-960
IPCC (2001). Small Islands. IPCC Third Assessment Report – ClimateChange 2001: Impacts, Adaptation and Vulnerability. Geneva,Intergovernmental Panel on Climate Change
Kaly, U.L., Pratt, C.R., Mitchell, J., and Howorth, R. (2003). TheDemonstration Environmental Vulnerability Index (EVI). SOPAC TechnicalReport 356. Suva, Fiji, South Pacific Applied Geoscience Commission
Kramer, P.A. (2003). Synthesis of coral reef health indicators for theWestern Atlantic: Results of the AGRRA Program (1997-2000). In Lang,J.C. (ed.) Status of Coral Reefs in the Western Atlantic: Results of InitialSurveys. Atlantic and Gulf Rapid Reef Assessment (AGRRA) Program
OFDA/CRED (2003). EM-DAT: The OFDA/CRED International DisasterDatabase. Brussels, Centre for Research on the Epidemiology of Disease http://www.cred.be/emdat
Seychelles Nation (2003). Indian Ocean Tuna Commission (IOTC)holds 8th Session: Officials advise caution despite record catch.Victoria, Seychelles Nation http://www.seychelles-online.com.sc/archives/10901203.html
SIDSNet (2003a). UN report warns small island developing statesincreasingly vulnerable. New York, United Nations Division forSustainable Development http://www.sidsnet.org/archives/other-newswire/2003/msg00922.html
SIDSNet (2003b). Thirty-fourth Pacific Island Forum. New York, UnitedNations Division for Sustainable Developmenthttp://www.sidsnet.org/docshare/other/20040120153820_PIFcom2003.pdf
SIDSNet (2003c). Report of the Pacific Regional Meeting for theReview of the Programme of Action for the Sustainable Developmentof Small Island Developing States. New York, United Nations Divisionfor Sustainable Developmenthttp://www.sidsnet.org/docshare/other/20030813142441_Apia_Meeting_Final_Report_8_August_2003.pdf
SIDSNet (2003d). Report of the AIMS Regional Preparatory Meeting toReview Implementation of the Programme of Action for the SustainableDevelopment of Small Island Developing States. New York, UnitedNations Division for Sustainable Developmenthttp://www.sidsnet.org/docshare/other/20031015130446_AIMS_report_praia_v5.pdf
UNDP (2003). The Human Development Report 2003. New York,United Nations Development Programme www.undp.org/hdr2003
UNDESA (2003). Report of the Caribbean Regional PreparatoryMeeting to Review the Programme of Action for the SustainableDevelopment of Small Island Developing States, 6-9 October, 2003.New York, United Nations Department of Economic and Social Affairshttp://www.un.org/esa/sustdev/sids/sids.htm
UNEP (2002). Africa Environment Outlook: Past, Present, and FuturePerspectives. Nairobi, United Nations Environment Programme
UNEP RRC-AP (2003). Maldives State of Environment Report 2002.Klongluang, Thailand, United Nations Environment Programme
Regional Resource Centre for Asia and the Pacifichttp://www.rrcap.unep.org/reports/soe/maldivessoe.cfm
UNEP-WCMC (2003). Species Conservation Database. Cambridge,United Nations Environment Programme World ConservationMonitoring Centre http://www.unep-wcmc.org
UNSD (2003). World Statistics Pocketbook: Small Island DevelopingStates. New York, United Nations Statistics Divisionhttp://www.sidsnet.org/docshare/other/20040219161354_sids_statistics.pdf
Whittingham, E., Campbell, J. and Townsley, P. (2003). Poverty andReefs. Volume 1: A Global Overview. DFID-IMM-IOC/UNESCO. Exeter,IMM Ltd
Wilkinson, C. (ed) (2000). Status of Coral Reefs of the World. GlobalCoral Reef Monitoring Network, Australian Institute of Marine Science
References
Figure 4: Hurricane Fabian struck the Caribbean in September2003. Vulnerability to natural disasters such as hurricanes area major concern among SIDS.
Source: REUTERS/Noaa-Handout

feature focus:
Freshwater
SUSTAINING THE ENVIRONMENT ● ROLE IN SOCIO!ECONOMICDEVELOPMENT ● PARTNERSHIPS TO FACILITATE SUSTAINABLE
DEVELOPMENT ● SUSTAINING THE FUTURE AND MEETING OUR GOALS
Sour
ce:S
till P
ictu
res
Sour
ce:S
till P
ictu
res
Sour
ce:S
till P
ictu
res

At the beginning of this century, world leadersdeclared their intention to work for a world inwhich people would be free from want andfear. This focus on a sustainable futureincluded “confronting the water crisis”.
The Millennium Declaration, adopted by189 Heads of State and Government at theUnited Nations Millennium Summit inSeptember 2000, presented eight goals and18 underlying targets. Target 10 of Goal 7focuses specifically on freshwater: it aims tohalve the proportion of people withoutsustainable access to safe drinking water bythe year 2015. But this is not the only goalwhere water has a role to play. Freshwater isrelevant and important for achieving all eightdevelopment goals contained in the MillenniumDeclaration (MDGs) (Box 1).
Water issues have remained high on theinternational environment agenda since theMillennium Summit. At the 2002 WorldSummit on Sustainable Development (WSSD),protection and management of waterresources was recognized by world leaders asfundamental for all three pillars of sustainabledevelopment. The WEHAB Initiative, proposedby UN Secretary-General Kofi Annan as acontribution to the WSSD, targets actions tofacilitate sustainable development in five keyareas, water and sanitation – and energy,health, agriculture and biodiversity – in whichwater resources also play a significant part.The WSSD reaffirmed the MDG target onwater and added two more developmenttargets related to water: a target for integratedwater resources management and a target forimproved sanitation (Box 1). This reflects the
growing severity of water problems and theurgent need for solutions. Internationalattention on water will continue, particularlywith the water and sanitation theme of CSD-12 and the recently-declared UN Decade ofFreshwater between 2005–2015. This willbuild upon the efforts made in 2003: theInternational Year of Freshwater.
The year 2003 flowed with variousinternational and regional meetings and otheractivities, and generated volumes of material inprint and on the web. The Third World WaterForum was held in the Japanese city of Kyotoin March, and the G-8 industrialized countriesused Evian, the French city famous for itsbottled water, as the venue for theirdiscussions on water in June. In November2003, the 14th Forum of Ministers of theEnvironment of Latin America and theCaribbean, held in Panama City, highlightedwater as one of the eight priority themes of theForum’s Initiative for Sustainable Development.In Africa, Addis Ababa hosted the Pan-AfricanImplementation and Partnership Conferenceon Water in December, bringing down thecurtain on the year but not the issue.
Water is often key in terms of povertyalleviation, consumption, production,sanitation, human settlements andbiodiversity. Transboundary water resourceissues are important in terms of governanceand sustainability. Water sustains all life andlinks environmental issues on land and inmarine areas. It is therefore, essential thatfreshwater, including groundwater, andmarine issues are considered as part of anintegrated system.
Freshwater: meeting our goals,sustaining our futureFrom household and boardroom to regional and global fora, water generated debate in 2003 among therich and poor, corporate and public sectors, and industrialized and developing countries. Water was notonly topical but also defined the sustainable development agenda during the year. It will remain a majorissue in the decades to come, because water is life – for people and the environment
GEO YEAR BOOK "##$$%
f eature
f ocus
Key Facts
● The total volume of water on earth is about 1.4 billion km3.
● The volume of freshwater resources is approximately35 million km3, or 2.5 per cent of the total water volume.
● Of these freshwater resources, about 24 million km3,68.9 per cent, is in the form of ice and permanent snowcover in mountainous regions, the Antarctic and Arctic.
● Some 8 million km3, 30.8 per cent, is stored undergroundin the form of groundwater (shallow and deep groundwaterbasins up to 2 000 metres, soil moisture, swamp waterand permafrost).
● Freshwater lakes and rivers contain an estimated105 000 km3 or 0.3 per cent of the world’s freshwater.
● The total usable freshwater supply for ecosystems andpeople is around 200 000 km3 of water, which is less thanone per cent of all freshwater resources.
● 3 011 freshwater species are listed as threatened,endangered, or extinct, 1 039 of which are fish. Four of thefive river dolphins and two of the three manatees arethreatened, as are around 40 freshwater turtles and morethan 400 inland water crustaceans.
● The amount of groundwater withdrawn annually is estimatedat 600–700 km3, representing about 20 per cent of globalwater withdrawals. About 1.5 billion people depend upongroundwater for their drinking water supply.
● According to estimates for the year 2000, agricultureaccounted for 70 per cent of the world’s total freshwater use.
● Per capita water consumption in developed countries ison average about 10 times more than in developingcountries. In developed countries, it ranges from 500 to800 litres per day whereas it is 60–150 litres per day indeveloping countries.
● Industrial uses account for about 20 per cent of globalfreshwater withdrawals. Of this, 57–69 per cent is used forhydropower and nuclear power generation, 30–40 per centfor industrial processes, and 0.5–3 per cent for thermalpower generation.
Sources: IUCN 2003, Shiklomanov 1999, UNEP 2002a, UNESCO 2000, UNDP
and others 1998, WMO 1997

$&FEATURE FOCUS: FRESHWATER
Sound water management is importantfor the environment, for reducing humanvulnerability resulting from degradation ofwater quality and water scarcity, and forenhancing human security and well-beingthrough strategic and effective managementresponses. The water issues in this section ofthe Year Book are discussed within the contextof the MDGs, starting with Goal 7 whichfocuses on environmental sustainability. Thisfirst part highlights the water resource baseand its distribution, emphasizing issues relatedto land use change and biodiversity, and howwater resources management is linked to
ecosystem functioning. The second part highlights socio-economic
issues, addressing the linkages between waterand poverty alleviation, provision of safe waterand sanitation, human health, food security,education and gender roles. Humanvulnerability resulting from poor managementof water resources is an issue that links all ofthese. It becomes clear that a supply of cleanand adequate water is fundamental toachieving the development goals.
The third part emphasizes the importance ofpartnerships, examines the roles of differentstakeholders, and reviews efforts at different
levels to manage water resources effectively.It demonstrates that the partnership principlesoutlined in Goal 8 are as applicable in the fieldof water as they are to the rest of thedevelopment arena. Integrated WaterResources Management (IWRM) and integratedcoastal area and river basin management(ICARM) are two of the approaches covered.Throughout the Feature Focus examples showhow technologies can play a role in sustainablewater supply and use at the local level. TheFeature Focus concludes by recognizing someimportant policy issues for consideration incharting the way forward.
Box 1: Internationally agreed development goals and selected targets relevant to water
Millennium Declaration Targets
Goal 1 ● Halve, between 1990 and 2015, the proportion of people whose income is less than one dollar a day
Eradicate extreme poverty and hunger ● Halve, between 1990 and 2015, the proportion of people who suffer from hunger
Goal 2 ● Ensure that, by 2015, children everywhere, boys and girls alike, will be able to complete a full course
Achieve universal primary education of primary schooling
Goal 3 ● Eliminate gender disparity in primary and secondary education, preferably by 2005, and to all levels
Promote gender equality and empower women of education no later than 2015
Goal 4 ● Reduce by two-thirds, between 1990 and 2015, the under-five mortality rate
Reduce child mortality
Goal 5 ● Reduce by three-quarters, between 1990 and 2015, the maternal mortality ratio
Improve maternal health
Goal 6 ● Halt by 2015 and begin to reverse the spread of HIV/AIDS
Combat HIV/AIDS, malaria and other diseases ● Halt by 2015 and begin to reverse the incidence of malaria and other major diseases
Goal 7 ● Integrate the principles of sustainable development into country policies and programmes
Ensure environmental sustainability and reverse the loss of environmental resources
● Halve by 2015 the proportion of people without sustainable access to safe drinking water
● Achieve by 2020 a significant improvement in the lives of at least 100 million slum dwellers
Goal 8 ● Develop further an open, rule-based, predictable, non-discriminatory trading and financial system.
Develop a global partnership for development Includes a commitment to good governance, development, and poverty reduction – both nationally
and internationally
● Address the special needs of the least developed countries, landlocked countries and Small Island
Developing States (SIDS)
● In cooperation with the private sector, make available the benefits of new technologies
WSSD Plan of Implementation ● Halve, by the year 2015, the proportion of people who are unable to reach or to afford safe drinking
water (as outlined in the Millennium Declaration) and the proportion of people who do not have
access to basic sanitation.
● Develop integrated water resources management and water efficiency plans by 2005
Sources: UN 2000a, UN 2002

GEO YEAR BOOK "##$$'
f eature
f ocus Figure 1: The world’s water cycle: global precipitation, evaporation, evapotranspiration and run-off
Precipitation9 000 km3
Precipitation110 000 km3
Evaporation9 000 km3
Evapotranspiration65 200 km3
River run-off42 600 km3
Infiltration
Groundwater flow2200 km3
Precipitation458 000 km3
Oceans and seas
Vapour transport
Evaporation502 800 km3
Lakes
Source: UNEP 2002a adapted from Shiklomanov 1999
Land

$(FEATURE FOCUS: FRESHWATER
FRESHWATER: SUSTAINING THEENVIRONMENTGoal 7: Ensure environmental sustainability
Water is a key component of all ecosystems.These provide critical goods and services topeople, including materials, food and otherorganic products, water storage andpurification, biogeochemical cycling and wasteremoval. Most global freshwater is bound upas ice in the Polar regions. Only a small, butvarying proportion is active at any one timewithin the global water cycle (Figure 1).
The world’s ecosystems are underpressure from numerous human activitiesand developments, including urbanization,industrialization and food production. Suchactivities require freshwater, and to meetdemands, the water cycle is inevitably disrupted.It is also influenced through land use changesthat directly affect water quantity, quality andwater flows. Ecosystems can be damaged,functions lost and vulnerable plants and animalsendangered. Much of the degradation offreshwater ecosystems results fromoverexploitation, habitat destruction, pollutionand the introduction of non-native species.
At the earth’s surface, freshwater providesthe habitat for large numbers of organisms.Species richness in relation to habitat extentis extremely high in many freshwater groups.For example, 40 per cent of the 25 000known fish species are freshwater forms.Given the distribution of water on the earth’ssurface, this is equivalent to one fish speciesfor every 15 km3 of freshwater, comparedwith one species for every 100 000 km3 ofsea water. The species richness increasesstrongly toward the equator.
In addition to the negative impacts onaquatic species caused by disrupting thequantity and quality of surface water sources,encroachment of non-native species is alsohaving a major impact on aquatic ecosystemsaround the world, reducing or eliminatingnative species in many cases (Heywood andGardner 1995). Studies of the introduction ofnon-native fish in Europe, North America,Australia, and New Zealand revealed that77 per cent of the species introduced led to a
drastic reduction or elimination of native fishspecies (Ross 1991).
Similarly, the introduction in the 1970s ofNile perch and Nile tilapia to Lake Victoria, theworld’s largest tropical lake, has fundamentallychanged the fish and associated biologicalcommunities of the lake. Approximately halfthe 350 species of cichlids have died outdue to the introduction of these two exoticfish species which fed on, and out-competed,the resident populations. Although a newfishery has now been developed based onNile perch, which currently generates aboutUS$400 million in export income, few withinthe local community are benefiting, as theyhave not made the transition to this industry(UNDP and others 2000). The unintendedintroduction of zebra mussels into the GreatLakes of North America has almost completelydisplaced native mussel species. This organismhas already cost more than US$1 000 millionmerely to control (Great Lakes Water QualityBoard 2001). In African wetlands, countriesspend billions of dollars every year to controlalien species, such as the water hyacinth, withlittle success (IUCN 2003).
Land use: a critical factorLand cover and land use changes have greatinfluence on freshwater resources around theworld. The protection of catchment areas isextremely important in maintaining highfreshwater quality (Box 2). Forest cover isparticularly beneficial. Recent literature showsa clear link between forests and the quality ofwater from a catchment, a more sporadic linkbetween forests and the quantity of wateravailable, and a variable link between forestsand constancy of flow (Dudley and Stolton2003). Well managed natural forests almostalways provide higher quality water, with lesssediment and fewer pollutants, than waterfrom other catchments. Forests therefore,often provide the basis for integratedmanagement of water resources. Removal offorest can adversely affect water supplies,putting people at risk and damaging theenvironment (FAO 2003a).
Both aquatic and terrestrial ecosystemsplay important roles in regulating freshwater
flows. Wetlands, for instance, buffer floodflows and filter incoming water, among otherbenefits (Table 1). This natural capacityhowever, has been much reduced due tohuman activities. About half of the world’swetlands were lost during the 20th century,primarily through conversion for agriculture(Finlayson and Davidson 1999). As weunderstand more about aquatic ecosystemdynamics, technologies are being developedthat mimic their functions, such as theconstruction of artificial wetlands for thepurification of water (Box 3).
Box 2: Land cover – a key to waterquality
There appears to be a clear link between the presence
of forests and the quality of water coming out of a
catchment. A large bottler of mineral water in Europe,
draws its main water supplies from heavily-farmed
watersheds, where the run-off of nutrients and
pesticides threatens the aquifers upon which the
company depends. In response, the company has found
that reforesting sensitive infiltration zones and switching
to organic farming practices is proving to be cheaper
than building water filtration plants.
Some water authorities also have made the link between
protecting for water supply and protecting for nature.
The city of New York applies a catchment protection
approach to maintaining its high quality drinking water.
A land and forest resource protection strategy is being
implemented that will result in substantial savings for
New York City, as compared to putting in a new water
treatment plant. The start-up cost for this strategy is
estimated to be US$1 000–1 500 million over 10 years,
as compared to the cost of US$6 000–8 000 million,
plus US$300–500 million annual operating costs,
otherwise required for a treatment plant.
In Ecuador, about 80 per cent of Quito’s drinking water
comes from two protected areas, the Cayambe Coca
Ecological Reserve and the Antisana Ecological Reserve.
A nominal water use fee on citizens of Quito, together
with one per cent of revenues of hydroelectric companies,
are used to finance conservation of the reserves.
On a global scale, about one-third of the largest cities
obtain a significant proportion of their drinking water
directly from protected areas.
Source: Dudley and Stolton 2003, Echavarria 2002

GEO YEAR BOOK "##$)#
f eature
f ocus Table 1: Benefits of wetlands
Ecological functions Products
● Water storage and purification ● Groundwater recharge and discharge ● Forest resources ● Wildlife resources
● Flood control ● Water transport ● Fisheries ● Forage resources
● Shoreline stabilization ● Sediment retention and erosion control ● Agricultural resources ● Water supply
● Storm protection ● Nutrient storage and recycling ● Medicinal resources ● Genetic resources
● Biomass export ● Micro climate stabilisation ● Raw materials for building, construction, ● Tourism and recreation opportunities
● Maintenance of ecosystem stability ● Maintenance of integrity of other ecosystems and industrial use ● Energy supply
● Maintenance of biodiversity
Sources: adapted from Dugan 1990 and Schuyt and Brander 2004
Box 3: Technology at work – biological water purification
Water purification is based on physical, chemical and biological processes. While we tend to rely on human engineered systems, technologies based onnatural processes can also be used to purify water and treat wastewater. These include phytotechnology based on wetlands, lagoons, grass-filtration, soilpurification, and soil aquifer storage and treatment. These technologies, shown in the graphics below, link water and food production, and are generally suited to developing communities.
Natural purification systems designed, constructed, operated and maintained in the same way as engineered systems perform just as well and usually cost less to construct and operate. The lower cost compared to mechanical treatment, which occupies less land area, depends on the sufficient availability of free or cheap land.
Source: UNEP 2000
Waste water Cleaner water
Water percolates down to the groundwaterbecoming purified as it travels through the soil
Recoverywell
Observationwell
Cleaner water tosupply network
Drawdown
Originalwater table
Mound
Treatedeffluent
Dune sand with siltand clay lenses
Water percolates through the soil
Collectionchannel
Distributionchannel
Water flows throughthe grass
02 C02
Bacteria
Algae
Sunlight
Waste water Cleaner water
Soil and grass filtration for purification of wastewater:Soil filtration relies on filtration by soil particles and bacteria growing on the surfaces of the soilparticles and plants (usually grasses) which take up water and nutrients (nitrogen and phosphorus),reducing the concentration of these nutrients. Soil filtration is used during the dry season. Grass filtration is used in the rainy season when the soil is saturated by water. Grasses can be grazed by livestock.
Constructed wetlands or phytoremediation: This is a technology for treating stormwater or wastewater. A constructed wetlandconsists of a gravel bed on which suitable wetland plants are grown. As waterpasses through the substrate, it is purified through the activity of bacteria attachedto the gravel, plant roots, soil and other particles.
Soil aquifer treatment for purification and storage of treated wastewater:Soil aquifer treatment relies on filtration through the soil and purifying action of bacteria attachedto soil particles. Purified water is stored in the groundwater aquifer and can be drawn foragricultural purposes, for example.
Symbiotic activity between algae and bacteria in a wastewater lagoon to purify sewage:As wastewater flows through a lagoon, bacteria consume the organic carbon in the waste. In assimilatingthe organic carbon, bacterial respiration produces carbon dioxide (CO2) and takes up oxygen (O2). Algaeutilize the carbon dioxide for photosynthesis and in turn produce oxygen required by the bacteria, hencethe symbiotic activity. Solids settle to the bottom of the lagoon, and pathogenic bacteria die-off in competition with other bacteria in the lagoon.Several lagoons in series are more effective and the last lagoon can be used for aquaculture.

)*FEATURE FOCUS: FRESHWATER
Drawing down suppliesThe withdrawal of freshwater from surface(rivers, lakes) or underground (aquifers)sources, at a rate faster than it is naturallyreplenished, is unsustainable and canultimately deplete the resource. The Aral Seain Central Asia is a dramatic example of thedevastating environmental and socio-economic impact of unsustainable waterwithdrawal (UNEP 2002a and 2002b –Figure 2), while withdrawals of groundwaterfrom the Ogallala Aquifer in the United States
points to potentially harmful effects on thecountry’s agriculture and environment as theaquifer’s waters are depleted (Morris andothers 2003).
On the global scale, the agricultural sectoraccounts for over two-thirds of freshwaterwithdrawal (Figure 3). Industrial use currentlyaccounts for a fifth of total global water use,while domestic use of freshwater was10 per cent of global water use in the year2000 (FAO 2003b). The proportion of waterused for different purposes, however, varies
between regions. The developing regionsuse relatively far more water for agriculturalpurposes, whereas the industrial sectoraccounts for the largest share of water usein the developed regions.
In the past 100 years, the world populationtripled, but water use for human purposesmultiplied sixfold (WWC 2000). There is muchcompetition for water resources and in theirallocation, the needs of ecosystems are oftenforgotten or ignored. This is due partly to ourlimited understanding of the complex linkagesand dependencies between and withinecosystems, and of their relation to humanneeds and activities now and in the future.Ecosystems, which are subject to waterstress become less robust and more proneto succumb to additional pressures. Aquaticecosystems and their flora and fauna areespecially at risk.
Industrial Domestic Agricultural
0
100
Source: GEO Data Portal, compiled from FAO 2003b
90
Figure 3: Estimated water use by sector, globally andregionally, for the year 2000
%
Africa Asiaand thePacific
LatinAmericaand the
Caribbean
NorthAmerica
globalWestAsia
80
70
60
50
40
30
20
10
Europe
Figure 2: Aral Sea degradation
The Aral Sea was oncethe world’s fourth-largest inland sea.Problems began in the1960s and 1970s withthe damming of themain rivers that feed itin order to grow cottonon arid land in whatwas then Soviet CentralAsia. The surface ofthe Aral Sea oncemeasured 66 100 km2.The sea is now aquarter of the size itwas 50 years ago andhas split into two.
Source: UNEP 2004
Source: UNEP-GRID Sioux Falls Source: UNEP-GRID Sioux Falls Source: MODIS Land Rapid ResponseTeam at NASA GSFC
Source: USGS EROS Data Center/ UNEP-GRID Sioux Falls
Source: USGS EROS Data Center/ UNEP-GRIDSioux Falls
Aug 1999 Sep 2002 Aug 2003
Aug/Sep 1973 Aug/Sep 1987

GEO YEAR BOOK "##$)"
Disrupting the flowDuring the 20th century, large dams becamea highly visible tool for managing freshwaterresources, contributing to socio-economicdevelopment by securing food production anddrinking water supply, energy generation andflood control. However, an enormous price inenvironmental terms, although rarelyaccounted for, often had to be paid to securethese benefits (WCD 2000). Many negativebiological, physical and chemical impacts havebeen attributed to dams, including changes inthe timing and frequency of downstream waterflows, upstream inundation, degradation of
water quality and upstream catchment areas,increased in-lake sedimentation, lake and riverbank scouring, degradation and loss of forestsand wildlife habitat, blocked movement ofmigratory species, modification of lacustrineand downstream habitats and loss of aquaticbiodiversity. Some of these effects have alsohad a very negative impact on local anddownstream human communities, includingthe disruption of fisheries and other water-related ecosystem services.
Dams and canals have fragmented almost60 per cent of the world’s 227 largest rivers(Revenga and others 2000). The only remaining
large free-flowing rivers are found in the tundraregions of North America and Russia, and inparts of Africa and Latin America.
Degrading qualityWhile industry does not use the largestquantities of freshwater, nor produce thelargest volume of water pollutants, it isresponsible for the production and use ofsome of the most hazardous waterpollutants (Fry and Rast 1998). Theseinclude heavy metals such as mercury(Box 4), polychlorinated biphenyls (PCBs),industrial solvents and other organicchemicals dangerous to environmental andhuman health.
Groundwater represents 90 per cent of theworld’s readily-available freshwater (Boswinkel2000). An estimated one-and-a-half billionpeople, a quarter of the world’s population,depend directly on this source for theirdrinking water (Shiklomanov 1997). It isalso the main source for irrigation in manycountries. Despite their importance,groundwater resources are oftenoverexploited, managed badly, and theirdynamics are usually poorly understood.As a result, they are under constant threat ofdegradation from contamination anddepletion. For example, poor irrigation
f eature
f ocus
0
25 000
Figure 4: Hypoxia in the northern Gulf of Mexico
square kilometres
1985
20 000
15 000
10 000
5 000
1986
1987
1988
1989
1990
1991
1992
1993
1994
1995
1996
1997
1998
1999
2000
2001
2002
Box 4: The increasing global mercury threat
Expanding industrialization over the last two centuries has increased levels of mercury in the
environment. Although a naturally occurring metal, excess mercury in ecosystems can be highly
toxic; it accumulates in living tissue and is particularly associated with underdevelopment of the
nervous system.
Mercury contaminates the water cycle, both directly and indirectly, although the most significant
releases of mercury are into the air. Once deposited, mercury can change to methyl mercury and
become concentrated as it moves through the food chain (biomagnification).
The worldwide risks of mercury are more severe than was previously understood. To address the
growing mercury challenge, it is necessary to reduce the use of mercury, substitute or eliminate
mercury-containing products and processes, control its emissions with end-of-pipe technologies,
and manage mercury wastes.
Source: UNEP 2003a
Satellite image of the northern Gulf of Mexico/Mississippi Delta, showing hypoxiccoastal water (light blue), January 2003
Source: Jacques Descloitres, MODIS Land Rapid Response Team, NASA/GSFC
Comparative size of hypoxia areas between 1985–2002. Nutrient enrichment iscausing dense algal blooms and a growing hypoxic area.
Source: Rabelais and others 2002

)$FEATURE FOCUS: FRESHWATER
practices and drawdown of groundwaternear coastal areas can both result ingroundwater salinization. Poor sewage,waste and effluent management can resultin the release of pollutants into surfacewaters and allow contamination of aquifers.Depletion occurs through overexploitationof available groundwater and land usechanges that alter surface run-off andreduce the replenishment of groundwatersupplies (UNEP 2002b).
On a global scale, agriculture is the mainsource of both nitrate and ammonia pollutionof surface and groundwater (FAO 2003c; seealso the section on Emerging Challenges).In addition to damaging many aquaticorganisms or making water less suitable fordrinking, excessive loading of nutrients in riverbasins can result in eutrophication and algalblooms in coastal waters, and the formationof deoxygenated (hypoxic) zones whichthreaten benthic marine life and economicallyimportant fisheries (Figure 4).
Where strong measures have been takenand sustained to reverse negative trendssome improvements in water quality havebeen achieved. For example, nearly 30 yearsof European Union (EU) environmentallegislation, with national and internationalactions to protect and improve the aquaticenvironment, are yielding results (EEA 2003).Pollution of rivers and lakes by phosphorusand organic matter from industry andhouseholds has been reduced and thepollution of rivers with heavy metals and otherhazardous substances is generallydecreasing. There has been progress inreducing overall water withdrawals and use inmost parts of Europe. There is, however, littleor no progress in combating nitrate andpesticide pollution, and water withdrawals forirrigation, energy use and tourism.
Weak data on some issues mean that theconclusions listed above must be treated withcaution (EEA 2003). Overall, there are stillknowledge gaps about the world’s freshwaterquality. Better data collection and informationsystems are required to provide reliable,consistent and appropriate freshwater dataand information (Box 5).
Box 5: Water quality data
Existing water quality data collection and monitoring systems are inadequate because of:
● incomplete data coverage (spatial and temporal);
● slow reporting and sharing of data; and
● insufficient training and capacity of local water authorities to collect data.
The main steps to invest in monitoring, assessment, and information systems are to:
● include monitoring programmes in water management plans, and invest in data collection and analysis capacity in countries, particularly in Africa, SIDS and Central Asia;
● encourage country participation in regional and global water quality monitoring and assessment programmes, such as GEMS/Water; and
● ensure that data and information about water quality are collected frequently and regularly using comparable methods.
Over 800 stations for freshwater monitoring worldwide have contributed data to the UNEPGEMS/Water Programme (see map below). Of these, 98 are measuring water quality in lakes andreservoirs. There are four types of stations:
Baseline stations are located in areas where there is little or no effect from point sources ofpollutants and removed from obvious anthropogenic influences;
Impact stations are located at sites with at least one major use of the water such as drinking watersupply, irrigation, or conservation of aquatic life;
Trend stations are primarily located on large rivers that are representative of large basins in whichhuman activity is high; and
Flux stations are monitoring at the mouths of major rivers upstream from estuarine effects.
By the end of 2003, the GEMS/Water database contained more than two million data points coveringover 100 water quality parameters, including physical/chemical parameters, such as temperature, pH,major ions, nutrients, metals, microbiological parameters, and organics. As the requirements forassessment and identification of national, regional and global water quality issues of concernincrease, the need for data that accurately reflect environmental conditions becomes greater.
Source: GEMS/Water 2003
The geographic distribution of the data contained in the GEMS/Water database is widespread witha higher concentration of stations in European countries, India and Japan.

GEO YEAR BOOK "##$))
FRESHWATER AND ITS ROLEIN SOCIO-ECONOMICDEVELOPMENTAs stressed in the previous section,safeguarding water for environmental needsis essential to achieve environmentalsustainability (Goal 7). The disruption of thewater cycle will inevitably affect biodiversityand ecosystem functioning and ultimately theprovision of ecosystem goods and servicesto humans. Degrading water quality, watershortages and changes in the flow not onlyhave an indirect impact on people throughsuch ecosystem changes, but the use ofwater for human needs such as drinking water,agriculture and industrial processes alsodirectly affect people’s health and well-being.
Safe drinking water and sanitationand human healthGoal 4: Reduce child mortality
Goal 5: Improve maternal health
Goal 6: Combat HIV/AIDS, malaria andother diseases
Goal 7: Target 10/WSSD Plan ofImplementation: Reduce by half, by 2015,the proportion of people withoutsustainable access to safe drinking waterand basic sanitation
Freshwater and human health are intimatelylinked. Contaminated drinking water is oneof the major causes of sickness and death.The vast majority of water-related deathsoccur in developing countries and many arecaused by relatively easily-treated andpreventable diarrhoeal diseases. Nine out of10 of the people affected are children underfive (Prüss and others 2002).
Although direct human consumption andsanitation are among the smallest uses offreshwater on an absolute scale, providingfreshwater of the quantity and quality requiredis one of humanity’s greatest continuingchallenges. The global population is now morethan 6.3 billion people, and the number isgrowing by about 77 million people every year(UNPD 2003). The availability of safe drinkingwater is critical to meeting the goals for
f eature
f ocus Box 6: Technology at work – membrane technology
Mimicking nature (membranes in seagull beaks,plant roots and kidneys), artificial membranescan be used to purify water.
Whereas natural permeation through a membranewill take place from low to high salt concentration,reverse osmosis is the application of pressure toforce water to move from high to low saltconcentration. This technology can be used fordesalinating water.
With the wide range of membranes nowavailable most contaminants of concern can beseparated from raw water sources. Membranescome in a range of pore sizes and permeabilityfrom micro-filtration, ultra-filtration, nano-filtration to hyper-filtration (reverse osmosis)and can filter out corresponding particle sizes(see diagram below). Membranes are alsoavailable in various materials – polymers,organo-mineral, ceramic or metallic – to copewith differing conditions. They are used to produce safe drinking water from brackish water,remove turbidity, algae, pathogens, viruses, and metal contaminants, clean industrial effluent,concentrate, purify or fractionate temperature sensitive solutions in the food, drug andbiotechnology industries, and are used in artificial kidneys. Fouling impedes performance, butseveral cleaning mechanisms are available such as back flushing, air bubbles and chemicals.
The costs of large-scale application of membrane technology for the desalinization of saline water toproduce drinking water are double those of conventional treatment costs. However, the potential forlower cost applications in the removal of bacterial and parasitic pathogens from surface water usingmicro-filtration are very promising. For example, off-cuts from hollow-fibre membrane micro-filters arenow being developed for use in developing countries for water purification at household andcommunity level.
Pressure-driven membrane types with associated pore sizes (indicated by box outline) and the type ofcontaminant that they can remove.
Source: ETC 2003
Pressure
Semi-permeablemembrane
Concentratedsolution
Pure water
0.001 0.01 0.1 1.00.0001pore size (µm)
bacteria;cysts/oocysts;turbidity;colloids(protozoa >10µm)
micro filtration
ultra filtration
nanofiltration
reverse osmosis
ions; dissolved gases viruses
herbicide; pesticide;sugars
organics
Reverse osmosis

)+FEATURE FOCUS: FRESHWATER
enhancing human well-being and security.The proportion of people served with some
form of improved water supply rose from78 per cent in 1990 to 82 per cent in 2000.Over the same period the world’s populationwith access to improved sanitation increasedfrom 51 per cent to 61 per cent (WHO andUNICEF 2003). Despite these gains, about1.1 billion people in the world lacked accessto safe drinking water in 2000, while another2.4 billion lacked access to improvedsanitation (see the GEO Indicators section).As expressed by the UN Secretary-GeneralKofi Annan in 2000: “No single measure woulddo more to reduce disease and save lives inthe developing world than bringing safe waterand adequate sanitation to all” (UN 2000b).
Freshwater distributes pollutants, and manydisease-causing micro-organisms (pathogens)and their vectors live in it. Infants and childrenare especially susceptible to sicknessassociated with contaminated drinking waterand inadequate sanitation, particularly todiarrhoeal diseases. Lack of safe drinking waterand sanitation also has obvious implications formaternal health and can exacerbate illnesseswhich affect the immune system, such asHIV/AIDS. Improved sanitation alone couldreduce related deaths by up to 60 per cent,episodes of diarrhoea by up to 40 per cent,and stunting of child growth by up to 50 percent (WEHAB Working Group 2002).
Illness and disability caused by water-related diseases contribute to a huge loss inhuman economic productivity. The Disability-Adjusted Life Year (DALY) is a unit ofmeasurement reflecting lost years of healthylife; the WHO has used it as a measure toreport on the impact of some water-associated diseases on health (WHO andUNICEF 2000). By far the largest impact iscaused by malaria (42.3 million DALYs),followed by lymphatic filariasis (5.64 millionDALYs), water-borne diseases such asschistosomiasis (1.76 million DALYs), andrelated infections (1.42 million DALYs).Various technologies, however, includingmembrane technologies (Box 6), offersolutions and can significantly improvedrinking water quality.
Existing water and sanitation systems areinadequate for 30–60 per cent of the urbanpopulation, mainly in developing countries.The situation is most severe for the estimated924 million people living in urban slums (UN-Habitat 2003a). There is a link between theurban population who do not have access toclean water through reliable piped waterservice, and poverty, partly due to the fact thatlow-income groups often have to buy theirwater from vendors at greatly inflated prices.People on a low income end up paying two to50 times more for a litre of water than higherincome groups, who are connected to oftenheavily subsidized water infrastructure (UN-Habitat 2003b). In some cities this difference iseven higher (UNEP in press) (Figure 5). Thisfurther reduces the limited financial resourcesof poor people and their coping capacity. It isnot surprising that many turn to water suppliesthat may not be clean, such as a local river, tomeet their daily needs.
Privatization of water supply and sanitationis often seen as a way to improve services andlighten the burden on scarce public finances(UN-Habitat 2003b). Although the aim is toprovide water and sanitation services moreefficiently through market mechanisms, severalhigh profile privatization initiatives in developingcountries have actually resulted in priceincreases that made the cost of access to safewater and sanitation prohibitive for the poor
(UN-Habitat 2003b). The more vulnerablemembers of society, particularly poor women,are the worst affected by such changes towater and sanitation pricing, and the stressesthat they cause to people’s livelihoods(Grossman and others 2003).
Poverty, hunger and freshwaterlinkagesGoal 1: Eradicate extreme poverty andhunger
In terms of socio-economic status, the poorestoften comprise the ‘water poor’ (Box 7). Themost vulnerable in this group include womenand children, the elderly, minorities includingindigenous people, those suffering fromHIV/AIDS and other illnesses, physical or mentalimpairments, and those living in arid rural areas,slums and surviving in the informal economy.
The incidence of hunger is rising again,after falling steadily during the first half of the1990s (FAO 2003d). Between 1995–1997 and1999–2001, the number of chronically hungryincreased by more than 18 million people(FAO 2003d). The link between extremepoverty, hunger and drought is strong: over athree-year period, drought was listed as acause in 60 per cent of all food emergenciesacross the world (FAO 2003d).
In developing countries, rainfed agriculturestill accounts for about 60 per cent of
0
1.5
Sources: UNEP in press, UN-Habitat 2001
1.2
Figure 5: The price urban residents pay for water in selected regions and the factor difference inprice for rich and poor living in the same city for selected cities
US$ per 1 000 litres
0.9
0.6
0.3
0
100
factor difference in price
Portau Prince
80
60
Asiaand thePacific
LatinAmericaand the
Caribbean
West Asiaand Northern
Africa
AfricaexcludingNorthern
Africa
Karachi Jakarta Cairo Lima Nairobi
40
20

GEO YEAR BOOK "##$)%
agricultural production (FAO 2003c). Farmerswho depend on rainfed agriculture in regionswith insufficient or variable rainfall are, therefore,vulnerable to crop yield reduction or total croplosses caused by dry spells and drought.
Irrigation has considerably increased cropproduction and yields and has contributedimmensely to better food security.An estimated 40 per cent of agriculturalproducts and 60 per cent of the world’s grainis nowadays grown on irrigated land (IFPRI2001). In 1998, irrigated land made upapproximately one-fifth of total arable landin developing countries but produced two-fifths of all crops (FAO 2003c). Althoughfood production cannot do without irrigation,current practices have caused seriousenvironmental damage in many areas. Poorirrigation management sometimes pollutesaquifers and causes soil salanization andwaterlogging, which together have affected40 million ha of land globally (UNEP 2002b).Rehabilitation is costly but, without it,such damage to arable land will result in areduction of productivity per hectare, andmay even lead to total abandonment ofseverely affected areas.
In addition, agricultural irrigation practicesare particularly water-intensive and sometimeswasteful. Data from 90 developing countriesshow that the total amount of water withdrawnfor irrigation varies per region, with water useefficiency ranging from 24 per cent in LatinAmerica and the Caribbean to 39 per cent inWest Asia (FAO 2003c). There is an absoluteceiling to the amount of water available in anycountry or region for irrigation and as thatceiling is approached it will be essential to findways to make more efficient use of water toachieve more crop per drop.
One of the projected manifestations ofclimate change is altered precipitationpatterns (IPCC 2001). Climate change mayadversely affect the availability of freshwaterfor food production that could make asignificant contribution to the eradication ofhunger and poverty. Spatial and temporalchanges in precipitation are of most concernand relevance. African communities, withtheir limited institutional and financialresources, would be particularly vulnerableto such changes.
The collection of rainwater for irrigationand domestic use has proved extremely
valuable to deal with rainfall variability,particularly at the household and communitylevels (Box 8). With the right equipment orfurther treatment, freshwater collected in thismanner can even be used as drinking water.
Aquatic ecosystems are a major source ofcheap, high quality protein, such as fish, formany local communities. Degraded aquaticecosystems, will not be able to produce asmuch food, and this will have negativeeconomic impacts on people, communitiesand the private sector that depend on theseresources. For example, the Aral Sea fisheriesthat used to employ more than 65 000people have collapsed (Glazovsky 1995).These effects are particularly acute forcommunities living by along rivers and lakeshores, who are dependent on activities suchas fishing and tourism.
Part of the difficulty in meeting freshwaterneeds for human use is due to a mismatchbetween the global distribution of thisresource and population distribution.The Congo River, for example, contains abouta third of Africa’s total river flow, yet onlyabout 10 per cent of Africa’s population liveswithin its drainage basin (Shiklomanov 1997).In Latin America and the Caribbean, about40 per cent of the population is concentratedin 25 per cent of the territory, which onlycontains about 10 per cent of the region’sfreshwater resources. Asia has the largestvolume of renewable freshwater resources;yet per capita water availability is the lowestin the world. In contrast, Australia and NewZealand have the smallest quantity ofavailable freshwater resources, yet thehighest per person water availability in theworld, because of the much smallerpopulation (Gleick 1993).
It is clear that the plight of many of thoseliving in poverty cannot be alleviated withouta sustainable natural resource base,including freshwater (Table 2). It is essentialto ensure that poverty alleviation or reductionstrategies do not result in additionaldegradation of freshwater resources andthe productivity of life-supporting systems(Hirji and Ibreek 2001).
f eature
f ocus Box 7: The water poor
The water poor can be defined as those:
● whose natural livelihood base is persistently threatened by severe drought or flood;
● whose livelihood depends on cultivation of food or gathering of natural products, and whose water
source is not dependable or sufficient;
● whose natural livelihood base is subject to erosion, degradation, or state confiscation (for example
for construction of major infrastructure) without due compensation;
● living far from a year-round supply of drinking water;
● obliged to expend a relatively high (greater than five per cent) proportion of household income
on water;
● whose water supply is bacteriologically or chemically contaminated, and who cannot afford to use,
or have no access to, an alternate water source;
● living in areas with high levels of water-associated disease (schistosomiasis, guinea-worm, malaria,
trachoma, cholera, typhoid, etc.) without means of protection; and
● women and girls who spend hours a day collecting water, putting their security, education,
productivity, and nutritional status at risk.
Source: GWP 2003

)&FEATURE FOCUS: FRESHWATER
Box 8: Technology at work – rainwater harvesting
This age-old technology is resurfacing as a solution for providing non-or under-serviced communities with potable water at or near the pointwhere water is needed. Recent innovations have included cleanercollection (a first flush diverter), storage and hygiene maintenance (on-site,low cost detection of contamination, purification and sterilization) andadaptation for local conditions.
Rainwater harvesting systems can be either owner or utility-operatedand managed. Rainwater collected using existing structures (such asrooftops, parking lots, playgrounds, parks, ponds and flood plains), hasfew negative environmental impacts compared to other systems built forwater resource development such as dams. Rainwater is relatively cleanand of a quality usually acceptable for most purposes with little or notreatment.
Other advantages of rainwater harvesting are:
● it can exist with, and provide a good supplement to, other water sourcesand utility systems, relieving pressure where other sources are scarce;
● it provides a water supply buffer for use in times of emergency or ifthere is a breakdown of the public water supply system, particularlyduring natural disasters;
● users of rainwater are usually the owners and operators of thecatchment system so they are likely to conserve water and prevent thestorage tank from drying up or leaking;
● rainwater harvesting technologies are flexible and can be adapted foralmost any requirement;
● construction, operation, and maintenance are not labour intensive;
● rainwater is free from chlorine;
● rainwater is the softest naturally-occurring source of water available (soft water containsless minerals that cause hard scale formation when water is boiled, and requires less soapfor lathering than hard water); and
● the security of the water supply is increased significantly with decentralized rainwaterharvesting points.
Before developing a rainwater harvesting system, however, the following need to be considered:
● are the catchment area and storage capacity adequate to sustain the system?
● are maintenance of the system and the quality of collected water within the owner/operator’scapacity?
● what measures need to be taken to prevent rainwater storage tanks from becoming breedinghabitats for disease-vectors, such as the malaria mosquito?
● rainwater is unlikely to contain fluoride, unlike commercial water supplies. Will users need tosupplement their intake from other sources to ensure dental health?
The amount of water harvested with this technology is small, but increasing, and there is anemerging worldwide movement to promote rainwater harvesting. It is, however, unclear whether thewidespread use of these technologies is feasible (IFPRI 2002). Construction and maintenance costsof water harvesting systems, particularly the labour costs, are very important in determiningwhether a technique will be widely adopted at the individual farm or household level.
Sources: IFPRI 2002, UNEP 2002c
Roof
Roof run-off
Gutter
Rain waterfirst flush
Rain
Overflow
Source: Murdoch University Environmental Technology Center
Diverter for the first flush from roof run-off
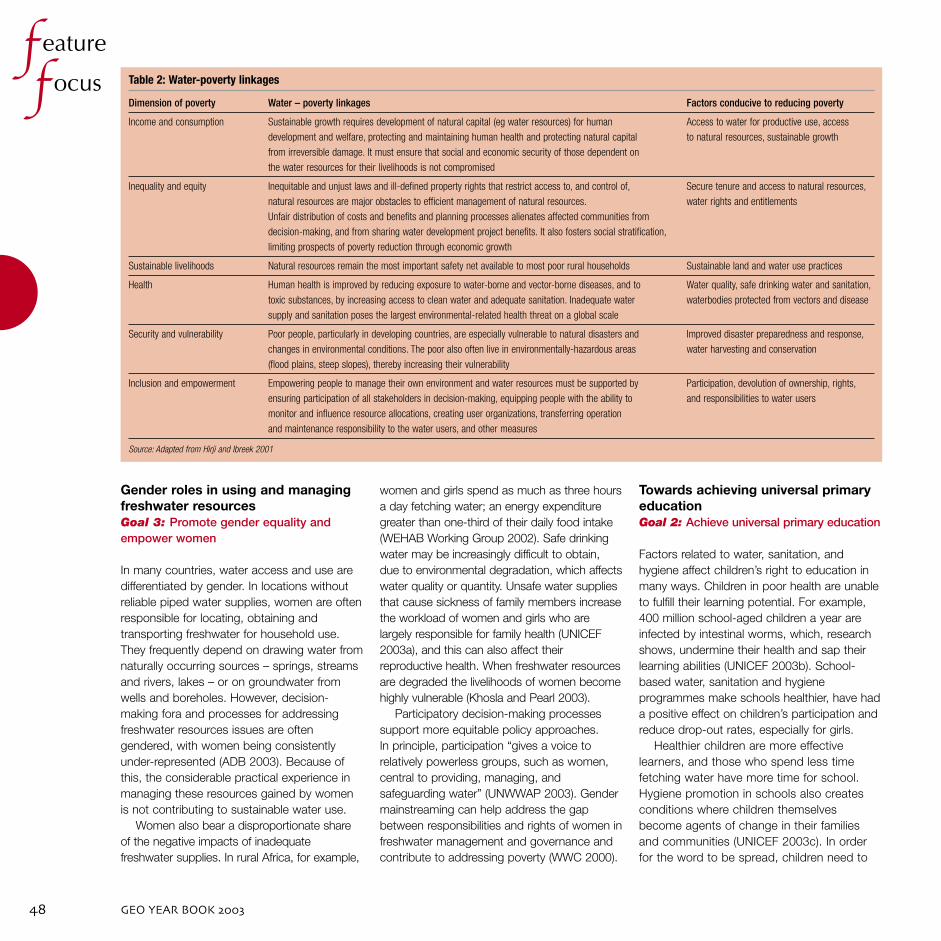
GEO YEAR BOOK "##$)'
Gender roles in using and managingfreshwater resourcesGoal 3: Promote gender equality andempower women
In many countries, water access and use aredifferentiated by gender. In locations withoutreliable piped water supplies, women are oftenresponsible for locating, obtaining andtransporting freshwater for household use.They frequently depend on drawing water fromnaturally occurring sources – springs, streamsand rivers, lakes – or on groundwater fromwells and boreholes. However, decision-making fora and processes for addressingfreshwater resources issues are oftengendered, with women being consistentlyunder-represented (ADB 2003). Because ofthis, the considerable practical experience inmanaging these resources gained by womenis not contributing to sustainable water use.
Women also bear a disproportionate shareof the negative impacts of inadequatefreshwater supplies. In rural Africa, for example,
women and girls spend as much as three hoursa day fetching water; an energy expendituregreater than one-third of their daily food intake(WEHAB Working Group 2002). Safe drinkingwater may be increasingly difficult to obtain,due to environmental degradation, which affectswater quality or quantity. Unsafe water suppliesthat cause sickness of family members increasethe workload of women and girls who arelargely responsible for family health (UNICEF2003a), and this can also affect theirreproductive health. When freshwater resourcesare degraded the livelihoods of women becomehighly vulnerable (Khosla and Pearl 2003).
Participatory decision-making processessupport more equitable policy approaches.In principle, participation “gives a voice torelatively powerless groups, such as women,central to providing, managing, andsafeguarding water” (UNWWAP 2003). Gendermainstreaming can help address the gapbetween responsibilities and rights of women infreshwater management and governance andcontribute to addressing poverty (WWC 2000).
Towards achieving universal primaryeducationGoal 2: Achieve universal primary education
Factors related to water, sanitation, andhygiene affect children’s right to education inmany ways. Children in poor health are unableto fulfill their learning potential. For example,400 million school-aged children a year areinfected by intestinal worms, which, researchshows, undermine their health and sap theirlearning abilities (UNICEF 2003b). School-based water, sanitation and hygieneprogrammes make schools healthier, have hada positive effect on children’s participation andreduce drop-out rates, especially for girls.
Healthier children are more effectivelearners, and those who spend less timefetching water have more time for school.Hygiene promotion in schools also createsconditions where children themselvesbecome agents of change in their familiesand communities (UNICEF 2003c). In orderfor the word to be spread, children need to
f eature
f ocus Table 2: Water-poverty linkages
Dimension of poverty Water – poverty linkages Factors conducive to reducing poverty
Income and consumption Sustainable growth requires development of natural capital (eg water resources) for human Access to water for productive use, access
development and welfare, protecting and maintaining human health and protecting natural capital to natural resources, sustainable growth
from irreversible damage. It must ensure that social and economic security of those dependent on
the water resources for their livelihoods is not compromised
Inequality and equity Inequitable and unjust laws and ill-defined property rights that restrict access to, and control of, Secure tenure and access to natural resources,
natural resources are major obstacles to efficient management of natural resources. water rights and entitlements
Unfair distribution of costs and benefits and planning processes alienates affected communities from
decision-making, and from sharing water development project benefits. It also fosters social stratification,
limiting prospects of poverty reduction through economic growth
Sustainable livelihoods Natural resources remain the most important safety net available to most poor rural households Sustainable land and water use practices
Health Human health is improved by reducing exposure to water-borne and vector-borne diseases, and to Water quality, safe drinking water and sanitation,
toxic substances, by increasing access to clean water and adequate sanitation. Inadequate water waterbodies protected from vectors and disease
supply and sanitation poses the largest environmental-related health threat on a global scale
Security and vulnerability Poor people, particularly in developing countries, are especially vulnerable to natural disasters and Improved disaster preparedness and response,
changes in environmental conditions. The poor also often live in environmentally-hazardous areas water harvesting and conservation
(flood plains, steep slopes), thereby increasing their vulnerability
Inclusion and empowerment Empowering people to manage their own environment and water resources must be supported by Participation, devolution of ownership, rights,
ensuring participation of all stakeholders in decision-making, equipping people with the ability to and responsibilities to water users
monitor and influence resource allocations, creating user organizations, transferring operation
and maintenance responsibility to the water users, and other measures
Source: Adapted from Hirji and Ibreek 2001

)(FEATURE FOCUS: FRESHWATER
attend school where they can absorbthe message that water is valuable andunderstand basic health skills. Whereeducation promotes improved water andsanitation practices, these improvementsin turn support educational development(UNWWAP 2003).
FRESHWATER PARTNERSHIPSTO FACILITATE SUSTAINABLEDEVELOPMENTGoal 8: Develop a global partnership fordevelopment
Efforts toward securing sustainable freshwaterresources should bring together a range ofdifferent stakeholders such as communitymembers, governments and the private sector.This diversity of stakeholders encompasses awide spectrum of expertise, includinghydrologists and climatologists, engineers andplanners, ecologists and sociologists, lawyersand diplomats. The establishment ofpartnerships is necessary. This is equallyevident at the international level – ranging fromage-old river basin agreements to the mostrecent multilateral environmental agreements.
Freshwater-related initiatives andprocesses at the global level A series of global conferences, meetings andevents focusing totally or in part on freshwaterresources and sustainable development havetaken place over the past three decades.An extensive knowledge base on water-related issues has been built. Major decisionsand recommendations have been made, mostrecently in the framework of the MDG andWSSD goals and targets. Yet most waterproblems remain. The increasing freshwaterdemands of an expanding global populationcontinue to outstrip the investment andinfrastructure needed to accomplish thegoals, particularly in developing countries.Stronger and more concerted efforts areclearly required on the part of governments,UN agencies and other water stakeholdersto overcome the primary constraints toimplementing the recommended actions ina timely and effective manner. These primary
constraints include limited public awarenessand understanding of human impacts onfreshwater resources and ecosystems, lackof stakeholder participation, weak governanceand accountability systems, and inadequatefunding and human resources (WLVC 2003).Legal and institutional frameworks are criticalto effective partnerships at different level.Box 9 gives an overview of basic principlesfor good freshwater governance, emphasizingthe need for strong and effective institutionsand laws.
Transboundary initiatives and riverbasin agreementsFreshwater resources are widely shared amongnations, regions and communities. Internationalriver basins account for nearly half the planet’sland surface, and host about 40 per cent of the
world’s population (UNEP 2002d). However,a common, long-term vision of transboundarywater systems, needed for their efficient,environmentally-sustainable management anduse, is still lacking in many cases. There isinevitably the potential for conflict over theshared use of these resources. On the plusside, the increasing number of river basinagreements offers a platform for collaborationthat can lead to a more equitable andsustainable use of shared freshwaterresources. A recent report highlighted the needfor countries to share freshwater as a majorforce for peace and cooperation, noting thatthe historical norm has been to establishtreaties, rather than resort to armed conflictsover this issue (UNEP 2002d).
There are 263 rivers that cross or demarcateinternational boundaries (UNEP 2002d). Issues
Box 9: Principles of good freshwater governance
Approaches
Open and transparent: water institutions should work in an open manner, using language understandableto the general public; water policy decisions should be transparent, particularly regarding financialtransactions.
Inclusive and communicative: wide participation should be ensured throughout the water policy chain,from conception to implementation and evaluation; governance institutions must communicate among waterstakeholders in very direct ways.
Coherent and integrative: water policies and actions must be coherent, with political leadership and astrong responsibility taken by institutions at different levels; water institutions should consider all potentialwater users and sectors and their linkages with, and impacts on, the traditional water sector.
Equitable and ethical: equity between and among various water interest groups, stakeholders andconsumers should be carefully monitored throughout the policy development and implementation process;penalties for malfeasance should be equitably applied – water governance must be strongly based on theethical principles of the society in which it functions and on the rule of law.
Performance and operation
Accountable: the rules of the game, as well as legislative roles and executive processes, must be clear;each water-related institution must explain and take responsibility for its actions; penalties for violating therules and arbitration-enforcing mechanisms must exist to ensure that satisfactory solutions to water issuescan be reached.
Efficient: concepts of political, social, and environmental efficiency related to water resources must bebalanced against simple economic efficiency; governmental systems should not impede needed actions.
Responsive and sustainable: water demands, evaluation of future water impacts and past experiencesshould be the basis for water policy; policies should be implemented, and decisions made, at the mostappropriate level; water policies should be incentive-based, to ensure clear social or economic gain if thepolicy is followed; long-term sustainability of water resources should be the guiding principle.
Source: Adapted from Rogers and Hall 2003

GEO YEAR BOOK "##$+#
involved in sharing transboundary freshwaterresources have grown more complex over time.The process of reaching agreements oninternational water systems, and themechanisms created therein for consultationand cooperation, provide countries with ameans of managing conflicting interests overshared freshwater resources. Organizationssuch as the Organization for Economic
Cooperation and Development (OECD) andthe Southern African Development Community(SADC) have brokered agreements andprotocols, including the Convention on theProtection and Use of Transboundary WaterCourses and International Lakes (1992) andthe Protocol on Shared Watercourse Systems inthe Southern African Development Community(2000). In 2003, the meeting of the Forum ofMinisters of Latin America and the Caribbeanalso defined management of water resourcesas a priority area for cooperation towardsustainable development of the region (Box 10).
Integrated Water ResourcesManagementWSSD Plan of Implementation: Developintegrated water resources managementand water efficiency plans by 2005
In developing an integrated approach to waterresource management, it must be recognizedthat there are fundamental linkages betweenupstream river basins and associated coastalzones. More than a third of the world’spopulation currently lives in settlements eitheron, or in close proximity to, coastal areas, andthis proportion is expected to increase in thefuture. An estimated 80 per cent of thepollutants entering coastal waters, mostly fromland-based sources, are transported via rivers(Box 11). Deforestation and other land usechanges in a river basin can increase loads ofsediment, nutrients and other chemicals tocoastal zones. Changes in flows attributable towater withdrawals for agricultural, industrial anddomestic use, and for hydropower production,can change salinities in estuaries and lagoons.
Tourism plays a major role in many riverbasins and coastal areas and has numerouslinkages with water in both systems (Box 12).At the same time, coastal zones contain someof the world’s most productive, andenvironmentally-sensitive, aquatic ecosystems,including estuaries, lagoons, mangrove forests,and coral reefs, all of which are beingsubjected to increased pressures.
Integrated Water Resources Management(IWRM) was introduced at the 1992 UNConference on Environment and Development
as a comprehensive approach for achievingsustainable freshwater resource use, reducinghuman vulnerability to water-relatedenvironmental change. At the same timeIntegrated Coastal Zone Management (ICZM)was widely advocated as the most appropriatepolicy framework for the coastal-marineinterface. Integrated Coastal Area and RiverBasin Management (ICARM) is a thirdapproach, merging the two. It promotes theadoption of goals, objectives and policies andthe establishment of governance mechanismsthat recognize the relationships between thetwo systems, with a view to developingenvironmental protection and encouragingsocio-economic development. Someinternational agreements and declarationsalready recognize this freshwater-coastallinkage such as the Convention on Protectionand Use of Transboundary Waters andInternational Lakes, the Global Programmeof Action for the Protection of the MarineEnvironment from Land-based Activities,and the EU Water Framework Directive.
f eature
f ocus
Box 11: Freshwater – coastlinkages in the Danube-BlackSea region
The Danube and Black Sea region contains thesingle most important non-oceanic water bodyin Europe. Every year, about 205 km3 of riverwater pour from the Danube into the Black Seafrom an 800 000 km2 basin.
The Black Sea is one of the most remarkableregional seas in the world. It is almost cut offfrom the rest of the world’s oceans but it is upto 2 212 metres deep. Its eutrophication sincethe 1960s, due to excessive loads of nutrientsthat enter via the rivers and directly from thecoastal activities, has had a major impact onbiological diversity and human use of the sea,including fisheries and recreation.
During recent years there has been a majorchange for the better due to a reduction in theuse of fertilizers in Black Sea catchment areas(see nitrogen cascade issue in the EmergingChallenges section).
Sources: ERN 2003, CEC 2001, Mee 2001
Box 10: LAC environment ministersplace water high on the agenda
The 14th Meeting of the Forum of Ministers of LatinAmerica and the Caribbean (LAC) defined themanagement of water resources as one of the prioritiesin the implementation of the LAC Initiative forSustainable Development. A decision adopted duringtheir November meeting in Panama City recognizeswater as an essential resource for life and economicdevelopment, and highlights activities such as tourismand agricultural irrigation.
In reaffirming the internationally-agreed target to halve,by the year 2015, the proportion of people with nosustainable access to safe drinking water and sanitation,the ministers committed their countries to initiatives forintegrated management of water resources throughwatershed management. They guaranteed the activeparticipation of all stakeholders, especially through thecreation of watershed councils or local managementbodies, and through workshops.
Furthermore they committed their countries to promote:
● user friendly and accessible technologies to preventwater loss and pollution by fostering sound water useand sanitation;
● the identification and evaluation of groundwaterresources in arid regions as an alternative forguaranteeing access to water in terms of quality andquantity;
● incentives and economic instruments for theprotection of natural resources (forests and water),such as economic compensation for public andprivate stakeholders who contribute to conservationof the environment; and
● The adoption of integrated planning approaches thattake into account the linkages between land use,watershed and coastal zone management, especiallyfor the region’s Small Island Developing States (SIDS).
Source: UNEP 2003b

+*FEATURE FOCUS: FRESHWATER
Many governments, internationalagencies and organizations, and donorscurrently use IWRM as a guiding principleto achieve sustainable freshwater resources.The World Water Council and the GlobalWater Partnership (2000) actively promotethe implementation of this concept.Nevertheless, successful implementationof IWRM remains elusive and there are fewconcrete examples of it in action. Practicalguidance on appropriate methods andtechniques for better identifying, analysingand integrating the various scientific,technical and socio-economic elementsto be considered in a given case is stillurgently needed (Box 13), and remainsa significant constraint to the effectiveimplementation of relevant freshwaterprogrammes and activities.
Stakeholder rolesWeak accountability, on the part of bothcitizens and governments, is a significantcause of the unsustainable use of freshwaterresources (WLVC 2003). At international levelthe responsibility for freshwater issues isspread among many agencies in the UnitedNations system (FAO, IAEA, UNDP, UNEP,UNESCO, WHO, WMO, World Bank, and
others). Although many agencies have arole in one or more facets of freshwatermanagement, there is often no central entityproviding overall guidance. This pattern ofinstitutional fragmentation is not unusual –it can be seen at virtually all governmentand agency levels, whether international,national or local, and also between ministrieswith overlapping responsibilities.
Water governance refers to the range ofpolitical, social, economic and administrativesystems in place to develop and managewater resources and deliver water services,at different levels (Rogers and Hall 2003).Transparency in the decision-making processis essential, particularly to engender trustamong freshwater stakeholders. Without it,public confidence in government policies andprogrammes can be completely undermined,especially at the local level. Effective trainingof local and national governmental and non-governmental staff, particularly in buildingcoalitions, managing projects and increasingmonitoring and evaluation skills, are alsoessential elements of practical programmesand activities directed to sustainablefreshwater resources. Finally, for their part,citizens need to assume a more vigilant rolein holding governments and agencies
accountable for addressing the fundamentallinkages between socio-economicdevelopment and sustainable freshwaterresources. The principles developed bythe World Lake Vision Committee in 2003certainly also apply to the implementationof freshwater programmes (Box 14).
Box 13: Integrated assessmentfor IWRM
To achieve sustainable freshwater supplies
IWRM requires a comprehensive assessment of
the readily-available freshwater resources, as
well as the natural and anthropogenic factors
affecting their supply and demand.
The scientific and engineering elements of
such an assessment are themselves
demanding and include the quantity, quality
and location of the freshwater resources in a
drainage basin (or aquifer), as well as the
basin’s geology, physiography, soil types, flora
and fauna, types and sources of pollution,
population centres, range of land uses,
locations of water withdrawals and return
flows, and so on. The environmental linkages
between these various components must also
be identified and factored into the sustainable
management equation.
Even more important are the relevant socio-
economic elements that need to be assessed.
These include the institutions responsible for
water allocation, use and protection in the
drainage basin; the existing legal framework(s)
and effectiveness of existing water governance
mechanisms, the prevailing social and cultural
customs, the basin demography, the health
and educational characteristics of the basin’s
inhabitants, the economic characteristics of the
basin and its inhabitants, the enforcement of
existing regulations and standards and the
prevailing political realities, among others.
These socio-economic and institutional
elements are critical because they define how
people use their freshwater resources, and
whether or not they do so in a sustainable
manner.
Sources: Laszlo and others 1988, Rast 2003
Box 12: Some tourism – water interlinkages
Over the last 30 years, there has been an explosive increase in international tourism – a sector that
now generates US$474 billion per year or about US$1.3 billion per day. In addition to economic
benefits, tourism also has water-related impacts. For example, tourism contributes about seven
per cent of the total wastewater pollution in the Mediterranean, where an average tourist accounts for
180 litres of wastewater per day. In some Mediterranean islands, drinking water sources have
become contaminated with saltwater, as a result of excessive withdrawals.
Tourists often use a disproportionate amount of water. In Granada, for example, the average tourist
uses seven times more freshwater than a local person, a ratio that is common in many tourist areas
in developing countries. In the Philippines, the quantity of water used for tourism is so high that rice
paddy cultivation is threatened by reduced water availability.
There is a range of technical and management approaches for mitigating the negative impacts of
tourism on water quality and quantity. These include measures for water conservation, engineered
and natural wastewater treatment systems, and options for water reuse. Some of these solutions can
be directly implemented by tourism managers, whereas others require broader political support, such
as the development of a water management and wastewater treatment plan.
Sources: Mastny 2002, UNEP 2003c, UNWWAP 2003, WTO 2003

GEO YEAR BOOK "##$+"
f eature
f ocus
ADB (2003). Gender Checklist: Water Supply and Sanitation. Manila,Asian Development Bankhttp://www.adb.org/Documents/Manuals/Gender_Checklists/Water/water100.asp?p=gencheck
Boswinkel, J.A. (2000). Information Note. International GroundwaterResources Assessment Centre, Netherlands Institute of AppliedGeoscience
CEC (2001). Communication from the Commission: EnvironmentalCooperation in the Danube – Black Sea Region. Brussels,Commission of European Communities http://europa.eu.int/eur-lex/en/com/pdf/2001/com2001_0615en01.pdf
Dudley, N. and Stolton, S. (2003). Running Pure: The Importance ofForest Protected Areas to Drinking Water. World Bank and WorldWide Fund for Nature Alliance for Forest Conservation andSustainable Use
Dugan, P.J. (1990). Wetland conservation: a review of current issuesand action. Gland, World Conservation Union
Echavarria, M. (2002). Financing Watershed Conservation: TheFONAG Water Fund in Quito, Ecuador. In Pagiola, S., Bishop, J., andLandell-Mills, N. (eds.) Selling Forest Environmental Services: Market-based Mechanisms for Conservation and Development. London,Earthscan
References
SUSTAINING OUR FUTURE ANDMEETING OUR GOALSSound water management is key to sustainingthe future of both humanity and theenvironment. It is closely linked to theinternationally-agreed development goals.Properly harnessed and utilized, water becomesan indispensable resource for development;squandered and abused it becomes a sourceof human suffering.
An adequate freshwater supply is requiredto maintain the viability of life-supportingecosystems. Polluting water not onlydamages ecosystems, but renders waterunsafe for drinking, and unsafe drinking wateris, on a global scale, currently the single mostimportant environment-related health threat.Irrigation has significantly improved cropyields, but in many areas, it has lead toserious environmental degradation – suchas salinization and the depletion andcontamination of aquifers – which in turnreduces the amount of food that can be
produced. Negative environmental impactssuch as these soon translate into poorhuman health and economic loss. One ofthe main global challenges to sustainabledevelopment is, therefore, to balance waterconsumption for economic and socialdevelopment as well as for ecosystemfunctions and services.
Although the water outlook is still too oftenone of degradation and depletion, a crisis isnot inevitable. UNEP’s Executive Director hasdescribed 2003 as “a year where the worldhas more than ever come to understand thatcooperation over water is something likea peace policy for the 21st century.” Coupledwith this, more governments and otherfreshwater stakeholders are recognizing thatan approach that integrates the protection ofaquatic and terrestrial ecosystems within thecontext of sustainable development is the wayforward to improved water supply andsanitation, food production, humansettlements, and other priority issues.
In many parts of the world, we arefar from achieving efficient and effectivemanagement of the limited amount offreshwater that is available on our planet.And the longer we wait to change prevalentpatterns of water use, the more difficult andexpensive it will be to achieve the MDGs andWSSD targets for sustainable environmental,social and economic development, includingpoverty eradication.
A broad range of policy instruments,management techniques and longstandingas well as innovative technologies are at ourdisposal. Firm commitments by politicalleaders and decision-makers are neededto implement prioritized action plansincorporating water management to achievethe relevant goals and targets at differentlevels: local, basin, national, transboundary,regional and/or global. To do so, countriesmust strengthen institutions and legalframeworks, secure sufficient financialresources, build capacities in managingwater resources and equitably involve allstakeholders – including women – in thedesign and implementation of integratedwater resource management plans andframeworks.
More than a billion people still live in a worldof want in terms of water and sanitation andtheir numbers are still increasing. Meeting thiswater challenge is vital to moving toward aworld where people are “free from want” asunderlined in the Millennium Declaration in2000. The 2003 International Year ofFreshwater has re-emphasized the urgencybehind this commitment by the world leadersat the Millennium Summit. Achieving theagreed goals and targets requires the urgentand concerted attention of freshwaterstakeholders at all levels – today.
Box 14: Principles for implementing the World Lake Vision
● a harmonious relationship between humans and nature is essential for sustainable use;
● the drainage basin (or aquifer) is the logical starting point for planning and management actions
for sustainable use;
● a long-term approach directed to preventing the causes of freshwater degradation is essential;
● policy development and decision-making for freshwater management should be based on sound
science and the best available information;
● the management of freshwater for sustainable use requires the resolution of conflicts among
competing users, taking into account the needs of present and future generations and of nature;
● citizens and other stakeholders should be encouraged to participate meaningfully in identifying
and resolving critical water problems; and
● good governance, based on fairness, transparency and empowerment of all stakeholders,
is essential for sustainable water use.
Source: Adapted from WLVC 2003

+$FEATURE FOCUS: FRESHWATER
EEA (2003). Europe’s Water: An Indicator-Based Assessment. TopicReport 1/2003. Copenhagen, European Environment Agencyhttp://reports.eea.eu.int/topic_report_2003_1/en
ERN (2003). The Danube. River Net. European Rivers Networkhttp://www.rivernet.org/danube/basic.htm
ETC (2003). Environmental Technology Centre. Murdoch University, Perthhttp://wwwies.murdoch.edu.au/etc/pages/aboutetc/about_a.html
FAO (2003a). State of the World’s Forests 2003. Rome, Food andAgriculture Organization
FAO (2003b). Irrigation and water use per country in the year 2000.FAO AQUASTAT 2003. Rome, Food and Agriculture OrganizationLand and Water Development Divisionhttp://www.fao.org/ag/agl/aglw/aquastat/main/index.stm
FAO (2003c). Agriculture, Food and Water: a contribution to the WorldWater Development Report. Rome, Food and Agriculture Organization
FAO (2003d). The State of Food Insecurity in the World 2003:Monitoring progress towards the World Food Summit and MillenniumDevelopment Goals. Rome, Food and Agriculture Organization
Finlayson, C.M. and Davidson, N.C. (1999). Global Review of wetlandresources and priorities for wetland inventory: project description andmethodology. In Finlayson, C.M, and Spiers, A.G. (eds.) Global Reviewof Wetland Resources and Priorities for Wetland Inventory. SupervisingScientist Report No.144. Canberra, Australia, Supervising Scientist
Fry, A. and Rast, W. (1998). Industry, Freshwater and SustainableDevelopment. Geneva, World Business Council for SustainableDevelopment and United Nations Environment Programme
GEMS/Water (2003). GEMS/Water Programme. Burlington, ON,United Nations Global Environmental Monitoring Systemhttp://www.gemswater.org
Gleick, P.H. (1993). Water in Crisis: A Guide to the World’s FreshWater Resources. Oxford, Oxford University Press
Glosovsky, N.F. (1995). The Aral Sea Basin. In Kasperson, J.X.,Kasperson, R.E. and Turner II, B.K. (eds.) Comparisons of ThreatenedEnvironments. Hong Kong, United Nations University Press
Great Lakes Water Quality Board (2001). Alien Invasive Species andBiological Pollution of the Great Lakes Basin Ecosystem. WashingtonDC, Great Lakes Water Quality Board
Grossman, A., Johnson, N., Sidhu, G. (2003). Diverting the Flow:A Resource Guide to Gender, Rights, and Water Privatization.New York, Women’s Environment and Development Organizationhttp://www.wedo.org/sus_dev/diverting1.htm
GWP (2003). Poverty Reduction and IWRM. Background Paper No. 8.Stockholm, Global Water Partnership Technical Advisory Committee
Heywood, V.H. and Gardner, K. (eds.) (1995). Human Influences onBiodiversity. Global Biodiversity Assessment. United NationsEnvironment Programme. Cambridge, Cambridge University Press
Hirji, R. and Ibreek, H. O. (2001). Environmental and Water ResourcesManagement. Environment Strategy Series, No. 2. Washington DC,World Bank Environment Department
IFPRI (2001). Overcoming Water Scarcity and Quality Constraints.2020 Focus 9. Washington DC, International Food Policy ResearchInstitute http://www.ifpri.org/2020/focus/ focus09.htm
IFPRI (2002). World Water and Food to 2025: Dealing With Scarcity.Washington DC, International Food Policy Research Institute
IPCC (2001). Climate Change 2001: Impacts, Adaptation and Vulnerability.Cambridge University Press, Intergovernmental Panel on Climate Change
IUCN (2003). Invasive Species in Africa’s Wetlands. Gland, WorldConservation Union www.ramsar.org/w.n.invasives_book1.htm
Khosla, P. and Pearl, R. (2003). Untapped Connections: Gender,Water, and Poverty: Key Issues, Government Commitments, andAction for Sutainable Development. New York, Women’s Environmentand Development Organizationhttp://www.wedo.org/sus_dev/untapped1. htm
Laszlo, J.D., Golubev, G.N., and Nakayama, M. (1988). Theenvironmental management of large international basins. WaterResources Development, 4, 103–107
Mastny, L. (2002). Redirecting International Tourism. In L. Starke (ed.)State of the World 2002. New York, Norton
Mee, L. D. (2001). Eutrophication in the Black Sea and a basin-wideapproach to its control. In B. von Bodungen and R. K. Turner (eds.)Science and Integrated Coastal Management. Berlin, DahlemUniversity Press
Morris, B.L., Lawrence, A.R.L., Chilton, P.J.C., Adams, B., Calow,R.C., and Klinck, B.A. (2003). Groundwater and its Susceptibility toDegradation: A Global Assessment of the Problem and Options forManagement. Early Warning and Assessment Report Series, RS.03–3. Nairobi, United Nations Environment Programme
Prüss, A., Kay, D., Fewtrell, L., Bartram, J. (2002). Estimating theBurden of Disease from Water, Sanitation, and Hygiene at a GlobalLevel. Environmental Health Perspectives, 110, 5, 537 – 42
Rabelais, N.N., Turner, R.E., Scavia, D. (2002). Beyond science intopolicy: Gulf of Mexico Hypoxia and the Mississippi River Delta.BioScience, 52, 2, 129–142
Rast, W. (2003). Sustainable Freshwater Resources: The Promise andthe Reality. In Holland, M.M., Blood, E.R., and Shaffer, L.R. (eds.)Achieving Sustainable Freshwater Systems: A Web of Connections.Washington DC, Island Press, 11–42
Revenga, C., Brunner, J., Henninger, N., Kassem, K., and Payne, R.(2000). Pilot Analysis of Global Ecosystems: Freshwater Systems.Washington DC, World Resources Institute
Rogers, P. and Hall, A.W. (2003). Effective Water Governance.Background Paper No. 7. Stockholm, Global Water Partnership,Technical Advisory Committee
Ross, S.T. (1991). Mechanisms structuring stream fish assemblages:Are there lessons from introduced species? Environmental Biology ofFishes, 30, 359–368
Schuyt, K. and Brander, L. (2004). Living Waters: Conserving the sourceof life. Gland, World Wide Fund for Nature and Amsterdam, VrijeUniversiteit Amsterdam International Institute for Environmental Studies
Shiklomanov, I.A. (1997). Comprehensive Assessment of theFreshwater Resources of the World: Assessment of Water Resourcesand Water Availability in the World. Stockholm, World MeteorologicalOrganization and Stockholm Environment Institute
Shiklomanov, I. A. (1999). World Water Resources: Modern Assessmentand Outlook for the 21st Century. Summary of World Water Resourcesat the Beginning of the 21st Century, prepared in the framework of theIHP UNESCO. St. Petersburg, State Hydrological Institute, FederalService of Russia for Hydrometeorology & Environment Monitoring
UN (2000a). UN Millennium Development Goals (MDG). New York,United Nations http://www.un.org/millenniumgoals/
UN (2000b). We the Peoples: the role of the United Nations in the21st Century. Report of the Secretary-General to the GeneralAssembly. A/54/2000. New York, United Nations
UN (2002). WSSD Plan of Implementation. Johannesburg, United Nationshttp://www.johannesburgsummit.org/html/documents/summit_docs/2309_planfinal.htm
UNDP, UNEP, World Bank, and WRI (1998). World Resources 1998–99:A Guide to the Global Environment. New York, Oxford University Press
UNDP, UNEP, World Bank, and WRI (2000). World Resources 2000 –2001: People and Ecosystems: The Fraying Web of Life. WashingtonDC, World Resources Institute http://www.wri.org/wri/wr2000
UNEP (2000). International Source Book on Environmentally SoundTechnologies for Wastewater and Stormwater Management. Osaka,United Nations Environment Programme International EnvironmentalTechnology Centrehttp://www.unep.or.jp/ietc/Publications/TechPublications/TechPub-15/main_index.asp
UNEP (2002a). Vital Water Graphics. An Overview of the State of theWorld’s Fresh and Marine Waters. Nairobi, United NationsEnvironment Programme
UNEP (2002b). Global Environment Outlook 3. London, Earthscan
UNEP (2002c). Rainwater Harvesting and Utilization: AnEnvironmentally Sound Approach for Sustainable Urban WaterManagement. Newsletter and Technical Publications. Japan, Divisionof Technology, Industry and Economics, International EnvironmentalTechnology Centre, United Nations Environment Programmehttp://www.unep.or.jp/ietc/Publications/Urban/UrbanEnv-2/index.asp
UNEP (2002d). Atlas of International Freshwater Agreements. Nairobi,United Nations Environment Programme
UNEP (2003a). Global Mercury Assessment. Geneva, United NationsEnvironment Programme Chemicals Programmehttp://www.chem.unep.ch/mercury/Report/GMA-report-TOC.htm
UNEP (2003b). Final Report of the Fourteenth Meeting of the Forum ofMinisters of the Environment of Latin America and the Caribbean PanamaCity, Republic of Panama – 20–25 November, 2003. UNEP/LAC-IG.XIV/4
UNEP (2003c). A Manual for Water and Waste Management: What theTourism Industry Can Do to Improve Its Performance. Paris, United NationsEnvironment Programme Division of Technology, Industry, and Economics
UNEP (2004). The Aral Sea: Salvaging Remnants of a Once Great Sea.Sioux Falls, United Nations Environment Programme GRID-Sioux Falls
UNEP (in press). Urbanization and the Environment: Key Data. Nairobi,United Nations Environment Programme
UNESCO (2000). Water Use in the World: Present Situation/FutureNeeds. Paris, United Nations Educational Social and Cultural Organizationhttp://unesco.org/science/waterday2000/water_use_in_the_world.htm
UNPD (2003). World Population Prospects. New York, United NationsPopulation Division
UN-Habitat (2001). The State of the World’s Cities 2001. Nairobi,United Nations Centre for Human Settlements
UN-Habitat (2003a). The Challenge of Slums. Global Report onHuman Settlements 2003. London, Earthscan
UN-Habitat (2003b). Water and Sanitation in the World’s Cities: LocalAction for Global Goals. London, Earthscan
UNICEF (2003a). The role of women and girls. Water, Environment,and Sanitation. New York, United Nations Children’s Fundhttp://www.unicef.org/about/index.html
UNICEF (2003b). The Scope of UNICEF’s Water and SanitationActivities. Water, Environment and Sanitation. United NationsChildren’s Fund http://www.unicef.org/wes/index_action.html
UNICEF (2003c). Water, Sanitation, and Education. WaterEnvironment and Sanitation. United Nations Children’s Fundhttp://www.unicef.org/wes/index_schools.html
UNWWAP (2003). World Water Development Report: Water for People,Water for Life. World Water Assessment Programme. United NationsEducational, Scientific and Cultural Organization and Berghahn Books
WCD (2000). Dams and Development. A New Framework forDecision-Making. World Commission on Dams. London, Earthscan
WEHAB Working Group (2002). Framework for Action on Water andSanitation. Johannesburg, World Summit on Sustainable Developmenthttp://www.johannesburgsummit.org/html/documents/summit_docs/wehab_papers/wehab_water_sanitation.pdf
WHO and UNICEF (2000). Global Water Supply and SanitationAssessment 2000 Report. New York, United Nations Children’s Fund
WLVC (2003). World Lake Vision: A Call to Action. Japan, World LakeVision Committee, International Lake Environment Committee, UnitedNations Environment Programme, and Shiga Prefecture
WMO (1997). Comprehensive Assessment of the FreshwaterResources of the World. Geneva, World Meteorological Organization
WTO (2003). Tourism Highlights Edition 2003. Madrid, World TourismOrganization, http://www.world-tourism.org/market_research/facts/highlights/Highlights.pdf
WWC (1999). The Poor Pay Much More for Water... Use Much Less –Often Contaminated. Press Release. Marseilles, World Water Council
WWC (2000). World Water Vision: Results of the GenderMainstreaming Project: The Way Forward. Paris, World Water VisionUnit – World Water Council, United Nations Educational Social andCultural Organization

GEO YEAR BOOK "##$+)
f eature
f ocus
Source: Still Pictures
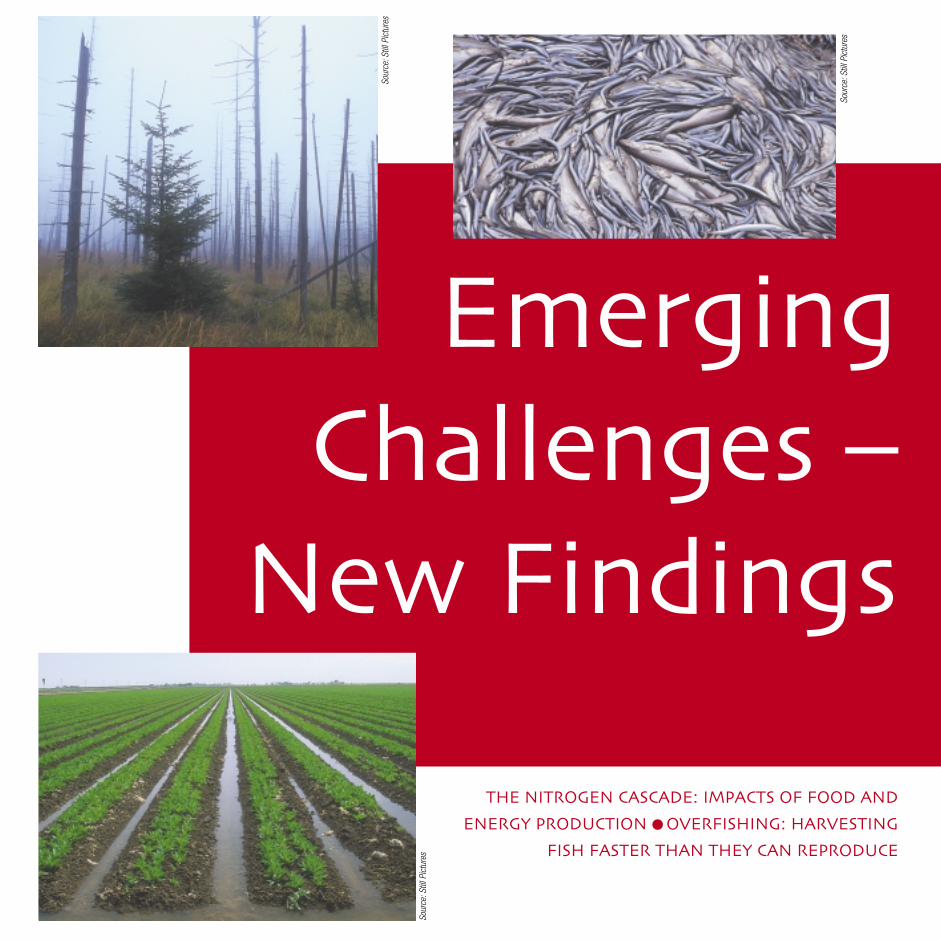
EmergingChallenges –
New Findings
THE NITROGEN CASCADE: IMPACTS OF FOOD ANDENERGY PRODUCTION ● OVERFISHING: HARVESTING
FISH FASTER THAN THEY CAN REPRODUCESo
urce
:Stil
l Pic
ture
s
Sour
ce:S
till P
ictu
res
Sour
ce:S
till P
ictu
res

Human activity is radically altering the world’snitrogen cycle through food and energyproduction. While some important food-producing systems are nitrogen-deficient,others are generating excess nitrogen,affecting air, land, and freshwater, andultimately environmental and human health.Nitrogen overload is also contributing to therapid growth of oxygen-starved zones in somecoastal waters. A new understanding ofnitrogen cycling provides the opportunity todevelop innovative and effective strategies toreduce the negative impacts of nitrogen on theenvironment and human health, whilemaintaining its benefits for society.
Three-quarters of the world’s fish stocks arebeing overexploited, threatening theirexistence, and jeopardizing the resourcesavailable for future generations. New dataabout fish stocks and the impacts of fishingmethods provide a sound scientific foundationto develop effective management regimes.
While both these emerging environmentalissues (Box 1) are globally relevant, theirextent, magnitude and impacts varysignificantly at regional and lower levels. Forexample, problems related to nitrogen exist allover the world but the nature of the problemvaries: there is too much nitrogen in someareas, while others have too little to meethuman needs. Local and regional perspectives
are, therefore, critically important to advanceour understanding of the threats andopportunities they provide. This local andregional texture is also important in designingand implementing solutions because social,cultural, political, and economic factors needto be considered for sound and effectiveenvironmental management. It is also clearthat, while people contribute to the problem,they are also part of the solution.
THE NITROGEN CASCADE:IMPACTS OF FOOD AND ENERGYPRODUCTION ON THE GLOBALNITROGEN CYCLEHuman activities have greatly increased theamount of reactive nitrogen that circulatesthrough the earth’s land, air, and water eachyear (Galloway and others 2003). The mainreason for this is the manufacture of reactivenitrogen as a fertilizer to increase foodproduction (Box 2). Nitrogen is necessary toincrease crop yields, but plants are inefficientat taking it up and often more fertilizers andanimal wastes are added than the plantsneed. As a result, only a fraction of thenitrogen applied to soils actually ends up incrops; in some regions it is less than 20 percent (Smil 1999). The rest ends up movingfreely through the environment where it mayhave serious impacts on the air, land,freshwater and oceans, as well as on humanhealth. However, some parts of the world,notably Africa, suffer the opposite problem – adeficiency of reactive nitrogen in the soil. Thiscontributes to low crop yields and to foodinsecurity in the region.
Another main source of excess reactivenitrogen in the environment has been itsinadvertent creation, in gaseous forms such asnitrogen oxides, from burning coal, oil, andnatural gas. Finally, untreated or partially treatedhuman and animal wastes add reactive
nitrogen to aquatic ecosystems, contributing todegradation and human health risks.
New insight – new understandingAlthough the environmental significance ofnitrogen has been studied for at least 150years (Box 3) scientists have only recentlydocumented how reactive nitrogen ‘cascades’through ecosystems, creating environmentaland human health problems all along the way(Galloway and others 2003). We have alsorecently come to a better understanding of themagnitude of the problem: human productionof reactive nitrogen is now greater than theamount created by natural processes on land,leading to a large increase in the amount ofnitrogen moving within the environment.Globally, humans create about 160 million
Emerging Challenges – New Findings New scientific research findings in 2003 on the nitrogen cycle and marine overfishing have shed lighton ongoing environmental challenges of global significance. Both issues are emerging environmentalchallenges in terms of strategic and adaptive policy responses and action at appropriate levels
GEO YEAR BOOK !""#$%
Box 1: Defining emerging environmentalissues
"An issue (positive or negative) which is not yetgenerally recognized but which may have significantimpact on human and/or ecosystem health.
"Emerging issues are often not ‘new’ issues, but theintensification, wider extension, transformation orchanged perception of familiar issues."
Source: Munn and others 2000
Box 2: What is reactive nitrogen?
Most of the nitrogen in the environment is in theglobal atmosphere in the form of atmosphericnitrogen (di-nitrogen or N2), where it makes up78 per cent of gases. This form of nitrogen is‘non-reactive’ and unusable by almost all livingthings, but can be made usable, or ‘reactive’,through both natural and artificial processes.In the natural process, bacteria (such asRhizobium and cyanobacteria) transform N2
from the air into ammonia (NH3) throughbiological nitrogen fixation.
Humans create reactive nitrogen from N2 inseveral ways: through the NH3-producingHaber-Bosch process (used mostly forfertilizer); through agriculture that inducesbiological nitrogen fixation (such as soybeancultivation); and as a byproduct of burningfossil fuels, which converts N2 and fossil N toreactive nitrogen oxides (NOx). Globally, aboutfive times more reactive nitrogen results fromfood production than from energy production.
Source: Galloway and others 2003

$&EMERGING CHALLENGES – NEW FINDINGS
tonnes of reactive nitrogen per year, comparedto natural rates of terrestrial biological nitrogenfixation, which are between 90–120 milliontonnes annually. However, we have notsimilarly increased de-nitrification processeswhich convert nitrogen primarily back to non-reactive N2. Reactive nitrogen is, therefore,accumulating in the environment.
Cascading through the environmentNitrogen is now known to be unusual amongthe elements that have had their cyclessignificantly perturbed by human action. As it moves along its biogeochemical pathway,the same atom of nitrogen can contribute tomany different negative impacts in sequence.Once nitrogen is converted into reactivenitrogen, it can be transported to any part ofthe system, no matter where it was introducedinto the environment. This sequence of effectshas been termed the nitrogen cascade(Figure 1). The concept of the cascade, andthe extensive research that underlies it, hasallowed us not only to determine the linkages
among the various aspects of the nitrogencycle, but also to begin to assess howchanges in one part of the cycling can delay orenhance the transfer of nitrogen to other partsof the cycle (Galloway and others 2003).
Nitrogen accumulates in the lower part ofthe atmosphere in the form of nitrous oxidethat contributes to global warming and is alsotransported to the stratosphere where itcontributes to ozone depletion. Excessreactive nitrogen in the air also results in higherconcentrations of small particles (aerosols) andincreased ozone levels (smog) in the lower partof the atmosphere, that cause respiratory
ailments in people. It may fall back to thesurface as acid rain, harming plants, corrodingbuildings, and acidifying soils, lakes, andstreams. In addition to acidification effects,it can also fertilize grasslands and forests,causing changes in species composition andoften an initial increase in plant growth,followed by, for some systems, a decrease inecosystem health. Nitrates may seep intogroundwater, making it unfit for humanconsumption. Excess reactive nitrogen is alsotransferred from the land into rivers, where itreduces biodiversity, and then to the seas andoceans where it can cause a variety of
Box 3: Our incrementalunderstanding of nitrogen
The 7th element of the periodic table wasnamed ‘nitrogene’ in 1790 by Jean AntoineClaude Chaptal (1756–1832). By 1850, thefundamental role of nitrogen in living systemsand its beneficial role in crop productionbecame clear: it was a common element inplant and animal tissues, indispensable forplant growth, underwent constant cyclingbetween organic and inorganic compounds,and was an effective fertilizer. Knowledge onthe negative impacts of nitrogen compoundson people and ecosystems also grew withtime. The contribution of nitrogen compoundsto air pollution was certainly known by the late19th century, as was the impact of excessnutrients (including nitrogen) on coastal marineecosystems, although for the latter, the focuswas on the positive impacts of nutrients onmarine productivity. It was not until the mid-20th century that negative impacts of excessnutrients were recognized as a seriousinternational problem.
Source: Nixon and Buckley 2002
Figure 1: The nitrogen cascade
Energy production
Atmosphere
Ozoneeffects
Foodproduction
People(food; fiber)
Human Activities
Norganic
TerrestrialEcosystems
Groundwatereffects
Crop Animal
Soil
Surface watereffects
Aquatic Ecosystems
ParticulateMattereffects
Forests &Grasslands
effects
Plant
Soil
Greenhouseeffects
N2O
Stratosphericeffects
N2O(terrestrial)
N2O(aquatic)
Oceaneffects
N2ONHx
NOy
NHx
NOy
Coastaleffects
Indicates denitrification potential
Agroecosystemeffects
NH3NOx
NO3NO3
NHx
NOx
Fertilizer
NO3– = nitrate
NOx = NO + NO2
NOy = other reactive nitrogen oxidesNH3 = ammoniaNHx = NH3 + NH4
+
Norganic = organic nitrogenN2O = nitrous oxide
A single atom of nitrogen can have sequential effects in various parts of the environment after it has been convertedfrom non-reactive N2 to a reactive form during energy or food production. There are three groups of reactive nitrogen compounds:● inorganic reduced forms of N: ammonia [NH3] and others forms [NHx], such as ammonium [NH4+];● inorganic oxidized forms: nitrogen oxide [NOx], nitrous oxide [N2O], nitrate [NO3-] and others [NOy]; and● organic compounds: urea, amines, proteins, nucleic acids and others [Norganic]
Source: adapted from Galloway and others 2003 and redrawn by Robert Smith, Charlottesville, US

GEO YEAR BOOK !""#$'
problems, including oxygen-starved coastalwaters that harm many forms of marine life(Box 4). The cascade continues as long as thenitrogen remains active in the environment,and it ceases only when reactive nitrogen isstored for a very long time, or is convertedback to non-reactive di-nitrogen (N2).
The enormous significance of the nitrogen
cascade comes into focus with the realizationthat it is linked with so many of the majorglobal and regional environmental challengesthat policymakers face at these levels today:ozone layer depletion, acidification of soils,global warming, surface and groundwaterpollution, biodiversity loss, and humanvulnerability. While the extent of its contribution
to these problems is still unclear, addressingthe issue of excess reactive nitrogen is one ofthe critical challenges for policymakers.
More than was bargained forReactive nitrogen does not cascade at thesame rate through all sectors of theenvironment. Some systems (most notablyforest and grassland soils) are able to slowdown the continuation of the cascade byaccumulating reactive nitrogen and thereforeacting as reservoirs. However, most systemshave a finite capacity to accumulate reactivenitrogen. As a system becomes saturated,more and more reactive nitrogen moves fromthese storage reservoirs to systems downwindor downstream. Table 1 shows those systemsthat have large accumulation potential andthose from which reactive nitrogen is mostreadily transferred. It also shows where reactivenitrogen is likely to move to, and some potentialeffects of excess nitrogen within each system.
With more anthropogenic reactive nitrogenpresent in the environment, it is likely to beincreasingly mobilized from storage reservoirs,compounding the consequences on peopleand ecosystems. However, just asanthropogenic activities have substantiallyincreased the rate of reactive nitrogenformation, so is it possible to intervene atcritical points along the nitrogen cascade andmake reactive nitrogen less abundant. This canbe done in two ways – decreasing the rate ofreactive nitrogen creation during energy andfood production, or converting reactive nitrogenback to N2 after it has been created and used.
Addressing the imbalanceRecent research is now able to helppolicymakers identify the dominant factors ineach problem area of the nitrogen cascade.Where there is excess nitrogen, the challengesare to use fertilizer more efficiently inagriculture, treat animal and human waste in amanner that will either reuse or eliminatereactive nitrogen, and reduce the amount ofnitrogen emitted from fossil-fuel burning. Eachof these steps would help to reduce bothglobal and regional impacts. In areas ofnitrogen deficiency, the challenge is to boost
Box 4: Oxygen-starved coastal zones
Oxygen-starved areas in bays and coastal waters have been expanding since the 1960s. The number ofknown locations around the world has doubled since 1990. While many of these sites are small coastal baysand estuaries, seabed areas in marginal seas of up to 70 000 km2 are also affected. Increased flows ofnitrogen from agricultural run-off and the deposition in coastal areas of air-borne nitrogen compounds fromfossil-fuel burning stimulate blooms of algae in these waters. The algae sink to the bottom where they aredecomposed by micro-organisms that use up most of the oxygen in the system, creating an inhospitablehabitat for fish, shellfish, and most other living things. In recent decades, large areas of coastal waters withharmful algal blooms, severely depleted oxygen levels, and disappearing seagrass beds have been identifiedand clearly linked with increased inputs from the nitrogen cascade.
The primary cause of these oxygen-starved areas varies. For example, the very large ‘dead-zone’ in the Gulf ofMexico is caused primarily by nitrogen from agricultural run-off, whereas the problems in the Baltic Sea,northern Adriatic Sea, Gulf of Thailand, Yellow Sea, and Chesapeake Bay result from a combination ofagricultural run-off, nitrogen compounds from fossil-fuel burning being deposited from the air, and dischargesof human wastes. Because of these different causal factors, different solutions are required.
Severe oxygen depletion of coastal waters has significant negative consequences to economically importantfisheries, ecosystem services, and biodiversity. These effects are difficult to quantify because the waters areoften simultaneously affected by overfishing and habitat destruction related to extensive coastal development.
Annual
Episodic
Periodic
Persistent
Oxygen depletion:
Global distribution of oxygen-depleted coastal zones. The 146 zones shown are associated with either majorpopulation concentrations or with watersheds that deliver large quantities of nutrients to coastal waters. (Annual – yearly events related to summer or autumnal stratification; Episodic – events occurring at irregularintervals greater than one year; Periodic – events occurring at regular intervals shorter than one year; Persistent –all-year-round hypoxia)
Sources: Boesch 2002, Caddy 2000, Diaz and others (in press), Green and Short 2003, Rabalais 2002

$(EMERGING CHALLENGES – NEW FINDINGS
reactive nitrogen in an affordable andsustainable manner.
Precision agriculture is part of the solutionas it matches the amount of nitrogen suppliedwith how much plants need both in amountand timing, reducing excessive and poorly-timed fertilizer application. Using biologicalsources of nitrogen inputs, such as nitrogen-fixing trees and cover crops (Sanchez 2002,Conway and Toenniessen 2003), togetherwith, or as an alternative to, fertilizer made inindustrial processes, can be part of asustainable solution in regions where reactivenitrogen is still a limiting factor for foodproduction, whether due to short supply, poordistribution or high cost. Developing countrieshave an opportunity to avoid the nitrogenoverload problems currently plaguingindustrialized nations by choosing improved,alternative and appropriate technologies andland use practices for supplying needednitrogen. The challenge is, of course, not tohave a negative impact on food production.
While recognizing that trade flows arebased on a wide range of factors andconsiderations, from the nitrogen perspective,relocating linked activities could have positivespin-offs. For example, producing animals inthe same regions as the food that feeds them(eg soybeans), would avoid shipping largeamounts of nutrients into regions such as theEuropean Union, where there is already anexcess of nitrogen. Locating food processing
and value-added industries in developingregions will not only help alleviate poverty butalso maintain nutrients near their agriculturalsources for more effective recycling.
Other interventions at strategic points in thenitrogen cascade can reduce the damagingimpacts of nitrogen compounds transferred toother parts of the system. Existingtechnologies can remove virtually all thenitrogen compounds from exhaust gases fromburning fossil-fuel. There are costs associatedwith this, but they are comparatively less thanthe costs of continued widespread pollution(Moomaw 2002). Alternative energy sources,which are not based on combustion ornitrogen-containing compounds, can also be
part of the solution, while appropriatesanitation technologies can help reduce theinflux of nitrogen in water systems (Box 5).
A number of countries and regionalintergovernmental organizations have takenaction on the problem of oxygen deprivationlinked to excess nitrogen accumulation inaquatic and marine ecosystems. Goals havebeen set through regional compacts to reducereactive nitrogen input to coastal and marineecosystems such as the Baltic Sea,Chesapeake Bay, and Seto Inland Sea, Japan(Boesch 2002). Steps have been taken toreduce agricultural nitrogen run-off,atmospheric deposition of nitrogen, andemissions of nutrients through sewage and
Box 5: Technology at work – sustainable sanitation
Sustainable sanitation can provide the solution for non-serviced or under-serviced communities to
meet their hygiene needs while receiving the benefits of recycling organic carbon, nitrogen and
phosphorus. By closing nutrient loops, nitrogen and phosphorus fertilizers are recycled back to grow
plants, rather than being flushed to rivers and seas where they cause contamination.
One approach is to separate the collection of urine and faecal matter. Urine is generally sterile but
contributes much of the nitrogen and phosphorus in wastewater. Once diluted, it can be used as a
fertilizer. Collected separately, the faecal matter can be composted in a composting toilet of which
several designs are available. An alternative approach to achieve sustainable sanitation for household
waste is for the graywater (from bathroom and laundry) to be treated through a wetland and the
blackwater (faeces and urine) treated to produce biogas (containing methane [CH4]), a source of
energy. After treatment the residue, which contains organic carbon, nitrogen and phosphorus, can be
applied to crops, producing food rather than moving on through the environment.
Source: UNEP 2002
Table 1. Characteristics of different systems in relation to the nitrogen cascade
System Accumulation potential Transfer potential Links to other systems Effects potential
Atmosphere Low Very high All but groundwater Human and ecosystem health, climate change
Agroecosystems Low to moderate Very high All Human and ecosystem health, climate change
Forests High Moderate, high in places All Biodiversity, net primary productivity, plant mortality,
groundwater
Grasslands High Moderate, high in places All Biodiversity, net primary productivity, groundwater
Groundwater Moderate Moderate Surface water, atmosphere Human and ecosystem health, climate change
Wetlands, streams, lakes, rivers Low to moderate Very high Atmosphere, marine coastal systems Biodiversity, ecological structure, eutrophication,
harmful algal blooms
Marine coastal regions Low to moderate Moderate Atmosphere Biodiversity, ecological structure, fish, eutrophication,
harmful algal blooms, hypoxia
Source: adapted from Galloway and others 2003

GEO YEAR BOOK !""#%"
industrial waste. Much of the progress inreducing reactive nitrogen sources is the resultof technologically-advanced waste treatmentfacilities, particularly in Europe and NorthAmerica, rather than of reductions from diffusenon-point sources such as agriculture, whichare more difficult to control.
The northwestern coastal area of the BlackSea is an example of a dramatic improvement ofan oxygen-starved zone. Following the collapseof the centrally planned economies in Easternand Central Europe, use of manufacturedfertilizers declined quickly because they were nolonger affordable. Within seven years, theamounts of nitrogen and phosphorus enteringthe Black Sea from the Danube and other rivershad dropped to half of previous levels; the ‘deadzone’ largely disappeared and fisheries haverebounded. Now the management goal is tomaintain this situation as the economy of theregion redevelops (Mee 2001).
Another example of reduction in nitrogenpollution, this time through policy intervention,comes from the Rhine River. With aninternationally agreed policy target to reducethe nitrate load in the Rhine by 50 per cent,improvements in sewage effluents andindustrial discharges by countries within theRhine basin contributed to an estimated 37per cent reduction in total nitrogen dischargeto the North Sea between 1985–2000.Further reductions will largely depend onefforts to reduce diffuse pollution fromagriculture (International Commission forProtection of Rhine 2001). The dominance ofpoint sources in the heavily populated andindustrialized Rhine region made quickreductions more easily attainable than is likelyto be the case in river basins dominatedby diffuse agricultural sources of nitrogen.
OVERFISHING: HARVESTINGFISH FASTER THAN THEY CANREPRODUCE In 2002, 72 per cent of the world’s marinestocks were being harvested faster than theycan reproduce (FAO 2002a) and fishingactivities were shown to be having an impacton important, and until recently, unresearchedand even undiscovered, marine ecosystems.
Major changes in the exploitation andmanagement of marine habitats are needed toavoid many marine fisheries from becomingcommercially extinct.
Despite an increase in the reach andintensity of commercial fishing operations andcontrary to some official data (see GEOIndicators section), the total quantity of fishcatches is estimated to have been declining byabout 700 000 tonnes a year since the late1980s (Watson and Pauly 2001). The initiativesthat have been taken for specific fisheries havebeen ineffective in addressing this downwardtrend. Alder and Lugten (2002) demonstratedfor the North Atlantic that there has been adecline in landings, despite a plethora ofagreements which focus on the managementof stocks. The measures taken for somespecies such as tuna may be too little and insome cases, such as for the cod offNewfoundland, possibly too late (Myers andWorm 2003).
Fish stocks that are recovering or rebuildingare generally small, isolated and easilymanaged, such as the orange roughy stock onNew Zealand’s North-east Chatham Rise(Ministry of Fisheries 2003). The gains inabundance are minor compared to otherstocks that continue to decline, especiallythose in the high seas shared among countries(such as the Patagonian toothfish) (Figure 1).
Other changes are taking place. Fishing fleetsare venturing farther from their home ports, offthe continental shelves and into deeper watersto meet the global demand for fish (Pauly andothers 2003). Consequently, fish are beingcaptured from stocks which were previouslyunexploited and the long-term viability of anumber of species may be jeopardized.
Illegal, unregulated and unreported (IUU)fishing has also increased in many areas.Fisheries management is primarily based onlanding data: if fish are caught and notrecorded in the official statistics then the data(including age, sex and size structure) neededfor management are distorted. If stockassessment specialists do not have a goodestimate of illegal fishing or account for it intheir analysis, the management measures thatare recommended may be inappropriate orinadequate. Techniques employed in IUUfishing also go unchecked: gear may be usedthat damages the marine environment or other,non-targeted, species including seabirds suchas the albatross, caught on long-line hooks.In 2003, greater attention was paid to illegalfishing, with many governments increasingtheir enforcement activities as one of manymeasures to address the problem ofoverfishing (FAO 2003a).
Fishing for food and revenueThe world marine fish catch in 2001, the mostrecent year for which global data are available,was reported at 84 million tonnes (FAO2003b), much of it caught by very fewcountries. According to reported statistics,the top four, accounting for over a third of theproduction from marine capture fisheries, wereChina, followed by Peru, the US and Japan.
Fisheries (marine plus inland) provide closeto 17 per cent of the total annual animalprotein consumed globally (FAO 2002a).International trade in all fisheries products(marine and inland fisheries and aquaculture)continued to be an important source ofrevenue on the global commodities markets.About 38 per cent (live weight equivalent) ofworld production entered international trade in2001. The net foreign exchange earnings forfishery commodities by developing countriesincreased from US$4 billion in 1981 toUS$17.7 billion in 2001 (Vannuccini 2003).
New analyses – new understandingIn 2003, new large-scale analyses of marinehabitats and species, and new ways ofanalysing data became available. The resultshave provided a stark warning about the
Figure 1: Patagonian toothfish (Dissostichuseleginoides)
Source: USDA Regulatory Fish Encyclopedia
20 cm

%)EMERGING CHALLENGES – NEW FINDINGS
impacts of fishing on the marine and coastalenvironment and will be helpful in addressingtrade-offs in fisheries management.
Impacts on predatory speciesChristensen and others (2003) used multiplemodels, which incorporated historical fisheriesinformation and environmental parameters, topredict the abundance of predators, such ashalibut, cod and sharks, in the North Atlanticover a 100-year period. This is the first long-term study to investigate the North Atlanticfisheries within an ecosystem context anddocument the decline of biomass for a numberof groups of organisms rather than selectedsingle-species fisheries of commercial interest.Results show that the biomass (the weight offish in a given area) of top predators in theNorth Atlantic has decreased by two-thirds inapproximately 50 years. Similar declines werenoted for other important species such asperch, anchovies, and flatfish due tooverfishing between 1900–1999.
A study of large predatory fish such astuna, shark, and swordfish in tropical andsubtropical oceans also pointed to an ongoingdecline of top-level ocean predators (Myersand Worm 2003). Their biomass was reducedby 80 per cent within 15 years of beingtargeted by the fishing industry.
These studies show how fishing activities canhave a rapid impact on marine fish populations.Many large top predators risk the same fate asthe barndoor skate, which made up 10 per centof the biomass in tows by research vessels inthe 1950s. In the last 20 years none have beencaught (Casey and Myers 1998). They alsodemonstrate how existing data, re-analysed withnew techniques, can describe the current andpossible future status of different stocks withenough resolution or detail to be of use to policyadvisors and managers.
New impacts on long-lived speciesFleets are increasingly moving beyond the200-mile limit of national jurisdiction (theExclusive Economic Zone) into the high seasand deeper waters (Pauly and Watson 2003).Consequently, fishing activities have spreadinto areas where old long-lived species such
as the orange roughy and Patagonian toothfishoccur and, until recently, were unexploited.
This is problematic. Many of these speciestake a long time to reach sexual maturity, andstocks may be quickly depleted oroverexploited once most of the older fish havebeen harvested, because the older fish are theones that reproduce. Rebuilding these stocksto sustainable levels can take 10–20 years orlonger depending on the species and degreeof overexploitation. Some species may neverrecover. Stocks of the armorhead(Pseudopentaceros wheeleri), once found onseamounts of the North Pacific, collapsed in1977 after a decade of fishing. Since then nomajor landings of this species have beenrecorded (Glover and Smith 2003).
The evidence shows that many of thesedeep sea fish stocks are highly vulnerable tooverfishing. Any exploitation should, therefore,take a precautionary approach until the lifehistory of the species is understood. Recentexperience has shown that, without thisunderstanding, sustainable fishing is notpossible – otherwise we are just mining theresource. A first step for policymakers wouldbe to put in place an international mechanismto designate and monitor high seas protectedareas. This would allow for the protection ofimportant areas or ecosystems on which manyof these long-lived species depend.
Ecosystem effectsSeagrasses form an important shallow waterecosystem that binds the seabed andreduces coastal erosion. They also provideshelter and nursery grounds for manyspecies. For example in the Philippines, 20per cent of the fish caught are associatedwith coral reefs and seagrass beds. Theglobal distribution of seagrasses was plottedfor the first time in 2003 (Green and Short2003). This atlas used information from avariety of sources and then predicteddistributions through modeling.
In many cases, distribution of seagrassbeds overlaps with intensive commercialfishing operations. This is a problem becausecertain fishing techniques drag heavy trawlinggear over the seabed, severely damaging theseagrass. Off Tanzania, in fisheries that usesuch trawling gear, 80 per cent of the by-catch in the prawn fishery is seagrass(Green and Short 2003). Studies in MaquoitBay, Maine, US, have projected that evensmall areas (0.3 km2) may take between10–17 years to recover. This can have adirect impact on the biodiversity, on localfisheries, and, ironically, on the livelihoods ofthe very people who cause the damage.Tropical and temperate coral reef ecosystemsare similarly at risk from damaging fishingtechniques (Box 6).
Box 6: Cold and deep water corals
Coral reefs do not only occur in warm tropical oceans. Cold water reefs are built by stony corals such asLophelia pertusa which flourish in the cold, nutrient and plankton rich currents on the seabed of continentalshelves and fringes down to several hundreds of metres below sea level. Cold water reefs rival their tropicalshallow-water counterparts in size, structure, complexity and biological functions, providing rich habitats thatsupport and sustain thousands of marine species, including commercial fish. Environmental threats, such asthe physical impact from trawling operations, have devastated many assemblies before scientists even knowtheir full distribution and begin to understand the ecological role of these biodiversity hotspots.
An example of a cold water coral system is the Darwin Mounds. These are located 180 km off the west coastof Scotland. The mounds are at a depth of about 1 000 m, and cover an area of approximately 100 km2.Fishing activities in this area targeted deep water species (eg blue ling, roundnose grenadier, black scabbardfish and tusk).
2003 saw an increased recognition of the importance of cold water coral systems. A European CommissionRegulation (2003/C 161 E/204) came into effect in August 2003, prohibiting the use of bottom trawls or similartowed nets within the vicinity of the Darwin Mounds. These emergency temporary measures were put in placewhile the commission develops more permanent measures to protect the area.
Source: DEFRA 2003, Freiwald and others (in press)

GEO YEAR BOOK !""#%!
Fishing down the food chainAnother effect of overfishing is the progressivedecrease of the trophic level (Box 7) of thecatch. Overexploitation of the top of the foodchain and the targeting of more abundantspecies lower in the food chain is called‘fishing down the food chain’ (Pauly andWatson 2003). Overfishing has shortened thechain and sometimes removed one or more ofthe links, increasing the system's vulnerabilityto natural and human induced stresses, aswell as reducing the supply of fish for humanconsumption (Figure 2).
Monitoring the average trophic level of fishcatches can show when stocks oflarger predatory fish are beginning to collapse.A study of fisheries off the west coast ofNewfoundland, for instance, described howthe average trophic level of the catchdecreased markedly over a 43-year period.The level went from a maximum of 3.65 in1957 to 2.6 in 2000 (Pauly and Watson 2003).This meant that, toward the end of thisperiod, fewer fish such as cod were beingcaught, the average size of fish caught wassmaller and other species, which the cod mayhave preyed upon, made up a greaterproportion of the catch, and were thereforealso being removed from the food chain. Aswell as the catch having less economic value,there are important long-term implications as,with less food, it may take cod stocks longerto recover. Overall, it is clear that managingtarget species without considering otherspecies and the ecosystem that supports thefisheries is not an effective approach.Appropriate mechanisms are needed to effectecosystem-based management thatencompasses multi-species management.
Non-food fisheries: the marineaquarium tradeBetween one-and-a-half and two millionpeople worldwide are estimated to keepmarine aquaria. The trade, which supplies thishobby with live marine animals, is worth anestimated US$200–330 million annually, andoperates throughout the tropics. Ornamentalmarine species (corals, other invertebratesand fish) are collected and transported mainly
BOX 7: What is a trophic level?
One way to understand the structure of ecosystems is toarrange them according to who eats who along a foodchain. Each link along the chain is called a trophic level.Levels are numbered according to how far particularorganisms are along the chain from the primaryproducers at level 1, to the top predators at the highestlevel. Within marine systems, large predators such assharks and saithe, are at a high trophic level, cod andsardines are in the middle, and shrimp are at a lowtrophic level with microscopic plants (mainlyphytoplankton) at the bottom sustaining marine life.
The arrows in the figure indicate who is eating who.In this example, cod are at trophic level 5, whereas thelarge saithe which eat them are on trophic level 6. Thesmall saithe, which feed on smaller prey, are at a lowertrophic level. A single species may consume prey fromseveral different levels. In this case, its trophic level iscalculated according to the proportion of its diet thatcomes from the various trophic levels it feeds on, andwill not necessarily be a whole number.
Source: Pauly and Watson 2003
Two alternative marine food chains.
Figure 2: Fishing down marine food webs
The arrow indicates how, over time, humans have depleted stocks of larger fish found closer to thesurface and are now fishing smaller fish from deeper water or on the bottom of the sea. When fish aretaken from the bottom the habitat usually changes from one rich in various plants and bottom-dwellingorganisms, to a near-lifeless muddy substrate.
Source: Daniel Pauly, Fisheries Centre, University of British Columbia, Canada

%#EMERGING CHALLENGES – NEW FINDINGS
from Southeast Asia, but also increasinglyfrom several island nations in the Indian andPacific Oceans, to the main destinationmarkets: the United States, the EuropeanUnion (EU) and, to a lesser extent, Japan(Wabnitz and others 2003).
Some 1 471 fish species and 140 coralspecies are traded worldwide. With nearlyall tropical marine aquarium fish andinvertebrates in trade taken directly from coralreefs and adjacent habitats, the aquariumindustry has attracted controversy, particularlyregarding its sustainability. A maximum of10 per cent of marine ornamental fish arecaptive-bred and probably less than one percent of the total trade in hard corals is derivedfrom cultured origins. Trade in this industryhas been on the increase. In 1997, forexample, 1 200 tonnes of coral were tradedinternationally, a tenfold increase on theamount of live coral traded in the late 1980s(Wabnitz and others 2003).
Opponents to the trade emphasize thatthere are significant challenges to achievingsustainability:
● The damaging techniques sometimes usedto collect reef specimens. Sodium cyanide,for example, is a non-selective techniqueused to capture fish. This adversely impactsthe overall health of fish and coral and non-target organisms;
● The over-harvesting of target organisms;
● The high levels of mortality associated withinsensitive shipping and poor husbandrypractices along the supply chain; and
● A paucity of information on the extent of themarine ornamental trade (Box 8).
Reducing pressureOverfishing is recognized as a problem thatneeds to be dealt with at international as wellas national level to protect fish stocks andentire ecosystems. Overall, there is a need toreduce fishing pressure in order to maintain orrestore degraded marine environments tohealthy ecosystems that include rich fishcommunities. If policymakers have the political
will to change the future of fisheries, there are anumber of options available to them, including:
● reduced quotas;
● phase-out of subsidies;
● fishery closures;
● improved monitoring and enforcement oflocal and international fishing regulationsthrough increased budgets and reducedlevels of corruption; and
● the establishment of marine protectedareas (MPAs).
The European Commission recognized thatcertain marine stocks, including herring, cod,and hake, were being overexploited in the NorthSea. In February 2003, measures came intoforce reducing fishing pressure in the area. Oneof the major pieces of legislation agreed was a
maximum of 15 days per month for vesselsfishing in restricted areas. This took into accountboth the conservation of stocks and also theeconomic reality of the impacts on livelihoods(Annex XVII to EU Regulation 2341/2002).
The federal government of Canada introducedin 2003 a plan of action to conserve cod stocksoff eastern Canada. The plan included closingthree areas to commercial fishing of cod,establishing no trawling zones, closing arecreational cod fishery and a 40 per centreduction in capelin landings, a source of food forcod (Department of Fisheries and Oceans 2003).An economic assistance package to reduce theimpact of the closure on coastal communitieswas also part of the action plan.
Marine protected areas (MPAs) are one of thetools that may be helpful in providing a refugefrom exploitation, and protecting biodiversity andessential habitats such as nursery grounds for
Box 8: Gaining an overview: the Global Marine Aquarium Database
In 2000, the UNEP World Conservation Monitoring Centre (UNEP-WCMC), the Marine Aquarium Council and
members of various aquarium trade associations began, in collaboration, to address the need for better
information and created the Global Marine Aquarium Database (GMAD). In August 2003, the dataset contained
102 928 trade records (7.7 million imported and 9.4 million exported animals) covering a total of 2 393 species
of fish, corals and invertebrates and spanning the years 1988–2003. An analysis of the database provided the
first global picture of trade in marine ornamental species.
This innovative partnership with traders has led to the collection of a unique data set and an analysis that will
assist national ministries and commercial organizations to develop a sustainable approach to the trade.
The GMAD can be accessed through the ‘Species’ page at http://www.unep-wcmc.org/
Source: Wabnitz and others 2003
On the way to the aquarium
Source: Peter Scott, Marine Aquarium Council, Hawaii, US

GEO YEAR BOOK !""#%*
fish. Studies in the Florida Keys and Caribbean(Faunce and others 2002), Southern California(Rogers-Bennett and others 2002) and thePhilippines (Alcala and others 2003) havedemonstrated that MPAs contribute to themaintenance of fish stocks. For some speciesthe spillover effect, whereby fish move from theMPAs into areas beyond, could help improve orat least maintain the exploited stocks. Forexample, several of Australia's seamounts in theSouthern Ocean are included in the Heard Islandand McDonald Islands Marine Reserve (theworld’s largest MPA) that may help to conservethe Patagonian toothfish. However, this MPA willnot contribute to conserving the toothfish unlessIUU fishing in the region is also addressed(Meyer and others 2000). MPAs are particularlyuseful when they are implemented incombination with other management measuressuch as reducing fishing effort.
CHALLENGES FOR THE FUTUREAlthough the environmental issues discussed inthis section are presented separately, they allinteract within the complex backdrop of globalchange. Our ability to understand and unravelthe integrated nature of environmentalchallenges is improving, enabling us toconsider various solutions to the differentproblems of a complicated world and choosethe best course to follow – one that causes theleast damage, and leads to the most benefits.
It is also important to tease apart interactinglocal, regional, and global drivers ofenvironmental change and to recognize thatthey vary substantially from place to place.This is vital to developing the appropriate mixof responses for any situation. Stratosphericozone depletion, climate change, andbiodiversity, for example, require globalsolutions. In other cases, including fisheries
and various challenges related to nitrogen,regional and/or national solutions also have amajor role to play.
The findings reviewed here underscore theurgent need to translate improved scientificunderstanding into improved policymaking andaction. As science targets opportunities forbetter progress, decision makers can moreeffectively use this information to addressenvironmental challenges and thereby improveconditions for all life on earth.
Alder, J. and Lugten, G. (2002). Frozen fish block: how committed areNorth Atlantic States to accountability, conservation and managementof fisheries? Marine Policy, 26, 345-357
Alcala, A.C., Russ, G.R. and Stockwell, B., (2003). Marine Reservesas Coastal and Marine Resources Management Tools. Paperpresented to the East Asian Seas Congress, 8–12 December 2003,Kuala Lumpur, Malaysia.
Boesch, D.F. (2002). Challenges and opportunities for science inreducing nutrient over-enrichment of coastal ecosystems. Estuaries,25, 886–900
Caddy, J. F. (2000). Marine catchment basin effects versus impacts offisheries on semi-enclosed seas. ICES Journal of Marine Science57:628-640.
Casey, J. M. and Myers, R. A. (1998). Near Extinction of a Large,Widely Distributed Fish. Science, 281, 690-692
Christensen, V., Guenette, S., Heymans, J. J., Walters, C. J., Watson,R., Zeller, D. and Pauly, D. (2003). Hundred-year decline of NorthAtlantic predatory fishes. Fish and Fisheries, 4, 1-24
Conway, G. and Toenniessen, G. (2003). Science for African FoodSecurity. Science, 299, 1187-1188
DEFRA (2003). News release. Department for Environment, Food andRural Affairs, U.K. http://www.defra.gov.uk/news/2003/030820a.htm
Delgado, C. L., Wada, N., Rosegrant, M.W., Meijer, S., and Ahmed,M. (2003). Outlook for Fish to 2020: Meeting Global Demand.Washington DC, International Food Policy Research Institutehttp://www.ifpri.org/pubs/fpr/pr15.pdf
Department of Fisheries and Oceans (2003). $50 Million Action Plan toAssist Fishers, Plant Workers and Communities Affected by Closure ofThree Cod Fisheries. Press Release. Ottawa, Canada. DFOhttp://www.dfo-mpo.gc.ca/media/newsrel/2003/hq-ac0424_e.htm DFO
Diaz, R.J., Nestlerode, J and Diaz, M.L. (in press). A global perspectiveon the effects of eutrophication and hypoxia on aquatic biota. In:Proceedings of the 7th International Symposium on Fish Physiology,Toxicology and Water Quality, Tallinn, Estonia, May 12-15, 2003, Rupp,G.L. and White, M.D. (editors). U.S. Environmental Protection Agency,Ecosystems Research Division, Athens, Georgia, US.
FAO (2002a). FAOSTAT on-line statistical service. Rome.http://apps.fao.org
FAO (2002b). State of the World Fisheries and Aquaculture. Rome.
FAO (2003a). FAO calls for intensified action to combat illegal fishing.Press Release. Rome.http://www.fao.org/english/newsroom/news/2003/25379-en.html
FAO (2003b). FishStat database. Rome.
Faunce, C.H., Serafy, J.E., Lorenz, J. and Snedeker, S. (2002). Fishutilization of mangrove fringe habitats within Southeastern Florida.Final report to US Geological Survey, Biological Resources Division,Florida Caribbean Science Centre. 88p.
Freiwald, A., Fossa, J., Grehan, A., Koslow, T., Roberts, M. (in press).Cold Water coral reefs. Draft background document. Commissionedby UNEP, Norway, Ireland, United Kingdom and WWF.
Galloway, J. N., Aber, J.D., Erisman, J.W., Seitzinger, S.P., Howarth,R.H., Cowling, E.B., and Cosby, B.J. (2003). The nitrogen cascade.BioScience, 53, 341-356
Glover, A. G., and Smith, C.R. (2003). The deep-sea floor ecosystem:current status and prospects of anthropogenic change by the year2025. Environmental Conservation, 30, 219–241
Green E. P. and Short, F.T. (2003). World Atlas Of Seagrasses. UNEPWorld Conservation Monitoring Centre. Berkeley, US, University ofCalifornia Press
International Commission for Protection of the Rhine (2001). TopicRhine 20th Edition http://iksr.firmen-netz.de/icpr/
Mee, L. D. (2001). Eutrophication in the Black Sea and a basin-wideapproach to its control, p. 71-91. In B. von Bodungen and R. K.Turner (eds.). Science and Integrated Coastal Management. Berlin,Germany, Dahlem University Press
Meyer, L., Constable, A. and Williams, R.. 2000. Conservation ofmarine habitats in the region of Heard Island and MacDonald Islands.Kingston, Australia, Antarctic Division Environment Australia.
Ministry of Fisheries (2003). Orange Roughy: A New Zealand SuccessStory. Press Release. Ministry of Fisheries, New Zealand.http://www.seafood.co.nz/newscentre/press/or.asp
Moomaw, W. R. (2002). Energy, industry and nitrogen: Strategies fordecreasing reactive nitrogen emissions. Ambio, 31, 2, 184-189
Munn, R. E., Whyte, A. and Timmerman, P. (2000). Emergingenvironmental issues for the 21st Century: A Study for GEO-2000.Nairobi, UNEP/DEIA&EW/TR., 99-5
Myers, R. A. and Worm, B. (2003). Rapid worldwide depletion ofpredatory fish communities. Nature, 423, 280-283
Nixon, S.W. and Buckley, B.A. (2002). "A strikingly rich zone" –Nutrient enrichment and secondary production in coastal marineecosystems. Estuaries, 25 4(B), 782-796
Pauly, D. and Watson, R. (2003). Counting the last fish. ScientificAmerican, 289, 1, 34-39
Pauly, D., Alder, J., Bennett, E., Christensen, V., Tyedmers, P. andWatson, R. (2003).The Futures for Fisheries. Science 302:1359-1361.
Rabalais, N.N. (2002). Nitrogen in aquatic ecosystems. Ambio, 31,102-112
Rogers-Bennett, L., Haaker, P.L., Karpov, K.A. and Kushner, D.J.(2002). Using spatially explicit data to evaluate marine protected areasfor abalone in Southern California. Conservation Biology, 16, 1308-1317
Sanchez, P. A. (2002). Soil fertility and hunger in Africa. Science, 295,2019-2020
Smil, V. (1999) Nitrogen in crop production: An account of globalflows. Global Biogeochem. Cycles 13: 647-662
Vannuccini, S. (2003). Overview Of Fish Production, Utilization,Consumption and Trade. Rome, FAO, Fishery Information, Data andStatistics Unit
UNEP (2002). Environmentally Sound Technology in Wastewater andStormwater Management – an International Source Book. InternationalWater Association Publishing and UNEP.
Watson, R. and Pauly, D. (2001). Systematic distortions in worldfisheries catch trends. Nature, 414, 534-536
Wabnitz, C., Taylor, M., Green, E. and Razak, T. (2003). From Oceanto Aquarium. UNEP-WCMC, Cambridge, UK
References

ATMOSPHERE ● NATURAL DISASTERS ● FORESTS
● BIODIVERSITY ● COASTAL AND MARINE AREAS
● FRESHWATER ● GLOBAL ENVIRONMENTAL ISSUES
GEOIndicators
Sour
ce:S
till P
ictu
res
Sour
ce:R
EUTE
RS/U
tpal
Bar
uah
Sour
ce:S
till P
ictu
res

Theme: ATMOSPHEREIssues: Climate changeStratospheric ozone depletionIndicators: Energy use per unit of GDP*CO2 emissions, totalCO2 emissions, per capita**Consumption of CFCs***Mountain glacier mass balance* MDG indicator no. 27 under Target 9, Goal 7
** MDG indicator no. 28(a) under Target 9, Goal 7
*** MDG indicator no. 28(b) under Target 9, Goal 7
Energy useThe amount of energy used to produce one unit of grossdomestic product (GDP) indicates the extent to whicheconomies are efficient in their consumption of suppliedenergy. Differences over time and across regions reflectnatural conditions, structural changes in the economy,changes in the energy efficiency of particular sectorsand differences in fuel mixes. In principle, the lower theratio the better the energy efficiency. Energy use per unitof GDP has decreased in all regions of the world(Figure 1), although there are not enough data to draw atrend line for the West Asia region.
GEO YEAR BOOK !""#$$
The set of GEO Indicators aims to give aconsistent and harmonized overview of themajor environmental trends at global andregional levels on an annual basis, making iteasy to track major environmental issues overthe years. For each issue, only one or twoindicators, or a few at most, are presented.These are considered to be the most suitableand reliable indicators currently available toillustrate the particular issue. Data for thepresent or even previous year can rarely bepresented, because it usually takes two tothree years to collect data from countries andcompile global databases of high quality.
A lack of good-quality data continues toplague and limit indicator selection. Althoughthere is a wealth of environmental informationaround nowadays, there are also many datagaps and shortcomings, at least with regard torobust, quantitative time series for manycountries and regions of the world. Data in theeconomic and – to a certain extent – socialdomains are generally more widely available,reliable and well understood. In the environmentaldomain, data collection is often still at an earlystage. High quality, comprehensive and timelydata on the environment remains a scarce
resource, and finding the ‘right’ information is notalways easy or possible.
Important issues where data areinadequate include freshwater quality,marine pollution, waste generation andmanagement, and land degradation. Forother issues, such as freshwater use orhazardous waste transfer, we can currentlyonly present a single year and show regionaldifferences – not yet trends as such. Untilsuch data sets are collected in a rigorous andtimely manner, following internationally agreedstandards and guidelines, significantdifficulties will exist in assessing accuratelythe extent of these problems.
Knowledge and information gaps also limitthe relevance and use of indicators in thedecision-making process. For example,casualties and damage caused by naturaldisasters give at most a vague indication ofthe vulnerability of societies to environmentalchange. Likewise, although the observedretreat of glaciers around the world appears tobe a very compelling indicator of globalwarming, the phenomenon could also belinked to other factors such as deforestation.Nevertheless, it is believed that the key trends
in pressure, state and response dynamics formajor environmental issues can still besuccessfully captured. As such, and notsurprisingly, several of the indicators presentedhere coincide with those selected formonitoring the internationally agreedenvironmental goals and targets, includingthose in the Millennium Declaration (MDGs)and WSSD Plan of Implementation.
The GEO Indicators are grouped byenvironmental thematic areas and issues.Indicators are portrayed graphically withexplanatory notes. Definitions of terms used,information sources and technical notes areprovided in an Annex to this section. Thedefinitions follow those given by the originaldata collecting agencies. The indicators arepresented at the global, regional and, in a fewcases, sub-regional level, based on theregional classification used in the GEO-3report (UNEP 2002). All data anddocumentation have been extracted from theGEO Data Portal, which holds the referencedatabase for use in the GEO assessment andreporting process (http://geodata.grid.unep.ch/).
1990
1991
1992
1993
1994
1995
1996
1997
1998
1999
2000
2001
2002
2003
160
360
Source: GEO Data Portal, compiled from United Nations Statistics Division
200
240
280
320
AfricaAsia and the Pacific
EuropeLatin Americaand the Caribbean
North Americaglobal
Figure 1: Energy use (kilogram oil equivalent) perUS$1 000 Gross Domestic Product (GDP) by region andglobal, 1990–2000
kilogram oil equivalent
GEO IndicatorsThe GEO Indicators are a set of selected quantitative parameters which reflect headline trends for themajor global and regional environmental issues addressed under the GEO reporting process

$%GEO INDICATORS
Carbon dioxide emissionsCarbon dioxide (CO2) emissions account for the largestshare of anthropogenic emissions of greenhouse gasesassociated with global warming (IPCC 2001), and maytherefore, be considered as an indicator of humanpressure on the global climatic system.
Total CO2 emissions continue to rise in most regions(Figure 2). In Europe, the emissions have decreasedslightly since 1990, partly because of implementation of
stricter regulations in the energy sector, but also due toeconomic downturn in the Central and Eastern Europeancountries. Per capita CO2 emissions show a generalstabilization or slight decline in most regions, with thehighest average for North America (Figure 3). Theincrease for West Asia around 1991 is mainly due toemissions related to the 1990–1991 Gulf War (Marlandand others 2003).
Consumption of CFCsThe depletion of the stratospheric ozone layer is to a greatextent brought about by chemicals known as ozone-depleting substances (ODS). The most widely used ofthese are the group of chlorofluorocarbons (CFCs).Emission of CFCs ultimately leads to higher concentrationsof chlorine in the atmosphere, resulting in the destructionof ozone molecules and a thinner ozone layer.
The consumption of CFCs is decreasing in most regions(Figure 4), following successful implementation of theMontreal Protocol on Substances that Deplete the OzoneLayer (UNEP 2003). It is expected that the gradualrestoration of the ozone layer will take place, but overseveral decades, provided that control measures under theMontreal Protocol are adhered to by all countries.
Mountain glacier mass balanceThe global climate shows signs of change, as witnessedby higher average temperatures during the last years,leading to melting ice caps and the retreat of mountainglaciers around the world (IPCC 2001). The yearly massbalance of a representative set of major mountain glaciers
could, therefore, reflect the pace of global warming.The yearly balance as measured at the glacier surfacerepresents the thickness change of the glacier in terms ofvolume and area. Between 1980–2001, the thickness of30 major mountain glaciers (Figure 5) has decreased byan average of six metres (Figure 6) (WGMS 2003). OnlyScandinavia has witnessed an increase, which is probablyrelated to changes in precipitation patterns. The flow ofglacier tongues reacts with a time delay of several yearsor even decades compared to climatic changes. Theaverage retreat process of mountain glaciers is, therefore,expected to continue rather dramatically in the comingdecades if the current trend in global warming remainsunchanged (Haeberli and Holzhauser 2003).
Figure 5: Location of glacier measurements
Vernagtferner, Hintereisferner, KesselwandfernerGulkana
Wolverine
PlaceSouth Cascade
Enchaurren Norte
Austre Brøggerbreen, Midre Lovénbreen
Storglaciären
Engabreen
Ålfotbreen, Nigardsbreen,GråsubreenHardangerjøkulen
Storbreen, Hellstugubreen
No. 125 (Vodopadniy), Maliy Aktru, Leviy Aktru
Urumqihe S. No. 1
Ts. Tuyuksuyskiy
DjankuatSt. Sorlin, Sarennes
GriesSilvretta
Caresèr
Sonnblickkees
Source: WGMS 2003
1989
1991
1992
1993
1994
1995
1996
1997
1998
1999
2000
2001
2002
2003
1990
0
25 000
Source: GEO Data Portal, compiled from United Nations Statistics Division
5 000
10 000
15 000
20 000
AfricaAsia and the Pacific
North AmericaWest Asiaglobal
Figure 2: Total carbon dioxide emissions (milliontonnes of CO2) by region and global, 1989–2000
million tonnes of CO2
EuropeLatin America and the Caribbean
1989
1991
1992
1993
1994
1995
1996
1997
1998
1999
2000
2001
2002
2003
1990
0
25
Source: GEO Data Portal, compiled from United Nations Statistics Division
5
10
15
20
AfricaAsia and the Pacific
North AmericaWest Asiaglobal
Figure 3: Total carbon dioxide emissions (tonnesof CO2) per capita by region and global, 1989–2000
tonnes of CO2
EuropeLatin America and the Caribbean
1988
1991
1992
1993
1994
1995
1996
1997
1998
1999
2000
2001
2002
2003
1990
1989
0
900 000
Source: GEO Data Portal, compiled from UNEP Ozone Secretariat
300 000
AfricaAsia and the Pacific
North Americaglobal
ODP tonnes
EuropeLatin Americaand the Caribbean
600 000
Figure 4: Consumption of chlorofluorocarbons (tonnes ofozone depleting potential) by region and global, 1988–2002
No data: Africa 1990–93; Asia and the Pacific 1990, 1991; West Asia

Theme: NATURAL DISASTERSIssue: Human vulnerability to extremenatural eventsIndicators: Number of people killed by naturaldisasters Number of people affected by natural disasters
The numbers of people killed and affected duringdisasters reflect both exposure to the physical threatsand the capacity of individuals and communities to copewith those threats. Both of them are indicators of humanvulnerability and (in)ability to cope with these events.
Number of people killedFor the period 1986–2002, the average total numberof reported deaths from natural disasters wasapproximately 46 000 per year for the world as a whole.Actual numbers vary considerably from one year to thenext, and no clear trend is discernible (Figure 7).
Number of people affectedOver the same period, the number of people affectedglobally by natural disasters, including those injured andleft homeless, has risen substantially (Figure 8). In 2002,this figure reportedly reached a total of 600 million.
Economic losses are estimated to have multipliedfive times since the 1970s, to a total of US$629 billionfor the 1990s (IFRC 2002), while it should be noted thatmany costs are unaccounted for, especially indeveloping countries.
GEO YEAR BOOK !""#$&
97
1975
1976
1977
1978
1979
1980
1981
1982
1983
1984
1985
1986
1987
1988
1989
1990
1991
1992
1993
1994
1995
1996
1997
1998
1999
2000
2001
2002
2003
153
106
861
185
Source: GEO Data Portal, compiled from OFDA/CRED
Figure 7: Number of people killed (per million of population) by region and global, 1975–2002
number of people per million
0
10
20
25
15
5
30
35
40
45
50
60
55
65
70
75
80
85
No data: West Asia 1976, 1978, 1979, 1980, 1984, 1986, 1988, 1990, 1994, 1995, 1999.
AfricaAsia and the Pacific
EuropeLatin Americaand the Caribbean
North AmericaWest Asiaglobal
1975
1979
1981
1983
1985
1987
1989
1991
2001
2003
1977
1993
1995
1997
1999
1976
1978
1980
1982
1984
1986
1988
1990
1992
1994
1996
1998
2000
2002
0
180 000
Source: GEO Data Portal, compiled from OFDA/CRED
20 000
120 000
140 000
160 000
Figure 8: Number of people affected (per million of population) by region and global, 1975–2002
number of people per million
No data: North America 1975, 1976. 1978, 1981, 1988, 1990; West Asia 1976, 1978, 1979, 1980, 1983, 1984, 1986, 1988,1990, 1994,1997, 2001.
100 000
80 000
60 000
40 000
AfricaAsia and the Pacific
EuropeLatin America and the Caribbean
North AmericaWest Asiaglobal
2003
0
Source: WGMS 2003
-7
-6
-5
-4
based on 30 glaciers (29 for 2001)
-1
-2
-3
Figure 6: Glacier mass balance (metres), global average,1980–2001
metres
1980
1992
1994
1996
1998
2000
1990
1982
1984
1986
1988
2002
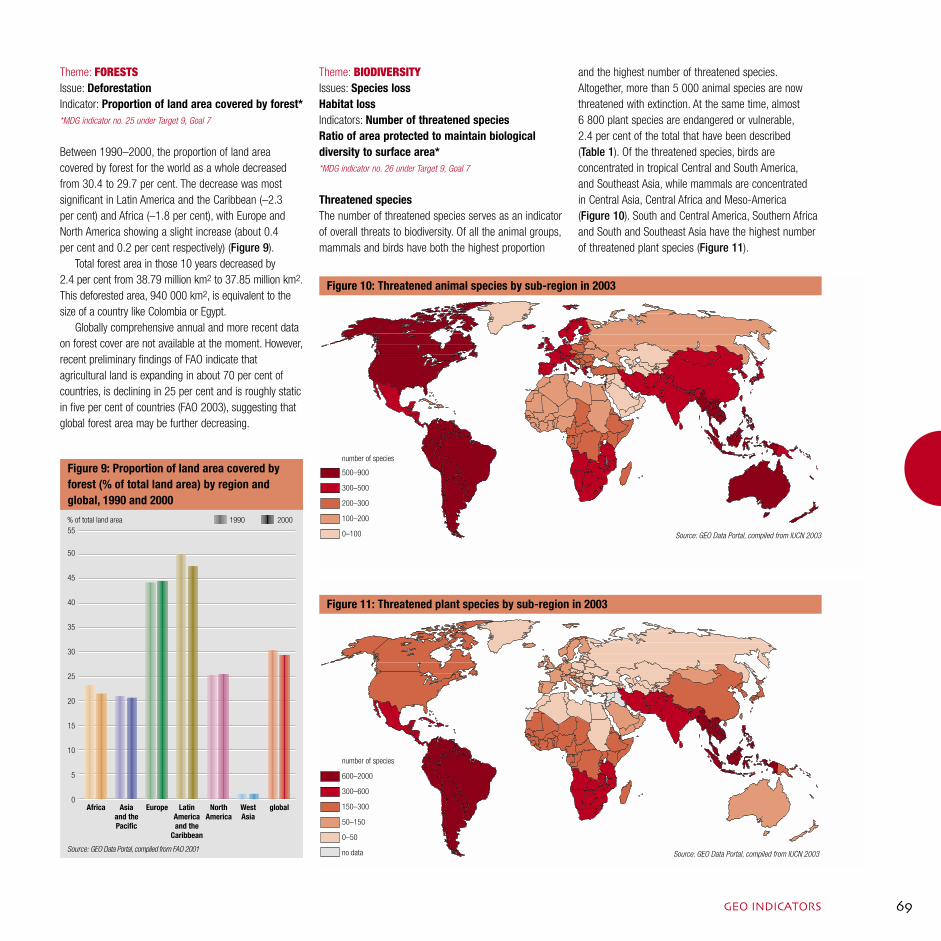
$'GEO INDICATORS
Theme: FORESTSIssue: DeforestationIndicator: Proportion of land area covered by forest**MDG indicator no. 25 under Target 9, Goal 7
Between 1990–2000, the proportion of land areacovered by forest for the world as a whole decreasedfrom 30.4 to 29.7 per cent. The decrease was mostsignificant in Latin America and the Caribbean (–2.3per cent) and Africa (–1.8 per cent), with Europe andNorth America showing a slight increase (about 0.4per cent and 0.2 per cent respectively) (Figure 9).
Total forest area in those 10 years decreased by2.4 per cent from 38.79 million km2 to 37.85 million km2.This deforested area, 940 000 km2, is equivalent to thesize of a country like Colombia or Egypt.
Globally comprehensive annual and more recent dataon forest cover are not available at the moment. However,recent preliminary findings of FAO indicate thatagricultural land is expanding in about 70 per cent ofcountries, is declining in 25 per cent and is roughly staticin five per cent of countries (FAO 2003), suggesting thatglobal forest area may be further decreasing.
Theme: BIODIVERSITYIssues: Species lossHabitat lossIndicators: Number of threatened speciesRatio of area protected to maintain biologicaldiversity to surface area* *MDG indicator no. 26 under Target 9, Goal 7
Threatened speciesThe number of threatened species serves as an indicatorof overall threats to biodiversity. Of all the animal groups,mammals and birds have both the highest proportion
and the highest number of threatened species.Altogether, more than 5 000 animal species are nowthreatened with extinction. At the same time, almost6 800 plant species are endangered or vulnerable,2.4 per cent of the total that have been described(Table 1). Of the threatened species, birds areconcentrated in tropical Central and South America,and Southeast Asia, while mammals are concentratedin Central Asia, Central Africa and Meso-America(Figure 10). South and Central America, Southern Africaand South and Southeast Asia have the highest numberof threatened plant species (Figure 11).
1990 2000
0
55
Source: GEO Data Portal, compiled from FAO 2001
45
% of total land area
50
Africa Asiaand thePacific
LatinAmericaand the
Caribbean
NorthAmerica
globalWestAsia
40
35
30
25
20
15
10
5
Europe
Figure 9: Proportion of land area covered byforest (% of total land area) by region andglobal, 1990 and 2000
Figure 10: Threatened animal species by sub-region in 2003
500–900
300–500
200–300
100–200
0–100
number of species
Source: GEO Data Portal, compiled from IUCN 2003
Figure 11: Threatened plant species by sub-region in 2003
600–2000
300–600
150–300
50–150
0–50
no data
number of species
Source: GEO Data Portal, compiled from IUCN 2003

GEO YEAR BOOK !""#%"
Protected areasThe proportion of area protected to maintain biodiversityindicates the level of policy response to the issue. Notingthat many important natural sites are not protected atall, and realizing that those under protection are notalways very well managed and adequately recorded, theproportion of area under protection has increased sincethe 1970s and is now estimated to be more than 12 percent of the earth’s land surface (or 18.8 million km2).Excluding those for which no starting data is known, thetotal is about 11 per cent (Figure 12).
Approximately 1.64 million km2 comprise marineprotected areas – 0.5 per cent of the surface area of
the oceans and less than one-tenth of the overall extentof protected areas worldwide. Marine areas remainunder-represented in the global protected area system(Chape and others 2003).
About nine per cent of total land area is classifiedunder IUCN management categories. The areas which arenot classified account for about 35 per cent of the totalnumber of sites, or 25 per cent of the total protected area.
The jump for West Asia between 1990–1995 is dueto establishment of a single large protected area(640 000 km2) in Saudi Arabia in 1994.
Theme: COASTAL AND MARINE AREAS Issue: Unsustainable use of living marine resources Indicator: Marine capture
Overexploitation of fisheries and other living marineresources threatens not only human food security butalso the sustainability of marine ecosystems. Three-quarters of fisheries stocks are maximally exploited, andmany have collapsed as a result of years ofunsustainable harvests (FAO 2002).
In 2001, reported global marine capture amounted toabout 84 million tonnes of fish, crustaceans andmolluscs (Figure 13) (but see Annex on data reliability).Since the late-1980s, this figure has not changeddramatically at the global level, with oscillations in thesecond half of the 1990s having been attributed to the1997–1998 El Niño event.
1960
1965
1970
1975
1980
1985
2003
1990
1995
2000
0
100
Source: GEO Data Portal, compiled from FAO (FISHSTAT Plus)
60
80
AfricaAsia andthe Pacific
EuropeLatin Americaand theCaribbean
North America
global
Figure 13: Catch of living marine resources(million tonnes) by region and global,1970–2002
million tonnes
40
20
West Asia
90
70
50
30
10
Table 1: Threatened species
Number of Threatened Threatened species in 2003Group described species species in 2003 as percentage of described species
Mammals 4 842 1 130 23.3
Birds 9 932 1 194 12.0
Reptiles 8 134 293 3.6
Amphibians 5 578 157 2.8
Fishes 28 100 750 2.7
Insects 950 000 553 0.1
Molluscs 70 000 967 1.4
Plants 287 655 6 774 2.4
Source: IUCN 2003
Africa
Africa
Asia and the Pacific
Asia and the Pacific
Europe
Europe
Latin America and theCaribbean
Latin America and theCaribbean
North America
North America
West Asia
West Asia
global
global
IUCN classified
total*
1975
1980
1985
2005
1990
1995
2000
0
25
Source: GEO Data Portal, compiled from UNEP-WCMC
Figure 12: Protected areas as percentage of total land area by region and global, 1975–2004
% of total land area
20
15
10
5
* total excludes thoseprotected areas for whichno starting date is known

%(GEO INDICATORS
Theme: FRESHWATERIssues: Sustainable water useAccess to improved water supply and sanitationIndicators: Water use per capitaWater use as percentage of annual renewableresourcesProportion of population with access to improvedwater supply*Proportion of population with access to improvedsanitation***MDG indicator no. 30 under Target 10, Goal 7
**MDG indicator no. 31 under Target 10, Goal 7
Water useThe indicators of water use reflect the overallanthropogenic pressure on freshwater resources. Theyalso give an indication of human vulnerability to watershortages and the need for adjustments in watermanagement policies. In many areas, water use isunsustainable: withdrawal exceeds recharge rates andthe water bodies are overexploited. The depletion ofwater resources can have negative impacts on aquaticecosystems and, at the same time, undermine the basisfor socio-economic development.
The map of per capita water use in 2000 by sub-regions (Figure 14) illustrates a high consumption,
for example, in Central Asia, North America and theMashriq. (The global average amounts to 633 m3/capita/year.) Water use is relatively low in most Africansub-regions: Southern Africa, Western Africa, EasternAfrica and Central Africa.
When relating water use to the availability ofrenewable water resources in the regions, countries inNorthern Africa, the Arabian Peninsula and the Mashriqstand out with values well over 100 per cent, indicatingthat more water is consumed than is available internally(Figure 15). A high percentage of use of renewable waterresources is also observed in Central and South Asia.
Water supply and sanitationAccess to improved water supply and sanitation isabsolutely crucial to human health while the availabilityof a reliable water supply and sanitation infrastructurehelps protect water resources from overexploitation andpollution, and maintain ecosystem health.
During 1990–2000, the percentage of the worldpopulation with access to improved water supply andsanitation rose from 78 to 82 per cent and 51 to 61per cent respectively (WHO/UNICEF 2003) (Figures 16and 17). However, despite the progress achieved, in 2000about 2.4 billion people still lacked access to improvedsanitation and 1.1 billion lacked access to safe drinkingwater (UNSD 2002).
There are not enough data reported by Europeancountries to include this region in the figures.
1990 2000
nodata
0
100
Source: GEO Data Portal, compiled from WHO/UNICEF
40
Figure 16: Population with access to improved watersupply (% of total) by region and global, 1990 and 2000
% of total population
Africa Asiaand thePacific
Latin Americaand the
Caribbean
NorthAmerica
globalWestAsia
20
60
80
10
30
50
70
90
Figure 14: Per capita water use (m3) by sub-region in 2000
1 700–2 500
800–1 700
600–800
200–600
<200
no data
m3
Source: GEO Data Portal, compiled from FAO (AQUASTAT)
Figure 15: Water use as percentage of quantity of annual renewable water resources by sub-region in 2000
>100
40–100
20–40
10–20
<10
no data
%
Source: GEO Data Portal, compiled from FAO (AQUASTAT)

GEO YEAR BOOK !""#%!
Theme: GLOBAL ENVIRONMENTAL ISSUESIssue: International environmental governance Indicator: Number of parties to multilateralenvironmental agreements
A number of multilateral environmental agreements(MEAs) have been negotiated and adopted to addressenvironmental issues of global significance. The MEAs
are important frameworks for global environmentalgovernance, and the number of countries and regionalorganizations that have ratified an MEA is an indicationof political will to address the issue concerned.
Ratification of the selected agreements has steadilygrown over time (Figure 18), with conventions such asCITES, CBD, World Heritage, UNFCCC (excluding theKyoto Protocol) and Vienna (including the Montreal
Protocol) approaching the maximum possible numberof parties. Taking an overview of the ratification of the13 MEAs, the proportion of maximum possibleratifications has increased in all regions. Europe, forexample, has reached a ratification rate of 78 per centof the maximum possible if all countries ratified all theMEAs. The rate stands at 71 per cent for the world as awhole (Table 2).
BaselUNCLOS
UNFCCC
POPs
UNCCD
Ramsar
PIC
Kyoto
Vienna/Montreal
CITIES
World Heritage
CBD
CMS
1971
1973
1975
2003
1977
1981
1983
1979
1985
1987
1989
1991
1993
1995
1997
1999
2001
0
200
Source: GEO Data Portal, compiled from MEA Secretariats
Figure 18: Number of parties to multilateral environmental agreements, 1971–2003
number of parties
160
140
120
80
180
100
40
20
60
Table 2: Number of parties to multilateral environmental agreements, by region*
PotentialNumber of ratifications Sum of maximum Overall
ratifications (no.of % ratifiedRegion World Vienna/ of all 13 countries (of possible(no. of countries) CBD CMS CITES Heritage Kyoto Montreal Ramsar PIC POPs UNCCD UNCLOS UNFCCC Basel MEAs x13) maximum)
Africa (53) 52 27 51 45 23 51 38 13 11 53 38 52 37 491 689 71
Asia and the Pacific (45) 44 9 28 39 33 41 23 8 8 44 33 44 33 387 585 56
Europe** (49) 46 36 44 48 34 46 46 15 11 46 35 46 46 499 637 78
LAC (34) 32 7 32 31 27 33 25 6 7 33 27 33 30 323 442 73
West Asia (12) 10 3 7 11 1 10 0 5 2 2 9 10 10 80 156 51
North America (2) 1 0 2 2 1 2 2 1 1 2 0 2 1 17 26 65
Global (195) 185 82 164 176 119 183 134 48 40 180 142 187 157 1 797 2 535 71
* Data on the number of parties as of December 2003. **Including the European Community as a separate party.Source: see Annex
1990 2000
0
100
Source: GEO Data Portal, compiled from WHO/UNICEF
40
Figure 17: Population with access to improved sanitation(% of total) by region and global, 1990 and 2000
% of total population
Asiaand thePacific
LatinAmericaand the
Caribbean
NorthAmerica
globalWestAsia
20
60
80
Africa
90
70
50
30
10no
data

%#GEO INDICATORS
Chape, S., Blyth, S., Fish, L., Fox, P. and Spalding, M. (compilers)(2003). 2003 United Nations List of Protected Areas. Gland, WorldConservation Union and Cambridge, United Nations EnvironmentProgramme World Conservation Monitoring Centre.http://www.unep.org/PDF/un-list-protected-areas.pdf
FAO (2001). Global Forest Resource Assessment 2000. Main Report.Rome, Food and Agriculture Organization
FAO (2002). State of the World Fisheries and Aquaculture 2002.Rome, Food and Agriculture Organization
FAO (2003). State of the World's Forests 2003 (SOFO). Rome, Foodand Agriculture Organization
FAO AQUASTAT (2003). Aquastat Information Service on Water inAgriculture and Rural Development. Food and AgricultureOrganization.http://www.fao.org/waicent/faoinfo/agricult/agl/aglw/aquastat/main/index.stm
FAO FISHSTAT Plus (2003). FISHSTAT Plus system. Food andAgriculture Organization.http://www.fao.org/fi/statist/FISOFT/FISHPLUS.asp
Haeberli, W. and Holzhauser, H. (2003). Alpine Glacier Mass ChangesDuring the Past Two Millennia. PAGES News 11, 1, 13-5
IPCC (2001). Climate Change 2001: The Scientific Basis. Contribution
of Working Group I to the Third Assessment Report of theIntergovernmental Panel on Climate Change. Cambridge, and NewYork, Cambridge University Press
IRFC (2002). World Disaster Report 2002. Geneva, InternationalFederation of Red Cross and Red Crescent Societies
IUCN (2003). 2003 IUCN Red List of Threatened Species.http://www.redlist.org/
Marland, G., Boden, T.A., and Andres, R. J. (2003). Global, Regional,and National Fossil Fuel CO2 Emissions. In Trends: A Compendium ofData on Global Change. Carbon Dioxide Information Analysis Center,Oak Ridge National Laboratory, US Department of Energy, Oak Ridge.
OFDA/CRED. EM-DAT (2003): The OFDA/CRED International DisasterDatabase. Brussels, Université Catholique de Louvain.http://www.cred.be/emdat/
UNEP (2002). Global Environment Outlook 3. Past, Present andFuture Perspectives. London, Earthscan
UNEP (2003). Information Provided by the Parties in Accordance WithArticle 7 of the Montreal Protocol on Substances That Deplete theOzone Layer. UNEP/OzL.Pro/15/4. 14 October 2003. FifteenthMeeting of the Parties to the Montreal Protocol on Substances ThatDeplete the Ozone Layer. Nairobi, 10-14 November 2003.http://www.unep.org/ozone/mop/15mop/15mop-4.e.pdf
UNEP-WCMC (2003). World Database on Protected Areas.http://sea.unep-wcmc.org/wdbpa/
UNSD (2002). United Nations Millennium Development Goals Dataand Trends, 2002. Report of the Interagency Expert Group on MDGIndicators, New York, April 2002. Statistics Division, Department ofEconomic and Social Affairs of the United Nations Secretariat.http://unstats.un.org/unsd/mi/mdg_report.pdf
Watson, R. and Pauly, D. (2001). Systematic distortions in worldfisheries catch trends. Nature, 414, 534-6
WGMS (2003). Glacier mass balance data. Zurich, World GlacierMonitoring Service. http://www.geo.unizh.ch/wgms
WHO/UNICEF (2003). Joint Monitoring Programme for Water Supplyand Sanitation. World Health Organization and United NationsChildren's Fund. http://www.wssinfo.org/en/22_wat_global_en.htmland http://www.wssinfo.org/en/32_san_global_en.html
References
Annex
GEO Indicators, units of measurement, sources of data and notes
Indicator, unit of measurement and source(s)
Energy use per unit of GDPUnit of measurement: kilogram of oil equivalent per US$1 000 of GDP converted from nationalcurrencies using purchasing power parity (PPP) conversion factors for the year 1995.Source: UN Statistics Division (UNSD) (as compiled from the International Energy Agency (IEA)and the World Bank).
Emission of CO2 (per capita) is the total amount of CO2 emitted by a country as a consequenceof human production and consumption activities, divided by the population of the country.Unit of measurement: tonne.Source: UNSD (as compiled from the United Nations Framework Convention on Climate Change(UNFCCC) and Carbon Dioxide Information Analysis Center (CDIAC)).
Consumption of CFCs is defined as production plus imports minus exports of controlledsubstances reported to the Secretariat of the Montreal Protocol by parties.Unit of measurement: tonne of ozone-depleting potential.Source: UNEP (Ozone Secretariat).
Mountain glacier mass balance represents a mean specific net (annual) balance of arepresentative set of major mountain glaciers.Unit of measurement: metre.Source: World Glacier Monitoring Service.
Number of people killed by natural disasters is the number of persons confirmed as dead andpersons missing and presumed dead.Number of people affected is the number of persons requiring immediate assistance, ierequiring basic survival needs such as food, water, shelter, sanitation and immediate medicalassistance.Unit of measurement: number.Source: OFDA/CRED EM-DAT.
Proportion of land area covered by forest.Unit of measurement: per cent.Source: FAO (Global Forest Resource Assessment).
Notes
Energy use is calculated by the IEA as production of fuels + inputs from other sources + imports – exports – international marine bunkers + stock changes.It includes coal, crude oil, natural gas liquids, refinery feedstocks, additives, petroleum products, gases, combustible renewables and waste, electricity and heat.Real GDP comes from the national income accounts deflated by reference to PPP tables prepared by the International Comparisons Program.
In the CO2 emission estimates of the CDIAC, the calculated country emissions of CO2 include emissions from consumption of solid, liquid and gas fuels;cement production; and gas flaring. National reporting to UNFCCC that follows the Intergovernmental Panel on Climate Change guidelines is based on nationalemission inventories and covers all sources of anthropogenic CO2 emissions as well as carbon sinks.
Ozone-depleting potential (ODP) is the ratio of the impact on ozone of a chemical compared to the impact of a similar mass of CFC-11. Thus, the ODP of CFC-11 is defined as 1.0.The five CFCs compiled for MDG indicator no.28 are CFC-11, CFC-12, CFC-113, CFC-114 and CFC-115.Not all parties meet reporting deadlines in time. Illegal production and trade are not covered by the reporting process.
Mass balance is calculated by dividing volume (expressed in m3) by area (expressed in m2), and represents thickness change of glaciers.Reliable time-series data are only available for a limited set of glaciers.
A disaster is a situation or event, which overwhelms local capacity necessitating a request to national or international level for external assistance; an unforeseenand often sudden event that causes great damage, destruction and human suffering. Natural disasters include droughts, earthquakes, extreme temperatures,famine, floods, insect infestation, slides, volcanic eruptions, wave/surges, wild fires and windstorms. Though often caused by nature, disasters can have humanorigins. Wars and civil disturbances that destroy homelands and displace people are included among the causes of disasters. Other causes can be buildingcollapse, blizzard, tornado, epidemic, explosion, fire, hazardous material or transportation incident (such as a chemical spill), or nuclear incident.The number of persons killed is usually more reliable than the number of affected people, because deaths are formally and better registered than those lefthomeless or injured. The database of people affected is compiled from various sources, including UN agencies, NGOs, insurance companies, research institutesand others, who may apply different procedures and definitions for the collection and reporting of the data. The total number of affected people could exceed thecountry population due to the fact that the same individual could be affected by more than one disaster or could be counted in more than one category.
Forest includes natural forests and forest plantations. The term refers to land with more than 10 per cent tree cover and area of more than 0.5 ha. Forests aredetermined both by the presence of trees and the absence of other predominant land uses. The trees should be capable of reaching a minimum height of fivemetres. Young stands that have not yet reached, but are expected to reach a crown density of 10 per cent and tree height of five metres are included underforest, as are temporarily unstocked areas. The term includes forests used for purposes of production, protection, multiple use or conservation (i.e. forest innational parks, nature reserves and other protected areas), as well as forest stands on agricultural lands (eg windbreaks and shelterbelts of trees with a widthof more than 20 m) and rubberwood plantations and cork oak stands. The term specifically excludes stands of trees established primarily for agriculturalproduction, for example fruit tree plantations. It excludes trees planted in agroforestry systems.

GEO YEAR BOOK !""#%)
Indicator, unit of measurement and source(s)
Number of threatened species.Unit of measurement: number.Source: IUCN (Red List of Threatened Species).
Ratio of area protected to maintain biological diversity to surface area.Unit of measurement: per cent.Source: UNEP-WCMC (World Data Base on Protected Areas)
Marine capture is a nominal catch of fish, crustaceans and molluscs in marine areas.Unit of measurement: tonne.Source: FAO (FISHSTAT Plus).
Water use per capita is annual gross quantity of water produced and used for agricultural,industrial and domestic purposes divided by the population of the country.Unit of measurement: cubic metre.Source: FAO (AQUASTAT).
Water use as a percentage of annual renewable resources is annual gross quantity ofwater produced and used for agricultural, industrial and domestic purposes as a percentage ofthe quantity of annual renewable water resources.Unit of measurement: per cent.Source: FAO (AQUASTAT).
Proportion of population with access to improved water supply.Unit of measurement: per cent.Source: WHO/UNICEF (Joint Monitoring Programme for Water Supply and Sanitation).
Proportion of population with access to improved sanitation.Unit of measurement: per cent.Source: WHO/UNICEF (Joint Monitoring Programme for Water Supply and Sanitation).
Number of parties to multilateral environmental agreements is the number of countriesand political and/or economic integration organizations, which have deposited their instrumentof ratification, accession, acceptance or approval of each of the 13 multilateral environmentalagreements (MEAs) listed in the next column. The list also includes status of ratification Webpage addresses of MEA secretariats.Unit of measurement: number.Source: MEA Secretariats.
Notes
The term ‘threatened species’ includes species listed as Critically Endangered, Endangered and Vulnerable i.e. those facing an extremely high risk, very highrisk or high risk of extinction in the wild, respectively, according to the relevant criteria for population size, range, and maturity as established under the IUCNRed List system.Regional time-series data cannot be presented due to the changes in reporting and definitions over the years.On the whole, only a small proportion of described species has been evaluated for threatened status. For animals, only birds and mammals are (almost)all evaluated (100 and 99 per cent respectively), while insects have been evaluated for less than 0.1 per cent of species. For plants, gymnosperms (mainlythe conifers and cycads) are the only major group to be almost completely evaluated (93 per cent).The data on species threatened in each group do not mean that the remainder are all not threatened. A number of species in many of the groups listed arelisted as Near Threatened or Data Deficient. Species assessed as Least Concern are often not reported and are not included. The numbers evaluated aretherefore an under-estimate.Due to changes in the classification system, the plant figures do not include species from the 1997 IUCN Red List of Threatened Plants.
Protected area is area of land and/or sea especially dedicated to the protection and maintenance of biological diversity, and of natural and associated culturalresources, and managed through legal or other effective means.The six IUCN management categories provide an internationally agreed framework within which countries can structure their protected area systems. IUCNmanagement categories are Strict Nature Reserve (Ia); Wilderness Area (Ib); National Park (II); Natural Monument (III); Habitat/Species Management Area (IV);Protected Landscape/Seascape (V); Managed Resource Protected Area (VI).Some sites (about eight per cent of the number of sites or five per cent of the total area) do not have a start or entry date registered in the database, andtherefore cannot be included in trend analysis.
Fish categories include demersal, pelagic and other marine fish and freshwater and diadromous fish caught in marine areas, as taken for commercial,industrial, recreational and subsistence purposes. The harvest from mariculture, aquaculture and other kinds of fish farming is excluded. Catches areexpressed in live weight, that is the nominal weight of the organisms at the time of capture.Data include all quantities caught and landed for both food and feed purposes but exclude discards. Data on illegal fish catch are not available.The general availability of fisheries data has not improved significantly over the last two decades, and although the available statistics probably reflect generaltrends reliably, the annual figures and the assessments involve some uncertainty. Recent publications have questioned the accuracy of the statistics fromcertain countries (Watson and Pauly 2001, FAO 2002).
It does not include other in situ uses: energy, mining, recreation, navigation, fisheries and the environment, which are typically non-consumptive uses of water.The typology of water use is independent from the source of water. Demands are covered by water production: withdrawals from natural sources, fossil waterabstraction (non-renewable production), non-conventional water production (including use of desalinated and treated wastewater). Some countries use theterm ‘water withdrawal’ or ‘water abstraction’ instead of ‘water use’, which could result in an under-estimation of total water use or consumption.Time series data for water consumption are not available for most countries.
Renewable water resources is the sum of internal and external renewable water resources. Internal renewable water resources (IRWR) is the part of thewater resources (surface water and groundwater) generated from endogenous precipitation. External renewable water resources is the part of the country’srenewable water resources shared with neighbouring countries. Renewable water resources corresponds to the maximum theoretical amount of wateravailable for a country in an average year over a long reference period. IRWR is computed by summing average annual surface run-off and groundwaterrecharge occurring inside the countries’ borders.Data refer to water use divided by natural renewable resources, except for regional values, where IRWR estimates were used to avoid double counting.(See also the notes on water use above.)
‘Improved’ water supply technologies are: household connection, public standpipe, borehole, protected dug well, protected spring, rainwater collection.‘Not improved’ are: unprotected well, unprotected spring, vendor-provided water, bottled water (based on concerns about the quantity of supplied water, notconcerns over the water quality), tanker truck-provided water. It is assumed that if the user has access to an ‘improved source’ then such source would belikely to provide 20 litres per capita per day at a distance no further than 1 km.In 1990, data for 75 per cent of world population were available. In 2000, data for 90 per cent of world population were available. Time series cannot beshown due to lack of data.
‘Improved’ sanitation technologies are: connection to a public sewer, connection to septic system, pour-flush latrine, simple pit latrine, ventilated improvedpit latrine. The excreta disposal system is considered adequate if it is private or shared (but not public) and if it hygienically separates human excreta fromhuman contact.In 1990, data for 75 per cent of regional population were available. In 2000, data for 87 per cent of regional population were available. Time series cannotbe shown due to lack of data.
Convention on Biological Diversity (CBD): http://www.biodiv.org/world/parties.asp.Convention on the Conservation of Migratory Species of Wild Animals (CMS): http://www.unep-wcmc.org/cms/.Convention on International Trade in Endangered Species of Wild Fauna and Flora (CITES): http://www.cites.org/eng/parties/chronolo.shtml.Convention Concerning the Protection of the World Cultural and Natural Heritage (World Heritage): http://whc.unesco.org/nwhc/pages/doc/main.htm.Kyoto Protocol to the UN Framework Convention on Climate Change (Kyoto): http://unfccc.int/resource/convkp.html.Vienna Convention for the Protection of the Ozone Layer and its Montreal Protocol on Substances that Deplete the Ozone Layer (Vienna/Montreal):http://www.unep.ch/ozone/ratif.shtml.Convention on Wetlands of International Importance Especially as Waterfowl Habitat (Ramsar): http://www.ramsar.org/key_cp_e.htm.Rotterdam Convention on the Prior Informed Consent Procedure for Certain Hazardous Chemicals and Pesticides in International Trade (PIC):http://www.pic.int/en/ViewPage.asp?id=345.Stockholm Convention on Persistent Organic Pollutants (POPs): http://www.pops.int/documents/signature/signstatus.htm.UN Convention to Combat Desertification in Those Countries Experiencing Serious Drought and/or Desertification Particularly in Africa (UNCCD):http://www.unccd.int/convention/ratif/doeif.php.UN Convention on the Law of the Sea (UNCLOS): http://www.un.org/Depts/los/convention_agreements/convention_agreements.htm.UN Framework Convention on Climate Change (UNFCCC): http://unfccc.int/resource/convkp.html.Basel Convention on the Control of Transboundary Movements of Hazardous Wastes and Their Disposal (Basel): http://www.basel.int/ratif/ratif.html.

%*
Acronyms and abbreviationsAarhus Convention on Access to Information, Public Convention Participation in Decision-Making and Access to
Justice in Environmental MattersAC Accession CountriesAFP Asia Forest PartnershipAIA Advance Informed AgreementAIMS Atlantic, Indian Ocean, Mediterranean, and the
South China Seas (SIDS grouping)AMAP Arctic Monitoring and Assessment ProgrammeAMCEN African Ministerial Conference on the Environment ANWR Arctic National Wildlife RefugeASEAN Association of Southeast Asian NationsASTER advance spaceborne thermal emission and reflection
radiometerAU African UnionBasel Basel Convention on the Control of Transboundary Convention Movements of Hazardous Wastes and their DisposalBPoA Barbados Programme of ActionCAC Codex Alimentarius CommissionCAFF Arctic Council’s Conservation of Arctic Flora and
FaunaCartagena Cartagena Protocol on Biosafety to the Protocol Convention on Biological Diversity CBD Convention on Biological DiversityCCD Convention to Combat Desertification in Those
Countries Experiencing Serious Drought and/orDesertification Particularly in Africa
CDIAC Carbon Dioxide Information Analysis CenterCDM Clean Development MechanismCE Central EuropeCEC Commission for Environmental CooperationCEE Central and Eastern EuropeCFCs chlorofluorocarbonsCITES Convention on International Trade in Endangered
Species of Wild Fauna and FloraCMS Convention on the Conservation of Migratory
Species of Wild AnimalsCNG compressed natural gasCO2 carbon dioxideCPAN Circumpolar Protected Areas NetworkCRED Centre for Research on the Epidemiology of
DisastersCSD Commission on Sustainable DevelopmentDALY disability adjusted life yearDRC Democratic Republic of CongoEC European CommunityEEA European Environment AgencyEEZ Exclusive Economic ZoneEfE Environment for Europe ENN Environmental News NetworkEROS Earth Resources Observation System of USGSERSDAC Earth Remote Sensing Data Analysis CenterEspoo Convention on Environmental Impact Assessment Convention in a Transboundary Context EVI Environment Vulnerability IndexEU European UnionFAO Food and Agriculture Organization of the UNFLEG Forest Law Enforcement and Governance G-8 Group of 8, an informal group of eight countries:
Canada, France, Germany, Italy, Japan, Russia, theUnited Kingdom and the United States
GCC Gulf Cooperation CouncilGC/GMEF Governing Council/Global Ministerial Environment
ForumGDP Gross Domestic ProductGEO Global Environment Outlook of UNEPGEMS Global Environment Monitoring SystemGFMC Global Fire Monitoring Center GHG greenhouse gasGIWA Global International Waters Assessment
GMAD Global Marine Aquarium DatabaseGMOs genetically modified organismsGRID Global Resource Information DatabaseGSFC Goddard Space Flight CenterHCFCs hydrochloroflourocarbonsHIPCs Heavily Indebted Poor CountriesHIV/AIDS human immunodeficiency virus/acquired
immunodeficiency syndromeIAEA International Atomic Energy AgencyIBAMA Brazilian Institute of the Environment and Renewable
Natural Resources ICARM integrated coastal area and river basin managementICES International Council for the Exploration of the Sea ICIMOD International Centre for Integrated Mountain
DevelopmentICRAN International Coral Reef Action NetworkICZM integrated coastal zone managementIEA International Energy AgencyIFCS Intergovernmental Forum on Chemical SafetyIFRC International Federation of Red Cross and Red
Crescent SocietiesILAC Latin American and Caribbean Initiative for
Sustainable DevelopmentIMO International Maritime OrganizationINPE National Institute for Space Research (Brazil)INSERM French National Institute for Health and Medical
Research IPCC Intergovernmental Panel on Climate ChangeIPPC International Plant Protection Convention IRWR internal renewable water resourceITOPF International Tanker Owners Pollution Federation
Ltd.ITTO International Tropical Timber OrganizationIUCN World Conservation UnionIUCN/SSC World Conservation Union/Species Survival
CommissionIUU illegal, unregulated and unreportedIWRM integrated water resources managementJAROS Japan Resources Observation System OrganizationKNMI Royal Netherlands Meteorological InstituteKyoto Protocol Kyoto Protocol to the UN Framework Convention on
Climate ChangeLAC Latin America and the CaribbeanLMOs living modified organismsMAC Marine Aquarium CouncilMDGs internationally agreed development goals contained
in the UN Millennium Declaration MEAs multilateral environmental agreementsMETI Ministry of Economy, Trade and Industry of JapanMODIS moderate resolution imaging spectroradiometerMPAs marine protected areasN nitrogenN2 di-nitrogen NH3 ammoniaNH4+ ammonium ionN2O nitrous oxideNO nitric oxideNO2 nitrogen dioxideNO3- nitrateNOX nitrogen oxidesNASA National Aeronautics and Space AdministrationNEPAD New Partnership for Africa’s DevelopmentNGO non-governmental organizationNOAA National Oceanic and Atmospheric AdministrationNRCAN Natural Resources CanadaNRTEE National Round Table on the Environment and the
Economy (Canada)O2 molecular oxygen ODP ozone depleting potential
ODS ozone-depleting substanceOECD Organization for Economic Cooperation and
DevelopmentOFDA Office of US Foreign Disaster AssistanceOSCE Organization for Security and Cooperation in Europe PCBs polychlorinated biphenylsPIC Rotterdam Convention on the Prior Informed
Consent Procedure for Certain HazardousChemicals and Pesticides in International Trade (PIC)
PM particulate matterPOPs persistent organic pollutantsPPP purchasing power parityPRTRs Pollutant Release and Transfer Registers Ramsar Convention on Wetlands of International Convention Importance Especially as Waterfowl Habitat REC Regional Environmental Centre for Central and
Eastern EuropeROPME Regional Organization for the Protection of the
Marine Environment SADC Southern African Development CommunitySAICM Strategic Approach to International Chemicals
ManagementSIDS Small Island Developing State(s)SNASPE National System of Protected Areas of the State
(Chile)SOPAC South Pacific Applied Geoscience CommissionTERM Transport and Environment Reporting MechanismUNCLOS UN Convention on the Law of the Sea UNDP United Nations Development ProgrammeUNECE United Nations Economic Commission for EuropeUNEP United Nations Environment ProgrammeUNEP-WCMC UNEP World Conservation Monitoring CentreUNESCO United Nations Educational, Scientific and Cultural
Organization UNFCCC United Nations Framework Convention on Climate
ChangeUNFF United Nations Forum on ForestsUNGA United Nations General AssemblyUN-Habitat United Nations Programme for Human SettlementsUNHCR United Nations High Commission for RefugeesUNICEF United Nations Children’s FundUNSD United Nations Statistics DivisionUNWWAP United Nations World Water Action ProgrammeUSCCSP United States Climate Change Science ProgramUSEPA United Sates Environmental Protection AgencyUSFWS United States Fish and Wildlife ServiceUSGS United States Geological SurveyVienna/ Vienna Convention for the Protection of the Ozone Montreal Layer and its Montreal Protocol on Substances that
Deplete the Ozone LayerWE Western EuropeWEHAB Water, Energy, Health, Agriculture and Biodiversity
InitiativeWGEM Ad Hoc Working Group on Environmental Monitoring
of the UNECEWGMS World Glacier Monitoring ServiceWHO World Health OrganizationWMO World Meteorological OrganizationWorld Bank International Bank for Reconstruction and
Development (IBRD) and the InternationalDevelopment Association (IDA)
World Convention Concerning the Protection of the Heritage World Cultural and Natural HeritageWRI World Resources InstituteWSSD World Summit on Sustainable DevelopmentWTO World Trade OrganizationWWC World Water CouncilWWDR World Water Development ReportWWF World Wildlife Fund for Nature

Acknowledgements
GEO YEAR BOOK !""#%$
Those listed below have contributed to the GEO Year Book 2003in a variety of ways, as authors, reviewers, contributors andparticipants in meetings.
AFRICAAbel Afouda, Département de Mathématiques, Université d'Abomey-Calavi, Bénin; Hans E. Beekman, South Africa; Mateete Bekunda,Faculty of Agriculture, Makerere University, Uganda; RonaldChawatama, Southern African Research and Documentation Centre,Musokotwane Environment Resource Centre for Southern Africa,Zimbabwe; Fatma Denton, Programme Energie, Environnement etDéveloppement du Tiers-Monde, Sénégal; Evans Kituyi, African Centrefor Technology Studies, Kenya; Takawira Machimbidza, NationalUniversity of Science and Technology, Zimbabwe; MaClaude Mafaiti,Southern African Development Community, Botswana; Clever Mafuta,Southern African Research and Documentation Centre, MusokotwaneEnvironment Resource Centre for Southern Africa, Zimbabwe; PatriciaMamvoto, Southern African Research and Documentation Centre,Musokotwane Environment Resource Centre for Southern Africa,Zimbabwe; Leonissah Munjoma, Southern African Research andDocumentation Centre, Musokotwane Environment Resource Centrefor Southern Africa, Zimbabwe; R. D. Munro, XXCEL Africa Limited,Kenya; Admire Ndhlovu, Midlands State University, Zimbabwe; EricOdada, Pan African Start Secretariat, Kenya National Academy ofSciences, University of Nairobi, Kenya; Youba Sokona, ProgrammeEnergie, Environnement et Développement du Tiers-Monde, Sénégal;Justice Utete, University of Zimbabwe, Zimbabwe.
ASIA and the PACIFICSharad P. Adhikary, Himalayan Climate Centre, Nepal; MozaharulAlam, Bangladesh Centre for Advanced Studies, Bangladesh; SuruchiBhadwal, The Energy and Resources Institute, India; PreetyBhandari, The Energy and Resources Institute, India; Twinkle Chopra,United Nations Environment Programme Regional Resource Centre forAsia and the Pacific, Thailand; Michelle Finnemore, GatewayAntarctica, Centre for Antarctic Studies and Research, University ofCanterbury, New Zealand; Goen Ho, Environmental TechnologyCentre, Murdoch University, Australia; Mylvakanam Iyngararasan,United Nations Environment Programme Regional Resource Centre forAsia and the Pacific, Thailand; Sunghan Jo, Department ofEconomics, Andong National University, Republic of Korea; K. VijayaLakshmi, Environment Systems Branch, Development Alternatives,India; Achira Leophairatana, United Nations Environment ProgrammeRegional Resource Centre for Asia and the Pacific, Thailand; VishalNarain, The Energy and Resources Institute, India; Shilpa Nischal,The Energy and Resources Institute, India; Purna Chandra LallRajbhandari, United Nations Environment Programme RegionalResource Centre for Asia and the Pacific, Thailand; TunnieSrisakulchairak, United Nations Environment Programme RegionalResource Centre for Asia and the Pacific, Thailand; Christopher G.Zamora, Asean Centre for Energy, Indonesia.
EUROPETheo Beckers, Institute for Globalization and SustainableDevelopment, The Netherlands; Tom Bigg, International Institute forEnvironment and Development, United Kingdom; Hans-Georg Bohle,South Asia Institute, University of Heidelberg, Germany; PhilippeBourdeau, Université Libre de Bruxelles, Belgium; Ian Douglas,School of Geography, University of Manchester, United Kingdom; JanWillem Erisman, Energy Research Centre of the Netherlands, TheNetherlands; Susan Greenwood Etienne, Scientific Committee onProblems of the Environment, France; Sherry Heileman, France; CarloHeip, Department of Ecosystems Studies, Centre for Estuarine andMarine Ecology, Netherlands Institute of Ecology, The Netherlands;Holger Hoff, Potsdam Institute for Climate Impact Research,
Germany; Mikhail Ivanov, Institute for Microbiology, Russian Academyof Sciences, Russian Federation; Ola Johannessen, NansenEnvironmental and Remote Sensing Center, Norway; Werner Klein,Fraunhofer Institute for Molecular Biology and Applied Ecology,Germany; Lucien Laubier, Centre d’Océanologie de Marseille, StationMarine d’Endoume, France; Edmund McManus, United NationsEnvironment Programme World Conservation Monitoring Centre,United Kingdom; Duncan McQueen, International Institute forEnvironment and Development, United Kingdom; ChristianNellemann, Global Resource Information Database-Arendal, Norway;Véronique Plocq Fichelet, Scientific Committee on Problems of theEnvironment, France; Hanna Reid, International Institute forEnvironment and Development, United Kingdom; Mirjam Schomaker,France; Uno Svedin, The Swedish Research Council for Environment,Agricultural Sciences and Spatial Planning, Sweden; Ronan Uhel,European Environment Agency, Denmark; Sonja Vermeulen,International Institute for Environment and Development, UnitedKingdom; Simon Wilson, Arctic Monitoring and AssessmentProgramme, The Netherlands; Adrian Wood, University ofHuddersfield, United Kingdom.
LATIN AMERICA and the CARIBBEANHernán Blanco, Recursos e Investigación para el DesarrolloSustentable, Chile; Nicola Borregaard, Recursos e Investigación parael Desarrollo Sustentable, Chile; Francisco Brzovic Parilo, Instituto deAsuntos Públicos, Universidad de Chile, Chile; Gerardo Evia, CentroLatino Americano de Ecología Social, Uruguay; Eduardo Gudynas,Centro Latino Americano de Ecología Social, Uruguay; Edgar E.Gutiérrez Espeleta, Observatorio del Desarrollo, Universidad deCosta Rica, Costa Rica; Ramón Pichs, Centro de Investigación de laEconomia Global, Cuba; Verónica Quirici, Centro Latino Americanode Ecología Social, Uruguay; Yosu Rodríguez Aldabe, Centro deInvestigación en Geografía y Geomática "Ing. Jorge L. Tamayo" A.C.,México; Osvaldo Sala, Departamento de Ecología, Facultad deAgronomía, Universidad de Buenos Aires, Argentina; Jose Sarukhán,Instituto de Ecología, Ciudad Universitaria, México.
NORTH AMERICAJackie Alder, Fisheries Centre, University of Vancouver, Canada;Sabrina Barker, Global Environment Monitoring System/Water,Environment Canada, Canada; Gene Berry, Lawrence LivermoreNational Laboratory, University of California, United States; Donald F.Boesch, University of Maryland Center for Environmental Science,United States; Joanna Burger, Rutgers University, United States;Pamela Chasek, International Institute for SustainableDevelopment/Earth Negotiations Bulletin, United States; Robert J.Diaz, Virginia Institute of Marine Science, United States; NoelleEckley, International Institute for Sustainable Development/EarthNegotiations Bulletin, United States; Amie Figueiredo, United NationsEnvironment Programme, Division of Early Warning and Assessment -North America, United States; Andrew S. Fraser, Global EnvironmentMonitoring System/Water, Environment Canada, Canada; James N.Galloway, Environmental Sciences, University of Virginia, UnitedStates; Chandra Giri, Science Application International Cooperation,Earth Resources Observation Satellites Data Center, United States;Alessandra Giuliani, United Nations Environment Programme,Regional Office for North America, United States; Betsy Hartmann,Population and Development Program, Hampshire College, UnitedStates; Susan Hassol, Aspen Global Change Institute, United States;Anthony C. Janetos, The H. John Heinz III Center for Science,Economics and the Environment, United States; Martin Jeffries,Geophysical Institute, University of Alaska, United States; David Keith,Department of Engineering and Public Policy, Carnegie MellonUniversity, United States; Tiina Kurvits, Global Resource InformationDatabase-Arendal, c/o Canadian Polar Commission, Ottawa, Canada;
Douglas A. Landis, Department of Entomology, Center for IntegratedPlant Systems, Michigan State University, United States; Craig Long,National Oceanic and Atmospheric Agency, National Weather Service,United States; Gyde Lund, Forest Information Services, United States;William Mansfield, United Nations Environment Programme, RegionalOffice for North America, United States; Margaret McCauley, UnitedStates Department of State, United States; Jerry M. Melillo, TheEcosystems Center, Marine Biological Laboratory, United States; RamChandra Mishra, United Nations Environment Programme, Division ofEarly Warning and Assessment -North America, United States; ErikaMonnati, United Nations Environment Programme, Division of EarlyWarning and Assessment – North America, United States; DerekMueller, Centre for Northern Studies, Laval University, Canada; TedMunn, Institute for Environmental Studies, University of Toronto,Canada; Adil Najam, Department of International Relations andCenter for Energy and Environmental Studies, Boston University,United States; Ramakrishna R. Nemani, National Aeronautics andSpace Administration Ames Research Center, United States; JoshuaT. Newton, Department of Geosciences, Oregon State University,United States; Prisna Nuengsigkapian, International Institute forSustainable Development/Earth Negotiations Bulletin, United States;Cheryl Palm, The Earth Institute at Columbia University, United States;Walter Rast, Aquatic Station, Department of Biology, Southwest TexasState University, United States; Richard Robarts, Global EnvironmentMonitoring System/Water, Environment Canada, Canada; MarkSchulman, International Institute for Sustainable Development/EarthNegotiations Bulletin, United States; Joni Seager, Department ofGeography, University of Vermont, United States; Sabrina Shaw,International Institute for Sustainable Development/Earth NegotiationsBulletin, United States; Robert L. Smith, United States; Chris Spence,International Institute for Sustainable Development/Earth NegotiationsBulletin, United States; Elsa Tsioumani, International Institute forSustainable Development/Earth Negotiations Bulletin, United States;Lynn Wagner, International Institute for SustainableDevelopment/Earth Negotiations Bulletin, United States; Anne Whyte,Mestor Associates, Canada; Aaron T. Wolf, Department ofGeosciences, Oregon State University, United States.
WEST ASIAMohammad S. Abido, Arabian Gulf University, Bahrain; Asma Ali AbuHussein, Arabian Gulf University, Bahrain; Abdullah Al-Droubi, ArabCentre for the Studies of Arid Zones and Drylands, Syria; Sabah Al-Jenaid, Arabian Gulf University, Bahrain; Waleed K. Al-Zubari,Arabian Gulf University, Bahrain; Mohammed M. Awny, Arabian GulfUniversity, Bahrain; Mohamed Aiet Belaid, Arabian Gulf University,Bahrain; Ameur Ben Mansoura, Arab Centre for the Studies of AridZones and Drylands, Syria; Yousif H. Edan, Arabian Gulf University,Bahrain; Adel Gouda, Arab Centre for the Studies of Arid Zones andDrylands, Syria; Sherif Kandil, Arabian Gulf University, Bahrain; AnwarSh. Abdoh Khalil, Arabian Gulf University, Bahrain; Saeed AbdullaMohammed, Arabian Gulf University, Bahrain; Abdulnaser H. Zayed,Arabian Gulf University, Bahrain.
UNEPMahmood Y. Abdulraheem; Abdu Ghassim Al-Assiri; Alex Alusa;Abdul Elah Al-Wadaee; A. Basel Al-Yousfi; Fareed Bushehri; DagDaler; Rob de Jong; Halifa Drammeh; Habib El-Habr; Ayman El-Talouny; Leone Gaetano; Jörn Heppeler; Melanie Hutchinson;Shafqat Kakakhel; Tim Kasten; Elizabeth Khaka; Isabel Martínez;Timo Maukonen; Patrick M’mayi; Kakuko Nagatani-Yoshida; NaomiPoulton; Daniel Puig; Mark Radka; Keith Robinson; FritsSchlingemann; Megumi Seki; Nalini Sharma; Surendra Shrestha;David Smith; Ricardo Sánchez Sosa; Anna Stabrawa; EstherSyokau; Sekou Toure; Veerle Vandeweerd; Brennan Van Dyke;Sabine Wildevuur.

GEO YEAR BOOK 2003 Collaborating Centres
Arabian Gulf University (AGU)
http://www.agu.edu.bh
Centro Latino Americano deEcología Social (CLAES),
http://www.ambiental.net/claes
European Environment Agency(EEA)
http://www.eea.eu.int
Global Resource InformationDatabase (GRID-Arendal)
http://www.grida.no/
International Institute forSustainable Development (IISD)
http://www.iisd.ca
Arab Centre for the Studies ofArid Zones & Drylands (ACSAD)
http://www.acsad.org
RING Alliance of PolicyResearch Organizations
c/o International Institute forEnvironment and
Development (IIED)
http://www.iied.org/index.html
Global Coordinating Team:
Marion Cheatle
Munyaradzi Chenje
Harsha Dave
Volodymyr Demkine
Carolyne Dodo
Winnie Gaitho
Tessa Goverse
Josephine Wambua
Regional Coordinating Team:
Adel F. Abdel-Kader
Keith Finlayson
Ashbindu Singh
Subrato Sinha
Ron Witt
Jaap van Woerden
Kaveh Zahedi
Electronic References
and Web-editing:
John Mugwe
Brian Ochieng
Public Awareness
and Outreach:
Eric Falt
Beth Ingraham
Nick Nuttall
Audrey Ringler
Support Team:
Ivar Baste
Jacquie Chenje
Dan Claasen
Andrea DeBono
Salif Diop
Mark Ernste
R. Norberto Fernández
Gregory Giuliani
Steve Halls
Christian Lambrechts
Steve Lonergan
Joanna Reid
Pinya Sarasas
Stefan Schwarzer
Jinhua Zhang
PRODUCTION
Southern African Research andDocumentation Centre (SARDC),
Musokotwane EnvironmentResource Centre for Southern
Africa (IMERCSA)
http://www.sardc.net/
Scientific Committee onProblems of the Environment
(SCOPE)
http://www.icsu-scope.org
The Energy and ResourcesInstitute (TERI)
http://www.teri.res.in
Observatorio del Desarrollo
Universidad de Costa Rica
http://www.odd.ucr.ac.cr

“It is our duty individually and collectively to takestock of the issues and developments of 2003 andof the measures taken during the year to achieve a
more sustainable future for the environment.”From the Preface by Klaus Töpfer, Executive Director, United Nations Environment Programme
The GEO Year Book 2003 is the first in an annual series associated with the UnitedNations Environment Programme (UNEP) flagship report, Global Environment
Outlook (GEO). Based upon a collaborative/comprehensive tracking and stocktakingprocess established with partners, the GEO Year Book 2003 includes:
• An Overview of major global and regional environmental issues and developments that shaped policy decisions and actions during the course of the year
• A Feature Focus on Water and its critical role in realizing variousinternationally-agreed development goals and targets,
including those contained in the UN MillenniumDeclaration and in the Plan of Implementation agreed at
the World Summit on Sustainable Development
• Emerging Challenges – New Findings presentingscientific progress made in 2003 that may assistsociety in recognizing and better understanding
emerging environmental issues and help decisionmakers in designing adequate responses
• GEO Indicators highlighting some of the keyglobal and regional environmental issues and trends
that have been identified in GEO reports. Theselected set of trend indicators will provide a
consistent and harmonized oversight of majorenvironmental changes
on an annual basis
Keeping abreast of environmental issues as they unfold,UNEP has encapsulated the most significant of these recent
developments in this readable and reliable volume – to inform, guideand stimulate further action for the health of our environment
United Nations Environment Programme
GLO
BAL EN
VIR
ON
MEN
T OU
TLOO
K Y
EAR
BO
OK
2003
www.unep.orgUNEP Division of Early Warning
and AssessmentP O Box 30552, Nairobi 00100 Kenya
Tel: +254 20 623562Fax: +254 20 623944e-mail: [email protected]
www.unep.org/geo/yearbook
UNEP ISBN paperback: 92-807-2415-0
hardcover: 92-807-2421-5