Cover Page
55
Investor Day Presentation January 13, 2011
-
Upload
khangminh22 -
Category
Documents
-
view
4 -
download
0
Transcript of Cover Page

Investor Day Presentation
January 13, 2011

1
Disclaimer
Statements made in this presentation may constitute "forward-looking statements" within the meaning of Section 27A of the Securities Act
of 1933, as amended, and Section 21E of the Securities Exchange Act of 1934, as amended. Such forward-looking statements relate to,
without limitation, Kilroy Realty Corporation’s (the “Company”) and Kilroy Realty, L.P.’s (the “Operating Partnership”) future economic
performance, plans and objectives for future operations and projections of revenue and other financial items. Forward-looking statements
can be identified by the use of words such as "may," "will," "plan," "should," "expect,” "anticipate," "estimate," “projected,” "continue" or
comparable terminology. Forward-looking statements are inherently subject to risks and uncertainties, many of which the Company and
the Operating Partnership cannot predict with accuracy and some of which the Company and the Operating Partnership might not even
anticipate. Although we believe that the expectations reflected in such forward-looking statements are based upon reasonable
assumptions at the time made, we can give no assurance that such expectations will be achieved. Future events and actual results,
financial and otherwise, may differ materially from the results discussed in the forward-looking statements. Readers are cautioned not to
place undue reliance on these forward-looking statements and are advised to consider the risk detailed in the Company’s Annual Report
on Form 10-K for the year ended December 31, 2009, as may be supplemented or amended by the Company’s Quarterly Reports on
Form 10-Q and Current Reports on Form 8-K, and risks detailed in the Operating Partnership’s registration statement filed on Form 10
with the SEC on August 18, 2010, as may be supplemented or amended by the Operating Partnership’s Quarterly Reports on Form 10-Q
and Current Reports on Form 8-K. The Company and the Operating Partnership assume no obligation to update and supplement
forward-looking statements that become untrue because of subsequent events, new information or otherwise.
This presentation includes information with respect to letters of intent (“LOIs”) that we have entered into with respect to space that we are
proposing to lease to certain tenants. There can be no assurance if or when the leases contemplated by these LOIs will be entered into
or, if entered into that the terms will not differ substantially from those described in this presentation. An LOI is not a definitive agreement
and one or more of the leases contemplated by LOIs may not result in a signed lease. In addition, this presentation contains information
regarding properties under contract. There can be no assurance that these transactions will close or, if they do, that the terms will not
differ from those described in this presentation. Accordingly, you should not rely on the information in this presentation regarding LOIs
and properties under contract as a prediction of future leasing or acquisition activity.
In this presentation, we rely on and refer to information and statistics regarding the industry and the sectors in which we operate,
including information relating to projected occupancy rates and projected rent growth. We obtained this information and statistics from
various third-party sources (including CBRE, JLL and REIS MetroTrend Futures), and, in some cases, on our own internal estimates. We
believe that these sources and estimates are reliable, but have not independently verified them and cannot guarantee their accuracy or
completeness.

2
Program
I. Tyler Rose Welcome
II. John Kilroy Company Update and
Strategy
III. Jeff Hawken Market and Leasing
Update
IV. Tyler Rose Financial Update
V. Chris Corpuz San Francisco Market
and Transbay District
VI. Q&A
VII. Property Tour 100 First Plaza, 303
Second Street
12400 High Bluff Drive, San Diego
999 Sepulveda Blvd, El Segundo
West Side Media Center, West LA
West Side Media Center, Los Angeles
12400 High Bluff Drive, San Diego
303 Second Street, San Francisco

3
John Kilroy
President
Chief Executive Officer
Company Update and Strategy

Significantly increased occupancy
Expanded geographic footprint and franchise
Increased asset base 30%, NOI 22% and square footage 17%
through $700 million of acquisitions
Diversified revenue sources and improved credit
profile
Continued to improve entitlements/value of future
development pipeline
Leveraged management team
Obtained investment grade ratings
4
Strong Momentum in 2010
Platform In-place for Continued Growth

Continue to expand West Coast franchise
Pursue acquisition opportunities in the best West Coast
markets
Be ready to commence development
Expand organization as needed
Maintain emphasis on leasing
Move occupancy back into the 90s
• Currently 92% leased with minimal rollover in 2011
Push rents as economy improves
Execute capital recycling plan
Preserve strong balance sheet
5
Key Strategies for 2011
Seek Growth Opportunities while Maintaining
a Disciplined Approach

6
Leasing Gaining Traction
Stabilized Portfolio Occupancy since 1999
Increased occupancy 630 bps from year end 2009
Executed new and renewal leases across all markets on approximately 2.0 million square feet
Continued opportunity for growth when comparing current occupancy of 89% versus KRC’s 10-year average of 94%
97% 97% 96%94% 90% 95% 95% 96% 94% 89%
83% 83%85% 86%
89% 92%
50%
60%
70%
80%
90%
100%
1999 2000 2001 2002 2003 2004 2005 2006 2007 2008 2009 1Q'10 2Q'10 3Q'10 4Q'10Leased
10 Year Avg : 94% YoY Increase: 630 bps

7
West Coast Acquisition Market Update
Current Market Conditions
KRC’s acquisitions pipeline is increasing
No pipeline in January 2010
Completed $700 million of acquisitions in 2Q through 4Q 2010
Now seeing more opportunities
Number of acquirers also increasing
Cap rates ranging from under 5% to 7% for high quality, stabilized assets
Financial capacity and surety of execution are key - Sellers underwriting buyers
In some cases, buyers under-estimating capital expenditure needs

8
303 Second Street, San Francisco
Buy quality assets in quality
locations at discounts to
replacement cost
Capitalize on opportunities at
inflection points in the cycle
KRC’s Acquisition Strategy
Increase rents over time
Obtain current cash flow from well-
leased properties
Avoid highly structured transactions
Value-Added and Best-in-Class
assets
Significant amenities, including
access to transportation and
publicly-funded infrastructure
Take advantage of window of
opportunity
Be both offensive and defensive
Pursue opportunities in key West
Coast markets

9
Extensive knowledge of markets
Vertically integrated platform with
broad skill set to evaluate
acquisitions and development
Thorough and streamlined due
diligence
KRC’s Competitive Advantage with Acquisitions
Community Space at 100 First Plaza, San Francisco 2211 Michelson, Irvine
KRC’s Competitive Advantage
No financing contingencies; access
to broad capital sources
Various transaction options,
including O.P. units
Public company transparency

10
KRC Target Markets
KRC’s footprint in the market dates back to 1970s; we sold the last property in 2007
Pursuing opportunities in Bellevue and Redmond markets
Acquired Overlake Office Center, a property located on the Microsoft campus
for $46 million
Target opportunities that fit well with existing portfolio given Company’s proven track
record and dominant position in Southern California
Continue to focus on coastal, higher barrier-to-entry, top-tier markets
Acquired Mission City Corporate Center, 2211 Michelson, 999 Town & Country and
Liberty Station totaling $227 million
Target Markets
International gateway city
Primary focus on South Financial district of CBD and monitoring other submarkets
including Silicon Valley and East Bay
Acquired 303 Second Street and 100 First Plaza totaling $425 million
Under contract on 250 Brannan for approximately $33 million
San
Francisco
Bay Area
Seattle
Southern
California

11
Actual FY 2009
NOI by Region
KRC Acquisition Diversification
San
Diego
56%
Los
Angeles
30%
Orange
County
12%
Other
3%
Acquisitions have diversified KRC into additional markets and broadened NOI by region
Increased real estate investments from approximately $2.7 billion as of December 31, 2009 to
approximately $3.5 billion as of December 31, 2010 (1)
Expanded asset base by 30%
Pro Forma (2)
___________________
(1) Real estate investments defined as undepreciated gross book assets.
(2) Estimated based on annualized results.
The Bay Area and Seattle now make up approximately 12% of NOI on a pro forma basis

$507
$254
$31$8
$98
$31 $25
$698
$0
$100
$200
$300
$400
$500
$600
$700
$800
1997 1998 1999 2000 2001 2002 2003 2004 2005 2006 2007 2008 2009 2010
($ in millions)
12
Disciplined Approach to Acquisitions
While KRC was not a significant buyer during the bubble years, opportunistic
acquisitions in 2010 represent ~ 40% of KRC’s total acquisitions since IPO
Bubble
Years
Total Property Acquisitions: $1.7 billion

13
Second Quarter 2010 Acquisitions
$71 million ($254 PSF)
279,000 square feet
San Diego
Acquired March/June 2010
6.6% cap rate
Excellent location with freeway accessibility and proximity to amenities
Mission City Corporate Center
$233 million ($317 PSF)
734,000 square feet
San Francisco
Acquired May 2010
6.5% cap rate
LEED Gold Certified
Majority leased during recession
Full city block with access and location next to amenities and transportation
303 Second Street
$103 million ($379 PSF)
272,000 square feet
Orange County
Acquired June 2010
6.7% cap rate
LEED Silver Certified
Limited scheduled tenant rollover in the next few years
One of the premier buildings in the region with significant long-term value
2211 Michelson
$22 million ($222 PSF)
99,000 square feet
Orange County
Acquired June 2010
8.6% cap rate (1)
Single tenant property with strong credit quality
Future development opportunity for 500,000 square feet of office/ MOB space (0.6 to 3.0 FAR)
999 Town & Country
(1) Going in cap rate of 7.0% with a contractual rent bump scheduled for June 2011 to 8.6%.

14
Fourth Quarter 2010 Acquisitions
$46 million ($377 PSF)
122,000 square feet
3-story, Class A office, built in1998
Initial cap rate of 6.4%
Off-market transaction
100% leased to Microsoft through December 2014
Microsoft recently funded 60% of a $30M freeway overpass to connect the Main campus and the West Campus (Overlake Office Center)
Overlake Office Center - Seattle
$192 million ($410 PSF)
466,000 square feet
27-story, Class A office with 3-
story detached parking structure,
built in 1988
LEED Gold certified
77% occupied and 94% leased to
16 tenants, no sizeable rollover
through 2015
Initial cap rate of 5% increasing to
7% at stabilization
Major tenants include Delta Dental
and GSA’s IRS and Federal
Energy Regulatory Commission
100 First Plaza- San Francisco
Overlake Office
Center
Microsoft
Campus
$31 million ($298 PSF)
103,900 square feet
LEED Gold certified
Built in 2009
Initial cap rate of 7.8%
95% leased to credit quality
tenants, BAE Systems and the
GSA through 2020
Located within Liberty Station,
which includes 125 acres of
parks and open spaces
Adjacent to San Diego
International Airport
Liberty Station – San Diego

15
Purchase price of $258/SF
Older buildings
60% leased, with near-term rollover
Commodity space
Significant repositioning costs
• Base building
• Downtime
• Lease-up
• Commissions
• Total approximately $100/SF
Estimated investment after capex
and lease up of approximately
$358/SF
Requires significant management
time
Conclusion: Need substantial discount to
price point to make this work in a choppy
market
Acquisition Case Study
Purchase price of $380/SF
Best in Class
New construction
Leased during downturn
Limited near-term rollover
94% occupied
Below replacement cost
LEED Silver
Amenity rich
Limited capex requirements
Secure, strong cash flow acquisition with
upside over time
Commodity Property Acquisition 2211 Michelson

16
($ in millions)
Development: The Other Growth Engine
KRC developed close to $450M of projects during the bubble years at yields
300 to 500 bps higher than acquisition cap rates at the time
Bubble Years
$0
$50
$100
$150
$200
$250
$300
$350
$400
$450
$500
1997 1998 1999 2000 2001 2002 2003 2004 2005 2006 2007 2008 2009 2010
$38
$131
$174
$202
$133
$62
$85
$23
$94
$297
$58
Total Development Starts: $1.3 billion
Bubble Years

17
Development Pipeline
Project Location
Gross Site
Acreage Est. RSF
Carlsbad Oaks Carlsbad 32.0 288,000
PCC Lot 8 Sorrento Mesa 5.0 170,000
Rancho Bernardo I-15 21.0 320,000-1M SF
San Diego CC (One Paseo - Mixed Use) Del Mar 23.0 up to 1.8M SF
Santa Fe II and III 56 Corridor 21.8 600,000
SG Lot 2 Sorrento Mesa 6.3 80,000
SG Lot 7 Sorrento Mesa 7.6 57,000
Orange County (Office/MOB) Orange County 6.0 100,000-500,000
TOTAL PIPELINE 122.7 2.1M - 4.5M SF
Proposed One Paseo Mixed Use Project
18
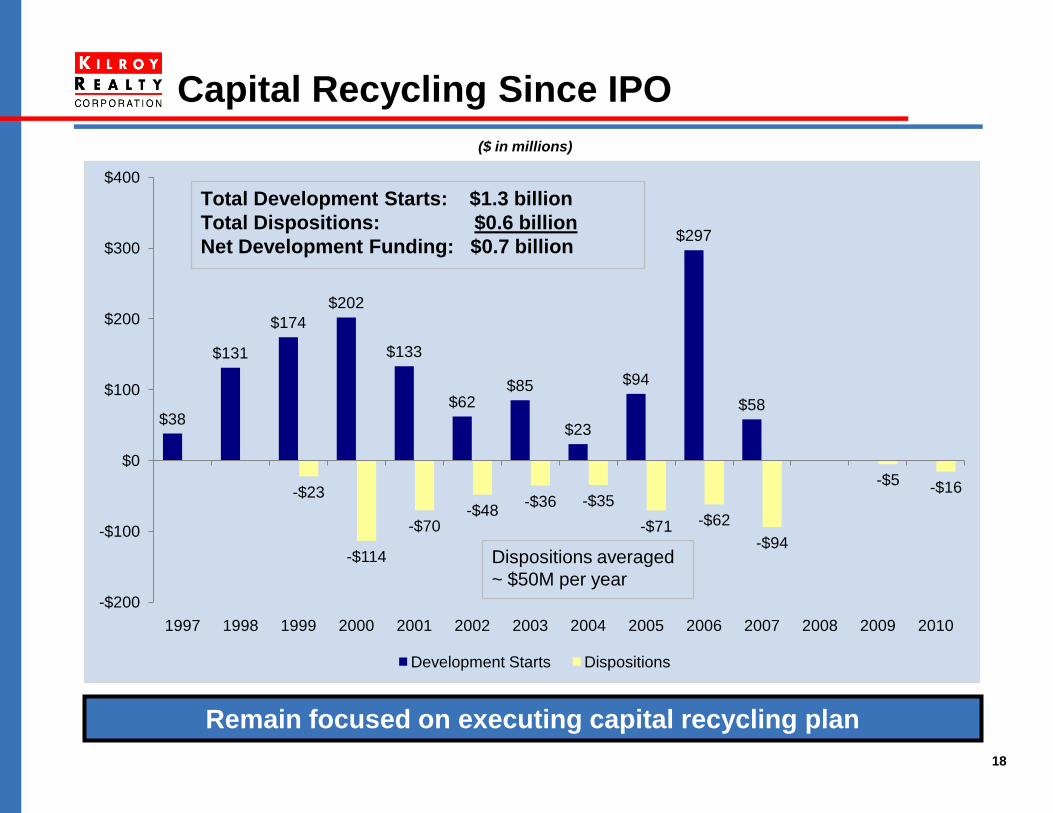
($ in millions)
Capital Recycling Since IPO
$38
$131
$174
$202
$133
$62$85
$23
$94
$297
$58
-$23
-$114
-$70-$48
-$36 -$35
-$71 -$62
-$94
-$5-$16
-$200
-$100
$0
$100
$200
$300
$400
1997 1998 1999 2000 2001 2002 2003 2004 2005 2006 2007 2008 2009 2010
Development Starts Dispositions
Total Development Starts: $1.3 billion
Total Dispositions: $0.6 billion
Net Development Funding: $0.7 billion
Dispositions averaged
~ $50M per year
Remain focused on executing capital recycling plan

2010 Summary
Significant acquisition activity has increased market share and
expanded franchise
Moving occupancy back to historical levels
Leveraged management team
Maintained strong balance sheet
2011 Outlook
Anticipate continued occupancy improvements
Expect increased acquisition activity
Prepared for development
Technology, education, healthcare and exports are expected to
drive demand
Job growth and pricing power to remain tepid in near term?
19
Summary and Outlook
Dynamic environment with changing opportunities
Flexibility/agility will be the key for growth

20
Jeff Hawken
Chief Operating Officer
Market and Leasing Update

21
Another record year of lease execution
Two million square feet leased in 2010
Four million square feet leased over the past two years
LOI conversion rates averaged greater than 90%
Tenant defaults significantly reduced
Historical leader on pushing rates and absorption
2.2 million square feet of LEED certified buildings
meeting tenant requirements
Strong Operating Performance in 2010
High quality assets located in strong barrier to entry markets

Professional
Services12%
Education &
Health Services23%
Manufacturing
15%F.I.R.E.
14%
Technology and
Media29%
Wholesale and
Retail Trade4%
Other
3%
22
Top 15 Tenants (2)
Strong Tenant Base
_________________________
(1) As of December 31, 2010.
(2) Based upon annualized contractual base rental revenue calculated on a straight line basis in accordance with GAAP, for leases for which rental
revenue is being recognized by the Company as of December 31, 2010.
(3) F.I.R.E. represents finance, insurance and real estate.
Revenue by Industry (1)
Diverse tenant base with significant industry sector diversification
(3)
Intuit, Inc. (Baa1/BBB) 5.0%
Bridgepoint Education, Inc. 5.0%
Scripps Health 4.2%
Delta Dental of California 3.6%
CareFusion Corporation (Baa3/BBB-) 3.4%
DIRECTV, Inc. (Baa2/BBB-) 2.8%
AMN Healthcare, Inc. (Ba3/BB-) 2.7%
Fish & Richardson P.C. 2.0%
Hewlett-Packard Company (A2/A) 1.9%
Wells Fargo (A1/AA-) 1.8%
BP Biofuels North America LLC 1.7%
Epson America, Inc. 1.6%
Mitchell International, Inc. 1.3%
Avnet, Inc. (Baa3/BBB-) 1.3%
Scan Health Plan 1.2%
Total Top Fifteen Tenants 39.5%

23
KRC’s strong balance sheet and access to capital provide a competitive advantage over landlords with no capacity to pay for TIs and other leasing costs
Provide highest quality service and maintain long-term tenant relationships
Renew leases early
Credit support to mitigate tenant default risks
Extensive network and long term relationships with the broker community
Kilroy Airport Center, Long Beach
Leasing Strategy
KRC has over 60 years of experience as a successful operator

24
Successfully Leasing Vacant Buildings
Significant 2010 Leasing Progress
Year End 2010Year End 2009
22 vacant buildings
1.7 million square
feet
Leased more than 70% of vacant building square footage
Sold one vacant building
Only 3 buildings remain 100% unleased

25
Occupancy Gains by Region
91.2%
93.2%96.4%
92.6%
89.4% 90.2% 89.9% 90.3%
80%
85%
90%
95%
100%
2005 2006 2007 2008 2009 3Q'10 2010 Leased
Los Angeles Portfolio Occupancy
’05 – ’08 Avg 93.4% YoY Increase
50 bps98.2%
95.7%91.4%
83.1%
76.8%
82.2%
86.4%
90.0%
75%
80%
85%
90%
95%
100%
2005 2006 2007 2008 2009 3Q'10 2010 Leased
San Diego Portfolio Occupancy
’05 – ’08 Avg 92.1% YoY Increase
960 bps
94.9%
98.6%94.8% 94.1%
84.8%
88.3%
93.5%
96.5%
80%
85%
90%
95%
100%
2005 2006 2007 2008 2009 3Q'10 2010 Leased
Orange County Portfolio Occupancy
’05 – ’08 Avg 95.6% YoY Increase
870 bps

26
KRC Market Fundamentals Update
Continued weakness in rates and vacancy in the West LA market
Demand remains tepid until job growth returns
Poised for rental growth due to lack of inventory and high desirability of location
Office market had second consecutive quarter of positive absorption; positive for the year
Seeing demand increase via large and small business expansions
Industrial market had strong 4Q absorption with vacancy rates trending down
Lease rates are expected to remain soft for the near future
Positive absorption in every quarter during 2010
2010 job growth flat; projected to be positive in 2011
Solid pipeline of demand from corporate users for large blocks of space
San Diego
Los Angeles
Orange
County
Third consecutive quarter of positive absorption
Continued strong demand from tech and media tenants
Double digit rent growth in South Financial District
San
Francisco
Expect third consecutive quarter of positive absorption
Vacancy rates are trending down; supply issue largely behind
Technology tenants driving demand in the area clustering near Microsoft’s campus
Seattle
(Eastside)

27
2010 Leasing Statistics
Total Leasing Transactions in 2010: 2.0 million square feet
•
• 65% Office
• 35% Industrial
GAAP Basis:
Office: -3.5%
Industrial: -24.1%
Office vsIndustrial
• 20% Los Angeles
• 37% Orange County
• 40% San Diego
• 3% San Francisco
GAAP Basis:
Los Angeles: 7.6%
Orange County: -23.0%
San Diego: -8.0%
San Francisco: NA
By Region
• 67% New
• 33% Renewal
GAAP Basis:
New: -21.9%
Renewal: -1.1%
New vsRenewal
477,000 SF of LOIs Currently Outstanding
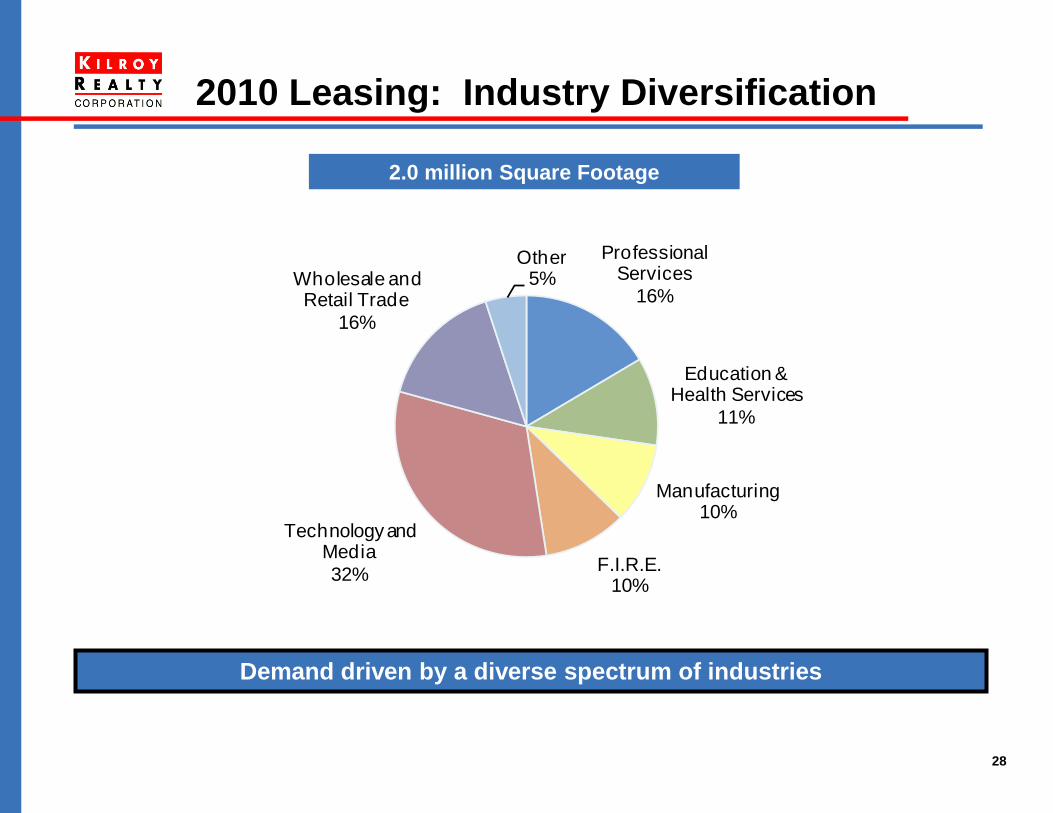
28
2010 Leasing: Industry Diversification
Professional Services
16%
Education & Health Services
11%
Manufacturing10%
F.I.R.E.10%
Technology and Media
32%
Wholesale and Retail Trade
16%
Other5%
2.0 million Square Footage
Demand driven by a diverse spectrum of industries

29
Note: Percentage of leased square footage expiring by year.
Lease Maturity Schedule
0.0%
5.0%
10.0%
15.0%
20.0%
2007 2008 2009 2010 2011 2012 2013 2014 2015
14.7%
13.5%
17.6%16.4%
5.8%
10.3%
12.1%
13.3%
16.6%
Historical 4-Year Average of 16% Next 5-Year Average of 12%

30
Successfully integrated $698 million of new
acquisitions into stabilized portfolio
Eight transactions, ten buildings
All properties to incorporate KRC branding
Leveraging existing property management teams in
San Diego and Orange County
Built new team in San Francisco
Given triple-net lease with Microsoft for Seattle
property, no need for on-site management
Integration Update

31
Financial Update
Tyler Rose
Chief Financial Officer
Financial Update

32
Full liquidity on our $500
million bank line (expandable to
$700 million)
Access to multiple sources
of capital
Comprehensive internal
investment process
Strong property, legal,
construction and
financial due diligence
teams
Centralized decision
making on capital
allocation
Prepared for another active
year
KRC Positioned for Future Growth
Santa Fe Summit, San Diego

33
2010 Financing Transactions
Total Capital Raise of $1.5 billion
Sources: Uses:
Equity $313 Acquisitions $646
Secured Debt $123 Repay Secured Debt $110
Bonds $575 Unsecured Debt Repayment $269
Bank Line $159 Other $145
Total $1,170 Total $1,170
Equity, $313
Bonds, $575
Bank Line, $500
$0
$200
$400
$600
$800
$1,000
$1,200
$1,400
$1,600
35%
16%
19%
38%
8%
21%
Secured Debt, $123
33%

34
Diversified Capital Structure
Bank Line4% Exchangeable
Notes9% Private
Placement Notes
2%
Unsecured Bonds16%
Secured Debt9%
Preferreds6%
Equity54%
…While Maintaining Low Leverage vs Peers
Year End 2010Year End 2008
Bank Line10%
Exchangeable Notes18%
Private Placement
Notes6%
Secured Debt12%Preferreds
8%
Equity46%

35
Extended Debt Maturities
Year End 2009 Year End 2010
Extended debt maturities with limited interest rate risk
Weighted Average Debt Maturity: ~2.5 years Weighted Average Debt Maturity: ~5 years
$255
$70
$399
$256
$3 $0
$100
$200
$300
$400
$500
2010 2011 2012 2013 2014 2015 2016 2017 2018+
$ in million
$70
$301
$159
$256
$325
$73
$385
0
100
200
300
400
500
2010 2011 2012 2013 2014 2015 2016 2017 2018+
$ in million

36
Strong Track Record of Financial Discipline
97% 97% 96%94%
90%
95% 95% 96%94%
89%
83%
89%
37%
44%
42%43%
41%40% 40%
39%
44% 44%
37%
41%
30%
35%
40%
45%
50%
55%
50%
60%
70%
80%
90%
100%
1999 2000 2001 2002 2003 2004 2005 2006 2007 2008 2009 2010
Occupancy Total Debt/ Undepreciated Book Value
Reduced leverage in 2009 to solidify balance sheet
12 Year Average Occupancy and Leverage of : 93% and 41%

37
West Side Media Center, Los Angeles
Free Rent
Approximately $4 million in
4Q10, $13 million for 2010
Occupancy
Office occupancy currently
87.5% - upside to valuation
as it increases to historical
level of 95%
Development
Pipeline of approximately
$1.3 billion to $1.8 billion
Historical ROC range
between 8% to 10%
Acquisitions
Valuation Upside
Occupancy increases, development and acquisitions will drive
potential upside

38
303 Second Street, San Francisco
Just closed a $135
million secured
mortgage
Seven-year term
4.27% fixed interest rate
Secured by 303 Second
Street
Loan to value of
approximately 60%
Lender is MetLife
Financing Update
Locked-in Rate Prior to Recent Rise in Treasuries

39
2010 Preliminary Results
2010 guidance on the
3Q10 Conference Call
FFO per share range
of $2.01 to $2.06
Occupancy guidance
of 88%
2010 preliminary results
FFO per share of
$2.04 to $2.05
Occupancy at 89%
Second quarter of
positive same store
results 2211 Michelson, Irvine

40
Chris Corpuz
Executive Vice President
San Francisco Market and Transbay District

41Collaborative tenant spaces at 303 Second Street
San Francisco Office Market
San Francisco market totals 73
million square feet with 17%
vacancy
Financial District is
approximately 50 million square
feet with overall vacancy of 14%
North Financial District
• 27 million square feet
and 16% vacancy
South Financial District
• 23 million square feet
and 12% vacancy
For the buildings that
compete directly with KRC,
the vacancy is less than 10%

42
Collaborative tenant spaces
San Francisco Office Market
Significant demand coming from
media and technology companies
1.3 million square feet of tech
leasing in 2010 – one of the
biggest years
Salesforce.com plans to build a
two million square foot
headquarter campus in the
Mission Bay area
Zynga recently signed 270,000
square foot lease at 650
Townsend
Others looking for significant
space include Twitter, Dolby,
MetaCafe and Goodby Silverstein
Collaborative work space
Unconstructed and loft-like
Open ducting
Ergonomic work clusters
“Not your father’s Buick”

43f
h
d
j
5

44
Zynga - 270,000 SF
Salesforce - 227,000 SF
Google - 195,684 SF Google - 63,000 SF
Fox Interactive - 70,302 SF Ubisoft - 62,000
Medivation - 63,817 SF Salesforce - 60,000 SF
Vontu - 53,000 SF Autodesk - 50,000 SF
Salesforce.com - 47,867 SF Yelp - 49,000 SF
Loopnet - 46,157 SF Wager Works - 45,000 SF
Symantec - 45,000 SF Stubhub - 45,000 SF
Microsoft/Razorfish - 42,659 SF Aliph - 40,000 SF
Google (SL) - 210,000 Nokia - 39,706 SF Trulia - 32,000 SF
Microsoft - 92,000 SF Omniture - 34,419 SF Snapfish - 30,328 SF
Verizon - 75,000 SF Slide - 35,373 SF Craigslist - 30,000 SF
Sega - 69,859 SF MySpace - 34,595 SF Pure Digital - 30,000 SF
Level 3 Comm. - 58,000 SF Monster - 34,232 SF Marin Software 28,711 SF
H5 Tech - 53,411 SF Splunk - 34,167 SF Quantcast - 26,350 SF
Service Source - 47,020 SF Wide Orbit - 32,000 SF Easy Rez - 20,000 SF
Hotwire - 44,356 SF Wired - 30,000 SF Meraki - 20,000 SF
Sales Force - 37,600 SF Camera Obscura - 30,000 SF Nielsen Mobile - 20,000 SF
Stubhub - 37,576 SF Yelp - 29,403 SF Glu Mobile - 19, 027
Fox Interactive - 34,595 SF Symantec - 27,646 SF Sun Run - 19027 SF
Fox Interactive (SL) -34,595 SF ON24 - 27,310 SF Adaptive Path - 18,865 SF
BEA Plumtree - 11,207 SF Dolby - 32,289 SF Coverty Inc. - 26,553 SF Aliph - 18,800 SF
Riverbed Technology - 63,000 SF Bebo - 31,311 SF AKQA - 22,000 SF Twitter - 64,000 SF LeadClick - 16,500 SF
Esurance - 49,612 SF Visage - 30,577 SF Live Nation Worldwide - 20,142 SF Open TV - 42,565 SF Citrix Online - 16,400 SF
Sales Force - 74,716 SF Auto Desk - 46,000 SF Second Life - 27,980 SF Schawk Inc. - 20,141 SF Cisco - 37,570 SF Salesforce - 15,956 SF
Yahoo - 42,782 SF LexisNexis - 43,839 SF AOL - 27,626 SF Metaweb Technologies - 20,000 SF Carat - 33,500 SF NGMOCO Inc. - 15,000 SF
Adteractive - 36,000 SF Ingenio - 37,647 SF Activision - 23,500 SF Mark Monitor - 19,313 SF United Bio - 30,000 SF Sendmemobile - 15,000 SF
Snapfish/HP - 30,328 Symantec - 16,788 SF Open Table - 17,500 SF Open Table - 17,116 SF Navisite - 21,805 SF DemandForce - 15,000 SF
2010 Total - 1,317,964 SF
20092006 2010
Technology Companies Have Arrived in SF in a Big Way
2010 is the Biggest Year
2005 20082007
2005 Total - 183,826 SF 2006 Total - 368,093 SF 2007 Total - 984,795 SF 2008 Total - 1,099,602 SF 2009 Total - 229,440 SF

45
Focus on properties with the
following characteristics:
Significant discount to
replacement cost
Tenant base oriented
toward growth tenants,
including tech and media
businesses
Collaborative workspaces
Proximity to public
infrastructure
Highly amenitized with
retail and restaurants
Proximity to workforce
KRC’s San Francisco Investment Strategy
100 First Plaza, San Francisco
250 Brannan Street, San Francisco

46
Under Contract: 250 Brannan
Approximately $33 million ($363 PSF)
91,000 square feet
3-story, Class A, brick and beams office building
77% leased to two tenants, Adobe and Splunk
through 2013
Initial cap on in-place leasing of approximately 6.8%
250 Brannan – San Francisco, CA
Major building systems renovation in 2001
Proximity to the Waterfront, AT&T Park and wide
array of retail and restaurants
Submarket is home to many well-known
technology companies, including Google, HP,
salesforce.com and Symantec

47
Transbay Project will Enhance Value of
KRC’s 303 Second Street and 100 First Plaza
100 First Street
$1.7 billion public-sector financed multi-
modal transit infrastructure project
Reinforces the migration of the epicenter of
the CBD to the “South of Market” (SOMA)
area
Includes 2,600 new homes, 3 million square
feet of new office space and significant retail
amenities
Features 2 parks
5.4 acre of public park on the roof of the
Transit Center
1.2 acre park on the west side
Dubbed the “Grand Central Station of the
West”
Expected completion of Phase I in 2017
303 Second Street and 100 First Street will
directly benefit from the area’s
redevelopment projects

48
Transbay map
H
a
d

49
Demolition Has Begun and the Area has
Already Seen Improvement

50Cross section of the planned project
City Park
Bus Level
Retail/
Concourse
Grand Hall
Train Mezzanine
Train Level
Transbay Terminal – Significant
Infrastructure Investment

51
Transbay Terminal – Value Enhancement to
Existing Owners

52
South Financial District Further Enhanced by
America’s Cup Plans for Redevelopment
San Francisco has been selected as
the host venue for the 34th America’s
Cup in 2013
The event is projected to have a $1.4
billion economic benefit to the San
Francisco region and generate more
than 8,000 jobs
America’s Cup is believed to deliver
the third largest economic impact in
sport to host countries, behind the
Olympic Games and soccer’s World
Cup
Event authorities project a $200
million budget with $55 million
allocated to infrastructure spending
that would provide substantial long
term benefits to the region’s
surrounding communities
KRC’s projects will directly benefit
from the redevelopment plans and
ongoing economic impact

Gaining traction on leasing core portfolio
High quality, well-located properties in high barrier-to-entry submarkets
Occupancy increased to 89% at year end; portfolio now 92% leased
Acquiring top tier assets at discounts to replacement cost
Expanding KRC franchise along the West Coast
Purchased 2.1 million square feet, totaling approximately $700 million
Anticipate additional acquisitions
Prepared for development
Expect another active year
53
Key Takeaways – John Kilroy
KRC is Well Positioned for Future Growth

Q&A
54