cover page December-2017 - Mobilization Society
212
Print ISSN 2230 – 9047 Online ISSN 2231 – 6736 Vol. 13, No. 1, January-April, 2018
-
Upload
khangminh22 -
Category
Documents
-
view
1 -
download
0
Transcript of cover page December-2017 - Mobilization Society

Print ISSN 2230 – 9047
Online ISSN 2231 – 6736
Vol. 13, No. 1, January-April, 2018

CHIEF PATRON
Dr. P.L. Gautam, Former ChairpersonProtection of Plant Varieties & Farmers Rights Authority (PPV&FRA)
New Delhi - 110012
EXECUTIVE COMMITTEE
President : Dr. J.P. SharmaGeneral Secretary : Dr. Rajneesh TyagiSecretary (Head Quarter) : Dr. N.V. KumbhareTreasurer : Mrs. Shashi Gupta
Chief Editor Editors On line EditorDr. J.P. Sharma Dr. R. Roy Burman, Dr. S.K. Dubey Dr. Reshma Gills
Dr. Souvik Ghosh, Dr. S.R.K. Singh Ms. Subhashree SahuDr. Nishi Sharma, Dr. M.S. Nain Dr. Hema BaliwadaDr. Sudipta Paul
Journal of Community Mobilization and Sustainable DevelopmentRegistration No.: 268Ag. 33221; Print ISSN : 2230 - 9047; Online ISSN : 2231-6736
Biannual Journal of Society for Community Mobilization for Sustainable Development, New Delhi -110012
Membership
Life Membership : R 5,000 Institutional Membership : R 5,000Corporate Membership : R 50,000 Foreign Membership : USD 500Online Indian Subscription : Individual/Institutional : R 600Online and Print Indian Subscription : Individual/Institutional : R 900Online for Foreign Subscription : Individual/Institutional : USD 60Online and Print for Foreign Subscription : Individual/Institutional : USD 90
All correspondence may be made at the following address:Chief Editor
Journal of Community Mobilization and Sustainable DevelopmentOffice of Joint Director (Extension), Indian Agricultural Research Institute, New Delhi-12 (India)
E-mail: [email protected]: www.mobilization.co.in
Available online: www.indianjournals.com(Indexed in : Indian Science Abstract, EBSCO Discovery, Agricola and Google Scholar)

Journal of Community Mobilization and Sustainable Development Vol. 13(1), January-April, 2018
ABOUT THE SOCIETY
ABOUT THE JOURNAL
MOBILIZATION Society was established in 2003 as a non-profit professional society aimed at sensitizingand mobilizing development partners and community for sustainable development. The Society, during theseensuing years has successfully mobilized researchers, academicians, planners, grass root mobilizers and studentand created conducive intellectual atmosphere for introspective deliberations and conducted National seminars/workshop to address the emerging problems experienced by the agrarian mass. Presently the Society has morethan 1100 Life Members. The recognition of the Society in the efforts for strengthening the forum for scientificcommunication is growing among the related professionals and concerned agricultural stakeholders rapidly.The Society works on following objectives-
1. To document the on-farm and adaptive research experiences in multi- disciplinary agri-bio sciences andextension education.
2. To offer a platform for sharing the empirical experiences of development professionals, communitymobilizers, academicians, multi-sectoral researchers, students etc. for the benefit of ultimate users.
3. To facilitate close and reciprocal linkage among the institutions for sustainable rural development.4. Promoting potential and practicing entrepreneurs.5. To disseminate the documented knowledge to the global partners through approach abstracting and
indexing.
Journal of Community Mobilization and Sustainable Development (print ISSN 2230 – 9047; online ISSN2231 – 6736) is published by Society for Community Mobilization for Sustainable Development twice ayear. The Journal of Community Mobilization and Sustainable Development has NAAS rating 5.30. The Journalof Community Mobilization and Sustainable Development, is also available on our websitewww.mobilization.co.in and it has been registered with www.indianjournal.com for national and globalabstracting and indexing. MOBILIZATION envisages reorienting the young professionals and researches forimbibing the values of community participation in research, training and extension efforts.
The aim and scope of the journal are:
1. Sharing the relevant experiences and issues related to agriculture and allied fields at the grass root leveland global forum to create the necessary academic and development climate.
2. Sensitizing the different stakeholders about the knowledge and innovation management system in pluralisticagri-rural environment.
3. Developing network among the related partners for convergence of their efforts for sustainable academicdevelopment of extension education discipline.

emerging problems e
Journal of Community Mobilization and Sustainable Development Vol. 11(1), January-April, 2018
EditorialSociety for Community Mobilization for Sustainable Development (MOBILIZATION) has organized 8th
National Seminar on “Potential, Prospects and Strategies for Doubling Farmers’ Income: Multi- stakeholderConvergence” from November 9-11, 2017 in association with Assam Agricultural University and ICAR- ATARI,Guwahati at College of Veterinary Sciences, Guwahati. The seminar was inaugurated on 9-11-17 by Dr. H. S. Gupta,Former DG, BISA, Chief Guest; Dr. K. M. Bujarbaruah, Vice Chancellor, AAU; Chairperson of Inaugural Sessionand Guests of Honour - Dr. M. Premjit Singh, Vice Chancellor, CAU; Dr. M. C. Sharma, Former Director, IVRI;Dr. V. V. Sadamate, Former Advisor, Planning Commission; Dr. J. P. Sharma, Joint Director (Extension), ICAR-IARI and President of Society for Community Mobilization for Sustainable Development. There were a total ofseven Technical Sessions held during two days on different themes.
The major recommendations of the Seminar have been documented. Bridging the gender gap between maleand female farmers’ accessibility of technologies, inputs and services to enhance the farm household’s income, rainwater harvesting and micro-irrigation technologies have been suggested for increasing cropping intensity and wateruse efficiency. Diversification and intensification of rice-fallow land through inclusion of oilseeds and pulses followingresidual soil moisture utilization and zero-tillage, promotion of location specific IFS model, documentation, validationand promotion of farmer-led innovations, rural entrepreneurship promotion, digital empowerment throughdevelopment, application and uses of mobile apps for fulfilling the information needs of farmers on various aspectsof their farming were some other recommendations. Innovative approaches requiring attention are sea-water farming,rice bio-park, plant doctor programme, genetic gardening with bio-fortified crops, up-scaling of community-ledand market-led extension models, value addition, storage and processing of the produce would provide the farmersan increased income and create employment opportunities and engagements of farm youth.
We are happy to place before you the January-April, 2018 issue of the journal. Some of the pertinent researchdomains contained in the issue are Construction and Standardization of Knowledge Test, Adoption and Impact ofICT applications, Farmer-led innovations, Cropping and Irrigation Dynamics, Changing Behaviour of Self HelpGroups, Farm Size and Productivity Relationship in Smallholder Farms, Marketing Behaviour of Vegetable Growers,Migration Pattern, Experiential Learning, Diversification of Agriculture, Perceived Constraints in Production of Btcotton, Agricultural Subsidies, health and nutrition etc.
I extend my heartfelt thanks to the members of the editorial team - Drs. Souvik Ghosh, S.K. Dubey, R. RoyBurman, Nishi Sharma, S.R.K. Singh, M.S. Nain and Sudipta Paul who very professionally edited the papers tobring out this issue on time. I also express my sincere gratitude to the researchers who have contributed the qualityresearch papers for the journal. I extend my special thanks to Dr. Reshma Gills, Ms. Subhashree Sahu and Dr.Hema Baliwada in shaping this issue of the journal as on-line editors.
J.P. SharmaChief Editor

emerging problems e

Journal of Community Mobilization and Sustainable Development Vol. 13(1), 1-5, January-April, 2018
*Corresponding author email id: [email protected]
Construction and Standardization of Knowledge Test to Measurethe Knowledge Level of Maize Growers on Maize ProductionTechnologies
Suraj Parkash* and Rajinder PeshinDivision of Agricultural Extension Education, Faculty of Agriculture, Sher-e-Kashmir University of Agricultural Sciences andTechnology of Jammu, (J&K)
ABSTRACT
Knowledge is one of the important components of behaviour as such it plays an important role in the covert andovert behaviour of an individual. To measure the knowledge level of maize growers of Jammu division of J&Kstate about recommended maize cultivation practices, a knowledge test has been developed that cover processobjective of recall and recognition with content area of maize cultivation practices. A preliminary test of fifty three(53) items was initially administered to twenty four (24) maize growers. Difficulty and discrimination indices oftest items were calculated. Only few items were discarded to ensure content validity of the test. Al l processobjectives are represented in the standardized test. Difficulty index was used for arranging the test items inincreasing order of difficulty to ensure the split of the test into two parallel halves. The reliability of the knowledgetest was measured with the help of split-half method and found to be 0.72. The reliability coefficient of the totaltest was worked out by using Spearman-Brown prophecy formula and found to be 0.84, which indicates thatknowledge test is quite reliable. Moreover, the intrinsic validity of the knowledge test was found to be 0.91, whichproves that test is valid for measuring the knowledge of maize growers. The final test was consisted of forty four(44) test items which contains four (4) objective type, two (2) close ended, five (5) identification of objects fromphotographs and thirty three (33) open response items.
Keywords: Maize growers, Knowledge test, Difficulty and discrimination indices, Reliability and validity
INTRODUCTION
Maize (Zea mays L.) is one of the most important cropsin world agricultural economy grown over an area of177 million hectares with a production of 967 milliontonnes (KPMG, 2014). India ranks fourth in area andsixth in production of maize. As maize has yield potentialfar higher than any other cereal, it is referred to as themiracle crop or the ‘Queen of Cereal’ (Anonymous,2011). Maize is the third most important food grain inIndia after wheat and rice. It is grown throughout thecountry, but the main producing states are AndhraPardesh, Karnataka, Maharasthra, Bihar, and MadhyaPardesh (Ministry of Agriculture, 2015).The area undermaize crop is 9.2 million hectares with a production of24.17 million tonnes (AICRP on Maize, 2016).
As the demand for maize is growing globally due toits multiple uses for food, feed and industrial sectors,we need to produce more from same or even lessresources. In India, maize occupies third position bothin area and production after rice and wheat. Maize isgrown in all the seasons namely kharif, rabi and spring.Of these three seasons, nearly 90% of the production isin kharif season, 7 to 8% during rabi season and remaining1-2% during spring season (Dass, 2009). Since 1950, therewas slight increase in area of maize crop but productionincreased by eight times and productivity increased bythree and half times (MoA, 2015).
Maize is the major crop of hilly districts of Jammuand Kashmir State and plays an important role in thelivelihood of the people. In J&K, maize is predominantly

2 Suraj Parkash and Rajinder Peshin
grown as rainfed crop during kharif season and forms astaple food of vast majority of rural households, besideits use as livestock feed and fodder. In J&K, futureincreases in maize production to meet domestic demandwill have to rely on improvements in yield per hectarerather than on the expansion of maize production area.
In the Jammu region 75 per cent cultivated area israinfed (DES, 2011). The productivity of maize at thenational level for 2014-15 was 2.56 t/ha whereas for thesame period it was 1.49 t/ha in J&K state (AICRP onMaize, 2016).
The main intention to develop knowledge test wasto identify the knowledge level of maize growers aboutrecommended maize production technologies. Thedetails of the standardization of the items are as follows
MATERIAL AND METHODS
Knowledge as defined in this study included thosebehaviours and test situations which emphasised theremembering either by recognition or recall of ideas,material or phenomena (Bloom et al., 1956). The variableindicated the extent of knowledge possessed at the timeof the interview as evident from his or her responses toa set of questions scientifically prepared for this purpose.Considering the importance of maize productiontechnologies in enhancing the productivity of maizeacknowledge test was developed by employing thefollowing methodology and standardization of test itemswas made as given below.
Collection of knowledge items: An item pool ofquestions was prepared by reviewing literature such asbooks, bulletins, magazines, the package of practice ofSher-e-Kashmir university of agriculture sciences andtechnology of Jammu, field extension personnel andconducting discussions with subject matter specialists.Finally a through scrutiny of the item pool was madewith the assistance of subject matter specialists. The itemswere collected with respect to scientific maize productiontechnologies. The items were edited and drafted in sucha way that each item highlighted only one idea and didnot have any ambiguity.
Item analysis: The item analysis usually yields two kindsof information, item difficulty and item discrimination.The index of item difficulty reveals how difficult an itemis where as the index of discrimination indicated the extentto which an item discriminates the well informed
individuals from poorly informed ones. The initiallyprepared 53 items on scientific maize productiontechnologies were administered to a group of 24respondents prior to the preparation of the final scheduleon non sampled respondents from village Sarnoo ofRajouri district of J&K state.
Each statement was having two response categorieseither correct or wrong. Each correct answer was given‘1’ score while wrong answer was awarded ‘0’ mark.Thus total score secured by all individual respondentson 53 items for correct answers was the knowledge score.The scores obtained by 24respondents were arranged indescending order and divided into six groups i.e. 4respondents in each group. The groups were named asG1, G2, G3, G4, G5 and G6. The range of scoreobtained by the respondents of six groups was asfollows:
For the purpose of item analysis, the middle twogroups G3 and G4 were eliminated keeping four extremegroups with high and low scores. The data pertaining tothe correct response for all the items in respect of thesefour groups were tabulated for calculating the difficultyand discrimination indices.
Calculation of difficulty index: Difficulty index ofan item was defined as the proportion of respondentsgiving correct answers to that particular item. This wascalculated by the formula:
Pi = ni/Ni x 100
Pi = Difficulty index in % of the ith itemni = Total number of respondents giving correct answerNi = Total number of respondents to whom the ithitem was administered
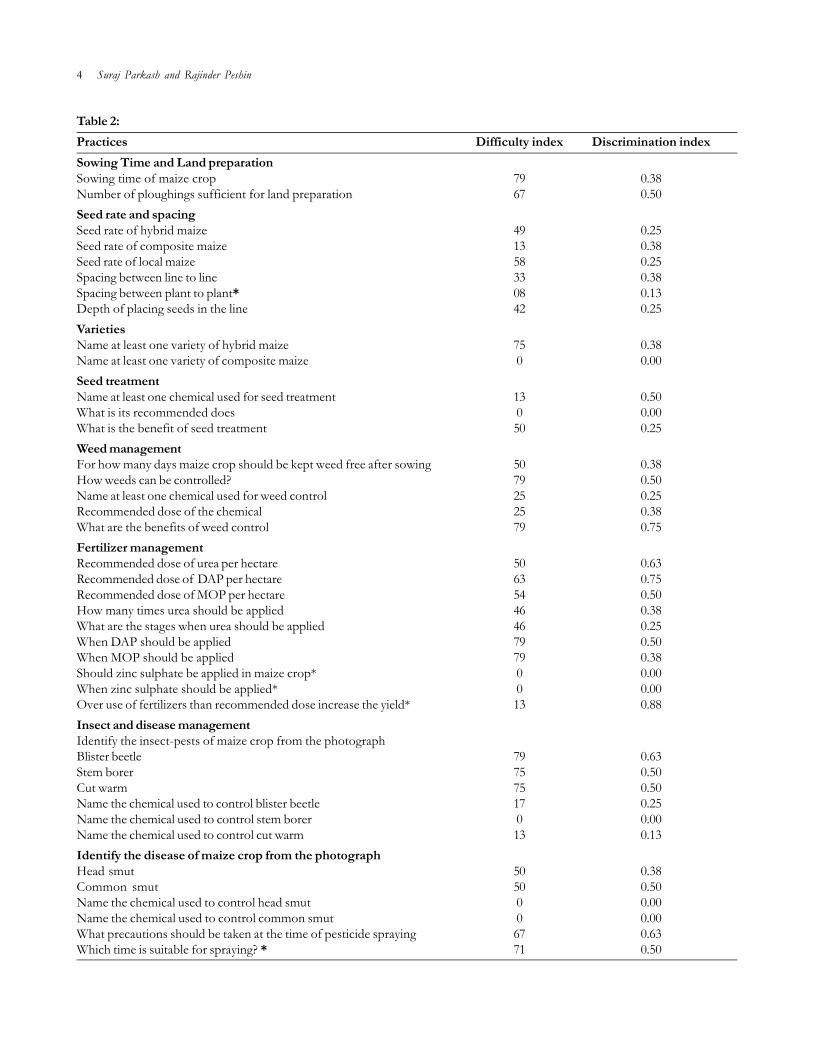
For example in the first item given in Table 2, 19respondents (ni) gave the correct answer and this schedulewas administered to 24 respondents.
Table 1: Range of scores obtained by the respondents (n=36)Group Score range No. of respondents
G1 38-33 4G2 33-32 4G3 31-30 4G4 30-28 4G5 28-26 4G6 26-24 4
Construction and Standardization of Knowledge Test to Measure the Knowledge Level of Maize Growers on Maize Production Technologies 3
Thus the difficulty index was calculated as
Pi = ni/Ni x 100 = 19/24 x 100 = 79.16
Which was rounded to 79.
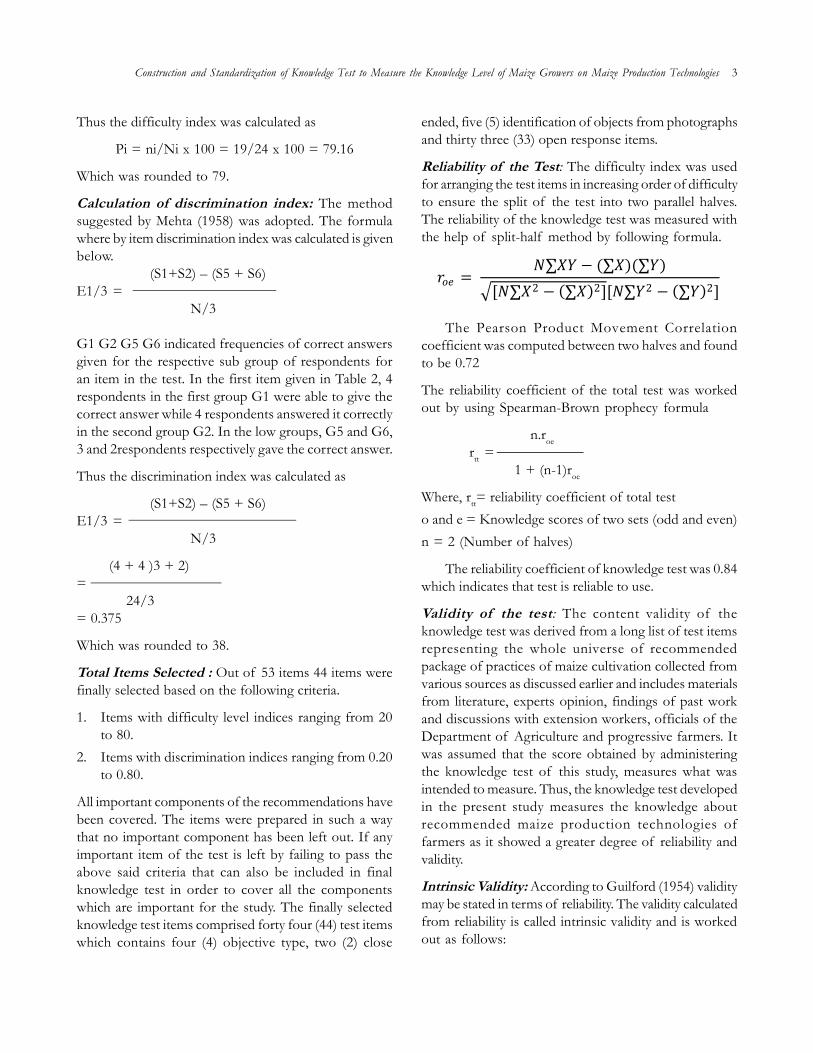
Calculation of discrimination index: The methodsuggested by Mehta (1958) was adopted. The formulawhere by item discrimination index was calculated is givenbelow. (S1+S2) – (S5 + S6)E1/3 = N/3
G1 G2 G5 G6 indicated frequencies of correct answersgiven for the respective sub group of respondents foran item in the test. In the first item given in Table 2, 4respondents in the first group G1 were able to give thecorrect answer while 4 respondents answered it correctlyin the second group G2. In the low groups, G5 and G6,3 and 2respondents respectively gave the correct answer.
Thus the discrimination index was calculated as
(S1+S2) – (S5 + S6)E1/3 = N/3
(4 + 4 )3 + 2)= 24/3= 0.375
Which was rounded to 38.
Total Items Selected : Out of 53 items 44 items werefinally selected based on the following criteria.
1. Items with difficulty level indices ranging from 20to 80.
2. Items with discrimination indices ranging from 0.20to 0.80.
All important components of the recommendations havebeen covered. The items were prepared in such a waythat no important component has been left out. If anyimportant item of the test is left by failing to pass theabove said criteria that can also be included in finalknowledge test in order to cover all the componentswhich are important for the study. The finally selectedknowledge test items comprised forty four (44) test itemswhich contains four (4) objective type, two (2) close
ended, five (5) identification of objects from photographsand thirty three (33) open response items.
Reliability of the Test: The difficulty index was usedfor arranging the test items in increasing order of difficultyto ensure the split of the test into two parallel halves.The reliability of the knowledge test was measured withthe help of split-half method by following formula.
The Pearson Product Movement Correlationcoefficient was computed between two halves and foundto be 0.72
The reliability coefficient of the total test was workedout by using Spearman-Brown prophecy formula
n.roertt = 1 + (n-1)roe
Where, rtt= reliability coefficient of total testo and e = Knowledge scores of two sets (odd and even)n = 2 (Number of halves)
The reliability coefficient of knowledge test was 0.84which indicates that test is reliable to use.
Validity of the test: The content validity of theknowledge test was derived from a long list of test itemsrepresenting the whole universe of recommendedpackage of practices of maize cultivation collected fromvarious sources as discussed earlier and includes materialsfrom literature, experts opinion, findings of past workand discussions with extension workers, officials of theDepartment of Agriculture and progressive farmers. Itwas assumed that the score obtained by administeringthe knowledge test of this study, measures what wasintended to measure. Thus, the knowledge test developedin the present study measures the knowledge aboutrecommended maize production technologies offarmers as it showed a greater degree of reliability andvalidity.
Intrinsic Validity: According to Guilford (1954) validitymay be stated in terms of reliability. The validity calculatedfrom reliability is called intrinsic validity and is workedout as follows:
푟표푒 = 푁∑푋푌 − (∑푋)(∑푌)
[푁∑푋2 − (∑푋)2][푁∑푌2 − (∑푌)2]
4 Suraj Parkash and Rajinder Peshin
Table 2:Practices Difficulty index Discrimination indexSowing Time and Land preparationSowing time of maize crop 79 0.38Number of ploughings sufficient for land preparation 67 0.50Seed rate and spacingSeed rate of hybrid maize 49 0.25Seed rate of composite maize 13 0.38Seed rate of local maize 58 0.25Spacing between line to line 33 0.38Spacing between plant to plant* 08 0.13Depth of placing seeds in the line 42 0.25VarietiesName at least one variety of hybrid maize 75 0.38Name at least one variety of composite maize 0 0.00Seed treatmentName at least one chemical used for seed treatment 13 0.50What is its recommended does 0 0.00What is the benefit of seed treatment 50 0.25Weed managementFor how many days maize crop should be kept weed free after sowing 50 0.38How weeds can be controlled? 79 0.50Name at least one chemical used for weed control 25 0.25Recommended dose of the chemical 25 0.38What are the benefits of weed control 79 0.75Fertilizer managementRecommended dose of urea per hectare 50 0.63Recommended dose of DAP per hectare 63 0.75Recommended dose of MOP per hectare 54 0.50How many times urea should be applied 46 0.38What are the stages when urea should be applied 46 0.25When DAP should be applied 79 0.50When MOP should be applied 79 0.38Should zinc sulphate be applied in maize crop* 0 0.00When zinc sulphate should be applied* 0 0.00Over use of fertilizers than recommended dose increase the yield* 13 0.88Insect and disease managementIdentify the insect-pests of maize crop from the photographBlister beetle 79 0.63Stem borer 75 0.50Cut warm 75 0.50Name the chemical used to control blister beetle 17 0.25Name the chemical used to control stem borer 0 0.00Name the chemical used to control cut warm 13 0.13Identify the disease of maize crop from the photographHead smut 50 0.38Common smut 50 0.50Name the chemical used to control head smut 0 0.00Name the chemical used to control common smut 0 0.00What precautions should be taken at the time of pesticide spraying 67 0.63Which time is suitable for spraying? * 71 0.50
Construction and Standardization of Knowledge Test to Measure the Knowledge Level of Maize Growers on Maize Production Technologies 5
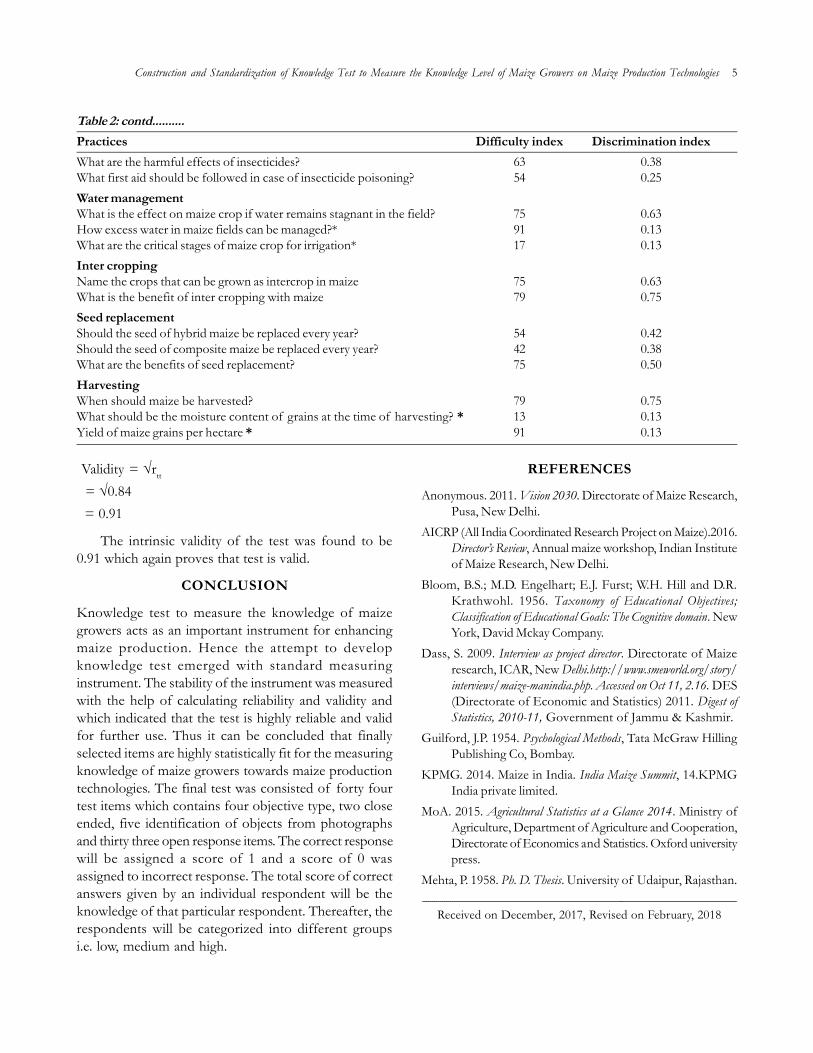
Table 2: contd..........Practices Difficulty index Discrimination indexWhat are the harmful effects of insecticides? 63 0.38What first aid should be followed in case of insecticide poisoning? 54 0.25Water managementWhat is the effect on maize crop if water remains stagnant in the field? 75 0.63How excess water in maize fields can be managed?* 91 0.13What are the critical stages of maize crop for irrigation* 17 0.13Inter croppingName the crops that can be grown as intercrop in maize 75 0.63What is the benefit of inter cropping with maize 79 0.75Seed replacementShould the seed of hybrid maize be replaced every year? 54 0.42Should the seed of composite maize be replaced every year? 42 0.38What are the benefits of seed replacement? 75 0.50HarvestingWhen should maize be harvested? 79 0.75What should be the moisture content of grains at the time of harvesting? * 13 0.13Yield of maize grains per hectare * 91 0.13
Validity = rtt
= 0.84 = 0.91
The intrinsic validity of the test was found to be0.91 which again proves that test is valid.
CONCLUSION
Knowledge test to measure the knowledge of maizegrowers acts as an important instrument for enhancingmaize production. Hence the attempt to developknowledge test emerged with standard measuringinstrument. The stability of the instrument was measuredwith the help of calculating reliability and validity andwhich indicated that the test is highly reliable and validfor further use. Thus it can be concluded that finallyselected items are highly statistically fit for the measuringknowledge of maize growers towards maize productiontechnologies. The final test was consisted of forty fourtest items which contains four objective type, two closeended, five identification of objects from photographsand thirty three open response items. The correct responsewill be assigned a score of 1 and a score of 0 wasassigned to incorrect response. The total score of correctanswers given by an individual respondent will be theknowledge of that particular respondent. Thereafter, therespondents will be categorized into different groupsi.e. low, medium and high.
REFERENCES
Anonymous. 2011. Vision 2030. Directorate of Maize Research,Pusa, New Delhi.
AICRP (All India Coordinated Research Project on Maize).2016.Director’s Review, Annual maize workshop, Indian Instituteof Maize Research, New Delhi.
Bloom, B.S.; M.D. Engelhart; E.J. Furst; W.H. Hill and D.R.Krathwohl. 1956. Taxonomy of Educational Objectives;Classification of Educational Goals: The Cognitive domain. NewYork, David Mckay Company.
Dass, S. 2009. Interview as project director. Directorate of Maizeresearch, ICAR, New Delhi.http://www.smeworld.org/story/interviews/maize-manindia.php. Accessed on Oct 11, 2.16. DES(Directorate of Economic and Statistics) 2011. Digest ofStatistics, 2010-11, Government of Jammu & Kashmir.
Guilford, J.P. 1954. Psychological Methods, Tata McGraw HillingPublishing Co, Bombay.
KPMG. 2014. Maize in India. India Maize Summit, 14.KPMGIndia private limited.
MoA. 2015. Agricultural Statistics at a Glance 2014. Ministry ofAgriculture, Department of Agriculture and Cooperation,Directorate of Economics and Statistics. Oxford universitypress.
Mehta, P. 1958. Ph. D. Thesis. University of Udaipur, Rajasthan.--------------------------------------------------------------------------------------------------------------------------------------------------------------
Received on December, 2017, Revised on February, 2018
Journal of Community Mobilization and Sustainable Development Vol. 13(1), 7-12, January-April, 2018
*Corresponding author email id: [email protected]
Adoption and Impact of Kisan Mobile Advisory - an ICT tool onAgriculture Progress in Malwa Region of Madhya Pradesh
Ghazala Khan1*, A.K. Dixit2, Arvind Saxena3 and D.S. Tomar4
1Programme Assistant (Computer), 2Senior Scientist & KVK Head, 3Associate Professor (Extension), College of Agriculture,Ganjbasoda (M.P.), 4Subject Matter Specialist (Agronomy), Krishi Vigyan Kendra, RVSKVV, Ujjain (M.P.)
ABSTRACT
The advent of the twenty-first century has seen a number of technological developments which affect almostevery aspect of our lives. At the core of this is the ever-growing use of ICT in all realms of life, from the work placeto the sports field, in schools and on a personal or social level. ICT is defined as a global network in which ideasare exchanged, or information and knowledge is shared, through using communication like cell phones, andtechnology like computers, to connect people. In the recent past Mobile Technology has emerged as a besttelecommunication technology resulting in the overwhelming increase in the number of mobile user day by day.There are 900 million users of mobile phone in India at present. This cost effective means of communication isbeing utilized by a top level business tycoon to a low level labour. Agricultural Scientist aims to improve andstrengthen existing agriculture extension services by integrating Information Technology with mobile services.Sharing of knowledge among experts, farmers, students and research scholars are very important to the growth ofthe agriculture sector. The study has revealed that though, farm advisories through mobile phones may not be theonly agent for improving farm production, productivity and rural economy, yet the quality of information,timeliness of information and trustworthiness of information help the farmers to a considerable extent in theirday to day job for which they were found struggling with the non-experts or the inputs dealers and most of thetimes ended up in disaster and loss.
Keywords: Adoption, Agriculture, ICT, Impact, Kisan Mobile Advisory
INTRODUCTION
Access and use of information sources is a first steptoward better targeting of extension programs andadvisory services that facilitate information sharing (Nainet al., 2015). Mobile communications technology hasbecome the world’s most common way of transmittingvoice, data, and services, and no technology has everspread faster. At the end of 2010 there were 5.25 billioncellular telephone subscriptions worldwide. By 2015 thenumber of mobile phone connections is expected toexceed the global population, Quiang et al. (2011). Thereare 900 million users of mobile phone in India at present.Mobile applications are software designed to takeadvantage of mobile technology and can be developedfor technology besides mobile phones. But mobilephones have many key advantages: affordability, wide
ownership, voice communications, and instant andconvenient service delivery. As a result, there has been aglobal explosion in the number of m-apps, facilitatedby the rapid evolution of mobile networks and by theincreasing functions and falling prices of mobile handsets.This cost effective means of communication is beingutilized by a top level business tycoon to a low levellabour. There are number of changes occur in cell phoneviz its size, shape, mode of operation, operating system,number of applications which reflect the price in themarket. At present multiple number of web basedapplication which are using for sending SMS to the Userfree of cost. These web enabled message done throughinternet and single message can be sent to bulk user at atime. Besides, farmer may visit ATIC, functioning as arepository of agricultural information for confirmationabout the technology (Pandey & Solanki, 2015).

There are an estimated 127.3 million cultivators inIndia. The majority of them are farmers subsisting onsmall plots of land, less than 5 acres in size. Deficits inphysical infrastructure, in the availability of agriculturalinputs such as seed, fertilizer and services in rural areasand in access to information are the major reasons forlow productivity growth. These factors create thecommunications and logistics environment for farmingFan et al. (1999) and Fong (2009). Deficits in physicalinfrastructure, problems with availability of agriculturalinputs and poor access to agriculture-related informationare the major constraints on the growth of agriculturalproductivity in India. The more rapid growth of mobiletelephony as compared to fixed line telephony and therecent introduction of mobile enabled informationservices provide a means to overcome existinginformation asymmetry. It also helps, at least partially, tobridge the gap between the availability and delivery ofagricultural inputs and agriculture infrastructure, Mittal etal. (2010). Krishi Vigyan Kendra, Ujjain which is aknowledge hub for the transfer of technology to thegrass root level, started farm advisory services (KisanMobile Advisory) for farmers in 2008 and the impactwas assessed in two phases extending from 2008 to 2014.The basic objective behind this project was to:
Provide improved services to the farmingcommunity through use of ICT.
Advice and help farmers to solve problems relatedto their farming activities.
Providing information to farmers so that they getalerted on important/useful information.
Updates farmers on latest technology in Agriculturesector for improved productivity and quality farmers.
Developing an advisory system which can beextended with any other types of crops in any otherstate of India through the KVK network.
Improving agricultural extension service by usingmobile device so that farmers can send queries abouttheir farming problem from their mobile device.
MATERIALS AND METHODS
KVK establishment have only one senior scientist, sixscientists and three technical assistant. The population ofUjjain district is 1986597 (Census, 2011) and there is onlyone KVK. The farm families are 160375. Farmers needlatest agriculture technologies which can be provided by
the scientist. But reaching of these 10 scientists to 1.6lakh farm families is not possible because any technologyof agriculture needs many years for adoption in the area.So no technology can be spread to the entire districtuntil or unless awareness is being created. Keeping thisin view and hoping for benefits of farmers, themessaging starts in April 2008 twice a week throughoutthe year. The beneficiaries included Farmers, FarmWomen, Agriculture Input supplier, Extension workersetc. Important aspect of messaging is time specific andtime efficient.
The area is Ujjain district where the study wasconducted in two phases. First phase year 2008 to 2011and second phase year 2011 to 2014. These phases weredistinguished on the basis of messaging script andnumber of beneficiaries. In First Phase the message werein roman script “Khet main pani bharne na de” can beread by only those farmer who can read English andnumber of beneficiaries were only 500 to 2000. In thesecond phase the messaging were on Unicode textsupported on every platform which can be read byfarmer who know Hindi but cannot read English andthe number of beneficiaries were 2000 to 5000 whichshows the impact of “Messaging in Local Language”.The assessment of the impact of messaging on adoptionof technology and creation of awareness to latestagriculture technology during these phases was the mainaspect behind the study. The component used for studyis well prepared questionnaire, survey, interviews anddirect as well as indirect interaction. 250–250 beneficiarieswere randomly selected from each phase. The messagedelivery mechanism is depicted below.
Message Uploaded to Website
User-Famer/Farm Women
User-Input Dealer
User – Extension Personnels
KVK UJJAIN
Feed Back from Farmers
Message delivery Model
RESULT AND DISCUSSION
Phase-1: The results of the intervention during the twophases of advisory services are presented in depth with
Adoption and Impact of Kisan Mobile Advisory - an ICT tool on Agriculture Progress in Malwa Region of Madhya Pradesh 7

8 Ghazala Khan et al.
Table 1: Descriptive Statistic and demographic profile ofrespondent (N=500)Category Frequency PercentAge 18-30 125 25
30-40 170 3440-50 130 26Above 50 75 15
Educational Middle to High School 120 24qualification High School to 255 51
Higher SecondaryGraduate or 85 17Post GraduateIlliterate 40 8
Gender Male 450 90Female 50 10
Land Holding <2ha 140 28>2 ha and <5 ha 260 52> 5ha 100 20
6
19
10
23 2520
15
47
4 6 8 8
0
8
19
487
13 1319
26
13 14
36
138 9
5 58
3 58
05
101520253035404550
Phase I(Year 2008-09 to 2010-11)
Phase II(Year 2011-12 to 2013-14)
Figure 1: Major Thematic area of the messages sent
Figure 2: Number of Messages Delivered
the aid of data and figures as depicted below. Data inTable 1 indicate that the age of the respondents variedfrom 18 to more than 50 who were actively engage inthe farming business. Majority of the respondents werethe youths comprising more than 59 percent who aresuppose to be highly active group. Education wise 51percent had passed high School or higher secondary.Agriculture being a male dominant area majority of therespondents 90 percent was males. Holding wise majorityof the respondents were having 2 to 5 hectare which
9561 52 65 63
87
423
R² = 0.352
0
50
100
150
200
250
300
350
400
450
2008-09 2009-10 2010-11 2011-12 2012-13 2013-14 Total
represents the general phenomenon of holding in thispart of the country. Similar findings were also beenreported by Omprakash et al. (2012).
Data in Figure 1 and 2 enumerates the total numberof messages sent to the respondents during 2008-09 to2013-14. It also gives a clear picture of the thematic areaon which the farm advisory was given. This is a clearindicative of the facts that the district has its own prioritiesand the fields like crop production, integrated cropmanagement, plant protection against insect pest anddiseases were the focal points on which the farmers hadthe desire to get the information’s.
The study shows that in phase I only 45% percentbeneficiaries understand the message but in phase II thepercentage of beneficiaries who understand message is

Adoption and Impact of Kisan Mobile Advisory - an ICT tool on Agriculture Progress in Malwa Region of Madhya Pradesh 9
increased by 26% which reflects the use of Hindi text ormessaging in Hindi Unicode is attracting much farmersthan English roman text. Other response of the farmersin terms of time specificity, significance, grasping of themessages and social upliftment is presented in tabularform below. All the responses indicate that there was aphenomenal change towards the adoption of themessages. Time specificity increased by 29 percent,selected themes getting a response ranging between 79to 88 percent, increase in the understanding of themessage by 26 percent and reliance on new gadgets by45 percent.
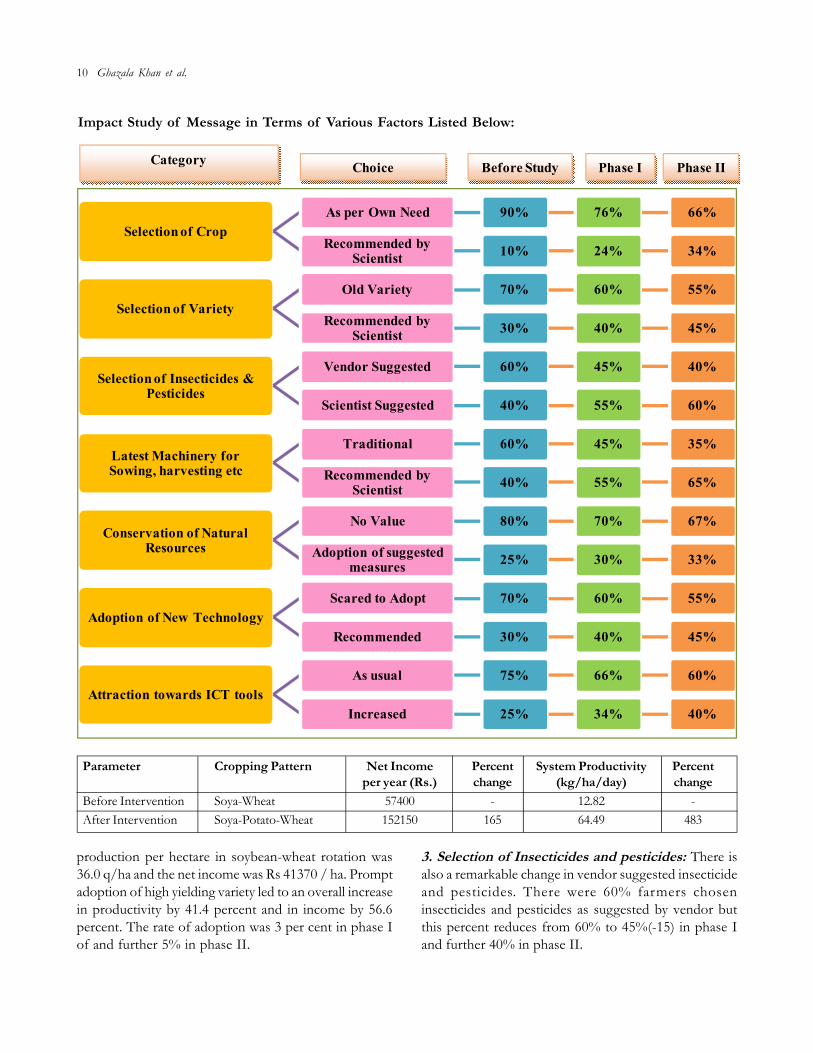
From the above model we can conclude:
1. Selection of Crop: As evident from the aboveimpact analysis, farmers were motivated for the selectionof alternate crop owing to reduction in the total growingperiod of soybean crop and inclusion of potato in theirrigated ecosystem, resulting in crop diversification fromyear 2008 to 2014. In the year 2008 there were 90%farmers had no alternate to their traditional crop, varietywhich reduced 10% in phase I and further 10% in phaseII. Similarly adoption based on “Scientificrecommendation” increases from 10% in both phasesrespectively.
2. Selection of Variety: Study on the horizontal spreadof seed based technology in the district based upon theactual sale of certified seed by various agencies from2008 to 2014 reveal that before intervention the average
Response of (Farmers) Beneficiaries
Impact of Message in local language
a) Time Specific informationPhase 1 Phase 2
Yes No Yes No60% 40% 89% 11%
b) Significance of ThemeIPM INM ICM VE NRM
Yes NO Yes NO Yes NO Yes NO Yes NO88% 12% 79% 21% 83% 17% 81% 19% 46% 14%
c) Grasping of message (Message Understanding)Phase I Phase II
Yes No Can’t Say Yes NO Can’t Say45% 33% 12% 71% 22% 7%
d) Social upliftment & Awareness about gadgetPhase I Phase II
Yes No Can’t Say Yes No Can’t Say20% 70% 10% 65% 25% 10%
10 Ghazala Khan et al.
Selection of CropAs per Own Need 90% 76% 66%
Recommended by Scientist 10% 24% 34%
Selection of VarietyOld Variety 70% 60% 55%
Recommended by Scientist 30% 40% 45%
Selection of Insecticides & Pesticides
Vendor Suggested 60% 45% 40%
Scientist Suggested 40% 55% 60%
Latest Machinery for Sowing, harvesting etc
Traditional 60% 45% 35%
Recommended by Scientist 40% 55% 65%
Conservation of Natural Resources
No Value 80% 70% 67%
Adoption of suggested measures 25% 30% 33%
Adoption of New TechnologyScared to Adopt 70% 60% 55%
Recommended 30% 40% 45%
Attraction towards ICT toolsAs usual 75% 66% 60%
Increased 25% 34% 40%
Before Study Phase I Phase IICategory Choice
Impact Study of Message in Terms of Various Factors Listed Below:
Parameter Cropping Pattern Net Income Percent System Productivity Percentper year (Rs.) change (kg/ha/day) change
Before Intervention Soya-Wheat 57400 - 12.82 -After Intervention Soya-Potato-Wheat 152150 165 64.49 483
production per hectare in soybean-wheat rotation was36.0 q/ha and the net income was Rs 41370 / ha. Promptadoption of high yielding variety led to an overall increasein productivity by 41.4 percent and in income by 56.6percent. The rate of adoption was 3 per cent in phase Iof and further 5% in phase II.
3. Selection of Insecticides and pesticides: There isalso a remarkable change in vendor suggested insecticideand pesticides. There were 60% farmers choseninsecticides and pesticides as suggested by vendor butthis percent reduces from 60% to 45%(-15) in phase Iand further 40% in phase II.
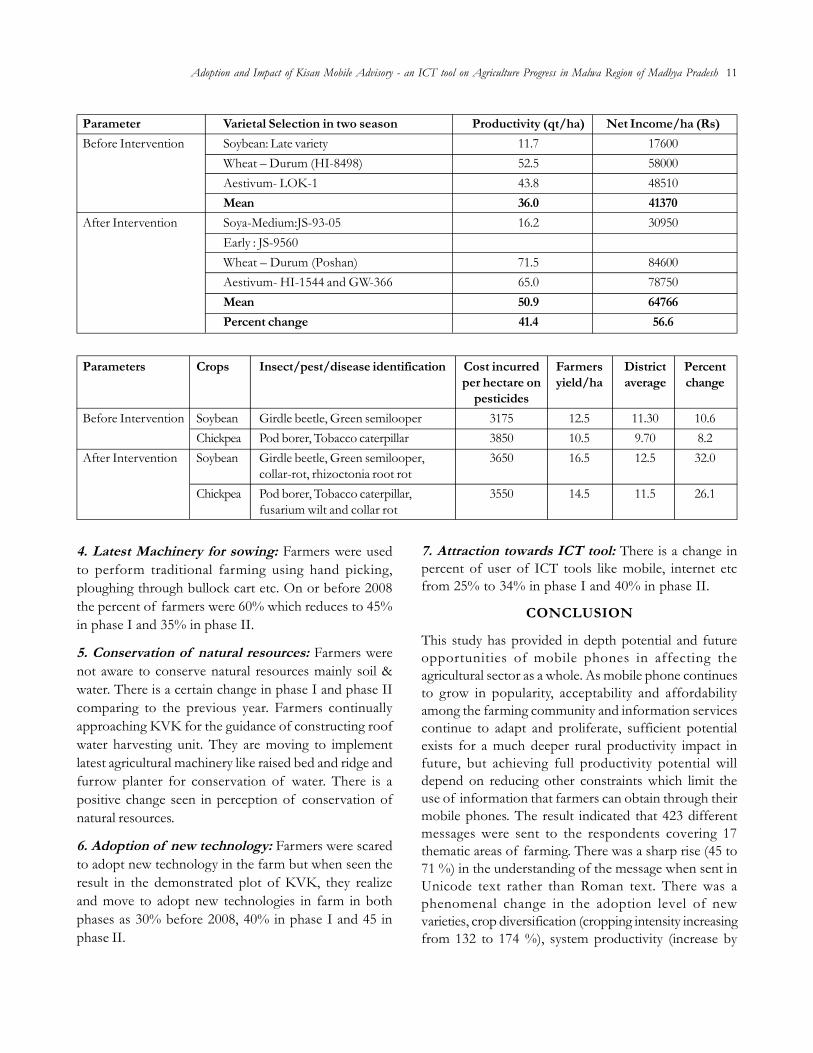
Adoption and Impact of Kisan Mobile Advisory - an ICT tool on Agriculture Progress in Malwa Region of Madhya Pradesh 11
Parameter Varietal Selection in two season Productivity (qt/ha) Net Income/ha (Rs)Before Intervention Soybean: Late variety 11.7 17600
Wheat – Durum (HI-8498) 52.5 58000Aestivum- LOK-1 43.8 48510Mean 36.0 41370
After Intervention Soya-Medium:JS-93-05 16.2 30950Early : JS-9560Wheat – Durum (Poshan) 71.5 84600Aestivum- HI-1544 and GW-366 65.0 78750Mean 50.9 64766Percent change 41.4 56.6
Parameters Crops Insect/pest/disease identification Cost incurred Farmers District Percentper hectare on yield/ha average change
pesticidesBefore Intervention Soybean Girdle beetle, Green semilooper 3175 12.5 11.30 10.6
Chickpea Pod borer, Tobacco caterpillar 3850 10.5 9.70 8.2After Intervention Soybean Girdle beetle, Green semilooper, 3650 16.5 12.5 32.0
collar-rot, rhizoctonia root rotChickpea Pod borer, Tobacco caterpillar, 3550 14.5 11.5 26.1
fusarium wilt and collar rot
4. Latest Machinery for sowing: Farmers were usedto perform traditional farming using hand picking,ploughing through bullock cart etc. On or before 2008the percent of farmers were 60% which reduces to 45%in phase I and 35% in phase II.
5. Conservation of natural resources: Farmers werenot aware to conserve natural resources mainly soil &water. There is a certain change in phase I and phase IIcomparing to the previous year. Farmers continuallyapproaching KVK for the guidance of constructing roofwater harvesting unit. They are moving to implementlatest agricultural machinery like raised bed and ridge andfurrow planter for conservation of water. There is apositive change seen in perception of conservation ofnatural resources.
6. Adoption of new technology: Farmers were scaredto adopt new technology in the farm but when seen theresult in the demonstrated plot of KVK, they realizeand move to adopt new technologies in farm in bothphases as 30% before 2008, 40% in phase I and 45 inphase II.
7. Attraction towards ICT tool: There is a change inpercent of user of ICT tools like mobile, internet etcfrom 25% to 34% in phase I and 40% in phase II.
CONCLUSION
This study has provided in depth potential and futureopportunities of mobile phones in affecting theagricultural sector as a whole. As mobile phone continuesto grow in popularity, acceptability and affordabilityamong the farming community and information servicescontinue to adapt and proliferate, sufficient potentialexists for a much deeper rural productivity impact infuture, but achieving full productivity potential willdepend on reducing other constraints which limit theuse of information that farmers can obtain through theirmobile phones. The result indicated that 423 differentmessages were sent to the respondents covering 17thematic areas of farming. There was a sharp rise (45 to71 %) in the understanding of the message when sent inUnicode text rather than Roman text. There was aphenomenal change in the adoption level of newvarieties, crop diversification (cropping intensity increasingfrom 132 to 174 %), system productivity (increase by

12 Ghazala Khan et al.
483 %), judicious use of pesticides (Yield increase by32%), curtailing the cost of production and increase inthe net profit per unit area (56%) and earning per family(Rs 41500 to 65,000). Simultaneously, there was increasedawareness towards adoption of new farm machineries,ICT tools, conservation of natural resources particularlywater harvesting systems to increase the farmproductivity. KVK has finally approached to over 15053farm families till the end of present financial year and islikely to cover the entire district by the end of XIIth plan.
REFERENCES
Christine Zhenwei Qiang, Siou Chew Kuek, Andrew Dymondand Steve Esselaar, 2011. Mobile Applications forAgriculture and Rural Development. ICT Sector UnitWorld Bank Report. 2011.
Fan, S.; P.B.R. Hazell and S. Thorat. 1999. Linkages betweenGovernment Spending, Growth, and Poverty in RuralIndia. Research Report No 110. International Food PolicyResearch Institute, Washington, D.C. 33
Fong, Michelle W.L. 2009. Digital Divide between Urban andRural Regions in China. The Electronic Journal on InformationSystems in Developing Countries, EJISDC, 36(6): 1-12. http://www.ejisdc.org/ojs2/ .
Ganesan, M.; Kavitha Karthikeyan; Suma Prashant andJayalakshmi Umadikar. 2013. Use of mobile multimediaagricultural advisory systems by Indian farmers: Resultsof a survey. J. Agril. Extension and Rural Development, 5(4):89-99.
Mittal Surabhi, Gandhi Sanjay and Tripathi Gaurav. 2010. Socio-economic Impact of mobile phones on Indian agriculture.Working Paper No. 246. Indian Council for Research onInternational Economic Relations, www.icrier.org.
Parganiha, Omprakash; S.K. Shrivastava; A.K. Chaubey andJ.L. Nag. 2012. Impact of Kisan Mobile Advisory (KMA)On Agricultural Technology Dissemination. Indian ResearchJournal of Extension Education, II(Special Issue): 175:178.
Pandey, M. and Soalnki, Dhriti. 2015. Constraints Faced inUtilization of Agricultural Technology Information Centre(ATIC) Facilities by Farm Families. J. CommunityMobilization and Sustainable Development 10(1): 104-107.
Nain, M.S.; Rashmi Singh; J.R. Mishra and J.P. Sharma. 2015.Utilization and Linkage with Agricultural InformationSources: A Study of Palwal District of Haryana State. J.Community Mobilization and Sustainable Development, 10(2):152-156.
--------------------------------------------------------------------------------------------------------------------------------------------------------------Received on February, 2018, Revised on March, 2018
Journal of Community Mobilization and Sustainable Development Vol. 13(1), 13-16, January-April, 2018
Introduction of Climbing Perch (Anabas Testudineus, Bloch) in LowLying Rice Field as a Component of Integration for DoublingFarmers Income in Assam
Pabitra Kumar Saharia1*, Sonmoina Bhuyan2, Ranjit Bordoloi3, D. Borah4, B. Rahman5, H. Rabha6 andP. Deka7
1,5,6&7Subject Matter Specialist, KVK Udalguri, AAU, Lalpool2Subject Matter Specialist (Fisheries Science), KVK Nalbari, AAU, Sariahtoli-7813373Subject Matter Specialist (Fisheries Science), KVK Karimganj, AAU; 4Senior Scientist and Head, KVK, Udalguri, AAU, Lalpool
ABSTRACT
Climbing perch (Anabas testudineus) is one of the high valued fish species which have high demand both nutritionallyand commercially in Assam. It is an air breathing species, which is known as Kawoi or Koi in Assam and adjacentstates. In nature Kawoi is commonly found in beels, river, paddy fields and swamps and its preferred habitats areheavily-vegetated stagnant waters. Field trials were done to access the possibility of Kawoi culture in low layingpaddy field as a component of integrated rice-fish farming. The outcome of the experiments were very promisingas the production from unit area has increased fourfold in terms of monetary value in comparison to single ricecultivation in low lying area. The calculated Benefit Cost Ratio for control was 1.73 which was 2.37 in treatments.
Keywords: Alternative farming, Options for doubling farmers’ income, Integration, Air breathing, Larvivorous
INTRODUCTION
Climbing perch (Anabas testudineus, Bloch) locally knownas Kawoi is one of the most demanded indigenous fishspecies of Assam. The hardy nature made this species apreferred one among the consumer. It is found in oxbowlakes, swamps, estuaries, medium or large rivers, floodedfields and stagnant waters in most tropical and sub-tropical Asia (Talwar et al., 1992). Naturally, Kawoi is alarvivorous species which is marketed at a size of 40gmor above. The induce breeding and culture of this speciesstarted in recent time owing to the market demand andlack of landing from the natural resources. The availabilityof seed from induce breeding made it possible to culturekawoi in confined water bodies like pond. However,there is very less report of culture of this species on ascientific line.
Recent studies suggest that worldwide 20% of allfresh water species are extinct, endangered or vulnerable(Moyle et al., 1992). The availability of this species isdeclining due to rough and unplanned water management
policy for irrigation, over exploitation, illegal practice ofcapture fisheries and various ecological changes in itsnatural habitat; this native species is threatened now(Chakraborty et al., 2010). Considering the importanceof this species in nutritional, economics and biodiversitypoint of view, it is required to develop an appropriateculture technique of A. testudineus. The successful inducebreeding and seed rearing of Kawoi in farmers field(Bhuyan et al., 2017) open up the farming possibilities ofthe species. As a part of farming possibility Kawoi wasintroduced in low lying rice field with the aim of utilizationof natural food of Kawoi fish found in rice field i.e.larvae of insect/pest. The introduction of Kawoi alsoworks as a systematic and scientific culture of fish inseasonal ponds of paddy field which were often act asgrowing ground of wild fish. Of course, wild catch fromthese resources are very much uncertain and unpredictableas scientific mode of integration of kawoi in paddy fieldswill usher certainity in production. Moreover,introduction of kawoi was also done to test the possibilityof controlling the recurring army worm pest creating
*Corresponding author email id: [email protected]
14 Pabitra Kumar Saharia et al.
havoc in most of the rice fields of Assam. Hence, thepresent communication was undertaken to record theperformance of Kawoi in rice field and economics ofthe integration of Kawoi with rice farming was evaluated.
MATERIALS AND METHODS
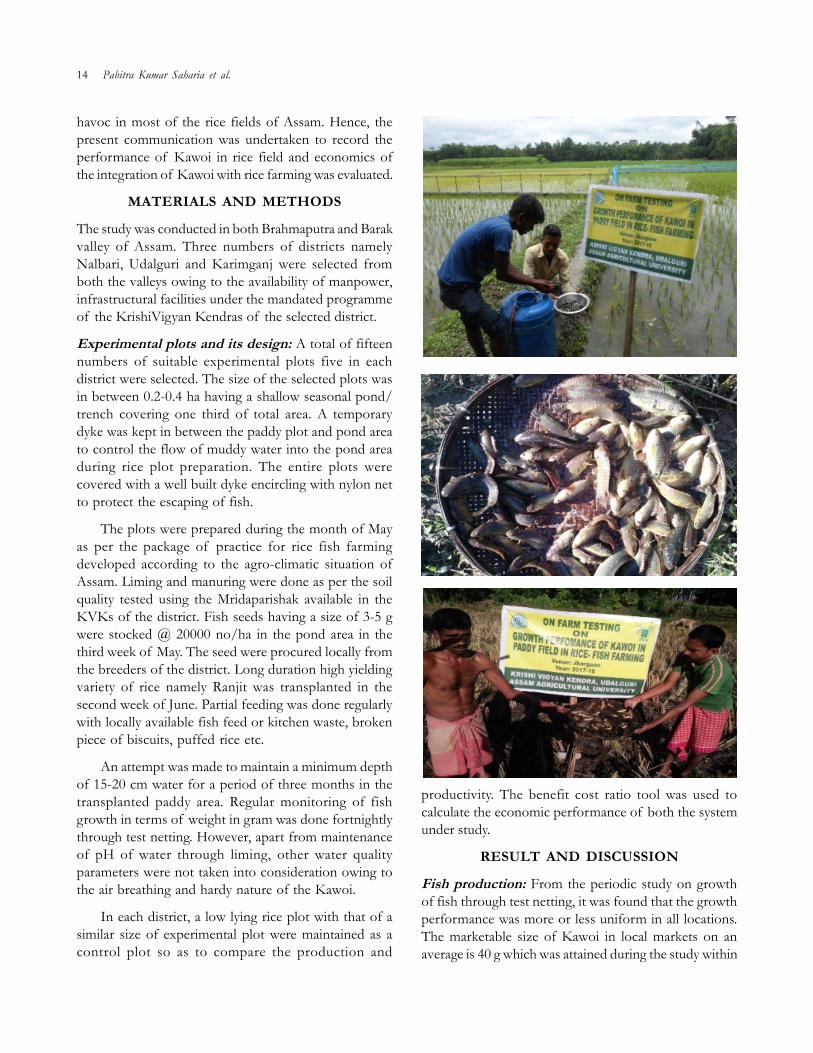
The study was conducted in both Brahmaputra and Barakvalley of Assam. Three numbers of districts namelyNalbari, Udalguri and Karimganj were selected fromboth the valleys owing to the availability of manpower,infrastructural facilities under the mandated programmeof the KrishiVigyan Kendras of the selected district.
Experimental plots and its design: A total of fifteennumbers of suitable experimental plots five in eachdistrict were selected. The size of the selected plots wasin between 0.2-0.4 ha having a shallow seasonal pond/trench covering one third of total area. A temporarydyke was kept in between the paddy plot and pond areato control the flow of muddy water into the pond areaduring rice plot preparation. The entire plots werecovered with a well built dyke encircling with nylon netto protect the escaping of fish.
The plots were prepared during the month of Mayas per the package of practice for rice fish farmingdeveloped according to the agro-climatic situation ofAssam. Liming and manuring were done as per the soilquality tested using the Mridaparishak available in theKVKs of the district. Fish seeds having a size of 3-5 gwere stocked @ 20000 no/ha in the pond area in thethird week of May. The seed were procured locally fromthe breeders of the district. Long duration high yieldingvariety of rice namely Ranjit was transplanted in thesecond week of June. Partial feeding was done regularlywith locally available fish feed or kitchen waste, brokenpiece of biscuits, puffed rice etc.
An attempt was made to maintain a minimum depthof 15-20 cm water for a period of three months in thetransplanted paddy area. Regular monitoring of fishgrowth in terms of weight in gram was done fortnightlythrough test netting. However, apart from maintenanceof pH of water through liming, other water qualityparameters were not taken into consideration owing tothe air breathing and hardy nature of the Kawoi.
In each district, a low lying rice plot with that of asimilar size of experimental plot were maintained as acontrol plot so as to compare the production and
productivity. The benefit cost ratio tool was used tocalculate the economic performance of both the systemunder study.
RESULT AND DISCUSSION
Fish production: From the periodic study on growthof fish through test netting, it was found that the growthperformance was more or less uniform in all locations.The marketable size of Kawoi in local markets on anaverage is 40 g which was attained during the study within
Introduction of Climbing Perch in Low Lying Rice Field as a Component of Integration for Doubling Farmers Income in Assam 15
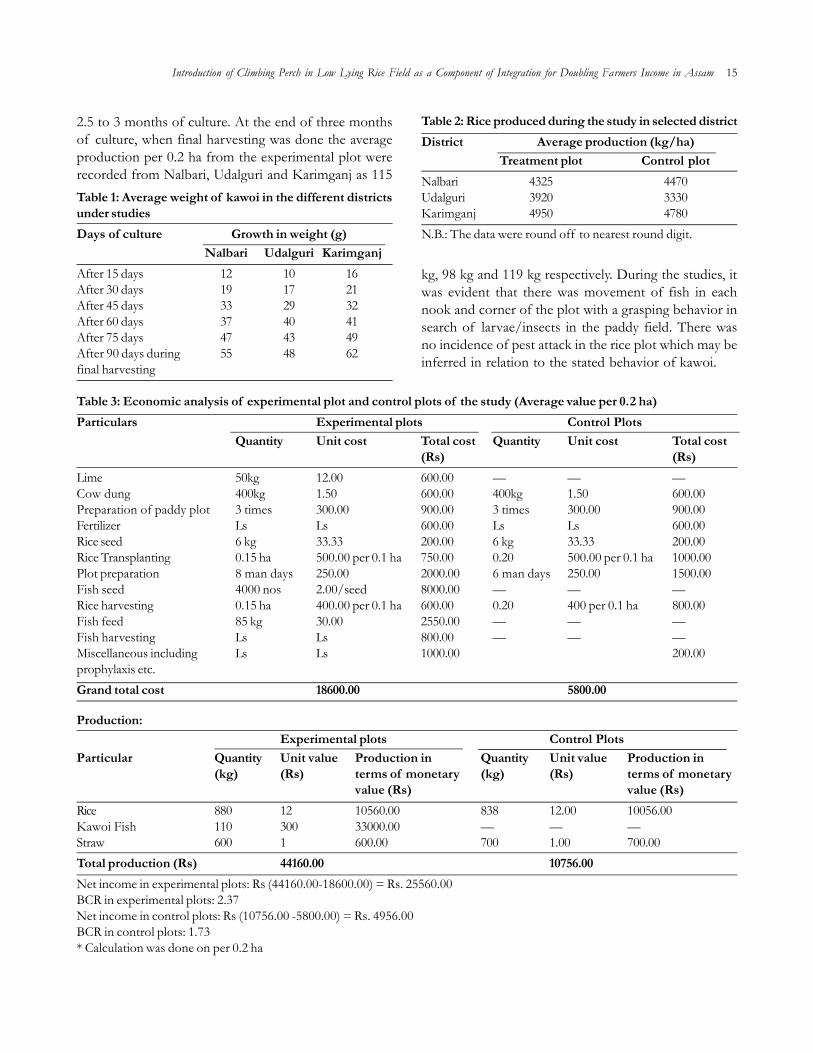
2.5 to 3 months of culture. At the end of three monthsof culture, when final harvesting was done the averageproduction per 0.2 ha from the experimental plot wererecorded from Nalbari, Udalguri and Karimganj as 115Table 1: Average weight of kawoi in the different districtsunder studiesDays of culture Growth in weight (g)
Nalbari Udalguri KarimganjAfter 15 days 12 10 16After 30 days 19 17 21After 45 days 33 29 32After 60 days 37 40 41After 75 days 47 43 49After 90 days during 55 48 62final harvesting
Table 2: Rice produced during the study in selected districtDistrict Average production (kg/ha)
Treatment plot Control plotNalbari 4325 4470Udalguri 3920 3330Karimganj 4950 4780N.B.: The data were round off to nearest round digit.
Table 3: Economic analysis of experimental plot and control plots of the study (Average value per 0.2 ha)Particulars Experimental plots Control Plots
Quantity Unit cost Total cost Quantity Unit cost Total cost(Rs) (Rs)
Lime 50kg 12.00 600.00 — — —Cow dung 400kg 1.50 600.00 400kg 1.50 600.00Preparation of paddy plot 3 times 300.00 900.00 3 times 300.00 900.00Fertilizer Ls Ls 600.00 Ls Ls 600.00Rice seed 6 kg 33.33 200.00 6 kg 33.33 200.00Rice Transplanting 0.15 ha 500.00 per 0.1 ha 750.00 0.20 500.00 per 0.1 ha 1000.00Plot preparation 8 man days 250.00 2000.00 6 man days 250.00 1500.00Fish seed 4000 nos 2.00/seed 8000.00 — — —Rice harvesting 0.15 ha 400.00 per 0.1 ha 600.00 0.20 400 per 0.1 ha 800.00Fish feed 85 kg 30.00 2550.00 — — —Fish harvesting Ls Ls 800.00 — — —Miscellaneous including Ls Ls 1000.00 200.00prophylaxis etc.Grand total cost 18600.00 5800.00
Production:Experimental plots Control Plots
Particular Quantity Unit value Production in Quantity Unit value Production in(kg) (Rs) terms of monetary (kg) (Rs) terms of monetary
value (Rs) value (Rs)Rice 880 12 10560.00 838 12.00 10056.00Kawoi Fish 110 300 33000.00 — — —Straw 600 1 600.00 700 1.00 700.00Total production (Rs) 44160.00 10756.00Net income in experimental plots: Rs (44160.00-18600.00) = Rs. 25560.00BCR in experimental plots: 2.37Net income in control plots: Rs (10756.00 -5800.00) = Rs. 4956.00BCR in control plots: 1.73* Calculation was done on per 0.2 ha
kg, 98 kg and 119 kg respectively. During the studies, itwas evident that there was movement of fish in eachnook and corner of the plot with a grasping behavior insearch of larvae/insects in the paddy field. There wasno incidence of pest attack in the rice plot which may beinferred in relation to the stated behavior of kawoi.

16 Pabitra Kumar Saharia et al.
Production of rice: There were no major differencesin rice production between the experimental plot andcontrol plot within the district. Highest production of4950 kg/ha of rice was recorded in the Karimganj districtwhereas the lowest production in the control plot wasrecorded with a production of 3300 kg/ha in theUdalguri district. Production of rice in the control plotof Nalbari district was recorded as 4470 kg/ha whichwas higher than the experimental plot. Since, there wasno report of pest attack particularly army worm in thecontrol plots so the variation of production was notsignificant in the study. The occurrence of pest/armyworm would have certainly affected the productionscenario of rice.
Economic analysis of the integration system: Fromthe economic analysis of the treatment and control plotit was found that the average net income from the controlplot was only Rs. 4956.00 whereas it was Rs. 25560.00 incase of experimental plots. The Benefit Cost Ratio forcontrol unit was only 1.73 which stands at 2.37 in theexperimental plots. The details of the economic analysisare given in the Table 3.
CONCLUSION
The culture of Kawoi has been popularized because ofthe need to exploit vast swampy and low lying paddyfields for immediate benefit to the people withoutinvolving expensive process. The vast low laying paddyfields need to be exploited carefully adopting scientificrearing to enhance productivity. However, at present thefisheries potential of these resources is still underutilized.The air breathing insectivorous Kawoi can be best utilizedas a candidate species suitable for integration in the paddyfields. Hence aquaculture reforms should address issuesthis area to enhance fish production to ensure sustainable
livelihood by enhancing income and at the same time thehavoc experienced in damaging paddy fields in recenttime in the state of Assam due to pest infestation can beminimized by undertaking this model cropping measuretechnology. The economic analysis echoes the possibilityof doubling the farmers’ income through the adoptionof integrated kawoi fish with rice cultivation in paddyfield. The farmers can take full advantage of judicioususe of low laying paddy fields and reap the benefits ofmodel cropping measure technology.
REFERENCE
Bhuyan Sonmoina and M. Deka. 2017. Bayushashi mas Kawoi aruMaguror palon prodhoti. Published by KVK Nalbari, AAUand SIPRD, Govt. of Assam, Nalbari; pp. 16-20.
Chakraborty, B.K. 2010. Status and Position of AquaticBiodiversity of Four Beels and its Floodplain Level ofNorthern Bangladesh with a Good Practice of BeelNurseries and Community Based Co-Management Policy.In: Justin A. Daniels (8 Ed.). Advances in EnvironmentalResearch. Nova Science Publishers, New York, USA.
Moyle, P.L. and R.A. Leidy. 1992. Loss of biodiversity in aquaticecosystem: Evidence from Fish Fauna. In: Fielder, P.L.and H.L. Jani (Eds). Conservation of biology: the theoryand practice of nature conservation, preservation andmanagement. Chapman and Hall, New York.
Sarma, K.; A.K. Pal; S. Ayyappan; T. Das; S.M. Manush; D.Debnath and K. Baruah. 2010. Acclimation of Anabastestudineus (Bloch) to three different temperaturesinfluences thermal tolerance and oxygen consumption.Fish Physiology. Biochem., 36: 85-90.
Talwar, P.K. and A.G. Jhingran. 1992. Inland fishes of Indiaand adjacent countries. A.A. Balkema, Rotterdam, TheNetherlands.
--------------------------------------------------------------------------------------------------------------------------------------------------------------Received on December, 2017, Revised on March, 2018

Journal of Community Mobilization and Sustainable Development Vol. 13(1), 17-26, January-April, 2018
*Corresponding author email id: [email protected]
A Study on Instigation of Farmer-led innovations and its Spread
Hema Baliwada1*, J.P. Sharma2, R.R. Burman3, M.S. Nain4, P. Venkatesh5 and Anil Kumar6
1Scientist, CTRI, Rajahmundry, 2Joint Director, Extension, 3Principal Scientist, 4Senior Scientist, Division of Agricultural Extension,5Scientist, Agricultural Economics, Indian Agricultural Research Institute, New Delhi-110012 and 6Principal Scientist, Design ofExperiments, IASRI, New Delhi-110012
ABSTRACT
To assess the process of origin and spread of farmer-led innovations, this study was conducted in Punjab andUttar Pradesh during 2015-16.A sample size of 50 innovators and 50 non-innovators constituting 100 farmersselected by stratified sampling. The socio-economic profile was compared between innovators and non-innovators,the results showed that there is significant difference between two groups. Wilcoxon Mann Whitney test resultsshowed that innovators have comparatively high mean rank for innovativeness (mean rank =67.11, U=419.50)and risk orientation (mean rank = 71.27, U=211.50) than non-innovators. Study also found significant differenceof level of social empowerment between innovators and non-innovators by using Wilcoxon Mann Whitney test.The results revealed that innovators have comparatively high mean rank of 60.94 than non-innovators (meanrank 40.06) due to their active social involvement and striving for recognition in the society. The major stimulantsfor different category of innovations identified were ‘Problem faced by self ’ for crop production (70%) andhorticulture (50%), ‘innovation induces innovation’ for farm machinery (80%), ‘experimented purposefully withcuriosity’ for processing and value addition (70%) and animal husbandry (60%). The time gap from idea generationto innovation is more (4-6 years) for farm machinery and processing and value addition innovations and less forhorticulture innovations (1-6 months). Majority of the respondents received technical support (mean rank 3.07)from the institutes followed by input support (mean rank 2.76), extension support (mean rank 2.46) and financialsupport (mean rank 1.71). Friedman test analysis revealed that major means of spread by farmers is throughlinkage with organizations (mean rank 5.50) and by institutions is through melas/exhibitions (mean rank 4.99)conducted by different institutions involved in scaling up of innovations. The major reasons for low adoption ofinnovations by the non-innovators identified were location specificity of the innovations (mean rank 6.52) andlack of demonstrations (mean rank 4.66).
Keywords: Farmer-led innovations, Spread, Stimulants, Time gap
INTRODUCTION
Farmers acquire the knowledge required for their workthrough their own experience with agricultural practicesand management of natural resources. In addition, theyinnovate due to necessity, changing conditions andcuriosity by doing informal experiments on new ideaseither from their own ingenuity or learned from otherfarmers, researchers, extensionists and other informationsources like mass media. There are several factors thatcan trigger the implementation of innovation generationactivities. These factors include shocks, scarcity of factorsof production, opportunities, interaction with keystakeholders, coincidence, creativity or socio-economic
factors (Saad, 2002). Innovation is viewed as the outcomeof various actors combining knowledge from differentsources. This process of combining knowledge requiresdifferent forms of interaction. Informal structures, inter-personal contact and even physical mobility are allconsidered mechanisms for the mobilization ofknowledge and stimulating innovations (Wolf, 2008).Innovation in agriculture and rural enterprise happenedfor millennia through chance and through the informaland also purposive action of rural people seeking newand better ways of production and organization. Ruralpeople themselves, therefore, have been a major sourceof new knowledge and practices. Small-scale farmers’

18 Hema Baliwada et al.
own creative responses continue to be important sourcesof improvement to agricultural productivity in manyregions of developing countries (Nigel et al., 2006).
There is often a significant interval between the timean innovation is developed and adopted by the fellowfarmers. For most innovations, there will also be a periodof decline where the innovation is replaced by a newone. It is also dependent on the innovative farmercontacts with other persons and the amount of distancein the locality, the adoption of a new technology by thefellow farmers may entail significant travel and transportcosts, and these costs increase with distance (Sunding etal., 2000). According to Akinnagbe (2010), the challengein adoption of farmer-led innovations is that, it is noteasy for fellow farmers to get accepted by fellow farmersand the community in general due to culture and attitude.Because of this reason, many people do not only provide“no support” but also discourage the innovative farmers,considering them someone wasting time for “no good”reasons. Previous studies reported that farmer-ledinnovations are vital and the creativity depends on theprevailing socio-economic condition of the farmers. Inthis context, present study was undertaken with anobjective of exploring comparative analysis of profileof farm innovators and non-innovators, to understandthe origin, spread of farmer-led innovations and toidentify the reasons for less adoption by the fellowfarmers.
MATERIALS AND METHODS
A list of innovative farmers recognized and awarded byvarious institutions such as
ICAR (Indian Council of Agricultural Research),PPVFRA (Protection of Plant Varieties and Farmer’sRights Authority), Ministry of Agriculture and FarmersWelfare, NIF (National Innovation Foundation) andTIFAC (Technology Information, Forecasting andAssessment Council) of Department of Science andTechnology, IARI (Indian Agricultural Research Institute),State Agricultural Universities was prepared. The datafrom these secondary sources revealed that Uttar Pradeshand Punjab have more number of innovative farmerscompared to other states. Therefore the present studywas conducted in these two purposively selected statesi.e., Uttar Pradesh and Punjab. The whole population ofinnovative farmers was divided into 5 broad categories.The broad areas of innovation selected for the study
were crop production, horticulture, farm machinery,processing and value addition and animal husbandry. Atleast 5 innovative farmers were available in each category.Therefore 5 innovative farmers were selected from eachcategory by stratified random sampling. Similarly 5 non-innovative farmers were selected randomly from thesame locality for better comparison. Fifty innovative andfifty non-innovative farmers constituted the total samplesize of 100 farmers. These selected farmers fall into the7 districts of Punjab (Batinda, Faridkot, Hoshiarpur,Nawanshahar, Ludhiana, Patiala and Sangrur) and 10districts of Uttar Pradesh (Aligarh, Bulandshahr,Ghaziabad, Hapur, Kanpurnagar, Kannauj, Meerut,Muzaffarnagar, Rampur and Saharanpur).
RESULTS AND DISCUSSION
Economic profile: The basic economic profile of therespondents was compared between innovators andnon-innovators with respect to own land, total cultivableland, farming experience and annual income. Foranalyzing the significant difference between twoindependent groups, ‘t’ test was carried out and the resultsare presented.
From the Table 1, it is clear that the innovators (mean23.82) significantly differ from non-innovators (mean13.54) in having higher total cultivable land size. As faras own land is concerned, there is not much differencebetween innovators (mean 18.76) and non-innovators(mean 11.82), but the innovators can go for substantialland increase due to their progressive nature. Thereforethe total cultivable land is more for innovators. It is alsoevident that majority of the innovative farmers lies inthe category of high annual income (Rs. 454000) thannon-innovators (Rs. 242000). Further return per unit landis also high in case of innovators. With respect to farmingexperience, there is no significant difference betweeninnovators (mean 30.00) and non-innovators (mean30.02). Further the value of ‘t’ test statistic is significantat 5 per cent level for own land (-4.329), total cultivableland (-5.118) and annual income (-5.686). The presentstudy findings are similar to Nigel et al. (2006) whoreported that several factors influencing the number offarmer innovations include level of education, size ofhousehold, amount of land available, age of householdhead and degree of contact with other areas.
Social profile: The extent of involvement of innovatorsand non-innovators with respect to their social

A Study on Instigation of Farmer-led innovations and its Spread 19
Table 1: Comparative economic profile description of innovators and non-innovators (N=100)Category Mean Standard error Levene’s test t-test for equality
of mean for equality of meansof variances (Equal variances)
F tOwn land (acre) Non-innovator 11.82 0.97 3.099* -4.329*
Innovator 18.76 1.27Total cultivable land (acre) Non-innovator 13.54 1.20 3.946* -5.118*
Innovator 23.82 1.61Farming experience (years) Non-innovator 30.02 0.11 0.077 0.119
Innovator 30.00 0.11Annual income (Rs) Non-innovator 242000 20221.22 12.148* -5.686*
Innovator 454000 31325.80* p<0.05, F=Value of the F-statistic; t= Value of the t statistic
participation, mass media exposure and extensionorientation was analyzed by Wilcoxon Mann Whitneytest in order to identify the significant difference in socialprofile of respondents between two groups.
The data from the Table 2 indicates that the innovators(58.37) have comparatively high mean rank than non-innovators (42.63) with respect to social participation dueto their active social involvement. It is also evident thatthe innovators have comparatively high mean rank formass media exposure (59.54) and extension orientation(70.59) than non-innovators mass media exposure(41.46) and extension orientation (30.41). It was foundthat the innovators were also having high informationseeking behavior. Further the test statistic of WilcoxonMann Whitney ‘U’ value revealed that there is significantdifference in social participation (856.5), mass mediaexposure (798.0) and extension orientation (245.5) at 5
per cent level. Similar findings reported by Ruter (2008),that farm innovations arise either from their owningenuity or learned from other farmers, researchers,extensionists and other information sources like the massmedia and extension orientation. Shilpashree (2011) alsoreported that majority of the innovative farmers belongsto high mass media utilization and extension orientationcategory.
Innovativeness: Innovativeness in terms of socio-psychological orientation of an individual to get linkedor closely associated with change was compared betweeninnovators and non-innovators. The responses of boththe groups were taken on the set of statements andanalyzed using Wilcoxon-Mann-Whitney test in order toidentify the significant difference between the groups.The mean ranks and the test statistic are presented inTable 3.
Table 2: Comparative social profile description of innovators and non-innovators (N=100)Category Mean rank Mann –Whitney Wilcoxon W Z value
Innovator Non-innovator U value(n1=50) (n2=50)
Social participation 58.37 42.63 856.5* 2131.50 -2.763Mass media exposure 59.54 41.46 798.0* 2073.00 -3.190Extension orientation 70.59 30.41 245.5* 1520.50 -7.017* p<0.05 significant difference at 5 per cent level
Table 3: Comparison of innovativeness as per Wilcoxon Mann Whitney test (N=100)Group Mean rank Standard deviation Mann whitney U Wilcoxon W Z valueInnovator 67.11 2.532 419.50* 1.69 -5.767Non-innovator 33.89 0.503* p<0.05 significant difference at 5 per cent level

20 Hema Baliwada et al.
Table 3 reveals that innovators have comparativelyhigh mean rank (67.11) than non-innovators (33.89) dueto their creative thinking and problem solving nature.Further the test statistic value (419.50) showed that thereis significant difference at 5 per cent level between thetwo groups. Similar findings by Gebre (2014) whoinferred that farming experience, participation in non-farm activities, access to credit service, participation inextension events and in social organizations were themajor factors influencing innovativeness.
Risk orientation: The degree to which the respondentsare oriented towards risk and uncertainty and has courageto face the problem was compared between two groups.From both the groups the responses were taken on a setof statements and Wilcoxon-Mann-Whitney test wascarried out to identify the significant difference and meanranks.
It is clear from the Table 4 that innovators havecomparatively high mean rank (71.27) than non-innovators(29.73) due to their psychological willingness to take riskin the venture. The value of test statistic (211.50) indicatesthat there is a significant difference at 5 per cent levelbetween two groups. Regarding the risk orientation, thestudy results of Leitgeb et al. (2013) were in controversywith the findings of present study, where it concludedthat a few of the farmers indicated that their innovationswere unsuccessful, and this is expected since innovationgenerally involves decision making under uncertaintywhich can result in positive or negative outcomes.
Social empowerment: The level of socialempowerment of both the innovators and non-innovators were taken on the fourteen statements underthe category of social empowerment. Wilcoxon-Mann-Whitney’s test was carried out in order to identify the
significant difference between two groups.
Data in the Table 5 represents significant differenceof level of social empowerment between innovatorsand non-innovators by using Wilcoxon Mann Whitneytest. The results revealed that innovators havecomparatively high mean rank of 60.94 than non-innovators (mean rank 40.06) due to their active socialinvolvement and striving for recognition in the society.Further Wilcoxon Mann Whitney test statistic value(728.00) reveals that it is significant as the computed p-value is less than the significant level at five per cent (p <0.05). It can be inferred that the innovators and non-innovators are significantly differed in level of socialempowerment due to the innovation. The findings arein line with the results of Gebre (2014) who inferredthat involvement in social organizations would createsuitable condition that may enable the farmers to developleadership experience. While they are practicing leadershipin the community, they would have an opportunity toget diverse information on various aspects of agriculturalpractices which in turn may be the basis for the enrichmentof innovativeness.
Stimulants of innovation: Broadly six differentstimulants of innovation (problem faced by self, problemfaced by peers, experimented purposefully with curiosity,own thinking but not faced any problem, simply occurredthe idea and innovation induces innovation) which wererelevant to the present study were identified. Then theinnovators (n1=50) responses under each selected broadcategory of the innovations were analyzed.
From the Table 6, it is evident that the percentagesof the respondents in each category varied according tothe type of stimulants. In respect of innovationsdeveloped in crop production category, ‘problem faced
Table 4: Comparison of risk orientation as per Wilcoxon Mann Whitney test (N=100)Group Mean rank Standard deviation Mann whitney U Wilcoxon W Z valueInnovator 71.27 4.479 211.50* 1.48 -7.180Non-innovator 29.73 0.503* p<0.05 significant difference at 5 per cent level
Table 5: Level of social empowerment based on Wilcoxon Mann Whitney test (N=100)Group Mean rank Standard deviation Mann Whitney U Wilcoxon W Z valueInnovator 60.94 10.32 728.00* 2003.00 -3.60Non-innovator 40.06 0.50* p<0.05 significant difference at 5 per cent level

A Study on Instigation of Farmer-led innovations and its Spread 21
Table 6: Comparison of thestimulants of innovation (n1=50)Category Crop Horticulture Farm Processing & Animal
production machinery value addition husbandryf (%) f (%) f (%) f (%) f (%)
Problem faced by self 7(70) 5(50) 2(20) - -Problem faced by peers - - - - -Experimented purposefully with curiosity - 2(20) - 7(70) 6(60)Own thinking but not faced any problem 2(20) 1(10) - 2(20) 3(30)Simply occurred the idea 1(10) 2(20) - 1(10) 1(10)Innovation induces innovation - - 8(80) - -Figures in parenthesis indicate percentage
by self ’ is the major stimulant (70%) followed by ‘ownthinking but not faced any problem’ (20%) and ‘simplyinnovation occurred by idea’ (10%). Similar findingsreported by Olga (2015), innovations appearing at thegrassroots level are triggered most often by needs ofthe everyday life in circumstances of limitations inresources. In horticulture category of innovations, majorstimulant identified is ‘problem faced by self ’ (50%)followed by ‘experimented purposefully with curiosity’and ‘simply occurred the idea’ with 20 per cent each and‘own thinking but not faced any problem’ (10%). It canbe inferred that majority of the crop production andhorticulture innovations are developed either to increaseproduction or income, therefore problem faced by selfis the major stimulant in both the categories. ‘Innovationinduces innovation’ (80%) is the major stimulant for farmmachinery category of innovations followed by ‘problemfaced by self ’ (20%). Most of the farm machinerydeveloped at farmer’s level is the modifications of theexisting ones to make minor improvements either toreduce labour cost or to increase efficiency of the existingmachinery. In processing and value addition category,the innovations mostly developed by ‘experimentingpurposefully with curiosity’ to start a new venture (70%)
followed by ‘own thinking but not faced any problem’(20%) and ‘simply occurred the idea’ (10%). The sametrend is also seen in animal husbandry category ofinnovations where majority developed innovations by‘experimenting purposefully with curiosity to start a newventure’ (60%). It is followed by other stimulants like‘own thinking but not faced any problem’ (30%) and‘simply occurred the idea’ (10%). This is similar to thefindings of Bayer (2013) who identified that one-thirdof the innovations developed with ‘out of curiosity’ andone-fourth with a target to increase the production. Itcan be concluded from the data that different stimulantspromote different type of innovations.
Time gap from idea generation to innovation: Thetime gap from idea generation to innovation developmentunder different category of innovations was analyzedfrom the responses of the innovators. The periods oftime gap (immediately, 1-6 months, 7-12 months, 1-3years, 4-6 years and more than 6 years) were identifiedbased on the category and the results are presented inTable 7. The percentage of the respondents (innovators)in each category is varied according to the time gap fromidea to innovation.
Table 7: Analysis of the time gap from idea generation to innovation (n1=50)Category Crop production Horticulture Farm Processing and Animal
machinery value addition husbandryf (%) f (%) f (%) f (%) f (%)
Immediately - - - - -1-6 months - 7 (70) - - -7-12 months 9 (90) 2 (20) - - 3 (30)1-3 years 1 (10) 1 (10) 1 (10) - 7 (70)4-6 years - - 9 (90) 10 (100) -> 6 years - - - - -Figures in parenthesis indicate percentage

22 Hema Baliwada et al.
In crop production category, the results showed that90 per cent of ideas took only 7-12 months and only 10per cent ideas took a period of 1-3 years time. Morethan two-third of horticulture ideas took 1-6 monthsfollowed by 7-12 months (20%) and 1-3 years (10%).Since the cereal crops are season specific, it took at leastone year in majority of the cases to convert the idea intoinnovation. However in case of horticulture crops whichare either short duration or perennial, more than two-third of the ideas took only 1-6 months. Whereas thefarm machinery ideas took minimum of 4-6 years inmajority of the cases (90%) followed by 1-3 years (10%).It is due to the fact that it requires sufficient time forcomplementary equipment for the manufacturing ormodifying the design to suit the requirement. In case ofprocessing and value addition category 100 per cent ofideas took 4-6 years as the establishment of processingunit needs suitable machinery, technical guidance andfinancial support. In case of animal husbandry ideas, morethan one-third of the ideas took 1-3 years followed by7-12 months (30%) as it also needs technical guidanceand financial support.
Type of support: The support received by theinnovators from different institutes for scaling up theinnovation was categorized into technical, input, extensionand financial support. The overall and category wisesupport is mentioned to analyze the major form ofsupport received by the innovators. From the Figure 1,it is evident that there is significant difference in the meanranks of different types of support received. Majorityof the respondents received technical support (mean rank3.07) from the institutes followed by input support (meanrank 2.76), extension support (mean rank 2.46) andfinancial support (mean rank 1.71).
Figure 2 shows innovation category wise supportreceived by the innovators. Most of the crop productioninnovators received input support (67%) followed bytechnical (26%), financial (4%) and extension support(3%). In case of crop production, it does not requiremuch financial support because most of the governmentschemes are focusing on giving input subsidy. Inhorticulture innovations, more than one-third receivedinput support followed by technical (29%), extension(23%) and financial support (10%). Here the percentageof support is almost uniform due to the fact thathorticulture needs input subsidy, technical guidance andto some extent financial support for establishment ofgreen house and other infrastructure. Where as in caseof farm machinery innovations, 71 per cent therespondents received technical support followed by input(19%), extension (8%) and financial support (2%). It isdue to designing of the machinery needs technicalguidance than others. More than three-fourth of theprocessing and value addition innovators receivedfinancial support followed by technical (10%), input (8%)and extension support (4%). The financial support ismore in case of processing and value addition category,mainly due to the establishment of processing unit needsfinancial support for infrastructure equipment. Where asin case of animal husbandry innovations more than halfof the respondents received extension support followedby technical (32%), financial (9%) and input support (4%).It is observed that animal husbandry innovations needmore extension and technical support.
Figure 1: Type of support received by the innovators
Table 8: Friedman test statistics ofsupport received byinnovators (n1=50)Test statistic valueQ (Observed value) 38.08*Q (Critical value) 7.81df 3P value < 0.02* p<0.05 significant difference at 5 per cent level
Further Friedman’s test was carried out to identifythe significant difference in type of support received fordifferent category of innovations. It is clear from theTable 8 that the computed p-value is significant at fiveper cent level (p < 0.05) with Q value 38.08. It can beinferred that the type of support received by theinnovators from different institutions are significantlydifferent according to category of innovations.
0
0.5
1
1.5
2
2.5
3
3.5
Financial Extension Input Technical
1.71
2.462.76
3.07
Mea
n ra
nk
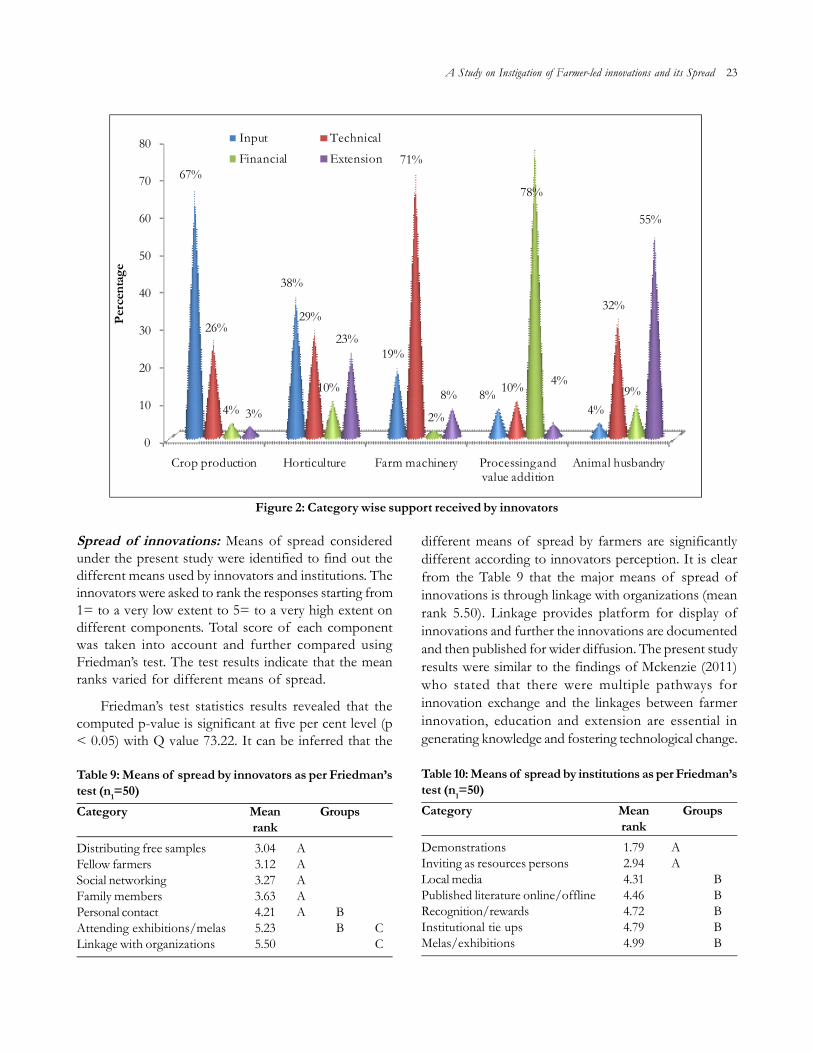
A Study on Instigation of Farmer-led innovations and its Spread 23
Figure 2: Category wise support received by innovators
Spread of innovations: Means of spread consideredunder the present study were identified to find out thedifferent means used by innovators and institutions. Theinnovators were asked to rank the responses starting from1= to a very low extent to 5= to a very high extent ondifferent components. Total score of each componentwas taken into account and further compared usingFriedman’s test. The test results indicate that the meanranks varied for different means of spread.
Friedman’s test statistics results revealed that thecomputed p-value is significant at five per cent level (p< 0.05) with Q value 73.22. It can be inferred that the
different means of spread by farmers are significantlydifferent according to innovators perception. It is clearfrom the Table 9 that the major means of spread ofinnovations is through linkage with organizations (meanrank 5.50). Linkage provides platform for display ofinnovations and further the innovations are documentedand then published for wider diffusion. The present studyresults were similar to the findings of Mckenzie (2011)who stated that there were multiple pathways forinnovation exchange and the linkages between farmerinnovation, education and extension are essential ingenerating knowledge and fostering technological change.
Table 9: Means of spread by innovators as per Friedman’stest (n1=50)Category Mean Groups
rankDistributing free samples 3.04 AFellow farmers 3.12 ASocial networking 3.27 AFamily members 3.63 APersonal contact 4.21 A BAttending exhibitions/melas 5.23 B CLinkage with organizations 5.50 C
Table 10: Means of spread by institutions as per Friedman’stest (n1=50)Category Mean Groups
rankDemonstrations 1.79 AInviting as resources persons 2.94 ALocal media 4.31 BPublished literature online/offline 4.46 BRecognition/rewards 4.72 BInstitutional tie ups 4.79 BMelas/exhibitions 4.99 B
0
10
20
30
40
50
60
70
80
Crop production Horticulture Farm machinery Processing and value addition
Animal husbandry
67%
38%
19%
8%4%
26%29%
71%
10%
32%
4%
10%
2%
4%9%
3%
23%
8%
78%
55%
Perc
enta
geInput TechnicalFinancial Extension

24 Hema Baliwada et al.
The perception of the innovators on different meansof spread through institutions was identified and analyzedby Friedman’s test. The test statistics results with Q value105.03 is significant at five per cent level (p < 0.05). Itcan be inferred that the different means of spreadperceived by the institutions are significantly differentaccording to innovators perception. The data from thetable 10highlights that the major means of spread isthrough melas/exhibitions (mean rank 4.99) conductedby different institutions involved in scaling up ofinnovations. It is followed by tie ups of the innovatorswith the institutions (mean rank 4.79), recognition/rewards (mean rank 4.72), published literature online/off line (mean rank 4.46), local media (4.31) and invitingas resource persons (mean rank 2.94). The least meansof spread is through conducting demonstrations ofinnovations with mean rank 1.79.
Non-innovators: The responses were taken from thenon-innovators (n2=50) in the study area regardingsource of information on innovations and motivatingfactors for adoption. The different sources andmotivating factors were identified and the respondentswere asked to rank the preferences.
It is clear from the Table 11, that farmers melas/exhibitions are the major source (mean rank 6.32) of
information for the non-innovators where theinnovations are displayed as live models with theireconomic impact and further direct interface with theinnovators is possible. It is followed by information fromfellow farmers (mean rank 4.90), personal contact withinnovative farmer (mean rank 4.70), contact withinnovative farmer (mean rank 4.70), information fromfamily members (mean rank 3.88), published literature(mean rank 3.20) and supporting organizations (meanrank 2.94). The least source of information is local media(mean rank 2.06). Further Friedman’s test statistics Qvalue 148.05, which is higher than the critical value (12.59)and is significant at five per cent level (p < 0.05). It canbe inferred that the different sources of information oninnovations are significantly different according to non-innovators perception.
Data was collected from the non-innovatorsregarding the innovation category wise motivating factors.The percentage of the respondents in each categoryvaried according to type of innovations. It is clear fromthe table 12that in crop production innovations, the majormotivating factor for the non-innovators is economicgain of the innovation (62%) followed by demand driven(28%); business factor and drudgery reduction with 4per cent each and social factor (2%). In horticultureinnovations, the major motivating factor is business factor(40%) followed by economic gain (34%), demand driven(20%), social factor (4%) and drudgery reduction (2%).Nearly half of the respondents in case of farm machinerywere opined that drudgery reduction is the majormotivating factor followed by social factor (24%),business factor (14%), economic gain (8%) and demanddriven (4%). In processing and value addition innovations,business factor (44%) is the major motivating factorfollowed by social factor (22%), economic gain (16%),demand driven (14%) and drudgery reduction (4%). Thesimilar results are seen in animal husbandry innovations,
Table 11: Source of information for the non-innovators asper Friedman’s test (n2=50)Category Mean Groups
RankLocal media 2.06 ASupporting organizations 2.94 A BPublished literature 3.20 A BFamily members 3.88 B CInnovative farmer 4.70 CFellow farmers 4.90 CFarmers melas/exhibitions 6.32 D
Table 12: Motivating factors for the non-innovators (n2=50)Factors Crop production Horticulture Farm machinery Processing and Animal
value addition husbandryf (%) f (%) f (%) f (%) f (%)
Demand driven 14(28) 10(20) 2(4) 7(14) 12(24)Business factor 2(4) 20(40) 7(14) 22(44) 16(32)Social factor 1(2) 2(4) 12(24) 11(22) 15(30)Economic gain 31(62) 17(34) 4(8) 8(16) 6(12)Drudgery reduction 2(4) 1(2) 25(50) 2(4) 1(2)Figures in parenthesis indicate percentage

A Study on Instigation of Farmer-led innovations and its Spread 25
Table 13: Reasons for non-adoption of innovations (n2=50)Problems Mean Rank
scoreLack of awareness on innovation 3.89 VLack of demonstrations on innovations 4.66 IICulture, attitude and perception of farmers 3.98 IVPoor economic condition and size of holdings 3.10 VILocation specificity of the innovations 6.52 IRisk factor and psychological fear 4.06 III
where the major factor is business factor (32%) followedby social factor (30%), demand driven (24%), economicgain (12%) and drudgery reduction (2%).
For generalization of results, Friedman’s test statistics(Q=112.02, P<0.05) was carried out to analyze the majormotivating factors of non-innovators for all theinnovations. From the results, it is clear that the majormotivating factor is drudgery reduction (mean rank 4.38)followed by economic gain (mean rank 3.85), social factor(mean rank 2.96), business factor (mean rank 2.10) anddemand driven (mean rank 1.71).
Results from the Table 13 show that the majoramong the constraints was location specificity of theinnovations as some of the innovations developed bythe farmers’ suits to their own requirement or to aparticular locality. This was similar to the findings ofGebre (2014) who reported that three-fourth of therespondents revealed that they were unable to accept theinnovations by other farmers in that area because of itsunsuitability while one-fourth revealed they were complexin their application. It is followed by lack ofdemonstrations on innovations. This was similar to thefindings of Gupta (2013) who summarized that thegovernment and aid organizations seldom consideracquiring ideas or innovative products and servicesdesigned at the grassroots by the people they are tryingto assist. The question of reciprocating the innovationsto fellow farmers seldom arises. In addition, a very smallnumber of these ideas reached people taking the initiativeto do so on their own.
CONCLUSION
The present study findings concluded that there issignificant difference in profile comparison of innovatorsand non-innovators which are directly linked to innovativethinking and creates platform for the new ideas of therespondents. The basic economic profile, involvement
in social organizations, psychological characteristics werecompared between innovators and non-innovators. Thestudy results showed that the innovators significantly differfrom non-innovators in having higher total cultivableland, high annual income than non-innovators. Withrespect to farming experience, there was no significantdifference between the two groups. Social profilecomparison analysis showed that the innovators havecomparatively high mean rank than non-innovators withrespect to social participation, mass media exposure andextension orientation than non-innovators. In the contextof innovativeness, innovators were comparatively inhigher side due to their creative thinking and problemsolving nature. At the same time innovators have highrisk orientation due to their psychological willingness totake risk in the venture. The present study mainlyidentified the origin and spread of farmer-ledinnovations. On the basis of results, category wisestimulants of innovations were identified and percentagesof the respondents in each category were variedaccording to the type of stimulants. ‘Problem faced byself ’ in crop production and horticulture, ‘Innovationinduces innovation’ in farm machinery, ‘curiosity to starta new venture’ for processing and value addition andanimal husbandry. Further, time gap from idea generationto innovation development under different category ofinnovations was analyzed. Farm machinery andprocessing and value addition category takes more timeas the establishment of unit needs suitable machinery,technical guidance and financial support. Different meansof spread by the innovators and institutions wasidentified. Linkage with organizations and conductingpromotional activities in scaling up of innovations likemelas/exhibitions/seminars by farmers and institutionsare the major means of spread of innovations. Studyalso found reasons for low adoption of innovations likelocation specificity of the innovations and lack ofdemonstrations.
REFERENCES
Akinnagbe, O.M. and A.R. Ajayi. 2010. Challenges of Farmer-Led Extension Approaches in Nigeria. World Journal ofAgricultural Sciences, 6(4): 353-359.
Andriopoulos, C. and P. Dawson. 2009. Managing Change,Creativity and Innovation. SAGE, Los Angeles.
Ann, W.B.; K. Patti; W. Chesha; V. Laurens van; Q. Gabriela; S.Kees and D. Boru. 2015. Exploring the impact of farmer-led research supported by civil society organisations.
26 Hema Baliwada et al.
Agriculture and Food Security journal. 4:4. Available onlineat: http://www.agricultureandfoodsecurity.com/content/4/1/4
Bayer, S. 2013. What determines innovation capacity in farmhouseholds? Insights fromruralGhana.https://editorialexpress.com/cgibin/conference/download.cgi?db_name=CSAE2014&paper_id=391.
Chambers, R. and J. Jiggins. 1989. Agricultural Research forResource-poor Farmers: A Parsimonious Paradigm.Agricultural Administration and Extension, 27: 109-128.
Gebre, G.G. and D.M. Zegeye. 2014. Challenges of farmers’innovativeness in central zone, Tigray, Ethiopia.International Journal of Agricultural Policy and Research, 2(5):215-223.
Gupta, A. 2013. Tapping the Entrepreneurial Potential ofGrassroots Innovation. Stanford Social InnovationReview. Sponsored Supplement. Rockfellar Foundation.
Hall, A. 2006. Public-private sector partnerships in an agriculturalsystem of innovation: concepts and challenges.International Journal of Technology Management and SustainableDevelopment, 5(1): 3-20.
Leitgeb, F.; F. Kummer; F.R. Funes-Monzote and C.R. Vogl.2013. Farmers’ experiments in Cuba. Renewable Agricultureand Food Systems, 29: 48-64.
Mckenzie, F.C. 2011. Farmer-Driven Innovation in Agriculture:Creating Opportunities for Sustainability. UnpublishedPh.D. thesis, School of Geosciences, The University ofSydney.
Million Alemayehu. 2001. Ayelech Fikre, an outstanding womenfarmer in Amhara Region, Ethiopia. In: Reij, C. andWaters-Bayer A. (Eds), Farmer innovation in Africa: asource of inspiration for agricultural development(London: Earthscan), pp. 28–32.
Nigel, P. and C.P. Buckley. 2006. Innovation challenges,constraints and opportunities for the rural poor.Background paper of United Kingdom’s Department forInternational Development (DFID), implementation ofthe IFAD Initiative for Mainstreaming of Innovation.
Olga V. Ustyuzhantseva. 2015. Institutionalization of grassrootsinnovation in India. Current Science, 108(14768): 25.
Prolinnova. 2004. Ethiopia progress report. UnpublishedAnnual Report. Leusden: Prolinnova Secretariat.
Saad, N. 2002. Farmer processes of experimentation andinnovation. CGIAR system wide program on participatoryresearch and gender analysis: Working Doc. No 21.
Sunding, D. and Z. David. 2000. The Agricultural InnovationProcess: Research and Technology Adoption in a ChangingAgricultural Sector. Handbook of AgriculturalEconomics. University of California, Berkeley.
Wolf, S.A. 2008. Professionalization of agriculture anddistributed innovation for multifunctional landscapes andterritorial development. Agriculture and Human Values, 25:203-07.
--------------------------------------------------------------------------------------------------------------------------------------------------------------Received on November, 2017, Revised on February, 2018

Journal of Community Mobilization and Sustainable Development Vol. 13(1), 27-35, January-April, 2018
Cropping and Irrigation Dynamics under Different GroundwaterMarket Regimes in West Bengal
Mamani Besra1, Souvik Ghosh2 and Subrato Gorain1
1Post-Graduate, Scholar, 2Professor and Head, Department of Agricultural Extension, Institute of Agriculture, Visva-BharatiUniversity, Sriniketan-731236, West Bengal
ABSTRACT
The present study was conducted in purposively selected Paschim Medinipur district of West Bengal having bettercropping and groundwater irrigation scenario. A total of 120 farmers including 60 member-farmers of WUAs,operating and managing government sources of groundwater irrigation as well as 60 farmers under private ownedgroundwater irrigation command area were sampled as respondents. Under private owned systems, farmers werecategorized based on their presence in groundwater marketing viz. self user, self user + seller, self user + seller +buyer, self user + buyer and buyers. Most of the farmers were buyers as they do not have any source forgroundwater irrigation. The irrigation use cost for self user is Rs. 22 per hour, while that for self user + seller, selfuser + seller + buyer and self user + buyer is Rs. 23, Rs. 24 and Rs. 24 per hour, respectively. It is interesting to notethat self user + seller and self user + seller + buyer category of farmers sell the irrigation at a cost of Rs. 31 andRs. 30 per hour, respectively. Buying cost of irrigation varied from Rs. 28 to Rs. 30 per hour. Due to less bargainingpower of the farmers not having any groundwater irrigation source are forced to buy at a relatively higher rate. Thecropping scenario and irrigation use efficiency are found better in case of buyer category of farmers, followeddiversified cropping pattern.
Keywords: Groundwater market, Groundwater irrigation, Farmers’ perceptions, Cropping scenario
INTRODUCTION
Indian water policy stresses on optimization ofgroundwater use in a way that its draft does not exceedits recharge potential (GOI, 2002). However,groundwater development in India is not in congruencewith the policy of sustainable and equitable exploitationof groundwater (Jeet, 2005). While it is over exploitedin the north western states, it remains poorly developedand under-utilized in the eastern states on account ofseveral economic and non-economic reasons (Srivastavaet al., 2012). The eastern region has 130 billion cubic meter(BCM) of annual replenishable groundwater, yet only27 per cent of it has been developed (Srivastava et al.,2014). Thus, there is ample scope to harness groundwaterpotential in this region for enhancing agriculture growthand benefit of the farmers. Due to the poor maintenanceof canal irrigation system, increasing number of tubewellwater markets has developed, particularly in West Bengal.Marginal and small farmers sell less water and buy more
water in comparison to other categories of farmers(Singh and Singh, 2003; Narayanamoorthy, 1995).Groundwater markets provide the institutionalmechanisms for increasing the poor farmers’ access toground water irrigation resources. In recent years, dueto inequality in the distribution of tubewells and non-availability of canal water during the rabi season, mostof the non-tubewell owners are forced to purchase waterfrom the tube well owner (Singh et al., 2007). On thisbackdrop, present study was contemplated to analysecropping and irrigation dynamics under differentgroundwater market regimes in West Bengal.
MATERIALS AND METHODS
Paschim Medinipur district in the state of West Bengalwas purposively selected having best agricultural andirrigation scenario in general and groundwater irrigationin particular. Two blocks i.e. Sankrailand Keshiary blocksand four villages from each block were randomly

28 Mamani Besra et al.
selected. A sample of 15 farmers from each of theselected villages was randomly chosen as the respondentsfor present study. Thus, a total of 120 farmers becamethe respondents in this present study.
The groundwater market scenario was analysedthrough exploration of information from differentcategories of farmers in groundwater irrigation marketas indicated below:
1. Self-users: The self-users do not enter the watermarkets because neither they have surplus water tosell nor are interested to buy from others.
2. Self-Users + Sellers: They are the owners of waterextraction mechanism (WEM) and their landholdingsare consolidated. They sell surplus water to otherfarmers because their landholdings are small to utilizethe full capacity of WEM and water markets offeran opportunity to spread its overhead expenses byincreasing the WEM utilization.
3. Self-users + Sellers + Buyers: Existence andoperation of this form of water markets is due tohigh degree of farm fragmentation. On the bigparcel of holding, farmers install a WEM to irrigatetheir field, supply surplus water to neighbouringfarmers and go for buying on the other parcel.
4. Self-users + Buyers: This form of water marketsexists generally because of fragmentation ofholdings. When the farmers install a WEM on thebig fragments to irrigate their fields only, the lack ofsurplus water for the other parcel of land orinaccessibility compels them to purchase water fromthe neighbouring WEM owners.
5. Buyers: This form of water markets arises mainlybecause of small size of holdings. Buyers aregenerally resource-poor farmers and they do notget a suitable partner to pool their resources to installa WEM. Another important reason is economicviability of WEM due to small and fragmentedholding. These farmers buy sufficient water fromneighboring WEM as and when required.
Groundwater market scenario in Pascim Medinipurdistrict in West Bengal is explored through understandingdetail of groundwater extraction mechanism/device andfunctioning, crops grown with groundwater irrigationsupply and groundwater pricing detail under differentgroundwater marketing regimes. Responses were takenfrom the selected farmers with the help of an interviewschedule.
RESULTS AND DISCUSSION
Present study has considered eight groundwater systemsrepresenting both government owned implementingparticipatory irrigation management (PIM) through wateruser association (WUAs) and private owned with fivedifferent groundwater marketing regimes viz. self user,self user + seller, self user + seller + buyer, self user +buyer and buyer, where 6 farmers as self user, 2 farmersas self user + seller, 11 farmers as self user + seller +buyer, 3 farmers as self user + buyer and 38 farmers asbuyers are there.
It is evident from the Table 1 that out of governmentowned four irrigation systems three systems are ofMedium Duty Tubewell (MDTW) and rest one of LowDuty Tubewell (LDTW). However, private owned
Table 1: Detail of groundwater extraction mechanism/device and functioning in Paschim Medinipur district of WestBengalName of selected Groundwater Pumping capacity (HP) Energy Energy Other Total costirrigation scheme and discharge consum- cost (Rs./ cost (Rs./ of oper-
ption hour of hour of ation (Rs./(Kilowatt) running) running) hour of
running)Pithapura MDTW Irrigation Scheme 7.5 HPDischarge 100 cubic meter/hour 5.52 11.04 5 16.04Kathnimaro MDTW Irrigation Scheme 7.5 HPDischarge 100 cubic meter/hour 5.52 11.04 5 16.04Baghmari MDTW Irrigation Scheme 7.5 HPDischarge 100 cubic meter/hour 5.52 11.04 5 16.04Gopalpur LDTW Irrigation Scheme 2.5 HPDischarge 30 cubic meter/hour 1.84 3.68 2 5.68Pirot STW Irrigation 2 HPDischarge 30 cubic meter/hour 1.47 2.94 2 4.94Karanji STW Irrigation 2 HPDischarge 30 cubic meter/hour 1.47 2.94 2 4.94Meghdumbur STW Irrigation 2 HPDischarge 30 cubic meter/hour 1.47 2.94 2 4.94Shipurlalpur STW Irrigation 2 HPDischarge 30 cubic meter/hour 1.47 2.94 2 4.94
Cropping and Irrigation Dynamics under Different Groundwater Market Regimes in West Bengal 29
irrigation systems are of Shallow Tubewell (STW). Thepumps with MDTWs, LDTW and STWs are of 7.5 HP,2.5 HP and 2 HP respectively. The discharge rate ofMDTW is 100 cubic meter per hour, while that of bothLDTW and STW is 30 cubic meter per hour. Energy
consumption in MDTW, LDTW and STW is 5.52, 1.84and 1.47 kilowatt, respectively. The operating cost /running cost as opined by the farmers are about Rs. 16,Rs. 6 and Rs. 5, respectively that includes the energy costas well as other costs of operation.
Table 2: Major crops grown and groundwater irrigation supply in government owned groundwater irrigation projects inPaschim Medinipur district of West BengalSeason wise name of Mean valuethe crop grown Area (acre) No. of irrigation Cost of each Total irrigation
given irrigation (Rs.) cost (Rs.)Pithapura MDTW Irrigation Scheme under Pithapura WUA (n=15):Kharif seasonPaddy 0.70 (0.42) 4 (2) 146 (112) 580 (279)Rabi seasonPaddy 0.54 (0.29) 20 (2) 136 (62) 2720 (1269)Vegetables 0.46 (0.25) 24 (3) 95 (50) 2280 (1258)Summer seasonVegetables 0.67 (0.26) 25 (3) 150 (54) 3750 (1556)Kathnimaro MDTW Irrigation Scheme under Kathnimaro WUA (n=15):Kharif seasonPaddy 1.09 (0.44) 6 (1) 226 (44) 1350 (237)Rabi seasonPaddy 0.75 (0.21) 15 (1) 268(96) 4020 (1466)Wheat 0.67 (0.24) 9 (1) 335 (186) 3010 (1565)Vegetables 0.67 (0.47) 25 (1) 146 (99) 3650 (2475)Summer seasonVegetables 0.88 (0.41) 26 (3) 189 (91) 4910 (2297)Baghmari MDTW Irrigation Scheme under Baghmari WUA (n=15):Kharif seasonPaddy 1.30 (0.70) 8 (6) 270 (375) 2160 (1038)Rabi seasonPaddy 0.50 (0.40) 19 (5) 163 (89) 3090 (1308)Wheat 0.60 (0.70) 10 (4) 246 (73) 2460 (746)Vegetables 0.60 (0.20) 22 (2) 123 (26) 2700 (80)Summer seasonVegetables 0.67 (0.59) 22 (6) 140 (82) 3080 (1813)Oilseeds 1.10 (0.80) 4 (1) 327 (253) 1300 (1000)Paddy 0.60 (0.40) 20 (1) 153 (40) 3060 (808)Gopalpur LDTW Irrigation Scheme under Gopalpur WUA (n=15):Kharif seasonPaddy 0.90 (0.40) 3 (1) 206 (108) 620 (201)Rabi seasonPaddy 0.50 (0.30) 14 (1) 174 (98) 2430 (1794)Wheat 0.44 (0.35) 11 (4) 200 (143) 2200 (2309)Oilseeds 0.34 (0.24) 3 (1) 75 (35) 220 (141)Summer seasonVegetables 0.50 (0.18) 17 (1) 179 (65) 3040 (1054)Oilseeds 0.33 (0.17) 5 (1) 105 (48) 520.00 (265)Note: Figures in the parenthesis indicate standard deviation values

30 Mamani Besra et al.
Major crops grown and groundwater irrigationsupply as responded by selected sample farmers ingovernment owned groundwater irrigation projects inPaschim Medinipur district of West Bengal are presentedin Table 2.
Under Pithapura MDTW irrigation command areas,during kharif season, paddy is grown in an average areaof 0.70 acre that used to require 4 irrigations (mainlyprotective irrigation) with cost of Rs. 580. However, thepaddy crop grown in rabi season in mean area of 0.54acre requires about 20 irrigations with cost of Rs. 2720.Vegetables are grown both in rabi and summer season inan average area of 0.46 and 0.67 ha requiring 24 and 25irrigations with a cost of Rs. 2280 and Rs. 3750,respectively.
In Kathnimaro MDTW irrigation command, similarcropping pattern is observed, paddy being the majorcrop both in kharif and rabi season with mean area of1.09 and 0.75 acre requiring 6 and 15 irrigation withaverage cost of Rs. 1350 and Rs.4020, respectively. Wheatis grown by the selected farmers in rabi season coveringa mean area of 0.67 acre requiring 9 irrigation withaverage cost of Rs. 3010. Vegetables are grown both inrabi and summer season in an average area of 0.67 and
0.88 acre requiring 25 and 26 irrigations with cost of Rs.3650 and Rs. 4910.
Diversified cropping pattern is followed by thesampled farmers (15) in Baghmari MDTW irrigationcommand. Paddy occupies 1.30 acre and 1 acre area inkharif and rabi season, respectively. In kharif season,protective irrigations (8±6) are used to given; howeveron an average 19 irrigations are required for paddy inrabi season with cost of Rs. 3090. Paddy is also grown insummer season (0.60 acre) requiring 20 irrigations withcost of Rs. 3060. Thus, irrigation cost for paddy cropgrown in summer costs very high. During rabi season,other crops grown are wheat and vegetables each with0.60 acre requiring on an average 10 and 22 irrigationswith a cost of Rs. 2460 and Rs. 2700. Vegetables are alsogrown in summer season in an area of 0.67 acre with 22irrigations costing Rs. 3080. Oilseeds are grown inrelatively more area (1.10 acre) that requires 4 irrigationswith cost of Rs. 1300.
Farmers in Gopalpur LDTW irrigation commandgrow paddy both in kharif and rabi season in averagearea of 0.90 and 0.50 acre providing 3 and 14 irrigationswith a cost of Rs. 620 and Rs. 2430. Oilseeds are grownboth in rabi and summer season in 0.34 and 0.33 acre
0
100
200
300
400
500
Padd
y
Padd
y
Whe
at
Oils
eeds
Veg
etab
les
Padd
y
Veg
etab
les
Oils
eeds
Kharif season
Rabi season Summer season
Cos
t of e
ach
irri
gatio
n pe
r ac
re o
f lan
d (R
s.)
Pithapura MDTW Irrigation Kathnimaro MDTW Irrigation Baghmari MDTW Irrigation Gopalpur LDTW Irrigation
Figure 1: Crop wise cost of irrigation per acre of land under government owned groundwater irrigation systems inPaschim Medinipur district of West Bengal
Cropping and Irrigation Dynamics under Different Groundwater Market Regimes in West Bengal 31
with 3 and 5 irrigations costing Rs. 220 and Rs. 520,respectively. Wheat is grown in an area of 0.44 acre withabout 11 irrigations costing Rs. 2200 during rabi season.Farmers also cultivate vegetables a mean area of 0.50acre that is used to require 17 irrigations with cost of Rs.3040.
It is worth mentioning here that the diversifiedcropping pattern is followed in all the selectedgroundwater irrigation systems’ command, where WUAsmanage the irrigation. The paddy occupies larger areafollowed by vegetables in dry season (rabi + summer)both requiring large number of irrigations as comparedto other crops grown like oilseeds and wheat. The costof each irrigation per acre of land cultivated is maximumin case of paddy and wheat grown in rabi seasonfollowed by oilseeds and vegetables grown in summerseason (Figure 1).
Major crops grown and groundwater irrigationsupply in private owned groundwater irrigation projectsunder different groundwater marketing regimes inPaschim Medinipur district of West Bengal are presentedin Table 3. The farmers are categorized based on theirpresence in groundwater marketing as self user (6farmers), self user + seller (2 farmers), self user + seller+ buyer (11 farmers), self user + buyer (3 farmers) andbuyers (38 farmers).
Self users grow paddy in all three seasons with costof each irrigation per acre of land being highest insummer season followed by rabi season and kharif season(Figure 2). It occupies 1.28, 1.17 and 0.83 acre of landwith irrigation cost of Rs. 793, Rs. 7675 and Rs. 5140 inkharif, rabi and summer season, respectively. Pulses arealso grown in rabi season covering a mean area of 0.83acre with irrigation cost of Rs. 790. Vegetables are alsocultivated in 0.83 acre of land in summer season withirrigation cost of Rs. 4920.
In the present study, there were two farmers whoare having STWs from which they provide irrigation totheir own crops as well as sell the water to others. Theseself user + seller category of farmers cultivate paddy inboth kharif and rabi season in an average area of 1.33and 1.63 acre with irrigation cost of Rs. 750 and Rs.8005, respectively. They grow vegetables in summerseason in an area of 1.17 acre with total cost of irrigationRs. 5260. Cost of irrigation per acre of land is less forself user + seller as compared to self user (Figure 2).
There are 11 out of 60 farmers sampled for presentstudy have STWs from which they irrigate their owncrops and sell the water to neighbouring farmers;however, due to fragmented holdings and patches ofland at distant locations also buy the water for irrigationto cultivated crops. These farmers also grow diversifiedcrops as evident from Table 3. Paddy is grown in allthree seasons. In rabi season, oilseeds and vegetables aregrown in 1 and 0.50 acre of land with total irrigationcost of Rs. 1160 and Rs. 3675, respectively. Vegetablesare also grown in summer season in an average area of0.74 acre with total irrigation cost of Rs. 4645. The costof irrigation per acre of land for this category of farmersis more than self user + seller but less than self user asthey sell the water to balance the cost they incur as buyer.
The farmers having more land and at different placesin fragmented manner not only use the water from theirown groundwater source (STW) but also buy the waterfrom others to grow the crops. These self user + buyercategory of farmers (3) in present study cultivate paddyin 1.08 acre with total cost of irrigation of Rs. 1163.They grow vegetables in mean area of 0.67 acre withcost of irrigation Rs. 4500 both in rabi and summerseason. Self user + buyer category of farmers bear morecost of irrigation as compared to previous threecategories.
Most of the farmers (38 out of 60) in present studyare buyers as they do not have any source for groundwaterirrigation. They cultivate paddy in 0.89 acre and 0.79 acrewith irrigation cost of Rs. 671 and Rs. 5295, respectively.The vegetables are also grown by them in both rabi andsummer season covering 0.40 acre and 0.60 acre arearequiring 26 irrigations with mean irrigation cost varyingfrom Rs. 3090 to Rs. 4554. Oilseeds are grown in 0.67acre with 6 irrigations costing Rs. 1000. The cost ofirrigation is highest for the buyers in study area(Figure 2).
Comparative cost of irrigation for the farmers asbuyers from private groundwater irrigation source(STWs) is higher than the member farmers of WUAs,operating and managing government sources ofgroundwater irrigation implementing the participatoryirrigation management reform (Figure 3). A perusal ofthe Table 4 suggests that irrigation use cost for self useris Rs. 22 per hour, while that for self user + seller, selfuser + seller + buyer and self user + buyer is Rs. 23, Rs.

32 Mamani Besra et al.
Table 3: Major crops grown and groundwater irrigation supply in private owned groundwater irrigation projects inPaschim Medinipur district of West Bengal
Season wise name Mean value (n=60)of the crop grown Area (acre) No. of irrigation Cost of each Total irrigation
given irrigation (Rs.) cost (Rs.)
Self user (n = 6) under private STWsKharif seasonPaddy 1.28 (0.77) 3 (1) 268 (199) 793 (497)Rabi seasonPaddy 1.17 (1.04) 16 (1) 480 (361) 7675 (5344)Pulses 0.83 (0.24) 6 (1) 133 (47) 790 (71)Summer seasonVegetables 0.83 (0.18) 25 (3) 197 (57) 4920 (1591)Paddy 0.83 (0.24) 15 (1) 343 (81) 5140 (1414)Self user + seller (n= 2) under private STWsKharif seasonPaddy 1.33 (0.47) 3 (1) 250 (212) 750 (778)Rabi seasonPaddy 1.63 (0.24) 16 (1) 501 (49) 8005 (1768)Summer seasonVegetables 1.17 (0.71) 28 (4) 188 (181) 5260 (6010)Self user + seller + buyer (n=11) under private STWsKharif seasonPaddy 1.79 (1.20) 3 (1) 350 (94) 677 (333)Rabi seasonPaddy 1.51 (1.40) 16 (2) 518 (217) 8285 (3125)Oilseed 1.00 (0) 5 (1) 232 (155) 1160 (115)Vegetables 0.50 (0.33) 25 (2) 101 (100) 3675 (2869)Summer seasonVegetables 0.74 (0.24) 28 (3) 166 (71) 4645 (2324)Paddy 0.50 (0.24) 14 (1) 200 (151) 2800 (2121)Self user + buyer (n=3) under private STWsKharif seasonPaddy 1.08 (0.69) 5 (2) 233 (153) 1163 (306)Rabi seasonVegetables 0.67 (0) 27 (1) 167 (26) 4500 (707)Summer seasonVegetables 0.67 (0) 27 (1) 167 (26) 4500 (707)Buyer (n = 38) under private STWsKharif seasonPaddy 0.89 (0.59) 3 (1) 225 (163) 671 (387)Rabi seasonPaddy 0.79 (0.53) 15 (1) 353 (247) 5295 (4218)Vegetables 0.40 (0.20) 26 (2) 119 (54) 3090 (1582)Oilseed 0.67 (0.47) 6 (1) 167 (1) 1000 (1000)Summer seasonVegetables 0.60 (0.27) 26 (3) 175 (84) 4554 (2325)

Cropping and Irrigation Dynamics under Different Groundwater Market Regimes in West Bengal 33
0
50
100
150
200
250
300
350
400
450
Paddy Paddy Pulses Oilseeds Vegetables Paddy Vegetables
Kharif season Rabi season Summer season
Cos
t of e
ach
irri
gatio
n pe
r ac
re o
f lan
d (R
s.)
Self user self user+sellerself user+seller+buyer self user + buyerbuyer
0
50
100
150
200
250
300
350
400
450
Paddy Paddy Oilseeds Vegetables Vegetables
Kharif season Rabi season Summer season
Cos
t of e
ach
irri
gatio
n pe
r ac
re o
f lan
d (R
s.)
WUA member farmers as buyers under Govt. owned groundwater IrrigationBuyers under private owned groundwater irrigation
Figure 3: Comparative cost of irrigation per acre of land paid by farmers as buyers under government and private ownedgroundwater irrigation systems in Paschim Medinipur district of West Bengal
Figure 2: Crop wise cost of irrigation per acre of land under different groundwater marketing regimes in private ownedgroundwater irrigation systems in Paschim Medinipur district of West Bengal
24 and Rs. 24 per hour, respectively. It is interesting tonote that self user + seller and self user + seller + buyercategory of farmers sell the irrigation at a cost of Rs. 31and Rs. 30 per hour, respectively, which is varied as evidentfrom standard deviation value. Buying cost of irrigationvaried from Rs. 28 to Rs. 30 per hour. It is worthmentioning here that due to less bargaining power ofthe farmers not having any groundwater irrigation sourceare forced to buy at a relatively higher rate as compared
to those farmers who are having source (STWs) but buywater due to fragmented holdings.
Findings of present study reiterates the statementof Chaudhary (1990) and Shah (1991) who mentionedthat the term ‘water market’ has been used to describe alocalized, village-level informal arrangement throughwhich owners of Water Extraction Mechanisms (WEMs)sell irrigation services to other members of the

34 Mamani Besra et al.
community. Empirical research indicated a variety ofcontract forms and a wide range of prices in groundwatermarkets. Buyers may pay for water by providing labour,or a share of the crop, though the tendency is to movetowards a cash charge per hour of water supplied asgroundwater markets developed. In the present study, itis observed that most of the farmers being marginal donot have any access to groundwater; therefore, they relyon others to get the water for raising the crops. Moench(1994) also observed that groundwater markets, in whichfarmers buy and sell irrigation water, provide one ofthe most promising institutional mechanisms forincreasing access to and use of groundwater for irrigation.Sharma and Sharma (2006) studied the groundwatermarket in Rajasthan and found that selling groundwaterhad become a growing business for making profit at thesocial cost. The sellers of water charged exorbitant prices,i.e. more than three times of the cost of water extractionfor buyers, as water price which became exploitative forthe buyers of the water, and contributed to increasinginequality among the rich and poor farmers. Both cashbased and in–kind types of transactions were observedin the study area. About 47 per cent of water buyerspaid through cash mode on hourly basis, while 53 percent preferred to pay through crop –output sharingmode. Srivastava et al. (2009) reported that both buyersand owners of WEMs are technically inefficient in water–use, as the actual use of irrigation water has been foundmuch higher than the optimum level. However, ‘Buyershave been found comparatively more efficient than‘Owners’ in water utilization. Overexploitation ofgroundwater resources raises concerns about the futuresustainability of agriculture. It is, therefore, becomingincreasingly important that groundwater is usedefficiently and groundwater market can emerge as a bettertool for improving the efficiency of irrigation wateracross farm-sizes and crops.
CONCLUSION
The present study revealed groundwater marketingscenario in Paschim Medinipur district of West Bengal.The irrigation performance as the perceived by thefarmers indicated a better irrigation performance ofprivate owned groundwater lift irrigation command ascompared to the government owned groundwater liftirrigation command. The differential cropping patternsbeing followed by the farmers in Paschim Medinipurdistrict showed the crop diversification has beentestimony in the minor (groundwater) irrigationcommand area with better productivity. The assuredirrigation from groundwater source largely influencedacreage under non-food grain crops like vegetables,oilseeds, pluses etc. With the development ofgroundwater market, small and marginal farmers are alsobenefited, as they get access to irrigation.
REFERENCES
Chaudhary, M.J. 1990. The adoption of tube-well technologyin Pakistan”, Pakistan appropriate response togroundwater overdraft in India, IWMI-TATA Water PolicyDevelopment Review, 29(3-4): 291-303.
Government of India (GOI), 2002. National Water Policy.Ministry of Water Resources, New Delhi.
Jeet, I. 2005. Groundwater Resources of India: Occurrence, Utilizationand Management. Mittal Publications, New Delhi.
Moench, M. 1994. Selling water: Conceptual and policy debatesover groundwater markets in India, Gujarat, India:VIKSAT, Pacific Institute, Natural Heritage Institute.
Narayanamoorthy, A. 1995. Bore-well water management: Watersellers versus water buyers. Economic Affairs, 40(1): 33-40.
Shah, T. 1991. Water market and irrigation development in India.Indian Journal of Agricultural Economics, 46(3): 335-348.
Sharma, P. and R.C. Sharma. 2006. Factors determining farmers’decision for buying irrigation water: Study of groundwater
Table 4: Groundwater irrigation costing/ pricing detail under different groundwater market regimes in Paschim Medinipurdistrict of West BengalStatus Irrigation use cost Irrigation selling cost Irrigation buying cost
(Rs/ hour) (Rs/ hour) (Rs/ hour)Self-users 22 (1) — —Self-Users + Sellers 23 (1) 31 (6) —Self-users + Sellers + Buyers 24 (2) 30 (2) 28 (2)Self-users + Buyers 24 (3) — 29 (1)Buyers — — 30 (2)Note: Figures in the parenthesis indicate standard deviation values

Cropping and Irrigation Dynamics under Different Groundwater Market Regimes in West Bengal 35
markets in Rajasthan. Agricultural Economics Research Review,19: 39-56.
Singh, D.R. and R.P. Singh. 2003. Groundwater markets andthe issues of equity and reliability to water access: A caseof Western Uttar Pradesh. Indian Journal of AgriculturalEconomics, 58(1): 115-127.
Singh, K.A.; A.K. Chaudhary and D.K. Sinha. 2007.Groundwater Marketing in Nalanda District of Bihar State:A Socio-economic Appraisal. Agricultural EconomicsResearch Review, 20: 333-344.
Srivastavaa, S.K.; R. Kumar and R.P. Singha. 2009. Extent ofgroundwater extraction and irrigation efficiency on farms
under different water-market regimes in central UttarPradesh. Agricultural Economics Research Review, 22: 87-97.
Srivastava, S.K.; S. Ghosh and A. Kumar. 2012. Spatial andtemporal investment pattern in irrigation development and impacton Indian agriculture. Research Bulletin No. 55, Directorateof Water Management (ICAR), Bhubaneswar, Odisha.
Srivastava, S.K.; S. Ghosh; A. Kumar and P.S. Brahmanand.2014. Unravelling the spatio-temporal pattern of irrigationdevelopment and its impact on Indian agriculture.Irrigation and Drainage, 63: 1–11.
--------------------------------------------------------------------------------------------------------------------------------------------------------------Received on January, 2018, Revised on March, 2018
Journal of Community Mobilization and Sustainable Development Vol. 13(1), 36-42, January-April, 2018
*Corresponding author email id:
Capacity Building: A Pathway for Changing Behaviour of Self helpGroups
Lakhwinder Kaur and Rajinder Kaur KalraDepartment of Extension Education, Punjab Agricultural University, Ludhiana, Punjab
ABSTRACT
Capacity building is an action plan to give training to improve skills of the members of self help groups toupgrade them. The present study was conducted in Majha, Malwa and Doaba zones of Punjab to determine thechange in behaviour of the members of self help groups after the trainings organised for them by var iousinstitutions. Twelve self help groups were selected from three cultural zones of Punjab. A total of 200 membersenrolling in these groups were selected based on probability proportion to size (PPS) of the self help group ineach district. The data were collected with the help of interview schedule. Majority of the respondents enrolled ina group for employment opportunities (97.5%), economic benefits (96%) and to develop habit of savings (91%).Most of respondents availed training opportunities provided to them by different agencies regarding productpreparation for their capacity building that resulted in behavioural changes in terms of knowledge, attitude andskill. Change in behavior of the members facilitates the effective functioning of the self help groups.
Keywords: Behaviour, Capacity building, Training, Self help groups
INTRODUCTION
Punjab over the last 10 years has recorded growth of9.4% in constant terms and CAGR of 15.3% GSDPgrowth in current prices for the same period. Against agrowth target of 5.9% during the 11th plan period, thestate achieved 6.7%; with target in the 12th plan period(2012-17) being set at 6.4%. Growth in the state hasalways been supported by strong agri-sector output.Indeed, Punjab being one of the largest producers offood grains (particularly wheat) recognized as the foodbowl of the country as a result of which India’s foodsecurity depends vitally on wheat and rice production inPunjab, which contributes more than 50 per cent of thecentral pool of cereal stocks. Punjab is home to 2.3% ofthe country’s population. The state contributes about threeper cent to India’s GDP through its contribution in theagricultural sector. It is interesting to note that Punjabrecords a per capita income of Rs 89,345 above thenational average level of Rs 68,747 for the same year(Anoymous, 2013a).
Punjab agriculture is the home of small and marginalfarmers (80%). Therefore, the future of sustainable
agriculture growth and food security in Punjab dependson the performance of small and marginal farmers.These farmers are heavily indebted as they are dependenton money lenders for credit facility (Kalkat, 2011).Poverty and unemployment are the major problemsfaced by the rural community (Singh et al., 2017). Alsomajority living in rural areas are illiterate and are belowpoverty line having poor economic status. Besides this,in comparison to urban, rural people have limited accessto all kinds of resources such as educational facilities,transportation, training facilities, credit and technologyetc. These are problems that cannot be tackled individuallybut can be better solved through group efforts.Promotion of self help groups is one of the strategiesthat have been adopted by the government as part oftheir community participation approach for the socio-economic development of rural people.
Uployment and undemployment in rural areas is amatter of serious concern. Industrial sector in the statehas failed to create sizeable employment for wards offarmers and rural labour. There is an urgent need toincrease the avenues of employment in rural areas. The
policy of empowerment of the rural poor through skilldevelopment, better health and education services andvocational training is urgently required which will ensureemployment for local people. The importance ofdevoting attention to the economic betterment anddevelopment of rural women through capacity buildingis associated to improve the skills of rural women thatresulted inefficient performance of different agriculturalactivities to increase agricultural production in a furtherextent (Anonymous, 2013b). Capacity building enabledthe feasible environment including communityparticipation (of women in particular) for skilldevelopment. It includes human resource development,the process of equipping individuals with theunderstanding, skills and access to information,knowledge and training that enables them to performeffectively; Organizational development, the elaborationof management structures, processes and procedures,not only within organizations but also the managementof relationships between the different organizations andsectors (public, private and community) and Institutionaland legal framework development, making legal andregulatory changes to enable organizations, institutionsand agencies at all levels and in all sectors to enhancetheir capacities (Anonymous, 1997). Capacity building isa system for changing behaviour in order to produce anincrease in quantity or an improvement in quality of anindividual’s contribution to the goals of an organization(Kondal, 2014).
To raise status in society was prime reason forrespondents joining the self help groups followed bypromoting income generating activities, getting of loan,promoting savings and repaid the old debts (Lakshmiand Vadivalagan, 2011). However looking at otherreasons, the present study has been planned to identifyvarious reasons for joining the group and to determinetheir participation in various training programmes.
MATERIALS AND METHODS
A complete list of women self help groups operatingin different parts of Punjab has been collected fromdifferent sources viz. regional office of National Bankfor Agriculture and Rural Development (NABARD)Chandigarh, regional office Milkfed Chandigarh and selfhelp groups formed under Agricultural TechnologyManagement Agency (ATMA) has been procured fromthe Chief Agriculture Officer of different districts.
The present study was conducted in three cultural zonesviz. Majha, Malwa and Doaba of Punjab State. Two districtsfrom each cultural zone viz. Pathankot and Amritsar(Majha), Jalandhar and Hoshiarpur (Doaba), Moga andLudhiana (Malwa) were selected randomly. At the thirdstage, from these 6 selected districts, 12 functional womenself help groups namely Mian Mamli, Nari Shakti, AmarDas, Ram Das, Maha Laxmi, Durga, Chetna, Sada ShivModern, Assal, Veer Honey, Baba Budha and Bibi Rajniself help groups were selected by using probabilityproportion to size (PPS) of self help groups in eachdistrict. Thus a sample of 200 members were selectedfor the investigation. The data were collected with thehelp of interview schedule and analysed with the helpof frequencies and percentages.
RESULTS AND DISCUSSION
Reasons for enrolling as a member of self helpgroups: The objective of the study was to identify thevarious reasons to join the group by the members ofself help groups. The reasons for joining the groups bythe members have been presented in Table 1. A closeexamination of the data revealed that a large percentageof members of Majha, Malwa and Doaba region enrolledin a group for getting employment opportunities (97.5%),economic benefits (96%) and to develop a habit ofsavings (91%). It indicated that promotion of self helpgroups provided employment to large number ofpeople for economic upliftment. It is important to notethat forty five per cent of members of Majha regionjoined group to overcome exploitation from moneylenders charging high rate of interest on credit ascompared to Malwa (37.93%) and Doaba (37.50 %)region. This showed that members of Malwa region aremore dependent on money lenders to satisfy theeconomic needs of the family. Findings of Geethamma(2007), Lakshmi and Vadivalagan (2011) and Kondal(2014) were in line with the present study who reportedthat members joined the groups for family support , todevelop habits of savings, for employmentopportunities, to avail credit facility thus improvingfinancial conditions of the family.
Training attended by the members of self helpgroups: Training is the need of the hour as it hassignificant impact to change knowledge, skills and attitudeof members of self help groups. Data exhibited in Table2 revealed that members underwent various training
Capacity Building: A Pathway for Changing Behaviour of Self help Groups 37

38 Lakhwinder Kaur and Rajinder Kaur Kalra
Table 1: Reasons for enrolling as a member of self help groups (n=200)Reasons Majha(n=62) Malwa(n=58) Doaba(n=80) Overall
f % f % f % f %Supplement family income 45 72.58 55 94.82 55 68.75 155 77.5Develop social ties 58 93.54 48 82.75 59 73.75 165 82.5Economic benefit 59 95.16 56 96.55 77 96.25 192 96.0Easy access to credit 45 72.58 40 68.96 59 73.75 144 72.0Employment opportunities 61 98.38 57 98.27 77 96.25 195 97.5Overcome exploitation 45 72.58 22 37.93 30 37.50 97 48.5Develop habit of savings 55 88.70 58 100.00 69 86.25 182 91.0Repay old debts 20 32.25 30 51.72 50 62.5 100 50.0Utilization of free time 10 16.12 12 20.68 43 53.75 65 32.5Motivated from KVKs 5 8.06 2 3.44 12 15.00 19 9.5*Multiple response
programmes for improving and upgrading their skills invarious entrepreneurial projects.
The various trainings conducted by KVKs, NGOsand Welfare societies were categorized into two categoriesviz. product preparation training and capacity buildingof self help groups. A crical look at the data in Table 2reported that members participated in productpreparation trainings like candle making (15.5%),detergent making (9%), processing of seasonal fruits andvegetables (5%), preparation of pickles, vermicelli andjuices (38.5%), promotion of embroidery work (17%),art of making household products (13%) and art ofmaking dunas (7.5%). However they also participated incapacity building of training which included formationand management of self help groups (19%) andentrepreneurial development (20%).
It is remarkable to note that members of MahaLaxmi, Durga and Sada Shiv Modern and Assal selfhelp groups participated in more than one training. Thismay be because of their keen desire to learn newtechniques to make groups more successful and wereable to increase their income in the range of Rs. 1500-2500 and monthly savings in the range of 150- 250 permonth. The increase in income and savings weremeasured before and after joining the groups.
The members of other groups like Baba Budha andBibi Rajni had attended only one training (Table 2).
It was quite clear from the data presented in Table 2that KVKs organised 11 trainings followed by welfaresocieties, NGOs and PAU who organised ten, six andthree trainings respectively. This indicated that the KVKs
have a limited role in group formation but play asignificant part in promoting these groups throughprovision of trainings.
A scrutiny of data from Table 3 reported thatmaximum duration of training was seven days followedby 5 days, 3 days, 2 days and one day respectively. It wasfound that most of the respondents (42.5%) attendedtrining of two days duration while 29 per cent of therespondents attended training of one day on produtpreparation. It was noted that the members of Durga,Assal and Maha Laxmi self help groups attended 7 daystraining while members of Ram Das and Durga attended5 days training. It is because of the family support thatmembers of the Durga self help were able to attendboth 5 and 7 days duration of the trainings.
Overall members of Maha Laxmi and Durga selfhelp groups participated in four different trainings dueto their strong links with extension personnel whilemembers of Sada Shiv Modern and Assal self helpgroups participated in three trainings. As members ofthese groups had high extension contacts with scientistsof KVKs, Punjab Agricultural University (PAU) andNGO. PAU acts as platform for the members to providespace in Kisan Mela to sale their produces while NGOslinked the groups with various banks to avail loan forpurchase of raw materials for undertaking entrepreneurialactivities on a small scale (Kaur et al., 2017). As a result,their income and savings were more than other self helpgroups. A scrutiny of data in Table 4 revealed thatmembers availed training opportunities provided tothem. A large majority (99%) attended only one trainingwhile18.5 per cent of the respondents participated in

Capacity Building: A Pathway for Changing Behaviour of Self help Groups 39
Table 2: Distribution of respondents based on the trainings attended by them (n=200)Name of the self Name of training Duration Organising agencies Beneficiarieshelp groups (Days) No.Product preparation trainingMian Mamli (n=20) Candle making 2 Pahal, Jalandhar 11 (5.5)
Detergent making 1 KVK, Jalandhar 18 (9.0)Nari Shakti (n=15) Candle making 2 Pahal, Jalandhar 7 (3.5)
Processing of seasonal fruits 1 KVK, Jalandhar 10 (5.0)and vegetables
Amar Das(n=18) Preparation of pickles 2 Save Planet, Amritsar 9 (4.5)Preparation of vermiceli 3 Save Planet, Amritsar 9 (4.5)
Guru Ram Das (n=14) Promotion of embroidery work 2 Save Planet, Amritsar 12 (6.0)Art of embroidery on suits 5 Sri Dharmasthal Educational 7 (3.5)
Trust, Syndicate bankMaha Laxmi (n=15) Preparation of pickles 1 KVK, Gurdaspur 3 (1.5)
Preparation of squashes 2 KVK, Gurdaspur 7 (3.5)Durga (n=15) Art of embroidery on suits 7 Baba Dhana Singh Educational 7 (3.5)
welfare SocietyArt of making soft toys 2 KVK, Gurdaspur 5 (2.5)Promotion of embroidery 5 Baba Dhana Singh Educational 8 (4.0)work of shawls welfare Society
Chetna (n=15) Art of making Dunas 2 Shubh Karman Society 15 (7.5)Sada Shiv Modern (n=30) Preparation of pickles 1 KVK, Gurdaspur 14 (7.0)
Preparation of squashes 1 KVK, Gurdaspur 10 (5.0)Assal (n=15) Preparation of pickles 2 KKG, PAU, Ludhiana 6 (3.0)
Preparation of household 7 KKG, PAU, Ludhiana 5 (2.5)products and rural crafts
Veer Honey (n=14) Basics of beekeeping 1 KKG, PAU, Ludhiana 3 (1.5)Baba Budha (n=16) Art of making soft toys as a 3 JS Educational Welfare Trust 16 (8.0)
source of self employmentBibi Rajni (n=13) Techniques of candle making 2 KVK, Moga 13 (6.5)
Capacity building of self help groupsAmar Das (n=18) Formation and management of 1 Save Planet, Amritsar 5 (2.5)
self help groupsMaha Laxmi (n=15) Entrepreneurship development 1 KVK, Gurdaspur 8 (4.0)
among farmersIntegrated training course in Home 7 KVK, Gurdaspur 5 (2.5)Science for entrepreneurship skilldevelopment
Durga (n=15) Management of self help groups 2 Baba Dhana Singh Educational 8 (4.0)welfare Society
Chetna (n=15) Formation of self help groups 1 Shubh Karman Society 10 (5.0)Sada Shiv Modern (n=30) Women empowerment 1 Shubh Karman Society 20 (10)Assal (n=15) Income generating activities for women 1 Rameshwar Welfare Society 7 (3.5)
Cooperative farming and group 1 Directorate of Extension 4 (2.0)formation Education, Ludhiana
Veer Honey (n=14) Benefits of self help groups 1 Rameshwar Welfare Society 11(5.5)
*Figures in parentheses indicate percentages

40 Lakhwinder Kaur and Rajinder Kaur Kalra
Table 3: Overall participation of members of self help groups in various training programmes (n=200)Name of the training Duration Name of the group BeneficiariesA) Product preparationDetergent making One Mian Mamli 18 (9.0)Processing of seasonal fruits and vegetables Nari Shakti 10 (5.0)Preparation of pickles Maha Laxmi 6 (3.0)Preparation of squashes Sada Shiv Modern 10 (5.0)Preparation of pickles Sada Shiv Modern 14 (7.0)Candle making Two Mian Mamli 11 (5.5)Preparation of pickles Amar Das 9 (4.5)Candle making Nari Shakti 7 (3.5)Promotion of embroidery work Guru Ram Das 12 (6.0)Preparation of squashes Maha Laxmi 7 (3.5)Art of making soft toys Durga 5 (2.5)Art of making Dunas Chetna 15 (7.5)Preparation of pickles Assal 6 (3.0)Techniques of candle making Bibi Rajni 13 (6.5)Preparation of Vermicelli Three Amar Das 9 (4.5)Art of making soft toys Baba Budha 16 (8.0)Art of embroidery on suits Five Ram Das 7 (3.5)Promotion of embroidery work of shawls Durga 8 (4.0)Art of embroidery on suits Seven Durga 7 (3.5)Preparation of household products and rural crafts Assal 5 (2.5)
B) Capacity building of self help groupsFormation and management of self help groups One Amar Das 5 (2.5)Entrepreneurship development among farmers Maha Laxmi 8 (4.0)Basics of bee keeping Veer Honey 3 (1.5)Formation of self help groups Chetna 10 (5.0)Women empowerment Sada Shiv Modern 20 (10)Income generating activities for women Assal 7 (3.5)Cooperative farming and group formation Assal 4 (2.0)Benefits of self help groups Veer Honey 11 (5.5)Management of self help groups Two Durga 8 (4.0)Integrated training course in Home Science for Seven Maha Laxmi 5 (2.5)entrepreneurship skill development*Figures in parentheses indicate percentages
two trainings. It is remarkable to note that members ofDurga self help groups attended all the three trainingsviz. art of embroidery on suits, art of making soft toysand promotion of embroidery work of shawls.However the members of others groups namely MianMamli, Nari Shakti, Amar Das, Ram Das, Maha Laxmi,Durga and Assal attended trainings twice while rest ofthe groups attended trainings once in a time. This showedthat whenever any training opportunities come, they mustbe grasped by the members based on their relevancyand needs.
Change in behaviour after training: Behaviour is thetendency by the members of self help groups to reactpositively or negatively towards materials and humanobjects. It is a favourable or unfavourable feelings ofmembers regarding the resources available with themsuch as common place for work, collected money toinvest, transportation facilities, wisdom of managers andlocal rural institutions. It is apparent from the data inTable 5 that a very high increase in knowledge wasperceived in terms of selection, purchase and market ofraw material, among majority of respondents (91.50%)

Capacity Building: A Pathway for Changing Behaviour of Self help Groups 41
in all the groups after joining the group and a significantchange in their skills (84%) regarding preparation ofvarious products on small scale was also observed afterthe training programmes. It indicated that willingness ofmembers to participate in various activities of the groupsand keen desire to learn new techniques made a favourablechange in their attitude (84.50%). The findings are inconsonance with study of Gupta and Singh (2012),Sharma et al. (2012) who observed that there was anincrease in knowledge, change in attitude anddevelopment of skill after participating in the training
Table 4: Percentage distribution of the respondents according to their frequency of participation in the trainingName of training Name of the group Number of times (f)
Zerof Oncef Twicef ThricefProduct preparation trainingCandle making, detergent making Mian mamli 1 9 10 -Candle making, Processing of seasonal fruits and vegetables Nari shakti 5 3 7 -Preparation of pickles, Preparation of Vermicelli Amar Das 4 10 4 -Promotion of embroidery work, Art of embroidery on suits Ram Das 2 15 2 -Preparation of pickles, Preparation of squashes Maha Laxmi 6 5 4 -Art of Embroidery on suits, Art of making soft toys, Durga 2 10 2 2Promotion of embroidery work of shawlsArt of making Dunas Chetna - 15 - -Preparation of pickles, Preparation of squashes Sada Shiv Modern - 24 - -Preparation of pickles, Preparation of household products Assal 5 7 3 -and rural craftsArt of making soft toys as a source of self employment Baba Budha - 16 - -Techniques of candle making Bibi Rajni - 13 - -Capacity building of self help groupsFormation and management of self help groups Amar Das - 5 - -Basics of bee keeping, benefits of self help groups Veer Honey - 14 - -Entrepreneurship development among farmers, Integrated Maha Laxmi 6 7 3 -training course for entrepreneurship skill developmentManagement of self help groups Durga - 8 - - Formation of self help groups Chetna - 10 - -Women empowerment Sada Shiv Modern - 20 - -Women empowerment through income generating activities, Assal 7 7 2 -cooperative farming and group formation
programme. The data further indicated that groupinteraction (93.50%) proved to be a remarkable outcomeof the training programme which further facilitatedgroup cohesiveness (95.50%). It can be attributed to thefact that members of the group get in touch with eachother and there was strong a bonding among them duringthese training programmes. The probe into the datafurther revealed that change in knowledge wasremarkable in Doaba region (96.75%) and Majha (90.32%)as compared to Malwa (86.20%) regions of Punjab.
Table 5: Distribution of respondents based on change in behaviour after training (n=200)Dimensions of behaviour Majha (n=62) Malwa (n=58) Doaba (n=80) Overall
f % f % f % f %Change in knowledge 56 90.32 50 86.20 77 96.25 183 91.50Change in skill 55 88.70 48 82.75 65 81.25 168 84.00Change in attitude 57 91.93 45 77.58 67 83.75 169 84.50Develop group cohesiveness 60 96.77 55 94.82 76 95.00 191 95.50Strengthen group interaction 60 96.77 50 86.20 77 96.25 187 93.50*Multiple response

42 Lakhwinder Kaur and Rajinder Kaur Kalra
CONCLUSION
Capacity building enhances the ability and skills of themembers to realize their full potential that enable themto work in a group and play different roles, necessaryfor development and maintenance of the groups. Traininggiven by various NGOs and KVKs helped the womenmembers of self help groups in acquiring the essentialskills required for certain income generating activities.Positive behaviour played a great role in tackling the issuesof rural poverty for improving sustainable livelihoodsecurity. It is observed that respondents underwenttrainings on candle making, detergent making, processingof seasonal fruits and vegetables, preparation of pickles,vermicelli and juices, promotion of embroidery work,art of making household products, art of making dunas,formation and management of self help groups andentrepreneurial development. New areas of capacitybuilding need to be explored in the changing scenarioof agriculture based on the needs of women. Problemsencounted by the members of self help groups inattending training needs to be given special attention andall efforts should be made to overcome difficulties andproblems so as to enhance their wholeheartedparticipation in various training programme.
REFERENCES
Anonymous. 1997. Capacity development resource book. NewYork: United Nations Development Programme (UNDP)Retrieved from http://www.iiep.unesco.org/ fileadmin/user_upload/Research_Highlights_Emergencies/chapter3.pdf on 10.4.2014
Anonymous. 2013a. State Update: Government of Punjab.Retrieved from http://cabdirect.org/abstracts/20093058326.html; jsessionid= E36D89004861274713902A2C9CA5FAD6 on 2.6.14
Anonymous. 2013b. Agriculture policy for Punjab. Retrievedfromhttp://punjab.gov.in/documents/10191/20775/Agriculture+policy+of+punjab.pdf/9db4456f-55c5-4b55-882a-adf58 on 6.6.2014
Kalkat, G.S. 2011. Problems of rural India. Retrieved fromhttp://sikhinstitute.org/july_2010/kalkat.html on2.2.2013
Kaur, L.; R. Kalra and R.K. Dhaliwal. 2017. Developmentperspectives of women self help groups in Punjab. Journalof Community Mobilization and Sustainable Development,12(2): 163-171.
Kondal, K. 2014. Women Empowerment through self helpgroups in Andhra Pradesh, India. Int. Res. J. Social Sci., 3:13-16. Retrieved from www.isca.in on 5.5.2014
Lakshmi, R. and G. Vadivalagan. 2012. Impact of self helpgroups on empowerment of women: A study inDhamapuri district, Tamil Nadu. Retrieved from www.jms.nonolympictimes.org/articles/5.pdf on 10.2.2013
Geethamma, C.A. 2007. Management of microfinancial institutionsand their functioning in empowerment of rural poor in Kolardistrict, M.Sc. (Business Admn) Thesis University ofAgricultural Sciences, Dharwad, India
Gupta, S. and S.K. Singh. 2012. Economic security among ruralwomen through self help groups : An analytical study.Indian Res. J. Ext. Edu., 12: 117-120.
Sharma, A.; B. Roy and D. Chakravorty. 2012. Potential of selfhelp groups as an Entrepreneur: a case study form UttarDinajpur district of West Bengal. J. Soc. Sci., 30: 83-87.
Singh, S.; N.L.M. Raman and B.S. Hansra. 2017. Perspectives ofAgritourism in Himachal Pradesh: A new dimension inhill agricultural diversification. Journal of CommunityMobilization and Sustainable Development, 12(2): 207-215.
--------------------------------------------------------------------------------------------------------------------------------------------------------------Received on December, 2017, Revised on January, 2018

Journal of Community Mobilization and Sustainable Development Vol. 13(1), 43-51, January-April, 2018
*Corresponding author email id: [email protected]
Participatory Agro-ecological and Socio-economic Analysis of JuteCultivation in West Bengal
Sujit Sarkar1*, Aniruddha Maity2, Tilak Mondal3, Seiko Jose4, Rumki Chisim Sangma5, Arpita MondalKhan6, Sailesh Kumar7 and S.K. Jha8
1Scientist, Indian Agricultural Research Institute, Regional Station, Kalimpong, 2Scientist, Indian Grassland and Fodder ResearchInstitute, Jhansi, 3Scientist, VPKAS, Almora, 4NIRJAFT, Barrackpore, 5Scientist, NERCER, Barapani, 6Scientist, NRC Orchid,Gangtok, 7Senior Scientist, CRIJAF, West Bengal, 8Principal Scientist, CRIJAF, West Bengal.
ABSTRACT
Jute cultivation in India is plagued with diverse socio-economic and technological issues and the area and productionhas reduced gradually over the period. Therefore the present study was undertaken in North 24 Pargan district ofWest Bengal with a sample of 150 jute cultivators to understand the major issues, problems and devise futurestrategies using participatory assessment technique. The secondary data was used to understand and support theprimary findings. In jute there was incidence mainly of jute semi looper locally called ghora or ladha poka whichcaused heavy losses because it attacks the crop at an early stage, other pests in jute were red hairy caterpillar andyellow mite. Stem rot was the most important disease in jute in this village. It is understood from wealth rankingthat majority of the Jute growers belonged to poor family (50%) followed by middle class (40%), rich (7%) andvery rich (3%) families. The major problems identified by the jute growers were use of low quality seeds (Rankbased quotient score-89.58), followed by pre-monsoon water shortage, semi-looper problem, labour shortageetc. The policy makers need to understand these ground problems before devising any strategy for revival ofgolden era in Jute cultivation.
Keywords: Agro-ecological, Jute, Participatory, Socio-economic, West Bengal
INTRODUCTION
Jute, known as golden fibre, is one of the most importantnatural fibres after cotton in terms of cultivation andusage. India is the largest producer of jute contributingabout 60 per cent of the total world production (Chapke,2013). The significant role played by jute in the country’seconomy can be accessed from the fact that more than4 million farm families are involved in jute farming andmajority of them belong to small and marginal categories(JTM scheme details, texmin.nic.in, 2016).
The jute production in India faced major setbackafter independence as main chunk of jute growing areasfell into Bangladesh. Government of India took severalreformative initiative, and after initial upward trend inarea and production during post-independence period,a declining trend was witnessed during 1985-86 and 1995-96 in area (decline being 35.6 per cent). The production
has also depicted the similar trend~ increasing at anaverage annual rate of 6.54 per cent during 1950-51 and1985-86 but declining at an average annual rate of 2.89%afterwards (Raja, K, Complete information on Area andProduction of jute in India, http://www.preservearticles.com/). Strenuous efforts were made to increaseproduction and area of jute but only with limited success.
Till today, the jute cultivators in our country facedmultiple crises like lack of quality seed, general socio-economic backwardness, slow progress in implementingnew technologies, lack of farmers’ organization,inconsistent government price policy, lack of HYV, lackof high fibre quality variety, lack of mechanization etc.Intermittently, government has been trying to push themup by diversifying the usage of jute product, banning ofplastic and polythin bags, campaigning its eco-friendlinessetc. Still the situation is not as good as expected.Sometimes, traditional jute growers get compelled to

44 Sujit Sarkar et al.
change their crops or even the farming profession toearn their livelihood. Hence, it is high need to analyze thelivelihood scenario of the jute growers using participatorytools and techniques to understand the problem anddevise future policy. According to Dabas et al. (2009),the PRA (Participatory Rural Appraisal) is one of themost effective tools to understand the technologies, extentof adoption, priorities, problems and prospects offarming community. Sharma et al. (2010) used thedifferent participatory tools and techniques to understandthe agri-rural situation for research, development andpolicy interventions in Badarpur said cluster of Faridabaddistrict of Haryana. Hence, the present study wasundertaken to assess the livelihood status of jute growersand their problem using different participatory techniquesto prepare micro level action plan to address the issue.
MATERIALS AND METHODS
Participatory Rural Appraisal (PRA) technology was usedto understand the livelihood scenario of jute growers.The state West Bengal was purposively selected as it wasoccupying the maximum area (71.15%) and also theleading producer of Jute (78.03%) in 2014-15(www.jutecomm.gov.in). In West Bengal, jute ispredominantly cultivated by the marginal (65%) and small(25%) farmers (Chapke et al., 2006). The district North24 Pargana was purposively selected as Jute is one themain cash crops to majority of the farmers in the district.The village Bargachia, a predominantly jute growingvillage, was selected randomly from North 24 parganadistrict. Total 150 jute cultivators were randomly selectedas a sample for the present study. The hot and humidclimate and alluvial loamy soils of the district provideideal conditions for the cultivation of Jute.
Different PRA tools used for the study includetransect walk, agro-ecological mapping, social mapping,time trend, seasonal calendar, time line, problem – solvingtree etc. Advance GPS technology was used to preparethe village map. Beside these, the secondary data werealso analyzed to understand production trend of Jute.The major problems identified in the village were listedand Rank Based Quotient (RBQ) of the problems wascalculated based on the ranking score and formula asgiven by Sabarathnam (1988). The following wealthranking formula was used for categorizing the farmersinto different social ladder-
Wealth ranking formula, Si = [(n+1-Ci)/n]×100
Where, Si is score of the household as per KI’s, Ci iscategory of the household as per KI’s, n is the total no.of wealth categories
RESULTS AND DISCUSSION
Basic information about the village: The villageBargachhia is situated in Amdanga block of North 24Pargana district, one of the important jute growing beltsof West Bengal. The mean annual rainfall was 1500 mmwith 120-130 rainy days per annum. The mean annualtemperature ranged between 15-380C with 80-85%relative humidity. The village was inhabited by 685households with a total population of 5626. The averageliteracy rate was 72 per cent while male literacy (73%)rate was marginal higher than the female literacy (70%)rate. Majority (70%) of the farmers were marginal farmer(<1 acre) followed by medium (1-5acre) farmer (20%)and large (>5acre) farmers (10%).
Village transect: GPS (global positioning systems)observations were taken at different landmarks andthroughout the outer boundaries to sketch maps of thestudy village. The GPS observation gave the longitudinaland latitudinal positions of different landmarks. Latitudeand longitude were needed to create a basic display onGoogle earth. The spreadsheet of lat/long co-ordinateswere imported to Google earth and pop-up balloons,icons and paths were easily created from the spreadsheetdata and the map of the village was drawn. The originalvillage map was almost similar to that drawn from GPSobservation (Figure 1).
Agro-ecological map: Agro-ecological map of thevillage Bargachhia was drawn to identify the various agro-ecological diversity present in the village. From the map(Figure 2), it can be understood that the cultivated areaof the village was distributed on either side (East andWest) of the residential area. The soil type varied fromclay-loam to clay. The low lands were mainly coveredwith clay soil whereas the upland and medium land withclay- loam.
In kharif season rice and Jute were the major cropswith some patches of vegetables like ridge gourd, bottlegourd, pointed gourd, chilli and brinjal in the uplands. Inthe rabi season, the farmer with irrigation facility cultivatedonion, rice, mustard and vegetables like cauliflower,cabbage, tomato, brinjal, potato, bitter gourd, coriander,chilli, okra, garlic etc. In pre-kharif season lentil and
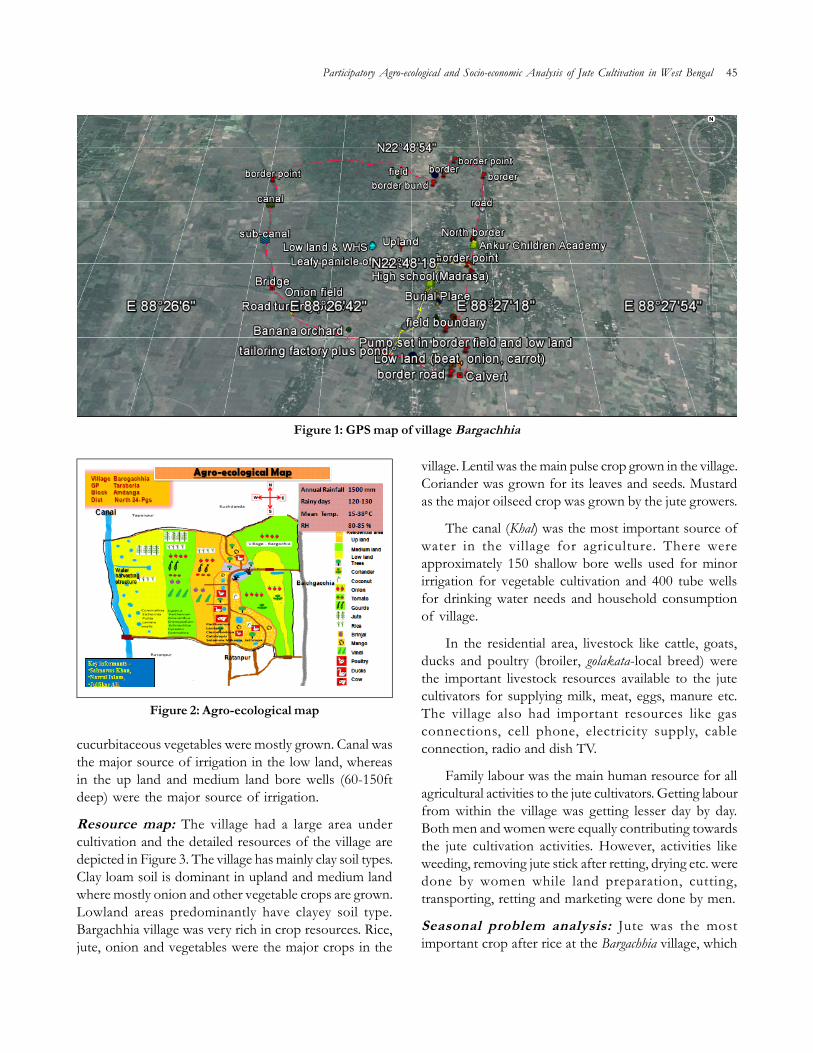
Participatory Agro-ecological and Socio-economic Analysis of Jute Cultivation in West Bengal 45
Figure 1: GPS map of village Bargachhia
cucurbitaceous vegetables were mostly grown. Canal wasthe major source of irrigation in the low land, whereasin the up land and medium land bore wells (60-150ftdeep) were the major source of irrigation.
Resource map: The village had a large area undercultivation and the detailed resources of the village aredepicted in Figure 3. The village has mainly clay soil types.Clay loam soil is dominant in upland and medium landwhere mostly onion and other vegetable crops are grown.Lowland areas predominantly have clayey soil type.Bargachhia village was very rich in crop resources. Rice,jute, onion and vegetables were the major crops in the
village. Lentil was the main pulse crop grown in the village.Coriander was grown for its leaves and seeds. Mustardas the major oilseed crop was grown by the jute growers.
The canal (Khal) was the most important source ofwater in the village for agriculture. There wereapproximately 150 shallow bore wells used for minorirrigation for vegetable cultivation and 400 tube wellsfor drinking water needs and household consumptionof village.
In the residential area, livestock like cattle, goats,ducks and poultry (broiler, golakata-local breed) werethe important livestock resources available to the jutecultivators for supplying milk, meat, eggs, manure etc.The village also had important resources like gasconnections, cell phone, electricity supply, cableconnection, radio and dish TV.
Family labour was the main human resource for allagricultural activities to the jute cultivators. Getting labourfrom within the village was getting lesser day by day.Both men and women were equally contributing towardsthe jute cultivation activities. However, activities likeweeding, removing jute stick after retting, drying etc. weredone by women while land preparation, cutting,transporting, retting and marketing were done by men.
Seasonal problem analysis: Jute was the mostimportant crop after rice at the Bargachhia village, which
Figure 2: Agro-ecological map

46 Sujit Sarkar et al.
was broadcasted in the month of March and harvestedin the end of July. Jute was mainly grown in low landarea and covered almost 45% of land area. In rice BPH(brown plant hopper), yellow stem borer and leaf folderwere the common insect pest and diseases like blast,brown spot and leaf blight were encountered by thefarmers. In jute there was incidence mainly of jute semilooper locally called ghora or ladha poka which causedheavy losses because it attacks the crop at an early stage,other pests in jute were red hairy caterpillar and yellowmite. Stem rot was the most important disease in jute inthis village. In case of vegetable crops Yellow vein mosaicvirus (okra), fruit and shoot borer (brinjal), sucking pestslike aphids, thrips in onion, cabbage, cauliflower anddisease like blight in all vegetable mainly early and lateblight in potato and tomato, alternaria leaf spot incabbage-cauliflower, powdery mildew in cucurbits createmajor constraint.
Wealth Ranking and Analysis: Wealth ranking refersto placing people on the different steps of the socialladder according to their own criteria. Agricultural
development must take in to account differences inwealth among farmers in order to determine prioritiesfor research and to develop interventions and technicalpackages that are relevant to and adoptable by majorityof the farmers. In present study wealth ranking has beendone based on real data about wealth to make it morequantitative and realistic.
The respondents were classified based on pre-defined criteria like very rich (>10 bigha land, pakkahouse, vehicles, farm implements etc.), rich (5-10 bighaland, pakka house), medium (3-5 bigha land, pakka ortin house, bike etc), and poor (<3 bigha land, kachhahouse). The key informants were asked to classify the100 sample households of the village based on abovecriteria. Wealth score of household as per KI wascalculated and correction factor was calculated using themaximum and minimum score and number of wealthcategories by KI’s. With correction factor the categoryrange was derived.
The value of S1, S2, S3 and S4 was come out as 100,75, 50 and 25. The correction factor was come out as
Figure 3: Resource map
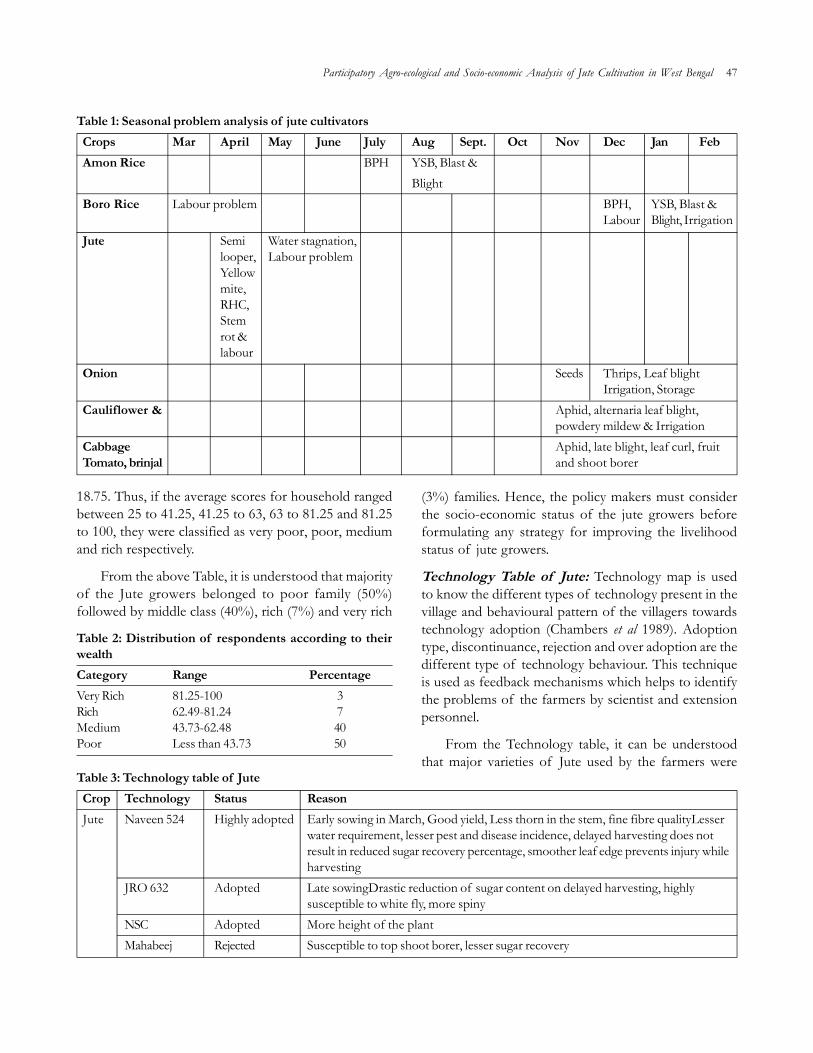
Participatory Agro-ecological and Socio-economic Analysis of Jute Cultivation in West Bengal 47
Table 1: Seasonal problem analysis of jute cultivatorsCrops Mar April May June July Aug Sept. Oct Nov Dec Jan FebAmon Rice BPH YSB, Blast &
BlightBoro Rice Labour problem BPH, YSB, Blast &
Labour Blight, IrrigationJute Semi Water stagnation,
looper, Labour problemYellowmite,RHC,Stemrot &labour
Onion Seeds Thrips, Leaf blightIrrigation, Storage
Cauliflower & Aphid, alternaria leaf blight,powdery mildew & Irrigation
Cabbage Aphid, late blight, leaf curl, fruitTomato, brinjal and shoot borer
18.75. Thus, if the average scores for household rangedbetween 25 to 41.25, 41.25 to 63, 63 to 81.25 and 81.25to 100, they were classified as very poor, poor, mediumand rich respectively.
From the above Table, it is understood that majorityof the Jute growers belonged to poor family (50%)followed by middle class (40%), rich (7%) and very rich
Table 2: Distribution of respondents according to theirwealthCategory Range PercentageVery Rich 81.25-100 3Rich 62.49-81.24 7Medium 43.73-62.48 40Poor Less than 43.73 50
Table 3: Technology table of JuteCrop Technology Status ReasonJute Naveen 524 Highly adopted Early sowing in March, Good yield, Less thorn in the stem, fine fibre qualityLesser
water requirement, lesser pest and disease incidence, delayed harvesting does notresult in reduced sugar recovery percentage, smoother leaf edge prevents injury whileharvesting
JRO 632 Adopted Late sowingDrastic reduction of sugar content on delayed harvesting, highlysusceptible to white fly, more spiny
NSC Adopted More height of the plantMahabeej Rejected Susceptible to top shoot borer, lesser sugar recovery
(3%) families. Hence, the policy makers must considerthe socio-economic status of the jute growers beforeformulating any strategy for improving the livelihoodstatus of jute growers.
Technology Table of Jute: Technology map is usedto know the different types of technology present in thevillage and behavioural pattern of the villagers towardstechnology adoption (Chambers et al 1989). Adoptiontype, discontinuance, rejection and over adoption are thedifferent type of technology behaviour. This techniqueis used as feedback mechanisms which helps to identifythe problems of the farmers by scientist and extensionpersonnel.
From the Technology table, it can be understoodthat major varieties of Jute used by the farmers were

48 Sujit Sarkar et al.
Naveen 524, JRO 632, and NSC seed. Among these,the variety Naveen 524 was highly popular in early sowingcondition due to its multiple advantages like-Good yield,less thorn in the stem, fine fibre quality, lesser waterrequirement, lesser pest and disease incidence, etc.
Time trend analysis of area and production of Jute:Time trend is a simple PRA technique, usually depictedin the form of graph (bar/ line) to show the trend ofcrop/ animal production, commodity prices, human/cattle population etc. The PRA finding of time trendrevealed that area and production in the villages declinedin last few decades due to low prices, lack of technologyand government supports. The similar trend was alsoreported in national figure. Hence, secondary data wereanalysed on area, production, import-export and pricesover the period to understand the Jute dynamics in India.
From the Figure 3, it can be deduced that after initialgain in area coverage there was a declining trend in last3-4 years. In case of production, it showed a fluctuatingtrend over the years. Many factors were responsible forthis fluctuation in production like irregular minimumsupport price, lack of input services like quality seeds,new varieties, declining pond in village ecosystem creatingcrisis of retting area of jute, lack of labour, lack oftechnological support like better crop management, pestmanagement, fertilizer management; and lack ofgovernment support etc.
Minimum Support Price (MSP) and Market Price(MP) Trend of Jute: From the Figure 4, it can beunderstood that MSP of Jute had increased substantiallyfrom Rs.785 in 2000-01 to Rs. 2700 in 2015-16.However, this increase was far below the required levelof Jute cultivator to maintain their livelihood standardas the annual inflation rate (CPI) had increased more than5% from 2005 onwards (http://www.inflation.eu/).Moreover, the percentage increase in MSP in last fewyears (2011 to 2014-15) showed a declining trend. It maybe one of the important reason for leaving jute cultivationin rural West Bengal which can be understood from thefact that the acreage under Jute in 2015-16 was very less(only 8.2.9 t/ha). It is beyond doubt that MSP is one ofthe important driving force for promoting farmerstowards jute cultivation and policy makers shouldprovide a fair MSP to maintain the livelihood standardof jute growers.
Gross cost and net return trend in Jute cultivation:The farmer of the villages reported about increasing costand less return from Jute cultivation as compare to othercrops. Hence, three years data of Gross cost and Netreturn on Cost 2 basis were analyzed and findingsindicated low profit (Figure 5) of farmers from the Jutecultivation. The secondary data of MoA also supprtedthe same hypothesis which revealed that indeed farmerfaced a loss of Rs. 2419/ha from jute cultivation. Hence,
0
2000
4000
6000
8000
10000
12000
873 1020
83.9
915.8 897.7 935.1 960.3 900.9 912.7 827.2 901 827.7 866.5 802.9 742.5
9000
11000
9000
10272.3
10839.611273 11210.5
10365.3
11103.910620.2
10690.7 11406.7 11416 11494
8842
Area ('000 ha) Production('000 bales)
Figure 4: Area and Production trend of Jute (Source:www.jutecomm.gov.in)

Participatory Agro-ecological and Socio-economic Analysis of Jute Cultivation in West Bengal 49
785 810 850 860 890 910 1000 10551250
13751575 1675
2200 2300 2400
3.18 4.94 1.18 3.49 2.25 9.89 5.50 18.48 10.00 14.55 6.35 31.34 4.55 4.350
500
1000
1500
2000
2500
3000
Year
MSP (Rs./Quintal)Percentage Increase
Figure 5: MSP Trend of Raw Jute for TD-5 Grade, Ex-Assam (source: price policy for jute, 2014; cacp.dacnet.nic.in, andhttp://texmin.nic.in/sites/default/files/note_on_jute_sector_0.pdf)
-10000
0
10000
20000
30000
40000
50000
60000
2009-10 2010-11 2011-12
39691.32
50394.4353323.79
10267.6
17573.23
-2419.88
Year
Cost C2 (Rs./ha)Net return on C2 basis (Rs./ha)
Figure 6: Gross cost and net return from Jute cultivation(source: http://eands.dacnet.nic.in/)
129.54
188.72
243.54278.45
298.66
260.16
334.79311.43
229.32
486.9 481.37
407.78
31.51 31.83 25.98 22.8260.02 63.39 71.04 59.79
126.79156.2
204.22178.31
0
100
200
300
400
500
600
Year
Export (US$Million)
Import (US$Million)
intesive efforts and farmers friendly startegies need tobe adopted to make Jute cultivation profitable.
Imports and exports trend of Jute: Beforeindependence India had monopoly in world juteproduction. But, India suffered a great setback in theproduction of jute as a result of partition of the countryin 1947 because about 75 per cent of the jute producingareas went to Bangladesh. As a result, India had to importhuge amount of raw jute from Bangladesh. To bridgethe gap between import and export, a lot of initiativeswere taken by government and production of raw jute
experienced a significant rise. However, recently the gapbetween import and export had increased resulting intoheavy loss to Indian ex-chequer and jute industry(Figure 6).
Problem Identification and Ranking: The majorproblems of the jute growers were identified based onperceived ranking and RBQ score was calculated foreach problem, which is presented in Table 4.
The major problems identified by the jute growerswere use of low quality seeds, followed by pre-monsoon
Figure 7: Export-Import trend of Jute, source:cacp.dacnet.nic.in, price policy for Jute, Oct. 2013

50 Sujit Sarkar et al.
Table 4: Ranking of Problem in jute cultivationProblem RBQLabour shortage in Jute 77.29Semi looper in Jute 77.92Yellow mite in Jute 49.79Red Hairy caterpillar in Jute 27.5Water stagnation in jute and stem rot 42.5Use of local variety seeds 89.58Pre-monsoon water shortage 88.96(boro rice, onion and ridge gourd)
water shortage, semi-looper problem, labour shortageetc. Based on the RBQ score, local and uses of inferiorquality seed was identified as a major problem andpossible problem tree and solution tree was drawn toaddress the issue (Figure 8).
Problem Tree and Solution Tree: The possible causesof the problem were asked to the farmers, theytriangulated among themselves and the solutions for eachspecific cause were also discussed which are presentedin following diagram.
CONCLUSION
Participatory Technology is a people-centredcommunity development approach using PRA tools to
analyse and empower and tackle their problems,opportunities and visions. It can greatly accelerate theprocess of self-help and learning. The findings of presentstudy showed that the jute growers lack behind inadoption of latest technologies, viz. quality seed of newvarieties, mechanization, improved retting tank, diseasemanagement, pest management etc. The jute cultivatorslacked in innovative social and community institution likeCustom hiring centre, Jute growers association whichcan facilitate the farmers to adopt latest technologies fromrelevant institution. Hence, intensive extension effortsshould be directed towards mobilizing and sensitizingthe communities to organize themselves to formcommunity based institution. The lack of quality seedand uses of local market seed was a big problem in thevillage. It not only lowered the production but also facedlow income, resulting into shifting towards other cashcrops. Hence, the extension workers should promotethe high quality certifies seed to demonstrate the potentialof good quality seed and its yield performance. Therewas also need of policy support from Government sidelike fair minimum support price, subsidy to jute industry,promotion of jute products at national level, investmentin research and extension, and high quality seedproduction policy etc. Then only, it can withstand the
Figure 8: Problem tree and solution tree for jute cultivation
Use of farm-saved seeds
Lack of awareness
Easy availability Non-affordability
Poor supply chain network of seed corporation or public agency
Poverty
High cost of good quality
seeds
Public-private partnership
Use of improved seeds
Non-availability of improved seeds
Less extension outreach
Poor communication network with outside public organization
Creating awareness
Increased seed production by SCs or public
agency
Reduction in cost
Limited seed production by seed corporation or public agency .
Easy affordability
Use ICTs, KCC, toll free
number
Practice village level seed production

Participatory Agro-ecological and Socio-economic Analysis of Jute Cultivation in West Bengal 51
steep pressure from neighbouring countries. Moreover,separate extension programs need to be formulated andimplemented with participatory approach consideringthe local resources to attract more farmers towards jutecultivation to restore the golden time in jute industry inthe country.
REFERENCES
cacp.dacnet.nic.in, price policy for Jute, Oct. 2013Chambers, R.; P. Arnold and L.A. Thrupp. 1989. Farmer – first
innovation and agricultural technology (eds). IntermediateTechnology Publications, London.
Chapke, R.; C.R. Biswas; S.K. Jha and S.K. Das. 2006.Technology evaluation through frontline demonstrationsand its impact. CRIJAF Bulletin, 3: 19.
Chapke, R.R. 2013. Role of Jute Cultivation in Farmers’Livelihood. Indian Res. J. Ext. Edu., 13(1): 132-135.
Dabas, J.P.S.; N. Sharma, and R.S. Chillar. 2009. Participatoryagro-ecosystem analysis of selected villages in districtJhunjhunu of Rajasthan. Journal of CommunityMobilization and Sustainable Development, 4(II): 34-40.
http://eands.dacnet.nic.in/. Comprehensive Scheme forstudying the Cost of Cultivation of principal Crops,
Directorate of Economics and Statistics, Ministry ofAgriculture, New Delhi)
http://texmin.nic.in/sites/default/files/note_on_jute_sector_0.pdf
http://www.inflation.eu/inflation-rates/india/historic-inflation/cpi-inflation-india.aspx
JTM scheme details, texmin.nic.in, 2016Price Policy for Jute. 2014. Commssion for agricultural cost and
prices, Ministry of agriculture and cooperation,Government of India, cacp.dacnet.nic.in.
Raja, K. Complete information on Area and Production of jutein India, (Downloaded, 25.08.2016). http://www.preservearticles.com/.
Sabarathnam, V.E. 1988. Manual of Field Experience Trainingfor ARS Scientists, NAARM, Hyderabad
Sharma, J.P.; S.K. Dubey; N. Sharma; N. Kishore; R. Jiyawan;P.P. Maurya; P. Sah and A.V. Dubey. 2010. Participatoryanalysis of agri-rural situation for research, developmentand policy interventions. Journal of Community Mobilisationand Sustainable Development, 5(2): 28-36.
www.jutecomm.gov.in.--------------------------------------------------------------------------------------------------------------------------------------------------------------
Received on December, 2017, Revised on January , 2018
Journal of Community Mobilization and Sustainable Development Vol. 13(1), 52-60, January-April, 2018
*Corresponding author email id: [email protected]
Assessment of Non-Timber Forest Products (NTFPs) basedLivelihood Systems among the Forest Dwellers of Chhattisgarh
Ashish Kumar Gupta1*, M.L. Sharma2 and M.A. Khan3
1Ph.D. Scholar, 2Professor and Head, 3Associate Professor, Department of Agricultural Extension, College of Agriculture, IndiraGandhi Krishi Vishwavidyalaya, Raipur-492012, Chhattisgarh
ABSTRACT
In this paper an attention is given to identify and assess the NTFPs based livelihood systems of the forestdwellers in Bilaspur district of Chhattisgarh. For this study total135 NTFPs collecting forest dwellers wererandomly selected as the respondents from the three randomly selected blocks of the Bilaspur District. The datawere collected from each respondent personally by using pretested interview schedule. This study elucidates that,100.00 per cent of the respondents were engaged in NTFPs collection as the sample population was NTFPsgatherers. However, 91.85 per cent were adopted NTFPs collection + agriculture, kind of occupation. MaximumNTFPs were available to the respondents in May month and all sample households were involved in mahuacollection. With regard to prevailing NTFPs based livelihood systems it was found that system 2A i.e. “NTFPs(Mahua, Tendupatta, Jamun, Sitaphal, Putu and Chhatani) + crop (kharif rice)” was most popular among 60 percent of respondents. But system 2D i.e. “NTFPs (Mahua, Tendupatta, Jamun, Sitaphal, Putu and Chhatani) +crop (kharif rice) + dairy” gives the highest per family average annual income. SWOT analysis of such prevailingNTFPs based livelihood systems describes the various strengths, weaknesses, opportunities, and threats whichare associated to such systems.
Keywords: Annual income, Forest, Non-timber, Occupation, Products, Respondents, SWOT analysis
INTRODUCTION
Forests provide significant social and economic benefitsat all levels, especially in developing countries. Forestsoffer numerous benefits to society (Wollenberg andIngles, 1998; Oksanen et al., 2003; Lawes et al., 2004),e.g. employment, aesthetics and ecological services suchas carbon sequestration. Forest products contribute tothe wellbeing of people, especially to low-income earnersin rural areas (World Bank, 2002; Kaimowitz, 2003;Sunderlin et al., 2005). The use of forest resources byrural communities may reduce the incidence of poverty(Neumann and Hirsch, 2000; Wunder, 2001; Sunderlin etal., 2005). On one hand, forest support the livelihood ofthe poor people of our country, especially the tribes,and on other hand it is remarkable to see that the poorestpeople of our country live in the rich forest and naturalresource base (Narain et al., 2005). Forest has alwaysplayed an important role in providing sustenance tomillions of rural people especially the tribal living in and
around the forest areas. It has been estimated that about275 million poor rural people in India depend on forestsfor at least part of their subsistence and cash livelihoods.
Among these forest products, Non-Timber ForestProducts (NTFPs) play a vital role in livelihood of peoplein and around the forests (Quang, 2006). However, thelevel of benefits that NTFPs can provide is location-specific and boom and bust cycles for specific productsimpact income generation significantly. NTFPs provide50 per cent of forest revenue and 75 per cent of forestexport income. It is claimed by Peters et al. (1989) andSchwartzman (1989) that timber-oriented forestmanagement often results in a decrease in productivityof the forest and alienation of forest-dependentpopulations. This has motivated the search for alternativeforest management strategies or policies. Such strategiesor policies should promote long term sustainable use ofsuch available NTFPs resources on one hand and alsoprevent it from their depletion and unsustainable
utilization on the other hand (Gupta et al., 2017). Non-timber-oriented forest management often promotessustainable forestry, because exploitation of non-timberforest products (NTFPs) may result in integration of theuse and conservation of forests (Gradwohl andGreenberg, 1988). At global level, more than two billionpeople are dwelling in forest, depending on NTFPs forsubsistence, income and livelihood security (Vantomme,2003).
NTFPs are considered to be important for sustainingrural livelihoods, reducing rural poverty, biodiversityconservation and facilitating rural economic growth atglobal level (Global NTFP Partnership, 2005). NTFPscontribute over 75 per cent of total forest export revenueand add significantly to the income of about 30 per centof rural people (International Tropical TimberOrganisation, 2006). Non-timber forest products(NTFPs) play vital role among the tribal people andprovide a source of income and subsistence living (Peterset al., 1989; Hegde et al., 1996). NTFPs like fuel-wood,medicinal plants, wild edible vegetables, house buildingmaterials etc. are integral part of day-to-day livelihoodactivities especially for tribal people (Sarmah, 2006).Other estimates suggest that up to 35 per cent of theincome of tribal households in India comes from thecollection of unprocessed NTFPs. Also, since NTFPsinvolve a large variety of seasonal products, returns arefrequent and relatively continuous. Moreover, localprocessing of NTFPs can increase off-farm ruralemployment opportunities.
The Recorded forest cover in Chhattisgarh is 55,621sq. km. which is 41.14% of its geographical area. InChhattisgarh, where 11,185 villages out of the total19,720 villages are forest fringed. The importance ofNTFPs in the livelihood security of the rural populationhas led the state government to declare NTFPs such astendu leaves, saal seed, harra, gum (khair, dhawara, kulluand babool) as nationalized NTFPs and establish theChhattisgarh Minor Forest Product Federation (CGMFP)with an objective to promote trade and developmentof these Non-Timber Forest Products (NTFPs) in theinterest of NTFPs collectors, mostly tribes. The remainingother NTFPs were left free for trade because theirdistribution and production varied with respect to timeand space. Bilaspur district is one of the district ofChhattisgarh Plains Agro-climatic Zone, which has themaximum area under forest along with wide diversity
of the plant species. NTFPs collection is one of the mostimportant activity that is performed throughout the yearby the forest dwellers of Chhattisgarh in general andBilaspur district in particular for their livelihoodsustainability. Beside this activity the forest dwellers werealso depends on other activities like wage earning, rainfedagriculture, animal husbandry etc to sustain theirlivelihood. But they are engaged themselves on such otheractivities for a limited period of time in a year. Hencethe objective of present study is assessment of NTFPsbased livelihood systems among the forest dwellers ofChhattisgarh.
MATERIALS AND METHODS
Research design: In the present investigation, ex-postfacto research design was employed. This design wasappropriate because the phenomenon had alreadyoccurred. Ex-post-facto research is the most systematicempirical enquiry in which the researcher does not haveany control over independent variables as theirmanifestation has already occurred or as they are inherentand not manipulate able thus, inferences about relationsamong variables were made without direct interventionfrom concomitant variation of independent anddependent variables.
Location of Study: The study was conducted in Bilaspurdistrict of Chhattisgarh state during the year 2014-2015.The Bilaspur district was selected purposively becausethis district is one of the densest forest district ofChhattisgarh Plains Agro-climatic Zone and the forestarea falls under this district is quite rich in terms ofdiversity and abundance of plant species. Out of totalseven blocks in the Bilaspur district, Pendra, Gaurela andKota blocks were selected purposively because suchblocks are densest forest block of the district as well asthe researcher is well familiar with these blocks. Then thethree villages were selected randomly from each selectedblock to make a total of nine villages in the sample.
Selection of respondents: Fifteen NTFPs collectingforest dwellers were selected randomly from each selectedvillage. Thus, the total 135NTFPs collecting forest dwellers(9X15=135) were considered as respondents for thisstudy.
Collection and analysis of data: The data werecollected personally through pre-tested interviewschedule. Collected data was tabulated, processed and
Assessment of Non-Timber Forest Products based Livelihood Systems among the Forest Dwellers of Chhattisgarh 53

54 Ashish Kumar Gupta et al.
analyzed by using appropriate statistical tools andmethods.
Operational definition of the NTFPs basedlivelihood systems: In this investigation for definingthe NTFPs based livelihood systems the followingoperational definition had been developed.
NTFPs based livelihood system is a system whichcomprises more than one occupation sources assubsystems, in which NTFPs collection is the mainoccupation source. Such occupation sources is associatedwith each other in such a manner that they have provideenough employment and income to the persons orhouseholds who are involved in it, so that they can sustaintheir livelihood for long term. Among such occupationsources the NTFPs collection is only occupation whichis available throughout the year to the persons orhouseholds who are living in or near the forest fringes.There are too many NTFPs based livelihood system ispossible in the same forest area or in different forestareas. Which is mainly depends upon the availability ofthe various NTFPs in those areas.
Designing of NTFPs based livelihood systems:Based on the enquired data from the respondents,prevailing NTFPs based livelihood systems had beendesigned. For designing such systems only thoseoccupation sources were selected in which more than 40per cent respondents were involved and which hadsignificantly contribute the livelihood of the respondents.While the selection of various NTFPs under such systemswas done on the basis of the criteria viz., number ofhouseholds involved in collection of those NTFPs,economic contribution made by those NTFPs andimportance of those NTFPs in the livelihood of therespondents.
Finally, for creating the prevailing NTFPs basedlivelihood systems, the cluster of five or more than fiveNTFPs were combined with the other selectedoccupation sources (i.e. occupations other than NTFPscollection). In this way it was found that there were toomany combinations of such system were possible. Buthere only those systems were picked up which hadprovides the optimum contribution in the livelihood ofthe respondents, which had the potential to provide theemployment throughout the year and in which greaterthan twenty five sampled households were involved. Inthis way total seven systems were finally selected but incase of some systems few subsystems were also selected.
SWOT analysis of prevailing NTFPs basedlivelihood systems: SWOT analysis of prevailingNTFPs based livelihood systems was done on the basisof observations of the researcher and discussions madebetween researcher and the respondents during collectionof data. This analysis helps in identification of strengths,weaknesses, opportunities and threats related to suchsystems.
RESULTS AND DISCUSSION
Occupation: The data from Table 1 reveals that 100.00per cent of the respondents were involved in NTFPscollection. This might be because of the fact that variousNTFPs are available to them in different seasons of ayear. Sawhney and Engel (2003) pointed out that inBandhavgarh National Park, India the majority of thesampled households (97%) were engaged in collectionof NTFPs.
Table 1: Distribution of the respondents according to theiroccupationKind of occupation* Frequ- Percen-
ency tageNTFPs collection 135 100.00NTFPs collection + Agriculture 124 91.85NTFPs collection + Animal Husbandry 56 41.48NTFPs collection + Wage earning 73 54.07NTFPs collection + Business 07 05.19NTFPs collection + Services 29 21.48*Data are based on multiple responses
While 91.85 per cent of them were involved inNTFPs collection + agriculture, 54.07 per cent in NTFPscollection + wage earning, 41.48 per cent in NTFPscollection + animal husbandry, 21.48 per cent in NTFPscollection + services and only 5.19 per cent respondentshad adopted NTFPs collection + business as theiroccupation (Table 2). Tejaswi (2008) reported thatmajority of the respondents i.e. cent per cent wereinvolved in NTFPs collection followed by wage earning(75.80%), agriculture (27.47%) and livestock rearing(26.37%). While only 6.59 per cent of them were engagedin services and allied activities. Saha (2015) stated that100per cent of the sample households had engaged in fishrelated activities. Almost 60 per cent of them participatedin different nonfarm income activities as well as inlivestock production. 48.57 per cent of them practicedcrop production. A large number of fishers’ householdsengaged in wages income and income from other sources
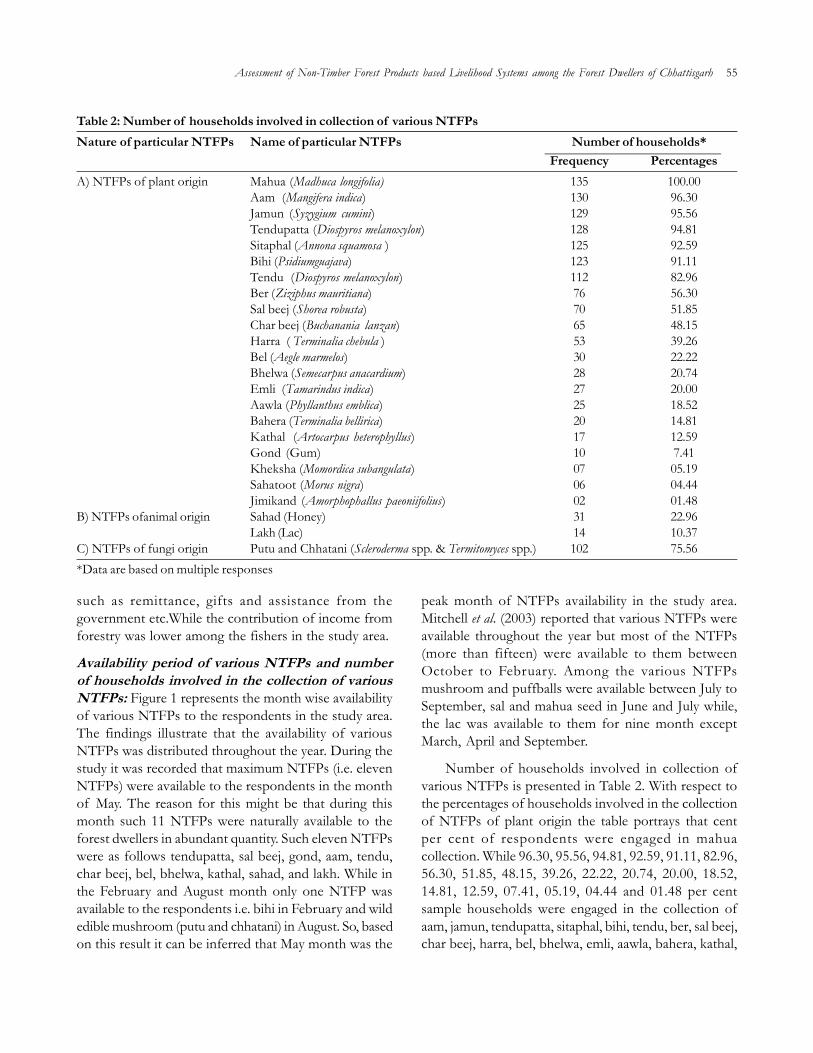
Assessment of Non-Timber Forest Products based Livelihood Systems among the Forest Dwellers of Chhattisgarh 55
such as remittance, gifts and assistance from thegovernment etc.While the contribution of income fromforestry was lower among the fishers in the study area.
Availability period of various NTFPs and numberof households involved in the collection of variousNTFPs: Figure 1 represents the month wise availabilityof various NTFPs to the respondents in the study area.The findings illustrate that the availability of variousNTFPs was distributed throughout the year. During thestudy it was recorded that maximum NTFPs (i.e. elevenNTFPs) were available to the respondents in the monthof May. The reason for this might be that during thismonth such 11 NTFPs were naturally available to theforest dwellers in abundant quantity. Such eleven NTFPswere as follows tendupatta, sal beej, gond, aam, tendu,char beej, bel, bhelwa, kathal, sahad, and lakh. While inthe February and August month only one NTFP wasavailable to the respondents i.e. bihi in February and wildedible mushroom (putu and chhatani) in August. So, basedon this result it can be inferred that May month was the
peak month of NTFPs availability in the study area.Mitchell et al. (2003) reported that various NTFPs wereavailable throughout the year but most of the NTFPs(more than fifteen) were available to them betweenOctober to February. Among the various NTFPsmushroom and puffballs were available between July toSeptember, sal and mahua seed in June and July while,the lac was available to them for nine month exceptMarch, April and September.
Number of households involved in collection ofvarious NTFPs is presented in Table 2. With respect tothe percentages of households involved in the collectionof NTFPs of plant origin the table portrays that centper cent of respondents were engaged in mahuacollection. While 96.30, 95.56, 94.81, 92.59, 91.11, 82.96,56.30, 51.85, 48.15, 39.26, 22.22, 20.74, 20.00, 18.52,14.81, 12.59, 07.41, 05.19, 04.44 and 01.48 per centsample households were engaged in the collection ofaam, jamun, tendupatta, sitaphal, bihi, tendu, ber, sal beej,char beej, harra, bel, bhelwa, emli, aawla, bahera, kathal,
Table 2: Number of households involved in collection of various NTFPsNature of particular NTFPs Name of particular NTFPs Number of households*
Frequency PercentagesA) NTFPs of plant origin Mahua (Madhuca longifolia) 135 100.00
Aam (Mangifera indica) 130 96.30Jamun (Syzygium cumini) 129 95.56Tendupatta (Diospyros melanoxylon) 128 94.81Sitaphal (Annona squamosa ) 125 92.59Bihi (Psidiumguajava) 123 91.11Tendu (Diospyros melanoxylon) 112 82.96Ber (Ziziphus mauritiana) 76 56.30Sal beej (Shorea robusta) 70 51.85Char beej (Buchanania lanzan) 65 48.15Harra ( Terminalia chebula ) 53 39.26Bel (Aegle marmelos) 30 22.22Bhelwa (Semecarpus anacardium) 28 20.74Emli (Tamarindus indica) 27 20.00Aawla (Phyllanthus emblica) 25 18.52Bahera (Terminalia bellirica) 20 14.81Kathal (Artocarpus heterophyllus) 17 12.59Gond (Gum) 10 7.41Kheksha (Momordica subangulata) 07 05.19Sahatoot (Morus nigra) 06 04.44Jimikand (Amorphophallus paeoniifolius) 02 01.48
B) NTFPs ofanimal origin Sahad (Honey) 31 22.96Lakh (Lac) 14 10.37
C) NTFPs of fungi origin Putu and Chhatani (Scleroderma spp. & Termitomyces spp.) 102 75.56*Data are based on multiple responses
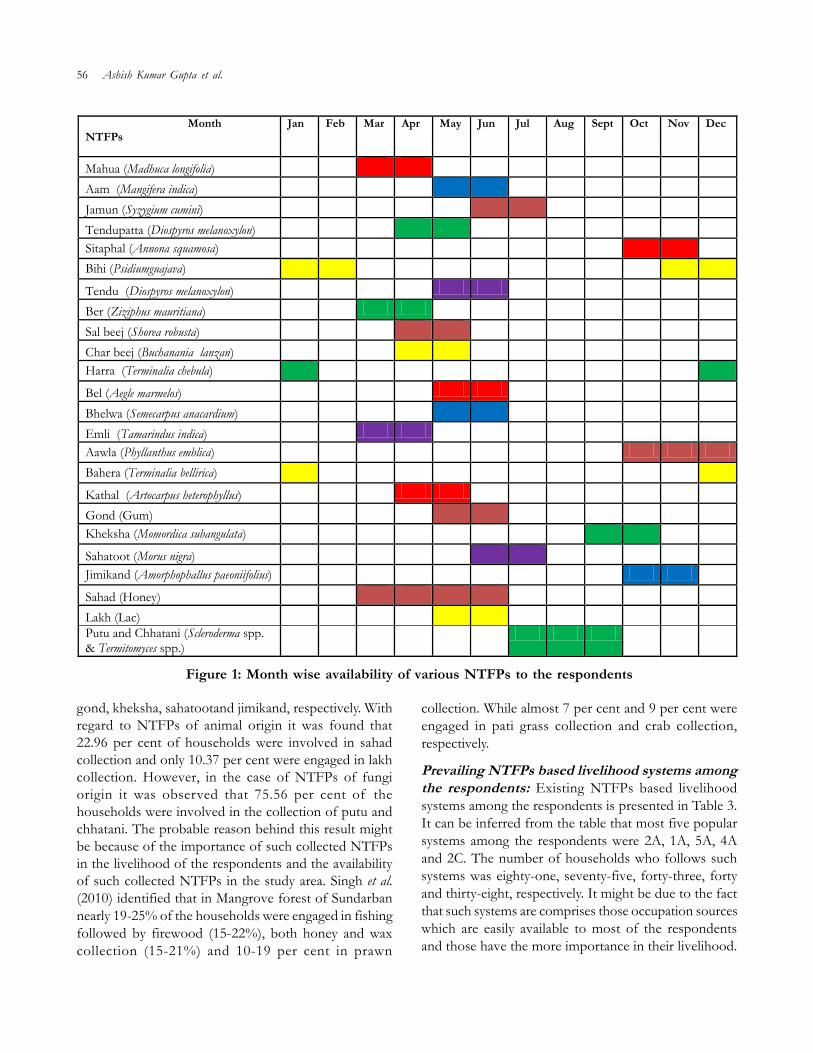
56 Ashish Kumar Gupta et al.
Month NTFPs
Jan Feb Mar Apr May Jun Jul Aug Sept Oct Nov Dec
Mahua (Madhuca longifolia)
Aam (Mangifera indica)
Jamun (Syzygium cumini)
Tendupatta (Diospyros melanoxylon)
Sitaphal (Annona squamosa)
Bihi (Psidiumguajava)
Tendu (Diospyros melanoxylon)
Ber (Ziziphus mauritiana)
Sal beej (Shorea robusta)
Char beej (Buchanania lanzan)
Harra (Terminalia chebula)
Bel (Aegle marmelos)
Bhelwa (Semecarpus anacardium)
Emli (Tamarindus indica)
Aawla (Phyllanthus emblica)
Bahera (Terminalia bellirica)
Kathal (Artocarpus heterophyllus)
Gond (Gum)
Kheksha (Momordica subangulata)
Sahatoot (Morus nigra)
Jimikand (Amorphophallus paeoniifolius)
Sahad (Honey)
Lakh (Lac) Putu and Chhatani (Scleroderma spp. & Termitomyces spp.)
Figure 1: Month wise availability of various NTFPs to the respondents
gond, kheksha, sahatootand jimikand, respectively. Withregard to NTFPs of animal origin it was found that22.96 per cent of households were involved in sahadcollection and only 10.37 per cent were engaged in lakhcollection. However, in the case of NTFPs of fungiorigin it was observed that 75.56 per cent of thehouseholds were involved in the collection of putu andchhatani. The probable reason behind this result mightbe because of the importance of such collected NTFPsin the livelihood of the respondents and the availabilityof such collected NTFPs in the study area. Singh et al.(2010) identified that in Mangrove forest of Sundarbannearly 19-25% of the households were engaged in fishingfollowed by firewood (15-22%), both honey and waxcollection (15-21%) and 10-19 per cent in prawn
collection. While almost 7 per cent and 9 per cent wereengaged in pati grass collection and crab collection,respectively.
Prevailing NTFPs based livelihood systems amongthe respondents: Existing NTFPs based livelihoodsystems among the respondents is presented in Table 3.It can be inferred from the table that most five popularsystems among the respondents were 2A, 1A, 5A, 4Aand 2C. The number of households who follows suchsystems was eighty-one, seventy-five, forty-three, fortyand thirty-eight, respectively. It might be due to the factthat such systems are comprises those occupation sourceswhich are easily available to most of the respondentsand those have the more importance in their livelihood.
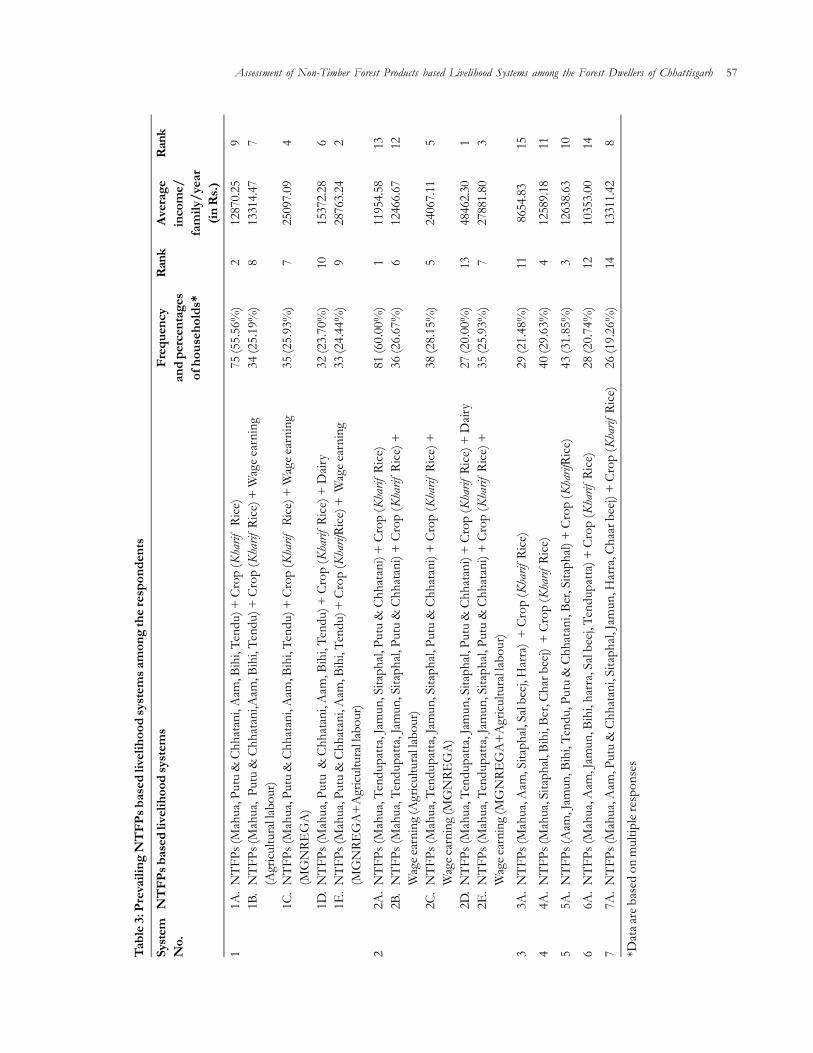
Assessment of Non-Timber Forest Products based Livelihood Systems among the Forest Dwellers of Chhattisgarh 57
Tabl
e 3: P
reva
iling
NT
FPs b
ased
live
lihoo
d sy
stem
s am
ong
the r
espo
nden
ts
Syst
emN
TFP
s bas
ed li
velih
ood
syst
ems
Freq
uenc
yR
ank
Aver
age
Ran
kN
o.an
d pe
rcen
tage
sin
com
e/of
hou
seho
lds*
fam
ily/y
ear
(in R
s.)
11A
.N
TFPs
(Mah
ua, P
utu
& C
hhat
ani,
Aam
, Bih
i, Te
ndu)
+ C
rop
(Kha
rif R
ice)
75 (5
5.56
%)
212
870.
259
1B.
NTF
Ps (M
ahua
, Put
u &
Chh
atan
i,Aam
, Bih
i, Te
ndu)
+ C
rop
(Kha
rif R
ice)
+ W
age e
arni
ng34
(25.
19%
)8
1331
4.47
7(A
gricu
ltura
l labo
ur)
1C.
NTF
Ps (M
ahua
, Put
u &
Chh
atan
i, A
am, B
ihi,
Tend
u) +
Cro
p (K
harif
Ric
e) +
Wag
e ear
ning
35 (2
5.93
%)
725
097.
094
(MG
NRE
GA
)1D
.N
TFPs
(Mah
ua, P
utu
& C
hhat
ani,
Aam
, Bih
i, Te
ndu)
+ C
rop
(Kha
rif R
ice)
+ D
airy
32 (2
3.70
%)
1015
372.
286
1E.
NTF
Ps (M
ahua
, Put
u &
Chh
atan
i, Aam
, Bih
i, Ten
du) +
Cro
p (K
harif
Rice
) + W
age e
arni
ng33
(24.
44%
)9
2876
3.24
2(M
GN
REG
A+
Agr
icultu
ral la
bour
)
22A
.N
TFPs
(Mah
ua, T
endu
patta
, Jam
un, S
itaph
al, P
utu
& C
hhat
ani)
+ C
rop
(Kha
rif R
ice)
81 (6
0.00
%)
111
954.
5813
2B.
NTF
Ps (M
ahua
, Ten
dupa
tta, J
amun
, Sita
phal,
Put
u &
Chh
atan
i) +
Cro
p (K
harif
Ric
e) +
36 (2
6.67
%)
612
466.
6712
Wag
e ear
ning
(Agr
icultu
ral la
bour
)2C
.N
TFPs
(Mah
ua, T
endu
patta
, Jam
un, S
itaph
al, P
utu
& C
hhat
ani)
+ C
rop
(Kha
rif R
ice)
+38
(28.
15%
)5
2406
7.11
5W
age e
arni
ng (M
GN
REG
A)
2D.
NTF
Ps (M
ahua
, Ten
dupa
tta, J
amun
, Sita
phal,
Put
u &
Chh
atan
i) +
Cro
p (K
harif
Ric
e) +
Dair
y27
(20.
00%
)13
4846
2.30
12E
.N
TFPs
(Mah
ua, T
endu
patta
, Jam
un, S
itaph
al, P
utu
& C
hhat
ani)
+ C
rop
(Kha
rif R
ice)
+35
(25.
93%
)7
2788
1.80
3W
age e
arni
ng (M
GN
REG
A+
Agr
icultu
ral la
bour
)
33A
.N
TFPs
(Mah
ua, A
am, S
itaph
al, S
al be
ej, H
arra
) +
Cro
p (K
harif
Ric
e)29
(21.
48%
)11
8654
.83
15
44A
.N
TFPs
(Mah
ua, S
itaph
al, B
ihi,
Ber,
Char
bee
j) +
Cro
p (K
harif
Ric
e)40
(29.
63%
)4
1258
9.18
11
55A
.N
TFPs
(Aam
, Jam
un, B
ihi,
Tend
u, P
utu
& C
hhat
ani,
Ber,
Sita
phal)
+ C
rop
(Kha
rifRi
ce)
43 (3
1.85
%)
312
638.
6310
66A
.N
TFPs
(Mah
ua, A
am, J
amun
, Bih
i, ha
rra,
Sal b
eej,
Tend
upat
ta) +
Cro
p (K
harif
Ric
e)28
(20.
74%
)12
1035
3.00
14
77A
.N
TFPs
(Mah
ua, A
am, P
utu
& C
hhat
ani, S
itaph
al, Ja
mun
, Har
ra, C
haar
bee
j) +
Cro
p (K
harif
Ric
e)26
(19.
26%
)14
1331
1.42
8
*Dat
a are
bas
ed o
n m
ultip
le re
spon
ses

58 Ashish Kumar Gupta et al.
It was also found that these five popular systems mainlyencompass the occupations viz., NTFPs collection andagriculture (kharif rice) because these two occupationsources have the greatest importance in the livelihoodof the respondents than the other occupation sources.So it can be inferred from this data that popularity ofthese systems are directly related to their livelihood.
With regard to per family average annual incomeobtained from each individual system, the data describesthat top five maximum earning systems were 2D, 1E,2E, 1C and 2C. The obtained per family average annualincome from these systems were as follows Rs. 48462.30,Rs. 28763.24, Rs. 27881.80, Rs. 25097.09 and Rs. 24067.11,respectively. It might be due to the fact that these systemscomprise those occupation sources which are the majorsources of their annual income. It was also found thatthese five systems were comprises mainly threeoccupations viz., NTFPs collection, agriculture (kharif
rice) and wage earning. And among the wage earningthe respondents were mainly involved in MGNREGA.Per family average annual income obtained from aparticular system reflects the relative profitability of thatparticular system over the other systems.
SWOT analysis of prevailing NTFPs basedlivelihood systems: SWOT analysis is an acronym forstrengths, weaknesses, opportunities, and threats. It is astructured planning method that evaluates the internaland external factors that are favorable and unfavorableto the given system. The internal factors consist ofthe strengths and weaknesses which are internal to thatgiven system. Whereas the external factors includesthe opportunities and threats which are external to thatgiven system. Here an attempt has been to be made tocarry out SWOT analysis of prevailing NTFPs basedlivelihood systems of the respondents and it is presentedin Box 1.
Box 1: SWOT analysis of prevailing NTFPs based livelihood systems of the respondents on the basis of observations anddiscussions during data collectionStrengths WeaknessesFree of cost and year round availability of NTFPs Lack of availability of timely market information and poor marketing
linkages for NTFPs and rice cropEmployment generation Lack of adequate skills related to collection, processing and marketing
of NTFPsAugmenting the annual income of the respondents Poor and unsustainable management of available resourcesAssisting the livelihood of the respondents Lack of awareness about importance and profitability of such systemsFamiliarity with various NTFPs Poor livestock possession and small size of land holdingsExistence of Government support and policies for Seasonal availability of NTFPssome selected NTFPsMultidimensional use of NTFPs Lack of knowledge about existing government support and policies
related to NTFPs and rice cropPredominance of rainfed and monocropping (Rice) systemOwnership on tree bearing the NTFPsDisenchantment of educated rural youth from NTFPs collectionLack of storage and transport facilities
Opportunities ThreatsScope of Entrepreneurship development DeforestationOptimum utilization of available resources Over collection of NTFPs by outsidersSolving the problem of unemployment Low and fluctuated market price of NTFPsImprove the rural economy Injury caused by attack of wild animalsValue addition of NTFPs and rice crop opens the Existence of bad weather (like drought, excess rainfall etc.)scope for earning of high incomePotential tool for rural development Poor producers share in consumer rupees
Forest fireUnsustainable harvesting of NTFPs by the forest dwellers

Assessment of Non-Timber Forest Products based Livelihood Systems among the Forest Dwellers of Chhattisgarh 59
SWOT analysis of such prevailing NTFPs basedlivelihood systems of the respondents reveals that suchsystems have the following strengths viz. free of costand year round availability of NTFPs in the forest,employment generation, augmenting the annual incomeof the respondents, assisting the livelihood of therespondents, familiarity with various NTFPs, existenceof Government support and policies for some selectedNTFPs like tendupatta and multidimensional use ofNTFPs. Such prevailing NTFPs based livelihood systemsopen the way for livelihood diversification among theforest dwellers. And this livelihood diversification helpsin supporting the livelihoods of the respondent byreducing their livelihood vulnerability. Pal et al. (2017)found that diversified livelihood activities reduce thelivelihood vulnerability of the respondents especially inthis age of climate change. The following weaknessesof such systems are as follows lack of availability oftimely market information on current prices, demandsand supplies of various NTFPs and rice crop and poormarketing linkages due to presence of middle man, lackof adequate skills related to collection, processing andmarketing of NTFPs, poor and unsustainablemanagement of available resources, lack of awarenessabout importance and profitability of such systems, poorlivestock possession and small size of land holdings,Seasonal availability of NTFPs, lack of knowledge aboutexisting government support and policies related toNTFPs and rice crop, predominance of rainfed andmonocropping (rice) system, ownership on tree bearingthe NTFPs, disenchantment of educated rural youth fromNTFPs collection and lack of storage and transportfacilities. Whereas the opportunities related to such systemsare as follows scope of entrepreneurship development,optimum utilization of available resources, solving theproblem of unemployment by providing year roundemployment trough such systems, improve the ruraleconomy, value addition of NTFPs and rice crop opensthe scope to the forest dwellers for earning of highincome and potential tool for rural development.Similarly, the threats linked with these systems are alsoidentified. This threats are as follows deforestation, overcollection of NTFPs by outsiders, low and fluctuatedmarket price of NTFPs, Injury caused by attack of wildanimals during the collection of NTFPs, existence ofbad weather (like drought, excess rainfall etc.), poorproducers share in consumer rupees, forest fire andunsustainable harvesting of NTFPs by the forest dwellers.
CONCLUSION
From the findings of this study it may be concluded thatcollection and marketing of NTFPs is one of the mostimportant activity performed by the forest dwellers forsustaining their livelihood. Various NTFPs are availableto the forest dwellers all-round the year in free of thecost. But the May month was found as the peak monthof availability of various NTFPs. Among the all collectedNTFPs, mahua, aam, jamun, tendupatta, sitaphal and bihihad shown the greater importance in the livelihood ofthe respondents. The findings of prevailing NTFPs basedlivelihood systems reflects that most of the respondentsare involved in those systems which are less profitablethan other systems. Hence there is a need to form groupsof forest dwellers according to their popular practicingNTFPs based livelihood systems and training should begiven to such groups on the efficient utilization of theirpracticing systems. The training domain should alsoinvolve the processing, value addition and marketingaspects of various NTFPs and rice crop, so that the profitability from prevailing NTFPs based livelihood systemscan be increased. Which will ultimately improves thelivelihood and socio-economic status of the forestdwellers. From the SWOT analysis of prevailing NTFPsbased livelihood systems it can be inferred that, if theweaknesses and threats related to such systems can bemanaged properly by formation of Self Help Group(SHG) or Commodity Interest Group and supportthrough government initiative in marketing of NTFPs.Then the forest dwellers will get maximum productivityand profitability from prevailing NTFPs based livelihoodsystems for their food security and sustainable growth.
REFERENCES
Global NTFP Partnership. 2005. In: Inception Workshop heldon 1-2 December at Marrakech, Morocco.
Gradwohl, J. and R. Greenberg. 1988. Saving the tropical forests.London, Earth scan.
Gupta, A.K.; M.L. Sharma and L. Singh. 2017. Utilization Patternof Non-Timber Forest Products (NTFPs) among theTribal Population of Chhattisgarh, India. InternationalJournal of Bio-resource and Stress Management, 8(2): 327-333.
Hegde, R.; S. Suryaprakash; L. Achoth and K.S. Bawa. 1996.Extraction of non-timber forest products in the forestsof Biligiri Rangan Hills, India: contribution to ruralincome. Economic Botany, 50: 243-251.

60 Ashish Kumar Gupta et al.
International Tropical Timber Organisation (ITTO). 2006.Status of tropical forest management 2005. Yokohama,ITTO.
Kaimowitz, D. 2003. ‘Not by bread alone. forests and rurallivelihoods in sub-Saharan Africa’; Oksanen, T.; B.Pajariand T. Tuomasjakka; Forests in poverty reduction strategies:capturing the potential; p. 45–63. Finland, European ForestInstitute.
Lawes, M.J.; J.A. Obiri and H.A. Eeley. 2004. ‘The uses andvalue of indigenous forest resources in South Africa;Lawes, M.J.; H.A.C. Eeley; C.M. Shackleton and B.S. Geach;Indigenous forests and woodlands in South Africa: policy, peopleand practice; p. 227–275.Pietermaritzburg, University ofKwaZulu-Natal Press.
Mitchell, C.P.; S.E. Corbridge; S.L. Jewitt; A.K. Mahapatra andS. Kumar. 2003. Non-Timber Forest Products: availability,production, consumption, management and marketingin Eastern India, on line cited on 28th April 2005, availableat www.frp.uk.com/dissemination_documents/FTR.pdf.
Narain, S.; S. Singh; H.S. Panwar and M. Gadgil. 2005. Thereport of tiger task force. Project Tiger, Union Ministry ofEnvironment and Forest, GOI.
Neumann, R.P. and E. Hirsch. 2000. Commercialization of non-timber forest products: Review analysis of research, Bogor.Center for International Forestry Research, London.
Oksanen, T.; B. Pajari and T. Tuomasjakka. 2003. Forests inpoverty reduction strategies: capturing the potential.European Forest Institute, Torikatu.
Pal, P.K.; Phubu Tshering Bhutia; Litan Das; Norden Lepchaand M.S. Nain. 2017.Livelihood Diversity in FamilyFarming in Selected Hill Areas of West Bengal, India.Journal of Community Mobilization and SustainableDevelopment, 12(2): 172-178.
Peters, C.M.; A.H. Gentry and R.O. Mendelsohn. 1989.Valuation of an Amazonian rainforest. Nature, 339: 655-656.
Quang. 2006. Commercial collection of NTFPs and householdliving in or near the forests. Science Direct.
Saha, B. 2015. Livelihood Diversification of Fishers in the Vicinityof Rudrasagar lake, Tripura. Journal of CommunityMobilization and Sustainable Development, 10(1): 93-99.
Sarmah, R. 2006. Non-timber forest products and theirutilization pattern in Changlang district of ArunachalPradesh. Ph.D. Thesis, Rajiv Gandhi University, Itanagar
Schwartzman, S. 1989. ‘Extractive reserves: rubber tapping forsustainable use of Amazon rain forests’; Bowder J.O.;Fragile lands of Latin America: strategies for sustainabledevelopment; p. 150–165. Boulder, West view Press.
Singh, A.; P. Bhattacharya; P. Vyas and S. Roy. 2010. Contributionof NTFPs in the Livelihood of Mangrove Forest Dwellersof Sundarban. Journal of Human Ecology, 29(3): 191-200.
Sunderlin, W.D.; A. Angelsen; B. Belcher; P. Burgers; R. Nasi; L.Santoso and S. Wunder. 2005. Livelihoods, forests andconservation in developing countries: An Overview. WorldDevelopment, 33: 1383–1402.
Vantomme. 2003. Forest Products Division, ForestryDepartment, FAO, Rome.
Wollenberg, E. and A. Ingles. 1998. Incomes from the forest:methods for the development and conservation of forestproducts for local communities. Bogor: CIFOR.
World Bank. 2002. A revised forest strategy for the World BankGroup. Washington, DC: World Bank.
Wunder, S. 2001. Poverty alleviation and tropical forest – whatscope for synergies? World Development, 29: 1817–1833.
--------------------------------------------------------------------------------------------------------------------------------------------------------------Received on December, 2017, Revised on January , 2018

Journal of Community Mobilization and Sustainable Development Vol. 13(1), 61-67, January-April, 2018
*Corresponding author email id: [email protected]
Farm Size and Productivity Relationship in Smallholder Farms: Someempirical evidences from Bihar, India
R.K.P. Singh1, Abhay Kumar2, K.M. Singh3, N. Chandra2, R.C. Bharati2, Ujjwal Kumar2 and Pankaj Kumar4*1Former Advisor, State Farmer’s Commission, Govt. of Bihar, Patna, India2Principal Scientist, Division of Socio-Economic and Extension, ICAR Research Complex for Eastern Region, Patna, Bihar, India3Director Extension Education cum University Professor (Agricultural Economics) and Chairman, Department of AgriculturalEconomics, DRRPCAU, Pusa, Bihar, India4Senior Scientist, DLFM, ICAR Research Complex for Eastern Region, Patna, Bihar, India
ABSTRACT
This article contributes to the limited literature on farm size and productivity in small land holder’s agriculture inBihar, India. Plot wise panel data of VDSA project are used to reach at precise conclusion. The results provideevidence for a positive relationship between farm size and productivity in case of small land holders’ agricultureand hence, an inverse relationship does not seem to apply within small landholders’ agriculture. A strong positiverelationship between farm size and output per hectare is a result of higher use of fertilizer, modern seeds andirrigation sources on comparatively larger land holders than small land holders in Bihar, India. It is mainly due tomore uneconomic land holdings of sub-marginal and marginal farmers to have limited access to water resources,quality input and credit. Access to resources and technology must be considered together for any agriculturaldevelopment programmes for small land holder’s agriculture. It is, therefore, needed to look for ways of improvingtheir access to resources for farming through increased opportunities for earning off farms and off season incomeor through improved credit market. Hence, small size and land fragmentation are key bottlenecks for the growthof agriculture in Bihar, India. The crop productivity can be increased through improving their access to institutionalfinancing system, agricultural extension network and farm technology centres. However, promotion of non-farmrural employment seems to be the most appropriate option for increasing crop productivity and improvinglivelihoods of small landholders in Bihar.
Keywords: Adoption, Farm size, Livelihood, Modern, Productivity, Smallholders
INTRODUCTION
Relationship between farm size and productivity indeveloping countries has been one of the oldest issuesof the interest of researchers. The debate on farm sizeand productivity relationship intensified, when Sen (1962)observed inverse relationship between farm size andoutput per hectare in Indian agriculture, suggesting thatsmall farms are more productive compared to large ones.Several studies confirmed the phenomenon in Indianagriculture and its statistical validity was adequatelyestablished (Mazumdar, 1965; Khusro, 1968; Rao, 1966and Saini, 1971). Usha Rani’s (1971) studies in IntensiveAgricultural Development Programme (IADP) districtsusing farm level observations showed that neither
cropping pattern nor inputs intensity nor even yield peracre differs across farms of different sizes. KrishnaBharadwaj (1974) also investigated the relationshipbetween productivity and size of farm and found thatin the majority of cases, an inverse relationship existed;however, it was not statistically significant. Jha et al. (2011)and Handral et al. (2017) while studying yield gap havealso opined that productivity of different crops hasincreased over the year in Bihar in spite of continuousincrease in small and marginal farms.
Chadha (1978) while studying farm level data forthree agro-climatic regions in Punjab found that theinverse relationship had ceased to hold in the moredynamic zones. However, Rudra (1983) opined that there

62 R.K.P. Singh et al.
is no scope for propounding a general law for an inverserelationship or even for a positive relationship. A recentstudy by Chattopadhyay and Sengupta (1997), suggestedthat the inverse relation between farm size andproductivity became stronger in the agriculturallydeveloped regions of West Bengal compared to therelatively less developed regions.
Despite a number of studies favouring the inverserelationship, it has failed to reach a consensus. On thecontrary, some studies concluded that the adoption ofnew agricultural technology by large farmers has reducedor even reversed the yield advantage of small farmers(Fan and Chang-Kang, 2005). Recent literature also showsthat small farms are not as efficient as large farms inagriculturally developed regions but they could be moreefficient in agriculturally backward regions (Toufique,2005).
To sum up, it is often pointed out that the differencein the size of farms is one of the reasons for thedifference in yields. It is argued that small cultivatorsincrease cropping intensity on their farms or havemultiple crops and that family labour works intensivelyon such farms thereby increasing output per unit of land.However, studies carried out on the relationship betweensize of farms and productivity show contradicting results.
The objective of this paper is to test the inverserelationship between farm size and productivity andidentify the changes, if any, with the introduction ofmodern technology in agriculture, particularly in contextof small holders’ agriculture. We have estimatedproductivity and input use in all the crops grown byfarmers on an annual basis and used them to compareperformance of the entire system of land-based activitiesacross various farm size categories. Agriculturaldevelopment indicators like; cropping pattern, intensityof cropping, use of chemical fertilizers, modern seedsand irrigation resources have been also examined fordifferent categories of farm households.
The paper investigates the farm size –productivityrelationship amongst smallholder farms of Biharprovince of India. Bihar is the most suitable region forstudying farm size and productivity relationship on farmsof small land holders because there is high populationdensity (1102/sq. km.) and very small landholdings (0.39ha). Marginal size of land holdings (< 1 ha) constitute 91percent of total farm holdings and possess 57 per cent
of cultivated land and their average size of landholdingsis 0.25 hectare (Government of India, 2012).
MATERIALS AND METHODS
The data used in this study were collected underICRISAT- ICAR collaborative project entitled “TrackingChanges in Rural Poverty in Households and VillageEconomies in South Asia.” In the project, data are beingsolicited from the panel of 40 households in each offour sample villages in Bihar. Data are being collectedby resident Investigators. For the selection ofrespondents, development indices of all the districts wereworked out on the basis of per hectare agricultural GDP,infrastructure (density of rural roads, extent ofelectrification, density of PHC and bank branches) andeducation level. Districts were arranged in descendingorder on the basis of development indices. Data set ofdistricts of the state was categorized in three quartiles.One district from lower quartile (consisting lessdeveloped districts) and another one from upper quartile(consisting of comparatively developed districts) wererandomly selected for drawing sample of blocks. Oneblock from each sample district, making two sampleblocks were also selected randomly. List of villages wereprepared for each sample block and two villages fromeach sample block were selected randomly. The censuswas conducted in four sample villages through thestructured schedule containing questions aboutdemographic characteristics, land ownership, livestock,and agricultural machineries possessed by households inthe village, etc. Households of sample village werearranged in ascending order on the basis of their landarea. Households owning land less than 0.20 hectare werecategorised as labour households and quartile ofremaining households of villages were formed, upperquartile was categorized as marginal households, middleas small households and lower as large households.Sample of 10 households from each category wererandomly selected, making sample of 40 households ineach village. Thus, a total of 160 sample households wereselected in Bihar for detailed investigation.
In sample villages, farm holdings up to 1 hectareconstitute 76 per cent of total farm holdings and thereare only five farmers who were having more than 4hectares of land and cannot be categorised as a groupfor analysis. Hence, analysis of data relating to farm size,productivity and other components were undertaken byre-categorizing of sample households in four groups that

Farm Size and Productivity Relationship in Smallholder Farms: Some empirical evidences from Bihar 63
is; sub-marginal (<0.40 ha), marginal (0.40-1 ha), small(1-2 ha) and medium farm households (2 ha and above).
RESULTS AND DISCUSSION
Cropping Intensity and Cropping pattern: Croppingintensity is a major source of agricultural growth in thecountry. There has been very slow growth of croppingintensity in most of Indian states and it varies widelyfrom one region to another. The cropping intensity alsovaries with area of land operated by farm households.The inverse relationship between farm size and croppingintensity has been observed in various studied (Bharadwaj,1974; Griffin, 1974; Berry and Cline 1976; Khan, 1979and Chand et al., 2011). Sau (1978) also observed lowcropping intensity on large farms and concluded thatthere is an inverse relationship between farm size andcropping intensity in few Indian states. Sen (1964) arguedthat small farms being family enterprises had a lowercost of labour as compared to large farms. So smallfarms are cultivated more intensively and produce ahigher level of output.
The cropping intensity of four categories of farmsunder study has been worked out to find croppingintensity on different categories of farm households inBihar, India. The cropping intensity was comparativelyhigh on marginal households (183) and low on mediumhouseholds (163%). However, cropping intensity wasidentical on sub marginal and small households (Table1). There is no clear cut trend of cropping intensity ondifferent size of farm holdings but upper category offarm households had the lowest level of croppingintensity.
The log linear form of the model was also appliedto know the relationship between cropping intensity (CI)and farm size. The estimated regression coefficient is (-) 0.577. The negative values of b in the model clearlyindicates the negative relationship between CI and farm
Table 1: Cropping Intensity on different category ofhouseholds, Bihar, IndiaLand class Cropping intensitySub Marginal 175Marginal 183Small 175Medium 163Total 171
Table 2: Log linear regression of cropping intensity andfarm size of study householdsIndependent variable Cropping intensity (%)
Coefficient Standard t-valueerror
Operated land (ha) -5.77 4.85 -1.19Constant 191.59 9.29 20.61No. of observation 118 R-squares 0.012 Adj R-Squared 0.0035
size but the coefficient of the CI is not found significantat even 10 % level of significance (Table 2).
Marginal farmers cultivated vegetables and spiceson comparatively large area due to availability of familyhuman labour for frequent inter culturing, irrigation, pestmanagement and supervision of these crops. The upper(medium) categories of farm households cultivate wheatin larger proportion of area in rabi season whereas othercategories of households cultivate two crops ofvegetables and spices in almost same period. These cropsare short duration crops which helped increasing croppingintensity on smaller size of farms.
Cropping Pattern: Cropping Pattern is the crop - mixgrown in a particular piece of land in an agricultural year.Introduction of new agricultural technologies hasintroduced a new crop – mix, which is more prominentin agriculturally developed area. Cropping patterns areaffected by a multiplicity of factors of which the resourceposition is one, which is mainly determined by size ofland holdings and non-farm income. While analysingcropping pattern of households under study, food grainemerged as most important crops which were grownon about 95 per cent of gross cropped area ofhouseholds under study. A comparatively largeproportion of gross cropped area was put to food grainscrops on medium size of farms (95.85) and lower onsmaller categories of households (Table 3). Rice andwheat jointly cultivated on about 94 per cent of grosscropped area on upper category (medium) farms. Noneof category of households cultivated rice and wheat onless than 87 per cent of their gross cropped area. Sub-marginal and marginal households put comparativelylarger proportion of area under spice and vegetables,mainly due to availability of more family labour on thesehouseholds. These crops are also more remunerative andthese categories of households try to earn more from

64 R.K.P. Singh et al.
their small piece of land. These results show that theproduction of staple food is a dominant considerationin all size categories of households. This is mainly due toconsideration of family consumption requirements onall categories of households under study. It was also partlydue to almost assured price of these crops throughprocurement centres. These crops are also less labourintensive than spices and vegetable crops.
The above discussion does not lead to clearconclusion that farm categories under study differ fromeach other with respect to their cropping pattern. Hence,Kendall’s coefficient of concordance was used to testthe compatibility of cropping pattern followed ondifferent categories of farms under study. The calculatedvalue of Chi square (28) is lower than table value of2
21, 0.05 indicating that the ranking of crops in the croppingpattern on four categories of households werecompatible (Table 4).
This finding clearly indicates that there has been asignificant difference in cropping pattern followed byfarm categories under study. The cropping patterns ofall categories of households are dominated by foodgrains but upper category of households (medium andsmall households) put more area under rice and wheatwhereas sub marginal and marginal categories ofhouseholds (<1 ha.) cultivated spices and vegetables on
Table 3: Area under different crops on different categories of households, Bihar, India (%)Particulars Sub Marginal Marginal Small Medium TotalPaddy 51.2 49.5 49.5 50.8 50.2Wheat 38.1 38.3 41.7 43.1 41.3Maize 0.6 0.2 0.0 0.0 0.1Pulses 4.7 4.8 4.3 2.0 3.4Food Grains 94.6 92.8 95.5 95.8 95.0Oilseed 2.4 3.6 2.3 1.8 2.4spices 0.1 0.1 0.1 0.0 0.0Vegetable 0.8 1.5 0.7 0.4 0.8Others 2.1 2.0 1.4 1.9 1.8
Table 4: Kendall’s coefficient of concordance for croppingpattern followed on different categories of householdsunder study, Bihar, IndiaParticulars of Concordance Test ValueEstimated coefficient of concordance (W) 0.98Estimated 2 28.0Table Value of 2
21, 0.05 32.67
comparatively large proportion of area. Upper categoryof households cultivated wheat on larger proportion oftheir land in rabi season but sub- marginal and marginalhouseholds preferred cultivation of spices and vegetables.However, categories of households under study do notdiffer significantly with respect to their cropping patterns.
Seed Replacement Rate: Seed is the most importantcritical determinant of crop production on which theperformance and efficacy of other inputs depend.Sustained increase in crop production and productivitynecessarily requires continuos development of new andimproved crop varieties and efficient system ofproduction and supply of seeds to farmers. An atempthas been also made to analyse the farm category wiseseed replacement rate of rice and wheat because thesetwo crops cover about 95 per cent of cropped area onfarms under study.
In study villages, seed replacement rates of rice andwheat were 61.68 per cent and 71.76 per cent, respectivelyon households under study (Table 5). The seedreplacement rates of the two principal crops were muchhigher because Government of Bihar made massiveefforts for increasing rice and wheat seed replacementrates. But seed replacement rates in case of both cropswere much higher on medium size of farms and itdeclined with decline in size of farm holdings.
The comparatively low level of seed replacementrats of both the principal crops on smaller size of farmhouseholds was mainly due to their poor access tosubsidized seeds. Seed replacement rate was higher onsmall and medium households because more than 50per cent of them could afford to purchase seeds frommarket also however, sub- marginal and marginal farmerscould not afford to purchase seeds from market due topoor liquidity and high price of seeds in the market.
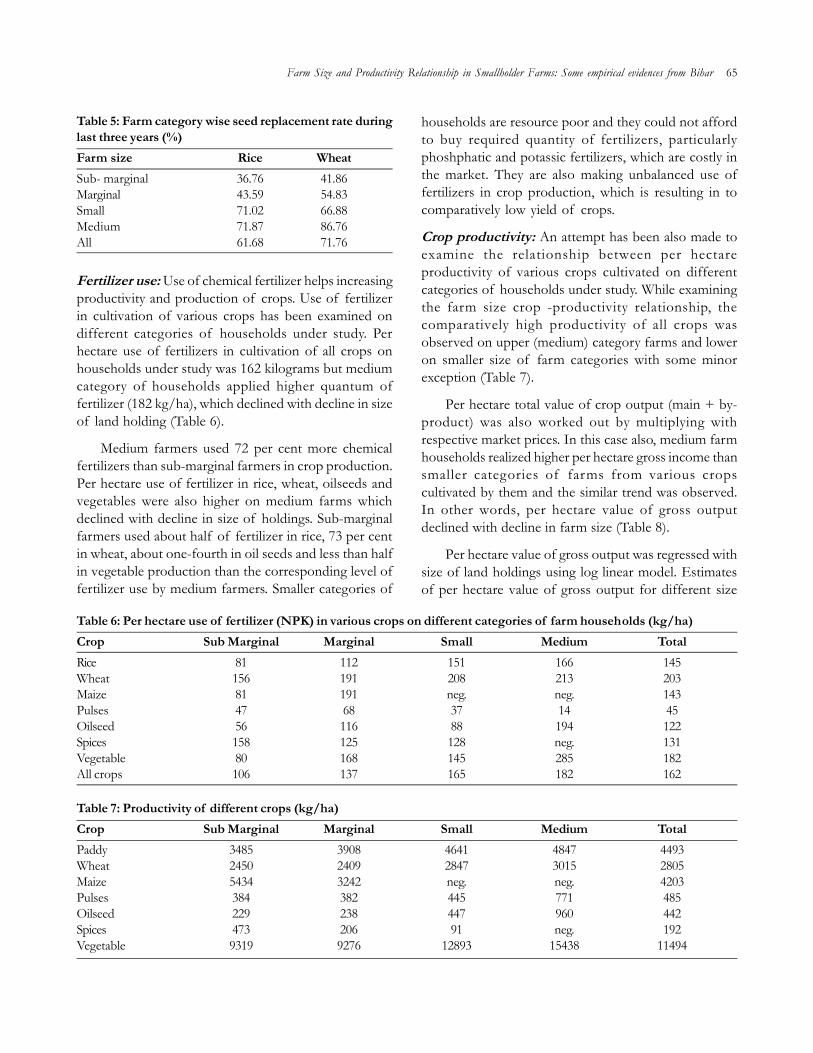
Farm Size and Productivity Relationship in Smallholder Farms: Some empirical evidences from Bihar 65
Fertilizer use: Use of chemical fertilizer helps increasingproductivity and production of crops. Use of fertilizerin cultivation of various crops has been examined ondifferent categories of households under study. Perhectare use of fertilizers in cultivation of all crops onhouseholds under study was 162 kilograms but mediumcategory of households applied higher quantum offertilizer (182 kg/ha), which declined with decline in sizeof land holding (Table 6).
Medium farmers used 72 per cent more chemicalfertilizers than sub-marginal farmers in crop production.Per hectare use of fertilizer in rice, wheat, oilseeds andvegetables were also higher on medium farms whichdeclined with decline in size of holdings. Sub-marginalfarmers used about half of fertilizer in rice, 73 per centin wheat, about one-fourth in oil seeds and less than halfin vegetable production than the corresponding level offertilizer use by medium farmers. Smaller categories of
Table 5: Farm category wise seed replacement rate duringlast three years (%)Farm size Rice WheatSub- marginal 36.76 41.86Marginal 43.59 54.83Small 71.02 66.88Medium 71.87 86.76All 61.68 71.76
Table 6: Per hectare use of fertilizer (NPK) in various crops on different categories of farm households (kg/ha)Crop Sub Marginal Marginal Small Medium TotalRice 81 112 151 166 145Wheat 156 191 208 213 203Maize 81 191 neg. neg. 143Pulses 47 68 37 14 45Oilseed 56 116 88 194 122Spices 158 125 128 neg. 131Vegetable 80 168 145 285 182All crops 106 137 165 182 162
households are resource poor and they could not affordto buy required quantity of fertilizers, particularlyphoshphatic and potassic fertilizers, which are costly inthe market. They are also making unbalanced use offertilizers in crop production, which is resulting in tocomparatively low yield of crops.
Crop productivity: An attempt has been also made toexamine the relationship between per hectareproductivity of various crops cultivated on differentcategories of households under study. While examiningthe farm size crop -productivity relationship, thecomparatively high productivity of all crops wasobserved on upper (medium) category farms and loweron smaller size of farm categories with some minorexception (Table 7).
Per hectare total value of crop output (main + by-product) was also worked out by multiplying withrespective market prices. In this case also, medium farmhouseholds realized higher per hectare gross income thansmaller categories of farms from various cropscultivated by them and the similar trend was observed.In other words, per hectare value of gross outputdeclined with decline in farm size (Table 8).
Per hectare value of gross output was regressed withsize of land holdings using log linear model. Estimatesof per hectare value of gross output for different size
Table 7: Productivity of different crops (kg/ha)Crop Sub Marginal Marginal Small Medium TotalPaddy 3485 3908 4641 4847 4493Wheat 2450 2409 2847 3015 2805Maize 5434 3242 neg. neg. 4203Pulses 384 382 445 771 485Oilseed 229 238 447 960 442Spices 473 206 91 neg. 192Vegetable 9319 9276 12893 15438 11494
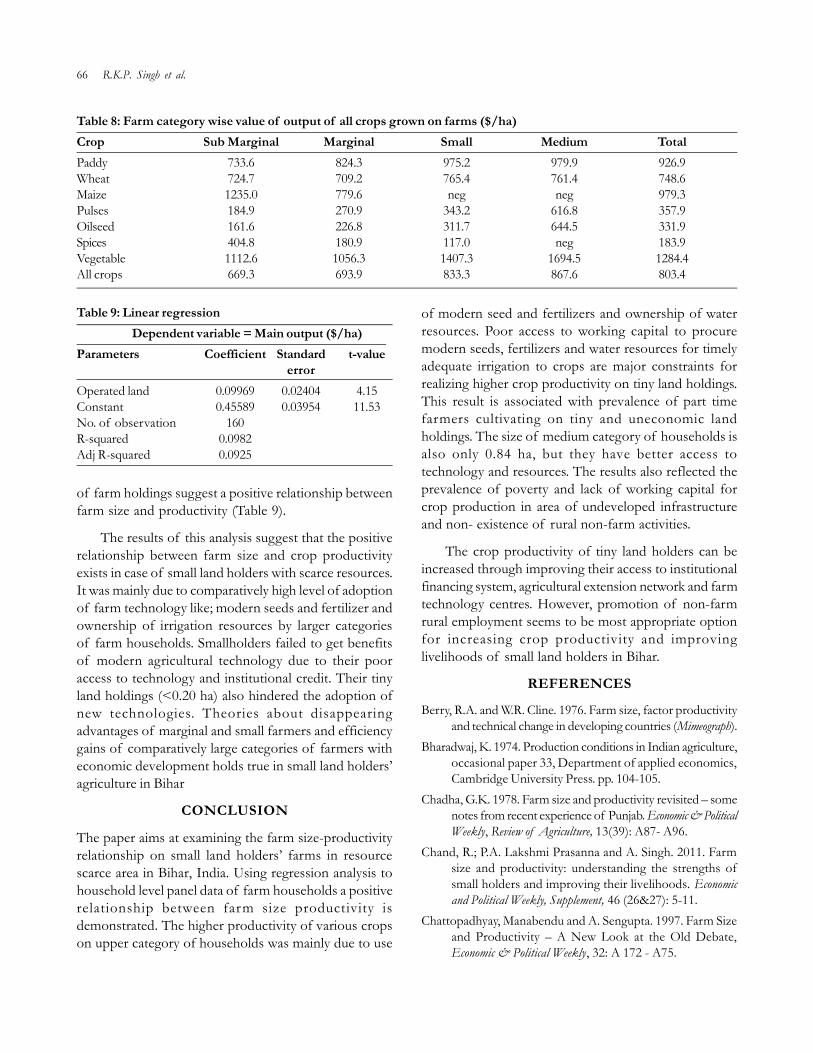
66 R.K.P. Singh et al.
of farm holdings suggest a positive relationship betweenfarm size and productivity (Table 9).
The results of this analysis suggest that the positiverelationship between farm size and crop productivityexists in case of small land holders with scarce resources.It was mainly due to comparatively high level of adoptionof farm technology like; modern seeds and fertilizer andownership of irrigation resources by larger categoriesof farm households. Smallholders failed to get benefitsof modern agricultural technology due to their pooraccess to technology and institutional credit. Their tinyland holdings (<0.20 ha) also hindered the adoption ofnew technologies. Theories about disappearingadvantages of marginal and small farmers and efficiencygains of comparatively large categories of farmers witheconomic development holds true in small land holders’agriculture in Bihar
CONCLUSION
The paper aims at examining the farm size-productivityrelationship on small land holders’ farms in resourcescarce area in Bihar, India. Using regression analysis tohousehold level panel data of farm households a positiverelationship between farm size productivity isdemonstrated. The higher productivity of various cropson upper category of households was mainly due to use
Table 8: Farm category wise value of output of all crops grown on farms ($/ha)Crop Sub Marginal Marginal Small Medium TotalPaddy 733.6 824.3 975.2 979.9 926.9Wheat 724.7 709.2 765.4 761.4 748.6Maize 1235.0 779.6 neg neg 979.3Pulses 184.9 270.9 343.2 616.8 357.9Oilseed 161.6 226.8 311.7 644.5 331.9Spices 404.8 180.9 117.0 neg 183.9Vegetable 1112.6 1056.3 1407.3 1694.5 1284.4All crops 669.3 693.9 833.3 867.6 803.4
Table 9: Linear regressionDependent variable = Main output ($/ha)
Parameters Coefficient Standard t-valueerror
Operated land 0.09969 0.02404 4.15Constant 0.45589 0.03954 11.53No. of observation 160 R-squared 0.0982 Adj R-squared 0.0925
of modern seed and fertilizers and ownership of waterresources. Poor access to working capital to procuremodern seeds, fertilizers and water resources for timelyadequate irrigation to crops are major constraints forrealizing higher crop productivity on tiny land holdings.This result is associated with prevalence of part timefarmers cultivating on tiny and uneconomic landholdings. The size of medium category of households isalso only 0.84 ha, but they have better access totechnology and resources. The results also reflected theprevalence of poverty and lack of working capital forcrop production in area of undeveloped infrastructureand non- existence of rural non-farm activities.
The crop productivity of tiny land holders can beincreased through improving their access to institutionalfinancing system, agricultural extension network and farmtechnology centres. However, promotion of non-farmrural employment seems to be most appropriate optionfor increasing crop productivity and improvinglivelihoods of small land holders in Bihar.
REFERENCES
Berry, R.A. and W.R. Cline. 1976. Farm size, factor productivityand technical change in developing countries (Mimeograph).
Bharadwaj, K. 1974. Production conditions in Indian agriculture,occasional paper 33, Department of applied economics,Cambridge University Press. pp. 104-105.
Chadha, G.K. 1978. Farm size and productivity revisited – somenotes from recent experience of Punjab. Economic & PoliticalWeekly, Review of Agriculture, 13(39): A87- A96.
Chand, R.; P.A. Lakshmi Prasanna and A. Singh. 2011. Farmsize and productivity: understanding the strengths ofsmall holders and improving their livelihoods. Economicand Political Weekly, Supplement, 46 (26&27): 5-11.
Chattopadhyay, Manabendu and A. Sengupta. 1997. Farm Sizeand Productivity – A New Look at the Old Debate,Economic & Political Weekly, 32: A 172 - A75.

Farm Size and Productivity Relationship in Smallholder Farms: Some empirical evidences from Bihar 67
Fan, S. and C. Chang-Kang. 2005. Is small beautiful? Farm size,productivity and poverty in Asian agriculture. AgriculturalEconomics, 32 (Supplement 1): 135-146.
Government of India. 2012. Agricultural Census-2010-11" AllIndia report on number and area of operational holdings,Agricultural Census Division, Ministry of Agriculture andCooperation, Ministry of Agriculture, Government ofIndia, New Delhi.
Griffin, K.B. 1974. The political economy of agrarian change, anessay on the green revolution, London: Macmillan Press.
Handral, A.R; A. Singh and G.K. Jha. 2017. An investigationof yield gaps in wheat and maize crops. J. CommunityMobilization and Sustainable Development, 12: 239-243.
Jha, G.K.; R.R. Burman; S.K. Dubey and Gajab Singh. 2011.Yield gap analysis of major oilseeds in India. J. CommunityMobilization and Sustainable Development, 6: 209-216.
Khan, M.H. 1979. Farm size and Land ProductivityRelationships in Pakistan. The Pakistan Development Review,18: 69-77.
Khusro, A.M. 1968. Returns to Scale in Indian Agriculture. In:A.M. Khusro (ed.), Readings in Agricultural DevelopmentAllied Publishers, New Delhi
Mazumdar, D. 1965. Size of Farm and Productivity: A Problemof Indian Peasant Agriculture. Economica New Series, 32:161-173.
Rani, U. 1971. Size of Farm and Productivity. Economic andPolitical Weekly, 6(26): A85-A87.
Rao, H. 1966. Alternative Explanations of the InverseRelationship between Farm Size and Output per Acre inIndia. Indian Economic Review, 1(2):1-12.
Rudra, Ashok. 1968. Farm Size and Yield per Acre. Economic &Political Weekly, 3(43): 1041-1044.
Saini, G.R. 1971 Holding Size, Productivity and Some RelatedAspects of Indian Agriculture. Economic & Political Weekly,6(26): A79 + A81-A85.
Sau, R. 1978. Growth, Employment and Removal of Poverty.Economic and Political Weekly, 13: 1279-81 + 1283-84.
Sen, A.K. 1964. Size of Holding and Productivity. The EconomicWeekly, 16: 34-38.
Toufique, K.A. 2005. Farm size and productivity in Bangladeshagriculture: role of transaction costs in rural labour markets.Economic and Political Weekly, 40(10): 988-992.
--------------------------------------------------------------------------------------------------------------------------------------------------------------Received on February, 2018, Revised on March, 2018

Journal of Community Mobilization and Sustainable Development Vol. 13(1), 68-74, January-April, 2018
*Corresponding author email id: [email protected]
Marketing Behaviour of Vegetable Growers in Uttarakhand hills
Shailesh Kumar1, Maniklal Roy2 and Anirban Mukherjee3*1Senior Scientist, 2Scientist, CRIJAF, Barrackpore, Kolkata-700120, West Bengal3Scientist, ICAR-VPKAS, Almora-263601, Uttarakhand
ABSTRACT
Vegetable production has great economic importance in hills of Uttarakhand. For deriving optimum return fromthe production, marketing of green vegetables is very crucial. A study was conducted in Almora and Nainitaldistricts of Uttarahand to find out marketing behaviour of the vegetable growers and constraints in marketing ofvegetable produce. Results revealed that distant mandi was a major choice for sale of the produce. Majority offarmers sold their full produce by using private mode of transportation. They followed grading and standardizationand spent more than six hours in a week for farm related activities. Relatives/friends and vegetable merchants weremajor sources of market preference. The major marketing constraints were higher commission rate of middlemen,fluctuating market rate, non-availability of nearby market, high transportation charges and high cost of packagingmaterial. The solution lies in creation of horticulture based self-help group at village level, organization of weeklyHat, strict compliance of rules and regulation of regulated market, guidance on market avenues from time to timeto the vegetable growers.
Keywords: Hill agriculture, Marketing constraints, Value chain, Vegetables
INTRODUCTION
Uttarakhand hills endowed with natural bounties and itsunique agro climatic condition offers favourable climatefor growing large number of horticultural cropsincluding vegetable. Vegetable offers an uniqueopportunity to earn money not only for hill farmers buteven the farmers of plain are gradually shifting tovegetable crops for better earning (Maity et al., 2013).Production of vegetables in hills generates income aswell as employment of farm families. One of thenecessary conditions for these farmers to get maximumreturn for their produce is the provision of assuredmarketing. In this era of technological developmentseveral technologies such as protected cultivation usingmodern poly house technologies (Negi et al., 2013), plug-tray nursery techniques (Shubha et al., 2015), plasticmulching etc have emerged and adopted in some nichearea of Himalaya. But it has not up scaled much due tolack of markets.
Hill farmers are key stakeholders of agriculturalsystem and critical end users of technology. It is therefore,
necessary to realise their needs, objectives and outlook.Apart from scarcity of water and weather vagaries,today’s main issue in hill agriculture is lack of marketinginfrastructure. Agriculture is still substantive no moreremains as lucrative due to lack of entrepreneurialenvironment. Now a day, young and educated farmersrather than old and traditional are more associating withinnovative modern technologies and extension systemsdelivered by private players (Mukherjee et al., 2011,Mukherjee and Maitym, 2015). But it is also lagging behindin hills. A producer has to incur very low marketing costdue to low volume of produce to sell, grade, packingand transport it to the market. Thus the business ofvegetable cultivation operates within these two extremesituations. Studies shows that farmers’ profit orientationand market orientation are required factors (Mukherjeeet al., 2012a&b) for making agriculture profit orientedalong with climate resilient particularly in hills (Mukherjeeet al., 2016). A very less studies have been carried outregarding the marketing behaviour and constraints facedby Hill farmers. In this backdrop, the study was framedwith following objectives:
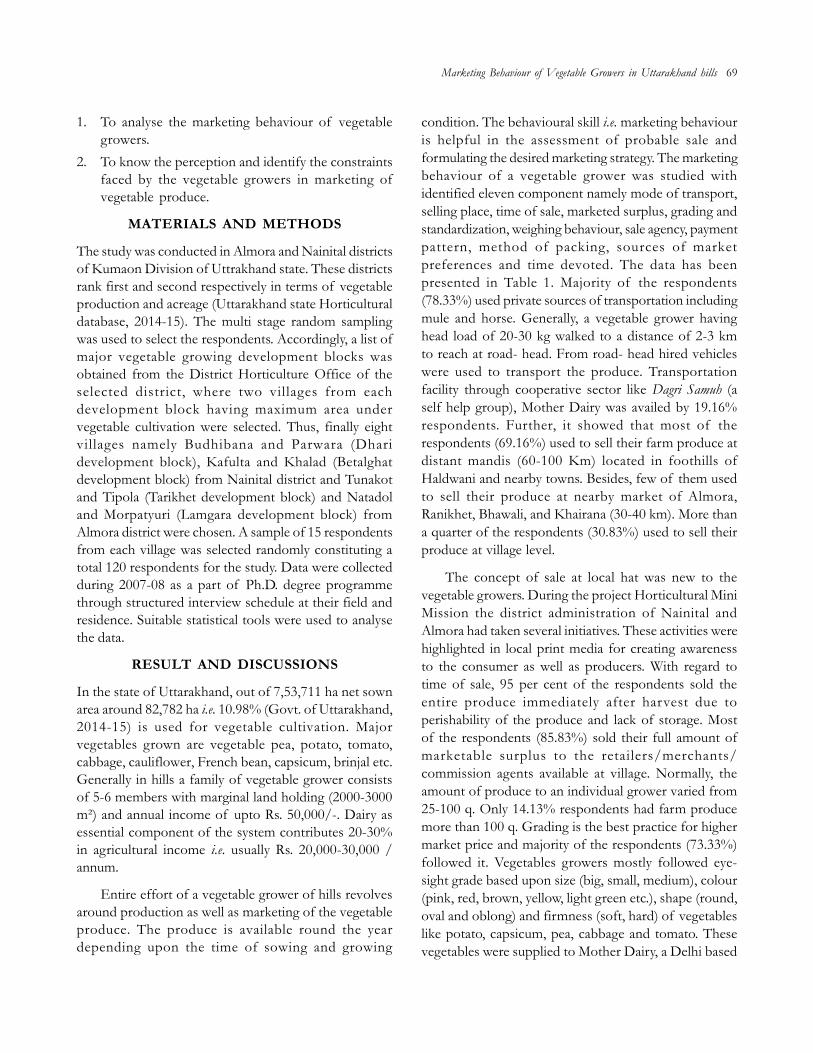
1. To analyse the marketing behaviour of vegetablegrowers.
2. To know the perception and identify the constraintsfaced by the vegetable growers in marketing ofvegetable produce.
MATERIALS AND METHODS
The study was conducted in Almora and Nainital districtsof Kumaon Division of Uttrakhand state. These districtsrank first and second respectively in terms of vegetableproduction and acreage (Uttarakhand state Horticulturaldatabase, 2014-15). The multi stage random samplingwas used to select the respondents. Accordingly, a list ofmajor vegetable growing development blocks wasobtained from the District Horticulture Office of theselected district, where two villages from eachdevelopment block having maximum area undervegetable cultivation were selected. Thus, finally eightvillages namely Budhibana and Parwara (Dharidevelopment block), Kafulta and Khalad (Betalghatdevelopment block) from Nainital district and Tunakotand Tipola (Tarikhet development block) and Natadoland Morpatyuri (Lamgara development block) fromAlmora district were chosen. A sample of 15 respondentsfrom each village was selected randomly constituting atotal 120 respondents for the study. Data were collectedduring 2007-08 as a part of Ph.D. degree programmethrough structured interview schedule at their field andresidence. Suitable statistical tools were used to analysethe data.
RESULT AND DISCUSSIONS
In the state of Uttarakhand, out of 7,53,711 ha net sownarea around 82,782 ha i.e. 10.98% (Govt. of Uttarakhand,2014-15) is used for vegetable cultivation. Majorvegetables grown are vegetable pea, potato, tomato,cabbage, cauliflower, French bean, capsicum, brinjal etc.Generally in hills a family of vegetable grower consistsof 5-6 members with marginal land holding (2000-3000m²) and annual income of upto Rs. 50,000/-. Dairy asessential component of the system contributes 20-30%in agricultural income i.e. usually Rs. 20,000-30,000 /annum.
Entire effort of a vegetable grower of hills revolvesaround production as well as marketing of the vegetableproduce. The produce is available round the yeardepending upon the time of sowing and growing
condition. The behavioural skill i.e. marketing behaviouris helpful in the assessment of probable sale andformulating the desired marketing strategy. The marketingbehaviour of a vegetable grower was studied withidentified eleven component namely mode of transport,selling place, time of sale, marketed surplus, grading andstandardization, weighing behaviour, sale agency, paymentpattern, method of packing, sources of marketpreferences and time devoted. The data has beenpresented in Table 1. Majority of the respondents(78.33%) used private sources of transportation includingmule and horse. Generally, a vegetable grower havinghead load of 20-30 kg walked to a distance of 2-3 kmto reach at road- head. From road- head hired vehicleswere used to transport the produce. Transportationfacility through cooperative sector like Dagri Samuh (aself help group), Mother Dairy was availed by 19.16%respondents. Further, it showed that most of therespondents (69.16%) used to sell their farm produce atdistant mandis (60-100 Km) located in foothills ofHaldwani and nearby towns. Besides, few of them usedto sell their produce at nearby market of Almora,Ranikhet, Bhawali, and Khairana (30-40 km). More thana quarter of the respondents (30.83%) used to sell theirproduce at village level.
The concept of sale at local hat was new to thevegetable growers. During the project Horticultural MiniMission the district administration of Nainital andAlmora had taken several initiatives. These activities werehighlighted in local print media for creating awarenessto the consumer as well as producers. With regard totime of sale, 95 per cent of the respondents sold theentire produce immediately after harvest due toperishability of the produce and lack of storage. Mostof the respondents (85.83%) sold their full amount ofmarketable surplus to the retailers/merchants/commission agents available at village. Normally, theamount of produce to an individual grower varied from25-100 q. Only 14.13% respondents had farm producemore than 100 q. Grading is the best practice for highermarket price and majority of the respondents (73.33%)followed it. Vegetables growers mostly followed eye-sight grade based upon size (big, small, medium), colour(pink, red, brown, yellow, light green etc.), shape (round,oval and oblong) and firmness (soft, hard) of vegetableslike potato, capsicum, pea, cabbage and tomato. Thesevegetables were supplied to Mother Dairy, a Delhi based
Marketing Behaviour of Vegetable Growers in Uttarakhand hills 69
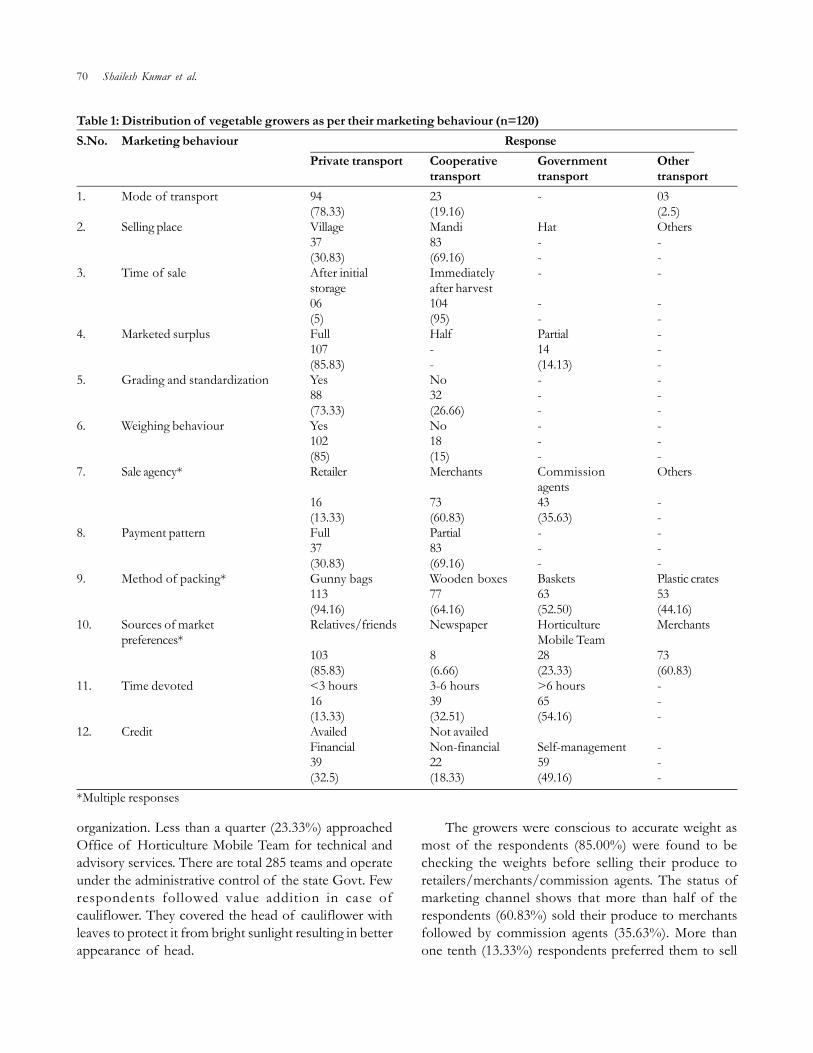
70 Shailesh Kumar et al.
organization. Less than a quarter (23.33%) approachedOffice of Horticulture Mobile Team for technical andadvisory services. There are total 285 teams and operateunder the administrative control of the state Govt. Fewrespondents followed value addition in case ofcauliflower. They covered the head of cauliflower withleaves to protect it from bright sunlight resulting in betterappearance of head.
The growers were conscious to accurate weight asmost of the respondents (85.00%) were found to bechecking the weights before selling their produce toretailers/merchants/commission agents. The status ofmarketing channel shows that more than half of therespondents (60.83%) sold their produce to merchantsfollowed by commission agents (35.63%). More thanone tenth (13.33%) respondents preferred them to sell
Table 1: Distribution of vegetable growers as per their marketing behaviour (n=120)S.No. Marketing behaviour Response
Private transport Cooperative Government Othertransport transport transport
1. Mode of transport 94 23 - 03(78.33) (19.16) (2.5)
2. Selling place Village Mandi Hat Others37 83 - -(30.83) (69.16) - -
3. Time of sale After initial Immediately - -storage after harvest06 104 - -(5) (95) - -
4. Marketed surplus Full Half Partial -107 - 14 -(85.83) - (14.13) -
5. Grading and standardization Yes No - -88 32 - -(73.33) (26.66) - -
6. Weighing behaviour Yes No - -102 18 - -(85) (15) - -
7. Sale agency* Retailer Merchants Commission Othersagents
16 73 43 -(13.33) (60.83) (35.63) -
8. Payment pattern Full Partial - -37 83 - -(30.83) (69.16) - -
9. Method of packing* Gunny bags Wooden boxes Baskets Plastic crates113 77 63 53(94.16) (64.16) (52.50) (44.16)
10. Sources of market Relatives/friends Newspaper Horticulture Merchantspreferences* Mobile Team
103 8 28 73(85.83) (6.66) (23.33) (60.83)
11. Time devoted <3 hours 3-6 hours >6 hours -16 39 65 -(13.33) (32.51) (54.16) -
12. Credit Availed Not availedFinancial Non-financial Self-management -39 22 59 -(32.5) (18.33) (49.16) -
*Multiple responses

Marketing Behaviour of Vegetable Growers in Uttarakhand hills 71
their produce to retailers because of their accessibilityand proximity. It was worried because majority of therespondents (69.16%) reported for having partialpayment. In hills, it is normal practice to give advance/loan to growers for social/consumption/ agriculturalpurpose. The growers used to supply to the produce inlieu of advance/loan taken from retailers/merchants/commission agents.
Packaging is an important issue as majority of therespondents (94.16%) preferred gunny bags over othermaterials due to cheap and easily availability. It wasfollowed by wooden boxes (64.16%), baskets made oflocal weedy shrubs (52.50%) and plastic crates (44.16%).Wooden boxes were used for costly vegetables likecapsicum and tomato. Use of plastic crates was restrictedto the vegetable growers dealing with Mother Dairy. Asfor source of information channels concerns the relatives/friends (85.83%) followed by vegetable merchant(60.83%) played a major role as sources of informationon market preferences. This might be due to upper handof these sources in terms of frequent interaction, easyaccess and credibility. They were aware of marketingcriteria of Mother Dairy and retailers. Mother dairypreferred cabbage having head weight of 300 gm.Retailers demanded hybrid capsicum over local one dueto thick skin. It did not shrivel in sun shine.
As for as time is concerned, more than half of therespondents (54.16%) devoted more than 6 hours in aweek followed by 3-6 hours and less than 3 hours in aweek during the month of May-September/October.The respondents were busy in arrangement of packingmaterial, purchase of farm inputs, transportation andcollection of money from creditors. Further, regardingcredit majority of the respondent (49.16%) managed itfrom own source i.e. savings. Around one third (32.50%)respondents approached to the financial institutions likeprimary cooperative societies and commercial banks.Most of the respondent availed loan of Rs. 10,000/.One fourth of them took loan for Rs. more than Rs.20,000/. For rest of the respondent amount varied inthe range of Rs. 10,000-20,000. The nature of loan wasshort term (5-6 month). It was used to repay with thesupply of vegetable produce to the financers.
Perception towards marketing of vegetables:Perception is a very personal thing which is related to
relevant past experience of an individual. It is a processby which impressions, opinions, feelings about an objectare formed by means of sensory operations. The averageperception score of vegetable growers towards variousaspects of marketing was measured by Likert’s methodof summated rating (1932) on 5 point continuum (i.e.Strongly agree, Agree, Undecided, Disagree and Stronglydisagree).The weigheted mean perception score for eachstatement are presented in Table 2.
Mean perception score of 4.85 indicated thatmajority of the vegetable growers were strongly agreein hills vegetables realizes maximum market price. Theywere well aware of climatic advantages of hill forcultivation of off-season vegetables in comparison toplain. This venture could utilize their marginal land andfamily labour in more productive way than low valuecrop production. The finding were similar to the findingsreported by UPAA; CDS:IDH (2000) that off seasonvegetable cultivation is profitable.
Around three fourth vegetable growers (74.16%)were strongly agreed that transaction cost was a majordemotivating factor for taking vegetables in the market.These were located 80 to 100 km away from their villages.Major reasons cited by the respondents were difficultand undulated terrain, high cost of packaging material,high cost of transportation and lack of proper policy.As per them, providing of local transport, local madepackaging material, better transportation and propervegetable production policy would increase the marketingefficiency. A majority of vegetable growers (54.16%)agreed to statement that government support formarketing is not sufficient. They reported that out of 25mandis only 20 were functional. These regulated/principal market/sub market yards were mostly confinedto plains i.e. Rudrapur, Haldwani and Dehradun. Majorityof vegetable growers (67.50%) disagreed that storagefacilities for vegetables were sufficient. The cold storageinfrastructure was non- existent in hills. Similarly, majorityof vegetable growers (63.33%) disagreed to thestatement that route are good to carry the produce upto main road. Poor road consumed their more time andcreated physical problem in completion of marketingprocess. Even in the Kumaon hill wide variation in densityof road has been reported i.e. 96 km in Pithoragarhdistrict and 943 km in Nainital. All these required properproduction policy.

72 Shailesh Kumar et al.
Constraints in marketing of vegetables: In hillsparticularly, the extremely perishable nature of vegetablesmakes marketing more difficult because of area ofproduction and area of consumption are located atdifferent places. Tough geographical terrain adds in thewoo. At field level several reasons were identified rangingfrom high commission rate to damage of vegetablesduring transportation. Perusal of Table 3 indicated thatmost serious problem of the respondents (85.83%) werehigher commission rate of middlemen.
It varied 8-12% of the produce subjected to placeof sale and types of vegetable. It was followed by non-availability of nearby market (73.33%) to sell theirvegetable produce. It was observed that during data
Table 2: Perception of vegetable growers towards marketing of vegetablesStatements SA(freq.) A(freq.) U(freq.) D(freq.) SD(freq.) MPSTransaction cost is the main factor for taking 89(74.16) 31(25.83) 0 0 0 4.74vegetables in the marketIn hills vegetables realizes maximum market price 103(85.83) 17(14.16) 0 0 0 4.85Marketing of vegetable crop is very simple 0 0 21(17.5) 72(60.00) 27(22.50) 1.95Vegetable growers get due share in consumer price 0 0 28(23.33) 33(27.50) 59(40.83) 1.74Institutional credit is easily available for growing vegetables 0 15(12.50) 0 88(73.33) 17(14.16) 2.10Government support for marketing is not sufficient 74(54.16) 38(31.66) 8(6.66) 0 0 4.55Pre and post harvest loss is high in vegetables 33(27.50) 87(72.50) 0 0 0 4.49Setting up regulated purchase centre of vegetable in 46(38.33) 58(48.33) 22(18.33) 4(3.33) 0 4.21nearby localities will boost up the production of vegetableStandardization and grading increases the burden 0 23(19.16) 0 97(80.83) 0 2.38of a vegetable growerI am satisfied with role of marketing channels 0 0 0 76(63.33) 44(36.66) 4.36A vegetable grower should apply the principle of 21(17.50) 62(51.66) 28(23.33) 9(7.50) 0 3.79business to run the enterprise successfullyICT should be strengthened in hills 48(40.00) 57(47.50) 15(12.50) 0 0 4.27There is a need of more co-operative agencies like 44(36.66) 54(45.00) 22(18.33) 0 0 4.18Mother Dairy in hillsI will increase area under vegetables for higher income 0 13(10.83) 17(14.16) 49(40.83) 41(34.16) 2.01Storage facilities for vegetables are sufficient 0 0 0 81(67.50) 39(32.50) 1.67Knowledge on preservation of vegetables is essential 11(9.16) 73(60.83) 34(28.33) 0 0 3.74for exigenciesThe route are good to carry the produce up to main road 0 0 17 (14.16) 27(22.50) 76(63.33) 1.27Farm women have lesser role in vegetable marketing 55(45.83) 42(35.00) 13(10.83) 0 0 3.58than menCreation of vegetables based Self Help Groups will 18(15.00) 71(59.16) 31(25.83) 0 0 3.85solve many inherent marketing problemsAverage 3.35SA: Strongly Agree A; Agree U: Undecided D: Disagree SD: Strongly Disagree; MPS: Mean Perception Score
collection the respondents were busy in transporting theirproduce to distant mandis. High cost of packing material(60.83%) was the next major bottleneck of vegetablegrowers. High cost of packing material such as papercardboard (Rs. 40 for packing of 18 kg) and plastic crates(Rs. 100/unit for packing of 25 kg) deterred them touse it. Vegetables are perishable in nature and can not bestored for a longer period at vegetable grower’s field.The price fluctuated day to day and even within a day.Thus they had no choice except disposing of the produceat price offered to them. High transportation charges(51.66%) reduced their consumer price. Even then, delayin arrival at mandis due to road blockage in rainy daysand religious pilgrimage (kanwar) affected the marketing

Marketing Behaviour of Vegetable Growers in Uttarakhand hills 73
Table 3: Marketing constraints as perceived by vegetable growersConstraints Frequency (n=120) Percentage RankHigher commission rate of middlemen 103 85.83 INon- availability of nearby market 88 73.33 IIHigh cost of packing material 73 60.83 IIIFluctuating market rate 67 55.83 IVHigh transportation charges 62 51.66 VDelay in sale 47 39.16 VIDamage of vegetable during transport 37 30.83 VII
process seriously. Damage of vegetable during transportwas experienced by 30.83% respondents. Uneven roadsresulted in abrasions on the fresh vegetables and affectedthe appearance of the produce reduced profit margindue to low market price.
Above findings are in line with the observations madeby Vinaygam and Gethakutty (2006); Verma (2007);Kumar and Sharma (2009); Sah et al. (2011); Mukherjee(2015); Yadav and Godara (2016) who reported thesekinds of problems faced by the farmers regardingmarketing of their produce. Vegetable growerssuggested establishment of more regulated markets,government intervention in case of low price of vegetableproduce, setting up mandis nearby villages, availabilityof low cost packing material, transportation facility andpurchase of low grade vegetable for processing.
CONCLUSION
The study revealed that in hills vegetable growers cultivatevegetables under various kinds of problems ranging fromdistant location of mandis to high cost of packagingmaterial as well as high commission rate. The positiveperception of vegetable growers for vegetables showedthat they wanted to transform their economy. Theyrequired more support from Union as well as StateGovernment. Two types of approaches i.e. short andlong term are urgently required to address the issue.Horticulture based self help group may tackle theproblem of credit as well as transportation to someextent. Organization of weekly/bi weekly hats on regularbasis may provide opportunity to have interaction withprospective buyers. On a long term basis strictcompliance of rules and regulations of regulated market,guidance on market avenues may further improve thesituation. In cumulative form all will have synergetic effectboosting the production as well as income of thevegetable growers of Uttarakhand hills in particular.
REFERENCES
Anon. 2008-09. Directorate of Economics and Statistics, Areaand production of vegetables in Uttarakhand,www.des.uk.gov.in
Kumar, S. and G. Sharma. 2009. Constraints in vegetableproduction in Uttarakhand hills. Indian Journal of ExtensionEducation, XXXXV(1&2): 84-87.
Likert, R. 1932. A technique for the measurement ofattitudes.Archives of Psychology, No. 140.
Maity, A.; A. Mukherjee; P. Pramanik and Shubha. 2013. Shiftingtowards vegetable cultivation from that of rice in PurbaMedinipur district of West Bengal. BIOINFOLET - AQuarterly Journal of Life Sciences, 10(3a): 876-878.
Mukherjee, A. 2015. Prioritization of Problems in IntegratedAgriculture: A Case of Rampur Village in Sub HumidRegion of Eastern India. Indian Res. J. Ext. Edu., 15(1):53-59.
Mukherjee, A.; R. Bahal; R.R. Burman and S.K. Dubey. 2012b.Factors Contributing Farmers’ Association in Tata KisanSansar: A Critical Analysis. Indian Research Journal ofExtension Education, 12(2): 81-86.
Mukherjee, A.; R. Bahal; R.R. Burman; S.K. Dubey and G.K.Jha. 2012a. Constraints in Privatized AgriculturalTechnology Delivery System of Tata Kisan Sansar. Journalof Global Communication, 5(2): 155-159.
Mukherjee, A.; R. Bahal; R.R. Burman; S.K. Dubey and G.K.Jha. 2011. Effectiveness of Tata Kisan Sansar in TechnologyAdvisory and Delivery Services in Uttar Pradesh. IndianResearch Journal of Extension Education, 11(3): 8-13.
Mukherjee, A. and A. Maity. 2015. Public–private partnershipfor convergence of extension services in Indian agriculture.Current Science, 109(9): 1557-1563.
Sah, U.; S.K. Dubey and J.P. Sharma. 2011. Potato Marketing inNorth East Region of India: A Diagnostic Study. Journalof Community Mobilization and Sustainable Development, 6(2):194-201.

74 Shailesh Kumar et al.
Shubha and A. Mukherjee. 2015. Plug tray Nursery: AnInnovative technique for Off-season Vegetable Cultivation.AGROBIOS NEWS LETTER, XIII(9): 79-80.
Thakur, D.S.; S.K. Chauhan and K.D. Sharma. 1988. Efficiencyand weakness of regulated markets, Indian journal ofAgricultural Marketing, 2(1).
UPAA; CDS:IDH. 2000. Techno feasibility report study withbench mark survey of Integrated Development ofHorticulture in Almora district Uttarakhand stateHorticultural database, (2014-15). Ministry of Agriculture,Govt of Uttarakhand. Dehradun, Uttarakhand.
Verma, P.K. 2007. Cost and returns of vegetable and fruit cropin Mahanadi river bed area: A case study of Chattisgarhregion, Agriculture Today, X(3): 35.
Vinayagam, S.S. and P.S. Geethakutty. 2006. Constraints facedby agri-business operators. Indian Journal of ExtensionEducation, XXXXII(1&2): 25-30.
Yadav, S.; S.K. Mehta and A.K. Godara. 2016. Socio-economicConstraints Perceived by Fruit Growers in Sirsa Districtof Haryana, Journal of Community Mobilization andSustainable Development, 11(1): 73-75.
---------------------------------------------------------------------------------------------------------------------------------------------------------------Received on November, 2017, Revised on February, 2018

Journal of Community Mobilization and Sustainable Development Vol. 13(1), 75-78, January-April, 2018
*Corresponding author email id: [email protected]
Perception of the farming community regarding quality of articlespublished in Haryana Kheti
Krishan Yadav1*, Rajesh Kumar2, Pardeep Kumar Chahal3 and Bharat Singh Ghanghas4
1Joint Director (Extension), 2DTP Operator, University Press, 3Assistant Professor (Extension Education), 4Assistant Scientist(Extension Education), CCS Haryana Agricultural University, Hisar, Haryana
ABSTRACT
Haryana Kheti is a monthly magazine published by Directorate of Extension Education, CCS Haryana AgriculturalUniversity, Hisar (Haryana) for more than fifty years. Every month approximately 3,500 copies of Haryana Khetigot printed and circulated all over the country. But 80 percent of it circulated within Haryana state. It covers allimportant aspects of agriculture that affects the day to day life of farming community like recent developments inthe field of agriculture, animal husbandry, home sciences along with government schemes and programmesrelated to welfare of farming community. The study revealed the perception of the Haryana Kheti among farmingcommunity as; ‘scientific nature of Haryana Kheti articles’ was ranked first, closely followed by the ‘accuracy ofinformation and ‘timeliness of the message’. The perceived utility in terms of ‘daily agricultural field practices’ and‘disease outbreaks & treatments’ were the most affected issues covered in Haryana Kheti, followed by the ‘informationon seed varieties’ and ‘animal husbandry & dairy activities’.
Keywords: Perception, Perceived Utility, Haryana Kheti
INTRODUCTION
Extension education is one of the three major functionsof the CCS Haryana Agricultural University, Hisar. Theresponsibility for planning, organizing, conducting andcoordinating the extension education activities of theuniversity in Haryana state lies with the Directorate ofExtension Education.
Its main aim is to transfer the well proven/testedtechnology to the farmers (males and females), livestockowners, rural youth, field staff of State Govt. and otherpersonnel engaged in developmental and professionalagencies in the sphere of agriculture, animal husbandry,horticulture, home agencies and other allied areas throughits well planned, skill-oriented and need-basedprogrammes (Agwu and Elizabeth, 2013). An excellentcollaboration/linkage is maintained with the HaryanaState Government Department of Agriculture,Horticulture, Animal Husbandry, Social Welfare (Womanand Child Development), etc. and non-governmentorganizations so that technologies may reach to the benefi-ciaries at their door steps (Behrans and Evans, 2002).
The approach is educational with major emphasison whole farm and family development. Since itsinception, the university has conceived and implementeda unique system of extension education for transfer oftechnology to its ultimate users (Sarkar, 1998). TheDirectorate acts as bridge between the research scientistsand the farmers and other beneficiaries to providefeedback, therefore, the role of the Directorate is twofoldi.e. transfer of technologies from scientists to the ultimateclients through field functionaries and to find out theproblems of the field to be passed on to various researchdepartments for working on a solution to the problem(Deepti, 2008).
For this purpose all modes and channels ofcommunication and extension are being used by theDirectorate like electronic media (Toll Free Numbers,Scientists talks on All India Radio and Doordarshan,Community Radio Station, SMS Services, Social Mediaetc.), print media (Publication of monthly agriculturalmagazine-Haryana Kheti, News/ success stories in leadingnews papers and magazines, leaflets, pamphlets etc) along

76 Krishan Yadav et al.
with farm advisory services through Krishi VigyanKendras (Ganesan et al., 2013).
One of the most important and powerfully tool ofextension in the armory of Directorate of ExtensionEducation is monthly agricultural magazine- HaryanaKheti, a magazine published by Directorate of ExtensionEducation since last fifty years. It covers all importantaspects of agriculture that affects the day to day life offarming community like recent developments in the fieldof agriculture, animal husbandry, home sciences, alongwith government schemes and programmes related towelfare of farming community (Cibbora, 2005).Approximately 3,500 copies of Haryana Kheti are printedevery month and circulated all over the country andabroad every month. But 80 percent of it circulates withinHaryana state. To study the farmers’ perceptions andperceived utility of the magazine, a study was conductedon the subscribers of Haryana Kheti.
MATERIAL AND METHODS
The sample was selected by choosing 10 respondentsrandomly from Eastern, Western, Northern and SouthernHaryana, respectively. Another 10 respondents wereselected from neighboring states of Punjab and Rajasthan.Total sample size was 50.
For collection of data a questionnaire was designedto record observations of the subscribers/ farmersrelated to Preference, Perception and Perceived utilityof the magazine. After pretesting and minor modificationaccordingly, it was mailed to the respondents on theaddress available in the list of subscribers in the O/oAssociate Director (Publication), along with a dullystamped and addressed return-envelope. But theresponses were very poor. The investigators received verypoor responses. So, the subscribers were contactedtelephonically and responses were filled in the interviewschedule by the investigators. The collected data wereanalyzed and interpreted for drawing the conclusion.Total Weightage Score (TWS) was calculated bymultiplying frequency with numbers 3, 2 and 1,respectively, of each variable and then dividing this TWSby total number of respondents (n=50) to calculateWeightage Mean Score (WMS). Finally, ranking wasallotted to the perceptions of the readers based uponthe value of WMS. In calculations, independent variables(age, gender, education background, mass media
exposure, etc) and dependent variables (preference,perception and perceived utility) were also taken intoconsideration.
RESULTS AND DISCUSSION
Perception regarding quality of articles publishedin Haryana Kheti: Perception of subscribers/ farmershas been conceptualized in terms of language,appropriateness of content, time of circulation, timelinessof message and length of the articles published inHaryana Kheti. Table 1 depicted the perception of therespondents about the quality of articles being publishedin Haryana Kheti. It was clearly observed thatrespondents ranked ‘scientific nature of Haryana Khetiarticles’ as 1st with 2.52 WMS closely followed by the‘accuracy of information as 2nd with 2.36 WMS. The‘timeliness of the message’ was also appreciated andranked 3 rd with WMS of 2.32. The respondents’perception about the ‘language & length of the articles’was ranked 4th and 5th.
The respondents’ were not satisfied with the ‘printingquality and visual/photographs printed’ in Haryana Kheti.Nearly half of the respondents (46%) mentioned ‘visualsand photographs of Haryana Kheti of ‘poor quality’and ranked last (8th). Only 26% of the respondentsconsidered the printing quality as ‘very good’ against the36% considered it as ‘poor’ and printing quality gotoverall 6th ranking. ‘Involvement of the readers was alsohighly missed by readers’ and it got the second last rank(7th).
Perceived utility of articles published in HaryanaKheti: Perceived utility will be measured on the basis ofknowledge gain, skill application and change in attitudeon three point continuums. Table 2 revealed that theapplication part of recommendations given byuniversity’s experts in Haryana Kheti. When asked aboutthe application of recommendations given in HaryanaKheti in their field practices, 46% of the farmers repliedpositively, closely followed by ‘somewhat’ (40%).Interestingly 14% of the farmers replied that they ‘donot apply’ the recommendations of Haryana Kheti intheir field.
Data presented in Table 3 reveal that multipleresponses were given by respondents when asked aboutthe information which affects their agricultural practicesthe most. The majority of the farmers (84%) replied
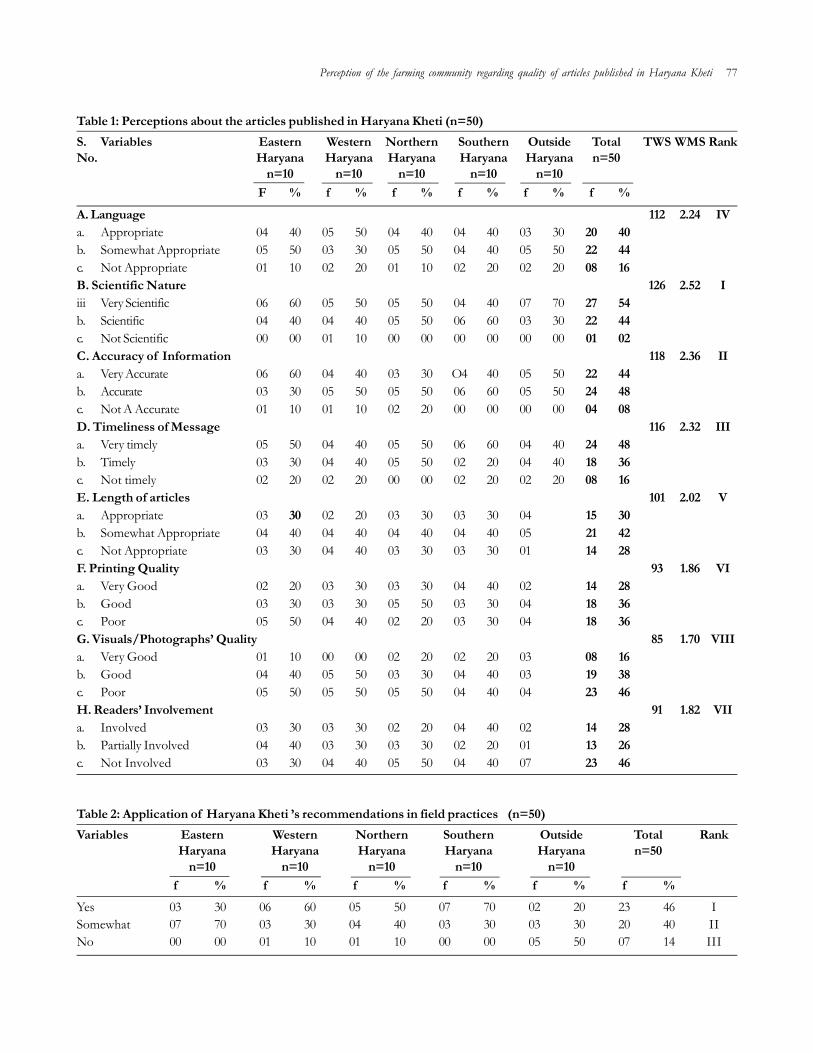
Perception of the farming community regarding quality of articles published in Haryana Kheti 77
Table 1: Perceptions about the articles published in Haryana Kheti (n=50)S. Variables Eastern Western Northern Southern Outside Total TWS WMS RankNo. Haryana Haryana Haryana Haryana Haryana n=50
n=10 n=10 n=10 n=10 n=10F % f % f % f % f % f %
A. Language 112 2.24 IVa. Appropriate 04 40 05 50 04 40 04 40 03 30 20 40b. Somewhat Appropriate 05 50 03 30 05 50 04 40 05 50 22 44c. Not Appropriate 01 10 02 20 01 10 02 20 02 20 08 16B. Scientific Nature 126 2.52 Iiii Very Scientific 06 60 05 50 05 50 04 40 07 70 27 54b. Scientific 04 40 04 40 05 50 06 60 03 30 22 44c. Not Scientific 00 00 01 10 00 00 00 00 00 00 01 02C. Accuracy of Information 118 2.36 IIa. Very Accurate 06 60 04 40 03 30 O4 40 05 50 22 44b. Accurate 03 30 05 50 05 50 06 60 05 50 24 48c. Not A Accurate 01 10 01 10 02 20 00 00 00 00 04 08D. Timeliness of Message 116 2.32 IIIa. Very timely 05 50 04 40 05 50 06 60 04 40 24 48b. Timely 03 30 04 40 05 50 02 20 04 40 18 36c. Not timely 02 20 02 20 00 00 02 20 02 20 08 16E. Length of articles 101 2.02 Va. Appropriate 03 30 02 20 03 30 03 30 04 15 30b. Somewhat Appropriate 04 40 04 40 04 40 04 40 05 21 42c. Not Appropriate 03 30 04 40 03 30 03 30 01 14 28F. Printing Quality 93 1.86 VIa. Very Good 02 20 03 30 03 30 04 40 02 14 28b. Good 03 30 03 30 05 50 03 30 04 18 36c. Poor 05 50 04 40 02 20 03 30 04 18 36G. Visuals/Photographs’ Quality 85 1.70 VIIIa. Very Good 01 10 00 00 02 20 02 20 03 08 16b. Good 04 40 05 50 03 30 04 40 03 19 38c. Poor 05 50 05 50 05 50 04 40 04 23 46H. Readers’ Involvement 91 1.82 VIIa. Involved 03 30 03 30 02 20 04 40 02 14 28b. Partially Involved 04 40 03 30 03 30 02 20 01 13 26c. Not Involved 03 30 04 40 05 50 04 40 07 23 46
Table 2: Application of Haryana Kheti ’s recommendations in field practices (n=50)Variables Eastern Western Northern Southern Outside Total Rank
Haryana Haryana Haryana Haryana Haryana n=50n=10 n=10 n=10 n=10 n=10
f % f % f % f % f % f %Yes 03 30 06 60 05 50 07 70 02 20 23 46 ISomewhat 07 70 03 30 04 40 03 30 03 30 20 40 IINo 00 00 01 10 01 10 00 00 05 50 07 14 III

78 Krishan Yadav et al.
Table 3: Perceived Utility of Articles Published in Haryana Kheti (n=50)Variables Eastern Western Northern Southern Outside Total Rank
Haryana Haryana Haryana Haryana Haryana n=50n=10 n=10 n=10 n=10 n=10
f % f % f % f % f % f %Agricultural Field Practices 09 90 07 70 10 100 09 90 07 70 42 84 IInformation on Seed Verities 07 70 07 70 07 70 08 80 05 50 34 68 IIDisease outbreak and Treatments 10 100 08 80 09 90 09 90 06 60 42 84 IAnimal and Dairy activities 07 70 04 40 07 70 05 50 06 60 29 58 IIIHome Sciences 04 40 02 20 03 30 01 10 00 00 10 20 VGovernment Policies 05 50 05 50 04 40 05 50 02 20 21 42 IVOthers 01 10 02 20 00 00 00 00 00 00 03 06 VI
that ‘Agricultural field practices’ and ‘Disease outbreaks& their treatments’ were the most affected issues (Rank1st). ‘Information on seed varieties’ and ‘Animal husbandryand dairy activities’ were also closely followed issues asranked 2nd and 3rd, respectively, in the list. Issues on ‘Homescience’ got the last ranking (5th) as all the respondentswere male.
CONCLUSION
The data pertaining to the perceived utility revealed thateven after more than 50 years of publication, HaryanaKheti enjoys a great credibility among the farmingcommunity as respondents still believe on scientific natureof Haryana Kheti articles, accuracy of informationpublished and timeliness of the message. This shows therelevance of this old extension tool in this era of IT andsocial media. As far as, perceived utility is concerned, themagazine is of great practical relevance, as the majorityof the farmers still depend upon it for their dailyagricultural field practices, disease outbreaks and theirtreatments, information on seed varieties and animalhusbandry & dairy activities’.
REFERENCES
Agwu, A.E. and A. Elizabeth. 2013. Access and utilization ofmodern information communication technologies amongextension personnel in Benue state of Nigeria. InAgricultural Extension and the Challenges of theMillennium Development Goals (MDGS). Proceedings,Annual National Conference. AESON. 7–21.
Behrans, J.H. and J.F. Evans. 2002. A reference manual onAgriculture Extension – Improving AgriculturalExtension Programmes- using Mass Media for ExtensionTeaching, pp. 147-148.
Cibbora, W. 2005. Extension, Farmers and ICT’s: A criticalreview, Department of Agriculture and RuralDevelopment: Agriculture University of Athens. Journalof Extension Education, 26: 16-17.
Deepti. 2008. Impact Assessment of All India CoordinatedResearch Project (AICRP) in Home Science on farmwomen. M.Sc. thesis, CCS Haryana Agricultural University,Hisar.
Ganesan, M.; K. Karthikeyan; S. Prashant and J. Umadikar.2013. Use of mobile multimedia agricultural advisorysystems by Indian farmers: Results of a survey. AfricanJournal of Agricultural Extension. Rural Development, 5(4):89-99.
Sarkar, A. 1998. Impact of mass communication on rural peoplein relation to agricultural information. Environment &Ecology, 15(4): 862-866.
---------------------------------------------------------------------------------------------------------------------------------------------------------------Received on November, 2017, Revised on December, 2017
Journal of Community Mobilization and Sustainable Development Vol. 13(1), 79-83, January-April, 2018
*Corresponding author email id: [email protected]
Fisher’s Outlook and Perception towards Fishery Resources of RiverIb
Rejani Chandran1, L.K. Tyagi1*, A.K. Jaiswar2, Sudhir Raizada3, Sangeeta Mandal1, Trivesh S. Mayekar1,Amit Singh Bisht1 and Sanjay Kumar Singh1
1ICAR-National Bureau of Fish Genetic Resources, Lucknow; 2ICAR-Central Institute of Fisheries Education, Mumbai3ADG (Inland Fisheries), Indian Council of Agricultural Research, New Delhi
ABSTRACT
Rivers harbour a wide plethora of aquatic flora and fauna and are centres of great human activities. Ib, a tributaryof Mahanadi River supports many fishing communities along its bank bringing challenges of sustainable use andshort-term profits versus long-term gains. People’s support and compliance is very important for conservation ofaquatic biodiversity. In this context, the study was undertaken to document fisher folk’s perception towardsbiodiversity conservation and outlook towards fishery resources in five villages along Ib River. The primaryoccupation of majority of the respondents was fishing (79%). The respondents feel that fishery resources are notadequate to sustain livelihood now and are plagued with bleak future. Reduction in water depth of the river,siltation, usage of small meshed nets and destructive methods has worsened the situation. The fishermen wantgovernment agencies to take centre stage in resolving these issues but are willing to join them in conservationefforts. The need is for the government agencies and fishermen to work hand in hand for co-management andconservation of fishery resources of river Ib.
Keywords: Fishermen, Perception, Fishery resources, Ib
INTRODUCTION
There are around 34,400 fish species in the world(Eschmeyer et al., 2017) of which 3,398 have beenreported in India (NBFGR, 2016). Water resources likerivers, streams, springs, headwaters, seas, etc harbour andsupport rich aquatic biodiversity. There is a complexdynamic relationship between accessing and utilizing thesefishery resources for immediate human gain and the needto conserve them for prosperity. All the species areecologically important and significant either as preferredfood, ornamental value or in the production of valueadded products. A species insignificant in one place maybe most relevant at another place. In recent years, theconcept of resource sustainability and awareness aboutconserving biodiversity has received a lot of attention.River Ib, one of the important tributaries of theMahanadi River basin is significant not only due to itsrich aquatic biodiversity but also due to its importanceas one of the most industrialized areas of Eastern Indiawith lot of coalmines (Mishra, 2009; Mohapatra and
Goswami, 2012; Sahu and Sahu, 2016). It originates inRaigarh district of Chhattisgarh and flows throughOdisha state, before falling into the Hirakud reservoiron Mahanadi. It supports a large community offishermen and traders involved in fishing along its bank.Conservation and protection of fishes is impracticalwithout considering the perception and ground realityof the fishermen and other user groups. Understandingperceptions of fishermen can provide action plans todesign or improve conservation efforts since the burdenof compliance and effects of regulation are to be borneby them (Jefferson et al., 2015; Bennet, 2016).Management programmes would perform significantlybetter if they are planned bearing in mind userperceptions.
In this background, a study was undertaken toanalyse and document the perception of local fishingcommunities towards the status and conservation of fishresources in River Ib, along its stretches in Odisha andChhattisgarh. The objectives of the study were:

80 Rejani Chandran et al.
1) To study the socio-economic profile of fishermeninvolved in fishing in River Ib
2) To document and analyse the perception offishermen towards the status and conservation offishery resources of River Ib.
MATERIALS AND METHODS
Locale of the study: The data for the study was basedon survey conducted in five villages along variousstretches of River Ib during January, 2016 to February,2017. Barghat and Katangidihi villages in Odisha alongdownstream river stretch; Lawakera and Samdamavillages of Chhattisgarh along the middle stretch andPamsala village in Chhattisgarh along the upper stretchwere selected as representative villages where majorfishing activity takes place.
Questionnaire design and procedure: Questionnairefor this study was designed based on earlier socio-economic fisheries-related studies (Tyagi et al., 2007; Tyagiet al., 2008 and Lal et al., 2012). In addition to this, fisherydevelopment officers, fisheries scientists and otherexperts were also consulted. A total of 100 respondentscomprising of local fishermen and traders were selectedthrough random sampling. The respondents wereinterviewed face-to-face individually and necessary carewas taken to collect the most reliable, relevant and exactground level information from the fishers’ level. Informalinteractions with fishermen/fisherwomen and smalltraders at various fishing sites, further enriched theobservations of interviews.
RESULT AND DISCUSSION
Socio-economic profile of fishermen: Majority (66percent) of the respondents interviewed were middleaged (36-55 years) with education either up to primary(36 percent) or middle school (29 percent) level (Table1). Fishing was recorded to be the primary occupationof the respondents (79 percent). Rest were involved inother occupations like small trading (13 percent). A few(8 percent) were also involved in aquaculture activities inponds leased to them. 50 percent of the respondentswere also involved in secondary occupations like labourwork. It was seen that younger respondents were moreeducated and less involved in fishing activities. It wasobserved that even though around 60 percent hadexpertise in fishing for 10-20 years, they have had limitedinteraction with government or extension personnel with
none of them having undergone any training orawareness programme on conservation or on otheraspects of riverine fishing. According to them, littlesupport has been provided by the government exceptfor the asbestos roofed house given 25 years ago. Therewas absence of fishermen co-operatives or self helpgroups in these villages.
It was found that the participation of men was morethan women in fishing activities (Table 2). Men play akey role in catching fish from the river. They usually fishin the morning and evening and hand over the catch towomen. Though not directly involved in catching fishes,women play a significant role in marketing fish andprocessing activities like drying and smoking of fishes.Fifty five per cent of women were involved in fish,marketing while twenty per cent respondents occasionallymarketed the fish. While women sell the fishes in marketor dry the unsold fish, the men involve in labour workfor secondary income. A few men (25 percent) werealso found to be involved in marketing but neither they
Table 1: Socio-economic profile of FishermenProfile PercentageAge (years)Young (18-35) 18Middle (36-55) 66Old (Above 56) 16EducationIlliterate 9Primary 36Middle 29Metric 20Above metric 6Major OccupationFishing 79Trading 13Aquaculture 8Fishing Experience<10 years 2410-20 years 60>20 years 16Extension ContactLow 100Medium 0High 0Social participationLow 100Medium 0High 0

Fisher’s Outlook and Perception towards Fishery Resources of River Ib 81
were involved nor interested in processing activities. Pre-harvest activities like net mending and boat repair workswere shared by both men and women.
People’s outlook with respect to fishery resources:Perception of the respondents about the status of thefishery resources of River Ib in the past, present andfuture time frame was sought, to understand the trendin the riverine fish diversity and catch (Table 3). Majorityof the people did not have knowledge of anymanagement strategy in place for conservation of aquaticbiodiversity. Almost all the respondents opined thatalthough there is no reduction in fish diversity as suchwhen compared to the past, there has been a reductionin average size of fishes caught and duration of fishingseason. It was felt that commercially important fisheslike Bhakur (Catla catla), Rohi (Labeo rohita) and Mrigala(Cirrhinus mrigala) which were normally caught abundantlythroughout the year in the past have declined and arenow captured mostly during monsoon season only. Thefrequency of occurrence of many fishes like Gurai(Channa sp), Boalle (Wallago attu), Bami (Anguilla sp), Chital(Notopterus notopterus), Khussuah (Colisa fasciata), Tengri(Mystus sp), Patharchatta (Garra sp), Sarana (Systomussarana), Kokia (Rita chryzea) and many others, though notcompletely unavailable have declined over time in thisriver. They are of the opinion that proportion of largefishes caught has steadily decreased over the years. Asper the respondents, they have to go near HirakudReservoir (around 80 km) in search of fishes. Majorityof the respondents remarked that the present catch was
inadequate (75 percent) or just adequate (25 percent) tosupport their livelihood making, it is difficult to becompletely dependent on fishing and thus they had totake up secondary occupations like labour and tradingto meet their financial needs. As per the respondents,fishing trade was difficult and less remunerative due towhich their children show little interest in carrying ontheir family occupation. Hence, most of the children ofthe fishermen are trying to take up business work ortrading. All the respondents were worried that fisheryresources would be grossly inadequate for the futureunless proper conservation and management options areimplemented.
Perceived causes for decline in fishery resources:Major cause for the declining fishery resources asperceived by the fishermen was destructive fishingpractise of poisoning and dynamiting (Table 4). Poachersand migratory fishermen often employ these practises inthe night. This indiscriminate fishing can have severeimpact on the fishery resources (Eyo and Ahmed, 2005;Katikiro et al., 2016) killing brood fishes and juveniles.Another cause for declining catch as reported by the
Table 3: People’s outlook with respect to status of fishery resourcesView Status of Fishery Resources
In Past At Present Likely to bein Future
Fishery resources are abundant 100Just adequate to sustain livelihood 25Not adequate to sustain livelihood, but earlier they were adequate 75Grossly inadequate and in very poor condition 100
Table 2: Roles played by men and women in fisheries resource managementRole Men (%) Women (%)
Always Sometimes Never Always Sometimes NeverCatching of fish from rivers 79 21 0 0 0 100Marketing of fishes in local market 25 20 55 55 20 25Undertaking fish processing activities like fish drying, etc. 0 0 100 50 40 10Net & Boat making & repairing 46 22 32 32 40 28
Table 4: Perceived causes for decline in fishery resourcesReason PercentageDestructive fishing 89Usage of small meshed gear 84Reduced water depth 40Siltation 25Reduced Rainfall 10
82 Rejani Chandran et al.
respondents was reduction in river depth. Sand miningactivity along the shores of River Ib has widened theriver, in turn reducing the depth. As bigger fishes arecaught from deeper waters, lack of sufficient water andproper habitat for the fishes are resulting in small sizedcatch. Siltation in the river is further aggravating thisproblem. Fishermen believe that after monsoon, largesized fishes migrate from Hirakud reservoir to eitherMahanadi or Ib rivers, based on the water availability.Hence, fishermen pray for good rainfall which wouldmean good catch. In addition to these, small mesh sizedgears are employed for catching fishes which completelycapture all fishes including the juveniles and fingerlings.Even though the fishermen know that using small meshednets are harmful, they do it to sustain their livelihood.They also fear that they will lose out on catch whencompared to a person using smaller mesh. The challengehere is to convince them as per the respondents,Government departments have not taken any initiativesto improve or enhance the fishery of River Ib.
Measures suggested for the enhancement of fisheryresources: Respondents suggested a few measures whichin their opinion can improve the status of fisheryresources and thus, help in their conservation. Majorityof the respondents felt that the government departmentsshould carry out enhancement measures like fishranching, increasing the water depth and reducing siltationin River Ib. This sentiment may be because of the factthat riverine fishery resource is common propertyresource. Other studies have also recorded similarexpectation from fishing communities (Tyagi et al., 2007).Respondents also felt that creating awareness among thefishermen about the ill effects of destructive fishingpractises and usage of small meshed gears will also helpimprove the catch and fishery resources of River Ib. AsState Fisheries Department are not adequately staffed totake up awareness programmes on a wider scale, fishingco-operative societies and non-government organizationscan play a significant role here. Studies conducted atvarious places have shown that where fishing co-operative societies were active and functioning effectively,their performance contributed significantly towardsconservation and sustainable management of fisheryresources (Tyagi et al., 2013; Tyagi et al., 2014).Respondents opined that expecting poor fishermen, whoare finding it difficult to make his ends meet, to
undertake, enforce and follow conservation andregulatory measures is unfair. Effective implementationsof these strategies are only possible if the governmentdepartments undertake measures to improve the fisheryand provide support to their sustenance. Further thesefishermen may be encouraged to form self-help groupsor societies to strengthen them and help open dialogueswith government agencies.
CONCLUSION
It is obvious from the current study that even thoughthe fishermen employed in fishing in River Ib are poorand not well educated, they are aware about the currentscenario of fishery resources and its causes. They are allso engaged in their daily efforts to sustain their livelihoodthat, they are unable to plan or execute conservationmeasures unless the government departments supportthem. Actions and strategies to improve the fisheryresources of river Ib need to be initiated by thegovernment departments. Planning bodies can sensitizeand train these fishermen to access new fishery resourcesor enhance market access through value addition. Thefishermen are more than willing to cooperate in suchactivities. Government departments and fishermen needto share the responsibility of conserving the fisheryresources of River Ib and work hand in hand for itsconservation and management.
REFERENCE
Anonymous. 2016. Annual Report, ICAR-National Bureau ofFish Genetic Resources 2015-2016, ICAR-NBFGR, CanalRing Road, P.O. Dilkusha, Lucknow, India, 103pp.
Bennett, N.J. 2016. Using perceptions as evidence to improveconservation and environmentalmanagement. Conservation Biology, 30: 582–592.
Eschmeyer, W.N. and R. Fricke and R. Van der Laan (eds). Catalogof fishes: genera, species, references. (http://researcharchive.calacademy.org/research/ichthyology/catalog/fishcatmain.asp)
Eyo, A.A. and Y.B. Ahmed. 2005. Management of inlandcapture fisheries and challenges in fish production inNigeria. In: 19th Annual Conference of the FisheriesSociety of Nigeria (FISON), 29 Nov - 03 Dec 2004, Ilorin,Nigeria: 624-636.
Jefferson, R.; E. McKinley; S. Capstick; S. Fletcher; H. Griffinand M. Milanese. 2015. Understanding audiences: makingpublic perceptions research matter to marineconservation. Ocean Coastal Management, 115: 61–70.

Fisher’s Outlook and Perception towards Fishery Resources of River Ib 83
Lal, K.K.; L.K. Tyagi; A.S Bisht; R.S. Patiyal and A.K. Yadav.2012. Educational roles of cooperative institutions infisheries resource management: Case studies fromNorthern India. Indian Journal of Adult Education, 73(1):87-94.
Mishra, P.P. 2009. Coal Mining and Rural Livelihoods: Case ofthe Ib Valley Coalfield, Orissa. Economic and Political Weekly,44: 117-123.
Mohapatra, H. and H. Goswami. 2012. Assessment and analysisof noise levels in and around Ib river coalfield, Orissa,India. Journal of Environmental Biology, 33: 649-655.
Katikiro, R.E. and J.J. Mahenge. 2016. Fishers’ Perceptions ofthe recurrence of dynamite-fishing practices on the coastof Tanzania. Frontiers in Marine Science, 3: 233.
Sahu, D.K. and B. Sahu. 2016. Assessment of air Quality andits impact in Jharsuguda and Rengali industrial area ofSambalpur and Jharsuguda districts in Odisha, India. IOSRJournal of Environmental Science, Toxicology and FoodTechnology, 10(9): 8-14.
Tyagi, L.K.; U.K. Sarkar and S.K. Paul. 2007. People’s perceptionabout conservation of fishery resources outside theprotected water bodies: A case study in Lakhimpur KhiriDistrict of UP. Indian Research Journal of ExtensionEducation, 7(1): 36-38.
Tyagi, L.K.; U.K Sarkar and S.K. Paul. 2008. People’s perceptionon conservation and management of fish germplasmresources in and around wildlife protected areas: A studyin Katerniaghat Wildlife Sanctuary, U. P. Indian ResearchJournal of Extension Education., 44(3&4): 44-51.
Tyagi, L.K.; A.S. Bisht, Amar Pal and K.K. Lal. 2013. Functioningof Fishing Cooperative Societies in Selected States of India.Journal of Community Mobilization and SustainableDevelopment, 8(1): 90-93.
Tyagi, L.K.; A.S. Bisht and Amar Pal. 2014. Performance ofFishing Cooperative Societies in Implementing FishConservation Measures: Case Studies from TwoReservoirs of Orissa. Journal of Community Mobilizationand Sustainable Development, 9(1): 48-51.
---------------------------------------------------------------------------------------------------------------------------------------------------------------Received on December, 2017, Revised on January, 2018

Journal of Community Mobilization and Sustainable Development Vol. 13(1), 84-90, January-April, 2018
*Corresponding author email id: [email protected], [email protected]
A Study on the Information System of Nature Fresh dairy Project inKerala
V. Sreeram1 and Jancy Gupta2*1Ph.D. Scholar, 2Principal Scientist and Ex-Head, Division of Dairy Extension, ICAR-NDRI, Karnal-132001, Haryana
ABSTRACT
Information is considered as an essential input to agricultural education, research and development and extensionactivities. Agricultural information system is a system in which agricultural information is generated, transformed,consolidated, received and fed back to underpin knowledge utilisation by agricultural producers. The presentstudy was framed with an objective to explore the information system of 2 Panchayaths in Kerala state, where theNature Fresh Model (NFM), an innovative dairy value chain is operational. Various actors, associated with theproject were identified and the farmers’ preference for different information sources was quantified. A comparisonof information scores of the project participants in the study areas in terms of z-scores shows that the informationlinkages are comparatively strong in Akathethara, where the project is institutionalized indicating the stronginformation system among the farmers with diverse actors.
Keywords: Dairying, Institutionalization, Knowledge, Linkage
INTRODUCTION
Information has an extensive and multifaceted role inagriculture (Mittal and Mehar, 2013). It is considered asa social good to be exchanged and discussed within socialnetworks (Rolls et al., 1999), one of the important inputsof livelihood sustenance (Haldar et al., 2016) or even as aproduction resource (Naidoo and Rolls, 2000) by thesmall scale farmers. Hence its efficient flow in a farmingsystem ensures that social learning process in thecommunity gets going, resulting in adoption ofinnovations. The potential users of agriculturalinformation include government decision-makers, policy-makers, planners, researchers, teachers and students,program managers, field workers and farmers (Zaman,2002). An agricultural information system consists ofcomponents (subsystems), information related processes(generation, transformation, storage, retrieval, integration,diffusion and utilization), system mechanisms (interfacesand networks) and system operations (control andmanagement) (Vidanapathirana, 2012). It integratesvertical networks which is the extension network itselfwhere the major information sources are formalextension agents (experts from any line departments) and
horizontal network composed of peer network,community association network and marketing networkwhere the informal sources like friends and neighboursdominate (Amalku, 2012; Hoang et al., 2007). Morefunctional cooperation and professional communicationbetween personal and institutional information sourcesare essential to enhance the diffusion of information andtechnology among the farmers (Demiryurek, 2010). Sofar agricultural information networks have been exploredin a variety of contexts like information related toagriculture (Haldar et al., 2016), among the organicfarmers (Demiryurek, 2010), in fisheries (Pretty andSmith, 2004) and agro forestry (Isaac, 2012; Warner,2007). This study was an attempt to look the dairyinformation system of 2 Panchayaths, in Kerala state wherethe Nature Fresh Model projects are operational sincethree years.
An overview of the Nature Fresh Model (NFM):The Nature Fresh (NF) model is such an innovative dairyvalue chain model, emerged as an alternate way to thecooperative channel of milk marketing. The mainobjective is to ensure maximum return to the dairyproducer while assuring supply of quality milk to the
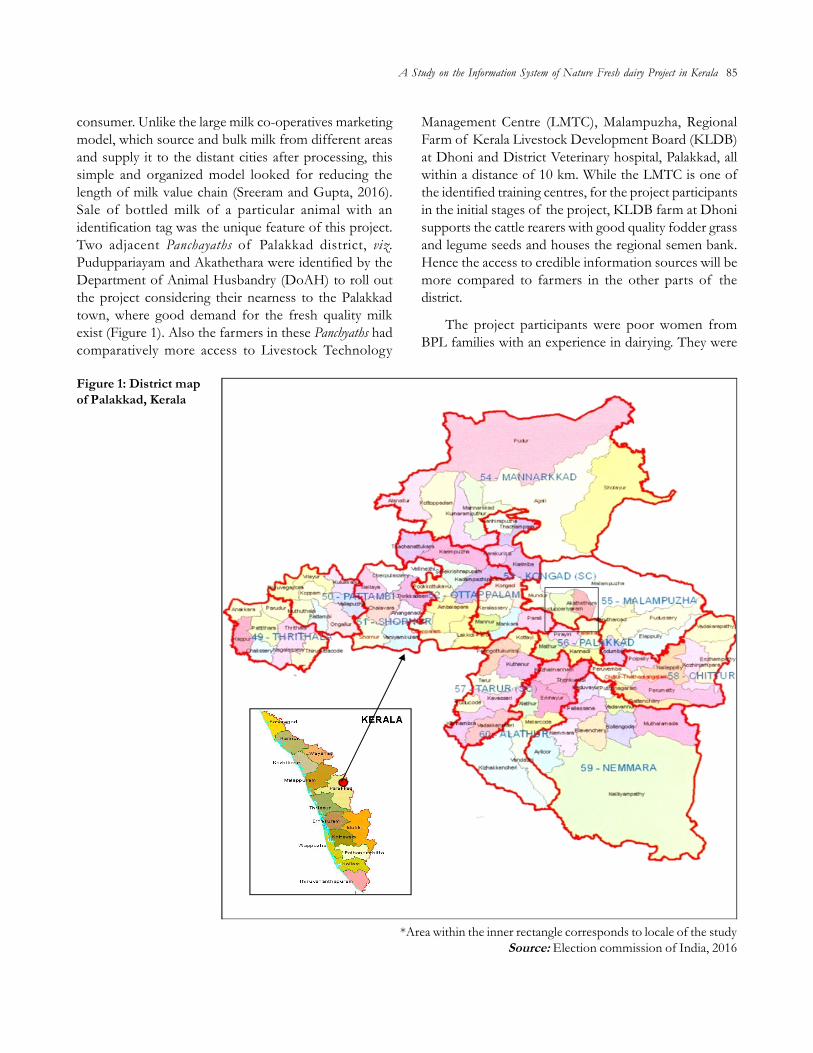
consumer. Unlike the large milk co-operatives marketingmodel, which source and bulk milk from different areasand supply it to the distant cities after processing, thissimple and organized model looked for reducing thelength of milk value chain (Sreeram and Gupta, 2016).Sale of bottled milk of a particular animal with anidentification tag was the unique feature of this project.Two adjacent Panchayaths of Palakkad district, viz.Puduppariayam and Akathethara were identified by theDepartment of Animal Husbandry (DoAH) to roll outthe project considering their nearness to the Palakkadtown, where good demand for the fresh quality milkexist (Figure 1). Also the farmers in these Panchyaths hadcomparatively more access to Livestock Technology
Management Centre (LMTC), Malampuzha, RegionalFarm of Kerala Livestock Development Board (KLDB)at Dhoni and District Veterinary hospital, Palakkad, allwithin a distance of 10 km. While the LMTC is one ofthe identified training centres, for the project participantsin the initial stages of the project, KLDB farm at Dhonisupports the cattle rearers with good quality fodder grassand legume seeds and houses the regional semen bank.Hence the access to credible information sources will bemore compared to farmers in the other parts of thedistrict.
The project participants were poor women fromBPL families with an experience in dairying. They were
Figure 1: District mapof Palakkad, Kerala
*Area within the inner rectangle corresponds to locale of the studySource: Election commission of India, 2016
A Study on the Information System of Nature Fresh dairy Project in Kerala 85
86 V. Sreeram and Jancy Gupta
organized into Joint Liability Groups (JLGs) by theKerala State Poverty Eradication Mission, theKudumabshree. A total of 10 groups were formed with5 members in each group, in both the Panchayaths. Underthe Project all the members got financial assistance fromDoAH to purchase two animals and construct a cattleshed according to the project norms under thesupervision of the village veterinary surgeon, who is theimplementing officer. A milk vendor was employed foreach two groups, to collect milk at the farm gate in everymorning and supply it to the consumer within 2 hoursof milking. Milk was supplied in well sterilized sealedand tagged bottles (650 ml) to the consumers located inthe nearby town area. A monitoring committee wasformed for the smooth functioning of the project,comprising of officials from Dairy Department,Kudumbashree, Village Cooperative Bank, VillagePanchayath and the veterinary Surgeon. While theKudumbashree took the lead role in launching the projectat Pudupperiayam, the veterinary surgeon was entrustedwith implementing the project at Akathetahra. Theproject was commenced in both the Panchayaths in 2013.Later in 2015, the dairy farmers of NF project wereorganized as Nature Fresh Promotion Council (NFPC)with the support of veterinarian at Akthethara. Also aGuidnace and Advisory Committee (GAC) wasconstituted here, comprising of veterinary doctor,experienced male counterparts of project members (5members) and all the project participants. Fortnightlygroup meetings and discussions are being organized onbehalf of NFPC on various pertinent issues for smoothrunning of the project.
MATERIALS AND METHODS
The Study Area: The study area was purposively selectedas the project is operational in both the Panchayaths andwas initiated by DoAH in 2013. Though the project issame, its mode of implementation varied significantly inboth these Panchayaths. The information system of thedairy farmers is hypothesized to be strong and diverse,with a blend of both the personal information sources(other project participants, progressive farmers, milkcooperative society staff) as well as the expert informationsources (Veterinarian, Milma Extension agent). A detailedstudy on their information systems gave valuable insightsregarding chief information sources of the farmers.Further a comparative study between the Panchayathswhich differ in the project implementation mode, will
give a clear picture of the information system operationalin the study locales. As the combination and integrationof different stakeholders very in both the Panchayaths,the study may augur well or drawing key inputs forstrengthening and restructuring the dairy informationsystem.
Sampling: To study the information networks amongthe NF project participating farmers, a completeenumeration was carried out by contacting all the farmersin the study areas. A complete list of the projectparticipants was obtained from Kudumbashree DistrictMission office. (How many respondents were sampledfrom this list and by which sampling technique). Personalinterviews using a well structured interview schedule wascarried out to elicit the information from the farmersregarding the major information sources, frequency ofcontact and its perceived usefulness. Focussed groupdiscussions and key informant meetings were also heldas a part of the data collection. Also actor systemmapping was done to delineate the diverse actors in thenetwork in the study areas.
To explore the information system in a system ActorLinkage Matrix (ALM) is the tool commonly used bymany researchers (Gupta, 1998; Mohammad, 2012).Though it is a handy tool to depict the strength, patternand kind of information flow, it has limited scope incomparing two information systems. The informationscores of each of the participant were calculatedfollowing the scoring method of Demiryurek (2010).Information scores for each component of the farmers’agricultural information system were calculated bymultiplying the weights of information contact withdegree of information usefulness. Total InformationScore is formulated as:
TISij = FCij x IUij
Where, FC is the number of contact with informationsources for the i-th dairy farmer and IU is the usefulnessof information for the i-th dairy farmer. It facilitates acomparative study of the information networks in thetwo Panchayaths based on the information scores.
RESULTS AND DISCUSSION
Based on the field survey and interviews, actorlandscape of the study areas where the project isoperational was explored. It is presented in the Table 1.The farmers’ information sources were classified into 4
A Study on the Information System of Nature Fresh dairy Project in Kerala 87
components of information system based on theirresponses obtained during the field survey. They werepeer network, extension network, community associationnetwork and mass media network based on theirfamiliarity and degree of contact with the differentsources. The results are presented in the Table 2.
In the peer network category, Akathethara farmershave more inclination towards progressive farmers asthe chief information source. At both the places, theveterinary doctor has the role of key information sourcein the extension network. Unlike in the case ofPudupperiayarm where the information links with theMilk Cooperative Society staff were preferred more,Akathethara farmers had less preference for the same.This is because, only a few project participants arepouring milk at the cooperative society and most ofthem had no contact with the secretary of the milkcooperative. Also there is a clear cut preference fordifferent sources in the extension network with aminimum inclination for the combination of different,at both the places. The community association networkdepicts an explicit difference with more stronginteractions among the members in Akathethara. This isbecause the project member’s organization, NFPC is agood platform for the farmers to meet and interactregularly (every fortnight) unlike the case of
Puduppariaram where the group meetings are irregularand minimum. Strengthening the alliance of both strongand weak ties in farmers’ information networks couldbe beneficial in the implementation of agriculturalprograms (Thuo et al., 2013). This is because interactionand networking among people with different skill sets isconducive for learning in a social system (Madzudzo,2011). The NFPC meeting brings together a number ofstrong and weak information ties on board like theveterinary doctor, experienced dairy farmers (themembers of GAC) as well as members of different JLgroups. Also this platform is conducive for building newlinks, like the inking of feed supply contract with theKomerela feeds Pvt. Ltd. by the NFPC recently. Thusthe fortnightly meetings of NFPC, in the presence ofveterinarian and GAC members are conducive forstrengthening the synergy between strong and weakinformation links at Akathethara.
Again farmers were asked to pick the most preferredinformation source regarding the dairy farming amongthese different information networks with the maximumchoice limit set as three. The results are presented in theTable 3. Though the preference for formal informationsources is more or less same, the farmers of Akathetharahad shown more dependence on their personalinformation sources including members of GAC and
Table 1. Dairy actor landscape of the study areasActor domain Puduppariaram AkathetharaPublic Department of Animal Husbandry (DoAH) Department of Animal Husbandry (DoAH)
Dairy Development Department (DDD) Dairy Development Department (DDD)Kudumbashree (KDMS) Kudumbashree (KDMS)Village Panchayath Village PanchayathLivestock Management and Training Centre (LMTC) Livestock Management and Training Centre (LMTC)Kerala Livestock Development Board (KLDB) Kerala Livestock Development Board (KLDB)Kerala Feeds Ltd. Kerala Feeds Ltd.New India Insurance Ltd. New India Insurance Ltd.
Private Milk & dairy product Traders Milk & dairy product TradersCattle feed retailers Cattle feed suppliersVeterinary medical shop Veterinary medical shopUnion Bank of India Private banksBanana product traders* Komrela Feeds Pvt. Ltd.
Cooperative Milk cooperative society (Milma) Milk cooperative society (Milma)Cooperative bank Cooperative bank
Independent Dairy farmers Nature Fresh Promotion Council (NFPC)*Banana product sellers: Dairy farmers of Puduppariaram are in agreement with these traders in the town area for collecting the leftover banana stalks as cattle feed for a nominal charge.

88 V. Sreeram and Jancy Gupta
other JL groups. The Kerala Cooperative Milk MarketingFederation (Milma) extension agent was reported as aninformation source only at Puduppariyaram, as the NFfarmers only there had a functional linkage with the milkcooperative society. But the other relevant institutions indairying like KLDB, LMTC etc. have not been identifiedby the farmers as their information source at both theplaces. This may be due to their limited participation in
improving the information scenario of the study areas.They had majorly acted as training institutions (LMTC),in the beginning of the project and for input supply(fodder seeds by KLDB farm). Preference for theveterinarian as the chief information source has its ownmerits and demerits. As a subject expert, his informationsupport is credible and highly useful to the farmer. Butinaccessibility of the veterinary doctor at needed times,
Table 2: Different combinations of information sources as reported by farmers of NF projectDifferent sources of Information Pudupperiyaram (n=50) Akathethara (n=52)combination Frequency Percentage Frequency PercentagePeer NetworkOnly progressive farmer 8 16.00 11 21.15Only own family members 12 24.00 15 28.84Milk vendors 4 8.00 8 15.38A combination any of the above 26 52.00 18 34.61Extension NetworkOnly veterinary doctor 28 60.00 37 71.15Only input dealer 6 12.00 5 9.62Only staff of MCS 11 16.00 3 5.74A combination of any of the above 5 12.00 7 13.46Community association NetworkOnly own JL group member 42 84.00 13 25.00Only with members of other JL Groups 0 0.00 11 21.15Only the members of GA committee (GAC)* - - 4 7.69A combination of any of the above 8 16.00 24 46.15Mass media NetworkTV/Radio/farm Magazine 40 80.00 36 69.23Farm school/ Demonstration 2 4.00 4 7.69A combination of any of the above 8 16.00 12 23.07*Guidance and Advisory Committee (GAC) is unique to Akathethara Panchayath.
Table 3: The chief information sources as reported by the farmers regarding the dairy related information in 2 PanchayathsInformation source Pudupperiyaram Akathethara
WAN Percentage WAN PercentageVeterinary surgeon 17 34.00 16 31.03MCS secretary 11 21.64 2 3.50Input dealer 6 12.60 5 9.53NF group members 8 15.62 12 23.32Experienced family member (in dairying) 3 5.33 7 14.07Milk Vendors 1 2.00 2 2.53Milma Extension agent 5 9.62 - -GAC member** - - 8 15.63Total 50 100.00 52 100.00Note: Weighted Average Number of farmers (WAN): Number of farmers is weighted by the number of information sourceshighlighted by them, with three being maximum number of sources. For instance, if a farmer has listed three sources then eachsource is given a weight of 0.33 and if one farmer has listed only one source as the most important then that is given a weight as 1.

A Study on the Information System of Nature Fresh dairy Project in Kerala 89
may deprive the farmers from getting crucial information,which happens at the field level many a times. Hencealternate credible information backup should be put inplace to supplement the formal information sources (likee-Vet connect project of Kerala Veterinary and AnimalSciences University).
z test was performed so as to compare betweensome of the relevant variables and the components ofagricultural information and communication network atboth the study areas. The results are presented in the Table4. The results of statistical analysis give a clear picture ofthe variables, which are significantly different in the studyareas. Among the selected socio economic variablespertinent to dairying, only the total milk production wassignificant different with a higher mean value atAkthethara. Though not statistically different, meanexperience in dairying of the Puduppariayaram farmerswere slightly more. But in the case of components ofinformation system, except the peer network, all otherinformation networks were significantly different in thetwo Panchayaths. The extension, community associationas well as the mass media networks was relatively strongat Akthethara, which can be inferred from the respectivehigher mean information scores. Finally the totalinformation network score also differed significantly andthe mean score was higher at Akthethara. Hence it maybe concluded that the institutionalization by means of
Table 4: Comparison of farmers of 2 Panchayaths in terms of socio economic variables and information system componentsas well as total information scoreVariables Puduppariaram Akathethara z test
Mean SD Mean SDAge 41.3 9.35 41.92 7.46 0.371Education 9.52 3.10 9.42 3.52 0.178Experience in dairying 23.06 11.32 19.00 9.52 1.94Total land holding 29.42 43.95 40.55 42.42 1.30Total Livestock Units (TLU) 4.66 1.973 5.09 1.96 1.12Total milk production 25.48 14.04 32.74 22.22 1.98*Training received 6.04 1.55 6.36 2.38 0.820Peer Network 4.58 1.86 4.71 1.50 0.611Extension network 5.00 0.422 4.16 2.51 3.63**Community association network 2.91 2.94 5.64 0.36 11.19**Mass media Network 2.75 0.183 2.75 0.081 9.57**Total Information Score 43.02 8.06 49.03 7.18 3.97****Significant at 0.01 level of probability, *Significant at 0.05 level of probability
formation of NFPC has contributed in a big way instrengthening the information system at the Panchayathby regular face to face meetings, group discussions,knowledge exchanges and furthering more linkagesamong the farmers and their pertinent informationsources. With these information in hand, the extensionmachinery can redesign the information network of theproject areas (Raina et al., 2011) to strengthen it and tomeet the emerging and diversified information needsof the farmers in a better way.
CONCLUSION
Access and use of information sources is a first steptoward better targeting of extension programs andadvisory services that facilitate information sharing (Nainet al., 2015). With a thorough information system study,the dynamics of flow, strength and diversity ofinformation linkages within a social system can bemapped. It can be used as an effective tool by policymakers to make most prudent decisions for strengtheningor modifying the existing information networks. Alsothere can be a differentiated information strategy by thedifferent knowledge providers, to give more emphasison specific areas, where their expertise is more. Finallythe efforts should be made to blend the personal andformal information sources so that dairy informationflow can be reinforced both vertically and horizontallyin the system.
90 V. Sreeram and Jancy Gupta
REFERENCES
Amlaku, A.; J. Sölkner; R. Puskur and M. Wurzinger. 2012.Livestock innovation systems and networks: findingsfrom small holder dairy farmers in Ethiopia. LivestockResearch for Rural Development, 24(9): 20-32.
Demiryurek, K. (2010). Analysis of information systems andcommunication networks for organic and conventionalhazelnut producers in the Samsun province of Turkey.Agricultural System, 103: 444–452.
Demiryurek, K.; H. Erdem; V. Ceyhan; S. Atasever and O. Uysal.2008. Agricultural information systems andcommunication networks: the case of dairy farmers in theSamsun province of Turkey. Information Research, 13(2): 4.
Halder, S.; S. Misra; S.B.D. Pal and R. Goswami. 2016.Understanding Agricultural Information Networks inWest Bengal, India. Indian Research Journal of ExtensionEducation, 16(1): 25-34.
Hoang, L.A.; J.C. Castella and P. Novosad. 2006. Social networksand information access: implications for agriculturalextension in a rice farming community in northernVietnam, Agriculture and Human Values, 23(7): 513–527.
Isaac, M.E.; B. Erickson; J. Quashie-Sam and V.R. Timmer.2007a. Transfer of knowledge on agroforestrymanagement practices: structure of informal advicenetworks. Ecological Society, 12 (2): 32-34
Madzudzo, E. 2011. Role of Brokerage in evolving innovationsystems: A case of the fodder innovation project in Nigeria.The Journal of Agricultural Education and Extension, 17(2):19-21.
Mary, T., A.B. Alexandra; E. Boris; U. Bravo; K.O. David; N.O.Evelyn; L.K.C. Nelson; D. Michael and N. Puppala. 2013.Social Network Structures among Groundnut Farmers.The Journal of Agricultural Education and Extension, 19(4):339-359.
Mittal, S. and M. Mehar. 2013. Agricultural information networks,information needs and risk management strategies: asurvey of farmers in Indo-Gangetic plains of India.
Socioeconomics Working Paper 10. Mexico, D.F.:CIMMYT.
Naidoo, G. and M.J. Rolls. 2000. A method to investigateagricultural information use by
small-scale Mauritian cattle keepers. Journal of AgriculturalEducation and Extension, 7(1): 57-65.
Nain, M.S.; R. Singh; J.R. Mishra and J.P. Sharma. 2015.Utilization and Linkage with Agricultural InformationSources: A Study of Palwal District of Haryana State.Journal of Community Mobilization and SustainableDevelopment. 10(2): 152-156.
Pretty, J. and D. Smith. 2004. Social capital in biodiversityconservation and management. Conservation Biology, 18(4):631–638.
Raina, V.; M.S. Nain; B.S. Hansra and D. Singh. 2011. MarketingBehaviour and Information Sources Utilization Patternof Flower Growers. Journal of Community Mobilization andSustainable Development, 6(2): 180-184.
Röling, N.G. 1988. Extension science: information system inagricultural development. Cambridge: CambridgeUniversity Press.
Rolls, M.J.; M. Slavik and I. Miller. 1999. Information systemsin Czech agriculture: sources and transfers of informationfor small and large scale farmers, new cooperatives andcompany farms. Reading: AERDD, University of Reading.(Rural Extension and Education Research Report (No.11).
Vidanapathirana, N.P. 2012. Agricultural information systemsand their applications for development of agriculture andrural community, a review study. In The 35th InformationSystems Research Seminar in Scandinavia–IRIS.
Zaman, M.A. 2002. Present status of agricultural informationtechnology systems and services in Bangladesh. from http//jsai.or.jp/afita/afita-conf/2002/part 1/p075.pdf.
---------------------------------------------------------------------------------------------------------------------------------------------------------------Received on December, 2017, Revised on January, 2018
Journal of Community Mobilization and Sustainable Development Vol. 13(1), 91-97, January-April, 2018
*Corresponding author email id: [email protected]
Marketing Analysis of Meat Retailing in Jammu
Amit Handoo1, Anil Bhat1*, Jyoti Kachroo1, Sushil Sharma2, Sudhakar Dwivedi1, Rakesh Sharma3 andNaveed Hamid1
1Division of Agricultural Economics and ABM, SKUAST Jammu, Chatha-1800092 Division of Agricultural Engineering, SKUAST-Jammu; 3KVK, R.S. Pura, Jammu
ABSTRACT
The rapid growth of Indian meat industry is driven by a combination of rising incomes, young and urbanizationpopulation and declining real poultry prices. The vertical integration in the meat industry and the retail boom inIndia are paving way to organized retailing. Although, many studies existed on meat consumption, most of themwere focused on urban household. To collect the relevant information among the respondents in Jammu, thepresent study makes use of a descriptive type of research design. A purposive sampling procedure has beenadopted for selecting sample households. To collect the data from the respondents in totally, 100 respondentswere sampled from the four selected areas. In addition, 5 Retailers from four areas were also selected. For analysisof data, Garrett ranking technique and marketing cost method were used. The finding of the study revealed thatamong various factors responsible for making preference and consuming meat, the taste appears to be having firstrank in Gandhi Nagar and Talabtillo whereas fat content the least. On the other hand nutritional value appears tobe highest rank i.e., I in Gangyal and Janipur whereas price and easy availability appears to be least. Whileidentifying the constraints faced by household and retailers the poor quality for chicken and high price for muttonappears to be the major hindrance or constraints faced by the households in four areas and on the other hand highcost of transportation appears to be major problem for retailers in Gangyal, Janipur and Gandhi Nagar. Whereascompetition from other traders appears to be major problem for retailers in Talabtillo. The study depicted thatmarketing margin per kg is highest for mutton in Gandhi Nagar Rs. 26.00/kg and for chicken in Talabtillo Rs.24.66/kg.
Keywords: Garret ranking, Retailing, Marketing margin, Meat retailing
INTRODUCTION
Food consumption is a basic action contributing tosurvival of human beings. Therefore, the understandingof the food culture creates a better understanding andmore intimate relationship among countries and people(Koo, 2008). The improvement in agriculture, allowedsome fundamental changes in the human way of life.Animal derived food goods are the most resourceintensive foods (Chemnitz and Becheva, 2014; Connorand Mínguez, 2012; Marlow, 2009; Science News, 2010).Animal protein foods are at the top of the food chain inrelation to the resources (Chemnitz and Becheva, 2014).In many developing nations, it is expected that globalmeat consumption will continue to rise (Buttriss, 2011;Connor and Mínguez, 2012). Fiala (2008) has suggested
that if meat consumption patterns continue along thesame path, then the consumption rates will be 7 2 percent higher than 2000 levels in the year 2030. Demandfor meat is growing rapidly in developing countries,particularly India, China and Brazil (Cheminitz andBecheva, 2014; OECD, 2011). Since 1970s, there was areduction in intake of whole grain cereals, pulses, fruitsand vegetables in India while intake of meat productshave been increased (Misra, 2011; Popkin, 2002; Popkin,2012).
The overall meat production in India appears to be5.1 million tonnes during the year 2012-13 and the targetfor production of meat was 6.4 million tonnes during2013-14 (Ministry of Agriculture, Govt. of India, 2014).The annual growth rate for production of meat was7.87 per cent in 2012-13 (Krishi Jagran, 2015).
92 Amit Handoo et al.
As per the Integrated Sample Survey Report (ISS),2012-13, total estimated meat production of Jammu andKashmir (J&K) state was worked out to be 322.781 lakhkgs consisting of 80.79 per cent of (260.762 lakh kgs)Red Meat and 19.21 per cent (62.019 lakh kgs) of WhiteMeat. The meat production in J&K registered a growthfrom 308.986 lakh kgs to 322.781 lakh kgs over theprevious year resulting into 4.47 per cent growth (TheEconomic Survey of J&K, 2013-14). In addition, theestimated results of survey worked out the meatavailability to be 2.701 kgs per person per year against2.650 kgs for 2010-11.
Food retailing in India is predominantly a small-scalebusiness. Small family-owned shops typically retail foodproducts in urban residential areas, urban markets andin villages throughout India. These grocery stores mainlysell food commodities. Small independent general stores(similar to grocery stores) retail branded foods.Specialized food stores sell one or two product categoriessuch as bakery products, dairy products, meat, fruits,vegetables, grains, pulses or spices. Specialized food storesare mainly located in shopping markets. Hawkers sellfresh fruits and vegetables on open stalls or handcarts inwet markets. The study was conducted to work out themarketing of meat retailing and to identify the constraintsfaced by the household in the purchase of meat and bythe seller in its marketing.
MATERIALS AND METHODS
Although there were various types of research studiesmentioned in literature for conducting study in differentdisciplines. To collect the relevant information amongthe respondents in Jammu the present study adopteddescriptive type of research design.
Sample area: The present study was carried out inJammu region. As it was not possible to cover up theentire Jammu regions, thus, conveniently four areas weretaken into consideration. To collect the relevantinformation mentioned in four areas equal number ofrespondents were chosen in all the respective areas. The
Table 1 elaborates the detail coverage structure of therespondents in the Jammu region of J&K state.
The study was based on primary and secondarysources of information. The research was conductedwith the help of schedule and after collection of therequired data, it was subjected for tabular and graphicalanalysis.
To work out the marketing of meat retailing, thepresent study incorporated the following variables-Marketing cost of the retailer in supply of chicken/mutton. It involves the cost of variables like labour, salary,ice, transportation, loading/unloading, rent for shop andother items.
To identify the constraints faced by the household inthe purchase of meat and by the seller in its marketing,the study utilized the statements in context to the retailerand consumers and their response were ascertained.
Marketing margin of retailers: To determine themarketing margin of retailers in different regionsfollowing steps have been involved in the study:
Quantity purchased (QP)
QPi = Sale per day *30 days or Monthly sales (MSi)
Purchase cost (PC)
PCi = MSi *Retailers purchase price (RPPi) or
PCi = MSi *RPPi
Total expenditure (TEi)
TEi = Purchase price (PPi) + Total cost (TCi) or
TEi = PPi + TCi
Total sales (TSi)
TSi = Retailers selling price (RSPi) * (MSi) or
TSi = RSPi * MSi
Market margin (MMi) of retailers
MMi = TSi - TEi
Where, i represent retailers selling the meat products inGandhi Nagar, Janipur, Talabtillo and Gangyal.
Garret ranking technique
Per cent position = 100*(Rij - 0.5)/Nj
Area wise coverage of respondentsAreas Respondents RetailersGangyal 25 5Gandhinagar 25 5Janipur 25 5Talabtillo 25 5

Marketing Analysis of Meat Retailing in Jammu 93
Where, Rij stands rank given for the ith factor (i= 1,2……8) by the jth individual (j = 1, 2 …. for urban andrural) and Nj stands for number of factors ranked by jth
individual. Once the per cent positions were found, scoreswere determined for each per cent position by referringGarett’s table. Then the scores for each factor weresummed over the number of households who rankedthat factor. In this way, total scores were arrived at foreach of the eight factors and mean scores were calculatedby dividing the total score by the number of respondents,who gave ranks. Finally, overall ranking of the eight factorswas done by assigning rank 1, 2, 3…8 in the descendingorder of the mean scores. The same procedure wasfollowed for four different areas of Jammu districts.
RESULTS AND DISCUSSIONS
The marketing cost of the retailers in supply of chickenand mutton in Table 1. It has been observed from thetable that retailers’ purchase price for chicken was Rs. 90per kg in all the study area. Whereas, in the case of mutton,it was Rs.310 per kg in all the study areas, except inGandhi Nagar area where it is found to be Rs. 300/kg.
The per month purchase cost of chicken was foundto be highest (Rs. 35,000) in Talabtillo followed by GandhiNagar (Rs. 1,21,500), whereas, for Gangyal and Janipurit is found to be (Rs. 108000) each. The per monthpurchase cost of mutton is found to be the highest (Rs.
2,79,000) in Janipur and Talabtillo area followed byGandhi Nagar (Rs. 2,25,000) and Gangyal (Rs. 186,000)each. The table further revealed that total marketing costfor chicken was found to be the highest (Rs. 9,000) inGangyal followed by Janipur (Rs. 8500). Whereas, in caseof mutton it is the highest in Tallabtillo (Rs. 20,100)followed by Gangyal (Rs. 19800), Gandhi Nagar (Rs.18,000), Janipur (Rs. 17,500). Therefore, total per monthexpenditure for chicken was found to be highest inTalabtillo (Rs. 1,43,000) followed by Gandhi Nagar (Rs.1,29,500), Gangyal (Rs. 1,17,000) and Janipur (Rs.1,16,500). Whereas, the total per month expenditure formutton was found to be the highest in Talabtillo (Rs.2,99,100) followed by Janipur (Rs. 2,96,500), GandhiNagar (Rs. 2,43,000) and Gangyal (Rs. 2,05,800).
As per the retailer’s sales price is concerned it is foundto be (Rs. 120) per kg for chicken in all the areas whereas,in case of mutton it is found to be (Rs. 350) per kg in allthe areas except in Gangyal it is (Rs. 360) per kg. Themarketing margin per month for chicken was found tobe the highest (Rs. 37,000) in Talabtillo followed byGandhi Nagar (Rs. 32,500), Janipur (Rs. 27,500),Gangyal(Rs. 27,000), whereas in case of mutton it is the highestin Gandhi Nagar (Rs. 19,500) followed by Janipur (Rs.18500), Talabtillo (Rs. 15,900), Gangyal (Rs. 10,200).
It has been observed from the Table 2 that themajority of the retailers in Gangyal felt that high cost of
Table 1: Marketing margin of the retailers in supply of chicken/muttonRetailer’s Level Gangyal Gandhi Nagar Janipur Talabtillo
Chicken Mutton Chicken Mutton Chicken Mutton Chicken Mutton(40 kg) (20 kg) (45 kg) (25 kg) (40kg) (30 kg) (50 kg) (30 kg)
Retailer’s purchase price Rs./kg 90 310 90 300 90 310 90 310Quantity purchased (kg/mnth) 1200 600 1350 750 1200 900 1500 900Purchase cost (Rs) 108000 186000 121500 225000 108000 279000 135000 279000Retailer’s expensesSalary per month 1500 1500 2000 2000 2000 2000 2000 2000Ice/ Electricity charges (Rs) 3000 2400 3000 3000 3000 3000 2500 2500Loading/ Unloading 1500 900 1000 1000 1500 1500 1500 1600Transportation — 12000 — 10000 — 9000 — 12000Rent 3000 3000 2000 2000 2000 2000 2000 2000Total cost 9000 19800 8000 18000 8500 17500 8000 20100Total expenditure 117000 205800 129500 243000 116500 296500 143000 299100Retailer’s Sale price/Consumer 120 360 120 350 120 350 120 350purchase price per kgTotal sale per month (Rs) 144000 216000 162000 262500 144000 315000 180000 315000Marketing Margin per month 27000 10200 32500 19500 27500 18500 37000 15900Marketing Margin (per kg) 22.25 17.00 24.07 26.00 22.95 20.55 24.66 17.66

94 Amit Handoo et al.
transport and competition from other traders was a majorconstraint. Whereas in Gandhi Nagar 60 per cent of theretailers are of the opinion that high cost of transportand not getting remunerative price for the meat. As faras the retailers from Janipur area concerned that 80 percent of the retailers reported that high cost oftransportation and not getting remunerative price as animportant problem. In Talabtillo area dwindlingconsumer interest in meat was found to be majorproblem as 80 per cent of retailers reported it. Finally, ithas been concluded from the table that high cost oftransportation appears to be major problem for retailersin Gangyal, Janipur and Gandhi Nagar, whereas,competition from other traders appears to be majorproblem for retailers in Talabtillo.
Table 3 depicted that the majority of the people (72per cent) from Gandhi Nagar area felt that poor qualitywas a major problem for purchasing chicken followedby fear of diseases (64 per cent). Whereas, in the case ofmutton (52 per cent) are of the opinion that high pricewas a major problem followed by fear of diseases (40per cent). It can be revealed that the majority of thepeople (72 per cent) from Gangyal area felt that poorquality was a major problem for purchasing chickenfollowed by fear of diseases (64 per cent). Whereas, in
the case of mutton (52 per cent) are of the opinion thathigh price was a major problem followed by fear ofdiseases (40 per cent). It can be revealed that the majorityof the people (64 per cent) from Janipur area felt thatfear of diseases was a major problem for purchasingchicken followed by poor quality (44 per cent). Whereas,in the case of mutton (72 per cent) are of the opinionthat fear of diseases was a major problem followed byfear of diseases (52 per cent). It can be revealed that themajority of the people (64 per cent) from Talabtillo areafelt that fear of diseases was a major problem forpurchasing chicken followed by poor quality (48 per cent).Whereas, in the case of mutton (60 per cent) are of theopinion that fear of diseases was a major problemfollowed by Non-availability of desired portion of meat(52 per cent).
Furthermore, for identifying the raking of eightfactors that are considered important ones by a majorityof households in their meat purchases were firstidentified. These factors were identified in consultationwith households and retailers. They included nutritivevalue, taste, freshness, tenderness, source of availability,price, fat content and easy availability. Each of the selectedmeat consuming households was asked to rank the aboveeight factors from rank 1 to rank 8. In this analysis, rank
Table 2: Constraints faced by retailers in the marketing of meatConstraints Number of Respondent (N)
Gangyal Gandhi Nagar Janipur Talabtillo Overall(N=5) (N=5) (N=5) (N=5) (N=20)
Not getting remunerative price for the meat 3 (60.00) 3(60.00) 4(80.00) 3(60.00) 13(65.00)High cost of transportation 4(80.00) 3(60.00) 4(80.00) 1(20.00) 12(60.00)Losses due to spoilage and markets 1(20.00) 2(40.00) 2(40.00) 1(20.00) 6(30.00)Dwindling consumer interest in meat 3(60.00) 1(20.00) 3(60.00) 4(80.00) 11(55.00)Competition from other traders 4(80.00) 2(40.00) 2(40.00) 5(100.00) 13(65.00)Note: Figure in parenthesis represent the percentage
Table 3: Problems faced by households in the purchase of meatProblems Gandhi Nagar Gangyal Janipur Talabtillo
Chicken Mutton Chicken Mutton Chicken Mutton Chicken Mutton(N=25) (N=25) (N=25) (N=25) (N=25) (N=25) (N=25) (N=25)
High price - 13(52.00) - 13(52.00) 10(40.00) 18(72.00) - 12(48.00)Lack of availability - 9(36.00) - 9(36.00) - - - -Poor quality 18(72.00) - 18(72.00) - 11(44.00) - 12(48.00) 10(40.00)Non-availability of 10(40.00) 7(28.00) 10(40.00) 7(28.00) 6(24.00) 18(72.00) - 13(52.00)desired portion of meatFear of diseases 16(64.00) 10(40.00) 16(64.00) 10(40.00) 16(64.00) 13(52.00) 16(64.00) 15(60.00)

Marketing Analysis of Meat Retailing in Jammu 95
Table 4: Factors considered in meat purchase decisionFactors Gandi Nagar Gangyal Janipur Talabtillo
Mean Rank Mean Rank Mean Rank Mean RankGarrett’s Garrett’s Garrett’s Garrett’s
score score score scoreNutritionalvalue 64.12 II 73.00 I 73.00 I 64.12 IITaste 72.52 I 41.52 VI 64.12 II 72.52 IFreshness 41.52 VI 56.96 III 56.96 III 49.24 IVTenderness 56.96 III 64.12 II 49.24 IV 56.96 IIISource ofavailability 49.24 IV 37.12 VII 47.08 V 41.52 VIPrice 37.12 VII 31.28 VIII 41.52 VI 47.08 VFat content 31.76 VIII 47.08 V 37.12 VII 31.28 VIIIEasy availability 47.08 V 49.24 IV 34.00 VIII 37.12 VII
64.12
72.52
41.52
56.96
49.24
37.1231.76
47.08
73
41.52
56.96
64.12
37.12
31.28
47.08 49.24
73
64.1256.96
49.24 47.08
41.5237.12
34
64.12
72.52
49.24
56.96
41.52
47.08
31.28
37.12
0
10
20
30
40
50
60
70
80
Nutritional value
Taste Freshness Tenderness Source of availability
Price Fat content Easy availability
Gandi Nagar Mean Garrett’s score Gangyal Mean Garrett’s score
Janipur Mean Garrett’s score Talabtillo Mean Garrett’s score
1 meant most important factor and rank 8 meant leastimportant factor. In the next stage, rank assigned to eachfactor by each individual was converted into per centposition using the formula mention in the methodologysection. Once the per cent positions were found, scoreswere determined for each per cent position by referringGarett’s table. Then the scores for each factor weresummed over the number of households who rankedthat factor. In this way, total scores were arrived at foreach of the eight factors and mean scores were calculated
by dividing the total score by the number of respondents,who gave ranks. Finally, overall ranking of the eight factorswas done by assigning rank 1, 2, 3…8 in the descendingorder of the mean scores. The same procedure wasfollowed for four different areas of Jammu districts.Table 4 and Figure 1 shows that in the purchase of meat,the Gangyal and Janipur households were concernedmost about the nutritional value followed by taste,freshness and tenderness. The Gangyal and Janipurhouseholds bothered the least about price and easy
Figure 1: Factors considered in meat purchase decision

96 Amit Handoo et al.
availability of meat. In respect of Gandhi Nagar andTalabtillo households, taste of meat, were ranked 1st andfat content was ranked last.
CONCLUSION
The present study concluded that Gangyal makeexpenditure on meat more than the other three areas interms of consumer preference for different types ofmeat in four areas is concerned..It has been concludedfrom the study that leg in chicken and mutton followedby liver are in particularly consumed by the respondentsin these areas. While determining the factors responsiblefor making preference and consuming meat, the tasteappears to be having first rank in Gandhi Nagar andTalabtillo whereas fat content the least. On the other handappears nutritional value appears to be highest rank i.e.,I in Gangyal and Janipur whereas price and easyavailability appears to be least. While identifying theconstraints faced by household and retailers the poorquality for chicken and high price for mutton appears tobe the major hindrance or constraints faced by thehouseholds in four areas and on the other hand highcost of transportation appears to be major problem forretailers in Gangyal, Janipur and Gandhi Nagar. Whereascompetition from other traders appears to be majorproblem for retailers in Talabtillo. The study concludedthat marketing margin per kg is highest for mutton inGandhi Nagar Rs. 26.00/kg and for chicken in TalabtilloRs. 24.66/kg respectively.
REFERENCES
Abdulrahman, A.M. 2013. Pattern of Meat Consumption inJalingo Local Government Area in Northern Taraba StateNigeria. Journal of Agriculture and Veterinary Sciences, 5(2):95-104.
Adesehinwa, A.O.K.; J.O. Okunola and M.K. Adewumi. 2004.Socio economic characteristics of ruminant livestockfarmers and their production constraints in some partsof South-western Nigeria. Livestock Research for RuralDevelopment, 16(8).
Akbay, C. and I. Boz. 2005. Turkey’s livestock sector: production,consumption and policies. Livestock Research for RuralDevelopment, 17(9).
Akinwumi, A.O., A.A. Odunsi; A.B. Omojola; J.R. Aworemiand A.O. Aderinola. 2011. Consumer perception andpreference for meat type in Ogbomosho area of Oyo State,Nigeria. International Journal of Applied Agricultural andApicultural Research, 7(1& 2).
Becker, T. 2000. Consumer perception of fresh meat quality: Aframework for analysis. British Food Journals, 102(3): 158-176.
Bilewicz, M.; R.Imhoff and M. Drogosz. 2011. The humanityof what we eat. Conceptions of human uniqueness amongvegetarians and omnivores European Journal of SocialPsychology, 41: 201-209.
Buttriss J.L. 2011. Feeding the planet: an unprecedentedconfluence of pressures anticipated Nutrition Bulletin, 36:235-241.
Economic Survey, J&K 2013-14. Directorate of Economics andStatistics, Govt. of J&K.
Gandhi, V.P. and G. Mani. 1995. Are livestock products rising inimportance? A study of the growth and behavior of theirconsumption in India, Indian Journal of AgriculturalEconomics, 50(3): 283-293.
Heinz, G. and P. Hautzinger. 2007. Meat Processing Technologyfor Small to Medium Producers. Food and AgricultureOrganization of the United Nations, pp. 5-7.
Jagadeesh B. 2010. Study on meat consumption patterns inrural households of Chittoor District of Andhra Pradesh.Tamilnadu Journal of Veterinary & Animal Sciences, 6(4):183-187.
Karthikeyan, R. and V.R. Nedunchezhian. 2013. VerticalIntegration Paving Way to Organised Retailing in IndianPoultry Industry. International Journal of Business andManagement Invention, 2(1): 39-46.
Kavithaa, N.V.; V. Rajkumar and C.M. Sree Lakshmi. 2014. Astudy on the season wise variation in consumptionbehavior of meat in erode district of Tamil Nadu,International Journal of Science, Environment and Technology,3(4): 1412-1414.
NSSO 2001. Levels and Patterns of Consumer Expenditure in India,1999-2000, Report no. 457, Ministry of Statistics andProgramme Implementation, Government of India,New Delhi.
Raghavendra, H.N.; S.B. Mahajanashetti; N.N. Karnool; V.S.Kulkarni and H. Basavaraj. 2009. Meat consumptionpattern and its preference in Dharwad district: A socio-economic analysis. Karnataka J. Agric. Sci., 22(2): 353-358.
Raju, D.T. and M.V.A.N. Suryanarayana. 2005. MeatConsumption in Prakasam District of Andhra Pradesh:An Analysis. Livestock Research for Rural Development,17(11).
Reddy, M.S. and D.T. Raju. 2010. Meat Consumption Patternin Hyderabad City, Indian J. Anim. Res., 44(4): 248-253.
Richardson, N.J.; H.J.H. MacFie and R. Shepherd. 1994.Consumer Attitudes to Meat Eating. Meat Science, 36(1-2): 57-65.

Marketing Analysis of Meat Retailing in Jammu 97
Sinha, P. and A.K. Giri. 1989. Consumption of livestockproducts – analysis and comparisonof data of NSS 32ndNSS 38th Round’, in Indian Society of AgriculturalEconomics 1989 Livestock Economy of India, Oxford andIBH Publishing Co. Pvt. Ltd., New Delhi.
Soundararajan, B. 2011. Sale of Processed Chicken Grows.www.sugunafoods.co.in
Tepper R. 2012. World’s meat consumption: Luxembourg eatsthe most per person, India the least’ The HuffingtonPost.
Thammi Raju, D. and M.V.A.N. Suryanarayana. 2005. Meatconsumption in Prakasam district of Andhra Pradesh:An analysis Livestock Res. Rural Dev., 17.
---------------------------------------------------------------------------------------------------------------------------------------------------------------Received on November, 2017, Revised on January, 2018
Journal of Community Mobilization and Sustainable Development Vol. 13(1), 98-106, January-April, 2018
*Corresponding author email id: [email protected]
Quality Status of Wheat Seed in Eastern India and the EarlyVegetative Growth of Wheat (Triticum aestivum L.) in Relation toSize of Seed
P.R. Kumar1*, C.B. Singh2, Ashish Kumar Gupta2 and Kundan Kumar3
1ICAR-Research Complex for Eastern Region, Research Centre, Ranchi-834010, Jharkhand2ICAR-Indian Agricultural Research Institute, Regional Station, Pusa Samastipur-848125, Bihar3ICAR-Research Complex for Eastern Region, Patna-800014, Bihar
ABSTRACT
Wheat crop in the North Eastern Plain Zone (IGP) of India, is the part of one of the largest agricul turalproduction systems viz., rice-wheat rotation, occupying more than 11 million ha. The yield potential of wheat inthe North Eastern Plains Zone of India is about 4.5 tons per hectare but generally, farmers realize a yield of only2.2 tons per hectare. Seed replacement rate of wheat in different eastern states has also been quite low. A study wasinitiated at the Indian Agricultural Research Institute, Regional Station, Pusa (Samastipur) in 2014-15 to evaluategermination and seedling growth parameters of wheat grown from seeds of varying size. Experiments wereconducted on quality evaluation of different seed grades of bread wheat available to the farmers for sowing tostudy the status of quality vis-à-vis size grading and what is its effect on germination and early dry matter gain withtwo objectives of this investigation. First, to assess the physical quality of wheat seed available to farmers in NorthEastern Plains Zone (which is also known as lower Gangetic plains) in terms of seed size and seed grading andsecond, to determine the relationships between seed size on one hand and germination and seedling developmentaland biomass traits on the other. This paper presents the results of an enquiry into the status vis-à-vis seedgrading, of seed lots of wheat which are available to farmers for sowing with the aim of estimating the extent towhich the quality of wheat seed can be improved by merely grading and to establish the relation between seed sizeand crop establishment. From the results of this study, it can be inferred that 67.97% of area in North easternplains zone (NEPZ) of India is sown with seed either saved by farmers or obtained locally. Use of sub-standardseed may be counted prime among many factors responsible for low productivity of wheat in lower Gangeticplains. Only seeds from authentic sources were found to be properly graded. It was also observed that wheat seedsupplied by registered companies are as good in terms of grading and germination as seeds supplied by governmentorganizations including national and state seed corporations. Graded seeds not only have higher germinationability but also higher seedling vigour in terms of dry matter gain in seedlings during early vegetative growthphase.
Keywords: Wheat, Seed, Vegetative, Relation
INTRODUCTION
In India, wheat covered about 30.23 million hectares areaduring 2015-16 rabi season and accounts for about 93.50million tons production (Anonymous, 2016a). Wheatcrop in the North Eastern Plain Zone (IGP) of India, isthe part of one of the largest agricultural productionsystems viz., rice-wheat rotation, occupying more than
11 million ha (Ladha et al., 2003). It accounts for morethan 36% of the area of wheat grown in the region. Theyield potential of wheat in the North Eastern Plains Zoneof India is about 4.5 tons per hectare but generally,farmers realize a yield of only 2.2 tons per hectare(Anonymous, 2016b). Seed replacement rate of wheatin different eastern states has also been quite low asshown in Table 1 (Anonymous, 2016 a).
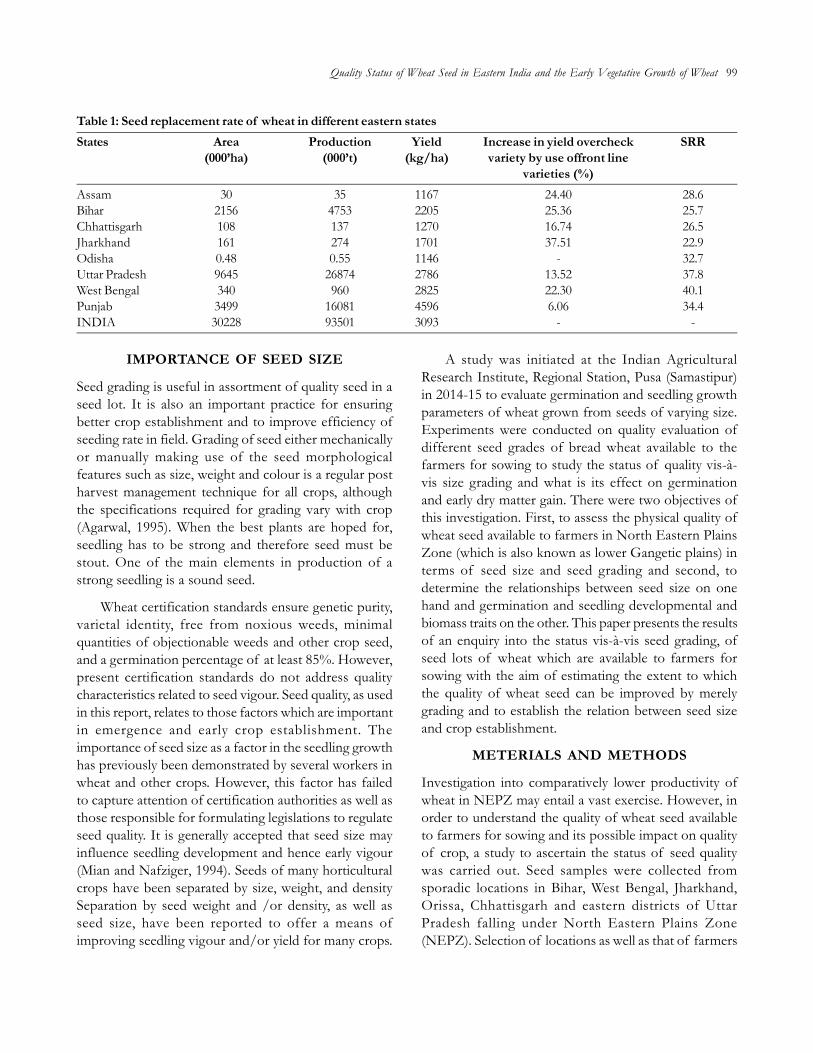
IMPORTANCE OF SEED SIZE
Seed grading is useful in assortment of quality seed in aseed lot. It is also an important practice for ensuringbetter crop establishment and to improve efficiency ofseeding rate in field. Grading of seed either mechanicallyor manually making use of the seed morphologicalfeatures such as size, weight and colour is a regular postharvest management technique for all crops, althoughthe specifications required for grading vary with crop(Agarwal, 1995). When the best plants are hoped for,seedling has to be strong and therefore seed must bestout. One of the main elements in production of astrong seedling is a sound seed.
Wheat certification standards ensure genetic purity,varietal identity, free from noxious weeds, minimalquantities of objectionable weeds and other crop seed,and a germination percentage of at least 85%. However,present certification standards do not address qualitycharacteristics related to seed vigour. Seed quality, as usedin this report, relates to those factors which are importantin emergence and early crop establishment. Theimportance of seed size as a factor in the seedling growthhas previously been demonstrated by several workers inwheat and other crops. However, this factor has failedto capture attention of certification authorities as well asthose responsible for formulating legislations to regulateseed quality. It is generally accepted that seed size mayinfluence seedling development and hence early vigour(Mian and Nafziger, 1994). Seeds of many horticulturalcrops have been separated by size, weight, and densitySeparation by seed weight and /or density, as well asseed size, have been reported to offer a means ofimproving seedling vigour and/or yield for many crops.
A study was initiated at the Indian AgriculturalResearch Institute, Regional Station, Pusa (Samastipur)in 2014-15 to evaluate germination and seedling growthparameters of wheat grown from seeds of varying size.Experiments were conducted on quality evaluation ofdifferent seed grades of bread wheat available to thefarmers for sowing to study the status of quality vis-à-vis size grading and what is its effect on germinationand early dry matter gain. There were two objectives ofthis investigation. First, to assess the physical quality ofwheat seed available to farmers in North Eastern PlainsZone (which is also known as lower Gangetic plains) interms of seed size and seed grading and second, todetermine the relationships between seed size on onehand and germination and seedling developmental andbiomass traits on the other. This paper presents the resultsof an enquiry into the status vis-à-vis seed grading, ofseed lots of wheat which are available to farmers forsowing with the aim of estimating the extent to whichthe quality of wheat seed can be improved by merelygrading and to establish the relation between seed sizeand crop establishment.
METERIALS AND METHODS
Investigation into comparatively lower productivity ofwheat in NEPZ may entail a vast exercise. However, inorder to understand the quality of wheat seed availableto farmers for sowing and its possible impact on qualityof crop, a study to ascertain the status of seed qualitywas carried out. Seed samples were collected fromsporadic locations in Bihar, West Bengal, Jharkhand,Orissa, Chhattisgarh and eastern districts of UttarPradesh falling under North Eastern Plains Zone(NEPZ). Selection of locations as well as that of farmers
Table 1: Seed replacement rate of wheat in different eastern statesStates Area Production Yield Increase in yield overcheck SRR
(000’ha) (000’t) (kg/ha) variety by use offront linevarieties (%)
Assam 30 35 1167 24.40 28.6Bihar 2156 4753 2205 25.36 25.7Chhattisgarh 108 137 1270 16.74 26.5Jharkhand 161 274 1701 37.51 22.9Odisha 0.48 0.55 1146 - 32.7Uttar Pradesh 9645 26874 2786 13.52 37.8West Bengal 340 960 2825 22.30 40.1Punjab 3499 16081 4596 6.06 34.4INDIA 30228 93501 3093 - -
Quality Status of Wheat Seed in Eastern India and the Early Vegetative Growth of Wheat 99

100 P.R. Kumar et al.
was random. Samples of seeds of wheat being sownfor Rabi crop of 2014-15 during the months ofNovember and December, 2014 were collected fromrandomly selected locations in fifteen districts of Biharviz., Samastipur, Vaishali, Darbhanga, Saharsa,Madhubani, Purnia, Khagaria, Buxar, Madhepura, Katihar,Sasaram, Jehanabad, four districts of eastern UttarPradesh (Kaushambi, Gorakhpur, Ghazipur andPratapgarh), four districts of West Bengal (Bolpur, UttarDinajpur, Malda and Bardhaman) and two districts ofJharkhand viz., Deoghar and Dumka during thepreparation for sowing of rabi crop under the ‘ProjectArea’ of “IARI outreach programme for strengtheningof wheat in North Eastern Plains Zone”. A total of 231samples of different varieties were collected. Onlysamples containing not less than 300 grams of seed wereincluded in the study. Breeder and foundation seedsamples were obtained from those farmers who wereunder contract with state or national seed corporations,state agricultural universities and ICAR institutes for seedproduction. A few samples of this category were alsocollected from Krishi Vigyan Kendras involved in seedproduction programme in this region.
Sources of seeds: The seeds were collected fromfarmers about to go for sowing, mostly undertaking fieldpreparations or in some cases where sowing wasunderway. The source of seed was recorded on the basisof information given farmers’ themselves.
Size grading and Seed recovery (%) in differentcomponent grades: Each sample so collected wasdivided into six component grades using top screen of5.5 mm round perforations as recommended by Bureauof Indian Standards (earstwhile Indian Standards Institute)(IS 10892, 1984) and with bottom screen of differentsizes with slotted perforations as shown in Table 2. The
seeds were screened using a common top screen andvarying bottom screens in successions. After separatinggrade I using 2.75 mm slotted screen (S1), the samplewas graded using 2.5 mm slotted apertures (S2) forseparating grade II seeds followed by 2.30 mm (S3) forgrade III seed, 2.10 mm screen (S4) for grade IV and1.8 mm screen (S5) for grade V seed from the lot.
Aperture size of sieves were calculated usingfollowing formula:
a = (25.4/b)-c,
where, a = aperture i.e., the cut point (equal errors orpartition size) at which a screening process operates individing the material screened into two size fractions[measured in mm].
b = mesh count i.e., the number of openings per linealinch, measured by counting the number of openingsfrom the centre of one wire to the centre of anotherwire one lineal inch away, and
c = distance between two successive perforations[measured in mm].
The screenings left after separating grade V seedswere weighed for calculating the percentage of the sixthgrade. The sixth grade was made up of tailings whichwere weighed for recording data and immediatelydiscarded. Different grades were stored for furtherstudies and their proportion was calculated as percentageusing the following formula:
Wt. of seeds retained in respective sievesSeed recovery (%) = x 100 Total weight of seeds
Samples were analysed for calculation of meanproportion of ‘good seed’ i.e., (grade I, II and III) andscreenings, i.e., (grade IV, V and tailings).
Trueness to type: All the samples collected fromfarmers’ fields were subject to grow out test forconfirmation of trueness to type. Plants grown fromeach sample were examined against a reference plot ofthe corresponding variety grown from nucleus seedmaintained at the station. Each sample was examined asto whether it belongs to the one stated by the concernedfarmer, if not cent percent, at least predominantly. If so,it was recorded as belonging to the stated variety. Incase the varietal characters did not confirm to the statedvariety. Correct identity was established by matching the
Table 2: Screen aperture sizes of sieves used for size gradingof samplesGrade Top screen aperture Bottom screen aperture
Size Shape Screen Size Shape(mm) No. (mm)
I 5.5 Round S 1 2.75 SlottedII 5.5 Round S 2 2.5 SlottedIII 5.5 Round S 3 2.3 SlottedIV 5.5 Round S 4 2.1 SlottedV 5.5 Round S 5 1.8 SlottedTailings 5.5 Round Without perforations
Quality Status of Wheat Seed in Eastern India and the Early Vegetative Growth of Wheat 101
diagnostic characters of the predominant types in thepopulation to other standard samples, and if foundcorrectly matching with any of them, identity wasrecorded as that of the corresponding standard sample.
Seed quality studies: Seeds collected during this surveybelong to 18 identifiable varieties developed by differentinstitutions in India. On account of varied pedigree, theyincidentally represented wide range of genetic variability.Quality evaluation of different grades of seeds of thesevarieties was carried out. For this, equal portions of pureseed fraction from all samples belonging to a varietywere drawn and composited to make one sufficientlylarge sample of that variety. Thereafter, samples of allvarieties thus constituted were graded into six componentgrades using the same procedure as used for size gradingof samples obtained from farmers’ field. The sieves usedwere the same as mentioned in Table 2. The sixth gradeconsisted of tailings which were weighed for recordingdata and discarded thereafter.
Test weight: Thousand seed weight of ungraded sampleas well as component grades of all varieties wererecorded using an electronic balance.
Germination: Germination test was conducted forseeds of first five grades (Grade I to V) separately.Germination test of an ungraded but cleaned samplewas also done side by side for comparison. Germinationtest of good seed fractions i.e., grade I, II and III takentogether and ‘screenings’ i.e., grades IV and V takentogether was conducted. Four replicates of hundred seedswere sown in paper towel medium and kept under thetest conditions of 20° ±1°C and 95° ± 3 per cent relativehumidity maintained in a germination chamberilluminated with fluorescent light. After the test periodof eight days the normal seedlings were counted andthe mean values expressed as percentage (ISTA, 1999)to the total number of seeds placed for germination.
Dry matter production (mg per 10 seedlings): After
recording the data for germination test, ten normalseedlings from all the samples put for germination testwere selected at random, dried in a hot air ovenmaintained at 85°C for 48 hr and cooled in a desiccatorsfor 30 minutes, and weighed in an electronic digitalbalance. The mean weight was expressed as dry matterproduction per 10 seedlings in milligram.
Conditions in which the corresponding crops weregrown, with respect to date of sowing, irrigation,fertilizer application and care in post-harvest operations,are not known. Therefore, to expect the resulting seedsto exhibit ideal characters like 1000 seed weight wouldnot be fair. In light of these facts, the quality has beenlooked at here is only composition of seed lots in termsof proportion of bold, medium small, undersized,shrivelled and broken seeds and other useless materialpresent in the samples collected and analyzed.
Seedling dry weight = Y/ [X- (a+b+c)]
Where, Y = Total dry weight of normal seedlingsX= Number of seeds kept for germinationa = Number of abnormal seedlingsb = Number of dead seedsc= Number of fresh un-germinated seeds
Vigour index: The Vigour index values were computed,adopting the procedure of Abdul-Baki and Anderson(1973) as given below and expressed as whole number-
Vigour index II= Germination (%) x seedling dryweight (mg)
RESULTS AND DISCUSSION
Sources of seed: The sources have been classified intofive categories for further tabulations.
Status of grading of seed available for sowing tofarmers: From a total of 231, samples 157 samples werefound to belong to farmers saved seeds which indicatesas high as 67.96% of the samples were farmers’ savedseed.
Table 3: Sources of samples of seed and classification of sources into congruent groupsInstitutions GroupState seed corporations, National Seed Corporation, Tarai Development Corporation Govt agenciesand NGOs including KVKs run by NGOs.State Agricultural Universities and KVKs run by SAUs SAUsBreeder and Foundation seeds Breeder and foundation seedPrivate seed companies (Large as well as small) Private companiesSeed Supplied by Local seed producers (unbranded) and Farmers’ own saved seeds Local and farm saved seed

102 P.R. Kumar et al.
Table 4: Composition of seed samples on the basis of seed sizeS. Source of seed Frequency Proportion of different grades (%) Good Screen- GradeNo. of seed in ungraded samples Seed ings V +
I II III IV V T (Grades (Grades TailingsI+II+III) IV+V+T) (%)
(%) (%)1 Seed Supplied by Local 84/231 21.1 24.3 33.5 15.5 3.9 1.7 78.9 21.1 5.6
seed producers (unbranded)2 Farmers’ own saved seeds 73/231 17.33 23.55 34.47 18.37 4.57 1.71 75.4 24.6 6.33 Local and farm saved seed 157/231 19.23 23.92 33.99 16.94 4.23 1.68 77.14 22.9 5.9
[S. no. 1 +2]4 Private companies 21/231 43.95 27.57 21.05 4.76 2 0.67 92.6 7.4 2.75 State seed corporations, 31/231 41.27 29.39 21.77 5.21 1.65 0.71 92.4 7.6 2.4
National Seed Corporation6 SAUs 12/231 52.04 23.75 16.62 4.75 2 0.83 92.4 7.6 2.87 Breeder and foundation seed 10/231 49.1 30.7 15.95 3.15 1.1 0 95.75 4.3 1.18 Seeds from authentic source 74/231 46.59 27.85 18.85 4.47 1.69 0.55 93.29 6.7 2.2
[S. No. 4+5+6+7]
The mean proportion of tailings and grade V seedin farm saved seed was 4.1 % and 1.7% respectively,making it obvious that such seed lots are subjected tominimal processing which restricts only to removal ofbroken shrivelled or undersize seeds. In most of the cases,the tailings included seeds of one or more of Chenopodiumsp., Cannabis sp, Amaranthus spinosus and Phalaris minor.
Comparison of quality of all purchased seeds: Seedsobtained from government agencies, research institutes,state agricultural universities, private companies withregistered brands have been classified together asauthentic source (Table 4). Farm saved seeds are notpurchased, therefore they have not been taken in thiscomparison. The mean proportion of good seed(cumulative recovery over sieve with a= 2.3 mm) in seedsfrom certified sources (breeder and foundation seeds,seeds from seed corporations, KVKs, KRIBHCO,IFFCO etc.) is 93.24% that entails only 6.76% ofscreenings. The mean proportion of good seed in seedspurchased from non-certified seeds source is 81.80%suggesting 18.2% of screenings. Data analysis of certifiedclass of seed brings out that it contains 92.68% of goodseed and 7.32% of screenings. In further analysis it wasfound seeds from private companies (sold as truthfullylabelled) contains 92.66% good seed i.e., 7.3% ofscreenings which is not very different from certifiedsources (including breeder and foundation classes ofseeds). The truthfully labelled seed from companies areas good in quality as certified class of seed. It points to
reliability of seeds from private sector and presents astrong case for public-private sector partnership, needof which is felt and expressed at many fora but concreteaction plan on considerable scale is yet to be visible.
Presence of grade IV and V seed indicated towardsincomplete removal of seeds with less than 2.3 mmdiameter which in turn indicated that seed agencies areeither using lower sieve with aperture size less than 2.3mm or are unable to attain complete removal of gradeIV and V material due to any reason concerned withfunctioning of processing machine (calibration ofaspirator or fast run of seed over the sieve).
Identity of samples (testing for genuineness ofvarieties): In the investigation of trueness to type, itwas found that as much as 13 samples were sold in thename of other varieties. The details are presented inTable 5.
Out of these 13 instances, 3 times PBW 343 wassold in the name of other varieties viz., UP 262 (3 times)and once as HUW 234. UP 262 was found to be sold inthe name of PBW 343 once. PBW 373 was found to besold as PBW 343 twice. In one instance CBW 38 hasbeen found to be supplied in the name of UP 262. Lok1 has been sold in the name of UP 262 twice, PBW 343once and Sharbati once. This indicates that there is highdemand of UP 262, Lok 1, PBW 343 and PBW 373,and that seed is available production in ample quantitywith small-time local producers at the same time. In one

Quality Status of Wheat Seed in Eastern India and the Early Vegetative Growth of Wheat 103
case NW 2036 was sold as UP 262. Popularity of thesevarieties, low awareness among farmers about varietiesand readiness of non-descript vendors with abundantstocks of these seeds make the environment conducivefor sale of seeds of these varieties interchangeably in thename of one another.
In addition, eight samples were reported un-named,referred generically by farmers as ‘gharaiya ‘(literallymeaning home-sourced). The samples were subject togrow out test in order to identify as to whether theybelong to varieties in vogue. The details are presented inTable 6.
It is notable that all of them are bold seeded varieties.The one at serial number 5 may possibly belong to oneof the umpteen NL types which come from Nepal andare widely cultivated in foothills of Nepal and adjoiningareas in Bihar and Uttar Pradesh. The mean good seedcomponent was as high as 89.54% despite being savedin a layman fashion and minimal processing. Strong
tendency of the concerned farmers to retain their ownseeds for their sowing can be attributed to this fact. Thus,a total of 21 samples constituting 9.1% of the total weresold either in disguised identity or were grown devoidof any identity. It is also pertinent to mention thatproportion of screenings on an average in these lots is20.1% and that of tailings works out to be 1.5%. Theaverage thousand grain weight was as high as 41.3 g.This holds the secret to popularity of these non-identifiedor non-descript varieties among farmers.
It is evident from Table 7 that seeds up to grade IIIi.e., seed retained over sieve with aperture size 2.3 mmexhibit germination ability over minimum seedcertification standard i.e., 85%. It was found that statusof grading of self saved seeds was less than satisfactory.The mean proportion of screenings was as high as 22.86%in 157 farmer saved samples and samples from localsuppliers put together as compared to 6.74% in seedsfrom authentic sources put together. It was highest infarm saved seeds (24.6%) followed by seeds suppliedby local producers (21.1%). It was lowest in breederseed and foundation seed samples (4.4%). Highproportion of grade V and tailings (6.3%) present infarmers ’saved seed pointed to lack of processing ofseed lots.
Tailings were present in all seeds in varyingproportions except in breeder and foundation seeds andhighest in farm saved seed (1.71%) followed by samplesfrom seed supplied by local producers (1.66%). In seedssupplied by seed corporations, it was 0.71%, in seedsupplied by universities, it is (0.83%) and in seed sold byprivate companies, it was 0.67%.
Table 5: Details of samples sold with changed variety namesParticulars Sold under Recognised in Frequ-
variety name grow out test encyas variety
Local supplier UP 262 Lok 1 2Farm saved UP 262 PBW 343 3Local supplier UP 262 NW 2036 1Farm saved UP 262 CBW 38 1Farm saved PBW 343 Lok 1 1Farm saved PBW 343 UP 262 1Local supplier PBW 343 PBW 373 2Farm saved HUW 234 PBW 343 1Farm saved Sharbati Lok 1 1
Table 6: Details of samples found without variety namesPlace from where sample 1000 seed Good seed Screenings Variety identified aftercollected weight (Grade I+ II+ III) (Grade IV+ V) grow out test
(g) (%) (%)Sahebganj, Jharkhand 38 75 20 PBW 343Vaishali, Bihar 42 78 21 PBW 343Coochbehar, West Bengal 46 74 24.5 SonalikaGaya, Bihar 36 72.5 26 PBW 154Darbhanga, Bihar 39 83 16.5 NLGorakhpur, U P 43 85 15 CBW 38Gopalganj, Bihar 45 89 11 K 9107Lakhisarai, Bihar 41 71 27 Lok 1Mean 41.3 78.4 20.1

104 P.R. Kumar et al.
Table 7: Germination and dry matter production by seeds of different sizesVariety Germination (%) of different grades of seed Dry matter (mg) of different grades of seed
Grade I II III IV V Grade I II III IV VHI 1563 94 98 97 78 69 208 192 188 152 141HD 2733 88 89 85 79 67 191 182 115 88 72HD 2824 91 86 80 71 66 230 175 154 125 113HD 2967 95 91 90 78 68 221 212 177 139 112CBW 38 90 85 84 80 72 203 165 150 121 94DBW 17 92 92 85 76 71 5277 220 208 113 72DBW 39 96 94 98 82 71 214 199 176 101 65K 9107 98 95 90 70 55 261 192 161 94 71Lok 1 95 94 94 82 62 240 199 173 111 100PBW 154 91 93 92 75 63 189 163 101 90 76PBW 343 88 91 90 78 73 233 195 148 116 84PBW 373 98 84 86 65 58 251 209 182 142 111PBW 502 98 96 92 71 52 212 201 179 161 119PBW 590 89 82 83 79 64 226 204 153 109 78Raj 4120 96 97 88 71 64 187 162 124 98 71UP 262 92 91 84 76 65 209 187 153 117 83NL 90 81 77 63 57 239 215 176 130 96NW 2036 94 93 94 85 73 226 207 179 129 100Mean 93.06 90.67 88.28 75.5 65 500.94 193.28 160.94 118.67 92.11C D at 5% 3.21 2.24 2.05 4.08 5.55 13.16 14.42 18.97 11.66 20.79
Table 8: Germination and seedling dry weight of ungraded seeds, graded seeds and screeningsVariety Ungraded seed Graded seeds (Grade I + II+ III) Screenings (Grade IV + V)
Germination Seedling dry Germination Seedling dry Germination Seedling dry(%) weight (mg) (%) weight (mg) (%) weight (mg)
HI 1563 91 175 95 194 73 148HD 2733 75 133 86 169 74 82HD 2824 77 147 85 181 68 109HD 2967 83 160 92 199 73 119CBW 38 79 254 87 198 76 96DBW 17 82 214 89 248 72 87DBW 39 81 179 93 201 75 86K 9107 80 198 94 177 62 86Lok 1 86 206 94 162 78 103PBW 154 84 132 92 159 72 74PBW 343 85 151 89 186 75 93PBW 373 79 196 87 168 62 129PBW 502 89 198 94 171 65 144PBW 590 76 149 85 197 75 91Raj 4120 78 190 84 229 51 66UP 262 83 163 92 184 46 115NL 85 201 85 211 84 194NW 2036 81 158 85 198 63 57
Mean 81.89 178 89.33 190.67 69.11 104.39CD at 5% 3.33 14.35 2.76 11.09 4.18 15.98
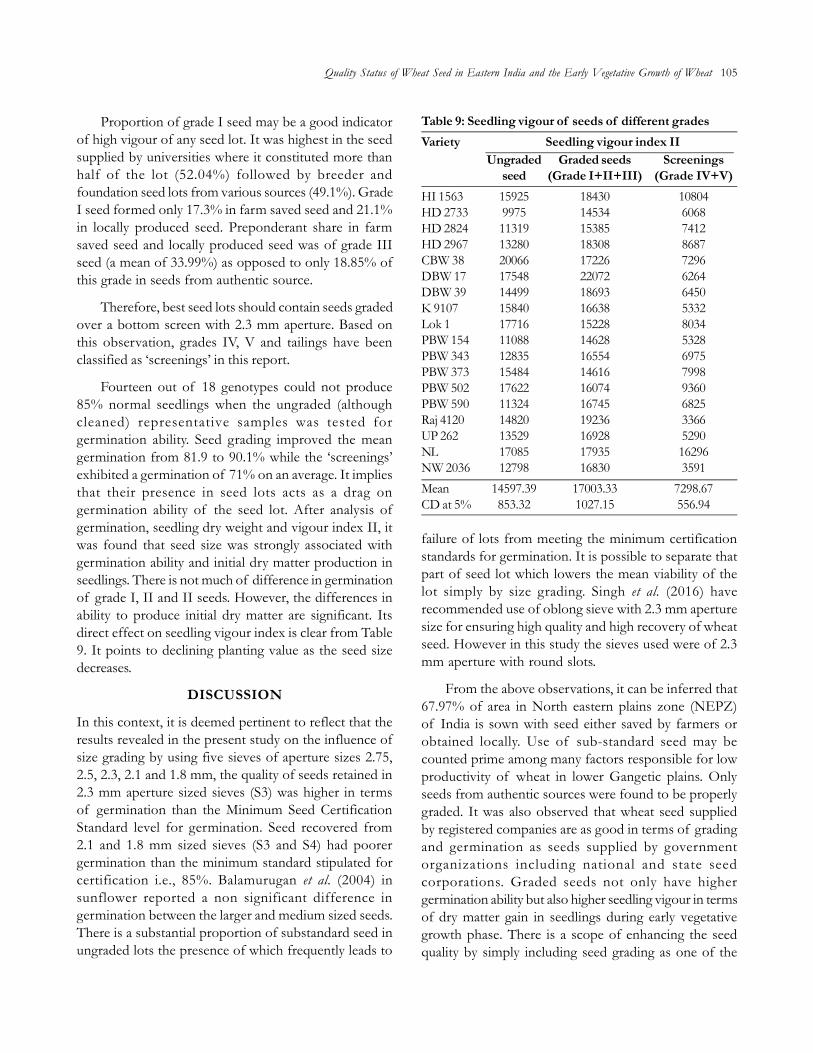
Quality Status of Wheat Seed in Eastern India and the Early Vegetative Growth of Wheat 105
Proportion of grade I seed may be a good indicatorof high vigour of any seed lot. It was highest in the seedsupplied by universities where it constituted more thanhalf of the lot (52.04%) followed by breeder andfoundation seed lots from various sources (49.1%). GradeI seed formed only 17.3% in farm saved seed and 21.1%in locally produced seed. Preponderant share in farmsaved seed and locally produced seed was of grade IIIseed (a mean of 33.99%) as opposed to only 18.85% ofthis grade in seeds from authentic source.
Therefore, best seed lots should contain seeds gradedover a bottom screen with 2.3 mm aperture. Based onthis observation, grades IV, V and tailings have beenclassified as ‘screenings’ in this report.
Fourteen out of 18 genotypes could not produce85% normal seedlings when the ungraded (althoughcleaned) representative samples was tested forgermination ability. Seed grading improved the meangermination from 81.9 to 90.1% while the ‘screenings’exhibited a germination of 71% on an average. It impliesthat their presence in seed lots acts as a drag ongermination ability of the seed lot. After analysis ofgermination, seedling dry weight and vigour index II, itwas found that seed size was strongly associated withgermination ability and initial dry matter production inseedlings. There is not much of difference in germinationof grade I, II and II seeds. However, the differences inability to produce initial dry matter are significant. Itsdirect effect on seedling vigour index is clear from Table9. It points to declining planting value as the seed sizedecreases.
DISCUSSION
In this context, it is deemed pertinent to reflect that theresults revealed in the present study on the influence ofsize grading by using five sieves of aperture sizes 2.75,2.5, 2.3, 2.1 and 1.8 mm, the quality of seeds retained in2.3 mm aperture sized sieves (S3) was higher in termsof germination than the Minimum Seed CertificationStandard level for germination. Seed recovered from2.1 and 1.8 mm sized sieves (S3 and S4) had poorergermination than the minimum standard stipulated forcertification i.e., 85%. Balamurugan et al. (2004) insunflower reported a non significant difference ingermination between the larger and medium sized seeds.There is a substantial proportion of substandard seed inungraded lots the presence of which frequently leads to
Table 9: Seedling vigour of seeds of different gradesVariety Seedling vigour index II
Ungraded Graded seeds Screeningsseed (Grade I+II+III) (Grade IV+V)
HI 1563 15925 18430 10804HD 2733 9975 14534 6068HD 2824 11319 15385 7412HD 2967 13280 18308 8687CBW 38 20066 17226 7296DBW 17 17548 22072 6264DBW 39 14499 18693 6450K 9107 15840 16638 5332Lok 1 17716 15228 8034PBW 154 11088 14628 5328PBW 343 12835 16554 6975PBW 373 15484 14616 7998PBW 502 17622 16074 9360PBW 590 11324 16745 6825Raj 4120 14820 19236 3366UP 262 13529 16928 5290NL 17085 17935 16296NW 2036 12798 16830 3591Mean 14597.39 17003.33 7298.67CD at 5% 853.32 1027.15 556.94
failure of lots from meeting the minimum certificationstandards for germination. It is possible to separate thatpart of seed lot which lowers the mean viability of thelot simply by size grading. Singh et al. (2016) haverecommended use of oblong sieve with 2.3 mm aperturesize for ensuring high quality and high recovery of wheatseed. However in this study the sieves used were of 2.3mm aperture with round slots.
From the above observations, it can be inferred that67.97% of area in North eastern plains zone (NEPZ)of India is sown with seed either saved by farmers orobtained locally. Use of sub-standard seed may becounted prime among many factors responsible for lowproductivity of wheat in lower Gangetic plains. Onlyseeds from authentic sources were found to be properlygraded. It was also observed that wheat seed suppliedby registered companies are as good in terms of gradingand germination as seeds supplied by governmentorganizations including national and state seedcorporations. Graded seeds not only have highergermination ability but also higher seedling vigour in termsof dry matter gain in seedlings during early vegetativegrowth phase. There is a scope of enhancing the seedquality by simply including seed grading as one of the

106 P.R. Kumar et al.
preparatory steps before sowing of wheat in northeastern plains zone. It is therefore required that farmersmay be made aware about concept of seed quality andseed grading.
REFERENCES
Abbul-Baki, A.A. and J.D. Anderson. 1973 Vigourdetermination in soybean seed by multiple criteria. CropSci., 13: 630-633.
Anonymous. 2016a. Progress Report of All India CoordinatedWheat & Barley Improvement Project 2015-16, Director’sReport. Ed. G.P. Singh, ICAR-Indian Institute of Wheat& Barley Research, Karnal, India. Pp. 96.
Anonymous. 2016b. Progress Report of the All IndiaCoordinated Wheat & Barley Improvement Project 2015-16, Vol. 1, Crop Improvement. Eds: Vinod Tiwari; R.Chatrath; G. Singh; R. Tiwari; B.S. Tyagi; Raj Kumar; S.K.Singh; Satish Kumar; C.N. Mishra; K. Venkatesh; H.M.Mamrutha; Vikas Gupta; Gopalareddy; Ajay Verma; InduSharma; R.K. Gupta and G.P. Singh. ICAR-IndianInstitute of Wheat and Barley Research, Karnal, India.pp. 258.
Ellis, R.H. and E.H. Roberts. 1980. Towards a rational basis forTesting Seed Quality in Seed Production. 1st Edition,Butterworths, London, pp. 605-635.
IS 10892 (1984). Recommendations for aperture size of sievesfor seed cleaners [FAD 20: Agriculture and Food ProcessingEquipments].
Ladha, J.K.; J.E. Hill; J.M. Duxbury; R.K. Gupta and R.J. Buresh.2003b. Improving the productivity and sustainability ofrice-wheat systems: issues and impacts. ASA Spec. Publ.65. ASA, CSSA and SSA, Madison, WI, pp. 1–231.
Larry, D. Robertson. 1984. Effect of Seed Size and Density onWinter Wheat Performance Contribution 84·326-S, ColbyBranch Experiment Station, Kansas State UniversityAgricultural Experiment Station and CooperativeExtension Service.
Mian, M.A.R. and E.D. Nafziger. 1994. Seed size and waterpotential effects on germination and seedling growth ofwinter wheat. Crop Science, 34: 169–171.
Singh, A.; P. Singh; C.B. Singh; A.L. Jatav and P. Singh. 2016.Standardization of sieve size for grading of seed of wheat(Triticum aestivum L.). Progressive Agriculture, 16(2): 174-177.
---------------------------------------------------------------------------------------------------------------------------------------------------------------Received on November, 2017, Revised on January, 2018

Journal of Community Mobilization and Sustainable Development Vol. 13(1), 107-112, January-April, 2018
*Corresponding author email id: [email protected]
A Study of Migration Pattern in Kumaun Hills and Associated Socio-Economic Factors
Nirmal Chandra1*, M.L. Roy2, Anirban Mukherjee3, Renu Jethi4 and Kushagra Joshi5
1Incharge and Principal Scientist, 2,3,4&5Scientist, Social Science Section, ICAR-Vivekananda Parvatiya Krishi Anusandhan Sansthan,Almora-263601, Uttarakhand
ABSTRACT
Migration is the physical movement of people from one place to another in search of improved livelihood andsecurity. The hill and mountainous states of India are the worst sufferers of migration. Uttarakhand is one of theIndian hill states with 10 hill districts. The present study was conducted in Almora district of Kumaun Uttarakhandtaking a random sample of 125 rural families from randomly selected 12 villages of six blocks. The objective ofthe study was to delineate the migration pattern in hills and associated socio-economic factors. Results showedthat majority of the sampled families (31.20%) were having more than 3 migrant members. It was found thatmajority of the migrants (77%) were males. The study revealed that majority of the migrants (46%) werebelonged to the age group of 15-30 years. It was also found that majority of the migration (83.33%) occurredfrom the households belonged to others castes. It was revealed that most of the migration (75%) occurred fromthe households having no land. It was also found that most of the migration (63.10%) occurred from thehouseholds having annual income of Rs 50000/- or less. It was exposed that males were mostly migrated foremployment (38%) and females were mostly migrated for marriage (59.76%). The most important factor behindmigration from hills was identified to be unemployment. The study suggests that more employment opportunitiesin terms of diversified farming, IT centres, agro-tourism etc. should be promoted in rural hill areas and it shouldbe supported by infrastructural facilities for education, health, market, electricity, drinking water etc. to retain therural youths in hills.
Keywords: Migration, Push factor, Pull factor, Hill people, Out migration, In migration
INTRODUCTION
United Nations defined migration as a move from onemigration defining area to another, usually crossingadministrative boundaries made during a given migrationinterval and involving a change of residence (UN, 1993).The change in residence can take place either permanentor semi-permanent or temporary basis (Premi, 1990).Migration in terms of physical movement from one placeto another in search of improved livelihood and securityis continued to be a major phenomenon in the historyhuman kind. When a region or a sector fails to providelivelihood and security to its people, then the people ofthat region or sector tends to migrate to other regionsor sectors which will provide them better livelihood andsecurity. In the modern age of liberization, privatizationand globalization, migration has become a global
phenomenon. Further the pressure of industrializationadds salt to this incident because it widens the gapbetween rural and urban areas which results a major shiftof the workforce from the rural areas to urban areasfor better livelihood and other facilities. In developingand underdeveloped countries where country’s economyis based on agriculture, the migration of people fromvillages to towns is very common. Internal migration isnow recognized as an important factor in influencingsocial and economic development of the developingcountries. Industrialization and economic developmenthas another side on the coin which is mass-scalemovements of people from villages to towns, fromtowns to cities, from cities to capitals and from onecountry to another country. Though the factors ofmigration are always a matter of debate and should notbe made exhaustive but these can be categorized into
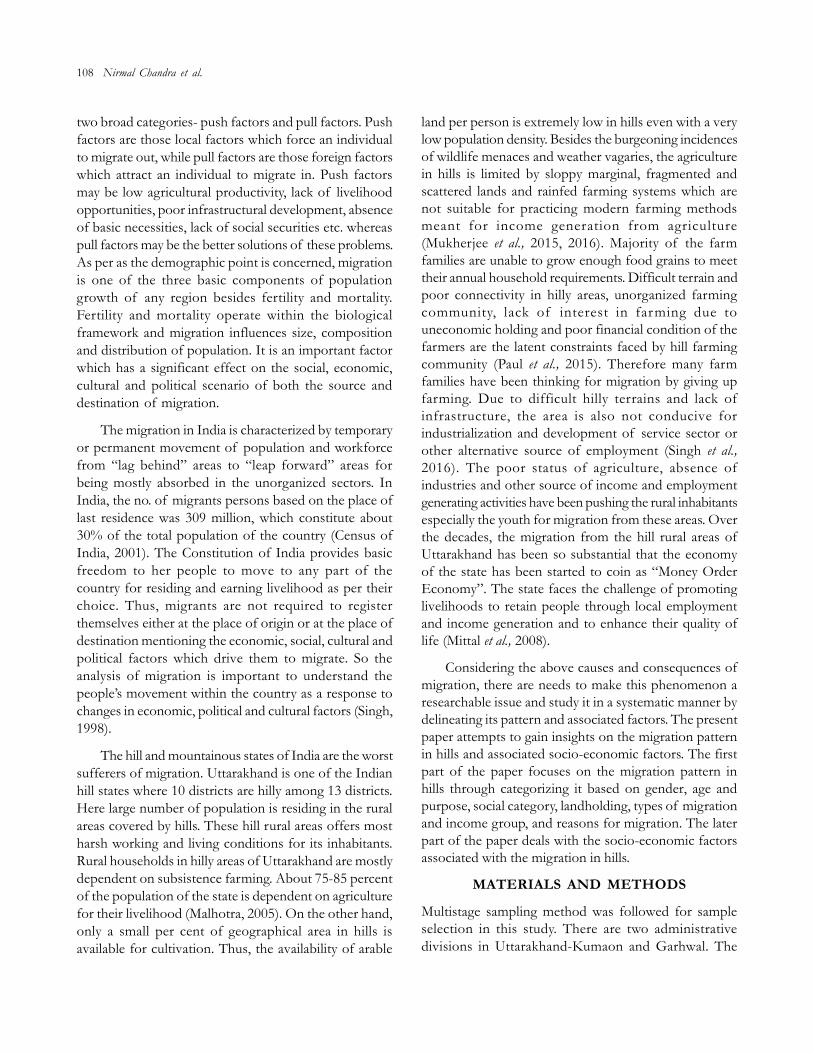
108 Nirmal Chandra et al.
two broad categories- push factors and pull factors. Pushfactors are those local factors which force an individualto migrate out, while pull factors are those foreign factorswhich attract an individual to migrate in. Push factorsmay be low agricultural productivity, lack of livelihoodopportunities, poor infrastructural development, absenceof basic necessities, lack of social securities etc. whereaspull factors may be the better solutions of these problems.As per as the demographic point is concerned, migrationis one of the three basic components of populationgrowth of any region besides fertility and mortality.Fertility and mortality operate within the biologicalframework and migration influences size, compositionand distribution of population. It is an important factorwhich has a significant effect on the social, economic,cultural and political scenario of both the source anddestination of migration.
The migration in India is characterized by temporaryor permanent movement of population and workforcefrom “lag behind” areas to “leap forward” areas forbeing mostly absorbed in the unorganized sectors. InIndia, the no. of migrants persons based on the place oflast residence was 309 million, which constitute about30% of the total population of the country (Census ofIndia, 2001). The Constitution of India provides basicfreedom to her people to move to any part of thecountry for residing and earning livelihood as per theirchoice. Thus, migrants are not required to registerthemselves either at the place of origin or at the place ofdestination mentioning the economic, social, cultural andpolitical factors which drive them to migrate. So theanalysis of migration is important to understand thepeople’s movement within the country as a response tochanges in economic, political and cultural factors (Singh,1998).
The hill and mountainous states of India are the worstsufferers of migration. Uttarakhand is one of the Indianhill states where 10 districts are hilly among 13 districts.Here large number of population is residing in the ruralareas covered by hills. These hill rural areas offers mostharsh working and living conditions for its inhabitants.Rural households in hilly areas of Uttarakhand are mostlydependent on subsistence farming. About 75-85 percentof the population of the state is dependent on agriculturefor their livelihood (Malhotra, 2005). On the other hand,only a small per cent of geographical area in hills isavailable for cultivation. Thus, the availability of arable
land per person is extremely low in hills even with a verylow population density. Besides the burgeoning incidencesof wildlife menaces and weather vagaries, the agriculturein hills is limited by sloppy marginal, fragmented andscattered lands and rainfed farming systems which arenot suitable for practicing modern farming methodsmeant for income generation from agriculture(Mukherjee et al., 2015, 2016). Majority of the farmfamilies are unable to grow enough food grains to meettheir annual household requirements. Difficult terrain andpoor connectivity in hilly areas, unorganized farmingcommunity, lack of interest in farming due touneconomic holding and poor financial condition of thefarmers are the latent constraints faced by hill farmingcommunity (Paul et al., 2015). Therefore many farmfamilies have been thinking for migration by giving upfarming. Due to difficult hilly terrains and lack ofinfrastructure, the area is also not conducive forindustrialization and development of service sector orother alternative source of employment (Singh et al.,2016). The poor status of agriculture, absence ofindustries and other source of income and employmentgenerating activities have been pushing the rural inhabitantsespecially the youth for migration from these areas. Overthe decades, the migration from the hill rural areas ofUttarakhand has been so substantial that the economyof the state has been started to coin as “Money OrderEconomy”. The state faces the challenge of promotinglivelihoods to retain people through local employmentand income generation and to enhance their quality oflife (Mittal et al., 2008).
Considering the above causes and consequences ofmigration, there are needs to make this phenomenon aresearchable issue and study it in a systematic manner bydelineating its pattern and associated factors. The presentpaper attempts to gain insights on the migration patternin hills and associated socio-economic factors. The firstpart of the paper focuses on the migration pattern inhills through categorizing it based on gender, age andpurpose, social category, landholding, types of migrationand income group, and reasons for migration. The laterpart of the paper deals with the socio-economic factorsassociated with the migration in hills.
MATERIALS AND METHODS
Multistage sampling method was followed for sampleselection in this study. There are two administrativedivisions in Uttarakhand-Kumaon and Garhwal. The

A Study of Migration Pattern in Kumaun Hills and Associated Socio-Economic Factors 109
present study was conducted in Kumaon division whichwas selected purposively. There are 6 districts in Kumaondivision. Amongst these districts, five districts viz. Almora,Bageshwar, Champawat, Nainital and Pithoragarh arepredominantly hill districts and the remaining one i.e.Udham Singh Nagar is in plains. Since the present studywas planned for the rural areas of hilly districts ofUttarakhand, the district Udham Singh Nagar wasdiscarded at the initial stage of sampling. Amongst fivehill districts of Kumaon division, Almora was selectedrandomly. Six blocks namely Hawalbagh, Lamgara,Dhauladevi, Bhaisiachhana, Chaukhutia and Dwarahatwere selected randomly from 11 blocks of Almoradistrict. Two villages from each selected block wereselected randomly. Thus, a total of 12 villages viz. Matelaand Sunaula from Hawalbagh block, Chaukuna andChaumu from Lamgara block, Bajeli and Balikhet fromDhauladevi block, Kasan and Lweta from Bhaisiachhanablock, Dhudalia and Chaukhutia from Chaukhutia blockand Almia Gaon and Oliya Gaon from Dwarahat blockwere surveyed for the purpose of the study. A total of125 farm families were selected randomly from thesevillages for focused group discussions to extract migrationrelated information. The primary data obtained throughfocused group discussions were tabulated and analyzedusing simple statistical tools like frequency, percentageand ranking.
RESULTS AND DISCUSSION
Family Members Migrated from Families Residingin Rural Hill Areas: Table 1 shows the percentage ofmigration from families residing in rural hill areas understudy. It was found that majority of the families (31.20%)were having more than 3 migrant members followedby families with 1 migrant member (26.40%), familieswith 2 to 3 migrant members (24.80%) and families withno migrant member (17.60%).
Distribution of Migrants on Gender Basis: Table 2depicts the distribution of migrants on gender basis inrural hill areas under report. It was revealed that majorityof the migrants (77%) were males and only 23 per centof the migrants were female.
Table 2: Distribution of migrants on gender basisName of Block Male Female Total
migrant MigrantHawalbagh 39 6 45Lamgara 41 11 52Dhauladevi 26 7 33Bhaisiachhana 35 9 44Chaukhutia 27 10 37Dwarahat 29 16 45Total 197(77%) 59(23%) 256
Table 1: Percentage of migration from families residing in rural hill areasName of Blocks No. of families
Families with 1 Families with 2-3 Families with more than 3 Families with no Total (N)migrant member migrant members migrant members migrant member
Hawalbagh 07 08 04 01 20Lamgara 03 04 11 03 21Dhauladevi 09 02 05 05 21Bhaisiachhana 03 05 07 05 20Chaukhutia 09 06 03 03 21Dwarahat 02 06 09 05 22Total 33 (26.40%) 31(24.80%) 39 (31.20%) 22(17.60%) 125
Distribution of Migrants on the Basis of Age andPurpose of Migration: Table 3 describes thedistribution of migrants on the basis of age and purposeof migration in rural hill areas under investigation. It wasexposed that majority of the migrants (46%) werebelonged to the age group of 15-30 years followed byage group of 31-50 years (28%) and age group of above50 years (17%). Only 9 per cent of the migrants werefound to be fallen under the age group of 1-14 years. Itwas also identified that the major purpose of migrationis employment for which 143 people out of total 256migrants were reported to be migrated. The second mostimportant purpose of migration covers many things suchas business, marriage, natural calamities, treatment, safedrinking water, infrastructure facility, electricity etc. Therewere 75 people who were reported to be migrated forthe aforesaid purposes. The third most important purposeof migration was identified to be education for which38 people were reported to be migrated.

110 Nirmal Chandra et al.
Households based on Social category ReportingDifferent Types of Migration: Table 4 indicates thepercentage of households based on social categoryreporting different types of migration. It was found thatmajority of the migration (83.33%) occurred from thehouseholds belonged to others category followed byhouseholds of the ST category (82%), Brahmins (63.64%)and Kshatriyas (48.47%). The lowest incidences ofmigration were reported from SC households (38.89%).As far as the duration of migration is concerned, highestpercentage (18%) of short term migration was reportedfrom ST households where households of Brahmin andothers showed no incidences of short term migration.Highest percentage (75%) of long term migration wasreported from households belonged to others categorywhile SC households showed least percentage (22.22%)of long term migration. Highest percentage (30.91%)of permanent migration was reported from Brahminhouseholds followed by ST households (30%) whereasSC households showed least percentage (7.41%) ofpermanent migration.
Household category based on LandholdingReporting Different Types of Migration: Table 5shows the percentage of household category based onlandholding reporting different types of migration. Itwas found that most of the migration (75%) occurredfrom the households having no land followed byhouseholds having 1-10 nali of land (70%), households
having 11-20 nali of land (55.93%) and householdspossessing 21-30 nali of land (49.63%). The lowestincidences of migration were reported from householdspossessing more than 30 nali of land (37.50%). As far asthe duration of migration is concerned, highestpercentage (12.50%) of short term migration wasreported from households possessing more than 30 naliof land where households possessing no land showedno incidences of short term migration. Highestpercentage (50%) of long term migration was reportedfrom households having no land while householdspossessing more than 30 nali of land showed leastpercentage (25%) of long term migration. Highestpercentage (40%) of permanent migration was reportedfrom households having 1-10 nali of land followed byhouseholds having no land (25%) whereas householdspossessing more than 30 nali of land showed nopermanent migration.
Households Category based on Income GroupReporting Different Types of Migration: Table 6depicts the percentage of household category based onincome group reporting different types of migration. Itwas found that most of the migration (63.10%) occurredfrom the households having annual income of Rs 50000/- followed by households having annual income of Rs50001-100000/- (53.64 %) and households having annualincome of more than Rs 150000/- (50%). There wasno migration reported from households with annual
Table 3: Distribution of migrants on the basis of age and purpose of migrationPurpose ofmigration Age Distribution of Migrants Total
1-14 years 15-30 years 31 to 50 years Above 50 yearsEmployment - 64 51 28 143Education 6 21 4 7 38Others* 16 33 17 9 75Total 22 (9 %) 118 (46%) 72 (28%) 44 (17 %) 256
Table 4: Percentage of households based on social categoryreporting different types of migration (N=125)Household Short term Long term Permanent Totalbased on migration migration migration (%)social category (%) (%) (%)Brahmin 0.00 32.73 30.91 63.64Kshatriya 1.31 35.37 11.79 48.47SC 9.26 22.22 7.41 38.89ST 18.00 34.00 30.00 82.00Others 0.00 75.00 8.33 83.33
Table 5: Percentage of household category based onlandholding reporting different types of migration (N=125)Landholding Short term Long term Permanent Total(Nali) migration migration migration (%)
(%) (%) (%)No land 0.00 50.00 25.00 75.00>0 <= 10 3.33 26.67 40.00 70.00>10 <=20 1.90 35.07 18.96 55.93>20 <= 30 7.19 34.53 7.91 49.63>30 12.50 25.00 0.00 37.50

A Study of Migration Pattern in Kumaun Hills and Associated Socio-Economic Factors 111
Table 6: Percentage of households category based on income group reporting different types of migration (N=125)Income Group Short term migration Long term migration Permanent migration Total (%)
(%) (%) (%)Upto Rs. 50000 4.85 31.07 27.18 63.10Rs. 50001-100000 2.73 41.82 9.09 53.64Rs. 100001-150000 5.00 34.29 10.71 0.00More than Rs. 150000 5.88 23.53 5.88 50.00
Table 8: Socio-economic factors associated with migration as perceived by the respondents (N=125)S.No. Socio-economic factor Frequency Percentage Rank
1. Unemployment 120 96.00 I2. Lack of interest of the educated youth in agriculture 110 88.00 II3. Employment/business opportunities outside the village 95 76.00 III4. Lack of health and education facilities 89 71.20 IV5. Lack of transport and communication infrastructure 87 69.60 V6. Poor agricultural productivity 83 66.40 VI7. Shrinkage in land holding due to divisions in family 77 61.60 VII8. Unavailability of irrigated land 75 60.00 VIII9. Marriage 73 58.40 IX10. Natural calamities 73 58.40 IX11. Lack of safe drinking water 71 56.80 X12. Lack of electricity 71 56.80 X
income of Rs. 100001-150000/-. As far as the durationof migration is concerned, highest percentage (5.88%)of short term migration was reported from householdspossessing annual income of more than Rs. 150000/-where households possessing annual income of Rs.50001-100000/- showed least incidences of short termmigration. Highest percentage (41.82%) of long termmigration was reported from households having annualincome of Rs. 50001-100000/- while householdspossessing annual income of more than Rs. 150000/-showed least percentage (23.53%) of long termmigration. Highest percentage (27.18 %) of permanentmigration was reported from households having annualincome upto Rs. 50000/- followed by households havingannual income of Rs. 100001-150000 (10.71%) whereashouseholds possessing annual income of more than Rs.150000/- showed least percentage (5.88%) of permanentmigration.
Distribution of Migrants by Reasons for Migration:Table 7 describes the distribution of migrants on thebasis of sex and reason for migration from rural hillareas under investigation. It was exposed that males weremostly migrated for employment (38%) followed bypermanent shift of the family (21.98%) and education(11.31%). On the other hand, the major reasons behind
female migration were found to be marriage (59.76%)followed by permanent shift of the family (21.64 %).Natural calamities in both the cases of male and femalemigration were identified to be most minor reason formigration.
Table 7: Percentage distribution of migrants by reasonsfor migration (N=125)Reasons for migration Male (%) Female (%)Employment 38.00 3.67Education 11.31 2.54Business 6.33 0.98Marriage 2.2 59.76Natural calamities 0.80 0.33Moved with household 21.98 21.64Others 19.38 11.08
Socio-economic factors Associated with Migrationas Perceived by the Respondents: Table 8 depicts thefactors associated with migration as perceived by therespondents. There are 12 factors identified throughfocused group discussion with the respondents and theseare ranked as per their gravity. The factor behindmigration which ranked first was “Unemployment”.Other factors forcing migration were as follows: lackof interest of the educated youth in agriculture (rank II),

112 Nirmal Chandra et al.
employment/business opportunities outside the village(rank III), lack of health and education facilities (rankIV), lack of transport and communication infrastructure(rank V), poor agricultural productivity (rank VI),shrinkage in land holding due to divisions in family (rankVII), unavailability of irrigated land (rank VIII), marriage(rank IX), natural calamities (rank IX), lack of safe drinkingwater (rank X) and lack of electricity (rank X). The studyindicates that economic factors are more dominatingfollowed by medical and educational factors.
CONCLUSION
The study deals with the migration pattern in hills coveringvarious aspects of migration. It also identifies some factorwhich are directly associated with migration from hill asperceived by the villagers. It was evidenced from thepresent study that majority of the rural hill families werehaving more than 3 migrant members, majority of themigrants were males, most of the migrants were belongedto the age group of 15-30 years, majority of themigration occurred from the households belonged toothers category followed by households of the STcategory, most of the migration occurred from thehouseholds having no land followed by householdshaving 1-10 nali of land, most of the migration occurredfrom the households having annual income of Rs 50000/-, males were mostly migrated for employment, the majorreasons behind female migration were found to bemarriage and the most important factor behind migrationfrom hills is unemployment. The study suggests that moreemployment opportunities in terms of diversifiedfarming, IT centres, agro-tourism etc. should bepromoted in rural hill areas with supportive infrastructuralfacilities for education, health, market, electricity, drinkingwater etc. to retain the rural youths in hills. Effectivenessof existing agency should have to be enhanced. Reachinghigher level of effectiveness and to accelerate the growth,the hindrance in the form of constraints that haveemerged must be minimised or removed. To retainyouths in agriculture, hill agriculture needs to be moreattractive and hassle free. The convergence of agriculturaldelivery services can be another option to make itpossible for the farmers. Increase in farm income andprovision of urban facilities in hilly area may help betterto retain youth from hills.
REFERENCES
Census of India. 2001. Soft copy, India D-series, MigrationTables. Registrar General and Census Commissioner,India.
Malhotra, S.P. 2005. Opportunities, challenges and prospects inagriculture and forestry. In: M.L. Dewan and JagdishBahadur (Eds.), Uttaranchal: Vision and ActionProgramme. Concept Publishing Company, New Delhi,pp. 54-66.
Mittal, S.; G. Tripathi and D. Sethi. 2008. Development Strategyfor the Hill Districts of Uttarakhand. Working paper No.217, Indian Council for Research on InternationalEconomic Relations.
Mukherjee, A. and A. Maity. 2015. Public–private partnershipfor convergence of extension services in Indian agriculture.Current Science, 109(9): 1557-1563.
Mukherjee, A.; R. Bahal; R.R. Burman and S.K. Dubey. 2012b.Conceptual Convergence of Pluralistic Extension at AligarhDistrict of Uttar Pradesh. Journal of Community Mobilizationand Sustainable Development, 7(1&2): 85-94.
Mukherjee, A.; R. Bahal; R.R. Burman; S.K. Dubey and G.K.Jha. 2012a. Constraints in Privatized AgriculturalTechnology Delivery System of Tata Kisan Sansar. Journalof Global Communication, 5(2): 155-159.
Mukherjee, A.; S. Rakshit; A. Nag; M. Ray; H.L. Kharbikar; K.Shubha; S. Sarkar; S. Paul; S. Roy; A. Maity; V.S. Meenaand R.R. Burman. 2016. Climate Change Risk Perception,Adaptation and Mitigation Strategy: An ExtensionOutlook in Mountain Himalaya. Conservation Agriculture:an approach to combat climate change in Indian Himalaya (JKBisht, VS Meena, PK Mishra and A Pattanayak. Springer.pp. 257-292. http://link.springer.com/chapter/10.1007/978-981-10-2558-7_10.
Paul, N.; P.S. Slathia; R. Kumar and M.S. Nain. 2015. TrainingNeeds and Constraints of Extension Officers in Transferof Agriculture Technology. Journal of CommunityMobilization and Sustainable Development, 10(1): 24-28.
Premi M.K. 1990. India. In Charles B. Nam, William J. Serow,and David F. Sly (eds.), International Handbook onInternal Migration. New York: Greenwood Press.
Singh, D.P. 1998. Internal Migration in India: 1961-1991.Demography India, 27(1): 245-261.
Singh, N.K.; R.P. Sahu and A. Mukherjee. 2016. A Case Studyof Backyard Poultry Farming in Bageshwar District ofUttarakhand. TECHNOFAME- A Journal ofMultidisciplinary Advance Research, 5(1): 95-98.
U.N. 1993. Readings in Population Research and Methodology,The United Nations Population Fund, New York.
--------------------------------------------------------------------------------------------------------------------------------------------------------------Received on November, 2017, Revised on December, 2017

Journal of Community Mobilization and Sustainable Development Vol. 13(1), 113-117, January-April, 2018
*Corresponding author email id: [email protected]
Income Generation by Women Self Help Groups
Kiranjot Sidhu1*, Manjot Kaur2 and Shikha Sharma3
1Principal Scientist, 2Ex-Research Fellow, 3Research Fellow, AICRP on Home Science-Extension, Punjab Agricultural University,Ludhiana, Punjab, India
ABSTARCT
SHG is a group of 10-20 people from a homogeneous class having common problems, they thrift on a regularbasis making small interest bearing loans to their members with the main aim of empowering women. Datacollected from 400 SHG’s from nine districts represented by different agro-climatic zones revealed that only 277were sustaining and the remaining had discontinued. Only half of these groups were involved in income generatingactivities less than half of income generating group members were participating. Further 59.37% were involved inincome generating activities even before becoming the member of SHG. There were only 5.78% entrepreneurialgroups with only 31.25% with all member involvement. In all the groups outsiders were engaged in entrepreneurialactivity beside the SHG members. In 100.0% cases these were family members of group members and in 25.00%non-family members. Half of groups had availed the facility of loan and it was distributed among 90.94% oftheir members but less than 12.0% amount used for the purpose it was taken. Further, it was found that the entiretotal amount invested was taken as loan from the banks. It was found that entrepreneurial groups reported higherincome per member than from individual income generating activities. Trainings undertaken by the members wasfound to be useful. Male participation in women group activity indicates that mixed family groups can be moreeffective in entrepreneurial activities. Mandatory investment from the group savings at initial stages of incomegeneration can help to ensure appropriate utilization of loan and also avoid membership for the purpose of onlyseeking loans.
Keywords: Entrepreneurial, Income generating, Loan, Training
INTRODUCTION
Self-help group is a self-governed, peer controlled smalland informal association of the people with a similarsocio-economic background, voluntarily coming throughto save regular small sums of money, mutually agreeingand contribute to a common found and to meet theiremergency need through self help funds for creditactivities has been collected through regular savingsdeposited by the members of SHGs on the weekly orfortnightly basis.
Self-help group origin in contemporary times canbe seen with the efforts of Mohammad Yonus in1983with the formation of Grameen Bank of Bangladesh. Hecame up with the idea to formally organizing womeninto groups to start saving money at regular intervals. Agroup of 10-20 homogeneous people come together,they thrift on a regular basis making small interest bearing
loans to their members with the main aim ofempowering women.
In India, SHGs are linked to banks for delivery ofmicro credit and they charge flat interest rates for loancalculations. SHG networks have access to differentinstitutional credit in India. SHG have full support ofGovernment as well as Non-Government organizations.Groups maintain simple records and documents, whichexhibit meetings, savings, expenditures and otherextracurricular activities. This system eliminates the needfor collateral and is closely related to that of solidaritylending widely used by microfinance institutions. Tomake the bookkeeping simple enough to be handled bythe members, flat interest rates are used for most loancalculations. Members make small regular savingscontributions over a few months until there is enoughcapital in the group to begin lending. Funds may then belent back to the members or to others in the village for

114 Kiranjot Sidhu et al.
any purpose. In India, SHGs are ‘linked’ to banks forthe delivery of microcredit.
Self-help groups are seen as instruments for a varietyof goals including empowering women, developingleadership abilities among poor people, increasing schoolenrolments, and improving nutrition and the use of birthcontrol. Financial intermediation is generally seen moreas an entry point to these other goals, rather than as aprimary objective.
MATERIALS AND METHODS
The study was conducted in the state of Punjab. Out of22 districts of the state, nine districts were selected torepresent different agro-climatic zones of the state.Secondary data regarding the Women.
Self Help Groups formed by different agencies inthe selected districts was collected. From the list ofSHG’s, the groups registered in 2008-09 were identified.The year of formation was kept consistent to reduceerror and bring uniformity in measurement ofsustainability period. From these groups a sample of400 SHGs was selected for data collection. To ensurewider representation, care was taken to select not morethan 2-3 SHG from one village. Interview schedule wasdeveloped which consisted of items to profile the group.The officials record, personal interviews secondary datafrom banks/lending institutions was taken.
The groups were classified into dormant and activecategories and active groups were further categorizedinto two groups as follows:
Individual income generation and micro-financinggroups: Those groups in which different memberswere engaged individually in generating income.Activity was performed either individually or withtheir family member and in some cases somenonmember.
Entrepreneurial and micro-financing groups: Thegroups, which were engaged in an entrepreneurialactivity as a group together. Members were jointlyengaged in one income generating activity in whichdifferent members were performing differentactivities and in some cases, were even engagingnonmembers.
Data was collected personally through interviewmethod and was tabulated. It was further statisticallyanalyzed to interpret the results.
RESULTS AND DISCUSSIONS
Individual income generation and micro-financinggroups: It was found that out of 400 SHG’s only 277were sustaining and the remaining had discontinued.
The perusal of data presented in Table 1 revealedthat only 51 (18.41%) groups were involved in incomegenerating activities out of the sustaining groups. Therewas total 528 members in these 51 groups, but only 256(48.48%), were involved in any income generatingactivities. This shows that more than half of the groupmembers were dormant and might had been added tofulfill group formation criteria.
Among the members involved in income generatingactivities 152 (59.37%), more than half were involved inincome generating activities even before becoming themember of any SHG, while only 104 (40.63%) startedincome generating activity after becoming the memberby SHG. The data in the above-discussed table clearly
Number of Number of Sampledistricts blocks
In the Sample In the Sample Villages SHGsstate state22 9 142 60 333 400
Table 1: Percentage distribution of members/ groups involved in income generatingGroups/members f %Groups whose members are involved in income generation (n=277 number of sustaining groups) 51 18.41Members involved in income generation among income generating groups (n=528: Members of 256 48.48groups involved in income generation)Members involved in income generation before and after becoming members(n=members involved in income generation)Were doing it before membership 152 59.37Started after becoming member 104 40.63
Income Generation by Women Self Help Groups 115
shows that the involvement of the members of SHG inincome generating activities after the formation orbecoming a member of a SHG is low.
Reena et al. (2014) in her study on SHG found thatgroup membership led to economic gain. SIDBI (2008)study also revealed the role of microfinance programmein poverty reduction and in increasing the standard ofliving of the people. It also increases various opportunitiesof income generation and people can easily access tobank credit. Sorokhaibain (2014) reported increase inincome and employment as a result of groupmembership.
Entrepreneurial and micro-financing groups: Thedata presented in Table 2 show the percentage distributionof groups involved in entrepreneurial activities. It wasfound that out of total 277 sustaining groups, membersof only 16(5.78%) groups were involved in incomegeneration at group level.
However, more than half of these groups (68.75%)were engaged in some entrepreneurial activity in whichonly few members were involved. All members of thegroup were engaged in one common enterprise in theremaining 31.25% groups. Further analysis revealed thatall the entrepreneurial groups had nonmembers engagedin the enterprise. In all the cases family members of somegroup members were engaged and in 25.00 per centthese nonmembers were the outsiders. This shows thatwomen involve their family members in economic
Table 2: Percentage distribution of groups involved in entrepreneurial activitiesf %
Entrepreneurial groups (n=277 number of sustaining groups) 16 5.77 Groups with all members involved in entrepreneurial activity (n=16 number of entrepreneurial groups) 5 31.25 Groups with few members involved in entrepreneurial activity (n=16 number of entrepreneurial groups) 11 68.75Groups with nonmembers involved in entrepreneurship 16 100 Family member 16 100 Non-family members 4 25.00
Table 3: Loan and its use by the group membersf %
Groups who took loan (n=277 sustaining groups) 147 53.07Members distributed among (n=1645: members of sustaining groups who took loan) 1496 90.94Amount of total loan taken in rupees 31327500Average loan per group in rupees (n=147: groups who took loan) 213112.00Percentage of balance amount to be returned in rupees 43.91Average percentage used for the activity for which loan was taken 11.29
activities of the group. The qualitative data point towardsone member and her family taking the lead inentrepreneurial activity and the remaining membersinvolved in production activities. Hence, it became moreof family enterprise for which loans from financialinstitutions could be easily secured in name of SHG andfew more women of the groups were providedemployment in production activities if the family wasnot able to produce sufficient quantity on its own. Itwas concluded from the above discussed table that thenumber of entrepreneurial groups were very less.Involvement of family members particularly the malemembers point towards lack of women empowermentin terms of handling different aspects of entrepreneurialactivity. It can also be concluded that the groups mighthad been formed only to convert a family enterpriseinto a group enterprise for securing loans/credit.
Singh et al. (2009) also observed that group activitywas limited to very few groups as majority of memberswere doing the activity individually.
Loan and its utilization: The data presented in Table3 indicate that out of 277 sustaining groups more thanhalf of groups (53.07%) had availed the facility of loan.The others cited procedural delays and lack ofcooperation of the bank officials as major reason reasonsfor not availing the loan. Singh (2012) also reported thatmain problems in bank linkages were lack of cooperation,lack of government support, procedural delay, apatheticattitude of bank officials and poor saving rates.

116 Kiranjot Sidhu et al.
Out of total 1645 members, the loan was distributedamong 1496 (90.94%) of their members. Total amountof loan (Rs. 31,32,7500) was distributed with an averageof Rs. 2,13,112 to each group. Further it was revealedthat 43.91 percent of total loan amount was still to bereturned after five years. Only 11.29 percent of theamount (as reported by SHG members) was used forthe activity for which it was taken. This percentage canfall further, if analyzed seeking details of expenses. Theabove-discussed table gives the clear picture of the useof loan by SHGs members. As reported by SHGmembers, they put it to use for personal activities.
Source of investment: The personal informationpresented in table 4 shows the of amount invested forentrepreneurial activities by groups. It was revealed thatin total, all the 16 entrepreneurial groups had investedthe amount of Rs. 8,95,000. Further, it was found thatthe entire total amount invested was taken as loan fromthe banks. There was no investment from personal savingsof members or group savings.
The above-discussed data clearly show that mostof people become member of SHG just to avail loanfacility from banks at lower interest rates. They merelyuse this loan for their personal purposes.
Income of members: The data presented in Table 5indicate that the annual income of members from incomegenerating activity/entrepreneurial comparison. It wasfound that entrepreneurial groups reported higher incomeof Rs. 13,438 as compare to an average income fromincome generating activities per member (Rs. 3,077). Itshows that group activity is more beneficial than activitiesundertaken at individual level. Therefore the above-presented data concluded that working in-group increasesthe productivity and performance of the group. Kaur(2014) reported an increase in income in the range ofRs.1000-1500 per month.
Training and its usefulness: The data presented in Table6 indicate that only 8.41 per cent members of thesustaining groups underwent training. Of these, 20.28percent had undertaken training on group formation.Training on income generating activity/entrepreneurialactivity was undertaken by all of them. However, theywere not involved in income generation/entrepreneurialactivity in which they had undertaken the training. Traineesfound the training very useful as shown by the high meanscore of 2.74 on the range of 1-3.
Hemalatha (2012) found that majority of themembers attended the training offered and all themembers who attended training show the initiative toengage in income generating activity. Kaur (2014) found
Table 4: Source of investment for entrepreneurial activitiesby groupsSource of investment for entrepreneurial activities bygroupsNo. of entrepreneurial groups 16Amount invested (Rs.) 895000Source wise percentage of amount investedFrom personal savings of members 0Group saving 0Bank loan 100.0Any other 0
Table 5: Annual income of members from income generating activity/ entrepreneurial comparisonIncome generating activity/ entrepreneurial Annual incomeAverage income per member from income generating activities (Rs.) 3077(n=total members engaged in income generating)Average income per member from entrepreneurial activity 13438(n=total members engaged entrepreneurial activity)
Table 6: Percentage distribution of members according to training undertaken and its usefulnessf %
Total members who took training (n=members of sustaining groups) 249 8.41 Percentage of members who took x training related to group formation 50 20.28
(n=total members who took training) Percentage of members who took training related to income generating/entrepreneurial 249 100.0
(n=total members who took training)Usefulness of training (Mean score 1-3) 2.74

Income Generation by Women Self Help Groups 117
that most of the respondents availed trainingopportunities provided to them by different agenciesfor capacity building. On the contrary, Randhawa andMann 2007 revealed that all the NGO promoted SHGshad received training on SHG orientation as well astraining on income generating activities but bankpromoted SHGs and government organizationpromoted SHGs performed badly in terms of capacitybuilding of SHG member. Sorokhaibain (2014) stressedupon efforts on part of the Government, NGOs aswell as the banking sector to promote SHGs in the state.
CONCLUSION
Only half of the groups were involved in incomegenerating activities out of the sustaining groups. Amongthe members involved in income generating activitiesmore than half were involved in income generatingactivities even before becoming the member of anySHG. Women who were already involved in incomegeneration either became the member of the SHG toavail benefit of group membership such as easy loansfrom the group / banks or were enrolled as membersto project their income generation activity as an outcomeof the group membership. It was observed that onlyhalf of the members of the groups were involved inincome generating activities, were doing these activitiesindividually. Out of these, majority were involved in theactivities before becoming the member of SHG. Amongthe sustaining groups, members of less than 6.0 % wereinvolved in income generating activity in a group as anenterprise, 68.75 per cent of them had very few membersinvolved in the enterprise. The average income inindividual activities was found to be very low but incomeincreased in case of entrepreneurial activities. Half ofthe sustaining groups had availed loan and more than90. 0 percent of their members had used this loan butvery few (less than 12.00%) had used it for the purposeit was availed. Trainings organized for the members werefound to be useful. Capacity building of SHG membersthrough vigorous training plays an important role inempowering women for future sustainability of SHGs.
There is a crucial need to focus on awareness programmeimparting training and developing skills. Focus shouldbe on entrepreneurial development rather than incomegeneration by individual members. Male participation inwomen group activity indicate that mixed family groupscan effectively pursue entrepreneurial activities. Mandatoryinvestment from the group savings at initial stages ofincome generation can help to ensure appropriateutilization of loan and also avoid membership for thepurpose of seeking loans.
REFERENCES
Hemalatha, A.V. 2012. Skill development of women microentrepreneurs - a study among self help group membersin Kerala. Asia Pacific Journal of Marketing & Mgnt., 1(3):113-120.
Kaur, L. 2014. Impact of self help groups on women empowerment inPunjab. PhD dissertation, Punjab Agricultural University,Ludhiana.
Randhawa, V. and K.M. Sukhdeep. 2007. Structure andfunctioning of self help groups in Punjab. Indian J. Agri.Res., 41(3): 157-163.
Reena; K. Rajdeep and A. Nikita. 2014.Comparative analysis ofwomen’s economic empowerment through self helpgroups. J. Business Mgnt. and Soc. Sci. Res., 3(4): 40-42.
SIDBI. 2008. Assessing Development Impact of Micro FinanceProgrammes. Agri. Finance corporation limited, Lucknow.
Singh, G.; S. Kumar and J. Singh. 2009. Performance and impactof SHGs in Punjab. J. Agri. Dev. Policy., 19: 77-90.
Singh. 2012. Micro finance and empowerment of scheduledcaste women: An impact of selh help groups in UttarPradesh and Uttaranchal. Retrieved from: http://planningcommission.nic.in/reports/sereports/ser/stdy-microfin.pdf on 02.02.2013.
Sorokhaibain, S.D. 2014. Socio-economic impact of self help groupsformed by non-government organization (NGOs) in rural Punjab.M.Sc. thesis, Punjab Agricultural University, Ludhiana.
Suguna, B. 2006. Empowerment of Rural Women throughSHG, Discovery Publishing House, New Delhi. pp. 1-16.
--------------------------------------------------------------------------------------------------------------------------------------------------------------Received on November, 2017, Revised on December, 2017

Journal of Community Mobilization and Sustainable Development Vol. 13(1), 118-122, January-April, 2018
*Corresponding author email id: [email protected]
Reaction and Viewing behaviour of Farmer’s towards “Mera PindMere Khet” Programme of Doordarshan Kendra Jalandhar
Jagjeet Singh Gill1* and Anil Sharma2 and Harsimranjit Singh Brar3
1Assistant Professor, University Institute of Agricultural Sciences, Chandigarh University, Mohali, Punjab2Assistant Director, Centre for Communication and International Linkages, Punjab Agricultural University, Ludhiana, Punjab3Research Scholar, Department of Extension Education, Punjab Agricultural University, Ludhiana, Punjab
ABSTRACT
The study entitled Reaction and Viewing behaviour of Farmer’s towards “Mera Pind Mere Khet” Programme ofDoordarshan Kendra Jalandhar was under taken with the objectives to study viewing behaviour and level ofsatisfaction of respondents for different aspects and subject matters related to this programme. Three districtsnamely Ludhiana, Gurdaspur and Muktsar were selected, two blocks were selected from each district, from eachblock three villages were then selected and ten MPMK viewing farming families were selected from each village.Adult member of each farming family were then selected purposely for study. Thus the total sample comprisedof 180 farmers for the present study. The data were collected by personal interview approach method, tabulatedand analyzed using appropriate statistical tools. The findings of the study revealed that more than half of therespondents were satisfied from summer and winter timings of the programme. In case of mass media exposure,42.78% respondents were reading newspaper every day. All the 180 respondents had subscribed farm literature.Study shows positive relationship between age of the farmers and their interest in reading farm literature.
Keywords: Impact, Reaction, Satisfaction level, Viewing behaviour
INTRODUCTION
India is an agrarian country. Most of the people in thiscountry are dependent of agriculture in direct or indirectways. For the development in Agriculture there is needof providing first hand information to farmers.Television is one of the cheap and quick methods todissimilate information to farmers (Hansra, 1981). Thequick dissimilation of information and knowledge helpsto change the farmers attitude, provide technicalknowledge and help in the adoption of new technologies.The mass media should be put to service for nationaldevelopment. Among the different mass media radioand television are considered as powerful media, as aninstitutionalized source of information for creatingawareness about the innovation existent with additionalinformation (Bellurkar, 2000). There are numerous ofprogrammes telecasted by Doordarshan in regionallanguages for providing knowledge and information tofarmers. Mera Pind Mere Khet is telecasted by Doordashan
Kendra Jalandhar in Punjabi language. This programmewas started in 1974. Now, this programme is telecasted5 days a week.
MATERIALS AND METHODS
Data for study were collected personally by interviewingthe respondents. The information given by respondentswere tabulated by using statistical tools such as coefficientof correlation, frequency, percentage etc.
RESULTS AND DISCUSSIONS
The results in Table 1 shows that from 180 respondents10.56 per cent respondents were in the age group of20-30 years, 33.89 per cent respondents were in the agegroup of 30-40 years, 22.22 per cent respondents werein the age group of 40-50 years and rest 33.33 per centrespondents were in age group of above 50 years. Incase of Educational qualification 36.67 per cent of therespondents were middle passed, 27.22 per cent of the

respondents were matric and 17.22 per cent wereilliterate. While 12.22 per cent respondents were graduatesand rest 6.67 percent were post-graduates. Majority ofthe respondents (59.34%) belonged to joint families andwere married. It is clear that 72.22 per cent of therespondents had no membership with any organization,15.56 per cent of the respondents had membership ofan organization and 7.22 per cent were office holders.Same study was conducted by Bhullar (1987); Kaur andMathur (1984); Asrani and Kaushik (2008); Singh et al.(2014).
It is clear from the Table 2 that 50.00 per cent ofthe respondents were fully satisfied for timing of MPMK
in summer, 44.44 per cent were partially satisfied and5.56 per cent were not satisfied for timing of MPMKprogramme in summer. In winter 55.56 per cent werefully satisfied for timing of MPMK programme, 36.11per cent were partially satisfied and 8.33 per cent werenot satisfied for timing of MPMK programme.However 33.33 per cent were fully satisfied aboutduration of MPMK programme, 62.22 per cent werepartially satisfied and 4.44 were not satisfied aboutduration of MPMK programme. As far as frequencyof programme is concerned, 43.89 per cent were fullysatisfied, 50.00 per cent were partially satisfied and 6.11were not satisfied. Sinha (2001) found that the majorityof the respondents expressed that the content were ‘fully
Figure 1: Distribution of respondents according to area of sampling for the studyNote: Figures in parenthesis shows number of respondents
Districts
Blocks
Madhpur (10) Mand tehara(10) Allawalpur (10) Sohal(10) Mauwana(10) Khakhawali (10)
Balala (10) Bahadr ke (10) Maan (10) Babri (10) Aulakh (10) Badal (10)
Kakrala (10) Tehara (10) Sidwan (10) Kothe (10) Bam (10) Akal chalani (10)
Punjab (180)
Ludhiana (60)
Gurdaspur (60)
Muktsar (60)
Samrala (30)
Sidwan bet (30)
Kahnuwan (30)
Gurdaspur (30)
Malout (30)
Lambi (30)
Reaction and Viewing behaviour of Farmer’s towards “Mera Pind Mere Khet” Programme of Doordarshan Kendra Jalandhar 119

120 Jagjeet Singh Gill et al.
Table 1: Distribution of respondents according to socio-personal characteristics (n=180)Socio-personal characteristics Category Number of Respondents PercentageAge 20-30 19 10.56
30-40 61 33.8940-50 40 22.2250 above 60 33.33
Educational Qualification Illiterate 31 17.22Middle 66 36.67Matric 49 27.22Graduate 22 12.22Post-Graduate 12 6.67
Social Participation No Membership 139 77.22Member of An Organization 28 15.56Office Holder 13 7.22Distinctive Feature 0 0.00
Table 2: Distribution of respondents according to satisfaction level with telecasting timing and frequency of MPMKprogrammeSatisfaction of viewers with Satisfaction of respondentstelecasting timing and frequency Satisfied Partially Not Satisfiedof MPMK programme Frequencey Percentage Frequencey Percentage Frequencey PercentageSummer timing 90 50.00 80 44.44 10 5.56Winter timing 100 55.56 65 36.11 15 8.33Duration of the programme 60 33.33 112 62.22 8 4.44Frequency of the programme 79 43.89 90 50.00 11 6.11
Table 3: Distribution of respondents according to their mass media exposure about different mass mediaDifferent mass media Category Number of Respondents PercentageNewspaper Everyday 77 42.78
Some days of week (2-3 days of week) 33 18.33Once a week 41 22.78Occasionally (2-3 days of month) 7 3.89Never 22 12.22
Other T.V. Programme Everyday 58 32.22Some days of week (2-3 days of week) 33 18.33Once a week 47 26.11Occasionally (2-3 days of month) 38 21.11Never 4 2.22
Farm Literature Package of practice for Rabi crops 52 28.89Package of practice for Kharif crops 56 31.11Progressive farming 34 18.89Changi Kheti 38 21.11
understandable’ with ‘easy language’ and ‘moderately’used technical terms. They also felt that volume andperiodicity of the magazine should be increased.
It is clear from the Table 3 that 42.78 per cent of therespondents read newspaper everyday, 18.33 per centof the respondents read some days of week, 22.78percent read once a week, 3.89 per cent read occasionally
and 12.22 per cent had never read the newspaper. Incase of mass media exposure about viewing TVprogramme 32.22 per cent of the respondents viewedTV programme everyday, 18.33 per cent of therespondents viewed TV programme some days of week,26.11 percent had viewed once a week, 21.11 per centoccasionally and 2.22 per cent had never viewed the TV

Reaction and Viewing behaviour of Farmer’s towards “Mera Pind Mere Khet” Programme of Doordarshan Kendra Jalandhar 121
programme. It is clear that 28.89 per cent of therespondents read package practice (Rabi), 31.11 per centof the respondents had read package practice (Kharif),18.89 percent read Progressive farming, 11.67 per centread Changi Kheti and 9.44 per cent had read all literature.Salem et al. (2008) mass media have a great influence onpeople’s awareness, attitude and behavior forreproductive health through different entertainment andeducational programmes.
Table 4: Coefficient of correlation between various aspectsSocio-economic characteristics ‘r’ valueAge and Interest in farm literature -0.0883Social participation and mass media exposure 0.5593Education and exposure about newspaper 0.2259Educational qualification and exposure about 0.3901TV programme
The results in Table 4 shows that the correlationbetween age and interest in farm literature was found tobe negative. It can be concluded that age and interest infarm literature were weakly uncorrelated and the socialparticipation decrease with the increase in the age andvice-versa. In case of Social participation and mass mediaexposure the result was found to be positive this showsthat that age and utility of programme were moderatelycorrelated and the mass media exposure increase withthe increase in the social participation and vice-versa. Incase of Education and exposure about newspaper resultwas found positive. It can be concluded that Educationand exposure about newspaper were weakly correlatedand the exposure about newspaper increase with theincrease in the educational qualification and vice-versa.In case of Educational qualification and exposure aboutTV programme result was found positive. It can beconcluded that Educational qualification and exposureabout TV programme were weakly correlated and theexposure about TV programme increase with the increasein the educational qualification and vice-versa. Momi(1980) found that age, education, operational landholding were positively correlated with awareness, likingand utility of farm broadcasts. Ozor and Madukwe(2005) reported a positive relationship between years ofexperience and technology adoption. Vinayak (1987)reported that age and land holding status were notcorrelated whereas education level, extension contactstatus, print media exposure, TV viewing status and farmbroad casting listening was found to be correlated with
viewers reaction towards Mera Pind Mere Khetprogramme, a telecast of Jalandhar Doordarshan.
CONCLUSION
In this study it is concluded that Mera Pind Mere Khetshowed effective results on farmers. Half of therespondents were fully satisfied from summer timingand 55.56 per cent were fully satisfied from timing inwinter, this show that respondets had high level ofsatisfaction about the programme. This study shows thatfarmers also used other methods like farm literature,newspaper to enhance their knowledge. The informationprovided in the programme found important andfarmers were satisfied from duration of the programme.It was found that the education of the farmer playsignificant role in utilizing the information provided byMPMK.
REFERENCES
Anonymous. 2011a. Agriculture in India (As per FAO 2010)http://en.wikipedia.org/wiki /Agriculture_in_India.
Asrani, S. and S. Kaushik. 2008. Effectiveness and impact ofinteractive electronic media on knowledge grain:Beekeeping. Journal of Community Mobilization andSustainable Development, 3(2): 106-110.
Bellurkar, C.M.; G.G. Nandapurkar and J.R. Rodge. 2000.Preferences and suggestions of televiewers towards variousTV programmes. Maharashtra J. Extn. Edu., 19: 33-35.
Bhullar, K.S. 1987. Impact of the periodical SANKET-PATTERin the dissemination of improved agricultural practicesamong the young farmers. M.Sc Thesis, PunjabAgricultural University, Ludhiana, India.
Hansra, A.S. 1981. A study of farmers information needs forstructuring farm television programme. M.Sc.Thesis.Punjab Agricultural, University, Ludhiana, India.
Kaur and Mathur. 1984. A study of farmers comprehension ofillustration. Indian Ext. Edu., 20: 1-6.
Momi, G.S. 1980. ‘Content and feedback analysis of farm andrural broadcasts from the All India Radio. Jalandhar,Punjab.’ Ph.D. Thesis, PAU, Ludhiana, India.
Ozor, N. and M.C. Madukwe. 2005. Obstacles to the adoptionof improved rabbit technologies by small scale farmers innsukka local government area of Enugu State, Nigeria.Agro-Science J. Tropical Agriculture, Food, Environment andExtension, 4: 70-73.
Salem, R.M.; J. Bernstein; T.M. Sullivan and R. Lande. 2008.Communication for Better Health. Population Reports, Series J,No. 56. INFO Project, Johns Hopkins Bloomberg Schoolof Public Health, Baltimore.

122 Jagjeet Singh Gill et al.
Singh, M.; R.R. Burman; J.P. Sharma; V. Sangeetha and M.A.Iquebal. 2014. Structural and Functional Mechanism ofMobile Based Agroadvisory Services and Socio-EconomicProfile of the Member Farmers. Journal of CommunityMobilization and Sustainable Development, 9(2): 192-199.
Sinha, R. 2001. Content analysis of ‘yuv rishman’ magazine andreaders reactions. M.Sc Thesis, Punjab Agricultural University,Ludhiana, India.
Vinayak, R.K. 1987. Content Analysis of Mera Pind Mere KhetProgramme Telecast from Jalandhar Doordarshan andFarmers Reactions towards the programme. UnpublishedM.Sc. Thesis, PAU, Ludhiana.
--------------------------------------------------------------------------------------------------------------------------------------------------------------Received on December, 2017, Revised on January, 2018
Journal of Community Mobilization and Sustainable Development Vol. 13(1), 123-126, January-April, 2018
*Corresponding author email id: [email protected]
Opinion and Satisfaction of Students Regarding ExperientialLearning Programme
Shachi Singh1* and Prabhjot Kaur2
1M.Sc. Scholar, 2Professor Department of Extension Education, Punjab Agricultural University, Ludhiana, Punjab
ABSTRACT
The present study was undertaken with the objectives to study the opinion and satisfaction level of the studentsregarding experiential learning programme. One hundred and fifty students who had undergone RAWE duringthe year 2014 and 2015 were selected randomly for the purpose of study. Experiential learning programme I wasorganized at campus and Experiential Learning II was organized outside the campus. Data were collected byquestionnaire approach. Findings of the study revealed that majority of the students were in agreement todifferent aspects of experiential learning programme. Overall satisfaction level was found to be high with scorerange of 12-15 and 10-12 in case of experiential learning programme I and experiential learning programme IIrespectively.
Keywords: Experiential learning programme, Opinion, Satisfaction
INTRODUCTION
Indian Council of Agricultural Research introduced aprogramme in 2006 named Experiential LearningProgramme aimed at equipping undergraduates withentrepreneurial skills (Lekang et al., 2016). The experientiallearning approach is a learner-centered approach andallows an individual student to manage and shareresponsibility for learning with teachers and farmers.Effective work experience training strategiesincorporating rural agricultural experiential learningapproach provide opportunities to a student to engagein fieldwork activity and to review and analyze criticallythis work experience activity so that they prove to beuseful in their real-life situations (Anonymous, 2011). Thestudents are attached to the research stations of particularzone and to stay in villages with farm families, agro-based industries, co-operatives NGOs and high-tech cellduring different phases of RAWE Programme(Anonymous, 2013). The expected outcomes from thestudents after this programme are learning newexperiences, managing relationships, observe problems,art of negotiation, understand the real life, timemanagement, practicing methods, develop teamwork,feedback, developing art of creative thinking, art of
listening, conflict management, understandingrecommended technology, understanding real world,money management, working style of local institution,working with local organizations/leaders and confidencebuilding (Chauhan, 2004).The present investigation wasundertaken with the objectives to study opinion andsatisfaction level of students regarding experientiallearning programme.
MATERIALS AND METHODS
The present study was conducted at Punjab AgriculturalUniversity (PAU), Ludhiana. A sample of 150 studentswas randomly selected from the students who hadundergone RAWE programme during the year 2014 and2015. Distributed questionnaire approach was followedto collect the data from the students of PunjabAgricultural University. Data were analyzed with the helpof common statistical tools, appropriate to the natureof data and for the purpose of the study.
RESULTS AND DISCUSSION
Opinion of students regarding ExperientialLearning Programme I: An opinion is a belief,impression, judgment or prevailing view held by a person.
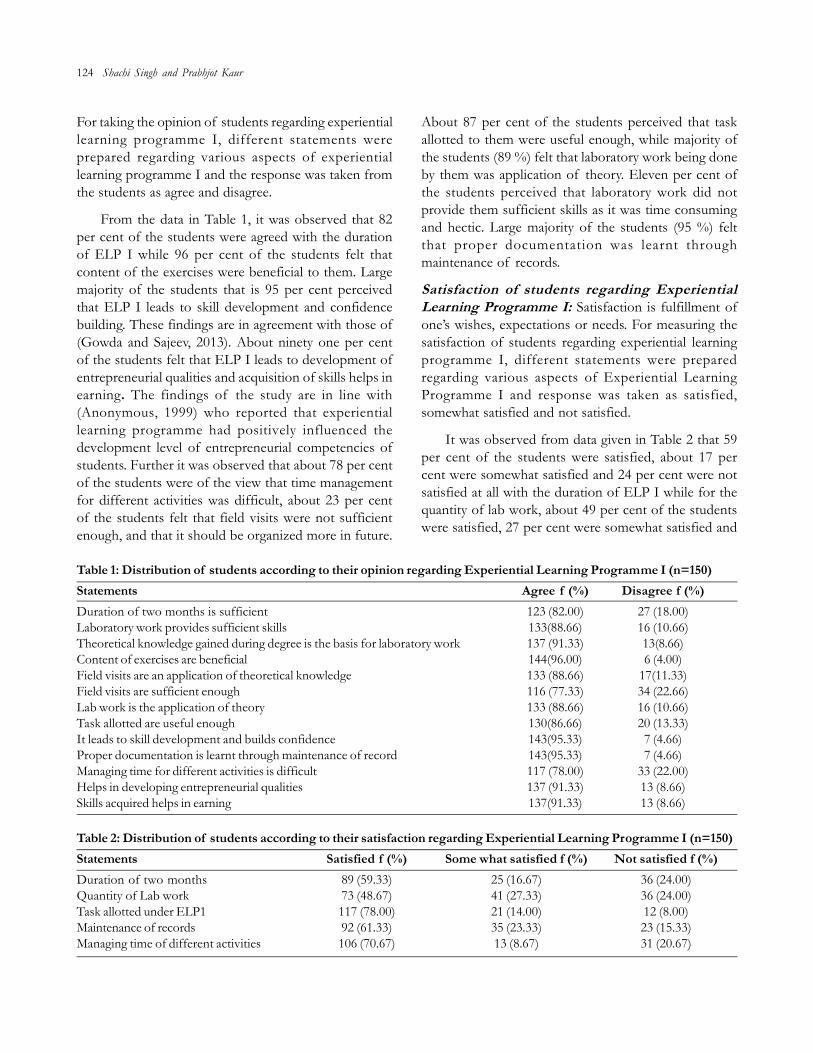
124 Shachi Singh and Prabhjot Kaur
For taking the opinion of students regarding experientiallearning programme I, different statements wereprepared regarding various aspects of experientiallearning programme I and the response was taken fromthe students as agree and disagree.
From the data in Table 1, it was observed that 82per cent of the students were agreed with the durationof ELP I while 96 per cent of the students felt thatcontent of the exercises were beneficial to them. Largemajority of the students that is 95 per cent perceivedthat ELP I leads to skill development and confidencebuilding. These findings are in agreement with those of(Gowda and Sajeev, 2013). About ninety one per centof the students felt that ELP I leads to development ofentrepreneurial qualities and acquisition of skills helps inearning. The findings of the study are in line with(Anonymous, 1999) who reported that experientiallearning programme had positively influenced thedevelopment level of entrepreneurial competencies ofstudents. Further it was observed that about 78 per centof the students were of the view that time managementfor different activities was difficult, about 23 per centof the students felt that field visits were not sufficientenough, and that it should be organized more in future.
About 87 per cent of the students perceived that taskallotted to them were useful enough, while majority ofthe students (89 %) felt that laboratory work being doneby them was application of theory. Eleven per cent ofthe students perceived that laboratory work did notprovide them sufficient skills as it was time consumingand hectic. Large majority of the students (95 %) feltthat proper documentation was learnt throughmaintenance of records.
Satisfaction of students regarding ExperientialLearning Programme I: Satisfaction is fulfillment ofone’s wishes, expectations or needs. For measuring thesatisfaction of students regarding experiential learningprogramme I, different statements were preparedregarding various aspects of Experiential LearningProgramme I and response was taken as satisfied,somewhat satisfied and not satisfied.
It was observed from data given in Table 2 that 59per cent of the students were satisfied, about 17 percent were somewhat satisfied and 24 per cent were notsatisfied at all with the duration of ELP I while for thequantity of lab work, about 49 per cent of the studentswere satisfied, 27 per cent were somewhat satisfied and
Table 1: Distribution of students according to their opinion regarding Experiential Learning Programme I (n=150)Statements Agree f (%) Disagree f (%)Duration of two months is sufficient 123 (82.00) 27 (18.00)Laboratory work provides sufficient skills 133(88.66) 16 (10.66)Theoretical knowledge gained during degree is the basis for laboratory work 137 (91.33) 13(8.66)Content of exercises are beneficial 144(96.00) 6 (4.00)Field visits are an application of theoretical knowledge 133 (88.66) 17(11.33)Field visits are sufficient enough 116 (77.33) 34 (22.66)Lab work is the application of theory 133 (88.66) 16 (10.66)Task allotted are useful enough 130(86.66) 20 (13.33)It leads to skill development and builds confidence 143(95.33) 7 (4.66)Proper documentation is learnt through maintenance of record 143(95.33) 7 (4.66)Managing time for different activities is difficult 117 (78.00) 33 (22.00)Helps in developing entrepreneurial qualities 137 (91.33) 13 (8.66)Skills acquired helps in earning 137(91.33) 13 (8.66)
Table 2: Distribution of students according to their satisfaction regarding Experiential Learning Programme I (n=150)Statements Satisfied f (%) Some what satisfied f (%) Not satisfied f (%)Duration of two months 89 (59.33) 25 (16.67) 36 (24.00)Quantity of Lab work 73 (48.67) 41 (27.33) 36 (24.00)Task allotted under ELP1 117 (78.00) 21 (14.00) 12 (8.00)Maintenance of records 92 (61.33) 35 (23.33) 23 (15.33)Managing time of different activities 106 (70.67) 13 (8.67) 31 (20.67)
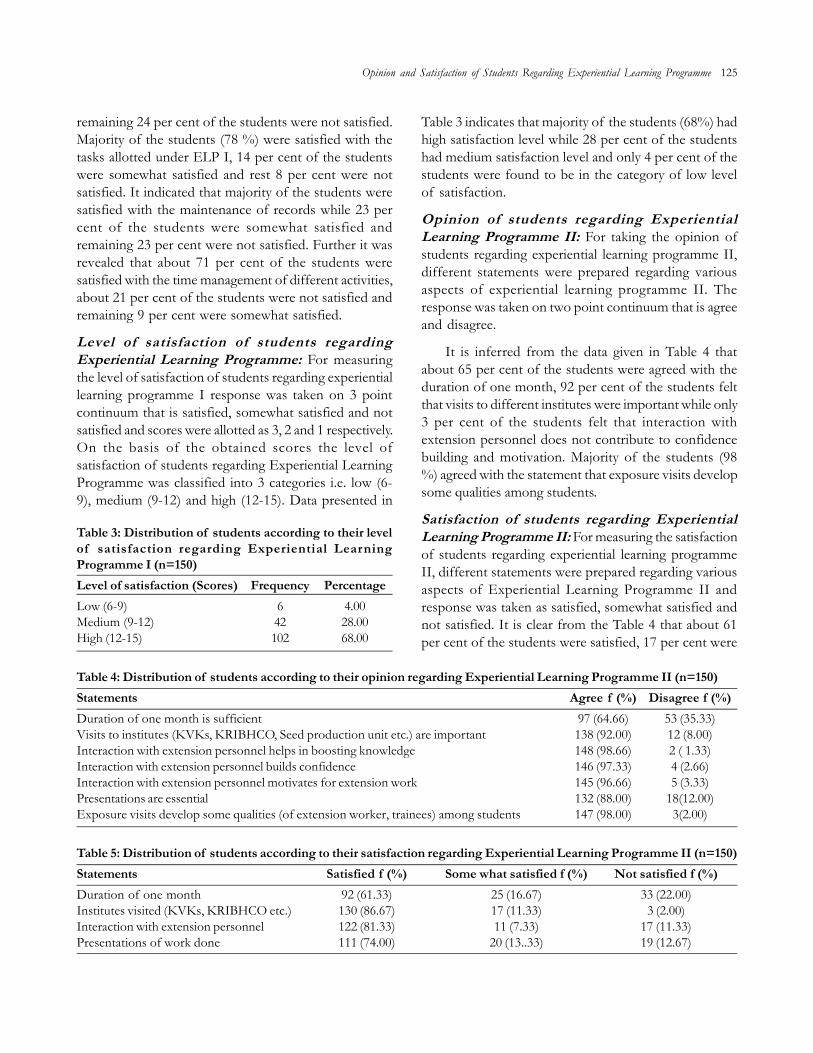
Opinion and Satisfaction of Students Regarding Experiential Learning Programme 125
remaining 24 per cent of the students were not satisfied.Majority of the students (78 %) were satisfied with thetasks allotted under ELP I, 14 per cent of the studentswere somewhat satisfied and rest 8 per cent were notsatisfied. It indicated that majority of the students weresatisfied with the maintenance of records while 23 percent of the students were somewhat satisfied andremaining 23 per cent were not satisfied. Further it wasrevealed that about 71 per cent of the students weresatisfied with the time management of different activities,about 21 per cent of the students were not satisfied andremaining 9 per cent were somewhat satisfied.
Level of satisfaction of students regardingExperiential Learning Programme: For measuringthe level of satisfaction of students regarding experientiallearning programme I response was taken on 3 pointcontinuum that is satisfied, somewhat satisfied and notsatisfied and scores were allotted as 3, 2 and 1 respectively.On the basis of the obtained scores the level ofsatisfaction of students regarding Experiential LearningProgramme was classified into 3 categories i.e. low (6-9), medium (9-12) and high (12-15). Data presented in
Table 3 indicates that majority of the students (68%) hadhigh satisfaction level while 28 per cent of the studentshad medium satisfaction level and only 4 per cent of thestudents were found to be in the category of low levelof satisfaction.
Opinion of students regarding ExperientialLearning Programme II: For taking the opinion ofstudents regarding experiential learning programme II,different statements were prepared regarding variousaspects of experiential learning programme II. Theresponse was taken on two point continuum that is agreeand disagree.
It is inferred from the data given in Table 4 thatabout 65 per cent of the students were agreed with theduration of one month, 92 per cent of the students feltthat visits to different institutes were important while only3 per cent of the students felt that interaction withextension personnel does not contribute to confidencebuilding and motivation. Majority of the students (98%) agreed with the statement that exposure visits developsome qualities among students.
Satisfaction of students regarding ExperientialLearning Programme II: For measuring the satisfactionof students regarding experiential learning programmeII, different statements were prepared regarding variousaspects of Experiential Learning Programme II andresponse was taken as satisfied, somewhat satisfied andnot satisfied. It is clear from the Table 4 that about 61per cent of the students were satisfied, 17 per cent were
Table 4: Distribution of students according to their opinion regarding Experiential Learning Programme II (n=150)Statements Agree f (%) Disagree f (%)Duration of one month is sufficient 97 (64.66) 53 (35.33)Visits to institutes (KVKs, KRIBHCO, Seed production unit etc.) are important 138 (92.00) 12 (8.00)Interaction with extension personnel helps in boosting knowledge 148 (98.66) 2 ( 1.33)Interaction with extension personnel builds confidence 146 (97.33) 4 (2.66)Interaction with extension personnel motivates for extension work 145 (96.66) 5 (3.33)Presentations are essential 132 (88.00) 18(12.00)Exposure visits develop some qualities (of extension worker, trainees) among students 147 (98.00) 3(2.00)
Table 5: Distribution of students according to their satisfaction regarding Experiential Learning Programme II (n=150)Statements Satisfied f (%) Some what satisfied f (%) Not satisfied f (%)Duration of one month 92 (61.33) 25 (16.67) 33 (22.00)Institutes visited (KVKs, KRIBHCO etc.) 130 (86.67) 17 (11.33) 3 (2.00)Interaction with extension personnel 122 (81.33) 11 (7.33) 17 (11.33)Presentations of work done 111 (74.00) 20 (13..33) 19 (12.67)
Table 3: Distribution of students according to their levelof satisfaction regarding Experiential LearningProgramme I (n=150)Level of satisfaction (Scores) Frequency PercentageLow (6-9) 6 4.00Medium (9-12) 42 28.00High (12-15) 102 68.00

126 Shachi Singh and Prabhjot Kaur
having somewhat satisfaction and 22 per cent of thestudents were not satisfied at all with the duration ofELP II.
Regarding visits to institutes about 87 per cent ofthe students were satisfied while only 11 per cent of thestudents were somewhat satisfied and it was also foundthat majority of the students (81%) were satisfied withtheir interaction with extension personnel, 7 per cent ofthem were somewhat satisfied and rest 11 per cent werenot satisfied at all. Seventy four per cent of the studentswere satisfied with the presentations, and about 13 percent of them were having somewhat satisfaction andremaining 13 per cent were not satisfied at all.
Level of satisfaction of students regardingExperiential Learning Programme: For measuringthe level of satisfaction regarding Experiential LearningProgramme II, response was taken on 3 point continuumthat is satisfied, somewhat satisfied and not satisfied andscores were allotted as 3, 2 1 respectively. On the basisof the obtained scores the satisfaction level were classifiedinto 3 categories that is low, medium and high. Data inTable 6 revealed that more than half of the students(54.66%) had high satisfaction level while about 35 percent of the students were found to be in the category ofmedium satisfaction level and only 10 per cent of thestudents had low level of satisfaction.
CONCLUSION
It was concluded that experiential learning programmewas highly successful in providing new experiences,understanding the real life situations, art of managementto the students. Most of the students were agreed withthe various aspects of experiential learning programme.It was concluded that majority of the students was havinghigher satisfaction level with various aspects ofexperiential learning programme.
REFERENCES
Anonymous. 1999. Essentials on entrepreneurship in :Explanatory variables for perceived utility of ExperientialLearning Programme of Indian Council of AgriculturalResearch. J. Comm. Mob. and Sus. Dev., 11: 1-8.
Anonymous. 2013. A-Report-on-Rural-Agricultural-Work-Experience. Retrieved from https://www. scribd.com/doc/2157396/A-Report-on-Rural-Agricultural-Work-Experience on 1/07/2016.
Chauhan, N.B. 2004. Rural Agricultural Work ExperienceProgramme (RAWEP): An appropriate model to createhigh quality human resources for sustainable extensionservices. Banaras Hindu University, Varanasi, India.Retrieved from http://agropedia.iitk.ac.in/openaccesscontent/rural-agricultural-work-experience-programme-rawep-appropriate-model-create-high-quality-hu- on 15/03/2015.
Gowda, N.K. and M.V. Sajeev. 2013. Perceptions on experientiallearning: A study of agriculture students. Indian Res. J.Ext. Edu., 1: 13-14.
Lekang, B.; M.S. Nain; R. Singh and J.P. Sharma. 2016.Explanatory variables for perceived utility of ExperientialLearning Programme of Indian Council of AgriculturalResearch. J. Comm. Mob. and Sus. Dev., 11: 1-8.
Anonymous. 2011. Annual report 2011-12.Retrieved fromhttp://www.skuast.org/site/annual-report/annual-report-11-12.pdf on 1/07/2016.
--------------------------------------------------------------------------------------------------------------------------------------------------------------Received on December, 2017, Revised on February, 2018
Table 6: Distribution of students according to their levelof satisfaction regarding Experiential LearningProgramme II (n=150)Level of satisfaction (scores) Frequency PercentageLow (6-8) 15 10.00Medium (8-10) 53 35.33High (10-12) 82 54.66

Journal of Community Mobilization and Sustainable Development Vol. 13(1), 127-132, January-April, 2018
*Corresponding author email id: [email protected]
Extent and Scope of Agriculture Diversification in Baghpat Districtof Uttar Pradesh
Surendar Kumar1, Sarita Joshi2 and Piyush Tomar3
1,2KVK, Baghpat, Sardar Vallabh Bhai Patel University of Agriculture and Technology, Meerut3Ph.D. Scholar Department of Veterinary Public Health and Epidemiology, LUVAS, Hisar
ABSTRACT
The study was conducted during 2015-17 in Baghpat district of western Uttar Pradesh falling in upper doabaregion of Ganga and Yamuna river and represents the agro-eco-socio situation of western Uttar Pradesh 200respondents were taken for the study. The major problem in diversification perceived and expressed by thefarmers were low level of investment, supporting price, technical guidance, transportation of produce, nonavailability of inputs, improper credit system and lack of developed marketing infrastructure. Animal husbandry& dairy, vegetable production, floriculture were the main choices of the farmers for diversification, however spices,medicinal plants, poultry and pulse were also focused by the sufficient number of farmers for diversification.Farmers suggested that relatively more trainings are required in field of medicinal plants, flowers, vegetables andspices with special reference to plant protection measures, marketing intelligence and post harvest management.However, some of the farmers also suggested requirement of regular training on veterinary aspects for animal andpoultry.
Keywords: Diversification, Support price, Backyard poultry, Crop intensification, Credit system & Market-led extension
INTRODUCTION
Diversification refers to increasing the alternative farmproduction pattern and basket of choice so that farmerscan get stability in their farm income, regularity inemployment throughout the year and minimizing the riskfactor in agriculture production. Commercially, thedecision of the farmers to grow a particular crop or gofor particular farm enterprises depends on the price,yields, infrastructure and availability of marketingopportunity with their farming situation. Thus, croppingpattern prevailing at a point of time is a reflection offarmers’ decision as directed by facilities, availabletechnology and market. Farmers have different viewsabout diversification on crop level as well as enterpriseslevel like dairy, poultry and other. But they have acommon view that diversification can play a vital role toincrease the productivity per unit area with employmentgeneration. Farmers household with diversified sourceof income have higher agriculture productivity, inputmanagement and human capital like education,communication and social participation which influence
for more participation in nonfarm activities (Saha, 2012).These factors play active role in decision making supportto diversified agriculture. Diversification is not onlyimportant to increase the income and employmentgeneration but it is highly relevant to sustainability ofagriculture production system and environment Gill etal. (2009).
MATERIALS AND METHODS
The study was conducted in Baghpat district of UttarPradesh, 200 respondents were selected from 26 villagesfalling under all 6 blocks to get the wider representation.Thus farmers whose are cultivating 5-10 hectare landcomprised as respondents for the study. A well structuredschedule was used to collect the information and opinionof the farmers. The trend of diversification wasoperationalised according to deviation from the base year1995-96 for measuring the trend and direction ofdiversification, the data between 1995-96 to 2005-06 and2005-06 to 2015-16 were compared to draw theconclusion. The choice of diversification of farmers was

128 Surendar Kumar et al.
opertionlised as an expression about selected diversifiedcomponent by them like dairy, vegetable, floriculture,poultry etc. It was measured in terms of change in areaand percentage. Internal diversification towards existingcropping pattern was also quantified. Crop wise areawas calculated to measure the trend and extent ofdiversification with in cropping pattern, the methodologyused by Yadav et al. (2000) was adopted and to quantifythe trend and extent of diversification through changingarea in different cropping system the methodology ofKumar et al. (2015) was adopted . Simple arithmetic meanand percentage value was the statically tools used toanalyze the data.
RESULTS AND DISCUSSION
The cropping pattern of Baghpat district by and large issugarcane based followed by wheat and fooder, all thethree crops occupies three fourth of total cultivable area.The area under sugarcane increased 76000 to 78500 haand in wheat 22000 to 22230. However, in case offodder, area slightly decreased 16500 to 16230 between1995-96 to 2015-16 (Sankhayakhi Patrika of Baghpatdistrict) other crops like jawar, bajara, pulses and milletstoo have lost their relevance in the cropping pattern. Thefarmers are not interested to shift towards orchard evensome of the case they are felling down their establishedorchard for cultivation purpose because of managementproblem and low return from orchard resultingdecreased area under orchard upto 7.55% and 24.86%during 1995-96 to 2005-06 and 2005-06 to 2015-16respectively. However, they are shifting towards vegetablefollowed by floriculture. Spices and medicinal plant arethe new emerging crops where farmers are focusing dueto suitability of these crops in existing cropping systemand ruminative price. The data presented in Table 1 and2 reveals that the farmers tried to diversify towards
vegetable and flowers during the last two decade. Thearea under these crops increased up to significant extent.Area under spices and medicinal plants is increasingslowly, however there is slightly increase in agro forestrywhile area under orchard especially mango orcharddecreased drastically. Table 3 and 4 reveals that area undersugarcane and wheat are almost constant during last twodecades but significant increase were noticed in area ofrice because of popularization of basmati varieties withcharming market price. Area under jawar, bajra and othermillets decreased drastically while area under potato andother vegetable crops increased up to significant level.In case of oilseed and pulses it is almost constant. Someof the farmers successfully adopted more than onecomponent at a time; many of them put their view asrequirement of multiple choices for diversification, sothat they can choose better option as per their resources,interest and availability of market. Importance ofmultioption diversification was also suggested by Singhet al. (2010) and highlighted that Integrated Farming
Table 2: Area and percentage increased under differentdirection of diversification between 2005-06 to 2015-16Crop/diversification Total Total %
cultivated cultivatedarea (ha) area (ha) increase1995-96 2005-06
Vegetable 13.96 22.24 59.31Fruits 7.02 7.52 7.12Flower 1.45 1.98 36.55Medicinal plants 0.12 0.15 25.00Spices 0.25 0.55 120.00
Table 3: Area and percentage increased under different cropthrough diversification/intensification between 1995-96 to2005-06Crop/diversification Total Total %
cultivated cultivated increasearea (ha) area (ha)1995-96 2005-06
Sugarcane 44.20 52.50 18.18Wheat 23.00 22.75 -01.08Rice 08.20 17.50 134.41Fooder 21.80 17.00 -10.58Potato 5.25 11.20 113.33Mustard 04.55 4.35 -04.59Pulses 04.32 4.85 12.26Any other crop 10.50 12.50 19.04Total 121.82 42.65 17.09
Table 1: Area and percentage under different direction ofdiversification between 1995-56 to 2005-06Crop/diversification Total Total %
cultivated cultivated increasearea (ha) area (ha)1995-96 2005-06
Vegetable 5.05 13.96 176.43Fruits 11.75 7.02 -67.37Flower 0.19 1.45 663.00Medicinal plants 0.03 0.12 400.00Spices 0.05 0.25 500.00

Extent and Scope of Agriculture Diversification in Baghpat District of Uttar Pradesh 129
system model is a basket of option and farmers canchoose appropriate combination of enterprises as pertheir resources and family need. It was also highlightedthat marginal and small farmers can integrate less landrequired enterprises such as mushroom, backyard poultryand bee keeping in their farming system
Regarding farmers’ choice for diversification, it wasrevealed that farmers are mostly interested indiversification towards dairy followed by vegetable,floriculture and poultry. Cultivation of spices andmedicinal plants is the other choice for diversification.In pulses, farmers were growing green gram and blackgram as a catch crop between the main crop of kharifand rabi season. Farmers were very much interested togrow medicinal plant and spices but due to lack ofknowledge, procurement facility and assured market theyare hesitant. During last two decades some farmersshowed the interest in agro-forestry as popular plantationwith their existing cropping system. Choice of farmers
varied for diversification as per their resources andavailability of market. Most of them had preference fordairy and animal husbandry being a traditionaloccupation. Vegetable cultivation and floriculture areanother preferable area for diversification. Land lessfarmers shown keen interest in less land requiredoccupation like backyard poultry. Importance ofbackyard poultry for land less farmers was also foundby Aahirer et al. (2015) and suggested that diversificationin agriculture with component like backyard poultry canhelp enhance the family income, employment generationwith insured rich diet for family member and genderequity.
Diversification and mechanization in agriculture haddirectly and indirectly affected number of livestock.During last four decades the population of buffaloeswas almost same as before. But the population of cattledeclined from 1915 to 2016, the population of poultryand pig had just increased. The reason behind decreasingthe number of cattle is mechanization in agriculture; dueto mechanization farmers are frequently replacing thebullock power by tractor. Numbers of buffalos are allmost constant because of their utility to draw the bullockcart and high yielding milk capacity as compare of cattle.
Table 4: Area and percentage increased under different cropthrough diversification/intensification between 2005-06 to2015-16Crop/diversification Total Total %
cultivated cultivated increasearea (ha) area (ha)1995-96 2005-06
Sugarcane 52.50 39.80 31.91Wheat 22.75 20.45 -11.24Rice 17.50 18.50 05.71Fooder 17.00 15.65 -08.62Potato 11.20 10.50 -06.66Mustard 04.35 05.50 26.43Pulses 04.85 06.25 28.86Any other crop 12.50 21.55 72.4Total 142.65 138.2 03.22
Table 5: Trend of crop diversification through various agronomic mechanism between 1995-96 to 2005-06 and 2005-06 to2015-16Crop/diversification Total diversified % share in Total diversified % share in
area (ha) diversification area (ha) diversification1995-96 to 2005-06 2005-06 to 2015-16
Complete Diversification 42.50 09.34 76.00 17.63Through Intensification 07.00 1.53 28.00 06.49Through Intercropping 03.80 0.83 08.50 01.97ThroughAgro forestry 1.15 0.25 2.50 00.58Through Multicropping 1.70 0.37 2.80 00.65Total diversified area 56.15 12.34 117.80 27.33Total area in (1995-96)-455 hectare, total area-(2005-2006))-431 hectare, total area- (2015-2016)-417 hectare
Table 6: Position of livestockLivestock Year
1975 1985 1995 2005 2015Cattle 1210 905 811 404 312Buffalo 1205 1109 1280 1303 1327Piggery 32 42 39 48 31Goat 102 86 72 88 81Sheep 36 32 27 31 33Poultry 54 76 102 108 285
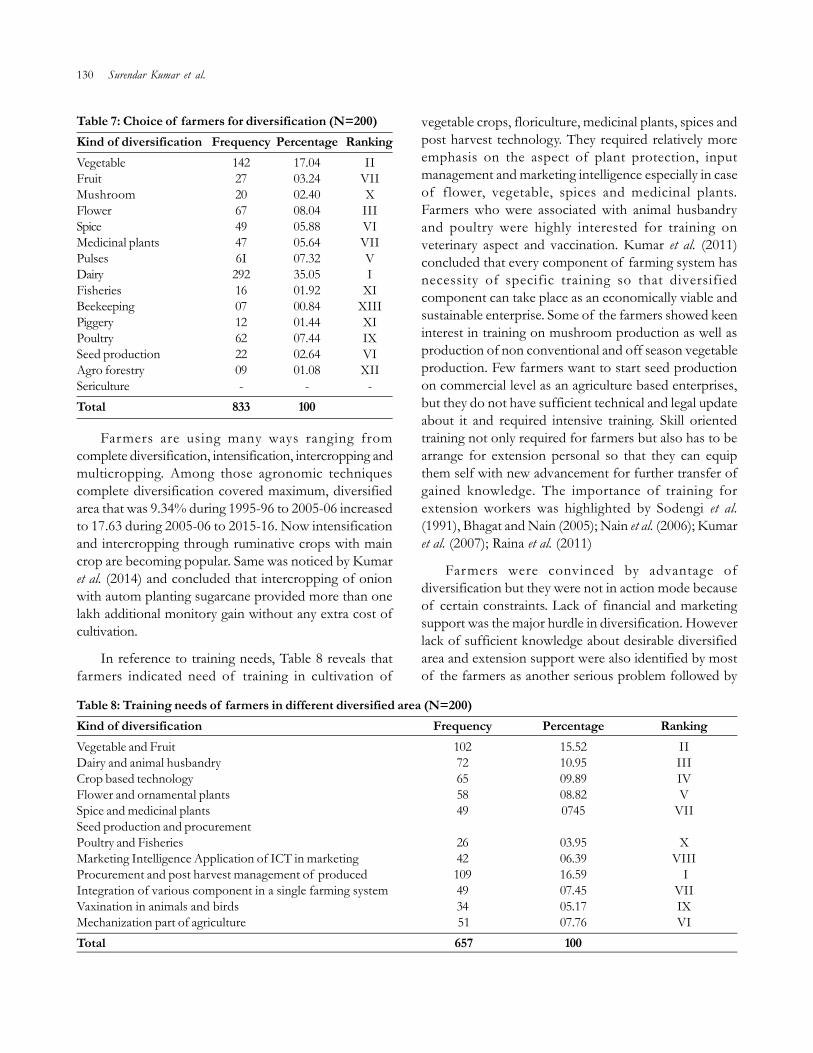
130 Surendar Kumar et al.
Farmers are using many ways ranging fromcomplete diversification, intensification, intercropping andmulticropping. Among those agronomic techniquescomplete diversification covered maximum, diversifiedarea that was 9.34% during 1995-96 to 2005-06 increasedto 17.63 during 2005-06 to 2015-16. Now intensificationand intercropping through ruminative crops with maincrop are becoming popular. Same was noticed by Kumaret al. (2014) and concluded that intercropping of onionwith autom planting sugarcane provided more than onelakh additional monitory gain without any extra cost ofcultivation.
In reference to training needs, Table 8 reveals thatfarmers indicated need of training in cultivation of
vegetable crops, floriculture, medicinal plants, spices andpost harvest technology. They required relatively moreemphasis on the aspect of plant protection, inputmanagement and marketing intelligence especially in caseof flower, vegetable, spices and medicinal plants.Farmers who were associated with animal husbandryand poultry were highly interested for training onveterinary aspect and vaccination. Kumar et al. (2011)concluded that every component of farming system hasnecessity of specific training so that diversifiedcomponent can take place as an economically viable andsustainable enterprise. Some of the farmers showed keeninterest in training on mushroom production as well asproduction of non conventional and off season vegetableproduction. Few farmers want to start seed productionon commercial level as an agriculture based enterprises,but they do not have sufficient technical and legal updateabout it and required intensive training. Skill orientedtraining not only required for farmers but also has to bearrange for extension personal so that they can equipthem self with new advancement for further transfer ofgained knowledge. The importance of training forextension workers was highlighted by Sodengi et al.(1991), Bhagat and Nain (2005); Nain et al. (2006); Kumaret al. (2007); Raina et al. (2011)
Farmers were convinced by advantage ofdiversification but they were not in action mode becauseof certain constraints. Lack of financial and marketingsupport was the major hurdle in diversification. Howeverlack of sufficient knowledge about desirable diversifiedarea and extension support were also identified by mostof the farmers as another serious problem followed by
Table 8: Training needs of farmers in different diversified area (N=200)Kind of diversification Frequency Percentage RankingVegetable and Fruit 102 15.52 IIDairy and animal husbandry 72 10.95 IIICrop based technology 65 09.89 IVFlower and ornamental plants 58 08.82 VSpice and medicinal plants 49 0745 VIISeed production and procurementPoultry and Fisheries 26 03.95 XMarketing Intelligence Application of ICT in marketing 42 06.39 VIIIProcurement and post harvest management of produced 109 16.59 IIntegration of various component in a single farming system 49 07.45 VIIVaxination in animals and birds 34 05.17 IXMechanization part of agriculture 51 07.76 VITotal 657 100
Table 7: Choice of farmers for diversification (N=200)Kind of diversification Frequency Percentage RankingVegetable 142 17.04 IIFruit 27 03.24 VIIMushroom 20 02.40 XFlower 67 08.04 IIISpice 49 05.88 VIMedicinal plants 47 05.64 VIIPulses 6I 07.32 VDairy 292 35.05 IFisheries 16 01.92 XIBeekeeping 07 00.84 XIIIPiggery 12 01.44 XIPoultry 62 07.44 IXSeed production 22 02.64 VIAgro forestry 09 01.08 XIISericulture - - -Total 833 100

Extent and Scope of Agriculture Diversification in Baghpat District of Uttar Pradesh 131
Table 9: Constraint facing by farmers in diversification(N=200)Kind of Constraint Frequency Percentage RankingFinancial 212 20.09 ITechnical 141 13.36 IIIExtension 102 09.66 IVTransportation 32 01.08 XIMarketing 176 06.68 IIStorage Grading and 76 07.20 VpackagingApplication of ICT in 45 04.26 IXinformation and marke-ting managementInput Management 23 02.18 XIIWild Animal 72 06.82 VIInitiation 64 06.06 VIITheft and any other kind 41 03.88 Xof damageRisk 62 05.87 VIIITotal 1055 100
lack of sufficient number of go downs and chain ofcold storage. It was also noticed by Udai et al. (2012)and Kumar et al. (2015). Majority of the farmers areconvinced about necessity of the diversification especiallyfarmers who are having commercial attitude in presentchallenging scenario, most of them feel that diversificationis only way to increase the productivity per unit area withopportunity of employment generation. Most of thefarmers thought that being a part of NCR they havebright opportunity for diversification, same time theyfeel that they are not utilizing that opportunity becauseof system based constraint and lack of proper marketinginfrastructure and low level of investment. The sameperception of the farmers were noticed by Kumar et al.(2011) and suggested to strengthen market-led extensionwith specific and commodity based extension service tospeed-up of diversification.
Based on the results some suggestion like; Promotionof organized market system and developing marketinghub in rural area, strengthening of market-led extension,organisation of need based skill oriented training, riskcovering policy for crop and animal insurance, availabilityof credit and promotion of integrated farming systemapproach can be made to promote the diversification inaddition to promotion of the post-harvest technologyat grass root level.
REFERENCES
Aahirer, M.C.; S.H. Ban; D.N. Pharate and A.B. Gayakwad. 2015.Employment and marketing practices indulge in backyardpoultry rearing. Paper presented and published in souvenirof national seminar on extension innovations andmethodologies for market-led agricultural growth anddevelopment organized by Indian Society of ExtensionEducation held at Rajmata Vijayaraje Scindia Krishi VishwaVidyalaya, Gwalior from 26-27 February 2015.
Bhagat, G.R. and M.S. Nain. 2005. Training needs of farmers inShiwalik Hills of Jammu and Kashmir Indian ResearchJournal of Extension Education, 5(2): 44-46.
Gill, M.S.; J.P. Singh and K.S. Gangwar. 2009. Integrated FarmingSystem and Sustainability. Indian Journal of Agronomy, 54(2):128-139.
Kumar, S. and C.R. Parjapati. 2011. Quantification ofinvolvement of farm women in animal husbandry anddairy based farming system. Journal of CommunityMobilization and Sustainable Development, 6(2): 190-193.
Kumar, S. and G. Pal. 2015. Trend of diversification in farmingsystem in Baghpat district of Western Uttar Pradesh.Journal of Community Mobilization and SustainableDevelopment, 10(2): 212-216.
Kumar, S.; A. Kumar and M. Kumar. 2014. Intercropping ofonion with autom planting sugarcane is a viable optionto enhance the productivity of sugarcane based croppingsystem. Annals of Horticulture, 7(2): 176-179.
Kumar, S.; S. Chudhary and G. Pal. 2013. Integrated FarmingSystem: A profitable option, A Book published by KrishiVigyan Kendra, Baghpat.
Kumar, Y.; U. Singh; G.R. Bhagat and M.S. Nain. 2007. TrainingNeed of Rice Growers: A Study of Preferences in JammuDistrict of J&K State. Indian Journal of Extension Education,43(1&2): 108-109.
Nain, M.S.; G.R. Bhagat and J. Chauhan. 2006. Perceptions ofgrass-root level extension workers towards in servicetraining. Indian Research Journal of Extension Education,6(1&2): 17-19.
Raina, M.S. Nain, B.S. Hansra and D. Singh. 2011. MarketingBehaviour and Information Sources Utilization Patternof Flower Growers. Journal of Community Mobilization andSustainable Development, 6(2): 180-184.
Saha, B. and R. Bahal. 2012. A scale of measure success inlivelihood diversification. Journal of Community Mobilizationand Sustainable Development, 7(1): 38-44.
Sankhayakhi Patrice of Baghpat District (2015-16).Singh, J.P.; B.G. Gangwar; P. Singh and D.K. Pandey. 2010. Design
and development of integrated farming system modelfor livelihood improvement of small farm holders ofwestern Utter Pradesh. Journal of Farming System Researchand Development, 16(1&2): 1-18.

132 Surendar Kumar et al.
Sodengi, B. 1991. Occupational diversification among rural youth:A study in costal Orissa, unpublished Ph.D. thesis,Division of Agricultural Extension. IARI, New Delhi.
Udai, O. and S. Phand. 2012. Constraint faced by village leaderin dairy development activities. Journal of CommunityMobilization and Sustainable Development, 7(1): 58-62.
Yadav, D.S.; R.M. Kumar and R. Achal. 2000. Diversification oftraditional cropping system. Indian Journal of Agronomy,35(1): 50-55.
--------------------------------------------------------------------------------------------------------------------------------------------------------------Received on November, 2017, Revised on January, 2018
Journal of Community Mobilization and Sustainable Development Vol. 13(1), 133-136, January-April, 2018
*Corresponding author email id: [email protected]
Perceived Constraints in Production of Bt cotton by the Growers inHaryana
Sumit Yadav1*, A.K. Godara2, M.S. Nain3 and Rashmi Singh4
1Research Scholar, 2Professor, Department of Extension Education CCSHAU, Hisar-125004, Haryana3,4Principal Scientist, Division of Agricultural Extension, ICAR-IARI, New Delhi-110012
ABSTRACT
Cotton is a major fiber crop and used for textile purpose by about 75 per cent of world’s population. The presentstudy was conducted in Haryana state to find out the seriousness of the constraints related to input, marketing,technical guidance, production and financial aspects. The most serious constraints perceived by the majority of thefarmers among all were failure of crop due to unfavorable weather conditions and high cost of seed. Otherconstraints related to technical guidance, marketing and financial constraints faced by the respondents were lack ofdemonstration and trial of Bt Cotton production, low price of farm produce at the time of harvesting and highrate of interest by money lenders.
Keywords: Constraints, Bt cotton, Growers and production technology
INTRODUCTION
Bt cotton has the pride to be the first transgenic cropapproved for commercial cultivation in India. Approvalof the first Genetically Engineered (GE) cotton (Btcotton) being an important development was applaudedby the scientific community both in India and outside, asa landmark decision paving way for more GE crops inIndia. According to International Cotton AdvisoryCommittee numerous benefits of this technology accrueto the grower (Anonymous, 2014). The benefitsassociated with the use of transgenic crops were adramatic decrease in the use of conventional and broad-spectrum insecticides, target pest specificity, improvedyield, lower production costs and compatibility withother biological control agents. As an example, thegrowing of transgenic modified cotton that expressesinsecticidal protein derived from Bacillus thuringiensisBerliner (Bt) is revolutionizing cotton production on aglobal scale (Head et al., 2005).
Bt-cotton was introduced in India in 2002 forcommercial production in Southern states followed byNorthern states (Haryana, Punjab and Rajasthan) in 2005.Presently, 1340 Bt cotton hybrids have been released andrecommended for cultivation in India (Bharud, 2014),
which has created a confusing situation for the farmersfor choosing the appropriate hybrid. With adoption ofBt cotton, there must be a change in package of practicesof cotton as Bt cotton required more crop managementthan non Bt cotton like usage of micro nutrient (Sulphur,Zinc and Boron), use of refugia crop, use of PlantGrowth Regulators or nipping operations and highdensity planting etc. Studies reveal that only 3% of thefarmers reported using refugia crop 1.75 % in Haryanato protect development of resistance in insects. AlthoughCotton farmers have reaped the benefit of Bt cottondue to decreased number of pesticide spray forbollworm resulting in lower cultivation cost but still arevulnerable to risk in reduction of yield due to severalconstraints. The present study aims to identify them indetail from farmers’ perspective.
MATERIALS AND METHODS
The present study was conducted in two districts Sirsaand Hisar of Haryana state which have largest area andproduction under Bt cotton among all the district ofHaryana. Multistage sampling technique was adopted forthe selection of district, block, village and the ultimaterespondents. There are nine blocks in Hisar district andsix blocks in Sirsa district out of these two blocks from

134 Sumit Yadav et al.
each district were selected randomly. A list of all thevillage of the two selected blocks was prepared and twovillages from each block were again selected randomly.Thus the eight villages were selected for the study. Avillage-wise list of Bt cotton growers, was prepared andfrom that list of 20 farmers were selected randomly.Therefore, 160 Bt cotton respondents from 8 villageswere selected for the present study.
To find out the probable constraints which hinderthe adoption of improved practices in Bt cotton, aninventory of constraints was prepared on the basis ofavailable literature, personal experience, discussion withexperts and farmers growing Bt cotton. A list ofconstraints was prepared and the farmers were asked tolist out their responses against each constraint against thecategories ‘very serious’, ‘serious’ and ‘not so serious’ andaccordingly weightage given to these response categorieswere 3, 2, and 1 respectively. Aggregate total wascalculated for each constraint separately and on the basisof calculated scores, mean scores, mean score percentagewere obtained which were ranked according to theirmaximum to minimum mean score percentage forassessing the seriousness of constraints. The maximummean score percentage so obtained was given the rank1st and the next subsequent one was given the rank 2nd
and soon the descending order.
RESULTS AND DISCUSSION
The constraints were studied under five major categoriesviz.; input related constraints, production related,Technical guidance related, financial aspect and marketingrelated constraints. The results have been presented inpreceding section.
Input related constraints: Majorly, eight constraintsrelated to inputs, faced by the farmers were enlisted andranked on the basis of weighted mean scores. Table 1reveals that ‘high cost of seeds’ was observed as themost serious constraint and it was ranked first with a
weighed mean score of 2.78. The constraint; inadequateavailability of quality seeds was ranked second with aweighted mean score of 2.63. While other constraintslike ‘Non availability of inputs on proper time at villagelevel’, ‘Inadequate credit facilities for the purchase ofinputs’,‘ lack of agricultural labour during peak seasons’,‘Lack of timely availability of micro-nutrient bearingfertilizers’ and ‘Lack of availability and high price ofquality fertilizers’ found place in descending order. Thefinding also supported with the finding of Godara et al.(2012), Visawadia et al. (2006).
Production related constraints: The results presentedin table 2 highlights that the ‘failure of crop due tounfavourable weather conditions’ was observed as themost serious constraint and was ranked first with a meanscore of 2.72, followed by ‘inadequate knowledgeregarding insect pest control’ with a means core of 2.28,Arshad et al. (2007) also found that inadequate knowledgeregarding insect pest control and failure of crop due toweather condition. Farmers were very much affectedby ‘non availability of labour’,‘ lack of irrigation facilities’,’lack of knowledge about area specific recommendedpackage of practices’, ‘Rain immediate after spraying’,which were ranked 3rd, 4th, 5th and6th, respectively. Thefindings are in line with the finding of Shashikant et al.(2011) and Singh et al. (2013).
Marketing related constraints: Table 3 reveals variousconstraints faced by the farmers related to marketing oftheir produce. Among these ‘low price of farm produceat the time of harvesting’ was ranked 1st with highestmean score of 2.77 followed by ‘lack of guidance forproper marketing’ with mean score of 1.87. The resultsare in consonance with Das et al. (2014). ‘Lack ofmarketing facilities at village level’ was rated as a seriousconstraint at third rank followed by ‘lack of gradingsystem’ and ‘lack of marketing knowledge’ Rani andSelvaraj (2015) also reported lack of marketingknowledge and ‘delay in payment by the marketingagencies’ as major constraints in their study.
Table 1: Input related constraints perceived by Bt cotton growersConstraints related to input VS S NSS Mean score Rank orderHigh cost of seed 131 24 5 2.78 IInadequate availability of quality seeds 109 43 8 2.63 IINon availability of inputs on proper time at village level 93 57 10 2.52 IIIInadequate credit facilities for the purchase of inputs 47 101 12 2.21 IVLack of agricultural labour during peak seasons 44 79 37 2.04 VLack of timely availability of micro-nutrient fertilizers 31 41 88 1.64 VILack of availability and high price of quality fertilizers 19 37 104 1.47 VII
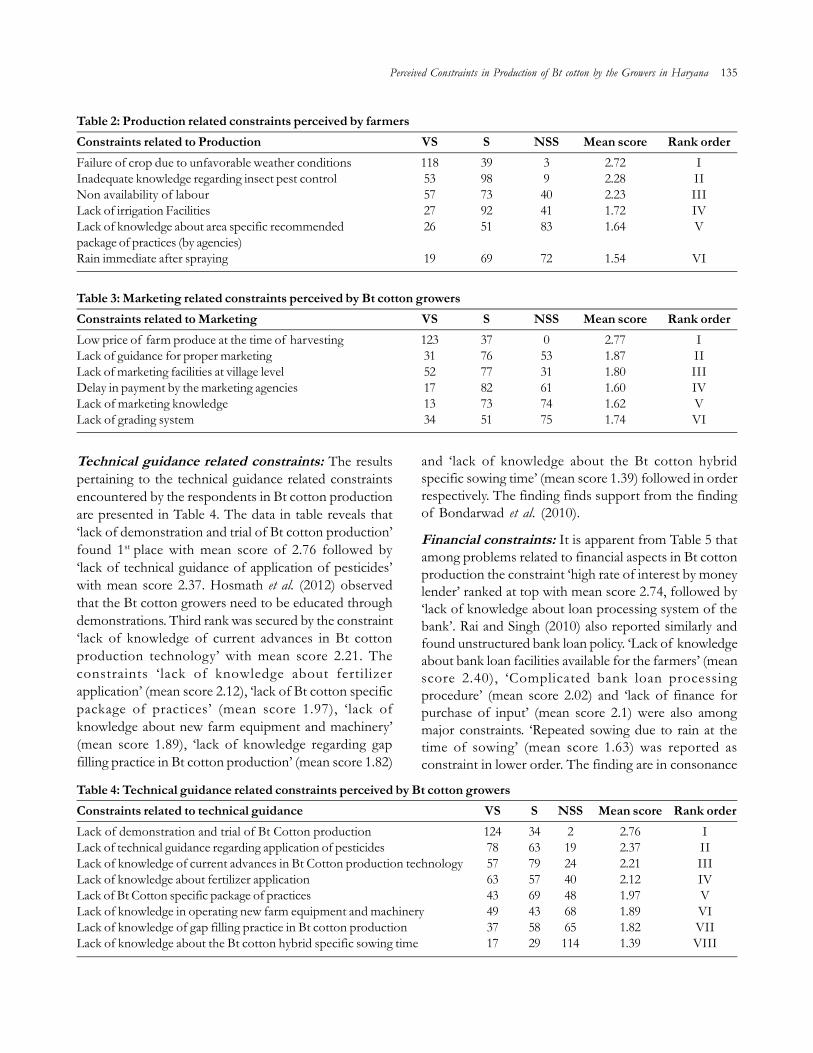
Perceived Constraints in Production of Bt cotton by the Growers in Haryana 135
Table 2: Production related constraints perceived by farmersConstraints related to Production VS S NSS Mean score Rank orderFailure of crop due to unfavorable weather conditions 118 39 3 2.72 IInadequate knowledge regarding insect pest control 53 98 9 2.28 IINon availability of labour 57 73 40 2.23 IIILack of irrigation Facilities 27 92 41 1.72 IVLack of knowledge about area specific recommended 26 51 83 1.64 Vpackage of practices (by agencies)Rain immediate after spraying 19 69 72 1.54 VI
Table 3: Marketing related constraints perceived by Bt cotton growersConstraints related to Marketing VS S NSS Mean score Rank orderLow price of farm produce at the time of harvesting 123 37 0 2.77 ILack of guidance for proper marketing 31 76 53 1.87 IILack of marketing facilities at village level 52 77 31 1.80 IIIDelay in payment by the marketing agencies 17 82 61 1.60 IVLack of marketing knowledge 13 73 74 1.62 VLack of grading system 34 51 75 1.74 VI
Table 4: Technical guidance related constraints perceived by Bt cotton growersConstraints related to technical guidance VS S NSS Mean score Rank orderLack of demonstration and trial of Bt Cotton production 124 34 2 2.76 ILack of technical guidance regarding application of pesticides 78 63 19 2.37 IILack of knowledge of current advances in Bt Cotton production technology 57 79 24 2.21 IIILack of knowledge about fertilizer application 63 57 40 2.12 IVLack of Bt Cotton specific package of practices 43 69 48 1.97 VLack of knowledge in operating new farm equipment and machinery 49 43 68 1.89 VILack of knowledge of gap filling practice in Bt cotton production 37 58 65 1.82 VIILack of knowledge about the Bt cotton hybrid specific sowing time 17 29 114 1.39 VIII
Technical guidance related constraints: The resultspertaining to the technical guidance related constraintsencountered by the respondents in Bt cotton productionare presented in Table 4. The data in table reveals that‘lack of demonstration and trial of Bt cotton production’found 1st place with mean score of 2.76 followed by‘lack of technical guidance of application of pesticides’with mean score 2.37. Hosmath et al. (2012) observedthat the Bt cotton growers need to be educated throughdemonstrations. Third rank was secured by the constraint‘lack of knowledge of current advances in Bt cottonproduction technology’ with mean score 2.21. Theconstraints ‘lack of knowledge about fertilizerapplication’ (mean score 2.12), ‘lack of Bt cotton specificpackage of practices’ (mean score 1.97), ‘lack ofknowledge about new farm equipment and machinery’(mean score 1.89), ‘lack of knowledge regarding gapfilling practice in Bt cotton production’ (mean score 1.82)
and ‘lack of knowledge about the Bt cotton hybridspecific sowing time’ (mean score 1.39) followed in orderrespectively. The finding finds support from the findingof Bondarwad et al. (2010).
Financial constraints: It is apparent from Table 5 thatamong problems related to financial aspects in Bt cottonproduction the constraint ‘high rate of interest by moneylender’ ranked at top with mean score 2.74, followed by‘lack of knowledge about loan processing system of thebank’. Rai and Singh (2010) also reported similarly andfound unstructured bank loan policy. ‘Lack of knowledgeabout bank loan facilities available for the farmers’ (meanscore 2.40), ‘Complicated bank loan processingprocedure’ (mean score 2.02) and ‘lack of finance forpurchase of input’ (mean score 2.1) were also amongmajor constraints. ‘Repeated sowing due to rain at thetime of sowing’ (mean score 1.63) was reported asconstraint in lower order. The finding are in consonance

136 Sumit Yadav et al.
Table 5: Constraints perceived by Bt cotton growers related to financial aspectConstraints related to finance VS S NSS Mean score Rank orderHigh rate of interest by money lenders 128 23 9 2.74 ILack of knowledge about loan processing system of the bank 39 83 38 2.52 IILack of knowledge about bank loan facilities available for the farmers 93 38 29 2.40 IIILack of finance for purchase of input 63 58 39 2.15 IVComplicated bank loan processing procedure 37 89 34 2.02 VRepeated sowing due to rain at the time of sowing 23 56 81 1.63 VI
with the findings of Visawadia et al. (2006) andRamasundaram et al. (2007).
CONCLUSION
On the basis of the findings, therefore, it may beconcluded that the most serious constraints perceivedby the farmers were high cost of seed, failure of cropdue to unfavourable weather condition, low price offarm produce at the time of harvesting, lack ofdemonstration trail of Bt cotton production and highrate of interest by money lenders. Bt cotton cultivationcan be increased by providing quality seeds at affordableprice, ensuring input supply at a competitive rate andcreation of knowledge regarding institutional creditfacilities available at cheaper interest rate. This requiresthat extension system to reorient their programmesaccording to the expressed constraints. Specialarrangement for research farm visit, support of weatherrelated advisories, arrangement of bankers- farmers-scientists interface, creation of awareness regarding e-NAM and other market linkages are some of the greyareas need to be focused in extension programmes sothat Bt cotton growers can harvest benefits in term ofhigher yield and income.
REFERENCES
Anonymous. 2014. Annual Report. All India CoordinatedCotton Improvement Project. CICR, Nagpur, p2.
Arshad, M.; A. Suhail; M. Asghar; M. Tayyib and F. Hafeez.2007. Factors Influencing the Adoption of Bt Cotton inthe Punjab, Pakistan. Journal of Agriculture and SocialSciences, 4: 121–124.
Bharud, R.W. 2014. Cotton developments in India. AICCIP,Mahatma Phule Agricultural University, Rahuri,Maharashtra, India.
Bondarwad, S.P.; S.D. Wangikar and N.D. Deshmukh. 2010.Present status of adoption of Bt cotton productiontechnology by farmers. Agriculture Update, 5(3/4): 322-324.
Das Litan; M.S. Nain; Rashmi Singh and R.R. Burman. 2014.Constraints in marketing of fruits as perceived by thefruit. Journal of Community Mobilization and SustainableDevelopment, 9(2): 114-117.
Godara, A.K.; B. Kaur; O.P. Bishnoi and S.K. Mehta. 2012.Socio-Economic impact and problems associated with BtCotton production in Haryana. Journal of Cotton ResearchDevelopment, 26(2): 277-280.
Head, G.; W. Moar; M. Eubanks; B. Freeman; J. Ruberson; A.Hagerty and S. Turnipseed. 2005. A multiyear large-scalecomparison of arthropod populations on commerciallymanaged Bt and non-Bt cotton fields. Environ. Entomol.,34: 1257–66.
Hosmath, J.A.; D.P. Biradar; V.C. Patil; Y.B. Palled; L.H.Malligawad; S.S. Patil; A.R. Alagawadi and A.S. Vastrad.2012. A survey analysis on advantages and constraints ofBt cotton cultivation in northern Karnataka. KarnatakaJournal of Agricultural Science, 25(1): 140-141.
Rai, D.P. and B. Singh. 2010. Extent of knowledge andconstraints in cotton production technology in MadhyaPradesh. Indian Research Journal of Extension Education,10(2): 78-80.
Ramasundaram, P.; S. Vennila and R.K. Ingle. 2007. Bt cottonperformance and constraints in central India. Outlook onAgric., 36(3): 175-180.
Rani, S.U. and G. Selvaraj. 2015. Adoption behaviour of Btcotton growers in irrigated and rainfed conditions of TamilNadu. Journal of Cotton Research and Development, 29(1):132-140.
Shashikant, V.G.; Itigi Prabhakar and B.L. Manjunatha. 2011.Constraints in production and marketing of redgram inGulbarga District of Karnataka.Journal of CommunityMobilization and Sustainable Development, 6(2): 202-204.
Singh, J.; U. Singh; D.P. Sheoran; R. Sharma and S. Prakash.2013. Adoption of Bt cotton technologies and constraintsfaced by cotton growers in Haryana. J. Cotton Res. and Dev.,27(1): 149-151.
Visawadia, H.R.; A.M. Fadadu and V.D. Tarpara. 2006. Acomparative analysis of production and marketing of Btcotton and hybrid cotton in saurashtra region of GujaratState. Agricultural Economics Research Review, 19: 293-300.
--------------------------------------------------------------------------------------------------------------------------------------------------------------Received on December, 2017, Revised on February, 2018

Journal of Community Mobilization and Sustainable Development Vol. 13(1), 137-141, January-April, 2018
(*Corresponding author) email id: *[email protected], [email protected], [email protected]
Occupational Status of Home Science Graduates and Post graduatesof Punjab Agricultural University, Ludhiana, Punjab
Sukhdeep Kaur Mann1*, Divya Sachan2 and Kanwaljit Kaur3
1Assistant Professor, 2Senior Research Fellow, 3Professors, Punjab Agricultural University, Ludhiana-141004, Punjab
ABSTRACT
Home Science education offers excellent opportunities for women to be efficient manager and dedicated employer.But due to lack of linkages among educational institution and industry there is a mismatch between supply anddemand. The present study was planned to identify the educational and employment status of Home sciencegraduates and Post graduates of Punjab Agricultural University, Ludhiana. Result of the study indicated that45.40 per cent and 30.27 per cent of the total respondents were having the highest qualification of M.Sc. and PhDin Home Science respectively. Majority of the respondents after graduation (63.04%) and after post graduation(30.88%) opted for higher studies and 26.08 per cent respondents after B.Sc., 23.52 and 32 per cent after M.Sc. andPh.D. respectively were home makers. The main reason for doing job was economic independence (49.42%).Majority of B.Sc. and M.Sc. students reported that they did not opt for job because they continued further studies(44.89%). Besides, lack of opportunities (32.65%) was the other reasons for not doing job.
Keywords: Home Science, Education, Employment and Occupational status
INTRODUCTION
In today’s economy, there is greater emphasis onknowledge and skill rather than labour, capital or land.The former provides an individual not only with thecompetencies but also modifies forces in the environmentfor the attainment of the desired goals. In the newmillennium, a knowledgeable society will play a vital rolein constructing a new history of humanity. Aknowledgeable and skilled society can be one of theunderpinnings to understand the vision for the developedIndia. The prime mover of prosperity and power isknowledge, whose efficient use can create wealth andimprove the quality of life.
Education is a powerful and pervasive driving forcefor enhancing knowledge and for overall developmentof individual and social transformation. This alone cansustain culture and civilization. Education enablesindividuals to discharge their economic, social, political,cultural, and spiritual, functions efficiently, therebyenhancing their status, position in the society, prestigeand quality of life.
According to Swaminathan (1997), education is oneof the five energies of human resource development;the others are health and nutrition, environment,employment, and political and economic freedom. Thesefive energies are interlinked and independent, buteducation is the key for the rest.
Home Science Education offers excellentopportunities for students to be good home maker,efficient manager and dedicated employer. Till 1997, theHome Science programme in SAU’s was of generalnature having three years duration of Bachelor’s degree.Later as per the recommendations of third and fourthDean’s committee of ICAR, it was decided to have B.Sc.Home Science degree programme of four years durationwith thrust on entrepreneurial skills, In-plant training andrural awareness work experience. Therefore, it wasplanned to know up to what extent this programme ishelpful in preparing students for various employmentand self- employment opportunities.”Home Sciencedevelops necessary competence required for the betterhome making and family living among the students. Itprepares the students for gainful employment and worthy

138 Sukhdeep Kaur Mann et al.
citizenship which is a requirement of any democraticsociety.
MATERIALS AND METHODS
The study was carried on graduates and post graduatesof College of Home Science, Punjab AgriculturalUniversity (PAU), Ludhiana. All the Home Sciencegraduates and post graduates who had completed theirB.Sc. /M.Sc. / PhD. in field of Home Science fromcollege of Home Science, Punjab Agricultural Universityduring the period 2011-2014 were selected for thepurpose of the study. Present contact numbers and e-mail id’s of Home Science graduates and post graduateswould be obtained from different sources (office ofDean College of Home Science, PAU, Ludhiana), friendsand parents of the pass out students. Total number ofstudents pass out during these years was 207.Questionnaire was mailed to all 207 students but responseof 185 students was received. So, the sample size for thepresent study was 185 respondents B.Sc. (92), M.Sc. (68)and Ph.D. (25).
RESULT AND DISCUSSION
Admission criteria and reasons for opting B.ScH.Sc. programme: It is evident from the Table 1 thatmajority of the respondents took admission throughopen category (78.91%) while the remaining respondentstook admission through reserved (9.72%), ICARnominee (6.48%) and sports category (4.86%). Further,
23.78 per cent of respondents said that they had takenadmission in Home Science by their own interest andnearly 22 per cent of the respondents reported that easyaccessibility of PAU was the reason for opting B.Sc.Home Science and 6.48 per cent took admission in HomeScience because there was no other option available.
Level of Education: The current level of educationof the respondents was also studied and Table 2 revealsthat 45.40 per cent and 30.27 per cent of the totalrespondents were having the degrees of M.Sc. and Ph.D.in Home Science respectively. Only few of therespondents i.e.1.62 per cent deviate from the field ofHome Science to other fields after graduation.
Reasons for not opting higher studies: The dataregarding reasons for not opting higher studies wererecorded through multiple response in table, findingsrevealed that from all the reasons for not opting forhigher studies, family not interested (85%) was the majorreasons followed by marriage of the respondents(82.50%). So, it can be concluded that respondents werenot able to continue/ opt for higher studies due to theirfamily obligations. Findings of the study are in conformitywith the findings of Godawat (2004) who also foundthat due to family problems respondents were not ableto opt for higher studies.
Table 1: Distribution of respondents according to theiradmission category and reasons for opting B.Sc H.Scprogramme (n=185)Category & reasons of admission Total No. of
Respondentsf (%)
CategoryOpen 146 (78.91)Reserved 18 (9.72)Sports 9 (4.86)ICAR nominee 12 (6.48)Reasons for opting B.Sc Home ScienceMy own interest in field of the study 44 (23.78)Applicability of the course of study in real 38 (20.54)life situationThere was no other option 12 (6.48)Parents interest 22 (11.89)More job opportunities 29 (15.67)Easy accessibility of educational institution 40 (21.62)
Table 2: Level of Education of the respondents (n=185)Level of Education Total no. of Respondents
f (%)B.Sc. Home Science only 21 (11.35)B.Sc & B.Ed 13 (7.02)B.Sc.+Diploma 8 (4.32)M.Sc Home Science 84 (45.40)MBA 2 (1.08)PhD 56(30.27)D. Pharmacy 1 (0.54)
Table 3: Distribution of respondents according to thereasons for not opting higher studiesReasons B.Sc. M.Sc. Total
(n1=24) (n2=16) (n=40)f (%) f (%) f (%)
Not interested 12 (50.00) 9 (56.25) 21 (52.50)Marriage 21 (87.50) 12 (75.00) 33 (82.50)Inconvenience 14 (58.33) 5 (31.25) 19 (47.50)Economic problems 18 (75.00) 11 (68.75) 29 (72.50)Family not interested 20 (83.33) 14 (87.5) 34 (85.00)Lack of opportunities 15 (62.50) 13 (81.25) 28 (70.00)Multiple response

Occupational status of Home Science Graduates and Post graduates of Punjab Agricultural University, Ludhiana 139
Employment and occupational status: Further anendeavour was made to find out the type of employment,occupation and vocation in which Home Sciencegraduates and post graduates were enrolled. An inspectionof table 4 revealed that majority of the respondents aftergraduation (63.04%) and after post graduation (30.88%)opted for higher studies. The findings also revealed that26.08 per cent respondents after graduation, 23.52 and32 per cent after M.Sc. and PhD respectively were homemakers. As for as teaching is concerned 1.08, 20.58 and68 per cent of the respondents after B.Sc., M.Sc. andPhD respectively were engaged in University, College orschool teaching jobs. Negligible numbers of respondentswere enrolled in bank, extension officer, policedepartment etc. Findings are also similar to the result ofKaur (1996) and Anonymous (1988).
0
10
20
30
40
50
60
70
80
90
Not interested Marriage Inconvenience Economic problems
Family not interested
Lack of opportunities
B.Sc Total
Perc
enta
ge o
f R
espo
nden
ts
Figure 1: Distribution of respondents according to Reasonfor not opting higher studies
Table 4: Employment and occupational status of Home Science Graduates and Post graduatesEmployment and occupational status After B.Sc. (n1=92) After M.Sc. (n2=68) After PhD (n3=25)
f (%) f (%) f (%)Homemaker 24 (26.08) 16 (23.52) 8 (32.00)Dietician 2 (2.17) 4 (5.88) -TeachingUniversity - 1 (1.47) 6 (24.00)College - 7 (10.29) 5 (20.00)School 1 (1.08) 6 (8.82) 3 (12.00)Research job - 6 (8.82) 3 (12.00)Entrepreneur/ Self employment 2 (2.17) 3 (4.41) -Further study 58(63.04) 21 (30.88) -Stock exchange 1 (1.08) 1 (1.47) -Bank 2 (2.17) 1(1.47) -Continental chef 1(1.08) - -Working in police department 1 (1.08) - -CDPO - 1 (1.47) -Women extension officer - 1 (1.47) -Percentage of Respondents
So, it can be analyzed that 10.86, 45.58 and 68 percent of respondents were employed after B.Sc., M.Sc.and PhD respectively. Self employment status ofrespondents was not found to be encouraging as only2.17 per cent after B.Sc., 4.41 per cent after M.Sc. andnone of the student after Ph.D. was self-employed.Findings are also in tune with Maya et al. (2009) in whichthey found that 5.33 per cent of the respondents wereengaged in independent profession So, it can beconcluded that even after introduction of In-plant trainingand experiential learning. Students were not able to utilizetheir skills in self employment activities.
Reasons for doing and not doing job: As revealedfrom Table 5, amongst all the respondents, more thanhalf were doing job due to economic independence(51.19%), followed by improvement in social status(33.33%), professional growth (29.76%), addition to thefamily income (22.62%), utilization of talent/ capabilitiesfor the benefit of the nation (20.24%), cover the risk oflife (20.24%) and use of leisure time (17.86%) being theother reasons for doing job. Findings of the study are intune with the those of Kaur (1996), Sandhu (1985) andKaur (1994) that women wanted to be economicallyindependent which was the major reason for doing job.
Amongst those who did not go for job majorityreported that they did not opt for job because theycontinued their studies (43.56%). Besides, lack ofopportunities (31.68%), parents/ husband did not allow
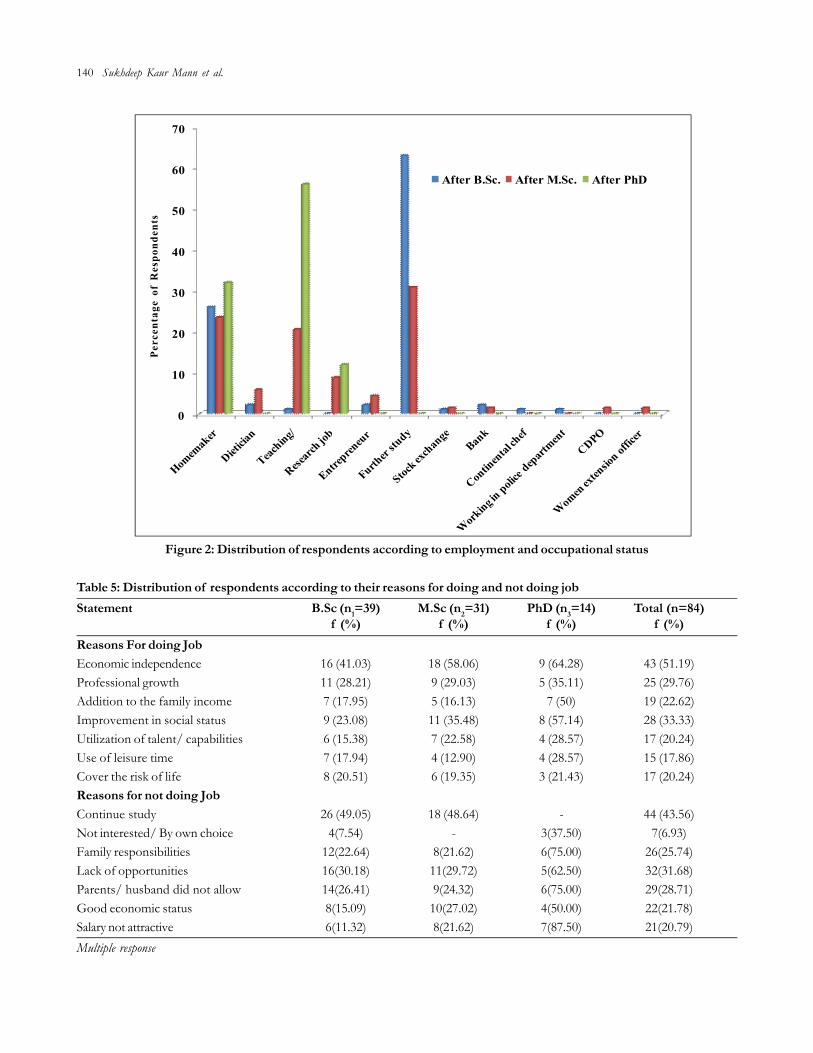
140 Sukhdeep Kaur Mann et al.
0
10
20
30
40
50
60
70
After B.Sc. After M.Sc. After PhD
Per
cent
age
of R
espo
nden
ts
Figure 2: Distribution of respondents according to employment and occupational status
Table 5: Distribution of respondents according to their reasons for doing and not doing jobStatement B.Sc (n1=39) M.Sc (n2=31) PhD (n3=14) Total (n=84)
f (%) f (%) f (%) f (%)Reasons For doing JobEconomic independence 16 (41.03) 18 (58.06) 9 (64.28) 43 (51.19)Professional growth 11 (28.21) 9 (29.03) 5 (35.11) 25 (29.76)Addition to the family income 7 (17.95) 5 (16.13) 7 (50) 19 (22.62)Improvement in social status 9 (23.08) 11 (35.48) 8 (57.14) 28 (33.33)Utilization of talent/ capabilities 6 (15.38) 7 (22.58) 4 (28.57) 17 (20.24)Use of leisure time 7 (17.94) 4 (12.90) 4 (28.57) 15 (17.86)Cover the risk of life 8 (20.51) 6 (19.35) 3 (21.43) 17 (20.24)Reasons for not doing JobContinue study 26 (49.05) 18 (48.64) - 44 (43.56)Not interested/ By own choice 4(7.54) - 3(37.50) 7(6.93)Family responsibilities 12(22.64) 8(21.62) 6(75.00) 26(25.74)Lack of opportunities 16(30.18) 11(29.72) 5(62.50) 32(31.68)Parents/ husband did not allow 14(26.41) 9(24.32) 6(75.00) 29(28.71)Good economic status 8(15.09) 10(27.02) 4(50.00) 22(21.78)Salary not attractive 6(11.32) 8(21.62) 7(87.50) 21(20.79)Multiple response

Occupational status of Home Science Graduates and Post graduates of Punjab Agricultural University, Ludhiana 141
(28.71%), family responsibilities (25.74%), good economicstatus (21.78%), salary not attractive (20.79%) and notinterested/ by own choice (6.93%) were the other reasonsfor not doing job. Maithi et al. also reported that majorityof the respondents were moderately satisfied with theirjob. The main reason for their dissatisfaction was non-availability of resources.
CONCLUSION
On the basis of major outcomes of the study it can beconcluded that majority of the respondents tookadmission through open category and only fewpercentage of respondents deviate from the field ofHome Science after their graduation. Further findingsrevealed that majority of the respondents were not ableto continue higher studies due to family obligations.Asfar as employment and occupational status wasconcerned, majority of the respondents were engagedin teaching and negligible number was found to beengaged in self employment activities.
REFERENCES
Anonymous. 1988. Careers for Home Scientist in India. IndianJournal of Home Science, 18(1): 45-50.
Godawat, A. 2004. Employment prospects of B.Sc. HomeScience program of SAUs of Rajasthan. PhD ThesisMaharana Pratap University of Agriculture andTechnology, Udaipur.
Kaur, M. 1994. A comparative study of Self-employed andService women of Urban House-hold of LudhianaDistrict, M.Sc. Thesis, Punjab Agricultural University,Ludhiana.
Kaur, R. 1996. Role analytical study of Home Science Graduatesof any Agricultural University. Thesis, Punjab AgriculturalUniversity, Ludhiana.
Kumari, M.; A. Srivastava ; R. Singh; Ratan and A. Kumar.2009. Relationship of socio-personal and economicvariables with gain in knowledge in nutrition trainingprogramme. Journal of Community Mobilization andSustainable Development, 4(2): 53-57.
Maithi, S.; B. Malik; S. Jha and S. Garai. 2009, Job satisfactionamong Pranibandus of Purba Medinipur District of WestBengal. Journal of Community Mobilization and SustainableDevelopment, 4(1): 77-79.
Sandhu, R. 1985. Management problems of employed farmHousewives. M.Sc. Thesis, Punjab Agricultural University,Ludhiana
Swaminathan, M.S. 1997. Education for Agriculture: Bridge toa century of hope on the farm front. Dr. M. .S.Swaminathan Committee report. Education Division,ICAR; New Delhi.
--------------------------------------------------------------------------------------------------------------------------------------------------------------Received on December, 2017, Revised on February, 2018

Journal of Community Mobilization and Sustainable Development Vol. 13(1), 142-146, January-April, 2018
*Corresponding author email id: [email protected]
Vocational Education of Academically Backward Rural Adolescents:A Step towards Furtherance
Ritu Singh1*, Huma Parveen2, Neera Agrawal3 and Shalini Thakur4
1Assistant Professor and Principal Investigator, 2,4Senior Research Fellow, 3Senior Technical Assistant, AICRP-CD, College of HomeScience, G.B. Pant University of Agriculture & Technology, Pantnagar, Uttarakhand
ABSTRACT
The lives of rural adolescents are characterized by limited resources, minimum exposure lack of education andawareness as well as opportunities affecting their lives. The objective of present study was to assess vocationalinterest of rural adolescents (both girls and boys) and make them vocationally aligned by providing intensiveinterventions so as to improve their living standards. Adolescents who scored less than 50% marks in their lastexams were considered academically backward. 10-15% of adolescents who scored least in the 7 th, 8th and 9th
standard were taken as the sample for study. Vocational interest of respondents was assessed using standardizedVocational Interest Record (VIR). Thereafter respondents were provided intensive interventions exposing themto various vocations and assisting them in selecting vocations as per their interest, aptitude and skills. The datawere analyzed with the help of frequency, percentage and z-test. Results revealed that intervention had significantimpact on their knowledge about the vocations and their choice of vocation according to their skills and interest.
Keywords: Intervention, Literary, Executive and constructive skills, Vocational education
INTRODUCTION
According to National Policy for skill development andentrepreneurship (2015), India is one of the youngestnations in the world with more than 62% of itspopulation into the working age group (15-59 years),and more than 54% of its total population below 25years of age. To reap this demographic dividend whichis expected to last for next 25 years, India needs to equipits workforce with employable skills and knowledge sothat they can contribute substantively to the economicgrowth of the country.
The situation of urban India is much better and undercontrol. The population has wide exposure and accessto knowledge and skills pertaining to all aspects of lifeespecially the different vocations and opportunities fortraining and establishment. However, rural people aredisadvantaged in these terms due to lack of education,adversity, as well as poor connectivity and mode oftransmission between rural and urban areas. Hence, it isnecessary to give an intervention to the rural people toenhance their knowledge in desirable aspects. The findings
of Gupta and Goel (2015) shows that there exist a vastscope of intervention that can be taken up throughservices of counseling, employment, educationalprograms and capacity building for the welfare of therespondents. According to Singh et al. (2015), trainingplays an important role to improve the knowledge.Knowledge is the cognitive component of the individual’smind and plays an important role in covert as well asovert behavior and individuals with a greater knowledgeof the technical nature of improved practices wouldlead to a high adoption. It is evident from their findingsthat training and guidance given to respondents haveplayed prime role in influencing technological changes,besides management orientation.
Since, India is majority a rural country any change incountry can be brought only by including the ruralpopulation. We need to tag the skilled knowledge ofrural areas and for that there is a necessity of focusedspecific interventions on vocational education so as tohone their opportunities of being better placed and paid/earned. The most necessary demand of our country isto have vocationalization and to provide more and more
vocational courses after primary education according tothe interest of adolescents (Soundaravalli, 2006). The terminterest has been defined as a favorable attitude towardsobjects. It is a tendency to become absorbed in anexperience and to continue with it (Mangat, 2008).Vocational interest is defined as one’s own pattern ofpreferences, attitudes, likes and dislikes, preferred in anymanner, wisely or unwisely by self or by another sourcesfor a given vocational area or vocation. Measuringvocational interest aims at assessing the inclinations ofthe young person so that he may be assisted in the choiceof an occupation that will sustain his interests, bepersonally satisfying, and keep him usefully employedthroughout his working life (Kulshrestha, 2005). Theterm ‘Vocational Interest’ may mean pleasure in theactivities of the occupation or it may even meansatisfaction in the job (Mohanty, 2006).
Earlier the adolescents had no interest in selectingvocations for their own as the adolescents preferred goingin the vocation, their parents wished them to go in. Thistrend has changed and now adolescents wish to selecttheir own vocations and have their own vocationalinterests. But many adolescents have neither theunderstanding of themselves nor the diversity ofvocations that are available as well as the necessaryprerequisites for those vocations. Usually in schools whereno vocational guidance program exists, adolescentschoose such vocations which have no or little relationshipwith their vocational aptitude and skills with the resultsthey get traumatic shock when they find that they havenot prepared themselves for the vocation which theywanted to enter. Therefore it is necessary to find out theinterests and abilities of the adolescents by the time theyfinished their schooling so as to provide enoughvocational subjects of their choice at the secondary levelschools which will facilitate them in finding suitableemployment. Sababa (2010) stated that most parents areilliterates who do not know anything about vocationalinterest or the vocations available. These create problemsto most adolescents. Keeping this in view, the presentstudy focused to study the vocational interests of ruraladolescents, provide vocational education and study theimpact of vocational education on vocational knowledgeand interest of selected rural adolescents.
MATERIALS AND METHODS
The study was part of All India Coordinated ResearchProject on ‘Capacity Building of Agrarian Families’ of
G.B. Pant University of Agriculture & Technology,Pantnagar, Uttarakhand. The six adopted villages ofUniversity viz. Turkagauri, Gokulnagar, Kanakpur,Chandipur, Pantpura village of Udham Singh Nagardistrict and Dogra village of Nainital district werepurposively selected. From these villages, ruralgovernment schools were selected as a research base forthe present study. The total sample for the present studycomprised of 112 adolescents randomly drawn fromacademically backward adolescents studying in 7th, 8th &9th standard of each selected rural government school.Adolescents who have scored less than 50% marks inthe last exams were considered as academically backward.The list of academically backward adolescents wasprepared from each selected class of each school andfrom that list bottom 10-15% of adolescents were takenas the sample for present study. Vocational InterestRecord (VIR) of Kulshrestha (1971) was used to identifythe vocational interests of respondents. This test includesten vocational areas: Literary (L), Scientific (Sc), Executive(E), Commercial (C), Constructive (Co), Artistic (A),Agriculture (AG), Persuasive (P), Social (S) and Household(H). Each of these areas has twenty Jobs/Vocation/Assignments on the record, 10 in horizontal and 10 onvertical side. Thus, this record contains 200 vocationsbelonging to the 10 different vocational interest areas.
The randomly selected respondents wereadministered VIR. After pre test, intervention onvocational education was given with the help of aneducational package as well as individual and groupcounseling. After this the adolescents were post tested.The pre test and post test data was analyzed by calculatingmean & standard deviation and further z-test was appliedto find the significance of results.
RESULTS AND DISCUSSION
Firstly, the sample of the present study was assessed fortheir socio-demographic and socio-economic status. Thedata in Table 1 shows socio-demographic and socio-economic status of respondents in terms of gender,religion, parents’ education, parents’ occupation and totalmonthly income of the family. Out of 112 adolescents,34%, 35% and 31% were academically backwardadolescents from 7th, 8th and 9th standard, respectively inwhich 56% were boys and 44% were girls. Among all,79%, 16% and 05% were Hindu, Muslim and Sikh,respectively. Besides this, high rate of illiteracy had beenseen among their parents (both mother and father) but
Vocational Education of Academically Backward Rural Adolescents 143
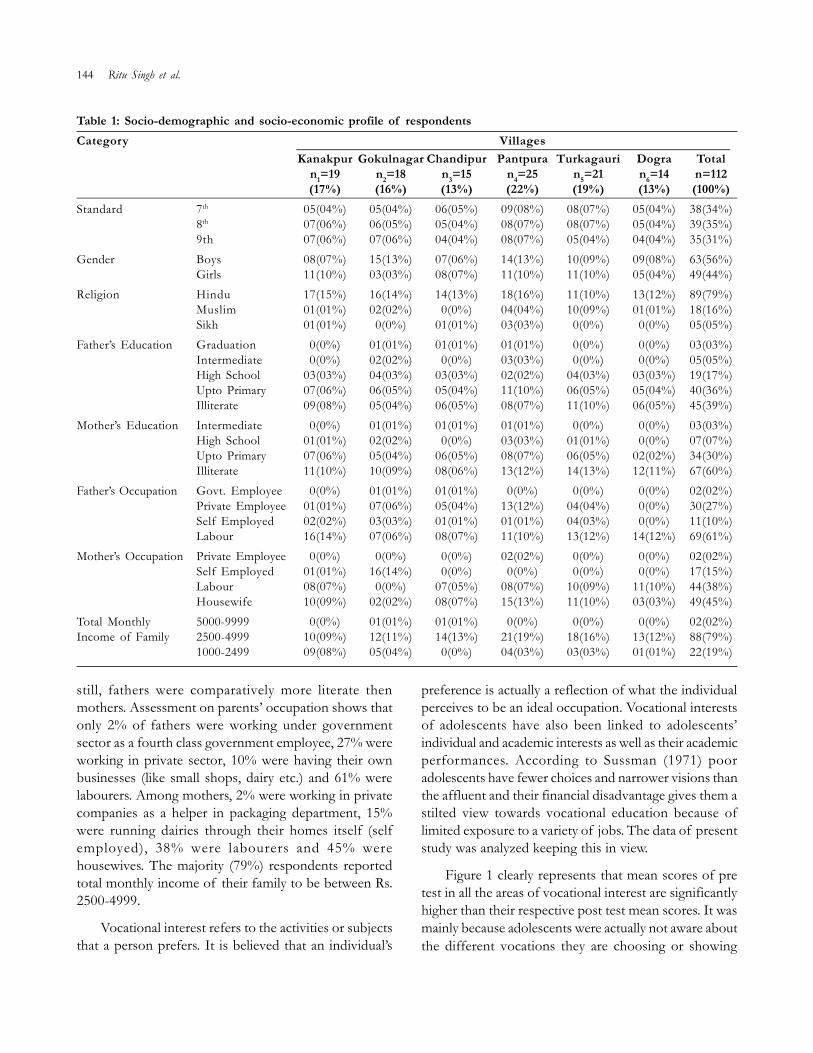
144 Ritu Singh et al.
Table 1: Socio-demographic and socio-economic profile of respondentsCategory Villages
Kanakpur Gokulnagar Chandipur Pantpura Turkagauri Dogra Totaln1=19 n2=18 n3=15 n4=25 n5=21 n6=14 n=112(17%) (16%) (13%) (22%) (19%) (13%) (100%)
Standard 7th 05(04%) 05(04%) 06(05%) 09(08%) 08(07%) 05(04%) 38(34%)8th 07(06%) 06(05%) 05(04%) 08(07%) 08(07%) 05(04%) 39(35%)9th 07(06%) 07(06%) 04(04%) 08(07%) 05(04%) 04(04%) 35(31%)
Gender Boys 08(07%) 15(13%) 07(06%) 14(13%) 10(09%) 09(08%) 63(56%)Girls 11(10%) 03(03%) 08(07%) 11(10%) 11(10%) 05(04%) 49(44%)
Religion Hindu 17(15%) 16(14%) 14(13%) 18(16%) 11(10%) 13(12%) 89(79%)Muslim 01(01%) 02(02%) 0(0%) 04(04%) 10(09%) 01(01%) 18(16%)Sikh 01(01%) 0(0%) 01(01%) 03(03%) 0(0%) 0(0%) 05(05%)
Father’s Education Graduation 0(0%) 01(01%) 01(01%) 01(01%) 0(0%) 0(0%) 03(03%)Intermediate 0(0%) 02(02%) 0(0%) 03(03%) 0(0%) 0(0%) 05(05%)High School 03(03%) 04(03%) 03(03%) 02(02%) 04(03%) 03(03%) 19(17%)Upto Primary 07(06%) 06(05%) 05(04%) 11(10%) 06(05%) 05(04%) 40(36%)Illiterate 09(08%) 05(04%) 06(05%) 08(07%) 11(10%) 06(05%) 45(39%)
Mother’s Education Intermediate 0(0%) 01(01%) 01(01%) 01(01%) 0(0%) 0(0%) 03(03%)High School 01(01%) 02(02%) 0(0%) 03(03%) 01(01%) 0(0%) 07(07%)Upto Primary 07(06%) 05(04%) 06(05%) 08(07%) 06(05%) 02(02%) 34(30%)Illiterate 11(10%) 10(09%) 08(06%) 13(12%) 14(13%) 12(11%) 67(60%)
Father’s Occupation Govt. Employee 0(0%) 01(01%) 01(01%) 0(0%) 0(0%) 0(0%) 02(02%)Private Employee 01(01%) 07(06%) 05(04%) 13(12%) 04(04%) 0(0%) 30(27%)Self Employed 02(02%) 03(03%) 01(01%) 01(01%) 04(03%) 0(0%) 11(10%)Labour 16(14%) 07(06%) 08(07%) 11(10%) 13(12%) 14(12%) 69(61%)
Mother’s Occupation Private Employee 0(0%) 0(0%) 0(0%) 02(02%) 0(0%) 0(0%) 02(02%)Self Employed 01(01%) 16(14%) 0(0%) 0(0%) 0(0%) 0(0%) 17(15%)Labour 08(07%) 0(0%) 07(05%) 08(07%) 10(09%) 11(10%) 44(38%)Housewife 10(09%) 02(02%) 08(07%) 15(13%) 11(10%) 03(03%) 49(45%)
Total Monthly 5000-9999 0(0%) 01(01%) 01(01%) 0(0%) 0(0%) 0(0%) 02(02%)Income of Family 2500-4999 10(09%) 12(11%) 14(13%) 21(19%) 18(16%) 13(12%) 88(79%)
1000-2499 09(08%) 05(04%) 0(0%) 04(03%) 03(03%) 01(01%) 22(19%)
still, fathers were comparatively more literate thenmothers. Assessment on parents’ occupation shows thatonly 2% of fathers were working under governmentsector as a fourth class government employee, 27% wereworking in private sector, 10% were having their ownbusinesses (like small shops, dairy etc.) and 61% werelabourers. Among mothers, 2% were working in privatecompanies as a helper in packaging department, 15%were running dairies through their homes itself (selfemployed), 38% were labourers and 45% werehousewives. The majority (79%) respondents reportedtotal monthly income of their family to be between Rs.2500-4999.
Vocational interest refers to the activities or subjectsthat a person prefers. It is believed that an individual’s
preference is actually a reflection of what the individualperceives to be an ideal occupation. Vocational interestsof adolescents have also been linked to adolescents’individual and academic interests as well as their academicperformances. According to Sussman (1971) pooradolescents have fewer choices and narrower visions thanthe affluent and their financial disadvantage gives them astilted view towards vocational education because oflimited exposure to a variety of jobs. The data of presentstudy was analyzed keeping this in view.
Figure 1 clearly represents that mean scores of pretest in all the areas of vocational interest are significantlyhigher than their respective post test mean scores. It wasmainly because adolescents were actually not aware aboutthe different vocations they are choosing or showing

Vocational Education of Academically Backward Rural Adolescents 145
0.000
0.500
1.000
1.500
2.000
2.500
3.000
3.500
4.000
2.88**
3.47** 2.69*
2.55* 2.79**
3.07**
1.51NS
4.14** 2.57*
2.64*
Pre test Post test
Mea
n
interest in. They just opted or reflected interest for goodnumber of different stream vocations because thosevocations sounded fancy to them or are looked up asreputed or glamorous or high earning vocations. Theydidn’t at all choose or showed interest in any particularvocation considering the reality, that is, their capabilitiesor feasibilities. This observation was an eye opener forthe researchers to understand that adolescents were almostunaware of the different vocations and its prerequisitesin terms of knowledge and skills. This observation wasused as a base to develop intensive intervention moduleon ‘vocational education’.
The Vocational Education module comprised ofbasic and detailed information about different streamvocations like literary, commercial, constructive, vocationsetc. Intensive group as well as individual counseling wasprovided to the respondents wherein they were exposedto various vocations and thereafter helped in identifyingtheir interest and capabilities for a particular stream ofvocation and selecting vocations accordingly. Lastly theywere also linked to few nearby institutes; training centresetc from where they can further sharpen their knowledgeand skills for vocation of their choice. Thus, after intensiveintervention on vocational education their knowledgeabout different vocations got channelized which restrictedtheir interest to similar stream vocations, so the meanscore on VIR got down significantly after intervention.The present finding reveals that awareness throughvocational education and counseling helps the
Fig. 1: Meandifferences in pre testand post test scoreson various aspects ofvocational interest ofadolescents*Significant at 0.05 level;**Significant at 0.01level; NS = Non-significant
respondents in filling up the gap between their knowledgeabout vocations and their own interests and capabilities.Monika et al. (2014) also found that the spread ofeducational opportunities and the explosion ofknowledge have helped in bringing the gap amongvarious adolescents with regard to the vocational choices.
CONCLUSION
The intervention module on vocational education wasquite effective and it has and shall enable the respondentsto select such subjects in schools which are according totheir preferred vocations. It has also proved useful forparents and teachers to understand the adolescents, theirinterests and capabilities and provide them opportunitieson the basis of their interests and capabilities. Vocationalinterest needs to be tapped through regular participantobservation and vocational education through intensiveguidance and counseling, workshops and self-directedactivities to help adolescents select appropriate subjectsat school level to get into vocation of their choice forsuccess, satisfaction and activeness.
REFERENCES
Acquiescence. 1989. In Oxford English dictionary. Retrieved fromhttps://en.oxforddictionaries.com/definition/vocation
Gupta, M. and S. Goel. 2015. Viable Interventions for Old AgeHomes in Delhi: A Case Study. Journal of CommunityMobilization and Sustainable Development, 10(2): 241-245.
Kulshrestha, S.P. 2005. Manual of Vocational Interest Record.National Psychological Corporation, Agra.
146 Ritu Singh et al.
Mangat, N. 2008. Relationship of Vocational Maturity withIntelligence, SES and Academic Achievement. Fourth Surveyof Research in Education, Vol. II Buds M.B. NCERT, NewDelhi.
Ministry of Skill Development and Entrepreneurship. 2015.National Policy for skill development and entrepreneurship.Retrieved from http://msde.gov.in/assets/images/Skill%20India/policy%20booklet-%20Final.pdf
Mohanty, G. 2006. A Study of Vocational Education in theState of Orissa since Independence. Fourth Survey ofResearch in Education, Vol. II Buds M.B. NCERT, New Delhi.
Monika, S. and L. Sushil. 2014. A Study of Vocational Interestof Male and Female Sports Adolescents of University.Research Journal of Physical Education Sciences, 2(6): 08-12.
Sababa, L.K. 2010. Implication of Vocational Awareness inSecondary School. In Mayo-Belwa Local Govt. Area ofAdamawa State University Nubi. A paper presentation,International Counseling Conference Enugu 2010.
Singh, R.K.; S. Verma; V. Mittoliya and S.K. Tyagi. 2015. Impactof KVK Training Programme on Socio-Economic Statusand Knowledge of Farmers in Khargone District ofMadhya Pradesh. Journal of Community Mobilization andSustainable Development, 10(1): 43-45.
Soundaravalli, S. 2006. A Critical Study of the Functioning ofthe Vocational Secondary school in Tamil Nadu. FourthSurvey of Research in Education, Vol. II Buds M.B. NCERT,New Delhi.
Sussman, B. 1971. Sociological Perspective and Vocational-Technical Education. In C. Schaffer (Eds.), VocationalEducation Social and Behavioral Perspectives (pp. 55-74).Lexington: Heath Lexington Books.
--------------------------------------------------------------------------------------------------------------------------------------------------------------Received on January, 2018, Revised on February, 2018

Journal of Community Mobilization and Sustainable Development Vol. 13(1), 147-150, January-April, 2018
*Corresponding author email id: [email protected]
Effectiveness of Short Duration Training Programmes on Field LevelWatershed Functionaries
Mukesh Kumar* and P. VijayakumarSchool of Agriculture, Indira Gandhi National Open University (IGNOU), Maidan Garhi, New Delhi-110068
ABSTRACT
The present investigation was conducted to study the effectiveness of the short duration training programmesorganised for field level watershed functionaries. Ten training programmes of four days duration on Soil andWater Conservation were organized in different parts of the country by the School of Agriculture, IGNOU withthe financial support of the Department of Land Resources, Ministry of Rural Development, Government ofIndia. A total of 325 participants attended the training programmes. The effectiveness of the training programmeswas assessed by evaluating the knowledge gained by the participants after completion of the programme byconducting pre- and post-test of the candidates. The results revealed that the average score of the participants inthe post-test (15.4) was comparatively higher than the pre-test score (8.7) which indicated that the awarenessprogramme had significant impact on the knowledge of the participants. Further, the improvement in knowledgeon an average of the participants was 82.99% which indirectly indicates the effectiveness of the training programme.The feedback from the participants revealed that they had gained a lot of knowledge in the new technologies andrecent trends in watershed management and soil & water conservation. They have also suggested that more suchtraining programmes needs to be conducted on regular basis.
Keywords: Effectiveness, Field level, Functionaries, Short Duration, Training programmes, Watershed
INTRODUCTION
Over the years, the increase in human and livestockpopulation in the country has placed the natural resourcessystem under great stress. Continuous depletion of thevegetative cover, increase in soil erosion and the alarmingfall in groundwater level are serious concerns. Increasinghuman and animal population, diversion of irrigationwithout adequate concern for the treatment of catchmentand provision of drainage and improper agriculturalpractices on marginal lands has caused a serious level ofdegradation (Bhan, 2014). Less biomass for animals notonly reduces animal productivity; the inevitableuncontrolled grazing pressure on already eroded landsfurther exacerbates the problem and deteriorates theecological balance. Growing population pressure, higherdemands for food and fodder coupled with impact ofrapidly changing socio-economic conditions have addedfuel to the fire. To tackle these problems, watershedmanagement has now been accepted as the mostfavoured tool. Indeed, it has been increasingly accepted
as a measure in regional and inter-regional programmesand became an integral part of development over thelast ten years. Watershed development projects in thecountry has been sponsored and implemented byGovernment of India from early 1970s onwards (Waniet al., 2005 and 2006). Government of India is focussingon this aspect through implementation of IntegratedWatershed Management Programme (IWMP) throughoutthe country. For implementing this project, a huge numberof human resource with sound knowledge and skills onvarious aspects of natural resource management,agriculture and allied fields is required. Capacity buildingand training of all functionaries and stakeholders involvedin the watershed programme implementation needs tobe taken up on war footing with definite action plan andrequisite professionalism and competence (NRAA, 2011).Knowledge assessment of farmers is very important tobridge the knowledge gap between cultivars andresearchers (Subba and Ghosh, 2016). Dissemination andutilization of new technology is most complex and

148 Mukesh Kumar and P. Vijayakumar et al.
significant problem (Tanwar, 2011). The School ofAgriculture, IGNOU organized a series of trainingprogramme in the area of Soil and Water Conservationwith the financial support of the Department of LandResources, Ministry of Rural Development, Governmentof India. The present study will help in determining theeffectiveness of the short duration training programmesorganised for field level watershed functionaries. Themajor objective of the training programmes was todevelop competent human resource for effectiveimplementation of watershed projects. The expectedoutcome of the training programme was to refresh theknowledge of watershed functionaries involved in thewatershed projects and develop skills in different aspectsof watershed management activities such as soilconservation, water management as well as in horticulture,agro-forestry, livestock etc.
MATERIALS AND METHODS
The training programme designed and implementedattracted Watershed Development Team members, BlockDevelopment Officers, Assistant Engineers, AssistantAgricultural Officers, Assistant Soil ConservationOfficers, Project Economists, Extension Officers fromdifferent State Departments and Subject MatterSpecialists. Ten training programmes of four daysduration each on different aspects of soil and waterconservation were organized and selected for the study.A total of 325 participants attended the training. Resourcepersons were drawn from KVK, ICAR Institutes, SAU,State Departments of Agriculture and other governmentorganizations for delivering lectures.
The training programmes focused on concept, scopeand importance of watershed management, selection ofwatersheds, watershed activities, rainfall and runoff, theircomponents and characteristics, instruments used for theirmeasurement; soil erosion, its types and classification,factors affecting water erosion, biological/agronomicaland mechanical measures for controlling soil erosion inarable lands, water harvesting its need and scope andmethods including roof water harvesting, storage ofharvesting rainwater and its proper utilization forirrigation.
The effectiveness of the training programmes wasassessed by evaluating the knowledge gained by theparticipants after completion of the programme byconducting pre- and post-test of the candidates. For this
purpose, a multiple choice teacher made test wasprepared based on the contents of the study materials.The improvement in knowledge was calculated usingthe formula (Rahmathulla et al. 2012):
Post test score – Pre test scoreImprovement in knowledge (%) = x 100 Pre test score
RESULTS AND DISCUSSION
The marks scored in pre-test and post-test werecompared and analyzed. The average marks obtainedby the participants in the pre- and post test is presentedin Table 1. The results revealed that the average score ofthe participants in the post-test (15.4) was comparativelyhigher than the pre-test score (8.7) which indicated thatthe training programmes had considerable impact onthe knowledge of the participants.
The lowest average pre-test score was 6 in KVK,Mehaboobnagar (AP) whereas the highest average pre-test score was 12 in Krishi Vigyan Kendra, Mitraniketan(Kerala). The lowest average post-test score was 14 inMRDS, Shillong (Meghalaya) whereas the highest averagepost-test score was 17 in CARD – KVK, Tiruvalla(Kerala).
The improvement in knowledge of the participantswas highest in KVK, Mehaboobnagar (AP). The averagepost-test score 16 was same at three places i.e. (i) KrishiVigyan Kendra, Mehaboobnagar (Andhra Pradesh); (ii)Krishi Vigyan Kendra, Mitraniketan, Vellanad,Thiruvananthapuram (Kerala); and (iii) Directorate ofExtension, Allahabad Agricultural Institute–DeemedUniversity, Allahabad (UP). However, the improvementin knowledge of the participants in all these three placeswere different i.e. 166.67, 33.33 and 77.78 per cent,respectively. This is due to the differences in the gapbetween the average pre- and post-test scores. Variationin enthusiasm and varied interest of the trainees mightbe the cause for differences in the score (Rahmathulla etal., 2006). Further, it has been found that the improvementin knowledge of the participants was 82.99% on anaverage which indirectly indicates the effectiveness ofthe training programme.
Feedback of the participants: The feedback obtainedfrom the participants using feedback proforma revealedthat the participants had gained a lot of knowledge inthe new technologies and recent trends in watershed
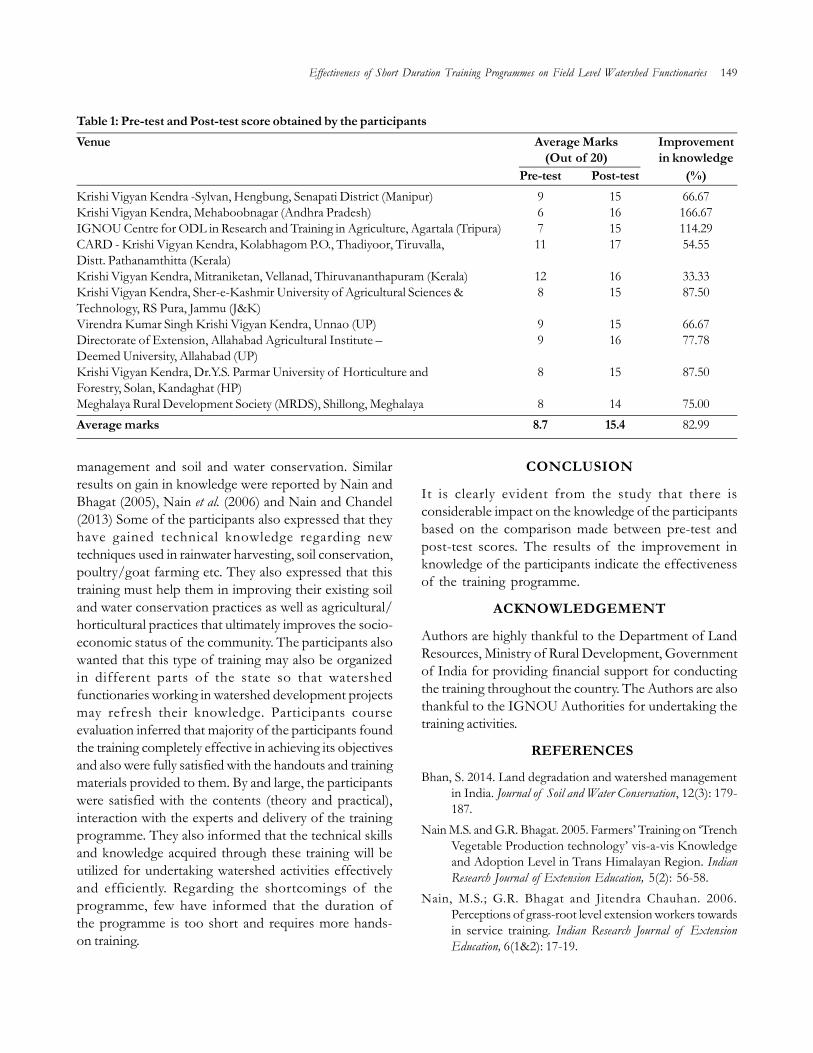
Effectiveness of Short Duration Training Programmes on Field Level Watershed Functionaries 149
Table 1: Pre-test and Post-test score obtained by the participantsVenue Average Marks Improvement
(Out of 20) in knowledgePre-test Post-test (%)
Krishi Vigyan Kendra -Sylvan, Hengbung, Senapati District (Manipur) 9 15 66.67Krishi Vigyan Kendra, Mehaboobnagar (Andhra Pradesh) 6 16 166.67IGNOU Centre for ODL in Research and Training in Agriculture, Agartala (Tripura) 7 15 114.29CARD - Krishi Vigyan Kendra, Kolabhagom P.O., Thadiyoor, Tiruvalla, 11 17 54.55Distt. Pathanamthitta (Kerala)Krishi Vigyan Kendra, Mitraniketan, Vellanad, Thiruvananthapuram (Kerala) 12 16 33.33Krishi Vigyan Kendra, Sher-e-Kashmir University of Agricultural Sciences & 8 15 87.50Technology, RS Pura, Jammu (J&K)Virendra Kumar Singh Krishi Vigyan Kendra, Unnao (UP) 9 15 66.67Directorate of Extension, Allahabad Agricultural Institute – 9 16 77.78Deemed University, Allahabad (UP)Krishi Vigyan Kendra, Dr.Y.S. Parmar University of Horticulture and 8 15 87.50Forestry, Solan, Kandaghat (HP)Meghalaya Rural Development Society (MRDS), Shillong, Meghalaya 8 14 75.00Average marks 8.7 15.4 82.99
management and soil and water conservation. Similarresults on gain in knowledge were reported by Nain andBhagat (2005), Nain et al. (2006) and Nain and Chandel(2013) Some of the participants also expressed that theyhave gained technical knowledge regarding newtechniques used in rainwater harvesting, soil conservation,poultry/goat farming etc. They also expressed that thistraining must help them in improving their existing soiland water conservation practices as well as agricultural/horticultural practices that ultimately improves the socio-economic status of the community. The participants alsowanted that this type of training may also be organizedin different parts of the state so that watershedfunctionaries working in watershed development projectsmay refresh their knowledge. Participants courseevaluation inferred that majority of the participants foundthe training completely effective in achieving its objectivesand also were fully satisfied with the handouts and trainingmaterials provided to them. By and large, the participantswere satisfied with the contents (theory and practical),interaction with the experts and delivery of the trainingprogramme. They also informed that the technical skillsand knowledge acquired through these training will beutilized for undertaking watershed activities effectivelyand efficiently. Regarding the shortcomings of theprogramme, few have informed that the duration ofthe programme is too short and requires more hands-on training.
CONCLUSION
It is clearly evident from the study that there isconsiderable impact on the knowledge of the participantsbased on the comparison made between pre-test andpost-test scores. The results of the improvement inknowledge of the participants indicate the effectivenessof the training programme.
ACKNOWLEDGEMENT
Authors are highly thankful to the Department of LandResources, Ministry of Rural Development, Governmentof India for providing financial support for conductingthe training throughout the country. The Authors are alsothankful to the IGNOU Authorities for undertaking thetraining activities.
REFERENCES
Bhan, S. 2014. Land degradation and watershed managementin India. Journal of Soil and Water Conservation, 12(3): 179-187.
Nain M.S. and G.R. Bhagat. 2005. Farmers’ Training on ‘TrenchVegetable Production technology’ vis-a-vis Knowledgeand Adoption Level in Trans Himalayan Region. IndianResearch Journal of Extension Education, 5(2): 56-58.
Nain, M.S.; G.R. Bhagat and Jitendra Chauhan. 2006.Perceptions of grass-root level extension workers towardsin service training. Indian Research Journal of ExtensionEducation, 6(1&2): 17-19.
150 Mukesh Kumar and P. Vijayakumar et al.
NRAA. 2011. Common Guidelines for WatershedDevelopment Projects-2008: Revised Edition – 2011,National Rainfed Area Authority, Government of India,pp. 51-52.
Rahmathulla, V.K.; G. Srinivasa and G.S.Vindhya. 2012. ImpactAssessment of Need Based Training Programmes inSericulture. Journal of Sericulture and Technology, 3(1&2):73-76.
Rahmathulla, V.K.; G. Srinivasa; G.S. Vindhya and R.K. Rajan.2006. Assessment of sericultural technology trainingprogramme – An analysis of sericulture trainees. IndianJournal of Sericulture, 45(1): 11-14.
Subba, S. and S. Ghosh. 2016. Knowledge Test on LargeCardamom (Amomum subulatum). Cultivation Practices inSikkim. Journal of Community Mobilization and SustainableDevelopment, 11(2): 173-181.
Tanwar, P.S. 2011. Constraints perceived by goat keepers inadoption of goat husbandry practices in semi-aridRajasthan. Journal of Community Mobilization and SustainableDevelopment, 6(1): 108-111.
Wani, S.P. and Y.S. Ramakrishna. 2005. Sustainable managementof rainwater through integrated watershed approach forimproved rural livelihoods. In: Watershed managementchallenges: Improved productivity, resources and livelihoods.(Sharma, B.R.; J.S. Samra; C.A. Scott and S.P. Wani (eds).Colombo, Sri Lanka: International Water ManagementInstitute. pp. 39-60.
Wani, S.P.; Y.S. Ramakrishna; T.K. Sreedevi; T.D. Long; W.Thawilkal; B. Shiferaw; P. Pathak and A.V.R. Kesava, Rao.2006. Issues, concepts, approaches and practices in theintegrated watershed management: Experience andlessons from Asia in Integrated Management ofWatershed for Agricultural Diversification and SustainableLivelihoods in Eastern and Central Africa: Lessons andexperiences from semi-arid South Asia. Proceedings ofthe International Workshop held 6–7 December 2004 atNairobi, Kenya. pp. 17–36.
--------------------------------------------------------------------------------------------------------------------------------------------------------------Received on January, 2018, Revised on February, 2018
Journal of Community Mobilization and Sustainable Development Vol. 13(1), 151-159, January-April, 2018
*Corresponding author email id: [email protected]
Stakeholders Perspective on Agricultural Subsidies in Punjab
Anupam Anand1* and Manmeet Kaur2
1Ph.D. Research Scholar, 2Assistant Professor, Department of Extension Education, Punjab Agricultural University, Ludhiana, Punjab
ABSTRACT
The present study entitled “Stakeholders Perspective on Agricultural Subsidies in Punjab” was undertaken tounderstand the perspectives of stakeholders viz. farmers and extension personnel regarding various aspects ofagricultural subsidies in terms of their awareness, satisfaction and problems. A random selection of ninetybeneficiary farmers and ninety non-beneficiary farmers and twenty extension personnel were selected from threerandomly selected districts of the three agro-climatic zones of Punjab. Findings of the study revealed that very less(25%) farmers were aware about the agriculture schemes providing subsidies whereas all the farmers were aware ofthe subsidies being provided in the areas of seeds, plant protection materials, machinery, micro-irrigation, powerand price (MSP). Input dealers and fellow farmers were found to be the most utilised sources by the farmers to getinformation regarding agricultural schemes/subsidies. Group meetings, informal personal contacts, farm andhome visits and office call were the most employed methods by the extension personnel for the dissemination ofthe information regarding the schemes/subsidies. The level of satisfaction of the beneficiary farmers was foundto be low regarding various aspects of the agricultural subsidies. Lengthy documentation procedure, lesser quantityand sub-standard quality of subsidized inputs were found to be the major problems faced by the farmersregarding agricultural subsidies. A considerable section of farmers also reported problems such as the lack ofawareness about the time of availability of subsidy and misallocation of subsidies. Lack of proper infrastructure,less funds, lack of staff and information facilities were the major problems reported by the extension personnelin the disbursement of agricultural subsidies.
Keywords: Agricultural subsidies, Awareness, Extension personnel, Farmers, Satisfaction, Problems
INTRODUCTION
Agriculture has been the backbone of the Indianeconomy and it will continue to remain so for a longtime. In 2013-14, agriculture and its allied sectorscontributed 13.94 per cent of the Gross DomesticProduct of the country. In addition, the sector recruitedabout 49 per cent of the entire manpower (Anonymous,2014a). The Indian agriculture, after independence wasin a critical situation and the partition of the countryworsened the food situation in the country. In view ofthis, the Government of India adopted a positiveapproach and hence a well-defined policy of integratedproduction programmes with defined targets and aproper distribution programme was adopted along withother measures. Since the mid-sixties, India has been usingnew technologies in agriculture. The new technologieswere in the form of a package programme whichincluded the use of high yielding varieties of seeds, assured
irrigation, chemical fertilizers, insecticides, pesticides andmachinery. Indian farmers were poor and not in aposition to buy these expensive inputs. Therefore, onthe recommendations of Jha Committee, 1964 (FoodGrain Price Committee), the Government of Indiastarted the scheme of subsidies on the purchase ofvarious agriculture inputs to facilitate the farmers (Singh,1994). Agricultural input subsidies have long been usedto promote smallholder farmers’ use of inputs, toincrease wages, to reduce food prices and to promoteeconomic growth (Crawford et al., 2003). Since manyyears, the Indian government has been providingsubsidies to agriculture sector in direct and indirect formfor encouraging agriculture production and attaining self-sufficiency. Various incentives are being provided by thegovernment along with price supporting schemes.Among the agricultural production incentives, subsidiesare considered to be the most dominant device to quicken
152 Anupam Anand and Manmeet Kaur
the growth of agricultural production. Most of thesubsidies provided are designed to recompense the highcost of production and to stimulate the use of moderninputs. Major areas of agricultural subsidies in India arefood, fertilizer, irrigation, power and credit. While foodand fertilizer subsidies are borne by the Centre, powerand irrigation subsidies are borne by the respective stategovernments and credit subsidies are given through thebanking system (Anonymous, 2014b). Subsidies on inputshave their roots in green revolution when extensivesubsidies were given on hybrid seeds, fertilizers, pesticidesetc. with two major objectives i.e. firstly to keep cost ofthe food grains at minimum and avoid food inflationand secondly to ensure income security of the farmers(Anonymous, 2014c). The Department of Agriculture& Cooperation, Government of India, has beenimplementing various schemes and programmes underwhich these subsidies are provided for the benefit offarmers through State Governments. Some of theschemes being carried out in Punjab are Rashtriya KrishiVikas Yojana (RKVY, 2007), National Mission onAgricultural Extension & Technology (NMAET, 2010),National Food Security Mission (NFSM, 2007), Missionfor Integrated Development of Horticulture (MIDH,2014), National Horticulture Mission (NHM, 2005),National Mission on Oilseeds and Oil Palm (NMOOP,2010), Cotton Technology Mission (CTM, 2000) etc. tohelp the small and marginal farmers reduce their cost ofcultivation, increase profit and encourage diversificationamong them which is a dire need in the state (Anonymous,2014d). The subsidies under various schemes are givenin the form of inputs such as seed, fertilizers, plantprotection materials, farm machinery, micro-irrigationunits and credit. State government through theDepartment of Agriculture, provides subsidy on gypsum,gobar gas plant, mini-kits, oilseeds, micro-nutrients,pesticides and insecticides, Jantar seeds, tractors,harvesters, combines, etc. (Grewal and Singh, 1992).According to a report, 75 percent of the population isdependent of agriculture in the state of Punjab which isalso referred to as the bread basket of the country(Anonymous, 2015). Agriculture in Punjab in the presentscenario is quiet progressive in terms of usage of inputsand technologies. As a result, the farmers in the statehave to invest more and more in agriculture because ofrise in cost of inputs. The return costs or constant marginsin the profit have led to stagnation in the agrarianeconomy of Punjab (Sidhu, 2002; Roy, 2013). Irrespective
of the various subsidies provided by the stategovernment, the farmers’ economic condition hasdeteriorated in the recent years resulting in heavy debts(Singh and Bhogal, 2014; Gaur, 2014). Therefore, thepresent study was conducted to study the level ofsatisfaction of the farmers regarding different aspectsof agricultural subsidies, sources of information usedby the farmers and extension personnel and problemsfaced by them regarding agricultural subsidies in Punjab.
MATERIALS AND METHODS
The study was conducted in three agro-climatic zonesof Punjab viz. Central Plain zone, Western zone and Sub-Mountainous Undulating zone and following multistagesampling design three districts viz. Amritsar, Bathindaand Hoshiarpur were selected these zones respectivelyon the basis that all the three districts had commonagricultural schemes which provided subsidies ondifferent inputs to the farmers. Further three blocks fromeach district were selected randomly thus making a totalof nine blocks. The selected agricultural schemes underwhich subsidies were provided to the farmers in Punjabare Rashtriya Krishi Vikas Yojana (RKVY), National FoodSecurity Mission-Pulses (NFSM-Pulses), National HorticultureMission (NHM), National Mission on Oilseeds and Oil Palm(NMOOP) and National Mission on Agricultural Extensionand Technology (NMAET). The study comprised of twotypes of respondents i.e. farmers and extension personnelwho are the stakeholders in the agricultural subsidyschemes. Amongst the farmers, the study consisted ofbeneficiary farmers who were availing subsidies underany of the selected five schemes and the non-beneficiaryfarmers who did not avail any subsidy under theseschemes. A list of farmers availing subsidies under thesefive schemes was obtained from the office of ChiefAgriculture Officer (CAO) of the three selected districts.From this list, two farmers availing subsidies from eachscheme were selected randomly, thus making a sampleof 10 farmers from each block and a total sample of90 beneficiary farmers from the three districts. A blockin a district is the representative of the villages it comprises.To select the non-beneficiary farmers, one village wasselected from each block randomly making a sample ofnine villages for this study. Further, ten farmers wereselected from each village based on probabilityproportional to the size of the land holding in that village,thus making a total of 90 non-beneficiary farmers. Thus,a total of 180 farmers were selected for this study. Apart

Stakeholders Perspective on Agricultural Subsidies in Punjab 153
from these 180 farmers, 20 extension personnel fromthe three selected districts were selected for this studybased on the criteria that these extension personnel weredirectly involved in the disbursement of the subsidiesunder the selected five schemes. Thus a total of 200respondents were selected for this study. A structuredinterview schedule was prepared to collect the data fromthese respondents.
RESULTS AND DISCUSSION
Awareness of the farmers regarding agriculturalschemes and different areas of subsidy in Punjab:The information pertaining to the awareness ofbeneficiary and non-beneficiary farmers regardingvarious agricultural schemes and subsidies under theseschemes has been presented in Table 1 and Table 2 andare discussed below.
Awareness of the farmers regarding variousagricultural schemes providing subsidies in Punjab:The data in Table 1 revealed that less than 50 per cent(41.11%) of the beneficiary farmers were aware aboutNFSM-Pulses scheme run by the State Department ofAgriculture in Punjab followed by 27.78 percent whowere aware about the RKVY scheme. Almost an equal
percentage of beneficiary farmers (23.33%), (22.22%)and (21.11%) were aware about the NHM, NMAETand NMOOP scheme respectively. Amongst the non-beneficiary farmers, almost one-third of them (32.22%)were aware about the NFSM-Pulses scheme followedby 24.44 per cent and 17.78 per cent who were awareabout the RKVY and NHM scheme respectively. A veryless percentage of non-beneficiary farmers i.e. 12.22 percent and 8.89 per cent were aware about the NMAETand NMOOP respectively. The data shows thatmaximum awareness was found for the NFSM-Pulsesscheme in both the categories of farmers while they wereleast aware about the NMOOP scheme. Based on theobservations and discussions with the farmers in bothcategories, it can be said that not a very large percentageof them were aware about any of the schemes and thefigures are more discouraging in case of non-beneficiaryfarmers. The findings are similar to the results of Singh(2014) and Vijayakumar (2014).
Awareness of the farmers regarding various areasof subsidy provided in Punjab: It is comprehensivefrom Table 2 that all the beneficiary farmers and non-beneficiary farmers were found to be aware about thesubsidies provided in the fields of power, seeds, micro-
Table 1: Distribution of farmers according to their awareness regarding various agricultural schemesS.No. Agricultural Schemes Beneficiary (n=90) Non-Beneficiary (n=90)
Frequencey Percentage Frequencey Percentage1. RKVY 25 27.78 22 24.442. NFSM-Pulses 37 41.11 29 32.223. NHM 21 23.33 16 17.784. NMOOP 19 21.11 8 8.895. NMAET 20 22.22 11 12.22
Table 2: Distribution of farmers according to their awareness regarding various areas of agricultural subsidiesS.No. Area of Subsidy Beneficiary (n=90) Non-Beneficiary (n=90)
Aware f (%) Unaware f (%) Aware f (%) Unaware f (%)1. Power 90 (100) - 90 (100) -2. Fertiliser
I. Inorganic 65 (72.22) 25 (27.78) 64 (71.11) 26 (28.89)II. Organic 30 (33.33) 60 (66.67) 22 (24.44) 68 (75.56)
3. Micro-Irrigation 90 (100) - 90 (100) -4. Seed 90 (100) - 90 (100) -5. Plant protection 90 (100) - 90 (100) -6. Machinery 90 (100) - 90 (100) -7. Credit 67 (74.44) 23 (25.56) 60 (66.67) 30 (33.33)8. Infrastructure 7 (7.78) 83 (92.22) 3 (3.33) 87 (96.67)9. Price (MSP) 90 (100) - 90 (100) -10. Export 4 (4.44) 86 (95.56) 3 (3.33) 87 (96.67)

154 Anupam Anand and Manmeet Kaur
irrigation units, plant protection materials, machinery andprice (MSP). More than 70 per cent of the beneficiaryand non-beneficiary farmers were aware about thesubsidy being provided on inorganic fertilizers whereasalmost one-third of the beneficiary farmers and 24.44per cent of the non-beneficiary farmers were aware aboutthe subsidies provided on organic fertilizers. The data inTable 2 also revealed that 74.44 per cent of thebeneficiary farmers and almost two-third of the non-beneficiary farmers were aware about the credit beingprovided as a subsidy to them. More than 90 per centof the beneficiary and non-beneficiary farmers wereunaware about the infrastructure and export subsidies.The findings clearly indicated that both the categories offarmers were well aware about the subsidies on variousinputs. The only areas where the farmers were foundunaware were those which were not commonly used bythem or in other words the practices which were not apart of their livelihood earning. It was observed that thefarmers were more concerned about the inputs on whichsubsidies were given. They were least bothered aboutthe scheme under which those inputs were provided tothem.
Sources of information used by the farmers toaccess information on agricultural subsidies:Farmers receive information about various agriculturalaspects from different sources such as State AgriculturalUniversities, mass media, fellow farmers, StateDepartment of Agriculture, etc. The distribution offarmers according to their source of informationregarding agricultural subsidies is given in Table 3 and
discussed below. The findings in Table 3 revealed thatthe biggest source of information for all the beneficiaryand 92.22 per cent of the non-beneficiary farmers wereinput dealers in their areas with rank one followed byfellow farmers at rank two, accessed by 96.66 per centand 76.67 per cent of beneficiary and non-beneficiaryfarmers respectively. Majority of the beneficiary farmers,i.e. 86.67 per cent and 81 per cent were also accessingthe information regarding agricultural subsidies from thecooperative societies and State Department ofAgriculture placed at rank 3 and rank 4 respectively whilea little more than 50 per cent of the non-beneficiaryfarmers accessed this information from the farm telecasts(53.33%) and cooperative societies (52.22%) placed atrank 3 and rank 4 respectively. Less than 50 per cent ofthe non-beneficiary farmers (46.67%) reported that theyaccessed their information from the State Departmentof Agriculture placing them at rank 5. In case ofbeneficiary farmers, rank 5 was occupied by the farmtelecasts accessed by 62.22 per cent of them.
Less than 30 per cent of the beneficiary farmers(28.89%) and almost one-fourth of the non-beneficiaryfarmers accessed this information from PunjabAgricultural University (PAU) and placed it at rank 8.The findings are in line with the findings of Adhiguru etal. (2009) and Nain et al. (2015). The in-depth discussionsand the observation during data collection indicated thatboth the category of farmers preferred localite sourcessuch as input dealers, fellow farmers and cooperativesocieties for such information. The farmers were buyingthe agricultural inputs from the local input dealers in their
Table 3: Distribution of farmers according to their source of information regarding agricultural schemes/subsidiesS.No. Sources of Information Beneficiary(n=90) Non-Beneficiary (n=90)
f (%) Rank f (%) Rank1. State Agriculture Department (ADO) 73 81.11 4 42 46.67 52. State Horticulture Department (HDO) 22 24.44 9 13 14.44 103. Punjab Agriculture University 26 28.89 8 23 25.56 84. Krishi Vigyan Kendras (KVK) 19 21.11 11 9 10 115. Kisan Call Centre (KCC) 21 23.33 10 15 16.67 96. Cooperatives Societies 78 86.67 3 47 52.22 47. Fellow Farmers 87 96.66 2 69 76.67 28. Input Dealers 90 100 1 83 92.22 19. Special campaigns on awareness of 12 13.33 12 6 6.67 12
schemes/subsidies10. Farm Telecasts 56 62.22 5 48 53.33 311. Radio 32 35.55 7 37 41.11 712. Newspapers 42 46.67 6 38 42.22 6
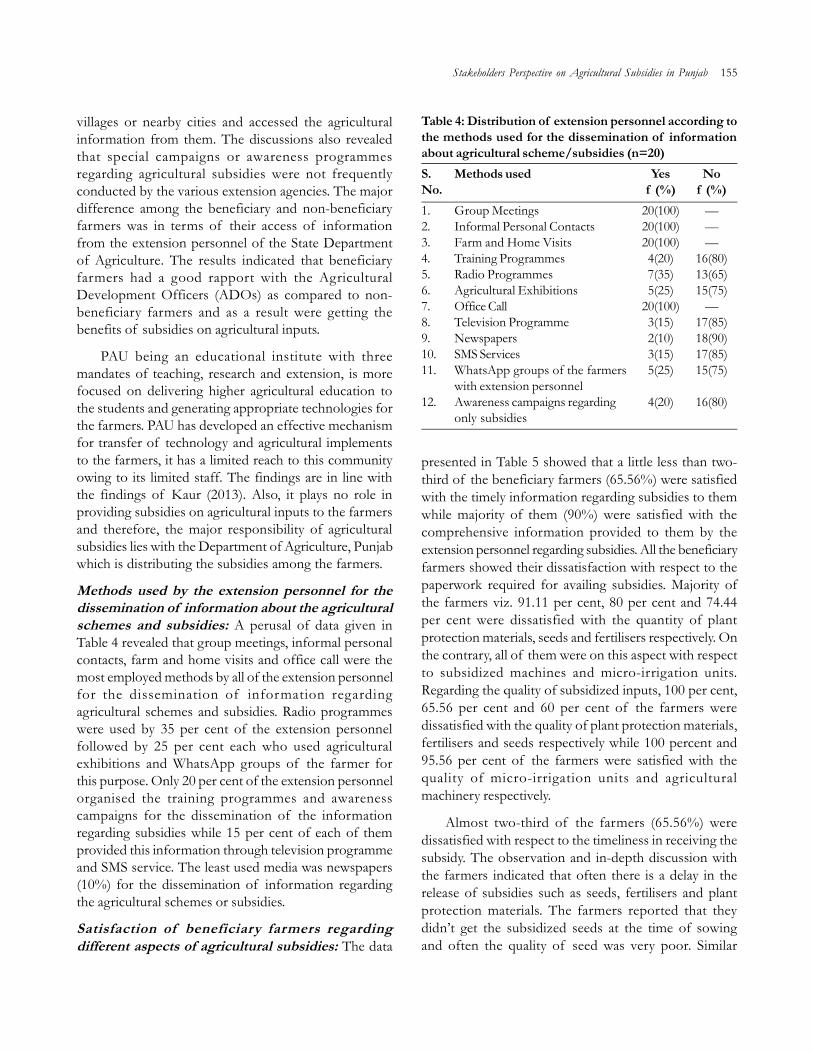
Stakeholders Perspective on Agricultural Subsidies in Punjab 155
villages or nearby cities and accessed the agriculturalinformation from them. The discussions also revealedthat special campaigns or awareness programmesregarding agricultural subsidies were not frequentlyconducted by the various extension agencies. The majordifference among the beneficiary and non-beneficiaryfarmers was in terms of their access of informationfrom the extension personnel of the State Departmentof Agriculture. The results indicated that beneficiaryfarmers had a good rapport with the AgriculturalDevelopment Officers (ADOs) as compared to non-beneficiary farmers and as a result were getting thebenefits of subsidies on agricultural inputs.
PAU being an educational institute with threemandates of teaching, research and extension, is morefocused on delivering higher agricultural education tothe students and generating appropriate technologies forthe farmers. PAU has developed an effective mechanismfor transfer of technology and agricultural implementsto the farmers, it has a limited reach to this communityowing to its limited staff. The findings are in line withthe findings of Kaur (2013). Also, it plays no role inproviding subsidies on agricultural inputs to the farmersand therefore, the major responsibility of agriculturalsubsidies lies with the Department of Agriculture, Punjabwhich is distributing the subsidies among the farmers.
Methods used by the extension personnel for thedissemination of information about the agriculturalschemes and subsidies: A perusal of data given inTable 4 revealed that group meetings, informal personalcontacts, farm and home visits and office call were themost employed methods by all of the extension personnelfor the dissemination of information regardingagricultural schemes and subsidies. Radio programmeswere used by 35 per cent of the extension personnelfollowed by 25 per cent each who used agriculturalexhibitions and WhatsApp groups of the farmer forthis purpose. Only 20 per cent of the extension personnelorganised the training programmes and awarenesscampaigns for the dissemination of the informationregarding subsidies while 15 per cent of each of themprovided this information through television programmeand SMS service. The least used media was newspapers(10%) for the dissemination of information regardingthe agricultural schemes or subsidies.
Satisfaction of beneficiary farmers regardingdifferent aspects of agricultural subsidies: The data
presented in Table 5 showed that a little less than two-third of the beneficiary farmers (65.56%) were satisfiedwith the timely information regarding subsidies to themwhile majority of them (90%) were satisfied with thecomprehensive information provided to them by theextension personnel regarding subsidies. All the beneficiaryfarmers showed their dissatisfaction with respect to thepaperwork required for availing subsidies. Majority ofthe farmers viz. 91.11 per cent, 80 per cent and 74.44per cent were dissatisfied with the quantity of plantprotection materials, seeds and fertilisers respectively. Onthe contrary, all of them were on this aspect with respectto subsidized machines and micro-irrigation units.Regarding the quality of subsidized inputs, 100 per cent,65.56 per cent and 60 per cent of the farmers weredissatisfied with the quality of plant protection materials,fertilisers and seeds respectively while 100 percent and95.56 per cent of the farmers were satisfied with thequality of micro-irrigation units and agriculturalmachinery respectively.
Almost two-third of the farmers (65.56%) weredissatisfied with respect to the timeliness in receiving thesubsidy. The observation and in-depth discussion withthe farmers indicated that often there is a delay in therelease of subsidies such as seeds, fertilisers and plantprotection materials. The farmers reported that theydidn’t get the subsidized seeds at the time of sowingand often the quality of seed was very poor. Similar
Table 4: Distribution of extension personnel according tothe methods used for the dissemination of informationabout agricultural scheme/subsidies (n=20)S. Methods used Yes NoNo. f (%) f (%)1. Group Meetings 20(100) —2. Informal Personal Contacts 20(100) —3. Farm and Home Visits 20(100) —4. Training Programmes 4(20) 16(80)5. Radio Programmes 7(35) 13(65)6. Agricultural Exhibitions 5(25) 15(75)7. Office Call 20(100) —8. Television Programme 3(15) 17(85)9. Newspapers 2(10) 18(90)10. SMS Services 3(15) 17(85)11. WhatsApp groups of the farmers 5(25) 15(75)
with extension personnel12. Awareness campaigns regarding 4(20) 16(80)
only subsidies
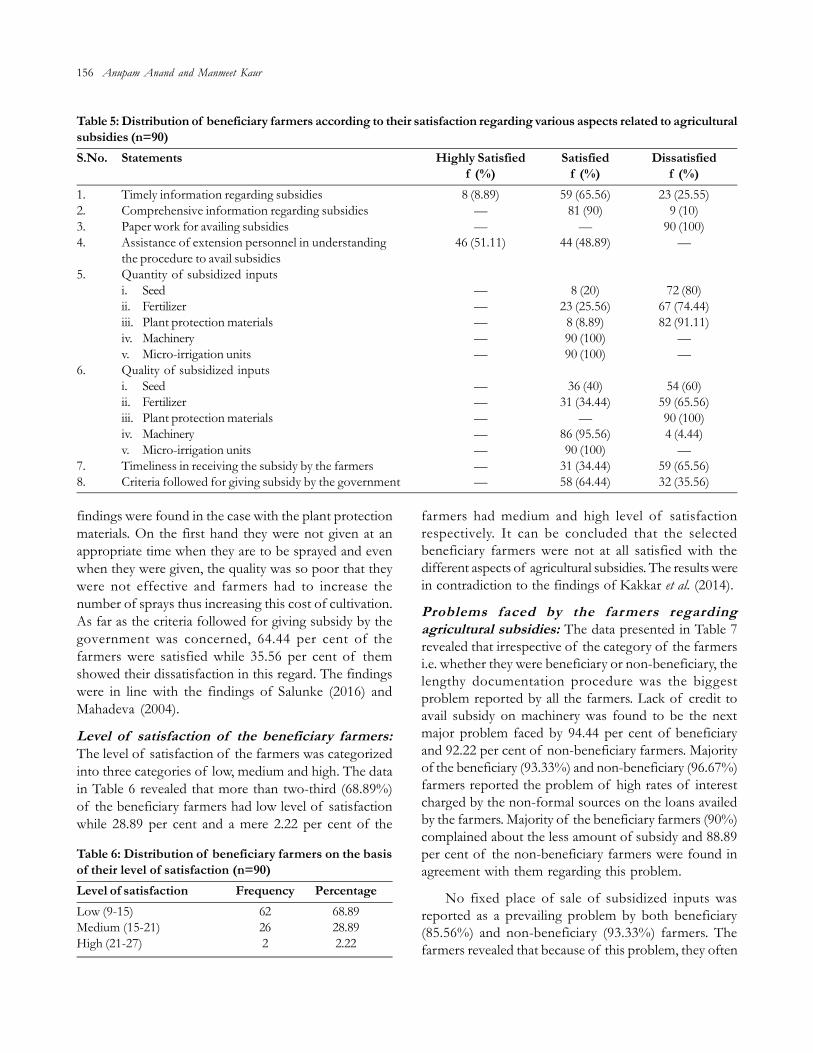
156 Anupam Anand and Manmeet Kaur
findings were found in the case with the plant protectionmaterials. On the first hand they were not given at anappropriate time when they are to be sprayed and evenwhen they were given, the quality was so poor that theywere not effective and farmers had to increase thenumber of sprays thus increasing this cost of cultivation.As far as the criteria followed for giving subsidy by thegovernment was concerned, 64.44 per cent of thefarmers were satisfied while 35.56 per cent of themshowed their dissatisfaction in this regard. The findingswere in line with the findings of Salunke (2016) andMahadeva (2004).
Level of satisfaction of the beneficiary farmers:The level of satisfaction of the farmers was categorizedinto three categories of low, medium and high. The datain Table 6 revealed that more than two-third (68.89%)of the beneficiary farmers had low level of satisfactionwhile 28.89 per cent and a mere 2.22 per cent of the
farmers had medium and high level of satisfactionrespectively. It can be concluded that the selectedbeneficiary farmers were not at all satisfied with thedifferent aspects of agricultural subsidies. The results werein contradiction to the findings of Kakkar et al. (2014).
Problems faced by the farmers regardingagricultural subsidies: The data presented in Table 7revealed that irrespective of the category of the farmersi.e. whether they were beneficiary or non-beneficiary, thelengthy documentation procedure was the biggestproblem reported by all the farmers. Lack of credit toavail subsidy on machinery was found to be the nextmajor problem faced by 94.44 per cent of beneficiaryand 92.22 per cent of non-beneficiary farmers. Majorityof the beneficiary (93.33%) and non-beneficiary (96.67%)farmers reported the problem of high rates of interestcharged by the non-formal sources on the loans availedby the farmers. Majority of the beneficiary farmers (90%)complained about the less amount of subsidy and 88.89per cent of the non-beneficiary farmers were found inagreement with them regarding this problem.
No fixed place of sale of subsidized inputs wasreported as a prevailing problem by both beneficiary(85.56%) and non-beneficiary (93.33%) farmers. Thefarmers revealed that because of this problem, they often
Table 5: Distribution of beneficiary farmers according to their satisfaction regarding various aspects related to agriculturalsubsidies (n=90)S.No. Statements Highly Satisfied Satisfied Dissatisfied
f (%) f (%) f (%)1. Timely information regarding subsidies 8 (8.89) 59 (65.56) 23 (25.55)2. Comprehensive information regarding subsidies — 81 (90) 9 (10)3. Paper work for availing subsidies — — 90 (100)4. Assistance of extension personnel in understanding 46 (51.11) 44 (48.89) —
the procedure to avail subsidies5. Quantity of subsidized inputs
i. Seed — 8 (20) 72 (80)ii. Fertilizer — 23 (25.56) 67 (74.44)iii. Plant protection materials — 8 (8.89) 82 (91.11)iv. Machinery — 90 (100) —v. Micro-irrigation units — 90 (100) —
6. Quality of subsidized inputsi. Seed — 36 (40) 54 (60)ii. Fertilizer — 31 (34.44) 59 (65.56)iii. Plant protection materials — — 90 (100)iv. Machinery — 86 (95.56) 4 (4.44)v. Micro-irrigation units — 90 (100) —
7. Timeliness in receiving the subsidy by the farmers — 31 (34.44) 59 (65.56)8. Criteria followed for giving subsidy by the government — 58 (64.44) 32 (35.56)
Table 6: Distribution of beneficiary farmers on the basisof their level of satisfaction (n=90)Level of satisfaction Frequency PercentageLow (9-15) 62 68.89Medium (15-21) 26 28.89High (21-27) 2 2.22

Stakeholders Perspective on Agricultural Subsidies in Punjab 157
remained unaware of the place where subsidized inputswere given by the government agencies. The problemof sub-standard quality of inputs was reported by 81.11per cent of beneficiary and 75.55 per cent of non-beneficiary farmers. Majority of the beneficiary (78.89%)and non-beneficiary (85.56%) farmers reported theproblem of lesser quantity of subsidized inputs such asin case of seeds, fertilisers and plant protection materials.Regarding the delay in release of subsidies, more thansixty per cent of beneficiary farmers agreed with it as aproblem while the figure was quite high among the non-beneficiary farmers (91.11%) who considered it as oneof the major problems associated with agriculturalsubsidies.
It was quite interesting to find that where only 53.33per cent of beneficiary farmers agreed that there wasmisallocation of subsidies, 90 per cent of the non-beneficiary termed it as the major factor contributing to
their non-receipt of subsidies. Approximately one-thirdof the beneficiary farmers (32.22%) reported lack ofawareness about the time of availability of subsidywhereas the percentage of agreement with this problemwas 82.22 per cent among the non-beneficiary farmers.The non-beneficiary farmers held this also as one of thefactors responsible for not receiving the subsidy. Thefindings were in line with the findings of Shivashankarand Uma (2014); Kakkar (2011); Salunkhe (2016) andMahadeva (2004).
Problems faced by the extension personnel indisbursement of agricultural subsidies: A scrutinyof data set in Table 8 showed that all the extensionpersonnel faced problems of lack of properinfrastructure, lack of funds for organizing extensionactivities, lack of extension personnel or supporting staff,overloaded with non-departmental work, absence ofdepartmental transportation and lack of information and
Table 7: Distribution of the farmers according to their problems regarding agricultural subsidiesS. Problems Beneficiary (n=90) Non-Beneficiary (n=90)No. Agree Disagree Agree Disagree
f (%) f (%) f (%) f (%)1. Lack of awareness about the time of availability of subsidy 29 (32.22) 61 (67.78) 74 (82.22) 16 (17.78)2. No fixed place of sale of subsidized inputs 77 (85.56) 13 (14.44) 84 (93.33) 6 (6.67)3. Delay in release of subsidies 55 (61.11) 35 (38.89) 82 (91.11) 8 (8.89)4. Lengthy documentation procedure 90 (100) — 90 (100) —5. Lesser quantity of subsidized inputs 71 (78.89) 19 (21.11) 77 (85.56) 13 (14.44)6. Sub-standard quality of subsidized inputs 73 (81.11) 17 (18.89) 68 (75.55) 22 (24.44)7. Lack of credit to avail subsidy on machineries 85 (94.44) 5 (5.56) 83 (92.22) 8 (8.89)8. High interest rates on the loans from non-formal sources 84 (93.33) 6 (6.67) 87 (96.67) 3 (3.33)
to avail subsidy9. Misallocation of subsidies 48 (53.33) 42 (46.67) 81 (90) 9 (10)
Table 8: Distribution of the extension personnel according to their problems faced in disbursement of agriculturalsubsidies (n=20)S.No. Problems Agree f (%) Disagree f (%)1. Lack of proper criteria for the selection of farmers regarding the subsidy programme. 6 (30) 14 (70)2. Lack of proper infrastructure for dissemination of information about the subsidy. 20 (100) —3. Lack of funds for organizing extension activities and campaigns. 20 (100) —4. Lack of extension personnel or support staff. 20 (100) —5. Red-tapism 12 (60) 8 (40)6. Lack of departmental transportation. 20 (100) —7. Over loaded with non-departmental work. 20 (100) —8. Lack of knowledge regarding all the aspects of the scheme for effective implementation. 4 (20) 16 (80)9. Low education level of farmers disables them to understand the subsidy scheme. 2 (10) 18 (90)10. Lack of information facilities (Phone, Computer, Office Internet etc.) 20 (100) —11. Poor support from state government regarding some central government schemes. 6 (30) 14 (70)12. Lack of farmers interest in subsidies 4 (20) 16 (80)

158 Anupam Anand and Manmeet Kaur
communication facilities for dissemination ofinformation about the subsidy. These factors hinderedthem the most as they had to perform every paperworkin the form of reports which takes a lot of their time.They also mentioned that most of their time was spendon carrying out census work or distribution of BPL(Below Poverty Line) cards, election duties, etc. ratherthan the service of farmers for which they have beenappointed. The extension personnel in order to reach tothe farmers in remote areas, had to use their personalvehicle as they lacked any transportation facility. Less thantwo-third (60%) of the extension personnel reportedred-tapism (the practice of requiring excessivepaperwork and tedious procedures before official actioncan be considered or completed) as one of the problemswhich hindered the smooth functioning in case ofsubsidies. An equal percentage of extension personneli.e. 30 per cent of them reported that there was a lackof proper criteria for the selection of farmers regardingthe subsidy programme and poor support from the stategovernment towards some central government schemes.Only 20 per cent of extension personnel reported thatlack of knowledge regarding all the aspects of thesubsidy scheme hampered its effective implementationby them while a similar percentage of them agreed thatthere was a lack of interest by the farmers regardingsubsidy. It clearly depicts that the farmers were veryinterested to avail subsidies if given to them. Only 10per cent of extension personnel felt that low educationof the farmers disabled them to understand theprocedures for availing subsidies. The findings were inline with the findings of Bortamuly and Khuhly (2013);Thanh and Singh (2007); Kumar et al. (2011) and Gupta(2014).
CONCLUSION
The findings of the study revealed that the subsidies werean important part of agriculture and that it should beproperly targeted especially to small and marginal farmersfor its effective implementation and utilisation. Specialawareness campaigns needs to be organised once thesubsidies are released from the government todisseminate the information on the availability of thesubsidies to all the sections of the farmers. Good qualityof subsidized inputs such as seeds, fertilisers and plantprotection materials need to be ensured by thegovernment for obtaining high yield of crops. PAU andKVKs should make provisions to providecomprehensive information about schemes and subsidies
in their various training programmes, campaign and otheractivities. An independent agency for monitoring andevaluation of disbursement of agricultural subsidiesneeds to be established to ensure strict enforcement ofguidelines of various schemes. This would facilitate inproviding the benefits of subsidies to the weaker sectionsi.e. small and marginal farmers in an effective manner. A“one-stop shop” for all subsidized agricultural inputs suchas seeds, fertilizers, soil nutrients and pesticides need tobe created for effective dissemination of inputs to allsection of farmers. This would help in avoidingconfusion among the farmers regarding the place ofavailability of subsidized inputs and save their time. Thiswill help in developing a sense of trust and increaseconfidence of farmers in public sector extension services.
REFRENCES
Adhiguru, P.; P.S. Birthal and B.G. Kumar. 2009. Strengtheningpluralistic agricultural information delivery systems inIndia. Agricultural Economic Research Review, 22: 71-9.
Anonymous. 2014a. Economy of India. Retrieved from http://en.wikipedia.org/wiki/Economy on 25/03/2015.
Anonymous. 2014b. Issues related to direct and indirect farmsubsidies and minimum support prices. Retrieved fromht tp ://www.c iv i l s e r v i c e ind i a . com/sub j ec t/GeneralStudies/notes/issues-related-to-direct-and-indirect-farms-subsidies-and-minimum-support-prices.html on 18/05/2016.
Anonymous. 2014c. Agriculture: subsidies, seeds, fertilizers andrelated issues. Retrieved fromhttp://www.insightsonindia.com/2014/11/12/agriculture-subsidies-seeds-fertilize r-related-issues/ on 06/04/2016.
Anonymous. 2014d. A farmer friendly handbook for government ofIndia schemes and programmes in 2014. Department ofAgriculture and Cooperation, Ministry of Agriculture,Government of India.
Anonymous. 2015. Introduction to Punjab. Retrieved fromhttp://agripb.gov.in/ on 28/06/2016.
Bortamuly, D. and B.L. Khuhly. 2013. Constraints faced by blocklevel extension functionaries in facilitating commodityinterest groups and farm schools under ATMA in NEIndian states. Journal of Academia and Industrial Research, 2:291-94.
Crawford, E.; V. Kelly.; T. Jayne and J. Howard. 2003. Input useand market development in sub-Saharan Africa: Anoverview. Food Policy, 28: 277-92.
Gaur, M. 2014. Indebtedness and farmer suicide in the liberalizedeconomy of Punjab. Global Journal for Research Analysis, 3:126-7.
Stakeholders Perspective on Agricultural Subsidies in Punjab 159
Grewal, S.S. and A.J. Singh. 1992. Growth of Punjab Agriculture-Facts and Issues. Department of Economics and Sociology.Punjab Agricultural University, Ludhiana and PunjabMandi Board, Chandigarh.
Gupta, S. 2014. Constraints in effective transfer of technologyto the farm women through KVKs. International Journalof Extension Education, 10: 131-35.
Kakkar, N. 2011. Reactions of farmers regarding agricultural subsidiesprovided by state department of agriculture under National FoodSecurity Mission. M.Sc. thesis, Punjab AgriculturalUniversity, Ludhiana, India.
Kakkar, N.; P. Kaur and R.K. Dhaliwal. 2014. Satisfaction offarmers regarding subsidies provided under NationalFood Security Mission. Journal of Community Mobilizationand Sustainable Development, 2: 107-109.
Kaur, M. 2013. A study on the research-extension-farmer linkages inthe agriculture sector of Punjab. Ph.D. dissertation, PunjabAgriculture University, Ludhiana, India.
Kumar, K.A.; G. Eswarappa and B.N. Manjunatha. 2011.Constraints faced by stakeholders in implementation ofagricultural technology management agency programme.Karnataka Journal of Agricultural Science, 24: 255-57.
Mahadeva, M. 2004. Agricultural input subsidies in Karnataka:quantum of subsidies to SC/ST farmers. AgriculturalDevelopment and Rural Transformation Unit, Institutefor Social and Economic Change. Nagarabhavi, Bangalore.
Nain, M.S.; R. Singh; J.R. Mishra and J.P. Sharma. 2015.Utilization and Linkage with Agricultural InformationSources: A Study of Palwal District of Haryana State.Journal of Community Mobilization and SustainableDevelopment, 10: 152-156.
Roy, V.C. 2013. Punjab facing stagnancy in agriculture: State’seconomic survey. Retrieved from http://www.businessstandard.com/article/economypolicy/punjabfacings
tagnancyinagriculturestateseconomicsurvey113033000131_1.html on 30/06/2016.
Salunkhe, H.A. 2016. Bureaucracy: A study of distributionprocess of agriculture subsidy in India. Proc InternationalConference on Global Trends in Engineering, Technology andManagement (ICGTETM-2016).
Shivashankar, S.C. and T.G. Uma. 2014. Agricultural subsidiesin India: Quantum of subsidies to SC/ST farmers inKarnataka. International Research Journal of Marketing andEconomics, 1: 63-78.
Sidhu, H.S. 2002. Crisis in agrarian economy in Punjab: Someurgent steps. Economic and Political Weekly, 37: 3132-38.
Singh G. 2014. Farm mechanization in Punjab: Social, economic andenvironmental implications. Punjab State Council for Science& Technology, India.
Singh, S. 1994. Agricultural development in India: A regional analysis.Kaushal Publication, Amritsar. (Original not seen. Citedby Kakkar, N. 2011. Reactions of farmers regarding agriculturalsubsidies provided by state department of agriculture underNational Food Security Mission. M.Sc. thesis, PunjabAgricultural University, Ludhiana, India).
Singh, S. and S. Bhogal. 2014. Depeasantization in Punjab: Statusof farmers who left farming. Current Science, 106: 1364-68.
Thanh, N.C. and B. Singh. 2007. Problems faced by extensionpersonnel –Some comparisons between Vietnam andIndia. Omon Rice, 15: 164-73.
Vijayakumar, K. 2014. Awareness of agricultural and welfareschemes among SC agriculturists in Parangipettai Union,Cuddalore District. International Journal of Advanced Libraryand Information Science, 3: 346-49.
--------------------------------------------------------------------------------------------------------------------------------------------------------------Received on January, 2018, Revised on February, 2018
Journal of Community Mobilization and Sustainable Development Vol. 13(1), 160-164, January-April, 2018
*Corresponding author email id: [email protected]
Farm Telecast Viewing Behaviour of Farmers of Punjab
Balwinder Singh*, P.K. Jain, R.S. Singh and B.S. HansraAgriculture Extension, 394-B, B.R.S. Nagar, Ludhiana-141012, Punjab, India
ABSTRACT
Television is a powerful media, as an institutionalized source of information dissemination. In Punjab, the “MeraPind Mere Khet” is an important farm telecast of Doordarshan Jalandhar. The present study was conducted toknow the viewing behaviour of farmers about this farm telecast. The study was conducted on randomly selected250 farmers from 10 villages of Punjab. A structured interview schedule was prepared to collect the informationfrom selected respondents. The data were collected through personal interview approach and data were analysedusing appropriate statistical tools. The majority of the respondents was middle aged males, matriculates andbelonged to medium size families with low social contacts. They possessed medium land holdings. Majority ofthe respondents had high level of awareness regarding the farm telecast and viewed the programme regularly. Itwas also found that more than half number of respondents (52.04 per cent) talk with others while viewing theprogramme. Majority of the respondents watched the programme from beginning to end, however they had notdiscussed the content with fellow farmers. Study further revealed that majority of the respondents never writesdown notes on a paper to preserve the information given in programme.
Keywords: Awareness, Doordarshan, Farm telecast, Television, Viewing behaviour
INTRODUCTION
In most of the countries of the world, mass media hasbecome a part and parcel of life. A large proportion ofpeople, around the globe, are being informed andentertained through mass media. Television, as a mediumof mass communication, is capable of producingindefinite reproduction of identical messages to receiversphysically separated (Venogopal, 1978). Through TV, theinformation reaches the minds of the individual througheyes and ears simultaneously and has a motivational impacton the viewers. It is considered as one of the mosteffective and quick mass medium for transmittinginformation to the farmers/rural community (Burmanet al., 2013). The significance of communication forhuman life cannot be overlooked. This is true becausebeyond the physical requirements of food and shelterman needs to communicate with his/her fellow humanbeings. This urge for communication is a primal one andin our contemporary civilization a necessity for survival.That is to say without communication no society canexist, much less develop and survive. For the existenceas well as the organization of every society,
communication is a fundamental and vital process. Themass media help to overcome the obstacle of prevalenceof traditional attitudes and cultural traits by exposingmany people simultaneously to important messages. Thisvital mission of disseminating information, ideas andattitudes to the public at large is accomplished by variousmedia of mass communication.
Among the different mass media radio and televisionare considered as powerful media, as an institutionalizedsource of information for creating awareness about theinnovation existent with additional information.Dhananjay and Nataraju (2010) reported that T.V. wasthe most prefer media followed by news paper, magazineand other mass media. They are used as powerfuleducational tools. The eye and ear mindedness of ruralwomen makes this media as one of the most promisingof the present day educational sources. They offer vitalityand newness, which attract attention, create interest andstimulate desire to learn. To keep pace with suchdevelopment, effective utilization of Radio andTelevision as a means of communication is very muchessential (Raina et al., 2011).

In Punjab, the Jalandhar Doordarshan telecasts avariety of programmes for the viewers in region ofPunjab State. It also telecasts a development programmebased on the rural community known as “Mera Pind MereKhet” (MPMK). This programme was commenced in1974 with the objective of dissemination of usefulagricultural information to the farmers. To begin with, itwas a weekly programme of 15 minutes duration, butpresently it is broadcasted for 30 minute duration for 5days a week. The present study was conducted to knowthe viewing behaviour of farmers.
MATERIALS AND METHODS
Out of five Agro-climatic zones of Punjab, one blockfrom each zone will be selected randomly from eachblock, two villages will be selected randomly. The criteriaadopted for the selection of villages were that eachselected villages must have at least 100 television sets,owned by the farming families. This way, 10 villages wereselected in all, i.e. two villages from each of the randomlyselected blocks. A list of television owning farmers fromeach of the selected villages was prepared and 25 farmerswere randomly selected out of this list of each selectedvillage. Thus, a total, 250 farmers constituted the samplefor this study. A structured interview schedule wasprepared to collect the information from selectedrespondents. The data were collected through personalinterview approach and data were analysed usingappropriate statistical tools.
RESULTS AND DISCUSSION
Socio economic profile of the respondents: Data inTable 1 indicates that 49.2 per cent of the respondentswere in middle age group i.e. 25-45 years followed by34.4 per cent of respondents in old age group (46 andabove) and rest of the rest of the respondents falls inyoung age group(18-25 years).
The data presented in Table 1 indicated that 89.6per cent of the respondents were male while only 9.6per cent respondents were female. It is clear from thedata in Table 1 that 42.4 per cent of the respondentshad matric passed, 26.4 per cent of the respondents weremiddle passed and 23.2 per cent of the respondents weregraduate and above. Only 8.0 per cent of respondentswere illiterate. The data revealed that 46.8 per cent ofthe respondents had 5-8 family members. Regarding theirsocial participation, it is clear from the data in Table 1that 71.6 per cent of the respondents had no membership,19.2 per cent of the respondents had member of anorganization and 9.2 per cent had office holder.
Operational land holdings: The respondents werecategorized into three groups i.e. small, medium andlarge. It can be observed that from total 250 respondents51.2 per cent had 637.44 hectares cultivated area i.e. 53.32per cent of total 1195.71 hectares cultivated area,followed by 28.4 per cent of the respondents of smallsize group with 163.02 hectares of cultivated area i.e.13.63 per cent of the total cultivated area. Only 20.4 percent of the respondents had large size group with 395.25
Table 1: Distribution of respondents according to their socio-economic characteristics (n=250)Socio-personal characteristics Category Number of Respondents(f) Percentage (%)Age Young (18-25) 41 16.4
Middle (25-45) 123 49.2Old (46 and above) 86 34.4
Sex Male 226 89.6Female 24 9.6
Education Qualification Illiterate 20 8.0Middle 66 26.4Matric 106 42.4Graduate and above 58 23.2
Family Size Upto 4 78 31.25-8 117 46.8Above 8 55 22.0
Social Participation No Membership 179 71.6Member of An Organization 48 19.2Office Holder 23 9.2
Farm Telecast Viewing Behaviour of Farmers of Punjab 161
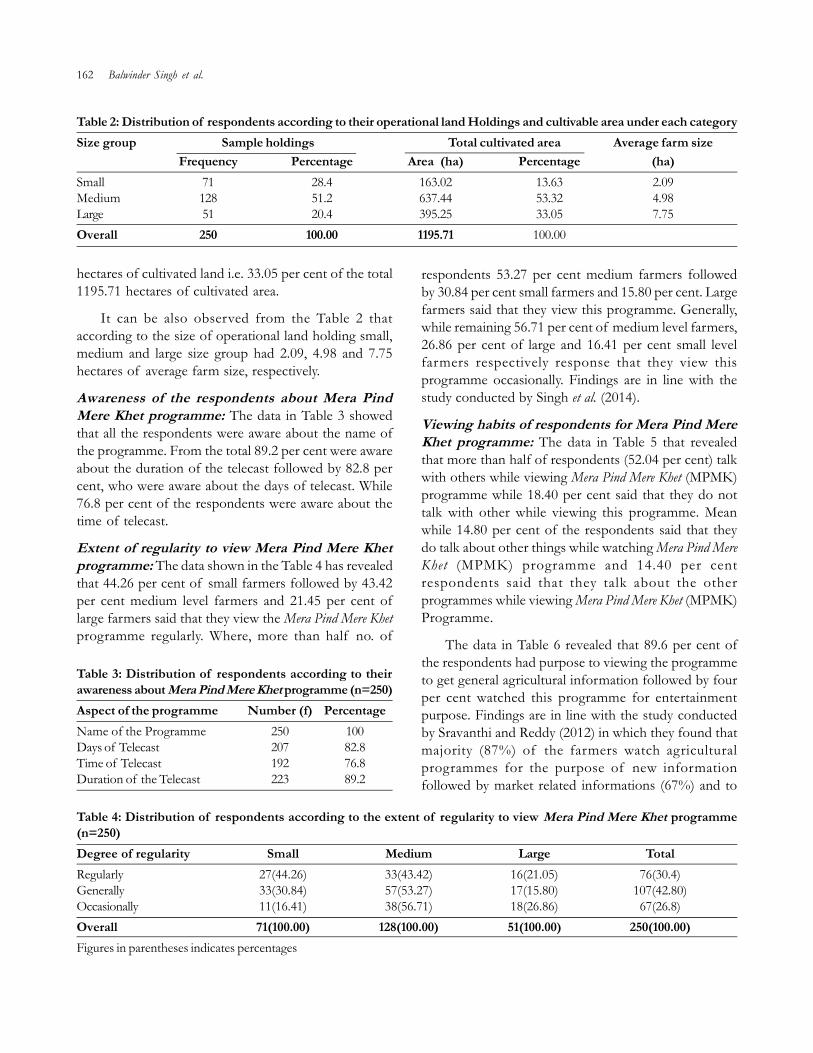
162 Balwinder Singh et al.
hectares of cultivated land i.e. 33.05 per cent of the total1195.71 hectares of cultivated area.
It can be also observed from the Table 2 thataccording to the size of operational land holding small,medium and large size group had 2.09, 4.98 and 7.75hectares of average farm size, respectively.
Awareness of the respondents about Mera PindMere Khet programme: The data in Table 3 showedthat all the respondents were aware about the name ofthe programme. From the total 89.2 per cent were awareabout the duration of the telecast followed by 82.8 percent, who were aware about the days of telecast. While76.8 per cent of the respondents were aware about thetime of telecast.
Extent of regularity to view Mera Pind Mere Khetprogramme: The data shown in the Table 4 has revealedthat 44.26 per cent of small farmers followed by 43.42per cent medium level farmers and 21.45 per cent oflarge farmers said that they view the Mera Pind Mere Khetprogramme regularly. Where, more than half no. of
respondents 53.27 per cent medium farmers followedby 30.84 per cent small farmers and 15.80 per cent. Largefarmers said that they view this programme. Generally,while remaining 56.71 per cent of medium level farmers,26.86 per cent of large and 16.41 per cent small levelfarmers respectively response that they view thisprogramme occasionally. Findings are in line with thestudy conducted by Singh et al. (2014).
Viewing habits of respondents for Mera Pind MereKhet programme: The data in Table 5 that revealedthat more than half of respondents (52.04 per cent) talkwith others while viewing Mera Pind Mere Khet (MPMK)programme while 18.40 per cent said that they do nottalk with other while viewing this programme. Meanwhile 14.80 per cent of the respondents said that theydo talk about other things while watching Mera Pind MereKhet (MPMK) programme and 14.40 per centrespondents said that they talk about the otherprogrammes while viewing Mera Pind Mere Khet (MPMK)Programme.
The data in Table 6 revealed that 89.6 per cent ofthe respondents had purpose to viewing the programmeto get general agricultural information followed by fourper cent watched this programme for entertainmentpurpose. Findings are in line with the study conductedby Sravanthi and Reddy (2012) in which they found thatmajority (87%) of the farmers watch agriculturalprogrammes for the purpose of new informationfollowed by market related informations (67%) and to
Table 2: Distribution of respondents according to their operational land Holdings and cultivable area under each categorySize group Sample holdings Total cultivated area Average farm size
Frequency Percentage Area (ha) Percentage (ha)Small 71 28.4 163.02 13.63 2.09Medium 128 51.2 637.44 53.32 4.98Large 51 20.4 395.25 33.05 7.75Overall 250 100.00 1195.71 100.00
Table 3: Distribution of respondents according to theirawareness about Mera Pind Mere Khet programme (n=250)Aspect of the programme Number (f) PercentageName of the Programme 250 100Days of Telecast 207 82.8Time of Telecast 192 76.8Duration of the Telecast 223 89.2
Table 4: Distribution of respondents according to the extent of regularity to view Mera Pind Mere Khet programme(n=250)Degree of regularity Small Medium Large TotalRegularly 27(44.26) 33(43.42) 16(21.05) 76(30.4)Generally 33(30.84) 57(53.27) 17(15.80) 107(42.80)Occasionally 11(16.41) 38(56.71) 18(26.86) 67(26.8)Overall 71(100.00) 128(100.00) 51(100.00) 250(100.00)Figures in parentheses indicates percentages
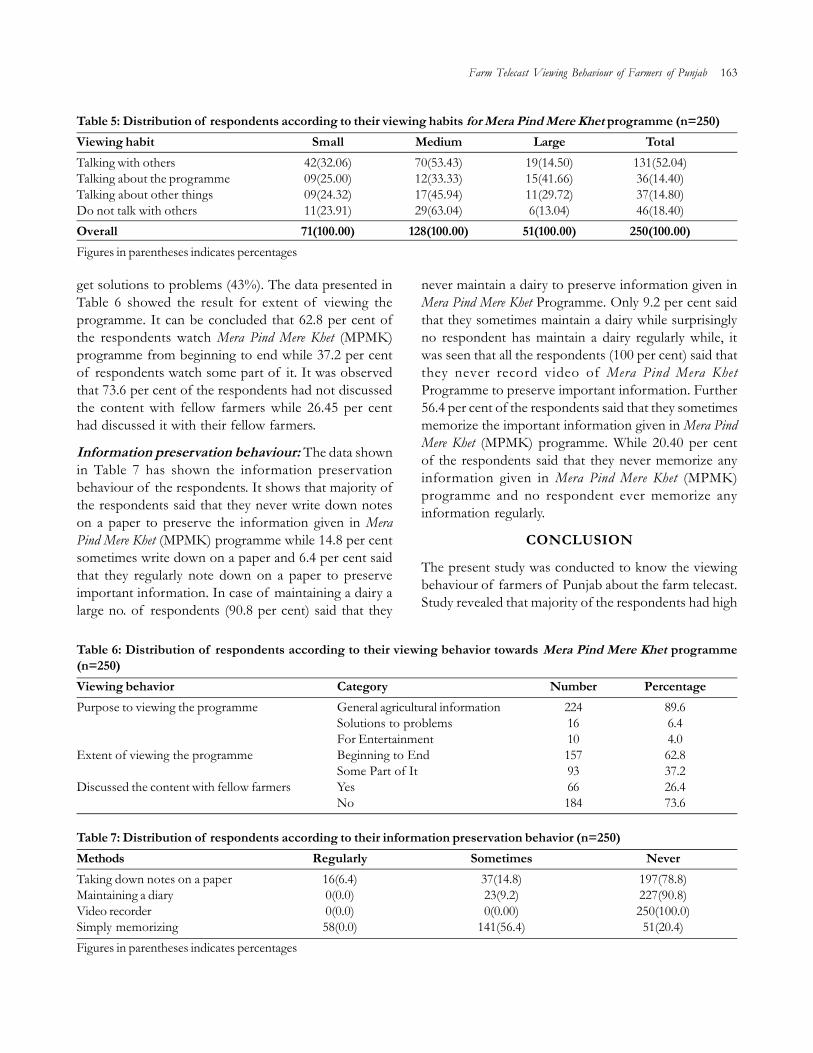
Farm Telecast Viewing Behaviour of Farmers of Punjab 163
get solutions to problems (43%). The data presented inTable 6 showed the result for extent of viewing theprogramme. It can be concluded that 62.8 per cent ofthe respondents watch Mera Pind Mere Khet (MPMK)programme from beginning to end while 37.2 per centof respondents watch some part of it. It was observedthat 73.6 per cent of the respondents had not discussedthe content with fellow farmers while 26.45 per centhad discussed it with their fellow farmers.
Information preservation behaviour: The data shownin Table 7 has shown the information preservationbehaviour of the respondents. It shows that majority ofthe respondents said that they never write down noteson a paper to preserve the information given in MeraPind Mere Khet (MPMK) programme while 14.8 per centsometimes write down on a paper and 6.4 per cent saidthat they regularly note down on a paper to preserveimportant information. In case of maintaining a dairy alarge no. of respondents (90.8 per cent) said that they
never maintain a dairy to preserve information given inMera Pind Mere Khet Programme. Only 9.2 per cent saidthat they sometimes maintain a dairy while surprisinglyno respondent has maintain a dairy regularly while, itwas seen that all the respondents (100 per cent) said thatthey never record video of Mera Pind Mera KhetProgramme to preserve important information. Further56.4 per cent of the respondents said that they sometimesmemorize the important information given in Mera PindMere Khet (MPMK) programme. While 20.40 per centof the respondents said that they never memorize anyinformation given in Mera Pind Mere Khet (MPMK)programme and no respondent ever memorize anyinformation regularly.
CONCLUSION
The present study was conducted to know the viewingbehaviour of farmers of Punjab about the farm telecast.Study revealed that majority of the respondents had high
Table 5: Distribution of respondents according to their viewing habits for Mera Pind Mere Khet programme (n=250)Viewing habit Small Medium Large TotalTalking with others 42(32.06) 70(53.43) 19(14.50) 131(52.04)Talking about the programme 09(25.00) 12(33.33) 15(41.66) 36(14.40)Talking about other things 09(24.32) 17(45.94) 11(29.72) 37(14.80)Do not talk with others 11(23.91) 29(63.04) 6(13.04) 46(18.40)Overall 71(100.00) 128(100.00) 51(100.00) 250(100.00)Figures in parentheses indicates percentages
Table 6: Distribution of respondents according to their viewing behavior towards Mera Pind Mere Khet programme(n=250)Viewing behavior Category Number PercentagePurpose to viewing the programme General agricultural information 224 89.6
Solutions to problems 16 6.4For Entertainment 10 4.0
Extent of viewing the programme Beginning to End 157 62.8Some Part of It 93 37.2
Discussed the content with fellow farmers Yes 66 26.4No 184 73.6
Table 7: Distribution of respondents according to their information preservation behavior (n=250)Methods Regularly Sometimes NeverTaking down notes on a paper 16(6.4) 37(14.8) 197(78.8)Maintaining a diary 0(0.0) 23(9.2) 227(90.8)Video recorder 0(0.0) 0(0.00) 250(100.0)Simply memorizing 58(0.0) 141(56.4) 51(20.4)Figures in parentheses indicates percentages
164 Balwinder Singh et al.
level of awareness regarding the farm telecast and viewedthe programme regularly. Majority of the respondentswatched the programme from beginning to end,however they had not discussed the content with fellowfarmers. Study further revealed that majority of therespondents never writes down notes on a paper topreserve the information given in programme. Televisionhas been acclaimed to be the most effective media fordiffusing information into rural areas and particularly torural women than any other mass media source in thestudy conducted by Manasa et al. (2012). They reportedthat 60.8 % of the viewers has medium useful level ofopinion about the programme. Mass media createempathetic spirit, widens people’s horizon and conduciveclimate for change. That is why Bellurkar (2000) statedthat the mass media should be put to service for nationaldevelopment.
REFERENCES
Bellurkar, C.M.; G.G. Nandapurkar and J.R. Rodge. 2000.Preferences and suggestions of televiewers towards variousTV programmes. Maharashtra J. Extn. Edu., 19:33-35.
Burman, R.R.; S.K. Dubey; J.P. Sharma; K. Vijayaragavan; V.Sangeetha and I. Singh. 2013. Information dynamics for
designing cyber extension model for agriculturaldevelopment. J. Community Mobilization and SustainableDevelop., 8: 182-185.
Dhananjay, B. and M.S. Nataraju. 2010. Preferences andsuggestions of farmers towards farm advertisements inmass media. Mysore J. Agric. Sci., 44: 581-584.
Manasa, G.; R.G. Reddy and M. Preethi. 2012. Attitude of therural women towards Telgu Television Programme. J. Res.ANGRAU, 40: 77-78
Raina, V.; M.S. Nain; B.S. Hansra and D. Singh. 2011. Marketingbehaviour and information sources utilization pattern offlower growers. J. Community Mobil. and Sustainable Dev.,6(2): 180-184.
Singh, J.; V.P. Chahal and Vidyulata. 2014. Farm telecast viewingbehaviour of farmers in Haryana. Indian Res. J. Ext. Edu.,14(3): 66-69.
Sravanthi, B. and P.R. Reddy. 2012. Study to elucidate the qualityparameters for telecasting the agricultural programmes. J.Res. ANGRAU, 40: 118-120.
Venugopal, P. 1978. A study of the characteristic viewing habitsand comprehension of television viewing farmers variousTV programmes. Maharashtra J. Extn. Edu., 19: 33-35.
--------------------------------------------------------------------------------------------------------------------------------------------------------------Received on January, 2018, Revised on March, 2018

Journal of Community Mobilization and Sustainable Development Vol. 13(1), 165-168, January-April, 2018
*Corresponding author email id: [email protected]
Perceived Benefits of Adoption of Low Tunnel Technology forVegetable Production in Punjab State
Lavleesh Garg* and Tejinder Singh RiarDepartment of Extension Education, Punjab Agricultural University, Ludhiana, Punjab
ABSTRACT
Protected cultivation has emerged as the best option for small farmers to increase the family income from the samepiece of land. Under protected cultivation low tunnel technology is helpful in management of abiotic and bioticstresses to the large extent which ultimately contributes towards its success. Cultivation under low tunnels is thepractice of raising the summer vegetables like chilly, tomato, cucurbits etc. during off season, where unfavourableenvironment does not allow them to raise these in open conditions. Small farmers are substantially increasingtheir income by adoption of protected cultivation of vegetables in off-season For maximizing the income,intercropping of suitable vegetables depending upon their growth development and fruiting period are beingpracticed for utilizing the space and time resources to its fullest extent. The study reports the perceived benefits ofthe adopter farmers and it was reported that on an average one can earn around Rs. 2-2.5 lakh/acre.
Keywords: Adoption, Benefits, Perceived, Production, Technology, Vegetable
INTRODUCTION
In India majority of the farmers (around 80%) fall inthe category of small land holding less than two hectare.In the present world of high cost of living it is verydifficult for them to sustain their life by traditional meansof farming. Protected cultivation is one of the bestoption for them to increase the family income from thesame piece of land. Under protected cultivation lowtunnel is the best way to enhance their family income. Interms of production of vegetables India ranks 2nd inthe world. However it is much below the level in termsof per capita consumptions or requirement of balanceddiet as per the Worlds Health Organisation. The presentvegetable production 162 million tones is to be raised to250 million tones (ministry of agriculture) by 2024-25(Singh, 1998). So there is ample scope of vegetableproduction in India and small farmers can play majorrole by adopting low tunnel vegetable cultivation.Vegetables, such as muskmelon, summer squash, bottlegourd, bitter gourd, round melon, cucumber etc. can betransplanted with this technique. Low tunnels are flexibletransparent covering that are installed over the rows orindividual beds of transplanted vegetables to enhance
plant growth by warming the air around the plants inthe open field during winter season. Now-a-days withthe introduction of biodegradable plastic for makinglow tunnels purposes, it becomes not only eco-friendly,but also sustainable technology for off season vegetableproduction. This biodegradable plastic of varyingdurability is available for its usage as per the requirementof one or more crop seasons.
The technology offers distinct advantages of quality,favourable market price to the growers as it advancesthe crop by 30 to 40 days than the normal season andproductivity of vegetables. Many cucurbits (squash,cucumbers, melons) respond well under row covers withincreased yields of as much as 25 percent (Helbacka,2002). The cost of installation of low tunnels is around25600/- per acre . Vegetables being short duration cropscan be fitted into crop rotations easily. As low tunneltechnology is used in winter, it can replace wheat in wheat-rice rotation, can help in crop diversification and canhelp to increase the cropping intensity also. This practiceis also helpful in increasing the cropping intensity andinclusion of basmati instead of paddy for saving theprecious underground water as most of the farmers

166 Lavleesh Garg and Tejinder Singh Riar
adopt this rotation i.e. winter vegetables followed bybasmati. Besides the economization of the naturalresources with this practice, the profitability realizationof the farmers is also the highest. The study explores theperceived benefits of adoption of low tunnel technologyin Punjab state.
MATERIAL AND METHODS
The study was conducted in Ferozepur district of Punjab.The dependent variable of this study was grower’sresponse, which is a reaction, as that of an organism ora mechanism, to a specific stimulus (Mangal, 1990). Inthis study it is considered as the reaction shown by thegrowers to cultivate vegetable under low tunneltechnologies and measured in light of three differentparameters such as: income from the vegetableproduction, problems and the benefit of this technology.Income from the vegetables grown by this method iscalculated on the basis of the information provided bythe grower’s through different questions on cost ofproduction and profit on different aspects of vegetablecultivation in low tunnel technology. To identify theproblems faced by the growers an open ended questionwas asked to indicate the problems faced by them duringthe cultivation. The benefits from these technologies werealso studied. The list was prepared on the basis of thebenefits quoted by the respondents. All possibleprecautions were taken to shun biasness and maintainfidelity and fairness of responses. Responses wererecorded accordingly, without making judgments orcomments on them.
RESULTS AND DISCUSSION
Cost of production/cultivation was calculated on thebasis of the replies of the different questions given bythe respondents, it was found that average cost ofproduction was around Rs. 114190/- per acre. Out ofthe total cost of production the chunk of the cost occurson protected sheath and harvesting of crops. Thereforework on mechanization of harvesting should be done.The gross profit from the cultivation of these vegetablesunder protected sheaths was Rs. 330000/- acre, whichmeans net profit, was around Rs. 215810/- per acre andthe detail of the cost and profit was given in the Table 1.Radha and Prasad (2001) revealed that net returns werein the tune of Rs. 55792 and 49758 from cauliflowerand tomato in Karim Nagar district of Andhra Pradesh.Low tunnel cultivation has clear edge in terms of
profitability over the traditional crops. Gupta (2013)reported similar returns from the combination ofvegetables grown under low tunnel technology and themaximum returns obtained by growing the chilly +cucumber. Thakur et al. (1997) also found that returnsfrom growing vegetables were very high and ranged fromRs. 75000-146000/- from tomato and cauliflowercultivation.
Growers also reported many benefits of thistechnology to them and are given in the Table 2. Thedata reveals that the major benefit of this technologywas cultivation of the crops under adverse conditionsand higher crop yield, which resulted in higher returndue to the favourable market price and advancement incrops by 30-40 days. Income from the small and themarginal land holdings can be increased by producingcrops earlier than their normal season and fetch higherprices due to higher market price and shortage of supplyin the market. It can act as entrepreneurial activity for the
Table 1: Mean Cost and profitability of growers during thevegetable production under low tunnel technology (n=50)Cost of production per acre/hectare (Rs.)Parameters AcreCost on land preparation 4650Cost on sowing of crop 600Cost on seed/seedling 3600Cost on seed treatment 20Cost on protected sheath 25600Cost on fertilizerUrea (kg) 390DAP (kg) 2400MOP (kg) 280Zn SO4 600FYM 2400Labour for fertilizer application 150Cost on weed controlManual or herbicide and labour charges 2700Cost on pest managementPesticide spray 1200Labour for pesticide spray 100Cost on harvestingManual 67500Cost on transportation to mandi/ market 2000Total Cost 114190Yield (quintal) 300Rate of sale of produce Rs. per quintal 1100Income from produce 330000Total income 330000Net income 215810
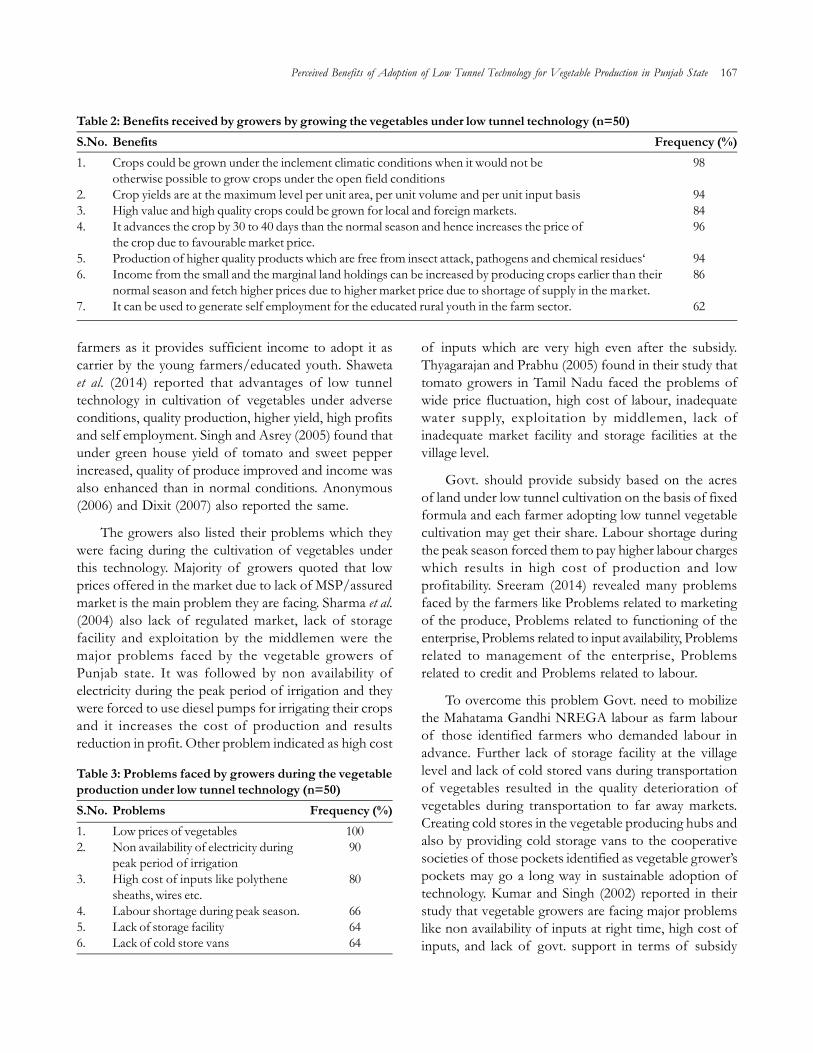
Perceived Benefits of Adoption of Low Tunnel Technology for Vegetable Production in Punjab State 167
farmers as it provides sufficient income to adopt it ascarrier by the young farmers/educated youth. Shawetaet al. (2014) reported that advantages of low tunneltechnology in cultivation of vegetables under adverseconditions, quality production, higher yield, high profitsand self employment. Singh and Asrey (2005) found thatunder green house yield of tomato and sweet pepperincreased, quality of produce improved and income wasalso enhanced than in normal conditions. Anonymous(2006) and Dixit (2007) also reported the same.
The growers also listed their problems which theywere facing during the cultivation of vegetables underthis technology. Majority of growers quoted that lowprices offered in the market due to lack of MSP/assuredmarket is the main problem they are facing. Sharma et al.(2004) also lack of regulated market, lack of storagefacility and exploitation by the middlemen were themajor problems faced by the vegetable growers ofPunjab state. It was followed by non availability ofelectricity during the peak period of irrigation and theywere forced to use diesel pumps for irrigating their cropsand it increases the cost of production and resultsreduction in profit. Other problem indicated as high cost
of inputs which are very high even after the subsidy.Thyagarajan and Prabhu (2005) found in their study thattomato growers in Tamil Nadu faced the problems ofwide price fluctuation, high cost of labour, inadequatewater supply, exploitation by middlemen, lack ofinadequate market facility and storage facilities at thevillage level.
Govt. should provide subsidy based on the acresof land under low tunnel cultivation on the basis of fixedformula and each farmer adopting low tunnel vegetablecultivation may get their share. Labour shortage duringthe peak season forced them to pay higher labour chargeswhich results in high cost of production and lowprofitability. Sreeram (2014) revealed many problemsfaced by the farmers like Problems related to marketingof the produce, Problems related to functioning of theenterprise, Problems related to input availability, Problemsrelated to management of the enterprise, Problemsrelated to credit and Problems related to labour.
To overcome this problem Govt. need to mobilizethe Mahatama Gandhi NREGA labour as farm labourof those identified farmers who demanded labour inadvance. Further lack of storage facility at the villagelevel and lack of cold stored vans during transportationof vegetables resulted in the quality deterioration ofvegetables during transportation to far away markets.Creating cold stores in the vegetable producing hubs andalso by providing cold storage vans to the cooperativesocieties of those pockets identified as vegetable grower’spockets may go a long way in sustainable adoption oftechnology. Kumar and Singh (2002) reported in theirstudy that vegetable growers are facing major problemslike non availability of inputs at right time, high cost ofinputs, and lack of govt. support in terms of subsidy
Table 2: Benefits received by growers by growing the vegetables under low tunnel technology (n=50)S.No. Benefits Frequency (%)1. Crops could be grown under the inclement climatic conditions when it would not be 98
otherwise possible to grow crops under the open field conditions2. Crop yields are at the maximum level per unit area, per unit volume and per unit input basis 943. High value and high quality crops could be grown for local and foreign markets. 844. It advances the crop by 30 to 40 days than the normal season and hence increases the price of 96
the crop due to favourable market price.5. Production of higher quality products which are free from insect attack, pathogens and chemical residues‘ 946. Income from the small and the marginal land holdings can be increased by producing crops earlier than their 86
normal season and fetch higher prices due to higher market price due to shortage of supply in the market.7. It can be used to generate self employment for the educated rural youth in the farm sector. 62
Table 3: Problems faced by growers during the vegetableproduction under low tunnel technology (n=50)S.No. Problems Frequency (%)1. Low prices of vegetables 1002. Non availability of electricity during 90
peak period of irrigation3. High cost of inputs like polythene 80
sheaths, wires etc.4. Labour shortage during peak season. 665. Lack of storage facility 646. Lack of cold store vans 64
168 Lavleesh Garg and Tejinder Singh Riar
results in poor adoption of vegetables by the farmers.Upadhyay et al. (2008) revealed in their study that 44 percent respondents reported lack of technical guidance asa problem in adoption of vermiculture technologythough they possessed good knowledge but they wantedto know more about this technology and technicalguidance was needed at different stages of usingvermiculture technology. The popularity of thistechnology amongst farmer’s increasing day by day dueto higher crop yield, water saving, quality produce dueto less attack of insect pest and diseases, early marketadvantage and higher income as compared to the normalseason crops attracted the farmers towards low tunneltechnology as such the problems need serious look frompolicy level.
CONCLUSION
The study revealed that profit from vegetables underlow tunnel cultivation gave higher returns than by othermethods. Benefits of cultivation of vegetables under lowtunnel were cultivation under adverse conditions, highyield, better quality, high returns, free from insect pestattack, earliness of crop and more over act as selfemployment or source of entrepreneurial activity. Theproblems faced by the growers during the cultivationof vegetables under low tunnel are low prices, nonavailability of electricity during peak period, high cost inthe beginning, labour shortage during peak season, lackof cold stores and cold stores mobile vans. In net shellthis technique is very beneficial to the small scale farmersas they get high revenue from the small holdings andalso arrange work for their family by engage them inthis high profit venture.
REFERENCES
Anonymous. 2006. Agricultural and Rural Development ofPunjab. The Punjab state Farmers Commission, Govt.of Punjab, pp. 43-44.
Dixit, A. 2007. Performance of leafy vegetables under protectedenvironment and open field condition. The Asian J. Hort.,2(1): 197-200.
Gupta, M. 2012. Effect of Intercropping of vegetables andwidth of polythene sheet on yield and economic returnsunder low tunnel technology. J. Krishi Vigyan, 1(1): 14-17.
Helbacka, J. 2002. Row covers for vegetable gardens, WashingtonState University, King County Cooperative ExtensionService, Fact Sheet No. 19.
Singh Kirti. 1998. challenges in agricultural vegetable productionin twenty first century. “National symposium on emergingscenario vegetable research and development.” Dec. 12-14, 1998: pp 1-11.
Kumar, R. and Singh, H. 2002. Problems in vegetableproduction in Bharatpur district of Rajasthan. Rural India,65: 48-50.
Mangal, S.K. 1990. Psychology: An Introduction to Human Behavior.Sterling Publishers Private Limited: New Delhi, India.
Radha, Y. and E.Y. Prasad, 2001. Economics of productionand marketing of vegetables in Karim Nagar DistrictAndhra Pradesh. Indian Journal of Agril. Mktg., 15: 61-65.
Sharma, A.; L.K. Sharma and G.S. Khurana. 2004. vegetablecultivation in Punjab: Shift from traditional crops. IndianJournal of Extension Education, 40: 87-90.
Shweta, S.K. Bhatia and Manu Malik. 2014. Protected Farming.Popular Kheti 2 (1). Available online at www.popularkheti.info © 2014 popularkheti.info ISSN:2321-0001
Singh, R. and R. Asrey. 2005. Performance of tomato and sweetpepper under unheated green house. Haryana Journal ofHorticulture Science, 34(1-2): 175-175.
Sreeram, V. 2014. Problems and Prospects of WomenEntrepreneurship in Kerala. Journal of CommunityMobilization and Sustainable Development, 9: 145-148.
Thankur, D.; S.H. Lal; D.R. Thankur; K.D. Sharma and A.S.Saini. 1997. Market supply response and marketing offarmers in the hills. Indian Journal of Agriculture Economics,52: 139-50.
Thyagarajan, S. and R. Prabhu. 2005. Recommendedtechnologies adopted by tomato growers. Agric. Ext. Rev.,17: 26-30.
Upadhyay, R.; P. Kaur and B. Upadhyay. 2008. Adoption ofvermiculture technology among rural women. Journal ofCommunity Mobilization and Sustainable Development, 3: 33-37.
--------------------------------------------------------------------------------------------------------------------------------------------------------------Received on January, 2018, Revised on February, 2018
Journal of Community Mobilization and Sustainable Development Vol. 13(1), 169-176, January-April, 2018
*Corresponding author email id: [email protected]
Investigation of Nutritional and Health Status of Indian Rural HillFarm Women
Renu Jethi1, Pratibha Joshi2, Nirmal Chandra3, M.L. Roy1 and Kushagra Joshi1
1Scientist, 3Principal Scientist, ICAR-Vivekananda Parvatiya Krishi Anusandhan Sansthan (ICAR), Almora-263601, Uttarakhand2Scientist, Centre for Agricultural Technology Assessment and Transfer, ICAR-Indian Agricultural Research Institute, New Delhi
ABSTRACT
In hill region of India, women play a major role in agricultural production, livestock and cottage industries andremain busy from dawn to dusk to collect water, fuel wood and fodder which adversely affects their health. Inorder to study nutritional status of farm women information regarding food intake was obtained from 120 farmwomen from high, mid and low hills using 24 hours recall method with interview schedule cum observat ionworksheet. Physiological characteristics and anthropometric measurements related to nutrition like weight, height,skin fold measurements, blood pressure, heart rate, energy expenditure rate, VO‚ max and pulse rate of subjectswere recorded. Results indicated that diet of farm women of high, mid and low hill region was inadequate interms of energy, protein and -carotene. It was also found that calcium and -carotene consumption by farmwomen during winter was significantly higher. On the basis of BMI, about 45 per cent subjects were foundChronic Energy Deficient (CED) and 22.5 percent were in the category of Low-Normal. Only 30 percent subjectswere in the category of Normal.
Keywords: Nutritional Status, Hill farm women, Chronic energy deficiency
INTRODUCTION
Uttarakhand is a small state in the northern part of Indiawith a total area of 53,484 km² of which 93% ismountainous. Uttarakhand is located between 28o 43'–31o 27' N latitudes and 770 34'–81o 02'E longitudes withan altitudinal variation ranging from 200 meter to morethan 8,000 meter above mean sea level. The averageannual rainfall of the state, as recorded is 1,547 mm. InUttarakhand about 70 percent population resides in ruralareas. More than three-fourths of state’s total populationdepends on agriculture for their livelihood and theeconomy is predominantly dependent on mountainagriculture. Uttarakhand is one of the few states in Indiawhere women are the active workforce in agriculture,due to their total involvement with agriculture, animalhusbandry, fodder and fuel-wood collection andhousehold activities. (Population Foundation of India,2002). Women here are therefore considered as thebackbone of hill agriculture and are the mainstay of ruraleconomy.
Small land holdings, low agricultural productivity andless job opportunities have given rise to out migration.This has dramatically dislocated Uttarakhand villagecommunities. The large scale out-migration of men insearch of employment in the plains or in the army hasled to a demographic imbalance in the region. While menpredominate in urban areas, the rural areas containsignificantly high female population (Rawat, 2004).Further, changes in the climate usually have more impacton sectors that are traditionally associated with women,such as crop cultivation, collection of fuel and fodderetc. Seasonal migration of men in search of job is bothwidespread and linked to low agricultural productivity.Because of male migration and thus reduced workforce,women who already do a disproportionate share ofwork are now doing an ever-increasing portion of thework towards agriculture and earning livelihoods. Thisphenomenon is referred to as the ‘feminization of hillagriculture and livelihood’. Increasingly women are leftwith no other choice but to cope with the food shortagesand the management of the home and farm.
170 Renu Jethi et al.
According to an assessment (Bhati and Singh, 1987)in the Himalayan region, a pair of bullocks works for1064 hrs, a man for 1212 hrs and a woman for 3484 hrsin a year on a one hectare farm. Unlike women in plainareas, the women here look after all the agriculturaloperations (except preparation of field) and trek longerareas to fetch fuel, fodder and water. This heavy work isbound to have its impact on the health of the womenand girls in hills of Uttarakhand. Borah and Kalita (2002)revealed that, the average time devoted by women inagricultural operation is 8 to 9 hours per day in peakseason and 4 to 5 hours in slack season. Severalresearchers have studied and confirmed that women workfor 14-18 hours daily (Ancheta, 1982; Kaur and Punial,1986) on live stock raising, fetching fodder, farmingoperations, collecting fuel and water from far off placesand expend more total energy a day as compared tomen. Kishtwaria et al. (2009) studied the extent ofparticipation and time spent by women in differentactivities in three different zones of Himachal Pradesh.In the hilly areas, contribution of labors is the mostimportant factor in livestock management andproduction. Majority of women were involved inperforming various farm activities i.e. cutting/uprooting(85.52%) weeding (79.32%), bundling (74.20%), picking/doffing (72.79%). The women spent maximum time intransplanting (327.68 hrs/years) followed bytransportation of manure (138.05 hrs/years). Most ofthe women in hills suffer from lower back pain due tocarrying heavy loads over long distances; they also sufferfrom various skin problems due to long exposure tosun. Due to use of agro-chemicals women are exposedto several health hazards and gynecological infection. Incase of rice transplantation, arthritis, intestinal andparasitic infections may take place due to long hours ofwork in mud and water (Pandey, 2001). Constantlycarrying heavy weights/loads on spine, commonly onhead and back has severe health implications. Backacheand joints pain are common and in extreme cases curvedspines and pelvic deformities can result creatingcomplications in child birth. Women are particularlyvulnerable to diseases during dry season. During this timethe journey times to collect water are the longest, foodstocks are lowest, the workload is highest and diseasesmost common.
Poor health has repercussions not only for womenbut also their families. Women with poor health and
nutrition are more likely to give birth to low weight infants.They are also less likely to be able to provide food andadequate care for their children. Finally, a woman’s healthaffects the household economic well being, as a womanwith poor health will be less productive in the labourforce. Women everywhere work for longer hours, theplight of poor rural women in hills is rather worse. Itdoes not matter if the women are old, young or pregnant,crucial household needs have to be met every day. Theagricultural and household workload in hill area isnightmarish to them in terms of drudgery involved inthese activities. The strenuous physical tasks allocated towomen, combined with limited food intake, exacerbatemalnutrition. Efforts have been done by variousinstitutions to raise the economic status of rural familiesthrough interventions in the field of agriculture. Butnutritional status of women depends upon several factorslike food intake, income, healthcare practices and statusof women in the society. Therefore it becomes necessaryto study whether improvement in economic status offarm families has led to improvement in nutritional statusof farm women. Seasonal shortfall in food availabilitytends to affect women disproportionately since theiralready inadequate intake will be curtailed drastically. Evenwhen more food is available, it tends to be preferentiallyallocated to men, thus preventing women fromaccumulating any reserves. If seasonal shortfall coincideswith pregnancy or lactation, the implications for womenand infants are particularly harsh (Chatterjee and Lambert,1989).
In a study it was calculated that daily kilocalorieexpenditure on various agricultural and domestic activitieswas 2473 for men and 2505 for women. Whereas averagedaily intake of kilocalories per man was estimated to be3270 and 2410 for women (Batliwala, 1987). Thus,women faced both a relative deprivation in comparisonwith men, and an absolute deficit vis-à-vis their calorieexpenditure. It was demonstrated that women’s dailyenergy expenditure was likely to be higher than men’s,particularly in rural settings where men’s work is seasonalbut women’s is continuous and includes domestic andreproductive chores. Anand and Kumar (2015) alsoreported that there are adverse disparities seen amongstthe entire population especially between men and womenwhich seems convincing enough to evolve strategies tocounter these disparities spread across economic andsocial domains. While much of data both from official

Investigation of Nutritional and Health Status of Indian Rural Hill Farm Women 171
and non-official sources on the health of the women aremissing, the few which is available after 2000, is casualand unhelpful to draw authoritative conclusions. Onesphere that has yet to receive adequate attention is therelationship between women’s work and women’snutritional status in the agricultural setting. There is a paucityof information on diet, dietary pattern and nutritionalstatus of hill farm women. Therefore, an attempt has tobe made to assess the dietary pattern and nutrition statusof farm women in hill region of Uttarakhand. Thereforethis study is being undertaken to assess nutritional statusof hill farm women during different seasons.
MATERIALS AND METHODS
The present study was conducted on 120 farm womenfrom low, mid and high hills of Uttarakhand. Thesubjects selected were in the age group of 18 to 45 years(excluding pregnant and lactating women) and activelyengaged in farming. Those women who willinglycooperated to provide information required for the studywere only included in the study. Anthropometricmeasurements of women recorded included weight,height, skin fold measurements, blood pressure and pulserate. The method suggested by Gibson (1990) wasfollowed for this study. Measurements were taken intriplicate and average values were recorded. The extentof malnutrition in women was assessed by computingthe BMI (Body Mass Index).
Weight (kg)BMI (kg/m²) =
Height (m) x Height (m)
The respondents were categorized into differentgrades of nutritional status using BMI index (James etal., 1988).
BMI Grades BMI RangeCED III Less than 16CED II From 16-17CED I From 17-18.5Low-Normal From 18.5 to 20Normal From 20-25Over weight & obesity More Than 25
Information regarding food intake was obtainedfrom 120 farm women using 24 hours recall methodusing pre-structured interview schedule. The data
pertaining to the daily intake of foodstuff along withquantity was collected using 24 hours recall method (2recalls). The quantity of raw food was calculated usingthe following formula:
TRQ x II RFI =
TCQ
Where, RFI = Raw amount of a food stuff consumedby the individualTRQ = Total raw quantity of food stuff used in thatpreparationII = Individual intake of the cooked amount ofpreparationTCQ = Total cooked quantity of food prepared.
The average daily intake of foods by individualrespondents was computed and compared with thesuggested levels of intake (ICMR 2010). The nutritivevalue for the quantity of raw foods consumed by theindividual respondents were calculated by using foodcomposition tables (Gopalan et al., 1989) and comparedwith the Recommended Daily Allowances (RDA).
Body density, percent body fat and fat free mass ofsubjects were calculated using skinfold thickness fromformula given by Durnin and Womersley (1974) asfollows:
20-29 years, D = 1.1599 – (0.0717 x L)30-39 years, D = 1.1423 – (0.0632 x L)40-49 years, D = 1.1333 – (0.0612 x L)D = Body DensitySiri Percent Fat Equation, 1961Percent Body Fat = (495 / Body Density) – 450Fat Mass (kg) = Body weight (kg) x (4.95/D – 4.5)Fat Free Mass (kg) = Body weight (kg) – Fat mass (kg)
Physiological characteristics in terms of B.P., H.R.energy expenditure rate, VO‚ Max and Total CardiacCost of Work (TCCW) was recorded. Mean bloodpressure (mmHg) was calculated using the measuredSystolic and Diastolic pressures, SP and DP.
Mean blood pressure (mmHg) = DP + 1/3 (SP-DP)Formula for calculating EEREnergy Expenditure Rate (kJ/min) = 0.159 x Avg.working HR – 8.72

172 Renu Jethi et al.
Formula for calculating VO2 maxVO2 max (l/min) = 0.023 x Body weight (kgs) – 0.034x Age (years) + 1.65Formula for calculatingTCCW (Total Cardiac Cost of Work) = Cardiac Costof Work (CCW)+Cardiac Cost of Recovery (CCR)Where,CCW = Average Heart Rate (AHR) x Duration ofActivityAHR = Average Working Heart Rate - Average RestingHeart RateCCR = Average Recovery Heart Rate- Average RestingHeart Rate (AWRHR)PCW (Physiological cost of work)= TCCW/Total timeof ActivityFrequency, Mean, Standard Deviation, Coefficient ofcorrelation and t test were used for statistical analysis.
RESULTS
Nutrient intake: The results in Table 1 shows thataverage energy consumption per capita per day of farm
women from high hills was 1802 (±252) kcal followedby 1716 (±245) kcal and 1712 (±293) kcal of farmwomen from mid and low hills respectively. It is evidentfrom the Table 3 that 37.5, 42.5 and 32.5 per cent farmwomen from low, mid and high hills consumed energyless than 75 per cent of RDA (2230). A study alsoreported the average energy intake by the rural womenof the central Himalaya below the standard requirement(Pant, 2002). Restriction in energy intake affects adverselythe utilization of dietary protein. It is also evident fromTable 2 that in low hills energy consumption by farmwomen in summer and winter differed significantly at 1per cent level.
Protein plays an important role in many bio-chemical,bio-physical and physiological processes in the body.Table-1 reveals that average protein consumption of farmwomen in high, mid and low hills was 46.2 (±8.6) g,41.6 (±7.8) g and 43.9 (±7.9) g which is 16, 24.3 and 20per cent lower than RDA respectively. Results presentedin Table 2 shows that in low hills protein consumptionby farm women in summer and winter differedsignificantly at 1 per cent level. It is also evident fromTable 3 that 17.5, 30 and 12.5 per cent farm women
Table 1: Average nutrient consumption by farm women in hillsNutrients Low Hills [Mean (SD)] Mid Hills [Mean (SD)] High Hills [Mean (SD)] RDAEnergy (kcal) 1711.8(±292.6) 1716(±245) 1802(±251.7) 2230Protein (g) 43.9(±7.9) 41.6(±7.8) 46.2(±8.6) 55Calcium (g) 731(±182) 879(±329) 965.3(±398.5) 600Iron (mg) 26.5(±5.4) 27.3(±8.9) 29.2(±7.5) 21-carotene (µg) 2837(±3015) 4459(±3463) 4504(±5020) 4800
Table 2: Nutrient consumption by farm women in hills during different seasonsNutrients Low Hills Mid Hills High Hills RDA
Summer Winter Paired Summer Winter Paired Summer Winter PairedMean Mean t-value Mean Mean t-value Mean Mean t-value(SD) (SD) (SD) (SD) (SD) (SD)
Energy (kcal) 1675.5 1748.1 5.993** 1751.8 1681 0.929 1818 1786 0.371 2230(±301.2) (±286.7) (±255.7) (±234.8) (±285.2) (±219.4)
Protein (g) 43.1 44.7 4.292** 42.1 41.6 0.286 47.9 44.6 1.121 55(±8.0) (±8.0) (±7.9) (±7.8) (±7.7) (±9.2)
Calcium (g) 653 809.4 4.395** 674.3 1083.9 5.858** 780 1150.5 3.120** 600(±151.2) (±180.1) (±170.5) (±324.2) (±194.5) (±464.7)
Iron (mg) 23.9 28.9 4.432** 22.6 31.9 3.497** 28.5 29.9 0.497 21(±4.4) (±5.3) (±3.6) (±10.3) (±5.8) (±8.9)
B-carotene (µg) 1808.8 3865.1 2.532* 3857.2 5061.9 0.970 1861.7 7146.3 3.804** 4800(±1494.3) (±3768.2) (±3786.4) (±3085.5) (±1963.2) (±5760.9)
* Significant at 5% level; **Significant at 1% level

Investigation of Nutritional and Health Status of Indian Rural Hill Farm Women 173
from low, mid and high hills consumed protein less than75 percent of RDA.
Intake of calcium was found to be higher thanRecommended Dietary Allowance (RDA) among farmwomen of three hill region during both seasons. In hills,coarse grains i.e, ragi and barnyard millet which are richin calcium content being the part of their daily dietcontributes towards higher intake of calcium. Averagecalcium consumption by farm women in low, mid andhigh hills was 731 (±182) g, 879 (±329) g and 965 (±398)g which was 21.6, 46.5 and 60.8 per cent higher thanRDA. Results presented in table-2 shows that calciumconsumption by farm women of low, mid and highhills in summer and winter differed significantly at 1 percent level. Table 3 shows that 92.5, 82.5 and 80 per centfarm women in high, low and mid hills were consumingcalcium more than RDA respectively. Some studies alsoreported higher percentage of women consumingadequate calcium in their diet (Dobhal et al., 2003). It isevident from table-2 that there was a significant variationin calcium consumption by farm women of threedifferent altitudes in hills at 1 percent level of significance.
Results presented in Table 1 shows that the averageiron consumption by farm women of low, mid andhigh hills was 26.5 (±5.4) mg, 27.3 (±8.9) mg and 29.2(±7.5) mg/day. Data presented in Table 2 shows thatiron consumption by farm women of low and mid hills
in summer and winter differed significantly at 1 per centlevel. It was also found that 85, 77.5 and 80 per centfarm women from low, mid and high hills wereconsuming iron more than RDA respectively. Whereas15, 22.5 and 20 per cent respondents from low, mid andhigh hills were consuming iron more than 75 per cent ofRDA but less than RDA respectively (Table 3). Diet offarm women was deficient in terms of energy, proteinand iron due to which the physical work capacity isdecreased (Singh 2012). In India nearly 70 percent ofwomen are estimated to be iron deficient. Iron deficiencycan exist without anemia. Iron deficiency Anemia (IDA)is very late manifestation of iron deficiency because irondeficiency is very well tolerated Anemia does not developtill storage iron is exhausted (Shah, 2004). The main reasonfor IDA have been determined to be inadequate intakeof iron, low bioavailability (1-6 percent) of dietary ironfrom plant foods (Rao et al., 1983).
Average consumption of -carotene by farmwomen in low, mid and high hills was 2837 (±3015) µg,4459 (±3463) µg and 4504 (±5020) µg. It is evident fromTable 2 that in low hills consumption of -carotene bythe farm women in summer and winter season differedsignificantly at 5 percent level whereas in high hillsconsumption of -carotene by the farm women insummer and winter season differed significantly at 1percent level.
Table 3 shows that 70, 47.5 and 62.5 per cent farmwomen were consuming –carotene less than 75 percentof RDA. It was found that intake of -carotene washigher than RDA in three hill regions during winters dueto the huge availability of green leafy vegetables likefenugreek leaves, spinach, amaranth, onion stalks, radishleaves and buck wheat. Over 80 percent of the dietarysupply of vitamin-A in the Indian diets is derived fromits precursors, -carotene, a-carotene, g-carotene and b-cryptoxanthin which are present in much plant food.Among these carotenoids, -carotene has the highestvitamin A activity. The important deficiency states dueto vitamin A intake in diet are night blindness, xerosisconjunctiva, xerosis cornea, bitot’s spots, keratomalaciaand follicular hyperkeratosis.
Protein-Calorie adequacy among farm women inhills: Table 4 clearly illustrates that majority of farmwomen of high, mid and low hills consumed inadequateprotein and calorie. It was found that 87.5 per cent
Table 3: Percentage distribution of farm women in hillsaccording to intake of nutrientsNutrient Group > 100 % 100 – 75 % >75%
of RDA of RDA of RDAProtein Low Hills 12.5 70 17.5
Mid Hills 12.5 57.5 30High Hills 32.5 55 12.5
Energy Low Hills 5 57.5 37.5Mid Hills 0 57.5 42.5High Hills 10 57.5 32.5
Calcium Low Hills 82.5 15 2.5Mid Hills 80 17.5 2.5High Hills 92.5 7.5 0
Iron Low Hills 85 15 0Mid Hills 77.5 22.5 0High Hills 80 20 0
B-carotene Low Hills 15 15 70(µg) Mid Hills 42.5 10 47.5
High Hills 35 2.5 62.5

174 Renu Jethi et al.
farm women in low and mid hills each and 67.5 percent farm women in high hills consumed inadequateprotein and calorie in their diet. Only 10 per cent and 5percent subjects in high and low hills respectivelyconsumed adequate protein and calorie. Withoutcorrecting the exiting calorie gap, the provision of proteinconcentrates will not prevent protein-calorie malnutrition(Reddy and Rao, 2000).
Physiological Characteristics: As per the physiologicalcharacteristics of the subject (Table 5) the mean age ofthe subjects was 23.5 years with ±4.31 standard deviation.The corresponding mean heart rate (rest) was found tobe 73.51 beats/min. The maximum heart rate was witha mean value of 172.10 beats/min with ± 6.54 SD. Themean VO2 max was observed to be 1.80 l/min. In
general, it was observed that the VO2 max of femaledecreased with increase in age. Similar results of VO2max of Indian female subjects were also reported earlier(Nag et al., 1988; Gite, 1996; Vidhu, 2001). The meanblood pressure of the subjects was 81.44 mm Hg with± 2.15 SD which is normal in Indian women. Thecorresponding pulse rate was found to be 68.24 with ±4.58 SD.
The Total Cardiac Cost of Work (TCCW) andPhysiological Cost of Work (PCW) were found 2017.5and 134.5 respectively, after 10 hours of agricultural andhousehold works.
Anthropometric measurements and body compositionof farm women in hills: Anthropometric data relatedto nutrition were recorded with anthropometric kit. Skin-fold thickness was measured at four sites i.e. biceps,triceps, subscapula and suprailiac. The data (mean ±Standard Deviation) pertaining to Bicep was 6.54 (±1.13)mm, Tricep 8.53 (±1.18) mm, Subscapular SFT 12.42(±1.51) mm, Suprailiac SFT 10.36 (±1.19) mm, BodyDensity (D) 1.033 (±0.002), % Body Fat 24.61 (±1.32),Fat mass 10.58 (±1.62) kg, and Fat free mass (kg) 31.93
Table 4: Protein calorie adequacy (%) among farm womenin hillsGroup P+C+ P+C- P-C+ P-C-Low Hills 5 7.5 0 87.5Mid Hills 0 12.5 0 87.5High Hills 10 22.5 0 67.5
Table 5: Physiological characteristics of the subjectPhysiological characteristics Range Mean Std. deviationAge (Years) 20-45 23.5 4.31Weight (kg) 38-59 48.5 3.19Stature, cm 142.5-161.5 152.5 3.1HR rest, beats/min (3 replication) 65-78 73.51 2.19HR max, beats/ min (3 replication) 168-196 172.10 6.54Mean Blood Pressure (3 replication) 75.24-96.56 81.44 2.15Pulse Rate (per min) 64-78 68.24 4.58VO‚ rest, l/min 0.16 – 0.28 0.20 0.03VO‚ max, l/min 1.61 – 2.11 1.8 0.06TCCW, beats/min (3 replication) 1870.5-2183.5 2017.5 5.12PCW, beats/min (3 replication) 129.5-137.5 134.5 6.14
Table 6: Anthropometric measurements and body composition of farm women in hillsParameters Mean ± SD 95th Percentile 50th Percentile 5th PercentileBicep (mm) 6.54 ± 1.13 8.41 6.54 4.67Tricep (mm) 8.53 ± 1.18 10.48 8.53 6.57Subscapular SFT (mm) 12.42 ± 1.51 14.92 12.42 9.92Suprailiac SFT (mm) 10.36 ± 1.19 12.33 10.36 8.39BMI, kg/m2 18.80 ± 2.69 23.25 18.80 14.36Body density (D) 1.033 ± 0.002 1.038 1.033 1.029% Body fat 24.61 ± 1.32 26.80 24.61 22.43Fat mass 10.58 ± 1.62 13.26 10.58 7.90Fat free mass (kg) 31.93 ± 3.55 37.80 31.93 26.07

Investigation of Nutritional and Health Status of Indian Rural Hill Farm Women 175
(±3.55) kg, which shows that women in N-W Himalayanregion is malnourished and they have very lean bodymass and fat free mass. Along with mean and standarddeviations 95th and 5th percentiles were also calculatedand presented in Table 6.
Prevalence of Chronic Energy Deficiency (CED)among farm women by physiological status:Prevalence rate of Chronic Energy Deficiency (CED) isused as a measure of (adult) nutrition and health statusfor any region. Nutritional status of farm women wasassessed using Body Mass Index (BMI). Body Mass Indexof the respondents was computed using height andweight values and subjects were classified into variouscategories of Chronic Energy Deficiency (James et al.,1988). The nutrition deficiency disease may not essentiallybe due to lack of single nutrient. It may occur due tolack of more than one nutrient in the diet taken by thepeople for a specified duration of the year Nutritiondeficiency is one of the major problems in the hilly region(Pant, 1994; Pant, 1998; Jalal et al., 2001).
The findings in Table 7 and Figure 1 shows that 45percent subjects were Chronic Energy Deficient and 22.5percent were in the category of Low-Normal. Only 30percent subjects were in the category of Normal. The
Table 7: Prevalence (%) of chronic energy deficiency (CED)among farm women by physiological statusBMI Grades BMI Range Frequency PercentageCED III Less than 16 15 12.5CED II From 16-17 11 9.2CED I From 17-18.5 28 23.3Low-Normal From 18.5 to 20 27 22.5Normal From 20-25 36 30Over weight & More than 25 3 2.5obesity
0
5
10
15
20
25
30
35
40
CED III CED III CED I Low Normal Normal Over Weight
Table 8: Relationship between nutrient consumption andbody mass indexNutrients Correlation co-efficientProtein 0.518*Energy 0.578**Significant at 1% level
Figure 1: Chronic Energy Deficiency (CED) among farmwomen by physiological status
Mean Body Mass Index (BMI) of the subject was foundto be 18.96 (±2.8) kg/m² with the range from 13.1 kg/m² to 25.6 kg/m².
The deficiencies restrain their physical growth andmental development and make them more susceptibleto morbidity and mortality due to infectious disease. Asignificantly positive relationship was found betweenprotein and Body Mass Index (0.52) at 1 per cent level.Also a significantly positive relationship was foundbetween energy and Body Mass Index (0.58) 1 percentlevel (Table 8). A study also reported that in case of hillregion a total of 52 per cent women were reported asChronic Energy Deficient and 20 per cent were foundto be low normal (Sharma et al., 2016).
CONCLUSION
The study concludes that the diet of farm women ofhigh, mid and low hill region of Uttarakhand isinadequate in terms of energy protein and iron. It wasalso found that calcium and -carotene consumptionduring winter was significantly higher than consumedduring summer season. This is due to huge availabilityof green leafy vegetables like fenugreek leaves, spinach,amaranth, onion stalks, radish leaves and buck wheat.Climate of hill region of Uttarakhand is suitable forcultivation of off-seasonal vegetables. But most of thefarmers are cultivating vegetables based on othertraditional knowledge. There is huge yield gap incultivation of vegetables. Off seasonal vegetableproduction will provide nutritional security to hillpopulation in Uttarakhand during lean seasons. About45 per cent respondents were Chronic Energy Deficient.The negative effects of malnutrition among women arecompounded by heavy work demands, poverty, childbearing and rearing and special nutritional needs ofwomen, resulting in increased susceptibility to illness andconsequently higher morbidity. The study populationbeing active workforce in hilly region of Uttarakhand,their health and nutritional status should be consideredas an important public health issue. Creating awareness
176 Renu Jethi et al.
and making them self sufficient in modifying foodbehavior and life style pattern within their accessibleenvironment should be included as an interventionstrategy in the regional programs.
REFERENCES
Anand, S. and A. Kumar. 2015. Contextualizing communitymobilization: Reviewing its need and importance in healthmilieu. Journal of Community Mobilization and SustainableDevelopment, 10(1): 63-69.
Batliwala, S. 1987. Women’s access to food. Indian Journal ofSocial Work, 48(3): 255-271.
Bhati, J.B. and Singh, D.V. 1987. Women’s contribution toagricultural economy in hill regions on North West India.Economic and Political Weekly, 22(17): 25.
Borah, R. and M. Kalita. 2002. Extent of participation andpostures adopted in performance of farm activity bywomen in Assam Rural India. Journal of Ergonomics, 65(1):7-10.
Dobhal, N. and R.S. Raghuvanshi. 2003. Nutritional profile ofwomen of district Uttarkashi. M.Sc. Thesis (unpub.), G.B.Pant University of Agriculture and Technology, Pantnagar.
Gibson, R.S. 1990. Principles of Nutritional Assessment. Oxford:Oxford Publishing Company.
Gopalan, C.; B.V. Ramasastri and S.C. Balasubramanyam. 1989.Food composition tables in nutritive value of Indian foods, 2nd
ed., Vol 1. National Institute of Nutrition (ICMR).Hyderabad, 47-67.
Indian Council of Medical Research. 2010. Nutrientsrequirements and recommended dietary allowances forIndians. A Report of the Expert Group of ICAR. NationalInstitute of Nutrition.
Jalal, D.S.; B.R. Pant and R.C. Joshi. 2001. Environmental Studyin Himalayan Region, Anmol Publication, New Delhi. 239p.
James, W.P.T.; Anna Ferro Lyzzi and J.C. Waterlow. 1988.Definition of Chronic Energy Deficiency in Adults.European Journal of Clinical Nutrition, 42: 969-981.
Kishtwaria, J.; R. Aruna and S. Sood. 2009. Work pattern of hillFarm Women-A study of Himachal Pradesh. Home Comm.Sci., 3(1): 67-70.
Pandey Hema. 2001. Understanding farm women, National ResearchCentre for Women in Agriculture. Bhubneshwar, pp. 15.
Pant, B.R. 1998. Geo-Economic Environment and Nutrition, AnmolPublication, New Delhi: 173p.
Pant, B.R. 2002. Drudgery and nutrition status of the ruralwomen in the central Himalaya (Uttarakhand Himalaya).The Indonesian Journal of Geography, 34(1): 1-16.
Population Foundation of India 2002. Provisional PopulationTotals of Uttaranchal, SRS Bulletin, Registrar General ofIndia, April 2001, RCH Rapid Household Survey, IIPS,Mumbai.
Rao, B.S.N.; C. Vijayasarathy and T. Prabhavathi. 1983. Ironabsortion from habitual diet of indians studied by theextrinsic tag technique. Indian Journal of Medical Research,77(5): 648-657.
Rawat Rajiv. 2004. Chipko’s Quiet Legacy: Forest Rights,Women’s Empowerment, Peoples’ Institutions, and NewUrban Struggles in Uttarakhand, India’ York University,Ontario, Canada (mimeo).
Reddy, P.P.Y.B. and A.P. Rao. 2000. Dietary habits, foodconsumption and nutrient intake among the Sugali, atribal population of Andhra Pradesh, India, Asia Pacific J.Clinical Nutrition, 9(1): 12-17.
Shah, A. 2004. Iron Deficiency Anemia-Part-I. Indian Journal ofMedical Science, 58(2): 79-81.
Sharma, N.; J.P.S. Dabas; P. Joshi; H. Budhiraja and Raksha.2016. Dietary Diversification among Farm Women inPlain and Hill Region of Northern India. Journal ofCommunity Mobilization and Sustainable Development, 11(2):164-168.
Singh, S.; Sinwal and Rathore Hemu. 2012. Assessment ofenergy balance of Indian farm women in relation to theirnutritional profile in lean and peak agricultural seasons.Work, 41: 4363-4371.
--------------------------------------------------------------------------------------------------------------------------------------------------------------Received on January, 2018, Revised on February, 2018
Journal of Community Mobilization and Sustainable Development Vol. 13(1), 177-181, January-April, 2018
*Corresponding author email id: [email protected]
Use of Revolving Stool for Drudgery Reduction among Farm WomenInvolved in Milking Dairy Animals
Pratibha Singh1*, C. Tiwari2, Anupama Pandey3 and D. Sharma4
1SMS/Asstt. Prof. (Home Science), 2Professor (Agronomy), 4Programme Assistant (Home Science), Krishi Vigyan Kendra, Kashipur(G.B. Pant University of Agriculture & Technology, Pantnagar), Bajpur Road, 244713, Distt. U.S. Nagar, Uttarakhand, India3Assistant Professor, Department of Home Science Extension, College of Home Science, G.B. Pant University of Agriculture &Technology, Pantnagar-263145, Distt. U.S. Nagar, Uttarakhand, India
ABSTRACT
Women engaged in dairy farming maintain their own convenient posture for performing the task. Use of revolvingstool has been popularized through various extension activities such as training, demonstration and field days toreduce drudgery involved in milking activity. Technology on revolving stool provided by the Department ofFamily Resource Management, College of Home Science, G.B. Pant University of Agriculture and Technology,Pantnagar has been used for conducting extension activities by Krishi Vigyan Kendra, Kashipur during the year2014-15 and 2015-16. Ten demonstrations were conducted in five villages of Rudrapur block, district U.S. Nagarnamely Danpur, Bhoorarani, Chattarpur, Khanpur-1 and Anandkhera-1. The observations and experiences ofrespondents were collected through questionnaire and field visits for its ease in operation and reduction inmusculo skeletal disorders. Results revealed mean score for the parameters for two years i.e. 2014-15 and 2015-16such as bio- mechanical- 4.3, 4.8; physical stress- 4.6, 4.6; work output-3.6, 4.0; tool factor- 4.8,4.8; field acceptability-4.6,4.6 and the average mean score were found to be 4.38 and 4.56 whereas acceptability score was found to be 70.8and 71.8, respectively. Percent change in knowledge pre exposure 11.36% and post exposure of training and fieldday it was found as 90.96%, profitability (in terms of health benefits) pre exposure 5.68% and post exposure itwas found as 93.18% and awareness regarding revolving stool pre exposure -7.95% and post exposure it wasfound as 98.86%. The results of ten demonstrations conducted on revolving stools revealed that they were highlyacceptable and relevant for drudgery reduction among farm women for milking operation of dairy animals.
Keywords: Dairy farming, Drudgery reduction, Milking, Revolving stool
INTRODUCTION
Dairy farming involves backbreaking tasks as all theactivities are carried out in arduous posture. Drudgery isconcerned as physical and mental strain, fatigue,monotony and hardship experienced by women(AICRP-1997-98). Milking is a strenuous activity as itrequires adoption of squatting posture for longer periodwhich induces static muscular strain in lower bodyextremity. Further muscles remain in a contracted statefor a long time. Prolonged muscular contraction stopsthe flow of blood into the muscles which heads to thediminished supply of oxygen and build-up of wasteproducts. Building up of waste products particularlycarbon dioxide and lactic acid brings about a painful
stage of fatigue (Sharma, 1997). The women adopt longstatic postures for some of the activities, which increasethe static muscular effort resulting in physiological costand low productivity. In some cases, the angle of bodydeviation in lumbar region is affected. Angle of bodydeviation from its natural alignment due to habitual errorcan damage the curve of backbone permanently becausein pulling and pushing inter vertebral disc which join thevertebrae is torn away, making fluid (viscous fluid) toflow away sciatic nerve causing the severe sciatic pain.With the going away of discs fluid, the backbone becomesless flexible and continues to pain at the time of workand after work (Oberoi, 1997). Work related to animalhusbandry is being conducted by women and major rolehas been played by the farm women of Punjab, Haryana,
178 Pratibha Singh et al.
Gujarat and Uttarakhand in white revolution. Researchersproved that any work design or work environment thathelps to perform the work with minimum energy andput minimum stress on cardio vascular system andmuscular system is the best design of work (Varghese etal., 1994). Deepali Chauhan (2013) carried out a studyon ergonomic assessment of farm women performingweeding and winnowing operations. She assessed impactof work related risk factors of weeding and winnowingoperations on anatomical body structure of female.Muscular and postural stress were observed higher inweeding operation as compared to winnowingoperation. It may be due to squatting poster adopted byfemales during weeding operation. Panwar and Gupta(2008) carried out a study on appropriateness of drudgeryreducing technologies as perceived by farm women. Theyreported that use of serrated sickle and wheel hoe ashighly appropriate technologies in terms of drudgeryreduction. So working posture becomes an importantfactor while designing ergonomically sound tools andequipment. Use of improved tools for performing theselected activities reduce the angle of deviation of theback and minimize the muscular efforts to perform thetask. Lower muscular efforts lead to lower fatigue.Therefore, improved tools for performing the selectedactivities are beneficial because they lead to the reductionof drudgery and reduce the muscular stress and help thewomen to adopt correct posture work and also reducethe angle of deviation. Corlett et al. (1983) showed theeffect of poor working posture in order to performtask could lead to postural stress, fatigue and pain whichmay in turn force the operator to stop work until themuscle recovers. Pinzke et al. (2001) opined that the highmuscle loads in combination with extreme positions andmovements of the hand and forearm might contributeto the development of injuries among milkers.Tripathi and Pandey (2011) reported 26 per cent savingin cardiac cost of women workers per unit of out putfor milking a buffalo using a revolving stool as comparedto the continuous squatting position while milking ananimal traditionally. Naik and Sumangala (2015) reportedthat there was a significant reduction in energyexpenditure, physiological cost of work, total cardiaccost of work, time taken and body angles when theactivities were carried out by using drudgery reducingtools i.e., revolving stand and stool for milking activityand Gopal khore spade in cleaning of animal shed activity.Therefore, improved tools for performing the selected
activities are beneficial because they lead to the reductionof drudgery, reduce the muscular stress, help the womento adopt correct posture work and also reduce the angleof deviation. The use of revolving stool may significantlyreduce the physiological and muscular cost of milkingactivity. Appropriate height of the stool improves theposture, therefore reduces the musculoskeletal problemsof women while performing the activity. Benefits ofstools have been realized because use of revolving stoolsaves energy and heart speed upto 6 percent. It helps inmaintaining posture (spinal cord) and hence reduces theproblem of backache. It provides comfort to legs andknees and thus helps in reduction of pain in legs. It reducesthe load on heart upto 13.48 percent during workingtime and reduces energy expenditure upto 8.75 per cent.This type of stool can be easily made by local carpenterhence cost of the stool can also be reduced by usingwooden or tin plate instead of steel. Ball bearing typeof stool makes convenience in movement. Revolvingstool can be used contrary to squatting posture ofworker engaged in milking operation to reduce the workstress of dairy workers involved in milking which wasdesigned as per the sitting height measurements offemales.
MATERIALS AND METHODS
Creation of awareness towards the use of revolvingstool for drudgery reduction: This was achieved bythe following methods:
Frequent visits made by the home scientists of KrishiVigyan Kendra, Kashipur to the field sites.
Continuous and healthy discussions with the farmwomen during field visits on need and importanceof drudgery reduction.
Creating awareness by conducting trainings anddemonstrations on related aspects of drudgeryreduction.
Field day organized by the home scientists tomotivate other farm women. The purpose was tointroduce a new idea and to stimulate the interest ofas many farm women as possible to offer generalguidance to answer questions and queries forpopularization and adoption of revolving stool.
Technical and scientific guidance provided to eachfarm women in using revolving stool
Demonstrations conducted on the use of revolvingstool.

Use of Revolving Stool for Drudgery Reduction among Farm Women Involved in Milking Dairy Animals 179
Selection of farm women for demonstrations andtraining: Ten physically fit farm women belonging to24-48 yrs of age were purposively selected from Danpur,Chattarpur, Bhoorarani, Khanpur-1 and Anandkhera-1villages of Rudrapur block, district Udham Singh Nagar,Uttarakhand state for conducting demonstrationspossessing dairy animals viz cows and buffalos for milkproduction. The technology provided by the Departmentof Family Resource Management, College of HomeScience has been used for conducting demonstrationson revolving stool through various extension activitiessuch as training, demonstration and field days. Ninetywomen were randomly selected for imparting trainings,field day and for identifying the factors and attributes in
production system that prioritizes the use of revolvingstool for milking activity. These extension activities wereorganized by Krishi Vigyan Kendra, Kashipur duringthe year 2014-15 and 2015-16 to motivate other farmwomen towards using revolving stool for milking activity.
Method of data collection: The observation andexperiences of respondents were collected through aquestionnaire (Table 1) and field visits as far as its ease inoperation and reduction in musculo skeletal disorderswere concerned. The information was collected fromthe farm women purposively selected for conductingdemonstrations. These farm women were interactedduring field visits and other extension activities for
Table 1: Statements to measure user opinion on the improved technology after ergonomic interventionActivity: Milking Technology: Revolving StoolS.No. Statements HR R N IR HIRBio Mechanical I feel1 I am able to maintain comfortable body posture at sitting position while using
the revolving stool2 Twisting of trunk while doing the activity was minimized with the use of the
revolving stool3 I could synchronize the movements of the animalPhysiological I feelFatigue/PhysicalStress4 No pains and cramps in the region of my body after performing the activity with
the revolving stoolWork Output I Feel5 The tool is effective as per time cost6 The revolving stool is effective in improving the production efficiencyTool Factor I feel7 The milking activity is light enough when I use the revolving Stool8 The height of the revolving stool needs to be adjusted to my working height9 The revolving stool is compact enough to store10 Easy to maintain or repair this tool11 The revolving stool serves multiple purposes12 The revolving stool is stable while sitting and performing the activity13 It is difficult to move the revolving stool on uneven grounds14 The seat of revolving stool is smooth and softField I feelAcceptability15 The improved tool is a good replacement to the existing work practice16 I shall possess the revolving stool17 The tool requires modificationHR = Highly Relevant; R = Relevant; N = Neutral; IR = Irrelevant; HIR = Highly Irrelevant
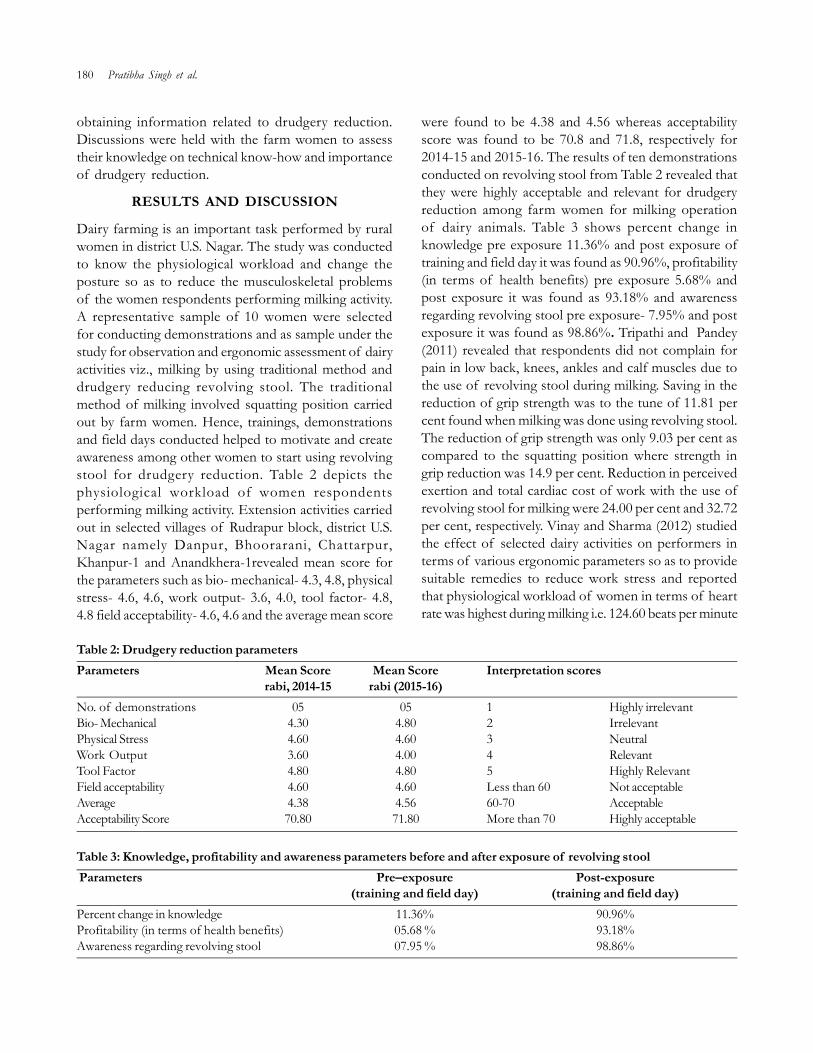
180 Pratibha Singh et al.
obtaining information related to drudgery reduction.Discussions were held with the farm women to assesstheir knowledge on technical know-how and importanceof drudgery reduction.
RESULTS AND DISCUSSION
Dairy farming is an important task performed by ruralwomen in district U.S. Nagar. The study was conductedto know the physiological workload and change theposture so as to reduce the musculoskeletal problemsof the women respondents performing milking activity.A representative sample of 10 women were selectedfor conducting demonstrations and as sample under thestudy for observation and ergonomic assessment of dairyactivities viz., milking by using traditional method anddrudgery reducing revolving stool. The traditionalmethod of milking involved squatting position carriedout by farm women. Hence, trainings, demonstrationsand field days conducted helped to motivate and createawareness among other women to start using revolvingstool for drudgery reduction. Table 2 depicts thephysiological workload of women respondentsperforming milking activity. Extension activities carriedout in selected villages of Rudrapur block, district U.S.Nagar namely Danpur, Bhoorarani, Chattarpur,Khanpur-1 and Anandkhera-1revealed mean score forthe parameters such as bio- mechanical- 4.3, 4.8, physicalstress- 4.6, 4.6, work output- 3.6, 4.0, tool factor- 4.8,4.8 field acceptability- 4.6, 4.6 and the average mean score
were found to be 4.38 and 4.56 whereas acceptabilityscore was found to be 70.8 and 71.8, respectively for2014-15 and 2015-16. The results of ten demonstrationsconducted on revolving stool from Table 2 revealed thatthey were highly acceptable and relevant for drudgeryreduction among farm women for milking operationof dairy animals. Table 3 shows percent change inknowledge pre exposure 11.36% and post exposure oftraining and field day it was found as 90.96%, profitability(in terms of health benefits) pre exposure 5.68% andpost exposure it was found as 93.18% and awarenessregarding revolving stool pre exposure- 7.95% and postexposure it was found as 98.86%. Tripathi and Pandey(2011) revealed that respondents did not complain forpain in low back, knees, ankles and calf muscles due tothe use of revolving stool during milking. Saving in thereduction of grip strength was to the tune of 11.81 percent found when milking was done using revolving stool.The reduction of grip strength was only 9.03 per cent ascompared to the squatting position where strength ingrip reduction was 14.9 per cent. Reduction in perceivedexertion and total cardiac cost of work with the use ofrevolving stool for milking were 24.00 per cent and 32.72per cent, respectively. Vinay and Sharma (2012) studiedthe effect of selected dairy activities on performers interms of various ergonomic parameters so as to providesuitable remedies to reduce work stress and reportedthat physiological workload of women in terms of heartrate was highest during milking i.e. 124.60 beats per minute
Table 3: Knowledge, profitability and awareness parameters before and after exposure of revolving stool Parameters Pre–exposure Post-exposure
(training and field day) (training and field day)Percent change in knowledge 11.36% 90.96%Profitability (in terms of health benefits) 05.68 % 93.18%Awareness regarding revolving stool 07.95 % 98.86%
Table 2: Drudgery reduction parametersParameters Mean Score Mean Score Interpretation scores
rabi, 2014-15 rabi (2015-16)No. of demonstrations 05 05 1 Highly irrelevantBio- Mechanical 4.30 4.80 2 IrrelevantPhysical Stress 4.60 4.60 3 NeutralWork Output 3.60 4.00 4 RelevantTool Factor 4.80 4.80 5 Highly RelevantField acceptability 4.60 4.60 Less than 60 Not acceptableAverage 4.38 4.56 60-70 AcceptableAcceptability Score 70.80 71.80 More than 70 Highly acceptable

Use of Revolving Stool for Drudgery Reduction among Farm Women Involved in Milking Dairy Animals 181
in comparison to other dairy activities such as cleaningetc. Suggestive tools/techniques to reduce work stressinvolved revolving stools for milking, long handle broomand dung collector for cleaning cattle shed, naveen sicklefor fodder cutting and trolley for disposing off the dung.The present study reveals that use of revolving stool formilking is beneficial and women should be motivated touse the revolving stool for reducing the drudgery due tomilking activity.
CONCLUSION
Revolving stool can be used at each household thosewho have milch animals. It is beneficial to use, easy tocarry and maintain. Extension workers should makeefforts to popularize this drudgery reducing technologyfor milking animals by the Indian rural women. The useof revolving stool helps to maintain good posture whenmilking as it reduces the problem of backache,physiological stress and enhances the work output.
ACKNOWLEDGEMENT
The authors greatly acknowledge the technology ofrevolving stool for milking dairy animals provided bythe Department of Family Resource Management,College of Home Science, GBPUA&T, Pantnagar forconducting the successful demonstrations.
REFERENCES
Annual Report. 1997-1998. Ergonomics studies on drudgeryreduction of Women Home, Farm and allied activities.All India Coordinated Research Project in Home ScienceGBPUAT, Pantnagar.
Chauhan Deepali. 2013. Ergonomic assessment of farmwomen performing weeding and winnowing operations.J. Community Mobilization and Sustainable Development, 8(2):262-265.
Corlett, N.; J. Wilson and I. Menerica. 1983. The Ergonomicsof Working. Applied Ergonomics, 3(6): 45-50.
Naik, D. and P.R. Sumangala. 2015. Ergonomic assessment ofwomen respondents performing dairy activities. KarnatakaJ. Agric. Sci., 28(2): 248-251.
Panwar, P. and P. Gupta. 2008. Appropriateness of DrudgeryReduction Technologies as Perceived by Farm Women. J.Community Mobilization and Sustainable Development, 3(2):76-77.
Pinzke, S.M. and G.A. Hansson. 2001. Physical workload onupper extremities in various operations during machinemilking. Annals of Agril. Environ. Medicine, 8(1):63-70.
Sharma, D. 1997. Ergonomics studies on drudgery reductionof Women Home, Farm and allied activities. All IndiaCoordinated Research Project in Home Science GBPUAT,Pantnagar.
Tripathi, H. and R. Pandey. 2011. Impact of drudgery reducingtechnology on ergonomics of rural women engaged inmilking of animals. Asian J. Dairy and Food Res., 30(3):174-177.
Varghese, M.A.; P.N. Saha and N. Atreya. 1994, A rapid appraisalof occupational workload from a modified scale perceivedexertion, Ergonomics, 37: 485-495.
Vinay, D. and D. Sharma. 2012. Corrective measure to reducephysical work strain of dairy farming. Indian J. AppliedRes., 1(7): 87-89.
--------------------------------------------------------------------------------------------------------------------------------------------------------------Received on February, 2018, Revised on March, 2018

Journal of Community Mobilization and Sustainable Development Vol. 13(1), 182-184, January-April, 2018
Depeasantry in Punjab: A Case Study
Priyanka Sharma1, Ravinder Kaur Dhaliwal2 and Lopamudra Mohapatra3
1M.Sc. Scholar, 2Professor, Department of Extension Education cum Director Student’s Welfare, PAU, Ludhiana3Assistant Professor, Department of Extension Education, PAU, Ludhiana
ABSTRACT
A decade back, in village Kanjhla like other villages of the state, agriculture was the main occupation. Among thefamilies selected, not a single family is doing farming now. They have shifted to other occupations like shops,labour work, and other small scale businesses to earn their livelihood. The main reasons for leaving farming werefalling productivity, fragmentation of holdings, increasing prices of inputs, low profit, etc. They either sold theirland or leased out their land. Indebtedness of farmers were also the main reasons for depeasantization. The nextgenerations of farmers don’t want to adopt farming as an occupation. The ‘push factors’ have affected a lot tothese small and marginal farmers. The growth-led transformation is related with the developmental factors likemechanization of agriculture, increasing employment and income, high education level, urbanisation, developmentof secondary and tertiary sectors and even state intervention for generating employment opportunities. Thesefactors are known as ‘pull factors’, which contribute to ‘pull’ the workforce from farming to more lucrative non-farm activities. On the other hand, distress-induced transformation is based on the hardship or cris is drivenfactors like falling productivity, increasing costs, decreasing returns and crop failure; unemployment andunderemployment; increasing indebtedness and even suicides. These factors are known as ‘push factors’, whichpush the agriculture workforce towards non-farm activities to earn their livelihood.
Keywords: Depeasantry, Pubjab, Shrinking
INTRODUCTION
The Punjab state has 5.03 m ha geographical area out ofwhich 4.23 m ha is under cultivation. Agriculture is away of life. About 75 percent of its population dependsdirectly on agriculture. It has shaped the thought, outlook,culture and economic life of our people. Therefore, itwill continue to control all strategies for planned socio-economic development of the state. Since the advent ofgreen revolution, the state has made rapid strides inagricultural production. The cropping intensity increasedfrom 126 per cent to 186 percent during the period 1965-66 to 2004-05 and 190 percent in 2012-2013. The statehas played a prominent role by achieving self- sufficiencyin food grains by contributing 60 per cent wheat and 40percent rice to the central pool (Anonymous, 2014).
The green revolution strategy which brought aphenomenal growth in the agricultural sector andimproved the economic conditions of the farmingcommunity during the 1970s and 1980’s, seems to begrowing dim with the passage of time. Punjab, the
pioneer of green revolution in India, is no more a stateof ever-booming agriculture as it is facing economiccrisis. Agriculture in Punjab had high growth for a longtime up to early 1990s. The crisis in agriculture hasmanifested itself in the form of stagnating productivity,rising cost of production, decelerating income, shrinkingemployment, mounting indebtedness and ecologicalimbalance. The overexploitation of natural resources,especially groundwater, further dragged the farm incomestowards digging deeper for submersible pumpsinstallation (Singh, 2008). During the era of high growth,the farmers attained high living standards, which alsoled to their social and cultural obligations being moreexpensive. Little wonder, the indebtedness of thefarmers, more so to the non-institutional agencies andparticularly of the small/marginal farmers, whoseeconomic base is poorer, increased faster than theirrepaying capacity. As a result, their distress continued tomount. The agrarian distress reached a high climax byearly 2000, when the Government of India sponsoredan all-India independent NSSO study (2003), which
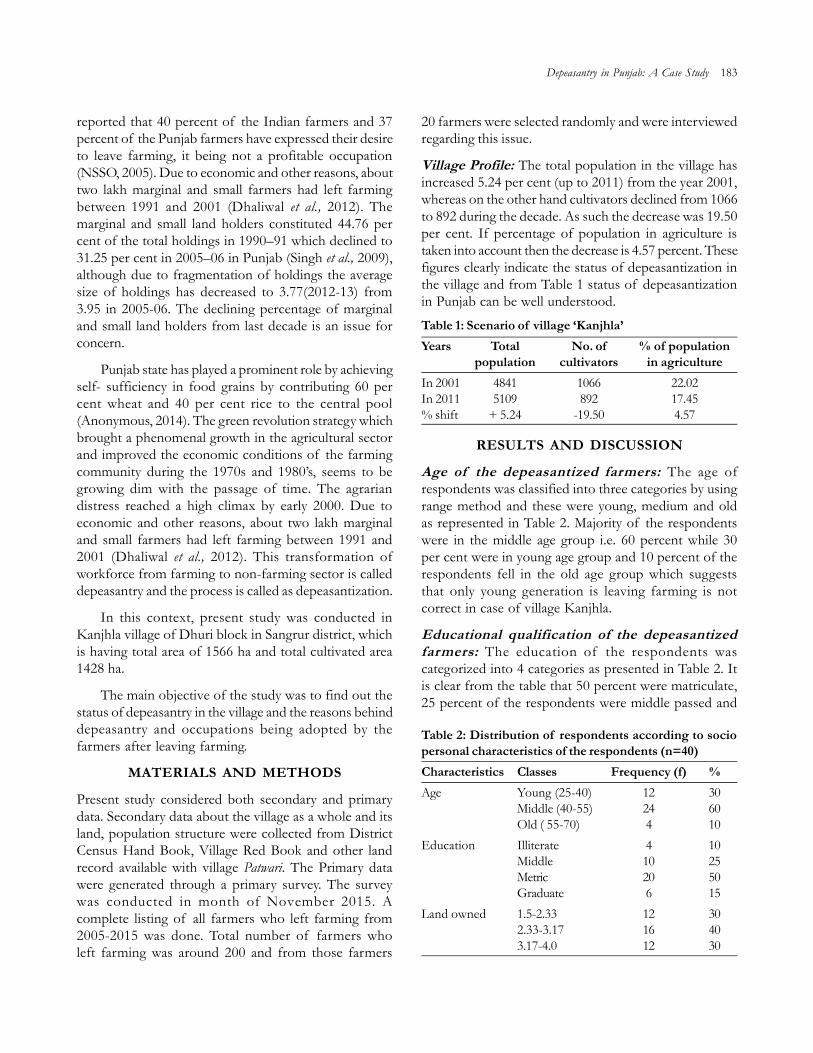
reported that 40 percent of the Indian farmers and 37percent of the Punjab farmers have expressed their desireto leave farming, it being not a profitable occupation(NSSO, 2005). Due to economic and other reasons, abouttwo lakh marginal and small farmers had left farmingbetween 1991 and 2001 (Dhaliwal et al., 2012). Themarginal and small land holders constituted 44.76 percent of the total holdings in 1990–91 which declined to31.25 per cent in 2005–06 in Punjab (Singh et al., 2009),although due to fragmentation of holdings the averagesize of holdings has decreased to 3.77(2012-13) from3.95 in 2005-06. The declining percentage of marginaland small land holders from last decade is an issue forconcern.
Punjab state has played a prominent role by achievingself- sufficiency in food grains by contributing 60 percent wheat and 40 per cent rice to the central pool(Anonymous, 2014). The green revolution strategy whichbrought a phenomenal growth in the agricultural sectorand improved the economic conditions of the farmingcommunity during the 1970s and 1980’s, seems to begrowing dim with the passage of time. The agrariandistress reached a high climax by early 2000. Due toeconomic and other reasons, about two lakh marginaland small farmers had left farming between 1991 and2001 (Dhaliwal et al., 2012). This transformation ofworkforce from farming to non-farming sector is calleddepeasantry and the process is called as depeasantization.
In this context, present study was conducted inKanjhla village of Dhuri block in Sangrur district, whichis having total area of 1566 ha and total cultivated area1428 ha.
The main objective of the study was to find out thestatus of depeasantry in the village and the reasons behinddepeasantry and occupations being adopted by thefarmers after leaving farming.
MATERIALS AND METHODS
Present study considered both secondary and primarydata. Secondary data about the village as a whole and itsland, population structure were collected from DistrictCensus Hand Book, Village Red Book and other landrecord available with village Patwari. The Primary datawere generated through a primary survey. The surveywas conducted in month of November 2015. Acomplete listing of all farmers who left farming from2005-2015 was done. Total number of farmers wholeft farming was around 200 and from those farmers
20 farmers were selected randomly and were interviewedregarding this issue.
Village Profile: The total population in the village hasincreased 5.24 per cent (up to 2011) from the year 2001,whereas on the other hand cultivators declined from 1066to 892 during the decade. As such the decrease was 19.50per cent. If percentage of population in agriculture istaken into account then the decrease is 4.57 percent. Thesefigures clearly indicate the status of depeasantization inthe village and from Table 1 status of depeasantizationin Punjab can be well understood.
RESULTS AND DISCUSSION
Age of the depeasantized farmers: The age ofrespondents was classified into three categories by usingrange method and these were young, medium and oldas represented in Table 2. Majority of the respondentswere in the middle age group i.e. 60 percent while 30per cent were in young age group and 10 percent of therespondents fell in the old age group which suggeststhat only young generation is leaving farming is notcorrect in case of village Kanjhla.
Educational qualification of the depeasantizedfarmers: The education of the respondents wascategorized into 4 categories as presented in Table 2. Itis clear from the table that 50 percent were matriculate,25 percent of the respondents were middle passed and
Table 1: Scenario of village ‘Kanjhla’Years Total No. of % of population
population cultivators in agricultureIn 2001 4841 1066 22.02In 2011 5109 892 17.45% shift + 5.24 -19.50 4.57
Table 2: Distribution of respondents according to sociopersonal characteristics of the respondents (n=40)Characteristics Classes Frequency (f) %Age Young (25-40) 12 30
Middle (40-55) 24 60Old ( 55-70) 4 10
Education Illiterate 4 10Middle 10 25Metric 20 50Graduate 6 15
Land owned 1.5-2.33 12 302.33-3.17 16 403.17-4.0 12 30
Depeasantry in Punjab: A Case Study 183

184 Priyanka Sharma et al.
Table 3: Distribution of respondents on the basis of statusof land (n=40)Status Frequency (f) PercentageSold 24 60Leased out 16 40
15 per cent were graduates, which suggests that thefarmers are not uneducated but they are not very wellqualified.
Land owned by the depeasantized farmers: Landowned by the respondents was classified into threecategories again by using range method as representedin Table 2. The study findings revealed that land ownedby the respondents varied between 1.5-4.0 acres as manyas 40 percent of the respondents owned 2.33-3.17 acresof land while 30 percent of the respondents owned 3.17-4.0 acres of land and an equal percent of respondentsowned 1.5-2.33 acres of land.
Table 4: Distribution of the respondents on the basis ofoccupations adopted after leaving farming (n=40)Occupations adopted Frequency (f) PercentageShop 14 35Private job 8 20Gone abroad 6 15Dairy farming 8 20Nothing 4 10
It is apparent from the data that in Table 3 that 60percent of the respondents had sold their land and 40per cent of the respondents had leased their land due toone or the other reasons.
The data placed in Table 4 reveal that 35 percent ofthe respondents had started various type of shops afterleaving farming, 20 percent of respondents started doingprivate jobs and an equal percent of respondents hadadopted dairy farming as an occupation whereas 15percent of respondents had gone abroad after leavingfarming to earn their livelihood and only 10 percent offarmers had done nothing.
The data in the Table 5 indicated that 40 percent ofthe respondents left farming for being a non- viableoption, 20 percent of the respondents left farmingbecause their next generation did not want to adoptfarming as an occupation whereas 15 percent of therespondents sold their land and left farming to pay theirdebt and an equal percentage of respondents had leftfarming due to old age while 10 percent of the
Table 5: Distribution of respondents on the basis of reasonsfor leaving farming (n=40)Reasons Frequency (f) PercentageNon- viable 16 40Debt repayment 6 15Drugs 4 10Old age 6 15Next generation don’t want to 8 20adopt farming
respondents sold their land and left farming due to drugaddiction.
CONCLUSION
The process of depeasantisation in Punjab began sinceearly 1990s and gathered momentum since 2000. Lowincome from farming due to low productivity and highproduction costs were the main reasons for leavingfarming in the state. The fragmentation of land holdingsincreased the cost of production, squeezed the returnsand hence brought the farmers under debt. The smallerand marginal farmers were most severely affected bythese problems. However, the other main reasons likehigh land rent, and low returns and money spent forsocial obligations were also responsible for pushing thesmaller farmers away from agriculture. Thus the ‘pushfactor’ has impacted strongly to small and marginalfarmers.
REFERENCES
Anynomous (NSSO). 2005. Situation Assessment Survey ofFarmers: Indebtedness of Farmer Households. Retrievedfrom mospi.nic.in on 14-11-2015.
Anonymous. 2014. Statistical Abstracts of Punjab. Pp. 77-79.Economic and Statistical Organization, Government ofPunjab.
Dhaliwal, H.S.; S.S. Walia and M.S. Sidhu. 2012. Options forMarginal and Small Farmers. pp. 2-13. Punjab AgriculturalUniversity, Ludhiana.
Singh, K. 2008. Water Table Behaviour in Punjab: Issues andPolicy Options. Proceedings of the 7th Annual Partners’ Meet.Pp. 331-357.International Crops Research Institute for theSemi-Arid Tropics Campus, Patancheru, Hyderabad.
Singh, K.; S. Singh and H.S. Kingra. 2009. Agrarian Crisis andDepeasantisation in Punjab: Status of Small/MarginalFarmers Who Left Agriculture. Ind. Journal of Agri. Econ.,64: 585-601.
--------------------------------------------------------------------------------------------------------------------------------------------------------------Received on December, 2017, Revised on January, 2018

Journal of Community Mobilization and Sustainable Development Vol. 13(1), 185-190, January-April, 2018
*Corresponding author email id: [email protected]
Socio - Economic Upliftment of Farmers through Udaipur AgroProducer Company Limited
Subhashree Sahu1*, J.P. Sharma2, R.R. Burman3, Premlata Singh4 and Eldho Varghese5
1CATAT, 2Joint Director (Ext.), 3,4Division of Agricultural Extension, ICAR-Indian Agricultural Research Institute, New Delhi5Division of Agricultural Statistics, IASRI, New Delhi
ABSTRACT
The present study was conducted in Udaipur Agro Producer Company Limited (UAPCL) in Udaipur of Rajasthan.The sample included 50 members and 50 non-members selected randomly to analyse the social and economicimpacts of participation in the organisation. The production, income and employment generation for the membersof the organisation were significantly higher in comparison to the non-members. There was considerable differencein the amount of savings, expenditure and assets owned between the members and non-members. A significantdifference between the members and non-members was observed in terms of food security and socialempowerment. The members were also relatively well off in terms of health, educational and habitat security.
Keywords: Employment, Food security, Habitat security, Income, Social empowerment, UAPCL
INTRODUCTION
India is mostly an agrarian economy but the agriculturalscenario of India is plagued with severe challenges. Indianagriculture is dominated with 85% small and marginalfarmers. Due to increasing demand of land for nonfarmuse, arising from industrialization and urbanization, theper capita availability of agricultural land in the rural areahas shrunken from 0.683 hectares in 1950-51 to 0.13hectares 2011 (DAC, 2014). Thus it is faced with theissues of dispersed land holdings, low marketable surplusand thus low profitability. Indian farmers specially needto be made aware of the benefits of economies of scalethrough collectivization in various aspects of inputprocurement, storage, marketing, processing, etc. Thefarmers can pool resources and form groups like farmerorganisations, farmer interest groups, commodity basedorganizations, farmer producer companies. The farmerorganisations provide common services like farm inputs,information, training, technical assistance, credit, research,enhanced bargaining power, marketing support and createopportunities for involvement in value-addition andprocessing. Nandeesa et al. (2013) reported that theMuttlur farmers of Nallavur Farmers ProducersOrganization, Chennai could increase their share in the
consumer price by resolving issues of trader exploitation,exploring new markets, accessing timely credit and qualityinputs. Patkar et al. (2012) reported that farmers can getbetter prices for commodities, reduce the productionand marketing risks, and eliminate the traditionalintermediaries by getting organized in groups. The SHGsare a powerful tool of socio-economic developmentof the poor women in rural areas as it accelerates thechange in income, occupation, social participation,expenditure, decision making and change in confidencelevel (Bansode et al., 2013). Sakthi et al. reported that themembers of TAMAFED (Tamil Nadu Mango GrowersFederation) in Tamil Nadu gained social and economicbenefits and the costs incurred on input and outputtransactions were quite low ultimately adding to thebenefit. Tolno et al. (2015) found positive farm incomeeffects of group membership for the potato producersin Middle Guinea. Keeping these things in mind, thepresent study was undertaken to analyse the socio-economic impact through participation in farmers’organisation.
MATERIALS AND METHODS
The study was conducted in Udaipur Agro ProducerCopany Limited (UAPCL) located in block Jhadol,

186 Subhashree Sahu et al.
Udaipur district of Rajasthan. Fifty UAPCL farmermembers and fifty non-members were selected throughsimple random sampling. To analyse the economic impact,the respondents were asked about their productiondetails, employment days generated, annual incomeearned, total annual savings, and their investment patternin various enterprises annually. The production, incomeand employment figures were taken considering gingercrop. The obtained data were analysed using the t-test inorder to find whether the differences between the figuresof the two groups were significant or not. For analyzingthe social impact, data were collected from therespondents on a set of statements listed under variousheads of food security, habitat security, educationalsecurity, health security and social empowerment.Frequency and percentage analysis was carried out foranalyzing habitat security, educational security and healthsecurity. To see the significance of difference in termsof food security and social empowerment between theUAPCL members and non-members, Wilcoxon MannWhitney U test was used.
RESULTS AND DISCUSSION
Measurement of the economic impact: Theeconomic impact was assessed though the annualproduction of ginger in quintals, employment daysgenerated and annual income from the ginger crop, totalannual savings and annual investment pattern perenterprise. The income for members and non-memberswas Rs 1.59 lakhs and Rs. 0.85 lakhs respectively. From
Table 1, the higher income generating capacity of themembers was clearly evident and the difference wassignificant, which was the result of adoption ofrecommended package of practices for efficientproduction and direct marketing of their producethrough their company outlets. From Table 2, it was clearthat the average production (50 q) for the members ofUAPCL was higher than the non-members’ production(30 q). It indicated higher production capacity of theUAPCL members, which was a result of access ofextension support about the recommended package ofpractices from networking with various agriculturalresearch institutes and availability of timely and goodquality inputs provided by the organisation.
The members of UAPCL were employed for 151days per year on an average whereas the non-memberscould find 100 days of employment from cultivationof ginger. It is clear from Table 3 that the higheremployment generation capacity of UAPCL is significant.Members saved up to Rs 15,000 per annum whereas thenon-members saved up to Rs 8,000 only. Table 4 indicatessignificant difference in the average savings of membersas compared to non-members. Table 5 represents theaverage investment (rupees in thousands) made by theUAPCL members and non-members in variousenterprises. Though there was significant difference inthe average investment made by the members ascompared to non-members due to the higher incomeearned by the member farmers; but the amount available
Table 1: Average income of respondents from ginger (n= 100)Group Mean (l) Std. Deviation Std. Error Mean t valueMembers of UAPCL 1.5967 .22967 .04193 12.59*Non- Members .8567 .22542 .04116*Significant at 5% level of significance
Table 2: Average production of ginger of the respondents (n= 100)Group Mean (q) Std. Deviation Std. Error Mean t valueMembers of UAPCL 50.3333 11.95778 2.18318 9.31*Non- Members 30.0000 .00000 .00000*Significant at 5% level of significance
Table 3: Average employment of respondents from ginger cultivation (n= 100)Group Mean (days) Std. Dev Std. Error Mean t valueMembers of UAPCL 151.6667 33.43376 6.10414 8.46*Non- Members 100.0000 .00000 .00000*Significant at 5% level of significance

Socio-Economic Upliftment of Farmers through Udaipur Agro Producer Company Limited 187
is too meagre and not very substantial to reap highbenefits.
Measurement of the social impact of UAPCL: Thesocial impact in the study area was studied by gatheringinformation from all the respondents under various headsof security in terms of food, habitat, education, healthand the level of social empowerment. The responsesof members and non-members were taken on thestructured schedule, coded and analysed using Wilcoxon-Mann-Whitney U nonparametric test in order to identifythe significance of difference between member and non-member farmers in case of food security. Table 6indicates that there was significant difference in termsof food security between the control and theexperimental group. In case of dwelling, 80% memberswere found to reside in owned houses, unlike the non-members, among whom 70 percent still dwelled in rented
houses, as evident form Table 7. Eighty percent ofmembers possessed toilet facilities in their houses ascompared to 66% in houses of non-members. Similarly86% members owned vehicles against 46% non-members. This may be attributed to the high income ofthe members as compared to non-members, so themembers are particularly well off in the social amenities.
Eighty six percent of the UAPCL members’ childrengot college education but only 26 percent of non-members’ children got the same. Table 8 depicts that 60percent members participated in functional literacyprogramme but none in case of non-members. Themembers’ and non-members’ responses on the schedulewere collected and then, frequency and percentage analysiswas done. The table below (Table 9) shows that it wasunaffordable for the non-members to bear expenditurefor health, so they primarily depend upon the locallyavailable health facilities only, unlike the members ofUAPCL. The obtained responses of members and non-members were rated and analysed using Wilcoxon-Mann-Whitney’s U test in order to identify the significanceof difference between member and non-memberfarmers in case of social empowerment. The following
Table 4: Average savings of respondents generated from ginger cultivation (n= 100)Group Mean (Rs) Std. Dev Std. Error Mean t valueMembers of UAPCL 15.1000 2.77116 .50594 12.94*Non- Members 8.2667 .82768 .15111*Significant at 5% level of significance
Table 5: Average investment capacity of respondents in various enterprises (n= 100)Group Mean (Rs) Std. Deviation Std. Error Mean t valueMembers of UAPCL 8.4333 1.45468 .26559 18.23*Non- Members 3.3333 .47946 .08754*Significant at 5% level of significance
Table 6: Level of food security of the respondents based onWilcoxon-Mann-Whitney test (n=100)Food Security Members Non members Z valueMean Rank 45.37 15.63 -6.708**Significant at 5% level of significance
Table 7: Distribution of respondents according their habitat security (n=100)Members Non-members
Frequency Percentage Frequency PercentageDwelling Owned 40 80 15 30
Rented 10 20 35 70Housing type Pucca 45 90 20 40
Kaccha 05 10 30 60Toilet facilities in house Yes 40 80 33 66
No 10 20 17 34Possession of vehicles Yes 43 86 23 46
No 7 14 27 54

188 Subhashree Sahu et al.
table (Table 10) indicates that there was significantdifference in case of social empowerment between thecontrol and the experimental groups in the study area.The members felt that they were more sociallyempowered than non-members.
DISCUSSION
The UAPCL members produced on an average 50quintals per year whereas the non-members producedonly 30 quintals of raw ginger. This sharp difference wasdue to the access to guidance and technical support fromthe tied up research organisations and adoption of therecommended package of practices by the memberfarmers. Membership to such organizations is consideredto increase the level of agricultural production and yield
economic benefit to farmers as well as promote theirgeneral welfare (Oyeyinka et al., 2009; Mwaura, 2014).Producers’ organizations help farmer members toperform better buying and selling due to scale benefitsand lower transaction costs for buyers and sellers, besidesproviding technical guidance in the production processand therefore, creating social capital (Patibandla and Sastry,2004). A wide difference between the incomes ofmembers and non-members was observed. TheUAPCL members earned almost double (i.e. 1.6 lakhs/yr) what the non-members were earning. This can beattributed to the direct sale of their products, withoutthe involvement of middlemen. Traditionally, small andmarginal cultivators sold their produce at the farm gate,often to middlemen at low prices (Fafchamps and Hill,
Table 8: Distribution of respondents according their educational security (n= 100)Statements Members Non-members
Frequency Percentage Frequency PercentageAccess to information regarding education opportunities for children Yes 40 80 28 56
No 10 20 22 44Children sent to public/ convent/ English medium schools Yes 38 76 16 32
No 12 24 34 68Children got collegiate education Yes 43 86 13 26
No 7 14 37 74Children sent to nearby town or cities for education Yes 42 84 8 16
No 8 16 42 84Adults from your family participate in functional literacy programme Yes 30 60 0 0
No 20 40 50 100Children had to stop their studies due to high cost & unaffordability Yes 4 8 40 80
No 46 92 10 20
Table 9: Distribution of respondents according their health security (A= Agree and D= Disagree) (n= 100)Statements Members Non-members
Frequency Percentage Frequency PercentageWe depend only on local hospital for all our health problems A 30 60 50 100
D 20 40 0 0We travel to outside town in order to get better health services A 15 30 0 0
D 35 70 50 100We can’t afford the health care facilities available A 7 14 45 90
D 43 86 5 10
Table 10: Level of social empowerment of the respondents as per Wilcoxon-Mann-Whitney test (n=100)Category Mean Rank Z value
Member Farmers Non member farmersSocial empowerment 45.50 15.50 -6.679**Significant at 5% level of significance

Socio-Economic Upliftment of Farmers through Udaipur Agro Producer Company Limited 189
2005). Research evidence increasingly points that producerorganizations can transform market arrangements infavour of marginal and small farmers (International Fundfor Agricultural Development, 2001) and ensure theireffective market participation (Stockbridge et al., 2003).Farmer organizations strengthen farmers’ bargainingpower, raise the price of produce, control monopsonyexploitation and increase social welfare (Shivramkrishna& Jyotishi, 2008). The finding is also in line with thefindings of Bachke (2009) that there is a positive causaleffect from membership in a farmers’ organization tooverall agricultural profits. This group of income is alwayssignificant and around 50% for agricultural profits.Sokchea and Culas (2015) conducted field surveys with75 farmers (including 39 contract farmers) in KampongThom province, Cambodia and also reported similarfindings that contract farming with farmer organizationssignificantly raises farmers’ income. The UAPCLmembers got employment (151 days) for more numberof days as compared to the non-members (100 days). Asignificant difference between the members and non-members was observed in terms of food security andsocial empowerment. There was also striking differencebetween the members and non-members in Rajasthanin terms of habitat, health and educational security. Thisis in accordance to the finding that the FPOs empowerthe small and marginal farmers along with instilling anentrepreneurial quality to farming (De Janvry et al., 1991).When farmers come together, they see it as anopportunity to socialize, share and learn. Also, Bingen etal. (2003) reported that the farmer organizations canprovide important platforms for capacity building,information exchange, and innovation in rural settings.Swanson (2008), Rondot and Collion (2001) also foundsimilar result that farmers’ organizations can be veryeffective in meeting the genuine needs of the ruralcommunities to support farmers and represent theirinterests in decision-making processes. This matches withthe findings of Armando (2009) that the farmerorganisations contribute directly and indirectly to genderequality through increased financial security for themembers. Formation of commodity specific FarmerInterest Groups (FIGs) has been highly beneficial tofarmers through better performance in yield and incomeof vegetables in Palakkad district of Kerala(Shanmugasundaram, 2015).
CONCLUSION
The membership in organisation was positively relatedto the socio-economic upliftment of the people in thestudy area. The production, income and employmentgenerated for the members were significantly higher incomparison to the non-members. Also, the memberscould divert their excess money towards saving,investment in other enterprises and purchasing of assets,unlike the non-members. The condition of members interms of food, health, education and habitat security wasin a much better condition than the non-members andthus the members had a greater sense of socialempowerment as compared to the non-members. Thus,this justifies that the membership in organization candirectly affect the socio-economic status of an individual.Thus, initiatives should be made to mobilize the farmers,especially small and marginal into groups and replicatesuch successful models across the country in order toreap benefits of collective action.
REFERENCES
Armando, C.P. 2009. Agricultural cooperatives and farmersorganizations: role in rural development and povertyreduction. Swedish Cooperative Centre, DevelopmentDirector, Stockholm.
Bachke, M.E. 2009. Are farmers’ organizations a good tool toimprove small-scale farmers’ welfare? Paper presented atNordic Conference in Development Economics,Oscarsborg, Norway, June 18-19, 2009.
Bansode, S.M.; G.S. Ankush; J.V. Mande and D.D. Suradkar.2013. Impact of SHG on Socio-economic Developmentof Their Members. J. Community Mobilization andSustainable Development, 8(1): 117-120.
Bingen, J.; A. Serrano and J. Howard. 2003. Linking farmers tomarkets: different approaches to human capitaldevelopment. Food Policy, 28(4): 405-419.
DAC. 2014. available at http://eands.dacnet.nic.in/De Janvry, A.; M. Fafchamps and E. Sadoulet. 1991. Peasant
household behavior with missing markets: Someparadoxes explained. Economic Journal, 101(409): 1400-1417.
Fafchamps, M. and R.V. Hill. 2005. Selling at the farm gate ortraveling to market. American J. Agril. Economics, 87(3):717-734.
International Fund for Agricultural Development. 2001. RuralPoverty Report 2001: The Challenge of Ending RuralPoverty. Accessed on 2 June 2014 from http://www.ifad.org/poverty/
190 Subhashree Sahu et al.
Mwaura, F. 2014. Effect of farmer group membership onagricultural technology adoption and crop productivity inUganda. African Crop Science Journal, 22(Supplement s4):917-927
Nandeesa, P.; R. Sanjeev and R.S.S. Hopper. 2013. Farmerproducer organisations - Enhancing farmers share in theconsumer price. LEISA India | 15.2
Oyeyinka, R.A.; S.O. Ayansina and C.O. Adamu. 2009. Effectof farmers organization on agricultural technologiesdevelopment in Afijio local Government areas of OyoState, Nigeria. OIDA International J. Sustainable Development,5(11): 43-50.
Parthiban, S.R.; M.S. Nain; R. Singh; S. Kumar and V.P. Chahal.2015. Farmers’ producer organisation in reducingtransactional costs: A study of Tamil Nadu MangoGrowers Federation (TAMAFED). Indian J. AgriculturalSci., 85(10): 1303–1307.
Patibandla, M. and T. Sastry. 2004. Capitalism and co-operation:co-operative institutions in a developing economy.Economic and Political Weekly, 3: 2997-3004.
Patkar, S.; S. Asthana; S. Arya; R. Natawidjaja; C. Widyastutiand S. Shenoy. 2012. Small scale farmers’ decisions inglobalised markets: Changes in India, Indonesia and China,IIED/HIVOS/ Mainumby, London/The Hague/LaPaz.
Rondot, P. and M.H. Collion. 2001. Agricultural producerorganisation: their contribution to rural capacity buildingand poverty reduction. Report of workshop, 28-30 June,World Bank, Washington.
Shanmugasundaram, B. 2015. Technological empowerment offarmer interest groups (FIGs) in Palakkad district ofKerala. J. Community Mobilization and SustainableDevelopment, 10(2): 251-255.
Sivramkrishna, S. and A. Jyotishi. 2008. Monopolisticexploitation in contract farming: articulating a strategy forgrower cooperation in Journal of International Development,20: 280-296.
Sokchea, A.N. and R.J. Culas. 2015. Impact of contract farmingwith farmer organizations on farmers’ Income: A CaseStudy of Reasmey Stung Sen Agricultural DevelopmentCooperative in Cambodia. Australasian Agribusiness Review,23(1).
Stockbridge, M.; A. Dorward; J. Kydd; J. Morrison and N. Poole.2003. Farmer Organizatios for Market Access: AnInternational Review. Accessed on 2 June 2014 from http://r4d.dfid.gov.uk/pdf/outputs/r8275_040518_intlrev_fo_mktaccss.pdf
Swanson, B.E. 2008. Global review of good agriculturalextension and advisory services practices. FAO, Rome.
Tolno, E.; H. Kobayashi; M. Ichizen; M. Esham and B. Siddighi.2015. Economic analysis of the role of farmerorganizations in enhancing smallholder potato farmers’income in middle Guinea. Journal of Agricultural Science,7(3).
--------------------------------------------------------------------------------------------------------------------------------------------------------------Received on January, 2018, Revised on March, 2018

Journal of Community Mobilization and Sustainable Development Vol. 13(1), 191-196, January-April, 2018
*Corresponding author email id: [email protected]
Identification of Constraints for Delineating Extension Strategiesfor Bt Cotton Cultivation in Punjab
Jagmit Singh1* and Dharminder Singh2
1M.Sc. Student, 2Assistant Extension Specialist, Department of Extension Education, PAU, Ludhiana, Punjab
ABSTRACT
The study was conducted in three main cotton growing districts of Punjab i.e. Bathinda, Mansa and Fazilka ofPunjab state to know the constraints faced by Bt cotton growers of Punjab. A total sample of 150 farmers from15 villages was taken for the study. It was found that major constraints faced by farmers regarding the productionof Bt cotton were high cost of seeds (85.33%), non-availability of canal water for pre-sowing irrigation (77.33%),poor quality of irrigation water (81.33%), sub standard quality of pesticides (87.33%), ineffectiveness of pesticides(94.67%), high cost of pesticides (79.33%) and non-availability of the labour for picking (71.33%). The majortechnological constraint reported by the 56.00 per cent respondents was the non-availability of cotton stalk uprooter. Price fluctuation and lower MSP of Bt cotton produce were the major marketing constraints faced by96.67% and 94.67% of the respondents, respectively, whereas 64.00 per cent of the respondents faced the constraintof high cost of cultivation of Bt cotton. About 48.00 per cent of the respondents reported the lack of properdemonstrations/ trainings/ awareness camps regarding Bt cotton cultivation practices as the major institutionalconstraint. Development of better Bt cotton varieties resistant to sucking pests and to keep quality check on seedsand pesticides along with fixed market selling prices were found important for delineating extension strategies forBt cotton cultivation in Punjab.
Keywords: Bt cotton, Production, Technological, Marketing, Institutional, Constraint, Punjab
INTRODUCTION
Cotton is one of the important cash crop of India andplays a dominant role in economy of the country; henceknown as ‘white gold’ and ‘king of fibers’. It contributesaround 30 per cent to the gross domestic product ofIndian agriculture. India is an important grower of cottonon a global scale. India accounts for approximately 25per cent of the world’s total cotton area and 16 per centof global cotton production. Most of the cotton in Indiais grown under rainfed conditions, whereas about onethird is grown under irrigated conditions. Cotton occupiesan area of 119.78 lakh hectares in India with aproduction of 398 lakh bales in the year 2013-14.However, India`s average yield of cotton is 566 kg/haas compared to worlds average productivity of 766 kg/ha (Anonymous, 2015a).
Indiscriminant use of pesticides in the cotton cropresulted in development of resistance in many insect-
pests of cotton crop and thus increasing the cost ofcultivation (Guillaume et al., 2008). Insect-pest resistantcotton commonly referred to as Bt cotton was firstintroduced commercially in 1996. It produces aninsecticidal protein from the naturally occurring soilbacterium Bacillus thuringiensis (Bt). Global adoption ofBt cotton has risen dramatically from 800,000 hectaresin its year of introduction in 1996 to 5.7 million hectaresin 2003. Significant economic and production advantageshave resulted from growing Bt cotton globally. Bt cottonwas approved in India on 26 March, 2002 for the centralzone (Maharashtra, Gujarat & Madhya Pradesh) and southzone states (Andhra Pradesh, Karnataka and Tamil Nadu).In northern zone including Punjab state, Bt cotton wasapproved for cultivation in the kharif season of year2005 (Choudhary and Gaur, 2010).
Being a major commercial crop, cotton occupies animportant place in agricultural scenario of Punjab. It isthe main kharif crop of south-western districts of the

192 Jagmit Singh and Dharminder Singh
state i.e. Bathinda, Mansa, Fazilka (part of erstwhileFerozepur), Muktsar, Faridkot, Barnala and Sangrur.Cotton crop was cultivated on an area 472 thousandhectares with average productivity of 16.00 quintal perhectare under irrigated conditions in Punjab (Anonymous,2015b). In recent years, pest menace in cotton is severeresulting in escalation of cost of production, increase incrop losses and reduction in productivity and income tofarmers, thus the present study was undertaken to studythe major constraints faced by the Bt cotton growers ofPunjab regarding Bt cotton cultivation.
MATERIALS AND METHODS
The Study was conducted in the Punjab state. Three majorcotton growing districts of the Punjab state i.e. Bathinda,Mansa and Fazilka were selected purposively becausethese were having their maximum area under Bt cottoncultivation. The five villages were selected from each ofthree districts (Bathinda, Mansa and Fazilka) and 10farmers from each village were taken for the study. Thus,a total sample of 150 farmers from 15 villages was takenfor the present study. An interview schedule was designedand finalized consisting of questions regarding theconstraints faced by the Bt cotton growers in cultivationof Bt cotton crop. These were categorized intoproduction, technological, marketing and institutionalproblems. Data were collected personally by visiting thestudy area and interviewing the farmers using structuredinterview schedule. Suggestions of the farmers aboutBt cotton cultivation were also sought in the study. Theresponse to the statements/ questions was recorded inyes/no form along with open ended questions. The datawere further analyzed with the help of suitable statisticaltools such as frequency, percentage.
RESULTS AND DISCUSSION
Production constraints regarding Bt cottoncultivation: The data in the Table 1 show thatrespondents faced many constraints related toproduction of Bt cotton and were further categorizedinto seed, sowing, weather related, irrigation, fertilizer,pesticides, labour related constraints. In case of seedrelated constraints, majority of the respondents (89.33%)felt that seed cost was high. Higher price of seed as aconstraint was also reported by Ramasundaram et al(2007). Sub-standard quality of seed was other constraintin Bt cotton cultivation faced by about 65.00 per centof the respondents. Nearly half (52.67%) of the
respondents found that seed of recommended varietywas not available for cultivation. In case of sowingrelated constraints, 34.67 per cent respondents faced theproblem of rainfall at the time of sowing or just afterthe sowing, which led to poor germination of cottonseeds. Also 21.33 per cent respondents were not awareof the recommended seed rate. Nearly one third (38.00%)of the respondents of the respondents were having noknowledge about the nutrient status of their soils. Asmany as 17.33 per cent of the respondents were havingthe problematic soils with high salinity in their lands. Similarfindings were also reported by Singh (2014). Gujjar andPadaria (2012) also studied the farmers perception andconstraints in adoption of Bt cotton technology andstated that for better adoption of Bt cotton constraintslike high seed cost, unavailability of irrigation in timeand adequate quantity and lack of informationdissemination of complete package of technologythrough public extension system need to be managed.
In case of weather related constraints, problem ofuncertain or fluctuating rainfall was faced by majorityof respondents (91.33%). Other constraint faced bymajority of the respondents (69.33%) was hightemperature at germination stage of Bt cotton. Problemsof high speed winds were faced by 52.67 per cent ofthe respondents. Half of the respondents also faced thedifficulty of unfavourable weather while spraying of thechemicals. In case of irrigation related constraints, majorconstraint faced by majority (77.33%) was non-availabilityof canal water for pre-sowing irrigation (rauni) of thecotton fields. About 81.33 per cent of the respondentsfaced the constraint of poor quality of irrigation water.Also 44.67 per cent of the respondents faced theconstraint of lack of irrigation at critical periods of thecrop growth. This untimely availability of water affectsthe sowing dates and maturity period of crop.
In case of pesticides related constraints, majority(94.67%) of the respondents perceived the recommendedpesticides to be ineffective against insect pests. About87.00 per cent respondents complained about sub-standard quality of the pesticides. About 80.00 percentof the respondents also reported the high cost ofpesticides as major constraint in Bt cotton cultivation.Problem of non availability of recommended pesticidewas faced by 27.33 per cent of respondents, while 52.00per cent of the respondents were not aware about therecommended doses of the pesticides. Such constraints

Identification of Constraints for Delineating Extension Strategies for Bt Cotton Cultivation in Punjab 193
Table 1: Distribution of respondents according to production constraints faced in Bt Cotton cultivation (n=150) Production constraints Frequency* Percentage Seed related Non-availability of seed of recommended variety 79 52.67 Sub-standard quality of seed 98 65.33 High cost 128 85.33 Sowing related Rainfall at the time of sowing 52 34.67 Lack of knowledge of recommended seed rate 32 21.33 Soil related Lack of knowledge about soil nutrient status 57 38.00 Problematic soils (alkalinity, salinity etc.) 26 17.33 Weather related High temperature at germination stage 104 69.33 Uncertain/fluctuating rainfall 137 91.33 High speed winds/storms 79 52.67 Unfavourable weather while spraying chemicals 74 49.33 Irrigation related Non-availability of canal water for pre-sowing irrigation (rauni) 116 77.33 Poor quality of irrigation water 122 81.33 Lack of irrigation water at critical periods of crop growth 67 44.67 Pesticides related Non availability of recommended pesticides 41 27.33 Sub-standard quality of pesticides 131 87.33 In-effectiveness of the recommended pesticides 142 94.67 High cost of pesticides 119 79.33 Lack of awareness about recommended doses 78 52.00 Fertilizers Shortage at required time 42 28.00 Poor quality of fertilizers 26 17.33 High prices of fertilizers 92 61.33 Lack of knowledge of recommended doses of fertilizers 38 25.33Labour Non availability of labour for hoeing/weeding 68 45.33 Non availability of labour for picking 107 71.33 Lack of skilled labour 40 26.67 High cost of labour 102 68.00*Multiple response
are faced by respondents, points out to the misleadinginformation provided by the some of the privateagencies or dealers. These findings are found to be inline with the findings of Singh and Kaur (2005).
In case of fertilizer application, 61.00 per cent ofthe respondents faced the high cost of fertilizer as majorconstraint. Shortage of fertilizers at required time andlack of awareness about the recommended doses wereother constraints faced by about one fourth of therespondents, whereas 17.33 per cent of respondentsreported the poor quality of fertilizers. The major
constraints regarding labour were found to be non-availability of the labour for picking and their high costwhich was faced by more than 70.00 per cent of therespondents. Also 45.33 per cent of the respondentsfaced the problem of non-availability of labour forhoeing operations, whereas 26.67 per cent of the farmersalso faced the difficulty of the lack of skilled labour forvarious operations in Bt cotton cultivation such as forspraying, weeding. The findings were also found to besimilar with those of Kumar (2004) as majority of hisrespondents were also facing the same type ofconstraints.
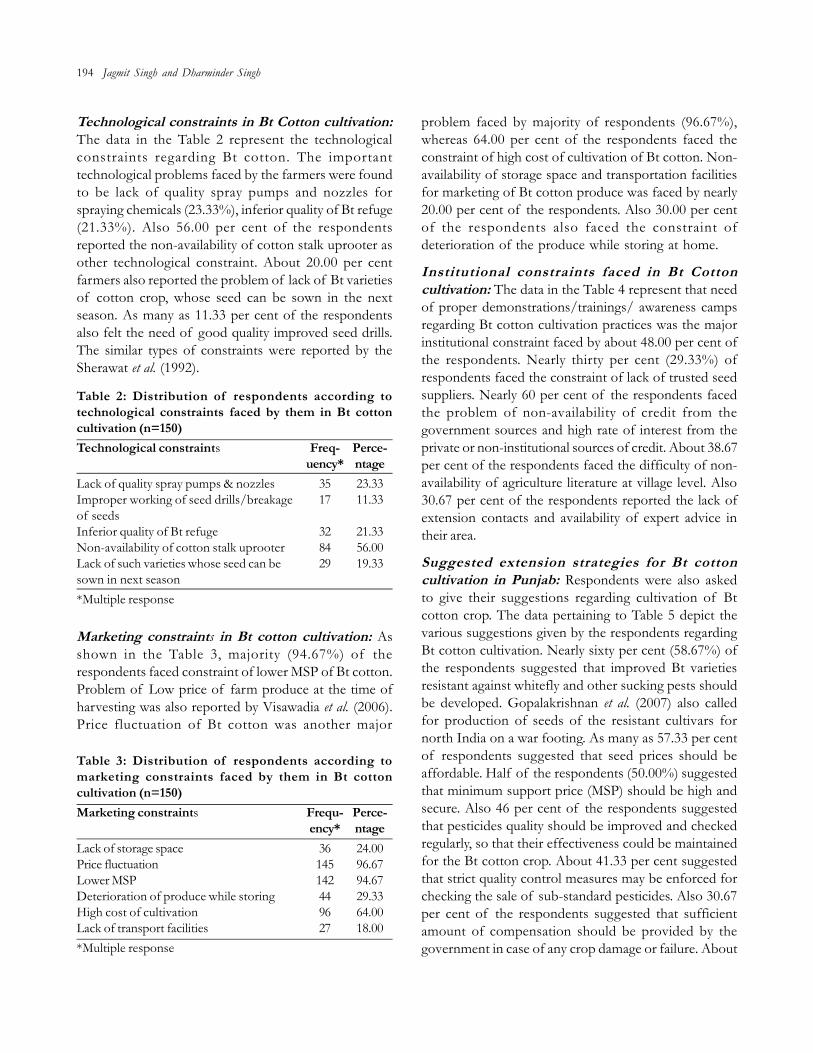
194 Jagmit Singh and Dharminder Singh
Technological constraints in Bt Cotton cultivation:The data in the Table 2 represent the technologicalconstraints regarding Bt cotton. The importanttechnological problems faced by the farmers were foundto be lack of quality spray pumps and nozzles forspraying chemicals (23.33%), inferior quality of Bt refuge(21.33%). Also 56.00 per cent of the respondentsreported the non-availability of cotton stalk uprooter asother technological constraint. About 20.00 per centfarmers also reported the problem of lack of Bt varietiesof cotton crop, whose seed can be sown in the nextseason. As many as 11.33 per cent of the respondentsalso felt the need of good quality improved seed drills.The similar types of constraints were reported by theSherawat et al. (1992).
Marketing constraints in Bt cotton cultivation: Asshown in the Table 3, majority (94.67%) of therespondents faced constraint of lower MSP of Bt cotton.Problem of Low price of farm produce at the time ofharvesting was also reported by Visawadia et al. (2006).Price fluctuation of Bt cotton was another major
Table 3: Distribution of respondents according tomarketing constraints faced by them in Bt cottoncultivation (n=150)Marketing constraints Frequ- Perce-
ency* ntageLack of storage space 36 24.00Price fluctuation 145 96.67Lower MSP 142 94.67Deterioration of produce while storing 44 29.33High cost of cultivation 96 64.00Lack of transport facilities 27 18.00*Multiple response
Table 2: Distribution of respondents according totechnological constraints faced by them in Bt cottoncultivation (n=150)Technological constraints Freq- Perce-
uency* ntageLack of quality spray pumps & nozzles 35 23.33Improper working of seed drills/breakage 17 11.33of seedsInferior quality of Bt refuge 32 21.33Non-availability of cotton stalk uprooter 84 56.00Lack of such varieties whose seed can be 29 19.33sown in next season*Multiple response
problem faced by majority of respondents (96.67%),whereas 64.00 per cent of the respondents faced theconstraint of high cost of cultivation of Bt cotton. Non-availability of storage space and transportation facilitiesfor marketing of Bt cotton produce was faced by nearly20.00 per cent of the respondents. Also 30.00 per centof the respondents also faced the constraint ofdeterioration of the produce while storing at home.
Institutional constraints faced in Bt Cottoncultivation: The data in the Table 4 represent that needof proper demonstrations/trainings/ awareness campsregarding Bt cotton cultivation practices was the majorinstitutional constraint faced by about 48.00 per cent ofthe respondents. Nearly thirty per cent (29.33%) ofrespondents faced the constraint of lack of trusted seedsuppliers. Nearly 60 per cent of the respondents facedthe problem of non-availability of credit from thegovernment sources and high rate of interest from theprivate or non-institutional sources of credit. About 38.67per cent of the respondents faced the difficulty of non-availability of agriculture literature at village level. Also30.67 per cent of the respondents reported the lack ofextension contacts and availability of expert advice intheir area.
Suggested extension strategies for Bt cottoncultivation in Punjab: Respondents were also askedto give their suggestions regarding cultivation of Btcotton crop. The data pertaining to Table 5 depict thevarious suggestions given by the respondents regardingBt cotton cultivation. Nearly sixty per cent (58.67%) ofthe respondents suggested that improved Bt varietiesresistant against whitefly and other sucking pests shouldbe developed. Gopalakrishnan et al. (2007) also calledfor production of seeds of the resistant cultivars fornorth India on a war footing. As many as 57.33 per centof respondents suggested that seed prices should beaffordable. Half of the respondents (50.00%) suggestedthat minimum support price (MSP) should be high andsecure. Also 46 per cent of the respondents suggestedthat pesticides quality should be improved and checkedregularly, so that their effectiveness could be maintainedfor the Bt cotton crop. About 41.33 per cent suggestedthat strict quality control measures may be enforced forchecking the sale of sub-standard pesticides. Also 30.67per cent of the respondents suggested that sufficientamount of compensation should be provided by thegovernment in case of any crop damage or failure. About

Identification of Constraints for Delineating Extension Strategies for Bt Cotton Cultivation in Punjab 195
Table 4: Distribution of respondents according to institutional constraints faced by them in Bt cotton cultivation (n=150)Institutional constraints Frequency* PercentageLack of trusted seed suppliers 44 29.33Lack of proper demonstrations/trainings/ awareness camps regarding 72 48.00Bt cotton cultivation practicesNon-availability of agriculture literature at village level 58 38.67Lack of extension contacts/experts advices 46 30.67Non-availability of credit from government sources 87 58.00High rate of interest from non-institutional sources 85 56.67*Multiple response
Table 5: Distribution of respondents according to suggested extension strategies for Bt cotton cultivation (n=150)Suggestions Frequency* PercentageMSP should be remunerative and secure 75 50.00Pesticides quality should be checked and improved and effective pesticides should be provided 69 46.00Better quality certified seeds should be produced and provided to farmers 57 38.00Seed prices should be reasonable 86 57.33Improved Bt varieties resistant against whitefly and other sucking pests should be developed 88 58.67More extension trainings/awareness camps should be organized in the villages 40 26.67Irrigation water facilities by should be enhanced. 23 15.33Sufficient compensation should be provided by govt. in case of crop failure 46 30.67* Multiple Response
38.00 per cent of the respondents suggested that betterquality seed should be provided by seed agencies. Morethan one fourth (26.67%) of the respondents suggestedthat more extension trainings, awareness camps regardingBt cotton should be organized in the villages.Venkatachalam et al. (2014) also reported that Farmers’dependency upon seed dealers and private companiesfor information about Bt cotton technology. About 15.33per cent of the respondents also suggested that irrigationwater facilities should be made enhanced.
On the basis of analysis of constraints faced by therespondents and suggestions the following extensionstrategies may be delineated for Bt cotton cultivation inthe state:
Public investment should be increased for boostingR&D facilities in Bt cotton crop these steps especiallyimportant for development new improved varietiesof Bt cotton resistant to sucking pests such aswhitefly.
Improved quality Bt cotton seeds should beprovided by the government departments at thereasonable prices to the farmers.
Minimum support price of the Bt cotton produceshould be ensured for the farmers.
The quality of pesticides should be improved andchecked regularly by the government authorities, tomaintain their effectiveness on the fields.
Awareness and demonstration camps regarding Btcotton should be organized to educate farmers aboutimproved production technologies.
CONCLUSION
Bt cotton technology cannot be doubted as a valuableoption for cotton farmers. But it has been facing somemajor constraints as challenges throughout its period,which caused a declining trend in terms of yield and netreturns for the farmers. High costs of seed and theirsub-standard quality was found to be major constraintfaced by the respondents. Also some farmers weresuffering from poor quality of underground irrigationwater and unavailability of canal water at time. Similarlysub-standard quality and ineffectiveness of therecommended pesticides along with their high costs weremajor constraints faced by the farmers in the recent years.Major marketing related problems faced by majority offarmers were sale price fluctuations and the lower MSPfollowed by lack of storage space and deterioration ofproduce while storing produce at home. Some farmersalso reported few institutional problems such as lack oftrusted seed suppliers, lack of proper seed

196 Jagmit Singh and Dharminder Singh
demonstrations / trainings / extension contacts /agricultural literature availability at village levels.Development of better Bt varieties resistant to suckingpests and to keep check on seeds and pesticides alongwith fixed market selling prices were found importantfor delineating extension strategies for Bt cottoncultivation in Punjab.
REFERENCES
Anonymous. 2015a. Area, production and productivity ofcotton in India. Retrieved from http://cotcorp.gov.in/statistics.aspx on 24.03.2015.
Anonymous. 2015b. Agricultural handbook. pp 6. PunjabAgricultural University, Ludhiana, Punjab, India.
Choudhary, B. and K. Gaur. 2010. Bt Cotton in India: A CountryProfile. ISAAA Series of Biotech Crop Profiles. ISAAA,Ithaca, New York, USA.
Gopalakrishnan, N.; S. Manickam and A.H. Prakash, 2007.Problems and prospects of cotton in different zones ofIndia. Retrieved from http://www.cicr.org.in/pdf/ELS/general3.pdf on 1512.2016.
Guillaume, P.; P. Mehta and D. Sengupta. 2008. IFPRI discussionpaper on Bt cotton and farmer suicide in India. Retrievedfrom http://www.ifpri.org/publication/Bt-cotton-and-farmer-suicides-india on 23-07-16.
Gujjar, L.R. and R.N. Padaria. 2012. Farmers perception andconstraints in adoption of Bt cotton technology. J. Comm.Mob. Sust. Dev., 7: 45-49.
Kumar, A.; N.S. Verma and B. Bhushan. 2004. Constraintsfaced by farmers regarding adoption of cotton productiontechnology. Ind. J. Soc. Res., 45: 27-31.
Ramasundaram, P.; S. Vennila and R.K. Ingle. 2007. Bt CottonPerformance and Constraints in Central India. Outlook onAgriculture, 46(3): 175-80.
Singh, A. 2014. Adoption gaps in recommended productiontechniques of Bt cotton (Gossypium hirusutum L.) inMuktsar district of Punjab. M.Sc. Thesis, PunjabAgricultural University, Ludhiana, India.
Singh, D. and R. Kaur. 2005. Integrated Pest Management inCotton: Field Facts from southwestern Punjab.Agricultural Technology Management Agency, Faridkot,Punjab, India.
Sherawat, P.S.; S.S. Punia and R.K. Khatkar. 1992. Adoption ofimproved agricultural technology for cotton in Hisar.Agric. Ext. Rev., 4: 147-53.
Venkatachalam, M.; B.S. Hansra; G.M.J. Chandre and P.K. Jain.2014. An insight into farmers’ perceptions and adotionbehavior on bt cotton cultivation. J. Comm. Mob. Sust.Dev., 9(1), 44-47.
Visawadia, H.R.; A.M. Fadadu and V.D. Tarpara. 2006. AComparative Analysis of Production and Marketing ofBt Cotton and Hybrid Cotton in Saurashtra Region ofGujarat State. Agricultural Economics Research Review, 19:293-300.
--------------------------------------------------------------------------------------------------------------------------------------------------------------Received on January, 2018, Revised on March, 2018

Journal of Community Mobilization and Sustainable Development Vol. 13(1), 197-201, January-April, 2018
Short Communication
Knowledge Level of Dairy Farmer in Roorkee Block of DistrictHaridwar
Amit Kumar, Rajbir Singh*, D.K. Singh, Atul Gupta, Neelkant1 and Vinod Kumar2
Department of LPM, College of Veterinary and Animal Sciences, SVPUAT, Modipuram, Meerut-250110, U.P.1Krihi Vigyan Kendra, Jakhdhar, Rudra Prayag; 2Krihi Vigyan Kendra, Dhanauri, Haridwar
ABSTRACT
The study was conducted in Roorkee Block of district Haridwar, Uttarakhand to find out the extent of scientificlivestock rearing understanding among dairy farmers. An appraisal of study area revealed that 46.67 percentlivestock owners belonged to young (18-38 years) age group, 48.33 per cent fall in the category of marginal farmers(below av. 1.0 ha land) group, 60.00 percent have secondary level of education and 100.00 and 95.83 percent hadtelevision and news paper as information sources, respectively. About 92.50 percent were depending on tube wellfor irrigation facility. Engagement with different village and district level social and agricultural organizations werefound to be 51.67 and 35.00 percent, respectively. Small family size owned by dairy farmers was 58.33 percent while46.33 percent dairy farmers had two earning member in their families. Livestock rearing in integration with cropcultivation including other activities or business being done by 85.83 percent dairy farmers while 14.17 percentrespondents had dairy farming as their sole livelihood source. Majority of farmers (42.50%) were found to rearfour milch animals. Plantation of poplar increased with the increase in land holdings sizes. Area covered undergreen fodder production was little bit higher (14%) with marginal farmers. On an average 57.61, 27.19 and 15.21percent had low, medium and high level of awareness about different scientific livestock manage mental parameters.Thus, it was concluded that the majority of dairy owners of study area possess low level of knowledge regardingimproved animal husbandry practices.
Keywords: Cropping pattern, Dairy farmers, Knowledge, Scientific livestock rearing, Socio-economic status
*Corresponding author email id: [email protected]
In India, livestock sector contributes nearly 25.6% ofvalue of output at current prices of total value of outputin Agriculture, Fishing & Forestry sector. The overallcontribution of Livestock Sector in total national GDP4.11% at current prices during 2012-13. Hardwar districtof Uttrakhand is well known for his holy importanceand quality animals, although, livestock component haslow share in the economy of state because of livestockrearing in this area is taken up as subsidiary to cropproduction. Roorkee block which is naturally enrichedwith Ganga canal, basically part of tehsil Roorkeecomprises 113 villages and as per 2012 census the tehsilhaving 70336 cattle and 130584 buffalo population ofvarying breeds. There are 3565 milk Societies inUttarakhand with members 135601 of Anchal dairycooperatives. In spite of India’s first Rankin world milkproduction, the average annual milk yield from bovines
is only 1214 kg as against the world average of 2104 kgper lactation (Planning Commission, 2012). As a fact thelarge quantity of milk is handled by farmers who areunaware about economic aspects of profitable dairybusiness. Adoption of dairying as Commercial enterpriseis a prerequisite of sustainable agriculture productionsystem. However, majority of rural dairy farmers rearingdairy animals, face difficulty to adopt the recommendedpackage of practices of livestock management on thescientific lines. Thus, in order to maximize the profitmargin and sensitization of farmers about the improvedscientific technologies in dairy production, it is necessaryto know the existing level of scientific knowledge aboutlivestock rearing among dairy farmers. The present studywas undertaken with the objectives to study theknowledge and resource status with socio- economicprofile of dairy farmers and their elementary knowledgeof scientific and improved animal rearing practices.

198 Amit Kumar et al.
The present study was conducted in Hardiwar districtof Uttarakhand where in general along with cropproduction, dairy farming is the main component ofthe existing agriculture production system. Roorkee blockwas selected among total of six blocks in Haridwardistrict for the investigation which is mainly known aslow land area of the district. Randomly, 120 dairy farmersfrom 12 villages were selected for the present study.Primary data were obtained by the means of a householdsurvey with the help of a comprehensive questionnairewith co-operation of RAWE (Rural Agricultural WorksExperience) students on age, education, informationsources, land holding pattern, irrigation facilities, socialparticipation approach, family size, main occupation,number and type of animals rearing, linkages with otheragencies, land distribution under crops, agriculturemechanization system, performance parameters of rearedbovines and knowledge level etc. The elementaryknowledge of a research innovation is prerequisite fortechnology adoption. To measure the knowledge levelregarding scientific dairy farming, a teacher made testhaving various component was developed. On the basisof observations collected for this purpose, dairy farmerswere classified into three groups i.e. high, medium andlow level groups.
Socio-economic profile of the respondents: Majority(46.67%) of livestock farmers belongs to the young agegroup followed by middle (32.50%) and old age group(20.83%). These findings are contradictory to reportedby Toppo (2005), Bhatt (2006), Saha et al. (2010), Ravaland Chandawat (2011), Sharma et al. (2012), Kumar etal. (2014, 2015) and Sarita (2016).
About 60.00 percent of dairy farmers had obtainedsecondary education whereas 21.67 percent had primarylevel of education followed by 14.17 percent who were
found to be graduated. Thus, 81.67 percent of dairyfarmers were having primary and secondary level ofeducation, which might be due to lack of awareness andavailability of quality educational facilitates in rural areas.Similar findings have been reported by Gour (2002),Bhatt (2006), Sen (2007) Sharma et al. (2012) and sarita etal. (2016).
Majority of respondents used Television, News Paperand Radio as sources of information regarding improvedagricultural practices including animal rearing.Furthermore, it was observed that 48.33, 30.00, 10.83,7.50 and 3.33 per cent of farmers were falls undermarginal, medium, medium-big, big and landlesscategory. Majority (78.33%) of dairy farmers had 0-2hectare of land holding. The smaller landholding sizescould be on account of emergence of nuclear familiesin the village systems. These results were in support ofstudy conducted by Bhatt (2006), Sen (2007), Sharma etal. (2012), Rathod et al. (2012), Kumar et al. (2015) andSarita et al. (2016).
Nearly 92.50 per cent farmers were found to haveirrigation facility as tube wells. About 61.67 per cent ofdairy farmers were engaged with mixed agriculture andanimal rearing, services and business practices whereasonly 14.17 per cent of the respondents had animal rearingas the sole means of livelihood. Hence, it can beconcluded that 75.84 per cent of farmers weredependent on agriculture and dairy farming alone. Thisfinding was in agreement with the results of variousworkers namely Gour (2002), Sen (2007) and Sharma etal. (2012).
It was observed that 51.67 and 35.00 percent of therespondents actively participated in village and districtlevel agricultural technology transfer programmes
Table 1: Mechanization of agriculture production systemFarm Implements Land size (ha)
Marginal Farmer* Medium Farmer Med–Big Farmer Big Farmer(< 1 ha) (1-2 ha) (2-3 ha) (> 3 ha)
Frequency Percentage Frequency Percentage Frequency Percentage Frequency PercentageTractor 43 74.13 36 100.00 13 100.00 09 100.00Harrow/Cultivator 38 65.51 36 100.00 13 100.00 09 100.00Seed sowing machine - - - - 09 69.23 04 100.00Sugarcane ridger 35 60.34 27 75.00 13 100.00 05 100.00Rotavator - - 04 11.00 08 61.54 05 100.00Spray machine 35 60.34 29 80.56 13 100.00 05 100.00* Landless farmers are also included in the category of marginal framer

Knowledge Level of Dairy Farmer in Roorkee Block of District Haridwar 199
organized by different agriculture based departmentsincluding animal husbandry, respectively and many ofthem had membership of various organizations like-Anchal milk cooperative societies, gram panchayat, villagecooperative societies and FACs. These findings are similarto those reported by Khokher (2008) and Sharma et al.(2012) which contradictory to those reported by Bhatt(2006).
Under the present investigation it was observed that58.33 percent of dairy farmers had small families withless than six members and 41.67 percent of dairy farmershad large family sizes with more than six members. Ithas been noticed that 46.33 percent of families havingtwo worth generator person or earning member. About33.33 percent with one worth generator person and 23.33percent families were there with more than two worthgenerator persons within the family. These findings arein view of family size contradictory to Sharma et al.
(2012). Out of the total respondents considered, 42.50percent had four milch animals followed by 17.50, 15.00,10.83, 9.17 and 5.00 percent of farmers who rearedtwo, six, ten, more than ten and eight animals, respectively.Majority of dairy farmers (60.00%) reared both cattleand buffaloes and 25.83 and 14.17 percent people rearedonly buffaloes and cattle, respectively. These findings werein agreement of Gour (2002) and Kumar et al. (2014,2015) while contradictory to Sharma et al. (2012).
It was observed that majority of dairy farmers hadcontact with the para vets, officers of dairy cooperatives,livestock extension officers and K.V.K scientists forobtaining information regarding animal husbandrypractices. Similar findings were reported by Gour (2002),Bhatt (2006) and Sharma et al. (2012).
Mechanization: During the survey some data on thefarm implements have also been collected to assess the
Table 2: Performance of Milk producing animalsParameters Local Cows CB Cows Buffaloes
Frequency Percentage Frequency Percentage Frequency PercentageCalving interval (Months) 12-15 months 17 18.89 50 17.54 25 6.94 16-19 months 26 28.89 86 30.18 91 25.2820-23 months 26 28.89 94 32.98 112 31.11More than 23 months 21 23.33 55 19.30 132 36.67Age at first calving (Years)1.5-3.0 years 08 8089 41 14.39 08 2.223.0-4.0 years 24 26.67 44 15.44 75 20.834.0-5.0 years 16 17.78 18 6.32 93 25.835.0-6.0 years - - - - 21 5.83More than 6.0 years - - - - - -Lactation length140-180 days 12 13.33 42 14.74 34 9.44181-220 days 18 20.00 94 32.98 120 33.33221-260 days 37 41.11 114 40.00 136 37.78261-300 days 23 25.56 35 12.28 70 19.44Parity orderOne 15 16.67 41 14.39 44 12.22Two 26 28.89 64 22.46 46 12.78Three 19 21.11 66 23.16 100 27.78Four 16 17.78 65 22.81 117 32.50More than four 14 15.56 49 17.19 53 14.72Average milk production (lit./day/animal)Up to 04 lt 29 32.22 27 9047 60 16.674.1 to 06 lt 39 43.33 59 20.70 76 21.116.1 to 8.0 lt 15 16.67 62 21.75 130 36.118.1 to 12 lt 07 7.78 81 28.42 44 12.22More than 12 lt - - 56 19.65 50 13.89

200 Amit Kumar et al.
present status of mechanization in the area of study andpresented in Table 3. According to survey, the area issaturated with sufficient numbers of tractor; howeverthe mechanization should not be viewed as displacementof man-power, in-reality it’s opened up new avenuesfor human employment Verma (2005). Sugarcane is themain agronomic crop of the area so that low populationsof seed sowing machine were found. The reason maybe the increasing trend of growing plywood tress likepoplar (populusdeltoides) for better remunerative. Thisrestricted the use of seed drill type machinery. Highnumber of spray machines (table 3) indicates that farmersare much interested in vegetable production. Thesefindings were in agreement with the results of Kumar etal. (2014, 2015).
Average performance of dairy animals: The resultsshown in Table 4 reveals that almost half (52.28%) ofcrossbreed cattle and almost two third (67.78%) ofbuffaloes were distressed with long calving intervalproblems, which might be the biggest reason affectingmilk production and adoption of commercial dairyfarming as business. About 43.33 percent dairy farmersowned local cows with 4.0-6.0 liter milk per day and32.22% had animals up to 4.0 liter milk per day. Similarly28.42% had cross breed cows producing milk 8.0-12.0liter per day while only 19.65% had cross breed cowsproducing milk more than 12.0 liter per day. On theother hand 36.11% farmers were keeping buffaloes with6.0-8.0 liter milk per day followed by 21.11% with 4.0to 6.0 liter per day and 13.89% with more than 12.0 literper day production of milk. These findings were inagreement of Kumar et al. (2014).
Knowledge of Dairy farmers about scientificlivestock rearing practices: The data collected on
colostrum feeding to calf, balance ration to heifers,breeding policy, silage preparation etc. under differentcharacteristics (Table 5) shows that the knowledge levelof all the respondent farmers was low in term ofrecommended package and practices for viablecommercial dairy farming. So that area of study is inrequirement for paying special attention towardsrecommended package and practices to the people toperform dairy farming in better ways. These findingsare similar to those reported by Saha et al. (2010) andKumar et al. (2014) and while contradictory to thosereported by Kumar et al. (2015).
The scientific livestock rearing knowledge level ofall the respondent farmers of Roorkee block of districtHaridwar was low in term of recommended packageand practices for viable commercial dairy farming.Almost one-third of respondent farmers acquired highereducation were active member of rural socialorganization. Most of the farmers were marginal tomedium land holders equipped with tube well irrigationfacilities having good scope of growing green fodderand other feeding components to make the dairy farmingmore profitable.
REFERENCES
Bhatt, P.M. 2006. Effect of mass media exposure on dairy farmersregarding animal husbandry practices. Ph.D. Thesis, AAU,Anand, Gujarat.
Census. 2012. Department of Animal Husbandry, Dairying andFisheries. http://dahd.nic.in
Gour, A.K. 2002. Factors influencing adoption of someimproved animal husbandry of dairying in Anand andVadodra district of Gujarat state. GAU, SardarKurshinagar.
Table 3: Distribution of dairy farmer on the basis of scientific dairy farming knowledgeCharacteristics Knowledge
High Medium LowFrequency Percentage Frequency Percentage Frequency Percentage
Calf management 12 10.00 34 28.33 74 61.67Heifers management 12 10.00 45 37.50 63 52.50Breeding management 04 3.33 22 18.33 94 78.33Feeding management 21 17.50 24 20.00 75 62.50Water management 31 25.83 42 35.00 47 39.17Cattle shed management 26 21.67 29 24.17 65 54.17Health management 16 13.33 29 24.17 75 62.50Clean milk production 24 20.00 36 30.00 60 50.00

Knowledge Level of Dairy Farmer in Roorkee Block of District Haridwar 201
Kumar, A.; V. Kumar; P. Kumar; A.K. Singh; S.S. Rawat and D.Chaudhari. 2015. Scientific livestock rearing knowledge: Astudy of dairy farmers in Narson of district Haridwar,Uttrakhand. International J. Basic and applied AgriculturalResearch, 13(1): 95-100.
Kumar, A.; V. Kumar; S.S. Rawar; P. Kumar; A.K. Singh and D.Chaudhari. 2014. Comparative study on scientific livestockrearing Knowledge of dairy farmers of Laksar block ofdistrict Haridwar. International J. Agril. Sci., 10(2): 671-676.
Kumar, A.; V. Kumar; S.S. Rawat; P. Kumar; A.K. Singh and D.Chaudhari. 2014. Study on Knowledge level of dairyfarmers for scientific livestock rearing practices inBhagwanpur block area of district Haridwar. InternationalJ. Agril. Sci., 10(2): 791-796.
Planning Commission. 2012. Report of the Working Groupon Animal Husbandry and Dairying for the Twelfth FiveYear Plan 2012–2017. Government of India, New Delhi.Planning commission. nic.in/aboutus/committee/wrkgrp11/wg11_rpanim.doc.
Rathod, P.K.; T.R. Nilam; S. Landge and A. Hatey. 2012. Farmer’sperception towards livestock extension service: A casestudy. Indian Research Journal of extension Education, 2: 1-5.
Raval, R.J. and M.S. Chandawat. 2011. Extent of knowledge ofimproved animal husbandry practices and socio-economical characteristics of dairy farmers of districtKheda, Gujarat. International Journal of Farm Sciences, 1(2):129-137.
Saha, D.; A.H. Akand and A. Hai. 2010. Livestock farmersknowledge about rearing practices in Genderbal districtof Jammu & Kashmir. Indian Res. J. Ext. Edu., 10(2): 15-19.
Sarita; S.P. Singh; A. Malik; M. Sharma and R. Ahuja. 2016.Socio-Economic and psychological characteristics of dairyfarmers of Hisar district. International Journal of Sciences,Environment & Technology, 5(5): 3466-3472.
Sen, P.N. 2007. Management practices adopted in dairy farmingby the farmers of Vadodra district of Gujarat. Ph.D. Thesis,AAU, Anand, Gujarat.
Singh, Gyanendra. 2006. Estimation of a Mechanization Indexand its Impact on Production and Economic Factors- aCase Study in India. Biosystem. Engineering, 93(1): 99-106.
Toppo. 2005. A study of participation and decision making offarm women in dairy occupation. M.Sc. Thesis, AAU,Anand.
Verma, S.R. 2005. Impact of Agricultural Mechanization onProduction, Productivity, Cropping Intensity, IncomeGeneration and Employment of Labour. Book on Statusof Farm Mechanization in India. Published by IASRI,New Delhi, pp. 133-153.
--------------------------------------------------------------------------------------------------------------------------------------------------------------Received on October, 2017, Revised on January, 2018

afsfsd

AUTHOR GUIDELINES
1. Society for Community Mobilization for Sustainable Development (MOBILIZATION) welcomes originalarticles. Articles (not exceeding 25,00-3,000 words) must be typed on one side of the paper, double-spaced,with wide margins on all four sides. An abstract (not exceeding 100-120 words) must accompany the article.The format followed must be Title, Name of the author(s), their affiliation, abstract, introduction, methodology,major findings, conclusion and reference.
2. E-mail the article in original as an attachment in MS Word to [email protected]. The author(s) shouldfurnish a certificate stating that the paper has neither been published nor has been submitted for publicationelsewhere.
3. Within the text, adopt the author-date method of citation minus the comma, for example, (Singh 2002). Ifmore than one work of the author is cited, separate the years of publication with a comma (Pandey 1996,1999). When more than one author is cited, the entries should be chronological with works of different authorsseparated by a semicolon (Pareek 1990; Sinha 1994; Dixit 1997). If gazetteers, reports and works ofgovernmental organizations are cited, mention the name of the organisation/institution sponsoring thepublication in the citation, fully spelt out at its first occurrence (Government of India 2003), and use itsabbreviation/ acronym in subsequent citations (GOI 2003).
4. Give separately the bibliographic details of all works cited in the article under References in the followingsequence: (a) Article: the name(s) of the author(s); the year of publication; title of the article (within single invertedcommas); the name of the journal (italicised); and the volume number, the issue number, the beginning andending page numbers. (b) Chapter in an edited work or compilation: the names(s) of the author(s); the year ofpublication; title of the chapter (within single inverted commas); the name(s) of the editor(s)/compiler(s); titleof the book (italicized); the beginning and ending page numbers of the chapters; place of publication; and thename of the publisher. (c) Book: the name(s) of the author(s); the year of publication; title of the book (italicized);place of publication; and the name of the publisher. The listing in References must follow the alphabeticalorder of the last name of the (first) author.
5. Use British, rather than American, spellings (labour, not labor; programme, not program). Similarly, use’s’,rather than ‘z’, in ‘ise’, ‘ising’, ‘isation’ words.
6. Write numerals between one and ninety-nine in words, and 100 and above in figures. However, the followingare to be in figures only: distance: 3 km; age: 32 years old; percentage: 64 percent; century: 20th century; andyears: 1990s.
7. Contributors are also required to provide on a separate sheet their name, designation, official address and E-mail ID.
8. All tables, charts and graphs should be typed on separate sheet. They should be numbered continuously inArabic numerals as referred to in the text.
9. Author(s) should be the life member of the Society.

afsfsd
A Study of Migration Pattern in Kumaun Hills and Associated Socio-Economic Factors ..... 107–Nirmal Chandra, M.L. Roy, Anirban Mukherjee, Renu Jethi and Kushagra Joshi
Income Generation by Women Self Help Groups ..... 113–Kiranjot Sidhu, Manjot Kaur and Shikha Sharma
Reaction and Viewing behaviour of Farmer’s towards “Mera Pind Mere Khet” Programme of Doordarshan ..... 118Kendra Jalandhar–Jagjeet Singh Gill and Anil Sharma and Harsimranjit Singh Brar
Opinion and Satisfaction of Students Regarding Experiential Learning Programme ..... 123–Shachi Singh and Prabhjot Kaur
Extent and Scope of Agriculture Diversification in Baghpat District of Uttar Pradesh ..... 127–Surendar Kumar, Sarita Joshi and Piyush Tomar
Perceived Constraints in Production of Bt cotton by the Growers in Haryana ..... 133–Sumit Yadav, A.K. Godara, M.S. Nain and Rashmi Singh
Occupational Status of Home Science Graduates and Post graduates of Punjab Agricultural University, ..... 137Ludhiana, Punjab–Sukhdeep Kaur Mann, Divya Sachan and Kanwaljit Kaur
Vocational Education of Academically Backward Rural Adolescents: A Step towards Furtherance ..... 142–Ritu Singh, Huma Parveen, Neera Agrawal and Shalini Thakur
Effectiveness of Short Duration Training Programmes on Field Level Watershed Functionaries ..... 147–Mukesh Kumar and P. Vijayakumar
Stakeholders Perspective on Agricultural Subsidies in Punjab ..... 151–Anupam Anand and Manmeet Kaur
Farm Telecast Viewing Behaviour of Farmers of Punjab ..... 160–Balwinder Singh, P.K. Jain, R.S. Singh and B.S. Hansra
Perceived Benefits of Adoption of Low Tunnel Technology for Vegetable Production in Punjab State ..... 165–Lavleesh Garg and Tejinder Singh Riar
Investigation of Nutritional and Health Status of Indian Rural Hill Farm Women ..... 169–Renu Jethi, Pratibha Joshi, Nirmal Chandra, M.L. Roy and Kushagra Joshi
Use of Revolving Stool for Drudgery Reduction among Farm Women Involved in Milking Dairy Animals ..... 177–Pratibha Singh, C. Tiwari, Anupama Pandey and D. Sharma
Depeasantry in Punjab: A Case Study ..... 182–Priyanka Sharma, Ravinder Kaur Dhaliwal and Lopamudra Mohapatra
Socio - Economic Upliftment of Farmers through Udaipur Agro Producer Company Limited ..... 185–Subhashree Sahu, J.P. Sharma, R.R. Burman, Premlata Singh and Eldho Varghese
Identification of Constraints for Delineating Extension Strategies for Bt Cotton Cultivation in Punjab ..... 191–Jagmit Singh and Dharminder Singh
Short CommunicationKnowledge Level of Dairy Farmer in Roorkee Block of District Haridwar ..... 197–Amit Kumar, Rajbir Singh, D.K. Singh, Atul Gupta, Neelkant and Vinod Kumar
Journal of Community Mobilization and Sustainable Development Vol. 13(1), January-April, 2018
Printed and Published by Dr. J.P. Sharma, President, Society for Community Mobilization for Sustainable Development, Divisionof Agricultural Extension, IARI, New Delhi-110012
CONTENTS
Contd..............
Construction and Standardization of Knowledge Test to Measure the Knowledge Level of Maize Growers ..... 1on Maize Production Technologies–Suraj Parkash and Rajinder Peshin
Adoption and Impact of Kisan Mobile Advisory - an ICT tool on Agriculture Progress in Malwa Region ..... 6of Madhya Pradesh–Ghazala Khan, A.K. Dixit, Arvind Saxena and D.S. Tomar
Introduction of Climbing Perch (Anabas Testudineus, Bloch) in Low Lying Rice Field as a Component of ..... 13Integration for Doubling Farmers Income in Assam–Pabitra Kumar Saharia, Sonmoina Bhuyan, Ranjit Bordoloi, D. Borah, B. Rahman, H. Rabha and P. Deka
A Study on Instigation of Farmer-led innovations and its Spread ..... 17–Hema Baliwada, J.P. Sharma, R.R. Burman, M.S. Nain, P. Venkatesh and Anil Kumar
Cropping and Irrigation Dynamics under Different Groundwater Market Regimes in West Bengal ..... 27–Mamani Besra, Souvik Ghosh and Subrato Gorain
Capacity Building: A Pathway for Changing Behaviour of Self help Groups ..... 36–Lakhwinder Kaur and Rajinder Kaur Kalra
Participatory Agro-ecological and Socio-economic Analysis of Jute Cultivation in West Bengal ..... 43–Sujit Sarkar, Aniruddha Maity, Tilak Mondal, Seiko Jose, Rumki Chisim Sangma, Arpita Mondal Khan,Sailesh Kumar and S.K. Jha
Assessment of Non-Timber Forest Products (NTFPs) based Livelihood Systems among the Forest ..... 52Dwellers of Chhattisgarh–Ashish Kumar Gupta, M.L. Sharma and M.A. Khan
Farm Size and Productivity Relationship in Smallholder Farms: Some empirical evidences from Bihar, India ..... 61–R.K.P. Singh, Abhay Kumar, K.M. Singh, N. Chandra, R.C. Bharati, Ujjwal Kumar and Pankaj Kumar
Marketing Behaviour of Vegetable Growers in Uttarakhand hills ..... 68–Shailesh Kumar, Maniklal Roy and Anirban Mukherjee
Perception of the farming community regarding quality of articles published in Haryana Kheti ..... 75–Krishan Yadav, Rajesh Kumar, Pardeep Kumar Chahal and Bharat Singh Ghanghas
Fisher’s Outlook and Perception towards Fishery Resources of River Ib ..... 79–Rejani Chandran, L.K. Tyagi, A.K. Jaiswar, Sudhir Raizada, Sangeeta Mandal, Trivesh S. Mayekar,Amit Singh Bisht and Sanjay Kumar Singh
A Study on the Information System of Nature Fresh dairy Project in Kerala ..... 84–V. Sreeram and Jancy Gupta
Marketing Analysis of Meat Retailing in Jammu ..... 91–Amit Handoo, Anil Bhat, Jyoti Kachroo, Sushil Sharma, Sudhakar Dwivedi, Rakesh Sharma and Naveed Hamid
Quality Status of Wheat Seed in Eastern India and the Early Vegetative Growth of Wheat ..... 98(Triticum aestivum L.) in Relation to Size of Seed–P.R. Kumar, C.B. Singh, Ashish Kumar Gupta and Kundan Kumar