Cover 2017.cdr
72
Volume 8 No.1 January-June 2018 ISSN : 0973-1865 Society for Conservation of Domestic Animal Biodiversity
-
Upload
khangminh22 -
Category
Documents
-
view
4 -
download
0
Transcript of Cover 2017.cdr

Volume 8 No.1 January-June 2018 ISSN : 0973-1865
Society for Conservation ofDomestic Animal Biodiversity

PRESIDENT
Dr Arjava Sharma, ICAR-NBAGR, Karnal
VICE PRESIDENTS
Dr M.S. Tantia, Principal Scientist, ICAR-NBAGR, Karnal
Dr R. Vinoo, NTRCoVS, Gannavaram
Dr G.C. Gahlot, Prof & Head COVAS RUVAS, Bikaner
Dr R.S. Gandhi, ADG (AP&B), ICAR, New Delhi
GENERAL SECRETARY
Dr R.K .Pundir, Principal Scientist, ICAR-NBAGR, Karnal
JOINT SECRETARIES
Dr A.K. Mishra, Principal Scientist, ICAR-NBAGR, Karnal
Dr Sanjeev Kumar, Principal Scientist, ICAR-CARI, Izatnagar
TREASURER
Dr N.K. Verma, Principal Scientist, ICAR-NBAGR, Karnal
MEMBERS
Dr Monika Sodhi, Principal Scientist, ICAR-NBAGR, Karnal
Dr P.K. Vij, Principal Scientist, ICAR-NBAGR, Karnal
Dr S. Jayakumar, Scientist, ICAR-NBAGR, Karnal
Dr R.S. Kataria, Principal Scientist, ICAR-NBAGR, Karnal
Dr K. P. Ramesha, Principal Scientist, ICAR-NDRI, SRS, Bangalore
Dr A.K. Patel, Principal Scientist, ICAR-CSWRI, Bikaner
Dr Bindya Liz Abraham, Assistant Professor, COVAS, Mannuthy
Dr Simarjeet Kaur, Assistant Professor, GADVASU, Ludhiana
Dr Aruna Pal, Assistant Professor, WBUAFS, Kolkata
Dr D. Cauveri, Assistant Professor, TANUVAS, Chennai

An of�icial publication of the Society for Conservation of Domestic Animal Biodiversity
Chief Editor
Dr P.K. Singh
ICAR-NBAGR, Karnal
Executive Editor
Dr S.K. Niranjan
ICAR-NBAGR, Karnal
Editor
Dr Indrajit Ganguly
ICAR-NBAGR, Karnal
Advisory Board
Chairman
Dr B. Prakash, Meerut
Members
Dr S.N.S. Parmar, Jabalpur
Dr G.K. Gaur, lzatnagar
Dr D. Kumar, Pantnagar
Dr D.N. Das, Bangalore
Dr Umesh Singh, Meerut
Dr S.S. Tomar, Mhou
Dr K.P. Singh, Hisar
Dr Vikas Vohra, Karnal
Editorial Ofce Animal Genetics Division, ICAR-National Bureau of Animal Genetic Resources P.O. Box 129, Karnal-132001 (Haryana), India www.nbagr.res.in, email : [email protected]
Published by Society for Conservation of Domestic Animal Biodiversity
Printer : Aaron Media, Karnal
Subscription (Annual) Indian Foreign
Individual Rs 300.00 US $ 100.00
Institutional Rs. 600.00 US $ 150.00
Single copy Rs. 300.00 US $ 75.00


Review
Goat genetic diversity of India - An overview
NK Verma
Research papers
Genetic analysis of body conformation traits of indigenous Uttara chicken
Manish K Singh, Shive Kumar, RK Sharma, SK Singh, Brijesh Singh and DV Singh
Migration pattern of Desi sheep of Gujarat – a note
GR Gowane, LLL Prince, C Paswan, RC Sharma and SMK Naqvi
Biochemical response in cattle vaccinated with Bm95 recombinant Vaccine
VK Pal, VM Gawali, SK Rewani, Jaswant Singh and SS Sengar
Development of allele-speci�ic PCR based DNA test for detection of syndactylism (mule foot)
related missense mutation in Holstein Friesian cattle
Anshuman Kumar, ID Gupta, Govind Mohan, S Jayakumar and Saket K. Niranjan
STR markers based genetic diversity evaluation of Chilika buffalo of Odisha state
Ravinder Singh, S Lavakumar, Ankita Gurao, SK Mishra, SK Niranjan, V Vohra, SK Dash and RS
Kataria
Standardization of a common protocol for establishment and cryopreservation of �ibroblast cell
lines from different indigenous livestock species
Himani Sharma, Rekha Sharma, RAK Aggarwal, PK Vij, Sonika Ahlawat, Th Randhir Singh,NV Patil
and MS Tantia
Study of performance and management practices of Dumba sheep in semi-arid region of the
India
AK Mishra, A Jain, S Singh and KS Rathore
Population trends and distribution of indigenous pigs in India
Rahul Behl, PK Vij, SK Niranjan, Jyotsna Behl and Arjava Sharma
01
11
16
20
24
29
36
45
50
JOURNAL OF LIVESTOCK BIODIVERSITY VOLUME 8, NUMBER 1, 2018
CONTENTS


Volume 8 (2018) Number 1
01
Goat genetic diversity of India - An overview
N K Verma*
ICAR-National Bureau of Animal Genetic Resources, Karnal – 132001, Haryana
ABSTRACT
Indian goats include well de�ined and documented populations designated by breeds and those (lesser known) which are not studied adequately and least documented. The inadequately studied populations or 'lesser known', goats form a major chunk (65%) of the total goat population. As per the policy of Govt. of India, all the livestock breeds have to be registered and should �ind a place in the gazette of India. There are 28 registered goat breeds as on date. Each breed is known for its utility (Meat/Milk/�iber). Most of the goats are
multipurpose yielding mainly meat in addition to their other speci�ic performance e.g. milk. The complete characterization (phenotypic and genetic) of these populations may indicate the distinctness of some or all of these populations. After confirming the distinctness the population can be assigned the breed status and the useful characteristics of the breed can be utilized for upgrading other non-descript populations.
Key Words: Breed, goat, native tract, population
*Corresponding author: [email protected]
Manuscript received: 05.3.2018; accepted: 30.6.2018
Goats contribute (26.40%) to the total livestock population of the country and is next to the cattle (37.28%). The estimated population of goats as per the latest livestock census (LC) is 135.17 million consisting of 37.61 m males and 97.55 m females (19th LC, 2012). There has been a decrease by 3.82% in the goat population as compared to the previous population (140.53 million) (18th LC, 2007). Male animals contributed more to this reduction (-7.79%) as compared to the females (-2.19%). Since goat farming is associated more with the rural life, the reduction in goat population is less in rural areas. The changes in goat population in rural and urban areas have been reported as -3.18 and -15.66%, respectively. Among the different states, maximum decrease (-23.65%) in goat population was recorded in West Bengal. Increase in goat population was recorded in Assam (42.81%) followed by Bihar (19.54%), Chhattisgarh (16.52%), Gujarat (6.87%) and Uttar Pradesh (5.36%). National Bureau of Animal Genetic Resources (NBAGR), Karnal has been identi�ied as a nodal agency to register the livestock breeds by Indian Council of Agricultural Research
(ICAR). Applications are received from the stakeholders for registering their goat populations as breed. After scrutiny and verifying the authenticity of information provided by the claimant, the accession number is assigned to the breed on the recommendation of breed registration committee. The accession number is a notation
Review

02
Volume 8 (2018) Number 1
signifying the name of country, species, state (denoted by code/s), name of breed, species and b r e e d ( b o t h d e n o t e d b y c o d e s ) i . e . INDIA_SPECIES_ABCD_BREED_XYEFG where ABCD = two digit code each for two states, XY = two digit code for species (06 for goat) and EFG = three digit code for breed (serial number in the list of registered breeds). For example, the accession number assigned to barbari is INDIA_GOAT_ 2017_ BARBARI_06002. Here 20 and 17 are the state codes for Uttar Pradesh and Rajasthan respectively where the breeding tract lies, 06 is the code for goat species and 002 is the code for Barbari breed.
There are 28 registered goat breeds as on date. This consists of 1( Changthangi) from Jammu & Kashmir, 2 ( Chegu and Gaddi) from Himachal Pradesh, 1 ( Beetal) from Punjab,2 ( Jamnapari and Barbari) from Uttar Pradesh, 1 ( Pantja) from Uttarakahand, 3 ( Jakhrana, Marwari and Sirohi) from Rajasthan, 5 ( Surti, Gohilwadi, Kutchi, Mehsani and Zalawadi) from Gujarat, 4 ( Sangamneri, Osmanabadi, Konkan Kanyal and Berari) from Maharashtra, 1( Ganjam) from Odisha, 1( Black Bengal) from West Bengal, 3 ( Kanniadu, Kodiadu and Salem Black) from Tamilnadu, 2 (Malabari and Attapaddy Black) from Kerala, 1 ( Teressa ) from Andaman & Nicobar, 1(Sume-Ne) from Nagaland.
Each breed is known for its utility (Meat/Milk/�iber). Most of the goats are multipurpose yielding mainly meat in addition to their other speci�ic performance e.g. milk by Jamnapari, Jakhrana, Surti, Beetal; �iber or pashmina by Changthangi, Gaddi, Chegu and multiple births by Black Bengal.
On the recommendation of ICAR-NBAGR, breed wise census was initiated by the State Animal Husbandry
Departments of each state. The state wise total goat population of the registered goat breeds available as per the breed wise census, 2013 is given in table 1 and their geographical distribution is depicted in the map.
After assigning the accession numbers, the characters of registered breeds have been published from time to time (NBAGR, 2008, 2009, 2012, 2015, 2016). The detailed information on the characters and performance of many of the registered breeds have also been published by ICAR-NBAGR in the form of breed monographs i.e. Jakhrana ( Verma et al., 2005), Marwari ( Dixit et al., 2005), Chegu ( Aggarwal et al., 2005), Barbari (Sharma et al., 2005), Beetal (Sharma et al., 2005), Sirohi (Verma et al., 2006), Ganjam ( Dash etal., 2006), Kutchi ( Dixit et al., 2 0 0 6 ) ) , G o h i lwa d i ( Ve r m a e t a l . , 2 0 0 6 ) , Attapady(Aggarwal et al., 2007), Changthangi ( Aggarwal et al., 2007), Malabari ( Verma et al., 2008), Sangamneri (Verma et al., 2010), Konkan Kanyal (Verma et al., 2011), Berari (Verma et al., 2012), Sikkim Black (Verma etal., 2015), Sikkim goats (Verma et al., 2015), Nagaland goats (Verma et al., 2017). A brief description of breeding tract and phenotypic characters of each recognized breed has been given here.
Attapady Black (Accession: INDIA_GOAT_0900_ ATTAPADY BLACK_06001): Tract: District: Palakkad / Palghat districts of Kerala; Body Size: Medium; Colour : Black; Horn Size& Shape: Small to medium, Curved backward; Ear: Semi-pendulous; Utility: Meat
Barbari (Accession: INDIA_GOAT_2017 _BARBARI _06002): Tract: Aligarh, Agra, Mathura, Etawah districts of Uttar Pradesh; Body Size: Small to
Jamnapari Changthangi Black Bengal
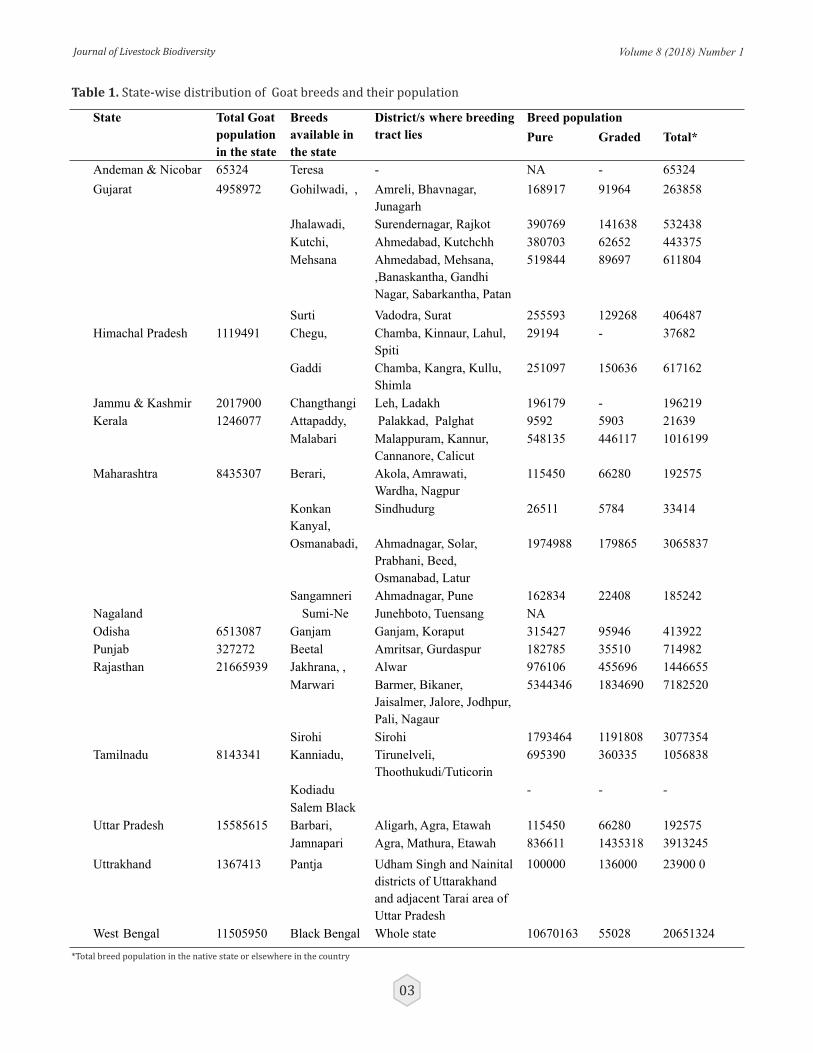
Table 1. State-wise distribution of Goat breeds and their population
Volume 8 (2018) Number 1
03
State
Total Goat
population
in the state
Breeds
available in
the state
District/s
where breeding
tract lies
Breed population
Pure
Graded
Total*
Andeman & Nicobar
65324
Teresa
-
NA
-
65324
Gujarat
4958972
Gohilwadi, ,
Amreli, Bhavnagar,
Junagarh
168917
91964
263858
Jhalawadi,
Surendernagar, Rajkot
390769
141638
532438
Kutchi,
Ahmedabad, Kutchchh
380703
62652
443375
Mehsana
Ahmedabad, Mehsana,
,Banaskantha, Gandhi
Nagar, Sabarkantha, Patan
519844
89697
611804
Surti Vadodra, Surat 255593 129268 406487
Himachal Pradesh 1119491 Chegu, Chamba, Kinnaur, Lahul,
Spiti 29194 - 37682
Gaddi Chamba, Kangra, Kullu,
Shimla 251097 150636 617162
Jammu & Kashmir 2017900 Changthangi Leh, Ladakh 196179 - 196219
Kerala 1246077 Attapaddy, Palakkad, Palghat 9592 5903 21639
Malabari Malappuram, Kannur,
Cannanore, Calicut 548135 446117 1016199
Maharashtra 8435307 Berari, Akola, Amrawati,
Wardha, Nagpur 115450 66280 192575
Konkan
Kanyal,
Sindhudurg 26511 5784 33414
Osmanabadi, Ahmadnagar, Solar,
Prabhani, Beed,
Osmanabad, Latur
1974988 179865 3065837
Sangamneri Ahmadnagar, Pune 162834 22408 185242 Nagaland Sumi-Ne Junehboto, Tuensang NA Odisha 6513087 Ganjam Ganjam, Koraput 315427 95946 413922 Punjab 327272 Beetal Amritsar, Gurdaspur 182785 35510 714982 Rajasthan 21665939 Jakhrana, , Alwar 976106 455696 1446655
Marwari Barmer, Bikaner,
Jaisalmer, Jalore, Jodhpur,
Pali, Nagaur
5344346 1834690 7182520
Sirohi Sirohi 1793464 1191808 3077354 Tamilnadu 8143341 Kanniadu, Tirunelveli,
Thoothukudi/Tuticorin
695390 360335 1056838
Kodiadu
-
-
-
Salem Black
Uttar Pradesh
15585615
Barbari,
Aligarh, Agra, Etawah
115450
66280
192575
Jamnapari
Agra, Mathura, Etawah
836611
1435318
3913245
Uttrakhand
1367413
Pantja
Udham Singh and Nainital
districts of Uttarakhand
and adjacent Tarai area of
Uttar Pradesh
100000
136000
23900
0
West Bengal
11505950
Black Bengal
Whole state
10670163
55028
20651324
*Total breed population in the native state or elsewhere in the country

medium; Colour : White with Tan / dark red spots; Horn Shape &Size :Medium, twisted, directed upward and backward; Ear: small, erect, tubular, directed upward and backward; Utility: Milk, Meat
B e e t a l ( A c c e s s i o n : I N D I A _ G O AT _ 1 6 0 0 _ BEETAL_06003): Tract: Amritsar, Batala, Gurdaspur districts of Punjab; Body Size: Medium to large; Colour :Mainly Black, Brown with white patches; Horn Shape & Size :Medium, slightly twisted, directed backward and upward; Ear: long, leafy, pendulous, Other characteristics :Tall , roman nose and long ears; Utility: Milk, Meat
Berari (Accession: INDIA_GOAT_1100_BERARI _06023): Tract: Akola, Amrawati, Wardha, Nagpur districts of Maharashtra; Body Size: Medium to large; Colour : Light to dark tan; Horn Shape & Size : Flat, small, oriented upward and backward; Ear: medium to long, pendulous, Other Characteristics:stripes on face extending from muzzle to base of horns, black coloured ring around neck in adult male, black hair line along the vertebral column extending up to tail in both sexes; Utility: Meat
Black Bengal (Accession: INDIA_GOAT_2100_ BLACK BENGAL_06004): Tract: widely distributed in West Bengal, Odisha, Assam, Manipur, Meghalaya, Tripura, Arunachal Pradesh states; Body Size: Small; Colour :Predominantly black, brown; Horn Shape &Size :Small to medium in size, directed upward and backward; Ear: Small, horizontally placed; Other Characteristics :Small-legged goat, Hair coat short and lustrous, nose line slightly depressed; Utility: Meat, fecundity.
Changthangi (Accession: INDIA_GOAT_0700_ CHANTHANGI_06005): Tract: Leh district of Jammu & Kashmir; Body Size: Small; Colour : Mainly white, white with grey or brown hair mixing also available; Horn Shape &Size :Large, curved outward, upward/downward and inward, bigger and thicker in males; Ear: Small, horizontally placed; Other Characteristics :White, lustrous hairy coat ( Pashmina, ), short legs, beard, pink muzzle; Utility: Meat, Pashmina.
C h e g u ( A c c e s s i o n : I N D I A _ G O A T _ 0 6 0 0 _ CHEGU_06006): Tract: Chamba, Kinnaur, Lahul, Spiti districts of Himachal Pradesh, and Leh of Jammu &
Kashmir; Body Size: Small; Colour : White, black, grey, brown and mixture of these colours; Horn Shape &Size : long, �lat, cork shaped, directed upward, backward and inward/outward; Ear: Small, erected; Visible Characteristics: Reddish/tan/black spots mostly around head, neck and abdominal areas. Face and muzzle tapering, possess long hair with a second coat of pashmina wool; Utility: Meat, �iber.
Gaddi (Accession:INDIA_GOAT _0600_GADDI_06007): Tract:, Jammu & Kashmir, District: Chamba, Kangra, Kullu, Shimla districts of Himachal Pradesh; Body Size: Medium; Colour : Mainly White; Horn Shape &Size: Directed upward and backward and occasionally twisted, medium in size; Ears: Medium, drooping; Other Characteristics : Skin covered with coarse long hair; Utility: Meat, �iber
G a n j a m ( A c c e s s i o n : I N D I A _ G O AT _ 1 5 0 0 _ GANJAM_06008): Tract: Ganjam, Koraput districts of Odisha; Body Size: Medium; Colour: Black or Brown black,White, brown with or without patches; Horn Shape &Size : Long, twisted and curved backward and upward, Ear: Medium, drooping; Utility: Meat
G o h i l w a d i ( A c c e s s i o n : I N D I A _ G O AT _ 0 4 0 0 _ GOHILWADI_06009): Tract: Amreli, Bhavnagar, Junagarh districts of Gujarat; Body Size: Medium; Colour : Black; Horn Shape &Size : Twisted and turned backward, Ear: Medium, tubular /drooping; Other Characteristics: Nose line is slightly convex. Body covered with coarse long hair; Utility: Milk, Meat.
J a k h r a n a ( A c c e s s i o n : I N D I A _ G O AT _ 1 7 0 0 _ JAKHRANA_06010): Tract: Alwar district of Rajasthan; Body Size: Large; Colour: Predominantly black with white spots on ears and muzzle; Horn Shape & Size: Broad and �lat, curving backward; Ear: Medium, drooping, having white spots; Other Characteristics : Straight face line. Forehead narrow and slightly bulging. White spot around muzzle, Udder size large with conical teats; Utility: Milk, Meat.
J a m n a p a r i ( Acce s s i o n : I N D I A _ G OAT _ 2 0 0 0 _ JAMNAPARI_06011): Tract: Agra, Mathura, Etawah districts of Uttar Pradesh and Bhind, Morena of Madhya Pradesh; Body Size: large; Colour : Mainly White, sometimes with patches of tan or black mostly
Volume 8 (2018) Number 1
04

Volume 8 (2018) Number 1
05
on head and neck; Horn Shape & Size : Short, sword shaped; Ear: Long pendulous slightly folded; Other Characteristics : tuft of hair on face, roman nose, Hair on thigh, curve along dorsal line; Utility: Milk, meat
Kanni Adu ( Access ion: INDIA_GOAT_1800_ K A N N I A D U _ 0 6 0 1 2 ) : T r a c t : T i r u n e l v e l i , Thoothukudi/Tuticorin districts of Tamil Nadu; Body Size: Medium; Colour : Predominantly Black; Horn Shape & Size : Broad, small, curving backward; Ear: Medium, drooping, white margin; Other Characteristics : White stripes on either side of the face extending from the base of the horn to corner of the muzzle, Utility: Milk, Meat.
K u t c h i ( A c c e s s i o n : I N D I A _ G O A T _ 0400_KUTCHI_06013): Tract: Gujarat, Rajasthan; District: Ahmedabad, Kuchh of Gujarat and Barmer, Bikaner, Jaisalmer, Jalore, Jodhpur, Pali, Nagaur districts of Rajasthan: Body Size: Medium, Colour : Predominantly black white, brown, and spotted; Horn Shape & Size : Short to long, thick and cork screw type, curved upward; Ear: Medium , pendulous, Other Characteristics : Long and coarse hair, slightly roman nose, white spot in the neck region, curly tuft hair on forehead; Utility: Milk, Meat.
M a l a b a r i ( A c c e s s i o n : I N D I A _ G O AT _ 0 9 0 0 _ MALABARI_06014): Tract: Malappuram, Kannur, Calicut districts of Kerala; Body Size: Medium; Colour : Mainly White; Horn Shape &Size :Short, Slightly twisted directed outward and upward; Ear: Medium, drooping, Ear tip is slightly curved; Other Characteristics : polled, Beard, mostly stall fed, proli�ic; Utility: Milk, Meat.
M a r w a r i ( A c c e s s i o n : I N D I A _ G O AT _ 1 7 0 0 _ MARWARI_06015): Tract: Barmer, Bikaner, Jaisalmer, Jalore, Jodhpur, Pali, Nagaur districts of Rajasthan; Body Size: Medium; Colour : Predominantly black; Horn Shape & Size :Short, pointed, directed upward and backward; Ear: Flat, long, drooping; Other Characteristics :Long shaggy hair coat; Utility: Milk, Meat.
M e h s a n a ( A c c e s s i o n : I N D I A _ G O AT _ 0 4 0 0 _ MEHSANA_06016): Tract: Gujarat , District: Ahmedabad, Banaskantha, Gandhi Nagar, Mehsana, Sabarkantha, Patan; Body Size: Medium; Colour : Black; Horn Shape &Size :Screw type, curved upward
and backward, pointed; Ear: medium, with white spots ranging from a few to complete white; Other Characteristics : White spots are present on the upper part of muzzle. Hair coat long and shaggy; Utility: Milk, Meat.
Osmanabadi (Accession: INDIA_GOAT_1100_ OSMANABADI _06017): Tract:, Ahmadnagar, Solar, Prabhani, Beed, Osmanabad, Latur districts of Maharashtra; Body Size: Medium; Colour Predominantly black; Horn Shape & Size : Slightly twisted, curved upward and backward; Ear: Medium size, drooping; Other Characteristics : Hairy coat, wattles, straight nose live Utility: Milk, Meat.
Sangamneri (Accession: INDIA_GOAT_1100_ SANGAMNERI _06018): Tract: Ahmadnagar, Pune districts of Maharashtra; Body Size: Medium; Colour : Mainly White, black or brown. Spotted animals are also available; Horn Shape &Size :Thin, directed upward and backward, medium; Ears: Medium, Horizontally placed or slightly drooping; Other Visible Characteristics: Coarse hairy coat, Face is triangular and convex type, Wattles, Beard; Utility: Milk, Meat.
Sirohi (Accession: INDIA_GOAT_1704_SIROHI _06019): Tract: Sirohi district of Gujarat and Rajsmand of Rajasthan; Body Size: Large; Colour : Predominantly brown with light or dark brown spots; Horn Shape &Size : Small to medium, curved upward and backward; Ears: Flat and leaf like pendulous ears; Other Characteristics : body medium to large, nose slightly roman, legs long, curve along dorsal line; Utility: Milk, Meat
Surti (Accession: INDIA_GOAT_0400_SURTI_06020): Tract: Vadodra, Surat districts of Gujarat; Body Size: Small to medium; Colour : Mostly White; Horn Shape & Size :. Small to medium, directed upward and backward; Ears: Medium sized, drooping; Other Characteristics :. Well-developed udder with large conical teats; Utility: Milk, Meat
Zalawadi (Accession:INDIA_GOAT_0400_ZALAWADI _06021): Tract: Rajkot and, Surendranagar districts of Gujarat; Body Size: Medium to large; Colour :Body is covered with black, lustrous, shining hairs; Horn Shape & Size : Horns are cork-screw type moving straight upwards, backwards and slightly outward

Volume 8 (2018) Number 1
06
with pointing tips; Ears: long, leaf like, pendulous, with white spots.; Other Characteristics : Well-developed udder with large conical teats, long legs; Utility: Milk, Meat.
K o n k a n K a n y a l ( A c c e s s i o n : I N D I A _ G O AT _ 1100_KONKAN KANYAL_06022): Tract: Sindudurg district of Maharashtra; Body Size: Medium, Colour :Mostly black, brown; Horn Shape & Size : Medium, cylindrical, pointing backward; Ears: Medium, white margin, �lat, long ,drooping; Other Characteristics : White marking on face and neck region, Ventral surface of the body is white. Legs long, medially white, belly white; Utility: Milk, Meat
P a n t j a ( A c c e s s i o n : I N D I A _ G O A T _ 2 4 2 0 _PANTJA_06024): Tract: Udam Singh Nagar of Uttarakhand; Body Size: Medium; Colour : Brown/tan; Horn Shape & Size : Small to medium, straight, curving upward, outward; Ears: Medium, �lat, drooping; Other Visible Characteristics : stripes on face extending from muzzle to base of horns, hair on thighs; Utility: Milk, Meat
Te r e s s a ( A c c e s s i o n : I N D I A _ G O AT _ 3 3 0 0 _ TERESSA_06025): Tract: Andeman & nicobar island, Body Size: Medium; Colour : Brown or tan ; Horn Shape & Size : Large horn with �lat base; Ears: Medium, erected, horizontally placed; Other Characteristics : Tall, black hairs on dorsal midline up to the tail. Black colored muzzle, eyelids and hoofs. White stripes starting from eye brows and extending up to nostrils or mouth; Utility: Milk, Meat.
K o d i A d u ( A c c e s s i o n : I N D I A _ G O AT _ 1 8 0 0 _ KODIADU_06026): Tract:, District: Thoothukudi & Ramanathapuram districts of Tamil Nadu; Body Size: Medium to large; Colour : Chem-Porai goats are white in colour with varying degree of reddish brown colour, whereas, Karum-Porai goats are white in colour with varying extent of splashes of black colour; Horn Shape & Size : small, thin orienting upward and backward; Ears: Medium, slightly drooping; Utility: Meat
Salem Black (Accession:INDIA_GOAT_1800_SALEM BLACK_06027): Tract: Salem and Erode districts of Tamil Nadu; Body Size: Medium to large; Colour : Predominantly black colour coat; Horn Shape & Size : Medium, grey in colour, curved upwards and
backwards, thicker and longer in males; Ears; medium size, black, slightly drooping; Other Characteristics : Animals tall, long, lean and leggy with compact body, muzzle, hooves black; Utility: Meat.
S u m i - N e ( A c c e s s i o n : I N D I A _ G O AT _ 1 4 0 0 _ SUMINE_06028): Tract: Zunehboto, Tuensang districts of Nagaland; Body Size: Small to Medium; Colour : White with black patch in the neck region; Horn Shape & Size : Pointed, directed upward and then slightly backward, Longer and thicker in males, orienting upward and backward; Ears: Medium size, erect and are placed horizontal ly; Other Characteristics : Nose line straight, Long hair in the adult males. In females, the long hair present generally on thigh region; Utility: Meat
Lesser known goats
Many populations of goat existing in different pockets of the country are either nondescript or graded or inadequately studied and hence are called lesser known populations. Due to lack of detailed study on them they are not properly documented. During the breed census conducted in 2013 these goats have been enumerated under graded category. Some populations which earlier belonged to this non descript category have been studied by taking visits to their respective breeding tracts. A good amount of information was generated and documented which strengthened the claim for their registration as new breed of goat. Still, there are populations left which require detailed study before assigning them the breed status if they are unique. The Information available on many lesser known goat populations have been compiled by Verma et al. (2010), Mishra et al. (2015) and Bhatia et al. (2016).
Non- descript goat breeds of temperate Himalayan region are Shingari and non-pashmina goat of Ladakh . Goats of North East (Roy et al ., 2007)region's are Singharey Sikkim ( Verma et al., 2015), Black North West arid and semi-( Verma et al., 2016). arid region's non-descript goats are Udaipuri (Barwal et al., 2010) ( Singh et al., 2010), Jaunpuri , Bundelkhandi, Rohilkhandi/ Bareilly ( Das, 2008; Bhatia et al.,2016) (Barwal et al., ), Chaugarkha 2007) (Singh et al., 2010)and Tarai goat . Goats of Southern region are Andaman goat, Teressa, Barren

Volume 8 (2018) Number 1
07
(Anthra, 2006) ( Tantia,2017 Naveen , Bidri goat ;Kumar et al., 2008) ( Tantia. 2017), Nandidurga Mahabubnagar whereas (Ekambaram et al., 2011)that of Eastern Region are Black Bengal type (Rao et al., 2006) ( Singh and Singh, 2006), Jharkhand Black , Kalahandi, Raigarhi , Ghumusari (Verma et al., 2015) (Rao et al., 2002; Verma et al., 2015) , Malkangiri(Verma et al., 2015) ( Verma et , Narayanpatnamal.,2015) and Assam Hill goats. Some of these populations have been studied but not found �it for breed status whereas some (six) are likely to be declared as new breeds.
General anagementm
It is generally believed that goat can eat anything and everything. They have very sensitive lips and are in the habit of smelling the food which is clean and tasty. Goats avoid eating soiled food unless they are pushed to starvation. Goats are kept on local vegetation. The feeding practices may be stall feeding, semi-stall feeding, grazing alone, and grazing with supplement feed. The large flocks are sent for pasture feeding. The natural grasses, shrubs, trees and crop residues form the part of pasture grazing. Fodder resources consists of Pala (Zizyphyus jujube), Khejri (Prosopis cineraria), Ber(Zizyphus rotundifoJia), Neem (Azadirachta indica), Babool (Acacia arabica),Kikkar (Acacia nilotica). Stall-fed animals are supplemented with the concentrate consisting of Loom, Guar, Moth, Moong, Bajra, Jowar, Maize etc. The pregnant animals and good milch goats are given extra ration. The newborn kids are kept on milk feeding and are allowed to suckle their mothers ad-lib.
Goats are generally kept open but at night they are shifted to temporary katcha houses constructed
using material like mud, bricks, stones, concrete, bamboo sticks, wooden logs and iron girdle etc. Very few houses are made puccka in a planned way. There is no proper arrangement of electric and water supply in the goat houses. They are made either on the ground level or on the pillars raised from the ground at 3-4 ft level. The floor in such elevated houses is made of wooden planks. A ramp is made for the entry and exit of the animals.
Small gates with temporary lock system are also made. The goat house with raised flooring help in keeping the house neat and clean as all the droppings and urine come down on the ground below the floor of house and do not accumulate on the floor. The raised flooring also provide good ventilation and keeps the animals free from infections. In some houses the feeding mangers are also made on the outer wall of the house. When the animals are small in number they share the owner's residence. For kids, basket /cage housing is used. In the field animals are kept open in a area fenced temporarily using sticks or ropes.
Health of goats is of prime importance for a good profitable goat farming. Good quality green fodder and balanced feed increase the productivity. Controlled and monitored breeding using good and selective bucks on healthy goats help in improving the breed. Buck can be kept in 1:9 ratio in a farm and buck should be replaced after every 12-18 months to avoid inbreeding in the flock. Males which are not selected for breeding purpose should be castrated at the age of 2-4 weeks. While selecting breeding bucks, males with fully developed, well extended and of equal sized testis should be
Singharey ( Sikkim) Sojat (Rajasthan) Bundelkhandi ( UP&MP)
preferred. Similarly, in doe the udder and teats should be well developed and symmetrical with sufficient milk to nourish the kids. For first time breeding, age of sexual maturity 12-15 months or 25 kg body weight should be considered for both sexes. Generally singlet is given during first kidding. The litter size increases in the subsequent kiddings and reach 3to 4 with improved feeding.
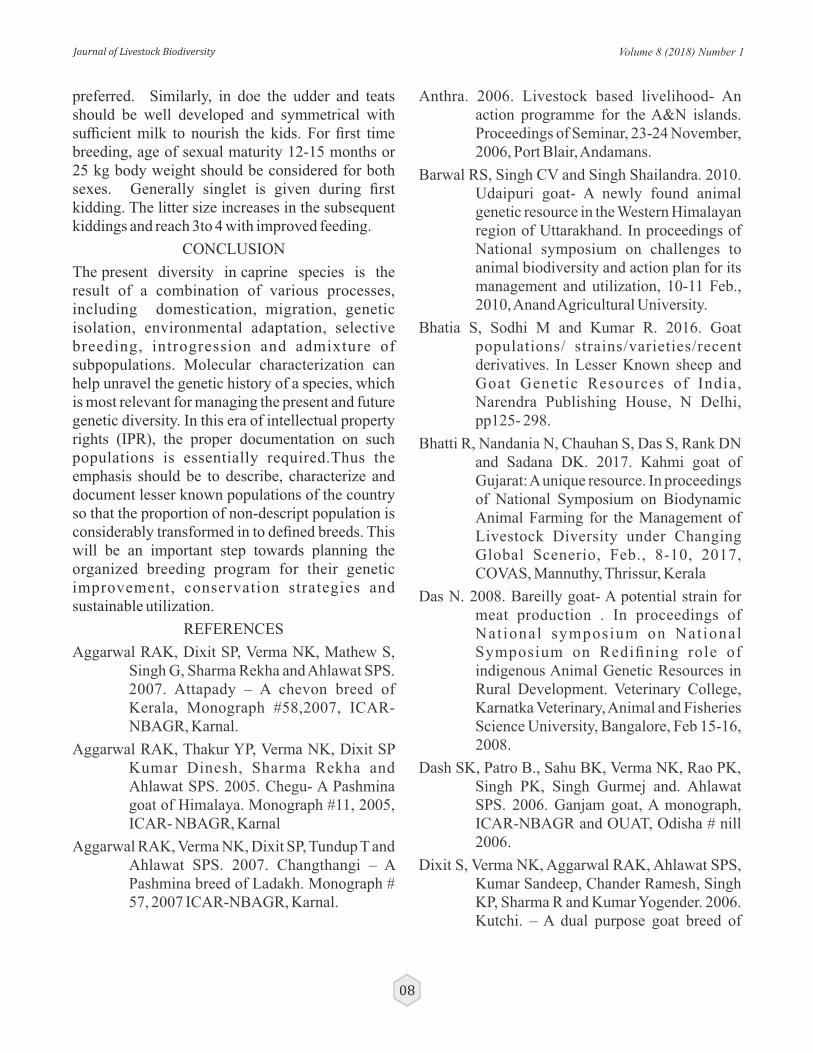
CONCLUSION
The present diversity in caprine species is the result of a combination of various processes, including domestication, migration, genetic isolation, environmental adaptation, selective breeding, introgression and admixture of subpopulations. Molecular characterization can help unravel the genetic history of a species, which is most relevant for managing the present and future genetic diversity. In this era of intellectual property rights (IPR), the proper documentation on such populations is essentially required.Thus the emphasis should be to describe, characterize and document lesser known populations of the country so that the proportion of non-descript population is considerably transformed in to defined breeds. This will be an important step towards planning the organized breeding program for their genetic improvement, conservation strategies and sustainable utilization.
REFERENCES
Aggarwal RAK, Dixit SP, Verma NK, Mathew S, Singh G, Sharma Rekha and Ahlawat SPS. 2007. Attapady – A chevon breed of Kerala, Monograph #58,2007, ICAR-NBAGR, Karnal.
Aggarwal RAK, Thakur YP, Verma NK, Dixit SP Kumar Dinesh, Sharma Rekha and Ahlawat SPS. 2005. Chegu- A Pashmina goat of Himalaya. Monograph #11, 2005, ICAR- NBAGR, Karnal
Aggarwal RAK, Verma NK, Dixit SP, Tundup T and Ahlawat SPS. 2007. Changthangi – A Pashmina breed of Ladakh. Monograph # 57, 2007 ICAR-NBAGR, Karnal.
Anthra. 2006. Livestock based livelihood- An action programme for the A&N islands. Proceedings of Seminar, 23-24 November, 2006, Port Blair, Andamans.
Barwal RS, Singh CV and Singh Shailandra. 2010. Udaipuri goat- A newly found animal genetic resource in the Western Himalayan region of Uttarakhand. In proceedings of National symposium on challenges to animal biodiversity and action plan for its management and utilization, 10-11 Feb., 2010, Anand Agricultural University.
Bhatia S, Sodhi M and Kumar R. 2016. Goat populations/ strains/varieties/recent derivatives. In Lesser Known sheep and Goat Genetic Resources of India, Narendra Publishing House, N Delhi, pp125- 298.
Bhatti R, Nandania N, Chauhan S, Das S, Rank DN and Sadana DK. 2017. Kahmi goat of Gujarat: A unique resource. In proceedings of National Symposium on Biodynamic Animal Farming for the Management of Livestock Diversity under Changing Global Scenerio, Feb., 8-10, 2017, COVAS, Mannuthy, Thrissur, Kerala
Das N. 2008. Bareilly goat- A potential strain for meat production . In proceedings of Nat ional symposium on National Symposium on Redifining role of indigenous Animal Genetic Resources in Rural Development. Veterinary College, Karnatka Veterinary, Animal and Fisheries Science University, Bangalore, Feb 15-16, 2008.
Dash SK, Patro B., Sahu BK, Verma NK, Rao PK, Singh PK, Singh Gurmej and. Ahlawat SPS. 2006. Ganjam goat, A monograph, ICAR-NBAGR and OUAT, Odisha # nill 2006.
Dixit S, Verma NK, Aggarwal RAK, Ahlawat SPS, Kumar Sandeep, Chander Ramesh, Singh KP, Sharma R and Kumar Yogender. 2006. Kutchi. – A dual purpose goat breed of
Volume 8 (2018) Number 1
08

G u j r a t M o n o g r a p h # 4 2 , 2 0 0 6 , ICAR_NBAGR, Karnal.
Dixit SP, Verma NK, Kumar Dinesh, Aggarwal RAK, Sharma Rekha and Ahlawat SPS. 2005. Marwari goat- The pride or hot arid region of India. Monograph #14, 2005, ICAR- NBAGR, Karnal
Ekambaram B, Gupta BR, Manthani GP, Sudhakar K and Reddy VR. 2011. Morphological characterization of Mahabubnagar goats. Indian Journal of Animal Sciences 81(2): 176-179.
t h19 Livestock Census. 2012. Ministry of
Agriculture, Department of Animal Husbandry, Dairying and Fisheries, Krishi Bhawan, N Delhi.
Mishra Priyanka and Verma NK. 2012. Goat genetic resources of India. Indian Farming 62(4): 30-33.
Naveen Kumar GS, Suranagi MD, Appannavar MM. 2008 . Awarenes s and mi lk production performance of coloured Bidri strain of goat of Bidar. In proceedings of Nat ional symposium on National Symposium on Redifining role of indigenous Animal Genetic Resources in Rural Development. Veterinary College, Karnatka Veterinary, Animal and Fisheries Science University, Bangalore, Feb 15-16, 2008.
NBAGR. 2008. Breed descriptors of Changthangi, Jakhrana and Gohilwadi goats. Indian Journal of Animal Sciences 78: 565-568.
NBAGR. 2008. Information on registration of farm animal germlasm. Indian Journal of Animal Sciences 78: 127-131.
NBAGR. 2009. Breed descriptors of goats. Indian Journal of Animal Sciences 79: 99-109.
NBAGR. 2012. Breed descriptors of goats. Indian Journal of Animal Sciences 82: 223-230.
NBAGR. 2015. New breeds/lines registered. News Letter 11(2): 6-7.
NBAGR. 2016. New breeds registered. News
Letter 13(1): 2-3.
Rao PK, Dash SK, Patro BN, Nayak S. 2006. Studies on Ganjam, Black Bengal, and their crosses found in Orissa. Indian Journal f Animal Product ion and Management 18: 135- 138
Roy BG, Roy U, Gogei D and Ahmed Z. 2007. Non pashmina goat of Ladakh: A note. Proceedings of National Symposium on Role of Animal Genetic Resources in Rural Livelihood Security. February 8-9,2007. Ranchi College of Veterinary Sciences & Animal Husbandry, Birsa Agriculture University, Ranchi.
Sharma Rekha, Verma NK, Dixit SP, Kumar Dinesh, Aggarwal RAK and Ahlawat SPS. 2005. Barbari goat. Monograph #16, 2005, ICAR- NBAGR, Karnal
Sharma Rekha, Pandey AK, Verma NK, Aggarwal RAK, Dixit SP, Kumar Dinesh and Ahlawat SPS. 2006. Beetal goat . Monograph # 26, 2006, ICAR- NBAGR, Karnal
Singh CV, Barwal RS, and Singh CB. 2010. Domestic animal biodiversity and breeding polcy for genetic up gradation of livestock of Uttarakhand. In proceedings of National symposium on challenges to animal biodiversity and action plan for its management and utilization, 10-11 Feb. , 2010 Anand Agricultural University.
Singh DK and Singh LB. 2006. Preweaning body weights of indigenous goats of Jharkhand. Proceedings of National Symposium on Conservation and Improvement of animals genetic resources under low input system: Challenges and Strategies. 9-10 Feb., 2006, NBAGR, Karnal.
Singh VK, Singh NS, Patel AK and Kumar P. 2010. Phenotypic characterization of Jaunpuri goats in its native tract. Proceedings of National Symposium on Challenges to Domestic Animal Biodiversity & Action
Volume 8 (2018) Number 1
09

P l a n f o r i t s M a n a g e m e n t a n d Utilization.10-11 February 2010, Anand Agriculture University, Anand. Pp115.
Verma NK, Dixit SP, Kumar Dinesh, Aggarwal RAK, Sharma Rekha and Ahlawat SPS. 2005. Jakhrana- A high potential milch breed of semi arid region by. Monograph #12, 2005, ICAR- NBAGR, Karnal.
Verma NK, Dixit SP, Aggarwal RAK, Sharma Rekha, Chander Ramesh and Ahlawat SPS. 2006. Sirohi- A popular goat of Arid and Semi arid region. Monograph # 29, 2006, ICAR-NBAGR, Karnal.
Verma NK, Aggarwal RAK, Dangi PS, Dixit SP, Sharma Rekha and Ahlawat SPS. 2007. Gohilwadi – A multi purpose goat of Gujrat , Monograph # 60, 2007 ICAR-NBAGR, Karnal.
Verma NK, Dangi PS, Aggarwal RAK., Dixit SP and Joshi BK ( 2008). Malabari- A highly p ro l ific goa t o f Southern reg ion Monograph #64,2008, ICAR-NBAGR, Karnal.
Verma NK, Aggarwal RAK, Dangi PS, Dixit SP and Joshi BK. 2010. Sangamneri – An important goat breed of Maharashtra. Monograph # 67, 2010, ICAR-NBAGR, Karnal.
Verma NK, Kaur Navneet and Mishra Priyanka. 2010. Lesser known goat populations- Need for their characterization and recognition. Journal of Livestock Biodiversity, Vol 2 (1): 01-06.
Verma NK, Aggarwal RAK, Dixit SP, Kawitkar VS, Dangi PS, Mishra Priyanka and Joshi BK. 2011. Konkan Kanyal- A new germplasm of Maharashtra. Monograph # 75, 2011, ICAR-NBAGR, Karnal.
Verma NK, Kuralkar SV, Aggarwal RAK, Dixit SP,
Mishra Priyanka, Kuralkar Prajakta, Dangi PS, and Joshi BK. 2012. Berari-An important goat germplasm of Vidarbha Monograph# 76, 2012. ICAR-NBAGR, Karnal.
Verma NK, Shivahre Pushp Raj, Aggarwal RAK, Sharma Rekha, Dangi PS, Bhutia NT. 2015. Sikkim Black Goats – Characters, Management And Microsatellite Based Genetic Profile. Journal of Livestock Biodiversity 5( 1&2): 1-6.
Verma N K, Aggarwal RAK, Rekha Sharma, Dangi PS and Bhutia NT. 2015 Phenotypic characterization of Singharey goat of Sikkim . Indian Journal of Animal Sciences 85(7): 810 – 812.
Verma NK, Mishra Priyanka, Aggarwal RAK, Dixit SP, Dangi, PS and Dash SK ( 2015). Characterization, performance and genetic diversity among goats of Odisha. Indian Journal of Animal Sciences 85(2): 165-171.
Verma NK, Aggarwal RAK, R Sharma, Dangi PS and NT Bhutia. 2015. Sikkim Black Goat- A newly explored germplasm. A leaflet # 86, 2015, ICAR-NBAGR, Karnal.
Verma NK, Aggarwal RAK, R Sharma, Dangi PS and NT Bhutia. 2015. Goat germplasm of Sikkim state.A Monograph # 94, 2015, ICAR-NBAGR, Karnal.
Verma NK, Aggarwal RAK, Shivahre Pushp Raj, Savino N and Sharma Arjava. 2017. Goat G e r m p l a s m o f N a g a l a n d s t a t e . Monograph # 101, 2017, ICAR-NBAGR, Karnal.
Verma NK, RAK Aggarwal and Arjava Sharma. 2017. Animal Genetic Resources of India – Goats- , # 106/2017 ( ISBN978-93-83537-36-5), ICAR-NBAGR, pp76.
Volume 8 (2018) Number 1
10

Volume 8 (2018) Number 1
Genetic analysis of body conformation traits of indigenous Uttara chicken
1 2 2 2 2 2MK Singh *, S Kumar , RK Sharma , SK Singh , B Singh and DV Singh
1DUVASU, Mathura-281 001 (UP), India
2G.B.P.U.A & T, Pantnagar-263145 (Uttarakhand), India
ABSTRACT
This investigation aimed to evaluate genetics of body conformation characteristics in indigenous of Uttara chicken
maintained at Govind Ballabh Pant University of Agriculture and Technology (India). Data was analysed using least-
squares analysis of variance technique. Least squares means of shank length, keel length and breast angle were estimated
at 8 and 20 weeks of age. Sires of the chicks signi�icantly (p<0.05) in�luenced the estimates of all the traits throughout the
ages. Male birds demonstrated better estimates than females at all stages. These results suggest that heritabilities are low
for linear body measurements in the early period of growth in indigenous Uttara chickens. These research-outcomes may
serve as base information to the breeders and academicians for chalking out breeding strategy in concerned aspect.
Keywords: Body conformation, heritability, Uttara chicken
*Corresponding author: [email protected]
Manuscript received: 09.1.2018; accepted: 30.6.2018
INTRODUCTION
A native chicken population from Uttarakhand, named as “Uttara fowl” a distinctive bird with rich black plumage and feathered shank has recently been identi�ied. This germ plasm has a number of desirable characters such as hardiness, adaptability to the wide agro-climatic variability ranging from tropical and subtropical to alpine zones of India, disease tolerance, and �lavor of meat and eggs (Singh et.al. 2017). Body conformation, which constitutes
body proportions as decided by bone size and degree of �leshing, is considered a better measure of body capacity of birds. External appearance which re�lects physiological changes related to egg production may also have bearing on the genetic potential of pullets for egg laying. Shank and keel lengths are indicators of skeletal growth and may be associated with egg production in laying hens. The amount of meat derived from a chicken increases as it grows. Breeders are interested in increasing the meat yield of the chicken and in improving the appearance of the carcass. Many of the body measurements that have been studied are good indicators of skeletal size. These include keel and shank length, breast angle, leg circumference and body depth, etc. The present investigation is, therefore, aimed at determining conformation traits of Uttara fowl with a view to yielding a more appropriate selection criterion in future.
MATERIALS AND METHODS
The present study was carried out on Uttara fowls (�igure 1 and 2) maintained at the Instructional Poultry Farm (IPF), of Govind Ballabh Pant University of Agriculture and Technology, Pantnagar,
11
Uttara Chicken
Research paper

Volume 8 (2018) Number 1
U.S. Nagar from July 2014 to February 2016 using 3836 eggs. The place is located between 28° 53' 23” to 30° 27' 50” N and 77° 34' 27” to 81° 02' 22” E at 243.84 m MSL (mean sea level) in the Tarai region of Uttarakhand State (India). The climate is humid sub-tropical. Winters are very severe and summers are hot and humid. Temperatures may rise to a maximum of 43°C in the summer and fall to a minimum of 2°C in the winter. Relative humidity ranges between 15 to 95 % (Singh et al., 2015).
The pedigreed population under present study descended from 25 sires and 200 dams which were raised under uniform farm conditions were utilized for present study. The details of birds are presented in Table 1 Body conformation traits measured at 8 and 20 weeks in morning before feeding as given below:
Shank length (cm): Shank length was measured by placing the jaw of the vernier caliper between the hock and tarsal-metatarsal joints.
Keel bone length (cm): The length of keel bone was measured between anterior and posterior ends of keel bone using Vernier caliper.
Breast angle (degree): Breastometer was placed at the point of 10-12 mm posterior to the anterior edge of the keel bone for measuring the breast angle.
The genetic and phenotypic parameters of various traits were estimated using following statistical model after taking care of hatch effect,
Y µ + h + s + d + eijkl = i ij k ijkl
Whereas,th th th Y = l observation on k sex of j sire in the ijkl
thi hatch,
µ = population mean,th h = �ixed effect due to i hatch ( i = 1, 2, ..H),i
th th S = random effect due to j sire within i ij
hatch (j = 1, 2,….S),th
d = effect due to k sex (k= 1,2),k
th e = random error associated with each l ijkl
observation with mean 0 and variance
The heritability of traits under study were estimated from sire component of variances and covariances using MMLSML computer programme of Harvey (1990). The data were analysed statistically by running ANOVAs using SPSS 16.0 software. Signi�icant mean differences between the treatments were determined at a 5% probability level (p<0.05) using Duncan's Multiple Range Test (DMRT) as modi�ied by Kramer (1957).
RESULTS AND DISCUSSION
Conformation traits at 8 weeks of age
It is evident from the Table 2 that the average 8 week shank lengths were 6.68 ± 0.06, 6.31 ± 0.05 and 6.55 ± 0.04 cm; keel lengths were 7.82 ± 0.08, 7.46 ± 0.07 and 7.70 ± 0.05 cm and breast angles were 52.79 ±
00.20, 50.76 ± 0.17 and 52.10 ± 0.09 ( ) in male, female and pooled sex, respectively. Sexual dimorphism for conformation traits accounted for 5.54, 4.60 and 3.85 % of the difference in SL, KL and BA between males and females at 8 week in Uttara fowl.
Higher shank length in males were reported by Sola-Ojo et al. (2011), Das et al. (2015), Padhi et al., (2015) and Das et al. (2016) whereas Sola-Ojo et al. (2011) and Das et al. (2015) found comparable shank lengths in females. Padhi et al. (2015) and Das et al. (2016) observed lengthy shanks in females. The average shank length in the pooled sex was comparable with the report of Pushkar (2013) in Uttara fowl (comb and crown types) but was lower than that reported by Das et al. (2016).
12
* Some birds are culled during different ages.
Table 1: Experimental population at different weeks of age for body conformation traits under study*
Sire Dam Traits in week Male Female Pooled
25 200 SL8 791 609 1400
KL8 791 609
BA8 791 609
SL20 687 488 1175
KL20 687 488
BA20 687 488

Volume 8 (2018) Number 1
The average keel length in males were comparable with the reports of Sola-Ojo et al. (2011) in Fulani chicken and Das et al. (2015) and Das et al. 2016) in RIR and CARI Sonali respectively. Higher keel lengths were reported by Padhi et al. (2015) in RIR. The average keel length in female was comparable with the reports Das et al. (2015) and Das et al. (2016).Lower keel length than present study in female was reported by Sola-Ojo et al. (2011). However, Padhi et al. (2015) reported higher keel lengths in female. The average keel lengths in pooled sex were comparable with the reports of Pushkar (2013) and Das et al. (2016).
The average breast angles in male and female were comparable with the reports of Champat et al. (2013), Das et al. (2015) and Das et al. (2016). Pushkar (2013) and Dash et al. (2016) found comparable breast angles in pooled sex.
Differences in conformation traits might be due to strain, line or breed studied and differences in management as well as rearing system. These �indings also indicated that the body conformation in poultry was sex dependent and sire-in�luenced. Male Uttara fowl were better than their female counterparts in all the conformation traits studied which is a clear instance of sex dimorphism. This possibly is an adaptive feature necessitates for the survival from predation and dominance in social order.
Conformation traits at 20 weeks of age
It is evident from the Table 2 that 20 week shank lengths were 10.17 ± 0.10, 9.39 ± 0.09 and 9.91 ± 0.06 cm; keel lengths were 10.64 ± 0.13, 10.39 ± 0.31 and 10.53 ± 0.09 cm and breast angles were 59.94 ± 0.39,
056.00 ± 0.31 and 58.61 ± 0.25 ( ) in male, female and pooled sex respectively. Sexual dimorphism
accounted for 7.67, 3.10 and 6.57 % of the difference in SL, KL and BA between male and female at 20 week in Uttara fowl.
Das et al. (2016) at 16 weeks found comparable shank lengths in males. Sola-Ojo et al. (2011) and Padhi et al. (2015) observed lengthy shanks in males. Sola-Ojo et al. (2011) and Das et al. (2016) in CARI Sonali at 16 weeks observed comparable shank lengths in females. The average shank length in pooled sex was comparable with the result of Das et al. (2016) in CARI Sonali at 16 weeks.
The average keel length in males was comparable with the result of Das et al. (2016). Higher keel lengths in males were reported by Sola-Ojo et al. (2011) and Padhi et al. (2015). The average keel lengths in females were comparable with the results of Sola-Ojo et al. (2011), Padhi et al. (2015) in PD1 × PD4, PD1 × PD3 and PD1 × IWI and Das et al. (2016) in CARI Sonali. The average keel length in pooled sex was comparable with the result of Das et al. (2016).
The attributed difference was due to the different strain, line or breed studied under different managemental and rearing system.
Heritability of conformation traits at 8 weeks of age
The estimates of heritability of shank length were 0.54 ± 0.23, 0.46 ± 0.25 and 0.50 ± 0.24; keel length were observed as 0.69 ± 0.27, 0.53 ± 0.26 and 0.61 ± 0.26 and breast angle were 0.59 ± 0.11, 0.42 ± 0.22 and 0.51 ± 0.17 in male, female and pooled sex respectively.
The higher heritability values of shank lengths were reported by Adeleke et al. (2011), Rajkumar et al. (2011) in Dwarf chicken at 6 weeks of age, Haunshi et
2al. (2012) in Kadaknath (h s) at 6 weeks of agewhereas Osei-Amponsah et al. (2013) found
13
Means within columns with different superscript differ significantly (P<0.05)
Table 2: Least-squares means of conformation traits in Uttara fowl at 8 and 20 weeks of age
Body conformation traits Male Female Pooled
8 week shank length (cm) 6.68 ± 0.06a 6.31 ± 0.05b 6.55 ± 0.04
8 week keel length (cm) 7.82 ± 0.08a 7.46 ± 0.07b 7.70 ± 0.05
8 week breast angle (0) 52.79 ± 0.20a 50.76 ± 0.17b 52.10 ± 0.09
20 week shank length (cm) 10.17 ± 0.10a 9.39 ± 0.09b 9.91 ± 0.06
20 week keel length (cm) 10.64 ± 0.13a 10.31 ± 0.12b 10.53 ± 0.09
20 week breast angle (0) 59.94 ± 0.39a 56.00 ± 0.31b 58.61 ± 0.25

comparable shank length's heritability. Rao et al. (2004) and Haunshi et al. (2012) reported lower heritability for shanks lengths. Higher keel lengths heritability was reported by Adeleke et al. (2011) and Das et al. (2015), whereas, Padhi et al. (2015) observed lower 8-week keel lengths heritability. Lower breast angle heritability was reported by Das et al. (2015) at 8-week.
Heritability of conformation traits at 20 weeks of age
The estimates of heritability of shank length were 0.38 ± 0.28, 0.30 ± 0.25 and 0.34 ± 0.26; keel length were 0.50 ± 0.13, 0.44 ± 0.28 and 0.47 ± 0.21 and breast angle was 0.54 ± 0.29, 0.39 ± 0.27 and 0.47 ± 0.28 in male, female and pooled sex respectively.
Higher heritability value of shank length was reported by Osei-Amponsah et al. (2013) and Padhi et al. (2015), whereas, Adeleke et al. (2011) observed lower 20-week shanks lengths heritability. Adeleke et al. (2011) and Padhi et al. (2015) observed lower 20-week keel lengths heritability. Lower heritability value of breast angle was reported by Padhi et al. (2015) at 20-week.
The high heritability values of conformation traits; shank length, keel length and breast angle, at 8 week of age in male, female and pooled basis suggested a major role of additive genetic variance in the phenotypic expression of these traits. The individual selection can be applied for genetic improvement of these traits. The moderate to high values of heritability estimates for shank length, keel length and breast angle at 20 weeks of age also revealed that there is a more possibility for genetic improvement of this trait by the individual selection.
CONCLUSION
The mean values of conformation traits revealed that male Uttara fowl were better than their female counterparts in all the conformation traits studied
which is a clear instance of sex dimorphism. Changes in heritability estimates across different ages could indicate various expressions of different genes at different ages of the chickens' growth and the reduction of environmental effects. The individual selection can be applied for genetic improvement of these traits.
ACKNOWLEDGEMENT
The authors are thankful to the Director, Experiment Station, Dean, College of Veterinary and Animal Sciences and Instructional Poultry Farms (I.P.F.), Nagla of G.B. Pant University of Agriculture and Technology, Pantnagar for providing necessary fac i l i t ies to conduct the experiment . The contribution of Dr. R. P. Singh, Retired Professor & Head Department of Animal Breeding, College of Animal Sciences, CCS Haryana Agricultural University, Hisar is also appreciated.
REFERENCES
Adeleke MA, Peters SO, Ozoje MO, Ikeobi CON, Bamgbose AM, and Adebambo OA. 2011. Genetic parameter estimates for body weight and linear body measurements in pure and crossbred progenies of Nigerian indigenous chickens. Livestock Research for Rural Development 23(1).
Das AK, Kumar S, Mishra AK, Rahim A and Kokate LS. 2016. Evaluating body conformation and feed ef�iciency characteristics in CARI-Sonali grower chicken. Indian Journal of Animal Sciences 86(2): 192–96.
Das AK, Kumar S, Rahim A and Kokate LS. 2015. Genetic analysis of body conformation and feed ef�iciency characteristics in a selected line of Rhode Island Red chicken. Asian Journal of Animal Science 9(6): 434-40.
Harvey WR. 1990. Users Guide for LSMLMW, Mixed
14
Volume 8 (2018) Number 1
Table 3: Heritability estimates of conformation traits in Uttara fowl
Body conformation traits Male Female Pooled
8 week shank length 0.54 ± 0.23 0.46 ± 0.25 0.50 ± 0.24
8 week keel length 0.69 ± 0.27 0.53 ± 0.26 0.61 ± 0.26
8 week breast angle 0.59 ± 0.11 0.42 ± 0.22 0.51 ± 0.17
20 week shank length 0.38 ± 0.28 0.30 ± 0.25 0.34 ± 0.26
20 week keel length 0.50 ± 0.13 0.44 ± 0.28 0.47 ± 0.21
20 week breast angle 0.54 ± 0.29 0.39 ± 0.27 0.47 ± 0.28

Model Least Squares and Maximum Likelihood Computer Program. PC-2 Version. Ohio State University, Columbus, USA.
Haunshi S, Shanmugam M, Padhi M, Kumar N, Matam R, Ullengala R, Maddula R and Panda, AK. 2012. Evaluation of two Indian native chicken breeds for reproduction traits and heritability of juvenile growth traits. Tropical Animal Health and Production 44:969–73.
Kramer, CY. 1957. Extension of multiple range tests to group correlated adjusted means. Biometrics 13: 13-17.
Osei-Amponsah R, Kayang BB and Naazie, A. 2013. Phenotypic and genetic parameters for production traits of local chickens in Ghana. Animal Genetic Resources 53, 45–50.
Padhi M K, Chatterjee RN, Haunshi S, Rajkumar U, Niranjan M and Rajaravindra KS. 2015. Evaluation of four different crossbreds developed for backyard poultry farming under intensive system. Indian Journal of Animal Science, 85(9): 985–90.
Padhi MK, Chatterjee RN, Rajkumar U, Bhattacharya TK, and Bhanja SK. 2015. Genetic and phenotypic parameters estimates for body weight, conformation, production and reproduction traits of PD1 (Vanaraja male
line) during different periods. Indian Journal of Animal Sciences 85(8): 883–88.
Rajkumar U, Reddy BLN, Padhi MK, Haunshi S, Niranjan M, Bhattacharya T K and Chatterjee RN. 2011. Inheritance of growth and production traits in sex linked dwarf chicken in a laying cycle of 64 weeks. Indian Journal of Poultry Science 46(2): 143-47.
Singh MK, Kumar Shive, Sharma RK, Singh SK, Singh Brijesh and Singh DV. 2017. Assessment of pre and post-incubation parameters in Uttara breeder hens. Indian Journal of Animal Research 51(5): 948-51.
Singh MK, Singh SK, Sharma RK, Singh Brijesh, Kumar Shive, Joshi, SK, Kumar Sandeep and Sathapathy S. 2015. Performance and carcass characteristics of guinea fowl fed on dietary Neem (Azadirachta indica) leaf powder as growth promoter. Iranian Journal of Veterinary Research 16(1): 78-82.
Sola-Ojo FE, Ayorinde KL, Bolu SAO, Toye AA, Kayode RMO, Alli OI, Adeyemi KD and Gomina P. 2011. Sexual dimorphism in growth traits and carcass characteristics in the Nigerian Fulani Ecotype chicken. American-Eurasian Journal of Sustainable Agriculture 5(3): 371-377.
Volume 8 (2018) Number 1
15

Volume 8 (2018) Number 1
Migration pattern of Desi sheep of Gujarat – a note
ABSTRACT
The study was conducted to understand the migration pattern of the local sheep of Gujarat commonly known as Desi or Patanwadi sheep. It was observed that the �locks of sheep are truly migratory and follow a shuttling pattern of migration depending on the availability of the feed resources and rainfall. Detailed survey and tracking of migratory �locks in Surendranagar district revealed that, Sayla, Muli and Chotila blocks (taluqua) harbours a number of villages where Bharwad or Rebari communities are mostly associated with migratory sheep husbandry practices. The sheep shifts from Saurashtra, Kutch and Bhuj region post Diwali to Ahmedabad and surrounding region and at the onset of monsoon again return to the dry region of Saurashtra, Kutch and Bhuj to avoid excess rainfall and to secure grazing resources. Geographical condition, soil make up, rainfall pattern, etc. play a signi�icant role in deciding the migratory route for nomads.
Keywords: Patanwadi sheep, Desi sheep, Migration, Gujarat state
*Corresponding author: [email protected]
Manuscript received: 06.6.2018; accepted: 30.6.2018
INTRODUCTION
Gujarat is one of the important states of India with respect to biodiversity resources in the country. This region is surrounded by deserts of Rann of Kutch from north, Arabian Sea from west and south, hills of Abu, Danta, Chota Udaipur, Rajpipla and Mathwar from eastern region adjacent to Rajasthan, Madhya-Pradesh and Maharashtra states. The state enjoys the bio-diversity arising out of deserts, hills, plains, forests and coastal areas. Sheep rearing is an important occupation of rural people of Gujarat as it provides gainful employment and income to the economically and socially backward rural masses. Desi sheep, also known by the name of Patanwadi, Kutchi, Kathiawari, Vadhiyari and Charotari is found in the coastal plains of the Saurashtra and Kutch regions of Gujarat, and the sandy loamy areas of Patan, Panch Mahals and Mehsana districts of Gujarat (SAPPLPP 2013). Desi sheep is bigger in size than the origional Patanwadi sheep available in the Patan region of Gujarat. It is managed and reared by traditional shepherds (Dhangar) of Rebari and
Bharwar tribes of Gujarat. There are three distinct strains of Patanwadi sheep, - i) non-migratory, red-faced animals with small bodies yielding relatively �iner �leece. These are typical Patanwadi and are found in north eastern Saurashtra; ii) the migratory type, with a larger body and long legs, a typical Roman nose and long tubular ears. This variety, which has coarser �leece, is found in western and north eastern Gujarat; iii) the meat type, with a big body, low stature and a coarse �leece, found in the south eastern part of the state around Palitana (Acharya, 1982). Present report primarily re�lects the migratory pattern of Desi sheep of Gujarat, which falls in second category, as revealed after surveying the migratory tract adopted by shepherds. However, the phenotypic characteristics of the Desi sheep revealed that the other features being same to sheep of second category, face colour has little changed from red to tan and black.
Desi sheep is probably evolved through the breeding of local sheep with the migratory sheep en-route of migration. Phenotypic characteristics of this sheep
GR Gowane*, LLL Prince, C Paswan, RC Sharma and SMK Naqvi
Division of Animal Genetics & Breeding, Central Sheep & Wool Research Institute,
Avikanagar-304501 (Rajasthan) India
16
Research paper

17
indicate that it is a cross between Patanwadi sheep (category one) and migratory sheep breeds of Rajasthan. Literary evidences suggest that mixing of breeds might have taken place as shepherds used to migrate from Rajasthan to Gujarat. Each year after the rains, a huge number of shepherds migrate from Rajasthan into regions of greater forage. Their migration lasts 7-10 months on the average and spans distances between 500 and 1000 miles. Broadly speaking, the direction of migration is towards areas bordering Uttar Pradesh, Madhya Pradesh and Gujarat (Rao, 2011). Migration of shepherds from Rajasthan is described by Singh (2012), “Droughts and crop failures are not uncommon and there are frequent historical references to mass migration to neighbouring areas like Malwa, Gujarat and Ajmer.” In the detailed migratory route map, Singh (2012) described the route of Rebaris or Raikas with their sheep from western Rajasthan to Gujarat and back. Desi sheep, is a heavy, mutton type breed that has high demand amongst the farmers of Gujrat and Rajasthan. In the institutionally managed �lock this sheep could attain average body weight of 3.03 kg at birth, 21.04 kg at 3 month and 28.23 kg at 6 month of age based on small data (CSWRI Annual Progress Report, 2009-10). Wool quality although is of rough carpet type, yields more than half kg during �irst six month clip.
MATERIALS AND METHODS
Desi sheep, being mostly migratory in nature, must not be looked in to region speci�ic entity. Mostly the information regarding whereabouts of �locks is available with the local Veterinarian and thereafter village head and medicine shop owners. Local traders are an easy access for making contact with the shepherds. A survey in the state of Gujarat that included three districts viz. Ahmedabad, Kheda and Surendranagar. Nearly 15 villages in and around these districts were surveyed along with migratory route of nomads. A number of farmers were surveyed for collecting the information. Survey was conducted during the month of August 2013.
RESULTS AND DISCUSSION
It was observed that Desi sheep currently dwells as native of Saurashtra region of Gujarat and they migrate to north-eastern region of Gujarat during the
period of scarcity of feeding resources. This is similar to the migratory pattern of most of the Rebaris in Rajasthan who have responded to the growing scarcity of grazing resources by adopting a more extended migratory strategy (Singh, 2012). The Rebaris have traditionally left their villages during drought-affected parts of the year but returned for the monsoon season (Khera, 2004). A thorough survey and information collected by discussion with shepherds, farmers, village Sarpanchs (head of village Panchayat), Veterinary of�icers, Medical shop owners, meat traders, etc. revealed that Saurashtra a n d K u t c h r e g i o n t h a t i n c l u d e s m a i n l y, Surendranagar, Kuchchh, Rajkot districts, or in short Kathiawar and Kutchh peninsula, harbours the native tract of the Desi sheep. All the shepherd communities who go for migration follow lunar calendar to decide the time and duration of migration, naturally it coincides with the major Indian festivals that help them remember the timings of arrival and departure with accuracy. Pastoralists stay in Saurashtra region from the onset of the monsoon (Month of Shravan) till the festival of Dipawali (Month of Kartik). These four months secure the grazing resources availability for their large sheep �locks in this comparatively semi arid and resource poor region. As the monsoon surpasses and winter approaches, the scarcity of resources to feed sheep compels the shepherds to migrate their �locks to relatively resource rich regions such as Ahmedabd, Kheda, Nadiad, Vadodara and nearby cities and villages. In this region, they stay for nearly eight (08) months and after the festival of Holi they start planning for migration back to their home tract and by the onset of monsoon, they reach the Saurashtra region.
Detailed survey and tracking of migratory �locks in Surendranagar district revealed that, Sayla, Muli and Chotila blocks (taluqua) harbours a number of villages where Bharwad or Rebari communities occupy complete villages and are mostly associated with migratory sheep husbandry practices. The terrain of this region is uneven and has widespread grasses (Eragrostis, Aristida) in abundance suitable for sheep grazing during 4 months stay. Mostly, the common property resources are vanishing day by
Volume 8 (2018) Number 1

18
day; however, forest lands (abandoned for sheep grazing) are used along with roadside vegetation for grazing. No extra supplementation such as concentrate, green or dry fodder is given to them and sheep travels for a long distance per day. In the Sayla district, we visited villages such as Sudamada, Nathupura, Nadala, Dhandalpur, Sirvaniya, etc. and observed small to large �locks starting from 50 or 100 to more than 500 or so per shepherd. Every village and the shepherds have separate route for migration so as to avoid con�lict for resources. Post Diwali, shepherds migrate to Karjan, Daboi and other blocks of Baroda, and several places such as Kheda, Mehmedabad, Pithai, Katraj, Kathlal, etc . of Ahmedabad and nearby districts. In this resource rich region, they travel with their sheep �locks with tremendous exchange of resources. Usually, it was heard from the shepherds that they are welcomed in most places and offered food and even in some cases money for allowing their sheep to sit for a night in the open �ield known as sheep penning, as the sheep manure will fertilise their land. However, this is not the case everywhere; Rebaris are more likely seen as a burden in the accommodating areas that results in con�lict and violence. Extension of agriculture has narrowed traditional routes (Bharara et al. 1999) and thus the problem of non-accommodation arose. However, it must be looked with great appreciation that these communities have not lost their interest in migratory sheep farming and are still adhered to all the old customs starting from sheep husbandry, to colourful dressing pattern. After travelling for miles
together they travel back to their home tract by the onset of monsoon and reach interiors of Saurashtra, Bhuj and Kutch as it allows them escape from water logging, trap freely available feed resources and avoid competition for resources. The travelled road map as per the surveyed route, collected information and available literature is drawn for more information (Fig. 1). The map suggests possible intermixing of breeds of Rajasthan and Gujarat and also depicts pictorial route of migratory sheep in Gujarat.
Geographical condition, soil make up, rainfall pattern, etc. play a signi�icant role in deciding the migratory route for nomads. Literature reveals that in general, during the period 1978-2008, more than ninety per cent of the districts had more number of years with below average rainfall. Only the districts of Dangs and Narmada had more number of years with above average rainfall as compared to below average rainfall (Hiremath and Shiyani, 2012). This has also probably led to forced migratory lifestyle of Nomads as they are completely dependent and vulnerable to change in climate. In the Kutch region, average rainfall is 322 mm, whereas in the south Gujarat, especially in Dangs it is 2000 mm. The plains receive more rainfall in Gujarat than Kutch and south Saurashtra-Kathiawar region. This is one reason, why shepherds migrate to Kutch and Saurashtra region by the onset of monsoon. Discussion with shepherds and Veterinary of�icers revealed that shepherds are aware of the problems associated with foot rot and associated diseases and thus do not stay for monsoon in the Ahmedabad and nearby region. Similarly, alluvial plain in the eastern region, especially in the mainland covering Ahmedabad, Vadodara and nearby districts, where river deposits, sandy loam and black soil exists allows for water stagnation. However, in the Kutch, Saurashtra and Kathiawar region the nature of soil is sandy loam, sandy and black. Hilly regions that include small mountains in Saurashtra and Kathiawar region present a favourable tract for sheep in the monsoon season. These factors combined with the availability and scarcity of feeding resources, presence of common property resources and market decides the migratory route and duration of the nomads and
Volume 8 (2018) Number 1
Figure 1: Migratory route map of sheep flocks across Gujarat

19
Volume 8 (2018) Number 1
their sheep �locks.
CONCLUSION
Migratory sheep husbandry is diminishing with advances in education and technology and it would be no wonder for the next generation to listen stories about the nomads who travelled for months together along with their sheep for hundreds of miles. Survey revealed existence of strong Rebari or Bharwad communities in the Saurashtra and Kutch region of Gujarat who are engaged in sheep migration. It was found that they follow a shuttle system of migration from Saurashtra and Kachchh region to plains of central and north Gujarat and back in a year. Mainly this pattern is dependent upon the availability of feed resources, and pattern of rainfall. Social con�licts arise due to shortage of common property resources and thus there is a threat to the existence of nomad culture in the region. A combined approach for detailed survey and information about the livestock and social heritage of nomadic tribes in Gujarat along with directed administrative reforms and provision to stop shrinkage of common property resources may help to stop extinction of real stakeholders of livestock biodiversity in this region.
ACKNOWLEDGEMENT
Authors acknowledge the help and support provided by the Director, CSWRI Avikanagar for carrying out this work. Support provided by Dr. Panchal (Veterinary of�icer, Kheda Gujarat) and Medical shop owner at Sayla (Mr. Jayantibhai), Village Sarpanch of Andej (Balwantbhai), Dairy secretary, Vatavas (Hemabhai) and all the migratory farmers was of immense help for collecting and compiling the information. Support and help provided by Dr. S. L. Sisodia (Veterinary Of�icer, CSWRI Avikanagar) and Mr. Ramkhiladi Meena proved much bene�icial.
REFERENCES
Acharya, R. M. 1982. Chapter 2: The North-Western arid and semi-arid region. In the book: Sheep and goat breeds of India. FAO of United Nations, Rome Italy.
Bharara, L. P., Mathur, Y. N. and Khan, W. 1999. Nomadism and Pastoralism: Socio-Economic Pro�i le , Grazing Systems and Feeding Management in the Rajasthan Desert. Hooja, R. and R. Joshi (eds.), Desert, Drought and Development. New Delhi: Rawat Publications.
CSWRI Annual Progress Report. 2009-2010. To evolve Proli�ic Sheep for Mutton Production. CSWRI Avikanagar.
Hiremath, D. B. and Shiyani, R. L. 2012. Adapting Gujarat to Climatic Vulnerabilities: The Road Ahead. Research Journal of Recent Sciences 1(5): 38-45.
Khera, R. 2004. Drought Proo�ing in Rajasthan: Imperatives, Experience and Prospects. UNDP India, Discussion Paper Series – 5
M. Nainsi. 1968. Marwar-ra-Pargana-ri-Vigat, N. Singh Bhati (ed.), Vol. I, Rajasthan Archyavidya Pratishthan, Jodhpur, p. 88 ff; Vol. II
Rao, S. C. 2011. Drought and Survival Strategies : The Case of Pastoralists, Chapter 5 in PhD Thesis: Drought prone regions and survival strategies: a study of semi-arid Andhra Pradesh. University of Hyderabad
SAPPLPP 2013. http://sapplpp.org/registered-sheep-breeds-of-india/patanwadi
Singh, V. 2012. Environmental migration as planned livelihood among the Rebaris of western Rajasthan, India. Global Environment: A Journal of History and Natural and Social Sciences 9: 50–73.

20
Biochemical response in cattle vaccinated with Bm95 recombinant Vaccine
V. K. Pal*, V.M. Gawali, S.K. Rewani, Jaswant Singh and S.S.Sengar
Department of Veterinary Parasitology
N.D.U.A.T., Kumarganj, Faizabad-224229, (U.P.)- India
ABSTRACT
Twelve healthy crossbred cattle divided into two groups (A and B) of six animals in each groups. Engorged adult Boophilus microplus female ticks were reared for hatching and larval emergence. Bm95 recombinant tick antigen was obtained from Indian Immunological Ltd., Hyderabad, India. Group A was inoculated with 1 ml of
thantigen on zero day and second dose in the same amount on 15 day after primary dose and group B kept as th th th
unvaccinated control. All animals were challenged with larval ticks on 30 day, 70 day and 120 day post vaccination. Blood samples were collected on zero day and weekly interval till one month and then fortnightly up to 5 months. Globulin, Albumin and Total serum protein (TSP) values were signi�icant (P<0.01) increased where as the values of Alanine aminotransferase (ALT) and Aspartate aminotransferase (AST) were signi�icant (P<0.01) decreased in group A animals as compared to control animals.
Keywords: Boophilus microplus, Bm95, female ticks, recombinant tick antigen
*Corresponding author: [email protected]
Manuscript received: 13.2.2018; accepted: 04.6.2018
INTRODUCTION
The bovine tick Boophilus annulatus and Boophilus microplus have been estimated to cause an annual weight loss of 0.7 kg/tick (Soulsby, 1982) and also been found to spread serious protozoan diseases like Babesiosis, Anaplasmosis among cattle and buffaloes in India. In the early 1990s, two such v a c c i n e s u s i n g r e c o m b i n a n t B m 8 6 w e r e subsequently registered in Latin American countries (Gavac, Heber Biotech S.A., Havana, Cuba) and Australia (TickGARD, Hoechst Animal Health, Australia) during 1993–1997. The present investigation was planned to assess the biochemical changes during the course of administration of Bm95 antigen in crossbred cattle.
MATERIALS AND METHODS
Twelve healthy cross bred cattle of about 2 years age having history of no previous exposure to ticks. They were selected from Instructional Bovine Farm, RVC, Kanke, Ranchi. Engorged adult Boophilus microplus female ticks were collected from naturally infested cattle herds in and around Ranchi. They were washed
and placed in B.O.D. incubator at temperature 28 ± 0
1 C and relative humidity (R.H.) 85 ± 5%. After oviposition, larval emergence was used for challenged on experimental animals. Bm95 recombinant tick antigen was obtained from Indian Immunological Ltd., Hyderabad. (Genebank accession no. AF150891.2).
Experimental cattle were divided into two groups (A and B) of six animals in each group. Animals of group A were inoculated with the �irst dose of 1 ml of Bm95 (200µg protein/ml) intramuscular on zero day and
ththe second dose in the same amount on 15 day after primary immunization where as group B was kept as unvaccinated control. Biochemical parameters such as Globulin (g/dL), Albumin (g/dL), Total serum protein (TSP g/dl), Alanine aminotransferase (ALT-IU/L) and Aspartate aminotransferase (AST-IU/L) were conducted by standard methods on 0-day, weekly interval up to 1- month and then fortnightly up to 5 months. To assess the biochemical response,
thall animals were challenged with larval ticks on 30 th thday, 70 day and 120 day post vaccination with
unfed larvae.
Volume 8 (2018) Number 1
Research paper

Volume 8 (2018) Number 1
Values having the same superscripts in column (small) and row (capital) did not differ significantly n = number of animals
Table 1. Globulin (g/dL) in cattle before and after vaccination and challenge
Groups Day A (n=6) B (n=6)aBefore vaccination 0 day 2.72±0.13 2.71±0.14
bPost vaccination 20th day B4.86±0.23 A2.64±0.11bcFirst challenge on 35th day 40th day B5.66±0.18 A2.66±0.20d 60th day B7.54±0.43 A2.64±0.19deSecond challenge on 70th day 80th day B8.29±0.10 A2.66±0.22e 100th day B9.11±0.57 A2.64±0.12eThird challenge on 120th day 120th day B8.83±0.28 A2.65±0.07 e 140th day B8.60±0.31 A2.53±0.16 de 160th day B8.26±0.26 A2.73±0.15c 180th day B6.48±0.15 A2.91±0.16
21
RESULTS AND DISCUSSION
The values of globulin and total serum protein in Bm95 vaccinated animals was highly increased from
th th th20 day to 100 day and then decreased from 120
thday to 180 day post immunization as well as tick challenge infestation as shown in Table 1 and 2. The present study revealed that increase in globulin value was probably due to immunological response which increased the immunoglobulin (Ig) or antibody (Kumar et al., 2009). Increased antibody response by Bm86 antigen has been reported by so many workers (Andreotti et al., 2002 and Rodriquez et al., 1995 a/b). The alteration of the concentration of total serum protein might be due to directly depend upon the serum globulin concentration as a result of increase the value of TSP in Bm95 vaccinated animals. In case of unvaccinated animals the value of globulin and TSP were found to be almost unchanged during �irst and second challenge whereas slightly increased after third challenge infestation. Increase in the serum globulin concentration in tick infested cattle has been
reported by El Kammah et al. (1982); O'Kielly et al. (1971); Springell et al. (1971); Williams et al. (1977); O'Kielly and Kennedy (1981) and Taylor and Plumb (1981).
The albumin concentration in Bm95 vaccinated animals was initially decreased from day of the vaccination to the last day of the �irst challenge, after that increased and attained the normal value during rest experimental periods whereas continuously decreased in unvaccinated control groups during different tick challenge infestations as Table 3. Lowering of albumin concentration in tick infested animals has been reported by O'Kielly and seifert (1970); O'Kielly et al. (1971); Springell et al. (1971) and O'Kielly and Kennedy (1981). Concentration of serum albumin was found to be more decreased in control group as compared to Bm95 vaccinated animals which might be due to liver dysfunction (Albumin is mainly
synthesized in liver, Chatterjea and Shinde, 1999) as a result of toxin secreted by the tick during feeding. A large number of ticks attached on control animals
Values having the same superscripts in column (small) and row (capital) did not differ significantly
Table 2. Total serum protein (g/dL) in cattle before and after vaccination and challenge
Groups Day A (n=6) B (n=6)a eBefore vaccination 0 day 5.96±0.13 6.03±0.16
b dePost vaccination 20th day B8.09±0.27 A5.98±0.12b cdFirst challenge on 35th day 40th day B8.67±0.15 A5.56±0.16
cd c 60th day B10.49±0.36 A5.37±0.20de bcSecond challenge on 70th day 80th day B11.17±0.17 A5.18±0.17f ab 100th day B12.19±0.59 A4.89±0.08ef ab Third challenge on 120th day 120th day B11.89±0.28 A4.76±0.05ef a 140th day B11.77±0.37 A4.61±0.17
de ab 160th day B11.3±0.27 A4.75±0.15c ab 180th day B9.66±0.14 A4.92±0.09

22
Volume 8 (2018) Number 1
would have produced more toxins as comparison to a small number of ticks on Bm95 vaccinated animals.
The values of ALT and AST were increased more in serum of unvaccinated control animals as compared to Bm95 vaccinated animals as shown in table 4 and 5. It might be due to the involvement of muscles during tick bite which releases some toxins which causing hypersensitivity reaction (Mustatov, 1969).
A large number of ticks feeding on unvaccinated control animals during different infestations might have released large amount of toxins, resulting in
signi�icant increase of both enzymes ALT and AST.
The total serum protein and globulin values were found at higher levels whereas ALT and AST values were almost near about normal range in Bm95
Values having the same superscripts in column (small) and row (capital) did not differ significantly
Table 4: ALT (g/dL) in cattle before and after vaccination and challenge
Groups Day A (n=6) B (n=6)a aBefore vaccination 0 day 16.20±2.08 16.72±2.04ab aPost vaccination 20th day 16.73±1.09 15.98±1.23ab aFirst challenge on 35th day 40th day 16.60±0.54 16.67±0.58
bc b 60th day A19.48±0.73 B24.07±0.81cd bcSecond challenge on 70th day 80th day A21.00±1.12 B26.98±1.04cde cd 100th day A22.17±0.87 B29.88±0.56de cd Third challenge on 120th day 120th day A22.88±1.01 B28.60±1.02e d 140th day A24.80±1.03 B31.18±1.33de d 160th day A23.75±0.83 B31.65±0.84cd cd 180th day A21.08±1.39 B28.87±1.04
Values having the same superscripts in column (small) and row (capital) did not differ significantly
Table 5: AST (g/dL) in cattle before and after vaccination and challenge
Groups Day A (n=6) B (n=6)aBefore vaccination 0 day 69.17±2.36 68.17±1.70aPost vaccination 20th day 68.33±1.20 67.83±1.08aFirst challenge on 35th day 40th day 68.83±1.17 69.17±1.74b 60th day 70.67±1.84 76.67±1.87
bcSecond challenge on 70th day 80th day A69.00±2.83 B79.50±0.56cd 100th day A71.00±1.57 B80.83±0.70bc Third challenge on 120th day 120th day A71.67±1.67 B80.50±1.45e 140th day A72.50±2.05 B84.83±0.98de 160th day A71.83±1.22 B84.50±1.26bc 180th day A70.83±1.89 B80.17±1.78
Values having the same superscripts in column (small) and row (capital) did not differ significantly
Table 3. Albumin (g/dL) in cattle before and after vaccination and challenge
Groups Day A (n=6) B (n=6)dBefore vaccination 0 day 3.24±0.07 3.32±0.10dPost vaccination 20th day 3.23±0.04 3.25±0.09
cFirst challenge on 35th day 40th day B3.01±0.08 A2.56±0.07b 60th day B2.95±0.17 A2.28±0.08abSecond challenge on 70th day 80th day B2.88±0.11 A2.22±0.06ab 100th day B3.08±0.12 A2.13±0.06ab Third challenge on 120th day 120th day B3.06±0.04 A2.06±0.08ab 140th day B3.17±0.06 A2.08±0.05ab 160th day B3.04±0.02 A2.14±0.06a 180th day B3.18±0.04 A2.01±0.10

Volume 8 (2018) Number 1
23
vaccinated animals as compared to unvaccinated control animals during different tick challenge infestations.
REFERENCES
Andreotti, R., Gomes, A., Malavazi-Piza, K. C., Sasaki, S. D., Sampaio, C.A.M. and Tanaka, A.S. (2002). BmTI antigens induced a bovine protective immune response against Boophilus m i c r o p l u s t i c k . I n t e r n a t i o n a l Immunopharmacology, 2 (2002): 557-563.
Chatterjea, M.N. and Shinde, R. (1999). Text book of th
Medical Biochemistry-5 Edn. pp. 88.
El Kammah, K.M., Hamdy, B.H. and Saoudi, O.A. (1982). The in�luence of ectoparasites (ticks and mites) on host serum enzymes. J. Egypt. Soc. Parasitol., 12 (1): 71-79.
Kumar A., Vihan V.S. and Sharma H.N. (2010). Haematological and Biochemical Effects of Tick Infestation in Common Indian Goat. Advances in bioresearch, vol 1 [1] june 2010: 163- 168
Mustatov, V.A. (1969). The reaction of animal skin to the repeated attachment and feeding of ixodid ticks. Parasitologiya Leningrad, 4: 66-69.
O'Kielly, J.C. and Seifert, G.W. (1970). Boophilus microplus infestation on blood composition of Shorthorn X Hereford cattle on high and low plains of Nutrition. Aust. J. Biol. Sci., 23: 681-696.
O'Kielly, J.C., Seedbeck, R.M. and Springell, P.H. (1971). Alternation in host metabolism by speci�ic and anorectic effects of the cattle tick, Boophilus microplus. II. Changes in the blood composition. Aust. J. Biol. Sci., 24: 381-389.
O'Kielly, J.C. and Kennedy, P.M. (1981). Metabolic changes in cattle due to speci�ic effect of the
tick Boophilus microplus. Br. J. Nutr., 45 (3): 557-566.
Rodriguez, M., Massard, C.L., Henrique D.A. Fonseca, A., Ramos, N. F., Machado, H., Labarta, V. and DE LA Fuente, J. (1995a). Effect of a vaccination with a recombinant Bm86 antigen preparation on natural infestations of B. microplus in grazing dairy and beef pure and cross-bred cattle in Brazil. Vaccine 13, 1804–1808.
Rodriguez, M., Penichet, M.L., Mouris, A. E., Labarta, V., L., Lorenzo Luaces, Rubiera, R., Cordoves, C., Sanchez, P.A., Ramos, E., Soto, A., Canales, M., Palenzuela, D., Triiguero, A., Lleonart, R., Herrera, L. and Dela Fuente, J. (1995b). Control of B. microplus populations in grazing cattle vaccinated with a recombinant Bm86 antigen preparation. Veterinary Parasitology. 57, 339–349.
Springell, P.H., O'Kielly, J.C. and Seebeck, R.M. (1971). Alteration in host metabolism by the speci�ic and anorectic effects of cattle tick, Boophilus microplus. Aust. J. Biol. Sci., 24: 1033-1045.
Soulsby, E.J.L. (1982). Helminths, Arthropods and th
protozoa of Domesticated animals. 7 Ed. English Language Book Society/Bailliere Tindall, London, pp. 809.
Taylor, R.J. and Plumb, I.R. (1981). The effect of natural tick infestation on various blood components and live mass in the bovine in South Africa. In : G.B. Whitehead and J.D. Gibson (Editors), Tick biology and control. Proceeding of International Congress, Tick Research Unit, Rhodes University, South Africa.
Williams, R.E., Hair, J.A. and Buckner, R.G. (1977). Effects of the Golf Coast tick on blood composition and weights of dry lot Hereford steers. J. Econ. Entomol., 70: 229-233.

24
Keywords: Allele-specific PCR, missense mutation, syndactylism, Holstein Friesian cattle
*Corresponding author: [email protected]
Manuscript received: 11.5.2018
Development of allele-specific PCR based DNA test for detection of syndactylism(mule foot) related missense mutation in Holstein Friesian cattle
1,2 2 1,2 1 1Anshuman Kumar *, I. D. Gupta , Govind Mohan , S Jayakumar and Saket K. Niranjan
1 Animal Genetics Division, ICAR-National Bureau of Animal Genetic Resources, Karnal- 132 001 (India)2 Animal Genetics and Breeding Division, ICAR-National Dairy Research Institute, Karnal- 132 001 (India)
ABSTRACT
Syndactylism or 'mule foot' is an autosomal recessive disorder of cattle, characterized by fusion of digits resulting in painful hooves and reduced mobility. The genetic defect has been reported in Holstein cattle populations, worldwide. Molecular studies have indicated the substitution of 2 nucleotides (delCGinsAT) in reading frame belonging to exon 33 of low-density lipoprotein-receptor-related protein 4 gene (LRP4) at chromosome 15 as the cause of mule foot. In this study, an allele specific polymerase chain reaction (AS-PCR) based method was developed for detecting the mule foot allele in cattle. In order to identify normal (wild-type) and mutant alleles at mule foot disease locus separately, two separate allele-specific forward primers were designed for each of the allele along with a common reverse primer. PCR reactions and conditions were standardized for amplification of each of loci separately. The wild-type and mutant alleles could be easily distinguished by detection of amplification from PCR of wild allele (CG) primer set, whereas no amplification by primer set for mutant allele (AT). Using the protocol, total 24 samples of Holstein Friesian (HF) bulls were screened, which were found to possess normal genotype at mule foot locus in all of the animals. This allele-specific PCR based DNA test was found suitable for the detection of mule foot mutation in cattle population specifically of Holstein lineages.
INTRODUCTION
In cattle, syndactylism, also called “mule foot,” refers to the fusion or non-division of the two functional digits of the bovine foot, consisting synostotic phalanges (Hart-Elcock et al., 1987; Charlier et al., 1996). Affected calf can have 1-4 fused hooves with varying degree of lameness and reduced mobility due to painful fusion of the hooves; and stiff and insecure joints. Interestingly, this abnormality is subjected to a right–left and a front–rear gradient i.e. right front foot is always first and most severely affected; if two feet are affected, it will be the two front feet; the right hind foot is next and the left hind foot is last and least likely to be fused. The condition can be detected as early as 42 days post conception with autoradiography (Gruneberg and Huston, 1968). Although, the
disease is simple autosomal recessive defect and reported in a number of cattle breeds however, it is ost prevalent in Holsteins. The disease also shows incomplete penetrance (79% in Holstein cattle) and variable expressivity (Huston, 1967, Millar et al., 2000). It is estimated that almost one-fifth of animals with homozygous condition may not show the fused hooves. Mulefoot carriers also had higher somatic cell score and lower productive life (Cole et al., 2016).
Earlier through genetic analysis, the locus of the disease trait was mapped to chromosome 15 (BTA 15) (Charlier et al., 1996; Drogemuller and Distl, 2006). Later, based on recent findings concerning the mouse mutants dan and mdig and a mouse knockout experiments , doublet missense substitution (c.4863_4864delCGinsAT) in exon 33 of
Volume 8 (2018) Number 1
Research paper

Volume 8 (2018) Number 1
25
low-density lipoprotein-receptor-related protein 4 (LRP4) gene was identified as a strong candidate causal mutation for syndactylism in Holstein cattle (Duchesne et al., 2006, Drogemuller et al., 2007). However, four other LRP4 non-synonymous point mutations were further reported in Holstein (c.4940C>T exon 33), Simmental (c.241G>A exon 3, c.3595G>A exon 26) and Simmental-Charolais crossbred (c.2719G>A exon 20) breeds of cattle. The LRP4 gene encodes a member of the multifunctional low-density lipoprotein (LDL) receptor molecule and has a critical role in limb development, involved in the control of limb development (Nykjaer et al., 2002). The gene alternatively called multiple epidermal growth factor-like domains 7 (MEGF7) is also involved in the control of bone morphogenetic protein and fibroblast-like growth factor. The mutation (c.4863_4864delCGinsAT) leads to amino acid changes at two LRP4 codons (p. Asn1621Lys; Gly1622Cys) affecting a conserved EGF like protein domain in Holstein cattle. However, other mutations at different locations of LRP4 coding sequence were also found responsible for the similar disease in Simmental cattle (Drogemuller and Distl, 2006).
In the 1970s, a peak in the frequency of mule foot animals was observed in the bovine population, however with the development of progeny testing (i.e., mating of tested individuals with affected animals) and of microsatellite marker genetic testing the frequency of syndactylism has considerably declined (Johnson et al., 1980) and is about 0.07% in U.S Holstein cattle at present (Cole et al., 2016). However, the fact that mule foot animals are observed in the current Holstein population reveals that carrier animals, especially bulls, are still used in cattle breeding in some parts of the world. Thus, eradication of this disorder specially in cattle population with Holstein lineages requires detection methods that are simple, accurate and economical. In this paper we describe a simple and cost effective
allele specific PCR protocol to screen mule foot i.e. syndactylism disease in cattle.
MATERIALS AND METHODS
Samples and DNA extraction
The blood samples of HF bulls were used for the standardization of PCR as well as further screening. DNA isolation was carried out as per standard phenol– chloroform procedure (Sambrook and Russel, 2001). The isolated DNA was checked for purity and quantity using Nanodrop Spectrophotometer (ND-1000, Thermo Fisher Scientific, USA) and the integrity was assessed by running in 0.8 % agarose gel. The isolated
ogenomic DNA was stored at -20 C until further use.
Primer designing
Primers were designed manually to amplify f l a n k i n g r e g i o n o f s y n d a c t y l i s m l o c u s (15:g.77675516CG>AT) at LRP4 gene (GenBank accession number, AC_000172.1). According to the principle of allele-specific PCR, two allele specific forward primers were designed for CG-wild type (F-WT) and AT- mutant allele (F-M). Since, the two nucleotides at their 3� terminus corresponded to the two nucleotide substitutions (CG>AT) in forward primers (Table 1). The reverse primer was designed as the common primer at downstream of the sequence. The primer sequences were searched for uniqueness using the NCBI BLASTW search engine.
PCR amplification
Two separate PCR reactions were prepared in the final volume of 20 μL in two tubes, each containing separate forward primer along with other common ingredients. The final concentrations of the PCR ingredients were: 14.35 µl of distilled water, 2 µl of 10×PCR buffer, 0.5 µl of 10mM dNTP mix (Thermo Fisher Scientific), 0.5 µl of each primer (10 pmol/ µl), 2.0 µl of genomic DNA (50 ng/ µl concentration), and 0.15 µl of Taq DNA polymerase
Primer Primer Sequences (5’ x 3’) Optimal primer concentration (µM) Amplicon size (bp)
F(WT) 5'-CTTGTGGCGTGAACAACGG-3' 0.25 932
F(M) 5’-CTTGTGGCGTGAACAAATG-3’ 0.25
R 5'-CGCAGGGTAGTCGGTAATGT-3' 0.25
Table 1: Primer sequences and PCR parameter for genotyping mulefoot disease locus in cattle

26
(5 U/ µl) (New England Biolabs). Gradient PCR cycling were followed for both the reactions. The PCR conditions were: initial denaturation at 95 °C for 2 min 30 sec and 32 cycles of denaturation at 94 °C for 30 sec, annealing at 55 to 61 °C for 30 sec, and extension at 72 °C for 60 sec and a final extension at 72 °C for 10 min. PCR products were analyzed on 2% agarose gel with ethidium bromide in TAE buffer for 50 min at 80V. After the electrophoresis, the PCR products were differentiated for allele identification as well as for their intensity of amplified fragments. The PCR conditions with most intense amplicon were chosen for further screening of 24 DNA samples of HF bulls.
RESULTS AND DISCUSSION
In order to screen out normal (wild-type) and mutant alleles at mulefoot disease locus in cattle of exotic inheritance specifically of Holstein, an allele-specific PCR based protocol was developed in this study. We designed two allele-specific forward primers for each of the allele and a common reverse primer to discriminate both of the alleles. We designed two 19-nucleotide-long allele-specific forward primers, F(M) and F(WT), complementary to the 5' end of the mule foot disease and normal locus, respectively while the oligonucleotide primers differ from each other by a single nucleotide at the 3' end. These primers were used in two separate tubes along with common reverse primer. The primers were selected because these fulfilled the criteria for highly-efficient allele-specific amplification as there were two nucleotides differences in wild and mutant genotypes.
Results of PCR cycles at different annealing temperature showed the amplifications at all of the annealing temperatures with almost equal intensity of bands of 932 nucleotide long for primers set of wild allele (Fig. 1). Among these,
oPCR reaction with initial denaturation at 95 C for 2
omin 30 sec and 32 cycles of denaturation at 94 C for o30 sec, annealing at 58.5 C for 30 sec, and extension
oat 72 C for 60 sec and a final extension at 72 °C for 10 min was taken as standard. Final volume and concentrations of PCR ingredients - 2 µl of 10×PCR buffer, 0.5 µl of 10mM dNTPs, 0.5 µl of each primer (10 pmol/ µl), 2.0 µl of genomic DNA (50 ng/ µl), and
0.15 µl of Taq DNA polymerase (5 U/ µl) in 20 µl reaction were also optimized with the PCR conditions. There was no amplification for the primers set of mutant allele which indicated absence of mutation in the samples. In carrier animals, both CG- and AT-specific primer pairs give rise to two PCR fragments of same length. However, in animals free from mulefoot disease, one DNA band could be recognized only from CG specific primer pair (wild type). Non amplification of PCR from primers specific to mutant allele also indicated about not yielding any false positive result by the protocol. This AS-PCR test was applied to the 24 samples of HF bulls, which also showed the presence of normal allele through observing CG allele specific PCR products (Fig. 2).
The AS-PCR, also known as amplification refractory mutation system (ARMS) or PCR amplification of specific alleles (PASA) is deemed to be a simpler, faster and reliable method for detecting the mutation involving single base change or small deletions (Kwok and Chen, 2003). It works on the principle of sequence-specific PCR primers that allow amplification of test DNA only. AS-PCR method works efficiently, if the nucleotide at the 3'-end of the primer perfectly complements the base at the mutant or wild-type sequences and there will be no amplification if target allele is not present in the DNA. The LRP4 c.4863_4864delCGinsAT mutation is particularly suitable for the development
Volume 8 (2018) Number 1
Fig. 1. Gradient PCR reaction for amplification of mulefoot disease locus. Ladder marker 50 bp (M), wild type allele (Lanes nos. 1,3,5), mutant allele
(Lanes nos. 2, 4, 6).

Volume 8 (2018) Number 1
27
of a allele specific PCR system because it is produced by a double substitution (CG>AT). Therefore, the use of an additional mismatch is not necessary.
The technique has been successfully applied previously for noninvasive prenatal screening of single-gene disorders like sickle cell anaemia and β-thalassaemia in human (Wu et al., 1989; Chiu et al., 2002); and Complex vertebral malformation in animals (Ghanem et al., 2008). The allele-specific PCR protocol is a time-efficient and cost-effective method for screening. It also reduces the risk for experimental errors since it involves fewer steps.
CONCLUSION
In this study, an allele-specific PCR based screening protocol was developed to screen out at mule foot disease mutation in cattle of exotic inheritance specifically of Holstein. By this protocol, wild-type and mule foot disease alleles could be easily distinguished by detection of amplification from PCR of wild allele (CG) primer set and no amplification by primer set for mutant allele (AT). This allele-specific PCR based DNA test was found simple, accurate and inexpensive and suitable for the detection of syndactylism related mutation in cattle population with Holstein lineages.
ACKNOWLEDGMENT
Authors are thankful to the Director, ICAR-National Bureau of Animal Genetic Resources, Karnal for providing the facilities.
REFERENCES
Charlier, C, Farnir, F, Berzi, P, Vanmanshoven, P, Brouwers, B, Vromans, H, and Georges, M. 1996. Identity-by-descent mapping of
recessive traits in livestock: application to map the bovine syndactyly locus to chromosome 15. Genome research 6(7), 580-589.
Chiu RWK, Lau TK, Leung TN, Chow KCK, Chui DHK., and Lo YMD 2002. Prenatal exclusion of thalassaemia major by examination of maternal plasma. Lancet 360:998–1000.
Cole, JB, Null, DJ, and VanRaden, PM 2016. Phenotypic and genetic effects of recessive haplotypes on yield, longevity, and fertility. Journal of dairy science 99(9), 7274-7288.
Drögemüller, C, and Distl, O 2006. Genetic analysis of syndactyly in German Holstein cattle. The Veterinary Journal 171(1), 120-125.
Drögemüller, C, Leeb, T, Harlizius, B, Tammen, I, Distl, O, Höltershinken, M, ... and Eggen, A 2007. Congenital syndactyly in cattle: four novel mutations in the low density lipoprotein receptor-related protein 4 gene (LRP4). BMC genetics 8(1), 5.
Ghanem, ME, Akita, M, Suzuki, T, Kasuga, A, and Nishibori, M. 2008. Complex vertebral malformation in Holstein cows in Japan and its inheritance to crossbred F1 generation. Animal reproduction science 103(3-4), 348-354.
Gruneberg, H, and Huston, K 1968. The development of bovine syndactylism, J. Embryol. Exp. Morphol. 19, 251–259.
Hart-Elcock, L, Leipold, HW and Baker, R 1987. Hereditary bovine syndactyly: diagnosis in bovine fetuses. Veterinary pathology 24(2), 140-147.
Huston, K. 1967. Fifteen years with mulefoot Holstein: Part A. Breeding experiments, Holstein–Friesian World 64, 2929–2931.
Johnson, JL, and Leipold, HW, Snider, GW, Baker, RD (1980) . Progeny test ing for bovine syndactyly, J. Am. Vet. Med. Assoc. 176, 549–550.
Millar, P, Lauvergne, JJ, and Dolling, C 2000. M e n d e l i a n I n h e r i t a n c e i n C a t t l e , Wageningen Academic, Wageningen.
Fig. 2. Allele specific PCR reaction (AS-PCR) for diagnosisof cattle for mule foot.
Ladder marker 1 Kb (M), wild type cattle(Lanes nos. 1–2, 3-4, 5-6, 7–8, 9-10, 11-12).

Nykjaer, A, and Willnow, TE 2002. The low-density lipoprotein receptor gene family: a cellular Swiss army knife? Trends Cell Biol., 12, 273–280.
Sambrook, J and Russell, DW 2001. Molecular cloning: A laboratory manual III. Cold Spring Laboratory Press; NY, Cold Spring Harbour.
Wu, DY, Ugozzolit., Palt, LBK, and Wallace, RB 1 9 8 9 . A l l e l e - s p e c i f i c e n z y m a t i c amplification of β-globin genomic DNA for diagnosis of sickle cell anemia (genetic d i s e a s e s / b a s e - p a i r m i s m a tc h / D NA polymerase/oligodeoxyribonucleotide/polymerase chain reaction).
Volume 8 (2018) Number 1
28

Volume 8 (2018) Number 1
STR markers based genetic diversity evaluation of Chilika buffaloof Odisha state
1 1 2 1 1 1 3 1Ravinder Singh , S Lavakumar , Ankita Gurao , SK Mishra , SK Niranjan , V Vohra , SK Dash and RS Kataria *
1ICAR-National Bureau of Animal Genetic Resources, GT Road By-Pass, Karnal-132001(Haryana), India
2College of Veterinary and Animal Sciences, Rajasthan University of Veterinary and Animal Sciences,
Bikaner-334001 (Rajasthan), India3Department of Animal Breeding and Genetics, Orissa University of Agriculture and Technology,
Bhubaneswar- 751 003 (Odisha) India
ABSTRACT
The study was conducted to genetically characterize the Chilika buffalo breed of Odisha state using
microsatellite (STR) markers allelic diversity. Blood samples of 48 unrelated animals were collected randomly
from different regions of breeding tract and DNA was extracted from whole blood using standard protocol.
Genetic diversity was assessed using 23 heterologous bovine microsatellite markers previously reported,
through PCR ampli�ication and fragment analysis on an automated DNA sequencer. A suf�icient allelic diversity
was observed with a mean of 3.97 alleles per locus. The mean observed heterozygosity in the population was
0.593, suggesting animals under random mating. Additionally, three quantitative tests were employed namely
the sign test, standardized difference test, and Wilcoxon sign rank test along with a qualitative test for mode
shift distortion of allelic frequencies, which showed that the population has not undergone any genetic
bottleneck in the recent past. The results indicate Chilika buffalo though a small population has been
maintaining suf�icient genetic diversity.
Key Words: allelic diversity, bottleneck, Chilika buffalo, microsatellite markers, genotyping
*Corresponding author: [email protected]
Manuscript received: 03.6.2018; accepted: 30.6.2018
INTRODUCTION
India has a huge diversity of buffalo population
from diverse geographical and agro-climatic zones
comprising more than 50% of world's buffalo
population, accounting for highest buffalo milk
production in the world (Kathiravan et al., 2012). In
India, along with the 13 registered buffalo
breeds/populations, there are many non-descript
buffalo populations, with signi�icant contribution
to milk as well as meat production, besides being
important part of draft power in agricultural
operations. These breeds/populations are well
adapted to the agro-climatic conditions of their
respective breeding tracts ( et al., 2009). Kataria
Among the 13 registered buffalo breeds, Chilika is
one of the sui generis riverine buffalo breed of India,
found around Chilika Lake in Odisha mainly in Puri,
Ganjam, and Khorda districts. Chilika has its abode
in the largest brackish lagoon of Asia, 'Chilika Lake'
after which the buffalo breed has been named
(Patro et al., 2003). As per breed-wise survey of
Department of Animal Husbandry & Dairying, total
population of the Chilika buffalo is estimated to be
a r o u n d 3 , 0 0 0
(http://dahd.nic.in/documents/statistics/livestoc
k-census). Local farmers rear these buffaloes due to
their unique potential to convert the wild brackish
water vegetation of Chilika Lake to nutritionally
superior milk and this forms the major part of their
income source with zero input (Singh et al., 2017).
Furthermore, this breed shares home tract with
several other buffalo breeds in the proximity. In
recent times due to breed improvement policy of
the Odisha state government, high milk yielding
29
Research paper

Volume 8 (2018) Number 1
Murrah breed has been introduced in the region
around native tract of Chilika buffalo. This
in�iltration may pose a threat to the unique
germplasm of 'Chilika' and other nearby breeds;
and possibly distort the native population's genetic
structure. Additionally, the introgression of
improver breeds like Murrah in this area could
initiate vicious circle because of their non-adaption
to the local conditions. Such an introgression will
not only dilute this important buffalo germplasm
but also disturb the Chilika Lake ecosystem as
outside breeds introduced are mostly stall fed.
Moreover, those breeds won't be as resistant to
fasciolosis and many other parasitic infections as
observed among the native Chilika buffaloes. Thus,
in order to mitigate these ecological disruptions
and conserve the Chilika breed, there is an urgent
need to demarcate the genetic structure of this
unique germplasm as a part of monitoring the small
population for maintaining suf�icient genetic
diversity.
Among various genetic markers, the microsatellite
(also known as STR, SSR) are the choice of markers
to study population genetics since they are not only
highly polymorphic with absence of null alleles but
also distributed globally in the genome (Dodgson et
al., 1997). These markers show locus speci�icity and
can be analysed using simple PCR ampli�ication
( et al., 2009) and amenable to genotyping Kataria
using automated sequencer. These properties of
microsatellite marker's enable the analysis of
several parameters of population genetics such as
populations' structure, relatedness between them,
and bottlenecks. In the present study genetic
diversity and bottleneck in Chilika buffalo
population was assessed using data generated on
23 heterologous bovine microsatellite markers. The
�luorescent labeled speci�ic primers were used for
evaluating the allele sizes of various loci among
different Chilika animals within the breed.
MATERIALS AND METHODS
Blood samples collection and DNA isolation
Blood samples of 48 unrelated animals of Chilika
buffalo breed were collected randomly from the
breeding tract of Odisha state of India. It was
ensured to collect samples from both side land area
surrounding Chilika Lake selecting the animals true
to breed and ensuring them being from unrelated
animals, covering almost 20 different villages of
Krushnaprasad and Brahmagiri blocks of Puri
district and Bhusandpur block of Khorda district.
Genomic DNA was isolated from blood samples
using standard phenol-chloroform extraction
method (Sambrook and Russell, 2001).
PCR ampli�ication and genotyping of STR markers
PCR ampli�ication of microsatellite (simple tandem
repeats, STR) loci was carried out after testing
quality and quantity of DNA samples on agarose gel
as well as by measuring OD260 and OD280 on a
Nanodrop (Thermo Fisher Scienti�ic). A set of 23
microsatellite markers reported earlier (Kataria et
al., 2009) for the genetic diversity analysis of
buffaloes were used in the present study (Table 1).
The forward primer for each marker was
�luorescently labelled with FAM, NED, VIC or PET
dyes. Polymerase chain reaction (PCR) was
performed in a total reaction volume of 25 μl, using
the thermal conditions as followed 94°C for 2 min,
32 cycles of 94°C for 1 min, speci�ic annealing
temperature for 1 min (Table 1), 72°C for 1 min, and
a �inal extension at 72°C for 5 min. The ampli�ied
PCR products checked on agarose gel containing
different dyes were then electrophoresed together
after multiplexing in different sets, considering the
expected size and dye labels, in an automated DNA
sequencer along with GS500LIZ (Applied
Biosystems, USA) as an internal lane control.
Data analysis
After acquiring the raw run data obtained after
fragment analysis on automated DNA sequencer,
the allele size data for each sample was then
extracted using GENEMAPPER software (Imle,
2005) and further analyzed for heterozygosity;
allele numbers, observed and expected; Fis for
inbreeding or loss of heterozygosity locus –wise, by
using GenAlEx 6.5 software (Peakall and Smouse,
2015). Polymorphism information contents (PIC)
values for each marker were derived by using the
30

Volume 8 (2018) Number 1
31
Microsatellite Locus Primers Sequence Allele Size Range in Buffalo Annealing Temperature (°C)
CSRM60 For- 5’-AAGATGTGATCCAAGAGAGAGGCA-3’
Rev-5’-AGGACCAGATCGTGAAAGGCATAG-3’ 160-188 55.0
ILSTS026 For- 5’-CTGAATTGGCTCCAAAGGCC -3’
Rev-5’-AAACAGAAGTCCAGGGCTGC-3’ 141-159 55.0
HEL13 For-5’-TAAGGACTTGAGATAAGGAG-3’
Rev-5’-CCATCTACCTCCATCTTAAC -3’ 166-192 55.0
ILSTS030 For- 5’-CTGCAGTTCTGCATATGTGG -3’
Rev-5’-CTTAGACAACAGGGGTTTGG-3’ 146-158 55.0
ILSTS033 For- 5’-TATTAGAGTGGCTCAGTGCC -3’
Rev-5’-ATGCAGACAGTTTTAGAGGG-3’ 126-138 58.4
ILSTS019 For- 5’-AAGGGACCTCATGTAGAAGC -3’
Rev-5’-ACTTTTGGACCCTGTAGTGC-3’ 161-181 56.0
ILSTS058 For- 5’-GCCTTACTACCATTTCCAGC -3’
Rev-5’-CATCCTGACTTTGGCTGTGG-3’ 118-170 55.0
ILSTS056 For- 5’-GCTACTGAGTGATGGTAGGG -3’
Rev-5’-AATATAGCCCTGGAGGATGG-3’ 140-172 55.0
ILSTS089 For- 5’-AATTCCGTGGACTGAGGAGC -3’
Rev- 5’-AAGGAACTTTCAACCTGAGG -3’ 118-126 61.0
CSSM66 For- 5’-ACACAAATCCTTTCTGCCAGCTGA -3’
Rev-5’-AATTTAATGCACTGAGGAGCTTGG-3’ 168-202 55.0
ILSTS095 For-5’-GAAAGATGTTGCTAGTGGGG-3’
Rev-5’- ATTCTCCTGTGAACCTCTCC -3’ 197-205 58.0
ILSTS029 For- 5’-TGTTTTGATGGAACACAGCC -3’
Rev-5’-TGGATTTAGACCAGGGTTGG-3’ 140-168 54.0
ILSTS028 For- 5’-TCCAGATTTTGTACCAGACC -3’
Rev-5’-GTCATGTCATACCTTTGAGC-3’ 141-169 55.0
ILSTS025 For- 5’-GTTACCTTTATATAAGACTCCC -3’
Rev-5’-AATTTCTGGCTGACTTGGACC-3’ 116-136 56.0
ILSTS052 For- 5’-CTGTCCTTTAAGAACAAACC -3’
Rev-5’-TGCAACTTAGGCTATTGACG-3’ 147-179 55.0
ILSTS060 For- 5’-TAGGCAAAAGTCGGCAGC -3’
Rev-5’-TTAAGGGGACACCAGCCC-3’ 160-188 65.0
BM1818 For- 5’-AGCTGGGAATATAACCAAAGG -3’
Rev-5’-AGTGCTTTCAAGGTCCATGC-3’ 241-253 56.0
ILSTS061 For- 5’-AAATTATAGGGGCCATACGG -3’
Rev-5’-TGGCCTACCCTACCATTTCC-3’ 105-133 55.0
CSSM33 For- 5’-CACTGTGAATGCATGTGTGAGC-3’
Rev-5’-CCATGATAAGAGTGCAGATGACT -3’ 155-177 61.0
CSSM19 For- 5’-TTGTCAGCAACTTCTTGTATCTTT -3’
Rev-5’-TGTTTTAAGCCACCCAATTATTTG -3’ 131-161 55.0
CSSM57 For- 5’-GTCGCTGGATAAACAATTTAAAGT -3’
Rev-5’-TGTGGTGTTTAACCCTTGTAATCT -3’ 103-131 60.0
CSSM47 For- 5’-TCTCTGTCTCTATCACTATATGGC -3’
Rev-5’-CTGGGCACCTGAAACTATCATCAT-3’ 127-163 55.0
CSSM45 For- 5’-TAGAGGCACAAGCAAACCTAACAC -3’
Rev-5’-TTGGAAAGATGCAGTAGAACTCAT -3’ 102-122 60.0
Table 1. Details of heterologous bovine microsatellite markers used to study genetic diversity in Chilika buffalo
formula given by Botstein et al. (1980). PIC takes
into consideration the number of alleles a marker
locus has and the frequency of these alleles for each
individual marker. Mode shift analysis was carried
out to generate information about population
having or not suffered from any bottle neck during
recent past with the help of online available
Bottleneck software (Cornuet et al., 1997).
RESULTS AND DISCUSSION
Previously, microsatellite markers based genetic
diversity analyzed using PAGE gel has been
reported in Chilika buffaloes ( et al., 2009), Mishra
but in the present study samples collected were

Volume 8 (2018) Number 1
32
Table 2. Genetic variability measures in Chilika buffalo across different microsatellite markers
S.No. Marker Alleles* Heterozygosity* PIC Fis
Na Ne Ho He
1. ILSTS89 7.000 3.695 0.756 0.729 0.683501 -0.036
2. ILSTS95 4.000 1.884 0.277 0.469 0.385811 0.411
3. CSSM47 13.000 7.030 0.848 0.858 0.842725 0.012
4. ILSTS33 5.000 3.648 0.652 0.726 0.675518 0.102
5. ILSTS60 7.000 1.842 0.739 0.457 0.427463 -0.617
6. BM1818 11.000 4.062 0.667 0.754 0.724284 0.116
7. ILSTS19 6.000 1.630 0.050 0.387 0.371061 0.871
8. ILSTS25 7.000 4.213 0.585 0.763 0.736868 0.232
9. ILSTS56 13.000 3.732 0.435 0.732 0.696795 0.406
10. HEL013 11.000 6.443 0.795 0.845 0.827747 0.058
11. ILSTS28 12.000 4.172 0.638 0.760 0.725551 0.160
12. ILSTS058 17.000 6.991 0.723 0.857 0.844065 0.156
13. ILSTS61 7.000 2.759 0.489 0.638 0.602802 0.233
14. CSSM19 9.000 4.615 0.652 0.783 0.755011 0.167
15. CSSM57 9.000 2.818 0.659 0.645 0.594232 -0.022
16. ILSTS52 9.000 3.659 0.800 0.727 0.685734 -0.101
17. CSSM45 11.000 5.275 0.432 0.810 0.788447 0.467
18. CSSM66 16.000 7.337 0.622 0.864 0.850177 0.280
19. ILSTS26 11.000 2.152 0.340 0.535 0.521193 0.364
20. ILSTS29 14.000 6.027 0.622 0.834 0.815543 0.254
21. ILSTS30 10.000 2.866 0.778 0.651 0.597307 -0.195
22. CSRM60 10.000 2.563 0.617 0.610 0.562282 -0.012
23. CSSM33 7.000 2.043 0.457 0.511 0.49117 0.106
Mean 9.826 3.976 0.593 0.693 0.661099 0.69322
Figure 1. Allele frequencies observed across23 microsatellite loci (listed in Table 2) in Chilika buffalo
from the animals randomly distributed across
eastern as well as western areas of Chilika Lake and
also �luorescent labelled speci�ic primers were used
and genotyped on automated DNA sequencer.
A set of 23 heterologous bovine microsatellite
markers, reported earlier (Kataria et al. 2009) used
to successfully amplify 48 random DNA samples of
Chilika buffalo. Different variability measures
within breed estimated for each locus in Chilika
buffalo viz., number of observed alleles (Na),
effective number of alleles (Ne), observed (Ho) and
expected heterozygosity (He) are given in Table 2. A
high allelic diversity was observed in Chilika buffalo
with a total number of 226 distinct alleles across 23
loci (Figure 1). Most of the loci exhibited high level
of allelic polymorphism as observed number of
alleles varied from 4 (ILSTS95 locus) to 17
(ILSTS058 locus) at different loci with a mean
number of 9.82 alleles (Table 2). The effective
numbers of alleles were less than the observed
values across all the loci and ranged between 1.63
(ILSTS019 locus) to 7.33 (CSSM66 locus) with a
mean of 3.97. The allelic values were higher than
reported in previous studies conducted on Indian
buffaloes (Navani et al., 2002; Mishra et al., 2009;
Mishra et al., 2010) and therefore it signi�ies higher
allelic diversity in Chilika buffaloes. On the other
hand mean number of different alleles and effective
number of alleles along with expected and observed
heterozygosity of Chilika buffalo were comparable
with that of reports on few other buffalo breeds
*Na-observed number of alleles, Ne-effective number of alleles, Ho-observed heterozygosity, He-expected heterozygosity, PIC-polymorphism information contests, fiss-inbreeding coefficient

Volume 8 (2018) Number 1
33
(Vijh et al. , 2008). The range of observed
heterozygosity was found to be 0.277-0.848 for
ILSTS95 and CSSM47 locus. Similarly, expected
heterozygosity was ranging from 0.387-0.864 for
ILSTS19 and CSSM66 locus. The higher value of
expected heterozygosity (0.693) in this breed might
possibly be due to the presence of number of
different alleles even at small frequencies in Chilika
population. Polymorphism Information Contents
(PIC) values ranged from 0.37 (ILSTS019) to 0.85
(CSSM66) with a mean of 0.66, indicating suitability
of markers used for genetic diversity analysis.
The suf�iciently high average values for Na (9.826),
He (0.693) and PIC (0.66) displayed by the panel of
23 microsatellite markers further supported their
suitability for genetic diversity analysis in other
buffalo breeds as well. In the present investigation,
heterozygote de�iciency analysis was evaluated on
the basis of obtained Fis (within-population-
inbreeding estimate) values. If the Fis value is more
than zero then it represents the condition of
heterozygote de�iciency for that particular locus
and several loci had positive value i.e. more than
zero revealing heterozygote de�iciency (Table 2).
Several loci contributed to this de�iciency (17/23),
b u t � ive l o c i c o n t r i b u t e d m a x i m a l ly fo r
heterozygote de�iciency, which were ILSTS95,
ILSTS19, ILSTS56, CSSM45 and ILSTS26 with
values of 0.411, 0.871, 0.406, 0.467 and 0.364,
respectively. A number of factors affect the level of
heterozygosity but among them the inbreeding,
presence of population sub-structure (Wahlund
effect), and null alleles are the prominent reasons.
The justi�ication of single speci�ic factor affecting
heterozygosity is tedious matter (Barker et al.,
2001) since lack of heterozygosity might not be
only due to aforesaid reasons alone but also may
result from cumulative effect of more than one
factors. Additionally, in the �ield area non-
availability of pedigree data is a big problem when
uncontrolled natural service is followed for
breeding the animals, so lack of heterozygosity
might also be due to the inadvertent sampling of few
related animals, still in this study just �ive of the
markers mentioned above showed high Fis values,
rests were showing suf�icient heterozygosity
extent.
The bottleneck analysis in Chilika buffalo was
demonstrated in this study on the basis of
heterozygosity excess by using different
approaches, the �irst approach is based on the
principle of heterozygosity excess, which works
upon the level of heterozygosity in a manner that
expected equilibrium gene diversity should be
lower than the observed gene diversity in a recently
bottlenecked population and it is calculated on the
basis of observed number of alleles with the
Table 3. Test for null hypothesis for mutation drift equilibrium under three mutation model (IAM, TPM and SMM)
using sign rank, standardized differences and Wilcoxon tests in Chilika buffalo
Test Parameter IAM TPM SMM
Sign Test Observed no. of loci with He excess 13 6 2
Expected no. of loci with He excess 13.82 13.64 13.6
p-value 0.44 0.00129* 0*
Standardized Difference Test T2 -0.43 -5.695 -15.538
p-value 0.33346 0* 0*
Wilcoxon Sign Rank Test p-value (two tail test for He excess and deficiency) 0.86967 0.00307* 0*
(* p < 0.01)
Figure 2. Mode shift analysis in Chilika buffalo showingnormal L-shaped distribution of allelic frequencies
without suffering any recent bottleneck

Volume 8 (2018) Number 1
34
assumption of a constant-size (equilibrium)
population (Luikart et al., 1998). Three different
test parameters viz. sign rank, standardized
differences and Wilcoxon tests were employed
under all the 3 models, In�inite Allele Model (IAM),
Stepwise Mutation Model (SPM) and Two Phase
Model (TPM) of microsatellite evolution to
investigate whether Chilika has experienced any
recent bottleneck (Table 3). Results of sign rank test
under IAM mutation model revealed value of 13.82
as expected number of loci with heterozygosity
excess on the other hand the observed number of
loci with heterozygosity excess was 13. In the case
of TPM and SMM, the expected and observed loci
with heterozygosity excess were 13.64 and 6; 13.6
and 2, respectively. The values for three tests
conducted for the Chilika buffalo signi�icantly
deviated and thereby null hypothesis of mutation
drift equilibrium was rejected indicating the
absence of genetic bottleneck in the recent past.
The probability values for sign rank test under IAM
(p = 0.44000), was not signi�icantly different but for
TPM (p = 0.00129) and SMM (p = 0.00000) were
signi�icantly different (Table 3). This again supports
the rejection of null hypothesis.
Another in�luential assessment of qualitative
graphical method which is based on mode-shift
distortion was also used in this study to visualize
the allele frequency distribution as an indicator for
genetic bottleneck. The results indicated the
absence of any recent bottlenecks in Chilika buffalo
and no mode shift (Luikart and Cornuet, 1997) was
found in the population (Figure 2), which is similar
to previous reports on Chilika and other buffalo
breeds (Kataria et al., 2010).
The present outcomes thus emphasize and re-
verify the ef�icacy of these microsatellite markers to
assess the existing genetic variability in one of the
important buffalo breeds of Odisha state of India.
Number of diversity analysis parameters suggests
abundance of genetic variability in Chilika buffalo
for its sustenance and the results obtained will be
useful for its future-breeding programme. Further,
it will be interesting to explore microsatellite based
diversity analysis in other Odisha buffalo breeds
like Paralakhemundi, Kalahandi, Sambalpuri and
Manda which would be quite valuable in assessing
the genetic variability among different buffalo
breeds/populations to assess the genetic
relationships among them and thus quite effective
in designing/planning the different breeding and
conservation strategies.
ACKNOWLEDGMENTS
Authors wish to thank Director, NBAGR, Karnal for
providing necessary facilities to carry out this work.
Technical help received from Mr. Naresh Yadav is
also gratefully acknowledged.
REFERENCES
Barker JSF, Tan SG, Moore SS, Mukherjee TK,
Matheson JL and Selvaraj OS. 2001. Genetic
variation within and relationships among
populations of Asian goats (Capra hircus).
Journal of Animal Breeding and Genetics 118:
213-234.
Botstein D, White RL, Skalnick MH and Davies RW.
1980. Construction of a genetic linkage map in
man using restriction fragment length
polymorphism. American Journal of Human
Genetics 32: 314-331.
Cornuet JM and Luikart G. 1997. Description and
power analysis of two tests for detecting recent
population bottlenecks from allele frequency
data. Genetics 144: 2001-2014.
Dodgson JB, Cheng HH and Okimoto RL. 1997. DNA
marker technology: a revolution in animal
genetics. Poultry Science 76: 1108-1113.
Imle P. 2005. Fluorescence-based fragment size
analysis. In Pharmacogenomics (pp. 139-146).
Humana Press.
Kataria RS, Kathiravan P, Bulandi SS, Pandey D and
Mishra BP. 2010. Microsatellite-based genetic
monitoring to detect cryptic demographic
bottleneck in Indian riverine buffaloes
(Bubalus bubalis). Tropical Animal Health and
Production 42: 849-855.
Kataria RS, Sunder S, Malik G, Mukesh M, Kathiravan,
P and Mishra BP. 2009. Genetic diversity and

Volume 8 (2018) Number 1
35
bottleneck analysis of Nagpuri buffalo breed of
India based on microsatellite data. Russian
Journal of Genetics 45: 826.
Kathiravan P, Kataria RS and Mishra BP. 2012. Power
of exclusion of 19 microsatellite markers for
parentage testing in river buffalo (Bubalus
bubalis). Molecular Biology Reports 39: 8217-
8223.
Luikart G and Cornuet JM. 1997. Empirical
evaluation of a test for identifying recently
bott lenecked populat ions from al lele
frequency data. Conservation Biology 12: 228-
37.
Luikart G, Allendorf FW, Cournuet JM and Sherwin
WB. 1998. Distortion of allele frequency
distributions provides a test for recent
population bottlenecks. Journal of Heredity 89:
238-47.
Mishra B.P, Kataria RS, Kathiravan P and Sadana D. K.
2 0 0 9 . M i c r o s a t e l l i t e b a s e d g e n e t i c
characterization of Jaffarabadi buffaloes.
Indian Veterinary Journal 86: 376-379.
Mishra BP, Kataria RS, Bulandi SS, Prakash B,
Kathiravan P, Mukesh M and Sadana DK. 2009.
Riverine status and genetic structure of Chilika
buffalo of eastern India as inferred from
cytogenetic and molecular marker-based
analysis. Journal of Animal Breeding and
Genetics 126: 69-79.
Mishra BP, Kataria RS, Kathiravan P, Singh KP, Sadana
DK and Joshi BK. 2010. Microsatellite based
genetic structuring reveals unique identity of
Banni among river buffaloes of Western India.
Livestock Science 127: 257-261.
Navani N, PK Jain, S Gupta Sisodia BS and S. Kumar.
2002. "A set of cattle microsatellite DNA
markers for genome analysis of riverine
buffalo (Bubalus bubalis)." Animal Genetics 33:
149-154.
Patro BN, Mishra PK and Rao PK. 2003. Chilika
buffaloes in Orissa: a unique germplasm.
Animal Genetic Resources Information 33: 73-
79.
Peakall R and Smouse PE. 2012. GenAlEx 6.5: genetic
analysis in Excel. Population genetic software
for teaching and researchdan update.
Bioinformatics 28: 2537e2539.
Sambrook J and Russell DW. 2001. Molecular
Cloning: A Laboratory Manual, New York: Cold
Spring Lab.
Singh R, Mishra SK, Rajesh C, Dash SK, Niranjan SK
and Kataria RS. 2017. Chilika- A distinct
registered buffalo breed of India. International
Journal of Livestock Research 7: 259-266.
Vijh RK, Tantia MS, Mishra B and Bharani Kumar, ST.
2008. Genetic relationship and diversity analysis
of Indian water buffalo (Bubalus bubalis). Journal
of Animal Science 86: 1495-1502.

Volume 8 (2018) Number 1
36
Standardization of a common protocol for establishment and cryopreservationof �ibroblast cell lines from different indigenous livestock species
1 1 1 1 1 2Himani Sharma , Rekha Sharma *, RAK Aggarwal , PK Vij , Sonika Ahlawat , Th Randhir Singh ,
3 1NV Patil and MS Tantia
1ICAR-National Bureau of Animal Genetic Resources, Karnal (Haryana) India
2Central Agricultural University, Imphal, (Manipur) India3ICAR-National Research Center on Camel, Bikaner, (Rajasthan) India
ABSTRACT
The majority of precious livestock genetic resources remain exposed to the vagaries of genetic erosion due to limitations of in situ conservation programs. Fibroblast bank offers a practical approach to preserve germplasm due to advancement of cell culture techniques. The objective of current study was to biologically develop, evaluate and cryopreserve the skin �ibroblast cells of different Indian livestock species obtained using an ef�icient, common protocol. Ear marginal tissues from Manipuri and Marwari horses (n=8) and Kutchi camel (n=6) were collected for this purpose. Primary culture and �irst passage was done using �ibroblast speci�ic media (HiFibroXL™). Epithelial-like and �ibroblast-like cells emerged from the tissue explant margins within 10-14 days of culture in both the species. Subsequent passaging of cells for both horse and camel was continued using DMEM+Ham's F12 (1:1) media with 10% FBS. Fibroblast cells showed typical fusiform morphology with centrally located oval nuclei. Cells exhibited radiating, �lame like or whirlpool like migrating patterns and density dependent inhibition during cell proliferation. The growth curve at passage-4 represented typical S-shape as the cell population passed through a lag phase, a logarithmic phase and a plateau phase. Population doubling time varied between 27.9 to 31.37 hrs with multiplication rate of 0.76- 0.86 population doubling/24
rd thhrs. The cells were cryopreserved from 3 to 6 passage stocking at least 75 cryogenically-preserved vials
6(1×10 cells/ml) per animal. The protocol was further validated in six more species, mithun, yak, buffalo, goat, sheep and donkey. It can be concluded that �ibroblast cell culture can be established from eight different livestock species at a faster rate and in a cost effective manner following a single common protocol described in this paper.
Key Words: Cryopreservation, epithelial cell, �ibroblast, Kutchi camel, Manipuri horse, Somatic cell culture
*Corresponding author: [email protected]
Manuscript received: 03.6.2018
INTRODUCTION
Biodiversity is facing unprecedented challenges worldwide and vulnerable animals are threatened by the introduction of foreign species, massive destruction of their natural habitats and industrial pollution, as also found in India. It is crucial to protect the genetic resources of indigenous livestock. The primary emphasis in conserving livestock animal genetic resources in India has been on in-situ conservation, which no doubt has several positive attributes. However, given the global progress,
actions have proceeded at a relatively conservative pace in our country (Goswami et al., 2016). This is not surprising considering the number of technical and socio-economic factors and most importantly �inances involved in governing the maintenance of live animals.
Modern scienti�ic methodologies can aid in accomplishing this feat. Semen from cattle has been viably cryobanked and stored since the late 1950's. In the interim, cryobanking techniques have been enhanced which has extended our capacity to store a
Research paper

variety of other tissues (e.g., embryos, blood cells, �ibroblast cells, primordial germ cells). The role of genetic resource banks, which provide collection, processing and storage of biomaterial, in the management and conservation of livestock species is particularly noticeable in the last decade. Under correct usage these recourses are enough to keep up current genetic diversity in the populations and allow their reproduction in the future. A core problem in creating such banks is to determine the quantity and type of preserved genetic material (Goswami et al., 2016). Most cryobanks focus on cryopreservation of the gametes (primarily sperm) and the embryos, being targeted to offspring reproduction by means of assisted reproductive technologies, including arti�icial insemination, in vitro fertilization and embryo transfer. Cryobanking of somatic cells as the nuclei donors for cloning is recently considered the additional approach for preservation and improvement of agricultural animals and poultry gene pools. Establishing somatic cell lines has been proposed as a practical approach to facilitate the conservation and utilization of genetic resource from various species (Li et al., 2009; Liu et al., 2011; Lin et al., 2013).
Somatic cell gene-banks for farm animals are more common in developed countries, but in developing countries including India, where much of the worlds dwindling genetic variation currently resides, it is in its infancy. Given the national depletion of animal genetic resources, the introduction of somatic cells in national gene-banks is required urgently (Singina et al., 2014). To date cryobanking of somatic cells has been an underutilized tool in national conservation programs. The approach is considered to be cumbersome and costly and moreover it is assumed that protocols need to be standardized for each livestock species to obtain somatic cells (Sharma et al., 2018).
Hence, there is a need for designing scienti�ic interventions to minimize the material, time and cost involved in generation of somatic cell lines for cryobanking. Standardization of a common protocol will lead to acquiring the genetic material relatively quickly and will be a source to provide an important reserve of genetic resources that can be used for a
wide variety of conservation, and research interests. In the present study, an attempt has been made to design a somatic cell culture protocol that is cost effective and is applicable across the livestock species. Cost often been cited as a limitation of gene banking will reduce substantially as the need for different cell culture consumables will be minimized.
MATERIALS AND METHODS
Sample collection
Ear pinna was selected for collection of skin biopsies as it offers advantages of easy accessibility, non-invasiveness and no limitations of sex or age of animal. Animal were selected only from the Government livestock farms so that all the government guidelines of animal ethics were followed. Cell culture media and chemicals were purchased from Sigma, USA unless otherwise indicated. Human �ibroblast speci�ic media- Hi�ibroXL was from HiMedia, India. Skin biopsies
2 (approximately 0.5 cm tissue) of 8 healthy adult animals each of Marwari and Manipuri horse and 6 Kutchi camels were collected in DMEM/Ham's F-12 (Dulbecco's Modi�ied Eagle's Medium (DME) and Ham's F-12 Nutrient Mixture 1:1 ratio) with antibiotic solution (100 IU/mL penicillin and 100 µg/mL streptomycin) after cleaning the marginal ear.
0Samples were brought to laboratory at 4 C in the shortest possible time.
Tissue explant culture2
Tissue was chopped into 1-2 mm pieces with sterile
Volume 8 (2018) Number 1
37
Figure.1 Distribution of horse and camel populationsunder study
Marwari horseManipuri horse
Kutchi camel
forceps and scalpel after removing hair, epidermis and fat layer. Tissue explants were placed in a 35mm sterile petri dish. Pre-warmed media having 10% FBS (Fetal Bovine Serum) and antibiotics (100 units/mL penicillin and 100µg/mL streptomycin) was added and dishes were incubated at 37°C with 5% CO in a humidi�ied incubator. After 24 hrs, 2
additional media was added to the tissue explants and these were left undisturbed for 6-7 days (Singh and Sharma 2011). Media was replaced every fourth day to remove cell debris. Dishes were observed for any sort of bacterial and fungal contamination. Explants were observed for migration of cells under inverted microscope every alternate day after one week.
Harvesting of cells
Once the minimum cell outgrowth of approximately 20 mm was observed around the tissue pieces, explants were removed from the petri dish. Cell monolayer was harvested using 0.25% trypsin-EDTA (Ethylenediaminetetraacetic acid) (Singh and Sharma 2011). Cell pellet was re-suspended in 1 ml of �ibroblast speci�ic growth medium. Cell count and viability was established with trypan blue dye exclusion method (Freshney, 2010). Viability of cells was determined by relative cell count of live cells to total number of cells under 10X magni�ication. All the
2cells were transferred to the 25cm surface area culture �lask and incubated at 37°C with 5% CO in a 2
humidi� ied atmosphere . F lasks were kept undisturbed till 80% �lask surface was con�luent with the cells. Harvesting of the cells was done as described earlier. Cell pellet was re-suspended in 1 ml of DMEM/Ham's F-12 (1:1) complete growth media and sub-cultured at a ratio of 1:2. During subsequent serial passaging, the procedure was same as described above except for cell seeding density of 80,000 cells/�lask.
Growth characteristicsthFibroblast cells of the 4 passage were studied in
DMEM/Ham's F-12 supplemented with 10% FBS and 2
antibiotics. Thirty 25cm cell culture �lasks were set 4 up per breed at a density of 8 × 10 cells per �lask and
were cultured for 10 days. Three �lasks were harvested every day and cell numbers was recorded
until the cell growth became negative. The multiplication rate (r) and population doubling time (PDT) was determined along the exponential phase of the cell growth as r =3.32(log N -log N )/ (t -t ), H i 2 1
PDT= 1/r; N is number of cells harvested, N is H i
number of cells seeded, t is hours during harvest and 2
t is hours at initial time. 1
Cryopreservation and re-culture
Fibroblast cells in exponential phase of growth (70-80% con�luency), were harvested using 0.25%
6 trypsin-EDTA. The cell suspension (1x10 viable cells/ ml) was freezed in DMEM/Ham's F-12 having 10% DMSO. Cryogenic vials were labeled with the animal name, passage number, freezing serial number and date. Gradual freezing was followed with vials �irst placed overnight in 1ºC cooler at -80 ºC and then transferred to liquid nitrogen for long term storage. To recover cells, cryovials were quickly thawed at 37ºC, contents were transferred into �lask containing DMEM/Ham's F-12 media with 10% FBS and cultured at 37ºC with 5% CO in a humidi�ied 2
incubator. Subsequent culture conditions and harvesting followed by cell viability estimation was as described in the preceding section.
RESULTS AND DISCUSSION
This study represents �irst report of �ibroblast cell line establishment from ear marginal tissues of different livestock species using a common cell culture protocol. Manipuri and Marwari horses and Kutchi camel were selected for the �ibroblast cell line generation due to the urgent need for their conservation.
Marwari and Manipuri horses are of utmost historical and practical importance. These are found in different geographical regions of India (Fig. 1) and have unique features of adaptability to extreme climatic conditions, subsistence on poor feed and fodder and better resistance capabilities to withstand environmental stress and tropical diseases. Marwari horse is the desert horse breed of Marwar region of Rajasthan and is capable of covering long distances with good speed by virtue of its strong limbs and hooves. This breed is known for its elegance, viguor, endurance, intelligence, animated gait, beauty, alertness and peculiar ear tips
Volume 8 (2018) Number 1
38

Figure 2. Cells emerging from ear tissue explant during primary culture in Human fibroblast specific medium (x40 magnification). a) tissue biopsy, b) tissue explants, c) primary cells coming out of tissue explants, d) cells ready for harvesting
Volume 8 (2018) Number 1
39
touching each other when horse rotates its ears to 180 degree. These horses are now reared mainly for riding and sports (Chauhan et al., 2010). Manipuri breed is one of the purest and prestigious breed of equines of India. Manipuri ponies are loved for their stamina and speed and are globally famous for use in polo game. The Marwari population in India deteriorated in the early 1900s due to improper management of the breeding stock, and only a few thousand purebred Marwari horses remain (Jun et al., 2014). At present their population is 42,175 (Estimated livestock population breed wise based on breed survey, 2013). Manipuri horse is only 477 out of total 6,24,732 horse population of India. Breed numbers have dwindled to an extent that the Manipur state government of�icially declared the ponies as an endangered breed in 2013. Key reasons for this decline were loss of grazing land, urbanization and encroachment of wetlands that formed the natural habitat of this species. Exports of animals also contributed towards its population decline.
Kutchi breed of camel inhabits the Ran of Kutch in Gujarat state. Kutchi camel is facing seriously threatened situation due to more than 20 percent continuous decline in its population in the last two Livestock census of India. Major issues faced by camel breeders include rapid depletion in grazing land and water sources, increase in soil salinity, lack
of health care services. Moreover, new generation is getting attracted to easier livelihoods options than the camel rearing. The population of Kutchi camel is only 20,653 out of 0.4 million camels in India.
A combination of two commercially available media, Human �ibroblast speci�ic media (HiFibroXL) and DMEM/Ham's F12 were selected for supporting outgrowth of �ibroblasts from tissue explants and subsequent multiplication of the cells. Adherent method of primary cell generation from skin was selected over the tissue enzyme digestion method as it was simple and avoided injury to tissue explants (Hu et al., 2009; Anand et al., 2012). The tissue explants got adhered to the surface of petri-dish and cells started to emerge from these explants after 10-14 days in culture, irrespective of the species (Fig. 2). Cells were heterogeneous which included �ibroblast, epithelial or keratinocytes. Fibroblast cells migrated from sides of the explants and started multiplying with increase in the incubation time. These �indings were consistent with the time duration reported in literature for �ibroblast emergence for various species (Pei et al., 2015). Similar to our observations, �ibroblasts migrated from the tissue pieces upto 12 days after explanting for the Luxi cattle (Liu et al., 2008) and Fars native goat (Singh et al., 2011).
The principal concern during primary culture of skin tissue expalnts should be to maximize the �ibroblast cells and to reduce other possible cell types such as
Manipuri horse fibroblasts observed in 12-14 days.
Marwari horse fibroblasts observed in 12-14 days.
Kutchi camel fibroblasts observed in 10-12 days.

Volume 8 (2018) Number 1
40
epithelial, keratinocytes or osteocytes. Keratinocytes as well as epithelial cells were observed to be very less in the current study, which can be attributed to the use of �ibroblast speci�ic media (HiFibroXL). Use of this media was continued for the �irst passage also to further reduce the unwanted cell types. This approach resulted in the establishment of epithelial free �ibroblast cell culture in the second passage itself. Otherwise a culture of pure �ibroblasts is obtained only after four to �ive passages (Mehrabani et al., 2016). With serial passaging �ibroblasts gradually outnumber their epithelial counterparts (Wang et al., 2012). Compared to �ibroblasts, epithelial cells take more time to detach from the tissue culture �lask surface during trypsinization (Liu et al . , 2014). Further, these cells take c o m p a ra t ive ly m o re t i m e t o a t t a c h a f t e r subculturing. Moreover, �ibroblasts have higher growth potential. However, due to the use of �ibroblast speci�ic medium in explant culture followed by �irst subculture, the process of obtaining �ibroblast cells was expedited substantially. It leads to almost pure �ibroblasts just after the �irst passage itself. This saved not only the time but also the costly consumables which are required for execution of higher number of cell passages. More importantly, it also maintains the cell health. It is not uncommon for cells to cease growth and show changes in biological characteristics or lose their diploid properties with time in cultures (Li et al., 2009). It happens due to a variety of stimuli and factors, especially those
determining hereditary traits might be undermined due to repeated trypsinization (Wang et al. 2012). Effective measures are thus required to ensure diploid stability in cultures of cells that are used for preserving valuable genetic resources (Liu et al. 2014). The genetic characteristics of the cells change by in vitro culture conditions after many passages, so a minimal number of passages are desirable to conserve them.
Fibroblast speci�ic media was not used further after the �irst passage. Reason being that the published literature stated that the number of cells harvested from this media were comparatively less than that of observed in the other commonly used cell culture media such as MEM, DMEM-Hi glucose or DMEM/Ham's F-12 under similar culture conditions (Sharma et al., 2018). It was reported that total cell
5count in the HiFibroXL media (11.85±0.74 x 10 /ml) was less than half of that observed in the
5DMEM/Ham's F-12 (27.50 ± 1.84 x 10 /ml) on day 6 of the culture This reduction was due to the synthesis of elongated and larger cytoplasmic cell extensions in HiFibroXL media, which cover the tissue culture surface much faster than the smaller cells and lead to phenomenon of contact inhibition. As a result, cell multiplication was inhibited and less number of cells was obtained for cryofreezing (Wang et al., 2012).
DMEM/Ham's F-12 media has been reported to support growth of a broad spectrum of cells that include epithelial, endothelial and granulosa cells (Yi et al., 2012). Since, it is devoid of growth factors and
Figure 3. Morphology of the fibroblast cells in vitro. a) Subcultured cells on day 2, b) fiber like cells on day 4, c) near confluence cells on day 6 of culture.
Day 2 Day 4 Day 6

Figure 4. Growth curve of fibroblast cells (Mean ± SE of three observations) in different species in DMEM/Ham’s F12 media (x 10 magnification).
Volume 8 (2018) Number 1
41
other cell growth and multiplication stimulants as well as hormones that make any media speci�ic and selective for a single type of cells. Moreover, this media is considered to be enormously nutritious for cells. It's simple constitution along with the widespread use makes it cheaper also. Thus a commonly used media for �ibroblast culture (DMEM/Ham's) was selected to multiply the skin �ibroblasts after second passage. Morphology, as the most important qualitative parameter of �ibroblast cells was evaluated by light microscopy (Fig. 3). The cells had �ibrous characteristics with turgor vitalis cytoplasm, and during growth, they showed typical �ibroblast like morphology as radiating, �lame-like or whirlpool migrating shapes. The selection of media for mass multiplication of the �ibroblats was further supported by the ability of culture media to support cell growth. It was re�lected in the pattern of cell growth depicted by a typical 'S shape' sigmoid mammalian growth curve in both the species (Fig. 4). The initial lag phase was approximately 48 h which correspond to the adaptation of �ibroblasts as well as their recovery from trypsin damage occurred during harvesting of cells. It was followed by exponential phase of cell growth after which contact inhibition directed the cell multiplication to slow down at sixth day for horse and eighth day for camel. Stationary phase was �inally culminated in the death phase of the cells.
Morphological observations were well supported by the observed values for population doubling time (PDT) and cell multiplication rate (r) in the two species. Within the tested samples, highest rate of proliferation was observed in Manipuri horse followed by Marwari horse and least in Kutchi camel
and (PDT= 26.9h <30.5h <31.37h; r= 0.76> 0.79 > 0.86). Observed values corresponded to the optimum cell culture conditions including suitable culture medium in accordance with the reports of Singh et al. (2011) who established three �ibroblast cell lines from lower edge ear skin samples of healthy dairy goats with a PDT of 25-30 h. Growth curve studies of Bactrian camel cell line revealed PDT of 26.13 h (Sharma et al., 2018). Liu et al. (2014) observed PDT of 30.2h for adherent �ibroblasts of Wuzhishan miniature pig WPF22 cells. However, much higher PDT have been reported in some other species viz. 35.7 h for Sinihe horse (Cui et al., 2013) and 48 h for Jining Black Grey goat (Li et al., 2009) and Wenchang Chicken (Pei et al., 2014). On the basis of cell growth characteristics observed in the present study, it is rational to conclude that DMEM/Ham's F-12 media should be an appropriate choice for secondary �ibroblast cell culture.
Cell line preservation was done by freezing of �ibroblast cells in the freezing media. A minimum number of 75 vials per animal were cryopreserved. Cell viability before freezing varied between 95-98%, after thawing between 83-89% and after re-culture of thawed cells, it was between 95-99% with normal morphology. Standard behavior of cells in culture as presented in viability, proliferation rate and integrity of nuclear genome increase the chances of successful cloning (Ogura et al . , 2013). Standardization of a common protocol for two different livestock species, horse (Equus caballus) and camel (Camulus dromedaries) in the current study, was further validated in six more species, mithun (Bos frontalis), yak (Bos grunniens), buffalo (Bubalus bubalis), goat (Capra hircus), sheep (Ovis
Manipuri horse
5C
ell
Den
sity
(x1
0/m
l)
Days in culture
Marwari horse
5C
ell
Den
sity
(x1
0/m
l)
Days in culture
Kutchi Camel
Days in culture
5C
ell
Den
sity
(x1
0/m
l)
aries) and donkey (Equus asinus). Cell health as well as a faster pace of cell multiplication was retained across these species. Morphology, con�luency, cell count and viability of �ibroblasts were also maintained.
Somatic cell cryopreservation is an alternative in vitro option for genetic diversity maintenance which needs customized culture condition for different species. Differential ability of a culture media in supporting �ibroblast cells of species has previously been documented in the literature (Gorji et al., 2016). Singh and Sharma (2011) tested three commercially available media, known to support human and porcine speci�ic �ibroblast cultures, for their growth potential on goat skin explants. They concluded that the best medium for goat cell line proliferation is porcine-speci�ic P-116. On the similar lines, different media have been recommended for establishing cell lines in case of diverse species such as Minimal essential medium for buffalo explants and Wenchang Chicken (Pei et al., 2014; Tasripoo et al., 2014), Porcine �ibroblast growth medium for goat ear explants (Mahipal et al., 2011), DMEM for Sinihe Horse (Cui et al., 2013) and Jining Black Grey goat (Li et al., 2009). The main objective here was to design a protocol that minimizes the cost of obtaining somatic cells for cryo-conservation and that is functional across the species so that gene banks in the developing countries can afford this mode of preserving livestock biodiversity for posterity. Viable cryopreserved cell lines from different livestock species can be obtained using the common protocol described here from very small amount of biopsy material, including that of dead animals and contain complete genome and proteome. Cryopreserved somatic cells after repeated thawing are capable to regenerate, and hence almost in�initely may serve as a source of biomaterial for use in assisted reproductive technologies and biological research, including retrospective reconstruction unlike the germ cells and embryos. Fibroblast cell lines are m o s t c o m m o n l y u s e d , b e c a u s e t h e y a r e differentiated adult cells and are considered as a good source for IPSC (Induced Pluripotent Stem Cells) that can also be used for drug testing and molecular studies.
The development of �ibroblast cell banks for various livestock species can provide an excellent resource for biological research and preserve valuable genetic materials. These �ibroblasts can be used for various applications such as feeder layer of embryonic stem cells, tissue engineering, and wound healing researches and are not restricted to their use as a donor cell for nuclear transfer in cloning. In summary, a single method has been described for skin �ibroblast generation from different indigenous livestock species. This method will make �ibroblast cell cryopreservation more ef�icient, faster, cost effective and can be a method of choice for the rapid creation of cell banks.
ACKNOWLEDGMENT
We are highly thankful to Indian Council for Agricultural Research for providing funds in the project “Consortium Research Platform on Agro biodiversity”. We gratefully acknowledge the facilities provided by the director NBAGR for carrying out the research work.
REFERENCES
Anand V, Dogra N, Singh S, Kumar SN, Jena MK, M a l a k a r D , D a n g A K , M i s h r a B P, Mukhopadhyay TK, Kaushik JK and Mohanty A K . 2 0 1 2 . E s t a b l i s h m e n t a n d characterization of a buffalo (Bubalus bubalis) mammary epithelial cell line. PLoS One 7(7):e40469.
Chauhan M, Gupta A and Dhillon S. 2010. Genetic diversity and population structure of three Indian horse breeds. Molecular biology reports 38:3505-11. Doi-10.1007/s11033-010-0461-z.
Cui P, Hu P, Li C, Guan W and Ma Y. 2013. Establishment and Characterization of a �ibroblast cell line from Sinihe Horse. Life Science Journal 10(4).
Estimated livestock population breed wise based on breed survey. 2013. Department of Animal Husbandry, Dairying and Fisheries. Ministry of Agriculture and Farmers Welfare, Government of India, pp 41.
Freshney RI. 2010. Culture of animal cells: a manual o f b a s i c te c h n i q u e a n d s p e c i a l i z e d
Volume 8 (2018) Number 1
42

applications. 6th ed. Hoboken NJ: Wiley-Blackwell 732.
Gorji ZE, Khaledi KJ, Amoli AD, Ganjibakhsh M, Nasimian A, Gohari NS, Izadpanah M, Vakhshiteh F, Farghadan M, Moghanjoghi SM, Rahmati H, Abolhassan S, Fazeli S and Farzaneh P. 2016. Establishment and characteristics of Iranian Sistani cattle � i b r o b l a s t b a n k : a w a y t o g e n e t i c conservation. Conservation Genetics Resources 9(28): 1-8.
Goswami M, Mishra A, Ninawe AS, Trudeau VL and Lakra WS. 2016. Bio-banking: an emerging a p p r o a c h f o r c o n s e r v a t i o n o f � i s h germplasm. Poultry, Fisheries and Wildlife S c i e n c e s 4 : 1 4 3 . d o i : 1 0 . 4 1 7 2 / 2 3 7 5 -446X.1000143.
Hu H, Wang J, Bu D, Wei H, Zhou L, Li F and Loor JJ. 2009. In vitro culture and characterization of a mammary epithelial cell line from Chinese Holstein dairy cow. Plos one 4(11):e7636. doi: 10.1371/journal.pone.0007636.
Jun J, Cho YS, Hu H, Kim HM, Jho S, Gadhvi P, Park KM, Lim J, Paek WK, Han K, Manica A, S Edwards JS and Bhak J. 2014. Whole genome sequence and analysis of the Marwari horse breed and its genetic origin. BMC Genomics 15(Suppl 9):S4. doi:10.1186/1471-2164-15-S9-S4.
Li LF, Yue H, Ma J, Guan WJ and Ma YH. 2009. Establishment and characterization of a �ibroblast line from Simmental cattle. Cryobiology 59:63-68.
Li XC, Yuea H, Li CY, Heb XH, Zhaob QJ, Mab YH, Guanb WJ and Maa JZ. 2009. Establishment and characterization of a �ibroblast cell line derived from Jining Black Grey goat for genetic conservation. Small Ruminant Research 87(1):17-26.
Liu C, Guo Y, Guan W, Yuehui Ma, Zhang HH and Tang X. 2008. Establishment and biological characteristics of Luxi cattle �ibroblast bank. Tissue and Cell 40:417–424.
Liu C, Guo Y, Lu T, Li X, Guan W and Ma Y. 2014. Establishment and genetic characteristics analysis of in vitro culture a �ibroblast cell
line derived from Wuzhishan miniature pig. Cryobiology 68:281-287.
Liu CQ, Guo Y, Guan WJ and Ma YH. 2011. Establishment and characterization of a �ibroblast cell line derived from Mongolian s h e e p . A n i m a l S c i e n c e J o u r n a l 82(2):215–222.
Lin PY, Yang YC, Hung SH, Lee SY, Lee MS, Chu IM and Hwang SM. 2013. Cryopreservation of h u m a n e m b r yo n i c s t e m c e l l s by a programmed freezer with an oscillating magnetic �ield. Cryobiology 66:256–260.
M a h i p a l S , A n i l S a n d P u s h p a Y. 2 0 1 1 . Characterization of GSF289: a �ibroblast cell line derived from goat ear skin explants. Journal of Biotech Research 3(1):1-6.
Mehrabani D, Booyash N, Aqababa H, Tamadon A, Zare S and Dianatpour M. 2016. Growth kinetics, plasticity and characterization of hamster embryonic �ibroblast cells. Italian Journal of Zoology 83(3): 306-311.
Ogura A, Inoue K and Wakayama T. 2013. Recent advancements in cloning by somatic cell nuclear transfer. Philosophical Transactions of the Royal Society of London. Series B, Biological Sciences 368(1609):20110329.
Pei P, He X, Zhao Y, Zhu Z, Kan J, Guan W and Ma Y. 2015. Establishment and characterization of a �ibroblast cell line derived from Gansu alpine �ine-wool sheep. Biocell 39(1):8–13.
Pei P, Pu Y, Zhao Y, Zhu Z, Kan J, Guan W and Ma Y. 2014. Establishment and biological characterization of �ibroblast cell line from the Wenchang Chicken. Life Science Journal 11(8): 85-89.
Sharma R, Sharma H, Ahlawat S, Aggarwal RAK, Vij PK and Tantia MS. 2018. First attempt on somatic cell cryopreservation of critically endangered Camelus bactrianus of India. Gene Reports 10:109-115.
S i n g h M , S h a r m a A K a n d Ya d av P. 2 0 1 1 . Characterization of gsf289: a �ibroblast cell line derived from goat ear skin explants. Journal of Biotech Research 3(1):1-6.
Volume 8 (2018) Number 1
43

Singh M and Sharma AK. 2011. Outgrowth of �ibroblast cells from goat explants in three different culture media and establishment of ce l l l ines . In Vi tro Cel lu lar and Development Biology 47:83-88.
Singina GN, Volkova NA, Bagirov VA and Zinovieva NA. 2014. Cryobanking of somatic cells in conservation of animal genetic resources: p ro s p e c t s a n d s u c c e s s e s ( re v i e w ) . A g r i c u l t u r a l B i o l o g y 6 : 3 - 1 4 . d o i : 10.15389/agrobiology.2014.6.3eng.
Tasripoo K, Suthikrai W, Sophon S, Jintana R, Nualchuen W, Usawang S, Bintvihok A, Techakumphu M and Srisakwattana K. 2014.
First cloned swamp buffalo produced from adult ear �ibroblast cell. Animal 1139-1145.
Wang H, Li X, Li C, Zhang W, Guan W and Ma Y. 2012. Establishment and Biological Characteristics of Qing Kedan Chicken Embryonic Fibroblast Line for Genetic Resource Conservation. Journal of Animal and Veterinary Advances 11:4374-4381.
Yi J, Coulouris G, Zaretskaya I, Cutcutache I, Rozen S and Madden TL. 2012. Primer-BLAST: a tool to design target-speci�ic primers for p o l y m e r a s e c h a i n r e a c t i o n . B M C Bioinformatics 13:134–146.
Volume 8 (2018) Number 1
44

Volume 8 (2018) Number 1
45
Study of performance and management practices of Dumba sheep insemi-arid region of the India
1 1 1 2AK Mishra *, A Jain , S Singh and KS Rathore
1ICAR- National Bureau of Animal Genetic Resources, Karnal- 132001 (Haryana) India2Deptt. of Animal Husbandry, Government of Rajasthan, India
ABSTRACT
Characterization and performance evaluation of fat –tailed Dumba sheep was undertaken through survey in Jaipur, Nagaur and Ajmer districts of Rajasthan. The data on body biometry, phenotypic characters and other performance traits were collected through measurements, personal observations and information provided by the sheep farmers. Dumba animals are large in size which is also re�lected by its body weight and body biometry. The coat colour is white, brown, white with brown patches and white with black patches all over the body. The predominant colour is white (43.86%), followed by brown or mixture of white and brown (41.23%) and black-white mixture (14.91%). Ears are large, pendulous and drooping. Ear length ranged from 9 to 26 cm. Legs, face and belly are devoid of wool. Head is slightly convex in majority of animals (62.02%). Muzzle is pink and hooves are light brown or grey in colour. Both the sexes are polled, however, horns were observed in some of the males. The price of Dumba animals is very high as claimed by sheep owners. Adult animals are sold at the rate of Rs 60000 to 125000 and lambs @ Rs 25000-40000. The average �lock size was 16.04. The average adult body weight of rams and ewes were 83.89 ± 3.95 and 58.76 ± 1.79 kg, respectively which ranged from 50 to 124 kg in rams and 35 to 96 kg in ewes. The overall body length, height, chest girth, paunch girth, face length, face width, ear length and tail length were 71.88 ± 0.55, 76.07 ± 0.60, 93.38 ± 0.79, 94.78 ± 0.85, 20.86 ± 0.18, 9.59 ± 0.08 and 17.69 ± 0.22 cm respectively. Body weight of lambs in the age groups of 1-3 and 3-6 months ranged between 11-32 and 20 -60 kg respectively. Animals are maintained under intensive or semi-intensive system of management with no grazing. Dumba sheep is maintained primarily for sacri�ice (qurbani) or earn handsome money from sale during the Bakr-Eid festival. Dumba sheep, on account of its demand for the religious ritual, is contributing to the livelihood of sheep farmers.
Keywords: Biometry, body weight, Dumba sheep, performance evaluation
*Corresponding author: [email protected]
Manuscript received: 06.6.2018
INTRODUCTION
Fat-tailed sheep breeding is an important traditional system of sheep production in arid /or semi-arid region. Dumba sheep are characterized by the deposition of fat in the tail (Pourlis, 2011). They are well known for their ability to walk long distances and to cope with harsh environmental conditions such as long periods of drought and high temperatures (Kashan et al., 2005). In India, Dumba sheep breeding is practiced since quite some time under semi-intensive production system in arid or
semi-arid region. Dumba sheep are maintained by the sheep farmers as well as live animal traders in Jaipur, Nagaur and Ajmer districts of Rajasthan, Delhi, Malerkotla tehsil of Punjab and Muzaffarnagar district of UP. The primary purpose of rearing Dumba sheep is to earn handsome income during the Eid festival as this sheep has great aesthetic and religious value. Dumba sheep are hardy and able to withstand the tough challenges of desert life. Therefore, these animals exhibit promising growth rate and attain high body weights when maintained under semi intensive and intensive system of management
Research paper

Volume 8 (2018) Number 1
46
under arid and semi-arid conditions of Rajasthan in India. In view of above, the present study was conducted to study the phenotypic characters, performance traits and management practices followed by sheep farmers in its distribution area.
MATERIALS AND METHODS
The survey was undertaken in May 2016 and February 2017 in twelve villages and mohllas belonging to Jaipur, Ajmer, Nagaur and Bikaner districts of Rajasthan, India. A total of 25 sheep �locks were surveyed during the study. The body biometry traits viz. body length (BL), height at wither (HW), chest girth (CG), paunch girth (PG), ear length (EL), face length (FL), face width (FW), tail length (TL), Rump length (RL), rump height (RH) and body weight (BW) were recorded from 118 adult animals (28 male and 90 females) as per the standard performae developed for phenotypic characterization of sheep genetic resources. Body weights of 73 lambs belonging to different age groups from birth to 12 months were also recorded. The body weight was recorded using spring weighing balance and biometric traits were recorded using measuring tape after making the animal to stand squarely on even ground. The data on other physical traits viz. head pro�ile, ear orientation, color pattern, production performance; reproduction traits etc . and management practices were collected by personnel observations and interviewing sheep farmers. The data were statistically analyzed as per standard statistical techniques (Snedecor and Cochron, 1989).
RESULTS AND DISCUSSION
Phenotypic characteristics
Dumba is maintained mainly in Jaipur, Nagour and Ajmer districts of Rajasthan. The animals are also available in Delhi, Malerkotla tehsil of Punjab and Muzzfarnagar districts of UP. Main objective of rearing Dumba is for sacri�ice (qurbani) or earning of money during the Eid festival as they have great aesthetic and religious value. The biometry and body weight of Dumba re�lects that it is large in size. The prominent coat colour is white (Figure1) and brown, however, some black animals and mixture of black-white and brown-white were also observed. The predominant colour is white (43.86%), followed by brown or mixture of white and brown (41.23% and black-white mixture (14.91%). The sheep are characterized by the deposition of fat in the tail. Leg, face and belly are devoid of wool. Head is slightly convex in majority of animals (62.02%). Muzzle is pink in colour and hooves are light brown or grey. Both the sexes are polled, however, horns were observed in some males. Ears are large in size, pendulous and drooping. Besides sheep, almost all sheep farmers reared goats and some poultry. The average �lock size was 16.04 (range: 2 to 65), comprising 15.88 Dumba and 0.16 others sheep. Of the Dumba sheep, 2.08 were male, 10.32 female and 3.48 lambs on an average. The udder is medium sized with medium sized teats.
The average body weight of rams and ewes were 83.89 ± 3.95 and 58.76 ± 1.79 kg, respectively which
Figure 1. Dumba Sheep

Volume 8 (2018) Number 1
47
ranged from 50 to 124 kg in rams and 35 to 96 kg in ewes. The overall body length, height, chest girth, paunch girth, face length, face width, ear length and tail length were 71.88 ± 0.55, 76.07 ± 0.60, 93.38 ± 0.79, 94.78 ± 0.85, 20.86 ± 0.18, 9.59 ± 0.08 and 17.69 ± 0.22 cm respectively (Table 1). The average body weight of adult Dumba sheep are more than that of other mutton producing sheep in the region viz. Malpura (Mishra et al., 2005) and Jaislameri (Arora et al. 2007). There is signi�icant difference between sexes for all the biometric traits under study except for ear length. Body weight of lambs in the age groups of 1-3 and 3-6 months were ranges between 11-32 and 20 -60 kg respectively (Table 2). The 3 to 6 months body weight of lambs is very important for marketing point of view. The study also reveals that 78.56% adult males weighed more than 60 kg and 51.38 % adult females weighed from 50 to 70 kg (Table 3). The body biometry and adult body weight of Dumba sheep reveals that this sheep is quite large in size and weigh more than other sheep breed of the country.
Management of Dumba sheep
In contrast to other sheep breed of the country, Dumba sheep are maintained under intensive
system of management with no grazing. 100% farmers provide concentrate and fodder to sheep. The major fodder was loom, leaf of Ardu and Rijika. The present �indings were not in agreement with earlier reports of Mishra et al., (2005), Mishra et al., (2016) and Arora et al., (2007). The majority of sheep farmers kept sheep in covered area. The hundred percent sheep farmers have PUCCA housing and 60% constructed separate houses and some farmers (12%) kept Dumba animals on upper story of their residence. The sheep are generally shorn 3 to 5 times in a year. The majority of farmers reported average greasy wool production from 100 g to 300 g per shearing. The marketing age of male lambs was reported to be 4 months by 54.17 % farmers (Table
Table 1. Body weight (kg) and biometry (cm) of adult Dumba sheep
Traits OverallMean ±SE Sex Male Mean±SE (Range) Female Mean±SE (Range)
N 118 28 90
Body weight 65.80±2.03 ** 83.89±3.95 (50-124) 58.76±1.79 (35-96)
Body length 71.88±0.55 ** 76.75±1.04 (69-88) 70.37±0.56 (60-86)
Height at wither 76.07±0.60 ** 82.75±1.01 (72-91) 73.99±0.56 (60-84)
Chest girth 93.38±0.79 * 99.96±1.45 (88-111) 91.33±0.82 (73-109)
Paunch girth 94.78±0.85 * 101.50±1.73 (84-113) 92.69±0.87 (73-110)
Face length 20.86±0.18 ** 22.50±0.30 (19-25) 20.36±0.17 (17-29)
Face width 9.59±0.08 ** 10.29±0.14 (9-12) 9.38±0.08 (6-11)
Ear length 17.69±0.22 NS 17.75±0.39 (11-21) 17.68±0.27 (9-26)
Rump length 19.07±0.43 ** 22.29±0.91 (14-32) 18.07±0.44 (9-25)
Height at rump 18.72±0.41 ** 23.00±0.87 (13-29) 17.78±0.44 (8-27)
Table 2. Body weight of Dumba lambs (kg)
Age 0-1 months 1-3 months 3-6 months 9-12 months
Overall 11.07±0.82 (22) 21.50 ± 1.64 (14) 35.13 ± 1.75 (30) 59.57 ±2.99 (7)
Sex ** **
Male 10.78± 1.20 (9) 24.00 ± 1.92 (9) 39.75 ± 2.58 (16) 60.40 ± 3.04 (5)
Female 11.27 ± 1.15 (13) 17.00 ± 1.82 (5) 29.86± 1.37 (14) 57.50 ± 9.50(2)
Range 4-18 11-32 20-60 48-72
** Significant at p≤ 0.01; figures within parentheses are number of observations
Group (kg) Male Female
<50 3.57 % (1) 29.16 % (21)
50-60 17.86 % (5) 33.33 %(24)
60-70 10.71 % (3) 18.05 % (13)
70-80 7.14 % (2) 9.72 % (7)
80-100 42.86 % (12) 9.72 % (7)
>100 17.85 % (5)
Table 3. Frequency distribution of body weight ofDumba sheep
figures within parentheses are number of observations
NS: non-significant, * P<0.05, ** P<0.001

4) with market price from Rs. 25000 to 40000 by majority of sheep farmers. The market price of adult/ old aged rams and ewes ranged from Rs. 15000 to 1.25 lacks (Table 4). Though, the ewes are not milked, however, the daily milk yield was reported to range from 250 to 500 ml. The mortality was reported to be 1 to 2% (Table 4) in adult (62.5 % farmers) and 10 to 20% in lambs (54.17 % sheep farmers).
Reproduction
The ewes are bred through natural mating. The average number of rams per �lock was 1.28 with a ram-ewe ratio of 1:8.06. The rams-ewes ratio was much higher than that reported by Mishra et al. (2016) in Kajali sheep. In all the surveyed �locks only Dumba ram was being used for breeding purpose. The rams are either selected from their own �lock or
exchanged with the other breeders. The rams are selected based on body conformation, especially the fat tail. Age at �irst mating in rams was reported about 12 months by 50% sheep breeders while as age at �irst lambing was reported about 15-18 months by 75% of farmers. The lambing take place throughout the year as reported by majority (78.26%) of sheep farmers, from November to January (21.74% farmers) and from July to September (72% sheep farmers). Majority of farmers reported that twining varied from 1 to 2 %. The annual lambing rate was reported as 95% by 63.64% farmers. The majority of farmers reported twinning rate 1-2%.
The study reveals that Dumba sheep is one of the heaviest sheep of India and managed in intensive system of management and reared for fetching
Table 4. Management practices adopted by Dumba sheep farmers
Particulars Items % of sheep farmers
Housing pattern
Housing Pucca 100%
Kutcha 0.00
Separate 60.00%
Part of owners house 40.00; (12% at upper story of house)
Breeding practices
Age at first breeding: Males 10- 12 months 45.83 %
12 months 50.00%
12 to 18 months 4.17 %
Lambing % 80- 90 % 22.73%
90-95% 13.64%
>95 % 63.64% (6: 100%)
Age at first lambing 12 to 15 months 25%
15-18 months 75%
Disposal of ewes 7- 8 years 18.18 %
8-10 years 9.09%
> 10 years to till death 68.18%
Marketing age < 4 months 29.17 %
4 months 54.17 %
4-6 months 4.17%
> 6 months 12.50%
Adult cost/ males (`) 15000 to 25000 40%
25000 to 50000 12%
50000 to 80000 36%
80000 to 1.25 lacs 12%
Health Management
Lamb Mortality <5% 41.67%
5-10 % 4.17%
10-20 % 54.17%
Adult mortality 1-2% 62.5%
2- 5 % 20.83%
> 5% 16.67%
Volume 8 (2018) Number 1
48

higher money during Bakr-Eid festival. The adaptation of Dumba sheep to the arid and semi-arid climate of Rajasthan, promising growth rate and their market demand indicated a fair scope of its propagation and development in India.
ACKNOWLEDGEMENT
The authors are thankful to the Director, ICAR- National Bureau of Animal Genetic Resources, Karnal for providing the facilities. Our sincere gratitude to all sheep keepers to allowed measurements of their animals. We also sincerely thank the Director, Animal Husbandry, Govt. of Rajasthan (India) and Deputy Directors of Jaipur, Ajmer and Nagaur districts and all veterinary of�icers of distribution area of Dumba sheep available in Rajasthan.
REFERENCES
Arora A L, Prince, L L L and Mishra A K. 2007. Performance Evaluation of Jaisalmeri Sheep in Farmers' Flocks. The Indian Journal of Animal Sciences. 77 (8): 759-762.
Kashan, NEJ, Mana�i Azar, GH, Afzalzadeh, A, Salehi, A.
2005. Growth performance and carcass quality of fattening lambs from fat-tailed and tailed sheep breeds, Small Ruminant Research, 60, 267–271
Mishra AK, Arora AL, Kumar Sushil, Sharma RC and Singh VK. 2005. MALPURA: A Mutton type sheep breed, published by ICAR- Central Sheep and Wool Research Institute, Avikanagar, via. Jaipur (Rajasthan)-304 501.
Mishra AK, Raja KN, Vohra V, Singh S and Singh Y. 2016. Phenotypic traits and performance of Kajali Sheep: a lesser known ovine genetic resource of Punjab, India. Indian Journal of Animal Sciences, 86(11): 1279-1282.
Pourlis AF. 2011. A review of morphological characteristics relating to the production and reproduction of fat-tailed sheep breeds, Trop Anim Health Prod, 43:1267–1287.
Snedecor GW and Cochran WG. 1989. Statistical th
Methods, 8 Edn., Af�iliated East-West Press, New Delhi and Iowa State University Press, Iowa, USA.
Volume 8 (2018) Number 1
49

Population trends and distribution of indigenous pigs in India
Rahul Behl*, PK Vij, SK Niranjan, Jyotsna Behl and Arjava Sharma
National Bureau of animal Genetic Resources, GT By-Pass Road, Karnal-132001 (Haryana) India
ABSTRACT
Indian indigenous pigs have unique features, including their adaptation for survival under most adverse conditions of nutrition, disease resistance, heat tolerance and ability to produce meat with comparatively less fat. The present status of indigenous pigs was evaluated in terms of their distribution and population trend. It is estimated that population of indigenous pigs will fall to 60.70 lakhs by 2025. Some regions in India still have sizable population of indigenous pigs. North-Eastern region of Assam comprising districts of Dhemaji, Lakhimpur and Sonitpur house about 4.28 percent of the indigenous pig population of India. Bhojpur district in Bihar has the highest population of indigenous pigs (128674) in the country. However, the decreasing population of indigenous pigs vis a vis increasing population of exotic and crossbred pigs indicate that the indigenous pigs require immediate care and attention to arrest the declining trend in their population.
Key words: indigenous pig, population trend, geographical distribution*Corresponding author: E-mail:[email protected]
Received on 26.6.2018
INTRODUCTION
Pigs (Sus scrofa) are the most efficient domestic animals in converting domestic and agricultural wastes into edible meat. Due to their high growth rate, better feed conversion ratio and large litter size, pigs produce the cheapest meat among all carcass producing animals that can be afforded by the weaker sections of the society providing an affordable source of good quality protein to poorer people. Pigs, in India, are traditionally reared either by the poorer and weaker sections or the tribal societies rearing mainly indigenous pigs (Bhat et al. 2010, Naskar et al. 2013). Besides indigenous pigs, some exotic breeds like Large White Yorkshire and Landrace and their crosses were introduced due to their better growth rates. Although, the growth rates and feed conversion ratio of indigenous pigs is less than those of the exotic or crossbred pigs (Kumar et al. 1990, Gaur et al. 1997), they have unique features like heat tolerance, disease resistance and ability to produce meat with less fat compared with exotic or crossbred pigs. They are well adapted to survive under most adverse conditions of nutrition and strive well on domestic and agricultural waste (Chhabra et al. 1999, Hetzer and Miller 1973, Naskar
et al. 2013). However, in the last decade the population of indigenous pigs as well as total pig population of our country has shown a declining trend. Only, the population of crossbred pigs has shown an increasing trend. This paper attempts to describe the present status of pigs in India in terms of their population trends and distribution with special emphasis on indigenous pigs.
MATERIALS AND METHODS
Secondary data on pig population was obtained from livestock census (Livestock census 2003, 2012) and state wise population densities were calculated. The district wise census data for indigenous pigs was grouped for population intervals to obtain the number of districts or states with specified minimum population. The regression equation for the population trend was developed (Gupta 2011) using census data from 1992 onwards and the population for the years 2020 and 2025 were estimated by method modified from (Singh et al. 1991) as
Y´ = a+bX´
Where, Y´= Estimated population in the year X´
b= Slope in the regression equation Y=a+bX
a = Y, when X=0
Volume 8 (2018) Number 1
50
Research paper
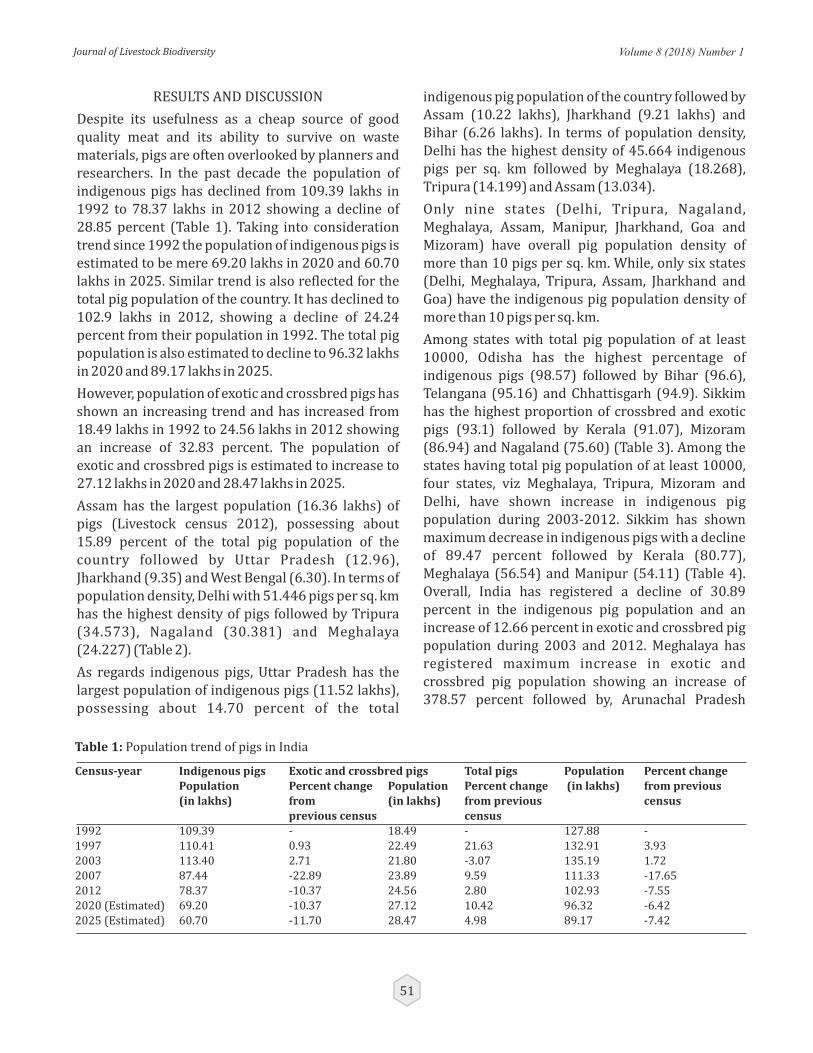
Volume 8 (2018) Number 1
51
RESULTS AND DISCUSSION
Despite its usefulness as a cheap source of good quality meat and its ability to survive on waste materials, pigs are often overlooked by planners and researchers. In the past decade the population of indigenous pigs has declined from 109.39 lakhs in 1992 to 78.37 lakhs in 2012 showing a decline of 28.85 percent (Table 1). Taking into consideration trend since 1992 the population of indigenous pigs is estimated to be mere 69.20 lakhs in 2020 and 60.70 lakhs in 2025. Similar trend is also reflected for the total pig population of the country. It has declined to 102.9 lakhs in 2012, showing a decline of 24.24 percent from their population in 1992. The total pig population is also estimated to decline to 96.32 lakhs in 2020 and 89.17 lakhs in 2025.
However, population of exotic and crossbred pigs has shown an increasing trend and has increased from 18.49 lakhs in 1992 to 24.56 lakhs in 2012 showing an increase of 32.83 percent. The population of exotic and crossbred pigs is estimated to increase to 27.12 lakhs in 2020 and 28.47 lakhs in 2025.
Assam has the largest population (16.36 lakhs) of pigs (Livestock census 2012), possessing about 15.89 percent of the total pig population of the country followed by Uttar Pradesh (12.96), Jharkhand (9.35) and West Bengal (6.30). In terms of population density, Delhi with 51.446 pigs per sq. km has the highest density of pigs followed by Tripura (34.573), Nagaland (30.381) and Meghalaya (24.227) (Table 2).
As regards indigenous pigs, Uttar Pradesh has the largest population of indigenous pigs (11.52 lakhs), possessing about 14.70 percent of the total
indigenous pig population of the country followed by Assam (10.22 lakhs), Jharkhand (9.21 lakhs) and Bihar (6.26 lakhs). In terms of population density, Delhi has the highest density of 45.664 indigenous pigs per sq. km followed by Meghalaya (18.268), Tripura (14.199) and Assam (13.034).
Only nine states (Delhi, Tripura, Nagaland, Meghalaya, Assam, Manipur, Jharkhand, Goa and Mizoram) have overall pig population density of more than 10 pigs per sq. km. While, only six states (Delhi, Meghalaya, Tripura, Assam, Jharkhand and Goa) have the indigenous pig population density of more than 10 pigs per sq. km.
Among states with total pig population of at least 10000, Odisha has the highest percentage of indigenous pigs (98.57) followed by Bihar (96.6), Telangana (95.16) and Chhattisgarh (94.9). Sikkim has the highest proportion of crossbred and exotic pigs (93.1) followed by Kerala (91.07), Mizoram (86.94) and Nagaland (75.60) (Table 3). Among the states having total pig population of at least 10000, four states, viz Meghalaya, Tripura, Mizoram and Delhi, have shown increase in indigenous pig population during 2003-2012. Sikkim has shown maximum decrease in indigenous pigs with a decline of 89.47 percent followed by Kerala (80.77), Meghalaya (56.54) and Manipur (54.11) (Table 4). Overall, India has registered a decline of 30.89 percent in the indigenous pig population and an increase of 12.66 percent in exotic and crossbred pig population during 2003 and 2012. Meghalaya has registered maximum increase in exotic and crossbred pig population showing an increase of 378.57 percent followed by, Arunachal Pradesh
Census-year Indigenous pigs Exotic and crossbred pigs Total pigs Population Percent change Population Percent change Population Percent change (in lakhs) from previous (in lakhs) from (in lakhs) from previous census previous census census 1992 109.39 - 18.49 - 127.88 -1997 110.41 0.93 22.49 21.63 132.91 3.932003 113.40 2.71 21.80 -3.07 135.19 1.722007 87.44 -22.89 23.89 9.59 111.33 -17.652012 78.37 -10.37 24.56 2.80 102.93 -7.552020 (Estimated) 69.20 -10.37 27.12 10.42 96.32 -6.422025 (Estimated) 60.70 -11.70 28.47 4.98 89.17 -7.42
Table 1: Population trend of pigs in India

Volume 8 (2018) Number 1
52
(362.5), Jharkhand (133.33) and Tripura (125.26).
Eight states (Uttar Pradesh, Bihar, Odisha, Manipur, Rajasthan, Tamilnadu, Madhya Pradesh and Andhra Pradesh) have shown decrease in both indigenous and exotic pig population during 2003 and 2012. During this period, Assam, which houses 15.89 percent of the total pig population of India has shown a decline of 2.85 percent in indigenous pigs and an increase of 25.05 percent in exotic pig population. Uttar Pradesh, Jharkhand and West Bengal, that together hold 28.61 percent of the total pig population of India, have shown 45.09, 15.5 and
51.97 percent decline in the indigenous pig population during this period, respectively (Table 4).
In the eighteen states in India that have about one lakh indigenous pigs, some cluster of districts have high density of the indigenous pigs (Table 5). For example, eight districts of cluster-V of Uttar Pradesh hold 24.93 and 3.6 percent population of indigenous pigs of the state and the country, respectively. Cluster-I in Assam comprising three districts of Dhemaji, Lakhimpur and Sonitpur has 32.80 and 4.28 percent of the indigenous pig population of the state and the country, respectively. Cluster-I in
Table 2: Total population and population density of pigs in the states of India as per 2012 livestock census
State
Indigenous Pigs Exotic/crossbred pigs Pig-overall
Total
population
Density
per
square
km
Percent of
their total
population
in India
Total
population
Density
per
square
km
Percent of
their total
population
in India
Total
population
Density
per
square
km
Percent of
their total
population
in India
*The pig population of Himachal Pradesh, Gujarat and Jammu & Kashmir is <10000.
Assam 1022354 13.034 13.04 613668 7.824 24.98 1636022 20.858 15.89
Uttar Pradesh 1152441 4.783 14.70 181951 0.755 7.407 1334392 5.539 12.96
Jharkhand 920625 11.549 11.75 41742 0.524 1.70 962367 12.073 9.35
West Bengal 595964 6.715 7.60 52147 0.588 2.12 648111 7.303 6.30
Bihar 625531 6.643 7.98 22143 0.235 0.90 647674 6.878 6.29
Meghalaya 409758 18.269 5.23 133623 5.958 5.44 543381 24.227 5.28
Nagaland 122969 7.417 1.57 380719 22.964 15.50 503688 30.381 4.89
Chhattisgarh 416916 3.084 5.32 22143 0.164 0.90 439059 3.248 4.27
Tripura 148891 14.199 1.90 213643 20.374 8.68 362534 34.573 3.52
Arunachal Pradesh 318976 3.809 4.07 37369 0.446 1.52 356345 4.255 3.46
Maharashtra 288301 0.937 3.68 37455 0.122 1.52 325756 1.059 3.16
Karnataka 261274 1.362 3.33 43524 0.227 1.77 304798 1.589 2.96
Odisha 276052 1.773 3.52 4264 0.027 0.17 280316 1.800 2.72
Manipur 94669 4.240 1.21 182546 8.176 7.43 277215 12.416 2.69
Telangana 236259 2.108 3.01 12061 0.108 0.49 248320 2.216 2.41
Mizoram 32286 1.532 0.41 212952 10.102 8.67 245238 11.633 2.38
Rajasthan 216589 0.632 2.76 21085 0.062 0.86 237674 0.694 2.31
Tamil Nadu 153190 1.178 1.95 30793 0.237 1.25 183983 1.415 1.79
Madhya Pradesh 161715 0.525 2.06 13538 0.044 0.55 175253 0.569 1.70
Andhra Pradesh 131752 0.809 1.68 14290 0.088 0.58 146042 0.896 1.42
Haryana 77153 1.745 0.98 49792 1.126 2.03 126945 2.871 1.23
Delhi 67765 45.664 0.86 8581 5.782 0.35 76346 51.446 0.74
Kerala 4965 0.128 0.06 50817 1.308 2.07 55782 1.435 0.54
Goa 37611 10.160 0.48 5956 1.609 0.24 43567 11.769 0.42
Punjab 14465 0.287 0.18 17756 0.353 0.72 32221 0.640 0.31
Sikkim 2451 0.345 0.03 27456 3.869 1.12 29907 4.215 0.29
Uttarakhand 12685 0.237 0.16 7222 0.135 0.29 19907 0.372 0.19
India 7837306 2.384 100.00 2456389 0.747 100.00 10293695 3.132 100.00

Volume 8 (2018) Number 1
53
Jharkhand comprising seven districts of Dumka, Godda, Pakur, Jamtara, Deoghar, Giridih and Dhanbad has about 37.96 and 4.46 percent indigenous pig population of the state and the country, respectively.
Similarly, 32.6 percent indigenous pig population of Bihar is localized in cluster-I, comprising of Bhojpur, Jehanabad and Nalanda. In Chhattisgarh, 63.24 percent of the indigenous pig population is localized in five Southern districts of Bastar, Dantewara, Kanker, Bijapur and Narayanpur (Cluster I). Districts of Rewa, Satna and Sidhi in Madhya Pradesh has 21.78 percent of the indigenous pig population of the state. In Rajasthan, 78.62 percent of the total pig population is localized in the North-Eastern part of the state (Cluster-I).
Some districts have appreciably high population of indigenous pigs. Bhojpur district of Bihar has the highest population (128674) of indigenous pigs in
India which is 1.64 percent of the indigenous pigs of the country and 20.57 percent of the indigenous pig population of the state (Table 5). West Garo district of Meghalaya (125441) has the second highest population of indigenous pigs in the country followed by Sonitpur (124739) and Dhemaji (105399) districts of Assam.
Both Assam and Jharkhand has eleven districts each with indigenous pig population of more than 30000 followed by West Bengal with nine districts and Uttar Pradesh with eight districts. Only twelve districts, Dhemaji, Lakhimpur and Sonitpur in Assam, Bhojpur and Gaya in Bihar, Dantewara in Chattisgarh, Dumka and Pakur in Jharkhand, East Khasi Hills and West Garo Hills in Meghalya and Jalpaiguri in West Bengal have indigenous pig population of more than 75000.
Many of the clusters that have high density of indigenous pig population, also have the exotic and
State Proportion of indigenous pig population Proportion of exotic and crossbred pig population (in percentage) (in percentage)Assam 62.47 37.53Uttar Pradesh 86.36 13.64Jharkhand 95.64 4.36West Bengal 91.98 8.02Bihar 96.60 3.40Meghalaya 75.37 24.63Nagaland 24.40 75.60Chhattisgarh 94.99 5.01Tripura 41.05 58.95Arunachal Pradesh 89.61 10.39Maharashtra 88.62 11.38Karnataka 85.57 14.43Odisha 98.57 1.43Manipur 34.17 65.83Telengana 95.16 4.84Mizoram 13.06 86.94Rajasthan 91.17 8.83Tamil Nadu 83.15 16.85Madhya Pradesh 92.05 7.95Andhra Pradesh 90.41 9.59Haryana 60.63 39.37Delhi 88.31 11.69Kerala 8.93 91.07Goa 86.36 13.64Punjab 43.75 56.25Sikkim 6.90 93.10Uttarakhand 65.00 35.00India 76.14 23.86
Table 3: Percentage of indigenous and exotic/crossbred pigs in states of India as per 2012 livestock census
*The pig population of Himachal Pradesh, Gujarat and Jammu & Kashmir is <10000

State Percent increase or decrease between 2003 and 2012 Indigenous Pig population Exotic and crossbred Total Pig population pig populationAssam -2.85 25.05 6.03Uttar Pradesh -45.09 -2.15 -41.59Jharkhand -15.50 133.33 -13.08West Bengal -51.97 -14.75 -50.23Bihar -2.64 -24.14 -3.57Meghalaya 4.86 378.57 29.83Nagaland -56.54 5.25 -21.86Chhattisgarh -22.63 57.14 -20.61Tripura 30.70 125.26 73.68Arunachal Pradesh -0.93 362.5 7.88Maharashtra -30.77 60.87 -25.97Karnataka -9.69 91.30 -2.24Odisha -51.24 -95.83 -57.70Manipur -54.11 -12.02 -33.01Mizoram 45.45 8.67 12.39Rajasthan -30.00 -25.00 -29.58Tamil Nadu -43.54 -36.73 -42.50Madhya Pradesh -50.00 -58.82 -50.84AP and Telangana -29.50 -45.83 -30.87Haryana -9.41 42.86 5.83Delhi 385.71 -35.71 175.00Kerala -80.77 0.00 -27.27Goa -54.76 100.00 -49.43Punjab -17.65 50.00 10.34Sikkim -89.47 42.10 -23.68Uttarakhand -51.85 16.67 -39.39India -30.89 12.66 -23.87
Table 4: Percent increase or decrease in indigenous, exotic/crossbred and total pig population between 2003 and 2012
*The pig population of Himachal Pradesh, Gujarat and Jammu & Kashmir is <10000
Volume 8 (2018) Number 1
54
crossbred pig population (Table 6). However proportion of the indigenous to exotic and crossbred pigs vary markedly in these clusters. Cluster-A in Assam comprising of three districts (Dhemaji, Lakhimpur and Sonitpur) that has 11.63 percent of the exotic and crossbred pig population of the state, but still 82.45 percent of its total pig population is of indigenous type. Similarly, cluster-A in Meghalaya comprising of East Khasi Hills, Ribhoi, West Khasi Hills and Jaintia Hills districts, possess 80.6 percent of the exotic and crossbred pig population of the state, but still 63.84 percent of its total pig population is of indigenous type. In contrast, 88.56 percent of the total pig population in the Cluster-D of Assam (Baksa, Chirang, Kokrajhar and Udalguri districts), is of exotic and crossbred type. This cluster has contributed 28.63 percent to the exotic and crossbred pig population of the state. Similarly, cluster-B in Tripura comprising districts of
Sepahijala, Gomati and South district has 62.76 percent of its total pig population as exotic type, which constitutes 41.86 percent of the exotic and crossbred pig population of Tripura.
Distribution of breeds of indigenous pig
Although previously the indigenous pigs were largely clubbed as non-descript, with only few references to some populations like Desi pigs of North India, Ankamali pigs of Peninsular India, Doom pigs of Assam and Ghoonghroo pigs of West Bengal (Bhat et al. 1981, Bhat et al. 2010, Naskar et al. 2013). But in the last few years many of these populations and some previously undescribed populations have been characterized and registered as new breeds of indigenous pigs at National Bureau of Animal Genetic Resources, Karnal, like Ghoongroo, Niang Megha, Agonda Goan, Tenyi Vo, Nicobari, Doom and Zovawk pigs.

Ta
ble
5: S
tate
s o
f In
dia
wit
h s
izea
ble
po
pu
lati
on
of
ind
igen
ou
s p
igs
and
dis
tric
ts w
ith
ind
igen
ou
s p
ig p
op
ula
tio
n o
f ab
ou
t 3
00
00
or
mo
re
S. N
. S
tate
P
op
ula
tio
n o
f
Clu
ste
rs o
f d
istr
icts
wit
h s
iza
ble
po
pu
lati
on
of
D
istr
icts
in
th
e s
tate
wit
h a
bo
ut
30
00
0 o
r m
ore
In
dig
en
ou
s p
igs
ind
ige
no
us
pig
s (T
ota
l p
op
ula
tio
n i
n t
he
Clu
ste
r)
ind
ige
no
us
pig
s p
op
ula
tio
n1
. U
ttar
Pra
des
h
11
52
44
1
Clu
ster
I: A
gra,
Mat
hu
ra, A
liga
rh, F
iro
zab
ad, E
tah
,
Mai
np
uri
, Bu
lan
dsh
ahr,
Kas
hir
am N
agar
,
Mah
amay
anag
ar (
14
63
65
)
Clu
ster
II:
Mee
rut,
Mu
zaff
arn
agar
, Sah
aran
pu
r, B
ijn
or,
M
ora
dab
ad, B
arei
lly,
Bad
aun
, Sh
ahja
han
pu
r, S
amb
al
(13
04
21
)
Clu
ster
III
: Jal
aun
, Ham
irp
ur,
Ban
da,
Ch
itra
ko
ot,
M
aho
ba,
Au
raiy
a (9
61
96
)
Clu
ster
IV
: Kan
pu
r-D
ehat
, Kan
pu
r-N
agar
, Un
nao
,
Lu
ckn
ow
, Har
do
i, Si
tap
ur,
Bah
raic
h, B
arab
ank
i,
Kan
nau
j, K
her
i (2
29
77
3)
C
lust
er V
: Rae
-Bar
eli,
Fat
ehp
ur,
All
ahab
ad, P
rata
pga
rh,
Ja
un
pu
r, M
irza
pu
r, A
met
hi,
Kau
sham
bh
i (2
87
30
7)
C
lust
er V
I: G
ora
kh
pu
r, M
ahar
ajga
nj,
Deo
ria,
Aza
mga
rh,
M
au, B
alli
a (8
79
51
)2
. A
ssam
1
02
23
54
C
lust
er I
: Dh
emaj
i, L
akh
imp
ur,
So
nit
pu
r (3
35
34
8)
C
lust
er I
I: T
insu
kia
, Dib
ruga
rh, S
ivas
agar
, Jo
rhat
,
Go
lagh
at, K
arb
i-A
ngl
on
g (1
56
96
1)
3.
Jhar
kh
and
9
20
62
5
Clu
ster
I: D
um
ka,
Go
dd
a, P
aku
r, J
amta
ra, D
eogh
ar,
G
irid
ih, D
han
bad
(3
49
49
4)
C
lust
er I
I: G
um
la, S
imd
ega,
Ran
chi,
Kh
un
ti (
17
45
30
)
Clu
ster
III
: Pal
amu
, Haz
arib
agh
, Ch
atra
, Lat
ehar
,
Gar
hw
a (2
21
90
4)
4.
Bih
ar
62
55
31
C
lust
er I
: Bh
ojp
ur,
Pat
na,
Jeh
anab
ad, N
alan
da
(20
39
00
)
Clu
ster
II:
Gay
a, N
awad
a, B
ank
a, J
amu
i (1
62
39
2)
C
lust
er I
II: K
ish
anga
nj,
Kat
ihar
, Pu
rnia
, Ara
ria,
Sah
arsa
,
Mad
hu
ban
i, Su
pau
l (1
02
14
7)
5.
Wes
t B
enga
l 5
95
96
4
Clu
ster
I: D
arji
lin
g, J
alp
aigu
ri, K
och
-Bih
ar (
13
94
65
)
Clu
ster
II:
Utt
ar D
inaj
pu
r, D
aksh
in D
inaj
pu
r, M
ald
ah
(10
56
10
)
Clu
ster
III
: Mu
rsh
idab
ad, B
irb
hu
m, B
ard
ham
an
(11
39
27
)
Clu
ster
IV
: So
uth
Tw
enty
Fo
ur
Par
gan
as, N
ort
h T
wen
ty
Fou
r P
arga
nas
, Hu
gli (
51
98
1)
C
lust
er V
: Ban
ku
ra, P
uru
liya
, Pas
hch
im M
edin
ipu
r
(17
54
32
)
Agr
a (3
28
19
), A
llah
abad
(4
25
13
), A
met
hi
(29
21
1),
F
ate
hp
ur
(4
93
33
),
Ka
np
ur
-Na
ga
r
(53
68
2),
K
aush
amb
hi
(39
98
1),
Pra
tap
garh
(3
44
50
), R
ae-B
arel
i (5
57
58
)
Bak
sa (
45
01
4),
Dh
emaj
i (1
05
39
9),
Dib
ruga
rh (
56
12
9),
G
ola
ghat
(6
94
42
),
Jorh
at
(60
85
8),
K
arb
i-A
ngl
on
g
(91
14
6),
K
ok
rajh
ar
(45
00
5),
L
akh
imp
ur
(10
52
10
),
Siv
asa
ga
r (6
09
36
),
So
nit
pu
r (1
24
73
9),
T
insu
kia
(3
98
96
)
Ch
atra
(6
07
48
), D
han
bad
(3
45
64
), G
od
da
(35
55
8),
G
um
la (
46
04
7),
Haz
arib
agh
(4
26
84
), L
ateh
ar (
44
93
4),
P
aku
r (9
45
40
),
Pal
amu
(4
23
78
),
Ran
chi
(53
10
7),
Sa
hib
gan
j (5
81
40
), S
imd
ega
(54
34
7)
Bh
ojp
ur
(12
86
78
), G
aya
(82
29
7),
Jam
ui (
31
44
7),
Pat
na
(37
42
1)
Ba
nk
ura
(5
06
14
),
Ba
rdh
ma
n
(71
95
2),
B
irb
hu
m
(30
37
8),
D
ak
shin
-Din
ajp
ur
(31
67
0),
D
arj
ilin
g
(34
45
2),
Ja
lpa
igu
ri
(89
32
4),
M
ald
ah
(5
17
07
),
Pas
hch
im m
edin
ipu
r (6
90
58
), P
uru
lia
(55
76
0)
Volume 8 (2018) Number 1
55

S. N
. S
tate
P
op
ula
tio
n o
f
Clu
ste
rs o
f d
istr
icts
wit
h s
iza
ble
po
pu
lati
on
of
D
istr
icts
in
th
e s
tate
wit
h a
bo
ut
30
00
0 o
r m
ore
In
dig
en
ou
s p
igs
ind
ige
no
us
pig
s (T
ota
l p
op
ula
tio
n i
n t
he
Clu
ste
r)
ind
ige
no
us
pig
s p
op
ula
tio
n6
. C
hh
atti
sgar
h
41
69
16
C
lust
er I
: Bas
tar,
Dan
tew
ara,
Kan
ker
, Bij
apu
r,
Nar
ayan
pu
r (2
63
63
8)
7.
Meg
hal
aya
40
97
58
C
lust
er I
: Eas
t K
has
i Hil
ls, W
est
Kh
asi H
ills
, Ri-
Bh
oi,
Ja
inti
a H
ills
(1
90
03
6)
C
lust
er I
I: E
ast
Gar
o h
ills
, So
uth
Gar
o H
ills
, Wes
t
Gar
o H
ills
(2
19
72
2)
8.
Aru
nac
hal
Pra
des
h 3
18
97
6
Clu
ster
I: C
han
glan
g, T
irap
, Lo
hit
, An
jaw
(7
28
58
)
Clu
ster
II:
Eas
t Si
ang,
Wes
t Si
ang,
Up
per
Sia
ng,
L
ow
er D
iban
g V
alle
y (
96
34
8)
C
lust
er I
II: E
ast
Kam
eng,
Lo
wer
Su
ban
siri
,
Up
per
su
ban
siri
, Ku
run
g K
um
ey, P
apu
n P
are
(14
20
58
)9
. M
ahar
ash
tra
28
83
01
C
lust
er I
: Ah
med
nag
ar, A
ura
nga
bad
, Bid
, Nas
hik
,
Jalg
aon
, Dh
ule
, Jal
na
(12
88
96
)1
0.
Od
issa
2
76
05
2
Clu
ster
I: K
ora
pu
t, M
alk
angi
ri, R
ayag
arh
a, G
ajap
ati
(1
03
63
7)
C
lust
er I
I: S
un
der
garh
, Sam
bal
pu
r, M
ayu
rbh
anj,
K
end
ujh
ar (
92
70
7)
11
. K
arn
atak
a 2
61
27
4
Clu
ster
I: B
idar
, Gu
lbar
ga, B
ijap
ur,
Bel
gau
m, B
agal
ko
t,
Rai
chu
r, K
op
pal
, Yad
gir
(17
23
41
)1
2.
Tel
anga
na
23
62
59
C
lust
er I
: Kh
amm
am, W
aran
gal,
Kar
imn
agar
,
Nal
gon
da
(11
13
83
)
Clu
ster
II:
Niz
amab
ad, M
edak
, Ran
gare
dd
y,
Meh
bu
bn
agar
(1
15
91
4)
13
. R
ajas
than
2
16
58
9
Clu
ster
I: A
jmer
, Alw
ar, J
aip
ur,
Bh
ilw
ara,
Ko
ta,
D
ausa
, Bh
arat
pu
r, B
aran
, Saw
ai M
adh
op
ur,
To
nk
,
Bu
nd
i, K
arau
li (
16
59
53
)1
4.
Mad
hya
Pra
des
h
16
17
15
C
lust
er I
: Rew
a, S
atn
a, S
idh
i (3
52
24
) N
il1
5.
Tam
iln
adu
1
53
19
0
Clu
ster
I: S
alem
, Cu
dd
alo
re, V
ilu
pu
ram
, Nam
akk
al,
Nil
T
iru
van
nam
alai
, Vel
lore
(8
19
53
)1
6.
Tri
pu
ra
14
88
91
C
lust
er I
: No
rth
dis
tric
t, U
nak
oti
, Dh
alai
, Kh
ow
ai,
Nil
W
est
Dis
tric
t (9
58
32
)
Clu
ster
II:
Sip
ahij
ala,
Go
mat
i, So
uth
Dis
tric
t (5
30
59
)1
7.
Nag
alan
d
12
29
69
C
lust
er I
: Mo
n, T
uen
san
g, K
iph
ire,
Wo
kh
a,
Nil
Z
un
heb
oto
(9
44
83
)1
8.
Man
ipu
r 9
46
69
C
lust
er I
: Sen
apat
i, U
kh
rul,
Imp
hal
Eas
t, T
ho
ub
al,
T
amen
glo
ng
(66
61
5)
Bas
tar
(69
34
6),
Bij
apu
r (3
48
93
), D
ante
war
a (7
94
02
),
Jash
pu
r (3
75
40
),
Na
ray
an
pu
r (3
45
23
),
Sa
rgu
ja
(37
21
0),
Kan
ker
(4
54
74
)
Eas
t G
aro
H
ills
(6
52
57
),
Eas
t K
has
i H
ills
(7
85
90
),
Jain
tia
Hil
ls (
40
38
6),
So
uth
Gar
o h
ills
(2
90
24
), W
est
Gar
o H
ills
(1
25
44
1),
Wes
t Kh
asi h
ills
(5
46
02
)
Eas
t K
amen
g (2
94
46
), E
ast
Sian
g (2
98
67
), K
uru
ng
Ku
mey
(3
43
41
),
Pap
un
P
are
(34
80
4),
W
est
Sian
g (3
84
77
)
Dh
ule
(3
01
98
), G
adch
iro
li (
38
65
4)
Ko
rap
ut
(30
25
1),
M
alk
angi
ri
(40
91
1),
Su
nd
arga
rh
(48
34
9)
Bag
alk
ot (
33
07
8)
Ka
rim
na
ga
r (2
92
47
),
Me
hb
ub
na
ga
r (5
43
96
),
War
anga
l (3
67
87
)
Volume 8 (2018) Number 1
56

Volume 8 (2018) Number 1
57
Ta
ble
6: S
tate
s o
f In
dia
wit
h s
izea
ble
po
pu
lati
on
of
exo
tic
and
cro
ssb
red
pig
s an
d d
istr
icts
wit
h e
xoti
c an
d c
ross
bre
d p
ig p
op
ula
tio
n o
f ab
ou
t2
00
00
or
mo
re
S. N
. S
tate
P
op
ula
tio
n o
f
Clu
ste
rs o
f d
istr
icts
wit
h s
iza
ble
po
pu
lati
on
of
D
istr
icts
in
th
e s
tate
wit
h a
bo
ut
30
00
0 o
r m
ore
In
dig
en
ou
s p
igs
ind
ige
no
us
pig
s (T
ota
l p
op
ula
tio
n i
n t
he
Clu
ste
r)
ind
ige
no
us
pig
s p
op
ula
tio
n1
. A
ssam
6
13
66
8
Clu
ster
A: D
hem
aji,
Lak
him
pu
r, S
on
itp
ur
(71
38
2)
C
lust
er B
: Tin
suk
ia, D
ibru
garh
, Siv
asag
ar, J
orh
at,
G
ola
ghat
, Kar
bi-
An
glo
ng
(21
03
92
)
Clu
ster
C: K
amru
p, G
oal
par
a (8
81
82
)
Clu
ster
D: B
aksa
, Ch
iran
g, K
ok
rajh
ar, U
dal
guri
(1
75
72
2)
2.
Nag
alan
d
38
07
19
C
lust
er A
: Mo
n, T
uen
san
g, K
iph
ire,
Zu
nh
ebo
to,
M
ok
ok
chu
ng,
Wo
kh
a (2
13
27
8)
C
lust
er B
: Ko
him
a, D
imap
ur,
Ph
ek, P
eren
(1
59
44
9)
3.
Tri
pu
ra
21
36
43
C
lust
er A
: No
rth
dis
tric
t, K
ho
wai
, Dh
alai
, Un
aku
ti,
W
est
dis
tric
t (1
24
21
5)
C
lust
er B
: So
uth
dis
tric
t, S
epah
ijal
a, G
om
ati (
89
42
8)
4.
Miz
ora
m
21
29
52
C
lust
er A
: Aiz
al, K
ola
sib
, Mam
it, C
ham
ph
ai (
15
09
01
)
Clu
ster
B: L
angl
ei, L
awn
gtla
i, Sa
iha,
Ser
chip
(6
20
51
)
5.
Man
ipu
r 1
82
54
6
Clu
ster
A: S
enap
ati,
Uk
hru
l, Im
ph
al E
ast,
T
amen
glo
ng
(69
06
6)
C
lust
er B
: Im
ph
al W
est,
Bis
hn
up
ur,
Th
ou
bal
,
Ch
ura
chan
dp
ur,
Ch
and
el (
11
34
80
)6
. U
ttar
Pra
des
h
18
19
15
C
lust
er A
: All
ahab
ad, P
rata
pga
rh, A
met
hi,
Rae
-Bar
eli
(3
69
94
)7
. M
egh
alay
a 1
33
62
3
Clu
ster
A: E
ast
Kh
asi H
ills
, Rib
ho
i, W
est
Kh
asi H
ills
,
Jain
tia
Hil
ls (
10
76
45
)
Bak
sa (
35
59
8),
Ch
iran
g (4
69
08
), D
ibru
garh
(6
08
21
),
Go
alp
ara
(46
44
4),
K
amru
p
(41
73
8),
K
arb
i-A
ngl
on
g (7
11
49
),
Ko
kra
jhar
(4
34
04
),
Lak
him
pu
r (2
60
33
),
Nag
aon
(1
96
17
), S
ivas
agar
(2
60
34
), S
on
itp
ur
(31
83
5),
T
insu
kia
(2
44
48
), U
dal
guri
(4
98
12
)
Dim
apu
r (5
86
89
), K
iph
ire
(25
89
8),
Ko
him
a (5
01
60
),
Mo
ko
kch
un
g (5
09
20
), M
on
(2
85
73
), P
hek
(3
82
05
),
Tu
en
san
g
(33
59
6),
W
ok
ha
(3
46
60
),
Zu
nh
eb
oto
(3
96
31
)
Dh
alai
(3
39
77
),
Go
mat
i (3
49
15
),
Kh
ow
ai
(31
97
2),
N
ort
h
dis
tric
t (2
48
31
),
Sep
ahij
ala
(24
92
9),
So
uth
d
istr
ict (
29
58
4),
Wes
t dis
tric
t (2
51
70
)
Aiz
alA
izaw
l (7
60
09
),
Ch
amp
hai
(3
22
49
),
Ko
lasi
b
(20
61
4),
Mam
it (
22
02
9)
Ch
ura
chan
dp
ur
(24
53
8),
Sen
apat
i (2
56
61
), T
ho
ub
al
(43
38
8)
Nil
Eas
t K
has
i H
ills
(5
30
00
), J
ain
tia
Hil
ls (
21
65
0),
Wes
t K
has
i Hil
ls (
20
49
5)

Volume 8 (2018) Number 1
58
The Ghoongroo pigs are black coloured, concave snouted, pendulous eared with a wither height of 66-95 cm in males and 59-92 cm in females. The litter size at furrowing is 8-18. These pigs are distributed in Darjeeling, Jalpaiguri, Cochbehar, North Dinajpur and South Dinajpur districts of West Bengal with an estimated population of approximately 15000 (Breed descriptor, 2013).
The Niang Megha pigs, which are found in Meghalaya, are mostly of black colour with short and erect ears, pot bellies and long snouts. The wither height of these pigs is 48-54 cm in males and 45-52 cm in females. The litter size at forrowing is 3-10. The estimated population of Niang Megha pigs is about 3.9 lakhs (Breed descriptor, 2013).
The Agonda Goan pigs are also mostly black coloured, short and erect eared, short snouted, pot bellied with a wither height of 46-64.5 cm in males and 48.2-74.8 cm in females. The litter size at furrowing is 2-13. These pigs are found in Tiswadi, Bardez and Peenem of North Goa district and Marmugoa, Salcete, Canacona and Quepem taluks of South Goa district with an estimated population of 37556 (Breed descriptor, 2015).
The Tenyi Vo pigs, found in Nagaland, are mostly black coloured with white patches on bellies. They have long and straight snouts that have white patches around nostrils, short and erect ears, concave toplines and pot bellies. The wither height of these pigs is 28-36 cm in males and 23-30 cm in females. The litter size at furrowing is 4-6. They are distributed in Kohima, Peren, Phek and Dimapur districts of Nagaland with an estimated population of 60000-70000 (Breed descriptor 2016).
The Nicobari breed of pigs are mostly black or brown coloured. Small percentage of animals is creamy white, reddish brown or black and brown mixed. These pigs have short ears, short to medium snouts with slight concave conformity, pot bellies of moderate size and concave toplines. The wither height is 51-86 cm in males and 50-82 cm in females. The litter size at forrowing is 4-12. Nicobari pigs are distributed in Nicobar district of Andaman and Nicobar islands, with an estimated population of 1.35 lakhs (Breed descriptor 2016).
The Doom pigs of Assam are black in colour with a concave snout, erect ears and straight toplines. The wither height is 60.4-66.2 cm in males and 65.0-71.0 cm in females. The litter size at furrowing is 5-8. These pigs are found in Agomani, Gauripur, Golakganj blocks and Bilasipara sub-division in Dhubri district and few areas of Bongoigaon and Kokrajhar districts of Assam with an estimated population of approximately 3000 (Breed descriptor 2016).
The Zovawk pigs, which are found in Mizoram, are black coloured, short and erect eared, pot bellied, short and concave snouted pigs. The wither height of these pigs is 45-54 cm in males and 47-50 cm in females. The litter size is 5-12. Zovawk pigs are distributed in Mamit, Kolasib, AizalAizawl, Lunglei, Sahia and Champhai districts of Mizoram with estimated population of about 40000 (Breed descriptor 2017).
CONCLUSION
Although, the total population of indigenous pigs at 78.35 lakhs (Census 2012) seems fairly large, but these pigs have shown steady decrease in numbers during 2003 to 2012. Further, during this period, the population of exotic and crossbred pigs have increased continuously. The exotic and crossbred pigs have already outnumbered the indigenous pigs in the seven states in India. These trends indicate that indigenous pigs require immediate care and attention to arrest the constant decline in their population.
REFERENCES
Bhat PN, Batt PP, Khan BU, Goswami OB and Singh B. 1981. Animal Genetic Resources of India. National Dairy Research Institute Karnal Publication. Pp 75-83.
Bhat PN, Mohan NH and Deo S. 2010. Pig production. Stadium Press (India) PVT. Ltd., Darya Ganj, New Delhi. Pp, 21.
Breed descriptor. 2013. New breeds of indigenous livestock: Ghoongroo and Niang Megha pigs. Indian Journal of Animal Sciences, 83: 453-455.
Breed descriptor (2015) New breeds of indigenous livestock and poultry: Agonda Goan pigs.

Volume 8 (2018) Number 1
59
Indian Journal of Animal Sciences, 85: 546-548.
Breed descriptor (2016) New breeds of indigenous livestock: Tenyi Vo, Nicobari and Doom pigs. Indian Journal of Animal Sciences, 86:1221-1225.
Breed descriptor (2017) New breeds of indigenous livestock: Zovawk pigs. Indian Journal of Animal Sciences, 87: 1427-1428.
Chhabra GK, Gaur GK, Ahlawat SPS and Paul S (1999) Inheritance of carcass traits in desi pigs. Indian Veterinary Journal, 76: 403-407.
Gaur GK, Chhabra AK and Paul S (1997) Growth intensity of indigenous pigs from birth to slaughter age. Indian Journal of Animal Sciences, 67: 344-346.
stGupta S.P. (2011) Statistical Methods, 41 edition, Sultan Chand and Company, New Delhi.
Hetzer OH and Miller LR (1973) Selection for high and low fatness in swine: correlated response of various carcass traits. Journal of Animal Sciences, 37: 1289-1301.
Kumar S, Singh Sk, Singh RL, Sharma BD, Dubey CB and Verma SS (1990) Effect of genetic and non genetic factors on body weight, efficiency of food utilization, reproductive performance and survivability of Landrace, Desi and their halfbreds. Indian Journal of Animal Sciences, 60: 1219-1223.
thLivestock census (2003) 17 Livestock census - 2003, Department of Animal Husbandry, Dairying and Fisheries, Ministry of Agriculture.
thLivestock census (2012) 19 Livestock census - 2012,
Department of Animal Husbandry, Dairying and Fisheries, Ministry of Agriculture.
Naskar S, Niranjan SK and Banik S (2013) Utilization of pig genetic resources in India. In: Sustainable utilization of Indigenous Animal Genetic Resources. Editors: RK Pundir, SK Niranjan and R Behl. NBAGR, Karnal publication. Pp 120-125.
Singh P, Tiwari CB and Dwivedi VK (1991) Regional imbalances in population dynamics of pigs in India: An appraisal. Indian Journal of Animal Sciences, 61: 71-74.

Volume 8 (2018) Number 1

Volume 8 (2018) Number 1

Volume 8 (2018) Number 1