EU Merger Remedies: A Preliminary Empirical Assessment
52
Discussion Paper No. 81 EU Merger Remedies: A Preliminary Empirical Assessment Tomaso Duso* Klaus Gugler** Burcin Yurtoglu*** January 2006 *Tomaso Duso, Social Science Research Center Berlin (WZB), Reichpietschufer 50, D-10785 Berlin, Germany. Tel: +49 30 25491 403, Fax: +49 30 25491 444. [email protected] **Klaus Gugler, University of Vienna. [email protected] ***Burcin Yurtoglu, University of Vienna. [email protected] Financial support from the Deutsche Forschungsgemeinschaft through SFB/TR 15 is gratefully acknowledged. Sonderforschungsbereich/Transregio 15 · www.gesy.uni-mannheim.de Universität Mannheim · Freie Universität Berlin · Humboldt-Universität zu Berlin · Ludwig-Maximilians-Universität München Rheinische Friedrich-Wilhelms-Universität Bonn · Zentrum für Europäische Wirtschaftsforschung Mannheim Speaker: Prof. Konrad Stahl, Ph.D. · Department of Economics · University of Mannheim · D-68131 Mannheim, Phone: +49(0621)1812786 · Fax: +49(0621)1812785
Transcript of EU Merger Remedies: A Preliminary Empirical Assessment

Discussion Paper No. 81
EU Merger Remedies: A Preliminary Empirical Assessment
Tomaso Duso* Klaus Gugler**
Burcin Yurtoglu***
January 2006
*Tomaso Duso, Social Science Research Center Berlin (WZB), Reichpietschufer 50, D-10785 Berlin, Germany. Tel: +49 30 25491 403, Fax: +49 30 25491 444. [email protected]
**Klaus Gugler, University of Vienna. [email protected]
***Burcin Yurtoglu, University of Vienna. [email protected]
Financial support from the Deutsche Forschungsgemeinschaft through SFB/TR 15 is gratefully acknowledged.
Sonderforschungsbereich/Transregio 15 · www.gesy.uni-mannheim.de Universität Mannheim · Freie Universität Berlin · Humboldt-Universität zu Berlin · Ludwig-Maximilians-Universität München
Rheinische Friedrich-Wilhelms-Universität Bonn · Zentrum für Europäische Wirtschaftsforschung Mannheim
Speaker: Prof. Konrad Stahl, Ph.D. · Department of Economics · University of Mannheim · D-68131 Mannheim, Phone: +49(0621)1812786 · Fax: +49(0621)1812785

EU Merger Remedies: A Preliminary Empirical Assessment ♣
Tomaso Duso∗ Humboldt University and WZB
Klaus Gugler University of Vienna
Burcin Yurtoglu University of Vienna
Abstract
Mergers that substantially lessen competition are challenged by antitrust authorities. Instead of blocking anticompetitive transitions straight away, authorities might choose to negotiate with the merging parties and allow the transactions to proceed with modifications that restore or preserve the competition in the involved markets. We study a sample of 167 mergers that were under the European Commission’s scrutiny from 1990 to 2002. We use an event study methodology to identify the potential anticompetitive effects of mergers as well as the remedial provisions on these transactions. Stock market reactions around the day of the merger’s announcement provide information on the first question, whereas the stock market reactions around the commission’s final decision day convey information about the outcome of the bargaining process between the authority and the merging parties. We first classify mergers according to their effects on competition and then we develop hypotheses on the effects that remedies are supposed to achieve depending on the merger’s competitive outcome. We isolate several stylized facts. First, we find that remedies were not always appropriately imposed. Second, the market seems to be able to predict remedies’ effectiveness when applied in phase I. Third, the market also seems able to produce a good prior to phase II’s clearances and prohibitions, but not to remedies. This can be due either to a measurement problem or related to the increased merging firms’ bargaining power during the second phase of the merger review. Keywords: Merger Control, Remedies, European Commission, Event Studies JEL Codes: L4, K21, C12, C13
♣ Acknowledgments: We would like to thank Mats Bergmann and Lars-Hendrik Röller for very valuable comments. We also thank Paul Heidhues, participants at the IIOC 2005 Conference in Atlanta, the Conference “Remedies and Sanction in Competition Policy 2005” in Amsterdam, the EARIE Conference 2005 in Porto, and seminar participants at the University of Vienna for helpful discussions. Cinzia Alcidi provided excellent research assistance. Tomaso Duso gratefully acknowledges financial support from the Deutsche Forschungsgemeinschaft through SFB/TR 15. ∗ Corresponding author: Social Science Research Center Berlin (WZB), Reichpietschufer 50, D10785 Berlin, Germany. Tel: +49 30 25491 403, Fax: +49 30 25491 444, E-Mail: [email protected].

1
1. Introduction
Few major mergers are completed without some conditions being imposed by an antitrust
authority such as divestitures, provision of access, termination of agreements or other behavioral
requirements. These conditions that seek to remedy the competition concerns caused by the
merger are an important instrument in merger control, yet an under-researched topic in the
economic literature. Looking at the European experience (see table 1), the economic importance
of merger remedies is evidenced by the fact that 191 of the 2,592 merger cases (around 7%)
notified to the European Commission (EC) until the end of 2004 have been decided as being
compatible with the common market only with commitments (either article 6.2 or 8.2).1 More
than half of phase II decisions (72 out of 121 – 59%) are compatible only with commitments, yet
only 19 mergers have been blocked since 1990. What is more, mergers that are cleared with
commitments are apparently the most important ones in terms of competition policy concerns,
since market power is most likely to increase due to the merger.
Table 1: Merger Cases and European Commission’s Decisions
Article, kind of decision. 90 91 92 93 94 95 96 97 98 99 00 01 02 03 04 All
6.1.a 2 5 9 4 5 9 6 4 6 1 1 1 1 0 0 54
6.1.b 5 47 43 49 78 90 109 118 207 236 293 299 240 203 220 2237
6.1.b remedies (6.2) 0 3 4 0 2 3 0 2 12 19 28 13 10 11 12 119
9.3. 0 1 1 1 0 3 7 4 4 6 7 13 9 3 59
Tot. Phase I 7 55 57 54 86 102 118 131 229 260 328 320 264 151 235 2469
8.2. 0 1 1 1 2 2 1 1 3 0 3 5 2 2 2 26
8.2. remedies 0 3 3 2 2 3 3 7 4 8 12 10 5 6 4 72
8.3. 0 1 0 0 1 2 3 1 2 1 2 5 0 0 1 19
8.4. 0 0 0 0 0 0 0 2 0 0 0 0 2 0 0 4
Tot. Phase II 5 4 3 5 7 7 11 9 10 17 20 9 6 7 121
Total final decisions 7 60 61 57 91 109 125 142 238 270 345 340 273 157 242 2590
Source: European Commission, Directorate Competition. Note: 6.1.a.: Out of scope of merger legislation; 6.1.b.: compatible; 6.1.b. remedies (6.2.): compatible with commitments; 9.3.: referral to member states; 8.2.: compatible; 8.2. remedies: compatible with commitments; 8.3.: prohibition; 8.4.: restore effective competition.
1 See http://www.europa.eu.int/comm/competition/mergers/cases/stats.html for statistics on EU merger control.

2
The situation is quite analogous in the USA. In its 1998 and 1999 fiscal years, the Federal Trade
Commission (FTC) challenged 63 mergers; of these 41 (65%) involved negotiated restructuring,
18 (29%) were abandoned, and only four (6%) were litigated.
Despite their economic importance, remedies are an under-researched topic as far as their
economic effects are concerned. In particular, there is no systematic econometric evidence on the
question of whether ordered remedies achieve what they are supposed to achieve, namely to
assure that proposed mergers do not lead to an increase in the firms’ market power net of any
efficiency gains. We review the existing evidence in the next section.
This paper answers these questions by analyzing the effects of remedies in a sample of 167
mergers analyzed by the European Commission between 1990 and 2002. We use an event study
methodology to identify the potential anticompetitive effects of mergers as well as the remedial
provisions on these transactions. Stock market reactions around the day of the merger’s
announcement provide information on the first question, whereas the stock market reactions
around the day of the commission’s final decision convey information about the outcome of the
bargaining process between the authority and the merging parties.
We isolate several stylized facts. First, we find that remedies were not always appropriately
imposed. That is, sometimes remedies were unduly imposed in mergers that we found being
efficiency increasing (type I errors), while some other times remedies were not imposed in
mergers that we found to increase market power (type II errors). Second, judging from our
results on abnormal returns the market seems to believe that remedies are effective when applied
in phase I, since positive abnormal returns for rivals are decreased when remedies are
announced. Third, it appears that the market is able to produce a good prior to phase II’s
clearances and prohibitions, but not for remedies in phase II. We suggest that information
leakage between phase I and phase II decisions plays an important role in explaining these
results. An additional explanation would be due to the merging firms’ increased bargaining
power vis-à-vis the commission during the phase II investigation, in those cases where a
prohibition is politically unfeasible.
The paper proceeds as follows. In section 2 we describe the existing literature on remedies as
well as event studies that have been used to assess antitrust decisions. In section 3 we present the
institutional background of the European Union (EU) merger control, while section 4 discusses
the policy issues related with the use of remedies and presents an international comparison. In
section 5 we discuss our approach, describe the event study methodology that we use to assess
mergers’ competitiveness as well as remedies effectiveness, and formulate hypotheses
concerning the use and the effects of remedies. In section 6 we introduce the data, present the

3
results of the event studies and, accordingly, give taxonomy of mergers. The results of our
empirical analysis are presented in section 7, while section 8 sums up and concludes with some
remarks and directions for further research.
2 The Evidence on Merger Remedies
2.1. General
Elzinga (1969) is perhaps the first study, which tried to evaluate the ex post effectiveness of
ordered remedies in challenged mergers. Using a random sample of 39 antimerger cases, he
analyzes the effectiveness of remedies under the Celler-Kefauver Amendment of 1950, which
revitalized the antimerger statute contained in Section 7 of the Clayton Act. He rates remedies
using a four category ranking system: successful, sufficient, deficient, or unsuccessful. The
cases are also measured by the time required to achieve the remedy. Elzinga’s results suggest
that only one out of ten cases can be classified as successful or sufficient. These two categories
correspond to cases where a full or partial divestiture was achieved and where these assets
created viable competitors in less than two years time.
Rogowsky (1986) extends Elzinga’s analysis to 104 merger cases brought by the FTC or DOJ
from 1968 to 1980. His case by case evaluation shows that in less than half of the cases only a
full or partial divestiture was achieved. Once the timeliness of remedies is taken into account, he
concludes that only two out of five cases remain successful or sufficient, because the ordered
assets were divested more than two years after the acquisition.2
Ellert (1976) is the first study that analyzes the valuation effects of antimerger complaints. He
studies the abnormal returns of 205 acquirers challenged under Section 7 of the Clayton Act
from 1950 to 1972 and shows that acquirers’ returns increase substantially over a long period
before the antitrust complaint. The cumulative abnormal returns average 23% (7%) over 100
(48) months before the complaint. In 123 mergers where defendants were ordered to divest
acquired assets, the cumulative abnormal returns are much higher, reaching 31% (13%) over 100
(48) months leading to the complaint. In the month of the complaint, both types of companies
experienced negative abnormal returns of almost 2%.3 Since the decrease in returns during the
complaint and settlement periods is much smaller than the increase over the period that led to the
complaint, Ellert argues that antimerger law has been largely unsuccessful in reversing the
discounted monopoly gains achieved by these mergers. 2 Pfunder, Plaine and Whittemore (1972) offer a similar analysis of US divestiture orders. 3 According to Ellert, the magnitude of this effect is consistent with the direct legal costs, loss of executive time, and
uncertainty affecting business decision-making introduced by the antitrust challenge.

4
More recently, Baer (1999) reviewed FTC divestiture orders entered during the agency's fiscal
years 1990 through 1994. He examined 35 orders involving 50 divestitures from a broad set of
industries by interviewing 37 buyers, eight respondents and two third parties. The divestiture
study reached three overall conclusions. First, most divestitures appear to have created viable
competitors in the market of concern (28 out of 37), whereas a higher percentage (19 out of 22)
of divestitures were successful when they involved the sale of an entire ongoing business.
Second, respondents tended to look for marginally acceptable buyers (those least likely to
become serious competitors) and engage in strategic conduct intended to impede the success of
these buyers (e.g. late and poor supply of indispensable inputs). Third, most buyers of divested
assets did not have access to sufficient information to prevent mistakes in the course of their
acquisitions and/or had incentives that differed from those of the FTC. Despite its novelty,
however, the divestiture study suffers from severe drawbacks, namely that only qualitative
information (interviews) has been used to assess the effects of a limited number (35) of
divestiture orders.
Motta et al. (2003) present a descriptive analysis of the use of remedies in EU merger control and
enumerate the most important pros and cons of the different provisions used by the European
commission. One can group merger remedies in two categories. (1) Structural remedies modify
the allocation of property rights and possibly create new firms. The most important structural
remedy is divestitures of entire ongoing businesses. Others involve the disposing of
shareholdings or the break up of other structural links such as interlocking directorates. (2) Non-
structural remedies or behavioral remedies constrain the merging firms' property rights. They
might consist of contractual arrangements such as compulsory licensing or access to intellectual
or infra-structural property. Also, many merger decisions involve a package of different
remedies. The most important advantage of structural remedies is that they are supposed to fully
and timely solve the competition concerns and need no (or not much) further monitoring by
antitrust authorities. However, while Motta et al. (2003) in principle favor the use of structural
remedies to clear problematic mergers, they point to information asymmetry and incentive
problems as well as to the increased possibility of pro-collusive effects of divestitures. Thus, they
suggest the same double test that the EC uses to assess mergers also for structural remedies,
namely that both single firm and joint dominance will not likely arise after divestiture (unilateral
and pro-collusive effects).
Moreover, as mentioned by Farrell (2003), the effectiveness of structural remedies may suffer
from inadequate buyers, "over" (or miss-) fixing and the discounting of merger efficiencies.
Cabral (2003) also qualifies the superiority of structural remedies, in his case asset sales.
5
Assuming a “free entry" equilibrium before and after the merger in a spatially differentiated
oligopoly, the author shows that by selling assets (e.g. stores) to potential rivals, merging firms
effectively "buy them off", that is, dissuade them from opening new stores, which may be
detrimental to consumers. The crucial assumption is the "free-entry" assumption: If the two firms
merge and there is no entry, then a monopoly with two stores arises; whereas if merging firms
sell assets (stores) to a third firm, then duopoly competition is maintained. This rationale
highlights the importance of assessing the counterfactual to the remedy decision, i.e. would entry
occur in the absence of imposing (structural) remedies or not.
2.2. Evidence Using Event Study Methodologies
One common prediction of some prevalent models in Industrial Organization, e.g. the Cournot
model, the Bertrand model with differentiated products and the dominant firm model, is that
horizontal mergers, ceteris paribus, result in higher product prices in equilibrium.4 While profit
increases for the merging (insider) firms can be due to two effects - the market power effect but
also (desirable) efficiency gains - profit increases of rival firms unambiguously must result from
the post merger increase in market power.
This latter effect may stem from several sources. First, in the logic of the aforementioned papers,
firms in an oligopolistic setting have a unilateral incentive to raise prices after the merger if there
are no efficiency gains. Second, an increased possibility for collusive behavior post merger
might also arise, because for instance the number of firms has gone down.5
Under the market power hypothesis, the merging firms’ combined stock prices should increase at
the time of the merger announcement. Any antitrust complaint that decreases the likelihood of
this event or reduces its market power related impact (such as an ordered divestiture) is expected
to have a negative impact on stock prices. The same pattern of abnormal stock price reaction is
expected for firms that are merging to achieve efficiency gains.
Since effective collusion generates monopoly rents, the collusion hypothesis implies that the
merging firms’ rivals in a horizontal merger will earn higher profits after the merger and, hence,
experience positive abnormal returns around the merger announcement. Any antitrust complaint
that decreases the likelihood of this event is again expected to decrease the rival firms’ market
value. Thus, a direct test of the collusion hypothesis, which relies on the efficient capital market
hypothesis, is based on the abnormal stock returns of rivals that are observed around the date of
4 See for instance Salant, Switzer and Reynolds (1983) and Farrell and Shapiro (1990). 5 These are called “unilateral” and “coordinated” effects in the EU merger regulation’s guidelines.

6
the merger’s announcement and around the announcement date of the antitrust complaint. The
fact that positive abnormal returns around the merger’s announcement for both the merging firms
and their rivals are reversed around the time of the announcement of the antitrust complaint,
suggests that the proposed merger is anticompetitive and the remedy is effective.
If the new firm resulting form a merger is more efficient than the merging companies, the
product market competition is intensified and consequently there will be an increase in output
and lower prices. Merging firms are expected to have higher profits due to their enhanced
efficiency and this change should be reflected in an abnormal stock price reaction of companies
announcing such mergers. The horizontal rivals of the merging companies have to cope with
lower prices in the product market and, hence, they are expected to have lower profits compared
to the pre-merger market structure. This product market effect implies a negative abnormal
return for the rival firms’ shares around the time of the merger announcement. Any event that
decreases the likelihood of such an efficiency increasing merger to go through should be good
news for the rivals. Consequently, the efficiency hypothesis predicts that rivals in an efficiency
increasing merger exhibit positive abnormal returns upon the announcement of an antitrust
complaint or an ordered remedy that reduces the efficiency effect of the merger.
A complicating factor concerning efficiency increasing mergers is the possibility that the merger
announcement signals some additional information that might reverse the rivals’ expected
profitability. Eckbo (1983) and Eckbo and Wier (1985) argue that if the production technologies
of competitors are related, then the proposed efficiency increasing merger can also signal
opportunities for the rivals to increase their productivity. Under this scenario, the merger
announcement is good news from the rival firms’ perspective, because it makes them (or the
market) aware of real profit opportunities that were so far unknown. The potential magnitude of
this “information effect” can be, according to Eckbo and Eckbo and Wier, so large that it might
offset the product market effect. Hence, they make no ambiguous prediction with respect to the
rivals’ abnormal returns around the merger announcement and around the announcement of the
antitrust complaint. They analyze a sample of 259 horizontal and vertical mergers in mining and
manufacturing industries of which 76 were challenged by government agencies. Though they
find significantly positive abnormal returns to shareholders of the rival firms, they explain that
the positive valuation effect may be due to positive information released by the merger. To
separate the market power effect from the information effect, they also estimate abnormal returns
to rival firms around the time of an antitrust challenge to the merger. They find no statistically
significant abnormal decreases in the stock prices of rival firms and they claim that this is
inconsistent with the market power hypothesis. In a similar paper, Stillman (1983) analyzes 11

7
horizontal mergers attempted between 1964 and 1972 that were challenged by antitrust
enforcement authorities. Instead of looking at the portfolio of rivals, he studies the valuation
effects for each of the 11 mergers. His findings suggest that only for one merger the market
power hypothesis cannot be rejected.
The second complicating factor concerning the rivals’ stock price is the possibility that the
merger announcement signals that a rival is more likely to become a merger target. The sign
pattern of the rivals’ abnormal returns would then generally be the same as under the collusion
hypothesis. If the proposed merger increases the likelihood that a rival will become an acquirer,
then the implied sign pattern would be the same as for the collusion or efficiency hypotheses,
depending on whether the market predicted higher or lower profits as a result of the expected
acquisition (McGuckin et al. 1992).6
Schumann (1993) argues that the impact of antitrust complaints on the value of rival firms will
also depend on the relative size of the rivals. For example, an antitrust complaint to an
efficiency increasing merger between the larger firms in an industry, will increase the probability
that small rivals will be subsequently acquired (the “small firm in play” hypothesis).
Alternatively, if the merger with a small rival (by either a large or small rival) cannot create the
efficiencies achievable through a combination of large firms (because of different technologies),
the antitrust complaint benefits smaller rivals at the expense of larger ones by protecting them
from the efficiency gains that their larger rivals might otherwise have achieved (the
“disadvantaged small rival” hypothesis”). Schumann (1993) conducts an event study analysis of
37 acquisitions that were challenged by the FTC over the period 1981-1987 and comes up with
the same pattern of abnormal returns as in Eckbo (1983) and Eckbo and Wier (1985). Consistent
with his arguments, he also finds that rivals’ abnormal returns around the time of the antitrust
complaint are positive and larger for rivals with smaller market shares.
In an analysis of trust formation during the first U.S. merger wave (1897-1903), Banerjee and
Eckard (1998) find that merging companies exhibit value gains of about 12% to 18%. They
conclude that these gains are due to the enhanced operational efficiency, because the trust
6 A recent test of the acquisition probability hypothesis (Song and Walkling, 2000) suggests that rivals earn
significantly positive abnormal returns and rivals that become targets in the subsequent year earn significantly larger
abnormal returns at the initial merger announcement than untargeted rivals. The sample of rivals in this study is,
however, based on Value Line classifications and not on some type of relevant market based on antitrust
considerations. Hence, their results are also consistent with the argument that acquisitions have a disciplining effect
in an industry and lead to a reduction in agency costs of the rival firms (Servaes and Tamayo, 2005).

8
competitors suffer an economically and statistically significant value loss (ranging from 3.5% to
9.5%).
Simpson (2001) employs the same methodology to test the collusion and efficiency hypothesis in
a merger of department stores in Denver and Southern California. He finds positive abnormal
returns for merging firms and their rivals consistent with an increased concentration due to this
merger. He also reports that rivals that operate in areas more likely to be affected by the merger
experience much higher abnormal returns. To discriminate between the collusion and acquisition
probability hypothesis, Simpson looks at the abnormal returns of likely targets among all rivals
and finds that these had returns, which were 2.3% higher than other rivals. The rivals which are
most likely to gain from the collusion have, however, still substantial (7.7%) abnormal returns.
McAfee and Williams (1988) criticized the Eckbo-Stillman methodology on two grounds. First,
the failure to detect market power may be due to the fact that rivals were large conglomerates,
which received only a small portion of their profits from the relevant market. Second, the
existence of an anti-merger policy may have had a deterrent effect on the types of mergers that
were attempted.7
Mullin et al. (1995) do find evidence for the market power hypothesis. They investigate the U.S.
Steel consolidation and incorporate an examination of downstream firms in addition to merging
and rival firms. They find reaction patterns that imply a dissolution of U.S. Steel lowers steel
prices and raises output. Slovin, Sushka and Hudson (1991) analyze whether airline
consolidation post-deregulation generates monopoly profits. They find insignificant abnormal
returns for the acquiring firms, but significantly positive abnormal returns to airline target firms
and argue that there is no evidence of monopoly gains from carrier consolidations after
deregulation. In contrast, Singal (1996) documents both significantly positive abnormal returns
to airline bidding firms and their target in a sample of mergers from the airline industry during
1985-1988. His tests show that mergers have enhanced both the market power and the efficiency
of merging firms.8 It is worth noting that Singal’s results are confirmed by an analysis of
product prices and profit changes from mergers.
More recent evidence is also inconclusive. Fee and Shaw (2004) find only slightly supportive
evidence consistent with collusion. They look at the upstream and downstream product market
7 However, Eckbo (1992) comparing US and Canadian experiences rejects this conjecture. Song and Walking (2000)
propose an alternative explanation to the market power hypothesis when finding positive abnormal returns for rivals,
namely that these positive returns are due to the investors’ anticipation of further M&A activity in the same industry. 8 Kim and Singal (1993) show that the impact of efficiency gains on airfares is more than offset by the post merger
increased market power.

9
effects of horizontal mergers and acquisitions and identify the customers, suppliers, and rivals of
the merging firms. In their sample of 554 US mergers, the net effect of a merger on a particular
supplier depends largely on the supplier’s ability to retain its product market relationship with
the merged entity. Consistent with previous studies, Fee and Shaw (2004) also report positive
abnormal returns to rivals of merging firms around announcements which range from 0.67% to
2.61%. An antitrust challenge to such mergers, however, does not lead to negative abnormal
returns for rivals. These findings concerning the rival firms’ stock price reaction is corroborated
by those presented by Shahrur (2005) in a more recent study using a sample of 463 US mergers
and takeovers. His results suggest that the average merger in his sample is driven by efficiency
considerations rather than collusion and buyer-power motives. The evidence provided by
Bittlingmayer and Hazlett (2000) on the antitrust action against Microsoft also rejects the joint
hypothesis that (a) Microsoft’s conduct was anticompetitive and (b) antitrust policy enforcement
produced net efficiency gains.9
In contrast to this fairly long list of event studies on the merger activity in the US and partly in
Canada, there are only a few studies of mergers that were analyzed by the European
Commission.10 Duso et al. (2003), using the same sample and, partly, the same methodology as
utilized in this paper, find evidence in favor of the market power hypothesis for a sub-sample of
EU mergers. Yet they look only at the reactions around the time of the merger’s announcement.
By contrasting the markets’ reactions with the actual commission’s decisions, they define type I
(i.e. procompetitive mergers blocked or modified by the authority) and type II errors
(anticompetitive mergers that were unconditionally cleared). In a second step, they use
regression analysis to study the determinants of such mistakes. They show that procedural issues,
market definition, as well as the merging firms’ country and industry of origin play a crucial role
in predicting both kinds of errors. However, they do not find any evidence of lobbying by firms
to be effective.
Aktas, de Bodt and Roll (2004a) provides another notable exception. They look at 602 decisions
by the EU Commission involving 1070 firms. Consistent with the rest of literature they
document significant abnormal returns for the target firms and smaller and less significant bidder
abnormal returns. They also estimate the abnormal price reaction to phase I and phase II
decisions and show that outright prohibitions are associated with negative abnormal returns and
9 Carstensen (1999) offers a less favorable conclusion on the Microsoft case. See also Comanor (2001), who
discusses the problem of remedy in the specific Microsoft case. 10 Brady and Feinberg (2000) used event studies to evaluate the impact of the introduction of the EU merger
regulation. They focus on merging firms and do not consider the effect on competitors.

10
approvals subject to conditions are relatively good news. In another paper the same authors
(Aktas et al., 2004b) suggest that European merger control is protectionist. They reach this
conclusion by showing that the likelihood of an intervention by the EU Commission is higher,
whenever the merger is proposed by a bidder from outside the EU and has a negative effect on
European rivals.
3. Institutional Background
There are four stages in the application of merger policy (Lyons, 2004): (1) The review
(investigation) decision, (2) Review, (3) Decision to prohibit or require remedies, and (4)
Appeal.
The first stage, which corresponds to phase I in the EU Merger control, selects the cases that
might raise a competitive concern. The second stage (phase II investigation) leads to an
assessment of the transaction’s competitive effects.11 The third stage (phase II decision) either
leads to a prohibition decision or to the choice of remedies that are aimed to remove the
competitive issues detected in stage 2. The fourth and final stage constitutes an important
disciplining mechanism for the soundness of decisions taken in the earlier stages.
In the US, stages 1 and 2 are concentrated in the hands of the two competition agencies (FTC
and DOJ). They then present their analysis to the court for a preliminary injunction which
corresponds to stage 3. While most of the cases are resolved before the agency goes to the court,
the immediacy of the courts has an important disciplining effect (Lyons, 2004).
In the EU, however, stages 1, 2 and 3 are concentrated in the hands of the Directorate General
Competition (DG Comp).12 A single team conducts the entire investigation and an appeal system
takes a period of several years.13 The role of the courts in Europe is limited to a formal and not
substantial control of the commission’s decision. However, in the last years some very
controversial cases (prohibitions) were overturned by the Court of First Instance and, in second
11 Eventually, remedies can also be imposed in Phase I. For details see the next section. 12 Every DG in the European Commission is headed by a politically appointed Commissioner. In our sample period
Karel Van Miert and Mario Monti were the DG Comp commissioners. Currently, Neelie Kroes is the head of DG
Comp. 13 In the Kali+Salz/MDK/Treuhand merger (M.308) of December 1993 the Court annulled the Commission’s
remedies on the basis of insufficient evidence to support collective dominance. The Court’s decision (C-68/94 & C-
30/95) came in March 1998.

11
instance, by the European Court of Justice.14 This is considered one major factor that triggered a
substantial review of the merger regulation as well as some fundamental changes in the
institutional details such as the creation of the Chief Economist Office.
3.1. The EU Merger Regulation
Merger control in the EU began in 1989 with the European Communities Merger Regulation
(ECMR), which came into force in September 21st 1990. The regulation was amended on May 1,
2004 after a 3-year review process.15 Since 1990 more than 2,500 mergers were under the
scrutiny of the European Commission.
According to the ECMR, a merger has community dimension if it takes place between firms with
a combined worldwide turnover of at least 5 billion Euros and a turnover within the European
Economic Area of more than 250 million Euros for each of at least two of the undertakings. This
definition also includes mergers between firms that produce outside of Europe and sell into
Europe. If necessary, a merger can be referred back to the member states for review.
Art. 2(3) of the ECMR states that “A concentration, which creates or strengthens a dominant
position as a result of which effective competition would be significantly impeded in the
common market or in a substantial part of it, shall be declared incompatible with the common
market.” This is commonly referred to as the dominance test (DT). DT constitutes an important
difference to the SLC (Substantial lessening of competition) test, which is used by the US
competition authorities. Some observers (e.g., Lyons, 2004) argue that the DT puts unnecessary
weight on the concept of dominance in cases where the more important issue concerns the
significant impediment of effective competition.16
The regulation defines the legal steps, which serve to control concentrations between
undertakings (see figure 1). Merging parties are obliged to notify their intentions to merge to the
commission when the deal has a community dimension. After receiving notification of the
14 The cases were Airtours/First Choice (M.1524), Tetra Laval/Sidel (M.2416), Schneider/Legrand (M.2283), and
General Electric/Honeywell (M.2022). Interestingly, according to our analysis, three out of four of these cases were
type I errors, i.e. procompetitive mergers that were unduly blocked by the Commission. 15 Council Regulation (EEC) No. 4064/89 was amended by Council Regulation (EC) No. 139/2004 on the control of
concentrations between undertakings that entered into force on January 20, 2004. Commission Regulation (EC)
No.802/2004 implements the Council Regulation (EC) No. 139/2004. See
http://europa.eu.int/comm/competition/mergers/review/ for a description of the review process. 16 The new merger regulation, which is applicable from May 1, 2004, focuses on the impact of a merger on
competition.

12
concentration, the commission has 25 working days to asses whether the concentration is
compatible with the common market (the so called phase I).
Figure 1: The EU Merger Control
After this short period of time, the commission can either clear the proposed concentration
unconditionally (Art 6.1.b), can decide to let it go through after verifying that the commitments
and obligations proposed by the undertakings can effectively restore competition (Art. 6.2.), or it
can decide that the proposed concentrations raise serious doubts as to its compatibility with the
common market (Art. 6.1c) and, therefore, a more in depth analysis is needed. In this case, the
commission opens the so-called phase II, which consists of 90 working days. During this period
of time, an in depth investigation is carried out. Generally, the commission makes use of the
entire available time, given the problematic nature of these cases, after which it has to come to a
final decision: either to block the merger (Art. 8.3) or to let it through unconditionally or with
commitments and obligations (Art. 8.2.).
Looking at figure 1, there are three events, which are important for our empirical analysis. The
first one is the merger announcement, which we define as the first rumor appearing in the press
about the proposed merger, and should help us identify the market assessment of the competitive
effects of the merger. The other two relevant events are the phase I and the phase II decision
dates, which should help us identify the effect of remedial action, as we will discuss in section 5.
4. Merger Remedies
Before describing how different jurisdictions deal with the use of remedies in merger control, we
shall illustrate several commonly accepted principles guiding most antitrust authorities.17 17 See the study on merger remedies by the OECD (2004) on this issue.
13
Largely, these principles were stated in the FTC’s Remedies Guidelines, which were issued at
the end of 1999 and were strongly influenced by Baer’s (1999) study mentioned earlier.18
First of all, the use of remedies should be considered only if they are demonstrably necessary, i.e.
the competition authority has the burden to prove that the mergers might impede or reduce
competition. In this case, the merging parties have to come up with proposed solutions to the
competitive concerns raised by the deal.
Structural remedies, in particular divestitures, should be preferred to behavioral remedies - such
as termination of exclusive agreements, obligations on licensing and access to essential
infrastructures or technology, use of patents etc. - because they are supposed to fully and timely
solve the competitive harm caused by the merger. Moreover, they need not much further
monitoring by antitrust authorities. Conduct remedies are, however, not prohibited and might be
used, mostly in a remedies-package proposed by the merging parties
The divestiture should be a demonstrably autonomous on-going business unit comprising the
entire business of one of the merging parties. This preference for “as is” divestitures is
supported by the higher success rate of such divestitures as compared to a limited divestiture in
the FTC’s divestitures study (Baer, 1999). In some cases (mostly in retail markets) the agencies
require the divestiture of overlapping assets to ensure that there is no increase in concentration.
A second aspect of the preferred divestitures is the increasing use of up-front buyers, which has
been considered as the “most vital tool in assuring a successful divestiture" (Parker and Balto,
2000).19 An up-front buyer is less commonly required when the divested assets constitute a
standalone business. The agencies are also using crown jewel provisions, which require the
divestiture of additional highly marketable assets, if the merging firms fail to divest the original
asset package as required by the consent decree. Finally, a divestiture trustee shall oversee the
implementation of the commitments.
18 The EU guidelines were very much affected by this study as well. Former EU competition commissioner Mario
Monti (2003) stated: “The Commission’s approach to remedies as set out in the notice was influenced by the FTC’s
previous study on the divestiture process […]. Furthermore, the EU and US antitrust authorities discussed their
respective approaches to remedies within the framework of a working group on merger control. The exchange of
expertise in this group proved invaluable to the drafting of the Notice on Remedies” 19 Unlike the FTC, the DOJ generally does not insist that the parties identify the buyer upfront, and is amenable to
divestitures arranged independently by the parties that do not require entry of a formal consent decree (the “fix-it-
first” approach). Halverson and Ewing (2005) argue that the DOJ believes that it has no power to review and block
a different transaction from the one, which the parties have not already agreed to (“post-fix”). The EU Commission,
instead, seem to follow the FTC approach and requires the merging parties to propose the buyer.

14
4.1. The Use of Remedies in the EU
At the end of 2001, the European Commission issued the Commission Notice (2001/C 68/03) on
remedies acceptable under Council Regulation (EEC) No 4096/89 and under Commission
Regulation (EC) No 447/89, which gives guidelines on the use of remedial action in merger
control. These guidelines were an important step in making the process of using remedies more
transparent, to increase legal certainty, as well as to achieve convergence towards the American
antitrust procedure.20
The notice on remedies clearly states that the commission is required to demonstrate that the
proposed concentration raises competition concerns. However, it is then the responsibility of the
parties to prove that the proposed remedies fully eliminate such concerns (see Monti, 2003).
Moreover, the parties must provide specific details and procedures, called in the EU antitrust
jargon “obligations”, relating to the commitments’ implementation.
The preferred remedy is the divestiture of viable standalone businesses, i.e. structural remedies,
but other remedies are possible such as exclusive agreements, licensing, and access to the
necessary infrastructure or technology. The divested activities must be preferably an already
existing business unit that can operate on a standalone basis. The purchaser must be suitable and
has to be approved by the commission.
Parallel to the introduction of the remedies guidelines a Remedies Enforcement Unit was
established within the DG Comp with the aim of developing and ensuring a consistent policy for
remedies in merger cases. The unit is expected to follow the implementation of remedies and
their revision, as well as monitor their effectiveness. Therefore, it is supposed to develop over
time best practice guidelines and enhance transparency in the remedies’ policy.
The implementation of the commitments is an equally delicate step, which involves the
monitoring of accepted divestitures, the approval of mandates to trustees and, finally, the
approval of proposed buyers for the divested assets. The role and powers of trustees have been
reinforced by the remedies notice. The trustee should ensure that no competitive harm comes to
the assets by the divestiture during the period between the implementation of the original
operation and the sale.
20 The FTC had already issued remedies guidelines in 1999. The Antitrust Division of the DOJ, instead, issued its
remedies guidelines in 2004.

15
4.2. The Use of Remedies in the USA and other Jurisdictions21
USA Section 7 of the Clayton Act (15 USC § 8) prohibits mergers that have the likely effect of
substantially lessening competition (SLC) or tending to create a monopoly in the relevant
market. Merger remedies have received little attention until Congress enacted the Hart-Scott-
Rodino Antitrust Improvements Act in 1976 (15 USC § 18a) (HSR Act).22 Subject to certain
exemptions, the HSR Act requires merging parties in transactions above certain thresholds to file
a notification form with the FTC and the Antitrust Division of the DOJ before closing the
transaction. The two agencies have 30 days to investigate the merger and, if their competitive
concerns are not resolved, they may issue a second request for additional significant
information.23 The waiting period is then extended by a further 30 days after the parties declare
themselves in substantial compliance with the second request, at which time the parties are
allowed to proceed with the deal unless the government has initiated proceedings to block the
transaction. The pre-closing notification guarantees the agencies timely knowledge of potentially
anticompetitive mergers. The HSR filing and second request processes provide them with
information to analyze the competition issues, to prepare for a preliminary injunction hearing,
and to evaluate any proposed remedy. Accordingly, the average number of FTC merger
enforcement actions after the HSR Act increased significantly.24
Both the FTC and the DOJ prefer to resolve concerns about anticompetitive effects by using
structural remedies that require the parties to divest business lines or assets to restore the
competition reduced by the merger.25 In general, such remedies are negotiated by the parties with
21 We will not discuss the remedies’ policy for the UK and Germany in this section, since the key authority in
Europe is the European Commission. However, German antitrust principles and tradition have very strongly
influenced the European approach to competition policy since its beginning. See Motta (2004) for a historical
perspective on European vs. US antitrust policy. 22 Baer and Redcay (2001). 23 “Second Request” refers to the official “Request for Additional Information and Documentary Material,” which
the agencies may issue pursuant to 15. USC § 18(a)e. 24 Baer and Redcay (2001) report that between 1983 and 1989 HSR filings averaged 1877 per year. Over the same
period the FTC averaged 11 merger enforcement actions annually. For the period between 1993 and 1999, those
figures were 3090 and 30, respectively. The workload statistics of the Antitrust Division of the DOJ for the fiscal
years 2000 and 2003 show that these numbers are 2375 and 10, respectively. 25 See http://www.ftc.gov/bc/mergerfaq.htm.
16
the agency staff and then incorporated into a binding consent order issued by the FTC; or a
binding consent decree issued by a federal court at the request of the DOJ.
Behavioral remedies are considered to be a less satisfactory solution than a divestiture, since they
often involve some form of ongoing regulation (Parker and Balto, 2000). On the other hand,
structural remedies are “relatively clean and certain” (McDavid and Breed, 2005). In some cases
the FTC has used behavioral remedies such as firewalls and nondiscrimination provisions in
vertical mergers.
Japan
The Japan Fair Trade Commission (JFTC) is responsible for the initiation of an investigation of
conduct that may violate the Antimonopoly Act (Act Concerning Prohibition of Private
Monopolization and Maintenance of Fair Trade - Act No. 54, 1947). The Act prohibits mergers
or acquisitions where the effect may be to substantially restrain competition or where such a
transaction is implemented through an unfair trade practice. The Act has been clarified by
guidelines published by the JFTC in 1998. Recently, JFTC (2004) has published a new set of
guidelines, which also devote some space on potential remedies.
The JFTC guidelines consider the divestitures as the most effective means to restore competition.
The divestitures aim to establish new competitors or strengthen the existing competitors of the
merging parties. Besides the usual divestitures, such measures include the reduction in the voting
rights or cancellation of interlocking directorates in another company.
If a divestiture is not a viable option, then JFTC considers promotions of imports or entry as
remedial measures as well. Behavioral remedies include the prohibition of discriminatory
treatment of competitors with respect to essential facilities for business and regulatory policies
by fixing some aspects of the behavior of the merging parties.26
Australia
The Australian Competition and Consumer Commission’s (ACCC) Guidelines (1999) outline the
merger review process under the Trade Practices Act 1974. The ACCC considers divestitures as
a more viable remedy than behavioral undertakings such as price, output, quality or service
guarantees and obligations. In practice, very few mergers attract ACCC concern and of those a
26 Besides a reduction of their turnaround slots, the remedy package in the merger between Japanese Airlines Co.
Ltd. (JAL) and Japan Airsystem Co. Ltd. (JAS) included remedial measures in favour of new airlines as well as
regulatory measures such as a reduction of 10% on normal fares and the requirement that fares would not be raised
during a period of 3 years (Arai, 2004).

17
vast majority goes forward after slight changes to their structure. For example, in 1996-97 147
mergers were considered by the ACCC, of these 140 were not opposed and of the remaining
seven, two proceeded with remedies and the other five were withdrawn.
Canada
In Canada, the Commissioner of Competition oversees the Competition Bureau, which is part of
the Federal Department of Industry. Under the Competition Act, the commissioner commences
an inquiry and, in case of a presumed violation, a formal recourse is taken by applying to the
Competition Tribunal for an order. The tribunal exercises no investigative functions and is purely
a body to make findings and issue remedial orders. The Tribunal has a wide range of remedies
available when it finds that the Competition Act has been violated. In case of mergers, these
include orders of divestiture assets and/or shares, the dissolution of the transaction or orders
regulating conduct. Out of 215 (267 in 2002/2003) merger cases concluded in 2003/2004, 6 (6)
cases were agreed with remedies and 6 (3) were abandoned either as a direct result of the
commissioner’s position or for other reasons.27
While divestitures have traditionally been the favorite remedy, behavioral remedies have been
used very frequently (Neylan, 2002). Campbell and Halladay (2002) analyze a number of merger
cases reviewed by the commissioner and suggest that the bureau has in fact been willing to use
diverse and innovative remedies in a considerable number of mergers.
5. Approach and Hypotheses
The evaluation of remedies’ effectiveness is intrinsically an empirical question. The first task is
to identify those mergers that are most likely to lead to an increase in market power and where
remedies should theoretically be applied. In particular, we classify mergers according to the
likely net effects of market power versus efficiency gains. We shall assume that the antitrust
authority follows a consumers' surplus standard, which is the adopted welfare measure in the US
as well as EU merger control.28 An anticompetitive merger is then defined as such to reduce
consumers' surplus. We look at the profit change of the rival firms at the merger’s announcement
date to assess the merger’s competitiveness, since there exists a correspondence between the
27 See the Annual report of the Commissioner of Competition (Competition Bureau Canada, 2003 and 20043). 28 Actually, the old EU merger regulation did not explicitly state the use of a consumer surplus standard. However,
Commissioner Monti stated several times that the ultimate scope of European competition policy is to serve
consumers’ interest.

18
decrease in consumers' surplus and the increase of competitors’ profits following a merger, as
long as the considered merger is profitable for the merging firms.29
In principle, a merger might have four possible effects on the merging and rival firms’ profits.
Table 2 lists these four possibilities as well as the optimal incidence of remedies. If the merger
generates positive profits for both the merging and the rival firms ( 0MΔΠ > and 0RΔΠ > ), the
market power effect following from the merger is likely to outweigh any efficiency gains (the
"umbrella effect"). In this case appropriate remedies should be imposed on the merging parties,
which reduce the market power effect (at least) until the point where the two effects neutralize
each other on consumer or total welfare (depending on which standard the competition authority
chooses).
If the merger generates positive profits for the merging firms but has a negative effect on rival
firms' profits ( 0MΔΠ > and 0RΔΠ < ), the efficiency effect of the merger is likely to outweigh
the market power effect, since only merging firms enjoy the positive effect of increased
efficiency. There should be no remedies in this case, at least none that (also) reduce the
efficiency gains from the merger.30
Table 2: Possible Effects of Mergers on Merging (M) and Rival (R)
Firms’ Profits and the Optimal Incidence of Remedies
0MΔΠ > 0MΔΠ <
0RΔΠ > Market Power Increase;
Remedies
Efficiency Reduction;
Possibly Remedies (if 0IΔΠ > )
0RΔΠ < Efficiency Increase;
No Remedies
Efficiency Reduction;
No Remedies
29 The correspondence between the sign of the rivals’ profit change and the change in consumers' surplus holds in a
class of models such as homogenous good Cournot competition and differentiated goods price competition (see
Neven and Röller, 2005 and Duso et al. 2003 on this point). However, in this model unprofitable mergers would not
occur. 30 Remember that, according to the merger regulation, efficiencies should be “merger specific” and should “benefit
consumers”. See Röller et al. (2001) on considerations about the role of efficiency gains in merger control.

19
The fact that mergers, which reduce the efficiency and profits of merging firms, happen cannot
be well explained by standard industrial organization models.31 Nevertheless, there is
overwhelming evidence that many of such mergers do take place. For example, Gugler et al.
(2003) find several of these mergers taking place around the world and attribute them to
managerial motives, such as growth and size maximization.32 Within this category, two cases can
be distinguished: mergers that reduce the profits of the merging firms but increase the profits of
the rival firms and mergers that reduce profitability of both parties.
If a merger decreases insider profits but increases rival firm profits ( 0MΔΠ < and 0RΔΠ > ), the
net effect of the merger on welfare depends on the relative magnitudes of the profit effects. If
industry profits go up ( 0IΔΠ > ), the merger may be considered as being predominantly
anticompetitive since rival firms react to the reduced efficiency of the merging firms by
increasing their prices. Here remedies may be considered, although the source of the problem is
not one of competition policy but one of inadequate corporate governance. If industry profits go
down, nothing can be said about the anticompetitive effects and necessary remedies.
The same holds true in the last case when both merging and rival firms’ profits decrease
( 0MΔΠ < and 0RΔΠ < ). One possible interpretation of this cell is that the merger not only
reduced the efficiency of the merging firms, but at the same time had an effect on industry
conduct. That is, the strategic interaction between firms has changed and reduced the
collusiveness in the industry. Alternatively, the merger led to an increase in competition in the
market, e.g. in technology markets leading to unambiguous improvements in consumer welfare.
Finally, these are also mergers, which could be explained by the pre-emption theory (Fridolfsson
and Stennek, 2005): firms rationally engage in apparently unprofitable mergers because being an
insider is better than being an outsider. In any case no remedies should be observed.
31 One exception is the literature on pre-emptive mergers (see Fridolfsson and Stennek, 2005 and Molnar, 2003). In
these models, profit maximizing firms rationally do unprofitable mergers in order to pre-empt rivals, in those cases
where being an insider is more profitable than being an outsider. 32 Molnar (2003) uses a sample of all horizontal mergers that resulted in 100% ownership of the target between 1981
and 1998 where both the acquiring and the target firms were quoted in the NYSE, AMEX, or NASDAQ stock
exchanges. He claims that, in his sample, pre-emptive motives for mergers find stronger support than hubris and
agency theories.

20
5.1. Measuring the Effects of Mergers and Remedial Actions: The Event Study
Methodology
The first aim of this paper is to provide a taxonomy of mergers by empirically estimating their
effects on merging firms' as well as rivals' profitability (also see Duso et al., 2003 on this point).
Therefore, the question is how to measure profitability. There are two strands of literature that
look at the effects of mergers and propose empirical methodologies to quantify them. One
possibility consists of using balance sheet data and following the performance of the involved
firms several years after the merger (see Gugler et al., 2003 as a recent example). The other
strand of literature, which we discussed in section 2, looks at stock market reactions to mergers’
announcements, under the assumptions that markets are able to efficiently process information
about the mergers. We follow this second approach and run event studies on the firms’ stock
prices to measure the merger’s profitability effects.
Under the assumptions of efficient markets and rational expectations, the market model predicts
that firm j’s stock return at time t ( tjR , ) is proportional to a market return:
tjtmtj RR ,,, εβα ++= .
To study the stock price reaction to the mergers’ announcements, we estimate the market model
over 240 trading days, starting 20 days prior to the announcement day and using the Scholes–
Williams (1977) method. We obtain estimated values for the model’s parameters α and β, which
we can use to predict what firm j’s stock price would have been, had the merger not been
announced or, more in general, had the event under consideration not occurred ( tjR ,ˆ ). For firm j,
we calculate then the abnormal return around the mergers’ announcement day t (ARj,t) as:
tmtjtjtjtj R RRRAR ,,,,,ˆˆˆ βα −−=−= ,
We then calculate a cumulative abnormal return over an event window of 2x+1 days (x = 0, 1, 2,
etc.):
∑+=
−=+ =
xt
xtjxtj ARCAR
τ
ττ,2, .
We calculate these measures for merging firms and all rivals for each merger. In order to obtain
the aggregate effects on merging firms and on rivals ( diΔΠ , i = M, R), we took the weighted

21
average of the cumulative abnormal returns of all firms in each of the two groups (i=M,R), the
weight being firm j’s market value ( djMV ):
A, DdRMiNjMV
MVCARiN
i
dj
N
i
dj
dj
di i
i
====ΔΠ
∑
∑
=
= ,,,,...,1
1
1 .
These give us a measure of the merger’s and remedies’ profitability effects.
5.2. Measurement Issues
We use the above explained methodology to quantify two effects. First, we asses the merger’s
competitive effect by looking at the reaction of merging and rival firms’ share prices around the
deal’s announcement date. This allows us to measure the merger’s profitability effects on
merging (M) and rival (R) firms, which we label AMΔΠ and A
RΔΠ , and thus classify mergers as
problematic and not so problematic according to table 2. Second, we look at the different merger
review’s decision dates and try to infer information about the effectiveness of antitrust
intervention from the stock market reactions to these events.
There are some measurement problems in doing this exercise, since one has to understand how
much the market predicts, or can predict, about the antitrust action around each event date as
well as how much information was disclosed to the market and when it happened.
We start with the merger’s announcement reactions. This measure is an unbiased measure of the
merger’s effects if the market assumed clearance without later commitments at the
announcement day. Indeed, the observed abnormal return around the announcement day is equal
to the real value of the merger ( *iΔΠ ) minus the expected value of the remedies ( [ ] IRE Ai ) given
the information available in the market at that time about remedies:33
[ ]AiiAi IRE−ΔΠ=ΔΠ * .
33 This formulation allows us to include clearances (remedies=0) and prohibitions (the strongest form of remedies).

22
As long as the expected value of remedies is low, one should expect the observed abnormal
return ( AiΔΠ ) to have the same sign as the real value of the merger ( *
iΔΠ ).34 Therefore, even
though we might wrongly measure the real merger value with our event study, we still should be
able to have an accurate prediction of the sign of this effect. This is what we are mostly
interested in for the first step of our analysis, since we need to know whether profits from the
merger are positive or negative in order to categorize mergers according to table 2.
To measure remedies’ effectiveness we look at the stock market’s reactions around the date
when the information about the commission’s decision was disclosed. The main problem is to
understand how much the market knows about, or how good the market can predict, the outcome
of the bargaining process between the commission and the merging parties, which results in the
imposed remedies.
The first important date is the phase I decision. After the first four weeks of investigation, the
commission has different possible choices - as discussed in section 3. If the merger does not raise
serious market power concerns, the commission clears the merger either unconditionally or with
conditions and obligations. In this case, our event study should capture the effect of this decision,
under the assumption of no information leakage during this first investigation period. Hence, for
these cases, the phase I decision effect is the difference between the remedies’ real effect (Ri) and
the market expectation about remedies, given the information available around the
announcement date:
[ ] RM,i IRER AiiPi =−=ΔΠ 1
The worst decision from the merging firms’ perspective - and therefore the decision that should
trigger strongest price reactions - is when market power concerns are substantial and the
commission decides to open a phase II investigation. In this case, the market reaction
corresponds to the update of the market’s beliefs about remedies. Indeed, when a case goes into
phase II, the probability of a commission’s intervention increases sharply.35 Therefore, the
abnormal returns around the day of the phase I decision for mergers that go into a phase II
34 Indeed, we would not expect a benevolent agency to impose remedies, which are higher than the value of the
merger for merging firms. 35 Table 1 shows that the incidence of remedies in phase I is 4%, while it increases to over 60% in phase II.
Moreover, a merger can be prohibited only after a phase II investigation.
23
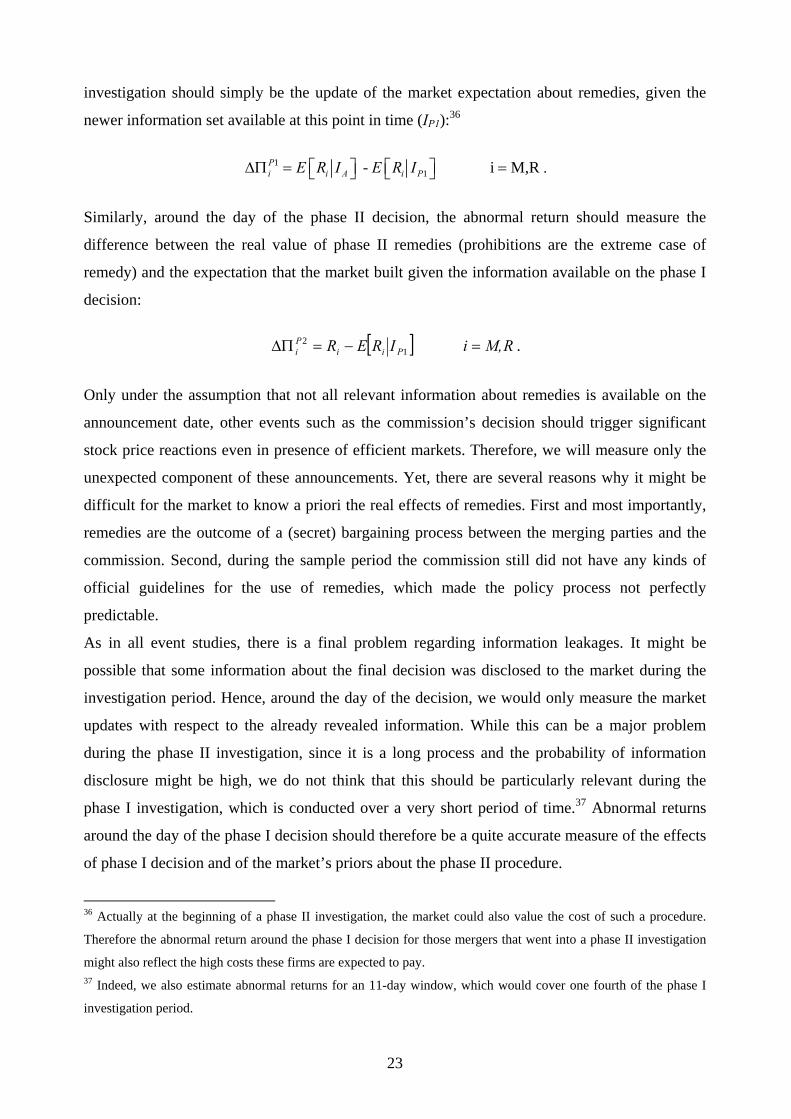
investigation should simply be the update of the market expectation about remedies, given the
newer information set available at this point in time (IP1):36
11- i M,RP
i i A i PE R I E R IΔΠ = ⎡ ⎤ ⎡ ⎤ =⎣ ⎦ ⎣ ⎦ .
Similarly, around the day of the phase II decision, the abnormal return should measure the
difference between the real value of phase II remedies (prohibitions are the extreme case of
remedy) and the expectation that the market built given the information available on the phase I
decision:
[ ] RM,i IRER PiiPi =−=ΔΠ 1
2 .
Only under the assumption that not all relevant information about remedies is available on the
announcement date, other events such as the commission’s decision should trigger significant
stock price reactions even in presence of efficient markets. Therefore, we will measure only the
unexpected component of these announcements. Yet, there are several reasons why it might be
difficult for the market to know a priori the real effects of remedies. First and most importantly,
remedies are the outcome of a (secret) bargaining process between the merging parties and the
commission. Second, during the sample period the commission still did not have any kinds of
official guidelines for the use of remedies, which made the policy process not perfectly
predictable.
As in all event studies, there is a final problem regarding information leakages. It might be
possible that some information about the final decision was disclosed to the market during the
investigation period. Hence, around the day of the decision, we would only measure the market
updates with respect to the already revealed information. While this can be a major problem
during the phase II investigation, since it is a long process and the probability of information
disclosure might be high, we do not think that this should be particularly relevant during the
phase I investigation, which is conducted over a very short period of time.37 Abnormal returns
around the day of the phase I decision should therefore be a quite accurate measure of the effects
of phase I decision and of the market’s priors about the phase II procedure.
36 Actually at the beginning of a phase II investigation, the market could also value the cost of such a procedure.
Therefore the abnormal return around the phase I decision for those mergers that went into a phase II investigation
might also reflect the high costs these firms are expected to pay. 37 Indeed, we also estimate abnormal returns for an 11-day window, which would cover one fourth of the phase I
investigation period.

24
5.4. Hypotheses
A comparison of the incidence of mergers and remedies allows us to formulate our first
hypothesis: Are remedies targeted at the right mergers (i.e., mergers that increase market
power)? Or, put another way, did the commission make type I errors (impose remedies in
procompetitive mergers) and type II errors (not impose remedies in anticompetitive mergers)
when compared to the counterfactual given by the market merger’s assessment?
We can then further evaluate the effectiveness of remedies by looking at the profitability effects
around the various decision dates. In general, we expect remedies that effectively reduce market
power to shrink rivals profitability in anticompetitive mergers. Analogously, we expect remedies
to reduce merging firms’ profitability in these mergers. However, if remedial action works in the
right way, it should not completely destroy profits stemming from the increase of merging firms’
productive efficiency. Hence, the reduction of merging firms’ profitability should not be drastic,
at least where the merger produces some efficiency gains.
In procompetitive mergers one should not observe remedies. If, however, the commission
mistakenly applied them in such cases (type I errors), the remedies should not have a strong
impact on both firms’ profitability otherwise the commission’s action would be detrimental to
efficiency.38
6. The Data, the Estimated Abnormal Returns, and Mergers Taxonomy
Our sample consists of 167 concentrations that have been analyzed by the European Commission
from the period 1990-2002. Our starting database was developed in Duso et al. (2003). Our
sample includes almost all phase II mergers completed by the EU till the end of 2001, and a
randomly matched sample of phase I cases, which run up to June 2002. Because of difficulties in
identifying competitors or their stock, we end up with 78 phase II cases and 90 phase I cases for
which we have complete information. We identify 880 different firms involved in several
mergers either as merging parties or as rivals.
38 One potential problem of our analysis is that we look at the “average competitiveness” of a merger. In many
cases, however, there are several product/geographical markets involved. Hence, there might be cases, which are on
average procompetitive but where competitive concerns are present in some, but not in all of the relevant markets. In
such a situation, it would then be right for the Commission to intervene in order to solve these problems in the
specific markets. Yet, with our methodology, we would define such a case as a type I error, since the deal was on
average procompetitive.

25
Table 3 presents a short description of relevant variables that illustrate some of the main
characteristics of the mergers in our sample. These variables are mostly derived from the
commission’s decision files.
The market value of the merging firms is on average 45 billion US dollars. The aggregate market
value of rivals is of course much larger (385 billion US dollars on average) since we have several
competitors involved in one merger, whose values are summed up.39 The merger’s average
number or rivals for which we have data is 3.66, since we are not able to identify all competitors
listed in the commission’s reports and varies between 1 and 14.
The majority of the concentrations in our sample (56.9%) were full mergers, 24% joint ventures,
13.1% partial acquisitions, 11.4% were tender offers, and only 6% consisted of asset acquisition.
In 41.3% of cases the geographical market definition is the European Economic Area, in 34.7%
it was defined to be national, and for the rest (21%) it was worldwide.
Remedies have been imposed in 35.3% of the mergers (6.6% in phase I and 28.7% in phase II).40
Only 12 mergers in our sample (7.1%) were blocked. Considering these prohibitions as an
extreme type of remedies, we have 43.1% of cases where the commission intervened to modify
the merger in order to restore effective competition. We will use these cases to identify the effect
of remedies by contrasting them to the rest of the sample, which consists of mergers that were
cleared outright.
Remedies are categorized as structural or behavioral using the information contained in the
commission’s decision. In 15.6% of the mergers, the commission adopted a “remedies mix”
consisting of structural and behavioral remedies together. In only 13.2% of the cases, pure
structural remedies have been imposed, while behavioral remedies have been adopted alone in
only 5.4% of the mergers in our sample.
The most adopted kinds of remedies are divestitures, which were imposed in 23.6% of the cases.
This corresponds to 67% of the mergers where remedies have been applied. The selling of shares
was imposed in 10.3% of cases, licensing agreements in 11.5%, the access to essential
technologies or facilities in 9.7%, the dismissing of exclusive agreements in 7.3%, and the
dissolution of interlocking directorates only in 3.6% of the mergers in our sample.
39 This information comes from our calculations on Datastream data and might therefore diverge from the (mostly
censored) figures reported in the Commission’s files. 40 Note that mergers where remedies were imposed in phase I are a little overrepresented in our sample (6.6%) in
comparison to the entire population (4.6% of cases).

26
Table 3: Variables Definition and Summary Statistics
Variable Description Mean Std. Dev.
mvd_mer_a Market value of the merging firm in million US $ 44416 84507 mvd_com_a Market value of the rivals in million US $ 385498 3858280competitors Average number of competitors 3.6687 2.5216 full Full acquisition 0.5689 0.4967 partial Partial acquisition 0.1317 0.3392 jv Joint Venture 0.2395 0.4281 assetacq Asset acquisition 0.0599 0.2380 tender Tender offer 0.1138 0.3185 phase1 The merger was cleared in phase I 0.5329 0.5004 phase2 The merger was cleared in phase II 0.4671 0.5004 national The geographical market is national 0.3473 0.4775 EEA The geographical market is the European Economic Area 0.4132 0.4939 world The geographical market is worldwide 0.2096 0.4082 remedies Remedies have been applied 0.3533 0.4794 prohibitions The merger was prohibited 0.0719 0.2590 sremedies Strong remedies: prohibitions are strongest type of remedy 0.4251 0.4959 structural Structural remedies have been imposed 0.2909 0.4556 behavioral Behavioral remedies have been imposed 0.2121 0.4101 remed_mix A remedies mix (structural and behavioral) was imposed 0.1557 0.3637 p_structural Only structural remedies have been imposed 0.1317 0.3392 p_behav Only behavioral remedies have been imposed 0.0539 0.2265 divestiture The remedy consisted in a divestiture 0.2364 0.4261 shares_sell The remedy consisted in selling shares 0.1030 0.3049 interlocking The remedy consisted in dissolving interlocking directorates 0.0364 0.1878 exclusive_agree The remedy consisted in eliminating exclusive agreements 0.0727 0.2605 licensing Merging firms must license some products / processes 0.1152 0.3202
access Merging firms must guarantee access to an essential technology/ facility
0.0970 0.2968
All variables excluding the market values and the average number of rivals are dummy variables.
For each case, merging firms and competitors have been identified from the published
commission’s decisions.41 The mergers’ announcement date was collected from the financial
press by using the Dow Jones Interactive database.42 For each firm j (merging and rival firms),
41 This is a big advantage of our data set, since we can rely on the Commission’s analysis concerning the market
definition (the relevant competitors). However, this has also the disadvantage that we might have picked the wrong
competitors because the Commission made mistakes in defining the relevant market. 42 This is a customizable business news and research product that integrates contents from newspapers, newswires,
journals, research reports, and web sites. The peculiarity of our approach is that we looked at the first rumours about
the merger, i.e. the first time a discussion of the mergers appeared in the international press, and not necessarily the
27
we have computed the abnormal return around the merger’s announcement day, as well as phase
I and phase II decision dates. We then calculated the cumulative 3-day, 5-day, and 11-day
abnormal returns for each firm. In order to obtain the aggregate effects on merging firms’ and on
competitors ( diΔΠ , i = M, R), we took the weighted average of the abnormal returns of all firms
in each of the two groups (i=M,R), the weight being the firms j’s market value ( djMV ), as we
described in paragraph 2.
Table 4 reports the preliminary statistics of the various measures of estimated aggregated
abnormal returns for merging firms and competitors around various points in time and using
different event windows.
According to our estimates, the mergers in our sample were on average profitable since the
average aggregated cumulative abnormal returns for the merging firms around the announcement
date ( AMΔΠ ) are positive and statistically significant at the 1% level for all used windows. The
size of the profitability effect ranges from 1.1% (1 day window) to 2.07% (5-day window).
This result seems however to be in line with the literature.43 The cumulative abnormal returns for
the rivals around the announcement date ( ARΔΠ ) are, instead, not statistically significantly
different from zero and very small in size.44 On average, these mergers seem to be welfare-
neutral, in the sense that neither they increase nor decrease the average rivals’ profits.
The notification date effects are for both merging and rival firms very small and almost always
insignificantly positive. Under the assumption of efficient markets, we would expect exactly
these kinds of effects. The notification, in fact, is a required act by the parties and should not official merger’s announcement by the involved parties. This has the advantage of reducing the noise in identifying
the “right” event. On the other hand, our measure of abnormal returns might be downward biased by the fact that the
market might still not be sure whether the merger will take place or not. What we observe is, therefore, the value
that the market attaches to a particular merger times the expected probability that this merger will really be
consumed. 43 See for instance Andrade et al. (2002). In fact, d
iΔΠ is the weighted sum of the acquiring and of the target firms’
abnormal returns. Depending on the event window, we estimate average abnormal returns for acquirers in the range
between -0.54% and 0.12% (not statistically significantly different from zero) and for the targets in the range
between 3.4% and 6.2% (statistically significantly greater than zero at the 1% level). These results are quite similar
to those reported by Aktas et al. (2004a) using a comparable sample of mergers analyzed by the EU Commission.
Note however that in their sample the phase II cases are much more underrepresented than in ours. 44 The abnormal returns for rivals are measured with errors, since we lost part of them due to the fact that they are
small - not quoted - firms. Because we have mostly the biggest competitors in our sample we possibly have another
bias towards “no significance”: big firms derive probably only a small fraction of their revenues from the market
under consideration and are, therefore, only partially affected by the merger.

28
convey any relevant information to the market since it is common knowledge that merging firms
must notify the transaction.
Table 4: Estimated Abnormal Returns
Variable 1 day 3 days 5 days 11 days
Announcement day
AMΔΠ 0.0114**
(0.0049) 0.0157***
(0.0059) 0.0207***
(0.0065) 0.0191***
(0.0072) ARΔΠ 0.0038
(0.0041) 0.0029
(0.0023) 0.0005
(0.0031) 0.0056
(0.0075)
Notification day
NMΔΠ 0.0028
(0.0028) 0.0072 **
(0.0032) 0.0044
(0.0035) 0.0081* (0.0058)
NRΔΠ 0.0041
(0.0063) 0.0030
(0.0045) 0.0024
(0.0034) 0.0050
(0.0136)
Phase 1 Decision
1pMΔΠ -0.0034**
(0.0016) -0.0112** (0.0058)
-0.0115** (0.0061)
-0.0143** (0.0075)
1pRΔΠ -0.0026 *
(0.0019) -0.0033 * (0.0025)
-0.0050 * (0.0036)
0.0098 ( 0.0145)
Phase II Decision
2pMΔΠ 0.0022
(0.0018) 0.0068**
(0.0029) 0.0033
(0.0038) 0.0068
(0.0087) 2p
RΔΠ -0.0002 (0.0025)
-0.0039 (0.0043)
-0.0054 (0.0057)
-0.0043 (0.0081)
Final Decision a
DMΔΠ -0.0024*
(0.0017) -0.0082* (0.0059)
-0.0101* (0.0062)
-0.0112* (0.0085)
DRΔΠ -0.0027
(0.0022) -0.0052* (0.0033)
-0.0076* (0.0047)
0.0078 (0.0151)
Sum
DM
AM ΔΠ+ΔΠ 0.0093*
(0.0054) 0.0075
(0.0085) 0.0104
(0.0089) 0.0074
(0.0112) DR
AR ΔΠ+ΔΠ 0.0012
(0.0031) -0.0023 (0.0035)
-0.0071 (0.0059)
0.0134 (0.0209)
We report the mean and standard errors (in parentheses) of the different abnormal returns. We use a one tailed t-test to test whether the abnormal returns are significantly positive or negative, and report significance: 1%, 5%, and 10% significance level are represented by ***, **, * respectively. aThis variable is defined as the abnormal return around the phase I decision date for cases cleared (with or without remedies) in phase I and as the sum of the abnormal returns around the phase I and phase II decision dates for the cases that went through the phase II procedure.

29
Looking at phase I decisions, we observe negative and statistically significant abnormal returns
for the merging firms as well as for the competitors for almost all event windows. This suggests
that the phase I decision is on average bad news for both merging firms (around -1%) and
competitors (-0.5%). Especially, the negative effect on merging firms’ stocks is relatively big,
since it comes close in absolute value to the average positive effect observed around the
announcement date. This would mean that, on average, around the phase I decision already
almost the entire profitability effect for the merging firms disappears. The interesting question is
then to look whether this average negative effect is driven by the cases where conditions and
obligations have been imposed by the commission, or whether it is a pure “decision effect”
independent of the use of remedies. We will turn to this question later on.
In the case of phase II decisions, almost all measures of abnormal returns are statistically
insignificant. The only exception is the measure of the cumulative 3-day abnormal returns for the
merging firms, which is positive (0.68%) and statistically significant at the 5% level. The effect
for the merging firms is on average positive, even though small, while the rivals’ abnormal
return is on average negative, and also very small.
As we pointed out before, we are interested in the stock market reactions around the final
decision date, since at this point in time all information about the outcome of the antitrust legacy
is provided to the market. First of all we have to define this event and which measure of
abnormal returns we consider. For mergers cleared in phase I, this is an easy task: the final
decision effect is simply the abnormal return around the phase I decision date. For cases that go
to phase II, we chose to use the sum of the phase I and phase II abnormal returns as the final
decision effect, since around the phase I decision the market updates its beliefs about the final
outcome. In fact, the probability that the merger will be blocked or cleared with remedies sharply
increases when a merger goes into a phase II investigation. Looking at this event, we observe
negative and significant abnormal returns for merging firms as well as competitors. The size of
this effect ranges from -0.24 to -1.1 % for the merging firms and from -0.27% to -0.78% for the
rivals.45
45 Just to give an idea, using the average market values, these effects amount to a loss of between 106 and 489
million dollars for the merging parties and between 1 and 3 billion dollars for the rivals.
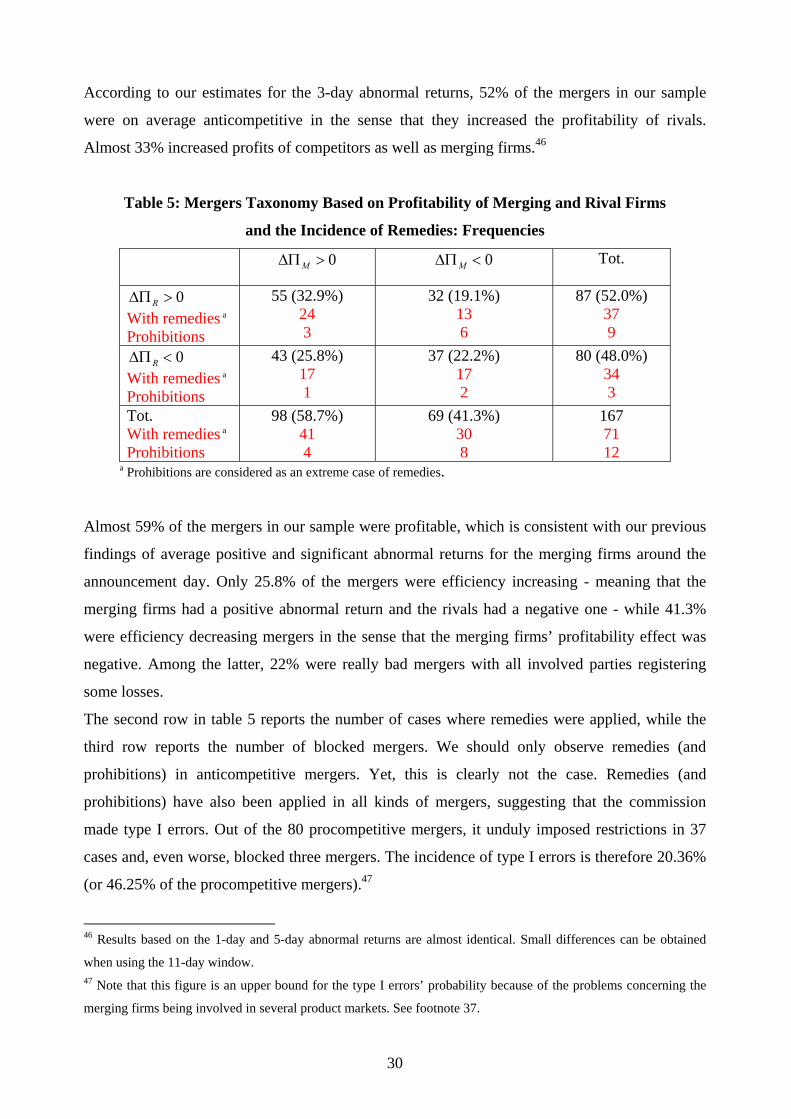
30
According to our estimates for the 3-day abnormal returns, 52% of the mergers in our sample
were on average anticompetitive in the sense that they increased the profitability of rivals.
Almost 33% increased profits of competitors as well as merging firms.46
Table 5: Mergers Taxonomy Based on Profitability of Merging and Rival Firms
and the Incidence of Remedies: Frequencies
0MΔΠ > 0MΔΠ < Tot.
0RΔΠ > With remedies a Prohibitions
55 (32.9%) 24 3
32 (19.1%) 13 6
87 (52.0%) 37 9
0RΔΠ < With remedies a Prohibitions
43 (25.8%) 17 1
37 (22.2%) 17 2
80 (48.0%) 34 3
Tot. With remedies a Prohibitions
98 (58.7%) 41 4
69 (41.3%) 30 8
167 71 12
a Prohibitions are considered as an extreme case of remedies.
Almost 59% of the mergers in our sample were profitable, which is consistent with our previous
findings of average positive and significant abnormal returns for the merging firms around the
announcement day. Only 25.8% of the mergers were efficiency increasing - meaning that the
merging firms had a positive abnormal return and the rivals had a negative one - while 41.3%
were efficiency decreasing mergers in the sense that the merging firms’ profitability effect was
negative. Among the latter, 22% were really bad mergers with all involved parties registering
some losses.
The second row in table 5 reports the number of cases where remedies were applied, while the
third row reports the number of blocked mergers. We should only observe remedies (and
prohibitions) in anticompetitive mergers. Yet, this is clearly not the case. Remedies (and
prohibitions) have also been applied in all kinds of mergers, suggesting that the commission
made type I errors. Out of the 80 procompetitive mergers, it unduly imposed restrictions in 37
cases and, even worse, blocked three mergers. The incidence of type I errors is therefore 20.36%
(or 46.25% of the procompetitive mergers).47
46 Results based on the 1-day and 5-day abnormal returns are almost identical. Small differences can be obtained
when using the 11-day window. 47 Note that this figure is an upper bound for the type I errors’ probability because of the problems concerning the
merging firms being involved in several product markets. See footnote 37.

31
Figure 2: The Distribution of Merging Firms’ and Rivals’ Abnormal Returns -.2
0.2
.4.6
Mer
ging
firm
s' a
bnor
mal
retu
rns
-.15 -.1 -.05 0 .05 .1Rivals' abnormal returns
-.2-.1
0.1
.2M
ergi
ng fi
rms'
abn
orm
al re
turn
s
-.1 -.05 0 .05Rivals' abnormal returns
a. with outliers b. without outliers
Moreover, the commission also made type II errors by not imposing remedies in some of the
mergers that were anticompetitive. Out of the 87 anticompetitive mergers in our sample, the
commission imposed remedies only in 37 cases (among which 9 prohibitions), which means that
the incidence of type II errors is as high as 29.94% of all cases (57.47% of the anticompetitive
ones). 48 This was the first question we wanted to answer. Yet, before moving to the testing of the
previously developed hypotheses, we want to take a closer look at the data.
Figure 2 gives a graphical representation of the joint distribution of merging and rival firms’
abnormal returns around the announcement date. A quite strong concentration around the origin
(no abnormal returns for either group of firms) can be observed. However, the dispersion is also
evident and generates the variation that is a prerequisite for our empirical tests.
It is also interesting to look at the size of the abnormal returns in the different sub-samples and
test hypotheses about their sign. Table 6 reports the average abnormal returns and their standard
errors along with a one-tailed t-test whether these are positive or negative.
The 3-day average abnormal return for merging firms is around 5% in profitable mergers and
around -2.7% in non-profitable mergers (both figures significant at the 1% significance level). In
these two sub-samples, the rivals have a positive abnormal return of 0.5% (significant at the 5%
level) and a negative abnormal return of -0.03% (not statistically different form zero)
respectively.
In anticompetitive mergers rivals have a positive and significant return of 2.3% and merging
firms an average positive abnormal return of 1.76%. In the sub-sample of mergers where both
the merging and the rival firms’ abnormal returns are positive, the profitability effect for merging 48 Duso et al. (2003) provide evidence on the determinants of type I and type II errors.
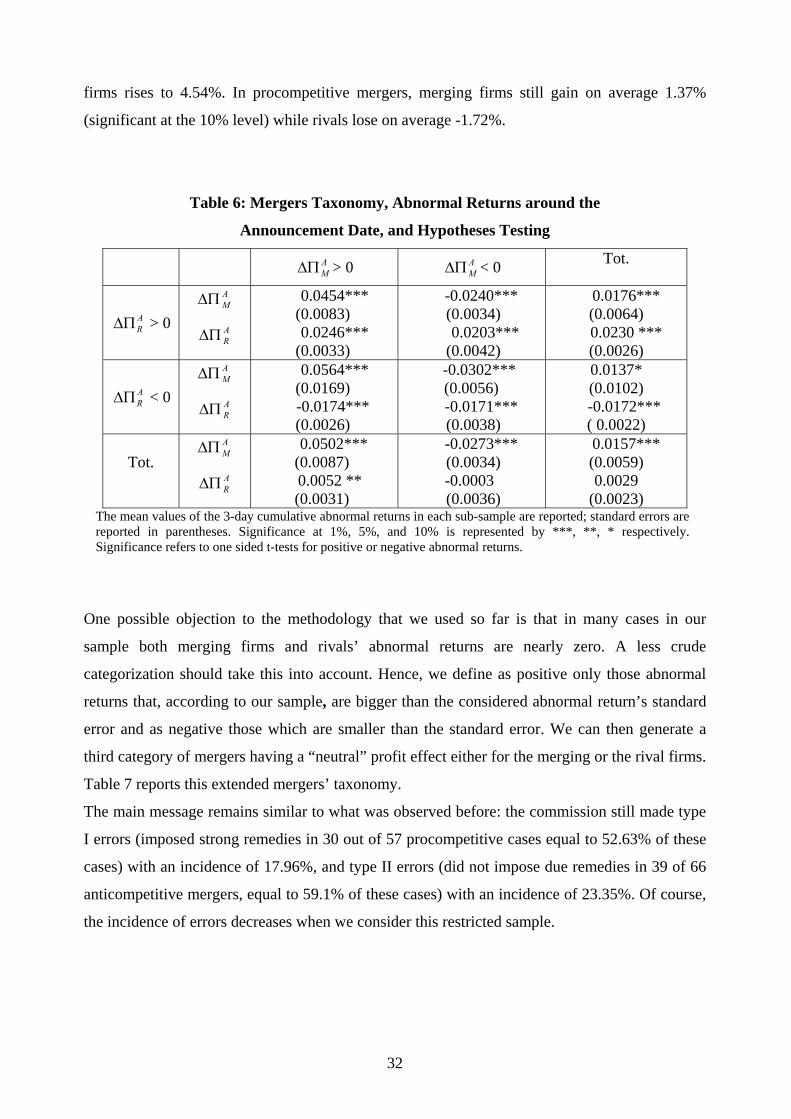
32
firms rises to 4.54%. In procompetitive mergers, merging firms still gain on average 1.37%
(significant at the 10% level) while rivals lose on average -1.72%.
Table 6: Mergers Taxonomy, Abnormal Returns around the
Announcement Date, and Hypotheses Testing
AMΔΠ > 0 A
MΔΠ < 0 Tot.
ARΔΠ > 0
AMΔΠ
ARΔΠ
0.0454*** (0.0083)
0.0246*** (0.0033)
-0.0240*** (0.0034)
0.0203*** (0.0042)
0.0176*** (0.0064)
0.0230 *** (0.0026)
ARΔΠ < 0
AMΔΠ
ARΔΠ
0.0564*** (0.0169)
-0.0174*** (0.0026)
-0.0302*** (0.0056)
-0.0171*** (0.0038)
0.0137* (0.0102)
-0.0172*** ( 0.0022)
Tot.
AMΔΠ
ARΔΠ
0.0502*** (0.0087)
0.0052 ** (0.0031)
-0.0273*** (0.0034) -0.0003
(0.0036)
0.0157*** (0.0059) 0.0029
(0.0023) The mean values of the 3-day cumulative abnormal returns in each sub-sample are reported; standard errors are reported in parentheses. Significance at 1%, 5%, and 10% is represented by ***, **, * respectively. Significance refers to one sided t-tests for positive or negative abnormal returns.
One possible objection to the methodology that we used so far is that in many cases in our
sample both merging firms and rivals’ abnormal returns are nearly zero. A less crude
categorization should take this into account. Hence, we define as positive only those abnormal
returns that, according to our sample, are bigger than the considered abnormal return’s standard
error and as negative those which are smaller than the standard error. We can then generate a
third category of mergers having a “neutral” profit effect either for the merging or the rival firms.
Table 7 reports this extended mergers’ taxonomy.
The main message remains similar to what was observed before: the commission still made type
I errors (imposed strong remedies in 30 out of 57 procompetitive cases equal to 52.63% of these
cases) with an incidence of 17.96%, and type II errors (did not impose due remedies in 39 of 66
anticompetitive mergers, equal to 59.1% of these cases) with an incidence of 23.35%. Of course,
the incidence of errors decreases when we consider this restricted sample.
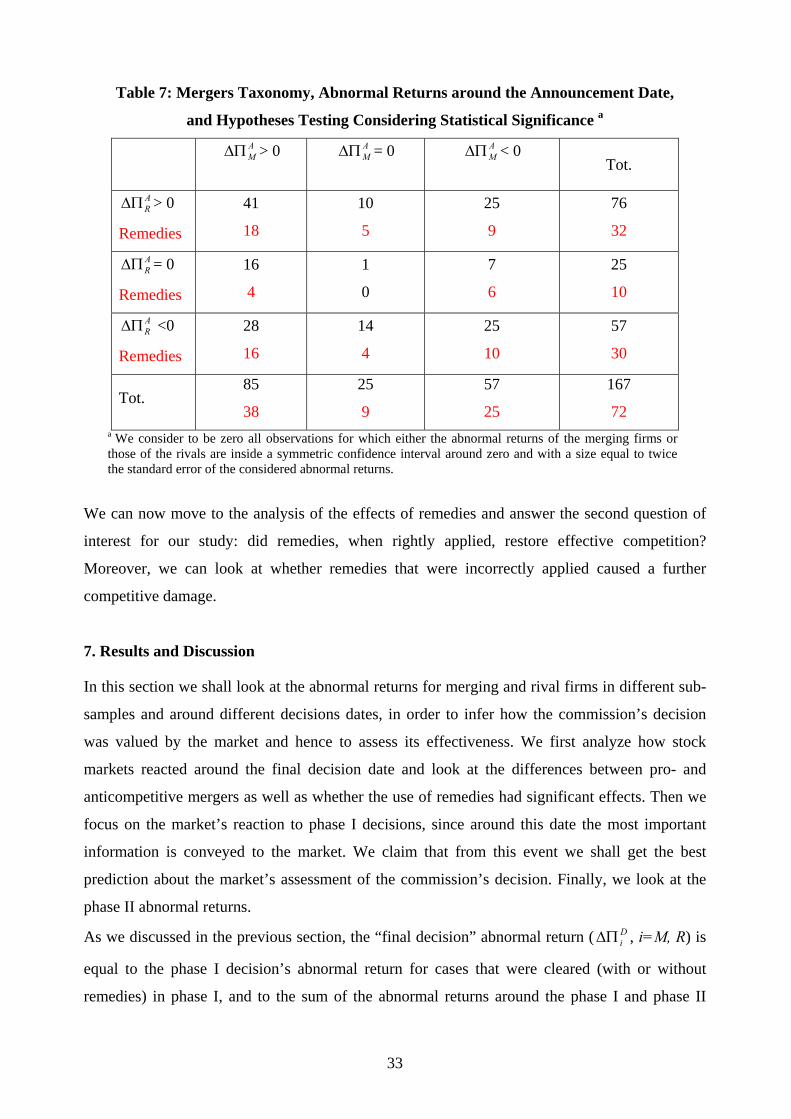
33
Table 7: Mergers Taxonomy, Abnormal Returns around the Announcement Date,
and Hypotheses Testing Considering Statistical Significance a
AMΔΠ > 0
AMΔΠ = 0
AMΔΠ < 0
Tot.
ARΔΠ > 0
Remedies
41
18
10
5
25
9
76
32
ARΔΠ = 0
Remedies
16
4
1
0
7
6
25
10
ARΔΠ <0
Remedies
28
16
14
4
25
10
57
30
Tot. 85
38
25
9
57
25
167
72 a We consider to be zero all observations for which either the abnormal returns of the merging firms or those of the rivals are inside a symmetric confidence interval around zero and with a size equal to twice the standard error of the considered abnormal returns.
We can now move to the analysis of the effects of remedies and answer the second question of
interest for our study: did remedies, when rightly applied, restore effective competition?
Moreover, we can look at whether remedies that were incorrectly applied caused a further
competitive damage.
7. Results and Discussion
In this section we shall look at the abnormal returns for merging and rival firms in different sub-
samples and around different decisions dates, in order to infer how the commission’s decision
was valued by the market and hence to assess its effectiveness. We first analyze how stock
markets reacted around the final decision date and look at the differences between pro- and
anticompetitive mergers as well as whether the use of remedies had significant effects. Then we
focus on the market’s reaction to phase I decisions, since around this date the most important
information is conveyed to the market. We claim that from this event we shall get the best
prediction about the market’s assessment of the commission’s decision. Finally, we look at the
phase II abnormal returns.
As we discussed in the previous section, the “final decision” abnormal return ( DiΔΠ , i=M, R) is
equal to the phase I decision’s abnormal return for cases that were cleared (with or without
remedies) in phase I, and to the sum of the abnormal returns around the phase I and phase II

34
decisions for those mergers, which went through a phase II investigation. Table 8 reports the
mean values and the standard errors of these measures in three different samples: the entire
sample, that of anticompetitive mergers, and the procompetitive mergers’ sample.49
The first striking result is that around the decision date all firms involved in the merger lost
value: our measures of abnormal returns are negative independently of the sub-sample as well as
of whether remedies were imposed or the case was cleared unconditionally.
The second compelling finding is that the market does not seem to significantly react to the
announcement of remedies (prohibitions) in any of the different kinds of mergers, since the
average final decision abnormal returns are never significantly different form zero neither for the
merging firms nor for the competitors when remedies have been imposed. Note however that
these are average effects for phase 1 and phase 2 decisions.
Table 8. Final Decision Abnormal Returns in Different Sub-samples and Remedies Effects
Entire sample Anticompetitive Procompetitive
Remedies No
Remedies Remedies
No
Remedies Remedies
No
Remedies
DMΔΠ
-0.0132
(0.0134)
-0.0046*
(0.0034)
-0.0198
(0.0239)
-0.0083*
(0.0052)
-0.0060
(0.0067)
-0.0009
(0.0042)
DRΔΠ
-0.0024
(0.0054)
-0.0087**
(0.0049)
-0.0037
(0.0068)
-0.0148*
(0.0091)
-0.0012
(0.0034)
-0.0024
(0.0034)
Obs 71 97 40 51 31 46 The “final decision date abnormal return” is defined as the abnormal return around the phase I decision date for cases cleared (with or without remedies) in phase I and as the sum of the abnormal returns around the phase I and phase II decision dates for the cases that went through the phase II procedure. Remedies also include prohibitions. The mean values of the 3-days cumulative abnormal returns in each sub-sample are reported; standard errors are reported in parentheses. Significance at 1%, 5%, and 10% is represented by ***, **, * respectively. Significance refers to one sided t-tests for negative abnormal returns. Anticompetitive are those mergers where the rivals’ profitability increased; procompetitive are those where it decreased.
On the other hand, the effects on merging firms’ profitability are on average economically more
relevant when remedies have been imposed, though this is not true for rivals. While merging
firms have more negative abnormal returns in anticompetitive mergers (-1.98%) than in
procompetitive ones (-0.83%) - which is consistent with the hypothesis of remedies reducing the
market power effect - exactly the opposite happens for the rivals’ abnormal returns. We test
whether average abnormal returns in cases with remedies are statistically different from those in 49 In this section we will define as anticompetitive all those mergers where rivals’ abnormal returns at the
announcement date were positive. This allows us to work with bigger samples.

35
mergers cleared without remedies. We cannot reject the null hypothesis of equal means.
Therefore, we conclude that, on average, remedies do not seem to have a significantly different
impact than unconditional clearance on merging firms’ and rivals’ profitability.
Interestingly, we observe more statistical significance looking at the cases where remedies have
not been applied. In particular, the average abnormal return around the decision date is negative
and significant in anticompetitive mergers (rivals gain) both for merging firms (-0.83%) and for
rivals (-1.48%). A similar result can be observed in the entire sample. Also in this case, the
reaction around the final decision date is negative both for merging firms and competitors when
no remedies were used, though only the rivals’ abnormal return is significantly different from
zero (-0.73%). This finding is quite puzzling. In order to more carefully interpret this finding,
however, one should consider that the remedies’ choice might be endogenous to the abnormal
returns around the decision date. Regression analysis, which accounts for this endogeneity
problem, could help to more cleanly measure the real effect of remedies.50
As we already stressed, the event that seems to trigger most of the market reactions is the phase I
decision. It is well known that merging firms are very unwilling to go through a phase II
investigation, since this is an extremely costly and risky process. Moreover, a commission’s
intervention in phase II is very likely, therefore the beginning of a phase II investigation should
have a significant impact on firms’ profitability.
Table 9 reports abnormal returns for merging and rival firms depending on the nature of the
phase I decision and looking at the entire sample and the sub-samples of anticompetitive and
procompetitive mergers. Figure 4 gives a graphical representation of these findings.
At the end of phase I, if the merger does not seem to be problematic in the sense that market
power concerns are low or nonexistent, the commission applies Art. 6.1b and clears the merger
unconditionally. In the entire sample, this event has a slightly negative but not statistically
significant impact on both merging firms and rivals. However, if we divide the sample into anti-
and pro-competitive mergers, we observe significantly different results. We find that the average
abnormal returns in case of anticompetitive mergers are significantly lower than in the case of
procompetitive mergers at the 5% significance level. Merging firms significantly lose almost 1%
in anticompetitive mergers and have almost zero abnormal returns (0.3% not significant) in
procompetitive mergers.
This result is quite surprising, since we would have expected the market to positively evaluate
the future profitability of merging firms for anticompetitive mergers that are approved without
50 See Duso et al. (2005) on this issue.
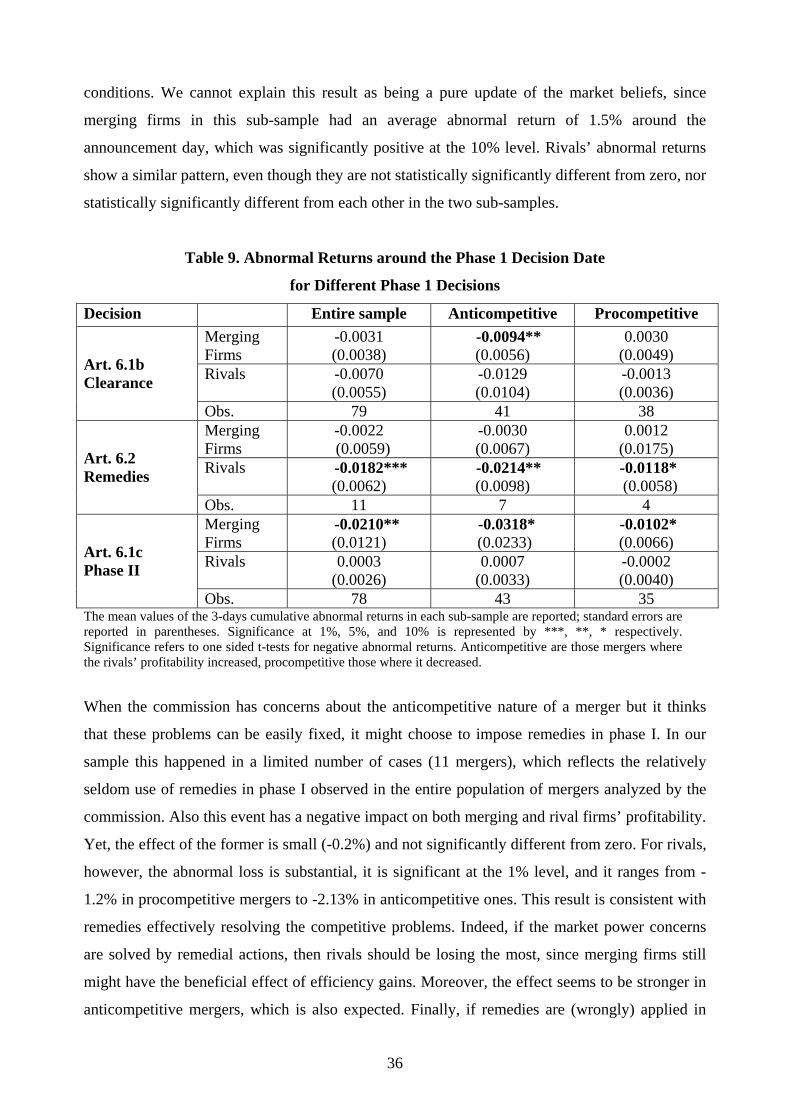
36
conditions. We cannot explain this result as being a pure update of the market beliefs, since
merging firms in this sub-sample had an average abnormal return of 1.5% around the
announcement day, which was significantly positive at the 10% level. Rivals’ abnormal returns
show a similar pattern, even though they are not statistically significantly different from zero, nor
statistically significantly different from each other in the two sub-samples.
Table 9. Abnormal Returns around the Phase 1 Decision Date
for Different Phase 1 Decisions
Decision Entire sample Anticompetitive Procompetitive Merging Firms
-0.0031 (0.0038)
-0.0094** (0.0056)
0.0030 (0.0049)
Rivals -0.0070 (0.0055)
-0.0129 (0.0104)
-0.0013 (0.0036)
Art. 6.1b Clearance
Obs. 79 41 38 Merging Firms
-0.0022 (0.0059)
-0.0030 (0.0067)
0.0012 (0.0175)
Rivals -0.0182*** (0.0062)
-0.0214** (0.0098)
-0.0118* (0.0058)
Art. 6.2 Remedies
Obs. 11 7 4 Merging Firms
-0.0210** (0.0121)
-0.0318* (0.0233)
-0.0102* (0.0066)
Rivals 0.0003 (0.0026)
0.0007 (0.0033)
-0.0002 (0.0040)
Art. 6.1c Phase II
Obs. 78 43 35 The mean values of the 3-days cumulative abnormal returns in each sub-sample are reported; standard errors are reported in parentheses. Significance at 1%, 5%, and 10% is represented by ***, **, * respectively. Significance refers to one sided t-tests for negative abnormal returns. Anticompetitive are those mergers where the rivals’ profitability increased, procompetitive those where it decreased.
When the commission has concerns about the anticompetitive nature of a merger but it thinks
that these problems can be easily fixed, it might choose to impose remedies in phase I. In our
sample this happened in a limited number of cases (11 mergers), which reflects the relatively
seldom use of remedies in phase I observed in the entire population of mergers analyzed by the
commission. Also this event has a negative impact on both merging and rival firms’ profitability.
Yet, the effect of the former is small (-0.2%) and not significantly different from zero. For rivals,
however, the abnormal loss is substantial, it is significant at the 1% level, and it ranges from -
1.2% in procompetitive mergers to -2.13% in anticompetitive ones. This result is consistent with
remedies effectively resolving the competitive problems. Indeed, if the market power concerns
are solved by remedial actions, then rivals should be losing the most, since merging firms still
might have the beneficial effect of efficiency gains. Moreover, the effect seems to be stronger in
anticompetitive mergers, which is also expected. Finally, if remedies are (wrongly) applied in

37
phase I in procompetitive mergers, they negatively impact rivals but not the merging firms: it’s
bad news for rivals and good news for merging parties, when an efficiency increasing merger
goes through even with remedies.
Figure 4: The Distribution of Merging Firms and Rivals’ Abnormal Returns around the
Phase I Decision Date for Different Decisions
-.02
0.0
2.0
4M
ergi
ng fi
rms'
abn
orm
al re
turn
s
-.1 -.05 0 .05 .1Rivals' abnormal returns
-.02
-.01
0.0
1.0
2.0
3M
ergi
ng fi
rms'
abn
orm
al re
turn
s
-.06 -.04 -.02 0 .02Rivals' abnormal returns
Art. 6.1b Art. 6.2
-.02
0.0
2.0
4.0
6M
ergi
ng fi
rms'
abn
orm
al re
turn
s
-.04 -.02 0 .02Rivals' abnormal returns
-.05
0.0
5M
ergi
ng fi
rms'
abn
orm
al re
turn
s
-.1 -.05 0 .05 .1Rivals' abnormal returns
Art. 8.1. Art. 8.2.
-.02
-.01
0.0
1.0
2M
ergi
ng fi
rms'
abn
orm
al re
turn
s
-.02 -.01 0 .01 .02Rivals' abnormal returns
Art. 8.3
38
When mergers raise serious competition concerns, the commission decides to open up a phase II
investigation. This is the event that triggered the largest, negative and strongly significant,
reaction for merging firms in our sample. On average the abnormal return is equal to -2.1%,
rising to -3.18% for those mergers that the market valued to be anticompetitive, and sinking to -
1.02% for the procompetitive ones. This is however not the case for competitors. Since the
variability is quite large, rivals face negligible average reactions when the commission
announces the opening of a phase II investigation. The abnormal returns are around 0.01% and
are not statistically significant different from zero.
From these last results, especially from the comparison between merging and rival firms’
different reactions around the phase I decision, we make our first inference of what the market
thought about remedies and about the occurrence of a phase II investigation.
First of all, it seems that the market values remedies to be successful in reducing the market
power effect in phase I. In fact, rivals’ profitability is reduced by the remedies but this is not true
for the merging firms. And this is even more evident in anticompetitive mergers where the
negative effect is almost double if compared to that in procompetitive mergers.51
Much more difficult to interpret are the results concerning the decision to open up a phase II
investigation. For merging firms, the market might react to two different kinds of news. The first
is related to the antitrust procedure. The market might value that the probability of remedies and,
in the worst case, of prohibitions is now extremely high. Since remedies hurt the merging parties,
the market reduces its predictions of the future value of these companies. The size of the
abnormal return should then represent the value of the remedies times the probability that they
will be imposed, given that the investigation is in the second phase.
The other kind of negative information that comes to the market at this point in time is that the
merging parties will be involved in a long and costly process: phase II. If this is the main
explanation, then the abnormal returns only represent the expected cost for the merging
companies and, eventually, the cost of the delay with which the merger will be consumed.
Information about the competitors’ reactions is particularly helpful in trying to identify which of
the two explanations better fits the data. Rivals do not have to pay the costs of the antitrust
procedure; therefore this explanation cannot be used to rationalize their abnormal returns.
However, their profitability is influenced by the phase II decision. The fact that the rivals’
abnormal returns are essentially equal to zero might suggest that the market does not think that
51 Note however that, given the limited size of the sample, the difference between the two values is not statistically
significant.
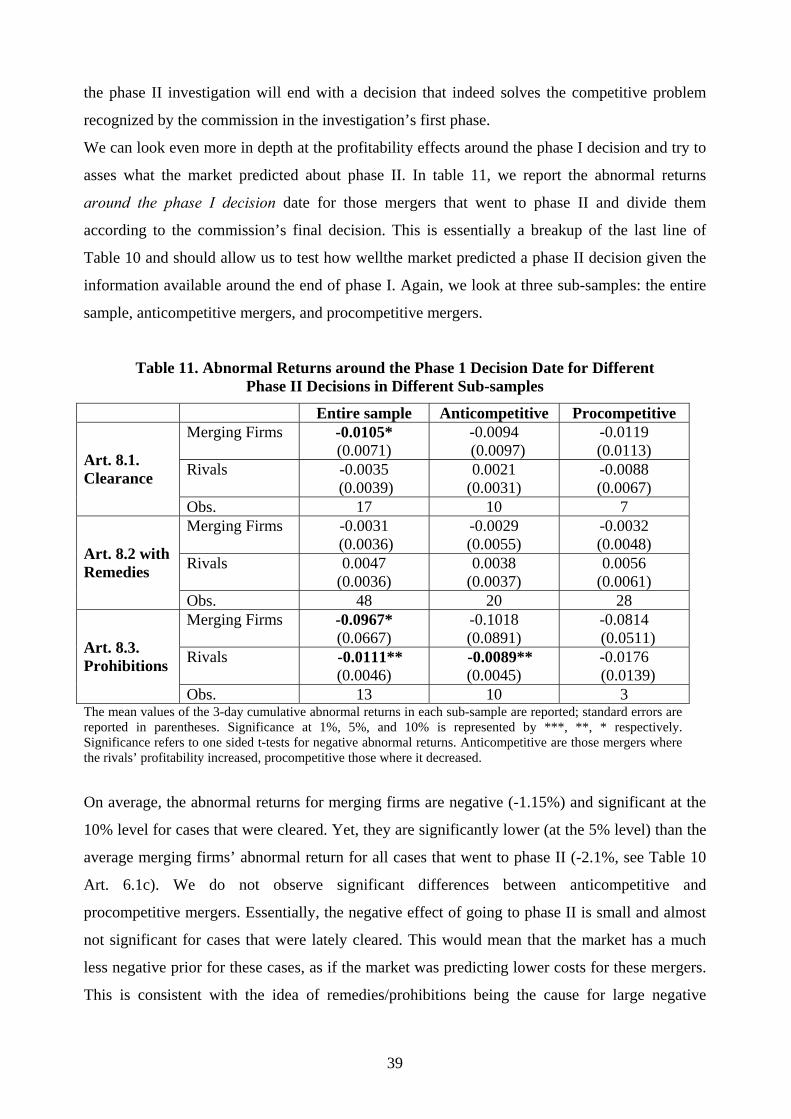
39
the phase II investigation will end with a decision that indeed solves the competitive problem
recognized by the commission in the investigation’s first phase.
We can look even more in depth at the profitability effects around the phase I decision and try to
asses what the market predicted about phase II. In table 11, we report the abnormal returns
around the phase I decision date for those mergers that went to phase II and divide them
according to the commission’s final decision. This is essentially a breakup of the last line of
Table 10 and should allow us to test how wellthe market predicted a phase II decision given the
information available around the end of phase I. Again, we look at three sub-samples: the entire
sample, anticompetitive mergers, and procompetitive mergers.
Table 11. Abnormal Returns around the Phase 1 Decision Date for Different Phase II Decisions in Different Sub-samples
Entire sample Anticompetitive Procompetitive Merging Firms -0.0105*
(0.0071) -0.0094
(0.0097) -0.0119 (0.0113)
Rivals -0.0035 (0.0039)
0.0021 (0.0031)
-0.0088 (0.0067)
Art. 8.1. Clearance
Obs. 17 10 7 Merging Firms -0.0031
(0.0036) -0.0029 (0.0055)
-0.0032 (0.0048)
Rivals 0.0047 (0.0036)
0.0038 (0.0037)
0.0056 (0.0061)
Art. 8.2 with Remedies
Obs. 48 20 28 Merging Firms -0.0967*
(0.0667) -0.1018 (0.0891)
-0.0814 (0.0511)
Rivals -0.0111** (0.0046)
-0.0089** (0.0045)
-0.0176 (0.0139)
Art. 8.3. Prohibitions
Obs. 13 10 3 The mean values of the 3-day cumulative abnormal returns in each sub-sample are reported; standard errors are reported in parentheses. Significance at 1%, 5%, and 10% is represented by ***, **, * respectively. Significance refers to one sided t-tests for negative abnormal returns. Anticompetitive are those mergers where the rivals’ profitability increased, procompetitive those where it decreased.
On average, the abnormal returns for merging firms are negative (-1.15%) and significant at the
10% level for cases that were cleared. Yet, they are significantly lower (at the 5% level) than the
average merging firms’ abnormal return for all cases that went to phase II (-2.1%, see Table 10
Art. 6.1c). We do not observe significant differences between anticompetitive and
procompetitive mergers. Essentially, the negative effect of going to phase II is small and almost
not significant for cases that were lately cleared. This would mean that the market has a much
less negative prior for these cases, as if the market was predicting lower costs for these mergers.
This is consistent with the idea of remedies/prohibitions being the cause for large negative

40
abnormal returns around the decision date. One can also read the negative abnormal returns in
these cases by measuring the (opportunity) cost of the phase II investigation, which is higher for
procompetitive mergers.
Rivals’ abnormal returns, which are on average very small in size (-0.35%), do not appear to be
significantly different from zero. The clearance of procompetitive mergers has, however, a larger
negative, even if insignificant, effect on rivals’ profitability: it is bad news for competitors that
an efficiency increasing merger went through without remedies. This finding is consistent with
our explanation as well.
A puzzling result is that the market does not have any significant prediction for those mergers
that were cleared with remedies in phase II. In this sub-sample, the abnormal returns of both
merging and rival firms are very small and not statistically significantly different from zero, as if
the market would not give a negative valuation to the forthcoming remedies.
One possible explanation is as follows. Some firms know that the commission will experience
political pressure not to block a merger in phase II, since they are "national champions" or firms
in strategic industries. Since firms are, nevertheless, reluctant to go through the lengthy phase II
investigation, they are willing to accept tougher remedies in phase I in order to avoid going into
phase II (because it is probably more costly than the imposed remedies). The commission on the
other hand might be willing to clear the case in phase I without a deeper investigation in order to
avoid a situation where they have less bargaining power. In circumstances in which this does not
happen and a phase II investigation is opened, the commission lost its threat because everybody
knows that the merger cannot be blocked and must, thus, accept conditions which are not very
severe.
Interestingly, the merging firms’ average abnormal return around the phase I decision in mergers
that were blocked by the commission in phase II is extremely negative and very significant.
These firms lose on average 9.67% of their value around the announcement that a phase II
investigation will start. The effect is even stronger for mergers valued to be anticompetitive,
where the abnormal return is -10.18%, though not significant given the small sample size and the
high standard error.52 This result suggests that the market was able to build a good prior about
prohibitions. Also rivals involved in mergers that were lately blocked significantly lose 1% of
their value around the phase I decision date. This is also in line with the interpretation that
prohibitions indeed solve the market power concerns, since otherwise there would not be any
reason for rivals to lose value when the merger was not allowed. 52 Note that the average abnormal return and its variability in case of a procompetitive merger are much lower than
in anticompetitive mergers.
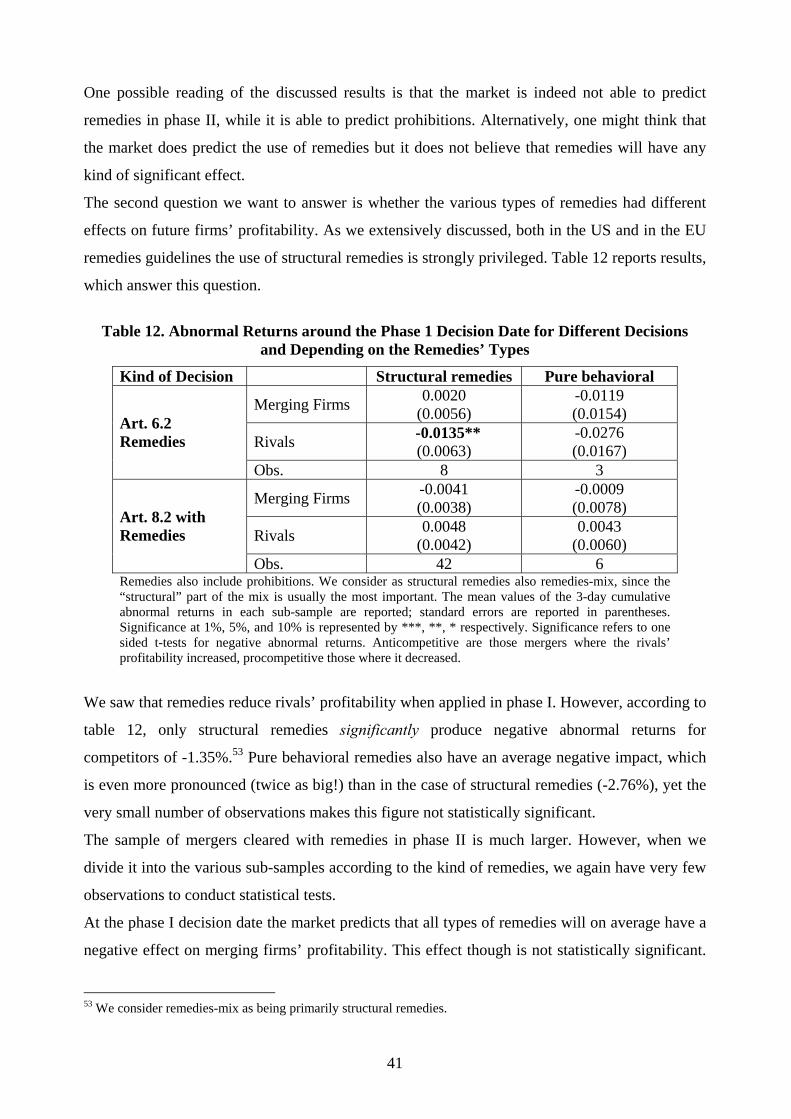
41
One possible reading of the discussed results is that the market is indeed not able to predict
remedies in phase II, while it is able to predict prohibitions. Alternatively, one might think that
the market does predict the use of remedies but it does not believe that remedies will have any
kind of significant effect.
The second question we want to answer is whether the various types of remedies had different
effects on future firms’ profitability. As we extensively discussed, both in the US and in the EU
remedies guidelines the use of structural remedies is strongly privileged. Table 12 reports results,
which answer this question.
Table 12. Abnormal Returns around the Phase 1 Decision Date for Different Decisions
and Depending on the Remedies’ Types
Kind of Decision Structural remedies Pure behavioral
Merging Firms 0.0020 (0.0056)
-0.0119 (0.0154)
Rivals -0.0135** (0.0063)
-0.0276 (0.0167)
Art. 6.2 Remedies
Obs. 8 3
Merging Firms -0.0041 (0.0038)
-0.0009 (0.0078)
Rivals 0.0048 (0.0042)
0.0043 (0.0060)
Art. 8.2 with Remedies
Obs. 42 6 Remedies also include prohibitions. We consider as structural remedies also remedies-mix, since the “structural” part of the mix is usually the most important. The mean values of the 3-day cumulative abnormal returns in each sub-sample are reported; standard errors are reported in parentheses. Significance at 1%, 5%, and 10% is represented by ***, **, * respectively. Significance refers to one sided t-tests for negative abnormal returns. Anticompetitive are those mergers where the rivals’ profitability increased, procompetitive those where it decreased.
We saw that remedies reduce rivals’ profitability when applied in phase I. However, according to
table 12, only structural remedies significantly produce negative abnormal returns for
competitors of -1.35%.53 Pure behavioral remedies also have an average negative impact, which
is even more pronounced (twice as big!) than in the case of structural remedies (-2.76%), yet the
very small number of observations makes this figure not statistically significant.
The sample of mergers cleared with remedies in phase II is much larger. However, when we
divide it into the various sub-samples according to the kind of remedies, we again have very few
observations to conduct statistical tests.
At the phase I decision date the market predicts that all types of remedies will on average have a
negative effect on merging firms’ profitability. This effect though is not statistically significant.
53 We consider remedies-mix as being primarily structural remedies.

42
For rivals, the effect of remedies is positive and around 0.4% independently of the different
remedies’ types and, also in this case, not statistically significantly different from zero. All
together these results seem to suggest that there are no significant differences between the
different types of remedies, even though they might strongly depend on the small sample size.
The final question we can answer is how the market reacts to phase II decisions. Table 12 reports
results for the abnormal return around this date. Again, we look at three sub-samples: the entire
sample, the sample of anticompetitive mergers, and the sample of procompetitive mergers. If it is
true that the market can build a good prior of the effect of the commission’s intervention, as it
seems to be according to the previous result, the market’s reaction around the final decision date
should only reflect the presence of “surprises” in the decision that could not be anticipated by the
market.
Table 12. Abnormal Returns around the Phase II Decision Date for Different Phase II
Decisions
Decision Entire sample Anticompetitive Procompetitive Merging Firms
0.0022 (0.0056)
0.0112 (0.0097)
-0.0068** (0.0037)
Rivals -0.0123 (0.0111)
-0.0182 (0.0180)
-0.0046 (0.0114)
Art. 8.1. Clearance
Obs. 17 10 7 Merging Firms
0.0047* (0.0033)
0.0104** (0.0051)
0.0006 (0.0042)
Rivals -0.0004 (0.0054)
-0.0034 (0.0062)
0.0017 (0.0082)
Art. 8.2. Remedies
Obs. 48 24 24 Merging Firms
0.0197** (0.0094)
0.0185* (0.0121)
0.0232* (0.0126)
Rivals -0.0067 (0.0078)
-0.0003 (0.0090)
-0.0261* (0.0109)
Art. 8.3 Prohibition
Obs. 13 9 4 The mean values of the 3-days cumulative abnormal returns in each sub-sample are reported; standard errors are reported in parentheses. Significance at 1%, 5%, and 10% is represented by ***, **, * respectively. Significance refers to one sided t-tests for negative abnormal returns. Anticompetitive are those mergers where the rivals’ profitability increased, procompetitive those where it decreased.
In the entire sample, each decision has a positive impact on merging firms’ profitability. That is,
the market probably expected even more severe measures and, on average, positively updates its
beliefs. Especially for mergers that were blocked, the abnormal return for merging firms is quite
substantial (1.97%) and largely significant. Remember, however, that the market reaction when a
phase II investigation was announced was a reduction of the stock prices by 10% on average for
merging firms. This result stays true in both the sub-samples of anticompetitive (1.85%) and
43
procompetitive mergers (2.32%). Also the announcement of remedies has a significant impact on
merging firms’ abnormal return, 0.47% in the entire sample, 1.04% in the sample of
anticompetitive mergers, but only 0.06% (and not significant) in the sample of procompetitive
mergers. Clearance has a positive but not significant impact on merging firms’ profitability in the
entire sample and when the market valued the deal to be anticompetitive. Instead, the effect is
negative and significant (-0.68%) in procompetitive mergers.
The effects for rivals are negligible, in the sense that they are not significantly different from
zero independently of the decision type and the kind of merger. There are however two
exceptions. When the merger was cleared without remedies, abnormal returns for rivals have
been on average substantial and negative (-1.23% in the entire sample, -1.82 for anticompetitive
mergers, and -0.68% in procompetitive mergers). Yet, given the low number of observations and
the high standard errors, these figures are not significant. A very strong and significant negative
reaction on competitors’ stock prices can be observed when the merger was blocked and the
market had valued this deal as being procompetitive.
Results for phase II decisions are very difficult to interpret since they do not fit our predictions.
We think that information leakage problems might play a crucial role during a phase II
investigation given its length. Therefore, the phase II abnormal returns might be a bad proxy for
the commission’s decision effect since they just reflect an update to reactions that we did not
observe and happened between the phase I and phase II decisions. In order to more cleanly
answer this question, one should look at the development patterns of abnormal returns during
this period of time and try to capture how much information was disclosed to the market before
the final decision.
8. Conclusions
Merger control is an important and widely discussed policy instrument. Its proponents claim that
it is necessary to maintain effective competition in markets subject to consolidations and at the
same time ensures that efficiencies produced by merger activity are not lost. Antagonists claim
that it is a costly process, subject to political capture, most likely used to reach other goals than
protecting consumers, and therefore essentially useless. Which of the two ideas is more plausible
is essentially an empirical question. Moreover, an ex-post policy evaluation might per se be
useful to improve the quality of the policy intervention based on the available evidence on its
effectiveness in the past.
This paper pursues several aims. First, we want to provide an extensive overview of the existing
literature on the effectiveness of remedial actions. Particularly, we appraise the literature on the
44
use of event studies that have quite extensively been applied in the past to assess antitrust
decisions. In doing so, we specifically tackle some issues related to the interpretation of such
methodology that diverges in different disciplines (finance vs. IO).
Second, we provide an international comparison of institutional arrangements and regulatory
approaches to deal with remedies in merger control. We conclude that there is a clear
convergence on some shared principles that guide competition authorities in the application of
remedies.
Finally, we present our own study based on an event study methodology of the European
commission’s decisions by examining a sample of 167 concentrations analyzed between 1990
and 2002. In particular, we aim at answering two interrelated questions: First, were remedies
correctly applied? Second, did remedies reach their goal of restoring competition and solve the
market power problem when applied?
Our empirical analysis reaches some first conclusions. We provide evidence that the commission
made some mistakes in its evaluation when contrasted to the market’s assessment of the merger
competitive effects. Not only did the commission unduly impose remedies in mergers that were
valued by the market to be procompetitive (type I errors), but also it unconditionally cleared
some mergers where the market recognized the existence of market power concerns (type II
errors).
We further look at stock price movements around the commission’s decision date in order to
infer how the market evaluated the commission’s decision. We observe that the market seems to
regard remedies as effective when adopted in phase I, since rivals mostly loose when remedies
are applied, especially in anticompetitive mergers. This corresponds to our expectations based on
a standard model of oligopolistic competition. Moreover, it seems that the market is able to
generate a good prior for some types of phase II decisions, when information about the opening
of an in depth investigation is provided. Particularly, the market predicts very clearly the
negative impact of prohibitions and the less severe impact of clearance without conditions and
obligations. Instead, the market seems not to be able to build a good prior about phase II
remedies. Our results suggest that the period between the phase I and phase II decisions deserves
special attention to assess the market’s evaluation of remedies in phase II, since it is difficult to
predict the outcome of the bargaining process between the authority and the merging parties.
Moreover, we suggest that one possible explanation for the apparently lower effectiveness of
remedies in phase II might be explained by the shift in bargaining power from the commission to
the firms when moving into phase II in cases where to prohibit a merger is politically difficult.

45
To understand the robustness of our approach, we discuss its several drawbacks and suggest
improvements and lines of further research. In particular, we tackle three essential issues. Most
fundamentally, we point out the implicit difficulty to evaluate the remedies’ effectiveness by
looking at the impact of the commission’s decisions on stock markets, since the policy choice
might be endogenous to the market outcome (see Duso and Röller, 2003). Regression analysis
might be a helpful development of the proposed methodology, since it allows for correcting this
endogeneity problem, testing causal relationships, and controls for the influence of other factors
(see Duso et al., 2005).
Second, the importance of information leakage during phase II investigation is highlighted by the
difficulties the market had to predict remedies. The findings about market reactions around the
phase II decision date seem to confirm this prediction. We propose to look at the long run
abnormal returns or, even better, at the evolution of stock prices during the in depth investigation
period in order to answer this question.
Finally, we suggest matching our sample with information about firms’ performance after the
merger based on balance sheet data as a robustness test of the adopted methodology. This would
allow us to create an alternative measure of the merger’s competitive effects.

46
Literature
Aktas, N., E. de Bodt and R. Roll, 2004a, “Market Response to European Regulation of Business
Combinations,” Journal of Financial and Quantitative Analysis, 39, 4, 731-757.
Aktas, N., E. de Bodt and R. Roll, 2004b, “European M&A Regulation is Protectionist,” mimeo.
Andrade, G., M. Mitchell and E. Stafford, 2001, “New Evidence and Perspectives on Mergers,”
Journal of Economic Perspectives, 15, 103-120.
Arai, K., 2004, “An Airline Merger in Japan: A Case Study Revealing Principles of Japanese
Merger Control,” Journal of Industry, Competition and Trade, 4, 3, 207-222.
Baer, W. J. and R. C. Redcay, 2003, “Solving Competition Problems in Merger Control: The
Requirements for an Effective Divestiture Remedy,” in F. Leveque and H. Shelanski,
Merger Remedies in American and European Union Competition Law, Edward Elgar
Publishing, MA: Northampton.
Baer, W. J., 1999, A Study of the Commission's Divestiture Process, FTC.
Banerjee, A. and E. W. Eckard, 1998, “Are Mega-mergers Anticompetitive? Evidence from the
First Great Merger Wave,” The Rand Journal of Economics, 29, 4, 803-827.
Bittlingmayer, G. and T. W. Hazlett, 2000, “DOS Kapital: Has Antitrust Action against
Microsoft Created Value in the Computer Industry?” Journal of Financial Economics,
55, 3, 329-359.
Brady, U. and R. Feinberg, 2000, “An examination of stock-price effects of EU merger control
policy,” International Journal of Industrial Organization, 18, 885-900.
Cabral, L. M. B., 2003, “Horizontal Mergers with Free-Entry: Why Cost Efficiencies May Be a
Weak Defense and Asset Sales a Poor Remedy,” International Journal of Industrial
Organization, 21, 607-623.
Campbell, A. Neiul, and Casey W. Halladay, 2002, “The Use of Behavioural Remedies in
Canadian Merger Law,” Paper delivered at the Canadian Bar Association Fall Conference
on Competition Law (Panel on Remedies in Competition Law: October 3rd and 4th,
2002).
Carstensen, Peter C., 1999, “Remedying the Microsoft Monopoly: Monopoly Law, the Rights of
Buyers, and the Enclosure Movement in Intellectual Property,” The Antitrust Bulletin,
Fall, 44, 3, 577-617.
47
Comanor, William S., 2001, The Problem of Remedy in Monopolization Cases: the Microsoft
Case as an Example, The Antitrust Bulletin, Spring: 46, 1, 115-133.
Competition Bureau Canada, 2003, Annual Report of the Commissioner of Competition.
Competition Bureau Canada, 2004, Annual Report of the Commissioner of Competition.
Duso, T. and L.-H. Röller, 2003, “Endogenous Deregulation: Evidence from OECD Countries,”
Economics Letters, 81, 1, 67-71.
Duso, T., D. Neven, and L.-H. Röller, 2003, “The Political Economy of European Merger
Control: Evidence Using Stock Market Data,” CEPR Discussion Paper DP3880.
Duso, T., K. Gugler, and B. Yurtoglu, 2005, “An Econometric Assessment of the EU Merger
Remedies: 1990-2002,” mimeo.
Eckbo, B. E. and P. Wier, 1985, “Antimerger Policy Under the Hart-Scott-Rodino Act: A Re-
examination of the Market Power Hypothesis,” The Journal of Law and Economics 28,
119-149.
Eckbo, B. E., 1983, “Horizontal Mergers, Collusion, and Stockholder Wealth,” Journal of
Financial Economics, 11, 241-273.
Eckbo, E. B., 1992, “Mergers and the Value of Antitrust Deterrence,” Journal of Finance, 47, 3,
1005-1029.
Ellert, James, 1976, “Mergers, Antitrust Law Enforcement and Stockholder Returns,” Journal of
Finance, 31, 2, 715-732.
Elzinga, K., 1969, “The Antimerger Law: Pyrrhic Victories?,” Journal of Law and Economics,
43, 52- .
Farell, J., 2003, “Negotiation and Merger Remedies: Some Problems,” in F. Leveque and H.
Shelanski, Merger Remedies in American and European Union Competition Law,
Edward Elgar Publishing, MA: Northampton.
Farrell, J. and C. Shapiro, 1990, “Horizontal Mergers: An Equilibrium Analysis,” American
Economic Review, March, 107-126.
Fee, E. C. and T. Shawn, 2004, “Sources of Gains in Horizontal Mergers: Evidence from
Customer, Supplier, and Rival Firms,” Journal of Financial Economics, 74, 423-460.
Fridolfsson, S. O. and J. Stennek, 2005, “Why Mergers Reduce Profits and Raise Share Prices,”
Journal of the European Economic Association, forthcoming.
48
Gugler, K., D.C. Mueller, B. B. Yurtoglu and C. Zulehner, 2003, “The Effects of Mergers: An
International Comparison,” International Journal of Industrial Organization, 21, 5, 625-
653.
Halverson, J. and K. Ewing, 2005, “Recent Developments in EU and US Merger Remedies,”
Competition Law.
Kim E. H. and V. Singal, 1993, “Mergers and Market Power: Evidence from the Airline
Industry,” American Economic Review, 83, 3, 549-69.
Lyons, Bruce, 2004, “Reform of European Merger Policy,” Review of International Economics,
12, 2, 246-261.
McAfee, R. P. and M. A. Williams, 1988, “Can Event Studies Detect Anticompetitive Mergers?”
Economics Letters, 28, 199-203.
McDavid, Janet and Logan Breed, 2005, “Merger Remedies,” The National Law Journal
(January 17, 2005).
McGuckin, R., F.R. Warren-Boulton, and P. Waldstein, 1992, “The Use of Stock Market Returns
in Antitrust Analysis of Mergers,” Review of Industrial Organization, 7, 1-11.
Molnar, J., 2003, “Preemptive Horizontal Mergers: Theory and Evidence,” mimeo, London.
Monti, M., 2003, “The Commission’s Notice on Merger Remedies,” in F. Leveque and H.
Shelanski, Merger Remedies in American and European Union Competition Law,
Edward Elgar Publishing, MA: Northampton.
Motta M., 2004, Competition Policy. Theory and Practice, Cambridge University Press.
Motta, M., M. Polo, and H. Vasconcelos, 2003, “Merger Remedies in the European Union: An
Overview,” in F. Leveque and H. Shelanski, Merger Remedies in American and
European Union Competition Law, Edward Elgar Publishing, MA: Northampton.
Mullin, L., J. Mullin, and W. Mullin, 1995, “The competitive effects of mergers: stock market
evidence from the U.S. Steel dissolution suit,” Rand Journal of Economics, 26, 314-330.
Neven, D. and L.-H. Röller, 2005, “Consumer Surplus vs. Welfare Standard in a Political
Economy Model of Merger Control,” International Journal of Industrial Organization,
forthcoming.
49
Neylan, S. C.D., 2002, “Quantification and Design of Merger Remedies under the Competition
Act,” Paper delivered at the Canadian Bar Association Fall Conference on Competition
Law (October 3 and 4, as part of the Panel on Remedies in Competition Law.
Organisation for Economic Co-operation and Development, 2004, “Merger Remedies,”
DAF/COMP(2004)21.
Parker, R.G. and D. A. Balto, 2000, “The Evolving Approach to Merger Remedies,” Antitrust
Report (Lexis Publishing), May, 2-28.
Pfunder, M.R., D.J. Plaine and A. M. Whittemore, 1972, “Compliance with Divestiture Orders
under Section 7 of the Clayton Act,” Antitrust Bulletin, 17, 1, 19-180.
Rogowsky, Robert A., 1986, “The Economic Effectiveness of Section 7 Relief,” Antitrust
Bulletin, Spring, 187-233.
Röller, L-H, J. Stennek, and F. Verboven, 2001, “Efficiency Gains from Mergers,” European
Economy, 5, 31-128.
Salant, S. W., S. Switzer and R. J. Reynolds, 1983, “Losses from Horizontal Merger: The Effects
of an Exogenous Change in Industry Structure on Cournot-Nash Equilibrium,” Quarterly
Journal of Economics, 98, 185-199.
Scholes, M., Williams, J., 1977, “Estimating Beta from Non-Synchronous Data,” Journal of
Financial Economics, 5, 309–327.
Schumann, L., 1993, “Patterns of Abnormal Returns and the Competitive Effects of Horizontal
Mergers,” Review of Industrial Organization, 8, 679-696.
Servaes, H. and A. Tamayo, 2005, “The Response of Industry Rivals to Control Threats,”
Working Paper: London Business School.
Simpson, H.D., 2001, “Did May Company’s Acquisition of Associated Dry Goods Corporation
Reduce Competition? An Event Study Analysis,” Review of Industrial Organization, 18,
351-362.
Singal V., 1996, “Airline Mergers and Competition: An Integration of Stock and Product Price
Effects,” Journal of Business, 69, 2, 233-68.
Slovin, M. B., M.E. Sushka, and C. D. Hudson, 1991, “Deregulation, Contestability, and Airline
Acquisitions,” Journal of Financial Economics, 30, 2, 231-251.

50
Song, M. H. and R.A. Walkling, 2000, “Abnormal Returns to Rivals of Acquisition Targets: A
Test of the ‘Acquisitions Probability’ Hypothesis,” Journal of Financial Economics, 55,
2, 143-171.
Stillman, R., 1983, “Examining Antitrust Policy Towards Horizontal Mergers,” Journal of
Financial Economics, 11, 225-240.