A Survey of Star-Forming Galaxies in the z=1.4-2.5 `Redshift Desert': Overview
Upload
khangminh22Category
view
2download
0
MNRAS 000, 1–15 (2020) Preprint 9 June 2021 Compiled using MNRAS LATEX style file v3.0
Pericentric passage-driven star formation in satellite galaxies andtheir hosts: CLUES from Local Group simulations
Arianna Di Cintio1,2?, Robert Mostoghiu 3, Alexander Knebe3,4,5 & Julio F. Navarro6
1Universidad de La Laguna. Avda. Astrofısico Fco. Sanchez, La Laguna, Tenerife, Spain2Instituto de Astrofısica de Canarias, Calle Via Lactea s/n, E-38206 La Laguna, Tenerife, Spain3Departamento de Fısica Teorica, Modulo 15, Facultad de Ciencias, Universidad Autonoma de Madrid, 28049 Madrid, Spain4Centro de Investigacion Avanzada en Fısica Fundamental (CIAFF), Facultad de Ciencias, Universidad Autonoma de Madrid, 28049 Madrid, Spain5International Centre for Radio Astronomy Research, University of Western Australia, 35 Stirling Highway, Crawley, Western Australia 6009, Australia6 Department of Physics and Astronomy, University of Victoria, Victoria, BC V8P 5C2, Canada
Accepted XXXX . Received XXXX; in original form XXXX
ABSTRACT
Local Group satellite galaxies show a wide diversity of star formation histories (SFHs)whose origin is yet to be fully understood. Using hydrodynamical simulations from the Con-strained Local UniversE project, we study the SFHs of satellites of Milky Way-like galaxies ina cosmological context: while in the majority of the cases the accretion onto their host galaxycauses the satellites to lose their gas, with a subsequent suppression in SF, in about 25% ofour sample we observe a clear enhancement of SF after infall. Peaks in SF clearly correlatewith the satellite pericentric passage around its host and, in one case, with a satellite-satelliteinteraction. We identify two key ingredients that result in enhanced SF after infall: galaxiesmust enter the host’s virial radius with a reservoir of cold gas Mgas,inf/Mvir,inf ∼> 10−2 andwith a minimum pericentric distance ∼>10 kpc (mean distance ∼50 kpc for the full sample),in order to form new stars due to compression of cold gas at pericentric passage. On the otherhand, satellites that infall with little gas or whose pericentric distance is too small, have theirgas ram-pressure stripped and subsequent SF quenched. The pericentric passage of satelliteslikewise correlates with SF peaks in their hosts, suggesting that this mechanism induces burstsof SF in satellites and central galaxies alike, in agreement with recent studies of our Galaxy’sSFH. Our findings can explain the recently reported multiple stellar populations observed indwarf galaxies such as Carina and Fornax, and should be taken into account in semi-analyticmodels of galaxy formation and satellite quenching.
Key words: galaxies: formation - star formation history - Local Group - dwarfs- Milky Way
1 INTRODUCTION
Studying dwarf galaxies and in particular understanding their starformation histories (SFHs) is crucial for our comprehension of theirformation and evolution within a cosmological context. The LocalGroup (LG) of galaxies is the ideal area in the Universe to per-form such study, given the vicinity of its dwarf galaxy populationto our own Milky Way (e.g. Mateo 1998, and references therein).Detailed SFHs can be obtained by means of accurately modelling
? Junior Leader Fellow ‘La Caixa’ Foundation, [email protected]
colour-magnitude diagrams in combination with the ability of re-solving individual stars, using the Hubble Space Telescope (HST)(e.g. Weisz et al. 2011, 2014; Skillman et al. 2017) and more re-cently thanks to the newly delivered Gaia DR2 data (e.g. Gallartet al. 2019; Fritz et al. 2020; McConnachie & Venn 2020). A largebody of observational work suggests that LG dwarfs have notablydiverse SFHs: understanding such variety and their origin is at thevery center of current observational and theoretical efforts (Dol-phin et al. 2005; Benıtez-Llambay et al. 2015; Gallart et al. 2015and references therein).
Several mechanisms can affect the star formation of dwarfgalaxies across cosmic times, amongst which we note the promi-nent role of reionization, which is expected to evaporate gas fromthe haloes of small galaxies (Shapiro et al. 1994), the interactionswith large-scale filaments of gas, the so-called ‘cosmic web strip-
c© 2020 The Authors

2 A. Di Cintio et al.
ping’ (Benıtez-Llambay et al. 2013), that is able to remove gas fromdwarfs, thus preventing further star formation, and the role of in-ternal stellar feedback, that expels the gas via energetic outflowepisodes (Governato et al. 2010).
In Benıtez-Llambay et al. (2015) the authors show that themain quantities that determine the SFH of isolated dwarf galaxiesare the halo mass of each galaxy at reionization time and their sub-sequent mass accretion history. The combination of these factorsleads to different star formation times that can be summarized ascontinuous, old, and old plus young SFHs. Galaxies that are alreadymassive at redshift z=6 are sufficiently large to retain their gas dur-ing reionization and continue to form stars, showing a decliningSFH with time as more gas is consumed. On the contrary, galaxieswith a total mass, including dark matter, of less than 108.5M atreionization, have all their gas photo-evaporated and can only formstars before z=6, ending up with a single, old stellar populations.
In addition to these mechanisms, we should consider thoseprocesses that are specific of dwarf satellite galaxies, such as rampressure stripping, as the satellites pass through the hot cloud ofgas around their host, leading to a truncation or reduction of theirstar formation, and tidal stripping and ‘stirring’, as an alternativeway of removing gas from dwarf galaxies and that leads to funda-mental changes in their configuration (Mayer et al. 2006). All ofthese physical processes can be at work simultaneously in satellitegalaxies of the LG, to give rise to the current variety of SFHs thatwe observe in dwarf spheroidals (dSphs) around our Galaxy, as in-dicated by deep photometric observations of Galactic satellites withHST (Weisz et al. 2014).
While all dSphs contain an ancient stellar population, whichin most cases is the dominant component (e.g., Sculptor, Draco,Ursa Minor), in other cases an intermediate age stellar componentis also present (e.g., Carina, Fornax, Leo I). The origin of such mul-tiple populations in dwarf galaxies such as Carina, Leo I or Fornaxremains an open question (Hurley-Keller et al. 1998; Gallart et al.1999; Monelli et al. 2003; Bono et al. 2010; Monelli et al. 2014;del Pino et al. 2013). In particular, the different age-metallicity re-lations derived for the two main SF peaks of the Carina dSphs, oc-curred at old and intermediate ages, clearly indicate that such starsformed from gas with different abundance patterns, which is incon-sistent with a simple evolution in isolation of this dwarf (de Boeret al. 2014; Hayashi et al. 2018).
Previous observational work has suggested that the close pas-sage of a satellite galaxy near its host could be connected with apeak in its SFH (e.g. Sohn et al. 2007; Pasetto et al. 2011; Rochaet al. 2012): such early findings have been recently supported by thework of Rusakov et al. (2021), who find a correspondence betweenthe main intermediate-age and young SFH events of Fornax dSphsand its pericentric passages around the Milky Way. Moreover, ithas been shown in novel work that the SFH of the host galaxy itselfcould be impacted by the pericentric passage of its satellites: threenarrow episodes of enhanced star formation have been derived forthe MW, whose timing coincide very well with the proposed Sagit-tarius dwarf galaxy pericentric passage (Ruiz-Lara et al. 2020).
Some early simulations hinted to a link between the surfacedensity profile of gas bound to the dwarfs, which steepens remark-ably at each pericenter passage because of tidal compression andtorques (Mayer et al. 2001). Other literature based on hydrodynam-ical cosmological simulations suggests that, for isolated galaxies,star formation can be reignited due to interactions with streams ofgas in the intergalactic medium (Wright et al. 2019) or by furtheraccretion of gas that may rekindle star formation even in galaxiesquenched by cosmic reionization (Rey et al. 2020), while dwarf-
dwarf mergers can offer a viable scenario for the formation ofgalaxies with multiple distinct populations (Benıtez-Llambay et al.2016).
More recently, Miyoshi & Chiba (2020) considered a time-varying gravitational potential for the MW, to calculate the orbitsof Galactic dSphs, guided with Gaia DR2 proper motions, andfound that the infall time of a satellite coincides well with the timewhen the star formation rate (SFR) peaked for classical dSphs. Fill-ingham et al. (2019) used DM only simulations to infer quench-ing timescales for low-mass satellites around the MW, showing arapid cessation of star formation following infall and quenchingtimescales that are shorter for those dSphs having high orbital ec-centricities; they further note that Carina and Fornax are on orbitswith relatively large pericenters of 60 and 58 kpc, respectively.Simpson et al. (2018) used Auriga simulations to show that rampressure stripping appears to be the dominant quenching mecha-nism for satellites, with 50% of quenched systems ceasing star for-mation within 1 Gyr of first infall; furthermore, they show a com-pression of gas within the satellite at pericentric passage, result-ing in a small enhancement in star formation. Hausammann et al.(2019), additionally, showed that while ram pressure is very effi-cient at stripping the hot and diffuse gas around dwarfs, the coldgas is more resilient to stripping and, under the right conditions,may be able to prolong star formation in satellites.
Genina et al. (2019) investigated the mechanisms that lead tothe formation of two spatially segregated metallicity populations inLocal Group dwarf galaxies: they found that if a satellite galaxy isable to retain some of its gas at infall, it is then the compression ofsuch gas, by ram pressure near pericentre, that triggers the forma-tion of new, metal-rich stars. Furthermore, the role of a satellite’sorbit in explaining the kinematical separation between metal poorand metal rich stars was explored in Sculptor and Carina dSphsin Sales et al. (2010). Finally, Applebaum et al. (2021) recentlyran ultra high-resolution simulations of ultra-faint dwarfs to showthat most of them are quenched prior to interactions with the MilkyWay, though some can retain their gas until infall.
Aside from simulations, semi-analytic models have histori-cally implemented schemes in which once a galaxy becomes asatellite it stops accreting gas, leading to its subsequent quench-ing (e.g. Starkenburg et al. 2013, and references therein). On topof that, tidal and ram-pressure stripping act on the already exist-ing gas, with only a few semi-analytic models accounting simulta-neously for ram-pressure stripping of cold gas as well as a grad-ual stripping of hot gas (Stevens & Brown 2017; Cora et al. 2018;Xie et al. 2020). Regardless of the specifics of each semi-analyticmodel, the so-far implemented processes tend to remove the fuelfor star formation in satellites, such that the modelled satellites areoften systematically gas-poor (Stevens & Brown 2017).
As such, there is mounting evidence that the orbital configu-ration as well as the gas availability at the moment of infall play afundamental role in shaping the evolution and star formation his-tory of satellite galaxies, such as the Local Group ones.
Motivated by previous observational and theoretical work, inparticular by the one of Miyoshi & Chiba (2020) and Rusakov et al.(2021), we investigated the origin of the diverse SFHs of satellitegalaxies within hydrodynamical cosmological simulations of theLocal Group from the CLUES project (Gottlober et al. 2010; Car-lesi et al. 2016). The advantage of these constrained simulationsis that they offer a unique opportunity to perform studies of LGsatellites, since they reproduce faithfully the LG environment.
The aim of our work is to understand the role of the environ-ment in shaping the SFHs of satellite galaxies, and in particular to
MNRAS 000, 1–15 (2020)

Enhanced SF in satellite galaxies 3
explore under what conditions a satellite’s infall into the main hostleads to either quenching or enhancing of its star formation.
This paper is organized as follows: in Section 2 we describethe hydrodynamical cosmological simulation of the Local Groupused for this study; in Section 3.1 we present our sample of satel-lite galaxies, compare them with a control sample of simulated iso-lated galaxies in Section 3.2 and quantify the role of infall in Sec-tion 3.3. We then proceed to discuss the main results of this work:we study in detail the differences between quenched and enhancedSFHs arising after infall in Section 4.1, in Section 4.2 we demon-strate that the necessary conditions to develop star formation in asatellite after infall depend on gas availability and pericentric dis-tances, and we show that this can influence the SFH of the hostgalaxy itself in Section 4.3. Finally, we compare our simulationswith recent literature data from the Gaia satellite in Section 4.4,before concluding in Section 5.
2 SIMULATIONS
In order to explore differences in star formation histories betweensatellite and isolated galaxies, we use one of the ConstrainedLocal Group Simulations from the CLUES project (Gottloberet al. 2010).1 The particular simulation used here is calledClues3 LGGas and has already been extensively analyzed else-where (e.g. Libeskind et al. 2010, 2011, 2013; Knebe et al. 2010,2011; Di Cintio et al. 2011, 2013); the halo catalogues and mergertrees are, further, publicly available.2 While all the physical andtechnical information can be found in the aforementioned papersand the database website, respectively, we include a brief summaryhere for completeness.
The CLUES simulations are performed with the treePM N-body + SPH code GADGET2 3 (Springel 2005), and their initialconditions are constrained such that the observed Local Volume, onscales smaller than≈5 h−1 Mpc, is reproduced. A zoom-in, higherresolution simulation is performed in a region of 2h−1 Mpc cen-tered on the Local Group (LG) with 40963 effective particles withinit. Within such region, it is possible to identify the three main galax-ies formally corresponding to the Milky Way (MW), Andromeda(M31) and Triangulum (M33) galaxies. The simulations assumea WMAP3 cosmology (Spergel et al. 2007), i.e. Ωm = 0.24,Ωb = 0.042, ΩΛ = 0.76 and h = 0.73, a normalization ofσ8 = 0.75 and a slope of the power spectrum of n = 0.95. Theparticle mass resolution is mDM = 2.1× 10⁵h−1M for the darkmatter particles,mgas = 4.4×10⁴h−1M for the gas particles andmstar = 2.2× 10⁴h−1M for the star particles. The gravitationalsoftening length is ε = 150h−1pc.
The Amiga-Halo-Finder AHF4 (Knollmann & Knebe 2009;Gill et al. 2004) has been used in combination with its bundledMERGERTREE code to identify and track in time all haloes andsubhaloes in the simulation. The (virial) mass of each halo is de-fined as the mass of a sphere containing ∆ = 94 times the criticalmatter density of the Universe ρcrit = 3H2/8πG at z=0, unless the
1 www.clues-project.org2 www.cosmosim.org3 We note that there are more recent, improved SPH formulations (e.g.Read et al. 2010; Hopkins 2013), but their advantages in simulations thatinclude star formation are not clear because of the importance of the subgridphysics modules that model star formation and feedback (e.g. Semboliniet al. 2016).4 http://popia.ft.uam.es/AHF
density profiles rises before, which might be the case for subhaloes(for which the radius is then the upturn point). In any case we willrefer to the (sub-)halo mass as Mvir and its radius as Rvir.
The feedback and star formation recipes are described inSpringel & Hernquist (2003). Essentially, the interstellar medium(ISM) is modelled as a two-phase medium composed of hot ambi-ent gas and cold gas clouds in pressure equilibrium. The thermo-dynamic properties of the gas are computed in the presence of auniform but evolving ultra-violet cosmic background switched onat z=6 (Haardt & Madau 1996). Cooling rates are calculated froma mixture of a primordial plasma composition and no metal depen-dent cooling is assumed. Star formation is treated stochastically, inorder to reproduce the Kennicutt-Schmidt law for spiral galaxies(Schmidt 1959; Kennicutt 1998). The first time a gas particle un-dergoes star formation, a star particle of half the gas particle’s massis created, reducing the gas particle mass appropriately. The secondepisode of star formation results in the gas particle converting all itsremaining mass into a star particle. Thus all star particles have thesame mass of mSTAR = 2.21 × 10⁴h−1M, while gas particleshave either their full original mass, or half their original mass.
3 ANALYSIS
3.1 Satellite Galaxy Sample
We select satellites belonging to one of the three main galaxies inthe simulated LG, namely the Milky Way, Andromeda or the Trian-gulum galaxy. All satellites used here are chosen to be more mas-sive than Mvir = 109M at infall time, and to contain at least100 star particles at redshift z=0: this selection criteria provides asample of 23 objects in total. The star formation histories are theninferred from the age histogram of the bound stars found withineach satellite galaxy at z=0.
In Fig. 1 the star formation histories of the 23 satellites in oursample are shown, together with their stellar, gas and halo mass atz=0 and satellite’s ID (unique identifier from the halo finder cata-logue5). SFHs are normalized to their peak value, and computed in50 linearly-spaced bins between 0 and 13.73 Gyrs, so that the bin-width is about 0.28 Gyrs. The first 12 objects are satellites of M31,the following seven are satellites of the MW and the last four aresatellites of M33. The vertical dashed red line in each panel indi-cates the time of first infall of each of these objects into their respec-tive host, defined as the time at which the satellite first crosses itshost’s virial radius. Some of the satellites may have ”backsplashed”(Balogh et al. 2000; Gill et al. 2005; Sales et al. 2007), and in thatcase the first infall is considered as the relevant one. Fig. 1 showsthe large variety of SFHs of our simulated satellites, not unlike whatis observed in the Local Group. A comparison of the cumulativeSFHs of our sample of simulated satellites together with observedsatellites of the Milky Way and Andromeda galaxy, from the Weiszet al. (2014) sample (their Fig.7), is offered in Fig. 2: the agreementbetween simulations, in grey, and observations, in red, provides fur-ther evidence that our simulation provides a realistic representationof the Local Group.
As in observations (e.g. Dolphin et al. 2005), we notice inFig. 1 that more massive galaxies show extended star formationhistories, while less massive systems formed most of their stars
5 In order to obtain the AHF − ID used in the www.cosmosim.orgdatabase one must add ‘snapnum = 496× 106 ’ to the ID given here.
MNRAS 000, 1–15 (2020)

4 A. Di Cintio et al.
0.0
0.5
1.0
SFR/
max
(SFR
)
Mhalo=9.38e+10Mstar=3.60e+09Mgas=6.96e+09M31,ID=16max(SFR)=5.4e-01
Mhalo=6.47e+09Mstar=6.11e+08Mgas=5.12e+06M31,ID=87max(SFR)=2.5e-01
Mhalo=3.21e+09Mstar=1.43e+08Mgas=0.00e+00M31,ID=194max(SFR)=4.2e-02
Mhalo=3.37e+09Mstar=4.46e+07Mgas=0.00e+00M31,ID=225max(SFR)=1.8e-02
Mhalo=2.73e+09Mstar=5.94e+07Mgas=3.30e+06M31,ID=249max(SFR)=1.7e-02
Mhalo=8.52e+08Mstar=2.50e+08Mgas=1.94e+06M31,ID=270max(SFR)=7.6e-02
0.0
0.5
1.0
SFR/
max
(SFR
)
Mhalo=3.58e+08Mstar=1.33e+08Mgas=0.00e+00M31,ID=505max(SFR)=2.5e-02
Mhalo=8.90e+08Mstar=4.63e+07Mgas=0.00e+00M31,ID=557max(SFR)=9.1e-03
Mhalo=1.10e+09Mstar=1.33e+07Mgas=0.00e+00M31,ID=594max(SFR)=1.2e-02
Mhalo=8.07e+08Mstar=4.94e+06Mgas=0.00e+00M31,ID=795max(SFR)=3.1e-03
Mhalo=5.59e+08Mstar=3.55e+06Mgas=0.00e+00M31,ID=1055max(SFR)=5.0e-03
Mhalo=3.63e+08Mstar=1.52e+07Mgas=0.00e+00M31,ID=1226max(SFR)=5.4e-03
0.0
0.5
1.0
SFR/
max
(SFR
)
Mhalo=7.42e+09Mstar=3.87e+08Mgas=1.22e+08MW,ID=91max(SFR)=1.4e-01
Mhalo=3.24e+09Mstar=2.88e+08Mgas=6.67e+05MW,ID=163max(SFR)=7.5e-02
Mhalo=1.72e+09Mstar=3.16e+08Mgas=1.82e+05MW,ID=195max(SFR)=1.1e-01
Mhalo=3.32e+09Mstar=7.04e+07Mgas=0.00e+00MW,ID=220max(SFR)=2.8e-02
Mhalo=2.56e+09Mstar=4.06e+06Mgas=0.00e+00MW,ID=310max(SFR)=6.8e-03
0 4 8 12Time [Gyrs]
Mhalo=5.03e+08Mstar=1.73e+08Mgas=4.88e+06MW,ID=387max(SFR)=5.2e-02
0 4 8 12Time [Gyrs]
0.0
0.5
1.0
SFR/
max
(SFR
)
Mhalo=4.94e+08Mstar=1.24e+08Mgas=2.12e+05MW,ID=485max(SFR)=3.9e-02
0 4 8 12Time [Gyrs]
Mhalo=5.45e+10Mstar=4.39e+09Mgas=3.80e+09M33,ID=17max(SFR)=1.3e+00
0 4 8 12Time [Gyrs]
Mhalo=2.17e+09Mstar=1.26e+08Mgas=2.94e+06M33,ID=248max(SFR)=3.8e-02
0 4 8 12Time [Gyrs]
Mhalo=5.11e+08Mstar=3.19e+07Mgas=6.06e+04M33,ID=844max(SFR)=1.4e-02
0 4 8 12Time [Gyrs]
Mhalo=6.53e+07Mstar=4.94e+06Mgas=0.00e+00M33,ID=4604max(SFR)=2.4e-03
Figure 1. The star formation histories of satellite galaxies of M31, MW and M33, whose infall mass is larger than 109 M and with at least 100 stellarparticles at z=0. The (first) infall time is indicated as a red dashed line. The z=0 total mass of dark matter, gas and stars is shown for each satellite (measuredin M), together with the satellites’ IDs. SFHs are normalized to their maximum value, indicated in units of M /yr. A large diversity in SFH shapes is seen,just like what found in the observed Local Group (e.g. Dolphin et al. 2005; Gallart et al. 2015, and references therein).
in the first 2-3 Gyrs. A sign of the combined effect of reioniza-tion and infall quenching was found already in Rocha et al. (2012)and Benıtez-Llambay et al. (2015): while classical dwarfs appearto be suppressed after infall, ultra-faint dwarfs tend to quench, forthe most part, long before infall. While we do not have the resolu-tion to study ultra-faint dwarfs, the trend between more extendedSFHs and increasing galaxy mass is reproduced in our simula-tions: the least massive satellites only form stars in the first fewGyrs of their evolution, and by the time of their first infall, theirSF has already been suppressed (see for example satellite ID=1055or ID=310, with Mstar∼ 106 M), while more luminous satelliteswhose SF is shut down, show a sign of infall quenching (see forinstance ID=387 or 270, with Mstar∼ 108 M). There is, how-ever, an interesting finding that emerges from this figure: severalsatellite galaxies keep forming a considerable amount of stars afterinfall, some of them showing clear peaks of SF just after infall (seegalaxy ID=16 or 17).
As such, Fig. 1 already shows one of the main conclusions ofthis study: galaxies do not necessarily shut-down their star forma-tion once becoming satellites. We investigate and quantify this inmore detail in what follows.
3.2 Comparison to Isolated Galaxies
We proceed next to derive the star formation histories of isolatedgalaxies in the simulated Local Group volume, i.e. of haloes con-taining at least 100 stellar particles and with Mvir>3 × 10⁸Mat redshift 0. This is a mass-selection criterion similar to thatused for satellite galaxies, and takes into account that satelliteswill lose some of their mass since infall: it yields a sample of83 objects. Before carrying on with our study, we remind thereader that the simulated isolated galaxies used here have alreadybeen extensively studied and analyzed in (Benıtez-Llambay et al.2015) who, in particular, showed that the SFHs of these objectsresemble in many respects those of observed Local Group iso-lated galaxies (their Fig. 4,5 and discussion in Sec.3). We illus-trate this in Fig. 3, where we show some examples of the SFHsobtained in our simulations, in several bins of mass. From top tobottom, we show the cumulative star formation of selected iso-lated galaxies with 106<Mstar/M<107, 107<Mstar/M<108
and 108<Mstar/M<109: the left column represents a typical caseof galaxies with intermediate and recent star formation, similar towhat is observed in isolated dwarf irregulars, while in the rightcolum more ancient SF are observed, resembling the SF of dwarfspheroidals. We are reassured, therefore, that we have a variety ofSF shapes resembling Local Group observations of nearby dwarfs.
MNRAS 000, 1–15 (2020)

Enhanced SF in satellite galaxies 5
0 4 8 12Time [Gyrs]
0.0
0.5
1.0
Cumu
lative
SF
LG SatellitesSIMOBS
Figure 2. The cumulative SFH of our simulated satellite galaxies, in grey,and observed Local Group confirmed satellites, in red, including classicaldSphs and dE from the Weisz et al. (2014) sample (their Fig.7). Simulatedand observed satellites show similarities in their diversity of SFHs: in bothgroups we find examples of very old as well as intermediate-to-young stellarpopulations, making CLUES an ideal testbed to investigate star formationin satellite galaxies.
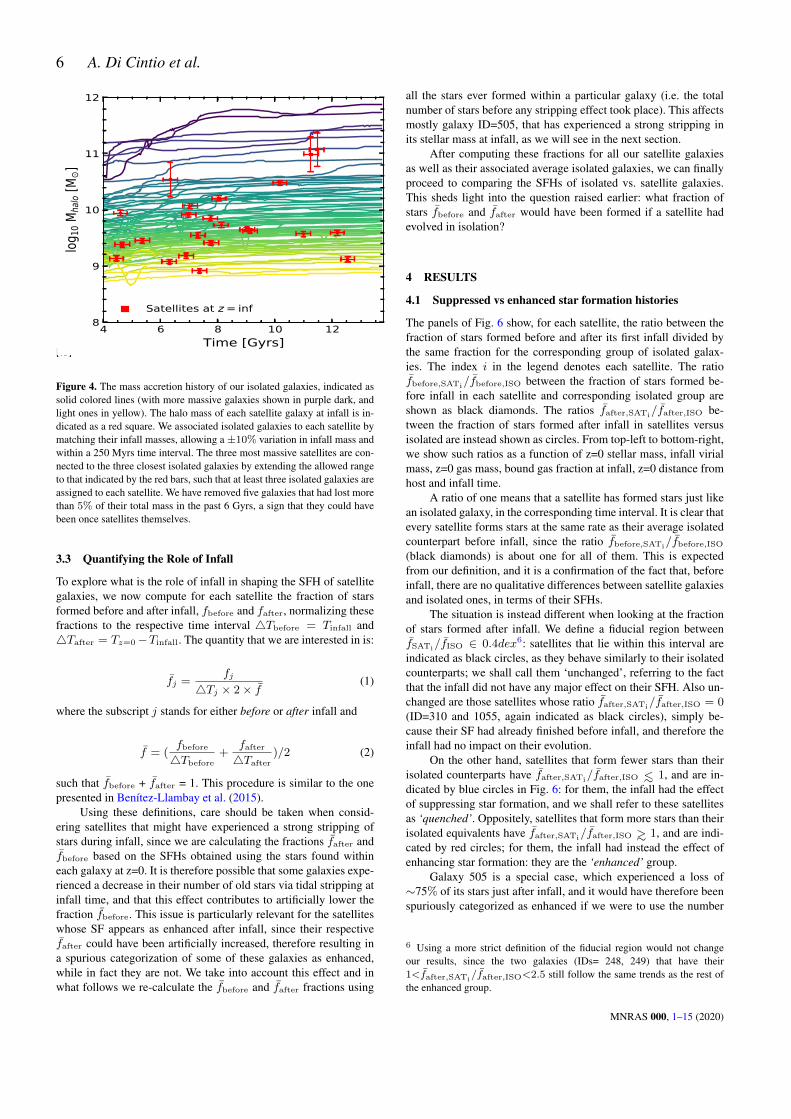
The question that we would like to address is what is the SFH thata satellite would have had, had it evolved in isolation rather thanbecoming a satellite? In order to faithfully compare the star for-mation history of satellite and isolated galaxies, we have to definea way to match the two samples. Associating satellites and centralgalaxies based on their mass at z=0 is not a good criterion, sincesatellites undergo substantial mass loss due to tidal stripping. Forsimilar reasons, using the stellar mass at z=0 is not an option, as thefinal stellar mass in satellite galaxies will be the result of the com-plex interplay between star formation and infall, which is exactlythe target of our study. A more reasonable and consistent approachis to assign isolated galaxies to satellites based upon the satellites’mass at the time of infall. In Fig. 4 we show as solid lines the evo-lution of the halo mass as a function of time for all the isolatedgalaxies of our sample, with the colour code scheme correspondingto progressively more massive galaxies as we move from yellow todark purple. By inspecting the mass accretion histoy of these iso-lated galaxies, we noted that some of them had lost a considerableamount of mass in the last few Gyrs, a sign of the fact that theymight have been not truly isolated objects in the past. We there-fore applied a further cut and removed all galaxies that had lostmore than 5% of their total mass in the last 6 Gyrs: this affectsfive objects in total, that were removed from all subsequent analy-sis. Superimposed in the same figure are the halo masses for the 23satellite galaxies at infall time, each of them indicated as a red box.To a given satellite galaxy we then associate those isolated galaxieswhose mass accretion history passes through the satellite’s infallmass value, allowing for a±10% variation in infall mass and usinga 250 Myrs wide time interval: the empty red squares around eachsatellite’s infall mass are indicative of this range. For satellites withhalo infall mass between 109 and 1010M, this method results inas many as 13 isolated galaxies assigned to each satellite. The threemost massive satellites, however, only have one isolated galaxypassing through their infall mass box, and in this case we extend themass range (indicated as red bars in Figure 4) so that at least threeisolated galaxies are assigned to each of these satellites. Once thisassignment has been made, we derive the average star formation
0.00
0.25
0.50
0.75
1.00
Cum
ulativ
e SF
9.61e+06
Mstar [106 107)
9.58e+06
0.00
0.25
0.50
0.75
1.00
Cum
ulativ
e SF
7.25e+07
Mstar [107 108)
1.04e+07
0 4 8 12Time [Gyrs]
0.00
0.25
0.50
0.75
1.00
Cum
ulativ
e SF
5.03e+08
Mstar [108 109)
0 4 8 12Time [Gyrs]
5.58e+08
Figure 3. The cumulative SFH of some example isolated galaxies in oursimulations: from top to bottom, we showed increasing bins in stellar mass.Galaxies in the left panel represent objects with a intermediate and youngSF, similar to dwarf irregulars, while in the right column we can see moreancient SFHs, just like what is observed in Local Group’s dwarf spheroidals
.
history of each group of associated isolated galaxies. We show thisin Fig. 5, where each panel shows the average SFHs over the totalnumber Niso of isolated galaxies associated with a certain satellite,ordered in the same way as in Fig. 1. We note that there is a pre-dominance of old stellar populations in isolated simulated galax-ies compared to observations, perhaps as a result of the relativelymild feedback adopted, as already noted in (Benıtez-Llambay et al.2015). Other theoretical studies based on sets of hydrodynamicalLG simulations found similar results: in Garrison-Kimmel et al.(2019) they observed that central dwarf galaxies evolving in LGenvironments tend to have their SFHs relatively similar to theirsatellite counterparts, meaning that they contain older stars thancentral galaxies around isolated MW-like galaxies. Therefore, theprevalence of galaxies with old stellar populations in our isolatedsample can be seen as a hint that the galaxy pair MW-M31 mightbe able to regulate star formation in dwarf galaxies even beyondtheir virial radii, as suggested in Garrison-Kimmel et al. (2019).This represents an interesting avenue for future theoretical inves-tigations. For the time being, we remark that this finding does notinvalidate our results, since we are going to derive relative quan-tities, that is, fraction of stars in isolated compared to simulatedsatellites, with feedback acting similarly in both groups.
MNRAS 000, 1–15 (2020)
6 A. Di Cintio et al.
[!b]
4 6 8 10 12Time [Gyrs]
8
9
10
11
12
log10
Mha
lo [M
]
Satellites at z = inf
Figure 4. The mass accretion history of our isolated galaxies, indicated assolid colored lines (with more massive galaxies shown in purple dark, andlight ones in yellow). The halo mass of each satellite galaxy at infall is in-dicated as a red square. We associated isolated galaxies to each satellite bymatching their infall masses, allowing a±10% variation in infall mass andwithin a 250 Myrs time interval. The three most massive satellites are con-nected to the three closest isolated galaxies by extending the allowed rangeto that indicated by the red bars, such that at least three isolated galaxies areassigned to each satellite. We have removed five galaxies that had lost morethan 5% of their total mass in the past 6 Gyrs, a sign that they could havebeen once satellites themselves.
3.3 Quantifying the Role of Infall
To explore what is the role of infall in shaping the SFH of satellitegalaxies, we now compute for each satellite the fraction of starsformed before and after infall, fbefore and fafter, normalizing thesefractions to the respective time interval 4Tbefore = Tinfall and4Tafter = Tz=0−Tinfall. The quantity that we are interested in is:
fj =fj
4Tj × 2× f(1)
where the subscript j stands for either before or after infall and
f = (fbefore
4Tbefore+
fafter
4Tafter)/2 (2)
such that fbefore + fafter = 1. This procedure is similar to the onepresented in Benıtez-Llambay et al. (2015).
Using these definitions, care should be taken when consid-ering satellites that might have experienced a strong stripping ofstars during infall, since we are calculating the fractions fafter andfbefore based on the SFHs obtained using the stars found withineach galaxy at z=0. It is therefore possible that some galaxies expe-rienced a decrease in their number of old stars via tidal stripping atinfall time, and that this effect contributes to artificially lower thefraction fbefore. This issue is particularly relevant for the satelliteswhose SF appears as enhanced after infall, since their respectivefafter could have been artificially increased, therefore resulting ina spurious categorization of some of these galaxies as enhanced,while in fact they are not. We take into account this effect and inwhat follows we re-calculate the fbefore and fafter fractions using
all the stars ever formed within a particular galaxy (i.e. the totalnumber of stars before any stripping effect took place). This affectsmostly galaxy ID=505, that has experienced a strong stripping inits stellar mass at infall, as we will see in the next section.
After computing these fractions for all our satellite galaxiesas well as their associated average isolated galaxies, we can finallyproceed to comparing the SFHs of isolated vs. satellite galaxies.This sheds light into the question raised earlier: what fraction ofstars fbefore and fafter would have been formed if a satellite hadevolved in isolation?
4 RESULTS
4.1 Suppressed vs enhanced star formation histories
The panels of Fig. 6 show, for each satellite, the ratio between thefraction of stars formed before and after its first infall divided bythe same fraction for the corresponding group of isolated galax-ies. The index i in the legend denotes each satellite. The ratiofbefore,SATi/fbefore,ISO between the fraction of stars formed be-fore infall in each satellite and corresponding isolated group areshown as black diamonds. The ratios fafter,SATi/fafter,ISO be-tween the fraction of stars formed after infall in satellites versusisolated are instead shown as circles. From top-left to bottom-right,we show such ratios as a function of z=0 stellar mass, infall virialmass, z=0 gas mass, bound gas fraction at infall, z=0 distance fromhost and infall time.
A ratio of one means that a satellite has formed stars just likean isolated galaxy, in the corresponding time interval. It is clear thatevery satellite forms stars at the same rate as their average isolatedcounterpart before infall, since the ratio fbefore,SATi/fbefore,ISO
(black diamonds) is about one for all of them. This is expectedfrom our definition, and it is a confirmation of the fact that, beforeinfall, there are no qualitative differences between satellite galaxiesand isolated ones, in terms of their SFHs.
The situation is instead different when looking at the fractionof stars formed after infall. We define a fiducial region betweenfSATi/fISO ∈ 0.4dex6: satellites that lie within this interval areindicated as black circles, as they behave similarly to their isolatedcounterparts; we shall call them ‘unchanged’, referring to the factthat the infall did not have any major effect on their SFH. Also un-changed are those satellites whose ratio fafter,SATi/fafter,ISO = 0(ID=310 and 1055, again indicated as black circles), simply be-cause their SF had already finished before infall, and therefore theinfall had no impact on their evolution.
On the other hand, satellites that form fewer stars than theirisolated counterparts have fafter,SATi/fafter,ISO ∼< 1, and are in-dicated by blue circles in Fig. 6: for them, the infall had the effectof suppressing star formation, and we shall refer to these satellitesas ‘quenched’. Oppositely, satellites that form more stars than theirisolated equivalents have fafter,SATi/fafter,ISO ∼> 1, and are indi-cated by red circles; for them, the infall had instead the effect ofenhancing star formation: they are the ‘enhanced’ group.
Galaxy 505 is a special case, which experienced a loss of∼75% of its stars just after infall, and it would have therefore beenspuriously categorized as enhanced if we were to use the number
6 Using a more strict definition of the fiducial region would not changeour results, since the two galaxies (IDs= 248, 249) that have their1<fafter,SATi
/fafter,ISO<2.5 still follow the same trends as the rest ofthe enhanced group.
MNRAS 000, 1–15 (2020)
Enhanced SF in satellite galaxies 7
0.0
0.5
1.0
SFR/
max
(SFR
)
Niso=3max(SFR)=1.4e+00
Niso=4max(SFR)=1.6e-01
Niso=7max(SFR)=2.3e-02
Niso=8max(SFR)=1.4e-02
Niso=6max(SFR)=1.7e-02
Niso=3max(SFR)=5.3e-03
0.0
0.5
1.0
SFR/
max
(SFR
)
Niso=4max(SFR)=4.2e-01
Niso=6max(SFR)=3.5e-02
Niso=9max(SFR)=1.0e-02
Niso=4max(SFR)=5.4e-03
Niso=5max(SFR)=5.9e-03
Niso=2max(SFR)=7.2e-03
0.0
0.5
1.0
SFR/
max
(SFR
)
Niso=8max(SFR)=1.0e-01
Niso=6max(SFR)=6.5e-02
Niso=10max(SFR)=1.3e-02
Niso=11max(SFR)=1.3e-02
Niso=9max(SFR)=1.3e-02
0 4 8 12Time [Gyrs]
Niso=3max(SFR)=1.0e-01
0 4 8 12Time [Gyrs]
0.0
0.5
1.0
SFR/
max
(SFR
)
Niso=11max(SFR)=8.4e-03
0 4 8 12Time [Gyrs]
Niso=3max(SFR)=1.4e+00
0 4 8 12Time [Gyrs]
Niso=10max(SFR)=1.3e-02
0 4 8 12Time [Gyrs]
Niso=11max(SFR)=1.7e-02
0 4 8 12Time [Gyrs]
Niso=11max(SFR)=1.1e-02
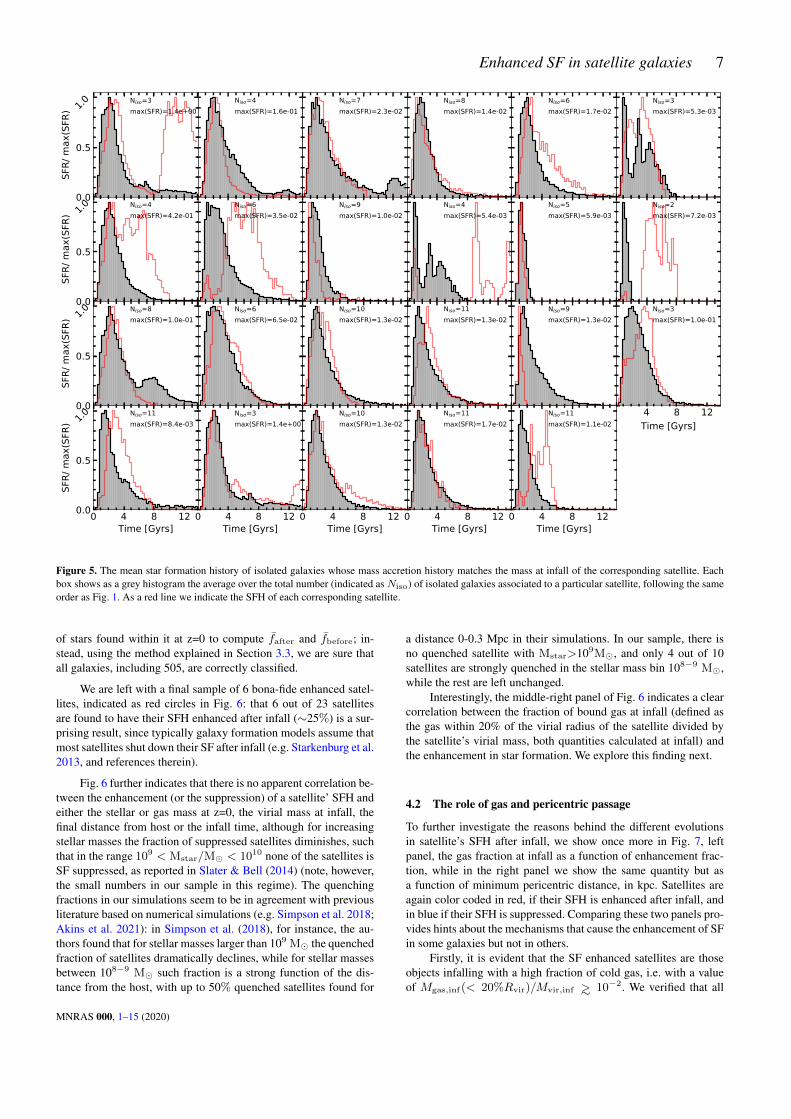
Figure 5. The mean star formation history of isolated galaxies whose mass accretion history matches the mass at infall of the corresponding satellite. Eachbox shows as a grey histogram the average over the total number (indicated as Niso) of isolated galaxies associated to a particular satellite, following the sameorder as Fig. 1. As a red line we indicate the SFH of each corresponding satellite.
of stars found within it at z=0 to compute fafter and fbefore; in-stead, using the method explained in Section 3.3, we are sure thatall galaxies, including 505, are correctly classified.
We are left with a final sample of 6 bona-fide enhanced satel-lites, indicated as red circles in Fig. 6: that 6 out of 23 satellitesare found to have their SFH enhanced after infall (∼25%) is a sur-prising result, since typically galaxy formation models assume thatmost satellites shut down their SF after infall (e.g. Starkenburg et al.2013, and references therein).
Fig. 6 further indicates that there is no apparent correlation be-tween the enhancement (or the suppression) of a satellite’ SFH andeither the stellar or gas mass at z=0, the virial mass at infall, thefinal distance from host or the infall time, although for increasingstellar masses the fraction of suppressed satellites diminishes, suchthat in the range 109 < Mstar/M < 1010 none of the satellites isSF suppressed, as reported in Slater & Bell (2014) (note, however,the small numbers in our sample in this regime). The quenchingfractions in our simulations seem to be in agreement with previousliterature based on numerical simulations (e.g. Simpson et al. 2018;Akins et al. 2021): in Simpson et al. (2018), for instance, the au-thors found that for stellar masses larger than 109 M the quenchedfraction of satellites dramatically declines, while for stellar massesbetween 108−9 M such fraction is a strong function of the dis-tance from the host, with up to 50% quenched satellites found for
a distance 0-0.3 Mpc in their simulations. In our sample, there isno quenched satellite with Mstar>109M, and only 4 out of 10satellites are strongly quenched in the stellar mass bin 108−9 M,while the rest are left unchanged.
Interestingly, the middle-right panel of Fig. 6 indicates a clearcorrelation between the fraction of bound gas at infall (defined asthe gas within 20% of the virial radius of the satellite divided bythe satellite’s virial mass, both quantities calculated at infall) andthe enhancement in star formation. We explore this finding next.
4.2 The role of gas and pericentric passage
To further investigate the reasons behind the different evolutionsin satellite’s SFH after infall, we show once more in Fig. 7, leftpanel, the gas fraction at infall as a function of enhancement frac-tion, while in the right panel we show the same quantity but asa function of minimum pericentric distance, in kpc. Satellites areagain color coded in red, if their SFH is enhanced after infall, andin blue if their SFH is suppressed. Comparing these two panels pro-vides hints about the mechanisms that cause the enhancement of SFin some galaxies but not in others.
Firstly, it is evident that the SF enhanced satellites are thoseobjects infalling with a high fraction of cold gas, i.e. with a valueof Mgas,inf(< 20%Rvir)/Mvir,inf ∼> 10−2. We verified that all
MNRAS 000, 1–15 (2020)

8 A. Di Cintio et al.
Figure 6. The normalized fraction of stars formed before (fbefore, diamonds) and after infall (fafter, circles) for each satellite, divided by the same number forthe average isolated galaxy group corresponding to each satellite. From top-left to bottom-right, we show this ratio as a function of z=0 stellar mass, total virialmass and gas mass, fraction of bound, cold gas at infall, z=0 distance from host galaxy and infall time. Satellites which have their star formation enhancedafter infall are indicated as red circles, satellites whose star formation is instead suppressed are indicated as blue circles. Satellites whose SF has not changedafter infall, compared to the isolated group, are indicated as black circles. Enhanced, quenched and unchanged satellites are selected taking into account afiducial region of fSATi
/fISO ∈ 0.4dex. Black diamonds refer to stars formed before infall, which are similar in satellites and isolated galaxies. Satellite IDsare shown for comparison with Fig. 1. Satellites ID=795 and 1226 have an enhancement ratio larger than the plot limits, and are therefore indicated with anupwards arrow. Satellites ID=310 and 1055, whose ratio is fafter,SATi
/fafter,ISO = 0, are categorized as unchanged and indicated as black circles, simplybecause their SF had already finished before infall, and therefore the infall had no impact on their subsequent evolution. Within our sample of 23 simulatedsatellites, as many as 6 are bona-fide enhanced galaxies, making up for ∼25% of the sample size. No correlation is observed between the enhancement ratioand any of the quantities shown, except in the case of gas fraction in the inner region of the satellite at infall time: enhanced satellites enter their host’s virialradius with a relatively large gas fraction, Mgas,inf(< 20%Rvir)/Mvir,inf ∼> 10−2.
MNRAS 000, 1–15 (2020)

Enhanced SF in satellite galaxies 9
10 2 10 1 100 101
f(SATi, after) / f(ISOmean, after)
0
10 3
10 2
10 1(M
gas(
<20
% R
vir)/
Mha
lo) z
=in
f
16
87194
225
249
270
505 557
594
795
1055
1226
91
163
195
220
310
387485 17
248
844
4604
101 102
Minimum pericentre [kpc]
0
10 3
10 2
10 1
(Mga
s(<
20%
Rvi
r)/M
halo
) z=
inf 16
87194
225
249
270
505 557
594
795
1055
1226
91
163
195
220
310
387 485 17
248
844
4604
Figure 7. The ratio of gas at infall within 20% of the virial radius of each satellite, normalized to the satellite’s virial mass, versus enhancement ratio (leftpanel) and minimum pericentric distance from host (right panel). The color code is the same as in Figure 6, with enhanced satellites indicated in red, quenchedin blue and unchanged in black (within the fiducial region shown as grey area). Those satellites that infall into their host galaxy with a large amount of coldgas, and nevertheless do not show an enhancement in their SFH, are those whose minimum pericentre is small, thus enabling the loss of such gas via rampressure stripping. Oppositely, if a galaxy infalls into its host with lots of bound gas and, additionally, its orbit results in a larger pericentric distance (minimumof 13 kpc, average of ∼47 kpc), the compression of such gas can result into a burst of newly forming stars.
the gas particles found within the 20% of the satellites’ radius atinfall are either in a cold or star forming phase with temperaturesof T< 105K and densities n> 0.12cm−3. Furthermore, we havechecked that none of the satellites infalling with less than 107Min gas, in absolute value and within their central region, is able toform new stars after infall.
However, there are a few satellites that, despite having largeamounts of cold, star forming gas at infall, do not show any en-hancement in their SF (namely IDs= 387,485): the reason for thismust be searched in their orbits.
In the right panel of Fig. 7 we see that these objects are onvery eccentric orbits, so that their pericentric distance is only a fewkpc, resulting in a net loss of gas by ram pressure stripping. Con-versely, enhanced satellites keep forming stars after infall becausetheir pericenter distance is larger (with a minimum of 13 kpc and anaverage of ∼47 kpc for the whole enhanced group), which allowsthe existing cold gas to be compressed during pericentric passage,rather than lost due to stripping: it is the compression of such gasat pericentric radius that leads to new bursts of SF in the enhancedsatellites group. Quenched satellite galaxies, on the other hand, donot form stars after infall, regardless of their orbit, since they didnot retain enough gas in the first place.
So far, our results suggest that in order for a satellite to en-hance its SF after infall, it must enter into its host galaxy with largereservoirs of cold gas and on an orbit whose pericentric distanceis not too small. We now consider examples of enhanced vs un-changed satellites, and additionally show that new stars form in en-hanced satellites exactly at the time of pericentric passage aroundtheir hosts.
In Fig. 8 we show the three most relevant examples of en-hanced satellites, from left to right we show ID=16, 17 and 795.In the top panels we indicate in solid red the virial radius of theirhost galaxy, and in black the orbit followed by the satellite, bothquantities as a function of cosmic time. The point at which the two
lines cross each other corresponds to the infall time, also indicatedas a dashed vertical red line. In the case of ID=795, we further indi-cate, with a black dashed line, the orbit of this satellite with respectto another dwarf galaxy, in this case ID=16. In the bottom panelswe show the normalized SFHs of such enhanced galaxies, togetherwith their properties at z=0. It is evident the strong correlation thatexists between the pericentric approach to the host galaxy and aburst of newly formed stars in the satellites, clearly visible in allof the studied cases, and happening respectively at ∼12, ∼13 and∼12.5 Gyrs. Moreover, in the case of satellite ID=795, a large burstof SF is also seen at∼9 Gyrs, correlating with the close-by passagewith satellite ID=16 (the closest approach is reached at 8.87 Gyrsand at a distance of 48.5 kpc), suggesting that this satellite-inducedenhancement could also happen in the real Universe. At pericentricpassage, either around their host or around another dwarf, as in thecase of ID=795, the total amount of gas decreases only slighty inthese satellites, accounting mainly for the conversion of gas intonew stars.
In Fig. 9 we show similar results but for those satellites thatinfall into the main host with plenty of cold gas but neverthelessdo not show enhancement in their SF, relative to the isolated galax-ies group. The reason is again related to their orbits: they experi-enced an extremely close-by pericentric passage, which is able toram pressure strip most of their gas and dark matter. These satel-lites lose about 99.9% of their gas just after the pericenter passage,going from a total gas mass of∼108M to∼104M in less than 3Gyrs. Some residual SF is observed during this time, which is thencompletely quenched once most of the star forming, cold gas, hasbeen stripped away. These objects survive despite their extreme or-bits; their z=0 properties, however, are a faithful reflection of theirviolent past: most of their dark matter has been stripped away fromthe outskirts, such that the leftover dark matter mass is only 4-5times the mass in stars, that, being centrally concentrated, undergoless stripping (less than 5%). Our galaxies are resolved enough and
MNRAS 000, 1–15 (2020)
10 A. Di Cintio et al.
0
200
400
600r, R
vir,h
ost [k
pc] r
Rvir, host
0 4 8 12Time [Gyrs]
0.0
0.5
1.0
SFR/
max(S
FR) Mhalo=9.38e+10
Mstar=3.60e+09Mgas=6.96e+09
M31,ID=16max(SFR)=5.4e-01
0 4 8 12Time [Gyrs]
Mhalo=5.45e+10Mstar=4.39e+09Mgas=3.80e+09
M33,ID=17max(SFR)=1.3e+00
0 4 8 12Time [Gyrs]
Mhalo=8.07e+08Mstar=4.94e+06Mgas=0.00e+00
M31,ID=795max(SFR)=3.1e-03
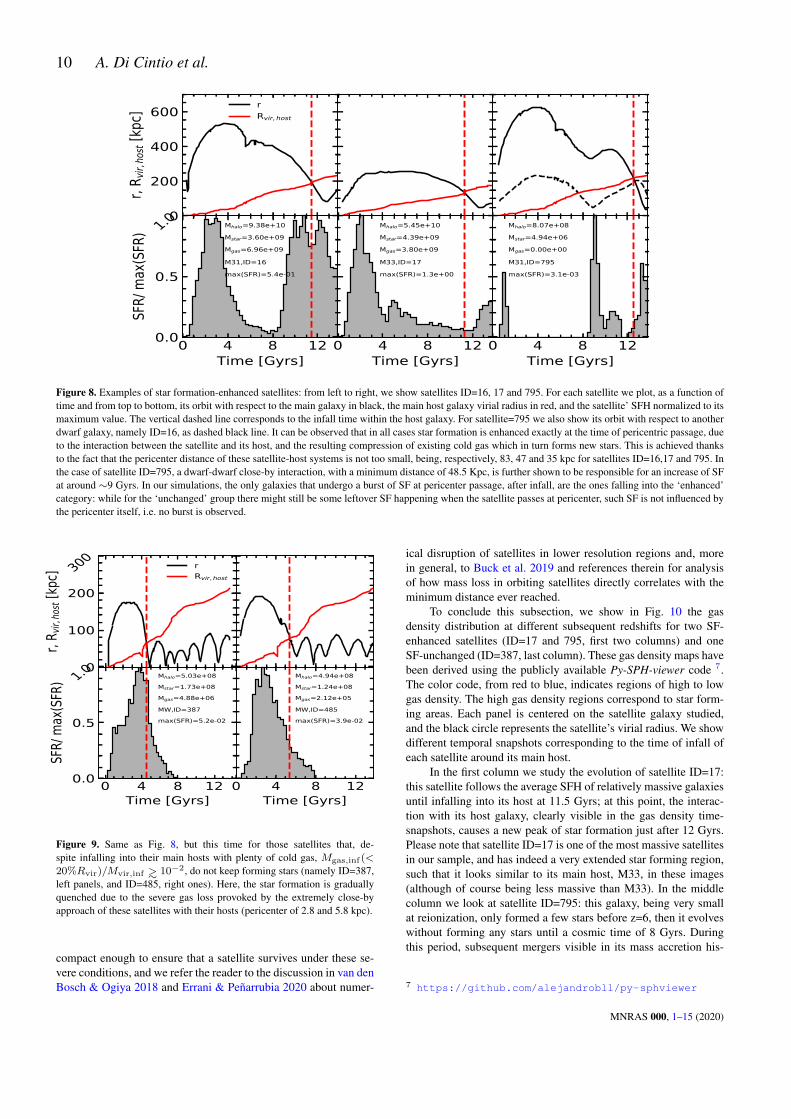
Figure 8. Examples of star formation-enhanced satellites: from left to right, we show satellites ID=16, 17 and 795. For each satellite we plot, as a function oftime and from top to bottom, its orbit with respect to the main galaxy in black, the main host galaxy virial radius in red, and the satellite’ SFH normalized to itsmaximum value. The vertical dashed line corresponds to the infall time within the host galaxy. For satellite=795 we also show its orbit with respect to anotherdwarf galaxy, namely ID=16, as dashed black line. It can be observed that in all cases star formation is enhanced exactly at the time of pericentric passage, dueto the interaction between the satellite and its host, and the resulting compression of existing cold gas which in turn forms new stars. This is achieved thanksto the fact that the pericenter distance of these satellite-host systems is not too small, being, respectively, 83, 47 and 35 kpc for satellites ID=16,17 and 795. Inthe case of satellite ID=795, a dwarf-dwarf close-by interaction, with a minimum distance of 48.5 Kpc, is further shown to be responsible for an increase of SFat around ∼9 Gyrs. In our simulations, the only galaxies that undergo a burst of SF at pericenter passage, after infall, are the ones falling into the ‘enhanced’category: while for the ‘unchanged’ group there might still be some leftover SF happening when the satellite passes at pericenter, such SF is not influenced bythe pericenter itself, i.e. no burst is observed.
0
100
200
300
r, Rvir
,hos
t [kpc
] rRvir, host
0 4 8 12Time [Gyrs]
0.0
0.5
1.0
SFR/
max(S
FR) Mhalo=5.03e+08
Mstar=1.73e+08Mgas=4.88e+06MW,ID=387max(SFR)=5.2e-02
0 4 8 12Time [Gyrs]
Mhalo=4.94e+08Mstar=1.24e+08Mgas=2.12e+05MW,ID=485max(SFR)=3.9e-02
Figure 9. Same as Fig. 8, but this time for those satellites that, de-spite infalling into their main hosts with plenty of cold gas, Mgas,inf(<20%Rvir)/Mvir,inf ∼> 10−2, do not keep forming stars (namely ID=387,left panels, and ID=485, right ones). Here, the star formation is graduallyquenched due to the severe gas loss provoked by the extremely close-byapproach of these satellites with their hosts (pericenter of 2.8 and 5.8 kpc).
compact enough to ensure that a satellite survives under these se-vere conditions, and we refer the reader to the discussion in van denBosch & Ogiya 2018 and Errani & Penarrubia 2020 about numer-
ical disruption of satellites in lower resolution regions and, morein general, to Buck et al. 2019 and references therein for analysisof how mass loss in orbiting satellites directly correlates with theminimum distance ever reached.
To conclude this subsection, we show in Fig. 10 the gasdensity distribution at different subsequent redshifts for two SF-enhanced satellites (ID=17 and 795, first two columns) and oneSF-unchanged (ID=387, last column). These gas density maps havebeen derived using the publicly available Py-SPH-viewer code 7.The color code, from red to blue, indicates regions of high to lowgas density. The high gas density regions correspond to star form-ing areas. Each panel is centered on the satellite galaxy studied,and the black circle represents the satellite’s virial radius. We showdifferent temporal snapshots corresponding to the time of infall ofeach satellite around its main host.
In the first column we study the evolution of satellite ID=17:this satellite follows the average SFH of relatively massive galaxiesuntil infalling into its host at 11.5 Gyrs; at this point, the interac-tion with its host galaxy, clearly visible in the gas density time-snapshots, causes a new peak of star formation just after 12 Gyrs.Please note that satellite ID=17 is one of the most massive satellitesin our sample, and has indeed a very extended star forming region,such that it looks similar to its main host, M33, in these images(although of course being less massive than M33). In the middlecolumn we look at satellite ID=795: this galaxy, being very smallat reionization, only formed a few stars before z=6, then it evolveswithout forming any stars until a cosmic time of 8 Gyrs. Duringthis period, subsequent mergers visible in its mass accretion his-
7 https://github.com/alejandrobll/py-sphviewer
MNRAS 000, 1–15 (2020)

Enhanced SF in satellite galaxies 11
Figure 10. Gas density maps at subsequent snapshots around infall redshift for satellites 17, 795 (enhanced SF) and 387 (unchanged SF). The evolution ofthe gas distribution is shown at increasing times from top to bottom. Each panel is centered on the satellite galaxy analyzed, with its virial radius indicatedas a black circle. The color scheme indicates high (in red) and low (in blue) gas densities. In the first column, the interaction of the satellite with its hostgalaxy can be appreciated: the pericentric passage in this case is ∼47 kpc, and the net result is an increase of the satellite SF. In the middle column, a closeapproach between the satellite galaxy and another dwarf can be observed in the first 3 panels, happening at around 8.5 Gyrs and provoking an episode ofstar formation, with a subsequent interaction with the main host at ∼12 Gyrs causing the final SF burst (the pericentric distance in this case is about 35 kpc).Finally, in the last column, an extremely close-by approach, with minimum distance of 2.8 kpc, is seen, which removes most of the existing gas from theinfalling satellite: its SFH is affected such that it completely stops 3 Gyrs after infall has occurred. Movies of the cosmic evolution of these satellites are foundat https://dicintioarianna.wixsite.com/mysite/movies.
MNRAS 000, 1–15 (2020)
12 A. Di Cintio et al.
0 4 8 12Time [Gyrs]
0.0
0.5
1.0
SFR/
max
(SFR
)
M31,ID=0max(SFR)=3.4e+00Mhalo=7.49e+11
0 4 8 12Time [Gyrs]
MW,ID=1max(SFR)=2.6e+00Mhalo=5.48e+11
0 4 8 12Time [Gyrs]
M33,ID=2max(SFR)=2.5e+00Mhalo=3.13e+11
0
200
400
600
r, R v
ir,ho
st [k
pc]
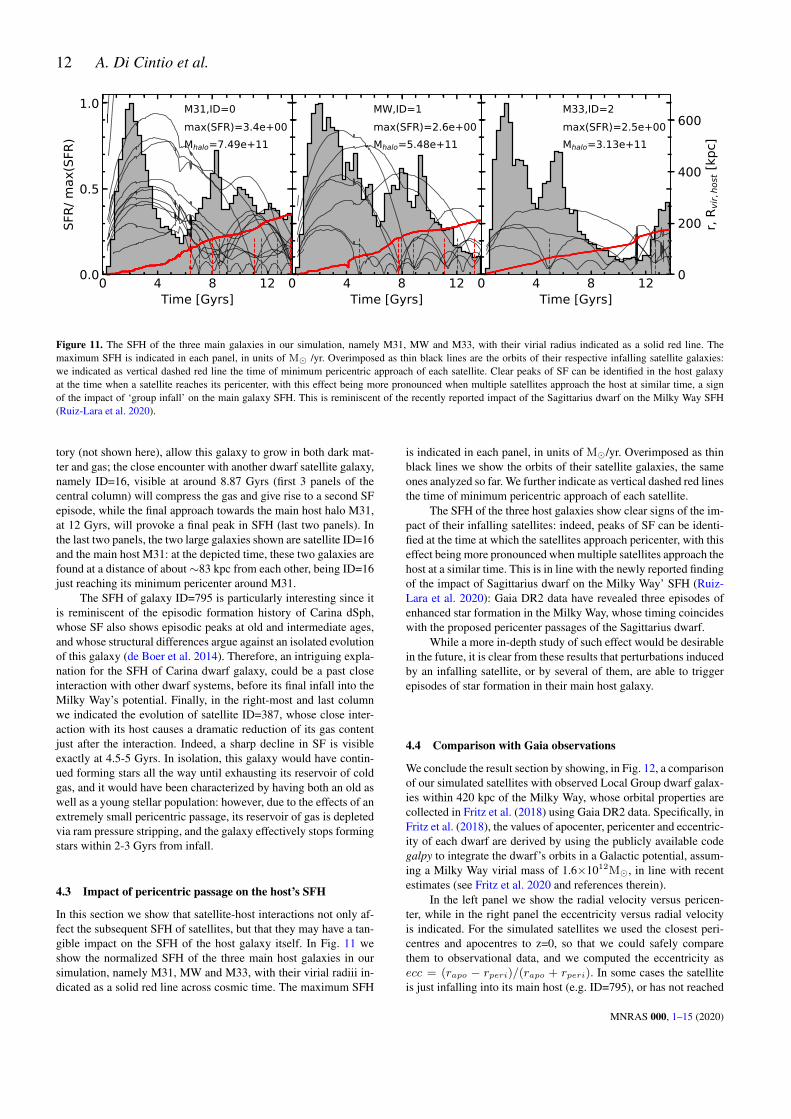
Figure 11. The SFH of the three main galaxies in our simulation, namely M31, MW and M33, with their virial radius indicated as a solid red line. Themaximum SFH is indicated in each panel, in units of M /yr. Overimposed as thin black lines are the orbits of their respective infalling satellite galaxies:we indicated as vertical dashed red line the time of minimum pericentric approach of each satellite. Clear peaks of SF can be identified in the host galaxyat the time when a satellite reaches its pericenter, with this effect being more pronounced when multiple satellites approach the host at similar time, a signof the impact of ‘group infall’ on the main galaxy SFH. This is reminiscent of the recently reported impact of the Sagittarius dwarf on the Milky Way SFH(Ruiz-Lara et al. 2020).
tory (not shown here), allow this galaxy to grow in both dark mat-ter and gas; the close encounter with another dwarf satellite galaxy,namely ID=16, visible at around 8.87 Gyrs (first 3 panels of thecentral column) will compress the gas and give rise to a second SFepisode, while the final approach towards the main host halo M31,at 12 Gyrs, will provoke a final peak in SFH (last two panels). Inthe last two panels, the two large galaxies shown are satellite ID=16and the main host M31: at the depicted time, these two galaxies arefound at a distance of about∼83 kpc from each other, being ID=16just reaching its minimum pericenter around M31.
The SFH of galaxy ID=795 is particularly interesting since itis reminiscent of the episodic formation history of Carina dSph,whose SF also shows episodic peaks at old and intermediate ages,and whose structural differences argue against an isolated evolutionof this galaxy (de Boer et al. 2014). Therefore, an intriguing expla-nation for the SFH of Carina dwarf galaxy, could be a past closeinteraction with other dwarf systems, before its final infall into theMilky Way’s potential. Finally, in the right-most and last columnwe indicated the evolution of satellite ID=387, whose close inter-action with its host causes a dramatic reduction of its gas contentjust after the interaction. Indeed, a sharp decline in SF is visibleexactly at 4.5-5 Gyrs. In isolation, this galaxy would have contin-ued forming stars all the way until exhausting its reservoir of coldgas, and it would have been characterized by having both an old aswell as a young stellar population: however, due to the effects of anextremely small pericentric passage, its reservoir of gas is depletedvia ram pressure stripping, and the galaxy effectively stops formingstars within 2-3 Gyrs from infall.
4.3 Impact of pericentric passage on the host’s SFH
In this section we show that satellite-host interactions not only af-fect the subsequent SFH of satellites, but that they may have a tan-gible impact on the SFH of the host galaxy itself. In Fig. 11 weshow the normalized SFH of the three main host galaxies in oursimulation, namely M31, MW and M33, with their virial radiii in-dicated as a solid red line across cosmic time. The maximum SFH
is indicated in each panel, in units of M/yr. Overimposed as thinblack lines we show the orbits of their satellite galaxies, the sameones analyzed so far. We further indicate as vertical dashed red linesthe time of minimum pericentric approach of each satellite.
The SFH of the three host galaxies show clear signs of the im-pact of their infalling satellites: indeed, peaks of SF can be identi-fied at the time at which the satellites approach pericenter, with thiseffect being more pronounced when multiple satellites approach thehost at a similar time. This is in line with the newly reported findingof the impact of Sagittarius dwarf on the Milky Way’ SFH (Ruiz-Lara et al. 2020): Gaia DR2 data have revealed three episodes ofenhanced star formation in the Milky Way, whose timing coincideswith the proposed pericenter passages of the Sagittarius dwarf.
While a more in-depth study of such effect would be desirablein the future, it is clear from these results that perturbations inducedby an infalling satellite, or by several of them, are able to triggerepisodes of star formation in their main host galaxy.
4.4 Comparison with Gaia observations
We conclude the result section by showing, in Fig. 12, a comparisonof our simulated satellites with observed Local Group dwarf galax-ies within 420 kpc of the Milky Way, whose orbital properties arecollected in Fritz et al. (2018) using Gaia DR2 data. Specifically, inFritz et al. (2018), the values of apocenter, pericenter and eccentric-ity of each dwarf are derived by using the publicly available codegalpy to integrate the dwarf’s orbits in a Galactic potential, assum-ing a Milky Way virial mass of 1.6×10¹²M, in line with recentestimates (see Fritz et al. 2020 and references therein).
In the left panel we show the radial velocity versus pericen-ter, while in the right panel the eccentricity versus radial velocityis indicated. For the simulated satellites we used the closest peri-centres and apocentres to z=0, so that we could safely comparethem to observational data, and we computed the eccentricity asecc = (rapo − rperi)/(rapo + rperi). In some cases the satelliteis just infalling into its main host (e.g. ID=795), or has not reached
MNRAS 000, 1–15 (2020)
Enhanced SF in satellite galaxies 13
100 101 102
Pericentre [kpc]
200
100
0
100
200V r
[km
/s]
16
87
194
225
249
270505
557
594
795
1055
1226
91163195
220
310
387
485
17
248
844
4604
AquII
BooI
BooII
CVenI
CVenII
CarICarI
CarII
CarIIICBerI
CraI
CraII DraI
DraII
EriII
FnxIFnxI
GruI
HerI
HorI
HyaII
HyiI
LeoI
LeoIILeoIV
LeoV
PhxI
PisII
RetII
SgrI
ScII
Seg1
Seg2 SxtI
TriII
TucII
TucIII
UMaI
UMaIIUMiI
Wil1
200 100 0 100 200Vr [km/s]
0.2
0.4
0.6
0.8
1.0
Ecce
ntric
ity
16
87194
225
249
270
505
557
594
795
1055
1226
91
163
195
220
310
387
485
17
248
844
4604
AquII
BooI
BooIICVenI
CVenII
CarICarI
CarII
CarIII
CBerI
CraI
CraII
DraIDraII
EriII
FnxIFnxI
GruIHerI
HorI
HyaII
HyiI
LeoI
LeoII
LeoIV LeoVPhxI
PisII
RetII
SgrI
ScII
Seg1
Seg2SxtI
TriII
TucII
TucIII
UMaIUMaII
UMiIWil1
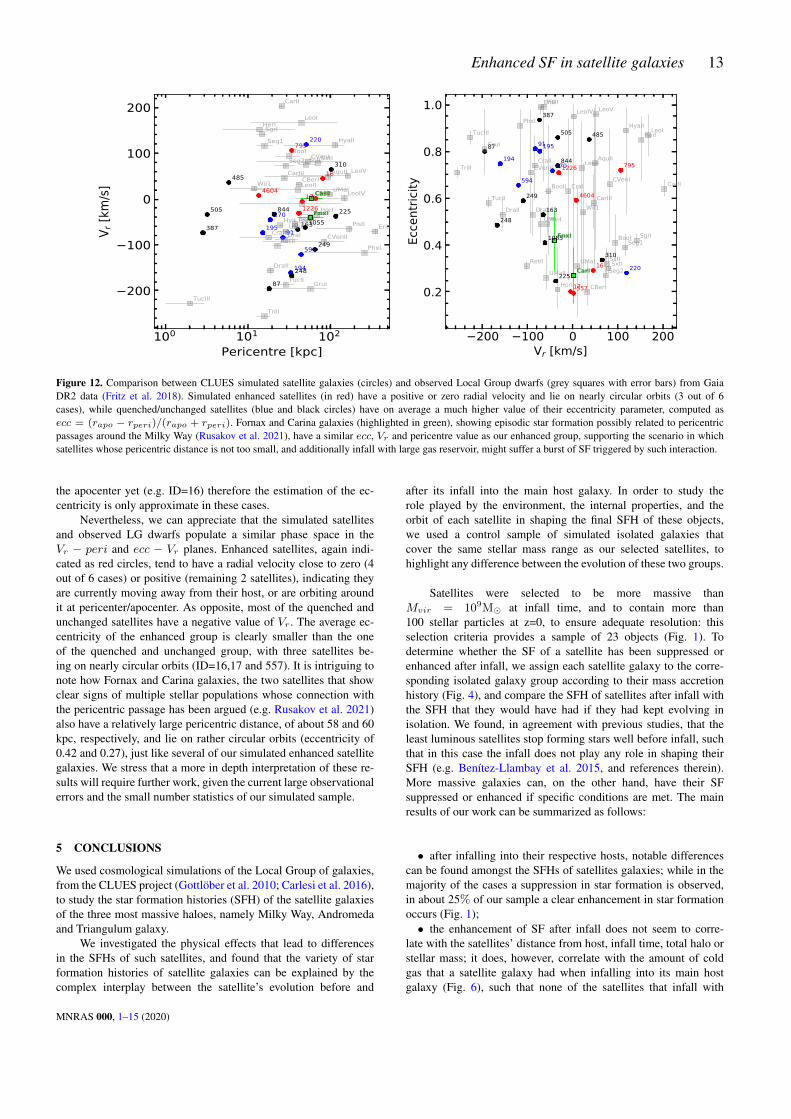
Figure 12. Comparison between CLUES simulated satellite galaxies (circles) and observed Local Group dwarfs (grey squares with error bars) from GaiaDR2 data (Fritz et al. 2018). Simulated enhanced satellites (in red) have a positive or zero radial velocity and lie on nearly circular orbits (3 out of 6cases), while quenched/unchanged satellites (blue and black circles) have on average a much higher value of their eccentricity parameter, computed asecc = (rapo − rperi)/(rapo + rperi). Fornax and Carina galaxies (highlighted in green), showing episodic star formation possibly related to pericentricpassages around the Milky Way (Rusakov et al. 2021), have a similar ecc, Vr and pericentre value as our enhanced group, supporting the scenario in whichsatellites whose pericentric distance is not too small, and additionally infall with large gas reservoir, might suffer a burst of SF triggered by such interaction.
the apocenter yet (e.g. ID=16) therefore the estimation of the ec-centricity is only approximate in these cases.
Nevertheless, we can appreciate that the simulated satellitesand observed LG dwarfs populate a similar phase space in theVr − peri and ecc − Vr planes. Enhanced satellites, again indi-cated as red circles, tend to have a radial velocity close to zero (4out of 6 cases) or positive (remaining 2 satellites), indicating theyare currently moving away from their host, or are orbiting aroundit at pericenter/apocenter. As opposite, most of the quenched andunchanged satellites have a negative value of Vr . The average ec-centricity of the enhanced group is clearly smaller than the oneof the quenched and unchanged group, with three satellites be-ing on nearly circular orbits (ID=16,17 and 557). It is intriguing tonote how Fornax and Carina galaxies, the two satellites that showclear signs of multiple stellar populations whose connection withthe pericentric passage has been argued (e.g. Rusakov et al. 2021)also have a relatively large pericentric distance, of about 58 and 60kpc, respectively, and lie on rather circular orbits (eccentricity of0.42 and 0.27), just like several of our simulated enhanced satellitegalaxies. We stress that a more in depth interpretation of these re-sults will require further work, given the current large observationalerrors and the small number statistics of our simulated sample.
5 CONCLUSIONS
We used cosmological simulations of the Local Group of galaxies,from the CLUES project (Gottlober et al. 2010; Carlesi et al. 2016),to study the star formation histories (SFH) of the satellite galaxiesof the three most massive haloes, namely Milky Way, Andromedaand Triangulum galaxy.
We investigated the physical effects that lead to differencesin the SFHs of such satellites, and found that the variety of starformation histories of satellite galaxies can be explained by thecomplex interplay between the satellite’s evolution before and
after its infall into the main host galaxy. In order to study therole played by the environment, the internal properties, and theorbit of each satellite in shaping the final SFH of these objects,we used a control sample of simulated isolated galaxies thatcover the same stellar mass range as our selected satellites, tohighlight any difference between the evolution of these two groups.
Satellites were selected to be more massive thanMvir = 109M at infall time, and to contain more than100 stellar particles at z=0, to ensure adequate resolution: thisselection criteria provides a sample of 23 objects (Fig. 1). Todetermine whether the SF of a satellite has been suppressed orenhanced after infall, we assign each satellite galaxy to the corre-sponding isolated galaxy group according to their mass accretionhistory (Fig. 4), and compare the SFH of satellites after infall withthe SFH that they would have had if they had kept evolving inisolation. We found, in agreement with previous studies, that theleast luminous satellites stop forming stars well before infall, suchthat in this case the infall does not play any role in shaping theirSFH (e.g. Benıtez-Llambay et al. 2015, and references therein).More massive galaxies can, on the other hand, have their SFsuppressed or enhanced if specific conditions are met. The mainresults of our work can be summarized as follows:
• after infalling into their respective hosts, notable differencescan be found amongst the SFHs of satellites galaxies; while in themajority of the cases a suppression in star formation is observed,in about 25% of our sample a clear enhancement in star formationoccurs (Fig. 1);• the enhancement of SF after infall does not seem to corre-
late with the satellites’ distance from host, infall time, total halo orstellar mass; it does, however, correlate with the amount of coldgas that a satellite galaxy had when infalling into its main hostgalaxy (Fig. 6), such that none of the satellites that infall with
MNRAS 000, 1–15 (2020)
14 A. Di Cintio et al.
Mgas∼< 107Mwithin their inner region (20% of Rvir) will formstars after infall;• in addition to infalling with relatively large cold gas fractions
(Mgas,inf(< 20%Rvir)/Mvir,inf∼>10−2 in our simulations, Fig. 7,left panel), another condition must be fulfilled in order for a satelliteto be able to keep forming stars after infall, namely that its pericen-tric distance to the main host galaxy should be relatively large (av-erage dperi∼47 kpc for our enhanced satellites, Fig. 7, right panel).This condition ensures that at pericentric passage the large frac-tion of existing gas is compressed rather than lost via ram-pressurestripping, so that the satellite is able to form new stars (Fig. 8 andFig. 10);• the peaks in star formation occuring after a satellite’s infall
correlate strongly with the satellite’s orbit around its host, such thatstar formation is enhanced exactly at the time of pericentric pas-sage, likely due to the compression of gas (Fig. 8); oppositely, satel-lites that fall in with large gas reservoir but have an extremely close-by approach with their hosts (dperi∼2-5 kpc, Fig. 9) will have theirgas removed and their SF will be abruptly quenched;• we found a case in which the SF of a satellite galaxy is affected
not only by the satellite-host interaction, but also by the close-bypassage with another dwarf galaxy, suggesting that this mechanismcould also happen in the real Universe (Fig. 8, right-most panel);• additionally, we identified clear peaks of SF in the host galax-
ies MW, M31 and M33, at the time their satellites reach pericenter,with this effect being more pronounced when multiple satellitesapproach the host at a similar time, a sign that satellite-host inter-actions not only affect the subsequent SFH of satellites, but theyhave a tangible impact on the final SFH of the host galaxy itself(Fig. 11);• finally, when comparing the eccentricity and radial velocities
of our simulated satellites with the observed Local Group ones,using the latest Gaia DR2 data, we observe that the enhanced satel-lites tend to be on more circular orbits with respect to quenchedones, and that some LG dwarfs follow similar trends (Fig. 12): inparticular, we closely resemble the cases of Carina and Fornax,whose low eccentricity and large pericenters of 60 and 58 kpc,respectively, correlate with clear peaks in their SF.
Our simulations show that close encounters with the main hostgalaxy, as well as with other dwarfs, are a viable mechanism to ex-plain the existence of multiple stellar populations in dwarf galaxiessuch as Carina, Leo I or Fornax (Hurley-Keller et al. 1998; Gallartet al. 1999; Monelli et al. 2003; Bono et al. 2010; Monelli et al.2014; del Pino et al. 2013) In particular, we show an example ofsatellite galaxy whose SFH resembles the one of Carina: in Fig. 8,right most panel, we show how interactions with a dwarf first, andwith the main host later, provoke two peaks of SF at intermediateand young ages, just as observed for the two SF peaks in Carina,which clearly indicate that such stars formed from gas with differ-ent abundance patterns (de Boer et al. 2014).
Moreover, recent work from Rusakov et al. (2021) also sup-ports this scenario, since a clear correlation is observed betweenthe intermediate and young SF events of Fornax dSphs and its peri-centric passages around the Milky Way. Our study is also in agree-ment with very recent work by Ruiz-Lara et al. (2020), that showhow the SFH of our own Milky Way galaxy could be impacted bythe pericentric passage of its satellites: three narrow episodes of en-hanced star formation have been derived for the MW, whose timingcoincides very well with the proposed Sagittarius dwarf pericen-
tric passage. Finally, in agreement with Miyoshi & Chiba (2020),who found a remarkable correlation between a smaller pericentricradius and a reduction of star formation after its peak, we find thata small pericenter leads to a removal of gas by ram-pressure andtherefore to a suppression in SF: this effect has been also observedin Fillingham et al. (2019), who showed that quenching timescalesare shorter for those dSphs with high orbital eccentricities.
A caveat to bear in mind is that some of our simulated satel-lites have, at z=0, more gas than the observed Local Group’ dwarfspheroidals. Therefore, in the future, verifying our results withother simulations, run within different environment and with dif-ferent initial conditions and sub-grid physics implementation, willstrengthen the robustness of our conclusions.
Nevertheless, we have shown here that the quenching of SF insatellite galaxies after their infall into a main host galaxy is not theonly possible outcome: enhanced star formation can also occur insatellite galaxies. This finding calls for a revision of galaxy forma-tion processes currently implemented into semi-analytic models,which have historically taken into account only a crude quenchingof satellite galaxies after their infall.
Ultimately, the complex interplay between the satellites’masses at reionization, their mass accretion history, gas reservoirat infall, type of orbit, evolution within a particular environmentand close interactions with other galaxies, can give rise to a varietyof SFHs reminiscent of the ones observed in the Local Group.
ACKNOWLEDGEMENTS
ADC kindly thanks JFN and the University of Victoria for thehospitality during the preparation of this work. ADC is supportedby a Junior Leader fellowship from ‘La Caixa’ Foundation (ID100010434), fellowship code LCF/BQ/PR20/11770010. AK andRM are supported by the Ministerio de Ciencia, Innovacion yUniversidades (MICIU/FEDER) under research grant PGC2018-094975-C21. AK further thanks Matt Berninger for serpentineprison. The authors kindly acknowledge the PIs of the CLUES col-laboration for data sharing, as well as A.Benıtez-Llambay, C. Gal-lart, T. Ruiz-Lara and G. Battaglia for many useful discussions. Wesincerely thank the referee for a careful review of our work.
DATA AVAILABILITY
The data underlying this article will be shared on reasonable re-quest to the corresponding author.
REFERENCES
Akins H. B., Christensen C. R., Brooks A. M., Munshi F., Applebaum E.,Engelhardt A., Chamberland L., 2021, ApJ, 909, 139
Applebaum E., Brooks A. M., Christensen C. R., Munshi F., Quinn T. R.,Shen S., Tremmel M., 2021, ApJ, 906, 96
Balogh M. L., Navarro J. F., Morris S. L., 2000, ApJ, 540, 113Benıtez-Llambay A., Navarro J. F., Abadi M. G., Gottlober S., Yepes G.,
Hoffman Y., Steinmetz M., 2013, ApJ, 763, L41Benıtez-Llambay A., Navarro J. F., Abadi M. G., Gottlober S., Yepes G.,
Hoffman Y., Steinmetz M., 2015, MNRAS, 450, 4207Benıtez-Llambay A., Navarro J. F., Abadi M. G., Gottlober S., Yepes G.,
Hoffman Y., Steinmetz M., 2016, MNRAS, 456, 1185Bono G. et al., 2010, PASP, 122, 651Buck T., Maccio A. V., Dutton A. A., Obreja A., Frings J., 2019, MNRAS,
483, 1314
MNRAS 000, 1–15 (2020)
Enhanced SF in satellite galaxies 15
Carlesi E. et al., 2016, MNRAS, 458, 900Cora S. A. et al., 2018, MNRAS, 479, 2de Boer T. J. L., Tolstoy E., Lemasle B., Saha A., Olszewski E. W., Mateo
M., Irwin M. J., Battaglia G., 2014, A&A, 572, A10del Pino A., Hidalgo S. L., Aparicio A., Gallart C., Carrera R., Monelli M.,
Buonanno R., Marconi G., 2013, MNRAS, 433, 1505Di Cintio A., Knebe A., Libeskind N. I., Brook C., Yepes G., Gottlober S.,
Hoffman Y., 2013, MNRAS, 431, 1220Di Cintio A., Knebe A., Libeskind N. I., Yepes G., Gottlober S., Hoffman
Y., 2011, MNRAS, 417, L74Dolphin A. E., Weisz D. R., Skillman E. D., Holtzman J. A., 2005, arXiv
e-prints, astroErrani R., Penarrubia J., 2020, MNRAS, 491, 4591Fillingham S. P. et al., 2019, arXiv e-prints, arXiv:1906.04180Fritz T. K., Battaglia G., Pawlowski M. S., Kallivayalil N., van der Marel
R., Sohn S. T., Brook C., Besla G., 2018, A&A, 619, A103Fritz T. K., Di Cintio A., Battaglia G., Brook C., Taibi S., 2020, MNRAS,
494, 5178Gallart C., Bernard E. J., Brook C. B., Ruiz-Lara T., Cassisi S., Hill V.,
Monelli M., 2019, Nature Astronomy, 3, 932Gallart C., Freedman W. L., Aparicio A., Bertelli G., Chiosi C., 1999, AJ,
118, 2245Gallart C. et al., 2015, ApJ, 811, L18Garrison-Kimmel S. et al., 2019, MNRAS, 489, 4574Genina A., Frenk C. S., Benıtez-Llambay A., Cole S., Navarro J. F., Oman
K. A., Fattahi A., 2019, MNRAS, 488, 2312Gill S. P. D., Knebe A., Gibson B. K., 2004, MNRAS, 351, 399Gill S. P. D., Knebe A., Gibson B. K., 2005, MNRAS, 356, 1327Gottlober S., Hoffman Y., Yepes G., 2010, in High Performance Computing
in Science and Engineering, S. Wagner, M. Steinmetz, A. Bode, M.M.Muller, ed., Springer, pp. 309–323
Governato F. et al., 2010, Nature, 463, 203Haardt F., Madau P., 1996, ApJ, 461, 20Hausammann L., Revaz Y., Jablonka P., 2019, A&A, 624, A11Hayashi K., Fabrizio M., Łokas E. L., Bono G., Monelli M., Dall’Ora M.,
Stetson P. B., 2018, MNRAS, 481, 250Hopkins P. F., 2013, MNRAS, 428, 2840Hurley-Keller D., Mateo M., Nemec J., 1998, AJ, 115, 1840Kennicutt, Robert C. J., 1998, ApJ, 498, 541Knebe A., Libeskind N. I., Knollmann S. R., Martinez-Vaquero L. A., Yepes
G., Gottlober S., Hoffman Y., 2011, MNRAS, 412, 529Knebe A., Libeskind N. I., Knollmann S. R., Yepes G., Gottlober S., Hoff-
man Y., 2010, MNRAS, 405, 1119Knollmann S. R., Knebe A., 2009, ApJS, 182, 608Libeskind N. I., Di Cintio A., Knebe A., Yepes G., Gottlober S., Stein-
metz M., Hoffman Y., Martinez-Vaquero L. A., 2013, Publ. Astron.Soc. Australia, 30, e039
Libeskind N. I., Knebe A., Hoffman Y., Gottlober S., Yepes G., SteinmetzM., 2011, MNRAS, 411, 1525
Libeskind N. I., Yepes G., Knebe A., Gottlober S., Hoffman Y., KnollmannS. R., 2010, MNRAS, 401, 1889
Mateo M. L., 1998, ARA&A, 36, 435Mayer L., Governato F., Colpi M., Moore B., Quinn T., Wadsley J., Stadel
J., Lake G., 2001, ApJ, 547, L123Mayer L., Mastropietro C., Wadsley J., Stadel J., Moore B., 2006, MNRAS,
369, 1021McConnachie A. W., Venn K. A., 2020, AJ, 160, 124Miyoshi T., Chiba M., 2020, ApJ, 905, 109Monelli M. et al., 2014, ApJ, 796, 90Monelli M. et al., 2003, AJ, 126, 218Pasetto S., Grebel E. K., Berczik P., Chiosi C., Spurzem R., 2011, A&A,
525, A99Read J. I., Hayfield T., Agertz O., 2010, MNRAS, 405, 1513Rey M. P., Pontzen A., Agertz O., Orkney M. D. A., Read J. I., Rosdahl J.,
2020, MNRAS, 497, 1508Rocha M., Peter A. H. G., Bullock J., 2012, MNRAS, 425, 231Ruiz-Lara T., Gallart C., Bernard E. J., Cassisi S., 2020, Nature Astronomy
Rusakov V., Monelli M., Gallart C., Fritz T. K., Ruiz-Lara T., Bernard E. J.,Cassisi S., 2021, MNRAS
Sales L. V., Helmi A., Battaglia G., 2010, Advances in Astronomy, 2010,194345
Sales L. V., Navarro J. F., Abadi M. G., Steinmetz M., 2007, MNRAS, 379,1475
Schmidt M., 1959, ApJ, 129, 243Sembolini F. et al., 2016, MNRAS, 459, 2973Shapiro P. R., Giroux M. L., Babul A., 1994, ApJ, 427, 25Simpson C. M., Grand R. J. J., Gomez F. A., Marinacci F., Pakmor R.,
Springel V., Campbell D. J. R., Frenk C. S., 2018, MNRAS, 478, 548Skillman E. D. et al., 2017, ApJ, 837, 102Slater C. T., Bell E. F., 2014, ApJ, 792, 141Sohn S. T. et al., 2007, ApJ, 663, 960Spergel et al. D. N., 2007, ApJS, 170, 377Springel V., 2005, MNRAS, 364, 1105Springel V., Hernquist L., 2003, MNRAS, 339, 289Starkenburg E. et al., 2013, MNRAS, 429, 725Stevens A. R. H., Brown T., 2017, MNRAS, 471, 447van den Bosch F. C., Ogiya G., 2018, MNRAS, 475, 4066Weisz D. R. et al., 2011, ApJ, 739, 5Weisz D. R., Dolphin A. E., Skillman E. D., Holtzman J., Gilbert K. M.,
Dalcanton J. J., Williams B. F., 2014, ApJ, 789, 147Wright A. C., Brooks A. M., Weisz D. R., Christensen C. R., 2019, MN-
RAS, 482, 1176Xie L., De Lucia G., Hirschmann M., Fontanot F., 2020, MNRAS, 498,
4327
This paper has been typeset from a TEX/LATEX file prepared by the author.
MNRAS 000, 1–15 (2020)
Copyright © 2022 FDOKUMEN