Multiwavelength study of X-ray selected star-forming galaxies within the Chandra Deep Field-South
16
arXiv:0705.1278v1 [astro-ph] 9 May 2007 Mon. Not. R. Astron. Soc. 000, 1–16 (2004) Printed 1 February 2008 (MN L A T E X style file v1.4) Multiwavelength Study of X-ray Selected Star Forming Galaxies within the Chandra Deep Field South DanielRosa–Gonz´alez 1 , Denis Burgarella 2 , Kirpal Nandra 3 , Daniel Kunth 4 , Elena Terlevich 1⋆ and Roberto Terlevich 1† 1 INAOE, Luis Enrique Erro 1. Tonantzintla, Puebla 72840. M´ exico. 2 Observatoire Astronomique Marseille Provence, Laboratoire d’Astrophysique de Marseille, 13376 Marseille Cedex 12, France 3 Astrophysics Group, Imperial College London, Blackett Laboratory, Prince Consort Road, London SW7 2AW 4 Institut d’Astrophysique, Paris, 98 bis Boulevard Arago, F-75014 Paris, France Accepted . Received ; in original form 1 February 2008 (CDFS-vs202) ABSTRACT We have combined multi-wavelength observations of a selected sample of starforming galaxies with galaxy evolution models in order to compare the results obtained for different SFR tracers and to study the effect that the evolution of the starforming regions has on them. We also aimed at obtaining a better understanding of the correc- tions due to extinction and nuclear activity on the derivation of the SFR. We selected the sample from Chandra data for the well studied region Chandra Deep Field South (CDFS) and chose the objects that also have UV and IR data from GALEX and GOODS-Spitzer respectively. Our main finding is that there is good agreement between the extinction corrected SFR(UV) and the SFR(X), and we confirm the use of X-ray luminosities as a trustful tracer of recent star formation activity. Nevertheless, at SFR(UV) larger than about 5M ⊙ yr −1 there are several galaxies with an excess of SFR(X) suggesting the presence of an obscured AGN not detected in the optical spectra. We conclude that the IR luminosity is driven by recent star formation even in those galaxies where the SFR(X) is an order of magnitude higher than the SFR(UV) and therefore may harbour an AGN. One object shows SFR(X) much lower than expected based on the SFR(UV); this SFR(X) ‘deficit’ may be due to an early transient phase before most of the massive X-ray binaries were formed. An X-ray deficit could be used to select extremely young bursts in an early phase just after the explosion of the first supernovae associated with massive stars and before the onset of massive X-ray binaries. Key words: Galaxies: fundamental parameters – ultraviolet: galaxies – X-rays: galax- ies 1 INTRODUCTION The UV emission in galaxies traces the presence of mas- sive stars related to a recent episode of star formation. For this reason, the UV luminosity is widely used as a tracer of the star formation activity not only in nearby galaxies but also in the early universe (e.g. Lilly et al. 1995, Madau et al. 1996). However it is important to bear in mind that the corrections applied to the observed UV fluxes (e.g. due to ex- tinction and evolutionary uncertainties) are neither unique nor straightforward implying that multiwavelength studies ⋆ Research Affiliate IoA, Cambridge, UK † Research Affiliate IoA, Cambridge, UK are necessary to improve the correction factors (e.g. Buat et al. 2005, Schmitt et al. 2006). The X-ray emission in normal galaxies – without an AGN component – is produced by high- and low- mass X-ray binaries, young supernova remnants and cooling hot gas (e.g. Fabbiano 1989). The relation between the observed X-ray luminosities and the current SFR is driven by the presence of High Mass X-ray Binaries (HMXB) where the primary star is a collapsed object with mass higher than 2.5 M⊙ and the secondary star is a massive star classified as O, B or Wolf Rayet (Van Bever and Vanbeveren 2000, Cervi˜ no, Mas- Hesse and Kunth 2002). Due to the strong correlation found between the X-ray luminosity and other tracers of recent star formation activity such as the FIR luminosity (David, Jones c 2004 RAS
-
Upload
independent -
Category
Documents
-
view
0 -
download
0
Transcript of Multiwavelength study of X-ray selected star-forming galaxies within the Chandra Deep Field-South
arX
iv:0
705.
1278
v1 [
astr
o-ph
] 9
May
200
7Mon. Not. R. Astron. Soc. 000, 1–16 (2004) Printed 1 February 2008 (MN LATEX style file v1.4)
Multiwavelength Study of X-ray Selected Star Forming
Galaxies within the Chandra Deep Field South
Daniel Rosa–Gonzalez1, Denis Burgarella2, Kirpal Nandra3, Daniel Kunth4,
Elena Terlevich1⋆ and Roberto Terlevich1†1 INAOE, Luis Enrique Erro 1. Tonantzintla, Puebla 72840. Mexico.2Observatoire Astronomique Marseille Provence, Laboratoire d’Astrophysique de Marseille, 13376 Marseille Cedex 12, France3Astrophysics Group, Imperial College London, Blackett Laboratory, Prince Consort Road, London SW7 2AW4Institut d’Astrophysique, Paris, 98 bis Boulevard Arago, F-75014 Paris, France
Accepted . Received ; in original form 1 February 2008 (CDFS-vs202)
ABSTRACT
We have combined multi-wavelength observations of a selected sample of starforminggalaxies with galaxy evolution models in order to compare the results obtained fordifferent SFR tracers and to study the effect that the evolution of the starformingregions has on them. We also aimed at obtaining a better understanding of the correc-tions due to extinction and nuclear activity on the derivation of the SFR. We selectedthe sample from Chandra data for the well studied region Chandra Deep Field South(CDFS) and chose the objects that also have UV and IR data from GALEX andGOODS-Spitzer respectively.
Our main finding is that there is good agreement between the extinction correctedSFR(UV) and the SFR(X), and we confirm the use of X-ray luminosities as a trustfultracer of recent star formation activity. Nevertheless, at SFR(UV) larger than about5M⊙ yr−1 there are several galaxies with an excess of SFR(X) suggesting the presenceof an obscured AGN not detected in the optical spectra. We conclude that the IRluminosity is driven by recent star formation even in those galaxies where the SFR(X)is an order of magnitude higher than the SFR(UV) and therefore may harbour anAGN. One object shows SFR(X) much lower than expected based on the SFR(UV);this SFR(X) ‘deficit’ may be due to an early transient phase before most of the massiveX-ray binaries were formed. An X-ray deficit could be used to select extremely youngbursts in an early phase just after the explosion of the first supernovae associated withmassive stars and before the onset of massive X-ray binaries.
Key words: Galaxies: fundamental parameters – ultraviolet: galaxies – X-rays: galax-ies
1 INTRODUCTION
The UV emission in galaxies traces the presence of mas-sive stars related to a recent episode of star formation. Forthis reason, the UV luminosity is widely used as a tracer ofthe star formation activity not only in nearby galaxies butalso in the early universe (e.g. Lilly et al. 1995, Madau etal. 1996). However it is important to bear in mind that thecorrections applied to the observed UV fluxes (e.g. due to ex-tinction and evolutionary uncertainties) are neither uniquenor straightforward implying that multiwavelength studies
⋆ Research Affiliate IoA, Cambridge, UK† Research Affiliate IoA, Cambridge, UK
are necessary to improve the correction factors (e.g. Buat etal. 2005, Schmitt et al. 2006).
The X-ray emission in normal galaxies – without anAGN component – is produced by high- and low- mass X-raybinaries, young supernova remnants and cooling hot gas (e.g.Fabbiano 1989). The relation between the observed X-rayluminosities and the current SFR is driven by the presenceof High Mass X-ray Binaries (HMXB) where the primarystar is a collapsed object with mass higher than 2.5 M⊙
and the secondary star is a massive star classified as O, B orWolf Rayet (Van Bever and Vanbeveren 2000, Cervino, Mas-Hesse and Kunth 2002). Due to the strong correlation foundbetween the X-ray luminosity and other tracers of recent starformation activity such as the FIR luminosity (David, Jones
c© 2004 RAS

2 Rosa–Gonzalez et al.
and Forman 1992) the radio emission (Ranalli, Comastri andSetti 2003) and the number of HMXB (Grimm et al. 2003),the X-ray luminosity has been used to calculate the starformation rate (SFR) even at high redshift (Nandra et al.2002, Laird et al. 2005). However at large distances, it isdifficult to separate the different contributors to the X-rayluminosity, hence the estimated SFR could be jeopardizedby the presence of obscured AGN unnoticed in the opticalspectral range and also by low mass X-ray binaries (LMXB)which are not related to the recent star formation event.
In addition, in very young systems we expect to ob-serve a deviation of the SFR given by the X-ray luminosi-ties [SFR(X)] with respect to the SFR given by the UV[SFR(UV)] due to the different time scales for the emissionfrom massive stars – responsible for the UV (e.g. Mas-Hesseand Kunth 1991) – and the formation of the first HMXBwhich dominate the X-ray luminosities. These different timescales would produce a time lag between the UV and X-ray emission – depending on the upper mass of the initialmass function of the ionizing cluster – of at least a few mil-lion years. Notice that stars with masses higher than about8M⊙ end their lives as supernovae after about 40 Myr whenthey might form a binary system. Therefore, the existenceof a time lag between the formation of the massive stellarcluster and the formation of the first compact object thatcould end as a binary system opens an oportunity to usethe lack of X-rays to search for young objects of between 4and up to ∼40 Myr. The lag between the formation of thefirst massive stars and the formation of compact objects hasbeen already successfully used to find young objects usingdeep radio observations in which – as in the case of X-rays –the radio emission from supernova remnants is produced af-ter some million years of the formation of the stellar cluster(Rosa-Gonzalez et al. 2007).
Multi-wavelength observations of the Chandra DeepField South (CDFS) – one of the best studied patches of thesky – have contributed to our understanding of fundamentalprocesses in galaxy evolution (e.g. Giacconi et al. 2001, Tozziet al. 2001, Gabasch et al. 2004, Adami et al. 2005, Ferreraset al. 2005). In this paper we focus on the relation betweenthe observed UV and X-rays based on archival data providedby the Great Observatories Origins Deep Survey (GOODS)for the CDFS, to study in detail the relation between theSFR(UV) and the SFR(X). We also include data obtainedfrom the Spitzer archives for estimating the star formationbased on Infrared luminosities [SFR(IR)] and to put strin-gent limits on the extinction corrections applied to the UVfluxes.
This paper is organized in the following way: in Sec-tion 2 we describe the galaxy sample; the method adoptedto obtain UV fluxes is presented in Section 3, and in Sec-tion 4 we obtain the star formation rate from UV and X-rayluminosities. The contamination by AGN and the existenceof fainter than expected X-ray galaxies are discussed in Sec-tion 5. Section 6 describes the FIR data of our subsampleof galaxies detected with Spitzer and the derived SFR(IR).Conclusions are presented in Section 7.
Throughout this work a standard, flat ΛCDM cosmol-ogy with ΩΛ= 0.7 and H0 = 70 km s−1 Mpc−1 is assumed.
2 THE SAMPLE
The Chandra Deep Field South (CDFS), centered in co-ordinates α2000 = 03h32m25s and δ2000 =-27o48′50′′, wasobserved during 942 ksec using the Advanced CCD Imag-ing Spectrometer on board the Chandra X-ray observatory.The CDFS data also include optical identifications based onR band imaging of the field (Giacconi et al. 2002, Rosatiet al. 2002, Alexander et al. 2003). We cross–correlated theChandra observations of the CDFS with UV data from theGalaxy Evolution Explorer (GALEX).
GALEX is a NASA Small Explorer Mission launched onthe 28th. of April 2003 developed in cooperation with theCentre National d’Etudes Spatiales of France and the SouthKorean Ministry of Science and Technology. It was designedto perform several surveys in two ultraviolet bands: FUVcentered at 1530A and NUV at 2310A. The detailed char-acteristics of GALEX are given in Morrissey et al. (2005).In brief, with a very wide 1.o25 field of view and an an-gular resolution of ∼ 5′′(FWHM), GALEX is performingthe first ultraviolet All-sky Imaging Survey (AIS) down tomAB = 20.5. The GALEX data at 2312 A (Near-UV), and1522 A (Far-UV) used in this work were obtained directly
from the MAST archive‡ and they are part of the GALEXDeep Imaging Survey project which reaches a magnitudelimit of mAB = 25.
Alexander et al. (2003) listed 326 CDFS sources ofwhich 293 were detected in the soft band (0.5–2 kev), 198 inthe hard band (2–10 kev) and 174 in both. We searched forthe GALEX counterpart in a circle of 5′′ radius including theposition errors both in GALEX and in Chandra. We wereleft with a preliminary subsample of 59 objects that includesonly those detected in the two GALEX bands. Some objectsthat are just upper limits in one or both of Chandra bandswere still retained in the analysis that follows. Notice thatthese weak sources were extracted from the main catalog byAlexander et al. (2003) where an X-ray source is defined asan object that is detected with a false-positive probabilityhigher than 10−7, at least in one of the seven standard bandsdefined in their paper. This first selection, would have ex-cluded most of the obscured AGNs contained in early typegalaxies, and also starforming galaxies with redshift largerthan about 1. The following step was to use the broad pho-
tometric classification given by the COMBO-17 team § toselect only objects classified as galaxies excluding QSO orSeyfert 1. The COMBO-17 classification is based on both thesize of the image, and the colours of the object. Objects withclearly extended morphology are classified as galaxies whilecompact objects which present a power law continuum areclassified as QSO (Wolf et al. 2004). After inspection of theprovided images (optical and UV) we removed those objectsfor which the GALEX source was not univocally associatedto an optical counterpart. In table 1 we present the finalsample of 29 galaxies including CDFS132, for which bothX-ray fluxes are considered upper limits.
‡ Multimission archive at STScI; http://archive.stsci.edu/§ COMBO-17 (Classifying Objects by Medium-Band Observa-tions - a spectrophotometric 17-filter survey) is a photometricsurvey perfomed with the MPG/ESO 2.2-m telescope at La Silla,Chile (Wolf et al. 2004).
c© 2004 RAS, MNRAS 000, 1–16

Multiwavelength Study of the Chandra Deep Field South 3
The separations between the Chandra and the corre-sponding GALEX source are smaller than 3′′ except forCDFS213 and CDFS325. For these galaxies we check thepositions given by Giacconi et al. (2002) and found thatthey lie closer to the optical couterpart. Different positiondeterminations are expected when different extraction meth-ods are used on difuse weak sources. The fluxes provided bythese authors for these sources are similar in both soft andhard band; for the soft X-rays flux of CDFS213, Alexanderet al. considered the value as an upper limit while Giacconiet al. give the soft X-ray flux as a detection.
As we mentioned above, some of the Chandra detectionsare only upper limits but we left them in the sample as theyhave been detected by GALEX in the two UV bands.
Table 1 lists UV and X-ray fluxes of the selected objects.It also includes the corresponding R band and the photomet-ric redshift based on COMBO-17 observations when spec-troscopic data was not avaliable. The COMBO-17 observa-tions of the CDFS include five different broad band filters(U,B,V,R and I) and 12 narrow filters necessary to constrainthe photometric redshifts with an accuracy of about 5% atz<∼1 (Wolf et al. 2004). The optical broad band data arepresented in Table 2.
The spectroscopic redshift (zsp) comes from Szokoly etal. (2004) except for CDFS132 and CDFS185 for which zsp
comes from the recent work by Ravikumar et al. (2006).
3 EXTINCTION-CORRECTED UV FLUXES
FROM TEMPLATE FITTING
To obtain the intrinsic UV flux at rest frame 2000 A fromthe optical spectra and UV observed values we adopteda template fitting approach (Bolzonella, Miralles, & Pello2000; Babbedge et al. 2004). We used 5 different galaxy tem-plates calculated with the GRASIL code (Silva et al. 1998)
that are accessible from a library of galaxy models ¶. Theextinction–free templates represent spirals (Sa, Sb and Sc),and the starburst galaxies M82 and Arp220. Notice that,for spirals, the obtained galaxy type represents an averageof the observed spectral energy distribution, but due to thelarge dispersion present in most of the observables (e.g. abso-lute magnitudes, colours) and in derived physical properties(like star formation history) we can not unequivocally as-sign a morphological type to a single spectrum. Therefore,the galaxy templates just correspond to an average of theintrinsic stellar emitted light without extinction; we do notattempt to fit as well a galaxy type.
From the comparison of models and observations weobtained the best match using a χ2 minimization. The ob-served data included the five optical bands (Table 2) pro-vided by Wolf et al. (2004) plus the two UV GALEX bands.For each object the original GRASIL template was shiftedaccording to the zsp or the COMBO-17 photometric redshift.The observed flux Fo(λ) and the flux given by the template,Ft(λ) can be expressed as a function of the extinction as(e.g. Osterbrook 1989)
Fo(λ) = Ft(λ) × 10−0.4AV k(λ)/R (1)
¶ http://web.oapd.inaf.it/granato/grasil/modlib/modlib.html
where the values k(λ) and R are tabulated for different ex-tinction curves. It is known that the appropriate extinctioncurve for local galaxies depends on the type of galaxy andon parameters, such as metallicity, that presumably deter-mine the characteristics of the dust. These parameters arenot known for the selected sample, so we included the ex-tinction law as one of the unknowns in the fitting grid.The best fit was found in a three dimensional grid wherewe change the galaxy template, the value of the visual ex-tinction (AV ) and the extinction curve. For this analysiswe adopted three different extinction curves: Milky Way(MW; Seaton 1979, Howarth 1983), Large Magallanic Cloud(LMC; Howarth 1983) and Calzetti law for starburst galax-ies (Calzetti; Calzetti, Kinney and Storchi-Bergmann 1994).Unfortunaly there is no independent information to furtherconstrain the extinction (e.g. hydrogen emission line ratios)or the morphologies of the galaxies (the optical images pro-vided by COMBO-17 are not good enough for a detailedmorphological study).
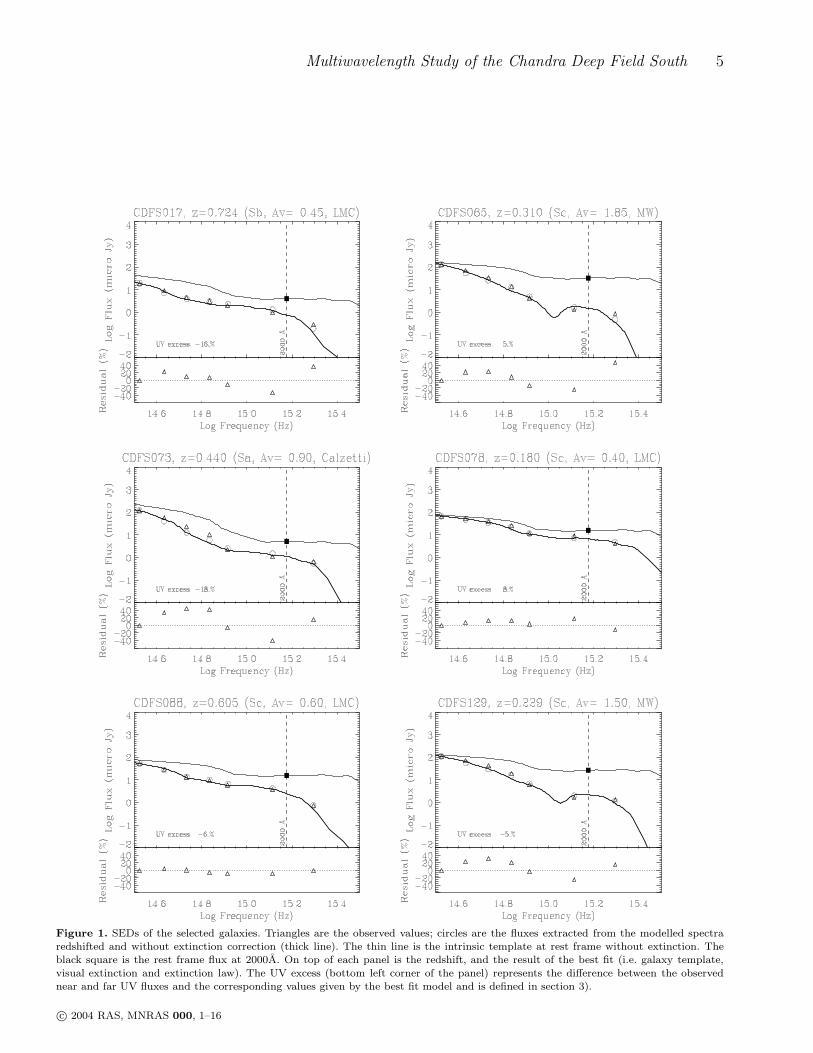
The results of the fitting are presented in Table 3 andthe individual fitted spectra compared to observed valuesare plotted in Figure 1. Once the best fit is obtained wecalculate the extinction corrected UV flux at 2000 A in thecorresponding rest frame template (Table 3). The providedUV flux corresponds to the rest frame value at 2000 A andit is directly obtained from the dust free template takinginto account the redshift of the source. A UV excess, thatquantifies the deviation of the model from the observed UVvalues, is calculated by adding the difference between theobserved near and far UV fluxes and the corresponding val-ues given by the best fit model. The obtained quantities,normalized by the sum of the observed UV fluxes and mul-tiplied by 100, are around ±15% and are indicated as labelsto the individual panels in Figure 1.
The rescaling of the original template to the observedflux in the I band, gives an estimate of the stellar content ofthe galaxies (Table 3). However, as the I band could be con-taminated by the emission of massive stars (red supergiants)which do not contribute significantly to the total mass of thegalaxy, the given stellar mass should be treated as an upperlimit of the total stellar mass.
c© 2004 RAS, MNRAS 000, 1–16

4 Rosa–Gonzalez et al.
Table 1. X-ray and UV characteristics of the selected objects. The columns are: object name, separation between Chandra and GALEXpositions (Chandra positions are from Alexander et al. 2003; in parenthesis, distances using positions by Giacconi et al. (2002) ), fluxand luminosity in the soft and hard X-ray bands1, Near-UV, Far-UV, R band and photometric redshift (spectroscopic redshift in boldif available). Units of the X-ray fluxes are 10−15erg s−1cm−2.
Name Separation F0.2−2 keV F2−10 keV Log L0.2−2 keV Log L2−10 keV Near-UV Far-UV R z(′′) (erg s−1) (erg s−1) micro Jy micro Jy (mag.)
CDFS017 0.47 1.08 2.59 42.60 42.98 0.99 0.30 21.42 0.724± 0.045CDFS065 1.19 < 0.09 1.14 < 40.54 41.64 1.32 0.90 19.22 0.310CDFS073 0.80 0.10 < 0.76 40.98 < 41.86 1.07 0.66 19.36 0.440± 0.013CDFS078 2.93 1.88 3.94 41.29 41.61 8.97 4.33 19.58 0.180± 0.009CDFS088 0.82 2.48 18.73 42.74 43.62 3.85 0.74 20.16 0.605CDFS129 0.14 0.22 < 0.94 40.61 < 41.24 1.61 1.37 19.18 0.229CDFS132 0.93 < 0.06 < 0.32 < 40.06 < 40.78 6.19 4.24 20.37 0.232CDFS149 0.50 0.23 0.75 40.06 40.57 4.67 2.97 20.12 0.131CDFS152 0.56 0.06 < 0.26 40.13 < 40.76 10.28 7.66 19.89 0.248CDFS158 1.04 0.09 < 0.33 40.71 < 41.28 3.32 0.93 20.71 0.363CDFS167 0.84 0.09 < 0.58 41.24 < 42.05 1.73 0.52 20.52 0.577CDFS185 1.02 0.06 < 0.42 40.93 < 41.77 2.80 1.37 22.20 0.511CDFS189 0.88 0.81 < 0.34 40.07 < 39.70 62.46 41.54 16.55 0.075± 0.01CDFS192 0.90 0.57 0.71 40.05 40.14 35.35 23.69 17.06 0.086± 0.012CDFS196 0.68 0.07 < 0.37 41.31 < 42.03 1.40 0.25 21.46 0.667CDFS207 0.81 0.18 0.93 39.83 40.54 4.75 3.16 17.08 0.115± 0.005CDFS213 4.90(3.02) 0.12 1.50 39.00 40.10 30.49 22.34 16.19 0.058± 0.003CDFS228 0.52 0.15 < 1.21 39.88 < 40.79 2.50 0.61 18.23 0.132± 0.01CDFS236 0.47 0.08 < 0.31 40.92 < 41.51 5.57 2.70 20.97 0.456CDFS238 0.76 0.06 < 0.29 40.10 < 40.78 1.55 1.02 20.10 0.241CDFS240 0.55 1.98 37.83 41.86 43.14 2.91 0.65 18.86 0.304± 0.003CDFS265 1.35 0.14 < 0.60 41.19 < 41.82 6.04 1.51 19.47 0.467± 0.008CDFS267 0.39 0.11 0.21 39.30 39.58 9.54 7.86 20.27 0.083± 0.005CDFS270 0.96 0.89 < 0.85 40.52 < 40.50 8.25 2.40 16.07 0.115± 0.005CDFS291 0.94 0.22 < 0.64 39.83 < 40.29 22.84 16.62 17.11 0.105CDFS292 0.45 0.22 < 0.72 41.11 < 41.63 20.97 13.28 19.87 0.366CDFS294 0.25 0.23 < 0.81 39.95 < 40.50 17.21 15.24 18.03 0.117± 0.006CDFS304 0.92 1.00 9.23 41.93 42.90 1.41 0.88 20.35 0.424CDFS325 3.57(1.4) 1.45 5.62 41.87 42.46 5.27 2.81 19.88 0.347
1 CDFS sources have been detected in at least one of the seven bands defined in Alexander et al 2003 (see text).
4 CORRELATION BETWEEN UV AND
X-RAY LUMINOSITIES
A strong correlation between the star formation rate calcu-lated from the UV [SFR(UV)] and from the X-ray luminosi-tites [SFR(X)] in the observed galaxies, if it exists, wouldsuggest, naıvely, that these luminosities are dominated bya young stellar population. Due to different timescales inthe processes involved, however, there is a very early stagewhen X-rays would not have yet been produced, as has beendiscussed in the Introduction.
There are several published relations between the UVluminosity and the current star formation rate, that also dis-cuss the difficulty of correcting the observed UV fluxes fromextinction (e.g. Madau, Pozzetti and Dickinson 1998; Rosa-Gonzalez, Terlevich and Terlevich 2002). For solar metallic-ity and a Salpeter IMF, the SFR(UV) is given by (Kennicutt1998),
SFR(UV )(M⊙yr−1) = 1.4 × 10⁻²⁸L2000(erg s−1 Hz−1) (2)
where L2000 is the extinction–corrected luminosity per unitof frequency at the rest frame wavelength of 2000 A.
For the X-ray luminosities we adopted the empirical lawderived by Ranalli et al. (2003) who combined the existing
relations between the SFR and the infrared and radio lu-minosities (Condon 1992, Kennicutt 1998) with the strongcorrelation between X-ray and IR observed in a sample oflocal star forming galaxies,
SFR(X)(M⊙yr−1) = 2.2 × 10−40L0.2−2kev (3)
This relation is, within the errors, equal to that byBauer et al. (2002) based on the correlation betweeen theSFR obtained by radio and the X-ray luminosities of galax-ies from the Chandra Deep Field North. Other calibrationsof the SFR(X) are based on the HMXB luminosities (e.g.Grimm et al. 2003, Persic et al. 2004). The relation betweenthe integrated luminosity of the HMXBs in the 2–10 keVband strongly correlates with the SFR given by the IR lumi-nosities and shows a very small scatter, smaller in fact thanthe scatter observed if the total X-ray luminosity is used.However due to the impossibility of separating the HMXBfrom the total luminosity we are forced to use Ranalli et al.(2003) empirical relation.
Figure 2 shows the SFR(X) obtained from equation 3against SFR(UV). We find that most of the galaxies lie closeto the solid line defined as SFR(X)=SFR(UV) even at lowvalues of the SFR(UV) (<∼ 5 M⊙ yr−1); this contradicts pre-
c© 2004 RAS, MNRAS 000, 1–16
Multiwavelength Study of the Chandra Deep Field South 5
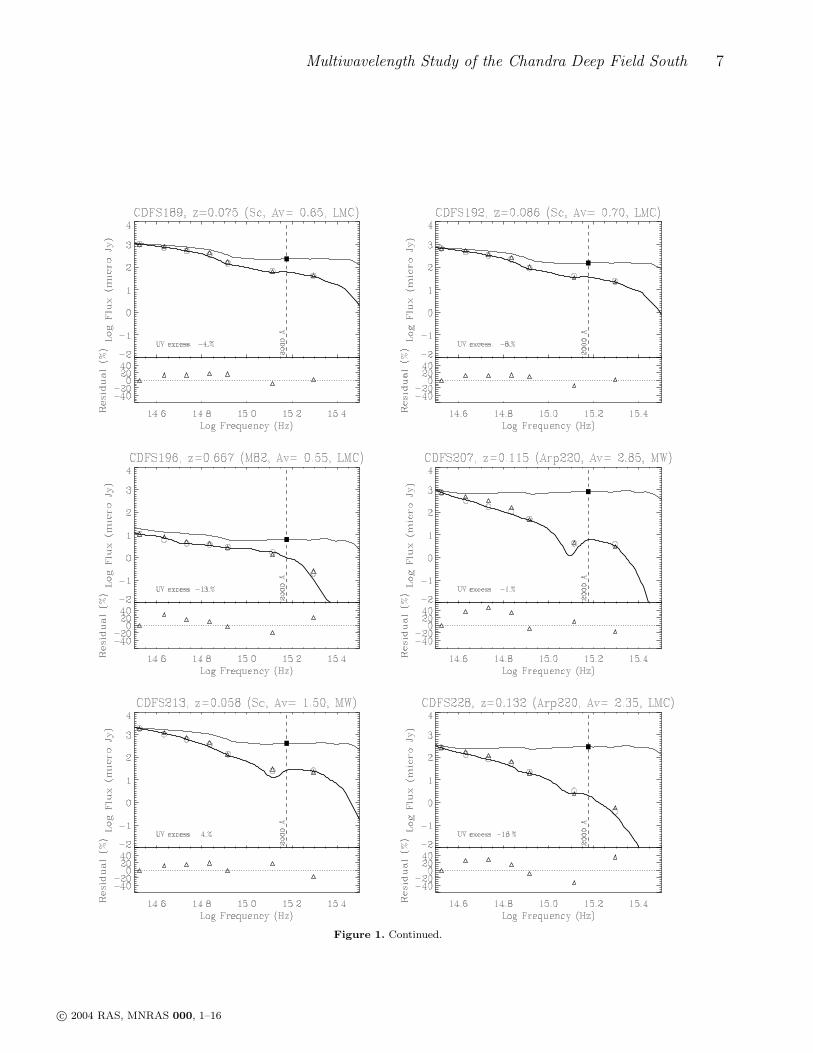
Figure 1. SEDs of the selected galaxies. Triangles are the observed values; circles are the fluxes extracted from the modelled spectraredshifted and without extinction correction (thick line). The thin line is the intrinsic template at rest frame without extinction. Theblack square is the rest frame flux at 2000A. On top of each panel is the redshift, and the result of the best fit (i.e. galaxy template,
visual extinction and extinction law). The UV excess (bottom left corner of the panel) represents the difference between the observednear and far UV fluxes and the corresponding values given by the best fit model and is defined in section 3).
c© 2004 RAS, MNRAS 000, 1–16

6 Rosa–Gonzalez et al.
Figure 1. Continued.
c© 2004 RAS, MNRAS 000, 1–16
Multiwavelength Study of the Chandra Deep Field South 7
Figure 1. Continued.
c© 2004 RAS, MNRAS 000, 1–16

8 Rosa–Gonzalez et al.
Figure 1. Continued.
c© 2004 RAS, MNRAS 000, 1–16

Multiwavelength Study of the Chandra Deep Field South 9
Figure 1. Continued.
c© 2004 RAS, MNRAS 000, 1–16

10 Rosa–Gonzalez et al.
Table 2. Optical magnitudes of the selected objects.
Name I R V B U
CDFS017 20.205 21.294 22.335 22.785 22.390CDFS065 18.147 19.112 20.104 21.197 21.566CDFS073 18.255 19.258 20.525 21.511 22.229CDFS078 18.851 19.440 19.923 20.522 20.457CDFS088 19.103 20.069 21.112 21.622 21.204CDFS129 18.308 19.064 19.822 20.799 21.122CDFS132 19.809 20.273 20.722 21.312 21.029CDFS149 19.433 20.004 20.529 21.109 21.081CDFS152 19.376 19.784 20.221 20.774 20.355CDFS158 19.975 20.583 21.252 22.106 21.688CDFS167 19.373 20.401 21.663 22.392 22.144CDFS185 22.012 22.130 22.811 23.069 22.199CDFS189 15.875 16.420 16.986 17.464 17.539CDFS192 16.328 16.905 17.499 18.013 18.136CDFS196 20.823 21.363 22.175 22.516 22.043CDFS207 16.230 16.949 17.642 18.490 18.972CDFS213 15.240 16.021 16.770 17.395 17.803CDFS228 17.371 18.073 18.758 19.548 19.883CDFS236 20.325 20.843 21.471 21.913 21.120CDFS238 19.198 20.023 20.809 21.680 21.805CDFS240 17.919 18.710 19.466 20.550 20.878CDFS265 18.647 19.330 20.246 20.845 20.457CDFS267 19.826 20.136 20.320 20.798 20.535CDFS270 15.190 15.934 16.637 17.505 18.027CDFS291 16.332 16.971 17.605 18.283 18.549CDFS292 19.467 19.756 20.131 20.597 19.738CDFS294 17.264 17.895 18.482 19.143 19.301CDFS304 19.309 20.223 21.321 22.175 22.176CDFS325 18.937 19.777 20.653 21.267 21.193
vious claims by Grimm, Gilfanov and Sunyaev (2003) whichare based on the luminosity of HMXB alone. In contrast,we would like to remark that the expression (used by us)given by Ranalli et al. (Equation 3) is obtained by directcomparison between radio and IR luminosities and there-fore, it refers to the total X-ray luminosity which includes,apart from the contribution due to HMXB and LMXB, theemission from young SNRs and the diffuse hot gas. Noticealso that when the X-ray luminosity is low, the SFR(X) de-rived from HMXB emission could be severely affected bystochastic effects since the flux would be dominated by afew binaries. The strong correlation found by Ranalli et al.extends to low values of the SFR (<∼ 0.1 M⊙ yr−1), and thepresence of LMXB that are not associated with the presentstar formation activity seems to be a minor effect. However,for galaxies with SFR smaller than 1M⊙year−1 and massestypical of a spiral galaxy, the X-ray luminosities and thederived SFR(X) could have an important contribution fromLMXB affecting the observed correlation. We estimate inwhat follows the X-ray luminosity due to LMXB. Grimm,Gilfanov and Sunyaev (2002) found a relation between thestellar mass and the total X-ray luminosity produced byLMXBs in the Galaxy. They compared the integrated lumi-nosity function of galactic LMXB detected by the All-SkyMonitor aboard the Rossi X-ray Timing Explorer and as-sumed a stellar mass for the Galaxy of 5×10¹⁰M⊙, in orderto get the X-ray luminosity per unit stellar mass due toLMXB,
LX(LMXB)(erg s−1) = 5 × 1028Ms (4)
where the stellar mass (Ms) is given in solar masses.
By combining the derived stellar masses (Table 3) withequation 4 we computed the luminosity produced by theLMXB and the percentage of the derived SFR(X) not re-lated to the recent star formation activity. The obtained val-ues presented in Table 3 show that the contamination of theestimated SFR(X) due to LMXB is lower than 20% for allthe cases except for CDFS213. In fact the X-ray luminosityof CDFS213 could be fully explained as due to emission fromLMXBs. This “extreme” galaxy is further discussed in Sec-tion 5. In order to visualize the LMXB contribution to theSFR(X) we calculated the X-ray luminosity for a starforminggalaxy having a stellar mass somewhere between the proto-type starburst galaxy (M82; stellar mass Ms = 5 × 10⁹M⊙,Mayya et al. 2006) and the typical mass of a spiral galaxylike the Milky Way (MW, Ms = 5 × 10¹⁰M⊙, Grimm et al.2002). We took arbitrarily Ms as 5 times larger than that ofM82 and represented the corresponding SFR(X) in Figure 2by a dotted line.
Figure 3 shows the histogram of the logarithm of theratio between the SFR(X) and SFR(UV) (∆XUV). The his-togram shows clearly that for the majority of the galaxiesthe SFR(X) is similar to SFR(UV), and that there are fivegalaxies with ∆XUV >1, and one galaxy with ∆XUV< −1.The nature of these galaxies is discussed in the next section.
c© 2004 RAS, MNRAS 000, 1–16

Multiwavelength Study of the Chandra Deep Field South 11
Table 3. Best template fit, estimated stellar mass (M⋆) and derived UV flux at 2000A (rest frame and extinction corrected). F2000*is the corrected flux combining optical, UV and Spitzer fluxes. Column 7 gives the derived SFR(UV) (in parenthesis, using the F2000*values). Column 8 is the SFR(X) (in parenthesis the SFR given by the hard X-rays for galaxies probably harbouring an obscured AGN).Column 9 represents the percentage of the SFR(X) that could be contaminated by the luminosity of LMXB.
Name Template M⋆ Extinction AV log F2000 log F2000∗ SFR(UV) SFR(X) LMXB Notes(×1010M⊙) Curve (mag.) (micro Jy) (micro Jy) (M⊙ yr−1) (M⊙ yr−1) %
CDFS017 Sb 14 LMC 0.45 0.61 – 13 866(1888) 0.18 (a)CDFS065 Sc 5.6 MW 1.85 1.51 1.42 14 7.6 8.0CDFS073 Sa 39 Calzetti 0.90 0.71 0.90 5.1 21 20CDFS078 Sc 0.87 LMC 0.40 1.20 1.08 2.0 43(82) 0.22 (a)CDFS088 Sc 11 LMC 0.60 1.19 1.60 33 1212(8321) 0.10 (a)CDFS129 Sc 2.4 MW 1.50 1.43 1.83 5.9 8.9 3.0CDFS132 Sc 0.62 LMC 0.10 0.83 0.84 1.5 2.5 2.7CDFS149 Sc 0.26 LMC 0.40 0.95 1.02 0.57 2.5 1.1CDFS152 M82-like 0.92 LMC 0.25 1.27 1.12 4.9(3.4) 2.9 3.4 (b)CDFS158 Sc 1.5 LMC 0.45 0.80 1.10 4.0 11 1.4CDFS167 Sb 16 Calzetti 0.95 0.86 0.68 14 39 4.7CDFS185 Arp220-like 0.13 MW 0.30 0.64 0.77 6.2 19 0.08CDFS189 Sc 2.1 LMC 0.65 2.36 2.47 4.4 2.6 9.0CDFS192 Sc 1.9 LMC 0.70 2.18 2.27 3.9 2.5 8.3CDFS196 M82-like 2.4 LMC 0.55 0.80 1.05 17.0 45 0.58CDFS207 Arp220-like 1.2 MW 2.85 2.92 0.94 40(0.42) 1.5 8.5 (b)CDFS213 Sc 2.2 MW 1.50 2.62 2.26 4.7(2.1) 0.22 110 (c,d)CDFS228 Arp220-like 0.54 LMC 2.35 2.47 – 19 1.7 3.6CDFS236 M82-like 1.5 LMC 0.20 0.94 1.54 9.4 18 0.91CDFS238 Sc 1.2 MW 1.20 1.07 1.21 2.9 2.7 4.7CDFS240 Sc 6.5 LMC 1.25 1.60 2.07 17 160(2783) 0.45 (a)CDFS265 M82-like 7.4 Calzetti 1.30 1.61 1.62 46 34 2.4CDFS267 Arp220-like 0.02 LMC 0.55 1.45 1.40 0.67 0.44 0.51CDFS270 Sc 9.7 LMC 1.95 2.65 1.57 21(1.8) 7.3 15 (b)CDFS291 Sc 2.8 LMC 0.90 2.19 1.63 6.1(1.7) 1.5 21 (b)CDFS292 Arp220-like 0.73 Calzetti 0.55 1.68 1.84 31 28 0.28CDFS294 Sc 1.5 MW 0.75 1.82 – 3.3 2.0 8.4CDFS304 Sb 8.0 Calzetti 0.95 0.83 – 6.1 189(1587) 0.47 (a)CDFS325 Sc 3.5 MW 0.75 1.21 – 9.2 164(577) 0.23 (a)
Notes on individual galaxies: (a) Possible obscured AGN, (b) galaxies in which we used the Spitzer data to correct the observed UVfluxes, (c) extremely weak in X-ray and (d) high contamination due to LMXB.
5 CONTAMINATION BY HIDDEN AGN AND
THE DISCOVERY OF X-RAY WEAK
GALAXIES
Figures 2 and 3 show that most of the galaxies (∼62% ofthe sample) lie within ±0.5 dex of the line which definesSFR(UV) = SFR(X) (∆XUV=0) consistent with them be-ing normal star forming galaxies. However, when SFR(UV)is higher than 5M⊙ yr−1 the scatter is significantly larger.Similar amounts of scatter reaching lower SFRs are found inother samples of galaxies when Seyfert 2 and LINER galax-ies are included in the relation between the SFR and theX-ray luminosity (e.g. Ranalli et al. 2003).
The large scatter seems to be related to two differentphenomena: i) galaxies that could be contaminated by thepresence of very obscured AGN that will cause the X-raysto be bright and the UV, faint, and ii) X-ray weak galaxiesdue to a small number of HMXB for a given SFR, or toan overcorrection of the observed UV fluxes. i) All galaxieswith SFR(X) higher than 100 M⊙ yr−1 show a ∆XUV largerthan 1; they could be contaminated by a very obscured AGNnot present in the optical SED but which nevertheless ispowering the X-rays (Comastri et al. 2001, Maiolino et al.
2003 and references therein). Figure 4 shows VLT spectraof three of these galaxies for which ∆XUV is larger than 1.
The spectra were extracted from Szokoly et al. (2004) ‖.CDFS088 is the only one of the three galaxies that
shows high excitation emission lines (e.g. [Ne V]) and strongoxygen lines suggestive of nuclear activity. The other twogalaxies do not present strong emission lines. They are clas-sified as normal galaxies (note that Szokoly et al. 2004 clas-sified these two galaxies as low emission line galaxies). Wewould like to remark, however, that strong optical lines dueto the presence of an AGN could have fallen outside thespectral optical range.
Hard X-rays may indicate that an AGN is present andthis can be tested by calculating the SFR given by hard X-rays [SFRhard(X)], and comparing it to the SFR(X) givenby the soft band.
All the galaxies with SFR(X) higher than 100 M⊙ yr−1
were detected in the hard X-ray band (Table 1 and Table 3).
‖ Szokoly et al. spectra obtained from the dedicated page:http://www.mpe.mpg.de/CDFS/data/
c© 2004 RAS, MNRAS 000, 1–16

12 Rosa–Gonzalez et al.
Figure 2. Open circles represent the SFR given by the UV ver-sus the SFR given by the soft X-ray [SFRsoft(X)]. The solid linerepresents equal values and the dashed lines a deviation of 0.5dex. Solid circles are the SFR calculated using the hard X-ray[SFRhard(X)] for the galaxies with ∆XUV greater than 1 (dot–dashed line). The arrows point to the SFR(UV) calculated usingthe empirical relation between the FIR luminosity and the extinc-tion in the UV for galaxies with ∆XUV ≤-0.5 detected by Spitzer.CDFS228, the outlier not observed by Spitzer, is marked. The hor-izontal dotted lines show the contamination due to LMXB for agalaxy with 5 times more stars than M82 and for a typical spiralgalaxy, as labelled (see text).
The corresponding SFR was calculated as (Ranalli et al.2003),
SFRhard(X)(M⊙yr−1) = 2. × 10−40L2−10kev(erg s−1) (5)
The calculated SFRhard(X) in these galaxies is higher thanthat obtained from the soft X-rays (see solid circles in Fig-ure 2), supporting the presence of an obscured AGN (orpartially obscured as for CDFS088).
The given SFR(X) in the soft and hard bands are basedon the empirical results from Ranalli et al. (2003) whichcompared the X-ray with IR and radio luminosities closelyrelated to recent star forming events. The observed scatteris around 0.3 dex covering the X-ray luminosity range from1038 to 1042 erg s−1. If the observed luminosities are due toLMXB, an X-ray luminosity of 4.5×1041 erg s−1 (equivalentto a SFR of 100M⊙ year−1) would imply the existence of agalaxy with an unfeasible stellar mass of about 1013M⊙. Inall the galaxies with SFR(X) greater than 100 M⊙ year−1
and ∆XUV higher than 1 the estimated contamination dueto LMXB is lower than 1% (Table 3). The suggestion beingtherefore that most of the X-ray luminosity for these objectsis related to the presence of a central massive black hole, andthe contribution due to LMXB and star forming processesis quite small.
CDFS078 is one of the galaxies for which ∆XUV is
Figure 3. Histogram of the relation between the SFR given bythe UV and by the X-rays. The mean and standard deviation areshown at the top.
higher than 1. In this case the SFR(UV) is about 2 M⊙
year−1 but the SFR(X) is 43 and the SFRhard(X) is close to100. Unfortunately this galaxy has no optical spectrum butit seems to be a low luminosity counterpart of the possibleactive galaxies discussed above.
Notice that for galaxies with ∆XUV>1, the absolutevalue of the UV excess defined as the difference between theobserved UV flux and the flux given by the model is below20%, therefore, the model seems to be a good representationof the stellar content of the galaxy and the observed UVfluxes are not heavily affected by the presence of an AGN.
In any case, we can not rule out the presence of anobscured, compact and very powerful star forming regionof which we are only detecting a small fraction of the pro-duced UV-optical emission. This effect known as age selec-
tive extinction is observed in the central regions of powerfulstarburst galaxies (e.g. Mayya et al. 2004).ii) Two galaxies CDFS207 and CDFS228 with SFR(UV)higher than 15M⊙ yr−1 show very low X-ray emission im-plying SFR(X) of about 1.5 M⊙ yr−1. These galaxies arethe most obscured ones in our sample (AV =2.85 and 2.35respectively) and are compatible with an Arp 220-like tem-plate. Of them, only CDFS228 was detected in the hardX-rays band, and the deduced SFRhard(X) ∼ 7 is still 6times lower than the corresponding SFR(UV).
For Arp220, the ratio between the X-ray luminositiesand the UV corrected by extinction LX/(ν LUV )= 1.7×10⁻³
(UV data obtained from Goldader et al. 2002 and X-ray datafrom Iwasawa et al. 2001), is similar to the values obtainedfor CDFS185 and CDFS207 of 1.2×10⁻³ and 1.6×10⁻³ re-spectively. However CDFS228 has a value of LX/(ν LUV )=4×10⁻⁵ indicating that we are probably overestimating theUV corrections. Unfortunately this galaxy was not observed
c© 2004 RAS, MNRAS 000, 1–16

Multiwavelength Study of the Chandra Deep Field South 13
Figure 4. VLT spectra of three of the five galaxies with ∆XUV > 1. The spectra were extracted from Szokoly et al. (2004).
by Spitzer so we could not further analyse the correctionfactor applied to the UV fluxes as discussed in the followingsection. The ratio LX/(ν LUV ) for the other two galaxies fit-ted with an Arp220-like spectrum is about a factor of fourbelow the Arp220 value.
Another extreme galaxy is CDFS213 where an impor-tant fraction of the observed X-ray flux could be due to thepresence of LMXBs (see Figure 2). In any case, even if theobserved X-ray flux has a strong contribution from LMXBswhich are not related to a recent burst, the estimated ∆XUVis smaller than -1. For estimating the SFR(X) in this galaxy,we are using the flux provided by Giacconi et al. (2002) in-stead of the upper limit provided by Alexander et al. (2003).If we consider that the observed X-ray luminosity is just anupper limit, the nature of this galaxy would be even moreextreme.
X-ray emission in the youngest objects is dominated byHMXB, therefore a delay between the stellar UV-continuumfrom massive stars (proportional to SFR(UV)) and the firstcompact object that is created after a supernova event (re-sponsible for the deduced SFR(X)) is expected. A similardelay between the formation of stellar clusters and the pro-duction of compact objects after supernova explosions is ob-served in radio. In fact, the lack of synchrotron radiationhas helped to identify young bursts of less than ∼20 Myrs(Rosa-Gonzalez et al. 2007).
There is always the possibility that we are just overes-timating the correction factors applied to the UV fluxes andtherefore we are not observing young objects. It has been in-dicated that in some cases the fluxes in the UV range couldbe badly estimated (e.g Burgarella, Buat, & Iglesias-Paramo2005, Buat et al. 2005). We explore this possibility in thenext section using Spitzer observations of the CDFS.
6 ANALYSIS OF SPITZER DATA
The release (DR3) of the Great Observatories Origins DeepSurvey (GOODS), one of Spitzer’s Legacy Science Pro-
grams, includes MIPS ⋆⋆ 24µm images for GOODS-S and
the corresponding source list ††. Table 4 shows the fluxesat 24 µm (S24) obtained by Spitzer for our sample of CDFSgalaxies. Notice that 5 galaxies were outside the Spitzer cov-erage. The Spitzer fluxes are from DR3 except for galaxieswith a Spitzer index of 000 (see Table 4). The fluxes of thesegalaxies were extracted directly from the scientific maps, us-ing the conversion factor between observed counts and fluxesprovided by the GOODS team (e.g. Dickinson & GOODS2004).
To estimate the total infrared luminosities (integratedbetween 8 and 1000µm) the 24µm luminosities obtainedfrom the observed fluxes were transformed to infrared lu-minosities using the empirical relation given by Takeuchi etal. (2005)
log LIR = 2.01 + 0.878 log L(25µm) (6)
where both luminosities are given in solar units. This rela-tion is based on the study of 1420 galaxies with availabledata in the four IRAS bands. Takeuchi et al. (2005) showthat this formulation provides good estimates of the total IRflux in a wide variety of galaxies including extreme galaxiessuch as Arp220.
The derivation of the L(25µm) from the observed S24
fluxes, requires to assume a spectral energy distribution andto estimate the corresponding K–correction. For each galaxywe used the template obtained by the optical fit describedin Section 3 but instead of using templates that only containstellar light we use those with dust emission included. A fulldescription of the templates and the application to modelgalaxies is given in several papers by the GRASIL group(e.g. Silva et al. 1998, Panuzzo et al. 2005, Vega et al. 2005).The luminosity at a given frequency (ν) is given by
Lν = 4πD2L
Sνo
(1 + z)(7)
where DL is the luminosity distance, Sνo is the observed flux
⋆⋆ The Multiband Imaging Photometer for Spitzer (MIPS) isfully described in Rieke et al. (2004).†† http://data.spitzer.caltech.edu/popular/goods/Documents/goods dataproducts.html
c© 2004 RAS, MNRAS 000, 1–16

14 Rosa–Gonzalez et al.
at 24µm, z is the redshift of the source and ν = νo(1 + z).Once we get Lν we normalize the corresponding template tothis value and find the luminosity at λ = 25µm.
6.1 Using the FIR to correct Dust Attenuation
We have explored the possibility that galaxies with ∆XUV≤-0.5 are outliers in Figure 2 because the estimated dustattenuation is biased or not accurate enough in the absenceof FIR constraints.
To this end we computed from the observed FIR a newvalue for the corrected flux at 2000 A (F2000∗), combiningthe IR luminosities obtained in the previous section with theGALEX data. Following Burgarella et al. (2005), the extinc-tion in the GALEX bands (AF UV and ANUV ) is related tothe IR flux (FIR) by
AF UV = −0.028[Log(FIR/FF UV )]3 (8)
+0.392[Log(FIR/FF UV )]2
+1.094[Log(FIR/FF UV )] + 0.546
ANUV = −0.075[Log(FIR/FNUV )]3
+0.639[Log(FIR/FNUV )]2
+0.673[Log(FIR/FNUV )] + 0.260
where FF UV and FNUV are the rest frame far-UV and near-UV fluxes respectively. FF UV and FNUV , together with therest frame F2000, were measured from the fitted spectrumobtained in section 3. Relation (8) was used to obtain the ex-tinction in the far- and near- UV and the extinction at 2000A was calculated as the mean value of AF UV and ANUV .The extinction corrected F2000 (F2000∗) was used to esti-mate the corrected SFR(UV).
The results of this correction are shown in Figure 2,where the arrows connect the original SFR(UV) with thenew corrected values. In two cases (CDFS207 and CDFS291)the new walues are much closer to the SFR(X), but forCDFS213 the new SFR(UV) is still below the SFR givenby the X-ray luminosities by a factor of about 10. This dif-ference between the SFR estimators will remain even aftertaking into account that CDFS213 may be affected by thepresence of LMXBs as showed in Figure 2 and discussed insection 4.
Unfortunately CDFS228 (labelled in the figure) is out-side the Spitzer field of view and it was not possible to per-form for it the analysis just discussed.
6.2 Infrared SFR
A significant fraction of the optical and UV light emittedby young and massive stars is absorbed by dust grains andre-emitted in the infrared regime making this wavelengtha good tracer of the current star formation activity as con-firmed by multiple observations (e.g. Yun, Reddy & Condon2001, Schmitt et al. 2006). A relation between the IR andthe current star formation rate for normal galaxies is givenby Kennicutt (1998)
SFR(IR)(M⊙yr−1) = 4.5 × 10−44LIR(erg s−1) (9)
Figure 5. Comparison between the SFR(IR) and the SFR(UV)for the galaxies detected by Spitzer. Filled circles are the galaxieswith ∆XUV greater than 1. Open circles are galaxies for whichwe extracted the 24 µm flux from the provided maps. The solidline represents equal values and the dashed lines a deviation of0.5 dex. The arrow connects the SFR(UV) calculated using F2000with the SFR(UV) using F2000∗ for CDFS270.
Notice that LIR refers to the luminosity integrated overthe full IR espectrum covering from 8 to 1000 µm, thereforeit is equivalent to the LIR calculated by equation 6.
The SFR(IR) computed using equation 9 is given inTable 4 and plotted against the SFR(UV) in Figure 5. Ingeneral we find a good correlation between the SFR(UV)and the SFR(IR) for most of the sample galaxies detectedby Spitzer.
CDFS088 and CDFS240, both with ∆XUV greater than1, were detected by Spitzer and have a SFR(IR) similar tothe SFR(UV), confirming that the observed X-ray luminos-ity is probably dominated by nuclear activity while both UVand FIR are dominated by the stellar energy input. Unfortu-nately CDFS017, CDFS304 and CDFS325 were outside theSpitzer fields and therefore not observed.
There is one galaxy, CDFS270, that is quite far from thecorrelation showed in Figure 5. The arrow plotted in Figure 5shows the result of applying the relation 8 to estimate theextinction in the UV range and to recalculate the luminosityand the corresponding SFR(UV) as explained in 6.1.
7 CONCLUSIONS
By comparing the SFR(UV) with the SFR(X) in starforminggalaxies selected from the CDFS, we have confirmed the useof the X-ray luminosity as a reliable tracer of the currentSFR even for galaxies with SFR as low as 1 M⊙ yr−1.
The observed deviations can be explained by two differ-ent scenarios. In one case we are detecting obscured AGN
c© 2004 RAS, MNRAS 000, 1–16
Multiwavelength Study of the Chandra Deep Field South 15
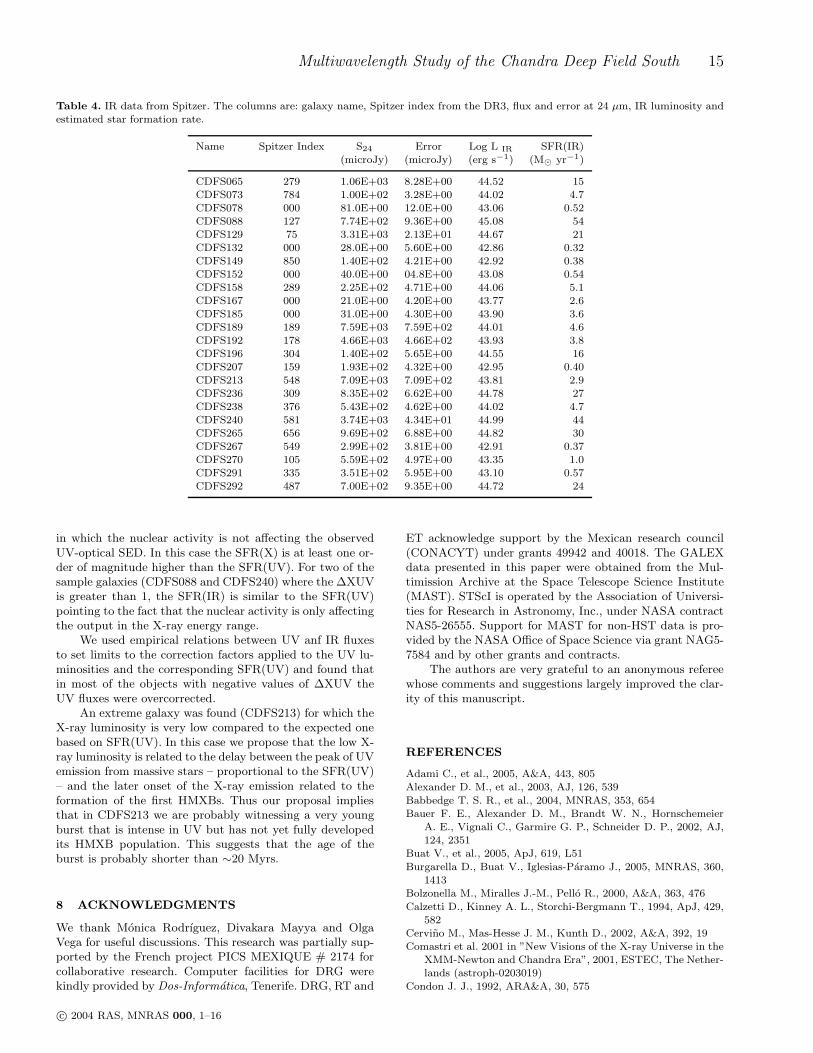
Table 4. IR data from Spitzer. The columns are: galaxy name, Spitzer index from the DR3, flux and error at 24 µm, IR luminosity andestimated star formation rate.
Name Spitzer Index S24 Error Log L IR SFR(IR)(microJy) (microJy) (erg s−1) (M⊙ yr−1)
CDFS065 279 1.06E+03 8.28E+00 44.52 15CDFS073 784 1.00E+02 3.28E+00 44.02 4.7CDFS078 000 81.0E+00 12.0E+00 43.06 0.52CDFS088 127 7.74E+02 9.36E+00 45.08 54CDFS129 75 3.31E+03 2.13E+01 44.67 21CDFS132 000 28.0E+00 5.60E+00 42.86 0.32CDFS149 850 1.40E+02 4.21E+00 42.92 0.38CDFS152 000 40.0E+00 04.8E+00 43.08 0.54CDFS158 289 2.25E+02 4.71E+00 44.06 5.1CDFS167 000 21.0E+00 4.20E+00 43.77 2.6CDFS185 000 31.0E+00 4.30E+00 43.90 3.6CDFS189 189 7.59E+03 7.59E+02 44.01 4.6CDFS192 178 4.66E+03 4.66E+02 43.93 3.8CDFS196 304 1.40E+02 5.65E+00 44.55 16CDFS207 159 1.93E+02 4.32E+00 42.95 0.40CDFS213 548 7.09E+03 7.09E+02 43.81 2.9CDFS236 309 8.35E+02 6.62E+00 44.78 27CDFS238 376 5.43E+02 4.62E+00 44.02 4.7CDFS240 581 3.74E+03 4.34E+01 44.99 44CDFS265 656 9.69E+02 6.88E+00 44.82 30CDFS267 549 2.99E+02 3.81E+00 42.91 0.37CDFS270 105 5.59E+02 4.97E+00 43.35 1.0CDFS291 335 3.51E+02 5.95E+00 43.10 0.57CDFS292 487 7.00E+02 9.35E+00 44.72 24
in which the nuclear activity is not affecting the observedUV-optical SED. In this case the SFR(X) is at least one or-der of magnitude higher than the SFR(UV). For two of thesample galaxies (CDFS088 and CDFS240) where the ∆XUVis greater than 1, the SFR(IR) is similar to the SFR(UV)pointing to the fact that the nuclear activity is only affectingthe output in the X-ray energy range.
We used empirical relations between UV anf IR fluxesto set limits to the correction factors applied to the UV lu-minosities and the corresponding SFR(UV) and found thatin most of the objects with negative values of ∆XUV theUV fluxes were overcorrected.
An extreme galaxy was found (CDFS213) for which theX-ray luminosity is very low compared to the expected onebased on SFR(UV). In this case we propose that the low X-ray luminosity is related to the delay between the peak of UVemission from massive stars – proportional to the SFR(UV)– and the later onset of the X-ray emission related to theformation of the first HMXBs. Thus our proposal impliesthat in CDFS213 we are probably witnessing a very youngburst that is intense in UV but has not yet fully developedits HMXB population. This suggests that the age of theburst is probably shorter than ∼20 Myrs.
8 ACKNOWLEDGMENTS
We thank Monica Rodrıguez, Divakara Mayya and OlgaVega for useful discussions. This research was partially sup-ported by the French project PICS MEXIQUE # 2174 forcollaborative research. Computer facilities for DRG werekindly provided by Dos-Informatica, Tenerife. DRG, RT and
ET acknowledge support by the Mexican research council(CONACYT) under grants 49942 and 40018. The GALEXdata presented in this paper were obtained from the Mul-timission Archive at the Space Telescope Science Institute(MAST). STScI is operated by the Association of Universi-ties for Research in Astronomy, Inc., under NASA contractNAS5-26555. Support for MAST for non-HST data is pro-vided by the NASA Office of Space Science via grant NAG5-7584 and by other grants and contracts.
The authors are very grateful to an anonymous refereewhose comments and suggestions largely improved the clar-ity of this manuscript.
REFERENCES
Adami C., et al., 2005, A&A, 443, 805Alexander D. M., et al., 2003, AJ, 126, 539
Babbedge T. S. R., et al., 2004, MNRAS, 353, 654Bauer F. E., Alexander D. M., Brandt W. N., Hornschemeier
A. E., Vignali C., Garmire G. P., Schneider D. P., 2002, AJ,124, 2351
Buat V., et al., 2005, ApJ, 619, L51
Burgarella D., Buat V., Iglesias-Paramo J., 2005, MNRAS, 360,1413
Bolzonella M., Miralles J.-M., Pello R., 2000, A&A, 363, 476
Calzetti D., Kinney A. L., Storchi-Bergmann T., 1994, ApJ, 429,582
Cervino M., Mas-Hesse J. M., Kunth D., 2002, A&A, 392, 19Comastri et al. 2001 in ”New Visions of the X-ray Universe in the
XMM-Newton and Chandra Era”, 2001, ESTEC, The Nether-lands (astroph-0203019)
Condon J. J., 1992, ARA&A, 30, 575
c© 2004 RAS, MNRAS 000, 1–16
16 Rosa–Gonzalez et al.
David L. P., Jones C., Forman W., 1992, ApJ, 388, 82
Dickinson, M., & GOODS 2004, Bulletin of the American Astro-nomical Society, 36, 1614
Fabbiano G., 1989, ARA&A, 27, 87
Ferreras I., Lisker T., Carollo C. M., Lilly S. J., Mobasher B.,2005, ApJ, 635, 243
Gabasch A., et al., 2004, ApJ, 616, L83
Giacconi R., et al., 2001, ApJ, 551, 624
Giacconi R., et al., 2002, ApJS, 139, 369
Giavalisco M., et al., 2004, ApJ, 600, L93
Goldader J. D., Meurer G., Heckman T. M., Seibert M., SandersD. B., Calzetti D., Steidel C. C., 2002, ApJ, 568, 651
Grimm H.-J., Gilfanov M., Sunyaev R., 2002, A&A, 391, 923
Grimm H.-J., Gilfanov M., Sunyaev R., 2003, MNRAS, 339, 793
Howarth I. D., 1983, MNRAS, 203, 301
Iwasawa K., Matt G., Guainazzi M., Fabian A. C., 2001, MNRAS,326, 894
Kennicutt, R. C., J., 1998, ARAA, 36, 189
Laird E. S., Nandra K., Adelberger K. L., Steidel C. C., ReddyN. A., 2005, MNRAS, 359, 47
Lilly, S. J., Tresse, L., Hammer, F., Crampton, D., and Le Fevre,O.: 1995, ApJ, 455, 108
Madau, P. , Ferguson, H. C. , Dickinson, M. E. , Giavalisco, M. ,Steidel, C. C. and Fruchter, A., 1996, MNRAS, 283, 1388
Madau, P., Pozzetti, L., and Dickinson, M., 1998, ApJ, 498, 106
Maiolino R., et al., 2003, MNRAS, 344, L59
Mas-Hesse J. M., Kunth D., 1991, A&AS, 8
Mayya Y. D., Bressan A., Rodrıguez M., Valdes J. R., ChavezM., 2004, ApJ, 600, 188
Mayya Y. D., Bressan A., Carrasco L., Hernandez-Martinez L.,2006, ApJ, 649, 172
Morrissey P., et al., 2005, ApJ, 619, L7
Nandra K., Mushotzky R. F., Arnaud K., Steidel C. C., Adel-berger K. L., Gardner J. P., Teplitz H. I., Windhorst R. A.,2002, ApJ, 576, 625
Osterbrock, D. E., 1989, Astrophysics of Gaseous Nebulae andActive Galactic Nuclei, University Science Books. Mill Valley,CA
Panuzzo P., Silva L., Granato G. L., Bressan A., Vega O., 2005,AIPC, 761, 187
Persic M., Rephaeli Y., Braito V., Cappi M., Della Ceca R.,Franceschini A., Gruber D. E., 2004, A&A, 419, 849
Ranalli P., Comastri A., Setti G., 2003, A&A, 399, 39
Ravikumar et al., 2006, Accepted for publication in A&A(astroph-0612152)
Rieke G. H., et al., 2004, ApJS, 154, 25
Rosati P., et al., 2002, ApJ, 566, 667
Rosa-Gonzalez D., Terlevich E., Terlevich R., 2002, MNRAS, 332,283
Rosa-Gonzalez D., Schmitt H. R., Terlevich E., Terlevich R., 2007,ApJ, 654, 226
Schmitt H. R., Calzetti D., Armus L., Giavalisco M., HeckmanT. M., Kennicutt R. C., Leitherer C., Meurer G. R., 2006,ApJ, 643, 173
Silva L., Granato G. L., Bressan A., Danese L., 1998, ApJ, 509,103
Seaton, M. J., 1979, MNRAS, 187, 73
Szokoly G. P., et al., 2004, ApJS, 155, 271
Takeuchi T. T., Buat V., Iglesias-Paramo J., Boselli A., Bur-garella D., 2005, A&A, 432, 423
Tozzi P., et al., 2001, ApJ, 562, 42
Van Bever J., Vanbeveren D., 2000, A&A, 358, 462
Vega O., Silva L., Panuzzo P., Bressan A., Granato G. L., ChavezM., 2005, MNRAS, 364, 1286
Wolf C., et al., 2004, A&A, 421, 913
Yun M. S., Reddy N. A., Condon J. J., 2001, ApJ, 554, 803
This paper has been produced using the Royal AstronomicalSociety/Blackwell Science LATEX style file.
c© 2004 RAS, MNRAS 000, 1–16