A Chandra View of Dark Matter in Early-Type Galaxies
22
arXiv:astro-ph/0601301v2 12 Apr 2006 Submitted to the Astrophysical Journal Preprint typeset using L A T E X style emulateapj v. 6/22/04 A CHANDRA VIEW OF DARK MATTER IN EARLY-TYPE GALAXIES Philip J. Humphrey 1 , David A. Buote 1 , Fabio Gastaldello 1 , Luca Zappacosta 1 , James S. Bullock 1 , Fabrizio Brighenti 2,3 and William G. Mathews 3 Submitted to the Astrophysical Journal ABSTRACT We present a Chandra study of mass profiles in 7 elliptical galaxies, of which 3 have galaxy-scale and 4 group-scale halos, demarcated at 10 13 M ⊙ . These represent the best available data for nearby objects with comparable X-ray luminosities. We measure ∼flat mass-to-light (M/L) profiles within an optical half-light radius (R eff ), rising by an order of magnitude at ∼10R eff , which confirms the presence of dark matter (DM). The data indicate hydrostatic equilibrium, which is also supported by agreement with studies of stellar kinematics in elliptical galaxies. The data are well-fitted by a model comprising an NFW DM profile and a baryonic component following the optical light. The distribution of DM halo concentration parameters (c) versus M vir agrees with ΛCDM predictions and our observations of bright groups. Concentrations are slightly higher than expected, which is most likely a selection effect. Omitting the stellar mass drastically increases c, possibly explaining large concentrations found by some past observers. The stellar M/L K agree with population synthesis models, assuming a Kroupa IMF. Allowing adiabatic compression (AC) of the DM halo by baryons made M/L more discrepant, casting some doubt on AC. Our best-fitting models imply total baryon fractions ∼0.04– 0.09, consistent with models of galaxy formation incorporating strong feedback. The groups exhibit positive temperature gradients, consistent with the “Universal” profiles found in other groups and clusters, whereas the galaxies have negative gradients, suggesting a change in the evolutionary history of the systems around M vir ≃ 10 13 M ⊙ . Subject headings: Xrays: galaxies— galaxies: elliptical and lenticular, cD— galaxies: halos— galaxies: ISM— dark matter 1. INTRODUCTION The nature and distribution of dark matter (DM) in the Universe is one of the fundamental problems facing modern physics. Cold DM lies at the heart of our current (ΛCDM) cosmological paradigm, which predicts substan- tial DM halos for objects at all mass-scales from galax- ies to clusters. Although ΛCDM has been remarkably successful at explaining large-scale features (e.g. Spergel et al. 2003; Perlmutter et al. 1999), observations of galax- ies have been more problematical for the theory. Dissi- pationless dark matter simulations find that dark matter halos are well characterized by a “Universal” mass den- sity profile (Navarro et al. 1997, hereafter NFW) over a wide range of Virial masses (M vir ) (e.g. Bullock et al. 2001). Low mass halos tend to form first in hierarchi- cal cosmologies and are consequently more tightly con- centrated than their later forming, high mass counter- parts. This tendency produces a predicted correlation between the DM halo concentration parameter (c, which is ratio between Virial radius, R vir , and the characteris- tic scale of the density profile) and M vir (Navarro et al. 1997). However, since mass and formation epoch are not perfectly correlated, we expect a significant scatter at fixed Virial mass (Jing 2000; Bullock et al. 2001; Wech- sler et al. 2002). The tight link between halo formation epoch and concentration implies that the precise relation between c and M vir is sensitive to the underlying Cos- 1 Department of Physics and Astronomy, University of Califor- nia at Irvine, 4129 Frederick Reines Hall, Irvine, CA 92697-4575 2 Dipartimento di Astronomia, Universit` a di Bologna, Via Ran- zani 1, Bologna 40127, Italy 3 University of California Observatories, Lick Observatory, Uni- versity of California at Santa Cruz, Santa Cruz, CA 95064 mological parameters, including σ 8 and the dark energy equation of state (Kuhlen et al. 2005), making an obser- vational test of this relation potentially a very powerful tool for cosmology. The mass profiles of galaxies also may provide valu- able clues as to the way in which galaxies form in DM halos. In particular, as baryons cool and collapse into stars, the associated increase in the central mass den- sity should in turn modify the shape of the DM halo. This process is typically modelled assuming adiabatic contraction (AC) of the DM particle orbits (e.g. Blu- menthal et al. 1986; Gnedin et al. 2004). If the galaxy halo subsequently evolves by major mergers, simulations are unclear as to whether these features would persist (e.g. Gnedin et al. 2004) or whether the merging process may destroy this imprint of star formation, or even mix the DM and baryons sufficiently to produce a total grav- itating mass profile more akin to NFW (Loeb & Peebles 2003; El-Zant et al. 2004). Observational tests of the predictions of ΛCDM have proven controversial. In clusters of galaxies there is over- whelming evidence for DM, and an increasing body of work verifying the predictions of ΛCDM. In particular re- cent, high-quality Chandra and XMM observations have revealed mass profiles in remarkable agreement with the Universal profile from deep in the core to a large frac- tion of R vir (e.g. Lewis et al. 2003; Zappacosta et al. 2006; Vikhlinin et al. 2005), and a distribution of c ver- sus M vir in good agreement with ΛCDM (Pointecouteau et al. 2005). In galaxies, however, the picture is much less clear. Rotation curve analysis of low surface brightness (LSB) disk galaxies has suggested significantly less cuspy density profiles than expected (e.g. Swaters et al. 2000).
Transcript of A Chandra View of Dark Matter in Early-Type Galaxies
arX
iv:a
stro
-ph/
0601
301v
2 1
2 A
pr 2
006
Submitted to the Astrophysical JournalPreprint typeset using LATEX style emulateapj v. 6/22/04
A CHANDRA VIEW OF DARK MATTER IN EARLY-TYPE GALAXIES
Philip J. Humphrey1, David A. Buote1, Fabio Gastaldello1, Luca Zappacosta1, James S. Bullock1, FabrizioBrighenti2,3 and William G. Mathews3
Submitted to the Astrophysical Journal
ABSTRACT
We present a Chandra study of mass profiles in 7 elliptical galaxies, of which 3 have galaxy-scale and4 group-scale halos, demarcated at 1013M⊙. These represent the best available data for nearby objectswith comparable X-ray luminosities. We measure ∼flat mass-to-light (M/L) profiles within an opticalhalf-light radius (Reff), rising by an order of magnitude at ∼10Reff, which confirms the presence ofdark matter (DM). The data indicate hydrostatic equilibrium, which is also supported by agreementwith studies of stellar kinematics in elliptical galaxies. The data are well-fitted by a model comprisingan NFW DM profile and a baryonic component following the optical light. The distribution of DMhalo concentration parameters (c) versus Mvir agrees with ΛCDM predictions and our observationsof bright groups. Concentrations are slightly higher than expected, which is most likely a selectioneffect. Omitting the stellar mass drastically increases c, possibly explaining large concentrationsfound by some past observers. The stellar M/LK agree with population synthesis models, assuminga Kroupa IMF. Allowing adiabatic compression (AC) of the DM halo by baryons made M/L morediscrepant, casting some doubt on AC. Our best-fitting models imply total baryon fractions ∼0.04–0.09, consistent with models of galaxy formation incorporating strong feedback. The groups exhibitpositive temperature gradients, consistent with the “Universal” profiles found in other groups andclusters, whereas the galaxies have negative gradients, suggesting a change in the evolutionary historyof the systems around Mvir≃ 1013M⊙.
Subject headings: Xrays: galaxies— galaxies: elliptical and lenticular, cD— galaxies: halos— galaxies:ISM— dark matter
1. INTRODUCTION
The nature and distribution of dark matter (DM) inthe Universe is one of the fundamental problems facingmodern physics. Cold DM lies at the heart of our current(ΛCDM) cosmological paradigm, which predicts substan-tial DM halos for objects at all mass-scales from galax-ies to clusters. Although ΛCDM has been remarkablysuccessful at explaining large-scale features (e.g. Spergelet al. 2003; Perlmutter et al. 1999), observations of galax-ies have been more problematical for the theory. Dissi-pationless dark matter simulations find that dark matterhalos are well characterized by a “Universal” mass den-sity profile (Navarro et al. 1997, hereafter NFW) over awide range of Virial masses (Mvir) (e.g. Bullock et al.2001). Low mass halos tend to form first in hierarchi-cal cosmologies and are consequently more tightly con-centrated than their later forming, high mass counter-parts. This tendency produces a predicted correlationbetween the DM halo concentration parameter (c, whichis ratio between Virial radius, Rvir, and the characteris-tic scale of the density profile) and Mvir(Navarro et al.1997). However, since mass and formation epoch are notperfectly correlated, we expect a significant scatter atfixed Virial mass (Jing 2000; Bullock et al. 2001; Wech-sler et al. 2002). The tight link between halo formationepoch and concentration implies that the precise relationbetween c and Mvir is sensitive to the underlying Cos-
1 Department of Physics and Astronomy, University of Califor-nia at Irvine, 4129 Frederick Reines Hall, Irvine, CA 92697-4575
2 Dipartimento di Astronomia, Universita di Bologna, Via Ran-zani 1, Bologna 40127, Italy
3 University of California Observatories, Lick Observatory, Uni-versity of California at Santa Cruz, Santa Cruz, CA 95064
mological parameters, including σ8 and the dark energyequation of state (Kuhlen et al. 2005), making an obser-vational test of this relation potentially a very powerfultool for cosmology.
The mass profiles of galaxies also may provide valu-able clues as to the way in which galaxies form in DMhalos. In particular, as baryons cool and collapse intostars, the associated increase in the central mass den-sity should in turn modify the shape of the DM halo.This process is typically modelled assuming adiabaticcontraction (AC) of the DM particle orbits (e.g. Blu-menthal et al. 1986; Gnedin et al. 2004). If the galaxyhalo subsequently evolves by major mergers, simulationsare unclear as to whether these features would persist(e.g. Gnedin et al. 2004) or whether the merging processmay destroy this imprint of star formation, or even mixthe DM and baryons sufficiently to produce a total grav-itating mass profile more akin to NFW (Loeb & Peebles2003; El-Zant et al. 2004).
Observational tests of the predictions of ΛCDM haveproven controversial. In clusters of galaxies there is over-whelming evidence for DM, and an increasing body ofwork verifying the predictions of ΛCDM. In particular re-cent, high-quality Chandra and XMM observations haverevealed mass profiles in remarkable agreement with theUniversal profile from deep in the core to a large frac-tion of Rvir (e.g. Lewis et al. 2003; Zappacosta et al.2006; Vikhlinin et al. 2005), and a distribution of c ver-sus Mvir in good agreement with ΛCDM (Pointecouteauet al. 2005). In galaxies, however, the picture is much lessclear. Rotation curve analysis of low surface brightness(LSB) disk galaxies has suggested significantly less cuspydensity profiles than expected (e.g. Swaters et al. 2000).
2 Humphrey et al.
Although this discrepancy led to a serious discussion ofmodifications to the standard paradigm (e.g. Hogan &Dalcanton 2000; Spergel & Steinhardt 2000; Zentner &Bullock 2002; Kaplinghat 2005; Cembranos et al. 2005),recent results, taking account of observational bias andthe 3-dimensional geometry of the DM halos, have donemuch to resolve the discrepancy (e.g. Swaters et al. 2003;Simon et al. 2005). However, some significant discrep-ancies remain, not least of which is that the DM halosof these galaxies appear less concentrated than expected(e.g. Gonzalez et al. 2000; Kassin et al. 2006). A possibleexplanation is that LSB galaxies are preferentially foundin low-concentration halos (Bullock et al. 2001; Bailinet al. 2005; Wechsler et al. 2005), making additional con-straints at the galaxy scale extremely important.
In many respects, kinematical mass measurements arefar more challenging for early-type than spiral galaxies.As essentially pressure-supported systems little is knowna priori about the velocity anisotropy tensor of the starsin elliptical galaxies, which is problematical for the deter-mination of the mass from stellar motions. Nonetheless,stellar kinematical measurements have widely been usedas a means to measure the gravitating matter within∼the optical half-light radius (Reff) of elliptical galax-ies (e.g. Binney et al. 1990; van der Marel 1991; Ger-hard et al. 2001). These studies tend to find relativelyflat mass-to-light (M/L) ratios within Reff , implying thatmost of the matter within this radius is baryonic. Con-sideration of the tilt in the fundamental plane can alsolead to the same conclusion (Borriello et al. 2003). Incontrast, Padmanabhan et al. (2004) pointed out thatdynamical M/L ratios within Reff are much larger thanpredicted by realistic stellar population synthesis modelsfor stars alone, allowing ∼
> 50% of the mass within Reff
to be dark.Attempts to extend kinematical studies of elliptical
galaxies to larger radii, where DM should be dominant,have proven controversial. In particular Romanowskyet al. (2003) argued against the existence of DM in asmall sample of elliptical galaxies, based on planetarynebulae dynamics within ∼5Reff . We note that this sam-ple was heavily biased towards very X-ray faint objects,which might hint at low-mass halos since they have notheld onto their hot gas. In any case Dekel et al. (2005)pointed out that their conclusions were very sensitiveto the uncertainty in the velocity anisotropy tensor, forplausible values of which the data were consistent withsubstantial DM halos. In fact globular cluster dynamicsin one of these systems, NGC 3379, does imply a signif-icant amount of DM (Pierce et al. 2006; Bergond et al.2006). As more kinematical studies of early-type galaxiesat large radii are appearing, it is becoming clear that atleast some elliptical galaxies host considerable DM halos(e.g. Statler et al. 1999; Romanowsky 2005). There per-sist some questions, however, as to the extent to whichall galaxies have DM halos consistent with ΛCDM. Inparticular Napolitano et al. (2005) argued that a sub-stantial number of early-type galaxy halos appear lessconcentrated than expected.
Gravitational lensing provides further evidence that, atleast some, early-type galaxies possess substantial DMhalos (e.g. Kochanek 1995; Fischer et al. 2000; Rusinet al. 2002). Since weak lensing of galaxies only pro-vides useful mass constraints in a statistical sense, the
relatively rare instances of strong lensing are required tostudy DM in individual systems. Nonetheless it has beenpossible in a few cases to decompose the mass into stel-lar and DM components, albeit with strong assumptionsor additional observational constraints (e.g. Rusin et al.2003; Treu & Koopmans 2004).
X-ray observations of the hot gas in early-type galax-ies provide a complementary means to infer the mass-profiles via techniques similar to those used in study-ing clusters. Since the X-ray emission from early-typegalaxies is typically not very bright, prior to the adventof Chandra and XMM this was limited by the relativelysparse information on the radial temperature and den-sity profiles of the hot gas which could be determinedby prior generations of satellites. Notwithstanding thislimitation, large M/L ratios (consistent with substantialDM) were inferred for a number of X-ray bright galax-ies, albeit with strong assumptions concerning the tem-perature and density profiles (e.g. Forman et al. 1985;Loewenstein & White 1999). Using a novel techniquewhich relied, instead, on the ellipticity of the X-ray halo,Buote & Canizares (1994) were able robustly to detectDM in the isolated elliptical NGC 720 (see also Buote &Canizares 1996, 1998; Buote et al. 2002). Detailed mea-surements of the radial mass distribution were, however,largely restricted to a few massive systems, which may beentwined with a group halo (e.g. Irwin & Sarazin 1996;Brighenti & Mathews 1997). Nevertheless Brighenti &Mathews (1997) were able to decompose the mass profilesof two systems, NGC 4472 and NGC 4649, into stellarand DM components. Sato et al. (2000) investigated theMvir-c relation using ASCA for a sample of objects rang-ing from massive clusters to ∼3 elliptical galaxies. Thelimited spatial resolution of ASCA necessitated some as-sumptions about the density profiles and, crucially, theauthors neglected any stellar mass component in theirfits. This omission may explain the very steep Mvir-crelation (with c200∼
> 30 for the galaxies) found by theseauthors, in conflict with ΛCDM (Mamon & Lokas 2005).
Although mass profiles of early-type galaxies are be-ginning to appear which exploit the improved sensitivityand resolution of Chandra and XMM, many of the mostinteresting constraints on DM are still restricted to mas-sive systems, which may be at the centres of groups. Forexample, Fukazawa et al. (2006) reported Chandra andXMM M/L profiles for ∼50 galaxies and groups, confirm-ing ∼flat profiles within Reff which rise at larger radii.However, the constraints at large radii were dominatedby the massive (group-scale) objects so the implicationsfor the DM content of normal galaxies are unclear. Fur-thermore, the authors included a substantial number ofhighly disturbed systems, in which hydrostatic equilib-rium may be questioned, and failed to account for theunresolved sources which dominate the emission in thelowest-LX objects in their sample4. Recently, however,detailed Chandra and XMM mass profiles have begunto appear for isolated early-type galaxies, also confirm-ing the presence of massive DM halos (e.g. O’Sullivan &Ponman 2004; Khosroshahi et al. 2004).
This paper is part of a series (see also Gastaldello et al.
4 Although the authors account for unresolved sources whenmeasuring the gas temperature, they do not account for it whencomputing the gas density, where its effect is more pronounced
A Chandra View of Dark Matter in Galaxies. 3
2006; Zappacosta et al. 2006; Buote et al. 2006a,b) us-ing high-quality Chandra and XMM data to investigatethe mass profiles of galaxies, groups and clusters. Thisprovides an unprecedented opportunity to place defini-tive constraints upon the Mvir-c relation over ∼2 ordersof magnitude in Mvir. In this paper, we focus on thetemperature, density and mass profiles of seven galax-ies and poor groups chosen from the Chandra archive.In order to compare to theory we perform spherically-averaged analysis, leaving a discussion of the ellipticitiesof the X-ray halos to a future paper. In § 2 we discussthe target selection. The data-reduction is described in§ 3 and the X-ray morphology is addressed in § 4. Wediscuss the spectral analysis in § 5, the mass analysis in§ 6, the systematic uncertainties in our analysis in § 7and reach our conclusions in § 8. The three systems forwhich we find Mvir< 1013M⊙ are optically isolated andso we refer to them as “galaxies”, and the other systemsin our sample as groups. We discuss this in more detailin § 8.3. In this paper, all error-bars quoted represent90% confidence limits, unless otherwise stated, and wecomputed Virial quantities assuming a “critical overden-sity” factor for the DM halos of ρhalo/ρcrit = 103 (whereρhalo is the mean density of a sphere of mass Mvir andradius Rvir).
2. TARGET SELECTION
We chose, for this initial study, to focus on objectsobserved with Chandra. Chandra data are particularlyvaluable for the study of galaxies since the unprecedentedspatial resolution makes it possible to resolve the temper-ature and density profiles deep into the galaxy core, al-lowing us to disentangle the stellar and dark matter, andresolve them into discrete components. We initially chosea set of potential target systems from detections listedin the X-ray catalogue of O’Sullivan et al. (2001) whichhave non-grating ACIS data in the Chandra archive. Toeliminate bright groups and cluster cDs in the sample,we excluded galaxies with LX∼
> 1043erg s−1. In order toperform the required spatially-resolved spectroscopy, werequired at least ∼5000 hot gas photons. The potentialtargets were processed and the 0.1–10.0 keV image ex-amined for evidence of large-scale disturbances (§ 4). Weincluded some systems with low-amplitude asymmetrieswhich should not strongly disturb hydrostatic equilib-rium (we discuss this in more detail in § 7.4). Preliminaryanalysis was conducted to estimate the Virial mass of theobject (§ 6). Since we aimed to focus on lower-mass ob-jects, systems for which a fit using a simple NFW profileyielded Mvir∼
> 1013M⊙were discounted. Massive objectsof this type are the focus of another study (Gastaldelloet al. 2006). The most promising candidates for studyfound via this method were chosen for detailed analysis.The properties of the 7 objects in our sample and theChandra exposures are shown in Table 1.
Our selection criteria naturally bias the sample towardsX-ray bright galaxies. One might expect that galaxiessitting in deep potential wells are more likely to retainhot gas than those with little dark matter, and so ourresults may be biased somewhat towards those galaxieswith substantial dark halos (in contrast to the oppositebias in the analysis of Romanowsky et al. 2003). As weare selecting objects which are not heavily disturbed, weare also biased towards galaxies which have not recently
undergone a major merger. For the purposes of this pa-per, however, we do not require statistical completeness,and we will discuss how to take account of these selectioneffects in Buote et al. (2006a).
3. DATA REDUCTION
For data reduction, we used the CIAO 3.2.2 and Hea-soft 5.3 software suites, in conjunction with Chandra cal-ibration database (Caldb) version 3.1.0. Spectral-fittingwas conducted with Xspec 11.3.1w. In order to ensure themost up-to-date calibration, all data were reprocessedfrom the “level 1” events files, following the standardChandra data-reduction threads5. We applied the stan-dard correction to take account of the time-dependentgain-drift as implemented in the standard CIAO tools.To identify periods of enhanced background (“flaring”),which seriously degrades the signal-to-noise (S/N) andcomplicates background subtraction (Markevitch 2002)we accumulated background lightcurves for each expo-sure from low surface-brightness regions of the activechips. We excluded obvious diffuse emission and datain the vicinity of any detected point-sources (see below).Periods of flaring were identified by eye and excised.Small amounts of residual flaring not removed by thisprocedure can be important in low surface-brightness re-gions at large radii, but this was taken into account in ourtreatment of the background (§ 3.1). The final exposuretimes are listed in Table 1.
Point source detection was performed using the CIAOtool wavdetect (Freeman et al. 2002). Point sources wereidentified in full-resolution images of the ACIS focal-plane, containing all active chips (except the S4 chip,which suffers from serious “streaking”, which can lead tofalse detections). To maximise the likelihood of identify-ing sources with peculiarly hard or soft spectra, imageswere created in three energy bands, 0.1–10.0 keV, 0.1–3.0 keV and 3.0–10.0 keV. Sources were detected sep-arately in each image. In order to minimize spuriousdetections at node or chip boundaries we supplied thedetection algorithm with exposure-maps generated at en-ergies 1.7 keV, 1.0 keV and 7 keV respectively (althoughthe precise energies chosen made little difference to theresults). The detection algorithm searched for structureover pixel-scales of 1, 2, 4, 8 and 16 pixels, and the detec-tion threshold was set to ensure ∼0.1 spurious detectionsper image. The source-lists obtained within each energy-band were combined and duplicated sources removed,and the final list was checked by visual inspection of theimages. The data in the vicinity of any detected pointsource were removed so as not to contaminate the diffuseemission. As discussed in Humphrey & Buote (2004, seealso Kim & Fabbiano 2004) a significant fraction of faintX-ray binary sources will not have been detected by thisprocedure, and so we include an additional componentto account for it in our spectral fitting (§ 5).
For each galaxy, we extracted spectra in a number ofconcentric annuli, centred on the nominal X-ray centroid.We determined the centroid iteratively by placing a 0.5′
radius aperture at the nominal galaxy position (obtainedfrom NED) and computing the X-ray centroid within it.The aperture was moved to the newly-computed cen-troid, and the procedure repeated until the computed
5 http://cxc.harvard.edu/ciao/threads/index.html
4 Humphrey et al.
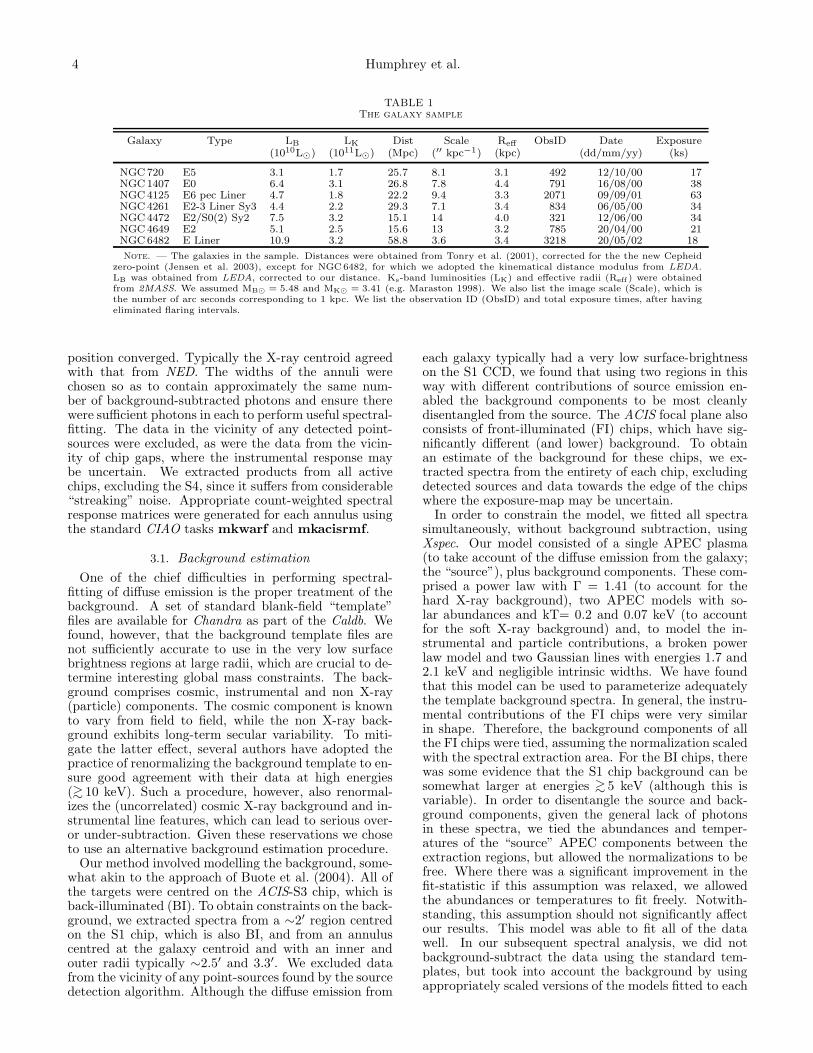
TABLE 1The galaxy sample
Galaxy Type LB LK Dist Scale Reff ObsID Date Exposure(1010L⊙) (1011L⊙) (Mpc) (′′ kpc−1) (kpc) (dd/mm/yy) (ks)
NGC 720 E5 3.1 1.7 25.7 8.1 3.1 492 12/10/00 17NGC 1407 E0 6.4 3.1 26.8 7.8 4.4 791 16/08/00 38NGC 4125 E6 pec Liner 4.7 1.8 22.2 9.4 3.3 2071 09/09/01 63NGC 4261 E2-3 Liner Sy3 4.4 2.2 29.3 7.1 3.4 834 06/05/00 34NGC 4472 E2/S0(2) Sy2 7.5 3.2 15.1 14 4.0 321 12/06/00 34NGC 4649 E2 5.1 2.5 15.6 13 3.2 785 20/04/00 21NGC 6482 E Liner 10.9 3.2 58.8 3.6 3.4 3218 20/05/02 18
Note. — The galaxies in the sample. Distances were obtained from Tonry et al. (2001), corrected for the the new Cepheidzero-point (Jensen et al. 2003), except for NGC6482, for which we adopted the kinematical distance modulus from LEDA.LB was obtained from LEDA, corrected to our distance. Ks-band luminosities (LK) and effective radii (Reff ) were obtainedfrom 2MASS. We assumed MB⊙ = 5.48 and MK⊙ = 3.41 (e.g. Maraston 1998). We also list the image scale (Scale), which isthe number of arc seconds corresponding to 1 kpc. We list the observation ID (ObsID) and total exposure times, after havingeliminated flaring intervals.
position converged. Typically the X-ray centroid agreedwith that from NED. The widths of the annuli werechosen so as to contain approximately the same num-ber of background-subtracted photons and ensure therewere sufficient photons in each to perform useful spectral-fitting. The data in the vicinity of any detected point-sources were excluded, as were the data from the vicin-ity of chip gaps, where the instrumental response maybe uncertain. We extracted products from all activechips, excluding the S4, since it suffers from considerable“streaking” noise. Appropriate count-weighted spectralresponse matrices were generated for each annulus usingthe standard CIAO tasks mkwarf and mkacisrmf.
3.1. Background estimation
One of the chief difficulties in performing spectral-fitting of diffuse emission is the proper treatment of thebackground. A set of standard blank-field “template”files are available for Chandra as part of the Caldb. Wefound, however, that the background template files arenot sufficiently accurate to use in the very low surfacebrightness regions at large radii, which are crucial to de-termine interesting global mass constraints. The back-ground comprises cosmic, instrumental and non X-ray(particle) components. The cosmic component is knownto vary from field to field, while the non X-ray back-ground exhibits long-term secular variability. To miti-gate the latter effect, several authors have adopted thepractice of renormalizing the background template to en-sure good agreement with their data at high energies(∼> 10 keV). Such a procedure, however, also renormal-
izes the (uncorrelated) cosmic X-ray background and in-strumental line features, which can lead to serious over-or under-subtraction. Given these reservations we choseto use an alternative background estimation procedure.
Our method involved modelling the background, some-what akin to the approach of Buote et al. (2004). All ofthe targets were centred on the ACIS-S3 chip, which isback-illuminated (BI). To obtain constraints on the back-ground, we extracted spectra from a ∼2′ region centredon the S1 chip, which is also BI, and from an annuluscentred at the galaxy centroid and with an inner andouter radii typically ∼2.5′ and 3.3′. We excluded datafrom the vicinity of any point-sources found by the sourcedetection algorithm. Although the diffuse emission from
each galaxy typically had a very low surface-brightnesson the S1 CCD, we found that using two regions in thisway with different contributions of source emission en-abled the background components to be most cleanlydisentangled from the source. The ACIS focal plane alsoconsists of front-illuminated (FI) chips, which have sig-nificantly different (and lower) background. To obtainan estimate of the background for these chips, we ex-tracted spectra from the entirety of each chip, excludingdetected sources and data towards the edge of the chipswhere the exposure-map may be uncertain.
In order to constrain the model, we fitted all spectrasimultaneously, without background subtraction, usingXspec. Our model consisted of a single APEC plasma(to take account of the diffuse emission from the galaxy;the “source”), plus background components. These com-prised a power law with Γ = 1.41 (to account for thehard X-ray background), two APEC models with so-lar abundances and kT= 0.2 and 0.07 keV (to accountfor the soft X-ray background) and, to model the in-strumental and particle contributions, a broken powerlaw model and two Gaussian lines with energies 1.7 and2.1 keV and negligible intrinsic widths. We have foundthat this model can be used to parameterize adequatelythe template background spectra. In general, the instru-mental contributions of the FI chips were very similarin shape. Therefore, the background components of allthe FI chips were tied, assuming the normalization scaledwith the spectral extraction area. For the BI chips, therewas some evidence that the S1 chip background can besomewhat larger at energies ∼
> 5 keV (although this isvariable). In order to disentangle the source and back-ground components, given the general lack of photonsin these spectra, we tied the abundances and temper-atures of the “source” APEC components between theextraction regions, but allowed the normalizations to befree. Where there was a significant improvement in thefit-statistic if this assumption was relaxed, we allowedthe abundances or temperatures to fit freely. Notwith-standing, this assumption should not significantly affectour results. This model was able to fit all of the datawell. In our subsequent spectral analysis, we did notbackground-subtract the data using the standard tem-plates, but took into account the background by usingappropriately scaled versions of the models fitted to each
A Chandra View of Dark Matter in Galaxies. 5
CCD, which were added according to the overlap betweenthe source region and the CCD. We found that the stan-dard background templates fared much worse than thesemodelled background estimates when the data were fromregions of low surface-brightness. We discuss the impactof the background treatment on our results in § 7.3.
4. X-RAY IMAGES
The X-ray image of each galaxy was examined to iden-tify any obvious surface-brightness disturbances or asym-metries which would be indicative of clear deviationsfrom hydrostatic equilibrium. We note that low-level X-ray asymmetries, such as the “fingers of emission” identi-fied by Randall et al. (2004) in the adaptively-smoothedimages of NGC 4649, probably do not merit concern6, as,provided care is taken to avoid seriously disturbed emis-sion regions, reliable mass profiles can be inferred evenin mildly disturbed systems (Buote & Tsai 1995).
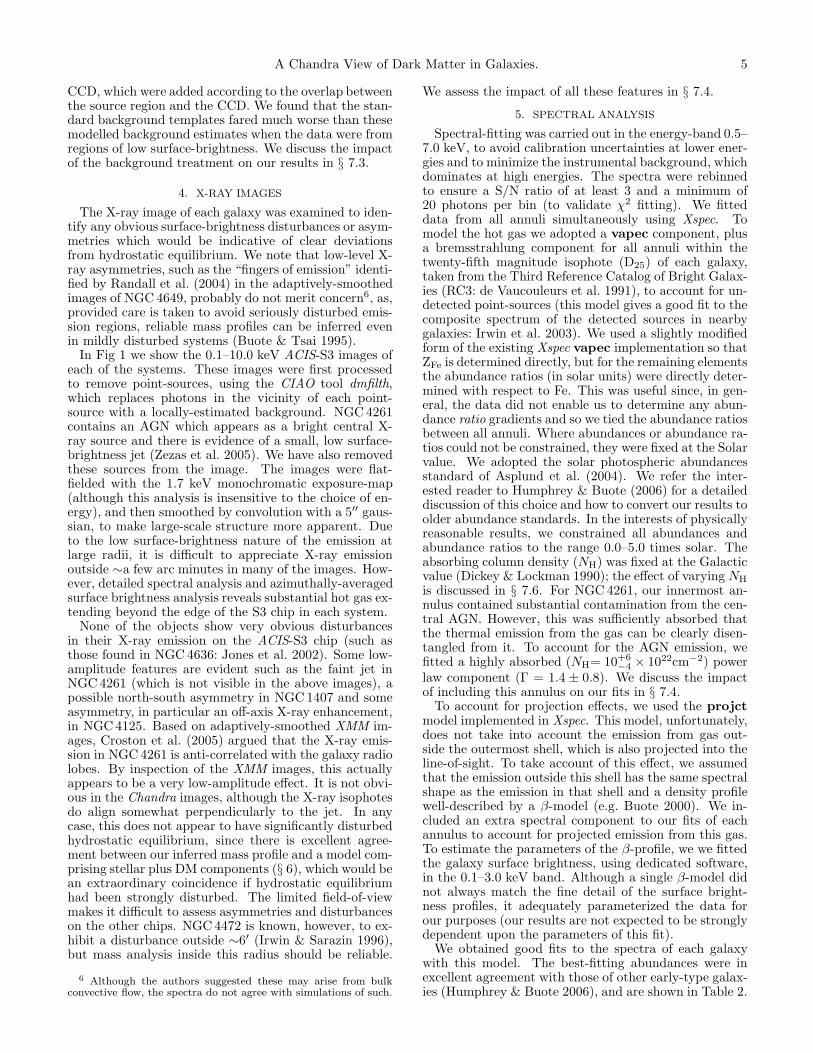
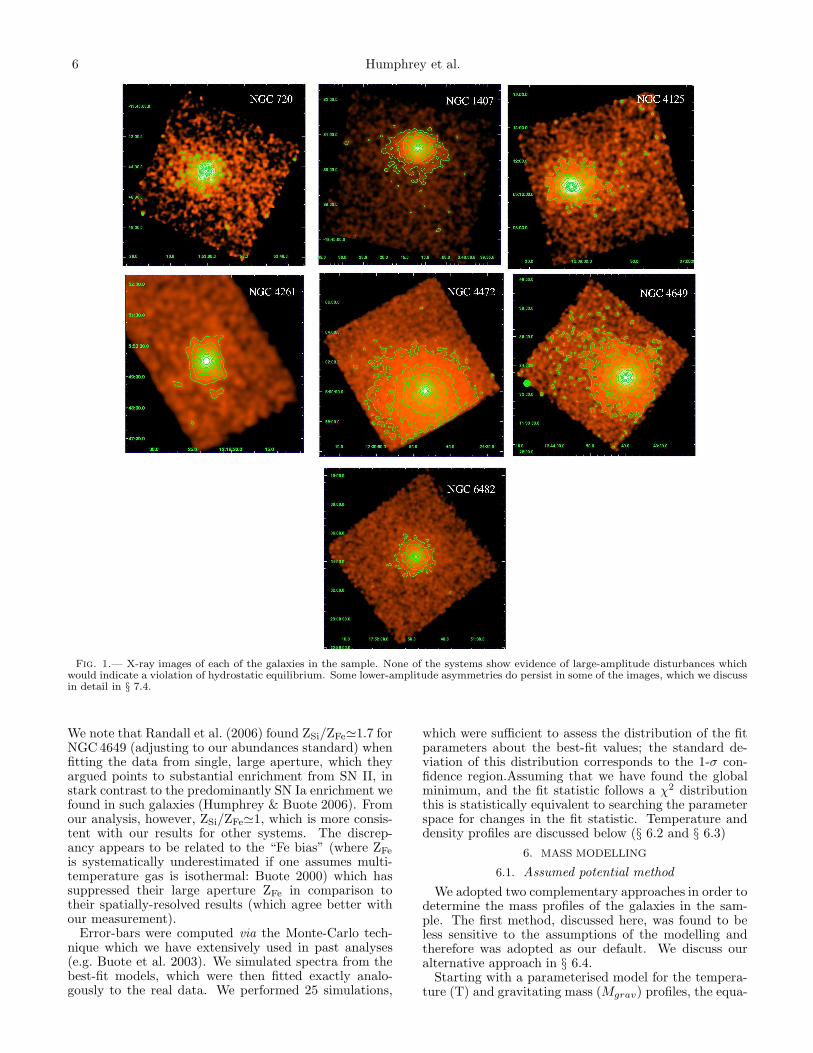
In Fig 1 we show the 0.1–10.0 keV ACIS-S3 images ofeach of the systems. These images were first processedto remove point-sources, using the CIAO tool dmfilth,which replaces photons in the vicinity of each point-source with a locally-estimated background. NGC 4261contains an AGN which appears as a bright central X-ray source and there is evidence of a small, low surface-brightness jet (Zezas et al. 2005). We have also removedthese sources from the image. The images were flat-fielded with the 1.7 keV monochromatic exposure-map(although this analysis is insensitive to the choice of en-ergy), and then smoothed by convolution with a 5′′ gaus-sian, to make large-scale structure more apparent. Dueto the low surface-brightness nature of the emission atlarge radii, it is difficult to appreciate X-ray emissionoutside ∼a few arc minutes in many of the images. How-ever, detailed spectral analysis and azimuthally-averagedsurface brightness analysis reveals substantial hot gas ex-tending beyond the edge of the S3 chip in each system.
None of the objects show very obvious disturbancesin their X-ray emission on the ACIS-S3 chip (such asthose found in NGC 4636: Jones et al. 2002). Some low-amplitude features are evident such as the faint jet inNGC 4261 (which is not visible in the above images), apossible north-south asymmetry in NGC 1407 and someasymmetry, in particular an off-axis X-ray enhancement,in NGC 4125. Based on adaptively-smoothed XMM im-ages, Croston et al. (2005) argued that the X-ray emis-sion in NGC 4261 is anti-correlated with the galaxy radiolobes. By inspection of the XMM images, this actuallyappears to be a very low-amplitude effect. It is not obvi-ous in the Chandra images, although the X-ray isophotesdo align somewhat perpendicularly to the jet. In anycase, this does not appear to have significantly disturbedhydrostatic equilibrium, since there is excellent agree-ment between our inferred mass profile and a model com-prising stellar plus DM components (§ 6), which would bean extraordinary coincidence if hydrostatic equilibriumhad been strongly disturbed. The limited field-of-viewmakes it difficult to assess asymmetries and disturbanceson the other chips. NGC 4472 is known, however, to ex-hibit a disturbance outside ∼6′ (Irwin & Sarazin 1996),but mass analysis inside this radius should be reliable.
6 Although the authors suggested these may arise from bulkconvective flow, the spectra do not agree with simulations of such.
We assess the impact of all these features in § 7.4.
5. SPECTRAL ANALYSIS
Spectral-fitting was carried out in the energy-band 0.5–7.0 keV, to avoid calibration uncertainties at lower ener-gies and to minimize the instrumental background, whichdominates at high energies. The spectra were rebinnedto ensure a S/N ratio of at least 3 and a minimum of20 photons per bin (to validate χ2 fitting). We fitteddata from all annuli simultaneously using Xspec. Tomodel the hot gas we adopted a vapec component, plusa bremsstrahlung component for all annuli within thetwenty-fifth magnitude isophote (D25) of each galaxy,taken from the Third Reference Catalog of Bright Galax-ies (RC3: de Vaucouleurs et al. 1991), to account for un-detected point-sources (this model gives a good fit to thecomposite spectrum of the detected sources in nearbygalaxies: Irwin et al. 2003). We used a slightly modifiedform of the existing Xspec vapec implementation so thatZFe is determined directly, but for the remaining elementsthe abundance ratios (in solar units) were directly deter-mined with respect to Fe. This was useful since, in gen-eral, the data did not enable us to determine any abun-dance ratio gradients and so we tied the abundance ratiosbetween all annuli. Where abundances or abundance ra-tios could not be constrained, they were fixed at the Solarvalue. We adopted the solar photospheric abundancesstandard of Asplund et al. (2004). We refer the inter-ested reader to Humphrey & Buote (2006) for a detaileddiscussion of this choice and how to convert our results toolder abundance standards. In the interests of physicallyreasonable results, we constrained all abundances andabundance ratios to the range 0.0–5.0 times solar. Theabsorbing column density (NH) was fixed at the Galacticvalue (Dickey & Lockman 1990); the effect of varying NH
is discussed in § 7.6. For NGC 4261, our innermost an-nulus contained substantial contamination from the cen-tral AGN. However, this was sufficiently absorbed thatthe thermal emission from the gas can be clearly disen-tangled from it. To account for the AGN emission, wefitted a highly absorbed (NH= 10+6
−4 × 1022cm−2) powerlaw component (Γ = 1.4 ± 0.8). We discuss the impactof including this annulus on our fits in § 7.4.
To account for projection effects, we used the projctmodel implemented in Xspec. This model, unfortunately,does not take into account the emission from gas out-side the outermost shell, which is also projected into theline-of-sight. To take account of this effect, we assumedthat the emission outside this shell has the same spectralshape as the emission in that shell and a density profilewell-described by a β-model (e.g. Buote 2000). We in-cluded an extra spectral component to our fits of eachannulus to account for projected emission from this gas.To estimate the parameters of the β-profile, we we fittedthe galaxy surface brightness, using dedicated software,in the 0.1–3.0 keV band. Although a single β-model didnot always match the fine detail of the surface bright-ness profiles, it adequately parameterized the data forour purposes (our results are not expected to be stronglydependent upon the parameters of this fit).
We obtained good fits to the spectra of each galaxywith this model. The best-fitting abundances were inexcellent agreement with those of other early-type galax-ies (Humphrey & Buote 2006), and are shown in Table 2.
6 Humphrey et al.
Fig. 1.— X-ray images of each of the galaxies in the sample. None of the systems show evidence of large-amplitude disturbances whichwould indicate a violation of hydrostatic equilibrium. Some lower-amplitude asymmetries do persist in some of the images, which we discussin detail in § 7.4.
We note that Randall et al. (2006) found ZSi/ZFe≃1.7 forNGC 4649 (adjusting to our abundances standard) whenfitting the data from single, large aperture, which theyargued points to substantial enrichment from SN II, instark contrast to the predominantly SN Ia enrichment wefound in such galaxies (Humphrey & Buote 2006). Fromour analysis, however, ZSi/ZFe≃1, which is more consis-tent with our results for other systems. The discrep-ancy appears to be related to the “Fe bias” (where ZFe
is systematically underestimated if one assumes multi-temperature gas is isothermal: Buote 2000) which hassuppressed their large aperture ZFe in comparison totheir spatially-resolved results (which agree better withour measurement).
Error-bars were computed via the Monte-Carlo tech-nique which we have extensively used in past analyses(e.g. Buote et al. 2003). We simulated spectra from thebest-fit models, which were then fitted exactly analo-gously to the real data. We performed 25 simulations,
which were sufficient to assess the distribution of the fitparameters about the best-fit values; the standard de-viation of this distribution corresponds to the 1-σ con-fidence region.Assuming that we have found the globalminimum, and the fit statistic follows a χ2 distributionthis is statistically equivalent to searching the parameterspace for changes in the fit statistic. Temperature anddensity profiles are discussed below (§ 6.2 and § 6.3)
6. MASS MODELLING
6.1. Assumed potential method
We adopted two complementary approaches in order todetermine the mass profiles of the galaxies in the sam-ple. The first method, discussed here, was found to beless sensitive to the assumptions of the modelling andtherefore was adopted as our default. We discuss ouralternative approach in § 6.4.
Starting with a parameterised model for the tempera-ture (T) and gravitating mass (Mgrav) profiles, the equa-
A Chandra View of Dark Matter in Galaxies. 7
TABLE 2Emission-weighted average abundances
Galaxy χ2/dof ZFe ZO/ZFe ZNe/ZFe ZMg/ZFe ZSi/ZFe ZS/ZFe ZNi/ZFe
NGC 7201 383.4/357 0.80+0.45−0.24 0.30±0.28 0.68±0.67 1.26±0.35 . . . . . . . . .
NGC 14071 222/221 2.1+1.1−0.9
† 0.37+0.21−0.25 . . . 1.10±0.23 1.21+0.31
−0.27 2.2±1.1 3.3+1.7−1.3
NGC 4125 327/307 0.55+0.22−0.13 0.29+0.13
−0.09 0.62±0.14 0.33±0.20 . . . . . . . . .
NGC 4261 307/319 1.72±0.50† <0.23 0.36+0.79−0.36 0.83±0.23 1.2±0.4 . . . 1.8+2.3
−1.8
NGC 4649 563/491 2.32+0.87−0.37 < 0.15 . . . 0.97±0.13 1.02±0.13 . . . 1.42+0.85
−0.73
NGC 44721 785/740 1.4+1.7−0.4
† 0.51±0.12 0.95 ±0.44 1.02±0.11 1.25±0.11 2.36±0.33 3.28±0.61
NGC 6482 256/262 >2.5 0.34±0.20 . . . 1.15±0.18 1.3±0.3 . . . 3.2+1.5−1.2
Note. — The best-fitting globally-averaged emission-weighted abundances and abundance ratios for each galaxy, shownalong with the quality of fit. Statistical errors represent the 90% confidence region. Where we were able to constrain anabundance gradient, we estimated an emission-weighted ZFe, extrapolated over a large aperture (see Humphrey & Buote
2006); those affected galaxies are marked (†). 1—results taken from Humphrey & Buote (2006). Where parameters couldnot be constrained, they were fixed at the Solar value, and listed as “. . . ”.
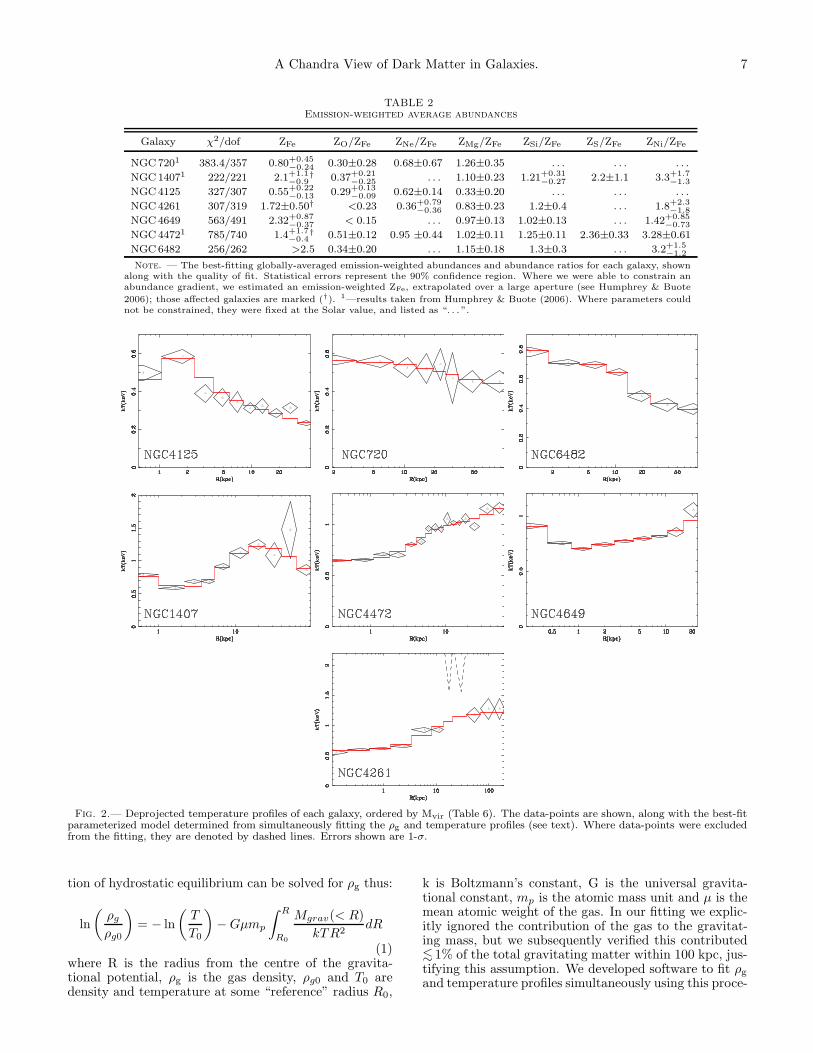
Fig. 2.— Deprojected temperature profiles of each galaxy, ordered by Mvir (Table 6). The data-points are shown, along with the best-fitparameterized model determined from simultaneously fitting the ρg and temperature profiles (see text). Where data-points were excludedfrom the fitting, they are denoted by dashed lines. Errors shown are 1-σ.
tion of hydrostatic equilibrium can be solved for ρg thus:
ln
(
ρg
ρg0
)
= − ln
(
T
T0
)
− Gµmp
∫ R
R0
Mgrav(< R)
kTR2dR
(1)where R is the radius from the centre of the gravita-tional potential, ρg is the gas density, ρg0 and T0 aredensity and temperature at some “reference” radius R0,
k is Boltzmann’s constant, G is the universal gravita-tional constant, mp is the atomic mass unit and µ is themean atomic weight of the gas. In our fitting we explic-itly ignored the contribution of the gas to the gravitat-ing mass, but we subsequently verified this contributed
∼< 1% of the total gravitating matter within 100 kpc, jus-tifying this assumption. We developed software to fit ρg
and temperature profiles simultaneously using this proce-
8 Humphrey et al.
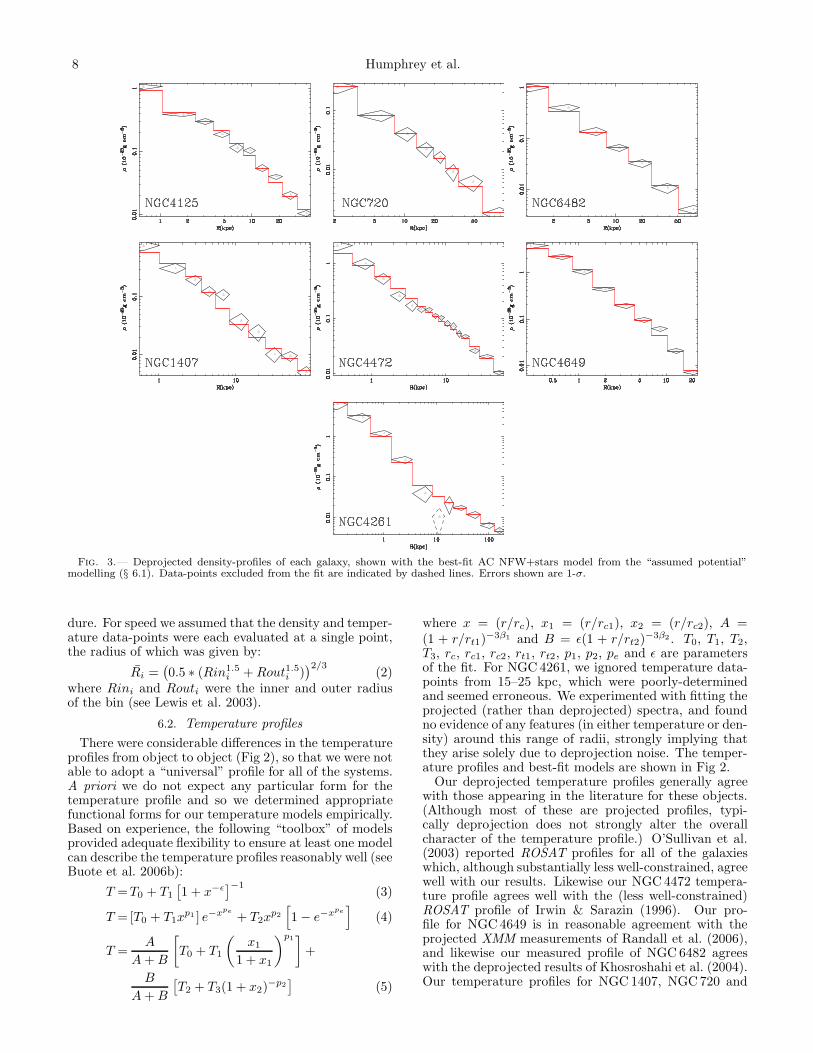
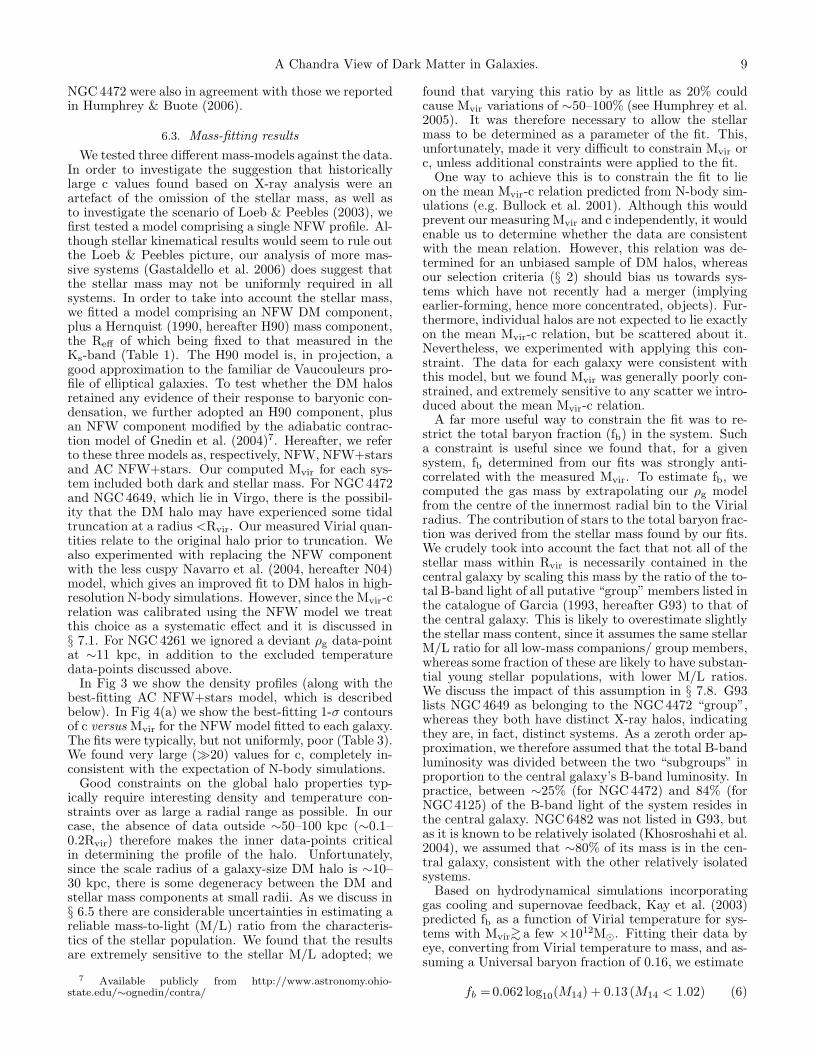
Fig. 3.— Deprojected density-profiles of each galaxy, shown with the best-fit AC NFW+stars model from the “assumed potential”modelling (§ 6.1). Data-points excluded from the fit are indicated by dashed lines. Errors shown are 1-σ.
dure. For speed we assumed that the density and temper-ature data-points were each evaluated at a single point,the radius of which was given by:
Ri =(
0.5 ∗ (Rin1.5i + Rout1.5
i ))2/3
(2)where Rini and Routi were the inner and outer radiusof the bin (see Lewis et al. 2003).
6.2. Temperature profiles
There were considerable differences in the temperatureprofiles from object to object (Fig 2), so that we were notable to adopt a “universal” profile for all of the systems.A priori we do not expect any particular form for thetemperature profile and so we determined appropriatefunctional forms for our temperature models empirically.Based on experience, the following “toolbox” of modelsprovided adequate flexibility to ensure at least one modelcan describe the temperature profiles reasonably well (seeBuote et al. 2006b):
T =T0 + T1
[
1 + x−ǫ]−1
(3)
T = [T0 + T1xp1 ] e−xpe
+ T2xp2
[
1 − e−xpe
]
(4)
T =A
A + B
[
T0 + T1
(
x1
1 + x1
)p1]
+
B
A + B
[
T2 + T3(1 + x2)−p2
]
(5)
where x = (r/rc), x1 = (r/rc1), x2 = (r/rc2), A =(1 + r/rt1)−3β1 and B = ǫ(1 + r/rt2)−3β2 . T0, T1, T2,T3, rc, rc1, rc2, rt1, rt2, p1, p2, pe and ǫ are parametersof the fit. For NGC 4261, we ignored temperature data-points from 15–25 kpc, which were poorly-determinedand seemed erroneous. We experimented with fitting theprojected (rather than deprojected) spectra, and foundno evidence of any features (in either temperature or den-sity) around this range of radii, strongly implying thatthey arise solely due to deprojection noise. The temper-ature profiles and best-fit models are shown in Fig 2.
Our deprojected temperature profiles generally agreewith those appearing in the literature for these objects.(Although most of these are projected profiles, typi-cally deprojection does not strongly alter the overallcharacter of the temperature profile.) O’Sullivan et al.(2003) reported ROSAT profiles for all of the galaxieswhich, although substantially less well-constrained, agreewell with our results. Likewise our NGC 4472 tempera-ture profile agrees well with the (less well-constrained)ROSAT profile of Irwin & Sarazin (1996). Our pro-file for NGC 4649 is in reasonable agreement with theprojected XMM measurements of Randall et al. (2006),and likewise our measured profile of NGC 6482 agreeswith the deprojected results of Khosroshahi et al. (2004).Our temperature profiles for NGC 1407, NGC 720 and
A Chandra View of Dark Matter in Galaxies. 9
NGC 4472 were also in agreement with those we reportedin Humphrey & Buote (2006).
6.3. Mass-fitting results
We tested three different mass-models against the data.In order to investigate the suggestion that historicallylarge c values found based on X-ray analysis were anartefact of the omission of the stellar mass, as well asto investigate the scenario of Loeb & Peebles (2003), wefirst tested a model comprising a single NFW profile. Al-though stellar kinematical results would seem to rule outthe Loeb & Peebles picture, our analysis of more mas-sive systems (Gastaldello et al. 2006) does suggest thatthe stellar mass may not be uniformly required in allsystems. In order to take into account the stellar mass,we fitted a model comprising an NFW DM component,plus a Hernquist (1990, hereafter H90) mass component,the Reff of which being fixed to that measured in theKs-band (Table 1). The H90 model is, in projection, agood approximation to the familiar de Vaucouleurs pro-file of elliptical galaxies. To test whether the DM halosretained any evidence of their response to baryonic con-densation, we further adopted an H90 component, plusan NFW component modified by the adiabatic contrac-tion model of Gnedin et al. (2004)7. Hereafter, we referto these three models as, respectively, NFW, NFW+starsand AC NFW+stars. Our computed Mvir for each sys-tem included both dark and stellar mass. For NGC 4472and NGC 4649, which lie in Virgo, there is the possibil-ity that the DM halo may have experienced some tidaltruncation at a radius <Rvir. Our measured Virial quan-tities relate to the original halo prior to truncation. Wealso experimented with replacing the NFW componentwith the less cuspy Navarro et al. (2004, hereafter N04)model, which gives an improved fit to DM halos in high-resolution N-body simulations. However, since the Mvir-crelation was calibrated using the NFW model we treatthis choice as a systematic effect and it is discussed in§ 7.1. For NGC 4261 we ignored a deviant ρg data-pointat ∼11 kpc, in addition to the excluded temperaturedata-points discussed above.
In Fig 3 we show the density profiles (along with thebest-fitting AC NFW+stars model, which is describedbelow). In Fig 4(a) we show the best-fitting 1-σ contoursof c versus Mvir for the NFW model fitted to each galaxy.The fits were typically, but not uniformly, poor (Table 3).We found very large (≫20) values for c, completely in-consistent with the expectation of N-body simulations.
Good constraints on the global halo properties typ-ically require interesting density and temperature con-straints over as large a radial range as possible. In ourcase, the absence of data outside ∼50–100 kpc (∼0.1–0.2Rvir) therefore makes the inner data-points criticalin determining the profile of the halo. Unfortunately,since the scale radius of a galaxy-size DM halo is ∼10–30 kpc, there is some degeneracy between the DM andstellar mass components at small radii. As we discuss in§ 6.5 there are considerable uncertainties in estimating areliable mass-to-light (M/L) ratio from the characteris-tics of the stellar population. We found that the resultsare extremely sensitive to the stellar M/L adopted; we
7 Available publicly from http://www.astronomy.ohio-state.edu/∼ognedin/contra/
found that varying this ratio by as little as 20% couldcause Mvir variations of ∼50–100% (see Humphrey et al.2005). It was therefore necessary to allow the stellarmass to be determined as a parameter of the fit. This,unfortunately, made it very difficult to constrain Mvir orc, unless additional constraints were applied to the fit.
One way to achieve this is to constrain the fit to lieon the mean Mvir-c relation predicted from N-body sim-ulations (e.g. Bullock et al. 2001). Although this wouldprevent our measuring Mvir and c independently, it wouldenable us to determine whether the data are consistentwith the mean relation. However, this relation was de-termined for an unbiased sample of DM halos, whereasour selection criteria (§ 2) should bias us towards sys-tems which have not recently had a merger (implyingearlier-forming, hence more concentrated, objects). Fur-thermore, individual halos are not expected to lie exactlyon the mean Mvir-c relation, but be scattered about it.Nevertheless, we experimented with applying this con-straint. The data for each galaxy were consistent withthis model, but we found Mvir was generally poorly con-strained, and extremely sensitive to any scatter we intro-duced about the mean Mvir-c relation.
A far more useful way to constrain the fit was to re-strict the total baryon fraction (fb) in the system. Sucha constraint is useful since we found that, for a givensystem, fb determined from our fits was strongly anti-correlated with the measured Mvir. To estimate fb, wecomputed the gas mass by extrapolating our ρg modelfrom the centre of the innermost radial bin to the Virialradius. The contribution of stars to the total baryon frac-tion was derived from the stellar mass found by our fits.We crudely took into account the fact that not all of thestellar mass within Rvir is necessarily contained in thecentral galaxy by scaling this mass by the ratio of the to-tal B-band light of all putative “group” members listed inthe catalogue of Garcia (1993, hereafter G93) to that ofthe central galaxy. This is likely to overestimate slightlythe stellar mass content, since it assumes the same stellarM/L ratio for all low-mass companions/ group members,whereas some fraction of these are likely to have substan-tial young stellar populations, with lower M/L ratios.We discuss the impact of this assumption in § 7.8. G93lists NGC 4649 as belonging to the NGC 4472 “group”,whereas they both have distinct X-ray halos, indicatingthey are, in fact, distinct systems. As a zeroth order ap-proximation, we therefore assumed that the total B-bandluminosity was divided between the two “subgroups” inproportion to the central galaxy’s B-band luminosity. Inpractice, between ∼25% (for NGC 4472) and 84% (forNGC 4125) of the B-band light of the system resides inthe central galaxy. NGC 6482 was not listed in G93, butas it is known to be relatively isolated (Khosroshahi et al.2004), we assumed that ∼80% of its mass is in the cen-tral galaxy, consistent with the other relatively isolatedsystems.
Based on hydrodynamical simulations incorporatinggas cooling and supernovae feedback, Kay et al. (2003)predicted fb as a function of Virial temperature for sys-tems with Mvir∼
> a few ×1012M⊙. Fitting their data byeye, converting from Virial temperature to mass, and as-suming a Universal baryon fraction of 0.16, we estimate
fb = 0.062 log10(M14) + 0.13 (M14 < 1.02) (6)
10 Humphrey et al.
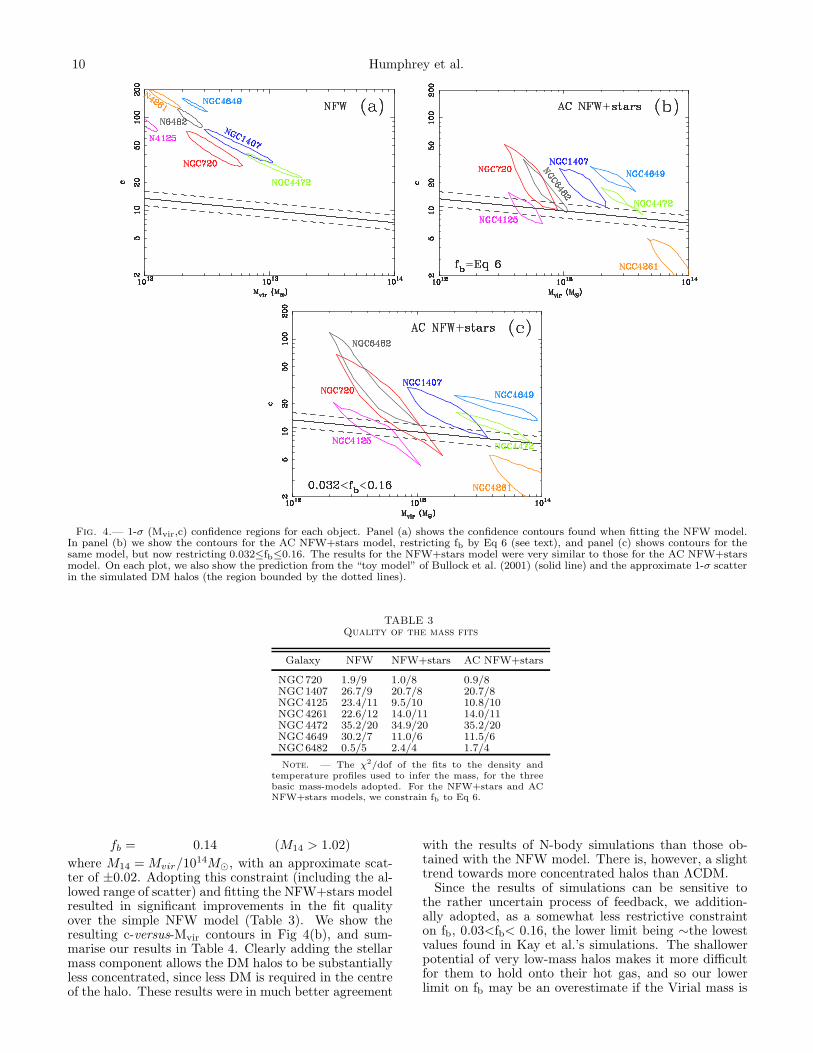
Fig. 4.— 1-σ (Mvir,c) confidence regions for each object. Panel (a) shows the confidence contours found when fitting the NFW model.In panel (b) we show the contours for the AC NFW+stars model, restricting fb by Eq 6 (see text), and panel (c) shows contours for thesame model, but now restricting 0.032≤fb≤0.16. The results for the NFW+stars model were very similar to those for the AC NFW+starsmodel. On each plot, we also show the prediction from the “toy model” of Bullock et al. (2001) (solid line) and the approximate 1-σ scatterin the simulated DM halos (the region bounded by the dotted lines).
TABLE 3Quality of the mass fits
Galaxy NFW NFW+stars AC NFW+stars
NGC 720 1.9/9 1.0/8 0.9/8NGC 1407 26.7/9 20.7/8 20.7/8NGC 4125 23.4/11 9.5/10 10.8/10NGC 4261 22.6/12 14.0/11 14.0/11NGC 4472 35.2/20 34.9/20 35.2/20NGC 4649 30.2/7 11.0/6 11.5/6NGC 6482 0.5/5 2.4/4 1.7/4
Note. — The χ2/dof of the fits to the density andtemperature profiles used to infer the mass, for the threebasic mass-models adopted. For the NFW+stars and ACNFW+stars models, we constrain fb to Eq 6.
fb = 0.14 (M14 > 1.02)
where M14 = Mvir/1014M⊙, with an approximate scat-ter of ±0.02. Adopting this constraint (including the al-lowed range of scatter) and fitting the NFW+stars modelresulted in significant improvements in the fit qualityover the simple NFW model (Table 3). We show theresulting c-versus-Mvir contours in Fig 4(b), and sum-marise our results in Table 4. Clearly adding the stellarmass component allows the DM halos to be substantiallyless concentrated, since less DM is required in the centreof the halo. These results were in much better agreement
with the results of N-body simulations than those ob-tained with the NFW model. There is, however, a slighttrend towards more concentrated halos than ΛCDM.
Since the results of simulations can be sensitive tothe rather uncertain process of feedback, we addition-ally adopted, as a somewhat less restrictive constrainton fb, 0.03<fb< 0.16, the lower limit being ∼the lowestvalues found in Kay et al.’s simulations. The shallowerpotential of very low-mass halos makes it more difficultfor them to hold onto their hot gas, and so our lowerlimit on fb may be an overestimate if the Virial mass is
A Chandra View of Dark Matter in Galaxies. 11
TABLE 4Best-fitting NFW+stars results
Galaxy fb=Eq 6 0.032≤fb≤0.16Mvir(1012M⊙) Rvir(kpc) c fb Mvir(1012M⊙) Rvir(kpc) c fb
NGC720 6.6+2.4−3.0 480+50
−90 18.+30.
−8.
0.044+0.037−0.003 6.6+6.0
−4.3 480 ± 120 18.+49.
−10.
0.044+0.095−0.012
NGC1407 16. ± 6. 650+80−100 18.+11.
−7.
0.065+0.041−0.001 21. ± 15. 720+140
−200 15.+16.
−6.
0.032+0.130−0.001
NGC4125 6.2+0.8−2.3 470+20
−70 10.+5.
−2.
0.039+0.035−0.001 7.2+1.4
−4.9 500+30−160 9.3+11.
−2.1 0.032+0.13−0.001
NGC4261 67.+41.
−15.
1040+200−90 3.7 ± 1.7 0.14+0.01
−0.03 57.+260−15.
990+760−100 4.0 ± 2.0 0.16+0.00
−0.13
NGC4472 33.+6.
−10.
820+50−100 13.+4.
−2.
0.084+0.037−0.001 63.+17.
−44.
1020+90−300 10.0+7.
−2.
0.032+0.13−0.00
NGC4649 35.+7.
−13.
840+60−120 21.+6.
−3.
0.086+0.037−0.001 93.+26.
−73.
1200+100−500 15.+11.
−3.
0.032+0.12−0.00
NGC6482 7.1+4.4−1.7 500+90
−40 18.+13.
−8.
0.075+0.013−0.032 3.6+5.5
−1.5 390+140−70 38.+76.
−24.
0.16+0.00−0.10
Note. — The best-fitting results for the NFW+stars model. All error-bars shown correspond to 90% confidence regions. Thefit results for the AC NFW+stars model are very similar, and are shown in Fig 4. Results are shown for the fits using the twodifferent constraints on fb we adopted (see text).
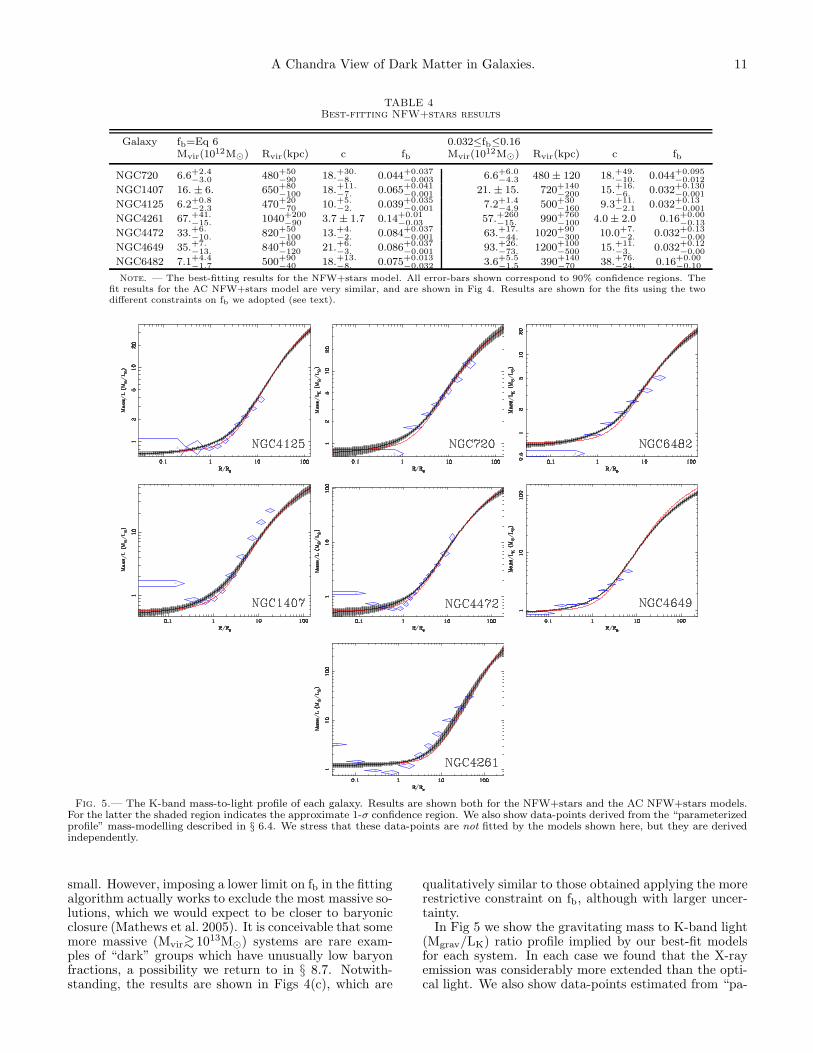
Fig. 5.— The K-band mass-to-light profile of each galaxy. Results are shown both for the NFW+stars and the AC NFW+stars models.For the latter the shaded region indicates the approximate 1-σ confidence region. We also show data-points derived from the “parameterizedprofile” mass-modelling described in § 6.4. We stress that these data-points are not fitted by the models shown here, but they are derivedindependently.
small. However, imposing a lower limit on fb in the fittingalgorithm actually works to exclude the most massive so-lutions, which we would expect to be closer to baryonicclosure (Mathews et al. 2005). It is conceivable that somemore massive (Mvir∼
> 1013M⊙) systems are rare exam-ples of “dark” groups which have unusually low baryonfractions, a possibility we return to in § 8.7. Notwith-standing, the results are shown in Figs 4(c), which are
qualitatively similar to those obtained applying the morerestrictive constraint on fb, although with larger uncer-tainty.
In Fig 5 we show the gravitating mass to K-band light(Mgrav/LK) ratio profile implied by our best-fit modelsfor each system. In each case we found that the X-rayemission was considerably more extended than the opti-cal light. We also show data-points estimated from “pa-
12 Humphrey et al.
rameterized profile” mass modelling (§ 6.4), which tendto agree reasonably well; the slight systematic differencesbetween the profiles are an artefact of the assumptionsused to derive the data-points and we discuss this in de-tail in § 6.4. Clearly Mgrav/LK increases very slowly withradius within Reff , rising very steeply outside this range.This arises naturally from the very different shapes ofthe stellar and DM halos, and is similar to M/L profilesseen from stellar kinematics and the results of Brighenti& Mathews (1997) for NGC 4472 and NGC 4649. ByRvir, Mgrav/LK reaches as high as ∼20–40 M⊙/L⊙ for thegalaxy-scale systems or ∼100-200 M⊙/L⊙ for the group-like objects. We stress that this only includes the light ofthe central galaxy which, for the group-like systems maybe a little as ∼25% of the total luminosity.
6.4. Parameterized profile mass modelling
We briefly discuss here an alternative technique to de-termine the mass profiles of X-ray bright objects whichwe have extensively employed in our previous studies, aswell as the companion papers to this present work (e.g.Lewis et al. 2003; Buote et al. 2006b; Gastaldello et al.2006; Zappacosta et al. 2006). This technique, whichwe here dub the “parameterized profile” method involvesparameterizing independently the temperature and den-sity profiles of the system with simple, empirical models.These functions were then inserted into the equation ofhydrostatic equilibrium, which we solved for the mass en-closed within any given radius. The temperature profileswere parameterized with the models discussed in § 6.2,and to fit ρg we adopted, where appropriate a, β-model,a “double-β” model or a “cusped-β” model, defined, re-spectively, as:
ρg =ρg0
[
1 + (r/rc)2]−3β/2
(7)
ρg =
√
ρg0 [1 + (r/rc)2]−3β
+ ρg1 [1 + (r/rc2)2]−3β2(8)
ρg =ρg023β/2−ǫ/2(r/rc)−ǫ[
1 + (r/rc)2]−3β/2+ǫ/2
(9)
Where the parameters ρg0, ρg1, rc, rc2, β, β2 and ǫ aredetermined by the fit. Fitting these models to the sim-ulated temperature and density profiles discussed in § 5(which were used therein to estimate the error-bars onkT and ρg in each data-bin) allowed us to estimate thescatter in the mass data-points arising from statisticalnoise, and hence the error-bars.
For a full discussion of this technique, we refer theinterested reader to Buote et al. (2006b), who demon-strate the good agreement typically found between thismethod and the assumed potential modelling of § 6.1,when fitting high-quality data. However, the mass data-points, especially at the innermost and outermost radii,are rather sensitive to the parameterized models adoptedto fit the temperature and, especially, ρg. The system-atic uncertainty introduced by the choice of ρg model canbe considerably larger than the statistical error. For ourpurposes the absence of data at very large radii, whichare vital to constrain the curvature of the mass model,exacerbated by the uncertainty introduced at small radiidue to the uncertain stellar mass-to-light ratio, magnifiedthe impact of these systematic effects. Notwithstandingthese reservations, it is still interesting to compare the re-sults obtained via both mass-fitting methods. We show
in Fig 6 the mass data-points computed using parame-terized potential modelling, along with the best-fittingmass models found in § 6.1. Clearly there is good overallagreement between the two methods although there aresome systematic differences, which reflect the systemat-ics inherent in our choice of parameterized model for ρg.
6.5. Stellar mass-to-Light ratios
It is interesting to compare the stellar M/L ratios(M∗/L) determined by our fitting to the expectations ofstellar population synthesis models. In order to ensurethat the optical light traces the stellar mass as closely aspossible, we opted to perform this comparison in the K-band. Table 5 shows M∗/LK determined from our modelsusing eq 6 to constrain fb. Since AC tends to increasethe cuspiness of the DM profile we found a significantlylower mass-to-light ratio for the AC NFW+stars modelthan for the NFW+stars model.
To compare our measured M∗/LK to single burst stel-lar population synthesis predictions, we first estimateda mean emission-weighted stellar age and metallicity foreach galaxy, as outlined in Appendix A. We linearlyinterpolated synthetic M∗/LK values based on the stel-lar population models of Maraston (1998) from updatedmodel-grids made available by the author8. For typ-ical early-type galaxies, K-band and 2MASS Ks-bandmagnitudes should differ by <0.1 magnitudes (Carpen-ter 2001), so we were able to compare directly the syn-thetic K-band M/L ratios with our measured M∗/LK ra-tios. The predicted M∗/LK ratios are shown in Table 5for different assumptions about the stellar IMF, which ispoorly-known in early-type galaxies. In this case we showpredicted M∗/LK assuming a standard Salpeter IMF,and for the IMF of Kroupa (2001). It is immediatelyclear that these ratios are very sensitive to this choice;M∗/LK is typically ∼50–60% higher if the Salpeter IMFis used.
Our measured M∗/LK for the NFW+stars models aretypically ∼20% lower than the synthetic M/L ratios,assuming the Kroupa IMF. Using the AC NFW+starsmodels, the discrepancy is ∼40%. Assuming a SalpeterIMF, the discrepancies for both models are consider-ably larger. This would seem to rule out the SalpeterIMF, in agreement with the conclusions of Padmanabhanet al. (2004). The best-fitting Mvir and c are sensitive toM∗/LK. If we fix M∗/LK to the synthetic value, this es-sentially pushes all the galaxies, except NGC 4261 (forwhich the measured and synthetic values are in excellentagreement) and NGC 720 in the direction of the high-Mvir range of their confidence contours shown in Fig 4.For NGC 720, Mvir is lowered and c increased. The fitsare then typically much worse (∆χ2 ∼7–35), and the lociin the Mvir-c plane slightly more discrepant with simula-tions.
There are a considerable number of systematic uncer-tainties in the computation of the synthetic M/L ra-tios, not the least of which is the very uncertain IMF,which could probably account for the modest discrep-ancy with our NFW+stars results (see § 8.4). In thecase of NGC 720, the rather young age inferred for thestellar population (∼3 Gyr) leads to a significantly lower
8 http://www-astro.physics.ox.ac.uk/∼maraston/Claudia’s-Stellar Population Models.html
A Chandra View of Dark Matter in Galaxies. 13
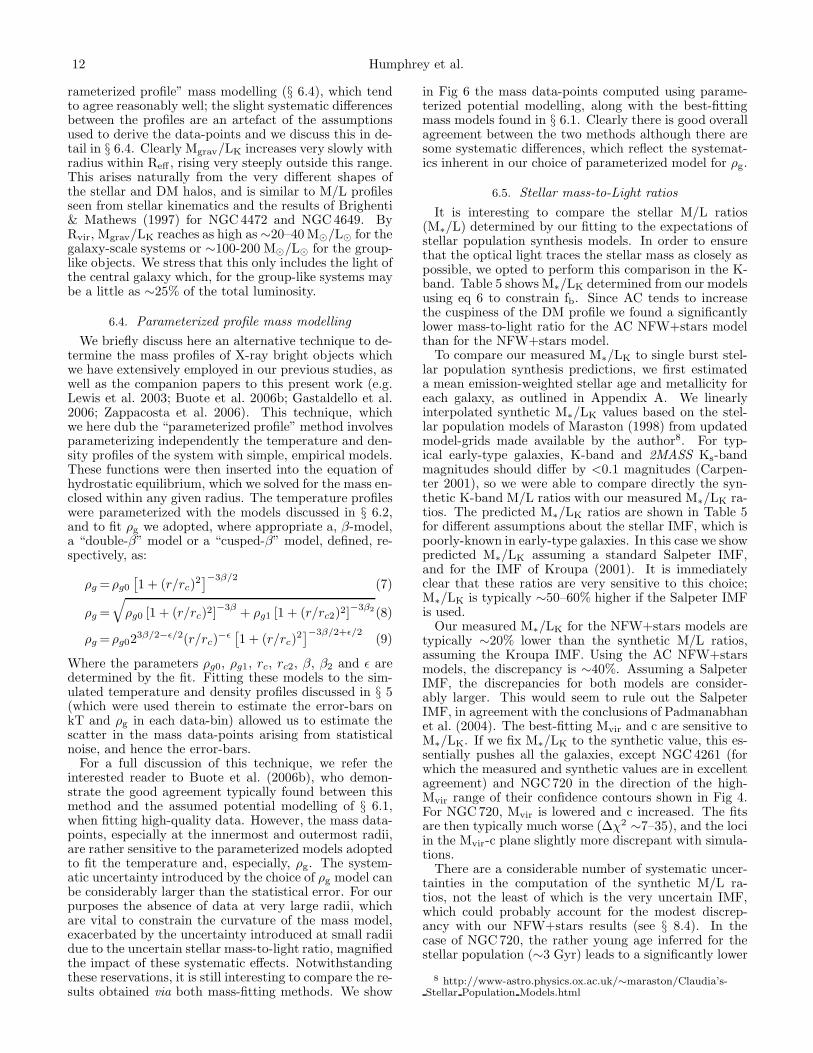
Fig. 6.— Mass profiles for each galaxy. The data-points were computed using parameterized profile modelling (§ 6.4). In addition weshow the best-fit NFW+stars mass models from assumed potential modelling, which generally agree reasonably well with the data-points,indicating the consistency of both approaches to determine the mass profiles. We show the total gravitating mass model (solid line) and,separately, the stellar mass contribution (dotted line), the DM contribution (dashed line) and the gas mass (dash-dot-dot line). The modelsare extrapolated out to Rvir.Errors shown are 1-σ.
TABLE 5Stellar mass-to-light ratios
Galaxy LK/LB Fitted M∗/LK (M⊙/L⊙) Pop. synthesis M∗/LK (M⊙/L⊙)NFW+stars AC NFW+stars Salpeter IMF Kroupa IMF
NGC 720 5.5 0.77+0.52−0.71 0.54+0.42
−0.48 0.54±0.11 0.35±0.07
NGC 1407 4.8 0.52+0.25−0.32 0.35±0.25 1.6±0.2 1.1±0.1
NGC 4125 3.8 0.72±0.11 0.53±0.11 1.7±0.5 1.1±0.4NGC 4261 5.0 1.2±0.1 1.0±0.1 1.9±0.1 1.3±0.1NGC 4472 4.3 0.51+0.24
−0.31 0.36±0.1 1.3±0.3 0.83±0.15NGC 4649 4.9 0.90±0.13 0.65±0.12 1.7±0.2 1.1±0.1NGC 6482 2.9 0.73+0.18
−0.27 0.52+0.19−0.23 1.58±0.02 1.05±0.02
Note. — K-band stellar mass-to-light ratios measured from our fits to the data using boththe NFW+stars and the AC NFW+stars models. Since AC tends to increase the cuspiness ofthe DM profiles, M∗/LK is substantially lower for the AC NFW+stars models. We also show thepredicted M∗/LK values derived from simple stellar population synthesis, assuming either theSalpeter or Kroupa (2001) IMF.
synthetic M∗/LK than measured. Fitting template mod-els to spatially-resolved spectra of this system, Remboldet al. (2005) found evidence of a significant age gradi-ent, which falls from ∼12 Gyr in the centre to ∼3 Gyrby 1 kpc. This may, therefore, represent a system inwhich a relatively small fraction of the stellar compo-
nent, produced in a modest, recent star-formation event(“frosting”) dominates the optical line emission. In thiscase, the synthetic M∗/LK may be underestimated. Wereturn to this issue in § 8.4.
7. SYSTEMATIC ERRORS
14 Humphrey et al.
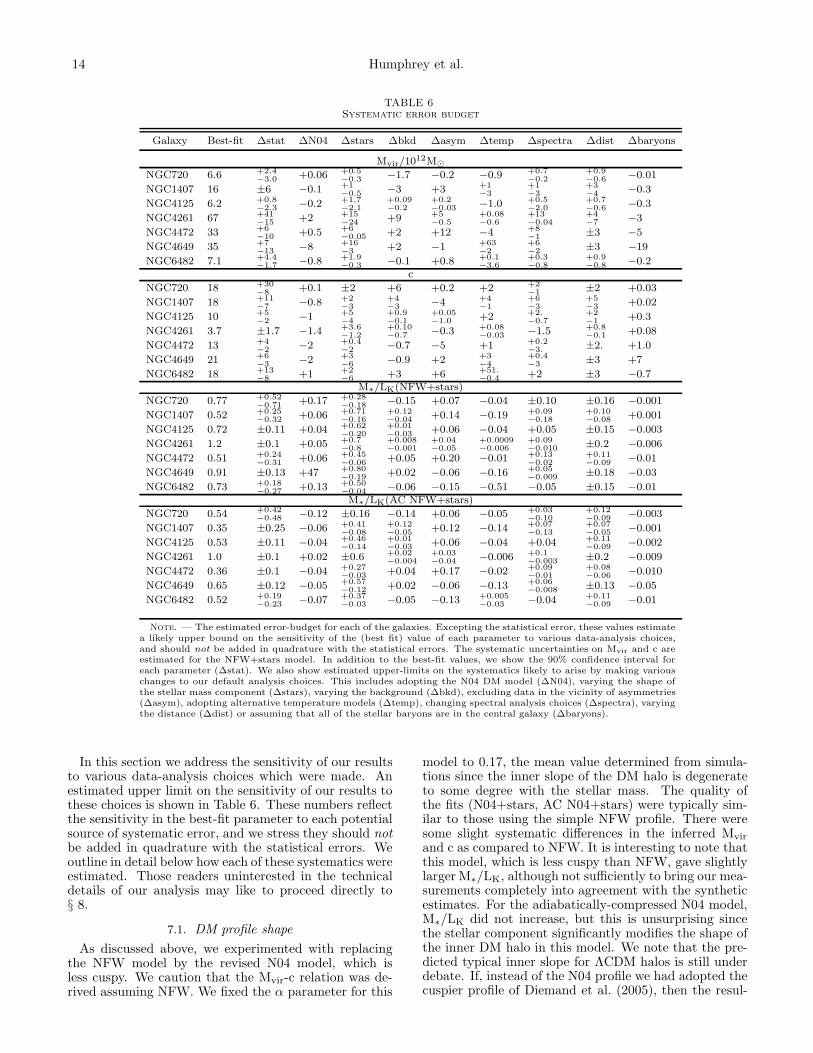
TABLE 6Systematic error budget
Galaxy Best-fit ∆stat ∆N04 ∆stars ∆bkd ∆asym ∆temp ∆spectra ∆dist ∆baryons
Mvir/1012M⊙
NGC720 6.6 +2.4−3.0 +0.06 +0.5
−0.3 −1.7 −0.2 −0.9 +0.7−0.2
+0.9−0.6 −0.01
NGC1407 16 ±6 −0.1 +1−0.5 −3 +3 +1
−3+1−3
+3−4 −0.3
NGC4125 6.2 +0.8−2.3 −0.2 +1.7
−2.1+0.09−0.2
+0.2−0.03 −1.0 +0.5
−2.0+0.7−0.6 −0.3
NGC4261 67 +41−15 +2 +15
−24 +9 +5−0.5
+0.08−0.6
+13−0.04
+4−7 −3
NGC4472 33 +6−10 +0.5 +6
−0.05 +2 +12 −4 +8−1 ±3 −5
NGC4649 35 +7−13 −8 +16
−3 +2 −1 +63−2
+6−2 ±3 −19
NGC6482 7.1 +4.4−1.7 −0.8 +1.9
−0.3 −0.1 +0.8 +0.1−3.6
+0.3−0.8
+0.9−0.8 −0.2
c
NGC720 18 +30−8 +0.1 ±2 +6 +0.2 +2 +2
−1 ±2 +0.03
NGC1407 18 +11−7 −0.8 +2
−3+4−3 −4 +4
−1+6−3
+5−3 +0.02
NGC4125 10 +5−2 −1 +5
−4+0.9−0.1
+0.05−1.0 +2 +2.
−0.7+2−1 +0.3
NGC4261 3.7 ±1.7 −1.4 +3.6−1.2
+0.10−0.7 −0.3 +0.08
−0.03 −1.5 +0.8−0.1 +0.08
NGC4472 13 +4−2 −2 +0.4
−2 −0.7 −5 +1 +0.2−3.
±2. +1.0
NGC4649 21 +6−3 −2 +3
−6 −0.9 +2 +3−4
+0.4−3 ±3 +7
NGC6482 18 +13−8 +1 +2
−6 +3 +6 +51.
−0.4 +2 ±3 −0.7M∗/LK(NFW+stars)
NGC720 0.77 +0.52−0.71 +0.17 +0.28
−0.18 −0.15 +0.07 −0.04 ±0.10 ±0.16 −0.001
NGC1407 0.52 +0.25−0.32 +0.06 +0.71
−0.16+0.12−0.04 +0.14 −0.19 +0.09
−0.18+0.10−0.08 +0.001
NGC4125 0.72 ±0.11 +0.04 +0.62−0.20
+0.01−0.03 +0.06 −0.04 +0.05 ±0.15 −0.003
NGC4261 1.2 ±0.1 +0.05 +0.7−0.8
+0.008−0.001
+0.04−0.05
+0.0009−0.006
+0.09−0.010 ±0.2 −0.006
NGC4472 0.51 +0.24−0.31 +0.06 +0.45
−0.06 +0.05 +0.20 −0.01 +0.13−0.02
+0.11−0.09 −0.01
NGC4649 0.91 ±0.13 +47 +0.80−0.19 +0.02 −0.06 −0.16 +0.05
−0.009 ±0.18 −0.03
NGC6482 0.73 +0.18−0.27 +0.13 +0.50
−0.04 −0.06 −0.15 −0.51 −0.05 ±0.15 −0.01M∗/LK(AC NFW+stars)
NGC720 0.54 +0.42−0.48 −0.12 ±0.16 −0.14 +0.06 −0.05 +0.03
−0.10+0.12−0.09 −0.003
NGC1407 0.35 ±0.25 −0.06 +0.41−0.08
+0.12−0.05 +0.12 −0.14 +0.07
−0.13+0.07−0.05 −0.001
NGC4125 0.53 ±0.11 −0.04 +0.46−0.14
+0.01−0.03 +0.06 −0.04 +0.04 +0.11
−0.09 −0.002
NGC4261 1.0 ±0.1 +0.02 ±0.6 +0.02−0.004
+0.03−0.04 −0.006 +0.1
−0.003 ±0.2 −0.009
NGC4472 0.36 ±0.1 −0.04 +0.27−0.03 +0.04 +0.17 −0.02 +0.09
−0.01+0.08−0.06 −0.010
NGC4649 0.65 ±0.12 −0.05 +0.57−0.12 +0.02 −0.06 −0.13 +0.06
−0.008 ±0.13 −0.05
NGC6482 0.52 +0.19−0.23 −0.07 +0.37
−0.03 −0.05 −0.13 +0.005−0.03 −0.04 +0.11
−0.09 −0.01
Note. — The estimated error-budget for each of the galaxies. Excepting the statistical error, these values estimatea likely upper bound on the sensitivity of the (best fit) value of each parameter to various data-analysis choices,and should not be added in quadrature with the statistical errors. The systematic uncertainties on Mvir and c areestimated for the NFW+stars model. In addition to the best-fit values, we show the 90% confidence interval foreach parameter (∆stat). We also show estimated upper-limits on the systematics likely to arise by making variouschanges to our default analysis choices. This includes adopting the N04 DM model (∆N04), varying the shape ofthe stellar mass component (∆stars), varying the background (∆bkd), excluding data in the vicinity of asymmetries(∆asym), adopting alternative temperature models (∆temp), changing spectral analysis choices (∆spectra), varyingthe distance (∆dist) or assuming that all of the stellar baryons are in the central galaxy (∆baryons).
In this section we address the sensitivity of our resultsto various data-analysis choices which were made. Anestimated upper limit on the sensitivity of our results tothese choices is shown in Table 6. These numbers reflectthe sensitivity in the best-fit parameter to each potentialsource of systematic error, and we stress they should notbe added in quadrature with the statistical errors. Weoutline in detail below how each of these systematics wereestimated. Those readers uninterested in the technicaldetails of our analysis may like to proceed directly to§ 8.
7.1. DM profile shape
As discussed above, we experimented with replacingthe NFW model by the revised N04 model, which isless cuspy. We caution that the Mvir-c relation was de-rived assuming NFW. We fixed the α parameter for this
model to 0.17, the mean value determined from simula-tions since the inner slope of the DM halo is degenerateto some degree with the stellar mass. The quality ofthe fits (N04+stars, AC N04+stars) were typically sim-ilar to those using the simple NFW profile. There weresome slight systematic differences in the inferred Mvir
and c as compared to NFW. It is interesting to note thatthis model, which is less cuspy than NFW, gave slightlylarger M∗/LK, although not sufficiently to bring our mea-surements completely into agreement with the syntheticestimates. For the adiabatically-compressed N04 model,M∗/LK did not increase, but this is unsurprising sincethe stellar component significantly modifies the shape ofthe inner DM halo in this model. We note that the pre-dicted typical inner slope for ΛCDM halos is still underdebate. If, instead of the N04 profile we had adopted thecuspier profile of Diemand et al. (2005), then the resul-
A Chandra View of Dark Matter in Galaxies. 15
tant M∗/LKwould have been even smaller, and in worseagreement with stellar population models.
7.2. Shape of the stellar potential
To account for the stellar component, we adopted anH90 model, the effective radius of the model being fixedto that determined by 2MASS. However, it is not en-tirely clear that the H90 model is an adequate descrip-tion of the stellar mass. There are some deviations be-tween H90 and the de Vaucouleurs model fitted as thede facto standard to the optical light profiles of ellipticalgalaxies, particularly in the critical central regions. Fur-thermore, the K-band light profiles of elliptical galaxiesmay, in fact, be better described by the Sersic profile(e.g. Brown et al. 2003). To investigate the sensitivityof our results to the H90 assumption, therefore, we ex-perimented with adopting a Sersic stellar mass potential(e.g. Prugniel & Simien 1997). To determine the two pa-rameters of this model (the Sersic index and half-lightradius) we obtained the Ks-band 2MASS images of eachgalaxy from NED, and fitted the surface brightness pro-files using dedicated software. A Sersic model fitted theKs-band light profile of each galaxy in the radial range5′′–3′ reasonably well. The fitted profiles tended to beslightly more centrally peaked than H90, which resultedprimarily in slightly lower inferred M∗/LK ratios whenadopted as mass models. We also experimented withreplacing the H90 model with a de Vaucouleurs model(Mellier & Mathez 1987), and adopting Reff values fromPahre (1999).
Elliptical galaxies exhibit radial colour gradients,which may reflect gradients in the metallicity or age ofthe stellar population (see discussion in § 8.4). Thesemay therefore imply a radial gradient in the stellar M/Lratio. It is beyond the scope of this present work to takesuch a gradient into account. However, we investigatedthe sensitivity of our results to the precise shape of theoptical light profile we adopted by experimenting withreplacing the K-band Reff for each galaxy with the (typi-cally larger) B-band value listed in RC3. For NGC 6482,for which Reff is not listed in RC3, we simply increasedReff by 50%.
7.3. Background subtraction
One of the major potential sources of systematic un-certainty in measuring the mass profiles of galaxies isthe background subtraction technique. This is especiallyimportant in the low surface-brightness regime at largeradii in our galaxies. In order to estimate the likely mag-nitude of uncertainty arising from our modelling, wheninitially fitting the background components (§ 3.1) weartificially adjusted the slope of the instrumental back-ground components, which dominate at high energy, tothe limits of their 90% confidence regions, refitting theother components and then refitted all the spectra withthese revised background models.
7.4. X-ray asymmetries
We note that there are some low-level asymmetries inthe X-ray surface brightness profiles (§ 4). In order toassess the potential impact of these features, we experi-mented with excluding or including the features. In par-ticular, we tried excluding data from the vicinity of the
jet and AGN in NGC 4261. We also excluded data froman off-axis X-ray asymmetry in NGC 4125 and excludeddata for NGC 4472 outside 6′, where Irwin & Sarazin(1996) pointed out that the X-ray data become asymmet-ric. These choices did not dramatically affect our results,indicating that these features did not indicate a signifi-cant violation of hydrostatic equilibrium, at least in anazimuthally-averaged sense. To gain an insight into pos-sible asymmetries in other sources, we tried re-extractingall our spectra, and re-deriving the mass profiles, fromsuitably-oriented semi-annuli (thereby excluding one halfof the emission from each system).
7.5. Temperature profile
In principle multiple temperature profiles may be ableto fit the same data adequately well but give rise toslightly different global halo parameters. In particularour constraints upon fb, the computation of which re-quires the extrapolation of the density (and hence tem-perature) profiles to large radius, may make Mvir andc sensitive to this effect. To test this, we experimentedwith cycling through each of our adopted temperatureprofiles (eq 3–5). Provided the fits were of compara-ble quality to our preferred choice, the impact on thebest-fit parameters reflect the systematic uncertainty inthis choice. Furthermore, we also experimented with ex-cluding the central bin from the temperature profiles ofNGC 1407 and NGC 4649, which may indicate a centraldisturbance (although there is no obvious X-ray morpho-logical disturbance in this region). These choices did notstrongly affect our results.
7.6. Spectral-fitting choices
A variety of choices are made in the spectral-fitting,each of which can affect, to some degree, the inferredρg and temperature in each radial bin. A thorough dis-cussion of these effects is given in Humphrey & Buote(2006).
Column density. In order to take account of possiblelocal deviations in the line-of-sight NH from the value ofDickey & Lockman (1990), we experimented with allow-ing NH to vary by ±25%.
Bandwidth. To estimate the impact of the bandwidthon our fits, we experimented with fitting the data in theenergy ranges 0.7–7.0 keV, 0.5–2.0 keV and 0.4–7.0 keV,in addition to our preferred choice 0.5–7.0 keV.
Plasma code. There are some uncertainties in the cor-rect modelling of the individual emission lines, in par-ticular those of Fe. This can systematically lead todifferences in the inferred temperature and density de-pending on choice of plasma code. We therefore ex-perimented with replacing the APEC model with theMEKAL plasma model.
Unresolved source component. We included a 7.3 keVbremsstrahlung component to account for unresolvedpoint sources within D25. This model is generally a goodfit to the resolved point sources in early-type galaxies,but is an empirical result which may not be appropriateto model all unresolved sources in all early-type galax-ies. We therefore tested the sensitivity of our results tothis model, by replacing the bremsstrahlung componentwith a simple power law (with Γ =1.5) or varying thetemperature of the component by ±25%
16 Humphrey et al.
7.7. Distance uncertainty
The estimated distance to the object enters into ourmass determination (Eq 1) primarily through the impacton the radial scale. To assess its impact on our fitting,we experimented by varying the distance by ±20%.
7.8. Stellar baryon fraction
In our analysis, we restricted fb to enable interestingconstraints on Mvir and c. For the stellar contributionto the baryon fraction, we assumed that mass is dividedamong group members following the B-band light, whichis not formally correct since M∗/L ratios are very sen-sitive to the age of the stellar population. To estimatehow much impact this makes to our fits, we experimentedwith assuming that all the stellar mass is in the centralgalaxy, which should place an upper limit on the uncer-tainty arising from this choice.
8. DISCUSSION
8.1. Hydrostatic equilibrium
Our fit results provide strong evidence that the gasis in hydrostatic equilibrium in these systems. Despitehighly nontrivial temperature and density profiles, wewere able to recover smooth mass profiles in remarkablygood agreement with expectation for these systems, us-ing two complementary techniques. If the gas is signifi-cantly out of hydrostatic equilibrium, this would repre-sent a remarkable “conspiracy” between the density andtemperature profiles. It is unsurprising that the gas isclose to hydrostatic equilibrium in these systems, sincewe took care to choose objects with relaxed X-ray mor-phology. Based on N-body/ hydrodynamical analysis,X-ray measurements are expected to give reliable con-straints on the DM in systems without obvious substruc-ture (Buote & Tsai 1995).
Further support for hydrostatic equilibrium is pro-vided by the general agreement between our measuredM∗/LK ratios and those predicted by SSP models, cou-pled with the agreement between the measured Mvir-crelation and that expected. Similarly a comparison be-tween our results and masses determined from stellardynamics provides even more evidence that our mea-sured mass profiles are reliable. Dynamically-determinedMgrav/LB within the B-band Reff are typically found tobe ∼4–10 (Gerhard et al. 2001; Trujillo et al. 2004). Wefound Mgrav/LB within the B-band Reff (taken from RC3or Faber et al. 1989) for our systems ranged from ∼3 to∼8, in good agreement with this result. For NGC 4649,outside Reff there is excellent agreement between ourmeasured Mgrav/L profile and that obtained from glob-ular cluster kinematics, although at small radii the X-ray data lie ∼30% lower (K. Gebhardt et al, in prepa-ration). van der Marel (1991) constructed stellar kine-matical models for 5 galaxies in our sample (NGC 720,NGC 1407 and NGC 4261, NGC 4472 and NGC 4649),under the assumption of a constant M/L profile. Strictlyspeaking a direct comparison cannot be made betweentheir Mgrav/LB measurements and our results since ourdata indicate this assumption is incorrect. However, if wesimply assume that these M/L ratios represent those in-tegrated out to Reff , the X-ray inferred masses vary from∼40% lower to ∼10% higher than those from kinemat-ics. Kronawitter et al. (2000) report Mgrav/LB∼8±1.5
for NGC 4472 within ∼50′′, at which radius our X-raydetermined value is ∼50% lower. The discrepancies be-tween the X-ray and dynamical masses are only modest(the X-ray mass being on average ∼20% lower), indicat-ing that the data must be close to hydrostatic equilib-rium. Turbulence is expected to contribute only ∼10%pressure support in clusters, which are believed to bemore turbulent than galaxies, (Rasia et al. 2006). There-fore, on a case-by-case basis, the observed differences aremost likely a manifestation of the mass-anisotropy de-generacy (e.g. Dekel et al. 2005).
8.2. Mass profiles
We obtained detailed mass profiles for 3 galaxies and4 group-scale systems, out to ∼10Reff. The data clearlyshow M/L profiles which are ∼flat within Reff and riseconsiderably outside this range. This confirms the pres-ence of substantial DM in at least some early-type galax-ies and indicates that a stellar mass component domi-nates within ∼Reff . This is consistent with studies ofstellar kinematics and similar to the mass decompositionanalysis of Brighenti & Mathews (1997).
The data are well-fitted by a model comprising a stel-lar mass (H90) component and an NFW DM profile.Omitting the stellar mass component led to systemat-ically poorer fits, smaller Mvir and vastly larger c (≫20),which are inconsistent with the predictions of ΛCDM.This effect is easy to understand— if we add a compactstellar mass component to an (extended) NFW profile,we increase the mass in the core which, by definition,makes the halo more concentrated. However, it is notentirely clear whether this effect, pointed out by Mamon& Lokas (2005), can completely account for the signifi-cantly steeper Mvir-c relation found by Sato et al. (2000).Based on our analysis of group-scale halos (Gastaldelloet al. 2006) we found that the inclusion of the stellarmass component does not have a strong effect on c inmost systems with Mvir∼
> 2×10¹³M⊙, provided the dataare fitted to a sufficiently large fraction of Rvir. Thedata did not allow us to distinguish statistically betweenthe simple NFW+stars model and scenarios in which theDM halo experiences adiabatic compression due to starformation (however, see § 8.4), or the NFW profile wasreplaced with the alternative N04 profile.
Comparing our inferred Mvir and c to the predictionsof ΛCDM we find general agreement. There is some ev-idence, however, that the concentrations are systemati-cally higher than one would expect, although the error-bars are typically large. Such a trend is also seen in ouranalysis of groups (Gastaldello et al. 2006). Whilst theslope of the Mvir-c relation therefore implied by our datais difficult to explain by varying the cosmological param-eters within reasonable limits (Buote et al. 2006a), wesuspect that the discrepancy can be resolved by takinginto account the selection function of our galaxies.
Our data were not selected in a statistically completemanner and, by choosing objects with relatively relaxedX-ray morphologies we are probably selecting objectswhich have not had a recent major merger. This sys-tematically biases us towards early-forming, hence higherconcentration halos. In fact, it is striking that all threede facto galaxies in our sample are relatively isolatedsystems (§ 8.3). Such systems preferentially might beexpected to occupy high-c halos (Zentner et al. 2005),
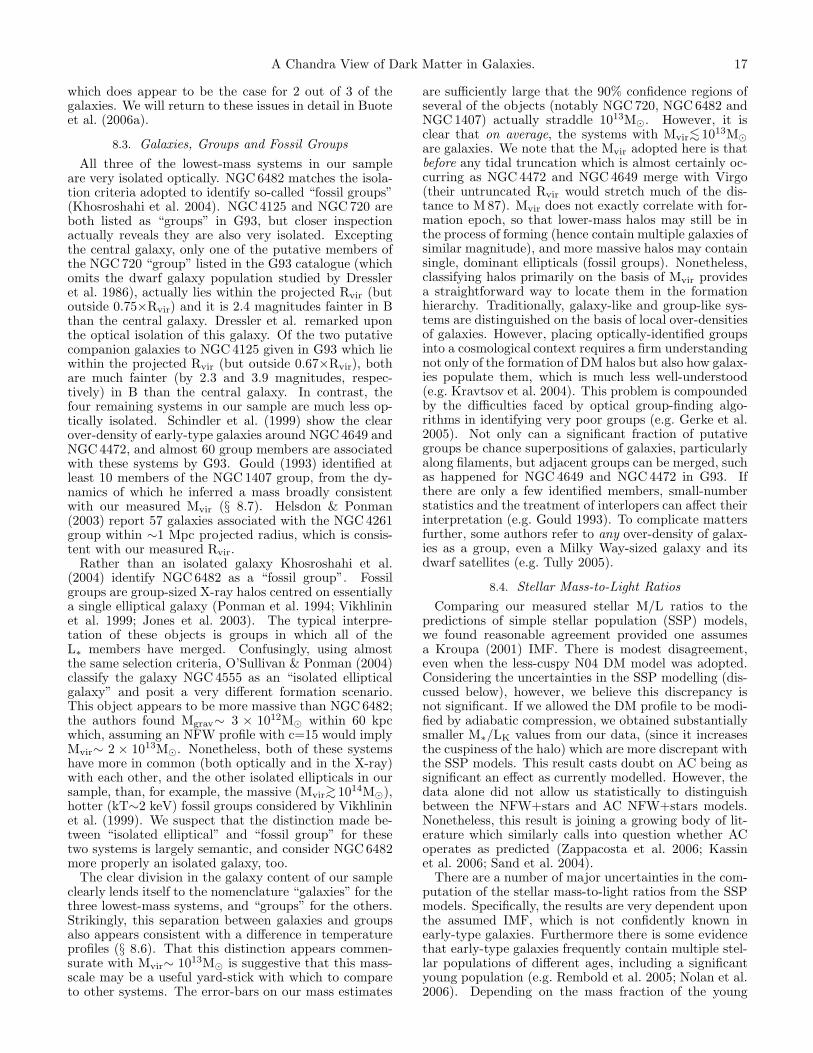
A Chandra View of Dark Matter in Galaxies. 17
which does appear to be the case for 2 out of 3 of thegalaxies. We will return to these issues in detail in Buoteet al. (2006a).
8.3. Galaxies, Groups and Fossil Groups
All three of the lowest-mass systems in our sampleare very isolated optically. NGC 6482 matches the isola-tion criteria adopted to identify so-called “fossil groups”(Khosroshahi et al. 2004). NGC 4125 and NGC 720 areboth listed as “groups” in G93, but closer inspectionactually reveals they are also very isolated. Exceptingthe central galaxy, only one of the putative members ofthe NGC 720 “group” listed in the G93 catalogue (whichomits the dwarf galaxy population studied by Dressleret al. 1986), actually lies within the projected Rvir (butoutside 0.75×Rvir) and it is 2.4 magnitudes fainter in Bthan the central galaxy. Dressler et al. remarked uponthe optical isolation of this galaxy. Of the two putativecompanion galaxies to NGC 4125 given in G93 which liewithin the projected Rvir (but outside 0.67×Rvir), bothare much fainter (by 2.3 and 3.9 magnitudes, respec-tively) in B than the central galaxy. In contrast, thefour remaining systems in our sample are much less op-tically isolated. Schindler et al. (1999) show the clearover-density of early-type galaxies around NGC 4649 andNGC 4472, and almost 60 group members are associatedwith these systems by G93. Gould (1993) identified atleast 10 members of the NGC 1407 group, from the dy-namics of which he inferred a mass broadly consistentwith our measured Mvir (§ 8.7). Helsdon & Ponman(2003) report 57 galaxies associated with the NGC 4261group within ∼1 Mpc projected radius, which is consis-tent with our measured Rvir.
Rather than an isolated galaxy Khosroshahi et al.(2004) identify NGC 6482 as a “fossil group”. Fossilgroups are group-sized X-ray halos centred on essentiallya single elliptical galaxy (Ponman et al. 1994; Vikhlininet al. 1999; Jones et al. 2003). The typical interpre-tation of these objects is groups in which all of theL∗ members have merged. Confusingly, using almostthe same selection criteria, O’Sullivan & Ponman (2004)classify the galaxy NGC 4555 as an “isolated ellipticalgalaxy” and posit a very different formation scenario.This object appears to be more massive than NGC 6482;the authors found Mgrav∼ 3 × 10¹²M⊙ within 60 kpcwhich, assuming an NFW profile with c=15 would implyMvir∼ 2 × 10¹³M⊙. Nonetheless, both of these systemshave more in common (both optically and in the X-ray)with each other, and the other isolated ellipticals in oursample, than, for example, the massive (Mvir∼
> 1014M⊙),hotter (kT∼2 keV) fossil groups considered by Vikhlininet al. (1999). We suspect that the distinction made be-tween “isolated elliptical” and “fossil group” for thesetwo systems is largely semantic, and consider NGC 6482more properly an isolated galaxy, too.
The clear division in the galaxy content of our sampleclearly lends itself to the nomenclature “galaxies” for thethree lowest-mass systems, and “groups” for the others.Strikingly, this separation between galaxies and groupsalso appears consistent with a difference in temperatureprofiles (§ 8.6). That this distinction appears commen-surate with Mvir∼ 1013M⊙ is suggestive that this mass-scale may be a useful yard-stick with which to compareto other systems. The error-bars on our mass estimates
are sufficiently large that the 90% confidence regions ofseveral of the objects (notably NGC 720, NGC 6482 andNGC 1407) actually straddle 1013M⊙. However, it isclear that on average, the systems with Mvir∼
< 1013M⊙
are galaxies. We note that the Mvir adopted here is thatbefore any tidal truncation which is almost certainly oc-curring as NGC 4472 and NGC 4649 merge with Virgo(their untruncated Rvir would stretch much of the dis-tance to M 87). Mvir does not exactly correlate with for-mation epoch, so that lower-mass halos may still be inthe process of forming (hence contain multiple galaxies ofsimilar magnitude), and more massive halos may containsingle, dominant ellipticals (fossil groups). Nonetheless,classifying halos primarily on the basis of Mvir providesa straightforward way to locate them in the formationhierarchy. Traditionally, galaxy-like and group-like sys-tems are distinguished on the basis of local over-densitiesof galaxies. However, placing optically-identified groupsinto a cosmological context requires a firm understandingnot only of the formation of DM halos but also how galax-ies populate them, which is much less well-understood(e.g. Kravtsov et al. 2004). This problem is compoundedby the difficulties faced by optical group-finding algo-rithms in identifying very poor groups (e.g. Gerke et al.2005). Not only can a significant fraction of putativegroups be chance superpositions of galaxies, particularlyalong filaments, but adjacent groups can be merged, suchas happened for NGC 4649 and NGC 4472 in G93. Ifthere are only a few identified members, small-numberstatistics and the treatment of interlopers can affect theirinterpretation (e.g. Gould 1993). To complicate mattersfurther, some authors refer to any over-density of galax-ies as a group, even a Milky Way-sized galaxy and itsdwarf satellites (e.g. Tully 2005).
8.4. Stellar Mass-to-Light Ratios
Comparing our measured stellar M/L ratios to thepredictions of simple stellar population (SSP) models,we found reasonable agreement provided one assumesa Kroupa (2001) IMF. There is modest disagreement,even when the less-cuspy N04 DM model was adopted.Considering the uncertainties in the SSP modelling (dis-cussed below), however, we believe this discrepancy isnot significant. If we allowed the DM profile to be modi-fied by adiabatic compression, we obtained substantiallysmaller M∗/LK values from our data, (since it increasesthe cuspiness of the halo) which are more discrepant withthe SSP models. This result casts doubt on AC being assignificant an effect as currently modelled. However, thedata alone did not allow us statistically to distinguishbetween the NFW+stars and AC NFW+stars models.Nonetheless, this result is joining a growing body of lit-erature which similarly calls into question whether ACoperates as predicted (Zappacosta et al. 2006; Kassinet al. 2006; Sand et al. 2004).
There are a number of major uncertainties in the com-putation of the stellar mass-to-light ratios from the SSPmodels. Specifically, the results are very dependent uponthe assumed IMF, which is not confidently known inearly-type galaxies. Furthermore there is some evidencethat early-type galaxies frequently contain multiple stel-lar populations of different ages, including a significantyoung population (e.g. Rembold et al. 2005; Nolan et al.2006). Depending on the mass fraction of the young
18 Humphrey et al.
component, this may substantially reduce M∗/LK in thegalaxy, hence possibly reconciling the data and the ACNFW+stars model. A small amount of star formationmay also give rise to a population of stars which candominate the light in the galaxy core, giving rise to sig-nificantly lower synthetic M∗/LK than measured. Thismay be the case in NGC 720 (see § 6.5). More problem-atically, there are known to be significant abundance,or possible age, gradients in the stellar populations ofearly-type galaxies (e.g. Trager et al. 2000; Kobayashi &Arimoto 1999; Rembold et al. 2005), which would trans-late into stellar M∗/LK gradients. Our simple modellingdid not allow us to account for such an effect per se.Although we suspect that such gradients will primarilylead to a M∗/LK value which reflects an average for thegalaxy, M∗/LK does depend to some extent upon theshape of the assumed stellar potential. Properly takingaccount of this effect is beyond the scope of this presentwork, but may bring the synthetic M/L ratios and ourresults into better agreement. Clearly this is only oneof a number of other systematic effects which may alsoreconcile the slight discrepancy (Table 6).
8.5. Baryon fractions
An interesting result from our analysis is that thesesystems, despite having masses ∼> 5×10¹²M⊙, do not ap-pear in general to be baryonically closed. To some ex-tent this trend was enforced by applying Eq 6 to con-strain the data. However, the excellent fits we obtainedby this method, in conjunction with the good agreementbetween the measured Mvir-c relation and the predictionsof ΛCDM and, crucially, our measurements at the groupscale (which do not employ this restriction: Gastaldelloet al. 2006), indicate that the inferred fb(∼0.04–0.09; Ta-ble 4) are accurate. Furthermore, if we relaxed this con-straint and instead restricted fb to a finite range, we alsofound that the data tended to favour modest values of fb.In particular, for any given system, the measured Mvir
and fb were strongly anti-correlated, so that our upperMvir constraint is in part imposed by the lower limit weplace on fb. Given the shapes of the Mvir-c contours(Fig 4), it is clear that good agreement with the Mvir-crelation predicted from simulations tends, therefore, torequire rather modest values of fb. This would suggestthat strong feedback plays an important role in the evo-lution of these objects.
8.6. Temperature profiles
By inspection of the temperature profiles (Fig 2) it isimmediately clear that, for all of the galaxy-scale sys-tems in our sample the temperature profiles have nega-tive gradients. In contrast the group-scale objects havepositive temperature gradients, similar to observationsof other X-ray bright groups and clusters (Gastaldelloet al. 2006; Vikhlinin et al. 2005; Piffaretti et al. 2005).This radical difference in the temperature profiles seemsconsistent with our division of galaxies and groups atMvir∼ 1013M⊙. The origin of this distinct demarca-tion between objects around 1013M⊙ is unclear, however.Negative temperature gradients are expected for isolatedgalaxies containing relatively cool gas, such as that aris-ing from stellar mass-loss. In the deep stellar potentialwell, compressive heating of the gradually inflowing gas
can dominate over radiative cooling to produce a nega-tive temperature slope. In contrast, if hotter (∼1–2 keV)baryons are allowed to flow in, radiative cooling domi-nates to produce a positive temperature gradient (Math-ews & Brighenti 2003). It is by no means clear, however,why the hot baryons appear to be present only in thesystems with Mvir∼
> 1013M⊙. One possibility is the localenvironment; all of the galaxy-scale objects are ratherisolated, whereas the groups NGC 4472 and NGC 4649,in particular, are found in a relatively dense cluster envi-ronment, which could provide a reservoir of hot baryons.However, such an explanation cannot easily account forthe positive temperature gradient in NGC 1407, which iscomparatively isolated, or the isolated system NGC 4555,which appears only slightly more massive than our galax-ies.
It is possible that selection effects may have playedsome role in the bimodal temperature profile behaviour,since both NGC 4125 and NGC 6482 are classified inNED as LINERS, and NGC 720 has a dominant youngstellar population (Appendix A). However, none of thesesystems show strong X-ray morphology disturbances inthe core, which might indicate a substantial energy inputfrom star-formation or AGN activity. In any case, thecooling time in the core of NGC 720 is only ∼200 Myr,substantially less than the implied time since the lastmajor burst of star formation, and so the negative tem-perature gradient cannot simply be related to energy in-jection during a starburst. Furthermore, at least twoof the group-scale systems also harbour AGN and do notshow obvious negative temperature gradients in the core.
Another example of an object we believe to be a galaxy(rather than a group) which exhibits a negative tem-perature gradient is the S0 NGC 1332 (Humphrey et al.2004). A possible counter-example to this trend might bythe “isolated elliptical galaxy” NGC 4555, which exhibitsa temperature profile akin to the groups in our sample(O’Sullivan & Ponman 2004). However, as we discuss in§ 8.3, this probably has comparable Mvir to the groups.
Another intriguing feature of two of the group scaleobjects is a central temperature peak, similar to a fea-ture we found in the cluster A 644 (Buote et al. 2005). Inthat system, we found a significant offset between the X-ray centroid and the emission peak in an otherwise fairlyrelaxed object. We suggested that both of these featuresmay be related to the cD “sloshing” in the potential wellof the cluster, which is relaxing following disturbance by,for example, a merger. We do not find obvious evidenceof a similar offset in either NGC 1407 or NGC 4649. How-ever, these groups may be in a comparably more relaxed(evolved) state than A 644. Alternatively, the centralpeaks may be related to past AGN activity heating thegas in the core of the galaxies, from which the system hashad time to relax dynamically but not cool completely.
8.7. Is NGC1407 a “dark group”?
Based on the group member dispersion velocity Gould(1993) suggested that NGC 1407 may lie in a massive(∼> a few ×1013M⊙) DM halo. Although such a conclu-
sion was strongly dependent on the association of thegalaxy NGC 1400, which exhibits a large peculiar veloc-ity, with the group, we can now confirm the presenceof a substantial DM halo around this system. Both thetemperature profile and our best-fit mass are similar to
A Chandra View of Dark Matter in Galaxies. 19
the bright X-ray group NGC 5044 (Buote et al. 2006b),and yet it is almost 2 orders of magnitude fainter in LX.NGC 5044 appears to be close to baryonic closure (Math-ews et al. 2005), and so has likely retained most of itslarge gaseous halo. On the other hand NGC 1407 is notbaryonically closed (we estimate fb≃0.06) and so the lossof much of its hot gas envelope easily explains its lowerLX/LB. Since the masses of the two systems are notconsiderably different, this points to substantial varia-tion in the evolutionary history of these two groups. Inparticular, feedback may have operated more efficientlyin evacuating the gas from NGC 1407.
Gould’s preferred mass estimate (∼ 1014M⊙) wouldimply a remarkably high M/L ratio for the system(Mvir/LB∼900M⊙/L⊙), making NGC 1407 a bona fide“dark group”. The existence of such an object wouldprovide a valuable insight into the process of star forma-tion in DM halos, as it would imply star formation wassomehow inhibited in that system. This mass estimateis, however, considerably larger than our preferred value∼ 1.5 × 10¹³M⊙, which implies a more modest M/L ra-tio (Mvir/LB∼140M⊙/L⊙). To some extent, though, ourconstraint on fb, which was necessary to obtain inter-esting Mvir constraints, has probably enforced this be-haviour. Such a restriction may not be valid in a sys-tem with an unusual star-formation history and so weexperimented with freeing fb. To enable Mvir to be con-strained, we restricted c to lie on the best-fit Mvir-c re-lation found by Bullock et al. (2001). The best-fittingmass, Mvir= (9.7+17.8
−6.2 ) × 1013M⊙, was in good agree-ment with Gould (1993)’s values, but implies a baryonfraction only of ∼0.003. Since this fit was statisticallyindistinguishable from the preferred model, we cannotdetermine which mass estimate is more likely.
9. SUMMARY
Using Chandra we have obtained detailed mass profilescentred on 7 elliptical galaxies, of which 3 were found tohave de facto galaxy-scale halos, with Mvir< 1013M⊙,and 4 had group-scale (1013M⊙<Mvir< 1014M⊙) halos.These represent the best available data for nearby objectswith comparable LX. In summary:
1. The M/L ratio profiles were ∼flat within Reff androse sharply outside this region, indicating substan-tial DM in all 7 systems.
2. The data were well-described by a two compo-nent model, comprising an NFW potential for theDM and a H90 stellar mass model. We were notable statistically to distinguish between this sce-nario and one in which the DM profile was mod-ified by “adiabatic compression” due to baryonicinfall. Similarly, we could not distinguish betweenthe NFW and the revised N04 DM halo profiles.
3. The distribution of the galaxies in the Mvir-c planewas in broad agreement with the predictions ofΛCDM, although with a slight trend toward moreconcentrated halos, in good agreement with ourmodelling of X-ray bright groups and poor clusters(Gastaldello et al. 2006). This probably representsa galaxy selection bias to earlier-forming systems,and we will discuss how we might account for it inBuote et al. (2006a). Allowing AC to modify the
shape of the DM halo did not appreciably affectthe Mvir-c relation.
4. Omitting the stellar mass component resulted insystematically poorer fits, smaller Mvir and un-physically large c, confirming the conclusions ofMamon & Lokas (2005). This may explain verylarge values of c found by some previous X-ray ob-servers (e.g. Sato et al. 2000; Khosroshahi et al.2004).
5. For the NFW+stars model, M∗/LK was found to bein approximate agreement with the predictions ofsimple stellar population synthesis models, assum-ing a Kroupa (2001) IMF. The AC NFW+starsmodels have significantly lower M∗/LK whichseems to cast doubt on the AC scenario, althoughthis conclusion is sensitive to the considerable un-certainties in the theoretical modelling.
6. Despite having Mvir∼> 5×10¹²M⊙, typically
fb∼0.04–0.09 for each galaxy, implying that feed-back has played an important role in the evolutionof these systems.
7. The temperature profiles of the galaxy-scalesystems all exhibited negative radial gradients,whereas the group-scale objects exhibited positivegradients, similar to the “Universal” temperatureprofiles being found in other X-ray bright groupsand clusters. This implies a strict line of demarca-tion between systems at Mvir∼ 1013M⊙.
8. In two of the groups, we found central temperaturepeaks, similar to that found in the cluster A 644(Buote et al. 2005), but no obvious central distur-bances in X-ray morphology. This may relate topast AGN activity, following which the heated gasin the core of the galaxy has relaxed but not cooled.
9. We confirm the suggestion of Gould (1993) thatthe elliptical galaxy NGC 1407 lies at the cen-tre of a massive DM halo, possibly making it a“dark group” with an unusually large M/L. Ourbest-fitting Mvir is considerably lower than that ofGould, implying M/L more consistent with normalgroups. Nonetheless, if we relax the assumptions ofour modelling very large masses (Mvir∼ 1014M⊙)are allowed.
We would like to thank Oleg Gnedin for making avail-able his adiabatic compression code. We would alsolike to thank Karl Gebhardt for communicating withus results from his paper in preparation. We thankLouisa Nolan for interesting discussions on the stellarpopulations of galaxies. This research has made use ofdata obtained from the High Energy Astrophysics Sci-ence Archive Research Center (HEASARC), provided byNASA’s Goddard Space Flight Center. This researchhas also made use of the NASA/IPAC ExtragalacticDatabase (NED) which is operated by the Jet Propul-sion Laboratory, California Institute of Technology, un-der contract with NASA. In addition, this work alsomade use of the HyperLEDA database (http://leda.univ-lyon1.fr). Support for this work was provided by NASA
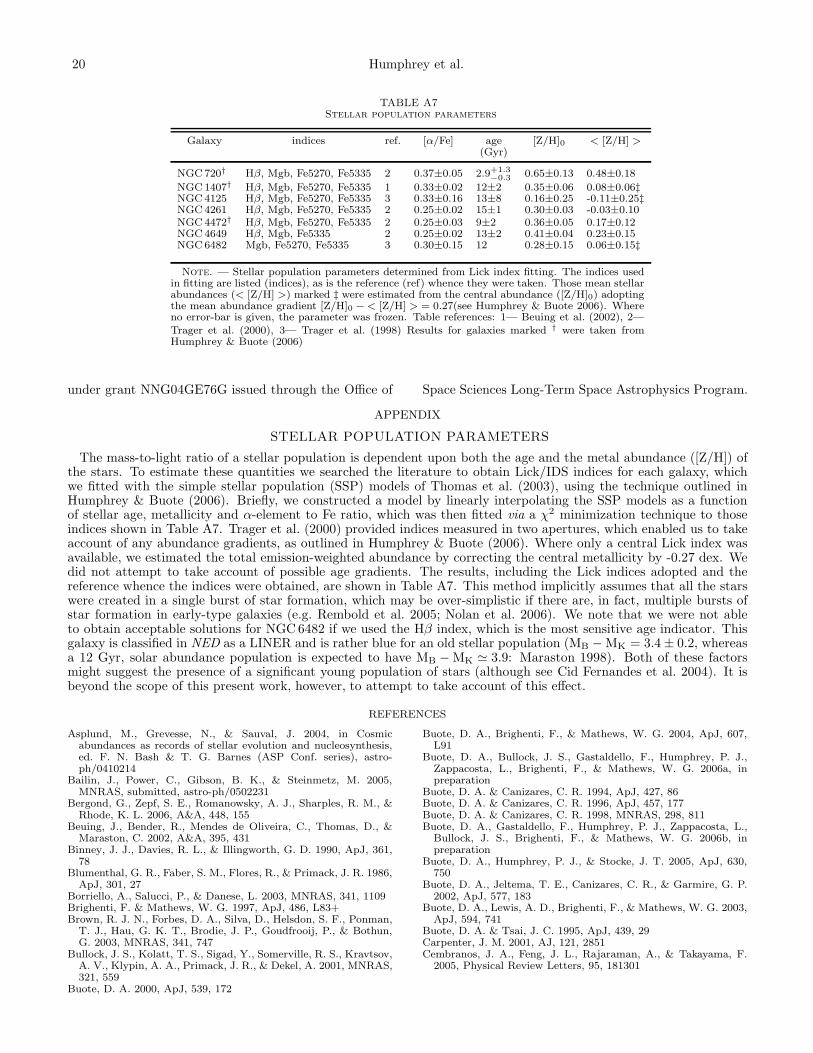
20 Humphrey et al.
TABLE A7Stellar population parameters
Galaxy indices ref. [α/Fe] age [Z/H]0 < [Z/H] >(Gyr)
NGC 720† Hβ, Mgb, Fe5270, Fe5335 2 0.37±0.05 2.9+1.3−0.3 0.65±0.13 0.48±0.18
NGC 1407† Hβ, Mgb, Fe5270, Fe5335 1 0.33±0.02 12±2 0.35±0.06 0.08±0.06‡NGC 4125 Hβ, Mgb, Fe5270, Fe5335 3 0.33±0.16 13±8 0.16±0.25 -0.11±0.25‡NGC 4261 Hβ, Mgb, Fe5270, Fe5335 2 0.25±0.02 15±1 0.30±0.03 -0.03±0.10NGC 4472† Hβ, Mgb, Fe5270, Fe5335 2 0.25±0.03 9±2 0.36±0.05 0.17±0.12NGC 4649 Hβ, Mgb, Fe5335 2 0.25±0.02 13±2 0.41±0.04 0.23±0.15NGC 6482 Mgb, Fe5270, Fe5335 3 0.30±0.15 12 0.28±0.15 0.06±0.15‡
Note. — Stellar population parameters determined from Lick index fitting. The indices usedin fitting are listed (indices), as is the reference (ref) whence they were taken. Those mean stellarabundances (< [Z/H] >) marked ‡ were estimated from the central abundance ([Z/H]0) adoptingthe mean abundance gradient [Z/H]0 − < [Z/H] > = 0.27(see Humphrey & Buote 2006). Whereno error-bar is given, the parameter was frozen. Table references: 1— Beuing et al. (2002), 2—Trager et al. (2000), 3— Trager et al. (1998) Results for galaxies marked † were taken fromHumphrey & Buote (2006)
under grant NNG04GE76G issued through the Office of Space Sciences Long-Term Space Astrophysics Program.
APPENDIX
STELLAR POPULATION PARAMETERS
The mass-to-light ratio of a stellar population is dependent upon both the age and the metal abundance ([Z/H]) ofthe stars. To estimate these quantities we searched the literature to obtain Lick/IDS indices for each galaxy, whichwe fitted with the simple stellar population (SSP) models of Thomas et al. (2003), using the technique outlined inHumphrey & Buote (2006). Briefly, we constructed a model by linearly interpolating the SSP models as a functionof stellar age, metallicity and α-element to Fe ratio, which was then fitted via a χ2 minimization technique to thoseindices shown in Table A7. Trager et al. (2000) provided indices measured in two apertures, which enabled us to takeaccount of any abundance gradients, as outlined in Humphrey & Buote (2006). Where only a central Lick index wasavailable, we estimated the total emission-weighted abundance by correcting the central metallicity by -0.27 dex. Wedid not attempt to take account of possible age gradients. The results, including the Lick indices adopted and thereference whence the indices were obtained, are shown in Table A7. This method implicitly assumes that all the starswere created in a single burst of star formation, which may be over-simplistic if there are, in fact, multiple bursts ofstar formation in early-type galaxies (e.g. Rembold et al. 2005; Nolan et al. 2006). We note that we were not ableto obtain acceptable solutions for NGC 6482 if we used the Hβ index, which is the most sensitive age indicator. Thisgalaxy is classified in NED as a LINER and is rather blue for an old stellar population (MB − MK = 3.4 ± 0.2, whereasa 12 Gyr, solar abundance population is expected to have MB − MK ≃ 3.9: Maraston 1998). Both of these factorsmight suggest the presence of a significant young population of stars (although see Cid Fernandes et al. 2004). It isbeyond the scope of this present work, however, to attempt to take account of this effect.
REFERENCES
Asplund, M., Grevesse, N., & Sauval, J. 2004, in Cosmicabundances as records of stellar evolution and nucleosynthesis,ed. F. N. Bash & T. G. Barnes (ASP Conf. series), astro-ph/0410214
Bailin, J., Power, C., Gibson, B. K., & Steinmetz, M. 2005,MNRAS, submitted, astro-ph/0502231
Bergond, G., Zepf, S. E., Romanowsky, A. J., Sharples, R. M., &Rhode, K. L. 2006, A&A, 448, 155
Beuing, J., Bender, R., Mendes de Oliveira, C., Thomas, D., &Maraston, C. 2002, A&A, 395, 431
Binney, J. J., Davies, R. L., & Illingworth, G. D. 1990, ApJ, 361,78
Blumenthal, G. R., Faber, S. M., Flores, R., & Primack, J. R. 1986,ApJ, 301, 27
Borriello, A., Salucci, P., & Danese, L. 2003, MNRAS, 341, 1109Brighenti, F. & Mathews, W. G. 1997, ApJ, 486, L83+Brown, R. J. N., Forbes, D. A., Silva, D., Helsdon, S. F., Ponman,
T. J., Hau, G. K. T., Brodie, J. P., Goudfrooij, P., & Bothun,G. 2003, MNRAS, 341, 747
Bullock, J. S., Kolatt, T. S., Sigad, Y., Somerville, R. S., Kravtsov,A. V., Klypin, A. A., Primack, J. R., & Dekel, A. 2001, MNRAS,321, 559
Buote, D. A. 2000, ApJ, 539, 172
Buote, D. A., Brighenti, F., & Mathews, W. G. 2004, ApJ, 607,L91
Buote, D. A., Bullock, J. S., Gastaldello, F., Humphrey, P. J.,Zappacosta, L., Brighenti, F., & Mathews, W. G. 2006a, inpreparation
Buote, D. A. & Canizares, C. R. 1994, ApJ, 427, 86Buote, D. A. & Canizares, C. R. 1996, ApJ, 457, 177Buote, D. A. & Canizares, C. R. 1998, MNRAS, 298, 811Buote, D. A., Gastaldello, F., Humphrey, P. J., Zappacosta, L.,
Bullock, J. S., Brighenti, F., & Mathews, W. G. 2006b, inpreparation
Buote, D. A., Humphrey, P. J., & Stocke, J. T. 2005, ApJ, 630,750
Buote, D. A., Jeltema, T. E., Canizares, C. R., & Garmire, G. P.2002, ApJ, 577, 183
Buote, D. A., Lewis, A. D., Brighenti, F., & Mathews, W. G. 2003,ApJ, 594, 741
Buote, D. A. & Tsai, J. C. 1995, ApJ, 439, 29Carpenter, J. M. 2001, AJ, 121, 2851Cembranos, J. A., Feng, J. L., Rajaraman, A., & Takayama, F.
2005, Physical Review Letters, 95, 181301
A Chandra View of Dark Matter in Galaxies. 21
Cid Fernandes, R., Gonzalez Delgado, R. M., Schmitt, H., Storchi-Bergmann, T., Martins, L. P., Perez, E., Heckman, T., Leitherer,C., & Schaerer, D. 2004, ApJ, 605, 105
Croston, J. H., Hardcastle, M. J., & Birkinshaw, M. 2005, MNRAS,357, 279
de Vaucouleurs, G., de Vaucouleurs, A., Corwin, H. G., Buta, R. J.,Paturel, G., & Fouque, P. 1991, Third Reference Catalogue ofBright Galaxies (Volume 1-3, XII, 2069 pp. 7 figs.. Springer-Verlag Berlin Heidelberg New York)
Dekel, A., Stoehr, F., Mamon, G. A., Cox, T. J., Novak, G. S., &Primack, J. R. 2005, Nature, 437, 707
Dickey, J. M. & Lockman, F. J. 1990, ARA&A, 28, 215Diemand, J., Zemp, M., Moore, B., Stadel, J., & Carollo, M. 2005,
MNRAS, 364, 665Dressler, A., Schechter, P. L., & Rose, J. A. 1986, AJ, 91, 1058El-Zant, A. A., Hoffman, Y., Primack, J., & Combes, F. a
nd Shlosman, I. 2004, ApJ, 607, L75Faber, S. M., Wegner, G., Burstein, D., Davies, R. L., Dressler, A.,
Lynden-Bell, D., & Terlevich, R. J. 1989, ApJS, 69, 763Fischer, P., et al. 2000, AJ, 120, 1198Forman, W., Jones, C., & Tucker, W. 1985, ApJ, 293, 102Freeman, P. E., Kashyap, V., Rosner, R., & Lamb, D. Q. 2002,
ApJS, 138, 185Fukazawa, Y., Botoya-Nonesa, J. G., Pu, J., Ohto, A., & Kawano,
N. 2006, ApJ, 636, 698Garcia, A. M. 1993, A&AS, 100, 47Gastaldello, F., Buote, D. A., Humphrey, P. J., Zappacosta, L.,
Bullock, J. S., Brighenti, F., & Mathews, W. G. 2006, inpreparation
Gerhard, O., Kronawitter, A., Saglia, R. P., & Bender, R. 2001,AJ, 121, 1936
Gerke, B. F., et al. 2005, ApJ, 625, 6Gnedin, O. Y., Kravtsov, A. V., Klypin, A. A., & Nagai, D. 2004,
ApJ, 616, 16Gonzalez, A. H., Williams, K. A., Bullock, J. S., Kolatt, T. S., &
Primack, J. R. 2000, ApJ, 528, 145Gould, A. 1993, ApJ, 403, 37Helsdon, S. F. & Ponman, T. J. 2003, MNRAS, 340, 485Hernquist, L. 1990, ApJ, 356, 359Hogan, C. J. & Dalcanton, J. J. 2000, Phys. Rev. D, 62, 063511Humphrey, P. J. & Buote, D. A. 2004, ApJ, 612, 848Humphrey, P. J. & Buote, D. A. 2006, ApJ, 639, 136Humphrey, P. J., Buote, D. A., & Canizares, C. R. 2004, ApJ, 617,
1047Humphrey, P. J., Buote, D. A., Gastaldello, F., Zappacosta, L.,
Bullock, J. S., Brighenti, F., & Mathews, W. G. 2005, in TheX-Ray Universe 2005
Irwin, J. A., Athey, A. E., & Bregman, J. N. 2003, ApJ, 587, 356Irwin, J. A. & Sarazin, C. L. 1996, ApJ, 471, 683Jensen, J. B., Tonry, J. L., Barris, B. J., Thompson, R. I., Liu,
M. C., Rieke, M. J., Ajhar, E. A., & Blakeslee, J. P. 2003, ApJ,583, 712
Jing, Y. P. 2000, ApJ, 535, 30Jones, C., Forman, W., Vikhlinin, A., Markevitch, M., David, L.,
Warmflash, A., Murray, S., & Nulsen, P. E. J. 2002, ApJ, 567,L115
Jones, L. R., Ponman, T. J., Horton, A., Babul, A., Ebeling, H.,& Burke, D. J. 2003, MNRAS, 343, 627
Kaplinghat, M. 2005, Phys. Rev. D, 72, 063510Kassin, S. A., de Jong, R. S., & Weiner, B. J. 2006, ApJ, in press,
astro-ph/0602027Kay, S. T., Thomas, P. A., & Theuns, T. 2003, MNRAS, 343, 608Khosroshahi, H. G., Jones, L. R., & Ponman, T. J. 2004, MNRAS,
349, 1240Kim, D. & Fabbiano, G. 2004, ApJ, 611, 846Kobayashi, C. & Arimoto, N. 1999, ApJ, 527, 573Kochanek, C. S. 1995, ApJ, 445, 559Kravtsov, A. V., Berlind, A. A., Wechsler, R. H., Klypin, A. A.,
Gottlober, S., Allgood, B., & Primack, J. R. 2004, ApJ, 609, 35Kronawitter, A., Saglia, R. P., Gerhard, O., & Bender, R. 2000,
A&AS, 144, 53Kroupa, P. 2001, MNRAS, 322, 231Kuhlen, M., Strigari, L. E., Zentner, A. R., Bullock, J. S., &
Primack, J. R. 2005, MNRAS, 357, 387Lewis, A. D., Buote, D. A., & Stocke, J. T. 2003, ApJ, 586, 135Loeb, A. & Peebles, P. J. E. 2003, ApJ, 589, 29Loewenstein, M. & White, R. E. 1999, ApJ, 518, 50Mamon, G. A. & Lokas, E. L. 2005, MNRAS, 362, 95
Maraston, C. 1998, MNRAS, 300, 872Markevitch, M. 2002, astro-ph/0205333Mathews, W. G. & Brighenti, F. 2003, ARA&A, 41, 191Mathews, W. G., Faltenbacher, A., Brighenti, F., & Buote, D. A.
2005, ApJ, 634, L137Mellier, Y. & Mathez, G. 1987, A&A, 175, 1Napolitano, N. R., Capaccioli, M., Romanowsky, A. J., Douglas,
N. G., Merrifield, M. R., Kuijken, K., Arnaboldi, M., Gerhard,O., & Freeman, K. C. 2005, MNRAS, 357, 691
Navarro, J. F., Frenk, C. S., & White, S. D. M. 1997, ApJ, 490,493
Navarro, J. F., Hayashi, E., Power, C., Jenkins, A. R., Frenk, C. S.,White, S. D. M., Springel, V., Stadel, J., & Quinn, T. R. 2004,MNRAS, 349, 1039
Nolan, L. A., Harva, M. O., Kaban, A., & Raychaudhury, S. 2006,MNRAS, 366, 321
O’Sullivan, E., Forbes, D. A., & Ponman, T. J. 2001, MNRAS, 328,461
O’Sullivan, E. & Ponman, T. J. 2004, MNRAS, 354, 935O’Sullivan, E., Ponman, T. J., & Collins, R. S. 2003, MNRAS, 340,
1375Padmanabhan, N., et al. 2004, New Astronomy, 9, 329Pahre, M. A. 1999, ApJS, 124, 127Perlmutter, S., et al. 1999, ApJ, 517, 565Pierce, M., et al. 2006, MNRAS, 366, 1253Piffaretti, R., Jetzer, P., Kaastra, J. S., & Tamura, T. 2005, A&A,
433, 101Pointecouteau, E., Arnaud, M., & Pratt, G. W. 2005, A&A, 435,
1Ponman, T. J., Allan, D. J., Jones, L. R., Merrifield, M., McHardy,
I. M., Lehto, H. J., & Luppino, G. A. 1994, Nature, 369, 462Prugniel, P. & Simien, F. 1997, A&A, 321, 111Randall, S. W., Sarazin, C. L., & Irwin, J. A. 2004, ApJ, 600, 729Randall, S. W., Sarazin, C. L., & Irwin, J. A. 2006, ApJ, 636, 200Rasia, E., Ettori, S., Moscardini, L., Mazzotta, P., Borgani, S.,
Dolag, K., Tormen, G., Cheng, L. M., & Diaferio, A. 2006,MNRAS, submitted, astro-ph/0602434
Rembold, S. B., Pastoriza, M. G., & Bruzual, G. 2005, A&A, 436,57
Romanowsky, A. J. 2005, in Mass Profiles and Shapes ofCosmological Structures, Proc of XXIst IAP Colloquium, Paris4–9 July, ed. G. A. Mamon
Romanowsky, A. J., Douglas, N. G., Arnaboldi, M., Kuijken, K.,Merrifield, M. R., Napolitano, N. R., Capaccioli, M., & Freeman,K. C. 2003, Science, 301, 1696
Rusin, D., Kochanek, C. S., & Keeton, C. R. 2003, ApJ, 595, 29Rusin, D., Norbury, M., Biggs, A. D., Marlow, D. R., Jackson,
N. J., Browne, I. W. A., Wilkinson, P. N., & Myers, S. T. 2002,MNRAS, 330, 205
Sand, D. J., Treu, T., Smith, G. P., & Ellis, R. S. 2004, ApJ, 604,88
Sato, S., Akimoto, F., Furuzawa, A., Tawara, Y., Watanabe, M.,& Kumai, Y. 2000, ApJ, 537, L73
Schindler, S., Binggeli, B., & Bohringer, H. 1999, A&A, 343, 420Simon, J. D., Bolatto, A. D., Leroy, A., Blitz, L., & Gates, E. L.
2005, ApJ, 621, 757Spergel, D. N. & Steinhardt, P. J. 2000, Physical Review Letters,
84, 3760Spergel, D. N., et al. 2003, ApJS, 148, 175Statler, T. S., Dejonghe, H., & Smecker-Hane, T. 1999, AJ, 117,
126Swaters, R. A., Madore, B. F., & Trewhella, M. 2000, ApJ, 531,
L107Swaters, R. A., Verheijen, M. A. W., Bershady, M. A., & Andersen,
D. R. 2003, ApJ, 587, L19Thomas, D., Maraston, C., & Bender, R. 2003, MNRAS, 339, 897Tonry, J. L., Dressler, A., Blakeslee, J. P., Ajhar, E. A., Fletcher,
A. ., Luppino, G. A., Metzger, M. R., & Moore, C. B. 2001, ApJ,546, 681
Trager, S. C., Faber, S. M., Worthey, G., & Gonzalez, J. J. . 2000,AJ, 119, 1645
Trager, S. C., Worthey, G., Faber, S. M., Burstein, D., & Gonzalez,J. J. 1998, ApJS, 116, 1
Treu, T. & Koopmans, L. V. E. 2004, ApJ, 611, 739Trujillo, I., Burkert, A., & Bell, E. F. 2004, ApJ, 600, L39Tully, R. B. 2005, ApJ, 618, 214van der Marel, R. P. 1991, MNRAS, 253, 710
22 Humphrey et al.
Vikhlinin, A., Kravtsov, A., Forman, W., Jones, C., Markevitch,M., Murray, S. S., & Van Speybroeck, L. 2005, ApJ, submitted,astro-ph/0507092
Vikhlinin, A., McNamara, B. R., Hornstrup, A., Quintana, H.,Forman, W., Jones, C., & Way, M. 1999, ApJ, 520, L1
Wechsler, R. H., Bullock, J. S., Primack, J. R., Kravtsov, A. V., &Dekel, A. 2002, ApJ, 568, 52
Wechsler, R. H., Zentner, A. R., Bullock, J. S., & Kravtsov, A. V.2005, ApJ, submitted, astro-ph/0512416
Zappacosta, L., Buote, D. A., Gastaldello, F., Humphrey, P. J.,Bullock, J. S., Brighenti, F., & Mathews, W. G. 2006, ApJ,submitted, astro-ph/0602613
Zentner, A. R., Berlind, A. A., Bullock, J. S., Kravtsov, A. V., &Wechsler, R. H. 2005, ApJ, 624, 505
Zentner, A. R. & Bullock, J. S. 2002, Phys. Rev. D, 66, 043003Zezas, A., Birkinshaw, M., Worrall, D. M., Peters, A., & Fabbiano,
G. 2005, ApJ, 627, 711