
Multiwavelength Optical Observations of Chromospherically Active Binary Systems
14
Astron. Astrophys. 330, 155–168 (1998) ASTRONOMY AND ASTROPHYSICS Multiwavelength optical observations of chromospherically active binary systems II. EZ Pegasi ? D. Montes, J. Sanz-Forcada, M.J. Fern´ andez-Figueroa, E. De Castro, and A. Poncet Departamento de Astrof´ ısica, Facultad de F´ ısicas, Universidad Complutense de Madrid, E-28040 Madrid, Spain (dmg@astrax.fis.ucm.es) Received 28 May 1997 / Accepted 17 September 1997 Abstract. The star EZ Peg, long ago classified as cataclysmic variable, has been shown to be a chromospherically active bi- nary system of the RS CVn-type. In this paper we have analysed, using the spectral subtraction technique, simultaneous spectro- scopic observations of the Hα,Hβ, Na i D 1 and D 2 , He i D 3 , Mg i b triplet, Ca ii H & K, and Ca ii infrared triplet lines. We have found that the hot component is the active star of the system, showing strong emission in the Hα, Ca ii H & K, H, and Ca ii IRT lines, and a strong filling-in of the Hβ line, how- ever the Na i D 1 and D 2 and Mg i b triplet lines do not present filled-in. The He i D 3 could present a total filling-in due to mi- croflaring. The observed variations (in different epochs and with the orbital phase) of the different activity indicators, formed at different height in the chromosphere, are correlated. Very broad wings have been found in the subtracted profiles of Hα and Ca ii IRT λ8498 and λ8662 lines. These profiles are well matched us- ing a two-component Gaussian fit (narrow and broad) and the broad component could be interpreted as arising from microflar- ing. The higher luminosity class of the hot component, that our spectra seem to indicate, could explain why the hot component is the active star of the system. Key words: stars: activity – stars: binaries: close – stars: chro- mospheres – stars: late-type – stars: individual: EZ Peg 1. Introduction EZ Peg (BD +24 ◦ 4742) has a misleading history of confused interpretation of the origin and composition of the system. The Send offprint requests to: D. Montes ? Based on observations made with the Isaac Newton, William Her- schel and Jacobus Kapteyn telescopes operated on the island of La Palma by the Royal Greenwich Observatory at the Spanish Observa- torio del Roque de Los Muchachos of the Instituto de Astrof´ ısica de Canarias spectrum of EZ Peg was originally classified by Cannon as G5 (Schlesinger et al. 1934). Vyssotsky & Balz (see Alden 1958) claimed that the star varies from B0 to G5, due to a spectrum taken in 1943 which appeared to be a B star spectrum. Later Howell & Bopp (1985) presented evidence that this erroneous interpretation of the spectrum was due to poor resolution data. Irvine (1972) proposed that EZ Peg was an U Gem system (a cataclysmic variable), but it is an unlikely explanation due to the normal UV emission of the system: in a color-color plot there is no strong UV excess typical of the dwarf novae and symbiotics (Szkody 1977). Furthermore linear polarimetry measurements of the system (Szkody et al. 1982) show that EZ Peg does not seem to be a cataclysmic variable. Howell & Bopp (1985) observed the double-lined spectrum of EZ Peg and interpreted the color-indices (B-V) and (U-B) as that of a composite spectral type of G5 IV + K0 IV. They observed Ca ii H & K, Hα and H lines in emission, and they supposed that this emission originated in the cooler star, because it is the most typical case. Howell et al. (1986) suggested that both components of EZ Peg were subgiants, and pointed out a slightly asymmetric profile in Hα, interpreted as a vertical motion in the atmosphere of the active star of the system. Griffin (1985) presented radial-velocity observations of the system, and he calculated the orbital elements. Recently Gunn et al. (1996) made cross-correlation radial velocity measurements of EZ Peg, showing a disagreement with the phases calculated from the ephemeris given by Griffin (1985). Vilkki et al. (1986) calculated a distance to EZ Peg of 83 pc using the trigonometric parallax method, and they suspected that EZ Peg belongs to the Hyades cluster. Barret (1996) calculated a distance of 82 pc using linear polarimetry. Finally, recent studies in the IR band by Mitrou et al. (1996) with the IRAS satellite indicated that the system does not seem to present any circumstellar matter. Continuing with the series of multiwavelength optical ob- servations of chromospherically active binaries (Montes et al. 1997b, hereafter Paper I), in this paper we present simultaneous observations in different optical wavelength bands, including
-
Upload
independent -
Category
Documents
-
view
0 -
download
0
Transcript of Multiwavelength Optical Observations of Chromospherically Active Binary Systems

Astron. Astrophys. 330, 155–168 (1998) ASTRONOMYAND
ASTROPHYSICS
Multiwavelength optical observationsof chromospherically active binary systems
II. EZ Pegasi?
D. Montes, J. Sanz-Forcada, M.J. Fernandez-Figueroa, E. De Castro, and A. Poncet
Departamento de Astrofısica, Facultad de Fısicas, Universidad Complutense de Madrid, E-28040 Madrid, Spain ([email protected])
Received 28 May 1997 / Accepted 17 September 1997
Abstract. The star EZ Peg, long ago classified as cataclysmicvariable, has been shown to be a chromospherically active bi-nary system of the RS CVn-type. In this paper we have analysed,using the spectral subtraction technique, simultaneous spectro-scopic observations of the Hα, Hβ, Na i D1 and D2, He i D3,Mg i b triplet, Ca ii H & K, and Ca ii infrared triplet lines.We have found that the hot component is the active star of thesystem, showing strong emission in the Hα, Ca ii H & K, Hε,and Ca ii IRT lines, and a strong filling-in of the Hβ line, how-ever the Na i D1 and D2 and Mg i b triplet lines do not presentfilled-in. The He i D3 could present a total filling-in due to mi-croflaring. The observed variations (in different epochs and withthe orbital phase) of the different activity indicators, formed atdifferent height in the chromosphere, are correlated. Very broadwings have been found in the subtracted profiles of Hα and Ca iiIRT λ8498 and λ8662 lines. These profiles are well matched us-ing a two-component Gaussian fit (narrow and broad) and thebroad component could be interpreted as arising from microflar-ing. The higher luminosity class of the hot component, that ourspectra seem to indicate, could explain why the hot componentis the active star of the system.
Key words: stars: activity – stars: binaries: close – stars: chro-mospheres – stars: late-type – stars: individual: EZ Peg
1. Introduction
EZ Peg (BD +24◦ 4742) has a misleading history of confusedinterpretation of the origin and composition of the system. The
Send offprint requests to: D. Montes? Based on observations made with the Isaac Newton, William Her-schel and Jacobus Kapteyn telescopes operated on the island of LaPalma by the Royal Greenwich Observatory at the Spanish Observa-torio del Roque de Los Muchachos of the Instituto de Astrofısica deCanarias
spectrum of EZ Peg was originally classified by Cannon as G5(Schlesinger et al. 1934). Vyssotsky & Balz (see Alden 1958)claimed that the star varies from B0 to G5, due to a spectrumtaken in 1943 which appeared to be a B star spectrum. LaterHowell & Bopp (1985) presented evidence that this erroneousinterpretation of the spectrum was due to poor resolution data.Irvine (1972) proposed that EZ Peg was an U Gem system (acataclysmic variable), but it is an unlikely explanation due to thenormal UV emission of the system: in a color-color plot there isno strong UV excess typical of the dwarf novae and symbiotics(Szkody 1977). Furthermore linear polarimetry measurementsof the system (Szkody et al. 1982) show that EZ Peg does notseem to be a cataclysmic variable.
Howell & Bopp (1985) observed the double-lined spectrumof EZ Peg and interpreted the color-indices (B-V) and (U-B)as that of a composite spectral type of G5 IV + K0 IV. Theyobserved Ca ii H & K, Hα and Hε lines in emission, and theysupposed that this emission originated in the cooler star, becauseit is the most typical case. Howell et al. (1986) suggested thatboth components of EZ Peg were subgiants, and pointed outa slightly asymmetric profile in Hα, interpreted as a verticalmotion in the atmosphere of the active star of the system.
Griffin (1985) presented radial-velocity observations of thesystem, and he calculated the orbital elements. Recently Gunn etal. (1996) made cross-correlation radial velocity measurementsof EZ Peg, showing a disagreement with the phases calculatedfrom the ephemeris given by Griffin (1985). Vilkki et al. (1986)calculated a distance to EZ Peg of 83 pc using the trigonometricparallax method, and they suspected that EZ Peg belongs to theHyades cluster. Barret (1996) calculated a distance of 82 pcusing linear polarimetry.
Finally, recent studies in the IR band by Mitrou et al. (1996)with the IRAS satellite indicated that the system does not seemto present any circumstellar matter.
Continuing with the series of multiwavelength optical ob-servations of chromospherically active binaries (Montes et al.1997b, hereafter Paper I), in this paper we present simultaneousobservations in different optical wavelength bands, including

156 D. Montes et al.: Multiwavelength optical observations of chromospherically active binary systems. II
Table 1. Observing log
Date IDS-INT UES-WHT
Hα Na I D1, D2, He I D3 Ca II H & K Hβ Echelle
UT ϕ S/N UT ϕ S/N UT ϕ S/N UT ϕ S/N UT ϕ S/N
1993/07/31 - - - - - - - - - - - - 02:05 0.954 315
1995/09/14 00:36 0.416 295 00:04 0.414 362 - - - - - - - -1995/09/15 00:23 0.501 332 00:02 0.500 343 - - - - - - - -
1996/11/26 21:25 0.141 295 - - - 23:11 0.148 295 - - - - -1996/11/27 20:39 0.224 295 20:49 0.225 362 19:35 0.220 295 - - - - -1996/11/28 19:24 0.306 295 20:25 0.310 362 21:44 0.314 295 21:19 0.312 362 - -
also a high resolution echelle spectrum. All the data seem topoint out that EZ Peg is a RS CVn system with an evolved G5active star, and a K0V or IV non-active star. We have appliedthe spectral subtraction technique, observing the Ca ii H & K,Hε, Hα and Ca IR triplet lines in emission, and a filling-in of theHβ line, proceeding from the hotter component of the system.
In Sect. 2 we give the details of our observations and datareduction. In Sect. 3 we discuss some of the stellar parametersof the binary system and in Sect. 4 the behavior of the differentchromospheric activity indicators is described. Finally in Sect. 5we present the conclusions.
2. Observations and data reduction
Spectroscopic observations of EZ Peg in several optical chro-mospheric activity indicators have been obtained during two ob-serving runs with the 2.5 m Isaac Newton Telescope (INT) at theObservatorio del Roque de Los Muchachos (La Palma, Spain)using the Intermediate Dispersion Spectrograph (IDS). In thefirst run (September 13-15 1995) we have obtained two spectra:in the Hα and Na i D1, D2, He i D3 line regions, using gratingH1800V, camera 500 and a 1024 x 1024 pixel TEK3 CCD as de-tector. The reciprocal dispersion achieved is 0.24 A/pixel whichyields a spectral resolution of 0.48 A and a useful wavelengthrange of 250 A centered at 6563 A (Hα) and 5876 A (HeiD3) respectively. In the second run (November 26-28 1996) weused the same configuration but two different gratings H1200Rand H1200B, for the red and blue spectral regions respectively.Using the same configuration a reciprocal dispersion of 0.39 Awas obtained which yields a spectral resolution of 0.94 A anda useful wavelength range of 385 A centered at 6563 A (Hα),5876 A (Hei D3), 4861 A (Hβ), 3950 A (Ca ii H&K) respec-tively.
In Table 1 we give the observing log. For each spectral re-gion observed we list the date, UT, orbital phase (ϕ) and signalto noise ratio (S/N) obtained.
We also analyse here echelle spectra obtained with the 4.2 mWilliam Herschel Telescope (WHT) and the Utrecht EchelleSpectrograph (UES) on July 31 1993 that we have retrievedfrom La Palma Data Archive (Zuiderwijk et al. 1994). TheseWHT/UES spectra were obtained with echelle 31 (31.6 grooves
per mm) and a 1280 x 1180 pixel EEV6 CCD as detector. Thecentral wavelength is 6127 A and covers a wavelength rangefrom 4845 to 8805 A over 53 echelle orders. The achievedreciprocal dispersion ranges from 0.045 to 0.080 A/pixel. Inorder to improve the S/N ratio and to avoid cosmic ray events,the final spectrum analysed here is the resulting from combine28 CCD images with exposure times of 240 s each, obtaininga final spectrum with a S/N of 315 in the Hα line region. InTable 2 we give the wavelength range and the spectral lines ofinterest in each echelle order.
In addition we also use one spectrum in the region of theCa ii IRT lines taken on January 16 1997 with the 1.0 m Ja-cobus Kapteyn Telescope (JKT) using the Richardson-BrealeySpectrograph (RBS) with a grating of 1200 grooves per mm,and a 1024 x 1024 pixel TEK4 CCD as detector. The recipro-cal dispersion achieved is 0.85 A/pixel which yields a spectralresolution of 1.7 A and a useful wavelength range of 865 Acentered at 8765 A.
The spectra have been extracted using the standard reduc-tion procedures in the IRAF 1 package (bias subtraction, flat-field division, and optimal extraction of the spectra). The re-duction of the JKT/RBS spectrum was carried out using the re-duction package REDucmE (Cardiel & Gorgas 1997, see also http://www.ucm.es/OTROS/Astrof/reduceme/reduceme.html). The wave-length calibration was obtained by taking spectra of a Cu-Arlamp in the INT/IDS spectra, a Th-Ar lamp in the WHT/UESspectrum and a Cu-Ne lamp in the JKT/RBS spectrum. Finally,the spectra have been normalized by a polynomial fit to theobserved continuum.
3. Stellar parameters of the binary system EZ Peg
EZ Peg is a double-lined spectroscopic binary with an or-bital period of 11.6598 days (Griffin 1985), classified as G5V-IV/K0IV. It is in synchronous rotation with a photometric periodof 11.6626 days (Howell et al. 1986). In Table 3 we show the
1 IRAF is distributed by the National Optical Observatory, which isoperated by the Association of Universities for Research in Astronomy,Inc., under contract with the National Science Foundation.

D. Montes et al.: Multiwavelength optical observations of chromospherically active binary systems. II 157
Table 2. UES spectral orders
No. λi λf Chromospheric Lines Other lines
1 4845.80 4897.29 Hβ2 4887.53 4939.463 4929.98 4982.354 4973.16 5026.005 5017.11 5070.416 5061.85 5115.627 5107.38 5161.638 5153.74 5208.48 Mg i b λ5167-72-839 5200.94 5256.1910 5249.02 5304.7711 5297.99 5354.2712 5347.89 5404.69 Ti i λ536613 5398.73 5456.07 Ti i λ542614 5450.54 5508.4315 5503.36 5561.8116 5557.21 5616.2317 5612.13 5671.7318 5668.14 5728.3419 5725.28 5786.0920 5783.58 5845.0121 5843.08 5905.14 Na i D1, D2, He i D3 Ti i λ586622 5903.82 5966.5323 5965.84 6029.2024 6029.17 6093.2125 6093.87 6158.5926 6159.96 6225.3927 6227.51 6293.6628 6296.55 6363.4429 6367.15 6434.78 Fe i λ6411.6630 6439.35 6507.75 Fe i λ649531 6513.20 6582.39 Hα32 6588.77 6658.7633 6666.11 6736.93 Fe i λ6678” Li i λ6708” Ca i λ671834 6745.30 6816.9535 6826.39 6899.90 O2 λ686736 6909.45 6982.8537 6994.56 7068.8738 7081.80 7157.0339 7171.24 7247.4340 7262.98 7340.1441 7357.09 7435.2542 7453.68 7532.8643 7552.84 7633.08 B-band λ760044 7654.68 7736.00 K i λ7665, 769945 7759.30 7841.7346 7866.82 7950.4047 7977.38 8062.1248 8091.08 8177.0349 8208.08 8295.2750 8328.51 8416.99 Ti i (M.33)51 8452.54 8542.33 Ca ii IRT λ8498, 8542 Ti i λ8468” Fe i λ8514” Ti i λ851852 8580.32 8671.46 Ca ii IRT λ8662 Fe i λ862153 8712.02 8804.56
adopted stellar parameters from Strassmeier et al. (1993) exceptfor Tconj (see below).
3.1. Radial velocities
In our high resolution echelle spectrum we can resolve bothcomponents in all the orders. We have calculated the radial ve-locity difference for this observation using 39 lines clearly seenin the echelle spectrum as double lines. The value obtained is16.17±0.72 km s−1 which results in a value for the orbital phaseof 0.944±0.002.
According to the ephemeris given by Strassmeier et al.(1993) the calculated phase for this spectrum is 0.997, whichis clearly in disagreement with our observation, since at thisphase the radial velocity difference is 0.92 km s−1 which yieldsa difference in wavelength between both components of only0.02 A. This ∆λ is lower than the resolution of the spectrumand then the lines from both components should be blended.Similar problems have been found in the other spectra when weuse this ephemeris. The phase deviation is the same for all theobservations and is very large to be ascribed to orbital periodvariations, so we thought of an error in the heliocentric Juliandate on conjunction (Tconj). In effect, we have found a mistake inthe Tconj given in the Strassmeier et al. (1993) catalog where theorbital data by Griffin (1985) are compiled. In the original paperthe epoch is determined using Modified Julian Date (MJD) andso a difference of 0.5 days must be added to the Strassmeier etal. (1993) date which used 2440000.0 Julian day as referencedate. The orbital phase of the echelle spectrum obtained usingthe corrected value of Tconj (2445737.165) is 0.954. Now, thedifference with the orbital phase that we deduce from our spec-trum is only 0.01, which is within the uncertainties given byGriffin (1985). We would notice that the large discrepancies inthe radial velocities which Gunn et al. (1996) found could bereduced using the corrected Tconj. Therefore we have used thecorrected Tconj given in Table 3 to calculate the orbital phasesof all the observations reported in this paper.
3.2. Spectral type and luminosity class
Several Ti i lines can be used as a luminosity classification cri-terium (Keenan & Hynek 1945; Kirkpatrick et al. 1991; Ginestetet al. 1994; Jashek & Jashek 1995) because they present a pos-itive luminosity effect (i.e. they are stronger in giants than indwarfs). We have analysed the behaviour of the Ti i lines thatappear in our echelle spectrum in order to improve the luminos-ity classification of the EZ Peg components.
In Fig. 1 we can notice the enhancement of the multiplet33 Ti i lines for the system in comparison with main sequencestars of spectral type similar to the components of EZ Peg. It isworth mentioning the case of the Ti i λ8382 line which is evenmore intense than the Fe i λ8388 line, showing a behaviour dif-ferent from that in the subgiant reference star (see Fig. 1 lowerpanel). This behaviour can be also observed in other Ti i lineslike λ5366.651 (Multiplet 35), λ5446.593 (M. 3), λ5866.453,λ5937.806 and λ5941.755 (M. 72), λ6554.226 and λ6556.066

158 D. Montes et al.: Multiwavelength optical observations of chromospherically active binary systems. II
Fig. 1. WHT/UES (Jul 1993), spectra inthe region of several lines of Ti I (M.33).In the upper panel we plot EZ Peg andin the lower panel three reference stars:HD 186427 (G3V), HD 44867 (G8IV),HD 185144 (K0V).
Table 3. Stellar parameters
Tsp SB R d B-V V-R Tconj Porb Prot Vsini(R�) (pc) (H.J.D.) (days) (days) (km s−1)
G5V-IV/K0IV: 2 - 83 0.73/0.91 0.58/0.71 2445737.165 11.6598 11.6626 9/7
(M.102), λ6599.112 (M.19). These results suggest a clear dif-ference in luminosity class between the two components of thesystem, being the G5 primary star more evolved than a subgiant,meanwhile the K0 star is probably a luminosity class V star.
As is explained in the following section all the activity indi-cators analysed here show that the hot component is the activestar of the system, contrary to the usual behaviour observed inchromospherically active binaries. Only in some BY Dra starsthe hot component tends to be the most active star of the sys-tem or even the only active component (Montes et al. 1996a).So we have used our Ca ii K spectra to determine the absolute
visual magnitude, MV of the active component by the applica-tion of the Wilson-Bappu effect (Wilson & Bappu 1957). Themean emission line width measured in our Ca ii K spectra is1.229 A, which come out to 60.39 km s−1 after the quadraticcorrection of the instrumental profile. We have used the rela-tion found for chromospherically active binaries by Montes etal. (1994) obtaining MV = 2.27. This value is lower than theMV that corresponds to a G5V (MV(Tsp) = 5.1 from Landolt-Bornstein (Schmidt-Kaler 1982)) but higher than for a G5III(MV(Tsp) = 0.9). This result indicates that the active componentof EZ Peg may be of luminosity class IV or higher.

D. Montes et al.: Multiwavelength optical observations of chromospherically active binary systems. II 159
Table 4. Hα line measures in the observed and subtracted spectrum
Observed Hα Spectrum Subtracted Hα Spectrum
Obs. ϕ Wobs Rc F(1.7A) Wsub I EW log FS
(A) (A) (A)
UES 1993 0.954 0.96 1.325 1.987 1.62 0.882 2.085 7.06
INT 1995 0.416 0.65 1.139 1.695 1.70 0.655 1.488 6.91” 0.501 0.54 1.059 1.657 1.69 0.639 1.400 6.89
INT 1996 0.141 1.48 1.131 1.779 2.43 0.604 2.272 7.10” 0.224 1.55 1.157 1.812 2.30 0.634 1.862 7.01” 0.306 1.35 1.134 1.784 2.16 0.638 1.677 6.96
The difference in luminosity class between the hot and coolcomponents that our spectra indicate could explain why the hotcomponent is the active star (see below), since if the hot com-ponent is a more evolved star it could have developed a deepconvective zone and therefore, according to the dynamo mecha-nism, should present a higher activity level. Anyway the coolerK0V component could also be active and present a faint emis-sion in the H & K lines, but due to the small contribution of thatstar to the combined spectrum of the system, this emission isvery difficult to be observed.
3.3. The Li I λ6707.8 line
We also analyse here the Lithium abundance of EZ Peg us-ing the Li i λ6707.8 line. This line appears in the order 33 ofthe WHT/UES echelle spectrum together with the Fe i λ6678and Ca i λ6718 lines. In Fig. 2 we can clearly see the Fe iand Ca i lines from both components, the expected positionsof these features for the hot (H) and cool (C) are given in thisfigure. However, the absorption Li i line appears centered inthe wavelength-position corresponding to the hot component,so we can suppose that the absorption line comes only fromthis star or that the contribution of the cool component to theobserved Li i is very small. This assumption seems to be rea-sonable because, as we show below, the hot component is theactive star of the system and a high Li i abundance is foundin chromospherically active binaries (Fernandez-Figueroa et al.1993; Barrado et al. 1997). In order to obtain the Li i equiv-alent width (EW), we have corrected the total EW measured,EW(Li i+Fe i)=50.4 (mA) from the relative contribution to thecontinuum (0.65). Then the contribution from the blend with theFe i λ 6704.41 line must be subtracted. The EW of the Fe i linewas calculated from the empirical relationship with (B-V) givenby Soderblom et al. (1990), obtaining EW(Fe i)=15.8 (mA),the same value is found with the relationship given by Favataet al. (1993) using the effective temperature. Finally, the cor-rected EW(Li i)corr=61.7 (mA) was converted into abundancesby means of the curves of growth computed by Pallaviciniet al. (1987), obtaining log N(Li i)=2.15 (on a scale wherelog N(H)=12.0) with an accuracy of≈ 0.30 dex. This high Li iabundance is similar to that obtained for other chromospheri-
cally active binaries by Fernandez-Figueroa et al. (1993) andBarrado et al. (1997) and it is related to the high activity levelof EZ Peg.
4. Chromospheric activity indicators
In the following we describe the behaviour of the different op-tical chromospheric activity indicators (formed at different at-mospheric heights) observed for EZ Peg: Na i D1, D2, and Mg ib triplet (upper photosphere and lower chromosphere), Ca iiIRT lines (lower chromosphere), Hα, Hβ, Ca ii H & K (middlechromosphere), and He i D3 (upper chromosphere). The chro-mospheric contribution in these features has been determinedusing the spectral subtraction technique described in detail byMontes et al. (1995a, b, c), (see also Paper I). The synthesizedspectrum has been constructed with reference stars of spec-tral types G5V and K0IV, taken from the spectral library ofMontes et al. (1997a), in the case of the INT/IDS spectra. Forthe WHT/UES spectrum we have used a G3V and K0V takenduring the same observing run, and for the JKT/RBS spectrum aG5III-IV and K0V have been used. The use of reference spectraof spectral type slightly different for each observing run and dif-ferent also from the system component spectra introduce someresidual in the absorption lines, but it does not affect signif-icantly the excess emission equivalent width measures in thesubtracted spectra. The uncertainties are within similar order tothat obtained in the reduction, synthesis and fitting procedures.Furthermore, we have considered a clear detection of excessemission or absorption lines only when these features in thedifference spectrum are larger than 3 σ.
The contribution of the hot and cool components to the to-tal continuum that yields a better fit between the observed andsubtracted spectra is 0.65/0.35.
The line profiles are displayed in Figs. 1 - 8. For each spec-trum we plot the observed (solid-line), the synthesized (dashed-line) and the subtracted one, additively offset for better display(dotted line).

160 D. Montes et al.: Multiwavelength optical observations of chromospherically active binary systems. II
Fig. 2. WHT/UES (Jul 1993), spectrum in the region of the Li I 6707.8 A line including also the Fe I 6677.99 A and Ca I 6717.69 A . Theexpected positions of this features for the hot (H) and cool (C) components are given.
Table 5. Parameters of the broad and narrow Gaussian components used in the fit of the Hα subtracted spectra
Hα broad component Hα narrow component
Obs. ϕ I FWHM EWB EWB/EWT I FWHM EWN EWN/EWT
(A) (A) (%) (A) (A) (%)
UES 1993 0.954 0.273 3.935 1.143 54.8 0.648 1.367 0.942 45.2
INT 1995 0.416 0.152 4.035 0.651 43.7 0.535 1.470 0.837 56.3” 0.501 0.129 4.096 0.562 40.1 0.535 1.470 0.838 59.9
INT 1996 0.141 0.123 9.418 1.209 53.2 0.493 2.028 1.064 46.8” 0.224 0.124 5.622 0.740 39.7 0.520 2.028 1.122 60.3” 0.306 0.091 5.528 0.536 32.0 0.572 1.876 1.142 68.0
4.1. The Hα line
We have taken several spectra of EZ Peg in the Hα line re-gion in three different epochs. One WHT/UES spectrum in July1993 at the orbital phase 0.954 (Fig. 3), two INT/IDS spectrain September 1995 at the phases 0.416 and 0.501 (Fig. 4) andthree more INT/IDS spectra in November 1996 at the phases0.141, 0.224 and 0.306 (Fig. 5). In all the spectra we can see theHα line in emission above the continuum with an asymmetryin the wavelength position corresponding to the Hα absorptionline of the cool component. The spectral subtraction reveals thatthe hot star is responsible for the excess Hα emission.
Table 4 gives the Hα line parameters, measured in the ob-served and subtracted spectra of EZ Peg as follows: column (1)the observing run, column (2) the orbital phase (ϕ) and columns(3), (4), (5) the following parameters measured in the observedspectrum: the full width at half maximum (Wobs); the residual in-tensity, Rc; and the Hα core flux, F(1.7A), measured as the resid-ual area below the central 1.7 A passband. The last four columnsgive the following parameters measured in the subtracted spec-trum: the full width at half maximum (Wsub), the peak emissionintensity (I), the excess Hα emission equivalent width (EW(Hα)), and absolute fluxes at the stellar surface logFS(Hα) ob-tained with the calibration of Pasquini & Pallavicini (1991) as afunction of (V - R), very similar values of FS(Hα) are obtained
using the more recent calibration of Hall (1996) as a functionof (V - R) and (B - V). As can be seen in Table 4 and Figs. 3, 4and 5 the excess Hα emission of EZ Peg show small variationswith the orbital phase and also seasonal variations from Jul 93to Nov 96. The higher Hα EW has been reached in the first nightof the 1996 run and in the 1993 observation. The higher valuescorrespond to the orbital phases closer to the conjunction (0.0).
The Hα subtracted profiles present at all the epochs broadwings which are not well matched using a single-Gaussian fit.These profiles have therefore been fitted using two Gaussiancomponents. The parameters of the broad and narrow compo-nents used in the two-Gaussian fit are given in table 5 and thecorresponding profiles are plotted in the left panel of Figs. 3, 4and 5. In some cases the blue wing is noticeable stronger thanthe red wing and the fit is better matched when the broad compo-nent is blue-shifted with respect to the narrow component. Thecool component of EZ Peg cannot account for this effect sinceany emission from that star would be on the red side of the ob-served line for these orbital phases. We have also observed broadcomponents in the most active systems of the sample of PaperI which we interpreted as microflaring that occurs in the chro-mosphere by similarity with the broad components also foundin the chromospheric Mg ii h & k lines (Wood et al. 1996) andin several transition region lines of active stars (Linsky & Wood

D. Montes et al.: Multiwavelength optical observations of chromospherically active binary systems. II 161
Fig. 3. WHT/UES Hα spectrum (Jul 1993). In the left panel we plot the observed spectrum (solid-line), the synthesized spectrum (dashed-line),the subtracted spectrum, additively offset for better display (dotted line). In the right panel we plot the subtracted Hα profile (dotted line). andthe the two Gaussian components fit (solid-line). The sort-dashed-line represents the broad component and the large-dashed-line the narrowone.
Fig. 4. INT/IDS Hα spectra (Sep 1995), as in Fig. 3
1994; Linsky et al. 1995; Wood et al. 1996, 1997; Dempseyet al. 1996a, b; Robinson et al. 1996). The contribution of thebroad component to the total EW of the line of EZ Peg rangesbetween 32% and 55% which is in the range observed to thestars analysed in Paper I. The larger changes in the excess Hαemission appear to occur predominantly in the broad componentand its contribution is related to the degree of stellar activity. Itis noticeable the change in the wings of the Hα line from the 1stto the 2nd night of the 1996 run, the two Gaussian componentsfit reveals that the contribution of the broad component changesfrom 53.2% to 39.7% (see Fig. 5).
4.2. The Hβ line
Two spectra in the Hβ line region are available. The WHT/UESspectrum (July 1993) and other in the INT/IDS 1996 run. Inboth spectra the Hβ line appears in absorption and the applica-tion of the spectral subtraction technique reveals a clear excessemission in this line (see Fig. 6). Again the relative velocityshift shows that the emissions belong to the hotter component.Contrary to the case of the Hα line the Hβ subtracted profilesdo not present broad wings and they are well matched using asingle-Gaussian fit.

162 D. Montes et al.: Multiwavelength optical observations of chromospherically active binary systems. II
Fig. 5. INT/IDS Hα spectra (Nov 1996), as in Fig. 3
Fig. 6. WHT/UES Hβ (Jul 1993) and INT/IDS Hβ (Nov 1996) spectra. For each spectrum we plot the observed spectrum (solid-line), thesynthesized spectrum (dashed-line), the subtracted spectrum, additively offset for better display (dotted line). and the Gaussian fit to thesubtracted spectrum (dotted-dashed line)

D. Montes et al.: Multiwavelength optical observations of chromospherically active binary systems. II 163
Table 6 gives the Hβ line parameters, measured in the ob-served and subtracted spectra as in the case of the Hα line, seealso our previous study of the excess Hβ emission in activebinaries (Montes et al. 1995d).
In Table 6 we also give the ratio of excess emission EW,EW(Hα)EW(Hβ) , for the two Hβ observations of EZ Peg, and the ratio of
excess emission EHαEHβ
with the correction:
EHα
EHβ=
EW(Hα)EW(Hβ)
∗ 0.2444 ∗ 2.512(B−R).
given by Hall & Ramsey (1992) that takes into account theabsolute flux density in these lines and the color difference inthe components.
We have used this ratio as a diagnostic for discriminatingbetween the presence of plages and prominences in the stellarsurface, following the results of Hall & Ramsey (1992) whofound that low EHα/EHβ (≈ 1-2) can be achieved both in plagesand prominences viewed against the disk, but that high ratios(≈ 3-15) can only be achieved in extended regions viewed offthe limb. The high ratio (EHα/EHβ >3, see Table 6) that we havefound in EZ Peg indicates that the emission would arise fromextended regions (prominences).
The excess Hβ emission is somewhat larger in the 1993observation than in the last night observation of the 1996 run,in agreement with the behaviour observed for the Hα line.
4.3. The Na I D1 and D2 and He I D3 lines
We have five spectra of EZ Peg in the region of Na i D1 and D2
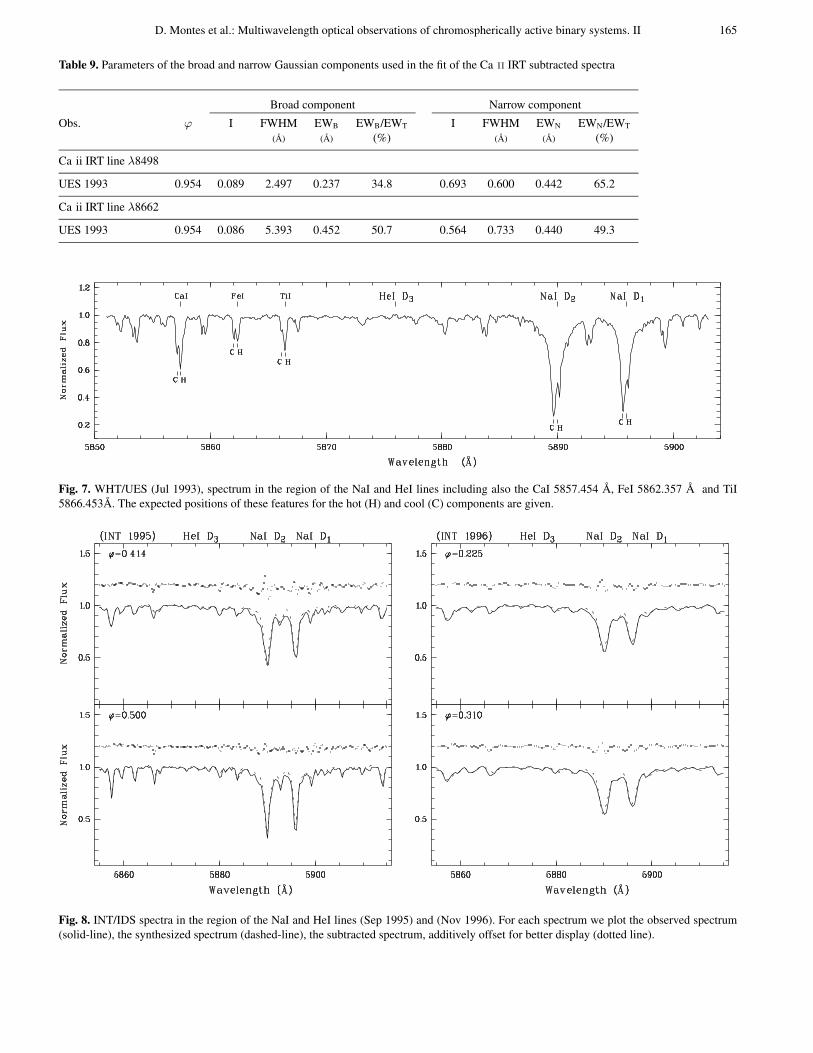
and He i D3 lines: one WHT/UES spectrum in July 1993 at theorbital phase 0.954 (Fig. 7), two INT/IDS spectra in September1995 at the phases 0.414 and 0.500 and two spectra in INT/IDSNovember 1996 at the phases 0.225 and 0.310 (Fig. 8). We havenot detected any significant absorption or emission for He i D3.
Saar et al. (1997) in their study of He i D3 in G and Kdwarfs found that while for few active stars the He i D3 linebehaves ”normally”, increasing in absorption with increasingrotation, and showing consistent correlations with other activityindicators, the behavior clearly diverges when stars become veryactive. They found a large filling-in He i D3 line in some veryactive K stars. On the other hand, they also found He i D3 EWsignificantly lower than the theoretical maximum value givenby Andretta & Giampapa (1995), suggesting that the line couldbe filling-in due to frequent low-level flaring.
Both facts could explain the absence of emission or absorp-tion due to a total filling-in of the He i D3 line that we havefound in EZ Peg and also in other dwarfs and subgiants chro-mospherically active binaries (see Paper I), since these stars arevery active and also present low-level flaring (microflares) asindicated by the Hα broad component that we have found (seesect. 4.1 and Paper I). In some cases He i D3 goes into emissiondue to flares (Huenemoerder & Ramsey 1987; Huenemoerderet al. 1990; Montes et al. 1996b; Paper I). However, in the mostevolved stars the behaviour is different as consequence of thelower chromospheric densities of these stars, as it is suggested
by Saar et al. (1997) and as it is indicated by the presence of theHe i D3 in absorption that we have reported in Paper I for severalchromospherically active binaries with giant components.
In the Na i D1 and D2 lines the spectra are too noisy to dis-tinguish a clear filled-in. Once again we can observe (see Fig. 7)that the redward lines of the double-lined spectrum usually arethe deepest, but in the Na i D blueshifted components are thedeepest ones. As it is well known, the Na i D lines are very sen-sitive to the temperature; this behaviour of the lines confirmsthat the hot star of the system is the redshifted one, which, asmentioned above, shows very high activity in Hα.
4.4. The Mg I b triplet lines
The Mg i b triplet lines λ5167.33, λ5172.68, and λ5183.61 areformed in the lower chromosphere and the region of temperatureminimum and they are good diagnostics of photospheric activity(Basri et al. 1989). A small filling-in of these lines have beenrecently found in some RS CVn system (Gunn & Doyle 1997;Gunn et al. 1997). As in the case of the Na i D1 and D2 lines, inthe subtracted spectrum corresponding to the echelle images noclear filled-in has been found. Thus the photospheric activity inEZ Peg is very low.
4.5. The Ca II H & K and Hε lines
We have taken three spectra in the Ca ii H & K line region dur-ing the 1996 run (see Fig. 9). These spectra exhibit strong Ca iiH & K emission lines and a small bump in the wavelength-position corresponding to the Hε line. The H & K emissionlines appear blue-shifted with respect to the observed absorp-tion lines in agreement with the orbital phase, which confirmsthat the emission originates in the hot component. The spectralsubtraction yields a satisfactory fit and reveals a small but clearemission in the Hε line.
The excess Ca ii H & K and Hε emissions equivalent widths(EW) have been measured by reconstruction of the absorptionline profile (described by Fernandez-Figueroa et al. 1994) andusing the spectral subtraction technique (explained by Monteset al. 1995c, 1996a). The Ca ii H & K surface flux, FS(Ca ii H& K) has been obtained by means of the linear relationshipbetween the absolute surface flux at 3950 A (in erg cm−2 s−1
A−1) and the colour index (V-R) by Pasquini et al. (1988).Table 7 gives the Ca ii H & K and Hε line parameters, mea-
sured in the observed and subtracted spectra. Column (1) givesthe observing run. Column (2) gives the orbital phase (ϕ). Incolumns (3) and (4) we list the EW for the K and H lines,obtained by reconstruction of the absorption line profile, incolumns (5) to (7) we give the EW for the K, H and Hε lines,measured in the subtracted spectrum, and in columns (8) to (10)the corresponding surface fluxes are listed.
The excess Ca ii H & K and Hε emissions change with theorbital phase during the three nights of the 1996 run in the sameway as the corresponding excess Hα emissions.

164 D. Montes et al.: Multiwavelength optical observations of chromospherically active binary systems. II
Table 6. Hβ line measurements in the observed and subtracted spectrum
Observed Hβ Spectrum Subtracted Hβ Spectrum
Obs. ϕ Wobs Rc F(1.7A) Wsub I EW EW(Hα)EW(Hβ)
EHαEHβ
(A) (A) (A)
UES 1993 0.954 0.91 0.561 1.235 0.94 0.364 0.489 4.27 3.49
INT 1996 0.312 2.13 0.660 1.237 1.54 0.244 0.411 4.08 3.33
Table 7. Ca ii H & K and Hε lines measures in the observed and subtracted spectrum
Reconstruction Spectral subtraction Absolute flux
Obs. ϕ EW EW EW EW EW log F log F log F(K) (H) (K) (H) (Hε) (K) (H) (Hε)
INT 1996 0.148 0.982 0.718 1.246 0.931 0.292 6.91 6.79 6.28” 0.220 0.975 0.671 1.191 0.910 0.194 6.82 6.78 6.10” 0.314 0.948 0.628 1.142 0.907 0.185 6.87 6.77 6.08
Table 8. Ca ii IRT lines measured in the observed and subtracted spectra
Reconstruction Spectral subtraction Absolute flux
Obs. ϕ EW EW EW EW EW EW log F log F log Fλ8498 λ8542 λ8662 λ8498 λ8542 λ8662 λ8498 λ8542 λ8662
UES 1993 0.954 0.256 - 0.238 0.680 - 0.892 6.43 - 6.55
JKT 1997 0.511 - - - 0.397 0.471 0.453 6.19 6.26 6.25
4.6. The Ca II IRT lines
The Ca ii infrared triplet (IRT) λ8498, λ8542, and λ8662 linesare other important chromospheric activity indicators (Linskyet al. 1979; Foing et al 1989; Dempsey et al. 1993). These linesshare the upper levels of the Ca ii H & K transitions (see forexample Mihalas 1978), but unlike the blue Ca ii lines, the IRTlies in a region of the spectrum with a well-defined continuum,making the calibration simpler. The IRT is formed in the lowerchromosphere. Shine & Linsky (1972, 1974) observed solarIRT plage profiles concluding that the emission results froma steepening of the temperature gradient in the chromosphere.This forces the temperature, electron density, and Ca II densitypopulation to be higher for a given optical depth, comparedto the quiet chromosphere, thus increasing the source functionthereby producing emission in the line cores.
In the observations carried out by Dempsey et al. (1993)only one star of the sample (BY Dra) showed emission abovethe local continuum in only theλ8498 line, and other seven starsrevealed emission rising above the shallow line core.
The λ8498 and λ8662 lines are included in the 1993WHT/UES echelle spectrum of EZ Peg (see Fig. 10), and both
lines exhibit a strong emission superposed to the red wing ofthe corresponding absorption line, in agreement with the orbitalphase (0.954). In the 1997 JKT/RBS spectrum at orbital phase0.511 the three Ca ii IRT lines are included (see Fig. 11). Inthis case the lines show a small emission reversal centered atthe absorption line in the observed spectrum and a clear excessemission in the difference spectrum.
Table 8 gives the Ca ii IRT line parameters, measured inthe observed spectra by reconstruction of the absorption lineprofile, and using the spectral subtraction. The columns in thistable have the same meaning as for the Ca ii H & K lines (seeTable 7). Notice that the underestimation of the reconstructionmethod is larger for the IRT lines than for the Ca ii H & K lines.The absolute fluxes at the stellar surface have been obtainedusing the calibration of Hall (1996) as a function of (V - R).
As in the case of the Hα line the subtracted profiles of theλ8498 and λ8662 lines also present broad wings. Therefore wehave used, as for the Hα profile, a two gaussian (broad andnarrow) fit. In Table 9 we list the parameters (I, FWHM, EW)of the broad and narrow components. The narrow componentsof both lines are very similar; however, the contribution of the
D. Montes et al.: Multiwavelength optical observations of chromospherically active binary systems. II 165
Table 9. Parameters of the broad and narrow Gaussian components used in the fit of the Ca ii IRT subtracted spectra
Broad component Narrow component
Obs. ϕ I FWHM EWB EWB/EWT I FWHM EWN EWN/EWT
(A) (A) (%) (A) (A) (%)
Ca ii IRT line λ8498
UES 1993 0.954 0.089 2.497 0.237 34.8 0.693 0.600 0.442 65.2
Ca ii IRT line λ8662
UES 1993 0.954 0.086 5.393 0.452 50.7 0.564 0.733 0.440 49.3
Fig. 7. WHT/UES (Jul 1993), spectrum in the region of the NaI and HeI lines including also the CaI 5857.454 A, FeI 5862.357 A and TiI5866.453A. The expected positions of these features for the hot (H) and cool (C) components are given.
Fig. 8. INT/IDS spectra in the region of the NaI and HeI lines (Sep 1995) and (Nov 1996). For each spectrum we plot the observed spectrum(solid-line), the synthesized spectrum (dashed-line), the subtracted spectrum, additively offset for better display (dotted line).

166 D. Montes et al.: Multiwavelength optical observations of chromospherically active binary systems. II
Fig. 9. INT/IDS Ca ii H & K spectra (Nov 1996), as in Fig. 6
broad component to the total EW is larger in the λ8662 line. Inthe subtracted spectrum the intensity of the λ8498 line is higherthan in λ8662; however, due to the contribution of the broadcomponent, the total excess emission EW is larger in the λ8662line.
5. Conclusions
In this paper we have analysed, using the spectral subtractiontechnique, simultaneous spectroscopic observations of severaloptical chromospheric activity indicators, at different epochs,of the RS CVn binary system EZ Peg.
We have found the Hα line in emission above the continuumin all the spectra, with noticeable changes in the line profile, thatin part are due to the superposition of the absorption line to theother component. The subtracted Hα profile is well matchedusing a two-components Gaussian fit (narrow and broad). Thebroad component is mainly responsible for the observed varia-tions of the subtracted profile, and its contribution to the totalEW increases with the degree of activity. We have interpretedthis broad component (also observed in other active systems in
Paper I) as arising from microflaring activity that take place inthe chromosphere.
A filled-in in the Hβ line has been found; however, the sub-tracted profiles do not present broad wings. The ratio (EHα/EHβ)that we have found indicates that the emission would arise fromextended regions viewed off the limb.
Strong Ca ii H & K emission from the hot component isobserved in our spectra. The spectral subtraction reveals alsoa small but clear emission in the Hε line. The lines λ8498 andλ8662 of the Ca ii IRT also show a strong emission. As in thecase of the Hα line the subtracted profiles of these lines are wellmatched using a two-component Gaussian fit.
We suggest that the He i D3 could present a total filling-indue to microflaring. We have not found filled-in by chromo-spheric emission in the Na i D1 and D2 lines nor in the Mg i btriplet lines.
All the activity indicators analysed here indicate that thehot component is the active star of the system, contrary to theusual behaviour observed in chromospherically active binaries.The variations (in different epochs and with the orbital phase)

D. Montes et al.: Multiwavelength optical observations of chromospherically active binary systems. II 167
Fig. 10. WHT/UES Ca ii IRT λ 8498 and λ 8662 spectra (Jul 1993), as in Fig. 3
Fig. 11. JKT/RBS Ca ii IRT spectrum (Jan 1997) at orbital phase 0.511
observed in the different indicators, formed at different heightsin the chromosphere, are correlated.
The analysis of several Ti i lines with a positive effect inluminosity class indicates that the hot component is not a mainsequence star but a subgiant or even of higher luminosity class,in contrast with the cool component that seems to be a dwarf.This result is confirmed by the application of the Wilson-Bappueffect to our Ca ii K spectra. This difference in luminosity class,and therefore in convective zone depth, between the hot and cool
components could explain why the hot component is the activestar of the system.
Acknowledgements. We thank N. Cardiel and J. Cenarro for havingtaken and reduced the 1997 JKT spectrum. This research has made useof La Palma Archive. This work has been supported by the Univer-sidad Complutense de Madrid and the Spanish Direccion General deInvestigacion Cientıfica y Tecnica (DGICYT) under grant PB94-0263.

168 D. Montes et al.: Multiwavelength optical observations of chromospherically active binary systems. II
References
Alden H.L., 1958, AJ, 63, 358Andretta V., Giampapa M.S., 1995, ApJ 439, 405Barrado D., Fernandez-Figueroa M.J., Garcıa Lopez R.J., De Castro,
E., Cornide M., 1997, A&A 326, 780Barret P., 1996, PASP 108, 412Basri G., Wilcots E., Stout N., 1989, PASP 101Cardiel N., Gorgas J., 1997 (in preparation)Dempsey R.C., Bopp B.W., Henry G.W., Hall D.S., 1993, ApJS 86,
293Dempsey R.C., Neff J., Linsky J.L., Brown A., 1996a, IAU Symp. 176,
K.G. Strassmeier & J.L. Linsky (eds.), Stellar Surface Structure, p.411
Dempsey R.C., Neff J., Thorpe M.J., et al., 1996b, ApJ 470, 1172Favata F., Barbera M., Micela G., Sciortino S., 1993, A&A 277, 428Fernandez-Figueroa M.J., Barrado D., De Castro E., Cornide M., 1993,
A&A 274, 373Fernandez-Figueroa M.J., Montes D., De Castro E., Cornide M., 1994,
ApJS 90, 433Foing B., Crivellari L., Vladilo G., Rebolo R., Beckman J., 1989,
A&AS 80, 189Ginestet N., Carquillat J.M., Jashek M., Jashek C., 1994, A&AS 108,
359Griffin R.F., 1985, The Observatory, 105, 81Gunn A.G., Hall J.C., Lockwood G.W., Doyle J.G., 1996, A&A 305,
146Gunn A.G., Doyle J.G., 1997, A&A 318, 60Gunn A.G., Doyle J.G., Houdebine E.R., 1997, A&A 319, 211Hall J.C., Ramsey L.W., 1992, AJ 104, 1942Hall J.C., 1996, PASP 108, 313Howell S.B., Bopp B.W., 1985, PASP 97, 72Howell S.B., Williams W.M., Barden S.C., Bopp B.W., 1986, PASP
98, 777Huenemoerder D.P., Ramsey L.W., 1987, ApJ 319, 392Huenemoerder D.P., Ramsey L.W., Buzasi D.L., 1990, Cool star stellar
systems and the Sun, Sixth Cambridge Workshop., G. Wallersteined., ASP Conference Series 9, p 236
Irvine N.J., 1972, PASP 84, 671Jashek C., Jashek M., 1995, ”The Behavior of chemical elements in
stars”, Cambridge University PressKeenan P.C., Hynek J.A., 1945, ApJ 101, 265Kirkpatrick J.D., Henry T.J., McCarthy D.W., Jr., 1991, ApJS 77, 417Linsky J.L., Hunten D., Glacken D., Kelch W., 1979, ApJS 41, 481Linsky J.L., Wood B.E., 1994, ApJ 430, 342Linsky J.L., Wood B.E., Judge P., Brown A., Andrulis C., Ayres T.R.,
1995, ApJ 442, 381Lutz T.E. 1970, AJ 75, 1007Mihalas D., 1978, in Stellar Atmospheres, 2d ed. (San Francisco: Free-
man), 381Mitrou C.K., Doyle J.G., Mathioudakis M., Antonopoulou E., 1996,
A&AS 115, 61Montes D., Fernandez-Figueroa M.J., De Castro E., Cornide M., 1994,
A&A 285, 609Montes D., Fernandez-Figueroa M.J., De Castro E., Cornide M., 1995a,
A&A 294, 165Montes D., Fernandez-Figueroa M.J., De Castro E., Cornide M., 1995b,
A&AS 109, 135Montes D., De Castro E., Fernandez-Figueroa M.J., Cornide M. 1995c,
A&AS 114, 287
Montes D., Fernandez-Figueroa M.J., De Castro E., Cornide M. 1995d,Stellar Surface Structure, IAU Symp 176, Poster Proceedings,Strassmeier K. (ed), p. 167
Montes D., Fernandez-Figueroa M.J., Cornide M., De Castro E., 1996a,A&A 312, 221
Montes D., Sanz-Forcada J., Fernandez-Figueroa M.J., Lorente R.,1996b, A&A 310, L29
Montes D., Martın E.L., Fernandez-Figueroa M.J., Cornide M., DeCastro E. 1997a, A&AS 123, 473
Montes D., Fernandez-Figueroa M.J., De Castro E., Sanz-Forcada J.,1997b, A&AS 125 (in press) (Paper I)
Pallavicini R., Cerruti-Sola M., Duncan D.K., 1987, A&A 174, 116Pasquini L., Pallavicini R., Pakull M., 1988, A&A 191, 253Pasquini L., Pallavicini R. 1991, A&A 251, 199Robinson R.D., Airapetian V.S., Maran S.P., Carpenter K.G., 1996,
ApJ 469, 872Saar S.H., Huovelin J., Osten R.A., Shcherbakow A.G., 1997, A&A
326, 741Schlesinger F., Barney I., Gesler C., 1934, Yale Trans., 10, 170Schmidt-Kaler T. 1982, in Landolt-Bornstein, Vol. 2b, ed K. Schaifers,
H.H. Voig (Heidelberg: Springer)Shine R.A., Linsky J.L., 1972, SoPh, 25, 357Shine R.A., Linsky J.L., 1974, SoPh, 39, 49Soderblom D.R., Oey M.S., Johnson D.R.H., Stone R.P.S., 1990, AJ
99, 595Strassmeier K.G., Hall D.S., Fekel F.C., Scheck M., 1993, A&AS 100,
173 (CABS)Szkody P., 1977, ApJ 217, 140Szkody P., Michalsky J.J., Stokes G.M., 1982, PASP 94, 137Vilkki E.U., Welty D.E., Cudworth K.M., 1986, AJ 92, 989Vyssotsky A.N., Balz A.G.A., 1958, Leander McCormick Publ., 13,
79Wilson O.C., Bappu M.K.V. 1957, ApJ 125, 661Wood B.E., Harper G.M., Linsky J.L., Dempsey R.C., 1996, ApJ 458,
761Wood B.E., Linsky J.L., Ayres T.R., 1997, ApJ 478, 745Zuiderwijk E.J., Martin R., Raimond E., van Diepem G.N.J. 1994,
PASP 106, 515.
This article was processed by the author using Springer-Verlag LaTEXA&A style file L-AA version 3.