Multiwavelength Properties of the X-Ray Sources in the Groth-Westphal Strip Field
18
arXiv:astro-ph/0402617v1 26 Feb 2004 Multiwavelength Properties of the X-ray Sources in the Groth-Westphal Strip Field 1 Takamitsu Miyaji 1 , Vicki Sarajedini 2 , Richard E. Griffiths 1 , Toru Yamada 3 , Matthew Schurch 1,4 , David Crist´obal-Hornillos 5 , Kentaro Motohara 6 ABSTRACT We summarize the multiwavelength properties of X-ray sources detected in the 80 ks XMM- Newton observation of the Groth-Westphal Strip, a contiguous strip of 28 HST Wide-Field Plane- tary Camera 2 (WFPC2) images. Among the ≈ 150 X-ray sources detected in the XMM-Newton field of view, 23 are within the WFPC2 fields. Ten spectroscopic redshifts are available from the Deep Extragalactic Evolutionary Probe (DEEP) and Canada-France Redshift Survey (CFRS) projects. Four of these show broad Mg II emission and can be classified as type 1 AGNs. Two of those without any broad lines, nevertheless, have [NeV] emission which is an unambiguous signature of AGN activity. One is a narrow-line Seyfert 1 and the other a type 2 AGN. As a followup, we have made near-infrared (NIR) spectroscopic observations using the OHS/CISCO spectrometer for five of the X-ray sources for which we found no indication of an AGN activity in the optical spectrum. We have detected Hα+[NII] emission in four of them. A broad Hα component and/or a large [NII]/Hα ratio is seen, suggestive of AGN activity. Nine- teen sources have been detected in the K s band and four of these are extremely red objects (EROs; I 814 − K s > 4). The optical counterparts for the majority of the X-ray sources are bulge-dominated. The I 814 − K s color of these bulge-dominated hosts are indeed consistent with evolving elliptical galaxies, while contaminations from star formation/AGN seems to be present in their V 606 − I 814 color. Assuming that the known local relations among the bulge luminosity, central velocity dispersion, and the mass of the central blackhole still hold at z ∼ 1, we compare the AGN luminosity with the Eddington luminosity of the central blackhole mass. The AGN bolometric luminosity to Eddington luminosity ratio ranges from 0.3 to 10%. Subject headings: galaxies: bulges – (galaxies:) quasars: general – galaxies: Seyfert – X-rays: galaxies – X-rays: general 1 Department of Physics, Carnegie Mellon Univer- sity, Pittsburgh, PA 15213 ([email protected] grif- fi[email protected]) 2 Department of Astronomy, University of Florida, P.O. Box 112055, Gainesville, FL 32611 ([email protected]fl.edu) 3 National Astronomical Observatory of Japan, Mitaka 181-8588, Japan; [email protected] 4 Department of Physics, U. Bristol, Tyndall Avenue, Bristol BS8 1TL, UK 5 Instituto de Astrof´ ısica de Canarias, 38200 La Laguna, Tenerife, Spain 6 Institute of Astronomy, University of Tokyo, Mitaka, Tokyo 181-0015, Japan 1 Based on observations from the XMM-Newton, an ESA 1. Introduction Deep X-ray images of a patch of the sky show numerous X-ray sources, which mainly consist of a mixture of absorbed and unabsorbed active galac- tic nuclei (AGNs). It is now recognized that these AGNs make up the bulk of what has been called the “X-ray Background”. While normal galaxies, whose X-ray emission is probably dom- science mission with instruments and contributions directly funded by ESA member states and the USA (NASA). Also based on data collected at Subaru Telescope, which is oper- ated by the National Astronomical Observatory of Japan. 1
Transcript of Multiwavelength Properties of the X-Ray Sources in the Groth-Westphal Strip Field

arX
iv:a
stro
-ph/
0402
617v
1 2
6 Fe
b 20
04
Multiwavelength Properties of the X-ray Sources in the
Groth-Westphal Strip Field 1
Takamitsu Miyaji1, Vicki Sarajedini2, Richard E. Griffiths1, Toru Yamada3, Matthew
Schurch1,4, David Cristobal-Hornillos5, Kentaro Motohara6
ABSTRACT
We summarize the multiwavelength properties of X-ray sources detected in the 80 ks XMM-Newton observation of the Groth-Westphal Strip, a contiguous strip of 28 HST Wide-Field Plane-tary Camera 2 (WFPC2) images. Among the ≈ 150 X-ray sources detected in the XMM-Newtonfield of view, 23 are within the WFPC2 fields. Ten spectroscopic redshifts are available from theDeep Extragalactic Evolutionary Probe (DEEP) and Canada-France Redshift Survey (CFRS)projects. Four of these show broad Mg II emission and can be classified as type 1 AGNs. Twoof those without any broad lines, nevertheless, have [NeV] emission which is an unambiguoussignature of AGN activity. One is a narrow-line Seyfert 1 and the other a type 2 AGN.
As a followup, we have made near-infrared (NIR) spectroscopic observations using theOHS/CISCO spectrometer for five of the X-ray sources for which we found no indication ofan AGN activity in the optical spectrum. We have detected Hα+[NII] emission in four of them.A broad Hα component and/or a large [NII]/Hα ratio is seen, suggestive of AGN activity. Nine-teen sources have been detected in the Ks band and four of these are extremely red objects(EROs; I814 − Ks > 4).
The optical counterparts for the majority of the X-ray sources are bulge-dominated. TheI814 − Ks color of these bulge-dominated hosts are indeed consistent with evolving ellipticalgalaxies, while contaminations from star formation/AGN seems to be present in their V606−I814
color. Assuming that the known local relations among the bulge luminosity, central velocitydispersion, and the mass of the central blackhole still hold at z ∼ 1, we compare the AGNluminosity with the Eddington luminosity of the central blackhole mass. The AGN bolometricluminosity to Eddington luminosity ratio ranges from 0.3 to 10%.
Subject headings: galaxies: bulges – (galaxies:) quasars: general – galaxies: Seyfert – X-rays: galaxies –X-rays: general
1Department of Physics, Carnegie Mellon Univer-sity, Pittsburgh, PA 15213 ([email protected] [email protected])
2Department of Astronomy, University of Florida,P.O. Box 112055, Gainesville, FL 32611([email protected])
3National Astronomical Observatory of Japan,Mitaka 181-8588, Japan; [email protected]
4Department of Physics, U. Bristol, Tyndall Avenue,Bristol BS8 1TL, UK
5Instituto de Astrofısica de Canarias, 38200 La Laguna,Tenerife, Spain
6Institute of Astronomy, University of Tokyo, Mitaka,Tokyo 181-0015, Japan
1Based on observations from the XMM-Newton, an ESA
1. Introduction
Deep X-ray images of a patch of the sky shownumerous X-ray sources, which mainly consist of amixture of absorbed and unabsorbed active galac-tic nuclei (AGNs). It is now recognized thatthese AGNs make up the bulk of what has beencalled the “X-ray Background”. While normalgalaxies, whose X-ray emission is probably dom-
science mission with instruments and contributions directlyfunded by ESA member states and the USA (NASA). Alsobased on data collected at Subaru Telescope, which is oper-ated by the National Astronomical Observatory of Japan.
1

inated by the integration of X-ray binaries, startto emerge (Miyaji & Griffiths 2002; Hornschemeieret al. 2003) at the faintest fluxes, the dominant X-ray source population in the deep Chandra andXMM-Newton Surveys comes from AGN activi-ties. Thus multiwavelength studies of these X-ray sources are key to understanding the detailedhistory and physical conditions of the formationand the growth of the supermassive blackholes(SMBHs), which are now known to reside in thecenters of almost all galaxies with a bulge (Magor-rian et al. 1998; Merritt & Ferrarese 2001).
The region known as the “Groth-WestphalStrip” (GWS), consists of Hubble Space Telescope(HST) Wide-Field Planetary Camera 2 (WFPC2)medium-deep images of a strip of 28 contiguousfields(Groth et al. 1994). It is a particularly usefulfield for extensive multiwavelength studies. Nu-merous on-going and future followup projects havebeen/ are being conducted on and around thisfield. Existing morphological information from theoriginal WFPC2 observations, combined with theDeep Extragalactic Evolutionary Probe (DEEP)2, Canada-France Redshift Survey (CFRS)3 andthe ongoing DEEP 2 4 redshift surveys, is pro-viding us with the first clues to the nature of theX-ray source counterparts.
Because of the contamination from starlight inthe host galaxy, optical searches for faint AGNsin deep survey fields such as GWS need elaborateefforts. Such attempts have been made by search-ing for an unresolved component at the centersof galaxies, searching for variable nuclei, and byselecting those with ultraviolet-excess cores (Sara-jedini, Green, Griffiths, & Ratnatunga 1999; Sara-jedini, Gilliland, & Kasm 2003; Beck-Winchatz &Anderson 1999). These surveys reveal up to 10%of galaxies as AGN candidates with nuclei extend-ing as faint as MB≃ –15. Optical searches, how-ever, are less sensitive to AGNs obscured by dustaround the active nucleus. On the other hand,X-ray surveys for AGNs are not hindered by theluminosity of the underlying host galaxy. In par-ticular, X-ray surveys with hard band (E > 2keV) sensitivity are also sensitive to the obscuredAGNs.
2http://deep.ucolick.org/3http://www.astro.utoronto.ca/∼lilly/CFRS/4http://deep.berkeley.edu/
In view of this, we have obtained an 80 ks expo-sure the northeast part of the GWS with XMM-Newton. This field also has the advantage of alow column density of neutral gas in our galaxy,corresponding to NH = 1.3 1020 cm−2 (Dickey &Lockman 1990). A quick look view and the pre-liminary Log N-Log S relations from these datahave been presented in Miyaji & Griffiths (2001)and Miyaji et al. (2003). In this paper, we presentthe nature of the 23 X-ray sources in the GWS,where morphological properties from the WFPC2images and some redshifts are available from theDEEP/CFRS redshift surveys. We further makesupplemental near infrared spectroscopic observa-tion for some of these X-ray sources for whichwe did not observe AGN signatures in the opticalspectra. Ks band photometry of the X-ray sourcesare also presented.
The scope of this paper is as follows. In Sec-tion 2, we describe the X-ray data and analysis,including source detection and spectral analysis.In Section 3, we explain the source of the opticaland near infrared (NIR) data. The optical andNIR nature of the XMM-Newton sources and re-lated statistics are presented. In 4, we discuss theoverall results on these X-ray sources and blackhole mass and the relationship with the bulge lu-minosity. We also comment on selected individ-ual sources. A summary is given in 5. Through-out this paper, we use H0 = 70 km s−1 Mpc−1,Ωm = 0.3, and ΩΛ = 0.7. Unless otherwise noted,Lx is the 2-10 keV rest-frame luminosity in units oferg s−1 calculated using the cosmological parame-ters shown above.
2. X-ray Data and Analysis
The field has been observed with XMM-Newtonas part of a Guaranteed Time program (PI: Grif-fiths). After cleaning for background flares, wehave obtained a total of 69 ks and 81 ks of expo-sure for EPIC PN and MOS respectively. The logof observation is shown in Table 1.
Table 1: Log of XMM-Newton ObservationsRev/OBSID cleaned exp. Obs. Date
0113/0127921001 51.(PN)/56.(MOS) 21-Jul.-2000
0114/0127921101 18.(PN)/25.(MOS) 23-Jul.-2000“ /0127921201
2

Firstly we have generated an X-ray image foreach of the PN, MOS1, and MOS2 data fromXMM-Newton revolutions 0113 and 0114. Wehave determined the positions of the counterpartX-ray sources by Gaussian fits for two broad lineAGNs detected in the Canada-France RedshiftSurvey (Lilly, Hammer, Le Fevre, & Crampton1995) and a few objects in the Medium Deep Sur-vey (MDS) database (Ratnatunga, Griffiths, &Ostrander 1999) with trivial X-ray counterparts.Based on the positions of the optical counterparts,we have determined the linear transformation co-efficients of the X-ray source positions. Duringthis process, we did not use X-ray sources whichfell in the gaps of the CCDs. Using the coefficients,we then aligned each cleaned EPIC event file.
Using the aligned events, we made summed im-ages in three energy bands, corresponding to pho-ton energies of 0.5-2, 2-4.5 and 4.5-10 keV. We alsomade a 2-10 keV image. In making the images, wehave used PATTERN≤4 (12) for the PN (MOS)data and applied the standard screening criteria.In order to avoid the instrumental line emissionfeature which dominates the background in 7.33-9.05 keV, the channel energy range correspondingto this energy range has been excluded from thePN data. Also exposure maps have been createdfor each energy band using the task “eexpmap”.The MOS exposure maps in each band have beenmultiplied by the ratio of the MOS and PN ef-ficiencies in the given band, so that the sourcecounts from the summed (PN+2MOSs) image di-vided by the summed exposure map gives countrates which can be converted to fluxes using thePN response. The slight shift due to the alignmentprocess (at most 2′′) is negligible in the usage ofthe exposure map.
The final source detection has been made to thesum of all PN and MOS data for the three bands.These three images were simultaneously fed intothe SAS software ’eboxdetect’ in the “local” mode.For each band, we have created the “backgroundmap” by cubic spline fitting the source excludedimage (divided by the exposure map) using thesources detected in the first step. The next stepis to use these “background” maps to re-run the’eboxdetect’ in the “map” mode, i.e., search for theexcess over the background map. The final stepis to make a multi-source maximum-likelihood fitover the background map using the positions of the
sources in the previous step as a starting model.This has been made using the SAS task “emlde-tect”. The images in the soft (0.5-2 keV), medium(2-4.5 keV), and ultra-hard (4.5-10 keV) bandshave been simultaneously fit. The procedure alsocalculates the source detection likelihood for eachband as well as for the sum of these. We acceptedsources with a likelihood parameter of
ML = − ln(1 − P ) > 14
where P is the probability that the source exists.We also made a separate source detection to the2-10 keV image to obtain fluxes of the sources ina more traditional energy band.
One of the caveats is that cubic spline fits gener-ated using the SAS procedure “esplinemap” some-times generate spurious wavy structures depend-ing on the choice of the number of spline nodes(the esplinemap parameter nsplinenodes). This isprobably because some structures in the input im-age are not well represented by the spline functionfor the given number of nodes. In order to obtainthe best background map, we have manually var-ied the number of spline nodes until a satisfactorybackground map is obtained. While this strategyinvolves a certain subjectiveness, we have checkedthe goodness of this strategy with extensive simu-lations. The basic results of this analysis are pre-sented in Miyaji et al. (2003). While the sourcedetection should be improved for further quantita-tive analysis (Baldi et al. 2002; Valtchanov, Pierre,& Gastaud 2001), our current source detectionscheme provides a sufficiently complete list of X-ray sources for the purpose of this paper which isfocused on the multiwavelength properties of theX-ray sources within a limited area. These havebeen verified by visual comparisons of the imagesand the detected source lists. The detected sourcecounts have been converted into “effective” countrates by dividing by the value of the exposure mapsmoothed with a σ = 12′′ gaussian.
In this paper, we concentrate on the sourceswhich fall within the HST WFPC2 fields of view.Sixteen of the original 28 GWS fields overlap withthe XMM field of view. Additionally, there is an-other WFPC2 field in this general field (PI Lilly).We excluded from this paper a few X-ray sourceslocated close to the edge of the WFPC2 field iftheir optical counterparts were not included in theMDS database. Table 2 lists the X-ray sources
3
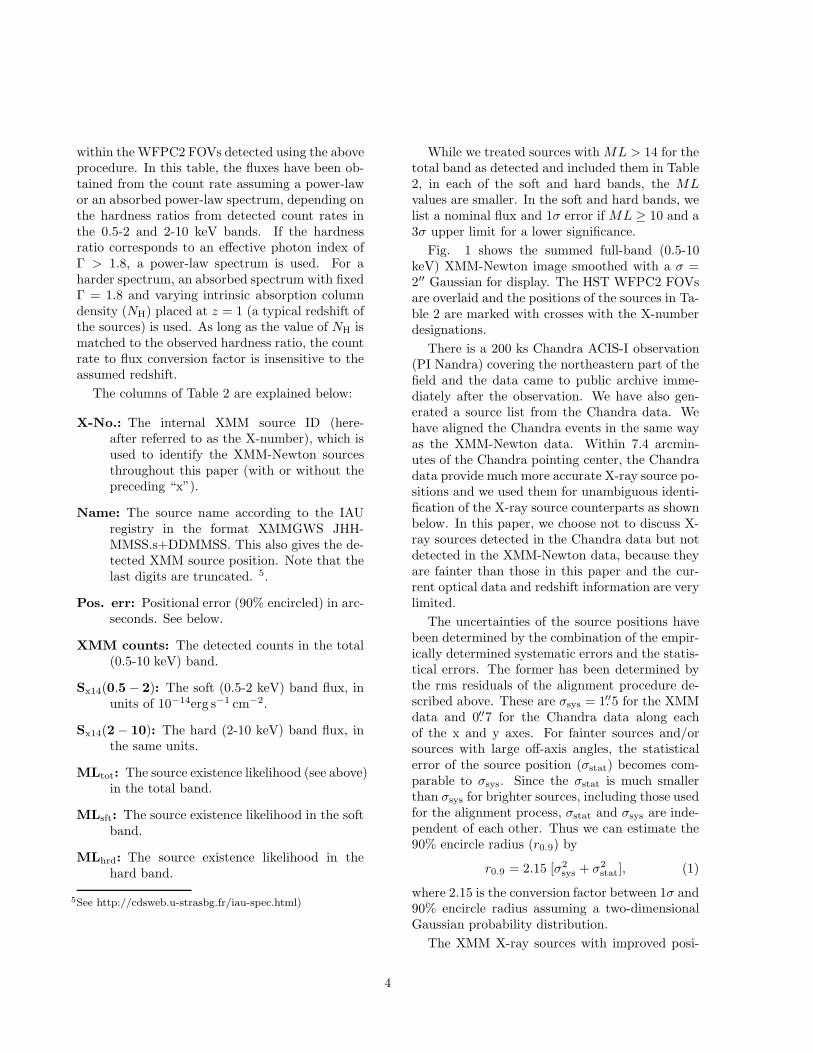
within the WFPC2 FOVs detected using the aboveprocedure. In this table, the fluxes have been ob-tained from the count rate assuming a power-lawor an absorbed power-law spectrum, depending onthe hardness ratios from detected count rates inthe 0.5-2 and 2-10 keV bands. If the hardnessratio corresponds to an effective photon index ofΓ > 1.8, a power-law spectrum is used. For aharder spectrum, an absorbed spectrum with fixedΓ = 1.8 and varying intrinsic absorption columndensity (NH) placed at z = 1 (a typical redshift ofthe sources) is used. As long as the value of NH ismatched to the observed hardness ratio, the countrate to flux conversion factor is insensitive to theassumed redshift.
The columns of Table 2 are explained below:
X-No.: The internal XMM source ID (here-after referred to as the X-number), which isused to identify the XMM-Newton sourcesthroughout this paper (with or without thepreceding “x”).
Name: The source name according to the IAUregistry in the format XMMGWS JHH-MMSS.s+DDMMSS. This also gives the de-tected XMM source position. Note that thelast digits are truncated. 5.
Pos. err: Positional error (90% encircled) in arc-seconds. See below.
XMM counts: The detected counts in the total(0.5-10 keV) band.
Sx14(0.5 − 2): The soft (0.5-2 keV) band flux, inunits of 10−14erg s−1 cm−2.
Sx14(2 − 10): The hard (2-10 keV) band flux, inthe same units.
MLtot: The source existence likelihood (see above)in the total band.
MLsft: The source existence likelihood in the softband.
MLhrd: The source existence likelihood in thehard band.
5See http://cdsweb.u-strasbg.fr/iau-spec.html)
While we treated sources with ML > 14 for thetotal band as detected and included them in Table2, in each of the soft and hard bands, the MLvalues are smaller. In the soft and hard bands, welist a nominal flux and 1σ error if ML ≥ 10 and a3σ upper limit for a lower significance.
Fig. 1 shows the summed full-band (0.5-10keV) XMM-Newton image smoothed with a σ =2′′ Gaussian for display. The HST WFPC2 FOVsare overlaid and the positions of the sources in Ta-ble 2 are marked with crosses with the X-numberdesignations.
There is a 200 ks Chandra ACIS-I observation(PI Nandra) covering the northeastern part of thefield and the data came to public archive imme-diately after the observation. We have also gen-erated a source list from the Chandra data. Wehave aligned the Chandra events in the same wayas the XMM-Newton data. Within 7.4 arcmin-utes of the Chandra pointing center, the Chandradata provide much more accurate X-ray source po-sitions and we used them for unambiguous identi-fication of the X-ray source counterparts as shownbelow. In this paper, we choose not to discuss X-ray sources detected in the Chandra data but notdetected in the XMM-Newton data, because theyare fainter than those in this paper and the cur-rent optical data and redshift information are verylimited.
The uncertainties of the source positions havebeen determined by the combination of the empir-ically determined systematic errors and the statis-tical errors. The former has been determined bythe rms residuals of the alignment procedure de-scribed above. These are σsys = 1.′′5 for the XMMdata and 0.′′7 for the Chandra data along eachof the x and y axes. For fainter sources and/orsources with large off-axis angles, the statisticalerror of the source position (σstat) becomes com-parable to σsys. Since the σstat is much smallerthan σsys for brighter sources, including those usedfor the alignment process, σstat and σsys are inde-pendent of each other. Thus we can estimate the90% encircle radius (r0.9) by
r0.9 = 2.15 [σ2sys + σ2
stat], (1)
where 2.15 is the conversion factor between 1σ and90% encircle radius assuming a two-dimensionalGaussian probability distribution.
The XMM X-ray sources with improved posi-
4

Fig. 1.— The WFPC2 fields of view are overlaid on the full band (0.5-10 keV) XMM-Newton image of theGWS. The underlying image has been smoothed with a σ = 2′′ Gaussian. The positions of the X-ray sourcesin Table 2 are marked.
5

Table 2
XMM-Newton Sources in the WFPC2-Strip
X-no. Name r90 XMM Sx14 Sx14 MLtot MLsft MLhrd
[′′] counts (0.5-2 keV) (2-10 keV)
x8 XMMGWS J141734.8+522809 2.3 1000 2.32±0.10 3.03±0.24 2581 2397 340x9 XMMGWS J141700.6+521918 2.3 1083 1.63±0.06 1.16±0.12 3005 3025 224x10 XMMGWS J141651.3+522046 2.3 1082 1.46±0.06 2.17±0.17 2844 2500 463x11 XMMGWS J141642.4+521813 2.4 910 1.21±0.06 4.01±0.23 2335 1490 835x20 XMMGWS J141741.7+522822 2.4 635 0.93±0.05 2.35±0.19 1463 1087 371x22 XMMGWS J141653.2+522104 2.4 681 0.80±0.04 1.82±0.16 1286 962 326x26 XMMGWS J141715.0+522311 2.4 443 0.47±0.03 0.82±0.10 810 681 132x28 XMMGWS J141704.1+522139 2.4 568 0.29±0.03 3.45±0.20 1049 202 896x33 XMMGWS J141816.3+522940 2.6 409 1.04±0.07 1.06±0.22 631 614 30x40 XMMGWS J141653.8+522042 2.7 187 0.27±0.03 <0.4 134 151 6x44 XMMGWS J141729.9+522748 2.6 241 0.31±0.03 0.72±0.12 307 224 65x46 XMMGWS J141745.6+522801 2.7 204 0.35±0.04 0.58±0.14 245 233 28x52 XMMGWS J141746.0+523031 2.8 179 0.16±0.03 2.01±0.23 189 44 177x55 XMMGWS J141633.5+521502 3.1 152 0.32±0.04 1.21±0.23 160 93 44x61 XMMGWS J141758.7+523138 3.1 135 0.32±0.04 0.94±0.19 134 108 39x66 XMMGWS J141649.8+521810 3.0 112 0.06±0.02 1.15±0.16 107 10 102x69 XMMGWS J141749.1+522811 3.1 129 0.23±0.03 0.41±0.13 121 111 13x83 XMMGWS J141639.7+521502 4.3 73 0.16±0.03 <0.7 33 31 2x118 XMMGWS J141753.1+522840 3.8 73 0.13±0.03 <0.7 47 41 6x125 XMMGWS J141756.9+523125 4.2 68 0.16±0.03 0.54±0.17 44 35 13x130 XMMGWS J141754.3+523125 4.8 52 0.10±0.03 0.51±0.17 22 14 12x133 XMMGWS J141720.0+522459 4.1 53 0.03±0.02 0.33±0.08 23 3 23x146 XMMGWS J141745.8+522950 3.9 61 <0.02 1.13±0.21 31 0 53
tions from the Chandra data are summarized inTable 3.
2.1. X-ray Spectral Properties
As a preview of the X-ray spectral propertiesof the detected sources, we plot a hardness ratiodiagram in Fig. 2. The hardness ratio betweenthe 2-4.5 keV and 4.5-10 keV is plotted againstthat between 0.5-2 keV and 2-4.5 keV. The typi-cal 1σ errors of the hardness ratios are 0.05–0.2;errors exceeding 0.4 are shown. We overplot gridsshowing the loci of absorbed power-law spectrafor varying values of the photon index Γ and in-trinsic absorption N z
H for z=0.7 and z=2 respec-tively as described in the figure caption (GalacticNH = 1.3 1020 cm−2 has been included). Key op-tical/IR properties (Sect. 3) of the X-ray sourcesare indicated.
For bright sources, (XMM counts & 300), X-ray pulse-height spectral analysis gives furtherconstraints on the spectral parameters. For thespectral analysis, we have used the data fromthe first observation in Table 1 (Rev/OBSID =0113/0127921001), which contain mostly good in-tervals free from background flares. The extrac-tion of the spectra has been made using the SAS
Table 3: Chandra PositionsXMM Chandra Position (J2000)X-no. RA() DEC() r90(
′′)x8 214.39514 52.46958 0.7x20 214.42441 52.47316 0.7x26 214.31275 52.38685 0.8x44 214.37476 52.46324 0.7x46 214.44027 52.46722 0.7x52 214.44140 52.50901 0.7x61 214.49547 52.52754 0.8x69 214.45498 52.46987 0.8x125 214.48674 52.52354 0.8x130 214.47583 52.52329 0.8x133 214.33364 52.41676 0.8x146 214.43923 52.49754 0.8
6

Fig. 2.— The X-ray color-color diagram of the X-ray sources in GWS. The inner symbol shows thespectral classification (see Sect. 3; one narrow-line Seyfert 1 has been included among AGN1s)and the outer symbol shows the morphologicalclassifications as labeled. Error bars show 1σ er-rors. The grid shows the location for absorbedpower-law spectra at z=0.7 (wider grid) and z=2(narrower grid, shown in thick lines). The solidlines correspond to photon indices of Γ = 1,2,and 3 from top to bottom and the dotted lines toLog NH = −∞, 21.5, 22.5, and 23.5 cm−2 from leftto right respectively. Objects x44 (X-ray source isoff-nucleus) and x83 (Galactic star) are excludedfrom the plot.
analysis package V5.4 and we have used the stan-dard screening criteria with PATTERN< 5 andPATTERN< 13 for PN and MOS respectively asbefore. The calibration files used to generate thecalibrated data products and response files for thespectral analysis (using the SAS task “epproc” and“emproc”) were up to date as of Aug. 7, 2003.We extracted the source spectra using a circularregion with a typical radius of 25′′, depending onthe source count. The background spectra havebeen extracted using an annular region surround-ing the source with inner and outer radii of 30′′ and60′′ respectively. We have further jointly analyzedtwo co-added MOS spectra and the PN data.
For sources with > 600 counts, we could rea-sonably constrain the parameters with a χ2 fitto the background subtracted spectra rebinnedto have at least 20 counts per bin. For faintersources, we have utilized the XSPEC implementa-tion of the C-statistics (Cash 1979) to the spectrawith much finer binnings. Because the C-statisticscannot be applied to background-subracted data,the background and (source+background) spectrahave been jointly fit. The background has been ap-proximated by one or two power-laws and a broadGaussian. This background model was then scaledby the source and background extraction areas andadded to the source model. The result was thenfitted to the source spectrum without backgroundsubtraction.
The source spectrum is fitted with a power-law, Galactic absorption (fixed at NH = 1.3 1020
cm−2), and an intrinsic absorption at the sourceredshift. For the sources without known redshifts,we have assumed a redshift for determining thevalue of N z
H. The results have been summarizedin Table 4. See comments to this table for details.
3. Optical Identifications and NIR Obser-vations
This field has been targeted by a number of pastand future survey projects in many wavelength,starting with the 28 contiguous HST WFPC ob-servations (Groth et al. 1994). The main source ofthe optical data summarized in this paper comesfrom the HST MDS (Ratnatunga, Griffiths, & Os-trander 1999) database and the DEEP survey. Wehave also made supplemental NIR spectroscopicobservations for several of the X-ray sources. In-
7

Table 4
Results of the X-ray Spectral Analysis
X-No. za Γ Nz
HSx14
b Log Lxc χ2/νd
1022cm−2 erg s−1 cm−2 erg s−1 or Prob.(%)
x8 1.223 2.2(2.0;2.5) <1.3 1.6 44.2 22./38x9 0.5* 2.5(2.3;2.9) <0.07 1.0 ... 20./47x10 0.801 2.2(2.0;2.8) <0.3 1.4 43.7 7./29x11 1* 1.7(1.4;2.2) 1.6(0.7;2.5) 3.5 ... 16./31x20 1.148 2.0(1.6;2.7) 1.8(0.7;3.3) 1.9 44.2 9./19x22 0.983 1.4(1.2;1.7) <0.5 2.7 44.2 11./20x28 0.76p 1.2(0.8;1.7) 3.0(1.7;5.3) 4.1 43.8 62.
aObjects without spectroscopic redshifts are marked with an asterisk and the assumedredshift for NH calculation is shown. Photometric redshifts are marked with “p”.
bSource flux in the 2-10 keV band at the observer’s frame, corrected for Galactic absorp-tion.
cThe base 10 logarithm of the source luminosity in the 2-10 keV band at the source restframe corrected for Galactic and intrinsic absorption.
dFor the χ2 fitting results, χ2 and the degrees of freedom are shown. For fits using C-statistics, we give the percentage of simulated spectra drawn from a Gaussian distributioncentered on the best fit with sigma from the covariance matrix which gives C-values smallerthan the observed. (Using the xspec command “goodness” with the “sim” option.)
frared (Ks) photometry of these sources from theEMIR-COSMOS project(Cristobal-Hornillos et al.2003) are also included. The basic results are sum-marized in Table 5.
3.1. Optical Morphology
Fig. 3 shows the HST WFPC2 F814W images(with the exception of x8, x20, and x44, wherethe F606W images are shown) with r0.9 error cir-cles for XMM and Chandra (where applicable)source positions. Because each WFPC2 imagemay have absolute astrometric error of ∼ 1′′, in afew cases, the X-ray sources in one WFPC2 FOVshow systematic offsets from their counterparts.In those cases, we have shifted the WFPC2 im-age by matching the positions of one of the X-raysources with its unambiguous counterpart in mak-ing overlays. In Fig. 3, the overlays for x8, x20,and x44 have been tuned using x8, those for x61,x125, and x130 using x61, those for x52, x146,and x118 using x146, and those for x69, x46 andx20 using x69. In any case, a translational shiftwithout a rotation gives a satisfactory correction,where all the unambiguous counterparts (includ-ing Chandra sources without XMM detections) are
within the Chandra error circles. Note that thedrawn error circles (r0.9) may be an overestimatein these cases.
All of the X-ray source counterparts have an en-try in the MDS database6, where the results of thedisk-bulge decomposition are provided. The en-tries from the MDS database, including the MDS-ID, magnitudes in F814W (or I814) and F606W (orV606) filters, and the bulge-to-total brightness ra-tios (B/T) (or other morphological classifications)have been shown in Table 5 in columns (2),(3),(4),and (5) respectively. The first and second entriesin column (5) (separated by a comma) are for theF606W and F814W bands respectively. If an en-try in column (5) shows a number between 0 and1, it means that the host galaxy has been decon-volved with an exponential disk+bulge model andthe bulge-to-total light ratio is shown. Other pos-sible entries in this column are “B” (pure bulge),“D” (pure disk), “S” (unresolved point source),and “G” (galaxy; emission is extended, but couldnot discriminate between the exponential disk andbulge models).
6http://archive.stsci.edu/mds
8

Table 5
Optical-Infrared Morphological and Spectroscopic Properties
(1) (2) (3) (4) (5) (6) (7) (8) (9) (10) (11) (12) (13) (14)
X-No. MDS-ID V606a I814
b B/Tc DEEP-ID KSd z Qz refe Class Opt. Linef IR linesg LogLx
x8 u26x7:0004 20.6 20.2 S,S 083 5407 17.4 1.22 3 D AGN1 MgII ... 44.1x9 u26xd:0007 20.4 19.4 0.28,0.24 144 2774 16.7 ... 0 ... ... ... ... ...x10 u26xd:0011 21.4 19.8 S,0.25 142 4838 16.9 0.808 5 D NLS1 [NeV] ... 43.8x11 u26xf:0001 18.1 17.7 S,S 173 7369 15.9 ... 0 ... ... ... ...x20 u2ay1:0025 23.4 21.5 B,B 083 5273 16.5 1.148 3 D AGN1 MgII ... 44.2x22 u26xd:0034 22.7 21.5 B,B 142 2752 18.3 0.983 3 O AGN-IR ... Hα,[NII] 43.9x26 u26xb:0010 21.2 20.9 S,S 123 2458 19.4 1.263 3 D AGN1 MgII ... 43.8x28 u26xc:0019 22.8 20.9 B,B 133 1016 17.6 0.757 -1 I ... ... ... 44.0x33 u2iy4:0004 ... 19.5 ...,S None ... 1.603 4 C AGN1 MgII ... 44.3x40 u26xd:0062? 23.1 23.3 S,S 142 2530 >21.5 ... 0 ... ... ... ... ...x44 u26x7:0120 25.3 23.7 G,B 082 5240 19.6 ... 0 ... ... ... ... ...x46 u2ay1:0019 21.4 20.7 (D,D) 074 2638 18.9 0.432 4 D ... LEX ... 42.6x52 u26x6:0011 22.9 21.9 B,0.41 062 2060 17.5 0.985 4 D AGN-IR LEX Hα,[NII] 44.0x55 u26xh:0177 24.7 23.7 D,B 184 2148 >20.9 0.0000 0 ... ... ... ... ...x61 u26x4:0021 23.0 21.6 0.51,B 053 4446 18.5 0.637 1 C ... LEX ... 43.2x66 u26xf:0024 22.4 20.1 0.22,B 164 6109 17.6 0.808 3 D AGN-IR LEX Hα,[NII] 43.6x69 u2ay1:0092 24.6 22.8 B,B 074 6236 18.7 0.995 3 O AGN-IR ... Hα,[NII] 43.3x83 u26xh:0001 14.8 15.6 S,B 184 7960 13.4 0.0000 0 ... Star ... ... ...x118 u26x6:0004 20.6 20.4 0.26,0.30 064 2873 17.6 0.719 -1 B ... ... ... 42.8x125 u26x5:0056 24.0 22.7 S,S 053 3424 19.3 1.554 -1 B ... ... ... 43.9x130 u26x5:0160 25.2 24.8 G,D 052 0940 >21.0 0.0000 0 ... ... ... ... ...x133 u26x9:0067 24.1 22.8 S,S 113 6354 19.9 0.704 -1 B ... ... ... 42.9x146 u26x6:0010 22.8 21.0 0.12,0.21 073 7749 17.9 0.873 3 D AGN2-Opt [NeV] ... 43.8
aErrors are smaller than 0.1 except (errors in parenthesis) x44 (0.1), x55 (0.2) and x130 (0.5).
bErrors are smaller than 0.1 except for x55 (0.2) and x130 (0.2).
cBulge to total ratio if applicable, or the morphological class (B:pure bulge, D:pure disk, S:stellar, G:galaxy) for the V606 band followed by that of theI814 band.
dErrors are smaller than 0.1 except for x26 (0.1), x44 (0.2), x125 (0.2) and x133 (0.1). Lower limit magnitudes correspond to the 3σ detection limit.
eRedshift reference–D: DEEP C:CFRS B: Brunner (1999) I: Im et al. (2002) O: Subaru OHS (this work)
fOnly key features are shown. Broad lines are indicated by boldface. Those with only low-excitation narrow emission lines are labeled as LEX.
gBroad lines are indicated by boldface.
9

Fig. 3.— Postage stamp images from the HSTWFPC2 images of the XMM-Newton sources inTable 2 are shown. Each image has a dimen-sion of 12′′ × 12′′. North is up and east is left.Large dashed circles and small solid circles are the90% error circles of XMM-Newton and Chandrasources (if they exist) respectively.
3.2. Optical Spectroscopic Classification
Optical spectra are available for 8 of our X-ray sources through the DEEP survey7 and twofrom the CFRS. Key AGN classification emissionlines are shown in column (12) of Table 5. Broadpermitted lines are indicated in boldface.
In summary, four X-ray sources show broad MgII emission lines and we classify these as type 1Seyfert/QSOs. They are identified with “AGN1”in column (12) of Table 5. Other objects with op-tical spectra show only narrow permitted and/orforbidden lines. Two of these show [NeV] emission,which is an unambiguous indicator of an AGN ac-tivity. One of these (x10) is a narrow-line Seyfert1 galaxy (“NLS1” in column [11]) as discussed inSect. 4.3. We tentatively classify the other object(x146) as a type 2 AGN and classify it as “AGN2-Opt”.
The other four objects do not show signs ofAGN activity in their optical spectra in that theyshow neither broad permitted lines nor high exci-tation lines. These are classified as “LEX” (low-excitation emission line objects) in column (12).
3.3. Subaru CISCO/OHS NIR Spectroscopy
We have made NIR spectroscopic observationsfor a subset of the X-ray sources with no op-tical spectroscopic indication of an AGN activ-ity. These include objects with optical spectrawhich show only low excitation lines as well asthose without optical spectra. Observations weremade using the CISCO spectrometer with the OHsuppressor (CISCO/OHS) (Motohara et al. 2002;Iwamuro et al. 2001) attached to the Nasmyth fo-cus of the 8.2m Subaru Telescope on March 22-24,2003. The JH-Grism with a 0.′′5 slit width wasused. The spectral resolution of this configurationis λ/∆λ = 400.
The primary purpose of the NIR spectroscopywas to detect the redshifted Hαλ6563+[NII]λλ6548, 6583 complex and investigate the AGNnature of these X-ray sources. The ratio of thestrengths of the [NII] doublet and Hα is a gooddiscriminator between the AGN and starburst ori-gins of the ionizing radiation. Typical Seyfert 2
7The spectra obtained by the DEEP team are pub-licly available and in the DEEP Public Database(http://saci.ucolick.org/verdi/public/index.html). Thusthey have not been reproduced here.
10

galaxies have log([NII]λ6583/Hα) >-0.25 (Veilleux& Osterbrock 1987). We also intended to searchfor broad components in Hα. Since a dust cloudis more transparent to redder light, moderatelyobscured AGN activities are much more visible inthe longer wavelength lines such as Hα rather thanshorter wavelength lines such as Hβ or Mg II. Infact, there have been a number of reported caseswhere X-ray source counterparts show broad Hαlines, even though they only show narrow lines inthe shorter wavelength optical spectra (Akiyama,Ueda, & Ohta 2002; Schmidt et al. 1998).
We did not include those with z<0.7 (x46,x61) in our NIR spectroscopy targets, because theHα+[NII] line complex does not fall within thewavelength range observable by CISCO/OHS JH-grism. Also in order to make spectroscopic obser-vation feasible within a reasonable exposure time,we limited our spectroscopic observation to thosewith an estimated H-band magitude of H < 21(Iwamuro et al. 2001), where H band magnitudeswere estimated by H ≈ I814 − 1.4 (Barger, Cowie,Mushotzky, & Richards 2001). Five from the 23XMM-Newton sources were observed during ourobserving run.
The resulting spectra, reduced following theprocedure by Iwamuro et al. (2001), are shownin Fig 4. Preliminary flux calibrations have beenmade using a nearby standard star observed im-mediately after the target.
We have detected the Hα+[NII] complex in 4 ofthe 5 observed X-ray sources. In all four cases, thespectra suggest a possible broad Hα component(FWHM ∼ 2000km s−1) and/or strong [NII] lines.This is indicated in column (13) of Table 5 andthe sources are classified as “AGN-IR” in column(11).
Because of the weak signal-to-noise ratio anddifficulty in determining the background, carefulanalysis is required to make any quantitative con-clusions. This will be the topic of a separate paperthat will describe the details of the observations,data reduction, and quantitative analyses for theSubaru CISCO-OHS spectra of the sources shownin this paper and a few additional sources observedduring the observation run.
Fig. 4.— Near-infrared (NIR) spectra of theXMM-Newton sources observed with CISCO-OHSon the Subaru Telescope. Redshifted positions ofcommon QSO emission lines from Wilkes (2000)are marked.
11

3.4. Infrared (Ks) Photometry
The Ks photometry was provided by the EMIR-COSMOS project (Guzman 2003; Balcells 2003).The GWS was imaged with the near-infrared cam-era INGRID on the William Herschel Telescope inthe Spanish Observatorio del Roque de los Mucha-chos during two runs in 2000 April and 2001June. These data are fully described in Cristobal-Hornillos et al. (2003). Atmospheric conditionswere photometric, with seeing ranging from 0.6′′
to 0.75′′ FWHM in 2000 April, and 0.60′′-1.30′′
FWHM in 2001 June. Source extraction and pho-tometry of Ks-band data was done using SExtrac-tor (Bertin & Arnouts 1996). Zeropoint uncer-tainty is 0.03mag. SExtractor BEST magnitudesare provided with errors including photon noise.The resulting Ks magnitudes are listed under col-umn (7) of Table 5.
3.5. Redshifts and X-ray Luminosities
Redshifts, redshift quality flag and the refer-ence source of the redshift are shown in columns(8), (9), and (10) of Table 5. The meanings of theredshift quality flags are: -1: photometric redshiftonly, 0: no redshift information, 1-5: as definedby the DEEP project (Lowenthal et al. 1997) orthe CFRS (Lilly, Hammer, Le Fevre, & Cramp-ton 1995) confidence class if the redshift source isCFRS. The redshift of x22 has been solely deter-mined by the Hα+[NII] complex from the SubaruOHS data. Since this feature is unambiguous, ithas been assigned the quality flag of 3.
For those with redshift information, we havecalculated the X-ray luminosity of the source andlisted the results in column (13). The luminositieshave been calculated from the 2-10 keV rest-framefluxes given in Table 2 and the K-correctionshave been made using the spectral assumptions de-scribed in Sect. 2. The luminosities have been cor-rected for possible intrinsic absorption using thesame spectral assumption. Because of the differ-ence in methods and exact time selections, the lu-minosities listed here can be slightly different fromthose in the full spectral analysis listed in Table 4.
4. Results and Discussion
4.1. X-ray Source Population
The 23 sources detected in our 80 ks XMM-Newton observation of the GWS are representativeof the X-ray sources that contribute most to the“Cosmic X-ray Background” and many of themrepresent the regime which marks the peak of ac-cretion onto SMBHs in centers of galaxies.
A dominant population in this field consists ofAGNs with Log Lx ∼ 44 at z ∼ 1. Only a few ofthem show signs of AGN activity in their opticalspectra. Subaru OHS NIR spectroscopy of fourof the X-ray sources with no previous optical sig-nature of AGNs revealed Hα+[NII] emission linesshowing hints of broad Hα and/or stronger narrow[NII] lines indicative of AGN activity.
The host galaxies of the X-ray sources tendto be bulge-dominated and four are extremely-red objects (EROs) (or Very Red Objects; VROs)(I814 − Ks ≥ 4). Also one object (x130) has anupper limit I814 − Ks < 4.8, which is consistentwith being an ERO. Fig. 5 shows V606 − I814 andI814−Ks colors of the X-ray sources in our sampleas a function of redshift. We have excluded x33(no Ks and V606 photometry available),x46 (X-raysource is off-nucleus, see below), and x83 (Galac-tic star) from the plot. Those without redshiftinformation are plotted left of z=0. For reference,we plot K- and evolution-corrected galaxy colorsfor elliptical (labeled as E1 in Fig. 5), Sa andSc galaxies from Poggianti (1997). Model E1 cor-responds to Poggianti’s model “E”, which has astar-formation rate with e-folding time of 1 Gyr.We have neglected the difference of cosmologicalparameters used by us andPoggianti (1997), whichcorresponds to a ∼ 10% difference in the age of theUniverse. In plotting these color tracks, we haveconverted the I and V magnitudes to I814 andV606 using the formulae given by Cowie, Songaila,& Barger (1999). We also plot the colors of anelliptical galaxy model, which we have calculatedfor our filters and cosmology from the evolvingSEDs by Kodama & Arimoto (1997) (labeled asE2). The plotted model is for a passively evolvinggalaxy after a short burst at the formation epochof zf = 4.62 and L = 0.1L∗ at z = 0. The differ-ence between K and Ks magnitudes have been ne-glected, following Cristobal-Hornillos et al. (2003).
12

Fig. 5.— The V606 − I814 (upper panel) andI814 − Ks colors of the X-ray sources plotted asa function of redshift. Those without redshift in-formation are plotted left of zero. The meaningsof the symbols are the same as those in Fig. 2.One sigma error bars are shown if σ ≥ 0.1. Thesolid, short-dashed, long-dashed curves are galaxycolors as functions of z, based on model spectra forElliptical (E1), Sa, and Sc galaxies after K- andevolution corrections given by Poggianti (1997).The thick dotted line show the colors of a pas-sively evolved elliptical model by Kodama & Ari-moto (1997). The dot-dashed lines are the colorscalculated from the mean radio-quiet QSO spec-trum by Elvis et al. (1994).
Fig. 5 shows that the I814 − Ks color of theX-ray sources with bulge-dominated hosts indeedtraces that of elliptical galaxies and, in particular,those of EROs with redshifts are roughly consis-tent with the passively evolving elliptical model(E2). The V606 − I814 color, which is more sen-sitive to the contaminations from star formationand AGN activities, shows a scatter towards bluercolors from the elliptical regime. The reddest one(x20), with I814 − Ks = 5.0 may be contributedby a dust enshrouded AGN or a starburst. Point-like sources tend to be distributed towards bluer(QSO) colors, although the scatter is large. Thescatter may be contributed to by unresolved hostgalaxies, intrinsic scatter in QSO colors and/orreddening by intrinsic dust absorption.
4.2. Bulge Mass and X-ray Luminosity
The HST imaging of this field has allowed usto find a significant population of X-ray sourcesat z ∼ 1 whose counterparts have a resolved bulgecomponent, either as part of a disk+bulge struc-ture or a pure bulge. In view of the relation-ship found between bulge mass and the centralblackhole mass in nearby galaxies (Magorrian etal. 1998; Merritt & Ferrarese 2001), it is interest-ing to make a first-order estimation of blackholemass (M•) from the bulge-component of the hostgalaxy and compare it with the X-ray luminos-ity. In the rough estimation below, we take theapproach of Aller & Richstone (2002) by first con-verting the bulge luminosity to the central velocitydispersion (σ) of the bulge stellar component us-ing an empirical relation. Then we use the tightσ−M• (Merritt & Ferrarese 2001; Tremaine et al.2002) correlation to obtain the estimated black-hole mass. We use the F814W K-correction for theE galaxy in Fig. 18(d) of Fukugita, Shimasaku, &Ichikawa (1995) to calculated the F814W absolutemagnitude (MF814W). We also assume an early-type galaxy color of
MBT− MF814W = 2.1
(Fukugita, Shimasaku, & Ichikawa 1995; Gonzalezet al. 2000). We then use the relations,
−MBT+ 5 logh70 = 20.5 + 7.7(log σ − 2.3),
M•/M⊙ = 1.48 108 (σ/200)4.65, (2)
(Gonzalez et al. 2000; Merritt & Ferrarese 2001)to obtain the estimated blackhole mass. Because
13

the F814W band corresponds to the B band atthe source rest frame of z ∼ 1, the combination ofthe K-correction and the magnitude conversion toMBT
is insensitive to the assumed galaxy spectralenergy distribution.
Fig. 6 shows the estimated M• versus Lx (ab-sorption corrected, see Sect. 3.5) for 10 X-raysources in the sample which have a resolved bulgecomponent in the HST WFPC2 F814W image(MDS).
It is interesting to estimate the Eddington ratioLbol/LEdd for these X-ray sources, where Lbol isthe bolometric luminosity of the AGN and LEdd
is the Eddington luminosity corresponding to theblackhole mass. Writing Lbol = b Lx, where b ≈
25 (Elvis et al. 1994), we overplot three lines show-ing (Lbol/LEdd)(25/b) = 10−1, 10−2, and 10−3 inFig. 6. Fig. 6 shows that the estimated blackholemasses for the 10 AGNs range from 107−1010 M⊙
and the Eddington ratios from 0.3%-10%.
These results have interesting implications onhow AGN evolve and the current stage of evo-lution for the AGN represented here (z ∼ 1,Log Lx ∼ 44). This is indeed a characteristic red-shift and luminosity marking the peak of the ac-cretion history of the universe. The result thatthese AGN are typically radiating at a few percentmay have important implications on the accretionhistory and formation of SMBHs. If this is a typ-ical Eddington ratio throughout the AGN phaseof these objects, the growth of the blackhole oc-curs on a timescale of ∼ ts/(Lbol/LEdd) ∼ a few× 109 yrs, where ts ∼ 5 107( ǫ
1−ǫ)( 0.1
1−0.1 )−1 yrsis the Salpeter timescale, that is the timescale atwhich the mass of an object accreting at the Ed-dington Luminosity grows by a factor of e (for aradiative efficiency ǫ ∼ 0.1 of a standard accretiondisk model). This scenario has difficulty in thatthe timescale of a few 109 yrs may be too long,while the number density of AGN at LogLx . 44decreases beyond z ∼ 1 (Ueda, Akiyama, Ohta,& Miyaji 2003). Alternatively, it is possible thatthese AGN have gone through a brief luminousphase in the past with near-Eddington accretionrates. These may have been observed as more lu-minous QSOs (Log Lx & 45) at z > 2. Yet anothermore exotic possibility is that they are just ac-creting with a low radiative efficiency (ǫ << 0.1),allowing much less time for the SMBH to grow.
We note, however, that there are a number of
Fig. 6.— The X-ray luminosity (absorption-corrected) plotted as a function of the centralblackhole mass (M•) estimated from the bulge lu-minosity (see text) for the 10 X-ray sources in thesample with resolved bulge components. The datapoints are shown with X-name labels. Three linescorrespond to (Lbol/LEdd)(25/b) = 10−1, 10−2,and 10−3, where Lbol = b Lx is the bolometric lu-minosity of the AGN component and LEdd is theEddington luminosity corresponding to M•.
14

caveats in interpreting these results and drawingconclusions relating the X-ray AGN evolution andgrowth of the SMBH. Firstly, the current MDSdatabase shows the analysis for stellar (point-like) images or galaxies (pure bulge, pure disk orbulge+disk decomposition), but only limited anal-ysis (Sarajedini, Green, Griffiths, & Ratnatunga1999) has been completed for decomposing point-like (stellar) nuclei from the host galaxy (stel-lar+bulge+disk, stellar+bulge or stellar+disk).Thus we select against those with strong AGNcomponents (or with large (Lbol/LEdd), which arelikely to be listed as “stellar” in the MDS databaseor the bulge luminosity in the database may becontaminated by the central AGN component.This situation should be improved in the future,where the HST images are analyzed with point-like nucleus+host galaxy decomposition. Extend-ing this study to other deep fields with X-ray andHST (WFPC2 as well as ACS) data, including theExtended Chandra Deep Field-South (E-CDFS)and the COSMOS field, will be a next logical step.Secondly, a much more fundamental limitation isthat we have assumed the local relations in Eq. 2are still valid at z ∼ 1. This assumption is notguaranteed to be valid.
4.3. Comments on Selected Individual Ob-jects
x8: This is a typical type 1 QSO at z=1.22 witha broad Mg II line.
x10: The DEEP optical spectrum shows manynarrow emission lines including high-excitationlines like [NeV]λλ3346, 3426, which are un-ambiguous indicators of AGN activity. Per-mitted lines (Mg II, Hβ) are also narrow.Since Hβ//[OIII]λ5007 ≈ 0.7 > 1/3, theselines are not dominated by a Seyfert 2. It iseither a Seyfert 2 whose emission lines areheavily contaminated by starburst activityor a narrow-line Seyfert 1 galaxy (NLS1)(Osterbrock & Pogge 1985), where Hβ iscontributed to from the (narrow end ofthe) broad line region. Because our X-rayspectral analysis shows no X-ray absorption(NH < 1021.5cm−2; see Table 4), the NLS1interpretation is more plausible.
x11: The optical counterpart has a very brightstellar (point-like) morphology and there is
no optical spectrum available for this sourceto discriminate between a galactic star and aQSO. However, its X-ray spectrum is incon-sistent with a thermal plasma, having a sig-nificant residual in the soft part. Also its X-ray to optical flux ratio Log (fx/fR) ≈ −0.7(fx is measured in 2-10 keV) is well withinthe AGN regime (roughly between -1 and 1;see e.g. Hornschemeier et al. 2001). Thus itis most likely to be a QSO.
x20: Thanks to the Chandra position, we canidentify the X-ray source with the bright-est bulge-dominated galaxy at z = 1.148,among four candidates apparently inter-acting with one another indicated by tidalbridges (See Fig. 3). It is an interestingcase where galaxy interactions are possiblyfeeding the AGN activity at this early stageof the universe. It has a QSO luminosity(LogLx = 44.2), but the optical image isdominated by bulge component of the hostgalaxy. The DEEP spectrum shows a broadMg II line. The X-ray spectrum shows anabsorption of Log NH ∼ 22.3. This is an ex-ample of optical type-1 X-ray type 2 AGN.This is also an ERO (I814 −Ks = 5.0) and asub-mm source detected in a deep SCUBAsurvey (Waskett et al. 2003).
x22: No previous optical/IR spectroscopic obser-vations existed for this source. Our Sub-aru OHS/CISCO observation detected Hαand [NII]λλ 6548,6583 emission lines, giv-ing z=0.983. Based on the sign of broad Hαand strong NII, high luminosity Log Lx ∼
44.2. While we mark it as an AGN-IR, itmay well be a type 1 AGN.
x28: This source is the most conspicuous hard X-ray source in the field with an intrinsic ab-sorption of Log NH ∼ 22.5 [cm−2]. It is abulge-dominated galaxy with no optical/IRspectroscopy and a photometric redshift ofz = 0.76 (Im et al. 2002) based on its V–Icolor alone. This is most likely a Seyfert 2based on the X-ray properties.
x46: The position of the source has been de-termined with Chandra and the relativealignment of the WFPC2 image and X-ray sources has been achieved the three
15

other CXO sources in the field. The X-ray source counterpart is identified with ahot spot just off the patchy irregular star-forming galaxy DEEP gss 074 2638 (MDSu2ay1:0019) at z=0.432. If we assume thatthe X-ray source is at the same redshift asthis irregular galaxy, the luminosity wouldbe Log Lx ≈ 42.8. This is too luminousfor an ultraluminous X-ray source (ULX).We also note that there is a nearby edge-ondisk galaxy (DEEP gss 074 2237, z=0.156).The X-ray source is 4′′ away (projected dis-tance of 10 kpc) from its nucleus and locatedtowards the direction perpendicular to thedisk. Therefore the X-ray source could be aULX associated with the halo of the galaxy.However, even if the X-ray source was atthe redshift of this disk galaxy, its luminos-ity would still be Log Lx = 41.8, again wellabove the ULX regime. One possibility isthat this irregular galaxy is undergoing amerging process and the X-ray source is atthe nucleus of one of the merging galaxies,or it may simply be a background QSO.
x52: The DEEP spectrum show no broad linesand the location of MgII shows only absorp-tion. Other features include [OII]λ3727 and[NeIII]λ3869. The presence of [NeV]λ3426 issuggested but uncertain. We observed thisobject with Subaru OHS and found a moder-ately broad Hα (FWHM ∼ 2000km s−1) anda strong [NII] doublet. (Fig. 4). The factthat there is no broad MgII line but a mod-erately broad Hα suggests that the AGN isobscured by a dust cloud. This is consistentwith the hard color of this object, with thesecond largest HR(2-4.5 keV/0.5-2 keV) inthe sample. See Fig. 2. This is an ERO(I814 − Ks = 4.4).
x66: We find no indication of an AGN in theDEEP spectrum. Like x52, our SubaruOHS observation revealed possible AGN ac-tivity through the detection of a moderatelybroad Hα (FWHM ∼ 2000km s−1) line anda strong [NII] doublet. This is an obscuredAGN similar to x52 and has a hardest HR(2-4.5 keV/0.5-2 keV). There is also a hint of[NeIII]λ3869, a line which is often strongerin AGN than starforming galaxies.
x69: A spectroscopic redshift of z = 0.995 hasbeen determined by our Subaru observa-tion in close agreement with the photomet-ric redshift determined by Brunner (1999)of zph = 0.935. The Subaru OHS spectrumseems to indicate either strong [NII]λ6583 orbroad Hα suggestive of AGN activity. Thisis an ERO (I814 − Ks = 4.1).
x83: Because of the low X-ray to optical flux ra-tio (Log (fx/fR) ≈ −3) for this bright opti-cal object (F606W=14.8), this is certainly aGalactic star.
x125: Although the MDS database shows that itis a point source, its color is consistent withan elliptical galaxy at the photometric red-shift of zph = 1.55 (Brunner 1999). The op-tical counterpart is probably dominated bythe host galaxy.
x146: This object is detected only in the hard (2-8 keV) X-ray band. The DEEP optical spec-trum clearly shows [NeV]λ3426 emission andstrong [NeIII]λ3869. This is a typical Seyfert2 galaxy with absorbed X-ray spectrum.
5. Summary
1. We summarize the properties of X-raysources in the GWS detected with XMM-Newton and discuss their morphology, opti-cal and NIR spectra.
2. Ten out of the 23 X-ray sources have spec-troscopic information available in the opticalband through the DEEP and CFRS projects.Four of them have broad emission lines andthus can be classified as type 1 AGN/QSOs.Two others have high excitation lines indica-tive of narrow line region of active galacticnuclei. Others do not reveal AGN signaturesin their optical spectra.
3. We have obtained NIR spectra for five ofthe sources which did not reveal AGN sig-natures in their optical spectra using theCISCO/OHS spectrograph on the SubaruTelescope. In four of the five, we detectbroad Hα and/or strong [NII] lines sugges-tive of AGN activity.
16

4. The X-ray hardness ratios and spectroscopicanalysis show that a major part of the ob-served X-ray sources consists of a mixtureof absorbed and unabsorbed AGNs. One ofthese AGNs (x20) has an absorbed X-rayspectrum with a broad MgII emission lineand is another example of an optical type1/X-ray type 2 AGN.
5. The V606 − I814 and I814 − Ks colors of theX-ray sources with bulge-dominated hostswell trace those of evolving elliptical galax-ies. Sources with stellar morphologies showbluer colors with some scatter, and consis-tent with AGN(QSO) with a host galaxycontamination and/or dust absorption.
6. Ten X-ray sources with redshift informa-tion have a resolved bulge. Based on anumber of assumptions concerning the bulgeluminosity-blackhole mass relation, we es-timate that these AGN have luminositiesranging from 0.3-10% of the Eddington lumi-nosity, suggesting that these massive black-holes have previously gone through massiveaccretion (maybe as luminous QSOs) or thattheir lifetimes are relatively long (& 109 yrs).
The authors are indebted to the efforts of theDEEP team for their observations, analysis, andarchiving. This work has been supported by theNASA Grant NAG5-10875 to TM (Long-TermSpace Astrophysics), NASA Grant NAG5-3651 toREG (XMM-Newton Mission Scientist support).
REFERENCES
Akiyama, M., Ueda, Y., & Ohta, K. 2002, ApJ,567, 42
Alexander, D. M., Vignali, C., Bauer, F. E.,Brandt, W. N., Hornschemeier, A. E., Garmire,G. P., & Schneider, D. P. 2002, AJ, 123, 1149
Aller, M. C. & Richstone, D. 2002, AJ, 124, 3035
Balcells, M. 2003, Revista Mexicana de As-tronomia y Astrofisica, 16, 69
Baldi, A., Molendi, S., Comastri, A., Fiore, F.,Matt, G., & Vignali, C. 2002, ApJ, 564, 190
Barger, A. J., Cowie, L. L., Mushotzky, R. F., &Richards, E. A. 2001, AJ, 121, 662
Beck-Winchatz, B. & Anderson, F. 1999, AJ 117,2582
Bertin, E. & Arnouts, S. 1996, A&AS, 117, 393
Brunner, B.J. 1999, PhD Thesis, Johns HopkinsUniversity
Cash, W. 1979, ApJ, 228, 939
Cowie, L. L., Songaila, A., & Barger, A. J. 1999,AJ, 118, 603
Cristobal-Hornillos, D., Balcells, M., Prieto, M.,Guzman, R., Gallego, J., Cardiel, N., Serrano,A., & Pello, R. 2003, ApJ, 595, 71
Dickey, J. M. & Lockman, F. J. 1990, ARA&A,28, 215
Elvis, M. et al. 1994, ApJS, 95, 1
Fukugita, M., Shimasaku, K., & Ichikawa, T.1995, PASP, 107, 945
Gonzalez, A. H., Williams, K. A., Bullock, J. S.,Kolatt, T. S., & Primack, J. R. 2000, ApJ, 528,145
Guzman, R. 2003,Revista Mexicana de As-tronomia y Astrofisica, 16, 209
Groth, E. et al. 1994, BAAS 185, 5309
Hornschemeier, A. E. et al. 2001, ApJ, 554, 742
Hornschemeier, A. E. et al. 2003, AJ, 126, 575
Im, M. et al. 2002, ApJ, 571, 136
Iwamuro, F., Motohara, K., Maihara, T., Hata,R., & Harashima, T. 2001, PASJ, 53, 355
Kodama, T. & Arimoto, N. 1997, A&A, 320, 41
Lehmann, I. et al. 2001, A&A, 371, 833
Lilly, S. J., Hammer, F., Le Fevre, O., & Cramp-ton, D. 1995, ApJ, 455, 75
Lowenthal, J. D. et al. 1997, ApJ, 481, 673
Magorrian, J. et al. 1998, AJ, 115, 2285
17

Merritt, D. & Ferrarese, L. 2001, in The CentralKiloparsec of Starbursts and AGN, ed. J. H.Knapen et al. (San Francisco: ASP), 335
Miyaji, T., Griffiths, R. E. 2001 in Galaxy Clus-ters and the High Redshift Universe Observedin X-rays: proceedings of the XXIst MoriondAstrophysics Meeting, eds. D. Neumann et al.(CD-ROM)
Miyaji, T. & Griffiths, R. E. 2002, ApJ, 564, L5
Miyaji, T., Griffiths, R. E., Lumb, D., Saraje-dini, V., & Siddiqui, H. 2003, AstronomischeNachrichten, 324, 24
Motohara, K. et al. 2002, PASJ, 54, 315
Osterbrock, D. E. & Pogge, R. W. 1985, ApJ, 297,166
Poggianti, B. M. 1997, A&AS, 122, 399
Ratnatunga, K. U., Griffiths, R. E., & Ostrander,E. J. 1999, AJ, 118, 86
Sarajedini, V. L., Green, R. F., Griffiths, R. E., &Ratnatunga, K. 1999, ApJS, 121, 417
Sarajedini, V. L., Gilland, R. L., Kasm, C. 2003,ApJ, in press (astro-ph/0308383)
Schmidt, M. et al. 1998, A&A, 329, 495
Tanaka, I., Yamada, T., Aragon-Salamanca, A.,Kodama, T., Miyaji, T., Ohta, K., & Arimoto,N. 2000, ApJ, 528, 123
Tremaine, S. et al. 2002, ApJ, 574, 740
Ueda, Y., Akiyama, M., Ohta, K., & Miyaji, T.2003, ApJ, 598, 886
Valtchanov, I., Pierre, M., & Gastaud, R. 2001,A&A, 370, 689
Veilleux, S. & Osterbrock, D. E. 1987, ApJS, 63,295
Waskett, T. J. et al. 2003, MNRAS, 341, 1217
Wilkes, B. J. 2000 in Allen’s Astrophysical Quan-tities, Fourth Edition, ed. A.N. Cox (NewYork:Springer), p585
This 2-column preprint was prepared with the AAS LATEXmacros v5.2.
18