A rapid test strip for diagnosing glycosylated hemoglobin ...
25
Analytical Sciences Advance Publication by J-STAGE Received March 26, 2018; Accepted May 22, 2018; Published online on June 1, 2018 DOI: 10.2116/analsci.18P135 1 It is highly advised to use this template to prepare your paper, which should be submitted as a “single” PDF-format file including all figures and tables. The mailing address is: [email protected] Original Papers/Rapid Communications/Notes/etc. A rapid test strip for diagnosing glycosylated hemoglobin (HbA1c) based on fluorescent affinity immunochromatography Chaoman Ang, * Doudou Lou, * Linling Hu, ** Wei Chen, * Yefei Zhu, *** Zhirui Guo, *** Ning Gu, *† and Yu Zhang *† * State Key Laboratory of Bioelectronics, Jiangsu Key Laboratory for Biomaterials and Devices, School of Biological Science and Medical Engineering & Collaborative Innovation Center of Suzhou Nano Science and Technology, Southeast University, Nanjing, P. R. China. ** Nanjing Nanoeast Biotech Co., LTD, Nanjing, P. R. China. *** Laboratory Medicine Center, The Second Affiliated Hospital of Nanjing Medical University, Nanjing, P. R. China. † Yu Zhang E-mail: [email protected]
-
Upload
khangminh22 -
Category
Documents
-
view
0 -
download
0
Transcript of A rapid test strip for diagnosing glycosylated hemoglobin ...
Analytical SciencesAdvance Publication by J-STAGEReceived March 26, 2018; Accepted May 22, 2018; Published online on June 1, 2018DOI: 10.2116/analsci.18P135
1
It is highly advised to use this template to prepare your paper, which should be submitted as a
“single” PDF-format file including all figures and tables. The mailing address is:
Original Papers/Rapid Communications/Notes/etc.
A rapid test strip for diagnosing glycosylated hemoglobin (HbA1c)
based on fluorescent affinity immunochromatography
Chaoman Ang,* Doudou Lou,* Linling Hu,** Wei Chen,* Yefei Zhu,*** Zhirui Guo,*** Ning
Gu,*† and Yu Zhang*†
* State Key Laboratory of Bioelectronics, Jiangsu Key Laboratory for Biomaterials and Devices,
School of Biological Science and Medical Engineering & Collaborative Innovation Center of
Suzhou Nano Science and Technology, Southeast University, Nanjing, P. R. China.
** Nanjing Nanoeast Biotech Co., LTD, Nanjing, P. R. China.
*** Laboratory Medicine Center, The Second Affiliated Hospital of Nanjing Medical University,
Nanjing, P. R. China.
†Yu Zhang
E-mail: [email protected]
Analytical SciencesAdvance Publication by J-STAGEReceived March 26, 2018; Accepted May 22, 2018; Published online on June 1, 2018DOI: 10.2116/analsci.18P135
2
Abstract
In this research, we developed a rapid and easy to operate point-of-care testing (POCT) strip
based on fluorescent affinity immunochromatography to quantitatively determine HbA1c
concentrations in whole blood. This assay based on a sandwich method performed on test strips
effectively utilized the principle of affinity chromatography column which was commonly used
in the detection of HbA1c, and the technology of traditional fluorescence
immunochromatographic test strips (FICTS) were combined. In our test strips, the test line of
traditional FICTS was transformed into the region of affinity chromatography, improving the
linearity and reducing the interference of the precursor of HbA1c and hemoglobin variants. The
test strips could quantitatively detect HbA1c in a wide range (3%-13.8%) with excellent
linearity (R2>0.99) and the assay accuracy were demonstrated by comparing with high
performance liquid chromatography (HPLC) (R2>0.95). The simple, rapid, effective and
quantitative strips will provide a novel method for detection of HbA1c in clinical.
Keywords: Fluorescent affinity immunochromatography, HbA1c, Rapid test strips, Affinity
chromatography, Lateral flow assay

Analytical SciencesAdvance Publication by J-STAGEReceived March 26, 2018; Accepted May 22, 2018; Published online on June 1, 2018DOI: 10.2116/analsci.18P135
3
Introduction
Diabetics is a global public health problem, characterized by hyperglycaemia. People with type
II dibetes have many complications such as high blood pressure, cerebral infarction and
nephrotic syndrome1-4. In China, the prevalence rate of adult with diabetes is 10.9% , and the
morbidity is as high as 5.9% under the age of 40. The number of patients is increasing, and the
diabetes has a trend of attacking young adults5. In the 1990s, Britain and the United States did
research on a large scale for diabetes by clinical pathology and physiology and the scientists
found that the decrease of diabetic complications was related to the lower percentage of
glycosylated hemoglobin to total hemoglobin (Hb)6. Glycosylated hemoglobin can accurately
reflect the long-term blood glucose control of diabetic and is an important indicator for the
condition of diabetes7-8. Glycosylated hemoglobin helps people understand diabetes
complications and guide patients to control blood glucose9-11. In 2010, the American Diabetes
Association (ADA) suggested that all diabetics should make at least two regular glycosylated
hemoglobin tests every year18.
HbA1c is a stable compound of glucose and hemoglobin. In vivo, once the hemoglobin is in
contact with the glucose, the non-enzymatic glycosylation could occur, and the degree of
glycosylation depends on the time and concentration of glucose. An unstable schiff base (the
HbA1c precursor) is formed at initial stage. The HbA1c precursor goes through by the Amadori
rearrangement to form HbA1c. The formation process of the ketone structure is irreversible,
slowly and throughout the erythrocyte life span (120 days)12-13. It is worth mentioning that total
glycosylated hemoglobin and HbA1c represent different meanings12. HbA1c is defined as a
stable compound of n-terminal valine residues on Hb combined with glucose, and glycosylation
sites on Hb forming glycosylated hemoglobin are more than that one. However, the ratio of
HbA1c to total glycosylated hemoglobin is similar (70%) in different people and HbA1c is a
effective long-term indicator of blood glucose level in diabetics12.
Analytical SciencesAdvance Publication by J-STAGEReceived March 26, 2018; Accepted May 22, 2018; Published online on June 1, 2018DOI: 10.2116/analsci.18P135
4
In recent years, ADA and the International Federation of Clinical Chemistry (IFCC) have been
working together to find a consistent, standardized, and parametrical method to detect the
glycosylated hemoglobin in the whole blood14-17. At present, the proportion of HbA1c to Hb is
used internationally as the HbA1c results. In 2010, ADA indicated that 6.5% was the cutoff
value for HbA1c at the guideline for diabetes diagnosis18. In the process of diabetes diagnosis,
relying on the results of the fasting glucose tests to monitor diabetics is not enough. Though the
cost of HbA1c tests is higher, HbA1c tests have certain advantages over the fasting glucose tests
in terms of the prevention of complications. Therefore, the glycosylated hemoglobin and blood
glucose for joint detection will be of great importance in the diagnosis and treatment for
diabetes 19.
At present, HbA1c is clinically detected through HPLC. This method is charactered by high
sensitivity and accuracy and its test results are presented in the form of percentage. But it still
has some shortcomings, on the one hand the supports from large-scale instrument and
professional experiment operation are required, on the other hand the cost of equipment
maintenance is high. Therefore, it’s difficult to promote HPLC method in community hospitals
and families20. Affinity chromatography is also widely used in the detection of glycosylated
hemoglobin (not only HbA1c). This test is not affected by such as HbF, HbS, HbC, formylation
Hb and acetylated Hb because of the presence of boric acid group in column21. These
hemoglobin variants have a great influence on many measurements due to the similar surface
charge of variants with HbA1c, for example, the ion exchange method22-23. The precursor of
HbA1c cannot interfere the measured value of glycosylated hemoglobin in affinity column, as a
result the precursor does not need to be removed from samples21. However, the affinity column
is difficult to operate and takes a long time to get results. Traditional FICTS for HbA1c is
simple and meets the requirements of POCT. But the cost is higher because of the scarcity of
excellent antibodies for HbA1c and the precursor could affect the test results24. Therefore, it is
Analytical SciencesAdvance Publication by J-STAGEReceived March 26, 2018; Accepted May 22, 2018; Published online on June 1, 2018DOI: 10.2116/analsci.18P135
5
necessary to find an ideal, fast, low-cost and convenient analysis method to achieve rapid and
accurate detection of HbA1c25.
In the current study, combining the principle of affinity chromatography, boric acid affinity area
was built on the nitrocellulose membrane (NC membrane) of the lateral flow immunoassay26.
Like many FICTS, quantitative fluorescent signal on test line was the test result and fluorescent
signal from control line guaranteed the validity of the test strips, establishing a POCT strip
based on sandwich assay. Compared with a new hemoglobin A1c analyzer from Biohermes,
Biohermes's instrument can only measure HbA1c in semi-quantitative detection according to the
color of hemoglobin, but results obtained from our HbA1c test strips based on fluorescent
affinity immunochromatography were more accurate and reliable27. We prepared a stable
fluorescent microspheres (FMS) for immunoassay by swelling and covalent coupling methods
to embed fluorescent molecules into carboxyl polystyrene microspheres and to crosslink Hb
antibodies with FMS. The affinity probe BSA-APBA was constructed by covalently coupling
bovine serum albumin (BSA) with aminophenylboronic acid (APBA), which was immobilized
on the NC membrane to capture the glycosylated hemoglobin. Compared with traditional FICTS,
our HbA1c test strips based on fluorescent affinity immunochromatography ensured accuracy
and the effectiveness to differentiate negative or positive results (below or above 6.5% of
HbA1c), at same time linear correlation was improved. In addition, the fluorescenct affinity
immunochromatography rapid diagnostic strips had good repeatability with the clinical results
(60 samples) from HPLC. In a sense, our HbA1c test strips based on fluorescent affinity
immunochromatography combined the advantages of affinity chromatography and fluorescent
immunochromatography with high accuracy and high sensitivity to detect HbA1c. And the test
procedures of our strips was simple, rapid and suitable for whole blood, without the complicated
pretreatment process and professional requirements for operators.

Analytical SciencesAdvance Publication by J-STAGEReceived March 26, 2018; Accepted May 22, 2018; Published online on June 1, 2018DOI: 10.2116/analsci.18P135
6
Experimental
Materials and Instruments
The fluorescent molecular (Cy5) was purchased from AAT Bioquest, Inc. Carboxyl polystyrene
microspheres (10%, w/v) were obtained from JSR Life Sciences. Dimethyl sulfoxide (DMSO),
4-morpholineethanesulfonic acid (MES), 1-(3-Dimethylaminopropyl)-3-ethylcarbodiimide
hydrochloride (EDC), TritonX-100, Tween-20, the goat-anti-mouse polyclonal antibody and
N-hydroxysulfosuccinimide (Sulfo-NHS) were purchased from Sigma-Aldrich Co., LLC. BSA
was acquired from Shanghai Yeasen Biotechnology Co., Ltd. The monoclonal antibody for
hemoglobin was supplied by Suzhou Lansion Biotechnology Co., Ltd. Monoclonal antibodies
for HbA10 (Hb6) and HbA1c (75C9) were purchased from HyTest Ltd. Nitrocellulose
membrane was supplied by Millipore. Conjugate pad, absorbent pad, polyvinyl chloride (PVC)
board and a complete set of equipment for preparation of strips were obtained from
Shanghai Kinbio Tech.Co.,Ltd. APBA was supplied by Aladdin. Human serum albumin (HSA)
was purchased from WuHan AmyJet Scientific Inc. The water used in the experiment was pure
water.
FMS were characterized with a particle size analyzer (Malvern Instruments Ltd.). The size
distributions and surface morphology were observed by scanning electron microscope (SEM)
from ZEISS. Fluorescent signals from solid phase was read by fluorescent strips reader
Nanoeasy 1700 (NE 1700) (Nanjing Nanoeast Biotech Co.,Ltd.).
Buffer solutions
Buffer solutions used in the study were activating buffer (15mM MES, pH5.5), binding buffer
for labeling antibodies on FMS (20mM carbonate buffer, pH9.0), blocking buffer (2%
BSA(w/v), pH 8.3), washing and saving buffer for FMS (5mM K2CO3 (w/v), 0.375% glycine
(w/v), 0.5% casein (w/v), 0.01% sodium azide (w/v)), saving and binding buffer for affinity
probe (20mM borate saline buffer, pH 9.0, the hemolytic agent (1.925% ammonium acetate
Analytical SciencesAdvance Publication by J-STAGEReceived March 26, 2018; Accepted May 22, 2018; Published online on June 1, 2018DOI: 10.2116/analsci.18P135
7
(w/v), 0.01% sodium azide (w/v), pH 8.6 using ammonium hydroxide), antibody dilution buffer
(20mM phosphate buffer, 0.9%NaCl, pH7.4) and sample pad treatment buffer[28] (100 mmol L-1
Na2B4O7.10H2O, 1% PVP (w/v), 0.2% casein (w/v)). All solutions were freshly prepared before
use.
Preparation of FMS for immunoassay
FMS were prepared as previously reported with modifications using swelling method29. Cy5
(10mg/mL, DMSO) at 13.5μL was added into 486.5μL of DMSO. Carboxyl polystyrene
microspheres (10%, w/v) at 100μL were diluted in ultra-pure grade water at 5mL. Then the
mixture of Cy5 and DMSO was added into microspheres. The solution was vibrated at 220rpm
at 25C for 5h in glassware. The mixture was centrifuged at 20000g at 25C for 15min three
times. The precipitation was suspended in ultra-pure grade water at 1mL (1% FMS).
After FMS were prepared, we prepared two kinds of microspheres for the traditional FICTS and
fluorescenct affinity immunochromatographic test strips with the same way30. FMS (1%) at
60μL were centrifuged at 20000g at 25C for 10min. The precipitation was suspended in 200μL
of activating buffer. An EDC/NHS solution including 0.8mg EDC and 0.8mg Sulfo-NHS
dissolved in 100μL of activating buffer was added into FMS which was incubated at 37C for
30min. The mixture was centrifuged at 20000g at 25C for 10min and the precipitation was
suspended in 200μL of binding buffer for labeling antibodies on FMS. The antibody (the
monoclonal antibody for HbA10 or the monoclonal antibody for Hb) at 120μg in antibody
dilution buffer was added into the latex which was incubated at 37C for 2 hours. The mixture
was centrifuged at 20000g at 25C for 10min. The precipitation was suspended in 200μL of
blocking buffer and incubated at 37C for an hour. Finally the mixture was centrifuged at
20000g at 25C for 10min three times and the precipitation was suspended in 200μL of saving
buffer (0.3% FMS). The illustration of making FMS was shown in Fig. 1a.

Analytical SciencesAdvance Publication by J-STAGEReceived March 26, 2018; Accepted May 22, 2018; Published online on June 1, 2018DOI: 10.2116/analsci.18P135
8
Construction of affinity probe BSA-APBA
2.68mg BSAwas dissolved in 300μL of activating buffer. An EDC/NHS solution including 2mg
EDC and 2mg Sulfo-NHS dissolved in 100μL of activating buffer was added into the BSA
solution which was incubated at 37 C for 30min. The mixture was collected with 30K
ultrafiltration tube by centrifugation at 4000g for 10min and the activated BSA solution was
added into 160μL of binding buffer. 2.4mg APBA dissolved in 240μL of saving buffer for
affinity probe was added into the activated BSA solution which was incubated at 37C for 2
hours. The solution was collected with 30K ultrafiltration tube by centrifugation at 4000g for
10min three times and the obtained affinity probe was dispersed in 400μL of saving buffer
(6.7mg/mL BSA).
Whole blood samples
Whole blood samples from a total of 75 patients were kindly provided by Zhongda Hospital
Southeast University (Nanjing, Jiangsu, China), the Second Affiliated Hospital of Nanjing
Medical University (Nanjing, Jiangsu, China), and Nanjing Drum Tower Hospital (Nanjing,
Jiangsu, China). Samples with the test results from HPLC included 25 negative samples (below
6.5% of HbA1c) and 50 positive samples (above 6.5% of HbA1c). All samples were stored at
−80C until use. The study was approved by the ethics committees of three hospitals.
Preparation of test strips
The test strips consists of four parts as shown in Fig. 2a, including the sample pad, NC
membrane, absorbent pad and PVC board. The sample pad was treated with sample pad
treatment buffer28. In traditional FICTS, FMS (3mg/mL) with the antibody for HbA10 were
dispensed on the front-end of NC membrane at a rate of 1.2μL/cm using a Kinbio XYZ
HM3030 dispenser. The antibody for HbA1c (75C9) and the goat-anti-mouse
polyclonal antibody diluted to 3mg/mL and 0.8mg/mL by antibody dilution buffer were
respectively dispensed on NC membrane like Fig. 2b at a rate of 0.8μL/cm as the test line and

Analytical SciencesAdvance Publication by J-STAGEReceived March 26, 2018; Accepted May 22, 2018; Published online on June 1, 2018DOI: 10.2116/analsci.18P135
9
control line.
In our test strips, the affinity probe of BSA-APBA (6.7mg/mL BSA) was dispensed on NC
membrane like Fig. 2c at a rate of 5μL/cm as the test line. The goat-anti-mouse
polyclonal antibody diluted to 0.8mg/mL was also dispensed on NC membrane. The distance
between test line and control line was near 3.7mm.
Fluorescence lateral flow assay procedure
In traditional FICTS, 3μL of the whole blood samples was added to 997μL of the
hemolytic agent at first and the mixture was incubated at 37C for 10min. After that, 100μL of
as-obtained mixture containing Hb and HbA1c was loaded onto the sample pad. During the
sample flow, the analytes were trapped by the HbA10 antibody on FMS to form the composites
which were subsequently bound to the HbA1c antibody on the test line. Finally, the fluorescent
signals were obtained by fluorescent strips reader NE 1700 after a 10min reaction.
In our test strips, 3μL of the whole blood samples was firstly added to 992μL of the
hemolytic agent at 37C for 10min. Because only 3μL of whole blood as the sample was tested
in dilution, the affinity probe on the NC membrane was enough to capture glucose and HbA1c.
Next, 5μL of FMS (3mg/mL) with the Hb antibody was added into the mixture at 37 C for
10min in order to form the composites of FMS-Hb antibody-analytes (Hb and glycosylated
hemoglobin). The obtained samples of 100μL were added to the sample pads. During the sample
flow, the composites were trapped by BSA-APBA on the test line. After a 10min reaction the
fluorescent signals were also recorded by reader NE 1700. In the developed method, FMS
labeled by the Hb antibody could capture Hb including HbA1c in the proportion of HbA1c/Hb,
therefore, the fluorescent signals on the test line represents the percentage results of HbA1c.

Analytical SciencesAdvance Publication by J-STAGEReceived March 26, 2018; Accepted May 22, 2018; Published online on June 1, 2018DOI: 10.2116/analsci.18P135
10
Results and Discussion
Principle of methods
FMS containing Cy5 dye were firstly prepared by swelling and adsorption method to act as
signal amplification label. As shown in Fig. 1c, FMS have uniform and spherical morphology
with an average size of 200nm. Dynamic Light Scattering (DLS) measurement indicated a
hydrodynamic size of 209 nm with polydispersive index of 0.008 (Fig. 1b). The fluorescence
spectra of FMS was shown in Fig. 1d with the fluorescent peak at 671nm which was consistent
with Cy5. The stability of FMS was shown in Fig. 1e. The hydrodynamic size and dispersivity
of FMS was stable during the six months’ storage time.
Fig. 1 a, The illustration of making FMS for immunoassay; b, The hydrodynamic size
distribution by number; c, SEM image; d, Excitation and emission spectra of FMS; e, The
stability of FMS.
The characteristics of affinity probe BSA-APBA was described in Supporting Information (Fig.
S1 and Table S1). The data demonstrated the successful preparation of the affinity probe.
The traditional FICTS were illustrated in Fig. 2b using double antibody sandwich method. After
adding the hemolytic sample, Hb and HbA1c were firstly trapped in the certain proportion by
Analytical SciencesAdvance Publication by J-STAGEReceived March 26, 2018; Accepted May 22, 2018; Published online on June 1, 2018DOI: 10.2116/analsci.18P135
11
the HbA10 antibody coupled FMS to form the composites, which were subsequently
immobilized by the HbA1c antibody on the test line to form a sandwich structure. The residual
FMS-antibody conjugates were captured by the goat-anti-mouse polyclonal antibody on the
control line and excess FMS and solutions were absorbed at last with the aid of the capillarity of
the absorbent pad. After completion of the reaction, the test line and the control line were
detected by reader NE 1700 (Fig. 2d). The test line reflected the concentration of HbA1c. The
signal value of test line increased with increasing the concentration of HbA1c. The control line
reflected the validity of the test strip. It is worth mentioning that the fluorescent signal value
(data) of reader NE 1700 was processed by the initial fluorescent intensity (readable) by a
standardized formula.
The principle of our strips based on fluorescent affinity immunochromatography for HbA1c was
slightly different from the traditional FICTS, which was also based on the sandwich method, as
shown in Fig. 2c. After hemolysis of the whole blood sample, FMS coupled with the Hb
antibody were incubated with the sample for 10min to ensure sufficient reaction. After adding
as-obtained mixture sample, the FMS-Hb antibody-HbA1c composites were captured in the
affinity chromatography area because of the ability of boric acid to capure polyhydroxyl groups,
which replaced the test line in traditional FICTS. The fluorescent signals obtained by reader NE
1700 at the test line were the results of all subsequent validation experiments.

Analytical SciencesAdvance Publication by J-STAGEReceived March 26, 2018; Accepted May 22, 2018; Published online on June 1, 2018DOI: 10.2116/analsci.18P135
12
Fig. 2 Schematic illustration of different lateral flow assays based on FMS; a, Components and
assembly of lateral flow test strips; b, Schematic illustration of traditional FICTS; c, Schematic
illustration of test strips for HbA1c based on fluorescent affinity immunochromatography; d,
The initial fluorescent intensity results were detected by reader NE 1700.
Linearity and Precision
The standard curves for traditional FICTS and our fluorescent affinity immunochromatography
test strips were constructed based on the measurement of a series of different concentrations of
HbA1c (4.7%, 7.4%, 9.8%, 10.8% and 13.8%) from clinical, which were accurately detected by
HPLC before we used. The readout curves of the strip based on fluorescent affinity
immunochromatography on the reader NE 1700 are shown in Fig. 3a.
After recording the fluorescent intensities, we obtained two standard curves by plotting the
fluorescent signals (y) against the concentration of HbA1c (x) as represented by two equations:
y = 10849x - 57.166, R2 = 0.9639 (traditional FICTS); y = 3810.6x - 25.15, R2 = 0.9961 (strips
based on fluorescent affinity immunochromatography), and linearity was displayed as shown in
Fig. 3b.
In the strips based on fluorescent affinity immunochromatography, the coefficients of variation

Analytical SciencesAdvance Publication by J-STAGEReceived March 26, 2018; Accepted May 22, 2018; Published online on June 1, 2018DOI: 10.2116/analsci.18P135
13
(CVs) were less than 15% based on five duplicated measurements at each concentration (4.7%,
7.4%, 9.8% and 13.8%) as shown in Fig. 3c. The batch-to-batch variation described in
Supporting Information was under 16% (Table S2).
Fig. 3 Linear relationship and CVs measurement; a, The readout curve for strips based on
fluorescent affinity immunochromatography at concentration of HbA1c from 4.7% to 13.8%; b,
Linearity of two assays; c, The standard curve and CVs for strips based on fluorescent affinity
immunochromatography.

Analytical SciencesAdvance Publication by J-STAGEReceived March 26, 2018; Accepted May 22, 2018; Published online on June 1, 2018DOI: 10.2116/analsci.18P135
14
Discrimination
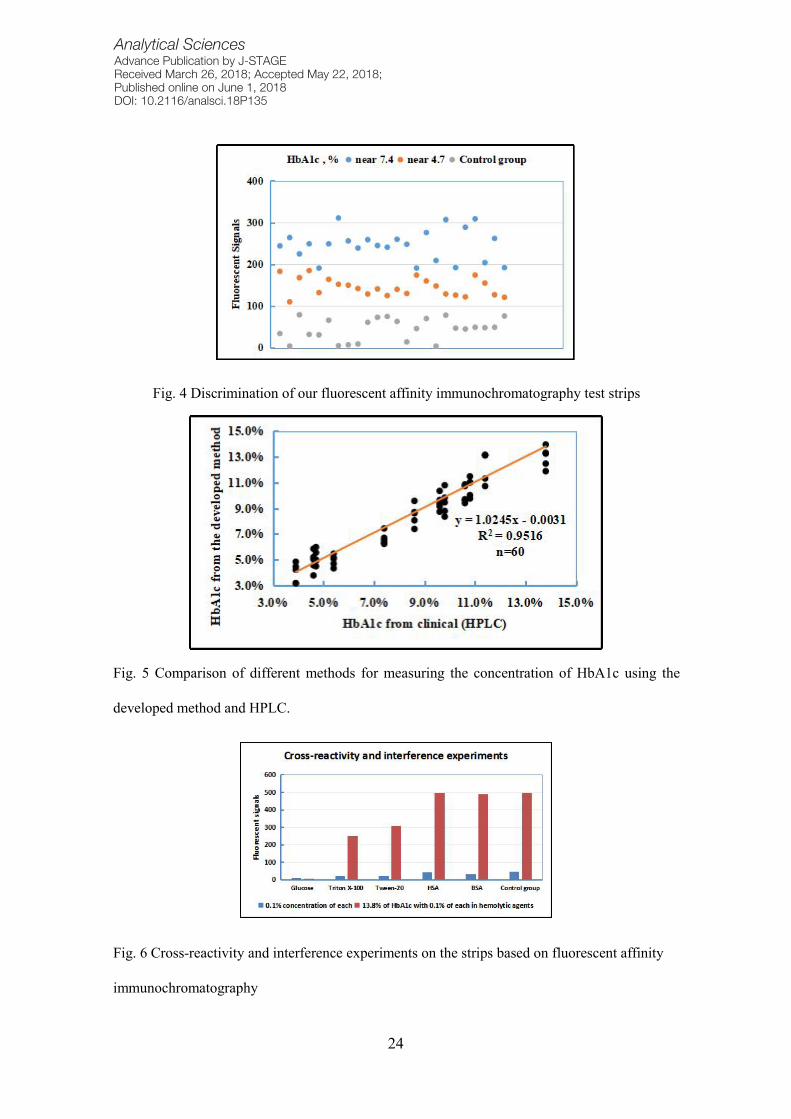
The effective discrimination of samples below or above 6.5% was the key to the rapid test strips
for HbA1c. To define the effectiveness of our fluorescent affinity immunochromatography test
strips, we analyzed the whole blood samples including 25 negative results (near 4.7%) and 25
positive results (near 7.4%). In addition, 25 serum samples were taken as control group. The test
results of negative samples were all negative (25/25), and positive samples were mostly positive
(23/25) bounded by the signal value of 200 in the strips based on fluorescent affinity
immunochromatography (Fig. 4).
Fig. 4 Discrimination of our fluorescent affinity immunochromatography test strips
HbA1c measurements in whole blood samples from clinical (HPLC)
In addition, for comparison between methods, 60 HbA1c samples were analyzed using both the
test strips based on fluorescent affinity immunochromatography and HPLC on clinical. As
shown in Fig. 5, a good level of agreement between the two methods was observed. The
equation was y = 1.0245x -0.0031, R2 = 0.9516, n=60, where y represented the concentration of
HbA1c obtained by the test strips and x was the concentration obtained by HPLC. Results from
the test strips based on fluorescent affinity immunochromatography had good consistency with
the clinical results (60 samples) from HPLC. The results suggested that the test strips based on

Analytical SciencesAdvance Publication by J-STAGEReceived March 26, 2018; Accepted May 22, 2018; Published online on June 1, 2018DOI: 10.2116/analsci.18P135
15
fluorescent affinity immunochromatography were effective for the quantitative determination of
HbA1c in whole blood samples.
Fig. 5 Comparison of different methods for measuring the concentration of HbA1c using the
developed method and HPLC.
Cross-reactivity and interference experiments
We verified the effects of several types of reagents including proteins (BSA, HSA), surfactants
(Triton x-100, Tween-20) and glucose on the strips based on fluorescent affinity
immunochromatography (Fig. 6). On the one hand, we needed to know whether there would be
false positive, so the sample (0.1% solution of the above regents) was measured on the strips
with negative results (the average fluorescent signals of ordinary zero samples were 45). On the
other hand, we wondered whether there is a false negative, so 13.8% of HbA1c in the hemolytic
agent containing the above reagent (0.1%) were tested (the average fluorescent signals of 13.8%
of HbA1c were 496). As a result, we found that surfactants (Triton x-100, Tween-20) would
slightly decrease the fluorescent signal value, because surfactants would wash off the
BSA-APBA from the NC membrane. At the same time, glucose significantly reduced the value
of fluorescent signals, because excess glucose competed with HbA1c in affinity
chromatography.

Analytical SciencesAdvance Publication by J-STAGEReceived March 26, 2018; Accepted May 22, 2018; Published online on June 1, 2018DOI: 10.2116/analsci.18P135
16
Fig. 6 Cross-reactivity and interference experiments on the strips based on fluorescent affinity
immunochromatography
HbA1c is an effective indicator for clinical diagnosis of diabetes7-8. It is also a “gold standard”
for long-term assessment of diabetics9-11. However, there are only a few methods to
quantitatively analyze HbA1c level in whole blood with plenty of limitations such as requiring
expensive instrumentation, complexity of the procedures, and long operation times20-21. These
methods cannot meet the current requirements for the detection of HbA1c.
Traditional FICTS based on the double antibody sandwich method effectively optimize the
processing steps, shorten the testing time and meet the requirements of the POCT. However, test
results with narrow linear range (Fig. 3b) will be affected by the precursor of HbA1c 22-24. It is
also notable that high quality antibodies for HbA1c are rare and expensive.
In the past decade, affinity chromatography has been used to detect glycosylated hemoglobin in
clinical departments. Although its procedures are complex and the time for obtaining results is
long, its results are accurate in accordance with clinical requirements31-32. In this paper, we
design a test strip for rapidly diagnosing glycosylated hemoglobin (HbA1c) based on
fluorescent affinity immunochromatography, which can be used to quantitatively detect HbA1c,
and the strips only need 3μL of the whole blood sample. This kind of strips based on the
sandwich method combine the advantages of affinity chromatography and fluorescent
immunochromatography, and ensure the operating time within 30min which meets the

Analytical SciencesAdvance Publication by J-STAGEReceived March 26, 2018; Accepted May 22, 2018; Published online on June 1, 2018DOI: 10.2116/analsci.18P135
17
requirements of POCT. Compared with the color results of hemoglobin in affinity
chromatography, the strips can improve accuracy and reduce interference by quantitative
fluorescent signals. Compared with traditional FICTS, the strips have larger linear range
(3%-13.8%) and good linear correlation (Fig. 3b), exclude the impact of precursor and save the
cost of the antibodies for HbA1c. Moreover, the strips ensure a good accuracy (CV<15%, Fig.
3c) and the discrimination (Fig. 4) on the cutoff value (6.5%) of HbA1c. In comparison with
clinical samples measured by HPLC, good consistency is still demonstrated on the strips (Fig.
5).
Conclusions
In summary, we have successfully constructed a test strip for HbA1c based on fluorescent
affinity immunochromatography using the affinity probe to replace the monoclonal antibody for
HbA1c on the test line in traditional FICTS. The developed method could improve the linear
correlation compared with traditional FICTS and rapidly provide qualitative results of HbA1c.
The assay is convenient, rapid (only 30 min) and low in cost. The method which is consistent
with clinical (HPLC) test results has excellent linearity, accuracy, and good discrimination of
positive and negative samples. This kind of strips has its unique advantages and good
performance on detecting HbA1c, which can provide a new method for the clinical detection of
HbA1c.
Acknowledgements
This work was supported by the National Key Research and Development Program of China
[No. 2017YFA0205502]; National Natural Science Foundation of China [No. 81571806,
81671820]; the Science and Technology Support Project of Jiangsu Province [No. BE2017763];
the Jiangsu Provincial Special Program of Medical Science [No. BL2013029]; and the
Fundamental Research Funds for the Central Universities.

Analytical SciencesAdvance Publication by J-STAGEReceived March 26, 2018; Accepted May 22, 2018; Published online on June 1, 2018DOI: 10.2116/analsci.18P135
18
Supporting Information
APBA had a strong absorption peak between 260nm and 300nm due to the presence of benzene
ring and the presence of the chromophore (amino). APBA was faint yellow and the absorption
of APBA in the visible band increased gradually from 700nm to 400nm. The standard curve of
APBA was represented by the equation: y=8.5443x+0.0508, in which y represented the
absorption peak at 287nm and x represented the concentration of APBA (mg/mL). The affinity
probe BSA-APBAwas characterized by UV-Vis absorption spectrum as shown in Fig. S1. In the
visible band, BSA-APBA (6.7mg/mL BSA) had absorption, while the absorption value of BSA
with the same concentration was near 0. The BSA-APBA was faint yellow, while BSA
(6.7mg/mL) was colorless under visual observation. The conjugating rate of BSA on APBA was
calculated by analyzing the percolate in the last procedure of construction of affinity probe
(Table S1). The conjugating ratio was 10.12%, that is, 1mg BSA could be coupled with 0.036
mgAPBA .
Fig. S1 UV-Vis absorption spectrum of affinity probe BSA-APBA and BSA
Analytical SciencesAdvance Publication by J-STAGEReceived March 26, 2018; Accepted May 22, 2018; Published online on June 1, 2018DOI: 10.2116/analsci.18P135
19
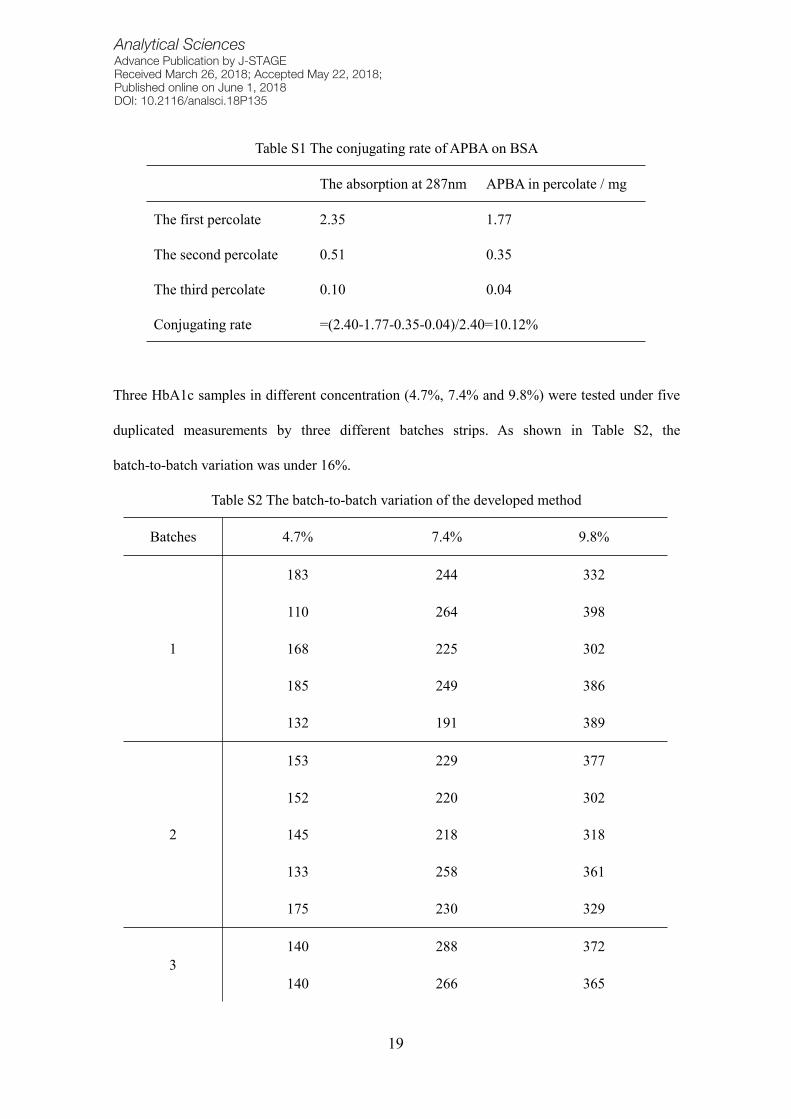
Table S1 The conjugating rate of APBA on BSA
The absorption at 287nm APBA in percolate / mg
The first percolate 2.35 1.77
The second percolate 0.51 0.35
The third percolate 0.10 0.04
Conjugating rate =(2.40-1.77-0.35-0.04)/2.40=10.12%
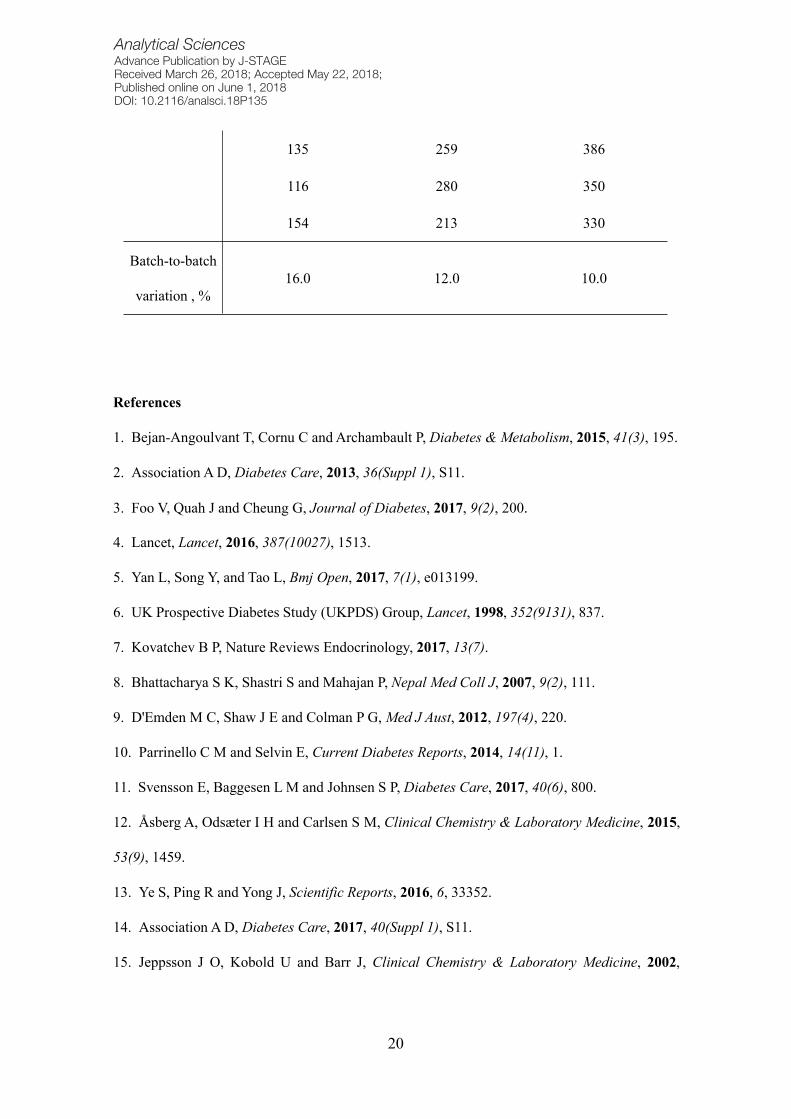
Three HbA1c samples in different concentration (4.7%, 7.4% and 9.8%) were tested under five
duplicated measurements by three different batches strips. As shown in Table S2, the
batch-to-batch variation was under 16%.
Table S2 The batch-to-batch variation of the developed method
Batches 4.7% 7.4% 9.8%
1
183 244 332
110 264 398
168 225 302
185 249 386
132 191 389
2
153 229 377
152 220 302
145 218 318
133 258 361
175 230 329
3140 288 372
140 266 365
Analytical SciencesAdvance Publication by J-STAGEReceived March 26, 2018; Accepted May 22, 2018; Published online on June 1, 2018DOI: 10.2116/analsci.18P135
20
135 259 386
116 280 350
154 213 330
Batch-to-batch
variation , %16.0 12.0 10.0
References
1. Bejan-Angoulvant T, Cornu C and Archambault P, Diabetes & Metabolism, 2015, 41(3), 195.
2. Association AD, Diabetes Care, 2013, 36(Suppl 1), S11.
3. Foo V, Quah J and Cheung G, Journal of Diabetes, 2017, 9(2), 200.
4. Lancet, Lancet, 2016, 387(10027), 1513.
5. Yan L, Song Y, and Tao L, Bmj Open, 2017, 7(1), e013199.
6. UK Prospective Diabetes Study (UKPDS) Group, Lancet, 1998, 352(9131), 837.
7. Kovatchev B P, Nature Reviews Endocrinology, 2017, 13(7).
8. Bhattacharya S K, Shastri S and Mahajan P, Nepal Med Coll J, 2007, 9(2), 111.
9. D'Emden M C, Shaw J E and Colman P G,Med J Aust, 2012, 197(4), 220.
10. Parrinello C M and Selvin E, Current Diabetes Reports, 2014, 14(11), 1.
11. Svensson E, Baggesen L M and Johnsen S P, Diabetes Care, 2017, 40(6), 800.
12. Åsberg A, Odsæter I H and Carlsen S M, Clinical Chemistry & Laboratory Medicine, 2015,
53(9), 1459.
13. Ye S, Ping R and Yong J, Scientific Reports, 2016, 6, 33352.
14. Association AD, Diabetes Care, 2017, 40(Suppl 1), S11.
15. Jeppsson J O, Kobold U and Barr J, Clinical Chemistry & Laboratory Medicine, 2002,

Analytical SciencesAdvance Publication by J-STAGEReceived March 26, 2018; Accepted May 22, 2018; Published online on June 1, 2018DOI: 10.2116/analsci.18P135
21
40(1), 78.
16. Hanas R and John G, Clinical Chemistry, 2010, 56(8), 1362.
17. Weykamp C., John W.G., Mosca A., Hoshino T., Little R., Jeppsson J.O., Goodall I.,
Miedema K., Myers G., Reinauer H., Sacks D.B., Slingerland R. and Siebelder C, Clinical
Chemistry, 2008, 54(2), 240.
18. 20042775, Diabetes Care, 2010, 33(Suppl 1), S62.
19. Dennedy, Rizza and Dinneen, “Classification and Diagnosis of Diabetes Mellitus”, 2016,
Chap. 38.
20. Hadjadj S, Duengler F and Barriere M, Diabetes & Metabolism, 2005, 31(3), 290.
21. Moiz B, Hashmi M R and Sadaf S, Clinical Biochemistry, 2008, 41(14), 1204.
22. Reynolds T M, Twomey P J and Harvey T C, Diabetic Medicine, 2004, 21(9), 1041.
23. Jaisson S, Leroy N and Desroches C, Diabetes & Metabolism, 2013, 39(4), 363.
24. Klenk D C, Hermanson G T and Krohn R I, Clinical Chemistry, 1982, 28(10), 2088.
25. Group I D F G D, Diabetes Research and Clinical Practice, 2014, 104(1), 1.
26. Pristoupil T I, Kramlová M and Stĕrbíková J, Journal of Chromatography A, 1969, 42(42),
367.
27. Zhou R, WangW and Song Z X, Journal of Clinical Laboratory Analysis, 2018, 32(1).
28. Liang R L, Deng Q T and Chen Z H, Scientific Reports, 2017, 7(1).
29. Li Z, Zhang H and Shen J, Polymer Composites, 2011, 32(11), 1712.
30. Herrwerth S, Rosendahl T and Feng C, Langmuir, 2003, 19(5), 1880.
31. Li Q, Tang J and Ju Y, Clinical Chemistry & Laboratory Medicine, 2016, 54(8), e231.
32. Vucheva E, Genova M and Niagolov Y, Acta Medica Bulgarica, 2012, 39(2), 3.

Analytical SciencesAdvance Publication by J-STAGEReceived March 26, 2018; Accepted May 22, 2018; Published online on June 1, 2018DOI: 10.2116/analsci.18P135
22
Figure Captions
Fig. 1 a, The illustration of making FMS; b, The hydrodynamic size distribution by number; c,
SEM image; d, Excitation and emission spectra of FMS; e, The stability of FMS.
Fig. 2 Schematic illustration of different lateral flow assays based on FMS; a, Components and
assembly of lateral flow test strips; b, Schematic illustration of traditional FICTS; c, Schematic
illustration of test strips for HbA1c based on fluorescent affinity immunochromatography; d,
The initial fluorescent intensity results were detected by reader NE 1700.

Analytical SciencesAdvance Publication by J-STAGEReceived March 26, 2018; Accepted May 22, 2018; Published online on June 1, 2018DOI: 10.2116/analsci.18P135
23
Fig. 3 Linear relationship and CVs measurement; a, The readout curve for strips based on
fluorescent affinity immunochromatography at concentration of HbA1c from 4.7% to 13.8%; b,
Linearity of two assays; c, The standard curve and CVs for strips based on fluorescent affinity
immunochromatography.
Analytical SciencesAdvance Publication by J-STAGEReceived March 26, 2018; Accepted May 22, 2018; Published online on June 1, 2018DOI: 10.2116/analsci.18P135
24
Fig. 4 Discrimination of our fluorescent affinity immunochromatography test strips
Fig. 5 Comparison of different methods for measuring the concentration of HbA1c using the
developed method and HPLC.
Fig. 6 Cross-reactivity and interference experiments on the strips based on fluorescent affinity
immunochromatography
Analytical SciencesAdvance Publication by J-STAGEReceived March 26, 2018; Accepted May 22, 2018; Published online on June 1, 2018DOI: 10.2116/analsci.18P135
25
Graphical Index
(A figure for GI should be inserted in high resolution JPG or TIF format.)
Refer to our website (http://www.jsac.or.jp/analsci/).
Color GI is recommended. (No extra charge)
Photocopy is acceptable if they can be clearly reproduced.