Multiwavelength Observations of A0620-00 in Quiescence
41
arXiv:1109.1813v1 [astro-ph.SR] 8 Sep 2011 Multiwavelength Observations of A0620-00 in Quiescence Cynthia S. Froning [email protected] Center for Astrophysics and Space Astronomy, University of Colorado, 593 UCB, Boulder, CO 80309-0593 1 Andrew G. Cantrell [email protected] Department of Astronomy, Yale University, P.O. Box 208101, New Haven, CT 06520 Thomas J. Maccarone [email protected] School of Physics and Astronomy, University of Southampton, SO17 1BJ, UK Kevin France, Juthika Khargharia, Lisa M. Winter 2 [email protected],[email protected],[email protected] Center for Astrophysics and Space Astronomy, University of Colorado, 593 UCB, Boulder, CO 80309-0593 Edward L. Robinson [email protected] Department of Astronomy, University of Texas at Austin, Austin, TX 78712 Robert I. Hynes [email protected] Department of Physics and Astronomy, Louisiana State University, Baton Rouge, LA 70803 Jess W. Broderick [email protected]
-
Upload
independent -
Category
Documents
-
view
0 -
download
0
Transcript of Multiwavelength Observations of A0620-00 in Quiescence
arX
iv:1
109.
1813
v1 [
astr
o-ph
.SR
] 8
Sep
201
1
Multiwavelength Observations of A0620-00 in Quiescence
Cynthia S. Froning
Center for Astrophysics and Space Astronomy, University of Colorado,
593 UCB, Boulder, CO 80309-05931
Andrew G. Cantrell
Department of Astronomy, Yale University, P.O. Box 208101, New Haven, CT 06520
Thomas J. Maccarone
School of Physics and Astronomy, University of Southampton, SO17 1BJ, UK
Kevin France, Juthika Khargharia, Lisa M. Winter2
[email protected],[email protected],[email protected]
Center for Astrophysics and Space Astronomy, University of Colorado,
593 UCB, Boulder, CO 80309-0593
Edward L. Robinson
Department of Astronomy, University of Texas at Austin, Austin, TX 78712
Robert I. Hynes
Department of Physics and Astronomy, Louisiana State University, Baton Rouge, LA
70803
Jess W. Broderick
– 2 –
School of Physics and Astronomy, University of Southampton, SO17 1BJ, UK
Sera Markoff
Astronomical Institute ‘Anton Pannekoek’, University of Amsterdam, Science Park 904,
1098 XH, the Netherlands
Manuel A. P. Torres, Michael Garcia
[email protected], [email protected]
Harvard-Smithsonial Center for Astrophysics, 60 Garden St., Cambridge, MA 021383
Charles D. Bailyn
Department of Astronomy, Yale University, P.O. Box 208101, New Haven, CT 06520
J. Xavier Prochaska
Department of Astronomy and Astrophysics, UCO/Lick Observatory, University of
California, 1156 High Street, Santa Cruz, CA 95064
Jessica Werk
University of Michigan, 500 Church St., Ann Arbor, MI 48109
Chris Thom
Space Telescope Science Institute, 4700 San Martin Dr., Baltimore, MD 21218
Stephane Beland, Charles W. Danforth, Brian Keeney
– 3 –
Center for Astrophysics and Space Astronomy, University of Colorado,
593 UCB, Boulder, CO 80309-0593
and
James C. Green
Center for Astrophysics and Space Astronomy, University of Colorado, 593 UCB, Boulder,
CO, 80309-05931
ABSTRACT
We present contemporaneous X-ray, ultraviolet, optical, near-infrared, and
radio observations of the black hole binary system, A0620-00, acquired in 2010
March. Using the Cosmic Origins Spectrograph on the Hubble Space Telescope,
we have obtained the first FUV spectrum of A0620-00, as well as NUV obser-
vations with STIS. The observed spectrum is flat in the FUV and very faint
(with continuum fluxes ≃ 1e − 17 ergs cm−2 s−1 A−1). The UV spectra also
show strong, broad (FWHM∼2000 km s−1) emission lines of Si IV, C IV, He II,
Fe II, and Mg II. The C IV doublet is anomalously weak compared to the other
lines, which is consistent with the low carbon abundance seen in NIR spectra
of the source. Comparison of these observations with previous NUV spectra
of A0620-00 show that the UV flux has varied by factors of 2–8 over several
years. We compiled the dereddened, broadband spectral energy distribution of
A0620-00 and compared it to previous SEDs as well as theoretical models. The
SEDs show that the source varies at all wavelengths for which we have multiple
samples. Contrary to previous observations, the optical-UV spectrum does not
continue to drop to shorter wavelengths, but instead shows a recovery and an
increasingly blue spectrum in the FUV. We created an optical-UV spectrum of
A0620-00 with the donor star contribution removed. The non-stellar spectrum
peaks at ≃3000 A. The peak can be fit with a T=10,000 K blackbody with a
small emitting area, probably originating in the hot spot where the accretion
1Department of Astrophysical and Planetary Sciences, University of Colorado
2Hubble Fellow.
3SRON, Netherlands Institute for Space Research, Sorbonnelaan 2, 3584 CA Utrecht, the Netherlands
– 4 –
stream impacts the outer disk. However, one or more components in addition
to the blackbody are needed to fit the FUV upturn and the red optical fluxes
in the optical-UV spectrum. By comparing the mass accretion rate determined
from the hot spot luminosity to the mean accretion rate inferred from the out-
burst history, we find that the latter is an order of magnitude smaller than the
former, indicating that ∼90% of the accreted mass must be lost from the system
if the predictions of the disk instability model and the estimated interoutburst
interval are correct. The mass accretion rate at the hot spot is 105 the accretion
rate at the black hole inferred from the X-ray luminosity. To reconcile these
requires that outflows carry away virtually all of the accreted mass, a very low
rate of mass transfer from the outer cold disk into the inner hot region, and/or
radiatively inefficient accretion. We compared our broadband SED to two mod-
els of A0620-00 in quiescence, the ADAF model and the maximally-dominated
jet model. The comparison suggests that strong outflows may be present in the
system, indicated by the discrepancies in accretion rates and the FUV upturn in
flux in the SED.
Subject headings: binaries: close — infrared: stars — stars: individual (A0620–
00) — stars: variables: other
1. Introduction
Low mass X-ray binaries (LMXBs) are interacting binary systems in which a late-type
star fills its Roche lobe and transfers material via an accretion disk to a neutron star or
black hole accretor. LMXBs have proven to be effective test beds for the study of the
physics of accretion and probes of fundamental physics in the strong gravity regime. For ex-
ample, observations of LMXBs have been used to determine the geometry of accretion flows
(Hynes et al. 2010), demonstrate evidence for black hole event horizons (Garcia et al. 2001),
find black hole and neutron star masses (Farr et al. 2010; Ozel et al. 2010; Charles & Coe
2006), measure black hole spins (McClintock et al. 2010; Miller et al. 2009), track thermonu-
clear bursts on neutron star surfaces (Strohmayer & Bildsten 2006), and probe disk-jet and
black hole-jet coupling processes (Fender et al. 2010). Radio and X-ray emission in sub-
Eddington black hole systems are correlated, with a correlation with black hole mass that
extends over eight orders of magnitude from stellar mass LMXBs to AGN (Merloni et al.
2003; Falcke et al. 2004). This correlation, dubbed the “Fundamental Plane” of black hole
activity, establishes the presence of common accretion processes at work across all observed
mass scales. These fundamental physical processes are often best studied in LMXBs, where
– 5 –
the shorter variability time scale allows for extensive tracking and modeling of transient
phenomena and the systems are not obscured or confused by emission from the AGN host
galaxy.
The observational properties of steady-state accretion disks are generally well described
by multi-temperature thermal emission from a classic thin disk, where the disk temperature
varies radially as T(R) ∝ R−3/4 (Shakura & Sunyaev 1973). In systems in the “low/hard
state” or in quiescence, where the accretion rate is roughly a few percent of the Eddington
luminosity, the picture is less well defined (see discussion in McClintock & Remillard 2006).
The X-ray spectrum is dominated by hard, non-thermal emission well-described by a power-
law but inconsistent with thermal emission from the disk. This emission is generally ascribed
to thermal Comptonization in a hot, optically thin accretion disk corona located near the
center of the system. A physical model for this corona was developed by Narayan & Yi (1994,
1995) who proposed that the thin disk is disrupted at large radii, forming an advection-
dominated accretion flow (ADAF) near the center of the system. The ADAF is a radiatively
inefficient flow in which most of the energy released by viscous dissipation is directly advected
with the flow. Merloni & Fabian (2001a,b) propose an alternate model in which the accretion
disk corona is driven by magnetic flares from the underlying accretion disk. These and other
publications on radiatively inefficient accretion flows and accretion disk coronae abound, but
the fundamental structure of the disk/corona at low accretion rates remains an unresolved
problem.
In recent years, moreover, there has been an increasing awareness of the ubiquity of
outflows in LMXBs across the full range of observed accretion states. The original ADAF
papers discussed the likelihood of outflows associated with the ADAF in quiescent systems,
which was later expanded upon by Blandford & Begelman (1999) to propose a model in
which most of the accreting gas is driven from the system by strong winds. Even more
dramatic has been the explosion of interest in jet emission in LMXBs (see Fender 2006, and
sources therein). Flat or inverted spectra have been observed in the radio to millimeter
regime in several LMXBs in the low/hard state. The spectra are attributed to synchrotron
emission from a highly collimated outflow. The jet emission may not be restricted to the
radio, however: it has been proposed that the jet can dominate the broadband spectrum of
quiescent LMXBs from the radio to X-rays (e.g., Markoff et al. 2001).
One of the best-studied LMXBs is the black hole system, A0620-00. A0620-00 was
discovered when it went into outburst in 1975 (Elvis et al. 1975). A0620-00 has been in a
quiescent state since 1976, during which extensive observations have shown that the system
is composed of a K-type donor star transferring mass to a black hole via an accretion disk
(Oke 1977; McClintock et al. 1983; McClintock & Remillard 1986). The black hole mass in
– 6 –
A0620-00 has been precisely determined, MBH = 6.6±0.25 M⊙ and the continuum fitting
method for estimating black hole spins from the thermal emission from the accretion disk
in the soft state gives an estimated spin of a∗ = 0.12±0.19 (Cantrell et al. 2010; Gou et al.
2010). Cantrell et al. also determined the distance to A0620-00 as d = 1.06± 0.12 kpc.
Gallo et al. (2006) presented radio observations of A0620-00, the first radio detection
of a quiescent black hole binary, and one that extended the Fundamental Plane to black
hole systems with luminosities as low as 10−8.5 of the Eddington luminosity. A0620-00 was
also detected by Spitzer at 24µm, which Muno & Mauerhan (2006) attributed to thermal
emission from a circumbinary disk. Gallo et al. (2007), however, noting the flat spectral
index between the radio and the mid-IR, argued that synchrotron emission from a jet was
responsible for the emission in both bands. They fit the radio to X-ray spectral energy
distribution (SED) with a maximally jet-dominated model in which, aside from visible and
near-infrared contributions from the donor star and the disk, the SED is dominated at
all energies by emission from the jet. This result is in contrast to ADAF models of the
quiescent disk in A0620-00 in which the X-ray emission is dominated by the ADAF and the
visible-UV emission by the outer thin disk (Narayan et al. 1996, 1997). Hence, A0620-00
is one of the key systems for which extensive multiwavelength observations have allowed
for tests of multiple quiescent accretion models, from which has sprung general consensus
about the importance of non-thermal emission from the jet and disk corona but lingering
disagreements about specific questions concerning the energetics of the corona, the structure
of the inner disk, and the relative contributions of each component in different wavebands
(Narayan & McClintock 2008; Markoff 2010).
Here, we present UV spectroscopy of A0620-00 obtained with the Cosmic Origins Spec-
trograph (COS) and Space Telescope Imaging Spectrograph (STIS) on the Hubble Space
Telescope (HST). The COS spectra are the first far-ultraviolet (FUV; λ < 2000 A) obser-
vations of this faint source. The UV wavebands provide several key tracers of the structure
of LMXB accretion disks and outflows, including line emission from the accretion disk chro-
mospheres and disk winds (e.g., Bayless et al. 2010; Haswell et al. 2002) and probes of the
SED near the expected peak temperatures of thermal emission components in the disk. As a
result, the FUV can provide key constraints on disk models in LMXBs (Hynes et al. 2009).
We combine the UV data with X-ray, optical, near-infrared, and radio observations, all ac-
quired over a four day period, to create a broadband SED. Using the multiwavelength data
set, we examine changes in the UV flux and broadband SED in the system over time and
compare the current properties of the system to models of the structure of quiescent black
hole X-ray binaries.
– 7 –
2. Observations and Data Reduction
2.1. HST UV Spectroscopy
A0620-00 was observed with COS on HST on 23 March 2010. The total exposure time
was 4.6 hr spread over a clock time of about 9 hours. A summary of all the observations can
be found in Table 1. We observed A0620-00 using the FUV G140L grating in the 1230 A
setting, which covers ∼1300 – 2400 A on the A segment of the FUV detector at a spectral
resolution of ∆λ ∼ 0.5 A (however, instrument sensitivity is very low for λ > 1800A). In the
same setting the B segment covers ∼200 – 1170 A with appreciable sensitivity down to the
Lyman limit (McCandliss et al. 2010). We stepped the grating to different fp-pos positions
for each exposure to minimize the effects of fixed pattern noise. Additional information
about the design and on-orbit performance of COS can be found in Osterman et al. (2011)
and the COS Instrument Handbook (Dixon et al. 2010).
We retrieved the COS data from the Multi-Mission Archive at STScI (MAST). The
data had been processed with V. 2.11b of CALCOS. That version of CALCOS did not
correctly perform the wavelength and flux calibration for Segment B data in G140L, so we
re-processed the Segment B data using a newer version of the CALCOS pipeline (v2.12),
employing specially-created reference files for flux and wavelength calibrations in the short-
wavelength segment B setting. The custom reference files were created to supplement the
CALCOS 2.12 release that included a first order dispersion solution for λ < 1150 A and a
flux calibration curve. A detailed discussion of the development of the calibration files is
available in Shull et al. (2010), based on data first presented in McCandliss et al. (2010). The
absolute flux accuracy for the Segment B data presented here is about 10%–15%. We coadded
the output one-dimensional spectral data products using a custom IDL code, described in
Danforth et al. (2010)1. The code performs a partial flat field correction (removing shadows
cast by the detector ion repeller grid), combines different wavelength settings, and creates
a weighted mean spectrum (with lower weight given to regions of uncertain flux calibration
near detector edges).
We also observed A0620-00 with STIS on 24 March 2010 using the G230L grating and
the 52×0.5 slit, which covers 1507–3180 A at ∆λ=3.2 A. The total exposure time was 2.9
hr acquired over a ∼7 hr time period. We retrieved the data from MAST. We also re-
trieved the 1998 STIS observations of A0620-00 (program GO-7393). The 2010 data were
processed by CALSTIS V. 2.26 and the 1998 data by CALSTIS V.2.23. Since STIS was
repaired during Servicing Mission Four, the NUV MAMA detector has been showing ele-
1See also http://casa.colorado.edu/~danforth/science/cos/costools.html
– 8 –
vated dark count rates (see the STIS Instrument Handbook for more information; Proffitt
et al. 2010). Although the dark count rate has been declining, in early 2010 it was still at
∼0.005 counts sec−1 pixel−1, a factor of 4 above pre-failure levels (STScI Analysis Newsletter,
February 2010). Probably as a result of the noisier data, CALSTIS was unable to automat-
ically extract the one-dimensional spectrum from the two-dimensional spectral image in the
2010 observations, so we extracted the spectra using the IRAF2/STSDAS task x1d, pro-
viding the location of the cross-dispersion profile in each exposure from inspection of the
two-dimensional images.
Figures 1 and 2 show the time-averaged UV spectra from the 2010 COS and STIS
observations of A0620-00, respectively. The red error bars in the figures show the Poisson
noise from CALCOS and CALSTIS, propagated through the averaging performed by the
coaddition tool and the pixel binning. While these error bars are roughly representative of
the noise in our spectra, they do not give the true uncertainty, because the data reduction
pipelines do not properly handle Poisson noise in the low count rate regime. In particular,
the pipelines incorrectly assign zero variance to zero count events and do not adopt two-
sided confidence limits to take into account the zero probability of negative net counts in
background-subtracted spectra. Accordingly, we present these error bars to give a visual
estimate of the scatter in each bin and between bins, but do not use them in our analysis
(except as input to specfit when fitting the emission lines).
For our spectral energy distribution, we calculate the mean in several line-free spectral
regions (shown in purple in the figures) and use the uncertainty on the mean for our error
bars. The error bars do not incorporate uncertainties in absolute flux calibration or in
background subtraction, however, that could move all the UV data relative to our other
wavebands. The absolute flux calibration uncertainty is fairly low for both instruments,
∼5% (Dixon et al. 2010; Proffitt et al. 2010). Our target was well-centered in the COS
aperture, so we did not experience any vignetting losses. The COS FUV channel has shown
evidence of on-orbit sensitivity degradations which are still being characterized and may
account for an additional uncertainty in the absolute flux calibration of ≤4% (Osten 2010).
2”IRAF is distributed by the National Optical Astronomy Observatory, which is operated by the Asso-
ciation of Universities for Research in Astronomy (AURA) under cooperative agreement with the National
Science Foundation.
– 9 –
2.2. Swift X-ray and UV Imaging
Swift made pointed observations of A0620-00 several times between 22 and 25 March
2010. The observations for the different dates have Swift identifiers 00031635001, 00031635002,
00031635003, and 00031635004, respectively. We retrieved and calibrated the X-Ray Tele-
scope (XRT; Burrows et al. 2005) and UV/Optical Telescope (UVOT; Roming et al. 2005)
data. Observation data and cumulative exposure times are listed in Table 1.
Because the individual XRT observations all have poor signal to noise, we add the
four dates’ data together for a total exposure time of 19939 sec. We use a 20 arcsecond
source circle. This corresponds to an encircled energy fraction of 75%, and is chosen as a
compromise between including all the source photons and minimizing background. A0620-00
is in a relatively uncrowded X-ray field. There is one source located 10′′ away, but it is 5%–
10% as bright as A0620-00 (based on examination of archival Chandra observations of the
field) and therefore likely contributes <10% of the counts in the A0620-00 extraction circle.
We find a total of 25 photons within the source regions. We estimate the background from
off-source regions with 100-114 (236′′–269′′) pixel radii, depending on which image is used.
We find that there is a total of 2.9 ± 0.1 photons per 20′′ radius circle. We thus estimate
22.1± 5.0 source counts within the 20′′ radius, with the uncertainties dominated by Poisson
statistics of the source counts. Extrapolating to the full point spread function, and dividing
by the exposure time gives 1.5± 0.3× 10⁻³ counts sec−1.
There are too few counts for X-ray spectroscopy, so we converted the count rate into a
flux using W3PIMMS3. We used NH=1.6×10²¹ (McClintock et al. 1995; Gallo et al. 2006),
and tried several different power law spectral models. For Γ = 2.0, the 0.5–8.0 keV unab-
sorbed flux is 6.4×10⁻¹⁴ ergs sec−1 cm−2, while the same quantity is 7.0×10⁻¹⁴ ergs sec−1 cm−2
with Γ = 1.7 and 5.8× 10⁻¹⁴ ergs sec−1 cm−2 with Γ = 2.5. Previous Chandra observations
of A0620-00 have found values of Γ from 2.06 (Gallo et al. 2006) to 2.26 (McClintock et al.
2003). For our SED (Table 4) we use the flux for the Γ=2.0 fit to allow a direct comparison
to the Gallo et al. (2006) SED. The statistical errors are, as stated above, about 20%, while
the systematic errors due to uncertainty in the spectral shape are likely to be about 10%.
The source flux is thus consistent with that found in August of 2005 by Gallo et al. (2006),
and a factor of about 2 larger than that found in February of 2000 by Kong et al. (2002).
For the Swift UVOT data, we used the archived level 2 processed data files. A source
region was defined with a 10′′ circular radius centered on the position of A0620-00. A
background region was defined with a 20′′ circular aperture in a region free from additional
3http://heasarc.gsfc.nasa.gov/Tools/w3pimms.html
– 10 –
sources, near A0620-00. Using these defined regions and the Swift Ftool4 uvotsource, we
extracted the background-subtracted flux from the Swift UVOT observations in the UVW1,
UVW2, UVM1, and U filters.
2.3. SMARTS/ANDICAM Optical and Near-Infrared Imaging
We observed A0620-00 at visible and near-infrared wavelengths using the ANDICAM
instrument mounted on the 1.3-m telescope at CTIO. ANDICAM is operated by the Small
and Moderate Aperture Research Telescope Systems (SMARTS) consortium5. We obtained
BVRIJHK observations of A0620-00 nightly (weather permitting) from 18 – 31 March 2010,
spanning several days around the HST observations. The BVI exposures are 6 minutes
each. The JHK exposures each consist of eight dithered 30-second exposures, which are
sky-subtracted and then combined. The data were reduced using standard IRAF tasks for
calibration and photometry. We determined the flux calibration and photometric errors using
comparison stars. The BVI data are calibrated using Landolt standards in other fields, while
the JHK magnitudes are calibrated using the 2MASS magnitudes of field stars. A0620-00
has been monitored regularly by the SMARTS consortium for over a decade. Further details
on how the data acquisition, reduction, and photometric calibration are undertaken for these
observations are available in Cantrell et al. (2008).
2.4. ATCA Radio Data
We observed A0620−00 with the Australia Telescope Compact Array (ATCA) on both
2010 March 23 and 24. Simultaneous 5.5 and 9.0 GHz observations were conducted with
the Compact Array Broadband Backend (CABB); the bandwidth is about 2 GHz at each
frequency. Because of the declination of the target, we used the hybrid H168 array, which in-
cludes a north-south spur to enable reasonable coverage of the uv-plane. The total integration
time on-source was 7.0 hours, split approximately evenly between the two observing sessions.
The primary calibrator was B1934−638, and the secondary calibrator was B0639−032.
We reduced and imaged the data with MIRIAD (Sault et al. 1995); note that a single
image was made at each frequency using the full 7.0 hour dataset. After flagging, the
effective frequencies of the two bands are 5.48 and 9.00 GHz. We set Briggs’ robust weighting
4See http://heasarc.gsfc.nasa.gov/docs/software/ftools/ftools_menu.html
5See http://www.astro.yale.edu/smarts
– 11 –
parameter (Briggs 1995) to 0.5 when forming the 9.00 GHz map, but found that a value of 0.0
at 5.48 GHz gave the best compromise between sensitivity and the suppression of sidelobes
from nearby sources. As A0620−00 is very close to the celestial equator, it was necessary to
use SIN (sine) projection when forming the images; though initially we had to modify the
MIRIAD source code to do this, the MIRIAD task INVERT has since been updated with
a built-in option. In addition, because of the wide bandwidths, we used the multi-frequency
deconvolution algorithm MFCLEAN (Sault & Wieringa 1994). The angular resolutions are
38 arcsec × 1.6 arcsec (beam position angle -1.2◦) and 23 arcsec × 1.3 arcsec (position angle
-1.1◦) at 5.48 and 9.00 GHz, respectively. At 5.48 GHz, the rms noise level is 13.5 µJy
beam−1, while at 9.00 GHz it is 16 µJy beam−1.
The source is not detected at either frequency. The 5σ upper limits are therefore 67.5
µJy beam−1 and 80 µJy beam−1 at 5.48 and 9.00 GHz, respectively.
2.5. Keck Optical Spectroscopy
Using the Low Resolution Imaging Spectrometer (LRIS; Oke et al. 1995) at the Keck
Observatory, we obtained visible band spectra of A0620-00 on 2010 Mar 25. The instrument
was configured using dichroic D560 coupled with the 600/7500 grating on the red arm and
the 600/4000 grism on the blue arm. The data were taken through the 1′′ long slit. In
this configuration, LRIS provides coverage from 3010–5600 A at 3.8–4.1 A (∼280 km s−1)
resolution in the blue arm and 5600–8870 at 4.7 A (∼160 km s−1) from the red arm. Data
were calibrated using the LowRedux software package.6 We calibrated the exposures with
spectra of arc line emission lamps and fluxed the data with a sensitivity function derived
from observations of G191B2B taken that night. The flux calibration does not include a
precise estimate of slit-loss and therefore only provides an accurate estimate of the relative
flux.
3. Analysis
3.1. Ultraviolet Spectra
The UV spectra of A0620-00 are shown in Figures 1 and 2. The spectra have not
been corrected for interstellar reddening. The observed continuum is flat in the FUV (1150–
6http://www.ucolick.org/~xavier/LowRedux/index.html
– 12 –
1700 A) and red in the NUV (1800–3200 A), with fluxes in the FUV≃ 1×10⁻¹⁷ ergs cm−2 s−1 A−1
and 3–7×10⁻¹⁷ ergs cm−2 s−1 A−1 in the NUV. The COS FUV spectrum shows prominent,
broad (FWHM∼2000 km s−1) emission lines of Si IV, C IV, and He II. In the NUV, the STIS
spectra show emission lines of Fe II and Mg II. Integrated line fluxes are given in Table 2,
based on Gaussian fits to the observed spectra using Specfit (Kriss 1994). The Si IV line was
slightly better fit with the doublet fixed to a 2:1 ratio than 1:1 but the difference was not
statistically significant. For C IV, we could not distinguish between fits with 2:1 or 1:1 line
ratios; we give the latter in Table 2. The line centroids were within ∼200 km s−1 of their
rest velocities.
Average continuum fluxes for the line-free regions (shown in purple in Figures 1 and 2)
are given in Table 3. The table also contains the UV measurements made by Swift/UVOT.
Overall, the UVOT fluxes are brighter than the STIS fluxes. Most of the UVOT UV filters
(particularly UVW2 and UVW1) have substantial red leak which accounts for much of the
discrepancy between the measurements. The UVOT U filter does have a square response
profile, although it has a broader high throughput region than that of Johnson U. The UVM2
filter has the most “UV-pure” filter coverage, so we compared the STIS fluxes (acquired on
March 24) to the UVM2 data (acquired on March 23, the same day as the COS observations)
by creating an average flux from the STIS spectrum weighted by the UVM2 filter profile.
The weighted STIS flux is 3.4 ± 0.2 × 10⁻¹⁷ ergs cm−2 s−1 A−1 while the UVM2 flux is
5.0± 1.7× 10⁻¹⁷ ergs cm−2 s−1 A−1. The UVM2 flux was calculated using the count rate to
flux density conversion factor given in Table 9 of Poole et al. (2008), which uses stellar spectra
(rather than the default gamma-ray burst model spectra) to determine the conversion factor.
The error bars do not include the absolute flux calibration uncertainties which are, however,
small: 5% for STIS and 2.8% for the UVOT UV filters (Proffitt et al. 2010; Poole et al.
2008).
A comparison of the STIS and UVM2 fluxes shows that A0620-00 may have varied
in the NUV by 50% in the one day between observations, being brighter during the COS
observations. However, given the uncertainties on the UVOT measurement, the data are
also consistent with no variation. We consider the 50% variation as a rough upper limit on
changes in the UV flux in A0620-00 between our observations.
A0620-00 has now been observed three times by STIS. Following the treatment of
McClintock & Remillard (2000, hereafter MR) in their Figure 2, we compare the STIS spec-
tra of A0620-00 to search for long-term variabilty. Figure 3 shows the continuum fluxes
obtained during each of the three STIS NUV observations of A0620-00. Each point is the
average of a 100 A spectral region, with the error bars showing the standard deviation of the
input points about the mean in each bin. Note that the fluxes from the 1998 spectra that
– 13 –
we present are similar to but not the same as those presented by McClintock & Remillard
(2000). Changes in the CALSTIS pipeline were made between 2000 and 2004 to improve
both the flux calibration (including implementation of time-dependent calibration files) and
background subtraction algorithms, resulting in slightly different calibrated spectra (C. Prof-
fitt, private communication). Our measurements and those of MR agree within the errors
but in the recalibrated spectra the evidence of variability between the two 1998 observa-
tions seen by MR is less evident, particularly given the scatter in each bin. However, the
1998 March measurements remain brighter than the May ones, particularly for wavelengths
>2800 A, where the former is about 20% brighter than the latter, consistent with the MR
estimates of the amplitude of the variability, ∼25%.
The 2010 NUV spectrum is substantially brighter than the 1998 spectra. Because of the
enhanced detector background emission, the uncertainties are larger in 2010 but even within
those uncertainties, A0620-00 is brighter than in 1998 across the spectrum. The typical
increases in flux are by by factors of ≃2–8. For reasons of clarity, the bin containing Mg II
is not shown in Figure 3, but the Mg II integrated line flux is also a factor of 2.2–2.3 higher
in 2010 than in the 1998 observations, consistent with the increase in the continuum level
and representing a slight decrease in equivalent width (from to 179±6 A to 154±4 A).
In 2003, A0620-00 transitioned from spending most of its time in a “passive” state to
one in which it is typically “active” (Cantrell et al. 2008). In its active state, A0620-00 is
brighter and more variable than in its passive state: measured I-band magnitudes of A0620-
00 span 0.4 mag in the active state versus 0.06 mag in the passive state. Assuming that
the donor star accounts for ∼75% of the I-band flux (Cantrell et al. 2010) and that all of
the 0.4 mag variability is in the remaining 25% flux component, the second component is
changing in I by a factor of 2.6. Consequently, it is unsurprising to see variations of a factor
of ≥2 in the UV (where the donor star contribution is negligible) between spectra taken
in the passive state and in the active state. That having been said, it is possible that the
UV variability in A0620-00 is large even when the target is mostly passive. MR noted that
the STIS spectrum was half as bright as the FOS observations of A0620-00 acquired six
years earlier (McClintock et al. 1995). Thus, the FOS fluxes are closer to the 2010 STIS
values, although the STIS observations are still a factor of 1.5–2 brighter. However, MR also
caution that the FOS data were obtained pre-COSTAR and may suffer from uncertain flux
calibration and background subtraction (the FOS prism and grating fluxes differ by ∼35%
in their region of overlap, for example).
Finally, using the time-tag event list, we searched for source variability in the COS
exposures, binning the A segment data (away from geocoronal lines) into 120 sec bins. The
FUV count rate for A0620-00 is quite low: ∼0.5 counts sec−1 from the target over the
– 14 –
1260–1700 A bandpass, compared to ∼1.5 counts sec−1 background counts over the same
waveband (based on the average of two detector regions above and below the target spectral
extraction window). The spectral count rate was very steady over the 9 hour observation
period, with no exposure average varying from the total average count rate of 0.44±0.11 cps
by more than 15%, or less than the uncertainties from Poisson noise.
3.2. Interstellar Reddening
Hynes (2005) reviewed various determinations of the interstellar reddening along the line
of sight to A0620-00 and concluded that the most robust measurement is that of Wu et al.
(1983), who obtained E(B–V) = 0.35±0.02. The Wu et al. measurement was based on fits
to the 2175 A interstellar absorption feature obtained by the five-channel spectrophotometer
aboard the Astronomical Netherlands Satellite when A0620-00 was in outburst in 1975.
Cantrell et al. (2010) found comparable reddening values for A0620-00: E(B–V) = 0.30±0.02
based on the stellar colors and assuming a K5V donor star. The near agreement suggests that
the reddening law is fairly standard from IR to UV wavelengths. MR fit the 2175 A feature
in their quiescent STIS spectra of A0620-00 but, due to the faintness of the source, were
unable to constrain the reddening to better than 0.3 ≤ E(B–V) ≤ 0.7. We examined whether
we could improve upon this result using the 2010 STIS observations spectra. Unfortunately,
although A0620-00 was brighter in 2010, the enhanced STIS background resulted in a noisy
spectrum that was no better, even when combined with the 1998 data, for constraining the
reddening. Here, we adopt the Wu et al. value, E(B-V)=0.35 and RV = 3.1.
3.3. The Spectral Energy Distribution
Figure 4 shows the times of the A0620-00 observations relative to each other. (We also
have four more SMARTS BVIH observations, two before and two after the time interval
shown in the figure.) The Swift X-ray data were acquired over a four-day period, from which
we obtain a single measurement. The Swift U-band observations (the only UVOT data we
use in the SED) were obtained starting a few hours after the STIS observations. The COS
and STIS UV spectra were acquired a day apart with the two radio observations (which
were treated as a single dataset in the imaging process) spanning the COS data acquisi-
tion interval. We obtained optical/NIR photometry nightly during this interval, including
measurements made while the UV data were acquired. These X-ray, UV, optical, NIR, and
radio data allow us to construct a broadband SED of A0620-00 based on quasi-simultaneous
(overlapping over a three day period) observations.
– 15 –
The NIR magnitudes were fairly stable during this period. Over the two week interval,
the I magnitudes varied by 0.12 mag while the H magnitudes changed by 0.2 mag. Between
the two days of the UV observations, the I-band flux brightened by 8% and the H by 6%,
although in both cases the scatter within the individual observations in each night (partially
due to periodic orbital variations) is comparable to the difference between the mean values
from night to night. The two J observations were statistically indistinguishable. A0620-
00 was more variable in B and V. The B magnitudes varied by 0.44 mag over two weeks,
though the variation was smaller (0.15 mag, or a 15% decrease in flux) over the two nights
when the COS and STIS observations were acquired. In V, the magnitudes varied by up to
0.25 mag over two weeks and 0.13 mag (12% decrease in flux) between the two UV observation
intervals. However, the orbital phases covered by the single B and V observations on each
night changed from Φ = 0.88–0.89 on 23 March to Φ = 0.98–0.99 on 24 March. The light
curve varies by ∼10% over those phases simply due to the donor star modulation (e.g., the
V light curve in Figure 2 of Cantrell et al. 2010). As a result, the non-donor star variability
in B and V may be as low as 2–5%, and it is impossible to determine if this represents
short-term flickering or a slower drift from one day to the next.
For the spectral energy distribution (SED), we used the average of the four nights around
our UV observations to determine the mean magnitudes for the optical/NIR. We set the error
bars to equal the rms scatter about the mean. The resultant error bars are then combined
in quadrature with the error bar on the absolute calibration for each filter to arrive at the
final uncertainties. (Note that for J, we have three nights of data and for K just one night.)
We chose to average over a four-night period rather than just using the data on the nights
of our UV observations because the scatter within the observations each night suggests that
our mean values may be biased by short-term variability that is not consistently sampled
in each filter and each night. For the UV, the error bars do not include an estimate of
the uncertainty induced by possible variability in the day between the COS and STIS data
acquisition. As noted above, a comparison between STIS and the Swift UVOT measurement
taken on the same day as the COS observations place a rough upper limit of 50% on the UV
variability between the two days.
Figure 5 shows the broadband SED for A0620-00. The data have been dereddened as-
suming E(B–V) = 0.35 (Wu et al. 1983) and using the extinction relation of Cardelli, Clayton, & Mathis
(1989). For the use of future modelers, we also include the observed (not corrected for inter-
stellar extinction) fluxes in Table 4. On the same figure we include two previous SEDs for
A0620-00, taken from MR and Gallo et al. (2007). The MR data include the 1998 March
STIS NUV spectra combined with 1992 January optical/NUV FOS spectra. We only show
their points for λ <3500 A because at longer wavelengths they subtracted out the donor
star contribution. They used the same dereddening correction that we adopt here. The
– 16 –
Gallo et al. (2007) SED includes simultaneous radio and X-ray data, with the optical/NIR
(IVH) data being acquired one day before (all in 2005 August). The Spitzer IR data were
acquired five months earlier, in 2005 March. Gallo et al. dereddened their data assuming
E(B–V) = 0.39. Here, we have adjusted their data to apply an E(B–V) = 0.35 dereddening
to place all the observations on the same scale.
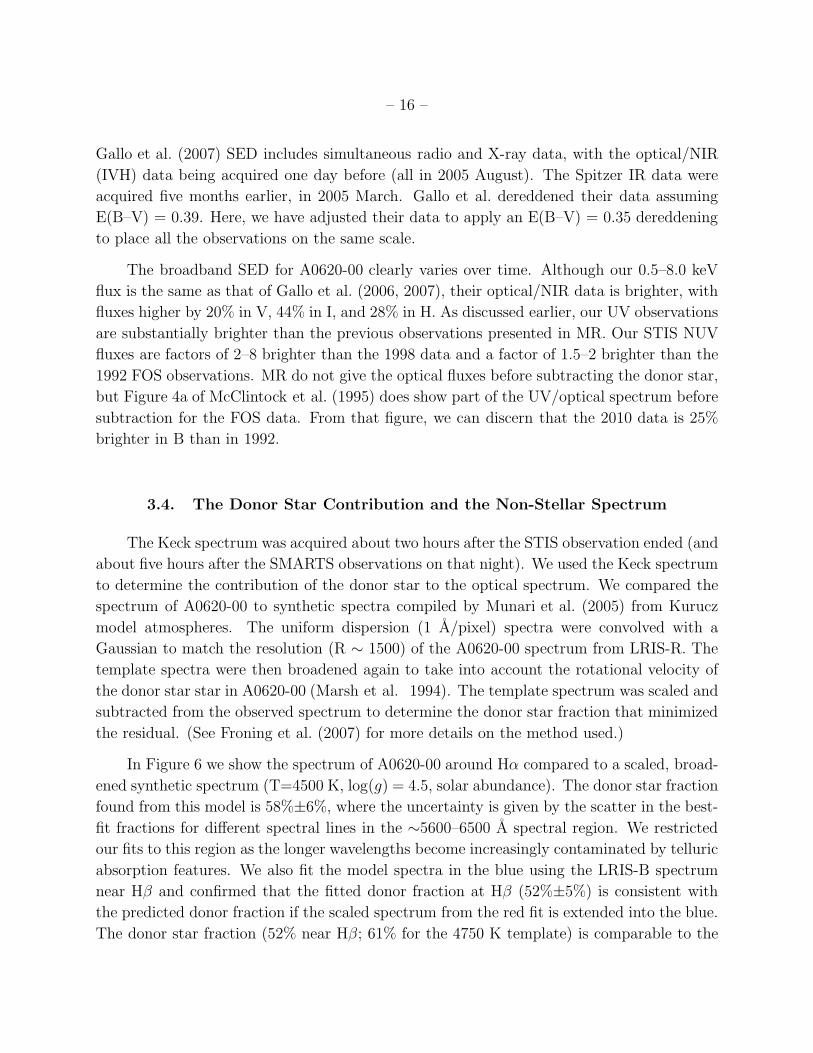
The broadband SED for A0620-00 clearly varies over time. Although our 0.5–8.0 keV
flux is the same as that of Gallo et al. (2006, 2007), their optical/NIR data is brighter, with
fluxes higher by 20% in V, 44% in I, and 28% in H. As discussed earlier, our UV observations
are substantially brighter than the previous observations presented in MR. Our STIS NUV
fluxes are factors of 2–8 brighter than the 1998 data and a factor of 1.5–2 brighter than the
1992 FOS observations. MR do not give the optical fluxes before subtracting the donor star,
but Figure 4a of McClintock et al. (1995) does show part of the UV/optical spectrum before
subtraction for the FOS data. From that figure, we can discern that the 2010 data is 25%
brighter in B than in 1992.
3.4. The Donor Star Contribution and the Non-Stellar Spectrum
The Keck spectrum was acquired about two hours after the STIS observation ended (and
about five hours after the SMARTS observations on that night). We used the Keck spectrum
to determine the contribution of the donor star to the optical spectrum. We compared the
spectrum of A0620-00 to synthetic spectra compiled by Munari et al. (2005) from Kurucz
model atmospheres. The uniform dispersion (1 A/pixel) spectra were convolved with a
Gaussian to match the resolution (R ∼ 1500) of the A0620-00 spectrum from LRIS-R. The
template spectra were then broadened again to take into account the rotational velocity of
the donor star star in A0620-00 (Marsh et al. 1994). The template spectrum was scaled and
subtracted from the observed spectrum to determine the donor star fraction that minimized
the residual. (See Froning et al. (2007) for more details on the method used.)
In Figure 6 we show the spectrum of A0620-00 around Hα compared to a scaled, broad-
ened synthetic spectrum (T=4500 K, log(g) = 4.5, solar abundance). The donor star fraction
found from this model is 58%±6%, where the uncertainty is given by the scatter in the best-
fit fractions for different spectral lines in the ∼5600–6500 A spectral region. We restricted
our fits to this region as the longer wavelengths become increasingly contaminated by telluric
absorption features. We also fit the model spectra in the blue using the LRIS-B spectrum
near Hβ and confirmed that the fitted donor fraction at Hβ (52%±5%) is consistent with
the predicted donor fraction if the scaled spectrum from the red fit is extended into the blue.
The donor star fraction (52% near Hβ; 61% for the 4750 K template) is comparable to the

– 17 –
44% contribution at the same wavelengths found by Neilsen, Steeghs, & Vrtilek (2008) from
2006 observations. This has decreased compared to the 85% donor star contribution found
by Marsh et al. (1994), which is consistent with the increase in non-stellar emission in the
system as A0620-00 transitioned to the more active state post-2003.
The donor star fraction depends on the adopted temperature of the template spectrum.
For a hotter template (T=5000 K), we obtain a donor star fraction of 76%±3% near Hα,
while a 4750 K template gives a fraction of 67%±6%. In general, the donor star spectral type
in A0620-00 has been assumed to range from K4V to K7V, but Gonzalez Hernandez et al.
(2004) found an earlier spectral type (T=4900 K, or roughly K3V) with supersolar abun-
dances. Here, we adopt the 4500 K template in accordance with previous NIR spectral fitting
that rejected stars earlier than K5V as inconsistent with the broadband NIR SED and the
H and K absorption spectra (Froning et al. 2007). Although we prefer a later spectral type
for reasons outlined in the 2007 paper, we caution that the true donor star temperature in
A0620-00 is not definitively determined and a small mismatch between the temperature or
metallicity of the template star and the true stellar values can lead to large errors in the
derived donor fraction (Hynes et al. 2005).
In Figure 7, we show the UV and optical dereddened spectra with the donor star con-
tribution subtracted. We flux-calibrated the Keck spectra using the I-band SMARTS pho-
tometric data acquired a few hours earlier. The non-stellar spectrum has a blue peak near
3000 A and a possible secondary peak near 5000 A. We compared the non-stellar spectrum
to a few simple prescriptions. The upper panel of Figure 7 compares a 10,000 K blackbody
spectrum to the non-stellar spectrum. Note that because of the negligible contribution of
the donor star to the UV spectrum, the flux peak near 3000 A is a robust result, independent
of uncertainties in the true temperature of the donor star. The blackbody curve was fit to
the spectrum by eye; it is not a formal fit and is intended to be illustrative. Because of noise
and gaps between the observed spectra, the blackbody peak is not tightly constrained. A
temperature range of ≃9000–11000 K provides equally good results: &11,000 K, the black-
body flux exceeds the FUV observed flux while .9000 K, the blackbody peaks moves too
far to the red.
A single blackbody does not describe the non-stellar spectrum. This remains true even
if a different donor star temperature is used for the template spectrum: the spectral shape
is not that of a single blackbody (although for a hotter donor star and an increased stellar
fraction, the non-stellar spectrum falls under the blackbody curve rather than exceeding it).
Given the apparent secondary peak in the spectrum near 5000 A, we also examined adding a
second, cooler (T∼5500 K) blackbody component. While the addition of a second blackbody
can give an improved fit to the long wavelength spectrum (>5000 A), the same component
– 18 –
also adds too much flux at shorter wavelengths causing the two-blackbody model to exceed
the observed blue (3000–5000 A) flux.
We also examined a blackbody plus single power law spectrum. The power law is of
the form fλ ∝ λα−2. The two components were scaled to the observed spectrum at 3000 A
and fit by eye. The lower panel of Figure 7 compares a blackbody plus power law to the
observed non-stellar spectrum. The blackbody has a temperature, TBB = 10,000 K and the
power law has a spectral index α = 1.9. At 3000 A, the blackbody is scaled to 70% of the
observed flux and the power law to 30%. This simple model provides an adequate fit to the
broadband shape of the UV-optical non-stellar spectrum. It is not perfect — in particular,
the increasing flux to shorter wavelengths in the FUV and the dip in the optical spectrum
between 4000–5500 A are not fit — but illustrates the need to include multiple emission
components to describe the broadband spectrum.
4. Discussion
4.1. The UV Spectrum
In this manuscript, we present the first FUV spectrum of A0620-00. Due to its quiescent
state and moderate reddening along the line of sight to the target, the FUV spectrum is
extremely faint, with an observed continuum flux level at ∼ 1 × 10⁻¹⁷ ergs cm−2 s−1 A−1.
While the NUV continuum observed with STIS has a red spectral shape, the continuum is
flat in the FUV. Once the spectra are dereddened, the NUV spectral shape is fairly flat but
the spectrum begins to turn up to the blue again in the FUV. The strongest UV emission
line is that of Mg II, but the UV spectra also show broad (FWHM∼2000 km s−1) emission
from Si IV, C IV, He II, and Fe II. The broad line widths rule out the donor star as the
source. The optical Balmer lines are double-peaked, indicating that they originate in the
Keplerian accretion disk. Given the similar line widths of the UV and Balmer lines (which
have FWHM of 1900 km s−1 and 2260 km s−1 for Hα and Hβ, respectively; Marsh, Robinson,
& Wood 1994), it is reasonable to assume that the UV lines also originate in the disk.
Doublet line fits to Si IV suggest that the line might form in an optically thin gas.
This is in contrast to high accretion rate X-ray binaries in which the lines are optically
thick, with accretion disk coronal models predicting optical depths in the lines ≥ 104
(Kallman, Raymond, & Vrtilek 1991; Ko & Kallman 1994). The emission lines in the high
state have been modeled as originating in an accretion disk corona, a temperature inversion
above an optically thick disk induced by X-ray irradiation (Ko & Kallman 1994; Raymond
1993). However, the X-ray luminosity is 8 orders of magnitude fainter in quiescence than in
– 19 –
outburst for A0620-00, and may not be sufficient to generate a disk corona.
The UV outburst spectrum of the black hole X-ray binary XTE J1118+480 showed an
anomalous emission line profile: the C IV and O V lines were extremely weak while the N V
emission was strong Haswell et al. (2002). The pattern persists in quiescence, where N V and
Si IV emission lines are detected but C IV is not (McClintock et al. 2003). The line ratios
are inconsistent with photoionization models wherein N V emission requires photoionization
parameters that also produce C IV and/or O V. Haswell et al. concluded that carbon is
underabundant in the system due to CNO processing of material in the donor star. They
used the relative nuclear and angular momentum loss time scales in the binary to infer the
donor star mass and orbital period at the time the system came into contact. They also
predicted that XTE J118+480 is at a later evolutionary stage than A0620-00.
The UV spectrum of A0620-00 also shows C IV emission that is weaker than the Si IV
emission. O V 1371 A is absent in the A0620-00 spectrum, as was also true in XTE
J1118+480. Unfortunately, we are not able to look for N enhancements as our chosen
COS G140L grating setting did not cover N V 1240 A. The NIR spectra of A0620-00 also
have very weak CO bandhead absorption in the spectrum of the donor star (Harrison et al.
2007; Froning et al. 2007). Comparison of stellar atmosphere models to the NIR spectrum of
A0620-00 indicate an underabundance of carbon in the donor star of [C/H]=-1.5. Thus, it is
clear from the UV and NIR spectra that A0620-00 is underabundant in C and likely has the
same CNO processing mechanism at work that produced the XTE J1118+480 abundance
pattern. Haswell et al.’s prediction that XTE J1118+480 is at a later evolutionary stage
than A0620-00 is also bourne out by comparisons of UV line ratios: whereas the C IV line
is about 12 times fainter than Si IV or He II in XTE J1118+480, it is only 1.5 times fainter
than Si IV in A0620-00 and actually brighter than He II (by a factor of 2). Haswell et al.’s
prediction can be tested more quantitatively by obtaining NIR spectra of XTE J1118+480
and modeling the CO bandhead absorption to compare the C abundance to that found for
A0620-00.
4.2. The Broadband SED and Non-Stellar Spectrum Over Time
Figure 5 compares the 2010 SED to two previous SEDs from McClintock & Remillard
(2000) and Gallo et al. (2007). The SED of A0620-00 varies over time at all wavelengths for
which we have more than one epoch (we have no information for radio or mid-IR variability).
Our optical-NIR data are 20–44% fainter than those seen by Gallo et al. in 2005, while our
UV observations are twice as bright as the 1992 FOS data and up to 8 times brighter
than the 1998 STIS data. While the previous UV observations showed a declining intensity
– 20 –
at higher energies, the new COS observations reveal a recovery and subsequent upturn
in the SED in the FUV. The relative normalizations of the STIS and COS spectra may
be offset due to variability in the target in the day between the observations, but each
observation independently supports a UV upturn: the dereddened NUV spectrum flattens
at short wavelengths and the FUV spectrum is blue. The 1998 observations (the solid blue
points in Figure 5) also hint at a flattening in the last three NUV points (although the bluest
point is an upper limit only).
MR compared the SEDs of A0620-00 and the neutron star X-ray binary, Cen X-4. They
particularly emphasized the factor of ∼3 drop in the UV intensity in the former while the
latter continually rose to the blue. They also noted that the X-ray flux in Cen X-4 was only
a factor of ∼2 smaller than the UV flux, whereas in A0620-00 the difference is much larger,
about an order of magnitude. They interpreted the differing SEDs in light of the ADAF
model as evidence of an event horizon in A0620-00 compared to a neutron star surface in
Cen X-4. While the NUV to X-ray ratio for A0620-00 remains large (≃20) in the latest SED,
the FUV flux is only a factor of ≃5 larger than the X-ray value. Moreover, the blue FUV
spectrum suggests a recovery in the flux to shorter wavelengths rather than a continuous
drop to the blue. Thus, the difference in the UV SEDs between the black hole and neutron
star systems is less dramatic at present than at the time of the MR comparison. In their
study of three black hole and one neutron star X-ray binaries, Hynes & Robinson (2011)
also note that the NUV SEDs do not differ noticeably between the two types of systems,
although the X-ray to NUV luminosity ratio is always higher in the neutron star binaries.
To constrain the source(s) of variability in A0620-00, we constructed a broadband UV-
optical spectrum of the system after the contribution of the donor star is subtracted (Fig-
ure 7). In that spectrum, the peak emission in the non-stellar component occurs near 3000 A.
A blackbody fit to the peak gives a temperature of T≃9000–11000 K. This is very similar to
the 9000 K blackbody that McClintock et al. (1995) fit to the FOS observations of A0620-00,
though our source must be larger and/or hotter to match the higher observed flux in 2010. A
temperature increase is the likely cause, given that our spectrum is also more blue. Indeed,
the 10,000 K blackbody in the upper panel of Figure 7 corresponds to an emitting area
of π(0.09R⊙)2, equivalent to the emitting area seen in 1992. Thus, assuming that a single
thermal component is present in the quiescent A0620-00, it appears to be fairly stable, with
small-scale temperature and/or emitting area changes over the past two decades. As noted
by McClintock et al. (1995), the emitting area is too small to correspond to the full accre-
tion disk. The UV/optical SEDS of several other X-ray binaries show evidence of blackbody
components at comparable size and temperature as our results. For example, Park (2011)
found a blackbody component with T ∼ 13000 K in Cen X-4. The radius, ∼ 2 × 109 cm is
comparable to ours, ∼ 4.5 × 109 cm. Similarly, Hynes & Robinson (2011) has fit the SEDS
– 21 –
of four LMXBs and found blackbody emission at T = 5000 – 13,000 K in three of them. All
have emitting areas much smaller than the area of the accretion disk.
There are several potential sources for this component. Perhaps the most likely is the
bright spot (the accretion stream-disk impact point), which is seen in quiescent Doppler
tomographic maps of the accretion disk in A0620-00 (Marsh et al. 1994; Shahbaz et al.
2004; Neilsen, Steeghs, & Vrtilek 2008). Other possibilities include: a) the bright spot is
located at a smaller radius in the disk than the circularization radius and the corresponding
m is lower (although this is inconsistent with the bright spot position in the outer disk in
optical Doppler maps); b) the thermal source is closer to the center of the system than the
bright spot, such as the transition radius in the inner disk (Hynes & Robinson 2011); c) the
emission source is optically thin emission from the disk (though Hynes & Robinson note that
a significant Balmer jump should be present in that case, which is not seen in the optical
spectrum of A0620-00); or d) the mass transfer rate we measure is currently higher than the
average rate indicated by the interoutburst interval (though the mass transfer rate seen in
the 1992 FOS observations was also a factor of several above that value).
For A0620-00, we favor the bright spot as the source, given that it is directly observed in
the optical Doppler maps of the system. If we assume that the bright spot is the blackbody
source, we can estimate the mass accretion rate following the method of Park (2011) and
equating the luminosity of the spot with the blackbody luminosity:
LBS = GMBHm
(
2
Rcirc
−1
RL1
)
= 4πR2
BBσT4
BB (1)
where LBS is the maximum luminosity of the bright spot (Menou & McClintock 2001) and
RBB and TBB are the blackbody radius and temperature we derive above. System parameters
(masses, mass ratios, orbital period) are taken from Cantrell et al. (2010). From this, we
obtain a mass accretion rate at the bright spot of m = 3.4×10⁻¹⁰ M⊙ yr−1. This rate is
substantially larger than the m < 5 × 10⁻¹⁵ M⊙ yr−1 rate at the black hole inferred by the
X-ray luminosity (McClintock et al. 1995). McClintock et al. attribute the discrepancy to
inefficient mass transfer through the quiescent disk within the paradigm of the disk instability
model. However, the disk mass transfer rate inferred from the interval between the two
observed outbursts of A0620-00 gives m ∼ 3 × 10⁻¹¹ M⊙ yr−1 (McClintock et al. 1983),
which is an order of magnitude below the rate we infer for the bright spot. To reconcile
these last two numbers requires that ∼90% of the mass flowing through the bright spot must
be lost from the disk if the disk instability model and the 58 yr outburst recurrence interval
for A0620-00 are correct. The relative mass transfer rates inferred from the X-ray luminosity
and the bright spot luminosity require that virtually all of the accreted mass fails to reach the
black hole and/or falls into the black hole without radiating efficiently, as through an ADAF.
– 22 –
Winds and/or a jet may carry off much of the material. The original ADAF models noted the
likelihood of outflows linked with ADAFs (Narayan & Yi 1995), and Blandford & Begelman
(1999), in their “ADIOS” model, propose that only a small fraction of the accreted material
falls into the black hole.
Finally, we note that the broad spectral coverage in our observations shows that a
single blackbody does not describe the full UV-optical spectrum. The addition of a powerlaw
component does a reasonable job of improving the fit at long wavelengths, though the overall
fit still deviates from the observed spectrum in the FUV and in parts of the optical spectrum
(most notably between 4000–5000 A). The powerlaw is not a unique description but it does
illustrate the need for a second source in addition to the thermal component to match the
red optical spectrum. The powerlaw is fairly flat in the optical but is not steep enough to
match the FUV upturn, which suggests the need for a more complex, physically-based model
for the broadband spectrum. Park & Garcia (2011) note that a multicomponent model may
also be needed in Cen X-4 to explain changes in the NUV to X-ray flux ratio in the SED
over time. In the following section, we compare our observations to two published models of
A0620-00in quiescence, the ADAF and maximally-jet dominated models.
4.3. SED Comparison to Quiescent Models
Narayan et al. (1997) fit an updated advection-dominated accretion flow (ADAF) model
to the SED of A0620-00 using data first presented in Narayan et al. (1996). The SED
consisted of the UV/optical FOS data discussed above as well as a ROSAT X-ray point and
optical data from the literature. Our NUV data are slightly brighter than the ADAF model
(which was fit to the fainter FOS data) but the shape of the model and our NUV data are
consistent. However, the ADAF model strongly underpredicts the FUV flux (by a factor ∼6)
and the blue spectral shape in that region. Comparing our data to the variations in model
values presented in Narayan et al. (1996) (Figures 6 & 7) suggests that the two would be in
closer agreement for those models in which the transition radius from thin disk to ADAF,
rtr, is decreased from log rtr = 3.8 to log rtr = 3.0. Decreasing the inner radius of the disk
unsurprisingly has the effect of shifting the peak in the disk model SED to the blue and
increasing the FUV emission. The smaller transition radius worsens the fit to the fainter
1992 FOS data, however, which is entirely inconsistent with the log rtr = 3.0 model. Thus,
viewed within the ADAF picture, the time-variable SED suggests changes in the structure
of the disk and the ADAF during quiescence, including possible changes in the size of the
ADAF radius by a factor of 6.
Changing the disk transition radius alone will not reconcile the ADAF model to our
– 23 –
observations, however. The decrease in the transition radius does not alter the predicted
X-ray fluxes in the model, whereas the X-rays also brightened in the 2010 data compared to
the earlier measurements, indicating the need to change other model parameters to match
the data. Ideally, a new ADAF model fit that takes into account the full SED would be
performed. The published ADAF model of A0620-00 is over a decade old and so does not
reflect many of the recent changes in the model. Given the discrepancies between the mass
accretion rate inferred at the bright spot and lower rates inferred from the interoutburst
interval and the X-ray luminosity in A0620-00, a model that incorporates significant mass
loss may be indicated. More recent ADAF models of other targets add an outflow component;
e.g., Yuan, Cui, & Narayan (2005). The outflow in that model was motivated by the radio
detections of low-state XRBs, but the outflow can also contribute synchrotron emission at
shorter wavelengths (e.g., Figure 2 of Yuan et al.). Thus, the addition of outflow components
can potentially reconcile the ADAF model with the excess FUV emission seen in A0620-00.
Gallo et al. (2007) fit a maximally-jet dominated model to the broadband spectrum
of A0620-00. We compared our SED to their model (Figure 4 in their paper) and found
good agreement between their model and our UV measurements. In particular, the observed
upturn in flux from the NUV to the FUV is consistent with the model shape in this region,
as the donor star and disk and the pre-acceleration inner jet synchrotron components drop
rapidly and the post-acceleration outer jet synchrotron component becomes the dominant
emitter. We examined in more detail how the maximally-jet dominated model would change
when fit to the 2010 data by running new fits including our observations. Because we had
limited radio and X-ray data, we fit a hybrid data set, taking the radio, mid-IR, and X-ray
data from the Gallo et al. (2007) epoch and the NIR, optical, and UV from our observations.
The primary result when comparing the jet-dominated model to the 2010 data is that a
thermal component does not account for the excess emission in the FUV. In the model the
thermal emission comes from a cool donor star plus a multi-temperature blackbody disk and
peaks in the I band, after which it drops rapidly, contributing negligible emission in the
FUV. Instead, the dominant source for the FUV fluxes is non-thermal synchrotron emission
from the jet. The pre-acceleration inner jet component of the model dominates the FUV
(and NUV shortward of ≃3100 A), although there can also be a contribution (about 30%
in our fit) from the post-acceleration outer jet component. Note that although we did not
detect radio emission from A0620-00, our upper limits from the ATCA were larger than the
previous detected VLA fluxes, so the jet may have been present at levels below our detection
threshold.
For both models, the question of the treatment of the thin disk component must be
reexamined. The thin disk in both cases is modeled using a multi-temperature blackbody.
The models do not include irradiation of the outer disk and donor star or a bright spot at the
– 24 –
accretion stream impact point. Irradiation is not significant for A0620-00 in quiescence given
its low X-ray luminosity (van Paradijs & Verbunt 1984), but the treatment of the accretion
disk and bright spot affects interpretation of the SED in the optical-UV in particular. It
is not clear that a thermal, steady-state accretion disk is the right model for a quiescent
soft X-ray transient disk. In cataclysmic variables, eclipse mapping has long indicated that
the accretion disks of quiescent dwaf novae have flat brightness temperature profiles that
do not match the T (R) ∝ R−3/4 profile expected for a steady-state disk (Horne 1993). The
≃10,000 K thermal component we fit to our observations is too small to originate in the bulk
of the disk; the hot spot is more likely if a thermal source is present.
5. Conclusions
We have presented broadband observations of the black hole X-ray binary, A0620-00,
centered around the first FUV spectroscopy of the system. Our primary results are as follows:
1. The observed spectrum of A0620-00 is red in the NUV and flat at FUV wavelengths.
The dereddened spectra show a flat spectrum in the NUV and a steady increase to the
blue in the FUV. The spectra show prominent, broad (FWHM∼2000 km s−1) emission
lines of Si IV, C IV, He II, Fe II, and Mg II. The C IV line is anomalously weak, which
is consistent with the weak C abundance seen in NIR spectra of the donor star. The
relative strength of the C IV line is not as low as that in XTE J1118+480, consistent
with the predictions of Haswell et al. (2002) that the latter is at a later stage of binary
evolution.
2. Comparisons with previous NUV spectroscopy of A0620-00 show that it is highly vari-
able at these wavelengths, with the most recent data being up to 8 times brighter
than previous observations. Comparison of our data from night to night suggests that
A0620-00 can also vary by ∼50% on short time scales.
3. We constructed a broadband (radio through X-ray), dereddened spectral energy dis-
tribution of A0620-00, based on semi-contemporaneous data acquired over a four-day
period. Comparison of the SED with two previous ones shows that the system varies
at all wavelengths for which we have multiple samples. The new data reveal that the
continuous decrease in flux to shorter wavelengths seen in previous optical-UV data
does not continue into the FUV, which instead shows a blue upturn. Comparison be-
tween 2005 and 2010 observations show variations of up to 44% in the optical/NIR
with no change in X-ray flux.
– 25 –
4. The UV-optical spectrum with the donor star contribution removed shows a peak near
3000 A. A single blackbody with T ≃ 10000 K fits the peak and has the same emitting
area as a 9000 K blackbody fit to an earlier observation by McClintock et al. (1995).
The emitting area is too small to be consistent with the bulk of the disk emitting as a
thermal blackbody. A possible thermal source is the mass accretion stream-disk impact
point (the “bright spot”).
5. The single blackbody component does not match the full UV-optical spectrum, in
particular the FUV upturn and the optical flux longward of 5000 A. The addition of
a powerlaw with α=1.9 provides a qualitatively improved fit to the spectral shape but
continued deviations suggest the need for more sophisticated, physically-based model
fits to the data.
6. By assuming that the blackbody component is emitted by the hot spot at the disk
edge, we calculated a mass accretion rate from the hot spot luminosity. This accretion
rate is an order of magnitude larger than the rate inferred from the interoutburst
interval and the disk instability model. To reconcile these requires that ∼90% of the
accreted material be lost from the system. The accretion rate at the hot spot is 105 the
accretion rate at the black hole as inferred from the X-ray luminosity. This indicates
that virtually all of the accreted material must escape the system, remain in the thin
disk, and/or be radiatively inefficient in the inner region of the system.
7. Comparisons to a previous ADAF model of A0620-00 shows that the transition radius
between the thin disk and the ADAF may need to be decreased to match the brighter
UV observations in the recent observations and may indicate changes in the relative
disk/ADAF sizes over time. Alternately, a revised model that includes mass loss in the
form of winds or a jet may reconcile the ADAF model with the observed SED. Com-
parisons to maximally jet-dominated models indicate that the UV emission shortward
of 3100 A is dominated by non-thermal synchrotron emission from the jet.
Thanks to Amanda Bayless for setup work on the ground-based observations and to
Derck Massa for useful discussions on interstellar reddening. Based on observations made
with the NASA/ESA Hubble Space Telescope, which is operated by the Association of
Universities for Research in Astronomy, Inc., under NASA contract NAS 5-26555. These
observations are associated with program 11550. This work was supported by NASA grant
NNX08AC146 to the University of Colorado at Boulder. Some of the data presented in this
paper were obtained from the Multimission Archive at the Space Telescope Science Institute
(MAST). Support for MAST for non-HST data is provided by the NASA Office of Space
– 26 –
Science via grant NNX09AF08G and by other grants and contracts. The Australia Telescope
is funded by the Commonwealth of Australia for operation as a National Facility managed
by CSIRO.
Facility: HST (COS, STIS), SWIFT, CTIO:1.3m, ATCA, KECK
REFERENCES
Bayless, A. J., Robinson, E. L., Hynes, R. I., Ashcraft, T. A., & Cornell, M. E. 2010, ApJ,
709, 251
Blandford, R. D., & Begelman, M. C. 1999, MNRAS, 303, L1
Briggs, D. S. 1995, Ph.D. Thesis, New Mexico Institute of Mining and Technology
Burrows, D. N., et al. 2005, Space Science Reviews, 120, 165
Cantrell, A. G., et al. 2010, ApJ, 710, 1127
Cantrell, A. G., Bailyn, C. D., McClintock, J. E., & Orosz, J. A. 2008, ApJ, 673, L159
Cardelli, J. A., Clayton, G. C., & Mathis, J. S. 1989, ApJ, 422, 158
Charles, P. A., & Coe, M. J. 2006, Compact stellar X-ray sources, 215
Danforth, C. W., Keeney, B. A., Stocke, J. T., Shull, J. M., & Yao, Y. 2010, ApJ, submitted
Dixon, W. V., et al. 2010, Cosmic Origins Spectrograph Instrument Handbook, Version 2.0
(Baltimore: STScI)
Elvis, M., Page, C. G., Pounds, K. A., Ricketts, M. J., & Turner, M. J. L. 1975, Nature,
257, 656
Falcke, H., Kording, E., & Markoff, S. 2004, A&A, 414, 895
Farr, W. M., Sravan, N., Cantrell, A., Kreidberg, L., Bailyn, C. D., Mandel, I., & Kalogera,
V. 2010, ApJ, submitted
Fender, R. P., Gallo, E., & Russell, D. 2010, MNRAS, 406, 1425
Fender, R. 2006, Compact stellar X-ray sources, 381
Froning, C. S., Robinson, E. L., & Bitner, M. A. 2007, ApJ, 663, 1215

– 27 –
Froning, C. S., Long, K. S., Drew, J. E., Knigge, C., & Proga, D. 2001, ApJ, 562, 963
Gallo, E., Migliari, S., Markoff, S., Tomsick, J. A., Bailyn, C. D., Berta, S., Fender, R., &
Miller-Jones, J. C. A. 2007, ApJ, 670, 600
Gallo, E., Fender, R. P., Miller-Jones, J. C. A., Merloni, A., Jonker, P. G., Heinz, S.,
Maccarone, T. J., & van der Klis, M. 2006, MNRAS, 370, 1351
Garcia, M. R., McClintock, J. E., Narayan, R., Callanan, P., Barret, D., & Murray, S. S.
2001, ApJ, 553, L47
Gonzaalez Hernandez, J. I. & Casares, J. 2010, A&A, 516, A58
Gonzalez Hernandez, J. I., Rebolo, R., Israelian, G., Casares, J., Maeder, A., & Meynet, G.
2004, ApJ, 609, 988
Gou, L., McClintock, J. E., Steiner, J. F., Narayan, R., Cantrell, A. G., Bailyn, C. D., &
Orosz, J. A. 2010, ApJ, 718, L122
Harrison, T. E., Howell, S. B., Szkody, P., & Cordova, F. A. 2007, AJ, 133, 162
Harrison, T. E., Osborne, H. L., & Howell, S. B. 2004, AJ, 127, 3493
Harrison, T. E., McNamara, B. J., Szkody, P., & Gilliland, R. L. 2000, AJ, 120, 2649
Haswell, C. A., Hynes, R. I., King, A. R., & Schenker, K. 2002, MNRAS, 332, 928
Horne K. 1993, Accretion Disks in Compact Stellar Systems, 117
Hynes, R. I. & Robinson, E. L. 2011, ApJ, submitted
Hynes, R. I. 2010, in XXI Canary Islands Winter School of Astrophysics, ed. T. Shahbaz,
submitted
Hynes, R.I., Bradley, C.K., Rupen, M., Gallo, E., Fender, R.P., Casares, J., & Zurita, C.
2009, MNRAS, 399, 2239
Hynes, R. I., Robinson, E. L., & Bitner, M. 2005, ApJ, 630, 405
Hynes, R. I. 2005, ApJ, 623, 1026
Jameson, R. F., King, A. R., & Sherrington, M. R. 1980, MNRAS, 191, 559
Kallman, T. R., Raymond, J. C., Vrtilek, S. D. 1991, ApJ, 370, 717
– 28 –
Ko, Y.-K., & Kallman, T. R. 1994, ApJ, 431, 273
Kong, A. K. H., McClintock, J. E., Garcia, M. R., Murray, S. S., & Barret, D. 2002, ApJ,
570, 277
Kriss, G. A. 1994, in Astronomical Data Analysis Software & Systems III, A.S.P. Conf.
Series, Vol. 61, ed. D. R. Crabtree, R. J. Hanisch, & J. Barnes (Astronomical Society
of the Pacific: San Francisco), p. 437
Long, K. S. & Gilliland, R. L. 1999, ApJ, 511, 916
Markoff, S. 2010, Lecture Notes in Physics, Berlin Springer Verlag, 794, 143
Markoff, S., Falcke, H., & Fender, R. 2001, A&A, 372, L25
Marsh, T. R., Robinson, E. L., Wood, J. H., 1994, MNRAS, 266, 137
McCandliss, S. R., France, K., Osterman, S., Green, J. C., McPhate, J. B., & Wilkinson, E.
2010, ApJ, 709, L183
McClintock, J. E., Narayan, R., Gou, L., Liu, J., Penna, R. F., & Steiner, J. F. 2010,
American Institute of Physics Conference Series, 1248, 101
McClintock, J. E. & Remillard, R. A. 2006, in Compact Stellar X-ray Sources, eds. W. Lewin
& M. van der Klis, (Cambridge: Cambridge University Press), 157
McClintock, J. E., Narayan, R., Garcia, M. R., Orosz, J. A., Remillard, R. A., & Murray,
S. S. 2003, ApJ, 593, 435
McClintock, J. E. & Remillard, R. A. 2000, ApJ, 531, 956
McClintock, J. E., Horne, K., & Remillard, R. A. 1995, ApJ, 442, 358
McClintock, J. E. & Remillard, R. A. 1986, ApJ, 308, 110
McClintock, J. E., Petro, L. D., Remillard, R. A. & Ricker, G. R. 1983, ApJL, 266, L27
Merloni, A., Heinz, S., & di Matteo, T. 2003, MNRAS, 345, 1057
Menou, K. & McClintock, J. E. 2001, ApJ, 557, 304
Merloni, A., & Fabian, A. C. 2001, MNRAS, 328, 958
Merloni, A., & Fabian, A. C. 2001, MNRAS, 321, 549
– 29 –
Miller, J. M., Reynolds, C. S., Fabian, A. C., Miniutti, G., & Gallo, L. C. 2009, ApJ, 697,
900
Munari, U., Sordo, R., Castelli, F., & Zwitter, T. 2005,A&A,442, 1127
Muno, M. P. & Mauerhan, J. 2006, ApJ, 648, L135
Narayan, R., & McClintock, J. E. 2008, New A Rev., 51, 733
Narayan, R., Barret, D., & McClintock, J. E. 1997, ApJ, 482, 448
Narayan, R., McClintock, J. E., & Yi, I. 1996, ApJ, 457, 821
Narayan, R., & Yi, I. 1995, ApJ, 452, 710
Narayan, R., & Yi, I. 1994, ApJ, 428, L13
Neilsen, J., Steeghs, D., & Vrtilek, S. D. 2008, MN, 384, 849
Osten, R., 2010, STScI ISR COS 2010-15 (v1)
Oke, J.B., et al. 1995, PASP, 107, 375
Oke, J. B. 1977, ApJ, 217, 181
Osterman, S., et al. 2010, Ap&SS, in press
Ozel, F., Psaltis, D., Narayan, R., & McClintock, J. E. 2010, ApJ, 725, 1918
Park, S. 2011, Masters Thesis, University of Southampton
Park, S. & Garcia, M. R. 2011, Bulletin of the American Astronomical Society, 43, #144.25
Poole, T. S., et al. 2008, MNRAS, 383, 627
Proffitt, C., et al. 2010, STIS Instrument Handbook, Version 9.0, (Baltimore: STScI)
Raymond, J. C. 1993, ApJ, 412, 267
Roming, P. W. A., et al. 2005, Space Science Reviews, 120, 95
Sault, R. J., & Wieringa, M. H. 1994, A&AS, 108, 585
Sault, R. J., Teuben, P. J., & Wright, M. C. H. 1995, Astronomical Data Analysis Software
and Systems IV, 77, 433
– 30 –
Shahbaz, T., Hynes, R. I., Charles, P. A., Zurita, C., Casares, J., Haswell, C. A., Araujo-
Betancor, S., & Powell, C. 2004, MNRAS, 354, 31
Shakura, N. I., & Sunyaev, R. A. 1973, A&A, 24, 337
Shull, J. M., France, K., Danforth, C. W., Smith, B., & Tumlinson, J. 2010, ApJ, 722, 1312
Sion, E. M., et al. 1998, ApJ, 496, 449
Strohmayer, T., & Bildsten, L. 2006, Compact stellar X-ray sources, 113
van Paradijs, J. & Verbunt, F. 1984, AIP Conf. Proc., 115, 49
Wu, C.-C., Panek, R. J., Holm, A. V., Schmitz, M., & Swank, J. H. 1983, PASP, 95, 391
Yuan, F., Cui, W., & Narayan, R. 2005, ApJ, 620, 905
This preprint was prepared with the AAS LATEX macros v5.2.
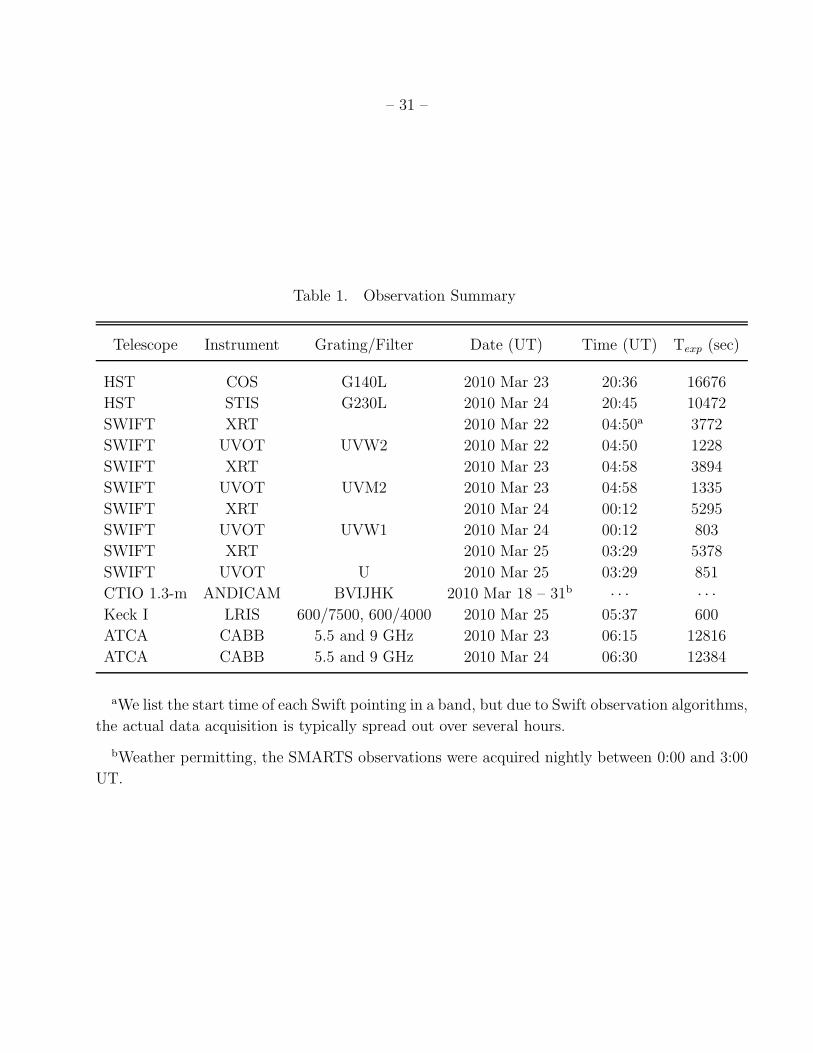
– 31 –
Table 1. Observation Summary
Telescope Instrument Grating/Filter Date (UT) Time (UT) Texp (sec)
HST COS G140L 2010 Mar 23 20:36 16676
HST STIS G230L 2010 Mar 24 20:45 10472
SWIFT XRT 2010 Mar 22 04:50a 3772
SWIFT UVOT UVW2 2010 Mar 22 04:50 1228
SWIFT XRT 2010 Mar 23 04:58 3894
SWIFT UVOT UVM2 2010 Mar 23 04:58 1335
SWIFT XRT 2010 Mar 24 00:12 5295
SWIFT UVOT UVW1 2010 Mar 24 00:12 803
SWIFT XRT 2010 Mar 25 03:29 5378
SWIFT UVOT U 2010 Mar 25 03:29 851
CTIO 1.3-m ANDICAM BVIJHK 2010 Mar 18 – 31b · · · · · ·
Keck I LRIS 600/7500, 600/4000 2010 Mar 25 05:37 600
ATCA CABB 5.5 and 9 GHz 2010 Mar 23 06:15 12816
ATCA CABB 5.5 and 9 GHz 2010 Mar 24 06:30 12384
aWe list the start time of each Swift pointing in a band, but due to Swift observation algorithms,
the actual data acquisition is typically spread out over several hours.
bWeather permitting, the SMARTS observations were acquired nightly between 0:00 and 3:00
UT.
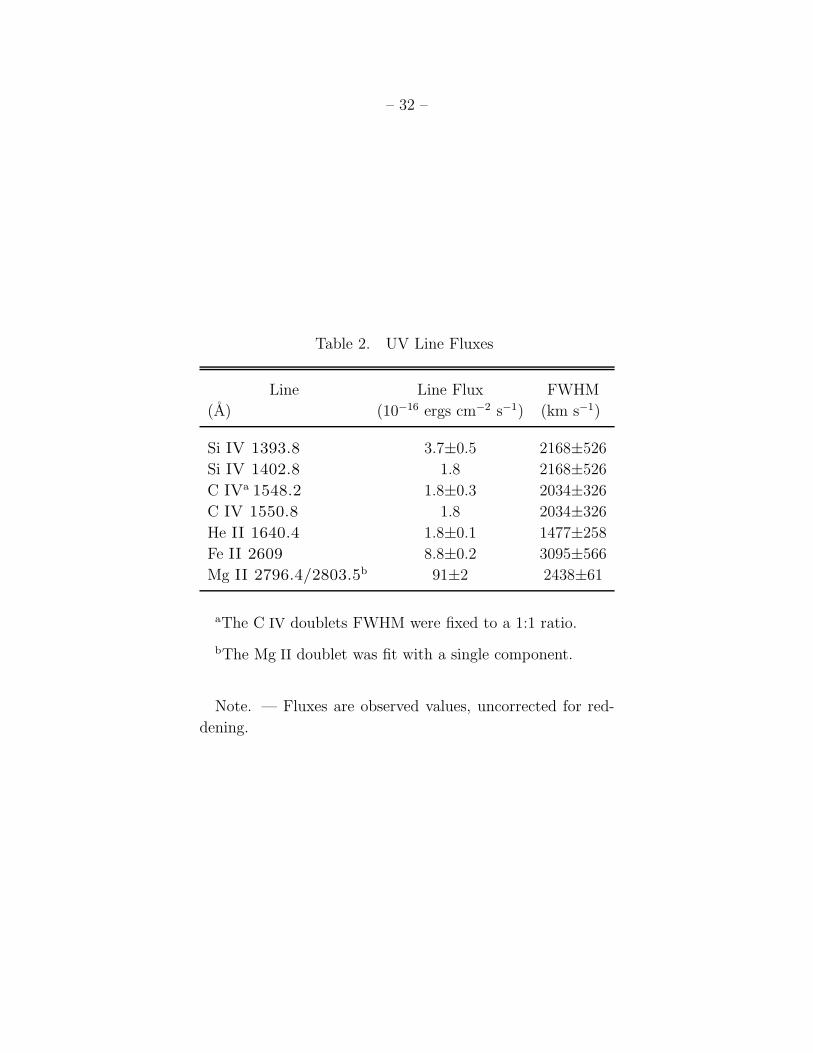
– 32 –
Table 2. UV Line Fluxes
Line Line Flux FWHM
(A) (10−16 ergs cm−2 s−1) (km s−1)
Si IV 1393.8 3.7±0.5 2168±526
Si IV 1402.8 1.8 2168±526
C IVa 1548.2 1.8±0.3 2034±326
C IV 1550.8 1.8 2034±326
He II 1640.4 1.8±0.1 1477±258
Fe II 2609 8.8±0.2 3095±566
Mg II 2796.4/2803.5b 91±2 2438±61
aThe C IV doublets FWHM were fixed to a 1:1 ratio.
bThe Mg II doublet was fit with a single component.
Note. — Fluxes are observed values, uncorrected for red-
dening.

– 33 –
Table 3. UV Continuum Fluxes
Date Instrument Filter λc Widtha Fλ
(A) (A) (10−17 ergs cm−2 s−1 A−1)
23 Mar COS · · · 1112.6 23.6 2.7±1.6
23 Mar COS · · · 1152.5 24.7 1.00±0.43
23 Mar COS · · · 1280.1 19.1 1.16±0.32
23 Mar COS · · · 1347.5 64.1 1.53±0.14
23 Mar COS · · · 1469.6 99.0 1.47±0.16
23 Mar COS · · · 1600.0 58.5 1.17±0.34
23 Mar COS · · · 1684.9 68.6 1.07±0.43
24 Mar STIS · · · 2034.0 167.0 2.94±0.52
24 Mar STIS · · · 2300.1 198.1 3.10±0.21
24 Mar STIS · · · 2490.5 176.6 4.11±0.18
24 Mar STIS · · · 2699.7 99.2 5.39±0.33
24 Mar STIS · · · 2975.8 248.3 7.01±0.32
22 Mar UVOT UVW2 2030 760 11.8±1.9b
23 Mar UVOT UVM2 2231 510 5.7±1.7
24 Mar UVOT UVW1 2634 700 10.1±1.8
25 Mar UVOT U 3501 875 7.9±1.6
aFor the COS and STIS data, the width is the size of the wavelength range
(centered on λc) over which the continuum flux average was calculated. For
UVOT, width refers to the FWHM of the imaging filter used.
bExposure marred by a detector feature running through the object location.
Note. — Fluxes are observed values, uncorrected for reddening.
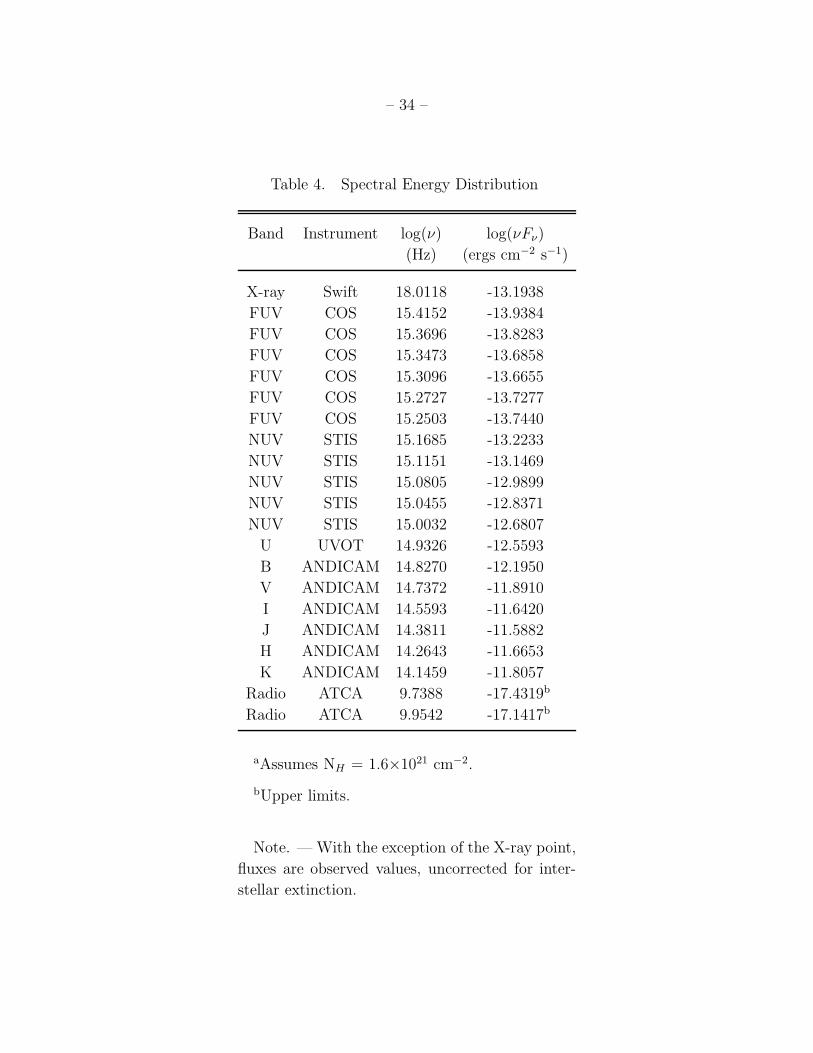
– 34 –
Table 4. Spectral Energy Distribution
Band Instrument log(ν) log(νFν)
(Hz) (ergs cm−2 s−1)
X-ray Swift 18.0118 -13.1938
FUV COS 15.4152 -13.9384
FUV COS 15.3696 -13.8283
FUV COS 15.3473 -13.6858
FUV COS 15.3096 -13.6655
FUV COS 15.2727 -13.7277
FUV COS 15.2503 -13.7440
NUV STIS 15.1685 -13.2233
NUV STIS 15.1151 -13.1469
NUV STIS 15.0805 -12.9899
NUV STIS 15.0455 -12.8371
NUV STIS 15.0032 -12.6807
U UVOT 14.9326 -12.5593
B ANDICAM 14.8270 -12.1950
V ANDICAM 14.7372 -11.8910
I ANDICAM 14.5593 -11.6420
J ANDICAM 14.3811 -11.5882
H ANDICAM 14.2643 -11.6653
K ANDICAM 14.1459 -11.8057
Radio ATCA 9.7388 -17.4319b
Radio ATCA 9.9542 -17.1417b
aAssumes NH = 1.6×1021 cm−2.
bUpper limits.
Note. — With the exception of the X-ray point,
fluxes are observed values, uncorrected for inter-
stellar extinction.
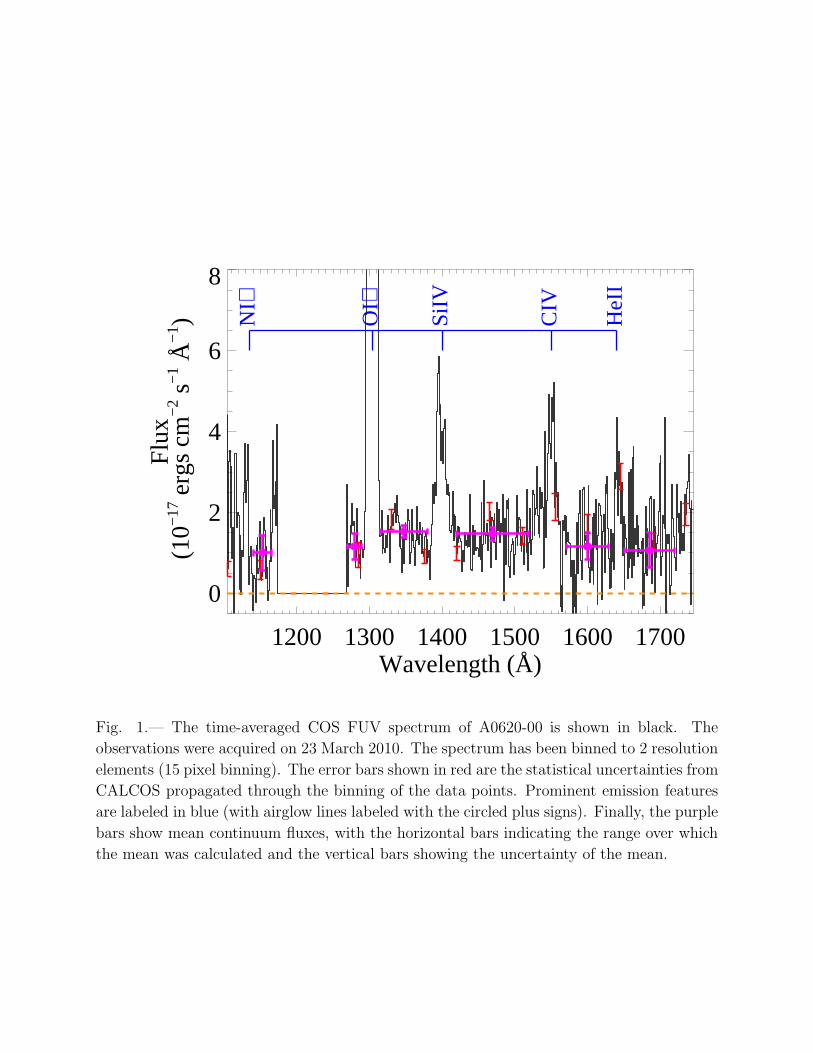
1200 1300 1400 1500 1600 1700Wavelength (Å)
0
2
4
6
8
Flu
x (
10−
17 e
rgs
cm−
2 s−
1 Å−
1 ) NI⊕
OI⊕
SiIV
CIV
HeI
I
Fig. 1.— The time-averaged COS FUV spectrum of A0620-00 is shown in black. The
observations were acquired on 23 March 2010. The spectrum has been binned to 2 resolution
elements (15 pixel binning). The error bars shown in red are the statistical uncertainties from
CALCOS propagated through the binning of the data points. Prominent emission features
are labeled in blue (with airglow lines labeled with the circled plus signs). Finally, the purple
bars show mean continuum fluxes, with the horizontal bars indicating the range over which
the mean was calculated and the vertical bars showing the uncertainty of the mean.
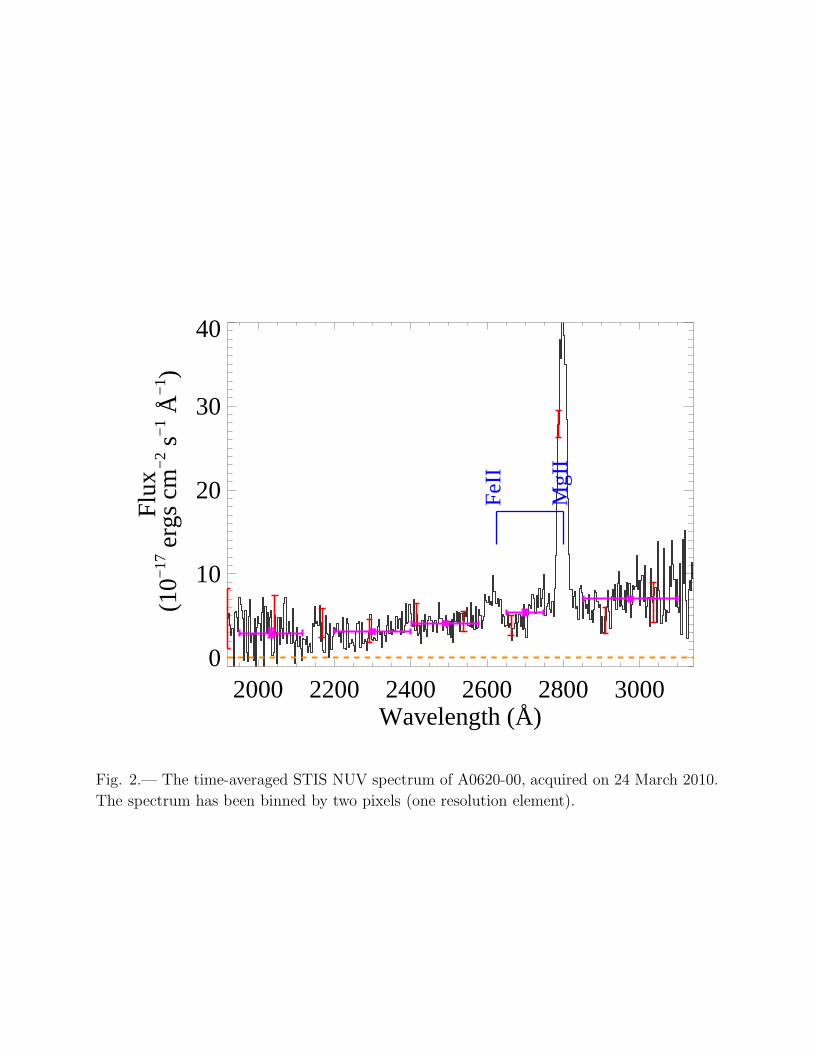
2000 2200 2400 2600 2800 3000Wavelength (Å)
0
10
20
30
40
Flu
x (
10−
17 e
rgs
cm−
2 s−
1 Å−
1 )
FeI
I
MgI
I
Fig. 2.— The time-averaged STIS NUV spectrum of A0620-00, acquired on 24 March 2010.
The spectrum has been binned by two pixels (one resolution element).
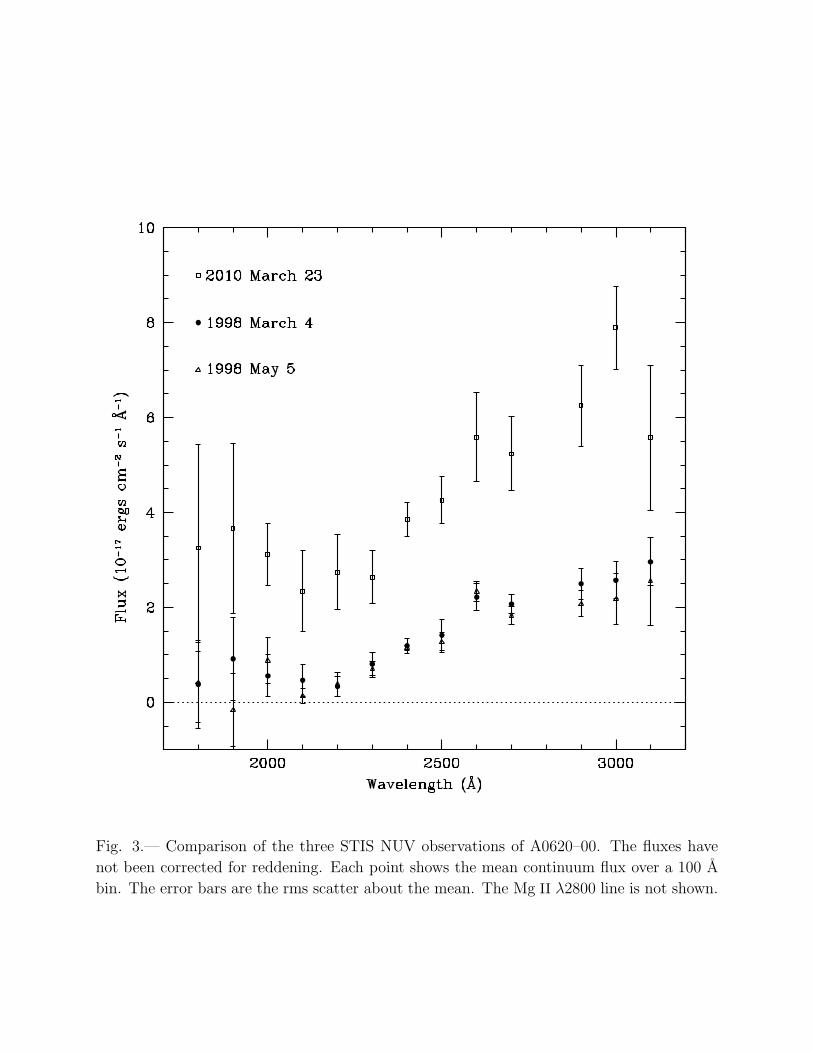
Fig. 3.— Comparison of the three STIS NUV observations of A0620–00. The fluxes have
not been corrected for reddening. Each point shows the mean continuum flux over a 100 A
bin. The error bars are the rms scatter about the mean. The Mg II λ2800 line is not shown.
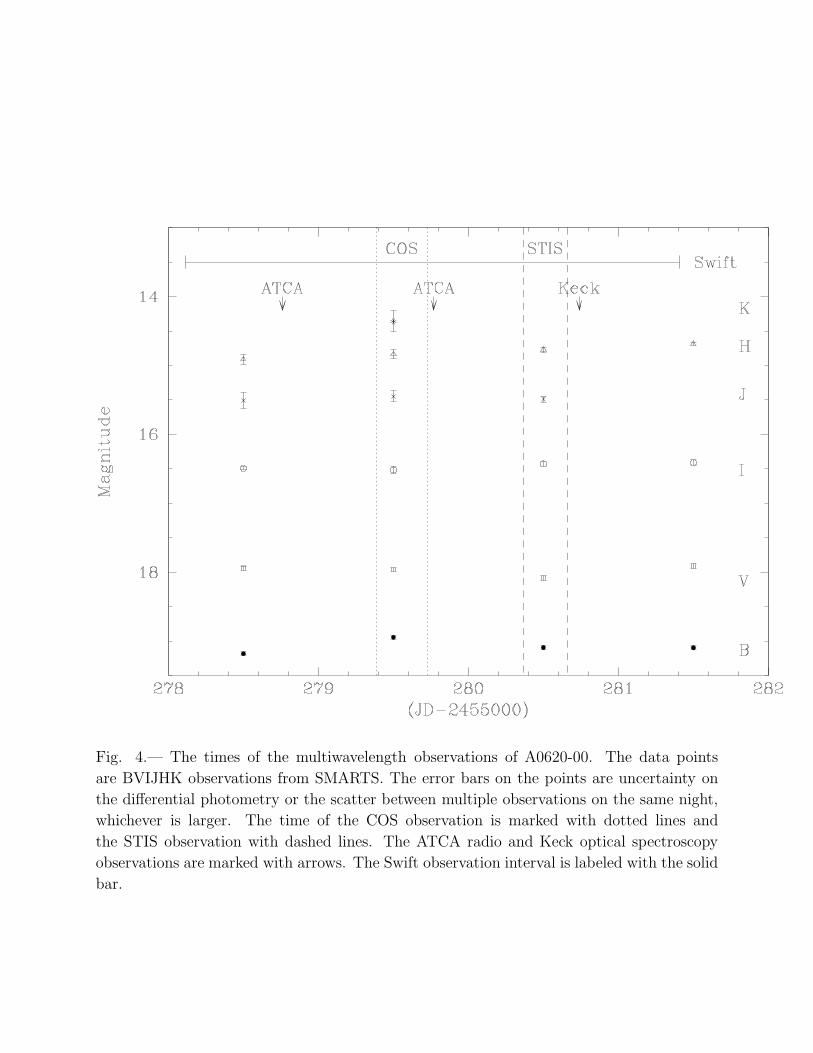
Fig. 4.— The times of the multiwavelength observations of A0620-00. The data points
are BVIJHK observations from SMARTS. The error bars on the points are uncertainty on
the differential photometry or the scatter between multiple observations on the same night,
whichever is larger. The time of the COS observation is marked with dotted lines and
the STIS observation with dashed lines. The ATCA radio and Keck optical spectroscopy
observations are marked with arrows. The Swift observation interval is labeled with the solid
bar.
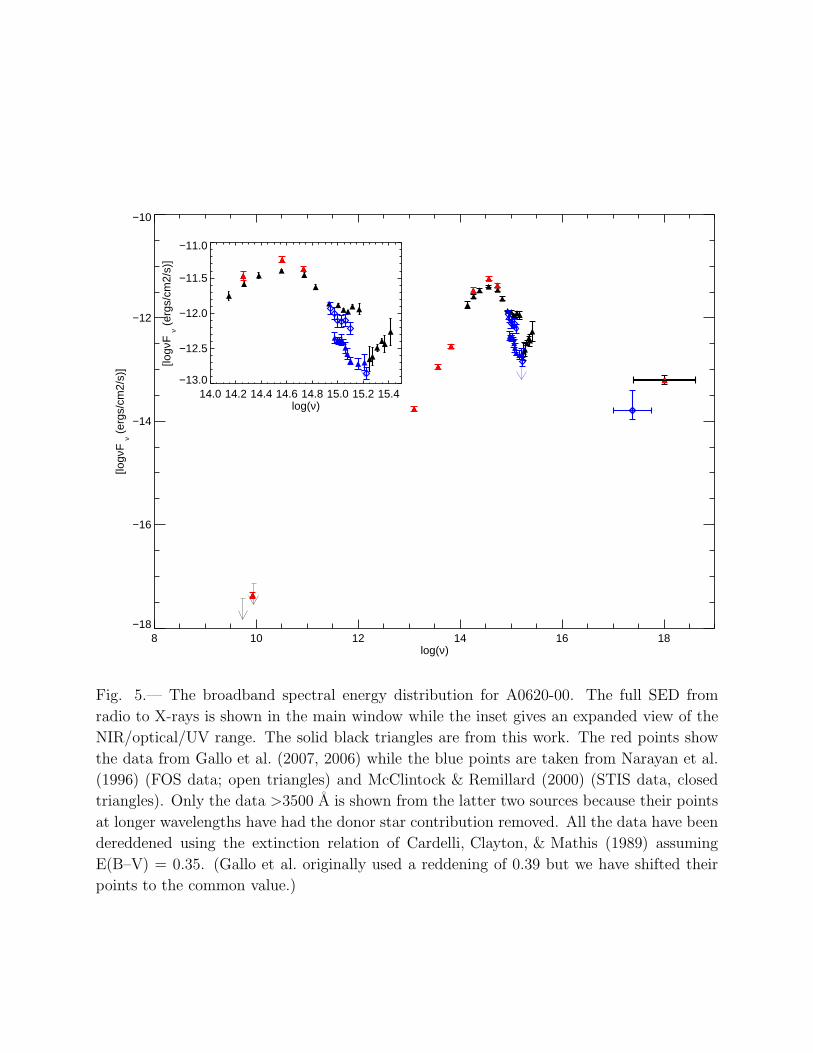
8 10 12 14 16 18log(ν)
−18
−16
−14
−12
−10
[logν
F ν (
ergs
/cm
2/s)
]
14.0 14.2 14.4 14.6 14.8 15.0 15.2 15.4log(ν)
−13.0
−12.5
−12.0
−11.5
−11.0
[logν
F ν (
ergs
/cm
2/s)
]
Fig. 5.— The broadband spectral energy distribution for A0620-00. The full SED from
radio to X-rays is shown in the main window while the inset gives an expanded view of the
NIR/optical/UV range. The solid black triangles are from this work. The red points show
the data from Gallo et al. (2007, 2006) while the blue points are taken from Narayan et al.
(1996) (FOS data; open triangles) and McClintock & Remillard (2000) (STIS data, closed
triangles). Only the data >3500 A is shown from the latter two sources because their points
at longer wavelengths have had the donor star contribution removed. All the data have been
dereddened using the extinction relation of Cardelli, Clayton, & Mathis (1989) assuming
E(B–V) = 0.35. (Gallo et al. originally used a reddening of 0.39 but we have shifted their
points to the common value.)
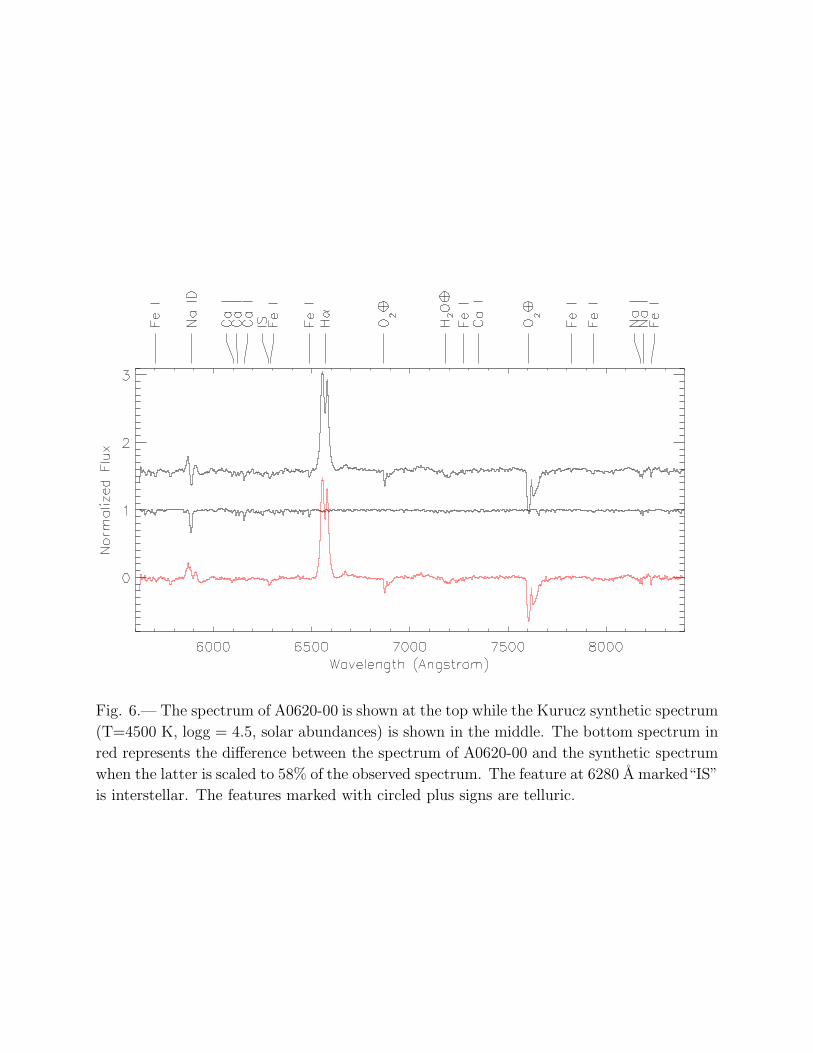
Fig. 6.— The spectrum of A0620-00 is shown at the top while the Kurucz synthetic spectrum
(T=4500 K, logg = 4.5, solar abundances) is shown in the middle. The bottom spectrum in
red represents the difference between the spectrum of A0620-00 and the synthetic spectrum
when the latter is scaled to 58% of the observed spectrum. The feature at 6280 A marked“IS”
is interstellar. The features marked with circled plus signs are telluric.
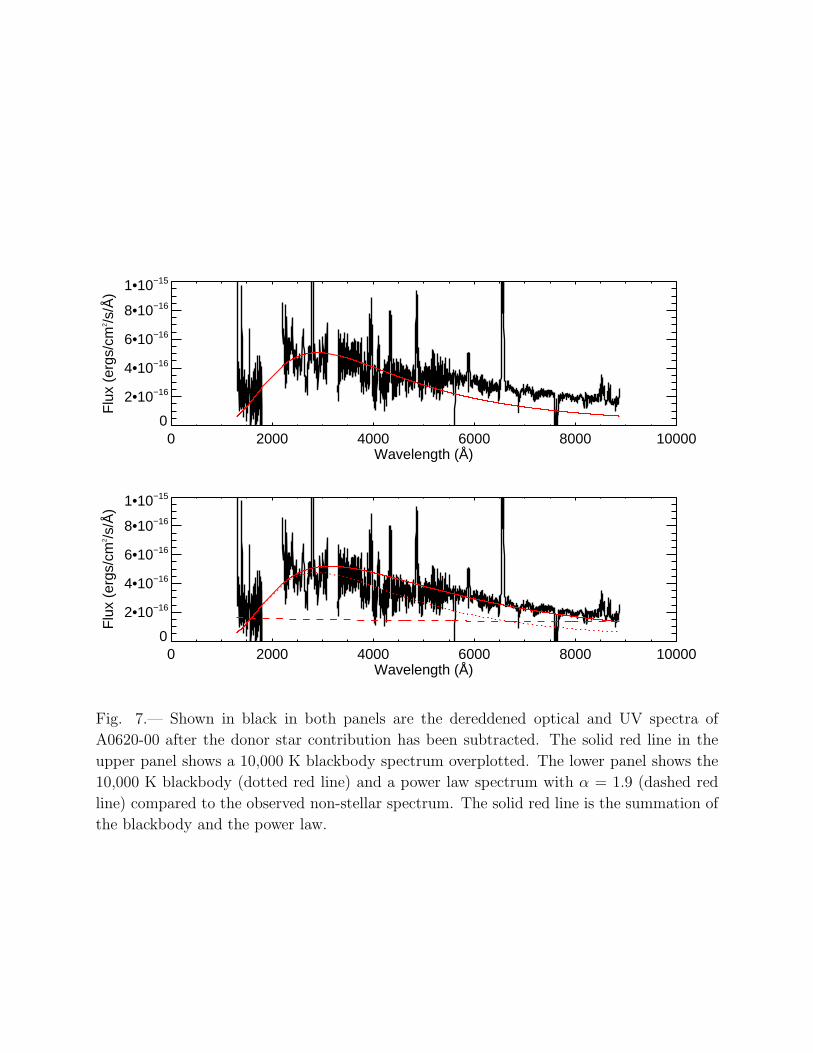
0 2000 4000 6000 8000 10000Wavelength (Å)
0
2•10−16
4•10−16
6•10−16
8•10−16
1•10−15
Flu
x (e
rgs/
cm2 /s
/Å)
0 2000 4000 6000 8000 10000Wavelength (Å)
0
2•10−16
4•10−16
6•10−16
8•10−16
1•10−15
Flu
x (e
rgs/
cm2 /s
/Å)
Fig. 7.— Shown in black in both panels are the dereddened optical and UV spectra of
A0620-00 after the donor star contribution has been subtracted. The solid red line in the
upper panel shows a 10,000 K blackbody spectrum overplotted. The lower panel shows the
10,000 K blackbody (dotted red line) and a power law spectrum with α = 1.9 (dashed red
line) compared to the observed non-stellar spectrum. The solid red line is the summation of
the blackbody and the power law.