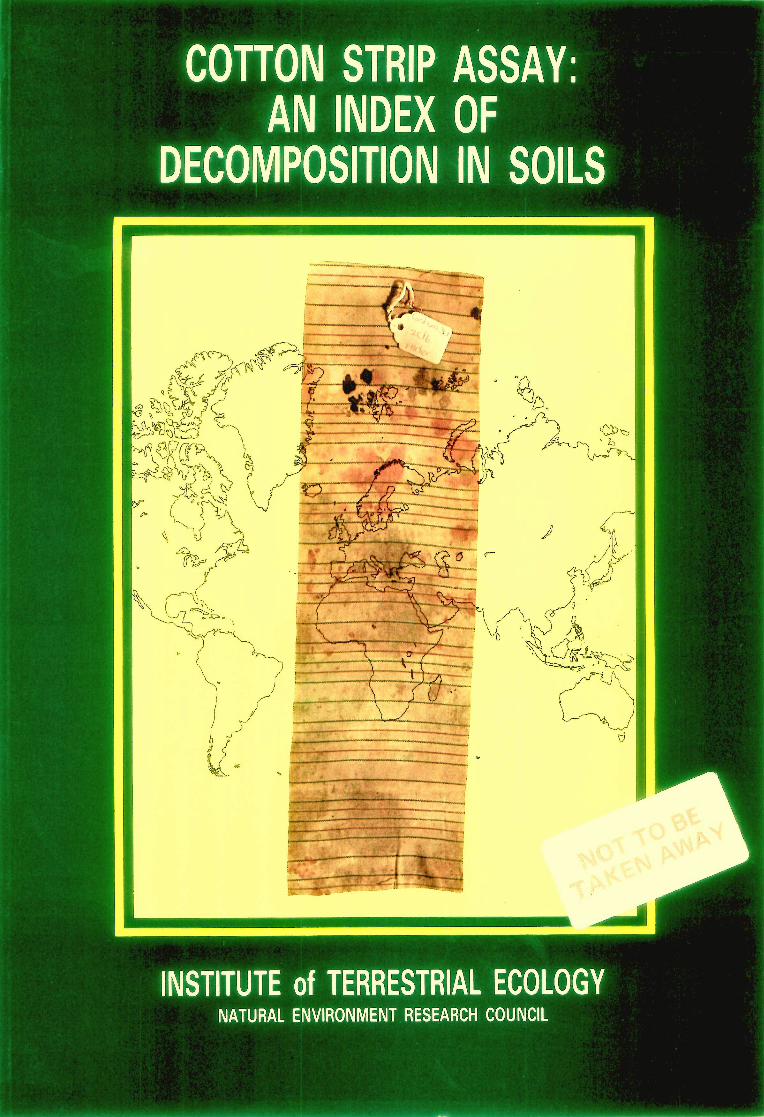
COTTON STRIP ASSAY: AN INDEX OF DECOMPOSITION N ...
180
COTTON STRIP ASSAY: AN INDEX OF DECOMPOSITION INSOILS INSTITUTE ofTERRESTRIAL ECOLOGY NATURAL ENVIRONMENT RESEARCH COUNCIL
-
Upload
khangminh22 -
Category
Documents
-
view
2 -
download
0
Transcript of COTTON STRIP ASSAY: AN INDEX OF DECOMPOSITION N ...
COTTON STRIP ASSAY:AN INDEX OF
DECOMPOSITION IN SOILS
INSTITUTE of TERRESTRIAL ECOLOGYNATURAL ENVIRONMENT RESEARCH COUNCIL

á
NaturalEnvironmentResearchCouncil
Cotton strip assay: an index ofdecomposition in soils
(ITE symposium no. 24)
Edited byA F HARRISON, P M LATTER and D W H WALTON
INSTITUTE OF TERRESTRIAL ECOLOGY

Printed in Great Britain by Titus Wilson & Son Ltd.@ NERC Copyright 1988
Published in 1988 byInstitute of Terrestrial EcologyMerlewood Research StationGRANGE-OVER-SANDSCumbriaLA11 6JU
BRITISH LIBRARY CATALOGUING-IN-PUBLICATION DATACotton strip assay: an index of decomposition in soils
ITE symposium, ISSN 0263-8614; no. 24)1. Cellulose — Biodegradation — Measurement2. Soils — AnalysisI. Harrison, A.F. II. Latter, P.M. Ill. Walton, D.W.H.IV. Institute of Terrestrial Ecology631.4'17 S592.6.C4ISBN 1 870393 06 6
COVER ILLUSTRATIONDesigned by C. B. Benefield
The Institute of Terrestrial Ecology (ITE) was established in 1973,from the former Nature Conservancy's research stations and staff,joined later by the Institute of Tree Biology and the Culture Centreof Algae and Protozoa. ITE contributes to, and draws upon, thecollective knowledge of the 14 sister institutes which make up theNatural Environment Research Council, spanning all the environ-mental sciences.
The Institute studies the factors determining the structure, compo-sition and processes of land and freshwater systems, and of individ-ual plant and animal species. It is developing a sounder scientificbasis for predicting and modelling environmental trends arising fromnatural or man-made change. The results of this research areavailable to those responsible for the protection, management andwise use of our natural resources.
One quarter of ITE's work is research commissioned by customers,such as the Department of Environment, the European EconomicCommunity, the Nature Conservancy Council and the OverseasDevelopment Administration. The remainder is fundamental re-search supported by NERC.
ITE's expertise is widely used by international organizations inoverseas projects and programmes of research.
Dr A F Harrison,Miss P M LatterInstitute of Terrestrial EcologyMerlewood Research StationGRANGE-OVER-SANDSCumbriaLA11 6JU044 84 (Grange-over-Sands) 2264
and Dr D W H WaltonBritish Antarctic SurveyHigh CrossMadingley RoadCAMBRIDGECB3 OET
PREFACE
GENERAL METHOD AND THEORY
CONTENTS
The cotton strip assay for cellulose decomposition studies in soil: history of the assay and develop-ment(P M Latter & D W H Walton)
The Shirley Soil Burial Test Fabric and tensile testing as a measureof biological breakdown of textiles(B F Sagar) 11
Microbial cellulases and their action on cotton fibres(B F Sagar) 17
Standardization of rotting rates by a linearizing transformation(M 0 Hill, P M Latter & G Bancroft) 21
Some statistical problems in analysing cotton strip assay data(D K Lindley & D M Howard) 25
The presentation of cotton strip assay results(D W H Walton) 28
The problem of cementation(D D French) 32
A critical evaluation of the cotton strip assay(P J A Howard) 34
Problems and advantages of using the cotton strip assay in polar and tundra sites(D W H Walton) 43
Seasonal patterns in cotton strip decomposition in soils(D D French) 46
ASPECTS RELATED TO USE OF THE ASSAY AND SOME EXPERIMENTAL APPLICATIONS
The colonization and decay of cotton by fungi in soil burial tests used in the textile industry(A R M Barr)
Relationships between tensile strength and increase in metabolic activity on cotton strips(R N Smith & J M Maw)
Cellulolysis of cotton by fungi in 3 upland soils(J Gillespie, P M Latter & P Widden)
Decomposition of cellulose in relation to soil properties and plant growth(P M Latter & A F Harrison)
Cellulolytic activity in dung pats in relation to their disappearance rate and earthworm biomass(P Holter)
Use of cotton cloth in microcosms to examine relationships between mycorrhizal and saprotrophicfungi(J Dighton & P M Latter) 78
Use of cotton strip assay to assess the effect of formaldehyde treatment on a peat soil(P M Latter & J Miles) 79
3
7
50
55
60,
68
72
4
FIELD APPLICATION IN SPECIFIC ENVIRONMENTS
Temperate
Discrimination between the effects on soils of 4 tree species in pure and mixed stands using cottonstrip assay(A H F Brown) 80
Changes in tensile strength loss of cotton strips with season and soil depth under 4 tree species(A H F Brown & G Howson) 86
Effects of tree species on forest soils in northern France, detected by cotton strip assay(C Nys & G Howson) 90
Use of the cotton strip assay to detect potential differences in soil organic matter decomposition inforests subjected to thinning(G Howson)
Demonstrating effects of clearfelling in forestry and the influence of temperature and moisture onchanges in cellulose decomposition(P M Latter & F J Shaw)
94
99
Patterns of decomposition assessed by the use of litter bags and cotton strip assay on fertilized andunfertilized heather moor in Scotland(D D French) 100
Effects of lime and pasture improvement on cotton strip decomposition in 3 Scottish acid hill soils(P J Vickery & M J S Floate) 109
Preliminary investigations into use of cotton strip assay for assessing effects of changing land useon soils in mid-Wales(J B Dixon & P F Randerson) 113
Examination of the biological activity of the soil under natural conditions(K Kuzniar) 114
Tropical
Use of the cotton strip assay at 3 altitudes on an ultrabasic mountain in Sabah, Malaysia(J Proctor, G Howson, W R C Munro & F M Robertson)
Decomposition rates in the ericaceous belt of Mount Aberdare, Kenya(H Collins, H Gitay, E Scandrett & T Pearce)
Polar
117
123
Cotton strip decomposition in relation to environmental factors in the maritime Antarctic(D D Wynn-Williams) 126
Using the cotton strip assay to assess organic matter decomposition patterns in the mires of SouthGeorgia(G J Lawson)
International comparisons
134
Use of cotton strip assay in wetland and upland environments — an international perspective(E Maltby) 140
Decomposition of cotton strips in soil: analysis of the world data set(P lneson, P J Bacon & D K Lindley) 155

5
APPENDICES
I Current method for preparation, insertion and processing of cotton strips 166
II Use of cotton in ecological studies. List of reference papers prior to publication of Symposiumproceedings 172
III Biodegradation studies at the US Army Natick Research Centre 174
IV List of participants 175
EPILOGUE 176
6
PREFACE
Nutrient cycling in natural, silvicultural forest or agri-cultural ecosystems is maintained by continued de-composition of organic matter on and within the soil.The rate of organic matter decomposition is a complexfunction of litter quality, soil and environmental factorsand, despite considerable research, it has not provedeasy to quantify or to model the interactions involved.
To investigate either the direct or indirect effects ofsoil and environmental factors separately from thoseof litter quality, many research workers have em-ployed standardized organic substrates, as analoguesin decomposition studies. One such substrate is cot-ton fabric strips, a robust material but readily conform-ing to soil shape. It is usually inserted vertically intosoil for a period of time, with their degree of decompo-sition being assessed by the loss in tensile strengthof the cotton.
The standardized procedure which has been de-veloped gives an integrated result over a particularperiod of time, and is here referred to as the 'cottonstrip assay'. Because the assay reacts to the entiretyof changes in environmental factors which controldecomposition (temperature, moisture, nutrient avail-ability), it is used where a comparative measure isrequired for the effects of natural variations or ofmanagement practices. Although initially used as acomparative index of cellulose decomposition in sur-veys, it is now frequently considered as a general
index of decomposer potential, as the results in thispublication demonstrate.
The assay has been used in many types of environ-ment with a wide geographical spread, with modifi-cations for experimental studies on macro- andmicroscales. This diversity of uses has led to manypublications throughout the scientific literature. It was,therefore, considered opportune to bring togetherthose using the assay at a Symposium in Grange-over-Sands, which was held in October 1985, to discusstechniques, to pool available data, and to considerfurther possible developments of the assay.
This publication presents the papers and topics dis-cussed. It is intended not only as a report of themeeting, but more as a handbook and reference basefor the cotton strip assay. For this reason, the paperswere revised after the meeting following the dis-cussions which took place, and have been fully ref-ereed and edited. The editors are most grateful tothe various referees and, in particular, to Professor AMacfadyen and Dr J C Frank land for their valuedcontribution. We also acknowledge the considerableassistance from typists, graphics programmers andmany others who have helped in numerous ways.
A F HarrisonP M Latter
GENERAL METHOD AND THEORY
The cotton strip assaystudies in soil: historyP M LATTER' and D W H WALTON2institute of Terrestrial Ecology, Merlewood
'British Antarctic Survey, Cambridge
1 SummaryThe history and development of the cotton strip assayas a field method for ecological use in the InternationalBiological Programme (1BP) and other studies are dis-cussed. The further standardization and progressiverefinement of the assay have reduced many of theoriginal uncertainties regarding the data. Use of thecotton strip assay in ecological studies is described.
2 History of soil burial methodsThe textile industry has long been concerned with theprevention of cloth decay, especially by fungal attack.To test the effectiveness of fungicide treatments, aroutine test has been devised in which strips of textileare buried in tanks of soil (Wade 1947; Barr 1988;etc). The loss in tensile strength of the cotton fibres,with time, is used as a quantitative assessment of therottenness of the fabric and, thus, the effectivenessof the fungicide. The value of the test and its wide-spread use stimulated the specification of the BritishStandard 2576 (Anon 1986) for general commercialapplication of the test.
As the soil burial test became more widely used, thevariability inherent in the use of different types of clothand soil became clear (Schmidt & Ruschmeyer 1958).One way of reducing variation inherent in the test wasto standardize the cloth type used. Restriction of clothtype to one general group, for instance unbleachedcalico, could, however, only be a partial solution, asdifferent fibre mixtures, thread densities and weavingtreatments in different mills could produce wide vari-ations in tensile strength (Sagar 1988a). A specializedcloth was, therefore, required and in the 1960s Toege-past Natuurwetenschappelijk Onderzoek (TNO) in theNetherlands produced such a material.
The breakdown of cotton fibres is of inte'rest to a rangeof textile scientists, and early work is summarized inThaysen and Bunker (1927) and Siu (1951). Researchhas been carried out on the soil burial method by thetextile industry, to develop an understanding of thetest (Barr 1988) and the optimum conditions for mi-crobial attack. Much of this research used cotton, andwas carried out at the Shirley Institute, Manchester.Detailed studies were made of the method of attack,both physical (Simpson & Marsh 1960; Kassenbeck1970) and chemical aspects (Blum & Stahl 1952; Selby1961; Halliwell 1965; Sternberg et al. 1977) and the
for cellulose decompositionof the assay and development
Research Station, Grange-over-Sands
7
cellulolytic enzymes involved (Sagar 1988b). A rangeof information was thus available by the early 1960sabout a test which measured the effects of biologicalattack on a partially processed natural substrate whichwas generally over 96% pure cellulose.
The decomposition of cotton in soil appears largelyto be due to microbial attack (Latter et al. 1988), aconclusion to be confirmed for normal soil tempera-tures by Richard (1945) during storage of cotton atpH 2.
3 Development of the cotton strip assay for soilstudiesCellulose comprises the bulk of plant material and is ofgreat significance in the decomposition of soil organicmatter by micro-organisms and microfauna, and thusin nutrient cycling, in natural and agricultural eco-systems. Although cellophane film, filter paper andlens tissue have been successfully used in cellulosedecomposition experiments, the need for a more ro-bust, flexible, standard substrate for ecological studiesin soil was recognized many years ago. As early as1945, Richard (1945) used cellulose cords of viscoserayon (regenerated cellulose fibre) in alpine areas ofSwitzerland, whilst in 1948, in Poland, Kuzniar (1948,1988) used strips of linen (a partially lignified fibre), asdo other east European workers still (Strzelczyk et al.1978; Sadanov 1982). Cotton tape was also used inAustralian soil studies (Rovira 1953) and for assessingcellulase activity of isolates of the fungi Pythium (Tay-lor & Marsh 1963) and Chaetomium (Farrow 1951).
Following on from Kuzniar's experiment and the soilburial method, strips of cotton (unbleached calico)with over 95% cellulose were inserted vertically intosoil profiles (Plate 6) for cellulose decomposition stud-ies on Pennine moorland sites (Latter et al. 1967).Visual observations showed marked differences inrotting of the cloth between sites, and the assay wasquantified by using tensile strength as the measure ofcloth decomposition. The purpose of the soil burialtest was, in essence, reversed to develop a fieldecological test (Table 1 & Plate 9).
The development of the International Biological Pro-gramme (IBP) from 1965 onwards included investi-gations of the decomposer cycle in variousecosystems. In the Tundra Biome, it was decided

8
Table 1. A comparison of the procedures and purpose of the soilburial test as used in the textile industry and the cotton strip assayused in field ecology
Soil burial textile test
Procedures:
Standard soilStandard or selected textilesVariable treatment of textileFrayed before burialControlled environment, highincubation temperature andmoisture
Soil is used to show:
Rotting of textile with varyingtreatments, eg fungicides, ortextile manufacturing variations
Suitability of textile for useunder particular environmentalconditions
Cotton strip assay as soil test
Procedures:
Variable soilsStandard textile-cottonStandard treatment of textileFrayed after burialVarying environment in field, orcontrolled for experiments
Cotton is used to show:
Ability of soil to rot cotton withvarying soils or site treatments
Suitability of soil environmentfor biological activity
to concentrate on the study of energy flow throughvarious trophic levels (Dahl & Gore 1968). With sitesspread over the polar and alpine regions of the world,an assay was needed to provide standardized inter-site comparisons of rates of cellulose decompositionin soil. A paper cellulose board (Rosswall 1974) wasused along with cotton textile strips (Healet al. 1974),and the latter became the most widely used methodproviding, for the first time, comparable data on cellu-lose decay from the arctic, antarctic and alpine sites(Heal et al. 1974). It, thus, became possible to test forthe effectiveness of a particular subset (the cellulolyticspecies) of the cosmopolitan soil flora on a globalscale.
To provide some degree of standardization, a singlesource of cotton, an unbleached commercial calico(Plate 7), continued to be supplied to IBP field scien-tists from stocks at the Institute of Terrestrial Ecol-ogy's Merlewood Research Station. Techniques forfield use were later refined and standardized (Latter &Howson 1977). One necessary step was the provisionof adequate supplies of a closely specified test cloth,as the TNO fabric was no longer available. The ShirleyInstitute produced the 'Shirley Soil Burial Test Fabric'(Plate 7) in 1976 (Walton & Allsopp 1977; Sagar1988a). The cloth was widely advertized and wassoon in use for commercial testing and for ecologicalstudies.
The assay has now been used, in particular, for polarstudies (eg Davis 1986; Wynn-Williams 1988) and forland management studies (eg Brown 1988; Brown &Howson 1988), and it has become apparent that cer-tain aspects, including some procedures taken overfrom the soil burial test, need further assessment inthe context of the ecological test with its high fieldvariability. Some technical aspects, including autoclav-ing to sterilize cloth prior to burial, washing to clean
retrieved cloth for storage until tensile tested, the bestconditions for storage of strips, the effect of width,the need for fraying of substrips for tensile testing,and the inter-comparability of different tensile testingmachines, are reported by Latter et al. (1988) andWalton (1985). The method for the assay, as we wouldcurrently recommend it, is given in Appendix I.
4 Ecological use of the assayThe impetus for more widespread use of the cottonstrip assay in soil was undoubtedly provided by thesuccessful world-wide experiments in the IBP TundraBiome. The development of the Shirley Soil BurialTest Fabric and its incorporation into the British Stan-dard 6085 (Anon 1981) commercial test provided, forthe first time, a single source of standard textile forall users. A wide variety of uses has ensued.
Commercial users continue to carry out fungicide as-sessment tests in laboratory soil tanks (Anon 1981).The Shirley Soil Burial Test Fabric has also been widelyused ecologically for field comparisons of cellulosedecomposition, having been supplied to research wor-kers in UK, USA, New Zealand, Australia, Canada andthe Antarctica. During IBP, the earlier type of clothwas also used in Finland, Ireland, Norway, USSR,Sweden and Alaska. Less orthodox usages have in-cluded assessments of cellulose decomposition incoal tips, compost heaps, and the rumen of sheep.
Many of the technical problems originally associatedwith the cotton strip assay have now been adequatelydocumented. We do not suggest that we understandexactly what occurs during biological attack, as muchstill remains to be learnt about the biochemistry ofcellulose decomposition (Sagar 1988b; Howard 1988).Nevertheless, the technique and data analysis nowappear sufficiently standardized for users to have con-fidence in the inter-comparability of data.
The papers in this volume emphasize the practicalnature of the assay. It is especially useful for earlydetection of biological change in soils or in pinpointingaspects of environmental change needing more detai-led investigation, eg the marked depression of cellu-lose decomposition on an oak (Quercusspp.) site at4-12 cm depth during summer (Brown 1988), theenhanced cellulose decomposition in sub-antarcticsites in the vicinity of rush (Juncusspp.)roots (Smith &Walton 1988), or the unexpectedly high cellulose de-composition at Rothera Point, Antarctica, possibly dueto radiant energy input (Wynn-Williams 1988). Infor-mation is currently available for a number of sitesworld-wide, and one purpose of the Workshop was tobring these data together. The Workshop results arediscussed by Ineson et al. (1988).
Some evidence is available suggesting that cellulosedecomposition relates to soil properties similar tothose affecting plant growth (Latter & Harrison 1988).

Cotton strip assay data show similar trends to weightloss of plant litter (French 1988), but a close relation-ship cannot be expected (Howard 1988) because thedecomposition of cellulose in plant litter is influencedin various ways by other chemical constituents towhich it is bound or closely allied. Partition of de-composition stages, thus, requires the use of individ-ual standard substrates to simplify the system forexamining the various influences of environmentalparameters. Decomposition of any single substratecan never be fully representative of any other, and thisis particularly true of cellulose. However, Shawky andHickisch (1984) show virtually the same ratio of weightlosses (1.1-1.2) when comparing 2 soils for decompo-sition of cotton, filter paper or wheat straw by Tricho-derma.
The use of this type of assay in soil, which integratesdecomposing activity over a period of time, partlyovercomes a sampling problem when working atwidely dispersed sites. Short-term changes in environ-mental conditions during the time taken to sampleremote sites should have no significant effect on anintegrated measurement, but could produce large dif-ferences in organism activity, if instantaneousmeasurements, such as respiration or enzyme assays(eg cellulase), are used. It is, however, obvious thatany decomposition test involving the addition of asubstrate to soil is no absolute' measure of activity,but only an index of the potential to attack that addedsubstrate. The same applies when natural litter fallsor is incorporated into soil.
As well as using the assay to examine cellulose de-composition unconfounded by other factors, whichwas the original purpose, the assay is often considereduseful as an index of general biological, or decompo-ser, activity, on the basis that cellulose is a major partof organic matter. Both uses are discussed in variouspapers in this volume. As different advantages andlimitations of using the assay apply in the 2 ap-proaches, the aims of any study and the purpose ofusing the assay should be examined critically from thestart.
Many of the criticisms raised by Howard (1988) arevalid, and the suggested need for 'a method for study-ing the decomposition of cellulose, and other constitu-ents, in plant litter' cannot be disputed, but the currentabsence of a method suitable for field use means thatanalogue substances will remain, for the present time,a practical means of assessing certain biological chan-ges. It would certainly be advantageous if similarsimple field tests could be developed for other sub-strates, eg chitin sheet or complexes of lignin andcellulose. We have had no success with silk as aprotein substrate as used by Richard (1945), as itappeared to be chemically or photochemically at-tacked, but chitin sheet and wood veneer (Latter 1984)appeared promising. In the meantime, we considerthat useful ecological and management information
9
can be obtained with this cotton strip assay- providedusers are well aware, as with any method, of itslimitations and that use of a simple method does notimply careless attention to detail.
5 AcknowledgementsThe authors acknowledge the many people who havecontributed to the development of the method, includ-ing staff at ITE Merlewood, and also staff at the ShirleyInstitute for much theoretical and practical advice.
6 ReferencesAnon. 1981. Method of test for the determination of the resistanceof textiles to microbiological deterioration. (BS 6085.) London:British Standards Institution.Anon. 1986. Methods of test for textiles - woven fabrics - determi-nation of breaking strength and elongation (strip method.(BS 2576.) London: British Standards Institution.
Barr, A.R.M. 1988. The colonization and decay of cotton by fungiin soil burial tests used in the textile industry. In: Cotton strip assayan index of decomposition in soils, edited by A.F. Harrison, P.M.Latter & D.W.H. Walton, 50-54. (ITE symposium no. 24.) Grange-over-Sands: Institute of Terrestrial Ecology.Blum, R. & Stahl, W.H. 1952. Enzyme degradation of cellulosefibres. Text. Res. J., 22, 178-192.Brown, A.H.F. 1988. Discrimination between the effects on soilsof 4 tree species in pure and mixed stands using cotton strip assay.In: Cotton strip assay. an index of decomposition in soils, editedby A.F. Harrison, P.M. Latter & D.W.H. Walton, 80-85. (ITE sym-posium no. 24.) Grange-over-Sands: Institute of Terrestrial Ecology.Brown, A.H.F. & Howson, G. 1988. Changes in tensile strengthloss of cotton strips with season and soil depth under 4 tree species.In: Cotton strip assay an index of decomposition in soils, editedby A.F. Harrison, P.M. Latter & D.W.H. Walton, 86-89. (ITE sym-posium no. 24.) Grange-over-Sands: Institute of Terrestrial Ecology.•Dahl, E. & Gore, A.J.P. 1968. Proceedings of working meeting onanalysis of ecosystems: tundra zone. Utaoset, Norway: Inter-national Biological Programme.Davis, B.C. 1986. Environmental factors influencing decompositionrates in two antarctic moss communities. Polar Biol., 5, 95-104.Farrow, W.M. 1951. A study of Chaetomium in cellulose decay.Proc. Iowa Acad. Sci., 58, 101-106.French, D.D. 1988. Patterns of decomposition assessed by the useof litter bags and cotton strip assay on fertilized and unfertilizedheather moor in Scotland. In: Cotton strip assay. an index of de-composition in soils, edited by A.F. Harrison, P.M. Latter & D.W.H.Walton, 100-108. (ITE symposium no. 24.) Grange-over-Sands: Insti-tute of Terrestrial Ecology.Halliwell, G. 1965. Hydrolysis of fibrous cotton and reprecipitatedcellulose by cellulolytic enzymes from soil micro-organisms. Bi-ochem. J., 95, 270-281.Heal, 0.W., Howson, G., French, D.D. & Jeffers, J.N.R. 1974.Decomposition of cotton strips in tundra. In: Soil organisms anddecomposition in tundra, edited by A.J. Holding, O.W. Heal, S.F.MacLean & P.W. Flanagan, 341-362. Stockholm: Tundra BiomeSteering Committee.Howard, P.J.A. 1988. A critical evaluation of the cotton strip assay.In: Cotton strip assay an index of decomposition in soils, editedby A.F. Harrison, P.M. Latter & D.W.H. Walton, 34-42. (ITE sym-posium no. 24.) Grange-over-Sands: Institute of Terrestrial Ecology.Ineson, P., Bacon, P.J. & Lindley, D.K. 1988. Decomposition ofcotton strips in soil: analysis of the world data set. In: Cotton stripassay an index of decomposition in soils, edited by A.F. Harrison,P.M. Latter & D.W.H. Walton, 155-165. (ITE symposium no. 24.)Grange-over-Sands: Institute of Terrestrial Ecology.Kassenbeck, P. 1970. Bilateral structure of cotton fibres as revea-led by enzymatic degradation. Text. Res. J., 40, 330-334.Kuzniar, K. 1948. (Studies on the cellulose decomposition in forestsoil). Inst. Bad. Lesn. Rozpr. i Spraw, 50, 1-44.
10
Kuzniar, K. 1988. Examination of the biological activity of thesoil under natural conditions. In: Cotton strip assay. an index ofdecomposition in soils, edited by A.F. Harrison, P.M. Latter &D.W.H. Walton, 114-116. (ITE symposium no. 24.) Grange-over-Sands: Institute of Terrestrial Ecology.Latter, P.M. 1984. The use of wood veneer in decompositionexperiments. Appl. Biochem. Biotechnol., 9, 371.Latter, P.M. & Harrison, A.F. 1988. Decomposition of cellulose inrelation to soil properties and plant growth. In: Cotton strip assay.an index of decomposition in soils, edited by A.F. Harrison, P.M.Latter & D.W.H. Walton, 68-71. (ITE symposium no. 24.) Grange-over-Sands: Institute of Terrestrial Ecology.Latter, P.M. & Howson, G. 1977. The use of cotton strips toindicate cellulose decomposition in the field. Pedobiologia, 17, 145-155.Latter, P.M., Cragg, J.B. & Heal, 0.W. 1967. Comparative studieson the microbiology of four moorland soils in the northern Pennines.J. Ecol., 55, 445-464.Latter, P.M., Bancroft, G. & Gillespie, J. 1988. Technical aspectsof the cotton strip assay method. Int. Biodeterior, 24. In press.Richard, F. 1945. The biological decomposition of cellulose andprotein test cords in soils under forest and grass associations. I.The method of determining biological soil activity by the so-called'tearing' test. Mitt. schweiz. Anst. forstl. VersWes., 24, 297-397.Rosswall, T. 1974. Cellulose decomposition studies on the tundra.In: Soil organisms and decomposition in tundra, edited by A.J.Holding, 0.W. Heal, S.F. MacLean & P.W. Flanagan, 325-340.Stockholm: Tundra Biome Steering Committee.Rovira, A.D. 1953. A study of the decomposition of organic matterin red soils of the Lismore district. Aust. Conf. Soil Sci., Adelaide,1, 3.17, 1-4.Sadanov, A.K. 1982. Changes in the number of microorganismsand mobile nitrogen level after application of ameliorants to salineflooded soil. lzv. Akad. Nauk. Kaz. Ssr Ser. Biol., (3), 53-56.Sagar, B.F. 1988a. The Shirley Soil Burial Test Fabric and tensiletesting as a measure of biological breakdown of textiles. In: Cottonstrip assay an index of decomposition in soils, edited by A.F.Harrison, P.M. Latter & D.W.H. Walton, 11-16. (ITE symposium no.24.) Grange-over-Sands: Institute of Terrestrial Ecology.Sagar, B.F. 1988b. Microbial cellulases and their action on cottonfibres. In: Cotton strip assay. an index of decomposition in soils,edited by A.F. Harrison, P.M. Latter & D.W.H. Walton, 17-20. (ITEsymposium no. 24.) Grange-over-Sands: Institute of TerrestrialEcology.
Schmidt, E.L. & Ruschmeyer, O.R. 1958. Cellulose decompositionin soil burial beds. I. Soil properties in relation to cellulose degra-dation. Appl. Microbiol., 6, 108-114.Selby, K. 1961. The degradation of cotton cellulose by the extracel-lular cellulase of Myrothecium verrucaria. Biochem. J., 79, 562-566.Shawky, B.T. & Hickisch, B. 1984. Cellulolytic activity of Trichod-ermasp. strain G, grown on various cellulose substrates. Zent.bl.Mikrobiol., 139, 91-96.Simpson, M.E. & Marsh, P.B. 1960. The decomposition of thecellulose of cotton fibres by fungi of the genus Aspergillus. De-velop. incl. Microbiol., 1, 248-252.Siu, R.G.H.1951. Microbial decomposition of cellulose.New York:Reinhold.Smith, M.J. & Walton, D.W.H. 1988. Patterns of cellulose de-composition in four subantarctic soils. Polar Biol. In press.Sternberg, D., Vijayakumar, P. & Reese, E.T.1977. p-glucosidase:microbial production and effect on enzymatic hydrolysis of cellu-lose. Can. J. Microbiol., 23, 139-147.Strzelczyk, E., Stopinski, M. & Dziadowiec, H. 1978. Studies oncellulose decomposition in forest soils of the reserve 'Las Piwnicki'near Torun. Acta Univ. Nicolai Copernic. Biol., 21, 115-128.Taylor, E.E. & Marsh, P.B. 1963. Cellulose decomposition byPythium. Can. J. Microbiol., 9, 353-358.Thaysen, A.C. & Bunker, H.J. 1927. The microbiology of cellulose,hemicelluloses, pectin and gums. London: Oxford University Press.Wade, G.C. 1947. Effect of some micro-organisms on the physicalproperties of cotton duck. J. Coun. scient. ind. Res. Aust. , 20, 459-467.Walton, D.W.H. 1985. Tensometer and jaw types in testing thetensile strength of textiles. Int. Biodeterior., 21, 301-302.Walton, D.W.H. & Allsopp, D. 1977. A new test cloth for soil burialtrials and other studies on cellulose decomposition. Int. Biodeterior.Bull., 13, 112-115.Wynn-Williams, D.D. 1988. Cotton strip decomposition in relationto environmental factors in the maritime Antarctic. In: Cotton stripassay an index of decomposition in soils,edited by A.F. Harrison,P.M. Latter & D.W.H. Walton, 126-133. (ITE symposium no. 24.)Grange-over-Sands: Institute of Terrestrial Ecology.

The Shirley Soil Burial Test Fabric and tensile testing asa measure of biological breakdown of textilesB F SAGARShiriey tnst;ture, Var3chesær
1 SurrmarvThe Snirley So I Bur al Test Faor c ras peen developedfor use by ecologists as well as by me text le naustryas a standard woven cotton fad- c for assessing :recellulolytic microdal activity n so Is The plain wovencloth contains combed 100% cotton 2 fold yarns, withcoloured marker threads introduced at 5 and 10 mmintervals in the warp to enable specimens to be easilyprepared in various widths according to requirementsThe fabric is produced to a high standard and is as freeas possible from any extraneous matter, with thedyestuff in the marker threads free from any biocidaleffects
The cellulolytic activity in the soil is assessed bydetermining the reduction in tensile strength of theburied test specimens, but, in the interpretation, it isimportant to be aware of the various factors affectingthe tensde properties of textile materials and the re-sults obtained from different testing instruments.
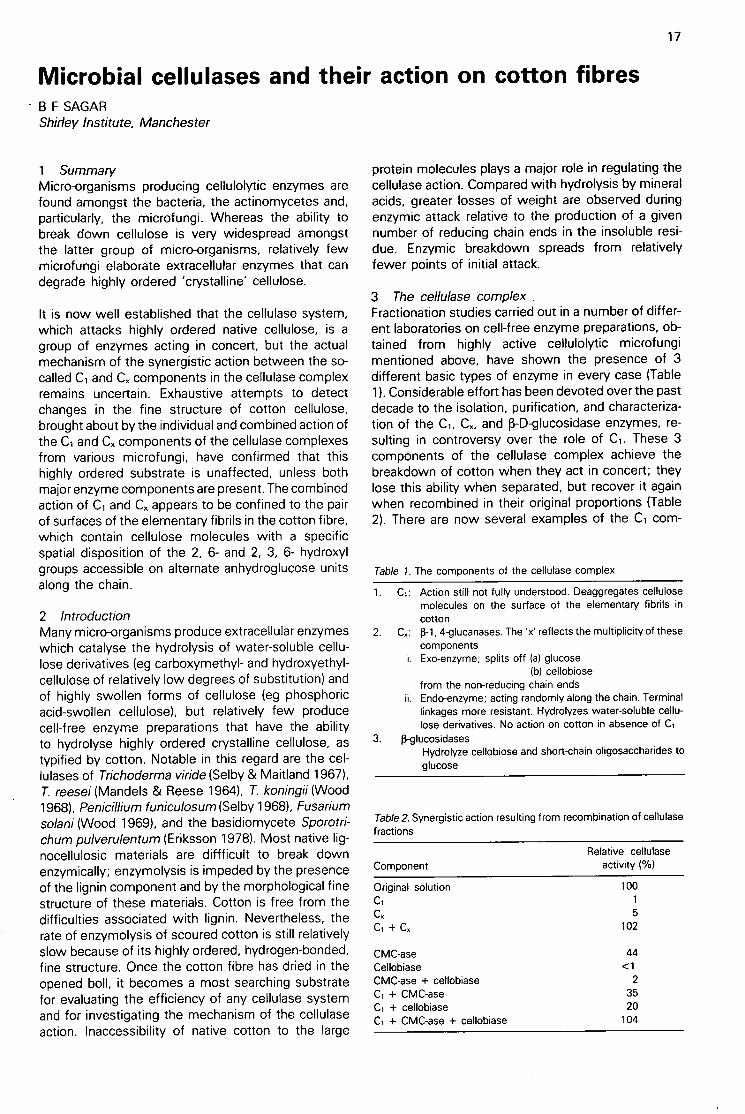
2 Use of cotton fabric to assess the cellulolytic ac-tivity of soilThe cotton strip assay, based on losses in tensilestrength of standard strips of cotton fabric placed insoil, is widely used by ecologists as a simple assay ofthe cellulolytic activity of the soil. Cotton fibres consistof unicellular seed hairs tapering from base to tip, withvariable length and diameter depending on the varietyof the cotton; typical fibre lengths are about 2.5 cm,with a diameter of about 15 R. The cotton hair in theunopened boll on the plant is a hollow, thick-walledcylinder (Figure 1), with a lumen containing proto-plasm and cell fluids. The exterior surface of the rawcotton fibre is a coherent membrane (the cuticle),consisting of wax and pectic substances. The cuticleis removed by kier boiling to expose the primary wall,which consists of a loose and somewhat felt-like
Cuticle Primary wall Secondary layers
Ma 0.1p thick] Ma 0.4p thick)
Winding layer Lumen boundaryWe 0. 1» thick) and contents
Figure 1. Schematic diagram of layered componentsof the cotton fibre cell wall
assembly of criss-crossing microfibrds. each about200-300 A thick The bulk of the cellulose is containedin the secondary wall ilying immediately inside theprimary wall) and is a tightly packed and well-orientedassemblage of fibrils. The fibrils seen with the opticalmicroscope are at least 200 A thick, but these areclearly bundles of much smaller units, and the elec-tron microscope reveals single elementary fibrils witha spread of diameter below 75 A lie no wider than thewidth of a single crystallite, as deduced from X-raymeasurements). Aggregation of elementary fibrils intomicrof ibrils (200-300 A thick) and then into macrofi-brils (1000 4) is evident in electron micrographs (Plate1)
xl.
11
Plate 1. Microfibrillar structure of cotton seen underthe transmission electron microscope
When the boll opens and the fibres dry, they collapseto give a twisted, ribbon-like structure (Plate 2 iv). Thiscollapse of the fibre on drying has been shown byKassenbeck (1970) to result in a bilateral structure.Four zones can be distinguished in the fibre cross-section, which differ in the organization of their finestructure as a result of the radial and tangential com-pressive forces produced in the fibre during its initialdesiccation. These 4 zones also differ in their accessi-bility to cellulase enzymes, and those parts of thecotton hair with the more open morphological struc-ture are the first to be attacked, as is seen clearlyunder the scanning electron microscope (Plate 2 ix-
In terms of direct observations on cotton fibres in vitro,6 stages of enzymic attack are observed (Table 1).Loss of tensile strength is a sensitive measum ofattack, and the cotton loses strength much faster thanit loses weight when repeatedly treated with a cr udecell-free enzyme preparation of relatively low enzymeactivity (Figure 2).
Measurements of changes in degree of polymeriza-tion, increase in solubility in sodium hydroxide (10%),

12
loss in weight, and production of reducing sugars haveall been used to quantify the progress of celluloseenzymolysis in the laboratory, but determination ofthe progressive loss of tensile strength of buried cot-ton strips is the most practicable way of assessing thecellulolytic activity of soil.
3 The Shirley Soil Burial Test FabricThe possibility that the Shirley Institute might producea standard fabric for soil burial tests was first sug-gested in 1975 by Dr D W H Walton of the NaturalEnvironment Research Council's British Antarctic Sur-vey. A test fabric made by Toegepast Natuurweten-schappelijk Onderzoek (TNO) in the Netherlandsceased to be available, and there was general consen-sus that a Shirley Soil Burial Test Fabric should beproduced which closely resembled the TNO specifi-cation. More than 20 organizations expressed theirkeen interest in the initial development of a suitabletest fabric.
A plain woven fabric was produced containing combed100% cotton yarns in a 2-folded form with the specifi-cations given in Table 2 and as recommended in BritishStandards 6085 (Anon 1981). Package-dyed yarn wasintroduced into the warp as marker threads (Plate 7)to enable specimens to be prepared in 10 mm, 20mm, 25 mm, 30 mm, etc, widths according to require-ments. It was obviously important that the dyestuffused should not affect the molecular structure of thecellulose (therefore, reactive dyes were ruled out),neither could they have any biocidal or biochemicalinfluence. A further requirement was that the dyedyarn should be fast to kier boiling, and not 'run' into
Te
100
BO
60
o—40
20
•
cl
cl
0
io
Table 1. Six stages of cellulase enzyme attack on cotton fibres
1. Increase in alkali swelling (18% NaOH)
2. Transverse incipient cracking
3. Loss of tensile strength
4. Lowering degree of polymerization (DP)
5. Increase in alkali solubility (10% NaOH)
6. Loss in weight and production of reducing sugars
Table 2. Shirley Soil Burial Test Fabric
The plain woven cloth contains combed 100% cotton yarns (Amer-ican type cotton, good middling) in a 2-folded form to the followingspecification(Linear density of yarn is given as: yarn count, ie number of840-yd hanks weighing 1lb (Ne), with 's signifying a 2-fold yarn,each component with the given yarn count; weight of yarn in g1000 m-1 (tex) where R indicates that the tex value is for thecombined linear density of 2 single yarns; Z and S conventionsdescribe direction of yarn twist)
Yarn countweight
Singles twist(turns m-1)
Folded twist(turns m-1)
Threads cm-1
'Marker threadsprepared in 10 mm, 20 mm, 25 mm, 30 mm, etc, widths accordingto requirements
20Number of daily treatments
0
1978 fabric(Green marker threads)1
Warp Weft
introduced in the warp enable specimens to be
—0— TS_ (2)
2/32's Ne 2/20's NeR 37.0/2 R 59.0/2
890 Z 630 Z 885 Z 885 Z
750 S 710 S 748 S 748 S
34 17 34 17
— — Weight loss (X)
30
I .—o
1981 fabric(Blue marker threads)1
Warp Weft
2/32's Ne 2/20's NeR 37.0/2 R 59.0/2
30
20
10
Figure 2. Loss in tensile strength (TSL) compared with loss in weight of cotton repeatedly treated with a crudecell-free cellulase preparation

adjacent white threads during preparation of the fabric.It was decided that selected vat dyes would best meetthese requirements, and 2 Imperial Chemical Industrydyes in contrasting colours were finally chosen: Cale-don Jade Green XN and Caledon Dark Brown BR. Yarnwas package-dyed by Tootal Ltd, Sunnyside Works,Bolton, England, and the first lot of fabric was prod-uced in August 1976. The fabric was finished in theShirley Institute's own finishing workroom and, im-mediately, a problem was experienced with bleedingof the green marker threads during the caustic scour.It was quickly established that the cause lay in thereduction of the vat dyestuff to the soluble leuco formassociated with the presence of reducing sugars onthe cloth. The problem was solved by including ResistSalt L (sodium m-nitro benzene sulphonate) (20 glitre-1) in the sodium hydroxide (20 g litre-1) pad-batchSCOW.
When stocks of the first batch of fabric were exhaus-ted, a further 1500 m of fabric were woven in 1981.Different dyes were used for the marker threads, andall the yarns were kier boiled prior to weaving to avoidthe problem of dye bleeding. Thus, the yarn (suppliedby UCO NV, Belgium) was treated by Fountain YarnDyers (Blackburn) Ltd, England, at 130°C for 45 mi-nutes with sodium hydroxide (10 g litre-'), LufibrolKB (BASF West Germany) (4 g litre-1), and Strodex(Dexter Chemicals, England) wetting agent (1 glitre-1). The yarn was cooled to 95°C, washed twicewith water at 95°C containing EDTA (5 g litre-1), warm-washed with acetic acid (0.4 g litre-1), followed by acold and then a warm wash with water. The kierboiling removes any protein in the fibre lumen. Yarnfor the warp marker threads was then dyed by Black-burn Yarn Dyers Ltd, England, with Solanthrene BlueRFS and Solanthrene Brown FR. (For successive clothbatches, the brown thread will be retained, but thesecond dye will be changed to aid recognition. Thenext batch will include red.)
The warp yarns were lightly sized with Courlose (so-dium carboxymethyl cellulose) containing emulsifiedtallow and prepared on to p weaver's beam for weav-ing. The final fabric was scoured and carefully finishedto the required width. The results for residual fatand wax content, obtained by Soxhlet extraction withmethylene chloride, demonstrate the superiority ofthe second method of preparing the fabric, comparedto that used for the earlier fabric (Table 3).
Table 3. Shirley Soil Burial Test Fabric, fat and wax content (ex-tracted with methylene chloride)
13
The fabric is used to assess the activity of cellulolyticmicro-organisms in the soil by tensile tests in the warpdirection, using the accurately spaced marker threadswoven in the fabric to define the specimen width. Forexample, to prepare 20 mm wide test specimens, thefabric is cut along the brown marker threads on eitherside of the pair of 10 mm strips defined by the green/blue marker threads. The specimen is then frayeddown from the cut edges (brown markers), until oneof the pair of green/blue marker ends is removed oneach side; this gives a specimen nominally 20 mmwide (as defined by the green/blue markers), with afringe of 5 mm on each side (as defined by the positionof the brown cut-markers) in relation to the outergreen/blue marker threads. The usual length of theindividual inserted cotton strip specimens is 33 cm,and 10 replicate strips are normally used in the field.In a typical textile laboratory test, 5 specimens weretested (the minimum number allowed in British Stan-dard 2576 (Anon 1986) is 5) to produce the results inTable 4.
Table 4. Shirley Soil Burial Test Fabric. Typical results for tensilestrength (kg 20 mm-1 width)
Tensile strength tests (Anon 1986):Machine - Instron, 0-100 kg range
Gauge length, 20 cmTraverse speed, 5 cm min-1
4 Tensile strength testing of cotton fabricTensile strength has long been accepted as one ofthe more important attributes of a woven textile. Eachof the construction features of a woven cloth affectsthe fabric's tensile strength, but, before consideringthe effects of some of these features, it is importantthat the units and terminology are clearly defined andunderstood.
4.1 Terminology and textile unitsIn defining the following terms relating to the tensilestrength testing of textiles, we have expressed apreference for SI units, but it has to be acknowledgedthat traditional units remain in widespread use in thetextile industry.Load: the application of a load to a specimen in its
axial direction causes a tension to be developed inthe specimen. The derived SI unit of force is thenewton (N), being the force needed to impart anacceleration of 1 m s-2 to a body with a mass of 1

14
kg. It is an invariable quantity. The traditional wayof expressing the load in gram weight (or evenpound weight) is still widely used (it is commonpractice to leave out the word 'weight' and quoteloads simply as kilograms or pounds) but, becauseof variations in gravitational force, a gram weightwill vary in the force it may impart at differentplaces (by about 0.5% as one moves in latitudefrom .00to 900).
Tensile strength or breaking load: the load at whichthe specimen breaks, expressed in newtons (N) orkg, where 1.0 kg = 9.8067 N; 1.0 N = 0.102 kg. Itis essential to define the specimen width for fabricstrength tests.
Stress: the ratio between force applied and the cross-sectional area of the specimen. The preferred SI
' units are kN m-2.Mass stress: because the cross-sections of many
fibres and fabric structures are irregular in shapeand difficult to measure, it is preferable to use thelinear density of the specimen (a dimension relatedto cross-section), expressed in tex, to establish themass stress unit, cN tex-1 (centinewtons per tex).
Tenacity: the mass stress at break (cN tex-1). Express-ing the breaking strengths of different materialsin terms of tenacity permits direct comparisonsbetween materials of varying fineness. To convertthe old units of g tex-1 to cN tex-1, multiply g tex-1by 0.981.
Strain: application of a load to a specimen causes itto stretch by an amount which varies with the initiallength of the specimen; the strain is the ratio of theelongation to the initial length. The shape of thestress versus strain curve for a textile fibre is largelygoverned by its molecular structure. Typical shapesof stress/strain curves for various textile fibres areshown in Figure 3.
Extension: the elongation expressed as a percentageof the initial length.
50
40
30
PolyesterCotton,/
--X-- Nylon 66AcrylicWool
//
/I
i 0 I /.
. ....................................... /
0 10 20 30 40
Strain (X)
Figure 3. Typical shapes of stress/strain curves forvarious textile fibres
Breaking extension: the extension of the specimen atbreaking point.
Initial or Young's modulus: because the overall stress/strain curves of textile materials are not linear, thebreaking stress gives no indication of the mechan-ical behaviour at low loads (low stress) and smallextensions (low strains), which govern how a textilestructure feels, drapes, and deforms. The appropri-ate measure for such small deformations is theinitial or Young's modulus, given by the linear re-lationship between stress and strain in the firstportion of the stress/strain curve where the materialbehaves elastically. The SI unit for initial modulusis the same as for breaking stress, ie N tex-1,but it must be remembered that it is essentially atheoretical value produced by projecting the initialslope of the stress/strain curve to an imaginarystrain of 1.0, and gives much higher numericalvalues than the actual breaking stress.
Work of rupture: the energy or work required to breakthe specimen, given by the area under the stress/strain curve. The work of rupture value is an indi-cation of the resistance of the material to suddenshock.
4.2 Constructional features affecting the tensile propertiesof fabricsWhilst each of the constructional features of a wovenfabric affects tensile strength, some of these featuresare important and obvious, whereas the effects ofothers are negligible or obscure. Certainly, the re-lationship of the strength of a fabric to its constructionis too involved and insufficiently understood in detailto be expressed in a single formula. The followingattempts to indicate briefly some of the more impor-tant relationships between construction and strength.
4.2.1 Fibre quality and fabric weightTwo most important factors are clearly the quality ofthe fibre and the total quantity of cotton fibre in thedirection under test. The integral strength of the fibresin a cross-section of the cloth gives an upper limit tothe strength that could possibly be achieved, but therealized strength of a fabric is usually only about 50%of this figure, because of fib're slippage and irregularityof fibre distribution along the yarn. The integralstrength of the yarns is a more useful guide thanfibre strength, and experience shows that the tensilestrength of fabrics of common construction is usuallybetween 85% and 125% of the integral strength ofall the yarns in the direction tested.
4.2.2 Yarn strengthIn order to examine the relationship between fabrictensile strength and integral yarn strength, imagine atest specimen from which all the crossing threadshave been removed, the longitudinal threads beinggripped as a band between parallel jaws. The threadsfail one by one in order of increasing extensibility asthe jaws are moved apart. The coefficient of variationof single-thread breaking extension of cotton yarns is

typically about 12%. With this amount of variationin breaking extension, a band of threads might beexpected to have a strength of only about 75% of theintegral strength of the threads but, in practice, thestrength of a fabric strip is nearly always considerablygreater because of the presence of the crossingthreads interlaced with the threads under tension.
4.2.3 The effects of the crossing threadsTaylor (1959) discusses in detail 3 effects associatedwith the presence of the crossing threads. Briefly,their presence (i) localizes the rupture, (ii) causescrimping (the bending imposed on yarns by their inter-lacing in a woven structure) of the longitudinal threadsso that they do not lie continuously in the direction ofstress, and (iii) increases the binding of the fibres inthe individual yarns, thereby increasing yarn strength.The first effect can be likened to the band of threadsbeing gripped at short intervals along the length, whichreduces the effective test length, thereby raising theobserved fabric strength by an amount depending onthe tightness of the weave. Yarn in a woven fabricmust be crimped, and the presence of crimp in thelongitudinal threads has been found to decrease thecloth strength ratio (the ratio of fabric strength tothe average single-thread strength multiplied by thenumber of longitudinal threads in the specimen) by anaverage of 1% for each 1% increase in crimp.
4.2.4 Yarn twistFabric strength is related to the twist in the yarnbecause of its influence on yarn strength. The strengthof a spun cotton yarn is, of course, less than theintegral strength of the component fibres in the cross-section of the yarn because of the obliquity of thefibres to the yarn axis, fibre slippage, and the fact thatall the fibres do not break simultaneously.
4.2.5 Threads per metre and yarn countAny increase in the density of a weave will generallytend to improve fabric tensile strength relative to yarnstrength, associated with improved fibre binding, but,if the yarns are already very well bound, as in the casewith folded or highly twisted yarns, the effects maybe small or offset by the accompanying increased yarncrimp.
4.2.6 Effect of weaveThe strongest weaves are generally found to be thosewith the greatest number of intersections in the weaverepeat, ie plain and 2/1 twill. However, the magnitudeof this effect depends on the type of cotton andthe yarn construction; with folded yarns twisted foroptimum yarn strength, the deleterious effect of thegreater yarn crimp associated with the plain weavemight overwhelm any advantages to be gained fromfibre binding.
5 Testing features affecting the results obtained5.1 The effects of humidity and temperatureThe influence of moisture on the mechanical proper-
15
ties of textile materials depends on the type of fibre.Whereas hydrophobic material such as polypropyleneor polyester may be little affected, the hydrophiliccellulose fibres, including cotton, exhibit significantdifferences in their stress/strain properties whentested under dry and wet conditions. A hysteresiseffect on tensile strength is shown during wetting/drying cycles. It is essential to carry out routine testingin a laboratory with a standard atmosphere of 65 ±2% relative humidity and 20 ± 2°C. Sufficient time(24 h) should be allowed for the sample to reachequilibrium with the standard atmosphere before thetests are carried out, and fabric samples for breakingstrength should be preconditioned at a relative hu-midity not exceeding 10% at a temperature of 50°Cfor 4 h and then conditioned in a standard atmospherefor 24 h. (Some users of the cotton strip assay, how-ever, do tensile testing on wet specimens to obviatehumidity control (Wynn-Williams 1988).)
5.2 Test specimen lengthThe breaking load (Si) recorded for a specimen corre-sponds to that of the weakest cross-section along thespecimen's length, ie the position where the aggre-gate strength of the longitudinal threads in the speci-men width is weakest. If the specimen had beentested in 2 halves, 2 breaking loads would have beenobtained, SI and Sz, the mean of which would havebeen higher than SI. Hence, because of this 'weaklink' effect, the apparent tensile strength can be in-creased by testing the material at a shorter gaugelength (ie initial jaw separation).
5.3 Rate of loading and time to breakThe more rapid the rate of loading, the higher thebreaking load. Midgley and Pierce (1926) establishedan empirical relationship between the tensile strengthvalues obtained and the time taken to break the speci-mens (fibres, yarns, and fabrics). The increase instrength amounts to about 10% for a 10-fold decreasein time taken to break the specimen.
6 The mechanics of tensile stength testing machinesThere are 3 basic methods of loading the specimento observe the effects of tensile forces.
6.1 Constant rate of traverse (CRT)When the load is applied on a pendulum lever ma-chine, both jaws move as the load is applied. The rateof loading and the time to break are influenced by theextension of the specimen. The velocity of the upperjaw is less than that of the lower jaw by an amountdependent upon the extensibility of the material.
6.2 Constant rate of loading (CRL)The specimen is gripped in a fixed top jaw and in abottom jaw which is movable. A force is applied at aconstant rate, extending the specimen until it eventu-ally breaks. Clearly, the loading causes the elongation.
16
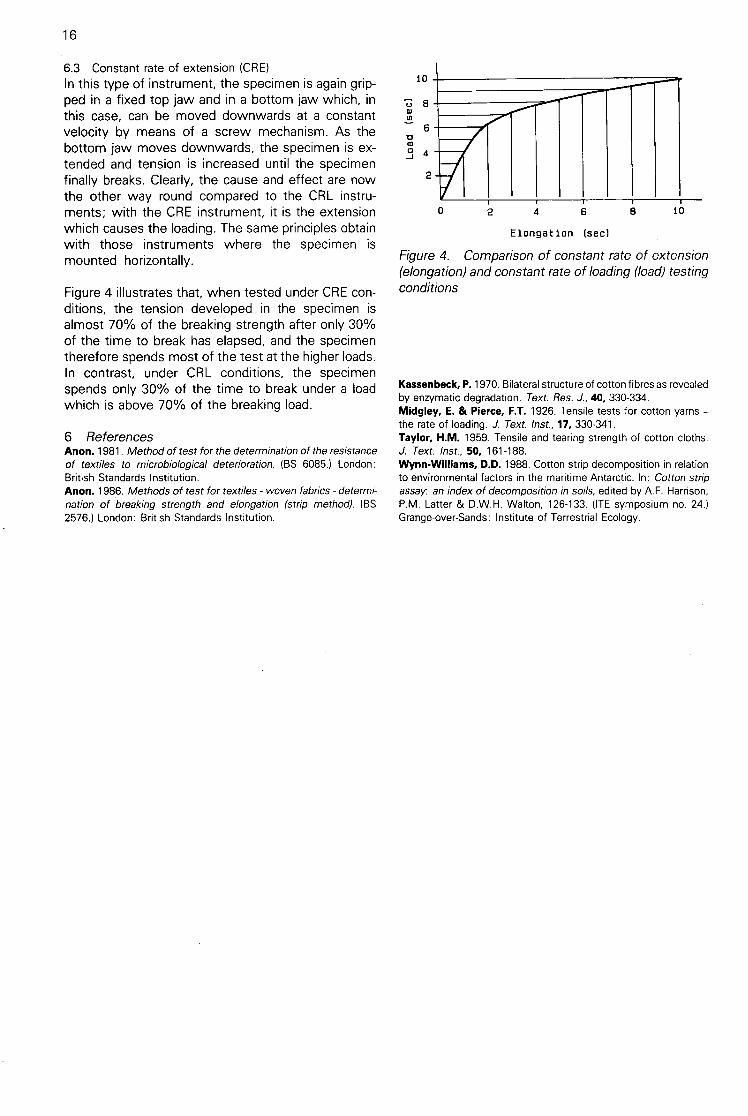
6.3 Constant rate of extension (CRE)In this type of instrument, the specimen is again grip-ped in a fixed top jaw and in a bottom jaw which, inthis case, can be moved downwards at a constantvelocity by means of a screw mechanism. As thebottom jaw moves downwards, the specimen is ex-tended and tension is increased until the specimenfinally breaks. Clearly, the cause and effect are nowthe other way round compared to the CRL instru-ments; with the CRE instrument, it is the extensionwhich causes the loading. The same principles obtainwith those instruments where the specimen ismounted horizontally.
Figure 4 illustrates that, when tested under CRE con-ditions, the tension developed in the specimen isalmost 70% of the breaking strength after only 30%of the time to break has elapsed, and the specimentherefore spends most of the test at the higher loads.In contrast, under CRL conditions, the specimenspends only 30% of the time to break under a loadwhich is above 70% of the breaking load.
6 ReferencesAnon. 1981. Method of test for the determination of the resistanceof textiles to microbiological deterioration. (BS 6085.) London:British Standards Institution.Anon. 1986. Methods of test for textiles - woven fabrics - determi-nation of breaking strength and elongation (strip method). (BS2576.) London: British Standards Institution.
in
In0-1
10
6
4
2
2 4 6 8 io
Elongation (sec)
Figure 4. Comparison of constant rate of extension(elongation) and constant rate of loading (load) testingconditions
Kassenbeck, P. 1970. Bilateral structure of cotton fibres as revealedby enzymatic degradation. Text. Res. J., 40, 330-334.Midgley, E. & Pierce, F.T. 1926. Tensile tests for cotton yarns —the rate of loading. J. Text. Inst., 17, 330-341.Taylor, H.M. 1959. Tensile and tearing strength of cotton cloths.J. Text. Inst., 50, 161-188.Wynn-Williams, D.D. 1988. Cotton strip decomposition in relationto environmental factors in the maritime Antarctic. In: Cotton stripassay an index of decomposition in soils, edited by A.F. Harrison,P.M. Latter & D.W.H. Walton, 126-133. (ITE symposium no. 24.)Grange-over-Sands: Institute of Terrestrial Ecology.
Microbial cellulases and their action on cotton fibres• B F SAGAR
Shirley Institute, Manchester
1 SummaryMicro-organisms producing cellulolytic enzymes arefound amongst the bacteria, the actinomycetes and,particularly, the microfungi. Whereas the ability tobreak down cellulose is very widespread amongstthe latter group of micro-organisms, relatively fewmicrofungi elaborate extracellular enzymes that candegrade highly ordered 'crystalline' cellulose.
It is now well established that the cellulase system,which attacks highly ordered native cellulose, is agroup of enzymes acting in concert, but the actualmechanism of the synergistic action between the so-called C1 and C. components in the cellulase complexremains uncertain. Exhaustive attempts to detectchanges in the fine structure of cotton cellulose,brought about by the individual and combined action ofthe C1 and C. components of the cellulase complexesfrom various microfungi, have confirmed that thishighly ordered substrate is unaffected, unless bothmajor enzyme components are present. The combinedaction of CI and C. appears to be confined to the pairof surfaces of the elementary fibrils in the cotton fibre,which contain cellulose molecules with a specificspatial disposition of the 2, 6- and 2, 3, 6- hydroxylgroups accessible on alternate anhydroglucose unitsalong the chain.
2 IntroductionMany micro-organisms produce extracellular enzymeswhich catalyse the hydrolysis of water-soluble cellu-lose derivatives (eg carboxymethyl- and hydroxyethyl-cellulose of relatively low degrees of substitution) andof highly swollen forms of cellulose (eg phosphoricacid-swollen cellulose), but relatively few producecell-free enzyme preparations that have the abilityto hydrolyse highly ordered crystalline cellulose, astypified by cotton. Notable in this regard are the cel-lulases of Trichoderma viride (Selby & Maitland 1967),T. reesei (Mandels & Reese 1964), T. koningii (Wood1968), Penicillium funiculosum (Selby 1968), Fusariumsolani (Wood 1969), and the basidiomycete Sporotri-chum pulverulentum (Eriksson 1978). Most native lig-nocellulosic materials are diffficult to break downenzymically; enzymolysis is impeded by the presenceof the lignin component and by the morphological finestructure of these materials. Cotton is free from thedifficulties associated with lignin. Nevertheless, therate of enzymolysis of scoured cotton is still relativelyslow because of its highly ordered, hydrogen-bonded,fine structure. Once the cotton fibre has dried in theopened boll, it becomes a most searching substratefor evaluating the efficiency of any cellulase systemand for investigating the mechanism of the cellulaseaction. Inaccessibility of native cotton to the large
17
protein molecules plays a major role in regulating thecellulase action. Compared with hydrolysis by mineralacids, greater losses of weight are observed duringenzymic attack relative to the production of a givennumber of reducing chain ends in the insoluble resi-due. Enzymic breakdown spreads from relativelyfewer points of initial attack.
3 The cellulase complex .Fractionation studies carried out in a number of differ-ent laboratories on cell-free enzyme preparations, ob-tained from highly active cellulolytic microfungimentioned above, have shown the presence of 3different basic types of enzyme in every case (Table1). Considerable effort has been devoted over the pastdecade to the isolation, purification, and characteriza-tion of the Cl, C., and 13-D-glucosidase enzymes, re-sulting in controversy over the role of Cl. These 3components of the cellulase complex achieve thebreakdown of cotton when they act in concert; theylose this ability when separated, but recover it againwhen recombined in their original proportions (Table2). There are now several examples of the C1 corn-
Table 1.The components of the cellulase complex
1. CI: Action still not fully understood. Deaggregates cellulosemolecules on the surface of the elementary fibrils incotton
2. C.: 13-1, 4-glucanases. The 'x' reflects the multiplicity of thesecomponents
i. Exo-enzyme; splits off (a) glucose(b) cellobiose
from the non-reducing chain endsii. Endo-enzyme; acting randomly along the chain. Terminal
linkages more resistant. Hydrolyzes water-soluble cellu-lose derivatives. No action on cotton in absence of CI
3. f3-glucosidasesHydrolyze cellobiose and short-chain oligosaccharides toglucose
Table 2. Synergistic action resulting from recombination of cellulasefractions
Relative cellulase
Component activity (%)
Original solutionCIC.CI + C.
CMC-aseCellobiaseCMC-ase + cellobiaseC1 + CMC-aseC1 + cellobiaseC1 + CMC-ase + cellobiase
100
5102
44<1
23520
104
18
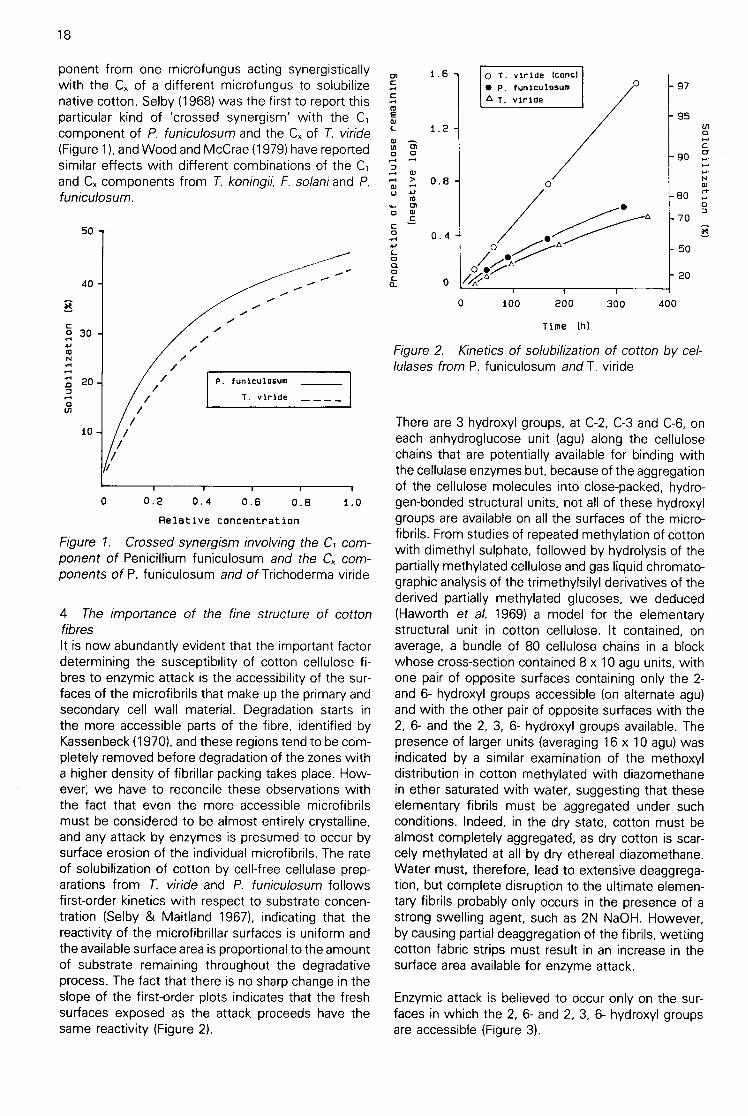
ponent from one microfungus acting synergisticallywith the Cx of a different microfungus to solubilizenative cotton. Selby (1968) was the first to report thisparticular kind of 'crossed synergism' with the C,component of P. funiculosumand the Cx of T. viride(Figure 1), and Wood and McCrae (1979) have reportedsimilar effects with different combinations of the C,and Cx components from T. koningii, F. solaniand P.funiculosum.
50
40
O
•
30
to
n
•
207
0
10 /
P. fun1culosum
T. viride
0.2 0.4 0.6 0.8 1.0
Relative concentration
Figure 1. Crossed synergism involving the C1 com-ponent of Penicillium funiculosum and the C„ com-ponents of P. funiculosum and of Trichoderma viride
4 The importance of the fine structure of cottonfibresIt is now abundantly evident that the important factordetermining the susceptibility of cotton cellulose fi-bres to enzymic attack is the accessibility of the sur-faces of the microfibrils that make up the primary andsecondary cell wall material. Degradation starts inthe more accessible parts of the fibre, identified byKassenbeck (1970), and these regions tend to be com-pletely removed before degradation of the zones witha higher density of fibrillar packing takes place. How-ever, we have to reconcile these observations withthe fact that even the more accessible microfibrilsmust be considered to be almost entirely crystalline,and any attack by enzymes is presumed to occur bysurface erosion of the individual microfibrils. The rateof solubilization of cotton by cell-free cellulase prep-arations from T. viride and P. funiculosum followsfirst-order kinetics with respect to substrate concen-tration (Selby & Maitland 1967), indicating that thereactivity of the microfibrillar surfaces is uniform andthe available surface area is proportional to the amountof substrate remaining throughout the degradativeprocess. The fact that there is no sharp change in theslope of the first-order plots indicates that the freshsurfaces exposed as the attack proceeds have thesame reactivity (Figure 2).
1.6
cotoo.)
•
1.2
mO 0
w0.8
4,
Ti0
C.0a0a.
0.4
0 T. v1r1de (corm)• P. funlculoSum
A T. viride
100
•0
/ • A0 Ilk/.
0
80•
70
50
20
300 400
0 97
95
90
200
Time ((i)
Figure 2. Kinetics of solubilization of cotton by cel-lulases from P. funiculosum and T. viride
Enzymic attack is believed to occur only on the sur-faces in which the 2, 6- and 2, 3, 6- hydroxyl groupsare accessible (Figure 3).
There are 3 hydroxyl groups, at C-2, C-3 and C-6, oneach anhydroglucose unit (agu) along the cellulosechains that are potentially available for binding withthe cellulase enzymes but, because of the aggregationof the cellulose molecules into close-packed, hydro-gen-bonded structural units, not all of these hydroxylgroups are available on all the surfaces of the micro-fibrils. From studies of repeated methylation of cottonwith dimethyl sulphate, followed by hydrolysis of thepartially methylated cellulose and gas liquid chromato-graphic analysis of the trimethylsilyl derivatives of thederived partially methylated glucoses, we deduced(Haworth et al. 1969) a model for the elementarystructural unit in cotton cellulose. It contained, onaverage, a bundle of 80 cellulose chains in a blockwhose cross-section contained 8 x 10 agu units, withone pair of opposite surfaces containing only the 2-and 6- hydroxyl groups accessible (on alternate agu)and with the other pair of opposite surfaces with the2, 6- and the 2, 3, 6- hydroxyl groups available. Thepresence of larger units (averaging 16 x 10 agu) wasindicated by a similar examination of the methoxyldistribution in cotton methylated with diazomethanein ether saturated with water, suggesting that theseelementary fibrils must be aggregated under suchconditions. Indeed, in the dry state, cotton must bealmost completely aggregated, as dry cotton is scar-cely methylated at all by dry ethereal diazomethane.Water must, therefore, lead to extensive deaggrega-tion, but complete disruption to the ultimate elemen-tary fibrils probably only occurs in the presence of astrong swelling agent, such as 2N NaOH. However,by causing partial deaggregation of the fibrils, wettingcotton fabric strips must result in an increase in thesurface area available for enzyme attack.
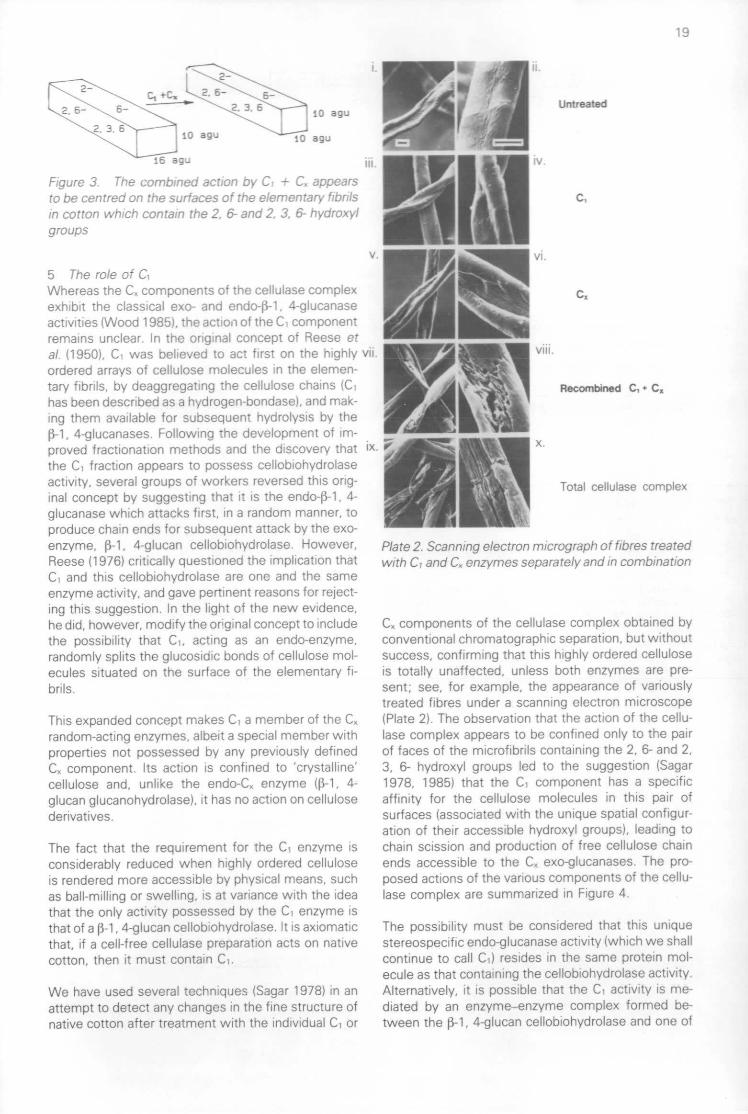
F c_re 3 're eotro -co 3C7 Cr c. 2 — C. acoears
To De centrec or tne s..:tataces17" :re eas:Dtertat
:n cotton thch conta n the 2 a- arc 2 3 6- rayoro,e,tgre0os
5 Tre role o1 C-Whereas the C. components o; :re ceiplase complexexhibit the classical exo- ann enoo-9-1. 4-g acanaseactivities [Wood 1985), the actioa of tne C.- componentremains unclear in me original concept of Reese et
al (19501, C- was pelieven to act first on the highly vii.ordered arrays of cellulose molecules :n the elemen-tary fibrils, by deaggregating the cellulose chains 10 -has been described as a hydrogen-bondasei, and mak-ing them available for subsequent hydrolysis by the
4-glucanases Following the development of im-proved fractionation methods and tne discovery that IX
the C- fraction appears to possess cellobiohydrolaseactivity, several groups of workers reversed this orig-inal concept by suggesting that it is the endo-9-1, 4-glucanase which attacks first, in a random manner, toproduce chain ends for subsequent attack by the exo-enzyme, 9-1, 4-glucan cellobiohydrolase. However,Reese (19761 critically questioned the implication thatCI and this ceHobiohydrolase are one and the sameenzyme activity, and gave pertinent reasons for reject-ing this suggestion. In the light of the new evidence,he did, however, modify the onginal concept to includethe possibility that CI. acting as an endo-enzyme,randomly splits the glucosidic bonds of cellulose mol-ecules situated on the surface of the elementary fi-brils.
This expanded concept makes C a member of the C.random-acting enzymes albeit a special member withproperties not possessed by any previously definedC„ component Its action is confined to 'crystallinecellulose and, unlike the endo-C, enzyme lp-1,4-
glucan glucanohydrolase), it has no action on cellulosederivatives
The fact that the requirement for the Ci enzyme isconsiderably reduced when highly ordered celluloseis rendered more accessible by physical means, suchas ball-milling or swelling, is at variance with the ideathat the only activity possessed by the C enzyme isthat of a 91 4-glucan cellobiohydrolase It is axiomaticthat, if a cell-free cellulase preparation acts on nativecotton, then it must contain CI
We have used several techniques (Sagar 1978) in anattempt to detect any changes in the fine structure ofnative cotton after treatment with the individual CI or
Untreated
CI
cx
Recombined C, • C.
Total cellulase complex
Plate 2. Scanning electron micrograph of fibres treatedwith C, and C, enzymes separately and in combination
C. components of the cellulase complex obtained byconventional chromatographic separation, but withoutsuccess, confirming that this highly ordered celluloseis totally unaffected, unless both enzymes are pre-sent; see, for example, the appearance of variouslytreated fibres under a scanning electron microscope(Plate 2). The observation that the action of the cellu-lase complex appears to be confined only to the pairof faces of the microfibrils containing the 2, 6- and 2,3, 6- hydroxyl groups led to the suggestion (Sagar1978, 19851 that the Ci component has a specificaffinity for the cellulose molecules in this pair ofsurfaces (associated with the unique spatial configur-ation of their accessible hydroxyl groups), leading tochain scission and production of free cellulose chainends accessible to the C, exo-glucanases. The pro-posed actions of the various components of the cellu-lase complex are summarized in Figure 4.
The possibility must be considered that this uniquestereospecific endo-glucanase activity (which we shallcontinue to call CI) resides in the same protein mol-ecule as that containing the cellobohydrolase activity.Alternatively, it is possible that the CI activity is me-diated by an enzyme-enzyme complex formed be-tween the j3-1, 4-glucan cellobiohydrolase and one of
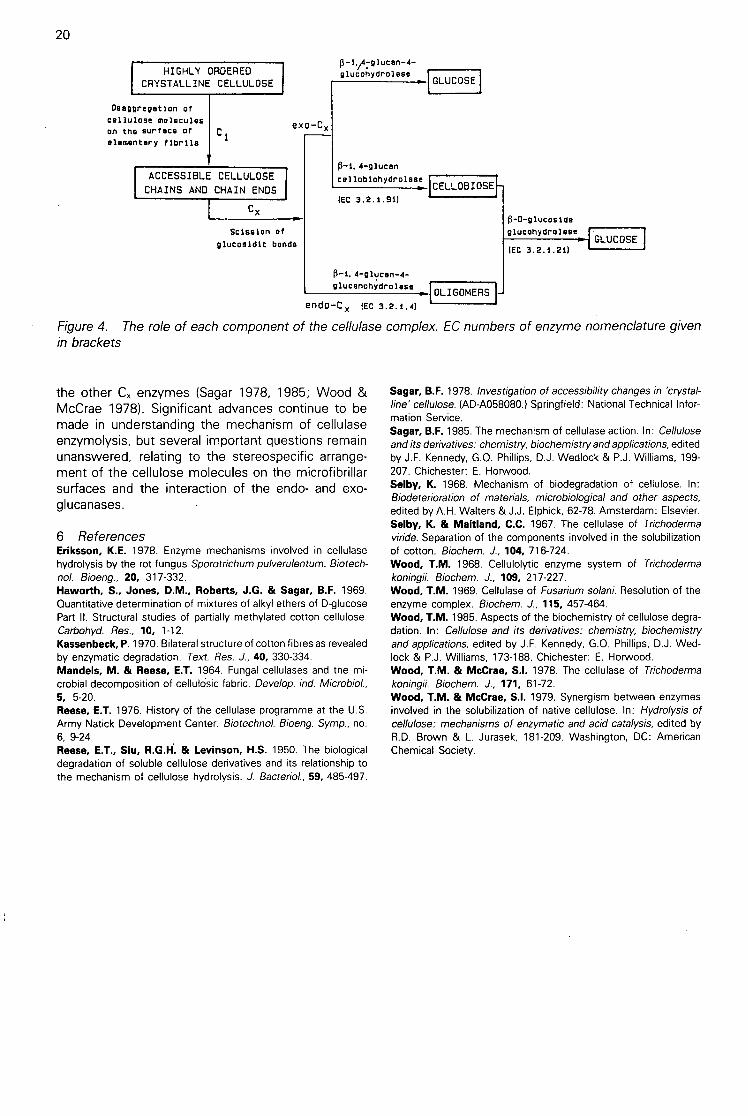
20
HIGHLY ORDEREDCRYSTALLINE CELLULOSE
Desegregation ofcellulose moleculeson the surface of c
1elementary fibrils
ACCESSIBLE CELLULOSECHAINS ANO CHAIN ENOS
Cx
Scission ofglucosidic bonds
exo-Cx
the other Cx enzymes (Sagar 1978, 1985; Wood &McCrae 1978). Significant advances continue to bemade in understanding the mechanism of cellulaseenzymolysis, but several important questions remainunanswered, relating to the stereospecific arrange-ment of the cellulose molecules on the microfibrillarsurfaces and the interaction of the endo- and exo-glucanases.
6 ReferelcsEriksson, K.E. 1978. Enzyme mechanisms involved in cellulasehydrolysis by the rot fungus Sporotrichum pulverulentum. Biotech-nol. Bioeng., 20, 317-332.Haworth, S., Jones, D.M., Roberts, J.G. & Sagar, B.F. 1969.Quantitative determination of mixtures of alkyl ethers of D-glucosePart II. Structural studies of partially methylated cotton cellulose.Carbohyd. Res., 10, 1-12.Kassenbeck, P. 1970. Bilateral structure of cotton fibres as revealedby enzymatic degradation. Text. Res. J., 40, 330-334.Mande Is, M. & Reese, E.T. 1964. Fungal cellulases and the mi-crobial decomposition of cellulosic fabric. Develop. ind. Microbiol.,5, 5-20.Reese, E.T. 1976. History of the cellulase programme at the U.S.Army Natick Development Center. Biotechnol. Bioeng. Symp., no.6, 9-24.Reese, E.T., Siu, R.G.H. & Levinson, H.S. 1950. The biologicaldegradation of soluble cellulose derivatives and its relationship tothe mechanism of cellulose hydrolysis. J. Bacteriol., 59, 485-497.
3-1/-9lucen-4-glucohydrolese
GLUCOSE
D-1.4-elucen
cellobiohydrolaseCELLOBIOSE
(2C 3.2.1AI)
p-O-glucosideglucohydrolese
IECGLUCOSE
4-glucen-4-elucenohYdrolese
endo - C fEC 3.2. i
Figure 4. The role of each component of the cellulase complex. EC numbers of enzyme nomenclature givenin brackets
OLIGOMERS
Sagar, B.F. 1978. Investigation of accessibility changes in 'crystal-line' cellulose. (AD-A058080.) Springfield: National Technical Infor-mation Service.Sagar, B.F. 1985. The mechanism of cellulase action. In: Celluloseand its derivatives: chemistry, biochemistry and applications, editedby J.F. Kennedy, G.O. Phillips, D.J. Wedlock & P.J. Williams, 199-207. Chichester: E. Norwood.Selby, K. 1968. Mechanism of biodegradation of cellulose. In:Biodeterioration of materials, microbiological and other aspects,edited by A.H. Walters & J.J. Elphick, 62-78. Amsterdam: Elsevier.Selby, K. & Maitland, C.C. 1967. The cellulase of Trichodermaviride. Separation of the components involved in the solubilizationof cotton. Biochem. J., 104, 716-724.Wood, T.M. 1968. Cellulolytic enzyme system of Trichoderma
Biochem. J., 109, 217-227.Wood, T.M. 1969. Cellulase of Fusarium solani. Resolution of theenzyme complex. Biochem. J., 115, 457-464.Wood, T.M. 1985. Aspects of the biochemistry of cellulose degra-dation. In: Cellulose and its derivatives: chemistry, biochemistryand applications, edited by J.F. Kennedy, G.O. Phillips, D.J. Wed-lock & P.J. Williams, 173-188. Chichester: E. Norwood.Wood, T.M. & McCrae, S.I. 1978. The cellulase of Trichoderma
Biochem. J., 171, 61-72.Wood, T.M. & McCrae, S.I. 1979. Synergism between enzymesinvolved in the solubilization of native cellulose. In: Hydrolysis ofcellulose: mechanisms of enzymatic and acid catalysis, edited byR.D. Brown & L. Jurasek, 181-209. Washington, DC: AmericanChemical Society.

Standardization of rotting rates by a linearizingtransformationM 0 HILL', P M LATTER' & G BANCROFT3'Institute of Terrestrial Ecology, Monks Wood Experimental Station, Huntingdon2Institute of Terrestrial Ecology, Merlewood Research Station, Grange-over-Sands3Aynsome Laboratories, Grange-over-Sands
1 SummaryLinearization is a mathematical technique for inferringprocess rates from an observed response variablethat, under constant conditions, does not change lin-early with time. Experiments have shown that, underconstant conditions, tensile strength of buried cottoncloth changes according to the relation:
y = yo/ (1 + (CRR.t)3)
where yo and y are initial and final tensile strength, tis time, and CRR is the cotton rotting rate. In soilinsertion tests, the initial and final tensile strengths(TS) of cotton are known, so the loss (CTSL) can becalculated, and CRR yr-1 may be estimated from theformula:
CRR = 3 (CTSL/final TS) x 365 / t
where t is the duration of insertion in days. Thus, usingCRR, degradation rates can be manipulated freely, egto derive a mean annual value, time to 50% CTSL (alsoused for estimating retrieval time), or a temperatureresponse coefficient 010.
2 IntroductionWhen a cotton strip is inserted in a particular soil, thereason commonly given is that the research workeraims to determine the potential for cellulose degra-dation under particular environmental conditions.
This vague answer requires elucidation. By 'potential'is meant the potential rate, which assumes that thereis such a thing as a general rate of cellulose degra-dation. In one sense, a generalized rate is a meaning-less hypothetical construct; much depends on howcellulose is presented to decomposer organisms inthe soil. However, if, to a reasonable approximation,the rate for one type of substrate is a multiple of thatfor another, then results for the rate of degradation ofa cotton strip could be generalized to materials suchas leaves and rotten wood.
Underlying this idea is a multiplicative model (cf Swiftet al. 1979, p259). In symbols:
R(T, M, Q,...) = const x f(T) x f(M) x f(Q) x
where R is the rate of the decomposition process, andT, M, 0, .. are variables such as temperature, moistureand substrate quality, which determine the value of
21
R. The advantage of the cotton strip method for soilassay is that it fixes the value of f(Q), allowing theeffects of the other variables to be determined moreaccurately.
3 Need for linearizationUnfortunately, the cotton strip assay does not lenditself naturally to the definition of a process rate, R, incontrast, for example, with respirometry, for whichthe rate of oxygen uptake defines a natural measureof the rate at which the process is occurring. Thepurpose of linearization is to convert an arbitrary re-sponse variable, which might be tensile strength loss,mass loss, FDA hydrolysis (Smith & Maw 1988), orsome such factor, to a derived variable that changeslinearly with time.
It is instructive to consider an analogous problemfamiliar to ecologists, namely how to define a processrate for the decay of organic matter in litter bags.Suppose that 100 g of litter are placed in a bag andthat, after one year, 50 g remain. This phenomenonwould very likely be described by saying that thedecay rate:
Underlying this description is a model of decay underconstant conditions, namely that the proportional rateof loss is constant.
In symbols:
k = loge (100/50) = 0.69 g yr-1
Y = yoexp(—kt)
where y is the measured response variable (massremaining in the bag), and k is a constant for thoseenvironmental conditions, called the decay rate.
Now, it is well known that, under field conditions,the actual instantaneous rate of decay will vary inresponse to temperature, moisture, and other environ-mental influences. The decay rate, k, is thus not inreality a constant, but an estimate of the average rateof decay over the year. This average value can betreated as a constant feature of the site, because thebetween-year variation will usually be small comparedto seasonal variation within a year.
To estimate k, we take logarithms:
k = loge (yo/y)/t
22
Note that loge is the inverse function of exp, ie if y =exp(x), then x = loge(y). Thus, the process rate, k, isestimated by using the inverse function (loge) of thefunction (exp) which defines the change in y underconstant conditions.
In order to perform a linearizing transformation of thiskind, one essential condition must apply, namely that,under constant conditions,
y/yo = f(Rt)
where R is a rate pbrameter and f is some function.In other words, the shape of the curves describingvariation in y over time must be independent of theexperimental conditions, although the rate at whichthings happen (ie the parameter R) may vary. If theshape of the curve f(x) is known, then it is possible toestimate the rate parameter from the equation
R = f-1(y/y0) / t
where f--1 denotes the inverse function of f.
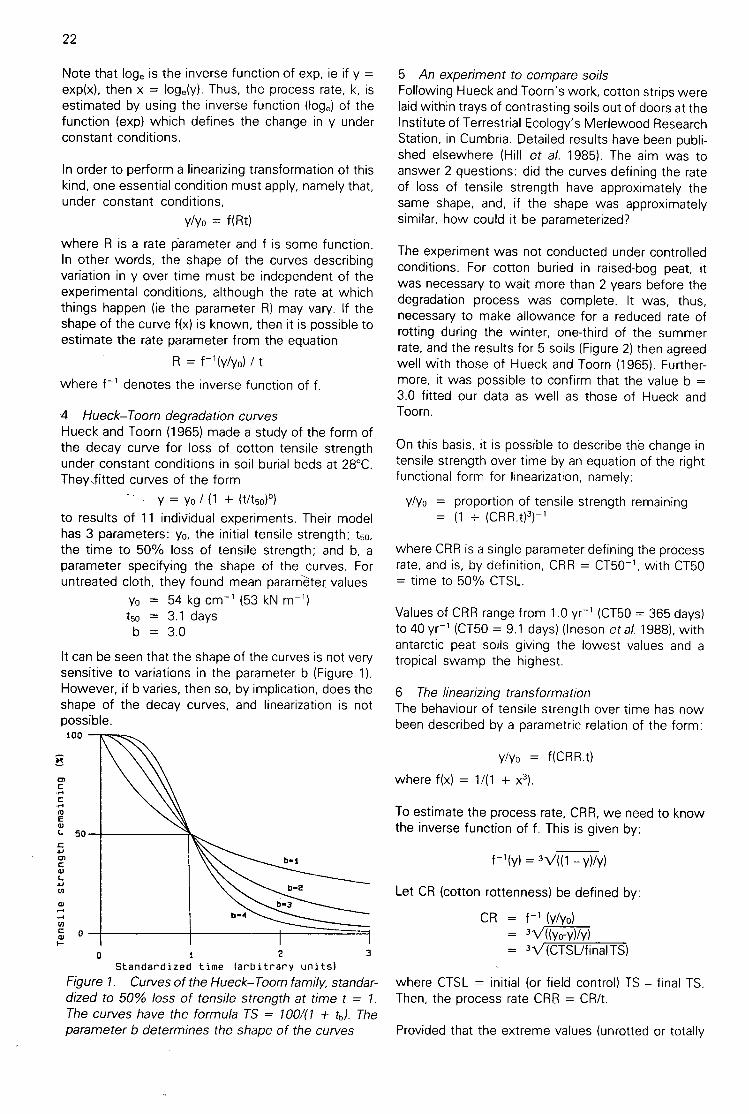
4 Hueck-Toorn degradation curvesHueck and Toorn (1965) made a study of the form ofthe decay curve for loss of cotton tensile strengthunder constant conditions in soil burial beds at 28°C.They.fitted curves of the form
y = yo (1 + (t/t5o)b)to results of 11 indiVidual experiments. Their modelhas 3 parameters: yo, the initial tensile strength; t50,
the time to 50% loss of tensile strength; and b, aparameter specifying the shape of the curves. Foruntreated cloth, they found mean param-dter values
yo = 54 kg cm-1 (53 kN m-1)t5o = 3.1 daysb = 3.0
It can be seen that the shape of the curves is not verysensitive to variations in the parameter b (Figure 1).However, if b varies, then so, by implication, does theshape of the decay curves, and linearization is notpossible.100
b-4
b 1
b 3
b2
2 3Standardized time (arbitrary units)
Figure 1. Curves of the Hueck-Toorn family, standar-dized to 50% loss of tensile strength at time t = 1.The curves have the formula TS = 1001(1 + tb). Theparameter b determines the shape of the curves
5 An experiment to compare soilsFollowing Hueck and Toorn's work, cotton strips werelaid within trays of contrasting soils out of doors at theInstitute of Terrestrial Ecology's Merlewood ResearchStation, in Cumbria. Detailed results have been publi-shed elsewhere (Hill et al. 1985). The aim was toanswer 2 questions: did the curves defining the rateof loss of tensile strength have approximately thesame shape, and, if the shape was approximatelysimilar, how could it be parameterized?
The experiment was not conducted under controlledconditions. For cotton buried in raised-bog peat, itwas necessary to wait more than 2 years before thedegradation process was complete. It was, thus,necessary to make allowance for a reduced rate ofrotting during the winter, one-third of the summerrate, and the results for 5 soils (Figure 2) then agreedwell with those of Hueck and Toorn (1965). Further-more, it was possible to confirm that the value b =3.0 fitted our data as well as those of Hueck andToorn.
On this basis, it is possible to describe the change intensile strength over time by an equation of the rightfunctional form for linearization, namely:
y/yo = proportion of tensile strength remaining= (1 + (CRR.t)3)-1
where CRR is a single parameter defining the processrate, and is, by definition, CRR = CT50-1, with CT50= time to 50% CTSL.
Values of CRR range from 1.0 yr-1 (CT50 = 365 days)to 40 yr-1 (CT50 = 9.1 days) (Ineson et al. 1988), withantarctic peat soils giving the lowest values and atropical swamp the highest.
6 The linearizing transformationThe behaviour of tensile strength over time has nowbeen described by a parametric relation of the form:
y/yo = f(CRRt)
where f(x) = 11(1 + x3).
To estimate the process rate, CRR, we need to knowthe inverse function of f. This is given by:
f-1(y) = 3V((1 — y)/y)
Let CR (cotton rottenness) be defined by:
CR = f-1 (y/yo) = 3 V((y0-y)/y)
= 3V(CTSLIfinal TS)
where CTSL = initial (or field control) TS - final TS.Then, the process rate CRR = CR/t.
Provided that the extreme values (unrotted or totally

100
75
50
25
100
75
50
25
0 -- •20
o-O-Cr Cb.bos..1.
0 .01Vo't
Ps
P. V,
'ON.%
• 0- Cm
• 8-12 cm• 16-20 cm
5 10
T I me ( weeks
••••\
rotted) of y/yo were avoided, independent estimatesof CRR were consistent for each soil, with a coefficientof variation of 11%. However, for values of y/yo outsidethe range 0.1-0.9, estimates of CRR were much lessreliable, as also discussed by Walton (1988). As a testof the linearizing transformation, CR was estimatedfrom CTSL after differing periods of burial (Figure 3).
15 20
O 1-limestone• Clay
o Sand
• Podzal
• Peat
Standardized time (arbitrary units)
Figure 2. Loss of tensile strength in relation to time in trays of soil at 1TE's Merlewood Research Station. Thecurve for each type of soil has been standardized by adjusting the timescale, so that, as far as possible, thecurves lie on top of one another. Allowance has also been made for a reduced rate of rotting in winter (cf Hillet al. 1985)
It is now recommended that CRR should be expressedin annual units, even if CT50 is as low as 3 days, whichis the sort of value obtained from soil burial beds at30°C. If CT50 = 3 days, then CRR = 365/CT50 = 122yr-1. This value may be compared directly with theslower rate of 21 yr-1 obtained out of doors at 14°C,suggesting that 010 for the process rate is about 3.0.
2
2 3
5 10
T I me (weeks)
15 20
23
Figure 3. Loss in tensile strength in relation to time in soil in a field experiment at Gisburn Forest, Lancashire(Brown & Howson 1988). Combined data for 4 monoculture plots are presented as unlinearized (CTSL %) andlinearized.(CR) according to formula in text

24
7 ApplicationsGiven the linearizing transformation, attention can befocused on the results of cotton strip assays, and theirinterpretation. In particular, it is possible to estimatean annual rate of rotting for a site, based on a numberof individual observations. Suppose that strips areburied at 4-monthly intervals, say on 1 January, 1 Mayand 1 September, and recovered after 6 weeks. If theseasonal rates of rotting, CRR, are 3 yr-1 for January,5 yr-1 May and 8 yr-1 September, then an estimate ofthe mean annual value is (3 + 5 + 8)/3 = 5.3 yr-1. Themeaning of this value is that, if each strip were leftin place until it had reached 50% CTSL, and thenwithdrawn and replaced by a fresh one, 53 stripswould be decomposed in 10 years. This annual valueallows a direct comparison with arctic sites, where itis possible to leave a single set of strips buried for awhole year before recovery.
A mean result can also be calculated for a sequentialsampling series, where strips are inserted at one timebut removed at several time intervals (provided thatthe means for any one removal date are within therange 10-90% CTSL).
The optimum retrieval time of approximately 50% lossis easily estimated using a CT50 calculated for a setof test control samples at a certain time t, where:
days to 50% CTSL =days at time t
CR at time t
Using the linearized process rate, CRR, it is also poss-ible to define a temperature response 010 for de-composition. If observations are available from testsat differing temperatures, and if the soils are not
too different, then the decomposition rate may beexpected to show a roughly exponential temperatureresponse:
ie loge CRR =(Q10)/10 x T.
CRR = constant x 010(T/10)
constant + loge CRR = constant + log.
In other words, if the slope of the regression of logeCRR on temperature is b, then:
010 = exp (10 x b)
8 ReferencesBrown, A.H.F. & Howson, G. 1988. Comparison of cellulose de-composition in stands of 4 tree species using cotton strips. Biol.Fertil. Soils. In press.Hill, MD., Latter, P.M. & Bancroft, G. 1985. A standard curve forinter-site comparison of cellulose degradation using the cotton stripmethod. Can. J. Soil Sci., 65, 609:619.Hueck, H.J. & Toorn, J. van der. 1965. An inter-laboratory exper-iment with the soil burial test. Int. Biodeterior. Bull., 1, 31-40.Meson, P., Bacon, P.J. & Lindley, D.K. 1988. Decomposition ofcotton strips in soil: analysis of the world data set. In: Cotton stripassay an index of decomposition in soils, edited by A.F. Harrison,P.M. Latter & D.W.H. Walton, 155-165. (ITE symposium no. 24.)Grange-over-Sands: Institute of Terrestrial Ecology.Smith, R.N. & Maw, J.M. 1988. Relationships between tensilestrength and increase in metabolic activity on cotton strips. In:Cotton strip assay an index of decomposition in soils, edited byA.F. Harrison, P.M.Latter & D.W.H. Walton, 55-59. (ITE symposiumno. 24.1 Grange-over-Sands: Institute of Terrestrial Ecology.Swift, M.J., Heal, 0.W. & Anderson, J.M. 1979. Decompositionin terrestrial ecosystems. Oxford: Blackwell Scientific.Walton, D.W.H. 1988. The presentation of cotton strip assay re-sults. In: Cotton strip assay an index of decomposition in soils,edited by A.F. Harrison, P.M. Latter & D.W.H. Walton, 28-31. (ITEsymposium no. 24.) Grange-over-Sands: Institute of TerrestrialEcology.

Some statistical problems in analysing cotton stripassay dataD K LINDLEY and D M HOWARDInstitute of Terrestrial Ecology, Merlewood Research Station, Grange-over-Sands
1 SummaryThe statistical methods suitable for data derived fromcotton strip assay are those which are also appropriatefor soil profile data, and the problems encountered aresimilar. Precision can be increased by using stratifiedsampling for survey work and blocking for designedexperimental studies. The need for adequate repli-cation of the experimental plots, rather than increasingthe number of replicate strips, is emphasized. Re-peated measurement techniques will be required toanalyse depth and time effects, and multiple re-gression may help to explain differences betweensites.
2 /ntroductionSome of the statistical problems in analysing datafrom the cotton strip assay are inherent, whilst someare enlarged by the observer or experimenter. Thedistinction between these 2 types is made becausethe observer obtains the information by a survey ap-proach, whereas the experimenter collects the infor-mation from a designed experiment.
The problems can be grouped under the followingheadings: •
i. within site variability;ii. problems with depth and time;iii. the use of appropriate experimental designs;iv. use of the global approach in bringing diverse data
together.
3 Within-site variability in surveysThe survey approach to cotton strip assay studies insoil suggests a situation where a number of strips areplaced at random on a site and the scientist is onlyconcerned with an average measure of loss of tensilestrength. A mean and standard error are initially calcu-lated for a specific site. Inspection of the first 78 setsof data collected together for the Workshop shows ahigh degree of variability on many sites. Using thecoefficient of variation (CV), SD/S, as the measure ofvariability and looking at the top and bottom of stripsonly, Figure 1 shows the distributions of the 2 sets ofCVs. The top substrips show more variability thanthose from the bottom substrips, and some extremelyvariable sites have been encountered. The CV has nouse in testing or estimating, but does provide a basisfor appreciating the precision possible in an exper-iment, thereby aiding decisions on the size of thesample and allowing for comparisons of variability.
Because of the considerable variation encountered in
Top
0
Bottom
15
10
25
20 40 60 80 100 >110
Coefficient of variation (%)
Figure 1. Histograms of coefficients of variation of topand bottom substrips of 78 decomposed cotton strips
the past on individual sites, it may be possible, in anyfuture work, to group the sampling points into strata,in such a way that variation within a stratum can beexpected to be less than variation between the strata.If successful, this method will increase the precisionby which the site means can be measured.
4 Experimental designAt the start of every experiment, the question to beanswered must be clearly defined. In other words, theexperiment must always have a preliminary idea or ahypothesis to test. For example, the question may be:'do the conditions of felling and not felling affect thedecomposition rate of cotton strips inserted in thesoil?' Some thought must also be given to the popu-lation of interest, so that the conclusions drawn arenot used outside this population.
Ineson et al. (1988) noted that there are a large numberof sets of data available about which there is know-ledge of variability. This knowledge should, if possible,be used to help in the design of experiments. Isthere any point in carrying out an experiment withinadequate replication in which, because of the in-herent variability of the data, it is impossible to detectdifferences between treatments? This approach couldbe justified, if the experiment was planned as a pilottrial.
4.1 ExampleThe critical point about the importance of adequatereplication can be illustrated by the following example.
26
It is assumed that there are 2 treatments, felling (F)and not felling (NE), and that these 2 treatments (t)have both been allocated to 3 blocks (r). A block, bydefinition, is a physical unit containing one completereplication of treatments. Plots within blocks must behomogeneous and differences between blocks madeto account for as much as-possible of the systematicvariation between plots.
Five cotton strips (s) can be randomly placed in the 6experimental plots so that the 30 cotton strips inthe field form the experiment. On completion of theexperiment, the following data were produced (Table1). The grand mean is a tensile strength of 16.40. Fortreatment F, the mean is 19.29, and for NF it is 13.51.Can the differences between the 2 treatments bedetected? Table 2 presents a skeleton analysis ofvariance (Steel & Torrie 1980).
Table 1. Example of a cotton strip assay data set prior to analysis
Treatment
Fellingreplicate
Not fellingreplicate
Source of variation
BlocksTreatmentsExperimental errorSampling error
Total
1 23.672 25.283 25.634 10.925 13.22
BlocksIl
19.9917.179.34
19.9923.18
21.7415.2516.9622.8724.19
/ 98.72 89.67 101.01
19.74
1 18.672 8.003 7.134 13.905 15.60
/ 63.30
12.66
Table 2. Skeleton analysis of variance
17.93 20.2 RF = 19.29
11.898.08
14.4518.328.25
17.9011.9814.3621.0413.13
60.99 78.41
12.20 15.68 RNF = 13.51
Degrees offreedom
212
24
29
The F ratio or variance ratio used to detect whether ornot there is a significant difference is the ratio of thetreatment MS/experimental error MS, in this case250.56/4.11 = 60.92. At the 5% level, the level in theF tables is 18.51. Therefore, the result is significant.It is important to note that analysis of variance is astatistical technique for testing differences between 2or more treatment means. If the analysis is reworked,based on the means, the skeleton analysis shown in
Table 3 is obtained. The degree of significance is thesame.
Table 3. Skeleton analysis of variance based on means
Degrees ofSource of variation freedom
BlocksTreatmentsExperimental error
Total
212
rt-1 5
The important statistical point to observe is that, bytaking 5 samples within each plot, the experimental(treatment) replication has not been increased.
It would have been more satisfactory to deploy the30 cotton strips over 5 blocks, with 3 strips allocatedto each plot. In this way, the replication of the treat-ments has been increased from 3 to 5. The degreesof freedom for the experimental error would then risefrom 2 to 4. However, it is recommended that thedegrees of freedom for experimental error should be10-20.
5 Problems with depth and timeWhen analysing the results of surveys and designedexperiments using cotton strip assay, the structureof the sources of variation is often oversimplified.Simplification is usually one of 2 types: (i) analysingfactorial experiments as if completely randomized,and (ii) ignoring the correlations of errors induced bysampling the same cotton strip at different depths.The first type of mistake leads to distorted probabilitiesin making inferences about either treatment or depthfactors. The second type constitutes a serious mistakeonly if the correlations are not homogeneous betweendepths, and affects only the tests for differences be-tween depths.
The method for analysing data which lack indepen-dence has been presented in a number of sources(Winer 1971; Gill & Hafs 1971). An appropriate analy-sis of variance is that for a split-plot design, as compari-sons between treatments (between cotton strips) arefree to vary more than comparisons between depths(within cotton strips).
For an effect lacking independence (depth or interac-tions), the degrees of freedom for both numerator anddenominator of the global F tests (eg 'all levels areequal' vs 'at least 2 differ') should be multiplied by acorrection factor, epsilon (Greenhouse & Geisser1959). However, Boik (1981) has shown that the ad-justment is limited to global F tests and should not beused for specific contrasts. He recommended testingeach contrast against its own variance. Barcikowskiand Robey (1984) recommended also using partitionederrors in a posteriori tests.

During the course of the Workshop, we will haveseen several examples of how the cotton strip assayperforms over time. Marked seasonal trends havebeen detected on several sites (Brown & Howson1988; Lawson 1988). In these situations, a number ofcotton strips would have been sampled at specifiedtimes throughout the season, and a site mean prod-uced for each time. If there are several sites and thequestion is whether there are differences betweenthe trends at different sites, it may be possible tosubdivide the main effect of time into polynomialcomponents and to test whether they have a signifi-cant interaction with sites.
6 Use of the global approach in combining diversedataIn decomposition studies of cotton strips in the tundra,Heal et al. (1974) successfully used the techniques ofmultiple regression and principal component analysisto 'explain' tensile strength losses on 24 sites. How-ever, we have no means of knowing, from their paper,whether their predictive equation would be successfulif it were applied to an independent set of data. In theintervening interval since 1974, their equations havebeen used on another data set (Smith & Walton 1988),and possibly also by other workers.
A major problem in combining diverse data sets is thedifficulty in obtaining a complete data set. It is one ofthe benefits of the Workshop that an attempt can bemade to construct a useful data set. lneson et al.(1988) demonstrate the application of multiple re-gression techniques to the data from the Workshop.
If sufficient complete sets can be assembled, it wouldbe valuable to construct predictive multiple regressionmodels for the major geographical regions, eg tundra,tropics, temperate zone, etc. Provided that these mo-dels can be successfully assembled, then we shouldbe able to test for differences between the regions.A useful approach to adopt would be a detailed studyof the residuals, ie the difference between the ob-served and predicted value for each site. Extremevalues, either positive or negative, could be examinedin detail, and further clues might emerge to explainany large difference obtained at that site.
27
7 ConclusionsIn this broad review, we draw attention to some stat-istical problems raised in the collection and analysisof cotton strip assay data. It has been noted that ahigh degree of variability can be expected when cottonstrips are laid down on individual sites. Notice shouldbe taken of this variability when organizing surveys anddesigning experiments, so that they are adequatelyreplicated. Multiple regression techniques are sug-gested as being one of the better ways of comparingdata from diverse sources, in spite of all the difficultieslikely to be encountered in obtaining a complete dataset.
8 ReferencesBarcikowski, R.S. & Robey, R.R. 1984. Decisions in single grouprepeated measures analysis: statistical tests and three computerpackages. Am. Statistn, 38, 148-150.Brown A.H.F. & Howson G. 1988. Changes in tensile strength lossof cotton strips with season and soil depth under 4 tree species.In: Cotton strip assay an index of decomposition in soils, editedby A.F. Harrison, P.M. Latter & D.W.H. Walton, 86-89. (ITE sym-posium no. 24.) Grange-over-Sands: Institute of Terrestrial Ecology.Boik, R.J. 1981. A prioritests in repeated measures designs: effectsof nonsphericity. Psychometrika, 46, 241-255.Gill, J.L. & Hafs, H.D. 1971. Analysis of repeated measurementsof animals. J. Anim. Sci., 33, 331-336.Greenhouse, S.W. & Geisser, S. 1959. On methods in the analysisof profile data. Psychometrika, 24, 95-112.Heal, 0.W., Howson, G., French, D.D. & Jeffers, J.N.R. 1974.Decomposition of cotton strips in tundra. In: Soil organisms anddecomposition in tundra, edited by A.J. Holding, OW. Heal, S.F.MacLean & P.W. Flanagan, 341-362. Stockholm: Tundra BiomeSteering Committee.Ineson, P., Bacon, P.J. & Lindley, D.K. 1988. Decomposition ofcotton strips in soil: analysis of the world data set. In: Cotton stripassay. an index of decomposition in soils, edited by A.F. Harrison,P.M. Latter & D.W.H. Walton, 155-165. (ITE symposium no. 24.)Grange-over-Sands: Institute of Terrestrial Ecology.Lawson G.J. 1988. Using the cotton strip assay to assess organicmatter decomposition patterns in the mires of South Georgia. In:Cotton strip assay an index of decomposition in soils, editedby A.F. Harrison, P.M. Latter & D.W.H. Walton, 134-138. (ITEsymposium no. 24.) Grange-over-Sands: Institute of TerrestrialEcology.Smith, M.J. & Walton, D.W.H. 1988. Patterns of cellulose de-composition in four subantarctic soils. Polar Biol. In press.Steel, R.G.D. & Torrie, J.H. 1980. Principles and procedure ofstatistics. A biometrical approach. New York: McGraw-Hill.Winer, B.J. 1971. Statistical principles in experimental design. NewYork: McGraw-Hill.
28
The presentation of cotton strip assay resultsD W H WALTONBritish Antarctic Survey, Cambridge
1 SummaryThe decomposition of cotton strips in the soil is meas-ured by a change in the tensile strength (TS) of samplesubstrips comprised of a standardized number of cot-ton threads. The development of the assay is dis-cussed in Latter and Walton (1988). A variety oftechniques have been used to present such tensilestrength data. This paper illustrates some of them andcomments on their effectiveness.
2 Tabulated dataTabulation of data is a common method of presen-tation. Older data were often obtained in pounds,but modern tensile strength testers (tensometer) givebreaking strain in kilograms or newtons (N) (conversionconstant 1 kg = 9.806 N).
Raw data are not easy for the reader to interpret. It issuggested that any data presented in tables shouldbe for tensile strength lost from cotton cloth (CTSL),or tensile strength remaining, given as percentagechange from initial TS (Table 1), or a control value.Table legends should state if percentages are derivedfrom mean or median values, and give the number ofreplicates and the control TS value. Percentagesbased on means provide a good indication of thedirection of change and allow immediate comparisonsbetween different sites, but give no indication of themicrosite variability in decomposition characteristic ofeach site.
Table 1. The mean tensile strength loss (%) of Shirley Soil BurialTest Fabric for 9 depths, in a sub-antarctic peat soil over a period
*Data sets used for Table 2
One method of standardizing to aid comparability is toconvert the basic data to a single standard time base,eg per day, per month, per 100 days, per year. How-ever, when the base period and standard period differconsiderably, the recalculated data can be misleadingbecause of seasonal variability. Table 2 illustratesanother effect of this type of recalculation. The calcu-lated percentage CTSL for any assay period at the
Table 2. Mean tensileTest Fabric calculatedstandard time periods3 sample periods in a
75
50
25
0
strength loss (CTSL %) of Shirley Soil Burialfor 2 depths (0-2 cm and 21-23 cm)* and 3(per day, month and year)*, using data fromsub-antarctic peat soil
*Using data as indicated in Table 1
lowest soil level, based on a sampling period of 9weeks, was 2.9 times that based on 56 weeks sam-pling (226-81% per year), whereas data for the uppersoil level were surprisingly similar for all assay peri-ods, ie per day 0.16-0.17%, per month 5.0-5.2%, peryear 56.5-61.8%. Thus, CTSL at this site seemed tobe proportional with time at the top of the soil profile,but at the base the usual curvilinear relationship ap-plied.
3 Graphical presentationFor clarity of presentation, figures should not containtoo many lines. The data in Table 1 can be showngraphically, but only about 5 of the soil profile depthscan be presented in a single figure without the illus-tration becoming too complex (Figure 1). Where dataare limited and a clear indication of mean variability isrequired, this type of presentation may be the bestchoice.
100
0
Figure 1. Meandecomposition, oBurial Test Fabricsoil (n = 8)
O 0- 2 cwA 3- 5 cmO 6- 8 cmo 9-11 cmX 12-14 cm
20 40 60
T [me (weeks)
changes in tensile strength, due tof 2 cm wide strips of Shirley Soilat 5 depths in a sub-antarctic peat
16
24

30
50
Figure 3. Examples of 3-dimensional presentation of tensile strength loss with depth and time for (i) a sub-antarctic peat and (ii) a temperate forest soil (Brown & Howson 1988)
Sequential series of assays at 6-week intervals
0
5
10
15
20
0
0
15200
100 Time (days)
C R R yr-1
300
1 2 3 4 5 6
CTSL CRR• 0 Gross ondA A Moss bonk
•Illre
* Dworr shrub
400
0 25 50 75 100 125 150
C TSL (kg yr-1)
Figure 4. Tensile strength loss plotted as kg yr-1 and as cotton rotting rate (CRR yr-1) for 4 sub-antarctic soils.Note that both mire and dwarf shrub show exaggerated CRR patterns due to the inclusion of almost completelydecomposed cotton strips
5 ReferencesBrown, A.H.F. & Howson, G. 1988. Changes in tensile strengthloss of cotton strips with season and soil depth under 4 tree species.In: Cotton strip assay-. an index of decomposition in soils, editedby A.F. Harrison, P.M. Latter & D.W.H. Walton, 86-89. (ITE sym-posium no. 24.) Grange-over-Sands: Institute of Terrestrial Ecology.Hill, M.O., Latter, P.M., & Bancroft, G. 1988. Standardization ofrotting rates by a linearizing transformation. In: Cotton strip assayan index of decomposition in soils, edited by A.F. Harrison, P.M.Latter & D.W.H. Walton. 21-24. (ITE symposium no. 24.) Grange-over-Sands: Institute of Terrestrial Ecology.
31
Latter, P.M. & Walton, D.W.H. 1988. The cotton strip assay forcellulose decomposition studies in soil: history of the assay anddevelopment. In: Cotton strip assay. an index of decomposition insoils, edited by A.F. Harrison. P.M. Latter & D.W.H. Walton, 7-10.(ITE symposium no. 24.) Grange-over-Sands: Institute of TerrestrialEcology.Lawson, G.J. 1988. Using the cotton strip assay to assess organicmatter decomposition patterns in the mires of South Georgia. In:Cotton strip assay. an index of decomposition in soils, editedby A.F. Harrison, P.M. Latter & D.W.H. Walton. 134-138. (ITEsymposium no. 24.) Grange-over-Sands: Institute of TerrestrialEcology.
32
The problem of cementationD D FRENCHInstitute of Terrestrial Ecology, Banchory Research Station, Banchory
1 SummaryUnder certain soil conditions, cotton strips may be-come 'cemented' and this may increase their meas-ured tensile strength from its 'true' (uncemented)value. Two kinds of cementation, concretion (cemen-tation by fine solids) and biotic cementation (resultingfrom microbial growth), are recognized, and somesuggestions are made for dealing with the problemwhen comparing different soil types.
2 The problemIn some soil types, or with particular conditions ortreatments, cotton strips may become 'cemented', iesome external agent acts on the fibres to bind themtogether, thereby possibly increasing their aggregatetensile strength (TS) over the uncemented state. Also,some of the features of fabrics listed by Sagar (1988)as having an effect on tensile strength (particularlyyarn strength and effects of crossing threads) couldbe influenced by external agents in soil.
French (1984) distinguished 2 kinds of cementation:i. concretion — cementing by fine solids, eg clay or
lime;ii. biotic cementation — cementing by a variety of
biotically produced bonding agents, eg microbialpolysaccharides and root exudates; resins may alsobe involved, but are often only a superficial deposit.
The first is an essentially abiotic 'physical' process,often not easily detectable without uncemented stripsfor comparison, but its effects can be measured byassessing the effect of artificial cementation with therelevant cementing agent (eg Figure 1). However, care
60
50Uncemented CoC0
3 CoC03
(20 g m-4) (50 g
Figure 1. Effects of artificial cementation (con-cretion) with CaCO3 on tensile strength (TS) of unrot-ted cotton strips. TS in both treatments is significantlyhigher than uncemented TS (P<0.001, t-test)
is necessary to ensure adequate mimicking of thefield conditions, especially the processes involved inimpregnating the cloth with the cementing agent;compare the attempts to cement cloth with calciumsalts by French (1984) and Latter et al. (1988) usingdifferent methods. Occasionally, an experienced cot-ton strip handler may be able to detect from the 'feel'of a strip whether it is cemented in this way.
Biotic cementation, conversely, is usually easily de-tectable from the 'feel' of a strip and its fraying behav-iour. Symptoms include:
i. observable coating of the threads (under a low-power light microscope);
ii. perceptible thickening of the cloth;iii. a tendency to a felted texture;iv. sticky or slimy coatings, especially when still wet,
often hardening on drying;v. cloth not cutting as cleanly as uncemented cloth;vi. threads tending to stick together when test seg-
ments are frayed.
This list of indicators is not exhaustive, and all thesefeatures may not be present together, even in a heavilycemented strip, but, using these or similar criteria, itis possible at least to rank strips as uncemented,cemented or heavily cemented. However, while bioticcementation is easily detectable, it is not easy toinduce it artificially under controlled conditions, es-pecially in combination with normal activity of soilmicroflora. Further, because it is usually only presenton partly decayed strips, it may not be possible tomeasure its effects on the TS of the cloth. There aresome indications (Latter et al. 1988) that the potentialeffect may be at least as great as that of concretion,and Figure 2 shows that some effect was probablypresent in at least one field study (French 1988).
However, TS increases are not all due to cementation.The early TS increase observed by Holter (1988), forexample, is more likely to be an effect of removal oflubricants, as noted by Smith and Maw (1988). Thelarge increases in TS observed in field control stripsin moss turves on Signy Island (Wynn-Williams 1988;Heal et al. 1974) do, however, seem to be related tothe extremely high quantities of mucopolysaccharidesfound in those sites (D D Wynn-Williams pers. comm.),so this example may be an extreme case of bioticcementation. Latter et al. (1988) were not able toreproduce this effect with mucopolysaccharides alonein pure culture, but there could be many possibleinteractions of such potential cementing agents withother soil constituents, greatly increasing the overalldegree of cementation.

10. _r80 —
60 —
40
20
0
1
Uncenurnt.d
— B I ot co I I y comented
0 10 20 30 40 50 60
S .c(kg)
Figure 2. Cumulative percentage frequencies of TSof uncemented and detectably biotically cementedstrips from a field experiment. Cemented strips havehigher TS than uncemented ones (Kolmagorov—Smir-nov test, n1 = 213, n2 = 207, X2 = 5.36, 0.05< P< 0.1).Difference in TS at 50% frequency = 3.5 kg, maximumdifference = 4 kg
3 Some partial remedies3.1 In any given study, if all strips are in the sametype of soil, and nearly all strips are cemented oruncemented to a similar extent, then no correction isneeded for intra-experiment comparisons, but cemen-tation should still be noted, if present.
3.2 Where different types of soil are being com-pared, especially if some are likely to contain concret-ing agents (all clay or limestone soils so far tested doappear to cement cotton cloth) and others not (egsandy brown earths), or where a potentially concretingsoil treatment, eg liming, has been applied, then anappropriate correction factor should be derived, alongthe lines suggested by French (1984), and applied toall strips in the concreted batch, as either all or nonewill be affected.
3.3 Biotic cementation can usually be ignored if de-tectable only in a few strips or test segments, but, ifpresent in more than approximately 10%, all ce-mented substrips should be noted. Then, either an
33
appropriate correction should be applied only to sub-strips with detectable cementation and its effectstested on the final result (see French 1984), or theuncorrected data should be interpreted with care.
3.4 If the TS of a cemented batch of strips is signifi-cantly less than that of an uncemented batch, thedifference is 'real', ie it may confidently be concludedthat the cemented sample is more decayed. If TS ofcemented strips is more than uncemented, a test ofprobable cementation effects is essential. That is,explicit corrections for cementation, appropriate to thesample, should be applied, and the relevant compari-sons calculated both with and without that correction.Because even a 1% or 2% correction may make thedifference between a statistically significant and anon-significant result if the variation is small enough,or the sample large enough, great care is neededin interpretation, and generally both corrected anduncorrected data should be presented.
4 ReferencesFrench, D.D. 1984. The problem of 'cementation' when usingcotton strips as a measure of cellulose decay in soils. Int. Biodet-erior., 20, 169-172.French, D.D. 1988. Some effects of changing soil chemistry ondecomposition of plant litters and cellulose on a Scottish moor.Oecologia. In press.Heal, 0.W., Howson, G., French, D.D. & Jeffers, J.N.R. 1974.Decomposition of cotton strips in tundra. In: Soil organisms anddecomposition in tundra, edited by A.J. Holding, 0.W. Heal, S.F.MacLean & P.W. Flanagan, 341-362. Stockholm: Tundra BiomeSteering Committee. •Holter, P. 1987. Cellulolytic activity in dung pats in relation to theirdisappearance rate and earthworm biomass. In: Cotton strip assayan index of decomposition in soils, edited by A.F. Harrison, P.M.Latter & D.W.H. Walton, 72-77. (ITE symposium no. 24.1 Grange-over-Sands: Institute of Terrestrial Ecology.Latter, P.M., Bancroft, G. & Gillespie, J. 1988. Technical aspectsof the cotton strip assay method. Int. Biodeterior, 24. In press.Sagar, B. 1988. The Shirley Soil Burial Test Fabric and tensiletesting as a measure of biological breakdown of textiles. In: Cottonstrip assay an index of decomposition in soils, edited by A.F.Harrison, P.M. Latter & D.W.H. Walton, 11-16. (ITE symposium no.24.1 Grange-over-Sands: Institute of Terrestrial Ecology.Smith, R.N. & Maw, J.M. 1988. Relationships between tensilestrength and increase in metabolic activity on cotton strips. In:Cotton strip assay an index of decomposition in soils, edited byA.F. Harrison, P.M. Latter & D.W.H. Walton, 55-59. (ITE symposiumno. 24.) (Grange-over-Sands: Institute of Terrestrial Ecology.Wynn-Williams, D.D. 1988. Cotton strip decomposition in relationto environmental factors in the maritime antarctic. In: Cotton stripassay. an index of decomposition in soils, edited by A.F. Harrison,P.M. Latter & D.W.H. Walton, 126-133. (ITE symposium no. 24.)Grange-over-Sands: Institute of Terrestrial Ecology.

34
A critical evaluation of the cotton strip assayP J A HOWARDInstitute of Terrestrial Ecology, Merlewood Research Station, Grange-over-Sands
1 SummaryThe structure and decomposition of cellulose are dis-cussed, and the traditional definition of cellulose de-composition as the release of glucose units is upheld.The cotton strip assay is described, and it is concludedthat changes in tensile strength of cotton strips cannotbe related direcly to specific biochemical processeswhich would be of interest to soil biologists.
The broader question of cellulose decomposition insoils is discussed, and the disruption to soil physiologi-cal processes caused by adding pure cellulose, inwhatever form, is noted.
Published applications of the cotton strip assay arecited, and appear to be associated with poor concep-tual models of soil physiological systems. It is con-cluded that the rate of breakdown of pure celluloseadded to soil cannot provide an index of litter de-composition rate, release of litter nutrients, or 'generalbiological activity'.
2 IntroductionThe cotton strip assay (Latter & Howson 1977;French & Howson 1982) was put into practical usebefore it was properly evaluated and before the re-lationships, if any, between tensile strength changeof cotton cloth and soil processes relevant to soilresearch programmes were examined. Even now,some 18 years later, this situation still holds, and thesignificance of tensile strength changes in terms ofsoil processes is a matter for conjecture. The purposeof this paper is to discuss (i) the structure and bio-chemical decomposition of cellulose, (ii) cotton striptensile strength changes in relation to enzymic degra-dation, and (iii) published applications of the cottonstrip assay, and to examine the wider aspects of themeasurement and importance of cellulose decompo-sition in soils.
Perhaps the clearest expression of the reasons forusing the assay is given by Walton and Allsopp (1977):(i) cellulose is a major constituent of plant remains;(ii) the decomposition of dead plant remains is a majorbiological process, of great interest to many scientistsstudying soil processes; (iii) cellulose provides animportant food source for a wide variety of organisms;and (iv) a method is needed to compare rates ofbreakdown of cellulose in different soils. Cotton is anatural substrate, and degradation of any materialmust begin with bond breaking, which leads to chan-ges in tensile strength. Walton and Allsopp consideredthat, as long as this technique is used for comparativeassessments of biological activity in different soils, itwill remain a powerful tool for field research.
3 The structure and decomposition of celluloseCellulose is a homopolymer, consisting of glucosemoieties joined in 0-1 ,4 linkages, the number of glu-cose moieties in a molecule being the degree ofpolymerization (DP). Native cellulose from higherplants has a DP of about 14000, and this value appearsto be remarkably constant. X-ray and infra-red datasuggest that the basic structure of cellulose involvesthe anhydrocellobiose unit (C12H20010) rather than theanhydroglucose unit (C61-11005), so that the shortestcellulose-like molecule would be cellotetrose (DP =4):
(C 6H1105) (C12H20010) • (C6H1105)
Here, (C61-11105) represents a glucose moiety with afree secondary hydroxyl group on C-4, and (C61-11106) isa glucose molecule with a reducing group. Cellobiose,cellotriose, and cellotetrose are water-soluble, cello-pentose is very sparingly soluble, and cellulose mol-ecules with DP greater than 6 are insoluble(Ljungdahl & Eriksson 1985).
Because cellulose is a polymer, we have to thinkrather carefully about how we define cellulose de-composition. In nature, cellulose is degraded by arange of aerobic and anaerobic fungi and bacteria,many of which occur in extreme conditions of tem-perature and pH. A list of fungi which have beenexamined in cellulose decomposition studies is givenin Ljungdahl and Eriksson (1985). Many fungi canutilize oligosaccharides and polysaccharides as carbonsources, but, in general, these molecules are too largeto be transported directly into the cell, and must firstbe hydrolyzed to their subunits. Cellulose representsan important potential carbon and energy source forfungi, many of which produce a series of enzymes,collectively called cellulase (Sagar 1988), which facili-tate the degradation of cellulose to glucose units.
Cellulose-degrading enzyme systems have been stud-ied in detail in 2 fungi, Sporotrichum pulverulentum,the conidial state of the white-rot fungus (Phaner-ochaeate chrysosporium) (Eriksson 1981), and themould Trichoderma reesei (Ryu & Mandels 1980).They have similar hydrolytic enzyme systems with atleast 3 components:
i. endo-1, 4-13-glucanases, which split randomly 1, 4-13-glucosidic linkages within the cellulosepolymer;exo-1, 4-3-glucanases, which split off either cello-biose or glucose from the non-reducing end of thecellulose polymer;
iii. 1, 4-p-glucosidases, which hydrolyze cellobioseand water-soluble cellodextrins to glucose.

However, relatively little plant cellulose occurs in themore or less pure form, for much of it is encrusted bylignin, hemicelluloses, and pectins. Some white-rotbasidiomycetes selectively remove lignin and hemi-cellulose without degrading much cellulose, whilstothers remove all the cell wall components (Otjen &Blanchette 1985).
Brown-rot fungi are generally basidiomycetes and de-compose mainly wood polysaccharides. They producecomponent (i) but lack (ii) (High ley 1975a, b), and thebiochemistry of cellulose degradation by them is notfully understood. It has been found that brown-rotfungi can attack cellulose at some distance from thefungal cell wall, and the initial attack could be bylow molecular weight substances that diffuse easilythrough wood cell walls. Brown-rot fungi degradecellulose in wood, but they do not seem to degradepure, isolated cellulose (Nilsson 1974a; High ley1977). High ley (1978) found that, in culture, the brown-rot fungus (Poria placenta) could not digest crystallinecellulose, unless glucose, starch, holocellulose, ormannose was added. Hydrolysis of crystalline cellu-lose is thought to occur with endo-glucanases attack-ing randomly over the cellulose polymer, creating endgroups for the exo-glucanases to attack from the non-reducing ends of the chains. Degradation of highlyordered cellulose in native cotton fibres depends al-most completely on the synergistic action of the 3enzyme systems listed above (Sagar 1988). None ofthem acting independently can solubilize cotton to asignificant extent (Eriksson & Wood 1984).
Bacterial cellulase systems appear to be more com-plex than those of fungi, and they cannot be character-ized neatly in terms of endo-1, 443-glucanases andexo-1, 443-glucanases. Many bacteria do not possess13-glucosidase (cellobiase) or, if they possess it, theymay still metabolize cellodextrins and cellobiose byphosphorylases (Ljungdahl & Eriksson 1985). In theend, in aerobic conditions, the result is the formationof glucose.
So, how do we define cellulose decomposition? Areduction in the DP, brought about by the action ofthe endo-glucanases, results in molecules which arestill, by definition, cellulose, until the DP falls to a verysmall value. Cellulose molecules with a DP greaterthan 4 are very sparingly soluble or insoluble. Manymicro-organisms can use glucose, and the reductionof the cellulose molecule to its basic glucose units isthe logical definition of cellulose decomposition. Thisdefinition has been used by soil researchers for manyyears, and cellulose decomposition has long beenmeasured by glucose production.
4 The relationships of cotton strip tensile strengthchanges to soil processesThe structure of cotton fibres is complex (Sagar 1988).It seems to be generally agreed that the glucose unitsare linked together to give a somewhat kinked but
35
rather rigid chain, about 2000 nm long and 0.75 nmwide. However, this structure alone is not sufficientto account for the physical properties of cellulosefibres (Rogers 1961). The strength of cotton fibresdepends on many structural features, such as theaverage chain lengths of the molecules, their hom-ogeneity, and orientation. A close correlation has beenfound between the strength of a fibre and the degreeof polymerization of the component cellulose mol-ecules (Siu 1951). Bundles of chains are thought tobe held together by hydrogen bonds and van derWaal's forces, to form microfibrils about 5 nm indiameter. Few, if any, cellulose chains cross from onemicrofibril to another, and the microfibrils are built upinto layers (Selby 1968).
The mode of breakdown of cotton fibres by soil organ-isms is not fully understood. Work cited in Section3 suggests that enzymic attack by endo-glucanaseswould progressively reduce the DP, and the syner-gistic effect of these, the exo-glucanases, and theglucosidases Would lead eventually to glucose. Ran-dom severing of the glycosidic linkages of the cellu-lose polymer would bring about a reduction in boththe chain length of the molecules and their homogen-eity. In this way, there would be an initial fall in tensilestrength, without much loss of glucose units. Therelationship between tensile strength and weight losssuggests such an effect (Siu 1951; Selby 1968; Healet al. 1974). There is also evidence that the inaccessi-bility of cotton fibres to large protein molecules delaysenzymic attack and results in the initial breakdownbeing localized (Sagar 1988). Nilsson (1974b) foundthat 15 out of 20 fungal species tested could producecavities in cotton fibres, and 18 species could producesurface erosion. Localized effects of this type willreduce tensile strength with small weight loss.
That such changes do actually occur was shown byHalliwell (1965), who found that enzymic degradationof purified cotton fibres resulted in the release ofinsoluble, non-filter-passing, very short fibres; insol-uble, filter-passing products; and soluble products,mainly glucose.
It has been suggested that cotton strip tensile strengthchanges might be calibrated in terms of weight loss.The results of Halliwell show that weight loss itselfis not readily interpretable; as much of it representsproducts of partial decomposition. Ghewande (1977)studied loss in weight of filter paper and of cotton incultures of 5 plant pathogenic fungi. For all the fungi,loss in weight of filter paper was greater than that ofcotton, and the ratios of the weight losses differedfor the different fungi. Different artificially processedcellulose materials seem to be attacked in differentways. In general, there was no correlation betweenloss in weight of the cellulose and cellulase pro-duction by a fungus (Ghewande & Deshpande 1975).

36
5 Application of the cotton strip assay5.1 Its use in ecological studiesRovira (1953) measured changes in tensile strengthof cotton tapes buried in soil, but his method has notbeen much used. The first recorded ecological use ofthe assay, as described by Latter and Howson (1977),appears to have been by Springett (1971), for assess-ing 'relative decomposition rates' in respect to mari-time pine (Pinus pinaster) litter. Latter and Howson(1977) described the method as used in the tundrabiome of the International Biological Programme, forassessing cellulose decomposer activity (Baker 1974;Heal et al. 1978). Other users have been Wynn-Willi-ams (1979, 1980) to study cellulose decomposition inantarctic soils; Miles (1981) and Miles and Young(1980) to study cellulose decomposition in heathlandand moorland soils colonized by birch (Betula spp.);and Brown et al. (1983), Brown (1988) and Brown andHowson (1988) to assess the 'potential for decompo-ser activity' in soils under alder (Alnus glutinosa), Scotspine (Pinus sylyestris), oak (Quercusspp.), and Norwayspruce (Picea abies).
5.2 Difficulties in interpretation of result§Several points which have arisen in various papersindicate that there are difficulties in interpretation, interms of soil organic matter decomposition processes.
Heal et al. (1974) and Latter and Howson (1977) havecomputed a series of regressions relating change intensile strength of cotton strips to weight loss ofcotton following decomposition. Though the relation-ships were statistically significant, in some caseshighly significant, there were also very significant dif-ferences in the regressions for the different sitesstudied. The authors themselves state that 'a strictcomparison between TS and weight losses cannot beexpected; weight loss represents an average measureof decomposition over the whole test piece, whereasthe tensile strength is a measure of loss at the mostdecomposed part'.
There appears to be no correlation between the de-composition of cellulose and cellulase activity in soils(Ross et al. 1978; Ross & Speir 1979).
Heal et al. (1974) used the cotton strip assay, essen-tially as described in Latter and Howson (1977), forrelating decomposition potential to weight losses oflitter. They found that (i) with low weight loss of cottonstrips, there was a very rapid loss of tensile strength,(ii) in very wet conditions, there was a decline intensile strength loss of cotton strips, although litterscontinued to show high weight losses under the sameconditions, and (iii) there was an important effect oflitter quality in the processes of decomposition.
5.3 Untenable arguments put forward to justify use of theassay5.3.1 Cellulose is a major constituent of plant detritusThe fact that cellulose is the major constituent of plant
remains does not justify the use of cotton strips, orany other pure and, especially, processed cellulosesubstrate, to simulate the decomposition of cellulosein plant remains. Plant cellulose does not enter thesoil in pure form; most plant cellulose is encrustedwith lignin and hemicelluloses. Plant material addedto soil in natural conditions always contains somenitrogen (N), and materials from various origins havecharacteristic carbon/nitrogen (C/N) values. Popu-lations of soil organisms develop during the degra-dation of these materials, and the resulting soil organicmatter also has characteristic C/N values. The re-sponse of the soil biota to the pure cellulose substratewill necessarily differ from that to plant litters. Ifanything is needed in such studies, it is a method forstudying the decomposition of cellulose, and otherconstituents, in plant litter.
5.3.2 The decomposition of dead plant detritus is a biologi-cal process of considerable importance in maintaining soilfertilityThe idea that cellulose decomposition can representlitter decomposition adequately is clearly a gross over-simplification. Minderman (1968) showed that differ-ent litter constituents decompose at different rates,and accumulation of residues is determined mainlyby the content of intractable constituents. Variousauthors have preferred to use lignin content as apredictor of litter decomposition rate (Fogel & Cro-mack 1977; Meentemeyer 1978; Melillo et al. 1982).Changes in log biomass were also correlated withlignin content (Charley & Richards 1983). Berg andStaaf (1980) found that, in the early stages of de-composition of Scots pine needle litter, ie up to 30%weight loss, loss in weight was due mainly to solublesubstances and degradation of cellulose and hemicel-lulose and was correlated with the initial levels ofN, phosphorus (P), potassium (K) and sulphur (S).Decomposition of lignin was unaffected by initial nutri-ent levels, and its decomposition started sooner inlitters with much lignin than in those with little. Inthe later stages of litter decomposition, weight lossdepended on lignin decomposition.
It is a matter of common observation that litters ofdifferent tree species decompose at different rates onthe same soil type, and that litter of a given speciesdecomposes at different rates on different soil types.The rate of litter decomposition is not a property solelyof the litter, but is the result of a complex interactionbetween plant species and soil chemistry (eg Coulsonet al. 1960; Davies et al. 1964). Similar effects appearto occur in grasslands, though perhaps they are lesspronounced (eg Barratt 1965).
5.3.3 Cellulose provides an important food source for awide variety of organismsCellulose is certainly an important carbon and energysource for micro-organisms, but polysaccharide mol-ecules are too large to be transported into cells, andcellulose must first be broken down to glucose units.

Because of the structure of cotton fibres and themode of action of cellulases on them, tensile strengthchange cannot be related to glucose release.
The degradation of any (purified cellulose) materialmust begin with bond breaking, leading to changes inits tensile strength, but this has more to do withthe properties of textiles than with the study of thetransformation of plant remains in soils. The import-ance of cellulose breakdown in soil systems lies inthe fact that it provides a source of carbon and energyfor a range of soil organisms, but they can only usethe glucose formed. Changes in the tensile strengthof cotton strips are closely related to the DP, whichis reduced by the bond breaking action of the endo-glucanases. However, the resulting material will stillbe cellulose, and needs to be broken down into theconstituent glucose units before it can be used by themicro-organisms. As this stage cannot be related totensile strength changes, the latter do not provideinformation which is of use to soil biologists.
An accurate method for determining cellulose de-composition in soils, by measuring the release ofglucose units, has existed for some years (Benefield1971) and is discussed by Ross (1974). Broadly, themethod involves incubating cellulose powder with aknown quantity of soil in a buffer solution containingPenicillin G as a bacteriostat. After incubation, theglucose formed is dehydrogenated by glucose oxi-dase, and the hydrogen peroxide so formed is cataly-zed by peroxidase to oxidize o-tolidine dihydrochloride.The latter reaction is determined colorimetrically.Penicillin G is thought not to suppress fungal activity,
.08
.06
.02
0
o 0
cbo
3 4
o icP oo cd)
so the method measures the activity of cellulase en-zymes present initially in the soil sample, plus anywhich were synthesized during the incubation. Thereare important physiological differences between thecotton strip assay and the normal methods for deter-mining cellulase activity. Although cellulase enzymesare inducible, cellulase methods such as that of Bene-field (1971) use a short incubation time, which isunlikely to allow major changes in the quantity ofcellulase to occur. Therefore, we may expect such amethod to reveal the current propensity of the soil todecompose cellulose.
Figure 1 shows the mean cellulase activities (ovendried (OD) basis), determined by the method of Bene-field (1971), of 48 soils (0-5 cm) in and around theEnglish Lake District, sampled at 4-weekly intervalsfor 56 weeks. Each point in the Figure is the mean of14 samples (Howard & Howard 1985). Figure 2 givesthe same results for loss-on-ignition (LOI) basis. Thesedata make the results for the different soils morecomparable as they vary considerably in organic mat-ter content. At any given pH value above pH 4, thereis clearly a considerable range of cellulase activity;below pH 4, the range is smaller. However, theseresults are for soils at 0-5 cm depth, and we have toconsider the meaning of cellulase activity at that depthin soils of different pH. Above pH 5, we are 'dealingwith mull soils. Litter deposited on the soil surfacedoes not stay there for long, but is pulled into the soilby the large earthworms (Lumbricidae). Thus, most ofthe litter cellulose decomposes in the soil. At thesame time, fine roots are being formed and decompo-sed there also. In such soils, we would expect a
5 6
37
pH
Figure 1. Plot of cellulase activity (OD basis) on pH. Means of 14 4-weekly samples of soils in 48-woods in andaround the English Lake District. r = —0.137 NS, r2 = 0.019

38
0 . 4
0 . 3 _
_J
I
cn
0
3
o 08, ,
4
0 n00 0
(ib o (
0
6
0 0
00 6)
0
generally high level of cellulase activity. By contrast,below pH 4, mixing of litter with mineral soil does notoccur, and the litter cellulose decomposes in thesuperficial organic layers. Thus, cellulase activity inthe surface mineral soil must be largely associatedwith root decomposition.
This is an important difference in cellulose decompo-sition in these extreme soil types, and must be recog-nized when interpreting the results of cellulase activitydeterminations. The reasons for the wide range incellulase activities of the soils with pH greater than 5(Figure 2) may, therefore, lie in differences in quantit-ies of leaf and root material added to the soil. Thedifferences in soils with pH less than 4 may be dueto differences in root turnover.
By contrast with cellulase activity measurements, cot-ton strips are inserted into the soil in the field and leftin position for weeks, which allows time for majorchanges in populations of organisms, and their bio-chemistry. The capacity of a soil to decompose cellu-lose is not a fixed property, like the capacity of a cowto eat hay. If we add more cellulose to a soil, the soilorganism population will grow to deal with it, but thistakes time. As cellulose contains no N, we wouldexpect the addition of pure cellulose to put a severeN stress on the soil. Mull soils with high levels of Nmineralization could cope with such stress better thanmor soils with low levels of N mineralization. How-ever, the real situation is not so simple, as mostcellulolytic fungi show greatly reduced production ofcellulases as substrate C/N increases. The white-rotfungi are exceptional in this regard, being able to
5 6
p H
Figure 2. Plot of cellulase activity (L01 basis) on pH. 48 soils as in Figure 1. r = 0.457 P<0.01, r2 = 0.209
produce cellulases at a C/N of 2000 (Charley & Rich-ards 1983, p34). It is clear that adding pure celluloseto soils stresses the physiology in ways which arelargely unpredictable, making the results difficult, ifnot impossible, to interpret without a considerableamount of additional information. Cotton strips arelikely to be decomposed in soil by a selected micro-flora, as indicated by Widden et al. (1986), and theresults obtained by the assay may show little compari-son with normal decomposition of plant litter or soilorganic matter.
5.4 Its use as an index of 'biological activity'It has been suggested that cotton strips may be usedto provide an index of 'biological activity' of soils,eg when comparing soils under different vegetationtypes. The idea that the rich diversity of soil physiologi-cal activities can be represented adequately by anysingle measurement can be dismissed by availableevidence. Plots of cellulase activity against coefficientof humidity (moisture content g-1LOI), oxygen uptake,and phosphatase activity (both on LOI basis) for the48 soils in Figures 1 and 2 are shown in Figures 3-5.The largest correlation coefficient is cellulase and pH(r2 = 0.209).
When the mean values of the soils from the 48 woodswere divided into 3 pH groups, <3.8, 3.8-5.0, and>5.0 (Pearsall 1938, 1952), there was no significantdifference between the mean values of the groupswith regard to humidity. However, for oxygen uptake(LOI basis), the mean of the pH <3.8 group wassignificantly lower than that of the intermediate group(19.9, 23.8, 23.6 respectively). For cellulase activity,
to
0.4
0.4
0
0z
2 3 4 5 6 7 8 9 10
Coefficient of humidity
Figure 3. Plot of cellulase activity (L01 basis) on coefficient of humidity (moisture content g-' L01). 48 soils asin Figure 1. r = 0.122 NS, r2 = 0.015
0
1-1 0.3
7 0.2
0 0o)E 0
0 o09 000
0 0 0 00 o (ID o
0.1 o° 0 &o % °c)(53 oo
o o
0
10 20 30 40
39
Oxygen uptake (jul g-1 LOI h-1)
Figure 4. Plot of cellulase activity on oxygen uptake (both on LOI basis). 48 soils as in Figure 1. r = 0.226 NS,= 0.051

40
0.4
0.2
0
2
00
CPO
Pc°000
QJ
the mean of the more acidic group and the mean ofthe intermediate group were significantly lower thanthe mean of the pH >5.0 group (0.106, 0.136, 0.207respectively). For phosphatase activity, the mean ofthe more acidic group was significantly lower thanthat of the intermediate group (3048, 4047, 3757 re-spectively).
Studying enzymes extracted from coniferous leaf lit-ter, Spalding (1977, 1980) found that cellulase activitywas poorly correlated with invertase (r = 0.33, r2 =0.11), p-glucosidase (r = 0.37, r2 = 0.14) and polyphen-oloxidase (r = 0.29, r2 = 0.08). Other workers havefound correlations among soil physiological activitiesto be good in some cases but not in others (Ladd &Butler 1972; Nankin et al. 1974; Voets et al. 1975;Nannipieri et al. 1978, 1979; Frankenberger & Dick1983). Furthermore, significant correlations betweenactivities observed in one year may not be found inanother (Hersman & Temple 1979).
Figure 2 shows that similar cellulase values are poss-ible in the pH range 4-6. Soils at the extremes of thisrange have greatly different chemical and biologicalproperties. Also, at any given pH, a wide range ofcellulase activities is possible. Figures 4 and 5 showthat a range of values for oxygen uptake and phospha-tase activity is possible for a given cellulase activity,and a range of cellulase activities is possible for givenvalues of oxygen uptake and phosphataseaCtivity. Itseemsclear that the fact that soils have differentcellulolytic activities cannot be used to make deduc-tions about their other physiological properties. Even
3 4 5 6 7 8
Phosphatase (mg phenol g LOI 3 h-1)
Figure 5. Plot of cellulase activity on phosphatase activity (both on LOI basis). 48 soils as in Figure 1.r = 0.280 NS, 12 = 0.078
if the cotton strip assay gave an adequate measure ofcellulose breakdown, its use in studies such as thoseof Brown and Howson (1988) would be pointless.
5.5 Its use in nutrient cycling studiesIt has been suggested that the cotton strip assay maybe used to indicate differences in nutrient cyclingunder different soil/vegetation systems, for examplein ITE's studies of the Gisburn Forest (Brown 1988)and of grasslands on Plynlimon, central Wales (GHowson pers. comm.). However, no plant nutrientsare bound to cellulose, and none would be released bycellulose decomposition. K occurs mainly in vacuolarsap, calcium (Ca) and magnesium (Mg) occur in pec-tates, and Mg also occurs in chlorophyll and enzymesystems. K and Ca accumulate in stemwood, while Pand N occur mostly in the nucleus and cytoplasm.
Brown and Howson (1988) present results from Gis-burn Forest which show that changes in tensilestrength of cotton strips reflect the growth of trees,either pure or in mixtures. As the tensile strengthchanges cannot be interpreted directly, a separatestudy is required on the factors affecting the rate ofrotting of the cotton strips, and to investigate if thosefactors could account for the observed differences intree growth. It would seem to be simpler to leave outthe intermediate step, and to study directly the factorsaffecting tree growth. A simple explanation for theseresults would be that the rate of rotting of cotton stripsand the growth of trees have nothing in common,except that they both depend on the amount of avail-able soil N (see Carlyle & Malcolm 1986a, b).

6 ConclusionsMost published uses of cotton strips are somewhatvague about what the method is intended to show.Phrases such as 'relative decomposition rates' or 'po-tential for decomposer activity' are common. In gen-eral, the assumption seems to be that changes intensile strength of cotton strips are in some wayrelated to plant litter decomposition.
The use of pure processed cellulose as a surrogatefor plant litter is based on highly oversimplified con-ceptual models of soil physiological systems. Suchmodels stress quantitative aspects, while ignoringimportant qualitative differences (cf Rome II 1935).
Furthermore, plant cellulose is not associated withnutrient elements, and its decomposition is not di-rectly relevant to nutrient cycling. The rate of break-down of pure cellulose is not strongly related to manyother important soil physiological processes, so itcannot be used as an index of biological activity.
In my opinion, the use of an unsuitable method forassessing cellulose decomposition, in associationwith poor conceptual models, is unlikely to increaseour knowledge of the functioning of soil biologicalsystems, or our ability to predict the consequences ofnatural or artificial perturbation.
7 ReferencesBaker, J.H. 1974. Comparison of the microbiology of four soils inFinnish Lapland. Oikos, 25, 209-215.Barratt, B.C. 1965. Decomposition of grass litters in three kinds ofsoil. Pl. Soil, 23, 265-269.Benefield, C.B. 1971. A rapid method for measuring cellulaseactivity in soils. Soil Biol. Biochem., 3, 325-329.Berg, B. & Staaf, H. 1980. Decomposition rate and chemical chan-ges of Scots pine needle litter. II. Influence of chemical composition.In: Structure and function of northern coniferous forests - an ecosy-stem study, edited by T. Persson, 373-390. (Ecological Bulletin 32.1Stockholm: Swedish Natural Science Research Council.Brown, A.H.F. 1988. Discrimination between the effects on soilsof 4 tree species in pure and mixed stands using cotton strip assay.In: Cotton strip assay an index of decomposition in soils, editedby A.F. Harrison, P.M. Latter & D.W.H. Walton, 80-85. (ITE sym-posium no. 24.1 Grange-over-Sands: Institute of Terrestrial Ecology.Brown, A.H.F. & Howson, G. 1988. Changes in tensile strengthloss of cotton strips with season and soil depth under 4 tree species.In: Cotton strip assay an index of decomposition in soils, editedby A.F. Harrison, P.M. Latter & D.W.H. Walton, 86-89. (ITE sym-posium no. 24.) Grange-over-Sands: Institute of Terrestrial Ecology.Brown, A.H.F., Gardener, C.L. & Howson, G. 1983. Differencesin some biological attributes of soils developed under four treespecies. In: Trans. biological processes & soil fertility, 58. Inter-national Society of Soil Science and British Society of Soil Science.Carlyle, J.C. & Malcolm, D.C. 1986a. Nitrogen availability beneathpure spruce and mixed larch + spruce stands growing on a deeppeat. I. Net N mineralization measured by field and laboratoryincubations. Pl. Soil, 93, 95-113.Carlyle, J.C. & Malcolm, D.C. 1986b. Nitrogen availability beneathpure spruce and mixed larch + spruce stands growing on a deeppeat. II. A comparison of N availability as measured by plant uptakeand long-term laboratory incubations. Pl. Soil, 93, 115-122.Charley, J.L. & Richards, B.N. 1983. Nutrient allocation in plantcommunities: Mineral cycling in terrestrial ecosystems. In: Physio-logical plant ecology IV, edited by O.L. Lange, P.S. Nobel, C.B.Osmond & H. Zieger, 5-45. Berlin: Springer.
41
Coulson, C.B., Davies, R.I. & Lewis, D.A. 1960. Polyphenols inplant, humus, and soil. I. Polyphenols of leaves, litter and superficialhumus from mull and mor sites. J. Soil Sci., 11, 30-44.Davies, R.I., Coulson, C.B. & Lewis, DA 1964. Polyphenols inplant, humus, and soil. III. Stabilization of gelatin by polyphenoltanning. J. Soil Sci., 15, 299-309.Eriksson, ICE. 1981. Cellulases of fungi In: Trends in the biologyof fermentations for fuels and chemicals, edited by A. Hollaender,19-32. New York: Plenum Press.Eriksson, ICE. & Wood, T.M. 1984. Biodegradation of cellulose.In: Biosynthesis and biodegradation of wood compbnents, editedby T. Higuchi, 469-503. New York: Academic Press.Fogel, R. & Cromack, K. 1977. Effect of habitat and substratequality on Douglas fir litter decomposition in western Oregon. Can.J. Bot., 55, 1632-1640.Frankenberger, W.T. & Dick, W.A. 1983. Relationships betweenenzyme activities and microbial growth and activity indices in soil.J. Soil Sci. Soc. Am., 47, 945-951.French, D.D. & Howson, G. 1982. Cellulose decay rates measuredby a modified cotton strip method. Soil Biol. Biochem., 14, 311-312.Ghewande, M.P. 1977. Decomposition of cellulose and the pro-duction of cellulolytic enzymes by plant pathogenic fungi J. Biol.Sci., 20, 69-73.Ghewande, M.P. & Deshpande, K.B. 1975. Cellulolytic enzymesof Helminthosporium apattarnae. Indian J. Microbiol., 15, 43-45.Halliwell, G. 1965. Hydrolysis of fibrous cotton and reprecipitatedcellulose by cellulolytic enzymes from soil micro-organisms. Bi-ochem. J., 95, 270-281.Hankin, L., Sands, D.C. & Hill, D.E. 1974. Relation of land use tosome degradative enzymatic activities of soil bacteria. Soil Sci.,118, 38-44.Heal, 0.W., Howson, G., French, D.D. & Jeffers, J.N.R. 1974.Decomposition of cotton strips in tundra. In: Soil organisms anddecomposition in tundra, edited by A.J. Holding, O.W. Heal, S.F.MacLean & P.W. Flanagan, 341-362. Stockholm: Tundra BiomeSteering Committee.Heal, 0.W., Latter, P.M. & Howson, G. 1978. A study of the ratesof decomposition of organic matter. In: Production ecology of Britishmoors and montane grasslands, edited by O.W. Heal & D.F.Perkins, 136-159. Berlin: Springer.Hersman, L.E. & Temple, K.L. 1979. Comparison of ATP, phospha-tase, pectinolase and respiration as indicators of microbial activityin reclaimed coal strip mine spoils. Soil Sci., 127, 70-73.High ley, T.L. 1975a. Can wood-rot fungi degrade cellulose withoutother wood constituents? Forest Prod. J., 25, 38-39.High ley, T.L. 1975b. Properties of cellulases of two brown-rot fungiand two white-rot fungi. Wood Fiber, 6, 275-281.High ley, T.L. 1977. Requirements for cellulose degradation by abrown-rot fungus. Mater. Org., 12, 25-36.High ley, T.L. 1978. Degradation of cellulose by culture filtrates ofPoria placenta. Mater. Org., 12, 161-174.Howard, P.J.A. & Howard, D.M. 1985. Multivariate analysis of soilphysiological data. (Merlewood research and development paperno. 105.) Grange-over-Sands: Institute of Terrestrial Ecology.Ladd, J.N. & Butler, J.H.A. 1972. Short-term assays of soil proteo-lytic enzyme activities using proteins and dipepqde derivatives assubstrates. Soil Biol. Biochem., 4, 19-30.Latter, P.M. & Howson, G. 1977. The use of cotton strips toindicate cellulose decomposition in the field. Pedobiologia, 17, 145-155.Ljungdahl, L.G. & Eriksson, K.E. 1985. Ecology of microbial cellu-lose degradation. Adv. microb. Ecol., 8, 237-299.Meentemeyer, V. 1978. Macroclimate and lignin control of litterdecomposition rates. Ecology, 59, 464-472.Melillo, J.M., Aber, J.D. & Muratore, J.F. 1982. Nitrogen andlignin control of hardwood leaf litter decomposition dynamics. Ecol-ogy, 63, 621-626.Miles, J. 1981. Effecrof birch on moorlands. Cambridge: Instituteof Terrestrial Ecology.Miles, J. & Young, W.F. 1980. The effects on heathland andmoorland soils in Scotland and northern England following coloniza-tion by birch (Betula spp.). Bull. Ecol., 11, 233-242.

42
Minderman, G. 1968. Addition, decomposition and accumulationof organic matter in forests. J. Ecol., 56, 355-362.Nannipieri, P., Johnson, R.L. & Paul, E.A. 1978. Criteria formeasurement of microbial growth and activity in soil. Soil Biol.Biochem., 10, 223-229.Nannipieri, P., Pedrazzini, F., Arcara, P.G. & Piovanelli, C. 1979.Changes in amino acids, enzyme activities, and biomasses duringsoil microbial growth. Soil Sci., 127, 26-34.Nilsson, T. 1974a. Comparative study of the cellulolytic activity ofwhite-rot and brown-rot fungi. Mater. Org., 9, 173-198.Nilsson, T. 1974b. Microscopic studies on the degradation of cello-phane and various cellulosic fibres by wood-attackingmicrofungi. Stud. for. suec., no. 117.Otjen, L. & Blanchette, R.A. 1985. Selective delignification ofaspen wood blocks in vitro by three white-rot basidiomycetes. Appl.environ. Microbiol., 50, 568-572.Pearsall, W.H. 1938. The soil complex in relation to plant communi-ties. II. Characteristic woodland soils. J. Ecol., 26, 194-209.Pearsall, W.H. 1952. The pH of natural soils and its ecologicalsignificance. J. Soil Sci., 3, 41-51.Rogers, H.J. 1961. The dissimilation of high molecular weightsubstances. In: The bacteria. Vol. 2: Metabolism, edited by I.C.Gunsalius & R.Y. Stanier, 257-318. New York; London: AcademicPress.Rome II, L.G. 1935. Ecological problems of the humus layer in theforest. Mem. Cornell Univ. agric. Exp. Stn, no. 170.Ross, D.J. 1974. Glucose oxidase activity in soil and its possibleinterference in assays of cellulase activity. Soil Biol. Biochem., 6,303-306.Ross, D.J. & Speir, T.W. 1979. Studies on a climosequence of soilsin tussock grasslands 23. Cellulase and hemicellulase activities oftopsoils and tussock plant materials. N.Z. JI Sci., 22, 25-33.Ross, D.J., Molloy, L.F., Bridger, B.A. & Cairns, A. 1978. Studieson a climosequence of soils in tussock grasslands 20. Decompo-sition of cellulose on the soil surface and in the topsoil. N.Z. JI Sci.,21, 459-65.Rovira, A.D. 1953. A study of the decomposition of organic matterin red soils of the Lismore district. Aust. Conf. Soil Sci., Adelaide,1, 3.17, 1-4.
Ryu, D.D.Y. & Mandels, M. 1980. Cellulase: biosynthesis andapplications. Enzyme microb. Technol., 2, 91-102.Sagar, B.F. 1988. Microbial cellulases and their action on cottonfibres. In: Cotton strip assay an index of decomposition in soils,edited by A.F. Harrison, P.M. Latter & D.W.H. Walton, 17-20. (ITEsymposium no. 24.) Grange-over-Sands: Institute of TerrestrialEcology.Selby, K. 1968. Mechanism of biodegradation of cellulose. In:Biodeterioration of materials, edited by A.H. Walters & J.J. Elphick,62-78. London; New York: Elsevier.Siu, R.G.H. 1951. Microbial decomposition of celtulose. New York:Reinhold.Spalding, B.P. 1977. Enzymatic activities related to the decompo-sition of coniferous leaf litter. J. Soil Sci. Soc. Am., 41, 622-627.Spalding, B.P. 1980. Enzymatic activities in coniferous leaf litter.J. Soil Sci. Soc. Am., 44, 760-764.Springett, J.A. 1971. The effects of fire on litter decomposition andon the soil fauna in a Pinus pinaster plantation. In: 4th ColloquiumPedobiologiae, Dijon, 1970, 529-535. Paris: Institut National de laRecherche Agronomique.Voets, J.P., Agrianto, G. & Verstraete, W. 1975. Etude ecologiquedes activites microbiologiques et enzymatiques des sols dans uneforet de feuillus. Revue Ecol. Biol. Sol, 12, 543-555.Walton, D.W.H. & Allsopp, D. 1977. A new test cloth for soil burialtrials and other studies on cellulose decomposition. Int. Biodeterior.Bull., 13, 112-115.Widden P., Howson, G. & French, D.D. 1986. Use of cotton stripsto relate fungal community structure to cellulose decompositionrates in the field. Soil Biol. Biochem., 18, 335-337.Wynn-Williams, D.D. 1979. Techniques used for studying terres-trial microbial ecology in the maritime Antarctic. In: Cold-tolerantmicrobes in spoilage and the environment, edited by A.D. Russell &D. Fuller, 67-81. London: Academic Press.Wynn-Williams, D.D. 1980. Seasonal fluctuations in microbial ac-tivity in Antarctic moss peat. Biol. J. Linn. Soc., 14, 11-28.

Problems and advantages of using the cotton stripassay in polar and tundra sitesD A (-• A A-,LTON3r t,sh Antarctic Syyroieyi. Camonzute
1 SirrrnarV
The principal difficulties pit using :he cotton strip assay
in tundra and polar soils are surnmarizeo Frozen
ground rocky soils ana pira interrerence aH affect.
the planning of experiments and me kkelmpog 0'retrieving an adequate number of inserted strips
Some advantages for tundra sites are described bk-efly.
2 IntroductionThe original methodological papers on the decay ofcotton fabrics as an analogue for cellulose decompo-sition describe either laboratory studies (Schmidt &Ruschmeyer 1958) or field studies (Latter & Howson19771. but without many details on the practical diffi-culties which may confront experimenters This paperdocuments some of the problems of using this assayin cold soils
3 Problems experienced in polar and tundra sitesThis assay was first used in polar sites during theInternational Biological Programme (Heal et a). 1974),
at Kevo, Finland, in July 1969; Signy Island, Antarctica,in January 1970; Hardangervidda, Norway, in June1971; and sites in Alaska, the USSR, northern Swedenand arctic Canada in the summer of 1972. There hadbeen trials of the method of inserting and retrievingstrips at Moor House, a cold temperate site in thenorthern Pennines, UK, as early as 1963, but tensilestrength measurements were not carried out on stripsfrom this site until 1968.
A problem encountered in cold temperate sites, and
experienced much more acutely in polar and tundrasites, is frozen ground. Strips cannot be inserted orextracted whilst the soil profile is frozen because ofdifficulties in making an insertion slot, a lack of closureof the soil round the strip once inserted, and thealmost certain damage to the fabric if it is pulled awayfrom a frozen soil during removal. Sites underlain bypermafrost have especially short experimental peri-ods. It is vital in these sites to ensure that the soil hasunfrozen to a level below the bottom of the strip,
before attempting removal.
In many exposed tundra sites, vegetation may bescanty and soil development limited. Soils may beonly 10 cm deep and often contain rocks which caneasily damage the strip on insertion. One way toavoid damage is first to make an insertion slot with asharpened steel plate (Plate 3 il (Smith & Walton1988). However, deep peat soils are also commonin the Arctic and allow easy insertion, but they are
- ••••
Plate 3. Insertion and retrieval of cotton strips in sub-antarctic soils:
i. A sharpened steel plate Is used to make the slotii. The strip is inserted using a blunt formeriii. Retrieval is by removing soil block in front of strip(Photographs M J Smith)

44
normally anaerobic in the lower layers, a conditiondisturbed by oxygen ingress during strip insertion — apoint to consider in all waterlogged soils.
Repeated walking on delicate vegetation to insert andharvest strips can damage the sod environment bycompaction, especially peat soils formed mainly fromcryptogams, but the damage may also be significantin comparisons of grazed and ungrazed temperatesites. To alleviate this problem on antarctic mossbanks, we have successfully used snow shoes.
In nutrient-poor sites, typical of many tundra sites,cotton normally decomposes very slowly, and stripsmust often be left in for long periods to approach atensile strength loss of cotton (CTSL) near to 50%. Itshould be remembered that, in these situations, aproportion of the strips can suffer damage from thegrowth of plant roots through the fabric.
Another difficulty of some tundra sites is a wide dispar-ity in decomposer activity at different levels in theprofile. This method easily and quickly identifies zonesof unusually high biological activity in the soil profile.To obtain adequate samples in the mid-range of CTSL
li
•3/4
Plate 4. When decomposition is slow, the entire stripcan be retrieved with ease and its position in the soilprofile carefully examined, but, even when decay isvery advanced, position of strip in profile can be seenbefore removal (Photograph D W H Walton)
for all levels in the soil, it may be necessary to harvestsome strips after all the cotton has disappeared at themost active point in the profile (Plate 4). It is usefulto photograph strips of this :type in situ. Generally,however, strips should be harvested as close to 50%CTSL as possible to obtain valid results.
Where soils are shallow and dry, the soil surface cancrack in summer. The cracks are often associated withthe strips and lead to desiccation of the upper levelsof the cloth, and possibly a carry-down of surfacematerial into the crack. This problem can occur notonly in tundra soils but in any sod type which does notclose completely around the strip after insertion.
A tedious problem in Antarctica, especially on SignyIsland, is bird interference. If any of the strip is leftprotruding above the soil surface, brown skuas (Ca-tharacta lonnbergn) exert considerable efforts in pull-ing the strips out of the ground. This problem may bepartly overcome either by pinning the top down undera plastic or glass rod or, more effectively, by trimmingthe cloth to the soil surface and running a locationwire from the strip to a central point so that it can befound again for harvesting.
A problem first noted in strips from Signy Island wasan increase in tensile strength after a period in thesoil. This increase was attributed to some form ofcementation between the cotton fibres, and is exam-ined in more detail by French (1988).
Attempts have been made to use cotton strips formeasuring cellulose breakdown in the sediments atthe bottom of antarctic freshwater lakes (Ellis-Evans19811. Insertion into soft sediment invariably resultsin folding of the strip, and the folds show significantlygreater CTSL than the rest of the strip. Carry-down ofsurface sediment is a problem, which can result insimilar CTSL levels being measured throughout theprofile, although assessment of microbial numbershas established that microbial activity is limited to thetop 4 cm. Maltby (1988) discusses other problemsconcerning insertion in aquatic or swampy sites.
4 Advantages of use in polar and tundra sitesThe low rates of decomposition characteristic of manytundra sites mean that strips can be retrieved in-frequently, yet still provide a detailed CTSL curve forthe soil profile. Seasonal variation in the soil activityis very marked allowing clear partitioning of break-down to a particular season (see Lawson 1988). Thetundra microflora is generally much less diverse thanin temperate or tropical soils, so that it is easier toisolate the most important decomposers of cotton.
In lake sites, there is virtually no seasonal temperaturechange in the sediments, so that the natural situationis equivalent to a controlled laboratory experimentThus, the interaction between CTSL and other factorscan be explored at constant temperature.

5 ReferencesEllis-Evans, J.C. 1981. Freshwater microbiology at Signy Island,South Orkney Islands, Antarctica. PhD thesis. Council for NationalAcademic Awards.French, D.D. 1988. The problem of cementation. In: Cotton stripassay. an index of decomposition in soils, edited by A.F. Harrison,P.M. Latter & D.W.H. Walton, 32-33. (ITE symposium no. 24.)Grange-over-Sands: Institute of Terrestrial Ecology.Heal, 0.W., Howson, G., French, D.D. & Jeffers, J.N.R. 1974.
Decomposition of cotton strips in tundra. In: Soil organisms anddecomposition in tundra, edited by A.J. Holding, O.W. Heal, S.F.
MacLean & P.W. Flanagan, 341-362. Stockholm: Tundra BiomeSteering Committee.Latter, P.M. & Howson, G. 1977. The use of cotton strips toindicate cellulose decomposition in the field. Pedobiologia,17, 145-155.
45
Lawson, G. J. 1988. Using the cotton strip assay to assess oranicmatter decomposition patterns in the mires of South Georgia. In:Cotton strip assay. an index of decomposition in soils, edited byA.F. Harrison, P.M. Latter & D.W.H. Walton, 134-138. (ITE sym-posium no. 24.) Grange-over-Sands: Institute of Terrestrial Ecology.Maltby, E. 1988. Use of cotton strip assay in wetland and uplandenvironments —an international perspective. In: Cotton strip assay.an index of decomposition in soils, edited by A.F. Harrison, P.M.Latter & D.W.H. Walton, 140-154. (ITE symposium no. 24.) Grange-over-Sands: Institute of Terrestrial Ecology.Schmidt, EL & Ruschmeyer, O.R.1958. Cellulose decompositionin soil burial beds. I. Soil properties in relation to cellulose degra-dation. Apo!. Microbiol., 6, 108-114.Smith, M.J. & Waiton, D.W.H. 1988. Patterns of cellulose de-
composition in four subantarctic soils. Polar Biol. In press.

46
Seasonal patterns in cotton strip decomposition in soilsD D FRENCHInstitute of Terrestrial Ecology, Banchory Research Station, Banchory
1 SummaryCotton strip assay can give a good indication of sea-sonal changes in soil decomposer activity, especiallyin temperate and sub-polar regions. Some examplesare given, with comments on the interpretation ofcotton strip data in relation to environmental changes.Some of the limitations of the assay, when used forthis purpose, are also discussed.
2 IntroductionCotton strip decomposition, measured by loss in ten-sile strength (CTSL), proceeds at rates such that, inmost temperate soils, complete CTSL takes about 3months, while in sub-polar and polar soils it may takea year or longer. Across this range of ecosystems,therefore, the rate of CTSL can be used to examineseasonal patterns of decomposition. Some commonquestions discussed in relation to soil decomposeractivity are given below.
— •t what time of year is decomposition most rapid?— What is the difference in magnitude between the
fastest and slowest seasonal rates?— Do CTSL profiles (pattern of change with depth
in the soil) vary during the year?
Three separate studies, in sub-antarctic (South Geor-gia), moorland (Glen Dye, Kincardineshire), and forestecosystems (Gisburn, Lancashire), are used to illus-trate the use of cotton strip assay to address thesequestions.
3 Sub-antarcticDifferences between CTSL rates and patterns ofchange with depth in soil profiles within sites on SouthGeorgia were largely related to soil temperature andmoisture changes, especially winter freezing, summerdrought (in surface layers) and waterlogging (withconsequent anoxia) at depth in mires (D W H Waltonpers. comm.). These relationships may either be directeffects of soil microclimate on microbial activity ordue to other causes, such as changes in rhizosphereexudates, soil microflora, etc.
4 MoorlandFreezing, drought and waterlogging are 3 factorswhich are said frequently to control soil organic matterdecomposition rates. At first sight, this appears to betrue in a comparison of changes in CTSL down soilprofiles in a Scottish heather (Calluna vulgaris) moor.The cotton strips were inserted by the horizon methodof French and Howson (1982) during 3 periods in theyear (Table 1). The general increase in maximum decayrates is approximately related to temperature sum(deg–days >0°C). The trends down the soil profiles
Table 1.Cotton strip tensile strength loss (CTSL) at Glen Dye, during3 contrasting periods in 1979-80, compared with some summaryclimatic data'
I Climatic data are from the nearest meteorological station (Ban-chow)2 Approximate depths are top = <1 cm, side = 1-5 cm, bottom =>5 cm3 n = 20 top and bottom, n = 10 side4 Nearly all rain fell in first 2 weeks or last week of this period5 Very even distribution of rainfall over the period
also indicate inhibition (i) by waterlogging (when notfrozen) in bottom segments of cotton strips over win-ter, and (ii) by drought in surface segments of cottonstrips in late spring and early summer, when nearlyall the rain fell mostly in early April. No obvious soilmicroclimatic constraints appeared to operate in Julyand August, which were warm throughout and whenrainfall was more evenly spread in time. Differencesin CTSL between depths were significant (ANOVA,P<0.05) in the first 2 periods, but not in the third.
lf, however, nutrients or carbohydrates were addedto the soil before inserting the cotton strips (French1988a), the CTSL differences between soil layerswere nearly all eliminated or, in a few cases, verymuch reduced (Figure 1). Especially large increases inCTSL occurred at the depths where decompositionwas apparently most limited by soil climate. Clearlysoil climate variation does not explain entirely thepatterns of CTSL with soil depth; these aspects arediscussed further elsewhere (French 1988b).

Top
S I de
Botom
60
O
-
20
1-
u
0
Alder
60
Winter Spr ing Summer
20 30 40 50 60 20 30 40 50 60 20 30 40 50 60
40
CTSL (kg)
•
5 10
Temperature (*C1
10 15
CTSL (kg) CTSL (kg)
Figure 1. Some examples of elimination of differences between depths in CTSL, after 3 applications of nutrientsor carbohydrates (CHO) to the soil (see French 1988a for details of method). Differences between depths incontrol plots were significant (ANOVA, P<0.05) in winter (CHO 4 gm-2) and spring (P 24 gm-2) but not insummer (N 40 gm-2), when the range (42-46) is, however, still greater than the range in N-treated soil (48-50).There are no significant differences between depths in treated plots
Pine Spruce
15
60
40DI t\/
\
- J \ 1 \ \ •\ \ \ .
in 20 \\\
60
0
40-61
_1
m 20
Oak
5
\
5 10Temperature (*C1
47
1:11[1:1Treobod
SO OW
0 0 4-8 8-12
........
Combro
10 15
Depth ere )
15
Figure 2. Changes in CTSL in relation to seasonal temperatures (measured by sucrose inversion) at 4 depthsunder 4 tree species at Gisburn Forest. Brown and Howson (1988) give details of method
48
Plne
0- 4
4- 8
C 8-12
12-16ti•ca
16-20
A I der
0- 4
4- 8
u 8-12-
.c
0- 12-16tlf
16-20
O 20 40 60
O 20 40
CTSL (kg)
5 ForestCotton strips inserted in soils under 4 different treespecies at Gisburn Forest (Brown 1988; Brown &Howson 1988) again showed very clear changes be-tween seasons, in overall CTSL rates and, in somecases, in CTSL profiles (Figure 3). Somewhat similarpatterns in cellulose decomposition were shown foroak (Quercus spp.) forest in Switzerland by Richard(1945), using cellulose cords. The CTSL data for Gis-burn showed no relationship between soil moistureand CTSL at 0-4 cm, probably because soil moisturewas never unfavourable; The optimal moisture con-tent range in these or similar soil types is about 100—300% oven dried weight (OD) (Figure 12 in Heal et al.1974; Figure 3c in Flanagan & Veurn 1974). Similarly,any relationship of CTSL with temperature is not asimple linear response, but involves a delayed reaction(Figure 2), where changes in CTSL with temperaturefollow a 'cyclic' pattern, deviating markedly from thesimple diagonal oscillation expected from an immedi-ate direct relationship. As well as this lack of simplerelationships between CTSL and soil climatic factorsat any one soil depth, there are differences between
Spruce
Oak
/ /I// /
11
Figure 3. Seasonal changes of CTSL profiles under 4 tree species at Gisburn Forest
Feb-May Moy-Tul - Aug-Oct
Oct-Ton
0 20 40 60
60 0 20 40 60
CTSL (kg)
tree species in the way CTSL profiles change (Figure3), and these differences are not related in any clearmanner to climatic patterns. Possible alternative orinteractive mechanisms are discussed in detail byBrown and Howson (1988).
6 DiscussionThe 3 studies referred to above indicate the valueof the cotton strip assay in demonstrating seasonalpatterns in decomposition processes. In each case,answers were obtained to the questions posed at thebeginning of this paper. Furthermore, the observeddeviations from simple relationships between CTSLand soil climatic variation forced a more detailed exam-ination of the mechanisms of decomposition, and theirimplications for ecosystem functioning. In this con-text, it is more informative to have estimates of thefull seasonal pattern of variation in decompositionrates than only a single integrated annual measure-ment, though that, in turn, may be better than a valuefor some shorter period (eg days or even hours) thatcannot be related to the whole year. The cotton stripassay seems better suited to such investigations than
either short-period measures such as soil respiration(with the attendant problem of root respiration) or litterweight loss which, in temperate and sub-polar regions,is generally more appropriate for longer-term esti-mates over several years.
However, if cotton strip assay is to be used in thisway, we also need to know the extent to which itrepresents a general index of decomposition activity.Climatic factors seem to have similar effects ondecomposition of litters (Urenlampi 1971) and ofstandard cellulose substrates (Rosswall 1974), re-spectively, so broad agreement in seasonal patternsis likely.
I have discussed elsewhere (French 1988a) the limitsto any general correlation between CTSL and litterweight losses over a complete annual cycle underdifferent edaphic conditions. I concluded that CTSLcan be taken as a reasonable general index for com-parisons over a wide environmental range but, for fineranalyses, the agreement between cotton strip assayresults and litter weight loss, or between weight lossof different litters, is not sufficiently close for any onesubstrate to be used as a surrogate for any other(s).Is this also true of seasonal patterns?
Unfortunately, there appear to be very few studieswhich include both cotton strip assay and other meas-ures of decomposition in directly comparable seasonalsamples. In 4 sites in Norway, both litter bags and
7 ReferencesBrown, A.H.F. 1988. Discrimination between the effects on soilsof 4 tree species in pure and mixed stands using cotton strip assay.In: Cotton strip assay an index of decomposition in soils, editedby A.F.Harrison, P.M. Latter & D.W.H. Walton, 80-85. (ITE sym-posium no. 24.) Grange-over-Sands: Institute of Terrestrial Ecology.Brown A.H.F. & Howson, G. 1988. Changes in tensile strengthloss of cotton strips with season and soil depth under 4 tree species.In: Cotton strip assay an index of decomposition in soils, editedby A.F. Harrison, P.M.Latter & D.W.H. Walton, 86-89. (ITE sym-posium no. 24.) Grange-over-Sands: Institute of Terrestrial Ecology.Flanagan, P.W. & Veum, A.K. 1974. Relationships between respir-ation, weight loss, temperature and moisture in organic residues intundra. In: Soil organisms and decomposition in tundra, edited byA.J. Holding, O.W. Heal, S.F. MacLean & P.W. Flanagan, 249-278.Stockholm: Tundra Biome Steering Committee.French, D.D. 1988a. Patterns of decomposition assessed by theuse of litter bags and cotton strip assay on fertilized and unfertilizedheather moor in Scotland. In: Cotton strip assay. an index of de-composition in soils, edited by A.F. Harrison, P. M. Latter & D.W.H.Walton, 100-108. (ITE symposium no. 24.) Grange-over-Sands: Insti-tute of Terrestrial Ecology.French, D.D. 1988b. Some effects of changing soil chemistry ondecomposition of plant litters and cellulose on a Scottish moor.Oecologia. In press.
49
cotton strips were sampled on 2 occasions during ayear, from comparable depths in the soil. In 2 sites,there was an equivalent pattern (summer/winter) inboth cotton strips and plant litters; in one site somelitters behaved like cotton strips and some (particularlybryophyte litter) did not; while in the fourth site nodiscernible seasonal pattern in CTSL was detectedbut litter weight losses increased in summer (cf dataquoted in Heal & French 1974; Heal et al. 1974, fromHardangervidda sites). These very limited data indicatea fair degree of agreement among cotton strip andlitter bag measures, but with enough exceptions tomake any detailed relationship somewhat doubtful.As with annual rates, some caution is needed in theinterpretation of seasonal patterns in CTSL as an indi-cation of the patterns expected in decay of any othersubstrates, 'natural' or otherwise.
Finally, a warning must be given of the dangers ofextrapolating annual estimates from a single periodwithin the year. In both the moorland and the foreststudies, the data from any single assay period, evenif linearized and corrected for the 'average' expectedeffects of overall macroclimate, as in Hill et al. (1985),would give a highly biased estimate of annual lossrates or patterns of decomposition down soil profiles.For studies comparing different site or managementeffects, it is essential to have at least one full year'sdata made up of several seasonal measurements inorder to estimate seasonal patterns in decompositionrates.
French, D.D. & Howson, G. 1982. Cellulose decay rates measuredby a modified cotton strip method. Soil Biol. Biochem., 14, 311-312.Heal, O.W. & French, D.D. 1974. Decomposition of organic matterin tundra. In: Soil organisms and decomposition in tundra, editedby A.J. Holding, O.W. Heal, S.F. MacLean & P.W. Flanagan, 279-310. Stockholm: Tundra Biome Steering Committee.Heal, 0.W., Howson, G., French, D.D. & Jeffers, J.N.R. 1974.Decomposition of cotton strips in tundra. In: Soil organisms anddecomposition in tundra, edited by A.J. Holding, O.W. Heal, S.F.MacLean & P.W. Flanagan, 341-362. Stockholm: Tundra BiomeSteering Committee.Hill, M.O., Latter, P.M. & Bancroft, G. 1985. A standard curve forinter-site comparison of cellulose degradation using the cotton stripmethod. Can. J. Soil Sci., 65, 609-619.Karenlampi, L. 1971. Weight loss of leaf litter on forest soil surfacein relation to weather at Kevo Station, Finnish Lapland. Rep. KevoSubarct. Res. Stn, 8, 101-103.Richard, F. 1945. The biological decomposition of cellulose andprotein test cords in soils under forest and grass associations. I.The method of determining biological soil acidity by the so-called'tearing' test. Mitt. schweiz. Anst. forstl. VersWes., 24, 297-397.Rosswall, T. 1974. Cellulose decomposition studies on the tundra.In: Soil organisms and decomposition in tundra, edited by A.J.Holding, O.W. Heal, S.F. MacLean & P.W. Flanagan, 325-340.Stockholm: Tundra Biome Steering Committee.
50
ASPECTS RELATED TO USE OF THE ASSAY AND SOMEEXPERIMENTAL APPLICATIONS
The colonization and decay of cotton by fungi in soilburial tests used in the textile industryA R M BARRCatomance Limited, Welwyn Garden City
1 SummaryThe colonization and decay of cellulose by microfungiwas examined by investigating the microbial popu-lations of various soil samples, using a screened sub-strate technique. Cotton cloth was chosen as thesubstrate because of its high degree of uniformity andits suitability for tensile strength testing.
The soil burial testing of materials is discussed, asalso are the aggressiveness and stability of the popu-lations of cellulose-destroying microfungi present inthe soil samples used. The necessity for standardiza-tion of test conditions is emphasized.
2 Introduction and historical reviewIn view of the confusion, uncertainty and often theresulting frustration that impinges on those immedi-ately concerned with decisions based on the resultsof biological tests, it was felt that an attempt shouldbe made to present a realistic picture of the situationsurrounding the mystique of the soil used in soil burialtests.
In the microbial population of soil, the saprophyticfungi play a major role in converting complex materialsof plant and animal origins into simpler compounds,which can be re-utilized by green plants. The de-composition part of this cycle is referred to as biodet-erioration, when it involves materials of commercialvalue. Microbial biodeterioration is basically, there-fore, the study of the behaviour of saprophytic micro-organisms.
Soil is the natural habitat of such organisms, and it islogical to utilize it in any study designed to investigatethe susceptibility of a substrate to biodeterioration.The simplest and certainly the easiest way of checkingon the susceptibility of a material to biodeteriorationis to bury it in, or place it in contact with, soil, and thento measure its response with time to the act of burial.Measurements on the effects of burial are usuallyassessed by calculating the loss in mass or the re-duction in strength of the substrate. Thus, any testutilizing soil provides a quick way of determining theresistance of a substrate to a wide variety of differentfungi.
When this kind of test is conducted out-of-doors, it isoften referred to as a field test, as is the case with the
well-known stake tests used for the evaluation ofwood preservatives. However, under field test con-ditions, it is only possible to standardize the test speci-mens and the way in which they are buried, becausethe weather conditions during the test period will giverise to variations in the moisture content of the soil,its temperature and packing density. This latter par-ameter can have a significant influence on the aerationof the soil, and thus give rise to a change in themicrobial activity within the soil. However, these limi-tations in no way negate the value of outdoor burialtests. In fact, the results of such tests have made asignificant contribution to our knowledge of materialdeterioration. The major objection to the field testingof preservative-treated material is frequently one ofeconomics, in that test sites are often costly to main-tain and the tests themselves usually take longer toperform than the more compact laboratory pro-cedures. On the other hand, this disadvantage iscounterbalanced by the fact that the results of fieldtests generally correlate more closely with end-usesituations than do the results of accelerated laboratorytests. It is, nevertheless, vital that there is available adependable accelerated method for testing the ser-viceability of materials. In the last 50 years, a greatdeal of time and effort on the part of a large numberof research workers has gone into trying to achievesuch a satisfactory soil contact laboratory test method.
The primary requirement of any test method is that itshould give some indication of how the material undertest is likely to behave in practice. The more preciselyit can do this, the better the method, and, as alreadyindicated, a further requirement imposed by commer-cial considerations is that the processes of decayshould be speeded up, so that a judgement on amaterial's resistance to biodeterioration can be ob-tained in the shortest possible time. This requirementapplies particularly to the testing of textiles. It is inter-esting to note that, of the many novel soil contacttests devised for testing textiles, few, if any, of themhave achieved official recognition, other than thosebased on straightforward burial procedures. Many ofthese test methods have been described and criticallyreviewed by Siu (1951).
Many species of micro-organisms are actually or po-tentially present in any soil. Their survival and activityis related to soil conditions. It is, therefore, necessary
Table 1. Test conditions specified for 6 official soil burial test methods
Countryandmethod
USAFranceIndiaSouth AfricaSwedenCanada
RH, relative humidity
Temperature(T)
28 ± 130 ± 130±230±230±229 ± 1
Soil pH
5.5-7.06.0-7.5
6.5-8.0
for us to determine the soil conditions in order tostandardize the test. Generally, an acid soil usually ofpH 5.5-7.5, with high microbial activity, and a suf-ficiently porous nature to permit the diffusion of airand water, has been found to be suitable for testingpurposes. Methods for testing a material's resistanceto attack by micro-organisms have imposed conditionson the following aspects of testing procedures:
i. the size and shape of the test specimen;ii. the manner of burial;iii. the size and composition of the containers used
for the soil;iv. the moisture content of the soil;v. the pH of the soil;vi. the temperature of the soil;vii. the method of incubation.
Table 1 lists some of the conditions of 6 official testmethods for assessing the resistance of textile ma-terials to attack by micro-organisms under conditionsof soil burial.
In any critical examination of testing procedures, itimmediately becomes apparent that the so-called triv-ial factors, such as soil contact with the test speci-mens, soil particle size and packing density, receivelittle or no attention. Furthermore, there is seldom anyreference in official specifications to the managementof soil beds. It is, therefore, not surprising that therehas been considerable difficulty in achieving reproduci-bility of results from test to test, or even within anindividual test.
3 The soil, micro-organisms and substrate screeningThe soil contains many different kinds of organisms.The natural consequence of this fact is that the ad-dition of a food supply to the soil will cause thepopulation to adjust itself, as regards numbers ofindividuals and balance of actively involved species,to meet the new conditions. Thus, for a time, organ-isms of one type or another become the controllingmembers of the population. This state of equilibriumcontinues either until the food supply runs out oruntil the conditions developing within the soil becomeunsuitable for any further activity on the part of thisgroup of the population. A new set of conditions isproduced, and then another set of organisms develops
Moisturecontent
(% oven dry weight)
25-3025
22-2525-3020-30
25
and so on, until the food supply is eventuallyexhausted.
Eggins and Lloyd (1968) described a new techniquefor the isolation of cellulolytic fungi from soil, andgave us a tool to obtain a better understanding ofthe microbial ecology of biodeterioration in soil. Thecellulosic substrate was chromatography paper andwas protected from direct contact with soil by the useof glass fibre fabric tape. The combination of substrateand screening tape was then buried, the result ofwhich was to select, out of the microbial populationpresent in the soil, only those organisms activelyresponsible for the colonization and decay of the papercellulose. Furthermore, this screening of the substratefrom direct contact with the soil minimized the risk ofcultivating contaminants from the soil during sub-sequent subculturing of the actual colonizers foridentification purposes.
Table 2. Summary of soils used in test beds
Incubationconditions
Temperature only (covered)Temperature/RH (open)Temperature/RH (open)Temperature/RH (covered)Temperature/RH (open)Temperature/RH (open)
51
i. Meadow soil, Clent, N Worcestershire, UK (Allsopp & Eggins1972)
ii. John lnnes potting soil no.1 (Barr 1978, Table 4)
iii. Garden soil, Welwyn Garden City, Hertfordshire, UK; sand; well-rotted horse manure in 1:1:1 mixture (Barr 1978, Table 5)
iv. Mixture as (no. iii), constituted for commercial soil burial bedsused 11 years, since 1965 (Barr 1978, Table 6)
v. John Innes potting soil no.1, used 7 years, since 1969 (Barr 1978,Table 6)
vi. As no. v, used one year, since 1976 (Barr 1978, Table 61
Allsopp and Eggins (1972) used this technique toevaluate the effects of substrate screening on thecolonization and decay of cotton cloth under con-ditions of soil burial. Boiling tubes supporting strips ofscreened and unscreened cloth, sterilized at 121°C for20 minutes in an autoclave, were subjected to soilburial under controlled conditions using soil no. i inTable 2. They assessed the rate of decay of the cottoncloth by measuring the tensile strength of strips re-moved at intervals from the soil over a period of 3weeks and obtained patterns of colonization by thesubsequent isolation of fungal species from the textiletest strips on to glucose agar and cellulose agar. Someresults of this work are reproduced in Table 3, andmay be summarized as follows.

52
i. The rate of decay in the screened cotton stripswas greater than in the unscreened strips, oncecolonization had taken place.
ii. The ultimate tensile strength losses in both thescreened and unscreened strips were approxi-mately the same.
iii. The fungi isolated from the screened strips werepredominantly celiulolytic species.
iv. More fungi were isolated from the unscreenedstrips of cotton cloth than from the screened strips.
It is clear from the results of this and earlier work that,by using a screened substrate technique, it should bepossible to obtain a microbial profile of soil in termsof those members of the population responsible forthe colonization and decay of the cellulosic substrate.Furthermore, it is also possible to equate such a profilewith information relating to the aggressiveness of thesoil as an agent of decay. Microbial profiles were thendetermined for 2 different burial soils under identicalincubation conditions, and the profiles obtained wereequated against the individual soils' ability to rot cellu-lose.
4 Method and resultsTest specimens, 10 cm long and 3.5 cm wide, werecut lengthwise from the warp direction of a standardcotton test cloth and fastened on to the outer surfaceof 12.5 cm lengths of 3.3 cm diameter glass tubing
with autoclavable, nutrient-free, non-toxic adhesivetape. All the tubes prepared in this way had glass fibrefabric tape fastened over the strips of cotton test cloth.The screened tubes were then autoclaved at 121°Cfor 20 minutes, cooled and divided into 2 equal setsin preparation for burial in soil nos i and ii (Table 2). Atthe start of the investigation, both these soils had beensieved through a standard screen and their moisturecontents set at 25%, based on the oven dried weightof soil. The 2 soils in this state were then placed to adepth of 12.5 cm in separate polythene boxes measur-ing 60 cm long by 37.5 cm wide by 20 cm in height,and covered with sheets of glass to prevent loss ofmoisture during conditioning and subsequent incu-bation. The soil beds were left in an incubation roomat 28°C for 3 weeks, the soil in each box being turnedover each day during this period.
Six screened substrate tubes for each of 5 harvestingperiods were then placed in each soil bed, care beingtaken to pack the soil loosely around each tube. Theywere incubated for 14 days at 28°C, and a relativehumidity (RH) of 85-90% was maintained throughoutthe test at the air/soil interface in each box.
At intervals of 2, 4, 7, 10 and 14 days, tubes wereremoved from each soil bed. The glass fibre fabrictape was removed from 2 tubes, and the underlyingstrips of cotton cloth for isolation work were cut intosections under sterile conditions and plated out on tocellulose agar and glucose agar (Eggins & Pugh 1962).The remaining 4 strips from each soil were cleaned in
Table 3. Fungal species isolated from cotton textile buried in the test soils. Isolation tests in soil no i refer to 9 samplings over 3-weekperiod and in soil nos ii and iii to 4 samplings over 10-day period
Screened cotton testsnumber occasions isolated
Soil burial bedspresence
Soil (see Table 2) iii iv—viMedium Cellulose
agarGlucose
agar
Aspergillus fumigatus 4 3A. nigerA. sydowiChaetomium globosum 0 1 2 2Fusarium oxysporum 3 3F. solani 2 1Gliocladium roseum 2Graphium sp.Humicola grisea 1 3 1 1Paecilomyces variotiPapulaspora sp. 0 1 1 1 2Penicillium chrysogenumP. funiculosum 4 3 3 7 3 2Peziza ostracoderma 2 0Rhizopus nigricans 2Rhizopus sp. 0 1 2 5Sporotrichum pruinosum 2 2Sporotrichum sp.Trichoderma viride 4 6 5 8 3 3Zygorrhynchus moelleri 1Streptomyces sp. 1
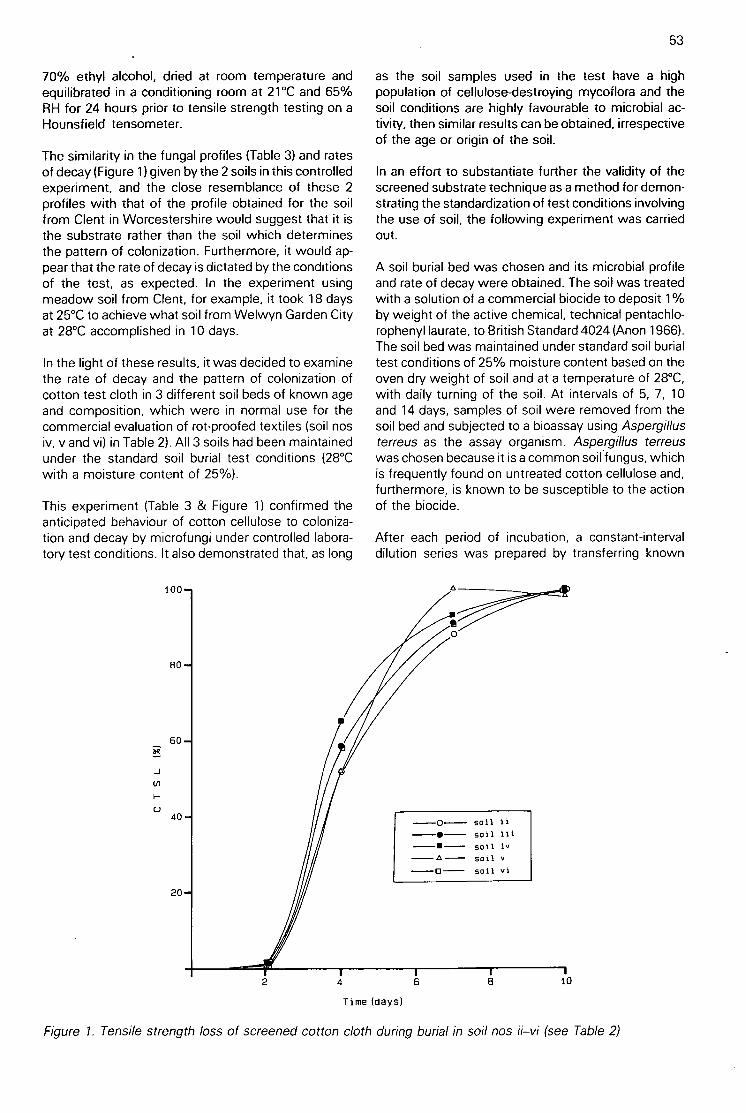
70% ethyl alcohol, dried at room temperature andequilibrated in a conditioning room at 21°C and 65%RH for 24 hours prior to tensile strength testing on aHounsfield tensometer.
The similarity in the fungal profiles (Table 3) and ratesof decay (Figure 1) given by the 2 soils in this controlledexperiment, and the close resemblance of these 2profiles with that of the profile obtained for the soilfrom Clent in Worcestershire would suggest that it isthe substrate rather than the soil which determinesthe pattern of colonization. Furthermore, it would ap-pear that the rate of decay is dictated by the conditionsof the test, as expected. In the experiment usingmeadow soil from Clent, for example, it took 18 daysat 25°C to achieve what soil from Welwyn Garden Cityat 28°C accomplished in 10 days.
In the light of these results, it was decided to examinethe rate of decay and the pattern of colonization ofcotton test cloth in 3 different soil beds of known ageand composition, which were in normal use for thecommercial evaluation of rot-proofed textiles (soil nosiv, v and vi) in Table 2). All 3 soils had been maintainedunder the standard soil burial test conditions (28°Cwith a moisture content of 25%).
This experiment (Table 3 & Figure 1) confirmed theanticipated behaviour of cotton cellulose to coloniza-tion and decay by microfungi under controlled labora-tory test conditions. It also demonstrated that, as long
100
80
60
(r)
40
20
2 4
Time (days)
53
as the soil samples used in the test have a highpopulation of cellulose-destroying mycoflora and thesoil conditions are highly favourable to microbial ac-tivity, then similar results can be obtained, irrespectiveof the age or origin of the soil.
In an effort to substantiate further the validity of thescreened substrate technique as a method for demon-strating the standardization of test conditions involvingthe use of soil, the following experiment was carriedout.
A soil burial bed was chosen and its microbial profileand rate of decay were obtained. The soil was treatedwith a solution of a commercial biocide to deposit 1%by weight of the active chemical, technical pentachlo-rophenyl laurate, to British Standard 4024 (Anon 1966).The soil bed was maintained under standard soil burialtest conditions of 25% moisture content based on theoven dry weight of soil and at a temperature of 28°C,with daily turning of the soil. At intervals of 5, 7, 10and 14 days, samples of soil were removed from thesoil bed and subjected to a bioassay using Aspergillusterreus as the assay organism. Aspergillus terreuswas chosen because it is a common soirfungus, whichis frequently found on untreated cotton cellulose and,furthermore, is known to be susceptible to the actionof the biocide.
After each period of incubation, a constant-intervaldilution series was prepared by transferring known
0
-----0---- Soil ii
• Soil iii
Soil iv
A- Soil v
-0 --- soil vi
6
Figure 1. Tensile strength loss of screened cotton cloth during burial in soil nos ii—vi (see Table 2)

54
weights of the biocide-treated soil to 28 ml screw-capUniversal bottles containing 10 ml of a liquid medium.The diluted soil suspensions were then sterilized byautoclaving for 20 minutes at 121°C, cooled to roomtemperature and inoculated with the assay organism.Incubation was for 5 days at 28°C, after which timethe fungicide/soil mixture serial dilutions were exam-ined for the development of the assay organism.
The results of this assay demonstrated that the toxicityof pentachlorophenyl laurate in soil was diminishingwith time. A screened substrate evaluation of themicrobial population of the fungicide/soil mixture, 11weeks after dosing with technical pentachlorophenyllaurate (Anon 1966), indicated that the soil microbialequilibrium was moving back towards the state whichexisted before the addition of the biocide.
5 ConclusionsAs regards the techniques employed in textile work,they demonstrate that, under highly controlled testconditions, soil can be used to obtain reliable infor-mation on the deterioration of cellulose by microfungi.
The value of information from soil burial tests is en-hanced by standardizing the test conditions of whichthe soil is a major part, along with the cellulose de-composing mycoflora of the soil which has beenshown to be extremely stable.
6 ReferencesAllsopp, D. & Eggins, H.O.W. 1972. A demonstration of theeffects of substrate screening on the colonisation and decay ofcotton textiles in soil burial tests. Mycopath. Mycol. appl. , 47, 331-336.Anon. 1966. Pentachlorophenyl laurate. (BS 4024.1 London: BritishStandards Institution.Barr, A.R.M. 1978. The role of soils in the colonisation and decayof cellulose by micro fungi. Proc. Ann. Cony. Br. Wood Preserv.Assoc., 1-14.Eggins, H.O.W. & Lloyd, A.O. 1968. Cellulolytic fungi isolated bythe screened substrate method. Experientia, 24, 749.Eggins, H.O.W. & Pugh, G.J.F. 1962. Isolation of cellulose de-composing fungi from the soil. Nature, Lond., 193, 94-95.Siu, R.G.H. 1951. Microbial decomposition of cellulose. NewYork: Reinhold.

Relationships between tensile strength and increase inmetabolic activity on cotton stripsR N SMITH and J M MAWSchool of Natural Sciences, Hatfield Polytechnic, Hatfield
1 SummaryMicrobial activity, as measured by fluorescein diace-tate (FDA) hydrolysis, has been compared with theaccumulation of microbial protein and loss in tensilestrength in experiments with soil burial of test fabric.The temporal patterns recorded for the 3 tests weresimilar. Tensile strength losses were found to occurin advance of the major increase in FDA hydrolysisand microbial protein accumulation. When cloth pro-tected by biocides was examined, no loss in tensilestrength was recorded, although a small but signifi-cant amount of FDA hydrolysis was obtained fromtreated cloth. The results demonstrate that FDA hy-drolysis can be a reliable method for monitoring thelevel of microbial activity on a biodegradable material.This method is inexpensive and, unlike tensilestrength measurements, permits a substrate of anyshape or form to be examined for microbial activity.
2 IntroductionStudies on the microbial degradation of cellulose havebeen based upon measurements of tensile strength(TS), dry weight and respiration. For example, Long(1976) added powdered cellulose to soil, and foundthat the rise in respiration reached a peak a significanttime after cotton textile buried in similar conditionshad lost its tensile strength. Rubidge (1977) reportedthat, whereas cotton duck cloth had lost all its strengthafter 9 days in soil, cellulase activity in the same soilsupplemented with microgranular cellulose reachedits maximum after 2 weeks. The powdered or micro-granular cellulose had been thoroughly mixed withthe soil and should have been more available to themicroflora than pieces of cotton textile. Despite thisincreased availability, the evidence was that microbialactivity associated with cellulose degradation con-tinued to rise and reached its maximum some timeafter all TS had been lost.
It is, therefore, proposed that the degradation of buriedcellulose may be divided into 3 stages:
i. initial colonization by micro-organisms;ii. initial degradation by enzymes released by the
pioneer colonizers, resulting in tensile strengthloss;
iii. proliferation of the pioneer community and perhapsother organisms, resulting in maximum enzymeactivity and the complete degradation of the ma-terial.
In soil microbiology, there is a need for a method ofmonitoring levels of microbial activity in samples of
55
cellulosic materials collected in the field, and in indus-try there is a similar requirement for monitoring thelevels of microbial activity in raw materials of naturalorigin. Microbial degradation of cellulosic materials innatural environments such as soil has traditionallybeen measured by the tensile strength loss of cottoncloth (CTSL) (Walton & Allsopp 1977; Latter & How-son 1977), weight loss (Long 1976), or the evolution ofcarbon dioxide (Schmidt & Ruschmeyer 1958). Whilsttensile strength loss can be a reliable indicator of initialdegradation, its use is limited to material which isamenable to this technique, and many natural prod-ucts are thereby excluded. Weight losses take muchlonger to become significant and can only be usedon material whose initial weight is known. Similarly,estimates of total protein can only be made if theinitial protein content is known, and this technique canbe time-consuming to perform. The validity of totalviable counts is suspect and often bears little relationto the active biomass present on the sample (Stotzky1972). Measurements of microbial ATP by lumi-nescence using standard luciferin-luciferase systemsare possible, but expensive, and only very small ali-quots can be sampled, which would be unrepresent-ative of the field soil situation without considerablereplication.
Microbial degradation of plant debris depends uponthe production of extracellular enzymes. These en-zymes are largely hydrolytic and, because in naturetheir substrates are heterogeneous, a battery of extra-cellular enzymes, eg cellulases, proteases, esterases,hemicellulases and pectinases, will be required todegrade them. A system which measures the abun-dance of such enzymes would give a useful indicationof the extent of degradative microbial activity present.One such enzyme, esterase, is one of the degradativeenzymes found in such enzyme consortia, and is pre-sent in commercial cellulase preparations. Fluor-escein diacetate is hydrolyzed by esterases to releasefluorescein, which can be quantified by fluorometryor spectrophotometry. Thus, the dxtentof esteraseactivity as measured by FDA hydrolysis will be pro-portional to the overall amount of microbial enzymeactivity, which will, in turn, be proportional to the rateof enzyme degradation occurring within the sample.Schnurer and Rosswall (1982) demonstrated that FDAhydrolysis could be an effective measure of total mi-crobial activity in soil and litter.
In the work presented below, the use of FDA hydroly-sis as a measure of microbial activity on soil burialfabric has been compared with 2 established me-
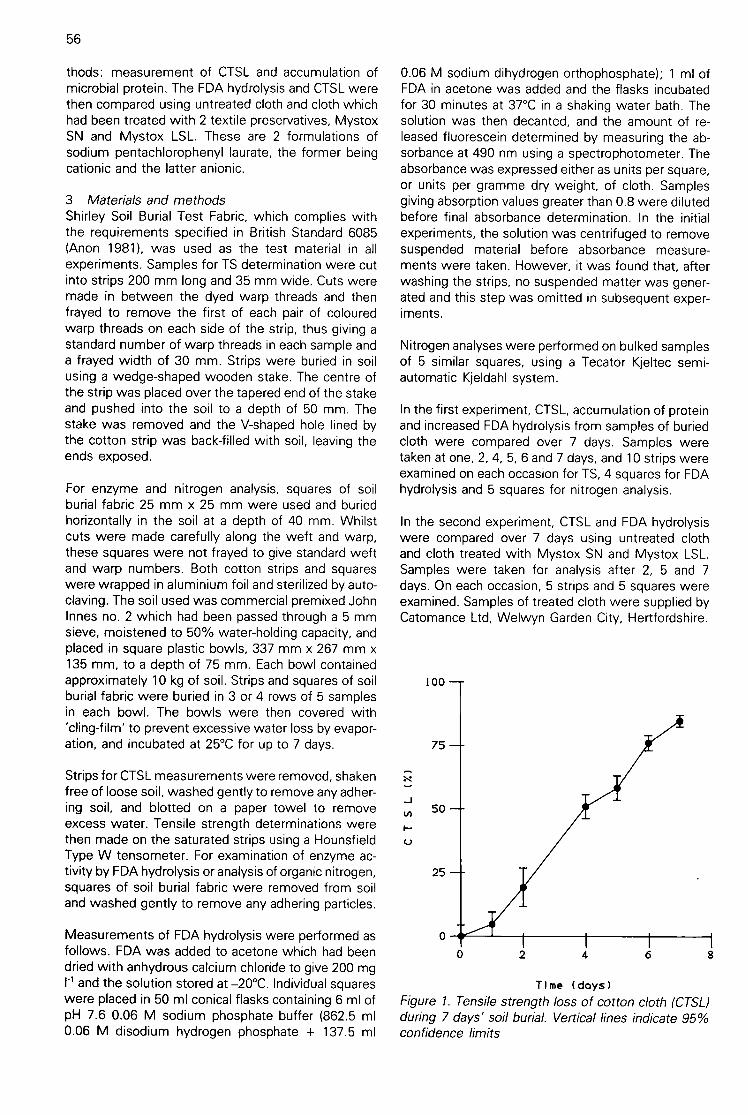
56
thods: measurement of CTSL and accumulation ofmicrobial protein. The FDA hydrolysis and CTSL werethen compared using untreated cloth and cloth whichhad been treated with 2 textile preservatives, MystoxSN and Mystox LSL. These are 2 formulations ofsodium pentachlorophenyl laurate, the former beingcationic and the latter anionic.
3 Materials and methodsShirley Soil Burial Test Fabric, which complies withthe requirements specified in British Standard 6085(Anon 1981), was used as the test material in allexperiments. Samples for TS determination were cutinto strips 200 mm long and 35 mm wide. Cuts weremade in between the dyed warp threads and thenfrayed to remove the first of each pair of colouredwarp threads on each side of the strip, thus giving astandard number of warp threads in each sample anda frayed width of 30 mm. Strips were buried in soilusing a wedge-shaped wooden stake. The centre ofthe strip was placed over the tapered end of the stakeand pushed into the soil to a depth of 50 mm. Thestake was removed and the V-shaped hole lined bythe cotton strip was back-filled with soil, leaving theends exposed.
For enzyme and nitrogen analysis, squares of soilburial fabric 25 mm x 25 mm were used and buriedhorizontally in the soil at a depth of 40 mm. Whilstcuts were made carefully along the weft and warp,these squares were not frayed to give standard weftand warp numbers. Both cotton strips and squareswere wrapped in aluminium foil and sterilized by auto-claving. The soil used was commercial premixed JohnInnes no. 2 which had been passed through a 5 mmsieve, moistened to 50% water-holding capacity, andplaced in square plastic bowls, 337 mm x 267 mm x135 mm, to a depth of 75 mm. Each bowl containedapproximately 10 kg of soil. Strips and squares of soilburial fabric were buried in 3 or 4 rows of 5 samplesin each bowl. The bowls were then covered with'cling-film' to prevent excessive water loss by evapor-ation, and incubated at 25°C for up to 7 days.
Strips for CTSL measurements were removed, shakenfree of loose soil, washed gently to remove any adher-ing soil, and blotted on a paper towel to removeexcess water. Tensile strength determinations werethen made on the saturated strips using a HounsfieldType W tensometer. For examination of enzyme ac-tivity by FDA hydrolysis or analysis of organic nitrogen,squares of soil burial fabric were removed from soiland washed gently to remove any adhering particles.
Measurements of FDA hydrolysis were performed asfollows. FDA was added to acetone which had beendried with anhydrous calcium chloride to give 200 mg
and the solution stored at —20°C. Individual squareswere placed in 50 ml conical flasks containing 6 ml ofpH 7.6 0.06 M sodium phosphate buffer (862.5 ml0.06 M disodium hydrogen phosphate + 137.5 ml
0.06 M sodium dihydrogen orthophosphate); 1 ml ofFDA in acetone was added and the flasks incubatedfor 30 minutes at 37°C in a shaking water bath. Thesolution was then decanted, and the amount of re-leased fluorescein determined by measuring the ab-sorbance at 490 nm using a spectrophotometer. Theabsorbance was expressed either as units per square,or units per gramme dry weight, of cloth. Samplesgiving absorption values greater than 0.8 were dilutedbefore final absorbance determination. In the initialexperiments, the solution was centrifuged to removesuspended material before absorbance measure-ments were taken. However, it was found that, afterwashing the strips, no suspended matter was gener-ated and this step was omitted in subsequent exper-iments.
Nitrogen analyses were performed on bulked samplesof 5 similar squares, using a Tecator Kjeltec semi-automatic Kjeldahl system.
In the first experiment, CTSL, accumulation of proteinand increased FDA hydrolysis from samples of buriedcloth were compared over 7 days. Samples weretaken at one, 2, 4, 5, 6 and 7 days, and 10 strips wereexamined on each occasion for TS, 4 squares for FDAhydrolysis and 5 squares for nitrogen analysis.
In the second experiment, CTSL and FDA hydrolysiswere compared over 7 days using untreated clothand cloth treated with Mystox SN and Mystox LSL.Samples were taken for analysis after 2, 5 and 7days. On each occasion, 5 strips and 5 squares wereexamined. Samples of treated cloth were supplied byCatomance Ltd, Welwyn Garden City, Hertfordshire.
-J
U.)
100
75
50
25
0
0 2 4 6
Time (days)Figure 1. Tensile strength loss of cotton cloth (CTSL)during 7 days' soil burial. Vertical lines indicate 95%confidence limits
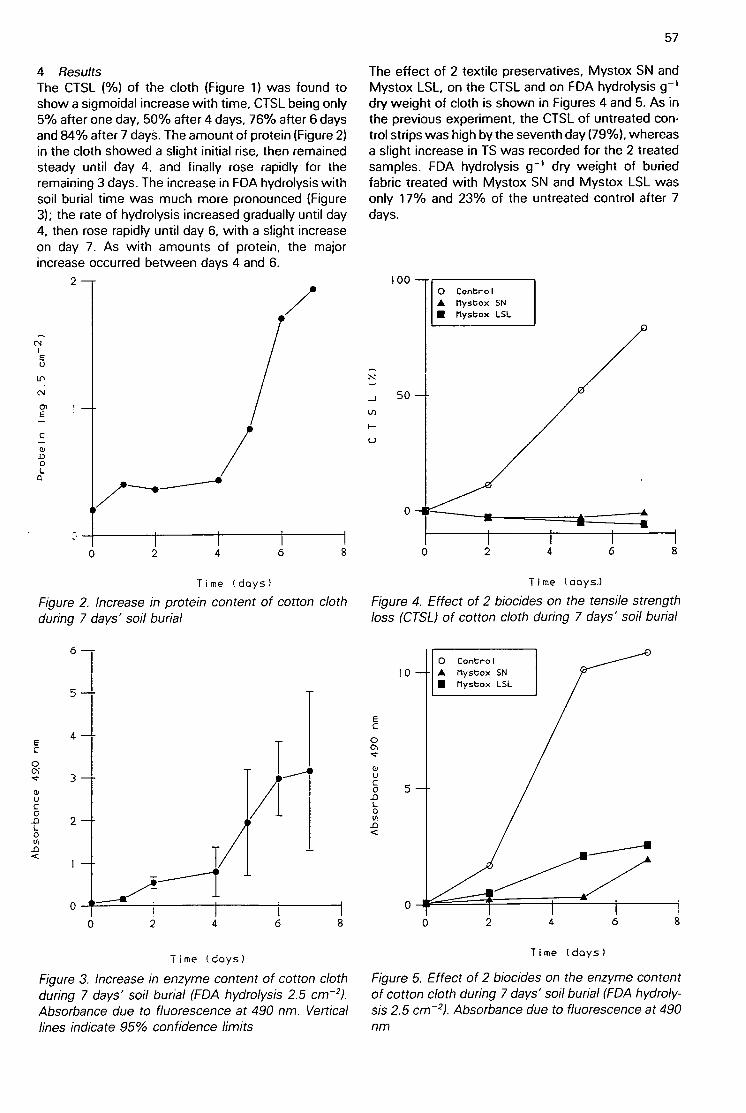
4 ResultsThe CTSL (%) of the cloth (Figure 1) was found toshow a sigmoidal increase with time, CTSL being only5% after one day, 50% after 4 days, 76% after 6 daysand 84% after 7 days. The amount of protein (Figure 2)in the cloth showed a slight initial rise, then remainedsteady until day 4, and finally rose rapidly for theremaining 3 days. The increase in FDA hydrolysis withsoil burial time was much more pronounced (Figure3); the rate of hydrolysis increased gradually until day4, then rose rapidly until day 6, with a slight increaseon day 7. As with amounts of protein, the majorincrease occurred between days 4 and 6.
2
Time (days)
Figure 2. Increase in protein content of cotton clothduring 7 days' soil burial
6
5
4
0
20
1
0
0
0 2
2 4
4
6 8
6 8
Time (days)
Figure 3. Increase in enzyme content of cotton clothduring 7 days' soil burial (FDA hydrolysis 2.5 cm-2).Absorbance due to fluorescence at 490 nm. Verticallines indicate 95% confidence limits
The effect of 2 textile preservatives, Mystox SN andMystox LSL, on the CTSL and on FDA hydrolysis g-1dry weight of cloth is shown in Figures 4 and 5. As inthe previous experiment, the CTSL of untreated con-trol strips was high by the seventh day (79%), whereasa slight increase in TS was recorded for the 2 treatedsamples. FDA hydrolysis g' dry weight of buriedfabric treated with Mystox SN and Mystox LSL wasonly 17% and 23% of the untreated control after 7days.
50
Time (days.)
Figure 4. Effect of 2 biocides on the tensile strengthloss (CTSL) of cotton cloth during 7 days' soil burial
100—
0
5
0
0
0 ControlA Mystox SN• Mystox LSL
0 Control10 A Mystox SN
• Mystox LSL
0 2
2 4
4 6
Time (days)
6 8
57
Figure 5. Effect of 2 biocides on the enzyme contentof cotton cloth during 7 days' soil burial (FDA hydroly-sis 2.5 cm-2). Absorbance due to fluorescence at 490nm

58
5 DiscussionThese results show that the temporal patterns ofCTSL, the extent of FDA hydrolysis, and protein ac-cumulation each followed the characteristic sigmoidcurve during the 7 days of soil burial (Long 1976; Hillet al. 1985). When the magnitudes of these changeswere compared, FDA hydrolysis gave a massive in-crease with absorbance, which rose from 0.06 for thecontrol to 3.16 after 7 days, whilst protein content 2.5cm-2 increased from 0.2 mg in the control to 1.928on day 7. However, FDA hydrolysis and protein ac-cumulation showed little increase during the first 4days, followed by a rapid increase during the last 3days and tailing off on day 7. Thus, the CTSL reached50% in advance of the major increase in protein ac-cumulation on cloth and FDA hydrolysis, and the sub-sequent CTSL appeared not to be affected by theincreased amounts of enzymes present during the last3 days. These results indicate that the CTSL in soilwas caused by a relatively small, but active, colonizingmicroflora.
In contrast, complete degradation and assimilationonly occur after a much longer time (Long 1976). Thus,CTSL may be considered a measure of initial stagesof colonization and biodegradative attack. Similarly,Schmidt and Ruschmeyer (1958) found that carbondioxide evolution from buried cellulose continued torise after double the time required for a near completeTS loss. Hill et al. (1985) demonstrated an exponentialdecline in CTSL, which again resembles the sigmoidcurve for CTSL reported in the present investigationand in Barr (1988). At the end of the incubation period,when biomass and enzyme levels were highest, theabsolute rate of CTSL was lower than earlier in theexperiment. It may be that the endo-gluconases re-sponsible for initial attack on the long glucan polymersare only susceptible to attack at a restricted numberof sites. This is a random event, resulting in an ex-ponential decline in the number of sites attacked asthe number of susceptible sites declines.
The protective action of Mystox SN and Mystox LSLhas been demonstrated by both CTSL values andamounts of FDA hydrolysis. When biocide-protectedcloth was examined, it was found that, even thoughno CTSL had been recorded, some microbial develop-ment had taken place on the protected material. Theextent of FDA hydrolysis arising by biocide-treatedmaterial after 7 days was similar tocuntreated materialafter only 2 days but, whereas the untreated fabric hadalso suffered an 11% CTSL, no CTSL was recorded fortreated cloth after 7 days. The slight increase in TScan be attributed to the lubricating effect of thesetreatments on material, rather than cementation asreported by French (1984, 1988). When the extent ofFDA hydrolysis caused by the microflora on treatedcloth was examined, a slight but significant amountof enzyme activity, in most cases between 17% and23% of the equivalent untreated control values, wasrecorded. Thus, even though no CTSL had been rec-
orded, some microbial development had taken placeon the protected material.
Measurements of FDA hydrolysis and CTSL are bothrelatively rapid techniques whereby about 60 repli-cates can be recorded per hour. In contrast, analysisfor total protein is a much slower procedure. The FDAhydrolysis technique has certain advantages over TSmeasurements. It can be performed using inexpensivereagents and standard equipment present in any bio-chemistry or microbiology laboratory, whilst tensilestrength measurements require expensive tensome-tric devices. The amount of FDA hydrolyzed rep-resents the extent of microbial activity in the wholeof the sample, whereas TS measurements representthe breaking strength of the weakest cross-segmentof the sample. FDA hydrolysis can also be used todetermine the extent of microbial activity in de-composing materials which are in a form that rendersthem unsuitable for TS or weight loss determinations.It can also be employed to monitor the microbialquality of wood pulp, wool and hay, or the extent ofmicrobial activity on decomposing leaf litter, straw orurban refuse.
6 ConclusionsExperiments with buried fabric have shown that FDAhydrolysis is a valuable indicator of microbial activityon decomposing material, and compares favourablywith tensile strength loss and protein accumulation.Both hydrolytic enzyme activity and protein accumu-lation followed initial CTSL, implying that CTSL wascaused by the relatively small pioneer microbial bio-mass which develops in the first stages of coloniza-tion. Tensile strength loss is only a measure of initialdegradation, whereas the increase in microbial bio-mass and enzyme activity which will occur at all stagesof degradation can be monitored by protein analysisand FDA hydrolysis. Thus, the use of TS measure-ments in conjunction with FDA hydrolysis can give amore complete picture of cellulose degradation.
It is proposed that, whilst a small amount of FDAhydrolysis up to 3.00 absorbance units g-1 may ormay not indicate damage to a material, absorbancereadings in excess of 9.00 units g-1 of material areindicative of severe microbial attack. The advantagesof this technique are that the reagents are inexpensiveand large representative samples can be examinedrapidly to give a result within 30 minutes.
7 ReferencesAnon. 1981. Method of test for the determination of the resistanceof textiles to microbiological deterioration. (BS 6085.) London:British Standards Institution.Barr, A.R.M. 1988. The colonization and decay of cotto'n by fungiin soil burial tests used in the textile industry. In: Cotton strip assay:an index of decomposition in soils, edited by A.F. Harrison, P.M.Latter & D.W.H. Walton, 50-54. (ITE symposium no. 24.) Grange-over-Sands: Institute of Terrestrial Ecology.French, D.D. 1984. The problem of cementation when using cottonstrips as a measure of cellulose decay in soils. Int. Biodeterior., 20,169-172.

French, D.D. 1988. The problem of cementation. In: Cotton stripassay. an index of decomposition in soils, edited by AF. Harrison,
P.M. Latter & D.W.H. Walton. 32-33. (ITE symposium no. 24.)Grange-over-Sands: Institute of Terrestrial Ecology.Hill, M.O., Latter, P.M. & Bancroft, G. 1985. A standard curve forinter-site comparison of cellulose degradation using the cotton stripmethod. Can. J. Soil Sci., 65, 609-619.Latter, P.M. & Howson, G. 1977. The use of cotton strips toindicate cellulose decomposition in the field. Pedobiologia, 17,
145-155.Long, PA. 1976. The effect of industrial and agricultural biocideson the soil microflora. PhD thesis (CNAA), Hatfield Polytechnic.
Rubidge, T. 1977. The effects of moisture content and incubationtemperature upon the potential cellulase activity of John Innes no.1 soil. Int. Biodeterior. Bull., 13, 39-44
59
Schmidt, E.L & Ruschmeyer, O.R. 1958. Cellulose decompositionin soil burial beds. 1. Soil properties in relation to cellulose degra-
dation. Appl. Microbiol., 6, 108-114.Schnurer, J. & Rosswall, T. 1982. Fluorescein diacetate hydrolysisas a measure of total microbial activity in soil and litter. Appl.environ. MicrobioL, 43, 1256-1261.Stotzky, G. 1972. Activity, ecology and population dynamics ofmicroorganisms in soil. CRC Crit. Rev. MicrobioL(Chem. Rubb.
2, 59-137.Walton, D.W.H. & Allsopp, D. 1977. A new test cloth for soilburial trials and other studies on cellulose_breakdown. Int. Biodet-erior. Bull., 13, 112-115.
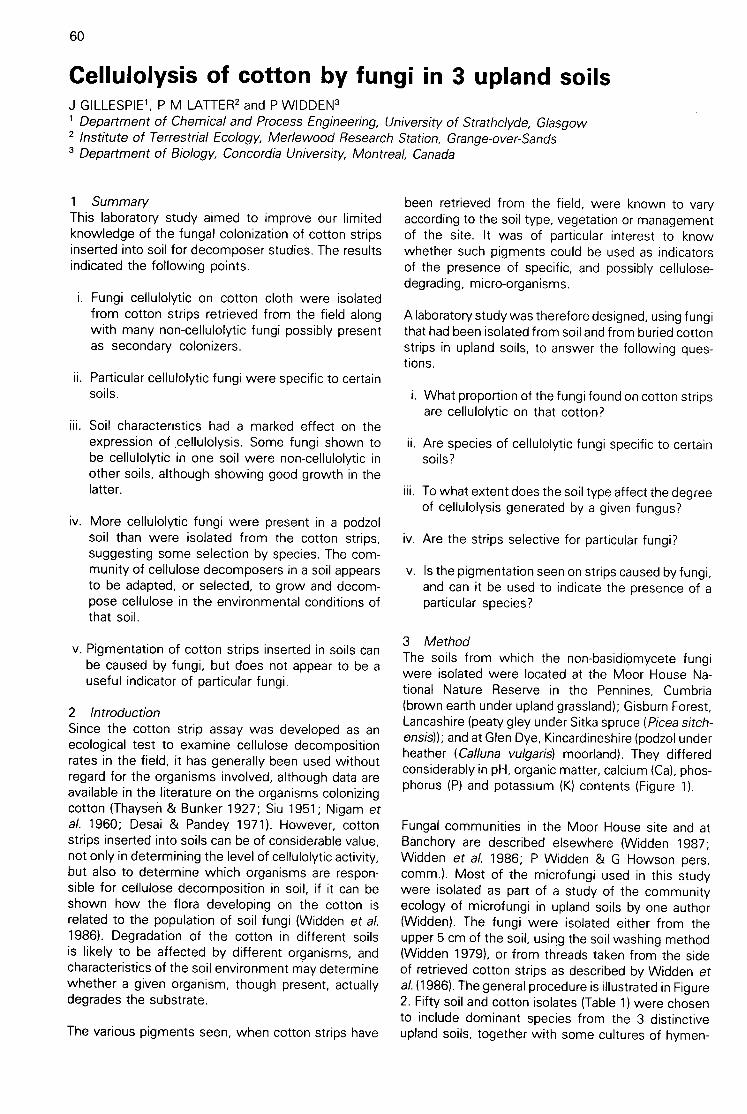
60
Cellulolysis of cotton by fungi in 3 upland soilsJ GILLESPIE', P M LATTER2 and P WIDDEN3' Department of Chemical and Process Engineering, University of Strathclyde, Glasgow2 Institute of Terrestrial Ecology, Merlewood Research Station, Grange-over-Sands3 Department of Biology, Concordia University, Montreal, Canada
1 SummaryThis laboratory study aimed to improve our limitedknowledge of the fungal colonization of cotton stripsinserted into soil for decomposer studies. The resultsindicated the following points.
i. Fungi cellulolytic on cotton cloth were isolatedfrom cotton strips retrieved from the field alongwith many non-cellulolytic fungi possibly presentas secondary colonizers.
ii. Particular cellulolytic fungi were specific to certainsoils.
iii. Soil characteristics had a marked effect on theexpression of ,cellulolysis. Some fungi shown tobe cellulolytic in one soil were non-cellulolytic inother soils, although showing good growth in thelatter.
iv. More cellulolytic fungi were present in a podzolsoil than were isolated from the cotton strips,suggesting some selection by species. The com-munity of cellulose decomposers in a soil appearsto be adapted, or selected, to grow and decom-pose cellulose in the environmental conditions ofthat soil.
v. Pigmentation of cotton strips inserted in soils canbe caused by fungi, but does not appear to be auseful indicator of particular fungi.
2 IntroductionSince the cotton strip assay was developed as anecological test to examine cellulose decompositionrates in the field, it has generally been used withoutregard for the organisms involved, although data areavailable in the literature on the organisms colonizingcotton (Thaysen & Bunker 1927; Siu 1951; Nigam etal. 1960; Desai & Pandey 1971). However, cottonstrips inserted into soils can be of considerable value,not only in determining the level of cellulolytic activity,but also to determine which organisms are respon-sible for cellulose decomposition in soil, if it can beshown how the flora developing on the cotton isrelated to the population of soil fungi (Widden et al.1986). Degradation of the cotton in different soilsis likely to be affected by different organisms, andcharacteristics of the soil environment rnay determinewhether a given organism, though present, actuallydegrades the substrate.
The various pigments seen, when cotton strips have
been retrieved from the field, were known to varyaccording to the soil type, vegetation or managementof the site. It was of particular interest to knowwhether such pigments could be used as indicatorsof the presence of specific, and possibly cellulose-degrading, micro-organisms.
A laboratory study was therefore designed, using fungithat had been isolated from soil and from buried cottonstrips in upland soils, to answer the following ques-tions.
i. What proportion of the fungi found on cotton stripsare cellulolytic on that cotton?
ii. Are species of cellulolytic fungi specific to certainsoils?
iii. To what extent does the soil type affect the degreeof cellulolysis generated by a given fungus?
iv. Are the strips selective for particular fungi?
v. Is the pigmentation seen on strips caused by fungi,and can it be used to indicate the presence of aparticular species?
3 MethodThe soils from which the non-basidiomycete fungiwere isolated were located at the Moor House Na-tional Nature Reserve in the Pennines, Cumbria(brown earth under upland grassland); Gisburn Forest,Lancashire (peaty gley under Sitka spruce (Picea sitch-ensis)); and at Glen Dye, Kincardineshire (podzol underheather (Calluna vulgaris) moorland). They differedconsiderably in pH, organic matter, calcium (Ca), phos-phorus (P) and potassium (K) contents (Figure 1).
Fungal communities in the Moor House site and atBanchory are described elsewhere (Widden 1987;Widden et al. 1986; P Widden & G Howson pers.comm.). Most of the microfungi used in this studywere isolated as part of a study of the communityecology of microfungi in upland soils by one author(Widden). The fungi were isolated either from theupper 5 cm of the soil, using the soil washing method(Widden 1979), or from threads taken from the sideof retrieved cotton strips as described by Widden etal. (1986). The general procedure is illustrated in Figure2. Fifty soil and cotton isolates (Table 1) were chosento include dominant species from the 3 distinctiveupland soils, together with some cultures of hymen-

omycetes, isolated from other sites and supplied byDr J C Frank land (Institute of Terrestrial Ecology,Merlewood Research Station).
Cellulolytic ability and pigment formation by fungi oncotton overlying each of the 3 soil types were testedusing the following procedure. Soil from the upper 0—
PH LOI
7 50
CaLcium Phosphorus
13000 10
0 0 0
Figure 1. Characteristics of the 3 soil types used to isolate fungi and to test cellulolysis, LOI, C and N as % andCa, P and K as pg g-'
Brown earth
Peaty gley
Podzol
From field sites
soil
soil
fromcotton strip
15 cm level at each study site was separately sievedthrough a 5 mm mesh screen and dried to about 25%of moisture-holding capacity for storage; 14 g of soilfrom each site was placed separately into a 9 cm glasspetri dish, and a piece of cotton cloth (Shirley SoilBurial Test Fabric, 1981 batch), 5 cm x 7 cm, waspressed on to the soil surface. Distilled water was
20
500
FUNGAL ISOLATESwashed particles
Carbon Nitrogen
0
Potassium
Sieved soil in laboratory
1111Brown •arth
Peaty Om
Podzol
Inoculationof
all isolates
on to cottOnoverlying each
of 3 soils
61
soil'/7/7'r
cotton strip
Figure 2. Diagram illustrating the isolation of fungi from soil and cotton, and their inoculation on to cottonoverlying the soil

62
Table 1. List of fungi used in this study, with sources of isolates and occurrence on cotton. Cellulolytic ability is given for cotton strips andcotton cellulose plates (where tested), and as reported by Domsch et al. (1980), Domsch and Gams (1970) (D); Flanagan (1981) (F); orGochenaur (1984) (G) on acid-swollen cellulose. Different isolates of the same species are indicated (i, ii)
Cellulolytic abilitySource of Occurrence Cotton Cotton Reported by
isolates on cotton strips plates
HYMENOMYCETESArmillaria mellea CBS culture osCollybia dryophila DW litter os +C. peronata DW litter os +Flammulina velutipes DW rotten wood os +Laccaria amethystea DW hater os +Marasmius androsaceus SS litter osMycena epipterygia DW litter osNolanea staurospora Moorland litter os
ASCOMYCETESAllescheria sp.1 UG soilPseudeurotium sp. SS soil
PHYTOMYCETESMucor circinelloides UG soil
FUNGI IMPERFECTICeuthospora lauri i & ii SS cotton it*
Chloridium chlamydosporis SS soil + +Chrysosporium merdarium UG soil +C. pannorum SS soil * + +Chrysosporium sp. UG soil + +Cylindrocarpon obtusisporum i SS soil . +
ii UG soil +Gilmaniella humicola SS soil * +Humicola fusco-atral SS soil + +Oidiodendron tenuissimum i UG soil +
ii SS soilPaecitomyces carneus UG soil +Penicillium daleae i SS soil .. + +
ii HM cotton +P. digitatum SS cotton +P. glabrum i SS cotton .. —
ii UG soilP. janthinellum SS cotton .. + -4-P. lividum UG soil * +P. melinii SS soil **
P. montanense HM soilP. spinulosum i SS soil + +
ii ' HM cottonP. thomii SS soil + + +Penicillium spp. UG soilPhialophora sp. SS soilThysanophora penicillioides SS soil .*
Tolypocladium cylindrosporum UG soilT. niveum UG cottonTrichocladium opacum SS soil + +1_ +Trichoderma polysporum SS soil + +T. virideaggr. i SS soil + +/— +
ii UG soil + +/—
STERILE MYCELIA i SS soilii SS soil
Unconfirmed identification11• indicates major colonizers, ie 10% of isolates on one or more cotton strips f rom either Sitka spruce or heather moorland sitesSS, Sitka spruce; UG, upland grassland; HM, heather moor sites; DW, deciduous woodland; os, isolated in other woodland studies; CBS,Centraalbureau voor Schimmelcultures, Baarn

armed to son a sr to crbig the midst_)re ciose to eidcacao fv. and the a snes were ster ( zed cy adtociay ng
Each tingis was the- hoojated serfaia)e.i, ch to mesarface cif me cotton is hig r. nociiim zit 'font theactiveH oro ha edge of an agar date siitife -heso dates iw ere hoJcated micm temoefa:ife =or 9weeks -Mee red ca:es z. ere ofesafed fd eachfungus and each so i
The fungal growth or the sir os was protodraphea at4 and 9 weeks and :he linear spread of mycelium wasrecorded after 9 weeks After incuoat on. the cotton
was removed and washed, first in 703i.: alcohol forone minute (a safety procedure to limit possible fungal:nfection during subsequent handling of clothi andthen with a jet of water The strips were dried at roomtemperature overnight and oven dried at 50-C for 4hours. The dried strips were then photographed.frayed to 3 cm width, and tested for tensile strength(TS) on a Monsanto Type W tensometer using a jawdistance of 3.5 cm.
Podzol Peaty gley Brown earth
Plate 5. Growth variation of fungi on cotton overlying3 soils
i. Trichocladium opacumPhialophora spp.
Ili. Sterile mycelium(Photographs J Gillespie)
4 ResultsFungal growth on cotton overlying the 3 soils variedmarkedly with soil type, being of different growthform, extent or colour. For example, Trichocladiumopacum and a sterile mycelium grew best and prod-uced a black coloration of cotton on the brown earth,but formed more restricted white or grey colonies onthe other 2 soils (Plate 5), whereas a Phialophoraspecies grew as thick mycelium on the podzol, butsparsely on the brown earth soil. Most of the fungi
63
17 4Tci grew on ail 3 sods. cut some grey% only Oci oneor 2 so.is More "ungi grey\ nest on tre crown earthso iTabie 2 groups la. c. ci -.can cc :re oter 2 so ls•groucs 2 and 3: 'he orofwn earn was the most fertilesod n fettrs of r erer OH and oaiidurn. and loweroraanic —atter 6gure 1. Other 'ung snowed no car-t cular preference 'or am one sod. but grew edoal ywell on 2 or all o-me so is iTatsie 2. groups 4a--ci,these fungi inciuge many of tre Pen;cW;urn spp Therewas a tendency +Or fengai speees to show bestgrowth on the sod from which they were isolated
For any one fungus, the same one of the 3 soils usuallyshowed highest rate of cellulolysis and the mostgrowth, but the degree of cellulolysis, as measuredby tensile strength loss of cotton (CTSLI, was moredependent on the soil type on which the fungus wasincubated (Figure 31. Thus, many fungi which grewwell on a particular soil produced no CTSL on thatsoil. Only one fungus. Tnchoderrna polysporum. wascellulolytic on all 3 soils. As with fungal growth, thehighest CTSL values occurred on the brown earth soilamong a group of fungi which, although they grew,produced no significant CTSL on the other 2 soils.Another group of fungi produced their highest CTSLon the peaty gley soil, while only 2 fungi, Laccariaamethystea and Oidiodendron tenuissimum, favouredthe podzol (Figure 3). Those fungi producing thehighest CTSL on either the peaty gley or podzol soilsalso produced some CTSL on other soils, and werefrom the group (Table 2, group 4) which showed noparticular growth preference for any soil.
Generally, a fungus gave the highest celluloly c ac-tivity on the soil from which it had originally beenisolated (Figure 31. Two fungi, Penicillium daleae andTnchoderma viride, each had 2 cellulolytic isolatesisolated from different soils, but both isolates of eachspecies gave the highest CTSL on the same soil,suggesting that selection for genetically different eco-types in the different soils of origin had not occurredWhere different species from the same genus weretested, there was also a tendency for these fungito have the highest activity on the same soil. Thus,Chrysosporium, Cylindrocarpon and Collybia specieswere most active on the brown earth, whereas bothspecies of Trichoderma were most active on the peatygley
Twenty-four fungi did not produce any significantCTSL, although some had been isolated originally fromcotton strips (Table 1).
Pigmentation of the cotton strips in culture was prod-uced by 23 fungi, but sometimes only on certain soils,and it was usually of indistinct greyish brown coloursTrichocladium opacum and Chrysosporium pannorumproduced a reddish pigment only on the brown earthsoil (Plate 8 i), whereas C. rnerdanurn produced differ-ent coloration on 2 of the soils (Plate 8 ii). Colours can,therefore, indicate fungal colonization, but the colours

64
Table 2. Relative linear spread of fungi inoculated on to cotton placed on the 3 soilsi. Fungi which grew best on one soil listed and grouped under that soil, with initials after species names indicating where good growth
also occurred on other soils
Brown earth
la *Allescheria sp.*Chrysosporium sp.• Flammulina velutipes
Mucor circinelloidesPhilalophora sp.Tolypocladium cylindrosporum
lb *Chryosporium pannorum PSterile mycelium
1 c Nolanea staurosporaPaecilomyces carneusPenicillium sp.Tolypocladium niveum
*Trichocladium opacum
Brown earth and peaty gley
4a *Humicola fusco-atraPseudeurotium sp.
*Trichoderma viride
G,PG,PG,PG,PG,P
* indicates fungi cellulolytic on cottonB, brown earth; G, peaty gley; P, podzol
Peaty gley
2a Marasmius androsaceus
2b Armillaria mellea B 3b Thysanophora penicillioides
2c *Chloridum chlamydosporis• Gilmaniella humicola*Oidiodendron tenuissimum
i &
4b *Cylindrocarpon obtusisporum i &P. digitatumP. glabrumP. lividumPenicillium sp.
*Trichoderma polysporum*T viride i &
are mostly too indistinct and variable to be useful asindicators of colonizing species. Three fungi (Allesch-eria sp., Humicola fusco-atra, Chrysosporiumsp.),which had shown pigmentation on cotton on soil pla-tes, produced little pigmentation when tested on Per-lite in place of soil, again indicating that soil/substrateconstituents can influence the colours produced oncotton by fungi.
5 Discussion and conclusionsVarious cellulolytic fungi isolated from 3 distinct up-land soils have been shown to grow on and to decom-pose cotton strip material incubated in vitro on thesame soils after autoclaving. Of the 50 fungi tested,22 produced a significant CTSL of the cotton overlyingthe 3 soils. A small number of these cellulolytic fungiwere recorded at high frequencies from cotton stripsburied in the field (notably Penicillium daleae, Tricho-derma polysporum and T. viride),whereas a numberof fungi which produced non-significant CTSL (notablyspecies of Penicillium)were also frequently isolatedfrom cotton (Table 1). In the case of the podzol, 8out of 13 cotton isolates tested gave no significantcellulolysis on cotton. These results suggest that suc-cessful colonization of the cotton by cellulose decom-posers is a competitive process, and that somecolonizers may well be secondary colonizers, usingglucose or other derivatives released during cellulose
Podzol
3a None
3c *Collybia dryophila*Collybia peronata* Laccaria amethystea
2d Chrysosporium merdarium B,P
ii. Fungi which showed no preference for any single soil, but grew equally on 2 or 3 of the soils
Brown earth, peaty gley andpodzol Peaty gley and podzol
4c Ceuthospora lauri i &P. montanenseP. spinulosum
* P. thomiiP. janthinellum
decomposition. In this regard, it is worth noting thatP. spinulosum has been shown to be cellulolytic byFlanagan (1981) and Gochenaur (1984), using acid-swollen cellulose as a substrate. This fungus has beenshown by Reese and Levinson (1952) to produce onlyendo-13-1, 4 glucanases and therefore to be unable toattack native cellulose. It is, therefore, probable thatthe fungus can attack the acid-swollen cellulose be-cause the partial hydrolysis opens up the cellulose toattack by endo-glucanases.
Chrysosporium pannorumand Trichocladium opacumwere both cellulolytic only on the brown earth soil(Figure 3), and were not recorded, or had very lowfrequency, on the cotton strips from the podzol, sothe cellulolytic fungi which colonize cotton in a soilmay, in part, be limited to those able to decomposecotton in that soil. However, Chloridium chlamydo-sporisand Gilmaniellasp., particularly abundant in thepodzol, but not recorded on cotton strips, did causeCTSL on this soil in the laboratory tests. Of 8 celluloly-tic fungi isolated from the podzol soil, 5 were recordedon cotton strips, indicating some selection of types bycotton in that soil. The fungal community in the soiland on cotton inserted in the podzol soil at the heathermoor site is fully discussed in Widden et al. (1986).(Information on colonization of cotton strips in thepeaty gley soil is yet to be published.) Shawky and

Brown earth Peaty gleyCTSL (X)
DEDE111
0 25
Cluysoeportusm pannorurn
Chryeasportum sp.
Ntescherto sp.
Trichocladium opacum
Flammulina velutipes
Col 'Ado peronato
C. dryophila
Pseudeurotlum sp.
Windrocorpon obtuesporum
Cyllndrocarpon obtusisportum
Chrysosportum merdarlum
50 0
Hickisch (1984) also reported a marked effect of soiltype on the decomposition of cotton, and other cellu-losic substrates, by Trichoderma species.
It is probable that the colonization of a cellulosicsubstrate is regulated by a selective process, basedon an ability to compete for the substrate in a particularenvironment. In this regard, it is noteworthy that themost successful microfungal colonizers were Trichod-erma species, which are fast-growing and known tobe active soil antagonists. Further studies with a widerrange of isolates would be needed to distinguishwhether adaptation or selection was the controllingfactor.
It must be emphasized that a number of features ofthis study are at variance with the natural situation.Single pure cultures were used, under laboratory con-ditions, with soil (not litter) as the substratum, possiblyaltered chemically and physically by sterilization. Purecotton is foreign to soil and cannot wholly represent
CTSL (X)
20 4-0
Cfick•dendron tenuissimum i
Arm! Bodo man
Trichoderma viride i
DEDE
Trichoderrno viride
111Penicillium daleae i
111
DEPenicillium dale°.
CI
Chloridium chlamydosporis
EIEDE
Gilmaniello humicolo
DEDE
liumicola fusco—otra
Podzol
DEDE
CTSL (X)
0 20
a amethystea
65
diodendron tenulasimurn
IIBrown earth
LI
Ill Peaty gley
Podzol
Figure 3. Fungi grouped in 3 columns according to the soil on which they showed highest CTSL. CTSL on othersoils is also shown. Smaller hatched blocks indicate origin of isolates obtained from the 3 soils. Different
isolates of the same species are indicated (i,
dead vegetation as a substrate for colonization andcellulose decomposition. Depending on the nature ofthe vegetation type, cotton could be easier or moredifficult to attack. The fungi which showed high activityin culture might not do so in the field, and thosegiving a negative result might be able to attack othercellulosic substrates under field conditions. The com-petitive element of a mixed microbial population wasalso eliminated by the test conditions.
The pigmentation of cotton produced by the fungi inthese experiments, mostly greyish brown but also red(Plate 8), may be similar to the blackish and reddishcoloration of cellulose residues from cellulose de-composition reported by Thaysen and Bunker (1927).However, as the nature of pigment production by anindividual fungus varied with soil type, pigmentationcannot be used as an index of either the presence ofthat fungus or of cellulose decomposition by it.
During this study, a cellulose agar medium was tested

66
as a possible screening method for cellulolytic abilityon cotton, but was not successful. It contained groundcotton passing through a 63 l sieve, with nitrate as anitrogen source and 0.1% glucose as an ancillarycarbon source. Of 20 fungi tested over a period of 7weeks, only a few showed any cellulolysis as evi-denced by visible clearing of the plates (Table 1).Clearing did not extend outside the colony and wasunaffected by added glucose. Allescheria and Chryso-sporium sp. showed clearing after 1-2 weeks, butclearing by Trichocladium opacum and Trichodermaviride could only be found using a microscope todetect the disappearance of amorphous material fromamong a larger crystalline form of the material. Theearlier loss of amorphous material is also discussedby Smith (1983) in relation to various cellulosic sub-strates.
Three species which gave positive results on cottonstrips gave negative results on the cellulose agar. Inmany studies where the clearing of cellulose on agarplates has been used to detect cellulolytic activity,acid-swollen cellulose (Aaronson 1970) has beenused. Comparison of such results with the cotton stripdata presented here suggests that this cellulose agarmethod was not a satisfactory indication of an abilityto attack natural cellulose. Smith (1983) suggests thatthe differential settlement of unequally sized particu-late cellulosic substrates may reduce the availabilityfor attack at the surface of agar plates.
Our data from cotton strips suggest that the cottonstrip assay is a sensitive method for detecting thecellulolytic ability of a fungus in soil. The strong influ-ence of soil type on cellulolytic ability (Figure 3) alsoshows that we should be very careful when laboratorytests are used to evaluate the cellulolytic ability offungi and then extrapolated back to field conditions.Not only are many fungi that are capable of degradingcellulose likely to give negative results using celluloseclearing, but changes in the mineral composition, pH,or other factors in soil or culture media may markedlychange the behaviour of the fungus. Clearly, in thisstudy, some fungi were effective cellulose degradersin the fertile soil, whereas others were effective in themore nutrient-poor soils. These studies support theconclusion of Park (1976), who showed that the influ-ence of nitrogen on the cellulolytic ability of soil micro-fungi varied from one species to another, somespecies responding better to low nitrogen levels,whereas others responded better to high levels.
In conclusion, and also in answer to the original 5questions, the following points can be made as aresult of this study.
i. Various fungi isolated from the 3 upland soils wereshown to be cellulolytic on cotton overlying the 3soils, but many non-cellulolytic fungi also occurredon the strips, possibly as secondary colonizers.
ii. Particular cellulolytic fungi were specific to certainsoils.
iii. The cellulolytic ability of individual species wasgreatly affected by soil type, and a group of fungithat gave the highest cellulolysis on the brownearth soil could be separated from a group whichfavoured the podzol and peaty gley soils for cellulo-lysis but showed. no particular growth preferencebetween the 3 soils. In both cases, there werefungi cellulolytic on one soil which showed noactivity on other soils, despite showing goodgrowth on them. Only Trichoderma polysporumwas actively cellulolytic on all 3 soils.
iv. Cellulolytic fungi recorded on cotton strips fromthe podzol were apparently selected from a com-munity of cellulolytic organisms present in the soil,as some cellulolytic fungi present in a particularsoil were not isolated from cotton retrieved fromthat soil. Their absence partly reflected their in-ability to decompose cotton on that soil.
v. Pigmentation on cotton strips can be caused byfungi, but is not recommended as an indicator ofthe presence of particular fungi.
In general, cellulolytic fungi present in a soil are ableto colonize and decompose cotton strips. The nativepopulation appears to be adapted to grow and decom-pose in the prevailing soil conditions of the site, butthe study demonstrates a clear separation betweengrowth and cellulolysis in their relative response tosoil properties.
6 AcknowledgementsDr P Widden acknowledges funding from the NaturalSciences and Engineering Research Council of Canadaand allowance of sabbatical leave from ConcordiaUniversity, which made the study possible.
7 ReferencesAaronson, S. 1970. Experimental microbial ecology. New York:Academic Press.Desal, A.J. & Pandey, S.N. 1971. Microbial degradation of cellu-losic textiles. J. scient. ind. Res., 30, 598-606.Domsch, K.H. & Gams, W. 1970. Fungi in agricultural soils.London: Longman.Domsch, K.H., Gams, W. & Anderson, T.H. 1980. Compendiumof soil fungi. New York: Academic Press.Flanagan, P.W. 1981. Fungal taxa, physiological groups, and bio-mass: a comparison between ecosystems. In: The fungal com-munity, its organization and role in the ecosystem, edited by D.T.Wicklow & G.C. Carroll, 569-592. New York: Marcel Dekker.Gochenaur, S.E. 1984. Fungi of a Long Island oak-birch forest II.Population dynamics and hydrolase patterns for the soil penicillia.Mycologia, 76, 218-221.Nigam, S.S., Ranganathan, S.K., Sen Gupta, S.R., Shukla, R.K. &Tandan, R.N. 1960. Microbial degradation of cotton cellulose insoil. J. scient. ind. Res., 19c, 20-24.Park, D. 1976. Nitrogen level and cellulose decomposition by fungi.Int. Biodeterior. Bull., 12, 85-99.
Reese, E.T. & Levinson, H.S. 1952. A comparative study of thebreakdown of cellulose by microorganisms. Physiologia Pl., 5, 345-366.Shawky, B.T. & Hickisch. B. 1984. Cellulolytic activity of Tricho-derma sp. Strain G. grown on various cellulose substrates. Zent.bl.Mikrobiol., 139, 91-96.Siu, R.G.H. 1951. Microbial decomposition of cellulose. NewYork: Reinhold.Smith, M.J. 1983. Differences in the types of cellulose used inthe detection of cellulolytic micro-organisms on agar media. RevueEcol. Biol. Sol, 20, 29-36.
67
Thaysen, A.C. & Bunker, H.J. 1927. Microbiology of cellulose,hemicellulose, pectin and gums. London: Oxford University Press.Widden, P. 1979. Fungal populations from forest soils in southernQuebec. Can. J. Bot., 57, 1324-1331.Widden, P. 1987. Fungal communities along an elevation gradientin northern England. Mycologia, 79, 298-309.Widden, P., Howson, G. & French, D.D. 1986. Use of cotton stripsto relate fungal community structure to cellulose decompositionrates in the field. Soil Biol. Biochem., 18, 335-337.
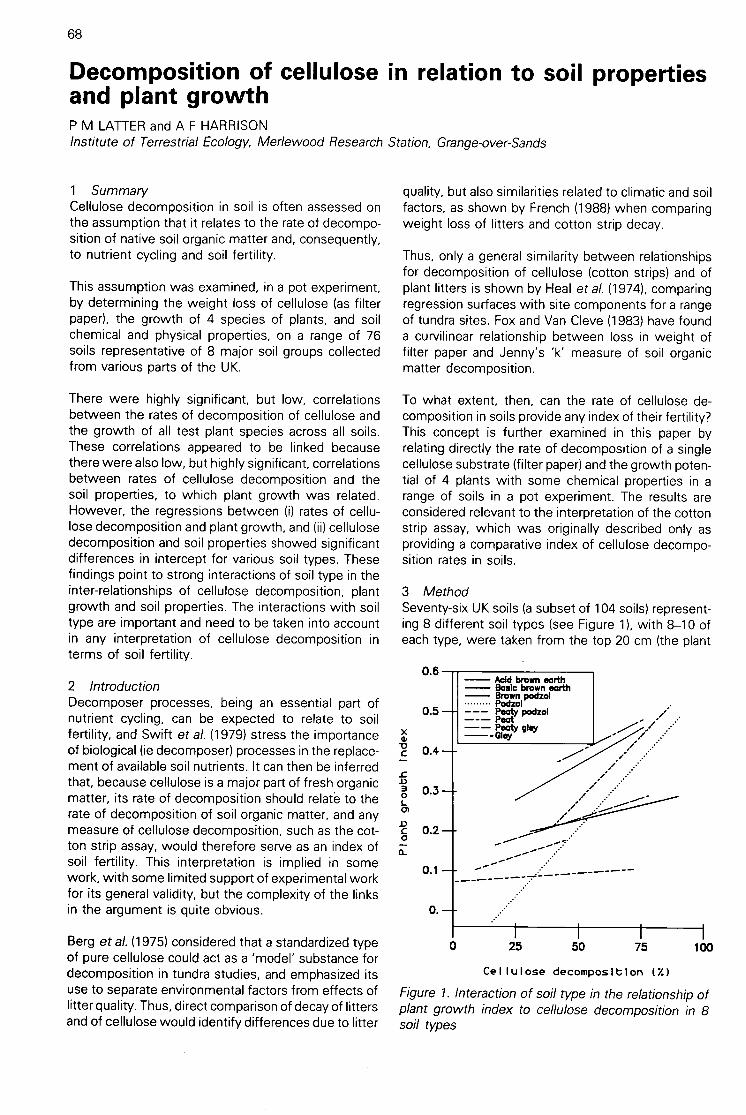
68
Decomposition of cellulose in relation to soil propertiesand plant growthP M LATTER and A F HARRISONInstitute of Terrestrial Ecology, Merlewood Research Station, Grange-over-Sands
1 SummaryCellulose decomposition in soil is often assessed onthe assumption that it relates to the rate of decompo-sition of native soil organic matter and, consequently,to nutrient cycling and soil fertility.
This assumption was examined, in a pot experiment,by determining the weight loss of cellulose (as filterpaper), the growth of 4 species of plants, and soilchemical and physical properties, on a range of 76soils representative of 8 major soil groups collectedfrom various parts of the UK.
There were highly significant, but low, correlationsbetween the rates of decomposition of cellulose andthe growth of all test plant species across all soils.These correlations appeared to be linked becausethere were also low, but highly significant, correlationsbetween rates of cellulose decomposition and thesoil properties, to which plant growth was related.However, the regressions between (i) rates of cellu-lose decomposition and plant growth, and (ii) cellulosedecomposition and soil properties showed significantdifferences in intercept for various soil types. Thesefindings point to strong interactions of soil type in theinter-relationships of cellulose decomposition, plantgrowth and soil properties. The interactions with soiltype are important and need to be taken into accountin any interpretation of cellulose decomposition interms of soil fertility.
2 IntroductionDecomposer processes, being an essential part ofnutrient cycling, can be expected to relate to soilfertility, and Swift et al. (1979) stress the importanceof biological (ie decomposer) processes in the replace-ment of available soil nutrients. It can then be inferredthat, because cellulose is a major part of fresh organicmatter, its rate of decomposition should relate to therate of decomposition of soil organic matter, and anymeasure of cellulose decomposition, such as the cot-ton strip assay, would therefore serve as an index ofsoil fertility. This interpretation is implied in somework, with some limited support of experimental workfor its general validity, but the complexity of the linksin the argument is quite obvious.
Berg et al. (1975) considered that a standardized typeof pure cellulose could act as a 'model' substance fordecomposition in tundra studies, and emphasized itsuse to separate environmental factors from effects oflitter quality. Thus, direct comparison of decay of littersand of cellulose would identify differences due to litter
quality, but also similarities related to climatic and soilfactors, as shown by French (1988) when comparingweight loss of litters and cotton strip decay.
Thus, only a general similarity between relationshipsfor decomposition of cellulose (cotton strips) and ofplant litters is shown by Heal et al. (1974), comparingregression surfaces with site components for a rangeof tundra sites. Fox and Van Cleve (1983) have founda curvilinear relationship between loss in weight offilter paper and Jenny's 'k' measure of soil organicmatter decomposition.
To what extent, then, can the rate of cellulose de-composition in soils provide any index of their fertility?This concept is further examined in this paper byrelating directly the rate of decomposition of a singlecellulose substrate (filter paper) and the growth poten-tial of 4 plants with some chemical properties in arange of soils in a pot experiment. The results areconsidered relevant to the interpretation of the cottonstrip assay, which was originally described only asproviding a comparative index of cellulose decompo-sition rates in soils.
3 MethodSeventy-six UK soils (a subset of 104 soils) represent-ing 8 different soil types (see Figure 1), with 8-10 ofeach type, were taken from the top 20 cm (the plant
0.6Acid brown earthBasic brown earthBrown podzol
Podzol0.5 --- Peaty podzol
--- Peat-- Peat), gley
Gley
0.4
0.3
0.2
0.1
0.
0
/
25 50 75 100
Cel lulose decompositIon (7.)
Figure 1. Interaction of soil type in the relationship ofplant growth index to cellulose decomposition in 8soil types
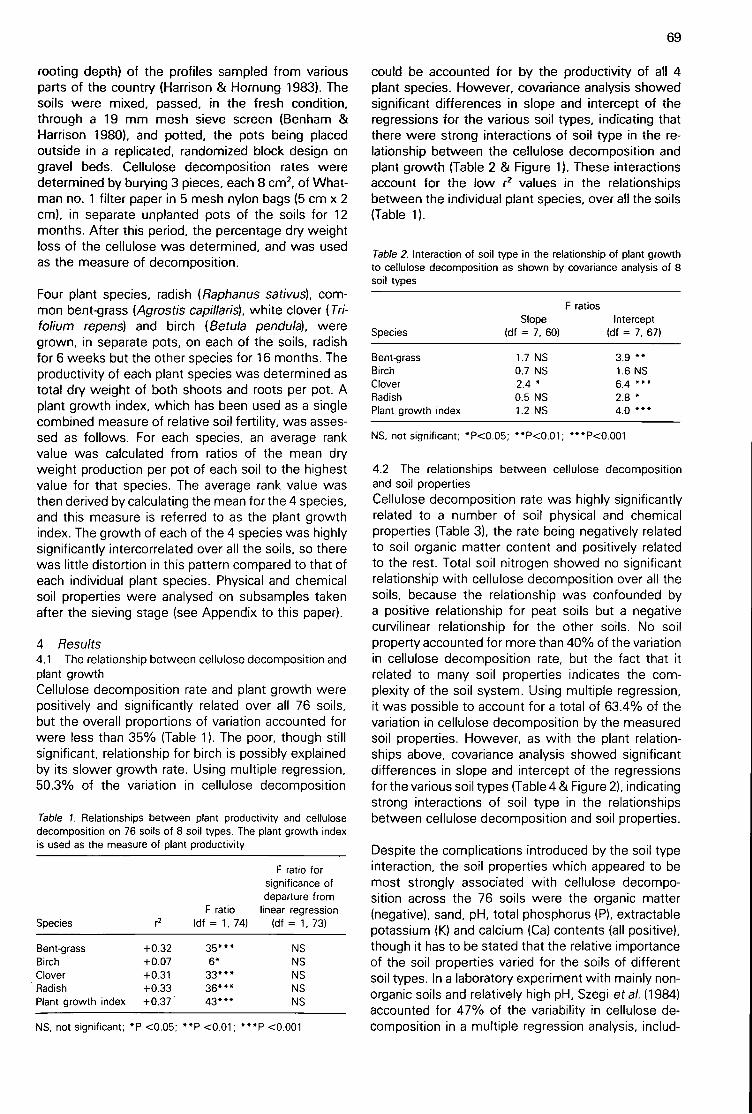
rooting depth) of the profiles sampled from variousparts of the country (Harrison & Hornung 1983). Thesoils were mixed, passed, in the fresh condition,through a 19 mm mesh sieve screen (Benham &Harrison 1980), and potted, the pots being placedoutside in a replicated, randomized block design ongravel beds. Cellulose decomposition rates weredetermined by burying 3 pieces, each 8 cm2, of What-man no. 1 filter paper in 5 mesh nylon bags (5 cm x 2cm), in separate unplanted pots of the soils for 12months. After this period, the percentage dry weightloss of the cellulose was determined, and was usedas the measure of decomposition.
Four plant species, radish (Raphanus sativus), com-mon bent-grass (Agrostis capillaris),white clover (Tri-folium repens) and birch (Betula pendula), weregrown, in separate pots, on each of the soils, radishfor 6 weeks but the other species for 16 months. Theproductivity of each plant species was determined astotal dry weight of both shoots and roots per pot. Aplant growth index, which has been used as a singlecombined measure of relative soil fertility, was asses-sed as follows. For each species, an average rankvalue was calculated from ratios of the mean dryweight production per pot of each soil to the highestvalue for that species. The average rank value wasthen derived by calculating the mean for the 4 species,and this measure is referred to as the plant growthindex. The growth of each of the 4 species was highlysignificantly intercorrelated over all the soils, so therewas little distortion in this pattern compared to that ofeach individual plant species. Physical and chemicalsoil properties were analysed on subsamples takenafter the sieving stage (see Appendix to this paper).
4 Results4.1 The relationship between cellulose decomposition andplant growthCellulose decomposition rate and plant growth werepositively and significantly related over all 76 soils,but the overall proportions of variation accounted forwere less than 35% (Table 1). The poor, though stillsignificant, relationship for birch is possibly explainedby its slower growth rate. Using multiple regression,50.3% of the variation in cellulose decomposition
Table 1. Relationships between plant productivity and cellulosedecomposition on 76 soils of 8 soil types. The plant growth indexis used as the measure of plant productivity
NS, not significant; *P <0.05; **P <0.01; ***P <0.001
could be accounted for by the productivity of all 4plant species. However, covariance analysis showedsignificant differences in slope and intercept of theregressions for the various soil types, indicating thatthere were strong interactions of soil type in the re-lationship between the cellulose decomposition andplant growth (Table 2 & Figure 1). These interactionsaccount for the low 12 values in the relationshipsbetween the individual plant species, over all the soils(Table 1).
Table 2. Interaction of soil type in the relationship of plant growthto cellulose decomposition as shown by covariance analysis of 8soil types
Species
Bent-grassBirchCloverRadishPlant growth index
F ratiosSlope
(df = 7, 60)
1.7 NS0.7 NS2.4 *0.5 NS1.2 NS
NS, not significant; *P<0.05; **P<0.01; ***P<0.001
Intercept(df = 7, 67)
3.9 **1.6 NS6.4 ***2.8 •4.0 **
69
4.2 The relationships between cellulose decompositionand soil propertiesCellulose decomposition rate was highly significantlyrelated to a number of soil physical and chemicalproperties (Table 3), the rate being negatively relatedto soil organic matter content and positively relatedto the rest. Total soil nitrogen showed no significantrelationship with cellulose decomposition over all thesoils, because the relationship was confounded bya positive relationship for peat soils but a negativecurvilinear relationship for the other soils. No soilproperty accounted for more than 40% of the variationin cellulose decomposition rate, but the fact that itrelated to many soil properties indicates the com-plexity of the soil system. Using multiple regression,it was possible to account for a total of 63.4% of thevariation in cellulose decomposition by the measuredsoil properties. However, as with the plant relation-ships above, covariance analysis showed significantdifferences in slope and intercept of the regressionsfor the various soil types (Table 4 & Figure 2), indicatingstrong interactions of soil type in the relationshipsbetween cellulose decomposition and soil properties.
Despite the complications introduced by the soil typeinteraction, the soil properties which appeared to bemost strongly associated with cellulose decompo-sition across the 76 soils were the organic matter(negative), sand, pH, total phosphorus (P), extractablepotassium (K) and calcium (Ca) contents (all positive),though it has to be stated that the relative importanceof the soil properties varied for the soils of differentsoil types. In a laboratory experiment with mainly non-organic soils and relatively high pH, Szegi et al. (1984)accounted for 47% of the variability in cellulose de-composition in a multiple regression analysis, includ-

70
Table 3. Relationships between cellulose decomposition or theplant growth index with soil properties in 76 soils of 8 soil types.Quadratic regression was used for relationships with a significantdeparture from linear regression . F ratio is for the linear, or quadratic(bracketted) regression with each property, df = 1, 75 (linear), 2,73(quadratic)
In Tables 3 and 4, all values expressed litre-1 soil, except organicmatter expressed kg-1 soilNS, not significant; *P <0.05; ***P <0.001
Table 4. Interaction of soil type in the relationship of cellulosedecomposition, or the plant growth index, to soil properties, asshown by covariance analysis of 8 soil types
NS, not significant; *P <0.05; "P <0.01; ***P <0.001
ing available nitrogen (N) and phosphorus, magnesium(negative), pH, and clay. In a further respiration exper-iment with added N, P, K, and cellulose powder, N,P. K, and pH accounted for 76% of the cellulosedecomposition. The poor relationship of cellulose de-composition with nitrogen recorded in our study wasno doubt due to our use of analyses for total nitrogen,most of which would be unavailable in many of theorganic soils used.
4.3 The relationships between plant growth and soil prop-ertiesThe plant growth index was significantly related to a
75To 8.1
0 50(1)
0 1 2 3Calcium (g
Figure 2. Interaction of soil type in the relationship ofcellulose decomposition to soil calcium (extractablein ammonium acetate at pH 7.0) in 8 soil types. Keyas for Figure 1
number of soil physical and chemical properties (Table3), being related negatively to organic matter but posi-tively to others. The proportion of variation of plantproductivity which could be accounted for by each ofthe soil properties was generally slightly higher thanfor cellulose decomposition. Using multiple re-gression, a total of 68.6% of the variation in plantproductivity could be accounted for by all the soilproperties included in the analysis. However, as withcellulose decomposition above, covariance analysisshowed significant differences in slope and interceptof the regressions for the various soil types (Table 4 &Figure 3), indicating that strong soil type interactionsoccurred in the relationships between plant pro-
100
0
0.5
0.4
0.3
0.2
0.1
rTo 2.7
- -ip To 9.2
0.
0 1 2 3
Calcium (g 1-1)
To 8.1
Figure 3. Interaction of soil type in the relationship ofplant growth index to extractable soil calcium in 8 soiltypes. Key as for Figure 1
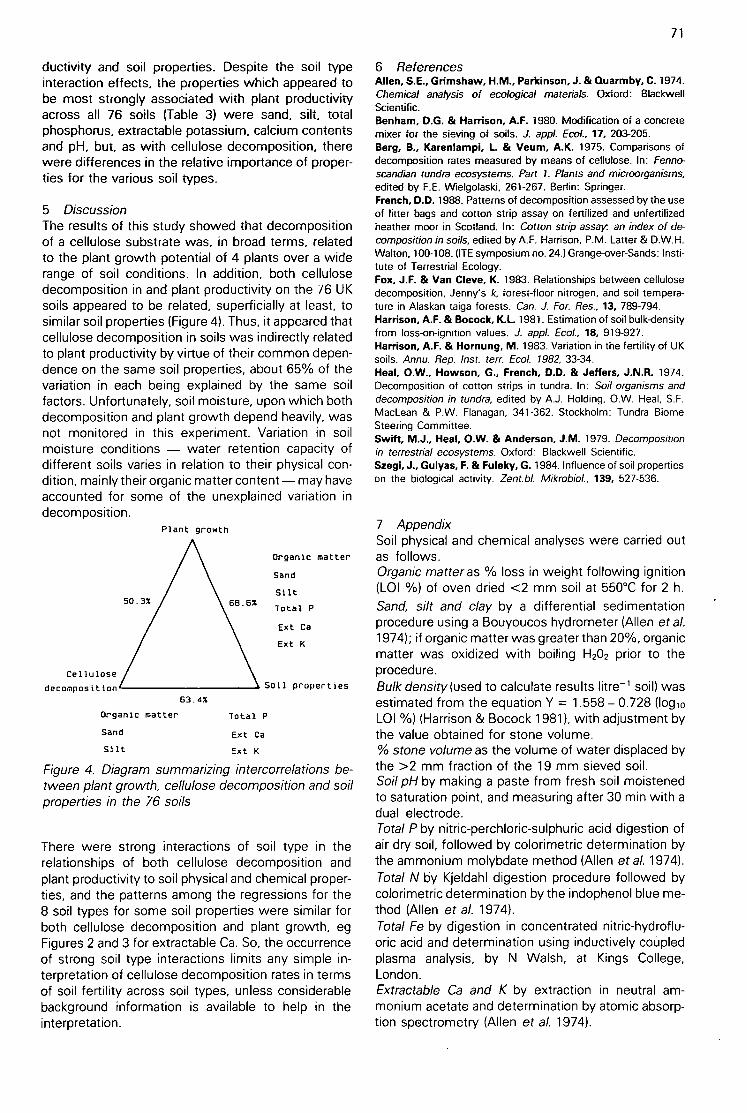
ductivity and soil properties. Despite the soil typeinteraction effects, the properties which appeared tobe most strongly associated with plant productivityacross all 76 soils (Table 3) were sand, silt, totalphosphorus, extractable potassium, calcium contentsand pH, but, as with cellulose decomposition, therewere differences in the relative importance of proper-ties for the various soil types.
5 DiscussionThe results of this study showed that decompositionof a cellulose substrate was, in broad terms, relatedto the plant growth potential of 4 plants over a widerange of soil conditions. In addition, both cellulosedecomposition in and plant productivity on the 76 UKsoils appeared to be related, superficially at least, tosimilar soil properties (Figure 4). Thus, it appeared thatcellulose decomposition in soils was indirectly relatedto plant productivity by virtue of their common depen-dence on the same soil properties, about 65% of thevariation in each being explained by the same soilfactors. Unfortunately, soil moisture, upon which bothdecomposition and plant growth depend heavily, wasnot monitored in this experiment. Variation in soilmoisture conditions — water retention capacity ofdifferent soils varies in relation to their physical con-dition, mainly their organic matter content — may haveaccounted for some of the unexplained variation indecomposition.
Cellulose
decomposition
50.3%
Drganic matter
Sand
Silt
Plant growth
63.4%
613.6%
Total P
Ext Ca
Ext K
Organic matter
Sand
Silt
Total P
Ext Ca
Ext K
Soil properties
Figure 4. Diagram summarizing intercorrelations be-tween plant growth, cellulose decomposition and soilproperties in the 76 soils
There were strong interactions of soil type in therelationships of both cellulose decomposition andplant productivity to soil physical and chemical proper-ties, and the patterns among the regressions for the8 soil types for some soil properties were similar forboth cellulose decomposition and plant growth, egFigures 2 and 3 for extractable Ca. So, the occurrenceof strong soil type interactions limits any simple in-terpretation of cellulose decomposition rates in termsof soil fertility across soil types, unless considerablebackground information is available to help in theinterpretation.
71
6 ReferencesAllen, S.E., Grimshaw, H.M., Parkinson, J. & Quarmby, C. 1974.Chemical analysis of ecological materials. Oxford: BlackwellScientific.Benham, D.G. & Harrison, A.F. 1980. Modification of a concretemixer for the sieving of soils. J. appl. Ecol., 17, 203-205.Berg, B., Karenlampi, L & Veum, A.K. 1975. Comparisons ofdecomposition rates measured by means of cellulose. In: Fenno-scandian tundra ecosystems. Part 1. Plants and microorganisms,edited by F.E. Wielgolaski, 261-267. Berlin: Springer.French, D.D. 1988. Patterns of decomposition assessed by the useof litter bags and cotton strip assay on fertilized and unfertilizedheather moor in Scotland. In: Cotton strip assay. an index of de-composition in soils, edited by A.F. Harrison, P.M. Latter & D.W.H.Walton, 100-108. (ITE symposium no. 24.) Grange-over-Sands: Insti-tute of Terrestrial Ecology.Fox, J.F. & Van Cleve, K. 1983. Relationships between cellulosedecomposition. Jenny's k, forest-floor nitrogen, and soil tempera-ture in Alaskan taiga forests. Can. J. For. Res., 13, 789-794.Harrison, A.F. & Bocock, K.L. 1981. Estimation of soil bulk-densityfrom loss-on-ignition values. J. appl. Ecol., 18, 919-927.Harrison, A.F. & Hornung, M. 1983. Variation in the fertility of UKsoils. Annu. Rep. Inst. terr. Ecol. 1982, 33-34.Heal, 0.W., Howson, G., French, D.D. & Jeffers, J.N.R. 1974.Decomposition of cotton strips in tundra. In: Soil organisms anddecomposition in tundra, edited by A.J. Holding, O.W. Heal, S.F.MacLean & P.W. Flanagan, 341-362. Stockholm: Tundra BiomeSteering Committee.Swift, M.J., Heal, 0.W. & Anderson, J.M. 1979. Decompositionin terrestrial ecosystems. Oxford: Blackwell Scientific.Szegi, J., Gulyas, F. & Fuleky, G. 1984. Influence of soil propertieson the biological activity. Zent.bl. Mikrobiol., 139, 527-536.
7 AppendixSoil physical and chemical analyses were carried outas follows.Organic matter as % loss in weight following ignition(L0) %) of oven dried <2 mm soil at 550°C for 2 h.Sand, silt and clay by a differential sedimentationprocedure using a Bouyoucos hydrometer (Allen et al.1974); if organic matter was greater than 20%, organicmatter was oxidized with boiling H202 prior to theprocedure.Bulk density (used to calculate results litre' soil) wasestimated from the equation Y = 1.558 – 0.728 (logloLOI %) (Harrison & Bocock 1981), with adjustment bythe value obtained for stone volume.% stone volume as the volume of water displaced bythe >2 mm fraction of the 19 mm sieved soil.Soil pH by making a paste from fresh soil moistenedto saturation point, and measuring after 30 min with adual electrode.Total P by nitric-perchloric-sulphuric acid digestion ofair dry soil, followed by colorimetric determination bythe ammonium molybdate method (Allen et al. 1974).Total N by Kjeldahl digestion procedure followed bycolorimetric determination by the indophenol blue me-thod (Allen et al. 1974).Total Fe by digestion in concentrated nitric-hydroflu-oric acid and determination using inductively coupledplasma analysis, by N Walsh, at Kings College,London.Extractable Ca and K by extraction in neutral am-monium acetate and determination by atomic absorp-tion spectrometry (Allen et al. 1974).

72
Cellulolytic activity in dung pats in relation to theirdisappearance rate and earthworm biomassP HOLTERInstitute of Population Biology, Copenhagen University, Copenhagen, Denmark
1 SummaryCellulolytic activity in cattle dung pats was measuredby cotton strip assay. Strips were inserted for 10 daysin pats colonized by varying numbers of earthworms(Lumbricidae); measurements covered dung age 0—40 days, ie 4 10-day periods.
Cellulolytic activity was confined to dung age 10-40days, with a maximum at 20-30 days. Activity washighest at the bottom of pats, and activity in the soilimmediately below pats was higher than in the soilbeyond. There was a strong, positive, correlation be-tween rate of dung disappearance and earthwormbiomass, whereas the stimulatory effect of worms oncellulolytic activity was barely significant. The data donot suggest that microbial decomposition is importantto the rapid disappearance of pats, leaving physicalremoval of dung as the most likely explanation of thepromotion of dung pat decay by earthworms.
2 IntroductionRapid decay of cattle dung pats is characteristic ofpastures with a large biomass of earthworms. In Dan-ish pastures, 75% of pat material may disappear withinonly 35-45 days (Holter 1979). Further, a close positivecorrelation has been found between the disappear-ance rate of pats and the biomass of worms underand in these pats (Holter 1983). Worms seem topromote the decay of dung pats, but the actual mech-anism has not been studied. The 2 most likely effectsof worms in this respect would seem to be (i) simpletransport, achieved by ingestion of dung and depo-sition of faeces elsewhere, and/or (ii) stimulation ofmicrobial decomposition in the dung pat itself. Thepresent paper deals only with the second possibility.
Detailed analyses of the organic components of cattledung during decomposition are not available. Waks-man et al.(1939) incubated horse manure in the labora-tory at variouS temperatures. In the fresh manure, the2 most important components were cellulose andhemicelluloses (closely followed by lignin), making up31% and 21% (20% lignin) of the dry weight. After 47days at 28°C, the lowest temperature used, themanure had lost 41% of its initial weight. The vastmajority of this loss (96%) was attributable to disap-pearance of cellulose (59%) and hemicellulose (37%).
Cattle dung analysed by Lucas et al. (1975) contained30% cellulose and 26% hemicellulose (based on dryweight), and so was rather similar to the horse manure.It seems reasonable to expect, therefore, that en-hanced decomposition within the dung pat should
manifest itself as increased cellulolytic activity.Consequently, I have tested whether cellulolytic ac-tivity in pats, assessed in field experiments as thereduction in tensile strength (TS) of cotton strips,based on the method of Latter and Howson (1977), isstimulated by the presence of earthworms. In addition,the proportion of cellulose in dung pats has beendetermined as a function of dung age.
3 MethodThe field site is in the Strodam nature reserve, about35 km north of Copenhagen. The experimental areawas a 150 m2 fenced part of a permanent pasture1'llogemosel, surrounded by woodland and grazed bycalves and heifers. The soil is a dark, poorly drainedfen soil, with a pH about 6.0 and a loss-on-ignition(LOI) of 34%. The earthworm fauna (mostly Lumbricusfestivus, L. rubellus, L. castaneusand Aporrectodeacaliginosa)has been described briefly by Holter (1983).
To examine cellulolytic activity in pats in relation todung age, fresh dung from dairy cows was collectedin bulk and mixed thoroughly for each of 3 exper-iments. The experimental pats, 22-24 cm diameterand containing 2 kg of dung, were laid out on piecesof nylon netting (7 mm mesh), which permitted easyremoval of whole pats.
Each 40-day experiment included 2 batches of other-wise identical dung pats: freely exposed pats, andpats in which the invasion of earthworms was stronglydelayed by one mm mesh nylon net (see Holter 1983).Each sampling comprised 3-4 pats of each type. Ex-perimental pats were placed in the field using thefollowing 2 types of sequence.
i. Sufficient pats for all ages in an experiment wereplaced in the field simultaneously, and then sam-pled in sequence, at 10-day intervals, from 0-30days.
ii. Replicate samples of pat material for each age ofdung were placed in the field in sequence, at 10-day intervals, so that simultaneous sampling of thepats of different ages from 10 to 40 days could allbe carried out at 40 days, under the same climaticconditions. The dung was stored at —18°C untilplaced in the field.
The first sequence was used for 2 experiments start-ing on August 1983 and May 1984, and the secondfor the last experiment on August 1984.

Above view
L -.. J
For measurements of cellulolytic activity, Shirley SoilBurial Test Fabric was used as 3 cm x 10 cm testpieces. Tensile strengths of the fabric were measuredat the Danish Textile Institute, using an Alwetron F-5000 tensometer with electronic chart recorder. Testpieces were frayed down to 2 cm width and con-ditioned in a humidity room at 20°C and RH 65% forat least 24 hours, prior to testing in the same room.
To test the effect of within-pat position, 6 test pieceswere inserted into each experimental pat, as shownin Figure 1. In the fresh dung, pieces were easilyinserted while the pats were manufactured. With olderpats (10, 20 or 30 days in field), the easiest procedurewas to lift the pat on its net, place it upside down,remove the net, insert the pieces from below, replacethe net and reposition the pat as before. This pro-cedure involved little visible damage to the pat, asviewed from above. In 2 experiments (autumn 1983,spring 1984), pieces were also inserted into the soilunder pats, with the upper edge 1-2 cm below thesoil surface, and in a neighbouring area with no dungpats. Pieces put into dung (or soil) and immediatelyremoved for testing served as field controls.
The test cotton pieces were retrieved after 10 daysand the used pats removed. On the same day, thepieces were washed in cold tap water without scrub-bing and dried quickly in an air current at room tem-perature. For practical reasons, the dry pieces usuallyhad to be stored for 1-2 months before tensilestrength testing.
Earthworms in the soil under the removed pats wereforced up for collection by 0.3% formalin (Satchell1971) from 0.125 m2 circular areas concentric withthe pats. Worms in the pats were recovered in thelaboratory by hand-sorting.
Fresh weight, dry weight and organic matter content(LOI at 500°C) of the pats were determined, and sub-samples of fresh dung were taken for cellulose analy-
Cross—section view
10 cm
73
Figure 1. Positions of cotton pieces in and beneath a dung pat, viewed from above and in cross-section. Cottonpositions: base (B), centre (C), periphery (P) and soil (S)
sis, using the procedure in Allen et al. (1974). Thehighly variable, and mostly minute, size of the dungparticles created some difficulties in analysis. To over-come these difficulties, 2 fractions, ie particles >500pm and 12-500 pm, representing practically 100% ofthe dung, were analysed separately as follows: 5 gof fresh dung (% dry weight and ash determinedseparately) was homogenized with 100 ml water in ablender to disperse particle aggregates, and passedthrough a 500 pm mesh sieve before washing with 5x 100 ml water. The material remaining on the sievewas air dried at 20-25°C, weighed and processedaccording to Allen et al. (1974). Before delignification,this larger particulate fraction (usually 200-250 mg)comprised about 30% of the total dry weight.
For the fine-particle fraction, 10 ml aliquots were takenfrom the vigorously stirred fluid that had passedthrough the sieve. Each aliquot was filtered on amembrane filter with pore size 12 pm (Sartorius, cellu-lose nitrate). The moist filtrate was gently scraped offthe filter, air dried and weighed. Usually, 40-50 mg dryfiltrate was obtained from 5-6 aliquots. The calculatedtotal amount of this fraction comprised 60-70% ofthe initial dung dry weight. The dry filtrate was thenprocessed as in Allen et al. (1974), with sizes of flasksand amounts of chemicals scaled down by one tenth.Filtering and washing were done on 5 pm membranefilters (Sartorius, polytetrafluoroethylene with highchemical resistance), and the filtrates were air driedat room temperature.
Average temperatures in the dung (or soil, see below)during the 10-day periods were measured by the su-crose inversion method (Jones 1972; Sibbesen 1975;Jones & Court 1980), using 10 ml tubes (6.8 cm x 1.6cm) inserted into the pats.
4 ResultsCellulolytic activity, measured as loss in tensilestrength of cotton (CTSL), in relation to dung age andposition within pats showed the same basic pattern

74
300 A Base
• Centre
0 Periphery
200
100
0
Dung age (days) Dung age (days)
Figure 2 i.Tensile strength loss of cotton pieces (CTSL) during 4 10-day periods; freely exposed pats, autumn1984. Points are in the middle of the periods. Field control TS 361.7 N (SE ± 5.6 N; n = 10)ii. Mean earthworm biomass (g per pat), content of organic matter (g per pat) and disappearance rate of thesame pats (% of initial dung weight) in relation to dung age(Bars indicate standard errors)
in all experiments. However, the last experiment (au-tumn 1984) provided the clearest illustration (Figure 2i), as all measurements were taken simultaneouslyand hence at the same temperature (second se-quence). No cellulolytic activity was recorded duringthe first 10-day period, but a sharp rise to a maximumoccurred during the third (second in the spring exper-iment) period, followed by a marked decline.
Before 10 days, TS values were actually about 5%higher than those of field controls in all experiments,as found in some early results for TS (Hill et al. 1985),and could be due to 'cementation', recently discussedby French (1984, 1988). Possibly, this phenomenon
Table 1. Dung temperature, water percentage and earthworm biomass in experiments 1-3(means of 10-day periods, with range shown in brackets)
0 10 20 30
0 Organic matterA Disappearance0 Worm biomass
0 0
40 0 10 20 30 40 50
was also present in strips from the other periods, butmasked by the high CTSL.
The amount of dung (as organic matter) per pat inrelation to age, the disappearance rate for each 10-day period (as % of dung initially present in eachperiod), and earthworm biomass are shown in Figure2 ii. The pats decayed fairly rapidly, the 75% disappear-ance time being 40-45 days, but no correlation isindicated between disappearance rates in the 4 peri-ods and cellulolytic activity. In this experimental exam-ple, earthworms arrived early and their biomassfluctuated relatively little.
300 50
200
100 •
•
10
F, freely exposed pats; E, pats enclosed to delay earthworm invasion; FS, soil below F; CS, control soil without dung* Measurements only from dung age 10-20 daysTemperatures and water percentages from the 2 types of pats and soil were pooled as there were no between-type differences

Temperature, earthworm biomass and rate of dungdisappearance varied in the 3 experiments (Table 1).In all experiments, the earthworm biomass in en-closed pats was only about 25% of that in those freelyexposed.
The measurements of cellulolytic activity are summa-rized in Table 2. Clearly, the experiments differ as tothe general level of CTSL, which was highest in spring1984, with the highest mean temperatures. TS values(not the percentage losses given here) within eachexperiment were analysed by 2-way ANOVA, the 2factors being dung age and position in pat or 'condition'(exposed, unexposed). Within condition, CTSL in thebottom of pats was always significantly (P<0.01 inmost cases) higher than that from the centre or periph-ery, whereas the latter never differed significantly.The differences between condition (within positions)at P<0.1 are shown in Table 3. It appears that celluloly-tic activity in the soil below exposed pats was signifi-cantly higher than in the control soil without dung. Onthe other hand, differences between the 2 conditionsof dung pats were barely significant, or absent, as inspring 1984.
Table 2. Cellulolytic activity in dung pats, expressed as tensilestrength loss of cotton (CTSL), compared with field controls. Valuesare averages of all 10-day periods
C, centre; P, periphery; B, baseF, freely exposed pats; E, pats enclosed to delay earthworm in-vasion; FS, soil below F; CS, control soil without dung* Values only from dung age 10-20 days
Table 3. Differences in tensile strength values between conditionof enclosed, unenclosed, dung pats or soil, for within-dung patpositions (2-way ANOVA)
Experiment
August-October 1983
May-June 1984August-October 1983
C, centre; B, base
Position
SoilSoil
Significance
P<0.1P<0.1P<0.025P<0.05P<0.1
Figure 2 shows the lack of any close correlation be-tween the 4 disappearance rates and the correspond-ing cellulolytic activities. To test whether thedisappearance rate was correlated with the generallevel of cellulolytic activity, I calculated the following
75
quantities, averaged over the 3 last 10-day periods: (i)CTSL % for dung pat centre + periphery (pooledbecause of the lack of significant differences); (ii) CTSL% at bottom of pat; (iii) earthworm biomass (g freshweight per pat); (iv) rate of dung disappearance (disap-pearance of organic matter in 10 days as percentage ofinitial amount). The coefficients of correlation obtainedwere: 0.92 (i/ii), 0.07 (i/iii), 0.15 (i/iv), 0.42 (ii/iii), 0.47 (ii/iv), 0.95 (iii/iv). Significant correlations (P<0.01) werefound only between cellulolytic activities in the 2positions (i/ii), and between earthworm biomass anddisappearance rate (iii/iv).
In Table 4, concentrations of holocellulose and a-cellulose in the 2 autumn experiments are shown.Only data from the first, third and fifth sampling aregiven because of the small variations within eachexperiment. Generally, the dung contains about 60%.holocellulose and 30% a-cellulose; in the 1983 exper-iment, concentrations decline slightly with increasingdung age.
Table 4. Cellulose concentration (fraction Of total organic matter inrelation to dung age. Data from autumn experiments in 1983 and1984
Dung age(days) Holocellulose a-cellulose
1983 0 0.62 0.2921 0.59 0.2743 0.58 0.25
1984 0 0.63 0.3120 0.62 0.3140 0.63 0.29
5 DiscussionCellulolytic ability of fungi isolated from dung hasrepeatedly been demonstrated (eg Fries 1955; Wick-low et al. 1980; Morinaga & Arimura 1984), and sothe presence of cellulolytic activity in dung pats is nosurprise. More interesting is the short duration of thisactivity (Figure 2). In this example, about 70% of thedung had disappeared after 40 days but, in cases whenmost of the dung was still present, the same declinein activity was found. This decline is not attributableto lack of natural substrate (Table 4) or to limitingnitrogen, because the C/N ratio was 12:20. Antagon-ism between members of the fungal population couldcause the reduced activity; interference betweendung fungi has been reported (Wicklow & Hirschfield1979; Wicklow & Yocom 1981).
The present work aims to testpromote dung disappearance bysition in the dung pat. It raisestions.
i. Do worms stimulate decoactivity) in the dung?
ii. If so, is decomposition in therapid disappearance of pats?
whether earthwormsstimulating decompo-the following 2 ques-
mposition (cellulolytic
dung important to the
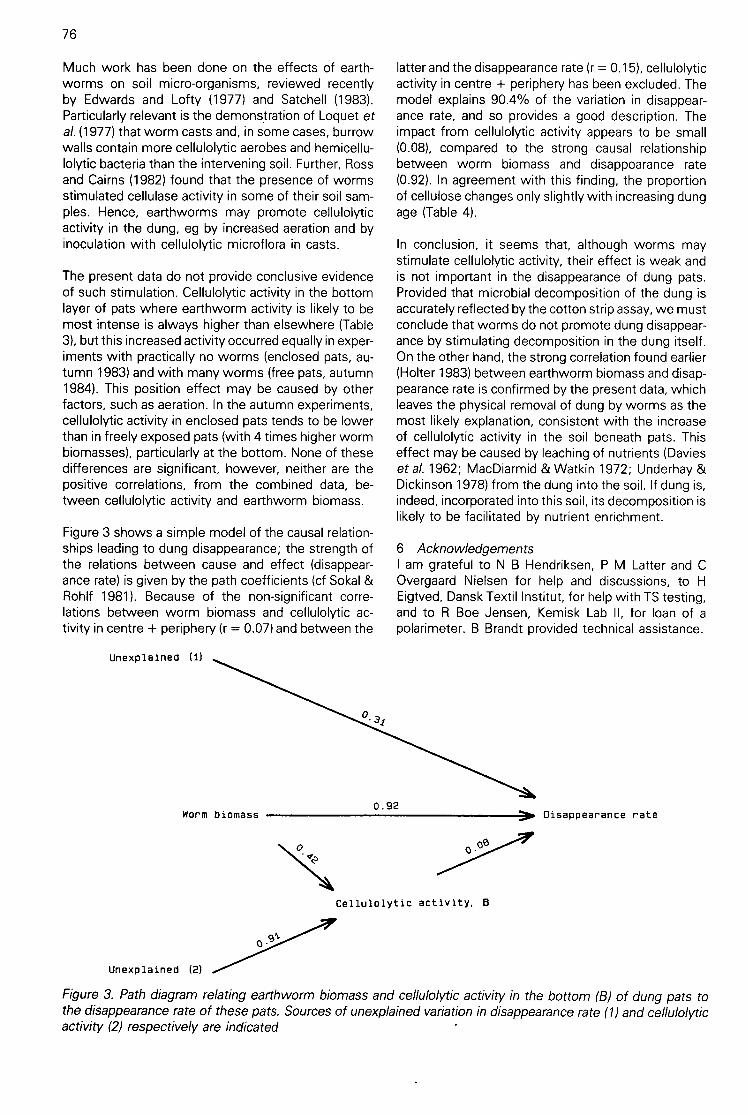
76
Much work has been done on the effects of earth-worms on soil micro-organisms, reviewed recentlyby Edwards and Lofty (1977) and Satchell (1983).Particularly relevant is the demonstration of Loquet etal. (1977) that worm casts and, in some cases, burrowwalls contain more cellulolytic aerobes and hemicellu-lolytic bacteria than the intervening soil. Further, Rossand Cairns (1982) found that the presence of wormsstimulated cellulase activity in some of their soil sam-ples. Hence, earthworms may promote cellulolyticactivity in the dung, eg by increased aeration and byinoculation with cellulolytic microflora in casts.
The present data do not provide conclusive evidenceof such stimulation. Cellulolytic activity in the bottomlayer of pats where earthworm activity is likely to bemost intense is always higher than elsewhere (Table3), but this increased activity occurred equally in exper-iments with practically no worms (enclosed pats, au-tumn 1983) and with many worms (free pats, autumn1984). This position effect may be caused by otherfactors, such as aeration. In the autumn experiments,cellulolytic activity in enclosed pats tends to be lowerthan in freely exposed pats (with 4 times higher wormbiomasses), particularly at the bottom. None of thesedifferences are significant, however, neither are thepositive correlations, from the combined data, be-tween cellulolytic activity and earthworm biomass.
Figure 3 shows a simple model of the causal relation-ships leading to dung disappearance; the strength ofthe relations between cause and effect (disappear-ance rate) is given by the path coefficients (cf Sokal &Rohlf 1981). Because of the non-significant corre-lations between worm biomass and cellulolytic ac-tivity in centre + periphery (r = 0.07) and between the
Unexplained (1)
Unexplained (2)
Worm biomass
o
0
0.92
latter and the disappearance rate (r = 0.15), cellulolyticactivity in centre + periphery has been excluded. Themodel explains 90.4% of the variation in disappear-ance rate, and so provides a good description. Theimpact from cellulolytic activity appears to be small(0.08), compared to the strong causal relationshipbetween worm biomass and disappearance rate(0.92). In agreement with this finding, the proportionof cellulose changes only slightly with increasing dungage (Table 4).
In conclusion, it seems that, although worms maystimulate cellulolytic activity, their effect is weak andis not important in the disappearance of dung pats.Provided that microbial decomposition of the dung isaccurately reflected by the cotton strip assay, we mustconclude that worms do not promote dung disappear-ance by stimulating decomposition in the dung itself.On the other hand, the strong correlation found earlier(Holter 1983) between earthworm biomass and disap-pearance rate is confirmed by the present data, whichleaves the physical removal of dung by worms as themost likely explanation, consistent with the increaseof cellulolytic activity in the soil beneath pats. Thiseffect may be caused by leaching of nutrients (Davieset al. 1962; MacDiarmid & Watkin 1972; Underhay &Dickinson 1978) from the dung into the soil. If dung is,indeed, incorporated into this soil, its decomposition islikely to be facilitated by nutrient enrichment.
6 AcknowledgementsI am grateful to N B Hendriksen, P M Latter and COvergaard Nielsen for help and discussions, to HEigtved, Dansk Textil Institut, for help with TS testing,and to R Boe Jensen, Kemisk Lab II, for loan of apolarimeter. B Brandt provided technical assistance.
Cellulolytic activity. B
Disappearance rate
Figure 3. Path diagram relating earthworm biomass and cellulolytic activity in the bottom (B) of dung pats tothe disappearance rate of these pats. Sources of unexplained variation in disappearance rate (1) and cellulolyticactivity (2) respectively are indicated

7 ReferencesAllen, S.E., Grimshaw, H.M., Parkinson, JA. & Quarmby, C.1974. Chemical analysis of ecological materials.Oxford: BlackwellScientific.Davies, E.B., Hogg, D.E. & Hopewell, H.G. 1962. Extent of returnof nutrient elements by dairy cattle: possible leaching losses. Trans.4th int. Conf. Soc. Soil Sci., Lower Hutt, New Zealand, 20, 715-720.Edwards, CA. & Lofty, J.R. 1977. Biology of earthworms. 2nded. London: Chapman & Hall.French, D.D.1984. The problem of 'cementation' when using cottonstrips as a measure of cellulose decay in soils. Int. Biodeterior., 20,169-172.French, D.D. 1988. The problem of cementation. In: Cotton stripassay. an index of decomposition in soils, edited by A.F. Harrison,P.M. Latter & D.W.H. Walton, 32-33. (ITE symposium no. 24.)Grange-over-Sands: Institute of Terrestrial Ecology.Fries, L. 1955. Studies in the physiology of Coprinus. I. Growthsubstance, nitrogen and carbon requirements. Svensk bot. Tidskr.,49, 475-535.Hill, M.O., Latter, P.M. & Bancroft, G. 1985. A standard curve forinter-site comparison of cellulose degradation using the cotton stripmethod. Can. J. Soil Sci., 65, 609-619.Holter, P. 1979. Effects of dung beetles (Aphodius spp.) andearthworms on the disappearance of cattle dung. Oikos, 32, 393-2402.Halter, P. 1983. Effect of earthworms on the disappearance rateof cattle droppings. In: Earthworm ecology from Darwin to vermicul-ture, edited by J E Satchell, 45-57. London: Chapman & Hall.Jones, R.J.A. 1972. The measurement of mean temperatures bythe sucrose inversion method. Soils Fertil., Harpenden, 35, 615-619.Jones, R.J.A. & Court, M.N. 1980. The measurement of meantemperatures in plant and soil studies by the sucrose inversionmethods. Pl. Soil, 54, 15-31.Latter, P.M. & Howson, G. 1977. The use of cotton strips toindicate cellulose decomposition in the field. Pedobiologia, 17, 145-155.Loquet, M., Bhatnagar, T., Bouche, M.B. & Rouelle, J. 1977.Essai d'estimation de l'influence écologique des lombriciens sur lesm icroorga n is m es. Pedobiologia, 17, 400-417.
77
Lucas, D.M., Fontenot, J.P. & Webb, ICE., Jr. 1975. Compositionand digestibility of cattle fecal waste. J. Anim. Sci., 41, 1480-1486.MacDiarmid, B.N. & Watkin, B.R.1972. The cattle dung patch. 2.Effect of a dung patch on the chemical status of the soil, andammonia nitrogen losses from the patch. J. Br. Grassld Soc., 27,43-48.Morinaga, T. & Arimura, T. 1984. Degradation of crude fiberduring the fungal succession on deer dung. Trans. mycol. Soc.Japan, 25, 93-100.Ross, D.J. & Cairns, A. 1982. Effects of earthworms and iyegrasson respiratory and enzyme activities of soil. Soil Biol. Biochem., 14,593-587.Satchell, J.E. 1971. Earthworms. In: Methods of study in quantitat-ive soil ecology,edited by J. Phillipson, 107-127. (IBP handbookno. 18.) Oxford: Blackwell Scientific.Satchell, J.E. 1983. Earthworm microbiology. In: Earthworm ecol-ogy from Darwin to vermiculture,edited by J.E. Satchel!, 351-364.London: Chapman & Hall.Sibbesen, E. 1975. Temperaturmaaling med sukkermetoden.Meddr K. Vet.- og Landbohojsk. a fd. Plant. ernaer.,no. 1101.Sokal, R.R. & Rohlf, F.J. 1981. Biometry.2nd ed. San Francisco:Freeman.Underhay, V.H.S. & Dickinson, C.H. 1978. Water, mineral andenergy fluctuations in decomposing cattle dung pats. J. Br. GrassldSoc., 33, 189-196.Waksman, S.A., Cordon, T.C. & Hulpoi, N. 1939. Influence oftemperature upon the microbiological population and decompo-sition processes in composts of stable manure. Soil Sci., 47, 83-114.Wicklow, D.T. & Hirschfield, B.J.1979. Evidence of a competitivehierarchy among coprophilous fungal populations. Can. J. Micro-biol., 25, 855-858.Wicklow, MT. & Yocom, D.H. 1981. Fungal species numbers anddecomposition of rabbit faeces. Trans. Br. mycol. Soc., 76, 29-32.Wicklow, D.T., Detroy, R.W. & Adams, S. 1980. Differential modi-fication of the lignin and cellulose components in wheat straw byfungal colonists of ruminant dung: ecological implications. Mycolo-gia, 72, 1065-1076.

78
Use of cotton cloth in microcosms to examinerelationships between mycorrhizal and saprotrophicfungiJ DIGHTON and P M LATTERInstitute of Terrestrial Ecology, Merlewood Research Station, Grange-over-Sands
Poster summarySmall pieces of Shirley Soil Burial Test Fabric (cot-ton)(2 cm x 10 cm) were used as one of a number ofsubstrates to investigate the effects of interactionsbetween saprotrophic and mycorrhizal fungi in con-trolled culture microcosms (Figure 1). Substrates wereplaced inside or outside a root exclusion zone, de-limited by a nylon mesh pervious to fungal hyphae butnot to roots, in a series of mini-propagators used asmicrocosms. The complexity of organism interactionswas built up in a factorial experimental design withthe following levels of complexity:
i. sterile medium (perlite:peat:nutrient solution);ii. fungus alone (saprotroph or mycorrhizal fungus);
non-mycorrhizal roots;iv. non-mycorrhizal roots plus saprotroph;v. mycorrhizal roots;
vii. mycorrhizal roots plus saprotroph.
Mycorrhizal roots were shown to enhance substratedecomposition to varying degrees, but the addition ofthe saprotroph to the mycorrhizal system suppressedthe decomposition rate. This work has been publishedin detail elsewhere (Dighton et al. 1987).
ReferenceDighton, J., Thomas, E.D. & Latter, P.M. 1987. Interactionsbetween tree roots, mycorrhizas, a saprotrophic fungus and thedecomposition of organic substrates in a microcosm. Biol. Fertil.Soils, 4, 145-150.
1
Cotton strip I
r e z
Cross-section
Seedling
4/
111
111
Medium
1
Figure 1. Illustration of microcosm used for plant—mycorrhiza—substrate decomposition interactionrez, root exclusion zone
Use of cotton strip assay to assess the effect offormaldehyde treatment on a peat soilP M LATTER' and J MILES2' Institute of Terrestrial Ecology, Merlewood Research Station, Grange-over-Sands2 Institute of Terrestrial Ecology, Banchory Research Station, Banchory
Poster summaryAn area of 2-3 ha of low-lying blanket bog on GruinardIsland, Wester Ross, Scotland, was known to be con-taminated with anthrax spores released during 1943.Formaldehyde was selected as the most suitableagent for decontamination. Prior to decontamination,the likely ecological consequences were investigatedand the cotton strip assay was used among otherbiological tests to assess the extent and rate of recov-ery of decomposer activity after a sterilizing applicationof 5% formaldehyde solution at 50 I fr1-2 (Miles et al.1988).
This example of a practical application of the assay
79
was described. The study effectively demonstratedthe early return of decomposer activity after the virtualelimination of all microbial activity, and showed thatrecovery was enhanced by the addition of fertilizer.
The results of the cotton strip assay gave similarresults to other assessments, which were of microbialpopulations or activity, and all tests indicated a recov-ery period of about 2 months.
ReferenceMiles, J., Latter, P.M., Smith, I.R. & Heil, O.W. 1988. Ecologicaleffects of killing Bacillus anthracis on Gruinard Island with formal-dehyde. Reclam. Reveg. Res. In press.

80
FIELD APPLICATION IN SPECIFIC ENVIRONMENTS
Temperate
Discrimination between the effects on soils of 4 treespecies in pure and mixed stands using cotton stripassayA H F BROWNInstitute of Terrestrial Ecology, Merlewood Research Station, Grange-over-Sands
1 SummarySoil differences which are thought to have developedmore than 20 years after planting under experimentalstands of 4 different tree species, at Gisburn Forest,Lancashire, could not readily be detected by chemicalanalysis.
Cotton strip assay, however, indicated that there wereclear between-species effects on soil biological ac-tivity. This method was also able to discriminate be-tween the soils of a given tree species, according towhether or not it was grown in association with othertree species. The height growth of most of the treespecies in mixture was improved, apparently throughmodification of soil nutrient availability, paralleled bythe rate of decomposition of the cotton strips.
2 BackgroundIt is generally agreed that soils are influenced byafforestation, and that different tree species are likelyto have differing effects. Further, species in mixturemay interact in their effects, both on each other andon the properties of the site. To obtain information onthese points, a long-term afforestation experimentwas established at Gisburn (in the Lancashire/York-shire border area of the west Pennines) in 1955. Thisexperiment has enabled the effects on vegetation andsoils of 4 tree species, both pure and mixed, to bemonitored (Holmes & Lines 1956; Brown & Harrison1983). The tree species planted consist-of 2 conifers,Norway spruce (Picea abies) and Scots pine (Pinussylvestris),and 2 deciduous hardwoods, oak (Quercuspetraea)and alder (Alnus glutinosa).The mixed standscomprise all possible 2-species combinations. Each ofthe resulting 10 treatments was planted as a 0.2ha plot in a randomized experiment with 3 replicateblocks.
The elevation of the experimental site ranged from260 m to 290 m, with a mean annual rainfall of1370 mm. Soils were surface water gleys, tendingtowards peaty gleys; the original vegetation consistedof a grazed fescue/bent-grass/mat-grass (Festuca/Ag-rostis/Nardus)sward similar to the poorest (Class 6)of Ball et A's (1981) rough pastures.
In attempting to measure changes in the soil and theeffects of the different species, the question arose ofwhich attributes should be assessed. Initially, empha-sis was placed on chemistry, using standard soil ana-lytical methods. Twenty years after planting thedifferent stands, chemical analyses of the soils gaveno consistent differences, even between the differentmonocultures, for most major nutrients (total nitrogen(N), extractable phosphorus (P), potassium (K) andmagnesium (Mg)). Analytical methods developed foragricultural soils are not appropriate for distinguishingdifferences in the predominantly poor soils used forforestry. In such soils, the rate of nutrient cycling maybe more important than the size of the nutrient pool(Harrison 1985), and Jacks' (1963) conclusion that the'natural fertility of a soil is a biophysical rather that aphysicochemical phenomenon' accords with thisview. At Gisburn, there was evidence that, in soilbiological terms, differences between the standswere developing at a relatively early stage in their life;for example, very different populations of higher fungiwere evident in the different stands (Brown 1978). Itwas, therefore, concluded that a biological assess-ment of soil differences might be informative. Organicmatter decomposition processes are regarded as im-portant both in nutrient cycling and as precursorsof soil chemical and pedological changes (Harrison1985); therefore, some measure of decomposer ac-tivity was considered most relevant. Measurement ofthe decomposition of the different species of tree litterwould be of very little value, as species differences inlitter quality are confounded with the differences insite properties, developed in the different stands. Amethod which was integrative over a period, ratherthan instantaneous like most measurements of respir-ation, was desirable. A method that could assay thechanges in properties which might have developeddown the mineral soil profile, in addition to the forestfloor, was also to be preferred. The cotton strip assay,providing an index of decomposer potential with astandard substrate, appeared very suitable.
3 Monoculture comparisonsFollowing a pilot study in the pure plots of one repli-cate block, a large-scale seasonal study of the 4 mono-

cultures of all 3 replicate blocks at Gisburn wasundertaken. This work is described more fully else-where (Brown & Howson 1988), but can be summari-zed here. A discrete 12-week assay was repeated at6-weekly intervals for a whole year. The pattern oftensile strength loss of cotton (CTSL) (averaged forwhole strips) showed seasonal differences in decom-poser activity, and between each of the 4 stands(Figure 1 in Brown & Howson 1988). Clear and signifi-cant differences between treatments were evidenton 8 of the 9 occasions, and these were consistentbetween the 3 blocks. Although the interpretation ofthese differences may be open to argument (Howard1988), good discrimination was achieved between theeffects of species on soil. It demonstrated that thesoils under the different trees were now different, insome way related to an important soil attribute — vizthe potential for decomposition of organic matter. Therelevance of these differences to other site par-ameters or processes is partly explored in the nextpaper (Brown & Howson 1988). Emphasis in the pre-sent paper is, however, placed on the effects of themixed-species plots at Gisburn, perhaps the mostimportant aspect of this long-term forestry exper-iment.
X X X000XXX000XXX 000 X XX 000 XXX 00XX X000 XXX 000 XXX 000 X XX000 XXX 00XX X000X XX000 XX X000 XXX.000 XX X00XXX000XX X000 XX X000 XXX000 X X X00XX X000 XXX000 XXX 000 X XX000 X XX00000 XXX000 XX X000XXX 000 XXX000 XX000 XXX000 XX X000 XXX000XXX000 XX000 XXX000XXX000 XXX000 XXX000 XX000 XX X000XXX000 X XX000 XX X000 XX000 XX X000XXX 000 Y. XX000 XXX000 XX000 XX X000XX X000 XX X000 vy X000 XXXXX000 XXX000XX X 000 v. v X000 XXX 00X XX000 XXX000XX X 000 X XX000 XXX00XXX000X XX000X X X000XXX000X XX00XXX 000 XXX000XXX000XXX000 XXX00XXX000X X X000 XX X000 XXX000 XXX00XXX000XXX000XXX000XXX000XXX00000XXX000XXX000 XXX000XXX000XX000 XXX000 XXX000 XX X00010tV V coo XX000 XXX000 XXX000 XX X000 X XX000 XX
000 VYX000 XX X000 XXXCOO XX X000 XX
000X XX000 XX X000 XX X000 XX X000 XX000XXX000XXX000 XXX000XXX000 XXXXX000XXX000XXX000XXX000XXX00XXX 000 XXX000XXX 000 XX X000 X XX00XXX000XXX000XXX000XXX000 XXX00X XX000XX X000 X XX000 V YVOCO XXXCO
X XXCOO XXX000 XXX000 X XXOCCX XX00XXX000 XXX000XXX 000 XXX000XXX00
Figure 1. Layout of a 2-species mixture at Gisburn
4 Mixture comparisonsThe mixed-species stands consist of a checkerboardplanting of groups of 3 x 6 trees of one species,alternating each way with similar groups of the ad-mixed species (Figure 1). Compared with soil differ-ences between monoculture species, thosedeveloping between subplots under the various mix-ture treatments (ie under a given single species withinthe 18-tree groups) could be expected to be smalland possibly undetectable, using traditional chemicalmethods. Nevertheless, that soil differences mightexist was suggested by the presence of differencesin tree performance observed in the mixed plots (Lines1982). Spruce, oak and alder heights have been sig-nificantly influenced by the presence of the admixedspecies (Figure 2). The sequence of effects broughtabout by the admixed species is pine >alder >oak =spruce (with pine and alder always having a positive
81
influence, spruce invariably a negative one, and oak anegative or neutral effect). In contrast, height growthof pine has remained identical, whether pure or mixed.One possible explanation of such differential heightgrowth is through changes in soil 'fertility'. As a start-ing point for differentiating the changes in these soils,the cotton strip assay was again applied. Because ofmanpower limitations, oak and oak mixtures were notincluded.
All the strips were buried in June 1980 in each treat-ment of both pure and mixed trees (except for thedifferent oak combinations) and in the 3 replicateblocks. In the mixed stands, sampling points werelocated as near as possible to the centre of 8 sample18-tree 'subplots', distributed on a systematic basisthrough each plot and in equivalent positions in purestands. Four strips were inserted, about 20 cm apart,at each sampling point. One strip per sampling positionwas subsequently removed on each of 4 retrievaloccasions, 3, 6, 9 and 12 weeks after insertion. Follow-ing standard preparation and testing for tensilestrength (Latter & Howson 1977), decay curves werederived (Figure 3), again averaged over the whole strip,and combining data from all 3 blocks.
Differences between tree treatments were significant,and it is evident that the sequence of mixture effectson CTSL for spruce and alder, at least, was the sameas that for the height data, ie pine >alder >spruce.That these 2 variables appear to be related is indicatedin Figure 4, in which tree heights are plotted againstCTSL after 9 weeks, ie the position on the decaycurve closest to a 50% CTSL. This degree of CTSL isregarded as providing optimum information (Hill et al.1988). In both spruce and alder, highly significantrelationships exist. In the case of pine, in which therewas no effect of mixtures on heights, there is a corre-sponding lack of a mixture effect on CTSL (Figure 3).
How can this close relationship between tree heightsand the decomposition of buried cotton cloth be inter-preted? One possible hypothesis is that the trees — inmixture — are growing better through some nutritionaladvantage, as already suggested, and that the in-creased CTSL in the mixed plots reflects an increasein the availability of the appropriate nutrient(s). Thestandard approach for checking on the nutritionalstatus of trees — at least in conifers — is to carry outfoliar analysis. Where the availability of an elementis limiting tree growth, a relationship between foliarconcentration of the element in question and treeheight growth can sometimes be expected. At Gis-burn, foliar sampling of the spruce trees (both pureand mixed) was carried out in the autumn of 1982,taking a lateral shoot from the first whorl on the southside of 10 trees per plot. All 3 replicate blocks weresampled, and the needles were analysed for N, P andK — the 3 nutrients which most commonly limit treegrowth on this type of site. No significant relationshipbetween tree heights and K content was obtained, but
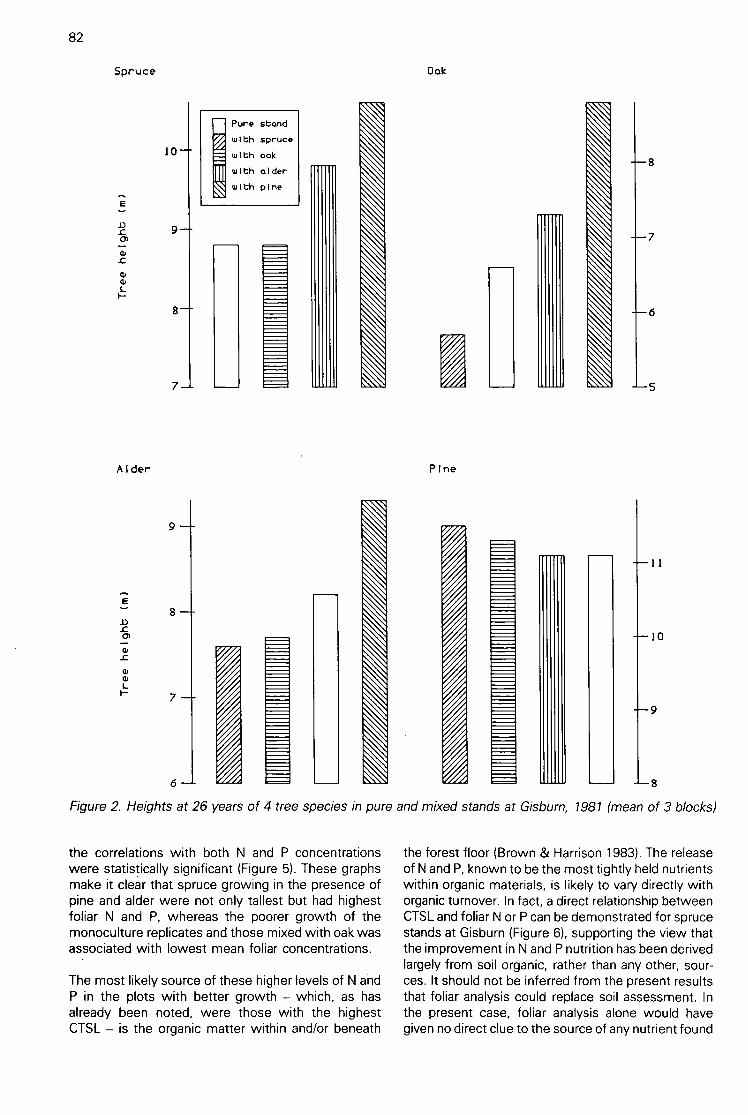
82
Spruce
Alder
10
9
8
7
Pure stand
with spruce
with oak
with alder
with pine
Figure 2. Heights at 26 years of 4 tree species in pure and mixed stands at Gisburn, 1981 (mean of 3 blocks)
the correlations with both N and P concentrationswere statistically significant (Figure 5). These graphsmake it clear that spruce growing in the presence ofpine and alder were not only tallest but had highestfoliar N and P, whereas the poorer growth of themonoculture replicates and those mixed with oak wasassociated with lowest mean foliar concentrations.
The most likely source of these higher levels of N andP in the plots with better growth — which, as hasalready been noted, were those with the highestCTSL — is the organic matter within and/or beneath
Oak
8
7
6
5
the forest floor (Brown & Harrison 1983). The releaseof N and P, known to be the most tightly held nutrientswithin organic materials, is likely to vary directly withorganic turnover. In fact, a direct relationship betweenCTSL and foliar N or P can be demonstrated for sprucestands at Gisburn (Figure 6), supporting the view thatthe improvement in N and P nutrition has been derivedlargely from soil organic, rather than any other, sour-ces. It should not be inferred from the present resultsthat foliar analysis could replace soil assessment. Inthe present case, foliar analysis alone would havegiven no direct clue to the source of any nutrient found
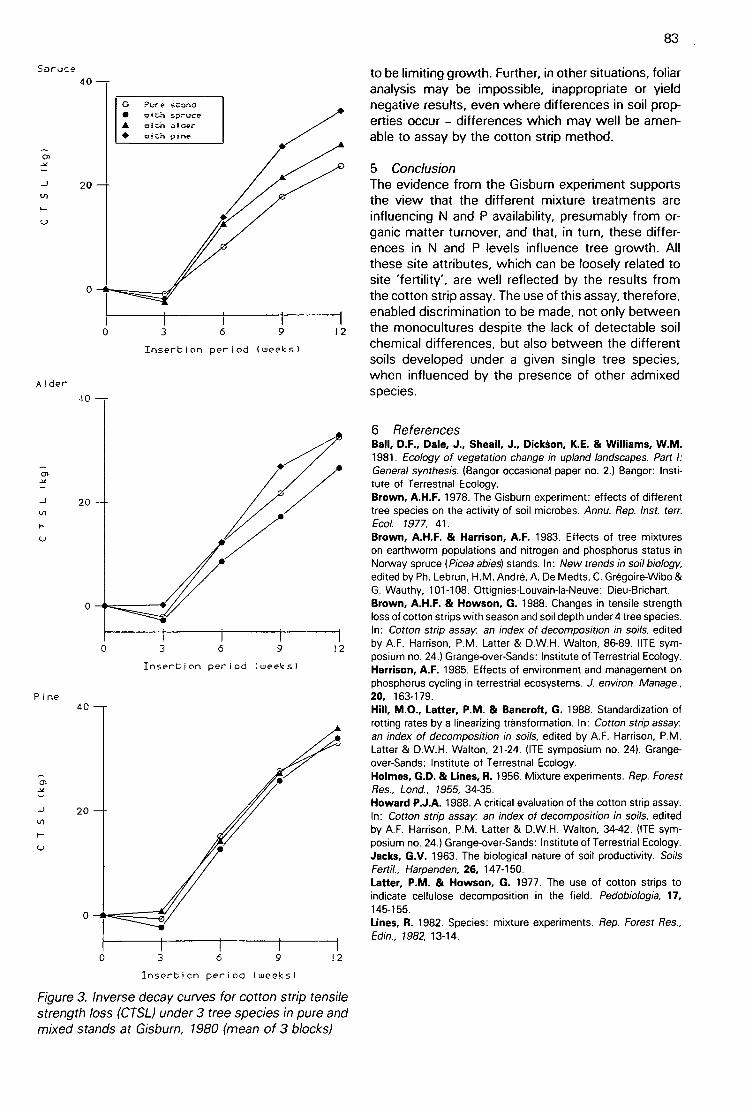
Spruce
20—in
U
M.:1er40 --
20
Pine
0
40
—a)
-J 20tn
0
0
0
O Pure sc3no• spruce
A vith older
• vich pine
I I0 3 6 9
Insertion period (weeks)
3 6 6Insertion period (weeks)
3 6 9
12
12
12
Insertion perioa (weeks)
Figure 3. Inverse decay curves for cotton strip tensilestrength loss (CTSL) under 3 tree species in pure andmixed stands at Gisburn, 1980 (mean of 3 blocks)
83
to be limiting growth. Further, in other situations, foliaranalysis may be impossible, inappropriate or yieldnegative results, even where differences in soil prop-erties occur — differences which may well be amen-able to assay by the cotton strip method.
5 ConclusionThe evidence from the Gisburn experiment supportsthe view that the different mixture treatments areinfluencing N and P availability, presumably from or-ganic matter turnover, and that, in turn, these differ-ences in N and P levels influence tree growth. Allthese site attributes, which can be loosely related tosite 'fertility', are well reflected by the results fromthe cotton strip assay. The use of this assay, therefore,enabled discrimination to be made, not only betweenthe monocultures despite the lack of detectable soilchemical differences, but also between the differentsoils developed under a given single tree species,when influenced by the presence of other admixedspecies.
6 ReferencesBall, D.F., Dale, J., Sheail, J., Dickton, K.E. & Williams, W.M.1981. Ecology of vegetation change in upland landscapes. Part I:General synthesis. (Bangor occasional paper no. 2.) Bangor: Insti-tute of Terrestrial Ecology.Brown, A.H.F. 1978. The Gisburn experiment: effects of differenttree species on the activity of soil microbes. Annu. Rep. Inst. terr.Ecol. 1977, 41.Brown, A.H.F. & Harrison, A.F. 1983. Effects of tree mixtureson earthworm populations and nitrogen and phosphorus status inNorway spruce (Picea abies)stands. In: New trends in soil biology,edited by Ph. Lebrun, H.M. André, A. De Medts, C. Gregoire-Wibo &G. Wauthy, 101-108. Ottignies-Louvain-la-Neuve: Dieu-Brichart.Brown, A.H.F. & Howson, G. 1988. Changes in tensile strengthloss of cotton strips with season and soil depth under 4 tree species.In: Cotton strip assay. an index of decomposition in soils, editedby A.F. Harrison, P.M. Latter & D.W.H. Walton, 86-89. (ITE sym-posium no. 24.) Grange-over-Sands: Institute of Terrestrial Ecology.Harrison, A.F. 1985. Effects of environment and management onphosphorus cycling in terrestrial ecosystems. J. environ. Manage.,20, 163-179.Hill, M.O., Latter, P.M. & Bancroft, G. 1988. Standardization ofrotting rates by a linearizing trånsformation. In: Cotton strip assay.an index of decomposition in soils, edited by A.F. Harrison, P.M.Latter & D.W.H. Walton, 21-24. (ITE symposium no. 24). Grange-over-Sands: Institute of Terrestrial Ecology.Holmes, G.D. & Lines, R. 1956. Mixture experiments. Rep. ForestRes., Lond., 1955,34-35.Howard P.J.A. 1988. A critical evaluation of the cotton strip assay.In: Cotton strip assay an index of decomposition in soils, editedby A.F. Harrison, P.M. Latter & D.W.H. Walton, 34-42. (ITE sym-posium no. 24.) Grange-over-Sands: Institute of Terrestrial Ecology.Jacks, G.V. 1963. The biological nature of soil productivity. SoilsFertil., Harpenden, 26, 147-150.Latter, P.M. & Howson, G. 1977. The use of cotton strips toindicate cellulose decomposition in the field. Pedobiologia, 17,145-155.Lines, R. 1982. Species: mixture experiments. Rep. Forest Res.,Edin., 1982,13-14.

Nitrogen
84
Spruce
11
10
8
10
9
O Pure stand
• with spruce
• with older
• with pine
•
•
•
is
6
Alder
• •
10
•
• •
su4r0.839
9
8
7
• o
•
• Momr -0.990
8 60 0 0 0 0 10 15 20 25 30
C T 5 L (kg) ' C T S L (kg)
Figure 4. Relationship between tree heights at 26 years (1981) and tensile strength loss of cotton strips after9 weeks (1980) in pure and mixed stands at Gisburn (means per plot)(** Significant at P.<0.01; *** P<0.001)
r.13.895***
•
Phosphorus
12 120 Pure stond
• withoakA with older
• with pine • •
10
8• •
•
r0.632M
6 61. 1.2 1,4 1.6 0.15 0.2 0.25 0.3 0.35
Follor nitrogen (X) Follor phosphorus (X)
Figure 5. Relationship between tree heights and concentrations of nitrogen and phosphorus in pure and mixedspruce stands at Gisburn, 1981 (means per plot)(* P<0.05; *** P<0.001)
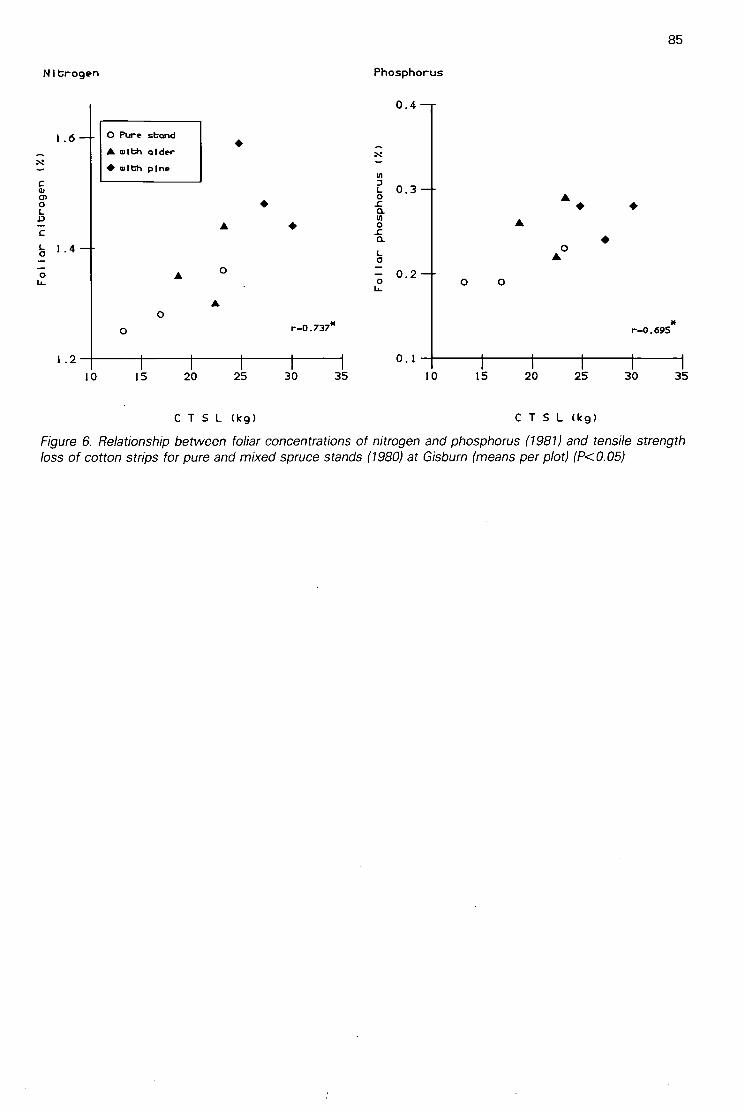
Nitrogen Phosphorus
0
0 r-0.737*
0.4
I .6 0 Pure stand• —
A with older— Nx —— • with One
triC 7a, L 0.3a) o0 • -CL 0.13 lil— A • oc _ca.L 1
•
. 4
0•
-
0.2L.
r-0.695
85
1.2 0.1
10 15 20 25 30 35 10 15 20 25 30 35
CTSL (kg) CTSL (kg)
Figure 6. Relationship between foliar concentrations of nitrogen and phosphorus (1981) and tensile strengthloss of cotton strips for pure and mixed spruce stands (1980) at Gisburn (means per plot) (P<0.05)

86
Changes in tensile strength loss of cotton strips withseason and soil depth under 4 tree speciesA H F BROWN and G HOWSONInstitute of Terrestrial Ecology, Merlewood Research Station, Grange-over-Sands
1 SummarySeasonal changes in tensile strength loss of cottonstrips (CTSL), used as an index of potential organicmatter breakdown, were determined in stands of 4tree species at Gisburn (Bow land Forest), Lancashire.
In general, decomposer potential is greater underalder (Alnusspp.) and pine (Pinus spp.) than under oak(Quercusspp.) and spruce (Piceaspp.). The seasonalpattern under oak (with a mid-season decline in ac-tivity) is very different from the seasonal curves forthe other species. CTSL also declines rapidly withdepth under oak and spruce, remaining relatively highat all depths under the alder and pine. This higherpotential for decomposition at depth under alder andpine is possibly related to the appreciable populationsof earthworms (Lumbricidae) under these 2 tree spe-cies; conversely, earthworms are rare in oak andspruce stands.
It has also been observed that feeding roots of oakand spruce tend to proliferate near the surface, butare distributed more evenly with depth in alder andpine, these patterns being related to those for CTSL.
2 BackgroundThe background to the study and a description of thesite are given by Brown and Harrison (1983) and Brown(1988). Briefly, the Gisburn study area consists of anexperimental planting of 4 tree species planted in0.2 ha plots, both as monoculture stands and in allpossible combinations of 2-species mixtures. These10 treatments are replicated in 3 blocks. The fourspecies are Scots pine (Pinus sylvestris), Norwayspruce (Picea abies),alder (Alnus glutinosa)and sess-ile oak (Quercus petraea).The aim of the study wasto use the cotton strip assay to test the hypothesisthat the 4 monoculture stands were altering the poten-tial for cellulose decomposer activity in the soils inwhich the biomass of earthworms and the distributionof fine roots were also found to differ.
3 MethodOrganic matter decomposer activity is known to varywith both soil depth and season (Swift et al. 1979). Inusing the cotton strip assay under the different treespecies, we wished to determine whether there wasalso any species interaction in cellulose decompo-sition with either of these sources of variation. Al-though the standard cotton strip assay givesinformation on depth differences, it is necessary torepeat the assay at intervals to provide seasonal infor-mation. To this end, assays were repeated on 9 oc-
casions, at 6-weekly intervals (ie for just over a year)in the monoculture plots of pine, spruce, alder andoak for each of the 3 replicate blocks. Assay periodsof 12 weeks were used, thus leading to an overlappingtime series of assays. Ten strips per plot were usedfor each test on each occasion, distributed on a sys-tematic basis throughout each tree plot. The ShirleySoil Burial Test Fabric (1976 batch) was used, the firstassay period starting on 5 January 1978, the lastfinishing on 26 February 1979. The methodology ofLatter and Howson (1977) was used throughout, pro-viding tensile strength loss (CTSL) data for 5 depthsat 4 cm intervals down the soil profiles. The data werealso calculated as cotton rotting rate (CRR), after Hillet al. (1988).
Cloth control tensile strength was 47.4 kg for thebatch of cloth used on occasions 1-4 and 54.4 kg forthe subsequent batch used on occasions 5-9.
To provide comparisons between cotton assay dataand other site parameters for the different tree stands,data on earthworm populations and the standing cropof fine roots are also presented. The earthwormswere sampled during 1981 using a dung bait method(Brown & Harrison 1983) for 2 of the 3 blocks, butexcluding oak stands. Some preliminary data on distri-bution of live roots one mm were obtained during1983 by hand-sorting replicate soil cores from the pineand spruce stands only.
4 Results and discussionThe results from the cotton strip assay indicated thatthere were clear seasonal patterns of cellulose de-composer activity associated with the different treespecies plots (also discussed by French 1988). Be-cause these results were consistent between theseparate blocks, the data have been combined fromthe 3 blocks to give means based on 30 strips per treespecies. CTSL or CRR averaged for all 5 depths, ierepresenting whole strips, provides a summary Of thechanges in decomposer activity with time in eachforest stand (Figure 1).
Statistically significant differences for CTSL (P<0.001on first, second, fifth, sixth occasions, and P<0.01 forthe other 4 occasions) occurred on all except the lastsampling occasion of the series. It is evident that,overall, cellulose decomposer activity was in the se-quence alder = pine>oak>spruce. Activity rose to apeak in late summer/early autumn in alder, pine andspruce stands, but with the pattern under oak beingvery different. Because the successive assay periods

Ton July Ton
1978 1979
were of identical length, the seasonal curves for CTSLand CRR are essentially similar. Only alder shows aslight discrepancy, when TS values were excessivelylow in summer (cf Walton 1988).
The seasonal patterns for the separate depths undereach tree species (Figure 2) show that the differentpattern for oak became more accentuated with depth,being similar to those for other species only at thesurface. At 16-20 cm, the oak curve was clearly bimo-dal, with a secondary minimum at the time at whichthe other species reached their seasonal maxima.
Inspection of the 4 sets of seasonal curves also re-veals that the decline in CTSL with depth, during theseason of high activity at least, was slight in alder andpine stands, but very marked under oak and spruce.This contrast between alder and pine, on the onehand, and oak and spruce, on the other, is possiblylinked with differences in both earthworm populationsand the distribution of the fine (ie the main feeding)roots. Figure 3 shows that alder and pine not only hadrelatively high numbers of earthworms, but that manyof them were Lumbricus rubellus, a partially burrow-ing species. The remainder consisted of surface-dwell-ing species (Brown & Harrison 1983). In contrast, thespruce stands had very few earthworms and negligibleLumbricus rubellus. From observation, populations ofearthworms in the oak plots were judged to be at leastas low as those of spruce. It is, therefore, possiblethat there has been more transport both of organicmatter and of its decomposer organisms into the soilprofiles of alder and pine stands through earthwormactivity; and that this is reflected in the relatively highlevels of CTSL at all sampled depths.
Yon July Ton
1978 1979
87
Figure 1. Changes with season in tensile strength loss of cotton strips, CTSL and CRR, following insertion under4 tree species, at Gisburn, 1978-79. Nine overlapping burial periods, each of 12 weeks; means of all depths(ie whole strip averages) for 3 blocks combined, points being placed on the retrieval date (for a 3D presentation
of the oak data, see Walton 1988)
Conversely, where the possibility of such mixing andtransport down the profile has only been slight, as inspruce (and oak) stands, there has been a concomitantrapid fall-off Of cellulose decomposer activity downthe profile.
Similar reasoning could also explain the contrast infine root distribution between pine and spruce (Figure4). Under pine, with little reduction in cellulose decom-poser activity (and concomitant nutrient release) withdepth, feeding roots likewise tend to occur at alldepths, with least at the surface where other environ-mental conditions, such as susceptibility to droughtand temperature fluctuations, are likely to be leastsuitable for root activity. In contrast, because cellulosedecomposer activity in the spruce stands was verymuch greater at the surface than at depth, the feedingroots were concentrated at the main source of nutri-ents made available. Because of the resulting surface-rooting of spruce under such conditions, this speciesis typically more prone to drought than the deeper-rooting pine.
It must be emphasized, however, that these interpret-ations now require testing in order to distinguish causefrom effect.
5 AcknowledgementsMany people assisted in the field work, laboratorytesting and data handling involved in this study, includ-ing S H Atkinson, A E Elliott, C L Gardener, S Gardener,and R W Hollstein.
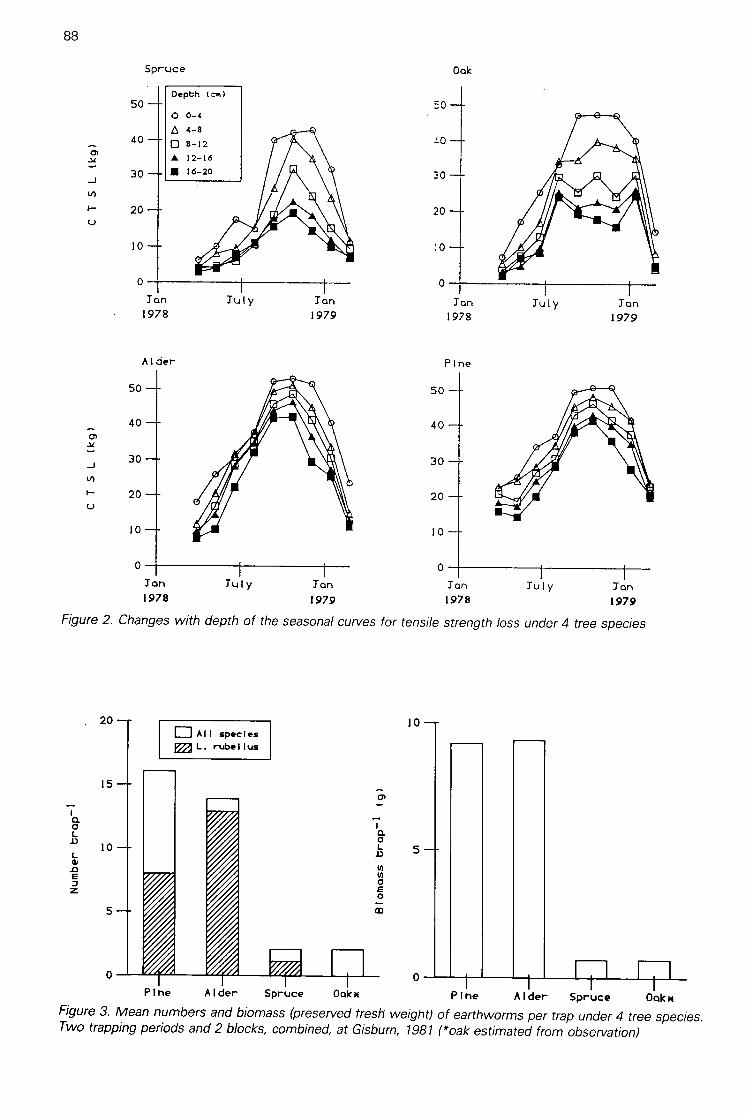
88
1
0
1978 1979 1978 1979
Figure 2. Changes with depth of the seasonal curves for tensile strength loss under 4 tree species
20 10ET] All speciesm L. rubellus
15
10
5
0 0P 1 ne A I der Spruce Oak* P 1 ne A I der Spruce Oak*
Figure 3. Mean numbers and biomass (preserved tresh weight) of earthworms per trap under 4 tree species.Two trapping periods and 2 blocks, combined, at Gisburn, 1981 (*oak estimated from observation)
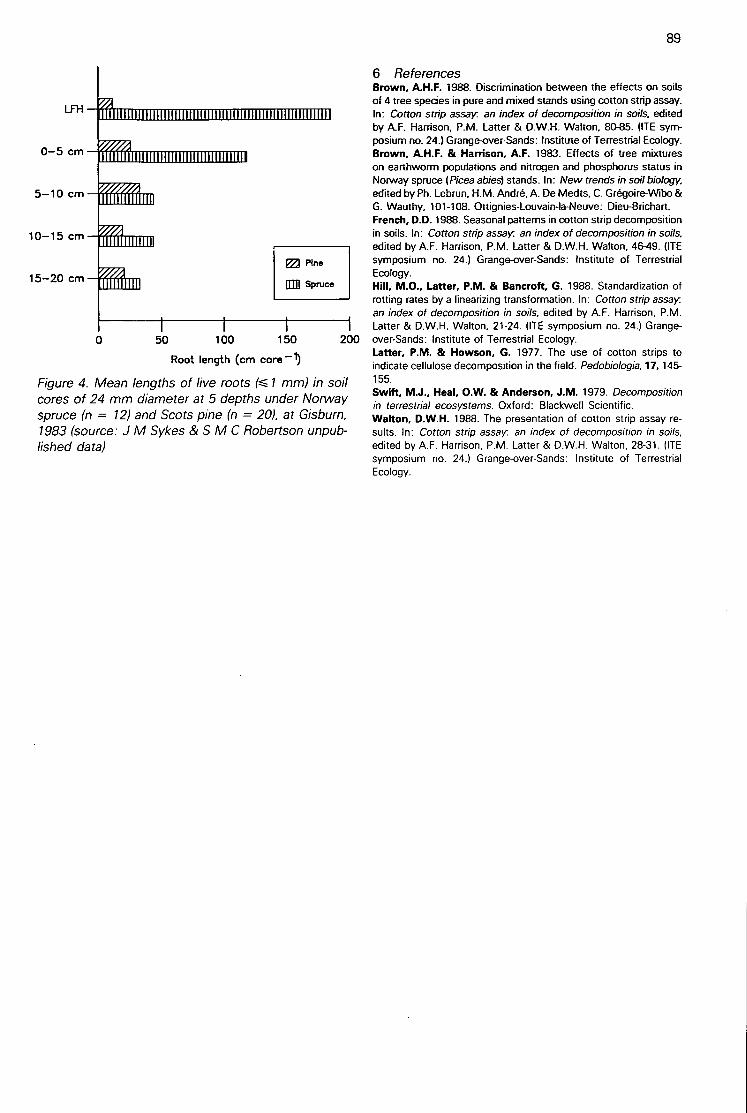
LFH
0-5 cm
5-10 cm
10-15 cm
15-20 cm
ED Pine
all Spruce
0 50 100 150 200
Root length (cm core-1)
Figure 4. Mean lengths of live roots mm) in soilcores of 24 mm diameter at 5 depths under Norwayspruce (n = 12) and Scots pine (n = 20), at Gisburn,1983 (source: J M Sykes & S M C Robertson unpub-lished data)
89
6 ReferencesBrown, A.H.F. 1988. Discrimination between the effects on soilsof 4 tree species in pure and mixed stands using cotton strip assay.In: Cotton strip assay. an index of decomposition in soils, editedby A.F. Harrison, P.M. Latter & D.W.H. Walton, 80-85. (ITE sym-posium no. 24.) Grange-over-Sands: Institute of Terrestrial Ecology.Brown, A.H.F. & Harrison, A.F. 1983. Effects of tree mixtureson earthworm populations and nitrogen and phosphorus status inNorway spruce (Picea abies) stands. In: New trends in soil biology,edited by Ph. Lebrun, H.M. Andre, A. De Medts, C. Grégoire-Wibo &G. Wauthy, 101-108. Ottignies-Louvain-la-Neuve: Dieu-Brichart.French, D.D. 1988. Seasonal patterns in cotton strip decompositionin soils. In: Cotton strip assay an index of decomposition in soils,edited by A.F. Harrison, P.M. Latter & D.W.H. Walton, 46-49. (ITEsymposium no. 24.) Grange-over-Sands: Institute of TerrestrialEcology.Hill, M.O., Latter, P.M. & Bancroft, G. 1988. Standardization ofrotting rates by a linearizing transformation. In: Cotton strip assayan index of decomposition in soils, edited by A.F. Harrison, P.M.Latter & D.W.H. Walton, 21-24. (ITE symposium no. 24.) Grange-over-Sands: Institute of Terrestrial Ecology.Latter, P.M. & Howson, G. 1977. The use of cotton strips toindicate cellulose decomposition in the field. Pedobiologia, 17, 145-155.Swift, M.J., Heal, 0.W. & Anderson, J.M. 1979. Decompositionin terrestrial ecosystems. Oxford: Blackwell Scientific.Walton, D.W.H. 1988. The presentation of cotton strip assay re-sults. In: Cotton strip assay. an index of decomposition in soils,edited by A.F. Harrison, P.M. Latter & D.W.H. Walton, 28-31. CITEsymposium no. 24.) Grange-over-Sands: Institute of TerrestrialEcology.
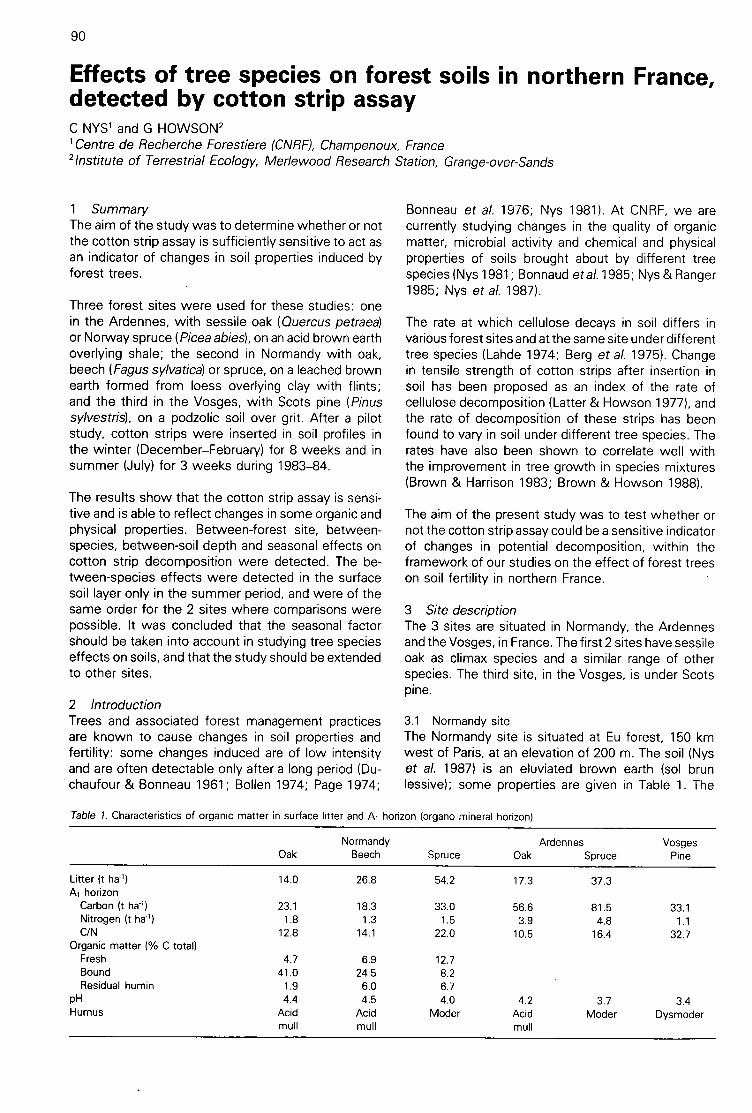
90
Effects of tree species on forest soils in northern France,detected by cotton strip assayC NYS1 and G HOWSON2'Centre de Recherche Forestiere (CNRF), Champenoux, France'Institute of Terrestrial Ecology, Merlewood Research Station, Grange-over-Sands
1 SummaryThe aim of the study was to determine whether or notthe cotton strip assay is sufficiently sensitive to act asan indicator of changes in soil properties induced byforest trees.
Three forest sites were used for these studies: onein the Ardennes, with sessile oak (Quercus petraea)or Norway spruce (Picea abies),on an acid brown earthoverlying shale; the second in Normandy with oak,beech (Fagus sylvatica)or spruce, on a leached brownearth formed from loess overlying clay with flints;and the third in the Vosges, with Scots pine (Pinussylvestris), on a podzolic soil over grit. After a pilotstudy, cotton strips were inserted in soil profiles inthe winter (December-February) for 8 weeks and insummer (July) for 3 weeks during 1983-84.
The results show that the cotton strip assay is sensi-tive and is able to reflect changes in some organic andphysical properties. Between-forest site, between-species, between-soil depth and seasonal effects oncotton strip decomposition were detected. The be-tween-species effects were detected in the surfacesoil layer only in the summer period, and were of thesame order for the 2 sites where comparisons werepossible. It was concluded that the seasonal factorshould be taken into account in studying tree specieseffects on soils, and that the study should be extendedto other sites.
2 IntroductionTrees and associated forest management practicesare known to cause changes in soil properties andfertility: some changes induced are of low intensityand are often detectable only after a long period (Du-chaufour & Bonneau 1961; Bo lien 1974; Page 1974;
Table 1. Characteristics of organic matter in surface litter and Al horizon (organo mineral horizon)
Bonneau et al. 1976; Nys 1981). At CNRF, we arecurrently studying changes in the quality of organicmatter, microbial activity and chemical and physicalproperties of soils brought about by different treespecies (Nys 1981; Bonnaudet al.1985; Nys & Ranger1985; Nys et al. 1987).
The rate at which cellulose decays in soil differs invarious forest sites and at the same site under differenttree species (Lande 1974; Berg et al. 1975). Changein tensile strength of cotton strips after insertion insoil has been proposed as an index of the rate ofcellulose decomposition (Latter & Howson 1977), andthe rate of decomposition of these strips has beenfound to vary in soil under different tree species. Therates have also been shown to correlate well withthe improvement in tree growth in species mixtures(Brown & Harrison 1983; Brown & Howson 1988).
The aim of the present study was to test whether ornot the cotton strip assay could be a sensitive indicatorof changes in potential decomposition, within theframework of our studies on the effect of forest treeson soil fertility in northern France.
3 Site descriptionThe 3 sites are situated in Normandy, the Ardennesand the Vosges, in France. The first 2 sites have sessileoak as climax species and a similar range of otherspecies. The third site, in the Vosges, is under Scotspine.
3.1 Normandy siteThe Normandy site is situated at Eu forest, 150 kmwest of Paris, at an elevation of 200 m. The soil (Nyset al. 1987) is an eluviated brown earth (sol brunlessive); some properties are given in Table 1. The
OakNormandy
Beech SpruceArdennes
Oak SpruceVosges
Pine
Litter (t ha-1) 14.0 26.8 54.2 17.3 37.3Al horizon
Carbon (t ha1) 23.1 18.3 33.0 56.6 81.5 33.1Nitrogen (t ha-1) 1.8 1.3 1.5 3.9 4.8 1.1C/N 12.8 14.1 22.0 10.5 16.4 32.7
Organic matter 1% C total)Fresh 4.7 6.9 12.7Bound 41.0 24.5 8.2Residual humin 1.9 6.0 6.7
pH 4.4 4.5 4.0 4.2 3.7 3.4Humus Acid Acid Moder Acid Moder Dysmoder
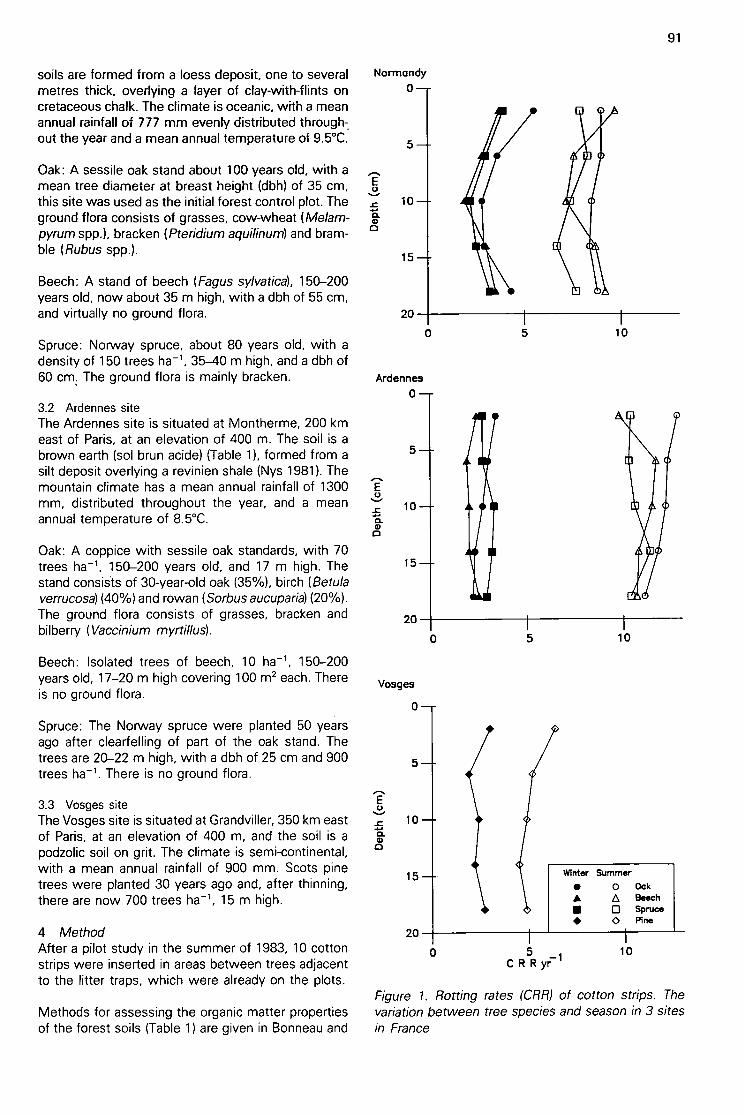
soils are formed from a loess deposit, one to severalmetres thick, overlying a layer of clay-with-flints oncretaceous chalk. The climate is oceanic, with a meanannual rainfall of 777 mm evenly distributed through:out the year and a mean annual temperature of 9.5°C.
Oak: A sessile oak stand about 100 years old, with amean tree diameter at breast height (dbh) of 35 cm,this site was used as the initial forest control plot. Theground flora consists of grasses, cow-wheat (Melam-pyrum spp.), bracken (Pteridium aquilinum) and bram-ble (Rubus spp.).
Oak: A coppice with sessile oak standards, with 70trees ha-', 150-200 years old, and 17 m high. Thestand consits of 30-year-old oak (35%), birch (Betulaverrucosa) (40%) and rowan (Sorbus aucuparia) (20%).The ground flora consists of grasses, bracken andbilberry (Vaccinium myrtillus).
Beech: Isolated trees of beech, 10 ha-1, 150-200years old, 17-20 m high covering 100 m2 each. Thereis no ground flora.
Spruce: The Norway spruce were planted 50 yearsago after clearfelling of part of the oak stand. Thetrees are 20-22 m high, with a dbh of 25 cm and 900trees ha'. There is no ground flora.
3.3 VosgessiteThe Vosges site is situated at Grandviller, 350 km eastof Paris, at an elevation of 400 m, and the soil is apodzolic soil on grit. The climate is semi-continental,with a mean annual rainfall of 900 mm. Scots pinetrees were planted 30 years ago and, after thinning,there are now 700 trees ha-', 15 m high.
4 MethodAfter a pilot study in the summer of 1983, 10 cottonstrips were inserted in areas between trees adjacentto the litter traps, which were already on the plots.
Methods for assessing the organic matter propertiesof the forest soils (Table 1) are given in Bonneau and
Normandy0
5
10
15
Beech: A stand of beech (Fagus sylvatica), 150-200years old, now about 35 m high, with a dbh of 55 cm,and virtually no ground flora. 20
Spruce: Norway spruce, about 80 years old, with adensity of 150 trees ha-', 35-40 m high, and a dbh of60 cm, The ground flora is mainly bracken. Ardennes
03.2 Ardennes siteThe Ardennes site is situated at Montherme, 200 kmeast of Paris, at an elevation of 400 m. The soil is a
5brown earth (sol brun acide) (Table 1), formed from asilt deposit overlying a revinien shale (Nys 1981). Themountain climate has a mean annual rainfall of 1300 -Esmm, distributed throughout the year, and a meanannual temperature of 8.5°C.
ci0
15
20
Vosges
0
5
15
20
0 5 10
O 5 10
O 5 —1C R R yr
Winter Summer
• 0 Oak• A Beech• 0 Spruce• 0 Pine
10
91
Figure 1. Rotting rates (CRR) of cotton strips. Thevariation between tree species and season in 3 sitesin France

92
Table 2. Analysis of variance of cotton strip rotting rates (CRR yr-1); F values for site and species effects
Table 3. Analysis of variance of cotton strip rotting rates (CRR yr-1); mean ± SD; F values for site effect for means of all species
Souchier (1982). The winter series were inserted for8 weeks and the summer series for 3 weeks, fromDecember 1983-February 1984 and in July 1984, re-spectively. Cotton strips were inserted and processedaccording to the method of Latter and Howson (1977),and the data expressed as cotton rotting rate (CRR)according to Hill et al. (1988).
5 ResultsThe rates of decomposition of cotton strips (CRR)decreased in the order oak>beech>spruce at bothsites (Figure 1), but the species effect is only signifi-cant in the humus layer of the soil (Table 2). Figure 1also shows that season, under the French climate,had the greatest effect on cellulose decomposition,significant at 1% (F ratio = 275, df 1, 194). The siteeffect shows different decomposition rates (P<0.01)in the summer (Table 3), despite the dry summer of1984.
A good relationship is apparent between the order ofthe CRR and the classification of humus type andsome soil properties over the 6 plots examined, theCRR values increasing with increasing pH, decreasingcarbon/nitrogen (C/N) and decreasing quantity of litteracross the sites. Thus, beech or oak sites with lowerquantity of litter and C/N ratio and higher pH showed
higher cellulose decomposition rates than the spruceplots. Figure 2 shows, for the Normandy site, that thephysical properties of soils are also highly related withthe CRR. The better the soil porosity, clay stability andsoil aggregation, the faster is the decomposition ofthe cotton strips.
6 ConclusionThe experiment indicates that the assay was suf-ficiently sensitive to differentiate between the effectson soils of different tree species, despite the drysummer of 1984. The relationships between cottonstrip decomposition rates and humus form and soilphysical and chemical properties show that this me-thod could be used as a test of soil biological activityin the same way that the mineral bag method is usedas an indicator of decline in soil fertility (Bonnaud etal. 1985).
It is concluded that the experiment should be repeatedat more sites with a similar range of tree s-pecies orsilvicultural treatments, because of the very significantinteraction between sites and species. Cotton stripsshould also be inserted for different periods of theyear to examine the seasonal variation patterns (cfBrown & Howson 1988) for different sites.
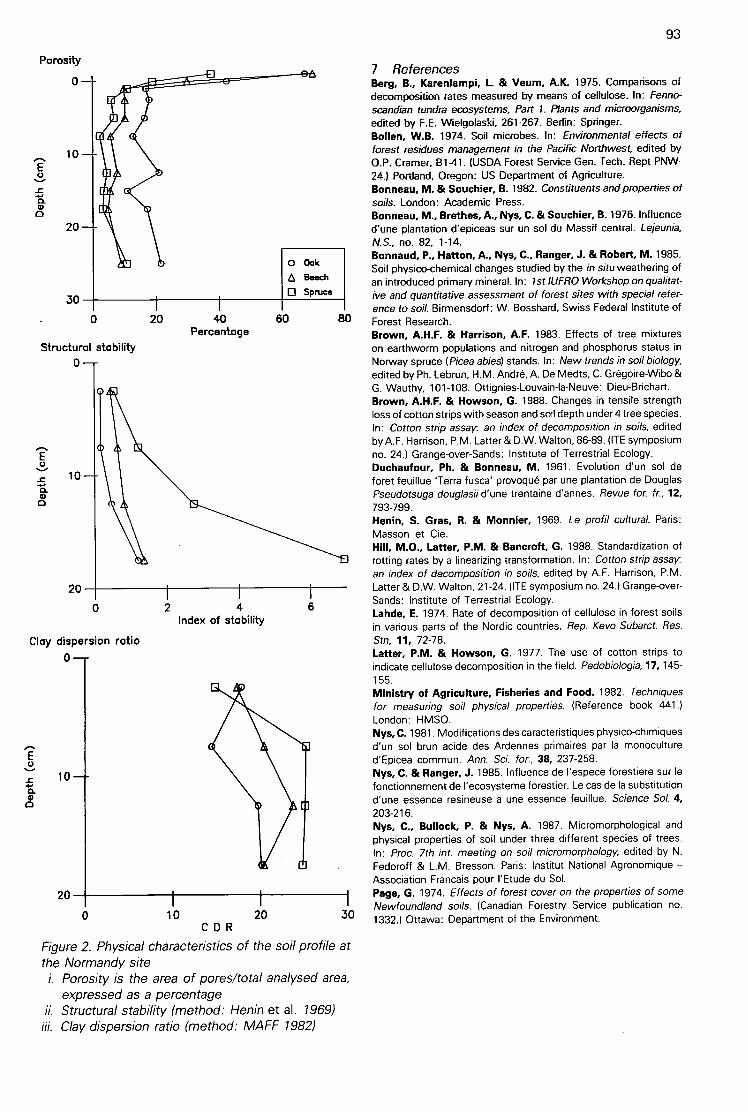
0 .
Porosity
0
Structural stability0
10
20
30
20
0 2 4Index of stability
Clay dispersion ratio
0
20
0 20 40Percentage
O Oak
A Beech
D Spruce
60 80
6
300 10 20C D R
Figure 2. Physical characteristics of the soil profile atthe Normandy sitei. Porosity is the area of pores/total analysed area,
expressed as a percentageStructural stability (method: Henin et al. 1969)Clay dispersion ratio (method: MAFF 1982)
93
7 ReferencesBerg, B., Karenlampi, L & Veum, A.K. 1975. Comparisons ofdecomposition rates measured by means of cellulose. In: Fenno-scandian tundra ecosystems. Part 1. Plants and microorganisms,edited by F.E. Wielgolaski, 261-267. Berlin: Springer.Bollen, W.B. 1974. Soil microbes. In: Environmental effects of
forest residues management in the Pacific Northwest, edited byO.P. Cramer. 81-41. (USDA Forest Service Gen. Tech. Rept PNW-24.) Portland, Oregon: US Department of Agriculture.Bonneau, M. & Souchier, B. 1982. Constituents and properties ofsoils. London: Academic Press.Bonneau, M., Brethes, A., Nys, C.& Souchier, B. 1976. Influence
d'une plantation d'epiceas sur un sol du Massif central. Lejeunia,N.S., no. 82, 1-14.Bonnaud, P., Hatton, A., Nys, C., Ranger, J. & Robert, M. 1985.Soil physico-chemical changes studied by the in situ weathering ofan introduced primary mineral. In: 1st IUFRO Workshop on qualitat-ive and quantitative assessment of forest sites with special refer-ence to soil. Birmensdorf: W. Bosshard, Swiss Federal Institute ofForest Research.Brown, A.H.F. & Harrison, A.F. 1983. Effects of tree mixtureson earthworm populations and nitrogen and phosphorus status inNorway spruce (Picea abies) stands. In: New trends in soil biology,
edited by Ph. Lebrun, H.M. André, A. De Medts, C. Grégoire-Wibo &G. Wauthy, 101-108. Ottignies-Louvain-la-Neuve: Dieu-Brichart.Brown, A.H.F. & Howson, G. 1988. Changes in tensile strengthloss of cotton strips with season and soil depth under 4 tree species.In: Cotton strip assay an index of decomposition in soils, editedby A.F. Harrison, P.M. Latter & D.W. Walton, 86-89. (ITE symposiumno. 24.) Grange-over-Sands: Institute of Terrestrial Ecology.Duchaufour, Ph. & Bonneau, M. 1961. Evolution d'un sol deforet feuillue 'Terra fusca' provoqué par une plantation de DouglasPseudotsuga douglasii d'une trentaine d'annes. Revue for. fr., 12,793-799.Henin, S. Gras, R. & Monnier, 1969. Le profil cultural. Paris:Masson et Cie.Hill, M.O., Latter, P.M. & Bancroft, G. 1988. Standardization ofrotting rates by a linearizing transformation. In: Cotton strip assayan index of decomposition in soils, edited by A.F. Harrison, P.M.Latter & D.W. Walton, 21-24. (ITE symposium no. 24.) Grange-over-Sands: Institute of Terrestrial Ecology.Lande, E. 1974. Rate of decomposition of cellulose in forest soilsin various parts of the Nordic countries. Rep. Kevo Subarct. Res.Stn, 11, 72-78.Latter, P.M. & Howson, G. 1977. The use of cotton strips toindicate cellulose decomposition in the field. Pedobiologia, 17, 145-155.Ministry of Agriculture, Fisheries and Food. 1982. Techniquesfor measuring soil physical properties. (Reference book 441.)London: HMSO.Nys, C. 1981. Modifications des caracteristiques physico-chimiquesd'un sol brun acide des Ardennes primaires par la monocultured'Epicea commun. Ann. Sci. for., 38, 237-258.Nys, C. & Ranger, J. 1985. Influence de l'espece forestiere sur lefonctionnement de l'ecosysteme forestier. Le cas de la substitutiond'une essence resineuse a une essence feuillue. Science Sol, 4,203-216.Nys, C., Bullock, P. & Nys, A. 1987. Micromorphological andphysical properties of soil under three different species of trees.In: Proc. 7th int. meeting on soil micromorphology, edited by N.Fedoroff & L.M. Bresson. Paris: Institut National Agronomique -Association Francais pour l'Etude du Sol.Page, G. 1974. Effects of forest cover on the properties of someNewfoundland soils. (Canadian Forestry Service publication no.1332.) Ottawa: Department of the Environment.
94
Use of the cotton strip assay to detect potentialdifferences in soil organic matter decomposition inforests subjected to thinningG HOWSONInstitute of Terrestrial Ecology, Merlewood Research Station, Grange-over-Sands
1 SummaryThe cotton strip assay was used to detect potentialchanges in rates of soil organic matter decompositionassociated with different thinning treatments of Sitkaspruce (Picea sitchensis)stands at Elwy Forest, northWales, UK. Cotton strips were inserted in the soil overa period of one year, in 4 3-month periods. In general,the losses in the tensile strength (CTSL), used as anindicator of decomposition of the cotton strip, weregreater at the surface than lower in the soil profile.With respect to the forest thinning treatments, theCTSL values were in the order: intermediate thinned>high intensity thinned>unthinned. Higher CTSL va-lues were also detected for the so-called 'tree' areasthan for the 'stump' areas within the thinned stands.
The cotton strip data are considered in relation to (i)the amounts of litter accumulated and the annuallitterfall under the stands, and (ii) the possible signifi-cance of differences in soil organic matter decompo-sition rates induced by the thinning practice.
2 IntroductionThe importance of leaf and branch litter decompositionand consequent nutrient release for the growth offorests ecosystems has long been recognized (Duvig-neaud & Denaeyer de Smet 1970; Witkamp & Ausmus1976; Ausmus et al. 1976; Miller et al. 1979; Harrison1978, 1985). Accumulations of litter frequently occur-ring on the forest floor (Turner & Long 1975; Adams &Dickson 1973; Carey et al. 1982) are usually dueto imbalances between the rates of production anddecomposition of this litter, resulting in a slowing ofnutrient cycling (Malmer 1969). Slowing of nutrientcycling in forests, particularly those on poor soils, islikely to result in a reduction of tree productivity. Underthose circumstances, therefore, any forest manage-ment practice which indirectly stimulates organic mat-ter decomposition, and thus nutrient cycling, wouldbe beneficial to tirnber production.
Thinning of the forest is known to stimulate the pro-duction and limber quality of plantation forests(Assmann 1970; Hibberd 1986). It also appears toresult in a reduction in the amount of litter accumu-lated on the forest floor, though high thinning treat-ments may result in high litter accumulation due tothe brash left behind. A reduction in the amount oflitter on the forest floor could be for 2 reasons, eithera decrease in the rate of litterfall or an increase in therate of the litter decomposition. As a preliminary testof the idea that thinning may indirectly stimulate the
decomposition of the litter, the cotton strip assay wasapplied to a Forestry Commission thinning exper-iment, for which some data on litter accumulation andlitterfall were available.
3 MethodThe site selected for study was a Forestry CommissionSitka spruce plantation (Elwy), near St Asaph, northWales (National Grid reference SJ 078767), planted in1952 at an altitude of 260 m on an unploughed uplandbrown earth (brown podzolic soil sensuAvery 1980),with some evidence of gleying of the profile at 5-10cm depth. The thinning treatments were arranged ina randomized block design with 3 replicates, each plotbeing about 0.5 ha. Line thinning was the methodapplied, which followed along the planting rows, andwas carried out at 3 intensities: (i) unthinned; (ii) inter-mediate with one line in 3 removed; and (iii) highwith 2 lines in 4 removed. The percentage of woodremoved was approximately 0, 33 and 50 respectively.The thinning took place in 1971-72, although a fewindividual trees have been removed subsequently in1978.
In July 1979, 20 cotton strips were randomly insertedin a vertical manner (Latter & Howson 1977) into thesoil, in only 2 of the 3 experimental blocks. Ten wereplaced within the lines of the remaining standing trees'tree' and 10 in an adjacent position within the linesof thinned stumps 'stump', as illustrated in Figure 1.Ten strips only were inserted in the soil of unthinnedstands. The strips were carefully removed after 3months, and on the day of removal new replicatestrips were inserted in similar adjacent positions. Thepattern of insertion and removal was continued forone year, giving 4 3-month periods. Each time, bothcloth and field controls were used.
The tensile strength of the strips, prepared as de-scribed in Latter and Howson (1977), was measuredusing a Monsanto Type W tensometer with pneumaticjaws and an automatic chart recorder. The ShirleySoil Burial Test Fabric (1976 batch) was used, and itshowed considerable variation in cloth control tensilestrength values depending on the roll used. Thus, thefield controls had mean tensile strength values of 55.2kg for insertion periods 1, 2 and 3, and 44.5 kg forperiod 4. The results presented were adjusted to allowfor this variation.
Litterfall was monitored monthly for a whole yearfrom mid-1979, using 8 randomly placed 25 cm

O 0 0 00 00 0 0O 0 0 0O 00 0 o o 000o0o o 0O 0 00
Unthinned control
()Standing trees
©Line thinning 1971-72
Figure 1. Within thinning treatment plot layout and cotton strip positions
diameter funnel-type litter traps, emptied at monthlyintervals. Litter accumulation on the forest floor wasrecorded in July 1978, by removing 25 10 cm diametercores per plot from each of the 3 blocks. For litterfalland for litter accumulation, the material was driedat 105°C and weighed. Weights were multiplied upaccordingly to give quantities in t ha'.
4 Results4.1 Cotton strip assayGenerally, the patterns of tensile strength lossshowed that potential decomposition was highest atthe soil surface and declined with depth (Figure 2 i).
Soil profile0
o. 10
o UntilInned
THINNED
O 1 in 3. tree
• 1 In 3, stump
p 2 In 4. tree
A 2 In 4...lump
15
20
30
Intermediate thinned1 line in 3
40
CTSL (kg)
0 0 000 (90 00 (0O ** 0 00.09O 00
50
The unthinned plots appeared to have the lowestCTSL at all the soil depths.
To investigate the effects of the thinning treatmentsfurther, a one-way analysis of variance was carried outon the CTSL data for each of the 4 3-month periodsseparately, using the mean values of the 5 depthsfrom each strip, and pooling the values from the 2blocks and the 'stump' and 'tree' areas. Bartlett's test(Snedecor & Cochrane 1967) indicated that the within-treatment variances were homogeneous and, there-fore, the data needed no transformation. Partitioningthe treatment sums of squares showed that unthinned
Seasonal50
40
30
V)1—
20
10
'Tree-'Stump .area area
O 0 0 0 0 0 0 00 < 0 0 0 0 0 00 0 0 00 o oo itoo 000o oo *0 000°0O 0000000000 0°0 y 0 0 0
irSilvicultural thinning 1978
<>Cotton strip
Aug Nov1979
High thinned2 lines in 4
Feb May1980
Figure 2. Tensile strength loss of cotton strips (CTSL) in thinning treatment plots
i. change down profile for one block, autumn 1979change throughout season, means of 2 blocks for the 5 treatments. Points are placed at retrieval dates
95

96
plots had significantly lower CTSL values than thecombined thinned plots in July-October 1979 (P<0.05) and in January-April 1980 (P<0.01), but thatthere was no significant difference between the inter-mediate and high thinned treatments (Table 1). Amultiple comparison of means using Tu key's HonestlySignificant Difference (HSD) test then revealed thatthe unthinned plots had a significantly lower CTSLthan both the high thinned (P<0.05) and intermediatethinned (P<0.01) treatments, in January-April 1980.In addition, the strips inserted in the 'tree' and 'stump'areas gave significantly different (P<0.05) CTSL va-lues for each depth (Table 1). Clearly, therefore, thereappears to be an interactive effect on potential de-composition between the thinning treatments them-selves and the zonation within the thinned plots. Therewas a further subordinate interaction of the seasonalfactor with a higher rate of decomposition of strips inthe 'tree' position and a lower rate for those in the'stump' position for the period January-July, the re-verse situation occurring in the period July-October(Table 1).
Table 1. Cellulose decomposition in the thinned and unthinnedplots and in the 'tree' and 'stump' areas of the thinned plots. Themean is for 5 depths for each strip, both blocks combinedi. The difference between thinned and unthinned plots is shown
by the F ratio obtained from a one-way analysis of varianceii. The difference between 'tree' and 'stump' areas is shown by a
paired T test
*P<0.05; **P<0.01
Nevertheless, the intermediate thinned plots appearto provide the best conditions for decomposition, be-cause this treatment showed a higher CTSL over theyear as a whole than either the high thinned or unthin-ned treatments.
4.2 LitterfallThe annual litterfall (Table 2 & Figure 3) was apprecia-bly greater in the unthinned plots than in either of thethinned treatments. The 2 thinned plots had similarlitterfall values, despite the different levels of thinning
Table2. Litterfall and forest floor accumulation for thinned andunthinned areas. Litter weight ha-1 with SE for treatment differ-ences
July 1979-June 19801Litterfall It ha-1 yr-1) 4.86 2.81 3.01 0.24*
July 19782Litter accumulated on the forest floor (t ha-1)L horizonF + H
* P<0.051 Data supplied by D Evans, ITE, Bangor2 Data supplied by Forestry Commission
40
30
20
10
Aug Nov1979
Un-thinned
Thinning treatmentInter- High SE
mediate
14.39 11.20 13.19 1.32 NS122.06 92.07 117.34 112.90 NS
0 Unthinned• Thinned 1 in 3A Thinned 1 in 4
Feb Moy1980
Figure 3. Seasonal changes in litterfall, July 1979-June 1980. Points are mean litterfall per month over4 3-monthly periods for 2 blocks combined
intensity. A one-way analysis of variance was carriedout on the annual litterfall data, combining the 2 blocksbut with no data transformation, as Bartlett's test againshowed that variances were homogeneous. Tukey'sHonestly Significant Difference test then showed thatthe annual litterfall under the unthinned plot wassignificantly higher (P<0.05) than under either of the2 thinned plots.
4.3 Litter accumulationThe quantity of litter (L) and fermentation and humus(F + H) material accumulated on the forest floor (Table2 & Figure 4) tended to be highest in the unthinnedplot, with slightly less material on the high thinnedplot and least on the intermediate thinned plot. How-ever, as these data were very limited in replication,the differences were not found to be statistically sig-nificant.
4.4 Decay rateThe data for annual litterfall (AL) and for the accumu-lated litter in the L layer (x) were used to calculate k
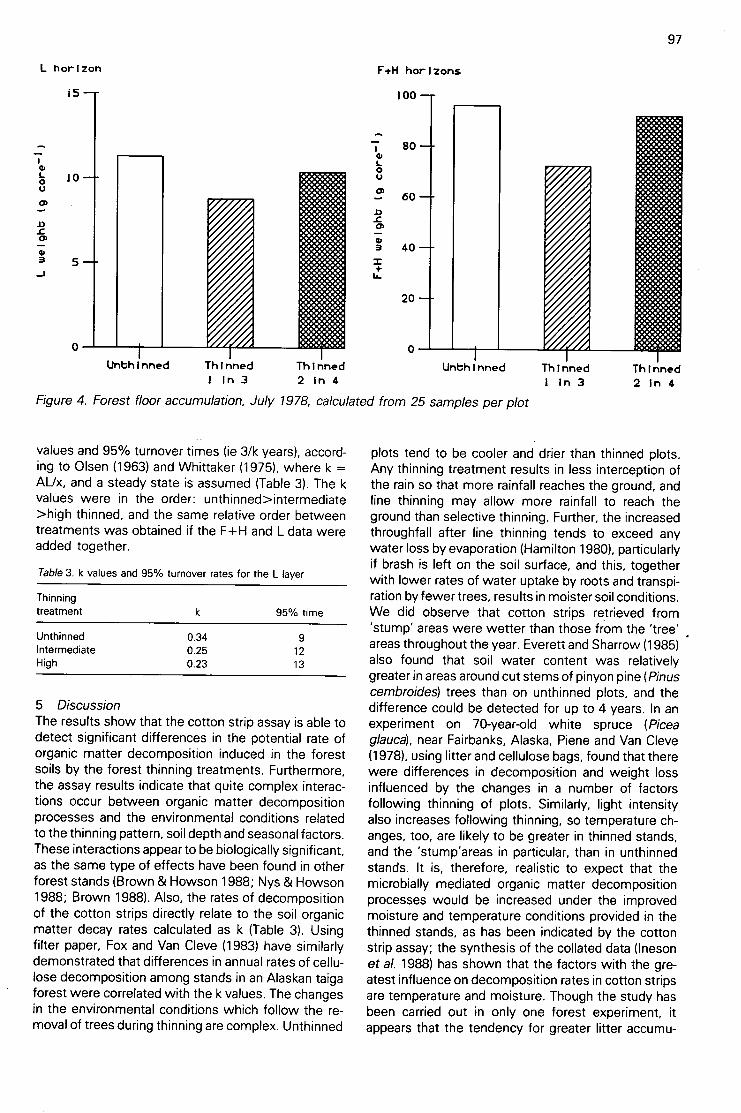
L horizon
U nthinnedIntermediateHigh
Unthinned Thinned1 In 3
Figure 4. Forest floor accumulation, July 1978, calculated from 25 samples per plot
values and 95% turnover times (ie 3/k years), accord-ing to Olsen (1963) and Whittaker (1975), where k =AL/x, and a steady state is assumed (Table 3). The kvalues were in the order: unthinned>intermediate>high thinned, and the same relative order betweentreatments was obtained if the F+H and L data wereadded together.
Table 3. k values and 95% turnover rates for the L layer
Thinningtreatment k 95% time
0.340.250.23
Thinned2 In 4
91213
5 DiscussionThe results show that the cotton strip assay is able todetect significant differences in the potential rate oforganic matter decomposition induced in the forestsoils by the forest thinning treatments. Furthermore,the assay results indicate that quite complex interac-tions occur between organic matter decompositionprocesses and the environmental conditions relatedto the thinning pattern, soil depth and seasonal factors.These interactions appear to be biologically significant,as the same type of effects have been found in otherforest stands (Brown & Howson 1988; Nys & Howson1988; Brown 1988). Also, the rates of decompositionof the cotton strips directly relate to the soil organicmatter decay rates calculated as k (Table 3). Usingfilter paper, Fox and Van Cleve (1983) have similarlydemonstrated that differences in annual rates of cellu-lose decomposition among stands in an Alaskan taigaforest were correlated with the k values. The changesin the environmental conditions which follow the re-moval of trees during thinning are complex. Unthinned
F+H horizons
100
80
60
40
20
Unthinned Thinned1 in 3
97
Thinned2 in 4
plots tend to be cooler and drier than thinned plots.Any thinning treatment results in less interception ofthe rain so that more rainfall reaches the ground, andline thinning may allow more rainfall to reach theground than selective thinning. Further, the increasedthroughfall after line thinning tends to exceed anywater loss by evaporation (Hamilton 1980), particularlyif brash is left on the soil surface, and this, togetherwith lower rates of water uptake by roots and transpi-ration by fewer trees, results in moister soil conditions.We did observe that cotton strips retrieved from'stump' areas were wetter than those from the 'tree'areas throughout the year. Everett and Sharrow (1985)also found that soil water content was relativelygreater in areas around cut stems of pinyon pine(Pinuscembroides) trees than on unthinned plots, and thedifference could be detected for up to 4 years. In anexperiment on 70-year-old white spruce (Piceaglauca),near Fairbanks, Alaska, Piene and Van Cleve(1978), using litter and cellulose bags, found that therewere differences in decomposition and weight lossinfluenced by the changes in a number of factorsfollowing thinning of plots. Similarly, light intensityalso increases following thinning, so temperature ch-anges, too, are likely to be greater in thinned stands,and the 'stump'areas in particular, than in unthinnedstands. It is, therefore, realistic to expect that themicrobially mediated organic matter decompositionprocesses would be increased under the improvedmoisture and temperature conditions provided in thethinned stands, as has been indicated by the cottonstrip assay; the synthesis of the collated data (Inesonet al. 1988) has shown that the factors with the gre-atest influence on decomposition rates in cotton stripsare temperature and moisture. Though the study hasbeen carried out in only one forest experiment, itappears that the tendency for greater litter accumu-
98
lation under unthinned stands is not just a resultof higher litterfall, but also due to generally slowerdecomposition rates. The cotton strip assay not onlydetected this general trend for slower decompositionin the unthinned stands, but has also produced evi-dence for quite subtle interactions between organicmatter decomposition processes in forest soils andenvironmental factors. In view of the direct links be-tween organic matter turnover, nutrient cycling andtree productivity on the poor afforested upland soils(Miller et al. 1979), these interactions and the potentialeffects of management practices on them warrantfurther study.
6 ReferencesAdams, S.N. & Dickson, DA. 1973. Some short-term effects of
lime and fertilizers on a Sitka spruce plantation. Forestry, 46, 31-
37,Assmann, E. 1970. The principles of forest yield study. Oxford:
Pergamon.Ausmus, B.S., Edwards, N.T. & Witkamp, M. 1976. Microbial
immobilization of carbon, nitrogen, phosphorus and potassium;implications for forest ecOsystem processes. In: The role of terres-
trial and aquatic organisms in decomposition processes, edited
by J.M. Anderson & A. Macfadyen, 397-416. Oxford: BlackwellScientific.Avery, B.W. 1980. Soil classification for England and Wales(Higher
categories). (Soil Survey technical monograph no. 14.)•Harpenden:Soil Survey of England and Wales.Brown, A.H.F. 1988. Discrimination between the effects on soilsof 4 tree species in pure and mixed stands using cotton strip assay.In: Cotton strip assay an index of decomposition in soils, edited
by A.F. Harrison, P.M. Latter & D.W.H. Walton, 80-85. (ITE sym-posium no. 24.) Grange-over-Sands: Institute of Terrestrial Ecology.Brown, A.H.F. & Howson, G. 1988. Changes in tensile strength
loss of cotton strips with season and soil depth under 4 tree species.In: Cotton strip assay an index of decomposition in soils, edited
by A.F. Harrison, P.M. Latter & D.W.H. Walton, 86-89. (ITE sym-posium no. 24.) Grange-over-Sands: Institute of Terrestrial Ecology.Carey, M.L. & Farrell, E.P. 1978. Production, accumulation and
nutrient content of Sitka spruce litterfall. Irish For., 35, 35-44.
Carey, M.L., Hunter, I.R. & Andrew, I. 1982. Pinus radiataforest
floors: factors affecting organic matter and nutrient dynamics. N.Z.
JI For. Sci., 12, 36-48.Duvigneaud, P. & Denaeyer de Sm et, S. 1970. Biological cycling of
minerals in temperate deciduous forests. In: Analysis of temperate
forest ecosystems,edited by D.E. Reichle, 199-225. London: Chap-man & Hall.
Everett, R.L. & Sharrow, S.H. 1985. Soil water and temperaturein harvested and non harvested pinyon-juniper stands. (Research
paper INT-342.) Ogden, Utah: United Statespepartment of Agricul-ture, FOrest Service, Intermountain R6search Station.Fox, J.D. & Van Cleve, K. 1983. Relationship between cellulosedecomposition, Jenny's k, forest floor nitrogen and soil temperaturein Alaskan taiga forests. Can. J. For. Res., 13, 789-794.Hamilton, G.J. 1980. Line thinning. (Forestry Commission leafletno. 77.) London: HMSO.Harrison, A.F. 1978. Phosphorus cycles of forest and upland grass-land ecosystems and some effects of land management practices.In: Phosphorus in the environment: its chemistry and biochemistry,edited by R. Porter & D.W. Fitzsimons, 175-199. (Ciba Foundationsymposium no. 57.) Amsterdam: Elsevier.Harrison, A.F. 1985. Effects of environment and management onphosphorus cycling in terrestrial ecosystems. J. environ. Manage.,20, 163-179.Hibberd, B.G. 1986. Forest practices. (Forestry Commission bull-etin no. 14. 10th ed.) London: HMSO.Ineson, P., Bacon, P.J. & Lindley, D.K. 1988. Decomposition ofcotton strips in soil: analysis of the world data set. In: Cotton stripassay an index of decomposition in soils,edited by A.F. Harrison,P.M. Latter & D.W.H. Walton, 155-165. (ITE symposium no. 24.)Grange-over-Sands: Institute of Terrestrial Ecology.Latter, P.M. & Howson, G. 1977. The use of cotton strips toindicate cellulose decomposition in the field. Pedobiologia, 17, 145-
155.Malmer, N. 1969. Organic matter and cycling of nutrients in virginand present ecosystems. Oikos (suppl.), 12, 79-86.Miller, H.G., Cooper, J.M., Miller, J.D. & Pauline, O.J.L. 1979.
Nutrient cycles in pine and their adaptation to poor soils. Can. J.For. Res., 9, 19-26.Nys, C. & Howson, G. 1988. Effects of tree species on forest soilsin northern France, detected by cotton strip assay. In: Cotton stripassay an index of decomposition in soils,edited by A.F. Harrison,P.M. Latter & D.W.H. Walton, 90-93. (ITE symposium no. 24.)Grange-over-Sands: Institute of Terrestrial Ecology.Olsen, J.S. 1963. Energy storage and the balance of producers anddecomposers in ecological systems. Ecology, 44, 322-331.Piene, H. & Van Cleve, K. 1978. Weight loss of litter and cellulosebags in a thinned white spruce forest in interior Alaska. Can. J. For.Res., 8, 42-46.Snedecor, G.W. & Cochrane, W.G. 1967. Statistical methods.6thed. Ames, Iowa: The Iowa State University Press.Turner, J. & Long, J.N. 1975. Accumulation of organic matter in aseries of Douglas-fir stands. Can. J. For. Res., 5, 681-690.Whittaker, R.H. 1975. Communities and ecosystems.New York:Macmillan.Witkamp, M. & Ausmus, B.S. 1976. Processes in decompositionand nutrient transfer in forest ecosystems. In: The role of terrestrialand aquatic organisms in decomposition processes,edited by A.Macfadyen, 375-396. Oxford: Blackwell Scientific.

Demonstrating effects of clearfelling in forestry and theinfluence of temperature and moisture on changes incellulose decompositionP M LAUER and F J SHAWInstitute of Terrestrial Ecology, Merlewood Research Station, Grange-over-Sands
Poster summaryWhen a forest is felled, the alteration of conditionsaffecting decomposition are complex. Litter input isreduced, the microclimate is altered and the variouseffects of living roots are replaced by those of deaddecomposing roots.
The cotton strip assay was used to assess the effectsof felling on decomposition processes in the soil pro-file of felled and unfelled plots at Kershope Forest,Cumbria, during 2 years following felling.
Cellulose decomposition increased after felling, to adepth of 20 cm (the lowest depth to which stripswere inserted), and the higher decomposition wasassociated with higher litter humidity and generallyhigher surface temperature on the felled plots. Hu-
99
midity in the litter region was recorded intermittentlywith a Vaisala humidity probe, and the thermal cellmethod (Ambrose 1980) was used to obtain an inte-grated measure of soil temperature during the periodof strip insertion.
The decomposition rate at Kershope was lower thanthose recorded on similar plots in north Wales atBeddgelert and in north Devon (Torridge).
The work is part of a larger study examining othereffects of clearfelling at a number of sites, and willbe fully reported elsewhere.
ReferenceAmbrose, W.R. 1980. Monitoring long-term temperature and hu-midity. Bull. Inst. Conserv. Cult. Mater., 6, 36-42.

100
Patterns of decomposition assessed by the use of litterbags and cotton strip assay on fertilized and unfertilizedheather moor in ScotlandD D FRENCHInstitute of Terrestrial Ecology, Banchory Research Station, Banchory
1 SummaryTensile strength losses from cotton strips (CTSL),weight losses from 2 plant litters, and the responsesof cotton and litter decay to soil amelioration werecompared, using data from treated and untreated plotson a Scottish moor. The rate of decomposition ofcotton strips, and the magnitude of responses to nutri-ents or carbohydrates added to the soil were generallyintermediate between decomposition of heather (Cal-luna vulgaris)stems and purple moor-grass (Moliniacaerulea)leaves, but the detailed patterns (shapes) oftheir responses to additives were very different.
Some wider comparisons are referred to, and it isgenerally is concluded that CTSL is a satisfactory indexof general decomposer activity in the field, at least sincool temperate and sub-polar sites, if comparisonsbetween sites or plots are made on a fairly gross scale(ie involving appreciable differences in climatic or ed-aphic parameters) or if only a rank order comparisonis required. Cotton strip assay should not be usedto estimate absolute decay rates or responses toenvironmental changes of natural litters, or as a meansof comparing very different assemblages of substra-tes. However, the assay can, in the latter case, helpto distinguish environmental from substrate 'quality'effects on decomposition rates.
2 IntroductionMuch of the justification for the use of the cotton stripassay in ecological studies lies in the 2 related ideasthat:
i. cotton strip tensile strength loss (CTSL) is a goodindex of cellulose decomposition rates in an ecosy-stem;
ii. cellulose decomposition rates can be used as ageneral index of the processes of organic matterdecomposition and nutrient release.
Howard (1988) is strongly critical of both these as-sumptions, but direct experimental evidence appearsto be scanty.
An experiment to test the effects of added nutrients orcarbon sources on decomposition rates on a Scottishmoor provided an opportunity, albeit limited, to com-pare the patterns of decay shown by CTSL with weightlosses from plant litters (in bags), using 2 contrastinglitters: purple moor-grass leaves and heather stems.
The following questions, related to the 2 assumptions
above, were addressed. How does CTSL comparewith weight losses from plant litters? Is the responseof CTSL to changes in soil conditions comparable withthe responses of weight losses from litters? Do theresults suggest that CTSL is a good index of overallrates and processes of decomposition and nutrientrelease under field conditions?
3 Site descriptionThe study site was a very uniform heather moor atGlen Dye, Kincardineshire. (Miles (1973) gives a gen-eral site description, and some climatic data are givenby French (1988a).) The experimental area was mownduring the spring of 1979 and the mowings removed.Neither the litter layer nor the underlying soil wasdisturbed or visibly altered by the mowing. Litters andcotton were inserted in late October of that year, aftertreatment of the experimental plots. (For details ofexperimental layout, see French (1988c).)
The plot treatments were:
i. untreated controls
N (ammonium nitrate) at 4, 16 and 40 g r11-2
P (potassium dihydrogen orthophosphate) at 6, 24and 60 g rTI-2
iv. Ca (calcium carbonate) at 10, 40 and 100 g rr1-2
v. CHO (carbohydrate—mixture of glucose and potatostarch 1:1) at 4, 16 and 40 g rr1-2
The 3 levels of each additive are hereafter referred toas levels 1, 4 and 10, being those multiples of thelowest levels applied (thus N 1, P 4, etc). All additiveswere evenly broadcast in dry form, at the above levels,on 3 occasions during September and October 1979,before the cotton and litters were put out. There werethen no further additions during the experiment.
4 Materials and methodsShirley Soil Burial Test Fabric (Walton & Allsopp 1977),in 30 cm x 10 cm strips, was wrapped around a turfcut in the'upper soil and litter, following the procedureof French and Howson (1982). Of the 5 substripsused in this method, I used data from the top 2 lyinghorizontally in the litter layer, these being most directlycomparable with the decomposing litter in litter bags.
The moor-grass leaves had been gathered immedi-

ately after autumnal senescence, so that they wereall of almost identical condition. The heather stemshad been selected to be between 2 mm and 4 mm indiameter, and cut to 10 cm long. Each litter was driedat 40°C, and 4 g samples were then wrapped in nylonhair nets and placed in the litter layer at the site. Litterbags were retrieved only at 45 weeks. Ingrowingmosses and lichens, extraneous litter fragments, andanimals were removed (but not invertebrate faeces),and each sample was dried at 40°C and weighed todetermine the weight loss from the sample.
Cotton strips were inserted and retrieved in 3 consecu-tive batches at 0-19, 19-34 and 34-45 weeks. Thetest substrips (frayed to 3 cm width) were preparedaccording to Latter and Howson (1977) and tensilestrength (TS) was measured on a Monsanto tensome-ter. Cloth controls and field controls in all plots andsample periods had identical mean TS values, so allfinal TS measurements could be related to a singleoriginal figure when calculating CTSL.
CTSL was corrected for cementation (French 1984,1988b), and litter weight losses for ground contact, bylinear regression (French 1988c), before analysing theresults.
5 Results5.1 Annual weight lOssesAn estimate of the total decomposition of cotton stripsover the 45-week period may be obtained simply by
Table 1. Tensile strength losses (CTSL) from cotton strips, and weight losses 1%) from plant litters, after. 45 weeks in fertilized andunfertilized plots, with percentage difference from controls
101
summing CTSL over all 3 batches (Table 1). The totalpercentage CTSL ranged from 69% in control plotsto 85% on plots receiving the higher levels of Caapplication. The data in Heal et al. (1974) and Latteret al. (1988) were used to estimate a relationshipbetween CTSL and weight loss of cotton strips, andthe observed CTSL was converted to weight loss. Thetotal CTSL represented weight losses of cotton ofabout 15-18%. This estimate involves some replace-ment of fresh material as it decays. An alternativeestimate, calculating the expected total weight loss ifthe first batch of cotton had been left for 45 weeks,assuming a negative exponential decay curve modifiedonly by seasonal effects, gives expected weight lossof about 30-50%. The corresponding range of weightlosses over 45 weeks for heather stems was 3-8%,and for moor-grass leaves 30-40%, so the observedCTSL converts to a range of weight losses eitherintermediate between results for the 2 litters or closeto the weight losses from moor-grass leaves.
5.2 Changes in decomposition rates by soil treatmentsThe overall response of CTSL to the 4 soil additivesis again intermediate between the 2 litters (Table 1),with a mean increase over untreated plots of 14%,compared to 9% for moor-grass or 111% for heather.Like the second (exponential) estimate of annualweight loss rates (Section 5.1), the size of changes inCTSL with added nutrients or carbon is more likemoor-grass (whose range it overlaps considerably)than heather. The significance of differences from
N, nitrogen; P, phosphorus; Ca, calcium; CHO, carbohydrate. 1, 4, 10 are relative amounts (proportion of lowest level) of additive in eachtreatment
1 Many moor-grass bags in this treatment were chewed by voles. All obviously chewed bags were rejected, but the weight loss from theremainder may still be higher than the actual decomposition loss* P<0.05 (Mann-Whitney U test)

102
Callum — Cotton assay8 •
6
4
2
a
Molinia — Cotton assay
40
35
30
40
o 35
"E
•
30
25
Molinia — Calluna
•
110 120 130 140 150
0
•
•
CTSL (kg)
110 120 130 140 150
CTSL (kg)
•
•
•
•
• Control• Nitrogen• Phosphorus• Calcium• Carbohydrate
•
•
• ••
•
25
0 2 4 6 8
Calluna weight loss (%)
Figure 1. Relations between weight losses fromheather (Calluna)and moor-grass(Molinia) litters andtensile strength loss from cotton strips (CTSL) onfertilized and unfertilized plots at Glen Dye
control plots follows a similar pattern. All treatmentdifferences in heather are significant (P<0.05), all but2 in cotton, but only 6 are significant in moor-grass(Table 1).
As well as the size of response to increased soil
Table 2. Correlations between mean decay rates (per treatment)of cotton strips and plant litters
• P<0.05 In = 13/
All Omitting alltreatments Omitting P 1 P treatments
nutrients and energy sources, the patterns of changemay also be examined. To what extent do the 3substrates respond similarly to the changed soil con-ditions? If all responses follow essentially the samepattern, then there should be significant correlationsbetween the decay rates of any 2 substrates, over alltreatments together. The experimental layout did notallow matching of individual samples, but means foreach treatment can be correlated (Figure 1 & Table 2).The response of heather wood decomposition to alllevels of P was exceptionally high, and the largeincrease in losses from moor-grass in treatment P 1might be spurious (due to removal of material byvoles (Muridae), see note to Table 1). Therefore, thecorrelations in Table 2 are calculated (i) on all points,(ii) excluding treatment P 1, and (iii) excluding allP treatments. Only cotton and moor-grass show asignificant relationship in any of these analyses; eventhe highest correlation between them accounts forless than half of the total variance, and the 2 significantcorrelations both exclude treatment P 1.
There are, then, no simple linear relationships be-tween heather and either of the other substrates overall treatments, with or without P, but there may be
• a broad correlation between cotton and moor-grass.However, if the responses of individual substrates toany one additive were to follow some kind of non-linear, possibly 'humped-shaped' curve, as describedby Heal et al. (1981, pp619-620) for response totemperature and moisture, a search for simple linear
• correlations may be unjustified. Are there any otherconsistent patterns of responses to treatments, eg ageneral ranking of optimal levels of each additiveamong the 3 materials? In such a case, the responsescould all follow the same pattern, but show no linearcorrelation between substrates.
In Figure 2, all responses are expressed as a percent-age of the maximum response to each additive byeach substrate, so that all are on a common scale,emphasizing the patterns, rather than magnitude, ofthe responses. There are not sufficient data to calcu-late true response curves, but the simplest probableordering of responses was estimated by Jonckheere's(1954) S test on the original weight loss or CTSL foreach substrate and additive, and these orders areindicated by the lines between points in Figure 2.
The level of each additive producing the largest in-crease in decay rates of heather wood was generally
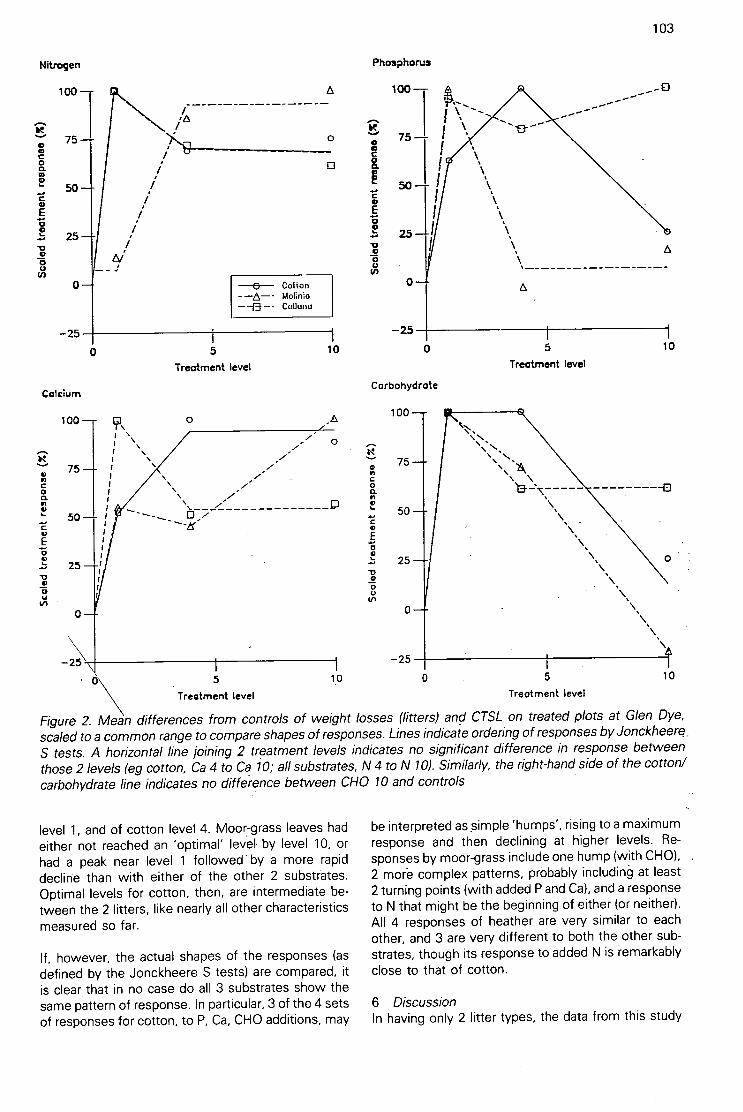
Nitrogen
100
75
50
25
0
–25
Calcium
25
–25
0 5
Treatment level
100 Y. 0 -Ai •
.----
I 0's/-i \
i . ....."75 i . ,y
i . yi \ yI .t . y
.i z JD
5
Treatment level
—8-- Cotton-
Calluna
0
10
1•0
Figure 2. Mean differences from controls of weight losses (litters) and CTSL on treated plots at Glen Dye,
scaled to a common range to compare shapes of responses. Lines indicate ordering of responses by Jonckheere,
S tests. A horizontal line joining 2 treatment levels indicates no significant difference in response between
those 2 levels (eg cotton, Ca 4 to Ca 10; all substrates, N 4 to N 10). Similarly, the right-hand side of the cotton/
carbohydrate line indicates no diffeience between CHO 10 and controls
level 1, and of cotton level 4. Moor-grass leaves hadeither not reached an 'optimal' level by level 10, orhad a peak near level 1 followed- by a more rapiddecline than with either of the other 2 substrates.Optimal levels for cotton, then, are intermediate be-tween the 2 litters, like nearly all other ch-aracteristicsmeasured so far.
If, however, the actual shapes of the responses (asdefined by the Jonckheere S tests) are compared, itis clear that in no case do all 3 substrates show thesame pattern of response. In particular, 3 of the 4 setsof responses for cotton, to P, Ca, CHO additions, may
A 100 —
Phosphorus
75 —
50 —
25
0
–25
0
Carbohydrate
100
75
50
25
0
–25
0
A
5
Treatment level
5
Treatment level
103
__a
A
10
-0
10
be interpreted as simple 'humps', rising to a maximumresponse and then declining at higher levels. Re-sponses by moor-grass include one hump (with CHO),2 more complex patterns, probably including. at least2 turning points (with added P and Ca), and a responseto N that might be the beginning of either (or neither).All 4 responses of heather are very similar to eachother, and 3 are very different to both the other sub-strates, though its response to added N is remarkablyclose to that of cotton.
6 DiscussionIn having only 2 litter types, the data from this study

104
Plate 6. Insertion of cotton strip in the field(Photograph G Howson)
Brown earth Peaty gley
Plate 7. The original unbleached calico cloth and theShirley Soil Burial Test Fabric (1976 green, and 1981blue) used for cotton strip assay (Photograph P ACoward)
Plate 8. Pigmentation of cotton produced after growth of fungi with 3 soils:i. Chrysosponum pannorum ii. Chrysosporium merdarium(Photographs J Gillespie)
Podzol
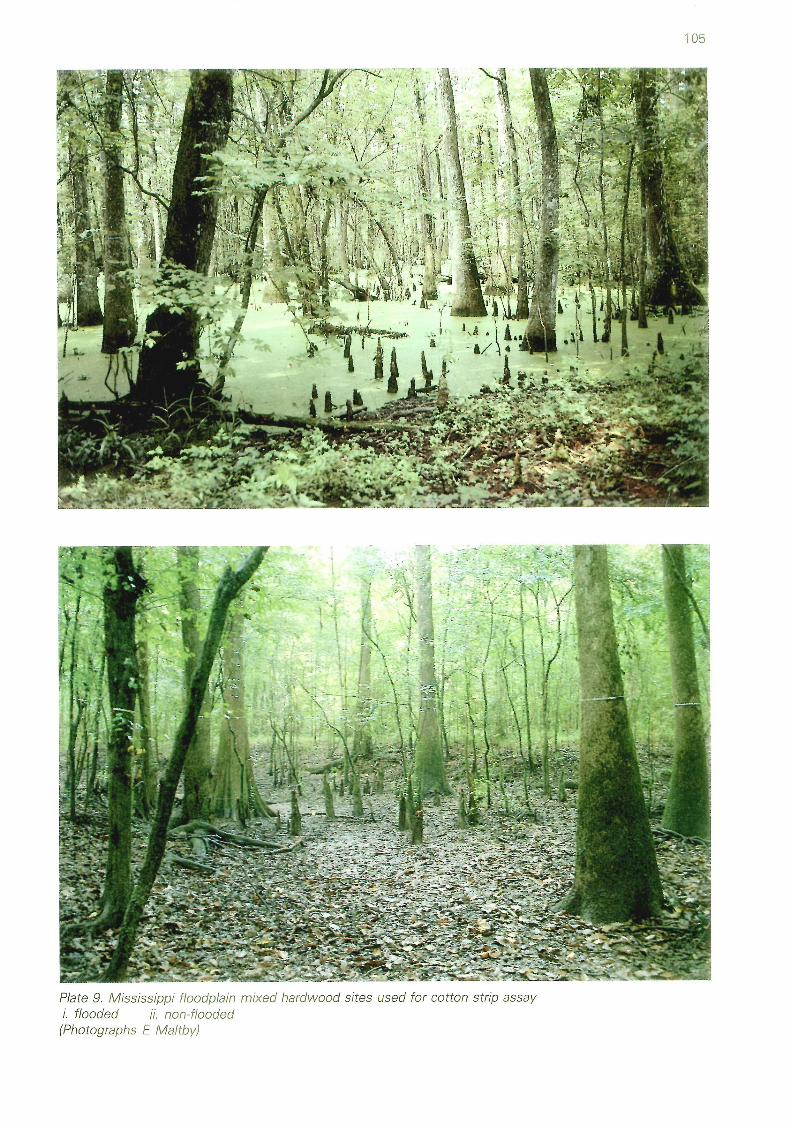
á

106
can only provide a limited comparison between resultsfrom the cotton strip assay and from litter decompo-sition as measured by weight loss. However, in theabsence of any other comparable information obtainedby simultaneous use of the 2 methods, it is importantto make this preliminary examination of any relation-ships between the 2 measures of decomposition pro-cesses in order to highlight some of the problemsinvolved. Comparison of the 2 measures on a seasonalbasis is also discussed in French (1988a).
6.1 Substrate quality and decompositionUsing similar criteria to Heal and French (1974), the 3substrates can be ranked in order of overall 'quality',and their decay rates compared with their quality rank.Cotton strips are essentially devoid of mineral nutri-ents, but they contain no lignin or other direct microbialinhibitors, and are not physically or structurally es-pecially difficult to decompose. Moor-grass leaveshave only moderate lignin content, are low in inhibitorycompounds, relatively high in mineral nutrients (1.5—2.0%) and present few physical or structural barriersto decomposers. Their general 'quality' is thus ratherhigher than that of cotton. Conversely, heather stemshave a high lignin content (>25%), a considerablequantity of other inhibitory substances (eg tannins),fairly low nutrient content (total nutrients <1%), arephysically hard and structurally intransigent. These areall features of low-quality substrates. The order ofsubstrate quality is therefore: heather<cotton<moor-grass. The decay rates of the 3 substrates are in thesame order as their quality ranking, and their overallresponses to soil additives, as to be expected, in thereverse order. Their differing patterns of response todifferent levels of additives may also be related totheir differing physical and chemical compositions,and the degree to which these require specializedmicro-organisms for their breakdown.
Despite the limitations of the data, it is possible tosmooth the responses derived from the Jonckheeretests, taking into account the decomposition mechan-isms which are possibly operative, to give a (partlyspeculative) series of full response curves (ie interp-olated and smoothed between actual data points)which are fully consistent with the available data (Fig-ure 3). The one case where the response of cotton isnot a simple hump (indicating an optimal level for thefull microflora decomposing a single simple substrate)is with addition of N. Widden et al. (1986) have shownthat there is selection of microflora by some of mysoil treatments, and also selection by cotton stripsfor particular cellulolytic organisms. My own fieldobservations (French 1988c) suggest selection of dif-ferent groups of organisms on cotton at different le-vels of added N, but not of P or Ca, where it seemsthat only the intensity and not the direction of microbialselection varies between treatment levels. The re-sponses of cotton strips to added N within the 3sample periods (which were summed for comparison
with litter weight losses) form a series from an im-mediate response to low levels of N which quicklydeclines, to little or no initial response to high levels,but the response increasing with time (French 1988c).This pattern suggests that low levels of N increasethe activity of the native microflora, without significantselection, the increase ceasing as the added N is usedup. However, higher levels of N, in combination withthe presence of cotton cellulose, alter the microflorathrough selection for a group which can efficientlyuse both cellulose and the extra N. This subgroup,however, takes some time to build up in the overallpopulation, so it shows no effect for several monthsafter N addition. Combining these 2 patterns gives acurve of the type shown in Figure 3.
Heather will select strongly for ligninolytic organisms,cn mPrhanismS of decomposition are likely to besimilar. Selection by substrate could conflict withselection by treatment, as many lignin decomposersare intolerant of, or do not compete well in, highnutrient conditions, while others, including many ba-sidiomycetes, have particular requirements for combi-nations of nutrients (and other environmentalconditions). Hence, at any one treatment level, thereis likely to be only a limited proportion of the totalmicroflora able to decompose heather wood underthose conditions. The strongest influence on decayrates here is likely to be the physical and chemicalintransigence of the heather wood, and it is notablethat all responses of heather in Figure 3 follow essen-tially the same pattern. This is not the case withthe other 2 substrates; with them, it is practicallyimpossible to fit a single shape of curve to the datafor all 4 additives.
Moor-grass leaves, with a more balanced mixture ofconstituents than either heather or cotton, would notbe expected to show any simple limits, or exert anymajor microbial selection pressure, and generally thissubstrate shows a more complex array of responsesthan heather or cotton.
The detailed relationships between substrate qualityand patterns of decomposition are discussed furtherelsewhere (French 1988c). Perhaps more important inthe context of this paper is the distinction betweenthe simple 'humps' characteristic of the responses ofcotton (a simple, almost pure, single substrate) andthe more complex or varied responses of the 2 litters(which both contain a mixture of substrates). Yet again,however, the cotton is intermediate, this time in itsdegree of variation, between the complete consist-ency of heather's responses and the very varied re-sponses of moor-grass. In many, ways, heather woodis a more distinctive substrate (ci also the correlationsbetween decay rates, Table 2) and, generally, the 2litters are no more similar than either of them andcotton.
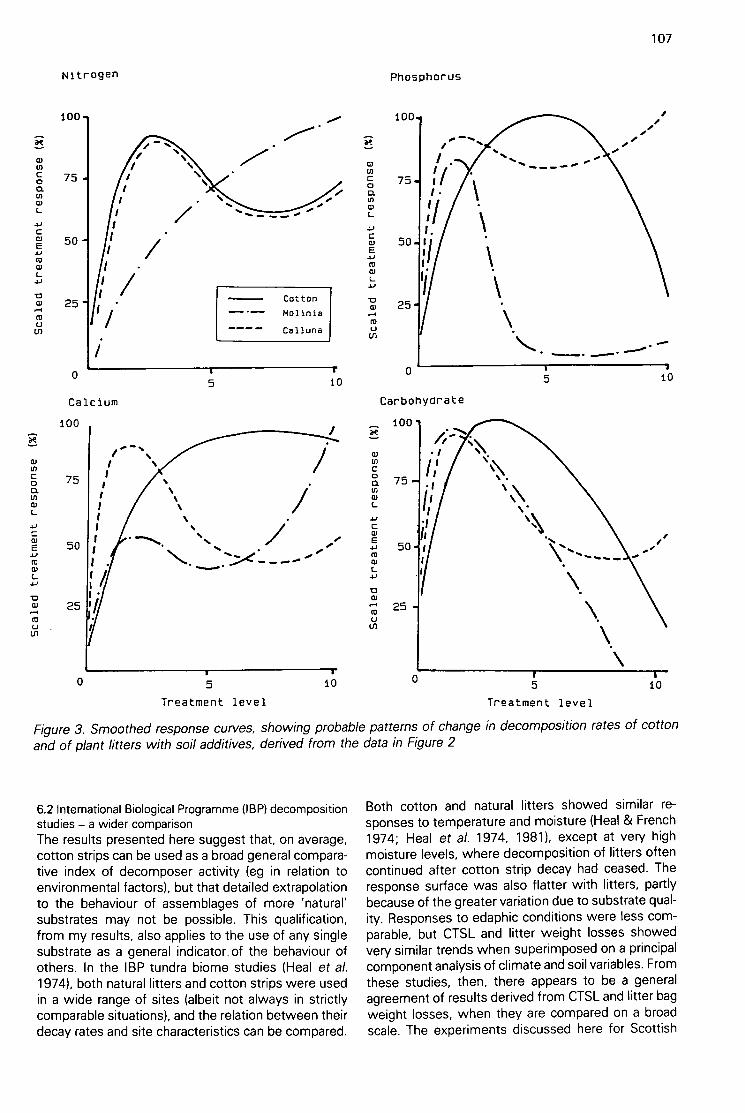
ae
a
J.1
Nitrogen
100
// % • ,"N.
75 / \%
50
25
0
Calcium
100
75
50
#
CoLI
5Treatment level
/-•
Cotton
Molinia
Calluna
5 10
10
Figure 3. Smoothed response curves, showing probable patterns of change in decomposition rates of cottonand of plant litters with soil additives, derived from the data in Figure 2
6.2 International Biological Programme (IBP) decompositionstudies — a wider comparisonThe results presented here suggest that, on average,cotton strips can be used as a broad general compara-tive index of decomposer activity (eg in relation toenvironmental factors), but that detailed extrapolationto the behaviour of assemblages of more 'natural'substrates may not be possible. This qualification,from my results, also applies to the use of any singlesubstrate as a general indicator of the behaviour ofothers. In the IBP tundra biome studies (Heal et al.1974), both natural litters and cotton strips were usedin a wide range of sites (albeit not always in strictlycomparable situations), and the relation between theirdecay rates and site characteristics can be compared.
Phosphorus
100
t
75 ff.•
I
50
25
Carbohydrate
100
75
25
....•• • • •
5Treatment level
5 10
107
10
Both cotton and natural litters showed similar re-sponses to temperature and moisture (Heal & French1974; Heal et al. 1974, 1981), except at very highmoisture levels, where decomposition of litters oftencontinued after cotton strip decay had ceased. Theresponse surface was also flatter with litters, partlybecause of the greater variation due to substrate qual-ity. Responses to edaphic conditions were less com-parable, but CTSL and litter weight losses showedvery similar trends when superimposed on a principalcomponent analysis of climate and soil variables. Fromthese studies, then, there appears to be a generalagreement of results derived from CTSL and litter bagweight losses, when they are compared on a broadscale. The experiments discussed here for Scottish
108
moorland indicate the probable limits of that agree-ment when the scale of comparison is narrower.
7 The use of the cotton strip assayAt Gisburn Forest, tree growth, nutrient release andnutrient uptake by trees were all related to CTSL insoils (Brown 1988). On a broader scale, the IBPstudiesdiscussed above showed strong parallels betweendecomposition of cotton and plant litters in their re-sponse to environmental variation. Other studies havegiven similar results, involving inter-relationships be-tween cotton strips, other decomposition measure-ments, and nutrient release and turnover. Yet Howard(1988) concludes that the breakdown of pure celluloseadded to soil cannot provide an index of litter de-composition rate, release of litter nutrients, or 'generalbio!ogica! activity'. This apparentIy contrdir‘t^h/ ,rsn-clusion is justified by his reference to poor conceptualmodels of 'soil physiological systems', and an argu-ment from a particular definition of cellulose de-composition through a reductio ad absurdumof thechain of connections from CTSL through cellulosedecomposition, litter decay and soil organic matterdecomposition, to nutrient release. Howard's ownarguments are themselves open to criticism; for ex-ample, he ignores the many alternative chains con-necting CTSL to nutrient release, such as CTSL beinga measure of physical penetration or 'opening up' ofthe substrate, which may be the process most limitingaccess to, and hence release of, nutrients and otherresources contained therein, with no need to invokecarbon loss rates in any direct form. Nevertheless, hiscritical examination of the models (actual or implied)involved in much of the use of cotton strips should beconsidered carefully by those using the method. Thisconsideration is especially important if the cotton stripassay is used as an indirect index of other processes,when the kind of model assumed, in relation to thepurpose of the measurement, may be critical to in-terpretation of results.
8 AcknowledgementsI thank Sir William Gladstone, Bt, for permission towork at Glen Dye. Many people assisted with field orlaboratory work, or provided useful advice and criti-cism during the study.
9 ReferencesBrown, A.H.F. 1988. Discrimination between the effects on soilsof 4 tree species in pure and mixed stands using cotton strip assay.In: Cotton strip assay an index of decomposition in soils, editedby A.F. Harrison, P.M. Latter & D.W.H. Walton, 80-85. (ITE sym-posium no. 24.) Grange-over-Sands: Institute of Terrestrial Ecology.French, D.D. 1984. The problem of 'cementation' when using cottonstrips as a measure of cellulose decay in soils. Int. Biodeterior., 20,169-172.French, D.D. 1988a. Seasonal patterns in cotton strip decompo-sition in soils. In: Cotton strip assay an index of decomposition insoils, edited by A.F. Harrison, P.M. Latter & D.W.H. Walton,46-49. (ITE symposium no. 24.) Grange-over-Sands: Institute ofTerrestrial Ecology.French, D.D. 1988b. The problem of cementation. In: Cotton stripassay an index of decomposition in soils, edited by A.F. Harrison,P.M. Latter & D.W.H. Walton, 32-33. (ITE symposium no. 24.)Grange-over-Sands: Institute of Terrestrial Ecology.French, D.D. 1988c. Some effects of changing soil chemistry ondecomposition of plant litters and cellulose on a Scottish moor.Oecologia. In 'press.
D. D. & Howson, C. 1202.Cau:ose decay rates n-rassuredby a modified cotton strip method. Soil Biol. Biochem., 14, 311-312.Heal, 0.W. & French, D.D. 1974. Decomposition of organic matterin tundra. In: Soil organisms and decomposition in tundra, editedby A.J. Holding, 0.W. Heal, S.F. MacLean & P.W. Flanagan, 279-310. Stockholm: Tundra Biome Steering Committee.Heal, 0.W., Howson, G., French, D.D. & Jeffers, J.N.R. 1974.Decomposition of cotton strips in tundra. In: Soil organisms anddecomposition in tundra, edited by A.J. Holding, 0.W. Heal, S.F.MacLean & P.W. Flanagan, 341-362. Stockholm: Tundra BiomeSteering Committee.Heal, 0.W., Flanagan, P.W., French, D.D. & MacLean, S.F. Jr.1981. Decomposition and accumulation of organic matter. In: Tun-dra ecosystems: a comparative analysis, edited by L.C. Bliss, 0.W.Heal & J.J. Moore, 587-634. Cambridge: Cambridge UniversityPress.Howard, P.J.A. 1988. A critical evaluation of the cotton strip assay.In: Cotton strip assay an index of decomposition in soils, editedby A.F. Harrison, P.M. Latter & D.W.H. Walton, 34-42. (ITE sym-posium no. 24.) Grange-over-Sands: Institute of Terrestrial Ecology.Jonckheere, A.R. 1954. A distribution-free k-sample test againstordered alternatives. Biometrika, 41, 33-145.Latter, P.M. & Howson, G. 1978. The use of cotton strips toindicate cellulose decomposition in the field. Pedobiologia, 17,145-155.Latter, P.M., Bancroft, G. & Gillespie, J. 1988. Technical aspectsof the cotton strip assay method. Int. Biodeterior, 24. In press.Miles J. 1973. Natural recolonization of experimentally bared soilin Callunetum in north-east Scotland. J. Ecol., 61, 399-412.Walton, D.W.H. & Allsopp, D. 1977. A new test cloth for soilburial trials and other studies on cellulose decomposition. Int.Biodeterior. Bull., 13, 112-115.Widden, P., Howson, G. & French, D.D. 1986. Use of cotton stripsto relate fungal community structure to cellulose decompositionrates in the field. Soil Biol. Biochem., 18, 335-337.

Hill Farming Research Organisation, Penicuik
1 SummaryIn 1978, cotton strips were buried for 36 days in 3sites under pasture with a control plot and 4 pastureimprovement treatments, including lime, basic slag,rye-grass(Lolium perenne)and white clover (Trifoliumrepens),applied 6-9 years earlier. All the sites weregrazed by wether sheep 3 times per year.
Decomposition of cellulose, measured as loss in ten-sile strength of cotton strips, was greatest in the 0-4cm depth layer of all limed treatments, and was leastin the deepest (8-12 cm) of the control treatments.Pasture improvements other than lime had little effecton decomposition rate. Decomposition of cellulosewas greater in the brown earth soil than in the 2 moreacid peaty podzolic soils.
2 IntroductionImprovement of natural and semi-natural grassland bythe use of introduced plants and fertilizers usuallyresults in a substantial increase in annual net primaryproduction, and concomitant increases in the rate ofnutrient cycling through enhanced decomposition ofsoil organic matter by invertebrates and micro-organ-isms (Floate et al. 1981; Hutchinson & King 1984).The cotton strip assay was used as an integratedmeasure of these decomposition processes in exper-imental plots with a range of pasture improvementtreatments on 3 hill country soils.
3 Site and treatment descriptionPasture improvement trials were established on 3contrasting soil types at the Hill Farming ResearchOrganisation's Field Research Station, Sourhope, Rox-burghshire, UK, in 1969, 1970 and 1971. The soilsranged from a brown earth (pH 5.0-5.5), through thinpeaty podzol (pH 4.0-4.5), to a thick peaty podzol (pH<4.0), and were situated at 300, 350 and 370 m abovesea level (55.5°N, 2.2°W). Semi-natural grassland
Table 1. Pre-treatment soil characteristics of soil types used in Sourhope pasture improvement experiment
' on sabbatical leave from CSIRO, Pastoral Research Laboratory, Division of Animal Production, Armidale, Australia2 now at Ministry of Agriculture and Fisheries, New Zealand
109
Effects of lime and pasture improvement on cotton stripdecomposition in 3 Scottish acid hill soilsP J VICKERY' and M J S FLOATE2
swards on these soils consisted of bent-grass/fescue(Agrostis/Festuca), mat-grass/fescue (Nardus/Fes-tuca),and moor-grass/mat-grass(Molinia/Nardus)re-spectively. Additional soil details are given in Table 1.
The pasture improvement treatments were applied tothe plots as follows:
C control;i. lime (at 6.3 t ha-1);ii. lime + basic slag (at 1.25 t ha-1);
iii. lime + basic slag + white clover (at 2.2 kg ha-1);iv. lime + basic slag + white clover + rye-grass (at
22 kg ha-') with 40 kg-' ha nitrogen (N).
The plots were grazed by wether sheep for 3 30-day periods (starting in mid-May, mid-July and mid-October), at stocking rates adjusted to dry matterpresent at the start of each period, so that 80-90% ofthe herbage was consumed in the 30-day grazingperiod. Full details of treatments and herbage pro-duction are given in Eadieet al. (1981) and Newbould(1981). Over the 10 years of the trials, annual pastureproduction from the control sites ranged between 1.5and 2.5 t ha-', while that from the fully improved sitesranged between 4.0 and 6.0 t ha-1.
4 Experimental detailsUsing the standard technique (Latter & Howson 1977),cotton strips were inserted in the soil profiles at the3 experimental sites on 26 June 1978 (summer) andremoved 36 days later. The strips were inserted inpairs at 5 locations within each pasture improvementtreatment. Depth of insertion of the strips varied be-tween soils due to stones and compactness of thelower soil horizons; the maximum depth of insertionpossible was 25 cm, but this was rarely achieved; theactual depths are given in the results. At the time ofinsertion, 2 strips from one location per treatment
110
were removed for field controls, leaving the overallexperimental design as follows:
3 soil types x 5 pasture improvement treatments x4 locations within treatments x 2 replicates withinlocations
At each location, the pairs of strips were covered witha small wire mesh cage to prevent disturbance bysheep grazing the plots. After removal, the cottonstrips were taken to the laboratory, carefully washed,divided into 4 cm substrips and each frayed back to 3cm. This represented 4 depths of measurement at 0-4 cm, 4-8 cm, 8-12 cm, and 12-16 cm. The dividedstrips were then sent to the Institute of TerrestrialEcology's Merlewood Research Station for tensilestrength (TS) testing. Some temperature and humiditydata were recorded at 2 sites (Table 2).
Table 2. Climatic information for the sitei. Environmental conditions during experiment 11978)
ii. Long-term average environmental conditions of experiment lo-cation
Precipitation (mm)Sunshine (h)
Statistical analysis of the data for loss in tensilestrength of cotton (CTSL), expressed as a percentage:
(field control TS - final TS at 36 days) x 100field control TS
Table 3. Tensile strength loss of cotton strips (CTSL) placed in control and in improved pasture plots at Sourhope. Summary of interactioneffects after 36 days' insertion, based on 351 observations and 9 missing values, with the means for the 3 soil types at 3 depths (cm). Fieldcontrol TS = 50.5 kg; effective standard error = ±4.48
Annual July
870 851400 160
was done on natural and transformed (arcsin) data,using a split-plot model, with soils and improvementtreatments as main plots split for 3 depth layers. Thetransformation corrected for some slight skewness inthe data but had little effect on the outcome of theanalysis of variance. Effects for locations and pairswithin the development treatment plots were notextracted, remaining in the error term of the analysis.Data from the deepest layer (12-16 cm) had numerousmissing observations and were not used for this re-port. In the 3 cm depth analyses, there were 9 missingvalues out of a total of 360 possible observations.Values for these observations were calculated viathe standard routine in GENSTAT analysis of variance(Genstat Manual 1977).
5 ResultsRate of decomposition of the cotton strips was signifi-cantiyaffected by the soii type (P<0.0-1), being greateron the brown earth than on the peaty podzols. Themean CTSL (%) for the 3 soils were 75.4, 70.0, and61.6 (pooled standard error ± 1,9%), decreasing inorder of soil pH. Soil type also had a significant effecton insertion depth of the strips (P<0.001), the meandepths for the soils being 17, 13 and 22 cm for thebrown earth, and the thin and thick peaty podzolicsites, respectively.
Over the 3 soil types, improvement treatment had avery significant influence on CTSL (P<0.001), beingleast on the control treatments and much greater inall the limed plots (Table 3). The pooled standard errorfor unconstrained and independent comparison of ef-fects (± 2.46%) indicated that the largest effect wasthe addition of lime, with little difference betweenthe other improvement treatments. Across all thetreatments, liming increased the pH of the soils by1.0, 0.6, and 0.9 units on the brown earth, and the thin
Control Lime
TreatmentsLime + basic slag
Lime + basic slag + clover + rye-Lime + basic slag + clover grass
Mean for 3 soil types 50.8 71.1 71.7 77.5 73.9
Brown earth0-4 87.7 94.9 88.9 88.8 96.34-8 65.6 85.1 82.4 78.5 83.28-12 48.1 68.3 68.4 63.9 76.4
Thin peaty podzol0-4 47.9 91.1 86.7 98.1 89.54-8 35.7 62.2 77.0 88.2 84.58-12 23.1 48.0 60.6 77.0 68.0
Thick peaty podzol0-4 52.2 92.0 93.8 97.8 95.54-8 51.5 74.4 81.7 88.1 86.58-12 47.2 46.1 46.4 65.4 38.2
and thick peaty podzolic soils, respectively. Becauseof the incomplete factorial nature of the experiment,it was impossible to separate the various treatmentsfurther. As expected, decomposition decreased withdepth; the mean decomposition for all soil types andimprovement treatments at 0-4 cm caused an 87%CTSL, while the CTSL at 12-16 cm was 58%.
Many interactions were significant; soils x depth andsoil x depth x treatment at P<0.001, treatment x depthat P<0.05; and treatment x soils at P<0.01. Becauseof the lack of independence between depths and thedifference in the maximum depth of insertion betweensoils, only the data for the first 3 depths were analysed(Table 3). The interactions show that decompositionrates in all soils, as measured by loss in tensilestrength of the cotton, responded to the liming treat-ment but with differing magnitude. The brown earthsite showed a higher initial rate for the control treat-ment, and decomposition of cellulose occurred furtherdown the profile than with the other soils. Variabilityfor all soils and improvement treatments was withinexpected limits, and the coefficient of variation was17.4% (Hill et al. 1985).
Decomposition of cellulose occurred throughout thebrown earth profile, and was faster for the pastureimprovement treatments than for the control at alldepths. This pattern also occurred with the thin peatypodzolic soil, but with an additional tendency for accel-erated decomposition at 8-12 cm under liming, basicslag, white clover and rye-grass treatments. By con-trast, the thick peaty podzolic profile only showedaccelerated cellulose decomposition for the 2 upperdepths, where all limed treatments resulted in greaterCTSL than in the control plot. In the upper 2 depths,the rates for treatments on the thick peaty podzolicsoil were higher than for the thin peaty podzolic andgenerally similar to the brown earth, but in the 8-12cm region the rates for the thick peaty podzolic wereconsiderably lower than for the brown earth.
6 DiscussionIn general, the results for cellulose decomposition, asmeasured by the cotton strip assay for soil type anddepth, are consistent with published results, such asthose of Heal et al. (1974). The peaty podzolic profilesshowed results for differences in decomposition be-tween depths which were consistent with the profiletypes of Heal et al. (1974), for peaty and grassedmineral soils respectively, with the thin peaty podzolicbeing similar to a mineral soil in this instance. Thesefindings are consistent with the peaty nature of theprofiles, where the highly acid conditions would eitherinhibit decomposition or, at least, confine it to theupper aerobic layers of the profile.
Elsewhere (Floate et al. 1981), we have noted a strongcorrelation between post-liming pH of the soils in thisexperiment and herbage litter decomposition meas-ured in mesh bags, the correlation for pH versus dry
111
matter loss rate being r = 0.9336 (P<0.001). However,with loss in tensile strength in the 0-4 cm depth layer,the correlation with pH was not as strong: r = 0.5123(P<0.1). Also, the correlation of CTSL (0-4 cm) withlitter decomposition was low (r = 0.2789 NS), a situ-ation discussed by French (1988). This result wassomewhat unexpected because of the obvious overalleffect of liming to increase the rate of decompositionof the cotton strips, and the greater rate of decompo-sition in the brown forest soil compared with the lowerpH peaty soils. In reviewing a considerable body ofliterature on cellulose decomposition, Siu (1951) con-cluded that bacteria and actinomycetes show greatestactivity in slightly alkaline conditions, while acid con-ditions favour fungal decomposition. Thus, it is poss-ible that the liming treatments resulted in a gross shiftin dominance from fungal to bacterial decomposition.Such a change 'could account for the overall effect ofpH in increasing decomposition of the cotton strips,without the 5 treatment differences in pH beingspecifically related to loss of tensile strength. Furtherdetailed study of the pH liming effect on cotton stripdecomposition will be necessary to uncover the mech-anism of this effect.
The results from the cotton strip assay have addedweight to our hypothesis that the increased pastureproduction, resulting from the improvement treat-ments, was partly a consequence of the effect oflime on microbial activity, and hence nutrient cycling.However, between the pasture improvement treat-ments, the cotton strips did not show a consistentpattern of differences, except that the maximumlosses in tensile strength in the peaty podzolic soilsoccurred with the lime plus basic slag and white clovertreatments. The overall similarity of loss of tensilestrength, and hence similarity of microbial activity,between pasture improvement treatments requiresfurther investigation to reconcile it with the long-termobserved differences in pasture and animal productionbetween the treatments.
7 AcknowledgementsWe wish to acknowledge gratefully the assistance ofMiss P M Latter and Mrs G Howson, ITE Merlewood,for helping to insert the cotton strips and to test thetensile strength. This study was undertaken when oneof us (P J Vickery) was a visiting scientist at the HillFarming Research Organisation, and use of its facilitiesfor the work is gratefully acknowledged.
8 ReferencesEadie, J., Hetherington, R.A., Common, T.G. & Floate, M.J.S.1981. Long-term responses of grazed hill pasture types to improve-ment procedures I. Nutrient cycling and soil changes. In: Theeffective use of forage and animal resources in the hills and uplands,edited by J. Frame, 167-168. (Occ. Symp. no. 12.) Edinburgh: BritishGrassland Society.French, D.D. 1988. Patterns of decomposition assessed by the useof litter bags and cotton strip assay on fertilized and unfertilizedheather moor in Scotland. In: Cotton strip assay an index of de-composition in soils, edited by A.F. Harrison, P.M. Latter & D.W.H.Walton, 100-108. (ITE symposium no. 24.) Grange-over-Sands: Insti-tute of Terrestrial Ecology.
112
Floate, M.J.S., Hetherington, R.A., Common, T.G. & Ironside,A.D. 1981. Long-term responses of grazed hill pasture types toimprovement procedures. II. Nutrient cycling and soil changes. In:The effective use of forage and animal resources in the hills anduplands, edited by J. Frame, 147-149. (Occ. Symp. no. 12.) Edin-burgh: British Grassland Society.Genstat Manual. 1977. GENSTAT, a general statistical program.Oxford: Numerical Algorithms Group.Heal, 0.W., Howson, G., French, D.D. & Jeffers, J.N.R. 1974.Decomposition of cotton strips in tundra. In: Soil organisms anddecomposition in tundra, edited by A.J. Holding, 0.W. Heal, S.F.MacLean & P.W. Flanagan, 341-362. Stockholm: Tundra BiomeSteering Committee.Hill, M.O., Latter, P.M. & Bancroft, G. 1985. A standard curve forinter-site comparison of cellulose degradation using the cotton stripmethod. Can. J. Soil Sci., 65, 609-619.
Hutchinson, K.J. & King, K.L. 1984. Biological aspects of nutrientcycling in grazed pasture. The underground movement. Proc. Aust.Soc. Anim. Prod., 15, 133-136.Latter, P.M. Howson, G. 1977. The use of cotton strips to indicatecellulose decomposition in the field. Pedobiologia, 157, 145-155.Newbould, P. 1981. The potential of indigenous plant resources.In: The effective use of forage and animal resources in the hills anduplands, edited by J. Frame, 1-15. (Occ. Symp. no. 12.) Edinburgh:British Grassland Society.Siu, R.G.H. 1951. Microbial decomposition of cellulose with specialreference to cotton textiles. New York: Reinhold.
Preliminary investigations into use of cotton strip assayfor assessing effects of changing land use on soils inmid-WalesJ B DIXON and P F RANDERSONDepartment of Applied Biology, University of Wales Institute of Science and Technology, Llysdinam FieldCentre, Llandrindod Wells
Poster summaryLand use change surveys indicate that much recentploughing and reseeding of hill land have been on thebrown earth soils of the slopes of the major uplandareas. A series of investigations comparing the ecol-ogy and management of indigenous bent-grass/sheep's fescue (Agrostis/Festuca ovina) grasslandwith reseeded rye-grass (Lolium) swards on brownearth soils of the Manod Association (Dixon 1987)has included assessments of microbial decompositionrates inferred from cotton strip decomposition. Re-sults were presented showing that decompositionrates at 'improved' sites are, as expected, consider-ably higher than at unimproved sites, and showedlittle change down the soil profile. The decompositionrate on the unimproved site decreased markedly downthe profile, and it is concluded that little mixing ofhorizons occurs at unimproved sites. As the decompo-sition in this experiment reached greater than 90%tensile strength loss of cotton in the improved soils,no proper comparisons betweeq individual improvedand reverted sites could be made.
113
Preliminary results of plot experiments to determinethe influence of lime on decomposition rates at anunimproved site showed little effect within 60 daysof application, although decomposition on the limedplot was 5% higher than on the unlimed plot between4-16 cm depth.
Further studies will continue to consolidate theseresearch findings, and will include use of other me-thods to examine litter decomposition and microbialactivity. It is considered that a single parameter suchas the cotton strip assay is inadequate as a measureof nutrient mineralization rates in these hill soils.
ReferenceDixon, J.B. 1987. Ecology and management of improved, unim-proved and reverted hill grasslands in mid-Wales. In: Agricultureand conservation in the hills and uplands, edited by M. Bell & R.G.H.Bunce, 32-37. CITE symposium no. 23.1Grange-over-Sands: Instituteof Terrestrial Ecology.

114
Examination of the biological activity of the soil undernatural conditionsK KUZNIARAcademy of Agriculture, Krakow, Poland
Poster summaryA systematic study was begun in the Putawy StateAgriculture Institute, Poland, in 1938 to determine thebiological activity of the soil profile. The results of thestudy were not published until 1948, because of thewar.
From 1938 to 1984, the biological activity of the soilin various natural environments in Poland was deter-mined with the aid of strips of cotton or linen cloth.Cellulose decomposition rates in the soiis varied ac-cording to their nutrient content and physical proper-ties. Using the rate of cellulose decomposition, it waspossible to determine the general level of biologicalactivity in soil for use in practical applications of landuse. The method was tested in different seasons, inloam, sand, clay and organic soils, in cultivated fields
0
50
100
150
0 25 50Cellulose loss (%)
with different crops with or without mineral or organicfertilization, under forest or grassland, or on the borderbetween cultivated fields and forests, in soils withdiffering moisture contents, and in marshy or moun-tainous regions.
The following method was used in the study.
Sterile strips of cloth, 150 cm long x 10 cm wide,were placed, if the soil conditions permitted, in narrowvertical iits riihe sod. The ho:es which occurredwere filled with soil from the same layer. In somecases, independent of the cloth strips, 9 cm clothpieces were placed vertically in the profile on glassplates with 12 cm sides. The decomposition of cellu-lose in the soil, examined with cloth, was estimatedafter removing the strips from the soil and drying
O Pine 120 yr (5)
A Pine 120 yr (7)
13 Pine, old (1)
O Spruce (4)
• Beech (2)
• Birch (3)
• Alder(6)
Field on gley (8)
X Field on sand (9)
75 100
Figure 1. Cellulose decomposition in forest soils in the neighbourhood of Poznan. Site numbers (Table 1) aregiven in brackets

Table 1.Cellulose decomposition in forest soils in the neighbourhood of Poznan
ND, not determined
them. The visible changes were described and thedegree of decomposition determined using a specialscale. Quantitative determination of the' cloth de-composition was carried out using analytical methods.The field observations were always made at about thesame time.
115
The results of one study (Kuzniar 1956) are illustratedin Table 1 and Figure 1, and the results of other studiesare presented by Kuzniar (1948, 1950, 1952a, b, 1953a,b, c, d, 1956, 1957, 1972, 1976, 1984) and by Skinnerand Kuzniar (1975). (The papers are all in Polish, withEnglish summaries.)

116
ReferencesKuzniar, K. 1948. Studies on the cellulose decomposition in forestsoil. Inst. Bad. Lesn. Rozpr. i Spraw, 50, 1-44.Kuzniar, K. 1950. New methods of determining a forest soil'sactivity. Sylwan, 3, 49-57.Kuzniar, K. 1952a. The energy of cellulose decomposition in thesoils of the national park in Pieniny Mountains. Acta microbial. pol.,1, 53-58.Kuzniar, K. 1952b. The energy of cellulose decomposition in thesoils of Biatowieza National Park. Acta microbiol. pol., 1, 257-269.Kuzniar, K. 1953a. Cellulose decomposition by the microorganismsin forest soil in winter. Ekol. Polska, 1, 137-140.Kuzniar, K. 1953b. The energy of cellulose decomposition in thesoils of the border of cultivated field and forest. Ekol. Polska, 1, 41-53.Kuzniar, K. 1953c. The influence of the forest border upon themicroflora of cultivated soils. Ekol. Polska, 1, 17-39.
Kuzniar, K. 1953d. The influence of the relief upon the biologicalactivity of cultivated loess soils. Ekol. Polska, 1, 31-55.Kuzniar, K. 1956. The energy of decomposition of cellulose inforest soils. Ekol. Polska, 4, 21-34.Kuzniar, K. 1957. The influence of various mulches applied inorchards on soil micro-organisms. Roczn. Nauk roln., 76, 335-367.Kuzniar, K. 1972. Preliminary results of investigations on the deter-mination of biological activity of garden soils. Zesz. nauk. wyzsz.Szk. roln. Krakow, 70, 201-212.Kuzniar, K. 1976. Determination of the biological activity of the soil.Prace Pol. Tow. glebozn., 111/19.Kuzniar, K. 1984. Introductory information on the methods of inves-tigation used for the determination of the biological activity of soilsin natural conditions. (Bibliography.) Krakow: Academia Rolnicza im.H. Kollataja w Krakowie.Skinner, F. & Kuzniar, K. 1975. Process of cellulose decompositionin cultivated and forest soils in Rothamsted. Acad. Rol. w PoznaniuKom. Mikr. PAN, 35-37.
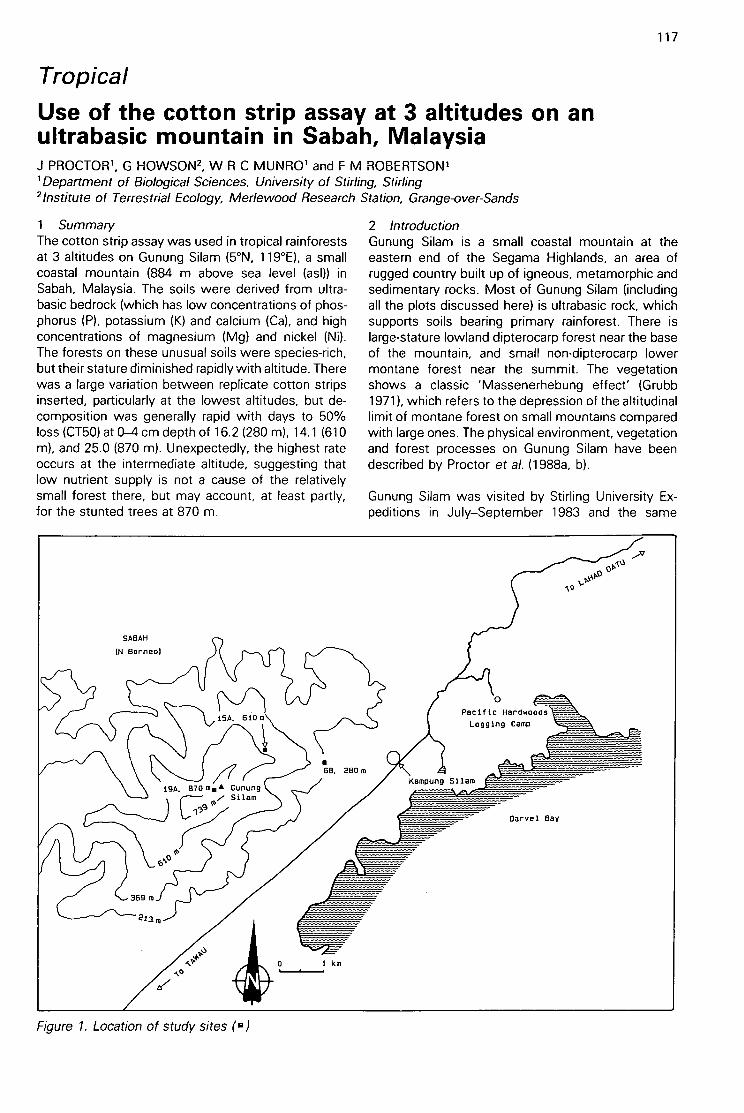
Tropical
Use of the cotton strip assay at 3 altitudes on anultrabasic mountain in Sabah, MalaysiaJ PROCTOR', G HOWSON', W R C MUNRO' and F M ROBERTSON''Department of Biological Sciences, University of Stirling, Stirling2Institute of Terrestrial Ecology, Merlewood Research Station, Grange-over-Sands
1 SummaryThe cotton strip assay was used in tropical rainforestsat 3 altitudes on Gunung Si lam (5°N, 119°E), a smallcoastal mountain (884 m above sea level (asI)) inSabah, Malaysia. The soils were derived from ultra-basic bedrock (which has low concentrations of phos-phorus (P), potassium (K) and calcium (Ca), and highconcentrations of magnesium (Mg) and nickel (Ni).The forests on these unusual soils were species-rich,but their stature diminished rapidly with altitude. Therewas a large variation between replicate cotton stripsinserted, particularly at the lowest altitudes, but de-composition was generally rapid with days to 50%loss (CT50) at 0-4 cm depth of 16.2 (280 m), 14.1 (610m), and 25.0 (870 m). Unexpectedly, the highest rateoccurs at the intermediate altitude, suggesting thatlow nutrient supply is not a cause of the relativelysmall forest there, but may account, at least partly,for the stunted trees at 870 m.
SABAH
(N Borneo(
369m
213 n
19A. 870 m•• GunungSilam
tr'
Figure 1. Location of study sites (la)
.613. 280 mKampung Silam
0Pacific HardwoodsLogging Camp
Oarvel Bay
.)vc)
10y.0°
117
2 IntroductionGunung Silam is a small coastal mountain at theeastern end of the Segama Highlands, an area ofrugged country built up of igneous, metamorphic andsedimentary rocks. Most of Gunung Silam (includingall the plots discussed here) is ultrabasic rock, whichsupports soils bearing primary rainforest. There islarge-stature lowland dipterocarp forest near the baseof the mountain, and small non-dipterocarp lowermontane forest near the summit. The vegetationshows a classic 'Massenerhebung effect' (Grubb1971), which refers to the depression of the altitudinallimit of montane forest on small mountains comparedwith large ones. The physical environment, vegetationand forest processes on Gunung Silam have beendescribed by Proctor et al. (1988a, b).
Gunung Silam was visited by Stirling University Ex-peditions in July—September 1983 and the same
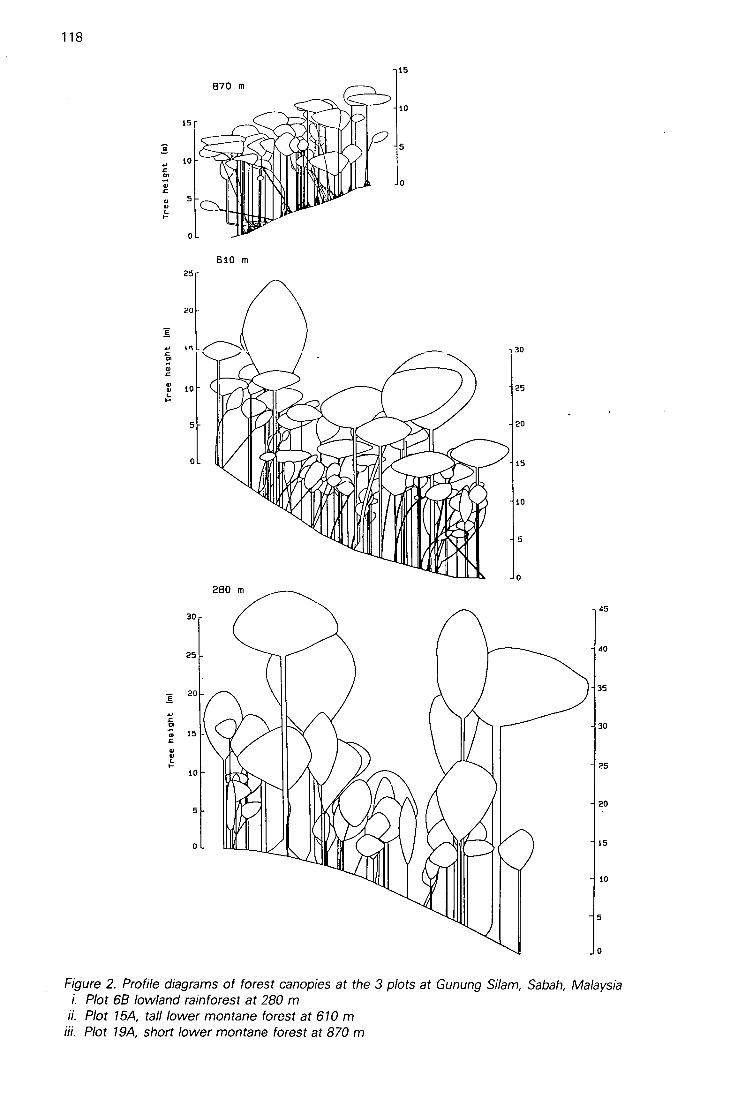
118
15
10
5
0
25-
20
1F
10
s
0
30
25
20
15
10
5
0
870 m
610 m
280 m
15
10
5
0
-,30
25
20
15
10
5
o
45
40
35
30
25
20
15
5
0
10
Figure 2. Profile diagrams of forest canopies at the 3 plots at Gunung Si lam, Sabah, Malaysiai. Plot 68 lowland rainforest at 280 m
ii. Plot 15A, tall lower montane forest at 610 miii. Plot 19A, short lower montane forest at 870 m

Table 1. The Sabah Forest Department plot numbers, the altitudes, the dimensions and a summary of structural and floristic features of3 rainforest plots on Gunung Si lam, Sabah
Sabah ForestDept
plot number
68
15A
19A
Altitude(m)
Dimensions(m)
280 40 x 100
610 40 x 60
870 20 x 20
months in 1984. The influence of the ultrabasic rockon the structure and species composition of the forestwas investigated, along with the causes of the 'Mas-senerhebung effect'. This paper reports our appli-cation of the cotton strip assay to test the hypothesisthat decomposition rates decrease with altitude, evenon small mountains. Grubb (1977) had suggested thatlow supply rates of nutrients (which would be likelyto be directly linked with decomposition rates) mightpartly account for the occurrence at low altitudes ofsmall-stature vegetation on wet tropical mountains.
3 The study plotsThree plots were selected from several establishedon the main east ridge of Gunung Silam by the SabahForest Department: plot 6B, lowland rainforest at 280m asl; plot 15A, tall lower montane forest at 610 masl; and plot 19A, short lower montane forest at 870m asl (Figures 1 & 2). A summary of the plot featuresis given in Table 1. Unlike the often stunted or sparsevegetation on ultrabasic soils (Proctor & Woodell1975), there is no barrenness, and the stunting of theforests near the summit seems part of a generalmontane effect that occurs on a range of substrata,.including ultrabasics.
4 Climate and soilsThe mean annual rainfall at a site at 20 m asl about 5km from the base of Gunung Silam is 2011 mm. Thereis no regularly defined dry season, although the periodJune—September (which encompasses the assaydates) is relatively dry. The rainfall for the 1984 assayperiod for a station at 10 m altitude (5 km from thebase of Gunung Silam) and for another at 884 m (onthe summit) was 159 mm and 91 mm respectively.Above 650 m, the dryness is offset to some extent bythe presence of a frequent cloud cap. Temperaturedata for the assay period are summarized in Table 2,and are probably representative of the whole year.Fox (1978) has commented that average daily tem-peratures in Sabah show little variation through theyear.
Height ofhighest Height of main
emergent tree canopy Main families(m) (m) (% basal area)
49 30-35
39
16
Table 2. The mean screen maximum and minimum temperaturesand the mean diurnal range for sites in the open at 10 m and 887 mon Gunung Silam, Sabah. Ranges are given in brackets. The dataare for 24 July-12 September 1984
20-25
10-12
Dipterocarpaceae (27.9)Anacardiaceae (21.5)Verbenaceae (7.8)Leguminosae (7.1)
Dipterocarpaceae (27.1)Euphorbiaceae (23.8)Anacardiaceae (12.4)Myrtaceae (10.1)
Myrtaceae (60.7)Rutaceae (24.0)Theaceae (5.7)Elaeocarpaceae (2.5)
119
The soils on Gunung Silam are brown to yellow-brown,with darker-coloured surface horizons. They are freelydrained and have a high proportion of sand (ie particles<0.063 mm), which, in the 0-15 cm depth samples,ranges from about 30% of the dry weight at 280 m toabout 25% of the dry weight at 610 m and 870 m(excluding the mor layer). The soils are stony and theaverage depth (measured at 50 randomly selectedpoints in each plot) to the first stones is 32.6 cm (280m), 6.1 cm (610 m) and 30.8 cm (870 m). However,sharp stakes could be driven down to 1.8 m at a soilpit in all the plots. At 280 m, the upper horizons hada well-developed crumb structure with a mull humusform and frequent earthworm (Lumbricidae) casts. Theforest at 610 m had a weaker crumb structure andmore stratification of organic matter in the upper soilhorizons. Exposed rock and scree are prevalent at thisplot, and the soil there is very stony. At 870 m, thereis a brown mor humus (not peat) which is well drainedand loosely packed, with extensive fine-root networkswhich often reach substantial depths (up to one mover prop roots).
The chemical analyses (Table 3) show several impor-tant features, including many which are typical ofultrabasic soils (Proctor & Woodell 1975). In general,the samples were mildly acid (pH range 5.3-6.0), butthe pH was much less in the mor humus at 870 m(mean 4.0). There was a marked excess of Mg at

120
Table 3. The means ± SE of pH; loss-on-ignition; exchangeable potassium, sodium, calcium, magnesium; acetic-acid extractablephosphorus, cobalt and chromium; exchangeable nickel; and cation exchange capacity (CEC) in 15 cm deep samples collected from eachof 3 plots on Gunung Si lam, Sabah. Values are expressed on an oven dried (105°C) basis where appropriate(n = 10 for acetic acid extractable elements and CEC; for other analyses, n = 18 for 870 m and n = 20 for 280 m and 610 m)
280 m and 870 m, but the soil at 610 m was morecalcareous. Exchangeable Ni showed relatively highconcentrations at 280 m and 610 m.
5 MethodThe cotton strip assay was first carried out in July–August 1983. However, the sampling periods of 24and 34 days used then were too long, as many stripswere decomposed well beyond the point when tensilestrength (TS) measurements are valid. We repeatedthe work in 1984 with shorter sampling periods, andthis timing proved to be more satisfactory. Only the1984 work is reported in detail. In July 1984, 4 stripswere placed at random within each of 10 subplots ineach of the plots at 280 m, 610 m and 870 m. Themethods followed those of Latter and Howson (1977).The strips were inserted vertically in the soil afterremoving the surface litter (ie recognizable plant re-mains but not soil organic matter). Sometimes (at610 m and 870 m), the soils were too stony to allowthe strips to be inserted to the full depth. The cottonstrips were carefully removed from each subplot after14 days and 20 days (610 m) or 21 days (280 m and870 m). Two field control strips were used on eachretrieval date at each plot. The strips were returnedto the base camp, washed in tap water, air dried usinga fan, and then stored between sheets of newspaperfor 8 weeks. Some cloth control strips were keptat the Institute of Terrestrial Ecology's MerlewoodResearch Station to allow changes caused by trans-port, washing and storage to be assessed. After cut-ting, fraying and drying, the TS of 4 cm substrips frayedto 3 cm was tested at a relative humidity of 60-70%,using a Monsanto Type W tensometer with 5 cm widepneumatic jaws.
The method of Hill et al. (1985) was used to calculateCT50, the time in days for the strips to lose 50% oftheir TS. This method allows comparisons betweensoils where the cotton has not been buried for thesame length of time. First, the cotton rottenness func-tion (CR) was calculated using the following formula:
in H202 the combined mor and mineral layers' depth was 15 cm, but the depth of each layer varied between samples
CT50 =
(mineral layer)
field control TS — final TSCR =
final TS
where the field control TS is the mean TS of the 20substrips from the 4 field control strips which hadbeen placed (2 on each sampling date) in each site,and where the final TS is the median final TS of thesamples for each depth, sample date and plot. (Themedian is used to avoid the bias due to non-linearityof change in TS with time and, as will be seen later,is further justified here in view of the high variabilityof the data.)
The CT50 was calculated using the formula:
no. of days in soil
CR
6 ResultsThe cloth control strips had a mean TS of 46.7 ± 0.9kg, and the field control strips a mean TS of 42.6 ±0.8 kg. These values are significantly different(P<0.001) and demonstrate a TS loss during transport,storage and burial in the soil.
The experimental strips showed a very high within-plot variability (see Lindley & Howard 1988) betweenreplicates, particularly at the lower altitudes. The re-sults (Table 4) show that decomposition rates areranked in the order 610 m, 280 m and 870 m. The dataare simplified (by combining results for the 14 day and20 or 21 day samples) in Figure 3. The plots at 280 mand 610 m show fairly similar patterns, whilst at 870m decomposition is much slower and decreases mark-edly with depth.
The overall CT50 values are generally rapid comparedwith those in temperate areas (Hill et al. 1985; Inesonet al. 1988).
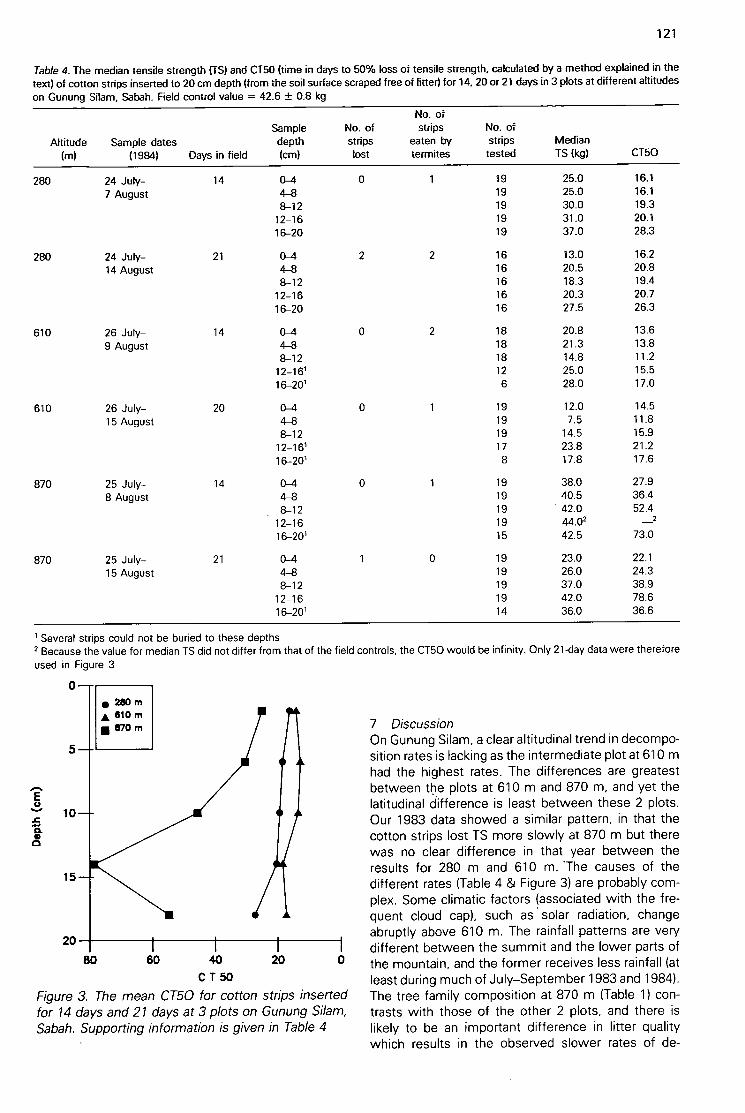
Table 4. The median tensile strength (TS) and CT50 (time in days to 50% loss of tensile strength, calculated by a method explained in thetext) of cotton strips inserted to 20 cm depth (from the soil surface scraped free of litter) for 14. 20 or 21 days in 3 plots at different altitudeson Gunung Silam, Sabah. Field control value = 42.6 ± 0.8 kg
0
5
100.
15
20
• 260 mA 610 m
• 670 m
80 60 40 20 0C T 50
Figure 3. The mean CT50 for cotton strips insertedfor 14 days and 21 days at 3 plots on Gunung Silam,Sabah. Supporting information is given in Table 4
121
Several strips could not be buried to these depths2 Because the value for median TS did not differ from that of the field controls, the CT50 would be infinity. Only 21-day data were thereforeused in Figure 3
7 DiscussionOn Gunung Silam, a clear altitudinal trend in decompo-sition rates is lacking as the intermediate plot at 610 mhad the highest rates. The differences are greatestbetween the plots at 610 m and 870 m, and yet thelatitudinal difference is least between these 2 plots.Our 1983 data showed a similar pattern, in that thecotton strips lost TS more slowly at 870 m but therewas no clear difference in that year between theresults for 280 m and 610 m. *The causes of thedifferent rates (Table 4 & Figure 3) are probably com-plex. Some climatic factors (associated with the fre-quent cloud cap), such as solar radiation, changeabruptly above 610 m. The rainfall patterns are verydifferent between the summit and the lower parts ofthe mountain, and the former receives less rainfall (atleast during much of July-September 1983 and 1984).The tree family composition at 870 m (Table 1) con-trasts with those of the other 2 plots, and there islikely to be an important difference in litter qualitywhich results in the observed slower rates of de-
122
composition of the cotton strips and the accumulationof mor humus there. Leakey and Proctor (1987) haveshown that the soil invertebrate biomass is muchlower at 870 m (1.5 g m-2 alcohol wet weight) thanat 610 m (4.5 g rn-2) or 280 m (7.1 g m-2). Earthwormsaccounted for only 0.3% of the biomass at 870 rn,18% at 610 rn and 85% at 280 m. These differencesmust reflect substrate quality, but are difficult to rec-oncile with the high rate of decomposition at 610 rn.The lower plots are less acid and more calcareousthan that at 870 rn, and the distinctly calcareous plotat 610 m may favour a more active soil microflora.However, there is a higher mean loss-on-ignition(Table 3) at 610 rn than 280 m. The results supportthe hypothesis that relatively low decomposition rates(and hence release of nutrients by mineralization) arelikely to occur at higher altitudes on tropical moun-tains. The importance of this slower process on forestsi.idiiiuw di wilipusitiuil iieeti further investigallori,and it is apparently not the explanation of the substan-tial differences in forest stature between the plots at280 m and 610 m. The cotton strip assay is seen tobe a useful preliminary tool for investigating forestchanges on mountains, and has led to the suggestionthat, even along a forest continuum, the causes of thechanges may differ from one part to another. Theassay serves as a guide for the more detailed workwhich is a prerequisite for a full explanation of rain-forest altitudinal zonation.
8 AcknowledgementWe are grateful to the Sabah Government for per-mission to work in their State, and to the Sabah ForestDepartment for their help and encouragementthroughout. Datuk HJ KM Mastan and Mr T C Liew,
in particular, are thanked for their support. We thankITE Merlewood for the use of the TS testing facilities.
9 ReferencesFox, J.E.D. 1978. The natural vegetation iof Sabah. Malaysia. 1.
The physical environment and classification. Trop. EcoL, 19, 218-239.Grubb, P.J. 1971. Interpretation of the 'Massenerhebung' effecton tropical mountains. Nature, Lond., 229, 44-45.Grubb, P.J. 1977. Control of forest growth and distribution on wettropical mountains with special reference to mineral nutrition. Ann.Rev. Ecol. Syst., 8, 83-107.Hill, M.O., Latter, P.M. & Bancroft, G. 1985. A standard curve forinter-site comparison of cellulose degradation using the cotton stripmethod. Can. J. Soil Sci., 65, 609-619.Ineson, P., Bacon, P.J. & Lindley, D.K. 1988. Decomposition ofcotton strips in soil: analysis of the world data set. In: Cotton stripassay: index of decomposition in soils, edited by A.F. Harrison,P.M. Latter & D.W.H. Walton, 155-165. (ITE symposium no. 24.)Grange-over-Sands: Institute of Terrestrial Ecology.Latter, P.M. & Howson, G. 1977. The use of cotton strips toindicate ceiiuiose uecuiriposiiluii iii ih ukJ. Pedobiologia, 17, 145-155.Leakey, R.J.G. & Proctor, J. 1987. Invertebrates in the litter andsoil at a range of altitudes on Gunung Silam, a small ultrabasicmountain in Sabah. J. trop. Ecol., 3, 119-129.Lindley, D.K. & Howard, D.M. 1988. Some statistical problems inanalysing cotton strip assay data. In: Cotton strip assay: an indexof decomposition in soils, edited by A.F. Harrison, P.M. Latter &D.W.H. Walton, 25-27. (ITE symposium no. 24.) Grange-over-Sands:Institute of Terrestrial Ecology.Proctor, J. & Woodall, S.R.J. 1975. The ecology of serpentinesoils. Adv. ecol. Res., 9, 255-366.Proctor, J., Lee, Y.F., Langley,.A.M., Munro, W.R.C. & Nelson,T. 1988a. Ecological studies on Gunung Silam, a small ultrabasicmountain in Sabah. I. Environment, forest structure and floristics.J. Ecol. In press.Proctor, J., Phillipps, C., Duff, G.K., Heaney, A. & Robertson,F.M. 1988b. Ecological studies on Gunung Silam, a small ultrabasicmountain in Sabah. II. Some forest processes. J. Ecol. In press.

Decomposition rates in the ericaceous belt of MountAberdare, KenyaH COLLINS', H GITAY2, E SCANDREW and T PEARCE''Department of Soil Science, University of Aberdeen, Aberdeen2Department of Microbiology & Botany, University of Aberystwyth, Aberystwyth3Hill Farming Research Organisation, Penicuik'Department of Plant Science, University of Aberdeen, Aberdeen
1 SummaryCotton strip decomposition rates were measured for7 sites, at 3000-4000 m altitude, in the ericaceousbelt of Mount Aberdare, Kenya.
Sites at lower altitudes (3100 m), estimated to havebeen undisturbed for the longest periods of time,showed a significantly greater rate of cellulose de-composition in the upper 8 cm of the soil than at adepth of 8-16 cm. Other sites did not show this trend.
There was no significant correlation between cellu-lose decomposition rates and soil concentrations ofnitrogen (N), phosphorus (P), potassium (K), iron (Fe) ormagnesium (Mg), although the relationship betweendecomposition rates and soil nitrogen in the upper 8cm of the soil merited further investigation. Neitherwas there any significant correlation between cellu-lose decomposition rates and soil organic matter, orsoil pH.
2 IntroductionThe mountains of East Africa form a series of 'islands'of high altitude (>3000 m) in an otherwise tropicalplateau at 1000-2000 m. Because of their relativeisolation, they form a distinct group, with characteristicvegetation and a high degree of endemism, 81% atthe species level (Hedberg 1961). Climatic featuresare important in creating this characteristic vegetation,especially the low temperatures (ground frost everynight in most areas during the period of investigation),large diurnal temperature variations (up to 42°C rec-orded), large variations in monthly rainfall (an averageof 19 mm in the driest month, 213 mm in the wettestmonth) and a 12-hour day.
Mount Aberdare comprises a range of rolling hills at3000-4000 m above sea level (asl), with 2 peaks atthe north and south ends (Sattima 4100 m; Kinangop4231 m). The zonation at this altitude is complex, with2 zones recognized (Hedberg 1951); the moorlandshrub zone, consisting of tussock grassland with scat-tered shrubs and trees, and the ericaceous zone, domi-nated by arborescent and shrubby bushes of 4 generawhich have an ericoid habit (Erica, Philippia, Stoebeand Cliffortia.)
The purpose of the study was to determine patternsin the vegetation of the ericaceous zone, and to at-tempt to assess the effect of various factors (both
123
climatic and edaphic) on the zonation of the area. Oneof the soil parameters investigated was the rate ofcellulose decomposition by the cotton strip assay(Latter & Howson 1977).
3 Site descriptionsSite 1: a gentle, south-facing slope, altitude 3100 masl, with a stand of degenerate Cliffortia woodland(canopy closed, height 4 m), and a full ground coverof forbs and grasses. Estimated age of community —50 years.Soil — clay, dark reddish brown, deep, well-developedcrumb above, massive below. Mottles of sesquioxidesin upper horizons. pH 5.4.Soil group, humic andosol.
Site 2A: the steep S/SW-facing slope of a streamgully, 3100 m asl, 16 m above stream bed, with astand of mature Philippia woodland (canopy closed,height 8 m). Ground cover of mosses, grasses andforbs. Estimated age of community — 50 years.Soil — clay, reddish brown, moderately deep, well-developed crumb above, massive below. Ferric hor-izon at 19-25 cm depth. pH 5.8Soil group, humic andosol.
Site 2B: the S/SW-facing steep slope of a streamgully, 3100 m asl, 14 m below site 2A, with a standof mature degenerate Philippia woodland (canopy clo-sed, height 8 m) and a full ground cover of forbs andgrasses. This site showed signs of regular disturbanceby buffalo and other animals. Estimated age of com-munity — 50 years.Soil — silty clay loam, black to brown below, gleyedtrachytic tuff below 100 cm, well-developed crumbabove, weak crumb below. Mottles of sesquioxides.pH 5.2.Soil group, humic andosol.
Site 3: a moderately steep, E/SE-facing exposed slopeat 3500 m asl, with a stand of young Cliffortia andStoebe (open canopy, bush height 0.5 m) and a groundcover of tussocky grasses. Evidence of recent burning.Estimated age of community — 2 years.Soil — humic clay, brownish black, strongly developedcrumb, strongly weathered trachyte below 90 cmdepth. pH 5.7.Soil type, dystric histosol.

124
Site 4A: the upper slope of a moderately steep west-facing valley, 3100 m asl, with mature Philippiawood-land (canopy closed, height 14 m) and a full groundcover of forbs and grasses. Estimated age of com-munity — 200 years.Soil — clay loam, dark reddish brown, deep, well-developed crumb, streaks of iron in upper horizons.pH 5.3.Soil group, humic andosol.
Site 4C: the crown of a slope, 3100 m asl, 10 mabove site 4A with mature/degenerate Stoebe/Phillipiawoodland (canopy open, height 1 m) and incursion ofSt John's wort (Hypericum), bamboo (Bambusa) andClutea.Estimated age of community — 200 years.Soil — silt loam, brownish black to reddish, brownbelow, deep, well-developed crumb, streaks of ferricmaterial in upper horizons. pH 5.2.Soil group, h1urnic, anclosol.
Site 5: an east-facing moderate slope at the base ofa basalt scarp, 4000 m asl, with a stand of youngStoebe (canopy closed, height 1 m) and a groundcover of grasses and few herbs. Estimated age ofcommunity — 4 years.Soil — peat above to peat loam below, reddish black,strong crumb, trachyte bedrock below 100 cm depth.pH 5.4.Soil group, dystric histosol.
4 MethodThe period of study was January–March 1985, duringone of the 2 annual dry seasons. Five main sites werechosen for investigation, and decomposition rateswere determined for a total of 7 subsites.
The sites each measured 750 cm2, and cotton strips(4 cm x 20 cm) were inserted randomly over the siteto a depth of 16 cm below the litter layer. Strips wereremoved after 6 weeks, air dried and returned toBritain. The top section of the strips, which had beenin the litter layer, were removed. The strips were thencut in half to correspond to 0-8 cm soil depth and 8–16 cm soil depth, and tensile strength was measuredat the Institute of Terrestrial Ecology's MerlewoodResearch Station, using a tensometer (Latter & How-son 1977). Field controls were performed by insertingstrips and removing them immediately at the timeof removal of test strips. These then underwent alltreatments performed on the test strips.
Total concentrations of selected ions in soils (N, P, K,Mg, Fe) were determined by sulphuric/perchloric aciddigestion (Cresser & Parsons 1979), and results wereconfirmed for N by performing Kjeldahl digestions onrandom soil samples (Hanna 1964). Organic mattercontent was determined by weight loss-on-ignition at375°C (Ball 1964). pH was determined by diluting freshsurface soil samples 1:3 with distilled water, andinserting a digital pH meter for readings after 15 min-utes.
Soils were classified according to the FAO/UNESCOsystem, as used by the Kenya Soil Survey (1982).
5 Results and discussionTensile strength loss (CTSL) of cotton strips is as-sumed to be caused by microbial decomposition ofcellulose fibres, and therefore is taken as a generalindicator of the potential for cellulose decompositionin the soil.
The CTSL values (Figure 1) were examined by one-way analysis of variance (ANOVA) of pooled results,using site and depth as constants, but no significantdifference was found between CTSL results at differ-ent depths or at different sites. However, based ontree girth and species composition, 4 sites (1A, 2A,4A, 4C) were considered to have been undisturbed fora long period of time. On these sites, the CTSL at the0-8 CM depth was slyililicariiiy highei iiiaii di. il ie 8–16 cm depth (P<0.01). By contrast, site 3, at 3500 masl, recently burnt and very exposed, showed signifi-cantly lower cellulose decomposition in the surfacesoil than at the lower depth (P<0.01).
100
75
VI 50
25
0
0- cm
8-16 cm
4A 1 28 5 4C 3 2A
S I be numbers
Figure 1. Tensile strength loss (CTSL) at the 7 sites(n = 5)
Sites 2B (2 m above a stream, and regularly disturbedby buffalo) and 5 (at 4000 m asl, but relatively unex-posed to climatic extremes) both showed no signifi-cant difference in decomposition rates between the 2soil depths.
The 3 sites with the greatest decomposition rates inthe top 8 cm of soil (1, 2B and 4A) were all closed-canopy woodland sites which experienced the leastdiurnal temperature fluctuation of all sites (tempera-tures never falling to below 2°C or rising above 25°C),and all had a rich ground flora of forbs. This findingconcurs with the observation that enzymic activities

100
75
505
4C
• 325
0
100
75
50
25
0
0
•
1
•2A
•
• 1
2A
5 10
Canopy height (m)
Figure 2. The relationship between tensile strengthloss in the top 8 cm and canopy height at the 7 sites
in soils may be negatively related to the temperaturerange of sites, ie the highest activities occur wherethere is least extreme variation in temperature (Speir1977).
There appeared to be an association between CTSLin the surface region and canopy height (Figure 2, r =0.613), with the exception of site 2A which is in astream gully. There also appeared to be a trend ofincreasing cellulose decomposition rates with increas-ing soil N levels in the upper 8 cm of the soil (Figure3, r = 0.620); however, this relationship was notstatistically significant if data from sites 4A and 1 wereincluded. It is suggested that this aspect would benefitby further investigation. There was no significant corre-lation between decomposition rates and soil nitrogen0-8 cm depth
•4C •5
•3
0.6 0.8 1.
Total nitrogen (%)
levels in the lower 8 cm depth (Figure 3) or betweencellulose decomposition rate and total soil P. K. Fe,
• 4A organic matter content, or soil pH.
Because of the wide annual climatic variation in the• 28 area of study, it was not possible to predict annual
cellulose decomposition rates from the present lim-ited data. Results showed that the rate of cellulosedecomposition did vary both within and between sites,but the reasons for this variation are unclear. It mustbe noted that cellulose decomposition rates, as deter-mined by cotton strip assay, do not necessarily reflectoverall microbial decomposition rates in soils.
• 4A
6 AcknowledgementsThis work was carried out as part of the Aberdeen/Aberystwyth Expedition to the Aberdares, Kenya. Weacknowledge all sponsors for their financial support,
15 and the Institute of Terrestrial Ecology's MerlewoodResearch Station for assistance in the present study.
•213
7 ReferencesBall, D.F. 1964. Loss-on-ignition as an estimate of organic matterand organic carbon in non-calcareous soils. J. Soil Sci., 15, 84-92.Cresser, M.S. & Parsons, J.W. 1979. Sulphuric-perchloric aciddigestion of plant material for the determination of N. P. K, Ca andMg. Analytica chim. Acta, 109, 431-436.Hanna, W.J. 1964. Methods of chemical analysis in soils. In:Chemistry of the soil, edited by F.E. Bear, 474-502. 2nd ed. NewYork: Reinhold.Hedberg, 0. 1951. Vegetation belts of the East African mountains.Svensk bot. Tidskr.,45, 140-202.Hedberg, 0. 1961. The phytogeographical position of the Afroalpineflora. Recent Adv. Bot., 1, 914-919.Kenya Soil Survey. 1982. Exploratory soil survey report no. El.Nairobi: Kenya Soil Survey.Latter, P.M. & Howson, G. 1977. The use of cotton strips toindicate cellulose decomposition in the field. Pedobiologia,17, 145-155.Speir, T.W. 1977. Studies on a climosequence of soils in tussockgrasslands. II. Urease, phosphatase, and sulphatase activities oftopsoils and their relationships with other properties including plantavailable sulphur. N.Z. JI Sci., 20, 159-166.
8-16 cm depth
125
1.2 1.4 0.6 0.8 1. 1.2 1.4
Total nitrogen (%)
Figure 3. The relationship between tensile strength loss and total nitrogen at the 7 sites

126
Polar
Cotton strip decomposition in relation to environmentalfactors in the maritime AntarcticD D WYNN-WILLIAMSBritish Antarctic Survey, Cambridge
1 SummaryPotential cellulose decomposition in moss peat, me-asured as tensile strength loss (CTSL) of cotton stripsinserted in the peat profile, was examined along alatitudinal transect in the maritime Antarctic. CTSLduring a whole year at Signy Island (60°S), GalindezIsland (65°S) and Rothera Point (68°S) was assessedreiaiive Lu adaphic and rnicrodirriatic conditions. Oc-casional increases in tensile strength emphasized theimportance of field controls. The pattern of CTSL downthe profile varied between moss turves and carpets,and between sites. The increase in CTSL with depthin Polytrichum peat at Signy Island contrasted with asimilar turf at Galindez Island and other tundra sites.Of the edaphic variables, nitrogen (N) and calcium(Ca) availability were probably contributory to CTSLlimitation, along with extremes of pH, peat watercontent and associated anaerobiosis in stagnant con-ditions. However, the factor which appeared to explainCTSL differences between sites along the transectwas sunshine and its associated ground-heating ef-fect. This was the only variable evidently accountablefor the high CTSL in the surface Drepanocladus peatat Rothera Point.
2 IntroductionThe rate of moss peat decomposition at Signy Island,South Orkney Islands, Antarctica, is slow (Davis 1981),and results in the accumulation of peat in deep banksin drier localities (Fenton 1980) and in shallower car-pets in wetter areas (Collins 1976). Measurement ofthe weight loss of autochthonous moss tissue in litterbags inserted in Signy Island moss peat is too slow(2-3% in 2 yr) to provide a sufficiently sensitive assayto detect seasonal and inter-species differences indecomposition rate (Davis 1986). However, the mosstissue contains 39-47% (dry wt) holocellulose, de-creasing with depth in the peat profile (Davis 1986).Measurement of the decomposition of moss cellu-lose, therefore, provides a method for investigatinga major aspect of peat accumulation. However, thenatural cellulose of plant cell walls differs both inphysical structure and chemical integrity with othercellular components from the crystalline nature ofprocessed textiles such as cotton (Sagar 1988; Ho-ward 1988). Nevertheless, the method of Latter andHowson (1977) for determining tensile strength lossof cotton strips inserted in the peat profile is appropri-ate for comparing the influences of different factorson the decomposition of the natural analogue underfield conditions.
Despite the artificial nature of processed cotton cellu-lose, its field degradation at Signy Island (Heal et al.1974; Wynn-Williams 1980) parallels measurementsof moss tissue decomposition in litter bags (Baker1972; Collins 1976; Fenton 1978; Davis 1986). There-fore, the cotton strip assay was chosen for the presentinvestigation to compare the influence of moisture,tompercturc and othor micrcc!imatic and edaphic fac-tors on potential cellulose decomposition at a rangeof sites in the maritime Antarctic in the summers of1977-78 and 1980-81. This study paralleled investi-gations of peat respiration (Wynn,Williams 1984) andthe microbiology of peat and mineral fellfield soils(Wynn-Williams 1985a).
3 Study sitesTwo communities were studied at Signy Island, onea moss turf (SIRS 1) dominated by Polytrichum alpe-stre and Chorisodontium aciphyllum, and the other amoss carpet (SIRS 2) dominated by Drepanocladusuncinatus, Calliergon sarmentosum, Calliergidium au-stro-stramineum and Cephaloziella varians (Collins etal. 1975). Polytrichum and Drepanocladus communi-ties occurred in the maritime Antarctic on a transectfrom 54°S to 68°S.
SIRS 1 and SIRS 2 have been described by Tilbrook(1973) and Collins et al. (1975). The physical andedaphic characteristics of these Signy Island sites andthose for comparison near Faraday Station on GalindezIsland and at Rothera Point (Figure 1) are given inTable 1. The Polytrichum moss turf on Galindez Islandwas on a gentle south-west slope at the base of ascree on Woozle Hill. The Drepanocladus carpet wasin a wet runnel between these Polytrichum turves,close to the shoreline. The depth of peat underlyingthe Polytrichum turf and Drepanocladus carpet was300 mm and 150 mm respectively.
At Rothera Point, where Polytrichum was absent, theDrepanocladus carpet was located in the west-facingcatchment area of a small stream, at the foot of asnowfield 75 m from the British Antarctic Survey (BAS)research station. The peat depth was 30-40 mm.
4 MethodThe procedures for insertion, retrieval and treatmentof cotton strips are described in Latter and Howson(1977) and Wynn-Williams (1980). At least 10 replicatecotton strips were inserted vertically into the peatprofile to a maximum depth of 180 mm. However,

Characteristic
f TSouth America .ierra del Fuego t
, ic=. I_,....1 ic CONVERGE-A, tvoNIA___-----__, PiCE- ti_.. - _ _ ,.....
.0
. 0-, i to4
So
6 00 S ei*- - -
- -- 0+
sco'x'covi0. °•
•'
k7.Galindez Is to /Pez. •
1:" Ir
Rothertfir LarsenPt Ice She 1 f
Falkland Islands
Southern Ocean
-,10
-, -, -, „0 f?. -- ---50e0 .. 0 ..,Signy Is „„
A -..South Orkney Island --..
N..-...
'..
Table 1. Habitat characteristics of the cotton strip insertion sites. Gravimetric data are expressed on a dry weight basis
Figure 1. Map showing the location of the 3 cotton strip assay sites at BAS research stations (•)
Mineral nutrient and LOI data from adjacent Uruguay Is2 1977-783 1981-824 Including green shoots5 With depth (* P<0.05, ** P<0.01) for the whole growing season6 At time of insertion of strips (February-March), depth 1-3 cm
Davis (1986)NA, not available
Weddell Sea
Moss carpet communitiesIs Is'
1233+0.053.11
SouthGeorgia
67443'S106c.7103
1150±141(4)
South • 0
Sandwich
Island
•
0. •
`100 •5'
Moss turf communities
Drepanocladus30-80
9001162
1295.187
3.312.353
9.5120220
127

128
many were pulled out by skuas (Catharacta skua)during the summer. Determination of CTSL of sub-strips from defined depths down to 120 mm wasmade relative to both cloth controls and separate fieldcontrols for each community. The latter were removedimmediately after insertion and treated in the samemanner as test strips. At Signy Island in 1977-78,substrips were 20 mm wide from 10-30 mm belowthe moss surface (ie immediately below the greenshoot layer) and 25 mm wide from each of the 6 lowerdepths. At the other sites, all substrips were cut 20mm wide throughout the profile. All measurementsof tensile strength (TS) were made at 100% relativehumidity (RH), except for those strips from Signy Is-land in 1977-78, tested at 80% RH. TS data wereadjusted for 100% RH and were converted to percent-ages of field control TS. This procedure enabled thecomparison of data (n = 11) for unbleached calico (TS± SE = 19.00 ± 0.10 kg cm-'), used at Signy Islandin 1977-78, with the Shirley Soil Burial Test Fabric(Walton & Allsopp 1977) used in 1980-81 (TS ± SE= 24.08 ± 0.26 kg cm-1, n = 19).
The TS of field controls differed significantly (P<0.01)from cloth controls, but there was no significant differ-ence within pooled field control strips from Polytri-chum, Chorisodontium, Calliergon and Cephaloziellastands, so an overall mean ± SE of 17.52 ± 0.35 kgcm-1 (n = 23) was used previously (Wynn-Williams1980, 1985a). However, to standardize the resultsthroughout the transect, field data were calculatedrelative to mean TS values for each equivalent horizonfield control. Of these field controls, the only signifi-cant differences were between Chorisodontium andboth Polytrichum (P<0.05) and Cephaloziella(P<0.01), and between Calliergon and Cephaloziella(P<0.05). The use of separate field controls gavemore sensitive measures of significance than thoseobtained using the overall mean field control value(Wynn-Williams 1980, 1985a), but the trends weresimilar.
Removal of strips by skuas from the Chorisodontiumcommunity in summer necessitated the extrapolationof spring data (74 d only) and adjustment for theconsequent overestimation of CTSL rate by an empiri-cal factor of 1.9 derived from a sole remaining strip.
5 Meteorological and edaphic dataData for mean air temperature and insolation wereobtained from the BAS Meteorological Section (D WLimbert pers. comm.). Details of microclimate moni-toring at Signy Island are described in Walton (1982).The duration of thawed conditions was monitored atSigny Island and interpolated from meteorologicaldata at Galindez Island and Rothera Point.
Peat moisture content and pH (1:1 dilution) weredetermined at the time of strip insertion (February1977 at Signy Island and March 1981 at GalindezIsland and Rothera Point), and were typical of summer
conditions (Wynn-Williams 1980, 1984). Redox con-ditions were assessed using silver-plated brass stripsinserted vertically in the peat profile (Wynn-Williams1980) and by platinum wire electrodes at SIRS 2, SignyIsland (Yarrington & Wynn-Williams 1985). Chemicalanalyses of soil were carried out at the Institute ofTerrestrial Ecology's Merlewood Research Station,using standard procedures (Allen et al. 1974).
6 Results6.1 Habitat conditions (Table 1)The duration of the 1981-82 summer thaw shows thatthe relative length of growing season at each site isnot dependent on latitude alone. As the thaw generallyproceeds downwards in the profile, the period of thawis somewhat shorter at lower depths, so that CTSL ofstrips may be underestimated there. The mean airtemperatures are based on monthly data from Novem-ber to February at each site. There was a iarge differ-ence in total annual insolation between the sites.However, for much of the year, there was extensivesnow cover and the heating of the moss surfaceis negligible. During summer, after the ground hadthawed, snow cover was sporadic and thin, so thatincident radiation was more likely to reach the surface.The mean daily insolation during this thawed periodwas, therefore, a better indication of ground heatinglikely to influence cellulose decomposition near thesurface. Integrated degree-day temperature data forpeat profiles were only available for Signy Island (Wal-ton 1977, 1982).
In spring at Signy Island, there was a significant in-crease in percentage moisture in Polytrichum standswith increasing depth of peat (r = 0.95, P<0.005 in1975, and r = 0.99, P<0.001 in 1976). However, thistrend gradually reversed during summer to becomestatistically insignificant. In Calliergon and Drepan-ocladus stands at Signy Island, there was an apparentdecrease in percentage moisture with increasingdepth, which was due to the consistently high watercontent and increasing bulk density with depth. Thetrend was most pronounced in spring (r = -0.99,P<0.02). Peat pH changed seasonally in both com-munities at Signy Island, although SIRS 2 was alwaysless acid than SIRS 1 (Wynn-Williams 1985b, c).
Total N was consistently more abundant in mosscarpets than turves, although extractable NO2- + NO3-N and NH4-N was variable between sites and stands(Table 1). The overall range of extractable phosphate(PO4-P) in moss peat from this sub-antarctic and antarc-tic region was extreme, being from 2.3 mg 100 g-1 inCalliergon peat at South Georgia to 1500 mg 100 g--1in Drepanocladus peat influenced by a large penguin(Pygoscelis papua) rookery on the Dion Islands (68°S)(R I Lewis Smith unpubl.). Amounts of NO2- + NO3-Nat Signy Island increased with depth in Polytrichumand decreased gradually in Drepanocladus peat, whilePO4-P decreased in both stands. Ca increased withdepth in all communities.
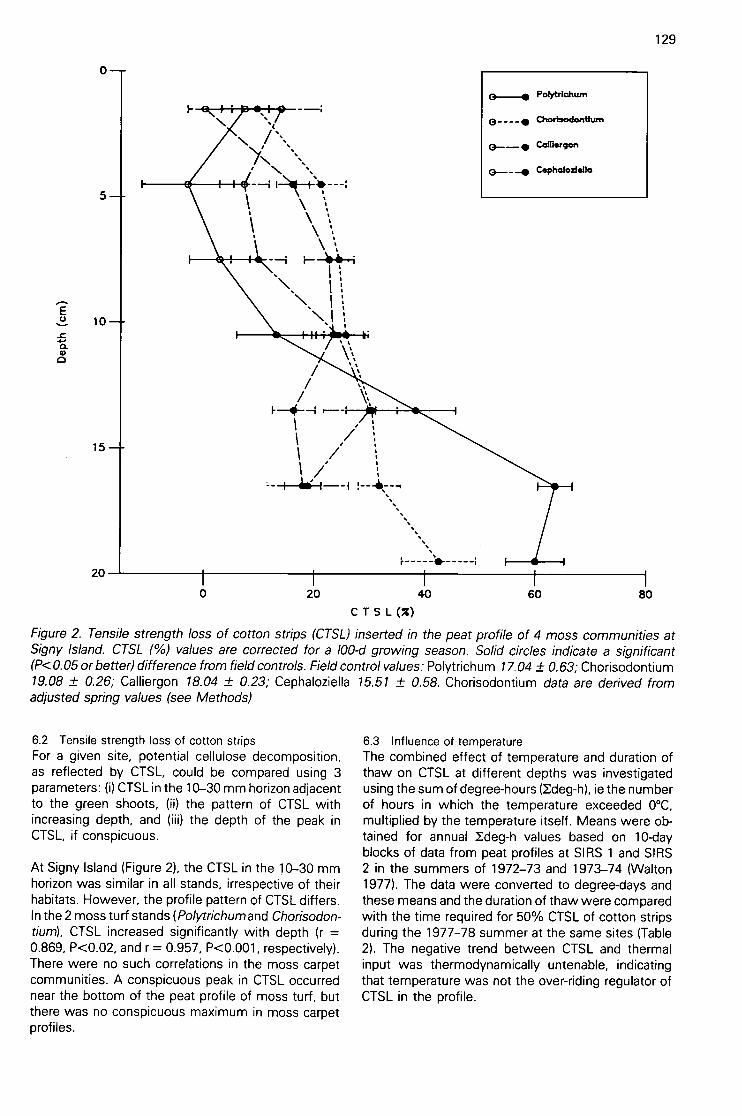
0
20
0 20 40 60 80
CTSL (z)
Figure 2. Tensile strength loss of cotton strips (CTSL) inserted in the peat profile of 4 moss communities atSigny Island. CTSL (%) values are corrected for a 100-d growing season. Solid circles indicate a significant(P<0.05 or better) difference from field controls. Field control values: Polytrich um 17.04 ± 0.63; Chorisodonti um19.08 ± 0.26; Calliergon 18.04 ± 0.23; Cephaloziella 15.51 ± 0.58. Chorisodontium data are derived fromadjusted spring values (see Methods)
6.2 Tensile strength loss of cotton stripsFor a given site, potential cellulose decomposition,as reflected by CTSL, could be compared using 3parameters: (i) CTSL in the 10-30 mm horizon adjacentto the green shoots, (ii) the pattern of CTSL withincreasing depth, and (iii) the depth of the peak inCTSL, if conspicuous.
At Signy Island (Figure 2), the CTSL in the 10-30 mmhorizon was similar in all stands, irrespective of theirhabitats. However, the profile pattern of CTSL differs.In the 2 moss turf stands (Polytrichumand Chorisodon-tium), CTSL increased significantly with depth (r =0.869, P<0.02, and r = 0.957, P<0.001, respectively).There were no such correlations in the moss carpetcommunities. A conspicuous peak in CTSL occurrednear the bottom of the peat profile of moss turf, butthere was no conspicuous maximum in moss carpetprofiles.
•
Polytrichurn
•
Chorisodentfum
0-- • CaMeriten
•
Cephaloziella
129
6.3 Influence of temperatureThe combined effect of temperature and duration ofthaw on CTSL at different depths was investigatedusing the sum of degree-hours (Edeg-h), ie the numberof hours in which the temperature exceeded 0°C,multiplied by the temperature itself. Means were ob-tained for annual Edeg-h values based on 10-dayblocks of data from peat profiles at SIRS 1 and SIRS2 in the summers of 1972-73 and 1973-74 (Walton1977). The data were converted to degree-days andthese means and the duration of thaw were comparedwith the time required for 50% CTSL of cotton stripsduring the 1977-78 summer at the same sites (Table2). The negative trend between CTSL and thermalinput was thermodynamically untenable, indicatingthat temperature was not the over-riding regulator ofCTSL in the profile.
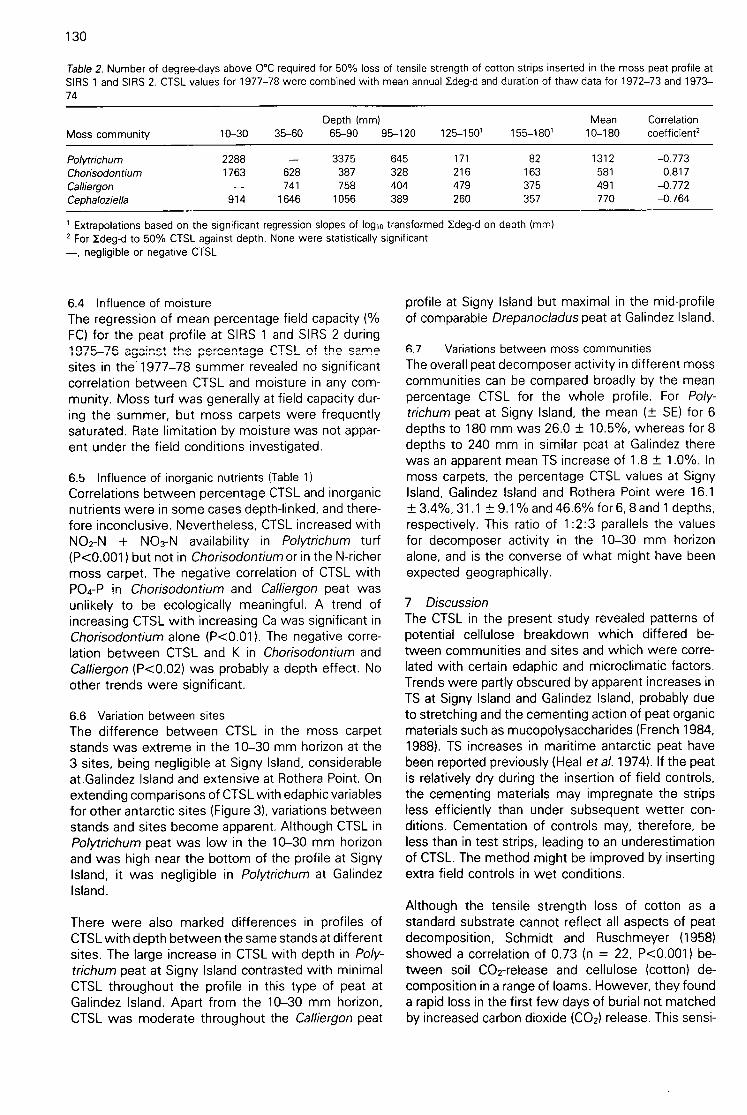
130
Table 2. Number of degree-days above 0°C required for 50% loss of tensile strength of cotton strips inserted in the moss peat profile atSIRS 1 and SIRS 2. CTSL values for 1977-78 were combined with mean annual Edeg-d and duration of thaw data for 1972-73 and 1973–74
Moss community
PolytrichumChorisodontiumCalliergonCephaloziella
Depth (mm) Mean Correlation10-30 35-60 65-90 95-120 125-1501 155-1801 10-180 coefficient2
22881763
914
628741
1646
3375387758
1056
Extrapolations based on the significant regression slopes of loglo transformed Edeg-d on depth (mm)2 For Ideg-d to 50% CTSL against depth. None were statistically significant—, negligible or negative CTSL
6.4 Influence of moistureThe regression of mean percentage field capacity (%FC) for the peat profile at SIRS 1 and SIRS 2 during"19-7 T'6, agoin.st the per^-r.t.gc. rTql "f th.osites in the 1977-78 summer revealed no significantcorrelation between CTSL and moisture in any com-munity. Moss turf was generally at field capacity dur-ing the summer, but moss carpets were frequentlysaturated. Rate limitation by moisture was not appar-ent under the field conditions investigated.
6.5 Influence of inorganic nutrients (Table 1)Correlations between percentage CTSL and inorganicnutrients were in some cases depth-linked, and there-fore inconclusive. Nevertheless, CTSL increased withNO2-N + NO3-N availability in Polytrichum turf(P<0.001) but not in Chorisodontiumor in the N-richermoss carpet. The negative correlation of CTSL withPO4-P in Chorisodontium and Calliergonpeat wasuniikely to be ecologically meaningful. A trend ofincreasing CTSL with increasing Ca was significant inChorisodontiumalone (P<0.01). The negative corre-lation between CTSL and K in ChorisodontiumandCalliergon(P<0.02) was probably a depth effect. Noother trends were significant.
6.6 Variation between sitesThe difference between CTSL in the moss carpetstands was extreme in the 10-30 mm horizon at the3 sites, being negligible at Signy Island, considerableat Galindez Island and extensive at Rothera Point. Onextending comparisons of CTSL with edaphic variablesfor other antarctic sites (Figure 3), variations betweenstands and sites become apparent. Although CTSL inPolytrichum peat was low in the 10-30 mm horizonand was high near the bottom of the profile at SignyIsland, it was negligible in Polytrichum at GalindezIsland.
There were also marked differences in profiles ofCTSL with depth between the same stands at differentsites. The large increase in CTSL with depth in Poly-trichum peat at Signy Island contrasted with minimalCTSL throughout the profile in this type of peat atGalindez Island. Apart from the 10-30 mm horizon,CTSL was moderate throughout the Calliergonpeat
645328404389
171 82216 163479 375260 357
profile at Signy Island but maximal in the mid-profileof comparable Drepanocladuspeat at Galindez Island.
6.7 Variations between moss communitiesThe overall peat decomposer activity in different mosscommunities can be compared broadly by the meanpercentage CTSL for the whole profile. For Poly-trichum peat at Signy Island, the mean (± SE) for 6depths to 180 mm was 26.0 ± 10.5%, whereas for 8depths to 240 mm in similar peat at Galindez therewas an apparent mean TS increase of 1.8 ± 1.0%. Inmoss carpets, the percentage CTSL values at SignyIsland, Galindez Island and Rothera Point were 16.1± 3.4%, 31.1 ± 9.1% and 46.6% for 6, 8 and 1 depths,respectively. This ratio of 1:2:3 parallels the valuesfor decomposer activity in the 10-30 mm horizonalone, and is the converse of what might have beenexpected geographically.
7 DiscussionThe CTSL in the present study revealed patterns ofpotential cellulose breakdown which differed be-tween communities and sites and which were corre-lated with certain edaphic and microclimatic factors.Trends were partly obscured by apparent increases inTS at Signy Island and Galindez Island, probably dueto stretching and the cementing action of peat organicmaterials such as mucopolysaccharides (French 1984,1988). TS increases in maritime antarctic peat havebeen reported previously (Heal et al. 1974). If the peatis relatively dry during the insertion of field controls,the cementing materials may impregnate the stripsless efficiently than under subsequent wetter con-ditions. Cementation of controls may, therefore, beless than in test strips, leading to an underestimationof CTSL. The method might be improved by insertingextra field controls in wet conditions.
Although the tensile strength loss of cotton as astandard substrate cannot reflect all aspects of peatdecomposition, Schmidt and Ruschmeyer (1958)showed a correlation of 0.73 (n = 22, P<0.001) be-tween soil CO2-release and cellulose (cotton) de-composition in a range of loarns. However, they founda rapid loss in the first few days of burial not matchedby increased carbon dioxide (CO2) release. This sensi-

0
100
15
20
0 20
•
40 60 BO
Signy hdand
Polytrichum
e___ • Calliergoo
Genre:ha Island
A_A Poiytrichum
A Drepanoclodus
Rothera point
• Drepanododus
131
CTS L (%)
Figure 3. Tensile strength loss of cotton strips inserted for 100 d. Moss peat at Signy Island (1977-78), atGalindez Island and Rothera Point (1981-82). Solid circles indicate significant difference from field control(P<0.05 or less). Field control values: Signy Is, Polytrichum 17.04 ± 0.63, Calliergon 18.04 ± 0.23; GalindezIs, Polytrichum 22.63 ± 0.16, Drepanocladus 22.19 ± 0.23; Rothera Point, Drepanocladus 21.30 ± 0.65
tivity of the CTSL method is valuable for inter-sitecomparisons, and necessary at maritime antarcticsites where peat decomposition is slow (Davis 1986).
The low CTSL in the 10-30 mm horizon of Polytrichumpeat at Signy Island was first reported at a similar sitenearby (Hut Bank) in the 1970-71 growing season(Heal et al. 1974), and again in 1975-76 by Fenton(1978). This unusual feature, shared by Polytrichumpeat at Galindez Island, was in contrast to most othertundra sites of the International Biological Programme(IBP) (Baker 1974; Heal et al. 1974, 1981) and a Polytri-chum moss bank site at South Georgia (Smith & Wal-ton 1988; Walton 1985). This contrast persists in theprofile as CTSL tends to decrease with increasingdepth in arctic tundra peat, such as palsa peat at Kevo(r = —0.934, P<0.02) (Baker 1974), rather than reacha maximum at 160-180 mm as occurred here. Thisdepth-related increase was also observed at SignyIsland in 1970-71 and 1975-76, but not in 1978-79when CTSL was moderate near the surface (Davis1986), although it did increase markedly from the
mid-profile downwards. Caution is, therefore, requiredwhen generalizing from individual seasons because ofannual variations in climate.
Although temperature and moisture are fundamentalfactors for cellulose breakdown (Heal et al. 1974),their influence may be obscured by interactions withother rate-limiting variables. The conspicuous de-crease in Edeg-h down the peat profile at Signy Islandwas not paralleled by demonstrable changes in CTSL.The fact that CTSL near the surface was faster inChorisodontium than Polytrichum may be associatedwith a higher mean surface temperature due to itshummocky growth form (Baker 1972), because otherabiotic factors and nutrient levels were similar in bothturf species. Although the summer estimate of thepeat profile pattern for Chorisodontium extrapolatedfrom spring data was valid, absolute values of percent-age CTSL were tentative.
The moss turf moisture content rarely exceeded fieldcapacity and was probably near optimal for tundra
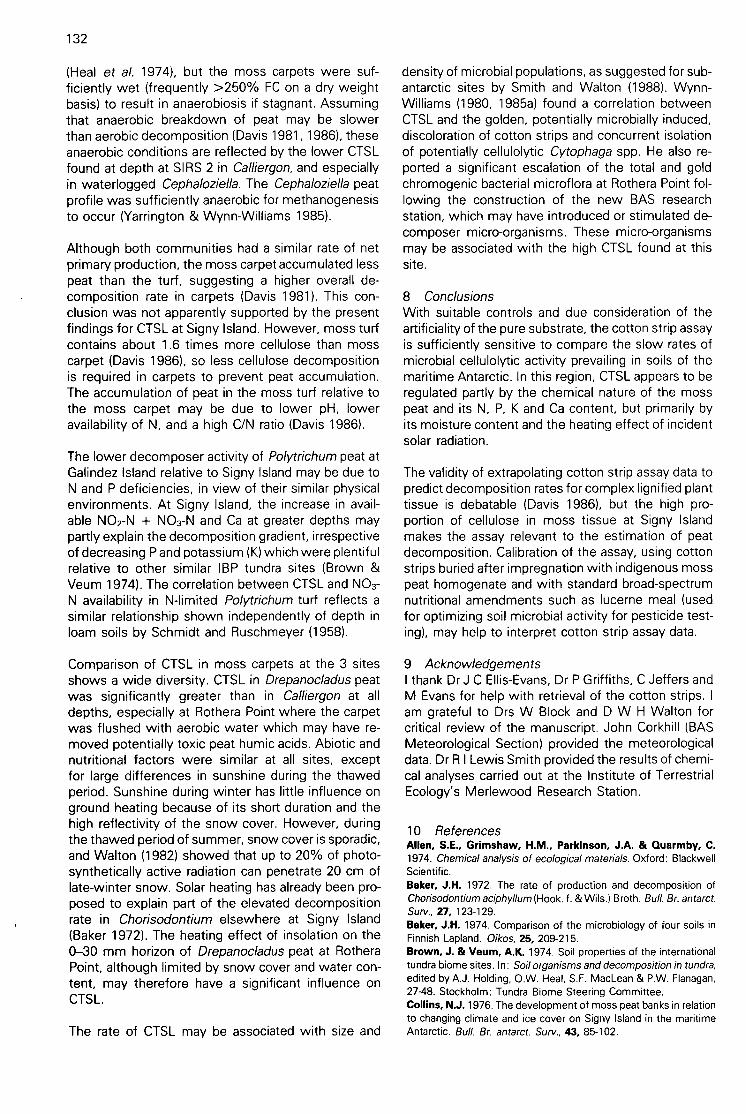
132
(Heal et al. 1974), but the moss carpets were suf-ficiently wet (frequently >250% FC on a dry weightbasis) to result in anaerobiosis if stagnant. Assumingthat anaerobic breakdown of peat may be slowerthan aerobic decomposition (Davis 1981, 1986), theseanaerobic conditions are reflected by the lower CTSLfound at depth at SIRS 2 in Calliergon,and especiallyin waterlogged Cephaloziella.The Cephaloziellapeatprofile was sufficiently anaerobic for methanogenesisto occur (Yarrington & Wynn-Williams 1985).
Although both communities had a similar rate of netprimary production, the moss carpet accumulated lesspeat than the turf, suggesting a higher overall de-composition rate in carpets (Davis 1981). This con-clusion was not apparently supported by the presentfindings for CTSL at Signy Island. However, moss turfcontains about 1.6 times more cellulose than mosscarpet (Davis 1986), so less cellulose decompositionis required in carpets to prevent peat accumulation.The accumulation of peat in the moss turf relative tothe moss carpet may be due to lower pH, loweravailability of N, and a high C/N ratio (Davis 1986).
The lower decomposer activity of Polytrichumpeat atGalindez Island relative to Signy Island may be due toN and P deficiencies, in view of their similar physicalenvironments. At Signy Island, the increase in avail-able NO2-N + NO3-N and Ca at greater depths maypartly explain the decomposition gradient, irrespectiveof decreasing P and potassium (K) which were plentifulrelative to other similar IBP tundra sites (Brown &Veum 1974). The correlation between CTSL and NO3-N availability in N-limited Polytrichum turf reflects asimilar relationship shown independently of depth inloam soils by Schmidt and Ruschmeyer (1958).
Comparison of CTSL in moss carpets at the 3 sitesshows a wide diversity. CTSL in Drepanocladuspeatwas significantly greater than in Calliergon at alldepths, especially at Rothera Point where the carpetwas flushed with aerobic water which may have re-moved potentially toxic peat humic acids. Abiotic andnutritional factors were similar at all sites, exceptfor large differences in sunshine during the thawedperiod. Sunshine during winter has little influence onground heating because of its short duration and thehigh reflectivity of the snow cover. However, duringthe thawed period of summer, snow cover is sporadic,and Walton (1982) showed that up to 20% of photo-synthetically active radiation can penetrate 20 cm oflate-winter snow. Solar heating has already been pro-posed to explain part of the elevated decompositionrate in Chorisodontium elsewhere at Signy Island(Baker 1972). The heating effect of insolation on the0-30 mm horizon of Drepanocladuspeat at RotheraPoint, although limited by snow cover and water con-tent, may therefore have a significant influence onCTSL.
The rate of CTSL may be associated with size and
density of microbial populations, as suggested for sub-antarctic sites by Smith and Walton (1988). Wynn-Williams (1980, 1985a) found a correlation betweenCTSL and the golden, potentially microbially induced,discoloration of cotton strips and concurrent isolationof potentially cellulolytic Cytophagaspp. He also re-ported a significant escalation of the total and goldchromogenic bacterial microflora at Rothera Point fol-lowing the construction of the new BAS researchstation, which may have introduced or stimulated de-composer micro-organisms. These micro-organismsmay be associated with the high CTSL found at thissite.
8 ConclusionsWith suitable controls and due consideration of theartificiality of the pure substrate, the cotton strip assayis sufficiently sensitive to compare the slow rates ofmicrobial cellulolytic activity prevailing in soils of themaritime Antarctic. In this region, CTSL appears to beregulated partly by the chemical nature of the mosspeat and its N, P, K and Ca content, but primarily byits moisture content and the heating effect of incidentsolar radiation.
The validity of extrapolating cotton strip assay data topredict decomposition rates for complex lignified planttissue is debatable (Davis 1986), but the high pro-portion of cellulose in moss tissue at Signy Islandmakes the assay relevant to the estimation of peatdecomposition. Calibration of the assay, using cottonstrips buried after impregnation with indigenous mosspeat homogenate and with standard broad-spectrumnutritional amendments such as lucerne meal (usedfor optimizing soil microbial activity for pesticide test-ing), may help to interpret cotton strip assay data.
9 AcknowledgementsI thank Dr J C Ellis-Evans, Dr P Griffiths, C Jeffers andM Evans for help with retrieval of the cotton strips. Iam grateful to Drs W Block and D W H Walton forcritical review of the manuscript. John Corkhill (BASMeteorological Section) provided the meteorologicaldata. Dr R I Lewis Smith provided the results of chemi-cal analyses carried out at the Institute of TerrestrialEcology's Merlewood Research Station.
10 ReferencesAllen, S.E., Grimshaw, H.M., Parkinson, J.A. & Quarmby, C.1974. Chemical analysis of ecological materials. Oxford: BlackwellScientific.Baker, J.H. 1972. The rate of production and decomposition ofChorisodontium aciphyllum (Hook. f. & Wils.) Broth. Bull. Br. antarct.Surv., 27, 123-129.Baker, J.H. 1974. Comparison of the microbiology of four soils inFinnish Lapland. Oikos, 25, 209-215.Brown, J. & Veum, A.K. 1974. Soil properties of the internationaltundra biome sites. In: Soil organisms and decomposition in tundra,edited by A.J. Holding, OW. Heal, S.F. MacLean & P.W. Flanagan,27-48. Stockholm: Tundra Biome Steering Committee.Collins, N.J. 1976. The development of moss peat banks in relationto changing climate and ice cover on Signy Island in the maritimeAntarctic. Bull. Br. antarct. Sum, 43, 85-102.

Collins, N.J., Baker, J.H. & Tilbrook, P.J. 1975. Signy Island,maritime Antarctic. In: Structure and function of tundra ecosystems,edited by O.W. Heal & T. Rosswall, 345-374. (Ecol. Bull. no. 20.)Stockholm: Swedish Natural Research Council.Davis, R.C.1981. Structure and function of two Antarctic terrestrialmoss communities. Ecol. Monogr., 51, 125-143.Davis, R.C.1986. Environmental factors influencing decompositionrates in two Antarctic moss communities. Polar BioL, 5, 95-103.Fenton, J.H.C. 1978. The growth of Antarctic moss peat banks.PhD thesis, University of London.Fenton, J.H.C. 1980. The rate of accumulation in Antarctic mossbanks. J. Ecol., 68, 211-228.French, D.D.1984. The problem of 'cementation' when using cottonstrips as a measure of cellulose decay in soils. Int. Biodeterior., 20,169-172.French, D.D. 1988. The problem of cementation. In: Cotton stripassay an index of decomposition in soils, edited by A.F. Harrison,P.M. Latter & D.W.H. Walton, 32-33. (ITE symPosium no. 24.)Grange-over-Sands: Institute of Terrestrial Ecology.Heal, 0.W., Howson, G., French, D.D. & Jeffers, J.N.R. 1974.Decomposition of cotton strips in tundra. In: Soil organisms anddecomposition in tundra, edited by A.J. Holding, 0.W. Heal, S.F.MacLean & P.W. Flanagan, 341-362. Stockholm: Tundra BiomeSteering Committee.Heal, 0.W., Flanagan, P.W., French, D.D. & MacLean, S.F. 1981.Decomposition and accumulation of organic matter. In: Tundraecosystems: a comparative analysis, edited by L.C. Bliss, J.B.Cragg, 0.W. Heal & J.J. Moore, 587-633. Cambridge: CambridgeUniversity Press.Howard, P.J.A.1988. A critical evaluation of the cotton strip assay.In: Cotton strip assay. an index of decomposition in soils, editedby A.F. Harrison, P.M. Latter & D.W.H. Walton, 34-42. (ITE sym-posium no. 24.) Grange-over-Sands: Institute of Terrestrial Ecology.Latter, P.M. & Howson, G. 1977. The use of cotton strips toindicate cellulose decomposition in the field. Pedobiologia, 17, 145-155.Sagar, B.F. 1988. The Shirley Soil Burial Test Fabric and tensiletesting as a measure of biological breakdown of textiles. In: Cottonstrip assay an index of decomposition in soils, edited by A.F.Harrison, P.M. Latter & D.W.H. Walton, 11-16. (ITE symposium no.24.) Grange-over-Sands: Institute of Terrestrial Ecology.
133
Schmidt, E.L & Ruschmeyer, O.R.1958. Cellulose decompositionin soil burial beds. I. Soil properties in relation to cellulose degra-dation. Appt Microbiot, 6, 108-114.Smith, M.J. & Watton, D.W.H. 1988. Cellulose decomposition infour subantarctic soils. Polar Biol. In press.Tilbrook. P.J. 1973. The Signy Island terrestrial reference sites. I.An introduction. BulL Br. antarct. Surv.. 33 & 34, 65-76.Walton, D.W.H. 1977. Radiation and soil temperatures 1972-74:Signy Island terrestrial reference site. (British Antarctic Survey datano. 1.) Cambridge: British Antarctic Survey.Watton, D.W.H. 1982. The Signy Island terrestrial reference sites:XV. Microclimate monitoring. 1972-74. Bull. Br. antarct. Surv., 55,111-126.Walton, D.W.H. 1985. Cellulose decomposition and its relationshipto nutrient cycling at South Georgia. In: Antarctic nutrient cyclesand food webs,edited by W.R. Siegfried, P.R. Condy & R.M. Laws,192-199. Berlin: Springer.Walton, D.W.H. & Allsopp, D. 1977. A new test cloth for soil burialtrials and other studies on cellulose decomposition. Int. Biodeterior.Bull., 13, 112-115.Wynn-Williams, D.D. 1980. Seasonal fluctuations in microbial ac-tivity in Antarctic moss peat. Biol. J. Linn. Soc., 14, 11-28.Wynn-Williams, D.D. 1984. Comparative respirometry of peat de-composition on a latitudinal transect in the maritime Antarctic. PolarBiol., 3, 173-181.Wynn-Williams, D.D. 1985a. Comparative microbiology of moss-peat decomposition on the Scotia Arc and Antarctic Peninsula. In:Antarctic nutrient cycles and food webs,edited by W.R. Siegfried,P.R. Condy & R.M. Laws, 204-210. Berlin: Springer.Wynn-Williams, D.D. 1985b. The Signy Island terrestrial referencesites: XVI. Peat 02-uptake in a moss turf relative to edaphic andmicrobial factors. Bull. Br. antarct. Surv., 68, 47-61.Wynn-Williams, D.D. 1985c. The Signy Island terrestrial referencesites: XVII. Peat 02-uptake in a moss carpet relative to edaphic andmicrobial factors. Bull. Br. antarct. Surv., 68, 61-70.Yarrington, M.R. & Wynn-Williams, D.D. 1985. Methanogenesisand the anaerobic micro-biology of a wet moss community at SignyIsland. In: Antarctic nutrient cycles and food webs, edited by W.R.Siegfried, P.R. Condy & R.M. Laws, 229-233. Berlin: Springer.
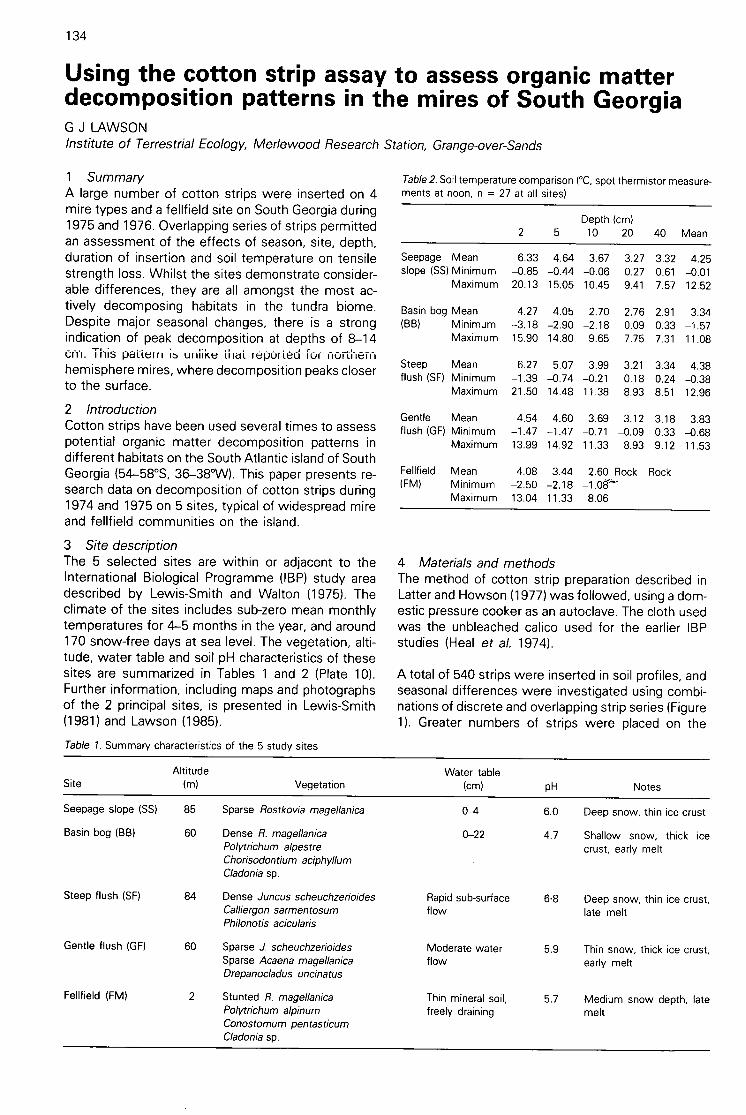
134
Using the cotton strip assay to assess organic matterdecomposition patterns in the mires of South GeorgiaG J LAWSONInstitute of Terrestrial Ecology, Merlewood Research Station, Grange-over-Sands
1 SummaryA large number of cotton strips were inserted on 4mire types and a fellfield site on South Georgia during1975 and 1976. Overlapping series of strips permittedan assessment of the effects of season, site, depth,duration of insertion and soil temperature on tensilestrength loss. Whilst the sites demonstrate consider-able differences, they are all amongst the most ac-tively decomposing habitats in the tundra biome.Despite major seasonal changes, there is a strongindication of peak decomposition at depths of 8-14cm. This pattern IS UI iiike ii ra i lepoi ted i0i 00E-then-I
hemisphere mires, where decomposition peaks closerto the surface.
2 IntroductionCotton strips have been used several times to assesspotential organic matter decomposition patterns indifferent habitats on the South Atlantic island of SouthGeorgia (54-58°S, 36-38°W). This paper presents re-search data on decomposition of cotton strips during1974 and 1975 on 5 sites, typical of widespread mireand fellfield communities on the island.
3 Site descriptionThe 5 selected sites are within or adjacent to theInternational Biological Programme (IBP) study areadescribed by Lewis-Smith and Walton (1975). Theclimate of the sites includes sub-zero mean monthlytemperatures for 4-5 months in the year, and around170 snow-free days at sea level. The vegetation, alti-tude, water table and soil pH characteristics of thesesites are summarized in Tables 1 and 2 (Plate 10).Further information, including maps and photographsof the 2 principal sites, is presented in Lewis-Smith(1981) and Lawson (1985).
Table 1.Summary characteristics of the 5 study sites
AltitudeSite (m) Vegetation
Seepage slope (SS) 85 Sparse Rostkovia magellanica
Basin bog (BB) 60 Dense R. magellanicaPolytrichum alpestreChorisodontium aciphyllumCladoniasp.
Steep flush (SF) 84 Dense Juncus scheuchzerioidesCalliergon sarmentosumPhilonotis acicularis
Gentle flush (GF) 60 Sparse J. scheuchzerioidesSparse Acaena magellanicaDrepanocladus uncinatus
Fellfield (FM) 2 Stunted R. magellanicaPolytrichum alpinumConostomum pentasticumCladoniasp.
Table 2. Soil temperature comparison (°C, spot thermistor measure-ments at noon, n = 27 at all sites)
4 Materials and methodsThe method of cotton strip preparation described inLatter and Howson (1977) was followed, using a dom-estic pressure cooker as an autoclave. The cloth usedwas the unbleached calico used for the earlier IBPstudies (Heal et al. 1974).
A total of 540 strips were inserted in soil profiles, andseasonal differences were investigated using combi-nations of discrete and overlapping strip series (Figure1). Greater numbers of strips were placed on the
Water table(cm)
0-4
0-22
pH Notes
6.0 Deep snow, thin ice crust
4.7 Shallow snow, thick icecrust, early melt
Rapid sub-surface 6.8 Deep snow, thin ice crust,flow late melt
Moderate water 5.9 Thin snow, thick ice crust,flow early melt
Thin mineral soil, 5.7 Medium snow depth, latefreely draining melt

4
•
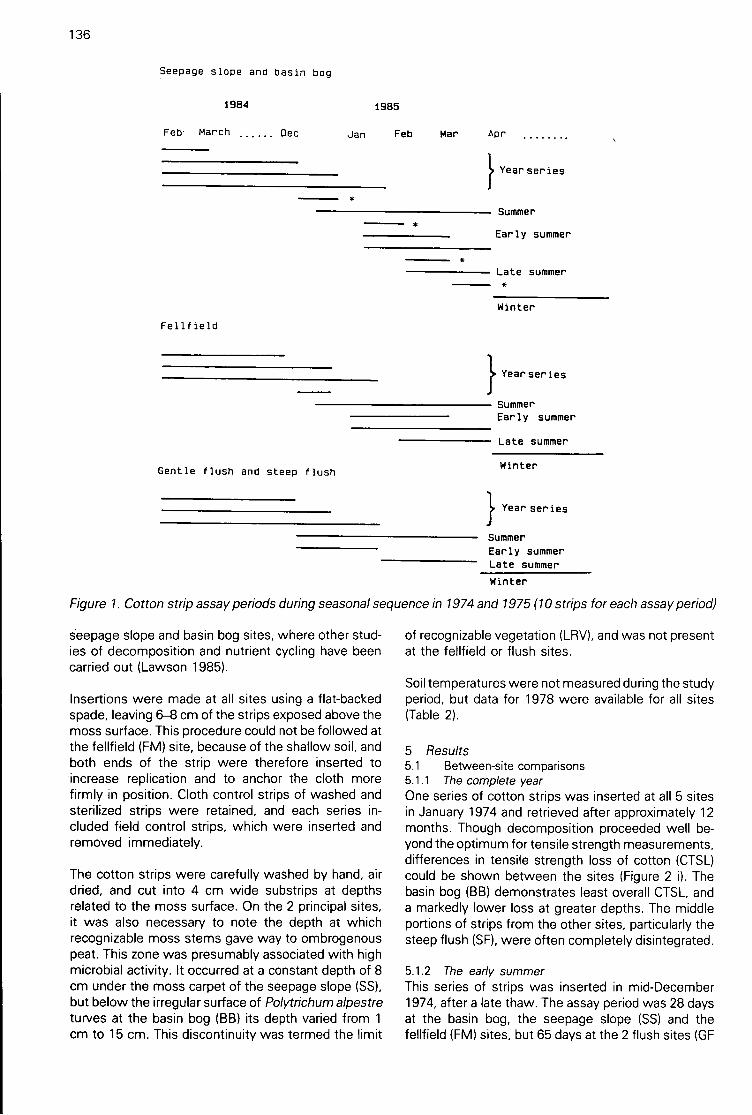
136
Seepage slope and basin bog
1984 1985
Feb March Dec Jan
Fellfield
Gentle flush and steep flush
seepage slope and basin bog sites, where other stud-ies of decomposition and nutrient cycling have beencarried out (Lawson 1985).
Insertions were made at all sites using a flat-backedspade, leaving 6-8 cm of the strips exposed above themoss surface. This procedure could not be followed atthe fellfield (FM) site, because of the shallow soil, andboth ends of the strip were therefore inserted toincrease replication and to anchor the cloth morefirmly in position. Cloth control strips of washed andsterilized strips were retained, and each series in-cluded field control strips, which were inserted andremoved immediately.
The cotton strips were carefully washed by hand, airdried, and cut into 4 cm wide substrips at depthsrelated to the moss surface. On the 2 principal sites,it was also necessary to note the depth at whichrecognizable moss stems gave way to ombrogenouspeat. This zone was presumably associated with highmicrobial activity. It occurred at a constant depth of 8cm under the moss carpet of the seepage slope (SS),but below the irregular surface of Polytrichum alpestreturves at the basin bog (BB) its depth varied from 1cm to 15 cm. This discontinuity was termed the limit
Feb Mar Apr
iYearseries
Summer
Early summer
Late summer
Winter
1Year series
SummerEarly summer
Late summer
Winter
1Year ser ies
SummerEarly summerLate summer
Winter
Figure 1. Cotton strip assay periods during seasonal sequence in 1974 and 1975 (10strips for each assay period)
of recognizable vegetation (LRV), andwas not presentat the fellfield or flush sites.
Soil temperatures were not measured during the studyperiod, but data for 1978 were available for all sites(Table 2).
5 Results5.1 Between-site comparisons5.1.1 The complete yearOne series of cotton strips was inserted at all 5 sitesin January 1974 and retrieved after approximately 12months. Though decomposition proceeded well be-yond the optimum for tensile strength measurements,differences in tensile strength loss of cotton (CTSL)could be shown between the sites (Figure 2 i). Thebasin bog (BB) demonstrates least overall CTSL, anda markedly lower loss at greater depths. The middleportions of strips from the other sites, particularly thesteep flush (SF), were often completely disintegrated.
5.1.2 The early summerThis series of strips was inserted in mid-December1974, after a late thaw. The assay period was 28 daysat the basin bog, the seepage slope (SS) and thefellfield (FM) sites, but 65 days at the 2 flush sites (GF
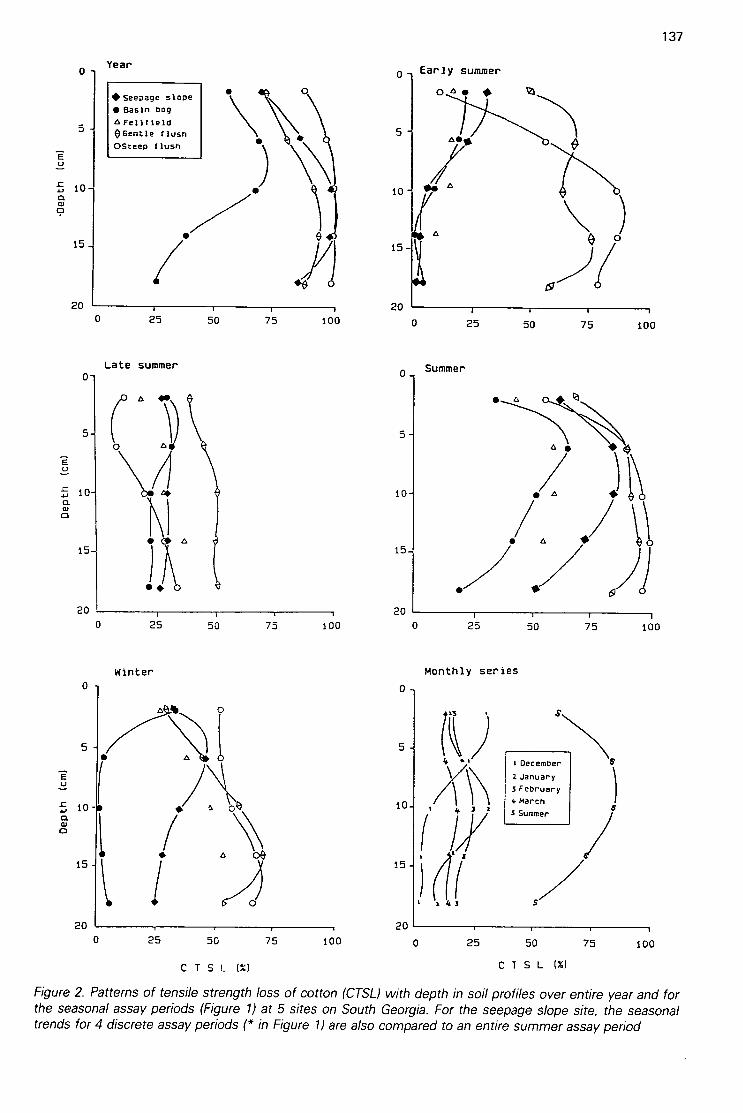
Year0
5
o
5
15
Late summer
Winter0 0
Early summer
/
Summer0
•
20 20o 25 50 75 100 o 25 50 75 100
A 46))5
A10
7 ) 1\
1\1 / / \\)
.rA A ( 15
/ :/. 2120 20
o 25 50 75 100 o 25 50 75 100
Monthly series
A •
• \LI\O,5 5 R)
.....u I /\\\ 4,\..E
104 3 I
.c
om \\
( /• A 00
a
i 2
15
) (1 4 3
15
1
• 6 • t'l
S
I ClecemberN\ s
2 January
5 February
4 MarchSS Summer
/
1
20 20o 25 50 75 100 o 25 50 75 100
137
CTSL (%) CTSL Po
Figure 2. Patterns of tensile strength loss of cotton (CTSL) with depth in soil profiles over entire year and forthe seasonal assay periods (Figure 1) at 5 sites on South Georgia. For the seepage slope site, the seasonaltrends for 4 discrete assay periods (* in Figure 1) are also compared to an entire summer assay period

138
and SF). Data from the flush sites have, therefore,been adjusted linearly to express the data on the same28 days' timescale as the other sites (Figure 2 ii). These2 flush sites clearly show maximum decomposition at10-14 cm during the first 2 months of summer. Overa shorter period after thaw, the other sites showedmaximum decomposition close to the surface, andvery little below 10 cm.
5.1.3 The late summerThe assay period for the late summer series was 54days, starting on 21 February 1975. It showed muchsmaller differences in decomposition with depth inthe profiles in all sites. There is an indication that CTSLis lowest clOse to the surface of the flush sites, andlosses appear to increase slightly with depth in thefellfield, seepage slope and basin bog sites (Figure 2iii). Water flows through both flushes at all depths, butthe surface- of the steep flush (SF)resemb:es a stream,which may explain the unusually low decompositionrecorded for this site.
5.1.4 The complete summerThe assay period for all sites was 114 days, startingon 23 December 1974. The period covers approxi-mately the sum of the periods displayed in Figures 2ii and 2 iii, and might be expected to integrate ratesof decomposition during the 2 periods, bearing in mindthat the CTSL is not linear with time. There are somequalitative indications that the patterns of decompo-sition down soil profiles from this series (Figure 2 iv)do reflect the sum of Figures 2 ii and 2 iii.
Decomposition generally decreases with depth inearly summer at the fellfield site, but increases in latesummer. Over-summer strips record a maxima at 4—8 cm, which is consistent with combining the 2 trends.
The 60-70% CTSL near the surface of the steep flushdoes not, however, correspond to the smaller lossesshown in Figures 2 ii and 2 iii. Similarly, the clearmaxima at 6-10 cm in the seepage slope and basinbog sites do not conform well to the sum of earlysummer and late summer trends. Nevertheless, inboth cases, the pattern of CTSL down the profile forthe summer period matches that for the whole year(Figure 2 i).
5.1.5 OverwinterOverwinter CTSL approaches 70% at 14-18 cm in theflush sites, despite low temperatures, but is insignifi-cant below 6 cm in the basin bog. The seepage slopeis intermediate between the other sites and shows apattern of declining decomposition with depth (Figure2 v).
5.2 Seasonal comparisonsCotton strips were placed at the basin bog and theseepage slope sites to cover the entire summer in 4,approximately monthly, intervals. The data for theseepage slope are illustrated (Figure 2 vi), and show
that the sum of the monthly series does not necess-arily match the pattern observed in the strips whichremained in place over the whole summer. There issome evidence that the decomposition maxima areclose to the surface immediately after thaw, but movedown the profile as the season proceeds. At the endof the season, no significant differences with depthare apparent.
6 DiscussionThis summary paper provides only a superficial reviewof the data available from one of the largest sets ofcotton strips to be inserted at closely adjacent sites.These data are to be analysed after being reworkedto a standardized timescale and temperature base indegree-days, and adjusted to account for the variabledepth of turf-forming mosses. The details of theseanalyses will be reported elsewhere.
The general pattern of potential decompositionshowed that the highest recorded CTSL was from 10—14 cm at the steep flush site, and exceeded 90% afteronly 65 days in the first half of summer. This rateis greater than the 100% CTSL in a 100-day periodpredicted for a South Georgian dwarf-shrub com-munity by Smith and Walton (1988), and confirms theirsuggestion that peat formed from greater rush (Juncusscheuchzerioides) has a particularly active microflora(Smith and Walton 1985). The pH recorded from thissite averaged 6.8, which may explain why the de-composition rate there is similar to that recorded fromthe surface of base-rich grassland in the UK and Ireland(64% loss in 52 days and 100% loss in 63 days,respectively (Heal et al. 1974)).
Heal et al. (1974) collated information from 24 IBPtundra biome sites, and it is interesting to note thatonly in the antarctic sites has there been any previousindication of CTSL increasing with depth. The presentstudy shows that decomposition frequently peaks atdepths between 8 cm and 14 cm. Even the fellfieldsite, with its comparatively dry mineral soil, shows thesame trend of increasing decomposition with depth.Walton (1985) confirmed the above patterns in anotherSouth Georgian mire, but reported quite differenttrends for a dry grassland and moss bank. Whilstconsiderable differences exist between the 5 sites,even the comparatively cold and acid basinbog showsa higher rate of decomposition than 22 of the 24 I BPtundra sites (Heal et al. 1974).
Both the rate and pattern of decomposition undergomarked changes at different times of year. Duringthaw, for example, some sites retain greatest activityclose to the surface (SS, FM and BB), whilst the flushsites (SF and GF) show a higher CTSL at greater depth.As the summer proceeds, the patterns of decompo-sition down soil profiles at all sites tend to becomemore similar.
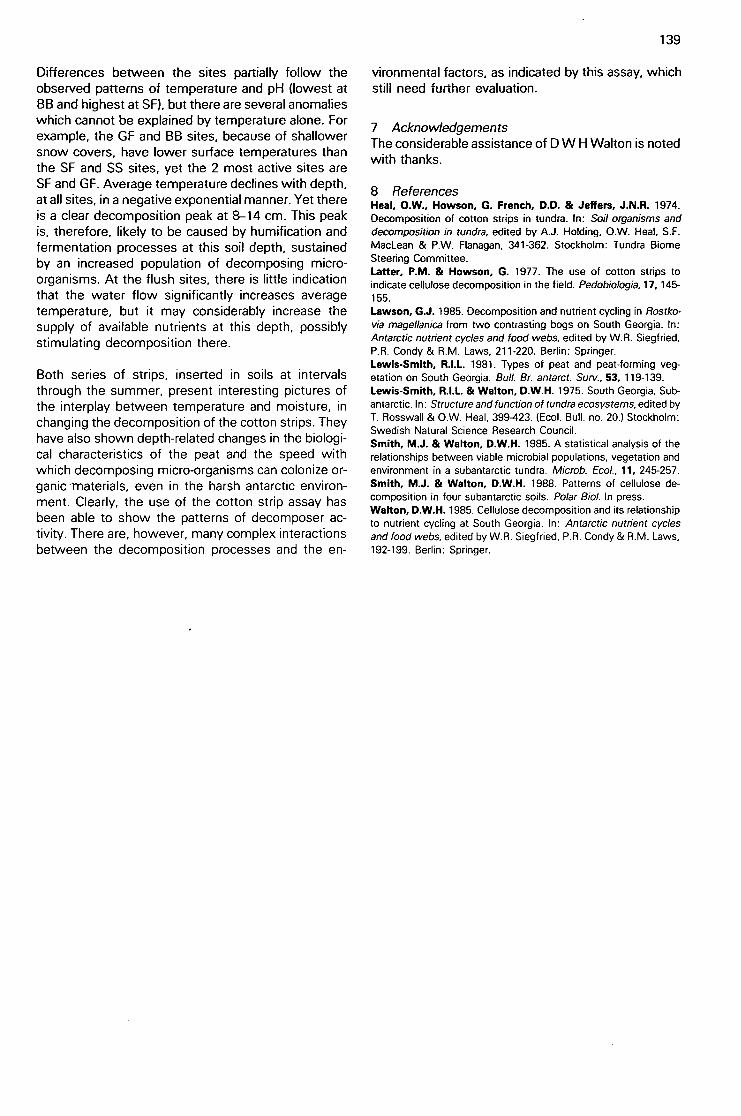
Differences between the sites partially follow theobserved patterns of temperature and pH (lowest atBB and highest at SF), but there are several anomalieswhich cannot be explained by temperature alone. Forexample, the GF and BB sites, because of shallowersnow covers, have lower surface temperatures thanthe SF and SS sites, yet the 2 most active sites areSF and GF. Average temperature declines with depth,at all sites, in a negative exponential manner. Yet thereis a clear decomposition peak at 8-14 cm. This peakis, therefore, likely to be caused by humification andfermentation processes at this soil depth, sustainedby an increased population of decomposing micro-organisms. At the flush sites, there is little indicationthat the water flow significantly increases averagetemperature, but it may considerably increase thesupply of available nutrients at this depth, possiblystimulating decomposition there.
Both series of strips, inserted in soils at intervalsthrough the summer, present interesting pictures ofthe interplay between temperature and moisture, inchanging the decomposition of the cotton strips. Theyhave also shown depth-related changes in the biologi-cal characteristics of the peat and the speed withwhich decomposing micro-organisms can colonize or-ganic Tnaterials, even in the harsh antarctic environ-ment. Clearly, the use of the cotton strip assay hasbeen able to show the patterns of decomposer ac-tivity. There are, however, many complex interactionsbetween the decomposition processes and the en-
139
vironmental factors, as indicated by this assay, whichstill need further evaluation.
7 AcknowledgementsThe considerable assistance of D W H Walton is notedwith thanks.
8 ReferencesHeal, 0.W., Howson, G. French, D.D. & Jeffers, J.N.R. 1974.Decomposition of cotton strips in tundra. In: Soil organisms anddecomposition in tundra, edited by A.J. Holding, O.W. Heal, S.F.MacLean & P.W. Flanagan, 341-362. Stockholm: Tundra BiomeSteering Committee.Latter, P.M. & Howson, G. 1977. The use of cotton strips toindicate cellulose decomposition in the field. Pedobiologia, 17, 145-155.Lawson, G.J. 1985. Decomposition and nutrient cycling in Rostko-via magellanica from two contrasting bogs on South Georgia. In:Antarctic nutrient cycles and food webs, edited by W.R. Siegfried,P.R. Condy & R.M. Laws, 211-220. Berlin: Springer.Lewis-Smith, R.I.L. 1981. Types of peat and peat-forming veg-etation on South Georgia. Bull. Br. antarct. Surv., 53, 119-139.Lewis-Smith, R.I.L. & Walton, D.W.H. 1975. South Georgia, Sub-antarctic. In: Structure and function of tundra ecosystems, edited byT. Rosswall & 0.W. Heal, 399-423. (Ecol. Bull. no. 20.) Stockholm:Swedish Natural Science Research Council.Smith, M.J. & Walton, D.W.H. 1985. A statistical analysis of therelationships between viable microbial populations, vegetation andenvironment in a subantarctic tundra. Microb. Ecol., 11, 245-257.Smith, M.J. & Walton, D.W.H. 1988. Patterns of cellulose de-composition in four subantarctic soils. Polar Biol. In press.Walton, D.W.H. 1985. Cellulose decomposition and its relationshipto nutrient cycling at South Georgia. In: Antarctic nutrient cyclesand food webs, edited by W.R. Siegfried, P.R. Condy & R.M. Laws,192-199. Berlin: Springer.

140
International comparisons
Use of cotton strip assay in wetland and uplandenvironments an international perspectiveE MALTBYDepartment of Geography, University of Exeter, Exeter
1 SummaryApplication of the cotton strip assay is examined in awide range of mainly wetland environments, whichinclude Everglades marsh (USA), Mississippi flood-plain (USA), Amazon floodplain (Brazil) and uplandmoorland (UK). The assay is particularly useful in re-mote sites, as well as in the spatially and temporallydiverse weiland ecosysierns.
Cellulose decomposition rates, as indicated by therate of tensile strength loss of inserted cotton strips,varies between water column and submerged peat insubtropical marsh, but greatest variations in cellulosedecomposition rates are caused by differences in nutri-ent loadings. Results from the Mississippi floodplainindicate marked differences in cellulose decompo-sition according to flooding regime and pH but, some-what surprisingly, the most waterlogged anaerobicsoil profile with relatively high nutrient status gives thehighest cellulose decomposition rates. In the Amazonfloodplain, decomposition in an anoxic swamp is asgreat as an adjacent podzol, and is significantly greaterthan in an oxisol profile. Cotton strip decay in acidmoorland peat increases in response to burning andthe application of lime and basic slag.
The cotton strip assay is a potentially powerful methodfor evaluating cellulose decomposition rates in differ-ent wetlands, and, in particular, for investigating theeffects of treatment/management alterations or natu-ral changes and trends.
2 Introduction — use in wetlands and uplandsWetland ecosystems include marsh, swamp, bog,floodplain, shallow lakes and diverse coastal habitats.Water saturation is an important feature of their gen-esis, but flooding regime, soil and water chemistry,physical properties and vegetation vary greatly inspace and time.
Ecological complexity, physical inaccessibility andtechnical problems of sampling systems at the inter-face of or between aquatic and terrestrial conditionsare reasons why, with the exception of bogs (eg Clymo1984; Heal et al. 1978; Latter et al. 1967), very fewdata exist on organic matter decomposition rates inthese systems world-wide. The cotton strip assayhas been used at a variety of sites in an attempt todetermine the effects of environmental variables andtreatments on the organic matter decomposition
cycle, and to produce a range of baseline data oncellulose decomposition in contrasting wetlands. Theassay, reviewed thoroughly by Latter and Howson(1977) and by Harrison et al. (1988), is favoured for anumber of reasons.
i. The methodology is extremely simple and doesfeiy oil opilisiicated equiprrient in the fd.
It is ideal for use in remote and often extremeenvironments (in terms of temperature and water-logging), where failure rate with mechanical, elec-tronic or chemical processes is often high.
ii. Insertion, retrieval and preparation for analysis ofthe strips can be carried out by operators withlimited training.
iii. Cotton strips are light and can be airmailed fromremote places at relatively low cost, for standardi-zed laboratory analysis.
iv. The flexible uniform cellulose substrate is highlyappropriate for investigation of cellulose decompo-sition across aquatic–soil/sediment interfaces. Infact, one of the possible criticisms of the methodin terrestrial soils, ie of the fabric acting as a wickconducting water from the surface of the soildownwards or from wetter lower horizons up-wards (Latter & Howson 1977), is of little signifi-cance when the soil is saturated or if the strip isactually suspended in a water column.
v. Relatively large numbers of strips can be set outto incorporate the extreme spatial variability andenvironmental complexity of wetlands.
vi. There is no necessity for continuous monitoring.Periodic sampling can coincide with other fieldactivities in a relatively low-cost experimental de-sign. This point is particularly important in remotesites, where a large proportion of project costs areassociated with travel and subsistence.
3 Sites and methodsThe full range of wetland or upland sites, conditionsand treatments investigated to date are summarizedin Table 1. Examples have been selected whichdemonstrate applications of the technique in detectingenvironmental influences on decomposition patternsand illustrating variations among ecosystems.

Table 1.Location, generazed sampling details and status of wetland sites where cotton strips were placed
Area
Everglades marshFlorida, USA(25° 35' N.81° 45' W )
Mississippi floodplainLouisiana, USA(31° 01' N,91° 44' W)(30° 22' N,89° 44' W)
Amazon floodplainBrazil, S. America(3° 06' S.60° 00' W)
Upland moorlandNorth York Moors, UK(54° 24' N,0° 58' W)
Exmoor, UK(51° 10' N,3° 50' W)
Wetland types, other habitats,soils sampled
Shark River Slough. Spike-rush/bladderwort association withstanding water and peatsubstrate. Strips in watercolumn and in upper part ofpeat profile
Red River Bay
Pearl River
Bottomland hardwood forest,floodplain alluvial soils.Sites investigated along ahydrological gradient from non-flooded to frequently flooded.Sampling to 26 cm in 2 cm units
Sites near Manaus. Swamp(anoxic), creek (high 02),podzol and oxisol (tropicalrainforest) sites. Samplingto 26 cm in 2 cm units
Glaisdale and Rosedale Moors.Bog (mainly cotton-grass), thinblanket peat, peaty gley/thiniron pan stagnopodzol complex(mainly heather). Includessites severely burnt (1976),and those in cycle of normalmanagement rotational burning.Sampling to 26 cm in 2 cm units
Dates
1984—present
Halscombe Allotment and Old 1982—Barrow Down. Bog (mainly moor- ongoinggrass), peat stagnohumic gley/thin iron pan or stagnopodzolmosaic (acid grassland — heather).Pinkery. Moorland on stagnohumicgley soil reclaimed in 19th century.Sampling depth 10-26 cmdepending on profile
Cotton strip data are also available for sites in New Zealand, Canada,
3.1 Everglades marsh: evaluation of water quality stan-dards on ecological processes — effects of increased nitro-gen (N) and phosphorus (P) loadings on decomposition inthe water column and submerged peatA marshland site was established in April 1983 on oneof the main channels, Shark River Slough, throughwhich water flows into the Everglades National Park.The overall aim was to examine the effects of in-creased nutrient loading on water quality, and to deter-mine the specific responses of periphyton (diatom/algae complex) and macrophytes. The overall objec-
1983(pilot)1984September—October
1983(pilot)1984August—October
1980-83(allseasons)
Site data & additionalinformation collected
Periphyton productivity.macrophytes. nutrients,discharge, height watercolumn, temperature; partof study on effects ofincreased N and P loadingon wetland system
Microbial numbers usingdilution plates, chemicaland physical soilproperties, soil temper-ature, redox, water levels,oxygen; part of study onwetland delineation anddifferentiation of wetland/non-wetland soil processes
Part of pilot studyinvestigating ecologicaldifferences betweenwetland sites
Microbial numbers usingdilution plates, chemicaland physical soilproperties; part of studyof fire effects onbiological properties oforganic horizons
Microbial numbers usingdilution plates, chemicaland physical soilproperties; part of studyon effects of surfacefertilizer treatment andgrazing on soil properties
Collaborators, status ofanalysis, publication
Everglades National Park(O Hendrix), NationalPark Service (M D Flora).Initial findings inMaltby (1985)
Laboratory for WetlandSoils and Sediments,Centre for WetlandResources (Faulkner eta/. 1987)
W J Junk, Max PlankInstitute. Raw data
Jefferies (1986)Some results available inNorth York Moors NationalPark: Moorland Managementand Research, 1977-84
Maltby (1986)
141
Australia, North Carolina, USA, and the Falkland Islands
tive of the experiment was to assess the adequacy ofthe present standards for the quality control of waterentering the Park (Flora et al. 1985). The experimentalsite is a 'wet prairie', dominated by a spike-rush/blad-derwort (Eleocharis/ Utricularia) plant association.Three open-ended channels (Plate 11) were con-structed parallel to the water flow and partitioned byfibre-glass sheets extending into the underlying peatto prevent cross-leakage. The centre channel receivedphosphate-phosphorus and nitrate-nitrogen at a rateof 10 I day-1, with an initial concentration of 3000

r
r)
2r
:1111 r_,L) ir
exrH4r.rr
19324 2 SE;
One :0 55 e»3114Hrl 7,:11 ;,1 FR
verel (34:or '4 fiPyfi P r)C.
SJDIT.ercier,n; r r n
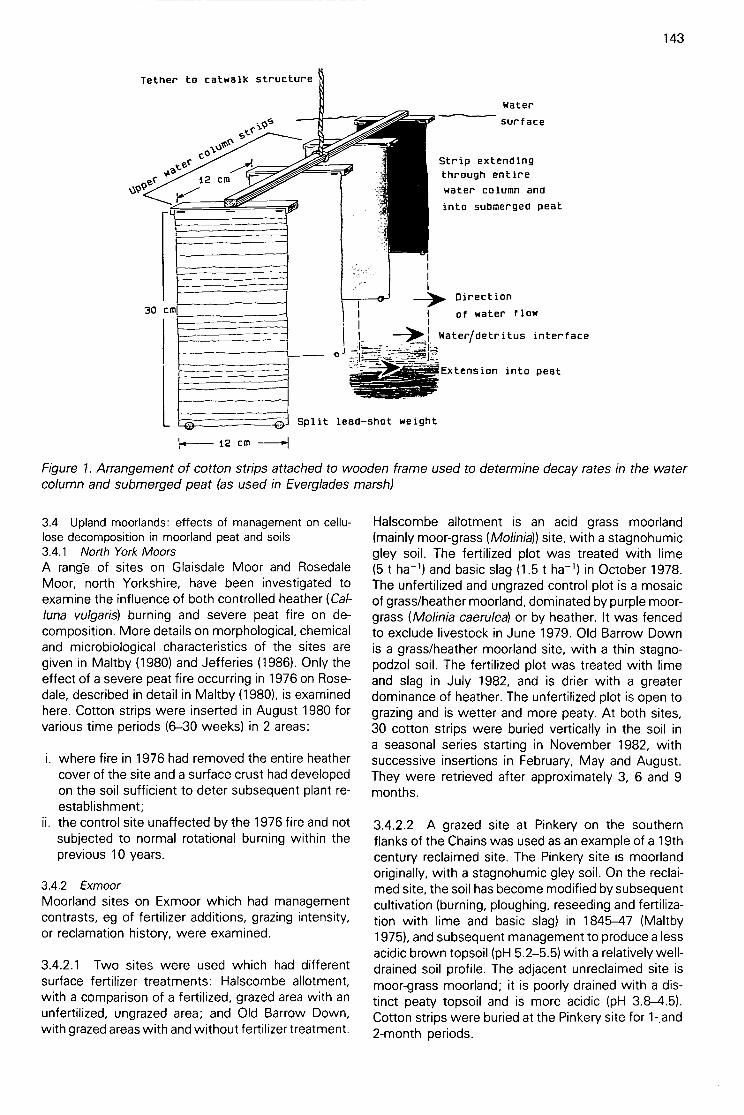
Tether to catwalk structure
‘Ncc'e`'
30 cm
A‘PINC°.
'grjel.12 cm
3.4 Upland moorlands: effects of management on cellu-lose decomposition in moorland peat and soils3.4.1 North York MoorsA range of sites on Glaisdale Moor and RosedaleMoor, north Yorkshire, have been investigated toexamine the influence of both controlled heather (Cal-luna vulgaris)burning and severe peat fire on de-composition. More details on morphological, chemicaland microbiological characteristics of the sites aregiven in Maltby (1980) and Jefferies (1986). Only theeffect of a severe peat fire occurring in 1976 on Rose-dale, described in detail in Maltby (1980), is examinedhere. Cotton strips were inserted in August 1980 forvarious time periods (6-30 weeks) in 2 areas:
i. where fire in 1976 had removed the entire heathercover of the site and a surface crust had developedon the soil sufficient to deter subsequent plant re-establishment;
ii. the control site unaffected by the 1976 fire and notsubjected to normal rotational burning within theprevious 10 years.
3.4.2 ExmoorMoorland sites on Exmoor which had managementcontrasts, eg of fertilizer additions, grazing intensity,or reclamation history, were examined.
3.4.2.1 Two sites were used which had differentsurface fertilizer treatments: Halscombe allotment,with a comparison of a fertilized, grazed area with anunfertilized, ungrazed area; and Old Barrow Down,with grazed areas with and without fertilizer treatment.
Direction
of water flow
--3011,1 Wateridetritus
Split lead—shot weight
Water
surface
Strip extendingthrough entirewater column and
into submerged peat
Extension into peat
interface
143
12 cm
Figure 1. Arrangement of cotton strips attached to wooden frame used to determine decay rates in the watercolumn and submerged peat (as used in Everglades marsh)
Halscombe allotment is an acid grass moorland(mainly moor-grass (Molinia))site, with a stagnohumicgley soil. The fertilized plot was treated with lime(5 t ha-') and basic slag (1.5 t ha-') in October 1978.The unfertilized and ungrazed control plot is a mosaicof grass/heather moorland, dominated by purple moor-grass (Molinia caerulea)or by heather. It was fencedto exclude livestock in June 1979. Old Barrow Downis a grass/heather moorland site, with a thin stagno-podzol soil. The fertilized plot was treated with limeand slag in July 1982, and is drier with a greaterdominance of heather. The unfertilized plot is open tograzing and is wetter and more peaty. At both sites,30 cotton strips were buried vertically in the soil ina seasonal series starting in November 1982, withsuccessive insertions in February, May and August.They were retrieved after approximately 3, 6 and 9months.
3.4.2.2 A grazed site at Pinkery on the southernflanks of the Chains was used as an example of a 19thcentury reclaimed site. The Pinkery site is moorlandoriginally, with a stagnohumic gley soil. On the reclai-med site, the soil has become modified by subsequentcultivation (burning, ploughing, reseeding and fertiliza-tion with lime and basic slag) in 1845-47 (Maltby1975), and subsequent management to produce a lessacidic brown topsoil (pH 5.2-5.5) with a relatively well-drained soil profile. The adjacent unreclaimed site ismoor-grass moorland; it is poorly drained with a dis-tinct peaty topsoil and is more acidic (pH 3.8 /1.5).Cotton strips were buried at the Pinkery site for 1-.and2-month periods.
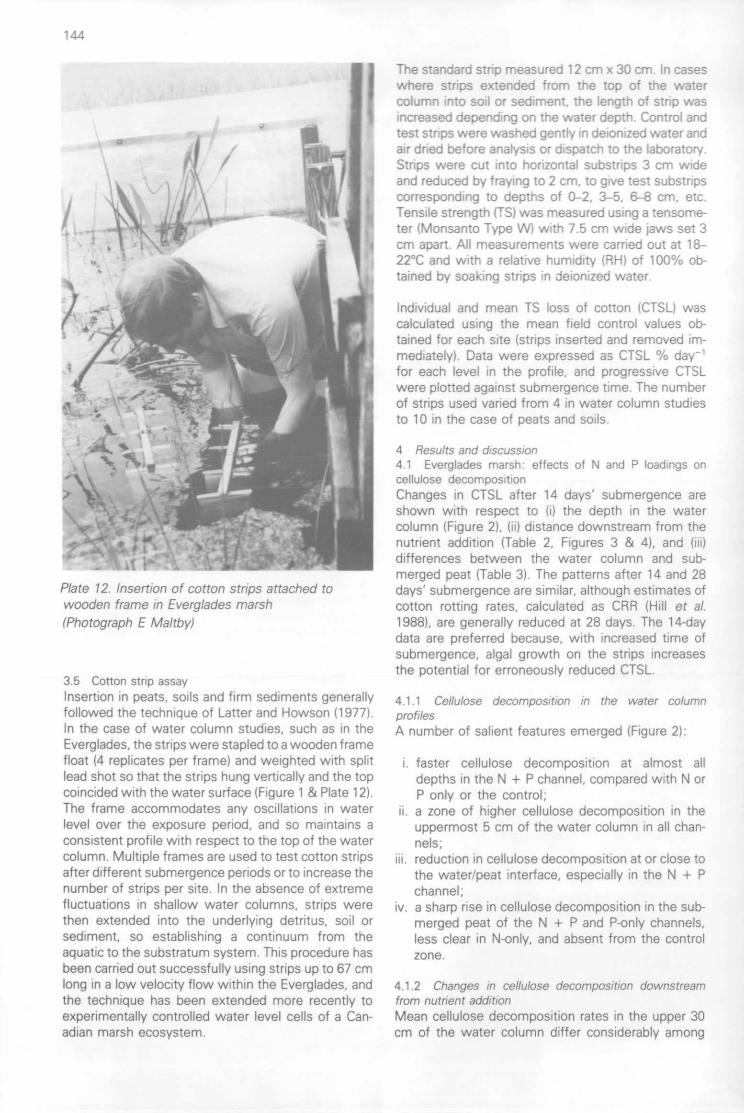
• "I
j's••
t sr v: as
$ t;-
a
Plate 12 Insertion of cotton strips attached towooden frame in Everglades marsh(Photograph E Maltby)
3.5 Cotton strip assavInsertion in peats soils and 5rm sediments generaHyfollowed the technique of Latter and Howson 1197iIn the case of water column studies such as in theEverglades, the strips were stapled to 3 wooden framefloat Hl replicates per framei and weighted with splitlead shot so that the strips hung vertcally and the topcoincided with the water surface Migure 1 & Plate 12iThe frame accommodates any oscillations in waterlevel over the exposure period and so maintains aconsistent profile with respect to tne top of the watercolumn Multiple frames are used to test cotton str.psafter different submergence periods or to increase thenumber of strips per site In the absence of extremefluctuations in shallow water columns, strips werethen extended into the underlying detritus soil orsediment, so establishing a continuum from theaquatic to the substratum system This procedure hasbeen carried out successfully using strips up to 67 cmlong in a low velocity flow within the Everglades, andthe technique has been extended more recently toexperimentally controlled water level cells of a Can-adian marsh ecosystem
coicu.o..ed:area 'co east- s te isi••0^-.0[11;3*.ekl, D:3:d 22ore eitaboesses:for each levet n 7^C± biihrisi. arts onsture_ _
I were ploHeo actainst soon- ergerise ins -ire r;urr:-2.cy-
of ships useo vaned from 4 in water column utuntesto 10 in the case of pea:s arc ay ,s
4 RES„
4 ' Evergiooes, roorellalosh archr-hris:OsinChanges in CTSL after 14 days' submergence areshown with respect to ai the depth in the watercolumn (Figure 24 Hi distance downstream frorr Incnutrient addition [Table 2, Figures 3 & 44 anddifferences between the water column and sub-merged pea; Table 3i The patterns after 14 and 28days' submergence are similar, although estimates ofcotton rotting rates, calculated as CRR IHill et al19881, are generally reduced at 28 days The 14-daydata are preferred because, wirn increased time ofsubmergence, algal growth on the strips increasesthe potential for erroneously reduced CTSL
4 1 Cellulose decomposition in the yvater cjilurTn
profitesA number of salient features emerged (Figure
i. faster cellulose decomposition at alrr.ost alldepths in the N P channel, compared with N orP only or the control;
H. a zone of higher cellulose decomposition in theuppermost 5 cm of the water column in all chan-nels;
H. reduction in cellulose decomposition at or close tothe water:peat interface, especially in the N Pchannel,
iy. a sharp rise in cellulose decomposition in the sub-merged peat of the N P and P-only channels,less clear in N-only, and absent from the controlzone.
4 1 2 Changes in cellulose decomposir,on downstreamfrom nutrient additionMean cellulose decomposition rates in the upper 30cm of the water column differ considerably among
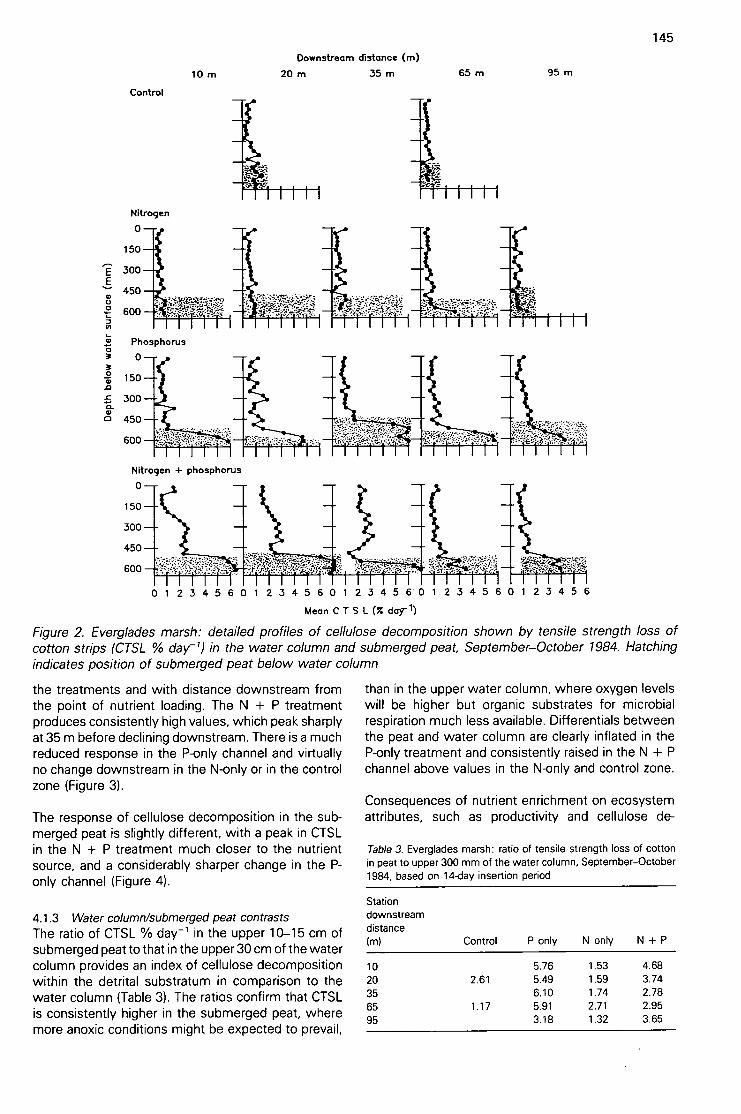
CA
Phosphorus
150
300
450
600
0
150_a
300a.cl 450
Control
Nitrogen
0
600
Downstream distance (m)
10 m 20 m 35 m
Nitrogen + phosphorus
0
150
300
450
600
the treatments and with distance downstream fromthe point of nutrient loading. The N + P treatmentproduces consistently high values, which peak sharplyat 35 m before declining downstream. There is a muchreduced response in the P-only channel and virtuallyno change downstream in the N-only or in the controlzone (Figure 3).
The response of cellulose decomposition in the sub-merged peat is slightly different, with a peak in CTSLin the N + P treatment much closer to the nutrientsource, and a considerably sharper change in the P-only channel (Figure 4).
4.1.3 Water column/submerged peat contrastsThe ratio of CTSL % day-1 in the upper 10-15 cm ofsubmerged peat to that in the upper 30 cm of the watercolumn provides an index of cellulose decompositionwithin the detrital substratum in comparison to thewater column (Table 3). The ratios confirm that CTSLis consistently higher in the submerged peat, wheremore anoxic conditions might be expected to prevail,
te=1
65 m 95 m
TV.
145
0 1 2 3 4 5 6 0 1 2 3 4 5 6 0 1 2 3 4 5 6 0 1 2 3 4 5 6 0 1 2 3 4 5 6
Mean CTSL (% dall)
Figure 2. Everglades marsh: detailed profiles of cellulose decomposition shown by tensile strength loss ofcotton strips (CTSL % day') in the water column and submerged peat, September—October 1984. Hatchingindicates position of submerged peat below water column
than in the upper water column, where oxygen levelswill be higher but organic substrates for microbialrespiration much less available. Differentials betweenthe peat and water column are clearly inflated in theP-only treatment and consistently raised in the N + Pchannel above values in the N-only and control zone.
Consequences of nutrient enrichment on ecosystemattributes, such as productivity and cellulose de-
Table3. Everglades marsh: ratio of tensile strength loss of cottonin peat to upper 300 mm of the water column, September—October1984, based on 14-day insertion period
Stationdownstreamdistance(rn) Control P only N only N + P

146
Table 2. Everglades marsh: cellulose decomposition rates (tensile strength loss of cotton strips (CTSL) after 14-day insertion period) andwater chemistry of experimental channels, with distance downstream from nutrient addition, September-October 1984
composition, are not well understood in flowing watersystems, especially those in sub-tropical environ-ments. Phosphorus loading consistent with previouslyagreed water quality standards, yielding 20 mg Hsoluble reactive P (East Everglades Resources Plan-ning Project 1980), has had a major influence on cellu-
lose decomposition rates in the water column,producing an order of magnitude increase in sub-merged peat. The levels of NO3-N loading are less than10% of the recommended standard of 700 mg H. Al-though they are 5-6 times the background of the controlchannel, there is no signi;.icant increase in cellulose
2.5
2.0
1.0
eM%,
0 . 5 .........
• N+PA Phosphorus• Nitrogen
o Control
-a•
25 50 75 100
Downstream distance (m)
Figure 3. Everglades marsh: cellulose decompositionin upper 300 mm of water column at various distancesdownstream from point source of nutrient addition,September-October 1984
decomposition rate in the N-only treatment for eitherthe water column or the submerged peat. In thissystem at least, N does not seem to be a significantfactor limiting aquatic cellulose decomposition. The N+ P treatment produces clearly the largest increase indecomposition in the water column, giving a maximumdifferential 6 times that of the control (Figure 3) and
/
6
4
2
•
, ..... ....
25 50 75 100
Downstream distance (m)
• N+P• Phosphorus*Nitrogen0 Control
Figure 4. Everglades marsh, cellulose decompositionin submerged peat at various distances downstreamfrom point source of nutrient addition, September-October 1984
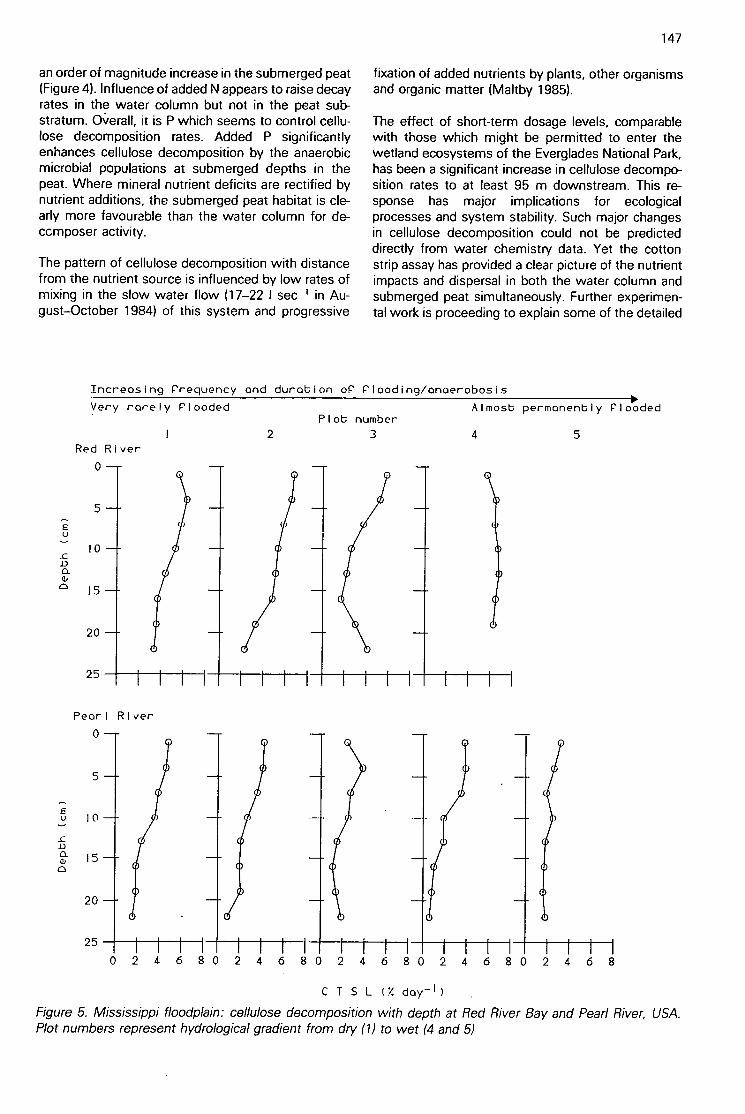
an order of magnitude increase in the submerged peat(Figure 4). Influence of added N appears to raise decayrates in the water column but not in the peat sub-stratum. OVerall, it is P which seems to control cellu-lose decomposition rates. Added P significantlyenhances cellulose decomposition by the anaerobicmicrobial populations at submerged depths in thepeat. Where mineral nutrient deficits are rectified bynutrient additions, the submerged peat habitat is cle-arly more favourable than the water column for de-ccmposer activity.
The pattern of cellulose decomposition with distancefrom the nutrient source is influenced by low rates ofmixing in the slow water flow (17-22 I sec' in Au-gust—October 1984) of this system and progressive
Increasing Prequency ond durationVery rarely Plooded
Pearl River0
5
10
20
25
0 2 4 6 80 2
Plot number3
147
fixation of added nutrients by plants, other organismsand organic matter (Maltby 1985).
The effect of short-term dosage levels, comparablewith those which might be permitted to enter thewetland ecosystems of the Everglades National Park,has been a significant increase in cellulose decompo-sition rates to at least 95 m downstream. This re-sponse has major implications for ecologicalprocesses and system stability. Such major changesin cellulose decomposition could not be predicteddirectly from water chemistry data. Yet the cottonstrip assay has provided a clear picture of the nutrientimpacts and dispersal in both the water column andsubmerged peat simultaneously. Further experimen-tal work is proceeding to explain some of the detailed
or Plooding/onaerobosis
Almost permanently Plooded
4 5
4 6 8 0 2 4 6 8 0 2 4 6 8 0 2 4 6 8
CTSL (% day-I)
Figure 5. Mississippi floodplain: cellulose decomposition with depth at Red River Bay and Pearl River, USA.Plot numbers represent hydrological gradient from dry (1) to wet (4 and 5)

148
Bacteria
8
Actinomycetes—m 8 j
7
0 60
5
Fungi
4
4
6
•
5
.134
3 •
2
Red River Pearl River
J
•
• 0-2 cm
• 6-7 cm
• 1 4-16 cm
A -A
0 I 2 3 4 5 0 1 2 3 4 5rIou number Plot; numbor
Figure 6. Mississippi floodplain: numbers (colony-forming units) of bacteria and actinomycetes on cellulosemedia (Faulkneret al. 1987) and filamentous fungi and yeasts on Martin's media for Red River and Pearl Riverprofiles

patterns of decay, with particular reference to the fateof nutrients in the peat detritus and different periodsof strip insertion. The technique offers scientists andwetland managers an inexpensive, versatile and rela-tively quick technique for detecting ecological im-pacts, which can be used in the planning of bufferzones for water quality control and the maintenanceof ecological stability. In the Everglades experiment,the results indicate that adherence to present stan-dards will not prevent significant changes occurring inthe natural ecosystem due to more nutrient-rich wa-ters entering the Park from its increasingly more far-med periphery.
4.2 Mississippi floodplain: differential effects of floodingregime and soil pHFor Red River Bay and Pearl River, CTSL % day' isplotted against soil profile depth for 2 weeks' insertionin 1984 (Figure 5). Cellulose decomposition is gener-ally much higher in the more nutrient-rich, high pHRed River soils than in the nutrient-poor, low pH PearlRiver soils. This result relates well to the generallyhigher numbers of bacteria and actinomycetes enu-merated on cellulose media at the Red River sites(Figure 6). However, yeast numbers are higher atPearl River, and there are no major differences infilamentous fungi estimates between the 2 areas,except for Red River Bay at the wet end of the transectwhere numbers generally declined (Figure 6).
The differentiation along the hydrological gradient,particularly marked in Red River Bay, showed surpris-ingly that the overall CTSL throughout the profile ishighest in the most waterlogged anaerobic plot (plot4) and least in one of the intermediate soil profiles(plot 3) which is periodically stressed either by floodingor by drying out. Differences among plots are least at
_c
–5
0
5
10a.
15
20
25
-
/'-
the surface and greater in the more anaerobic zones ofthe soil profiles below 14 cm (Figure 5). The anaerobicprofile (plot 4) is characterized by high CTSL whichis maintained with depth, in contrast with the moreaerobic profiles, which have high surface cotton decayrates that decline progressively with depth (eg plots1 and 2). In between these extremes of decay rate,the intermediate soil profile at plot 3 gives a sharpincrease in CTSL at depth where the soil environmentis more constantly anaerobic and the microbiota moreadapted to anaerobic decomposition. This result im-plies that some soils may have microflora well ad-justed to cellulose breakdown under anaerobicconditions, some under aerobic conditions, but otherswhere neither condition is constant may lack closeadjustment to either. Such differentiation is less clearin the low pH environment at Pearl River, and mayexplain why it has not been readily observed in pre-vious studies of cotton strip decay in anaerobic sys-tems which have been concentrated in very acid,generally peat-forming environments. The Mississippifloodplain studies reported in more detail elsewhere(Faulkner et al. 1987) underline that cellulose break-down may not necessarily be inhibited by anaerobicconditions per se,and that the cotton strip assay maybe a most valuable tool differentiating wetland/non-wetland soil regimes on the basis of intrinsic soilprocesses.
4.3 Amazon floodplain: variation in cellulose decompo-sition ratesDecomposition profiles derived from the 28-day inser-tion time are given in Figure 7. Tukey's HonestlySignificant Difference test showed the differencesbetween sites to be oxisol>swamp/podzol atP<0.001 (D M Howard pers. comm.). The creek siteis excluded from statistical analysis because of a lackof sequential depth value.-Overall, 14 days' exposure
-A-
0-- Oxiaol
Swamp
Podzol
• Creek
149
0 1 2 3 4
CTSL (% da5r1 )
Figure 7. Amazon floodplain: cellulose decomposition at 4 sites near Manaus, Brazil (July—August 1984): oxisol,anoxic swamp, podzol and aerobic creek, mean of 5 ± SE

150
Cotton strip assay
0.0
0
5
10
15
0
Bacteria
0
Control
0 Bacteria5 A Actinomycetes
Burnt
_c • Bacteria
•
• Actinornycetes
010
15
1
CTSL (% darl )
and actinomycetes
O Control
• Burnt
3 4 5
Logic' number g-1
values are greater than those for 28 days (P<0.001),but this fact does not alter the relationship of sites,and there is no significant interaction between sitesand exposure time.
4.4 Upland moorlands: effect of management on cellulosedecomposition in peat and soils4.4.1 North York MoorsComparative results of cotton strip assay after 6weeks' insertion and dilution plate counts of micro-organisms are given for severely burnt and controlpeat profiles in Figure 7. There is a clear increase inCTSL due to fire in the upper part of the soil profile,and particularly at 3-5 cm depth. The increase incotton decay rate corroborates earlier findings of asurge in microbial numbers (Figure 8; Maltby 1980),which results in increased biological activity in thepeat for at least 5 years after the fire.
'Normal' rotational prescribed burning also stimulatescotton strip decay rates (Jefferies 1986), and evidence
2
Soil profileControl
Furhgl uI,u yeGats
0
5
10
15
7 3
F/H
Om
Oh 2
•
Burnt
Oh 1 Om
Of
Control
o FungiA Yeasts
Burnt
• Fungi
A Yeasts
4 5 6 7
Log/0 number (1--1
Figure 8. North York Moors: effect of severe fire in 1976 on cellulose decomposition by cotton strip assay andmicrobial numbers with depth in peaty horizon of stagnohumic gley (determinations by J Jefferies 1981)(standard errors for CTSL and microbial numbers were all within the points). The broken line in control indicatesa structural break. Soil profile terms in Figures 8 and 10 according to Avery (1980)
discussed elsewhere suggests that the peat cover onthe North York Moors is generally becoming progress-ively more aerobic (Maltby 1980, 1986b). The cottonstrip assay will provide a useful method for the com-parative assessment of cellulose decompositionunder different burning intensities and strategies valu-able in the development of sound moorland manage-ment techniques.
4.4.2 Exmoor4.4.2.1 Seasonal variations of cotton strip assay ratesin soil profiles receiving a surface treatment of fertilizerand in untreated control areas are shown in Figure 9,using insertion periods of approximately 3 months.Results indicate the sharp fluctuations in CTSL accord-ing to season and between years, the variation beingparticularly marked at lower sampling depths (eg 12-14 cm). A retrieval problem encountered on the surf-ace-treated sites during summer 1984 and 1985 wasthat high rates of decay, probably as a result of theparticularly wet summers, caused detachment of the
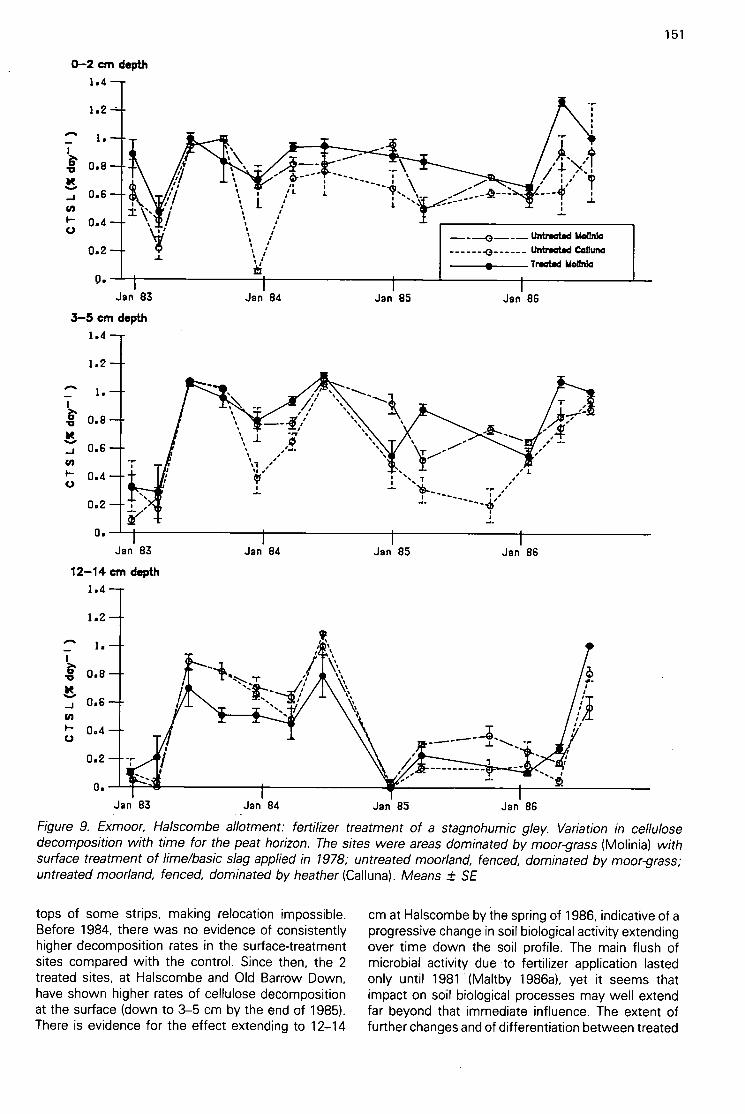
, \
' \ /§— t-4 , n . --4- \k ii , L ; L 1i '/ ,v i i
0.4 J.
Nts; i
0.2,,, i4
0- 2 cm depth
0.Jan 83 Jan 84
3-5 cm depth
o.Jan 83
12- 14 cm depth1.4
1.2
0.8
0.6
0.4
0.2
0.
Jan 83
Jan 85 Jan 86
• ,,, \ -,_.... /,/ s, -i,, • , r ••,,
• •,,,Z.---\ i i
• • •-....... , -
ss ...---
o
0 • :-Jr„,,,-- •\ ,'-.-
%:1 r
/ L
0--
Jan 84
Jan 84
tops of some strips, making relocation impossible.Before 1984, there was no evidence of consistentlyhigher decomposition rates in the surface-treatmentsites compared with the control. Since then, the 2treated sites, at Halscombe and Old Barrow Down,have shown higher rates of cellulose decompositionat the surface (down to 3-5 cm by the end of 1985).There is evidence for the effect extending to 12-14
Jan 85 Jan 86
- _ Untreated Melly&
-0 Untreated Callan°Treated Mattnla
Jan 85 Jan 86
151
Figure 9. Exmoor, Halscombe allotment: fertilizer treatment of a stagnohumic gley. Variation in cellulosedecomposition with time for the peat horizon. The sites were areas dominated by moor-grass (Molinia) withsurface treatment of lime/basic slag applied in 1978; untreated moorland, fenced, dominated by moor-grass;untreated moorland, fenced, dominated by heather (Calluna). Means ± SE
cm at Halscombe by ihe spring of 1986, indicative of aprogressive change in soil biological activity extendingover time down the soil profile. The main flush ofmicrobial activity due to fertilizer application lastedonly until 1981 (Maltby 1986a), yet it seems thatimpact on soil biological processes may well extendfar beyond that immediate influence. The extent offurther changes and of differentiation between treated

152
and untreated sites will undoubtedly influence plan-ning recommendations for management of the Ex-moor uplands (Curtis & Maltby 1980).
4.4.2.2 Differential development of soil profiles dueto 19th century reclamation results in strong contrasts
Cotton strip assay
0
5
E
"ao 15
20
25
0
Bacteria and actinomycetes
0
5
15
20
Fungi and yeasts
0
5
15
UnreclaimedO Bacteria
•
ActInomycetesReclaimed• BacteriaA Actinomycetes
O Unrecloimed
• Reclaimed
1 2CTSL (% day -1)
2 3Log,
4 5 6,0 number g-
UnreclaimedO Fungi
•
YeastsReclaimed• Fungi• Yeasts
3
pH
0
5
10
15
20
7 8 3
Calcium
0
5
10
15
20 20
2 3 4 5 6, 7 8 0Logi 0 number g-
in both soil biological properties and pedogenesis(Maltby 1975, 1977, 1984). There is a marked differ-ence in CTSL in the soil profiles of reclaimed andunreclaimed sites (Figure 10), which is related to con-trasts in dilution plate counts of micro-organisms, soilprofile morphology and soil chemistry. Higher rates of
Soil profileUnrecloimed Reclaimed
Rootmotpeat
Om
Oh
4
Ap1
Ap2
Ah
5 6
2 4 6 a 10Meq 100 g-1
Figure 10. Exmoor, Pinkery: cellulose decomposition and microbial numbers with depth in winter 1984 85 forunreclaimed stagnohumic gley and adjacent profile reclaimed 1845-47. Numbers (CFU) of actinomycetes andbacteria (modified Jensen's media) and filamentous fungi and yeasts (Martin's media); sticky point pH andextractable Ca (determination by L White)

cellulose decomposition within the reclaimed soil helpexplain the maintenance of a brown topsoil and failureof a peaty horizon to redevelop, despite location in anactive peat-forming environment (Maltby & Crabtree1976).
5 Precautions in application of assayExperience has underlined several areas requiring par-ticular attention in experimental designs.
5.1 Cotton strips can be inserted by a spade or othertools in soils with only shallow surface flooding, butaccurate insertion becomes difficult when water co-lumns exceed 50 cm. In all flooded sites, the water/soil interface can be indicated on the strip with a shortcut (which can be made underwater after insertion),and great care must be taken to locate the site withflagging tape in order to aid retrieval. At the otherextreme, sites can dry out for parts of the year. Inclay-rich profiles, particularly frequent on floodplains,insertion can be impaired and only very poor soilcontact achieved due to temporary hardening andshrinkage of the soil. The sampling strategy should bedesigned to avoid, if possible, the need to insert stripsat these times.
5.2 Lack of previous information on decay rates inmany environments demands pilot studies to estab-lish the timing of assay periods. This requirement hasbeen particularly important in water column studies,and in experiments in the sub-tropics and tropics.There may still be problems in comparative studies intemperate areas, where strips in some treatmentsmay decompose much more rapidly than in controlsites in certain seasons (eg Exmoor).
5.3 Decay is so 'rapid in sub-tropical and tropicalwetland environments that any all-year-round investi-gation using the Shirley Soil Burial Test Fabric wouldbe impracticable, unless carried out locally, and, inany case, will be much more time-consuming than intemperate or high-latitude regions (a heavier form ofcloth could, however, be used).
5.4 Biotic interference with strips can be a periodicproblem in wetland or marginal wetland sites. Thisinterference includes algal growth, which may inducesome TS increase due to filamentous binding, and rootgrowth which may penetrate long-exposed strips. It isgenerally necessary to discard strips subjected to thisdegree of disturbance. Fauna, especially termites andcrayfish in low-latitude floodplains and swamps, mayeat through strips, and in grazed sites sheep or otherherbivores may pull up the strips or eat off the exposedtops. Vickery and Floate (1988) used mesh cages todeter sheep.
6 ConclusionThe cotton strip assay offers a surrogate and averagingmeasure of detailed and complex biological processesin soil, sediment and aquatic environments. It is poten-
153
tially powerful in differentiating a wide range ofecological environments and in measuring the com-parative effects of treatments or natural changes andtrends. The assay integrates the influence of manyfactors, only some of which have been illustrated here.Considerable research effort must still be directedtowards explaining decay rates and interpreting pat-terns in the light of ecological or pedogenic data.Recent efforts to standardize data using a linearizationapproach (Hill et al. 1988) are an encouraging basisfor further work. The modelling of decay rates in termsof climatic and other variables (Ineson et al. 1988)provides insight to understanding global and environ-mental patterns. However, the greatest value of thecotton strip methodology will probably remain primar-ily as a means of comparative analysis within individualstudies. The assay offers scope for considerabledevelopment and improvement in understanding thebehaviour, reaction and management of extremelycomplex ecosystems in future research on decompo-sition and related processes in wetlands.
7 AcknowledgementsMark Flora, David Walker, Rosemary Maltby and DanScheidt are thanked for their help in the Everglades.Mark Flora kindly made available unpublished waterchemistry data, and the study was made possible byfinancial assistance from Everglades National Park. DrGary Hendrix, Research Director, is thanked for hisparticular support. Steve Faulkner assisted in the Lou-isiana study, which has been supported by a researchcontract from the US Army Corps of Engineers, Water-ways Experiment Station, Vicksbury, MS. JennetteJefferies carried out the North York Moors analyses,and Linda White the sampling of Exmoor unreclaimedand reclaimed profiles. Investigation of the effects ofsurface treatment and grazing at Halscombe and OldBarrow Down has been supported financially by theExmoor National Park. Dr Wolfgang Junk is thankedfor his help in sampling the Amazon floodplain. Thestatistical analyses of the Amazon data were carriedout at the Institute of Terrestrial Ecology's MerlewoodResearch Station.
8 ReferencesAvery, B.W. 1980. Soil classification for England and Wales. (SoilSurvey technical monograph no. 14.) Harpenden: Soil Survey ofEngland and Wales.Clymo, R.S. 1984. The limits to peat bog growth. Phil. Trans. R.Soc. B, 303, 605-654.Curtis, L. & Maltby, E. 1980. Conserve or concede. How best tostrike the balance of use in Britain's smallest National Park —Exmoor. Fmrs' Wkly, 27 June.East Everglades Resources Planning Project. 1980. Proposedmanagement plan for the East Everglades. Miami: MetropolitanDade County Planning Dept.Faulkner, S.P., Patrick, W.H. Jr., Maltby, E., Gambrel!, R.P. &Parker, W.B. 1987. Characterisation of bottomland hardwood wet-land transition zones in the lower Mississippi river valley. Reportof U.S. Army Corps. of Engineers, Waterways Experiment Station,Vicksburg.

154
Flora, M.D., Walker, D.R., Scheidt, D.J., Rice, R.G. & Lander,D.H. 1985. The response of experimental channels in EvergladesNational Park to increased nitrogen and phosphorus loading: Part1 - Nutrient uptake and periphyton productivity. South FloridaResearch Centre Report. (Unpublished.)Harrison, A.F., Latter, P.M. & Walton, D.W.H., eds. 1987. Cottonstrip assay an index of decomposition in soils. (ITE symposiumno. 24.) Grange-over-Sands: Institute of Terrestrial Ecology.Heal, 0.W., Latter, P.M. & Howson, G. 1978. A study of the ratesof decomposition of organic matter. In: Production ecologyof Britishmoors and montane grasslands, edited by O.W. Heal & D.F. Perkins,136-159. Berlin: Springer.Hill, M.O., Latter, P.M. & Bancroft, G. 1988. Standardization ofrotting rates by a linearizing transformation. In: Cotton strip assayan index of decomposition in soils, edited by A.F. Harrison, P.M.Latter & D.W.H. Walton, 21-24. (ITE symposium no. 24.) Grange-over-Sands: Institute of Terrestrial Ecology.lneson, P., Bacon, P.J. & Lindley, D.K. 1988. Decomposition oicotton strips in soil: analysis of the world data set. In: Cotton striassay an index of decomposition in soils, edited by A.F. Harrison,P.M. Latter & D.W.H. Walton, 155-165. (ITE symposium no. 24:Grange-over-Sands: Institute of Terrestrial Ecology.Jeffries, J. 1986. The effect of burning on selected biological ancphysico-chemical properties of surface peat horizons on the NortlYork Moors. PhD thesis, University of Exeter.Latter, P.M. & Howson, G. 1977. The use of cotton strips tcindicate cellulose decomposition in the field. Pedobiologia, 17, 145155.Latter, P.M., Cragg, J.B. & Heal, 0.W. 1967. Comparative studie:on the microbiology of four moorland soils in the Northern PenninesJ. Ecol., 55, 445-464.
Maltby, E. 1975. Numbers of soil micro-organisms as ecologicalindicators of changes resulting from moorland reclamation on Ex-moor, UK. J. Biogeogr., 2, 117-136.Maltby, E. 1977. Ecological indicators of changes in soil conditionsresulting from moorland reclamation on Exmoor. PhD thesis, Uni-versity of Bristol.Maltby, E. 1980. The impact of severe fire on Calluna moorland inthe North York Moors. Bull. Ecol., 11, 683-708.Maltby, E. 1984. Response of the soil microflora to moorlandreclamation for improved agriculture. Pl. Soil, 76, 183-193.Maltby, E. 1985. Effects of nutrient loadings on decompositionprofiles in the water column and submerged peat in the Everglades.In: Tropical peat resources - prospects and potential. Proc. int.Peat Soc. Symp., 450-464.Maltby, E. 1986a. Soil property responses to surface treatmentand associated management practices at Halscombe Allotment/Numbers Ball and Old Barrow Down/Hawkridge Plain 1978-86.Exmoor National Park Authority.Maltby, E. 1986b. Investigations of the peat cover of the NorthYork Moors. In: Moorland management, edited by D.C. Statham,28-41. Helmsley, Yorkshire: North York Moors National Park Auth-ority.Maltby, E. & Crabtree, K. 1976. Soil organic matter and peataccumulation on Exmoor: a contemporary and palaeoenvironmen-tal evaluation. Trans. Inst. Br. Geogr., N.S. 1, 259-278.Vickery, P.J. & Floate, M.J.S. 1988. Effects of lime and pastureimprovement on cotton strip decomposition in three Scottish acidhill soils. In: Cotton strip assay an index of decomposition in soils,edited by A.F. Harrison, P.M. Latter & D.W.H. Walton, 109-112.(ITE symposium no. 24.) Grange-over-Sands: Institute of TerrestrialEcology.
Decomposition of cotton strips in soil: analysis of theworld data setP INESON, P J BACON and D K LINDLEYInstitute of Terrestrial Ecology, Merlewood Research Station, Grange-over-Sands
1 SummaryThis paper reports the results from the statisticalanalyses performed on the cotton strip data set, ob-tained during the Symposium workshop on the use ofcotton strip assay in decomposition studies. The dataset, derived from various workers, contained infor-mation from 329 replicated cotton strip insertions. Thedata were examined using multiple regression, in anattempt to determine the factors which appeared tocontrol the rate of decomposition of cotton strips insoil in a world-wide comparison.
Analysis of the large data set highlighted the problemsassociated with the limited geographical distributionof strip placement. Analysis of a subset of sites forwhich an increased number of variables were availablerevealed the importance of climatic factors in deter-mining cotton strip decay rate. In particular, potentialevaporation derived from literature values related veryclosely to decomposition rate.
2 IntroductionMany attempts have been made by soil ecologists toutilize standard substrates in organic matter decompo-sition studies, with the expectation that such substra-tes would enable inter-site comparisons ofdecomposition to be made, by removing the confound-ing effect of substrate quality (Swift et al. 1979).Substrates have ranged from shoe-laces (Rosswall1974) through to matchsticks (Abrahamsen et al.1975), with cellulose being the most widely used.
The cotton strip assay has been applied in a widevariety of situations around the world, both to compareeffects of various treatments on rates of decompo-sition at a single site (eg Howson 1988) or at differentsites (Heal et al. 1974). The inter-site study of Heal et'p1. (1974) compared tensile strength loss of cottonstrips (CTSL) at a number of sites in the tundra biomeand, although cotton strips have since been used morewidely, that remains the only global survey of rates ofdecomposition using cotton strips.
Global comparisons and models of decompositionprocesses have been attempted by few workers(Esser et al. 1982; Berg et al. 1984), and such studieshave been aggravated by the paucity of data for com-parable substrates at sufficiently widespreadcations. Therefore, the current Symposium was seenas an opportunity to collate the existing cotton stripdata in order to determine those environmental factorscontrolling decomposition of this material at the globalscale.
155
During the course of the Symposium, 2 workshopsessions were held in which interactive analyses ofthe available data were attempted. Suggestions weremade by participants as to which analyses shouldbe performed and, from these sessions, there aroseseveral conclusions and suggestions for further work.The current paper is principally a report of the outcomeof these workshop sessions and of subsequent re-analysis of the world-wide data set after additionalinformation and amendments had been p.rovided bythe relevant authors.
3 Methods3.1 Originaldata setDelegates to the Symposium were asked, prior to themeeting, to provide data on the tensile strength lossfollowing insertion of cotton strips into soils. Thevariables requested, together with the units ofmeasurement, are outlined in Table 1. The data werecollated into a standard tabular form, and then codedin a manner suitable for analysis using the GENSTATstatistical computer package (Alvey et al. 1983). Allcomputations were carried ouf on a Honeywell 66/DPS-300, in batch mode.
A total of 329 cases was included in the full dataset, with each case representing the mean value ofreplicated strips for the same site and treatment. Thecalculation of the standard cotton rotting rate (CRR),as described by Hill et al. (1985), was performed foreach case to permit comparison of results, expressedon a yearly basis. Data sets outside the recommendedlimits of 10-90% tensile strength loss were rejected.
The mean, minimum and maximum values for eachof the variables requested from the contributors (Table2) revealed that several important variables were miss-ing from the data set, either because they had notbeen measured, or because authors had failed toprovide them. Unfortunately, no data were providedfor assay period air temperature, soil temperature orsoil moisture content for any of the cases, and themajority of contributors were unable to supply datafor many aspects of soil chemistry.
3.2 Augmented data setAfter the Symposium, the data sets were checked byauthors and some further information was provided.It was also decided that estimates for certain variablescould be obtained from published sources in order toexplain the variance observed in CRR rates for as widea range of sites as possible, in terms of climaticfactors.
156
Table 1. The variables requested for the full data set
Mnemonic
Details of strip placement
DEPTHTSSE
FCCLOC
WIDTHDAYSDAYNO
YEARCLOTHSTRIPNAME
Site characteristics
SITEPLOTSUBPLOTCOUNTRYLATLONGHABITVEGMANALT
Climatic variables
CLIMTEMPRAINSOILTSOILMPTEMP
PRAINPSOILTPSO I LM
Soil characteristics
STYPELOITOTNEXTNTOTPEXTPCAEXTKPH
Variable
Depth in soil cmMean tensile strength kgStandard error of the mean of tensilestrengthField control tensile strength kgCloth controlNumber of samplesFrayed width of tested substrip cmNumber of days in the fieldStandard day number when sampleswere placedYearCloth batch (colour code)Code number for stripName of worker
Name of siteName of plotName of subplotCountryLatitudeLongitudeHabitat typeVegetation typeForm of managementAltitude
Climatic zoneMean annual temperatureTotal annual rainfallMean annual soil temperature
Soil typeLoss on ignitionTotal soil nitrogenExtractable soil nitrogenTotal soil phosphorusExtractable soil phosphorusTotal soil calciumExtractable soil potassiumSoil pH
* denotes an alphanumeric string
Mean soil moisture % moist weightPeriod mean temperature during strip °CinsertionPeriod rainfallPeriod soil temperaturePeriod soil moisture
mm d-'°C% moist weight
pg
pg g -1
pg
pg g
pg g-1
Units
Values of mean daily temperature, precipitation andpotential evaporation calculated for the period of stripinsertion were derived from the climatic compilationof Muller (1982), using data for the nearest climaticstation at comparable altitude. Where possible, actualclimatic data provided by the individual workers wereused in preference to those derived from Muller(1982), and there was generally good agreement be-tween these values where both were available.
Table 2. Mean, minimum and maximum values for numerical datain the full data set. The mnemonics used to describe the variablesare outlined in Table 1
*denotes missing values
The augmented data set was restricted to data fordecomposition rates of strips in the top 2 cm of thesoil, and to strips not receiving any additional form oftreatment. Duplicate site cases were only used if theyrepresented results from insertions during differentperiods of the year, and this resulted in the selectionof 48 cases, representing all of the sites identified inFigure 1.
4 Results of analyses4.1 Original data setThe analyses of the basic data set are described in3 sections: (i) a brief discussion of the choice ofparameters used to describe the rate of cotton striprotting; (ii) a brief description of some sample analysesperformed during the workshop; and (iii) a more com-prehensive investigation of the data set undertakenafter the workshop, with the benefit of experience ofthe analyses done during the workshop. As a resultof this latter analysis, several difficulties in analysing
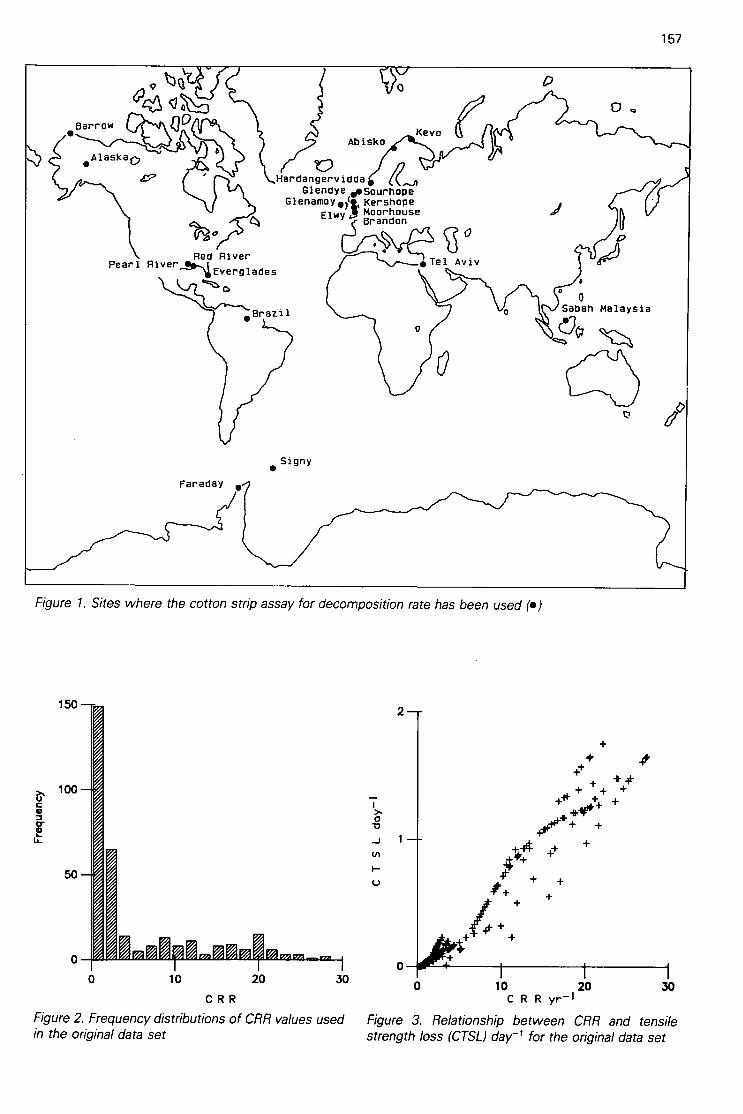
°
Red RiverPearl River.AN Everglades
FaradaY •
Signy•
0 10 20 30
C R R
Abisko
HardangerviddaGlendye e•Sourhope
Glenamoy•4 KershopeElwy Moorhouse
Brandon
2
Kevo
• Tel Aviv
Figure 1. Sites where the cotton strip assay for decomposition rate has been used(4D)
0
0
og
0 10 20C R R yr—I
6
0 0Sabah Malaysia
157
30
Figure 2. Frequency distributions of CRR values used Figure 3. Relationship between CRR and tensilein the original data set strength loss (CTSL) day-' for the original data set

158
the original data set were revealed. The shortness ofthe section describing analyses requested by del-egates during the workshop is largely due to oursubsequent realization that the data set was oftenincompatible with the analyses which had been re-quested.
4.1.1 Measurement of cotton strip decompositionThe work of Hill et al. (1985, 1988) has establisheda 'cotton rotting rate' parameter (CRR), which wasspecifically designed to be less affected by the knowntechnical difficulties of the procedure. In general, thisparameter was used as the dependent variable, de-scribing cotton rotting rates, throughout the analyses.A histogram of its distribution is given in Figure 2, andcan be seen to be highly skewed, most values beingof small magnitude from 0 to 5 (due to the predomi-nance of cold sites), but with a very long tail to theright. During the workshop, one of the delegates re-quested the calculation of an earlier measure of cottonrotting rate, CTSL day-', and, having calculated thismeasure, we decided, for interest's sake, to see howclosely it was related to the CRR parameter of Hill etal. (1985). The scatter diagram shown in Figure 3reveals a surprisingly tight relationship. Indeed, thelinear correlation between the 2 variables explains96% of their variation, but the scatter plot reveals asigmoid 'backbone' arising from the transformationequation applied by Hill et al. (1985), and suggeststhat the linearization of the decay curve is not fullyachieved.
Table 3. CRR as a function of temperature, longitude, absolutelatitude and the number of days of strip insertion
Regression coefficients: Y-variate = CRR
Variation accounted for 69.1%
Correlation matrix: df = 326
It is somewhat surprising that the less robust conven-tional measure, CTSL day-1, is so highly correlatedwith the CRR measure that the 2 could almost beregarded as equivalent. In practice, given that thequality of the cloth is carefully controlled to give astandard tensile strength, and that all investigatorsendeavour to remove their cloth at a time when it isexpected to be around 50% rotted, the correlation isperhaps rather less surprising with hindsight. It does,however, indicate that the procedural difficulties may,in practice, be rather less than were feared. In viewof the fact that the CRR measure of Hill et al. (1985)is biologically sound and mathematically robust, wehave preferred this measure in our subsequent analy-ses. However, for the benefit of investigators whohave used the other method, or those who wish tocompare previous results with the values of CRR givenin this paper, the regression equation predicting CRRfrom CTSL day-1 was found to be:
4.1.2 Examples of analyses requested during the work-shopSeveral requests were made to investigate the re-lationship between CRR and fundamental environ-mental parameters, such as temperature and latitude.The example given below analyses CRR as a functionof temperature, longitude, absolute latitude and thenumber of days the strips were in the soil. These 4variables were derived from a step-wise regression.Absolute latitude (ALAT) is the latitude expressed asa positive number, representing degrees from theequator, regardless of whether in the northern orsouthern hemisphere. The analysis is given in Table3, from which it can be seen that all 4 predictorvariables are significantly related, and that the analysisis based on almost the entire data set (327 out of 329).
CRR = 0.8433 + 14.5620 x CTSL day-1
5 10 15 20
Fitted values
Figure 4. Scatter plot of residuals as a function of fittedvalues for the regression outlined in Table 3
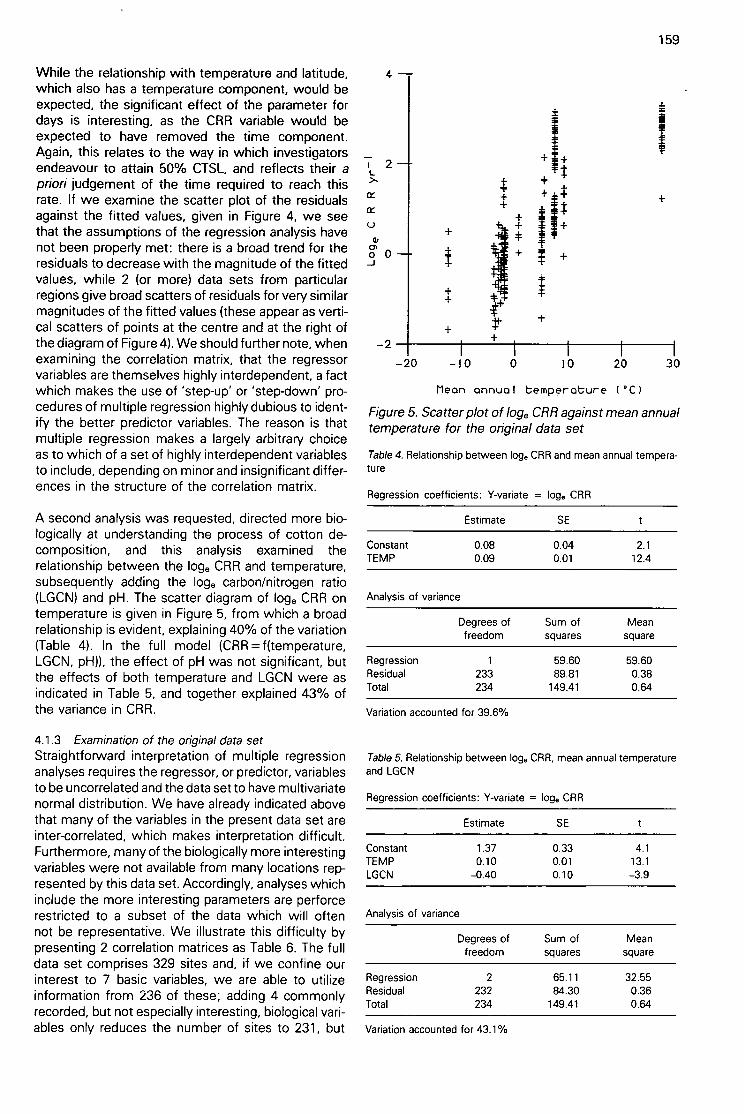
While the relationship with temperature and latitude,which also has a temperature component, would beexpected, the significant effect of the parameter fordays is interesting, as the CRR variable would beexpected to have removed the time component.Again, this relates to the way in which investigatorsendeavour to attain 50% CTSL, and reflects their apriori judgement of the time required to reach thisrate. If we examine the scatter plot of the residualsagainst the fitted values, given in Figure 4, we seethat the assumptions of the regression analysis havenot been properly met: there is a broad trend for theresiduals to decrease with the magnitude of the fittedvalues, while 2 (or more) data sets from particularregions give broad scatters of residuals for very similarmagnitudes of the fitted values (these appear as verti-cal scatters of points at the centre and at the right ofthe diagram of Figure 4). We should further note, whenexamining the correlation matrix, that the regressorvariables are themselves highly interdependent, a factwhich makes the use of 'step-up' or 'step-down' pro-cedures of multiple regression highly dubious to ident-ify the better predictor variables. The reason is thatmultiple regression makes a largely arbitrary choiceas to which of a set of highly interdependent variablesto include, depending on minor and insignificant differ-ences in the structure of the correlation matrix.
A second analysis was requested, directed more bio-logically at understanding the process of cotton de-composition, and this analysis examined therelationship between the loge CRR and temperature,subsequently adding the loge carbon/nitrogen ratio(LGCN) and pH. The scatter diagram of loge CRR ontemperature is given in Figure 5, from which a broadrelationship is evident, explaining 40% of the variation(Table 4). In the full model (CRR = f(temperature,LGCN, pH)), the effect of pH was not significant, butthe effects of both temperature and LGCN were asindicated in Table 5, and together explained 43% ofthe variance in CRR.
4.1.3 Examination of the original data setStraightforward interpretation of multiple regressionanalyses requires the regressor, or predictor, variablesto be uncorrelated and the data set to have multivariatenormal distribution. We have already indicated abovethat many of the variables in the present data set areinter-correlated, which makes interpretation difficult.Furthermore, many of the biologically more interestingvariables were not available from many locations rep-resented by this data set. Accordingly, analyses whichinclude the more interesting parameters are perforcerestricted to a subset of the data which will oftennot be representative. We illustrate this difficulty bypresenting 2 correlation matrices as Table 6. The fulldata set comprises 329 sites and, if we confine ourinterest to 7 basic variables, we are able to utilizeinformation from 236 of these; adding 4 commonlyrecorded, but not especially interesting, biological vari-ables only reduces the number of sites to 231, but
-2
4 -
Variation accounted for 39.6%
Variation accounted for 43.1%
-2 0 - 10 0 10 20 30
Mean annua 1 temperature ( °C
Figure 5. Scatter plot of loge CRR against mean annualtemperature for the original data set
Table 4. Relationship between log. CRR and mean annual tempera-ture
Regression coefficients: Y-variate = loge CRR
Degrees of Sum offreedom squares
Table 5. Relationship between loge CRR, mean annual temperatureand LGCN
Regression coefficients: Y-variate = log, CRR
Degrees of Sum offreedom squares
Meansquare
Meansquare
159
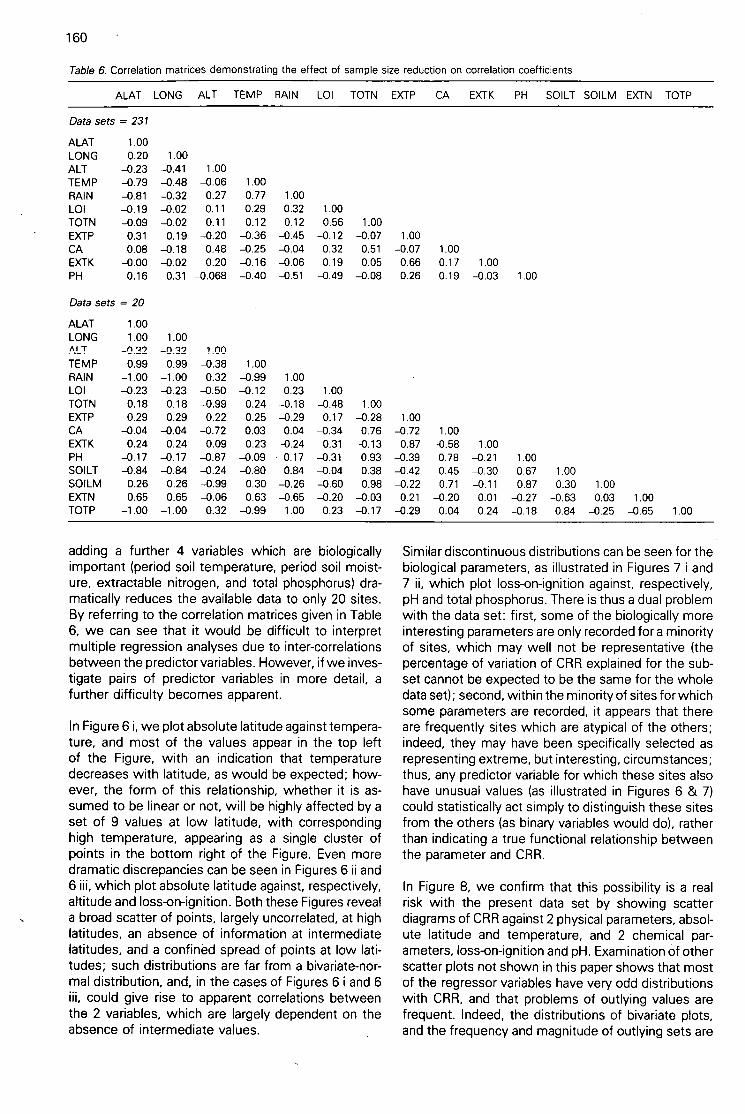
160
Table 6. Correlation matrices demonstrating the effect of sample size reduction on correlation coefficients
adding a further 4 variables which are biologicallyimportant (period soil temperature, period soil moist-ure, extractable nitrogen, and total phosphorus) dra-matically reduces the available data to only 20 sites.By referring to the correlation matrices given in Table6, we can see that it would be difficult to interpretmultiple regression analyses due to inter-correlationsbetween the predictor variables. However, if we inves-tigate pairs of predictor variables in more detail, afurther difficulty becomes apparent.
In Figure 6 i, we plot absolute latitude against tempera-ture, and most of the values appear in the top leftof the Figure, with an indication that temperaturedecreases with latitude, as would be expected; how-ever, the form of this relationship, whether it is as-sumed to be linear or not, will be highly affected by aset of 9 values at low latitude, with correspondinghigh temperature, appearing as a single cluster ofpoints in the bottom right of the Figure. Even moredramatic discrepancies can be seen in Figures 6 ii and6 iii, which plot absolute latitude against, respectively,altitude and loss-on-ignition. Both these Figures reveala broad scatter of points, largely uncorrelated, at highlatitudes, an absence of information at intermediatelatitudes, and a confined spread of points at low lati-tudes; such distributions are far from a bivariate-nor-mal distribution, and, in the cases of Figures 6 i and 6iii, could give rise to apparent correlations betweenthe 2 variables, which are largely dependent on theabsence of intermediate values.
Similar discontinuous distributions can be seen for thebiological parameters, as illustrated in Figures 7 i and7 ii, which plot loss-on-ignition against, respectively,pH and total phosphorus. There is thus a dual problemwith the data set: first, some of the biologically moreinteresting parameters are only recorded for a minorityof sites, which may well not be representative (thepercentage of variation of CRR explained for the sub-set cannot be expected to be the same for the wholedata set); second, within the minority of sites for whichsome parameters are recorded, it appears that thereare frequently sites which are atypical of the others;indeed, they may have been specifically selected asrepresenting extreme, but interesting, circumstances;thus, any predictor variable for which these sites alsohave unusual values (as illustrated in Figures 6 & 7)could statistically act simply to distinguish these sitesfrom the others (as binary variables would do), ratherthan indicating a true functional relationship betweenthe parameter and CRR.
In Figure 8, we confirm that this possibility is a realrisk with the present data set by showing scatterdiagrams of CRR against 2 physical parameters, absol-ute latitude and temperature, and 2 chemical par-ameters, loss-on-ignition and pH. Examination of otherscatter plots not shown in this paper shows that mostof the regressor variables have very odd distributionswith CRR, and that problems of outlying values arefrequent. Indeed, the distributions of bivariate plots,and the frequency and magnitude of outlying sets are

7
0
—L
30
.0
1)
80
•
60
•
40
20
0 200 400 600 800 1000Altitude (m)
+ +
+ ++++ +
++ +
00 20 40 60 80 100
Losson ignition (X)
Figure 6. Scatter plots showing the relationship be-tween absolute latitude and mean annual tempera-ture, altitude, and loss-on-ignition
161
such that it is not possible to suggest useful non-lineartransforms.
Unfortunately, the only feasible solution to these dif-ficulties is to obtain more data to fill the gaps. If allthe sites which were extreme in any parameter areomitted, the resulting data set is very small and almostcertainly unrepresentative. Had the data set rep-resented a more comprehensive series of sites (effec-tively filling in the gaps between the majority of sitesand some of the extreme ones), a multivariate tech-nique, such as principal component analysis, used onthe predictor variables might perhaps have overcomestatistical difficulties. However, principal componentanalysis does itself require a full data set in order toordinate any one set, and would also be prone togiving undUe weight to extreme values in any variable.Thus, in the analyses described below, we have feltobliged to confine our remarks to the broader trendexhibited by the fundamental physico-chemical par-ameters which are recorded for the great majority ofdata sets. Even so, our conclusions have to be modi-fied in the light of which data sets were actuallyincluded in which analyses.
4.1.4 Relationships with basic physico-chemical par-amet&sDuring the workshop, a regression analysis on a largeproportion of the data set indicated that 3 parameters,absolute latitude, temperature, and cotton strip depth,explained about 70% of the variance of CRR. Duringsubsequent analyses, we noticed that this same equa-tion explained 60% of the variation with a data set of326, but only 34% with a data set reduced to 228by the inclusion of additional interesting biologicalparameters. It appears, from a number of analyses,that temperature and absolute latitude are almostsynonymous with regard to this data set, their inter-correlation explaining 60% of their variance. For sev-eral different, but large, subsets of data, absolutelatitude and temperature are both highly significantpredictors, but the accuracy of the prediction is notgreatly affected by which is used, as might be ex-pected given their high inter-correlation. For example,on a data set of 230, the relationship with the best 9parameters (absolute latitude, temperature, rainfall,loss-on-ignition, total nitrogen, extractable phos-phorus, calcium, total potassium and pH) is foundto include temperature, rainfall and total nitrogen ashaving significant effects. However, the effects ofrainfall and total nitrogen are only just significant(P<0.05, as opposed to the very highly significanteffect of temperature, P<0.001), and the overall equa-tion only explains 2% more variation than the corre-lation with temperature alone (which explains 35%variance).
A different, and somewhat larger, data set, with 325degrees of freedom and using absolute latitude,temperature, rainfall and loss-on-ignition as predictorvariables, ascribes highly significant effects to tem-perature, loss-on-ignition and rainfall, but not absolute

1 62
CRR 1.00DEPTH -0.20 1.00ALAT -0.75 0.10TEMP 0.78 -0.14RAIN 0.48 -0.09LOI -0.65 0.07
ConstantTEMPLOIRAINDEPTH
Analysis of variance
RegressionResidualTotal
Estimate
10.540.55
- 0.07- 0.00- 0.11
Degrees offreedom
Variation accounted for 73.0%
Soil pH
Figure 7. Scatter plots showing the relationship between loss-on-ignition with pH and total phosphorus
Table 7. Correlation matrix derived when attempting to provide apredictive equation for CRR, using 328 cases
CRR DEPTH ALAT TEMP RAIN
CRR 1.00DEPTH -0.30 1.00
1.00 ALAT -0.43 0.11 1.00- 0.94 -1.00 TEMP 0.57 -0.19 -0.79- 0.72 0.79 1.00 RAIN 0.42 -0.06 -0.82
0.50 -0.46 -0.19 1.00 LOI -0.01 0.01 -0.13TOTN 0.07 -0.05 -0.06
Table 8. The analysis of variance table for the regression analysisshown in Table 7
Regression coefficients, Y-variate = CRR
SE
0.720.040.010.000.04
14.714.2- 9.5- 4.1-2.8
Sum of MeanSquares Square
4 11939 2984.82323 4332 13.41327 16271 49.76
ltitude, and explains 72% of the variation. Again,temperature explains a considerable proportion (60%)of the variation on its own. It is interesting to note thatthe larger data set (328 as opposed to 230) has nearlytwice as much variance explained by the total modeland by temperature alone (72% and 37% for thefull model and 60% and 36% for temperature alone,
100
80
-
60
40
20
Table9. Correlation matrix derived when attempting to provide apredictive equation for CRR, using 235 cases
LOI CRR DEPTH ALAT TEMP RAIN LOI TOTN
Table 10.The analysis of variance table for the regression analysisshown in Table 9
Regression coefficients, Y-variate = CRR
ConstantTEMPDEPTHLOI
0
0 50 100 150
Totol soil phosphorus (0 g-I)
Analysis of variance
RegressionResidualTotal
Estimate
2.420.14
-0.05-0.01
3231234
Variation accounted for 37.1%
1.000.770.230.09
Degrees of Sum offreedom squares
1.000.20 1.000.06 0.57 1.00
SE
0.260.010.010.00
160.2262.8423.0
9.410.3-3.7-2.2
Meansquare
53.401.141.81
respectively). Temperature appears to be the mostimportant of the physico-chemical parameters rec-orded, with loss-on-ignition and rainfall also havingsignificant predictive effects, but the importance vary-ing considerably with the sets of data that are includedin a particular analysis.
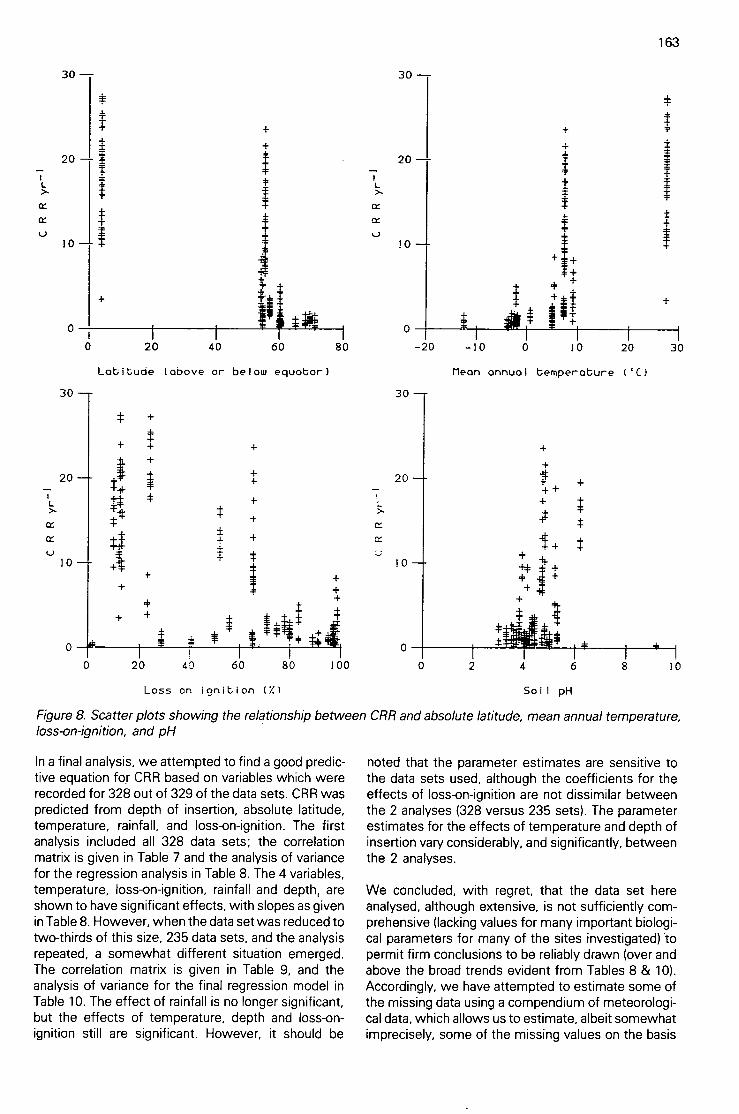
30—
20
10
30
207
10
0 20 40 60 80
Latitude (above or below equator)
0 20 40
Loss on ignition (%)
60 80 100
In a final analysis, we attempted to find a good predic-tive equation for CRR based on variables which wererecorded for 328 out of 329 of the data sets. CRR waspredicted from depth of insertion, absolute latitude,temperature, rainfall, and loss-on-ignition. The firstanalysis included all 328 data sets; the correlationmatrix is given in Table 7 and the analysis of variancefor the regression analysis in Table 8. The 4 variables,temperature, loss-on-ignition, rainfall and depth, areshown to have significant effects, with slopes as givenin Table 8. However, when the data set was reduced totwo-thirds of this size, 235 data sets, and the analysisrepeated, a somewhat different situation emerged.The correlation matrix is given in Table 9, and theanalysis of variance for the final regression model inTable 10. The effect of rainfall is no longer significant,but the effects of temperature, depth and loss-on-ignition still are significant. However, it should be
30—
20—
!0 —
30
20
10
-20 -10 0Mean annual temperature (°C)
-ft
Soil pH
163
10 20 30
0 2 4 6 8 10
Figure 8. Scatter plots showing the relationship between CRR and absolute latitude, mean annual temperature,loss-on-ignition, and pH
noted that the parameter estimates are sensitive tothe data sets used, although the coefficients for theeffects of loss-on-ignition are not dissimilar betweenthe 2 analyses (328 versus 235 sets). The parameterestimates for the effects of temperature and depth ofinsertion vary considerably, and significantly, betweenthe 2 analyses.
We concluded, with regret, that the data set hereanalysed, although extensive, is not sufficiently com-prehensive (lacking values for many important biologi-cal parameters for many of the sites investigated) topermit firm conclusions to be reliably drawn (over andabove the broad trends evident from Tables 8 & 10).Accordingly, we have attempted to estimate some ofthe missing data using a compendium of meteorologi-cal data, which allows us to estimate, albeit somewhatimprecisely, some of the missing values on the basis

164
50 Table 12. The analysis of variance table for the regression analysisof the extended data set
40
7 30
20
10
00 5 10 15 20
PEVAP rem day -1) dur I ng assay per I od
Figure 9. Scatter plot showing the relationship be-tween CRR and period potential evaporation (PEVAP),using the augmented data set
of their geographic locations. This analysis is describedbelow.
4.2 Augmented data setAnalysis of the original data set had highlighted theover-riding importance of climatic factors in determin-ing the rate of decomposition of cotton strips. In theanalyses of the extended data set, soil chemical vari-ables were not included, and period temperatures,rainfall and potential evaporation (PEVAP) were de-rived from published tables.
Table 11 shows the correlation matrix between thevariables used in the multiple regression analysis, inwhich CRR was the dependent variable. From thismatrix, the importance of PEVAP in explaining de-composition rate is apparent, and this importance isreinforced in Table 12, which shows the analysis ofvariance table and regression coefficients resultingfrom the step-wise multiple regression. Period poten-tial evaporation explained 77% of the variance, yield-ing the equation:
CRR = 0.20 + 3.13 (PEVAP)
Regression coefficients, Y-variate = CRR
Variation accounted for 77.0%
Degrees of Sum offreedom Squares
Meansquare
Additinn inf other variab!es faed tn irnrrnve signifi-
cantly the explanation of residual variance, and Figure9 shows the plot of CRR against PEVAP. Examinationof the residuals failed to suggest any need for trans-formation, and they appeared randomly distributed.
5 ConclusionsOne of the principal conclusions arising from thisanalysis of available cotton strip data is that it is verydifficult to perform a posteriori multivariate analysesusing a data set which is heterogeneous. The first partof the analysis revealed that apparent trends in thedata were really a consequence of the few locationsin which research effort had been made. This limitationseverely affected the nature of the results, and theirinterpretation. It proved far more satisfactory to selecta limited number of cases, examining these in moredetail and extracting back-up information from publi-shed sources.
It is apparent from the analysis of the extended dataset that the decomposition of cotton strips is stronglyinfluenced by climate, and that the most useful cli-matic parameter for predicting cotton strip decay rateis PEVAP. In fact, the equation linking decompositionrate to PEVAP could be of use in deciding the timeperiods for inserting cotton strips at new sites.
The close relationship between PEVAP and decompo-sition rate is due to the fact that the 2 principal environ-mental controls on decomposition are temperature
Table 11. Correlation matrix derived when attempting to derive a predictive equation for CRR, using the restricted data set (df = 43)
TS 1.00CRRDAYSLATLONGTEMPPTEMPRAINPRAINPEVAPALT
TS
- -0.16-0.11-0.24-0.110.22
-0.070.02
-0.050.00
-0.16
CRR
1.00-0.68-0.67-0.07
0.670.690.620.670.88
-0.39
DAYS
1.000.620.11
-0.70-0.70-0.67-0.63-0.630.45
LAT
1.00-0.17-0.94-0.78-0.83-0.60-0.780.37
LONG
1.000.290.280.300.21
-0.070.15
TEMP
1.000.830.850.710.77
-0.51
PTEMP
1.000.720.700.80
-0.38
RAIN
1.000.760.62
-0.32
PRAIN
1.000.67
-0.40
PEVAP
1.00-0.47
ALT
1.00

and moisture (Bunnell et al. 1977). The magnitude ofPEVAP is dictated by rainfall and temperature, beinglarge when rainfall and temperature are high, andlower when either of these factors decrease. Thus,conditions of high PEVAP are those which favour ahigh decomposition rate.
The current synthesis of data suggests that decompo-sition of a single substrate, when placed in a widelydiverging range of environments, can be modelledwith accuracy from readily available climatic data.Swift et al. (1979) suggested that decomposition rateis the product of the interaction of substrate quality,physical environment and decomposer organisms. Hillet al. (1985) concluded, from a mathematical modelof the decay process of cotton in soil, that the rate ofdegradation depended mainly on the physico-chemicalenvironment in the soil, and was insensitive to thesize of the microbial inoculum.
In the synthesis presented here, the substrate qualityhas been kept constant between sites, and differencesin cellulose decomposition rates at different sites are,therefore, due to a combination of physico-chemicalenvironment and presence of decomposer organisms.The analysis further suggests that, of these 2 factors,a major component determining decay rate is physicalenvironment, particularly temperature and moisture,as reflected by PEVAP. Residual values may well bea combination of discrepancies between publishedPEVAP values and actual site values, differences insite chemistry, or a measure of decomposer popu-lation differences. The simplest hypothesis necessaryto explain the observed results is to assume that'wherever a cotton strip is placed, it will select for acellulolytic flora capable of cotton degradation, andthat the subsequent rate of decay becomes a simplefunction of physico-chemical environment.
A major feature lacking in the current analysis is thedetailed description of soil chemistry at each of thesites and, if the cotton strip method is to be used toincrease our understanding of the controlling factorsfor cotton decay around the world, it is essential thatworkers make a full assessment and record of climaticand chemical parameters at their sites.
The results reported here lend support to the obser-vatio'ris of Meentemeyer (1978) that decompositionon a regional scale relates to evaporative losses. Theparameter investigated by Meentemeyer (1978) wasactual evapotranspiration, to which potential evapor-ation, as used in this study, approximates. The morerecent work of Berg et al. (1984) confirms that thisapproach is useful for furthering our understanding of
t the decomposition of standard litter material fromScots pine (Pinus sylvestris), yet he also emphasizesthat local site variability, acting both through litterquality and microscale climate, can be extremely im-portant in determining litter decomposition rates (Berget al. 1982).
We emphasize that the rate of litter decay is deter-
165
mined by the interaction of substrate quality, physico-chemical environment and decomposer population.Although the use of a standard substrate can provideinsights into the factors controlling the rates of de-composition, it is currently impossible to extrapolatesuch results to the natural substrates intrinsic to thesite.
6 AcknowledgementsWithout the ready co-operation of the following peoplein supplying cotton strip data and information on thesites (Figure 1), this analysis could not have beendone: D D French (Glendye), G Howson (Elwy), PM Latter (Kershope), A Ligget (Branden), E Maltby(Everglades, Pearl River, Red River, Brazil), J Proctor(Sabah, Malaysia), K Van Cleve (Alaska), P J Vickery(Sourhope), Professor Y Waisel (Tel Aviv), D D Wynn-Williams (Faraday, Signy).
7 ReferencesAbrahamsen, G., Hornvedt, R. & Tveite, B. 1975. Impacts ofacid precipitation on coniferous forest ecosystems. (SNSF-projectresearch report FR 2/75.) Aas: SNSF Project, Norwegian ForestResearch Institute.Alvey, N.G., Banfield, C.F., Baxter, R.I. et a/. 1983. Genstat man-ual. Harpenden: Rothamsted Experimental Station.Berg, B., Hannus, K., Popoff, T. & Theander, 0. 1982. Changesin organic chemical components of needle litter during decompo-sition: long-term decomposition in a Scots pine forest. 1. Can. J.Bot., 60, 1310-1319.Berg, B., Jansson, P. & Meentemeyer, V. 1984. Litter decompo-sition and climate - regional and local models. In: State and changeof forest ecosystems - indicators in current research, edited byG.I. Agren, 369-404. Uppsala: Swedish University of AgriculturalSciences.Bunnell, F.L., Tait, D.E.N., Flanagan, P.W. & Van Cleve, K. 1977.Microbial respiration and substrate weight loss. 1. A general modelof the influences of abiotic variables. Soil Biol. Biochem., 9, 33-40.Esser, G., Asselmann, I. & Lieth, H. 1982. Modelling the carbonreservoir in the system compartment 'litter'. SCOPE/UNEP Sander-band, 52, 39-58.Heal, 0.W., Howson, G., French, D.D. & Jeffers, J.N.R. 1974.Decomposition of cotton strips in tundra. In: Soil organisms anddecomposition in tundra, edited by A.J. Holding, O.W. Heal, S.F.MacLean & P.W. Flanagan, 341-362. Stockholm: Tundra BiomeSteering Committee.Hill, M.O., Latter, P.M. & Bancroft, G. 1985. A standard cuive forinter-site comparisons of cellulose degradation using the cottonstrip method. Can. J. Soil Sci., 65, 605-619.Hill, M.O., Latter, P.M. & Bancroft, G. 1988. Standardization ofrotting rates by a linearizing transformation. In: Cotton strip assay:an index of decomposition in soils, edited by A.F. Harrison, P.M.Latter & D.W.H. Walton, 21-24. (ITE symposium no. 24.) Grange-over-Sands: Institute of Terrestrial Ecology.Howson, G. 1988. Use of the cotton strip assay to detect potentialdifferences in soil organic matter decomposition in forests subjectedto thinning. In: Cotton strip assay. an index of decomposition insoils, edited by A.F. Harrison, P.M. Latter & D.W.H. Walton,94-98. (ITE symposium no. 24.) Grange-over-Sands: Institute ofTerrestrial Ecology.Meentemeyer, V. 1978. Macroclimate and lignin control of litterdecomposition rates. Ecology, 59, 465-472.
M.J. 1982. Selected climatic data for a global set ofstandard stations for vegetation science. The Hague: Junk.Rosswall, T. 1974. Cellulose decomposition studies on the tundra.In: Soil organisms and decomposition in tundra, edited by A.J.Holding, O.W. Heal, S.F. MacLean & P.W. Flanagan, 325-340.Stockholm: Tundra Biome Steering Committee.Swift, M.J., Heal, 0.W. & Anderson, J.M. 1979. Decompositionin terrestrial ecosystems. Oxford: Blackwell Scientific.

166
Appendix ICurrent method for preparation, insertion andprocessing of cotton strips
Plate 14 illustrates diagrammatically the use of theassay.
1 MaterialShirley Soil Burial Test Fabric should normally be used(Walton & Allsopp 1977; Sagar 1988). This is 100%combed cotton, with coloured marker threads in thewarp direction to aid cutting and fraying of samples tosize (Plate 7).
2 PreparationFor field studies, the usual size of strip is 35 cm (weft)x 10 cm (warp). The strips are torn, or cut, fromthe cloth. Initial washing of the Shirley cloth is notnecessary as contamination is kept to a minimumduring production. Other sizes of piece are used ac-cording to the purpose and method of the experiment(Collins et al. 1988; Holter 1988).
Packs of 5 strips are wrapped together in aluminiumfoil, and sterilized in an autoclave at 121° for 15 min,to avoid the introduction of organisms alien to a soil.Some 3-4 kg gain in tensile strength occurs, possiblydue to relaxation of strains put into the fabric duringthe finishing processes, or to alteration to the threadcrimp of the cloth (B F Sagar pers. comm.), but thevariability in tensile strength (TS) is not increased(Latter et al. 1988).
3 Field placingFor investigation down a soil profile, strips are insertedvertically using a spade (Plate 6). A sharp knife is usedto check for any roots or stones which may impedesubsequent insertion and to cut through the litterlayer to diminish carry-down of surface material duringinsertion. Then, folding the lower 2-3 cm of strip overthe blade of a small straight spade, the strip is pushedvertically into the soil, leaving approximately 4 cmprotruding above the surface. In most soils, it isnecessary to ease removal of the spade by sliding itsideways a few times, while the strip should remainin place. The creation of a gap round the strip, whichcan be caused by moving the spade forward or back-wards, is to be avoided. The soil is then pressed backagainst the strip after insertion, using the feet or handsaccording to the nature of the surface.
To reduce mechanical stretching of cloth or potentialdamage from stones, some workers first make a slotin the soil with a sharpened steel plate and then insertthe strip into this slot using a blunt-edged former(Walton 1988). Maltby (1988) has also devised a spe-cial tool to aid insertion in bogs. The aim in all casesmust be to minimize disturbance of the site and to
attain close contact between strip and soil. For siteswith a gritty or stony subsoil near the surface, Frenchand Howson (1982) placed strips round the base of ablock of the surface peat, calling this the horizonmethod. Lawson (1988), on the other hand, placed the2 ends of strip into the soil.
Where interference by animals is expected, the pro-truding top of the strip can be firmly pinned down orthe strip completely inserted (or trimmed down), andthe position marked in some way; alternatively, a cageof plastic-coated wire can be firmly fixed over theposition (Vickery & Floate 1988). Plastic rods, 30 cmlong, are frequently used to mark positions; these areinert and bend without breaking.
4 ControlsIn the early stages of experiments with the un-bleached calico, it became apparent that the variabilityof the tensile strength of undecayed cloth was con-siderable and that systematic controls at all stages ofuse were vital. They were needed to assess the ef-fects of batch of cloth, autoclaving, washing, themechanical stretching which occurred during field in-sertion, and of soil impregnation or cementation. Thecontrols allowed assessment of the minimum detect-able change in TS that could be attributed to cellulosedecay in the soil.
Cloth controls are unburied samples used to checkbatch variation and effect of sterilization or storage ofcloth. The TS of fabric controls was not found to varyin any pattern throughout the width and length of asingle roll of cloth. -However, Howson (1988) hasfound variation between batches of the earlier Shirleycloth.
Field controls (also called insertion controls) are mostimportant because they provide a baseline for ex-pression of TS loss of cotton (CTSL) and allow forerrors due to insertion and retrieval and for any TSincrease due to cementation in particular soils (French1988). Field controls are inserted and removed on thesame day, usually at the time of retrieval, but, in someextreme conditions where soil may be in a differentcondition at insertion and retrieval dates, eg frozen orvery dry, then 2 sets of field controls may be neededto cover the range of conditions at both times. Theyshould be placed on each plot type, or soil, at eachsampling. Field controls are then washed and testedalong with the test samples.
5 Retrieval timeCotton strips are left in the field until the tensile
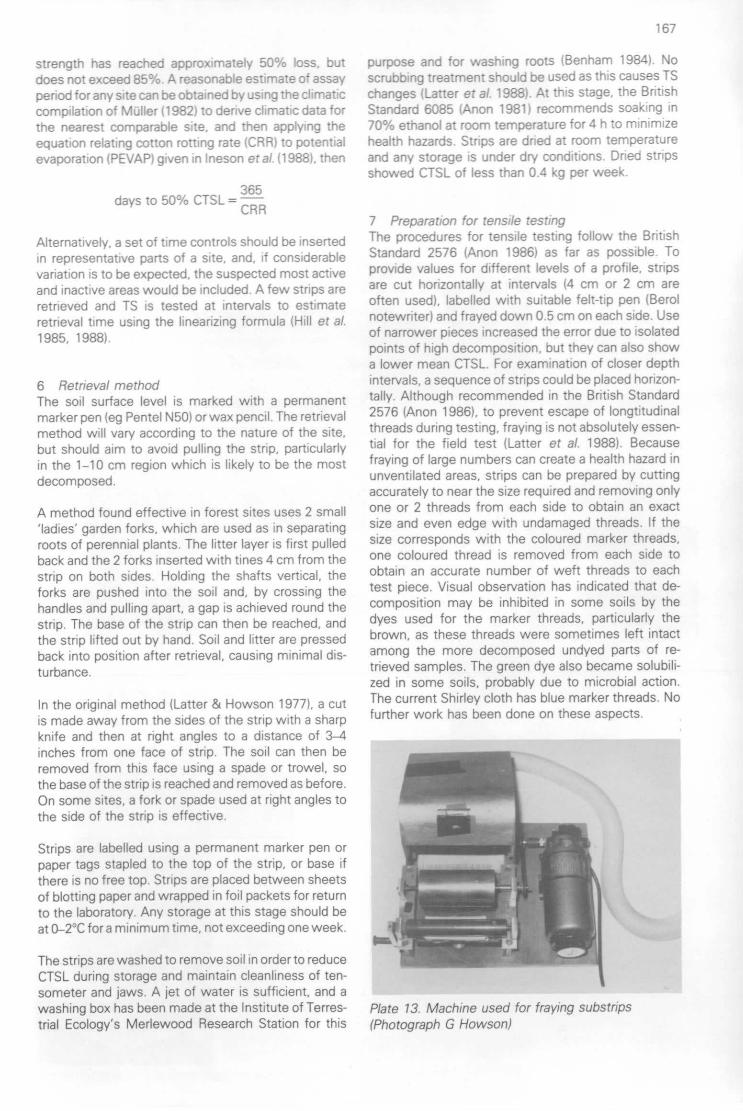
coes5.er cc-
CavS 7.9
85.2 TC .- t ddta '
Alferca' ce -sertecn represectat :e ca'tsvarction s to be expected. t-e s..specteo crest aCT ve
and :mact ye areas would be nciuded A fey. str.ps areremeved anc TS is tested at mervais to es' materetrieval t me usino the linear:zing formwa 'Hill or a/1985, 1988)
6 Retrieval methodThe soil surface level is marked with a permanentmarker pen (eg Pentel N50} or wax pencil The retrieval
method will vary according to the nature of The site .
but should awn to avoid pulling the strip, particularlyin the 1-10 cm region which is hkely to be the most
decomposed.
A method found effective in forest sites uses 2 small'ladies' garden forks, which are used as in separatingroots of perennial plants The litter layer is first pulledback and the 2 forks inserted with tines 4 cm from thestrip on both sides Holding the shafts vertical, tneforks are pushed into the soil and, by crossing thehandles and pulling apart, a gap is achieved round thestrip The base of the strip can then be reached, andthe strip lifted out by hand Soil and litter are pressedback into position after retrieval, causing minimal dis-turbance
In the original method (Latter & Howson 1977), a cutis made away from the sides of the strip with a sharpknife and then at right angles to a distance of 3-4inches from one face of strip The soil can then beremoved from this face using a spade or trowel, sothe base of the strip is reached and removed as beforeOn some sites, a fork or spade used at right angles tothe side of the strip is effective
Strips are labelled using a permanent marker pen orpaper tags stapled to the top of the strip, or base ifthere is no free top. Strips are placed between sheetsof blotting paper and wrapped in foil packets for returnto the laboratory. Any storage at this stage should beat 0-2°C for a minimum time, not exceeding one week.
The strips are washed to remove soil in order to reduceCTSL during storage and maintain cleanliness of ten-someter and jaws. A jet of water is sufficient, and awashing box has been made at the Institute of Terres-trial Ecology's Merlewood Research Station for this
7 P'eDara:nr7 'or 7P-c
pro:seg./es "ens e tEst
Starciaro 2576 Artsso 19815( sis Oit-i.":5. :Joss Die TO
provioe values 'or different ievels of a profile, str DS
are cut horizontally a". intervals '4 cm or 2 cm areoften useci. labelled w 1n syitacie fel5" p pen :Berol
notewritew and 'rayed down 0 5 cm on each side Useof narrower pieces increased the error due to isolatedpoints of high decomposition, but tney can also showa lower mean CTSL For examination of closer depthIntervals, a sequence of strips could be placed horizon-tally. Although recommended in the British Standard2576 !Anon 1986). to prevent escape of longtitudInalthreads during testing, fraying is not absolutely essen-tial for the field test (Latter et al. 19881 Becausefraying of large numbers can create a health hazard inunventilated areas, strips can be prepared by cuttingaccurately to near the size required and removing onlyone or 2 threads from each side to obtain an exactsize and even edge with undamaged threads. If thesize corresponds with the coloured marker threads,one coloured thread is removed from each side toobtain an accurate number of weft threads to eachtest piece. Visual observation has indicated that de-composition may be inhibited in some soils by thedyes used for the marker threads, particularly thebrown, as these threads were sometimes left intactamong the more decomposed undyed parts of re-trieved samples. The green dye also became solubili-zed in some soils, probably due to microbial action.The current Shirley cloth has blue marker threads. Nofurther work has been done on these aspects
Plate 13. Machine used for fraying substrips(Photograph G Howson)
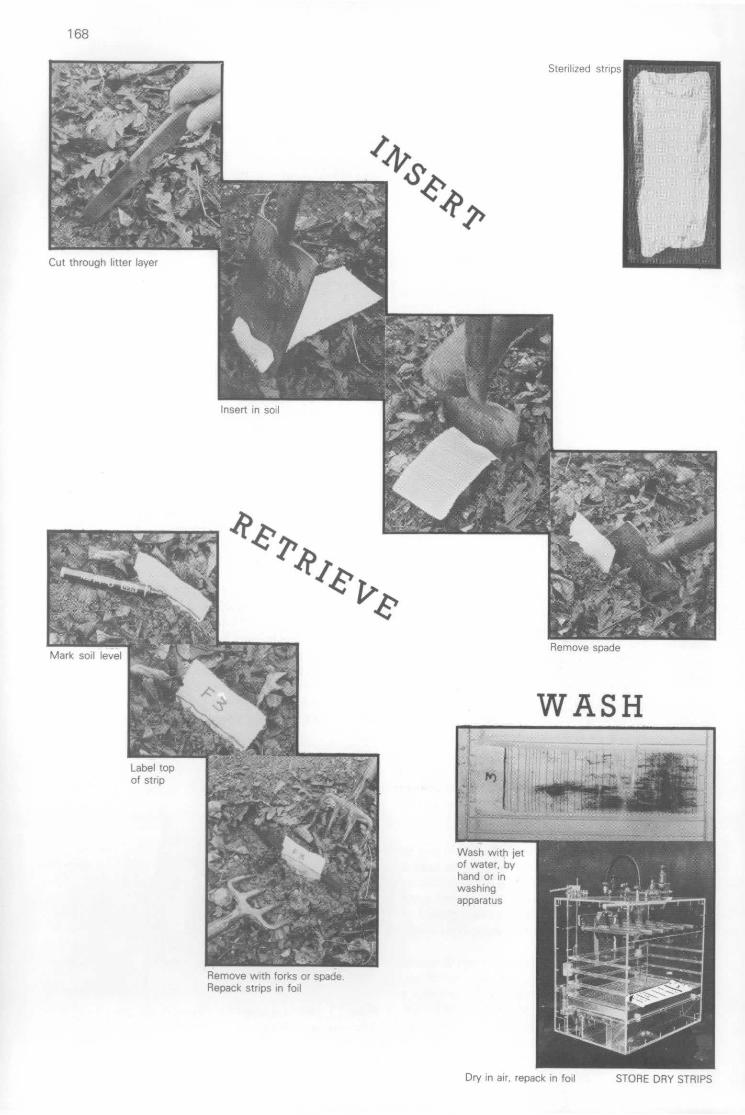
U")
311111elbassa,

Substnp
4—
3 A
Tensorpeter laws
Peeks,,
PeN6,44,
its4p44,
spteAro,p4p
a7,<A
Output*
Plate 14. Diagram of method for use of cotton strip assay in the field based onprocedures used at Merlewood Research Station. Some alternative procedures areshown by adjacent illustrations and others are referred to in Appendix 1 where themethod is fully described (Photographs G Howson)
• The chart recorder output is modified to compress the extension curve, normally shown, to a single vertical
line indicating only the breaking load Ths modification allows the output of many successive results on asingle chart
Fray wqr, tweezerswire brusn or mach neiPlate 131
Condition substnps4 hours at 50-C
24 nours at 25'C 65% RH
0
5
I 10
a
2030
Results
90
CTSL(kg)
169
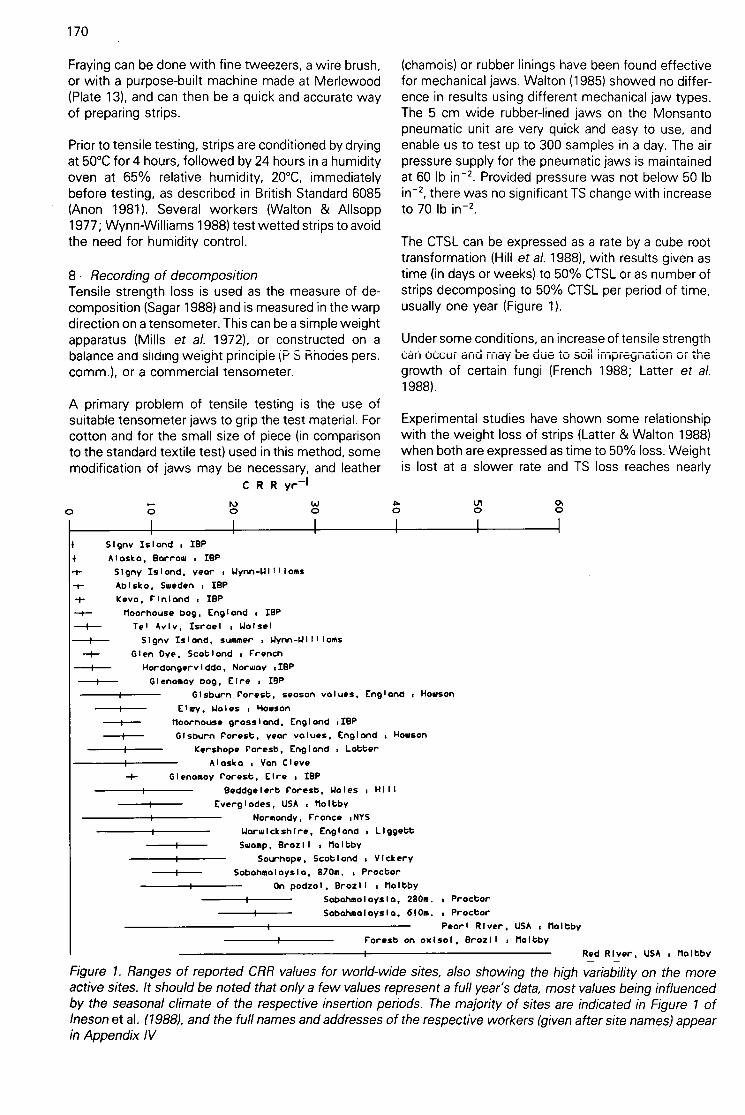
170
Fraying can be done with fine tweezers, a wire brush,or with a purpose-built machine made at Merlewood(Plate 13), and can then be a quick and accurate wayof preparing strips.
Prior to tensile testing, strips are conditioned by dryingat 50°C for 4 hours, followed by 24 hours in a humidityoven at 65% relative humidity, 20°C, immediatelybefore testing, as described in British Standard 6085(Anon 1981). Several workers (Walton & Allsopp1977; Wynn-Williams 1988) test wetted strips to avoidthe need for humidity control.
8 Recording of decompositionTensile strength loss is used as the measure of de-composition (Sagar 1988) and is measured in the warpdirection on a tensometer. This can be a simple weightapparatus (Mills et al. 1972), or constructed on abalance and sliding weight principie (P S Rhodes pers.comm.), or a commercial tensometer.
A primary problem of tensile testing is the use ofsuitable tensometer jaws to grip the test material. Forcotton and for the small size of piece (in comparisonto the standard textile test) used in this method, somemodification of jaws may be necessary, and leather
C R R yr -1
Sign,/ Isiond • IBPAlosko, Borrow , IBP
Signy Isiond, yeor Wynn-Willioms
Ablsko, Sweden IBPKevo, Finland • IBP
-+- Moorhouse bog, England 1 IBPTel Aviv, Isroel • WolselSignv Island, summer Wynn-Willloms
Glen Dye, Scotiond FrenchHordongervlddo, Norwoy •IBPGlenomoy bog, Eire • IBP
Gisburn Forest, seoson values,Elwy, Woles • Howson
— 1--- Moorhouse grosslond, Engiond .IBPGisburn Forest, year volues, England • Howson
Kershope Forest, Englond LotterAlosko • Van Cleve
-1- Glenomoy Forest, Eire IBPBeddgelert Forest, Woies • Hill
Everglades, USA • MoltbYNormandy, Fronce •NVS
Warwickshire, Englond • LiggettSwomp, Brozil Maltby
Sourhope, Scoblond VickerySobohmoloysio, 870m. • Proctor
On podzol, Brozil MaltbySobohmoloysla, 280m. ProctorSobohmoloysla, 610m. • Proctor
Peorl River,Forest on oxlsol, Brozil
(chamois) or rubber linings have been found effectivefor mechanical jaws. Walton (1985) showed no differ-ence in results using different mechanical jaw types.The 5 cm wide rubber-lined jaws on the Monsantopneumatic unit are very quick and easy to use, andenable us to test up to 300 samples in a day. The airpressure supply for the pneumatic jaws is maintainedat 60 lb in-2. Provided pressure was not below 50 lbin-2, there was no significant TS change with increaseto 70 lb in-2.
The CTSL can be expressed as a rate by a cube roottransformation (Hill et al. 1988), with results given astime (in days or weeks) to 50% CTSL or as number ofstrips decomposing to 50% CTSL per period of time,usually one year (Figure 1).
Under some conditions, an increase of tensile strengthcan occur arid irlay be due to soil impregnation or thegrowth of certain fungi (French 1988; Latter et al.1988).
Experimental studies have shown some relationshipwith the weight loss of strips (Latter & Walton 1988)when both are expressed as time to 50% loss. Weightis lost at a slower rate and TS loss reaches nearly
England , Howson
USA MoltbyMaltby
Red River, USA Maltby_ _Figure 1. Ranges of reported CRR values for world-wide sites, also showing the high variability on the moreactive sites. It should be noted that only a few values represent a full year's data, most values being influencedby the seasonal climate of the respective insertion periods. The majority of sites are indicated in Figure 1 ofMeson et al. (1988), and the full names and addresses of the respective workers (given after site names) appearin Appendix IV

100%, while weight loss is approximately 25%. The2 parameters are, to some extent, based on differentaspects of cellulose decomposition (Howard 1988;Sagar 1988), and a close relationship is not to beexpected.
When carried out according to these instructions,many ecologists have found the assay a usefuladdition to their studies, giving information on com-parative decomposition activity in ecological investi-gations. The assay is simple and easy to use on anysite with only slight modifications of insertion/retrievalmethod to suit site conditions. Any careful worker canquickly be trained.
The current cost of cloth from the Shirley Institute is£6 per metre, and the approximate time in minutestaken to process one cotton strip of 5 profile subsam-ples (excluding travelling time) is as follows:
Tear, pack and sterilizePlace in fieldRetrieve from fieldWash, dry and re-packCut, label and frayTensile test and write out data
1.52.52.82.4
10.06.0
The availability of a tensometer is likely to be the mainproblem, but these machines are available in manyuniversities. At the present time, the Monsanto ma-chine at Merlewood can be used for a bench fee.
9 ReferencesAnon. 1981. Method of test for the determination of the resistanceof textiles to microbiological deterioration. (BS 6085.) London: Bri-tish Standards Institution.Anon. 1986. Methods of test for textiles - woven fabrics - andelongation (strip methoch. (BS 2576.) London: British StandardsInstitution.Benham, D.G.1984. Vegetation/root washing machine. Annu. Rep.Inst. terr. Ecol. 1983, 88-89.Collins, H., Gitay, H., Scandrett, E. & Pearce, T. 1988. Decompo-sition rates in the ericaceous belt of Mount Aberdare, Kenya. In:Cotton strip assay an index of decomposition in soils, editedby A.F. Harrison, P.M. Latter & D.W.H. Walton, 123-125. (ITEsymposium no. 24.) Grange-over-Sands: Institute of TerrestrialEcology.French, D.D. 1988. The problem of cementation. In: Cotton stripassay. an index of decomposition in soils, edited by A.F. Harrison,P.M. Latter & D.W.H. Walton, 32-33. (ITE symposium no. 24.)Grange-over-Sands: Institute of Terrestrial Ecology.French, D.D. & Howson, G.1982. Cellulose decay rates measuredby a modified cotton strip method. Soil Biol. Biochem., 14, 311-312.Hill, M.O., Latter, P.M. & Bancroft, G. 1985. A standard curve forinter-site comparison of cellulose degradation using the cotton stripmethod. Can. J. Soil Sci., 65, 609-619.Hill, M.O., Latter, P.M. & Bancroft, G. 1988. Standardization ofrotting rates by a linearizing transformation. In: Cotton strip assay.an index of decomposition in soils, edited by A.F. Harrison, P.M.Latter & D.W.H. Walton, 21-24. (ITE symposium no. 24.) Grange-over-Sands: Institute of Terrestrial Ecology.
171
Hotter, P. 1988. Cellulolytic activity in dung pats in relation to theirdisappearance rate and earthworm biomass. In: Cotton strip assay.an index of decomposition in soils, edited by A.F. Harrison, P.M.Latter & D.W.H. Walton, 72-77. (ITE symposium no. 24.) Grange-over-Sands: Institute of Terrestrial Ecology.Howard, P.J.A. 1988. A critical evaluation of the cotton strip assay.In: Cotton stiip assay an index of decomposition in soils, editedby A.F. Harrison, P.M. Latter & D.W.H. Walton. 34-42. (ITE sym-posium no. 24.) Grange-over-Sands: Institute of Terrestrial Ecology.Howson, G. 1988. Use of the cotton strip assay to detect potentialdifferences in soil organic matter decomposition in forests subjectedto thinning. In: Cotton strip assay. an index of decomposition insoils, edited by A.F. Harrison, P.M. Latter & D.W.H. Walton,94-98. (ITE symposium no. 24.) Grange-over-Sands: Institute ofTerrestrial Ecology.lneson, P., Bacon, P.J. & Undley, D.K. 1988. Decomposition ofcotton strips in soil: analysis of the world data set. In: Cotton stripassay: an index of decomposition in soils, edited by A.F. Harrison,P.M. Latter & D.W.H. Walton, 155-165. (ITE symposium no. 24.)Grange-over-Sands: Institute of Terrestrial Ecology.Latter, P.M. & Howson, G. 1977. The use of cotton strips toindicate cellulose decomposition in the field. Pedobiologia, 17,145-155.Latter, P.M. & Walton, D.W.H. 1988. The cotton strip assay forcellulose decomposition studies in soil: history of the assay anddevelopment. In: Cotton strip assay. an index of decomposition insoils, edited by A.F. Harrison, P.M. Latter & D.W.H. Walton, 7-10.(ITE symposium no. 24.) Grange-over-Sands: Institute of TerrestrialEcology.Latter, P.M., Bancroft, G. & Gillespie, J. 1988. Technical aspectsof the cotton strip assay method. Int. Biodeterior, 24. In press.Lawson, G.J. 1988. Using the cotton strip assay to assess organicmatter decomposition patterns in the mires of South Georgia. In:Cotton strip assay an index of decomposition in soils, editedby A.F. Harrison, P.M. Latter & D.W.H. Walton, 134-138. (ITEsymposium no. 24.) Grange-over-Sands: Institute of TerrestrialEcology.Maltby, E. 1988. Use of cotton strip assay in wetland and uplandenvironments -an international perspective. In: Cotton strip assay.an index of decomposition in soils, edited by A.F. Harrison, P.M.Latter & D.W.H. Walton, 140-154. (ITE symposium no. 24.) Grange-over-Sands: Institute of .Terrestrial Ecology.Mills, J., Allsopp, D. & Eggins, H.O.W. 1972. Some new develop-ments in cellulosic material testing using perfusion techniques. In:Biodeterioration of materials Vol II, edited by A.H. Walters & E.H.H.Van Der Plas, 227-232. Barking, Essex: Applied Science.
M.J. 1982. Selected climatic data for a global set of stan-dard stations for vegetation science. The Hague: Junk.Sagar, B.F. 1988. The Shirley Soil Burial Test Fabric and tensiletesting as a measure of biological breakdown of textiles. In: Cottonstrip assay an index of decomposition in soils, edited by A.F.Harrison, P.M. Latter & D.W.H. Walton, 11-16. (ITE symposium no.24.) Grange-over-Sands: Institute of Terrestrial Ecology.Vickery, P.J. & Floate, M.J.S. 1988. Effects of lime and pastureimprovement on cotton strip decomposition in 3 Scottish acid hillsoils. In: Cotton strip assay. an index of decomposition in soils,edited by A.F. Harrison, P.M. Latter & D.W.H. Walton, 109-112.(ITE symposium no. 24.) Grange-over-Sands: Institute of TerrestrialEcology.Walton, D.W.H. 1985. Tensometer and jaw types in testing textilesfor tensile strengths. Int. Biodeterior., 21, 301-302.Walton, D.W.H. 1988. Problems and advantages of using the cottonstrip asay in polar and tundra sites. In: Cotton strip assay. an indexof decomposition in soils, edited by A.F. Harrison, P.M. Latter &D.W.H. Walton, 43-45. (ITE symposium no. 24.) Grange-over-Sands:Institute of Terrestrial Ecology.Watton, D.W.H. & Allsopp, D. 1977. A new test cloth for soil burialtrials and other studies on cellulose decomposition. Int. Biodeterior.Bull., 13, 112-115.Wynn-Williams, D.D. 1988. Cotton strip decomposition in relationto environmental factors in the maritime Antarctic. In: Cotton stripassay an index of decomposition in soils, edited by A.F. Harrison,P.M. Latter & D.W.H. Walton, 126-133. (ITE symposium no. 24.)Grange-over-Sands: Institute of Terrestrial Ecology.

172
Appendix IIUse of cotton in ecological studiesList of reference papers prior to publication ofSymposium proceedings
Agarwal, C.P. & Chauhan, R.K.S. 1976. Neurospora tetrasperma:its occurrence in Indian soil and its cellulolytic activity. Proc. Indiannat. Sci. Acad. B, 42, 122-124.Baker, J.H. 1974. Comparison of the microbiology of four soils inFinnish Lapland. Oikos, 25, 209-215.
*Beiderbeck, V.O., Paul, E.A., Lowe, W.E., Shields, J.A. & Wil-lard, J.R. 1974. Soil microorganisms: 11. Decomposition of cellu-lose and plant residues. (Matador Project technical report no. 39.)Saskatoon: University of Saskatchewan.Brown, A.H.F., Gardener, C.L. & Howson, G. 1973. Differencesin some biological attributes of soils developed under four treespecies. In: Biological processes and soil fertility, edited by J.Tinsley & D.S. Jenkinson. 58. Readina: British Society of SoilScience.Davis, R.C. 1986. Environmental factors influencing decompo-sition rates in two antarctic moss communities. Polar Biol., 5, 95-103.Dighton, J., Thomas, E.D. & Latter, P.M. 1987. Interactionsbetween tree roots, mycorrhizas, a saprotrophic fungus and thedecomposition of organic substrates in a microcosm. Biol. Fertil.Soils, 4, 145-150.French, D.D. & Howson, G. 1982. Cellulose decay rates meas-ured by a modified cotton strip method. Soil Biol. Biochem., 14,311-312.French, D.D. 1984. The problem of 'cementation' when usingcotton strips as a measure of cellulose decay in soils. Int. Biodet-erior., 20, 169-172.Greaves, M.P., Cooper, S.L., Davies, H.A., Marsh, J.A.P. &Wingfield, G.I. 1978. Methods of analysis for determining theeffects of herbicides on soil micro-organisms and their activities.(Technical report no. 45.) Yarnton: Weed Research Organization.Grossbard, E. 1973. Rapid techniques for the assessment of theeffect of herbicides on soil microorganisms and cellulolytic activity.In: Modern methods of the study of microbial ecology, editedby T. Rosswall, 473-474. Stockholm: Swedish Natural ScienceResearch Council.Grossbard, E. 1975. Techniques for the assay of the effects ofherbicides on the soil microflora. In: Some methods for microbialassay, edited by R.G. Board & D.W. Lovelock, 235-256. London:Academic Press.Grossbard, E. & Wingfield, G.I. 1975. The effect of herbicides oncellulose decomposition. In: Some methods for microbial assay,edited by R.G. Board & D.W. Lovelock, 235-236. London: Aca-demic Press.Heal, 0.W., Flanagan, P.W., French, D.D. & MacLean, S.F. Jr.1981. Decomposition and accumulation of organic matter. In:Tundra ecosystems: a comparative analysis, edited by L.C. Bliss,O.W. Heal & J.J. Moore, 587-634. Cambridge: Cambridge Univer-sity Press.Heal, 0.W., Howson, G., French, D.D. & Jeffers, J.N.R. 1974.Decomposition of cotton strips in tundra. In: Soil organisms anddecomposition in tundra, edited by A.J. Holding, O.W. Heal, S.F.MacLean & P.W. Flanagan, 341-362. Stockholm: Tundra BiomeSteering Committee.Heal, 0.W., Latter, P.M. & Howson, G. 1978. A study of therates of decomposition of organic matter. In: Production ecologyof British moors and montane grasslands, edited by O.W. Heal &D.F. Perkins, 136-159. Berlin: Springer.Hornung, M. 1986. Soil data collection and interpretation in somecurrent projects in the Institute of Terrestrial Ecology. Rep. WelshSoils Discuss. Grp, no. 22, 67-98.Hill, M.O., Latter, P.M. & Howson, G. 1985. A standard curvefor inter-site comparison of cellulose degradation using the cottonstrip method. Can. J. Soil Sci., 65, 609-619.
Latter, P.M. & Howson, G. 1977. The use of cotton strips toindicate cellulose decomposition in the field. Pedobiologia, 17,145-155.Liggett, A.C. 1983. Comparative assessment of the cellulaseactivity in the soils of Brandon Marsh Nature Reserve. BSc thesis,Coventry (Lanchester) Polytechnic.Maltby, E. 1985. Effects of nutrient loadings on decompositionprofiles in the water column and submerged peat in the Evergla-des. In: Tropical peat resources - prospects and potential. Proc.int. Peat Soc. Symp., 450-464.Maltby, E. 1986. Investigations of the peat cover of the NorthYork Moors. In: Moorland management, edited by D.C. Statham,28-41. Helmsley, Yorkshire: North York Moors National Park.Maltby, E. 1986. Soil property responses to surface treatmentand associated management practices at Halscombe Allotment/Numbers Ball and Old Barrow Down/Hawkridge Plain 1978-1986.Exmoor National Park Authority.Miles, J. & Young, W.F. 1980. The effects on heathland andmoorland soils in Scotland and northern Engrand following coloniz-ation by birch (Betula spp.). Bull. Ecol., 11, 233-242.Miles, J. 1981. Effect of birch of moorlands. Cambridge: Instituteof Terrestrial Ecology.Miles, J. 1984. Gruinard Island. Assessment of ecological conse-quences of decontamination. Phase II. (Natural Environment Re-search Council contract report to the Ministry of Defence.)Banchory: Institute of Terrestrial Ecology. (Unpublished.)Miles, J., Latter, P.M., Smith, I.R. & Heal, 0.W. 1988. Ecologicaleffects of killing Bacillus anthracis on Gruinard Island with formal-dehyde. Reclam. Reveg. Res. In press.Mirzoev, 0.G. 1973. Cellulose decomposition in the litter/humusof birch/Carex pilosa stands of different ages. Lesovedenie, no.1, 86-88.Rovira, A.D. 1953. A study of the decomposition of organic matterin red soils of the Lismore district. Aust. Conf. Soil Sci., Adelaide,1, 3.17, 1-4.
*Smagina, M.V. 1984. The activity of cellulose-decomposingmicro-organisms in peat-bog soils. Lesovedenie, no. 1, 52-58.Smith, M.J. & Walton, D.W.H. 1988. Patterns of cellulose de-composition in four subantarctic soils. Polar Biol. In press.Springett, J.A. 1971. The effects of fire on litter decompositionand on the soil fauna in a Pinus pinaster plantation. In: 4th Collo-quium Pedobiologiae, Dijon, 1970,529-535. Paris: Institut Nationalde la Recherche Agronomique.Springett, J.A. 1979. The effects of a single hot summer fireon soil fauna and on litter decomposition in jarrah (Eucalyptusmarginata) forest in Western Australia. Aust. J. Ecol., 4, 279-291.Springett, J.A. 1980. The use of cotton strips in a microcosmstudy of the energy cost of a predator-prey relationship. In: Soilbiology as related to land use practices, edited by D.L. Dindal,637-642. Washington, DC: Office of Pesticide and Toxic Substan-ces, EPA.Tsutsumi, T. & Katagiri, S. 1974. The relationship between sitecondition and circulation of nutrients in forest ecosystem (II).Moisture index as a means of evaluation of Site condition. J. Jap.For. Soc., 56, 434-440.Walton, D.W.H. 1985. Tensometer and jaw types in testingtextiles for tensile strengths. Int. Biodeterior., 21, 303-302.Walton, D.W.H. & Allsopp, D. 1977. A new test cloth for soilburial trials and other studies on cellulose decomposition. Int.Biodeterior. Bull., 13, 112-115.Widden, P., Howson, G. & French, D.D. 1986. Use of cottonstrips to relate fungal community structure to cellulose decompo-sition rates in the field. Soil Biol. Biochem., 18, 335-337.

'Wingfield, G.I. 1980. Effect of asulam on cellulose decompositionin three soils. BulL environ. Contam. Toxicol., 24, 473-476.
`Wingfield, G.I. 1980. Effects of time of soil collection and storageon microbial decomposition of cellulose in soil. Bull. environ.Contam. ToxicoL, 24, 671-675.Wynn-Williams, D.D. 1979. Techniques used for studying terres-trial microbial ecology in the maritime Antarctic. In: Cold tolerantmicrobes in spoilage and the environment, edited by A.D. Rus-sell & D. Fuller, 67-81. London: Academic Press.
173
Wynn-Williams, D.D. 1980. Seasonal fluctuations in microbialactivity in antarctic moss peat. Biol. J. Linn. Soc.,14, 11-28.Wynn-Williams, D.D. 1985. Comparative microbiology of moss-peat decomposition on the Scotia Arc and Antarctic Peninsula. In:Antarctic nutrient cycles and food webs, edited try W.R. Siegfried,P.R. Condy. & R.M. Laws, 204-210. Berlin: Springer.
`used weight loss, not tensile strength, as the measure of de-composition
174
Appendix IIIBiodegradation studies at the US Army Natick ResearchCentreScience and Advanced Technology Laboratory, Natick Research Development and Engineering Centre,Natick, Massachusetts, USA
Dr A M Kaplan is the principal investigator for microbio-logical studies at the US Army Natick Research Centre,where some basic and applied research is carried outon cellulosic materials such as textiles, clothing, ortentage, which have been subject to microbiologicaldeterioration. The studies include chemical, physicalor biological aspects.
Although the work is largely aimed at solving prob-lems of deterioration, including aspects of the use ofthe soil burial method, Dr Kaplan's published workalso discusses some more theoretical concepts con-cerning the interfacing of environment, substrate andmicro-organisms (eg Kaplan 1977), along with theproblems of relating phenomena observed in labora-tory evaluations to actual field situations. He stressesthat the environment is the dominant force in anybiodegradation process, and considers that know-ledge of the role of the specific environment in deter-mining the course and sequence of events in anybiodegradation process can be used to plan exper-imental studies so as to provide valid predictions ofresponses in the field.
Readers may like to know of the work of this group inthe USA, and the following list gives some of therelevant publications.
ReferencesDarby, R.T. & Kempton, A.G. 1962. Soil burial of fabrics treatedwith minimal concentrations of fungicides. Text. Res. J., 32, 548-552.Kempton, A.C., Maisel, H. & Kaplan A.M. 1963. A study of thedeterioration of fungicide-treated fabrics in soil burial. Text. Res. J.,33, 87-93.Kaplan, A.M. 1977. Microbial degradation of materials in laboratoryand natural environments. Develop. ind. Microbiol., 18, 203-211.Kaplan, A.M. 1979. Prediction from laboratory studies of biodegrad-ntinn poll, rtnnte in 'natiirar anwirnnr-nontc In- Prnrooriinoc c,f tho
workshop; microbial degradation of pollutants in marine environ-ments, edited by A.W. Bourquin & P.N. Pritchard, 479-484. (PB-298 254.) Florida.Kaplan, A.M. 1984. Military needs and criteria for industrial bio-cides. Develop. ind. Microbiol., 25, 373-378.Kaplan, A.M. & Rubidge, T. 1978. Letters to the Editor. Int.Biodeterior. Bull., 14, 31-34.Kaplan, A.M., Mandels, M., Pillion, E. & Greenberger, M. 1970.Resistance of weathered cotton cellulose to cellulase action. Appl.Microbiol., 20, 85-93.Rogers, M.R. & Kaplan, A.M. 1962. The necessity for scouringthe 'standard' blue-line cotton fabric. Text. Res. J., 32, 161-162.Wiley, B.J., Herbert, R.L., Armstrong, J. & Kaplan, A.M. 1982.The aerobiology of an environmental test chamber. Mycologia, 74,886-893.Wendt, T.M., Kaplan, A.M. & Greenberger, M. 1970. Weight lossas a method for estimating the microbial deterioration of PVC filmin soil burial. Int. Biodeterior. Bull., 6, 139-143.
Appendix IVList of participants
Mr A R M BARR, Catomance Ltd, 96 Bridge RoadEast, Welwyn Garden City, Hertfordshire, AL7 1JW.Mr G BANCROFT, Aynsome Laboratories Ltd, Kents-ford Road, Grange-over-Sands, Cumbria, LA11 7BA.Miss H COLLINS, Department of Soil Science, Uni-versity of Aberdeen, Aberdeen, AB9 2UE, Scotland.Mr J B DIXON, Department of Applied Biology, Uni-versity of Wales Institute of Science and Technology,Llysdinam Field Centre, Newbridge-on-Wye, Llan-drindod Wells, Powys, Wales.Miss T DOYLE, School of Botany, Trinity College,Dublin 2, Ireland.Mr J GILLESPIE, Department of Chemical and Pro-cess Engineering, University of Strathclyde, JamesWeir Building, 75 Montrose Street, Glasgow, G1 1XJ,Scotland.Mr J A HARRIS, Environment & Industry ResearchUnit, Biology & Biochemistry Department, North EastLondon Polytechnic, Romford Road, London, E154LZ.Dr P HOLTER, Institute of Population Biology, Copen-hagen University, University Park 15, DK2100, Co-penhagen, Denmark.
*Professor K KUZNIAR, Akademia Rolnicza, InstytytMeliotacji Rolnych i Lesnych, Aleje Mickiewicza 24/28, 30-059 Krakow, Poland.
*Miss A LIGGETT, 22 Selworthy Green, Liverpool,L16 9JJ.Professor A MACFADYEN, Department of Biology,University of Ulster, Coleraine, Co. Londonderry,BT52 1SA, Northern Ireland.
*Dr E MALTBY, Department of Geography, Universityof Exeter, Amory Building, Rennes Drive, Exeter, EX44RJ.Dr J M MAW, School of Biological Sciences, HatfieldPolytechnic, PO Box 109, College Lane, Hatfield,Hertfordshire, AL10 9AB.Dr C NYS, So Is Forestiers, Centre de RechercheForestiere, Champenoux, 54280 Siechamps, France.
*Dr J PROCTOR, Department of Biological Sciences,University of Stirling, Stirling, FK9 4LA, Scotland.Dr B SAGAR, Shirley Institute, Didsbury, Manches-ter, M20 8RX.Dr R N SMITH, School of Natural Sciences, HatfieldPolytechnic, PO Box 109, College Lane, Hatfield,Hertfordshire, AL10 9AB.
175
*Professor K VAN CLEVE, Forest Soils Laboratory,O'Neill Building, University of Alaska, Fairbanks99701, Alaska, USA.
*Dr P J VICKERY, CSIRO, Pastoral Research Labora-tory, Division of Animal Production, Armidale, NewSouth Wales 2350, Australia.
*Professor Y WAISEL, Faculty of Life Sciences, De-partment of Botany, Tel-Aviv University, Ramat-Aviv,Israel.Dr D W H WALTON, British Antarctic Survey, HighCross, Madingley Road, Cambridge, CB3 OET.
*Dr P WIDDEN, Department of Biology, ConcordiaUniversity, 1455 de Maisonneuse West, Montreal,Quebec, H3G 1M8, Canada.Miss S WIGFULL, Environment & Industry ResearchUnit, Biology & Biochemistry Department, North EastLondon Polytechnic, Romford Road, London, E154LZ.Dr D D WYNN-WILLIAMS, British Antarctic Survey,High Cross, Madingley Road, Cambridge, CB3 OET.Mr G XU, Institute of Forestry & Soil Science, Shen-yang, People's Republic of China. (Visitor at Merle-wood.)
Institute of Terrestrial Ecology staffMerlewood Research Station, Grange-over-Sands, Cumbria,LA11 6JU
Mrs L Ashburner, Dr P J Bacon, Mr A H F Brown, DrJ Dighton, Dr J C Frankland, Dr A F Harrison, Mrs DM Howard, Mr P J A Howard, Mrs G Howson, Dr PIneson, Miss P M Latter, Mr G J Lawson, Mr D KLindley, Mr C Mylechraine, Mrs J P Poskitt, Mrs F JShaw
BanchoryResearch Station, Hill of Brathens, Glassel, Ban-chory, Kincardineshire, AB3 4BY, Scotland
Mr D D French, * Dr J Miles
Monks Wood Experimental Station, Abbots Ripton, Hunting-don, PE17 2L5
Dr M 0 Hill
*indicates those contributing papers, or data sets forthe workshop session, but not present at the Sym-posium
176
Epilogue
'Though analogy is often misleading, it is the least misleading thing we have' (Samuel Butler)
Apart from a small workshop meeting at the Universityof Aston in 1977, this Symposium provided the firstopportunity for a major group of cotton strip users topool their expertise and data. What has it achieved?
The accounts in this volume represent studies at 3levels: global, as in the comparison of world-widesites; local, in the study of habitats, treatments andmanagement; and micro-, as an experimental tool formicrocosms and microhabitats. They reflect the usesand applications of the assay over the last 2 decades,and each gives scope for further development. Fromthe wide range of papers and the animated discussionswhich took place between participants, some impor-tant general points have emerged.
The tendency to use the assay as a general index ofdecomposition is apparent in several of the papers.As an index of decomposition, reflecting the overalleffect of the environment on one analogue substrateover a period of time, it will always have its value andits limitations, and both are critically discussed.
Our understanding of all the soil processes involvedin the reduction of tensile strength is still incomplete,and the continuing discussion on the validity of ana-logue substrates in general is both useful and necess-ary. Despite this shortcoming, use of the assay in acomparative, rather than absolute, mode in which itcan detect (with remarkable sensitivity) differences inthe potential for decomposition in widely dispersedand/or diverse habitats is a most valuable tool tothe ecologist. The papers generate some interestingconcepts and ideas to be followed up, and reportsome intriguing patterns of activity which have alreadyprovided, or will provide, triggers to stimulate furtherresearch into the real processes underlying the differ-ences observed in the field.
Future improvements to the interpretation of cottonstrip assay data must include investigations of:
— colonization rates of the fabric in soil;— the selectivity of cotton as a substrate;— characterization of the succession of colonizing
organisms;— relationships with other decomposition par-
ameters, with specific environmental factors and
with plant growth. Routine measurement of tem-perature is recommended using the thermal cellmethod (see p. 99).
Suggestions were made for impregnating strips withtannins, to mimic leaf litter, or with nutrients, to extendtheir use as a test material.
Given all the advantages, it might reasonably havebeen expected that the analysis of many data sets ona global scale would have taken our general under-standing of this assay a stage forward. In fact, theexamination of 329 inseriions has emphasizedsparsity of the ancillary site data which are clearlyessential for further progress. Even the geographicaldistribution of field sites for which data were availableat the time of the workshop was too limited to deriveany convincing global conclusions, but we have ident-ified the important gaps in our knowledge, which factalone justifies the present attempt at global analysis.The global synthesis has suggested that, amongstthose variables tested so far, potential evapotranspira-tion is the best predictor of cotton rotting rate. The database now established at the Institute of TerrestrialEcology's Merlewood Research Station provides uswith the opportunity to extend the synthesis exercise,by the addition of necessary micro-environmentaldata. We hope that users will continue to participatein this exercise and that a better synthesis can bepublished in due course.
Can we now look forward to an increasing use ofthe assay by ecologists world-wide, especially forcomparative investigations between and within indi-vidual habitats? To those ecologists who have usedthe assay, its strengths are still those described over20 years ago: cheapness; ease of replication and useby unskilled workers in the field; adaptability to varioussituations. The availability of a standard cloth from asingle source has reduced experimental variance andincreased confidence in the assay.
We hope those applying the assay, or prospectiveusers, will gain the information they require from thisvolume, and that future studies will be better plannedand statistically analysed as a result, leading to aninternational standardization of approach.

á

ISBN 1 870393 06 6
ISSN 0263-8614