
Rising Star
71
Rising Star The past, present, and future of hydrophilic interaction liquid chromatography LC TROUBLESHOOTING A view of the selectivity landscape BIOPHARMACEUTICAL PERSPECTIVES CZE–MS for characterizing mAbs ANALYSIS FOCUS The evolution of foodomics March 2019 Volume 32 Number 3 www.chromatographyonline.com
-
Upload
khangminh22 -
Category
Documents
-
view
3 -
download
0
Transcript of Rising Star

Rising StarThe past, present, and future of hydrophilic interaction
liquid chromatography
LC TROUBLESHOOTING
A view of the selectivity
landscape
BIOPHARMACEUTICAL
PERSPECTIVES
CZE–MS for characterizing mAbs
ANALYSIS FOCUS
The evolution of
foodomics
March 2019
Volume 32 Number 3
www.chromatographyonline.com
Supelco® analytical products.
Exquisite accuracy. Every time.Maintaining your high standards
requires analytical products you
can rely on, along with the right
documentation and expert guidance.
That's why the entire range of
Supelco® analytical products, from
spectroscopy and spectrometry,
to mobile analysis, chromatography
and titration, are exquisitely
developed to comply with the
same guidelines and regulations
that you do.
So for a fl awless performance
time after time, choose Supelco®
analytical products.
The Life Science Business
of Merck operates as
MilliporeSigma in the
US and Canada.
Merck, the vibrant M and Supelco are trademarks of
Merck KGaA, Darmstadt, Germany or its affi liates. All other
trademarks are the property of their respective owners.
Detailed information on trademarks is available via publicly
accessible resources.
© 2019 Merck KGaA, Darmstadt, Germany and/or its affi liates.
All Rights Reserved.
For more information, please visit:
SigmaAldrich.com/Supelco
Chro
mato
gra
phy
Find what you are looking for!
MACHEREY-NAGEL
Manufacturer of premium
chromatography media
www.mn-net.com
� CHROMABOND® columns with classical and
innovative SPE phases
� Original NUCLEOSIL®, professional NUCLEODUR®
and highly efficient NUCLEOSHELL® HPLC columns
� Robust TLC glass plates, economical aluminum and
polyester sheets

Coupling powersPioneering new fields in ultra-trace analysis, the new GCMS-TQ 8050 NX triple quadrupole couplesthe powers of a world-leading GC and a newlydesigned detector. Both provide outstanding sensi-tivity at femtogram and even sub-femtogram levels.
Superior performance of NX technologiese.g. new flow controller and time management formaintenance
A wide variety of optional products supportstrace analysissuch as autosamplers and inlets
Comfortable, easy change of accessories through the advanced, illuminated GC oven
The GCMS-TQ 8050 NX complements the ShimadzuNX family, coupling the Nexis GC-2030 with thequadrupole series TQ-8050, TQ-8040 or QP-2020.Shimadzu’s NX series provides high-end GCMS solu-tions for every analytical challenge.
www.shimadzu.eu /coupling-powers

LC•GC Europe March 2019108
Editorial Policy:
All articles submitted to LC•GC Europe
are subject to a peer-review process in association
with the magazine’s Editorial Advisory Board.
Cover:
Original materials courtesy: Argus/stock.adobe.
com
Features148 The Rising Role of Foodomics
Lewis Botcherby
LCGC Europe spoke to Alejandro Cifuentes from the Institute of Food
Science Research, in Madrid, Spain, about his current foodomics
research projects, the overall state of the fi eld, and the future of
foodomics.
Columns126 LC TROUBLESHOOTING
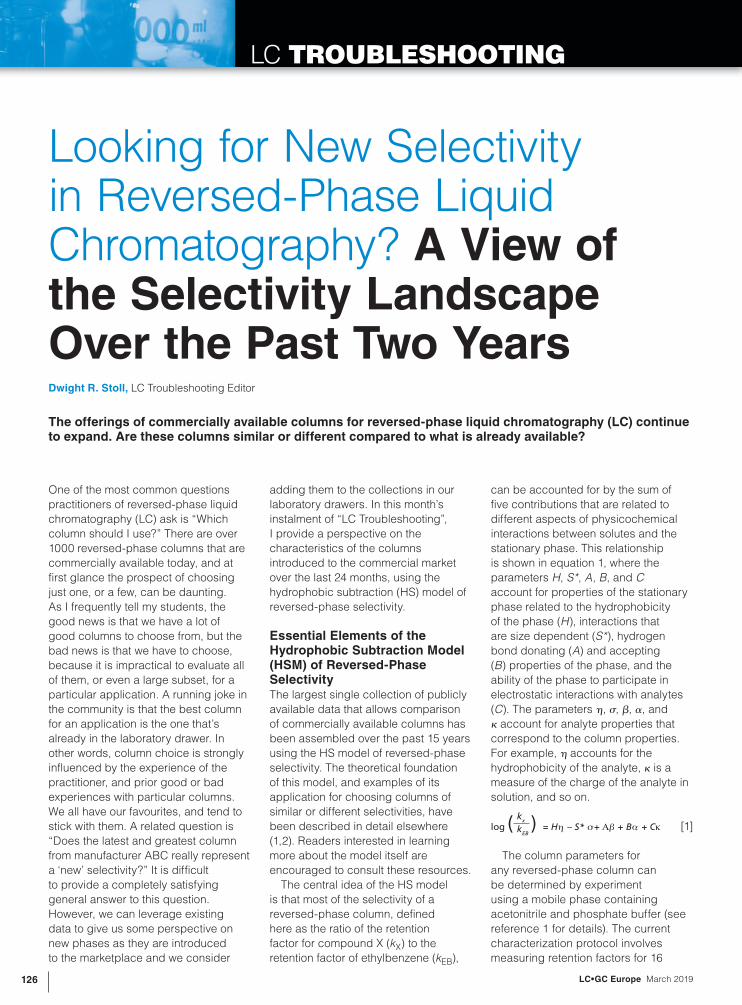
Looking for New Selectivity in Reversed-Phase Liquid
Chromatography? A View of the Selectivity Landscape Over
the Past Two Years
Dwight R. Stoll
The offerings of commercially available columns for reversed-phase
liquid chromatography continue to expand. Are these columns similar
or different compared to what is already available?
130 BIOPHARMACEUTICAL PERSPECTIVES
Middle-Up Characterization of the Monoclonal Antibody
Infl iximab by Capillary Zone Electrophoresis–Mass Spectrometry
Klára Michalíková, Elena Dominguez-Vega, Govert W. Somsen, and
Rob Haselberg
The potential of CZE–MS for the middle-up characterization of mAbs is
highlighted.
140 COLUMN WATCH
Perspectives on the Adoption and Utility of 1.0-mm Internal
Diameter Liquid Chromatography Columns
David S. Bell
The utility of 1.0-mm internal diameter (i.d.) columns, and the arenas
in which they play a relatively strong role, are investigated.
144 SAMPLE PREPARARTION PERSPECTIVES
Recent Advances in Solid-Phase Microextraction, Part 1: New
Tricks for an Old Dog
Douglas E. Raynie
Advances in SPME are discussed in this month’s instalment.
160 THE ESSENTIALS
Hydrophobic Interaction Chromatography of Proteins
A discussion of HIC theory and its application to the analysis of proteins
Departments154 Products
158 Events
161 The Applications Book
COVER STORY114 Hydrophilic Interaction Liquid Chromatography: An Update
David V. McCalley
This article is an update on the technique
of HILIC and covers recent ideas on the
mechanism of separation, and how it may
be manipulated to suit the separation of
particular sample types. The advantages of
HILIC are discussed, and also the actual and
perceived disadvantages of the technique.
March | 2019
Volume 32 Number 3
d
It’s the DAWN of a new day.
Learn more at wyatt.com/NextGen

LC•GC Europe March 2019110
‘Like’ our page LCGC Join the LCGC LinkedIn groupFollow us @ LC_GC
Published by
MultiMedia Healthcare
LLC
Vice President/
Group Publisher
Mike Tessalone
Editorial Director
Laura Bush
Editor-in-Chief
Alasdair Matheson
Managing Editor
Kate Jones
Associate Editor
Lewis Botcherby
Associate Publisher
Oliver Waters
Sales Executive
Liz Mclean
Senior Director, Digital
Media
Michael Kushner
Webcast Operations
Manager
Kristen Moore
Project Manager
Vania Oliveira
Digital Production Manager
Sabina Advani
Managing Editor Special
Projects
Kaylynn Chiarello-Ebner
kaylynn.chiarello.ebner@
ubm.com
Art Director
Dan Ward
Subscriber Customer Service
Visit (chromatographyonline.com)
to request or change a
subscription or call our customer
service department on
+001 218 740 6877
Hinderton Point,
Lloyd Drive,
Cheshire Oaks,
Cheshire,
CH65 9HQ, UK
Tel. +44 (0)151 353 3500
Fax +44 (0)151 353 3601
Daniel W. Armstrong
University of Texas, Arlington, Texas, USA
Günther K. Bonn
Institute of Analytical Chemistry and
Radiochemistry, University of Innsbruck,
Austria
Deirdre Cabooter
Department of Pharmaceutical and
Pharmacological Sciences, University of
Leuven, Belgium
Peter Carr
Department of Chemistry, University
of Minnesota, Minneapolis, Minnesota,
USA
Jean-Pierre Chervet
Antec Scientific, Zoeterwoude, The
Netherlands
Jan H. Christensen
Department of Plant and Environmental
Sciences, University of Copenhagen,
Copenhagen, Denmark
Danilo Corradini
Istituto di Cromatografia del CNR, Rome,
Italy
Hernan J. Cortes
H.J. Cortes Consulting,
Midland, Michigan, USA
Gert Desmet
Transport Modelling and Analytical
Separation Science, Vrije Universiteit,
Brussels, Belgium
John W. Dolan
LC Resources, McMinnville, Oregon,
USA
Anthony F. Fell
Pharmaceutical Chemistry,
University of Bradford, Bradford, UK
Attila Felinger
Professor of Chemistry, Department of
Analytical and Environmental Chemistry,
University of Pécs, Pécs, Hungary
Francesco Gasparrini
Dipartimento di Studi di Chimica e
Tecnologia delle Sostanze Biologicamente
Attive, Università “La Sapienza”, Rome,
Italy
Joseph L. Glajch
Momenta Pharmaceuticals, Cambridge,
Massachusetts, USA
Davy Guillarme
School of Pharmaceutical Sciences,
University of Geneva, University of
Lausanne, Geneva, Switzerland
Jun Haginaka
School of Pharmacy and Pharmaceutical
Sciences, Mukogawa Women’s
University, Nishinomiya, Japan
Javier Hernández-Borges
Department of Chemistry
(Analytical Chemistry Division),
University of La Laguna
Canary Islands, Spain
John V. Hinshaw
Serveron Corp., Beaverton, Oregon,
USA
Tuulia Hyötyläinen
VVT Technical Research of Finland,
Finland
Hans-Gerd Janssen
Van’t Hoff Institute for the Molecular
Sciences, Amsterdam, The Netherlands
Kiyokatsu Jinno
School of Materials Sciences, Toyohasi
University of Technology, Japan
Huba Kalász
Semmelweis University of Medicine,
Budapest, Hungary
Hian Kee Lee
National University of Singapore,
Singapore
Wolfgang Lindner
Institute of Analytical Chemistry,
University of Vienna, Austria
Henk Lingeman
Faculteit der Scheikunde, Free University,
Amsterdam, The Netherlands
Tom Lynch
Analytical consultant, Newbury, UK
Ronald E. Majors
Analytical consultant, West Chester,
Pennsylvania, USA
Debby Mangelings
Department of Analytical Chemistry and
Pharmaceutical Technology, Vrije
Universiteit, Brussels, Belgium
Phillip Marriot
Monash University, School of Chemistry,
Victoria, Australia
David McCalley
Department of Applied Sciences,
University of West of England, Bristol, UK
Robert D. McDowall
McDowall Consulting, Bromley, Kent, UK
Mary Ellen McNally
DuPont Crop Protection, Newark,
Delaware, USA
Imre Molnár
Molnar Research Institute, Berlin, Germany
Luigi Mondello
Dipartimento Farmaco-chimico, Facoltà
di Farmacia, Università di Messina,
Messina, Italy
Peter Myers
Department of Chemistry,
University of Liverpool, Liverpool, UK
Janusz Pawliszyn
Department of Chemistry, University of
Waterloo, Ontario, Canada
Colin Poole
Wayne State University, Detroit,
Michigan, USA
Fred E. Regnier
Department of Biochemistry, Purdue
University, West Lafayette, Indiana, USA
Harald Ritchie
Advanced Materials Technology, Chester,
UK
Koen Sandra
Research Institute for Chromatography,
Kortrijk, Belgium
Pat Sandra
Research Institute for Chromatography,
Kortrijk, Belgium
Peter Schoenmakers
Department of Chemical Engineering,
Universiteit van Amsterdam, Amsterdam,
The Netherlands
Robert Shellie
Deakin University, Melbourne, Australia
Yvan Vander Heyden
Vrije Universiteit Brussel, Brussels,
Belgium
Editorial Advisory Board
Subscribe on-line at
www.chromatographyonline.com
The Publishers of LC•GC Europe would like to thank the members of the Editorial Advisory Board
for their continuing support and expert advice. The high standards and editorial quality associated
with LC•GC Europe are maintained largely through the tireless efforts of these individuals.
LCGC Europe provides troubleshooting information and application solutions on all aspects of
separation science so that laboratory-based analytical chemists can enhance their practical
knowledge to gain competitive advantage. Our scientific quality and commercial objectivity
provide readers with the tools necessary to deal with real-world analysis issues, thereby
increasing their efficiency, productivity and value to their employer.
SUBSCRIPTIONS: LC•GC Europe is free to qualifi ed readers in Europe. To apply for a free subscription, or to change your name or address, go to
www.chromatographyonline.com, click on Subscribe, and follow the prompts.
To cancel your subscription or to order back issues, please email your request to
[email protected], putting LCE in the subject line.
Please quote your subscription number if you have it.
MANUSCRIPTS: For manuscript preparation guidelines, visit www.chromatographyonline.com or
call the Editor, +44 (0)151 353 3500. All submissions will be handled with reasonable care, but the
publisher assumes no responsibility for safety of artwork, photographs or manuscripts. Every
precaution is taken to ensure accuracy, but the publisher cannot accept responsibility for the
accuracy of information supplied herein or for any opinion expressed.
DIRECT MAIL LIST: Telephone: +44 (0)151 353 3500.
Reprints: Reprints of all articles in this issue and past issues of this publication are available
(250 minimum). Licensing and Reuse of Content: Contact our official partner, Wright’s Media, about
available usages, license fees, and award seal artwork at [email protected] for more
information. Please note that Wright’s Media is the only authorized company that we’ve partnered
with for MultiMedia Healthcare materials.
© 2019 MultiMedia Healthcare LLC (UK) all rights reserved. No part of the publication may be
reproduced in any material form (including photocopying or storing it in any medium by electronic
means and whether or not transiently or incidentally to some other use of this
publication) without the written permission of the copyright owner except in accord-
ance with the provisions of the Copyright Designs & Patents Act (UK) 1988 or under
the terms of the license issued by the Copyright License Agency’s 90 Tottenham
Court Road, London W1P 0LP, UK.
Applications for the copyright owner’s permission to reproduce any part of this
publication outside of the Copyright Designs & Patents Act (UK) 1988 provisions,
should be forwarded in writing to Permission Dept. fax +1 732-647-1104 or email:
[email protected]. Warning: the doing of an unauthorized act in relation to a
copyright work may result in both a civil claim for damages and criminal prosecution.
10% Post
Consumer
Waste

We’ll focus on the water,
so you can focus on
making a diff erence.
Whether you’re rewriting the textbooks, striving
for analytical perfection or protecting the
vulnerable, your work should be your focus not
your lab water.
That’s why the Milli-Q® portfolio supplies
best-in-class water solutions for every kind of
water purity, because we cater for every kind of
laboratory. And with the right expert support
it means we can save you precious time and
physical space, so you can keep your focus on
making the diff erence that really matters.
To fi nd out more, visit:
MerckMillipore.com/labwater
Merck, the vibrant M and Milli-Q are trademarks of Merck KGaA,
Darmstadt, Germany or its affi liates. All other trademarks are
the property of their respective owners. Detailed information on
trademarks is available via publicly accessible resources.
© 2019 Merck KGaA, Darmstadt, Germany and/or its affi liates.
All Rights Reserved.
The Life Science Business of Merck operates
as MilliporeSigma in the US and Canada.
112 LC•GC Europe March 2019
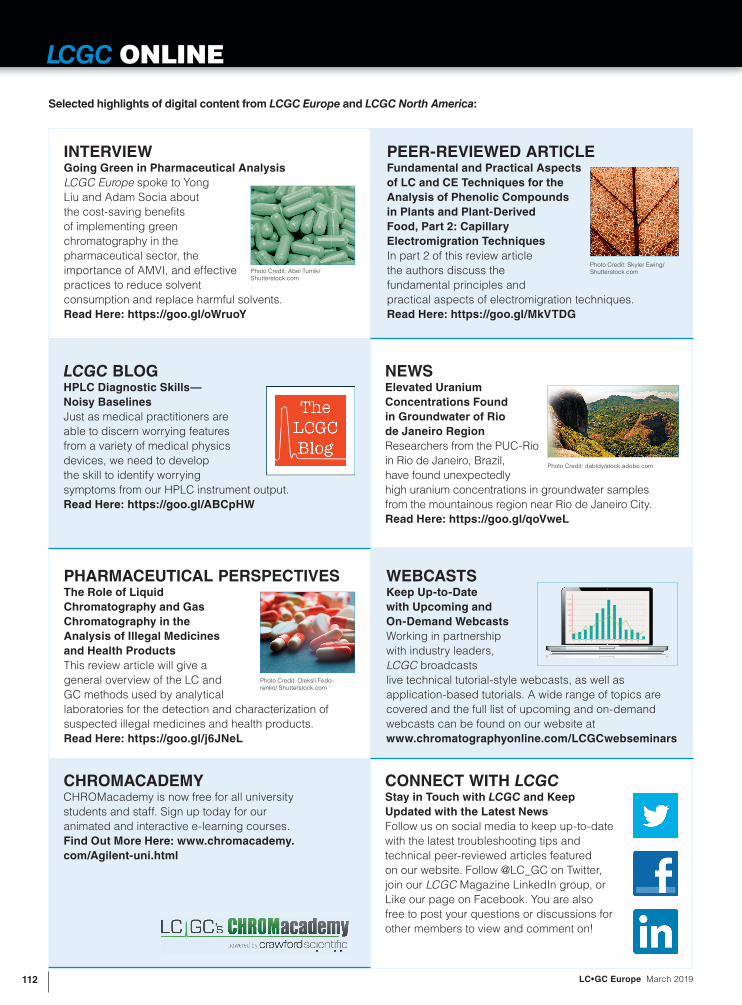
LCGC ONLINE
Selected highlights of digital content from LCGC Europe and LCGC North America:
PHARMACEUTICAL PERSPECTIVESThe Role of Liquid
Chromatography and Gas
Chromatography in the
Analysis of Illegal Medicines
and Health Products
This review article will give a
general overview of the LC and
GC methods used by analytical
laboratories for the detection and characterization of
suspected illegal medicines and health products.
Read Here: https://goo.gl/j6JNeL
CONNECT WITH LCGCStay in Touch with LCGC and Keep
Updated with the Latest News
Follow us on social media to keep up-to-date
with the latest troubleshooting tips and
technical peer-reviewed articles featured
on our website. Follow @LC_GC on Twitter,
join our LCGC Magazine LinkedIn group, or
Like our page on Facebook. You are also
free to post your questions or discussions for
other members to view and comment on!
LCGC BLOGHPLC Diagnostic Skills—
Noisy Baselines
Just as medical practitioners are
able to discern worrying features
from a variety of medical physics
devices, we need to develop
the skill to identify worrying
symptoms from our HPLC instrument output.
Read Here: https://goo.gl/ABCpHW
NEWSElevated Uranium
Concentrations Found
in Groundwater of Rio
de Janeiro Region
Researchers from the PUC-Rio
in Rio de Janeiro, Brazil,
have found unexpectedly
high uranium concentrations in groundwater samples
from the mountainous region near Rio de Janeiro City.
Read Here: https://goo.gl/qoVweL
WEBCASTSKeep Up-to-Date
with Upcoming and
On-Demand Webcasts
Working in partnership
with industry leaders,
LCGC broadcasts
live technical tutorial-style webcasts, as well as
application-based tutorials. A wide range of topics are
covered and the full list of upcoming and on-demand
webcasts can be found on our website at
www.chromatographyonline.com/LCGCwebseminars
CHROMACADEMYCHROMacademy is now free for all university
students and staff. Sign up today for our
animated and interactive e-learning courses.
Find Out More Here: www.chromacademy.
com/Agilent-uni.html
INTERVIEWGoing Green in Pharmaceutical Analysis
LCGC Europe spoke to Yong
Liu and Adam Socia about
the cost-saving benefits
of implementing green
chromatography in the
pharmaceutical sector, the
importance of AMVI, and effective
practices to reduce solvent
consumption and replace harmful solvents.
Read Here: https://goo.gl/oWruoY
PEER-REVIEWED ARTICLEFundamental and Practical Aspects
of LC and CE Techniques for the
Analysis of Phenolic Compounds
in Plants and Plant-Derived
Food, Part 2: Capillary
Electromigration Techniques
In part 2 of this review article
the authors discuss the
fundamental principles and
practical aspects of electromigration techniques.
Read Here: https://goo.gl/MkVTDG
Photo Credit: Abel Tumik/
Shutterstock.com
Photo Credit: Skyler Ewing/
Shutterstock.com
Photo Credit: dabldy/stock.adobe.com
Photo Credit: Oleksii Fedo-
renko/ Shutterstock.com

Agilent 8890 GC system
Agilent 8860 GC system
Spend More Time on What MattersNew Agilent 8890 and 8860 intelligent GC systems
First, Agilent Intuvo redrew the boundaries of GC intelligence. Now, two new GCs have
extended that intelligence to the entire portfolio of Agilent GC systems. So, you can
have the freedom to work the way you want—while delivering quality data, every time.
The Agilent 8890 GC ensures that your system is working properly, and guides you
through problem resolution. What’s more, mobile access features let you check on
your lab anytime, anywhere.
The Agilent 8860 GC makes routine analysis anything but routine. It monitors system
health, tracks injections, and alerts you to leaks. So, you can plan your work—including
maintenance—rather than react to unexpected downtime.
Learn about the latest additions to our family of intelligent GC systems:
www.agilent.com/chem/gc
© Agilent Technologies, Inc. 2019
It is now almost 30 years since the publication of Alpert’s
landmark paper that named the technique of hydrophilic
interaction liquid chromatography (HILIC) and discussed its
mechanism and applications (1). Alpert clearly recognized
that separations were influenced by the partition of solutes
between a water layer held on the surface of a polar column
and the bulk mobile phase rich in an organic solvent such as
acetonitrile. Additional mechanisms, such as ionic retention
and adsorption, can be superimposed on this process.
Retention increases with increasing polarity of the solute,
broadly opposite to that in reversed phase. Nevertheless,
there are considerable differences in the selectivity of the
techniques, indicating their complementary nature and
orthogonality, which is also an advantage for two-dimensional
(2D) separations. Polar solutes are retained in HILIC that have
little or no retention in reversed phase; for example uracil can
show good retention in HILIC, whereas it is used as a void
volume marker in reversed-phase chromatography.
There are many advantages of HILIC over reversed-phase
chromatography; indeed, for some polar neutral solutes,
there is hardly an alternative to HILIC to achieve sufficient
retention for separation. However, there are real and perceived
disadvantages of HILIC that can provide a barrier to more
widespread uptake of the technique. The aim of this paper is to
provide an update on the mechanism of separation of HILIC,
to discuss the manipulation of its selectivity, its advantages
and limitations (and how they may be overcome), together with
some new applications of the technique.
Which Solutes are Suitable for HILIC?Polar and ionized solutes that are hydrophilic are likely to be
retained in HILIC; as a guide, the log of the solute distribution
ratio between octanol and water can be considered where:
Log Dow = log {[neutral + ionized solute]octanol ] /
[neutral + ionized solute]water} [1]
Log Dow values can be measured experimentally, or
obtained from a number of commercial simulation software
packages. Hydrophobic solutes have a high positive log
D value, that is, they prefer to partition into the relatively
nonpolar (octanol) in a shake flask experiment (this simulates
the bulk mobile phase in HILIC), and thus they are less
retained. Conversely, very hydrophilic solutes have a large
negative value (prefer to partition into water) and thus are
more retained. Typically, solutes with a value of log D > ~+1
will show low retention in HILIC. However, ionic effects can
contribute to retention; for example, the protonated base
nortriptyline (log D ~+1) gives high retention on a silica
column using aqueous acetonitrile buffered at ww pH 3
because of interaction with negatively charged silanols
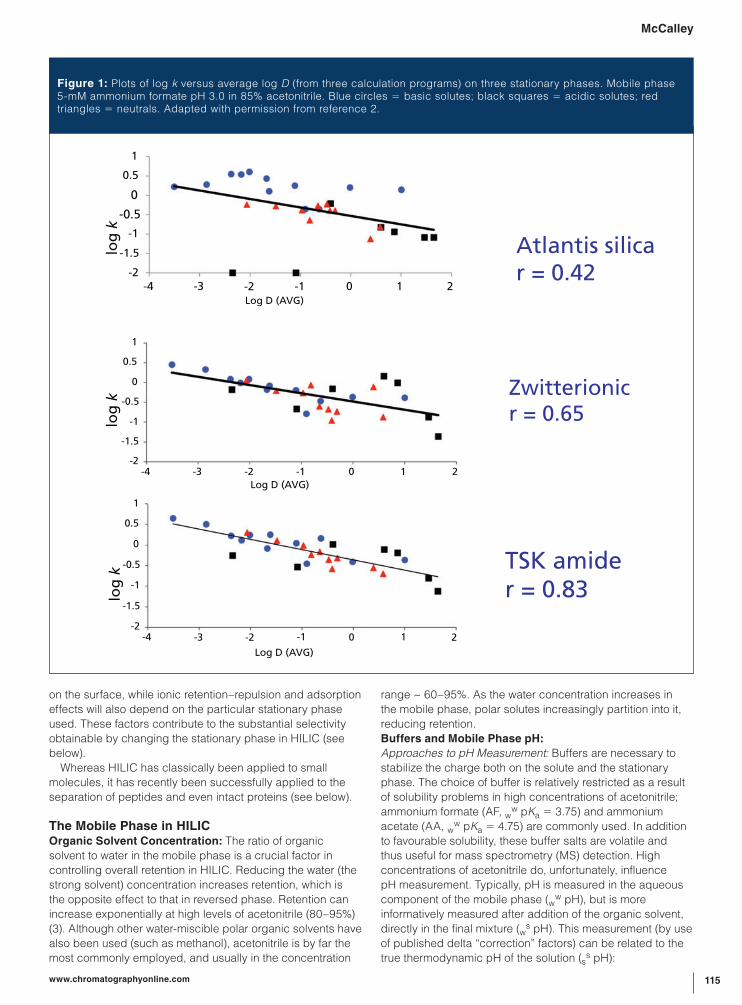
(2). Figure 1 indicates a rough correlation on three HILIC
stationary phases between log Dow and retention for some
acidic, basic, and neutral solutes. The correlation is best
for TSK amide (r = 0.83), which has a thick neutral polymer
layer that shields stationary phase silanol groups (negatively
charged) from ionic retention of protonated bases or
repulsion of charged acids. The bare silica column shows no
such shielding from ionic effects, resulting in a much poorer
correlation (r = 0.42). Clearly, the retention of neutrals by
partition should depend on the extent of the water-rich layer
Hydrophilic Interaction Liquid
Chromatography: An UpdateDavid V. McCalley, Centre for Research in Biosciences, University of the West of England, Frenchay, Bristol, UK
This article is an update on the technique of hydrophilic interaction liquid chromatography (HILIC) and covers recent ideas on the mechanism of separation, and how it may be manipulated to suit the separation of particular sample types. The advantages of HILIC are discussed, and also the actual and perceived disadvantages of the technique and how the latter can be overcome. Some new applications of HILIC for characterization of biopharmaceuticals, where it can even be applied to the separation of intact proteins, and to applications in metabolomics, will be discussed.
KEY POINTS• HILIC is a valuable and complementary alternative to
reversed phase, especially for separation of polar and
ionized solutes.
• HILIC can be applied to the separation of small
molecules, but also to peptides and even large
proteins, such as monoclonal antibodies.
• HILIC has some advantages over reversed-phase,
such as the ease of coupling of detectors that utilize
solvent evaporation, and low column back pressure.
• Some tips are given on how to overcome
shortcomings of HILIC, such as longer column
equilibration times.
Ph
oto
Cre
dit: A
rgu
s/s
toc
k.a
do
be.c
om
LC•GC Europe March 2019114
on the surface, while ionic retention–repulsion and adsorption
effects will also depend on the particular stationary phase
used. These factors contribute to the substantial selectivity
obtainable by changing the stationary phase in HILIC (see
below).
Whereas HILIC has classically been applied to small
molecules, it has recently been successfully applied to the
separation of peptides and even intact proteins (see below).
The Mobile Phase in HILICOrganic Solvent Concentration: The ratio of organic
solvent to water in the mobile phase is a crucial factor in
controlling overall retention in HILIC. Reducing the water (the
strong solvent) concentration increases retention, which is
the opposite effect to that in reversed phase. Retention can
increase exponentially at high levels of acetonitrile (80–95%)
(3). Although other water-miscible polar organic solvents have
also been used (such as methanol), acetonitrile is by far the
most commonly employed, and usually in the concentration
range ~ 60–95%. As the water concentration increases in
the mobile phase, polar solutes increasingly partition into it,
reducing retention.
Buffers and Mobile Phase pH:
Approaches to pH Measurement: Buffers are necessary to
stabilize the charge both on the solute and the stationary
phase. The choice of buffer is relatively restricted as a result
of solubility problems in high concentrations of acetonitrile;
ammonium formate (AF, ww pKa = 3.75) and ammonium
acetate (AA, ww pKa = 4.75) are commonly used. In addition
to favourable solubility, these buffer salts are volatile and
thus useful for mass spectrometry (MS) detection. High
concentrations of acetonitrile do, unfortunately, influence
pH measurement. Typically, pH is measured in the aqueous
component of the mobile phase (ww pH), but is more
informatively measured after addition of the organic solvent,
directly in the final mixture (ws pH). This measurement (by use
of published delta “correction” factors) can be related to the
true thermodynamic pH of the solution (ss pH):
1
0
-1
-2-4 -3 -2 -1 0 1 2
-4 -3 -2 -1 0 1 2
-4 -3 -2 -1 0 1 2
Atlantis silicar = 0.42
Zwitterionicr = 0.65
TSK amider = 0.83
Log D (AVG)
Log D (AVG)
Log D (AVG)
log
klo
g k
log
k
0.5
-0.5
-1.5
1
0
-1
-2
0.5
-0.5
-1.5
1
0
-1
-2
0.5
-0.5
-1.5
Figure 1: Plots of log k versus average log D (from three calculation programs) on three stationary phases. Mobile phase 5-mM ammonium formate pH 3.0 in 85% acetonitrile. Blue circles = basic solutes; black squares = acidic solutes; red triangles = neutrals. Adapted with permission from reference 2.
115www.chromatographyonline.com
McCalley
ss pH = w
s pH- δ [2]
The ss pH ultimately determines the retention properties of
the solute in the system. Correspondingly, the ionization of
buffers is also governed by their ss pKa values. Unfortunately,
these values are rarely available, leading to the widespread
adherence to the (less correct and less informative) ww pH
and ww pKa values. This difficulty can be considered a
disadvantage of the HILIC technique because it complicates
interpretation and prediction of retention.
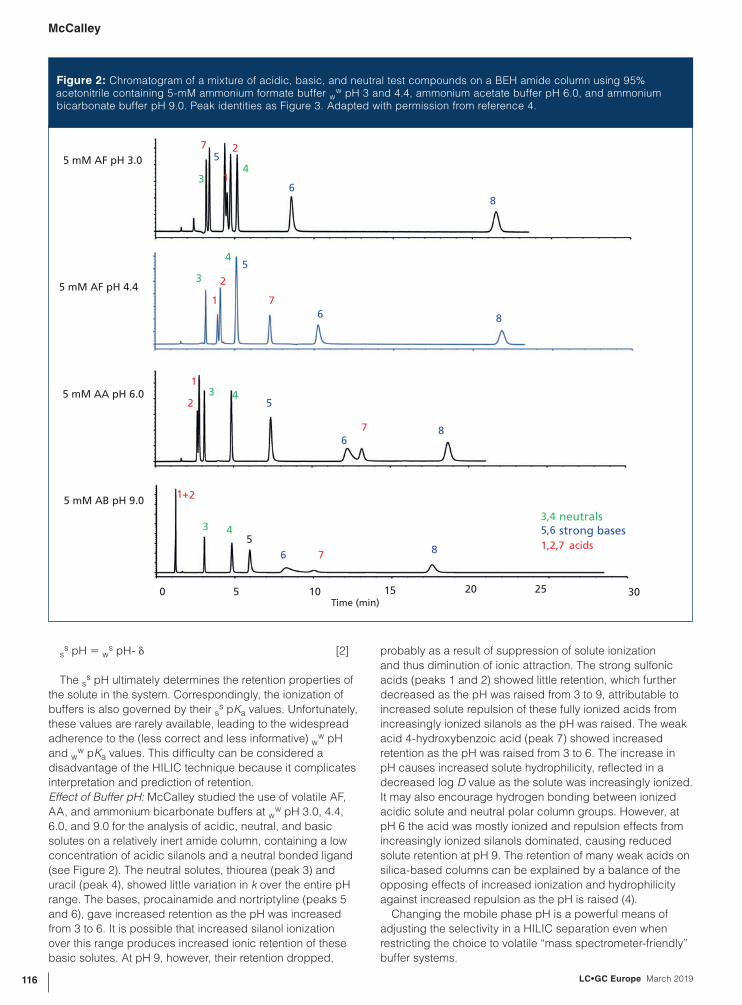
Effect of Buffer pH: McCalley studied the use of volatile AF,
AA, and ammonium bicarbonate buffers at ww pH 3.0, 4.4,
6.0, and 9.0 for the analysis of acidic, neutral, and basic
solutes on a relatively inert amide column, containing a low
concentration of acidic silanols and a neutral bonded ligand
(see Figure 2). The neutral solutes, thiourea (peak 3) and
uracil (peak 4), showed little variation in k over the entire pH
range. The bases, procainamide and nortriptyline (peaks 5
and 6), gave increased retention as the pH was increased
from 3 to 6. It is possible that increased silanol ionization
over this range produces increased ionic retention of these
basic solutes. At pH 9, however, their retention dropped,
probably as a result of suppression of solute ionization
and thus diminution of ionic attraction. The strong sulfonic
acids (peaks 1 and 2) showed little retention, which further
decreased as the pH was raised from 3 to 9, attributable to
increased solute repulsion of these fully ionized acids from
increasingly ionized silanols as the pH was raised. The weak
acid 4-hydroxybenzoic acid (peak 7) showed increased
retention as the pH was raised from 3 to 6. The increase in
pH causes increased solute hydrophilicity, reflected in a
decreased log D value as the solute was increasingly ionized.
It may also encourage hydrogen bonding between ionized
acidic solute and neutral polar column groups. However, at
pH 6 the acid was mostly ionized and repulsion effects from
increasingly ionized silanols dominated, causing reduced
solute retention at pH 9. The retention of many weak acids on
silica-based columns can be explained by a balance of the
opposing effects of increased ionization and hydrophilicity
against increased repulsion as the pH is raised (4).
Changing the mobile phase pH is a powerful means of
adjusting the selectivity in a HILIC separation even when
restricting the choice to volatile “mass spectrometer-friendly”
buffer systems.
5 mM AF pH 3.0
7 2
4
4
4neutralsstrong bases3
3,4
3
3
3
4
8
8
6
5
5
5
6
6
6
0 5 10 15 20 25 30 Time (min)
5
8
8
5,6
1
1
1
1+
2
2
2
7
7
71,2,7 acids
5 mM AF pH 4.4
5 mM AA pH 6.0
5 mM AB pH 9.0
Figure 2: Chromatogram of a mixture of acidic, basic, and neutral test compounds on a BEH amide column using 95% acetonitrile containing 5-mM ammonium formate buffer w
w pH 3 and 4.4, ammonium acetate buffer pH 6.0, and ammonium bicarbonate buffer pH 9.0. Peak identities as Figure 3. Adapted with permission from reference 4.
LC•GC Europe March 2019116
McCalley

NovaFFF SoftwareNovaFFF Software
ICP-MSICP-MSRIRIUVUVDLSDLSMALSMALS
The FFF - MALS Platform Next Level Nano, Bio and Polymer Analysis
Contact us for more information: www.postnova.com
NEW
Electrical Asymmetrical
Flow FFF Option!
Effect of Buffer Concentration: An increase in volatile buffer
concentration of AA or AF tends to increase the retention of
neutral compounds. This result may be a result of the salt
increasing the volume of water in the stationary phase layer,
a selective process that may depend on the nature of the
salt. For basic compounds, retention decreases with
increasing buffer concentration on silica-based columns,
as a result of the competitive interaction of the buffer cation
with ionized stationary phase silanols. Conversely, the
insulating effect of buffer ions on charged silanols results in
reduced repulsion from the column and a higher retention
of acidic solutes. Clearly, ionic interaction effects (both
attractive and repulsive) could be minimized—or in
some cases even eliminated—by the use of high buffer
concentrations, although their deliberate suppression
is questionable because they can give rise to useful
selectivity effects. In addition, high buffer concentrations
are undesirable for use in liquid chromatography (LC)–MS
because they can suppress solute ionization and thus reduce
detection sensitivity (3).
Alternative Buffers to AA and AF: Simple organic acid
additives, such as 0.1% formic and acetic acid, have been
employed instead of salt buffers because they give reduced
ion suppression effects in MS; unfortunately, they can give
poor peak shapes for some acidic and basic solutes. The
inferior peak shapes may be a result of the very low ionic
strength of simple acids, especially in high concentrations of
acetonitrile, causing overloading effects even at relatively low
solute concentrations (5). These effects may be in addition to
the lack of deactivating effect of the ammonium ion (present
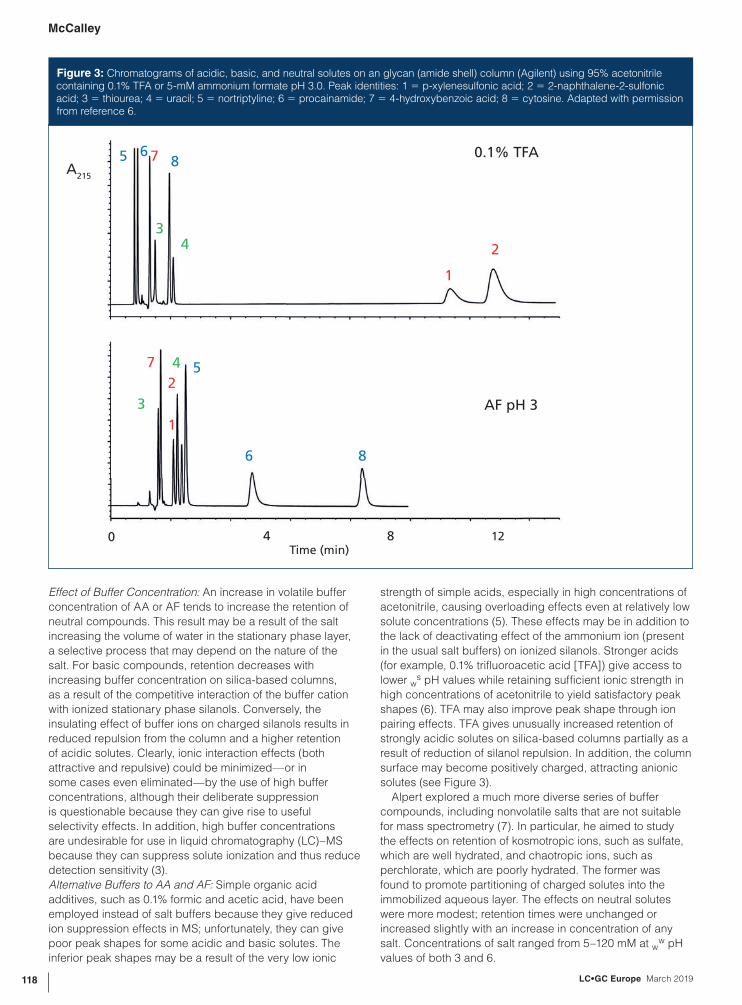
in the usual salt buffers) on ionized silanols. Stronger acids
(for example, 0.1% trifluoroacetic acid [TFA]) give access to
lower ws pH values while retaining sufficient ionic strength in
high concentrations of acetonitrile to yield satisfactory peak
shapes (6). TFA may also improve peak shape through ion
pairing effects. TFA gives unusually increased retention of
strongly acidic solutes on silica-based columns partially as a
result of reduction of silanol repulsion. In addition, the column
surface may become positively charged, attracting anionic
solutes (see Figure 3).
Alpert explored a much more diverse series of buffer
compounds, including nonvolatile salts that are not suitable
for mass spectrometry (7). In particular, he aimed to study
the effects on retention of kosmotropic ions, such as sulfate,
which are well hydrated, and chaotropic ions, such as
perchlorate, which are poorly hydrated. The former was
found to promote partitioning of charged solutes into the
immobilized aqueous layer. The effects on neutral solutes
were more modest; retention times were unchanged or
increased slightly with an increase in concentration of any
salt. Concentrations of salt ranged from 5–120 mM at ww pH
values of both 3 and 6.
5 6 7
1
2
A215
0.1% TFA
AF pH 3
0 4 8 12Time (min)
7
2
1
5
6 8
4
3
43
8
Figure 3: Chromatograms of acidic, basic, and neutral solutes on an glycan (amide shell) column (Agilent) using 95% acetonitrile containing 0.1% TFA or 5-mM ammonium formate pH 3.0. Peak identities: 1 = p-xylenesulfonic acid; 2 = 2-naphthalene-2-sulfonic acid; 3 = thiourea; 4 = uracil; 5 = nortriptyline; 6 = procainamide; 7 = 4-hydroxybenzoic acid; 8 = cytosine. Adapted with permission from reference 6.
LC•GC Europe March 2019118
McCalley
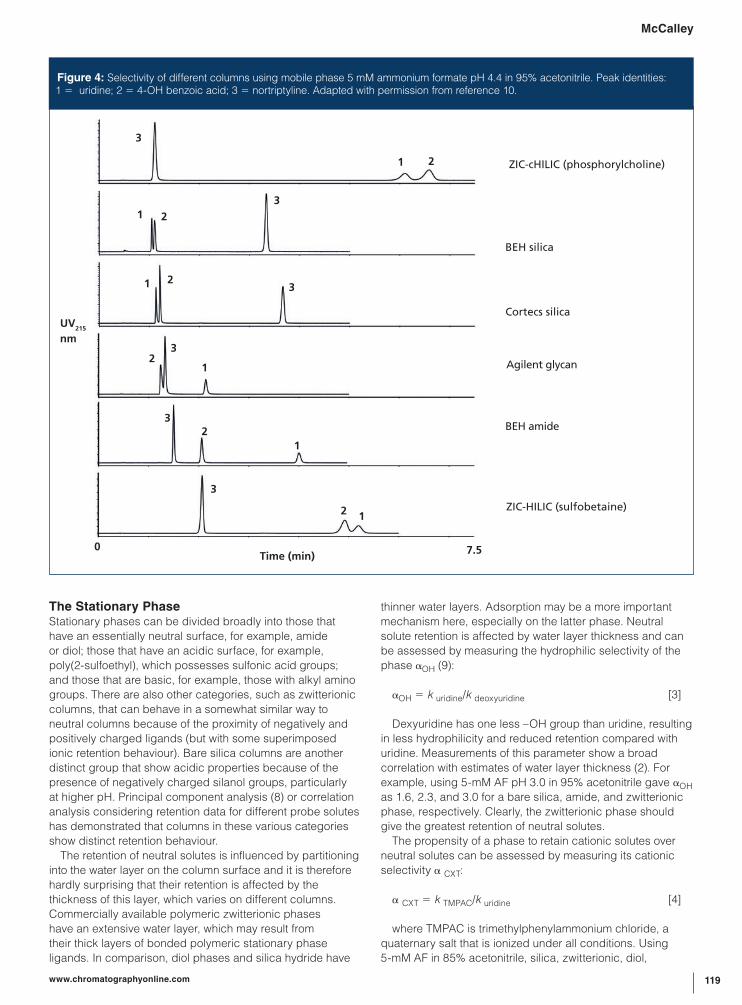
The Stationary PhaseStationary phases can be divided broadly into those that
have an essentially neutral surface, for example, amide
or diol; those that have an acidic surface, for example,
poly(2-sulfoethyl), which possesses sulfonic acid groups;
and those that are basic, for example, those with alkyl amino
groups. There are also other categories, such as zwitterionic
columns, that can behave in a somewhat similar way to
neutral columns because of the proximity of negatively and
positively charged ligands (but with some superimposed
ionic retention behaviour). Bare silica columns are another
distinct group that show acidic properties because of the
presence of negatively charged silanol groups, particularly
at higher pH. Principal component analysis (8) or correlation
analysis considering retention data for different probe solutes
has demonstrated that columns in these various categories
show distinct retention behaviour.
The retention of neutral solutes is influenced by partitioning
into the water layer on the column surface and it is therefore
hardly surprising that their retention is affected by the
thickness of this layer, which varies on different columns.
Commercially available polymeric zwitterionic phases
have an extensive water layer, which may result from
their thick layers of bonded polymeric stationary phase
ligands. In comparison, diol phases and silica hydride have
thinner water layers. Adsorption may be a more important
mechanism here, especially on the latter phase. Neutral
solute retention is affected by water layer thickness and can
be assessed by measuring the hydrophilic selectivity of the
phase αOH (9):
αOH = k uridine/k deoxyuridine [3]
Dexyuridine has one less –OH group than uridine, resulting
in less hydrophilicity and reduced retention compared with
uridine. Measurements of this parameter show a broad
correlation with estimates of water layer thickness (2). For
example, using 5-mM AF pH 3.0 in 95% acetonitrile gave αOH
as 1.6, 2.3, and 3.0 for a bare silica, amide, and zwitterionic
phase, respectively. Clearly, the zwitterionic phase should
give the greatest retention of neutral solutes.
The propensity of a phase to retain cationic solutes over
neutral solutes can be assessed by measuring its cationic
selectivity α CXT:
α CXT = k TMPAC/k uridine [4]
where TMPAC is trimethylphenylammonium chloride, a
quaternary salt that is ionized under all conditions. Using
5-mM AF in 85% acetonitrile, silica, zwitterionic, diol,
UV215
nm
3
3
3
3
3
3
0 7.5Time (min)
2
2
2
2
2
2
ZIC-cHILIC (phosphorylcholine)
BEH silica
Cortecs silica
Agilent glycan
BEH amide
ZIC-HILIC (sulfobetaine)
1
1
1
1
1
1
Figure 4: Selectivity of different columns using mobile phase 5 mM ammonium formate pH 4.4 in 95% acetonitrile. Peak identities: 1 = uridine; 2 = 4-OH benzoic acid; 3 = nortriptyline. Adapted with permission from reference 10.
119www.chromatographyonline.com
McCalley
and amide columns gave values of 7.1, 1.0, 0.6, and 0.5,
respectively, for this parameter, demonstrating considerable
preferential retention of cationic solutes on bare silica.
Similarly, the anionic selectivity of columns can be measured
from:
α AS = k BSA/k uridine [5]
where BSA is the strong acid benzenesulfonic acid. Once
again when using 5-mM AF in 85% acetonitrile, amino and
amide columns gave values of 6.6 and 0.33, respectively,
demonstrating the considerably increased selectivity for
acids of the amino phase (4).
Changing the stationary phase is probably the most
effective way to change the selectivity of the separation
(2), as shown in Figure 4 for neutral uridine, the acid
4 –hydroxybenzoic acid, and the base nortriptyline
(10). Both bare silicas show preferential retention of
nortriptyline because of attractive interactions with
negatively charged silanols. The low pore occupancy of
water in silica columns (7–9% in 89% acetonitrile [11])
and their poor hydrophilic selectivity explains their low
retention of uridine. Bonded phases have fewer silanols,
which may in addition be partially shielded, resulting
in low retention of nortriptyline on the zwitterionic and
amide phases. Reduced silanol interactions and good
hydrophilic selectivity on these phases may also explain
their improved retention of neutral and acidic probes.
A “toolbox” of phases of different selectivity might
first contain the neutral and quasi-neutral amide and
zwitterionic columns, which are good “general-purpose”
phases. A bare silica column or phase containing
bonded acidic groups (for example, sulfonic acid)
should be included to give good retention or separation
of bases and an amino column could be used for the
separation of acids. The substantial variation in selectivity
between different columns in HILIC is an advantage over
reversed-phase methods, where interchange of stationary
phases has a relatively smaller effect on selectivity.
Advantages of HILICAs well as the high retention of polar and ionized
compounds, the complementary nature to reversed-phase
chromatography, and the beneficial changes in selectivity
of different stationary phases, HILIC demonstrates
a number of other advantages over reversed-phase
chromatography.
Low Viscosity of the Mobile Phase: Many of
the advantages of HILIC stem from its use of high
concentrations of acetonitrile (typically 60–95%) in the
mobile phase, giving low viscosity, and allowing the use
of long columns, or fast flow with conventional columns. A
45 × 0.46 cm column packed with 2.7-μm shell particles
operated at a flow of 2.0 mL/min generated over 100,000
theoretical plates for four basic drugs in a reasonable
analysis time (<15.0 min) (12). For solutes amenable to either
10.00
9.00
8.00
7.00
6.00
5.00
4.00
3.00
2.00
1.00
0.00
Proca
inam
ide
Nort
ripty
line
Dip
henhyd
ram
ine
TMPA
C
cyto
sine
pyrid
ine
BSApXSA
2-NSA
4-OH b
enzo
ic
Basic compounds
Acidic compounds
Are
a S
/N 9
0%
Ace
ton
itri
le-b
uff
er/
10%
Ace
ton
itri
le-b
uff
er
Figure 5: Signal-to-noise ratios using flow injection analysis coupled with optimized MRM triple quadrupole mass spectrometry for 10 solutes with a HILIC mobile phase (5-mM AF pH 3.0 in 90% acetonitrile) and a reversed phase (5-mM AF pH 3.0 in 10% acetonitrile).
LC•GC Europe March 2019120
McCalley
HILIC or reversed phase (such as moderately hydrophobic
base nortriptyline), the organic-rich mobile phase used in
the former technique provides increased solute diffusion
and thus flatter van Deemter curves in the C-term region
(mass transfer). However, if the increase in solute diffusion is
factored out using reduced plots, reversed phase shows a
slight advantage in the C-term region at fast flow rates. This
means that a somewhat improved performance at high flow
rates is obtained for hydrophobic solutes using reversed
phase rather than hydrophilic solutes using HILIC (13).
However, HILIC is clearly favoured in many cases by the
possibility of longer columns (at normal or reduced flow) to
generate high efficiency.
Peak Shape of Ionogenic Compounds: Peak shapes
of basic compounds can be surprisingly good in HILIC.
The basic drugs diphenhydramine, procainamide,
and nortriptyline gave excellent peak shapes using
a bare silica column with a simple AF buffer pH 3 in
acetonitrile. This column has a high cationic selectivity; in
reversed-phase chromatography, strong ionic interactions
can be associated with poor peak shape, which is
not always true in HILIC. Good peak shapes may be
associated with higher sample capacity in HILIC, with
column efficiency being maintained at much higher solute
mass than in reversed phase (14).
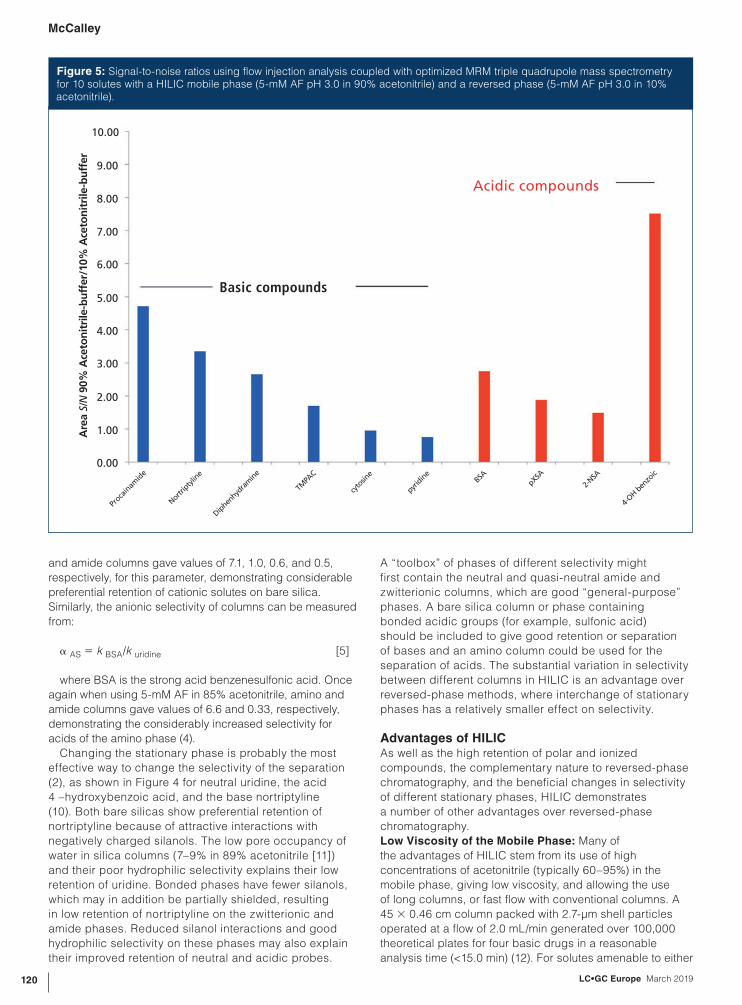
Compatibility with Electrospray Ionization (ESI)-MS
and Other Evaporative Detectors: The low viscosity, high
volatility, and low surface tension of high concentrations of
acetonitrile are conducive to higher sensitivity in ESI-MS (15).
Figure 5 compares the relative signal-to-noise (S/N)
ratio for six basic and four acidic solutes by flow injection
analysis (FIA) ESI-MS using a triple quadrupole MS and
multiple reaction monitoring (MRM) conditions optimized
for each solute. On average, a sensitivity increase of ~3×
for the HILIC conditions (90% acetonitrile–10% 5 mM
AF pH 3.0) compared with reversed-phase conditions
(10% acetonitrile–90% 5 mM AF pH 3.0) was obtained.
The use of FIA avoids introduction of the samples into a
chromatographic surface, which potentially might confound
the results with adsorption effects. Gradient elution of
mixtures of solutes using an appropriate column can also
be used to assess difference in detection sensitivity. While
possible column adsorption effects may indeed confound
the results, as well as possible elution in different mobile
phase composition (dependent on the column), this method
can be used to evaluate the response of solutes in mixtures
simultaneously, as they can be separated on the column.
As FIA has no separation stage, solutes are best evaluated
individually, making the procedure more laborious. It also
arguably presents a more realistic simulation of normal
a) Trastuzumab (Herceptin®)
i) 2.0e+5
i) 1.5e+5 ii) 4.5e+5
ii) 4.5e+5
1.6e+5
1.2e+5 3.6e+5
2.7e+5
1.8e+5
9.0e+4
9.0e+4
6.0e+4
3.0e+4
0.0 0.0
3 5 7 3 5 79 11
3
Fc/2
Fc/2LC
LCFd’ Fd’
Fc/2
LC
Fd’
Fc/2
LC
Fd’
5 7 9 11
Time (min) Time (min)
Time (min) Time (min)
3.6e+5
2.7e+5
1.8e+5
9.0e+4
1.2e+5
8.0e+4
4.0e+4
0.0
b) Trastuzumab B
0.0
3 5 7
TIC
TIC
TIC
TIC
Figure 6: Middle-up analysis of (a) Trastuzumab and (b) Trastuzumab B (biosimilar). Total ion chromatograms using i) reversed-phase LC–MS and ii) HILIC–MS. Adapted with permission from reference 21, copyright 2016, American Chemical Society.
121www.chromatographyonline.com
McCalley
experimental conditions. The average gain in sensitivity was
reported as 7–10 times (16), but improved modern interface
designs showed more modest gains (17). Similar beneficial
increases in sensitivity can be obtained with other mobile
phase evaporation detectors, such as the charged aerosol
detector (18).
Disadvantages of HILIC and How They May be OvercomeSample Injection: Using injection solvents of higher
eluotropic strength than the mobile phase (that is, increased
water concentration) gives increasing deterioration in peak
shape (19). This effect can be problematic if the sample
is not soluble in high concentrations of acetonitrile (that
is, in appropriately “weak” mobile phases). The effect can
be moderated by injecting small volumes. Alternatively,
for small-molecular-weight (MW) compounds, isopropyl
alcohol (IPA) or a mixture of 50:50 acetonitrile–IPA has
been recommended. For drug discovery applications,
dimethylsulfoxide in at least 80% acetonitrile can be used,
whereas for peptide analysis, pure ethanol or IPA is possible
(20).
Use of the mobile phase or a weaker solvent as an
injection solvent to avoid peak distortion is not normally
possible with biopharmaceuticals because of limited
solubility in high concentrations of acetonitrile and
possible protein denaturation or precipitation. Therefore,
in one study, an aqueous sample was injected followed
by a fast gradient ramp incorporating a high percentage
of acetonitrile at the beginning of the method, in addition
to a small injection volume (21), which produced good
results.
Long Equilibration Times: Full isocratic equilibrium of the
column (where retention times stabilized to 99–101% of the
value at “infinite” equilibration time), with buffered acetonitrile
mobile phase, can require more than 20 min (> 40 column
volumes) when purging the 10× 0.21-cm columns at 0.5 mL/
min (10). In isocratic analysis, full equilibration is necessary
because the selectivity of the separation can change with
equilibration time. Full equilibration was found to depend on
the nature of the HILIC stationary phase, the purging flow rate,
and the original or “storage” solvent. These long equilibration
times are not, however, a barrier to the use of gradient elution
in HILIC. In gradient elution, a repeatable partial equilibrium
was demonstrated (10) in an equilibration time of as little as
5 min, implying that HILIC can be reliably used under these
conditions. Selectivity changes can occur in the separation
dependent on the particular equilibration time between
gradient runs. Therefore, this parameter must be kept constant
in a series of analyses; however, this does not appear to be a
problem when using modern HPLC instruments.
Retention Time Instability and Drift: HILIC has sometimes
been found to suffer from irreproducible or drifting retention
times. This problem is often associated with insufficient
equilibration of the column (see above), especially in
isocratic applications. However, one study found retention
time irreproducibility was associated with storage of
the (organic-rich) mobile phase while connected to the
instrument, rather than in tightly sealed bottles, which gave
excellent day-to-day repeatability of retention (22).
Automated QuEChERS Method
• High matrix clean-up due to non-dispersive method
• Also applicable for fatty and coloured matrices
• High robustness in the laboratory routine 24/7
• High degree of automation with online LC-MS
www.LCTech.de
McCalley
Extra care may be necessary in mobile phase preparation.
The commonly used buffer salts AF and AA are hygroscopic
and should be stored in a dessicator at room temperature
to improve reproducibility of buffer preparation. For isocratic
analysis using high concentrations of acetonitrile (low
concentrations of water), some consideration should be
given to preparing the mobile phase by premixing aqueous
and organic liquids by weight, taking into consideration the
density of the liquids. Errors might otherwise result if metering
relatively small volumes of aqueous phase using the HPLC
instrument.
In gradient analysis, particularly with high-pressure mixing
systems that use a separate pump for each solvent flow,
the use of one channel delivering small volumes (difficult to
achieve reproducibly and accurately) throughout the gradient
run should be avoided. This is especially true when the total
flow is relatively low, which is necessary with a small-diameter
column, and when a relatively shallow gradient is employed,
as is often the case with HILIC. Therefore, a gradient from
90% to 80% acetonitrile is best not devised with bottle A
containing 90% acetonitrile and bottle B 0% acetonitrile
at a total flow of 0.4 mL/min. This would result in pump B
delivering only ~0.045 mL/min, even at its maximum flow at
the end of the gradient.
Some New Applications of HILICAnalysis of Glycans “Bottom-Up” Methods: HILIC has
established itself as an essential technique for monitoring
glycans in monoclonal antibody (mAb) drugs designed to
target specific antigens. mAbs have MW ~150,000, of which
about 5% by weight can be glycans. Much analytical work
needs to be performed in the characterization of mAbs
or their biosimilars that have similar efficacy and safety
to the original drug, or biobetters, which are improved
products. Many of the original biopharmaceuticals are
coming off patent, giving scope for the development of
these substitute drugs. Glycosylation is one of the important
causes of microheterogeneity caused by post-translational
modification (PTM) that can occur, for example, during
production and storage; thus, its characterization is of great
importance to enable potential differences in the products
to be assessed.
About ten sugars are commonly found as constituents
of glycans, which may be attached to the Fc fragment of
the mAb. A glycan is a mono-, poly-, or oligosaccharide,
but typically contains ~10 monosaccharides. N -glycans
can be cleaved from the mAb by an enzyme, such as
PNGase-F. The resulting free N -glycans can be analyzed
in their native state or reacted with 2-amino benzamide
(2-AB) or procainamide to give sensitive fluorescent
derivatives. However, 2-AB derivatives are difficult to
detect by ESI-MS because of poor ionization efficiency.
An alternative derivative after PNGase-F deglycosylation,
which apparently gives both good fluorescent and
ESI-MS sensitivity, has recently been proposed (23). In
addition to releasing N -glycans from IGg Fc domains,
the proposed approach also produced complete release
of Fab domain N -glycans. Gradient elution analysis
on a wide-pore (300 Å) amide column was used in
their analysis. Complete release of N -glycans from
Fab domains was obtained using this procedure with
HILIC–MS, showing a peak of mass 148.4 kDa before
deglycosylation and 145.3 kDa after, implying the loss of
two N -glycans.
Characterization of Intact or Large Fragment Protein
Biopharmaceuticals and mAbs: Guillarme and co-workers
(24) employed a wide-pore sub-2-μm amide HILIC
column to successfully characterize intact and digested
(25–100 kDa fragment) protein biopharmaceuticals using
gradients of 65–80% acetonitrile and 0.1% TFA. The
300-Å pore size packing allowed the accommodation
of large biomolecules and fragments without resulting in
restricted diffusion. The separations were reported to be
highly orthogonal to reversed-phase LC, while the kinetic
performance remained comparable. The authors stressed
the following advantages of HILIC: i) compatibility with
MS, ii) reduced requirement of high temperatures that are
necessary in reversed-phase LC to limit undesirably strong
adsorption, and iii) the possibility of coupling columns in
series to gain extra resolving power. Applications were
shown to the analysis of six different insulins (one of the
oldest biopharmaceuticals, RMM~6000); reversed-phase
LC and HILIC were shown to be complementary, with
better separation of insulin and insulin glulisine by HILIC,
but superior separation of insulin and insulin lispro by
reversed-phase chromatography. High efficiencies were
obtained in both (isocratic) analyses. The authors compared
characterization of trastuzumab by HILIC, reversed phase,
and ion exchange, even gaining some results with intact
proteins, although reduction of disulphide bonds prior to
chromatography or partial digestion of the mAb typically
yields better results in terms of both chromatographic
123www.chromatographyonline.com
McCalley

and mass spectrometry characterization. Trastuzumab
(Herceptin) is a mAb widely used for the treatment of some
types of breast cancer. Whether these large molecules
are denatured during separation (which should still allow
for their analytical—if not their preparative—separation,
retaining their biological activity) remains to be confirmed.
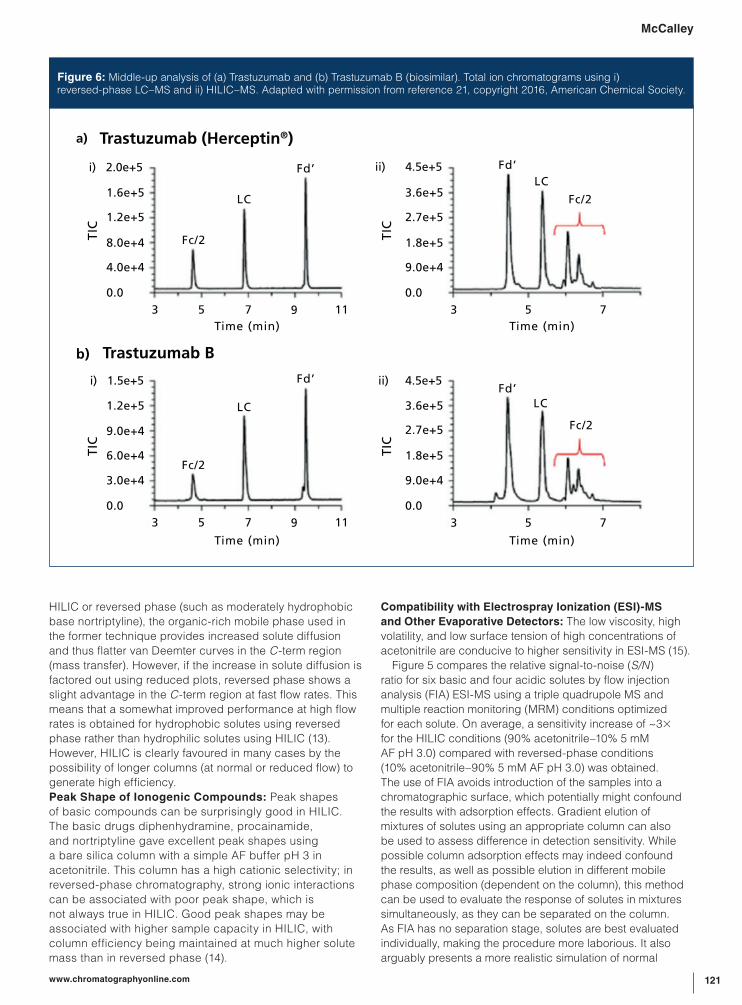
HILIC–MS was used to compare originator and
biosimilar therapeutic mAbs at the intact and the so-called
“middle-up” level of analysis, again using a wide-pore
300-Å amide column (21). While “bottom-up” analysis
(where the sample is processed to give the simplest
building blocks, for example, liberated peptides or
glycopeptides) is most often used as the subsequent
analysis of these smaller molecules is easier, it loses
structural information on these complex molecules. In the
HILIC analysis, 0.1% TFA was again used as mobile phase
additive, even though it can cause some ion suppression
in MS detection. It was preferred due to its solubilizing
effect on proteins and its low pH suppression of silanol
ionization. The intact mAb was digested, then reduced to
give Fd’, light chain (LC), and Fc/2 subunits (two of each)
of about 25 kDa, containing attached intact glycans, and
then subjected to reversed-phase and HILIC analysis.
The two techniques were complementary, as can be
seen in Figure 6, which shows middle-up separations of
Trastuzumab (Herceptin) and its biosimilar Trastuzumab
B. Reversed-phase analysis gave a separation of the
three main fragments, but offered information about the
glycosylation pattern only after examination of the MS data.
In contrast, HILIC–MS on the same sample allowed for
a direct and immediate comparison of the glycosylation
profiles. Furthermore, Guillarme (25) demonstrated the use
of HILIC coupled with MS to characterize the antibody-drug
conjugate (ADC) Brentuximab vedotin, which is used in
the treatment of Hodgkin’s lymphoma. ADCs enable the
delivery of cytotoxic drugs (present in this case with an
average drug-to-antibody ratio of four) to therapeutic targets
with an antibody-directed mechanism. As with mAbs, these
materials need to be characterized because of the structural
complexity and heterogeneity. A middle-up approach
with fragment (~25 kDa) analysis using a 300-Å amide
column and a gradient of 85–73% acetonitrile with 0.08%
TFA and 0.02% formic acid was used. It was found that
HILIC analysis offered a completely complementary and
orthogonal set of information to reversed-phase analysis;
elution order was essentially the opposite to that observed
in reversed phase. Only one HILIC–MS run was necessary
to obtain highly important information on structural
microheterogeneity.
HILIC in Metabolomics: The human metabolome consists
of small molecules—generally accepted as having a MW
<1500 Da—dictated by the genes of the individual and
also the individual’s environment, and therefore it consists
of a mixture of endogenous and exogenous compounds.
Whereas nuclear magnetic resonance (NMR) spectroscopy
provides standard analytical methodology common to most
samples and does not require analytical development,
it suffers from spectral overlap and low sensitivity. Thus,
MS, which is considerably more sensitive, coupled with
separation techniques such as gas chromatography
(GC) and LC provides a valuable alternative to NMR.
LC clearly has broader application possibilities than
GC because it is amenable to nonvolatile, highly polar,
and thermally labile samples without derivatization.
The complementary use of HILIC and reversed-phase
chromatography coupled with MS expands the number
of detected analytes and provides considerably more
comprehensive analyte coverage (26). Important classes
of compound that have been analyzed by HILIC include
phospholipids, which are the main constituents of
biological membranes. They are important signalling
molecules and potential biomarkers for ovarian cancer,
diabetes mellitus, and other conditions. They consist of a
polar phosphate head group, two fatty acid chains, and
a glycerol group. HILIC eluents are more compatible with
ESI-MS than normal-phase chromatography eluents, which
are traditionally used for these solutes. Typical mobile
phases are acetonitrile containing AA or AF buffers, in
conjunction with bare silica or diol columns. Organic
acids, sugars, amino acids, nucleosides, and nucleotides,
which can be biomarkers of inherited metabolic disease,
are other examples of metabolites amenable to HILIC.
A comparative study of the analysis of 764 metabolites
using either HILIC or reversed-phase analysis showed that
HILIC methods markedly improved the coverage of polar
metabolite groups, such as phosphates or carbohydrates,
and therefore represented a worthy alternative to
reversed-phase separations (27). Zwitterionic sorbents,
such as those containing sulfobetaine groups, had a
particular broad application range. In addition, selectivity
was highly diverse among the HILIC methods investigated
(which used different stationary phases). For example,
an amide column gave good retention of nucleosides,
whereas a phophorylcholine sorbent was most appropriate
for the separation of carbohydrates.
A further advantage of HILIC over reversed
phase in metabolic studies appears to be that
glycerophospholipids, generally observed in cell and
plasma samples, tend to appear in narrow retention time
ranges instead of covering major parts of the retention
window, which is often found for reversed-phase
separations (28). These compounds give extensive ion
suppression in ESI-MS. For analysis of a broad range
of metabolites, the risk of suppression increases with
increased spreading of the retention window of the
interferents. In the same article, considerable differences
in selectivity for metabolites and matrix interferents were
shown between bare silica, zwitterionic, and amide HILIC
stationary phases. Thus, a particular HILIC column may be
the optimum for each individual application.
ConclusionsHILIC has become an indispensable technique for the
analysis of polar and ionized solutes poorly retained
by traditional reversed-phase methods. For samples
amenable to both HILIC and reversed-phase analysis,
the techniques show a complementary nature. In fact, for
such samples, the use of HILIC may be advantageous
because of the favourable coupling with MS and other
evaporative detectors, the low viscosity of the mobile
phase (allowing the use of long columns), and good peak
shapes for some basic pharmaceuticals.The mechanism
of HILIC separation, however, appears complex, which
can pose a barrier to the more widespread adoption of
LC•GC Europe March 2019124
McCalley

the technique. Nevertheless, a greater understanding of
the effect of some simple parameters could lead to more
straightforward method development. Problems such as
longer equilibration times are not a barrier to the use of
gradient methods. Some new applications, such as the
characterization of biopharmaceuticals, and its use in
metabolomics, indicate good potential for the use of the
technique in these areas, where it is complementary to
reversed-phase methodology.
References(1) A.J. Alpert, J. Chromatogr. 499, 177–196 (1990).
(2) A. Kumar, J.C. Heaton, and D.V. McCalley, J. Chromatogr. A 1276,
33–46 (2013).
(3) D.V. McCalley, J. Chromatogr. A 1523, 49–71 (2017).
(4) D.V. McCalley, J. Chromatogr. A 1534, 64–74 (2018).
(5) J.C. Heaton, J.J. Russell, T. Underwood, R. Boughtflower, and D.V.
McCalley, J. Chromatogr. A 1347, 39–48 (2014).
(6) D.V. McCalley, J. Chromatogr. A 1411, 41–49 (2015).
(7) A.J. Alpert, J. Chromatogr. A 1538, 45–53 (2018).
(8) N.P. Dinh, T. Jonsson, and K. Irgum, J. Chromatogr. A 1218,
5880–5891 (2011).
(9) Y. Kawachi, T. Ikegami, H. Takubo, Y. Ikegami, M. Miyamoto, and N.
Tanaka, J. Chromatogr. A 1218, 5903–5919 (2011).
(10) D.V. McCalley, J. Chromatogr. A 1554, 61–70 (2018).
(11) N.P. Dinh, T. Jonsson, and K. Irgum, J. Chromatogr. A 1320, 33–47
(2013).
(12) D.V. McCalley, J. Chromatogr. A 1193, 85–91 (2008).
(13) J.C. Heaton, X. Wang, W.E. Barber, S.M. Buckenmaier, and D.V.
McCalley, J. Chromatogr. A 1328, 7–15 (2014).
(14) D.V. McCalley, J. Chromatogr. A 1171, 46–55 (2007).
(15) S.R. Needham, P.R. Brown, K. Duff, and D. Bell, J. Chromatogr. A
869, 159–170 (2000).
(16) A. Periat, J. Boccard, J.L. Veuthey, S. Rudaz, and D. Guillarme, J.
Chromatogr. A 1312, 49–57 (2013).
(17) A. Periat, I. Kohler, A. Bugey, S. Bieri, F. Versace, C. Staub, and D.
Guillarme, J. Chromatogr. A 1356, 211–220 (2014).
(18) J.J. Russell, J.C. Heaton, T. Underwood, R. Boughtflower, and D.V.
McCalley, J. Chromatogr. A 1405, 72–84 (2015).
(19) J.C. Heaton and D.V. McCalley, J. Chromatogr. A 1427, 37–44
(2016).
(20) J. Ruta, S. Rudaz, D.V. McCalley, J.L. Veuthey, and D. Guillarme, J.
Chromatogr. A 1217, 8230–8240 (2010).
(21) V. D’Atri, S. Fekete, A. Beck, M. Lauber, and D. Guillarme, Anal.
Chem. 89, 2086–2092 (2017).
(22) N. Gray, J. Heaton, A. Musenga, D.A. Cowan, R.S. Plumb, and N.W.
Smith, J. Chromatogr. A 1289, 37–46 (2013).
(23) M.A. Lauber, Y.Q. Yu, D.W. Brousmiche, Z. Hua, S.M. Koza, P.
Magnelli, E. Guthrie, C.H. Taron, and K.J. Fountain, Anal. Chem. 87,
5401–5409 (2015).
(24) A. Periat, S. Fekete, A. Cusumano, J.L. Veuthey, A. Beck, M.
Lauber, and D. Guillarme, J. Chromatogr. A 1448, 81–92 (2016).
(25) V. D’Atri, S. Fekete, D. Stoll, M. Lauber, A. Beck, and D. Guillarme,
J. Chromatogr. B Analyt. Technol. Biomed. Life Sci. 1080, 37–41
(2018).
(26) D.Q. Tang, L. Zou, X.X. Yin, and C.N. Ong, Mass Spectrom. Rev. 35,
574–600 (2016).
(27) S. Wernisch and A. Pennathur, Anal. Bioanal. Chem. 408,
6079–6091 (2016).
(28) A. Elmsjo, J. Haglof, M.K. Engskog, I. Erngren, M. Nestor, T.
Arvardsson, and C. Pettersson, J. Chromatogr. A 1568, 49–56
(2018).
David McCalley is Professor of Bioanalytical Science at
the University of the West of England, Bristol. He is a past
winner of the Silver Jubilee medal of the UK Chromatographic
Society. In the past three years, he has given invited lectures
in London, San Francisco, Cork, Paris, Prague, Balaton,
Sandefjord, Cannes, and Princeton. His research is directed
towards the understanding of the fundamental separation
mechanisms that occur in liquid chromatography. These
studies have included the effects of pressure on separations,
superficially porous packings, overloading, reversed-phase,
and hydrophilic interaction chromatography.
the micro-Chip Chromatography Company
Changing the ART of analytical
chromatography with
μPAC™Pillar Array Columns:
These micro-Chip columns feature
a perfectly-ordered separation bed
of free-standing pillars ensuring:
• excellent separation power
• unprecedented reproducibility
• unrivalled robustness
Enhance the data productivity
of your nano-LC/MS system
for complex biological samples.
Discover our products on
www.pharmafluidics.com
or meet us at
Pittcon (March 17-21, Philadelphia, USA)
or ABRF (March 23-26, Texas, USA)
FOLLOW US
125www.chromatographyonline.com
McCalley
LC•GC Europe March 2019126
LC TROUBLESHOOTING
One of the most common questions
practitioners of reversed-phase liquid
chromatography (LC) ask is “Which
column should I use?” There are over
1000 reversed-phase columns that are
commercially available today, and at
first glance the prospect of choosing
just one, or a few, can be daunting.
As I frequently tell my students, the
good news is that we have a lot of
good columns to choose from, but the
bad news is that we have to choose,
because it is impractical to evaluate all
of them, or even a large subset, for a
particular application. A running joke in
the community is that the best column
for an application is the one that’s
already in the laboratory drawer. In
other words, column choice is strongly
influenced by the experience of the
practitioner, and prior good or bad
experiences with particular columns.
We all have our favourites, and tend to
stick with them. A related question is
“Does the latest and greatest column
from manufacturer ABC really represent
a ‘new’ selectivity?” It is difficult
to provide a completely satisfying
general answer to this question.
However, we can leverage existing
data to give us some perspective on
new phases as they are introduced
to the marketplace and we consider
adding them to the collections in our
laboratory drawers. In this month’s
instalment of “LC Troubleshooting”,
I provide a perspective on the
characteristics of the columns
introduced to the commercial market
over the last 24 months, using the
hydrophobic subtraction (HS) model of
reversed-phase selectivity.
Essential Elements of the Hydrophobic Subtraction Model (HSM) of Reversed-Phase Selectivity The largest single collection of publicly
available data that allows comparison
of commercially available columns has
been assembled over the past 15 years
using the HS model of reversed-phase
selectivity. The theoretical foundation
of this model, and examples of its
application for choosing columns of
similar or different selectivities, have
been described in detail elsewhere
(1,2). Readers interested in learning
more about the model itself are
encouraged to consult these resources.
The central idea of the HS model
is that most of the selectivity of a
reversed-phase column, defined
here as the ratio of the retention
factor for compound X (kX) to the
retention factor of ethylbenzene (kEB),
can be accounted for by the sum of
five contributions that are related to
different aspects of physicochemical
interactions between solutes and the
stationary phase. This relationship
is shown in equation 1, where the
parameters H, S*, A, B, and C
account for properties of the stationary
phase related to the hydrophobicity
of the phase (H), interactions that
are size dependent (S*), hydrogen
bond donating (A) and accepting
(B) properties of the phase, and the
ability of the phase to participate in
electrostatic interactions with analytes
(C). The parameters η, σ, β, α, and
κ account for analyte properties that
correspond to the column properties.
For example, η accounts for the
hydrophobicity of the analyte, κ is a
measure of the charge of the analyte in
solution, and so on.
log ( ) = Hη – S* σ+ Αβ + Bα + Cκ
kx
kEB
[1]
The column parameters for
any reversed-phase column can
be determined by experiment
using a mobile phase containing
acetonitrile and phosphate buffer (see
reference 1 for details). The current
characterization protocol involves
measuring retention factors for 16
Looking for New Selectivity in Reversed-Phase Liquid Chromatography? A View of the Selectivity Landscape Over the Past Two YearsDwight R. Stoll, LC Troubleshooting Editor
The offerings of commercially available columns for reversed-phase liquid chromatography (LC) continue to expand. Are these columns similar or different compared to what is already available?

127www.chromatographyonline.com
LC TROUBLESHOOTING
probe solutes and regressing those
values against the known solute
parameters for the 16 probes. Since
the beginning of this work in the
early 2000s, over 700 commercially
available columns have been
characterized in this way, and for the
last five years the characterization work
has been done in my laboratory. These
Figure 1: Distribution of the “similarity factor”, FS, values for each of the 40 new entries into the hydrophobic subtraction model (HSM) database compared to its “nearest neighbour” in the existing set of columns.
25
0-3 3-5 5-7 7-13
Fs Value for Nearest Neighbour
Nu
mb
er
of
Ne
w E
ntr
ies
20
15
10
5
0
Table 1: Reversed-phase stationary
phase types of new entries in the
hydrophobic subtraction model (HSM)
database in the last 24 months
PhaseNumber of
Columns
C18 12
Polar Embedded 6
C8 5
C4 4
Cyano 4
Phenyl 4
AQ 2
Pentafluorophenyl
propyl2
Biphenyl 1
Total 40
Pure Chromatography
ADVANTAGESee What It Can Do for You and Your Lab
Sign up today to access Restek’s
years of chromatography knowledge at
www.restek.com/advantage
LC•GC Europe March 2019128
LC TROUBLESHOOTING
change in selectivity that is tolerable
when trying to identify columns with
similar selectivity (or “equivalent”
columns) (2).
New Entries in the HSM Database in the Last 24 Months Over the last 24 months, we have made
40 new entries for reversed-phase
columns in the publicly available
hydrophobic subtraction model
(HSM) database. A summary of the
numbers of columns in different phase
categories is shown in Table 1. Some
of these columns are truly new, both to
the database and to the commercial
market. Others have been on the market
for some time, but have only been
characterized by the HSM recently.
What’s New, and What’s Not?Using the similarity factor (FS) as a
measure of similarity of the new entries
to columns already in the database,
we can explore a variety of interesting
questions.
Question #1: How many of the new
entries constitute an addition of a “new”
selectivity to the database?
In thinking about this question, I am
defining a “new” selectivity as one for
which there is currently no equivalent
data are accessible through two free,
public websites (3,4).
With the column parameters in hand,
we can then think about how similar or
different any particular pair of columns
is. For this purpose, Snyder and Dolan
and coworkers have advocated for the
use of a “similarity factor”, FS, which
is a weighted distance between two
columns in five-dimensional selectivity
space. The relationship between FS
and the column parameters is shown in
equation 2:
where XH, XS*, etc. are the weighting
coefficients with values of 12.5,
100, 30, 143, and 83, suggested by
Snyder and coworkers (1). When FS is
calculated this way, columns for which
FS < 3 are considered “equivalent”,
meaning that they are effectively
interchangeable, and will produce
very similar chromatograms for most
applications. Several users have told
me that for many applications even
FS < 10 is sufficient to obtain very
similar separations. Of course, this
must be verified experimentally for any
particular application, but it is at least
a good guideline. Columns for which
FS > 100 are considered very different,
and looking for such columns may be
useful when intentionally assembling
a set of columns with very different
selectivities. Interpretation of FS values
between 3 and 100 depends on the
properties of solutes in a particular
mixture of interest, and the degree of
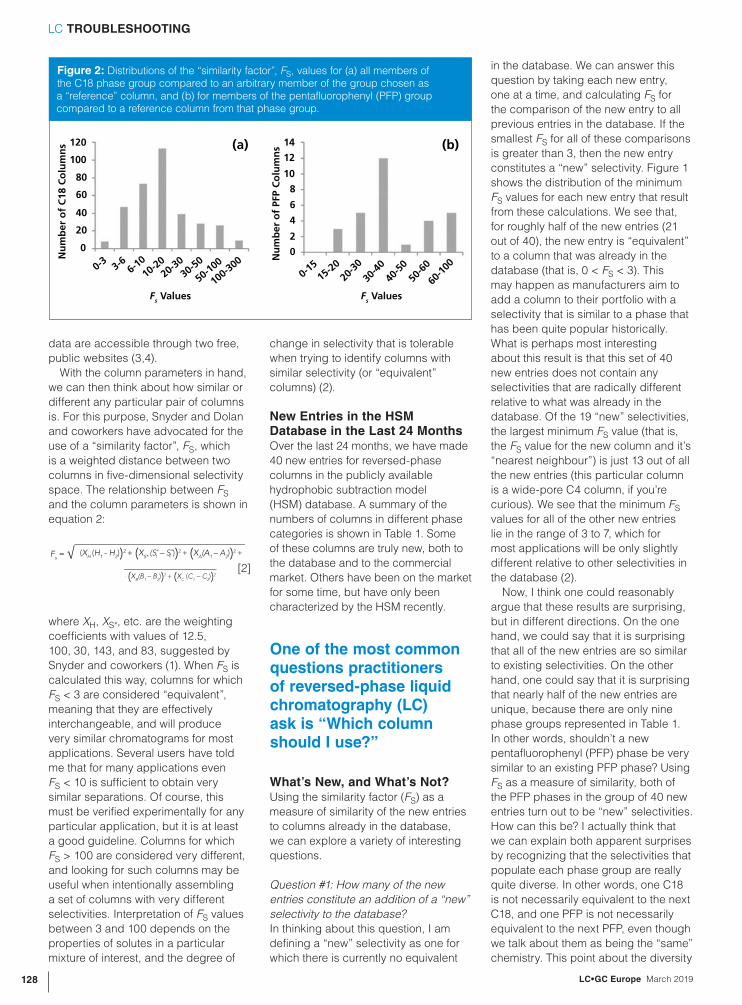
in the database. We can answer this
question by taking each new entry,
one at a time, and calculating FS for
the comparison of the new entry to all
previous entries in the database. If the
smallest FS for all of these comparisons
is greater than 3, then the new entry
constitutes a “new” selectivity. Figure 1
shows the distribution of the minimum
FS values for each new entry that result
from these calculations. We see that,
for roughly half of the new entries (21
out of 40), the new entry is “equivalent”
to a column that was already in the
database (that is, 0 < FS < 3). This
may happen as manufacturers aim to
add a column to their portfolio with a
selectivity that is similar to a phase that
has been quite popular historically.
What is perhaps most interesting
about this result is that this set of 40
new entries does not contain any
selectivities that are radically different
relative to what was already in the
database. Of the 19 “new” selectivities,
the largest minimum FS value (that is,
the FS value for the new column and it’s
“nearest neighbour”) is just 13 out of all
the new entries (this particular column
is a wide-pore C4 column, if you’re
curious). We see that the minimum FS
values for all of the other new entries
lie in the range of 3 to 7, which for
most applications will be only slightly
different relative to other selectivities in
the database (2).
Now, I think one could reasonably
argue that these results are surprising,
but in different directions. On the one
hand, we could say that it is surprising
that all of the new entries are so similar
to existing selectivities. On the other
hand, one could say that it is surprising
that nearly half of the new entries are
unique, because there are only nine
phase groups represented in Table 1.
In other words, shouldn’t a new
pentafluorophenyl (PFP) phase be very
similar to an existing PFP phase? Using
FS as a measure of similarity, both of
the PFP phases in the group of 40 new
entries turn out to be “new” selectivities.
How can this be? I actually think that
we can explain both apparent surprises
by recognizing that the selectivities that
populate each phase group are really
quite diverse. In other words, one C18
is not necessarily equivalent to the next
C18, and one PFP is not necessarily
equivalent to the next PFP, even though
we talk about them as being the “same”
chemistry. This point about the diversity
Figure 2: Distributions of the “similarity factor”, FS, values for (a) all members of the C18 phase group compared to an arbitrary member of the group chosen as a “reference” column, and (b) for members of the pentafluorophenyl (PFP) group compared to a reference column from that phase group.
120 14
12
10
8
6
4
2
0
(a) (b)
0-3
0-15
15-20
20-3
030
-40
50-6
060
-100
40-5
03-6
10-20
20-30
30-50
50-100
100-300
6-10N
um
be
r o
f C
18
Co
lum
ns
Nu
mb
er
of
PFP
Co
lum
ns
100
80
60
Fs Values F
s Values
0
20
40
Fs = √ (X
H (H
1 - H
2))2 + (XS*
(S*
– S*))2 + (XA
(A1 – A
2))2 +
1 2
+ (XB(B
1 – B
2))2 + (XC
(C1 – C
2))2
[2]
One of the most common questions practitioners of reversed-phase liquid chromatography (LC) ask is “Which column should I use?”
129www.chromatographyonline.com
LC TROUBLESHOOTING
of selectivities within a phase group has been discussed for
quite a long time, but I don’t think the extent of the diversity is
widely appreciated. Readers interested in the history of this
issue, some of the origins of the selectivity diversity, and the
consequences for method development are referred to John
Dolan’s article on the topic in this column several years ago
(5).
One way to examine this is to look at the distribution of
FS values for all columns within a particular phase group
compared to some arbitrary “reference” column within that
group. Currently, there are 344 columns in the HSM database
that are identified as “C18”, and 31 that are identified as
“PFP”. Figure 2 shows the distributions of FS values for the
members of each group relative to a randomly selected
member of the same group (that is, the “reference column”).
We see that in each case very few columns within a group
are similar enough to be “equivalent” to the reference column.
In the case of the C18s, just five columns meet that criterion,
and in the case of the PFPs the reference column itself is
unique! In other words, it is far more likely that any C18
chosen from the group will be different from another member
of the group than it is that the two will be equivalent.
Question #2: How many columns that previously had no
equivalent in the database now have at least one equivalent
due to the addition of the new entries?
The previous question was focused on the extent to which
new entries to the database reflect the addition of “new”
selectivities. But, this is not the only way to add value to
the complement of commercially available phases. New
entries that are “equivalent” to columns that previously had
no equivalent in the database are also important, because
they provide users with alternate columns in case a problem
develops with the column originally used to develop a
method (for example, if the manufacturer goes out of
business, or discontinues the product). Of the 689 columns
in the database prior to the addition of the 40 most recent
entries, 329 of those were “unique” in the sense that there
was no other column in the database with FS < 3. Of those
329, 322 still have no equivalent column, even after the
addition of the 40 new entries. In other words, seven of the
40 new entries fill a role as an “equivalent” for a column that
previously did not have one.
SummaryThe continuously changing offerings of reversed-phase
columns present both opportunities and challenges to
practitioners looking to choose a column. On one hand,
it is great to be able to choose from over 1000 different
commercially available options. On the other hand, it can be
difficult to tell whether or not new offerings add truly unique
selectivity that we have not seen before. The hydrophobic
subtraction model of reversed-phase selectivity is a tool,
supported by a freely available database of more than 700
columns, that can be used to answer a variety of questions
along these lines. Continued research on this and related
models will be important to the community as we look to
efficiently develop effective LC methods, even as the number
of commercially available columns continues to increase.
References(1) L.R. Snyder, J.W. Dolan, D.H. Marchand, and P.W. Carr, in Advances
in Chromatography (CRC Press, Boca Raton, USA, 2012), pp.
297–376.
(2) J.W. Dolan and L.R. Snyder, LCGC North Am. 34(9), 730–741 (2016).
(3) hplccolumns.org, (n.d.). http://hplccolumns.org/index.php.
(4) http://www.usp.org/usp-nf/compendial-tools/pqri-approach-column-
equiv-tool, (n.d.).
(5) J.W. Dolan, LCGC Europe 24(3), 142–148 (2011).
Dwight R. Stoll is the editor of “LC Troubleshooting”. Stoll is
a professor and co-chair of chemistry at Gustavus Adolphus
College in St. Peter, Minnesota, USA. His primary research
focus is on the development of 2D-LC for both targeted and
untargeted analyses. He has authored or coauthored more
than 50 peer-reviewed publications and three book chapters
in separation science and more than 100 conference
presentations. He is also a member of LCGC ’s editorial
advisory board. Direct correspondence to: LCGCedit@ubm.
com
InertSustainTh e new standard for your (U)HPLC Methods
for more information:www.glsciences.eu
The good news is that we have a lot of good columns to choose from, but the bad news is that we have to choose.
This point about the diversity of selectivities within a phase group has been discussed for quite a long time, but I don’t think the extent of the diversity is widely appreciated.

BIOPHARMACEUTICAL PERSPECTIVES
Monoclonal antibodies (mAbs)
have taken a prominent and
increasingly important position
in today’s drug development
and production, providing high
specificity and limited side effects
in the treatment of life-threatening
diseases. The production of a mAb
using mammalian cells will often
result in a heterogeneous product,
as it will undergo post-translational
modifications (PTMs) (1).
Moreover, potential degradation or
rearrangements at different stages
of the production, purification, and
storage may lead to structural variants
(1). N-glycosylation is an important
source of heterogeneity of mAbs
and most commonly occurs in the
crystallizable (Fc) domain of the heavy
chain (HC) (2). Fc glycosylation is
fundamental to provide the mAb with
the proper effector functions and
affects quality, pharmacokinetics,
immunogenicity, and potency of the
drug. Glycosylation is considered a
critical quality attribute (CQA) of the
mAb (2). Antibody variants, resulting
from asparagine and glutamine
deamidation, methionine oxidation,
C-terminal lysine truncation, or
N-terminal pyroglutamation, are other
sources of product heterogeneity (3),
and should be assessed at different
stages of the production.
Mass spectrometry (MS) has
become a primary tool for the
characterization of mAbs (4), yielding
molecular weights of the main
protein and variants, identification of
PTMs, and glycosylation patterns.
MS can be used for analysis at the
intact mAb level using a top-down
approach, or for the determination of
peptides obtained after enzymatic
digestion of the mAb (that is,
bottom-up). The choice will mainly
depend on the analytical question,
for example, relating to overall protein
heterogeneity or to specific locations
of protein modification. Intact
mAb analysis might be hindered
by poor ionization efficiencies
and lack of MS resolution. The
so-called middle-up approach
provides a practical alternative,
facilitating the characterization of
mAb heterogeneity by analyzing
mAb subunits of 25–50 kDa (5).
Before analysis, mAbs are cleaved
by reduction of the intra-chain
disulfide bridges (yielding light
chain [LC] and heavy chain [HC])
or by enzymatic cleavage using
papain or IdeS (yielding Fab and
Fc fragments). Middle-up analysis
decreases the overall complexity of
the probed molecules, resulting in a
more straightforward interpretation of
Middle-Up Characterization of the
Monoclonal Antibody Infliximab by
Capillary Zone Electrophoresis–
Mass SpectrometryKlára Michalíková1,2, Elena Dominguez-Vega3,4, Govert W. Somsen3, and Rob Haselberg3, 1Charles University, Faculty
of Pharmacy in Hradec Kralové, Department of Analytical Chemistry, Czech Republic, 2Current address: Czech Academy
of Sciences, Institute of Microbiology, Prague, Czech Republic, 3Division of Bioanalytical Chemistry, Amsterdam Institute of
Molecules, Medicines and Systems, Vrije Universiteit Amsterdam, Amsterdam, Netherlands, 4Current address: Center for
Proteomics and Metabolomics, Leiden University Medical Center, Leiden, Netherlands
Capillary zone electrophoresis-electrospray ionization time-of-fl ight mass spectrometry (CZE–ESI-TOF-MS) for the characterization of the monoclonal antibody (mAb) infl iximab and its variants is presented. Infl iximab was analyzed using a middle-up approach involving either reduction or digestion with the enzyme IdeS. A multilayer capillary coating of Polybrene-dextran sulfate-Polybrene (PB-DS-PB) in combination with a background electrolyte of 40% acetic acid provided efficient separation of the obtained antibody fragments, that is, light chain (LC) and heavy chain (HC), as well as F(ab’)2 and Fc/2 parts. C-terminal lysine variants were also resolved. Recorded mass spectra of HC and Fc/2 fragments permitted assignment of 13 glycoforms and provided a quantitative profi le, with G0F the most abundant glycoform (~50%). CZE–ESI-TOF-MS represents an efficient means for the straightforward analysis of a monoclonal antibody and its proteoforms.
Ph
oto
Cre
dit: ke
nto
h/S
hu
tte
rsto
ck.c
om
LC•GC Europe March 2019130

the obtained MS data and allowing
more accurate assessment of
glycosylation profiles. It has been
applied to the MS-based assessment
of the conjugation degree of antibody
conjugates (6), and for the analysis
of degradation products in mAbs (7),
modifications in HCs or LCs (8), and
HC glycosylation (9).
When analyzing real-life samples
(which are frequently mixtures),
obtaining good-quality mass
spectra of proteins often requires
separation prior to MS detection.
Several separation techniques can be
employed for the separation of mAbs
and their subunits (10,11). Charge
heterogeneity can be assessed by
ion exchange chromatography (IEC)
and capillary isoelectric focusing
(CIEF), whereas size-exclusion
chromatography (SEC) and capillary
gel electrophoresis (CGE) can
be used for determination of size
variants. Unfortunately, the mobile
phases employed to obtain the
highest separation efficiency by
these methods often show serious
incompatibilities with MS detection.
Therefore, reversed-phase liquid
chromatography (LC) is still most
commonly used in combination with
MS for mAb characterization (12),
although reversed-phase LC may
lack the selectivity to distinguish
certain protein modifications.
Recently, hydrophilic interaction
liquid chromatography (HILIC)–
MS has been shown to be very
useful for resolving glycoforms of
biopharmaceuticals, including mAbs
(13). Capillary zone electrophoresis
(CZE), on the other hand, has shown
good potential for the separation of
closely related charge variants and
isoforms of proteins (14). In addition,
CZE has the intrinsic capacity to
produce narrow peaks for proteins
and—nowadays—can be coupled
rather easily to mass spectrometric
detection. Consequently, over the
last few years, the use of CZE–MS in
middle-up and intact mAb analysis
has increased. It has, for example,
been used to separate mAb subunits
and estimate their molecular weights
(15), to identify PTMs on the intact
and subunit level (16,17), and to make
in-depth glycosylation profiles (18).
The aim of this article is to highlight
the potential of CZE–MS for the middle-
up characterization of mAbs. Infliximab
was selected as a model compound
because it comprises extensive
variation in glycosylation as well as
HC C-terminal lysine variants. Prior to
CZE–MS analysis, infliximab was either
reduced to yield its HCs and LCs, or
digested using the proteolytic enzyme
IdeS, resulting in its F(ab)2 and Fc/2
subunits. CZE separation, CZE–MS
interfacing, and MS conditions were
carefully optimized to achieve detailed
glycoform and C-terminal lysine
profiles of the infliximab fragments.
Materials and MethodsChemicals: Polybrene
(hexadimethrine bromide, PB;
average Mw = 15,000), dextran
sulfate sodium salt (DS; average
Mw > 500,000), methanol,
propan-2-ol (IPA), ethylene glycol
(99.5%), and DL-dithiothreitol (99.0%)
were purchased from Sigma Aldrich.
Acetic acid (99.8%) and ammonium
hydroxide (25% v/v) were obtained
from Merck. A formulation of infliximab
(Remicade) comprised sucrose,
INNOVATION YOU CAN TRUST – PERFORMANCE YOU CAN RELY ON
| fused-core.com | Made in the USA
HALO® and Fused-Core® are registered trademarks of Advanced Materials Technology
You Have Unique mAbsDiscover More With Fused-Core®
BIOCLASS 1000 Å
www.chromatographyonline.com 131

sodium phosphate, and polysorbate
80. FragIT MicroSpin columns
containing immunoglobulin-degrading
enzyme of Streptococcus pyogenes
(IdeS; Genovis) were used for
mAb digestion. Ultra-pure water
was produced by a Milli-Q system
(Millipore). Background electrolyte
(BGE) was prepared daily by diluting
acetic acid with water to a final
concentration of 40% v/v (6.9 M,
~pH 2.0).
Sample Preparation: Reduction
of protein disulfide bonds was
accomplished by incubating the
infliximab formulation with 50-mM
dithiothreitol (DTT) for 10 min at
37 °C. The reaction was quenched
with acetic acid (final concentration,
1% v/v). Digestion with IdeS was
performed following the FragIT
MicroSpin (Genovis) kit instructions.
All final reaction mixtures were
centrifuged three times against six
volumes of water using Vivaspin
3 kDa MWCO filter tubes (GE
Healthcare) and applying 15000 × g
at 25 °C. The sample residue was
reconstituted in water and yielded
a final concentration of 5 mg/mL of
infliximab.
CE System: The CZE experiments
were performed on a PA 800plus
capillary electrophoresis system
(Beckman Coulter). Fused-silica
capillaries had a total length of
80 cm and 50 μm internal diameter
(i.d.) × 375 μm outside diameter
(o.d.) (Polymicro Technologies).
New capillaries were subsequently
rinsed with methanol (5 min), 1
M NaOH (30 min), and water (10
min) at 20 psi. After conditioning,
Polybrene-dextran sulfate-Polybrene
(PB-DS-PB) triple layer coating
was applied using the procedure
described elsewhere (19). Samples
were injected hydrodynamically at
1.5 psi for 5 s (~1% of the capillary
Inte
nsi
ty (
cnts
)
Time (min)
18 20
1
2
3
4
0.5
1.0
1.5
0.5
1.0
1.5
2.0
23400 23500 23600 23700 23800
Inte
nsi
ty (
x10
6cn
ts)
23433.8
23532.5
0.0
0.5
1.0
1.5
2.0
2.5
3.0
(a)
50825.4
0.5
1.0
1.5
2.0
2.5
Inte
nsi
ty (
x1
05
cnts
)
0.0
0.2
0.4
0.6
0.8
1.0
*^^
^ *** *
## *
*
* ** *
x 1
06
x 1
05
x 1
05
14 1612 22
Molecular Weight (Da)
(b)
(c)
0.050953.1
m/z 1302.9
m/z 1374.7
m/z 1378.1
50500 50600 50700 50800 50900 51000 51100 51200
Molecular Weight (Da)
*
*
Figure 2: CZE–MS of reduced infliximab. (a) EIEs for the m/z of the most intense ion observed for the LC (green), HC (black), and HCK (red) subunits; dashed lines indicate the position of the apices of the HC and HCK peaks. (b) Deconvoluted mass spectrum obtained for the peak at 18.0 min (LC). (c) Deconvoluted mass spectra obtained for the peaks at 19.0 min (HC; black) and 19.5 min (HCK; red); glycan structures of assigned HC glycoforms are indicated; symbols: •, mannose; Þ, galactose; , fucose; , N-acetylhexosamine; phosphate adducts are indicated with *; in the top spectrum HCK variants are indicated with #; in the bottom spectrum HC variants without C-terminal lysine are indicated with .̂
Time (min)
10 15 2010 110
40%
50%
30%
25%
20%
15%
10%
0
10
20
30A
bso
rban
ce (
mA
U)
Figure 1: CZE–UV of reduced infliximab using BGEs of increasing concentration of acetic acid in water (v/v).
Mass spectrometry (MS) has become a primary tool for the characterization of mAbs (4), yielding molecular weights of the main protein and variants, identifi cation of PTMs, and glycosylation patterns.
LC•GC Europe March 2019132
BIOPHARMACEUTICAL PERSPECTIVES
volume). A voltage of -30 kV was applied, and the
cartridge temperature was maintained at 25 °C. CZE–UV
measurements were conducted in a 60 cm capillary (50
cm to the detector) treated in the same way as described
earlier. The separation voltage was -25 kV and the
detection wavelength was 214 nm.
Mass Spectrometry: A micrOTOF QII
orthogonal-accelerated quadrupole time-of-flight (QTOF)
mass spectrometer (Bruker Daltonics) was used for
detection of mAb fragments. CZE–MS coupling was
achieved via a co-axial sheath-liquid interface (Agilent
Technologies). Sheath liquid consisting of 1:1 IPA and
water (v/v) was delivered by a 2.5 mL gas-tight syringe
(Hamilton) at a flow rate of 180 μL/h using a syringe
pump (KD Scientific Inc.). Electrospray ionization (ESI)
in positive mode was achieved applying a voltage of
-4.5 kV. Other settings were: nebulizer pressure, 0.4 bar;
dry gas flow rate, 4.0 L/min; dry gas temperature, 190 °C;
ion energy, 5 eV; collision energy, 10 eV; in-source
collision-induced dissociation, 0 eV. CZE–MS data were
analyzed using Bruker Daltonics Data Analysis software.
Molecular weight determinations of proteins were
performed using the “Charge Deconvolution” utility of the
software.
Results and DiscussionThe model compound infliximab is an immunoglobulin
G1 (IgG1) therapeutic antibody comprised of two
LCs (214 amino acids each) and two HCs (450 amino
acids each) interconnected by four disulfide bridges.
From the amino acid sequence of the LC and HC
(Figure S1, see supplementary material: http://www.
chromatographyonline.com/supplementary-information-
middle-characterization-monoclonal-antibody-infliximab-
capillary-zone-elec), the theoretical molecular weights and
isoelectric points of the protein subunits were derived.
CZE–MS Conditions: Reduction of protein disulfide bonds
using DTT represents a straightforward way to generate
LC (~25 kDa) and HC (~50 kDa) fragments of a mAb.
CZE-UV analysis of a reduced infliximab sample was used
for optimization of the separation conditions. A BGE of
0.5% (v/v) acetic acid (pH 3.0) was used as the starting
point, in which both the LC (pI 5.8) and HC (pI 8.2) are net
positively charged. In order to prevent protein adsorption
to the capillary inner wall, a positively charged PB-DS-PB
coating was applied, yielding an anodic electroosmotic
flow. This multilayer coating is fully MS-compatible and
can allow highly efficient protein CZE (19). Using 0.5%
acetic acid as BGE, a partial separation of the mAb
fragments was obtained; this was improved by increasing
the concentration of acetic acid. Analysis of the reduced
infliximab employing a BGE of 10% (v/v) acetic acid
resulted in two well-resolved, narrow, and symmetric peaks
(Figure 1). Further increase of the acetic acid concentration
provided an enhanced protein separation with the later
migrating peak resolving into two bands. A BGE of 40%
(v/v) acetic acid (pH 2.0) was selected for further CZE–MS
experiments. The addition of methanol, IPA, or ethylene
glycol up to 10% (v/v) led to longer protein migration times,
but did not improve the separation any further.
CZE–MS coupling was accomplished using a coaxial
sheath liquid sprayer and the reduced infliximab sample
Kromasil anniversary30 yearsof chromatography
Beyond expectations
30 years has gone since Kromasilwas first introduced to the marketand changed the performanceexpectations on preparative HPLCpacking materials.
Today, Kromasil is offering a full-range product line for analysis andproduction by UHPLC/HPLC and SFC,and stands ready to support yourfuture separations.
We are Nouryon
AkzoNobel Specialty Chemicals is nowNouryon, your partner in essentialchemistry for a sustainable future.
www.kromasil.com
www.chromatographyonline.com
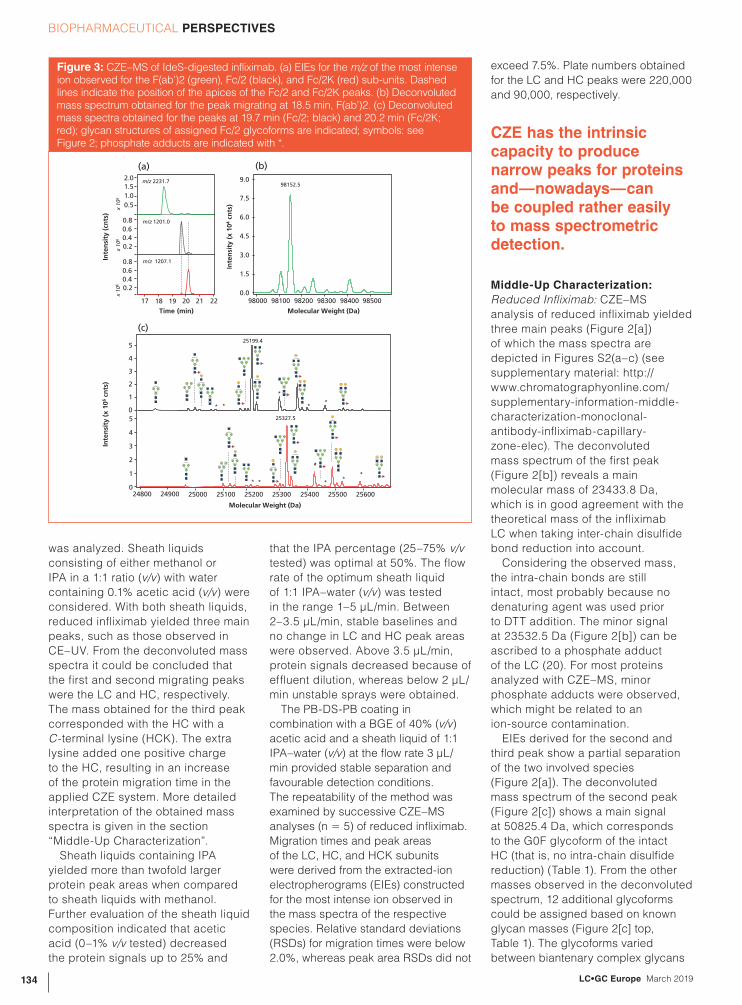
was analyzed. Sheath liquids
consisting of either methanol or
IPA in a 1:1 ratio (v/v) with water
containing 0.1% acetic acid (v/v) were
considered. With both sheath liquids,
reduced infliximab yielded three main
peaks, such as those observed in
CE–UV. From the deconvoluted mass
spectra it could be concluded that
the first and second migrating peaks
were the LC and HC, respectively.
The mass obtained for the third peak
corresponded with the HC with a
C-terminal lysine (HCK). The extra
lysine added one positive charge
to the HC, resulting in an increase
of the protein migration time in the
applied CZE system. More detailed
interpretation of the obtained mass
spectra is given in the section
“Middle-Up Characterization”.
Sheath liquids containing IPA
yielded more than twofold larger
protein peak areas when compared
to sheath liquids with methanol.
Further evaluation of the sheath liquid
composition indicated that acetic
acid (0–1% v/v tested) decreased
the protein signals up to 25% and
that the IPA percentage (25–75% v/v
tested) was optimal at 50%. The flow
rate of the optimum sheath liquid
of 1:1 IPA–water (v/v) was tested
in the range 1–5 μL/min. Between
2–3.5 μL/min, stable baselines and
no change in LC and HC peak areas
were observed. Above 3.5 μL/min,
protein signals decreased because of
effluent dilution, whereas below 2 μL/
min unstable sprays were obtained.
The PB-DS-PB coating in
combination with a BGE of 40% (v/v)
acetic acid and a sheath liquid of 1:1
IPA–water (v/v) at the flow rate 3 μL/
min provided stable separation and
favourable detection conditions.
The repeatability of the method was
examined by successive CZE–MS
analyses (n = 5) of reduced infliximab.
Migration times and peak areas
of the LC, HC, and HCK subunits
were derived from the extracted-ion
electropherograms (EIEs) constructed
for the most intense ion observed in
the mass spectra of the respective
species. Relative standard deviations
(RSDs) for migration times were below
2.0%, whereas peak area RSDs did not
exceed 7.5%. Plate numbers obtained
for the LC and HC peaks were 220,000
and 90,000, respectively.
Middle-Up Characterization:
Reduced Infliximab: CZE–MS
analysis of reduced infliximab yielded
three main peaks (Figure 2[a])
of which the mass spectra are
depicted in Figures S2(a–c) (see
supplementary material: http://
www.chromatographyonline.com/
supplementary-information-middle-
characterization-monoclonal-
antibody-infliximab-capillary-
zone-elec). The deconvoluted
mass spectrum of the first peak
(Figure 2[b]) reveals a main
molecular mass of 23433.8 Da,
which is in good agreement with the
theoretical mass of the infliximab
LC when taking inter-chain disulfide
bond reduction into account.
Considering the observed mass,
the intra-chain bonds are still
intact, most probably because no
denaturing agent was used prior
to DTT addition. The minor signal
at 23532.5 Da (Figure 2[b]) can be
ascribed to a phosphate adduct
of the LC (20). For most proteins
analyzed with CZE–MS, minor
phosphate adducts were observed,
which might be related to an
ion-source contamination.
EIEs derived for the second and
third peak show a partial separation
of the two involved species
(Figure 2[a]). The deconvoluted
mass spectrum of the second peak
(Figure 2[c]) shows a main signal
at 50825.4 Da, which corresponds
to the G0F glycoform of the intact
HC (that is, no intra-chain disulfide
reduction) (Table 1). From the other
masses observed in the deconvoluted
spectrum, 12 additional glycoforms
could be assigned based on known
glycan masses (Figure 2[c] top,
Table 1). The glycoforms varied
between biantenary complex glycans
Inte
nsi
ty (
cnts
)
Time (min)
20 21
0.5
1.0
1.5
2.0
0.2
0.4
0.6
0.8
Inte
nsi
ty (
x1
04
cnts
)
98152.5
0.0
1.5
3.0
4.5
6.0
7.5
9.0
(a)
25199.4
1
2
3
4
5
Inte
nsi
ty (
x1
06
cnts
)
0
1
2
3
4
5
*
**
*
*
*
*
*
* *
x 1
06
x 1
06
x 1
06
18 1917 22
Molecular Weight (Da)
(b)
(c)
025327.5
*
m/z 2231.7
m/z 1201.0
m/z 1207.1
0.2
0.4
0.6
0.8
98000 98100 98200 98300 98400 98500
*
25000 25100 25200 25300 25400 25500 256002490024800
Molecular Weight (Da)
Figure 3: CZE–MS of IdeS-digested infliximab. (a) EIEs for the m/z of the most intense ion observed for the F(ab’)2 (green), Fc/2 (black), and Fc/2K (red) sub-units. Dashed lines indicate the position of the apices of the Fc/2 and Fc/2K peaks. (b) Deconvoluted mass spectrum obtained for the peak migrating at 18.5 min, F(ab’)2. (c) Deconvoluted mass spectra obtained for the peaks at 19.7 min (Fc/2; black) and 20.2 min (Fc/2K; red); glycan structures of assigned Fc/2 glycoforms are indicated; symbols: see Figure 2; phosphate adducts are indicated with *.
CZE has the intrinsic capacity to produce narrow peaks for proteins and—nowadays—can be coupled rather easily to mass spectrometric detection.
LC•GC Europe March 2019134
BIOPHARMACEUTICAL PERSPECTIVES
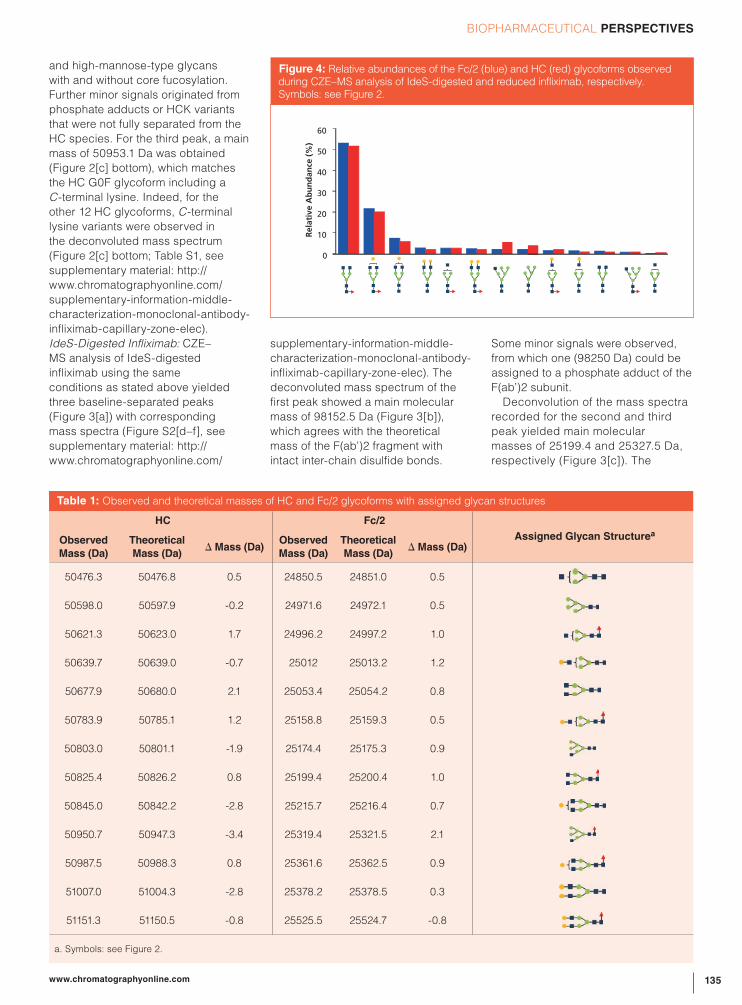
and high-mannose-type glycans
with and without core fucosylation.
Further minor signals originated from
phosphate adducts or HCK variants
that were not fully separated from the
HC species. For the third peak, a main
mass of 50953.1 Da was obtained
(Figure 2[c] bottom), which matches
the HC G0F glycoform including a
C-terminal lysine. Indeed, for the
other 12 HC glycoforms, C-terminal
lysine variants were observed in
the deconvoluted mass spectrum
(Figure 2[c] bottom; Table S1, see
supplementary material: http://
www.chromatographyonline.com/
supplementary-information-middle-
characterization-monoclonal-antibody-
infliximab-capillary-zone-elec).
IdeS-Digested Infliximab: CZE–
MS analysis of IdeS-digested
infliximab using the same
conditions as stated above yielded
three baseline-separated peaks
(Figure 3[a]) with corresponding
mass spectra (Figure S2[d–f], see
supplementary material: http://
www.chromatographyonline.com/
supplementary-information-middle-
characterization-monoclonal-antibody-
infliximab-capillary-zone-elec). The
deconvoluted mass spectrum of the
first peak showed a main molecular
mass of 98152.5 Da (Figure 3[b]),
which agrees with the theoretical
mass of the F(ab’)2 fragment with
intact inter-chain disulfide bonds.
Some minor signals were observed,
from which one (98250 Da) could be
assigned to a phosphate adduct of the
F(ab’)2 subunit.
Deconvolution of the mass spectra
recorded for the second and third
peak yielded main molecular
masses of 25199.4 and 25327.5 Da,
respectively (Figure 3[c]). The
0
10
20
30
40
50
60
Rela
tive A
bu
nd
an
ce (
%)
Figure 4: Relative abundances of the Fc/2 (blue) and HC (red) glycoforms observed during CZE–MS analysis of IdeS-digested and reduced infliximab, respectively. Symbols: see Figure 2.
Table 1: Observed and theoretical masses of HC and Fc/2 glycoforms with assigned glycan structures
HC Fc/2
Assigned Glycan StructureaObserved
Mass (Da)
Theoretical
Mass (Da)Δ Mass (Da)
Observed
Mass (Da)
Theoretical
Mass (Da)Δ Mass (Da)
50476.3 50476.8 0.5 24850.5 24851.0 0.5
50598.0 50597.9 -0.2 24971.6 24972.1 0.5
50621.3 50623.0 1.7 24996.2 24997.2 1.0
50639.7 50639.0 -0.7 25012 25013.2 1.2
50677.9 50680.0 2.1 25053.4 25054.2 0.8
50783.9 50785.1 1.2 25158.8 25159.3 0.5
50803.0 50801.1 -1.9 25174.4 25175.3 0.9
50825.4 50826.2 0.8 25199.4 25200.4 1.0
50845.0 50842.2 -2.8 25215.7 25216.4 0.7
50950.7 50947.3 -3.4 25319.4 25321.5 2.1
50987.5 50988.3 0.8 25361.6 25362.5 0.9
51007.0 51004.3 -2.8 25378.2 25378.5 0.3
51151.3 51150.5 -0.8 25525.5 25524.7 -0.8
a. Symbols: see Figure 2.
135www.chromatographyonline.com
BIOPHARMACEUTICAL PERSPECTIVES

second peak thus comprises the Fc/2
fragment of infliximab bearing the
G0F glycan structure. The main mass
of the third peak corresponds to the
Fc/2 G0F glycoform with a C-terminal
lysine (Fc/2K). Based on the
observed masses, in addition to the
main glycoform, 12 other glycoforms
could be assigned for both the
native Fc/2 fragment (Table 1) and
the Fc/2 lysine variants (Table S1,
see supplementary material: http://
www.chromatographyonline.com/
supplementary-information-middle-
characterization-monoclonal-
antibody-infliximab-capillary-zone-
elec). The assigned glycoforms nicely
matched those observed for reduced
infliximab. The Fc/2 and Fc/2K
subunits were baseline separated, so
no Fc/2K signals were observed in
the Fc/2 spectrum and vice versa.
Considerations and Comparisons:
Good mass resolution is required
to resolve comigrating compounds.
TOF-MS provided a mass resolution
of 12,000, allowing differentiation
of mass differences of about 2.1 Da
and 4.2 Da among proteins of 25
and 50 kDa, respectively. This
resolving power is quite sufficient for
distinguishing different glycoforms
of HC or Fc subunits. However,
minor mass modifications, such
as the reduction of one disulfide
bridge (Δ = 2 Da) or deamidation
(Δ = 1 Da), cannot be resolved.
These result in broadening of the
MS signal and may contribute to the
uncertainty of the measured mass.
In the present study, observed mass
deviations from theoretical values
did not exceed 2.1 and 3.4 Da for the
Fc/2 and HC fragments, respectively.
This means that the observed
molecular masses can be reliably
assigned to the indicated glycoforms.
Indeed, the assigned structures
are in accordance with glycans
typically found for IgG1 antibodies.
The majority of the glycoforms were
previously indicated for infliximab
applying either bottom-up (21),
released glycan (22), or middle-up
(23) approaches.
From the deconvoluted mass
spectra of the HC and Fc/2,
relative intensities for the assigned
glycoforms can be derived assuming
an equimolar response per glycoform
(Figure 4). The main glycoform
(G0F) represents more than 50%
of the total signal, whereas the low
abundant species are around 0.5%.
This illustrates the excellent dynamic
range of the developed method.
When comparing the glycosylation
profiles obtained for the HC and
Fc/2 subunits, only minor differences
were observed in relative intensities
for the glycoforms, confirming that
the responses reflect glycoform
composition.
In comparison with the middle-up
approach employing reduction,
IdeS digestion exhibited increased
MS signal intensity and better CZE
separation of the subunits. The
smaller size of the Fc/2 fragments
relative to the HC fragments yield
more efficient ionization and narrower
charge state distributions, providing
higher sensitivity and better resolved
mass spectra. From the CZE point
of view, differences caused by
modifications are relatively larger
for Fc/2 fragments and therefore
induce more efficient separations.
The Fc/2 and Fc/2K fragments
were baseline separated by CZE,
whereas this was not the case
for the HC and HCK fragments.
Moreover, no glycoform separation
was obtained for the HC fragments,
whereas partial separation of Fc/2
glycoforms was observed (Figure S3,
see supplementary material: http://
www.chromatographyonline.com/
supplementary-information-middle-
characterization-monoclonal-
antibody-infliximab-capillary-zone-
elec). As the glycans are neutral,
the differences in electrophoretic
mobility of the Fc/2 glycoforms can be
ascribed to size differences. Similar
observations were made in previous
CZE studies of intact glycoproteins
(18,24).
ConclusionsCZE–MS employing a positively
charged, noncovalent coated capillary
and a sheath-liquid interface has been
evaluated for the middle-up analysis
of the antibody infliximab. The
developed method allowed for fast
screening of antibody heterogeneity,
exploiting the combined resolution
of CZE and TOF-MS for reliable
assignment of C-terminal lysine
variants and glycoforms. Independent
of the middle-up approach chosen
(that is, reduction or IdeS digestion),
separation of the subunits was
obtained under the same conditions.
Moreover, highly similar glycoprofiles
were obtained in both cases. Overall,
this work clearly highlights the
potential of the developed CZE–MS
method for the assessment of mAb
microheterogeneity.
AcknowledgementFinancial support from the European
Social Fund and the State Budget
of the Czech Republic, Project no.
CZ.1.07/2.3.00/30.0061, is gratefully
acknowledged.
References(1) X. Wang, Z. An, W. Luo, N. Xia, and Q.
Zhao, Protein Cell 9, 74–85 (2018).
(2) F. Cymer, H. Beck, A. Rohde, and D.
Reusch, Biologicals 52, 1–11 (2018).
(3) S. Fekete, A.L. Gassner, S. Rudaz, J.
Schappler, and D. Guillarme, Trends in
Analytical Chemistry 42, 74–83 (2013).
(4) H. Zhang, W. Cui, and M.L. Gross, FEBS
Letters 588, 308–317 (2014).
(5) A. Beck, F. Debaene, H. Diemer, E.
Wagner-Rousset, O. Colas, A. van
Dorsselaer, and S. Cianférani, Journal of
Mass Spectrometry 50, 285–297 (2015).
(6) E. Wagner-Rousset, M.C. Janin-Bussat,
O. Colas, M. Excoffier, D. Ayoub, J.F.
Haeuw, I. Rilatt, M. Perez, N. Corvaia, and
A. Beck, Mabs 6, 173–184 (2014).
(7) H. Lau, D. Pace, B.X. Yan, T. McGrath,
S. Smallwood, K. Patel, J. Park, S.S.
Park, and R.F. Latypov, Journal of
Chromatography B 878, 868–876 (2010).
(8) J. Zhang, H.B. Liu, and V. Katta, Journal
of Mass Spectrometry 45, 112–120 (2010).
(9) E. Wagner-Rousset, A. Bednarczyk,
M.C. Bussat, O. Colas, N. Corvaia, C.
Schaeffer, A. Van Dorsselaer, and A.
Beck, Journal of Chromatography B 872,
23–37 (2008).
(10) A.L. Capriotti, C. Cavaliere, P. Foglia,
R. Samperi, and A. Laganà, Journal of
Chromatography A 1218, 8760–8776
(2011).
(11) M. Tassi, J. De Vos, S. Chatterjee, F.
Sobott, J. Bones, and S. Eeltink, Journal
of Separation Science 41, 125–144 (2018).
(12) B. Bobály, V. D’Atri, M. Lauber, A. Beck,
D. Guillarme, and S. Fekete, Journal of
Chromatography B 1096, 1–10 (2018).
(13) E. Domínguez-Vega, S. Tengattini, C.
Peintner, J. van Angeren, C. Temporini,
R. Haselberg, G. Massolini, and G.W.
Somsen, Talanta 184, 375–381 (2018).
(14) R. Haselberg, G.J. de Jong, and G.W.
Somsen, Journal of Chromatography A
1159, 81–109 (2007).
(15) M. Han, B.M. Rock, J.T. Pearson, and
D.A. Rock, Journal of Chromatography B
1011, 24–32 (2016).
(16) A.M. Belov, L. Zang, R. Sebastiano, M.R.
Santos, D.R. Bush, B.L. Karger, and A.R.
Ivanov, Electrophoresis 39, 2069–2082
(2018).
(17) K. Jooß, J. Hühner, S. Kiessig, B.
Moritz, and C. Neusüß, Analytical and
Bioanalytical Chemistry 409, 6057–6067
(2017).
(18) R. Haselberg, Th. De Vijlder, R. Heukers,
M.J. Smit, E.P. Romijn, G.W. Somsen, and
E. Dominguez-Vega, Analytica Chimica
Acta 1044, 181–190 (2018).
LC•GC Europe March 2019136
BIOPHARMACEUTICAL PERSPECTIVES

(19) R. Haselberg, G.J. de Jong, and G.W.
Somsen, Analytica Chimica Acta 678,
128–134 (2010).
(20) S.K. Chowdhury, V. Katta, R. Beavis,
and B.T. Chait, Journal of the American
Society for Mass Spectrometry 1,
382–388 (1990).
(21) J. Stadlmann, M. Pabst, D. Kolarich, R.
Kunert, and F. Altmann, Proteomics 8,
2858–2871 (2008).
(22) C. Lee, M. Jeong, J.J. Lee, S. Seo, S.C.
Cho, W. Zhang, and O. Jaquez, mAbs 9,
968–977 (2017).
(23) M. Tsuda, Y. Otani, A. Yonezawa, S.
Masui, Y. Ikemi, M. Denda, Y. Sato,
S. Nakagawa, T. Omura, S. Imai,
T. Nakagawa, M. Hayakari, and K.
Matsubara, Biological and Pharmaceutical
Bulletin 41, 1716–1721 (2018).
(24) R. Haselberg, G.J. de Jong, and G.W.
Somsen, Analytical Chemistry 85,
2289–2296 (2013).
Klára Michalíková works at the
Laboratory of Environmental
Biotechnology of the Academy of
Sciences, Czech Republic, focusing
on emerging organic pollutants
decomposition in the environment
using microorganisms. Prior to this,
she gained extensive knowledge in the
field of capillary electrophoresis and its
hyphenation with mass spectrometry
while obtaining her Ph.D. at the Faculty
of Pharmacy of Charles University,
Czech Republic.
Elena Dominguez Vega received
her Ph.D. degree at the University of
Alcala, Spain. Afterwards, she joined
the group of Professor G.W. Somsen
(Vrije Universiteit Amsterdam) where
she worked on the development of new
electrophoretic technologies to study
protein heterogeneity, conformation, and
affinity. Subsequently, she joined the
Center for Proteomic and Metabolomics
(Leiden University Medical Center)
as senior researcher with a focus
on MS-based methodologies to
characterize intact proteins of
pharmaceutical and biomedical interest.
Govert W. Somsen is a full professor
of biomolecular analysis and analytical
chemistry at the Vrije Universiteit
Amsterdam, Netherlands. His
current research interests include the
compositional and conformational
characterization of intact
biomacromolecules, and the bioactivity
screening of compounds in complex
samples. His group have built up an
internationally recognized expertise
in the hyphenation of separation
techniques with mass spectrometry
and optical spectroscopy for the
analysis of intact proteins.
Rob Haselberg is an assistant
professor at the Vrije Universiteit
Amsterdam where he focuses
on the characterization of intact
(bio)macromolecules, such as
biopharmaceuticals and industrial
polymers. For this, he develops and
applies novel analytical approaches
based on liquid chromatography,
capillary electrophoresis, mass
spectrometry, and optical detection.
Koen Sandra is the editor of
“Biopharmaceutical Perspectives”. He
is the Scientific Director at the Research
Institute for Chromatography (RIC,
Kortrijk, Belgium) and R&D Director at
anaRIC biologics (Ghent, Belgium). He
is also a member of LCGC Europe’s
editorial advisory board. Direct
correspondence about this column to
the editor-in-chief, Alasdair Matheson,
137www.chromatographyonline.com
BIOPHARMACEUTICAL PERSPECTIVES
The life science business of Merck operates as MilliporeSigma in the U.S. and Canada.
Merck, the vibrant M, Sigma-Aldrich, Sigma, Millipore, Ascentis, Astec, Cerilliant, Carbosieve, Certipur, Supelco and TraceCERT are trademarks of Merck KGaA, Darmstadt, Germany or its DI¿OLDWHV��$OO�RWKHU�WUDGHPDUNV�DUH�WKH�SURSHUW\�RI�WKHLU�UHVSHFWLYH�RZQHUV��'HWDLOHG�LQIRUPDWLRQ�RQ�WUDGHPDUNV�LV�DYDLODEOH�YLD�SXEOLFO\�DFFHVVLEOH�UHVRXUFHV�
�������0HUFN�.*D$��'DUPVWDGW��*HUPDQ\�DQG�RU�LWV�DI¿OLDWHV��$OO�5LJKWV�5HVHUYHG�
/LW��1R��0.B$'����(1�����������
IMAGINE THE NEXT 350 YEARS
Supelco®�DQDO\WLFDO�SURGXFWV�IURP�0HUFN��$FFXUDWH��3UHFLVH��&RQVLVWHQW��
:H�NQRZ�RQO\�WKH�PRVW�DFFXUDWH�DQDO\WLFDO�SURGXFWV�ZLOO�GR��7KDW¶V�ZK\�0HUFN�RIIHUV�WKH�6XSHOFR®
SRUWIROLR�RI�DQDO\WLFDO�SURGXFWV��:KDWHYHU�\RXU�QHHGV��RXU�SRUWIROLR�LV�DOZD\V�¿W�IRU�SXUSRVH��
HQVXULQJ�\RXU�UHVXOWV�DUH�DFFXUDWH��SUHFLVH�DQG�UHSURGXFLEOH��DQG�\RXU�V\VWHPV�IXOO\�FHUWL¿HG�
Our comprehensive portfolio, developed by analytical chemists for analytical chemists, covers a
broad range of analytical solutions, and every product is meticulously quality-controlled to maintain
WKH�LQWHJULW\�RI�\RXU�WHVWLQJ�SURWRFROV��$QG�ZLWK�6XSHOFR® scientists dedicated to your analytical
DSSOLFDWLRQV��WKH�H[SHUWLVH�\RX�QHHG�LV�DOZD\V�RQ�KDQG�
SigmaAldrich.com/Supelco
Merck beginning
ZLWK�D�SKDUPDF\
in Darmstadt,
Germany
16681850
1951
1975
1966
19351827
Establishment of
partnership EMD
Aldrich Chemical
&RPSDQ\�)RXQGHG
Merger to form
Sigma-Aldrich
Corporation
Supelco
)RXQGHG
Sigma Chemical
&RPSDQ\�)RXQGHGTransformation
into a research-based
company
1993
Supelco Acquired
by Sigma-Aldrich
1995Establishment of
Merck KGaA and
public listing
Footprint of Supelco
��������(QWHUV�*&�EXVLQHVV�ZLWK�DGVRUEHQWV�DQG�SDFNHG�*&�FROXPQV
������(QWHUV�FDUERQ�DGVRUEHQW�EXVLQHVV�ZLWK�&DUERVLHYH®
��������(QWHUV�+3/&�ZLWK�683(/&26,/��OLQH�RI�VWDEOH����P�VSKHULFDO�SDUWLFOHV�ZLWK�WUXH�PRQROD\HU�
bonding
��������(QWHUV�WKH�DLU�VDPSOLQJ�PDUNHW�E\�LQWURGXFLQJ�D�OLQH�RI�VROYHQW�GHVRUSWLRQ�WXEHV�IRU�
LQGXVWULDO�K\JLHQLVWV�WR�KHOS�SURWHFW�ZRUNHUV�IURP�EHLQJ�H[SRVHG�WR�WR[LF�FKHPLFDOV
�������(QWHUV�VDPSOH�SUHSDUDWLRQ�EXVLQHVV�ZLWK�6XSHOFOHDQ��63(�WXEHV
������/DXQFKHV�630(�¿EHUV
������,62������±�4XDOLW\�0DQDJHPHQW�6\VWHP
�������6LJPD�$OGULFK�DFTXLUHV�$VWHF®��OHDGHU�LQ�FKLUDO�FKURPDWRJUDSK\
��������)LUVW�WR�PDUNHW�JOREDOO\�)XVHG�&RUH®�SDUWLFOHV�MRLQWO\�ZLWK�$GYDQFHG�0DWHULDOV�7HFKQRORJ\��
introduced Ascentis® Express
�������6XSHOFR® expanded to include all analytical products from Merck KGaA for a comprehensive
range of analytical techniques
Founders of SupelcoDr. Walter Supina
%RUQ�LQ�+DUWIRUG��&RQQHFWLFXW��:DOW�
obtained his doctorate in chemical
HQJLQHHULQJ�LQ�����
Mr. Nicholas Pelick
%RUQ�LQ�6FUDQWRQ��3HQQV\OYDQLD��
1LFN�REWDLQHG�KLV�PDVWHU¶V�GHJUHH�
LQ�ELRFKHPLVWU\�LQ�����
2015
2010
Acquisition
of Millipore
Acquisition of
Sigma-Aldrich
Reference materials
for accurate results
Chemical Standards and
&HUWL¿HG�5HIHUHQFH�0DWHULDOV
Cerilliant®, Certipur®, TraceCERT®
$QDO\VLV�ZLWK�mobility
and ease-of-use
Comprehensive
analytical portfolio
6DPSOH�3UHSDUDWLRQ�
Chromatography,
Titration,
Spectroscopy,
3KRWRPHWU\
Analytical test kits
and test strips
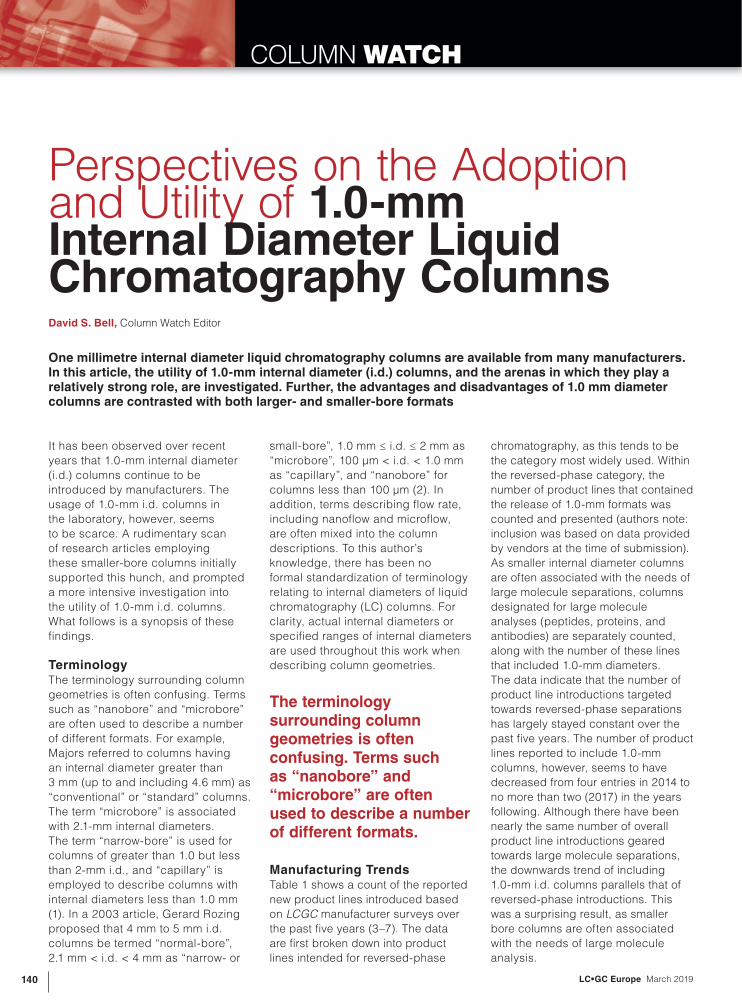
LC•GC Europe March 2019140
COLUMN WATCH
It has been observed over recent
years that 1.0-mm internal diameter
(i.d.) columns continue to be
introduced by manufacturers. The
usage of 1.0-mm i.d. columns in
the laboratory, however, seems
to be scarce. A rudimentary scan
of research articles employing
these smaller-bore columns initially
supported this hunch, and prompted
a more intensive investigation into
the utility of 1.0-mm i.d. columns.
What follows is a synopsis of these
findings.
TerminologyThe terminology surrounding column
geometries is often confusing. Terms
such as “nanobore” and “microbore”
are often used to describe a number
of different formats. For example,
Majors referred to columns having
an internal diameter greater than
3 mm (up to and including 4.6 mm) as
“conventional” or “standard” columns.
The term “microbore” is associated
with 2.1-mm internal diameters.
The term “narrow-bore” is used for
columns of greater than 1.0 but less
than 2-mm i.d., and “capillary” is
employed to describe columns with
internal diameters less than 1.0 mm
(1). In a 2003 article, Gerard Rozing
proposed that 4 mm to 5 mm i.d.
columns be termed “normal-bore”,
2.1 mm < i.d. < 4 mm as “narrow- or
small-bore”, 1.0 mm ≤ i.d. ≤ 2 mm as
“microbore”, 100 μm < i.d. < 1.0 mm
as “capillary”, and “nanobore” for
columns less than 100 μm (2). In
addition, terms describing flow rate,
including nanoflow and microflow,
are often mixed into the column
descriptions. To this author’s
knowledge, there has been no
formal standardization of terminology
relating to internal diameters of liquid
chromatography (LC) columns. For
clarity, actual internal diameters or
specified ranges of internal diameters
are used throughout this work when
describing column geometries.
Manufacturing TrendsTable 1 shows a count of the reported
new product lines introduced based
on LCGC manufacturer surveys over
the past five years (3–7). The data
are first broken down into product
lines intended for reversed-phase
chromatography, as this tends to be
the category most widely used. Within
the reversed-phase category, the
number of product lines that contained
the release of 1.0-mm formats was
counted and presented (authors note:
inclusion was based on data provided
by vendors at the time of submission).
As smaller internal diameter columns
are often associated with the needs of
large molecule separations, columns
designated for large molecule
analyses (peptides, proteins, and
antibodies) are separately counted,
along with the number of these lines
that included 1.0-mm diameters.
The data indicate that the number of
product line introductions targeted
towards reversed-phase separations
has largely stayed constant over the
past five years. The number of product
lines reported to include 1.0-mm
columns, however, seems to have
decreased from four entries in 2014 to
no more than two (2017) in the years
following. Although there have been
nearly the same number of overall
product line introductions geared
towards large molecule separations,
the downwards trend of including
1.0-mm i.d. columns parallels that of
reversed-phase introductions. This
was a surprising result, as smaller
bore columns are often associated
with the needs of large molecule
analysis.
Perspectives on the Adoption and Utility of 1.0-mm Internal Diameter Liquid Chromatography ColumnsDavid S. Bell, Column Watch Editor
One millimetre internal diameter liquid chromatography columns are available from many manufacturers. In this article, the utility of 1.0-mm internal diameter (i.d.) columns, and the arenas in which they play a relatively strong role, are investigated. Further, the advantages and disadvantages of 1.0 mm diameter columns are contrasted with both larger- and smaller-bore formats
The terminology surrounding column geometries is often confusing. Terms such as “nanobore” and “microbore” are often used to describe a number of different formats.
141www.chromatographyonline.com
COLUMN WATCH
Reviewing one major column
supplier website, 94 column
products (including guard systems)
out of 547 (17%) were described
as having 1.0 mm diameters. The
data suggest that column vendors
are paying less attention to 1.0-mm
i.d. column formats, but still retain a
considerable portfolio of 1.0-mm i.d.
options.
User TrendsIn the last high performance
liquid chromatography (HPLC)
column survey published by
Ron Majors in 2012, column
dimensions below 2.1-mm i.d.
were not reported in the top five
employed column formats (1).
An increase in the popularity of
2.1-mm and 3.0-mm columns
from previous surveys (8,9)
was speculated as being due
to the increase in use of mass
spectrometric (MS) detection
in conjunction with liquid
chromatography (LC).
The data presented in Table 2
is based on surveys of end-user
purchasing habits conducted in
2007, 2009, and 2012. The values
noted are weighted averages
attempting to estimate the number
of columns used per year, per
instrument. In a relative sense,
columns based on 3 mm and
larger internal diameters have
historically dominated usage
(and continue to do so). As
noted above, there has been a
significant rise in the use of 2.1-
mm i.d. columns, largely due to
adoption of LC–MS platforms.
Smaller diameters of greater than
or equal to 1.0 mm and less than
2 mm (typically 1.0 mm and herein
noted as such for simplicity)
have risen as well. Lastly, smaller
diameters than 1.0 mm appeared
to rise between 2007 and 2009,
but levelled out according to
the 2012 results. In this treatment,
the lower column usage for the
smaller two diameter classes can
be attributed to the smaller number
of available instruments suitable for
their operation (1).
In an attempt to further understand
the general trends on 1.0-mm
i.d. column usage from the user
perspective, several literature
searches were attempted. The lack
of common terminology, however,
made this task extremely difficult.
It suffices to report that finding
either fundamental or applied
papers specifically using 1.0-mm
i.d. columns proved onerous. The
user results seem to indicate that,
although the 1.0-mm column formats
are available from a number of
manufacturers, the format is not well
adopted.
Why Go Narrow?The desire for narrower columns
stems from several areas of interest.
Smaller column volumes result in less
solvent consumption, and therefore
Smaller column volumes result in less solvent consumption, and therefore may reduce cost and provide for an overall greener separation technology.
BioLC Innovations......with Incredible Reproducibility!
Discover more at www.ymc.de
• SEC for high resolved MAbs
• HIC with exceptional effi ciency
• RP-C4-Widepore with superior stability
• IEX for high recovery
Proteins AntibodiesOligonucleotidesPeptides
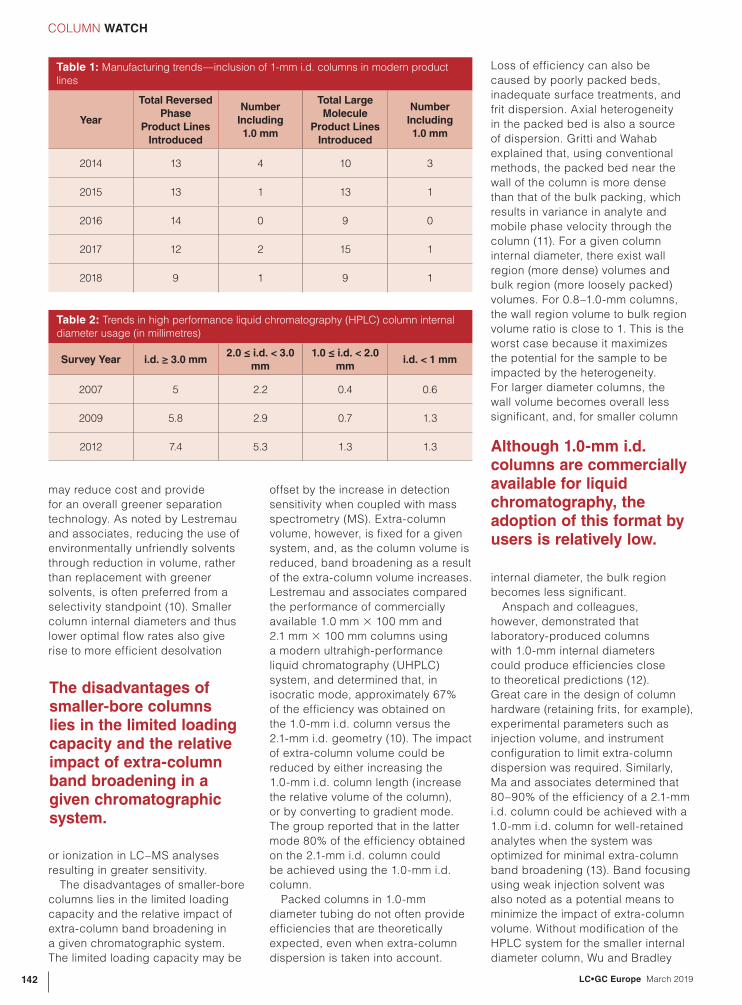
LC•GC Europe March 2019142
COLUMN WATCH
Loss of efficiency can also be
caused by poorly packed beds,
inadequate surface treatments, and
frit dispersion. Axial heterogeneity
in the packed bed is also a source
of dispersion. Gritti and Wahab
explained that, using conventional
methods, the packed bed near the
wall of the column is more dense
than that of the bulk packing, which
results in variance in analyte and
mobile phase velocity through the
column (11). For a given column
internal diameter, there exist wall
region (more dense) volumes and
bulk region (more loosely packed)
volumes. For 0.8–1.0-mm columns,
the wall region volume to bulk region
volume ratio is close to 1. This is the
worst case because it maximizes
the potential for the sample to be
impacted by the heterogeneity.
For larger diameter columns, the
wall volume becomes overall less
significant, and, for smaller column
internal diameter, the bulk region
becomes less significant.
Anspach and colleagues,
however, demonstrated that
laboratory-produced columns
with 1.0-mm internal diameters
could produce efficiencies close
to theoretical predictions (12).
Great care in the design of column
hardware (retaining frits, for example),
experimental parameters such as
injection volume, and instrument
configuration to limit extra-column
dispersion was required. Similarly,
Ma and associates determined that
80–90% of the efficiency of a 2.1-mm
i.d. column could be achieved with a
1.0-mm i.d. column for well-retained
analytes when the system was
optimized for minimal extra-column
band broadening (13). Band focusing
using weak injection solvent was
also noted as a potential means to
minimize the impact of extra-column
volume. Without modification of the
HPLC system for the smaller internal
diameter column, Wu and Bradley
may reduce cost and provide
for an overall greener separation
technology. As noted by Lestremau
and associates, reducing the use of
environmentally unfriendly solvents
through reduction in volume, rather
than replacement with greener
solvents, is often preferred from a
selectivity standpoint (10). Smaller
column internal diameters and thus
lower optimal flow rates also give
rise to more efficient desolvation
or ionization in LC–MS analyses
resulting in greater sensitivity.
The disadvantages of smaller-bore
columns lies in the limited loading
capacity and the relative impact of
extra-column band broadening in
a given chromatographic system.
The limited loading capacity may be
offset by the increase in detection
sensitivity when coupled with mass
spectrometry (MS). Extra-column
volume, however, is fixed for a given
system, and, as the column volume is
reduced, band broadening as a result
of the extra-column volume increases.
Lestremau and associates compared
the performance of commercially
available 1.0 mm × 100 mm and
2.1 mm × 100 mm columns using
a modern ultrahigh-performance
liquid chromatography (UHPLC)
system, and determined that, in
isocratic mode, approximately 67%
of the efficiency was obtained on
the 1.0-mm i.d. column versus the
2.1-mm i.d. geometry (10). The impact
of extra-column volume could be
reduced by either increasing the
1.0-mm i.d. column length (increase
the relative volume of the column),
or by converting to gradient mode.
The group reported that in the latter
mode 80% of the efficiency obtained
on the 2.1-mm i.d. column could
be achieved using the 1.0-mm i.d.
column.
Packed columns in 1.0-mm
diameter tubing do not often provide
efficiencies that are theoretically
expected, even when extra-column
dispersion is taken into account.
Table 1: Manufacturing trends—inclusion of 1-mm i.d. columns in modern product
lines
Year
Total Reversed
Phase
Product Lines
Introduced
Number
Including
1.0 mm
Total Large
Molecule
Product Lines
Introduced
Number
Including
1.0 mm
2014 13 4 10 3
2015 13 1 13 1
2016 14 0 9 0
2017 12 2 15 1
2018 9 1 9 1
Table 2: Trends in high performance liquid chromatography (HPLC) column internal
diameter usage (in millimetres)
Survey Year i.d. ≥ 3.0 mm2.0 ≤ i.d. < 3.0
mm
1.0 ≤ i.d. < 2.0
mmi.d. < 1 mm
2007 5 2.2 0.4 0.6
2009 5.8 2.9 0.7 1.3
2012 7.4 5.3 1.3 1.3
The disadvantages of smaller-bore columns lies in the limited loading capacity and the relative impact of extra-column band broadening in a given chromatographic system.
Although 1.0-mm i.d. columns are commercially available for liquid chromatography, the adoption of this format by users is relatively low.

www.chromatographyonline.com
COLUMN WATCH
143
reported a 73% loss of efficiency on a
1.0-mm i.d. column for a well retained
analyte when compared to a 4.6-mm
i.d. column of the same length (14).
Who Uses 1.0-mm i.d. Columns?As noted above, finding research
where 1.0 mm i.d. columns were
specifically utilized was difficult.
For example, in a review of
micro-UHPLC as applied to residue
and contaminant analysis, Blokland
and colleagues made no mention
of column internal diameters in the
region of 1.0 mm, yet described
much research using 2.1 mm and
sub-1.0-mm i.d. columns (15). With
the preconception that 1.0-mm i.d.
columns would be most popular in
large molecule analyses, the many
articles pored over were again found
to be either based on 2.1-mm or
sub-1.0-mm i.d. columns.
Olkowiscz and associates compared
method performance using a 1.0-mm
i.d. column (termed “LC microflow”)
versus “direct”, and a “preconcentration”
system utilizing 75-μm columns for the
quantitation of cardiac troponin T in
mouse heart (16). The group determined
that the preconcentration method
utilizing the 75-μm column provided a
significant gain in sensitivity without loss
of accuracy and precision as compared
to the 1.0-mm i.d. column setup.
One successful usage of 1.0-mm
i.d. columns discovered was
for the analysis of monoamine
neurotransmitters in microdialysis
samples (17). As expected, the group
demonstrated a significant increase
sensitivity using the 1.0-mm i.d.
column as compared to a 2.1-mm
i.d. column. Careful attention to
band broadening as a result of
extra-column volume was noted. In
addition, the group reported the
use of a weak sample injection
solvent to aid in focusing the sample
at the head of the column. In this
case, the 1.0-mm i.d. format fit the
needed sample size, sensitivity
requirements, and speed of analysis
desired.
ConclusionsAlthough 1.0-mm i.d. columns are
commercially available for liquid
chromatography, the adoption of this
format by users is relatively
low. The increase in sensitivity
afforded by the reduction in column
volume from the more popular
2.1 mm to 1.0 mm is confounded
by decreases in efficiency and
loadability. The effort needed to
reduce extra-column volumes or
compensate for instrument band
broadening to focus analytes at
the head of columns appears to
be a strong barrier. In addition, the
packing quality of commercially
available 1.0-mm i.d. columns may
be suspect due to the challenges
of wall effects. The apparent
popularity of sub-1.0-mm i.d.
columns suggests that users
are more apt to move straight to
“capillary” formats rather than deal
with 1.0-mm nuances. In some
cases, however, the 1.0-mm
i.d. format can provide the right
combination of sensitivity and
speed.
References(1) R.E. Majors, LCGC Europe 25(1), 31–39
(2012).
(2) G. Rozing, LCGC Europe 6(6A), 1–7
(2003).
(3) R.E. Majors, LCGC Europe 27(4),
195–207 (2014).
(4) M. Swartz and R.E. Majors,
LCGC Europe 28(4), 232–243 (2015).
(5) D.S. Bell, LCGC Europe 29(4), 214–224
(2016).
(6) D.S. Bell, LCGC Europe 31(4), 234–247
(2018).
(7) D.S. Bell, LCGC Europe 30(4), 196–207
(2017).
(8) R.E. Majors, LCGC North Am. 27(11),
956–972 (2009).
(9) R.E. Majors, LCGC North Am. 25(6),
532–544 (2007).
(10) F. Lestremau, D. Wu, and R. Szücs, J.
Chromatogr. A 1217(30), 4925–4933
(2010).
(11) F. Gritti and M. Farooq Wahab,
LCGC Europe 31(2), 90–101
(2018).
(12) J.A. Anspach, T.D. Maloney, and L.A.
Colón, J. Sep. Sci. 30(8), 1207–1213
(2007).
(13) Y. Ma, A.W. Chassy, S. Miyazaki,
M. Motokawa, K. Morisato, H. Uzu,
M. Ohira, M. Furuno, K. Nakanishi, H.
Minakuchi, K. Mriziq, T. Farkas,
O. Fiehn, and N. Tanaka, J.
Chromatogr. A 1383, 47–57
(2015).
(14) N. Wu and A.C. Bradley, J. Chromatogr.
A 1261, 113–120 (2012).
(15) M.H. Blokland, H.G. Mol, and A.
Gerssen, LCGC Europe 27(s9), 13–18
(2014).
(16) M. Olkowicz, I. Rybakowska, S.
Chlopicki, and R.T. Smolenski,
Talanta, 131, 510–520 (2015).
(17) J. Van Schoors, K. Maes, Y. Van
Wanseele, K. Broeckhoven, and A.
Van Eeckhaut, J. Chromatogr. A
1427, 69–78 (2016).
David S. Bell is a director of
Research and Development
at Restek. He also serves on
the Editorial Advisory Board
for LCGC and is the Editor for
“Column Watch”. Over the past
20 years, he has worked directly
in the chromatography industry,
focusing his efforts on the design,
development, and application of
chromatographic stationary phases
to advance gas chromatography,
liquid chromatography, and
related hyphenated techniques.
His undergraduate studies in
chemistry were completed at the
State University of New York at
Plattsburgh (SUNY Plattsburgh),
USA. He received his Ph.D. in
analytical chemistry from The
Pennsylvania State University, USA,
and spent the first decade of his
career in the pharmaceutical industry
performing analytical method
development and validation using
various forms of chromatography and
electrophoresis. His main objectives
have been to create and promote
novel separation technologies and
to conduct research on molecular
interactions that contribute to
retention and selectivity in an array
of chromatographic processes.
His research results have been
presented in symposia worldwide,
and have resulted in numerous
peer-reviewed journal and
trade magazine articles. Direct
correspondence to: LCGCedit@ubm.
com
The increase in sensitivity afforded by the reduction in column volume from the more popular 2.1 mm to 1.0 mm is confounded by decreases in efficiency and loadability.
The apparent popularity of sub-1.0-mm i.d. columns suggests that users are more apt to move straight to “capillary” formats rather than deal with 1.0-mm nuances.
LC•GC Europe March 2019144
SAMPLE PREPARATION
PERSPECTIVES
The evolution of chemical extractions using sorptive phases follows an interesting history.
The evolution of chemical extractions
using sorptive phases follows an
interesting history. It likely started
with the column chromatography
cleanup procedures that we all
performed in our sophomore organic
chemistry classes and that are
widely used in the organic discipline.
This evolution eventually led to
solid-phase extraction (SPE), which
was developed and popularized
beginning in the 1970s. But the big
breakthrough was the advent of
solid-phase microextraction (SPME).
Perhaps what is most notable is
that as SPME gained acceptance,
a plethora of techniques sprouted
where the researchers seemingly
attempted to place a stationary phase
on any surface that could potentially
be exposed to a sample—inside
needles and capillaries, on vial
surfaces and lids, on stir bars, and
so on. Since the patent protection
on SPME was lifted, several new
advances have been noted. In this
instalment, we provide an overview of
some of these major advances related
to the traditional practice of SPME.
ApplicationsA series of three critical reviews
explored the application of SPME
in environmental (1), food (2), and
clinical (3) analysis. Environmental
samples like soils, sediments,
and wastewater were discussed
and thin-film and cold-fibre SPME
approaches were emphasized (1).
In vivo SPME of living animals and
plants was reviewed for environmental
and ecological studies (4). Particular
interest on quantification methods is
noted. A discussion of SPME used
for food analysis includes emphasis
of new phases, calibration studies,
and discusses the determination
of contaminants and food quality
(2). Another review of food
applications of SPME looked at
volatile, semivolatile, and nonvolatile
components from a diverse set of
food samples (5). Fibres overcoated
with polydimethylsiloxane (PDMS)
did not show the matrix interferences
common in food analysis using direct
immersion SPME (6). We will not
discuss the bioanalytical and clinical
analysis review (3) in this instalment
of “Sample Preparation Perspectives”
because it will be the topic of part 2 in
this series.
Commercial AdvancesOnly recently have multiple SPME
fibres been able to be desorbed
automatically in a single gas
chromatography (GC) sequence
without manual intervention. In
evaluating the Gerstel Multi-Fiber
Exchange (MFX) system,
modifications to the cap and potential
cooling minimized sample storage
stability, defined as less than 10%
sample loss (7). Short-term exposure
and time-weighted average data were
obtained and a new diffusive fibre
holder was investigated.
One new configuration for SPME
sampling is the Custodian SPME
syringe marketed by PerkinElmer.
Designed for field sampling, the
syringe features a ballpoint pen-style
mechanism for situations where
analyst dexterity may be limited.
Another design is the PAL (Prep
and Load) SPME Arrow (8,9). Key
features of the device are a stainless
steel fibre designed to provide a
greatly enhanced sample capacity,
as illustrated in Figure 1. Another
Recent Advances in Solid-
Phase Microextraction, Part 1:
New Tricks for an Old Dog Douglas E. Raynie, Sample Preparation Perspectives Editor
Solid-phase microextraction (SPME) was introduced nearly 30 years ago and since that time has matured into a widely used tool in the arsenal of sample preparation techniques. Simultaneously, it has spawned a host of related techniques where sorbent coatings are placed on stir bars, magnetic particles, vial walls, and so on. Over the past few years, several advances in SPME have been developed, including increasing the sorbent surface area available for extraction, accommodating direct analysis by mass spectrometry (MS), and sorbent overcoating to resist fouling by sugars, lipids, and other macromolecules present in some sample types. These advances are discussed in this month’s instalment. The use of SPME for microsampling of biological systems, so-called bio-SPME, will be the focus of Part 2.
Gas tight valves from the company
that invented them.
Valves for Gas Chromatography
TWO POSITION & MULTI-POSITION VALVES
• For injection, stream selection, and trapping
• Bores from 0.25 mm (.010”) to 4 mm (.156”)
• <GTQ�FGCF�XQNWOG�ƂVVKPIU�HQT�1/32”, 1/16”, 1/8” or 1/4” tubing
• Alloys and polymer composites to meet virtually any system requirement
• Manual, pneumatic, or electric actuation
®
www.vici.com | [email protected] | 800-367-8424
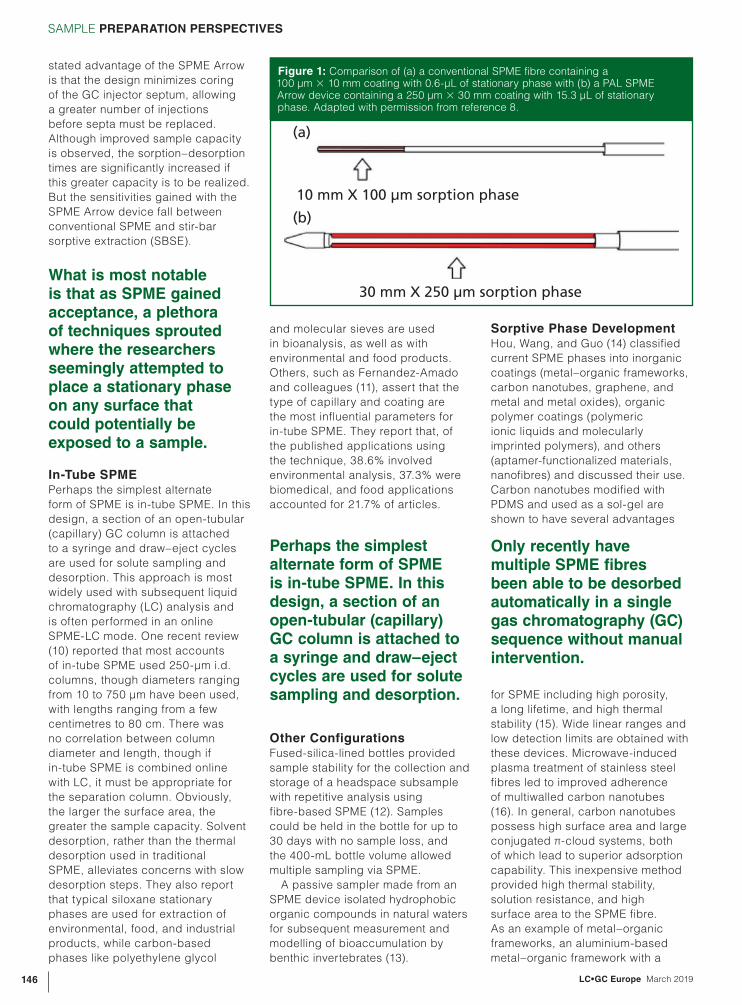
LC•GC Europe March 2019146
SAMPLE PREPARATION PERSPECTIVES
Sorptive Phase DevelopmentHou, Wang, and Guo (14) classified
current SPME phases into inorganic
coatings (metal–organic frameworks,
carbon nanotubes, graphene, and
metal and metal oxides), organic
polymer coatings (polymeric
ionic liquids and molecularly
imprinted polymers), and others
(aptamer-functionalized materials,
nanofibres) and discussed their use.
Carbon nanotubes modified with
PDMS and used as a sol-gel are
shown to have several advantages
for SPME including high porosity,
a long lifetime, and high thermal
stability (15). Wide linear ranges and
low detection limits are obtained with
these devices. Microwave-induced
plasma treatment of stainless steel
fibres led to improved adherence
of multiwalled carbon nanotubes
(16). In general, carbon nanotubes
possess high surface area and large
conjugated π-cloud systems, both
of which lead to superior adsorption
capability. This inexpensive method
provided high thermal stability,
solution resistance, and high
surface area to the SPME fibre.
As an example of metal–organic
frameworks, an aluminium-based
metal–organic framework with a
stated advantage of the SPME Arrow
is that the design minimizes coring
of the GC injector septum, allowing
a greater number of injections
before septa must be replaced.
Although improved sample capacity
is observed, the sorption–desorption
times are significantly increased if
this greater capacity is to be realized.
But the sensitivities gained with the
SPME Arrow device fall between
conventional SPME and stir-bar
sorptive extraction (SBSE).
In-Tube SPMEPerhaps the simplest alternate
form of SPME is in-tube SPME. In this
design, a section of an open-tubular
(capillary) GC column is attached
to a syringe and draw–eject cycles
are used for solute sampling and
desorption. This approach is most
widely used with subsequent liquid
chromatography (LC) analysis and
is often performed in an online
SPME-LC mode. One recent review
(10) reported that most accounts
of in-tube SPME used 250-μm i.d.
columns, though diameters ranging
from 10 to 750 μm have been used,
with lengths ranging from a few
centimetres to 80 cm. There was
no correlation between column
diameter and length, though if
in-tube SPME is combined online
with LC, it must be appropriate for
the separation column. Obviously,
the larger the surface area, the
greater the sample capacity. Solvent
desorption, rather than the thermal
desorption used in traditional
SPME, alleviates concerns with slow
desorption steps. They also report
that typical siloxane stationary
phases are used for extraction of
environmental, food, and industrial
products, while carbon-based
phases like polyethylene glycol
and molecular sieves are used
in bioanalysis, as well as with
environmental and food products.
Others, such as Fernandez-Amado
and colleagues (11), assert that the
type of capillary and coating are
the most influential parameters for
in-tube SPME. They report that, of
the published applications using
the technique, 38.6% involved
environmental analysis, 37.3% were
biomedical, and food applications
accounted for 21.7% of articles.
Other ConfigurationsFused-silica-lined bottles provided
sample stability for the collection and
storage of a headspace subsample
with repetitive analysis using
fibre-based SPME (12). Samples
could be held in the bottle for up to
30 days with no sample loss, and
the 400-mL bottle volume allowed
multiple sampling via SPME.
A passive sampler made from an
SPME device isolated hydrophobic
organic compounds in natural waters
for subsequent measurement and
modelling of bioaccumulation by
benthic invertebrates (13).
10 mm X 100 μm sorption phase
30 mm X 250 μm sorption phase
(a)
(b)
Figure 1: Comparison of (a) a conventional SPME fibre containing a 100 μm × 10 mm coating with 0.6-μL of stationary phase with (b) a PAL SPME Arrow device containing a 250 μm × 30 mm coating with 15.3 μL of stationary phase. Adapted with permission from reference 8.
Only recently have multiple SPME fi bres been able to be desorbed automatically in a single gas chromatography (GC) sequence without manual intervention.
Perhaps the simplest alternate form of SPME is in-tube SPME. In this design, a section of an open-tubular (capillary) GC column is attached to a syringe and draw–eject cycles are used for solute sampling and desorption.
What is most notable is that as SPME gained acceptance, a plethora of techniques sprouted where the researchers seemingly attempted to place a stationary phase on any surface that could potentially be exposed to a sample.

www.chromatographyonline.com
SAMPLE PREPARATION PERSPECTIVES
(16) Z. Tang, Y. Liu, and Y. Duan, J.
Chromatogr. A 1425, 34–41
(2015).
(17) S. Lirio, W.-L. Liu, C.-L. Lin, C.-H. Lin,
and H.-S. Huang, J. Chromatogr. A
1428, 236–245 (2016).
(18) S. Ansari and M. Karimi, Talanta 164,
612–625 (2017).
(19) A. Sarafriz-Yazdi and N. Razavi, TrAc
Trend Anal. Chem. 73, 81–90
(2015).
(20) M. Cui, J. Qiu, Z. Li, M. He, M. Jin, J.
Kim, M. Quinto, and D. Li, Talanta 132,
564–571 (2015).
(21) M.V. Nair and G.S. McKelly, Forensic
Sci. Intl. 268, 131–138 (2016).
“Sample Prep Perspectives” editor
Douglas E. Raynie is a Department
Head and Associate Professor at
South Dakota State University, USA.
His research interests include green
chemistry, alternative solvents,
sample preparation, high-resolution
chromatography, and bioprocessing
in supercritical fluids. He earned
his Ph.D. in 1990 at Brigham Young
University under the direction of
Milton L. Lee. Raynie is a member
of LCGC ’s editorial advisory board.
Direct correspondence about this
column via e-mail to LCGCedit@ubm.
com
polymethacrylate monolith provided
efficient isolation of penicillins in
milk samples using in-tube SPME
(17). Ansari and Karimi reviewed the
application of molecular-imprinted
polymers (MIP) for drug analysis
in the coated, in-tube, monolithic,
sol-gel, and membrane SPME modes
(18). The low cost, high porosity,
reproducibility, and increased
sensitivity are touted as advantages
of MIPs. Another review of MIP-SPME
focused on applications (19). In
another study, hydrofluoric acid
was used to etch the surface of a
stainless steel wire and increase its
surface area (20). Then the wire was
coated with an ionic liquid as the
sorptive phase and, after optimizing
conditions, used for the extraction
of aqueous alkylphenols with
enrichment factors 6.5 to 16.8 times
greater than that with a commercial
polyacrylate fibre with an 85-μm
film. Glass-fibre filters coated with
PDMS in the capillary microextraction
mode were found to be 30-fold more
sensitive than dynamic SPME for
isolating methamphetamine vapours
associated with forensic samples
(21).
ConclusionDespite its longevity in the sample
preparation world, SPME is seeing
a tremendous growth spurt. Recent
advances and those expected in the
foreseeable future centre primarily
on the development of novel sorptive
phases and formats that allow for the
analysis of emerging systems, such
as sampling living systems or harsh
environments.
References(1) E.A. Souza-Silva, R. Jiang, A.
Rodriguez-Lafuente, E. Gionfriddo,
and J. Pawliszyn, TrAC Trend Anal.
Chem. 71, 224–235 (2015).
(2) E.A. Souza-Silva, E. Gionfriddo, and J.
Pawliszyn, TrAC Trend Anal. Chem. 71,
236–248 (2015).
(3) EA. Souza-Silva, N. Reyes-Garces,
G.A. Gomez-Rios, E. Boyaci, B. Bojko,
and J. Pawliszyn, TrAC Trend Anal.
Chem. 71, 249–264 (2015).
(4) J. Xu, G. Chen, S. Huang, J. Qiu,
R. Jiang, F. Zhu, and G. Ouyang, T
rAC Trend Anal. Chem. 85, 26–35
(2016).
(5) C.-H. Xu, G.-S. Chen, Z.-H. Xiong,
Y.-X. Fan, X.-C. Wang, and Y. Liu,
TrAC Trend Anal. Chem. 80, 12–29
(2016).
(6) A. Naccarato and J. Pawliszyn, Food
Chem. 206, 67–73 (2016).
(7) G.A. Gomez-Rios, N. Reyes-Garces,
and J. Pawliszyn, J. Sep. Sci. 38,
3560–3567 (2015).
(8) A. Kremser, M.A. Jochmann, and T.C.
Schmidt, Anal. Bioanal. Chem. 408,
943–952 (2016).
(9) A. Helin, T. Ronkko, J. Parshintsev, K.
Hartonen, B. Schilling, T. Laubli, and
M.-L. Riekkola, J. Chromatogr. A 1426,
56–63 (2015).
(10) P. Serra-Mora, Y. Moliner-Martinez,
C. Molins-Legua, R.Herraez-Hernandez,
J. Verdu-Andres, and P. Campins-Falco,
Comp. Anal. Chem. 76, 427–461
(2017).
(11) M. Fernandez-Amado, M.C.
Prieto-Blanco, P. Lopez-Mahia, S.
Muniategui-Lorenzo, and D. Prada-
Rodriguez, Anal. Chim. Acta 906, 41–57
(2016).
(12) C.A. Harvey, J.C. Carter, J.R. Ertel,
C.T. Alviso, S.C. Chinn, and R.S.
Maxwell, J. Chromatogr. A 1401, 1–8
(2015).
(13) K.A. Maruya, W. Lao, D. Tsukada, and
D.W. Diehl, Chemosphere 137, 192–197
(2015).
(14) X. Hou, L. Wang, and Y. Guo, Chem.
Lett. 46, 1444–1455 (2017).
(15) A. Amiri and F. Ghaemi, Microchim.
Acta 184, 297–305 (2017).
SEPARATION SCIENCE
HPLC2019MILANOSlam
slam
your
science.
win
2000 €(1st prize)
16-20 June 2019Milan, Italy www.hplc2019-milan.org
Despite its longevity in the sample preparation world, SPME is seeing a tremendous growth spurt.

LC•GC Europe March 2019148
ANALYSIS FOCUS: FOODOMICSA
Q. Foodomics has evolved in terms
of knowledge and technology
since the term was coined in 2009.
What is foodomics and why is it
important?
A: Foodomics was defined for the
first time by our research group
in 2009 as “a new discipline that
studies the food and nutrition
domains through the application
and integration of advanced ‘omics’
technologies to improve consumer’s
well-being, health, and knowledge”
(1). Foodomics has subsequently
been applied by many laboratories
and numerous papers have been
published in the literature (2–15).
Basically, we believe that foodomics,
even in its current early stages,
can provide new answers to many
crucial questions that need to be
solved in food science and nutrition.
Q. Could you give a general
overview of the fi eld with regards
to major research areas, the
chromatographic techniques used,
and the analytical challenges that
have been overcome during this
decade?
A: The major research areas of
foodomics include investigations
on food safety, food quality, food
traceability, and food bioactivity.
As you can deduce, the number of
research areas where foodomics
can play a role is therefore huge.
Any food-related research in which
an “omics” methodology is applied
may be considered a part of
foodomics. Apart from miniaturization,
there are two other major analytical
developments that have had a
clear influence on the evolution of
foodomics in the past ten years.
The first is related to the new
and fast sequencing methods that
are categorized together under the
common umbrella of next-generation
sequencing (NGS), which is having
a crucial impact on genomics and
transcriptomics applications. The
second is the manufacture of high
resolution mass spectrometers with
improved features and capabilities
that are becoming available at
more affordable prices, and which
are significantly contributing to the
progression of foodomics in general,
and metabolomics and proteomics in
particular.
In foodomics, we develop
transcriptomics, proteomics, and
metabolomics approaches to study
the safety, quality, and traceability
of foods, or to investigate how foods
(including functional ingredients)
interact with our genome and the
subsequent modifications that these
interactions can generate at the
proteome and metabolome level.
The chromatographic techniques
used in foodomics are those
typically used in proteomics
and metabolomics, such as
liquid chromatography (LC),
ultrahigh-performance liquid
chromatography (UHPLC), nano-LC,
gas chromatography (GC), or capillary
electrophoresis (CE) hyphenated to
high-resolution mass spectrometry
(HRMS).
With these techniques we are
able to obtain massive amounts of
information at different expression
levels, such as proteins and
metabolites.
In addition, we have developed
many comprehensive two-dimensional
liquid chromatography tandem mass
spectrometry (LC×LC–MS/MS)
methods for metabolomics profiling
of different natural compounds in
complex matrices (7,8). Logically, an
important additional step in all these
procedures is the use of adequate
sample preparation techniques (6).
One of the main analytical challenges
that we had to overcome was the
development of the three different
“omics” strategies used in foodomics:
transcriptomic-, proteomic-, and
metabolomic methods.
Considering that practically all
“omics” laboratories around the
world may work in just one of these
The Rising Role of FoodomicsTen years since its official defi nition, foodomics continues to expand the scientifi c knowledge of food and nutrition while resolving many analytical challenges along the way. LCGC Europe spoke to Alejandro Cifuentes from the Institute of Food Science Research, in Madrid, Spain, about his current foodomics research projects, the overall state of the fi eld, and the future of foodomics.
Interview by Lewis Botcherby, Associate Editor, LCGC Europe
Ph
oto
Cre
dit :
Da
nie
l V
inc
ek -
sto
ck.a
do
be
.co
m
One of the main analytical challenges that we had to overcome was the development of the three different “omics” strategies used in foodomics: transcriptomic-, proteomic-, and metabolomic methods.
We believe that foodomics, even in its current early stages, can provide new answers to many crucial questions that need to be solved in food science and nutrition.
Our ASPEC® systems simplify your solid phase extraction tasks even with the most complex matrix.
WE’LL MAKE EXTRACTIONS EASIER.
ASPEC offers food scientists the instruments and consumables
to tackle extractions, along with technical support to help you
easily transfer to a new system.
www.gilson.com/contact
LC•GC Europe March 2019150
ANALYSIS FOCUS: FOODOMICS
“omics” disciplines, the amount
of work we had to face was really
challenging! Collaboration with
other groups and laboratories was,
of course, essential to meet these
challenges. For example, we always
need collaborations for in vivo
experiments because we do not
have the necessary infrastructure
in our institute. As a result, in
our publications we usually have
co-authors from other institutions and
countries.
Q. Data management is a huge part
of any “omics” fi eld and is often
cited as a bottleneck in research.
Is this true for foodomics? And if
so, what is being done to solve this
issue?
A: Data handling is a global problem
for any discipline that generates
huge amounts of data and foodomics
is no exception. This bottleneck
prevents the integration of data from
the different “omic” levels making it
impossible to obtain the biological
meaning from the data generated in
a straightforward way. At the moment
there is no bioinformatic tool that can
put together and handle the data that
we generate from transcriptomics,
proteomics, and metabolomics
experiments simultaneously.
Other typical problems are the
difficult data storage, the slow
processing time, the improvement
needed by metabolomic databases,
the suitable mining of massive
datasets, and the need for
harmonized and standardized
methods to generate and analyze
data, among many others. Fortunately,
there are many groups all around the
world working on these problems and
trying to solve them.
Q. How has data that can be
obtained at present translated
to useful dietary or medical
information?
A: After several years working in
foodomics, we have obtained useful
information about the antiproliferative
effect of several extracts from natural
sources and food by-products.
For example, we have found a
very interesting and active extract
obtained from rosemary using
a green extraction process that
has demonstrated an impressive
antiproliferative activity against
different in vitro and in vivo models
of colon cancer together with low
toxicity.
The biological mechanisms of this
activity were found and explained via
foodomics. This was one of the first
works published in which the three
“omics” levels were simultaneously
interrogated (9). This is the first step
to understanding and demonstrating
scientifically the health impact of a
given food or dietary ingredient before
providing any dietary or medical
recommendation. I will discuss other
aspects of this research in more detail
later.
Although foodomics is a new
discipline and still in its early stages,
the discipline is expected to help to
overcome the controversial messages
that consumers are continuously
receiving from the food industries and
the regulatory agencies about the
benefits and risks of different foods.
Q. From an analytical perspective
what challenges do scientists
involved in foodomics face?
A: As foodomics uses advanced
analytical instruments and “omics”
approaches, the challenges to
be faced are the common ones
for any laboratory working with
these technologies. Thus, for
transcriptomics we must evaluate if
the cost linked to a transcriptomic
study using microarrays compensates
(or not) for the option to do the
same study using NGS of all the
transcripts—something unthinkable a
few years ago.
Regarding proteomics studies,
we are now moving from the
classical procedures, such as using
two-dimensional electrophoresis,
(isoelectric focusing followed by size
separation), imaging comparison,
tryptic hydrolysis, and matrix-assisted
laser desorption–ionization (MALDI)
MS/MS of peptides, to very powerful
strategies using isotopic derivatization
of enzymatically hydrolyzed proteins
followed by nano-LC–HRMS analysis
for identification and quantitation of all
the proteins (and samples) in a single
run.
In metabolomics the challenges
remain linked to getting a picture as
wide as possible of the metabolome
of any biological system. This means
putting together several metabolomics
platforms, such as LC–HRMS plus
GC–HRMS and CE–HRMS, to reduce
the bias induced by the sample
preparation step as much as possible,
and to manage the development
of metabolomics databases. Of
course, all of them share the same
analytical constraints related to speed,
sensitivity, and resolution. There will
always be a desire to improve these
factors in any analytical instrument.
Q. You recently published two
papers using a multianalytical
platform based on pressurized
liquid extraction (PLE), in vitro
assays, and liquid chromatography/
gas chromatography coupled to
high-resolution mass spectrometry
to investigate food by-products
valorization. Why were you
investigating food by-products
valorization, what was novel about
your approach, and what were your
main fi ndings?
A: One unique aspect of the group
involved in publishing these two
papers is the capability of integrating
different areas of expertise and
backgrounds (3,4). One co-author
has expertise in the development
of new green processes to get
valuable extracts from different
raw materials that, ultimately, can
increase the viability and economic
interest of the whole study. Another
important aspect of these studies is
sustainable development, which is
an important goal of our group as
we enter a new “green food era”. In
view of the potential of Colombian
food by-products as a promising
source of bioactive phytochemicals,
a multianalytical platform based on
Although foodomics is a new discipline and still in its early stages, the discipline is expected to help to overcome the controversial messages that consumers are continuously receiving from the food industries and the regulatory agencies about the benefi ts and risks of different foods.
151www.chromatographyonline.com
ANALYSIS FOCUS: FOODOMICS
separation techniques coupled to
HRMS was presented as part of an
integrated valorization strategy for
these by-products and includes PLE
using green solvents and different in
vitro evaluations of their bioactivity.
Thus, a comprehensive
phytochemical profiling analysis
of the compounds extracted
from goldenberries calyx (using
an optimized PLE process) was
performed by LC and GC coupled
to quadrupole time-of-flight tandem
mass spectrometry (QTOF-MS/
MS), applying new and integrated
identification approaches for
the confident identification and
structural elucidation of the bioactive
phytochemicals from the HRMS data.
Q. Could this “multianalytical”
technique be adapted for other
applications?
A: The proposed strategy could be
readily implemented in many other
applications, such as the complete
characterization of preparations with
health-promoting effects intended
to be used as functional foods or
in traditional medicines. And, of
course, for revalorization of any food
by-products by obtaining from them
bioactive compounds with added
value via, for example, some specific
bioactivity.
Q. You mentioned earlier
a metabolomics study you
published last year to investigate
metabolomic changes in cells in
response to rosemary diterpene
exposure (2). What was the aim of
this research, and what were your
main fi ndings?
A: Rosemary diterpenes have
demonstrated diverse biological
activities, such as anticancer and
anti-inflammatory properties, as well
as other beneficial effects against
neurological and metabolic disorders.
In particular, carnosic acid (CA),
carnosol (CS), and rosmanol (RS)
diterpenes have shown interesting
results on anticancer activity.
However, little was known about the
toxic effects of rosemary diterpenes
at the concentrations needed to
exert their antiproliferative effect
on cancer cells. In the mentioned
work, CA, CS, and RS exhibited a
concentration-dependent effect on
cell viability of two human colon
cancer cell lines (HT-29 and HCT116)
after 24 h exposure. The HT-29
cell line was more resistant to the
inhibitory effect of the three diterpenes
than the HCT116 cell line. Among
the three diterpenes, RS exerted the
strongest effect in both cell lines. To
investigate the hepatotoxicity of CA,
CS, and RS, undifferentiated and
differentiated HepaRG cells were
exposed to increasing concentrations
of the diterpenes (from 10 mM to
100 mM). Differentiated cells were
found to be more resistant to the toxic
activity of the three diterpenes than
undifferentiated HepaRG, probably
related to a higher detoxifying function
GREAT FLUIDIC SOLUTIONS
…from OEM customizations to spare parts
Europe: Biotech AB 7HO����������������������LQIR#ELRWHFKïXLGLFV�FRP�USA: Biotech USA LLC 7HO���������������VDOHV#ELRWHFKïXLGLFV�FRP�Japan: BioNik Inc.7HO������������������LQIR#ELRQLNLQF�FRP�
<RXU�'HJDVVLQJ�([SHUWZZZ�ELRWHFKïXLGLFV�FRP
%,27(&+�'(*$6L��35(3��'HJDVVHU�Lj�$Q�LQ�OLQH��PHPEUDQH�GHJDVVHU�
Lj�6XLWDEOH�IRU�DJJUHVVLYH�PHGLD�DQG�RUJDQLF�VROYHQWV
Lj�)ORZ�UDWHV�XS�WR��������PO�PLQ�SHU�FKDQQHO
Lj�'HOLYHUHG�DV�6WDQG�DORQH�RU�2(0�RSHQ�IUDPH
Lj�$YDLODEOH�ZLWK�����FKDQQHOV
The global movement of food and related raw materials will increase in the next few years and it will bring about an increasing number of contamination episodes worldwide.

LC•GC Europe March 2019152
ANALYSIS FOCUS: FOODOMICS
of differentiated HepaRG cells
compared with the undifferentiated
cells.
The metabolic profiles of
differentiated HepaRG cells in
response to CA, CS, and RS were
examined to determine biochemical
alterations and deepen the study
of the effects of rosemary phenolic
diterpenes at the molecular level.
A multiplatform metabolomics
study based on liquid and gas
chromatography hyphenated to HRMS
was used and revealed that rosemary
diterpenes exerted different effects
when HepaRG cells were treated
with the same concentration of each
diterpene. RS revealed a greater
metabolome alteration followed by
CS and CA, in agreement with their
observed cytotoxicity. In this work,
we demonstrated the usefulness of
metabolomics combined with cell
lines for toxicity studies because it
provides valuable information about
early events in the metabolic profiles
of cells after the treatment with the
investigated compounds. Interestingly,
this new analytical method reduces
the use of animals classically used in
toxicology studies.
Q. Are there any other recent
research projects that you
think demonstrate the value of
foodomics?
A: We have recently founded the
first Joint Research Center for Green
Foodomics Research in Beijing
together with the Chinese Academy
of Agricultural Sciences (CAAS), and
in a year a major reference work on
comprehensive foodomics (10 books
and more than 150 book chapters)
will be published (10).
The 65,000 results obtained
in Google using the search term
“foodomics” may be regarded
as additional proof of the interest
generated by foodomics among
research institutions, agencies, food
industries, regulatory laboratories,
scientific instrumentation
manufacturers, and consumers.
In this regard, we are in
collaboration with several Latin
American universities to work
together on foodomics for food waste
and food by-product revalorization,
mainly through different stays,
exchanges, courses, or roundtables.
This interaction with students,
teachers, and local people is
probably one of the most rewarding
experiences that one may have in
science.
Q. What are you currently working
on?
A: Amongst the different bioactivities
studied related to the consumption
of health-promoting food
components, their possible
neuroprotective effect is gaining
importance because of the
huge negative impact that
neurodegenerative diseases have
in society. However, to date, the
mechanisms through which the
neuroprotective activities would
be exerted are largely unknown.
In this regard, foodomics might be
a very useful tool to discover the
neuroprotective effects of dietary
terpenes at a molecular level.
The main aim of the new project in
which we are working is to study the
neuroprotective activity of terpenes
and terpenoids from natural extracts,
such as microalgae, seaweeds, and
food-related by-products from olive
oil and orange juice production,
carrying out a systematic study
of different chemical structures
combined with in vitro and in vivo
Alzheimer’s disease models and
a foodomics study of their activity.
The selection of this family of
compounds is based on previously
published reports highlighting the
possible neuroprotective effect of
some terpenoids, although, up to
now, there still exists a lot of missing
information on how they may exert
this activity. This project proposal
also includes the development of a
new methodology for the valorization
of by-products and fractions based
on the concept of biorefinery and
zero-waste philosophy.
Q. What is the future of
foodomics?
A: In the future of food science, the
first demand will still be to guarantee
food safety. The global movement of
food and related raw materials will
increase in the next few years and it
will bring about an increasing number
of contamination episodes worldwide.
In addition, many food products
containing multiple and processed
ingredients shipped from all over the
world will share common storage
spaces and production lines, which
will make it even more complicated
to face food safety episodes. As a
result, ensuring the safety, quality,
and traceability of food will be even
more complicated and important than
now. It will require the development
of new, more advanced, and more
powerful analytical strategies as
proposed by foodomics.
Foodomics can also help
to investigate and solve other
crucial topics in food science and
nutrition, such as establishing the
global role and functions of the
gut microbiome; obtaining sound
scientific evidence that supports
or refutes the beneficial claims of
functional foods and constituents;
establishing analytical methods
to guarantee food safety, origin,
traceability, and quality, including
the discovery of biomarkers to detect
unsafe products, the understanding
of the stress adaptation responses
of foodborne pathogens, or the early
detection of food safety problems;
and understanding the molecular
basis of biological processes with
agronomic and economic relevance,
such as the interaction between
crops and their pathogens, as well as
physicochemical changes that take
place during fruit ripening.
We are still far from solving many
of the aforementioned challenges.
This is why we need to keep
working, probably for a number of
years, before getting the necessary
perspective (and knowledge) on
these complex and fundamental
topics.
Q. How do you see foodomics
becoming more commonly used in
practice?
A: Food industries and regulatory
agencies have traditionally not been
particularly interested in any new
approaches that may require more
investment or effort.
We are not proposing to use
foodomics as a sledgehammer to
crack a nut. The problem is that there
are many questions that need to be
solved and clarified in food science
and nutrition. These issues are much
bigger and more crucial to our health
than a nut, and, you can be sure, to
address them you really need to have
the right approach, investment, and
knowledge. For example, traditional
153www.chromatographyonline.com
ANALYSIS FOCUS: FOODOMICS
References(1) A. Cifuentes, J. Chromatogr. A 1216,
7109 (2009).
(2) T. Acunha et al., Anal. Chim. Acta
1037(1), 40–151 (2018).
(3) D. Ballesteros-Vivas et al., J.
Chromatogr. A 1584, 155–164 (2019).
(4) D. Ballesteros-Vivas et al., J.
Chromatogr. A 1584, 144–154 (2019).
(5) A. Cifuentes, Ed., Special issue on
Foodomics and Modern Food Analysis
in TrAC-Trends in Analytical Chemistry
96, 1–212 (2017).
(6) T. Martinovic, M.G. Šrajer, and D. Josic,
Electrophoresis 39, 1527–1542 (2018).
(7) L. Montero, M. Herrero, E. Ibáñez, and
A. Cifuentes, J. Chromatogr. A 1313,
275–284 (2013).
(8) L. Montero, V. Sáez, D. von Baer,
A. Cifuentes, and M. Herrero, J.
Chromatogr. A 1536, 205–215 (2018).
(9) C. Ibáñez, A. Valdés, V. García-Cañas,
C. Simó, M. Celebier, L. Rocamora,
A. Gómez, M. Herrero, M. Castro,
A. Segura-Carretero, E. Ibáñez,
J.A. Ferragut, and A. Cifuentes, J.
Chromatogr. A 1248, 139–153 (2012).
(10) A. Cifuentes, Ed., Major References
Work on Comprehensive Foodomics
(Elsevier, To be published in 2021).
(11) A. Cifuentes, Ed., Foodomics.
Advanced Mass Spectrometry in
Modern Food Science and Nutrition
(John Wiley & Sons, Hoboken, New
Jersey, USA. 2013). (The first book
published on foodomics)
(12) M. Herrero et al., Mass Spec. Rev. 31,
49–69 (2012).
(13) T Skov, A.H. Honoré, H.M. Jensen, T
targeted analytical approaches are
the ones typically used by food
industries and regulatory agencies,
and they are useful to detect known
allergens in foods, no doubt.
However, the use of foodomics—in
this case based on proteomics
approaches—might be essential
to obtain the complete de novo
sequencing and identification of
new previously unknown food
allergens.
In addition, the use of
foodomics-based systems, biology
combined with data mining,
interpretation, and integration,
might be a key tool to discover the
molecular mechanisms beneath food
allergies at a physiological level. For
example, you can also think about
the new possibilities for foodomics
related to safety and bioactivity
of new compounds from food
by-products or waste revalorization,
or how to elucidate the complexity
of the food digestome or the food
microbiome, to mention a few. I
fully expect foodomics to lead food
science and nutrition research into a
new era.
Næs, and S.B. Engelsen, TrAC Trends
in Analytical Chemistry 60, 71–79
(2014).
(14) P. Ferranti, Curr. Opin. Food Sci. 22,
102 (2018).
(15) A. Bordoni and F. Capozzi, Current
Opinion in Food Science 4, 124–128
(2015).
Alejandro Cifuentes
is a Professor at the
National Research
Council of Spain
(CSIC) in Madrid,
Spain, and Head
of the Laboratory
of Foodomics and
Director of the Metabolomics Platform
(International Excellence Campus
CSIC + University Autonoma of
Madrid). He is the Founding Director
of the Institute of Food Science
Research and Deputy Director of the
Institute of Industrial Fermentations,
both belonging to CSIC. Alejandro’s
activities include advanced analytical
method development for foodomics,
food quality, and safety, as well as
the isolation and characterization of
natural bioactive compounds and
their effect on human health.
www.pss-polymer.com
PERFECT
SEPARATION SOLUTIONS
Dextran
PEG
PEO
PMMA
Polystyrene
Polystyrene (High Temp)
PullulanWhen Standard means Superior
GPC/SEC ReadyCal Calibration Kits
www.pss-shop.com

LC•GC Europe March 2019154
PRODUCTS
Lab equipment
Trackman
Connected is a tablet
with accessories
and applications
that make pipetting
on 96- and 384-well
plates faster and
more reliable,
reportedly improving
efficiency at the bench by tracking pipetting tasks. Designed to
communicate with Pipetman M Connected via Bluetooth, the
tablet interacts in real-time with the pipette and guides users
through their protocol with PipettePilot.
www.gilson.com
Gilson, Middleton, Wisconsin, USA.
Chromatography software
DataApex has launched
a new version of Clarity
Chromatography software.
Clarity version 8 comes with
a graphically enhanced user
interface, improvements
in MS and GLP options,
and new control modules.
According to the company,
Clarity brings easy operation, user support, and optional
extensions for various applications, such as PDA, MS, GPC,
NGA, and many more. A free demo is available from DataApex’s
website.
www.dataapex.com
DataApex, Prague, Czech Republic.
HPLC columns
Based on core–shell technology, the
Nucleoshell Biphenyl phase from
Macherey-Nagel extends the column
range for fast and efficient HPLC,
according to the company. The
separation principle of the specially
biphenylpropyl modifi ed silica is
determined by π-π and hydrophobic
interactions. Thus, it shows an enhanced retention for aromatic
and unsaturated substances and is recommended for the
sophisticated analytical separations of mycotoxins, phthalates,
pesticides, pharmaceuticals, hormones, DNPH aldehydes, and
many more substances.
www.mn-net.com
Macherey-Nagel GmbH & Co. KG, Düren, Germany.
(U)HPLC columns
YMC-Triart Bio C4 is a
new wide-pore phase
for (U)HPLC. As a result
of its 300-Å pore size, it
is designed for peptide
and protein separations.
Excellent reproducibility is
provided, according to the
company. High pH (1–10)
and temperature (up to
90 °C) stability is offered.
https://ymc.de/
rp-bioseparation.html
YMC Europe GmbH, Dinslaken, Germany.
Columns
Analysts that are working
with analytical or
preparative HPLC, or with
substances of interest that
require normal phase,
reversed phase, HILIC,
GPC/SEC, or ion-exclusion separations can be sure that
Knauer can offer a wide range of columns. To extend
the lifetime, analytical Knauer columns can be equipped
with an integrated precolumn. They are certifi ed in this
confi guration to ensure performance and quality.
www.knauer.net/columns
Knauer Wissenschaftliche Geräte GmbH, Berlin,
Germany.
GC
GL Sciences’s CryoFocus-4 is
a GC cryogenic trap, used to
refocus analytes on the column.
The technology was developed
using knowledge learned with
Optic-4, a multi-mode inlet for gas
chromatography. Cooling is done
using either CO2 (-50 °C) or LN2
(-150 °C). Low temperature trapping is combined with a
fast heating rate (60 °C/s). The result, according to the
company, is very sharp peaks, and improved separation of
volatile and semivolatile compounds.
www.glsciences.eu
GL Sciences B.V., Eindhoven, Netherlands.

155www.chromatographyonline.com
PRODUCTS
GC–MS
An automated GC–MS-based
system determines 3-MCPD,
2-MCPD, and glycidyl fatty
acid esters in edible oil
meeting the requirements of
standard ISO, AOCS, and
DGF methods. Samples
are automatically prepared
and analyzed, including
analyte derivatization and
evaporation of excess reagent and solvent for best limits of
determination and system stability.
www.gerstel.com
Gerstel GmbH & Co. KG, Mülheim an der Ruhr, Germany.
Microchip column
PharmaFluidics has launched a
μPAC trapping column with identical
stationary phase support morphology
compared to the analytical μPAC
columns. By effectively desalting
and preconcentrating the analytes
of interest onto the trap column,
analytical column lifetime and
workfl ow throughput can be
improved, according to the company.
Dilute samples can be loaded in
a bidirectional way at high fl ow
rates and with minimal loss of
chromatographic performance.
www.pharmafl uidics.com
PharmaFluidics, Ghent, Belgium.
Multi-angle static light scattering
Introducing the next
generation DAWN
multi-angle static light
scattering (MALS)
detector for absolute
characterization of the
molar mass and size of
macromolecules and
nanoparticles in solution.
DAWN offers high
sensitivity, a wide range
of molecular weight, size,
and concentration, and a large selection of confi gurations and
optional modules for enhanced capabilities, according to the
company.
https://www.wyatt.com/dawn
Wyatt Technology, Santa Barbara, California, USA.
Flow modulator
LECO has introduced a Flux
fl ow modulator option for
routine GC×GC analysis.
While LECO’s traditional
thermal modulation
alternative is still available
and offers high sensitivity,
the Flux fl ow modulator is a
cost-effective option that makes GC×GC more accessible
and easy to use, according to the company. Another
advantage of the Flux is that it does not require cryogens
to carry out GC×GC, saving the user time and resources
in their laboratory.
www.leco.com/fl ux-gcxgc-fl ow-modulator
LECO Corporation, Saint Joseph, Michigan, USA.
GPC/SEC calibration
ReadyCals allows for the rapid
preparation of reproducible
GPC/SEC calibration curves
without the inconvenience
of individually weighing the
standards, according to the
company. New in the PSS ReadyCal family are the
Dextran ReadyCals: reference material: dextran, nine
different standards with Mp 180–298 000 Da; application:
calibration of aqueous GPC/SEC systems; set contains
3 × 5 vials-1.5 mL for fi ve calibrations.
www.pss-shop.com
PSS GmbH, Mainz, Germany.
HPLC affinity column
Tosoh Bioscience has
introduced TSKgel FcR-IIIA-
NPR, an HPLC affinity column
based on recombinant
FcRIIIa receptor, a key player
in antibody-dependent
cell-mediated cytotoxicity
(ADCC). FcRIIIa affinity chromatography reportedly
allows fast evaluation of biologic activity and glycoform
patterns of antibodies. This method can provide
valuable information during cell line selection, upstream
optimization, or quality control of therapeutic antibodies.
www.tosohbioscience.de
Tosoh Bioscience GmbH, Griesheim, Germany.
LC•GC Europe March 2019156
PRODUCTS
Mass spectrometer
The Thermo Scientifi c ISQ EM single
quadrupole mass spectrometer for
high performance and productivity
standards has a mass range of
10–2000 m/z. The system offers the
power to detect and quantify small
and large molecules, and supports
analytical needs across an extensive
range of applications, from drug development to manufacturing
support and quality control. The system’s heated electrospray
ionization (HESI) and dual HESI/atmospheric pressure chemical
ionization (APCI) probes facilitate the measurement of polar and
nonpolar analytes, enabling application fl exibility. It is integrated
with HPLC systems and fully controlled by Thermo Scientifi c
Chromeleon Chromatography Data System.
www.thermofi sher.com/ISQEM
Thermo Fisher Scientifi c, California, USA.
HPLC system
The Agilent 1260 Infi nity II Prime LC system
provides the highest convenience standard
in the 1260 Infi nity II LC portfolio, as well as
an extended pressure range (up to 800 bar),
excellent quaternary mixing, and specifi cally
designed columns, according to the
company. The automated instrument features
reportedly increase analytical laboratory
efficiency and the intelligent system emulation technology (ISET)
ensures seamless method transfers from many Agilent and
third-party legacy instruments. The improved convenience level of
the system is highlighted with a local user interface—the Agilent
Infi nityLab LC Companion.
www.agilent.com
Agilent Technologies, Inc., California, USA.
FID gas station
The VICI FID gas station
combines the reliability of
the VICI DBS hydrogen and
zero-air generators into one
compact and convenient
package. Available in high and
ultrahigh purity for all GC detector and carrier gas applications.
The generator is available in two styles: fl at for placement under
a GC, or the Tower. Available in H2 fl ow ranges up to 1 L/min and
10.5 bar.
www.vicidbs.com
VICI AG International, Schenkon, Switzerland.
HILIC columns
Hilicon offers a broad range
of hydrophilic interaction
liquid chromatography (HILIC)
products to separate polar
compounds. Three column
chemistries in UHPLC and HPLC,
iHILIC-Fusion, iHILIC-Fusion(+),
and iHILIC-Fusion(P), provide customized and
complementary selectivity, excellent durability, and
ultralow column bleeding, according to the company.
The columns are suitable for the LC–MS analysis
of polar compounds in “omics” research, food and
beverage analysis, pharmaceutical discovery, and
clinical diagnostics.
www.hilicon.com
Hilicon AB, Umeå, Sweden.
Sample automation
Markes’ new Centri multitechnique
platform is an advance in sample
automation and concentration for
GC–MS, according to the company,
and offers four sampling modes: HiSorb
high-capacity sorptive extraction,
headspace, SPME, and thermal
desorption. The company reports
analyte focusing allows increased
sensitivity in all modes, state-of the-art robotics increase
sample throughput, and sample re-collection allows
repeat analysis without having to repeat lengthy sample
extraction procedures.
http://chem.markes.com/Centri
Markes International Ltd., Llantrisant, UK.
LC accessories
Restek has expanded the company’s
line of liquid chromatography
accessories for chromatographers.
High-quality couplers, fi ttings,
unions, tees, and crosses; PEEK and
stainless steel tubing; mobile phase
maintenance and safety products,
including bottle tops, valves, fi lters, and spargers are now
available.
www.restek.com/LCacc
Restek Corporation, Bellefonte, Pennsylvania, USA.

157www.chromatographyonline.com
PRODUCTS
Sample prep
LCTech has introduced an automated
system designed to clean up samples
that need to remain melted in PCB
and dioxin analysis. Three specifi cally
designed heating zones keep the
sample liquid from sample vial to the
fi rst column. The DEXTech Heat,
which is based on the established
DEXTech Pure system, processes
difficult samples, such as stearin
or PFADs. Excellent automated,
reliable results, without clogging, are
produced, according to the company.
www.LCTech.de
LCTech GmbH, Obertaufkirchen,
Germany.
Triple detection
Postnova has introduced the Triple
Detection for thermal fi eld-fl ow
fractionation (FFF) and GPC/SEC.
Triple Detection is the combination of
multi-angle light scattering (MALS),
viscosity detection, refractive index
detection, and UV detection. In a
single separation experiment, Triple Detection provides molar
mass distribution, molecular size distribution, and molecular
structure (branching, composition) of polymers, biopolymers,
polysaccharides, proteins, and antibodies.
www.postnova.com
Postnova Analytics GmbH, Landberg, Germany.
Electrochemical detector
The Decade Elite from Antec
Scientifi c is designed as an
easy-to-use electrochemical
detector that can integrate with any
LC system on the market, according
to the company. The system can
reportedly handle fast eluting
peaks in (U)HPLC and deliver fast
stabilization from dedicated fl ow
cells. When used with the SenCell,
the system is a highly sensitive
electrochemical detector.
www.AntecScientifi c.com
Antec Scientifi c, Zoeterwoude, Netherlands.
Method modelling software
Molnár-Institute’s DryLab
software has a 35-year
history in scientifi c method
modelling. Using a DoE
of twelve input runs, the
software integrates the theory of solvophobic interactions
and linear solvent strength (LSS) to predict the movements
of peaks, selectivity changes, and retention times of any
multidimensional design space. The software’s automation
module creates method sets in the most economic and
ecologic order, executes runs, and acquires results from
the CDS. Mass and other integrated data are retrieved and
ambiguity in peak tracking is reduced to a minimum.
www.molnar-institute.com
Molnár-Institute, Berlin, Germany.
Pesticide reference materials
Spex CertiPrep has introduced
a new pesticide mix to address
the European Commission’s
Regulation 2017/170. The
Commission is amending
Annexes II, III, and V to
Regulation (EC) No 396/2005
of the European Parliament
and of the Council as regards to maximum residue levels
for bifenthrin, carbetamide, cinidon-ethyl, fenpropimorph,
and trifl usulfuron in or on certain products.
www.spexeurope.com
Spex Europe, Dalston Gardens, Stanmore, UK.
Seals
The Bal Seal provides excellent
sealing performance in a broad range
of pressures, temperatures, fl ow rates,
and media, helping pump designers
meet PM requirements of more than
1 M cycles/60 L. The seal allows for
precise control of frictional forces,
resulting in reduced contamination. Designs for UHPLC,
with pressures greater than 20,000 psi, are also available.
www.balseal.com
Bal Seal Engineering, Foothill Ranch, California, USA.
T r i p l e D e t e c t i o nOnline Coupling to FFF and SEC
FFFSEC
PN3621 MALS Detector
Particle SizeRg / Molar Mass
PN3150 RI Detector
Concentration
PN3310 ViscometerDetector
Intrinsic ViscosityBranching
cosity
+
+
on
e
End [%B]
T [°C]
Flow
rate
[mL/m
in]
T [°C]
tG [min]tG [min]
Star
t[%
B]
tG [min]
T [°C]
En
d[%
B]
Start [%B]Flow rate
T [°C]
Flow
rate
[mL/m
in]
tG [min]
LC•GC Europe March 2019158
EVENT NEWS
6–7 May 2019Method Development for the
Separation of Therapeutic Proteins
(Biopolymers)
Molnár-Institute, Berlin, Germany
E-mail: [email protected]
Website: http://molnar-institute.com/
fileadmin/user_upload/Training/
SeminarRegistrationForm.pdf
12–17 May 2019 International Symposium on
Capillary Chromatography (ISCC)
and the GC×GC Symposium
Fort Worth, Texas, USA
E-mail: [email protected]
Website: www.isccgcxgc.com
13–17 May 20195th Workshop on Analytical
Metabolomics
Aristotle University, Thessaloniki, Greece
E-mail: [email protected]
Website: http://biomic.web.auth.gr/
workshop2019
22–23 May 20193rd International Conference and
Exhibition on Petroleum, Refi ning,
and Environmental Technologies
(PEFTEC 2019)
Rotterdam, Netherlands
E-mail: [email protected]
Website: www.ilmexhibitions.com/peftec/
17–18 June 2019 Analytical Quality by Design
Naarden-Bussum, Netherlands
E-mail: [email protected]
Website: www.kantisto.nl/index.php/
agenda/30-agenda-items/38-analytical-
quality-by-design
18–20 June 2019LABWorld China 2019
Shanghai New International Exhibition
Center (SNIEC), Shanghai, China
E-mail: [email protected]
Website: www.pmecchina.com/
labworld/en
7–10 July 2019International Symposium
on Preparative and Process
Chromatography (PREP 2019)
Baltimore, USA
E-mail: [email protected]
Website: www.prepsymposium.org/
Please send any upcoming event
information to Lewis Botcherby at
The 48th International Symposium on High
Performance Liquid Phase Separations and Related
Techniques (HPLC 2019)
The 48th International Symposium on High
Performance Liquid Phase Separations
and Related Techniques (HPLC 2019) will be
held 16–20 June 2019 at the Milano-Bicocca
University, Milan, Italy. This is the first time that
this symposium will be held in Italy.
The HPLC symposium series is the largest,
most recognized international forum on high performance liquid chromatography
(HPLC) and related techniques. It is the ideal location for industrial and academic
researchers to exchange information with other colleagues from all over the world.
Both fundamental and practical aspects of separation science will be covered
during the conference, with the main focus being on new, highly relevant trends
emerging in this field, cutting-edge applications, and innovation in the technology.
Among the many topics that will be covered at HPLC 2019, particular emphasis
will be given to hyphenated techniques, in particular liquid chromatography
coupled to mass spectrometry (LC–MS), design and characterization of
stationary phases, micro- and nano-fluidics, supercritical fluid chromatography
(SFC) and capillary electrophoresis (CE) and their applications in proteomics,
metabolomics, food analysis, and characterization of biopharmaceuticals and
biosimilars. HPLC 2019 will also feature some unique highlights, such as a
session entirely dedicated to HPLC for process analytical technology (PAT) and
quality assessment in preparative chromatography, and a session focusing on
high-performance thin-layer chromatography (HPTLC). A complete list of topics
can be found on the HPLC website.
Thanks to its multidisciplinary character, the symposium
represents an important source for analytical chemists,
biochemists, and engineers seeking practical solutions to
their problems. Researchers will be presenting their work
as lectures in topical scientific sessions or in exciting poster
sessions. We strongly encourage the active participation
of younger scientists in the symposium. A great amount
of effort has been made to guarantee low student fees,
including some special packages designed to give students
the opportunity to attend short courses taught by highly
reputed experts. We are offering 14 short courses on different topics, whose
description can be found online.
A series of awards will be presented during the conference, including the Csaba
Horváth Young Scientist Award, the Best Poster Award, the Uwe Neue Award,
and many more. In addition to the traditional awards, HPLC 2019 will feature new
exciting ideas to recognize the scientific activity of young colleagues, which will be
announced soon on the website and on social media.
A rich scientific and social programme awaits participants, starting with the
opening ceremony in the exclusive location of the “Giuseppe Verdi” Conservatorio
di Milano, the largest music academy in Italy and one of the most important
worldwide. A unique opening event merging music and science will celebrate the
genius of Leonardo da Vinci on the 500th anniversary of his death.
Milan is a cosmopolitan and vibrant centre of Italian culture. The various cultures
of northern Europe and Mediterranean countries merge and as such Milan has
a lot to offer, including art museums, history, opera (La Scala), music, fashion,
design, and Italian culinary delights.
Milan also offers a wide range of accommodation for all budgets, and with its
three international airports it is easily accessible by plane, and also by car or train
for those closer by.
The organizers look forward to welcoming participants in Milan in 2019!
E-mail: [email protected] Website: www.hplc2019-milan.org
EEVVEENNTT NNEEWWSSEVENT NEWS
LC•GC Europe March 2019158
powered by
www.chromacademy.com/hplc_troubleshooting.html
Try it now for FREE @
For more information contact:
Glen Murry: +1 732.346.3056 | [email protected]
Peter Romillo: +1 732.346.3074 | [email protected]
Jacqueline Robertson: +44 (0)1357 522961 | [email protected]
Become the lab expert with our interactive
Get answers fast. Reduce downtime. Increase efficiency.
HPLC Troubleshooter
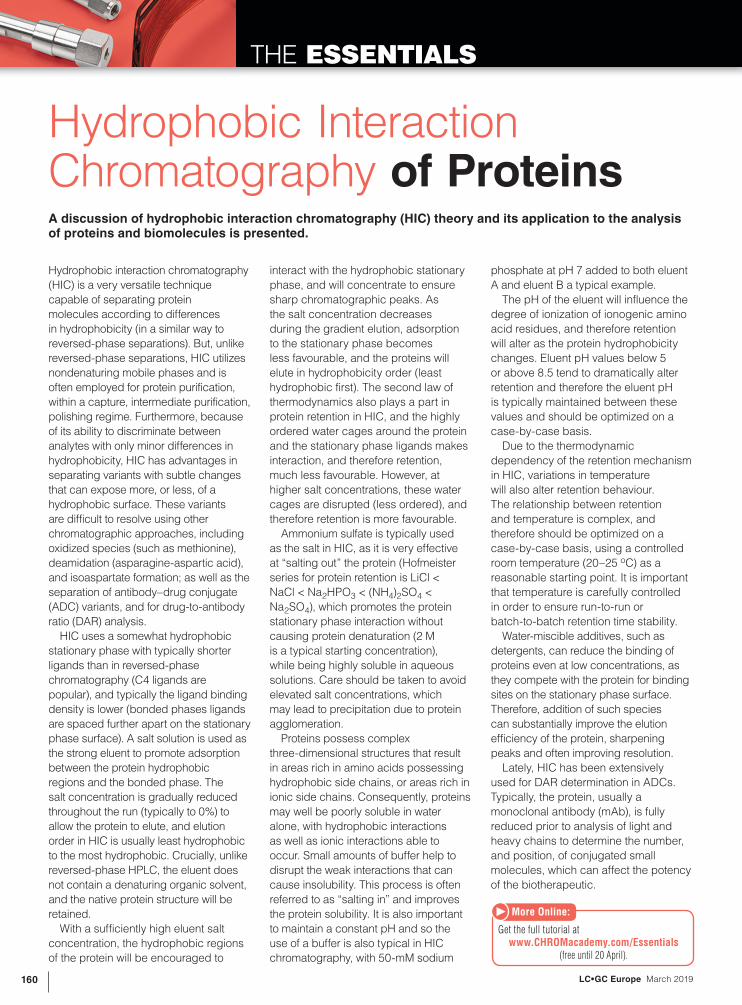
LC•GC Europe March 2019160
THE ESSENTIALS
Hydrophobic interaction chromatography
(HIC) is a very versatile technique
capable of separating protein
molecules according to differences
in hydrophobicity (in a similar way to
reversed-phase separations). But, unlike
reversed-phase separations, HIC utilizes
nondenaturing mobile phases and is
often employed for protein purification,
within a capture, intermediate purification,
polishing regime. Furthermore, because
of its ability to discriminate between
analytes with only minor differences in
hydrophobicity, HIC has advantages in
separating variants with subtle changes
that can expose more, or less, of a
hydrophobic surface. These variants
are difficult to resolve using other
chromatographic approaches, including
oxidized species (such as methionine),
deamidation (asparagine-aspartic acid),
and isoaspartate formation; as well as the
separation of antibody–drug conjugate
(ADC) variants, and for drug-to-antibody
ratio (DAR) analysis.
HIC uses a somewhat hydrophobic
stationary phase with typically shorter
ligands than in reversed-phase
chromatography (C4 ligands are
popular), and typically the ligand binding
density is lower (bonded phases ligands
are spaced further apart on the stationary
phase surface). A salt solution is used as
the strong eluent to promote adsorption
between the protein hydrophobic
regions and the bonded phase. The
salt concentration is gradually reduced
throughout the run (typically to 0%) to
allow the protein to elute, and elution
order in HIC is usually least hydrophobic
to the most hydrophobic. Crucially, unlike
reversed-phase HPLC, the eluent does
not contain a denaturing organic solvent,
and the native protein structure will be
retained.
With a sufficiently high eluent salt
concentration, the hydrophobic regions
of the protein will be encouraged to
interact with the hydrophobic stationary
phase, and will concentrate to ensure
sharp chromatographic peaks. As
the salt concentration decreases
during the gradient elution, adsorption
to the stationary phase becomes
less favourable, and the proteins will
elute in hydrophobicity order (least
hydrophobic first). The second law of
thermodynamics also plays a part in
protein retention in HIC, and the highly
ordered water cages around the protein
and the stationary phase ligands makes
interaction, and therefore retention,
much less favourable. However, at
higher salt concentrations, these water
cages are disrupted (less ordered), and
therefore retention is more favourable.
Ammonium sulfate is typically used
as the salt in HIC, as it is very effective
at “salting out” the protein (Hofmeister
series for protein retention is LiCl <
NaCl < Na2HPO3 < (NH4)2SO4 <
Na2SO4), which promotes the protein
stationary phase interaction without
causing protein denaturation (2 M
is a typical starting concentration),
while being highly soluble in aqueous
solutions. Care should be taken to avoid
elevated salt concentrations, which
may lead to precipitation due to protein
agglomeration.
Proteins possess complex
three-dimensional structures that result
in areas rich in amino acids possessing
hydrophobic side chains, or areas rich in
ionic side chains. Consequently, proteins
may well be poorly soluble in water
alone, with hydrophobic interactions
as well as ionic interactions able to
occur. Small amounts of buffer help to
disrupt the weak interactions that can
cause insolubility. This process is often
referred to as “salting in” and improves
the protein solubility. It is also important
to maintain a constant pH and so the
use of a buffer is also typical in HIC
chromatography, with 50-mM sodium
phosphate at pH 7 added to both eluent
A and eluent B a typical example.
The pH of the eluent will influence the
degree of ionization of ionogenic amino
acid residues, and therefore retention
will alter as the protein hydrophobicity
changes. Eluent pH values below 5
or above 8.5 tend to dramatically alter
retention and therefore the eluent pH
is typically maintained between these
values and should be optimized on a
case-by-case basis.
Due to the thermodynamic
dependency of the retention mechanism
in HIC, variations in temperature
will also alter retention behaviour.
The relationship between retention
and temperature is complex, and
therefore should be optimized on a
case-by-case basis, using a controlled
room temperature (20–25 oC) as a
reasonable starting point. It is important
that temperature is carefully controlled
in order to ensure run-to-run or
batch-to-batch retention time stability.
Water-miscible additives, such as
detergents, can reduce the binding of
proteins even at low concentrations, as
they compete with the protein for binding
sites on the stationary phase surface.
Therefore, addition of such species
can substantially improve the elution
efficiency of the protein, sharpening
peaks and often improving resolution.
Lately, HIC has been extensively
used for DAR determination in ADCs.
Typically, the protein, usually a
monoclonal antibody (mAb), is fully
reduced prior to analysis of light and
heavy chains to determine the number,
and position, of conjugated small
molecules, which can affect the potency
of the biotherapeutic.
Hydrophobic InteractionChromatography of ProteinsA discussion of hydrophobic interaction chromatography (HIC) theory and its application to the analysis of proteins and biomolecules is presented.
Get the full tutorial at www.CHROMacademy.com/Essentials
(free until 20 April).
More Online:
CONTENTS
THE APPLICATIONS
BOOK
Food and Beverage
163 Determination of Fatty Acid Esters of 2- and 3-Monochloro-1,2- propanediol (MCPD) and Glycidol in Edible Oil Using GC–MS TQ
Waldemar Weber, Shimadzu Europa GmbH
Medical/Biological
165 Separation and Identification of Non-Covalent Metal Complexes from Bacteria by HILIC–MS
Karen Scholz1, Matthias Baune1, Heiko Hayen1, and Wen Jiang2,
1Institute of Inorganic and Analytical Chemistry, University of Münster,
Münster, Germany, 2HILICON AB
167 Extraction of Loperamide and N-Desmethyl Loperamide from Blood Followed by LC–MS/MS Analysis
Tina Fanning, UCT, LLC
Pharmaceutical/Drug Discovery
168 Add More Confidence to Your UHPLC–MS AnalysisRudolf Köhling, Merck
169 Assessing Antibody ADCC Activity by Affinity HPLCTosoh Bioscience GmbH
170 Reversed-Phase Analyses of Monoclonal Antibodies Using High TemperaturesYMC Europe GmbH
General
172 Identifying Long-Chain and Short-Chain Branching in PolymersChris Deng, Wyatt Technology
Nic
ola
s F
ara
maz/s
tock.a
do
be.c
om
mach
ista
/sto
ck.a
do
be.c
om
p
hasin
/sto
ck.a
do
be.c
om
cassis
/sto
ck.a
do
be.c
om
F16
-ISO
10
0/s
tock.a
do
be.c
om
CONTENTS
162 THE APPLICATIONS BOOK – MARCH 2019
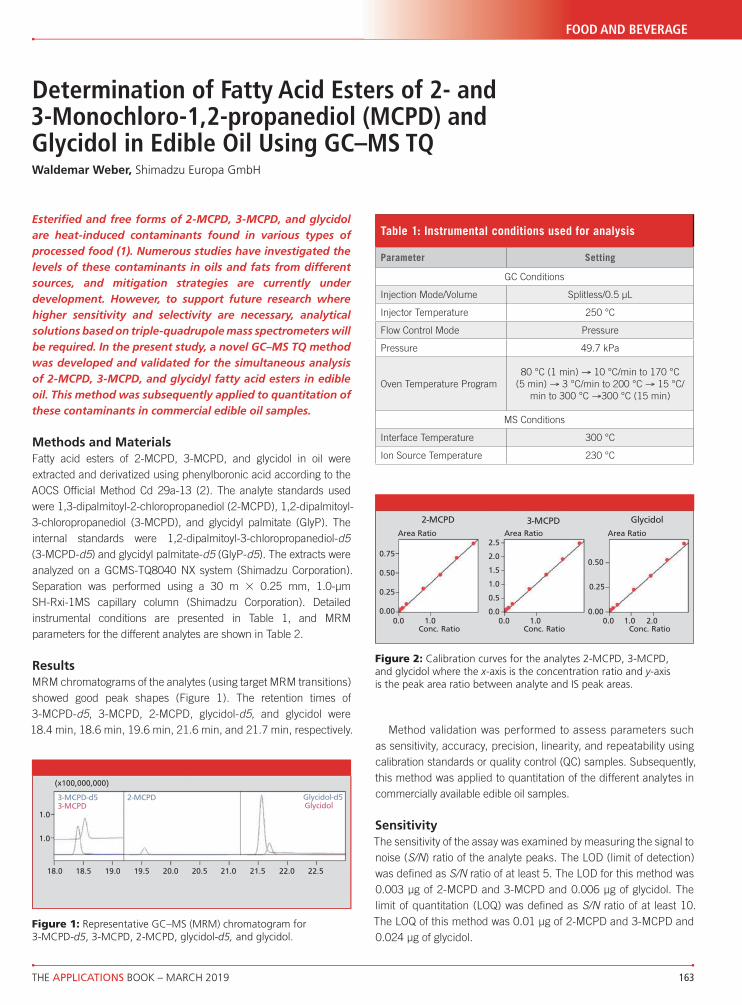
THE APPLICATIONS BOOK – MARCH 2019 163
FOOD AND BEVERAGE
Determination of Fatty Acid Esters of 2- and 3-Monochloro-1,2-propanediol (MCPD) and Glycidol in Edible Oil Using GC–MS TQWaldemar Weber, Shimadzu Europa GmbH
Esterifi ed and free forms of 2-MCPD, 3-MCPD, and glycidol
are heat-induced contaminants found in various types of
processed food (1). Numerous studies have investigated the
levels of these contaminants in oils and fats from different
sources, and mitigation strategies are currently under
development. However, to support future research where
higher sensitivity and selectivity are necessary, analytical
solutions based on triple-quadrupole mass spectrometers will
be required. In the present study, a novel GC–MS TQ method
was developed and validated for the simultaneous analysis
of 2-MCPD, 3-MCPD, and glycidyl fatty acid esters in edible
oil. This method was subsequently applied to quantitation of
these contaminants in commercial edible oil samples.
Methods and Materials
Fatty acid esters of 2-MCPD, 3-MCPD, and glycidol in oil were
extracted and derivatized using phenylboronic acid according to the
AOCS Offi cial Method Cd 29a-13 (2). The analyte standards used
were 1,3-dipalmitoyl-2-chloropropanediol (2-MCPD), 1,2-dipalmitoyl-
3-chloropropanediol (3-MCPD), and glycidyl palmitate (GlyP). The
internal standards were 1,2-dipalmitoyl-3-chloropropanediol-d5
(3-MCPD-d5) and glycidyl palmitate-d5 (GlyP-d5). The extracts were
analyzed on a GCMS-TQ8040 NX system (Shimadzu Corporation).
Separation was performed using a 30 m × 0.25 mm, 1.0-μm
SH-Rxi-1MS capillary column (Shimadzu Corporation). Detailed
instrumental conditions are presented in Table 1, and MRM
parameters for the different analytes are shown in Table 2.
Results
MRM chromatograms of the analytes (using target MRM transitions)
showed good peak shapes (Figure 1). The retention times of
3-MCPD-d5, 3-MCPD, 2-MCPD, glycidol-d5, and glycidol were
18.4 min, 18.6 min, 19.6 min, 21.6 min, and 21.7 min, respectively. Method validation was performed to assess parameters such
as sensitivity, accuracy, precision, linearity, and repeatability using
calibration standards or quality control (QC) samples. Subsequently,
this method was applied to quantitation of the different analytes in
commercially available edible oil samples.
Sensitivity
The sensitivity of the assay was examined by measuring the signal to
noise (S/N) ratio of the analyte peaks. The LOD (limit of detection)
was defi ned as S/N ratio of at least 5. The LOD for this method was
0.003 μg of 2-MCPD and 3-MCPD and 0.006 μg of glycidol. The
limit of quantitation (LOQ) was defi ned as S/N ratio of at least 10.
The LOQ of this method was 0.01 μg of 2-MCPD and 3-MCPD and
0.024 μg of glycidol.
(x100,000,000)
3-MCPD-d5 2-MCPD Glycidol-d5Glycidol3-MCPD
1.0
1.0
18.0 18.5 19.0 19.5 20.0 20.5 21.0 21.5 22.0 22.5
Figure 1: Representative GC–MS (MRM) chromatogram for
3-MCPD-d5, 3-MCPD, 2-MCPD, glycidol-d5, and glycidol.
2-MCPD
Area Ratio
0.75
0.50
0.50
0.250.25
0.00 0.000.0 1.0
2.5
2.0
1.5
1.0
0.5
0.00.0 0.01.0 1.0 2.0
Conc. Ratio Conc. Ratio Conc. Ratio
Area Ratio Area Ratio
3-MCPD Glycidol
Figure 2: Calibration curves for the analytes 2-MCPD, 3-MCPD,
and glycidol where the x-axis is the concentration ratio and y-axis
is the peak area ratio between analyte and IS peak areas.
Table 1: Instrumental conditions used for analysis
Parameter Setting
GC Conditions
Injection Mode/Volume Splitless/0.5 μL
Injector Temperature 250 °C
Flow Control Mode Pressure
Pressure 49.7 kPa
Oven Temperature Program
80 °C (1 min) A 10 °C/min to 170 °C
(5 min) A 3 °C/min to 200 °C A 15 °C/
min to 300 °C A300 °C (15 min)
MS Conditions
Interface Temperature 300 °C
Ion Source Temperature 230 °C
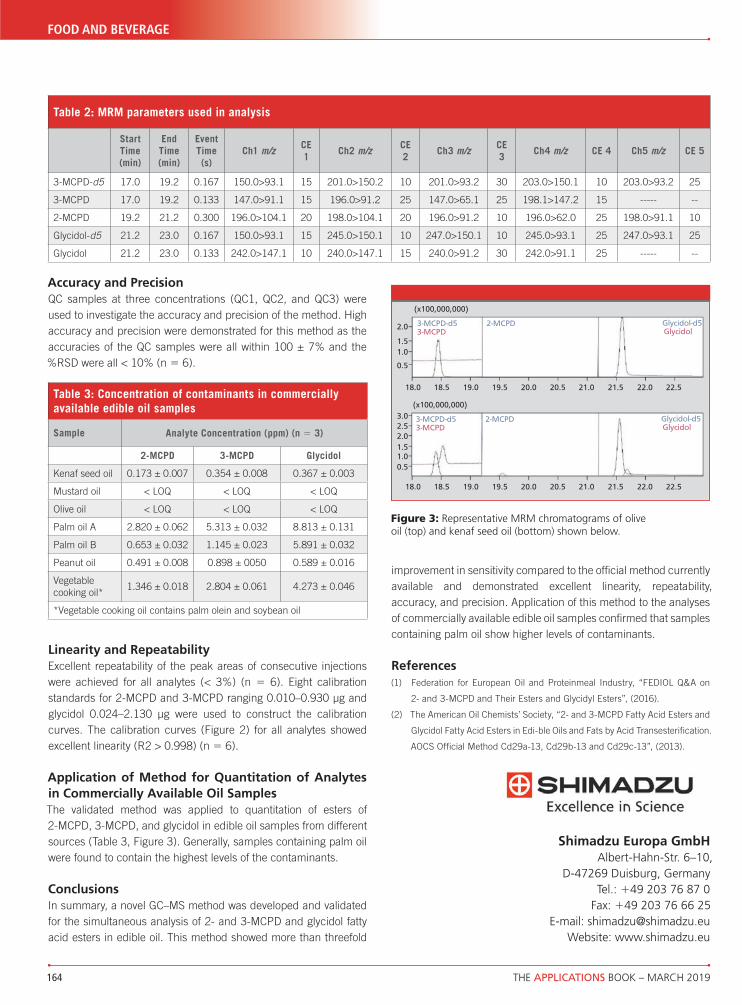
164 THE APPLICATIONS BOOK – MARCH 2019
FOOD AND BEVERAGE
Accuracy and Precision
QC samples at three concentrations (QC1, QC2, and QC3) were
used to investigate the accuracy and precision of the method. High
accuracy and precision were demonstrated for this method as the
accuracies of the QC samples were all within 100 ± 7% and the
%RSD were all < 10% (n = 6).
Linearity and Repeatability
Excellent repeatability of the peak areas of consecutive injections
were achieved for all analytes (< 3%) (n = 6). Eight calibration
standards for 2-MCPD and 3-MCPD ranging 0.010–0.930 μg and
glycidol 0.024–2.130 μg were used to construct the calibration
curves. The calibration curves (Figure 2) for all analytes showed
excellent linearity (R2 > 0.998) (n = 6).
Application of Method for Quantitation of Analytes
in Commercially Available Oil Samples
The validated method was applied to quantitation of esters of
2-MCPD, 3-MCPD, and glycidol in edible oil samples from different
sources (Table 3, Figure 3). Generally, samples containing palm oil
were found to contain the highest levels of the contaminants.
Conclusions
In summary, a novel GC–MS method was developed and validated
for the simultaneous analysis of 2- and 3-MCPD and glycidol fatty
acid esters in edible oil. This method showed more than threefold
improvement in sensitivity compared to the offi cial method currently
available and demonstrated excellent linearity, repeatability,
accuracy, and precision. Application of this method to the analyses
of commercially available edible oil samples confi rmed that samples
containing palm oil show higher levels of contaminants.
References
(1) Federation for European Oil and Proteinmeal Industry, “FEDIOL Q&A on
2- and 3-MCPD and Their Esters and Glycidyl Esters”, (2016).
(2) The American Oil Chemists’ Society, “2- and 3-MCPD Fatty Acid Esters and
Glycidol Fatty Acid Esters in Edi-ble Oils and Fats by Acid Transesterification.
AOCS Official Method Cd29a-13, Cd29b-13 and Cd29c-13”, (2013).
Shimadzu Europa GmbHAlbert-Hahn-Str. 6–10,
D-47269 Duisburg, Germany
Tel.: +49 203 76 87 0
Fax: +49 203 76 66 25
E-mail: [email protected]
Website: www.shimadzu.eu
(x100,000,000)
3-MCPD-d5 2-MCPD Glycidol-d5Glycidol3-MCPD
18.0 18.5 19.0 19.5 20.0 20.5 21.0 21.5 22.0 22.5
(x100,000,000)
3-MCPD-d5 2-MCPD Glycidol-d5Glycidol3-MCPD
18.0 18.5 19.0 19.5 20.0 20.5 21.0 21.5 22.0 22.5
2.0
1.5
1.0
0.5
3.0
2.5
2.0
1.51.0
0.5
Figure 3: Representative MRM chromatograms of olive
oil (top) and kenaf seed oil (bottom) shown below.
Table 2: MRM parameters used in analysis
Start
Time
(min)
End
Time
(min)
Event
Time
(s)
Ch1 m/zCE
1 Ch2 m/z
CE
2 Ch3 m/z
CE
3 Ch4 m/z CE 4 Ch5 m/z CE 5
3-MCPD-d5 17.0 19.2 0.167 150.0>93.1 15 201.0>150.2 10 201.0>93.2 30 203.0>150.1 10 203.0>93.2 25
3-MCPD 17.0 19.2 0.133 147.0>91.1 15 196.0>91.2 25 147.0>65.1 25 198.1>147.2 15 ----- --
2-MCPD 19.2 21.2 0.300 196.0>104.1 20 198.0>104.1 20 196.0>91.2 10 196.0>62.0 25 198.0>91.1 10
Glycidol-d5 21.2 23.0 0.167 150.0>93.1 15 245.0>150.1 10 247.0>150.1 10 245.0>93.1 25 247.0>93.1 25
Glycidol 21.2 23.0 0.133 242.0>147.1 10 240.0>147.1 15 240.0>91.2 30 242.0>91.1 25 ----- --
Table 3: Concentration of contaminants in commercially
available edible oil samples
Sample Analyte Concentration (ppm) (n = 3)
2-MCPD 3-MCPD Glycidol
Kenaf seed oil 0.173 ± 0.007 0.354 ± 0.008 0.367 ± 0.003
Mustard oil < LOQ < LOQ < LOQ
Olive oil < LOQ < LOQ < LOQ
Palm oil A 2.820 ± 0.062 5.313 ± 0.032 8.813 ± 0.131
Palm oil B 0.653 ± 0.032 1.145 ± 0.023 5.891 ± 0.032
Peanut oil 0.491 ± 0.008 0.898 ± 0050 0.589 ± 0.016
Vegetable
cooking oil*1.346 ± 0.018 2.804 ± 0.061 4.273 ± 0.046
*Vegetable cooking oil contains palm olein and soybean oil

THE APPLICATIONS BOOK – MARCH 2019 165
MEDICAL/BIOLOGICAL
Separation and Identifi cation of Non-Covalent Metal Complexes from Bacteria by HILIC–MSKaren Scholz1, Matthias Baune1, Heiko Hayen1, and Wen Jiang2, 1Institute of Inorganic
and Analytical Chemistry, University of Münster, Münster, Germany, 2HILICON AB
Pseudomonas bacteria are a genus of rod-shaped, ubiquitous, and
gram-negative bacteria, which are resistant against commonly used
antibiotics and disinfectants. Pseudomonads are able to survive
in extreme conditions (1) and are increasingly used as whole-cell
biocatalysts. The range of their biotechnological applications is not
limited by the toxicity of used chemicals because of their manifold
survival strategies (2).
Pseudomonads require iron(III) for metabolism and growth.
Under aerobic conditions, the iron(III) is almost insoluble and
the pseudomonas bacteria synthesize yellow-green fl uorescent
molecules called pyoverdines. These molecules can react with
iron(III) and form stable hexadentate iron(III)-complexes in the
extracellular space and transport the metal (1). The pyoverdines
consist of three structural parts: (i) chromophoric unit derived from
2,3-diamino-6,7-dihydroxyqunoline; (ii) strain specifi c peptide
moiety consisting of 6–14 proteinogenic and nonproteinogenic
amino acids; (iii) acyl side chain derived from malic acid, succinic
acid, their mono amides, α-ketoglutaric acid, or glutamic acid.
Pyoverdines are highly polar molecules that conventional
reversed-phase high performance liquid chromatography (HPLC) is
problematic due to insuffi cient retention. Furthermore, we intended
to separate and identify intact metal complexes in our study.
Hydrophilic interaction liquid chromatography (HILIC) is well suited
for the separation of polar compounds and enables the separation
of polar non-covalent metal species (3,4). In this study, we aimed
to use a charge modulated HILIC stationary phase (iHILIC®-Fusion)
to separate different siderophores of the Pseudomonas taiwanensis
VLB120 bacteria.
Experimental
LC–MS System: Agilent 1100er LC system and Q Exactive™ Plus
Hybrid Quadrupole-Orbitrap™ mass spectrometer, equipped with a
Figure 1: Structures of siderophores produced by P. taiwanensis VLB120: four pyoverdines with an acyl side chain derived from
malic acid (1), succinic acid (2), malic acid amide (3), succinic acid amide (4); one pyoverdine (5) with proline in the peptide moiety.
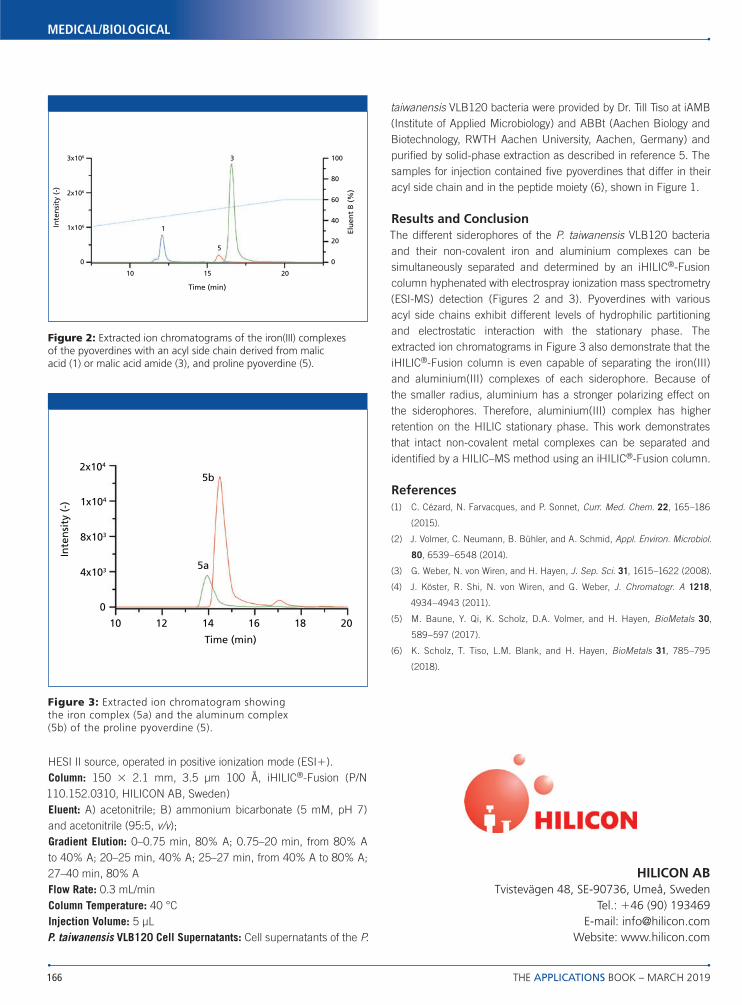
166 THE APPLICATIONS BOOK – MARCH 2019
MEDICAL/BIOLOGICAL
HESI II source, operated in positive ionization mode (ESI+).
Column: 150 × 2.1 mm, 3.5 μm 100 Å, iHILIC®-Fusion (P/N
110.152.0310, HILICON AB, Sweden)
Eluent: A) acetonitrile; B) ammonium bicarbonate (5 mM, pH 7)
and acetonitrile (95:5, v/v);
Gradient Elution: 0–0.75 min, 80% A; 0.75–20 min, from 80% A
to 40% A; 20–25 min, 40% A; 25–27 min, from 40% A to 80% A;
27–40 min, 80% A
Flow Rate: 0.3 mL/min
Column Temperature: 40 °C
Injection Volume: 5 μL
P. taiwanensis VLB120 Cell Supernatants: Cell supernatants of the P.
taiwanensis VLB120 bacteria were provided by Dr. Till Tiso at iAMB
(Institute of Applied Microbiology) and ABBt (Aachen Biology and
Biotechnology, RWTH Aachen University, Aachen, Germany) and
purifi ed by solid-phase extraction as described in reference 5. The
samples for injection contained fi ve pyoverdines that differ in their
acyl side chain and in the peptide moiety (6), shown in Figure 1.
Results and Conclusion
The different siderophores of the P. taiwanensis VLB120 bacteria
and their non-covalent iron and aluminium complexes can be
simultaneously separated and determined by an iHILIC®-Fusion
column hyphenated with electrospray ionization mass spectrometry
(ESI-MS) detection (Figures 2 and 3). Pyoverdines with various
acyl side chains exhibit different levels of hydrophilic partitioning
and electrostatic interaction with the stationary phase. The
extracted ion chromatograms in Figure 3 also demonstrate that the
iHILIC®-Fusion column is even capable of separating the iron(III)
and aluminium(III) complexes of each siderophore. Because of
the smaller radius, aluminium has a stronger polarizing effect on
the siderophores. Therefore, aluminium(III) complex has higher
retention on the HILIC stationary phase. This work demonstrates
that intact non-covalent metal complexes can be separated and
identifi ed by a HILIC–MS method using an iHILIC®-Fusion column.
References
(1) C. Cézard, N. Farvacques, and P. Sonnet, Curr. Med. Chem. 22, 165–186
(2015).
(2) J. Volmer, C. Neumann, B. Bühler, and A. Schmid, Appl. Environ. Microbiol.
80, 6539–6548 (2014).
(3) G. Weber, N. von Wiren, and H. Hayen, J. Sep. Sci. 31, 1615–1622 (2008).
(4) J. Köster, R. Shi, N. von Wiren, and G. Weber, J. Chromatogr. A 1218,
4934–4943 (2011).
(5) M. Baune, Y. Qi, K. Scholz, D.A. Volmer, and H. Hayen, BioMetals 30,
589–597 (2017).
(6) K. Scholz, T. Tiso, L.M. Blank, and H. Hayen, BioMetals 31, 785–795
(2018).
HILICON ABTvistevägen 48, SE-90736, Umeå, Sweden
Tel.: +46 (90) 193469
E-mail: [email protected]
Website: www.hilicon.com
3x10⁶
Time (min)
3
5
0
20
20
40
60
80
100
1510
0
11x106
2x10⁶
Inte
nsi
ty (
-)
Elu
en
t B
(%
)
2x10⁴
1x10⁴
8x10³
4x10³
0
5b
5a
10 12 14 16 18 20
Time (min)
Inte
nsi
ty (
-)
Figure 2: Extracted ion chromatograms of the iron(III) complexes
of the pyoverdines with an acyl side chain derived from malic
acid (1) or malic acid amide (3), and proline pyoverdine (5).
Figure 3: Extracted ion chromatogram showing
the iron complex (5a) and the aluminum complex
(5b) of the proline pyoverdine (5).
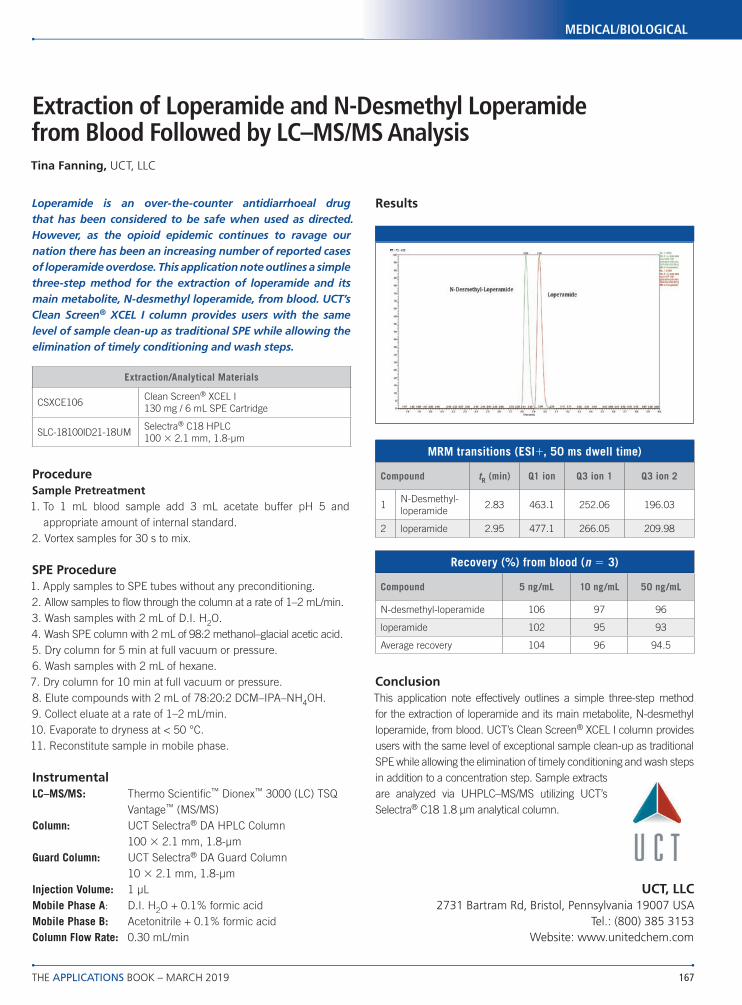
THE APPLICATIONS BOOK – MARCH 2019 167
MEDICAL/BIOLOGICAL
Extraction of Loperamide and N-Desmethyl Loperamide from Blood Followed by LC–MS/MS AnalysisTina Fanning, UCT, LLC
Loperamide is an over-the-counter antidiarrhoeal drug
that has been considered to be safe when used as directed.
However, as the opioid epidemic continues to ravage our
nation there has been an increasing number of reported cases
of loperamide overdose. This application note outlines a simple
three-step method for the extraction of loperamide and its
main metabolite, N-desmethyl loperamide, from blood. UCT’s
Clean Screen® XCEL I column provides users with the same
level of sample clean-up as traditional SPE while allowing the
elimination of timely conditioning and wash steps.
Procedure
Sample Pretreatment
1. To 1 mL blood sample add 3 mL acetate buffer pH 5 and
appropriate amount of internal standard.
2. Vortex samples for 30 s to mix.
SPE Procedure
1. Apply samples to SPE tubes without any preconditioning.
2. Allow samples to fl ow through the column at a rate of 1–2 mL/min.
3. Wash samples with 2 mL of D.I. H2O.
4. Wash SPE column with 2 mL of 98:2 methanol–glacial acetic acid.
5. Dry column for 5 min at full vacuum or pressure.
6. Wash samples with 2 mL of hexane.
7. Dry column for 10 min at full vacuum or pressure.
8. Elute compounds with 2 mL of 78:20:2 DCM–IPA–NH4OH.
9. Collect eluate at a rate of 1–2 mL/min.
10. Evaporate to dryness at < 50 °C.
11. Reconstitute sample in mobile phase.
Instrumental
LC–MS/MS: Thermo Scientifi c™ Dionex™ 3000 (LC) TSQ
Vantage™ (MS/MS)
Column: UCT Selectra® DA HPLC Column
100 × 2.1 mm, 1.8-μm
Guard Column: UCT Selectra® DA Guard Column
10 × 2.1 mm, 1.8-μm
Injection Volume: 1 μL
Mobile Phase A: D.I. H2O + 0.1% formic acid
Mobile Phase B: Acetonitrile + 0.1% formic acid
Column Flow Rate: 0.30 mL/min
Results
Conclusion
This application note effectively outlines a simple three-step method
for the extraction of loperamide and its main metabolite, N-desmethyl
loperamide, from blood. UCT’s Clean Screen® XCEL I column provides
users with the same level of exceptional sample clean-up as traditional
SPE while allowing the elimination of timely conditioning and wash steps
in addition to a concentration step. Sample extracts
are analyzed via UHPLC–MS/MS utilizing UCT’s
Selectra® C18 1.8 μm analytical column.
UCT, LLC2731 Bartram Rd, Bristol, Pennsylvania 19007 USA
Tel.: (800) 385 3153
Website: www.unitedchem.com
Extraction/Analytical Materials
CSXCE106Clean Screen® XCEL I
130 mg / 6 mL SPE Cartridge
SLC-18100ID21-18UMSelectra® C18 HPLC
100 × 2.1 mm, 1.8-μm
MRM transitions (ESI+, 50 ms dwell time)
Compound tR (min) Q1 ion Q3 ion 1 Q3 ion 2
1N-Desmethyl-
loperamide2.83 463.1 252.06 196.03
2 loperamide 2.95 477.1 266.05 209.98
Recovery (%) from blood (n = 3)
Compound 5 ng/mL 10 ng/mL 50 ng/mL
N-desmethyl-loperamide 106 97 96
loperamide 102 95 93
Average recovery 104 96 94.5
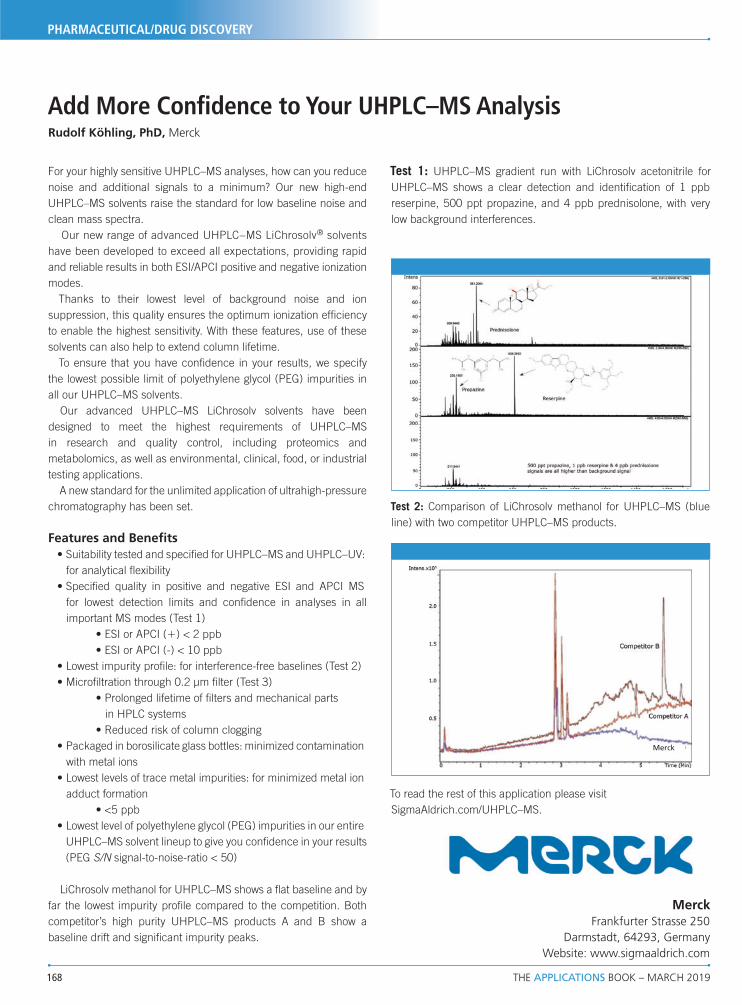
168 THE APPLICATIONS BOOK – MARCH 2019
PHARMACEUTICAL/DRUG DISCOVERY
Add More Confi dence to Your UHPLC–MS AnalysisRudolf Köhling, PhD, Merck
For your highly sensitive UHPLC–MS analyses, how can you reduce
noise and additional signals to a minimum? Our new high-end
UHPLC–MS solvents raise the standard for low baseline noise and
clean mass spectra.
Our new range of advanced UHPLC–MS LiChrosolv® solvents
have been developed to exceed all expectations, providing rapid
and reliable results in both ESI/APCI positive and negative ionization
modes.
Thanks to their lowest level of background noise and ion
suppression, this quality ensures the optimum ionization effi ciency
to enable the highest sensitivity. With these features, use of these
solvents can also help to extend column lifetime.
To ensure that you have confi dence in your results, we specify
the lowest possible limit of polyethylene glycol (PEG) impurities in
all our UHPLC–MS solvents.
Our advanced UHPLC–MS LiChrosolv solvents have been
designed to meet the highest requirements of UHPLC–MS
in research and quality control, including proteomics and
metabolomics, as well as environmental, clinical, food, or industrial
testing applications.
A new standard for the unlimited application of ultrahigh-pressure
chromatography has been set.
Features and Benefi ts
• Suitability tested and specifi ed for UHPLC–MS and UHPLC–UV:
for analytical fl exibility
• Specifi ed quality in positive and negative ESI and APCI MS
for lowest detection limits and confi dence in analyses in all
important MS modes (Test 1)
• ESI or APCI (+) < 2 ppb
• ESI or APCI (-) < 10 ppb
• Lowest impurity profi le: for interference-free baselines (Test 2)
• Microfi ltration through 0.2 μm fi lter (Test 3)
• Prolonged lifetime of fi lters and mechanical parts
in HPLC systems
• Reduced risk of column clogging
• Packaged in borosilicate glass bottles: minimized contamination
with metal ions
• Lowest levels of trace metal impurities: for minimized metal ion
adduct formation
• <5 ppb
• Lowest level of polyethylene glycol (PEG) impurities in our entire
UHPLC–MS solvent lineup to give you confi dence in your results
(PEG S/N signal-to-noise-ratio < 50)
LiChrosolv methanol for UHPLC–MS shows a fl at baseline and by
far the lowest impurity profi le compared to the competition. Both
competitor’s high purity UHPLC–MS products A and B show a
baseline drift and signifi cant impurity peaks.
Test 1: UHPLC–MS gradient run with LiChrosolv acetonitrile for
UHPLC–MS shows a clear detection and identifi cation of 1 ppb
reserpine, 500 ppt propazine, and 4 ppb prednisolone, with very
low background interferences.
Test 2: Comparison of LiChrosolv methanol for UHPLC–MS (blue
line) with two competitor UHPLC–MS products.
To read the rest of this application please visit
SigmaAldrich.com/UHPLC–MS.
MerckFrankfurter Strasse 250
Darmstadt, 64293, Germany
Website: www.sigmaaldrich.com
Merck

THE APPLICATIONS BOOK – MARCH 2019 169
PHARMACEUTICAL/DRUG DISCOVERY
Assessing Antibody ADCC Activity by Affi nity HPLCTosoh Bioscience GmbH
Antibody-dependent cell-mediated cytotoxicity (ADCC)
is a crucial mechanism of action (MoA) of anti-tumour
therapeutic antibodies and FcγIIIa receptor plays a key role
in this process by interacting with the N-glycans of IgG Fc
regions. Hence, affi nity chromatography on Fc receptor
ligands can deliver valuable information about expected
ADCC activity and mAb glycoform distribution.
A new HPLC column, TSKgel FcR-IIIA-NPR, is based on a
recombinant FcaIIIa receptor ligand and allows fast assessment of
biologic activity of monoclonal antibodies (mAbs). As Fc-glycans
of antibodies are known to play an important role in Fc-mediated
interactions, the separation pattern of mAbs on TSKgel FcR-IIIA-NPR
can be correlated to FC-glycans as well (1). Terminal galactose
residues increase affi nity to FcaRIIIa while core fucose residues
reduce it. This correlates with the known infl uence of galactose and
fucose on antibody-dependent cell-mediated cytotoxicity (ADCC)
activity. Accordingly, early eluting peaks of TSKgel FcR-IIIA-NPR
represent glycoforms with low ADCC activity, while late eluting
peaks represent glycoforms with high ADCC activity (Figure 1).
Separation of mAb Glycoforms
Figure 2 demonstrates the specifi city of the recombinant FcaRIIIA
ligand for N-glycans of the Fc domain of mAbs. Adalimumab
analyzed with TSKgel FcR-IIIA-NPR shows a typical pattern of three
peaks, corresponding with the molecule’s glycan heterogeneity.
Treatment of adalimumab with PNGase F de-glycosylates the
sample. De-glycosylated adalimumab does not bind to TSKgel
FcR-IIIA-NPR; the N-glycan related peaks are absent.
HPLC Conditions
Column: TSKgel FcR-IIIA-NPR (4.6 mm × 7.5 cm L, 5-μm)
Mobile Phase: A: 50 mmol/L sodium citrate, pH 6.5;
B: 50 mmol/L sodium citrate, pH 4.5
Flow Rate: 1 mL/min
Temp.: 25 °C
Detection: UV @ 280 nm
Sample: 50 μL of adalimumab or PNGase F treated
adalimumab (1 μg/μL)
Conclusion
A rapid 30-min separation on TSKgel FcR-IIIA-NPR allows the analysis
of large numbers of mAb samples to gain valuable fi rst information on
the distribution of glycoforms and expected ADCC activity. This fast and
effi cient method can be applied to purifi ed samples and supernatant
alike and can be used in many phases of development and production
such as cell line screening in early R&D, biosimilar or originator
comparison, upstream development and optimization, monitoring of
glycoengineering, or lot-to-lot comparison in QC.
Reference
(1) M. Kiyoshi et al., Sci. Rep. 8, 3955 (2018) doi:10:1038/s41598-018-
22199-8
TSKgel is a registered trademark of Tosoh Corporation
Tosoh Bioscience GmbHIm Leuschnerpark 4 64347 Griesheim, Darmstadt, Germany
Tel: +49 6155 7043700 Fax: +49 6155 8357900
E-mail: [email protected]
Website: www.tosohbioscience.de
0 5 10 15 20
Retention Time (min)
Low activityHigh activity
Mid activity
AB
S 280 n
m
10 15 20 35 300
2×10⁵
4×10⁵
6×10⁵
8×10⁵
1×10⁶
0
2×10⁵
4×10⁵
6×10⁵
8×10⁵
1×10⁶
0
20
40
60
Asn
% B
80
100
Detector Respon
se (A
U)
Detector Respon
se (A
U)
Retention Time (min)
Adalimumab
10 15 20 35 300
20
40
60
% B
80
100
Retention Time (min)
Column: TSKgel FcR-IIIA-NPR
Mobile phase A: 50 mmol/L citrate, pH 6.5
Mobile phase B: 50 mmol/L citrate, pH 4.5
Flow rate: 1 mL/min
Detection: UV @ 280 nm
Sample: 50 μL of adalimumab or PNGase F treated adalimumab (1 μg/μL)
Adalimumab treated
with PNGase F
Glycans (+)
Glycans (-)
Figure 1: Separation of mAb glycoforms according
to their affi nity to Fc receptor/ADCC activity.
Figure 2: Analysis of adalimumab and de-glycosylated adalimumab
(Data kindly provided by Leila Ghaleh, TU Darmstadt).
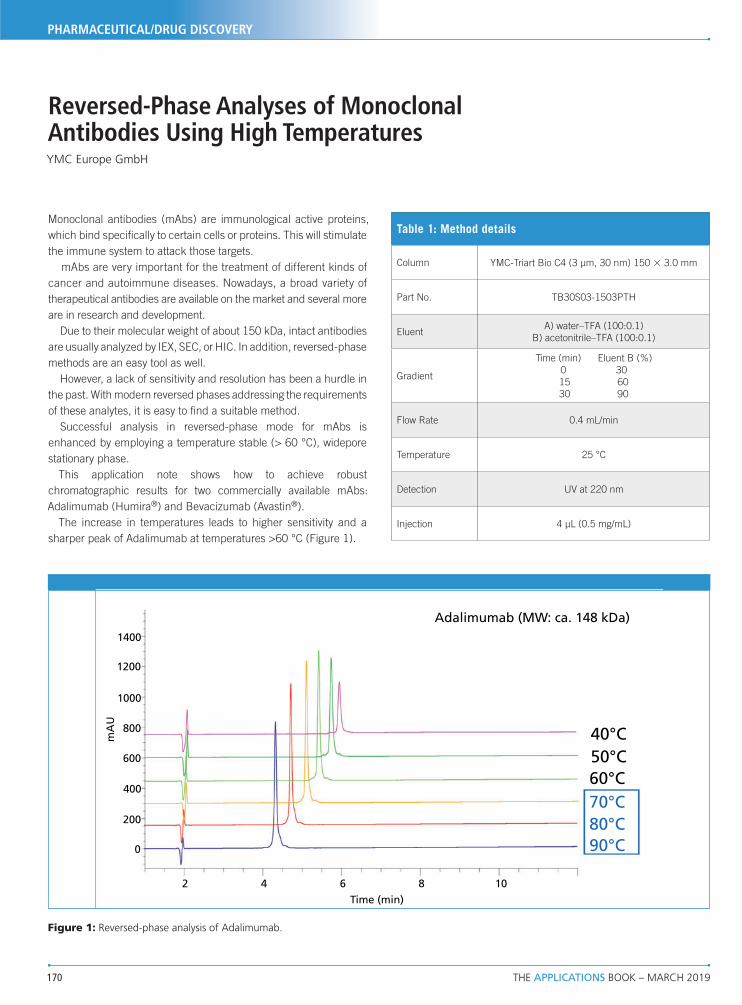
170 THE APPLICATIONS BOOK – MARCH 2019
PHARMACEUTICAL/DRUG DISCOVERY
Reversed-Phase Analyses of Monoclonal Antibodies Using High TemperaturesYMC Europe GmbH
Monoclonal antibodies (mAbs) are immunological active proteins,
which bind specifi cally to certain cells or proteins. This will stimulate
the immune system to attack those targets.
mAbs are very important for the treatment of different kinds of
cancer and autoimmune diseases. Nowadays, a broad variety of
therapeutical antibodies are available on the market and several more
are in research and development.
Due to their molecular weight of about 150 kDa, intact antibodies
are usually analyzed by IEX, SEC, or HIC. In addition, reversed-phase
methods are an easy tool as well.
However, a lack of sensitivity and resolution has been a hurdle in
the past. With modern reversed phases addressing the requirements
of these analytes, it is easy to fi nd a suitable method.
Successful analysis in reversed-phase mode for mAbs is
enhanced by employing a temperature stable (> 60 °C), widepore
stationary phase.
This application note shows how to achieve robust
chromatographic results for two commercially available mAbs:
Adalimumab (Humira®) and Bevacizumab (Avastin®).
The increase in temperatures leads to higher sensitivity and a
sharper peak of Adalimumab at temperatures >60 °C (Figure 1).
1400
1200
1000
800
600
200
400
0
2 4 6 8 10
Time (min)
mA
U
40°C
Adalimumab (MW: ca. 148 kDa)
50°C
60°C
70°C
80°C
90°C
Figure 1: Reversed-phase analysis of Adalimumab.
Table 1: Method details
Column YMC-Triart Bio C4 (3 μm, 30 nm) 150 × 3.0 mm
Part No. TB30S03-1503PTH
EluentA) water–TFA (100:0.1)
B) acetonitrile–TFA (100:0.1)
Gradient
Time (min) Eluent B (%)
0 30
15 60
30 90
Flow Rate 0.4 mL/min
Temperature 25 °C
Detection UV at 220 nm
Injection 4 μL (0.5 mg/mL)
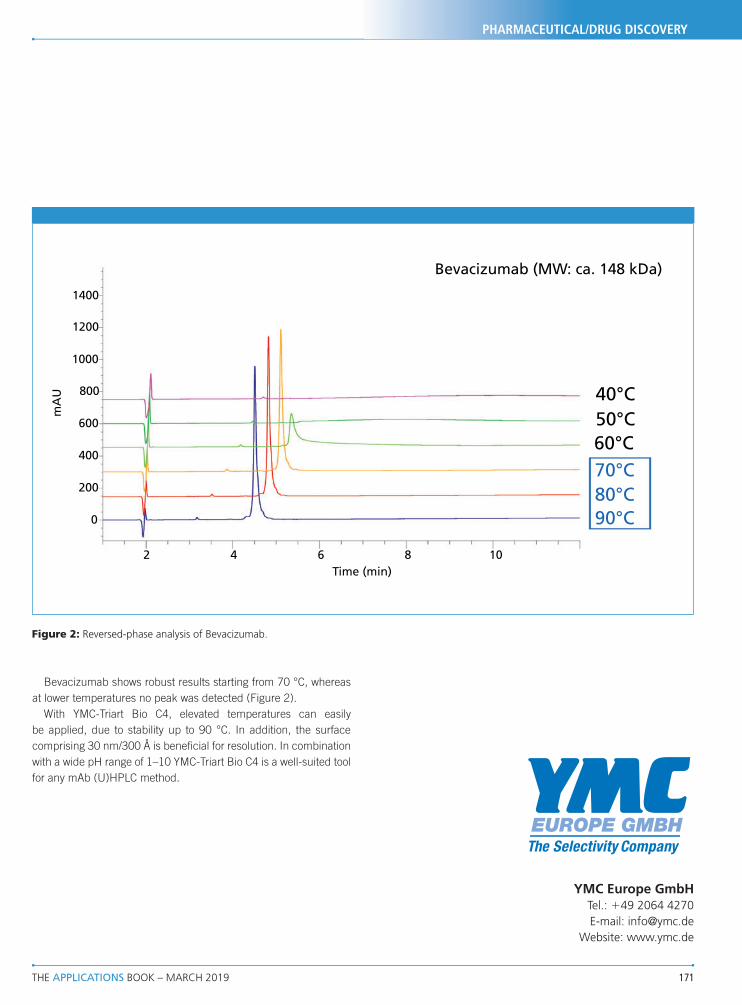
THE APPLICATIONS BOOK – MARCH 2019 171
PHARMACEUTICAL/DRUG DISCOVERY
Bevacizumab shows robust results starting from 70 °C, whereas
at lower temperatures no peak was detected (Figure 2).
With YMC-Triart Bio C4, elevated temperatures can easily
be applied, due to stability up to 90 °C. In addition, the surface
comprising 30 nm/300 Å is benefi cial for resolution. In combination
with a wide pH range of 1–10 YMC-Triart Bio C4 is a well-suited tool
for any mAb (U)HPLC method.
YMC Europe GmbHTel.: +49 2064 4270
E-mail: [email protected]
Website: www.ymc.de
1400
1200
1000
800
600
200
400
0
2 4 6 8 10
Time (min)
mA
U 40°C
50°C
60°C
70°C
80°C
90°C
Bevacizumab (MW: ca. 148 kDa)
Figure 2: Reversed-phase analysis of Bevacizumab.
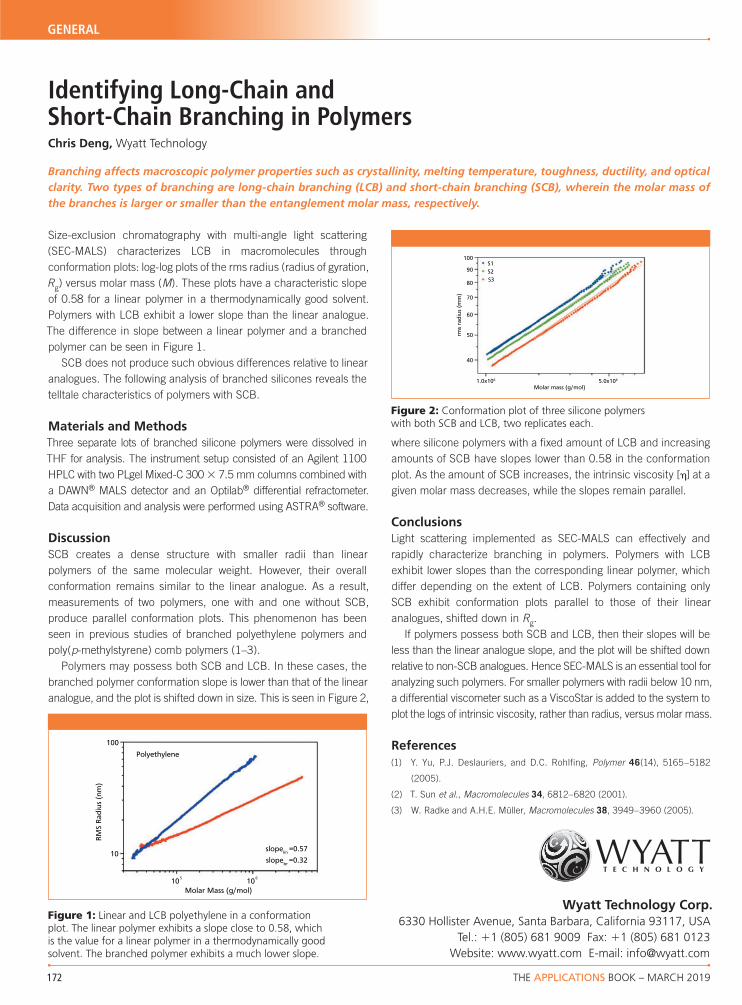
172 THE APPLICATIONS BOOK – MARCH 2019
GENERAL
Identifying Long-Chain and Short-Chain Branching in PolymersChris Deng, Wyatt Technology
Branching affects macroscopic polymer properties such as crystallinity, melting temperature, toughness, ductility, and optical
clarity. Two types of branching are long-chain branching (LCB) and short-chain branching (SCB), wherein the molar mass of
the branches is larger or smaller than the entanglement molar mass, respectively.
Wyatt Technology Corp.6330 Hollister Avenue, Santa Barbara, California 93117, USA
Tel.: +1 (805) 681 9009 Fax: +1 (805) 681 0123
Website: www.wyatt.com E-mail: [email protected]
Size-exclusion chromatography with multi-angle light scattering
(SEC-MALS) characterizes LCB in macromolecules through
conformation plots: log-log plots of the rms radius (radius of gyration,
Rg) versus molar mass (M). These plots have a characteristic slope
of 0.58 for a linear polymer in a thermodynamically good solvent.
Polymers with LCB exhibit a lower slope than the linear analogue.
The difference in slope between a linear polymer and a branched
polymer can be seen in Figure 1.
SCB does not produce such obvious differences relative to linear
analogues. The following analysis of branched silicones reveals the
telltale characteristics of polymers with SCB.
Materials and Methods
Three separate lots of branched silicone polymers were dissolved in
THF for analysis. The instrument setup consisted of an Agilent 1100
HPLC with two PLgel Mixed-C 300 × 7.5 mm columns combined with
a DAWN® MALS detector and an Optilab® differential refractometer.
Data acquisition and analysis were performed using ASTRA® software.
Discussion
SCB creates a dense structure with smaller radii than linear
polymers of the same molecular weight. However, their overall
conformation remains similar to the linear analogue. As a result,
measurements of two polymers, one with and one without SCB,
produce parallel conformation plots. This phenomenon has been
seen in previous studies of branched polyethylene polymers and
poly(p-methylstyrene) comb polymers (1–3).
Polymers may possess both SCB and LCB. In these cases, the
branched polymer conformation slope is lower than that of the linear
analogue, and the plot is shifted down in size. This is seen in Figure 2,
where silicone polymers with a fixed amount of LCB and increasing
amounts of SCB have slopes lower than 0.58 in the conformation
plot. As the amount of SCB increases, the intrinsic viscosity [η] at a
given molar mass decreases, while the slopes remain parallel.
Conclusions
Light scattering implemented as SEC-MALS can effectively and
rapidly characterize branching in polymers. Polymers with LCB
exhibit lower slopes than the corresponding linear polymer, which
differ depending on the extent of LCB. Polymers containing only
SCB exhibit conformation plots parallel to those of their linear
analogues, shifted down in Rg.
If polymers possess both SCB and LCB, then their slopes will be
less than the linear analogue slope, and the plot will be shifted down
relative to non-SCB analogues. Hence SEC-MALS is an essential tool for
analyzing such polymers. For smaller polymers with radii below 10 nm,
a differential viscometer such as a ViscoStar is added to the system to
plot the logs of intrinsic viscosity, rather than radius, versus molar mass.
References
(1) Y. Yu, P.J. Deslauriers, and D.C. Rohlfing, Polymer 46(14), 5165–5182
(2005).
(2) T. Sun et al., Macromolecules 34, 6812–6820 (2001).
(3) W. Radke and A.H.E. Müller, Macromolecules 38, 3949–3960 (2005).
100
10
10 10
Polyethylene
Molar Mass (g/mol)
slopelin
=0.57
slopebr
=0.32
RMS R
ad
ius
(nm
)
5 6
Figure 1: Linear and LCB polyethylene in a conformation
plot. The linear polymer exhibits a slope close to 0.58, which
is the value for a linear polymer in a thermodynamically good
solvent. The branched polymer exhibits a much lower slope.
100
90
80
70
60
50rms
rad
ius
(mm
)
S1
S2
S3
1.0x10⁶
Molar mass (g/mol)5.0x106
40
Figure 2: Conformation plot of three silicone polymers
with both SCB and LCB, two replicates each.

iHILIC -Fusion®
advances HILIC separations in UHPLC and HPLC
HILICONHILICON
μ Excellent durability and ultra-low bleeding for LC-MS
μ iHILIC -Fusion(P): pH 1-10; 5 μm ®
μ iHILIC -Fusion and iHILIC -Fusion(+): pH 2-8; 1.8, 3.5, and 5 μm® ®
μ Charge modulated hydroxyethyl amide/amide HILIC columns
μ Versatile columns for ”Omics” studies and other applications
μ Three complementary selectivities for separation of polar compounds
For more information:
Email: [email protected] | Website: www.hilicon.com© 2019 HILICON AB. All rights reserved. | iHILIC is a registered trademark of HILICON AB, Sweden
®
iHILIC -Fusion®
iHILIC -Fusion(+)®
iHILIC -Fusion(P)®
Silica based Silica based Polymer based
N
NHN
O
NH2
O
OH
OH
N
OO
NH
COOH
O
HN
CONH2
HO
NH
O
OH
O
HN
N
OHO
HN
OOH
NHO
N
O
OH5 proline pyoverdin

www.gerstel.com
3-MCPD? 2-MCPD? Glycidol?
Automated determination of contaminants in edible oil and fat based on ISO 18363-1, AOCS Cd 29c-13, and DGF C-VI 18 (10):
O WorkStation Sample Prep Solution or
O Complete automation incl. GC/MS
O Evaporation step for lowest limits of determination and best system stability
O�Analytical support at your service
Samples are automatically prepared and analyzed, including derivatization and evaporation of excess solvent and reagent for best limits of determination and optimal GC/MS system stability.
What can we do for you?