HST FUV Observations of Brightest Cluster Galaxies: The Role of Star Formation in Cooling Flows and...
17
arXiv:1006.3796v1 [astro-ph.CO] 18 Jun 2010 DRAFT VERSION J UNE 22, 2010 Preprint typeset using L A T E X style emulateapj v. 11/10/09 HST FUV OBSERVATIONS OF BRIGHTEST CLUSTER GALAXIES: THE ROLE OF STAR FORMATION IN COOLING FLOWS AND BCG EVOLUTION KIERAN P. O’DEA,ALICE C. QUILLEN Department of Physics and Astronomy, University of Rochester, Rochester, NY 14627, USA CHRISTOPHER P. O’DEA,GRANT R. TREMBLAY,BRADFORD T. SNIOS,STEFI A. BAUM,KEVIN CHRISTIANSEN,JACOB NOEL-STORR Rochester Institute of Technology, 84 Lomb Memorial Drive, Rochester, NY 14623, USA ALASTAIR C. EDGE Institute for Computational Cosmology, Department of Physics, Durham University, Durham DH1 3LE, Great Britain AND MEGAN DONAHUE AND G. MARK VOIT Michigan State University, Physics and Astronomy Dept., East Lansing, MI 48824, USA Draft version June 22, 2010 ABSTRACT Quillen et al and O’Dea et al carried out a Spitzer study of a sample of 62 brightest cluster galaxies (BCGs) from the ROSAT brightest cluster sample chosen based on their elevated Hα flux. We present Hubble Space Telescope Advanced Camera for Surveys (ACS) far ultraviolet (FUV) images of the Lyα and continuum emis- sion of the luminous emission-line nebulae in 7 BCGs found to have an Infrared excess. We confirm that the BCGs are actively forming stars suggesting that the IR excess seen in these BCGs is indeed associated with star formation. Our observations are consistent with a scenario in which gas which cools from the ICM fuels the star formation. The FUV continuum emission extends over a region ∼ 7 - 28 kpc (largest linear size) and even larger in Lyα. The young stellar population required by the FUV observations would produce a significant fraction of the ionizing photons required to power the emission line nebulae. Star formation rates estimated from the FUV continuum range from ∼ 3 to ∼ 14 times lower than those estimated from the infrared, however both the Balmer decrement in the central few arcseconds and detection of CO in most of these galaxies imply that there are regions of high extinction that could have absorbed much of the FUV continuum. Analysis of archival VLA observations reveals compact radio sources in all seven BCGs and kpc scale jets in A 1835 and RXJ 2129+00. The four galaxies with archival deep Chandra observations exhibit asymmetric X-ray emission, the peaks of which are offset from the center of the BCG by ∼ 10 kpc on average. A low feedback state for the AGN could allow increased condensation of the hot gas into the center of the galaxy and the feeding of star formation. Subject headings: galaxies:clusters — galaxies:active — stars:formation 1. INTRODUCTION The assembly of rich, X-ray luminous galaxy clusters is such that the largest baryonic mass fraction of the system is occupied by hot T ∼ 10 7 - 10 8 K gas pervading the intraclus- ter medium (ICM). In the central regions (r 10 - 100 kpc) of many clusters, the time scale for this gas to cool to T 10 4 K can be shorter than the cluster lifetime (e.g., Cowie & Binney 1977; Fabian & Nulsen 1977; Edge et al. 1992), giving rise to a subsonic, pressure-driven cooling flow that deposits mass onto the luminous and massive cD elliptical galaxy at the cluster center. “Cool core” clusters such as these often ex- hibit intense optical emission line nebulae associated with these central brightest cluster galaxies (BCGs). The nebulae exhibit extended Lyα emission (Hu 1992) and far UV con- tinuum emission (O’Dea et al. 2004). A previous study of two BCGs, Abell 1795 and Abell 2597 (O’Dea et al. 2004), found that the nebula exhibited both a diffuse component of Lyα and more compact features such as knots and filaments. The Lyα emission was closely tied to the radio morphology suggesting that star formation and associated ionization was present at the edges of radio lobes. That work demonstrated how Lyα and far-ultraviolet continuum observations provide unique constraints on the physical properties of the nebulae in clusters. The far-UV continuum together with optical and infrared observations constrain the star formation history and the properties of young stars associated with the nebula. The Lyα to Hα or Hβ flux ratio is a diagnostic of ionization, metal and dust content (Ferland & Osterbrock 1985; Binette et al. 1993). Previous optical and UV observations have found evi- dence for significant star formation in some BCGs in cool core clusters (Johnstone & Fabian 1987; Romanishin 1987; McNamara & O’Connell 1989, 1993; McNamara 2004; McNamara et al. 2004; Hu 1992; Crawford & Fabian 1993; Hansen et al. 1995; Allen 1995; Smith et al. 1997; Cardiel et al. 1998; Hutchings & Balogh 2000; Oegerle et al. 2001; Mittaz et al. 2001; O’Dea et al. 2004; Hicks & Mushotzky 2005; Rafferty et al. 2006; Bildfell et al. 2008; Loubser et al. 2009; Pipino et al. 2009). Nearly all BCGs with young stellar populations are in cooling flows (Bildfell et al. 2008; Loubser et al. 2009). However, some BCGs in cooling flows do not have significant star formation (Quillen et al. 2008; Loubser et al. 2009). Hence BCGs exhibiting elevated rates of star formation could be those
Transcript of HST FUV Observations of Brightest Cluster Galaxies: The Role of Star Formation in Cooling Flows and...

arX
iv:1
006.
3796
v1 [
astr
o-ph
.CO
] 18
Jun
201
0DRAFT VERSIONJUNE 22, 2010Preprint typeset using LATEX style emulateapj v. 11/10/09
HSTFUV OBSERVATIONS OF BRIGHTEST CLUSTER GALAXIES: THE ROLE OFSTAR FORMATION IN COOLINGFLOWS AND BCG EVOLUTION
K IERAN P. O’DEA, ALICE C. QUILLENDepartment of Physics and Astronomy, University of Rochester, Rochester, NY 14627, USA
CHRISTOPHERP. O’DEA, GRANT R. TREMBLAY, BRADFORD T. SNIOS, STEFI A. BAUM , KEVIN CHRISTIANSEN, JACOB NOEL-STORRRochester Institute of Technology, 84 Lomb Memorial Drive,Rochester, NY 14623, USA
ALASTAIR C. EDGEInstitute for Computational Cosmology, Department of Physics, Durham University, Durham DH1 3LE, Great Britain
AND
MEGAN DONAHUE AND G. MARK VOITMichigan State University, Physics and Astronomy Dept., East Lansing, MI 48824, USA
Draft version June 22, 2010
ABSTRACTQuillen et al and O’Dea et al carried out a Spitzer study of a sample of 62 brightest cluster galaxies (BCGs)
from the ROSAT brightest cluster sample chosen based on their elevated Hα flux. We presentHubble SpaceTelescopeAdvanced Camera for Surveys (ACS) far ultraviolet (FUV) images of the Lyα and continuum emis-sion of the luminous emission-line nebulae in 7 BCGs found tohave an Infrared excess. We confirm that theBCGs are actively forming stars suggesting that the IR excess seen in these BCGs is indeed associated withstar formation. Our observations are consistent with a scenario in which gas which cools from the ICM fuelsthe star formation. The FUV continuum emission extends overa region∼ 7− 28 kpc (largest linear size) andeven larger in Lyα. The young stellar population required by the FUV observations would produce a significantfraction of the ionizing photons required to power the emission line nebulae. Star formation rates estimatedfrom the FUV continuum range from∼ 3 to∼ 14 times lower than those estimated from the infrared, howeverboth the Balmer decrement in the central few arcseconds and detection of CO in most of these galaxies implythat there are regions of high extinction that could have absorbed much of the FUV continuum. Analysis ofarchival VLA observations reveals compact radio sources inall seven BCGs and kpc scale jets in A 1835 andRXJ 2129+00. The four galaxies with archival deepChandraobservations exhibit asymmetric X-ray emission,the peaks of which are offset from the center of the BCG by∼ 10 kpc on average. A low feedback state forthe AGN could allow increased condensation of the hot gas into the center of the galaxy and the feeding of starformation.Subject headings:galaxies:clusters — galaxies:active — stars:formation
1. INTRODUCTION
The assembly of rich, X-ray luminous galaxy clusters issuch that the largest baryonic mass fraction of the system isoccupied by hotT ∼ 107 − 108 K gas pervading the intraclus-ter medium (ICM). In the central regions (r . 10−100 kpc) ofmany clusters, the time scale for this gas to cool toT . 104 Kcan be shorter than the cluster lifetime (e.g., Cowie & Binney1977; Fabian & Nulsen 1977; Edge et al. 1992), giving rise toa subsonic, pressure-driven cooling flow that deposits massonto the luminous and massive cD elliptical galaxy at thecluster center. “Cool core” clusters such as these often ex-hibit intense optical emission line nebulae associated withthese central brightest cluster galaxies (BCGs). The nebulaeexhibit extended Lyα emission (Hu 1992) and far UV con-tinuum emission (O’Dea et al. 2004). A previous study oftwo BCGs, Abell 1795 and Abell 2597 (O’Dea et al. 2004),found that the nebula exhibited both a diffuse component ofLyα and more compact features such as knots and filaments.The Lyα emission was closely tied to the radio morphologysuggesting that star formation and associated ionization waspresent at the edges of radio lobes. That work demonstratedhow Lyα and far-ultraviolet continuum observations provide
unique constraints on the physical properties of the nebulaein clusters. The far-UV continuum together with optical andinfrared observations constrain the star formation history andthe properties of young stars associated with the nebula. TheLyα to Hα or Hβ flux ratio is a diagnostic of ionization, metaland dust content (Ferland & Osterbrock 1985; Binette et al.1993).
Previous optical and UV observations have found evi-dence for significant star formation in some BCGs in coolcore clusters (Johnstone & Fabian 1987; Romanishin 1987;McNamara & O’Connell 1989, 1993; McNamara 2004;McNamara et al. 2004; Hu 1992; Crawford & Fabian1993; Hansen et al. 1995; Allen 1995; Smith et al.1997; Cardiel et al. 1998; Hutchings & Balogh 2000;Oegerle et al. 2001; Mittaz et al. 2001; O’Dea et al. 2004;Hicks & Mushotzky 2005; Rafferty et al. 2006; Bildfell et al.2008; Loubser et al. 2009; Pipino et al. 2009). Nearly allBCGs with young stellar populations are in cooling flows(Bildfell et al. 2008; Loubser et al. 2009). However, someBCGs in cooling flows do not have significant star formation(Quillen et al. 2008; Loubser et al. 2009). Hence BCGsexhibiting elevated rates of star formation could be those

2 O’DEA ET AL.
Table 1HSTObservation Log
Source RA Dec z kpc/′′ Line/Cont Filter
Abell 11 00:12:33.87 -16:28:07.7 0.151 2.60 Line F125LPCont. F150LP
Abell 1664 13:03:42.52 -24:14:43.8 0.128 2.26 Line F125LPCont. F150LP
Abell 1835 14:01:02.10 +02:52:42.8 0.253 3.91 Line F140LPCont. F165LP
ZWCL 348 01:06:49.39 +01:03:22.7 0.254 3.92 Line F140LPCont. F165LP
ZWCL 3146 10:23:39.62 +04:11:10.8 0.290 4.32 Line F140LPCont. F165LP
ZWCL 8193 17:17:19.21 +42:26:59.9 0.175 2.94 Line F140LPCont. F150LP
RXJ 2129+00 21:29:39.96 +00:05:21.2 0.235 3.70 Line F140LPCont. F165LP
Note. — HSTobservations obtained under program 11230 (PI: O’Dea). Theexposure time ineach long pass filter was 1170s. Positions are given in degrees for epoch J2000 and are measuredfrom radio source positions in archival VLA data at 8.5 or 5 GHz. See Table 2 for a summary of thearchival radio images.
experiencing a low level of feedback from the AGN. Evi-dence for residual cooling can be inferred from the reservoirsof cold gas found in BCGs. Alternatively, star formationcould also be attributed to stripping from a gas rich galaxy(Holtzman et al. 1996). Recent estimates of condensationand star formations rates show that in a few systems they arein near agreement (e.g., O’Dea et al. 2008). Recent worksuggests that star formation tends to occur when the centralcooling time drops below a critical value (Rafferty et al.2008; Voit et al. 2008; Cavagnolo et al. 2008). In our studyof 62 BCGs with the Spitzer IRAC and MIPS we found thatabout half of the BCGs in our sample showed evidence formid-IR emission produced by star formation (Quillen et al.2008). The IR emission was typically unresolved by the 8arcsec (FWHM) PSF of MIPS at 24µm.
In this study we enlarge the sample of objects studiedby O’Dea et al. (2004) to include more distant BCGs andthose with higher star formation rates (estimated in the IR).Brightest cluster galaxies with high Hα luminosities werechosen from the ROSAT Brightest Cluster Sample (BCS,Ebeling et al. 1998). Their Hα luminosities are in the range1042–1043 erg s−1. These galaxies have been observed withtheSpitzer Space Telescope(Quillen et al. 2008; O’Dea et al.2008). The FUVHSTobservations presented here allow us toconfirm that on-going star formation is present in the BCGsand to determine its spatial scale and morphology (subject todust extinction). Throughout this paper we useH0 = 71 kms−1 Mpc−1, ΩM = 0.27, andΩΛ = 0.73.
2. OBSERVATIONS
2.1. FUV continuum and Lyα images
Observations were obtained with the Solar Blind Channel(SBC) MAMA detector of the Advanced Camera for Surveys(ACS) (Clampin et al. 2004) on theHubble Space Telescope(HST) during cycle 11 (program 11230, PI: O’Dea). Eachgalaxy was observed in two long pass filters, the one contain-ing the Lyα line, the other redward of this line to measurethe continuum. The F140LP filter containing the Lyα linewas used for all galaxies except the nearer BCGs, Abell 11and Abell 1664, which were observed using the F125LP fil-ter. The continuum filter chosen was F140LP for objects withredshiftz< 0.11 , F150LP for objects with redshift 0.11<
z < 0.19 (ZWCL8193, Abell 11, and Abell 1664) and theF165LP filter for the remaining objects with 0.19< z< 0.31(Abell 1835, ZWCL348, RXJ 2129+00, ZWCL3146). Ob-servations were obtained using a 3 point position dither. Theexposure time in each filter was 1170s so that the observationsin the two filters was approximately oneHSTorbit per galaxy.Observations were taken between March 2008 and February2009. The long pass filters, F125LP, F140LP, F150LP, andF165LP, have pivot wavelengths of 1438, 1527, 1611 and1758 Å, respectively, and similar maximum wavelengths of2000 Å but minimum or cut-off wavelengths of 1250, 1370,1470 and 1650 Å respectively. The pixel scale for the SBCis approximately 0.′′034× 0.′′030/pixel. The camera field ofview is 34.′′6 × 30.′′8. These FUV observations are summa-rized in Table 1.
The ACS/SBC images were reduced with the ACS calibra-tion pipeline producing calibrated drizzled images. Contin-uum images were shifted to the position of the line imagesand subtracted from the line images after multiplication byanadjusted corrective factor larger than 1 to take into accountthe additional continuum photons present in the line images.Our procedure was to increase the correction factor until re-gions of the image became negative. FUV and continuumsubtracted Lyα images are shown in Figures 1-7. The fluxesof the continuum subtracted Lyα are given in Table 3.
2.2. Comparison images
Observed at the same time were optical images with theWPFC2 camera on boardHSTusing the broad band F606Wfilter for Abell 1664, ZWCL 8193 and RXJ 2129.6+0005.Visible broad band images observed with WFPC2 were avail-able from the Hubble Legacy Archive for the remaining galax-ies in either the F702W filter (Abell 1835) or the F606W filter(ZWCL 348, ZWCL 3146, and Abell 11). The broad band op-tical images are shown for comparison in Figures 1-7.
We have overlayed 3µm continuum observations as con-tours in Figures 1-7 on the FUV continuum images. Theseimages were taken with the IRAC camera on theSpitzerSpace Telescopeand are described by Egami et al. (2006);Quillen et al. (2008). We find that the FUV and Lyα emis-sion is located near the center of the brightest cluster galaxiesas seen at 3µm.
STAR FORMATION IN BCG COOLING FLOWS 3
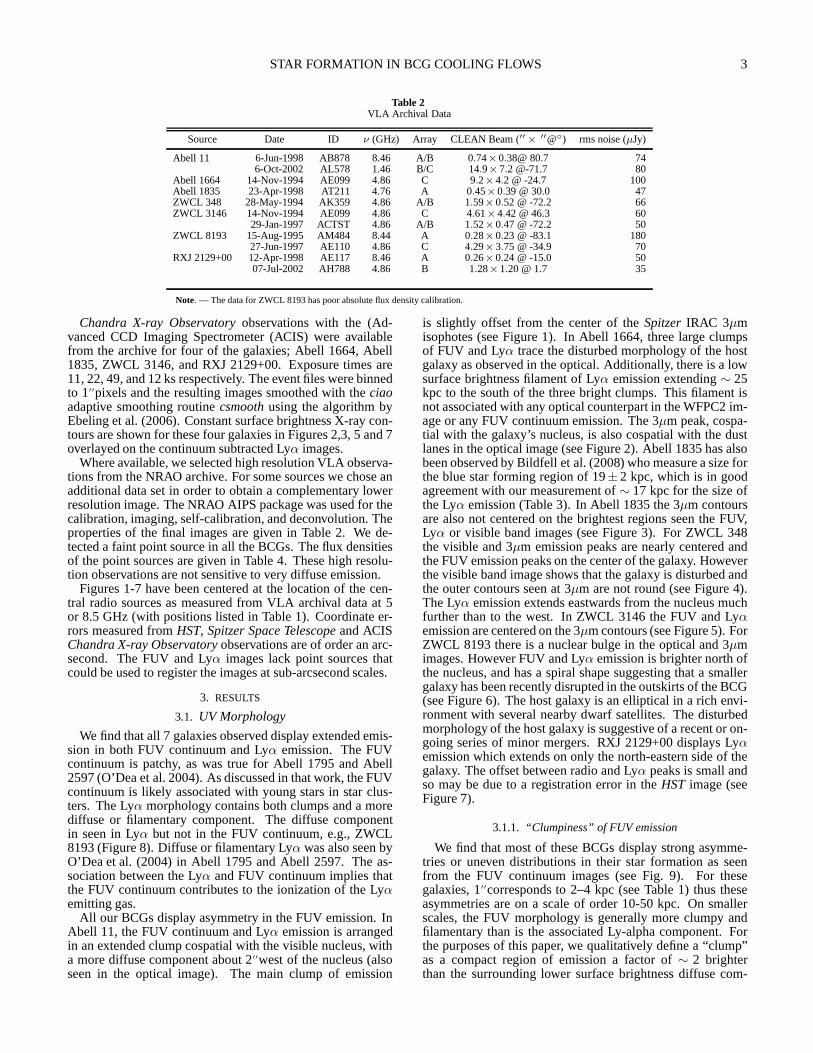
Table 2VLA Archival Data
Source Date ID ν (GHz) Array CLEAN Beam (′′ × ′′@) rms noise (µJy)
Abell 11 6-Jun-1998 AB878 8.46 A/B 0.74×0.38@ 80.7 746-Oct-2002 AL578 1.46 B/C 14.9×7.2 @-71.7 80
Abell 1664 14-Nov-1994 AE099 4.86 C 9.2×4.2 @ -24.7 100Abell 1835 23-Apr-1998 AT211 4.76 A 0.45×0.39 @ 30.0 47ZWCL 348 28-May-1994 AK359 4.86 A/B 1.59×0.52 @ -72.2 66ZWCL 3146 14-Nov-1994 AE099 4.86 C 4.61×4.42 @ 46.3 60
29-Jan-1997 ACTST 4.86 A/B 1.52×0.47 @ -72.2 50ZWCL 8193 15-Aug-1995 AM484 8.44 A 0.28×0.23 @ -83.1 180
27-Jun-1997 AE110 4.86 C 4.29×3.75 @ -34.9 70RXJ 2129+00 12-Apr-1998 AE117 8.46 A 0.26×0.24 @ -15.0 50
07-Jul-2002 AH788 4.86 B 1.28×1.20 @ 1.7 35
Note. — The data for ZWCL 8193 has poor absolute flux density calibration.
Chandra X-ray Observatoryobservations with the (Ad-vanced CCD Imaging Spectrometer (ACIS) were availablefrom the archive for four of the galaxies; Abell 1664, Abell1835, ZWCL 3146, and RXJ 2129+00. Exposure times are11, 22, 49, and 12 ks respectively. The event files were binnedto 1′′pixels and the resulting images smoothed with theciaoadaptive smoothing routinecsmoothusing the algorithm byEbeling et al. (2006). Constant surface brightness X-ray con-tours are shown for these four galaxies in Figures 2,3, 5 and 7overlayed on the continuum subtracted Lyα images.
Where available, we selected high resolution VLA observa-tions from the NRAO archive. For some sources we chose anadditional data set in order to obtain a complementary lowerresolution image. The NRAO AIPS package was used for thecalibration, imaging, self-calibration, and deconvolution. Theproperties of the final images are given in Table 2. We de-tected a faint point source in all the BCGs. The flux densitiesof the point sources are given in Table 4. These high resolu-tion observations are not sensitive to very diffuse emission.
Figures 1-7 have been centered at the location of the cen-tral radio sources as measured from VLA archival data at 5or 8.5 GHz (with positions listed in Table 1). Coordinate er-rors measured fromHST, Spitzer Space Telescopeand ACISChandra X-ray Observatoryobservations are of order an arc-second. The FUV and Lyα images lack point sources thatcould be used to register the images at sub-arcsecond scales.
3. RESULTS
3.1. UV Morphology
We find that all 7 galaxies observed display extended emis-sion in both FUV continuum and Lyα emission. The FUVcontinuum is patchy, as was true for Abell 1795 and Abell2597 (O’Dea et al. 2004). As discussed in that work, the FUVcontinuum is likely associated with young stars in star clus-ters. The Lyα morphology contains both clumps and a morediffuse or filamentary component. The diffuse componentin seen in Lyα but not in the FUV continuum, e.g., ZWCL8193 (Figure 8). Diffuse or filamentary Lyα was also seen byO’Dea et al. (2004) in Abell 1795 and Abell 2597. The as-sociation between the Lyα and FUV continuum implies thatthe FUV continuum contributes to the ionization of the Lyαemitting gas.
All our BCGs display asymmetry in the FUV emission. InAbell 11, the FUV continuum and Lyα emission is arrangedin an extended clump cospatial with the visible nucleus, witha more diffuse component about 2′′west of the nucleus (alsoseen in the optical image). The main clump of emission
is slightly offset from the center of theSpitzerIRAC 3µmisophotes (see Figure 1). In Abell 1664, three large clumpsof FUV and Lyα trace the disturbed morphology of the hostgalaxy as observed in the optical. Additionally, there is a lowsurface brightness filament of Lyα emission extending∼ 25kpc to the south of the three bright clumps. This filament isnot associated with any optical counterpart in the WFPC2 im-age or any FUV continuum emission. The 3µm peak, cospa-tial with the galaxy’s nucleus, is also cospatial with the dustlanes in the optical image (see Figure 2). Abell 1835 has alsobeen observed by Bildfell et al. (2008) who measure a size forthe blue star forming region of 19±2 kpc, which is in goodagreement with our measurement of∼ 17 kpc for the size ofthe Lyα emission (Table 3). In Abell 1835 the 3µm contoursare also not centered on the brightest regions seen the FUV,Lyα or visible band images (see Figure 3). For ZWCL 348the visible and 3µm emission peaks are nearly centered andthe FUV emission peaks on the center of the galaxy. Howeverthe visible band image shows that the galaxy is disturbed andthe outer contours seen at 3µm are not round (see Figure 4).The Lyα emission extends eastwards from the nucleus muchfurther than to the west. In ZWCL 3146 the FUV and Lyαemission are centered on the 3µm contours (see Figure 5). ForZWCL 8193 there is a nuclear bulge in the optical and 3µmimages. However FUV and Lyα emission is brighter north ofthe nucleus, and has a spiral shape suggesting that a smallergalaxy has been recently disrupted in the outskirts of the BCG(see Figure 6). The host galaxy is an elliptical in a rich envi-ronment with several nearby dwarf satellites. The disturbedmorphology of the host galaxy is suggestive of a recent or on-going series of minor mergers. RXJ 2129+00 displays Lyαemission which extends on only the north-eastern side of thegalaxy. The offset between radio and Lyα peaks is small andso may be due to a registration error in theHST image (seeFigure 7).
3.1.1. “Clumpiness” of FUV emission
We find that most of these BCGs display strong asymme-tries or uneven distributions in their star formation as seenfrom the FUV continuum images (see Fig. 9). For thesegalaxies, 1′′corresponds to 2–4 kpc (see Table 1) thus theseasymmetries are on a scale of order 10-50 kpc. On smallerscales, the FUV morphology is generally more clumpy andfilamentary than is the associated Ly-alpha component. Forthe purposes of this paper, we qualitatively define a “clump”as a compact region of emission a factor of∼ 2 brighterthan the surrounding lower surface brightness diffuse com-

4 O’DEA ET AL.
Table 3Lyα & FUV Continuum Properties
Aperture Radius Cont. Sub. Lyα Flux FUV Flux L.A.S. Lyα L.A.S. FUVSource (′′) (10−14 erg cm−2 s−1) (10−14 erg cm−2 s−1) arcsec (kpc) arcsec (kpc) Morphology
Abell 11 2.0 8.8±0.3 18.9±0.2 5.5 (14.5) 4.5 (11.7) Lopsided, clumpy FUV, similar LyαAbell 1664 3.0 7.7±0.4 39.8±0.2 18.0 (40.7) 12.2 (27.6) Very clumpy & patchy, long filament to SAbell 1835 2.0 14.4±0.3 22.9±0.2 4.3 (17.0) 3.8 (14.8) Symmetric “core”, outer filamentsZWCL 348 2.0 9.9±0.3 11.8±0.3 6.4 (24.8) 3.3 (12.9) Clumpy, patchy, lopsidedZWCL 3146 3.0 9.3±0.3 17.7±0.2 6.5 (28.1) 5.1 (22.0) More symmetric, diffuseZWCL 8193 2.0 6.3±0.4 42.8±0.2 10.8 (31.8) 8.8 (25.8) Clumpy, filamentary, lopsidedRXJ 2129+00 2.0 1.9±0.7 2.1±0.7 4.1 (15.3) 2.0 (7.4) Lyα lopsided “shell”, FUV faint
Note. — Fluxes were measured using aperture photometry and an aperture that covers the bulk of the emission visible in Figures1-7. Errors are from count rate statistics. Ingeneral, the morphologies of the Lyα and FUV continuum emission were generally similar (unless otherwise noted), and the FUV emission typically spanned a slightly smaller linearextent than did the Lyα as it is less diffuse and extended. See the associated discussion in Section 3.
ponent. Abell 11, 1664, ZWCL 8193, and RXJ 2129+00may be described as “clump-dominated”, in which the ma-jority (> 50%) of the FUV flux is associated with compact(< 2 kpc) bright clumps. For example, the majority of FUVemission in Abell 11 is associated with three bright clumps,the largest of which (the northern-most clump) extends∼ 0.6kpc. The three bright clumps together contribute>∼ 60% ofthe total FUV flux from the source. The FUV morphology ofRXJ 2129+00 is almost entirely associated with three small(∼ 0.5 kpc) clumps, and appears to lack a diffuse component.For Abell 1835, ZWCL 348, and ZWCL 3146, the distinctionbetween clumpy FUV emission and the diffuse component isless clear, and the flux seems to more gradually peak towardthe center than, for example, ZWCL 8193. Note also thatthese galaxies are vastly more symmetric on> 20 kpc scalesthan are the “clump-dominated” BCGs.
The high star formation rates of the galaxies studied herecompared to others in the ROSAT BCG sample may be re-lated to the large scale X-ray structure. We will discuss thisin more detail later. Comparisons between Lyα and existingHα images (not shown) suggest that there are large variationsin emission line ratio. This can be explained either by patchyextinction or with shocks, affecting the intrinsic line ratios.
McNamara (1997) classified the morphology of star form-ing regions in cooling core BCGs (studied using mainlyground based optical observations) into four classes - point,disk, lobe, and amorphous. McNamara (1997) noted that thedisks were very rare and that the amorphous morphologiesare the most common. All of the seven BCGs studied herefall in the amorphous class. Why are disks so rare? We notethat the star formation occurs over a large spatial scale (7-28 kpc). One possibility is that the stars form before the gascan collapse into a disk. In addition, studies of the kinemat-ics of the optical emission line nebulae in cool core BCGsfind that the gas motions are mostly turbulent with very lit-tle organized rotation (e.g., Heckman et al. 1989; Baum et al.1992; Wilman et al. 2006, 2009). Thus, the lack of star form-ing disks may reflect the lack of systematic rotation in the starforming gas.
i
3.1.2. Radio Emission
We detect a compact radio point source in all seven of theBCGs. In ZWCL 8193 the radio point source is 3 arcsec fromthe center of the BCG at the location of FUV-bright debrisfeatures and may be associated with a merging galaxy (Figure6). The flux densities and spectral indexes of the unresolvedemission are given in Table 4. We find that the spectral in-
dexes of the point sources are steep. This suggests that thepoint sources are not flat spectrum parsec scale beamed jets,but are possibly extended on at least tens of parsec scales.We also include FIRST (Becker et al. 1995) flux densities andNVSS (Condon et al. 1998) flux densities and powers in Table4. The FIRST (∼ 5 arcsec) and NVSS (∼ 45 arcsec) flux den-sities are in good agreement indicating that there is very littleadditional flux density on scales between 5 and 45 arcsec. Themean value of the NVSS log powers for the seven BCGs is logPν = 24.33; while A1795 is log Pν = 24.87 and A2597 is logPν = 25.42. The radio powers for the seven BCGs are typicalfor our sample of 62 (Quillen et al. 2008; O’Dea et al. 2008).
We detect faint jets in RXJ 2129+00 and Abell 1835. InRXJ 2129+00 the jet extends about 1 arcsec to the SE of thecore and has a flux density of 1.9 mJy at 8.46 GHz. The jet inAbell 1835 has a total extent of about 1.5 arcsec, and seems tostart initially oriented to the West but then curves toward theNW. The jet flux density is 2.3 mJy at 4.76 GHz. For thesetwo we have overlayed radio contours on the images show-ing Lyα emission so the orientation of the radio emission canbe seen. In neither galaxy are the radio jets clearly associ-ated with Lyα emission or lying near emitting filaments aswas true for the nearer galaxies Abell 1795 and Abell 2597(O’Dea et al. 2004). We suggest that the more powerful radiosources in Abell 1795 and 2597 are able to trigger star for-mation in their environments, while the weaker radio sourcesstudied here are not. The lack of FUV emission aligned withthe radio jet indicates that scattered AGN light (which wouldbe aligned with the jet) does not contribute significantly.
Govoni et al. (2009) have found a faint, diffuse “mini-halo" around the BCG in A1835 which extends for severalhundred kpc. The diffuse radio emission suggests that theAGN was much more active in the past and/or that A1835 hasexperienced a cluster merger (e.g., Murgia et al. 2009).
3.1.3. X-ray Morphology
Here we discuss the X-ray structure and its relation to theBCG in the four sources for which we have X-ray imag-ing. For Abell 1664, the outer 3µm isophotes extend tothe south-west where there is excess X-ray emission (seeFigure 2). The asymmetric X-ray morphology was alsonoted by Kirkpatrick et al. (2009). Abell 1835 also dis-plays asymmetric X-ray structure (see Figure 3, and alsoSchmidt, Allen & Fabian 2001). Though the FUV and Lyαemission are centered on the 3µm contours in ZWCL 3146,again the X-ray emission is lopsided, extending south-eastofthe nucleus (see Figure 5). RXJ 2129+00 also displays asym-metric X-ray emission contours extending to the south-west
STAR FORMATION IN BCG COOLING FLOWS 5
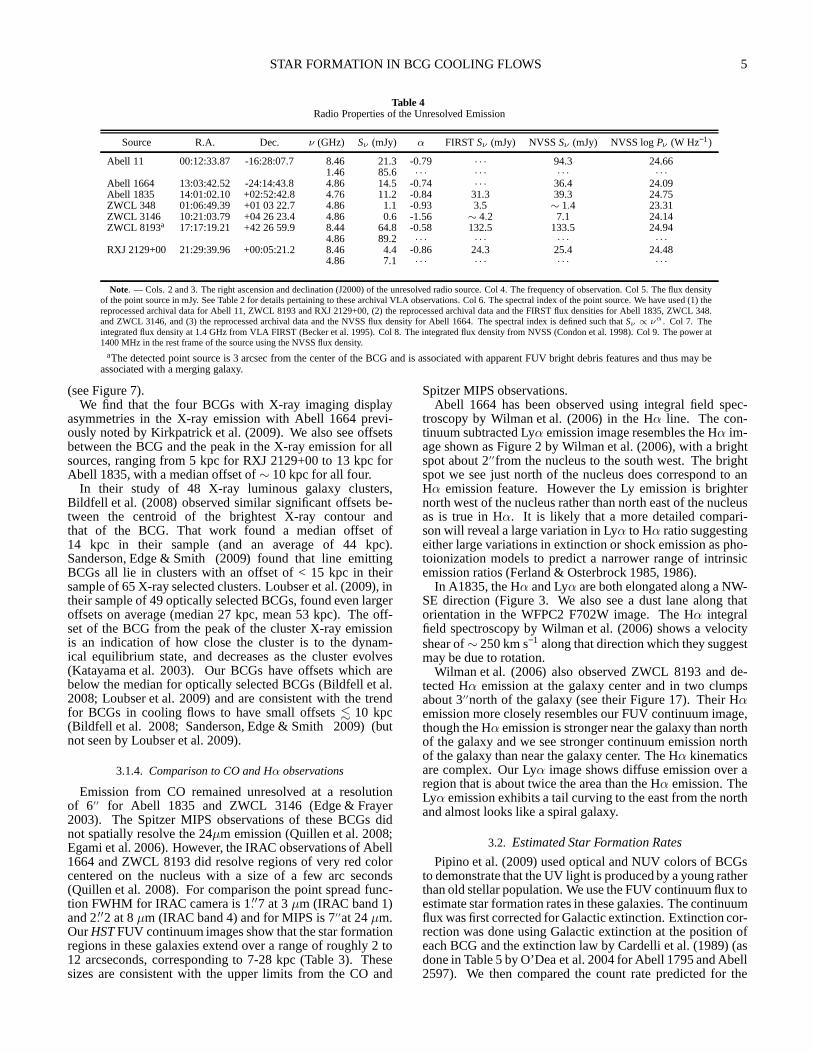
Table 4Radio Properties of the Unresolved Emission
Source R.A. Dec. ν (GHz) Sν (mJy) α FIRSTSν (mJy) NVSSSν (mJy) NVSS logPν (W Hz−1)
Abell 11 00:12:33.87 -16:28:07.7 8.46 21.3 -0.79 · · · 94.3 24.661.46 85.6 · · · · · · · · · · · ·
Abell 1664 13:03:42.52 -24:14:43.8 4.86 14.5 -0.74 · · · 36.4 24.09Abell 1835 14:01:02.10 +02:52:42.8 4.76 11.2 -0.84 31.3 39.3 24.75ZWCL 348 01:06:49.39 +01 03 22.7 4.86 1.1 -0.93 3.5 ∼ 1.4 23.31ZWCL 3146 10:21:03.79 +04 26 23.4 4.86 0.6 -1.56 ∼ 4.2 7.1 24.14ZWCL 8193a 17:17:19.21 +42 26 59.9 8.44 64.8 -0.58 132.5 133.5 24.94
4.86 89.2 · · · · · · · · · · · ·
RXJ 2129+00 21:29:39.96 +00:05:21.2 8.46 4.4 -0.86 24.3 25.4 24.484.86 7.1 · · · · · · · · · · · ·
Note. — Cols. 2 and 3. The right ascension and declination (J2000)of the unresolved radio source. Col 4. The frequency of observation. Col 5. The flux densityof the point source in mJy. See Table 2 for details pertainingto these archival VLA observations. Col 6. The spectral index of the point source. We have used (1) thereprocessed archival data for Abell 11, ZWCL 8193 and RXJ 2129+00, (2) the reprocessed archival data and the FIRST flux densities for Abell 1835, ZWCL 348.and ZWCL 3146, and (3) the reprocessed archival data and the NVSS flux density for Abell 1664. The spectral index is defined such thatSν ∝ να. Col 7. Theintegrated flux density at 1.4 GHz from VLA FIRST (Becker et al. 1995). Col 8. The integrated flux density from NVSS (Condon et al. 1998). Col 9. The power at1400 MHz in the rest frame of the source using the NVSS flux density.
aThe detected point source is 3 arcsec from the center of the BCG and is associated with apparent FUV bright debris featuresand thus may beassociated with a merging galaxy.
(see Figure 7).We find that the four BCGs with X-ray imaging display
asymmetries in the X-ray emission with Abell 1664 previ-ously noted by Kirkpatrick et al. (2009). We also see offsetsbetween the BCG and the peak in the X-ray emission for allsources, ranging from 5 kpc for RXJ 2129+00 to 13 kpc forAbell 1835, with a median offset of∼ 10 kpc for all four.
In their study of 48 X-ray luminous galaxy clusters,Bildfell et al. (2008) observed similar significant offsetsbe-tween the centroid of the brightest X-ray contour andthat of the BCG. That work found a median offset of14 kpc in their sample (and an average of 44 kpc).Sanderson, Edge & Smith (2009) found that line emittingBCGs all lie in clusters with an offset of < 15 kpc in theirsample of 65 X-ray selected clusters. Loubser et al. (2009),intheir sample of 49 optically selected BCGs, found even largeroffsets on average (median 27 kpc, mean 53 kpc). The off-set of the BCG from the peak of the cluster X-ray emissionis an indication of how close the cluster is to the dynam-ical equilibrium state, and decreases as the cluster evolves(Katayama et al. 2003). Our BCGs have offsets which arebelow the median for optically selected BCGs (Bildfell et al.2008; Loubser et al. 2009) and are consistent with the trendfor BCGs in cooling flows to have small offsets. 10 kpc(Bildfell et al. 2008; Sanderson, Edge & Smith 2009) (butnot seen by Loubser et al. 2009).
3.1.4. Comparison to CO and Hα observations
Emission from CO remained unresolved at a resolutionof 6′′ for Abell 1835 and ZWCL 3146 (Edge & Frayer2003). The Spitzer MIPS observations of these BCGs didnot spatially resolve the 24µm emission (Quillen et al. 2008;Egami et al. 2006). However, the IRAC observations of Abell1664 and ZWCL 8193 did resolve regions of very red colorcentered on the nucleus with a size of a few arc seconds(Quillen et al. 2008). For comparison the point spread func-tion FWHM for IRAC camera is 1.′′7 at 3µm (IRAC band 1)and 2.′′2 at 8µm (IRAC band 4) and for MIPS is 7′′at 24µm.OurHSTFUV continuum images show that the star formationregions in these galaxies extend over a range of roughly 2 to12 arcseconds, corresponding to 7-28 kpc (Table 3). Thesesizes are consistent with the upper limits from the CO and
Spitzer MIPS observations.Abell 1664 has been observed using integral field spec-
troscopy by Wilman et al. (2006) in the Hα line. The con-tinuum subtracted Lyα emission image resembles the Hα im-age shown as Figure 2 by Wilman et al. (2006), with a brightspot about 2′′from the nucleus to the south west. The brightspot we see just north of the nucleus does correspond to anHα emission feature. However the Ly emission is brighternorth west of the nucleus rather than north east of the nucleusas is true in Hα. It is likely that a more detailed compari-son will reveal a large variation in Lyα to Hα ratio suggestingeither large variations in extinction or shock emission as pho-toionization models to predict a narrower range of intrinsicemission ratios (Ferland & Osterbrock 1985, 1986).
In A1835, the Hα and Lyα are both elongated along a NW-SE direction (Figure 3. We also see a dust lane along thatorientation in the WFPC2 F702W image. The Hα integralfield spectroscopy by Wilman et al. (2006) shows a velocityshear of∼ 250 km s−1 along that direction which they suggestmay be due to rotation.
Wilman et al. (2006) also observed ZWCL 8193 and de-tected Hα emission at the galaxy center and in two clumpsabout 3′′north of the galaxy (see their Figure 17). Their Hαemission more closely resembles our FUV continuum image,though the Hα emission is stronger near the galaxy than northof the galaxy and we see stronger continuum emission northof the galaxy than near the galaxy center. The Hα kinematicsare complex. Our Lyα image shows diffuse emission over aregion that is about twice the area than the Hα emission. TheLyα emission exhibits a tail curving to the east from the northand almost looks like a spiral galaxy.
3.2. Estimated Star Formation Rates
Pipino et al. (2009) used optical and NUV colors of BCGsto demonstrate that the UV light is produced by a young ratherthan old stellar population. We use the FUV continuum flux toestimate star formation rates in these galaxies. The continuumflux was first corrected for Galactic extinction. Extinctioncor-rection was done using Galactic extinction at the position ofeach BCG and the extinction law by Cardelli et al. (1989) (asdone in Table 5 by O’Dea et al. 2004 for Abell 1795 and Abell2597). We then compared the count rate predicted for the

6 O’DEA ET AL.
Table 5Star Formation & Cluster Properties
M(H2) SFRIR SFRHα SFRFUV Balmer Dec Central Entropy Central Cooling TimeSource (1010M⊙ yr−1) (M⊙ yr−1) (M⊙ yr−1) (M⊙ yr−1) (F
[
Hα/Hβ]
) (KeV cm2) (Gyr)
Abell 11 1.1 35 9.7 4.8 · · · · · · · · ·
Abell 1664 1.9 15 5.6 4.6 5.2 14.40 0.81Abell 1835 7.9 125 40.5 11.7 5 11.44 0.58ZWCL 348 52 15.5 6.1 4.27 · · · · · ·
ZWCL 3146 7.0 67 47.1 12.4 3.7 11.42 0.59ZWCL 8193 1.5 59 7.6 5.4 5.9 · · · · · ·
RXJ 2129+00 13 2.3 0.9 > 2 21.14 0.82
Note. — Infrared estimated star formation rates are by O’Dea et al. (2008) except for Abell 1835 and ZWCL 3146 which are by Egamiet al. (2006).These star formation rates are estimated from the 8 and 24µm fluxes (Quillen et al. 2008). Molecular gas mass estimates for Abell 11, Abell 1665, Abell1835, and ZWCL 3146. by Edge (2001), but corrected to a Hubbleconstant of 75 Mpc−1 km s−1. The ZWCL 8193 molecular mass is by Salome & Combes(2003). Note ZWCL 3146 also contains about 1010 M⊙ of warm molecular hydrogen (Egami et al. 2006). Star formation rates are estimated from thelimited-aperture observations by Crawford et al. (1999) (long slit of width 1.′′3) excepting for ZWCL 348 which used the Hα flux from the Sloan DigitalSky Survey archive (and a 3′′ diameter fiber). The central entropies and cooling times of the clusters are given by Cavagnolo et al. (2009). Neither theHα
or UV based star formation rate estimates have been corrected for internal extinction.
observed filter by the STSDAS synthetic photometry pack-ageSYNPHOT for a spectrum produced bySTARBURST991
(Leitherer et al. 1999; Vazquez & Leitherer 2005).The UV continuum estimated star formation rates are listed
in Table 5. We compare the UV continuum estimated star for-mation with those based on the limited aperture Hα fluxesby Crawford et al. (1999) (using 1.′′3 wide slit) or spec-troscopic measurements from the Sloan Digital Sky Sur-vey archive (using a 3′′diameter fiber) and those estimatedfrom infrared observations with theSpitzer Space Telescopeby Egami et al. (2006); Quillen et al. (2008); O’Dea et al.(2008). Neither the UV continuum estimated or Hα esti-mated star formation rates have been corrected for internalextinction. This Table also lists molecular gas masses by Edge(2001); Salome & Combes (2003).
Balmer decrements are available for most of the galax-ies considered here and range from∼ 3− 5 (Crawford et al.1999), see Table 5. Assuming an intrinsic Hα/Hβ theoreticalline ratio of 2.86 (“case B” recombination, Osterbrock 1989),the observed Balmer decrement allows us to estimate the colorexcess associated with the internal extinction in the source,following the parameterization of Cardelli et al. (1989):
E (B−V)Hα/Hβ =2.5× log
(
2.86/Robs)
k(λα) − k(
λβ
) (1)
where Robs = F (Hα)/F (Hβ) is the observed flux ratio,and the extinction curves at Hα and Hβ wavelengths arek(λα) ≈ 2.63 andk
(
λβ
)
≈ 3.71, respectively, as given byCardelli et al. (1989). One caveat is that if processes otherthan recombination (e.g., shocks, cosmic ray heating) con-tribute to Hα, the intrinsic Hα/Hβ ratio would be higher thanthe theoretical “Case B” value and the estimated extinctionswould be upper limits. With this possibility in mind, theupper-limit intrinsic optical extinction isE(B−V) ∼ 0.6 fora Balmer decrement of 5, corresponding to an extinction inthe FUV of AFUV ∼ 5.5 and therefore a correction factor of160 to the measured flux.
We note from Table 5 that IR star formation rates exceedthose estimated in Hα and these exceed those estimated fromthe FUV continuum. This would be consistent with patchybut significant levels of extinction. The correction factores-timated for the UV photometry of 160 for a Balmer decre-
1 http://www.stsci.edu/science/starburst99/
ment of 5 is vastly higher than that required to make upthe deficit of star formation rates estimated between the UVand (e.g.) the IR. Large levels of extinction are also likelybecause of the high molecular gas content in these galax-ies and the dust lanes seen in the optical images. Previ-ous comparisons by Hu (1992) between Hα and Lyα fluxsuggested modest extinctions intrinsic to the cluster of orderE(B− V) ≈ 0.09− 0.25. This was done assuming an unab-sorbed Lyα/Hα ratio of 13 for photoionization and collisionmodels (Ferland & Osterbrock 1986). However the BCGsconsidered by Hu (1992) were not chosen via their Hα lu-minosity. As Hα luminosity is correlated with both molecu-lar gas mass and infrared luminosity (O’Dea et al. 2008) is itperhaps not surprising that the sample considered here wouldhave higher estimated internal extinctions than the same con-sidered by Hu (1992).
In short, FUV estimated star formation rates range from∼ 3to∼ 14 times lower than those estimated from theSpitzerob-servations. Balmer decrements and molecular gas observa-tions suggest that internal extinction could be extremely highin some regions. The discrepancy between the estimated starformation rates and the internal extinction correction factorfrom the Balmer decrement suggest that internal extinctionispatchy. As the infrared estimated star formation rate is leastsensitive to extinction, it can be considered the most accurate,and suggests that about 90% of the FUV continuum has beenabsorbed. When taking patchy extinction into account, thediscrepancy between star formation rates estimated at differ-ent wavelengths may be reconciled. Moreover, even when ac-counting for internal extinction, a one-to-one correspondencebetween star formation rates measured in the UV and IR arenot necessarily expected, as the associated star formationin-dicators in those wavelength regimes may probe different as-pects of the star forming region (e.g., Johnson et al. 2007).
O’Dea et al. (2008) found that in gas-rich star formingBCGs the nominal gas depletion time scale is about 1 Gyr.Since star formation is not highly efficient, it seems likelythat1 Gyr is an upper limit to the life time of the star formation.Pipino et al. (2009) suggest that the star formation in BCGsis relative recent with ages less than 200 Myr. Thus, a typi-cal star formation rate of 50M⊙ yr−1 would result in a totalmass of less than 1010 M⊙ which is a small fraction of thetotal stellar mass in a BCG (e.g., von der Linden et al. 2007)as also noted by, e.g., Pipino et al. (2009).
O’Dea et al. (2008) noticed a discrepancy between the in-

STAR FORMATION IN BCG COOLING FLOWS 7
frared estimated star formation rates and the size of the starforming regions. Here we have confirmed that the star form-ing regions are not large and remain under 30 kpc. This putsthe galaxies somewhat off the Kennicutt relation (Kennicutt1998) but (as shown by O’Dea et al. 2008 in their Figure 8)only by a modest factor of a few. While we confirm the dis-crepancy we find that it is small enough that it could be ex-plained by other systematic effects such as an overestimateofthe H2 mass. The CO to H2 conversion factor is suspectedto be uncertain by a factor of a few (e.g., Israel et al. 2006).Thus, there may be no significant discrepancy between thesize of the star forming regions as measured in the FUV andthat predicted with the Kennicutt relation.
3.3. Is the young stellar population sufficient to ionize thenebula?
The fact that the Lyα morphology closely traces that of theunderlying FUV continuum emission suggests that the lat-ter provides at least a significant fraction of ionizing photonsfor the former, and that the nebula is ionized locally. Herewe explore this argument more quantitatively, in consideringwhether the observed FUV continuum is consistent with a suf-ficient number of hot stars required to ionize the nebula. Thisquestion can be addressed using simple arguments outlinedby Zanstra (1931) and employed in similar contexts by (e.g.,Baum & Heckman 1989; O’Dea et al. 2004). We assume acase B recombination scenario (Osterbrock 1989), in whichthe medium is optically thin to Balmer photons but opticallythick to Lyman photons, and that in 104 K gas,∼ 45% of allBalmer photons will emerge from the nebula as Hα photons.We further assume that all ionizing photons that are emittedby the stars are absorbed by the gas. This makes our estimatea rough lower limit, as in reality, a significant fraction of ion-izing photons will escape, increasing the number of requiredstars.
Given these assumptions, the number of ionizing photonsrequired to power the nebula is can be estimated via its ob-served Hα luminosity using the Zanstra (1931) method, whichrelates the emission-line luminosity toQtot, the total numberof photons with energies greater than 13.6 eV needed, per sec-ond, to ionize the nebula:
Qtot =2.2LHα
hναphotons s−1 (2)
where LHα is the total nebular Hα luminosity,h is Planck’sconstant,να is the frequency of the Hα line, and 2.2 is theinverse of the 0.45 Balmer photon to Hα photon ratio assumedabove.
For each galaxy in our sample (save Abell 11, for which wedo not have an Hα luminosity) we have calculated this valueand scaled it in terms of a required star formation rate as pre-dicted by the sameSTARBURST99 models used to calculatethe star formation rates based on the FUV continuum. Wepresent these results in Table 6. In every case the ratio of theobserved star formation rate to that required by the Zanstramethod is of order unity, suggesting that the FUV contin-uum provides a significant fraction of ionizing photons forthe nebula. Note that it is likely that stellar photoionizationis not the only source of energy for cooling flow nebula (e.g.,Voit & Donahue 1997). This result is consistent with the no-tion that the nebula is ionized locally by the young stars em-bedded within it, as supported by the similar morphologies ofthe Lyα emission and FUV continuum emission. O’Dea et al.
(2004) undertook a similar exercise in their study of the coolcore clusters Abell 1795 and Abell 2597, finding that therewere enough hot stars present to within a factor of a few. Thatwork also estimated the degree to which a hidden quasar ion-izing continuum would contribute ionizing photons, findingthat a modest AGN luminosity could contribute∼ 10% ofwhat was required.
4. DISCUSSION AND SUMMARY
In this paper we have presented high angular resolution im-ages in FUV continuum and Lyα of 7 BCGs selected on thebasis of IR emission which suggested the presence of signif-icant star formation. We confirm that the BCGs are activelyforming stars. This confirms that the IR excess seen in theseBCGs is indeed associated with star formation. Our obser-vations are consistent with a scenario in which gas whichcools from the ICM fuels the star formation (O’Dea et al.2008; Bildfell et al. 2008; Loubser et al. 2009; Pipino et al.2009). The FUV continuum emission extends over a region∼ 7−28 kpc (largest linear size) and even larger in Lyα. Bothcontinuum and line emission contains clumps and filaments,but the Lyα emission also contains a diffuse component.
Star formation rates estimated from the FUV continuumrange from about 3 to 14 times lower than those estimatedfrom the infrared. However, both the Balmer decrement inthe central arcsec, the presence of dust lanes seen in the opti-cal images, and the detection of CO in these galaxies suggestthat there are regions of dense gas and high extinction withinthe central 10-30 kpc. Thus, the lower star formation rates es-timated in the FUV are consistent with the expected internalextinction.
We find that the young stellar population required by theFUV observations would produce a significant fraction of theionizing photons required to power the emission line nebula.
We find unresolved radio emission in each of the sevenBCGs. In addition, Abell 1835 and RXJ 2129+00 alsoexhibit weak kpc scale jets. The unresolved radio emis-sion in ZWCL 8193 is offset from the center of the BCGby 3 arcsec and may be associated with a merging galaxy.These BCGs tend to have fairly compact (< 1 kpc), weak,steep spectrum radio structures. The hypothesis that theradio source are confined to the sub-kpc scale by densegas (as originally suggested for GPS and CSS sources,e.g., Wilkinson et al. 1984; van Breugel, Heckman & Miley1984; O’Dea, Baum & Stanghellini 1991; O’Dea 1998)could be tested via VLBI observations. On the other hand,the radio properties could be explained if nuclear fueling hasbeen reduced by a previous AGN activity cycle and we arenow seeing the galaxies following a period of relative AGNquiescence. It is tempting to also account for the high starformation rate with a period of low feedback. Rapid coolingin the IGM fueling the current high star formation may bedue to a previous reduction in energy deposited into the IGM.Kirkpatrick et al. (2009) find that cooling rates could be highenough to fuel the star formation in Abell 1664. Similar cool-ing rates have been estimated for most of the other galaxies inour sample (O’Dea et al. 2008).
We note that there is FUV continuum and Lyα emission inAbell 1795 and Abell 2597 which is closely associated withthe radio sources - suggesting a contribution from jet inducedstar formation (O’Dea et al. 2004). However, the radio jetsin Abell 1835 and RXJ 2129+00 show no relationship withthe FUV emission. While both Abell 1795 and Abell 2597host star formation, it is at a lower level than estimated for

8 O’DEA ET AL.
Table 6Can Hot Stars Ionize the Nebula?
Hα Luminosity Qrequired SFR(Qrequired)
Source (erg s−1 cm−2) (photons s−1) (M⊙ yr−1)
(
SFRFUVSFR
[
Qrequired]
)
(1) (2) (3) (4) (5)
Abell 11 · · · · · · · · · · · ·
Abell 1664 6.38×1041 4.64×1053 2.12 2.17Abell 1835 1.68×1042 1.22×1054 5.58 2.09ZWCL 348 1.95×1042 1.41×1054 6.47 0.94ZWCL 3146 3.29×1042 2.39×1054 1.10 1.13ZWCL 8193 2.79×1042 2.03×1054 9.29 0.58RXJ 2129+00 3.33×1040 2.42×1052 1.11 8.1
Note. — Results of a photon-counting exercise designed to determine whether there are sufficienthot stars present (giving rise to the underlying FUV continuum) to ionize the emission-line nebula.We have used the Zanstra (1931) method relating the Hα emission line luminosity with the number ofionizing photons required to give rise to that luminosity, assuming all ionizing photons are absorbedin 104 K gas obeying a case B recombination scenario. (1) Source name; (2) Hα luminosities inerg s−1 cm−2, from Crawford et al. (1999) excepting ZWCL 348, whose Hα luminosity is from theSDSS archive; (3) number of ionizing photons, per second, required to ionize the nebula, as estimatedusing the Zanstra (1931) method described in section 3.3; (4) star formation rate required to powerthe nebula, estimated by comparing Qrequired with a STARBURST99 model calculating the numberof photons with energies greater than 13.6 eV for a 107 yr old starburst assuming a continuous starformation rate of 1 M⊙ yr−1 and an IMF with an upper mass cutoff of 100 M⊙ and slopeα = 2.35; (5)Comparing the value calculated in column (4) with the “observed” star formation rate as estimatedby comparing our FUV photometry with the sameSTARBURST99 model. A ratio greater than 1indicates that enough ionizing photons are present from theyoung stellar population to ionize thenebula. Obviously, there are significant uncertainties associated with these estimates. As such, this ismeant only as an order-of-magnitude exercise. That the ratios are all of order unity indicates that theFUV emission due to the young stellar population is of sufficient strength to power the emission-linenebula.
the 7 of our sample. In addition the 7 BCGs studied hereare generally have less powerful radio sources than those inAbell 1795 and Abell 2597. The combination of higher SFRand lower radio power in our BCGs suggests that the radiosources have a smaller relative impact on the triggering and/orproperties of the star formation and associated emission linenebulae. Further, the lack of FUV emission aligned with theradio jets indicates that the contribution from scattered AGNlight is small.
We have also noted that most of our galaxies exhibit asym-metries in their distribution of star formation and 4 of themshow lopsided X-ray contours. Feedback from an AGN (jetsand bubbles) would not be expected to push the X-ray emit-ting gas off-center. However disturbances in the IGM couldlead to higher cooling rates in the gas as the cluster relaxesand slowly evolves to equilibrium (e.g., Russell et al. 2010).
We thank the referee for a prompt and constructive re-port. This work is based on observations made with theNASA/ESA Hubble Space Telescope, obtained at the SpaceTelescope Science Institute, which is operated by the Associ-ation of Universities for Research in Astronomy, Inc., underNASA contract 5-26555. Support forHST program 11230was provided by NASA through a grant from the Space Tele-scope Science Institute, which is operated by the Associa-tion of Universities for Research in Astronomy, Inc., underNASA contract NAS 5-26555. This research made use of (1)the NASA/IPAC Extragalactic Database (NED) which is op-erated by the Jet Propulsion Laboratory, California Instituteof Technology, under contract with the National Aeronauticsand Space Administration; and (2) NASA’s Astrophysics DataSystem Abstract Service. The National Radio Astronomy Ob-servatory is a facility of the National Science Foundation op-erated under cooperative agreement by Associated Universi-
ties, Inc. KPO was supported by an NSF REU program at theUniversity of Rochester.
REFERENCES
Allen, S. W. 1995, MNRAS, 276, 947Baum, S. A., & Heckman T., 1989, ApJ, 336, 681Baum, S. A., Heckman, T. M., van Breugel, W., 1992, ApJ, 389, 208Baum, S. A., Laor, A., O’Dea, C. P., Mack, J., & Koekemoer, A. M. 2005,
ApJ, 632, 122Becker, R. H., White, R. L., & Helfand, D. J. 1995, ApJ, 450, 559Bildfell C., Hoekstra H., Babul A., Mahdavi A., 2008, MNRAS,389, 1637Binette, L., Wang, J., Villar-Martin, M., Martin, P. G. & Magris, G. G. 1993,
ApJ, 414, 535Cardiel, N., Gorgas, J., & Aragon-Salamanca, A. 1998, Ap&SS, 263, 83Cardelli, J. A., Clayton, G. C., & Mathis, J. S., 1989, ApJ, 345, 245Cavagnolo, K. W., Donahue, M., Voit, G. M., Sun, M., 2008, ApJ, 683, L107Cavagnolo, K. W., Donahue, M., Voit, G. M., Sun, M., 2009, ApJS, 182, 12Clampin, M., Sirianni, M., Hartig, G. F., Ford, H. C., Illingworth, G. D.,
Burmester, W., Koldewynd, W., Martel, A. R., Riess, A., Schrein, R. J., &Sullivan, P. C. 2004, Scientific Detectors for Astronomy, The Beginningof a New Era; eds. Amico, P., Beletic, J. W., & Beletic, J. E., p. 555-563,Kluwer Academic Publishers
Condon, J. J., Cotton, W. D., Greisen, E. W., Yin, Q. F., Perley, R. A.,Taylor, G. B., & Broderick, J. J. 1998, AJ, 115, 1693
Cowie, L. L., & Binney, J. 1977, ApJ, 215, 723Crawford, C. S., & Fabian, A. C. 1993, MNRAS, 265, 431Crawford, C. S., Allen, S. W., Ebeling, H., Edge, A. C., & Fabian, A. C.
1999, MNRAS, 306, 857Donahue, M., Voit, G. M., O’Dea, C. P., Baum, S. A., & Sparks, W. B. 2005,
ApJ, 630, L13Ebeling, H., Edge, A. C., Böhringer, H., Allen, S. W., Crawford, C. S.,
Fabian, A. C., Voges, W., & Huchra, J. P. 1998, MNRAS, 301, 881Ebeling, H., White, D. A., & Rangarajan, F. V. N. 2006, MNRAS,368, 65Edge, A. C., Stewart, G. C., & Fabian, A. C. 1992, MNRAS, 258, 177Edge, A. C. 2001, MNRAS, 328, 762Edge, A. C., & Frayer, D. T. 2003, 594, L13Edwards, L. O. V., Robert, C., Molla, M., & McGee, S. L. 2009, MNRAS,
396, 1953Egami, E., et al. 2006, ApJ, 647, 922Egami, E., Rieke, G. H., Fadda, D., & Hines, D. C. 2006, ApJ, 652, L21

STAR FORMATION IN BCG COOLING FLOWS 9
Fabian, A. C., & Nulsen, P. E. J. 1977, MNRAS, 180, 479Ferland, G. J., & Osterbrock, D. E. 1985, ApJ, 289, 105Ferland, G. J., & Osterbrock, D. E. 1985, ApJ, 300, 658Govoni, F., Murgia, M., Markevitch, M., Feretti, L., Giovannini, G., Taylor,
G. B., Carretti, E., 2008, A&A, 499,371Hansen, L., Jorgensen, H.E., Norgaard-Nielsen, H. U., 1995, A&A, 297, 13Heckman, T. M., Baum, S. A., van Breugel, W. J. M., McCarthy, P., 1989,
ApJ, 338, 48Hicks, A. K., & Mushotzky, R. 2005, ApJ, 635, L9Holtzman, J. A. et al. 1996, AJ, 112, 416Hu, E. M. 1992, ApJ, 391, 608Hutchings, J. B., & Balogh, M. L. 2000, AJ, 119, 1123Israel, F. P., Tilanus, R. P. J., & Baas, F. 2006, A&A, 445, 907Johnson, B. D., et al. 2007, ApJS, 173, 392Johnstone, R. M., Fabian, A. C., & Nulsen, P. E. J. 1987, MNRAS, 224, 75Katayama H., Hayashida K., Takahara F., Fukita Y., 2003, ApJ, 585, 687Kennicutt, R. C., 1998, ApJ, 498, 541Kirkpatrick, C. C., McNamara, B. R., Rafferty, D. A., Nulsen, P. E. J.,
Birzan, L., Kazemzadeh, F., Wise, M. W., Gitti, M., Cavagnolo, K. W.2009, ApJ, 697, 867
Leitherer, C. et al. 1999, ApJS, 123, 3Loubser, S. I., Sanchez-Blazquez, P., Sansom, A. E., & Soechting, I. K.
2009, MNRAS, 398, 133McNamara, B. R., & O’Connell, R. W. 1989, AJ, 98, 2018McNamara, B. R. & O’Connell, R. W. 1993, AJ, 105, 417McNamara, B. R. 1997, Galactic Cluster Cooling Flows, 115, 109McNamara, B. R., 2004, Proceedings of The Riddle of Cooling Flows in
Galaxies and Clusters of Galaxies, held in Charlottesville, VA, May 31 -June 4, 2003, Eds. T. Reiprich, J. Kempner, and N. Soker., page 177
McNamara, B. R., 2007, ASP Conference Series, 115, 109McNamara, B. R., Wise, M. W., & Murray, S. S. 2004, ApJ, 601, 173McNamara, B. R., Rafferty, D. A., Birzan, L,; Steiner, J,; Wise, M. W,;
Nulsen, P. E. J., Carilli, C. L., Ryan, R., & Sharma, M. 2006, ApJ, 648,164
Mittaz, J. P. D., et al., 2001, A&A, 365, L93
Murgia, M., Govoni, F., Markevitch, M., Feretti, L., Giovannini, G., Taylor,G. B., Carretti, E., 2009, A&A, 499, 679
O’Dea, C. P., Baum, S. A., & Stanghellini, C. 1991, ApJ, 380, 66O’Dea, C. P., 1998, PASP, 110, 493O’Dea, C. P., Baum, S. A., Mack, J., Koekemoer, A. M., & Laor, A. 2004,
ApJ, 612, 131O’Dea, C. P. et al. 2008, ApJ, 681, 1035Oegerle, W. R., et al., 2001, ApJ, 560, 187Osterbrock, D. E., Astrophysics of gaseous nebulae and active galactic
nuclei, University Science Books, 1989Pipino, A., Kaviraj, S., Bildfell, C., Babul, A., Hoekstra,H., & Silk, J. 2009,
MNRAS, 395, 462Quillen, A. C. et al.2008, ApJS, 176, 39Rafferty, D. A., McNamara, B. R., Nulsen, P. E. J., & Wise, M. W. 2006,
astro.ph..5323, ApJ, 652, 216Rafferty, D. A., McNamara, B. R., & Nulsen, P. E. J. 2008, ApJ,687, 899Romanishin, W. 1987, ApJ 323, L113Russell, H. R., Sanders, J. S., Fabian, A. C., Baum, S. A., Donahue, M.,
Edge, A. C., McNamara, B. R., O’Dea, C. P., 2010, MNRAS, in press.Salome, P., & Combes, F. 2003, A&A, 414, 657Sanderson, A. J. R., Edge, A. C., Smith, G. P., 2009, MNRAS, 398, 1698Schmidt, R. W., Allen, S. W., Fabian, A. C., 2001, MNRAS, 327,1057Smith, E. P., Bohlin, R. C., Bothum, G. D., O’Connell, R. W., Roberts, M.
S., Neff, S. G., Smith, A. M., & Stecher, T. P. 1997, ApJ, 478, 516van Breugel, W., Heckman, T., & Miley, G. 1984, ApJ, 276, 79Vazquez, G. A., & Leitherer, C. 2005, ApJ, 621, 695Voit, G. M., & Donahue, M., 1997, ApJ, 486, 242Voit, G. M., Cavagnolo, K. W., Donahue, M., Rafferty, D. A., McNamara, B.
R., Nulsen, P. E. J., 2008, ApJ, 681, L5von der Linden, A., Best, P. N., Kauffmann, G., White, S. D. M., 2007,
MNRAS, 379, 867Wilkinson, P. N., Booth, R. S., Cornwell, T. J., & Clark, R. R.1984, Nature,
308, 619Wilman, R. J., Edge, A. C., & Swinbank, A. M. 2006, MNRAS, 371,93Wilman, R. J., Edge, A. C. & Swinbank, A. M., 2009 MNRAS, 395, 1355Zanstra, H. 1931, Pub. Dom. Ap. Obs., 4, 209

10 O’DEA ET AL.
Figure 1. Abell 11. (upper left)HSTWFPC2 F606W optical image. Note the dust lane. (upper right)HSTSBC FUV continuum image with 3µm SpitzerIRACband 1 contours overlayed. Contour separation is a factor oftwo in surface brightness. (bottom) Continuum subtractedHSTSBC Lyα image of Abell 11. Thewhite cross marks the position of the unresolved VLA radio source (Table 4). . At the redshift of Abell 11 (z= 0.151), 1′′corresponds∼ 2.6 kpc.
STAR FORMATION IN BCG COOLING FLOWS 11
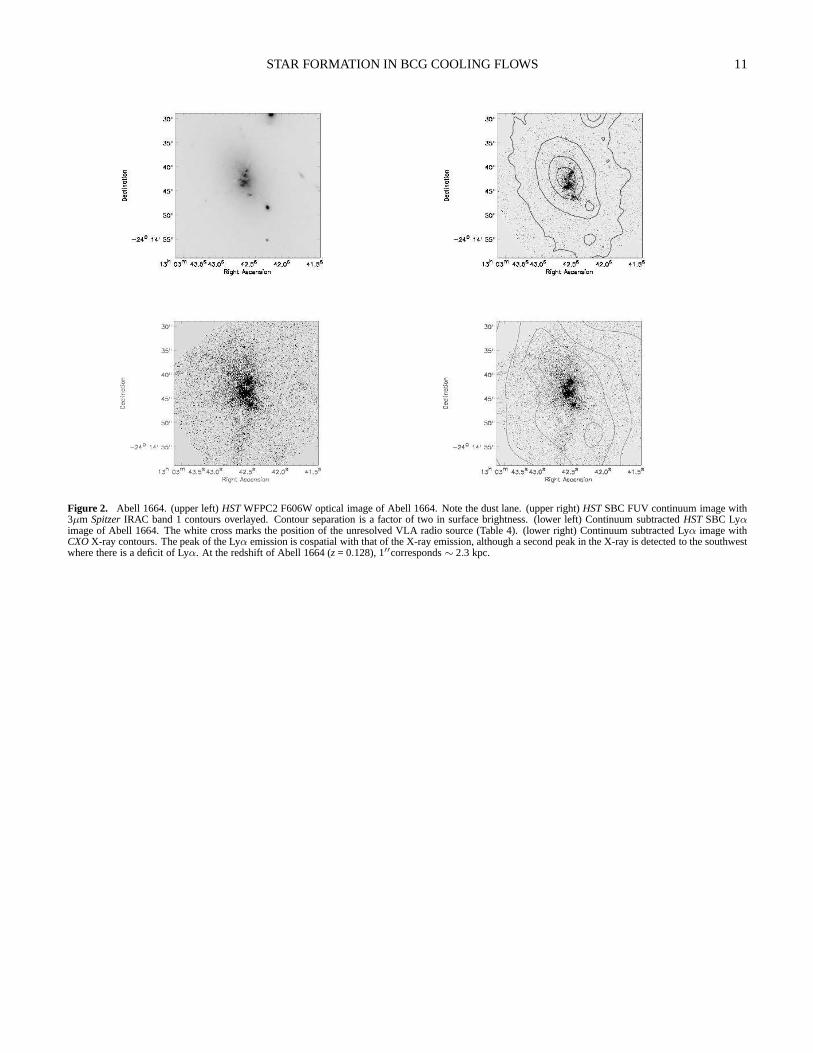
Figure 2. Abell 1664. (upper left)HSTWFPC2 F606W optical image of Abell 1664. Note the dust lane. (upper right)HSTSBC FUV continuum image with3µm SpitzerIRAC band 1 contours overlayed. Contour separation is a factor of two in surface brightness. (lower left) Continuum subtractedHSTSBC Lyαimage of Abell 1664. The white cross marks the position of theunresolved VLA radio source (Table 4). (lower right) Continuum subtracted Lyα image withCXOX-ray contours. The peak of the Lyα emission is cospatial with that of the X-ray emission, although a second peak in the X-ray is detected to the southwestwhere there is a deficit of Lyα. At the redshift of Abell 1664 (z= 0.128), 1′′corresponds∼ 2.3 kpc.

12 O’DEA ET AL.
Figure 3. Abell 1835. (upper left)HSTWFPC2R-band (F702W) image of Abell 1835. Note the dust lane. (upperright) HSTSBC FUV continuum imageoverlayed withSpitzerIRAC 3µm contours. (lower left) Continuum subtractedHSTLyα image of Abell 1835 (gray scale) with 5 GHz VLA radio contours.There is no obvious relation between the Lyα and the radio jet. (lower right) Continuum subtracted Lyα image withChandraX-ray contours. As in Abell 1664,the two peaks in X-ray emission are offset from the peak in theLyα emission. At the redshift of Abell 1835 (z= 0.253), 1′′corresponds to∼ 4 kpc.

STAR FORMATION IN BCG COOLING FLOWS 13
Figure 4. ZWCL 348. (upper left) opticalHSTWFPC2 F606W image of ZWCL 348. Note the dust lane. (upper right) FUV HSTSBC continuum imageoverlayed with 3µm contours. (bottom) Continuum subtractedHSTSBC Lyα image of ZWCL 348. The white cross marks the position of the unresolved VLAradio source (Table 4). At the redshift of ZWCL 348 (z= 0.254), 1′′corresponds to∼ 4 kpc.

14 O’DEA ET AL.
Figure 5. ZWCL 3146. (upper left) OpitcalHSTWFPC2 F606W image of ZWCL 3146. (upper right)HSTSBC FUV continuum image overlayed with 3µmcontours. (lower left) Continuum subtractedHSTSBC Lyα image of ZWCL 3146. The white cross marks the position of the unresolved VLA radio source (Table4). (lower right) Continuum subtracted Lyα image with X-ray contours. Note the asymmetry in the X-ray emission. At the redshift of ZWCL 3146 (z= 0.290),1′′corresponds to∼ 4.3 kpc.

STAR FORMATION IN BCG COOLING FLOWS 15
Figure 6. ZWCL 8193. (upper left)HSTWFPC2 F606W image of ZWCL 8193. Note the dust lane. (upper right) HSTSBC FUV continuum image overlayedwith 3µm contours. (bottom) Continuum subtractedHSTSBC Lyα image of ZWCL 8193. The Lyα fillament has a spiral appearance. The white cross marksthe position of the unresolved VLA radio source (Table 4). Atthe redshift of ZWCL 8193 (z= 0.175), 1′′corresponds to∼ 3 kpc.

16 O’DEA ET AL.
Figure 7. RXJ 2129+00. (upper left) OpticalHSTWFPC2 F606W image of RXJ 2129+00. (upper right)HSTSBC FUV continuum image overlayed with 3µmcontours. (lower left) Continuum subtractedHSTLyα image of RXJ 2129+00 overlayed with 8 GHz VLA radio contours.(lower right) Continuum subtractedLyα image with X-ray contours. At the redshift of RXJ 2129+00 (z= 0.235), 1′′corresponds to∼ 3.7 kpc.
Continuum Subtracted Lyman Alpha FUV Continuum
15 kpc
ZWCL 8193
Figure 8. Comparison of continuum-subtracted Lyα and FUV continuum images for ZWCL 8193. In general, the Lyα is more diffuse, extended, and smoothlydistributed than is the underlying FUV continuum, which is more tightly arranged in clumpy and filamentary morphologies. The FUV continuum likely traceslocalized sites of star formation, which in turn photoionizes the smoother and more extended Lyα halos.

STAR FORMATION IN BCG COOLING FLOWS 17
Abell 11 Abell 1664 Abell 1835
ZWCL 3146ZWCL 348 ZWCL 8193
5 kpc 18 kpc 10 kpc
10 kpc 12 kpc 10 kpc
RXJ 2129+00
7 kpc
Figure 9. HST/ACS FUV images of the BCGs in our sample. Many exhibit clumpyand filamentary morphologies on< 10 kpc scales and general asymmetrieson> 20 kpc scales. Abell 11, 1664, ZWCL 8193, and RXJ 2129+00 may be described as “clump-dominated”, in which the majority (> 50%) of the FUV flux isassociated with compact bright clumps (as opposed to the lower surface brightness diffuse component). East is left, North is up.