genotype x environment interaction and stability analysis of ...

Joint Effect of MCP-1 Genotype GG and MMP-1 Genotype2G/2G Increases the Likelihood of Developing PulmonaryTuberculosis in BCG-Vaccinated IndividualsMalathesha Ganachari1, Jorge A. Ruiz-Morales1, Juan C. Gomez de la Torre Pretell2, Jeffrey Dinh1, Julio
Granados3, Pedro O. Flores-Villanueva1*
1 The Methodist Hospital Research Institute, The Methodist Hospital, Houston, Texas, United States of America, 2 Non-Governmental Organization VIMASI, San Borja, Lima,
Peru, 3 Division of Immunogenetics, Department of Transplantation Immunology, Mexican National Institute of Medicine and Nutrition ‘‘Salvador Zubiran’’, Mexico D.F.,
Mexico
Abstract
We previously reported that the – 2518 MCP-1 genotype GG increases the likelihood of developing tuberculosis (TB) in non-BCG-vaccinated Mexicans and Koreans. Here, we tested the hypothesis that this genotype, alone or together with the –1607 MMP-1 functional polymorphism, increases the likelihood of developing TB in BCG-vaccinated individuals. Weconducted population-based case-control studies of BCG-vaccinated individuals in Mexico and Peru that included 193 TBcases and 243 healthy tuberculin-positive controls from Mexico and 701 TB cases and 796 controls from Peru. We alsoperformed immunohistochemistry (IHC) analysis of lymph nodes from carriers of relevant two-locus genotypes and in vitrostudies to determine how these variants may operate to increase the risk of developing active disease. We report that a jointeffect between the – 2518 MCP-1 genotype GG and the – 1607 MMP-1 genotype 2G/2G consistently increases the odds ofdeveloping TB 3.59-fold in Mexicans and 3.9-fold in Peruvians. IHC analysis of lymph nodes indicated that carriers of thetwo-locus genotype MCP-1 GG MMP-1 2G/2G express the highest levels of both MCP-1 and MMP-1. Carriers of thesesusceptibility genotypes might be at increased risk of developing TB because they produce high levels of MCP-1, whichenhances the induction of MMP-1 production by M. tuberculosis-sonicate antigens to higher levels than in carriers of theother two-locus MCP-1 MMP-1 genotypes studied. This notion was supported by in vitro experiments and luciferase basedpromoter activity assay. MMP-1 may destabilize granuloma formation and promote tissue damage and disease progressionearly in the infection. Our findings may foster the development of new and personalized therapeutic approaches targetingMCP-1 and/or MMP-1.
Citation: Ganachari M, Ruiz-Morales JA, Gomez de la Torre Pretell JC, Dinh J, Granados J, et al. (2010) Joint Effect of MCP-1 Genotype GG and MMP-1 Genotype2G/2G Increases the Likelihood of Developing Pulmonary Tuberculosis in BCG-Vaccinated Individuals. PLoS ONE 5(1): e8881. doi:10.1371/journal.pone.0008881
Editor: Carlos Penha-Goncalves, Instituto Gulbenkian de Ciencia, Portugal
Received September 28, 2009; Accepted January 1, 2010; Published January 25, 2010
Copyright: � 2010 Ganachari et al. This is an open-access article distributed under the terms of the Creative Commons Attribution License, which permitsunrestricted use, distribution, and reproduction in any medium, provided the original author and source are credited.
Funding: This work was supported by the National Institutes of Health grant R01 HL084347 and by recruitment funds from the Methodist Hospital ResearchInstitute (TMHRI), Houston, Texas. The funders had no role in study design, data collection and analysis, decision to publish, or preparation of the manuscript.
Competing Interests: The authors have declared that no competing interests exist.
* E-mail: [email protected]
Introduction
We previously reported an association between the -2518
functional promoter polymorphism (-2518A.G) of the Monocyte
Chemoattractant Protein (MCP)-1 gene and susceptibility to pulmo-
nary tuberculosis (TB) in non BCG-vaccinated Mexicans and
Koreans [1]. The chromosome region 17q11.2, where the MCP-1
gene is located, was identified as a TB susceptibility region by
linkage analysis of multi-case families [2]. Fine mapping of this
region using linkage disequilibrium association mapping and
potentially functional SNPs revealed association of the -2518
MCP-1 SNP the with disease [1]. Given that most of individuals
living in endemic countries are vaccinated with BCG, we
wondered whether the – 2518 MCP-1 susceptibility allele G and
GG genotype also increase the odds of developing disease in BCG-
vaccinated individuals.
The Matrix Metalloproteinase (MMP)-1 gene, which encodes a
potent collagenase, is an excellent candidate gene for influencing
the expression of pulmonary TB since inflammation-mediated
tissue damage may contribute to the spread of M. tuberculosis
infection [3,4]. Persistent degradation of the extracellular matrix
(ECM) during inflammation leads to tissue damage [3,4]. Collagen
is an essential component of lung ECM and of M. tuberculosis-
induced granulomas [5,6] and provides support to macrophages
and T-cells, which play a role in the organization of these
immune-mediated granulomas [6,7]. In the context of granulo-
matous inflammation, the collagenase activity of MMP-1 is
involved in inflammation-induced tissue damage in several
lung diseases [8] and may contribute to the destabilization of
granuloma formation and the damage of adjacent tissues in TB
[9,10]. As granulomas in TB prevent the spread of infection,
MMP-1 may contribute to the dissemination of infection and to
disease progression [7]. A functional polymorphism located in the
promoter region of MMP-1 enhances expression of the gene [11].
This polymorphism consists of the insertion of a guanine at
position – 1607 (-1607_1608insG) and creates an Ets-1 transcrip-
tion factor binding site [11]. Furthermore, a genome wide analysis
showed that the chromosome region 11q14–11q23 may contribute
PLoS ONE | www.plosone.org 1 January 2010 | Volume 5 | Issue 1 | e8881

to the regulation of TNF-alpha in TB, and the MMP-1 gene is
located within that region at 11q22.2 [12].
Given that both the -2518 MCP-1 allele G and the -1607 MMP-1
allele 2G increase expression of the genes, and MCP-1 contributes
to ECM remodeling through the induction of MMP-1 expression in
bronchial epithelial cells [1,13,14], we tested the hypothesis that
these biologically functional polymorphisms, alone or in combina-
tion, might influence the expression of phenotypes prone to disease
progression.
We selected Mexicans and Peruvians for this study because they
have similar ethnic backgrounds but are exposed to different
environmental conditions. Moreover, the TB burden is considered
to be low in Mexico (0 to 24 estimated new TB cases per 100,000
population), but moderate to high in Peru (100 to 299 estimated
new TB cases per 100,000 population) [15].
Results
Clinical Features of Cases and ControlsAll study subjects were vaccinated with BCG at birth. We
studied 193 and 701 sputum smear-positive cases of TB from
Mexico and Peru, respectively (Table 1). None of the patients had
history of any preconditions that may increase the chance of
developing active TB, including preconditions affecting immune
function, malnutrition and other lung diseases. Their body mass
indexes (BMI) were $18.5 kg/m2 before disease onset (Table 1).
In addition, all cases were new TB cases: none had a history of
previous TB or had received previous treatment for TB. Thus,
these TB patients were very unlikely to be cases of re-infection or
recidivating TB. The patients developed evident symptoms of
disease less than 1 year after exposure to a TB case. All patients
had active TB disease of at least three months of evolution with
chest radiographs showing alveolar infiltrates in the lungs. Hilar
adenopathy was present in most Mexican (98%) and Peruvian
cases (96%). None of the patients had multi-drug resistant
(MDR)-TB.
We also studied 243 and 796 healthy tuberculin-positive (PPD+)
control individuals in Mexico and Peru, respectively (Table 1).
Approximately 91% of Mexican and 98% of Peruvian controls
were household contacts of a sputum smear-positive TB case, the
rest were close contacts of community cases. All controls showed a
PPD response .15 mm of induration and remained healthy for a
period of more than 2 years after exposure, making it likely that
they were latently infected individuals with capacity to control the
spread of infection during that critical period [16–20].
All cases and controls were negative in serologic tests for HIV
infection. TB cases and controls were similar in demographics,
BMI (prior to development of disease in the case of TB patients),
and consumption of cigarettes and alcohol, both within and
between populations (Table 1). We did not have a significant
proportion of individuals with these habits among our cases or
controls in either of the populations studied. Cases and controls
were of similar socioeconomic status within nationalities and
all individuals recruited were of low socioeconomic status. We
attained successful genotyping rates in our cases and controls from
Mexico and Peru.
Mexican and Peruvian cases and controls were Mestizo to the
third generation. Mestizos from Mexico and Peru are mainly an
admixture of Spanish, Amerindians and Africans. None of our
cases or controls were pure Amerindians, neither pure Caucasians
nor pure non-Caucasian Africans. Thus, the presence of sub-
populations in our samples of cases or controls from Peru and
Mexico is unlikely. Mexican Mestizos from Mexico D.F. (the
Federal District) have an admixture of Spanish (50.0364.11%),
Table 1. Demographic and clinical features of tuberculosis cases and controls A.
Parameter Mexicans Peruvians
Tuberculosis(n = 193)
HealthyTuberculin-Positive(n = 243)
Tuberculosis(n = 701)
HealthyTuberculin-Positive(n = 796)
Gender
Male, n (%) 125 (65) 153 (63) 404 (57.6) 440 (55.3)
Age (years), mean 6 SD
Female 3567 3663 29610 3369
Male 3664 3762 30610 3469
BMI B (kg/m2), mean 6 SD
Female 26.265 27.365.6 22.863.2 25.264.5
Male 25.463 25.564.4 22.763.2 25.363.7
Smokers, n (%) C
Female 5 (2.6) 4 (1.6) 5 (0.01) 29 (0.036)
Male 17 (8.8) 22 (9) 46 (0.07) 35 (0.044)
Alcohol use, n (%) D
Female 0 (0) 0 (0) 0 (0) 0 (0)
Male 13 (6.7) 21 (8.6) 24 (0.034) 13 (0.016)
AThe distribution of categorical variables was compared by x2 or Fisher’s exact tests and that of continuous variables by student t-test. There were no significantdifferences between the groups for any of the parameters tested.
BBMI = body mass index, which was based on self-report of weight, before development of disease in the case of tuberculosis patients, and height measured by a nurse.CAll smokers reported consumption of ,6 cigarettes per day.DAll alcohol users reported consumption of ,1 drink per day.doi:10.1371/journal.pone.0008881.t001
MCP-1 and MMP-1 in TB
PLoS ONE | www.plosone.org 2 January 2010 | Volume 5 | Issue 1 | e8881

Amerindian (49.0363.76%), and African (0.9461.27%) [21]. The
genetic background of Peruvian Mestizo is close to that of Mexican
Mestizo [22]; however, since subtle differences in the admixture of
cases and controls may introduce bias we applied a methodology
developed by Reich and Golstein to adjust for differences in the
genetic admixture of cases and controls as explained in Materials
and Methods [23]. The results of these corrections are provided in
Table 2 and discussed in the next section.
Based on the frequency of alleles at the MCP-1 and MMP-1 loci
in both populations, we estimated that given the size of both
samples we had 90% power to detect an odds ratio (OR) of 1.5,
which was significant at an a of 0.025. Considering all the
characteristics of our samples and our genotyping success rate, it is
unlikely that we obtained our results because of selection bias
(including poor ascertainment of the phenotypes) or information
bias (including genotyping errors), or due to an unadjusted known
confounder or type I and II errors.
Univariate Analysis of the -2518 MCP-1 and -1607 MMP-1Promoter Polymorphisms and Susceptibility to TB inBCG-Vaccinated Individuals
The distribution of MCP-1 and MMP-1 genotypes in Mexican
and Peruvian controls were in Hardy-Weinberg equilibrium. The
genomic control SNPs were all in Hardy-Weinberg equilibrium
(Table S1) [1]. We observed a significant association of the MCP-1
susceptibility allele G with disease progression in Both Mexicans
(OR = 1.75; 95% CI 1.3–2.3) and Peruvians (OR = 1.29; 95%
CI 1.1–1.5) (Table 2). This association remained significant
after correction for genetic admixture and for the number of
comparisons in both Mexicans and Peruvians (Table 2). The
MCP-1 genotype GG was significantly associated with TB in
Mexicans (OR = 2.66, 95% CI 1.47–4.79, p = 0.001, Table 3) and
marginally associated with disease in Peruvians (OR = 1.43, 95%
CI 1.02–2.0, p = 0.036, Table 4).
We noticed that our current point estimates of the -2518 MCP-1
allele G and genotype GG associations with disease were lower than
those previously published for individuals non-vaccinated with the
BCG [1]. Thus, we pooled the information from Mexican cases and
controls recruited for the previous and present studies. We observed
an almost 2-fold drop in the OR for the association of the -2518
MCP-1 genotype GG with disease progression in BCG-vaccinated
individuals (OR = 2.66) when compared with the total Mexican
sample (OR = 4.2) or non-vaccinated individuals (OR = 5.4) (Figure
S1). In addition, the dose effect of the allele G observed in non-
vaccinated was lost in BCG-vaccinated individuals and we did not see
a significant association of the MCP-1 genotype AG with disease in this
stratum. Given that the odds of developing active disease (reflected by
the measured OR) were not homogeneous in strata formed by BCG
vaccination status (Figure S1), we concluded that BCG vaccination is
a modifier of the effect of the MCP-1 susceptibility allele G and
genotype GG on progression to disease [24].
Our results from analysis of the -1607 MMP-1 polymorphism
revealed that this polymorphism influences the expression of active
disease in both, Mexican and Peruvian populations. Although the
point estimates of main effects (ORs) were limited in strength, we
observed an association of the -1607 MMP-1 allele 2G with
susceptibility to developing TB in both Mexicans and Peruvians
(Table 2). The proportion of carriers of the MMP-1 allele 2G was
increased among Mexican (OR = 1.56. 95% CI 1.14–2.16, Table 2)
and Peruvian (OR = 1.4, 95% CI 1.19–1.67, Table 2) TB cases. This
association remained significant after corrections for population
stratification and number of comparisons. Carriers of the MMP-1
genotype 2G/2G were significantly over-represented in Mexican TB
cases (OR = 2.71, 95% CI 1.15–6.3, p = 0.02, Table 3) and in
Peruvian TB cases (OR = 1.6, 95% CI 1.05–2.4, p = 0.027, Table 4).
Table 2. Univariate analysis of MCP-1 and MMP-1 alleles and progression to pulmonary tuberculosis A.
Mexicans TB B
(386 chromosomes)n (frequency)
PPD+ C
(486 chromosomes)n (frequency)
TB vs PPD+OR (95% CI) D
(uncorrected statistics)
TB vs PPD+Corrected statistics
- 2518 MCP-1
A 123 (0.32) 267 (0.55) 1.75 (1.3–2.3) x2/l= 11, p = 0.0041
G 263 (0.68) 219 (0.45) (x2 = 15.72, p = 0.0001) *p = 0.0082
- 1607 MMP-1
1G 73 (0.19) 179 (0.27) 1.56 (1.14–2.16) x2/l= 6.27, p = 0.012
2G 313 (0.81) 489 (0.73) (x2 = 8.36, p = 0.0038) *p = 0.024
Peruvians TB B
(1402 chromosomes)n (frequency)
PPD+ C
(1592 chromosomes)n (frequency)
TB vs PPD+OR (95% CI) D
(uncorrected statistics)
TB vs PPD+Corrected statistics
- 2518 MCP-1
A 421 (0.3) 567 (0.36) 1.29 (1.1–1.5) x2/l = 8.54, p = 0.0035
G 981 (0.7) 1025 (0.64) (x2 = 10.52, p = 0.0012) *p = 0.007
- 1607 MMP-1
1G 313 (0.22) 460 (0.29) 1.4 (1.19–1.67) x2/l = 13.64, p = 0.0002
2G 1089 (0.78) 1132 (0.71) (x2 = 16.8, p = 0.00001) *p = 0.0004
AGroups were compared by x2 analysis: x2 values obtained were first corrected for population admixture dividing x2 by l (genomic controls coefficient l= 1.332 forMexicans and = 1.2315 for Peruvians), and the p-values corrected according to the number of comparisons (*p = Bonferroni corrected). Two comparisons were donein Mexicans and Peruvians.
BTB = New cases of pulmonary TB.CPPD+ = Healthy tuberculin reactors.DOR = Odds ratio, CI = Confidence interval.doi:10.1371/journal.pone.0008881.t002
MCP-1 and MMP-1 in TB
PLoS ONE | www.plosone.org 3 January 2010 | Volume 5 | Issue 1 | e8881
The population admixture coefficients (l) calculated for
Mexicans (1.332) and Peruvians (1.2315) were low and did not
significantly modify our estimates of associations of alleles with
disease (Table S1 and Table 2) [1]. We did not see major
differences in the admixture background of our cases and controls,
or these differences were not significant enough to bias our analysis
of associations [23].
Multivariate Analysis of Main and Joint Effects of the-2518 MCP-1 and -1607 MMP-1 Genotypes inSusceptibility to Developing Active Pulmonary TB
Based on the results obtained in the univariate analysis of
associations we collapsed MCP-1 and MMP-1 genotypes that
were not found to be associated with TB in both populations.
Thus, the MCP-1 genotypes AA and AG and MMP-1 genotypes
1G/1G and 1G/2G were collapsed into MCP-1 genotype A/-
and MMP-1 genotype 1G/-, respectively. Collapsing non-
significant genotypes at each locus allowed us to test the
hypothesis that the joint effects of susceptibility genotypes -2518
MCP-1 GG and -1607 MMP-1 2G/2G are greater than that of
the independent (main) effects of these two genotypes. We
obtained a significant and consistent joint effect of the two-
locus genotype MCP-1 GG and MMP-1 2G/2G in both
Mexicans and Peruvians. The ORs observed in carriers of the
two-locus genotype MCP-1 GG and MMP-1 2G/2G were 3.59
(95% CI 1.54–8.33, p = 0.003, Table 5) in Mexicans and 3.9
(95% CI 2.56–5.95, p = 0.0001, Table 6) in Peruvians. In
Peruvians, the logistic regression adjusted OR estimated for the
carriers of the MCP-1 genotype GG that did not carry the
MMP-1 genotype 2G/2G was 0.69 (p = 0.02). This was because
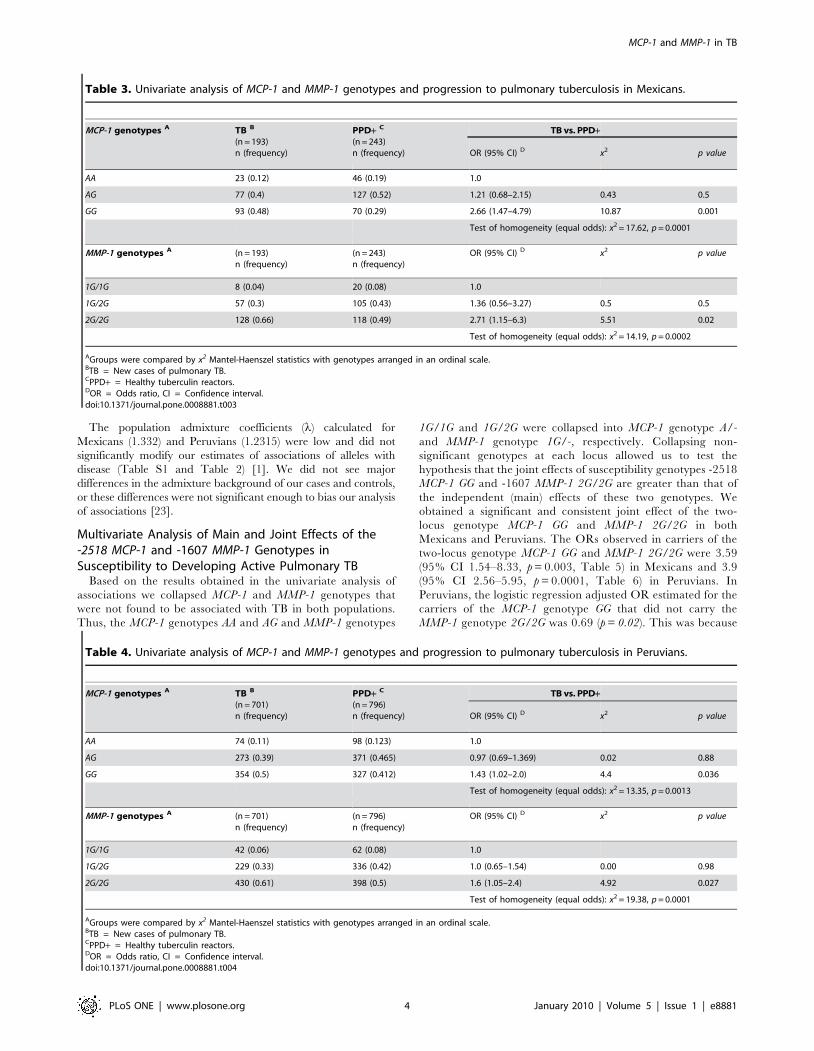
Table 3. Univariate analysis of MCP-1 and MMP-1 genotypes and progression to pulmonary tuberculosis in Mexicans.
MCP-1 genotypes A TB B
(n = 193)n (frequency)
PPD+ C
(n = 243)n (frequency)
TB vs. PPD+
OR (95% CI) D x2 p value
AA 23 (0.12) 46 (0.19) 1.0
AG 77 (0.4) 127 (0.52) 1.21 (0.68–2.15) 0.43 0.5
GG 93 (0.48) 70 (0.29) 2.66 (1.47–4.79) 10.87 0.001
Test of homogeneity (equal odds): x2 = 17.62, p = 0.0001
MMP-1 genotypes A (n = 193)n (frequency)
(n = 243)n (frequency)
OR (95% CI) D x2 p value
1G/1G 8 (0.04) 20 (0.08) 1.0
1G/2G 57 (0.3) 105 (0.43) 1.36 (0.56–3.27) 0.5 0.5
2G/2G 128 (0.66) 118 (0.49) 2.71 (1.15–6.3) 5.51 0.02
Test of homogeneity (equal odds): x2 = 14.19, p = 0.0002
AGroups were compared by x2 Mantel-Haenszel statistics with genotypes arranged in an ordinal scale.BTB = New cases of pulmonary TB.CPPD+ = Healthy tuberculin reactors.DOR = Odds ratio, CI = Confidence interval.doi:10.1371/journal.pone.0008881.t003
Table 4. Univariate analysis of MCP-1 and MMP-1 genotypes and progression to pulmonary tuberculosis in Peruvians.
MCP-1 genotypes A TB B
(n = 701)n (frequency)
PPD+ C
(n = 796)n (frequency)
TB vs. PPD+
OR (95% CI) D x2 p value
AA 74 (0.11) 98 (0.123) 1.0
AG 273 (0.39) 371 (0.465) 0.97 (0.69–1.369) 0.02 0.88
GG 354 (0.5) 327 (0.412) 1.43 (1.02–2.0) 4.4 0.036
Test of homogeneity (equal odds): x2 = 13.35, p = 0.0013
MMP-1 genotypes A (n = 701)n (frequency)
(n = 796)n (frequency)
OR (95% CI) D x2 p value
1G/1G 42 (0.06) 62 (0.08) 1.0
1G/2G 229 (0.33) 336 (0.42) 1.0 (0.65–1.54) 0.00 0.98
2G/2G 430 (0.61) 398 (0.5) 1.6 (1.05–2.4) 4.92 0.027
Test of homogeneity (equal odds): x2 = 19.38, p = 0.0001
AGroups were compared by x2 Mantel-Haenszel statistics with genotypes arranged in an ordinal scale.BTB = New cases of pulmonary TB.CPPD+ = Healthy tuberculin reactors.DOR = Odds ratio, CI = Confidence interval.doi:10.1371/journal.pone.0008881.t004
MCP-1 and MMP-1 in TB
PLoS ONE | www.plosone.org 4 January 2010 | Volume 5 | Issue 1 | e8881

most of the Peruvian cases carrying the MCP-1 genotype GG
also carried the MMP-1 genotype 2G/2G (Table 6).
We used the Pearson goodness-of-fit x2 and the Hosmer-
Lemeshow (HL) x2 tests to estimate the magnitude of the differences
between the event rate predicted by the logistic models and that
observed in the cases and controls to which the models were applied
[24,25]. The null hypothesis for these tests states that the expected
and observed event rates predicted by the model are not significantly
different. A p-value .0.1 indicates that the model provides a good fit
for the data since at this level of significance the null hypothesis
cannot be rejected [24,25]. The full model (main and interaction
terms) and the interaction model alone fitted the observed data.
Indeed, the statistic estimates (x2 and p values) were the same for the
full and the interaction models in Mexicans and Peruvians (full
model: Pearson x2 = 0, p.0.1 and HL x2 = 0, p.0.1; interaction
model: Pearson x2 = 0, p.0.1 and HL x2 = 0, p.0.1). These results
clearly indicate that the interaction model alone was sufficient and
provides a better fit for the observed data. Consistent with this
observations, a model with the main effects alone was not sufficient to
explain the data observed and the null hypothesis was rejected in
Mexicans (Pearson x2 = 8.95, p = 0.0028; HL x2 = 8.95, p = 0.0114) or
Peruvians (Pearson x2 = 40.56, p,0.00001; HL x2 = 17.83,
p,0.00001). In addition, the ORs obtained for the joint effects were
greater than the expected assuming additivity in both populations.
Table 5. Multivariate analysis of main and joint effects of MCP-1 and MMP-1 tuberculosis susceptibility genotypes in Mexicans.
Mexicans A TB B
(n = 193)n (frequency)
PPD+ C
(n = 243)n (frequency)
A/- 1G/- 45 (0.23) 86 (0.35)
A/- 2G/2G 55 (0.28) 87 (0.36)
GG 1G/- 20 (0.10) 38 (0.16)
GG 2G/2G 73 (0.38) 32 (0.13)
TB versus PPD+
OR (95% CI) D Standard error z p value
Main effect of MMP-1 genotype 2G/2G 1.21 (0.73–1.98) 0.75 0.75 0.45
Main effect of MCP-1 genotype GG 1.00 (0.52–1.93) 0.33 0.02 0.98
Joint effects of MMP-1 2G/2G and MCP-1 GG 3.59 (1.54–8.33) 1.54 2.97 0.003
AGroups were compared using multiple logistic regression analysis. In the annotations for combinations of genotype at the two loci under study, the MCP-1genotype is listed first followed by the MMP-1 genotype. Individuals carrying MCP-1 genotypes AA or AG were grouped under the A/- denomination.Individuals carrying MMP-1 genotypes 1G/1G or 1G/2G were grouped under 1G/- denomination. The following is an example of annotations of combinationgenotypes at the two loci studied: A/- 1G/- refers to individual carriers of a genotype AA or AG at the MCP-1 locus and a genotype 1G/1G or 1G/2G at MMP-1locus.
BTB = New cases of pulmonary TB.CPPD+ = Healthy tuberculin reactors.DOR = Odds ratio, CI = Confidence interval.doi:10.1371/journal.pone.0008881.t005
Table 6. Multivariate analysis of main and joint effects of MCP-1 and MMP-1 tuberculosis susceptibility genotypes in Peruvians.
Peruvians A TB B
(n = 701)n (frequency)
PPD+ C
(n = 796)n (frequency)
A/- 1G/- 163 (0.23) 203 (0.26)
A/- 2G/2G 184 (0.26) 266 (0.33)
GG 1G/- 108 (0.15) 195 (0.24)
GG 2G/2G 246 (0.35) 132 (0.17)
TB versus PPD+
OR (95% CI) D Standard error z p value
Main effect of MMP-1 genotype 2G/2G 0.86 (0.65–1.14) 0.12 21.05 0.295
Main effect of MCP-1 genotype GG 0.69 (0.5–0.94) 0.11 22.33 0.02
Joint effects of MMP-1 2G/2G and MCP-1 GG 3.9 (2.56–5.95) 0.84 6.33 0.0001
AGroups were compared using multiple logistic regression analysis. In the annotations for combinations of genotype at the two loci under study, the MCP-1 genotype islisted first followed by the MMP-1 genotype. Individuals carrying MCP-1 genotypes AA or AG were grouped under the A/- denomination. Individuals carrying MMP-1genotypes 1G/1G or 1G/2G were grouped under the 1G/- denomination. The following is an example of annotations of combination genotypes at the two loci studied:A/- 1G/- refers to individual carriers of a genotype AA or AG at the MCP-1 locus and a genotype 1G/1G or 1G/2G at MMP-1 locus.
BTB = New cases of pulmonary TB.CPPD+ = Healthy tuberculin reactors.DOR = Odds ratio, CI = Confidence interval.doi:10.1371/journal.pone.0008881.t006
MCP-1 and MMP-1 in TB
PLoS ONE | www.plosone.org 5 January 2010 | Volume 5 | Issue 1 | e8881
Indeed, the ORs calculated for the additive model were 1.21 and
0.55 in Mexicans and Peruvians, respectively (Tables 5 and 6,
Materials and Methods section) [24]. Thus, we concluded that the
MCP-1 and MMP-1 genotypes GG and 2G/2G jointly increase the
odds of developing TB in Mexicans and Peruvians, and that these
joint effects are multiplicative [24].
Immunohistochemistry (IHC) Analysis of Lymph Nodesfrom Tuberculosis Cases Carriers of Relevant MCP-1 andMMP-1 Genotypes
Early events are relevant for progression from infection to
disease [1,26]. Consequently, we analyzed lymph nodes from
untreated Peruvian TB cases that were experiencing a local (node)
inflammatory process with less than 15 days of evolution. We
assessed whether carriers of the MCP-1 genotype GG and MMP-1
genotype 2G/2G produce increased levels of MCP-1 and MMP-1
at an early stage of the inflammatory process [1,26]. We used
immunohistochemistry (IHC) since the available specimens were
archived samples fixed in paraformaldehyde and embedded in
paraffin, and in our experience protein epitopes are better
preserved than mRNA in such samples. Since MMP-1 functions
are tightly regulated by tissue inhibitors of metalloproteinases
(TIMPS) in tissues undergoing inflammation [27–29], we used a
polyclonal antibody that detects only free MMP-1 (pro-MMP-1
and mature activated MMP-1).
All nodes tested showed mainly paucicellular and fibrotic old
granulomas, and a great deal of tissue damage as reflected by the
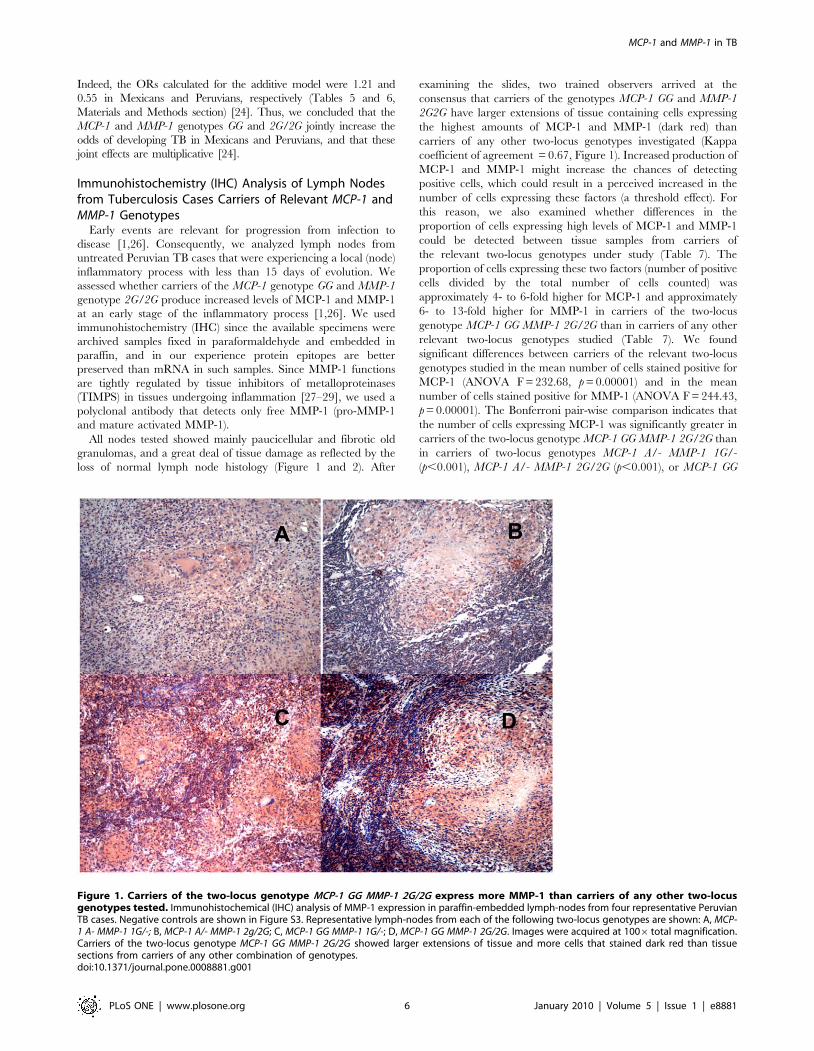
loss of normal lymph node histology (Figure 1 and 2). After
examining the slides, two trained observers arrived at the
consensus that carriers of the genotypes MCP-1 GG and MMP-1
2G2G have larger extensions of tissue containing cells expressing
the highest amounts of MCP-1 and MMP-1 (dark red) than
carriers of any other two-locus genotypes investigated (Kappa
coefficient of agreement = 0.67, Figure 1). Increased production of
MCP-1 and MMP-1 might increase the chances of detecting
positive cells, which could result in a perceived increased in the
number of cells expressing these factors (a threshold effect). For
this reason, we also examined whether differences in the
proportion of cells expressing high levels of MCP-1 and MMP-1
could be detected between tissue samples from carriers of
the relevant two-locus genotypes under study (Table 7). The
proportion of cells expressing these two factors (number of positive
cells divided by the total number of cells counted) was
approximately 4- to 6-fold higher for MCP-1 and approximately
6- to 13-fold higher for MMP-1 in carriers of the two-locus
genotype MCP-1 GG MMP-1 2G/2G than in carriers of any other
relevant two-locus genotypes studied (Table 7). We found
significant differences between carriers of the relevant two-locus
genotypes studied in the mean number of cells stained positive for
MCP-1 (ANOVA F = 232.68, p = 0.00001) and in the mean
number of cells stained positive for MMP-1 (ANOVA F = 244.43,
p = 0.00001). The Bonferroni pair-wise comparison indicates that
the number of cells expressing MCP-1 was significantly greater in
carriers of the two-locus genotype MCP-1 GG MMP-1 2G/2G than
in carriers of two-locus genotypes MCP-1 A/- MMP-1 1G/-
(p,0.001), MCP-1 A/- MMP-1 2G/2G (p,0.001), or MCP-1 GG
Figure 1. Carriers of the two-locus genotype MCP-1 GG MMP-1 2G/2G express more MMP-1 than carriers of any other two-locusgenotypes tested. Immunohistochemical (IHC) analysis of MMP-1 expression in paraffin-embedded lymph-nodes from four representative PeruvianTB cases. Negative controls are shown in Figure S3. Representative lymph-nodes from each of the following two-locus genotypes are shown: A, MCP-1 A- MMP-1 1G/-; B, MCP-1 A/- MMP-1 2g/2G; C, MCP-1 GG MMP-1 1G/-; D, MCP-1 GG MMP-1 2G/2G. Images were acquired at 1006total magnification.Carriers of the two-locus genotype MCP-1 GG MMP-1 2G/2G showed larger extensions of tissue and more cells that stained dark red than tissuesections from carriers of any other combination of genotypes.doi:10.1371/journal.pone.0008881.g001
MCP-1 and MMP-1 in TB
PLoS ONE | www.plosone.org 6 January 2010 | Volume 5 | Issue 1 | e8881
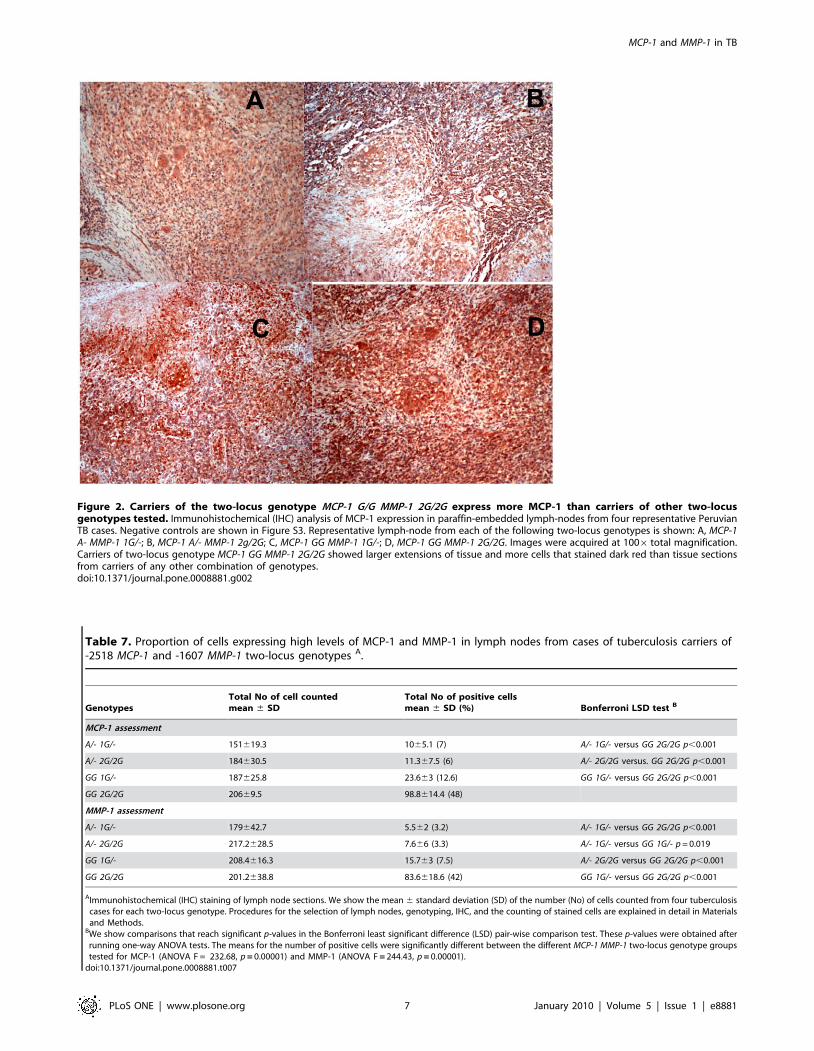
Figure 2. Carriers of the two-locus genotype MCP-1 G/G MMP-1 2G/2G express more MCP-1 than carriers of other two-locusgenotypes tested. Immunohistochemical (IHC) analysis of MCP-1 expression in paraffin-embedded lymph-nodes from four representative PeruvianTB cases. Negative controls are shown in Figure S3. Representative lymph-node from each of the following two-locus genotypes is shown: A, MCP-1A- MMP-1 1G/-; B, MCP-1 A/- MMP-1 2g/2G; C, MCP-1 GG MMP-1 1G/-; D, MCP-1 GG MMP-1 2G/2G. Images were acquired at 1006 total magnification.Carriers of two-locus genotype MCP-1 GG MMP-1 2G/2G showed larger extensions of tissue and more cells that stained dark red than tissue sectionsfrom carriers of any other combination of genotypes.doi:10.1371/journal.pone.0008881.g002
Table 7. Proportion of cells expressing high levels of MCP-1 and MMP-1 in lymph nodes from cases of tuberculosis carriers of-2518 MCP-1 and -1607 MMP-1 two-locus genotypes A.
GenotypesTotal No of cell countedmean 6 SD
Total No of positive cellsmean 6 SD (%) Bonferroni LSD test B
MCP-1 assessment
A/- 1G/- 151619.3 1065.1 (7) A/- 1G/- versus GG 2G/2G p,0.001
A/- 2G/2G 184630.5 11.367.5 (6) A/- 2G/2G versus. GG 2G/2G p,0.001
GG 1G/- 187625.8 23.663 (12.6) GG 1G/- versus GG 2G/2G p,0.001
GG 2G/2G 20669.5 98.8614.4 (48)
MMP-1 assessment
A/- 1G/- 179642.7 5.562 (3.2) A/- 1G/- versus GG 2G/2G p,0.001
A/- 2G/2G 217.2628.5 7.666 (3.3) A/- 1G/- versus GG 1G/- p = 0.019
GG 1G/- 208.4616.3 15.763 (7.5) A/- 2G/2G versus GG 2G/2G p,0.001
GG 2G/2G 201.2638.8 83.6618.6 (42) GG 1G/- versus GG 2G/2G p,0.001
AImmunohistochemical (IHC) staining of lymph node sections. We show the mean 6 standard deviation (SD) of the number (No) of cells counted from four tuberculosiscases for each two-locus genotype. Procedures for the selection of lymph nodes, genotyping, IHC, and the counting of stained cells are explained in detail in Materialsand Methods.
BWe show comparisons that reach significant p-values in the Bonferroni least significant difference (LSD) pair-wise comparison test. These p-values were obtained afterrunning one-way ANOVA tests. The means for the number of positive cells were significantly different between the different MCP-1 MMP-1 two-locus genotype groupstested for MCP-1 (ANOVA F = 232.68, p = 0.00001) and MMP-1 (ANOVA F = 244.43, p = 0.00001).
doi:10.1371/journal.pone.0008881.t007
MCP-1 and MMP-1 in TB
PLoS ONE | www.plosone.org 7 January 2010 | Volume 5 | Issue 1 | e8881

MMP-1 1G/- (p,0.001). No other pair-wise comparisons were
significant. Likewise, the number of cells expressing MMP-1 in
carriers of the genotypes MCP-1 GG MMP1 2G/2G was
significantly greater than in carriers of genotypes MCP-1 A/-
MMP-1 1G/- (p,0.001), MCP-1 A/- MMP-1 2G/2G (p,0.001), or
MCP-1 GG MMP-1 1G/- (p,0.001). The Bonferroni pair-wise
comparison of carriers of genotypes MCP-1 A /- MMP-1G/- and
MCP-1 GG MMP-1 1G/- also showed significant differences in the
number of MMP-1 positive cells (p = 0.019), while other
comparisons did not show significant differences. Thus, carriers
of the two-locus MCP-1 MMP1 genotype GG 2G/2G have the
highest numbers of cells expressing both MCP-1 and MMP-1.
Cells producing large amounts of MMP-1 and MCP-1 were
mainly located in areas surrounding old granulomas (Figures 1 and
2). Cells producing copious amounts of MCP-1 and MMP-1 (dark
red) were also observed adjacent to or surrounding the necrotic
areas (Figure S2). Monocytes produce MCP-1 and MMP-1 in
response to M. tuberculosis antigens and their presence in M.
tuberculosis-induced granulomas is a hallmark of TB infection (1,
28–30). Consistent with this, we observed that cells of the
monocytic lineage were among the most important sources of
both, MCP-1 and MMP-1 (Figure S2). A panel of appropriate
negative controls is shown in Figure S3.
Analysis of MCP-1 and MMP-1 Biological InteractionsWe developed an in vitro model to study whether MCP-1
interacts with MMP-1at the biological level. To test this in a
meaningful way we used cells of the monocytic lineage, which are
important constituents of granulomatous lesions in TB, and
stimulated them with M. tuberculosis-sonicate antigens, human
rMCP-1, or both. THP-1 monocytic cells were first stimulated
with increasing amounts of M. tuberculosis-sonicate antigens or
human rMCP-1 and expression of MMP-1 was monitored by real-
time PCR. Stimulation with M. tuberculosis-sonicate antigens
induced MMP-1 expression in a dose-dependent manner whereas
human rMCP-1 alone did not (Figure 3A and 3B). As a positive
control, human rMCP-1 alone induced the expression of CD11b
by THP-1 cells, in a dose-dependent manner (data not shown).
Stimulation of cells with M. tuberculosis-sonicate antigens alone
significantly increased the expression of MMP-1 (Z = 23.85, p =0.0001, Figure 3C). Remarkably, addition of exogenous human
rMCP-1 to THP-1 cells stimulated with M. tuberculosis-sonicate
increased the expression of MMP-1 mRNA in a dose-dependent
fashion and to higher levels than in cells stimulated with antigen
alone (Kruskal-Wallis x2 = 27.13, p = 0.0001, Figure 3C). We
observed significant differences in the levels of MMP-1 mRNA
when comparing cells stimulated with M. tuberculosis antigen alone
versus cells stimulated with antigen plus 1000 pg/ml of rMCP-1
(Z = 23.62, p = 0.0003), 2000 pg/ml of rMCP-1 (Z = 22.817,
p = 0.0049), or 4000 pg/ml of rMCP-1 (Z = 22.012, p = 0.0442)
(Figure 3C). The levels of MMP-1 mRNA expression were
significantly greater in cells stimulated with M. tuberculosis-sonicate
plus the various concentrations of rMCP-1 than in cells stimulated
with M. tuberculosis-sonicate antigens alone, with the exception of
cells stimulated with M. tuberculosis-sonicate antigens plus 500 pg/
ml of rMCP-1 (Figure 3C). Addition of rMCP-1 alone at various
concentrations did not induce MMP-1 expression.
Accumulation of free MMP-1 protein (not neutralized by
TIMPs or alpha-2-macroglobulins) was preserved in this in vitro
system (Figure 3D) [27]. The data reported in Figure 3D were
obtained using a functional assay that assessed levels of active
protein in the culture media of stimulated cells (see Materials and
Methods). Although it is evident that rMCP-1 induces a dose-
dependent incremental accumulation of MMP-1 in culture media,
testing for differences in the mean MMP-1 concentrations between
variables was not significant using the Kruskal-Wallis test
(Figure 3D). However, the accumulation of MMP-1 was greater
in cells stimulated with M. tuberculosis-sonicate antigens than that in
non-stimulated cells (Z = 23.127, p = 0.0018). Moreover, the
accumulation of MMP-1 in culture media of cells stimulated with
M. tuberculosis-sonicate antigens plus rMCP-1 was always signifi-
cantly greater than in that culture media from cells stimulated with
antigen alone. The Z and p-values obtained using the Wilcoxon-
Mann-Whitney U-test to compare two independent samples were
always significant and did not change in magnitude over all
comparisons performed (Z = 22.966, p = 0.03, Figure 3D) because
there were no statistically significant differences in the levels of
MMP-1 accumulation in culture media of cells stimulated with
antigen plus various doses of rMCP-1. Nevertheless, the results
from these experiments support the idea that MCP-1 potentiates
the induction of MMP-1 production following stimulation of cells
of the monocytic lineage by M. tuberculosis-sonicate antigens. Non-
stimulated control cells did not show significant MMP-1 secretion
(Figures 3C and 3D). Hence, we concluded that MCP-1
potentiates MMP-1 mRNA expression and MMP-1 secretion by
cells of the monocytic lineage following stimulation by M.
tuberculosis-sonicate antigens.
Analysis of the Effects of M. tuberculosis-SonicateAntigens and MCP-1 on the Activation of -1607 MMP-1Promoter Variants 1G and 2G
Our in vitro model also allowed us to assess whether the -1607
MMP-1 allele 2G induces a higher promoter activity than the allele
1G in cells of the monocytic lineage that are simulated with M.
tuberculosis-sonicate antigens alone or in the presence of human
rMCP-1. We used a dual luciferase assay to control for the
efficiency of transfections [31]. The results of the luciferase assays
were in agreement with those obtained from the ex vivo IHC
analysis of lymph nodes and in our in vitro experiments outlined
above. M. tuberculosis-antigen stimulated cells transfected with
vector containing the -1607 MMP-1 allele 1G expressed higher
luciferase activity than non-stimulated cells transfected with the
same vector, but the difference was marginally significant (t = 2.48,
p = 0.048) (Figure 4). In contrast, antigen stimulated cells
transfected with vector containing the allele 2G expressed
significantly higher luciferase activity than non-stimulated cells
transfected with the same vector (t = 6.99, p = 0.0004, Figure 4).
Addition of human rMCP-1 to antigen stimulated cells increased
the levels of luciferase activity in a dose-dependent manner beyond
those observed in cells stimulated with antigen alone (Figure 4).
The increments in luciferase activity produced by the addition of
increasing amounts of human rMCP-1 to antigen stimulated cells
were significant for the allele 1G (ANOVA F = 10.23, p = 0.005)
and highly significant for the allele 2G (ANOVA F = 172.3,
p,0.00001). Remarkably, cells transfected with vector containing
the MMP-1 allele 2G expressed significantly higher levels of
luciferase activity than cells transfected with vector containing the
MMP-1 allele 1G when stimulated with M. tuberculosis antigen
alone (t = 18.38, p = 0.0001), with antigen plus 500 pg/ml of
human rMCP-1 (t = 13.32, p = 0.0001), or with antigen plus
2000 pg/ml human rMCP-1 (t = 11.99, p = 0.001) (Figure 4).
Discussion
This study of BCG-vaccinated Mexicans and Peruvians reveals
a significant and consistent joint effect of the -2518 MCP-1
genotype GG and the -1607 MMP-1 genotype 2G/2G. The two-
locus genotype MCP-1 GG MMP-1 2G/2G increased the likelihood
MCP-1 and MMP-1 in TB
PLoS ONE | www.plosone.org 8 January 2010 | Volume 5 | Issue 1 | e8881

of developing TB 3.59-fold in Mexicans and 3.9-fold in Peruvians.
To build a conceptual frame upon which to understand the
significance of our main finding we will first discuss our results
from the univariate analysis of associations.
The current point estimates of independent associations of the
susceptibility -2518 MCP-1 genotype GG are significantly lower
than those previously observed in non BCG-vaccinated Mexicans
(OR = 5.4) and Koreans (OR = 6.9) [1]. The odd ratios (OR)
obtained in the present study were 2.66 in Mexicans and 1.43 in
Peruvians. In addition, we did not see a dose effect of the MCP-1
susceptibility allele G, and consequently did not see an association
of MCP-1 genotype AG with disease in BCG-vaccinated Mexicans
or Peruvians. Comparison between our current and previous data
obtained in Mexican cases and controls suggests that BCG
vaccination may have modified the effect of the -2518 MCP-1
allele G and genotype GG on disease progression although other
factors may have contributed. For example, differences in the
virulence of circulating bacilli between the periods when we
recruited the previous and the current Mexican samples.
However, it should be noted that both Mexican samples are from
the same geographical area, although they were obtained at
slightly different periods of time. Moreover, the demographics and
clinical features of Mexican cases and controls recruited for both
studies were similar, with the only exception being the BCG
vaccination status. We could not confirm this finding in Peruvians
since it was not feasible to recruit unvaccinated cases or controls in
Peru. Although it is likely that we would find non BCG-vaccinated
individuals in remote villages in Peru, these villages are difficult to
access. However, it is worth mentioning that clinicians have
observed that BCG vaccination modifies the rate of progression
from infection to active TB [16]. This finding highlights the need
to pay special attention to the BCG vaccination status of cases and
Figure 3. MCP-1 increases MMP-1 expression inTHP-1 monocytic cells stimulated by M. tuberculosis-sonicate antigens. We measured therelative changes in MMP-1 gene expression by real-time PCR. Data are presented as the fold change in gene expression normalized to theendogenous reference gene PDHB and relative to untreated controls (RQ values). A, MMP-1 expression following 24 hours in vitro stimulation of THP-1cells with the indicated amounts of M. tuberculosis-sonicate antigens. The effective dose 50 (ED50) of the M. tuberculosis-sonicate is indicated. B, MMP-1 expression data following 24 hours in vitro stimulations of THP-1 cells with the indicated amounts of human recombinant MCP-1 (rMCP-1). Graph Aand B show data from one of three experiments. C, MMP-1 expression data for non-stimulated (2) and M. tuberculosis-sonicate antigen stimulated (+)THP-1 cells that were cultured for 24 hours with the indicated amounts of human rMCP-1. The results presented are from three independentexperiments showing minimum and maximum RQ values. D, MMP-1 secretion levels for non-stimulated (2) and M. tuberculosis-sonicate antigenstimulated (+) THP-1 cells that were cultured for 48 hours in serum-free media with or without increasing amounts of human rMCP-1. Resultspresented are from three independent experiments and the bars indicate the standard deviation from the mean. The ED50 of M. tuberculosis-sonicatewas used to stimulate the cells for the experiments shown in B, C, and D. The p-values from Wilcoxon-Mann-Whitney U-tests of comparisons of twoindependent variables are shown in C and D. Antigen = M. tuberculosis-sonicate 1000 ng/ml.doi:10.1371/journal.pone.0008881.g003
MCP-1 and MMP-1 in TB
PLoS ONE | www.plosone.org 9 January 2010 | Volume 5 | Issue 1 | e8881

controls to avoid misclassification of the controls and bias when
searching for genetic determinants of susceptibility to progression
from infection to active tuberculosis.
It is interesting that the point estimates of MCP-1 association
with disease in Mexicans were greater in strength that those
observed in Peruvians in the present study. Differences in the
genomic structure and antigenic composition of the BCG sub-
strains used for vaccination in Peruvians and Mexicans may in
part explain these results [32,33]. In Mexico, a BCG sub-strain
derived from the BCG Copenhagen (Denmark) 1331 sub-strain
has been in use since 1927 [34]. In Peru, the original BCG strain
or the BCG sub-strain Moscow was used from 1924 to 1990
[34–36]. Since our youngest cases and controls from Peru were
born before 1991, it is very likely that most of them were
immunized with the original BCG or the BCG Moscow
sub-strain.
In animal models, diverse BCG sub-strains exhibit varied
protective efficacy against experimental infection with M.
tuberculosis and induced qualitatively different immune responses
[37]. Thus, certain sub-strains of BCG might induce a modest
protective immunity that could slightly modify the effect of certain
susceptibility genotypes. This might be the case with the BCG
Mexico sub-strain. Alternatively, certain BCG sub-strains may
induce an overwhelmingly intense pro-inflammatory recalled
response to mycobacterial antigens that in turn may promote
tissue damage independent of the effect of certain susceptibility
genotypes. This might be the case for the original BCG or BCG
Moscow used in Peru. It is worth mentioning the results of a
clinical trial conducted in Mexican children to assess the
expression profiles induced by different BCG sub-strains [38] that
showed that the sub-strain Japan - which is structurally close to the
Moscow sub-strain used in Peru - induces a more prominent
recalled pro-inflammatory response than the BCG Copenhagen
1331 sub-strain used in Mexico [38]. The intense inflammatory
response induced by certain BCG sub-strains may over-ride the
protective effect of certain genotypes.
Other prominent factors may have also contributed to
differences in the point estimates of MCP-1 genotype GG
association with disease in Mexicans and Peruvians, such as a
more intense exposure to M. tuberculosis bacilli or the lower
socioeconomic conditions in Peru. While Peruvians live in a
moderate to high TB burdened country, the TB burden is lower in
Mexico and Mexicans enjoy a relatively better socioeconomic
status than Peruvians [15,39,40]. Poor living conditions may
partially over-ride the independent effect of some loci, including
the effect of genotypes that confer resistance to disease progression.
In addition, a more pathogenic M. tuberculosis strain might be
circulating in Peru. For example, in a study of M. tuberculosis
samples from various Latin-American countries, 5.9% of the
isolates from 185 TB cases belonged to the Beijing family [41].
Although there are no data on the incidence of this strain in
Mexico, the same study reported that the incidence of this strain
was markedly lower in samples from Argentinean TB cases (1% of
512 isolates), Brazilian TB cases (0.8% of 252 isolates), and
Paraguayan TB cases (0.6% of 166 isolates), than in the Peruvian
samples [41].
An association between the – 2518 MCP-1 allele G and
resistance to TB was observed in Ghanaians [42]. This association
was attributed to the -362 MCP-1 allele C inherited in linkage
disequilibrium with the - 2518 MCP-1 allele G [42]. The same
study found no association of MCP-1 with tuberculosis in a sample
from Russia [42]. In a Chinese population from Hong Kong, no
associations of MCP-1 with tuberculosis was found [42,43].
Notably, association of the MCP-1 genotype GG with susceptibility
to developing TB was found in a more ethnically homogeneous
population of Han Chinese TB cases and controls [44].
Differences in study design may explain these disparate results,
particularly with respect to the criteria for selection of controls,
including the adjustment for BCG vaccination and nutritional
status, the stringency of the methodology used for the correct
ascertainment of exposure and ‘‘latent’’ infection status, and the
utilization of methods to correct for genetic admixture, or in the
Figure 4. Luciferase activity in response to stimulation with M. tuberculosis-sonicate antigens and human rMCP-1 is greater in THP-1cells transfected with the -1607 MMP-1 2G variant than in those transfected with the MMP-1 1G promoter variant. The activities ofpromoters carrying the -1607 alleles 1G and 2G were compared using a dual-luciferase assay system (see Materials and Methods for details). Cellswere stimulated overnight with or without M. tuberculosis-sonicate antigens and with the indicated amounts of human recombinant MCP-1. The dataare presented as the ratio of Firefly Luciferase signal to Renilla Luciferase (control) signal. The error bars represent the standard deviation of meansobtained from four independent experiments. Blue bars indicate cells transfected with plasmids containing the -1607 MMP-1 1G variant and red barsshow data from cells transfected with plasmids containing the 2G variant. Addition of human rMCP-1 to cells stimulated with M. tuberculosis-sonicateantigens increased specific luciferase activity in a dose-dependent manner and to a level greater than that induced by M. tuberculosis antigens alone.The p-values from student t-tests are shown. In blue we show the p-values from comparisons of non-stimulated cells and cells stimulated with M.tuberculosis-sonicate antigens alone. Antigen = M. tuberculosis-sonicate 10 ng/ml.doi:10.1371/journal.pone.0008881.g004
MCP-1 and MMP-1 in TB
PLoS ONE | www.plosone.org 10 January 2010 | Volume 5 | Issue 1 | e8881

criteria to detect and correct genotyping or sampling errors
reflected in departure from Hardy-Weinberg equilibrium
[1,17,20,23,45–47].
In this study we carefully established a cut-off at which we could
increase the specificity of the PPD tests to detect latently infected
controls among BCG-vaccinated individuals. To do this, we used
the QuantiFERON-TB in-tube test, which discriminates between
immunity induced by BCG vaccination and that induced by M.
tuberculosis infection (see the Materials and Methods section) [48].
This test is highly sensitive and specific in detecting M. tuberculosis
infected individuals [48]. Hence, all the controls in the present
study had a PPD response .15 mm and were very likely ‘‘latently’’
infected with M. tuberculosis bacilli [16–20]. Since they were
‘‘latently’’ infected and might progress to disease, we ensured that
they remained healthy for a period of at least two years after
exposure [16,17]. This provided a control population to identify
genetic determinants of the progression from M. tuberculosis
infection to active TB disease [1]. The criteria for the
ascertainment of tuberculosis cases in the present study were very
stringent and based on clinical features (signs and symptoms of
TB), chest X-ray findings, and positive sputum-smear tests.
However, these were not culture proven cases of M. tuberculosis
infection and this might be seen as a source of bias since there is a
remote possibility that they were infected with non-tuberculous
mycobacterias (NTM) instead of M. tuberculosis. We think that this
constitutes a minor limitation because the incidence of pulmonary
TB caused by NTM is extremely low compare with that caused by
M. tuberculosis [49,50]. Moreover, NTM infection produces
pulmonary disease when host immunity is impaired and/or in
patients suffering from other chronic lung diseases [49,50], which
was not the case in our tuberculosis patients since we excluded
individuals who were affected by immuno-deficiencies, receiving
treatments that compromise immunity, or suffering from other
lung diseases. In addition, if our cases were infected with NTM we
would have needed extended periods of multidrug therapy to
attain sterilization of the sputum (sputum negativity) [49,50], and
all our TB cases attained sputum negativity in the first 4 months of
treatment. Moreover, recidivating disease is very common among
cases of NTM-caused pulmonary disease [49,50], and, we
excluded TB cases suffering from recidivating TB. Hence, it is
very unlikely that any of our cases were infected with NTM rather
than M. tuberculosis. None of the studies reporting discrepant
findings adopted our stringent criteria for the selection of controls.
The frequency of the susceptibility -2518 MCP-1 allele G is
markedly higher in Mexicans (0.45, Table 2) and Peruvians (0.64,
Table 2) than in Caucasians (0.15 to 0.242) and non-Caucasian
Africans (0.05 to 0. 175) [51]. Consequently, ours discrepant
results may also reflect ethnic-specific characteristics resulting from
unique environments and selective evolutionary pressures [52], as
demonstrated for the natural resistance-associated macrophage protein
(NRAMP)-1 gene [52,53]. Notably, we have experimentally
observed that the -362 MCP-1 polymorphism is not functional
(Table S2) and do not think that the findings in Ghanaians are
biologically relevant [42]. The contribution of the -1607 MMP-1
genotype 2G/2G to the expression of active pulmonary TB might
also be population-specific since the frequency of the allele 2G in
Caucasians (0.433) and non-Caucasian Africans (0.375) is lower
than in Mexicans (0.73) and Peruvians (0.71) (Table 2) [54].
Our results from the genetic analysis of joint effects support the
notion that susceptibility to disease progression is a complex trait.
Notably, 38% of Mexicans and 35% of Peruvians TB cases carry
the two-locus susceptibility genotype MCP-1 GG MMP-1 2G/2G.
However, 13% and 17% of latently infected healthy controls in
Mexico and Peru also carry that susceptibility genotype and have
not developed disease to date, indicating that other factors are
involved in determining the fate of infection in these populations,
including other genetic loci [45]. Our analysis of lymph nodes
from TB cases and the results of our in vitro experiments support
the hypothesis that carriers of the two-locus genotype MCP-1 GG
MMP-1 2G/2G are at increased risk for progression to active TB
because they express a unique phenotype characterized by high
levels of both MCP-1 and free MMP-1. Our results from the
dual-luciferase experimental model further support to this
notion. Our in vitro data indicate that MCP-1 potentiates M.
tuberculosis-antigens induction of MMP-1 expression in cells of the
monocytic lineage. Consequently, we observed numerous cells
expressing large amounts of MCP-1 and MMP-1 adjacent to or
surrounding necrotic areas in lymph nodes of cases with an
ongoing inflammatory process. This support the notion that
increased production of MMP-1 may destabilize the organization
of new granulomas, thus contributing to the dissemination of
infected cells and disease progression. Hence, we have brought
together results from human population genetic and in vitro
studies into a coherent hypothesis. Moreover, TB cases that are
carriers of the two-locus genotype MCP-1 GG MMP-1 2G/2G
may benefit from treatment to neutralize the deleterious effect of
MMP-1.
In summary, our results indicate that BCG vaccination modifies
the effect of the MCP-1 susceptibility allele G. More studies are
required to understand the mechanisms underlying this interesting
effect. Most important, we show that the – 2518 MCP-1
susceptibility genotype GG and the -1607 MMP-1 genotype 2G/
2G jointly increase the likelihood of progression to active TB in a
sub-group of BCG-vaccinated Mexicans and Peruvians. The
strength and consistency of this association in both populations
supports the notion that this joint effect is more important than the
independent effects of either gene. Given that the two promoter
polymorphisms are functional and both result in increased gene
expression, we propose that increased levels of MCP-1, and
consequently MMP-1, contribute to disease progression in BCG-
vaccinated carriers of the two-locus genotype MCP-1 GG MMP-1
2G/2G. Increased MMP-1 availability and activity early in M.
tuberculosis infection may destabilize granuloma formation, in
particular the correct organization of new granulomas, promoting
spread of the infection and progression to active TB. Animal
models are needed to better understand how the two-locus
genotype MCP-1 GG MMP-1 2G/2G may induce tissue damage in
the lung during early stages of infection and to assess whether
carriers of that two-locus genotype may benefit from treatment to
neutralize the deleterious effect of excess production of MCP-1
and MMP-1.
Materials and Methods
Ethics StatementAll subjects provided informed consent, under protocols
approved by the institutional review boards of the University of
Texas Health Center at Tyler (the principal investigator spent 2
years as a faculty member in this institution), The Methodist
Hospital (TMH) in Houston (Texas, USA), the Ministry of Health
in Peru, and the Mexican National Institute of Medicine and
Nutrition ‘‘Salvador Zubiran’’.
Study SubjectsWe conducted case-control studies in Mexico and Peru. TB
patients and controls were adults of Mestizo ethnicity aged 18 to
50 years, who were recruited in the cities of Mexico and in Lima
and Callao in Peru, as part of the World Health Organization’s
MCP-1 and MMP-1 in TB
PLoS ONE | www.plosone.org 11 January 2010 | Volume 5 | Issue 1 | e8881

DOTS community surveillance program for early detection of
new TB cases [15]. Samples from Mexico were from the same
geographical area as the cases and controls of our previous study
[1]. From April 2006 through May 2007, 220 TB cases and 243
healthy controls were enrolled in Mexico, and from November
2005 through June 2009, 737 TB cases and 819 controls were
enrolled in Peru. None of the potential participants declined to
participate in the study. We could not obtain genotyping data for
27 TB cases from Mexico, and 36 TB cases and 23 controls from
Peru. Thus, our sample size was 193 TB cases and 243 controls
from Mexico, and 701 TB cases and 796 controls from Peru.
We applied most of the inclusion and exclusion criteria used in
our previous study [1], with the only exception being BCG
vaccination status. Thus, all cases and controls recruited in the
present study were vaccinated with BCG at birth, had negative
serologic tests for HIV infection, were of similar socioeconomic
status within nationalities, and were unrelated to the third
generation, as determined by a questionnaire. BCG vaccination
status of cases and controls was confirmed by the presence of a scar
in the left shoulder and vaccination records in the clinical charts.
We assessed the nutritional status of our cases and controls using
BMI as the main criterion [1,55,56]. The BMI for each subject
was determined, based on self-reported weight, before disease in
the case of TB patients, and height, measured by a nurse [1].
Individuals with a BMI ,18.5 kg/m2 were considered to be
malnourished [55,56] and were excluded from the study because
this condition compromises immunity and predisposes to disease
progression [57].
All TB cases exhibited symptoms (weight loss .10 kg, cough,
fever, night sweats for more than 1 month, or cervical or axillary
lymphadenopathy) and chest radiographic findings consistent with
pulmonary TB, a positive sputum acid-fast smear, and a history of
close contact to a TB patient. Only new TB cases were included in
the study. All cases developed disease less than 1 year after
recorded exposure to an index case.
The controls were healthy latently infected individuals with a
history of close contact to a sputum-smear positive TB patient for a
period of more than one month. A tuberculin skin test was
administered to all controls, using the Mantoux method to deliver
5 tuberculin units of purified protein derivative (Tubersol; Sanofi
Pasteur Inc., Swifwater, PA) intradermally [18–20]. The diameter
of induration was measured 48 hours after inoculation. We
recruited controls that had a tuberculin reaction .15 mm of
induration: by using this cut-off, we increased the specificity of the
test [19,20]. This strongly positive tuberculin reaction is much
more likely to be caused by M. tuberculosis infection than by the
BCG vaccination [16,20].
To find the optimal PPD cut-off to distinguish infected from
non-infected individuals, we performed a preliminary study in
Peru involving 200 randomly selected and heavily exposed persons
(household contacts of a sputum-smear positive TB case) who
remained healthy for at least 2 years after exposure. Subjects were
stratified into those with PPD .15 and those with PPD .10 mm
but #15 mm. In each group, 100 randomly selected individuals
were tested to determine whether they were infected with M.
tuberculosis using the QuantiFERON (QFT)-TB Gold in-tube test
(Cellestis, Inc., Valencia, CA). A positive QTF-TB test is an
unequivocal sign of positive M. tuberculosis infection [48]. Among
those with a PPD .15 mm, 91% were QFT-TB positive
compared with only 48% of those with a PPD .10 mm but
#15 mm. Hence, we decided to use a PPD .15 mm of indura-
tion as the cut-off for selection of controls.
To further ascertain that these control individuals were resistant
to disease progression, we ensured that a period of at least 2 years
since exposure to a TB patient had passed at the time of
recruitment. The first 2 years is a critical period during which most
of M. tuberculosis infected individuals who are susceptible to disease
progression develop active TB [17]. All control individuals had
negative sputum smears for acid-fast bacilli tests and normal chest
radiographs. None of these healthy controls had received
isoniazid, consistent with standard medical practice in Mexico
and Peru. All potential controls whose tuberculin skin tests
showed #15 mm of induration were excluded from the study.
Blood Samples and Single Nucleotide Polymorphisms(SNPs) Analysis
Genomic DNA was isolated from blood cell pellets using DNA
extraction kits (Qiagen, Valencia, CA). We genotyped the -
2518A.G SNP in MCP-1 (rs1024611), the -1607_1608insG variant
in MMP-1 (rs1799750), and 42 genomic control SNPs listed in
Table S1. The rs1024611 and rs1799750 SNPs were genotyped in
duplicate using the tetra-arms technique [58]. We did not find
discrepancies in the typing results for MCP-1 and MMP-1. We will
make primer sequences available and procedures available upon
request. To confirm our results for the MCP-1 and MMP-1 gene
analysis, we sequenced 10 randomly selected Mexican and
Peruvian cases and controls. Previously published genotyping
results of genomic controls for Mexicans were applied to our
sample of Mexicans in the present study [1]. The 42 SNPs used as
genomic controls in Peruvians were genotyped using an Illumina
platform. Given that Africans are the founders of all human races
and that the -2518 MCP-1 allele A and the -1607 MMP-1 allele 1G
are the most frequent in this population [51,54], we used them as
reference alleles.
Ex Vivo Analysis of Lymph-Nodes and In Vitro StudiesFor immunohistochemistry (IHC), 35 axillary or cervical lymph
nodes fixed in paraformaldehyde and embedded in paraffin were
obtained from archived samples at the Hospital Maria Auxiliadora
in Lima, Peru. All of these were from TB patients that met the
inclusion/exclusion criteria described above. We then selected 16
TB cases that were carriers of the genotype combinations under
study and had a lymph node inflammatory process of no more
than 15 days of evolution. The lymph nodes analyzed were all
from males with no significant differences in age, either within or
between groups. We extracted genomic DNA from four core
sections (80 mm thick) per sample, using the Recoverall Total
Nucleic Acid Isolation kit (Applied Biosystems, Foster City, CA)
and deparaffination and extraction protocols provided with the kit.
The genomic DNA was genotyped as described above. For IHC
we used heat-induced epitope retrieval in citrate buffer (Thermo/
Fisher Scientific Inc., Waltham, MA), anti-human MMP-1/
Collagenase-1 rabbit purified total polyclonal IgG antibody Ab-6
(Thermo/Fisher Scientific Inc) or anti-human MCP-1/CCL-2
mouse IgG2B monoclonal antibody from clone 23002 (R&D
Systems, Minneapolis, MN), and the biotin-free HRP-polymer
AEC-based detection system (UltraVision LP Detection System,
Lab Vision Products, Fremont, CA). We immunostained 5-mm
thick sections in duplicate for each case, using contrast Blue for
counterstaining (KPL Inc., Gaithersburg, ME). Negative controls
were sections incubated with irrelevant normal rabbit IgG (KPL
Inc., Gaithersburg, ME) or irrelevant normal mouse IgG2B
antibody (R&D Systems). We used 1X Automation buffer pH 7.5
(Biomeda Inc., Albuquerque, NM) in all wash steps. SuperMount
permanent aqueous mounting media (BioGenex, San Ramon, CA)
was used for mounting immunostained tissue sections. Immuno-
stained tissue sections were first assessed at 1006 or 2006 total
magnification and 0.8 numerical aperture of the objective lenses.
MCP-1 and MMP-1 in TB
PLoS ONE | www.plosone.org 12 January 2010 | Volume 5 | Issue 1 | e8881
The tissue sections were assessed by two trained observers who
were blind to the clinical and genotyping information. Image
acquisition was performed using a computerized analysis system
comprising: a BX41 microscope with a U-TVIX-2 and a U-
CMAD3 tube and adapter attached for on-screen viewing, a
C3040 4.1 megapixel digital camera, and Magnafire-SP software
(Olympus America Inc.). The number of cells expressing high
levels of MCP-1 and MMP-1 was assessed at 4006magnification
with the aid of a 10610 mm ocular grid with 100 individual
squares of 1 mm square (Microscope World, Carlsbad, CA). Five
randomly selected fields per slide (one slide per individual with
duplicate samples) were evaluated.
Culture Conditions, RT-PCR and Dual-Luciferase AssayFor the assessment of MMP-1 expression we used the 7500 Fast
Real-Time PCR System. We used assay-on-demand primers for
MMP-1 (ID Hs00233958), CD11b (Hs00167304), and the house
keeping gene PDHB (Pyruvate dehydrogenase beta, ID Hs00168650)
(Applied Biosystems). To calculate the relative quantity (RQ) of
MMP-1, we used the 2 -DDCT method implemented in the software
[59]. The data are presented as the fold change in gene expression
normalized to the endogenous reference gene PDHB and relative
to the untreated controls (RQ values). THP-1 cells (16106 cells/
ml) were stimulated with the indicated amounts of M. tuberculosis-
lysate obtained after sonication (M. tuberculosis-sonicate) as
described previously [1], or the indicated amounts of human
rMCP-1 (R&D Systems), or both. Cells were cultured for 24 and
48 hours in complete RPMI (10% FCS) or serum-free media
(Macrophage SFM medium, Invitrogen, Carlsbad, CA) as
indicated in the figure legends. Cells were then harvested and
total RNA was extracted using TRIzol (Invitrogen). Complemen-
tary DNA (cDNA) was obtained from 3 mg of total RNA using the
High Capacity cDNA Reverse Transcription Kit (Applied
Biosystems). Approximately 100 ng cDNA was used to determine
the expression levels of the housekeeping gene PDHB and MMP-1.
Supernatants from the same cultures were harvested and kept at
220uC until analyzed. MMP-1 activity in the supernatants was
tested using Fluorokine E, Human Active MMP-1 kits (R&D
Systems) and the Multi-mode Microplate Reader Synergy 2
(BioTek Instruments Inc., Winooski, VT). This assay uses a
monoclonal antibody to capture free MMP-1 and assesses its levels
by measuring the amount of cleaved collagen peptide by
monitoring fluorescence. Since the antibody captures only free
MMP-1 and the assay is a functional assay, detection of MMP-1
that is complexed and neutralized by alpha-2-macroglobulin or
TIMPs is excluded.
We compared the activity of promoters carrying the -1607
MMP-1 alleles 1G and 2G using the dual-luciferase assay system
and Glomax 96-microplate luminometer (Promega, Madison, WI).
The MMP-1 promoter region spanning positions 21350 to 21766
was cloned into the Firefly Luciferase vector pGL4.10[luc2]
(Promega), expanded in DH5a E. coli cells (Invitrogen) and
purified using an endotoxin free plasmid purification system
(Qiagen). Alleles containing promoter fragments were obtained by
PCR from genomic DNA obtained from -1607 MMP-1 homozy-
gous 1G/1G and 2G/2G. THP-1 cells were co-transfected with
pGL4.10[luc2] vectors containing the allele 1G or the allele 2G and
control pGL4 Renilla Luciferase vector pGL4.73[hRluc/SV40]
(Promega) in a 50:1 ratio using Effectene transfection reagents
from Qiagen. Cells were cultured overnight in complete RPMI
(10% FCS) and then washed three times in RPMI, re-suspended in
complete RPMI, and stimulated overnight with or without M.
tuberculosis-sonicate antigens and human rMCP-1. Protocols
provided by the dual-luciferase assay system were followed for
transfection of the cells, preparation of cell lysates, and
measurements of the dual-luciferase signals.
Statistical AnalysisStatistical analysis was performed using Intercooled STATA10
software (Stata Corporation, College Station, TX). Based on
preliminary data for frequencies of alleles observed at the two loci
in both populations, we calculated that our sample size would
provide 90% power to detect an OR of 1.5 with a two-sided a of
0.025. Sample size calculations were performed as explained
elsewhere [1]. Hardy-Weinberg equilibrium was calculated using
chi-square (x2) tests for n(n+1)/2 degrees of freedom, where n is the
number of alleles in the polymorphism tested [1,47]. Expected
genotype proportions were obtained using allele frequencies
observed in the controls and the binomial equation [47].
Univariate analysis of categorical data. Association of
alleles with disease was analyzed using 262 contingency tables,
and two-sided x2 tests [60]. The x2 values were corrected for
population stratification, primarily to control for differences in the
level of admixture between cases and controls, by dividing the x2
values by an estimated value of l [23]. We used our previously
calculated l values for the Mexican sample [1]. For Peruvians lwas calculated as the mean of x2 from comparison of the allele
frequencies of 42 SNPs located across the genome in a randomly
selected sample of 96 cases and 96 controls. SNPs selected as
genomic controls were not in LD (Table S1) [23,61]. The x2-values
obtained from the analysis of allele associations with disease were
divided by l and the p-values calculated based on the adjusted x2-
values. The resulting p-values were further adjusted according to
the number of comparisons, using the Bonferroni correction (*p-
values). We used the method of Reich and Goldstein to control for
genetic admixture because this method provides a precise
coefficient to correct for stratification while testing for
associations [23]. This practical approach is unmatched by other
proposed methods [23]. For example, methods that rely on
principal component analysis to deal with stratification might not
be practical since they impose the stratified analysis of sub-groups
exhibiting similar characteristics, increasing dimensionality and
the sample size required [62].
We used multiple 262 tables, with genotypes arranged in an
ordinal scale, and x2 Mantel-Haenszel statistics to test each of the
three genotypes produced by the diallelic locus for association with
disease, primarily to obtain valid estimates for association for each
stratum, and to assess dose effects and homogeneity of the odd
ratios (OR) across strata [46]. To test for homogeneity of OR we
used the Breslow and Day’s test provided in the SATA10 output.
Before routinely collapsing information across strata we consid-
ered it important to obtain estimates of association for each
stratum using x2 Mantel-Haenszel statistics to make sure that they
could be meaningfully pooled [46].
Multivariate analysis of categorical data. To test main
and joint (interaction) effects, we used multiple logistic regression
analysis. Based on the results from univariate analysis of genotypes
we collapsed MCP-1 and MMP-1 genotypes that were not found to
be associated with disease and ran a hypothesis driven analysis of
joint effects. We declared a significant interaction effect if the
observed joint OR was greater than the expected OR, and
the Z statistics and p values were significant [24,25]. We per-
formed Pearson and Hosmer-Lemeshow goodness-of-fit x2 tests to
determine whether the observed models differed from the
predicted [25]. The desirable outcome of non-significance
(p.0.1) means that the predicted model does not differ from the
observed [25]. The ORs for the additive model were obtained
using STATA10 output and the following formula: (ORGG +
MCP-1 and MMP-1 in TB
PLoS ONE | www.plosone.org 13 January 2010 | Volume 5 | Issue 1 | e8881

OR2G/2G) – 1; were ORGG is the adjusted OR for the MCP-1
genotype GG in the absence of MMP-1 genotype 2G/2G and
OR2G/2G is the adjusted OR for the MMP-1 genotype 2G/2G in
the absence of MCP-1 genotype GG [24].
Other statistic methods. To analyze IHC results we used
the Kappa statistic and a modified Rietveld and van Houd scale
[63]. According to this scale the interpretation of Kappa
coefficients is as follows: ,0 = Less than chance agreement,
0.01–0.2 = Slight agreement, 0.21–0.40 = Fair agreement, 0.41–
0.60 = Moderate agreement, 0.61–0.8 = Substantial agreement,
0.81–0.99 = Almost perfect agreement [63]. We performed one-
way analysis of variance (ANOVA) to determine whether
differences in the means number of positive cells between groups
were significant [64]. Twenty observations for each genotype
group (4 patients per group 65 randomly selected fields per
patient) were tested. ANOVA tests were followed by Bonferroni
least significant difference pair-wise comparisons [64]. For the
analysis of some in vitro experiments non-parametric Kruskal-
Wallis or one-way ANOVA were used to compare mean values
between groups, and Wilcoxon-Mann-Whitney U-test or student
t-tests for independent variables were used to compare two groups
mean values [64]. Before running ANOVA we confirmed normal
distribution of the data and homocedasticity using Shapiro-Wilk
and Barlett’s tests, respectively [64]. If these assumptions were
violated non-parametric tests were run.
Supporting Information
Supplemental MaterialFigure S1 shows the BCG-modifier effect in Mexicans comparing
the strength of OR and CI in the pool and in samples used in the
previous and present studies. Figure S2 shows IHC of lymph nodes
from TB cases in which cells expressing MCP-1 and MMP-1
producing surround necrotic areas. Figure S3 shows typical
examples of negative controls results from IHC analysis. Table S1
lists SNPs typed as genomic controls, SNP name, chromosome
location and position, allele characteristics, call rates (CR) for each
SNP in cases and controls, genotype frequencies, Hardy-Weinberg
equilibrium assessment (HWE), minor allele frequencies (MAF), and
chi-square values resulting from comparison of allele frequencies.
Table S2 shows results of the assessment of the effect of the -362
G.C MCP-1 SNP (rs2857656) on MCP-1 promoter activity.
Figure S1 BCG vaccination modifies the effect of the -2518
MCP-1 susceptibility allele G and genotypes. Odd ratios (OR) and
95% confidence intervals (CI) are shown as measurements of the
strength of associations between the -2518 MCP-1 A to G transition
and progression from infection to active TB. Diamonds represent
the OR and error bars represent the CI. An OR of 1 indicates no
association. The further the value of the OR is from 1, in a
negative or positive direction, the stronger the association. In the
upper part of the figure, the pool of Mexican TB cases and the
latently infected PPD+ controls from this and our previous study
(1) is shown. The pool consists of 628 TB cases (61 homozygous
AA, 245 heterozygous, and 322 homozygous GG) and 577 latently
infected healthy PPD+ controls (128 homozygous AA, 288
heterozygous, and 161 homozygous GG). In the lower part of
the figure the strata of non-BCG (left) vaccinated cases and
controls from our previous study (1) and BCG (right) vaccinated
cases and controls from the present study (Table 3) are shown. We
used x2 Mantel-Haenszel statistics to test for genotype association
with disease progression.
Found at: doi:10.1371/journal.pone.0008881.s001 (0.01 MB
PDF)
Figure S2 Cells producing MMP-1 and MCP-1 are also located
adjacent to necrotic areas. Immunohistochemical (IHC) analysis of
MMP-1 and MCP-1 expression in paraffin-embedded lymph-
nodes from Peruvian TB cases carriers of the two- locus genotype
MCP-1 GG MMP-1 2G/2G. Arrows indicate necrotic areas
surrounded by cells expressing large amounts of MMP-1 (A) and
MCP-1 (B) in dark red. There are many cells with pycnotic
(condensed) nuclei in A and B. Images were acquired at 2006total
magnification.
Found at: doi:10.1371/journal.pone.0008881.s002 (0.21 MB
PDF)
Figure S3 Negative controls. Immunohistochemical (IHC)
analysis of MMP-1 and MCP-1 expression in paraffin-embedded
lymph-nodes from Peruvian TB cases presented in Figure 1 and 2.
In A, negative control incubated with normal rabbit IgG. In B,
negative control incubated with normal mouse IgG2B. Images
were acquired at 1006 total magnification.
Found at: doi:10.1371/journal.pone.0008881.s003 (0.45 MB
PDF)
Table S1 Genomic Controls. A These SNPs were genotyped as
genomic controls. All SNPs selected are not in linkage disequilib-
rium and should segregate independently from each other. To
control for errors in the estimation of chi-square (x2) values and
HWE p-values all the SNPs selected have Minor Allele frequencies
(MAF) .0.1 (high MAF). This ensured that we will have at least
10 out of 100 carriers of the rare allele and at least 1 homozygous
for the rare allele in the dataset. We list SNP names, chromosome
location and position, allele characteristics, call rates (CR) for each
SNP in cases and controls, genotype frequencies (in black for
controls and in red for cases), Hardy-Weinberg equilibrium
assessment (HWE), minor allele frequencies (MAF), and chi-
square (x2) values resulting from comparison of allele frequencies.B We included in the analysis those SNPs with call rates (CR)
.95% to avoid errors in the estimation of x2 values. We did not
need to re-cluster any of the loci tested to obtained call rate values
presented in the table. We reanalyzed five loci using Tetra-Arms
technique and the concordance rate was 100%. Thus, genotyping
results obtained with the Illunina platform are highly reproducible.C Hardy-Weinberg equilibrium (HWE) test was done using the
BeadStudio 3.0 Genotyping Module (GT) software from Illumina.
The Null hypothesis for the HWE tested is: the distribution of
genotypes is not in Hardy-Weinberg equilibrium. All loci tested in
the control population were in HWE. D A chi-square (x2) value
.3.8 is significant at p,0.05, and a x2 value .6.6 is significant at
p,0.01 with 1 degree of freedom. A value of lambda was obtained
as follows: l=S x2/number of SNPs = 51.723/42 = 1.2315.
Found at: doi:10.1371/journal.pone.0008881.s004 (0.10 MB
DOC)
Table S2 Luciferase activity in response to PMA and M.
tuberculosis-sonicate antigens stimulation of THP-1 cells transfected
with vectors containing the -362 MCP-1 alleles G or C. A The
promoter region spanning positions -537 to position -156 of MCP-
1 gene containing the -362 MCP-1 alleles G and C were amplified
from - 362 MCP-1 homozygous GG or CC and cloned into the
Firely Luciferase vector pGL4.10[luc2] (Promega Corporation,
Madison, WI), expanded in DH5a E. coli cells (Invitrogen,
Carlsbad, CA) and purified using an endotoxin free plasmid
purification system (Qiagen, Valencia, CA). B THP-1 cells were
co-transfected with pGL4.10[luc2] vectors containing the -362
MCP-1 allele G or the allele C and control pGL4 Renilla
Luciferase vector pGL4.73[hRluc/SV40] (Promega Corporation,
Madison, WI) in a 50:1 ratio using Effectene transfection reagents
from Qiagen (Valencia, CA). Cells were cultured overnight in
MCP-1 and MMP-1 in TB
PLoS ONE | www.plosone.org 14 January 2010 | Volume 5 | Issue 1 | e8881

complete RPMI (10% FCS) and then washed three times in
RPMI, re-suspended in complete RPMI, and stimulated overnight
with or without PMA or M. tuberculosis-sonicate antigens. Protocols
provided by the dual-luciferase assay system were followed for
transfection of cells, preparation of cell lysates, and measurement
of dual-luciferase signals. The data are presented as the ratio of
Firefly Luciferase and Renilla Luciferase (control) signal. The
standard deviation of means obtained from three independent
experiments. C We run student t-tests using STATA10 to
determine whether the alleles induce statistically different
expression levels of luciferase in THP-1 cells. Vectors containing
the -362 MCP-1 alleles are available upon request.
Found at: doi:10.1371/journal.pone.0008881.s005 (0.03 MB
DOC)
Acknowledgments
We are grateful to all patients and healthy donors for their kind
cooperation. We thank Dr. Michael Lieberman and Dr. James Musser
at TMHRI for their encouraging support of our work.
Author Contributions
Conceived and designed the experiments: MG JARM POFV. Performed
the experiments: MG JARM JD POFV. Analyzed the data: MG JARM
JCGdlTP JD JG POFV. Contributed reagents/materials/analysis tools:
JCGdlTP JG POFV. Wrote the paper: POFV. Helped in designing
protocols for the recruitment of TB cases and controls in Peru: JCGdlTP,
JG.
References
1. Flores-Villanueva PO, Ruiz-Morales JA, Song Ch-H, Flores LM, Jo E-K, et al.
(2005) A functional promoter polymorphism in monocyte chemoattractant protein-1 is
associated with increased susceptibility to pulmonary tuberculosis. J Exp Med
12: 1649–1658.
2. Jamienson SE, Miller EN, Black JF, Peacock CS, Cordell HJ, et al. (2004)
Evidence for a cluster of genes on chromosome 17q11.2-q21 controlling
susceptibility to tuberculosis and leprosy in Brazilians. Genes Immun 5: 46–57.
3. Monack DM, Muller A, Falkow S (2004) Persistent bacterial infections: the
interface of the pathogen and host immune system. Nat Rev Microbiol 9:
747–765.
4. Coraux C, Roux J, Jolly T, Birembaut P (2008) Epithelial cell-extracellular
matrix interactions and stem cells in airway epithelial regeneration. Proc Am
Thorac Soc 5: 689–694.
5. Suki B, Stamenovic D, Lutchen KR, Ingenito EP (2005) Biomechanics of the
lung parenchyma: critical roles of collagen and mechanical forces. J Appl Physiol
5: 1892–1899.
6. Kaarteenacho-Wiik R, Sademies O, Paaho P, Risteli J, Soini Y (2007)
Extracellular matrix proteins and myofibroblasts in granulomas of sarcoidosis,
atypical mycobacteriosis, and tuberculosis of the lung. Hum Pathol 38: 147–153.
7. Ulrichs T, Kaufmann HE (2006) New insights into the function of granulomas in
human tuberculosis. J Pathol 208: 261–269.
8. O’Reilly PJ, Gaggar A, Blalock JE (2008) Interfering with extracellular matrix
degradation to blunt inflammation. Curr Opin Pharmacol 8: 242–248.
9. Chang JC, Wysocki A, Tchou-Wong K-M, Moskowitz N, Zhang Y, et al. (1996)
Effect of Mycobacterium tuberculosis and its components on macrophages and the
release of matrix metalloproteinases. Thorax 51: 306–311.
10. Elkington PTG, Nuttfall RK, Boyle JJ, O’Kane CM, Horncastle DE, et al.
(2005) Mycobacterium tuberculosis, but not vaccine BCG, specifically upregulates
Matrix Metalloproteinase-1. Am J Crit Care Med 172: 1596–1604.
11. Reutter JL, Mitchell TI, Buttice G, Meyers J, Gusella JF, et al. (1998) A single
nucleotide polymorphism in the matrix metalloproteinase promoter creates an
Ets binding site and augments transcription. Cancer Res 58: 5321–5325.
12. Stein CM, Zalwango S, Malone LL, Won S, Mayanja-Kissa H, et al. (2008)
Genome Scan of M. tuberculosis infection and disease in Ugandans. PLoS One 3:
e4094.
13. Gueders MM, Foidart J–M, Noel A, Cataldo DD (2006) Matrix metallopro-
teinases (MMPs) and tissue inhibitors of MMPs in the respiratory tract: Potential
implications in asthma and other lung diseases. Eur J Pharmacol 533: 133–144.
14. Rovin BH, Saxena R (1999) A novel polymorphism in the MCP-1 gene
regulatory region that influences MCP-1 expression. Biochem Biophys Res
Commun 259: 344–348.
15. World Health Organization (2008) Global tuberculosis control: surveillance,
planning, financing: WHO report 2008. 304 p.
16. Fitzgerald D, Haas DW (2005) Mycobacterium tuberculosis. In: Mandell GL,
Bennett JE, Dolin R, eds. Mandell, Douglas, and Bennett’s Principles and
Practice of Infectious Diseases. Pennsylvania: Elsevier. pp 2852–2886.
17. Caminero Luna JA (2004) A tuberculosis Guide for Specialist Physicians. Paris:
International Union Against Tuberculosis and Lung Disease. 49 p.
18. Molina-Gamboa J, Ponce-de-Leon-Rosales S, Rivera-Morales I, Romero C,
Baez R, et al. (1994) Evaluation of sensitivity of RT-23 purified protein
derivative for determining tuberculin reactivity in a group of health care
workers. Clin Infect Dis 19: 784–786.
19. American Thoracic Society (2000) Diagnostic standards and classification of
tuberculosis in adults and children. Am J Respir Crit Care Med 161: 1376–1397.
20. Wang L, Turner MO, Elwood RK, Shulzer M, FitzGerald JM (2002) A meta-
analysis of the effect of Bacille Calmette Guerin vaccination on tuberculin skin
test measurements. Thorax 57: 804–809.
21. Cerda-Flores RM, Villalobos-Torres MC, Barrera-Saldana HA, Cortes-
Prieto LM, Rivas F, et al. (2002) Genetic admixture in three Mexican Mestizo
populations based on D1S80 and HLA-DQA1 loci. Am J Hum Biol 14:
257–263.
22. Cervantes J (2002) Genetic differences between mestizo populations of Bolivia
and Peru. Bull Inst Fr Etudes Andines 2: 213–222.
23. Reich DE, Goldstein DB (2001) Detecting association in a case-control study
while correcting for population stratification. Genet Epidemiol 20: 4–16.
24. Szklo M, Nieto FJ (1999) Defining and Assessing Heterogeneity of Effects:Interaction. In: Epidemiology: Beyond the Basics. Massachusetts: Jones and
Barlett Publishers. pp 211–254.
25. Dupont WD (2002) Multiple Logistic Regression. In: Statistical Modeling forBiomedical Researchers. Cambridge: Cambridge University Press. pp 207–262.
26. Davis JM, Ramakrishnan L (2009) The role of the granuloma in expansion and
dissemination of early tuberculosis infection. Cell 136: 37–49.
27. Cawston TE, Mercer E (1986) Preferential binding of collagenase to alpha-2-
macroglobulin in the presence of the tissue inhibitor of metalloproteinases. FEBSLett 209: 9–12.
28. Hoheisel G, Sack U, Hui DS, Huse K, Chan KS, et al. (2001) Occurrence of
matrix metalloproteinase and tissue inhibitors of metalloproteinases intuberculosis pleuritis. Tuberculosis 81: 203–209.
29. Rand L, Green JA, Saraiva L, Friedland JS, Elkington PT (2009) Matrix
metalloproteinase-1 is regulated in tuberculosis by a p38 MAPK-dependent, p-
aminosalicylic acid-sensitive signaling cascade. J Immunol 182: 5865–5872.
30. Colotta F, Borre A, Wang JM, Tattanelli M, Maddalena F, et al. (1992)Expression of a monocyte chemotactic cytokine by human mononuclear
phagocytes. J Immunol 148: 760–765.
31. Sherf BA, Navarro SL (1996) Dual-Luciferase reporter assay: an advanced co-reporter technology integrating Firefly and Renilla luciferase assays. Prom Notes
Mag 57: 2–8.
32. Behr MA, Wilson MA, Gill WP, Salamon H, Schoolnik GK, et al. (1999)
Comparative genomics of BCG vaccines by whole-genome DNA microarray.Science 284: 1520–1523.
33. Brosch R, Gordon SV, Garnier T, Eiglmeier K, Frigui W, et al. (2007) Genome
plasticity of BCG and impact on vaccine efficacy. Proc Natl Acad Sci U S A 104:5596–5601.
34. Oettinger T, Jørgensen M, Ladefoged A, Hasløv K, Andersen P (1999)
Development of the Mycobacterium bovis BCG vaccine: review of the historical and
biochemical evidence for a genealogical tree. Tuber Lung Dis 79: 243–250.
35. Behr MA, Small PM (1999) A historical and molecular phylogeny of BCGstrains. Vaccine 17: 915–922.
36. Santiago EM, Lawson E, Gillenwater K, Kalangi S, Lescano AG, et al. (2003) A
Prospective study of bacillus Calmette-Guerin scar formation and tuberculin skintest reactivity in infants in Lima, Peru. Pediatrics 112: e298–2302.
37. Castillo-Rodal AI, Castanon-Arreola M, Hernadez-Pando R, Calva JJ, Sada-
Dıaz E, et al. (2006) Mycobacterium bovis BCG substrains confer different levels of
protection against Mycobacterium tuberculosis infection in a BALB/c model ofprogressive pulmonary tuberculosis. Infect Immun 74: 1718–1724.
38. Wu B, Huang C, Garcia L, Ponce de Leon A, Sifuentes Osorio J, et al. (2007)
Unique gene expression profiles in infants vaccinated with different strains ofMycobacterium bovis Calmette-Guerin. Infect Immun 75: 3658–3664.
39. Lonnroth K, Jaramillo E, Williams BG, Dye C, Raviglione M (2009) Drivers of
tuberculosis epidemics: The role of risk factors and social determinants. Soc Sci
Med 12: 2240–2246.
40. Paes de Barros R, Ferreira FHG, Molinas Vega JR, Saavedra Chanduvi J.Measuring Inequality of Opportunities in Latin America and the Caribbean.
Washington: The World Bank. 195 p.
41. Ritacco V, Lopez B, Cafrune PI, Ferrazoli L, Suffys PN, et al. (2008)Mycobacterium tuberculosis strains of the Beijing genotype are rarely observed in
tuberculosis patients in South America. Mem Inst Oswaldo Cruz 103: 489–492.
42. Thye T, Nejentsev S, Intemann CD, Browne EN, Chinbuah MA, et al. (2008)
MCP-1 promoter variant -362 associated with protection from pulmonarytuberculosis in Ghana, West Africa. Hum Mol Genet 18: 381–388.
43. Chu SF, Tam CM, Wong HS, Kam KM, Lau YL, et al. (2007) Association
between RANTES functional polymorphisms in Hong Kong Chinese. GenesImmun 8: 475–479.
MCP-1 and MMP-1 in TB
PLoS ONE | www.plosone.org 15 January 2010 | Volume 5 | Issue 1 | e8881

44. Xu ZE, Xie YY, Chen JJ, Xing LL, Zhang AH, et al. (2009) Monocyte
chemotactic protein-1 gene polymorphism and monocyte chemotactic proteinexpression in Chongqing Han children with tuberculosis. Zhonghua Er Ke Za
Zhi 47: 200–203.
45. Takiff HE (2007) Host genetics and susceptibility. In: Palomino CP, CardosoLeao S, Ritacco V, eds. Tuberculosis 2007, from basic science to patient cares.
TuberculosisTextbook.com. pp 207–262.46. Thomas DC (2004) Statistical Methods in Genetic Epidemiology. In: Testing
Candidate Gene Associations. New York: Oxford University Press. pp 253–282.
47. Lynch M, Walsh B (1998) The Hardy-Weinberg Principle. In: Genetics andAnalysis of Quantitative Traits. Massachusetts: Sinauer Associates Inc. pp 54–56.
48. Diel R, Loddenkemper R, Meywald-Walter K, Gottschalk R, Nienhaus A (2009)Comparative performance of tuberculin skin test, QuantiFERON-TB-GOLD in
tube assay, and T-spot.TB test in contact investigations for tuberculosis. Chest135: 1010–1018.
49. Field SK, Cowie RL (2006) Lung disease due to the more common
nontuberculous Mycobacteria. Chest 129: 1653–1672.50. Johnson MM, Waller EA, Leventhal JP (2008) Nontuberculous mycobacterial
pulmonary disease. Curr Opin Pulm Med 14: 203–210.51. http://www.ncbi.nlm.nih.gov/projects/SNP/snp_ref.cgi?rs = 1024611.
52. Delgado JC, Baena A, Thim S, Goldfeld AE (2002) Ethnic-specific genetic
associations with pulmonary tuberculosis. J Infect Dis 186: 1463–1468.53. Li HT, Zhang TT, Zhou YQ, Huang QH, Huang J (2006) SLC11A1 (formerly
NRAMP1) gene polymorphisms and tuberculosis susceptibility: a meta-analysis.Int J Tuberc Lung Dis 10: 3–12.
54. http://www.ncbi.nlm.nih.gov/projects/SNP/snp_ref.cgi?rs = 1799750.
55. WHO Working Group (1986) Use and interpretation of anthropometric
indicators of nutritional status. Bull World Health Organ 64: 929–931.
56. Bailey BE, Ferro-Luzzi A (1995) Use of body mass index of adults in assessing
individual and community nutritional status. Bull World Health Organ73:
673–680.
57. Schaible UE, Kaufman SHE (2007) Malnutrition and infection: Complex
mechanisms and global impacts. Plos Medicine 4: 806–812.
58. Ye S, Dhillon S, Ke X, Collins AR, Day NM (2001) An efficient procedure for
genotyping single nucleotide polymorphisms. Nucleic Acid Res 29: e88–8.
59. Livak KJ, Schmittgen TD (2001) Analysis of relative gene expression data using
real-time quantitative PCT and the 2 -DDCT method. Methods 25: 402–4008.
60. Hartl DL, Clark AG (1997) Population frequencies and genotypes. In: Principles
of population genetics. Massachusetts: Sinauer Associates Inc. pp 140–143.
61. Pritchard JK, Rosenberg NA (1999) Use of unlinked genetic markers to detect
population stratification in association studies. Am J Hum Genet 65: 220–228.
62. Paschou P, Ziv E, Burchard EG, Choudhr S, Rodriguez-Cintron W, et al. (2007)
PCA-correlated SNPs for structure identification in worldwide human
populations. PLoS Genet 3: 1672–1686.
63. Viera AJ, Garrett JM (2005) Understanding interobserver agreement: The
Kappa Statistic. Fam Med 5: 360–363.
64. Dupont WD (2002) Fixed effect analysis of variance. In: Statistical Modeling for
Biomedical Researchers. Cambridge: Cambridge University Press. pp 207–262.
MCP-1 and MMP-1 in TB
PLoS ONE | www.plosone.org 16 January 2010 | Volume 5 | Issue 1 | e8881
Copyright © 2022 FDOKUMEN