Observations of the Naked-Eye GRB 080319B: Implications of Nature's Brightest Explosion
45
arXiv:0803.3215v3 [astro-ph] 15 Dec 2008 Observations of the Naked-Eye GRB 080319B: Implications of Nature’s Brightest Explosion J. S. Bloom 1,2 , D. A. Perley 1 , W. Li 1 , N. R. Butler 1 , A. A. Miller 1 , D. Kocevski 1 , D. A. Kann 5 , R. J. Foley 1 , H.-W. Chen 3 , A. V. Filippenko 1 , D. L. Starr 1,4 , B. Macomber 1 , J. X. Prochaska 6 , R. Chornock 1 , D. Poznanski 1 , S. Klose 5 , M. F. Skrutskie 7 , S. Lopez 8 , P. Hall 9 , K. Glazebrook 10 , and C. H. Blake 11 1 Department of Astronomy, University of California, Berkeley, CA 94720-3411. 2 Sloan Research Fellow. 3 Department of Astronomy & Astrophysics, University of Chicago, Chicago, IL 60637. 4 Las Cumbres Global Telescope Network, 6740 Cortona Dr. Santa Barbara, CA 93117. 5 Th¨ uringer Landessternwarte Tautenburg, Sternwarte 5, D-07778 Tautenburg, Germany. 6 University of California Observatories/Lick Observatory, University of California, Santa Cruz, CA 95064. 7 Department of Astronomy, P.O. Box 3818, University of Virginia, Charlottesville, VA 22903-0818. 8 Departamento de Astronoma, Universidad de Chile, Casilla 36-D, Santiago, Chile. 9 Physics and Astronomy, Toronto, Ontario, M3J 1P3, Canada. 10 Centre for Astrophysics and Supercomputing, Swinburne University of Technology, Hawthorn, VIC 3122, Australia 11 Harvard-Smithsonian Center for Astrophysics, 60 Garden Street, Cambridge, MA 02138. ABSTRACT The first gamma-ray burst (GRB) confirmed to be bright enough to be seen with the naked eye, GRB 080319B at redshift z =0.937, allowed for exquisite follow-up observations across the electromagnetic spectrum. We present our de- tailed optical and infrared observations of the afterglow, consisting of over 5000 images starting 51 s after the GRB trigger, in concert with our own analysis of
-
Upload
independent -
Category
Documents
-
view
1 -
download
0
Transcript of Observations of the Naked-Eye GRB 080319B: Implications of Nature's Brightest Explosion
arX
iv:0
803.
3215
v3 [
astr
o-ph
] 1
5 D
ec 2
008
Observations of the Naked-Eye GRB 080319B: Implications of
Nature’s Brightest Explosion
J. S. Bloom1,2, D. A. Perley1, W. Li1,
N. R. Butler1, A. A. Miller1, D. Kocevski1, D. A. Kann5,
R. J. Foley1, H.-W. Chen3, A. V. Filippenko1, D. L. Starr1,4,
B. Macomber1, J. X. Prochaska6, R. Chornock1,
D. Poznanski1, S. Klose5, M. F. Skrutskie7,
S. Lopez8, P. Hall9, K. Glazebrook10, and C. H. Blake11
1 Department of Astronomy, University of California, Berkeley, CA 94720-3411.
2 Sloan Research Fellow.
3 Department of Astronomy & Astrophysics, University of Chicago, Chicago, IL 60637.
4 Las Cumbres Global Telescope Network, 6740 Cortona Dr. Santa Barbara, CA 93117.
5 Thuringer Landessternwarte Tautenburg, Sternwarte 5, D-07778 Tautenburg, Germany.
6 University of California Observatories/Lick Observatory, University of California, Santa
Cruz, CA 95064.
7 Department of Astronomy, P.O. Box 3818, University of Virginia, Charlottesville, VA
22903-0818.
8 Departamento de Astronoma, Universidad de Chile, Casilla 36-D, Santiago, Chile.
9 Physics and Astronomy, Toronto, Ontario, M3J 1P3, Canada.
10 Centre for Astrophysics and Supercomputing, Swinburne University of Technology,
Hawthorn, VIC 3122, Australia
11 Harvard-Smithsonian Center for Astrophysics, 60 Garden Street, Cambridge, MA 02138.
ABSTRACT
The first gamma-ray burst (GRB) confirmed to be bright enough to be seen
with the naked eye, GRB 080319B at redshift z = 0.937, allowed for exquisite
follow-up observations across the electromagnetic spectrum. We present our de-
tailed optical and infrared observations of the afterglow, consisting of over 5000
images starting 51 s after the GRB trigger, in concert with our own analysis of
– 2 –
the Swift UVOT, BAT, and XRT data. The event is extreme not only in observed
properties but intrinsically: it was the most luminous event ever recorded at op-
tical and infrared wavelengths and had an exceedingly high isotropic-equivalent
energy release in γ-rays. At early times, the afterglow evolution is broadly con-
sistent with being reverse-shock dominated, but then is subsumed by a forward
shock at around 1000 s. The overall spectral energy distribution, spanning from
ultraviolet through near-infrared wavelengths, shows no evidence for a significant
amount of dust extinction in the host frame. The afterglow evolution, however, is
highly chromatic: starting at about 1000 s the index shifts blueward before shift-
ing back to the red at late times. In our deepest late-time observations, we find
tentative evidence for an optical jet break and a luminous supernova. Finally,
we examine the detectability of such events with current and future facilities and
find that such an event could be detected in gamma-rays by BAT out to z = 10.7
(8σ), while the nominal EXIST sensitivity would allow detection to z ≈ 32. At
K band, this source would have been easily detected with meter-class telescopes
to z ≈ 17.
Subject headings: gamma rays: bursts, gamma-ray bursts: individual: 080319B
1. Introduction
The longevity and burst-discovery prowess of the Swift mission (Gehrels et al. 2004)
has led to a boom in correlative studies of the properties of a large sample of gamma-ray
bursts (GRBs) observed systematically and uniformly. At the same time, the sheer number of
bursts encompasses an ever-expanding volume of interesting parameter space, often revealing
rarities that help to redefine and shape the totality of our understanding of the phenomenon.
It is in the backdrop of the latter that GRB080319B superlatively reigns.
At 06:12:49 (UTC is used throughout this paper), GRB080319B triggered (Racusin et al.
2008a) the Swift Burst Alert Telescope (BAT), the second GRB trigger that day in what
would be 5 GRB triggers in a 24 hr period. The extreme brightness of the burst at high en-
ergies, in the X-ray afterglow, and in the ultraviolet/optical/infrared (UV/O/IR) afterglow
led to a flurry of follow-up observations, many automatically triggered on robotic facilities.
Contemporaneous imaging, both all-sky and directed, uncovered a fast-rising optical after-
glow which peaked a time from trigger of t ≈ 18.3 s at V ≈ 5.3 mag (Cwiok et al. 2008a;
Covino et al. 2008; Swan et al. 2008; Karpov et al. 2008a; Schubel et al. 2008; Wozniak et al.
2008); this makes the afterglow of GRB080319B the first confirmed counterpart that could
have been seen with the unaided eye in dark skies.
– 3 –
At a redshift of z = 0.937 (Vreeswijk et al. 2008), the event was relatively nearby com-
pared to the Swift distribution of long-duration events (e.g., Jakobsson et al. 2006; Daigne et al.
2006; Le & Dermer 2007), yet near the median for redshifts of pre-Swift events. One aim
of this article is to place the observed properties (particularly energetics) in the context of
both distributions; we show in §3 that GRB080319B was not only potentially the highest-
fluence event ever observed, it also had an isotropic-equivalent energy release comparable
to the highest known values yet recorded. The other significant aim is to analyze in detail
our long-wavelength observations, in both the optical and IR, with high time cadence on
moderate-sized robotic telescopes. The quality of the data, coupled with those available in
the literature and from public archives, reveals a complex evolution of the afterglow that we
attempt to reconcile with canonical afterglow theory. Unless noted, we assume a concordance
cosmology with H0 = 71 km s−1 Mpc−1, ΩΛ = 0.70, and Ωm = 0.3. A redshift of z = 0.937
corresponds to a luminosity distance of 6011.3 Mpc (distance modulus 43.89 mag). All of
the results presented herein, though generally consistent with our previous results in GCN
Circulars1, supersede them.
2. Optical/IR Observations and Reductions
2.1. PAIRITEL
The Peters Automated Infrared Imaging Telescope (PAIRITEL; Bloom et al. 2006),
responding automatically to the Swift trigger via an open-source package2 connected to the
GCN, began taking data on the field at 06:13:39.7 (t = 51 s after the Swift trigger). The
1.3 m telescope is equipped with NICMOS3 arrays to simultaneously observe in bands J,
H, and Ks (1.2, 1.6, and 2.2 µm, respectively). Each image consists of a 256 × 256 pixel
array with a scale of 2′′ pixel−1. Data are obtained as a double-correlated read, with a 51 ms
accumulation since reset on the first (“short”) read and 7.851 s on the second (“long”) read.
Both the long and the short read exposures are saved to disk. The telescope is dithered
by ∼ 1′ after every third exposure. With no shutter, the standard reductions necessarily
incorporate per-pixel models of the combined detector dark current and sky flux fitted over
time (Wood-Vasey et al. 2007). In a modified version of our automated pipeline, once these
time-specific frames (“sky+dark”) are subtracted from the object frames, they are combined
into 3−12 file intermediate mosaics with effective integration times of 24−96 s per image,
which in turn are stacked to form the final mosaics.
1http://gcn.gsfc.nasa.gov/.
2http://sourceforge.net/projects/pygcnsock.
– 4 –
25.0
20.0
15.0
10.0
5.0
mag
nitu
de (
V)
10−1
100
101
102
103
104
105
106
107
108
F ν (
µJy)
or
F ν,
X (
nJy)
UVW2UVM2UVW1UBVclearRIzJHK
Thi
s w
ork
GC
N
XRTBAT
α0 = 2.264 ± 0.010α1,b = −0.500 (fixed)α1,a = 1.279 ± 0.017∆β01 = 0.006 ± 0.020∆β1(b−a) = 1.180 (fixed)χ2 = 938.3/592
Com
pone
nt 0
.1
Component 0.0
Com
ponent 0.2
Component 1 (chromatic)
−0.3
−0.2
−0.1
−0.0
0.1
0.2
0.3
resi
dual
(m
ag)
101 102 103 104 105 106
t−ttrigger (sec)
0.8
0.9
1.0
1.1
1.2
1.3
flux
ratio
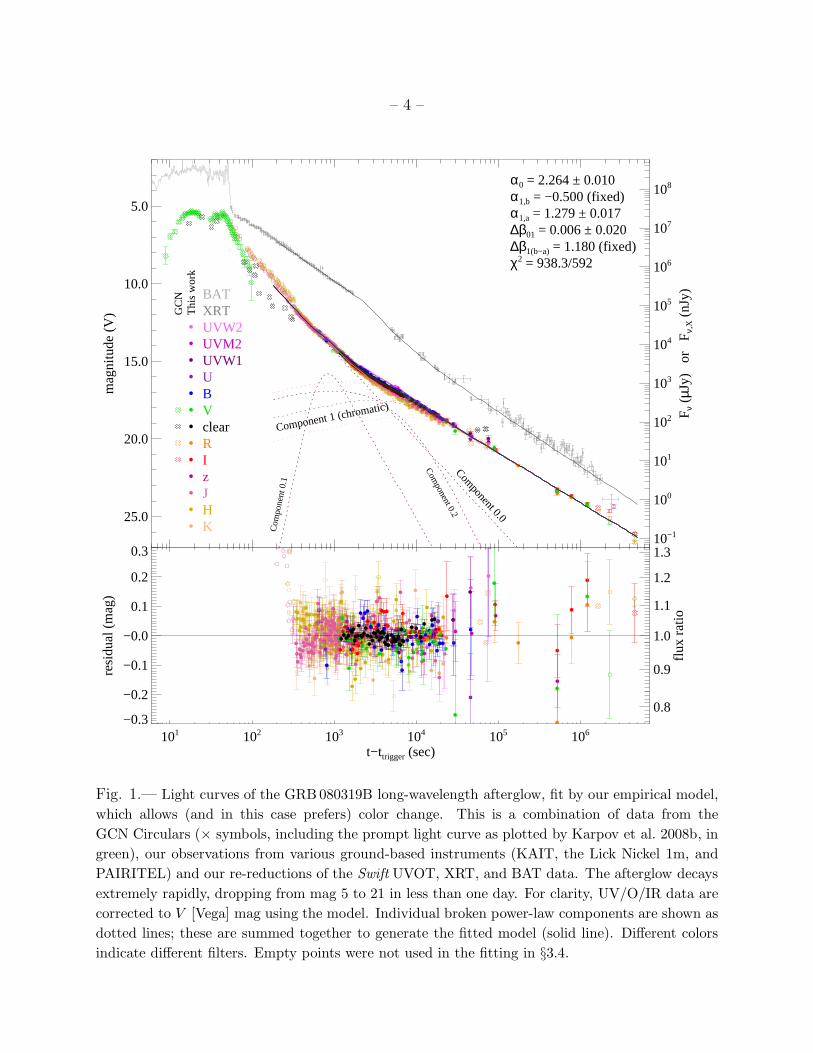
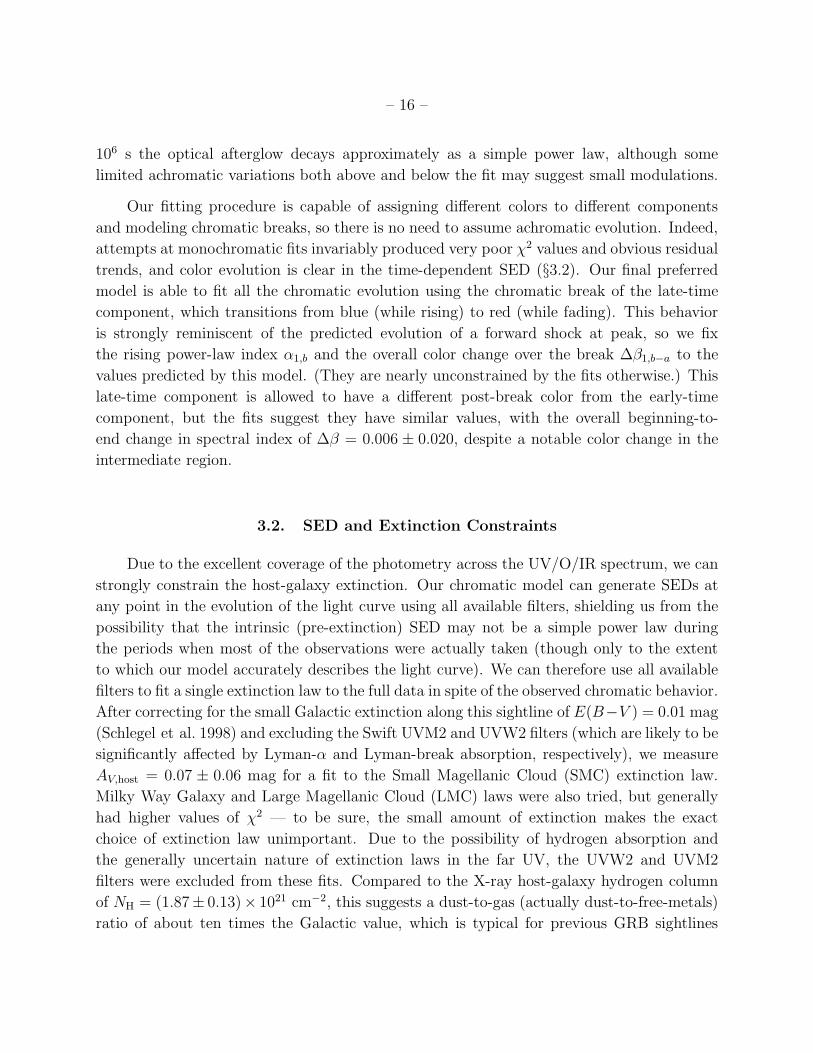
Fig. 1.— Light curves of the GRB 080319B long-wavelength afterglow, fit by our empirical model,
which allows (and in this case prefers) color change. This is a combination of data from the
GCN Circulars (× symbols, including the prompt light curve as plotted by Karpov et al. 2008b, in
green), our observations from various ground-based instruments (KAIT, the Lick Nickel 1m, and
PAIRITEL) and our re-reductions of the Swift UVOT, XRT, and BAT data. The afterglow decays
extremely rapidly, dropping from mag 5 to 21 in less than one day. For clarity, UV/O/IR data are
corrected to V [Vega] mag using the model. Individual broken power-law components are shown as
dotted lines; these are summed together to generate the fitted model (solid line). Different colors
indicate different filters. Empty points were not used in the fitting in §3.4.
– 5 –
During the first few minutes on target (253 s in J , 289 s in H , and 289 s in Ks),
the afterglow was saturated in the exposures, where we have adopted the saturation/non-
linearity threshold determined from data for the 2MASS South camera3: 37000 counts in a
single pixel in the J and H bands, and 33000 counts in a single pixel in the Ks band. In
addition, a number of the final science frames suffered from poor sky+dark-frame subtraction
and could not be photometered or included in the final mosaics. These frames were removed
following an inspection by eye prior to the construction of the final mosaics. Less than 4%
of the 7.8 s exposures were removed following this procedure.
Our initial IR photometry report (Bloom et al. 2008) noted that the afterglow had
been strongly detected simultaneously in all three filters during the first few minutes of
observations. Indeed, the ability to detect the transient in single 7.8 s exposures lasted for a
few hours. In total, we obtained 1822 simultaneous J , H , and Ks observations of the GRB
(5466 total frames) over the course of 6 hr, though as the afterglow begins to fade we bin
together individual frames to increase the signal-to-noise ratio and improve readability of
the light curve.
2.1.1. Photometry on Unsaturated Frames
A custom pipeline was used to perform photometry on the 7.8 s exposures constructed
from the difference of the two readouts which occurred 7.851 and 0.051 s following array reset.
This pipeline was also used on the intermediate mosaics constructed from the 7.8s frames.
Zeropoint determinations were made in comparison to the 2MASS catalog. The statistical
uncertainties are small, while the total uncertainty on any individual image is dominated
by systematics, especially at early times, associated with our ability to accurately zeropoint
relative to 2MASS. We quantify this systematic uncertainty empirically by measuring the
photometric scatter in a mag 10 star (hereafter “S1”), located at α = 14h32m03s.55, δ =
+3618′29′′.6 (J2000), a few arcmin from the position of the GRB optical afterglow (OA). In
all three bands the systematic contribution is ∼4%. The resulting light curves are presented
in Figs. 1–2 and listed in Table 1.
3http://www.ipac.caltech.edu/2mass/releases/allsky/
doc/sec4 2.html .
– 6 –
20.0
18.0
16.0
14.0
12.0
10.0
8.0
mag
nitu
de
102
103
104
105
106
F ν (
µJy)
UVW2 + 2.5UVM2 + 2.5UVW1 + 2U + 1.5B + 0.2VclearRIJHK
Nic
kel
KA
ITU
VO
TP
AIR
ITE
LG
CN
t−ttrigger (sec)
−0.3
−0.2
−0.1
−0.0
0.1
0.2
0.3
resi
dual
(m
ag)
2•102 5•102 1•103 2•103 5•103 1•104 2•104
t−ttrigger (sec)
0.8
0.9
1.0
1.1
1.2
1.3
flux
ratio
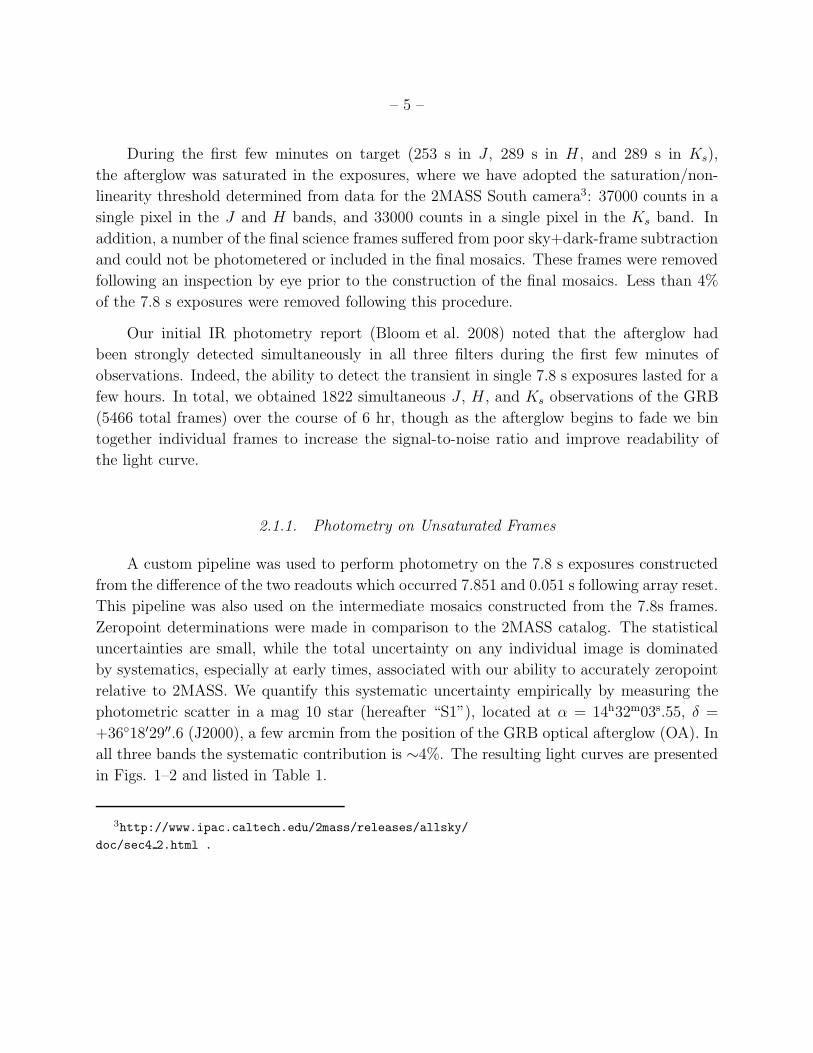
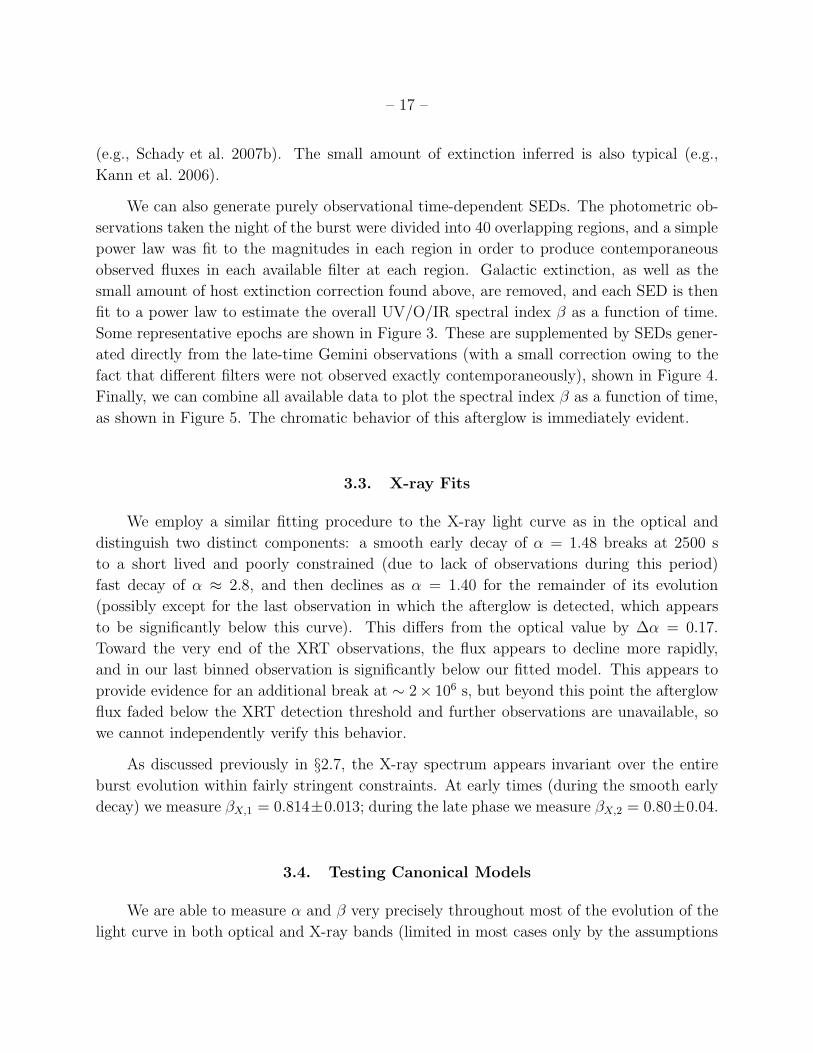
Fig. 2.— Detailed optical-IR light curve covering much of the first night after the afterglow,
demonstrating the exquisite time sampling and overall goodness-of-fit of the model. The earliest-
time PAIRITEL observations are saturated/non-linear and uncertain (see §2.1.1); these are not
included in fitting or modeling.
– 7 –
2.1.2. Photometry on Early-Time Imaging
Due to the extreme brightness of the early afterglow, a large number of early PAIRI-
TEL frames are highly saturated or otherwise nonlinear (when the magnitude is . 9). We
employed two methods to recover the photometry in these early epochs (see Tables 2–3).
First, since there is sufficient signal in the 51 ms short reads to detect the GRB well above
the noise when JHKs & 7, we use the procedure described in Eisner et al. (2007) to extract
the flux from the GRB in the short reads and calibrate this to the 2MASS system using
stars in the corresponding long reads. The uncertainty of these measurements is primarily
dominated by the determination of the zeropoint. Second, we developed a simple method
to extract photometry from saturated “long minus short” frames, using an annulus centered
on the GRB position. We use S1 to determine the zeropoint for each of the individual sat-
urated long minus short (7.8 s) frames. The inner annulus radius was chosen to exclude
any saturated pixels in any frame, while the outer annulus radius was selected to provide
sufficient signal without including too much noise as the wings of the point-spread function
(PSF) become dominated by noise from the background. The accuracy of these early mea-
surements of the GRB afterglow is strongly limited by the determination of the zeropoint:
high near-IR backgrounds and the annulus aperture lead to a large scatter in the determined
zeropoints for each frame. Thus, the uncertainty for these early measurements is dominated
by a large systematic term, defined as the scatter of the individual zeropoints. We include
these points in early-time light-curve plots and in our data table to show the general early
behavior of the IR afterglow, but do not include them in any fitting or model analysis. We
emphasize that photometry of these saturated frames is subject to unaccounted-for system-
atic uncertainties, but note qualitative agreement with other submitted early IR imaging
(Racusin et al. 2008b).
2.2. KAIT and Nickel
At Lick Observatory, the Katzman Automatic Imaging Telescope (KAIT; Filippenko et al.
2001) GRB alert system (Li et al. 2003) responded to GRB080319B automatically. While
ordinarily the time to slew is < 1 min, since KAIT was following GRB080319A (which trig-
gered Swift 30 min earlier) our first observations of GRB080319B did not start until 19 min
after the BAT trigger. We followed the GRB OA with a combination of filters (BV I and
unfiltered) and with varying exposure times (20 s initially, then 40 s, then 300 s guided expo-
sures), and continued until 280 min after the BAT trigger. We also observed GRB080319B
with the Lick 1-m Nickel telescope remotely from the University of California, Berkeley,
between 116 and 392 min after the BAT trigger, using BV RI filters and exposure times of
– 8 –
300 s and 360 s.
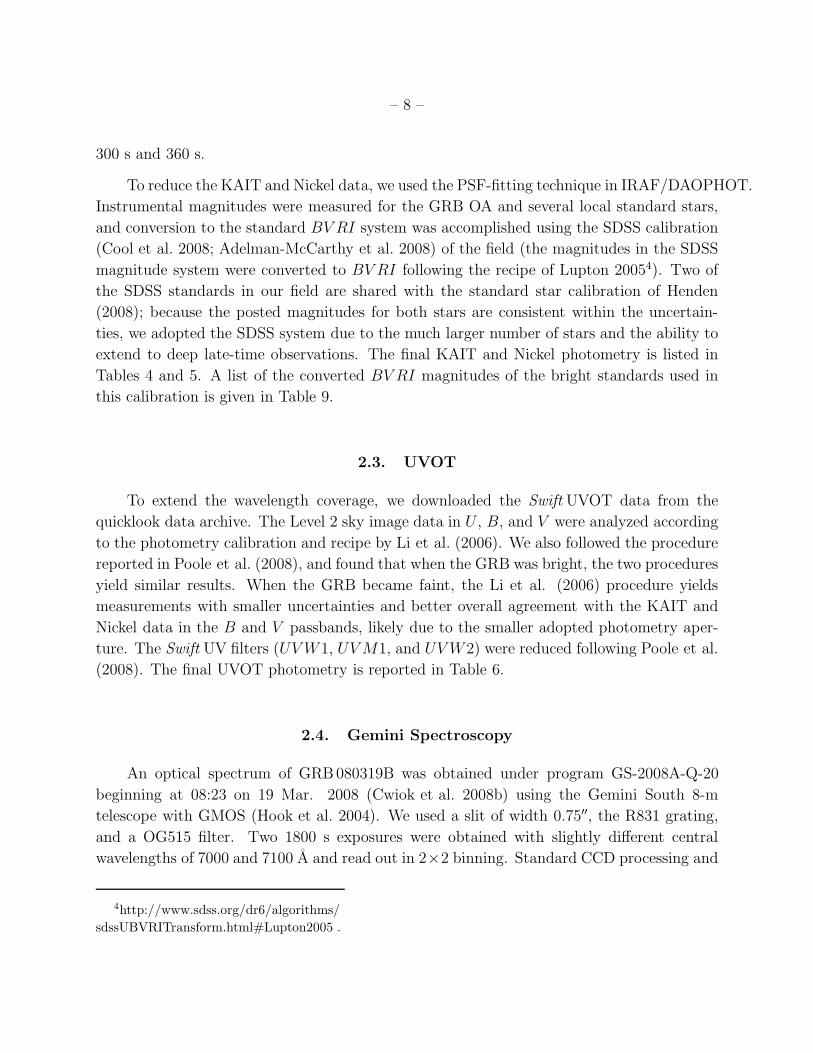
To reduce the KAIT and Nickel data, we used the PSF-fitting technique in IRAF/DAOPHOT.
Instrumental magnitudes were measured for the GRB OA and several local standard stars,
and conversion to the standard BV RI system was accomplished using the SDSS calibration
(Cool et al. 2008; Adelman-McCarthy et al. 2008) of the field (the magnitudes in the SDSS
magnitude system were converted to BV RI following the recipe of Lupton 20054). Two of
the SDSS standards in our field are shared with the standard star calibration of Henden
(2008); because the posted magnitudes for both stars are consistent within the uncertain-
ties, we adopted the SDSS system due to the much larger number of stars and the ability to
extend to deep late-time observations. The final KAIT and Nickel photometry is listed in
Tables 4 and 5. A list of the converted BV RI magnitudes of the bright standards used in
this calibration is given in Table 9.
2.3. UVOT
To extend the wavelength coverage, we downloaded the Swift UVOT data from the
quicklook data archive. The Level 2 sky image data in U , B, and V were analyzed according
to the photometry calibration and recipe by Li et al. (2006). We also followed the procedure
reported in Poole et al. (2008), and found that when the GRB was bright, the two procedures
yield similar results. When the GRB became faint, the Li et al. (2006) procedure yields
measurements with smaller uncertainties and better overall agreement with the KAIT and
Nickel data in the B and V passbands, likely due to the smaller adopted photometry aper-
ture. The Swift UV filters (UV W1, UV M1, and UV W2) were reduced following Poole et al.
(2008). The final UVOT photometry is reported in Table 6.
2.4. Gemini Spectroscopy
An optical spectrum of GRB080319B was obtained under program GS-2008A-Q-20
beginning at 08:23 on 19 Mar. 2008 (Cwiok et al. 2008b) using the Gemini South 8-m
telescope with GMOS (Hook et al. 2004). We used a slit of width 0.75′′, the R831 grating,
and a OG515 filter. Two 1800 s exposures were obtained with slightly different central
wavelengths of 7000 and 7100 A and read out in 2×2 binning. Standard CCD processing and
4http://www.sdss.org/dr6/algorithms/
sdssUBVRITransform.html#Lupton2005 .
– 9 –
spectrum extraction were accomplished with IRAF (for more details, see Foley et al. 2006).
The data were extracted using the optimal algorithm of Horne (1986). The spectrum shows
a featureless continuum with no strong absorption systems, emission features, or spectral
breaks. Unfortunately, our wavelength range does not cover the spectral range of the VLT
spectrum where strong absorption features were seen (Vreeswijk et al. 2008). With our
spectral coverage, and given the proposed redshift of GRB 080319B (Vreeswijk et al. 2008),
the strongest ISM absorption lines for a galaxy at z = 0.937 are expected to be Ti II 3384
and the Ca II doublet at λ ≈ 3950A. We do not detect Ti II λ3384 to a 3σ rest-frame
absorption equivalent width limit of W = 0.05 A over a spectral resolution element, while
the Ca II H & K absorption doublet is blended with the atmospheric A-band absorption.
No additional features were found in our observed wavelength range of 5950–8150 A.
2.5. Gemini Imaging
In the nights following the burst, we began a program of additional imaging using
Gemini South and Gemini North. On the first night following the event, we acquired 4 ×
180 s of GMOS imaging in each of the g, r, i, and z filters under excellent seeing conditions
(0.85′′) despite the low elevation of the target (airmass of 2.5). A second epoch was acquired
the following night in r only, and additional multicolor epochs were taken later on March
25 and 28, and April 2. Imaging was taken at Gemini North on April 14 (g, r, i) and
17 (z). Data were reduced using the standard Gemini IRAF package and photometered
using SExtractor (Bertin & Arnouts 1996) aperture magnitudes. The field was calibrated
relative to select stars from SDSS DR6 (Adelman-McCarthy et al. 2008, Table 10). The
Gemini filters appear to be somewhat nonstandard compared to the SDSS survey filters,
so significant color-term corrections were necessary. As the number of comparison stars
used was large we were able to calculate these individually for each observation. The color
dependence is about 20% in g on Gemini North and 30% on Gemini South. In r, i, and z
it is about 10%, 15%, and 5% (respectively) on both telescopes. The final photometry is
given in Table 7. For use in the light-curve fitting (for which a comparison to the early-time
BV RI observations is necessary), the gri magnitudes for the afterglow were then converted
back to V RI using the equations of Lupton (2005).
2.6. GCN Circulars
Finally, to supplement our data at very early times and late times, we downloaded
additional photometry from the GCN Circulars. Of particular note, we downloaded the
– 10 –
corrected TORTORA light curve (Karpov et al. 2008b) containing high-quality optical pho-
tometry throughout the prompt phase, and Hubble Space Telescope (HST) data points at
late times (Tanvir et al. 2008; Levan et al. 2008), which allow us to complete the entire light
curve of this event. Due to the fact that GCN observations are preliminary and may have
large calibration offsets, we do not use any of the GCN points in any of our fits or models,
though we do show them in light-curve plots. Instead, we focus our analysis on the inter-
mediate phase of the burst, from 300 s to 106 s, during which we have good time sampling.
The GCN data shown in our plots are listed in Table 8.
2.7. Swift BAT and XRT
Our high-energy reduction pipeline is described in detail by Butler et al. (2007) for the
Swift BAT and by Butler & Kocevski (2007a) for the Swift XRT. GRB080319B exhibits
one dominant emission episode of duration ∆t ≈ 60 s, composed of multiple unresolved
spikes. The BAT spectrum in the time interval −1.1 s to 57.4 s is acceptably fit (χ2/ν =
13.55/55) by a simple power law with photon index α = −1.01 ± 0.02 and energy fluence
(1.96 ± 0.03) × 10−4 erg cm−2 (15–350 keV). The BAT catches only the low-energy portion
of a spectrum extending beyond Epeak,obs = 651+13−14 keV (Golenetskii et al. 2008), with an
isotropic-equivalent energy release in γ-rays of ∼ 1054 erg. There is evidence for a gamma-
ray tail detected up to ∼ 1000 s as seen in Fig. 1. This extended emission at late times is
similar to that observed in the extremely bright BATSE GRB 980923 (Giblin et al. 1999)
and Swift GRB 061007 (Mundell et al. 2007; Schady et al. 2007a).
The Swift XRT began observing during the tail of the prompt emission phase at t = 66 s.
We find (see, also, Butler 2008) that the X-ray spectrum is unchanging until quite late times
(t = 2.91 Ms) despite a break in the X-ray light curve at t ≈ 1 ks (Fig. 1). The combined
XRT/BAT data are well fit by an absorbed power law with Γ = 1.814± 0.011 and an excess
column density over Galactic of NH = (1.87±0.13)×1021 cm−2 at z = 0.937. The early-time
windowed timing (WT) mode (66 s < t < 4.95 ks) X-ray photon index Γ1 = 1.814 ± 0.013
is closely consistent with the late-time photon-counting (PC) mode (4.95 ks < t < 2.91
Ms) X-ray photon index Γ2 = 1.80 ± 0.04, assuming a constant NH. From negligible . 1%
variations in the X-ray hardness ratio (see, e.g., Butler & Kocevski 2007b), the magnitude
of any secular trends in Γ1 or Γ2 must be at the few-percent level or less, and there is no
evidence for variation in NH.
– 11 –
12.5
12.0
11.5
11.0
1000200040006000800010000 λeff,rest (Å)
3.0•104
4.0•104
5.0•104
6.0•104
8.0•104
1.0•105
1.5•105
2.0•105
β = 0.50 ± 0.12AV = 0.07 (fixed)RV = 2.74 (fixed)χ2/dof = 0.80 / 1
β = 0.50AV = 0
β = 0.56 ± 0.12AV = 0.0 (fixed)χ2/dof = 0.90 / 1
t = 430s
J
HK
14.5
14.0
13.5
13.0
12.5
Mag
nitu
de (
AB
)
6000
8000
10000
15000
20000
30000
40000
F ν (
µJy)
β = 0.36 ± 0.09AV = 0.07 (fixed)RV = 2.74 (fixed)χ2/dof = 0.55 / 3
β = 0.36AV = 0
β = 0.47 ± 0.08AV = 0.0 (fixed)χ2/dof = 0.42 / 3
t = 875s
UB
JH
K
15.5
15.0
14.5
14.0
13.5
3000
4000
5000
6000
8000
10000
15000β = 0.33 ± 0.04AV = 0.07 (fixed)RV = 2.74 (fixed)χ2/dof = 3.26 / 5
β = 0.33AV = 0
β = 0.43 ± 0.03AV = 0.0 (fixed)χ2/dof = 1.49 / 5
t = 1400s
UBVI
JH
K
λeff (Å)
18.5
18.0
17.5
17.0
16.5
20004000600080001000020000λeff (Å)
150
200
300
400
500
600
800β = 0.07 ± 0.03AV = 0.07 (fixed)RV = 2.74 (fixed)χ2/dof = 5.24 / 7
β = 0.07AV = 0
β = 0.18 ± 0.03AV = 0.0 (fixed)χ2/dof = 9.77 / 7
t = 8750sUVW2
UVM2
UVW1
UBVRIJHK
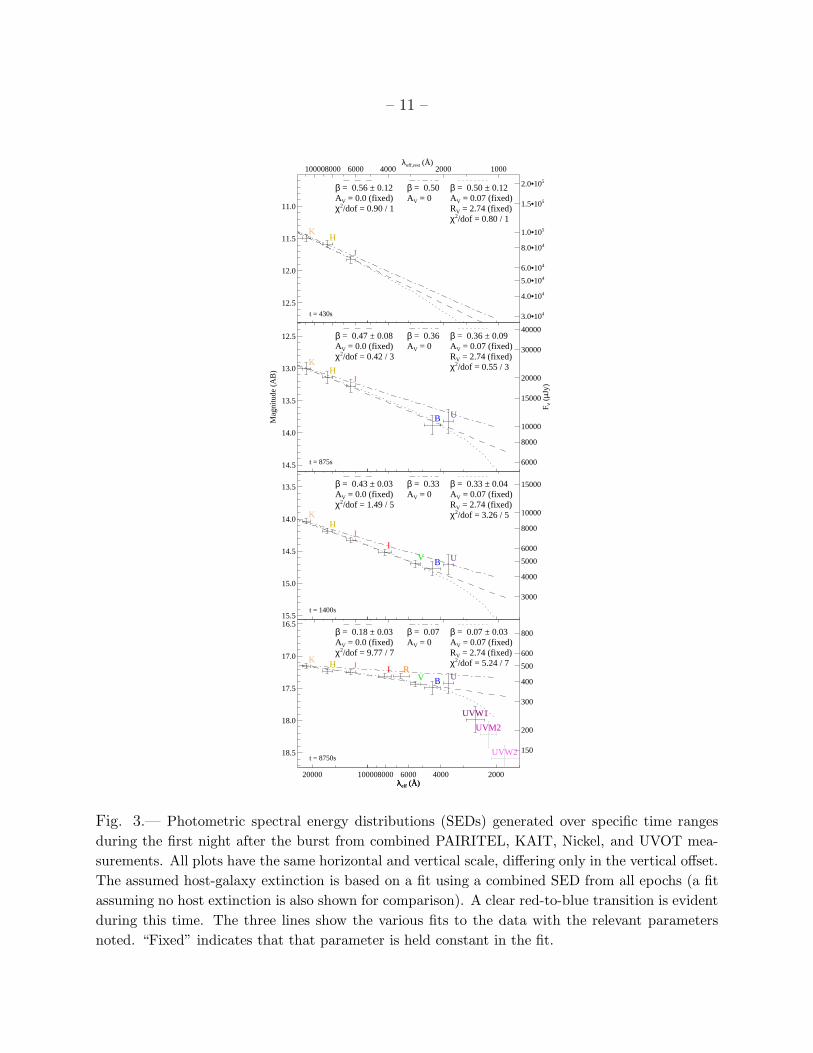
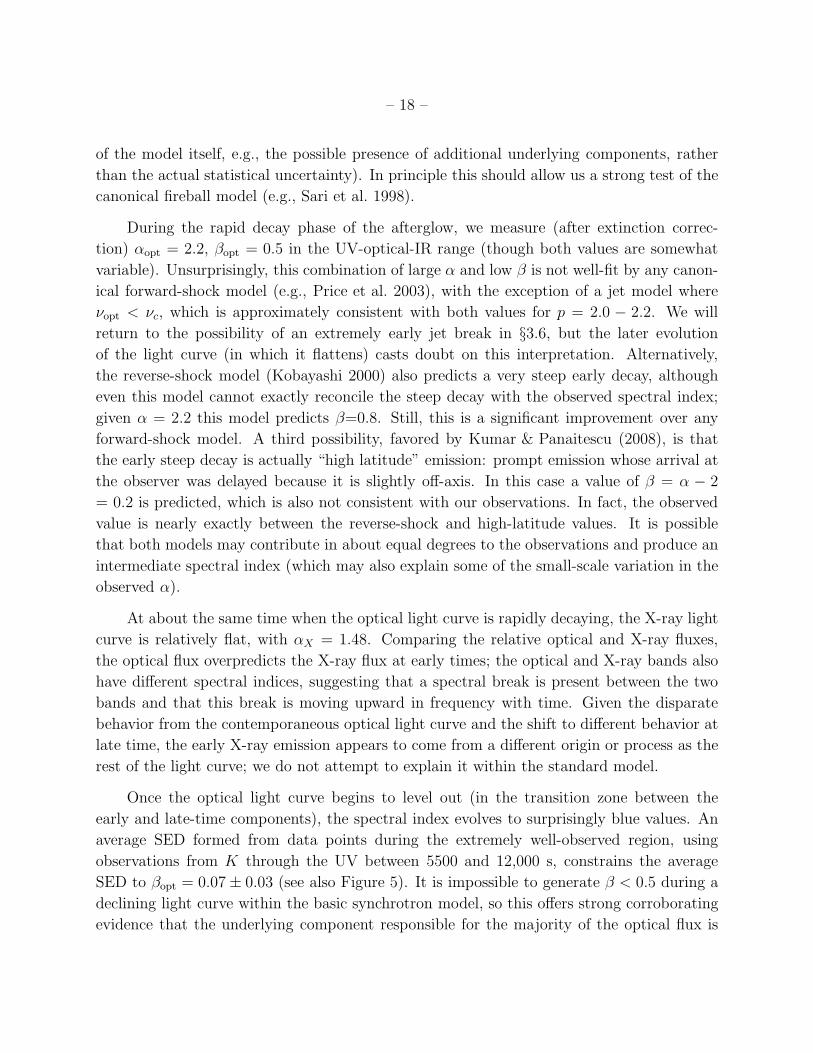
Fig. 3.— Photometric spectral energy distributions (SEDs) generated over specific time ranges
during the first night after the burst from combined PAIRITEL, KAIT, Nickel, and UVOT mea-
surements. All plots have the same horizontal and vertical scale, differing only in the vertical offset.
The assumed host-galaxy extinction is based on a fit using a combined SED from all epochs (a fit
assuming no host extinction is also shown for comparison). A clear red-to-blue transition is evident
during this time. The three lines show the various fits to the data with the relevant parameters
noted. “Fixed” indicates that that parameter is held constant in the fit.
– 12 –
21.5
21.0
20.5
20.0
19.5
1000200040006000800010000 λeff,rest (Å)
10
15
20
30
40
50
60β = 0.46 ± 0.20AV = 0.07 (fixed)RV = 2.74 (fixed)χ2/dof = 0.03 / 2
β = 0.46AV = 0
β = 0.60 ± 0.20AV = 0.0 (fixed)χ2/dof = 0.01 / 2
t = 90000s
gr
iz
24.0
23.5
23.0
22.5
22.0
Mag
nitu
de (
AB
)
0.8
1.0
1.5
2.0
3.0
4.0
5.0
F ν (
µJy)
β = 0.73 ± 0.41AV = 0.07 (fixed)RV = 2.74 (fixed)χ2/dof = 0.79 / 2
β = 0.73AV = 0
β = 0.86 ± 0.40AV = 0.0 (fixed)χ2/dof = 0.75 / 2
t = 522000s
gr
iz
25.0
24.5
24.0
23.5
23.0
0.3
0.4
0.5
0.6
0.8
1.0
1.5
2.0β = 1.07 ± 0.24AV = 0.07 (fixed)RV = 2.74 (fixed)χ2/dof = 0.05 / 1
β = 1.07AV = 0
β = 1.23 ± 0.23AV = 0.0 (fixed)χ2/dof = 0.01 / 1
t = 1211397s
g
r
i
λeff (Å)
25.5
25.0
24.5
24.0
20004000600080001000020000λeff (Å)
0.2
0.3
0.4
0.5
0.6
0.8
1.0β = 2.83 ± 0.23AV = 0.07 (fixed)RV = 2.74 (fixed)χ2/dof = 0.09 / 2
β = 2.83AV = 0
β = 2.97 ± 0.23AV = 0.0 (fixed)χ2/dof = 0.04 / 2
t = 2287803sg
r
i
z
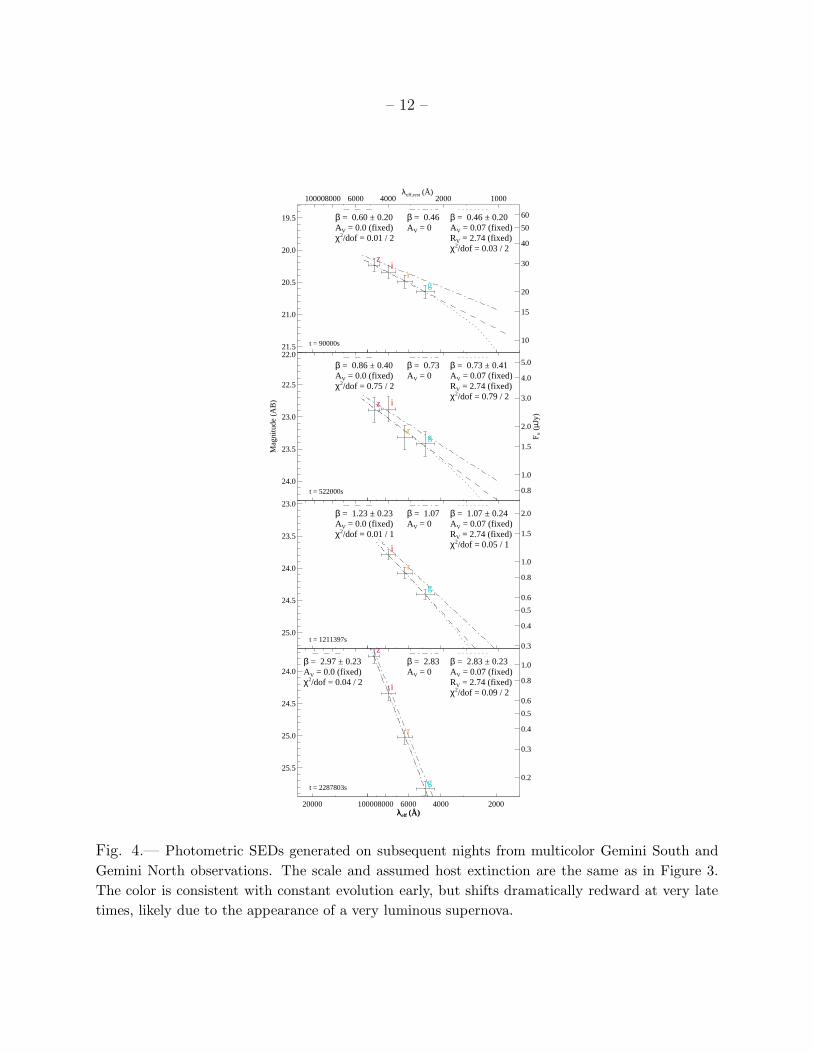
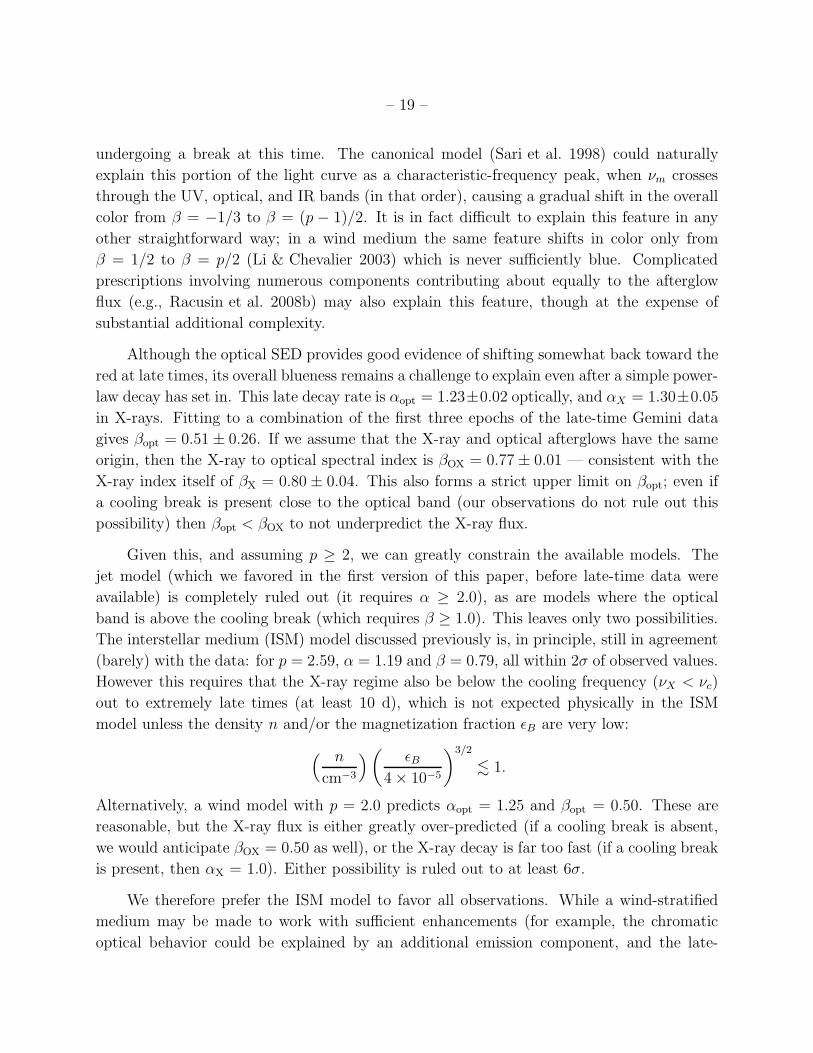
Fig. 4.— Photometric SEDs generated on subsequent nights from multicolor Gemini South and
Gemini North observations. The scale and assumed host extinction are the same as in Figure 3.
The color is consistent with constant evolution early, but shifts dramatically redward at very late
times, likely due to the appearance of a very luminous supernova.
– 13 –
0.0
0.2
0.4
0.6
0.8
1.0
1.2
β
100 1000 10000t−ttrigger (sec)
βOX
βopt
βX
105 106
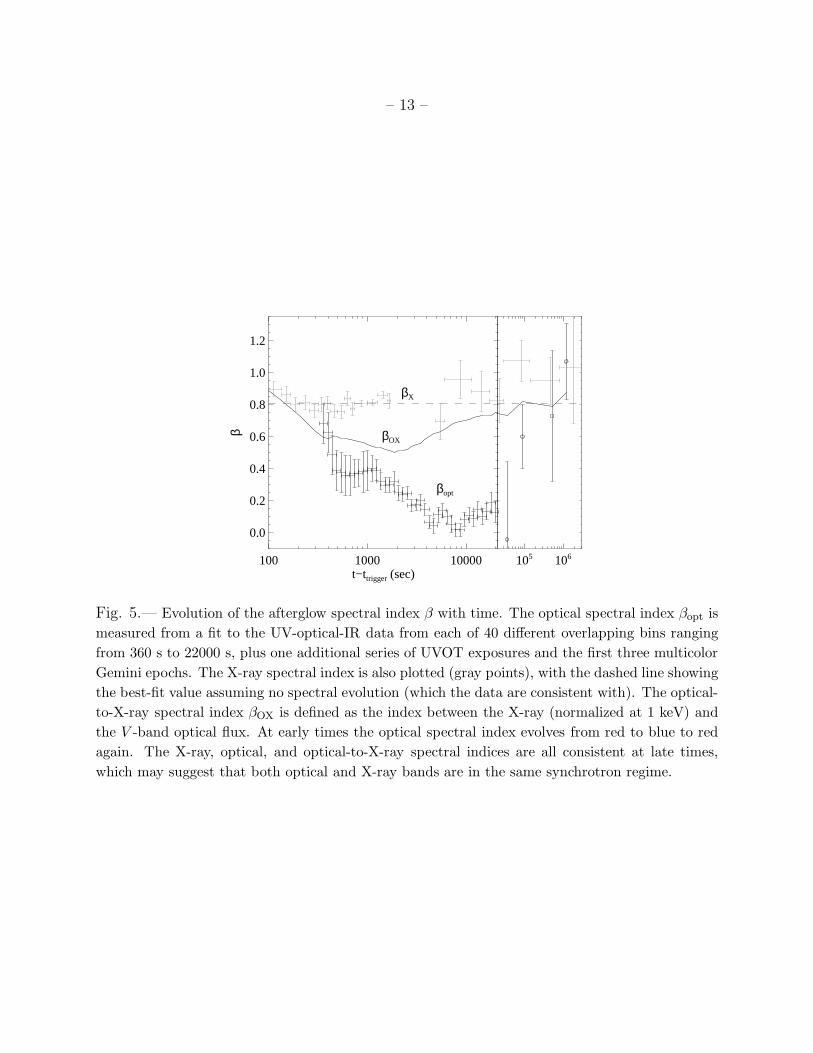
Fig. 5.— Evolution of the afterglow spectral index β with time. The optical spectral index βopt is
measured from a fit to the UV-optical-IR data from each of 40 different overlapping bins ranging
from 360 s to 22000 s, plus one additional series of UVOT exposures and the first three multicolor
Gemini epochs. The X-ray spectral index is also plotted (gray points), with the dashed line showing
the best-fit value assuming no spectral evolution (which the data are consistent with). The optical-
to-X-ray spectral index βOX is defined as the index between the X-ray (normalized at 1 keV) and
the V -band optical flux. At early times the optical spectral index evolves from red to blue to red
again. The X-ray, optical, and optical-to-X-ray spectral indices are all consistent at late times,
which may suggest that both optical and X-ray bands are in the same synchrotron regime.
– 14 –
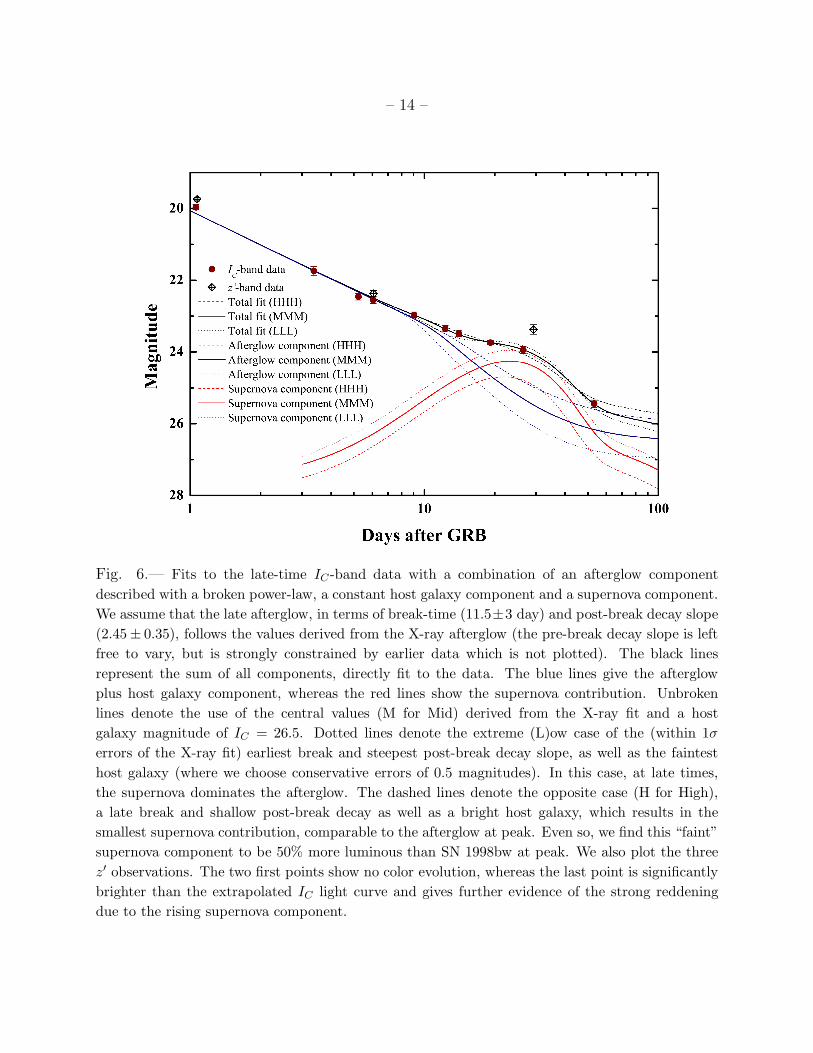
Fig. 6.— Fits to the late-time IC -band data with a combination of an afterglow component
described with a broken power-law, a constant host galaxy component and a supernova component.
We assume that the late afterglow, in terms of break-time (11.5±3 day) and post-break decay slope
(2.45± 0.35), follows the values derived from the X-ray afterglow (the pre-break decay slope is left
free to vary, but is strongly constrained by earlier data which is not plotted). The black lines
represent the sum of all components, directly fit to the data. The blue lines give the afterglow
plus host galaxy component, whereas the red lines show the supernova contribution. Unbroken
lines denote the use of the central values (M for Mid) derived from the X-ray fit and a host
galaxy magnitude of IC = 26.5. Dotted lines denote the extreme (L)ow case of the (within 1σ
errors of the X-ray fit) earliest break and steepest post-break decay slope, as well as the faintest
host galaxy (where we choose conservative errors of 0.5 magnitudes). In this case, at late times,
the supernova dominates the afterglow. The dashed lines denote the opposite case (H for High),
a late break and shallow post-break decay as well as a bright host galaxy, which results in the
smallest supernova contribution, comparable to the afterglow at peak. Even so, we find this “faint”
supernova component to be 50% more luminous than SN 1998bw at peak. We also plot the three
z′ observations. The two first points show no color evolution, whereas the last point is significantly
brighter than the extrapolated IC light curve and gives further evidence of the strong reddening
due to the rising supernova component.
– 15 –
3. Analysis
3.1. Optical Light Curve
We fit the optical data in all filters simultaneously by fitting a series of summed
Beuermann et al. (1999) functions, a generalization of the procedure described by Perley et al.
(2008). Several iterations of different models with varying assumptions and complexity were
fitted, with our final preferred model motivated by a combination of assumptions of under-
lying physical behavior (as will be described shortly) and the necessity to fit the data with a
reasonable χ2 and without large trends in the residuals. This model contains two elements:
a monochromatic, rapidly falling component which dominates at early times (. 104 s), plus
a chromatically evolving second component which peaks at about 103 – 104 s (depending
on the filter). The first component is actually a sum of three Beuermann functions (this
was necessary to fit several low-level modulation “wiggles” in the data); the second compo-
nent is a single Beuermann function, but the peak time is allowed to be a function of the
filter central wavelength to allow the break (peak) to be chromatic. (Modulations are seen
at late times as well, but we do not have the temporal coverage to accurately attempt to
characterize them.) We exclude points after 2 × 10⁶ s, which appear to be contaminated by
additional light (possibly due to a supernova; see §3.7) in most filters. We use only our own
calibrated data; observations reported in the GCN Circulars are excluded from the fits. Very
early points from UVOT and PAIRITEL that were heavily affected by pileup, saturation, or
nonlinearity effects were excluded, and a small number of other conspicuous outliers at late
times were manually flagged during the fitting process.
Our model is found to match the data very well, with no obvious residual trends, with
the exception of a possible chromatic divergence of the very early-time IR measurements from
the initial power law. The final value for χ2 = 938 (over 592 degrees of freedom) is reasonable,
if not strictly statistically acceptable, although this is not necessarily a surprise given the
large number of different instruments and very complicated behavior of the afterglow. A
modest underestimate of the systematic errors could account for χ2/dof > 1. All optical
photometry from our measurements and the GCN Circulars is presented in Figure 1. Here
we adopt the convention for the spectral index (β) and the temporal index (α) such that
fν ∝ ν−β t−α. A subset of these observations showing our measurements in more detail is
shown in Figure 2.
The early afterglow decay is extremely rapid: α ≈ 2.24. At about 500 s the light
curve flattens slightly, and then levels out much more significantly around 1500 s, as noted
by Li et al. (2008). Our rapid temporal sampling ends at 20,000 s due to bright morning
twilight, but we began Gemini observations the following night, and from then until about
– 16 –
106 s the optical afterglow decays approximately as a simple power law, although some
limited achromatic variations both above and below the fit may suggest small modulations.
Our fitting procedure is capable of assigning different colors to different components
and modeling chromatic breaks, so there is no need to assume achromatic evolution. Indeed,
attempts at monochromatic fits invariably produced very poor χ2 values and obvious residual
trends, and color evolution is clear in the time-dependent SED (§3.2). Our final preferred
model is able to fit all the chromatic evolution using the chromatic break of the late-time
component, which transitions from blue (while rising) to red (while fading). This behavior
is strongly reminiscent of the predicted evolution of a forward shock at peak, so we fix
the rising power-law index α1,b and the overall color change over the break ∆β1,b−a to the
values predicted by this model. (They are nearly unconstrained by the fits otherwise.) This
late-time component is allowed to have a different post-break color from the early-time
component, but the fits suggest they have similar values, with the overall beginning-to-
end change in spectral index of ∆β = 0.006 ± 0.020, despite a notable color change in the
intermediate region.
3.2. SED and Extinction Constraints
Due to the excellent coverage of the photometry across the UV/O/IR spectrum, we can
strongly constrain the host-galaxy extinction. Our chromatic model can generate SEDs at
any point in the evolution of the light curve using all available filters, shielding us from the
possibility that the intrinsic (pre-extinction) SED may not be a simple power law during
the periods when most of the observations were actually taken (though only to the extent
to which our model accurately describes the light curve). We can therefore use all available
filters to fit a single extinction law to the full data in spite of the observed chromatic behavior.
After correcting for the small Galactic extinction along this sightline of E(B−V ) = 0.01 mag
(Schlegel et al. 1998) and excluding the Swift UVM2 and UVW2 filters (which are likely to be
significantly affected by Lyman-α and Lyman-break absorption, respectively), we measure
AV,host = 0.07 ± 0.06 mag for a fit to the Small Magellanic Cloud (SMC) extinction law.
Milky Way Galaxy and Large Magellanic Cloud (LMC) laws were also tried, but generally
had higher values of χ2 — to be sure, the small amount of extinction makes the exact
choice of extinction law unimportant. Due to the possibility of hydrogen absorption and
the generally uncertain nature of extinction laws in the far UV, the UVW2 and UVM2
filters were excluded from these fits. Compared to the X-ray host-galaxy hydrogen column
of NH = (1.87± 0.13)× 1021 cm−2, this suggests a dust-to-gas (actually dust-to-free-metals)
ratio of about ten times the Galactic value, which is typical for previous GRB sightlines
– 17 –
(e.g., Schady et al. 2007b). The small amount of extinction inferred is also typical (e.g.,
Kann et al. 2006).
We can also generate purely observational time-dependent SEDs. The photometric ob-
servations taken the night of the burst were divided into 40 overlapping regions, and a simple
power law was fit to the magnitudes in each region in order to produce contemporaneous
observed fluxes in each available filter at each region. Galactic extinction, as well as the
small amount of host extinction correction found above, are removed, and each SED is then
fit to a power law to estimate the overall UV/O/IR spectral index β as a function of time.
Some representative epochs are shown in Figure 3. These are supplemented by SEDs gener-
ated directly from the late-time Gemini observations (with a small correction owing to the
fact that different filters were not observed exactly contemporaneously), shown in Figure 4.
Finally, we can combine all available data to plot the spectral index β as a function of time,
as shown in Figure 5. The chromatic behavior of this afterglow is immediately evident.
3.3. X-ray Fits
We employ a similar fitting procedure to the X-ray light curve as in the optical and
distinguish two distinct components: a smooth early decay of α = 1.48 breaks at 2500 s
to a short lived and poorly constrained (due to lack of observations during this period)
fast decay of α ≈ 2.8, and then declines as α = 1.40 for the remainder of its evolution
(possibly except for the last observation in which the afterglow is detected, which appears
to be significantly below this curve). This differs from the optical value by ∆α = 0.17.
Toward the very end of the XRT observations, the flux appears to decline more rapidly,
and in our last binned observation is significantly below our fitted model. This appears to
provide evidence for an additional break at ∼ 2× 10⁶ s, but beyond this point the afterglow
flux faded below the XRT detection threshold and further observations are unavailable, so
we cannot independently verify this behavior.
As discussed previously in §2.7, the X-ray spectrum appears invariant over the entire
burst evolution within fairly stringent constraints. At early times (during the smooth early
decay) we measure βX,1 = 0.814±0.013; during the late phase we measure βX,2 = 0.80±0.04.
3.4. Testing Canonical Models
We are able to measure α and β very precisely throughout most of the evolution of the
light curve in both optical and X-ray bands (limited in most cases only by the assumptions
– 18 –
of the model itself, e.g., the possible presence of additional underlying components, rather
than the actual statistical uncertainty). In principle this should allow us a strong test of the
canonical fireball model (e.g., Sari et al. 1998).
During the rapid decay phase of the afterglow, we measure (after extinction correc-
tion) αopt = 2.2, βopt = 0.5 in the UV-optical-IR range (though both values are somewhat
variable). Unsurprisingly, this combination of large α and low β is not well-fit by any canon-
ical forward-shock model (e.g., Price et al. 2003), with the exception of a jet model where
νopt < νc, which is approximately consistent with both values for p = 2.0 − 2.2. We will
return to the possibility of an extremely early jet break in §3.6, but the later evolution
of the light curve (in which it flattens) casts doubt on this interpretation. Alternatively,
the reverse-shock model (Kobayashi 2000) also predicts a very steep early decay, although
even this model cannot exactly reconcile the steep decay with the observed spectral index;
given α = 2.2 this model predicts β=0.8. Still, this is a significant improvement over any
forward-shock model. A third possibility, favored by Kumar & Panaitescu (2008), is that
the early steep decay is actually “high latitude” emission: prompt emission whose arrival at
the observer was delayed because it is slightly off-axis. In this case a value of β = α − 2
= 0.2 is predicted, which is also not consistent with our observations. In fact, the observed
value is nearly exactly between the reverse-shock and high-latitude values. It is possible
that both models may contribute in about equal degrees to the observations and produce an
intermediate spectral index (which may also explain some of the small-scale variation in the
observed α).
At about the same time when the optical light curve is rapidly decaying, the X-ray light
curve is relatively flat, with αX = 1.48. Comparing the relative optical and X-ray fluxes,
the optical flux overpredicts the X-ray flux at early times; the optical and X-ray bands also
have different spectral indices, suggesting that a spectral break is present between the two
bands and that this break is moving upward in frequency with time. Given the disparate
behavior from the contemporaneous optical light curve and the shift to different behavior at
late time, the early X-ray emission appears to come from a different origin or process as the
rest of the light curve; we do not attempt to explain it within the standard model.
Once the optical light curve begins to level out (in the transition zone between the
early and late-time components), the spectral index evolves to surprisingly blue values. An
average SED formed from data points during the extremely well-observed region, using
observations from K through the UV between 5500 and 12,000 s, constrains the average
SED to βopt = 0.07 ± 0.03 (see also Figure 5). It is impossible to generate β < 0.5 during a
declining light curve within the basic synchrotron model, so this offers strong corroborating
evidence that the underlying component responsible for the majority of the optical flux is
– 19 –
undergoing a break at this time. The canonical model (Sari et al. 1998) could naturally
explain this portion of the light curve as a characteristic-frequency peak, when νm crosses
through the UV, optical, and IR bands (in that order), causing a gradual shift in the overall
color from β = −1/3 to β = (p − 1)/2. It is in fact difficult to explain this feature in any
other straightforward way; in a wind medium the same feature shifts in color only from
β = 1/2 to β = p/2 (Li & Chevalier 2003) which is never sufficiently blue. Complicated
prescriptions involving numerous components contributing about equally to the afterglow
flux (e.g., Racusin et al. 2008b) may also explain this feature, though at the expense of
substantial additional complexity.
Although the optical SED provides good evidence of shifting somewhat back toward the
red at late times, its overall blueness remains a challenge to explain even after a simple power-
law decay has set in. This late decay rate is αopt = 1.23±0.02 optically, and αX = 1.30±0.05
in X-rays. Fitting to a combination of the first three epochs of the late-time Gemini data
gives βopt = 0.51 ± 0.26. If we assume that the X-ray and optical afterglows have the same
origin, then the X-ray to optical spectral index is βOX = 0.77 ± 0.01 — consistent with the
X-ray index itself of βX = 0.80 ± 0.04. This also forms a strict upper limit on βopt; even if
a cooling break is present close to the optical band (our observations do not rule out this
possibility) then βopt < βOX to not underpredict the X-ray flux.
Given this, and assuming p ≥ 2, we can greatly constrain the available models. The
jet model (which we favored in the first version of this paper, before late-time data were
available) is completely ruled out (it requires α ≥ 2.0), as are models where the optical
band is above the cooling break (which requires β ≥ 1.0). This leaves only two possibilities.
The interstellar medium (ISM) model discussed previously is, in principle, still in agreement
(barely) with the data: for p = 2.59, α = 1.19 and β = 0.79, all within 2σ of observed values.
However this requires that the X-ray regime also be below the cooling frequency (νX < νc)
out to extremely late times (at least 10 d), which is not expected physically in the ISM
model unless the density n and/or the magnetization fraction ǫB are very low:
( n
cm−3
)
(
ǫB
4 × 10⁻⁵
)3/2
. 1.
Alternatively, a wind model with p = 2.0 predicts αopt = 1.25 and βopt = 0.50. These are
reasonable, but the X-ray flux is either greatly over-predicted (if a cooling break is absent,
we would anticipate βOX = 0.50 as well), or the X-ray decay is far too fast (if a cooling break
is present, then αX = 1.0). Either possibility is ruled out to at least 6σ.
We therefore prefer the ISM model to favor all observations. While a wind-stratified
medium may be made to work with sufficient enhancements (for example, the chromatic
optical behavior could be explained by an additional emission component, and the late-
– 20 –
time discrepancies in the optical and X-rays could be explained by evolution of the cooling
frequency in a way not predicted by canonical models), this model is simpler as it explains all
of our observations without the need for such components — with the exception of the very
early-time data, where standard assumptions are most expected not to hold. Our conclusion
here therefore disagrees with that of Kumar & Panaitescu (2008) and Racusin et al. (2008b),
who prefer a wind-stratified model at late times.
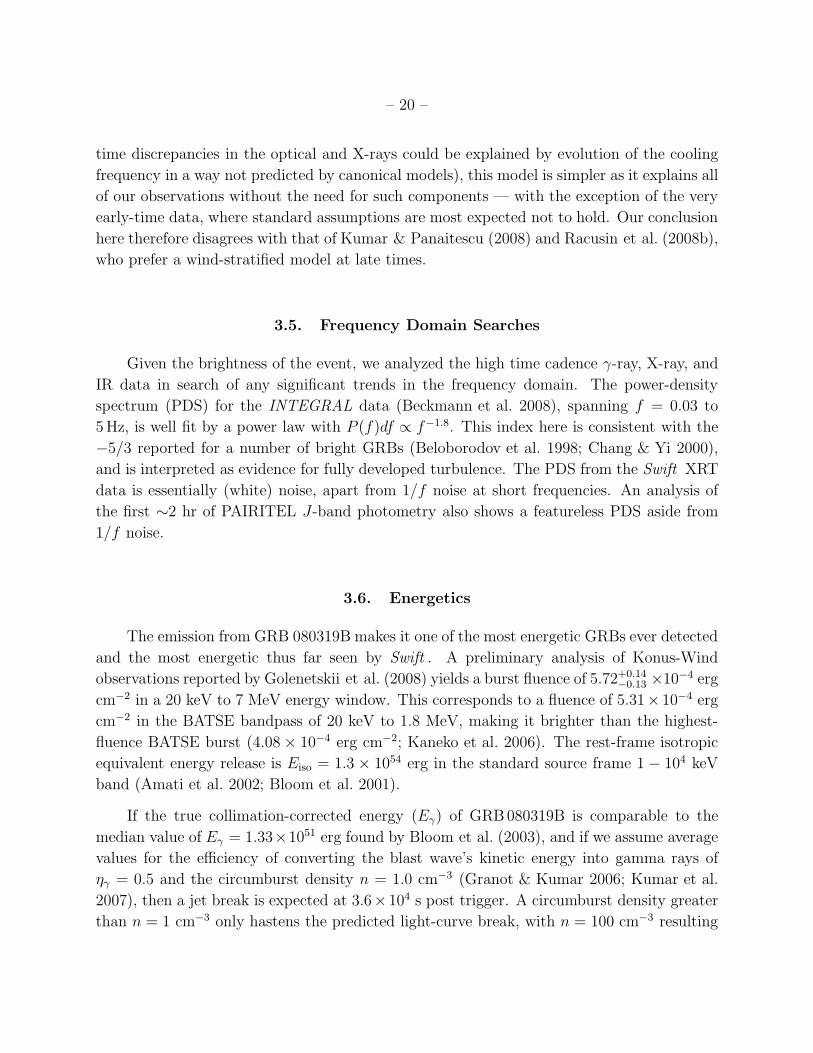
3.5. Frequency Domain Searches
Given the brightness of the event, we analyzed the high time cadence γ-ray, X-ray, and
IR data in search of any significant trends in the frequency domain. The power-density
spectrum (PDS) for the INTEGRAL data (Beckmann et al. 2008), spanning f = 0.03 to
5Hz, is well fit by a power law with P (f)df ∝ f−1.8. This index here is consistent with the
−5/3 reported for a number of bright GRBs (Beloborodov et al. 1998; Chang & Yi 2000),
and is interpreted as evidence for fully developed turbulence. The PDS from the Swift XRT
data is essentially (white) noise, apart from 1/f noise at short frequencies. An analysis of
the first ∼2 hr of PAIRITEL J-band photometry also shows a featureless PDS aside from
1/f noise.
3.6. Energetics
The emission from GRB 080319B makes it one of the most energetic GRBs ever detected
and the most energetic thus far seen by Swift . A preliminary analysis of Konus-Wind
observations reported by Golenetskii et al. (2008) yields a burst fluence of 5.72+0.14−0.13 ×10⁻⁴ erg
cm−2 in a 20 keV to 7 MeV energy window. This corresponds to a fluence of 5.31× 10⁻⁴ erg
cm−2 in the BATSE bandpass of 20 keV to 1.8 MeV, making it brighter than the highest-
fluence BATSE burst (4.08 × 10⁻⁴ erg cm−2; Kaneko et al. 2006). The rest-frame isotropic
equivalent energy release is Eiso = 1.3 × 1054 erg in the standard source frame 1 − 104 keV
band (Amati et al. 2002; Bloom et al. 2001).
If the true collimation-corrected energy (Eγ) of GRB080319B is comparable to the
median value of Eγ = 1.33×1051 erg found by Bloom et al. (2003), and if we assume average
values for the efficiency of converting the blast wave’s kinetic energy into gamma rays of
ηγ = 0.5 and the circumburst density n = 1.0 cm−3 (Granot & Kumar 2006; Kumar et al.
2007), then a jet break is expected at 3.6×10⁴ s post trigger. A circumburst density greater
than n = 1 cm−3 only hastens the predicted light-curve break, with n = 100 cm−3 resulting
– 21 –
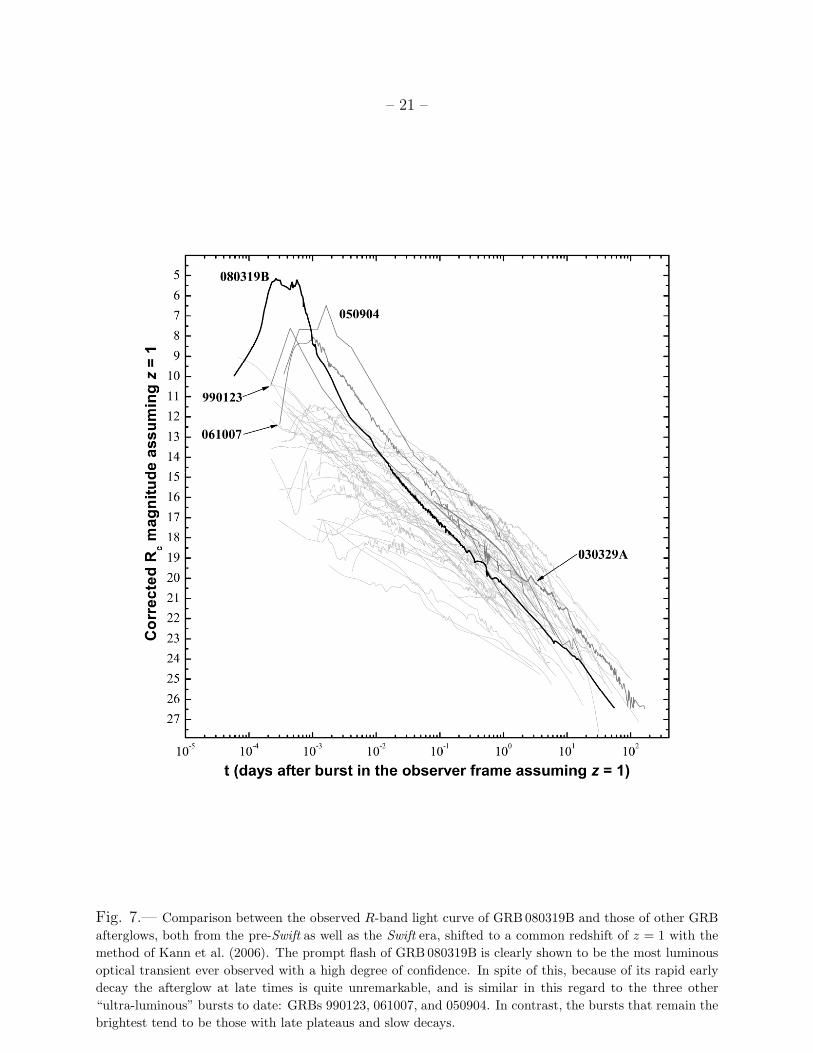
Fig. 7.— Comparison between the observed R-band light curve of GRB 080319B and those of other GRB
afterglows, both from the pre-Swift as well as the Swift era, shifted to a common redshift of z = 1 with the
method of Kann et al. (2006). The prompt flash of GRB 080319B is clearly shown to be the most luminous
optical transient ever observed with a high degree of confidence. In spite of this, because of its rapid early
decay the afterglow at late times is quite unremarkable, and is similar in this regard to the three other
“ultra-luminous” bursts to date: GRBs 990123, 061007, and 050904. In contrast, the bursts that remain the
brightest tend to be those with late plateaus and slow decays.
– 22 –
in tjet = 7.8 × 10³ s. Likewise, a collimation-corrected energy less than Eγ = 1.3 × 1051 erg
will also push the expected jet break to earlier times, with Eγ = 1050 erg yielding tjet ≈ 103 s.
No canonical jet break is observed in the GRB light curve. The only unambiguous
steepening feature is an X-ray break observed at t = 2620 ± 470 s. However, no contempo-
raneous optical break is observed. There is evidence of a break at very late times (& 106 s).
Unfortunately, the afterglow is extremely faint at this point, but both the last X-ray obser-
vation, the last g-band detection, and the final HST F606W measurement from the GCN
circulars are significantly (though only mildly: 2–3σ) below our fitted power-law extrapo-
lation. Furthermore, the fact that the afterglow shifts to dramatically redder colors at this
point (simultaneously, i and z rise above the fitted curve) suggests that the optical flux may
be dominated by supernova light (§3.7; host-galaxy light likely contributes as well), and the
afterglow contribution is actually even smaller than this, which would strongly favor a break.
Unfortunately, given the lack of available late-time X-ray data we cannot strongly constrain
whether or not the break is chromatic.
Treating this feature as a jet break, the very late break time (t = 10 d) imposes strong
demands on the afterglow energetics. Assuming n = 1 cm−3 and ηγ = 0.5, this places a
lower limit on the collimation-corrected energy of 4.0 × 1051 erg, significantly higher than
any pre-Swift value (Bloom et al. 2003) and the vast majority of Swift bursts, but compara-
ble to the handful of “hyper-energetic” outlier events discovered by Swift : GRBs 050904
(Tagliaferri et al. 2005), 050820A (Cenko et al. 2006), and 070125 (Chandra et al. 2008;
Updike et al. 2008). The lack of an early jet break would then argue that the extreme
brightness of this GRB is at least partially intrinsic to the explosion itself.
Alternatively, a jet break may have occurred extremely early (within the first 100 s)
before the start of our observations. Such a model has been suggested to explain the lack
of an apparent jet break in another powerful event detected by Swift , such as GRB 061007
— see Schady et al. 2007a and Mundell et al. 2007). In this case, Eγ would actually have
an unusually low, though not unprecedented, energy release of ∼ 1049 erg. One could also
appeal to the minor break in the X-ray light curve (and presume the optical break was hidden
by other effects), which would indicate a fairly canonical energy near 1051 erg; either of these
cases would point to extreme collimation given the large Eiso. However, as we have already
discussed, in these cases the “post-break” light-curve slopes in the optical and X-rays of
αO = 1.23 and αX = 1.40 are much too shallow for the prediction of t−p (Sari et al. 1999),
where generally we expect the electron index p ≥ 2.0.
A final possibility is that multiple jets, with very different opening angles, were involved,
similar to the model proposed for GRB 030329 (Berger et al. 2003). In this scenario, we
might expect to see both an early break (from highly collimated, highly relativistic emission)
– 23 –
and a late break (from less collimated, less relativistic emission), presuming that the emission
at different times was dominated by different jet components. Assuming that the prompt
emission and optical flash were associated with the narrow jet, the lack of a break at late
times5 need not imply unusual energetics. The fact that the early-time X-ray break is very
sharp, and also apparently achromatic, might argue for this interpretation, and the lack of
a contemporaneous optical break could be explained if the optical counterpart of the early
X-ray shallow decay phase were hidden by the bright reverse shock. This model is the one
favored by Racusin et al. (2008b).
3.7. Supernova Constraints
Detailing the nature of the late-time behavior and the evolution of the likely supernova
counterpart is beyond the scope of this paper, but we performed a few basic fits using the
method of Zeh et al. (2004) of the late-times observations under various model assumptions
(host brightnesses, using an extrapolation of the late-time light curve and a SN 1998bw-like
supernova template). In all assumptions we measure a luminosity relative to SN 1998bw in
the same rest-frame epoch, of greater than one, with an overall distribution of k = 2.3± 0.8
(Figure 6). In particular, the existence of a late afterglow break and host galaxy with a
magnitude comparable to the HST measurement of Levan et al. (2008) favor higher values,
which provides evidence that this unusually bright GRB may be associated with an unusually
bright (even compared to other GRB supernovae: Ferrero et al. 2006) supernova. For s, the
relative rest-frame time to maximum light relative to SN 1998bw, we measure s = 0.89±0.10.
4. Discussion and Conclusions
The PDS analysis reflects quantitatively what is qualitatively a light curve without
strong brightening features. Such “smooth” afterglows have been seen before (e.g., Laursen & Stanek
2003; Stanek et al. 2005), yet many GRBs with high-quality optical/IR afterglow observa-
tions show significant jaggedness, often on timescales less than the time since trigger (e.g.,
Jakobsson et al. 2004). The afterglow in this case is not entirely featureless; slow modula-
tions of less than 10% with ∆t/t are observed at around 200 s and 700 s, but these have
been seen before in other afterglows, including the undulating afterglow of GRB 030329
5To be sure, Racusin et al. (2008b) claim a late-time jet break but we find no significant evidence of such
in the XRT data alone. The apparent discrepancy may be due to the different time binnings of the late-time
data.
– 24 –
(Lipkin et al. 2004).
While an observation of periodicity (f ∼> 1 Hz) in the prompt phase could be considered
a reasonable manifestation of a magnetized neutron star powering the initial internal shocks
(e.g., Metzger et al. 2008), the absence of such a signature in the INTEGRAL PDS by no
means rules out such a hypothesis. The concordance of the PDS with other GRBs in the pre-
Swift sample suggests, prima facie, a similarity between GRB080319B and other events in
the hydrodynamic properties of the (emitting) outflow; also absent is any substantial evidence
for a difference in microphysical parameters. We are left with the reasonable conclusion that
the extreme brightness of GRB080319B has more to do with macroscopic parameters of
the central engine (in particular, the collimation angle, Mejecta, initial Lorentz factor, and
possibly the circumburst medium could all be responsible) than extrema in shock parameters.
There is a qualitative similarity in the intrinsic behavior of the three brightest afterglow
events (Fig. 7), requiring more than 9 s in the rest frame from γ-ray trigger to reach peak
brightness. Yet, as noted with GRBs 050904 and 990123 (Kann et al. 2007a), even the
brightest events fade very rapidly and reach by day 1 a magnitude comparable to that of
the general population. In our adopted cosmology, Mpeak,r = −38.3 mag at a time t ≈ 10
s (rest frame) from trigger. Likewise, Mpeak,r(990123) = −36.0 mag at a time t = 18.1
s and Mpeak,r(050904) = −37.1 mag at a time t = 71.2 s. Compared to GRBs 990123
and 050904, GRB080319B does not appear to support the proposed brightness vs. tpeak
relation (Panaitescu & Vestrand 2008) (i.e., that brighter events are seen to take longer
from trigger to peak); still, the existence of a rough relation when including fainter events
suggests that the very brightest events such as these may allow for the longest follow-up
delay at a given redshift. This afterglow “turn on” delay for some fraction of events has
important implications for follow-up of high-redshift GRBs since tens of seconds in the rest
frame becomes a delay of minutes in the observer frame (Fig. 9). Such a consideration,
for example, could relax requirements for extremely rapid repointing of satellites to catch
afterglows at their brightest.
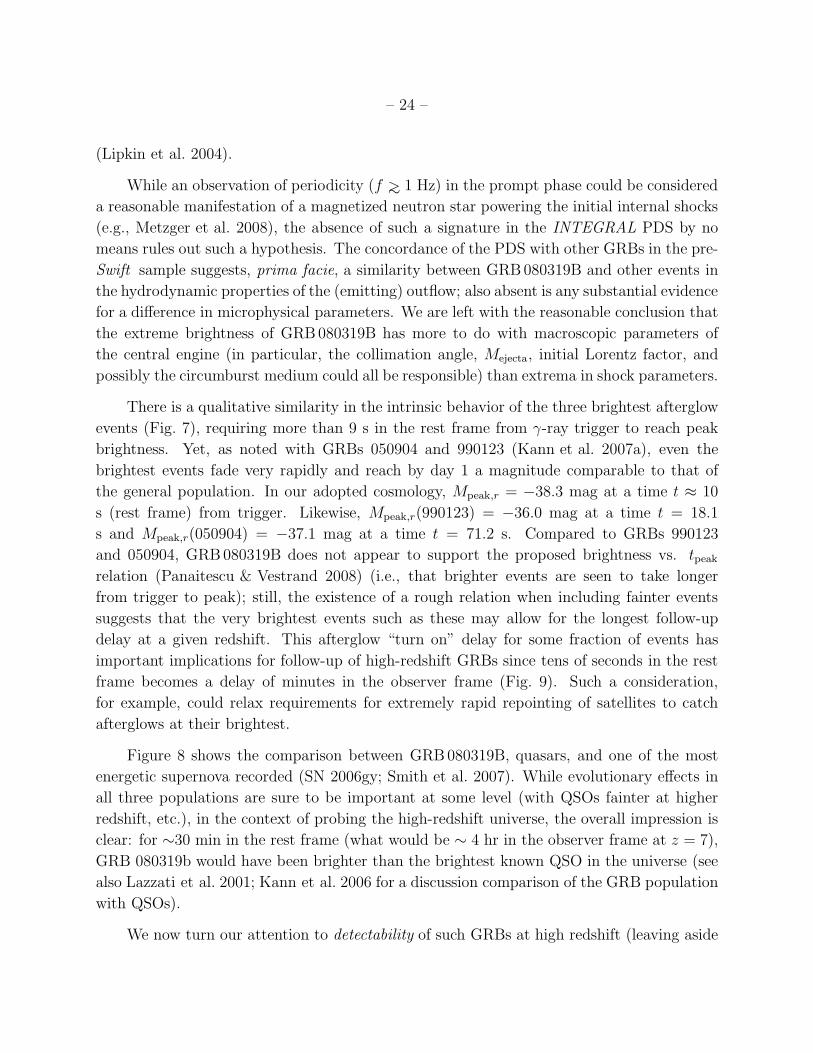
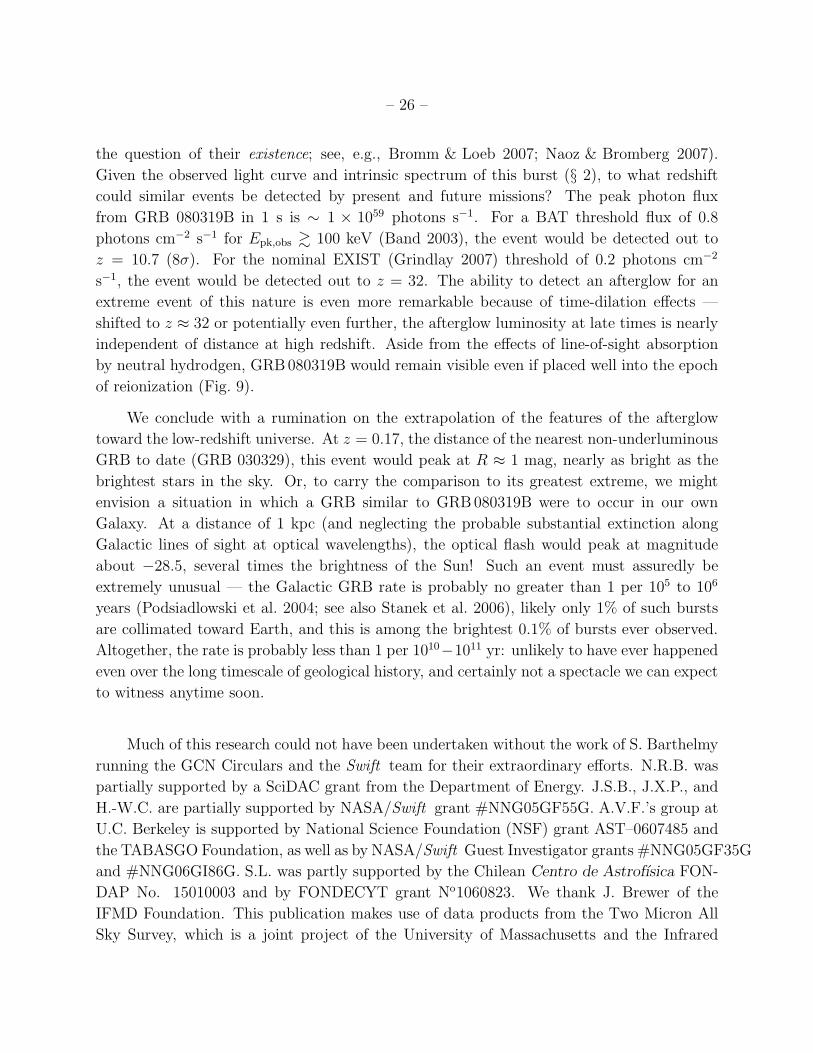
Figure 8 shows the comparison between GRB080319B, quasars, and one of the most
energetic supernova recorded (SN 2006gy; Smith et al. 2007). While evolutionary effects in
all three populations are sure to be important at some level (with QSOs fainter at higher
redshift, etc.), in the context of probing the high-redshift universe, the overall impression is
clear: for ∼30 min in the rest frame (what would be ∼ 4 hr in the observer frame at z = 7),
GRB 080319b would have been brighter than the brightest known QSO in the universe (see
also Lazzati et al. 2001; Kann et al. 2006 for a discussion comparison of the GRB population
with QSOs).
We now turn our attention to detectability of such GRBs at high redshift (leaving aside
– 25 –
10-4 10-2 100 102
Time Since Explosion [day]
-20
-25
-30
-35
-40M
r [AB
]
Most Luminous QSO Known
10-4 10-2 100 102
Time Since Explosion [day]
-20
-25
-30
-35
-40M
r [AB
]
SD
SS
QS
O
dis
trib
utio
n
GRB 080319BGRB 050904
GRB 990123
SN 2006gy
Fig. 8.— Rest-frame comparison of the most luminous optical/IR probes of the distant universe,
showing the absolute magnitude (Mr, in AB magnitudes as defined by Oke & Gunn 1982) versus
time of GRB 080319B (red circles) and SN2006gy (blue triangles; Smith et al. 2007). Transformed
light curves of GRB 990123 (yellow stars; adapted from Galama et al. 1999) and GRB050904 (green
squares; adapted from Kann et al. 2007b) are also shown. For reference, the most luminous known
QSO (Schneider et al. 2007) is shown with a dashed horizontal line; the distribution of SDSS
QSO magnitudes, adapted from Fig. 6 of Schneider et al., is shown as horizontal banding (darker
indicates higher density of sources per unit magnitude). The afterglow of GRB080319B was the
brightest GRB afterglow ever recorded and was at early times ∼103 times more luminous than the
most luminous QSO.
– 26 –
the question of their existence; see, e.g., Bromm & Loeb 2007; Naoz & Bromberg 2007).
Given the observed light curve and intrinsic spectrum of this burst (§ 2), to what redshift
could similar events be detected by present and future missions? The peak photon flux
from GRB 080319B in 1 s is ∼ 1 × 1059 photons s−1. For a BAT threshold flux of 0.8
photons cm−2 s−1 for Epk,obs & 100 keV (Band 2003), the event would be detected out to
z = 10.7 (8σ). For the nominal EXIST (Grindlay 2007) threshold of 0.2 photons cm−2
s−1, the event would be detected out to z = 32. The ability to detect an afterglow for an
extreme event of this nature is even more remarkable because of time-dilation effects —
shifted to z ≈ 32 or potentially even further, the afterglow luminosity at late times is nearly
independent of distance at high redshift. Aside from the effects of line-of-sight absorption
by neutral hydrodgen, GRB080319B would remain visible even if placed well into the epoch
of reionization (Fig. 9).
We conclude with a rumination on the extrapolation of the features of the afterglow
toward the low-redshift universe. At z = 0.17, the distance of the nearest non-underluminous
GRB to date (GRB 030329), this event would peak at R ≈ 1 mag, nearly as bright as the
brightest stars in the sky. Or, to carry the comparison to its greatest extreme, we might
envision a situation in which a GRB similar to GRB080319B were to occur in our own
Galaxy. At a distance of 1 kpc (and neglecting the probable substantial extinction along
Galactic lines of sight at optical wavelengths), the optical flash would peak at magnitude
about −28.5, several times the brightness of the Sun! Such an event must assuredly be
extremely unusual — the Galactic GRB rate is probably no greater than 1 per 105 to 106
years (Podsiadlowski et al. 2004; see also Stanek et al. 2006), likely only 1% of such bursts
are collimated toward Earth, and this is among the brightest 0.1% of bursts ever observed.
Altogether, the rate is probably less than 1 per 1010−1011 yr: unlikely to have ever happened
even over the long timescale of geological history, and certainly not a spectacle we can expect
to witness anytime soon.
Much of this research could not have been undertaken without the work of S. Barthelmy
running the GCN Circulars and the Swift team for their extraordinary efforts. N.R.B. was
partially supported by a SciDAC grant from the Department of Energy. J.S.B., J.X.P., and
H.-W.C. are partially supported by NASA/Swift grant #NNG05GF55G. A.V.F.’s group at
U.C. Berkeley is supported by National Science Foundation (NSF) grant AST–0607485 and
the TABASGO Foundation, as well as by NASA/Swift Guest Investigator grants #NNG05GF35G
and #NNG06GI86G. S.L. was partly supported by the Chilean Centro de Astrofısica FON-
DAP No. 15010003 and by FONDECYT grant No1060823. We thank J. Brewer of the
IFMD Foundation. This publication makes use of data products from the Two Micron All
Sky Survey, which is a joint project of the University of Massachusetts and the Infrared
– 27 –
10 100 1000 10000Observer Time Since Trigger [sec]
20
15
10
5
0K
-ban
d [V
ega
mag
]
z=0.40z=0.94z=3 z=7 z=10 z=13 z=16
OMFG!
PAIRITEL 10-sigma Detection
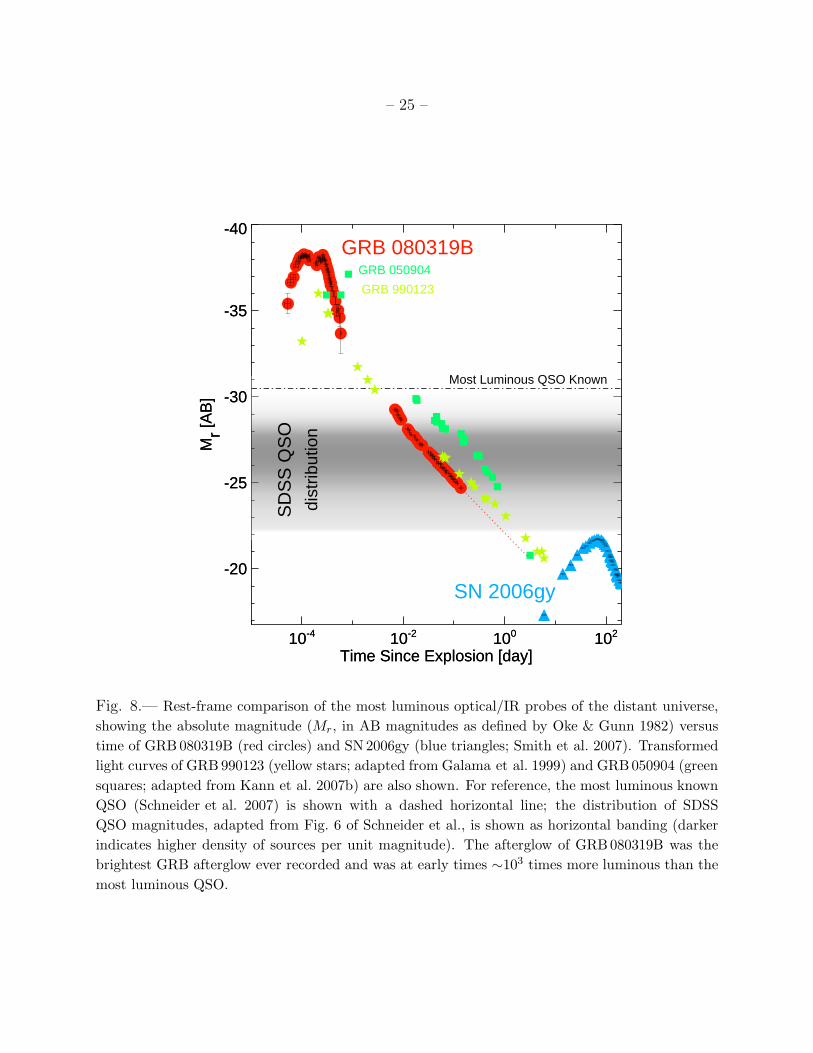
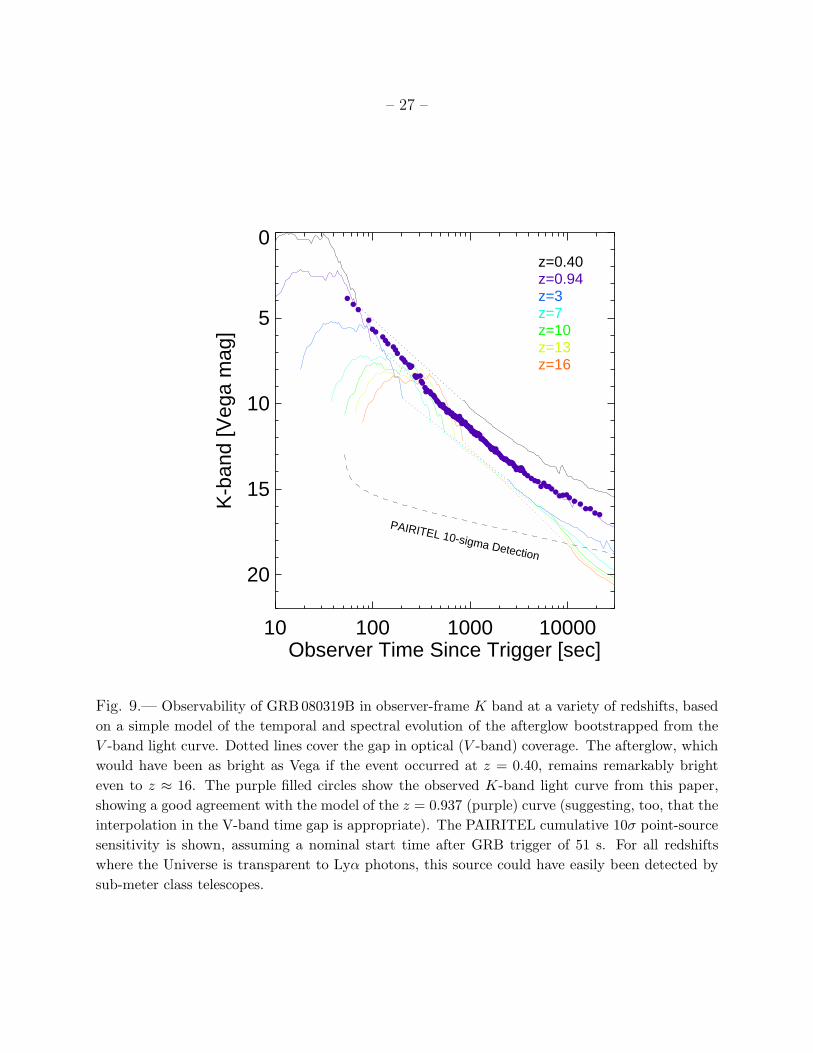
Fig. 9.— Observability of GRB 080319B in observer-frame K band at a variety of redshifts, based
on a simple model of the temporal and spectral evolution of the afterglow bootstrapped from the
V -band light curve. Dotted lines cover the gap in optical (V -band) coverage. The afterglow, which
would have been as bright as Vega if the event occurred at z = 0.40, remains remarkably bright
even to z ≈ 16. The purple filled circles show the observed K-band light curve from this paper,
showing a good agreement with the model of the z = 0.937 (purple) curve (suggesting, too, that the
interpolation in the V-band time gap is appropriate). The PAIRITEL cumulative 10σ point-source
sensitivity is shown, assuming a nominal start time after GRB trigger of 51 s. For all redshifts
where the Universe is transparent to Lyα photons, this source could have easily been detected by
sub-meter class telescopes.
– 28 –
Processing and Analysis Center/California Institute of Technology, funded by NASA and
the NSF. KAIT and its ongoing research were made possible by donations from Sun Mi-
crosystems, Inc., the Hewlett-Packard Company, AutoScope Corporation, Lick Observatory,
the NSF, the University of California, the Sylvia & Jim Katzman Foundation, and the
TABASGO Foundation. Partially, based on observations obtained at the Gemini Observa-
tory, which is operated by the Association of Universities for Research in Astronomy, Inc.,
under a cooperative agreement with the NSF on behalf of the Gemini partnership: the Na-
tional Science Foundation (United States), the Science and Technology Facilities Council
(United Kingdom), the National Research Council (Canada), CONICYT (Chile), the Aus-
tralian Research Council (Australia), Ministrio da Cincia e Tecnologia (Brazil) and SECYT
(Argentina). We thank the Gemini Observatory staff for their excellent work in observing
GRB080319B; the assistance of the Lick Observatory staff is also acknowledged. The Pe-
ters Automated Infrared Imaging Telescope is operated by the Smithsonian Astrophysical
Observatory (SAO) and was made possible by a grant from the Harvard University Milton
Fund, the camera loan from the University of Virginia, and the continued support of the
SAO and UC Berkeley. The PAIRITEL project is further supported by NASA/Swift Guest
Investigator Grant #NNG06GH50G. We are grateful to E. E. Falco and the Mt. Hopkins
staff (W. Peters, R. Hutchins, T. Groner) for their continued assistance with PAIRITEL.
REFERENCES
Adelman-McCarthy, J. K. et al. 2008, ApJS, 175, 297
Amati, L. et al. 2002, A&A, 390, 81
Band, D. L. 2003, ApJ, 588, 945
Beckmann, V., Mereghetti, S., Kienlin, A. v., Beck, M., Savchenko, V., Borkowski, J., and
Gotz, D. 2008, GCN Circular 7450
Beloborodov, A. M., Stern, B. E., and Svensson, R. 1998, ApJ, 508, L25
Berger, E. et al. 2003, Nature, 426, 154
Bertin, E. and Arnouts, S. 1996, A&AS, 117, 393
Beuermann, K. et al. 1999, A&A, 352, L26
Bloom, J. S., Frail, D. A., and Kulkarni, S. R. 2003, ApJ, 594, 674
Bloom, J. S., Frail, D. A., and Sari, R. 2001, AJ, 121, 2879
– 29 –
Bloom, J. S., Starr, D., and Perley, D. A. 2008, GCN Circular 7434
Bloom, J. S., Starr, D. L., Blake, C. H., Skrutskie, M. F., and Falco, E. E. 2006, in Astronom-
ical Society of the Pacific Conference Series, Vol. 351, Astronomical Data Analysis
Software and Systems XV, ed. C. Gabriel, C. Arviset, D. Ponz, & S. Enrique, 751
Bromm, V. and Loeb, A. 2007, in American Institute of Physics Conference Series, Vol.
937, Supernova 1987A: 20 Years After: Supernovae and Gamma-Ray Bursters, ed.
S. Immler, K. Weiler, & R. McCray, 532–541
Butler, N. 2008, GCN Circular 7499
Butler, N. R. and Kocevski, D. 2007a, ApJ, 663, 407
—. 2007b, ApJ, 668, 400
Butler, N. R., Kocevski, D., Bloom, J. S., and Curtis, J. L. 2007, ApJ, 671, 656
Cenko, S. B. et al. 2006, ApJ, 652, 490
Chandra, P. et al. 2008, ArXiv e-prints, 0802.2748
Chang, H.-Y. and Yi, I. 2000, ApJ, 542, L17
Cool, R. J. et al. 2008, GCN Circular 7465
Covino, S. et al. 2008, GCN Circular 7446
Cwiok, M. et al. 2008a, GCN Circular 7445
—. 2008b, GCN Circular 7445
Daigne, F., Rossi, E. M., and Mochkovitch, R. 2006, MNRAS, 372, 1034
Eisner, J. A., Hillenbrand, L. A., White, R. J., Bloom, J. S., Akeson, R. L., and Blake, C. H.
2007, ApJ, 669, 1072
Ferrero, P. et al. 2006, A&A, 457, 857
Filippenko, A. V., Li, W. D., Treffers, R. R., and Modjaz, M. 2001, in Astronomical Society of
the Pacific Conference Series, Vol. 246, IAU Colloq. 183: Small Telescope Astronomy
on Global Scales, ed. B. Paczynski, W.-P. Chen, & C. Lemme (San Francisco, CA:
ASP), 121
Foley, R. J. et al. 2006, ApJ, 645, 450
– 30 –
Galama, T. J. et al. 1999, Nature, 398, 394
Gehrels, N. et al. 2004, ApJ, 611, 1005
Giblin, T. W., van Paradijs, J., Kouveliotou, C., Connaughton, V., Wijers, R. A. M. J.,
Briggs, M. S., Preece, R. D., and Fishman, G. J. 1999, ApJ, 524, L47
Golenetskii, S., Aptekar, R., Mazets, E., Pal’shin, V., Frederiks, D., and Cline, T. 2008,
GCN Circular 7482
Granot, J. and Kumar, P. 2006, MNRAS, 366, L13
Grindlay, J. E. 2007, in American Institute of Physics Conference Series, Vol. 921, The First
GLAST Symposium, ed. S. Ritz, P. Michelson, & C. A. Meegan (New York, NY:
AIP), 211–216
Henden, A. 2008, GCN Circular 7528
Hentunen, V., Oksanen, A., and Kehusmaa, P. 2008, GCN Circular 7484
Hook, I. M., Jørgensen, I., Allington-Smith, J. R., Davies, R. L., Metcalfe, N., Murowinski,
R. G., and Crampton, D. 2004, PASP, 116, 425
Horne, K. 1986, PASP, 98, 609
Jakobsson, P. et al. 2004, New Astronomy, 9, 435
—. 2006, A&A, 447, 897
Jelinek, M., Castro-Tirado, A. J., Chantry, V., and Pla, J. 2008, GCN Circular 7476
Kaneko, Y., Preece, R. D., Briggs, M. S., Paciesas, W. S., Meegan, C. A., and Band, D. L.
2006, ApJS, 166, 298
Kann, D. A., Klose, S., and Zeh, A. 2006, ApJ, 641, 993
Kann, D. A. et al. 2007a, ArXiv e-prints, 0712.2186
Kann, D. A., Masetti, N., and Klose, S. 2007b, AJ, 133, 1187
Karpov, S. et al. 2008a, GCN Circular 7452
—. 2008b, GCN Circular 7558
Kobayashi, S. 2000, ApJ, 545, 807
– 31 –
Krugly, Y., Slyusarev, I., and Pozanenko, A. 2008, GCN Circular 7519
Kumar, P. et al. 2007, MNRAS, 376, L57
Kumar, P. and Panaitescu, A. 2008, ArXiv e-prints, 0805.0144
Laursen, L. T. and Stanek, K. Z. 2003, ApJ, 597, L107
Lazzati, D., Ghisellini, G., Haardt, F., and Fernandez-Soto, A. 2001, in Gamma-ray Bursts
in the Afterglow Era, ed. E. Costa, F. Frontera, & J. Hjorth, 191
Le, T. and Dermer, C. D. 2007, ApJ, 661, 394
Levan, A. J., Tanvir, N. R., Fruchter, A. S., and Graham, J. 2008, GCN Circular 7710
Li, W., Chornock, R., Perley, D. A., and Filippenko, A. V. 2008, GCN Circular 7438
Li, W., Filippenko, A. V., Chornock, R., and Jha, S. 2003, PASP, 115, 844
Li, W., Jha, S., Filippenko, A. V., Bloom, J. S., Pooley, D., Foley, R. J., and Perley, D. A.
2006, PASP, 118, 37
Li, Z.-Y. and Chevalier, R. A. 2003, in Lecture Notes in Physics, Berlin Springer Verlag, Vol.
598, Supernovae and Gamma-Ray Bursters, ed. K. Weiler, 419–444
Lipkin, Y. M. et al. 2004, ApJ, 606, 381
Metzger, B. D., Thompson, T. A., and Quataert, E. 2008, ApJ, 676, 1130
Mundell, C. G. et al. 2007, ApJ, 660, 489
Naoz, S. and Bromberg, O. 2007, MNRAS, 380, 757
Novak, R. 2008, GCN Circular 7504
Oke, J. B. and Gunn, J. E. 1982, PASP, 94, 586
Panaitescu, A. and Vestrand, W. T. 2008, MNRAS, 387, 497
Perley, D. A. et al. 2008, ApJ, 672, 449
Podsiadlowski, P., Mazzali, P. A., Nomoto, K., Lazzati, D., and Cappellaro, E. 2004, ApJ,
607, L17
Poole, T. S. et al. 2008, MNRAS, 383, 627
– 32 –
Price, P. A. et al. 2003, ApJ, 589, 838
Racusin, J. L., Gehrels, N., Holland, S. T., Kennea, J. A., Markwardt, C. B., Pagani, C.,
Palmer, D. M., and Stamatikos, M. 2008a, GCN Circular 7427
Racusin, J. L. et al. 2008b, ArXiv e-prints, 0805.1557
Sari, R., Piran, T., and Halpern, J. P. 1999, ApJ, 519, L17
Sari, R., Piran, T., and Narayan, R. 1998, ApJ, 497, L17+
Schady, P. et al. 2007a, MNRAS, 380, 1041
—. 2007b, MNRAS, 377, 273
Schlegel, D. J., Finkbeiner, D. P., and Davis, M. 1998, ApJ, 500, 525
Schneider, D. P. et al. 2007, AJ, 134, 102
Schubel, M. et al. 2008, GCN Circular 7461
Smith, N. et al. 2007, ApJ, 666, 1116
Stanek, K. Z. et al. 2005, ApJ, 626, L5
—. 2006, Acta Astronomica, 56, 333
Swan, H., Yuan, F., and Rujopakarn, W. 2008, GCN Circular 7470
Tagliaferri, G. et al. 2005, A&A, 443, L1
Tanvir, N. R., Levan, A. J., Fruchter, A. S., Graham, J., Wiersema, K., and Rol, E. 2008,
GCN Circular 7569
Updike, A. C. et al. 2008, ArXiv e-prints, 0805.1094
Vreeswijk, P. M., Smette, A., Malesani, D., Fynbo, J. P. U., Milvang-Jensen, B., Jakobsson,
P., Jaunsen, A. O., and Ledoux, C. 2008, GCN Circular 7444
Wood-Vasey, W. M. et al. 2007, ArXiv e-prints, 0711.2068
Wozniak, P., Vestrand, W. T., Wren, J., and Davis, H. 2008, GCN Circular 7464
Zeh, A., Klose, S., and Hartmann, D. H. 2004, ApJ, 609, 952
This preprint was prepared with the AAS LATEX macros v5.2.
– 33 –
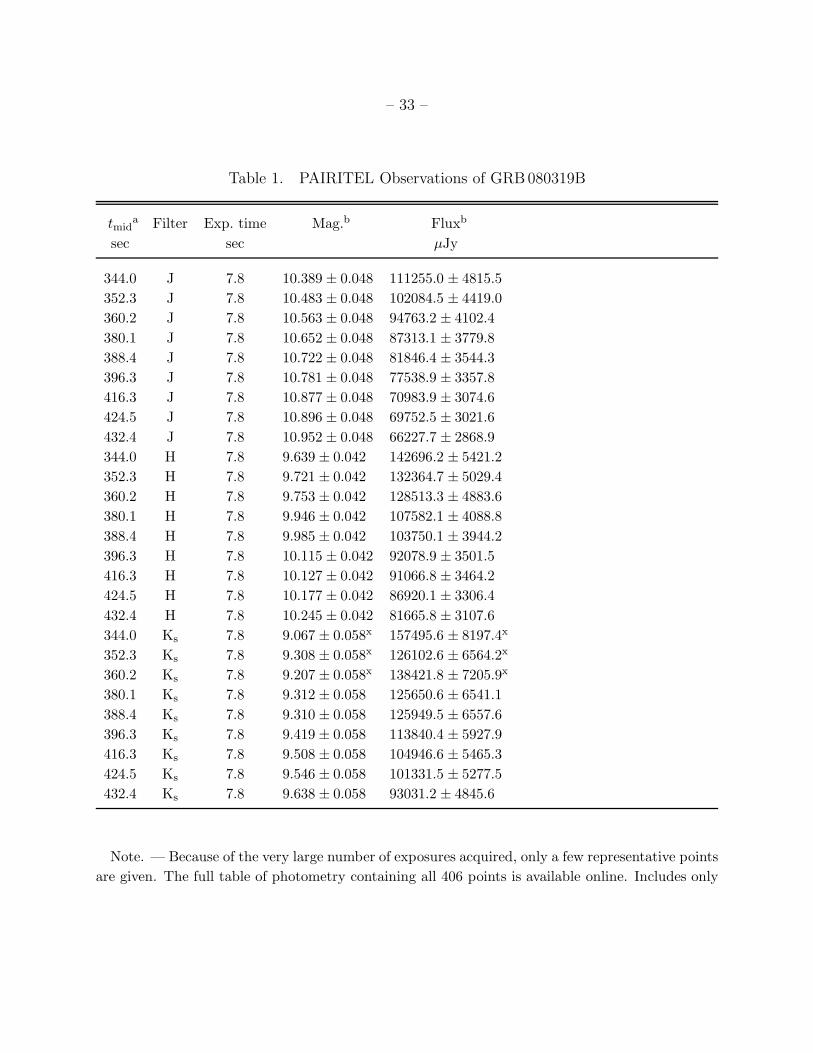
Table 1. PAIRITEL Observations of GRB080319B
tmida Filter Exp. time Mag.b Fluxb
sec sec µJy
344.0 J 7.8 10.389 ± 0.048 111255.0 ± 4815.5
352.3 J 7.8 10.483 ± 0.048 102084.5 ± 4419.0
360.2 J 7.8 10.563 ± 0.048 94763.2 ± 4102.4
380.1 J 7.8 10.652 ± 0.048 87313.1 ± 3779.8
388.4 J 7.8 10.722 ± 0.048 81846.4 ± 3544.3
396.3 J 7.8 10.781 ± 0.048 77538.9 ± 3357.8
416.3 J 7.8 10.877 ± 0.048 70983.9 ± 3074.6
424.5 J 7.8 10.896 ± 0.048 69752.5 ± 3021.6
432.4 J 7.8 10.952 ± 0.048 66227.7 ± 2868.9
344.0 H 7.8 9.639 ± 0.042 142696.2 ± 5421.2
352.3 H 7.8 9.721 ± 0.042 132364.7 ± 5029.4
360.2 H 7.8 9.753 ± 0.042 128513.3 ± 4883.6
380.1 H 7.8 9.946 ± 0.042 107582.1 ± 4088.8
388.4 H 7.8 9.985 ± 0.042 103750.1 ± 3944.2
396.3 H 7.8 10.115 ± 0.042 92078.9 ± 3501.5
416.3 H 7.8 10.127 ± 0.042 91066.8 ± 3464.2
424.5 H 7.8 10.177 ± 0.042 86920.1 ± 3306.4
432.4 H 7.8 10.245 ± 0.042 81665.8 ± 3107.6
344.0 Ks 7.8 9.067 ± 0.058x 157495.6 ± 8197.4x
352.3 Ks 7.8 9.308 ± 0.058x 126102.6 ± 6564.2x
360.2 Ks 7.8 9.207 ± 0.058x 138421.8 ± 7205.9x
380.1 Ks 7.8 9.312 ± 0.058 125650.6 ± 6541.1
388.4 Ks 7.8 9.310 ± 0.058 125949.5 ± 6557.6
396.3 Ks 7.8 9.419 ± 0.058 113840.4 ± 5927.9
416.3 Ks 7.8 9.508 ± 0.058 104946.6 ± 5465.3
424.5 Ks 7.8 9.546 ± 0.058 101331.5 ± 5277.5
432.4 Ks 7.8 9.638 ± 0.058 93031.2 ± 4845.6
Note. — Because of the very large number of exposures acquired, only a few representative points
are given. The full table of photometry containing all 406 points is available online. Includes only
– 34 –
non-saturated exposures; photometry from the saturated epochs is given in Tables 2 and 3.
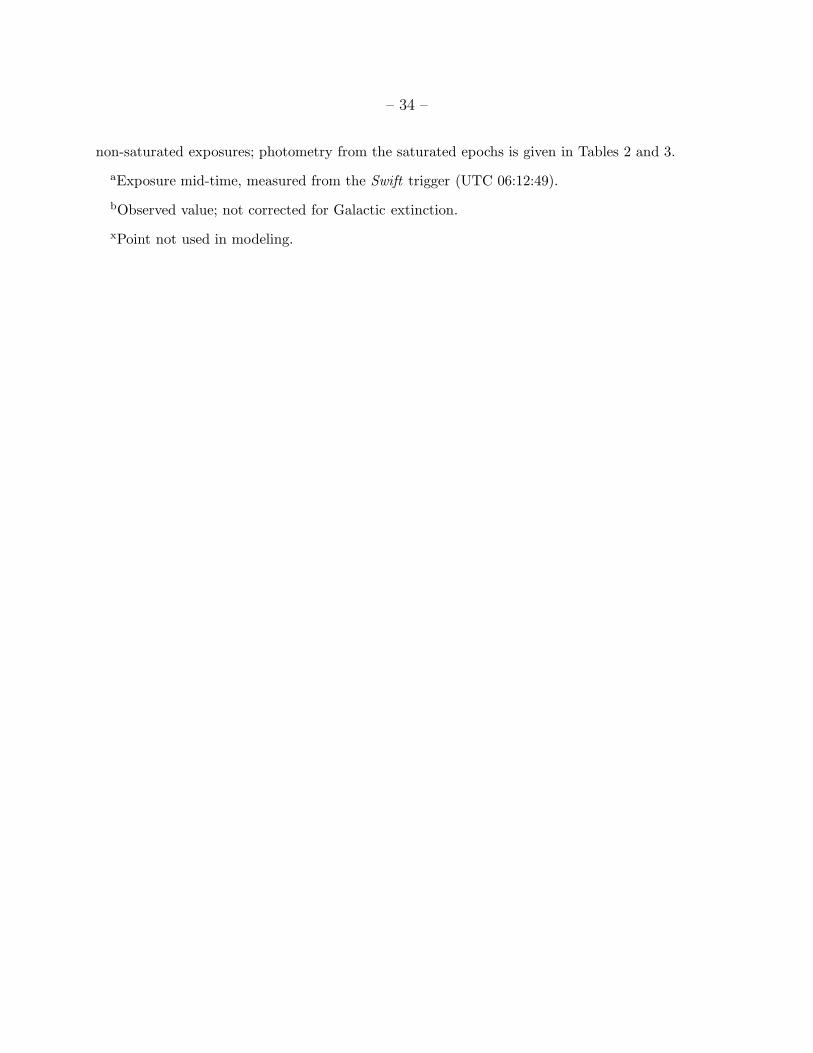
aExposure mid-time, measured from the Swift trigger (UTC 06:12:49).
bObserved value; not corrected for Galactic extinction.
xPoint not used in modeling.
– 35 –
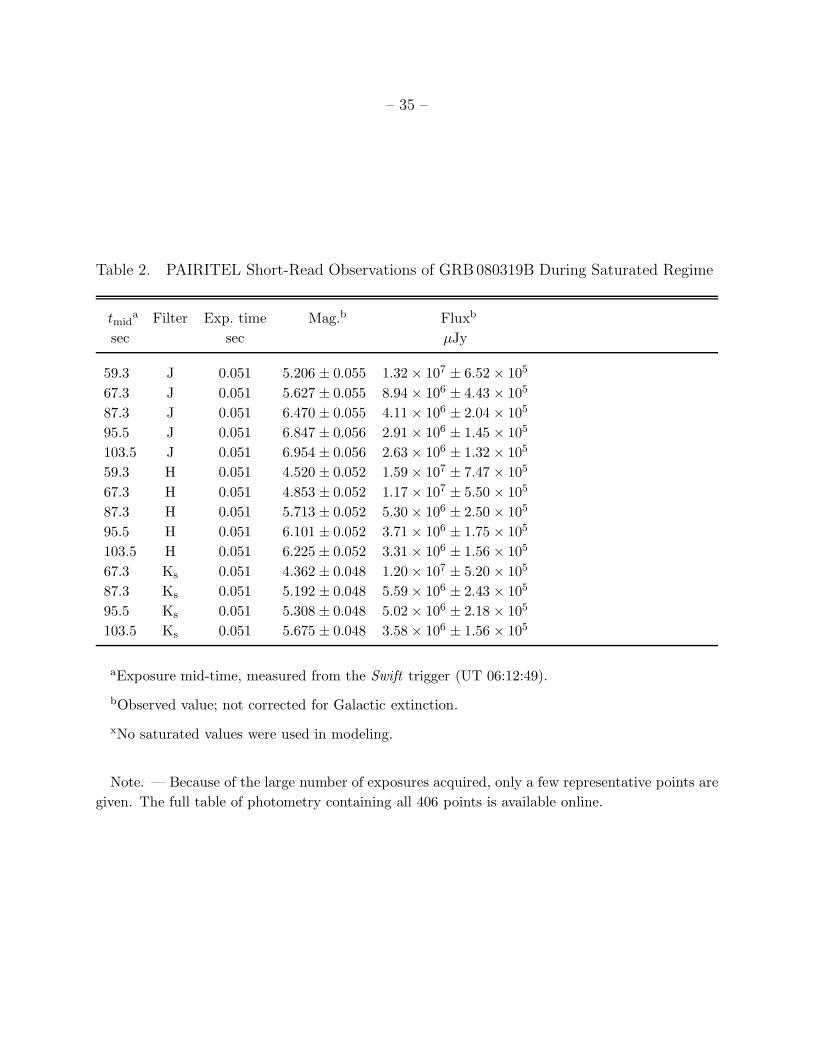
Table 2. PAIRITEL Short-Read Observations of GRB080319B During Saturated Regime
tmida Filter Exp. time Mag.b Fluxb
sec sec µJy
59.3 J 0.051 5.206 ± 0.055 1.32 × 10⁷ ± 6.52 × 10⁵
67.3 J 0.051 5.627 ± 0.055 8.94 × 10⁶ ± 4.43 × 10⁵
87.3 J 0.051 6.470 ± 0.055 4.11 × 10⁶ ± 2.04 × 10⁵
95.5 J 0.051 6.847 ± 0.056 2.91 × 10⁶ ± 1.45 × 10⁵
103.5 J 0.051 6.954 ± 0.056 2.63 × 10⁶ ± 1.32 × 10⁵
59.3 H 0.051 4.520 ± 0.052 1.59 × 10⁷ ± 7.47 × 10⁵
67.3 H 0.051 4.853 ± 0.052 1.17 × 10⁷ ± 5.50 × 10⁵
87.3 H 0.051 5.713 ± 0.052 5.30 × 10⁶ ± 2.50 × 10⁵
95.5 H 0.051 6.101 ± 0.052 3.71 × 10⁶ ± 1.75 × 10⁵
103.5 H 0.051 6.225 ± 0.052 3.31 × 10⁶ ± 1.56 × 10⁵
67.3 Ks 0.051 4.362 ± 0.048 1.20 × 10⁷ ± 5.20 × 10⁵
87.3 Ks 0.051 5.192 ± 0.048 5.59 × 10⁶ ± 2.43 × 10⁵
95.5 Ks 0.051 5.308 ± 0.048 5.02 × 10⁶ ± 2.18 × 10⁵
103.5 Ks 0.051 5.675 ± 0.048 3.58 × 10⁶ ± 1.56 × 10⁵
aExposure mid-time, measured from the Swift trigger (UT 06:12:49).
bObserved value; not corrected for Galactic extinction.
xNo saturated values were used in modeling.
Note. — Because of the large number of exposures acquired, only a few representative points are
given. The full table of photometry containing all 406 points is available online.
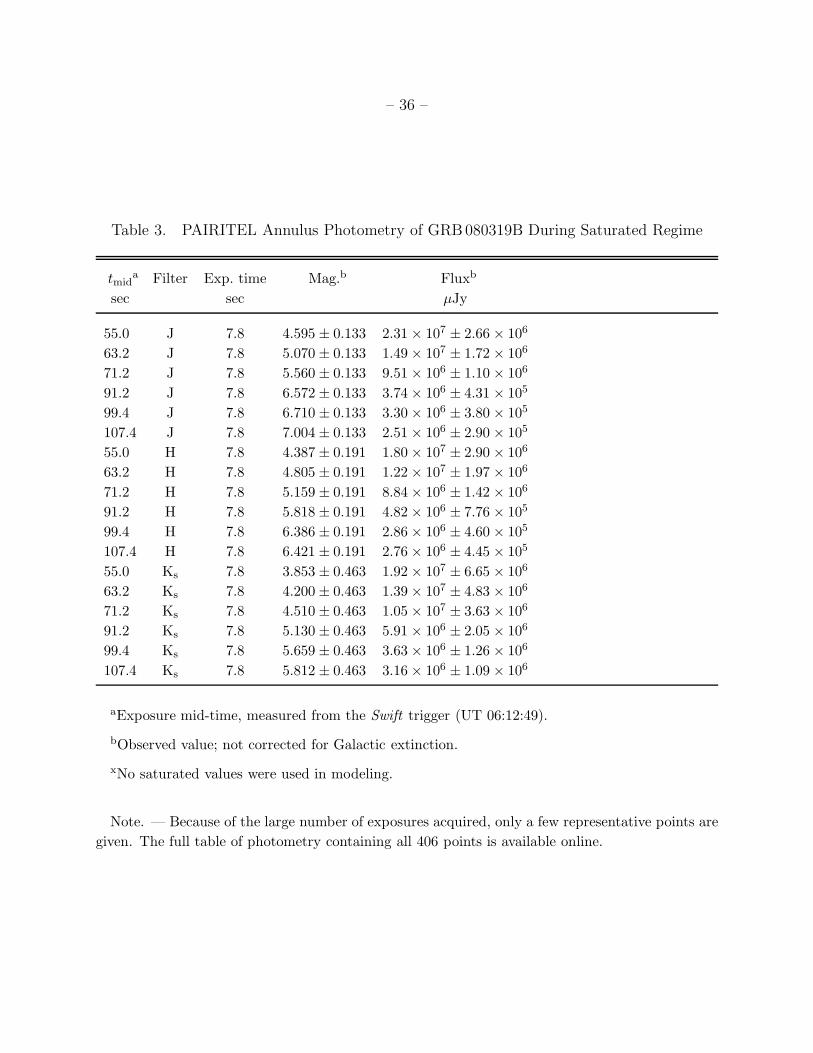
– 36 –
Table 3. PAIRITEL Annulus Photometry of GRB080319B During Saturated Regime
tmida Filter Exp. time Mag.b Fluxb
sec sec µJy
55.0 J 7.8 4.595 ± 0.133 2.31 × 10⁷ ± 2.66 × 10⁶
63.2 J 7.8 5.070 ± 0.133 1.49 × 10⁷ ± 1.72 × 10⁶
71.2 J 7.8 5.560 ± 0.133 9.51 × 10⁶ ± 1.10 × 10⁶
91.2 J 7.8 6.572 ± 0.133 3.74 × 10⁶ ± 4.31 × 10⁵
99.4 J 7.8 6.710 ± 0.133 3.30 × 10⁶ ± 3.80 × 10⁵
107.4 J 7.8 7.004 ± 0.133 2.51 × 10⁶ ± 2.90 × 10⁵
55.0 H 7.8 4.387 ± 0.191 1.80 × 10⁷ ± 2.90 × 10⁶
63.2 H 7.8 4.805 ± 0.191 1.22 × 10⁷ ± 1.97 × 10⁶
71.2 H 7.8 5.159 ± 0.191 8.84 × 10⁶ ± 1.42 × 10⁶
91.2 H 7.8 5.818 ± 0.191 4.82 × 10⁶ ± 7.76 × 10⁵
99.4 H 7.8 6.386 ± 0.191 2.86 × 10⁶ ± 4.60 × 10⁵
107.4 H 7.8 6.421 ± 0.191 2.76 × 10⁶ ± 4.45 × 10⁵
55.0 Ks 7.8 3.853 ± 0.463 1.92 × 10⁷ ± 6.65 × 10⁶
63.2 Ks 7.8 4.200 ± 0.463 1.39 × 10⁷ ± 4.83 × 10⁶
71.2 Ks 7.8 4.510 ± 0.463 1.05 × 10⁷ ± 3.63 × 10⁶
91.2 Ks 7.8 5.130 ± 0.463 5.91 × 10⁶ ± 2.05 × 10⁶
99.4 Ks 7.8 5.659 ± 0.463 3.63 × 10⁶ ± 1.26 × 10⁶
107.4 Ks 7.8 5.812 ± 0.463 3.16 × 10⁶ ± 1.09 × 10⁶
aExposure mid-time, measured from the Swift trigger (UT 06:12:49).
bObserved value; not corrected for Galactic extinction.
xNo saturated values were used in modeling.
Note. — Because of the large number of exposures acquired, only a few representative points are
given. The full table of photometry containing all 406 points is available online.
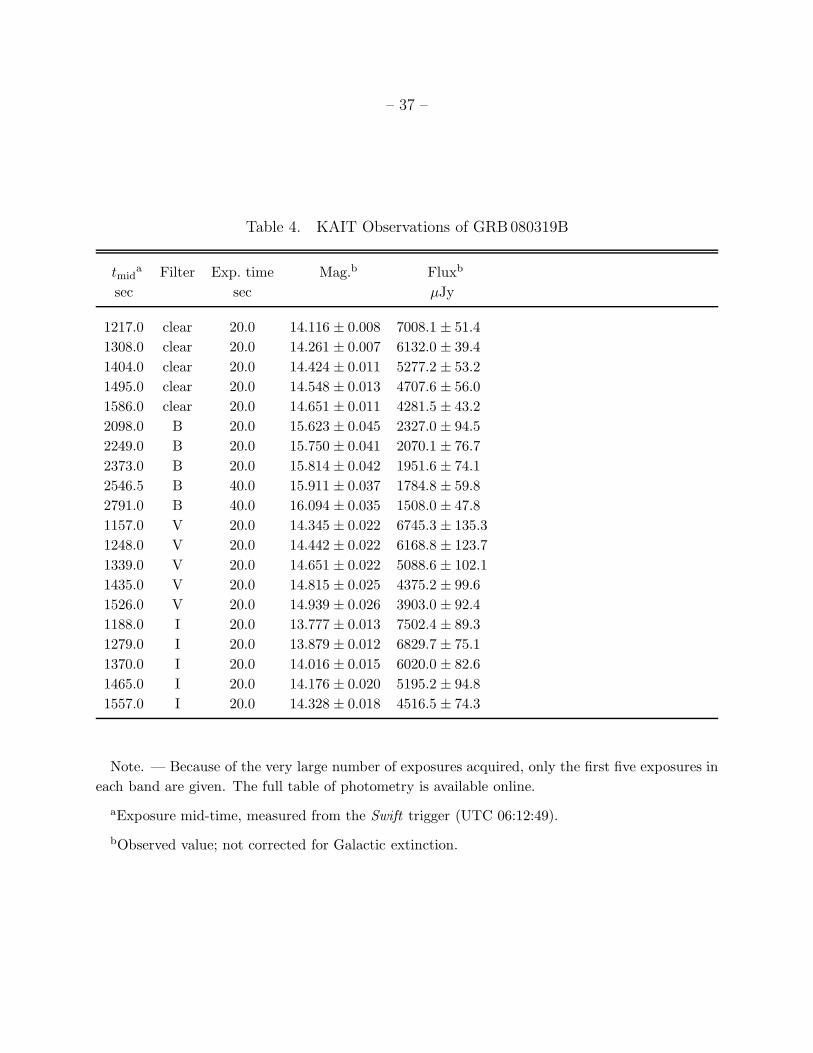
– 37 –
Table 4. KAIT Observations of GRB080319B
tmida Filter Exp. time Mag.b Fluxb
sec sec µJy
1217.0 clear 20.0 14.116 ± 0.008 7008.1 ± 51.4
1308.0 clear 20.0 14.261 ± 0.007 6132.0 ± 39.4
1404.0 clear 20.0 14.424 ± 0.011 5277.2 ± 53.2
1495.0 clear 20.0 14.548 ± 0.013 4707.6 ± 56.0
1586.0 clear 20.0 14.651 ± 0.011 4281.5 ± 43.2
2098.0 B 20.0 15.623 ± 0.045 2327.0 ± 94.5
2249.0 B 20.0 15.750 ± 0.041 2070.1 ± 76.7
2373.0 B 20.0 15.814 ± 0.042 1951.6 ± 74.1
2546.5 B 40.0 15.911 ± 0.037 1784.8 ± 59.8
2791.0 B 40.0 16.094 ± 0.035 1508.0 ± 47.8
1157.0 V 20.0 14.345 ± 0.022 6745.3 ± 135.3
1248.0 V 20.0 14.442 ± 0.022 6168.8 ± 123.7
1339.0 V 20.0 14.651 ± 0.022 5088.6 ± 102.1
1435.0 V 20.0 14.815 ± 0.025 4375.2 ± 99.6
1526.0 V 20.0 14.939 ± 0.026 3903.0 ± 92.4
1188.0 I 20.0 13.777 ± 0.013 7502.4 ± 89.3
1279.0 I 20.0 13.879 ± 0.012 6829.7 ± 75.1
1370.0 I 20.0 14.016 ± 0.015 6020.0 ± 82.6
1465.0 I 20.0 14.176 ± 0.020 5195.2 ± 94.8
1557.0 I 20.0 14.328 ± 0.018 4516.5 ± 74.3
Note. — Because of the very large number of exposures acquired, only the first five exposures in
each band are given. The full table of photometry is available online.
aExposure mid-time, measured from the Swift trigger (UTC 06:12:49).
bObserved value; not corrected for Galactic extinction.
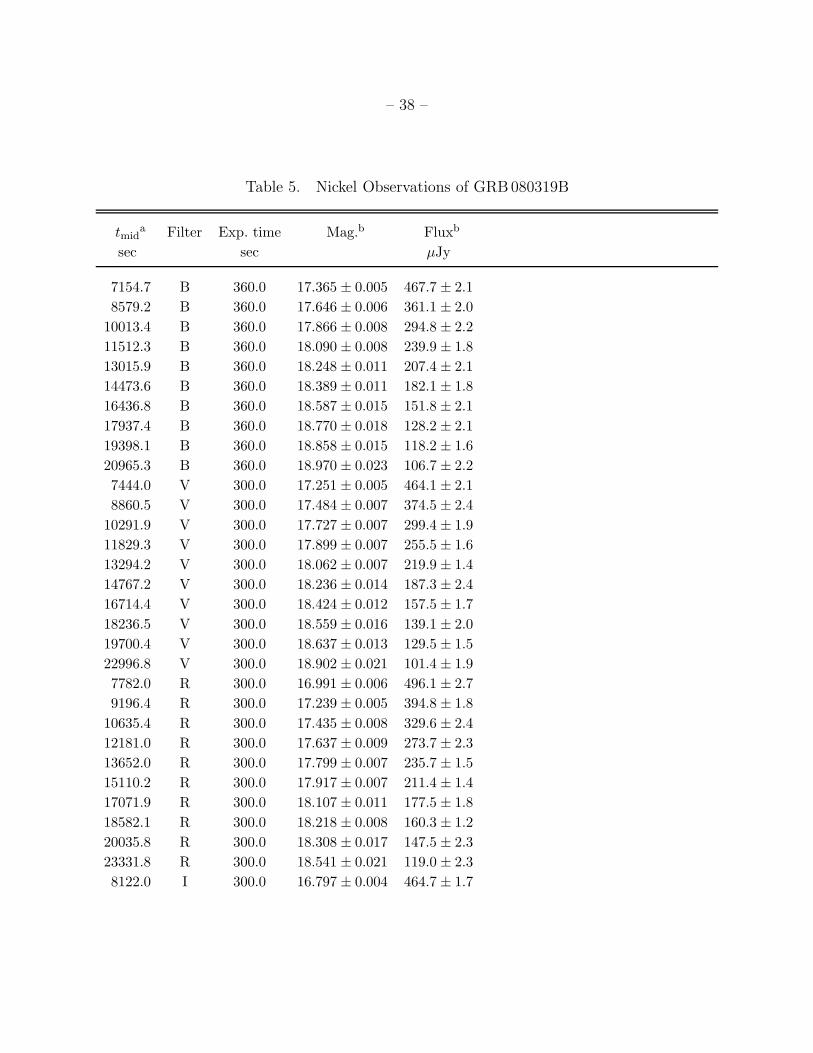
– 38 –
Table 5. Nickel Observations of GRB080319B
tmida Filter Exp. time Mag.b Fluxb
sec sec µJy
7154.7 B 360.0 17.365 ± 0.005 467.7 ± 2.1
8579.2 B 360.0 17.646 ± 0.006 361.1 ± 2.0
10013.4 B 360.0 17.866 ± 0.008 294.8 ± 2.2
11512.3 B 360.0 18.090 ± 0.008 239.9 ± 1.8
13015.9 B 360.0 18.248 ± 0.011 207.4 ± 2.1
14473.6 B 360.0 18.389 ± 0.011 182.1 ± 1.8
16436.8 B 360.0 18.587 ± 0.015 151.8 ± 2.1
17937.4 B 360.0 18.770 ± 0.018 128.2 ± 2.1
19398.1 B 360.0 18.858 ± 0.015 118.2 ± 1.6
20965.3 B 360.0 18.970 ± 0.023 106.7 ± 2.2
7444.0 V 300.0 17.251 ± 0.005 464.1 ± 2.1
8860.5 V 300.0 17.484 ± 0.007 374.5 ± 2.4
10291.9 V 300.0 17.727 ± 0.007 299.4 ± 1.9
11829.3 V 300.0 17.899 ± 0.007 255.5 ± 1.6
13294.2 V 300.0 18.062 ± 0.007 219.9 ± 1.4
14767.2 V 300.0 18.236 ± 0.014 187.3 ± 2.4
16714.4 V 300.0 18.424 ± 0.012 157.5 ± 1.7
18236.5 V 300.0 18.559 ± 0.016 139.1 ± 2.0
19700.4 V 300.0 18.637 ± 0.013 129.5 ± 1.5
22996.8 V 300.0 18.902 ± 0.021 101.4 ± 1.9
7782.0 R 300.0 16.991 ± 0.006 496.1 ± 2.7
9196.4 R 300.0 17.239 ± 0.005 394.8 ± 1.8
10635.4 R 300.0 17.435 ± 0.008 329.6 ± 2.4
12181.0 R 300.0 17.637 ± 0.009 273.7 ± 2.3
13652.0 R 300.0 17.799 ± 0.007 235.7 ± 1.5
15110.2 R 300.0 17.917 ± 0.007 211.4 ± 1.4
17071.9 R 300.0 18.107 ± 0.011 177.5 ± 1.8
18582.1 R 300.0 18.218 ± 0.008 160.3 ± 1.2
20035.8 R 300.0 18.308 ± 0.017 147.5 ± 2.3
23331.8 R 300.0 18.541 ± 0.021 119.0 ± 2.3
8122.0 I 300.0 16.797 ± 0.004 464.7 ± 1.7
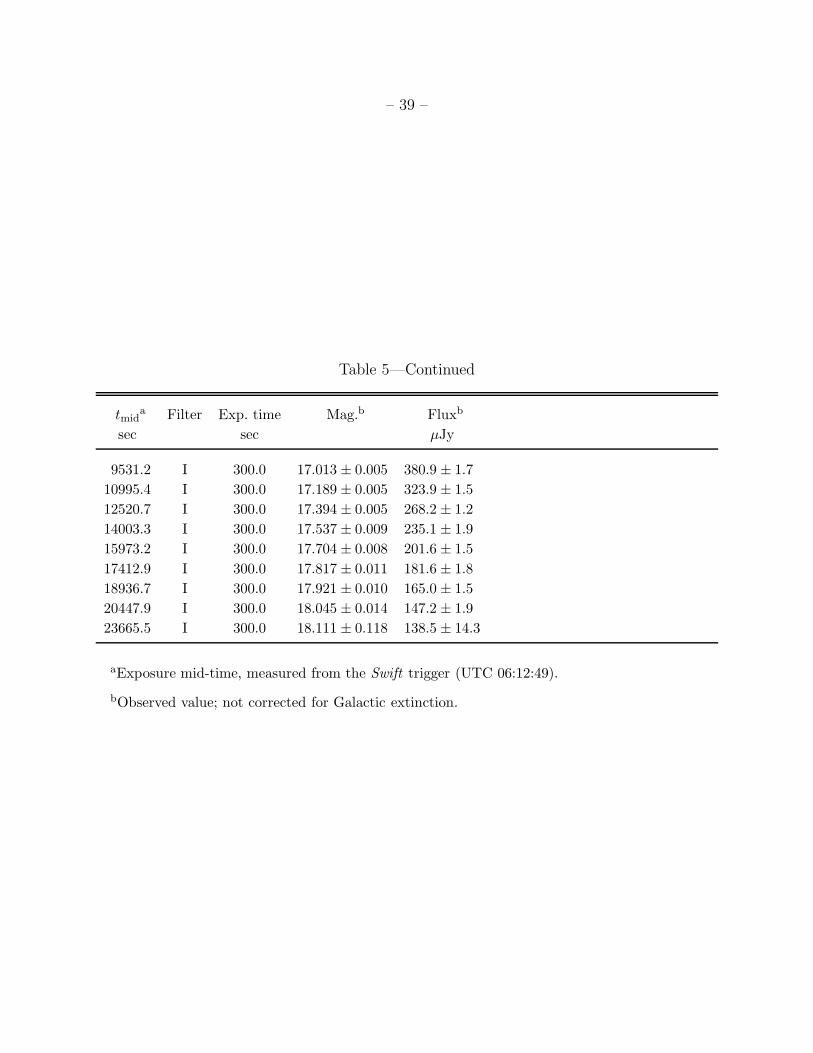
– 39 –
Table 5—Continued
tmida Filter Exp. time Mag.b Fluxb
sec sec µJy
9531.2 I 300.0 17.013 ± 0.005 380.9 ± 1.7
10995.4 I 300.0 17.189 ± 0.005 323.9 ± 1.5
12520.7 I 300.0 17.394 ± 0.005 268.2 ± 1.2
14003.3 I 300.0 17.537 ± 0.009 235.1 ± 1.9
15973.2 I 300.0 17.704 ± 0.008 201.6 ± 1.5
17412.9 I 300.0 17.817 ± 0.011 181.6 ± 1.8
18936.7 I 300.0 17.921 ± 0.010 165.0 ± 1.5
20447.9 I 300.0 18.045 ± 0.014 147.2 ± 1.9
23665.5 I 300.0 18.111 ± 0.118 138.5 ± 14.3
aExposure mid-time, measured from the Swift trigger (UTC 06:12:49).
bObserved value; not corrected for Galactic extinction.
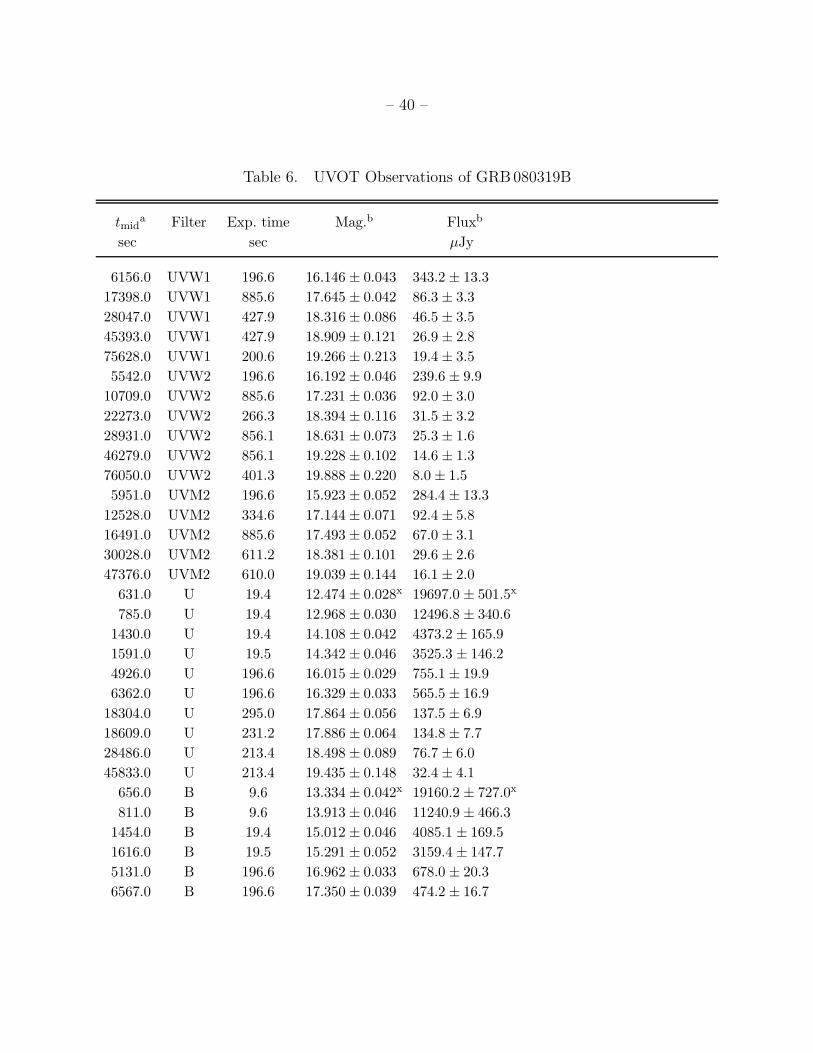
– 40 –
Table 6. UVOT Observations of GRB080319B
tmida Filter Exp. time Mag.b Fluxb
sec sec µJy
6156.0 UVW1 196.6 16.146 ± 0.043 343.2 ± 13.3
17398.0 UVW1 885.6 17.645 ± 0.042 86.3 ± 3.3
28047.0 UVW1 427.9 18.316 ± 0.086 46.5 ± 3.5
45393.0 UVW1 427.9 18.909 ± 0.121 26.9 ± 2.8
75628.0 UVW1 200.6 19.266 ± 0.213 19.4 ± 3.5
5542.0 UVW2 196.6 16.192 ± 0.046 239.6 ± 9.9
10709.0 UVW2 885.6 17.231 ± 0.036 92.0 ± 3.0
22273.0 UVW2 266.3 18.394 ± 0.116 31.5 ± 3.2
28931.0 UVW2 856.1 18.631 ± 0.073 25.3 ± 1.6
46279.0 UVW2 856.1 19.228 ± 0.102 14.6 ± 1.3
76050.0 UVW2 401.3 19.888 ± 0.220 8.0 ± 1.5
5951.0 UVM2 196.6 15.923 ± 0.052 284.4 ± 13.3
12528.0 UVM2 334.6 17.144 ± 0.071 92.4 ± 5.8
16491.0 UVM2 885.6 17.493 ± 0.052 67.0 ± 3.1
30028.0 UVM2 611.2 18.381 ± 0.101 29.6 ± 2.6
47376.0 UVM2 610.0 19.039 ± 0.144 16.1 ± 2.0
631.0 U 19.4 12.474 ± 0.028x 19697.0 ± 501.5x
785.0 U 19.4 12.968 ± 0.030 12496.8 ± 340.6
1430.0 U 19.4 14.108 ± 0.042 4373.2 ± 165.9
1591.0 U 19.5 14.342 ± 0.046 3525.3 ± 146.2
4926.0 U 196.6 16.015 ± 0.029 755.1 ± 19.9
6362.0 U 196.6 16.329 ± 0.033 565.5 ± 16.9
18304.0 U 295.0 17.864 ± 0.056 137.5 ± 6.9
18609.0 U 231.2 17.886 ± 0.064 134.8 ± 7.7
28486.0 U 213.4 18.498 ± 0.089 76.7 ± 6.0
45833.0 U 213.4 19.435 ± 0.148 32.4 ± 4.1
656.0 B 9.6 13.334 ± 0.042x 19160.2 ± 727.0x
811.0 B 9.6 13.913 ± 0.046 11240.9 ± 466.3
1454.0 B 19.4 15.012 ± 0.046 4085.1 ± 169.5
1616.0 B 19.5 15.291 ± 0.052 3159.4 ± 147.7
5131.0 B 196.6 16.962 ± 0.033 678.0 ± 20.3
6567.0 B 196.6 17.350 ± 0.039 474.2 ± 16.7
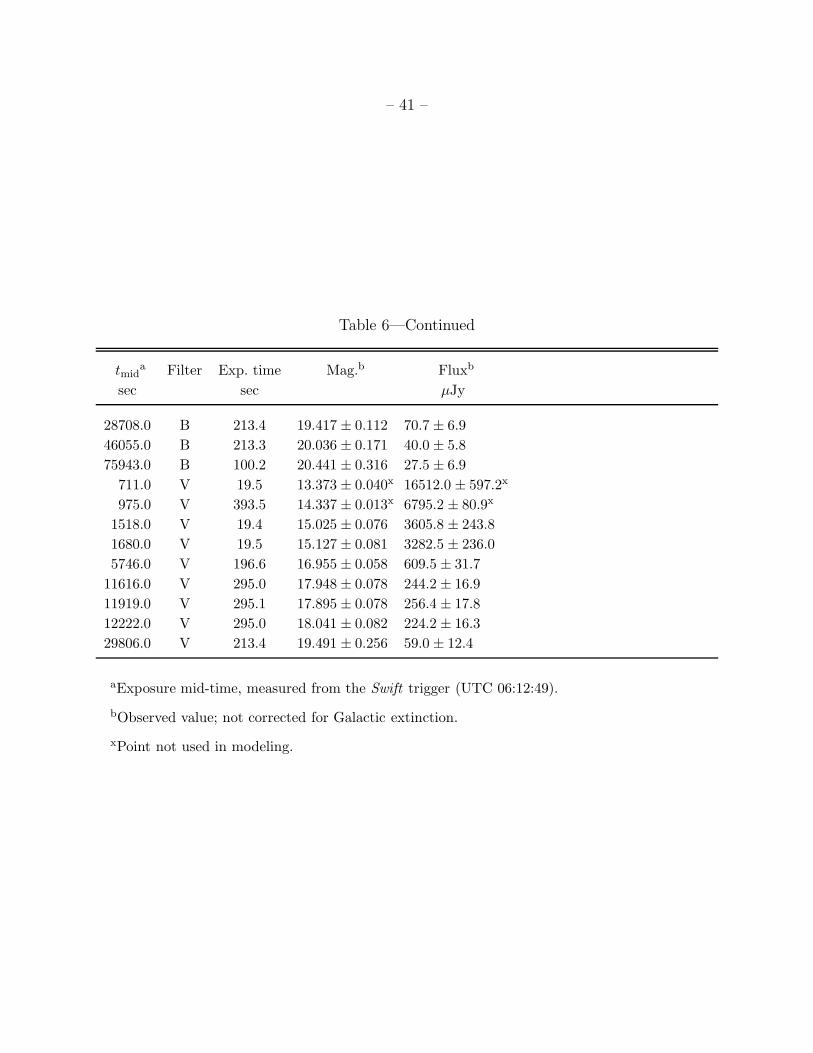
– 41 –
Table 6—Continued
tmida Filter Exp. time Mag.b Fluxb
sec sec µJy
28708.0 B 213.4 19.417 ± 0.112 70.7 ± 6.9
46055.0 B 213.3 20.036 ± 0.171 40.0 ± 5.8
75943.0 B 100.2 20.441 ± 0.316 27.5 ± 6.9
711.0 V 19.5 13.373 ± 0.040x 16512.0 ± 597.2x
975.0 V 393.5 14.337 ± 0.013x 6795.2 ± 80.9x
1518.0 V 19.4 15.025 ± 0.076 3605.8 ± 243.8
1680.0 V 19.5 15.127 ± 0.081 3282.5 ± 236.0
5746.0 V 196.6 16.955 ± 0.058 609.5 ± 31.7
11616.0 V 295.0 17.948 ± 0.078 244.2 ± 16.9
11919.0 V 295.1 17.895 ± 0.078 256.4 ± 17.8
12222.0 V 295.0 18.041 ± 0.082 224.2 ± 16.3
29806.0 V 213.4 19.491 ± 0.256 59.0 ± 12.4
aExposure mid-time, measured from the Swift trigger (UTC 06:12:49).
bObserved value; not corrected for Galactic extinction.
xPoint not used in modeling.
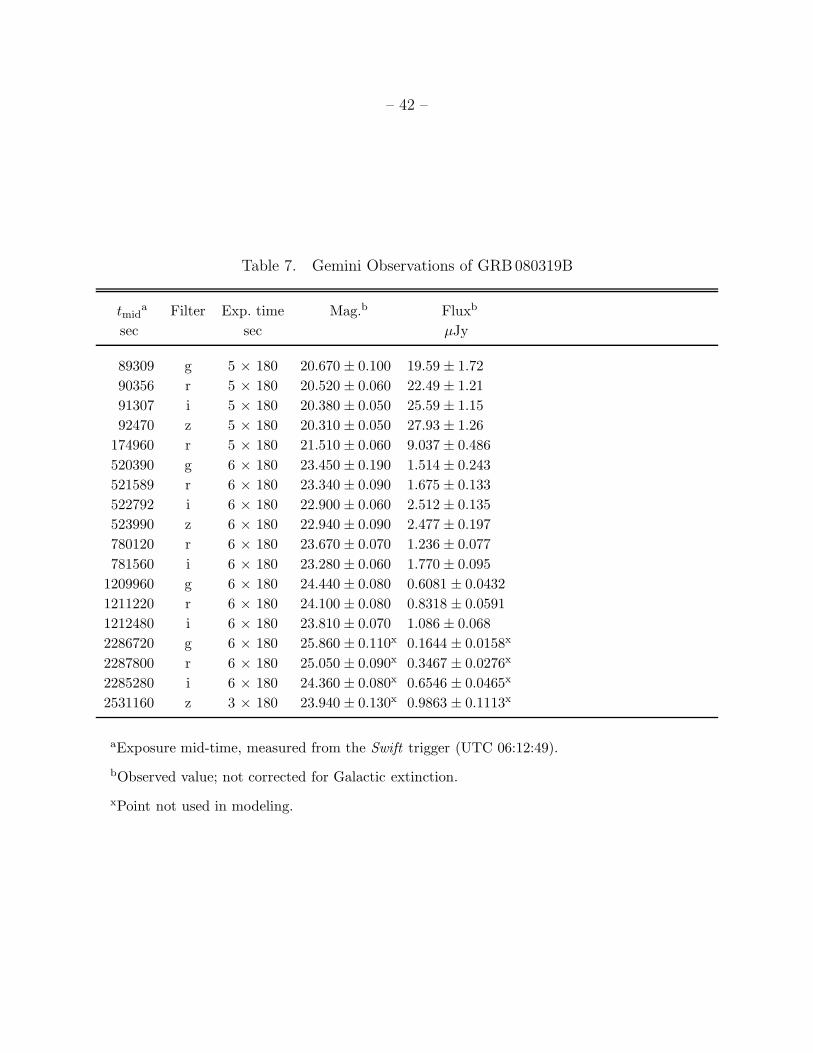
– 42 –
Table 7. Gemini Observations of GRB080319B
tmida Filter Exp. time Mag.b Fluxb
sec sec µJy
89309 g 5 × 180 20.670 ± 0.100 19.59 ± 1.72
90356 r 5 × 180 20.520 ± 0.060 22.49 ± 1.21
91307 i 5 × 180 20.380 ± 0.050 25.59 ± 1.15
92470 z 5 × 180 20.310 ± 0.050 27.93 ± 1.26
174960 r 5 × 180 21.510 ± 0.060 9.037 ± 0.486
520390 g 6 × 180 23.450 ± 0.190 1.514 ± 0.243
521589 r 6 × 180 23.340 ± 0.090 1.675 ± 0.133
522792 i 6 × 180 22.900 ± 0.060 2.512 ± 0.135
523990 z 6 × 180 22.940 ± 0.090 2.477 ± 0.197
780120 r 6 × 180 23.670 ± 0.070 1.236 ± 0.077
781560 i 6 × 180 23.280 ± 0.060 1.770 ± 0.095
1209960 g 6 × 180 24.440 ± 0.080 0.6081 ± 0.0432
1211220 r 6 × 180 24.100 ± 0.080 0.8318 ± 0.0591
1212480 i 6 × 180 23.810 ± 0.070 1.086 ± 0.068
2286720 g 6 × 180 25.860 ± 0.110x 0.1644 ± 0.0158x
2287800 r 6 × 180 25.050 ± 0.090x 0.3467 ± 0.0276x
2285280 i 6 × 180 24.360 ± 0.080x 0.6546 ± 0.0465x
2531160 z 3 × 180 23.940 ± 0.130x 0.9863 ± 0.1113x
aExposure mid-time, measured from the Swift trigger (UTC 06:12:49).
bObserved value; not corrected for Galactic extinction.
xPoint not used in modeling.
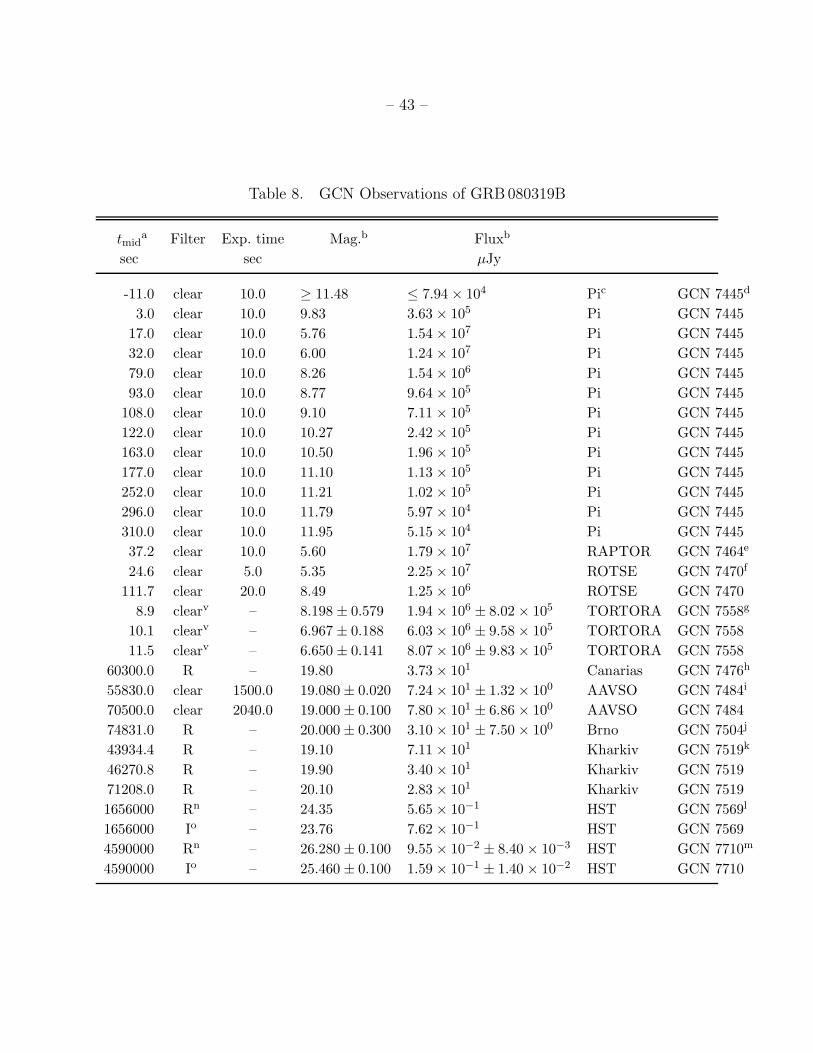
– 43 –
Table 8. GCN Observations of GRB080319B
tmida Filter Exp. time Mag.b Fluxb
sec sec µJy
-11.0 clear 10.0 ≥ 11.48 ≤ 7.94 × 10⁴ Pic GCN 7445d
3.0 clear 10.0 9.83 3.63 × 10⁵ Pi GCN 7445
17.0 clear 10.0 5.76 1.54 × 10⁷ Pi GCN 7445
32.0 clear 10.0 6.00 1.24 × 10⁷ Pi GCN 7445
79.0 clear 10.0 8.26 1.54 × 10⁶ Pi GCN 7445
93.0 clear 10.0 8.77 9.64 × 10⁵ Pi GCN 7445
108.0 clear 10.0 9.10 7.11 × 10⁵ Pi GCN 7445
122.0 clear 10.0 10.27 2.42 × 10⁵ Pi GCN 7445
163.0 clear 10.0 10.50 1.96 × 10⁵ Pi GCN 7445
177.0 clear 10.0 11.10 1.13 × 10⁵ Pi GCN 7445
252.0 clear 10.0 11.21 1.02 × 10⁵ Pi GCN 7445
296.0 clear 10.0 11.79 5.97 × 10⁴ Pi GCN 7445
310.0 clear 10.0 11.95 5.15 × 10⁴ Pi GCN 7445
37.2 clear 10.0 5.60 1.79 × 10⁷ RAPTOR GCN 7464e
24.6 clear 5.0 5.35 2.25 × 10⁷ ROTSE GCN 7470f
111.7 clear 20.0 8.49 1.25 × 10⁶ ROTSE GCN 7470
8.9 clearv – 8.198 ± 0.579 1.94 × 10⁶ ± 8.02 × 10⁵ TORTORA GCN 7558g
10.1 clearv – 6.967 ± 0.188 6.03 × 10⁶ ± 9.58 × 10⁵ TORTORA GCN 7558
11.5 clearv – 6.650 ± 0.141 8.07 × 10⁶ ± 9.83 × 10⁵ TORTORA GCN 7558
60300.0 R – 19.80 3.73 × 101 Canarias GCN 7476h
55830.0 clear 1500.0 19.080 ± 0.020 7.24 × 101 ± 1.32 × 100 AAVSO GCN 7484i
70500.0 clear 2040.0 19.000 ± 0.100 7.80 × 101 ± 6.86 × 100 AAVSO GCN 7484
74831.0 R – 20.000 ± 0.300 3.10 × 101 ± 7.50 × 100 Brno GCN 7504j
43934.4 R – 19.10 7.11 × 101 Kharkiv GCN 7519k
46270.8 R – 19.90 3.40 × 101 Kharkiv GCN 7519
71208.0 R – 20.10 2.83 × 101 Kharkiv GCN 7519
1656000 Rn – 24.35 5.65 × 10⁻¹ HST GCN 7569l
1656000 Io – 23.76 7.62 × 10⁻¹ HST GCN 7569
4590000 Rn – 26.280 ± 0.100 9.55 × 10⁻² ± 8.40 × 10⁻³ HST GCN 7710m
4590000 Io – 25.460 ± 0.100 1.59 × 10⁻¹ ± 1.40 × 10⁻² HST GCN 7710
– 44 –
Note. — Most of the TORTORA measurements have been omitted to save space. The full table
of GCN photometry used in our plot is available online.
aExposure mid-time, measured from the Swift trigger (UTC 06:12:49).
bObserved value; not corrected for Galactic extinction.
c“Pi−of−the−Sky” Collaboration
dCwiok et al. (2008a)
eWozniak et al. (2008)
fSwan et al. (2008)
gKarpov et al. (2008b)
hJelinek et al. (2008)
iHentunen et al. (2008)
jNovak (2008)
kKrugly et al. (2008)
lTanvir et al. (2008)
mLevan et al. (2008)
nConverted from F606W.
oConverted from F804W.
vCalibrated to V -band and plotted as V in our figures.
xNo GCN observations were used in modeling.
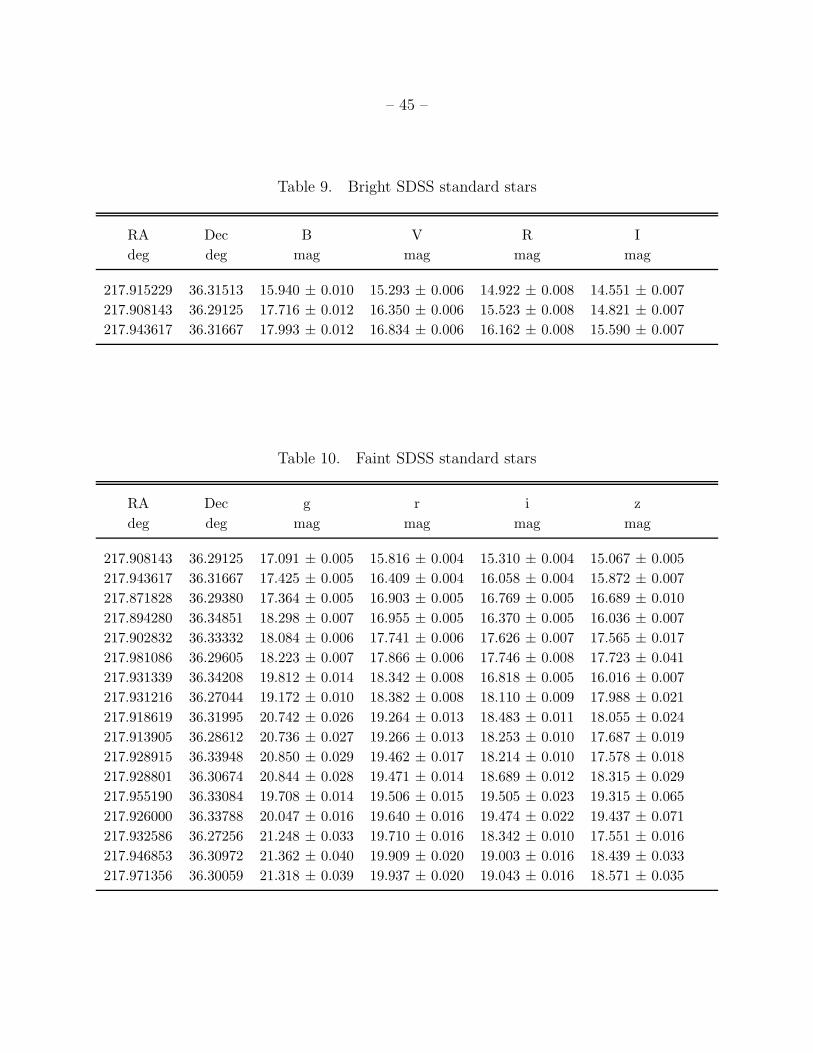
– 45 –
Table 9. Bright SDSS standard stars
RA Dec B V R I
deg deg mag mag mag mag
217.915229 36.31513 15.940 ± 0.010 15.293 ± 0.006 14.922 ± 0.008 14.551 ± 0.007
217.908143 36.29125 17.716 ± 0.012 16.350 ± 0.006 15.523 ± 0.008 14.821 ± 0.007
217.943617 36.31667 17.993 ± 0.012 16.834 ± 0.006 16.162 ± 0.008 15.590 ± 0.007
Table 10. Faint SDSS standard stars
RA Dec g r i z
deg deg mag mag mag mag
217.908143 36.29125 17.091 ± 0.005 15.816 ± 0.004 15.310 ± 0.004 15.067 ± 0.005
217.943617 36.31667 17.425 ± 0.005 16.409 ± 0.004 16.058 ± 0.004 15.872 ± 0.007
217.871828 36.29380 17.364 ± 0.005 16.903 ± 0.005 16.769 ± 0.005 16.689 ± 0.010
217.894280 36.34851 18.298 ± 0.007 16.955 ± 0.005 16.370 ± 0.005 16.036 ± 0.007
217.902832 36.33332 18.084 ± 0.006 17.741 ± 0.006 17.626 ± 0.007 17.565 ± 0.017
217.981086 36.29605 18.223 ± 0.007 17.866 ± 0.006 17.746 ± 0.008 17.723 ± 0.041
217.931339 36.34208 19.812 ± 0.014 18.342 ± 0.008 16.818 ± 0.005 16.016 ± 0.007
217.931216 36.27044 19.172 ± 0.010 18.382 ± 0.008 18.110 ± 0.009 17.988 ± 0.021
217.918619 36.31995 20.742 ± 0.026 19.264 ± 0.013 18.483 ± 0.011 18.055 ± 0.024
217.913905 36.28612 20.736 ± 0.027 19.266 ± 0.013 18.253 ± 0.010 17.687 ± 0.019
217.928915 36.33948 20.850 ± 0.029 19.462 ± 0.017 18.214 ± 0.010 17.578 ± 0.018
217.928801 36.30674 20.844 ± 0.028 19.471 ± 0.014 18.689 ± 0.012 18.315 ± 0.029
217.955190 36.33084 19.708 ± 0.014 19.506 ± 0.015 19.505 ± 0.023 19.315 ± 0.065
217.926000 36.33788 20.047 ± 0.016 19.640 ± 0.016 19.474 ± 0.022 19.437 ± 0.071
217.932586 36.27256 21.248 ± 0.033 19.710 ± 0.016 18.342 ± 0.010 17.551 ± 0.016
217.946853 36.30972 21.362 ± 0.040 19.909 ± 0.020 19.003 ± 0.016 18.439 ± 0.033
217.971356 36.30059 21.318 ± 0.039 19.937 ± 0.020 19.043 ± 0.016 18.571 ± 0.035