\u003ctitle\u003eAnalog to digital conversion for finite frames\u003c/title\u003e
Upload
independentCategory
view
4download
0
The Astronomical Journal, 144:28 (11pp), 2012 July doi:10.1088/0004-6256/144/1/28C© 2012. The American Astronomical Society. All rights reserved. Printed in the U.S.A.
METALLICITIES OF EMISSION-LINE GALAXIES FROM HST ACS PEARS ANDHST WFC3 ERS GRISM SPECTROSCOPY AT 0.6 < z < 2.4
Lifang Xia1, Sangeeta Malhotra1, James Rhoads1, Nor Pirzkal2, Amber Straughn3, Steven Finkelstein4,Seth Cohen1, Harald Kuntschner5, Martin Kummel5, Jeremy Walsh5, Rogier A. Windhorst1, and Robert O’Connell6
1 School of Earth and Space Exploration, Arizona State University, AZ 85287-1404, USA; [email protected] Space Telescope Science Institute, Baltimore, MD 21218, USA
3 Astrophysics Science Division, Goddard Space Flight Center, Code 665, Greenbelt, MD 20771, USA4 George P. and Cynthia Woods Mitchell Institute for Fundamental Physics and Astronomy, Department of Physics and Astronomy,
Texas A & M University, College Station, TX 77843, USA5 European Southern Observatory, Karl Schwarzschild Str. 2, D-85748 Garching, Germany6 Department of Astronomy, University of Virginia, Charlottesville, VA 22904-4325, USA
Received 2011 December 21; accepted 2012 May 23; published 2012 June 14
ABSTRACT
Galaxies selected on the basis of their emission-line strength show low metallicities, regardless of their redshifts.We conclude this from a sample of faint galaxies at redshifts between 0.6 < z < 2.4, selected by their prominentemission lines in low-resolution grism spectra in the optical with the Advanced Camera for Surveys on theHubble Space Telescope and in the near-infrared using Wide-Field Camera 3. Using a sample of 11 emission-linegalaxies at 0.6 < z < 2.4 with luminosities of −22 � MB � −19 which have [O ii], Hβ, and [O iii] line fluxmeasurements from the combination of two grism spectral surveys, we use the R23 method to derive the gas-phaseoxygen abundances: 7.5 < 12 + log(O/H) < 8.5. The galaxy stellar masses are derived using Bayesian-basedMarkov Chain Monte Carlo (πMC2) fitting of their spectral energy distribution, and span the mass range8.1 < log(M∗/M�) < 10.1. These galaxies show mass–metallicity (M–Z) and luminosity–metallicity (L–Z)relations, which are offset by −0.6 dex in metallicity at given absolute magnitude and stellar mass relative to thelocal Sloan Digital Sky Survey galaxies, as well as continuum-selected DEEP2 samples at similar redshifts. Theemission-line-selected galaxies most resemble the local “green peas” galaxies and Lyα galaxies at z � 0.3 andz � 2.3 in the M–Z and L–Z relations and their morphologies. The G−M20 morphology analysis shows that 10 outof 11 show disturbed morphology, even as the star-forming regions are compact. These galaxies may be intrinsicallymetal poor, being at early stages of formation, or the low metallicities may be due to gas infall and accretion dueto mergers.
Key words: galaxies: abundances – galaxies: evolution – galaxies: starburst – galaxies: star formation – galaxies:statistics
Online-only material: color figures
1. INTRODUCTION
Nebular lines from H ii regions are signposts for detectionand measurement of current star formation. They are also usefulfor measuring the metallicity of galaxies. From such studies(Lequeux et al. 1979; Garnett & Shields 1987; Skillman et al.1989; Zaritsky et al. 1994) we have learned the mass–metallicity(M–Z) and luminosity–metallicity relations (L–Z; e.g., Tremontiet al. 2004), whereby galaxies with higher stellar mass andhigher absolute luminosity show higher metallicities. It isexpected, and observed, that going to higher redshifts shouldshow a shift in the M–Z relation (Erb et al. 2006; Rodrigueset al. 2008; Mannucci et al. 2009; Moustakas et al. 2011).Higher redshift galaxies do show a lower metallicity for thesame given stellar mass (e.g., Erb et al. 2006; Maiolino et al.2008) for galaxies in the early stages of star formation. Effectsof downsizing are also seen in M–Z effects. Since lower massgalaxies continue star formation until later epochs, one wouldexpect the slope of the M–Z relation to also change the offsetin the M–Z and L–Z relations. Zahid et al. (2011) show that atz = 0.8, the high mass (M > 1010.6 M�) galaxies have attainedthe metallicities seen for the same mass galaxies at z = 0,but low mass galaxies (M ≈ 109.2 M�) still show a metallicitydeficit compared to the same mass galaxies at z = 0.
In order to go fainter (and lower stellar masses) at higherredshifts, we analyze nebular line emission of 11 galaxies in
Chandra Deep Field South (CDF-S), observed with the HubbleSpace Telescope Advanced Camera for Surveys (HST-ACS)grism in the optical (from the PEARS program; PI: Malhotra)and the HST Wide-Field Camera 3 (WFC3) grism (from theERS program; PI: O’Connell; e.g., Straughn et al. 2011) at near-infrared wavelengths. This sample is selected to show emissionlines in the slitless spectra, reaching limits of 26.7 mag andredshifts at z � 2.3. Together, these grism data sets spana wavelength range from λ = 0.6–1.6 μm. This allows usto measure metallicities using the R23 diagnostic indicator,R23 = ([O ii]+[O iii])/Hβ (Pagel et al. 1979; Kewley & Dopita2002), for a wide range of redshift, 0.5 � z � 2.4, withoutinterference by Earth’s atmosphere. Much of this redshiftrange is inaccessible to ground-based observations due to H2Oabsorption bands, and even more is lost to OH airglow emissionlines. Our work demonstrates the crucial value of slitless HSTspectra in studying the physical properties of galaxies at anotherwise challenging redshift range.
The paper is organized as below. In Section 2 we brieflyintroduce the surveys and the data sample. In Section 3 wepresent the measurements of the metallicity and the stellarmass, and assess the metallicity accuracy by comparing with themetallicity measured from follow-up Magellan spectroscopy oftwo galaxies. We show the results of the M–Z relation and theL–Z relation in Section 4. Finally, we discuss the results and giveour conclusions in Section 5. We use a “benchmark” cosmology
1

The Astronomical Journal, 144:28 (11pp), 2012 July Xia et al.
with Ωm = 0.27, ΩΛ = 0.73, and H0 = 71 km s−1 Mpc−1
(Komatsu et al. 2011), and we adopt AB magnitudes throughoutthis paper.
2. DATA
The HST/ACS G800L Probing Evolution and ReionizationSpectroscopically survey (PEARS, PI: S. Malhotra, programID 10530) is the largest survey conducted to date with the slitlessgrism spectroscopy mode of the HST ACS. PEARS provideslow-resolution (R ∼ 100) slitless grism spectroscopy in thewavelength range from 6000 Å to 9700 Å. The survey coversfour ACS pointings in the GOODS-N (Great ObservatoriesOrigins Deep Survey North) field and five ACS pointings inthe CDF-S fields. Eight of these PEARS fields were observedin 20 orbits each (three roll angles per field), yielding spectraof all objects of ABF850LP � 26.5 mag. The ninth field wasthe Hubble Ultra Deep Field (HUDF), which was observed in40 orbits. Combined with the earlier data from the GRAPESprogram (the GRism ACS Program for Extragalactic Science;PI: S. Malhotra, program ID 9793), the HUDF field reachesgrism depths of ABF850LP � 27.5 mag.
The emission lines most commonly identified from thePEARS grism data are [O ii] λ3727 Å, the [O iii] λλ4959,5007 Å doublet, and Hα 6563 Å. Due to the low spectral reso-lution, the Hβ line is only marginally resolved from the [O iii]doublet. With the ACS G800L grism’s wavelength coverage,galaxies at 0.6 < z < 0.9 can be observed in both the [O ii] and[O iii] lines, and galaxies at redshifts 0.9 < z < 1.5 can be ob-served in only the single line of [O ii] λ3727 Å, and at z < 0.5 inthe Hα lines of typical line fluxes ∼1.5–2 × 10⁻¹⁷ erg cm−2 s−1
(Straughn et al. 2009).The HST WFC3 Early Release Science (ERS) (PID GO-
11359, PI: O’Connell) program consists of one field ob-served with both the G102 (0.8–1.14 μm; R ∼ 210) and G141(1.1–1.6 μm; R ∼ 130) infrared grisms, with two orbits of ob-servation per grism. This field overlaps with the ACS G800LPEARS grism survey, and hence faint galaxies can be ob-served with composite spectra in the wavelength range fromλ � 0.6–1.6 μm with the detection of the emission lines, suchas Hα at z � 1.6, [O iii] doublet at 0.2 � z � 2.4, and [O ii]doublet at 0.6 � z � 3.6 with a signal-to-noise ratio (S/N) �2 line flux limit of ∼3.0 × 10⁻¹⁷ erg cm−2 s−1 (Straughn et al.2011).
Straughn et al. (2009) selected 203 emission-line galaxies(ELGs) from the PEARS southern fields, using a two-dimensional line detection and extraction procedure. Straughnet al. (2011) presented a total catalog of 48 ELGs from theWFC3 ERS II program (Windhorst et al. 2011), demonstratingthe unique capability of the WFC3 to detect star-forming galax-ies in the infrared reaching to fluxes of AB(F098M) � 25 mag ina depth of two orbits. The combination of these two catalogsyields a sample of 11 ELGs with detection of the [O ii], [O iii],and Hβ lines in the composite spectral range 0.6–1.6 μm, whichenables us to utilize the R23 method to measure metallicity, andto extend the study of the M–Z relation of ELGs continuouslyfrom z � 0.6 to 2.4. We compare the selection of the [O iii] linefluxes, the equivalent width (EW), redshifts, and the absoluteB-band magnitude of the 11 ELGs from the combined catalogwith respect to the Straughn et al. (2009) PEARS ELG sampleand the Straughn et al. (2011) WFC3 ERS ELG sample.
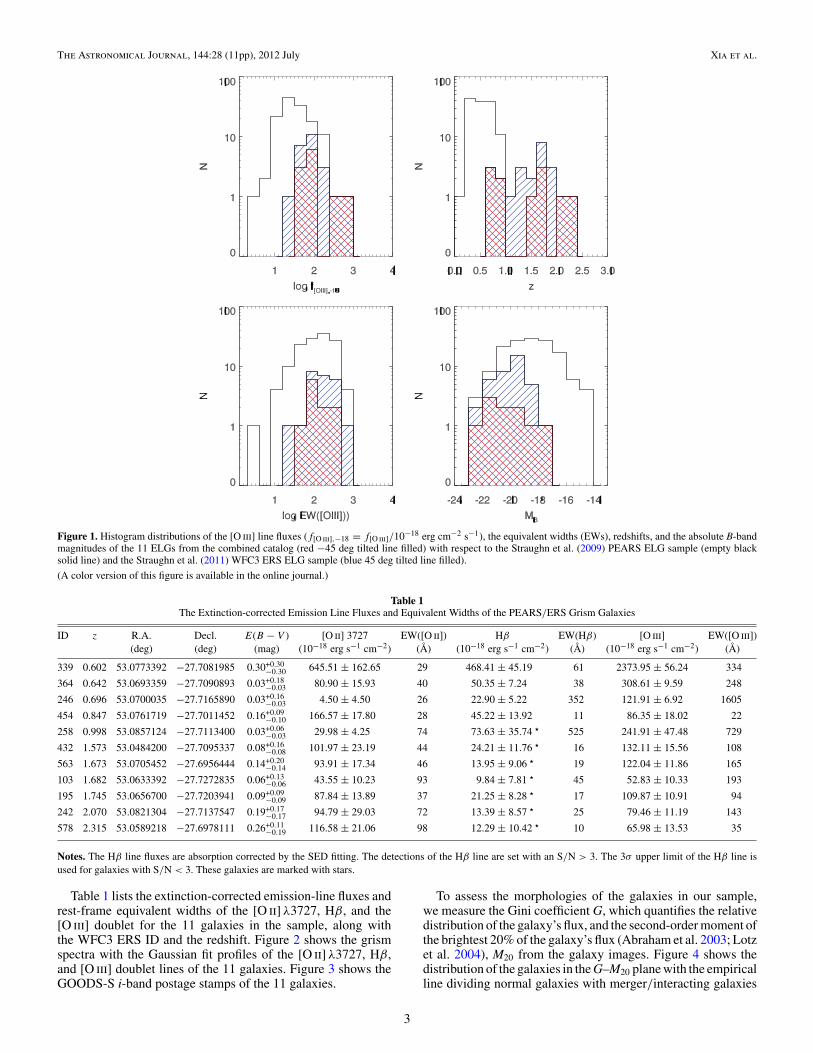
Figure 1 shows the distributions of line fluxes, EWs, redshifts,and absolute magnitudes of the ERS and PEARS samples,
along with the current sample of 11 galaxies selected as havingemission lines in both optical and NIR spectra. The empty blacksolid line histogram represents that of the PEARS ELG sample.The blue 45 degree tilted solid line filled histogram representsthe WFC3 ERS ELG sample, and the red −45 degree tiltedline filled histogram is that of the sample in this paper. Becausethe ERS observations are shallower than the PEARS samples,we are confined to relatively bright end of the PEARS sample.The top left panel shows that the [O iii] emission-line fluxesin our sample are representative of the two parent samples at>5 × 10⁻¹⁷ erg cm−2 s−1, which is the bright end of the twoparent samples. The EWs ([O iii]) (left bottom panel) are inthe range from tens to thousands of angstroms with peak athundreds of the parent samples. The redshifts (right top panel)and the absolute B-band magnitudes (right bottom panel) arerepresentative of the ERS parent sample while offset to highredshift with respect to the PEARS sample, which is mainly atz < 1 and extends to MB ∼ −17.
The HST/ACS PEARS data reduction was similar to theGRAPES project’s data analysis (Pirzkal et al. 2004), whilefurther steps for identifying emission-line sources are describedin Meurer et al. (2007) and Straughn et al. (2009). The analysis ofthe WFC3 ERS data is discussed in Windhorst et al. (2011) andStraughn et al. (2011). The emission-line fluxes are measuredfrom one-dimensional extracted spectra, using the IDL codemfit to fit single or multiple Gaussian line profiles. Due tothe marginal splitting of the Hβ and [O iii] doublet, the [O iii]line is fitted with a double Gaussian profile with the ratio of[O iii] λ4959 to [O iii] λ5007 constrained to be 1:3 with the sameGaussian widths.
The Hβ line wavelength is fixed at the redshifted wavelengthof 4861 Å, given by the observed wavelength of the stronger[O iii] λ5007 line. The underlying Hβ absorption amounts areobtained by fitting galaxy spectral energy distributions (SEDs;discussed in detail in the next section; Pirzkal et al. 2012) withthe population synthesis model of Bruzual & Charlot (2003).The EW of the Hβ absorption features range from 4 to 7 Å,which agrees with the amount obtained in other studies, e.g., ∼3± 2 Å (Lilly et al. 2003). The absorption feature is smoothedto the same Gaussian profile as the [O iii] line, and then addedto the grism spectra. The absorption-corrected Hβ line flux isfinally measured by adding a Gaussian profile (same as thatof the [O iii] Gaussian profile) with changing amplitude at thefixed wavelength, on the [O iii] already fitted double Gaussianprofiles. An Hβ line flux with S/N > 3 is assumed as detection,and for line fluxes with S/N < 3 (1σ ∼ 5×10⁻¹⁸ erg cm−2 s−1),we use a 3σ upper limit to the Hβ line flux, which give in a lowerlimit to the galaxy oxygen abundance on the lower branch (seethe next section).
The amount of dust extinction is also obtained from theSED fitting, and ranges from Av = 0–1.2 mag. The extinctioncorrection is done using the IDL code calz unred (written by W.Landsman), based on the reddening curve from Calzetti et al.(2000). Studies show that the gas can suffer more extinctionthan the stellar content, hence we assume E(B − V )stellar =0.44E(B − V )gas, as has been found locally (Calzetti et al.2000). Due to the degeneracy of the extinction and the stellarpopulation age, the extinction values have large uncertainties.The uncertainties of the extinction values are folded intothe uncertainties in the metallicity. The results show that theuncertainty due to the extinction is in the order of 0.02–0.1 dex,and the dominant part of the uncertainties in the metallicitiesresult from the faint line flux of Hβ compared to [O iii] λ5007.
2
The Astronomical Journal, 144:28 (11pp), 2012 July Xia et al.
Figure 1. Histogram distributions of the [O iii] line fluxes (f[O iii],−18 = f[O iii]/10−18 erg cm−2 s−1), the equivalent widths (EWs), redshifts, and the absolute B-bandmagnitudes of the 11 ELGs from the combined catalog (red −45 deg tilted line filled) with respect to the Straughn et al. (2009) PEARS ELG sample (empty blacksolid line) and the Straughn et al. (2011) WFC3 ERS ELG sample (blue 45 deg tilted line filled).
(A color version of this figure is available in the online journal.)
Table 1The Extinction-corrected Emission Line Fluxes and Equivalent Widths of the PEARS/ERS Grism Galaxies
ID z R.A. Decl. E(B − V ) [O ii] 3727 EW([O ii]) Hβ EW(Hβ) [O iii] EW([O iii])(deg) (deg) (mag) (10−18 erg s−1 cm−2) (Å) (10−18 erg s−1 cm−2) (Å) (10−18 erg s−1 cm−2) (Å)
339 0.602 53.0773392 −27.7081985 0.30+0.30−0.30 645.51 ± 162.65 29 468.41 ± 45.19 61 2373.95 ± 56.24 334
364 0.642 53.0693359 −27.7090893 0.03+0.18−0.03 80.90 ± 15.93 40 50.35 ± 7.24 38 308.61 ± 9.59 248
246 0.696 53.0700035 −27.7165890 0.03+0.16−0.03 4.50 ± 4.50 26 22.90 ± 5.22 352 121.91 ± 6.92 1605
454 0.847 53.0761719 −27.7011452 0.16+0.09−0.10 166.57 ± 17.80 28 45.22 ± 13.92 11 86.35 ± 18.02 22
258 0.998 53.0857124 −27.7113400 0.03+0.06−0.03 29.98 ± 4.25 74 73.63 ± 35.74 � 525 241.91 ± 47.48 729
432 1.573 53.0484200 −27.7095337 0.08+0.16−0.08 101.97 ± 23.19 44 24.21 ± 11.76 � 16 132.11 ± 15.56 108
563 1.673 53.0705452 −27.6956444 0.14+0.20−0.14 93.91 ± 17.34 46 13.95 ± 9.06 � 19 122.04 ± 11.86 165
103 1.682 53.0633392 −27.7272835 0.06+0.13−0.06 43.55 ± 10.23 93 9.84 ± 7.81 � 45 52.83 ± 10.33 193
195 1.745 53.0656700 −27.7203941 0.09+0.09−0.09 87.84 ± 13.89 37 21.25 ± 8.28 � 17 109.87 ± 10.91 94
242 2.070 53.0821304 −27.7137547 0.19+0.17−0.17 94.79 ± 29.03 72 13.39 ± 8.57 � 25 79.46 ± 11.19 143
578 2.315 53.0589218 −27.6978111 0.26+0.11−0.19 116.58 ± 21.06 98 12.29 ± 10.42 � 10 65.98 ± 13.53 35
Notes. The Hβ line fluxes are absorption corrected by the SED fitting. The detections of the Hβ line are set with an S/N > 3. The 3σ upper limit of the Hβ line isused for galaxies with S/N < 3. These galaxies are marked with stars.
Table 1 lists the extinction-corrected emission-line fluxes andrest-frame equivalent widths of the [O ii] λ3727, Hβ, and the[O iii] doublet for the 11 galaxies in the sample, along withthe WFC3 ERS ID and the redshift. Figure 2 shows the grismspectra with the Gaussian fit profiles of the [O ii] λ3727, Hβ,and [O iii] doublet lines of the 11 galaxies. Figure 3 shows theGOODS-S i-band postage stamps of the 11 galaxies.
To assess the morphologies of the galaxies in our sample,we measure the Gini coefficient G, which quantifies the relativedistribution of the galaxy’s flux, and the second-order moment ofthe brightest 20% of the galaxy’s flux (Abraham et al. 2003; Lotzet al. 2004), M20 from the galaxy images. Figure 4 shows thedistribution of the galaxies in the G–M20 plane with the empiricalline dividing normal galaxies with merger/interacting galaxies
3

The Astronomical Journal, 144:28 (11pp), 2012 July Xia et al.
Figure 2. Example of composite grism spectra from the HST/ACS PEARS G800L grism spectroscopy and the HST/WFC3-IR ERS G102 and G141 grism spectroscopy.The emission lines [O ii] λ3727, Hβ, and [O iii] λ5007, Hα, and [S ii] are detected. The Hβ and [O iii] doublet are detected in both G800L and G102 grisms, and theG102 grism resolves the [O iii] λλ4959, 5007. The fitting of the [O iii] doublet is constrained to make the ratio of the [O iii] λ4959 to [O iii] λ5007 fluxes 1:3 and touse the same line width for both. The detection of both [O ii] and [O iii] in the composite spectra enables the metallicity measurement using the R23 method.
(A color version of this figure is available in the online journal.)
4

The Astronomical Journal, 144:28 (11pp), 2012 July Xia et al.
Figure 3. GOODS-S i-band postage stamps of the 11 ERS galaxies in our sample. The irregular morphologies, interacting companions, and tidal features demonstratethe ongoing star formation of these galaxies.
(A color version of this figure is available in the online journal.)
Figure 4. Gini coefficient G vs. M20 to demonstrate the morphology analysisof the 11 galaxies in our sample. The dashed line is the empirical line dividinginteracting galaxies (upper region) with normal galaxies (lower region) fromLotz et al. (2004). The blue stars represent galaxies based on B-band imageanalysis. The red triangles are that based on i-band image analysis. Most galaxieslie above the line demonstrating disturbed morphologies.
(A color version of this figure is available in the online journal.)
(Lotz et al. 2004). The blue stars represent that measured fromthe GOODS B-band image and the red triangles show that
measured from the GOODS i-band image. We can see thatfrom the B-band image, all of the galaxies lie above the dashedline, which is the region of the outlier galaxies showing merger/interacting and dwarf/irregular morphologies. From the i-bandimage, 8 out of 11 galaxies are on and above the line and 3 arebelow the line. The visual check of the galaxies below the dashedline shows that two galaxies (246, 578) have obvious multipleknots and irregular shape, and the galaxy 258 is in the regionof dwarf galaxies, which is in agreement with the low massestimation log(M) = 8.74 M�. Therefore, we see that 10 outof 11 show disturbing morphologies, interacting companions,and tidal features, which demonstrate the ongoing active starformation in these galaxies. At the same time, the half-lightradii of the galaxies are shown in Table 2, which span the rangefrom 1 to 8 kpc, with 8 out of 11, r1/2 < 3 kpc, showing compactmorphology.
3. MEASUREMENTS
3.1. Metallicity
Using the strong nebular lines [O ii] λ3727, Hβ, and the[O iii] doublet measured from the combined grism spectra,we measure the gas-phase oxygen abundance by the mostcommonly used R23 (R23 = ([O ii]+[O iii])/Hβ) diagnosticindicator (Pagel et al. 1979; Kewley & Dopita 2002). Wecalculate the metallicities by iteration, using the parameterized
5
The Astronomical Journal, 144:28 (11pp), 2012 July Xia et al.
Table 2The Ionization Parameter, Metallicity, Half-light Radius, Absolute Magnitude, Galaxy Stellar Mass, SFR, and SSFR of the PEARS/ERS Grism Galaxies
ID z log(R23) log q 12 + log(O/H) r1/2 MB log M∗ Age SFR SSFR(1) (2) (3) (4) (5) (kpc) (mag) (M�) (Myr) (M� yr−1) (×10−9 yr−1)
339 0.604 0.81+0.05−0.05 8.12 ± 1.28 8.10+0.20
−0.16 8.10 −19.74 9.19 +0.02−0.34 . . . 15.20 ± 1.72 10.64 ± 4.16
364 0.637 0.89+0.07−0.07 7.97 ± 0.10 8.22+0.16
−0.13 1.72 −19.19 8.72 +0.21−0.25 56.9+27.7
−53.7 1.70 ± 0.39 1.90 ± 0.84
246 0.691 0.74+0.10−0.10 8.58 ± 0.51 7.71+0.28
−0.27 1.97 −17.57 8.12 +0.14−0.33 50.4+0.04
−47.1 1.06 ± 0.21 3.31 ± 0.81
454 0.847 0.75+0.14−0.14 7.29 ± 0.17 8.25+0.23
−0.23 1.37 −20.12 9.48 +0.08−0.08 60.8+71.5
−32.1 2.41 ± 1.40 0.60 ± 0.37
258 0.997 0.40+−0.16 8.02 ± 0.11 7.49+
−0.17 2.20 −18.99 8.74 +0.06−0.06 90.1+35.8
−35.3 5.78 ± 3.66 7.83 ± 5.61
432 1.573 0.82+−0.15 7.58 ± 0.13 8.25+
−0.26 4.14 −20.05 9.16 +0.10−0.29 51.0+44.5
−47.8 2.71 ± 2.44 1.73 ± 1.56
563 1.673 0.90+−0.15 7.64 ± 0.13 8.37+
−0.28 1.58 −21.70 9.63 +0.07−0.28 46.5+52.2
−43.3 3.66 ± 2.24 0.51 ± 0.37
103 1.682 0.61+−0.16 7.46 ± 0.12 7.97+
−0.22 1.07 −19.41 9.23 +0.08−0.07 93.1+72.8
−68.8 1.59 ± 1.35 0.88 ± 0.83
195 1.745 0.90+−0.15 7.61 ± 0.10 8.38+
−0.27 1.89 −21.74 9.56 +0.13−0.29 23.9+29.2
−20.8 3.80 ± 2.02 2.30 ± 1.22
242 2.070 0.83+−0.16 7.46 ± 0.21 8.32+
−0.29 2.09 −21.42 9.85 +0.09−0.30 39.7+55.1
−36.5 14.51 ± 9.60 1.91 ± 1.37
578 2.315 0.77+−0.16 7.32 ± 0.16 8.27+
−0.26 5.82 −22.16 10.02 +0.11−0.29 19.0+40.2
−15.8 19.17 ± 12.81 0.50 ± 0.53
Notes. The missing upper errors in log(R23) and 12 + log(O/H) denote the lower limits due to the use of the upper limits of Hβ line fluxes. The galaxy stellar massesderived from the Salpeter IMF are scaled to that from the Chabrier (2003) IMF to be consistent in comparison with other studies.
calibrations between the oxygen abundance 12 + log(O/H),the ionization parameter q, and R23 that are derived fromtheoretical photoionization models by Kewley & Dopita (2002)and Kobulnicky & Kewley (2004).
We select the R23 method, because it relies on measuringsome of the brightest nebular emission lines, which allows itto be used for faint galaxies in the distant universe. However,it has one major drawback, which is that the relation betweenR23 ≡ (fO ii + fO iii)/fHβ and the gas phase oxygen abundance12 + log(O/H) is in general double-valued, with both a high(12 + log(O/H) > 8.5) and a low (12 + log(O/H) < 8.5),metallicity branch solution. For the present data set, we relyon a set of three secondary metallicity indicators to decidewhether our galaxies lie on the upper or lower branch. Firstis the “O32” ratio, fO iii/fO ii. While this is primarily sensitiveto the ionization parameter q (Kewley & Dopita 2002), it canalso be used as a branch indicator (Maiolino et al. 2008), withratios of fO iii/fO ii > 2 indicating a lower branch solution,and fO iii/fO ii < 1 indicating an upper branch solution. Secondis the ratio fO iii/fHβ , with fO iii/fHβ > 3 indicating 7.4 �12 + log(O/H) � 8.5 (Maiolino et al. 2008). Third is theequivalent width of the Hβ line. Hu et al. (2009) show thatEW(Hβ) correlates with metallicity, such that EW(Hβ) � 30 Åimplies a lower branch solution, and EW(Hβ) � 10 Å impliesthe upper branch solution.
Other popular branch indicators—notably the [O iii] λ4363line strength and the N2 diagnostic indicator (N2 =log([N ii] λ6584/Hα)—are not practical for our data set, giventhe faintness of the [O iii] λ4363 line, and the blending of[N ii] λ6584 with Hα in HST grism spectroscopy. Nevertheless,the combination of EW(Hβ), fO iii/fO ii, and fO iii/fHβ providesreasonable confidence in our branch identifications for most ofour sample.
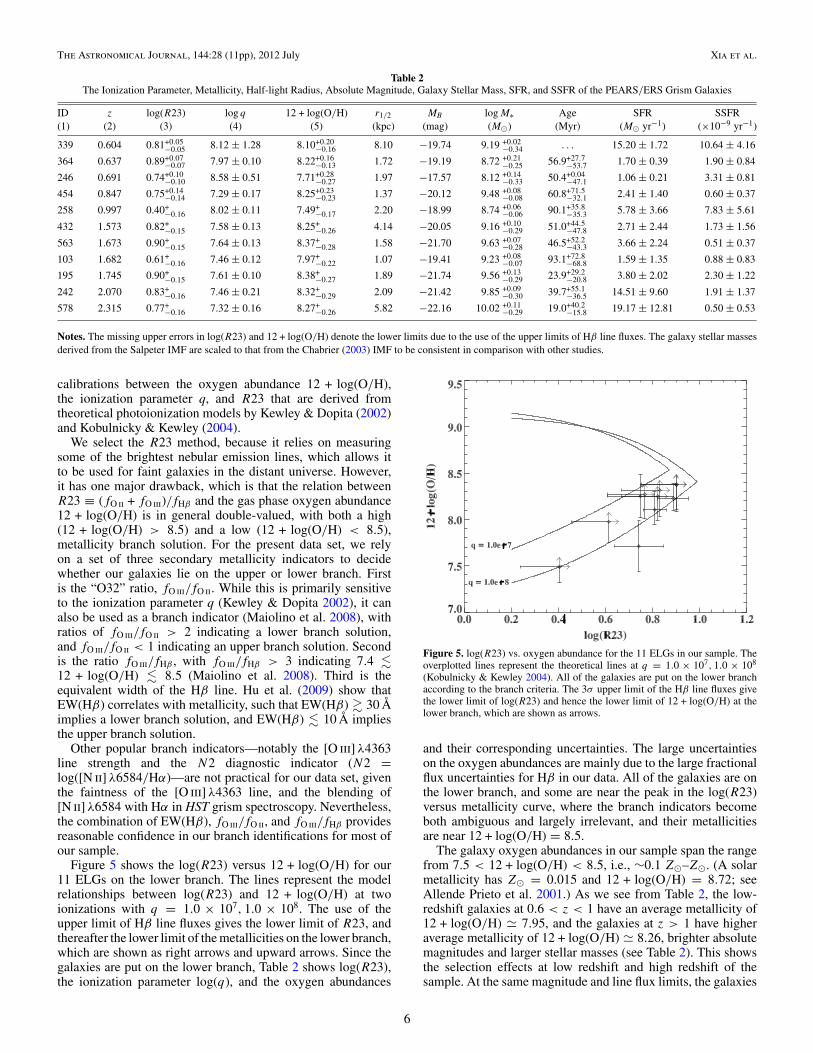
Figure 5 shows the log(R23) versus 12 + log(O/H) for our11 ELGs on the lower branch. The lines represent the modelrelationships between log(R23) and 12 + log(O/H) at twoionizations with q = 1.0 × 10⁷, 1.0 × 10⁸. The use of theupper limit of Hβ line fluxes gives the lower limit of R23, andthereafter the lower limit of the metallicities on the lower branch,which are shown as right arrows and upward arrows. Since thegalaxies are put on the lower branch, Table 2 shows log(R23),the ionization parameter log(q), and the oxygen abundances
Figure 5. log(R23) vs. oxygen abundance for the 11 ELGs in our sample. Theoverplotted lines represent the theoretical lines at q = 1.0 × 10⁷, 1.0 × 10⁸
(Kobulnicky & Kewley 2004). All of the galaxies are put on the lower branchaccording to the branch criteria. The 3σ upper limit of the Hβ line fluxes givethe lower limit of log(R23) and hence the lower limit of 12 + log(O/H) at thelower branch, which are shown as arrows.
and their corresponding uncertainties. The large uncertaintieson the oxygen abundances are mainly due to the large fractionalflux uncertainties for Hβ in our data. All of the galaxies are onthe lower branch, and some are near the peak in the log(R23)versus metallicity curve, where the branch indicators becomeboth ambiguous and largely irrelevant, and their metallicitiesare near 12 + log(O/H) = 8.5.
The galaxy oxygen abundances in our sample span the rangefrom 7.5 < 12 + log(O/H) < 8.5, i.e., ∼0.1 Z�–Z�. (A solarmetallicity has Z� = 0.015 and 12 + log(O/H) = 8.72; seeAllende Prieto et al. 2001.) As we see from Table 2, the low-redshift galaxies at 0.6 < z < 1 have an average metallicity of12 + log(O/H) � 7.95, and the galaxies at z > 1 have higheraverage metallicity of 12 + log(O/H) � 8.26, brighter absolutemagnitudes and larger stellar masses (see Table 2). This showsthe selection effects at low redshift and high redshift of thesample. At the same magnitude and line flux limits, the galaxies
6

The Astronomical Journal, 144:28 (11pp), 2012 July Xia et al.
selected with larger redshifts tend to be more massive, brighter,and higher metallicity galaxies. Hence, to evaluate the evolutionof the metallicity for same mass galaxies at different redshifts,we need to enlarge the sample to include faint low-mass galaxiesat high redshift.
Two galaxies out of the 11 ELGs (ERS ID numbers 339, 364)have follow-up Magellan spectroscopy, which covers the wave-length range from 4000 to 9000 Å, with a wavelength resolutionof ∼3 Å (L. Xia et al. 2012, in preparation). The metallicitiesmeasured from the Magellan spectra using the R23 methodon the strong emission lines [O ii], Hβ, and [O iii] doubletgive 12 + log(O/H) = 8.07 ± 0.14 for ERS339 and 8.18 ±0.15 for ERS364 (L. Xia et al. 2012, in preparation). Themetallicities obtained from the HST ACS/WFC3 grism spec-tra (12 + log(O/H) = 8.10+0.20
−0.16 for ERS339 and 8.22+0.16−0.13 for
ERS364) and that obtained from the Magellan spectroscopicspectra agree to within 1σ (∼0.1 dex), underscoring the feasi-bility of ELG metallicity measurements using the HST/WFC3IR grism data.
3.2. Stellar Mass
The galaxy stellar masses are derived by comparing the ob-served photometry with the model spectra library produced bythe Bruzual & Charlot (2003) stellar population synthesis code(BC03 hereafter). The galaxies in our sample are located in theACS pointings of the GOODS-South field. The optical broad-band BV iz photometry is obtained from HST/ACS GOODSversion 2.0 images (Giavalisco et al. 2004). The UV photom-etry in F225W, F275W, and F336W, as well as the near-IRphotometry in F098M (Ys), F125W (J), and F160W (H) arefrom the new WFC3 ERS mosaics (Windhorst et al. 2011). Inthis paper, we adopt the galaxy stellar masses measured us-ing the Bayesian-based Markov Chain Monte Carlo (MCMC;πMC2) method, which allows us to compare the observationsto arbitrarily complex models, and to compute 95% credible in-tervals that provide robust constraints for the model parameter(see Pirzkal et al. 2012 for details). The models are generatedusing the single (SSP), two (SSP2) stellar instantaneous pop-ulations, or an exponentially decaying star formation historymodel (EXP). The parameters assumed in the models are theSalpeter initial mass function (IMF), metallicities ranging fromZ = 0.004 to 0.02 (Z�), the stellar population ages, the relativeratio between the old and young stellar populations, the Calzettiet al. (2000) extinction law, and the half-life τ value in the caseof EXP models. We divide by a factor of 1.8 to make the galaxystellar masses derived from Salpeter IMF in this paper consis-tent with that in other studies derived from the Chabrier (2003)IMF (Erb et al. 2006). The comparison of the R23 and the SEDbest-fit metallicities shows agreement to within ∼0.1 dex forsix galaxies, and ∼0.5 dex higher metallicity for the other fivegalaxies from the SED fitting method. The higher metallicityhas very little effect on the estimated galaxy masses as shownby Pirzkal et al. (2012). The results of the galaxy stellar massesand stellar population ages are shown in the sixth column ofTable 2. The galaxies show young ages of 20–90 Myr and lowmasses ∼108–1010 M�.
4. RESULTS
The wide spectral coverage of the HST/ACS PEARS andWFC3 ERS composite grism spectra provides galaxies at0.6 < z < 2.4 with full set of emission lines [O ii], Hβ,and [O iii], which extend the study of the evolution of the L–Z
Figure 6. L–Z relation between the rest-frame B-band absolute magnitude vs.the oxygen abundance for the 10 ELGs at 0.6 < z < 2.4. The metallicity isderived from the R23 indicator and the x-axis is the rest-frame B-band absolutemagnitude. The red solid dots represent the galaxies with z > 1, and theblue triangles represent the galaxies with z < 1. The solid line represents therelation obtained by Tremonti et al. (2004) for SDSS star-forming galaxies atz ∼ 0.1. The dashed line illustrates the relation obtained by Zahid et al. (2011)for DEEP2 galaxies at z ∼ 0.8. The dotted line and the empty stars show therelation obtained by Hu et al. (2009) for USEL galaxies at z = 0−1. The emptyupside down triangles are that of Salzer et al. (2009) for [O iii]-selected z ∼ 0.3galaxies. The blue solid line shows the best linear fit of our sample, which givesa relationship of 12 + log(O/H) = (4.75±0.86)–(0.17±0.04)MB . The PEARSsample shows an offset by about −0.6 dex in metallicity relative to the localrelation at z ∼ 0.1.
(A color version of this figure is available in the online journal.)
relation and the M–Z relation to redshift z � 2.5. In this section,we will show the results of the L–Z relation and the M–Z relation,which provide important clues to the evolution of galaxies bycomparing with the relations at different redshifts.
4.1. L–Z Relation
Previous results show important evolution of the slope and thezero point of the L–Z relation with respect to redshift, decreasingmetallicity with increasing redshift at a given luminosity. Withthe sample of 11 grism ELGs at 0.6 < z < 2.4, we investigatethe evolution of the L–Z relation with redshift. Followingtradition, we present the rest-frame absolute B-band magnitudeas a measure of the luminosities. The rest-frame B-band absolutemagnitudes are computed from the best-fit SED with the BC03stellar population synthesis model.
Figure 6 shows the relationship between the absolute rest-frame B magnitude versus the gas-phase oxygen abundancederived from R23 diagnostic indicator. The lines plotted inFigure 6 are the local L–Z relation obtained by Tremonti et al.(2004) for ∼53,000 Sloan Digital Sky Survey (SDSS) galaxiesat z ∼ 0.1 (solid line), the L–Z relation obtained by Zahidet al. (2011) from 1350 DEEP2 ELGs at z ∼ 0.8 (dashed line),that obtained by Hu et al. (2009) from a sample of ultra-strongemission-line (USEL) galaxies at z � 0–1 (dotted line andempty stars), and that of Salzer et al. (2009) for 15 star-forminggalaxies at z ∼ 0.3 (open upside down triangles). Our sample of11 galaxies span a range in luminosity −17 < MB < −23and in metallicity 7.5 < 12 + log(O/H) < 8.5. The redsolid dots represent the galaxies with z > 1, and the greentriangles represent the galaxies with z < 1. The blue solidline shows the best linear fit of the 11 galaxies, a relation of
7

The Astronomical Journal, 144:28 (11pp), 2012 July Xia et al.
12 + log(O/H) = (4.75 ± 0.86) − (0.17 ± 0.04)MB with acorrelation coefficient of −0.77.
Compared to the other relationships shown in Figure 6,ACS+WFC3 grism galaxies are about 7 mag brighter in lu-minosities than the local SDSS galaxies and the z ∼ 0.8 DEEP2galaxies at fixed metallicity. The DEEP2 sample (Zahid et al.2011) shows little evolution compared to the SDSS sample,about ∼0.1 dex relative to the local L–Z relation, while theERS grism galaxies show ∼0.6 dex lower metallicities than theSDSS galaxies at given luminosity. The grism galaxies show agood match with the metal-poor galaxies of Hu et al. (2009) andSalzer et al. (2009) along the fitted L–Z relation.
The Hu et al. (2009) USEL galaxies have high equivalentwidth with EW(Hβ > 30 Å), extend to fainter galaxies to MB ∼−16, and show low metallicities of 7.1 < 12 + log(O/H) <8.4. The Salzer et al. (2009) are [O iii]-selected galaxies([O iii]/Hβ > 3) at z ∼ 0.3 and show brighter luminosity andhigher metallicities. The difference of the galaxies on the L–Zfigure shows the different physical properties of the three sam-ples: the USELs are basically selected to be fainter dwarf galax-ies, the low-redshift Salzer et al. (2009) are [O iii]-selectedbrighter galaxies. Since the three samples follow the L–Z re-lationship of the metal-poor galaxies well, and the L–Z relationsof the SDSS galaxies and the DEEP2 galaxies are obtained byaveraging large samples, we conclude that the big offset in theL–Z relation between the local and the three metal-poor galaxysamples is due to the selection of a sample of young strongemission-line star-forming galaxies, which will be further illus-trated in the next subsection.
4.2. M–Z Relation
Figure 7 shows the relation between the stellar masses and thegas-phase oxygen abundances for the 11 star-forming galaxiesin our sample at 0.6 < z < 2.4. The solid line represents theM–Z relation at z ∼ 0.1 from Tremonti et al. (2004) for the localSDSS galaxies, which are selected to be star-forming galaxiesbased on lines Hα, Hβ, and [N ii]. The dashed line shows theM–Z relation at z ∼ 0.8 for the 1350 Hβ-selected blue DEEP2galaxies from Zahid et al. (2011). The dotted line and the dash-dotted line are UV-color-selected galaxies at z ∼ 2.3 from Erbet al. (2006) and the UV-selected Lyman break galaxies (LBGs)at z ∼ 3.1 from Mannucci et al. (2009), respectively. The redline shows the best fit to the M–Z relation for the ELGs in oursample.
The green triangles illustrate the sample of the “green peas”from Cardamone et al. (2009) and Amorin et al. (2010), whichare extremely compact (r < 3 kpc) star-forming galaxies at0.11 < z < 0.35 selected by color from the SDSS spectroscopicobservation, with an unusual large equivalent width of up to∼1000 Å. We recalculate the gas-phase oxygen metallicity bythe R23 method for the “green peas” sample. Also plotted are theLyα emitters at z ∼ 0.3, and ∼2.3 from Finkelstein et al. (2011a,2011b), shown in empty red circles and black asterisks with 2σand 3σ upper limits, and one extremely metal poor galaxiesXMPG WISP5-230 (Atek et al. 2011). All data presented havebeen scaled to a Chabrier (2003) IMF. To ensure the consistencyof the comparison, the conversion given by Kewley & Ellison(2008) is used to convert to the same metallicity calibration ofKobulnicky & Kewley (2004) to avoid the differences arisingfrom different metallicity indicators (Zahid et al. 2011). Themetallicity of the XMPG galaxy from Atek et al. (2011) ismeasured by the direct T e method, and is not converted to thesame metallicity diagnostic due to the absence of the [O ii] flux
Figure 7. Relation between the stellar masses and the gas-phase oxygenabundances for our sample of 11 ELGs from PEARS and ERS grism dataat 0.6 < z < 2.4. The metallicities are estimated from the R23 method. Thestellar masses are estimated from the SED fitting with BC03 model and havebeen scaled to a Chabrier (2003) IMF to be consistent with other studies. Thedefinition of the points of our sample are the same as Figure 5. Also plotted forcomparison are the green peas (empty green triangulars) at z � 0.3 (Amorinet al. 2010), Lyα galaxies at z � 0.3 and z � 2.3 (Finkelstein et al. 2011a,2011b), and the WISP XMPG galaxy at z � 0.7 (Atek et al. 2011). The solidred line is the best fit of the M–Z relation to the 11 ELGs in our sample. Thesolid line represents the M–Z relation at z � 0.1 from Tremonti et al. (2004)for the local SDSS galaxies. The dashed line shows the M–Z relation at z � 0.8for the 1350 DEEP2 galaxies from Zahid et al. (2011). The dotted line and thedash-dotted line are that at z � 2.3 from Erb et al. (2006) and at z � 3.1 fromMannucci et al. (2009), respectively. The M–Z relations at different redshiftsare calibrated to the same metallicity indicator of Kobulnicky & Kewley (2004)from Zahid et al. (2011). The large offset of ∼0.5 dex of this sample relative tothe other relations at similar redshift demonstrates that these galaxies may beat the early stages of galaxy evolution. Infall of gas due to mergers is anotherpopular explanation, e.g., Peeples et al. (2009) and Rodrigues et al. (2012).
(A color version of this figure is available in the online journal.)
and the conversion relationship between the direct T e methodand the R23 method in Kobulnicky & Kewley (2004).
From Figure 7, our grism galaxies span the range 8.1 <log(M∗/M�) < 10.1 and 7.5 < 12 + log(O/H) < 8.5, with theaverage values of 〈log(M∗/M�)〉 = 9.3 and 〈12 + log(O/H)〉 =8.1. Although this is a small sample, it shows a similarcorrelation between metallicity and stellar mass, increasingoxygen abundance with the increase of the stellar masses. Thered dots in Figure 7 show the six galaxies with redshift z > 1 andwith emission lines observed in WFC3 ERS. The blue trianglesrepresent the galaxies with 0.6 < z < 1. We fit the M–Z relationwith a second-order polynomial (Maiolino et al. 2008):
12 + log(O/H) = A[log(M) − log(M0)]2 + K0, (1)
the best-fit parameters to the 11 ELGs in our sample giveA = −0.07, log(M0) = 11.87, and K0 = 8.63. FromTable 2, we see that these high-redshift galaxies have higherstellar masses with a mean of 〈log M∗/M�〉 � 9.6 and highermetallicities with a mean of 〈12 + log(O/H)〉 � 8.3. The low-redshift subsample has lower galaxy stellar masses with a meanof 〈log M∗/M�〉 � 8.8 and lower metallicities with a mean of〈12 + log(O/H)〉 � 8.0. The offset shown between the high-redshift subsample and the low-redshift subsample includesthe evolution of the M–Z relation with redshift and selectioneffect, which for the same emission-line detection high-redshiftgalaxies tend to be more luminous, more massive, and moremetal-enriched than the low-redshift galaxies.
8

The Astronomical Journal, 144:28 (11pp), 2012 July Xia et al.
We examine the M–Z relation by comparing our samplewith that at different redshift ranges. Compared with the localrelation at z ∼ 0.1, the SDSS galaxies with comparable stellarmass to the average of the grism sample, M∗ ∼ 109.3 M�,have 12 + log(O/H) � 8.8, which is about ∼0.6 dex higherthan the average of the grism galaxies. For the low-redshiftsubsample with a mean of z � 0.8, the M–Z relation showsa large offset of ∼0.6 dex with that of Zahid et al. (2011) atz � 0.8 too. This big difference between our sample and thatof Tremonti et al. (2004) and Zahid et al. (2011) is mainlydue to the different selection criteria of the galaxies. The localSDSS galaxies (Tremonti et al. 2004) and the DEEP2 galaxies(Zahid et al. 2011) are obtained from large spectroscopicsurvey, and the M–Z relations show the average relationshipsof the dominant galaxy populations at that redshift. Table 3lists the physical properties including redshift range, selection,absolute magnitude, emission-line EW, half-light radius, andstar formation rate (SFR) of the different comparing samples.We can see that the SDSS and DEEP2 samples are not selectinghigh-EW star-forming galaxies compared with the “green peas”(Amorin et al. 2010), USELs (Hu et al. 2009), LBGs (Mannucciet al. 2009), and our PEARS/ERS ELGs, which are biasedto high-EW emission lines (up to ∼1000 Å) and compact(r1/2 < 3 kpc) galaxies.
For the high-redshift subsample with a mean of z � 2, theM–Z relation shows an offset of ∼0.2 dex with respect to that ofthe LBGs at z � 2.3 (Erb et al. 2006). The low metallicitygalaxies basically fall between the relation at z � 2.3 andz � 3.1 and have low metallicities down to 12+log(O/H) ∼ 7.5,7.7. The “green peas” (Hoopes et al. 2007; Overzier et al. 2008;Amorin et al. 2010) at z � 0.3 are found to be metal-poorby ∼0.5 dex relative to other galaxies of similar stellar mass,and show compact and disturbed morphology. From Figure 7,we find that 7 out of 11 of the HST/ACS+WFC3 grism ELGsare in the similar metallicity range 12 + log(O/H) ∼ 8.3 andfour galaxies are more metal-poor by up to 0.6 dex, comparedwith the green peas at the same galaxy stellar masses, whichshows significant chemical enrichment from z � 0.8 to z � 0.3at the low stellar mass range. To confirm this evolution withhigher statistical significance, we will need a larger sample ofgalaxies extending to low mass faint galaxies at high redshifts.The strong emission-line-selected Lyα galaxies at z � 0.3,at z � 2.3 and XMPG WISP5 230 at z � 0.7 show similarlower metallicities at 7.2 < 12 + log(O/H) < 8.2 withrespect to the average M–Z relations obtained from large surveysamples.
The detailed analysis of the morphologies, sizes, colors, andSSFRs based on the M–Z relation (Pirzkal et al. 2006; L. Xiaet al. 2012, in preparation) show that the strong emission-line-selected grism galaxies are biased toward young compactinteracting dwarf star-forming galaxies. Pirzkal et al. (2006)show small physical sizes of ∼1–2 kpc for the ELGs observedfrom the GRAPES survey, and L. Xia et al. (2012, in preparation)present high SSFRs 10−9–10−7 yr−1 for the ELGs from thePEARS survey. Since the galaxies in our sample are partlythe subsample of the PEARS ELGs, the results of the sizesand the SSFRs are consistent with the previous results, withr1/2 < 3 kpc and SSFR ∼ 10−9 yr−1. This confirms the selectioneffects of the young compact disturbed ELGs in the sample.The early stage of galaxy evolution (downsizing effect) orinteraction-induced pristine gas inflow picture may account forthe offset of the grism galaxies in metallicity relative to the localsample.
5. DISCUSSION AND SUMMARY
We use a sample of 11 ELGs at 0.6 < z < 2.4 observedby HST/ACS PEARS and HST WFC3 ERS programs at0.6–1.6 μm to demonstrate the effectiveness of the grism spectra(R ∼ 100–300) used for the metallicity measurement. Withthe [O ii], Hβ, and [O iii] lines in the composite spectra ofthe two grism spectra surveys, we use the R23 method toderive the gas-phase oxygen abundances, 12 + log(O/H). Fortwo galaxies that have follow-up Magellan spectroscopy, themetallicities obtained from the grism spectra and from theMagellan spectroscopic spectra are consistent to within 1σ(0.1 dex), which demonstrates the feasibility of the HST/WFC3IR grism spectra used here for the study of galaxy metallicities.
The measured gas-phase abundances are in the low metallicityrange 7.5 < 12 + log(O/H) < 8.5. The galaxy stellar massesare derived from MCMC SED fitting and span the range8.1 < log(M∗/M�) < 10.1. Both the L–Z relation and the M–Zrelation show that with the increase of the galaxy stellar massor the luminosity, the metallicity increases, which agrees withthe enrichment history of galaxy evolution. The M–Z relationof this sample shows significant offset by about −0.6 dex inmetallicity at a given stellar mass relative to the local M–Zrelation from SDSS galaxies and the galaxies from the DEEP2survey at similar redshifts z � 0.8. The L–Z relation is fitted by astraight line of 12+log(O/H) = (4.75±0.86)–(0.17±0.04)MB
with a correlation coefficient of −0.77, which is also offset byabout −0.6 dex in metallicity relative to the local and z � 0.8L–Z relations.
Our sample of galaxies at z � 0.8 show similarity to the localgreen peas in morphology and low metallicity. Two galaxiesshow significant poorer metallicity by ∼0.5 dex compared withthe “green peas” at the same galaxy stellar masses, whichsignifies different physical processes in the galaxy evolutionand chemical enrichment from z � 0.8 to z � 0.2 at the lowstellar mass range. The different contributions by downsizingand gas inflow/outflow need to be further examined in detail bylarger samples.
By comparing the PEARS/ERS sample with other emission-line-selected samples (Erb et al. 2006; Hu et al. 2009; Mannucciet al. 2009; Salzer et al. 2009; Amorin et al. 2010; Zahidet al. 2011; Finkelstein et al. 2011a, 2011b) in Table 3, wefind that the physical properties of the ELGs at differentredshifts show great similarities: e.g., (1) ultra-strong emissionlines of about 10−17 erg cm−2 s−1, high-emission-line EWsup to ∼1000 Å, and hence very high SSFRs to 10−9 yr−1;(2) compact morphology (r1/2 < 3 kpc); (3) evidence formergers/interactions from the asymmetries of the morphology,such as companions and wispy tidal tails around a compact star-forming region, three “green peas” shown in Cardamone et al.(2009), and 10 out of 11 galaxies in our sample (see Figure 3).Hence, we conclude that the offsets shown in the M–Z andL–Z relations with respect to that obtained from average oflarge sample are mainly due to the selection effects based onprominent emission lines. Van der Wel et al. (2011) shows anabundant population of extreme emission line galaxies (EELGs)from the HST/WFC3 CANDELS Survey (Cosmic AssemblyNear-IR Deep Extragalactic Legacy Survey) and confirms thephysical properties of low stellar masses ∼108 M�, and strongoutflows due to enormous starbursts in the EELGs by theHST/WFC3 grism spectra.
Taken together, the properties of the ELGs: compact star-bursts, low metallicities, disturbed morphologies, and low
9

Th
eA
stronom
icalJou
rnal,144:28
(11pp),2012July
Xia
etal.
Table 3The Selection Criteria and Physical Properties of the Comparison Samples in the Paper
Sample Survey z Selection fline MB EW r1/2 SFR(1) (2) (3) (4) (10−17 erg cm−2 s−1) (mag) (Å) (kpc) (M� yr−1)
Tremonti et al. (2004) SDSS 0.005 < z < 0.25 Hα, Hβ, [N ii] . . . (−16, −22) EW(Hα) ∼ 3–200 . . . . . .
Salzer et al. (2009) KISS z ∼ 0.3 [O iii] . . . (−19.5, −22.5) . . . . . . . . .
Finkelstein et al. (2011b); LAEs HETDEX z ∼ 0.3 Lyα >1400 . . . EW([Lyα]) ∼ 20–40 . . . . . .
Amorin et al. (2010); green pea SDSS 0.11 < z < 0.35 color . . . . . . EW([O iii]) < 1000 <3 <30Zahid et al. (2011) DEEP2 0.75 < z < 0.82 Hβ, color . . . (−19.5, −22) 〈EW(Hβ)〉 ∼ 8.9 . . . . . .
Hu et al. (2009); USELs DEMOS 0 < z < 1 [O iii], Hα >1.5 (−16, −21) EW(Hβ) < 500 . . . . . .
Erb et al. (2006) LRIS-B z ∼ 2.3 UV-colors >15 (−20.5, −23.5) . . . . . . 20–60Finkelstein et al. (2011a); LAEs HETDEX z ∼ 2.3 Lyα >200 . . . EW([O iii]) < 300 . . . 20–40Mannucci et al. (2009); LBGs AMAZE, LSD 2.6 < z < 3.4 . . . >1.1 . . . . . . 0.7–2.4 5–40This paper PEARS, ERS 0.6 < z < 2.3 Emission lines >5 (−17.5, −22.5) EW([O iii]) < 1600 1–8.1 1–20
10

The Astronomical Journal, 144:28 (11pp), 2012 July Xia et al.
masses, indicate that these are dwarf galaxies undergoing theirearly stages of galaxy evolution with prominent signs of strongactivities of interaction (gas accretion and outflow) with com-panion galaxies. Both the downsizing effect and inflow/outflowplay important roles in these low metallicity galaxies’ evolution.To examine the mode of the star formation of these low-mass,low-metallicity galaxies in the whole scenario of galaxy evolu-tion requires a larger sample of this kind of ELGs from opticalto NIR spectroscopy with morphologies to give us a more com-prehensive picture of these galaxies. Trump et al. (2011) presenta sample of 28 ELGs at z ∼ 2 with prominent [O iii] and Hβin the GOODS-S region of the CANDELS. Combined withthe PEARS spectra, this sample will greatly enhance the sam-ple at redshift z ∼ 2 at the low-mass low-metallicity region ofthe M–Z relation, which is important to study and understandthe physical processes effecting galaxy evolution.
We thank the anonymous referee for the comments whichare very helpful in clarifying and improving this paper. Thispaper is based on Early Release Science observations madeby the WFC3 Scientific Oversight Committee. PEARS is anHST Treasury Program 10530 (PI: Malhotra). Support for theprogram was provided by NASA through a grant from theSpace Telescope Science Institute, which is operated bythe Association of Universities for Research in Astronomy, Inc.,under NASA contract NASA5-26555 and is supported by HSTgrant 10530.
REFERENCES
Abraham, R., van den Bergh, S., & Nair, P. 2003, ApJ, 588, 218Allende Prieto, C. A., Lambert, D. L., & Asplund, M. 2001, ApJ, 556, L63Amorin, R. O., Enrique, P. M., & Vilchez, J. M. 2010, ApJ, 715, 128Atek, H., Siana, B., Scarlata, C., et al. 2011, ApJ, 743, 121Bruzual, G., & Charlot, S. 2003, ApJ, 405, 538Calzetti, D., Armus, L., Bohlin, R. C., et al. 2000, ApJ, 533, 682
Cardamone, C., Schawinski, K., Sarzi, M., et al. 2009, MNRAS, 399, 1191Chabrier, G. 2003, PASP, 115, 763Erb, D. K., Shapley, A. E., Pettini, M., et al. 2006, ApJ, 644, 813Finkelstein, S. L., Cohen, S. H., Moustakas, J., et al. 2011a, ApJ, 733, 117Finkelstein, S. L., Hill, G. J., Gebhardt, K., et al. 2011b, ApJ, 729, 140Garnett, D. R., & Shields, G. A. 1987, ApJ, 317, 82Giavalisco, M., Ferguson, H. C., Koekemoer, A. M., et al. 2004, ApJ, 600,
93Hoopes, C. G., Heckman, T. M., Salim, S., et al. 2007, ApJS, 173, 441Hu, E. M., Cowie, L. L., Kakazu, Y., & Barger, A. J. 2009, ApJ, 698, 2014Kewley, L. J., & Dopita, M. A. 2002, ApJS, 142, 35Kewley, L. J., & Ellison, S. L. 2008, ApJ, 681, 1183Kobulnicky, H. A., & Kewley, L. J. 2004, ApJ, 617, 240Komatsu, G., Smith, K. M., Dunkley, J., et al. 2011, ApJS, 192, 18Lequeux, J., Rayo, J. F., Serrano, A., Peimbert, M., & Torres-Peimbert, S. 1979,
A&A, 80, 155Lilly, S. J., Carollo, C. M., & Stockton, A. N. 2003, ApJ, 597, 730Lotz, J. M., Parimack, J., & Madau, P. 2004, AJ, 128, 163Maiolino, R., Nagao, T., Grazian, A., et al. 2008, A&A, 488, 463Mannucci, F., Cresci, G., Maiolino, R., et al. 2009, MNRAS, 398, 1915Meurer, G. R., Tsvetanov, Z. I., Gronwall, C., et al. 2007, AJ, 134, 77Moustakas, J., Zaritsky, D., Brown, M., et al. 2011, arXiv:1112.3300Overzier, R. A., Heckman, T. M., Kauffmann, G., et al. 2008, ApJ, 677, 37Pagel, B. E. J., Edmunds, M. G., Blackwell, D. E., Chun, M. S., & Smith, G.
1979, MNRAS, 189, 95Peeples, M., Pogge, R., & Stanek, K. Z. 2009, ApJ, 695, 259Pirzkal, N., Rothberg, B., Nilsson, K. K., et al. 2012, ApJ, 748, 122Pirzkal, N., Xu, C., Ferreras, I., et al. 2006, ApJ, 636, 582Pirzkal, N., Xu, C., Malhotra, S., et al. 2004, ApJS, 154, 501Rodrigues, M., Hammer, F., Flores, H., et al. 2008, A&A, 492, 371Rodrigues, M., Puech, M., Hammer, F., Rothberg, B., & Flores, H.
2012, MNRAS, 421, 2888Salzer, J. J., Willams, A. L., & Gronwall, C. 2009, ApJ, 695, L67Skillman, E. D., Kennicutt, R. C., Jr., & Hodge, P. W. 1989, ApJ, 347, 875Straughn, A. N., Kuntschner, H., Kummel, M., et al. 2011, AJ, 141, 14Straughn, A. N., Pirzkal, N., Meurer, G. R., et al. 2009, AJ, 138, 1022Tremonti, C. A., Heckman, T. M., Kauffmann, G., et al. 2004, ApJ, 613, 898Trump, J. R., Weiner, B. J., Scarlata, C., et al. 2011, ApJ, 743, 144van der Wel, A., Straughn, A. N., Rix, H.-W., et al. 2011, ApJ, 742, 111Windhorst, R. A., Cohen, S. H., Hathi, N. P., et al. 2011, ApJS, 193, 27Zahid, H. J., Kewley, L. J., & Bresolin, F. 2011, ApJ, 730, 137Zaritsky, D., Kennicutt, R. C., & Huchra, J. P. 1994, ApJ, 420, 87
11
Copyright © 2022 FDOKUMEN