AEGIS: Enhancement of Dust-enshrouded Star Formation in Close Galaxy Pairs and Merging Galaxies up...
12
arXiv:astro-ph/0607272v2 14 Apr 2007 Accepted for publication in the ApJL AEGIS Special Issue AEGIS: Enhancement of Dust-enshrouded Star Formation in Close Galaxy Pairs and Merging Galaxies up to z ∼ 1 1 Lihwai Lin 2,3 , David C. Koo 3 , Benjamin J. Weiner 4 , Tzihong Chiueh 2 , Alison L. Coil 5,6 , Jennifer Lotz 7,8 , Christopher J. Conselice 9 , S. P. Willner 10 , H. A. Smith 10 , Puragra Guhathakurta 3 , J.-S. Huang 10 , Emeric Le Floc’h 5 , Kai G. Noeske 3 , Christopher N. A. Willmer 5 , Michael C. Cooper 11 , and Andrew C. Phillips 3 ABSTRACT Using data from the DEEP2 Galaxy Redshift Survey and HST /ACS imag- ing in the Extended Groth Strip, we select nearly 100 interacting galaxy systems including kinematic close pairs and morphologically identified merging galaxies. Spitzer MIPS 24 μm fluxes of these systems reflect the current dusty star for- mation activity, and at a fixed stellar mass (M ∗ ) the median infrared luminosity (L IR ) among merging galaxies and close pairs of blue galaxies is twice (1.9±0.4) that of control pairs drawn from isolated blue galaxies. Enhancement declines 1 Some of the data presented herein were obtained at the W. M. Keck Observatory, which is operated as a scientific partnership among the California Institute of Technology, the University of California and the National Aeronautics and Space Administration. The Observatory was made possible by the generous financial support of the W.M. Keck Foundation. 2 Department of Physics, National Taiwan University, Taipei 106, Taiwan; Email: [email protected] 3 UCO/Lick Observatory, Department of Astronomy and Astrophysics, University of California, Santa Cruz, CA 95064 4 Department of Astronomy, University of Maryland, College Park, MD 20742 5 Steward Observatory, University of Arizona, Tucson, AZ 85721 6 Hubble Fellow 7 National Optical Astronomy Observatory, Tucson, AZ 85719 8 Leo Goldberg Fellow 9 School of Physics and Astronomy, University of Nottingham, Nottingham NG7 2RD, UK 10 Harvard-Smithsonian Center for Astrophysics, Cambridge, MA 02138 11 Department of Astronomy, University of California, Berkeley, CA 94720
-
Upload
independent -
Category
Documents
-
view
0 -
download
0
Transcript of AEGIS: Enhancement of Dust-enshrouded Star Formation in Close Galaxy Pairs and Merging Galaxies up...

arX
iv:a
stro
-ph/
0607
272v
2 1
4 A
pr 2
007
Accepted for publication in the ApJL AEGIS Special Issue
AEGIS: Enhancement of Dust-enshrouded Star Formation in
Close Galaxy Pairs and Merging Galaxies up to z ∼ 1 1
Lihwai Lin 2,3, David C. Koo 3, Benjamin J. Weiner 4, Tzihong Chiueh2, Alison L. Coil 5,6,
Jennifer Lotz 7,8, Christopher J. Conselice 9, S. P. Willner 10, H. A. Smith 10, Puragra
Guhathakurta 3, J.-S. Huang 10, Emeric Le Floc’h 5, Kai G. Noeske 3, Christopher N. A.
Willmer 5, Michael C. Cooper 11, and Andrew C. Phillips 3
ABSTRACT
Using data from the DEEP2 Galaxy Redshift Survey and HST/ACS imag-
ing in the Extended Groth Strip, we select nearly 100 interacting galaxy systems
including kinematic close pairs and morphologically identified merging galaxies.
Spitzer MIPS 24 µm fluxes of these systems reflect the current dusty star for-
mation activity, and at a fixed stellar mass (M∗ ) the median infrared luminosity
(LIR ) among merging galaxies and close pairs of blue galaxies is twice (1.9±0.4)
that of control pairs drawn from isolated blue galaxies. Enhancement declines
1 Some of the data presented herein were obtained at the W. M. Keck Observatory, which is operated
as a scientific partnership among the California Institute of Technology, the University of California and
the National Aeronautics and Space Administration. The Observatory was made possible by the generous
financial support of the W.M. Keck Foundation.
2Department of Physics, National Taiwan University, Taipei 106, Taiwan; Email: [email protected]
3UCO/Lick Observatory, Department of Astronomy and Astrophysics, University of California, Santa
Cruz, CA 95064
4Department of Astronomy, University of Maryland, College Park, MD 20742
5Steward Observatory, University of Arizona, Tucson, AZ 85721
6Hubble Fellow
7National Optical Astronomy Observatory, Tucson, AZ 85719
8Leo Goldberg Fellow
9School of Physics and Astronomy, University of Nottingham, Nottingham NG7 2RD, UK
10Harvard-Smithsonian Center for Astrophysics, Cambridge, MA 02138
11Department of Astronomy, University of California, Berkeley, CA 94720

– 2 –
with galaxy separation, being strongest in close pairs and mergers and weaker in
wide pairs compared to the control sample. At z ∼ 0.9, 7.1% ± 4.3% of massive
interacting galaxies (M∗ > 2 × 10¹⁰M⊙) are found to be ULIRGs, compared to
2.6% ± 0.7% in the control sample. The large spread of LIR/M∗ among inter-
acting galaxies suggests that this enhancement may depend on the merger stage
as well as other as yet unidentified factors (e.g., galaxy structure, mass ratio,
orbital characteristics, presence of AGN or bar). The contribution of interacting
systems to the total IR luminosity density is moderate (. 36%).
Subject headings: galaxies:interactions - galaxies:evolution - large-scale structure
of universe - infrared:galaxies
1. INTRODUCTION
Galaxy-galaxy interaction has long been regarded as a key process in galaxy evolution,
especially as a mechanism for enhancing star formation during mergers (Larson & Tinsley
1978; Barton et al. 2000). Hydrodynamic N -body simulations show that active star for-
mation can be triggered by gaseous inflows resulting from mergers of gas-rich galaxies
(Mihos & Hernquist 1996; Barnes 2004; Cox 2004). Interaction-triggered star formation is
also thought to be responsible for luminous infrared sources. In the local universe, luminous
infrared galaxies (LIRGs) and ultra luminous infrared galaxies (ULIRGs) are primarily merg-
ing systems (Sanders 1988; Borne et al. 1999). Nevertheless, by studying various star forma-
tion indicators of interacting galaxies and normal galaxies, Bergvall, Laurikainen, & Aalto
(2003) concluded that galaxy interactions in general are inefficient triggers of starbursts;
interactions are a necessary but not sufficient condition to trigger violent starbursts.
The importance of galaxy interactions in the volume-averaged galaxy star formation rate
(SFR) remains an open question. Recent studies of mid-IR (MIR) sources at a median red-
shift of z ∼0.7 suggest that the IR density at that epoch is dominated by morphologically nor-
mal galaxies instead of strongly interacting galaxies (Bell et al. 2005; Melbourne, Koo, & Le Floc’h
2005). Two main factors may contribute to this result. First, only a small fraction of the
galaxy population may be undergoing a major merger at any given time (Carlberg et al.
2000; Bundy et al. 2004; Lin et al. 2004). Second, the overall SFR in normal galaxies at
z ∼0.7 may be enhanced relative to the local population (Bell et al. 2005), perhaps as the
result of internal processes such as a higher gas fraction leading to a higher SFR, such
that galaxy interactions may have less dramatic effects on triggering star formation at that
epoch and/or may be harder to identify. It is the aim of this Letter to examine this second
hypothesis.
– 3 –
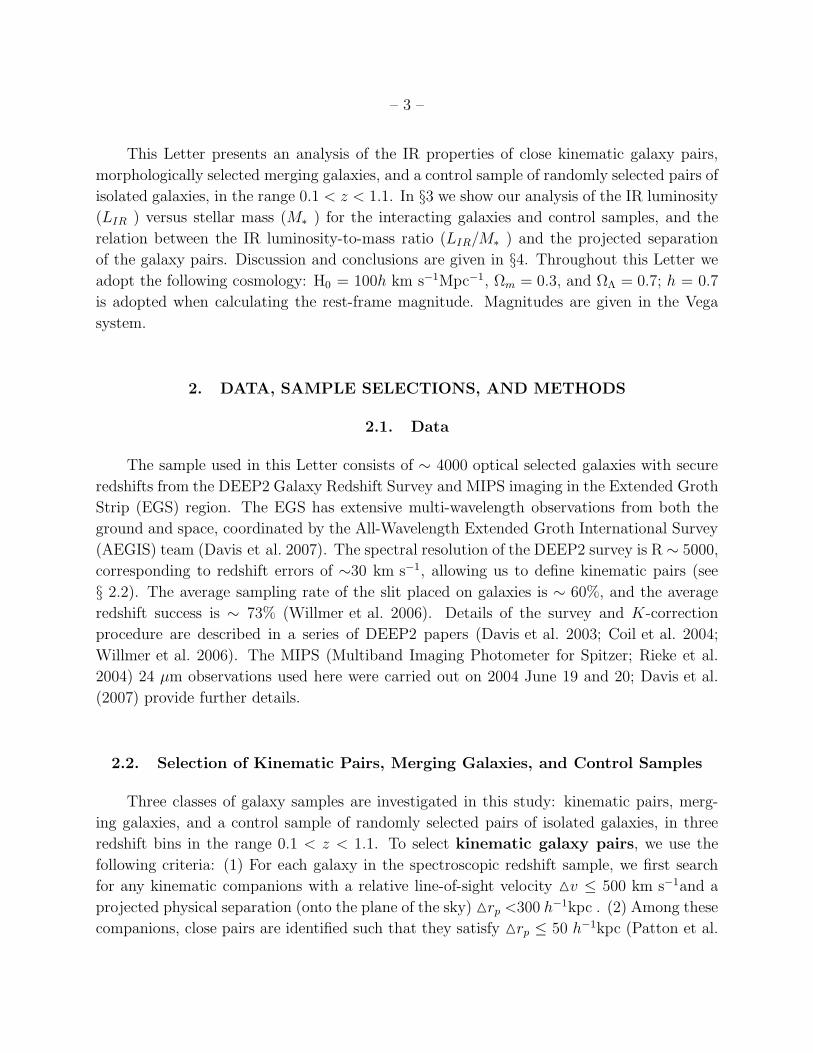
This Letter presents an analysis of the IR properties of close kinematic galaxy pairs,
morphologically selected merging galaxies, and a control sample of randomly selected pairs of
isolated galaxies, in the range 0.1 < z < 1.1. In §3 we show our analysis of the IR luminosity
(LIR ) versus stellar mass (M∗ ) for the interacting galaxies and control samples, and the
relation between the IR luminosity-to-mass ratio (LIR/M∗ ) and the projected separation
of the galaxy pairs. Discussion and conclusions are given in §4. Throughout this Letter we
adopt the following cosmology: H0 = 100h km s−1Mpc−1, Ωm = 0.3, and ΩΛ = 0.7; h = 0.7
is adopted when calculating the rest-frame magnitude. Magnitudes are given in the Vega
system.
2. DATA, SAMPLE SELECTIONS, AND METHODS
2.1. Data
The sample used in this Letter consists of ∼ 4000 optical selected galaxies with secure
redshifts from the DEEP2 Galaxy Redshift Survey and MIPS imaging in the Extended Groth
Strip (EGS) region. The EGS has extensive multi-wavelength observations from both the
ground and space, coordinated by the All-Wavelength Extended Groth International Survey
(AEGIS) team (Davis et al. 2007). The spectral resolution of the DEEP2 survey is R ∼ 5000,
corresponding to redshift errors of ∼30 km s−1, allowing us to define kinematic pairs (see
§ 2.2). The average sampling rate of the slit placed on galaxies is ∼ 60%, and the average
redshift success is ∼ 73% (Willmer et al. 2006). Details of the survey and K-correction
procedure are described in a series of DEEP2 papers (Davis et al. 2003; Coil et al. 2004;
Willmer et al. 2006). The MIPS (Multiband Imaging Photometer for Spitzer; Rieke et al.
2004) 24 µm observations used here were carried out on 2004 June 19 and 20; Davis et al.
(2007) provide further details.
2.2. Selection of Kinematic Pairs, Merging Galaxies, and Control Samples
Three classes of galaxy samples are investigated in this study: kinematic pairs, merg-
ing galaxies, and a control sample of randomly selected pairs of isolated galaxies, in three
redshift bins in the range 0.1 < z < 1.1. To select kinematic galaxy pairs, we use the
following criteria: (1) For each galaxy in the spectroscopic redshift sample, we first search
for any kinematic companions with a relative line-of-sight velocity v ≤ 500 km s−1and a
projected physical separation (onto the plane of the sky) rp <300 h−1kpc . (2) Among these
companions, close pairs are identified such that they satisfy rp ≤ 50 h−1kpc (Patton et al.
– 4 –
2002; Lin et al. 2004). We find a total of 56 close pairs. (3) For comparison, wide pairs are
identified as kinematic companions with 50 h−1kpc ≤ rp ≤ 300 h−1kpc , and we retain
only wide pairs that are closest companions to each other (such that there is only one wide
pair companion per galaxy). The spectroscopic redshift sample is not entirely complete,
however; it is possible that for a given galaxy, there exists a closer companion that is missing
in the redshift sample. Therefore, rp for each paired system is an upper limit on the actual
distance to the closest companion. To minimize this effect we also search for photometric
companions of each galaxy, and we keep only those wide pairs that do not have a photometric
companion (with observed mR < 1 mag) within rp ≤ 30 h−1kpc , for a sample of 126 wide
pairs. (4) Absolute magnitude limits were applied to all pair samples within a given redshift
bin (see Table 1). (5) To study the effect of interactions between two gas-rich galaxies, we
further applied a color cut using rest-frame U − B = 0.25 as the division between blue and
red galaxies and only include blue galaxies in our samples. It is possible that we have missed
some red, dusty, late-type galaxies due to our color selection. However, the number density
of that population is ∼8% compared to the blue galaxy population (Weiner et al. 2005) and
is therefore negligible for our analysis.
We also define a set of morphologically identified merging galaxies using a subsample
of blue galaxies in the EGS that have deep HST images taken with Advanced Camera
for Surveys (ACS) as part of GO program 10134 (PI: M. Davis). These morphologically
identified merging galaxies are preferentially in strongly interacting systems and are in a
different merger stage than the kinematic close pairs. We identify merging galaxies using
three non-parametric parameters: the Gini coefficient (G), the second-order moment of
the brightest 20% of a galaxy’s pixels (M20), and the asymmetry measurement (A), all of
which have been shown to identify merger candidates (Conselice 2003; Conselice et al. 2003;
Lotz, Primack, & Madau 2004). We first select galaxies with morphological parameters of
G > −0.115 ∗ M20 + 0.384 or A > 0.25 (see Lotz et al. 2007 for discussion on G and
M20 in detail), and then we perform by-eye examinations of each object to keep only those
candidates that show apparent interaction signatures (eg., tidal tails, distorted morphology,
and double nuclei). This results in a sample of 56 merging systems.
For a fair comparison with isolated galaxies we also construct a sample of 1800 control
pairs, each of which consists of two galaxies randomly selected from galaxies that are iso-
lated, with no spectroscopic companion within 100 h−1kpc or photometric companion (with
observed mR < 1 mag) within 30 h−1kpc . Isolated galaxies have the same magnitude and
color cut as adopted for interacting galaxies.
– 5 –
2.3. Stellar Mass and Total IR Luminosity
Stellar masses are derived from rest-frame (B−V ) colors and absolute MB magnitude as
described by the models of Bell & de Jong (2001) and Bell et al. (2005), who find a scatter
of ∼0.3 dex in the resulting stellar mass estimates. These measurements were further refined
by comparison with the stellar masses derived by Bundy et al. (2006) using detailed fits to
the spectral energy distribution (SED). Empirically we find that the difference between the
masses estimated using the rest-frame colors and the SED fits is improved by making small
corrections for the redshift, rest-frame (U − B) and (B − V ) colors:
log10M∗
M⊙
= −0.4(MB − 5.48) + 1.737(B − V ) + 0.098(U − B)
−0.130(U − B)2 − 0.268z − 1.003. (1)
These terms have the effect of correcting the z = 0 measurements of Bell & de Jong (2001)
to the galaxy redshift as well as accounting for evolution in color. Masses estimated from
Equation 1 agree with those from full SED fits (when available; Bundy et al. 2006) to an
rms accuracy of 0.25 dex.
Local studies have shown that the rest-frame MIR luminosity is tightly correlated with
the total IR luminosity over a wide range of galaxy types (Roussel et al. 2001; Papovich & Bell
2002). This relation appears to hold up reasonably well to z ∼ 1 (Elbaz et al. 2002;
Appleton et al. 2004) and hence allows us to estimate the IR luminosity from the ob-
served flux of 24 µm corresponding to the rest-frame 11-21 µm flux over the redshift range
0.1 < z < 1.1. Following the same procedure adopted by Le Floc’h et al. (2005), we convert
the observed 24 µm flux into the total IR luminosity by fitting for each source using SEDs
from Chary & Elbaz (2001). 1 Because of the large PSF (FWHM 6”) of the 24 µm data,
we work on the total IR luminosity in pairs rather than the IR luminosity of each individual
galaxy. This also allows us to make comparisons to local ULIRGs, which are found to be
highly distorted merging systems (Sanders 1988; Borne et al. 1999), and to merger simula-
tions in the literature (Barnes 2004; Jonsson et al. 2006), which yield the total star formation
rate of the merger system. For each pair, we then calculate the mean IR luminosity-to-mass
ratio, LIR/M∗ , by summing the IR luminosity of both galaxies and dividing by the total
stellar mass of both components.
1Various template libraries lead to a scatter in this conversion of a factor of 2-3 (Le Floc’h et al. 2005).

– 6 –
3. RESULTS
Figure 1 shows the relation between LIR and M∗ for three of the galaxy samples. A
relatively tight correlation is seen for the control pairs, and the close pairs and mergers
are within the bounds of this relation but tend to occupy the upper region of LIR for a
given M∗ . In the highest redshift bin, the fraction of merging galaxies and close pairs more
massive than 2 × 10¹⁰M⊙ that are ULIRGs is 7.1% ± 4.3%, compared to 2.6% ± 0.7% for
the control sample. To address quantitatively the difference of LIR among those samples, we
compute the median LIR/M∗ for each sample. Using the median value of LIR/M∗ rather than
performing the K-S test avoids the problem of handling the upper limits. When calculating
the median LIR/M∗ , stellar mass cuts are further applied in each redshift bin (see Table 1).
Over the entire redshift range, the median LIR/M∗ of pairs and mergers is twice (1.9 ± 0.4)
that of the control sample. To assess if our results are sensitive to the method we have
adopted to estimate stellar masses, we also apply the same analysis on a subsample of the
data with stellar mass measurements derived from the SED-fitting procedure of Bundy et al.
(2006). The enhancement in LIR/M∗ increases to 3.1 ±1.3 in this case, consistent with our
initial result within the 1σ uncertainties.
An alternative way to investigate the effect of galaxy interactions on the star formation
rate is to study the dependence of LIR/M∗ on the pair separation, as shown in Figure 2. For
comparison, distributions of LIR/M∗ in control pairs are also shown along the right-hand
axes. The merging galaxies and close pairs possess higher median LIR/M∗ than wide pairs
and control pairs, as shown in Table 1, but also have a wider spread in LIR/M∗ . The
declining envelope of LIR/M∗ as a function of rp is similar to the behavior of the local pair
results reported by Barton et al. (2000), who use various sets of emission lines as the star
formation tracer. The median LIR/M∗ of wide pairs, on the other hand, becomes close to
that of the control pairs, indicating that the effect of galaxy interaction on star formation
activity is limited to several tens of h−1kpc .
4. DISCUSSION AND CONCLUSION
Using data from the DEEP2 Galaxy Redshift Survey with MIPS 24 µm imaging in the
EGS, we find that the combined IR luminosity at a given stellar mass of blue merging galaxies
and kinematic close pairs is greater by a factor of 1.9 ± 0.4 than that of control pairs ran-
domly drawn from blue isolated galaxies. This enhancement is consistent with low-redshift
studies of the SFR in galaxy pairs (Lambas et al. 2003; Nikolic, Cullen, & Alexander 2004).
In addition, we also observe a declining envelope of the LIR/M∗ with increased projected
separation of kinematic galaxy pairs. Based on the assumption that the IR emission is tightly

– 7 –
associated with the SFR, our results qualitatively support the picture of tidally triggered
starbursts as predicted in hydrodynamic simulations, although the effect is apparently not
large. The frequency of ULIRGs in massive interacting systems is only 7.1% ± 4.3% in the
highest redshift bin (0.75 < z < 1.1), and no ULIRGs are found below a combined stellar
mass for the pair of 4×10¹⁰M⊙. The mass ratio between two gas-rich galaxies may be a key
element in generating ULIRG luminosities (Dasyra et al. 2006), along with the dependence
on the combined stellar mass of the interacting system. The wide spread of specific star
formation rates in interacting galaxies found here (as inferred from the broad distribution of
LIR/M∗ ), and also seen in Barton et al. (2000), indicates that some other mechanism(s) may
determine the strength of the induced star formation as well – e.g., the galaxy structure, the
mass/luminosity ratio, the orbital configuration, and the existence of AGN and/or bar. For
example, studies by Lambas et al. (2003) and Woods, Geller, & Barton (2006) suggest that
pairs with comparable luminosity do show stronger star formation activity than pairs with a
larger luminosity contrast. The scatter in LIR/M∗ that we find could also be due to the fact
that these systems are in different stages of merging: some kinematic pairs are likely on their
first approach while others are being seen after their first passage. Another possibility is that
some of the close pairs selected by our rp and v criteria are not physical close pairs in
real space (as opposed to redshift space; Perez et al. 2006). Our results nevertheless provide
a constraint on the amount of induced star formation activity due to galaxy interactions at
z ∼ 0.1 − 1.1.
Finally, we note that tidally triggered star formation contributes moderately to the
high IR luminosity density at intermediate redshifts of 0.4 < z < 1.1. Lin et al. (2004)
estimated that the pair fraction (rp ≤50 h−1kpc and v ≤500 km s−1) of L∗ galaxies over
this redshift range is less than 15% and that the redshift evolution in the pair fraction is also
much lower than the rapid decline of IR luminosity density seen with decreasing redshift.
Additionally, the fraction of morphologically identified merging galaxies remains roughly
constant at 7% up to z ∼ 1 (Lotz et al. 2006). These results, when combined with the
moderate increase of star formation activity seen in interacting systems shown here, indicate
that the contribution of galaxy interactions to the total IR density at intermediate redshift is
. 36%. This is consistent with the conclusions from the studies of IR populations of various
morphology types by Bell et al. (2005) and Melbourne, Koo, & Le Floc’h (2005).
This Letter was prepared as part of the All-Wavelength Extended Groth International
Survey (AEGIS) collaboration. We thank S. M. Faber and P. Jonsson for useful discussions
and the anonymous referee for valuable comments; L. Lin acknowledges support from Taiwan
COSPA project, and from Taiwan NSC grant NSC94-2112-M-002-026 and NSC93-2917-I-
002-008. C. J. Conselice acknowledge an NSF Astronomy and Astrophysics Fellowship and

– 8 –
PPARC for support. A. L. Coil is supported by NASA through Hubble Fellowship grant
HF-01182.01-A. The DEEP2 project was supported by NSF grants AST00-71198, AST05-
07428 and AST05-07483. This work is based in part on observations made with the Spitzer
Space Telescope, which is operated by the Jet Propulsion Laboratory, California Institute
of Technology, under a contract with NASA. Support for this work was provided by NASA
through contract 1255094 issued by JPL/Caltech. We close with thanks to the Hawaiian
people for use of their sacred mountain.
REFERENCES
Appleton, P. N. et al. 2004, ApJS, 154, 147
Barnes, J. E. 2004, MNRAS, 350, 798
Barton, E. J., Geller M. J., & Kenyon S. J. 2000, ApJ, 530, 660
Bell, E. F. & de Jong, R. S. 2001, ApJ, 550, 212
Bell, E. F. et al. 2005, ApJ, 625, 23
Bergvall, N., Laurikainen, E., & Aalto, S. 2003, A&A, 405, 31
Borne, K. D., et al. 1999, Ap&SS, 266, 137
Bundy, K., Fukugita, M., Ellis, R. S., Kodama, T., & Conselice, C. J. 2004, ApJ, 601, L123
Bundy, K., et al. 2006, ApJ, 651, 120
Carlberg, R. G., et al. 2000, ApJ, 532, L1
Chary, R. & Elbaz, D. 2001, ApJ, 556, 562
Coil, A. L., et al. 2004, ApJ, 609, 525
Conselice, C. J. 2003, ApJS, 147, 1
Conselice, C. J., Bershady, M. A., Dickinson, M., & Papovich, C. 2003, AJ, 126, 1183
Cox, T. J. 2004, PhD thesis, UC Santa Cruz
Dasyra et al. 2006, ApJ, 638, 745
Davis, M., et al. 2003, SPIE, 4834, 161 (astro-ph/0209419)
– 9 –
Davis, M., et al. 2007, this volume
Elbaz, D., Cesarsky, C. J., Chanial, P., Aussel, H., Franceschini, A., Fadda, D., & Chary, R.
R. 2002, A&A, 384, 848
Jonsson, P., Cox, T. J., Primack, J. R., & Somerville, R. S. 2006, ApJ, 637, 255
Lambas, D. G., Tissera, P. B., Alonso, M. S., & Coldwell, G. 2003, MNRAS, 346, 1189
Larson, R. B., & Tinsley, B. M. 1978, ApJ, 219, 46
Le Floc’h, E., et al. 2005, ApJ, 632, 169
Lin, L. et al. 2004, ApJ, 617, L9
Lotz, J. M., Primack, J., & Madau, P. 2004, AJ, 128, 163
Lotz, J. M., et al. 2007, ApJ submitted (astro-ph/0602088)
Melbourne, J., Koo, D. C., & Le Floc’h, E. 2005, ApJ, 632, L65
Mihos, J. C., & Hernquist, L. 1996, ApJ, 464, 641
Nikolic, B., Cullen, H., & Alexander, P. 2004, MNRAS, 355, 874
Papovich, C., & Bell, E. F. 2002, ApJ, 579, L1
Patton, D. R., et al. 2002, ApJ, 565, 208
Perez, M. J., Tissera, P. B., Lambas, D. G., & Scannapieco, C. 2006, A&A, 449, 23
Rieke, G. H., et al. 2004, ApJS, 154, 25
Roussel, H., Sauvage, M.,Vigroux, L., & Bosma, A. 2001, A&A, 372, 427
Sanders, D. B., et al. 1988, ApJ, 325, 74
Weiner, B. J., et al. 2005, ApJ, 620, 595
Willmer, C. N. A., et al. 2006, ApJ, 647, 853
Woods, D. F., Gellar, M. J., & Barton, E. J. 2006, AJ, 132, 197
This preprint was prepared with the AAS LATEX macros v5.2.

– 10 –
Table 1. Properties of the pair sample
z Sample MB(individual) M∗(combined) No. d24 median LIR/M∗
0.1 < z <0.4 MG -21.7 ≤ MB ≤ -18.7 9.7≤log10M∗≤10.7 3(9) · · · · · ·
· · · close pair -21 ≤ MB ≤ -18 9.7≤log10M∗≤10.7 10(10) 68±10(%) 2.2±0.7
· · · wide pair -21 ≤ MB ≤ -18 9.7≤log10M∗≤10.7 17(20) 89±6(%) 1.3±0.1
· · · control pair -21 ≤ MB ≤ -18 9.7≤log10M∗≤10.7 480(600) 74±11(%) 1.0±0.3
0.4 < z <0.75 MG -22.7 ≤ MB ≤ -19.7 10≤log10M∗≤11 13(18) 62±13(%) 3.1±0.8
· · · close pair -22 ≤ MB ≤ -19 10≤log10M∗≤11 21(24) 71±7(%) 2.7±0.4
· · · wide pair -22 ≤ MB ≤ -19 10≤log10M∗≤11 44(54) 64±5(%) 1.7±0.3
· · · control pair -22 ≤ MB ≤ -19 10≤log10M∗≤11 502(600) 60±7(%) 1.5±0.4
0.75 < z <1.1 MG -23.7 ≤ MB ≤ -20.7 10.3≤log10M∗≤11.3 20(29) 73±10(%) 3.3±2.7
· · · close pair -23 ≤ MB ≤ -20 10.3≤log10M∗≤11.3 22(22) 76±7(%) 3.8±0.8
· · · wide pair -23 ≤ MB ≤ -20 10.3≤log10M∗≤11.3 45(52) 62±5(%) 1.5±0.2
· · · control pair -23 ≤ MB ≤ -20 10.3≤log10M∗≤11.3 547(600) 64±7(%) 1.9±0.5
Note. — MB is the rest-frame B-band magnitude of each galaxy in pairs. The luminosity range of merging galaxies (MGs)
is chosen to be twice as bright as that of individual galaxy in pairs because merging galaxies are assumed to be comprised
of two galaxies. M∗ is the stellar mass cut when computing the median LIR/M∗ and 24 µm detection rate d24. In the fifth
column, the values outside (inside) the parentheses are the numbers of paired systems with (without) a stellar mass cut.
Error bars quoted here are computed by bootstrapping.

– 11 –
9
10
11
12
log 1
0 (L
IR/L
Sun
)0.1<z<0.4 0.4<z<0.75
0.75<z<1.1
ULIRGs
LIRGs
ULIRGs
LIRGs
ULIRGs
LIRGscontrol blue-blue pairs
9
10
11
12
log 1
0 (L
IR/L
Sun
)0.1<z<0.4 0.4<z<0.75
0.75<z<1.1
ULIRGs
LIRGs
ULIRGs
LIRGs
ULIRGs
LIRGs
close blue-blue pairs
9
10
11
12
log 1
0 (L
IR/L
Sun
)0.1<z<0.4 0.4<z<0.75
0.75<z<1.1
ULIRGs
LIRGs
ULIRGs
LIRGs
ULIRGs
LIRGs
merging galaxies (G, M20, A)
9
10
11
12
log 1
0 (L
IR/L
Sun
)0.1<z<0.4 0.4<z<0.75
0.75<z<1.1
ULIRGs
LIRGs
ULIRGs
LIRGs
ULIRGs
LIRGs
9
10
11
12
log 1
0 (L
IR/L
Sun
)0.1<z<0.4 0.4<z<0.75
0.75<z<1.1
ULIRGs
LIRGs
ULIRGs
LIRGs
ULIRGs
LIRGs
9
10
11
12
log 1
0 (L
IR/L
Sun
)0.1<z<0.4 0.4<z<0.75
0.75<z<1.1
ULIRGs
LIRGs
ULIRGs
LIRGs
ULIRGs
LIRGs
9
10
11
12
log 1
0 (L
IR/L
Sun
)0.1<z<0.4 0.4<z<0.75
0.75<z<1.1
ULIRGs
LIRGs
ULIRGs
LIRGs
ULIRGs
LIRGs
9 9.5 10 10.5 11 11.5 12log10 M*
0.1<z<0.4 0.4<z<0.75
0.75<z<1.1
ULIRGs
LIRGs
ULIRGs
LIRGs
ULIRGs
LIRGs
9 9.5 10 10.5 11 11.5 12log10 M*
0.1<z<0.4 0.4<z<0.75
0.75<z<1.1
ULIRGs
LIRGs
ULIRGs
LIRGs
ULIRGs
LIRGs
9 9.5 10 10.5 11 11.5 12log10 M*
0.1<z<0.4 0.4<z<0.75
0.75<z<1.1
ULIRGs
LIRGs
ULIRGs
LIRGs
ULIRGs
LIRGs
9 9.5 10 10.5 11 11.5 12log10 M*
0.1<z<0.4 0.4<z<0.75
0.75<z<1.1
ULIRGs
LIRGs
ULIRGs
LIRGs
ULIRGs
LIRGs
9 9.5 10 10.5 11 11.5 12log10 M*
0.1<z<0.4 0.4<z<0.75
0.75<z<1.1
ULIRGs
LIRGs
ULIRGs
LIRGs
ULIRGs
LIRGs
9 9.5 10 10.5 11 11.5 12log10 M*
0.1<z<0.4 0.4<z<0.75
0.75<z<1.1
ULIRGs
LIRGs
ULIRGs
LIRGs
ULIRGs
LIRGs
9 9.5 10 10.5 11 11.5 12log10 M*
0.1<z<0.4 0.4<z<0.75
0.75<z<1.1
ULIRGs
LIRGs
ULIRGs
LIRGs
ULIRGs
LIRGs
9
10
11
12
9 9.5 10 10.5 11 11.5 12
log 1
0 (L
IR/L
Sun
)
log10 (M*/MSun)
0.1<z<0.4 0.4<z<0.75
0.75<z<1.1
ULIRGs
LIRGs
ULIRGs
LIRGs
ULIRGs
LIRGs
9
10
11
12
9 9.5 10 10.5 11 11.5 12
log 1
0 (L
IR/L
Sun
)
log10 (M*/MSun)
0.1<z<0.4 0.4<z<0.75
0.75<z<1.1
ULIRGs
LIRGs
ULIRGs
LIRGs
ULIRGs
LIRGs
9
10
11
12
9 9.5 10 10.5 11 11.5 12
log 1
0 (L
IR/L
Sun
)
log10 (M*/MSun)
0.1<z<0.4 0.4<z<0.75
0.75<z<1.1
ULIRGs
LIRGs
ULIRGs
LIRGs
ULIRGs
LIRGs
9
10
11
12
9 9.5 10 10.5 11 11.5 12
log 1
0 (L
IR/L
Sun
)
log10 (M*/MSun)
0.1<z<0.4 0.4<z<0.75
0.75<z<1.1
ULIRGs
LIRGs
ULIRGs
LIRGs
ULIRGs
LIRGs
9
10
11
12
9 9.5 10 10.5 11 11.5 12
log 1
0 (L
IR/L
Sun
)
log10 (M*/MSun)
0.1<z<0.4 0.4<z<0.75
0.75<z<1.1
ULIRGs
LIRGs
ULIRGs
LIRGs
ULIRGs
LIRGs
9
10
11
12
9 9.5 10 10.5 11 11.5 12
log 1
0 (L
IR/L
Sun
)
log10 (M*/MSun)
0.1<z<0.4 0.4<z<0.75
0.75<z<1.1
ULIRGs
LIRGs
ULIRGs
LIRGs
ULIRGs
LIRGs
9
10
11
12
9 9.5 10 10.5 11 11.5 12
log 1
0 (L
IR/L
Sun
)
log10 (M*/MSun)
0.1<z<0.4 0.4<z<0.75
0.75<z<1.1
ULIRGs
LIRGs
ULIRGs
LIRGs
ULIRGs
LIRGs
Fig. 1.— Total IR luminosity (LIR ) vs. stellar mass (M∗ ) for kinematic close pairs
(blue circles), control pairs (green crosses), and morphologically identified merging galaxies
(magenta triangles). Systems without a 24 µm detection are assigned low LIR values < 3×10⁹
L⊙. Horizontal red solid lines represent the IR thresholds for ULIRGs (LIR ≥ 1012 L⊙) and
LIRGs (LIR ≥ 1011 L⊙). Black dotted lines correspond to 70 µJy (5σ) in 24 µm at lower
and upper redshift limits. Arrows in the lower right corner of each panel show the scatter
(0.3 dex) in the conversion of 24 µm flux into total LIR between different template libraries.
It can been seen that the close pairs and merging galaxies possess higher LIR than control
pairs for a given M∗ .

– 12 –
0
5
100.1 < z< 0.4
9.7 < log10M* < 10.7
0
5
100.1 < z< 0.4
9.7 < log10M* < 10.7
0
5
100.1 < z< 0.4
9.7 < log10M* < 10.7
0
5
100.1 < z< 0.4
9.7 < log10M* < 10.7
0
5
10
15
20
L IR
/M*
(LS
un/M
Sun
)0.1 < z< 0.4
0.4 < z < 0.75
9.7 < log10M* < 10.7
10 < log10M* < 11
0
5
10
15
20
L IR
/M*
(LS
un/M
Sun
)0.1 < z< 0.4
0.4 < z < 0.75
9.7 < log10M* < 10.7
10 < log10M* < 11
0
5
10
15
20
L IR
/M*
(LS
un/M
Sun
)0.1 < z< 0.4
0.4 < z < 0.75
9.7 < log10M* < 10.7
10 < log10M* < 11
0
5
10
15
20
L IR
/M*
(LS
un/M
Sun
)0.1 < z< 0.4
0.4 < z < 0.75
9.7 < log10M* < 10.7
10 < log10M* < 11
0
5
10
15
20
0 100 200 300
∆rp (h-1kpc)
0.1 < z< 0.4
0.4 < z < 0.75
0.75 < z < 1.1
9.7 < log10M* < 10.7
10 < log10M* < 11
10.3 < log10M* < 11.3 ( 44.7 )
0
5
10
15
20
0 100 200 300
∆rp (h-1kpc)
0.1 < z< 0.4
0.4 < z < 0.75
0.75 < z < 1.1
9.7 < log10M* < 10.7
10 < log10M* < 11
10.3 < log10M* < 11.3 ( 44.7 )
0
5
10
15
20
0 100 200 300
∆rp (h-1kpc)
0.1 < z< 0.4
0.4 < z < 0.75
0.75 < z < 1.1
9.7 < log10M* < 10.7
10 < log10M* < 11
10.3 < log10M* < 11.3 ( 44.7 )
0
5
10
15
20
0 100 200 300
∆rp (h-1kpc)
0.1 < z< 0.4
0.4 < z < 0.75
0.75 < z < 1.1
9.7 < log10M* < 10.7
10 < log10M* < 11
10.3 < log10M* < 11.3 ( 44.7 )
0
5
10
15
20
0 100 200 300
∆rp (h-1kpc)
0.1 < z< 0.4
0.4 < z < 0.75
0.75 < z < 1.1
9.7 < log10M* < 10.7
10 < log10M* < 11
10.3 < log10M* < 11.3 ( 44.7 )
0
5
10
15
20
0 100 200 300
∆rp (h-1kpc)
0.1 < z< 0.4
0.4 < z < 0.75
0.75 < z < 1.1
9.7 < log10M* < 10.7
10 < log10M* < 11
10.3 < log10M* < 11.3 ( 44.7 )
0
5
10
15
20
0 100 200 300
∆rp (h-1kpc)
0.1 < z< 0.4
0.4 < z < 0.75
0.75 < z < 1.1
9.7 < log10M* < 10.7
10 < log10M* < 11
10.3 < log10M* < 11.3 ( 44.7 )
0
5
10
15
20
0.1 < z< 0.4
0.4 < z < 0.75
0.75 < z < 1.1
9.7 < log10M* < 10.7
10 < log10M* < 11
10.3 < log10M* < 11.3 ( 44.7 )
Fig. 2.— LIR/M∗ as a function of projected separation for kinematic galaxy pairs (blue
circles) and merging galaxies (magenta triangles) in three redshift bins. Merging galaxies
are assigned to rp ∼ 5 h−1kpc , which is the minimum separation of kinematic close pairs.
Galaxies with LIR > 1012 L⊙ (ULIRGs) are shown as larger symbols. Distributions of
LIR/M∗ in control pairs are also shown along the right-hand axes for comparison. Data
points at LIR/M∗ = 0 refer to those sources with no 24 µm detection. The number within
the parentheses in the bottom panel denotes the LIR/M∗ of the closest data point. Close
pairs (rp < 50 h−1kpc ) and merging galaxies are found to have a higher median LIR/M∗
and a wider spread of LIR/M∗ than those of wide pairs (rp > 50 h−1kpc ) or control pairs
(see Table 1).