Risk-Based Freeway Merging and Lane-Changing Decisions ...
148
Clemson University Clemson University TigerPrints TigerPrints All Dissertations Dissertations August 2021 Risk-Based Freeway Merging and Lane-Changing Decisions for Risk-Based Freeway Merging and Lane-Changing Decisions for Autonomous Vehicles Autonomous Vehicles Weimin Jin Clemson University, [email protected] Follow this and additional works at: https://tigerprints.clemson.edu/all_dissertations Recommended Citation Recommended Citation Jin, Weimin, "Risk-Based Freeway Merging and Lane-Changing Decisions for Autonomous Vehicles" (2021). All Dissertations. 2838. https://tigerprints.clemson.edu/all_dissertations/2838 This Dissertation is brought to you for free and open access by the Dissertations at TigerPrints. It has been accepted for inclusion in All Dissertations by an authorized administrator of TigerPrints. For more information, please contact [email protected].
-
Upload
khangminh22 -
Category
Documents
-
view
0 -
download
0
Transcript of Risk-Based Freeway Merging and Lane-Changing Decisions ...

Clemson University Clemson University
TigerPrints TigerPrints
All Dissertations Dissertations
August 2021
Risk-Based Freeway Merging and Lane-Changing Decisions for Risk-Based Freeway Merging and Lane-Changing Decisions for
Autonomous Vehicles Autonomous Vehicles
Weimin Jin Clemson University, [email protected]
Follow this and additional works at: https://tigerprints.clemson.edu/all_dissertations
Recommended Citation Recommended Citation Jin, Weimin, "Risk-Based Freeway Merging and Lane-Changing Decisions for Autonomous Vehicles" (2021). All Dissertations. 2838. https://tigerprints.clemson.edu/all_dissertations/2838
This Dissertation is brought to you for free and open access by the Dissertations at TigerPrints. It has been accepted for inclusion in All Dissertations by an authorized administrator of TigerPrints. For more information, please contact [email protected].
i
RISK-BASED FREEWAY MERGING AND LANE-CHANGING DECISIONS FOR
AUTONOMOUS VEHICLES
A Dissertation
Presented to
the Graduate School of
Clemson University
In Partial Fulfillment
of the Requirements for the Degree
Doctor of Philosophy
Civil Engineering
by
Weimin Jin
August 2021
Accepted by:
Dr. Mashrur “Ronnie” Chowdhury, Committee Chair
Dr. Patrick Gerard
Dr. Wayne Sarasua
Dr. Yunyi Jia
ii
ABSTRACT
The safe freeway merging and lane-changing operation for fully Autonomous
Vehicles (AVs) in mixed traffic (i.e., the presence of AVs and non-AVs in the traffic
stream) is a challenging task. The AV merging and lane-changing operation could
increase crash risks and reduce operational efficiency significantly in mixed traffic.
This dissertation quantifies the freeway merging crash risk and develops a
freeway merging decision strategy based on crash risk assessment for an AV attempting
to merge in the target lane with non-AVs. The performance of the risk-based merging
decision strategy is evaluated in uncongested, near-congested, and congested traffic
conditions. The analyses show that compared to the base scenarios, the risk-based
merging strategy causes less abrupt acceleration/deceleration of an AV’s immediate
upstream vehicle in the target lane on the freeway. The risk-based merging strategy meets
the requirement for the minimum safe gap between an AV intending to merge and the
immediate downstream vehicle in the target lane during the merging process. The risk-
based merging strategy also produces lower crash risk in terms of Time Exposed Time-
to-Collision (TET) and Time Integrated Time-to-Collision (TIT) compared to the base
scenarios. Moreover, the risk-based merging strategy has a shorter merging duration and
a lower impact on the average speed of traffic in the target lane compared to the base
scenarios.
This dissertation also quantifies the freeway lane-changing crash risk, establishes
risk models that help evaluate the lane-changing crash risk for an AV, and develops a
lane-changing decision strategy based on a two-stage crash-risk minimization process for
iii
an AV intending to change a lane. The lane-changing crash-risk minimization is
generated in the following two stages: (i) gap selection and (ii) lane-changing
maneuvering from the current lane to the target lane. The performance of the risk-based
lane-changing decision strategy is evaluated in a near-congested traffic condition. The
analyses show that compared to the base scenario, the risk-based lane-changing strategy
causes less abrupt acceleration/deceleration of an AV’s immediate upstream vehicle in
the target lane on the freeway. The risk-based lane-changing strategy outperforms the
base scenario in maintaining the minimum safe gap between an AV and its immediate
downstream vehicle in the target lane. The risk-based lane-changing strategy also
produces lower crash risk in terms of TET and TIT compared to the base scenario.
Moreover, the risk-based lane-changing strategy has a lower impact on the average speed
of traffic in the target lane compared to the base scenario.

iv
DEDICATION
I dedicate this dissertation to our beloved daughter, Zoey Jin.
v
ACKNOWLEDGMENTS
I would first sincerely appreciate my supervisor, Dr. Mashrur “Ronnie”
Chowdhury, for his guidance, encouragement, and support during the process of
completing this dissertation. Without his help, my dissertation could not be delivered
successfully.
I would then thank Dr. Patrick Gerard, Dr. Wayne Sarasua, and Dr. Yunyi Jia for
serving my committee members. I appreciate their time reviewing my dissertation and
providing insightful comments during the process, from the proposal to the defense of my
dissertation.
I would appreciate my wife, Fengjiao Zou, for her support on my decision on
pursuing my Ph.D. degree, her tireless efforts in taking care of our family, her company
during my Ph.D. journey in the U.S. Without her selfless devotion to my family, my
Ph.D. journey would not have succeeded. I would also appreciate the support and
unconditional love of my parents living in China.
I would thank my previous teammates in our Transportation Cyber-Physical-
Social Systems (TCPSS) Lab, including Mizanur Rahman, Sakib Kahn, Mhafuzul Islam,
Sabbir Salek, and Zadid Khan, for their help and support in my research and projects
conducted at Clemson University.
Finally, I would thank my brothers and sisters at church. More specifically, I
appreciate Keith Winship, Abby Winship, Carl Ureta, Jan Ureta, Lucas Clay, and Liwei
Hua for their spiritual and physical involvement in my life and family.
vi
TABLE OF CONTENTS
Page
TITLE PAGE .................................................................................................................... i
ABSTRACT ..................................................................................................................... ii
DEDICATION ................................................................................................................ iv
ACKNOWLEDGMENTS ............................................................................................... v
LIST OF TABLES ........................................................................................................ viii
LIST OF FIGURES ........................................................................................................ ix
CHAPTER
I. INTRODUCTION ......................................................................................... 1
1.1 Problem Statement ............................................................................. 1
1.2 Research Objectives ........................................................................... 4
1.3 Research Contributions ...................................................................... 4
1.4 Dissertation Organization .................................................................. 5
II. LITERATURE REVIEW .............................................................................. 7
2.1 Merging Decisions for Autonomous Vehicles ................................... 7
2.2 Merging Crash Risk Assessment for Autonomous
Vehicles.............................................................................................. 8
2.3 Lane-Changing Decisions for Autonomous Vehicles........................ 9
2.4 Lane Changing Crash Risk Quantification for
Autonomous Vehicles ...................................................................... 11
III. RESEARCH METHOD............................................................................... 13
3.1 Merging Decision Strategy for Autonomous Vehicles .................... 13
3.11 Overall Framework .................................................................... 13
3.12 Risk Identification ...................................................................... 15
3.13 Prior Crash Risk Prediction ....................................................... 17
3.14 Likelihood Estimation of Measured Gap ................................... 20
3.15 Posterior Crash Risk Prediction ................................................. 22

vii
Table of Contents (Continued)
Page
3.16 Vehicle Control Functions ......................................................... 24
3.2 Lane-Changing Decision Strategy for Autonomous Vehicles ......... 27
3.21 Overall Framework .................................................................... 27
3.21 Risk Identification ...................................................................... 31
3.22 Risk Model Development .......................................................... 34
3.23 Lane-Changing Decisions .......................................................... 36
IV. ANALYSIS AND FINDINGS .................................................................... 45
4.1 Analysis and Findings of Merging Decisions
for Autonomous Vehicles ................................................................ 45
4.11 Roadway Setup .......................................................................... 45
4.12 Experimental Setup .................................................................... 47
4.13 Safety-Related Evaluation Results ............................................. 51
4.14 Operational Efficiency ............................................................... 58
4.2 Analysis and Findings of Lane-Changing Decisions
for Autonomous Vehicles ................................................................ 61
4.21 Roadway Setup .......................................................................... 61
4.22 Experimental Setup .................................................................... 62
4.23 Safety-Related Evaluation Results ............................................. 65
4.24 Operational Efficiency ............................................................... 70
V. CONCLUSIONS AND RECOMMENDATIONS ...................................... 73
REFERENCES .............................................................................................................. 77
APPENDICES ............................................................................................................... 87
A: Sample Data for the Risk Model for the Merging Decision ........................ 88
B: Sample Data for the Risk Model for the Lane-Changing Decision ........... 115
C: Model Estimates for the Merging Decision ............................................... 134
D: Model Estimates for the Lane-Changing Decision .................................... 136

viii
LIST OF TABLES
Table Page
3.1 TTC values considered in different conditions ............................................ 17
3.2 Variables in the mixed-effects logistic regression ....................................... 20
3.3 Parameters for each type of gap ................................................................... 22
4.1 Comparison of TET and TIT for different strategies in
different roadway traffic conditions....................................................... 58
A-1 Variables used in the “prior” crash risk model ............................................ 88
A-2 Representative data for the “prior” crash risk model
considering the lead vehicle ................................................................... 88
A-3 Representative data for the “prior” crash risk model
considering the lag vehicle................................................................... 101
B-1 Variables for the risk model used at t1 ....................................................... 115
B-2 Representative data for the risk model used at t1 ....................................... 115
B-3 Variables for the risk model used at t2 ....................................................... 124
B-4 Representative data for the risk model used at t2 ....................................... 124
D-1 Confusion matrix for the risk model used at t1 .......................................... 137
D-2 Performance metrics for the risk model used at t1 ..................................... 137
D-3 Confusion matrix for the risk model used at t2 .......................................... 138
D-4 Performance metrics for the risk model used at t2 ..................................... 138

ix
LIST OF FIGURES
Figure Page
3.1 Risk-based merging decision framework ..................................................... 14
3.2 Illustration of an example of a merging scenario......................................... 15
3.3 MPC for an autonomous vehicle’s merging maneuver................................ 27
3.4 Lane-changing process for a subject AV ..................................................... 29
3.5 Risk-based lane-changing decision framework ........................................... 30
3.6 Illustration of an example of a lane-changing scenario ............................... 32
3.7 Flowchart of the lane-changing decision module ........................................ 37
3.8 Acceleration/deceleration process for AV seeking an
downstream gap ..................................................................................... 38
3.9 Acceleration/deceleration for seeking an upstream gap .............................. 41
3.10 Acceleration/deceleration in the lane-changing maneuvering ..................... 43
4.1 Roadway setup in the simulation ................................................................. 46
4.2 AV perception, planning and control functions
for the freeway merging ......................................................................... 48
4.3 Finite-state diagram for an AV merging ...................................................... 49
4.4 Vehicle hardware setup in the simulation .................................................... 49
4.5 Cumulative probabilities of the difference between the
measure gap and the minimum safe gap ................................................ 53
4.6 Cumulative probabilities of the acceleration/deceleration of
the lag vehicle ........................................................................................ 55
4.7 Comparison of the merging duration for different strategies
in different traffic conditions ................................................................. 59
4.8 Comparison of the average speed changes in the target lane
in different traffic conditions ................................................................. 60
4.9 Simulated environment ................................................................................ 62
4.10 Vehicle control functions considered for different
lane-changing decision strategies .......................................................... 65
4.11 Distribution of the difference between the measured gap
and the minimum safe gap ..................................................................... 67
4.12 Acceleration/deceleration of the lag vehicle during
the lane-changing maneuvering ............................................................. 68
4.13 TET and TIT ................................................................................................ 70
4.14 Total duration for different lane-changing strategies ................................... 71
4.15 Speed reduction for different lane-changing strategies ............................... 72

1
CHAPTER ONE
INTRODUCTION
1.1 Problem Statement
Roadway traffic crashes are significant public safety concerns in the U.S., where
94% of roadway traffic crashes are associated with human driver errors (NHTSA, 2018).
Fully autonomous vehicles, which take driving responsibilities away from human drivers,
could eliminate human driver errors and crashes associated with human driver errors
(NHTSA, 2018). However, many safety-related challenges to Autonomous Vehicles
(AVs) exist. The mixed traffic scenario (i.e., AVs traveling with non-AVs) adds
challenges to an AV’s safety. In the future, AVs will co-exist with other human-driven
vehicles on the roads. A study by Bhavsar et al. (Bhavsar et al., 2017) found that non-
AVs contributed to AV-involved crashes in mixed traffic. Challenges related to sensing
and communication technologies, and controller design significantly impact AV safety
(Sarker et al., 2019). Moreover, safety-related challenges amplify under different traffic
conditions, such as congested and non-congested.
In addition to roadway traffic conditions, complex roadway scenarios, such as the
freeway merging and lane changing, will add to AV safety challenges. Over 450,000
lane-changing and merging-related crashes occurred in the U.S. alone in 2015, and
around 16% of those crashes resulted in injuries (NHTSA, 2017). These challenges will
require evaluating an AV’s safety under different roadway scenarios.
2
Guaranteeing safety is always the highest priority in the operation of AVs in
mixed traffic (Sarker et al., 2019). Currently, AVs usually are programmed to drive
conservatively (Schwarting et al., 2019). However, an AV cannot be programmed to
achieve absolute safety without critically considering its operation in the merging lane.
Besides safety, AV driving strategies need to consider the functionality of an AV
merging in mixed traffic. An overly conservative AV driving strategy may hinder the
normal traffic flow and endanger other non-AVs in mixed traffic. For example, in 57% of
crashes between AVs and human-driven vehicles that occurred in 2018 in California, the
AVs were hit by human-driven vehicles primarily due to confusion triggered by AVs’
operation (Stewart, 2018). An ideal driving strategy for an AV in the freeway merging
area is to take a reasonable time to find a safe gap that will not result in any potential
crash risk with the surrounding non-AVs while an AV moves to the target lane on the
freeway.
Risky lane-changing maneuverings by vehicles negatively impact roadway traffic
safety (Chen et al., 2019; Guo et al., 2010; Sen et al., 2003). According to a National
Highway Traffic Safety Administration (NHTSA) report, almost 100% of lane-changing
crashes are due to human driver errors (Sen et al., 2003). AV technology promises to
eliminate errors associated with human drivers and eventually reduce the number of
roadway crashes significantly (Katrakazas et al., 2019). However, the mixed traffic adds
safety challenges to an AV’s lane-changing on freeways. Thus, a non-connected AV (i.e.,
no vehicle to vehicle or vehicle to infrastructure communications) needs to use its in-

3
vehicle sensors to perceive and predict its surrounding vehicles’ actions, and navigate
among them accordingly to ensure safe lane-changing maneuvering in mixed traffic.
Different lane-changing decision strategies exist for modeling a human driver’s
lane-changing behavior (Rahman et al., 2013). However, lane-changing decisions are
more complex for AVs, especially in a mixed traffic environment, where safety risk
assessment is critical. An AV should consider both the safety and the operational
efficacies for lane-changing maneuvers in mixed traffic. If a subject AV is overly
conservative, it will disrupt traffic flow in mixed traffic. Any inappropriate lane-changing
maneuvers performed by an AV will pose a crash risk between an AV and its
surrounding vehicles. Thus, it is necessary to develop an AV’s freeway lane-changing
decision strategy by considering safety risks in mixed traffic.
A lane-changing decision strategy of an AV may not ensure a safe lane-changing
maneuver if an AV does not assess the crash risk between an AV intending to change a
lane and its surrounding vehicles. An AV’s surrounding vehicles may include its
immediate upstream and downstream vehicles in the target lane and its immediate
upstream and downstream vehicles in the current lane of an AV. The lane-changing crash
risk between an AV and its surrounding vehicles must be evaluated during a lane-
changing operation. An AV may be overly cautious and stay longer in the current lane if
it is unwilling to take any risk. On the other hand, an AV may take a reasonable time to
change a lane if it takes an acceptable risk.

4
1.2 Research Objectives
The objectives of the dissertation are to:
1. Determine statistically significant factors associated with freeway merging
and lane-changing crash risks.
2. Develop risk models that help evaluate the freeway merging and lane-
changing crash risks of an AV in mixed traffic.
3. Develop freeway merging and lane-changing decision strategies based on risk
assessments by an AV in mixed traffic.
1.3 Research Contributions
Most of the existing literature focused on human-driven merging decision
strategies. A few studies focused on an AV’s merging decision strategies (Dong et al.,
2018; Marinescu et al., 2012). However, previous studies did not determine statistically
significant factors associated with the merging crash risk in an AV’s merging decision
process. These studies did not evaluate the merging crash risk of an AV in mixed traffic.
Without assessing the merging crash risk, the likelihood of a potential crash between a
merging AV and non-AVs in the target freeway lane could be high. The author
determines statistically significant factors associated with the freeway merging crash risk
and evaluates the merging crash risk for an AV merging in mixed traffic, which would
contribute to improving an AV controller design. The author develops a safe merging
strategy for an AV, based on risk assessment, which provides a better safety performance
than existing methods.
5
Most previous studies (Lin et al., 2019; Liu et al., 2019) did not quantify lane-
changing crash risk in mixed traffic. Few studies (Wang et al., 2020; Yang et al., 2018)
accounted for some safety indicators (e.g., minimum safe distance between the subject
AV and its downstream vehicle in the target lane) into the lane-changing decisions of the
AVs. Previous studies did not determine statistically significant factors associated with
lane-changing crash risk. Previous studies (Wang et al., 2020; Wang et al., 2020) only
considered safety between a subject AV and its immediate upstream and downstream
vehicles in the target lane. These studies did not consider safety risks between a subject
AV in the current lane and its immediate upstream and downstream vehicles in the
current lane. The author determines statistically significant factors associated with
freeway lane-changing crash risk. The author also considers the safety between an AV
and its surrounding vehicles, including its immediate upstream and downstream vehicles
in the target lane and immediate upstream and downstream vehicles in the current lane.
The author quantifies the lane-changing crash risk for an AV lane-change in mixed
traffic, which would contribute to improving an AV controller design. The author
develops a safe lane-changing strategy for an AV, based on risk assessment and risk
minimization, providing a better safety performance than existing methods.
1.4 Dissertation Organization
The remainder of the dissertation is organized as follows: literature review
(Chapter Two), research method (Chapter Three), analysis and findings (Chapter Four),
and conclusions and recommendations (Chapter Five). The literature review chapter
entails the previous studies on the following: merging decision strategies for an AV,

6
merging crash risk assessment for an AV, lane-changing decision strategies for an AV,
and lane-changing crash risk quantification for an AV. The risk-based merging and lane-
changing decision strategies for an AV are included in the research method chapter. The
roadway and experimental setup and safety and operational evaluation results of the
merging and lane-changing decision strategies for an AV are detailed in the analysis and
findings section. Finally, the dissertation presents conclusions and future research
directions in the conclusions and recommendations chapter.

7
CHAPTER TWO
LITERATURE REVIEW
2.1 Merging Decision Strategies for Autonomous Vehicles
Most merging decision strategies focused on human-driven vehicles. These
human-driven decision strategies are developed based on gap acceptance theories
(Ahmed, 1999; Hidas, 2005; Kondyli & Elefteriadou, 2011; Marczak et al., 2013).
However, decision strategies based on discrete choice modeling (Sun et al., 2014) and
game theory (Arbis & Dixit, 2019; Kang & Rakha, 2018) have been developed in
previous studies. Few studies developed merging decision strategies for AVs (Dong et
al., 2018; Garzón & Spalanzani, 2019; Wang & Chan, 2018). Dong et al. (Dong et al.,
2018) presented an intention-based merging where they focused on cooperative merging
for autonomous vehicles. They developed a planning method for an AV ramp merging in
a freeway. Their model, Multi-Merging Leading Probabilistic Graphical Model (MML-
PGM), provided the functionality for an AV in a merging scenario to estimate the
intentions of the human drivers in a merging area. They found that the MML-PGM
method has a lower collision rate than other methods presented by the studies (Galceran
et al., 2017; Marinescu et al., 2012). Garzón and Spalanzani (Garzón & Spalanzani,
2019) developed a merging decision strategy for an AV based on game theory. They
estimated the movements of other vehicles in the target lane and the vehicle’s reaction to
the movements of an AV. Their analysis showed that their strategy reduced the frequency
of collisions compared to a rule-based strategy. However, in their study, some scenarios

8
led to collisions between an AV and the other vehicles in the target lane. Wang and Chen
(Wang & Chan, 2018) developed a reinforcement learning algorithm on an AV merging
maneuver. They found that their algorithm enabled an AV to perform safe, smooth, and
timely merging operations. However, as their study used a reinforcement learning
algorithm, a large amount of reliable data is needed to train the model for AVs to perform
a merging operation.
There is no crash risk-based merging decision strategy for AVs in previous
literature to the best of the author’s knowledge. Evaluating the merging crash risk is
essential as the crash risk imposed on an AV may lead to a potential collision during the
merging process. To address this issue, the author focuses on the merging decision
strategy of AVs based on crash risk evaluation in different traffic conditions.
2.2 Merging Crash Risk Assessment for Autonomous Vehicles
Several studies investigated crash risk at freeway merging areas for human-driven
vehicles (Gu et al., 2019; Li et al., 2017; Yang & Ozbay, 2011). Few studies considered
the safety of an AV during the AV merging decisions. Wei et al. (Wei et al., 2013)
developed a cost function that considers safety. The safety cost includes two different
terms: clear distance and braking distance. The clear distance penalizes an AV moving
too close to the surrounding vehicles. The braking distance between two vehicles
considers the relative velocities between an AV and other vehicles. They found that a
cost function representing cooperation smoothness and safety decreases by 41.7%,
compared with methods that do not consider the intention of merging vehicles. Wang and
Chen (Wang & Chan, 2018) developed a reinforcement learning function on an AV’s

9
merging maneuver. Their reward function includes the distance between an AV and its
downstream vehicle and the distance between an AV and its upstream vehicle in the
target lane. They found that the reward function enables an AV to operate a safe merging
operation. Garzón and Spalanzani (Garzón & Spalanzani, 2019) developed a game
theory-based merging decision strategy. They placed a low reward value in the reward
function for an AV merging decision if there is a collision between an AV and other
vehicles or an AV goes out of the normal place in the roadway. However, their merging
decision strategy still led to some collisions based on their analysis.
Previous studies did not determine statistically significant factors associated with
the merging crash risk in an AV’s merging decision process. They did not evaluate the
merging crash risk of an AV in mixed traffic.
2.3 Lane-Changing Decision Strategies for Autonomous Vehicles
Yu et al. developed a game theory-based lane-changing decision strategy, which
considered the intentions of surrounding vehicles by estimating the driving
aggressiveness (Yu et al., 2018). Turning signal and lateral movement of the surrounding
vehicles were used to assess their driving aggressiveness. The game theory-based lane-
changing decision strategy used driver aggressiveness data to determine the timing and
acceleration of lane change. They used Simulink and dSPACE simulation platforms to
evaluate the performance of their game theory-based decision strategy. Their evaluation
results showed that the game theory-based decision strategy outperformed a rule-based
decision strategy in safe maneuvering by interacting with other vehicles.
10
Recently, several studies developed artificial intelligence-based lane-changing
decision models. Liu et al. (Liu et al., 2019) developed a lane-changing decision model
for AVs combining the Support Vector Machine (SVM) with the Bayesian parameters
optimization strategy. They analyzed the lane-changing decision from three different
factors: (i) lane-changing benefit in terms of improving the driving speed of the subject
AV; (ii) safety, which is avoiding collision between the subject AV and its upstream
vehicle in the target lane; and (iii) tolerance, which is reducing the number of
unnecessary lane changes. This SVM-based model considered these factors for
optimizing SVM model parameters. Liu et al. (Liu et al., 2019) found that the SVM-
based model performed better than a rule-based model in terms of operational efficiency
and the number of lane changes through their simulation and real-world experiments. In
another study, Wang et al. (Wang et al., 2019) developed a lane-changing decision model
combining deep reinforcement learning with rule-based constraints for AVs. They
evaluated their deep reinforcement learning decision approach in terms of average speed
and the average number of lane changes, and compared these two metrics to a rule-based
model in a simulation environment. They found that their model improved the average
speed and reduced the number of lane-changes than a rule-based model.
A recent study conducted by Wang et al. (Wang et al., 2020) developed a lane-
changing model that includes four components: (i) longitudinal control algorithm, (ii)
lane changing decision algorithm, (iii) lane-changing trajectory generation method, and
(iv) MPC-based trajectory tracking (Wang et al., 2020). This dynamic lane-changing
model mimicked human driving behaviors. Wang et al. (Wang et al., 2020) conducted

11
field experiments with four vehicles, including an autonomous vehicle and three human-
driven vehicles in a connected and autonomous vehicle testbed. They evaluated the
model’s performance in safety, comfort, and operational efficiency in four different
experimental runs. They found that the lane-changing model was efficient when the
human-driven vehicles were cooperative and generated AV trajectories were smoother
and safer than human-driven vehicles.
2.4 Lane Changing Crash Risk Quantification for Autonomous Vehicles
The quantification of the crash risk is very crucial for an AV lane-changing
decision strategy. However, previous studies (Ali et al., 2019; Lin et al., 2019; Xie et al.,
2019) did not quantify potential lane-changing crash risks for an AV. Few studies (Wang
et al., 2020; Yang et al., 2018) accounted for the safety indicators (e.g., minimum safety
distance between an AV and other vehicles in the target lane) in their lane-changing
decisions. Wang et al. (Wang et al., 2020) considered some safety indicators such as the
minimum safety distance and maximum deceleration in an AV lane-changing decision in
a mixed traffic environment. They used the minimum safety distance between an AV and
its downstream vehicle in the target lane. Based on Gipps’s safety distance algorithm
(Gipps, 1981), they determined the minimum safe distance for executing the lane-
changing for an AV. They also used the maximum deceleration of an AV’s upstream
vehicle in the target lane when an AV changed to the target lane. The maximum
deceleration also determined the lane-changing execution during the lane-changing
decision. Based on the analysis of vehicle trajectory in the field test, they found that their
model produced smoother and safer lane-changing maneuvers than human drivers.

12
A recent study conducted by Wang et al. (Wang et al., 2020) considered drivers’
risk perception in a mixed traffic environment for developing a lane-changing decision
strategy for AVs. They developed a lane change safety indicator using the minimum
safety deceleration (MSD) of the upstream vehicle in the target lane when the subject AV
performed a lane-changing maneuver. They utilized naturalistic driving data to calibrate
the MSDs. Based on their analysis, they found that MSD >= -0.85 m/s2 ensures an AV a
safe and polite lane-changing maneuver, and MSD >= -1.76 m/s2 ensures an AV a safe
lane-changing but may induce an aggressive lane-changing maneuver.
Previous studies did not determine statistically significant factors associated with
lane-changing crash risk. These studies did not consider the lane-changing crash risk
between the subject AV and its surrounding vehicles, including its immediate upstream
and downstream vehicles in the target lane and between the subject AV and its immediate
upstream and downstream vehicles in the current lane.
13
CHAPTER THREE
RESEARCH METHOD
3.1 Merging Decision Strategy for Autonomous Vehicles
3.1.1 Overall Framework
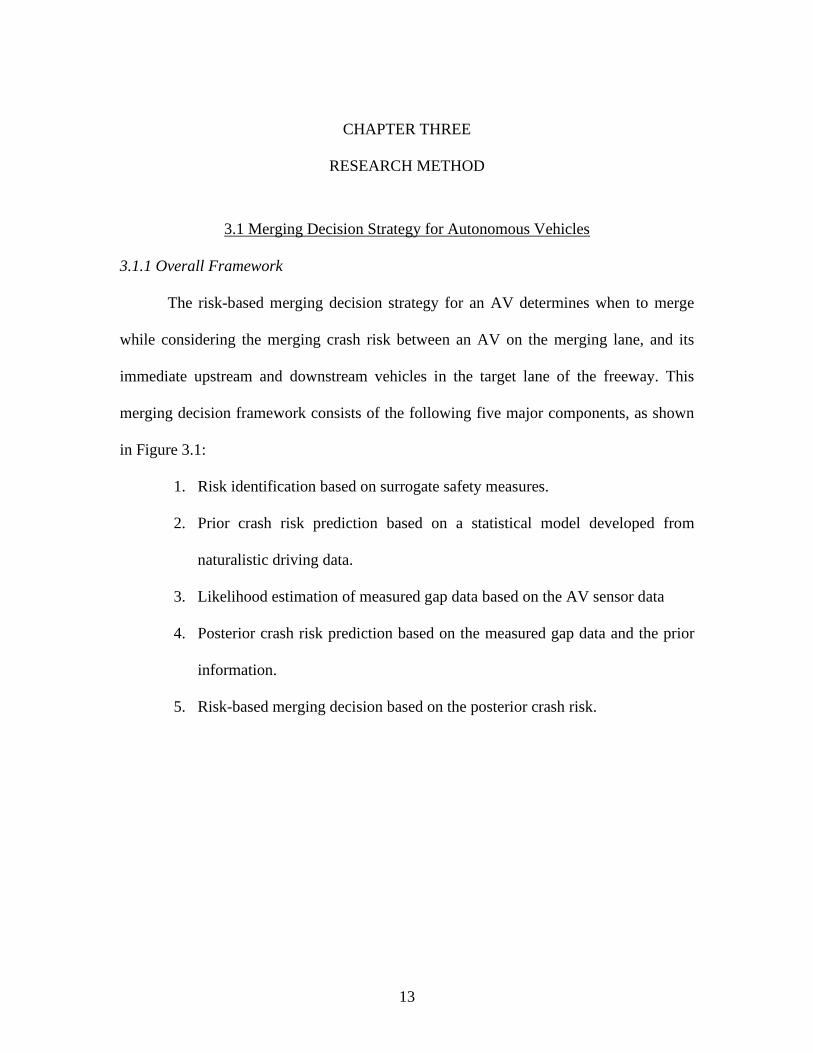
The risk-based merging decision strategy for an AV determines when to merge
while considering the merging crash risk between an AV on the merging lane, and its
immediate upstream and downstream vehicles in the target lane of the freeway. This
merging decision framework consists of the following five major components, as shown
in Figure 3.1:
1. Risk identification based on surrogate safety measures.
2. Prior crash risk prediction based on a statistical model developed from
naturalistic driving data.
3. Likelihood estimation of measured gap data based on the AV sensor data
4. Posterior crash risk prediction based on the measured gap data and the prior
information.
5. Risk-based merging decision based on the posterior crash risk.
14
Figure 3.1: Risk-based merging decision framework
As shown in Figure 3.1, the posterior crash risk prediction module uses Bayes’
theorem to update posterior information based on the prior information and the AV
sensor data. The advantage of the merging decision strategy developed in this study is
that it incorporates the prior information, including the relationship between the merging
crash risk and its contributing factors in a naturalistic driving environment. Another
advantage of the merging decision strategy is that it assesses the AV’s merging crash risk
in mixed traffic.
15
3.1.2 Risk Identification
In this section, the author discusses the risk identification method for a subject
vehicle intending to merge to the freeway target lane. The risk identification method
generally applies to any merging vehicle, which could be an AV or a non-AV. In the
subsequent sections, the author will refer to a subject merging vehicle’s upstream and
downstream vehicle in the target lane as “lag vehicle” and “lead vehicle”, respectively.
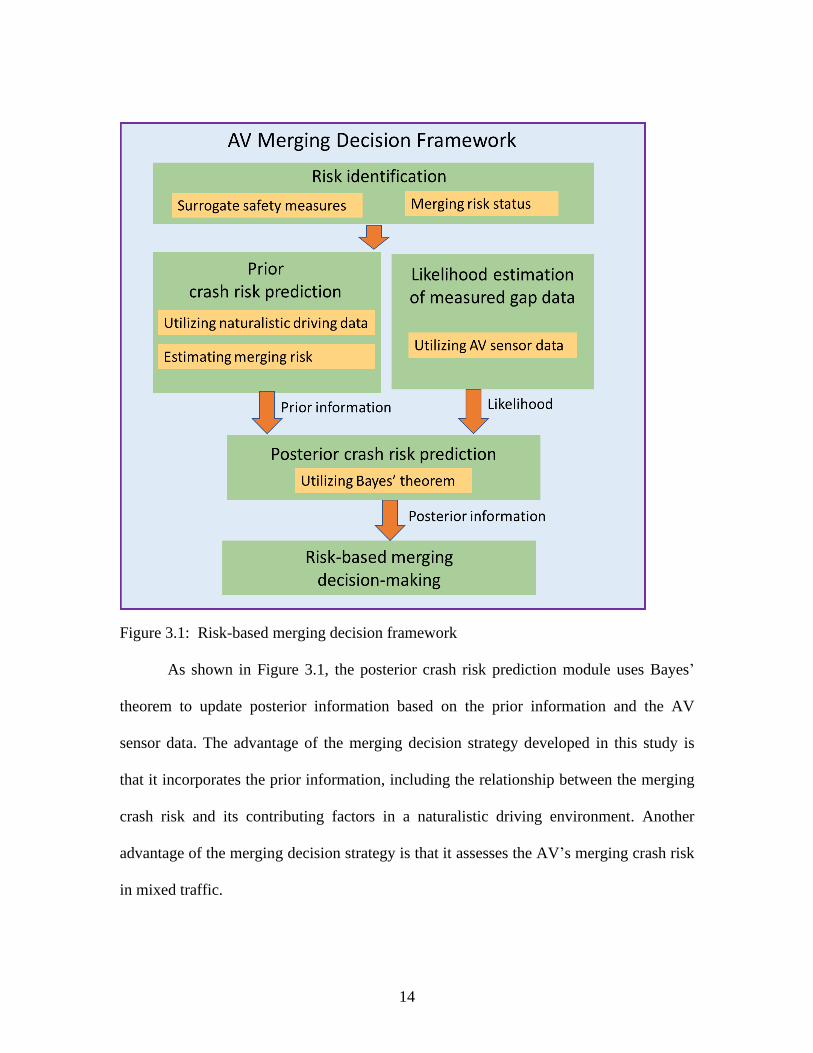
The author estimates the merging crash risk of the subject vehicle by identifying
potential conflicts between the subject vehicle and its immediate lead and lag vehicles in
the target lane. As shown in Figure 3.2, during the merging process, two possible
conflicts for the subject vehicle are considered in this study: i) conflict between the
subject vehicle and the lead vehicle in the target lane, ii) conflict between the subject
vehicle and the lag vehicle in the target lane.
Figure 3.2: Illustration of an example of a merging scenario
Time-to-Collision (TTC) is one of the surrogate safety indicators widely used in
previous studies (Gu et al., 2020; Li et al., 2017; Rahman et al., 2019). In general, if the

16
TTC value (TTC value is greater than or equal to zero) is small, a potential conflict
between the subject merging vehicle and the lead/lag vehicles in the target lane will arise,
which may result in crashes. A threshold for TTC is used to identify a conflict between
two vehicles at each time step t . An indicator variable, ( , )Conflict t j , is defined as
below.
( )0, if TTC>
,1, otherwise
Conflict t j
=
(3-1)
where, t is the time step. j is the Identification (ID) of a conflict. is the
threshold for TTC. The TTC threshold used in previous studies varied. Based on the
sensitivity analysis of previous studies (Li et al., 2017; Liu et al., 2021), they found that
using multiple TTC thresholds has no significant impact on their results related to safety
impacts. In this study, 2 seconds (i.e., 2 seconds) is used as the TTC threshold to indicate
a conflict between two vehicles. The TTC of 2 seconds is also adopted from previous
studies (Gu et al., 2020; Li et al., 2017; Rahman et al., 2019). The TTC is calculated
based on a previous study (Yang & Ozbay, 2011), which considered the speed,
acceleration, and position of two vehicles. The TTC can be computed by solving Eq. (3-
2):
21
02
a t V t D + − = (3-2)
where, a is the relative acceleration of two vehicles; t is the time; D is the
gap (i.e., the longitudinal distance between the rear bumper of the front vehicle and the
front bumper of the following vehicle) between two vehicles; V is the relative speed of
two vehicles.
17
There are two possible roots (i.e., 1t and 2t ) after solving Eq. (3-2):
2
1
2V V a Dt
a
− − + =
(3-3)
2
2
2V V a Dt
a
− + + =
(3-4)
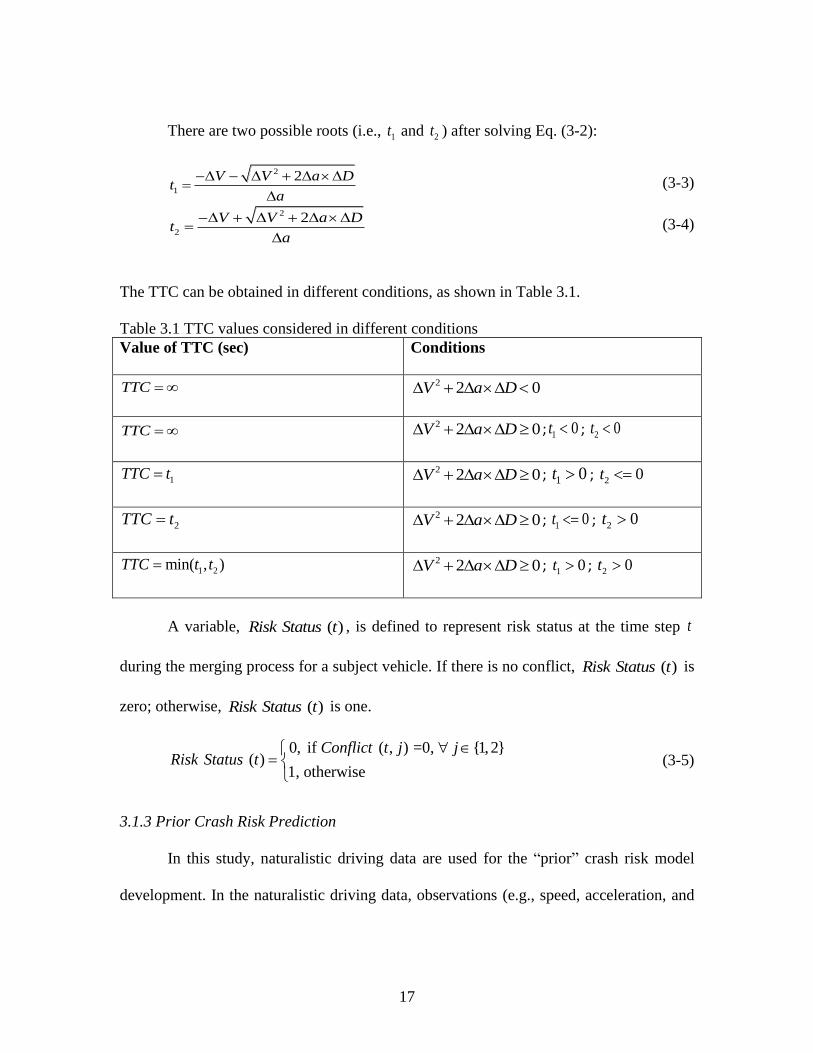
The TTC can be obtained in different conditions, as shown in Table 3.1.
Table 3.1 TTC values considered in different conditions
Value of TTC (sec) Conditions
TTC = 2 2 0V a D +
TTC = 2 2 0V a D + ; 1 0t ; 2 0t
1TTC t= 2 2 0V a D + ; 1 0t ; 2 0t =
2TTC t= 2 2 0V a D + ; 1 0t = ; 2 0t
1 2min( , )TTC t t= 2 2 0V a D + ; 1 0t ; 2 0t
A variable, ( )Risk Status t , is defined to represent risk status at the time step t
during the merging process for a subject vehicle. If there is no conflict, ( )Risk Status t is
zero; otherwise, ( )Risk Status t is one.
0, if ( , ) =0, {1,2}
( )1, otherwise
Conflict t j jRisk Status t
=
(3-5)
3.1.3 Prior Crash Risk Prediction
In this study, naturalistic driving data are used for the “prior” crash risk model
development. In the naturalistic driving data, observations (e.g., speed, acceleration, and

18
location of the vehicles) are usually measured repeatedly within the same vehicle.
Therefore, observations are more correlated within a vehicle than they are between
vehicles. A mixed-effects logistic regression model is used to consider the correlations
between observations within the same vehicle. The mixed-effects logistic regression
model is formulated as follows,
P( ( ) 1| )
ln1 P( ( ) 1| )
Risk Status t
Risk Status t
== +
− =
XXβ Ζu
X (3-6)
where, P( ( ) 1| )Risk Status t = X = the probability of there being a risky merging
event. Here, X represents a N p matrix of p explanatory variables. N is the number
of observations in the dataset used in the model. q
j
j
N n= . jn is the number of
observations within the vehicle j . q is the number of vehicles in the dataset. β
represents a 1p vector of the fixed effects regression coefficients. Ζ is the N q
matrix of q random effects. u is a 1q vector of the random effects. ~ (0, )Nu G . G is
the variance-covariance matrix of the random effects.
The probability of there being a risky merging event is derived as follows:
1
P( ( ) 1| )1 exp( )
Risk Status t = =+ −
XXβ
(3-7)
The mixed-effects logistic regression model is estimated using naturalistic
freeway driving data supported by the Next Generation Simulation (NGSIM) program
(FHWA, 2006). These data were initially collected on April 13, 2005, on I-80 in
Emeryville, California. Based on previous studies (Montanino & Punzo, 2013;

19
Montanino & Punzo, 2013; Punzo et al., 2011), researchers reconstructed the original
data to eliminate the unrealistic data regarding vehicle accelerations and decelerations
while preserving the driving dynamics. Therefore, the author uses the reconstructed
NGSIM data. These freeway vehicle trajectory data are suitable for this study because it
represents vehicles’ driving behaviors in the naturalistic driving environment. The author
uses the data to help evaluate the merging crash risk of an AV in mixed traffic. The
author uses passenger car data because the AV considered in this study is a passenger car.
In this study, a series of variables such as the speed, acceleration, and gap between the
merging vehicle and the lead/lag vehicles on the freeway, as shown in Table 3.2, are used
to develop the “prior” crash risk model. The data used for developing the mixed-effects
logistic regression model include the vehicle trajectory of 193 merging vehicles and their
immediate lead and lag vehicles on the freeway. In total, 13,746 observations (each
observation represents a data point including a series of variables of Table 3.2, measured
every 0.1 seconds) are used to develop the mixed-effects logistic regression model. The
representative sample data are shown in Appendix A.
The author uses open-source software R (R Core Team, 2013) to estimate the
coefficients of the mixed-effects logistic regression model. The generalized linear mixed
model (“glmer”) function in the R library “lme4” (Bates et al., 2015) is used to estimate
the coefficients of the mixed-effects logistic regression model.

20
Table 3.2 Variables in the mixed-effects logistic regression model
Variables Definition
Speed_Merge Speed of the merging vehicle (m/s)
Acce_Merge Acceleration of the merging vehicle (m/s2)
Speed_Lag Speed of the lag vehicle (m/s)
Acce_Lag Acceleration of the lag vehicle (m/s2)
Speed_Lead Speed of the lead vehicle (m/s)
Acce_Lead Acceleration of the lead vehicle (m/s2)
Gap_Lag Longitudinal distance between the merging vehicle and the lag
vehicle (m)
Gap_Lead Longitudinal distance between the merging vehicle and the lead
vehicle (m)
Remaining_Dist Distance between the position of merging vehicle and the endpoint
of the merging lane (m)
Spd_Dif_lag Speed difference between the merging vehicle and its lag vehicle
(m/s2)
3.1.4 Likelihood Estimation of Measured Gap
An AV can measure the gap between an AV in the merging area and the lead/lag
vehicles on the freeway using radar sensors. In the subsequent sections, the author will
refer to the gap between two vehicles as the longitudinal distance between the rear
bumper of the front vehicle and the front bumper of the following vehicle in this study.
To predict the likelihood of measured lead or lag gap given that an event is a risky

21
merging event or a non-risky merging event at a time step t , the author uses an
approximation, shown below,
| |
( | ) { } { }
( ) ( )
t t a t a
Gap E a Gap E a
P Gap a E P Gap a P Gap a
F a F a
= = = + − = −
= + − − (3-8)
where, | Gap EF is a Cumulative Distribution Function (CDF) of a gap given an
event E ( E could be a risky merging event or a non-risky merging event); a is a value
of the measured gap; a is an offset parameter, and 0.5 m is used.
The likelihood of the measured gap, ( | )kP Gap a E= is estimated for four types of
gaps: i) lead gap | ( ) 0Risk Status t = , lead gap given that an event is a non-risky merging
event; ii) lead gap | ( ) 1Risk Status t = , lead gap given that an event is a risky merging
event; iii) lag gap | ( ) 0Risk Status t = , lag gap given that an event is a non-risky merging
event; iv) lag gap | ( ) 1Risk Status t = , lag gap given that an event is a risky merging
event.
The Probability Density Functions (PDFs) for four different types of gaps are
estimated based on six-hour data (e.g., gap) for three different traffic conditions (i.e.,
uncongested, near-congested, and congested) from a microscopic traffic simulator,
SUMO (Lopez et al., 2018). The SUMO data is used to represent the gap distributions in
the traffic conditions and roadways where an AV will drive with human drivers. The
estimated parameters of the PDF for each type of gap are shown in Table 3.3. The model
estimation is conducted in R software using the function “fitdist” in the library
“fitdistrplus” (Delignette-Muller & Dutang, 2015). Different random distributions such as
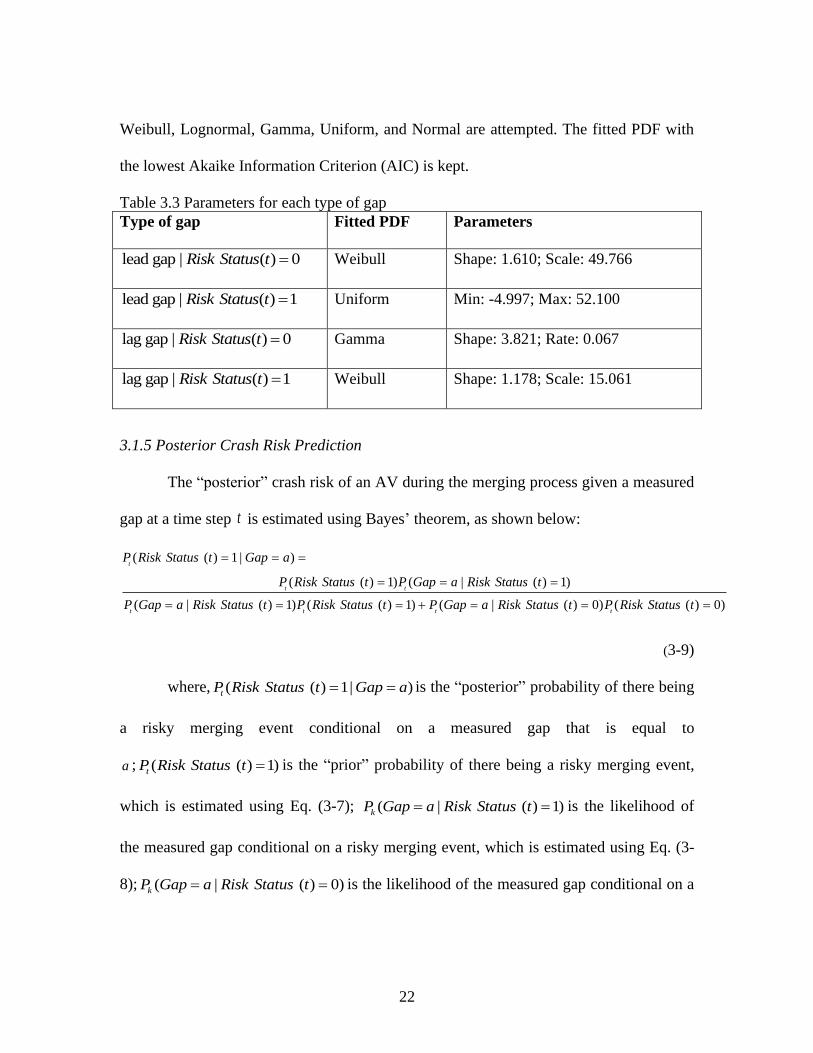
22
Weibull, Lognormal, Gamma, Uniform, and Normal are attempted. The fitted PDF with
the lowest Akaike Information Criterion (AIC) is kept.
Table 3.3 Parameters for each type of gap
Type of gap Fitted PDF Parameters
lead gap | ( ) 0Risk Status t = Weibull Shape: 1.610; Scale: 49.766
lead gap | ( ) 1Risk Status t = Uniform Min: -4.997; Max: 52.100
lag gap | ( ) 0Risk Status t = Gamma Shape: 3.821; Rate: 0.067
lag gap | ( ) 1Risk Status t = Weibull Shape: 1.178; Scale: 15.061
3.1.5 Posterior Crash Risk Prediction
The “posterior” crash risk of an AV during the merging process given a measured
gap at a time step t is estimated using Bayes’ theorem, as shown below:
( ( ) 1 | )
( ( ) 1) ( | ( ) 1)
( | ( ) 1) ( ( ) 1) ( | ( ) 0) ( ( ) 0)
t
t t
t t t t
P Risk Status t Gap a
P Risk Status t P Gap a Risk Status t
P Gap a Risk Status t P Risk Status t P Gap a Risk Status t P Risk Status t
= = =
= = =
= = = + = = =
(3-9)
where, ( ( ) 1| )tP Risk Status t Gap a= = is the “posterior” probability of there being
a risky merging event conditional on a measured gap that is equal to
a ; ( ( ) 1)tP Risk Status t = is the “prior” probability of there being a risky merging event,
which is estimated using Eq. (3-7); ( | ( ) 1)kP Gap a Risk Status t= = is the likelihood of
the measured gap conditional on a risky merging event, which is estimated using Eq. (3-
8); ( | ( ) 0)kP Gap a Risk Status t= = is the likelihood of the measured gap conditional on a
23
non-risky merging event, which is estimated using Eq. (3-8); ( ( ) 0)tP Risk Status t = is
the “prior” probability of there being a non-risky merging event, which is equal to
1 ( ( ) 1)tP Risk Status t− = .
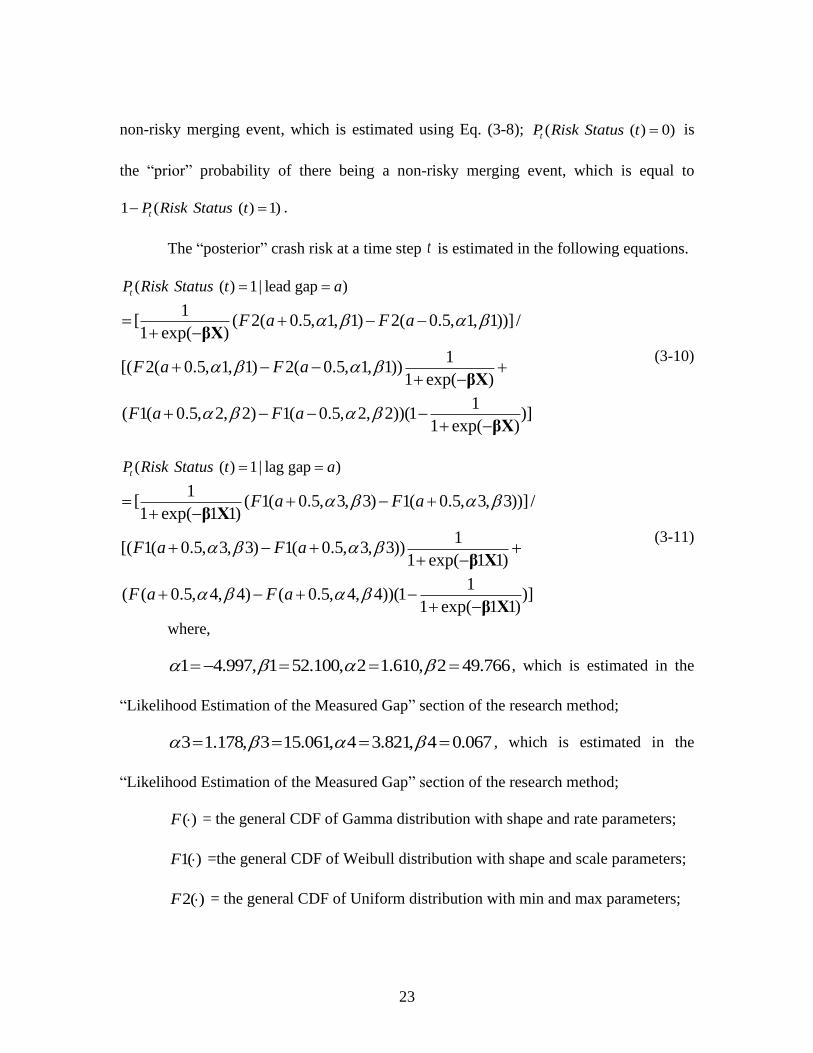
The “posterior” crash risk at a time step t is estimated in the following equations.
( ( ) 1| lead gap )
1[ ( 2( 0.5, 1, 1) 2( 0.5, 1, 1))] /1 exp( )
1[( 2( 0.5, 1, 1) 2( 0.5, 1, 1))
1 exp( )
1( 1( 0.5, 2, 2) 1( 0.5, 2, 2))(1 )]
1 exp( )
tP Risk Status t a
F a F a
F a F a
F a F a
= =
= + − −+ −
+ − − ++ −
+ − − −+ −
βX
βX
βX
(3-10)
( ( ) 1| lag gap )
1[ ( 1( 0.5, 3, 3) 1( 0.5, 3, 3))] /1 exp( 1 1)
1[( 1( 0.5, 3, 3) 1( 0.5, 3, 3))
1 exp( 1 1)
1( ( 0.5, 4, 4) ( 0.5, 4, 4))(1 )]
1 exp( 1 1)
tP Risk Status t a
F a F a
F a F a
F a F a
= =
= + − ++ −
+ − + ++ −
+ − + −+ −
β X
β X
β X
(3-11)
where,
1 4.997, 1 52.100, 2 1.610, 2 49.766 =− = = = , which is estimated in the
“Likelihood Estimation of the Measured Gap” section of the research method;
3 1.178, 3 15.061, 4 3.821, 4 0.067 = = = = , which is estimated in the
“Likelihood Estimation of the Measured Gap” section of the research method;
( )F = the general CDF of Gamma distribution with shape and rate parameters;
1( )F =the general CDF of Weibull distribution with shape and scale parameters;
2( )F = the general CDF of Uniform distribution with min and max parameters;

24
1.35, 0.44,0.05, 0.63, 0.50, 0.57− − − −=β , which is estimated in the “Prior Crash
Risk Prediction” section of the research method. The detailed model estimation results
are shown in Appendix C.
[1, Acce_Merge, Remaining_Distance, Speed_lead, Acce_lead, Gap_lead]T=X ;
1 -1.38,0.36,-4.08,4.72,0.03,5.67,-3.26=β , which is estimated in the “Prior
Crash Risk Prediction” section of the research method. The detailed model estimation
results are shown in Appendix C.
1 [ Remainin gg_Disd t, 1, Spee _Merge, Acce_Merge, Acce_lag, Gap_lag, Spd_Dif_la ]T
=X
Using Eq. (3-10) and Eq. (3-11), the probability of there being a risky merging
event can be determined.
3.1.6 Vehicle Control Functions
The vehicle control functions considered in this study include (i) control function
related to an AV preparing to merge, (ii) control function that supports an AV merging
process, and (iii) control function related to an AV after it completes the merging
maneuver. During the stage (i) and (iii), the longitudinal speed control is determined by a
well-developed car-following model, Intelligent Driver Model (IDM), which is related to
longitudinal movement. IDM has been implemented in the longitudinal control for both
human-driven vehicles and autonomous vehicles (Talebpour & Mahmassani, 2016; Wang
et al., 2020). During stage (i), there are two possible driving scenarios when an AV is
driving in the merging lane. Firstly, if a front vehicle is in the merging lane, an AV
follows the IDM to maintain the desired distance between an AV and its front vehicle in
25
the merging lane. Secondly, suppose there is no front vehicle in the merging lane. In that
case, an AV follows the IDM, assuming that there is a standstill front vehicle at the end
of the merging lane and decelerates gradually until an AV reaches the endpoint of the
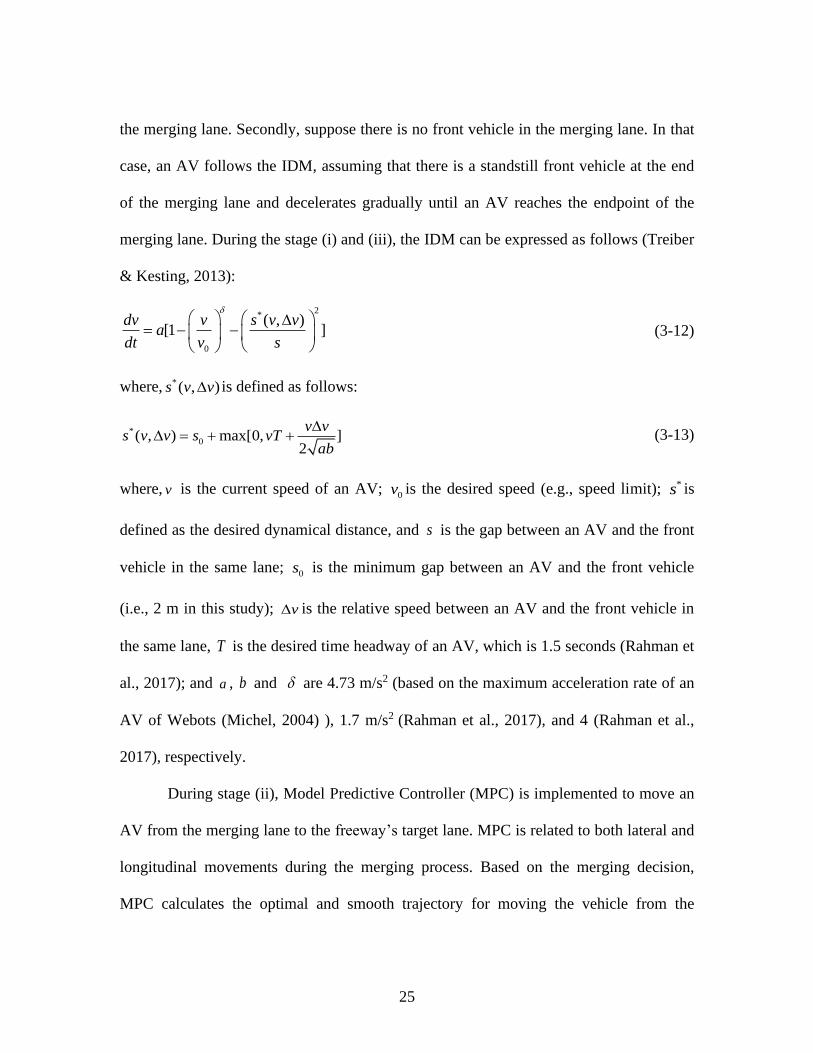
merging lane. During the stage (i) and (iii), the IDM can be expressed as follows (Treiber
& Kesting, 2013):
2*
0
( , )[1 ]
dv v s v va
dt v s
= − −
(3-12)
where, *( , )s v v is defined as follows:
*
0( , ) max[0, ]2
v vs v v s vT
ab
= + + (3-13)
where, v is the current speed of an AV; 0v is the desired speed (e.g., speed limit); *s is
defined as the desired dynamical distance, and s is the gap between an AV and the front
vehicle in the same lane; 0s is the minimum gap between an AV and the front vehicle
(i.e., 2 m in this study); v is the relative speed between an AV and the front vehicle in
the same lane, T is the desired time headway of an AV, which is 1.5 seconds (Rahman et
al., 2017); and a , b and are 4.73 m/s2 (based on the maximum acceleration rate of an
AV of Webots (Michel, 2004) ), 1.7 m/s2 (Rahman et al., 2017), and 4 (Rahman et al.,
2017), respectively.
During stage (ii), Model Predictive Controller (MPC) is implemented to move an
AV from the merging lane to the freeway’s target lane. MPC is related to both lateral and
longitudinal movements during the merging process. Based on the merging decision,
MPC calculates the optimal and smooth trajectory for moving the vehicle from the

26
merging lane to the target lane. As shown in Figure 3.3, the MPC uses the current vehicle
state (i.e., location, speed, heading, and steering wheel angle ) of an AV as a vehicle state
input. Then, the MPC uses the kinematic bicycle model to predict the future vehicle state
(Kong et al., 2015). The optimization model minimizes the cost function and produces
the optimized control input for an AV to move smoothly. The control input to an AV is
the steering wheel angle during the merging process. The following equation presents
the cost function, J , of the MPC:
2 2 2
1 , 2 ,, 3 ,1
h
i cte i d i diJ w C w C w C == + + (3-14)
,i cte i refC y y= − (3-15)
, 1i d i iC −= − (3-16)
, 1i d i iC −= − (3-17)
where, i is an AV’s heading at time step i (i.e., 0.02 seconds for each time step);
the cost term, ,i cteC , is the cross-track error (i.e., the distance between the centerline of the
current lane iy and the centerline of the target lane
refy ), ,i dC
is the heading difference
of an AV between two consecutive time steps. i is an AV’s steering wheel angle at time
step i . ,i dC
is the steering wheel angle difference of an AV between the two successive
time steps. The optimization model minimizes the cost function J by optimizing the
control input up to a defined time horizon, h ( 1 sh = is used in this study, so the time
horizon includes 50 time steps). While ,i cteC tries to move the vehicle to the target lane,
the cost terms ,i dC
and ,i dC
ensure a smooth trajectory with no abrupt movement during
the merging process. 1w ,
2w , and 3w are the weights for the associated cost terms (
1w ,

27
2w , and 3w are 1, 10, and 10, respectively in this study). In the MPC, there is one
constraint for the steering wheel angle, [ 0.25, 0.25] − + .
Figure 3.3 MPC for an autonomous vehicle’s merging maneuver
3.2 Lane-Changing Decision Strategy for Autonomous Vehicles
3.2.1 Overall Framework
The risk-based lane-changing decision strategy determines which gap a subject
AV should select, when a subject AV should start to change a lane, and how an AV
performs maneuvers to minimize the lane-changing crash risk effectively. Figure 3.4(a)
illustrates critical timestamps of a lane-changing process for a subject AV. 0t marks the
time when an AV decides to change lanes. In this study, the author assumes that 1) a
subject AV has already decided to change to the target adjacent lane on the freeway, and
2) a subject AV will not compete for the same gap with other vehicles intending to be in

28
the target lane by changing lanes. 1t marks the starting time of the lane-changing
maneuvering. 2t marks the time when an AV just crosses the lane marking between the
current lane and target lane. 4t marks the ending time of the lane-changing maneuvering.
The lane-changing process from 2t to
4t is the high lane-changing crash risk period.
Therefore, risk minimization should be performed before 2t to minimize the lane-
changing crash risk effectively. The risk-based lane-changing decision strategy is
developed based on a two-stage crash-risk minimization process generating in the
following: (i) gap selection in the current lane (i.e., the lane-changing process from 0t to
1t ), and (ii) lane-changing maneuvering in the current lane (i.e., the lane-changing
process from 1t to
2t ). In the gap selection stage, the subject AV evaluates the lane-
changing crash risk for its upstream and downstream gaps in the target lane, and
minimizes the lane-change crash risk from 1t to
4t , as shown in Figure 3.4(b). Suppose
the subject AV finds a downstream gap at 1t and starts to make lane-changing maneuvers,
as shown in Figure 3.4(c). The subject AV executes lane-changing maneuvering with a
suitable acceleration to minimize the lane-change crash risk from 2t to
4t , as shown in
Figure 3.4(d).

29
Figure 3.4 lane-changing process for a subject AV
The risk-based lane-changing decision framework consists of the following
modules: i) risk-identification module, ii) risk model-development module, and iii)
decision module, as shown in Figure 3.5. The risk-identification module identifies the
lane-changing crash risk based on surrogate safety measures.

30
In the risk model-development module, naturalistic driving data are utilized to
develop the risk model. Statistically significant factors associated with lane-changing
crash risk are identified in the model development. The risk model is used for risk
minimization in the AV lane changes. The risk minimization process is generated in the
following stages: (i) gap selection in the current lane, and (ii) lane-changing maneuvering
in the current lane. Based on the risk minimization, the decision module decides which
gap an AV should select, when an AV starts to execute a lane-change, and how an AV
performs maneuvers to minimize the lane-changing crash risk effectively.
Figure 3.5 Risk-based lane-changing decision framework
31
3.2.2 Risk Identification
In this section, the author discusses the risk-identification method for a subject
vehicle intending to change a lane on the freeway. The risk-identification method
generally applies to any lane-changing vehicle, which could be an AV or a non-AV. In
the subsequent sections, the author will refer to a subject vehicle’s upstream and
downstream vehicle in the target lane as “lag vehicle” and “lead vehicle”, respectively.
The author will refer to a subject vehicle’s upstream and downstream vehicle in the
current lane as “following vehicle” and “front vehicle”, respectively.
The author estimates the lane-changing crash risk of a subject vehicle by
identifying potential conflicts between a subject vehicle and its lead and lag vehicles in
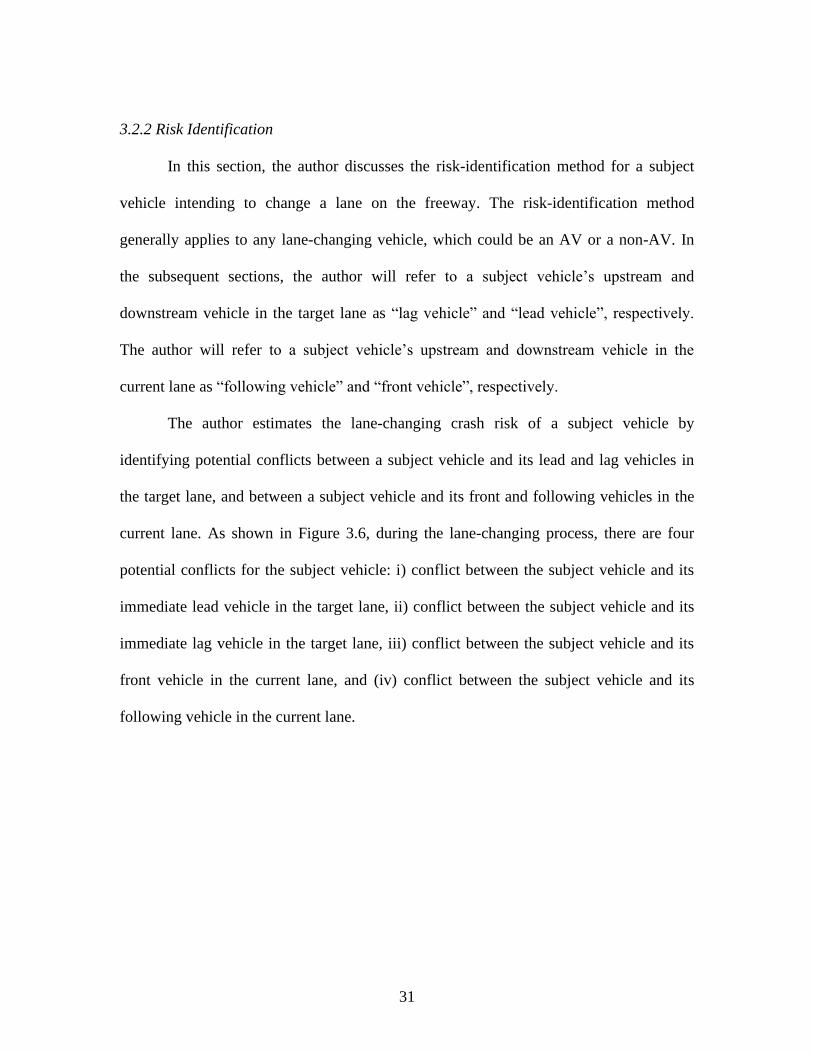
the target lane, and between a subject vehicle and its front and following vehicles in the
current lane. As shown in Figure 3.6, during the lane-changing process, there are four
potential conflicts for the subject vehicle: i) conflict between the subject vehicle and its
immediate lead vehicle in the target lane, ii) conflict between the subject vehicle and its
immediate lag vehicle in the target lane, iii) conflict between the subject vehicle and its
front vehicle in the current lane, and (iv) conflict between the subject vehicle and its
following vehicle in the current lane.

32
Figure 3.6 Illustration of an example of a lane-changing scenario
TTC has been widely used as one of the surrogate safety measures (Cai et al.,
2018; Li et al., 2016; Yang & Ozbay, 2011). A TTC threshold is used to indicate a
conflict between two vehicles at each time step t . An indicator variable, ( , )Conflict t j ,
is defined as below.
0,if TTC>
( , )1, otherwise
Conflict t j
=
(3-18)
where, t is the time step. j is the ID of a conflict. is the threshold for TTC.
The TTC threshold used in previous studies varied. Based on the sensitivity analysis of
previous studies (Li et al., 2017; Liu et al., 2021), they found that using multiple TTC
thresholds has no significant impact on the results related to safety impacts. In this study,
the TTC of 3 seconds is used as a threshold to identify conflicts between two vehicles.
The TTC of 3 seconds is also adopted from previous studies (Rahman et al., 2019; Van
Dijck & van der Heijden, 2005; Wakasugi, 2005). In this dissertation, the TTC is

33
calculated based on a previous study (Yang & Ozbay, 2011), which considered the
acceleration, speed, and position of two vehicles. The TTC calculation is detailed in the
“3.1.2 Risk Identification” section.
A variable, ( )Risk Status t , represents risk status (i.e., either conflict(s) or no
conflict) at time step t during lane-changing maneuvering for the subject vehicle, as
shown in Eq. (3-19). If there is no conflict, ( )Risk Status t is zero; otherwise,
( )Risk Status t is one.
0, if ( , ) =0, {1,2,3,4}
( )1, otherwise
Conflict t j jRisk Status t
=
(3-19)
Similarly, a variable Risk Status represents the lane-changing crash risk status
for a subject vehicle during the lane-changing maneuvering. Risk Status is formulated
using Eq. (3-20). ( ) /tN
LC
t
Risk Status t t T is the summation of all risk status at each
time step divided by the lane-changing maneuvering duration. If
( ) / 0tN
LC
t
Risk Status t t T = , Risk Status is zero. If ( ) / 0tN
LC
t
Risk Status t t T ,
Risk Status is one, for which it is considered as a risky lane-change.
0, if ( ) / 0
1, if ( ) / 0
t
t
N
LC
t
N
LC
t
Risk Status t t T
Risk Status
Risk Status t t T
=
=
(3-20)
where, tN is the total number of time steps during the lane-changing
maneuvering; LCT is the lane-changing maneuvering duration.
34
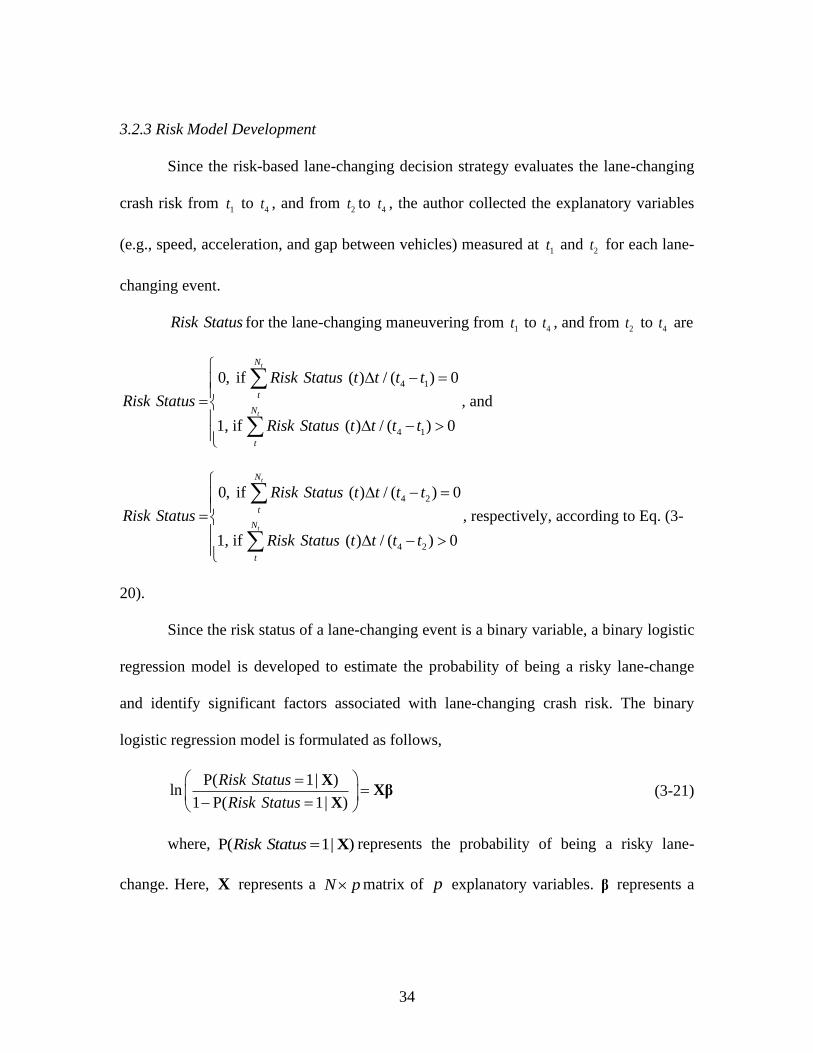
3.2.3 Risk Model Development
Since the risk-based lane-changing decision strategy evaluates the lane-changing
crash risk from 1t to
4t , and from 2t to
4t , the author collected the explanatory variables
(e.g., speed, acceleration, and gap between vehicles) measured at 1t and
2t for each lane-
changing event.
Risk Status for the lane-changing maneuvering from 1t to
4t , and from 2t to
4t are
4 1
4 1
0, if ( ) / ( ) 0
1, if 0
( ) / ( )
t
t
N
t
N
t
Risk Status t t t t
Risk Status
Risk Status t t t t
− =
= −
, and
4 2
4 2
0, if ( ) / ( ) 0
1, if 0
( ) / ( )
t
t
N
t
N
t
Risk Status t t t t
Risk Status
Risk Status t t t t
− =
= −
, respectively, according to Eq. (3-
20).
Since the risk status of a lane-changing event is a binary variable, a binary logistic
regression model is developed to estimate the probability of being a risky lane-change
and identify significant factors associated with lane-changing crash risk. The binary
logistic regression model is formulated as follows,
P( | )ln
1
P 11 ( | )
Risk Status
Risk Status
=
=
− =
XXβ
X (3-21)
where, P( | ) 1Risk Status = X represents the probability of being a risky lane-
change. Here, X represents a N p matrix of p explanatory variables. β represents a
35
1p vector of the regression coefficients. The probability of being a risky lane-change
can be formulated as presented in Eq. (3-22).
1
P( | )1 exp( )
1Risk Status ==+ −
XXβ
(3-22)
The logistic regression model is developed using the naturalistic driving data
supported by the NGSIM program (FHWA, 2006). The author uses these data to develop
the logistic regression model to understand better the lane-changing crash risk in the
naturalistic driving environment. These data were collected on a freeway segment in
California. According to previous studies (Montanino & Punzo, 2013; Montanino &
Punzo, 2013; Punzo et al., 2011), researchers reconstructed the original data to i)
eliminate the unrealistic data regarding vehicle accelerations and decelerations and ii)
smooth out the random disturbances in the data, while preserving the driving dynamics.
These freeway vehicle trajectory data are suitable for this study because it provides
vehicles’ driving behaviors in a naturalistic driving environment. These data are used to
help evaluate the lane-changing crash risk of an AV in mixed traffic. In this study, a
series of variables, such as the speed and acceleration of lane-changing vehicles and the
surrounding vehicles on the freeway and the gap between the lane-changing vehicle and
the surrounding vehicles, are used to develop the logistic regression model. The author
extracts data related to the lane-changing vehicles and their immediate front and
following vehicle in the current lane and immediate lead and lag vehicles in the target
lane. The author only uses passenger car data for the model development. The author
extracted 420 lane-changing events, which are at least involved with the lane-changing

36
vehicle, its immediate lead and lag vehicles in the target lane, and its immediate front
vehicles in the target lane, are analyzed. The representative sample data are shown in
Appendix B. The detailed model estimation results are shown in Appendix D.
3.2.4 Lane-Changing Decisions
Figure 3.7 shows the logic of the lane-changing decision module for the gap
selection and lane-changing maneuvering stages. The author minimizes lane-changing
crash risks for multiple gaps available for a subject AV based on the risk minimization
and risk assessment. The lane-changing crash risk can be acceptable when a suitable gap
is selected for a subject AV intending to make a lane-change. Initially, a subject AV
assesses a downstream gap. A subject AV will plan longitudinal acceleration/deceleration
to minimize the lane-changing crash risk for the downstream gap and assess the lane-
changing crash risk for the downstream gap. If the lane-changing crash risk related to a
subject AV for moving into the downstream gap in the target lane is acceptable, a subject
AV will go for the downstream gap. TTCs between a subject AV and its lead vehicle, and
between a subject AV and its lag vehicle are also assessed to ensure safety before the
subject AV makes lane-changing maneuvering. If both TTCs between a subject AV and
its lead vehicle, and between a subject AV and its lag vehicle are greater than thresholds,
the lane-changing maneuvering stage will be triggered. Suppose the lane-changing crash
risk related to a subject AV for moving into the downstream gap in the target lane is not
acceptable. In that case, a subject AV will assess the lane-changing crash risk for an
upstream gap and prepare longitudinal acceleration/deceleration to minimize the lane-
changing crash risk for the upstream gap. If the lane-changing crash risk related to a

37
subject AV for moving into the upstream gap in the target lane is acceptable, a subject
AV will go for the upstream gap. If both TTCs between a subject AV and its lead vehicle,
and between a subject AV and its lag vehicle are greater than thresholds, the lane-
changing maneuvering stage will be triggered. Suppose neither the lane-changing crash
risk for the upstream gap nor the lane-changing crash risk for the downstream gap is
acceptable. In that case, a subject AV maintains the speed provided by the IDM, until the
next decision cycle comes.
Minimize risk for a
downstream gap
Execute suitable acceleration of
the AV for seeking a
downstream gap
Yes
No
Minimize risk for an upstream
gap
Yes
No
Minimize risk for the lane-
change maneuvering
Execute suitable acceleration of the AV for the lane-change maneuvering
Execute suitable acceleration of
the AV for seeking an
upstream gap
Start
End
Gap Selection Stage
Lane-change Maneuvering
Stage
Risk for a downstream gap
is acceptable?
TTC is greater than a
threshold?
Yes
TTC is greater than a
threshold?
Risk for an upstream gap is acceptable?
Yes
No
No
Continue
Continue
Continue
Figure 3.7 Flowchart of the lane-changing decision module

38
Gap Selection Stage
This section discusses acceleration/deceleration processes for a subject AV to go for the
upstream and downstream gaps in the target lane. Longitudinal acceleration/deceleration
is determined to achieve the desired position to minimize the lane-changing crash risk for
the upstream and downstream gaps.
Scenario 1: AV is seeking a downstream gap
Figure 3.8 shows an acceleration/deceleration process for a subject AV to go for a
downstream gap. Longitudinal acceleration/deceleration is performed to achieve the
desired position to minimize the lane-changing crash risk. Here, the
acceleration/deceleration process starts at an initial position and ends at the desired
position that minimizes the lane-changing crash risk.
Figure 3.8 Acceleration/deceleration process for AV seeking a downstream gap
The optimization objective for seeking a downstream gap is:
1
1 exp( )adj adj
Min+ −X β
(3-23)

39
subject to,
2 2,1 ,1 1 1 min
1 1
2 2
adjtadjt
AV AV AV adj AV adj adj adjD D v t a t v t a t D= + + − −
2 2,4 4 4 ,4 min
1 1
2 2
frontfront
AV adj adj AV AV adj AV adjD v t a t D v t a t D= + + − −
2 2,3 3 3 ,3 min
1 1
2 2
adjadj
AV adj adj AV AV adj AV adjD v t a t D v t a t D= + + − −
0 3adjt
4.6 4AVa−
4 4 3 3[1, , , ]adj AV AV adj adj adjv a t v a t v a t= + + +X
[2.24,0.23, 0.19, 0.13]T
adj = − −β
Decision variables are AVa ,and
adjt .
As shown in Figure 3.8, 1v is the speed of the lag vehicle in the target lane at the
initial position. 1a is the acceleration of the lag vehicle in the target lane at the initial
position. ,1
adjt
AVD is the lag gap at the initial position. ,1
adjt
AVD is the lag gap at the final
position. ,3
adj
AVD is the lead gap at the initial position. ,3
adj
AVD is the lead gap at the final
position. 3v is the speed of the lead vehicle in the target lane at the initial position.
3a is
the acceleration of the lead vehicle in the target lane at the initial position. ,4
front
AVD is the
front gap at the initial position. ,4
front
AVD is the front gap at the final position. AVv is the
initial speed of the AV at the initial position.AVa is the desired acceleration for the AV to

40
seek a downstream gap. Here, 4.6 4AVa− is considered based on a previous study
(Wang et al., 2020). adjt is the time spent for the AV to move from the initial position to
the final position. 3 seconds is considered as the maximum time. A longer time may
increase the lane-changing preparation time (i.e., the time between 0t to
1t ) and
negatively impacts the traffic, especially for the following vehicles in the current lane.
minD is the minimum gap and 2 m is considered in this study. adjX is the vector of
explanatory variables in the risk model. Based on the model estimation, the speed of the
subject AV, the speed of Vehicle 4, and the speed of Vehicle 3 are kept as explanatory
variables to achieve the best model performance in terms of Akaike Information Criterion
(AIC). adjβ is the vector of regression coefficients in the risk model.
Scenario 2: AV is seeking an upstream gap
Figure 3.9 shows an acceleration/deceleration process for the subject AV to go for
an upstream gap. The longitudinal acceleration/deceleration is performed to achieve the
desired position to minimize the lane-changing crash risk. Here, the
acceleration/deceleration process starts from an initial position (i.e., the AV is near the
downstream gap) and ends in the final position (i.e., the AV is near the upstream gap),
which minimizes the lane-changing crash risk.

41
Figure 3.9 Acceleration/deceleration for seeking an upstream gap
The optimization objective for seeking an upstream gap is:
1
1 exp( )back back
Min+ −X β
(3-24)
subject to,
2 2,4 4 4 ,4 min
1 1
2 2
frontfront
AV back back AV AV back AV backD v t a t D v t a t D= + + − −
2 2
2, 2,1 1, 2 2 min
1 1
2 2
back back adjt
AV AV AV back AV back back backD D D L v t a t v t a t D= + + + + − −
2 2
min1, 1 1 1,
1 1
2 2back back back back
back adjtAV AV AV AV DD v t a t D L v t a t− = + − − −
4.6 4AVa−
0 3backt
4 4 1 1[1, , , ]back AV AV back back backv a t v a t v a t= + + +X
[2.24,0.23, 0.19, 0.13]T
back = − −β
Decision variables are AVa , and
backt .

42
As shown in Figure 3.9, ,1backAVD is the gap between the vehicle 1 and the AV. L is
the vehicle length, and 5 m is considered in this study. 1v is the initial speed of Vehicle 1.
1a is the initial acceleration of Vehicle 1. backt is the time spent for the AV moving from
the initial position to the final position. 3 seconds is considered as the maximum time. A
longer time may increase the lane-changing preparation time and negatively impact
traffic, especially for the following vehicles in the current lane. 2,1backD is the gap between
Vehicle 1 and Vehicle 2. 2v is the initial speed of Vehicle 2; 2a is the initial acceleration
of Vehicle 2. 2,back
AVD is the gap between Vehicle 2 and the AV in the final position. backX
is the vector of explanatory variables in the risk model. Based on the model estimation,
the speed of the subject AV, the speed of Vehicle 4, and the speed of Vehicle 1 are kept
as explanatory variables to achieve the best model performance in terms of AIC. backβ is
the vector of regression coefficients in the risk model.
Lane-changing Maneuvering Stage
After the gap selection process determines the target gap (i.e., upstream gap or
downstream gap), the decision module decides the acceleration of a subject AV moving
from the initial position to a subject AV’s final position in the lane-changing
maneuvering. Figure 3.10(a) shows the speed, acceleration, and position of a subject AV
and its lead, lag, and front vehicles when the subject AV initiates the lane-changing
maneuvering in the current lane at the initial position. Figure 3.10(b) shows the final
position of the subject AV and the lead and lag vehicles when the subject AV just crosses
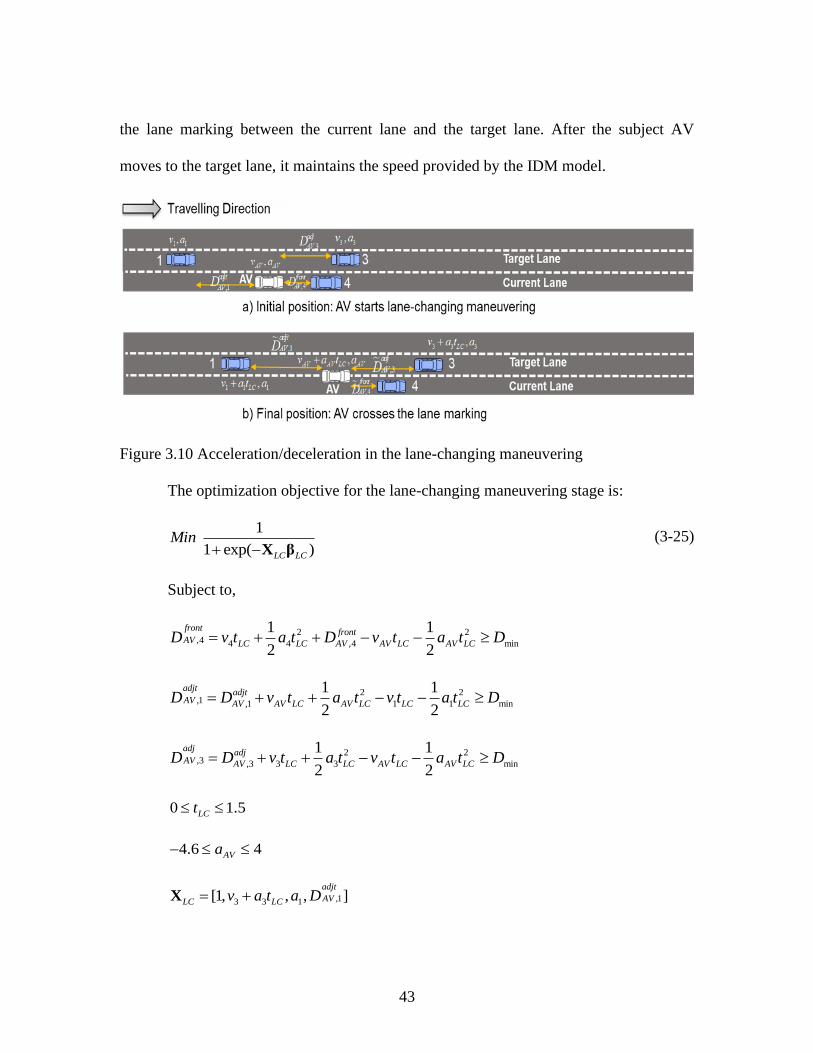
43
the lane marking between the current lane and the target lane. After the subject AV
moves to the target lane, it maintains the speed provided by the IDM model.
Figure 3.10 Acceleration/deceleration in the lane-changing maneuvering
The optimization objective for the lane-changing maneuvering stage is:
1
1 exp( )LC LC
Min+ −X β
(3-25)
Subject to,
2 2,4 4 4 ,4 min
1 1
2 2
frontfront
AV LC LC AV AV LC AV LCD v t a t D v t a t D= + + − −
2 2,1 ,1 1 1 min
1 1
2 2
adjtadjt
AV AV AV LC AV LC LC LCD D v t a t v t a t D= + + − −
2 2,3 ,3 3 3 min
1 1
2 2
adjadj
AV AV LC LC AV LC AV LCD D v t a t v t a t D= + + − −
0 1.5LCt
4.6 4AVa−
,13 3 1[1, , , ]adjt
AVLC LCv a t a D= +X
44
[0.78, 0.002,0.13, 0.06]T
LC = − −β
Decision variables areAVa , and
LCt .
LCt is the desired time for the subject AV crossing the lane marking between the
current lane and the target lane. Here, 1.5 seconds is considered as the maximum time
based on multiple experiments in this study. LCX is the vector of explanatory variables in
the risk model. Based on the model estimation, the speed of Vehicle 3, the acceleration of
Vehicle 1, and the gap between the subject AV and Vehicle 1 are kept as explanatory
variables to achieve the best model performance in terms of AIC. Lcβ is the vector of
coefficients in the risk model.
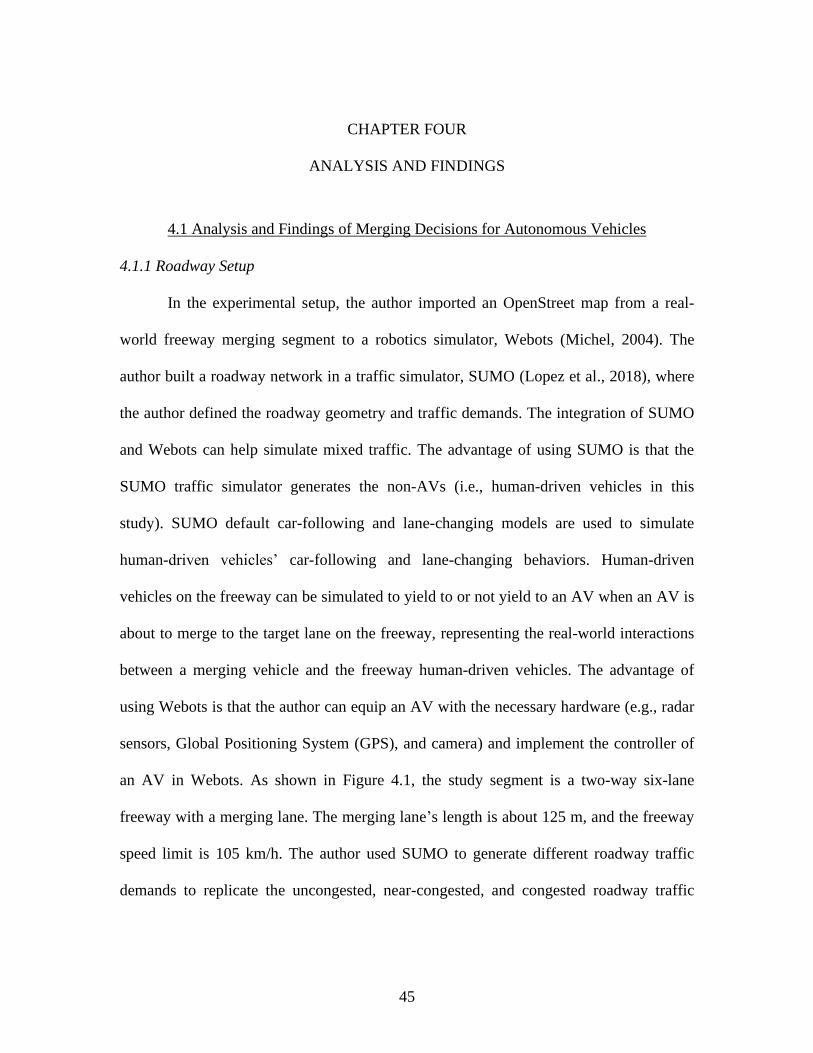
45
CHAPTER FOUR
ANALYSIS AND FINDINGS
4.1 Analysis and Findings of Merging Decisions for Autonomous Vehicles
4.1.1 Roadway Setup
In the experimental setup, the author imported an OpenStreet map from a real-
world freeway merging segment to a robotics simulator, Webots (Michel, 2004). The
author built a roadway network in a traffic simulator, SUMO (Lopez et al., 2018), where
the author defined the roadway geometry and traffic demands. The integration of SUMO
and Webots can help simulate mixed traffic. The advantage of using SUMO is that the
SUMO traffic simulator generates the non-AVs (i.e., human-driven vehicles in this
study). SUMO default car-following and lane-changing models are used to simulate
human-driven vehicles’ car-following and lane-changing behaviors. Human-driven
vehicles on the freeway can be simulated to yield to or not yield to an AV when an AV is
about to merge to the target lane on the freeway, representing the real-world interactions
between a merging vehicle and the freeway human-driven vehicles. The advantage of
using Webots is that the author can equip an AV with the necessary hardware (e.g., radar
sensors, Global Positioning System (GPS), and camera) and implement the controller of
an AV in Webots. As shown in Figure 4.1, the study segment is a two-way six-lane
freeway with a merging lane. The merging lane’s length is about 125 m, and the freeway
speed limit is 105 km/h. The author used SUMO to generate different roadway traffic
demands to replicate the uncongested, near-congested, and congested roadway traffic

46
conditions. For determining the traffic condition on the freeway, the author used
Highway Capacity Manual (HCM) (HCM, 2010) to evaluate the Level of Service (LOS)
for different traffic conditions. The freeway segment’s capacity with a free-flow speed of
113 km/h is 2400 pc/h/lane for equivalent base conditions. The author assumed that the
study’s freeway segment is a level terrain, and there are no trucks and recreational
vehicles on the freeway segment. Therefore, based on the HCM, the traffic demands for
uncongested, near-congested, and congested traffic conditions are assumed 1200
pc/h/lane (LOS of B), 2300 pc/h/lane (LOS of E), and 2533 pc/h/lane (LOS of F),
respectively.
Figure 4.1 Roadway setup in the simulation
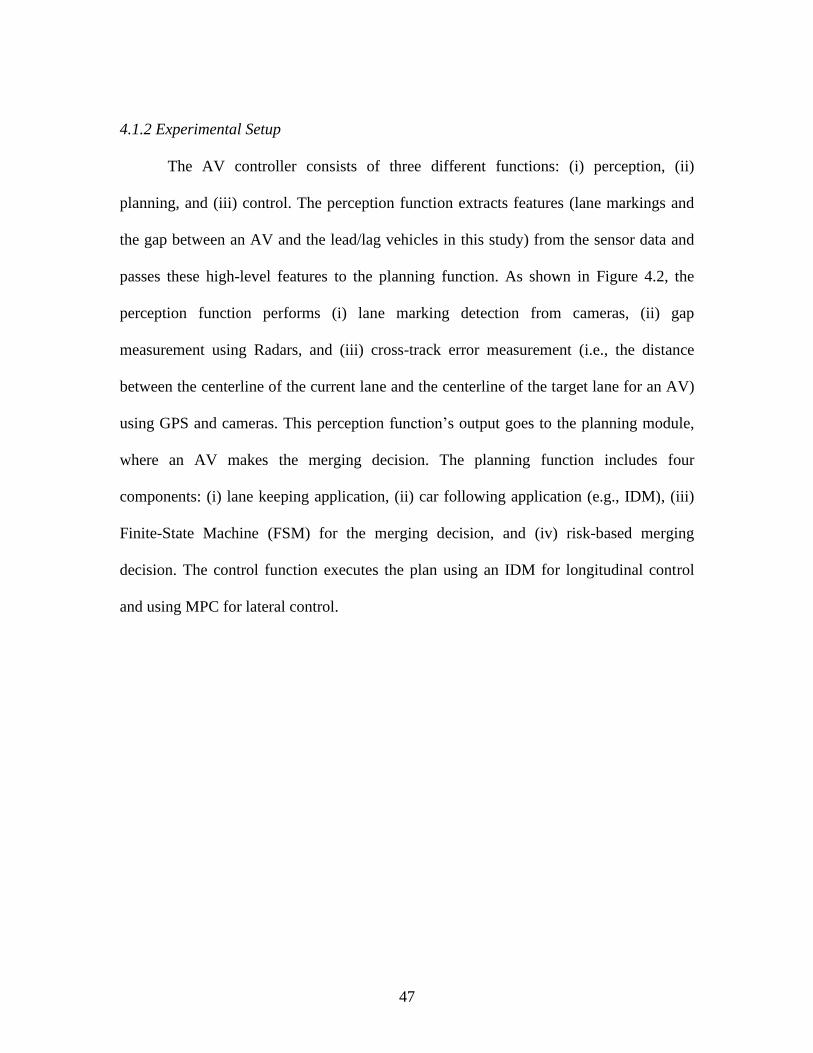
47
4.1.2 Experimental Setup
The AV controller consists of three different functions: (i) perception, (ii)
planning, and (iii) control. The perception function extracts features (lane markings and
the gap between an AV and the lead/lag vehicles in this study) from the sensor data and
passes these high-level features to the planning function. As shown in Figure 4.2, the
perception function performs (i) lane marking detection from cameras, (ii) gap
measurement using Radars, and (iii) cross-track error measurement (i.e., the distance
between the centerline of the current lane and the centerline of the target lane for an AV)
using GPS and cameras. This perception function’s output goes to the planning module,
where an AV makes the merging decision. The planning function includes four
components: (i) lane keeping application, (ii) car following application (e.g., IDM), (iii)
Finite-State Machine (FSM) for the merging decision, and (iv) risk-based merging
decision. The control function executes the plan using an IDM for longitudinal control
and using MPC for lateral control.
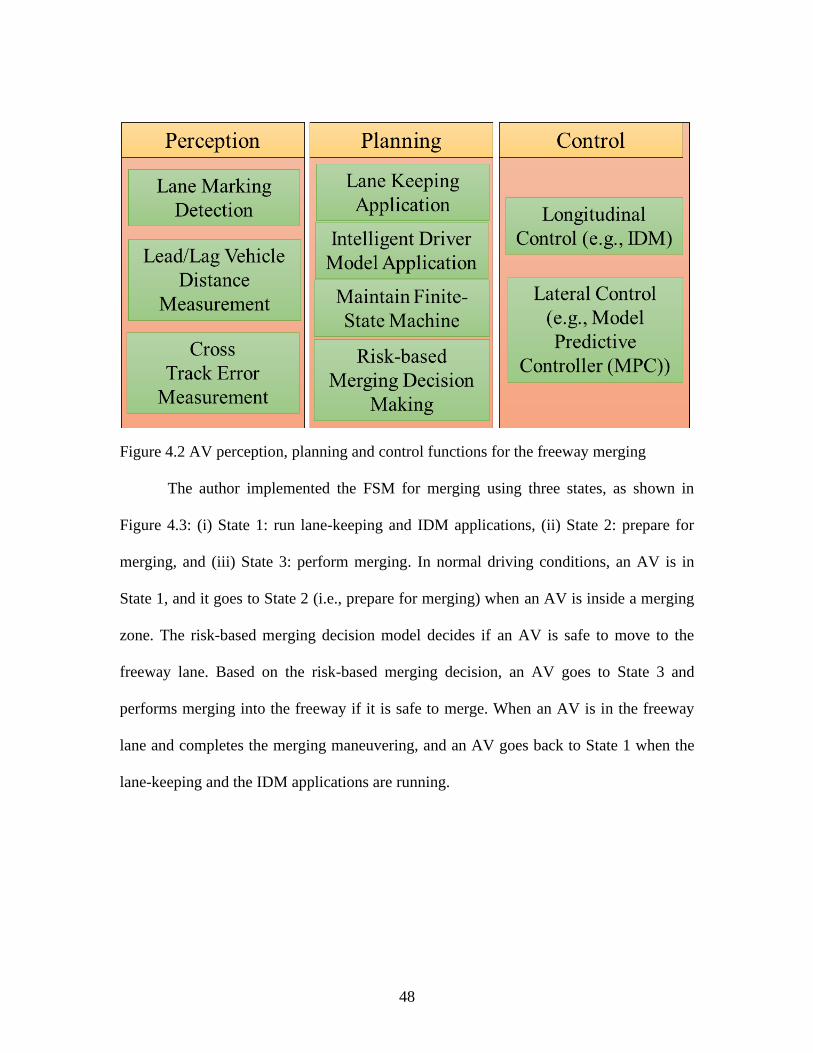
48
Figure 4.2 AV perception, planning and control functions for the freeway merging
The author implemented the FSM for merging using three states, as shown in
Figure 4.3: (i) State 1: run lane-keeping and IDM applications, (ii) State 2: prepare for
merging, and (iii) State 3: perform merging. In normal driving conditions, an AV is in
State 1, and it goes to State 2 (i.e., prepare for merging) when an AV is inside a merging
zone. The risk-based merging decision model decides if an AV is safe to move to the
freeway lane. Based on the risk-based merging decision, an AV goes to State 3 and
performs merging into the freeway if it is safe to merge. When an AV is in the freeway
lane and completes the merging maneuvering, and an AV goes back to State 1 when the
lane-keeping and the IDM applications are running.
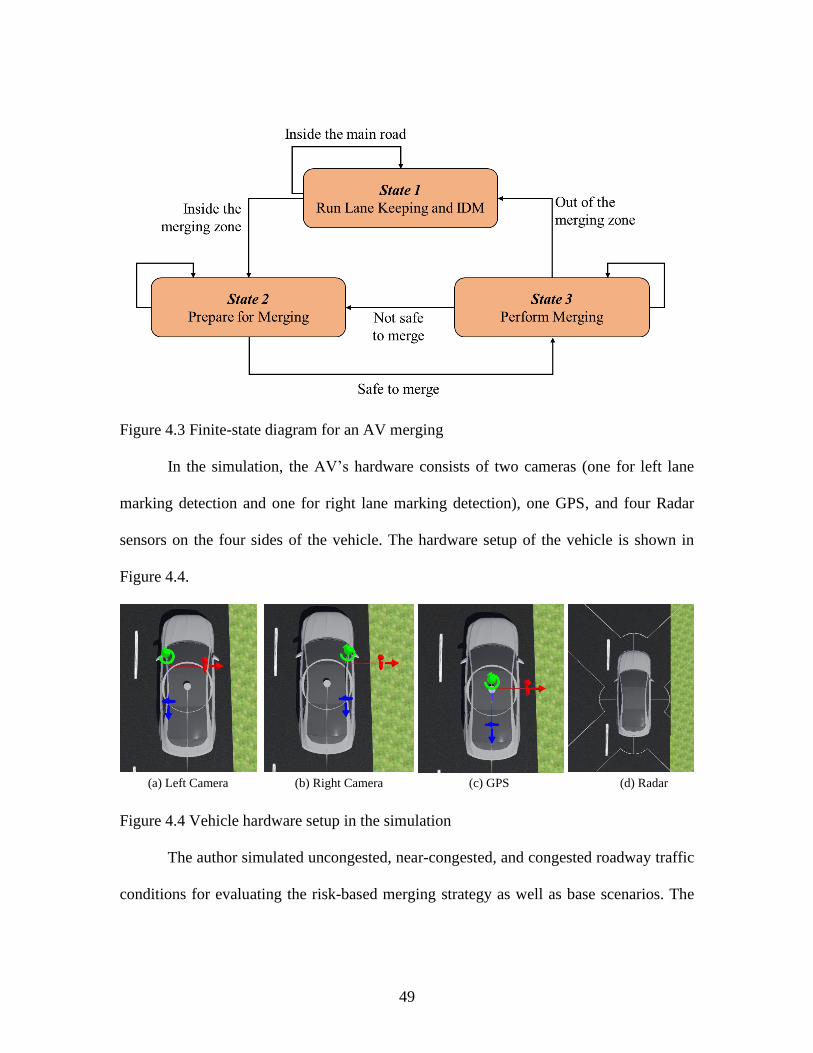
49
Figure 4.3 Finite-state diagram for an AV merging
In the simulation, the AV’s hardware consists of two cameras (one for left lane
marking detection and one for right lane marking detection), one GPS, and four Radar
sensors on the four sides of the vehicle. The hardware setup of the vehicle is shown in
Figure 4.4.
(a) Left Camera (b) Right Camera (c) GPS (d) Radar
Figure 4.4 Vehicle hardware setup in the simulation
The author simulated uncongested, near-congested, and congested roadway traffic
conditions for evaluating the risk-based merging strategy as well as base scenarios. The
50
author conducted six different simulations for each traffic condition, so the simulation
can represent AV’s different driving conditions in the same traffic condition. The author
maintains the same driving environment and vehicle control functions in the simulation
for the risk-based merging strategy and base scenarios.
Base Scenarios
According to (Yang et al., 2019), investigating lane change gap acceptance using
human-driven data would provide a reference for autonomous vehicle-related
applications (Yang et al., 2019). In this dissertation, the author considered gap-based
strategies for merging decisions, which are based on human driver gap acceptance
concepts, with two different critical gaps as the base scenarios. The gap-based strategies
follow the principle of the gap acceptance theory (Marczak et al., 2013), in which a
critical gap is specified to compare with a gap between an AV and its lead or lag vehicle
in the target lane. The AV will merge to the target lane if both lead and lag gaps are
larger than the corresponding critical gaps. The critical gaps are determined based on the
lead and lag gaps accepted by merging vehicles in SUMO. The 50th percentile and 85th
percentile of the gaps are assumed to be values of the critical gaps for two different gap-
based strategies. In the subsequent sections, the author will refer to the two gap-based
strategies as “gap-based strategy that uses 50th percentile gap” and “gap-based strategy
that uses 85th percentile gap”.
Risk-based Merging Strategy
The “posterior” crash risk (determined using Eq. (3-10) and Eq. (3-11)) of an AV,
is compared with a risk threshold. If the “posterior” crash risk of an AV is lower than the
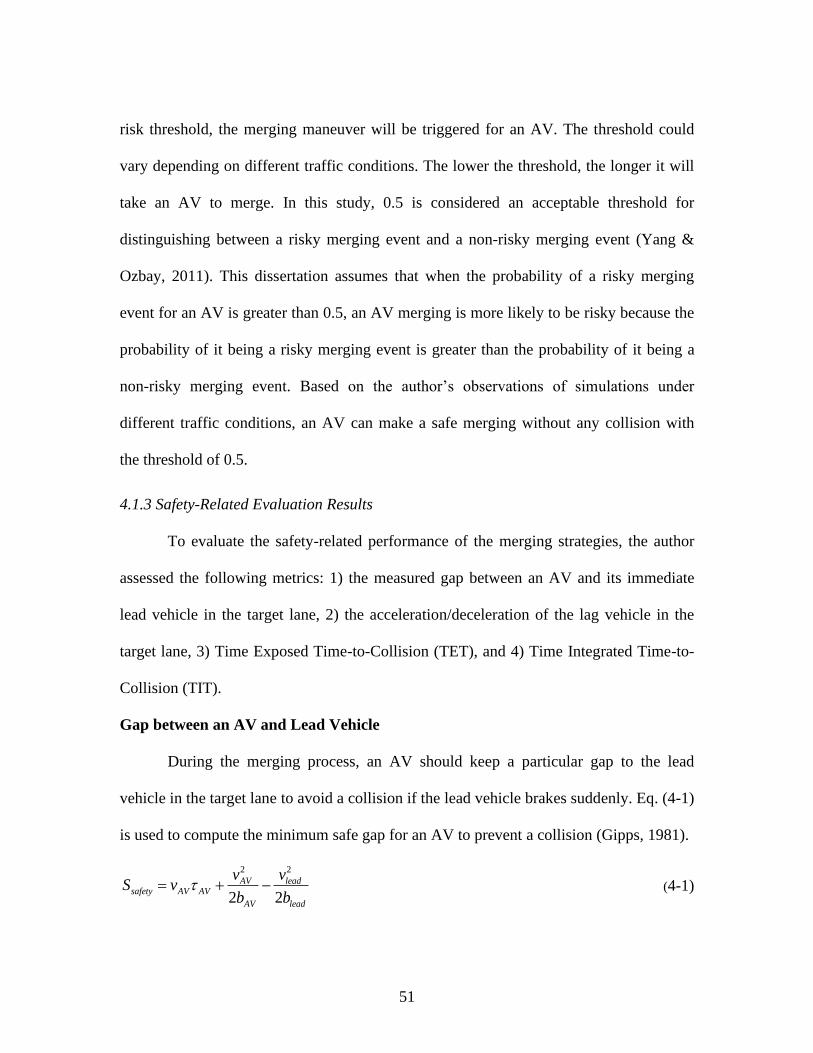
51
risk threshold, the merging maneuver will be triggered for an AV. The threshold could
vary depending on different traffic conditions. The lower the threshold, the longer it will
take an AV to merge. In this study, 0.5 is considered an acceptable threshold for
distinguishing between a risky merging event and a non-risky merging event (Yang &
Ozbay, 2011). This dissertation assumes that when the probability of a risky merging
event for an AV is greater than 0.5, an AV merging is more likely to be risky because the
probability of it being a risky merging event is greater than the probability of it being a
non-risky merging event. Based on the author’s observations of simulations under
different traffic conditions, an AV can make a safe merging without any collision with
the threshold of 0.5.
4.1.3 Safety-Related Evaluation Results
To evaluate the safety-related performance of the merging strategies, the author
assessed the following metrics: 1) the measured gap between an AV and its immediate
lead vehicle in the target lane, 2) the acceleration/deceleration of the lag vehicle in the
target lane, 3) Time Exposed Time-to-Collision (TET), and 4) Time Integrated Time-to-
Collision (TIT).
Gap between an AV and Lead Vehicle
During the merging process, an AV should keep a particular gap to the lead
vehicle in the target lane to avoid a collision if the lead vehicle brakes suddenly. Eq. (4-1)
is used to compute the minimum safe gap for an AV to prevent a collision (Gipps, 1981).
2 2
2 2
AV leadsafety AV AV
AV lead
v vS v
b b= + − (4-1)
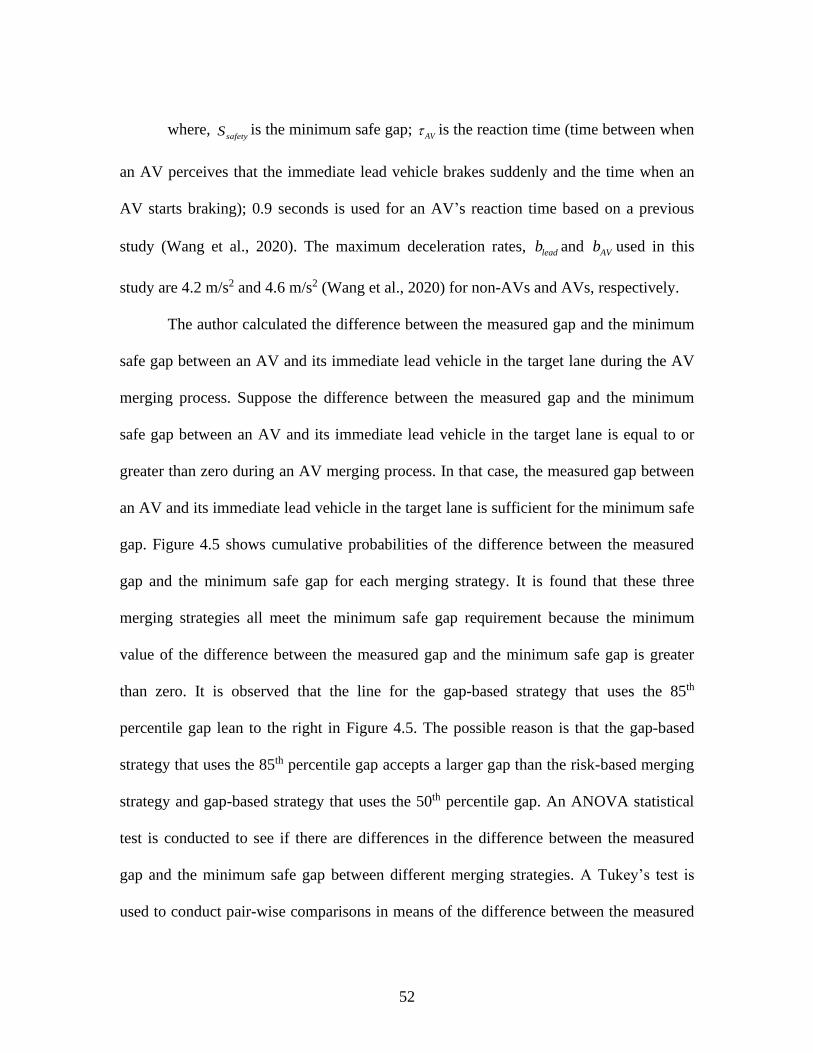
52
where, safetyS is the minimum safe gap;
AV is the reaction time (time between when
an AV perceives that the immediate lead vehicle brakes suddenly and the time when an
AV starts braking); 0.9 seconds is used for an AV’s reaction time based on a previous
study (Wang et al., 2020). The maximum deceleration rates, leadb and AVb used in this
study are 4.2 m/s2 and 4.6 m/s2 (Wang et al., 2020) for non-AVs and AVs, respectively.
The author calculated the difference between the measured gap and the minimum
safe gap between an AV and its immediate lead vehicle in the target lane during the AV
merging process. Suppose the difference between the measured gap and the minimum
safe gap between an AV and its immediate lead vehicle in the target lane is equal to or
greater than zero during an AV merging process. In that case, the measured gap between
an AV and its immediate lead vehicle in the target lane is sufficient for the minimum safe
gap. Figure 4.5 shows cumulative probabilities of the difference between the measured
gap and the minimum safe gap for each merging strategy. It is found that these three
merging strategies all meet the minimum safe gap requirement because the minimum
value of the difference between the measured gap and the minimum safe gap is greater
than zero. It is observed that the line for the gap-based strategy that uses the 85th
percentile gap lean to the right in Figure 4.5. The possible reason is that the gap-based
strategy that uses the 85th percentile gap accepts a larger gap than the risk-based merging
strategy and gap-based strategy that uses the 50th percentile gap. An ANOVA statistical
test is conducted to see if there are differences in the difference between the measured
gap and the minimum safe gap between different merging strategies. A Tukey’s test is
used to conduct pair-wise comparisons in means of the difference between the measured

53
gap and the minimum safe gap among the three merging strategies. Based on the
ANOVA test and Tukey’s test results, it is found that there are differences between the
risk-based merging strategy (mean is 32.9 m; sample size is 483) and the gap-based
strategies that use the 50th percentile gap (mean is 45.1 m; sample size is 277) and the
85th percentile gap (mean is 112.8 m; sample size is 150) strategies at a 0.05 significance
level.
Figure 4.5 Cumulative probabilities of the difference between the measured gap and the
minimum safe gap between an AV and its lead vehicle

54
Acceleration/Deceleration of the Lag Vehicle
It is possible that when an AV is moving to the target lane, the lag vehicle may
press the brake dramatically. The deceleration of the lag vehicle should not be greater
than the maximum deceleration of the lag vehicle during an AV merging process. The
maximum deceleration of the lag vehicle was considered as 4.2 m/s2 based on a previous
study (Wang et al., 2020).
The author evaluated the maximum deceleration of the lag vehicle during an AV
merging process. The percentage of time when the deceleration of the lag vehicle is
greater than 4.2 m/s2, relative to total AV merging maneuvering duration in all
simulations (around 54 seconds) for the risk-based merging strategy, the gap-based
strategy that uses 50th percentile gap, and the gap-based strategy that uses 85th percentile
gap is 2.4%, 3.0%, and 3.1%, respectively. The risk-based merging strategy causes less
abrupt acceleration/deceleration of the lag vehicle in the target lane on the freeway
compared to the gap-based strategies that use the 50th and 85th percentile gap.
Figure 4.6 shows cumulative probabilities of the acceleration (including negative
values) of the lag vehicle for each merging strategy. It is observed that lines for the gap-
based strategies that use the 50th percentile gap and the 85th percentile gap lean to the left
in Figure 4.6. The gap-based strategies that use the 50th percentile gap and the 85th
percentile gap tend to force the lag vehicle to decelerate more than the risk-based
merging strategy does. An ANOVA statistical test is performed to observe if there is a
statistically significant difference in the lag vehicle’s acceleration between the three
different AV merging strategies. A Tukey’s test is used to conduct pair-wise comparisons

55
in means of the lag vehicle’s acceleration among the three different AV merging
strategies. Based on the ANOVA test and Tukey’s test, it is found that there are
differences in the acceleration of the lag vehicle between the risk-based merging strategy
(mean is 0.22 m/s2; sample size is 737) and the gap-based strategy that uses the 50th
percentile gap (mean is -0.03 m/s2; sample size is 861) and between the risk-based
merging strategy and the gap-based strategy that uses the 85th percentile gap (mean is -
0.07 m/s2; sample size is 708) at a 0.05 significance level. There is no difference between
the gap-based strategy that uses the 50th percentile gap and the gap-based strategy that
uses the 85th percentile gap at a 0.05 significance level.
Figure 4.6 Cumulative probabilities of the acceleration of the lag vehicle

56
TET and TIT
The author evaluated two aggregated safety metrics: Time Exposed Time-to-
Collision (TET) (Li et al., 2017; Rahman et al., 2019) and Time Integrated Time-to-
Collision (TIT) (Li et al., 2017; Rahman et al., 2019) to identify potential conflicts
between vehicles on the freeway. TET is the total time spent under dangerous or risky
driving conditions (i.e., when TTC is less than or equal to 2 seconds), formulated as
below:
1
1, 0 ( ) 2( ) ,
0,
Nn
n n
n
TTC kTET k k
otherwise=
== =
(4-2)
1
( )T
k
TET TET k=
= (4-3)
where, k is the time step, n is the vehicle ID, N is the total number of vehicles in
the freeway merging section. n is the indicator variable, k is the observation time
interval (i.e., 0.2 s for the evaluation of the merging scenario), T is the total simulation
period, which is the time period from when an AV prepares for the merging to when an
AV completes the merging.
TIT represents the difference between TTC values and the conflict threshold (i.e.,
2s) when the TTC is lower than the TTC threshold, as shown below.
1
1 1( ) [ ] , 0 ( ) 2
( ) 2
N
n
n n
TIT k k TTC kTTC k=
= − = (4-4)
1
( )T
k
TIT TIT k=
= (4-5)
In Table 4.1, lower TET and TIT values indicate less time spent under dangerous
traffic conditions that could lead to a potential crash. From the last two columns (grey

57
colored area) in Table 4.1, it is observed that overall, the risk-based merging strategy has
the lowest TET and TIT. The risk-based merging strategy (TET=0.03, TIT=0.02) reduces
TET and TIT by 85% and 75%, respectively, compared to the gap-based strategy that
uses the 50th percentile gap (TET=0.2, TIT=0.08). The risk-based merging strategy
reduces TET and TIT by 93% and 100%, respectively, compared to the gap-based
strategy that uses the 85th percentile gap (TET=0.43, TIT=7.32). The results of TET and
TIT indicate that risk-based merging strategy produces the lowest crash risk compared to
gap-based strategies. The possible reason is that the risk-based merging strategy
quantifies and assesses the crash risk during the merging decision process, thus reducing
the crash risk.
The gap-based strategy that uses the 85th percentile gap has higher crash risk than
the risk-based merging strategy and gap-based strategy that uses the 50th percentile gap.
Based on the observation during the simulation, in several simulation scenarios, the gap-
based strategy that uses the 85th percentile gap did not find a suitable gap in a short time.
An AV stopped at the endpoint of the merging lane. The AV had to merge to the target
lane at a very low speed, thus significantly increasing the crash risk between the AV and
the lag vehicle in the target lane.

58
Table 4.1 Comparison of TET and TIT for different merging strategies in different
roadway traffic conditions
Strategy Uncongested
Traffic Condition
Near-congested
Traffic
Condition
Congested
Traffic
Condition
Total
TET TIT TET TIT TET TIT TET TIT
Gap-based
(50th gap)
0.2 0.08 0 0 0 0 0.2 0.08
Gap-based
(85th gap)
0 0 0.1 6.46 0.33 0.86 0.43 7.32
Risk-based
merging
strategy
0 0 0 0 0.03 0.02 0.03 0.02
4.1.4 Operational Efficiency
To evaluate the strategy’s operational efficiency-related performance, the author
assessed the following metrics: 1) the merging duration related to an AV merging process
and 2) the average speed of traffic in the target lane.
Merging Duration related to an AV Merging Process
The AV’s merging duration is defined as the time elapsed for an AV between
when it prepares for the merging and when it completes the merging maneuvering.
The author evaluated the merging duration for different merging strategies in
various traffic conditions. The average merging duration is obtained by averaging the
results of all simulations for each merging strategy, as shown in Figure 4.7. It is observed
that on average, the risk-based merging strategy (average merging duration is 3.0 seconds
based on the simulation results) has the lowest merging duration compared to gap-based
strategies that use the 50th percentile gap (average merging duration is 4.8 seconds based

59
on the simulation results) and 85th percentile gap (average merging duration is 14.7
seconds based on the simulation results) strategies. The gap-based strategy that uses the
85th percentile gap may overestimate the merging crash risk and thus takes a longer time
to prepare and complete the merging than the other two strategies. The risk-based
merging strategy quantifies the merging crash risk in different traffic conditions, and thus
takes a shorter time to prepare and complete the merging.
Figure 4.7 Comparison of the merging duration for different strategies in different traffic
conditions
Average Speed of Traffic in the Target Lane
To evaluate if an AV merging could impact the traffic in the target lane, the
author assessed an aggregated operational efficiency indicator: the average speed of
traffic in the target lane.
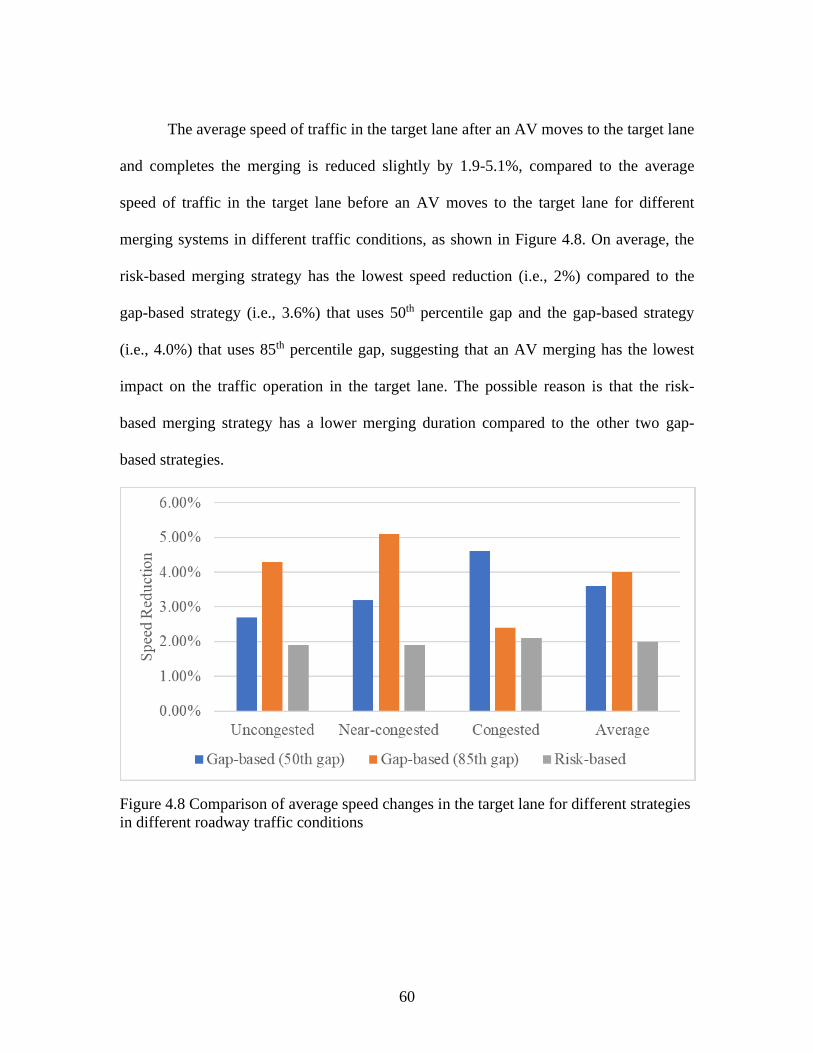
60
The average speed of traffic in the target lane after an AV moves to the target lane
and completes the merging is reduced slightly by 1.9-5.1%, compared to the average
speed of traffic in the target lane before an AV moves to the target lane for different
merging systems in different traffic conditions, as shown in Figure 4.8. On average, the
risk-based merging strategy has the lowest speed reduction (i.e., 2%) compared to the
gap-based strategy (i.e., 3.6%) that uses 50th percentile gap and the gap-based strategy
(i.e., 4.0%) that uses 85th percentile gap, suggesting that an AV merging has the lowest
impact on the traffic operation in the target lane. The possible reason is that the risk-
based merging strategy has a lower merging duration compared to the other two gap-
based strategies.
Figure 4.8 Comparison of average speed changes in the target lane for different strategies
in different roadway traffic conditions
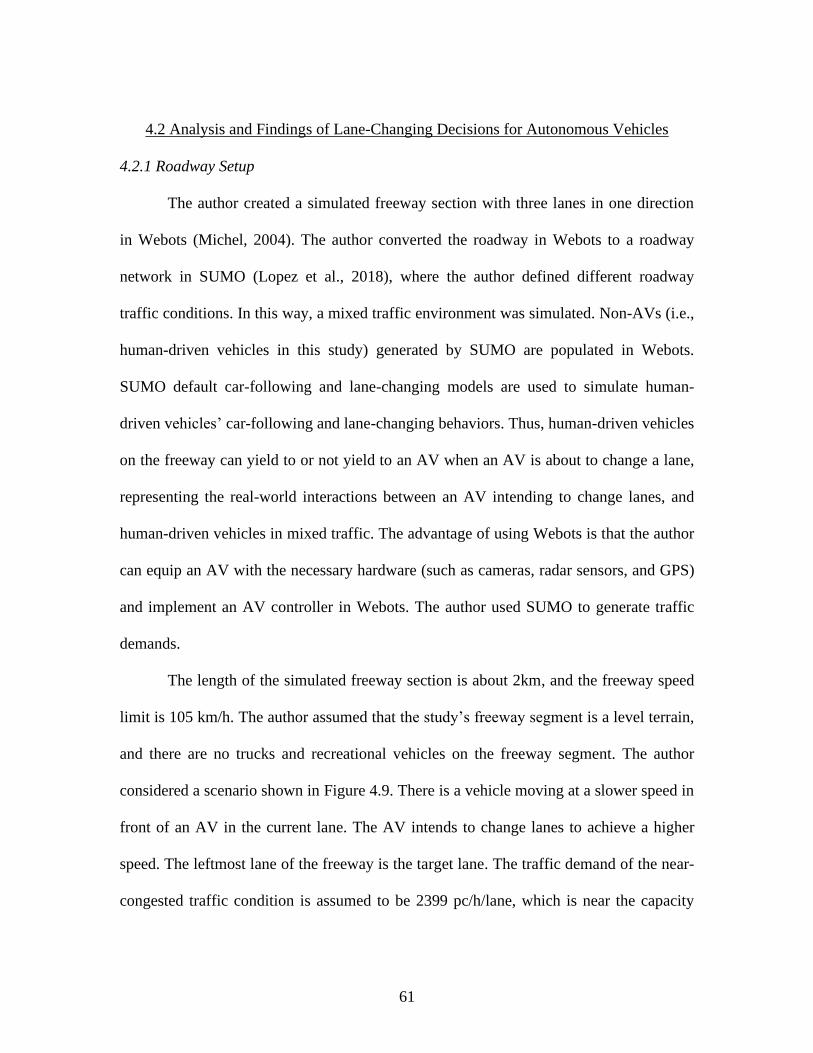
61
4.2 Analysis and Findings of Lane-Changing Decisions for Autonomous Vehicles
4.2.1 Roadway Setup
The author created a simulated freeway section with three lanes in one direction
in Webots (Michel, 2004). The author converted the roadway in Webots to a roadway
network in SUMO (Lopez et al., 2018), where the author defined different roadway
traffic conditions. In this way, a mixed traffic environment was simulated. Non-AVs (i.e.,
human-driven vehicles in this study) generated by SUMO are populated in Webots.
SUMO default car-following and lane-changing models are used to simulate human-
driven vehicles’ car-following and lane-changing behaviors. Thus, human-driven vehicles
on the freeway can yield to or not yield to an AV when an AV is about to change a lane,
representing the real-world interactions between an AV intending to change lanes, and
human-driven vehicles in mixed traffic. The advantage of using Webots is that the author
can equip an AV with the necessary hardware (such as cameras, radar sensors, and GPS)
and implement an AV controller in Webots. The author used SUMO to generate traffic
demands.
The length of the simulated freeway section is about 2km, and the freeway speed
limit is 105 km/h. The author assumed that the study’s freeway segment is a level terrain,
and there are no trucks and recreational vehicles on the freeway segment. The author
considered a scenario shown in Figure 4.9. There is a vehicle moving at a slower speed in
front of an AV in the current lane. The AV intends to change lanes to achieve a higher
speed. The leftmost lane of the freeway is the target lane. The traffic demand of the near-
congested traffic condition is assumed to be 2399 pc/h/lane, which is near the capacity

62
(i.e., 2400pc/h/lane). The Level of Service (LOS) of the near-congested traffic condition
is E based on the HCM method (HCM, 2010)). The author considered the near-congested
traffic condition because the near-congested traffic condition is a challenge for an AV
lane-change and may pose a high crash risk on an AV. The author conducted 30 different
simulation runs for the base scenario and the risk-based lane-changing decision strategy
under the near-congested traffic condition.
Figure 4.9 Simulated environment
4.2.2 Experimental Setup
The following section discusses the experimental setup for the base scenario and
the risk-based lane-changing strategy considered in this study.
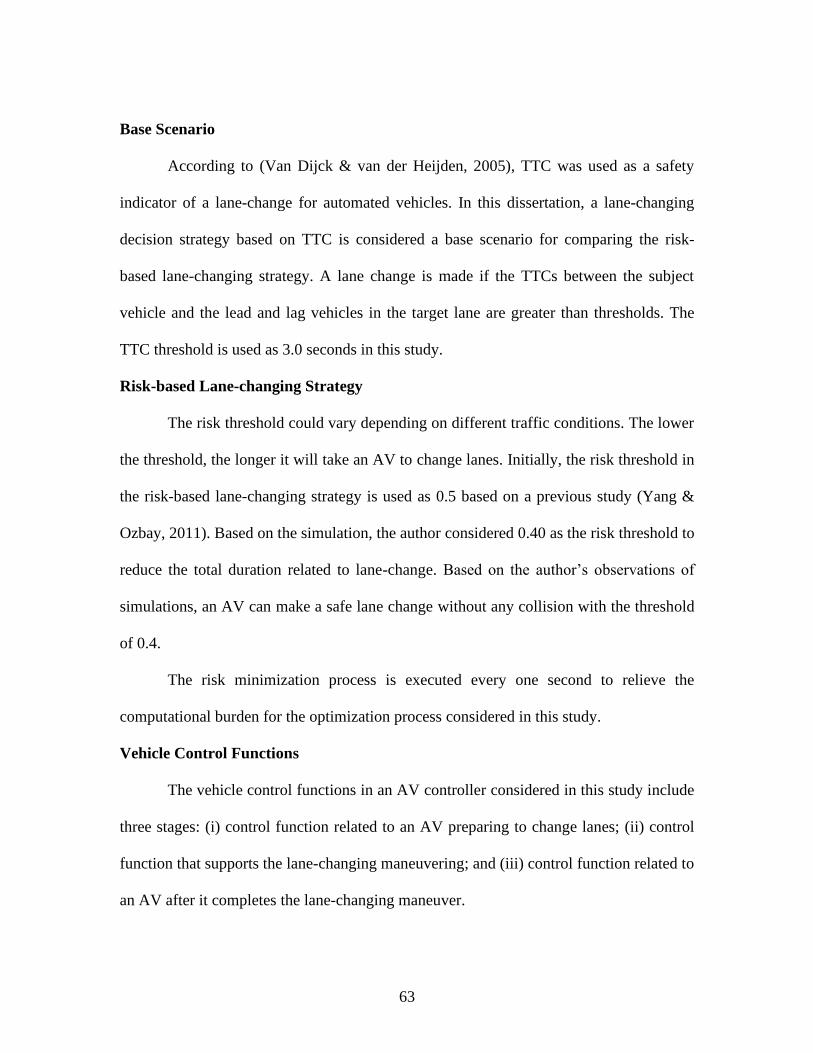
63
Base Scenario
According to (Van Dijck & van der Heijden, 2005), TTC was used as a safety
indicator of a lane-change for automated vehicles. In this dissertation, a lane-changing
decision strategy based on TTC is considered a base scenario for comparing the risk-
based lane-changing strategy. A lane change is made if the TTCs between the subject
vehicle and the lead and lag vehicles in the target lane are greater than thresholds. The
TTC threshold is used as 3.0 seconds in this study.
Risk-based Lane-changing Strategy
The risk threshold could vary depending on different traffic conditions. The lower
the threshold, the longer it will take an AV to change lanes. Initially, the risk threshold in
the risk-based lane-changing strategy is used as 0.5 based on a previous study (Yang &
Ozbay, 2011). Based on the simulation, the author considered 0.40 as the risk threshold to
reduce the total duration related to lane-change. Based on the author’s observations of
simulations, an AV can make a safe lane change without any collision with the threshold
of 0.4.
The risk minimization process is executed every one second to relieve the
computational burden for the optimization process considered in this study.
Vehicle Control Functions
The vehicle control functions in an AV controller considered in this study include
three stages: (i) control function related to an AV preparing to change lanes; (ii) control
function that supports the lane-changing maneuvering; and (iii) control function related to
an AV after it completes the lane-changing maneuver.

64
Depending on different lane-changing strategies, the vehicle control function
varies. As shown in Figure 4.10, for the base scenario, during stages (i) and (iii), the
longitudinal speed control of an AV is determined by the IDM. During stage (ii), MPC is
implemented to calculate the optimal and smooth trajectory for moving an AV from the
current lane to the target lane (Kong et al., 2015), and an AV follows the lead vehicle in
the target lane to achieve the desired speed based on the IDM.
For the risk-based lane-changing strategy, during stage (i), initially, the
longitudinal speed control of an AV is determined by the IDM. Later, the longitudinal
acceleration provided by the gap selection stage will overwrite the acceleration provided
by IDM once the gap selection is triggered. During stage (ii), longitudinal acceleration
provided by the lane-changing maneuvering stage will control the longitudinal speed of
an AV before an AV crosses the lane marking between the current lane and target lane.
Once an AV is in the target lane, the longitudinal speed is determined by the IDM.
During stage (ii), MPC is also implemented to calculate the optimal and smooth
trajectory for moving an AV from the current lane to the target lane. During the (iii), the
longitudinal speed control of an AV is determined by the IDM.
The parameters of the IDM defined in Eq. (3-12) and (3-13) are the followings:
T , a , b and are 1.5 seconds (Rahman et al., 2017), 4.73 m/s2 (based on the maximum
acceleration rate of an AV of Webots (Michel, 2004) ), 1.7 m/s2 (Rahman et al., 2017),
and 4 (Rahman et al., 2017), respectively.
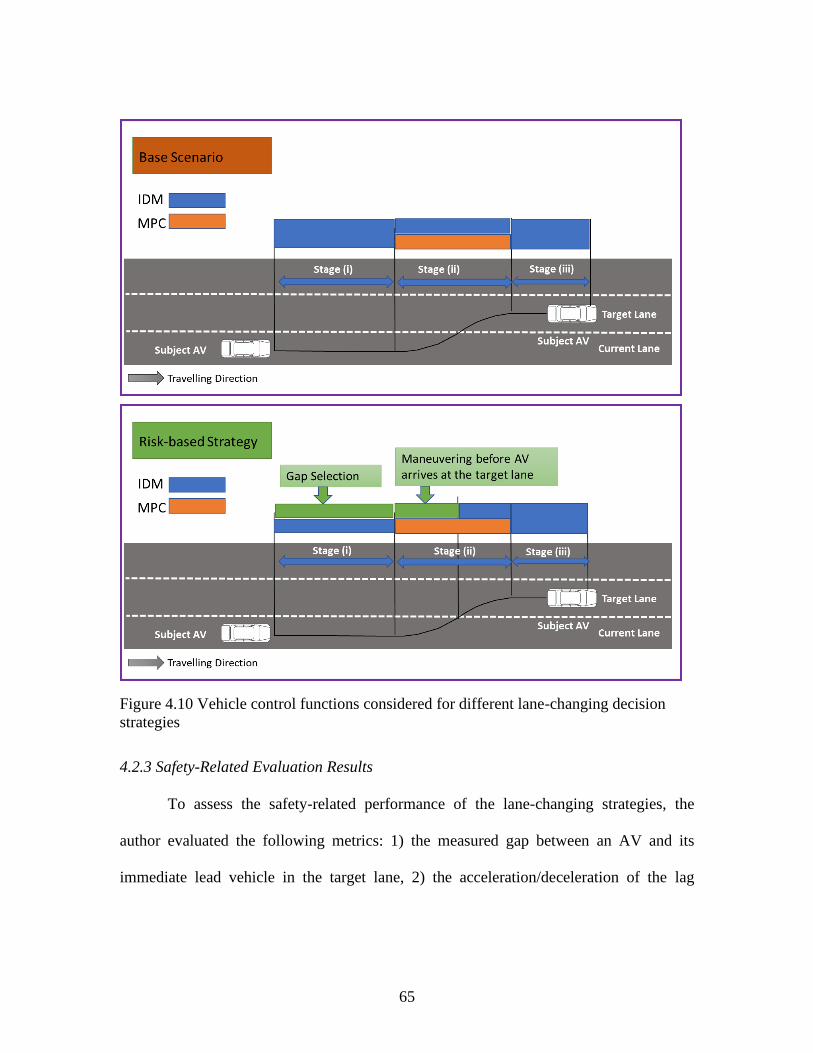
65
Figure 4.10 Vehicle control functions considered for different lane-changing decision
strategies
4.2.3 Safety-Related Evaluation Results
To assess the safety-related performance of the lane-changing strategies, the
author evaluated the following metrics: 1) the measured gap between an AV and its
immediate lead vehicle in the target lane, 2) the acceleration/deceleration of the lag

66
vehicle in the target lane, 3) Time Exposed Time-to-Collision (TET), and 4) Time
Integrated Time-to-Collision (TIT).
Gap between an AV and Lead Vehicle
The subject AV should maintain a particular gap commensurate to the lead
vehicle in the target lane during the lane-changing maneuvering if the lead vehicle brakes
suddenly. Eq. (4-6) is used to calculate the minimum safe gap based on (Gipps, 1981).
2 2
2 2
AV leadsafe AV AV
AV lead
v vS v
b b= + − (4-6)
where, safeS is the minimum safe gap;
AV is the reaction time (i.e., the time
between when an AV perceives that the immediate lead vehicle brakes suddenly and
when an AV starts braking); 0.9 seconds is used for an AV’s reaction time based on a
previous study (Wang et al., 2020). The maximum deceleration rates are considered as
4.2 m/s2 and 4.6 m/s2 (Wang et al., 2020) for non-AVs and AVs, respectively.
Suppose the difference between the measured gap and the minimum safe gap
between an AV and the lead vehicle in the target lane is equal to or greater than zero
during an AV merging process. In that case, the measured gap between an AV and its
immediate lead vehicle in the target lane is sufficient for the minimum safe gap. Figure
4.11 shows the cumulative probabilities of the difference between the measured gap and
the minimum safe gap during the lane-changing maneuvering. As shown in Figure 4.11,
the minimum values of the difference between the measured gap and the minimum safe
gap are -25.4 m and 11.8 m for the base scenario and risk-based lane-changing strategy,
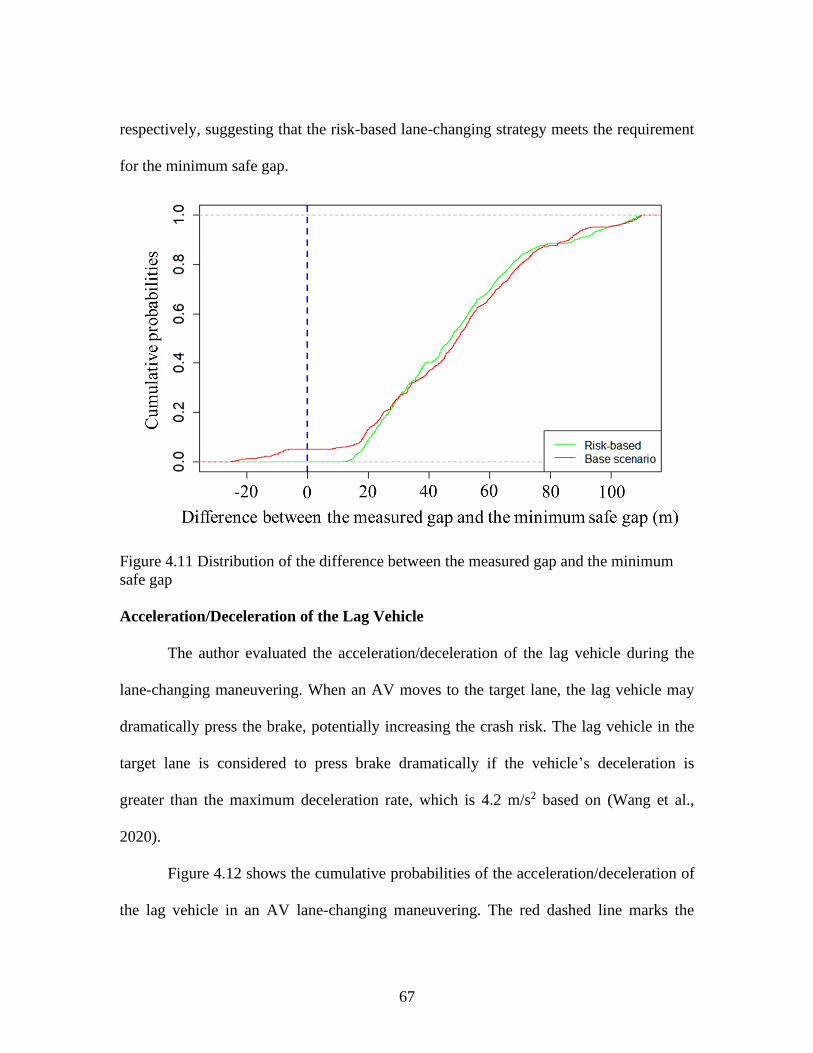
67
respectively, suggesting that the risk-based lane-changing strategy meets the requirement
for the minimum safe gap.
Figure 4.11 Distribution of the difference between the measured gap and the minimum
safe gap
Acceleration/Deceleration of the Lag Vehicle
The author evaluated the acceleration/deceleration of the lag vehicle during the
lane-changing maneuvering. When an AV moves to the target lane, the lag vehicle may
dramatically press the brake, potentially increasing the crash risk. The lag vehicle in the
target lane is considered to press brake dramatically if the vehicle’s deceleration is
greater than the maximum deceleration rate, which is 4.2 m/s2 based on (Wang et al.,
2020).
Figure 4.12 shows the cumulative probabilities of the acceleration/deceleration of
the lag vehicle in an AV lane-changing maneuvering. The red dashed line marks the

68
deceleration rate of the lag vehicle at 4.2 m/s2. It is observed that both strategies caused
the lag vehicle to press the brake dramatically for around 40% of the time in the lane-
changing maneuvering. The possible reason is that in the simulation, the speed difference
between an AV and the lag vehicle is significant, which is around 8 m/s. The lag vehicle
must reduce to a lower speed in a short time. It is found that the risk-based lane-changing
strategy produces a lower proportion of the deceleration rate lower than 4.2 m/s2,
compared to the base scenario, as shown on the left side of the red dashed line in Figure
4.12. The result indicates that the risk-based lane-changing strategy causes less abrupt
acceleration/deceleration of the lag vehicle in the target lane on the freeway.
Figure 4.12 Acceleration/deceleration of the lag vehicle during the lane-changing
maneuvering

69
TET and TIT
The author evaluated the two aggregated safety-related metrics: TET and TIT
aggregated for all the vehicles for different traffic conditions during the lane-changing
maneuvering. TET is the total time spent under risky driving conditions (i.e., when TTC
is less than or equal to 3 seconds), which is formulated as below:
1
1, 0 ( ) 3( ) ,
0,
Nn
n n
n
TTC kTET k k
otherwise=
== =
(4-7)
1
( )T
k
TET TET k=
= (4-8)
where, k is the time step, n is the vehicle ID, N is the total number of vehicles in
the freeway section. n is the indicator variable, k is the observation time interval (i.e.,
0.02 seconds for the evaluation of the lane-changing scenario), T is the time period
between when an AV starts to prepare to change lanes and ends the lane-changing in the
target lane.
TIT represents the difference between TTC values and the TTC threshold (i.e.,
TTC is 3 seconds) when the TTC is lower than the TTC threshold, as shown below.
1
1 1( ) [ ] , 0 ( ) 3
( ) 3
N
n
n n
TIT k k TTC kTTC k=
= − = (4-9)
1
( )T
k
TIT TIT k=
= (4-10)
Higher TET and TIT values imply higher crash risks. As shown in Figure 4.13,
the risk-based lane-changing strategy (TET=5.92, TIT=0.19) reduces TET and TIT by
44% and 69%, respectively, compared to the base scenario (TET=10.54, TIT=0.62).
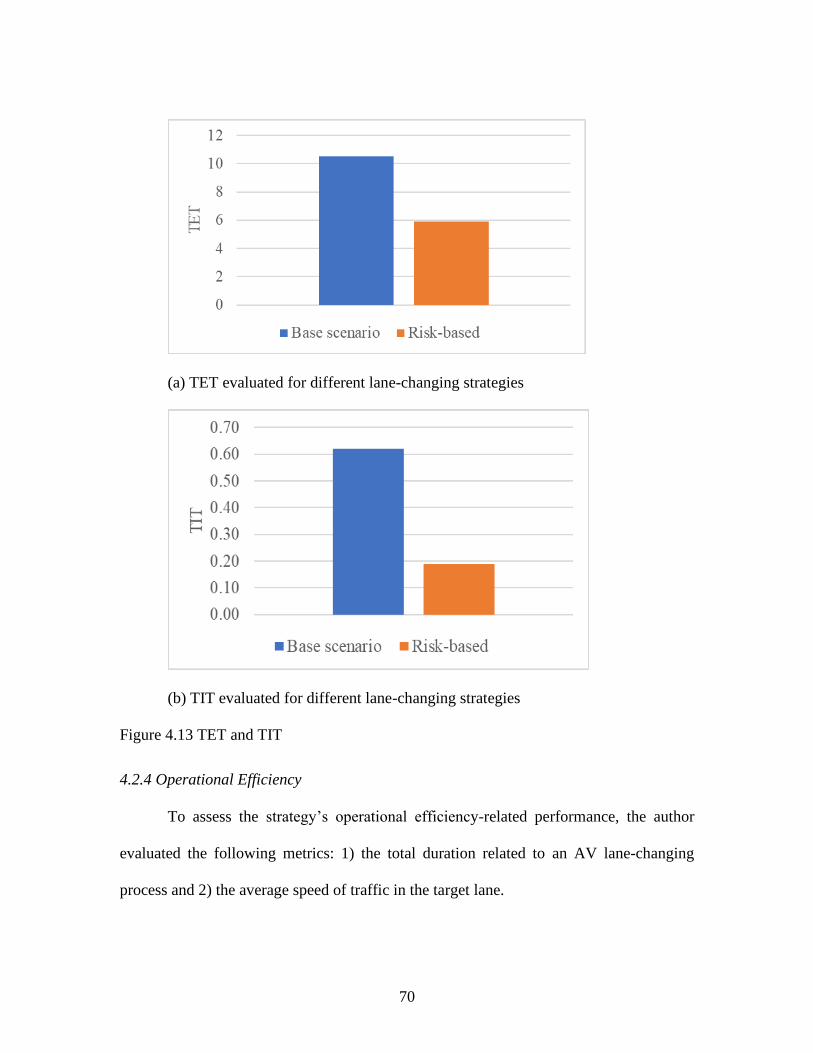
70
(a) TET evaluated for different lane-changing strategies
(b) TIT evaluated for different lane-changing strategies
Figure 4.13 TET and TIT
4.2.4 Operational Efficiency
To assess the strategy’s operational efficiency-related performance, the author
evaluated the following metrics: 1) the total duration related to an AV lane-changing
process and 2) the average speed of traffic in the target lane.
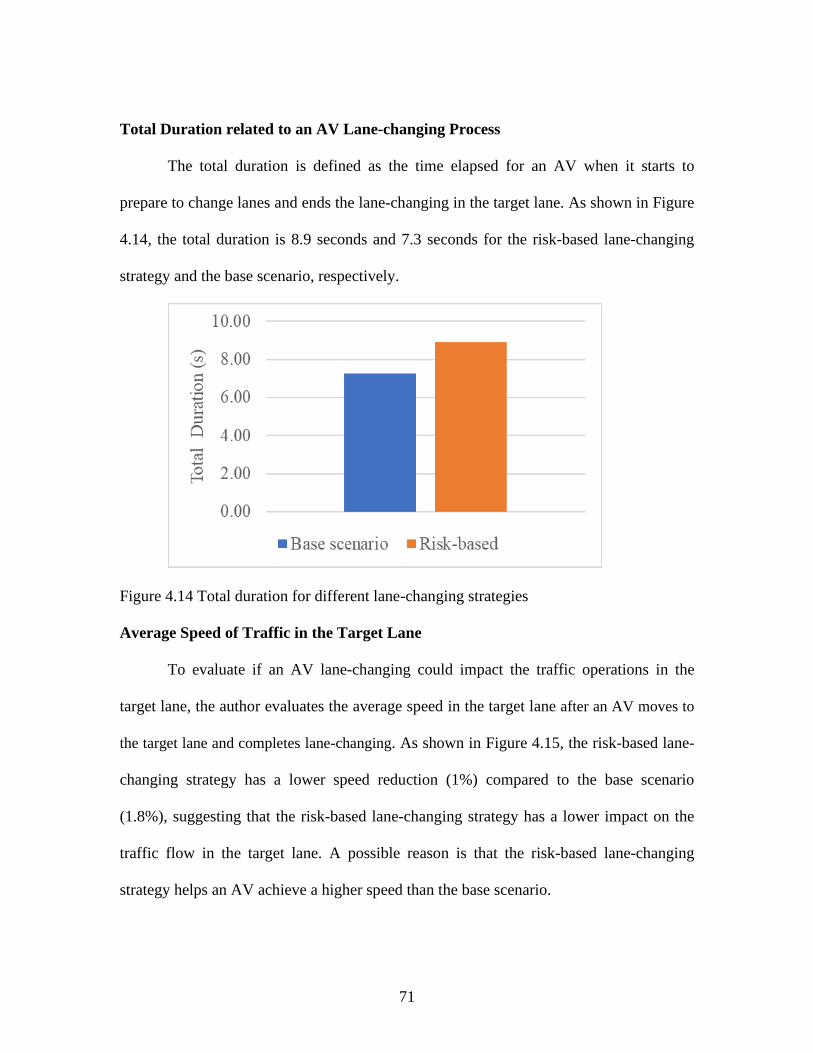
71
Total Duration related to an AV Lane-changing Process
The total duration is defined as the time elapsed for an AV when it starts to
prepare to change lanes and ends the lane-changing in the target lane. As shown in Figure
4.14, the total duration is 8.9 seconds and 7.3 seconds for the risk-based lane-changing
strategy and the base scenario, respectively.
Figure 4.14 Total duration for different lane-changing strategies
Average Speed of Traffic in the Target Lane
To evaluate if an AV lane-changing could impact the traffic operations in the
target lane, the author evaluates the average speed in the target lane after an AV moves to
the target lane and completes lane-changing. As shown in Figure 4.15, the risk-based lane-
changing strategy has a lower speed reduction (1%) compared to the base scenario
(1.8%), suggesting that the risk-based lane-changing strategy has a lower impact on the
traffic flow in the target lane. A possible reason is that the risk-based lane-changing
strategy helps an AV achieve a higher speed than the base scenario.

72
Figure 4.15 Speed reduction for different lane-changing strategies

73
CHAPTER FIVE
CONCLUSIONS AND RECOMMENDATIONS
AVs could reduce significant numbers of roadway crashes by eliminating human-
driver errors. However, the mixed traffic adds more safety challenges to an AV operation.
In mixed traffic, non-AVs contribute to AV-involved crashes on the roadway. On the
other hand, any confusing driving strategy performed by an AV may lead to potential
crashes between AVs and non-AVs. Therefore, it is crucial to analyze crash risk for an
AV under complex roadway scenarios, such as freeway merging and lane-changing in
mixed traffic.
A merging operation of an AV is very challenging and complex in mixed traffic.
The risk-based merging decision strategy is developed based on crash risk assessment for
an AV in mixed traffic. Therefore, the merging decision strategy is developed to reduce
potential merging crash risk. The author considers the safety between an AV and its
surrounding vehicles, including its lead and lag vehicles in the target lane during the
merging process. The analyses reveal that the risk-based merging strategy causes less
abrupt acceleration/deceleration of the lag vehicle in the target lane during the merging
process compared with the base scenarios. The risk-based merging strategy meets the
requirements for the minimum safe gap between an AV and its lead vehicle in the target
lane during the merging process. The risk-based merging strategy also produces the
lowest crash risk in terms of two aggregated safety indicators, TET and TIT. Compared
to the base scenarios, the risk-based merging strategy provides more operationally
efficient merging in terms of the merging duration. Moreover, the risk-based merging

74
strategy has the lowest impact on the traffic speed in the target lane. Overall, the risk-
based merging decision strategy shows higher safety benefits for an AV merging
operation compared to the base scenarios.
A lane-changing operation of an AV is very challenging and complex in mixed
traffic. The risk-based lane-changing decision strategy is based on crash risk assessment
for an AV in mixed traffic. The author considers the safety between an AV and its
surrounding vehicles, including its lead and lag vehicles in the target lane and its front
and following vehicles in the current lane during the lane-changing process. The author
quantifies the lane-changing crash risk, establishes a risk model that helps evaluate the
lane-changing crash risk for an AV, and develops a lane-changing decision strategy for
an AV intending to change a lane. The lane-changing crash risk minimization is
generated in the following two stages: (i) gap selection and (ii) lane-changing
maneuvering from the current lane to the adjacent target lane. The risk-based lane-
changing strategy is evaluated in near-congested traffic conditions. The analyses show
that the risk-based lane-changing strategy causes less abrupt acceleration/deceleration of
the lag vehicle in the target lane compared to the base scenario. The risk-based lane-
changing strategy outperforms the base scenario in maintaining the minimum safe gap
between an AV and its lead vehicle in the target lane. The risk-based lane-changing
strategy also produces a lower crash risk in terms of TET and TIT compared to the base
scenario. In addition, the risk-based lane-changing strategy has a lower impact on the
average speed of the traffic in the target lane. The lane-changing decision strategy shows
higher safety benefits for an AV’s lane-changing operation.
75
The following recommendations are presented related to an AV’s merging and
lane-changing risk mitigation strategies:
• Future research should consider more complex freeway merging and
weaving scenarios, such as multi-lane ramps in a complex interchange, for
analyzing the merging crash risk of AVs at the on-ramp merging areas.
• Future research should consider the utilization of additional autonomous
vehicle sensor data, in addition to the camera, GPS, and radar data on
developing the risk model for estimating the merging and lane-changing
crash risk for an AV.
• The penetration rate of AVs in mixed traffic will impact the merging and
lane-changing crash risk. Future research should consider different
penetration rates of AVs in mixed traffic.
• The Society of Automotive Engineers (SAE) defined different levels of
driving automation. This research considers a fully autonomous vehicle
without any driver intervention, i.e., Level 5 driving automation. Future
research should consider Level 3 and Level 4 driving automation in the
merging and lane-changing risk assessment in mixed traffic.
• This research presented in the dissertation should be evaluated in the real
world in complex merging and lane-changing scenarios.
• The risk assessment strategy presented in this research is based on
statistical methods. Future research should compare the performance of
the risk model with that of other artificial intelligence methods.

76
• Future research should consider the impact of weather conditions on the
merging and lane-changing risk assessment, as the weather will impact AV
sensors’ functionality and reliability.
• This research only considers AVs without any connectivity with
surrounding vehicles and infrastructure. Future research should consider
scenarios where an AV is connected and can communicate with the
surrounding vehicles in a connected vehicle environment.
77
REFERENCES
Ahmed, K. I. (1999). Modeling Drivers ’ Acceleration and Lane Changing Behavior
[Massachusetts Institute of Technology]. In Massachusetts Institute of Technology:
Vol. Ph.D. http://web.mit.edu/its/papers/DRIVIN.PDF
Ali, Y., Zheng, Z., Haque, M. M., & Wang, M. (2019). A game theory-based approach
for modelling mandatory lane-changing behaviour in a connected environment.
Transportation Research Part C: Emerging Technologies, 106(June), 220–242.
https://doi.org/10.1016/j.trc.2019.07.011
Arbis, D., & Dixit, V. V. (2019). Game theoretic model for lane changing: Incorporating
conflict risks. Accident Analysis and Prevention, 125(August 2017), 158–164.
https://doi.org/10.1016/j.aap.2019.02.007
Bates, D., Mächler, M., Bolker, B., & Walker, S. (2015). Fitting Linear Mixed-Effects
Models Using {lme4}. Journal of Statistical Software, 67(1), 1–48.
https://doi.org/10.18637/jss.v067.i01
Bhavsar, P., Das, P., Paugh, M., Dey, K., & Chowdhury, M. (2017). Risk analysis of
autonomous vehicles in mixed traffic streams. Transportation Research Record,
2625, 51–61. https://doi.org/10.3141/2625-06
Cai, Q., Saad, M., Abdel-Aty, M., Yuan, J., & Lee, J. (2018). Safety Impact of Weaving
Distance on Freeway Facilities with Managed Lanes using Both Microscopic Traffic
and Driving Simulations. Transportation Research Record.
https://doi.org/10.1177/0361198118780884

78
Chen, T., Shi, X., & Wong, Y. D. (2019). Key feature selection and risk prediction for
lane-changing behaviors based on vehicles’ trajectory data. Accident Analysis and
Prevention, 129(March), 156–169. https://doi.org/10.1016/j.aap.2019.05.017
Delignette-Muller, M. L., & Dutang, C. (2015). {fitdistrplus}: An {R} Package for
Fitting Distributions. Journal of Statistical Software, 64(4), 1–34.
Dong, C., Dolan, J. M., & Litkouhi, B. (2018). Interactive ramp merging planning in
autonomous driving: Multi-merging leading PGM (MML-PGM). IEEE Conference
on Intelligent Transportation Systems, Proceedings, ITSC, 2018-March, 1–6.
https://doi.org/10.1109/ITSC.2017.8317887
FHWA. (2006). Interstate 80 freeway dataset. Federal Highway Administration, Next
Generation Simulation, FHWA-HRT, 6, 135.
Galceran, E., Cunningham, A. G., Eustice, R. M., & Olson, E. (2017). Multipolicy
decision-making for autonomous driving via changepoint-based behavior prediction:
Theory and experiment. Autonomous Robots, 41(6), 1367–1382.
Garzón, M., & Spalanzani, A. (2019). Game theoretic decision making for autonomous
vehicles’ merge manoeuvre in high traffic scenarios. 2019 IEEE Intelligent
Transportation Systems Conference (ITSC), 3448–3453.
Gipps, P. G. (1981). A behavioural car-following model for computer simulation.
Transportation Research Part B: Methodological, 15(2), 105–111.

79
Gu, X., Abdel-Aty, M., Xiang, Q., Cai, Q., & Yuan, J. (2019). Utilizing UAV video data
for in-depth analysis of drivers’ crash risk at interchange merging areas. Accident
Analysis and Prevention, 123(November 2018), 159–169.
https://doi.org/10.1016/j.aap.2018.11.010
Gu, X., Cai, Q., Lee, J., Xiang, Q., Ma, Y., & Xu, X. (2020). Proactive crash risk
prediction modeling for merging assistance system at interchange merging areas.
Traffic Injury Prevention, 21(3), 234–240.
https://doi.org/10.1080/15389588.2020.1734581
Guo, F., Wotring, B. M., & Antin, J. F. (2010). Evaluation of lane change collision
avoidance systems using the national advanced driving simulator.
HCM. (2010). 11. Basic Freeway Segments. In Highway Capacity Manual 2010,
Volumes 1 - 4, including 2014 Errata. Transportation Research Board.
Hidas, P. (2005). Modelling vehicle interactions in microscopic simulation of merging
and weaving. Transportation Research Part C: Emerging Technologies, 13(1), 37–
62. https://doi.org/10.1016/j.trc.2004.12.003
Kang, K., & Rakha, H. A. (2018). Modeling driver merging behavior: A repeated game
theoretical approach. Transportation Research Record, 2672(20), 144–153.
https://doi.org/10.1177/0361198118792982
Katrakazas, C., Quddus, M., & Chen, W. H. (2019). A new integrated collision risk
assessment methodology for autonomous vehicles. Accident Analysis and
Prevention, 127(September 2018), 61–79. https://doi.org/10.1016/j.aap.2019.01.029

80
Kondyli, A., & Elefteriadou, L. (2011). Modeling driver behavior at freeway-ramp
merges. Transportation Research Record, 2249, 29–37.
https://doi.org/10.3141/2249-05
Kong, J., Pfeiffer, M., Schildbach, G., & Borrelli, F. (2015). Kinematic and dynamic
vehicle models for autonomous driving control design. 2015 IEEE Intelligent
Vehicles Symposium (IV), 1094–1099.
Li, S., Xiang, Q., Ma, Y., Gu, X., & Li, H. (2016). Crash risk prediction modeling based
on the traffic conflict technique and a microscopic simulation for freeway
interchange merging areas. International Journal of Environmental Research and
Public Health, 13(11). https://doi.org/10.3390/ijerph13111157
Li, Y., Li, Z., Wang, H., Wang, W., & Xing, L. (2017). Evaluating the safety impact of
adaptive cruise control in traffic oscillations on freeways. Accident Analysis &
Prevention, 104, 137–145.
Li, Y., Xing, L., Wang, W., & Dong, C. (2017). Evaluating impacts of different car-
following types on rear-end crashes at freeway weaving section. Journal of
Southeast University (English Edition), 33(3), 335–340.
https://doi.org/10.3969/j.issn.1003-7985.2017.03.013
Li, Y., Xu, C., Xing, L., & Wang, W. (2017). Integrated Cooperative Adaptive Cruise
and Variable Speed Limit Controls for Reducing Rear-End Collision Risks Near
Freeway Bottlenecks Based on Micro-Simulations. IEEE Transactions on Intelligent
Transportation Systems, 18(11), 3157–3167.
https://doi.org/10.1109/TITS.2017.2682193
81
Lin, D., Li, L., & Jabari, S. E. (2019). Pay to change lanes: A cooperative lane-changing
strategy for connected/automated driving. Transportation Research Part C:
Emerging Technologies, 105(August 2018), 550–564.
https://doi.org/10.1016/j.trc.2019.06.006
Liu, S., Wang, X., Hassanin, O., Xu, X., Yang, M., Hurwitz, D., & Wu, X. (2021).
Calibration and evaluation of responsibility-sensitive safety (RSS) in automated
vehicle performance during cut-in scenarios. Transportation Research Part C:
Emerging Technologies, 125, 103037.
Liu, Y., Wang, X., Li, L., Cheng, S., & Chen, Z. (2019). A novel lane change decision-
making model of autonomous vehicle based on support vector machine. IEEE
Access, 7, 26543–26550.
Lopez, P. A., Behrisch, M., Bieker-Walz, L., Erdmann, J., Flötteröd, Y.-P., Hilbrich, R.,
Lücken, L., Rummel, J., Wagner, P., & Wießner, E. (2018). Microscopic Traffic
Simulation using SUMO. IEEE Intelligent Transportation Systems Conference
(ITSC).
Marczak, F., Daamen, W., & Buisson, C. (2013). Merging behaviour: Empirical
comparison between two sites and new theory development. Transportation
Research Part C: Emerging Technologies, 36, 530–546.
https://doi.org/10.1016/j.trc.2013.07.007

82
Marinescu, D., Čurn, J., Bouroche, M., & Cahill, V. (2012). On-ramp traffic merging
using cooperative intelligent vehicles: A slot-based approach. IEEE Conference on
Intelligent Transportation Systems, Proceedings, ITSC, 900–906.
https://doi.org/10.1109/ITSC.2012.6338779
Michel, O. (2004). Webots: Professional Mobile Robot Simulation. Journal of Advanced
Robotics Systems, 1(1), 39–42.
Montanino, M, & Punzo, V. (2013). Reconstructed NGSIM I80-1. Cost Action TU0903—
Multitude.
Montanino, Marcello, & Punzo, V. (2013). Making NGSIM data usable for studies on
traffic flow theory: Multistep method for vehicle trajectory reconstruction.
Transportation Research Record, 2390(1), 99–111.
NHTSA. (2017). Traffic Safety Facts 2015. Report No. DOT HS 812 384.
NHTSA. (2018). Automated vehicles for safety. Online Verfügbar Unter Https://Www.
Nhtsa. Gov/Technology-Innovation/Automatedvehicles-Safety, Zuletzt Geprüft Am,
21.
Punzo, V., Borzacchiello, M. T., & Ciuffo, B. (2011). On the assessment of vehicle
trajectory data accuracy and application to the Next Generation SIMulation
(NGSIM) program data. Transportation Research Part C: Emerging Technologies,
19(6), 1243–1262.
R Core Team. (2013). R: A Language and Environment for Statistical Computing.

83
Rahman, M., Chowdhury, M., Xie, Y., & He, Y. (2013). Review of Microscopic Lane-
Changing Models and Future Research Opportunities. IEEE Transactions on
Intelligent Transportation Systems, 14(4), 1942–1956.
Rahman, M., Chowdhury, M., Dey, K., Islam, M. R., & Khan, T. (2017). Evaluation of
Driver Car-Following Behavior Models for Cooperative Adaptive Cruise Control
Systems. Transportation Research Record, 2622(1), 84–95.
https://doi.org/10.3141/2622-08
Rahman, M. H. S., Abdel-Aty, M., Lee, J., & Rahman, M. H. S. (2019). Safety benefits
of arterials’ crash risk under connected and automated vehicles. Transportation
Research Part C: Emerging Technologies, 100(December 2018), 354–371.
https://doi.org/10.1016/j.trc.2019.01.029
Sarker, A., Shen, H., Rahman, M., Chowdhury, M., Li, F., Dey, K., Wang, Y., &
Narman, H. S. (2019). A review of sensing and communication, human factors, and
controller aspects for information-aware connected and automated vehicles. ArXiv,
21(1), 7–29.
Schwarting, W., Pierson, A., Alonso-Mora, J., Karaman, S., & Rus, D. (2019). Social
behavior for autonomous vehicles. Proceedings of the National Academy of
Sciences, 116(50), 24972–24978.
Sen, B., Smith, J. D., Najm, W. G., & others. (2003). Analysis of lane change crashes.
Stewart, J. (2018). Why people keep rear-ending self-driving cars. The Wired.
84
Sun, J., Ouyang, J., & Yang, J. (2014). Modeling and Analysis of Merging Behavior at
Expressway On-Ramp Bottlenecks. Transportation Research Record: Journal of the
Transportation Research Board, 2421(1), 74–81. https://doi.org/10.3141/2421-09
Talebpour, A., & Mahmassani, H. S. (2016). Influence of connected and autonomous
vehicles on traffic flow stability and throughput. Transportation Research Part C:
Emerging Technologies, 71, 143–163. https://doi.org/10.1016/j.trc.2016.07.007
Treiber, M., & Kesting, A. (2013). Traffic flow dynamics. Traffic Flow Dynamics: Data,
Models and Simulation, Springer-Verlag Berlin Heidelberg.
Van Dijck, T., & van der Heijden, G. A. J. (2005). VisionSense: an advanced lateral
collision warning system. IEEE Proceedings. Intelligent Vehicles Symposium, 2005.,
296–301.
Wakasugi, T. (2005). A study on warning timing for lane change decision aid systems
based on driver’s lane change maneuver. Proceedings: International Technical
Conference on the Enhanced Safety of Vehicles, 2005, 7p--7p.
Wang, J., Zhang, Q., Zhao, D., & Chen, Y. (2019). Lane change decision-making through
deep reinforcement learning with rule-based constraints. 2019 International Joint
Conference on Neural Networks (IJCNN), 1–6.
Wang, P., & Chan, C.-Y. (2018). Autonomous Ramp Merge Maneuver Based on
Reinforcement Learning with Continuous Action Space. ArXiv Preprint
ArXiv:1803.09203., 1–8. http://arxiv.org/abs/1803.09203

85
Wang, Sun, Q., Li, Z., & Zhang, H. (2020). Human-like lane change decision model for
autonomous vehicles that considers the risk perception of drivers in mixed traffic.
Sensors (Switzerland), 20(8). https://doi.org/10.3390/s20082259
Wang, Z., Zhao, X., Xu, Z., Li, X., & Qu, X. (2020). Modeling and field experiments on
autonomous vehicle lane changing with surrounding human-driven vehicles.
Computer-Aided Civil and Infrastructure Engineering, 1–13.
https://doi.org/10.1111/mice.12540
Wei, J., Dolan, J. M., & Litkouhi, B. (2013). Autonomous vehicle social behavior for
highway entrance ramp management. IEEE Intelligent Vehicles Symposium,
Proceedings, Iv, 201–207. https://doi.org/10.1109/IVS.2013.6629471
Xie, D. F., Fang, Z. Z., Jia, B., & He, Z. (2019). A data-driven lane-changing model
based on deep learning. Transportation Research Part C: Emerging Technologies,
106(October 2018), 41–60. https://doi.org/10.1016/j.trc.2019.07.002
Yang, H., & Ozbay, K. (2011). Estimation of traffic conflict risk for merging vehicles on
highway merge section. Transportation Research Record, 2236, 58–65.
https://doi.org/10.3141/2236-07
Yang, M., Wang, X., & Quddus, M. (2019). Examining lane change gap acceptance,
duration and impact using naturalistic driving data. Transportation Research Part C:
Emerging Technologies, 104(October 2018), 317–331.
https://doi.org/10.1016/j.trc.2019.05.024

86
Yang, Zheng, S., Wen, C., Jin, P. J., & Ran, B. (2018). A dynamic lane-changing
trajectory planning model for automated vehicles. Transportation Research Part C:
Emerging Technologies, 95(June 2017), 228–247.
https://doi.org/10.1016/j.trc.2018.06.007
Yu, H., Tseng, H. E., & Langari, R. (2018). A human-like game theory-based controller
for automatic lane changing. Transportation Research Part C: Emerging
Technologies, 88(March 2017), 140–158. https://doi.org/10.1016/j.trc.2018.01.016

87
APPENDICES

88
Appendix A
Sample Data for the Risk Model for the Merging Decision
Table A-1 Variables used in the “prior” crash risk model Variables Definition
VehicleID Vehicle ID of the merging vehicle
Speed_Merge Speed of the merging vehicle (m/s)
Acce_Merge Acceleration of the merging vehicle (m/s2)
Speed_Lag Speed of the lag vehicle (m/s)
Acce_Lag Acceleration of the lag vehicle (m/s2)
Speed_Lead Speed of the lead vehicle (m/s)
Acce_Lead Acceleration of the lead vehicle (m/s2)
Gap_Lag Longitudinal distance between the merging vehicle and the lag vehicle (m)
Gap_Lead Longitudinal distance between the merging vehicle and the lead vehicle (m)
Remaining_Dist Distance between the position of merging vehicle and the endpoint of the merging lane
(m)
Risk_Status It is defined by Eq. (3-5)
Table A-2 Representative data for the “prior” crash risk model considering the lead
vehicle VehicleI
D
Speed_Merg
e
Acce_Merg
e Speed_lea
d
Acce_lea
d
Gap_lea
d
Remaining_Distanc
e
Risk_Statu
s
46 15.55386 -0.51593 7.09548 -0.47865 8.7203 93.1051 1
46 15.54195 -0.11913 7.0622 -0.33277 7.87232 91.5509 1
46 15.56741 0.2546 7.04168 -0.2052 7.01975 89.99416 1
46 15.60761 0.402 7.03042 -0.11262 6.16203 88.4334 1
46 15.62983 0.2222 7.02622 -0.04203 5.30166 86.87041 1
46 15.61075 -0.19078 7.03065 0.0443 4.44366 85.30934 1
46 15.54933 -0.61427 7.05021 0.19559 3.59375 83.75441 1
46 15.46353 -0.85801 7.09365 0.43439 2.75675 82.20805 1
46 15.37529 -0.88241 7.16492 0.7127 1.93572 80.67052 1
46 15.0509 -0.9666 6.40629 0.34409 12.94741 74.59855 1
46 14.92708 -1.23826 6.4264 0.20109 12.09734 73.10584 1
46 14.77857 -1.48503 6.43185 0.05455 11.26267 71.62798 1
46 14.61669 -1.6188 6.42313 -0.08726 10.44332 70.16632 1
46 14.45533 -1.61359 6.39586 -0.27261 9.63737 68.72078 1
46 14.3032 -1.52129 6.34581 -0.50049 8.84163 67.29046 1
46 14.16041 -1.42791 6.27708 -0.68731 8.0533 65.87442 1
46 14.02198 -1.38431 6.20206 -0.75029 7.2713 64.47222 1
46 13.88332 -1.3866 6.1332 -0.6886 6.49629 63.08389 1
46 13.74144 -1.41878 6.07668 -0.56512 5.72982 61.70975 1

89
VehicleI
D
Speed_Merg
e
Acce_Merg
e Speed_lea
d
Acce_lea
d
Gap_lea
d
Remaining_Distanc
e
Risk_Statu
s
46 13.59323 -1.48212 6.03321 -0.43473 4.97381 60.35042 1
46 13.43758 -1.55649 6.00189 -0.31325 4.23024 59.00666 1
46 13.2809 -1.5668 5.98195 -0.19932 3.50034 57.67857 1
46 13.13517 -1.45732 5.97244 -0.09517 2.78408 56.36506 1
46 13.00485 -1.30324 5.97225 -0.00182 2.08081 55.06457 1
46 12.87672 -1.28123 5.98141 0.09161 1.39129 53.7769 1
46 12.72734 -1.49387 6.00233 0.20919 0.71879 52.50417 1
46 12.54159 -1.85742 6.04024 0.37909 0.06865 51.25001 1
46 11.65625 -2.04515 6.70947 -1.28044 14.81129 46.45707 0
46 11.489 -1.67248 6.59332 -1.16158 14.32172 45.30817 0
46 11.36344 -1.25563 6.52116 -0.72158 13.8375 44.17183 0
46 11.27356 -0.89879 6.50726 -0.13903 13.36086 43.04447 0
46 7.7225 -0.58915 6.33126 -0.67008 6.29407 20.51616 0
46 7.68614 -0.36355 6.28838 -0.42881 6.1543 19.74755 0
46 7.61094 -0.16628 6.30094 -0.08395 5.61849 16.69309 0
46 7.59175 -0.19192 6.27295 -0.27995 5.48661 15.93392 0
46 7.5654 -0.26358 6.24333 -0.29617 5.35441 15.17738 0
124 15.29441 -0.10574 6.42077 0.3774 2.03329 94.46825 1
124 15.25523 -0.39172 6.49477 0.74001 1.15724 92.94273 1
124 15.18908 -0.66159 6.21636 -0.00947 13.64752 91.42382 1
124 15.09808 -0.90992 6.20543 -0.10925 12.75825 89.91401 1
124 14.98475 -1.13334 6.18307 -0.22368 11.87809 88.41554 1
124 14.85177 -1.32981 6.14807 -0.34995 11.00771 86.93036 1
124 14.70194 -1.49825 6.10146 -0.4661 10.14767 85.46017 1
124 14.5381 -1.63839 6.04696 -0.54499 9.29856 84.00636 1
124 14.36304 -1.75065 5.9898 -0.57158 8.46123 82.57005 1
124 14.17943 -1.8361 5.93567 -0.5413 7.63685 81.15211 1
124 13.98979 -1.8964 5.89035 -0.45325 6.82691 79.75313 1
124 13.79641 -1.93385 5.85748 -0.32874 6.03302 78.37349 1
124 13.60127 -1.9513 5.83419 -0.23288 5.25631 77.01336 1
124 13.40606 -1.95219 5.80915 -0.25038 4.49662 75.67276 1
124 13.21201 -1.94047 5.76719 -0.41956 3.75214 74.35156 1
124 13.01996 -1.92052 5.69854 -0.68652 3.01999 73.04956 1
124 12.45705 -1.8574 5.40303 -0.97993 0.87793 69.25655 1
124 11.42555 -1.35634 5.02795 -0.09016 14.47253 62.15892 0
124 11.31459 -1.10966 5.01675 -0.11202 13.84274 61.02746 0
124 11.20939 -1.05197 5.0061 -0.10654 13.22241 59.90652 0

90
VehicleI
D
Speed_Merg
e
Acce_Merg
e Speed_lea
d
Acce_lea
d
Gap_lea
d
Remaining_Distanc
e
Risk_Statu
s
124 11.0896 -1.19789 4.99759 -0.08506 12.61321 58.79756 0
124 10.94284 -1.4676 4.991 -0.06586 12.01803 57.70328 0
124 10.28413 -1.38523 4.95745 -0.11869 9.80025 53.49649 0
124 10.17601 -1.08118 4.94322 -0.14229 9.27697 52.47889 0
124 10.087 -0.89009 4.92861 -0.14605 8.76113 51.47019 1
124 9.99915 -0.87854 4.91642 -0.12197 8.25287 50.47028 1
124 9.89289 -1.06254 4.9093 -0.07117 7.75451 49.48099 1
124 9.75156 -1.41336 4.90945 0.00157 7.27029 48.50583 0
124 7.42219 0.49425 8.34067 -0.07779 3.88337 29.31905 0
124 7.46506 0.42873 8.32573 -0.14941 3.96945 28.57255 0
124 7.49338 0.28321 8.31356 -0.12176 4.05146 27.82321 0
124 7.49894 0.05556 8.30153 -0.12025 4.13171 27.07331 0
124 7.00901 -0.67716 8.11369 -0.7927 4.72131 22.72571 0
124 7.01337 0.04363 7.98599 -1.277 4.81857 22.02437 0
124 7.08618 0.72807 7.80463 -1.81364 4.89042 21.31575 0
124 7.29389 0.56349 7.59559 0.19163 4.37138 7.99702 0
124 7.38665 0.92755 7.60566 0.1007 4.39328 7.25835 0
124 7.60718 0.16438 7.60417 -0.06177 4.41385 4.23514 0
124 7.61362 0.06441 7.59277 -0.11403 4.41176 3.47378 0
140 13.1925 -1.2146 5.87322 -0.49537 10.53389 93.78303 1
140 13.02073 -1.7177 5.84225 -0.3097 9.81604 92.48096 1
140 12.83317 -1.87562 5.83304 -0.09215 9.11603 91.19764 1
140 12.65809 -1.75079 5.83174 -0.01298 8.43339 89.93183 1
140 12.51346 -1.44636 5.81576 -0.15982 7.76362 88.68048 1
140 12.40683 -1.06622 5.7692 -0.46555 7.09986 87.4398 1
140 12.07431 -0.79266 5.13058 -0.88908 3.01074 80.10717 1
140 11.98588 -0.88435 5.08657 -0.44011 2.3208 78.90858 1
140 11.90128 -0.84597 5.076 -0.10568 1.63827 77.71845 1
140 11.82967 -0.71611 5.06463 -0.11375 0.96177 76.53548 1
140 11.77198 -0.5769 5.01842 -0.46205 0.28642 75.35829 1
140 11.72139 -0.50594 6.45056 -0.18844 12.49674 74.18615 0
140 11.66619 -0.55197 6.41087 -0.39687 11.97121 73.01953 0
140 11.59251 -0.73675 6.35561 -0.55254 11.44752 71.86028 0
140 11.48822 -1.04289 6.29396 -0.61654 10.92809 70.71145 0
140 11.35014 -1.38085 6.2362 -0.57759 10.4167 69.57644 0
140 11.19013 -1.6001 6.18911 -0.47095 9.9166 68.45743 0
140 11.03201 -1.58121 6.15357 -0.35534 9.42875 67.35423 0
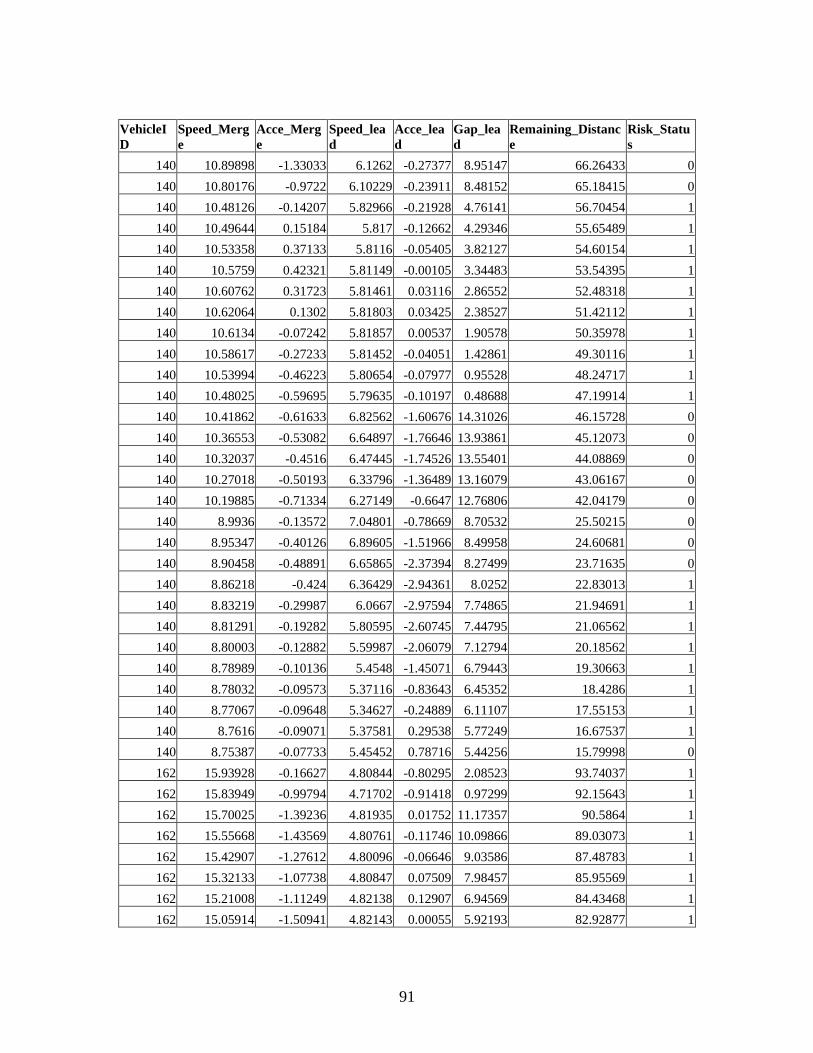
91
VehicleI
D
Speed_Merg
e
Acce_Merg
e Speed_lea
d
Acce_lea
d
Gap_lea
d
Remaining_Distanc
e
Risk_Statu
s
140 10.89898 -1.33033 6.1262 -0.27377 8.95147 66.26433 0
140 10.80176 -0.9722 6.10229 -0.23911 8.48152 65.18415 0
140 10.48126 -0.14207 5.82966 -0.21928 4.76141 56.70454 1
140 10.49644 0.15184 5.817 -0.12662 4.29346 55.65489 1
140 10.53358 0.37133 5.8116 -0.05405 3.82127 54.60154 1
140 10.5759 0.42321 5.81149 -0.00105 3.34483 53.54395 1
140 10.60762 0.31723 5.81461 0.03116 2.86552 52.48318 1
140 10.62064 0.1302 5.81803 0.03425 2.38527 51.42112 1
140 10.6134 -0.07242 5.81857 0.00537 1.90578 50.35978 1
140 10.58617 -0.27233 5.81452 -0.04051 1.42861 49.30116 1
140 10.53994 -0.46223 5.80654 -0.07977 0.95528 48.24717 1
140 10.48025 -0.59695 5.79635 -0.10197 0.48688 47.19914 1
140 10.41862 -0.61633 6.82562 -1.60676 14.31026 46.15728 0
140 10.36553 -0.53082 6.64897 -1.76646 13.93861 45.12073 0
140 10.32037 -0.4516 6.47445 -1.74526 13.55401 44.08869 0
140 10.27018 -0.50193 6.33796 -1.36489 13.16079 43.06167 0
140 10.19885 -0.71334 6.27149 -0.6647 12.76806 42.04179 0
140 8.9936 -0.13572 7.04801 -0.78669 8.70532 25.50215 0
140 8.95347 -0.40126 6.89605 -1.51966 8.49958 24.60681 0
140 8.90458 -0.48891 6.65865 -2.37394 8.27499 23.71635 0
140 8.86218 -0.424 6.36429 -2.94361 8.0252 22.83013 1
140 8.83219 -0.29987 6.0667 -2.97594 7.74865 21.94691 1
140 8.81291 -0.19282 5.80595 -2.60745 7.44795 21.06562 1
140 8.80003 -0.12882 5.59987 -2.06079 7.12794 20.18562 1
140 8.78989 -0.10136 5.4548 -1.45071 6.79443 19.30663 1
140 8.78032 -0.09573 5.37116 -0.83643 6.45352 18.4286 1
140 8.77067 -0.09648 5.34627 -0.24889 6.11107 17.55153 1
140 8.7616 -0.09071 5.37581 0.29538 5.77249 16.67537 1
140 8.75387 -0.07733 5.45452 0.78716 5.44256 15.79998 0
162 15.93928 -0.16627 4.80844 -0.80295 2.08523 93.74037 1
162 15.83949 -0.99794 4.71702 -0.91418 0.97299 92.15643 1
162 15.70025 -1.39236 4.81935 0.01752 11.17357 90.5864 1
162 15.55668 -1.43569 4.80761 -0.11746 10.09866 89.03073 1
162 15.42907 -1.27612 4.80096 -0.06646 9.03586 87.48783 1
162 15.32133 -1.07738 4.80847 0.07509 7.98457 85.95569 1
162 15.21008 -1.11249 4.82138 0.12907 6.94569 84.43468 1
162 15.05914 -1.50941 4.82143 0.00055 5.92193 82.92877 1

92
VehicleI
D
Speed_Merg
e
Acce_Merg
e Speed_lea
d
Acce_lea
d
Gap_lea
d
Remaining_Distanc
e
Risk_Statu
s
162 14.84835 -2.10796 4.79768 -0.23747 4.91686 81.44393 1
162 14.58998 -2.58363 4.75571 -0.4197 3.93344 79.98494 1
162 14.32245 -2.67534 4.71248 -0.43239 2.97243 78.55269 1
162 14.0955 -2.26947 4.68476 -0.27719 2.03136 77.14314 1
162 13.95649 -1.39017 4.68193 -0.02828 1.1039 75.74749 1
162 13.93193 -0.24559 5.51026 1.63627 10.64361 74.3543 1
162 14.0124 0.80474 5.67907 1.68813 9.81028 72.95306 1
162 14.73179 -0.7152 6.10054 0.07493 2.9545 61.28349 1
162 14.61303 -1.18759 6.10564 0.05105 2.10376 59.82219 1
162 14.48664 -1.26389 6.108 0.02352 1.26589 58.37352 1
162 14.39448 -0.92167 6.09429 -0.02408 13.96612 56.93408 1
162 14.36279 -0.31689 6.09101 -0.03285 13.13894 55.4978 1
162 14.48987 0.00917 6.03745 -0.25164 9.78403 49.71657 1
162 14.42823 -0.61649 5.99557 -0.4188 8.94076 48.27374 1
162 14.30229 -1.25936 5.93163 -0.63939 8.10369 46.84351 1
162 14.12844 -1.73847 5.84641 -0.85219 7.27549 45.43067 1
162 13.93657 -1.91868 5.75118 -0.95229 6.45695 44.03701 1
162 13.75922 -1.77351 5.66553 -0.85645 5.64758 42.66109 1
162 13.61889 -1.40329 5.60768 -0.57851 4.84646 41.2992 1
162 13.51992 -0.98974 5.58487 -0.22809 4.05296 39.94721 1
162 13.45066 -0.69255 5.593 0.08127 3.26719 38.60214 1
162 13.39307 -0.57597 5.62511 0.32114 2.4904 37.26284 1
162 13.3294 -0.63671 5.67847 0.53356 1.7253 35.9299 1
162 13.24293 -0.86471 5.7517 0.73225 0.97617 34.6056 1
162 13.11922 -1.23702 6.80023 -0.01818 16.25592 33.29368 0
162 12.22925 -1.40853 6.65973 -0.55858 13.34017 27.00765 0
162 12.13316 -0.96092 6.59161 -0.68124 12.78601 25.79433 0
162 12.07323 -0.59922 6.52081 -0.70804 12.23077 24.58701 0
162 12.03715 -0.36084 6.45612 -0.64684 11.67267 23.3833 1
162 11.97095 -0.13961 6.30768 -0.17609 9.41493 18.58638 1
162 11.95564 -0.15303 6.30645 -0.01224 8.85001 17.39082 1
162 11.93753 -0.18112 6.32364 0.17185 8.28861 16.19706 1
162 11.91247 -0.25062 6.36415 0.40512 7.73379 15.00582 1
162 11.87173 -0.40738 6.43649 0.72338 7.19026 13.81864 1
162 11.80127 -0.70465 6.54901 1.12522 6.66504 12.63852 1
183 13.69218 -0.83956 4.37119 -0.90305 1.80531 93.46127 1
183 13.46746 -1.22105 4.07662 -0.11998 9.65531 90.75557 1

93
VehicleI
D
Speed_Merg
e
Acce_Merg
e Speed_lea
d
Acce_lea
d
Gap_lea
d
Remaining_Distanc
e
Risk_Statu
s
183 13.32792 -1.39536 4.09115 0.14533 8.73164 89.42278 1
183 13.17454 -1.53383 4.12551 0.34356 7.82673 88.10532 1
183 13.01046 -1.6408 4.16628 0.40767 6.94232 86.80428 1
183 12.83989 -1.70566 4.20725 0.40971 6.07905 85.52029 1
183 12.67167 -1.68222 4.25329 0.46041 5.23721 84.25312 1
183 12.51893 -1.52741 4.31074 0.57455 4.4164 83.00123 1
183 12.39296 -1.25972 4.37701 0.66262 3.6148 81.76193 1
183 12.29651 -0.96446 4.44105 0.64038 2.82925 80.53228 1
183 12.22206 -0.74459 4.49249 0.51449 2.0563 79.31008 1
183 12.15479 -0.67262 4.52846 0.35969 1.29367 78.0946 1
183 12.07718 -0.77609 6.1004 0.01967 16.32424 76.88688 0
183 11.97292 -1.0426 6.10365 0.03255 15.73732 75.68959 0
183 10.2329 -0.48967 6.34827 0.01222 11.05084 64.78126 0
183 10.19843 -0.34466 6.33752 -0.10751 10.66475 63.76142 0
183 10.16307 -0.35364 6.33387 -0.03649 10.28182 62.74511 0
183 10.11488 -0.48189 6.34734 0.13468 9.90508 61.73363 0
183 9.30305 -0.69548 6.35274 -0.37221 7.29632 54.01536 0
183 9.22835 -0.74696 6.29493 -0.57809 7.00298 53.09253 0
183 9.12902 -0.99337 6.23306 -0.61878 6.71339 52.17963 0
183 6.15116 -0.26929 6.19399 -0.68605 6.95697 14.09131 0
183 6.11608 -0.35086 6.15262 -0.41363 6.96063 13.4797 0
183 5.41396 0.48597 6.09583 -0.00716 7.33339 8.35854 0
183 6.00252 -0.16297 6.02679 -0.21973 7.49376 3.66036 0
186 14.05508 -0.7959 3.86698 0.38749 2.64961 94.20823 1
186 13.93925 -1.15833 3.89225 0.25272 1.64492 92.81431 1
186 13.80014 -1.39108 4.07874 0.04194 9.21745 91.4343 1
186 13.65309 -1.47056 4.07172 -0.07014 8.25931 90.06899 1
186 13.51721 -1.35879 4.0533 -0.18421 7.31293 88.71727 1
186 13.39989 -1.17319 4.02348 -0.29822 6.37528 87.37728 1
186 13.28638 -1.13508 3.98463 -0.38854 5.44511 86.04864 1
186 13.15164 -1.34737 3.94229 -0.42338 4.52416 84.73347 1
186 12.9838 -1.67848 3.90359 -0.38698 3.61614 83.43509 1
186 12.7952 -1.88601 3.87433 -0.29263 2.72407 82.15558 1
186 12.61181 -1.83385 3.85723 -0.17101 1.8486 80.89439 1
186 9.22446 -0.88102 6.10297 -0.02961 5.02031 59.43814 0
186 9.15123 -0.73238 6.10061 -0.02359 4.71526 58.52302 0
186 9.07799 -0.73232 6.0991 -0.01513 4.41737 57.61522 1

94
VehicleI
D
Speed_Merg
e
Acce_Merg
e Speed_lea
d
Acce_lea
d
Gap_lea
d
Remaining_Distanc
e
Risk_Statu
s
186 8.98662 -0.91379 6.09834 -0.00761 4.12854 56.71656 0
186 4.4721 0.09659 5.95306 0.07351 3.60903 41.55506 0
186 4.47115 -0.00945 5.93469 -0.18369 3.75538 41.10794 0
186 4.46172 -0.09434 5.89625 -0.38438 3.89884 40.66177 0
186 4.44974 -0.11976 5.85426 -0.41988 4.03929 40.2168 0
186 4.69852 0.11462 5.16584 -0.47498 5.52655 33.87123 0
186 4.70202 0.03495 5.16564 -0.00201 5.57291 33.40103 0
186 5.46677 0.26398 5.94254 0.0274 7.27632 23.66692 0
186 5.48184 0.15065 5.94977 0.07232 7.32312 23.11874 0
186 5.49613 -0.0014 5.98628 -0.00765 7.51664 20.92103 0
186 5.49403 -0.02102 5.97379 -0.1249 7.56462 20.37163 0
186 5.48955 -0.04479 5.95864 -0.15154 7.61152 19.82267 0
186 5.48739 0.10496 6.08 0.09669 7.99475 15.99038 0
186 5.49833 0.10934 6.08483 0.04833 8.05339 15.44054 0
186 5.50987 0.11545 6.08588 0.01048 8.11099 14.88955 0
186 5.52437 0.14498 6.08326 -0.02625 8.16689 14.33712 0
186 5.54602 0.21643 6.07601 -0.07251 8.21989 13.78252 0
186 5.58102 0.35005 6.06179 -0.14213 8.26796 13.22441 0
186 5.63838 0.57355 6.03623 -0.25565 8.30775 12.66058 0
202 13.72371 -0.43035 5.53783 0.49915 9.65023 92.44987 1
202 13.61551 -1.08207 5.56128 0.23447 8.84481 91.08832 1
202 13.44486 -1.70643 5.56088 -0.004 8.05642 89.74384 1
202 13.24018 -2.04685 5.53666 -0.24222 7.28606 88.41982 1
202 13.04266 -1.97517 5.48666 -0.49994 6.53046 87.11555 1
202 12.88544 -1.57222 5.41274 -0.7392 5.78319 85.82701 1
202 12.77433 -1.11113 5.32743 -0.85311 5.0385 84.54957 1
202 12.68381 -0.90512 5.25462 -0.72807 4.29558 83.28119 1
202 12.57882 -1.04997 5.22006 -0.3456 3.5597 82.02331 1
202 12.44418 -1.34633 5.23714 0.17073 2.839 80.77889 1
202 12.29265 -1.5153 5.2994 0.62264 2.13968 79.54963 1
202 12.14863 -1.44025 5.38641 0.87004 1.46346 78.33477 1
202 11.84123 -0.89271 6.42787 -0.15232 12.12736 74.75478 0
202 11.73896 -1.02273 6.36804 -0.59825 11.59027 73.58088 0
202 11.60051 -1.38451 6.26393 -1.04113 11.05661 72.42083 0
202 11.40816 -1.9235 6.12283 -1.41095 10.52807 71.28001 0
202 11.16055 -2.47614 5.9594 -1.63432 10.00797 70.16396 0
202 10.87662 -2.83927 5.79261 -1.66794 9.49957 69.0763 0

95
VehicleI
D
Speed_Merg
e
Acce_Merg
e Speed_lea
d
Acce_lea
d
Gap_lea
d
Remaining_Distanc
e
Risk_Statu
s
202 10.32596 -2.61616 5.51236 -1.27784 8.52346 66.98494 0
202 10.11538 -2.10583 5.40832 -1.0404 8.05275 65.9734 0
202 9.96177 -1.53606 5.31658 -0.91732 7.58824 64.97723 1
202 9.85395 -1.07822 5.22235 -0.94232 7.12507 63.99183 1
202 9.77231 -0.81645 5.11811 -1.04242 6.65965 63.0146 1
202 9.69637 -0.75934 5.01077 -1.07343 6.19109 62.04496 1
202 9.60897 -0.87402 4.91913 -0.91637 5.72211 61.08407 1
202 9.50014 -1.08834 4.86247 -0.56662 5.25834 60.13405 1
202 9.37117 -1.28971 4.8483 -0.14174 4.80605 59.19693 1
202 9.23492 -1.36252 4.86831 0.20016 4.36939 58.27344 1
202 9.1095 -1.25412 4.90448 0.36164 3.94889 57.36249 1
202 9.00868 -1.00826 4.93918 0.34708 3.54195 56.46163 1
202 8.93565 -0.73028 4.96163 0.22451 3.14454 55.56806 1
202 8.88354 -0.52106 4.96747 0.05839 2.75294 54.67971 1
202 8.83975 -0.43792 4.95452 -0.12955 2.36441 53.79573 1
202 8.79035 -0.49399 4.91901 -0.35504 1.97728 52.9167 1
202 8.72374 -0.66613 4.8557 -0.63316 1.59047 52.04432 1
202 8.63441 -0.89334 4.48502 -0.33463 10.65256 51.18088 0
202 8.52614 -1.08266 4.42966 -0.55351 10.24292 50.32827 0
202 8.41161 -1.14531 4.34949 -0.80176 9.83671 49.48711 0
202 8.30687 -1.04739 4.24893 -1.00562 9.43091 48.65642 0
202 8.22382 -0.83047 4.14105 -1.07878 9.02263 47.83404 0
202 8.16572 -0.58101 4.04303 -0.98017 8.61036 47.01746 1
202 8.12786 -0.37858 3.96877 -0.74259 8.19445 46.20468 1
202 8.10079 -0.27074 3.92458 -0.44191 7.77683 45.3946 1
202 8.07302 -0.27768 3.91096 -0.1362 7.36063 44.5873 1
202 8.0339 -0.39118 3.92818 0.17222 6.95006 43.78391 1
202 7.97767 -0.56234 3.98051 0.52326 6.55034 42.98614 0
202 5.47849 -0.05684 6.08772 -0.12342 3.00941 18.7505 0
202 5.47567 -0.02824 5.99325 -0.9447 3.06118 18.20294 0
202 5.73612 0.23594 5.55944 -0.81797 2.95805 12.08471 0
202 5.70112 -0.35004 5.39772 -1.61716 2.92772 11.5146 1
202 5.58377 -1.17342 5.20227 -1.95451 2.88956 10.95622 0
210 5.36013 0.17915 6.20897 -0.38931 5.54538 85.63979 0
210 5.39985 0.39726 6.12527 -0.83699 5.61793 85.09981 0
210 5.46929 0.69441 6.01962 -1.05647 5.67296 84.55288 0
210 5.57508 1.05791 5.91951 -1.00109 5.7074 83.99537 0

96
VehicleI
D
Speed_Merg
e
Acce_Merg
e Speed_lea
d
Acce_lea
d
Gap_lea
d
Remaining_Distanc
e
Risk_Statu
s
210 5.72145 1.4636 5.84315 -0.76364 5.71958 83.42323 0
210 5.90217 1.80729 5.7894 -0.53746 5.7083 82.83301 0
210 6.10261 2.00434 5.73916 -0.50241 5.67195 82.22275 1
210 8.9764 0.12813 4.57335 -0.00534 11.67835 66.13222 0
210 9.02214 0.45737 4.57306 -0.00287 11.23345 65.23001 0
210 9.11499 0.9285 4.57291 -0.00151 10.77924 64.31851 1
210 9.66872 1.11078 4.57126 -0.00826 8.81922 60.52962 1
210 9.73314 0.6442 4.56989 -0.0137 8.30289 59.5563 1
210 9.75146 0.18326 4.56759 -0.02296 7.78451 58.58116 1
210 9.72749 -0.23973 4.56365 -0.03942 7.26812 57.60841 1
210 9.66591 -0.61576 4.55667 -0.06982 6.75719 56.64181 1
210 9.57613 -0.89787 4.54389 -0.12779 6.25397 55.6842 1
210 9.4743 -1.01832 4.52086 -0.23027 5.75862 54.73677 1
210 9.23505 0.15374 4.38499 0.21097 2.83914 49.17521 1
210 9.60974 -0.55901 4.73023 0.66614 7.74364 39.62825 0
210 9.52043 -0.89303 4.75497 0.24742 7.2671 38.67621 0
210 9.39878 -1.21651 4.7443 -0.10675 6.80164 37.73633 1
210 9.25646 -1.4232 4.70312 -0.41175 6.34632 36.81069 1
210 9.1106 -1.45859 4.641 -0.62124 5.89936 35.89963 1
210 8.97023 -1.4037 4.5762 -0.64793 5.45995 35.0026 1
210 8.82835 -1.41887 4.53102 -0.45182 5.03022 34.11977 1
210 8.67057 -1.57774 4.52023 -0.10787 4.61518 33.25271 1
210 8.03653 -1.15233 4.67244 0.39978 3.15931 29.95347 1
210 7.96758 -0.68948 4.70211 0.29672 2.83277 29.15671 1
210 7.86909 -0.69791 3.94044 -2.50692 9.9938 22.82675 1
210 7.73843 -1.30663 3.74759 -1.92853 9.59471 22.0529 0
210 7.573 -1.65428 3.62592 -1.21668 9.2 21.2956 0
210 7.04957 0.02187 4.38391 0.53161 6.65532 15.57703 0
210 7.05293 0.03361 4.3703 -0.13607 6.38705 14.87173 0
210 7.04932 -0.03615 4.3001 -0.70202 6.11213 14.1668 1
210 7.03022 -0.19093 4.18104 -1.19061 5.82721 13.46378 1
210 6.9862 -0.44027 4.02801 -1.5303 5.53139 12.76516 1
210 6.90445 -0.81748 3.86259 -1.65426 5.2272 12.07471 1
210 6.76664 -1.37807 3.70388 -1.58702 4.92093 11.39805 1
210 6.5526 -2.14043 3.56129 -1.42598 4.6218 10.74279 0
252 15.33146 -1.35326 4.57339 -0.00743 22.21089 89.89019 0
252 15.14238 -1.89081 4.57298 -0.00409 21.15395 88.37595 0
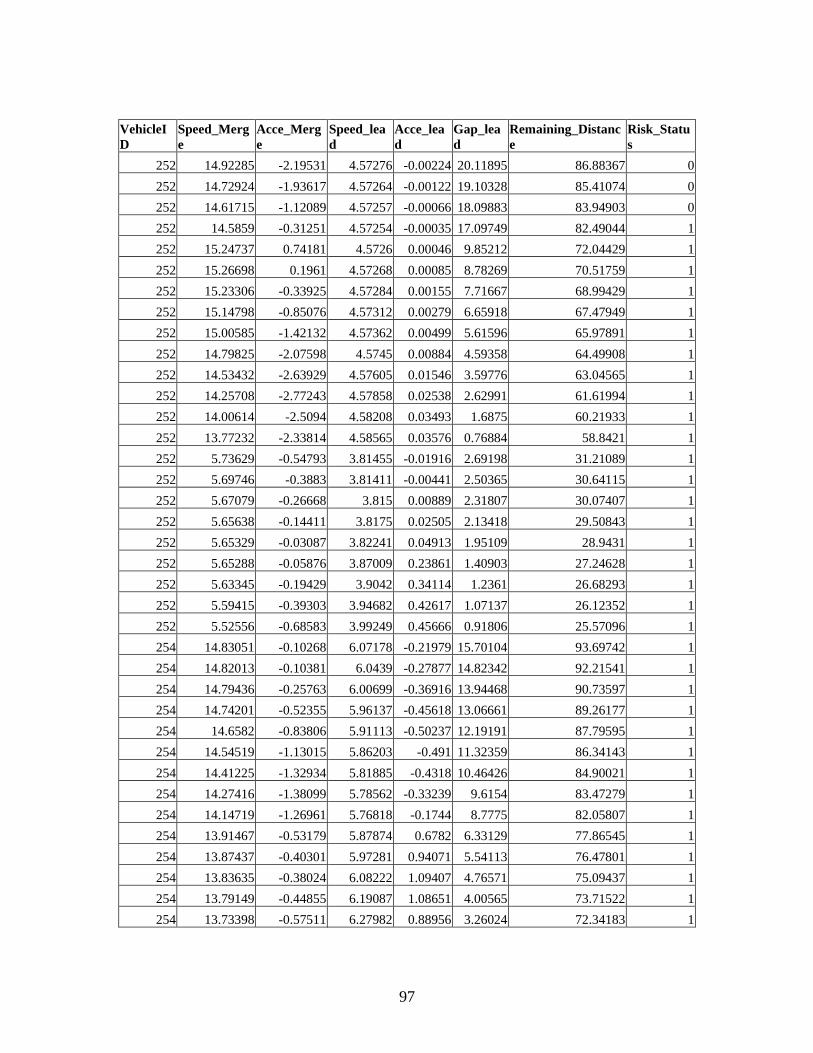
97
VehicleI
D
Speed_Merg
e
Acce_Merg
e Speed_lea
d
Acce_lea
d
Gap_lea
d
Remaining_Distanc
e
Risk_Statu
s
252 14.92285 -2.19531 4.57276 -0.00224 20.11895 86.88367 0
252 14.72924 -1.93617 4.57264 -0.00122 19.10328 85.41074 0
252 14.61715 -1.12089 4.57257 -0.00066 18.09883 83.94903 0
252 14.5859 -0.31251 4.57254 -0.00035 17.09749 82.49044 1
252 15.24737 0.74181 4.5726 0.00046 9.85212 72.04429 1
252 15.26698 0.1961 4.57268 0.00085 8.78269 70.51759 1
252 15.23306 -0.33925 4.57284 0.00155 7.71667 68.99429 1
252 15.14798 -0.85076 4.57312 0.00279 6.65918 67.47949 1
252 15.00585 -1.42132 4.57362 0.00499 5.61596 65.97891 1
252 14.79825 -2.07598 4.5745 0.00884 4.59358 64.49908 1
252 14.53432 -2.63929 4.57605 0.01546 3.59776 63.04565 1
252 14.25708 -2.77243 4.57858 0.02538 2.62991 61.61994 1
252 14.00614 -2.5094 4.58208 0.03493 1.6875 60.21933 1
252 13.77232 -2.33814 4.58565 0.03576 0.76884 58.8421 1
252 5.73629 -0.54793 3.81455 -0.01916 2.69198 31.21089 1
252 5.69746 -0.3883 3.81411 -0.00441 2.50365 30.64115 1
252 5.67079 -0.26668 3.815 0.00889 2.31807 30.07407 1
252 5.65638 -0.14411 3.8175 0.02505 2.13418 29.50843 1
252 5.65329 -0.03087 3.82241 0.04913 1.95109 28.9431 1
252 5.65288 -0.05876 3.87009 0.23861 1.40903 27.24628 1
252 5.63345 -0.19429 3.9042 0.34114 1.2361 26.68293 1
252 5.59415 -0.39303 3.94682 0.42617 1.07137 26.12352 1
252 5.52556 -0.68583 3.99249 0.45666 0.91806 25.57096 1
254 14.83051 -0.10268 6.07178 -0.21979 15.70104 93.69742 1
254 14.82013 -0.10381 6.0439 -0.27877 14.82342 92.21541 1
254 14.79436 -0.25763 6.00699 -0.36916 13.94468 90.73597 1
254 14.74201 -0.52355 5.96137 -0.45618 13.06661 89.26177 1
254 14.6582 -0.83806 5.91113 -0.50237 12.19191 87.79595 1
254 14.54519 -1.13015 5.86203 -0.491 11.32359 86.34143 1
254 14.41225 -1.32934 5.81885 -0.4318 10.46426 84.90021 1
254 14.27416 -1.38099 5.78562 -0.33239 9.6154 83.47279 1
254 14.14719 -1.26961 5.76818 -0.1744 8.7775 82.05807 1
254 13.91467 -0.53179 5.87874 0.6782 6.33129 77.86545 1
254 13.87437 -0.40301 5.97281 0.94071 5.54113 76.47801 1
254 13.83635 -0.38024 6.08222 1.09407 4.76571 75.09437 1
254 13.79149 -0.44855 6.19087 1.08651 4.00565 73.71522 1
254 13.73398 -0.57511 6.27982 0.88956 3.26024 72.34183 1

98
VehicleI
D
Speed_Merg
e
Acce_Merg
e Speed_lea
d
Acce_lea
d
Gap_lea
d
Remaining_Distanc
e
Risk_Statu
s
254 13.66475 -0.69236 6.33204 0.52218 2.52696 70.97535 1
254 13.5935 -0.7125 6.33522 0.03185 1.80114 69.616 1
254 13.53334 -0.60153 6.27909 -0.56133 1.07571 68.26267 1
254 13.48986 -0.43485 4.77894 -0.02116 21.44314 66.91368 0
254 13.45439 -0.35466 4.7777 -0.01244 20.57547 65.56824 0
254 13.40704 -0.47349 4.77698 -0.00718 19.71247 64.22754 0
254 13.32416 -0.82883 4.77655 -0.00427 18.85771 62.89512 0
254 13.18385 -1.40313 4.77632 -0.00233 18.01696 61.57674 0
254 6.09419 -0.04943 7.43632 -0.09856 10.52647 8.7478 0
254 6.12076 0.26569 7.4449 0.08577 10.65889 8.13573 0
254 6.16904 0.48285 7.46322 0.18318 10.7883 7.51882 0
254 6.21414 0.45101 7.48398 0.20758 10.91529 6.89741 0
300 13.83771 -0.46074 5.60564 0.85445 2.90119 89.87573 1
300 13.78075 -0.56959 5.6658 0.60158 2.0897 88.49766 1
300 13.72324 -0.57506 5.69431 0.28507 1.2868 87.12533 1
300 13.67442 -0.48828 5.42116 -1.00872 15.83633 85.75789 1
300 13.63503 -0.39388 5.2994 -1.21763 15.00277 84.39439 1
300 13.59425 -0.40781 5.15796 -1.41435 14.15915 83.03497 1
300 13.53265 -0.61596 5.00896 -1.49002 13.30678 81.6817 1
300 13.42917 -1.03485 4.86954 -1.39421 12.45081 80.33878 1
300 13.2695 -1.59662 4.75294 -1.16594 11.59915 79.01183 1
300 13.05328 -2.16228 4.66237 -0.90568 10.76007 77.70651 1
300 12.79456 -2.58716 4.59069 -0.71684 9.93968 76.42705 1
300 12.51455 -2.80008 4.52502 -0.65668 9.14072 75.17559 1
300 12.23159 -2.82958 4.45413 -0.70898 8.36299 73.95244 1
300 11.95287 -2.78719 4.37495 -0.7918 7.60519 72.75715 1
300 11.67226 -2.80611 4.29306 -0.81886 6.86727 71.58992 1
300 11.37823 -2.9403 4.21475 -0.78309 6.15092 70.4521 1
300 11.06399 -3.14238 4.13782 -0.7693 5.4583 69.3457 1
300 10.72828 -3.35716 4.05261 -0.85209 4.79073 68.27287 1
300 10.37164 -3.56639 3.95382 -0.98796 4.14896 67.23571 1
300 10.00374 -3.67896 3.8497 -1.04114 3.53355 66.23533 1
300 9.64289 -3.60852 3.75907 -0.90629 2.94516 65.27104 1
300 9.30072 -3.42168 3.7019 -0.5717 2.38528 64.34097 1
300 8.98364 -3.17079 3.69356 -0.08346 1.85628 63.44261 1
300 8.70021 -2.8343 3.7418 0.48243 1.36044 62.57259 1
300 8.08554 -0.60963 4.07746 0.01453 11.53398 59.27611 0
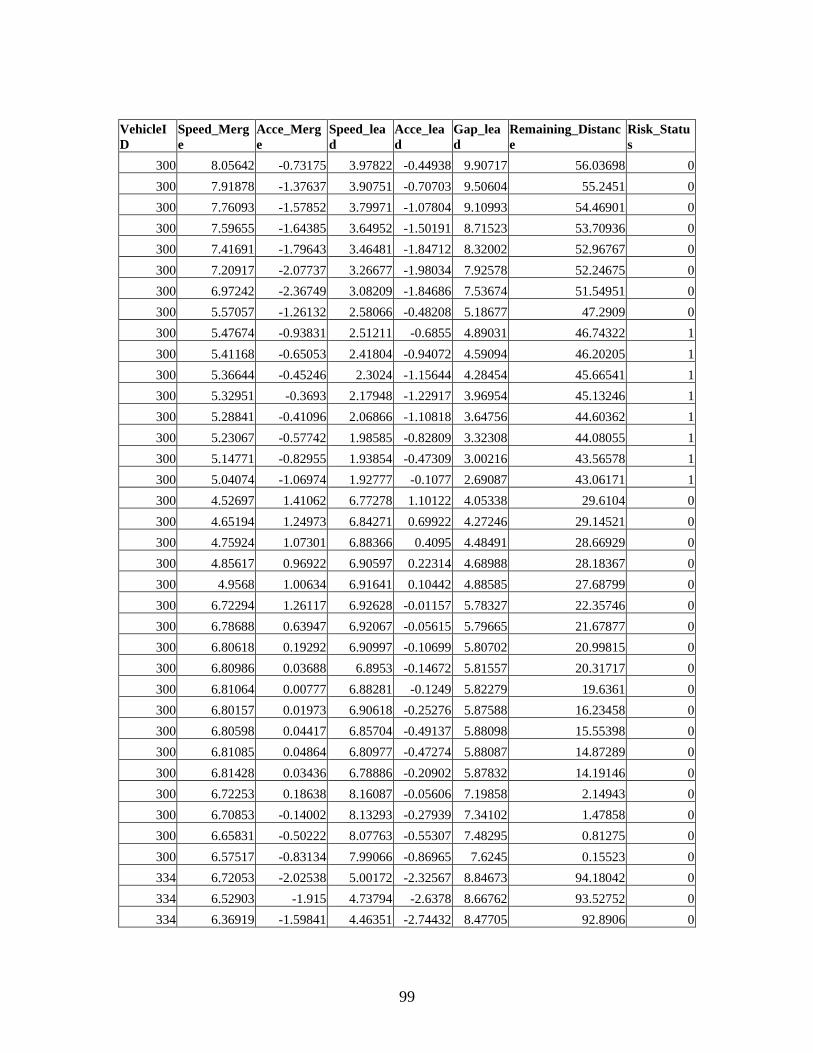
99
VehicleI
D
Speed_Merg
e
Acce_Merg
e Speed_lea
d
Acce_lea
d
Gap_lea
d
Remaining_Distanc
e
Risk_Statu
s
300 8.05642 -0.73175 3.97822 -0.44938 9.90717 56.03698 0
300 7.91878 -1.37637 3.90751 -0.70703 9.50604 55.2451 0
300 7.76093 -1.57852 3.79971 -1.07804 9.10993 54.46901 0
300 7.59655 -1.64385 3.64952 -1.50191 8.71523 53.70936 0
300 7.41691 -1.79643 3.46481 -1.84712 8.32002 52.96767 0
300 7.20917 -2.07737 3.26677 -1.98034 7.92578 52.24675 0
300 6.97242 -2.36749 3.08209 -1.84686 7.53674 51.54951 0
300 5.57057 -1.26132 2.58066 -0.48208 5.18677 47.2909 0
300 5.47674 -0.93831 2.51211 -0.6855 4.89031 46.74322 1
300 5.41168 -0.65053 2.41804 -0.94072 4.59094 46.20205 1
300 5.36644 -0.45246 2.3024 -1.15644 4.28454 45.66541 1
300 5.32951 -0.3693 2.17948 -1.22917 3.96954 45.13246 1
300 5.28841 -0.41096 2.06866 -1.10818 3.64756 44.60362 1
300 5.23067 -0.57742 1.98585 -0.82809 3.32308 44.08055 1
300 5.14771 -0.82955 1.93854 -0.47309 3.00216 43.56578 1
300 5.04074 -1.06974 1.92777 -0.1077 2.69087 43.06171 1
300 4.52697 1.41062 6.77278 1.10122 4.05338 29.6104 0
300 4.65194 1.24973 6.84271 0.69922 4.27246 29.14521 0
300 4.75924 1.07301 6.88366 0.4095 4.48491 28.66929 0
300 4.85617 0.96922 6.90597 0.22314 4.68988 28.18367 0
300 4.9568 1.00634 6.91641 0.10442 4.88585 27.68799 0
300 6.72294 1.26117 6.92628 -0.01157 5.78327 22.35746 0
300 6.78688 0.63947 6.92067 -0.05615 5.79665 21.67877 0
300 6.80618 0.19292 6.90997 -0.10699 5.80702 20.99815 0
300 6.80986 0.03688 6.8953 -0.14672 5.81557 20.31717 0
300 6.81064 0.00777 6.88281 -0.1249 5.82279 19.6361 0
300 6.80157 0.01973 6.90618 -0.25276 5.87588 16.23458 0
300 6.80598 0.04417 6.85704 -0.49137 5.88098 15.55398 0
300 6.81085 0.04864 6.80977 -0.47274 5.88087 14.87289 0
300 6.81428 0.03436 6.78886 -0.20902 5.87832 14.19146 0
300 6.72253 0.18638 8.16087 -0.05606 7.19858 2.14943 0
300 6.70853 -0.14002 8.13293 -0.27939 7.34102 1.47858 0
300 6.65831 -0.50222 8.07763 -0.55307 7.48295 0.81275 0
300 6.57517 -0.83134 7.99066 -0.86965 7.6245 0.15523 0
334 6.72053 -2.02538 5.00172 -2.32567 8.84673 94.18042 0
334 6.52903 -1.915 4.73794 -2.6378 8.66762 93.52752 0
334 6.36919 -1.59841 4.46351 -2.74432 8.47705 92.8906 0

100
VehicleI
D
Speed_Merg
e
Acce_Merg
e Speed_lea
d
Acce_lea
d
Gap_lea
d
Remaining_Distanc
e
Risk_Statu
s
334 6.24908 -1.2011 4.19851 -2.64999 8.272 92.26569 0
334 6.16195 -0.87132 3.95877 -2.39741 8.05167 91.64949 0
334 6.09209 -0.69857 3.75164 -2.07125 7.81764 91.04029 0
334 6.02102 -0.7107 3.57441 -1.77238 7.57297 90.43818 0
334 5.93012 -0.90898 3.41897 -1.55433 7.32185 89.84517 0
334 4.78749 -0.13106 1.58804 -1.12563 4.20446 83.78866 1
334 4.75399 -0.33491 1.48788 -1.00156 3.87785 83.31326 1
334 4.71812 -0.35879 1.38295 -1.0493 3.54433 82.84145 1
334 4.69106 -0.27052 1.26339 -1.19568 3.20156 82.37234 1
334 4.66464 -0.26425 1.13757 -1.25819 2.84886 81.90588 1
334 4.61491 -0.49727 1.0315 -1.06067 2.49052 81.44439 1
334 4.52098 -0.93931 0.97247 -0.59025 2.13566 80.99229 1
334 4.38311 -1.37867 0.96803 -0.04448 1.79416 80.55398 1
334 4.30593 0.41248 2.99796 0.16952 3.83853 65.40187 0
334 4.35826 0.5233 3.04555 0.47584 3.70727 64.96605 0
334 4.43202 0.73759 3.13293 0.87384 3.57736 64.52285 0
334 5.04726 -0.30351 5.50485 -0.40582 2.73593 52.76875 0
334 5.05187 0.04603 5.45041 -0.5444 2.77579 52.26357 0
334 5.08813 0.36261 5.39206 -0.58345 2.80618 51.75475 0
334 5.14255 0.54423 5.34219 -0.49869 2.82615 51.2405 0
334 5.19996 0.57406 5.31054 -0.31655 2.8372 50.7205 0
334 5.25006 0.50102 5.30114 -0.09394 2.84232 50.1955 0
334 5.28937 0.39315 5.31462 0.1348 2.84484 49.66656 0
334 8.22759 0.71076 7.46653 -0.08224 18.76228 29.98572 0
334 8.27464 0.4704 7.46302 -0.03508 18.68112 29.15826 0
334 8.30905 0.34416 7.44706 -0.15962 18.59491 28.32735 0
334 8.33668 0.27624 7.40599 -0.41069 18.50184 27.49368 0
334 8.3581 0.21423 7.33986 -0.66136 18.40002 26.65787 0
334 8.37293 0.14829 7.25983 -0.80025 18.28871 25.82058 0
334 8.38211 0.09183 7.18083 -0.79002 18.16859 24.98237 0
334 8.38731 0.05201 7.11392 -0.6691 18.04125 24.14364 0
334 8.38988 0.02571 7.06224 -0.51678 17.90848 23.30465 0
334 8.3906 0.00716 7.02156 -0.40684 17.77158 22.46559 0
334 8.38973 -0.00868 6.98331 -0.38245 17.63094 21.62662 0
334 8.38727 -0.02461 6.93737 -0.45947 17.48594 20.78789 0
334 8.38332 -0.03947 6.87421 -0.63155 17.33504 19.94956 0
334 8.37855 -0.0477 6.78832 -0.85891 17.17601 19.1117 0

101
VehicleI
D
Speed_Merg
e
Acce_Merg
e Speed_lea
d
Acce_lea
d
Gap_lea
d
Remaining_Distanc
e
Risk_Statu
s
334 8.37428 -0.04272 6.68208 -1.06241 17.00679 18.27427 0
334 8.37187 -0.02414 6.56646 -1.15621 16.82625 17.43709 0
334 8.37164 -0.00232 6.45585 -1.10603 16.63467 16.59992 0
334 8.37223 0.00592 6.35994 -0.95911 16.43344 15.7627 0
334 8.37091 -0.01322 6.27826 -0.81682 16.22418 14.92561 0
334 8.36432 -0.0659 6.20017 -0.78088 16.00776 14.08918 0
334 8.34872 -0.156 6.10798 -0.92191 15.78369 13.25431 0
334 8.31906 -0.29658 5.98094 -1.27046 15.54988 12.4224 0
334 8.26745 -0.51614 5.80247 -1.78462 15.30338 11.59566 0
334 8.18398 -0.83467 5.57091 -2.31568 15.04207 10.77726 0
334 8.06419 -1.19789 5.3038 -2.67109 14.76603 9.97084 0
334 7.91926 -1.4493 5.03091 -2.72883 14.4772 9.17891 0
334 7.77646 -1.42796 4.78344 -2.4748 14.1779 8.40127 0
334 7.66541 -1.11053 4.58297 -2.0047 13.86966 7.63473 0
334 7.60076 -0.64655 4.43264 -1.50324 13.55284 6.87465 0
334 7.54637 -0.18412 3.95761 -1.45539 12.1867 3.84896 0
334 7.50518 -0.41184 3.77092 -1.86691 11.81328 3.09845 0
334 7.43054 -0.74639 3.55061 -2.20316 11.42528 2.35539 0
334 7.31088 -1.19665 3.31845 -2.32158 11.02604 1.6243 0
334 7.14025 -1.70626 3.10194 -2.1651 10.62221 0.91028 0
334 6.92508 -2.15174 2.92411 -1.77827 10.22211 0.21777 0
Table A-3 Representative data for the “prior” crash risk model considering the lag
vehicle
VehicleID Speed_Merge Acce_Merge Speed_lag Acce_lag Gap_lag Remaining_Distance Risk_Status
46 15.55386 -0.51593 6.31841 2.37226 2.57193 93.1051 0
46 15.54195 -0.11913 6.55893 2.40519 3.47024 91.5509 0
46 15.56741 0.2546 6.78873 2.29802 4.3481 89.99416 0
46 15.60761 0.402 6.99494 2.0621 5.20937 88.4334 0
46 15.62983 0.2222 7.16536 1.70426 6.05582 86.87041 0
46 15.61075 -0.19078 7.28852 1.23159 6.88804 85.30934 0
46 15.54933 -0.61427 7.35416 0.6564 7.70755 83.75441 0
46 15.46353 -0.85801 7.35452 0.00358 8.51846 82.20805 0
46 15.37529 -0.88241 7.28692 -0.67599 9.3273 80.67052 0
46 15.0509 -0.9666 6.84499 -0.28919 12.61163 74.59855 0
46 14.92708 -1.23826 6.89431 0.49327 13.41491 73.10584 0
46 14.77857 -1.48503 6.97782 0.83507 14.19499 71.62798 0
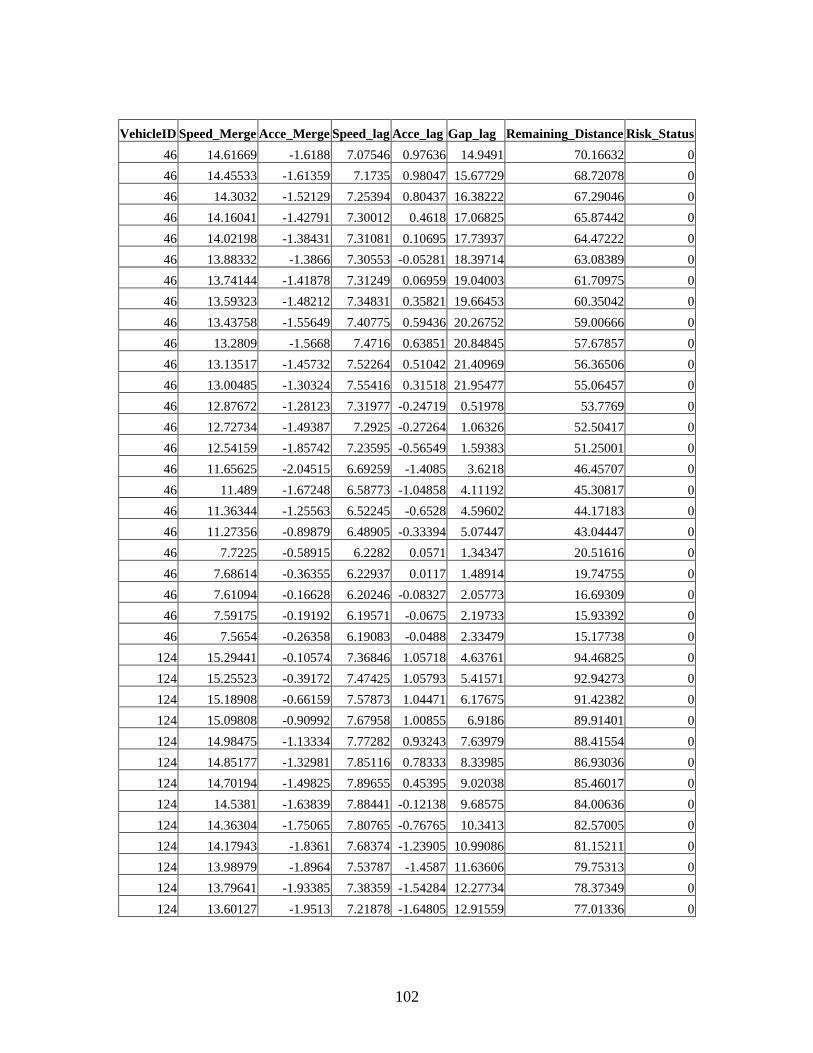
102
VehicleID Speed_Merge Acce_Merge Speed_lag Acce_lag Gap_lag Remaining_Distance Risk_Status
46 14.61669 -1.6188 7.07546 0.97636 14.9491 70.16632 0
46 14.45533 -1.61359 7.1735 0.98047 15.67729 68.72078 0
46 14.3032 -1.52129 7.25394 0.80437 16.38222 67.29046 0
46 14.16041 -1.42791 7.30012 0.4618 17.06825 65.87442 0
46 14.02198 -1.38431 7.31081 0.10695 17.73937 64.47222 0
46 13.88332 -1.3866 7.30553 -0.05281 18.39714 63.08389 0
46 13.74144 -1.41878 7.31249 0.06959 19.04003 61.70975 0
46 13.59323 -1.48212 7.34831 0.35821 19.66453 60.35042 0
46 13.43758 -1.55649 7.40775 0.59436 20.26752 59.00666 0
46 13.2809 -1.5668 7.4716 0.63851 20.84845 57.67857 0
46 13.13517 -1.45732 7.52264 0.51042 21.40969 56.36506 0
46 13.00485 -1.30324 7.55416 0.31518 21.95477 55.06457 0
46 12.87672 -1.28123 7.31977 -0.24719 0.51978 53.7769 0
46 12.72734 -1.49387 7.2925 -0.27264 1.06326 52.50417 0
46 12.54159 -1.85742 7.23595 -0.56549 1.59383 51.25001 0
46 11.65625 -2.04515 6.69259 -1.4085 3.6218 46.45707 0
46 11.489 -1.67248 6.58773 -1.04858 4.11192 45.30817 0
46 11.36344 -1.25563 6.52245 -0.6528 4.59602 44.17183 0
46 11.27356 -0.89879 6.48905 -0.33394 5.07447 43.04447 0
46 7.7225 -0.58915 6.2282 0.0571 1.34347 20.51616 0
46 7.68614 -0.36355 6.22937 0.0117 1.48914 19.74755 0
46 7.61094 -0.16628 6.20246 -0.08327 2.05773 16.69309 0
46 7.59175 -0.19192 6.19571 -0.0675 2.19733 15.93392 0
46 7.5654 -0.26358 6.19083 -0.0488 2.33479 15.17738 0
124 15.29441 -0.10574 7.36846 1.05718 4.63761 94.46825 0
124 15.25523 -0.39172 7.47425 1.05793 5.41571 92.94273 0
124 15.18908 -0.66159 7.57873 1.04471 6.17675 91.42382 0
124 15.09808 -0.90992 7.67958 1.00855 6.9186 89.91401 0
124 14.98475 -1.13334 7.77282 0.93243 7.63979 88.41554 0
124 14.85177 -1.32981 7.85116 0.78333 8.33985 86.93036 0
124 14.70194 -1.49825 7.89655 0.45395 9.02038 85.46017 0
124 14.5381 -1.63839 7.88441 -0.12138 9.68575 84.00636 0
124 14.36304 -1.75065 7.80765 -0.76765 10.3413 82.57005 0
124 14.17943 -1.8361 7.68374 -1.23905 10.99086 81.15211 0
124 13.98979 -1.8964 7.53787 -1.4587 11.63606 79.75313 0
124 13.79641 -1.93385 7.38359 -1.54284 12.27734 78.37349 0
124 13.60127 -1.9513 7.21878 -1.64805 12.91559 77.01336 0

103
VehicleID Speed_Merge Acce_Merge Speed_lag Acce_lag Gap_lag Remaining_Distance Risk_Status
124 13.40606 -1.95219 7.04261 -1.76177 13.55193 75.67276 0
124 13.21201 -1.94047 6.86862 -1.73987 14.18627 74.35156 0
124 13.01996 -1.92052 6.71623 -1.52389 14.81664 73.04956 0
124 12.45705 -1.8574 5.30408 -1.51689 2.50619 69.25655 0
124 11.42555 -1.35634 5.10747 0.1706 6.53225 62.15892 0
124 11.31459 -1.10966 5.13387 0.26403 7.15032 61.02746 0
124 11.20939 -1.05197 5.16409 0.30219 7.75485 59.90652 0
124 11.0896 -1.19789 5.19185 0.2776 8.34462 58.79756 0
124 10.94284 -1.4676 5.21211 0.20261 8.91769 57.70328 0
124 10.28413 -1.38523 5.19061 -0.19875 11.03998 53.49649 0
124 10.17601 -1.08118 5.16672 -0.2389 11.54091 52.47889 0
124 10.087 -0.89009 5.14464 -0.22085 12.03514 51.47019 0
124 9.99915 -0.87854 5.12717 -0.17471 12.52234 50.47028 0
124 9.89289 -1.06254 5.11273 -0.14441 13.00035 49.48099 0
124 9.75156 -1.41336 5.09876 -0.13971 13.46564 48.50583 0
124 7.42219 0.49425 5.58955 0.52157 5.9897 29.31905 0
124 7.46506 0.42873 5.66967 0.80125 6.16923 28.57255 0
124 7.49338 0.28321 5.79187 1.222 6.33938 27.82321 0
124 7.49894 0.05556 5.96247 1.70595 6.49303 27.07331 0
124 7.00901 -0.67716 7.09477 1.40267 6.84176 22.72571 0
124 7.01337 0.04363 7.20637 1.11603 6.82246 22.02437 0
124 7.08618 0.72807 7.28817 0.81798 6.80226 21.31575 0
124 7.29389 0.56349 6.87375 1.45181 7.87527 7.99702 0
124 7.38665 0.92755 6.99023 1.16477 7.91492 7.25835 0
124 7.60718 0.16438 7.16988 0.16669 8.08632 4.23514 0
124 7.61362 0.06441 7.17824 0.08358 8.12986 3.47378 0
140 13.1925 -1.2146 6.46749 0.43378 2.73093 93.78303 0
140 13.02073 -1.7177 6.50745 0.3996 3.38226 92.48096 0
140 12.83317 -1.87562 6.54446 0.37012 4.01113 91.19764 0
140 12.65809 -1.75079 6.56127 0.16809 4.62082 89.93183 0
140 12.51346 -1.44636 6.52756 -0.33713 5.21941 88.68048 0
140 12.40683 -1.06622 6.43156 -0.95995 5.81693 87.4398 0
140 12.07431 -0.79266 4.08551 1.4391 0.5793 80.10717 0
140 11.98588 -0.88435 4.3008 2.1529 1.34781 78.90858 0
140 11.90128 -0.84597 4.55225 2.51454 2.08271 77.71845 0
140 11.82967 -0.71611 4.81938 2.67124 2.78375 76.53548 0
140 11.77198 -0.5769 5.0891 2.69721 3.45203 75.35829 0

104
VehicleID Speed_Merge Acce_Merge Speed_lag Acce_lag Gap_lag Remaining_Distance Risk_Status
140 11.72139 -0.50594 5.35203 2.62929 4.08896 74.18615 0
140 11.66619 -0.55197 5.60056 2.48527 4.69553 73.01953 0
140 11.59251 -0.73675 5.82789 2.27334 5.27199 71.86028 0
140 11.48822 -1.04289 6.02758 1.99693 5.81806 70.71145 0
140 11.35014 -1.38085 6.19332 1.65742 6.33374 69.57644 0
140 11.19013 -1.6001 6.3189 1.25579 6.82086 68.45743 0
140 11.03201 -1.58121 6.39832 0.79413 7.28423 67.35423 0
140 10.89898 -1.33033 6.42609 0.27773 7.73152 66.26433 0
140 10.80176 -0.9722 6.39795 -0.28134 8.1719 65.18415 0
140 10.48126 -0.14207 4.62093 0.20858 0.57509 56.70454 0
140 10.49644 0.15184 4.65522 0.34288 1.15922 55.65489 0
140 10.53358 0.37133 4.706 0.50781 1.74197 54.60154 0
140 10.5759 0.42321 4.77012 0.64116 2.32255 53.54395 0
140 10.60762 0.31723 4.83731 0.67189 2.89959 52.48318 0
140 10.62064 0.1302 4.89697 0.59662 3.47195 51.42112 0
140 10.6134 -0.07242 4.94745 0.50485 4.03855 50.35978 0
140 10.58617 -0.27233 4.9981 0.50651 4.59736 49.30116 0
140 10.53994 -0.46223 5.06254 0.64433 5.14509 48.24717 0
140 10.48025 -0.59695 5.15129 0.88755 5.67799 47.19914 0
140 10.41862 -0.61633 5.2692 1.17909 6.19293 46.15728 0
140 10.36553 -0.53082 5.41414 1.44943 6.68807 45.12073 0
140 10.32037 -0.4516 5.5745 1.60353 7.16266 44.08869 0
140 10.27018 -0.50193 5.73018 1.55688 7.61666 43.06167 0
140 10.19885 -0.71334 5.86117 1.30988 8.05042 42.04179 0
140 8.9936 -0.13572 6.12177 0.05367 13.63478 25.50215 0
140 8.95347 -0.40126 6.12394 0.0217 13.91772 24.60681 0
140 8.90458 -0.48891 6.12173 -0.02211 14.19601 23.71635 0
140 8.86218 -0.424 5.53893 1.9202 0.21767 22.83013 0
140 8.83219 -0.29987 5.76634 2.27408 0.52426 21.94691 0
140 8.81291 -0.19282 6.01059 2.44253 0.80449 21.06562 0
140 8.80003 -0.12882 6.24964 2.39049 1.05952 20.18562 0
140 8.78989 -0.10136 6.45919 2.09552 1.29259 19.30663 0
140 8.78032 -0.09573 6.61798 1.58788 1.50883 18.4286 0
140 8.77067 -0.09648 6.71496 0.96982 1.7144 17.55153 0
140 8.7616 -0.09071 6.76156 0.46592 1.9144 16.67537 0
140 8.75387 -0.07733 6.78404 0.22483 2.11139 15.79998 0
162 15.93928 -0.16627 6.17321 2.03297 2.64924 93.74037 0

105
VehicleID Speed_Merge Acce_Merge Speed_lag Acce_lag Gap_lag Remaining_Distance Risk_Status
162 15.83949 -0.99794 6.37605 2.02839 3.59558 92.15643 0
162 15.70025 -1.39236 6.54937 1.7332 4.51067 90.5864 0
162 15.55668 -1.43569 6.67507 1.25699 5.39884 89.03073 0
162 15.42907 -1.27612 6.74549 0.70425 6.26719 87.48783 0
162 15.32133 -1.07738 6.75876 0.13272 7.12345 85.95569 0
162 15.21008 -1.11249 6.71643 -0.42334 7.97282 84.43468 0
162 15.05914 -1.50941 6.6223 -0.9413 8.8165 82.92877 0
162 14.84835 -2.10796 6.48191 -1.40386 9.65315 81.44393 0
162 14.58998 -2.58363 6.30238 -1.79536 10.4819 79.98494 0
162 14.32245 -2.67534 6.09247 -2.0991 11.3049 78.55269 0
162 14.0955 -2.26947 3.61009 1.2199 1.46108 77.14314 0
162 13.95649 -1.39017 3.77722 1.67132 2.479 75.74749 0
162 13.93193 -0.24559 3.95312 1.75895 3.47688 74.3543 0
162 14.0124 0.80474 4.1039 1.50786 4.46773 72.95306 0
162 14.73179 -0.7152 4.15453 -0.31397 12.75383 61.28349 0
162 14.61303 -1.18759 4.11945 -0.35089 13.80319 59.82219 0
162 14.48664 -1.26389 5.99822 0.70125 1.20167 58.37352 0
162 14.39448 -0.92167 6.0404 0.42172 2.03707 56.93408 0
162 14.36279 -0.31689 6.06492 0.24523 2.86686 55.4978 0
162 14.48987 0.00917 6.0937 0.02439 6.21302 49.71657 0
162 14.42823 -0.61649 6.09506 0.0136 7.04634 48.27374 0
162 14.30229 -1.25936 6.09587 0.00809 7.86698 46.84351 0
162 14.12844 -1.73847 6.09649 0.0062 8.67017 45.43067 0
162 13.93657 -1.91868 6.09724 0.0075 9.45411 44.03701 0
162 13.75922 -1.77351 6.09843 0.01189 10.22019 42.66109 0
162 13.61889 -1.40329 6.1004 0.01967 10.97204 41.2992 0
162 13.51992 -0.98974 6.10365 0.03255 11.71366 39.94721 0
162 13.45066 -0.69255 6.11429 0.01846 1.24228 38.60214 0
162 13.39307 -0.57597 6.11018 -0.04102 1.97056 37.26284 0
162 13.3294 -0.63671 6.09711 -0.13079 2.69379 35.9299 0
162 13.24293 -0.86471 6.07318 -0.2392 3.41077 34.6056 0
162 13.11922 -1.23702 6.03701 -0.36176 4.11899 33.29368 0
162 12.22925 -1.40853 5.8677 0.04351 7.45089 27.00765 0
162 12.13316 -0.96092 5.88928 0.21581 8.07528 25.79433 0
162 12.07323 -0.59922 5.90673 0.17445 8.69193 24.58701 0
162 12.03715 -0.36084 5.90298 -0.03748 9.30534 23.3833 0
162 11.97095 -0.13961 5.81187 -0.07306 11.76715 18.58638 0

106
VehicleID Speed_Merge Acce_Merge Speed_lag Acce_lag Gap_lag Remaining_Distance Risk_Status
162 11.95564 -0.15303 5.81367 0.018 12.38134 17.39082 0
162 11.93753 -0.18112 5.81428 0.00608 12.99368 16.19706 0
162 11.91247 -0.25062 5.81405 -0.00229 13.60351 15.00582 0
162 11.87173 -0.40738 5.82406 0.10015 14.20829 13.81864 0
162 11.80127 -0.70465 6.63197 0.04096 0.93457 12.63852 0
183 13.69218 -0.83956 6.582 -0.79142 15.1695 93.46127 0
183 13.46746 -1.22105 5.03165 -0.80575 1.47774 90.75557 0
183 13.32792 -1.39536 4.9665 -0.65149 2.31388 89.42278 0
183 13.17454 -1.53383 4.9035 -0.63001 3.14099 88.10532 0
183 13.01046 -1.6408 4.83131 -0.72189 3.9589 86.80428 0
183 12.83989 -1.70566 4.74863 -0.82674 4.76803 85.52029 0
183 12.67167 -1.68222 4.66201 -0.86625 5.569 84.25312 0
183 12.51893 -1.52741 4.57676 -0.85245 6.36321 83.00123 0
183 12.39296 -1.25972 4.49304 -0.83724 7.15321 81.76193 0
183 12.29651 -0.96446 4.41129 -0.81747 7.94173 80.53228 0
183 12.22206 -0.74459 4.33788 -0.73409 8.73014 79.31008 0
183 12.15479 -0.67262 4.28025 -0.5763 9.51759 78.0946 0
183 12.07718 -0.77609 3.70932 -0.03934 1.72665 76.88688 0
183 11.97292 -1.0426 3.72129 0.11968 2.55181 75.68959 0
183 10.2329 -0.48967 4.07172 -0.07014 9.49912 64.78126 0
183 10.19843 -0.34466 4.0533 -0.18421 10.11362 63.76142 0
183 10.16307 -0.35364 4.02348 -0.29822 10.72759 62.74511 0
183 10.11488 -0.48189 3.98463 -0.38854 11.3406 61.73363 0
183 9.30305 -0.69548 6.05163 0.31651 2.62946 54.01536 0
183 9.22835 -0.74696 6.07081 0.19172 2.94521 53.09253 0
183 9.12902 -0.99337 6.08194 0.11137 3.24992 52.17963 0
183 6.15116 -0.26929 5.16564 -0.00201 6.20751 14.09131 0
183 6.11608 -0.35086 5.2016 0.35958 6.29896 13.4797 0
183 5.41396 0.48597 5.85004 0.58458 6.43168 8.35854 0
183 6.00252 -0.16297 5.93925 0.00275 6.38917 3.66036 0
186 14.05508 -0.7959 4.81037 1.64273 3.96404 94.20823 0
186 13.93925 -1.15833 4.96424 1.53871 4.86154 92.81431 0
186 13.80014 -1.39108 5.09 1.25762 5.73255 91.4343 0
186 13.65309 -1.47056 5.17707 0.8707 6.58015 90.06899 0
186 13.51721 -1.35879 5.22025 0.43178 7.40985 88.71727 0
186 13.39989 -1.17319 5.21861 -0.01641 8.22798 87.37728 0
186 13.28638 -1.13508 5.17514 -0.43469 9.0391 86.04864 0

107
VehicleID Speed_Merge Acce_Merge Speed_lag Acce_lag Gap_lag Remaining_Distance Risk_Status
186 13.15164 -1.34737 5.09702 -0.78124 9.84457 84.73347 0
186 12.9838 -1.67848 4.99607 -1.0095 10.64334 83.43509 0
186 12.7952 -1.88601 4.8883 -1.07769 11.43402 82.15558 0
186 12.61181 -1.83385 4.79041 -0.97886 12.21617 80.89439 0
186 9.22446 -0.88102 5.22181 0.99235 3.59954 59.43814 0
186 9.15123 -0.73238 5.30203 0.80219 3.98446 58.52302 0
186 9.07799 -0.73232 5.3765 0.74465 4.35461 57.61522 0
186 8.98662 -0.91379 5.46314 0.86641 4.70695 56.71656 0
186 4.4721 0.09659 6.04967 0.89126 5.13834 41.55506 0
186 4.47115 -0.00945 6.1069 0.57227 4.97477 41.10794 0
186 4.46172 -0.09434 6.13051 0.23613 4.80789 40.66177 0
186 4.44974 -0.11976 6.12014 -0.10365 4.64085 40.2168 0
186 4.69852 0.11462 4.25586 0.14534 4.06944 33.87123 0
186 4.70202 0.03495 4.2907 0.3484 4.11057 33.40103 0
186 5.46677 0.26398 3.98051 0.52326 5.26998 23.66692 0
186 5.48184 0.15065 4.07481 0.94296 5.41068 23.11874 0
186 5.49613 -0.0014 4.73738 1.67885 5.81779 20.92103 0
186 5.49403 -0.02102 4.87055 1.33172 5.88014 20.37163 0
186 5.48955 -0.04479 4.96427 0.93713 5.93267 19.82267 0
186 5.48739 0.10496 5.00963 0.1395 6.24489 15.99038 0
186 5.49833 0.10934 5.07246 0.62834 6.28749 15.44054 0
186 5.50987 0.11545 5.18669 1.14223 6.31981 14.88955 0
186 5.52437 0.14498 5.33957 1.52884 6.33828 14.33712 0
186 5.54602 0.21643 5.50666 1.67091 6.34221 13.78252 0
186 5.58102 0.35005 5.65988 1.53218 6.33434 13.22441 0
186 5.63838 0.57355 5.77825 1.18374 6.32034 12.66058 0
202 13.72371 -0.43035 3.63636 -0.36527 4.13949 92.44987 0
202 13.61551 -1.08207 3.60163 -0.34726 5.14087 91.08832 0
202 13.44486 -1.70643 3.59587 -0.05758 6.12577 89.74384 0
202 13.24018 -2.04685 3.62179 0.25915 7.08761 88.41982 0
202 13.04266 -1.97517 3.65321 0.31423 8.02656 87.11555 0
202 12.88544 -1.57222 3.66438 0.11173 8.94866 85.82701 0
202 12.77433 -1.11113 3.66088 -0.035 9.86001 84.54957 0
202 12.68381 -0.90512 4.93348 0.4421 1.59023 83.28119 0
202 12.57882 -1.04997 4.95996 0.26476 2.35212 82.02331 0
202 12.44418 -1.34633 4.9697 0.09735 3.09957 80.77889 0
202 12.29265 -1.5153 4.9667 -0.02997 3.83216 79.54963 0

108
VehicleID Speed_Merge Acce_Merge Speed_lag Acce_lag Gap_lag Remaining_Distance Risk_Status
202 12.14863 -1.44025 4.95685 -0.09845 4.55133 78.33477 0
202 11.84123 -0.89271 4.92898 -0.07787 6.65016 74.75478 0
202 11.73896 -1.02273 4.92121 -0.07776 7.33194 73.58088 0
202 11.60051 -1.38451 4.91428 -0.06928 8.00056 72.42083 0
202 11.40816 -1.9235 4.91144 -0.02841 8.65024 71.28001 0
202 11.16055 -2.47614 4.91655 0.05119 9.27463 70.16396 0
202 10.87662 -2.83927 4.93367 0.17121 9.86892 69.0763 0
202 10.32596 -2.61616 5.03034 0.61721 10.96039 66.98494 0
202 10.11538 -2.10583 5.12877 0.98427 11.45905 65.9734 0
202 9.96177 -1.53606 5.26827 1.39501 11.92839 64.97723 0
202 9.85395 -1.07822 5.441 1.72732 12.36969 63.99183 0
202 9.77231 -0.81645 5.62706 1.86055 12.78422 63.0146 0
202 9.69637 -0.75934 5.80345 1.76397 13.17351 62.04496 0
202 9.60897 -0.87402 5.95529 1.51832 13.53887 61.08407 0
202 9.50014 -1.08834 6.0788 1.23519 13.88101 60.13405 0
202 9.37117 -1.28971 6.17373 0.94921 14.20076 59.19693 0
202 9.23492 -1.36252 6.23394 0.60215 14.50086 58.27344 0
202 9.1095 -1.25412 6.2479 0.13956 14.78702 57.36249 0
202 9.00868 -1.00826 4.66707 -0.59776 1.33634 56.46163 0
202 8.93565 -0.73028 4.62765 -0.39418 1.76714 55.56806 0
202 8.88354 -0.52106 4.60393 -0.23724 2.1951 54.67971 0
202 8.83975 -0.43792 4.59023 -0.13697 2.62005 53.79573 0
202 8.79035 -0.49399 4.58242 -0.07808 3.04084 52.9167 0
202 8.72374 -0.66613 4.57802 -0.04409 3.45542 52.04432 0
202 8.63441 -0.89334 4.57556 -0.0246 3.86131 51.18088 0
202 8.52614 -1.08266 4.5742 -0.01351 4.25649 50.32827 0
202 8.41161 -1.14531 4.57348 -0.0072 4.64031 49.48711 0
202 8.30687 -1.04739 4.57314 -0.00348 5.01368 48.65642 0
202 8.22382 -0.83047 4.57303 -0.00108 5.37876 47.83404 0
202 8.16572 -0.58101 4.57311 0.00085 5.73803 47.01746 0
202 8.12786 -0.37858 4.57341 0.00294 6.09347 46.20468 0
202 8.10079 -0.27074 4.57399 0.00578 6.44615 45.3946 0
202 8.07302 -0.27768 4.57499 0.01004 6.79595 44.5873 0
202 8.0339 -0.39118 4.57663 0.01642 7.14168 43.78391 0
202 7.97767 -0.56234 4.57908 0.02452 7.48154 42.98614 0
202 5.47849 -0.05684 4.73023 0.66614 4.56831 18.7505 0
202 5.47567 -0.02824 4.75497 0.24742 4.64037 18.20294 0
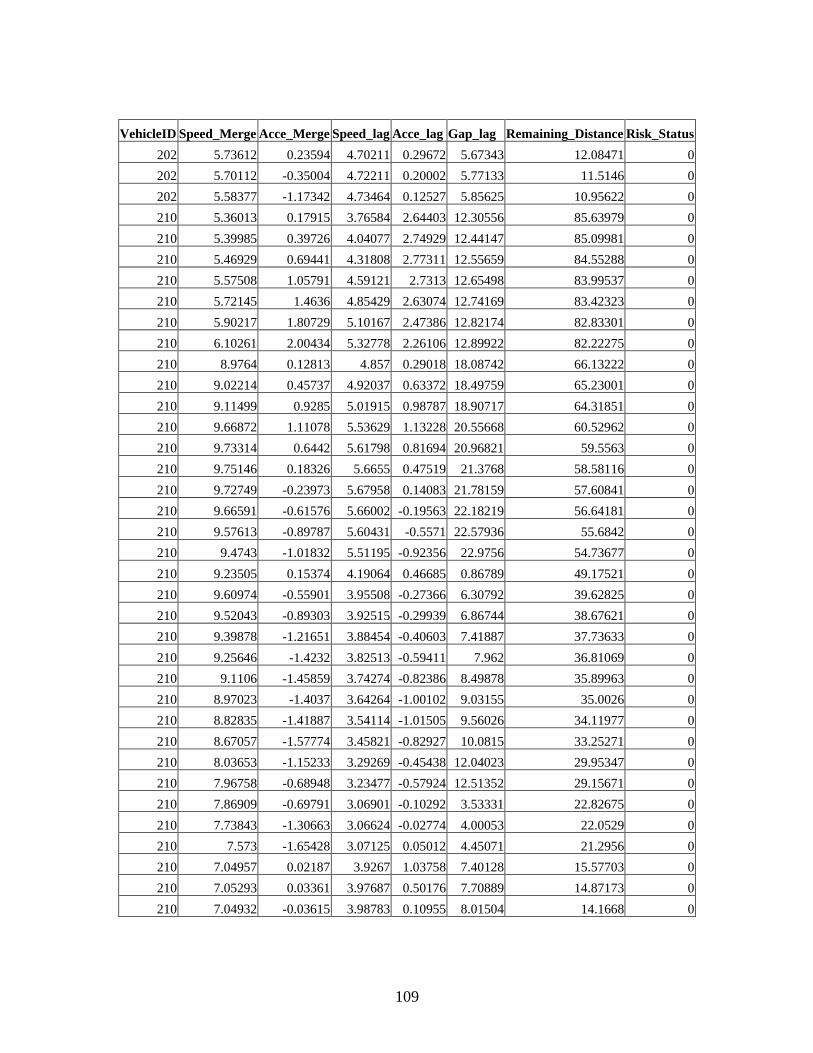
109
VehicleID Speed_Merge Acce_Merge Speed_lag Acce_lag Gap_lag Remaining_Distance Risk_Status
202 5.73612 0.23594 4.70211 0.29672 5.67343 12.08471 0
202 5.70112 -0.35004 4.72211 0.20002 5.77133 11.5146 0
202 5.58377 -1.17342 4.73464 0.12527 5.85625 10.95622 0
210 5.36013 0.17915 3.76584 2.64403 12.30556 85.63979 0
210 5.39985 0.39726 4.04077 2.74929 12.44147 85.09981 0
210 5.46929 0.69441 4.31808 2.77311 12.55659 84.55288 0
210 5.57508 1.05791 4.59121 2.7313 12.65498 83.99537 0
210 5.72145 1.4636 4.85429 2.63074 12.74169 83.42323 0
210 5.90217 1.80729 5.10167 2.47386 12.82174 82.83301 0
210 6.10261 2.00434 5.32778 2.26106 12.89922 82.22275 0
210 8.9764 0.12813 4.857 0.29018 18.08742 66.13222 0
210 9.02214 0.45737 4.92037 0.63372 18.49759 65.23001 0
210 9.11499 0.9285 5.01915 0.98787 18.90717 64.31851 0
210 9.66872 1.11078 5.53629 1.13228 20.55668 60.52962 0
210 9.73314 0.6442 5.61798 0.81694 20.96821 59.5563 0
210 9.75146 0.18326 5.6655 0.47519 21.3768 58.58116 0
210 9.72749 -0.23973 5.67958 0.14083 21.78159 57.60841 0
210 9.66591 -0.61576 5.66002 -0.19563 22.18219 56.64181 0
210 9.57613 -0.89787 5.60431 -0.5571 22.57936 55.6842 0
210 9.4743 -1.01832 5.51195 -0.92356 22.9756 54.73677 0
210 9.23505 0.15374 4.19064 0.46685 0.86789 49.17521 0
210 9.60974 -0.55901 3.95508 -0.27366 6.30792 39.62825 0
210 9.52043 -0.89303 3.92515 -0.29939 6.86744 38.67621 0
210 9.39878 -1.21651 3.88454 -0.40603 7.41887 37.73633 0
210 9.25646 -1.4232 3.82513 -0.59411 7.962 36.81069 0
210 9.1106 -1.45859 3.74274 -0.82386 8.49878 35.89963 0
210 8.97023 -1.4037 3.64264 -1.00102 9.03155 35.0026 0
210 8.82835 -1.41887 3.54114 -1.01505 9.56026 34.11977 0
210 8.67057 -1.57774 3.45821 -0.82927 10.0815 33.25271 0
210 8.03653 -1.15233 3.29269 -0.45438 12.04023 29.95347 0
210 7.96758 -0.68948 3.23477 -0.57924 12.51352 29.15671 0
210 7.86909 -0.69791 3.06901 -0.10292 3.53331 22.82675 0
210 7.73843 -1.30663 3.06624 -0.02774 4.00053 22.0529 0
210 7.573 -1.65428 3.07125 0.05012 4.45071 21.2956 0
210 7.04957 0.02187 3.9267 1.03758 7.40128 15.57703 0
210 7.05293 0.03361 3.97687 0.50176 7.70889 14.87173 0
210 7.04932 -0.03615 3.98783 0.10955 8.01504 14.1668 0
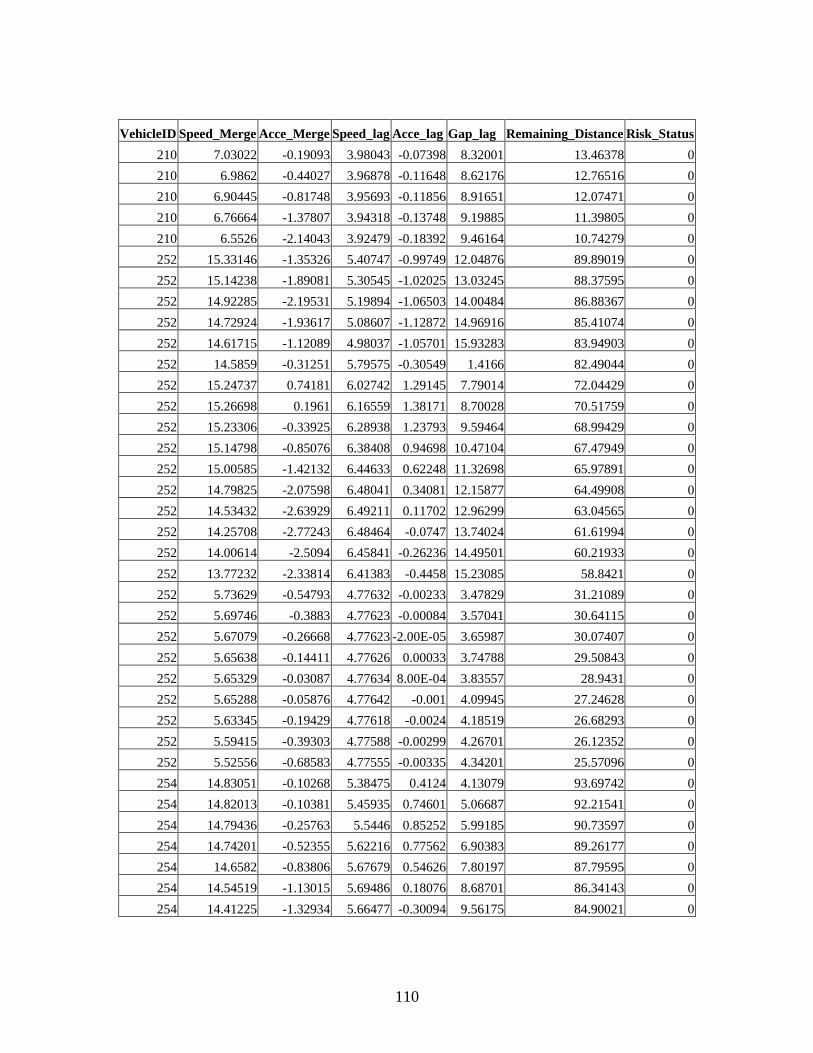
110
VehicleID Speed_Merge Acce_Merge Speed_lag Acce_lag Gap_lag Remaining_Distance Risk_Status
210 7.03022 -0.19093 3.98043 -0.07398 8.32001 13.46378 0
210 6.9862 -0.44027 3.96878 -0.11648 8.62176 12.76516 0
210 6.90445 -0.81748 3.95693 -0.11856 8.91651 12.07471 0
210 6.76664 -1.37807 3.94318 -0.13748 9.19885 11.39805 0
210 6.5526 -2.14043 3.92479 -0.18392 9.46164 10.74279 0
252 15.33146 -1.35326 5.40747 -0.99749 12.04876 89.89019 0
252 15.14238 -1.89081 5.30545 -1.02025 13.03245 88.37595 0
252 14.92285 -2.19531 5.19894 -1.06503 14.00484 86.88367 0
252 14.72924 -1.93617 5.08607 -1.12872 14.96916 85.41074 0
252 14.61715 -1.12089 4.98037 -1.05701 15.93283 83.94903 0
252 14.5859 -0.31251 5.79575 -0.30549 1.4166 82.49044 0
252 15.24737 0.74181 6.02742 1.29145 7.79014 72.04429 0
252 15.26698 0.1961 6.16559 1.38171 8.70028 70.51759 0
252 15.23306 -0.33925 6.28938 1.23793 9.59464 68.99429 0
252 15.14798 -0.85076 6.38408 0.94698 10.47104 67.47949 0
252 15.00585 -1.42132 6.44633 0.62248 11.32698 65.97891 0
252 14.79825 -2.07598 6.48041 0.34081 12.15877 64.49908 0
252 14.53432 -2.63929 6.49211 0.11702 12.96299 63.04565 0
252 14.25708 -2.77243 6.48464 -0.0747 13.74024 61.61994 0
252 14.00614 -2.5094 6.45841 -0.26236 14.49501 60.21933 0
252 13.77232 -2.33814 6.41383 -0.4458 15.23085 58.8421 0
252 5.73629 -0.54793 4.77632 -0.00233 3.47829 31.21089 0
252 5.69746 -0.3883 4.77623 -0.00084 3.57041 30.64115 0
252 5.67079 -0.26668 4.77623 -2.00E-05 3.65987 30.07407 0
252 5.65638 -0.14411 4.77626 0.00033 3.74788 29.50843 0
252 5.65329 -0.03087 4.77634 8.00E-04 3.83557 28.9431 0
252 5.65288 -0.05876 4.77642 -0.001 4.09945 27.24628 0
252 5.63345 -0.19429 4.77618 -0.0024 4.18519 26.68293 0
252 5.59415 -0.39303 4.77588 -0.00299 4.26701 26.12352 0
252 5.52556 -0.68583 4.77555 -0.00335 4.34201 25.57096 0
254 14.83051 -0.10268 5.38475 0.4124 4.13079 93.69742 0
254 14.82013 -0.10381 5.45935 0.74601 5.06687 92.21541 0
254 14.79436 -0.25763 5.5446 0.85252 5.99185 90.73597 0
254 14.74201 -0.52355 5.62216 0.77562 6.90383 89.26177 0
254 14.6582 -0.83806 5.67679 0.54626 7.80197 87.79595 0
254 14.54519 -1.13015 5.69486 0.18076 8.68701 86.34143 0
254 14.41225 -1.32934 5.66477 -0.30094 9.56175 84.90021 0

111
VehicleID Speed_Merge Acce_Merge Speed_lag Acce_lag Gap_lag Remaining_Distance Risk_Status
254 14.27416 -1.38099 5.58159 -0.83183 10.43101 83.47279 0
254 14.14719 -1.26961 5.4564 -1.25184 11.30009 82.05807 0
254 13.91467 -0.53179 6.21665 0.9598 1.12208 77.86545 0
254 13.87437 -0.40301 6.32162 1.04963 1.87736 76.47801 0
254 13.83635 -0.38024 6.42908 1.07464 2.61809 75.09437 0
254 13.79149 -0.44855 6.52313 0.94051 3.34493 73.71522 0
254 13.73398 -0.57511 6.5884 0.65271 4.05948 72.34183 0
254 13.66475 -0.69236 6.62043 0.32027 4.76392 70.97535 0
254 13.5935 -0.7125 6.62731 0.0688 5.46054 69.616 0
254 13.53334 -0.60153 6.62358 -0.03727 6.15151 68.26267 0
254 13.48986 -0.43485 6.62468 0.01094 6.83803 66.91368 0
254 13.45439 -0.35466 6.64511 0.2043 7.51896 65.56824 0
254 13.40704 -0.47349 6.69452 0.49418 8.19021 64.22754 0
254 13.32416 -0.82883 6.76864 0.7412 8.84576 62.89512 0
254 13.18385 -1.40313 6.84395 0.75304 9.47975 61.57674 0
254 6.09419 -0.04943 5.75842 1.16251 11.91961 8.7478 0
254 6.12076 0.26569 5.91697 1.58551 11.93998 8.13573 0
254 6.16904 0.48285 6.11001 1.93035 11.94589 7.51882 0
254 6.21414 0.45101 6.31595 2.05936 11.9357 6.89741 0
300 13.83771 -0.46074 4.36769 0.24795 1.15352 89.87573 0
300 13.78075 -0.56959 4.40185 0.3416 2.0914 88.49766 0
300 13.72324 -0.57506 4.44424 0.42392 3.01931 87.12533 0
300 13.67442 -0.48828 4.49212 0.47875 3.93753 85.75789 0
300 13.63503 -0.39388 4.53955 0.47433 4.84708 84.39439 0
300 13.59425 -0.40781 4.57446 0.34909 5.74905 83.03497 0
300 13.53265 -0.61596 4.58827 0.13811 6.6435 81.6817 0
300 13.42917 -1.03485 4.58858 0.00307 7.52756 80.33878 0
300 13.2695 -1.59662 4.5876 -0.00974 8.39575 79.01183 0
300 13.05328 -2.16228 4.59051 0.02911 9.24202 77.70651 0
300 12.79456 -2.58716 4.59908 0.08568 10.06157 76.42705 0
300 12.51455 -2.80008 4.61568 0.16601 10.85146 75.17559 0
300 12.23159 -2.82958 4.6438 0.28118 11.61023 73.95244 0
300 11.95287 -2.78719 4.68469 0.40884 12.33705 72.75715 0
300 11.67226 -2.80611 4.73213 0.47447 13.03107 71.58992 0
300 11.37823 -2.9403 4.77094 0.38807 13.6918 70.4521 0
300 11.06399 -3.14238 4.78374 0.12799 14.31982 69.3457 0
300 10.72828 -3.35716 4.89159 -0.443 1.04933 68.27287 0

112
VehicleID Speed_Merge Acce_Merge Speed_lag Acce_lag Gap_lag Remaining_Distance Risk_Status
300 10.37164 -3.56639 4.85942 -0.32171 1.60054 67.23571 0
300 10.00374 -3.67896 4.83032 -0.29096 2.11789 66.23533 0
300 9.64289 -3.60852 4.7959 -0.34421 2.60259 65.27104 0
300 9.30072 -3.42168 4.74883 -0.4707 3.05778 64.34097 0
300 8.98364 -3.17079 4.68481 -0.64022 3.48766 63.44261 0
300 8.70021 -2.8343 4.60529 -0.79518 3.89715 62.57259 0
300 8.08554 -0.60963 4.29771 -0.60721 5.43291 59.27611 0
300 8.05642 -0.73175 4.21444 -0.02421 6.98086 56.03698 0
300 7.91878 -1.37637 4.20864 -0.058 7.35188 55.2451 0
300 7.76093 -1.57852 4.19185 -0.16789 7.70878 54.46901 0
300 7.59655 -1.64385 4.1637 -0.28147 8.05206 53.70936 0
300 7.41691 -1.79643 4.12954 -0.34167 8.3808 52.96767 0
300 7.20917 -2.07737 4.0965 -0.33031 8.69207 52.24675 0
300 6.97242 -2.36749 4.07016 -0.26343 8.98229 51.54951 0
300 5.57057 -1.26132 4.13442 0.40833 10.39249 47.2909 0
300 5.47674 -0.93831 4.18572 0.51296 10.52159 46.74322 0
300 5.41168 -0.65053 4.23999 0.54271 10.63877 46.20205 0
300 5.36644 -0.45246 4.28716 0.47176 10.74669 45.66541 0
300 5.32951 -0.3693 4.31839 0.31225 10.8478 45.13246 0
300 5.28841 -0.41096 4.32799 0.09599 10.94384 44.60362 0
300 5.23067 -0.57742 4.3119 -0.16089 11.03572 44.08055 0
300 5.14771 -0.82955 4.26411 -0.47783 11.12408 43.56578 0
300 5.04074 -1.06974 4.17562 -0.88495 11.21059 43.06171 0
300 4.52697 1.41062 3.4636 1.94115 6.64968 29.6104 0
300 4.65194 1.24973 3.6811 2.17497 6.74676 29.14521 0
300 4.75924 1.07301 3.90507 2.23973 6.83217 28.66929 0
300 4.85617 0.96922 4.11117 2.06101 6.90667 28.18367 0
300 4.9568 1.00634 4.27916 1.67989 6.97444 27.68799 0
300 6.72294 1.26117 5.22635 2.00065 8.05052 22.35746 0
300 6.78688 0.63947 5.43963 2.13283 8.18525 21.67877 0
300 6.80618 0.19292 5.63848 1.98853 8.30202 20.99815 0
300 6.80986 0.03688 5.80048 1.61992 8.40296 20.31717 0
300 6.81064 0.00777 5.91652 1.16044 8.49237 19.6361 0
300 6.80157 0.01973 6.16899 0.58054 8.85556 16.23458 0
300 6.80598 0.04417 6.25875 0.89765 8.91028 15.55398 0
300 6.81085 0.04864 6.37823 1.19475 8.95355 14.87289 0
300 6.81428 0.03436 6.50786 1.29635 8.98419 14.19146 0
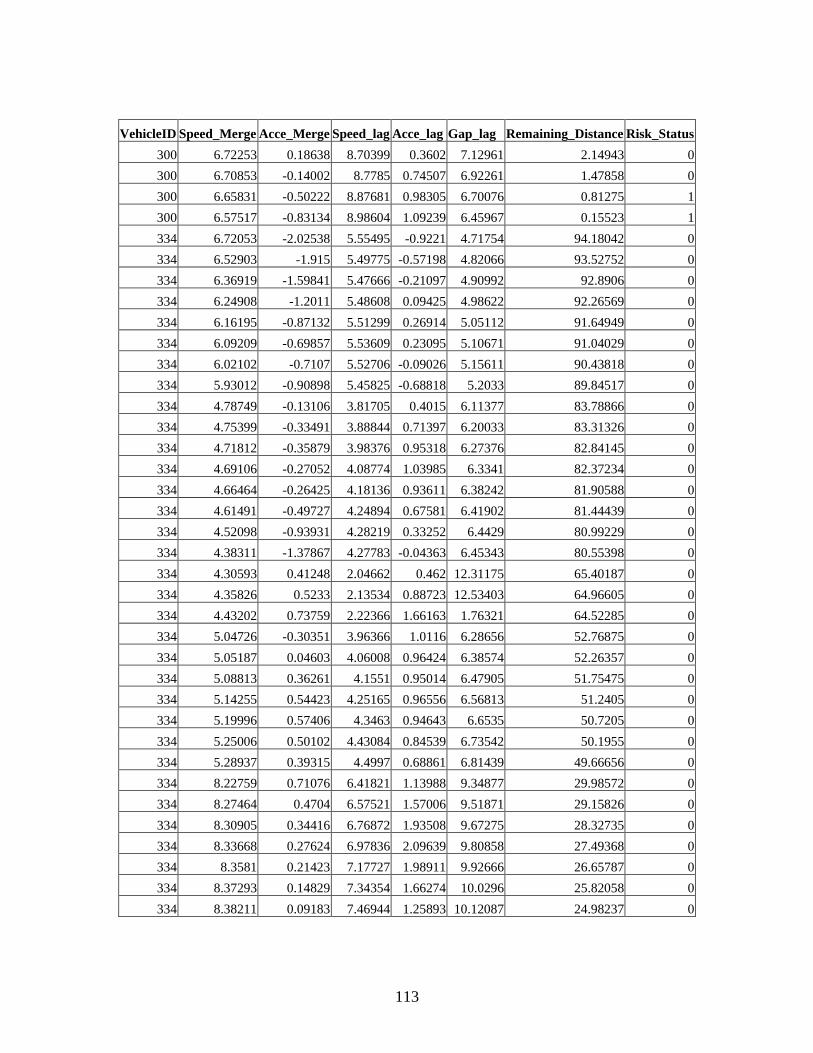
113
VehicleID Speed_Merge Acce_Merge Speed_lag Acce_lag Gap_lag Remaining_Distance Risk_Status
300 6.72253 0.18638 8.70399 0.3602 7.12961 2.14943 0
300 6.70853 -0.14002 8.7785 0.74507 6.92261 1.47858 0
300 6.65831 -0.50222 8.87681 0.98305 6.70076 0.81275 1
300 6.57517 -0.83134 8.98604 1.09239 6.45967 0.15523 1
334 6.72053 -2.02538 5.55495 -0.9221 4.71754 94.18042 0
334 6.52903 -1.915 5.49775 -0.57198 4.82066 93.52752 0
334 6.36919 -1.59841 5.47666 -0.21097 4.90992 92.8906 0
334 6.24908 -1.2011 5.48608 0.09425 4.98622 92.26569 0
334 6.16195 -0.87132 5.51299 0.26914 5.05112 91.64949 0
334 6.09209 -0.69857 5.53609 0.23095 5.10671 91.04029 0
334 6.02102 -0.7107 5.52706 -0.09026 5.15611 90.43818 0
334 5.93012 -0.90898 5.45825 -0.68818 5.2033 89.84517 0
334 4.78749 -0.13106 3.81705 0.4015 6.11377 83.78866 0
334 4.75399 -0.33491 3.88844 0.71397 6.20033 83.31326 0
334 4.71812 -0.35879 3.98376 0.95318 6.27376 82.84145 0
334 4.69106 -0.27052 4.08774 1.03985 6.3341 82.37234 0
334 4.66464 -0.26425 4.18136 0.93611 6.38242 81.90588 0
334 4.61491 -0.49727 4.24894 0.67581 6.41902 81.44439 0
334 4.52098 -0.93931 4.28219 0.33252 6.4429 80.99229 0
334 4.38311 -1.37867 4.27783 -0.04363 6.45343 80.55398 0
334 4.30593 0.41248 2.04662 0.462 12.31175 65.40187 0
334 4.35826 0.5233 2.13534 0.88723 12.53403 64.96605 0
334 4.43202 0.73759 2.22366 1.66163 1.76321 64.52285 0
334 5.04726 -0.30351 3.96366 1.0116 6.28656 52.76875 0
334 5.05187 0.04603 4.06008 0.96424 6.38574 52.26357 0
334 5.08813 0.36261 4.1551 0.95014 6.47905 51.75475 0
334 5.14255 0.54423 4.25165 0.96556 6.56813 51.2405 0
334 5.19996 0.57406 4.3463 0.94643 6.6535 50.7205 0
334 5.25006 0.50102 4.43084 0.84539 6.73542 50.1955 0
334 5.28937 0.39315 4.4997 0.68861 6.81439 49.66656 0
334 8.22759 0.71076 6.41821 1.13988 9.34877 29.98572 0
334 8.27464 0.4704 6.57521 1.57006 9.51871 29.15826 0
334 8.30905 0.34416 6.76872 1.93508 9.67275 28.32735 0
334 8.33668 0.27624 6.97836 2.09639 9.80858 27.49368 0
334 8.3581 0.21423 7.17727 1.98911 9.92666 26.65787 0
334 8.37293 0.14829 7.34354 1.66274 10.0296 25.82058 0
334 8.38211 0.09183 7.46944 1.25893 10.12087 24.98237 0
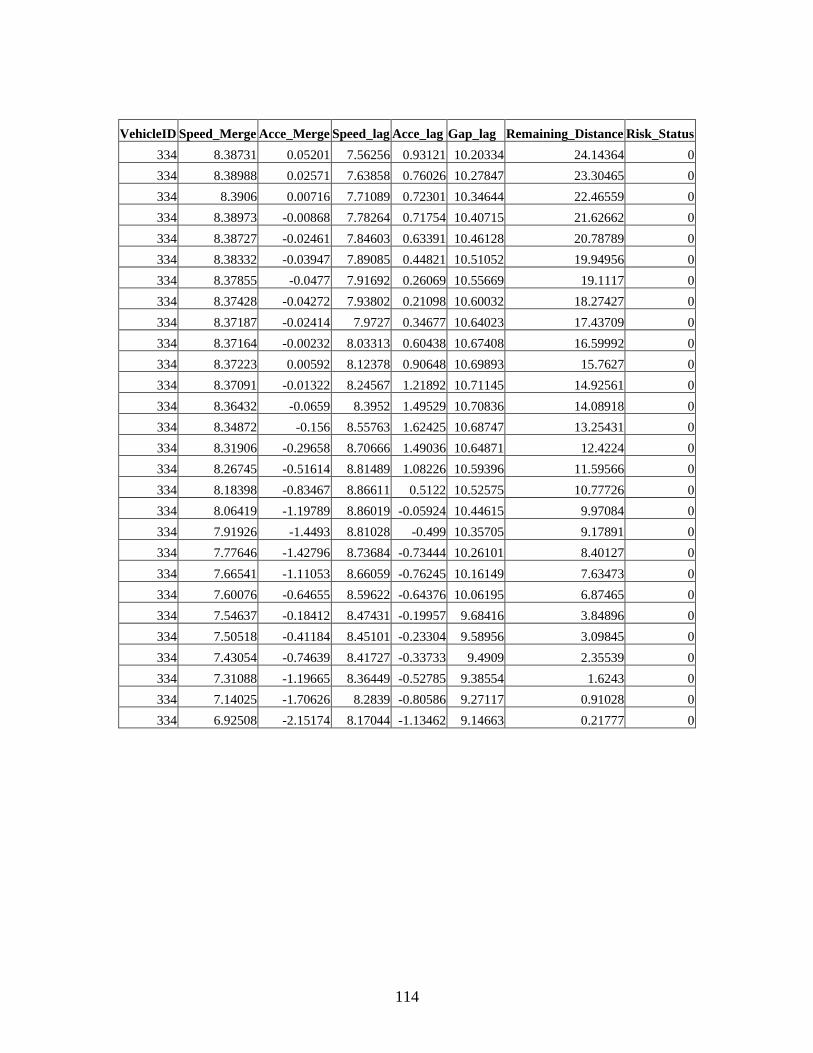
114
VehicleID Speed_Merge Acce_Merge Speed_lag Acce_lag Gap_lag Remaining_Distance Risk_Status
334 8.38731 0.05201 7.56256 0.93121 10.20334 24.14364 0
334 8.38988 0.02571 7.63858 0.76026 10.27847 23.30465 0
334 8.3906 0.00716 7.71089 0.72301 10.34644 22.46559 0
334 8.38973 -0.00868 7.78264 0.71754 10.40715 21.62662 0
334 8.38727 -0.02461 7.84603 0.63391 10.46128 20.78789 0
334 8.38332 -0.03947 7.89085 0.44821 10.51052 19.94956 0
334 8.37855 -0.0477 7.91692 0.26069 10.55669 19.1117 0
334 8.37428 -0.04272 7.93802 0.21098 10.60032 18.27427 0
334 8.37187 -0.02414 7.9727 0.34677 10.64023 17.43709 0
334 8.37164 -0.00232 8.03313 0.60438 10.67408 16.59992 0
334 8.37223 0.00592 8.12378 0.90648 10.69893 15.7627 0
334 8.37091 -0.01322 8.24567 1.21892 10.71145 14.92561 0
334 8.36432 -0.0659 8.3952 1.49529 10.70836 14.08918 0
334 8.34872 -0.156 8.55763 1.62425 10.68747 13.25431 0
334 8.31906 -0.29658 8.70666 1.49036 10.64871 12.4224 0
334 8.26745 -0.51614 8.81489 1.08226 10.59396 11.59566 0
334 8.18398 -0.83467 8.86611 0.5122 10.52575 10.77726 0
334 8.06419 -1.19789 8.86019 -0.05924 10.44615 9.97084 0
334 7.91926 -1.4493 8.81028 -0.499 10.35705 9.17891 0
334 7.77646 -1.42796 8.73684 -0.73444 10.26101 8.40127 0
334 7.66541 -1.11053 8.66059 -0.76245 10.16149 7.63473 0
334 7.60076 -0.64655 8.59622 -0.64376 10.06195 6.87465 0
334 7.54637 -0.18412 8.47431 -0.19957 9.68416 3.84896 0
334 7.50518 -0.41184 8.45101 -0.23304 9.58956 3.09845 0
334 7.43054 -0.74639 8.41727 -0.33733 9.4909 2.35539 0
334 7.31088 -1.19665 8.36449 -0.52785 9.38554 1.6243 0
334 7.14025 -1.70626 8.2839 -0.80586 9.27117 0.91028 0
334 6.92508 -2.15174 8.17044 -1.13462 9.14663 0.21777 0

115
Appendix B
Sample Data for the Risk Model for the Lane-changing Decisions
Table B-1 Variables for the risk model used at t1 Variables Definition
Speed_LC_veh Speed of the lane-changing vehicle (m/s)
Speed_front Speed of the front vehicle in the current lane (m/s)
Speed_lead Speed of the lead vehicle (m/s)
Risk Status It is defined by Eq. (3-20)
Table B-2 Representative data for the risk model used at t1
Speed_LC_veh Speed_front Speed_lead Risk Status
7.83919 7.82069 8.72551 0
7.82294 9.20805 8.21511 0
7.46117 9.30977 6.20087 0
8.31385 8.55648 7.46527 0
7.58975 6.37559 7.12543 0
9.25935 10.71896 8.90157 0
11.5134 12.19155 9.14541 0
8.8552 7.48076 9.22908 0
7.87267 11.78752 12.09023 0
10.81795 8.32915 9.16331 0
10.81782 7.70104 7.65521 0
8.87808 10.32343 9.95734 0
10.08131 6.17758 10.24532 0
7.12653 7.62569 10.28925 0
8.90855 7.20633 18.33362 0
9.72477 9.14519 12.1931 0
6.86982 8.50447 9.94047 0
9.00296 8.64831 8.64018 0
9.55193 9.09816 6.86832 0
10.22415 6.79892 11.1828 0
10.47137 10.51094 10.71991 0
5.83174 4.85198 9.24862 0
7.69339 7.49651 8.77623 0
7.93896 6.09658 9.39711 0
5.57554 4.11572 6.88821 0
7.85566 7.95756 10.02301 0
7.12508 7.66088 8.70662 0
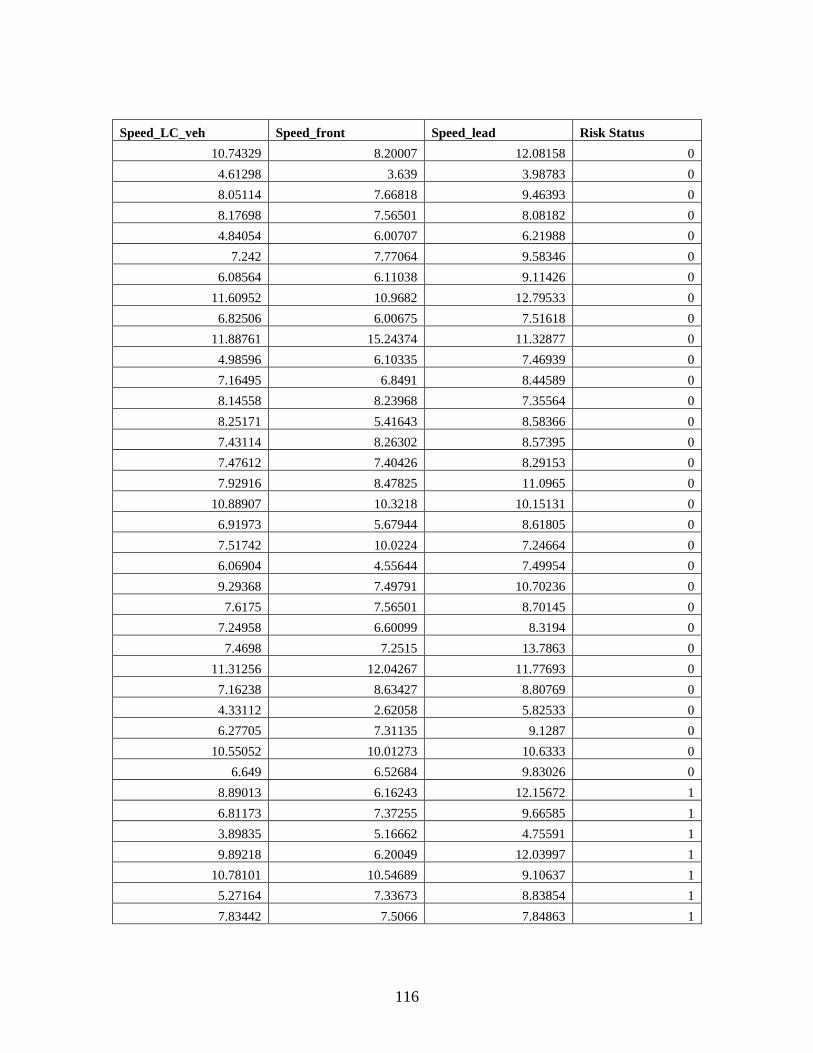
116
Speed_LC_veh Speed_front Speed_lead Risk Status
10.74329 8.20007 12.08158 0
4.61298 3.639 3.98783 0
8.05114 7.66818 9.46393 0
8.17698 7.56501 8.08182 0
4.84054 6.00707 6.21988 0
7.242 7.77064 9.58346 0
6.08564 6.11038 9.11426 0
11.60952 10.9682 12.79533 0
6.82506 6.00675 7.51618 0
11.88761 15.24374 11.32877 0
4.98596 6.10335 7.46939 0
7.16495 6.8491 8.44589 0
8.14558 8.23968 7.35564 0
8.25171 5.41643 8.58366 0
7.43114 8.26302 8.57395 0
7.47612 7.40426 8.29153 0
7.92916 8.47825 11.0965 0
10.88907 10.3218 10.15131 0
6.91973 5.67944 8.61805 0
7.51742 10.0224 7.24664 0
6.06904 4.55644 7.49954 0
9.29368 7.49791 10.70236 0
7.6175 7.56501 8.70145 0
7.24958 6.60099 8.3194 0
7.4698 7.2515 13.7863 0
11.31256 12.04267 11.77693 0
7.16238 8.63427 8.80769 0
4.33112 2.62058 5.82533 0
6.27705 7.31135 9.1287 0
10.55052 10.01273 10.6333 0
6.649 6.52684 9.83026 0
8.89013 6.16243 12.15672 1
6.81173 7.37255 9.66585 1
3.89835 5.16662 4.75591 1
9.89218 6.20049 12.03997 1
10.78101 10.54689 9.10637 1
5.27164 7.33673 8.83854 1
7.83442 7.5066 7.84863 1

117
Speed_LC_veh Speed_front Speed_lead Risk Status
9.24416 8.5902 12.18905 1
12.3264 7.61581 12.84598 1
12.63453 11.96236 11.42225 1
9.0999 7.61943 7.62976 1
7.14146 9.00008 8.23603 1
6.85323 6.49666 9.60982 1
10.62809 9.08674 10.55182 1
8.46312 3.04833 3.04833 1
6.26832 3.59786 7.30572 1
12.64775 10.71669 12.42012 1
12.60137 19.01637 9.60579 1
14.00618 13.44197 10.86139 1
4.6411 2.6318 5.29313 1
8.56024 8.8397 9.81167 1
12.16445 4.63331 10.6921 1
5.01683 4.17385 4.00693 1
5.27907 4.48341 11.9222 1
6.00812 8.83665 7.61508 1
7.47977 9.03377 5.46827 1
7.50656 7.52864 6.24333 1
11.82745 6.67631 7.67132 1
9.79404 9.93958 12.18666 1
11.79916 4.34888 10.62749 1
7.61273 6.78021 6.09581 1
9.49422 10.21151 10.31706 1
4.63732 6.03175 6.33568 1
6.13464 6.82323 6.18563 1
7.03828 7.20052 8.93625 1
15.61134 8.00316 12.38154 1
8.89847 7.65751 8.78148 1
6.43152 0.94617 7.44137 1
4.93701 5.04341 6.58861 1
9.16867 5.19027 9.29723 1
6.57022 2.2949 7.48581 1
7.80747 7.96568 9.31467 1
7.74205 8.44174 9.31307 1
8.26514 7.54968 9.13911 1
6.73054 7.8439 8.03203 1

118
Speed_LC_veh Speed_front Speed_lead Risk Status
12.03131 9.48473 8.65059 1
5.95377 5.0612 7.60848 1
3.52816 6.34856 6.81511 1
6.60735 5.99339 8.50252 1
8.56605 7.67633 8.81611 1
8.33336 7.16447 6.90391 1
14.24997 9.2349 18.81906 1
8.51119 4.71879 8.10898 1
8.53359 6.21011 10.26099 1
6.59177 3.71276 7.04369 1
9.3963 9.51244 9.14719 1
7.72827 7.61863 9.14451 1
4.19239 3.43029 4.25129 1
7.38046 8.15171 6.98833 1
9.1265 9.03788 7.61831 1
5.24959 4.5595 6.07244 1
8.62459 7.52732 9.62867 1
7.15017 5.1587 9.02468 1
7.26825 6.08889 7.5846 1
8.59117 7.34344 9.87191 1
5.15862 6.84899 9.02965 1
9.4313 9.78912 9.2486 1
6.21681 6.06246 6.07031 1
8.79825 5.89714 7.61967 1
8.52231 10.14164 10.4784 1
5.4508 7.28286 6.00445 1
10.70905 7.61114 9.12396 1
7.52244 7.27005 7.54313 1
5.19136 3.69408 7.62007 1
8.66572 6.57221 8.30354 1
8.53499 5.83185 9.13598 1
4.75844 9.12082 6.0671 1
3.33528 1.51623 4.57125 1
8.72762 7.51074 9.48752 1
13.8964 11.46759 10.54105 1
5.26878 9.18494 7.89315 1
12.08763 9.22166 11.37917 1
6.11829 6.091 9.14385 1

119
Speed_LC_veh Speed_front Speed_lead Risk Status
7.38398 3.37287 7.62003 1
9.64873 7.41714 10.32978 1
7.08327 7.15784 8.92491 1
8.07936 8.29411 8.39835 1
6.40244 1.42857 9.10341 1
9.12188 7.70654 12.75499 1
6.66687 4.75176 8.24249 1
8.09871 6.03649 8.74719 1
4.2907 4.29855 4.48091 1
4.79347 2.57854 19.24745 1
7.18485 2.20924 6.28053 1
6.10448 7.6804 7.14054 1
8.15692 7.76505 8.04956 1
7.12116 9.70093 5.61377 1
6.67784 6.07781 8.44487 1
7.20167 7.68134 6.85606 1
9.58244 7.35818 7.69952 1
5.12927 6.27175 6.63615 1
10.30046 10.35102 7.62047 1
10.34803 5.35648 7.62731 1
7.19079 5.5753 7.91124 1
8.92453 7.62196 9.62454 1
4.88708 4.56828 4.49493 1
5.88627 5.96161 6.68666 1
7.63799 6.52893 6.88387 1
5.30884 3.51156 6.16452 1
5.34262 2.44635 7.45822 1
10.34822 7.76121 11.49238 1
11.21665 9.57475 12.27843 1
12.50684 8.98806 12.53754 1
7.10246 7.07063 8.96817 1
7.55797 5.05578 7.91481 1
11.31212 7.81744 8.09167 1
9.65518 8.70521 9.55317 1
10.50123 8.99486 9.79521 1
9.18656 8.70308 10.88837 1
9.12918 7.72168 11.86313 1
11.18337 11.79631 14.66772 1

120
Speed_LC_veh Speed_front Speed_lead Risk Status
8.38944 7.0782 9.17458 1
7.67565 6.55593 8.93792 1
10.11604 4.48969 10.60724 1
8.56997 8.49645 8.60087 1
7.57077 9.09258 8.08084 1
8.80241 6.30893 10.42154 1
7.70796 6.17805 7.96643 1
12.14718 8.36661 19.88142 1
6.45664 6.45903 11.21756 1
9.91897 3.97102 8.30448 1
13.82142 11.1548 18.39702 1
11.30177 9.81141 11.54955 1
7.34831 7.1405 10.78065 1
5.87158 4.9254 5.90899 1
6.37095 4.7467 5.87153 1
7.46579 7.00423 8.38033 1
13.733 10.5947 10.93822 1
6.69943 5.94748 6.83601 1
6.23683 4.0441 11.0107 1
5.78064 3.04857 4.57358 1
3.76407 4.39521 4.22923 1
8.70172 9.43511 9.54178 1
7.21914 4.57014 10.61587 1
12.32766 9.91567 11.54624 1
6.76119 8.34083 7.63252 1
4.36328 4.78332 5.34039 1
3.1206 5.21765 1.51362 1
6.06292 5.38504 8.07277 1
8.15058 4.86901 9.63794 1
9.01006 10.65753 7.08648 1
9.49923 6.03804 8.95823 1
10.19664 7.75132 10.7051 1
11.93432 10.51757 10.74714 1
9.01217 7.98322 11.15052 1
9.0979 18.28552 7.90428 1
12.24167 9.4028 8.21003 1
8.21532 7.39182 8.07308 1
8.64661 9.24839 7.90154 1

121
Speed_LC_veh Speed_front Speed_lead Risk Status
9.21493 6.0934 6.15199 1
13.79491 11.19198 10.22681 1
6.31384 1.81244 9.35421 1
7.75395 5.46418 3.91499 1
8.24249 7.57645 7.60011 1
9.82346 6.03119 10.25227 1
8.61742 5.66876 11.15073 1
5.69293 4.16834 10.56817 1
5.97968 3.81159 6.03657 1
7.49547 4.78044 8.24139 1
6.06292 6.0906 6.77916 1
8.47333 7.43657 9.14035 1
7.40523 8.56983 8.4621 1
8.46824 6.20366 9.20372 1
4.43805 3.42819 9.25484 1
8.46312 3.04833 9.14282 1
7.03396 6.3812 6.08362 1
7.31352 7.59981 6.75643 1
5.56403 4.57067 7.80365 1
3.01601 2.15666 4.62153 1
8.86486 8.53094 8.33783 1
5.34627 2.71464 6.28265 1
15.04203 18.29033 14.46781 1
7.24542 6.88829 8.64101 1
6.0266 7.65196 6.96862 1
10.98025 9.07264 10.87316 1
3.50679 2.8081 7.27241 1
3.27451 7.16395 5.58951 1
10.94289 10.99867 11.33576 1
5.63787 7.73863 7.18316 1
9.80246 10.08257 9.40422 1
7.40547 9.20067 11.70596 1
8.59925 4.65537 9.17754 1
6.43527 5.05729 7.63431 1
8.05469 9.58222 6.82658 1
6.68347 9.09589 7.5592 1
10.22348 9.15503 11.07646 1
7.14639 7.61465 9.04499 1

122
Speed_LC_veh Speed_front Speed_lead Risk Status
3.32989 3.26882 4.28733 1
4.85804 6.18431 5.2938 1
10.77164 9.5412 13.11012 1
7.80823 8.99705 6.10013 1
11.17514 8.22924 11.69329 1
6.60826 6.45987 7.66096 1
9.75766 8.32729 7.49885 1
7.85142 7.7919 7.85291 1
10.33733 8.24197 7.15389 1
10.41568 7.94128 11.45792 1
9.4118 9.96143 9.80495 1
8.59145 6.06489 4.77804 1
6.81185 9.34211 8.01845 1
8.05954 9.49522 10.23957 1
14.296 12.90347 8.34339 1
7.87548 6.43473 9.63209 1
9.39374 6.84455 11.21085 1
6.09865 3.45873 7.76795 1
11.01705 11.68339 11.3791 1
3.07168 4.46234 3.06936 1
10.86934 7.1488 6.73997 1
10.5191 13.56092 6.22293 1
9.85484 8.01077 8.82204 1
7.78317 5.11587 7.15563 1
8.49768 7.94786 9.85998 1
11.70965 9.61418 8.2284 1
7.91526 6.10854 10.35751 1
4.1323 1.40248 6.31936 1
8.8779 9.12473 8.08891 1
4.62475 4.38622 5.78408 1
8.86376 6.09595 12.24025 1
7.703 8.70247 9.08991 1
6.0346 5.58614 7.45301 1
9.05649 10.36057 10.74287 1
6.74159 2.65509 6.356 1
10.09448 9.11155 12.8415 1
10.34312 7.72708 7.88059 1
6.68381 6.04841 8.89406 1

123
Speed_LC_veh Speed_front Speed_lead Risk Status
7.22074 6.00236 8.85472 1
8.94277 7.11187 10.70566 1
6.56288 4.26412 10.1121 1
2.74188 5.82713 3.8915 1
8.92613 4.78491 8.93702 1
9.98202 9.58383 8.56692 1
5.91673 5.99776 7.38015 1
10.42744 9.10422 12.79709 1
7.83868 7.34402 9.0704 1
1.7701 1.22048 3.58535 1
5.34032 5.46315 6.07661 1
9.04008 11.08662 7.40358 1
7.25812 5.94598 9.77828 1
8.23444 7.00396 8.89085 1
8.51346 6.78576 7.9616 1
8.60911 9.84798 8.68393 1
8.39773 8.25872 9.55955 1
10.33648 7.65332 21.04777 1
10.05633 9.47182 14.45826 1
11.4189 6.95311 11.44101 1
11.26053 9.15513 15.66632 1
10.04326 9.18666 4.70571 1
5.25799 3.63441 6.47797 1
12.436 12.2024 8.53348 1
5.61612 4.2791 8.90462 1
7.88844 5.55283 9.36529 1
6.10838 8.23665 7.63568 1
7.37589 5.34227 9.40176 1
10.1807 9.74302 9.80545 1
10.48807 10.11569 7.6384 1
7.00923 8.51061 7.51072 1
8.30727 8.64922 6.05399 1
15.34579 21.39249 10.24429 1
10.09933 8.70537 9.12088 1
4.08003 6.10049 4.53905 1
5.75311 8.59414 7.57958 1
6.3822 10.05045 5.9986 1
6.03202 4.27346 9.50961 1

124
Speed_LC_veh Speed_front Speed_lead Risk Status
7.09368 4.60291 9.03772 1
4.97385 4.70559 6.70999 1
11.8877 8.55979 15.85374 1
11.95801 9.16058 10.71285 1
Table B-3 Variables for the model used at t2 Variables Definition
Speed_lead Speed of the lead vehicle (m/s)
Acce_lag Acceleration of the lag vehicle (m/s2)
Gap_lag Longitudinal distance between the lane-changing vehicle and the lag vehicle (m)
Risk Status It is defined by Eq. (3-20)
Table B-4 Representative data for the risk model used at t2
Speed_lead Acce_lag Gap_lag Risk Status
9.61773 0.18438 5.68649 0
9.64241 2.14919 18.76476 0
7.58484 -0.0503 9.17581 0
6.4708 -0.95536 9.26938 0
7.79213 -0.78093 2.04656 0
10.43224 -0.00922 5.28052 0
6.53803 -0.13453 8.96131 0
11.85782 0.45265 22.21397 0
3.26531 -0.77675 2.76214 0
10.68261 0.30417 18.26985 0
5.27695 -0.09713 11.25257 0
8.67189 -0.47206 15.22416 0
7.91805 0.264 5.92353 0
10.59334 1.03439 5.87648 0
6.58829 0.08622 17.15219 0
6.99005 0.11734 14.14539 0
13.70681 0.1176 22.42876 0
8.73284 -2.15841 13.18588 0
9.13401 0.45177 24.05113 0
8.53961 -0.0806 18.58349 0
7.91262 0.44236 17.12888 0
8.29429 -0.29549 5.28687 0
12.49597 -0.59494 15.98744 0
19.13616 -1.61713 23.53193 0
6.76641 -0.30693 15.42792 0
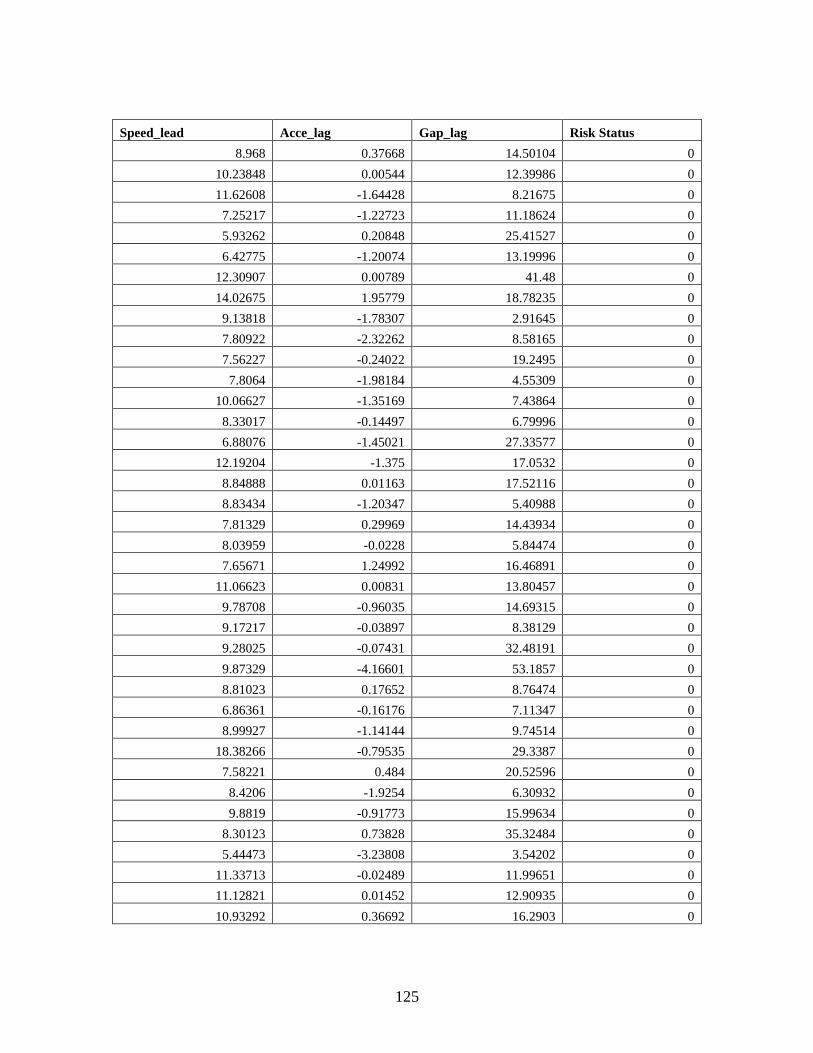
125
Speed_lead Acce_lag Gap_lag Risk Status
8.968 0.37668 14.50104 0
10.23848 0.00544 12.39986 0
11.62608 -1.64428 8.21675 0
7.25217 -1.22723 11.18624 0
5.93262 0.20848 25.41527 0
6.42775 -1.20074 13.19996 0
12.30907 0.00789 41.48 0
14.02675 1.95779 18.78235 0
9.13818 -1.78307 2.91645 0
7.80922 -2.32262 8.58165 0
7.56227 -0.24022 19.2495 0
7.8064 -1.98184 4.55309 0
10.06627 -1.35169 7.43864 0
8.33017 -0.14497 6.79996 0
6.88076 -1.45021 27.33577 0
12.19204 -1.375 17.0532 0
8.84888 0.01163 17.52116 0
8.83434 -1.20347 5.40988 0
7.81329 0.29969 14.43934 0
8.03959 -0.0228 5.84474 0
7.65671 1.24992 16.46891 0
11.06623 0.00831 13.80457 0
9.78708 -0.96035 14.69315 0
9.17217 -0.03897 8.38129 0
9.28025 -0.07431 32.48191 0
9.87329 -4.16601 53.1857 0
8.81023 0.17652 8.76474 0
6.86361 -0.16176 7.11347 0
8.99927 -1.14144 9.74514 0
18.38266 -0.79535 29.3387 0
7.58221 0.484 20.52596 0
8.4206 -1.9254 6.30932 0
9.8819 -0.91773 15.99634 0
8.30123 0.73828 35.32484 0
5.44473 -3.23808 3.54202 0
11.33713 -0.02489 11.99651 0
11.12821 0.01452 12.90935 0
10.93292 0.36692 16.2903 0
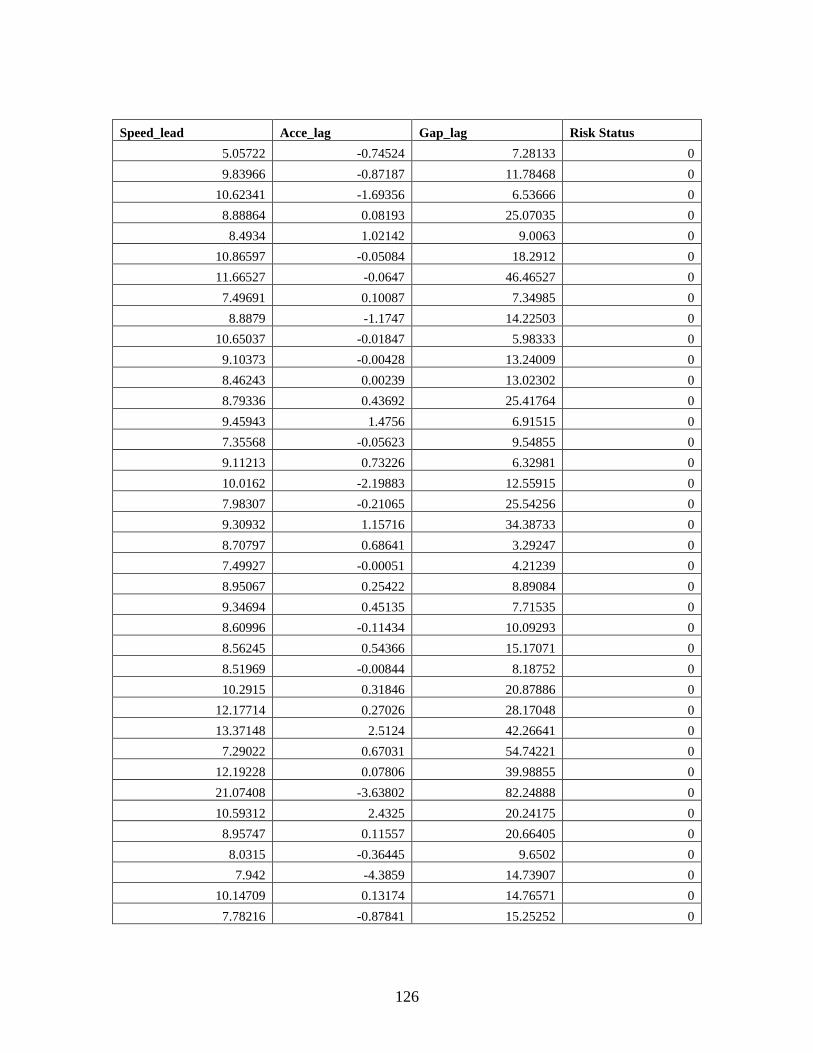
126
Speed_lead Acce_lag Gap_lag Risk Status
5.05722 -0.74524 7.28133 0
9.83966 -0.87187 11.78468 0
10.62341 -1.69356 6.53666 0
8.88864 0.08193 25.07035 0
8.4934 1.02142 9.0063 0
10.86597 -0.05084 18.2912 0
11.66527 -0.0647 46.46527 0
7.49691 0.10087 7.34985 0
8.8879 -1.1747 14.22503 0
10.65037 -0.01847 5.98333 0
9.10373 -0.00428 13.24009 0
8.46243 0.00239 13.02302 0
8.79336 0.43692 25.41764 0
9.45943 1.4756 6.91515 0
7.35568 -0.05623 9.54855 0
9.11213 0.73226 6.32981 0
10.0162 -2.19883 12.55915 0
7.98307 -0.21065 25.54256 0
9.30932 1.15716 34.38733 0
8.70797 0.68641 3.29247 0
7.49927 -0.00051 4.21239 0
8.95067 0.25422 8.89084 0
9.34694 0.45135 7.71535 0
8.60996 -0.11434 10.09293 0
8.56245 0.54366 15.17071 0
8.51969 -0.00844 8.18752 0
10.2915 0.31846 20.87886 0
12.17714 0.27026 28.17048 0
13.37148 2.5124 42.26641 0
7.29022 0.67031 54.74221 0
12.19228 0.07806 39.98855 0
21.07408 -3.63802 82.24888 0
10.59312 2.4325 20.24175 0
8.95747 0.11557 20.66405 0
8.0315 -0.36445 9.6502 0
7.942 -4.3859 14.73907 0
10.14709 0.13174 14.76571 0
7.78216 -0.87841 15.25252 0

127
Speed_lead Acce_lag Gap_lag Risk Status
9.66507 0.01385 13.38152 0
7.62279 0.8154 22.80724 0
13.32235 -0.95208 20.397 0
6.61043 -1.96101 12.17383 0
9.79463 -1.17425 10.00914 0
12.02643 0.52539 14.34081 0
10.64597 1.00445 10.68427 0
12.04761 -0.46746 14.1548 0
11.22305 0.05354 10.73435 0
10.72863 -0.28126 12.23778 0
7.89902 -0.22397 25.43468 0
12.17668 0.32191 20.23929 0
6.30757 -0.30497 10.02906 0
6.9776 -0.16101 5.03237 0
12.16742 -0.42027 39.94629 0
9.35938 0.1304 43.41318 0
6.81306 0.11155 4.51832 0
8.78656 0.56152 12.06291 0
6.54089 0.38365 18.72438 0
8.96901 0.03886 3.74879 0
9.12881 0.19188 19.87719 0
8.85498 -0.52919 10.5498 0
9.02394 -0.71271 5.4227 0
8.0728 -0.03364 6.58009 0
6.10932 0.48182 10.01159 0
9.12169 -0.36209 25.24854 0
10.50475 -0.28238 43.30212 0
9.19832 -1.52893 9.49361 0
10.66883 0.03759 11.78544 0
7.45976 -0.02256 33.64489 0
11.77337 -1.27319 12.12008 0
7.25928 -0.39941 13.77396 0
8.31745 1.82524 19.19513 0
6.79906 0.01803 13.56554 0
7.33701 -0.13748 9.27953 0
8.5314 0.16276 17.46178 0
7.51591 -0.60216 8.43695 0
10.13308 -0.57559 30.26506 0
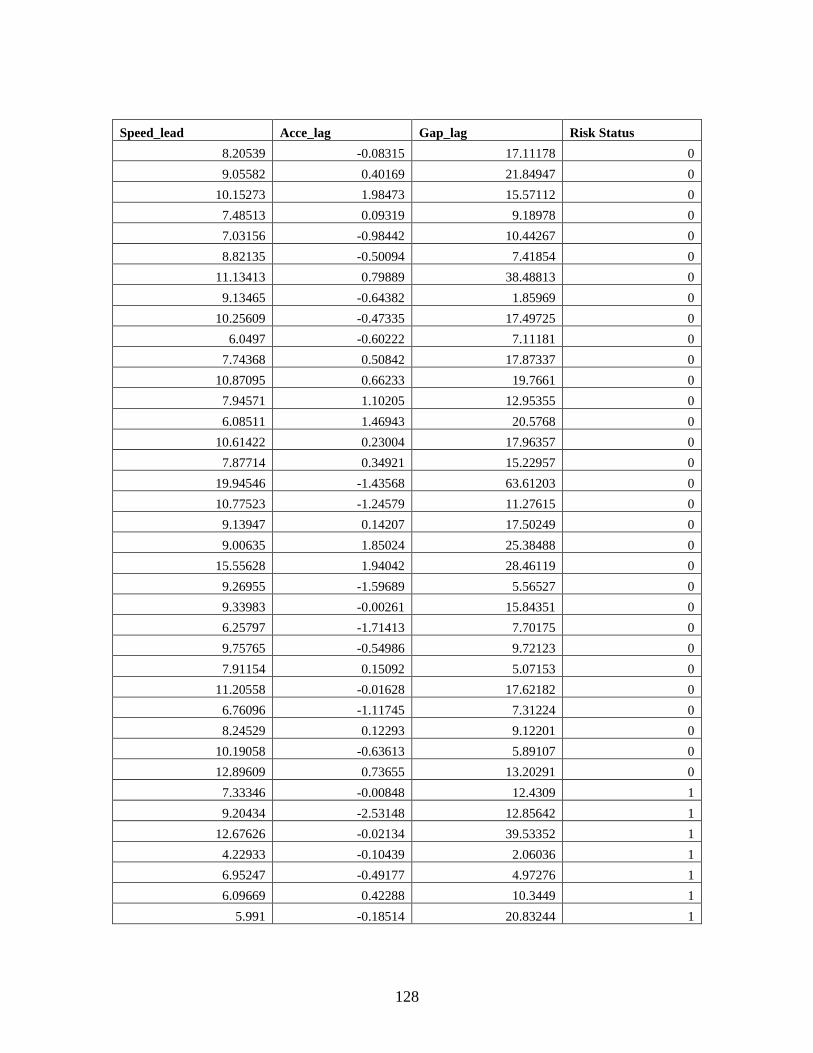
128
Speed_lead Acce_lag Gap_lag Risk Status
8.20539 -0.08315 17.11178 0
9.05582 0.40169 21.84947 0
10.15273 1.98473 15.57112 0
7.48513 0.09319 9.18978 0
7.03156 -0.98442 10.44267 0
8.82135 -0.50094 7.41854 0
11.13413 0.79889 38.48813 0
9.13465 -0.64382 1.85969 0
10.25609 -0.47335 17.49725 0
6.0497 -0.60222 7.11181 0
7.74368 0.50842 17.87337 0
10.87095 0.66233 19.7661 0
7.94571 1.10205 12.95355 0
6.08511 1.46943 20.5768 0
10.61422 0.23004 17.96357 0
7.87714 0.34921 15.22957 0
19.94546 -1.43568 63.61203 0
10.77523 -1.24579 11.27615 0
9.13947 0.14207 17.50249 0
9.00635 1.85024 25.38488 0
15.55628 1.94042 28.46119 0
9.26955 -1.59689 5.56527 0
9.33983 -0.00261 15.84351 0
6.25797 -1.71413 7.70175 0
9.75765 -0.54986 9.72123 0
7.91154 0.15092 5.07153 0
11.20558 -0.01628 17.62182 0
6.76096 -1.11745 7.31224 0
8.24529 0.12293 9.12201 0
10.19058 -0.63613 5.89107 0
12.89609 0.73655 13.20291 0
7.33346 -0.00848 12.4309 1
9.20434 -2.53148 12.85642 1
12.67626 -0.02134 39.53352 1
4.22933 -0.10439 2.06036 1
6.95247 -0.49177 4.97276 1
6.09669 0.42288 10.3449 1
5.991 -0.18514 20.83244 1
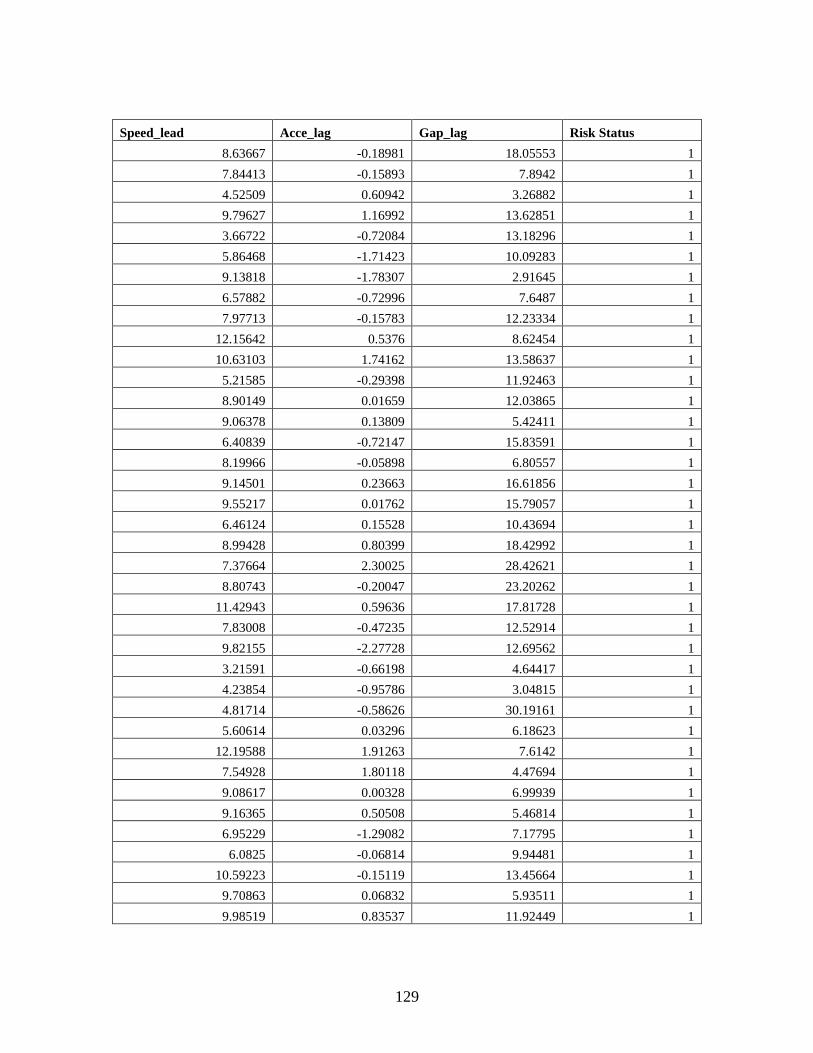
129
Speed_lead Acce_lag Gap_lag Risk Status
8.63667 -0.18981 18.05553 1
7.84413 -0.15893 7.8942 1
4.52509 0.60942 3.26882 1
9.79627 1.16992 13.62851 1
3.66722 -0.72084 13.18296 1
5.86468 -1.71423 10.09283 1
9.13818 -1.78307 2.91645 1
6.57882 -0.72996 7.6487 1
7.97713 -0.15783 12.23334 1
12.15642 0.5376 8.62454 1
10.63103 1.74162 13.58637 1
5.21585 -0.29398 11.92463 1
8.90149 0.01659 12.03865 1
9.06378 0.13809 5.42411 1
6.40839 -0.72147 15.83591 1
8.19966 -0.05898 6.80557 1
9.14501 0.23663 16.61856 1
9.55217 0.01762 15.79057 1
6.46124 0.15528 10.43694 1
8.99428 0.80399 18.42992 1
7.37664 2.30025 28.42621 1
8.80743 -0.20047 23.20262 1
11.42943 0.59636 17.81728 1
7.83008 -0.47235 12.52914 1
9.82155 -2.27728 12.69562 1
3.21591 -0.66198 4.64417 1
4.23854 -0.95786 3.04815 1
4.81714 -0.58626 30.19161 1
5.60614 0.03296 6.18623 1
12.19588 1.91263 7.6142 1
7.54928 1.80118 4.47694 1
9.08617 0.00328 6.99939 1
9.16365 0.50508 5.46814 1
6.95229 -1.29082 7.17795 1
6.0825 -0.06814 9.94481 1
10.59223 -0.15119 13.45664 1
9.70863 0.06832 5.93511 1
9.98519 0.83537 11.92449 1

130
Speed_lead Acce_lag Gap_lag Risk Status
10.371 -0.21631 13.77208 1
6.34081 0.93608 12.36668 1
6.74373 -0.44636 3.36956 1
10.86998 0.03876 16.74229 1
10.42516 -1.98999 15.76118 1
7.88479 0.94455 24.94259 1
8.93543 0.84533 24.86634 1
9.09307 -2.94969 7.57716 1
10.53285 -0.14284 9.38039 1
9.13773 0.13941 17.99011 1
4.60838 0.02378 6.84149 1
10.38758 -0.24056 5.82869 1
10.64545 0.41046 31.45186 1
9.18756 1.55584 21.244 1
5.76955 -3.13033 6.54216 1
8.069 -0.01511 10.34346 1
7.66353 0.11152 8.05265 1
3.29044 -2.73662 5.43311 1
7.91128 0.03556 3.49549 1
6.62674 1.34423 6.66899 1
7.61755 -0.74021 4.63995 1
8.28423 -0.68305 10.47455 1
5.09469 -0.56592 11.10892 1
4.38767 0.26747 3.19498 1
9.28417 -0.29687 12.33409 1
13.92813 -0.81361 4.34971 1
9.14183 0.33359 12.85132 1
6.68177 0.05022 4.32828 1
6.10695 0.11625 6.95772 1
5.65937 0.00086 4.2633 1
8.56208 0.02682 7.11336 1
14.71127 -0.62162 9.70636 1
8.84656 -0.21049 13.72592 1
4.57251 -0.08759 4.27621 1
9.1399 -2.05836 5.54903 1
3.12818 -0.01545 3.30928 1
9.09572 0.51513 6.24141 1
10.94273 0.0849 12.01761 1

131
Speed_lead Acce_lag Gap_lag Risk Status
6.99504 -0.39655 3.3359 1
8.43282 0.73963 24.67981 1
8.57456 -0.00216 25.3775 1
6.20613 -0.05988 7.41821 1
9.61325 -0.69922 11.36682 1
1.51251 1.54923 5.12302 1
10.80597 -0.24856 11.21625 1
6.83038 -0.30356 8.46577 1
9.51928 0.54071 7.2136 1
9.69854 -0.10872 7.27541 1
7.90639 0.32761 15.05868 1
6.2456 -0.02398 10.92291 1
10.78976 -1.39135 24.19255 1
9.7457 0.21366 9.07663 1
6.66453 0.32278 9.99996 1
7.35737 -0.43057 8.05309 1
9.82906 -0.01751 5.63088 1
5.2469 -0.05779 6.39602 1
7.83636 -0.94755 6.60085 1
9.93985 0.32367 6.48627 1
7.19943 -0.44373 16.57586 1
11.43013 -0.46381 27.83421 1
12.90466 -3.61016 6.71054 1
8.30387 -0.56561 8.56425 1
7.61954 -0.70398 25.98138 1
7.62134 -0.08653 8.25919 1
9.23936 -0.14192 2.89639 1
10.26677 0.98129 8.22227 1
7.67318 0.09997 30.5072 1
10.75876 0.51814 16.81889 1
5.72399 -0.28784 9.92296 1
8.99796 -0.74144 9.70511 1
9.25141 1.61773 15.72774 1
3.82979 -1.68198 4.64318 1
10.53748 -0.6789 6.35859 1
11.14469 0.0305 15.14686 1
5.51437 -0.05876 14.08262 1
6.01112 -0.16243 11.1928 1

132
Speed_lead Acce_lag Gap_lag Risk Status
5.82931 -1.61157 6.18656 1
8.83154 0.05546 12.4881 1
5.85828 0.1999 19.24348 1
7.35503 0.22125 8.85298 1
6.0133 -0.04395 9.92097 1
7.71289 0.69432 4.7846 1
10.40089 0.02741 9.64024 1
6.94779 -0.1909 13.93884 1
7.60094 0.7826 13.94427 1
4.67999 -1.16246 12.58363 1
11.18276 -1.78982 27.99025 1
6.12421 -1.52694 10.24073 1
6.86328 -0.40246 6.07522 1
11.98736 1.10078 10.49103 1
9.14392 0.03796 4.34382 1
4.44273 -2.20916 3.26664 1
7.22406 -0.393 6.16053 1
8.92358 -1.98462 10.0672 1
6.98299 0.55882 6.61924 1
9.48504 0.00993 26.6562 1
7.99246 -0.18228 16.16426 1
9.68215 0.09198 6.23983 1
7.71493 0.01353 13.95557 1
5.33003 -0.13484 5.06898 1
12.38053 0.02629 5.03983 1
8.61287 0.00585 9.61428 1
7.42505 0.65017 8.38542 1
9.78758 -0.46736 8.70959 1
8.83092 -0.13675 32.96929 1
6.33821 1.85146 15.05761 1
12.74106 -1.38816 14.1816 1
15.88822 -1.73453 12.65544 1
10.88303 1.62656 17.12767 1
9.45622 1.20193 13.63363 1
14.48635 0.10223 3.40448 1
8.04812 -0.82315 7.00472 1
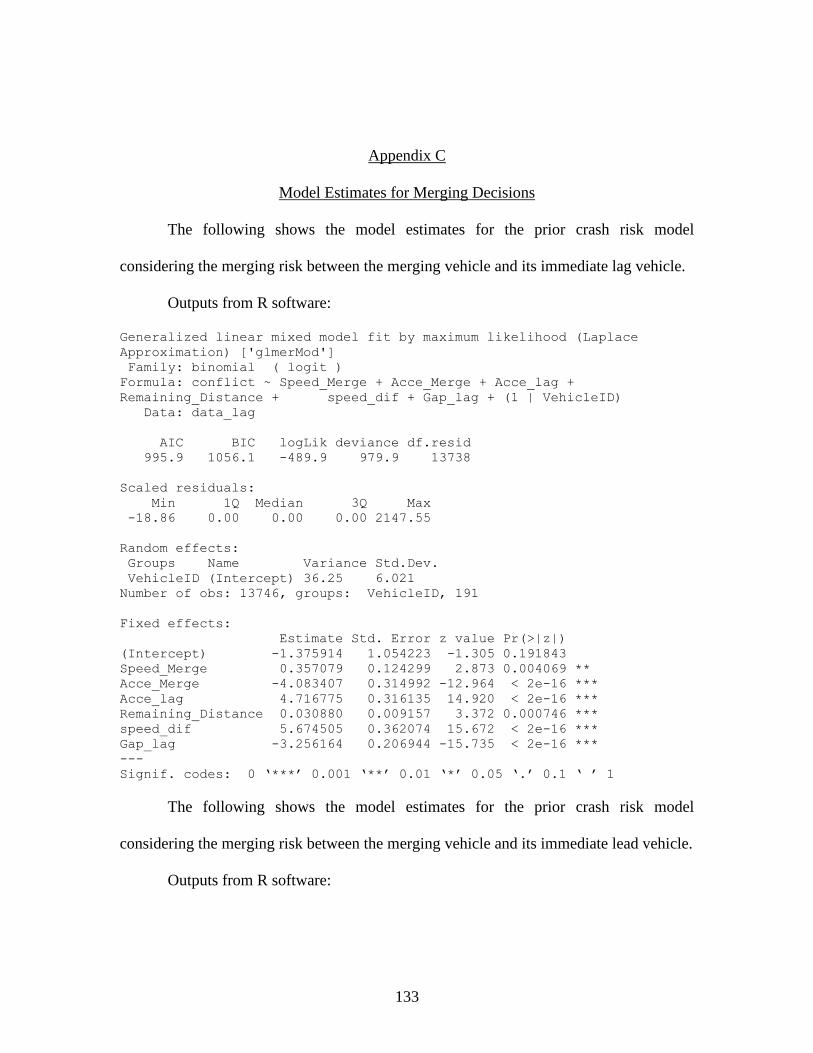
133
Appendix C
Model Estimates for Merging Decisions
The following shows the model estimates for the prior crash risk model
considering the merging risk between the merging vehicle and its immediate lag vehicle.
Outputs from R software:
Generalized linear mixed model fit by maximum likelihood (Laplace
Approximation) ['glmerMod']
Family: binomial ( logit )
Formula: conflict ~ Speed_Merge + Acce_Merge + Acce_lag +
Remaining_Distance + speed_dif + Gap_lag + (1 | VehicleID)
Data: data_lag
AIC BIC logLik deviance df.resid
995.9 1056.1 -489.9 979.9 13738
Scaled residuals:
Min 1Q Median 3Q Max
-18.86 0.00 0.00 0.00 2147.55
Random effects:
Groups Name Variance Std.Dev.
VehicleID (Intercept) 36.25 6.021
Number of obs: 13746, groups: VehicleID, 191
Fixed effects:
Estimate Std. Error z value Pr(>|z|)
(Intercept) -1.375914 1.054223 -1.305 0.191843
Speed_Merge 0.357079 0.124299 2.873 0.004069 **
Acce_Merge -4.083407 0.314992 -12.964 < 2e-16 ***
Acce_lag 4.716775 0.316135 14.920 < 2e-16 ***
Remaining_Distance 0.030880 0.009157 3.372 0.000746 ***
speed_dif 5.674505 0.362074 15.672 < 2e-16 ***
Gap_lag -3.256164 0.206944 -15.735 < 2e-16 ***
---
Signif. codes: 0 ‘***’ 0.001 ‘**’ 0.01 ‘*’ 0.05 ‘.’ 0.1 ‘ ’ 1
The following shows the model estimates for the prior crash risk model
considering the merging risk between the merging vehicle and its immediate lead vehicle.
Outputs from R software:

134
Generalized linear mixed model fit by maximum likelihood (Laplace
Approximation) ['glmerMod'] Family: binomial ( logit )
Formula: conflict ~ Acce_Merge + Remaining_Distance + Speed_lead +
Acce_lead + Gap_lead + (1 | VehicleID)Data: data_lead
AIC BIC logLik deviance df.resid
6398.9 6451.6 -3192.4 6384.9 13739
Scaled residuals:
Min 1Q Median 3Q Max
-63.546 -0.188 -0.025 0.055 26.018
Random effects:
Groups Name Variance Std.Dev.
VehicleID (Intercept) 11.81 3.436
Number of obs: 13746, groups: VehicleID, 191
Fixed effects:
Estimate Std. Error z value Pr(>|z|)
(Intercept) 1.349326 0.335930 4.017 5.90e-05 ***
Acce_Merge -0.443147 0.059074 -7.501 6.31e-14 ***
Remaining_Distance 0.051307 0.001918 26.744 < 2e-16 ***
Speed_lead -0.634264 0.033078 -19.175 < 2e-16 ***
Acce_lead -0.496883 0.054489 -9.119 < 2e-16 ***
Gap_lead -0.574225 0.015773 -36.406 < 2e-16 ***
---
Signif. codes: 0 ‘***’ 0.001 ‘**’ 0.01 ‘*’ 0.05 ‘.’ 0.1 ‘ ’ 1

135
Appendix D
Model Estimates for Lane-Changing Decisions
The following shows the model estimates for the risk model using explanatory
variables collected at t1.
Outputs from R software:
Call:
glm(formula = risk ~ Speed_LC_veh + Speed_front + Speed_lead, family =
"binomial", data = data_t1)
Deviance Residuals:
Min 1Q Median 3Q Max
-2.2039 0.4568 0.5668 0.6451 1.2179
Coefficients:
Estimate Std. Error z value Pr(>|z|)
(Intercept) 2.24392 0.57742 3.886 0.000102 ***
Speed_LC_veh 0.23483 0.10034 2.340 0.019264 *
Speed_front -0.18844 0.07198 -2.618 0.008849 **
Speed_lead -0.13023 0.06577 -1.980 0.047710 *
---
Signif. codes: 0 ‘***’ 0.001 ‘**’ 0.01 ‘*’ 0.05 ‘.’ 0.1 ‘ ’ 1
(Dispersion parameter for binomial family taken to be 1)
Null deviance: 308.75 on 334 degrees of freedom
Residual deviance: 299.16 on 331 degrees of freedom
AIC: 307.16
Number of Fisher Scoring iterations: 4
The following shows the model estimates for the risk model using explanatory variables
collected at t2.
Outputs from R software:
Call:
glm(formula = risk ~ Speed_lead + Acce_lag + Gap_lag, family =
"binomial", data = data_t2)
Deviance Residuals:
Min 1Q Median 3Q Max
-1.463 -1.119 0.000 1.094 1.927
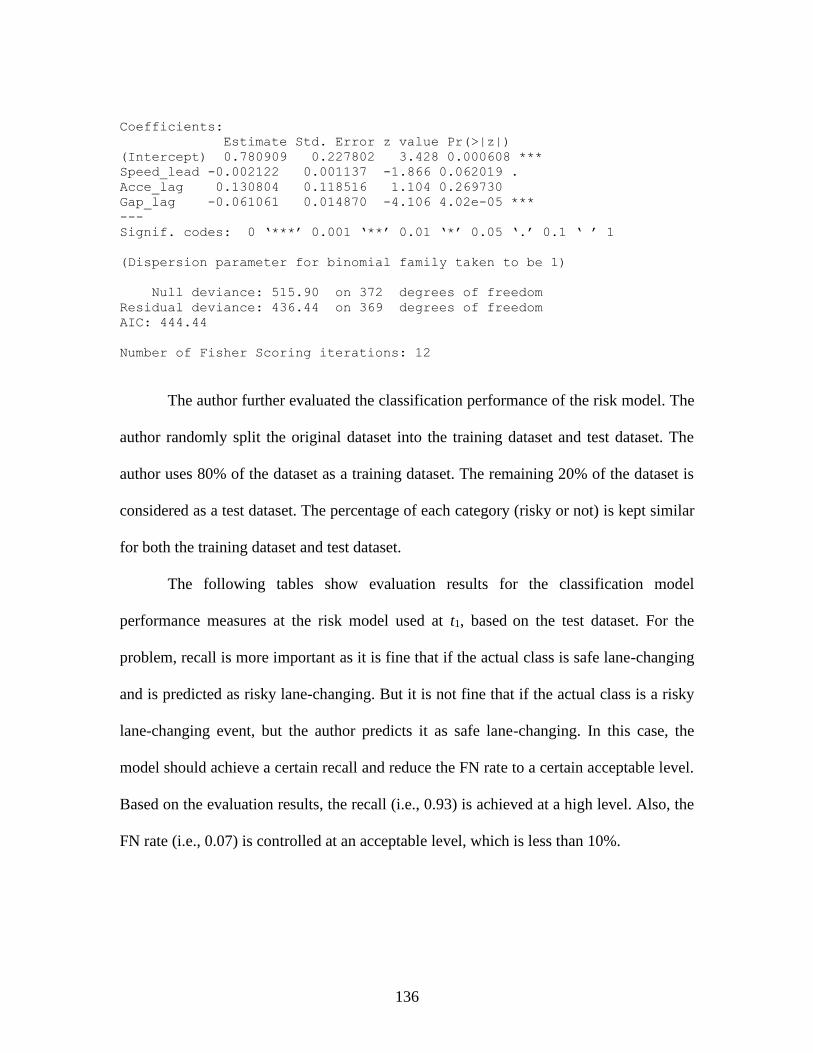
136
Coefficients:
Estimate Std. Error z value Pr(>|z|)
(Intercept) 0.780909 0.227802 3.428 0.000608 ***
Speed_lead -0.002122 0.001137 -1.866 0.062019 .
Acce_lag 0.130804 0.118516 1.104 0.269730
Gap_lag -0.061061 0.014870 -4.106 4.02e-05 ***
---
Signif. codes: 0 ‘***’ 0.001 ‘**’ 0.01 ‘*’ 0.05 ‘.’ 0.1 ‘ ’ 1
(Dispersion parameter for binomial family taken to be 1)
Null deviance: 515.90 on 372 degrees of freedom
Residual deviance: 436.44 on 369 degrees of freedom
AIC: 444.44
Number of Fisher Scoring iterations: 12
The author further evaluated the classification performance of the risk model. The
author randomly split the original dataset into the training dataset and test dataset. The
author uses 80% of the dataset as a training dataset. The remaining 20% of the dataset is
considered as a test dataset. The percentage of each category (risky or not) is kept similar
for both the training dataset and test dataset.
The following tables show evaluation results for the classification model
performance measures at the risk model used at t1, based on the test dataset. For the
problem, recall is more important as it is fine that if the actual class is safe lane-changing
and is predicted as risky lane-changing. But it is not fine that if the actual class is a risky
lane-changing event, but the author predicts it as safe lane-changing. In this case, the
model should achieve a certain recall and reduce the FN rate to a certain acceptable level.
Based on the evaluation results, the recall (i.e., 0.93) is achieved at a high level. Also, the
FN rate (i.e., 0.07) is controlled at an acceptable level, which is less than 10%.
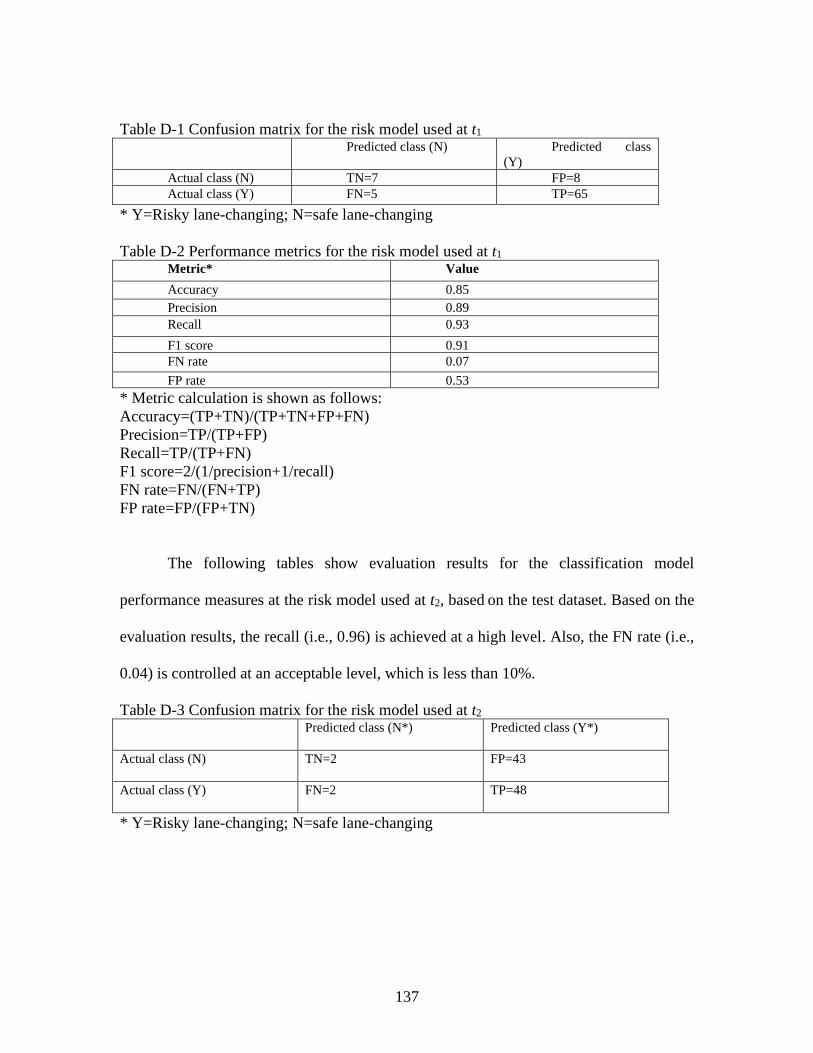
137
Table D-1 Confusion matrix for the risk model used at t1 Predicted class (N) Predicted class
(Y)
Actual class (N) TN=7 FP=8
Actual class (Y) FN=5 TP=65
* Y=Risky lane-changing; N=safe lane-changing
Table D-2 Performance metrics for the risk model used at t1 Metric* Value
Accuracy 0.85
Precision 0.89
Recall 0.93
F1 score 0.91
FN rate 0.07
FP rate 0.53
* Metric calculation is shown as follows:
Accuracy=(TP+TN)/(TP+TN+FP+FN)
Precision=TP/(TP+FP)
Recall=TP/(TP+FN)
F1 score=2/(1/precision+1/recall)
FN rate=FN/(FN+TP)
FP rate=FP/(FP+TN)
The following tables show evaluation results for the classification model
performance measures at the risk model used at t2, based on the test dataset. Based on the
evaluation results, the recall (i.e., 0.96) is achieved at a high level. Also, the FN rate (i.e.,
0.04) is controlled at an acceptable level, which is less than 10%.
Table D-3 Confusion matrix for the risk model used at t2 Predicted class (N*) Predicted class (Y*)
Actual class (N) TN=2 FP=43
Actual class (Y) FN=2 TP=48
* Y=Risky lane-changing; N=safe lane-changing
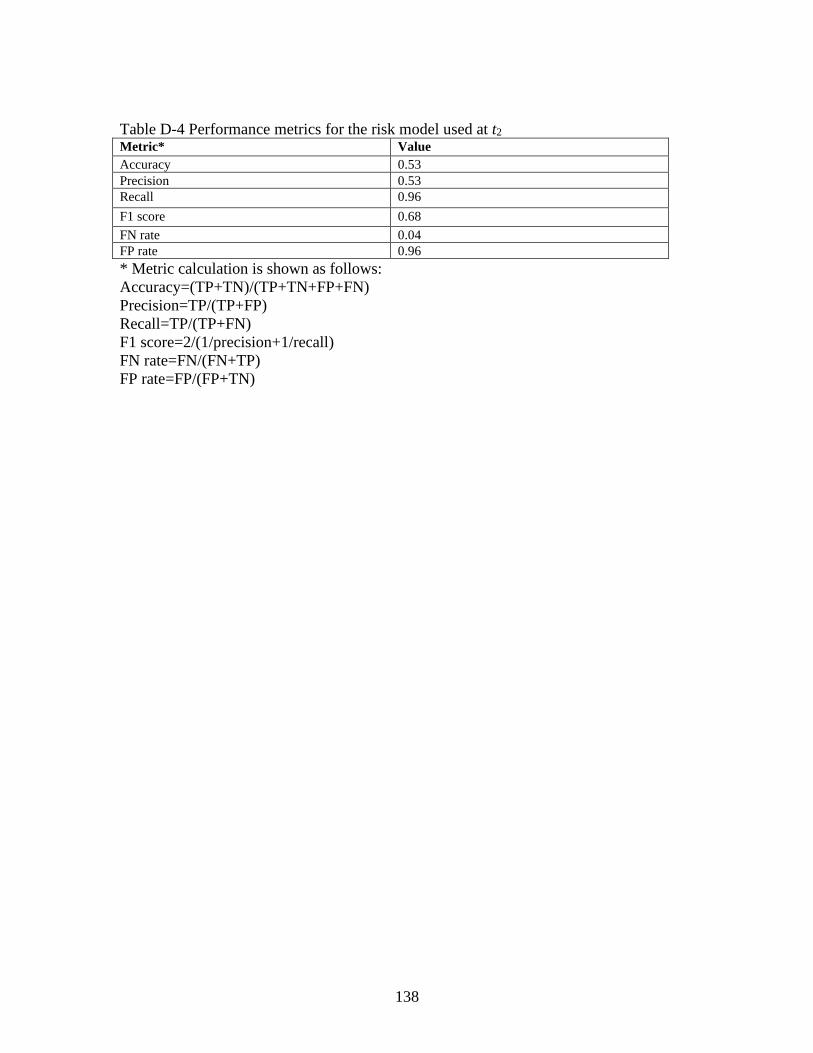
138
Table D-4 Performance metrics for the risk model used at t2 Metric* Value
Accuracy 0.53
Precision 0.53
Recall 0.96
F1 score 0.68
FN rate 0.04
FP rate 0.96
* Metric calculation is shown as follows:
Accuracy=(TP+TN)/(TP+TN+FP+FN)
Precision=TP/(TP+FP)
Recall=TP/(TP+FN)
F1 score=2/(1/precision+1/recall)
FN rate=FN/(FN+TP)
FP rate=FP/(FP+TN)